0001450011pimco:PIMCOINDEXBloombergUSAggregateIndex22128BroadBasedIndexMember2018-06-300001450011pimco:PIMCOINDEXFTSE3MinusMonthTreasuryBillIndex22129AdditionalIndexMember2019-07-31
UNITED STATES
SECURITIES AND EXCHANGE COMMISSION
Washington, D.C. 20549
FORM N-CSR
CERTIFIED SHAREHOLDER REPORT OF REGISTERED MANAGEMENT
INVESTMENT COMPANIES
Investment Company Act file number: 811-22250
PIMCO ETF Trust
(Exact name of registrant as specified in charter)
650 Newport Center Drive, Newport Beach, CA 92660
(Address of principal executive office)
Bijal Y. Parikh
Treasurer (Principal Financial & Accounting Officer)
PIMCO ETF Trust
650 Newport Center Drive, Newport Beach, CA 92660
(Name and address of agent for service)
Copies to:
Adam T. Teufel
Dechert LLP
1900 K Street, N.W.
Washington, D.C. 20006
Registrant’s telephone number, including area code: (888) 877-4626
Date of fiscal year end: June 30
Date of reporting period: June 30, 2024
Form N-CSR is to be used by management investment companies to file reports with the Commission not later than 10 days after the transmission to stockholders of any report that is required to be transmitted to stockholders under Rule 30e-1 under the Investment Company Act of 1940 (17 CFR 270.30e-1). The Commission may use the information provided on Form N-CSR in its regulatory, disclosure review, inspection, and policymaking roles.
A registrant is required to disclose the information specified by Form N-CSR, and the Commission will make this information public. A registrant is not required to respond to the collection of information contained in Form N-CSR unless the Form displays a currently valid Office of Management and Budget (“OMB”) control number. Please direct comments concerning the accuracy of the information collection burden estimate and any suggestions for reducing the burden to Secretary, Securities and Exchange Commission, 100 F Street, NE, Washington, DC 20549-1090. The OMB has reviewed this collection of information under the clearance requirements of 44 U.S.C. § 3507.
| Item 1. | Reports to Stockholders. |
| | (a) | The following is a copy of the reports transmitted to shareholders pursuant to Rule 30e-1 under the Investment Company Act of 1940, as amended (the “Act”) (17 CFR 270.30e-1). |
| | • | | PIMCO 25+ Year Zero Coupon U.S. Treasury Index Exchange-Traded Fund |
| | • | | PIMCO 1-5 Year U.S. TIPS Index Exchange-Traded Fund |
| | • | | PIMCO 15+ Year U.S. TIPS Index Exchange-Traded Fund |
| | • | | PIMCO Broad U.S. TIPS Index Exchange-Traded Fund |
| | • | | PIMCO 0-5 Year High Yield Corporate Bond Index Exchange-Traded Fund |
| | • | | PIMCO Investment Grade Corporate Bond Exchange-Traded Fund |
| | • | | PIMCO Active Bond Exchange-Traded Fund |
| | • | | PIMCO Commodity Strategy Active Exchange-Traded Fund |
| | • | | PIMCO Enhanced Low Duration Active Exchange-Traded Fund |
| | • | | PIMCO Enhanced Short Maturity Active Exchange-Traded Fund |
| | • | | PIMCO Enhanced Short Maturity Active ESG Exchange-Traded Fund |
| | • | | PIMCO Intermediate Municipal Bond Active Exchange-Traded Fund |
| | • | | PIMCO Multisector Bond Active Exchange-Traded Fund |
| | • | | PIMCO Municipal Income Opportunities Active Exchange-Traded Fund |
| | • | | PIMCO Preferred and Capital Securities Active Exchange-Traded Fund |
| | • | | PIMCO Senior Loan Active Exchange-Traded Fund |
| | • | | PIMCO Short Term Municipal Bond Active Exchange-Traded Fund |
| | • | | PIMCO Ultra Short Government Active Exchange-Traded Fund |
| | (b) | Not applicable to the Registrant. |
PIMCO Commodity Strategy Active Exchange-Traded Fund
CMDT | Principal Listing Exchange: NYSE Arca
Annual Shareholder Report | June 30, 2024
This annual shareholder report contains important information about the PIMCO Commodity Strategy Active Exchange-Traded Fund (the "Fund") for the period of July 1, 2023 to June 30, 2024 (the "reporting period"). You can find additional information about the Fund at www.pimco.com/literature. You can also request this information by contacting us at 888.400.4ETF (888.400.4383).
This report describes changes to the Fund that occurred during the reporting period.
What were the Fund costs for the last year?
(based on a hypothetical $10,000 investment)
| Fund Name | Cost of a $10,000 investment | Costs paid as a percentage of a $10,000 investment |
|---|
| PIMCO Commodity Strategy Active Exchange-Traded Fund | $68 | 0.64% |
How did the Fund perform during the reporting period and what affected its performance?
The following affected performance (on a gross basis) during the reporting period:
• Underweight exposure to natural gas contributed to relative performance, as the commodity posted negative returns.
• Underweight exposure to corn contributed to relative performance, as the commodity posted negative returns.
• Overweight exposure to brent crude oil contributed to relative performance, as the commodity posted positive returns.
• Underweight exposure to soybean oil contributed to relative performance, as the commodity posted negative returns.
• Overweight exposure to gasoline contributed to relative performance, as the commodity posted positive returns.
• Tactical positioning in cocoa, specifically exposure between June 2023 and February 2024, contributed to relative performance, as the
commodity posted positive returns.
• Underweight exposure to gold detracted from relative performance, as the commodity posted positive returns.
• Underweight exposure to copper detracted from relative performance, as the commodity posted positive returns.
• There were no other material detractors for the Fund.
In addition to the Fund's performance, the tables in this section include performance of: (i) a broad-based securities market index (i.e., a regulatory index) and (ii) one or more supplemental index(es). Effective July 24, 2024, the Fund's regulatory index is the S&P 500 Index. The Fund's regulatory index is shown in connection with certain regulatory requirements to provide a broad measure of market performance.
The table below illustrates cumulative returns for the 10-year period ended June 30, 2024 or the life of the Fund, if shorter. Cumulative returns are based on a hypothetical initial investment equal to the greater of either $10,000 or the investment minimum applicable to the share class.
Cumulative Returns Based on $10,000 Investment
| PIMCO Commodity Strategy Active Exchange-Traded Fund (at NAV) | S&P 500 Index | Bloomberg Commodity Index Total Return |
|---|
| 5/9/2023 | $10,000 | $10,000 | $10,000 |
| 5/31/2023 | $9,640 | $10,118 | $9,478 |
| 6/30/2023 | $10,092 | $10,786 | $9,861 |
| 7/31/2023 | $10,851 | $11,133 | $10,478 |
| 8/31/2023 | $10,899 | $10,955 | $10,398 |
| 9/30/2023 | $10,939 | $10,433 | $10,326 |
| 10/31/2023 | $10,907 | $10,214 | $10,353 |
| 11/30/2023 | $10,770 | $11,146 | $10,120 |
| 12/31/2023 | $10,531 | $11,653 | $9,848 |
| 1/31/2024 | $10,748 | $11,849 | $9,887 |
| 2/29/2024 | $10,732 | $12,481 | $9,742 |
| 3/31/2024 | $11,171 | $12,883 | $10,064 |
| 4/30/2024 | $11,354 | $12,357 | $10,335 |
| 5/31/2024 | $11,349 | $12,969 | $10,516 |
| 6/30/2024 | $11,304 | $13,435 | $10,354 |
The table below shows the average annual total returns of the Fund, a regulatory index, and one or more supplemental index(es) for certain periods ended June 30, 2024.
Average Annual Total Returns (%)
| Fund/Index Name | 1 Year | Since Inception 5/9/23 |
|---|
| PIMCO Commodity Strategy Active Exchange-Traded Fund (at NAV) | 12.01% | 11.32% |
| PIMCO Commodity Strategy Active Exchange-Traded Fund (at Market Price) | 12.06% | 11.29% |
| S&P 500 Index | 24.56% | 30.00% |
| Bloomberg Commodity Index Total Return | 5.00% | 3.21% |
All Fund returns are net of fees and expenses and include applicable fee waivers and/or expense limitations. Absent any applicable fee waivers and/or expense limitations, performance would have been lower and there can be no assurance that any such waivers or limitations will continue in the future.
Performance quoted represents past performance. Past performance is not a guarantee or a reliable indicator of future results.Current performance may be lower or higher than performance shown. Investment return and the principal value of an investment will fluctuate. Shares may be worth more or less than original cost when redeemed. Returns shown do not reflect the deduction of taxes that a shareholder would pay on Fund distributions or the redemption of Fund shares.Differences in the Fund’s performance versus an index and related attribution information with respect to particular categories of securities or individual positions may be attributable, in part, to differences in the pricing methodologies used by the Fund and the index. For performance current to the most recent month-end, visit www.pimco.com/literature or via 888.400.4ETF (888.400.4383).
Key Fund StatisticsFootnote Reference* (as of the end of the reporting period)
| Total Net Assets | $302,502 |
| # of Portfolio Holdings | 290 |
| Portfolio Turnover Rate | 50% |
| Total Net Management Fees Paid During the Reporting Period | $1,399 |
| Footnote | Description |
Footnote* | Dollar amounts displayed in 000's |
What did the Fund invest in?
Allocation Breakdown (% of Net Assets)Footnote Reference*
| Footnote | Description |
Footnote* | % of Net Assets includes derivatives instruments, if any, valued at the value used for determining the Fund’s net asset value. The notional exposure of such derivatives investments therefore may be greater than what is depicted. |
| Corporate Bonds & Notes | 51.5% |
| Commodities | 11.8% |
| Asset-Backed Securities | 10.8% |
| Affiliated Investments | 6.7% |
| Sovereign Issues | 3.1% |
| U.S. Government Agencies | 0.5% |
| Non-Agency Mortgage-Backed Securities | 0.5% |
| Short-Term Instruments | 21.8% |
| Other Investments | (1.3%) |
| Other Assets and Liabilities, Net | (5.4%) |
| Total | 100.0% |
This is a summary of certain changes and planned changes of the Fund since the beginning of the reporting period. For more information, you may refer to the Fund's next prospectus, which we expect to be available by October 31, 2024 or upon request at 888.400.4ETF (888.400.4383).
Change to Principal Investment Strategies. Effective January 16, 2024, the Fund has an investment strategy to invest, under normal circumstances, in commodity-linked derivative instruments and commodities that, in the aggregate, provide the Fund with notional exposure to commodities within 20% (plus or minus) of the value of the Fund’s net assets. Previously, the Fund sought to maintain, under normal circumstances, notional exposure to commodities within 20% (plus or minus) of the value of the Fund’s net assets.
For additional information about the Fund, including the Fund's prospectus, financial information, holdings and proxy voting information, please visit www.pimco.com/literature or contact 888.400.4ETF (888.400.4383). For tax information about the Fund, please visit: https://www.pimco.com/tax.
PIMCO Commodity Strategy Active Exchange-Traded Fund
Annual Shareholder Report |
June 30, 2024
CMDT | Principal Listing Exchange: NYSE Arca
PIMCO Multisector Bond Active Exchange-Traded Fund
PYLD | Principal Listing Exchange: NYSE Arca
Annual Shareholder Report | June 30, 2024
This annual shareholder report contains important information about the PIMCO Multisector Bond Active Exchange-Traded Fund (the "Fund") for the period of July 1, 2023 to June 30, 2024 (the "reporting period"). You can find additional information about the Fund at www.pimco.com/literature. You can also request this information by contacting us at 888.400.4ETF (888.400.4383).
This report describes changes to the Fund that occurred during the reporting period.
What were the Fund costs for the last year?
(based on a hypothetical $10,000 investment)
| Fund Name | Cost of a $10,000 investment | Costs paid as a percentage of a $10,000 investment |
|---|
| PIMCO Multisector Bond Active Exchange-Traded Fund | $72 | 0.69% |
How did the Fund perform during the reporting period and what affected its performance?
The following affected performance (on a gross basis) during the reporting period:
• Exposure to the U.S. cash rate contributed to performance, as the 3-month Secured Overnight Financing Rate rose.
• Exposure to high yield credit contributed to performance, as the asset class posted positive returns.
• Exposure to non-agency residential mortgage-backed securities contributed to performance, as spreads tightened.
• U.S. duration positioning detracted from performance, as rates rose.
• Brazilian duration positioning detracted from performance, as rates rose.
• Mexican duration positioning detracted from performance, as rates rose.
In addition to the Fund's performance, the tables in this section include performance of a broad-based securities market index (i.e., a regulatory index). The Fund's regulatory index is shown in connection with certain regulatory requirements to provide a broad measure of market performance.
The table below illustrates cumulative returns for the 10-year period ended June 30, 2024 or the life of the Fund, if shorter. Cumulative returns are based on a hypothetical initial investment equal to the greater of either $10,000 or the investment minimum applicable to the share class.
Cumulative Returns Based on $10,000 Investment
| PIMCO Multisector Bond Active Exchange-Traded Fund (at NAV) | Bloomberg U.S. Aggregate Index |
|---|
| 6/21/2023 | $10,000 | $10,000 |
| 6/30/2023 | $10,008 | $9,968 |
| 7/31/2023 | $10,060 | $9,961 |
| 8/31/2023 | $10,025 | $9,897 |
| 9/30/2023 | $9,844 | $9,646 |
| 10/31/2023 | $9,710 | $9,494 |
| 11/30/2023 | $10,175 | $9,924 |
| 12/31/2023 | $10,517 | $10,303 |
| 1/31/2024 | $10,570 | $10,275 |
| 2/29/2024 | $10,520 | $10,130 |
| 3/31/2024 | $10,664 | $10,223 |
| 4/30/2024 | $10,501 | $9,965 |
| 5/31/2024 | $10,692 | $10,134 |
| 6/30/2024 | $10,774 | $10,230 |
The table below shows the average annual total returns of the Fund and a regulatory index(es) for certain periods ended June 30, 2024.
Average Annual Total Returns (%)
| Fund/Index Name | 1 Year | Since Inception 6/21/23 |
|---|
| PIMCO Multisector Bond Active Exchange-Traded Fund (at NAV) | 7.66% | 7.55% |
| PIMCO Multisector Bond Active Exchange-Traded Fund (at Market Price) | 7.68% | 7.78% |
| Bloomberg U.S. Aggregate Index | 2.63% | 2.24% |
All Fund returns are net of fees and expenses and include applicable fee waivers and/or expense limitations. Absent any applicable fee waivers and/or expense limitations, performance would have been lower and there can be no assurance that any such waivers or limitations will continue in the future.
Performance quoted represents past performance. Past performance is not a guarantee or a reliable indicator of future results.Current performance may be lower or higher than performance shown. Investment return and the principal value of an investment will fluctuate. Shares may be worth more or less than original cost when redeemed. Returns shown do not reflect the deduction of taxes that a shareholder would pay on Fund distributions or the redemption of Fund shares.Differences in the Fund’s performance versus an index and related attribution information with respect to particular categories of securities or individual positions may be attributable, in part, to differences in the pricing methodologies used by the Fund and the index. For performance current to the most recent month-end, visit www.pimco.com/literature or via 888.400.4ETF (888.400.4383).
Key Fund StatisticsFootnote Reference* (as of the end of the reporting period)
| Total Net Assets | $1,005,834 |
| # of Portfolio Holdings | 951 |
| Portfolio Turnover Rate | 398% |
| Total Net Management Fees Paid During the Reporting Period | $1,976 |
| Footnote | Description |
Footnote* | Dollar amounts displayed in 000's |
What did the Fund invest in?
Allocation Breakdown (% of Net Assets)Footnote Reference*
| Footnote | Description |
Footnote* | % of Net Assets includes derivatives instruments, if any, valued at the value used for determining the Fund’s net asset value. The notional exposure of such derivatives investments therefore may be greater than what is depicted. |
| U.S. Government Agencies | 42.1% |
| Asset-Backed Securities | 37.9% |
| Corporate Bonds & Notes | 24.9% |
| Non-Agency Mortgage-Backed Securities | 23.9% |
| U.S. Treasury Obligations | 9.8% |
| Sovereign Issues | 1.6% |
| Loan Participations and Assignments | 1.6% |
| Affiliated Investments | 0.3% |
| Municipal Bonds & Notes | 0.3% |
| Short-Term Instruments | 1.7% |
| Other Investments | 1.6% |
| Other Assets and Liabilities, Net | (45.7%) |
| Total | 100.0% |
This is a summary of certain changes and planned changes of the Fund since the beginning of the reporting period. For more information, you may refer to the Fund's next prospectus, which we expect to be available by October 31, 2024 or upon request at 888.400.4ETF (888.400.4383).
Changes to Total Annual Fund Operating Expenses. Annual fund operating expenses increased during the year by 0.15% as a result of higher expenses related to interest.
For additional information about the Fund, including the Fund's prospectus, financial information, holdings and proxy voting information, please visit www.pimco.com/literature or contact 888.400.4ETF (888.400.4383). For tax information about the Fund, please visit: https://www.pimco.com/tax.
PIMCO Multisector Bond Active Exchange-Traded Fund
Annual Shareholder Report |
June 30, 2024
PYLD | Principal Listing Exchange: NYSE Arca
PIMCO Preferred and Capital Securities Active Exchange-Traded Fund
PRFD | Principal Listing Exchange: NYSE Arca
Annual Shareholder Report | June 30, 2024
This annual shareholder report contains important information about the PIMCO Preferred and Capital Securities Active Exchange-Traded Fund (the "Fund") for the period of July 1, 2023 to June 30, 2024 (the "reporting period"). You can find additional information about the Fund at www.pimco.com/literature. You can also request this information by contacting us at 888.400.4ETF (888.400.4383).
What were the Fund costs for the last year?
(based on a hypothetical $10,000 investment)
| Fund Name | Cost of a $10,000 investment | Costs paid as a percentage of a $10,000 investment |
|---|
| PIMCO Preferred and Capital Securities Active Exchange-Traded Fund | $79 | 0.74% |
How did the Fund perform during the reporting period and what affected its performance?
The following affected performance (on a gross basis) during the reporting period:
• Overweight exposure to U.K. Additional Tier 1 ("AT1") securities contributed to performance, as the AT1 market benefited from the
post-March 2023 recovery.
• Security selection within U.S. non-financial subordinate debt, particularly overweight exposure to an energy company, contributed to
performance, as energy prices remained high.
• Overweight exposure to French AT1 securities contributed to performance, as the AT1 market benefited from the post-March 2023
recovery.
• Security selection within U.S. preferred securities, particularly underweight exposure to a custodian, detracted from performance, as it
recovered from volatility in the banking sector.
• Security selection within U.S. insurance capital, particularly underweight exposure to a retirement services company, detracted from
performance, as it benefited from growth in retail fixed annuity products.
• Overweight exposure to U.S. duration at the intermediate part of the curve detracted from performance, as rates rose.
In addition to the Fund's performance, the tables in this section include performance of: (i) a broad-based securities market index (i.e., a regulatory index) and (ii) one or more supplemental index(es). Effective July 24, 2024, the Fund's regulatory index is the Bloomberg U.S. Aggregate Index. The Fund's regulatory index is shown in connection with certain regulatory requirements to provide a broad measure of market performance.
The table below illustrates cumulative returns for the 10-year period ended June 30, 2024 or the life of the Fund, if shorter. Cumulative returns are based on a hypothetical initial investment equal to the greater of either $10,000 or the investment minimum applicable to the share class.
Cumulative Returns Based on $10,000 Investment
| PIMCO Preferred and Capital Securities Active Exchange-Traded Fund (at NAV) | Bloomberg U.S. Aggregate Index | ICE BofA US All Capital Securities Index |
|---|
| 1/18/2023 | $10,000 | $10,000 | $10,000 |
| 1/31/2023 | $10,164 | $10,044 | $10,233 |
| 2/28/2023 | $9,968 | $9,785 | $10,037 |
| 3/31/2023 | $9,355 | $10,033 | $9,560 |
| 4/30/2023 | $9,472 | $10,094 | $9,707 |
| 5/31/2023 | $9,410 | $9,984 | $9,593 |
| 6/30/2023 | $9,482 | $9,948 | $9,688 |
| 7/31/2023 | $9,721 | $9,941 | $9,844 |
| 8/31/2023 | $9,598 | $9,878 | $9,780 |
| 9/30/2023 | $9,416 | $9,627 | $9,670 |
| 10/31/2023 | $9,173 | $9,475 | $9,378 |
| 11/30/2023 | $9,723 | $9,904 | $9,976 |
| 12/31/2023 | $10,185 | $10,283 | $10,294 |
| 1/31/2024 | $10,314 | $10,255 | $10,562 |
| 2/29/2024 | $10,360 | $10,110 | $10,653 |
| 3/31/2024 | $10,541 | $10,203 | $10,762 |
| 4/30/2024 | $10,368 | $9,946 | $10,540 |
| 5/31/2024 | $10,596 | $10,114 | $10,746 |
| 6/30/2024 | $10,705 | $10,210 | $10,815 |
The table below shows the average annual total returns of the Fund, a regulatory index, and one or more supplemental index(es) for certain periods ended June 30, 2024.
Average Annual Total Returns (%)
| Fund/Index Name | 1 Year | Since Inception 1/18/23 |
|---|
| PIMCO Preferred and Capital Securities Active Exchange-Traded Fund (at NAV) | 12.91% | 4.83% |
| PIMCO Preferred and Capital Securities Active Exchange-Traded Fund (at Market Price) | 12.88% | 4.85% |
| Bloomberg U.S. Aggregate Index | 2.63% | 0.77% |
| ICE BofA US All Capital Securities Index | 11.63% | 5.24% |
All Fund returns are net of fees and expenses and include applicable fee waivers and/or expense limitations. Absent any applicable fee waivers and/or expense limitations, performance would have been lower and there can be no assurance that any such waivers or limitations will continue in the future.
Performance quoted represents past performance. Past performance is not a guarantee or a reliable indicator of future results.Current performance may be lower or higher than performance shown. Investment return and the principal value of an investment will fluctuate. Shares may be worth more or less than original cost when redeemed. Returns shown do not reflect the deduction of taxes that a shareholder would pay on Fund distributions or the redemption of Fund shares.Differences in the Fund’s performance versus an index and related attribution information with respect to particular categories of securities or individual positions may be attributable, in part, to differences in the pricing methodologies used by the Fund and the index. For performance current to the most recent month-end, visit www.pimco.com/literature or via 888.400.4ETF (888.400.4383).
Key Fund StatisticsFootnote Reference* (as of the end of the reporting period)
| Total Net Assets | $116,116 |
| # of Portfolio Holdings | 148 |
| Portfolio Turnover Rate | 64% |
| Total Net Management Fees Paid During the Reporting Period | $606 |
| Footnote | Description |
Footnote* | Dollar amounts displayed in 000's |
What did the Fund invest in?
Allocation Breakdown (% of Net Assets)Footnote Reference*
| Footnote | Description |
Footnote* | % of Net Assets includes derivatives instruments, if any, valued at the value used for determining the Fund’s net asset value. The notional exposure of such derivatives investments therefore may be greater than what is depicted. |
| Corporate Bonds & Notes | 59.3% |
| Preferred Securities | 34.2% |
| Short-Term Instruments | 5.3% |
| Other Investments | 0.6% |
| Other Assets and Liabilities, Net | 0.6% |
| Total | 100.0% |
For additional information about the Fund, including the Fund's prospectus, financial information, holdings and proxy voting information, please visit www.pimco.com/literature or contact 888.400.4ETF (888.400.4383). For tax information about the Fund, please visit: https://www.pimco.com/tax.
PIMCO Preferred and Capital Securities Active Exchange-Traded Fund
Annual Shareholder Report |
June 30, 2024
PRFD | Principal Listing Exchange: NYSE Arca
PIMCO Ultra Short Government Active Exchange-Traded Fund
BILZ | Principal Listing Exchange: NYSE Arca
Annual Shareholder Report | June 30, 2024
This annual shareholder report contains important information about the PIMCO Ultra Short Government Active Exchange-Traded Fund (the "Fund") for the period of July 1, 2023 to June 30, 2024 (the "reporting period"). You can find additional information about the Fund at www.pimco.com/literature. You can also request this information by contacting us at 888.400.4ETF (888.400.4383).
What were the Fund costs for the last year?
(based on a hypothetical $10,000 investment)
| Fund Name | Cost of a $10,000 investment | Costs paid as a percentage of a $10,000 investment |
|---|
| PIMCO Ultra Short Government Active Exchange-Traded Fund | $14 | 0.14% |
How did the Fund perform during the reporting period and what affected its performance?
The following affected performance (on a gross basis) during the reporting period:
• Selection to United States Treasury bills contributed to relative performance, as interest rates rose.
• There were no other material contributors or detractors for this Fund.
In addition to the Fund's performance, the tables in this section include performance of: (i) a broad-based securities market index (i.e., a regulatory index) and (ii) one or more supplemental index(es). Effective July 24, 2024, the Fund's regulatory index is the Bloomberg U.S. Aggregate Index. The Fund's regulatory index is shown in connection with certain regulatory requirements to provide a broad measure of market performance.
The table below illustrates cumulative returns for the 10-year period ended June 30, 2024 or the life of the Fund, if shorter. Cumulative returns are based on a hypothetical initial investment equal to the greater of either $10,000 or the investment minimum applicable to the share class.
Cumulative Returns Based on $10,000 Investment
| PIMCO Ultra Short Government Active Exchange-Traded Fund (at NAV) | Bloomberg U.S. Aggregate Index | FTSE 3-Month Treasury Bill Index |
|---|
| 6/21/2023 | $10,000 | $10,000 | $10,000 |
| 6/30/2023 | $10,015 | $9,968 | $10,014 |
| 7/31/2023 | $10,056 | $9,961 | $10,060 |
| 8/31/2023 | $10,102 | $9,897 | $10,107 |
| 9/30/2023 | $10,147 | $9,646 | $10,152 |
| 10/31/2023 | $10,191 | $9,494 | $10,200 |
| 11/30/2023 | $10,240 | $9,924 | $10,247 |
| 12/31/2023 | $10,288 | $10,303 | $10,295 |
| 1/31/2024 | $10,333 | $10,275 | $10,343 |
| 2/29/2024 | $10,374 | $10,130 | $10,388 |
| 3/31/2024 | $10,421 | $10,223 | $10,436 |
| 4/30/2024 | $10,465 | $9,965 | $10,483 |
| 5/31/2024 | $10,516 | $10,134 | $10,532 |
| 6/30/2024 | $10,559 | $10,230 | $10,579 |
The table below shows the average annual total returns of the Fund, a regulatory index, and one or more supplemental index(es) for certain periods ended June 30, 2024.
Average Annual Total Returns (%)
| Fund/Index Name | 1 Year | Since Inception 6/21/23 |
|---|
| PIMCO Ultra Short Government Active Exchange-Traded Fund (at NAV) | 5.43% | 5.45% |
| PIMCO Ultra Short Government Active Exchange-Traded Fund (at Market Price) | 5.41% | 5.44% |
| Bloomberg U.S. Aggregate Index | 2.63% | 2.24% |
| FTSE 3-Month Treasury Bill Index | 5.64% | 5.63% |
All Fund returns are net of fees and expenses and include applicable fee waivers and/or expense limitations. Absent any applicable fee waivers and/or expense limitations, performance would have been lower and there can be no assurance that any such waivers or limitations will continue in the future.
Performance quoted represents past performance. Past performance is not a guarantee or a reliable indicator of future results.Current performance may be lower or higher than performance shown. Investment return and the principal value of an investment will fluctuate. Shares may be worth more or less than original cost when redeemed. Returns shown do not reflect the deduction of taxes that a shareholder would pay on Fund distributions or the redemption of Fund shares.Differences in the Fund’s performance versus an index and related attribution information with respect to particular categories of securities or individual positions may be attributable, in part, to differences in the pricing methodologies used by the Fund and the index. For performance current to the most recent month-end, visit www.pimco.com/literature or via 888.400.4ETF (888.400.4383).
Key Fund StatisticsFootnote Reference* (as of the end of the reporting period)
| Total Net Assets | $362,970 |
| # of Portfolio Holdings | 34 |
| Portfolio Turnover Rate | 0% |
| Total Net Management Fees Paid During the Reporting Period | $211 |
| Footnote | Description |
Footnote* | Dollar amounts displayed in 000's |
What did the Fund invest in?
Allocation Breakdown (% of Net Assets)Footnote Reference*
| Footnote | Description |
Footnote* | % of Net Assets includes derivatives instruments, if any, valued at the value used for determining the Fund’s net asset value. The notional exposure of such derivatives investments therefore may be greater than what is depicted. |
| Short-Term Instruments | 110.2% |
| Other Assets and Liabilities, Net | (10.2%) |
| Total | 100.0% |
For additional information about the Fund, including the Fund's prospectus, financial information, holdings and proxy voting information, please visit www.pimco.com/literature or contact 888.400.4ETF (888.400.4383). For tax information about the Fund, please visit: https://www.pimco.com/tax.
PIMCO Ultra Short Government Active Exchange-Traded Fund
Annual Shareholder Report |
June 30, 2024
BILZ | Principal Listing Exchange: NYSE Arca
PIMCO 0-5 Year High Yield Corporate Bond Index Exchange-Traded Fund
HYS | Principal Listing Exchange: NYSE Arca
Annual Shareholder Report | June 30, 2024
This annual shareholder report contains important information about the PIMCO 0-5 Year High Yield Corporate Bond Index Exchange-Traded Fund (the "Fund") for the period of July 1, 2023 to June 30, 2024 (the "reporting period"). You can find additional information about the Fund at www.pimco.com/literature. You can also request this information by contacting us at 888.400.4ETF (888.400.4383).
What were the Fund costs for the last year?
(based on a hypothetical $10,000 investment)
| Fund Name | Cost of a $10,000 investment | Costs paid as a percentage of a $10,000 investment |
|---|
| PIMCO 0-5 Year High Yield Corporate Bond Index Exchange-Traded Fund | $60 | 0.57% |
How did the Fund perform during the reporting period and what affected its performance?
The following affected performance (on a gross basis) during the reporting period:
• Security selection within the finance and brokerage sector, specifically underweight exposure to a provider of co-working spaces,
contributed to performance, as spreads widened after filing for bankruptcy.
• Underweight exposure to duration contributed to performance, as interest rates rose.
• Security selection within the energy services sector, specifically underweight exposure to an international provider, contributed to
performance, as the bond price fell.
• Security selection within the retail sector, specifically underweight exposure to a vehicle retailer, detracted from performance, as
spreads tightened amid improved earnings.
• Security selection within the paper and packaging sector, specifically overweight exposure to a packaging producer, detracted from
performance, as spreads widened amid weak earnings.
• Security selection within the healthcare sector, specifically underweight exposure to a staffing provider, detracted from performance,
as spreads tightened amid refinancing.
In addition to the Fund's performance, the tables in this section include performance of: (i) a broad-based securities market index (i.e., a regulatory index) and (ii) one or more supplemental index(es). Effective July 24, 2024, the Fund's regulatory index is the Bloomberg U.S. Aggregate Index. The Fund's regulatory index is shown in connection with certain regulatory requirements to provide a broad measure of market performance.
The table below illustrates cumulative returns for the 10-year period ended June 30, 2024 or the life of the Fund, if shorter. Cumulative returns are based on a hypothetical initial investment equal to the greater of either $10,000 or the investment minimum applicable to the share class.
Cumulative Returns Based on $10,000 Investment
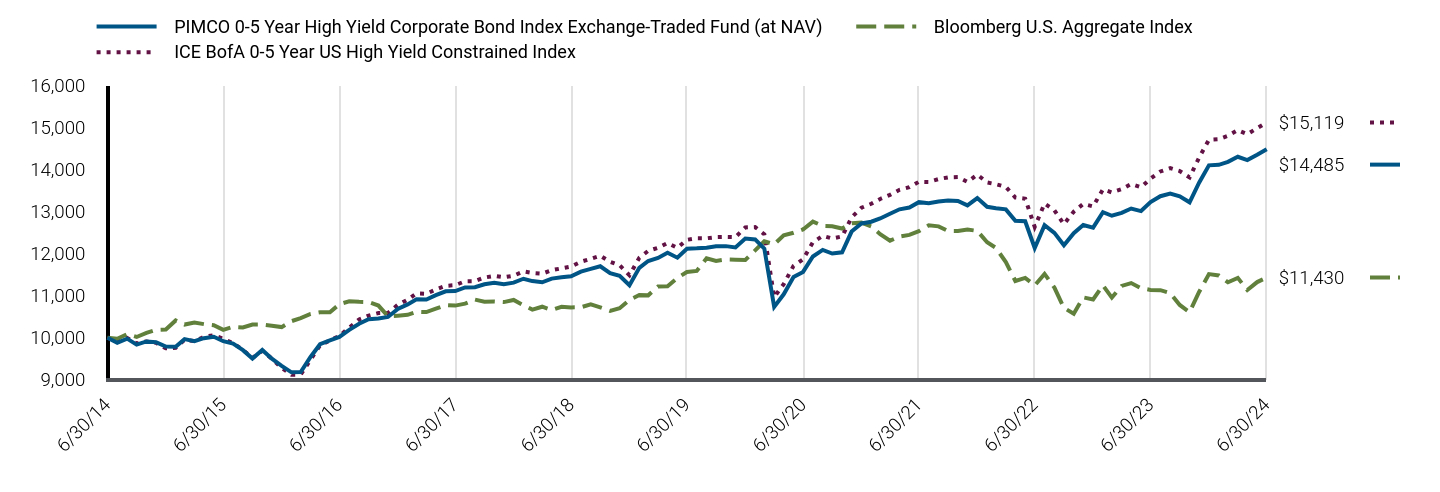
| PIMCO 0-5 Year High Yield Corporate Bond Index Exchange-Traded Fund (at NAV) | Bloomberg U.S. Aggregate Index | ICE BofA 0-5 Year US High Yield Constrained Index |
|---|
| 6/30/14 | $10,000 | $10,000 | $10,000 |
| 7/31/14 | $9,880 | $9,975 | $9,911 |
| 8/31/14 | $9,977 | $10,085 | $9,996 |
| 9/30/14 | $9,834 | $10,017 | $9,865 |
| 10/31/14 | $9,911 | $10,115 | $9,911 |
| 11/30/14 | $9,894 | $10,187 | $9,877 |
| 12/31/14 | $9,790 | $10,196 | $9,747 |
| 1/31/15 | $9,785 | $10,410 | $9,759 |
| 2/28/15 | $9,966 | $10,312 | $9,951 |
| 3/31/15 | $9,915 | $10,360 | $9,917 |
| 4/30/15 | $9,988 | $10,323 | $10,018 |
| 5/31/15 | $10,022 | $10,298 | $10,060 |
| 6/30/15 | $9,916 | $10,186 | $9,973 |
| 7/31/15 | $9,860 | $10,257 | $9,870 |
| 8/31/15 | $9,703 | $10,242 | $9,707 |
| 9/30/15 | $9,503 | $10,311 | $9,520 |
| 10/31/15 | $9,708 | $10,313 | $9,687 |
| 11/30/15 | $9,500 | $10,286 | $9,503 |
| 12/31/15 | $9,330 | $10,252 | $9,282 |
| 1/31/16 | $9,176 | $10,393 | $9,118 |
| 2/29/16 | $9,184 | $10,467 | $9,120 |
| 3/31/16 | $9,541 | $10,563 | $9,477 |
| 4/30/16 | $9,844 | $10,604 | $9,818 |
| 5/31/16 | $9,934 | $10,607 | $9,936 |
| 6/30/16 | $10,019 | $10,797 | $10,043 |
| 7/31/16 | $10,186 | $10,865 | $10,240 |
| 8/31/16 | $10,333 | $10,853 | $10,434 |
| 9/30/16 | $10,438 | $10,847 | $10,525 |
| 10/31/16 | $10,456 | $10,764 | $10,585 |
| 11/30/16 | $10,493 | $10,509 | $10,589 |
| 12/31/16 | $10,686 | $10,524 | $10,781 |
| 1/31/17 | $10,791 | $10,544 | $10,905 |
| 2/28/17 | $10,914 | $10,615 | $11,054 |
| 3/31/17 | $10,909 | $10,610 | $11,045 |
| 4/30/17 | $11,012 | $10,692 | $11,148 |
| 5/31/17 | $11,103 | $10,774 | $11,234 |
| 6/30/17 | $11,109 | $10,763 | $11,249 |
| 7/31/17 | $11,196 | $10,809 | $11,343 |
| 8/31/17 | $11,202 | $10,906 | $11,346 |
| 9/30/17 | $11,271 | $10,854 | $11,431 |
| 10/31/17 | $11,306 | $10,861 | $11,470 |
| 11/30/17 | $11,270 | $10,847 | $11,437 |
| 12/31/17 | $11,310 | $10,897 | $11,474 |
| 1/31/18 | $11,402 | $10,771 | $11,577 |
| 2/28/18 | $11,347 | $10,669 | $11,540 |
| 3/31/18 | $11,317 | $10,737 | $11,523 |
| 4/30/18 | $11,406 | $10,658 | $11,606 |
| 5/31/18 | $11,439 | $10,734 | $11,649 |
| 6/30/18 | $11,462 | $10,720 | $11,692 |
| 7/31/18 | $11,571 | $10,723 | $11,806 |
| 8/31/18 | $11,638 | $10,792 | $11,876 |
| 9/30/18 | $11,699 | $10,722 | $11,950 |
| 10/31/18 | $11,536 | $10,638 | $11,806 |
| 11/30/18 | $11,474 | $10,701 | $11,723 |
| 12/31/18 | $11,247 | $10,898 | $11,486 |
| 1/31/19 | $11,661 | $11,014 | $11,901 |
| 2/28/19 | $11,824 | $11,007 | $12,065 |
| 3/31/19 | $11,897 | $11,219 | $12,139 |
| 4/30/19 | $12,021 | $11,221 | $12,251 |
| 5/31/19 | $11,903 | $11,421 | $12,139 |
| 6/30/19 | $12,117 | $11,564 | $12,329 |
| 7/31/19 | $12,125 | $11,589 | $12,366 |
| 8/31/19 | $12,139 | $11,890 | $12,365 |
| 9/30/19 | $12,173 | $11,826 | $12,392 |
| 10/31/19 | $12,178 | $11,862 | $12,396 |
| 11/30/19 | $12,148 | $11,856 | $12,393 |
| 12/31/19 | $12,359 | $11,848 | $12,622 |
| 1/31/20 | $12,337 | $12,076 | $12,631 |
| 2/29/20 | $12,117 | $12,293 | $12,460 |
| 3/31/20 | $10,732 | $12,221 | $10,965 |
| 4/30/20 | $11,032 | $12,438 | $11,274 |
| 5/31/20 | $11,444 | $12,496 | $11,708 |
| 6/30/20 | $11,564 | $12,575 | $11,866 |
| 7/31/20 | $11,932 | $12,762 | $12,269 |
| 8/31/20 | $12,087 | $12,659 | $12,423 |
| 9/30/20 | $12,002 | $12,652 | $12,360 |
| 10/31/20 | $12,030 | $12,596 | $12,410 |
| 11/30/20 | $12,525 | $12,720 | $12,861 |
| 12/31/20 | $12,717 | $12,737 | $13,091 |
| 1/31/21 | $12,758 | $12,646 | $13,185 |
| 2/28/21 | $12,836 | $12,463 | $13,300 |
| 3/31/21 | $12,948 | $12,308 | $13,398 |
| 4/30/21 | $13,054 | $12,405 | $13,517 |
| 5/31/21 | $13,097 | $12,445 | $13,579 |
| 6/30/21 | $13,224 | $12,533 | $13,707 |
| 7/31/21 | $13,198 | $12,673 | $13,706 |
| 8/31/21 | $13,241 | $12,649 | $13,773 |
| 9/30/21 | $13,266 | $12,539 | $13,813 |
| 10/31/21 | $13,251 | $12,536 | $13,820 |
| 11/30/21 | $13,148 | $12,573 | $13,707 |
| 12/31/21 | $13,320 | $12,541 | $13,878 |
| 1/31/22 | $13,113 | $12,271 | $13,693 |
| 2/28/22 | $13,081 | $12,134 | $13,650 |
| 3/31/22 | $13,053 | $11,797 | $13,588 |
| 4/30/22 | $12,782 | $11,349 | $13,335 |
| 5/31/22 | $12,770 | $11,422 | $13,306 |
| 6/30/22 | $12,133 | $11,243 | $12,636 |
| 7/31/22 | $12,677 | $11,518 | $13,192 |
| 8/31/22 | $12,493 | $11,192 | $13,030 |
| 9/30/22 | $12,199 | $10,709 | $12,699 |
| 10/31/22 | $12,486 | $10,570 | $12,998 |
| 11/30/22 | $12,679 | $10,959 | $13,183 |
| 12/31/22 | $12,617 | $10,909 | $13,122 |
| 1/31/23 | $12,985 | $11,245 | $13,530 |
| 2/28/23 | $12,901 | $10,954 | $13,455 |
| 3/31/23 | $12,971 | $11,232 | $13,534 |
| 4/30/23 | $13,073 | $11,300 | $13,655 |
| 5/31/23 | $13,012 | $11,177 | $13,578 |
| 6/30/23 | $13,224 | $11,137 | $13,784 |
| 7/31/23 | $13,366 | $11,130 | $13,954 |
| 8/31/23 | $13,427 | $11,059 | $14,032 |
| 9/30/23 | $13,363 | $10,778 | $13,964 |
| 10/31/23 | $13,221 | $10,607 | $13,813 |
| 11/30/23 | $13,688 | $11,088 | $14,285 |
| 12/31/23 | $14,100 | $11,512 | $14,709 |
| 1/31/24 | $14,112 | $11,481 | $14,722 |
| 2/29/24 | $14,182 | $11,318 | $14,804 |
| 3/31/24 | $14,304 | $11,423 | $14,937 |
| 4/30/24 | $14,224 | $11,134 | $14,842 |
| 5/31/24 | $14,353 | $11,323 | $14,985 |
| 6/30/24 | $14,485 | $11,430 | $15,119 |
The table below shows the average annual total returns of the Fund, a regulatory index, and one or more supplemental index(es) for certain periods ended June 30, 2024.
Average Annual Total Returns (%)
| Fund/Index Name | 1 Year | 5 Years | 10 Years |
|---|
| PIMCO 0-5 Year High Yield Corporate Bond Index Exchange-Traded Fund (at NAV) | 9.54% | 3.64% | 3.78% |
| PIMCO 0-5 Year High Yield Corporate Bond Index Exchange-Traded Fund (at Market Price) | 9.08% | 3.64% | 3.75% |
| Bloomberg U.S. Aggregate Index | 2.63% | (0.23%) | 1.35% |
| ICE BofA 0-5 Year US High Yield Constrained Index | 9.68% | 4.16% | 4.22% |
All Fund returns are net of fees and expenses and include applicable fee waivers and/or expense limitations. Absent any applicable fee waivers and/or expense limitations, performance would have been lower and there can be no assurance that any such waivers or limitations will continue in the future.
Performance quoted represents past performance. Past performance is not a guarantee or a reliable indicator of future results.Current performance may be lower or higher than performance shown. Investment return and the principal value of an investment will fluctuate. Shares may be worth more or less than original cost when redeemed. Returns shown do not reflect the deduction of taxes that a shareholder would pay on Fund distributions or the redemption of Fund shares.Differences in the Fund’s performance versus an index and related attribution information with respect to particular categories of securities or individual positions may be attributable, in part, to differences in the pricing methodologies used by the Fund and the index. For performance current to the most recent month-end, visit www.pimco.com/literature or via 888.400.4ETF (888.400.4383).
Key Fund StatisticsFootnote Reference* (as of the end of the reporting period)
| Total Net Assets | $1,230,384 |
| # of Portfolio Holdings | 927 |
| Portfolio Turnover Rate | 49% |
| Total Net Management Fees Paid During the Reporting Period | $6,595 |
| Footnote | Description |
Footnote* | Dollar amounts displayed in 000's |
What did the Fund invest in?
Allocation Breakdown (% of Net Assets)Footnote Reference*
| Footnote | Description |
Footnote* | % of Net Assets includes derivatives instruments, if any, valued at the value used for determining the Fund’s net asset value. The notional exposure of such derivatives investments therefore may be greater than what is depicted. |
| Corporate Bonds & Notes | 94.1% |
| Affiliated Investments | 3.4% |
| Loan Participations and Assignments | 0.6% |
| Common Stocks | 0.4% |
| Short-Term Instruments | 4.7% |
| Other Investments | 0.2% |
| Other Assets and Liabilities, Net | (3.4%) |
| Total | 100.0% |
For additional information about the Fund, including the Fund's prospectus, financial information, holdings and proxy voting information, please visit www.pimco.com/literature or contact 888.400.4ETF (888.400.4383). For tax information about the Fund, please visit: https://www.pimco.com/tax.
PIMCO 0-5 Year High Yield Corporate Bond Index Exchange-Traded Fund
Annual Shareholder Report |
June 30, 2024
HYS | Principal Listing Exchange: NYSE Arca
PIMCO 1-5 Year U.S. TIPS Index Exchange-Traded Fund
STPZ | Principal Listing Exchange: NYSE Arca
Annual Shareholder Report | June 30, 2024
This annual shareholder report contains important information about the PIMCO 1-5 Year U.S. TIPS Index Exchange-Traded Fund (the "Fund") for the period of July 1, 2023 to June 30, 2024 (the "reporting period"). You can find additional information about the Fund at www.pimco.com/literature. You can also request this information by contacting us at 888.400.4ETF (888.400.4383).
What were the Fund costs for the last year?
(based on a hypothetical $10,000 investment)
| Fund Name | Cost of a $10,000 investment | Costs paid as a percentage of a $10,000 investment |
|---|
| PIMCO 1-5 Year U.S. TIPS Index Exchange-Traded Fund | $21 | 0.20% |
How did the Fund perform during the reporting period and what affected its performance?
The following affected performance (on a gross basis) during the reporting period:
• Exposure to U.S. real yields contributed to absolute performance for both the Fund and the ICE BofA 1-5 Year U.S. Treasury Inflation-
Protected Securities Index, as two to three year real yields moved lower.
• There were no other material contributors or detractors for this Fund.
In addition to the Fund's performance, the tables in this section include performance of: (i) a broad-based securities market index (i.e., a regulatory index) and (ii) one or more supplemental index(es). Effective July 24, 2024, the Fund's regulatory index is the Bloomberg U.S. Aggregate Index. The Fund's regulatory index is shown in connection with certain regulatory requirements to provide a broad measure of market performance.
The table below illustrates cumulative returns for the 10-year period ended June 30, 2024 or the life of the Fund, if shorter. Cumulative returns are based on a hypothetical initial investment equal to the greater of either $10,000 or the investment minimum applicable to the share class.
Cumulative Returns Based on $10,000 Investment
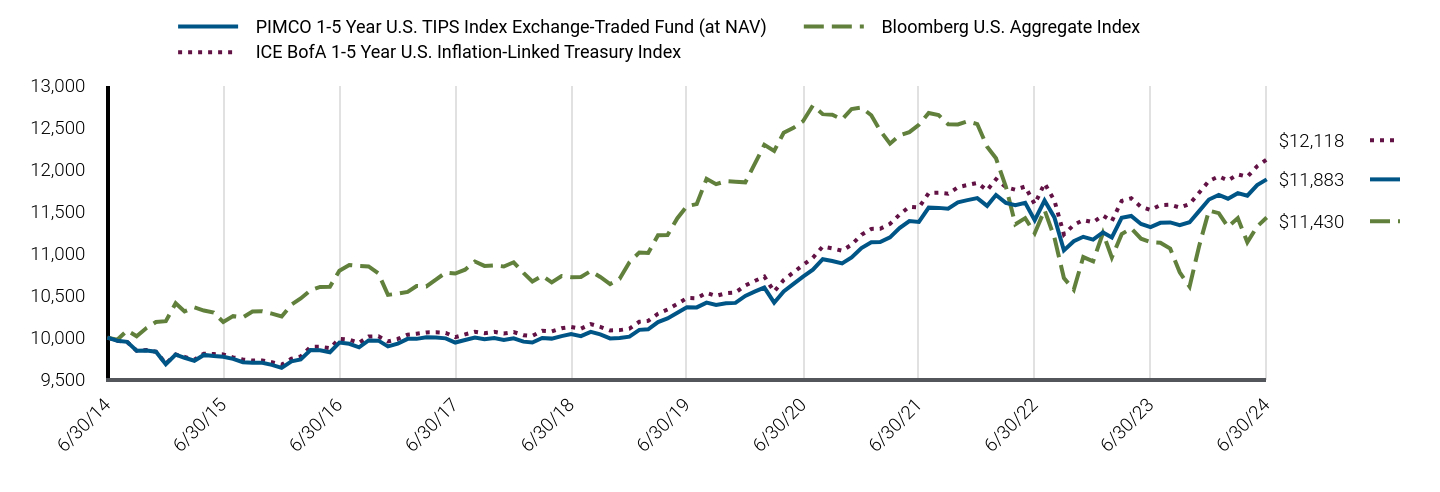
| PIMCO 1-5 Year U.S. TIPS Index Exchange-Traded Fund (at NAV) | Bloomberg U.S. Aggregate Index | ICE BofA 1-5 Year U.S. Inflation-Linked Treasury Index |
|---|
| 6/30/14 | $10,000 | $10,000 | $10,000 |
| 7/31/14 | $9,964 | $9,975 | $9,964 |
| 8/31/14 | $9,951 | $10,085 | $9,949 |
| 9/30/14 | $9,844 | $10,017 | $9,845 |
| 10/31/14 | $9,848 | $10,115 | $9,852 |
| 11/30/14 | $9,834 | $10,187 | $9,833 |
| 12/31/14 | $9,685 | $10,196 | $9,693 |
| 1/31/15 | $9,799 | $10,410 | $9,800 |
| 2/28/15 | $9,761 | $10,312 | $9,771 |
| 3/31/15 | $9,726 | $10,360 | $9,737 |
| 4/30/15 | $9,795 | $10,323 | $9,810 |
| 5/31/15 | $9,782 | $10,298 | $9,805 |
| 6/30/15 | $9,773 | $10,186 | $9,801 |
| 7/31/15 | $9,748 | $10,257 | $9,766 |
| 8/31/15 | $9,709 | $10,242 | $9,741 |
| 9/30/15 | $9,703 | $10,311 | $9,728 |
| 10/31/15 | $9,701 | $10,313 | $9,729 |
| 11/30/15 | $9,677 | $10,286 | $9,708 |
| 12/31/15 | $9,641 | $10,252 | $9,679 |
| 1/31/16 | $9,718 | $10,393 | $9,750 |
| 2/29/16 | $9,741 | $10,467 | $9,776 |
| 3/31/16 | $9,852 | $10,563 | $9,890 |
| 4/30/16 | $9,850 | $10,604 | $9,892 |
| 5/31/16 | $9,827 | $10,607 | $9,875 |
| 6/30/16 | $9,942 | $10,797 | $9,987 |
| 7/31/16 | $9,927 | $10,865 | $9,976 |
| 8/31/16 | $9,886 | $10,853 | $9,938 |
| 9/30/16 | $9,967 | $10,847 | $10,013 |
| 10/31/16 | $9,965 | $10,764 | $10,016 |
| 11/30/16 | $9,897 | $10,509 | $9,955 |
| 12/31/16 | $9,929 | $10,524 | $9,985 |
| 1/31/17 | $9,986 | $10,544 | $10,036 |
| 2/28/17 | $9,986 | $10,615 | $10,047 |
| 3/31/17 | $10,005 | $10,610 | $10,063 |
| 4/30/17 | $10,001 | $10,692 | $10,064 |
| 5/31/17 | $9,992 | $10,774 | $10,057 |
| 6/30/17 | $9,942 | $10,763 | $10,006 |
| 7/31/17 | $9,972 | $10,809 | $10,039 |
| 8/31/17 | $10,001 | $10,906 | $10,071 |
| 9/30/17 | $9,981 | $10,854 | $10,054 |
| 10/31/17 | $9,997 | $10,861 | $10,070 |
| 11/30/17 | $9,972 | $10,847 | $10,050 |
| 12/31/17 | $9,993 | $10,897 | $10,067 |
| 1/31/18 | $9,953 | $10,771 | $10,030 |
| 2/28/18 | $9,943 | $10,669 | $10,022 |
| 3/31/18 | $9,997 | $10,737 | $10,081 |
| 4/30/18 | $9,989 | $10,658 | $10,074 |
| 5/31/18 | $10,019 | $10,734 | $10,113 |
| 6/30/18 | $10,043 | $10,720 | $10,128 |
| 7/31/18 | $10,019 | $10,723 | $10,107 |
| 8/31/18 | $10,070 | $10,792 | $10,162 |
| 9/30/18 | $10,040 | $10,722 | $10,129 |
| 10/31/18 | $9,991 | $10,638 | $10,086 |
| 11/30/18 | $9,996 | $10,701 | $10,090 |
| 12/31/18 | $10,012 | $10,898 | $10,107 |
| 1/31/19 | $10,093 | $11,014 | $10,189 |
| 2/28/19 | $10,099 | $11,007 | $10,201 |
| 3/31/19 | $10,185 | $11,219 | $10,286 |
| 4/30/19 | $10,229 | $11,221 | $10,336 |
| 5/31/19 | $10,297 | $11,421 | $10,401 |
| 6/30/19 | $10,361 | $11,564 | $10,472 |
| 7/31/19 | $10,360 | $11,589 | $10,469 |
| 8/31/19 | $10,417 | $11,890 | $10,533 |
| 9/30/19 | $10,389 | $11,826 | $10,497 |
| 10/31/19 | $10,409 | $11,862 | $10,529 |
| 11/30/19 | $10,414 | $11,856 | $10,537 |
| 12/31/19 | $10,497 | $11,848 | $10,620 |
| 1/31/20 | $10,550 | $12,076 | $10,678 |
| 2/29/20 | $10,596 | $12,293 | $10,727 |
| 3/31/20 | $10,416 | $12,221 | $10,549 |
| 4/30/20 | $10,550 | $12,438 | $10,686 |
| 5/31/20 | $10,639 | $12,496 | $10,777 |
| 6/30/20 | $10,726 | $12,575 | $10,865 |
| 7/31/20 | $10,809 | $12,762 | $10,951 |
| 8/31/20 | $10,934 | $12,659 | $11,085 |
| 9/30/20 | $10,912 | $12,652 | $11,063 |
| 10/31/20 | $10,883 | $12,596 | $11,034 |
| 11/30/20 | $10,954 | $12,720 | $11,107 |
| 12/31/20 | $11,066 | $12,737 | $11,223 |
| 1/31/21 | $11,135 | $12,646 | $11,294 |
| 2/28/21 | $11,137 | $12,463 | $11,296 |
| 3/31/21 | $11,193 | $12,308 | $11,354 |
| 4/30/21 | $11,303 | $12,405 | $11,464 |
| 5/31/21 | $11,387 | $12,445 | $11,558 |
| 6/30/21 | $11,376 | $12,533 | $11,549 |
| 7/31/21 | $11,547 | $12,673 | $11,721 |
| 8/31/21 | $11,544 | $12,649 | $11,724 |
| 9/30/21 | $11,534 | $12,539 | $11,712 |
| 10/31/21 | $11,610 | $12,536 | $11,789 |
| 11/30/21 | $11,636 | $12,573 | $11,816 |
| 12/31/21 | $11,660 | $12,541 | $11,841 |
| 1/31/22 | $11,568 | $12,271 | $11,753 |
| 2/28/22 | $11,698 | $12,134 | $11,885 |
| 3/31/22 | $11,604 | $11,797 | $11,791 |
| 4/30/22 | $11,577 | $11,349 | $11,760 |
| 5/31/22 | $11,604 | $11,422 | $11,798 |
| 6/30/22 | $11,397 | $11,243 | $11,588 |
| 7/31/22 | $11,631 | $11,518 | $11,835 |
| 8/31/22 | $11,431 | $11,192 | $11,632 |
| 9/30/22 | $11,038 | $10,709 | $11,228 |
| 10/31/22 | $11,148 | $10,570 | $11,342 |
| 11/30/22 | $11,200 | $10,959 | $11,399 |
| 12/31/22 | $11,166 | $10,909 | $11,373 |
| 1/31/23 | $11,252 | $11,245 | $11,453 |
| 2/28/23 | $11,192 | $10,954 | $11,386 |
| 3/31/23 | $11,426 | $11,232 | $11,627 |
| 4/30/23 | $11,448 | $11,300 | $11,658 |
| 5/31/23 | $11,352 | $11,177 | $11,556 |
| 6/30/23 | $11,316 | $11,137 | $11,519 |
| 7/31/23 | $11,366 | $11,130 | $11,577 |
| 8/31/23 | $11,371 | $11,059 | $11,582 |
| 9/30/23 | $11,337 | $10,778 | $11,548 |
| 10/31/23 | $11,373 | $10,607 | $11,590 |
| 11/30/23 | $11,505 | $11,088 | $11,724 |
| 12/31/23 | $11,643 | $11,512 | $11,864 |
| 1/31/24 | $11,697 | $11,481 | $11,918 |
| 2/29/24 | $11,653 | $11,318 | $11,871 |
| 3/31/24 | $11,719 | $11,423 | $11,942 |
| 4/30/24 | $11,689 | $11,134 | $11,914 |
| 5/31/24 | $11,815 | $11,323 | $12,040 |
| 6/30/24 | $11,883 | $11,430 | $12,118 |
The table below shows the average annual total returns of the Fund, a regulatory index, and one or more supplemental index(es) for certain periods ended June 30, 2024.
Average Annual Total Returns (%)
| Fund/Index Name | 1 Year | 5 Years | 10 Years |
|---|
| PIMCO 1-5 Year U.S. TIPS Index Exchange-Traded Fund (at NAV) | 5.01% | 2.78% | 1.74% |
| PIMCO 1-5 Year U.S. TIPS Index Exchange-Traded Fund (at Market Price) | 4.98% | 2.78% | 1.73% |
| Bloomberg U.S. Aggregate Index | 2.63% | (0.23%) | 1.35% |
| ICE BofA 1-5 Year U.S. Inflation-Linked Treasury Index | 5.21% | 2.96% | 1.94% |
All Fund returns are net of fees and expenses and include applicable fee waivers and/or expense limitations. Absent any applicable fee waivers and/or expense limitations, performance would have been lower and there can be no assurance that any such waivers or limitations will continue in the future.
Performance quoted represents past performance. Past performance is not a guarantee or a reliable indicator of future results.Current performance may be lower or higher than performance shown. Investment return and the principal value of an investment will fluctuate. Shares may be worth more or less than original cost when redeemed. Returns shown do not reflect the deduction of taxes that a shareholder would pay on Fund distributions or the redemption of Fund shares.Differences in the Fund’s performance versus an index and related attribution information with respect to particular categories of securities or individual positions may be attributable, in part, to differences in the pricing methodologies used by the Fund and the index. For performance current to the most recent month-end, visit www.pimco.com/literature or via 888.400.4ETF (888.400.4383).
Key Fund StatisticsFootnote Reference* (as of the end of the reporting period)
| Total Net Assets | $491,717 |
| # of Portfolio Holdings | 24 |
| Portfolio Turnover Rate | 25% |
| Total Net Management Fees Paid During the Reporting Period | $1,189 |
| Footnote | Description |
Footnote* | Dollar amounts displayed in 000's |
What did the Fund invest in?
Allocation Breakdown (% of Net Assets)Footnote Reference*
| Footnote | Description |
Footnote* | % of Net Assets includes derivatives instruments, if any, valued at the value used for determining the Fund’s net asset value. The notional exposure of such derivatives investments therefore may be greater than what is depicted. |
| U.S. Treasury Obligations | 99.8% |
| Other Assets and Liabilities, Net | 0.2% |
| Total | 100.0% |
For additional information about the Fund, including the Fund's prospectus, financial information, holdings and proxy voting information, please visit www.pimco.com/literature or contact 888.400.4ETF (888.400.4383). For tax information about the Fund, please visit: https://www.pimco.com/tax.
PIMCO 1-5 Year U.S. TIPS Index Exchange-Traded Fund
Annual Shareholder Report |
June 30, 2024
STPZ | Principal Listing Exchange: NYSE Arca
PIMCO 15+ Year U.S. TIPS Index Exchange-Traded Fund
LTPZ | Principal Listing Exchange: NYSE Arca
Annual Shareholder Report | June 30, 2024
This annual shareholder report contains important information about the PIMCO 15+ Year U.S. TIPS Index Exchange-Traded Fund (the "Fund") for the period of July 1, 2023 to June 30, 2024 (the "reporting period"). You can find additional information about the Fund at www.pimco.com/literature. You can also request this information by contacting us at 888.400.4ETF (888.400.4383).
What were the Fund costs for the last year?
(based on a hypothetical $10,000 investment)
| Fund Name | Cost of a $10,000 investment | Costs paid as a percentage of a $10,000 investment |
|---|
| PIMCO 15+ Year U.S. TIPS Index Exchange-Traded Fund | $19 | 0.20% |
How did the Fund perform during the reporting period and what affected its performance?
The following affected performance (on a gross basis) during the reporting period:
• Exposure to U.S. real yields detracted from absolute performance for both the Fund and the ICE BofA 15+ Year U.S. Treasury Inflation-
Protected Securities Index, as 15+ year real yields moved higher.
• There were no other material contributors or detractors for this Fund.
In addition to the Fund's performance, the tables in this section include performance of: (i) a broad-based securities market index (i.e., a regulatory index) and (ii) one or more supplemental index(es). Effective July 24, 2024, the Fund's regulatory index is the Bloomberg U.S. Aggregate Index. The Fund's regulatory index is shown in connection with certain regulatory requirements to provide a broad measure of market performance.
The table below illustrates cumulative returns for the 10-year period ended June 30, 2024 or the life of the Fund, if shorter. Cumulative returns are based on a hypothetical initial investment equal to the greater of either $10,000 or the investment minimum applicable to the share class.
Cumulative Returns Based on $10,000 Investment

| PIMCO 15+ Year U.S. TIPS Index Exchange-Traded Fund (at NAV) | Bloomberg U.S. Aggregate Index | ICE BofA 15+ Year U.S. Inflation-Linked Treasury Index |
|---|
| 6/30/14 | $10,000 | $10,000 | $10,000 |
| 7/31/14 | $10,126 | $9,975 | $10,123 |
| 8/31/14 | $10,438 | $10,085 | $10,397 |
| 9/30/14 | $9,822 | $10,017 | $9,791 |
| 10/31/14 | $10,085 | $10,115 | $10,072 |
| 11/30/14 | $10,243 | $10,187 | $10,199 |
| 12/31/14 | $10,361 | $10,196 | $10,342 |
| 1/31/15 | $11,123 | $10,410 | $11,059 |
| 2/28/15 | $10,688 | $10,312 | $10,672 |
| 3/31/15 | $10,588 | $10,360 | $10,568 |
| 4/30/15 | $10,533 | $10,323 | $10,522 |
| 5/31/15 | $10,121 | $10,298 | $10,177 |
| 6/30/15 | $9,748 | $10,186 | $9,800 |
| 7/31/15 | $10,011 | $10,257 | $9,978 |
| 8/31/15 | $9,756 | $10,242 | $9,789 |
| 9/30/15 | $9,495 | $10,311 | $9,478 |
| 10/31/15 | $9,682 | $10,313 | $9,659 |
| 11/30/15 | $9,685 | $10,286 | $9,680 |
| 12/31/15 | $9,456 | $10,252 | $9,508 |
| 1/31/16 | $9,738 | $10,393 | $9,745 |
| 2/29/16 | $10,003 | $10,467 | $10,042 |
| 3/31/16 | $10,399 | $10,563 | $10,419 |
| 4/30/16 | $10,440 | $10,604 | $10,477 |
| 5/31/16 | $10,287 | $10,607 | $10,354 |
| 6/30/16 | $10,844 | $10,797 | $10,845 |
| 7/31/16 | $11,226 | $10,865 | $11,263 |
| 8/31/16 | $11,231 | $10,853 | $11,250 |
| 9/30/16 | $11,225 | $10,847 | $11,184 |
| 10/31/16 | $10,960 | $10,764 | $10,962 |
| 11/30/16 | $10,454 | $10,509 | $10,502 |
| 12/31/16 | $10,355 | $10,524 | $10,383 |
| 1/31/17 | $10,491 | $10,544 | $10,513 |
| 2/28/17 | $10,650 | $10,615 | $10,690 |
| 3/31/17 | $10,586 | $10,610 | $10,602 |
| 4/30/17 | $10,685 | $10,692 | $10,730 |
| 5/31/17 | $10,682 | $10,774 | $10,743 |
| 6/30/17 | $10,538 | $10,763 | $10,570 |
| 7/31/17 | $10,544 | $10,809 | $10,560 |
| 8/31/17 | $10,859 | $10,906 | $10,905 |
| 9/30/17 | $10,711 | $10,854 | $10,769 |
| 10/31/17 | $10,777 | $10,861 | $10,824 |
| 11/30/17 | $10,932 | $10,847 | $10,994 |
| 12/31/17 | $11,333 | $10,897 | $11,379 |
| 1/31/18 | $11,153 | $10,771 | $11,229 |
| 2/28/18 | $10,717 | $10,669 | $10,778 |
| 3/31/18 | $10,959 | $10,737 | $11,051 |
| 4/30/18 | $10,976 | $10,658 | $11,088 |
| 5/31/18 | $10,964 | $10,734 | $11,108 |
| 6/30/18 | $11,157 | $10,720 | $11,231 |
| 7/31/18 | $11,048 | $10,723 | $11,117 |
| 8/31/18 | $11,115 | $10,792 | $11,227 |
| 9/30/18 | $10,802 | $10,722 | $10,867 |
| 10/31/18 | $10,233 | $10,638 | $10,290 |
| 11/30/18 | $10,355 | $10,701 | $10,410 |
| 12/31/18 | $10,495 | $10,898 | $10,558 |
| 1/31/19 | $10,779 | $11,014 | $10,838 |
| 2/28/19 | $10,677 | $11,007 | $10,755 |
| 3/31/19 | $11,214 | $11,219 | $11,282 |
| 4/30/19 | $11,168 | $11,221 | $11,263 |
| 5/31/19 | $11,736 | $11,421 | $11,812 |
| 6/30/19 | $11,722 | $11,564 | $11,821 |
| 7/31/19 | $11,872 | $11,589 | $11,998 |
| 8/31/19 | $12,869 | $11,890 | $13,023 |
| 9/30/19 | $12,460 | $11,826 | $12,477 |
| 10/31/19 | $12,346 | $11,862 | $12,505 |
| 11/30/19 | $12,479 | $11,856 | $12,607 |
| 12/31/19 | $12,310 | $11,848 | $12,429 |
| 1/31/20 | $13,178 | $12,076 | $13,310 |
| 2/29/20 | $13,548 | $12,293 | $13,685 |
| 3/31/20 | $13,471 | $12,221 | $13,614 |
| 4/30/20 | $14,276 | $12,438 | $14,418 |
| 5/31/20 | $14,175 | $12,496 | $14,315 |
| 6/30/20 | $14,356 | $12,575 | $14,500 |
| 7/31/20 | $15,321 | $12,762 | $15,458 |
| 8/31/20 | $15,172 | $12,659 | $15,322 |
| 9/30/20 | $15,119 | $12,652 | $15,271 |
| 10/31/20 | $14,852 | $12,596 | $15,000 |
| 11/30/20 | $15,309 | $12,720 | $15,465 |
| 12/31/20 | $15,410 | $12,737 | $15,570 |
| 1/31/21 | $15,253 | $12,646 | $15,410 |
| 2/28/21 | $14,342 | $12,463 | $14,491 |
| 3/31/21 | $14,031 | $12,308 | $14,184 |
| 4/30/21 | $14,353 | $12,405 | $14,508 |
| 5/31/21 | $14,667 | $12,445 | $14,833 |
| 6/30/21 | $15,218 | $12,533 | $15,385 |
| 7/31/21 | $15,872 | $12,673 | $16,046 |
| 8/31/21 | $15,849 | $12,649 | $16,032 |
| 9/30/21 | $15,528 | $12,539 | $15,707 |
| 10/31/21 | $15,910 | $12,536 | $16,099 |
| 11/30/21 | $16,575 | $12,573 | $16,776 |
| 12/31/21 | $16,488 | $12,541 | $16,689 |
| 1/31/22 | $15,479 | $12,271 | $15,674 |
| 2/28/22 | $15,544 | $12,134 | $15,744 |
| 3/31/22 | $14,998 | $11,797 | $15,205 |
| 4/30/22 | $13,880 | $11,349 | $14,071 |
| 5/31/22 | $13,081 | $11,422 | $13,280 |
| 6/30/22 | $12,168 | $11,243 | $12,355 |
| 7/31/22 | $13,233 | $11,518 | $13,435 |
| 8/31/22 | $12,656 | $11,192 | $12,858 |
| 9/30/22 | $10,770 | $10,709 | $10,932 |
| 10/31/22 | $10,995 | $10,570 | $11,142 |
| 11/30/22 | $11,617 | $10,959 | $11,777 |
| 12/31/22 | $11,279 | $10,909 | $11,431 |
| 1/31/23 | $11,848 | $11,245 | $12,002 |
| 2/28/23 | $11,532 | $10,954 | $11,683 |
| 3/31/23 | $11,943 | $11,232 | $12,105 |
| 4/30/23 | $11,908 | $11,300 | $12,074 |
| 5/31/23 | $11,692 | $11,177 | $11,851 |
| 6/30/23 | $11,763 | $11,137 | $11,923 |
| 7/31/23 | $11,559 | $11,130 | $11,721 |
| 8/31/23 | $11,170 | $11,059 | $11,318 |
| 9/30/23 | $10,420 | $10,778 | $10,559 |
| 10/31/23 | $9,962 | $10,607 | $10,107 |
| 11/30/23 | $10,715 | $11,088 | $10,875 |
| 12/31/23 | $11,336 | $11,512 | $11,502 |
| 1/31/24 | $11,325 | $11,481 | $11,482 |
| 2/29/24 | $11,080 | $11,318 | $11,236 |
| 3/31/24 | $11,155 | $11,423 | $11,318 |
| 4/30/24 | $10,589 | $11,134 | $10,740 |
| 5/31/24 | $10,979 | $11,323 | $11,131 |
| 6/30/24 | $11,080 | $11,430 | $11,242 |
The table below shows the average annual total returns of the Fund, a regulatory index, and one or more supplemental index(es) for certain periods ended June 30, 2024.
Average Annual Total Returns (%)
| Fund/Index Name | 1 Year | 5 Years | 10 Years |
|---|
| PIMCO 15+ Year U.S. TIPS Index Exchange-Traded Fund (at NAV) | (5.81%) | (1.12%) | 1.03% |
| PIMCO 15+ Year U.S. TIPS Index Exchange-Traded Fund (at Market Price) | (5.88%) | (1.13%) | 1.03% |
| Bloomberg U.S. Aggregate Index | 2.63% | (0.23%) | 1.35% |
| ICE BofA 15+ Year U.S. Inflation-Linked Treasury Index | (5.71%) | (1.00%) | 1.18% |
All Fund returns are net of fees and expenses and include applicable fee waivers and/or expense limitations. Absent any applicable fee waivers and/or expense limitations, performance would have been lower and there can be no assurance that any such waivers or limitations will continue in the future.
Performance quoted represents past performance. Past performance is not a guarantee or a reliable indicator of future results.Current performance may be lower or higher than performance shown. Investment return and the principal value of an investment will fluctuate. Shares may be worth more or less than original cost when redeemed. Returns shown do not reflect the deduction of taxes that a shareholder would pay on Fund distributions or the redemption of Fund shares.Differences in the Fund’s performance versus an index and related attribution information with respect to particular categories of securities or individual positions may be attributable, in part, to differences in the pricing methodologies used by the Fund and the index. For performance current to the most recent month-end, visit www.pimco.com/literature or via 888.400.4ETF (888.400.4383).
Key Fund StatisticsFootnote Reference* (as of the end of the reporting period)
| Total Net Assets | $706,924 |
| # of Portfolio Holdings | 16 |
| Portfolio Turnover Rate | 4% |
| Total Net Management Fees Paid During the Reporting Period | $1,400 |
| Footnote | Description |
Footnote* | Dollar amounts displayed in 000's |
What did the Fund invest in?
Allocation Breakdown (% of Net Assets)Footnote Reference*
| Footnote | Description |
Footnote* | % of Net Assets includes derivatives instruments, if any, valued at the value used for determining the Fund’s net asset value. The notional exposure of such derivatives investments therefore may be greater than what is depicted. |
| U.S. Treasury Obligations | 99.5% |
| Short-Term Instruments | 0.1% |
| Other Assets and Liabilities, Net | 0.4% |
| Total | 100.0% |
For additional information about the Fund, including the Fund's prospectus, financial information, holdings and proxy voting information, please visit www.pimco.com/literature or contact 888.400.4ETF (888.400.4383). For tax information about the Fund, please visit: https://www.pimco.com/tax.
PIMCO 15+ Year U.S. TIPS Index Exchange-Traded Fund
Annual Shareholder Report |
June 30, 2024
LTPZ | Principal Listing Exchange: NYSE Arca
PIMCO 25+ Year Zero Coupon U.S. Treasury Index Exchange-Traded Fund
ZROZ | Principal Listing Exchange: NYSE Arca
Annual Shareholder Report | June 30, 2024
This annual shareholder report contains important information about the PIMCO 25+ Year Zero Coupon U.S. Treasury Index Exchange-Traded Fund (the "Fund") for the period of July 1, 2023 to June 30, 2024 (the "reporting period"). You can find additional information about the Fund at www.pimco.com/literature. You can also request this information by contacting us at 888.400.4ETF (888.400.4383).
What were the Fund costs for the last year?
(based on a hypothetical $10,000 investment)
| Fund Name | Cost of a $10,000 investment | Costs paid as a percentage of a $10,000 investment |
|---|
| PIMCO 25+ Year Zero Coupon U.S. Treasury Index Exchange-Traded Fund | $14 | 0.15% |
How did the Fund perform during the reporting period and what affected its performance?
The following affected performance (on a gross basis) during the reporting period:
• U.S. interest rate strategies overall, including duration, curve positioning and instrument selection, contributed to performance due to
overweight exposure to the back end of the curve, as U.S. Treasury yields fell during the fourth quarter of 2023.
• There were no other material contributors or detractors for this Fund.
In addition to the Fund's performance, the tables in this section include performance of: (i) a broad-based securities market index (i.e., a regulatory index) and (ii) one or more supplemental index(es). Effective July 24, 2024, the Fund's regulatory index is the Bloomberg U.S. Aggregate Index. The Fund's regulatory index is shown in connection with certain regulatory requirements to provide a broad measure of market performance.
The table below illustrates cumulative returns for the 10-year period ended June 30, 2024 or the life of the Fund, if shorter. Cumulative returns are based on a hypothetical initial investment equal to the greater of either $10,000 or the investment minimum applicable to the share class.
Cumulative Returns Based on $10,000 Investment
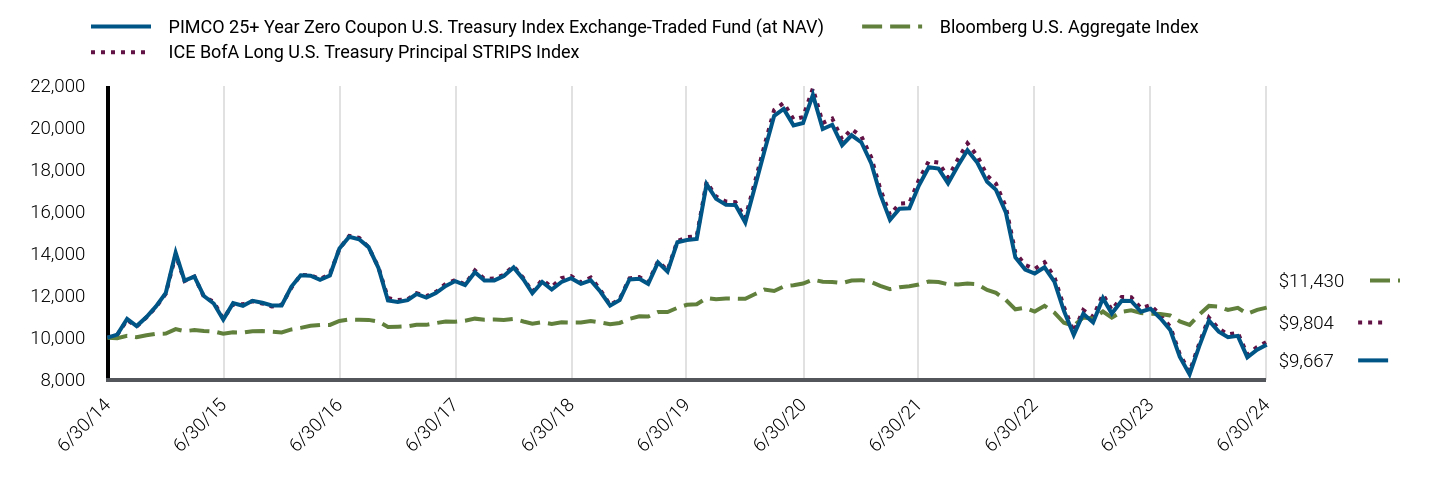
| PIMCO 25+ Year Zero Coupon U.S. Treasury Index Exchange-Traded Fund (at NAV) | Bloomberg U.S. Aggregate Index | ICE BofA Long U.S. Treasury Principal STRIPS Index |
|---|
| 6/30/14 | $10,000 | $10,000 | $10,000 |
| 7/31/14 | $10,144 | $9,975 | $10,136 |
| 8/31/14 | $10,890 | $10,085 | $10,841 |
| 9/30/14 | $10,554 | $10,017 | $10,525 |
| 10/31/14 | $10,984 | $10,115 | $10,969 |
| 11/30/14 | $11,487 | $10,187 | $11,454 |
| 12/31/14 | $12,134 | $10,196 | $12,098 |
| 1/31/15 | $14,043 | $10,410 | $13,936 |
| 2/28/15 | $12,716 | $10,312 | $12,694 |
| 3/31/15 | $12,905 | $10,360 | $12,909 |
| 4/30/15 | $11,981 | $10,323 | $11,946 |
| 5/31/15 | $11,625 | $10,298 | $11,706 |
| 6/30/15 | $10,864 | $10,186 | $10,907 |
| 7/31/15 | $11,643 | $10,257 | $11,584 |
| 8/31/15 | $11,518 | $10,242 | $11,587 |
| 9/30/15 | $11,753 | $10,311 | $11,737 |
| 10/31/15 | $11,662 | $10,313 | $11,629 |
| 11/30/15 | $11,534 | $10,286 | $11,483 |
| 12/31/15 | $11,534 | $10,252 | $11,564 |
| 1/31/16 | $12,433 | $10,393 | $12,384 |
| 2/29/16 | $12,974 | $10,467 | $12,993 |
| 3/31/16 | $12,949 | $10,563 | $12,967 |
| 4/30/16 | $12,753 | $10,604 | $12,794 |
| 5/31/16 | $12,960 | $10,607 | $13,024 |
| 6/30/16 | $14,242 | $10,797 | $14,230 |
| 7/31/16 | $14,802 | $10,865 | $14,843 |
| 8/31/16 | $14,683 | $10,853 | $14,749 |
| 9/30/16 | $14,309 | $10,847 | $14,304 |
| 10/31/16 | $13,317 | $10,764 | $13,350 |
| 11/30/16 | $11,766 | $10,509 | $11,888 |
| 12/31/16 | $11,698 | $10,524 | $11,789 |
| 1/31/17 | $11,786 | $10,544 | $11,833 |
| 2/28/17 | $12,079 | $10,615 | $12,114 |
| 3/31/17 | $11,910 | $10,610 | $11,974 |
| 4/30/17 | $12,120 | $10,692 | $12,176 |
| 5/31/17 | $12,462 | $10,774 | $12,566 |
| 6/30/17 | $12,693 | $10,763 | $12,737 |
| 7/31/17 | $12,499 | $10,809 | $12,536 |
| 8/31/17 | $13,116 | $10,906 | $13,200 |
| 9/30/17 | $12,719 | $10,854 | $12,801 |
| 10/31/17 | $12,725 | $10,861 | $12,814 |
| 11/30/17 | $12,936 | $10,847 | $12,997 |
| 12/31/17 | $13,345 | $10,897 | $13,411 |
| 1/31/18 | $12,768 | $10,771 | $12,827 |
| 2/28/18 | $12,115 | $10,669 | $12,173 |
| 3/31/18 | $12,651 | $10,737 | $12,755 |
| 4/30/18 | $12,291 | $10,658 | $12,417 |
| 5/31/18 | $12,655 | $10,734 | $12,839 |
| 6/30/18 | $12,831 | $10,720 | $12,933 |
| 7/31/18 | $12,565 | $10,723 | $12,629 |
| 8/31/18 | $12,728 | $10,792 | $12,866 |
| 9/30/18 | $12,196 | $10,722 | $12,280 |
| 10/31/18 | $11,525 | $10,638 | $11,551 |
| 11/30/18 | $11,787 | $10,701 | $11,833 |
| 12/31/18 | $12,773 | $10,898 | $12,821 |
| 1/31/19 | $12,804 | $11,014 | $12,881 |
| 2/28/19 | $12,562 | $11,007 | $12,634 |
| 3/31/19 | $13,585 | $11,219 | $13,633 |
| 4/30/19 | $13,142 | $11,221 | $13,205 |
| 5/31/19 | $14,543 | $11,421 | $14,596 |
| 6/30/19 | $14,649 | $11,564 | $14,780 |
| 7/31/19 | $14,701 | $11,589 | $14,830 |
| 8/31/19 | $17,303 | $11,890 | $17,419 |
| 9/30/19 | $16,605 | $11,826 | $16,710 |
| 10/31/19 | $16,328 | $11,862 | $16,482 |
| 11/30/19 | $16,317 | $11,856 | $16,451 |
| 12/31/19 | $15,483 | $11,848 | $15,688 |
| 1/31/20 | $17,213 | $12,076 | $17,444 |
| 2/29/20 | $18,862 | $12,293 | $19,118 |
| 3/31/20 | $20,558 | $12,221 | $20,839 |
| 4/30/20 | $20,884 | $12,438 | $21,171 |
| 5/31/20 | $20,101 | $12,496 | $20,382 |
| 6/30/20 | $20,212 | $12,575 | $20,497 |
| 7/31/20 | $21,554 | $12,762 | $21,859 |
| 8/31/20 | $19,931 | $12,659 | $20,214 |
| 9/30/20 | $20,131 | $12,652 | $20,422 |
| 10/31/20 | $19,157 | $12,596 | $19,436 |
| 11/30/20 | $19,631 | $12,720 | $19,922 |
| 12/31/20 | $19,289 | $12,737 | $19,577 |
| 1/31/21 | $18,295 | $12,646 | $18,571 |
| 2/28/21 | $16,840 | $12,463 | $17,095 |
| 3/31/21 | $15,600 | $12,308 | $15,839 |
| 4/30/21 | $16,131 | $12,405 | $16,381 |
| 5/31/21 | $16,155 | $12,445 | $16,407 |
| 6/30/21 | $17,240 | $12,533 | $17,512 |
| 7/31/21 | $18,108 | $12,673 | $18,396 |
| 8/31/21 | $18,044 | $12,649 | $18,333 |
| 9/30/21 | $17,342 | $12,539 | $17,622 |
| 10/31/21 | $18,179 | $12,536 | $18,486 |
| 11/30/21 | $18,922 | $12,573 | $19,251 |
| 12/31/21 | $18,331 | $12,541 | $18,650 |
| 1/31/22 | $17,417 | $12,271 | $17,715 |
| 2/28/22 | $17,034 | $12,134 | $17,323 |
| 3/31/22 | $15,964 | $11,797 | $16,227 |
| 4/30/22 | $13,823 | $11,349 | $14,046 |
| 5/31/22 | $13,245 | $11,422 | $13,462 |
| 6/30/22 | $13,053 | $11,243 | $13,270 |
| 7/31/22 | $13,351 | $11,518 | $13,590 |
| 8/31/22 | $12,665 | $11,192 | $12,886 |
| 9/30/22 | $11,279 | $10,709 | $11,466 |
| 10/31/22 | $10,131 | $10,570 | $10,282 |
| 11/30/22 | $11,137 | $10,959 | $11,312 |
| 12/31/22 | $10,723 | $10,909 | $10,993 |
| 1/31/23 | $11,882 | $11,245 | $12,060 |
| 2/28/23 | $11,147 | $10,954 | $11,318 |
| 3/31/23 | $11,760 | $11,232 | $11,940 |
| 4/30/23 | $11,749 | $11,300 | $11,926 |
| 5/31/23 | $11,235 | $11,177 | $11,406 |
| 6/30/23 | $11,373 | $11,137 | $11,547 |
| 7/31/23 | $10,923 | $11,130 | $11,083 |
| 8/31/23 | $10,373 | $11,059 | $10,523 |
| 9/30/23 | $9,095 | $10,778 | $9,221 |
| 10/31/23 | $8,255 | $10,607 | $8,366 |
| 11/30/23 | $9,574 | $11,088 | $9,703 |
| 12/31/23 | $10,812 | $11,512 | $10,953 |
| 1/31/24 | $10,287 | $11,481 | $10,427 |
| 2/29/24 | $10,019 | $11,318 | $10,157 |
| 3/31/24 | $10,088 | $11,423 | $10,232 |
| 4/30/24 | $9,069 | $11,134 | $9,197 |
| 5/31/24 | $9,426 | $11,323 | $9,559 |
| 6/30/24 | $9,667 | $11,430 | $9,804 |
The table below shows the average annual total returns of the Fund, a regulatory index, and one or more supplemental index(es) for certain periods ended June 30, 2024.
Average Annual Total Returns (%)
| Fund/Index Name | 1 Year | 5 Years | 10 Years |
|---|
| PIMCO 25+ Year Zero Coupon U.S. Treasury Index Exchange-Traded Fund (at NAV) | (15.00%) | (7.98%) | (0.34%) |
| PIMCO 25+ Year Zero Coupon U.S. Treasury Index Exchange-Traded Fund (at Market Price) | (15.27%) | (8.00%) | (0.38%) |
| Bloomberg U.S. Aggregate Index | 2.63% | (0.23%) | 1.35% |
| ICE BofA Long U.S. Treasury Principal STRIPS Index | (15.10%) | (7.88%) | (0.20%) |
All Fund returns are net of fees and expenses and include applicable fee waivers and/or expense limitations. Absent any applicable fee waivers and/or expense limitations, performance would have been lower and there can be no assurance that any such waivers or limitations will continue in the future.
Performance quoted represents past performance. Past performance is not a guarantee or a reliable indicator of future results.Current performance may be lower or higher than performance shown. Investment return and the principal value of an investment will fluctuate. Shares may be worth more or less than original cost when redeemed. Returns shown do not reflect the deduction of taxes that a shareholder would pay on Fund distributions or the redemption of Fund shares.Differences in the Fund’s performance versus an index and related attribution information with respect to particular categories of securities or individual positions may be attributable, in part, to differences in the pricing methodologies used by the Fund and the index. For performance current to the most recent month-end, visit www.pimco.com/literature or via 888.400.4ETF (888.400.4383).
Key Fund StatisticsFootnote Reference* (as of the end of the reporting period)
| Total Net Assets | $1,388,401 |
| # of Portfolio Holdings | 22 |
| Portfolio Turnover Rate | 22% |
| Total Net Management Fees Paid During the Reporting Period | $1,697 |
| Footnote | Description |
Footnote* | Dollar amounts displayed in 000's |
What did the Fund invest in?
Allocation Breakdown (% of Net Assets)Footnote Reference*
| Footnote | Description |
Footnote* | % of Net Assets includes derivatives instruments, if any, valued at the value used for determining the Fund’s net asset value. The notional exposure of such derivatives investments therefore may be greater than what is depicted. |
| U.S. Treasury Obligations | 99.9% |
| Other Assets and Liabilities, Net | 0.1% |
| Total | 100.0% |
For additional information about the Fund, including the Fund's prospectus, financial information, holdings and proxy voting information, please visit www.pimco.com/literature or contact 888.400.4ETF (888.400.4383). For tax information about the Fund, please visit: https://www.pimco.com/tax.
PIMCO 25+ Year Zero Coupon U.S. Treasury Index Exchange-Traded Fund
Annual Shareholder Report |
June 30, 2024
ZROZ | Principal Listing Exchange: NYSE Arca
PIMCO Active Bond Exchange-Traded Fund
BOND | Principal Listing Exchange: NYSE
Annual Shareholder Report | June 30, 2024
This annual shareholder report contains important information about the PIMCO Active Bond Exchange-Traded Fund (the "Fund") for the period of July 1, 2023 to June 30, 2024 (the "reporting period"). You can find additional information about the Fund at www.pimco.com/literature. You can also request this information by contacting us at 888.400.4ETF (888.400.4383).
This report describes changes to the Fund that occurred during the reporting period.
What were the Fund costs for the last year?
(based on a hypothetical $10,000 investment)
| Fund Name | Cost of a $10,000 investment | Costs paid as a percentage of a $10,000 investment |
|---|
| PIMCO Active Bond Exchange-Traded Fund | $70 | 0.69% |
How did the Fund perform during the reporting period and what affected its performance?
The following affected performance (on a gross basis) during the reporting period:
• Long exposure to securitized credit contributed to relative performance, as spreads tightened.
• Curve positioning in the U.S., primarily underweight exposure to the long end of the yield curve, contributed to relative performance, as
yields rose.
• Overweight exposure to senior financials within investment grade corporate credit contributed to relative performance, as spreads
tightened.
• Underweight exposure to non-financial investment grade corporate credit detracted from relative performance, as spreads
tightened.
• There were no other material detractors for this Fund.
In addition to the Fund's performance, the tables in this section include performance of a broad-based securities market index (i.e., a regulatory index). The Fund's regulatory index is shown in connection with certain regulatory requirements to provide a broad measure of market performance.
The table below illustrates cumulative returns for the 10-year period ended June 30, 2024 or the life of the Fund, if shorter. Cumulative returns are based on a hypothetical initial investment equal to the greater of either $10,000 or the investment minimum applicable to the share class.
Cumulative Returns Based on $10,000 Investment
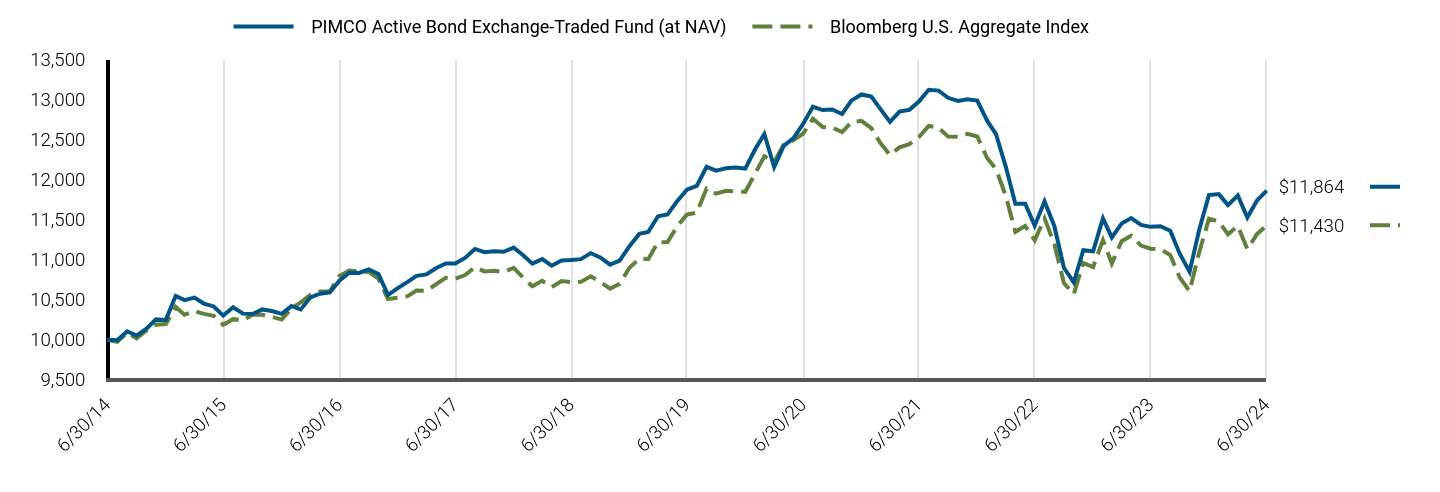
| PIMCO Active Bond Exchange-Traded Fund (at NAV) | Bloomberg U.S. Aggregate Index |
|---|
| 6/30/14 | $10,000 | $10,000 |
| 7/31/14 | $9,993 | $9,975 |
| 8/31/14 | $10,104 | $10,085 |
| 9/30/14 | $10,052 | $10,017 |
| 10/31/14 | $10,139 | $10,115 |
| 11/30/14 | $10,254 | $10,187 |
| 12/31/14 | $10,248 | $10,196 |
| 1/31/15 | $10,547 | $10,410 |
| 2/28/15 | $10,495 | $10,312 |
| 3/31/15 | $10,527 | $10,360 |
| 4/30/15 | $10,452 | $10,323 |
| 5/31/15 | $10,416 | $10,298 |
| 6/30/15 | $10,301 | $10,186 |
| 7/31/15 | $10,406 | $10,257 |
| 8/31/15 | $10,326 | $10,242 |
| 9/30/15 | $10,322 | $10,311 |
| 10/31/15 | $10,379 | $10,313 |
| 11/30/15 | $10,359 | $10,286 |
| 12/31/15 | $10,323 | $10,252 |
| 1/31/16 | $10,420 | $10,393 |
| 2/29/16 | $10,379 | $10,467 |
| 3/31/16 | $10,530 | $10,563 |
| 4/30/16 | $10,575 | $10,604 |
| 5/31/16 | $10,592 | $10,607 |
| 6/30/16 | $10,738 | $10,797 |
| 7/31/16 | $10,837 | $10,865 |
| 8/31/16 | $10,835 | $10,853 |
| 9/30/16 | $10,879 | $10,847 |
| 10/31/16 | $10,823 | $10,764 |
| 11/30/16 | $10,560 | $10,509 |
| 12/31/16 | $10,645 | $10,524 |
| 1/31/17 | $10,723 | $10,544 |
| 2/28/17 | $10,799 | $10,615 |
| 3/31/17 | $10,817 | $10,610 |
| 4/30/17 | $10,894 | $10,692 |
| 5/31/17 | $10,954 | $10,774 |
| 6/30/17 | $10,952 | $10,763 |
| 7/31/17 | $11,022 | $10,809 |
| 8/31/17 | $11,135 | $10,906 |
| 9/30/17 | $11,094 | $10,854 |
| 10/31/17 | $11,107 | $10,861 |
| 11/30/17 | $11,100 | $10,847 |
| 12/31/17 | $11,151 | $10,897 |
| 1/31/18 | $11,053 | $10,771 |
| 2/28/18 | $10,951 | $10,669 |
| 3/31/18 | $11,008 | $10,737 |
| 4/30/18 | $10,926 | $10,658 |
| 5/31/18 | $10,991 | $10,734 |
| 6/30/18 | $10,997 | $10,720 |
| 7/31/18 | $11,007 | $10,723 |
| 8/31/18 | $11,082 | $10,792 |
| 9/30/18 | $11,029 | $10,722 |
| 10/31/18 | $10,938 | $10,638 |
| 11/30/18 | $10,989 | $10,701 |
| 12/31/18 | $11,169 | $10,898 |
| 1/31/19 | $11,323 | $11,014 |
| 2/28/19 | $11,347 | $11,007 |
| 3/31/19 | $11,544 | $11,219 |
| 4/30/19 | $11,565 | $11,221 |
| 5/31/19 | $11,735 | $11,421 |
| 6/30/19 | $11,876 | $11,564 |
| 7/31/19 | $11,924 | $11,589 |
| 8/31/19 | $12,161 | $11,890 |
| 9/30/19 | $12,113 | $11,826 |
| 10/31/19 | $12,144 | $11,862 |
| 11/30/19 | $12,153 | $11,856 |
| 12/31/19 | $12,139 | $11,848 |
| 1/31/20 | $12,381 | $12,076 |
| 2/29/20 | $12,571 | $12,293 |
| 3/31/20 | $12,159 | $12,221 |
| 4/30/20 | $12,423 | $12,438 |
| 5/31/20 | $12,520 | $12,496 |
| 6/30/20 | $12,698 | $12,575 |
| 7/31/20 | $12,912 | $12,762 |
| 8/31/20 | $12,871 | $12,659 |
| 9/30/20 | $12,878 | $12,652 |
| 10/31/20 | $12,822 | $12,596 |
| 11/30/20 | $12,992 | $12,720 |
| 12/31/20 | $13,066 | $12,737 |
| 1/31/21 | $13,040 | $12,646 |
| 2/28/21 | $12,888 | $12,463 |
| 3/31/21 | $12,723 | $12,308 |
| 4/30/21 | $12,851 | $12,405 |
| 5/31/21 | $12,874 | $12,445 |
| 6/30/21 | $12,978 | $12,533 |
| 7/31/21 | $13,125 | $12,673 |
| 8/31/21 | $13,114 | $12,649 |
| 9/30/21 | $13,024 | $12,539 |
| 10/31/21 | $12,986 | $12,536 |
| 11/30/21 | $13,007 | $12,573 |
| 12/31/21 | $12,989 | $12,541 |
| 1/31/22 | $12,738 | $12,271 |
| 2/28/22 | $12,569 | $12,134 |
| 3/31/22 | $12,161 | $11,797 |
| 4/30/22 | $11,700 | $11,349 |
| 5/31/22 | $11,700 | $11,422 |
| 6/30/22 | $11,426 | $11,243 |
| 7/31/22 | $11,729 | $11,518 |
| 8/31/22 | $11,419 | $11,192 |
| 9/30/22 | $10,899 | $10,709 |
| 10/31/22 | $10,716 | $10,570 |
| 11/30/22 | $11,119 | $10,959 |
| 12/31/22 | $11,106 | $10,909 |
| 1/31/23 | $11,516 | $11,245 |
| 2/28/23 | $11,279 | $10,954 |
| 3/31/23 | $11,454 | $11,232 |
| 4/30/23 | $11,521 | $11,300 |
| 5/31/23 | $11,435 | $11,177 |
| 6/30/23 | $11,411 | $11,137 |
| 7/31/23 | $11,419 | $11,130 |
| 8/31/23 | $11,362 | $11,059 |
| 9/30/23 | $11,075 | $10,778 |
| 10/31/23 | $10,851 | $10,607 |
| 11/30/23 | $11,368 | $11,088 |
| 12/31/23 | $11,808 | $11,512 |
| 1/31/24 | $11,820 | $11,481 |
| 2/29/24 | $11,683 | $11,318 |
| 3/31/24 | $11,803 | $11,423 |
| 4/30/24 | $11,527 | $11,134 |
| 5/31/24 | $11,743 | $11,323 |
| 6/30/24 | $11,864 | $11,430 |
The table below shows the average annual total returns of the Fund and a regulatory index(es) for certain periods ended June 30, 2024.
Average Annual Total Returns (%)
| Fund/Index Name | 1 Year | 5 Years | 10 Years |
|---|
| PIMCO Active Bond Exchange-Traded Fund (at NAV) | 3.98% | (0.02%) | 1.72% |
| PIMCO Active Bond Exchange-Traded Fund (at Market Price) | 4.03% | (0.01%) | 1.71% |
| Bloomberg U.S. Aggregate Index | 2.63% | (0.23%) | 1.35% |
All Fund returns are net of fees and expenses and include applicable fee waivers and/or expense limitations. Absent any applicable fee waivers and/or expense limitations, performance would have been lower and there can be no assurance that any such waivers or limitations will continue in the future.
Performance quoted represents past performance. Past performance is not a guarantee or a reliable indicator of future results.Current performance may be lower or higher than performance shown. Investment return and the principal value of an investment will fluctuate. Shares may be worth more or less than original cost when redeemed. Returns shown do not reflect the deduction of taxes that a shareholder would pay on Fund distributions or the redemption of Fund shares.Differences in the Fund’s performance versus an index and related attribution information with respect to particular categories of securities or individual positions may be attributable, in part, to differences in the pricing methodologies used by the Fund and the index. For performance current to the most recent month-end, visit www.pimco.com/literature or via 888.400.4ETF (888.400.4383).
Key Fund StatisticsFootnote Reference* (as of the end of the reporting period)
| Total Net Assets | $4,326,761 |
| # of Portfolio Holdings | 1,217 |
| Portfolio Turnover Rate | 351% |
| Total Net Management Fees Paid During the Reporting Period | $21,011 |
| Footnote | Description |
Footnote* | Dollar amounts displayed in 000's |
What did the Fund invest in?
Allocation Breakdown (% of Net Assets)Footnote Reference*
| Footnote | Description |
Footnote* | % of Net Assets includes derivatives instruments, if any, valued at the value used for determining the Fund’s net asset value. The notional exposure of such derivatives investments therefore may be greater than what is depicted. |
| U.S. Government Agencies | 56.9% |
| Corporate Bonds & Notes | 23.7% |
| Asset-Backed Securities | 15.6% |
| U.S. Treasury Obligations | 12.6% |
| Non-Agency Mortgage-Backed Securities | 7.6% |
| Affiliated Investments | 1.9% |
| Municipal Bonds & Notes | 0.7% |
| Preferred Securities | 0.6% |
| Loan Participations and Assignments | 0.5% |
| Sovereign Issues | 0.3% |
| Short-Term Instruments | 1.6% |
| Other Investments | 0.0% |
| Other Assets and Liabilities, Net | (22.0%) |
| Total | 100.0% |
This is a summary of certain changes and planned changes of the Fund since the beginning of the reporting period. For more information, you may refer to the Fund's next prospectus, which we expect to be available by October 31, 2024 or upon request at 888.400.4ETF (888.400.4383).
Changes to Total Annual Fund Operating Expenses. Annual fund operating expenses increased during the year by 0.11% as a result of higher expenses related to interest.
For additional information about the Fund, including the Fund's prospectus, financial information, holdings and proxy voting information, please visit www.pimco.com/literature or contact 888.400.4ETF (888.400.4383). For tax information about the Fund, please visit: https://www.pimco.com/tax.
PIMCO Active Bond Exchange-Traded Fund
Annual Shareholder Report |
June 30, 2024
BOND | Principal Listing Exchange: NYSE
PIMCO Broad U.S. TIPS Index Exchange-Traded Fund
TIPZ | Principal Listing Exchange: NYSE Arca
Annual Shareholder Report | June 30, 2024
This annual shareholder report contains important information about the PIMCO Broad U.S. TIPS Index Exchange-Traded Fund (the "Fund") for the period of July 1, 2023 to June 30, 2024 (the "reporting period"). You can find additional information about the Fund at www.pimco.com/literature. You can also request this information by contacting us at 888.400.4ETF (888.400.4383).
What were the Fund costs for the last year?
(based on a hypothetical $10,000 investment)
| Fund Name | Cost of a $10,000 investment | Costs paid as a percentage of a $10,000 investment |
|---|
| PIMCO Broad U.S. TIPS Index Exchange-Traded Fund | $20 | 0.20% |
How did the Fund perform during the reporting period and what affected its performance?
The following affected performance (on a gross basis) during the reporting period:
• Exposure to U.S. real yields detracted from absolute performance for both the Fund and the ICE BofA U.S. Treasury Inflation-Protected
Securities Index, as U.S. real yields moved higher.
• Exposure to the inflation accrual component of Treasury Inflation-Protected Securities contributed to absolute performance for both
the Fund and the ICE BofA U.S. Treasury Inflation-Protected Securities Index, as U.S. inflation moved higher.
• There were no other material contributors or detractors for the Fund.
In addition to the Fund's performance, the tables in this section include performance of: (i) a broad-based securities market index (i.e., a regulatory index) and (ii) one or more supplemental index(es). Effective July 24, 2024, the Fund's regulatory index is the Bloomberg U.S. Aggregate Index. The Fund's regulatory index is shown in connection with certain regulatory requirements to provide a broad measure of market performance.
The table below illustrates cumulative returns for the 10-year period ended June 30, 2024 or the life of the Fund, if shorter. Cumulative returns are based on a hypothetical initial investment equal to the greater of either $10,000 or the investment minimum applicable to the share class.
Cumulative Returns Based on $10,000 Investment
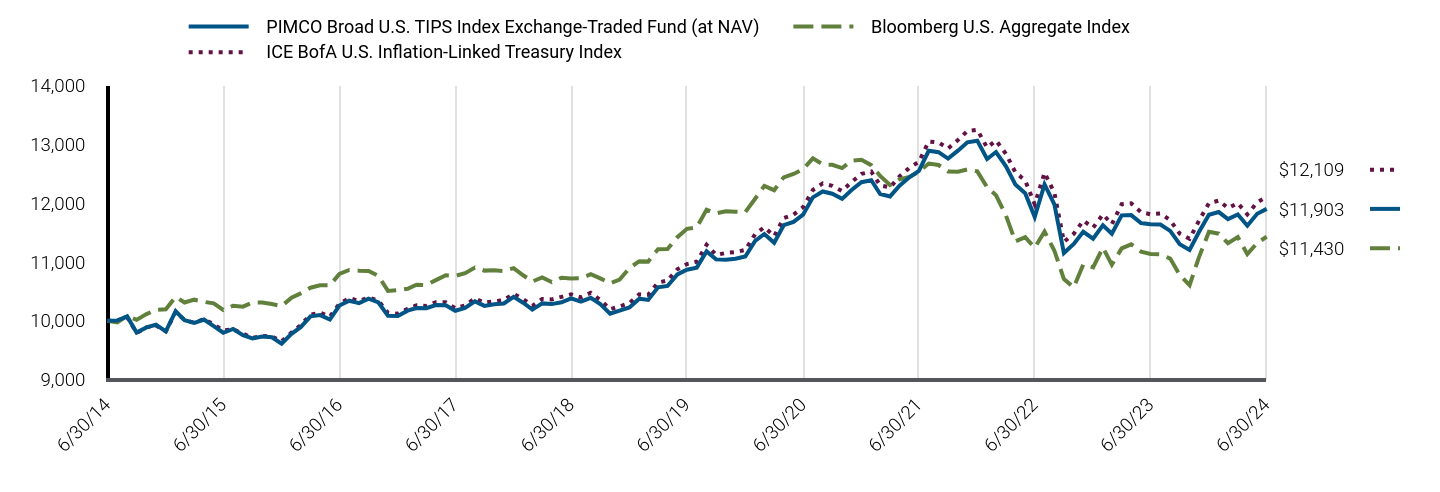
| PIMCO Broad U.S. TIPS Index Exchange-Traded Fund (at NAV) | Bloomberg U.S. Aggregate Index | ICE BofA U.S. Inflation-Linked Treasury Index |
|---|
| 6/30/14 | $10,000 | $10,000 | $10,000 |
| 7/31/14 | $10,005 | $9,975 | $10,007 |
| 8/31/14 | $10,076 | $10,085 | $10,067 |
| 9/30/14 | $9,801 | $10,017 | $9,794 |
| 10/31/14 | $9,889 | $10,115 | $9,890 |
| 11/30/14 | $9,934 | $10,187 | $9,922 |
| 12/31/14 | $9,822 | $10,196 | $9,822 |
| 1/31/15 | $10,164 | $10,410 | $10,150 |
| 2/28/15 | $10,012 | $10,312 | $10,014 |
| 3/31/15 | $9,965 | $10,360 | $9,967 |
| 4/30/15 | $10,022 | $10,323 | $10,030 |
| 5/31/15 | $9,910 | $10,298 | $9,941 |
| 6/30/15 | $9,798 | $10,186 | $9,836 |
| 7/31/15 | $9,862 | $10,257 | $9,858 |
| 8/31/15 | $9,756 | $10,242 | $9,782 |
| 9/30/15 | $9,702 | $10,311 | $9,711 |
| 10/31/15 | $9,735 | $10,313 | $9,743 |
| 11/30/15 | $9,721 | $10,286 | $9,736 |
| 12/31/15 | $9,614 | $10,252 | $9,654 |
| 1/31/16 | $9,779 | $10,393 | $9,800 |
| 2/29/16 | $9,893 | $10,467 | $9,926 |
| 3/31/16 | $10,077 | $10,563 | $10,106 |
| 4/30/16 | $10,098 | $10,604 | $10,139 |
| 5/31/16 | $10,022 | $10,607 | $10,070 |
| 6/30/16 | $10,261 | $10,797 | $10,292 |
| 7/31/16 | $10,343 | $10,865 | $10,385 |
| 8/31/16 | $10,301 | $10,853 | $10,340 |
| 9/30/16 | $10,378 | $10,847 | $10,397 |
| 10/31/16 | $10,312 | $10,764 | $10,343 |
| 11/30/16 | $10,086 | $10,509 | $10,136 |
| 12/31/16 | $10,083 | $10,524 | $10,122 |
| 1/31/17 | $10,174 | $10,544 | $10,206 |
| 2/28/17 | $10,218 | $10,615 | $10,264 |
| 3/31/17 | $10,216 | $10,610 | $10,254 |
| 4/30/17 | $10,269 | $10,692 | $10,316 |
| 5/31/17 | $10,266 | $10,774 | $10,318 |
| 6/30/17 | $10,172 | $10,763 | $10,215 |
| 7/31/17 | $10,221 | $10,809 | $10,263 |
| 8/31/17 | $10,332 | $10,906 | $10,382 |
| 9/30/17 | $10,254 | $10,854 | $10,310 |
| 10/31/17 | $10,281 | $10,861 | $10,334 |
| 11/30/17 | $10,295 | $10,847 | $10,354 |
| 12/31/17 | $10,408 | $10,897 | $10,459 |
| 1/31/18 | $10,304 | $10,771 | $10,366 |
| 2/28/18 | $10,192 | $10,669 | $10,256 |
| 3/31/18 | $10,297 | $10,737 | $10,371 |
| 4/30/18 | $10,285 | $10,658 | $10,364 |
| 5/31/18 | $10,315 | $10,734 | $10,408 |
| 6/30/18 | $10,382 | $10,720 | $10,452 |
| 7/31/18 | $10,327 | $10,723 | $10,399 |
| 8/31/18 | $10,392 | $10,792 | $10,477 |
| 9/30/18 | $10,284 | $10,722 | $10,355 |
| 10/31/18 | $10,123 | $10,638 | $10,197 |
| 11/30/18 | $10,175 | $10,701 | $10,245 |
| 12/31/18 | $10,228 | $10,898 | $10,302 |
| 1/31/19 | $10,377 | $11,014 | $10,451 |
| 2/28/19 | $10,357 | $11,007 | $10,445 |
| 3/31/19 | $10,570 | $11,219 | $10,650 |
| 4/30/19 | $10,593 | $11,221 | $10,686 |
| 5/31/19 | $10,790 | $11,421 | $10,877 |
| 6/30/19 | $10,869 | $11,564 | $10,965 |
| 7/31/19 | $10,905 | $11,589 | $11,004 |
| 8/31/19 | $11,181 | $11,890 | $11,294 |
| 9/30/19 | $11,047 | $11,826 | $11,121 |
| 10/31/19 | $11,037 | $11,862 | $11,154 |
| 11/30/19 | $11,057 | $11,856 | $11,169 |
| 12/31/19 | $11,094 | $11,848 | $11,206 |
| 1/31/20 | $11,360 | $12,076 | $11,473 |
| 2/29/20 | $11,476 | $12,293 | $11,592 |
| 3/31/20 | $11,326 | $12,221 | $11,439 |
| 4/30/20 | $11,626 | $12,438 | $11,745 |
| 5/31/20 | $11,682 | $12,496 | $11,805 |
| 6/30/20 | $11,804 | $12,575 | $11,931 |
| 7/31/20 | $12,099 | $12,762 | $12,224 |
| 8/31/20 | $12,199 | $12,659 | $12,335 |
| 9/30/20 | $12,160 | $12,652 | $12,295 |
| 10/31/20 | $12,073 | $12,596 | $12,206 |
| 11/30/20 | $12,224 | $12,720 | $12,359 |
| 12/31/20 | $12,357 | $12,737 | $12,497 |
| 1/31/21 | $12,389 | $12,646 | $12,536 |
| 2/28/21 | $12,155 | $12,463 | $12,302 |
| 3/31/21 | $12,115 | $12,308 | $12,268 |
| 4/30/21 | $12,297 | $12,405 | $12,453 |
| 5/31/21 | $12,440 | $12,445 | $12,601 |
| 6/30/21 | $12,549 | $12,533 | $12,702 |
| 7/31/21 | $12,890 | $12,673 | $13,048 |
| 8/31/21 | $12,866 | $12,649 | $13,031 |
| 9/30/21 | $12,758 | $12,539 | $12,929 |
| 10/31/21 | $12,892 | $12,536 | $13,072 |
| 11/30/21 | $13,034 | $12,573 | $13,227 |
| 12/31/21 | $13,062 | $12,541 | $13,248 |
| 1/31/22 | $12,750 | $12,271 | $12,944 |
| 2/28/22 | $12,869 | $12,134 | $13,066 |
| 3/31/22 | $12,632 | $11,797 | $12,840 |
| 4/30/22 | $12,318 | $11,349 | $12,526 |
| 5/31/22 | $12,170 | $11,422 | $12,385 |
| 6/30/22 | $11,765 | $11,243 | $11,980 |
| 7/31/22 | $12,318 | $11,518 | $12,517 |
| 8/31/22 | $11,980 | $11,192 | $12,176 |
| 9/30/22 | $11,153 | $10,709 | $11,343 |
| 10/31/22 | $11,307 | $10,570 | $11,480 |
| 11/30/22 | $11,513 | $10,959 | $11,704 |
| 12/31/22 | $11,397 | $10,909 | $11,583 |
| 1/31/23 | $11,626 | $11,245 | $11,810 |
| 2/28/23 | $11,482 | $10,954 | $11,643 |
| 3/31/23 | $11,793 | $11,232 | $11,982 |
| 4/30/23 | $11,797 | $11,300 | $11,998 |
| 5/31/23 | $11,663 | $11,177 | $11,847 |
| 6/30/23 | $11,641 | $11,137 | $11,811 |
| 7/31/23 | $11,636 | $11,130 | $11,824 |
| 8/31/23 | $11,529 | $11,059 | $11,711 |
| 9/30/23 | $11,303 | $10,778 | $11,482 |
| 10/31/23 | $11,206 | $10,607 | $11,394 |
| 11/30/23 | $11,514 | $11,088 | $11,706 |
| 12/31/23 | $11,804 | $11,512 | $11,999 |
| 1/31/24 | $11,849 | $11,481 | $12,044 |
| 2/29/24 | $11,730 | $11,318 | $11,916 |
| 3/31/24 | $11,807 | $11,423 | $12,001 |
| 4/30/24 | $11,617 | $11,134 | $11,809 |
| 5/31/24 | $11,820 | $11,323 | $12,014 |
| 6/30/24 | $11,903 | $11,430 | $12,109 |
The table below shows the average annual total returns of the Fund, a regulatory index, and one or more supplemental index(es) for certain periods ended June 30, 2024.
Average Annual Total Returns (%)
| Fund/Index Name | 1 Year | 5 Years | 10 Years |
|---|
| PIMCO Broad U.S. TIPS Index Exchange-Traded Fund (at NAV) | 2.26% | 1.84% | 1.76% |
| PIMCO Broad U.S. TIPS Index Exchange-Traded Fund (at Market Price) | 2.31% | 1.85% | 1.76% |
| Bloomberg U.S. Aggregate Index | 2.63% | (0.23%) | 1.35% |
| ICE BofA U.S. Inflation-Linked Treasury Index | 2.52% | 2.01% | 1.93% |
All Fund returns are net of fees and expenses and include applicable fee waivers and/or expense limitations. Absent any applicable fee waivers and/or expense limitations, performance would have been lower and there can be no assurance that any such waivers or limitations will continue in the future.
Performance quoted represents past performance. Past performance is not a guarantee or a reliable indicator of future results.Current performance may be lower or higher than performance shown. Investment return and the principal value of an investment will fluctuate. Shares may be worth more or less than original cost when redeemed. Returns shown do not reflect the deduction of taxes that a shareholder would pay on Fund distributions or the redemption of Fund shares.Differences in the Fund’s performance versus an index and related attribution information with respect to particular categories of securities or individual positions may be attributable, in part, to differences in the pricing methodologies used by the Fund and the index. For performance current to the most recent month-end, visit www.pimco.com/literature or via 888.400.4ETF (888.400.4383).
Key Fund StatisticsFootnote Reference* (as of the end of the reporting period)
| Total Net Assets | $98,743 |
| # of Portfolio Holdings | 42 |
| Portfolio Turnover Rate | 125% |
| Total Net Management Fees Paid During the Reporting Period | $220 |
| Footnote | Description |
Footnote* | Dollar amounts displayed in 000's |
What did the Fund invest in?
Allocation Breakdown (% of Net Assets)Footnote Reference*
| Footnote | Description |
Footnote* | % of Net Assets includes derivatives instruments, if any, valued at the value used for determining the Fund’s net asset value. The notional exposure of such derivatives investments therefore may be greater than what is depicted. |
| U.S. Treasury Obligations | 99.5% |
| Short-Term Instruments | 0.1% |
| Other Assets and Liabilities, Net | 0.4% |
| Total | 100.0% |
For additional information about the Fund, including the Fund's prospectus, financial information, holdings and proxy voting information, please visit www.pimco.com/literature or contact 888.400.4ETF (888.400.4383). For tax information about the Fund, please visit: https://www.pimco.com/tax.
PIMCO Broad U.S. TIPS Index Exchange-Traded Fund
Annual Shareholder Report |
June 30, 2024
TIPZ | Principal Listing Exchange: NYSE Arca
PIMCO Enhanced Low Duration Active Exchange-Traded Fund
LDUR | Principal Listing Exchange: NYSE Arca
Annual Shareholder Report | June 30, 2024
This annual shareholder report contains important information about the PIMCO Enhanced Low Duration Active Exchange-Traded Fund (the "Fund") for the period of July 1, 2023 to June 30, 2024 (the "reporting period"). You can find additional information about the Fund at www.pimco.com/literature. You can also request this information by contacting us at 888.400.4ETF (888.400.4383).
What were the Fund costs for the last year?
(based on a hypothetical $10,000 investment)
| Fund Name | Cost of a $10,000 investment | Costs paid as a percentage of a $10,000 investment |
|---|
| PIMCO Enhanced Low Duration Active Exchange-Traded Fund | $51 | 0.50% |
How did the Fund perform during the reporting period and what affected its performance?
The following affected performance (on a gross basis) during the reporting period:
• Overweight exposure to investment grade corporate credit during the first half of 2024, specifically financials, contributed to relative
performance, as corporate credit spreads tightened.
• Overweight exposure to commercial mortgage-backed securities ("CMBS") contributed to relative performance, as CMBS posted
positive return.
• U.S. duration positioning, specifically overweight exposure to the 2 year part of the curve and underweight exposure to the 10 year part
of the curve, contributed to relative performance, due to the curve steepening.
• A long bias to the Japanese yen versus the U.S. dollar detracted from relative performance, as the Japanese yen depreciated.
• There were no other material detractors for this Fund.
In addition to the Fund's performance, the tables in this section include performance of: (i) a broad-based securities market index (i.e., a regulatory index) and (ii) one or more supplemental index(es). Effective July 24, 2024, the Fund's regulatory index is the Bloomberg U.S. Aggregate Index. The Fund's regulatory index is shown in connection with certain regulatory requirements to provide a broad measure of market performance.
The table below illustrates cumulative returns for the 10-year period ended June 30, 2024 or the life of the Fund, if shorter. Cumulative returns are based on a hypothetical initial investment equal to the greater of either $10,000 or the investment minimum applicable to the share class.
Cumulative Returns Based on $10,000 Investment

| PIMCO Enhanced Low Duration Active Exchange-Traded Fund (at NAV) | Bloomberg U.S. Aggregate Index | ICE BofA 1-3 Year U.S. Treasury Index |
|---|
| 6/30/14 | $10,000 | $10,000 | $10,000 |
| 7/31/14 | $9,999 | $9,975 | $9,992 |
| 8/31/14 | $10,034 | $10,085 | $10,009 |
| 9/30/14 | $10,033 | $10,017 | $10,003 |
| 10/31/14 | $10,059 | $10,115 | $10,031 |
| 11/30/14 | $10,068 | $10,187 | $10,045 |
| 12/31/14 | $10,035 | $10,196 | $10,021 |
| 1/31/15 | $10,092 | $10,410 | $10,071 |
| 2/28/15 | $10,146 | $10,312 | $10,050 |
| 3/31/15 | $10,174 | $10,360 | $10,073 |
| 4/30/15 | $10,201 | $10,323 | $10,078 |
| 5/31/15 | $10,247 | $10,298 | $10,085 |
| 6/30/15 | $10,237 | $10,186 | $10,088 |
| 7/31/15 | $10,254 | $10,257 | $10,093 |
| 8/31/15 | $10,217 | $10,242 | $10,089 |
| 9/30/15 | $10,178 | $10,311 | $10,119 |
| 10/31/15 | $10,259 | $10,313 | $10,109 |
| 11/30/15 | $10,263 | $10,286 | $10,084 |
| 12/31/15 | $10,240 | $10,252 | $10,075 |
| 1/31/16 | $10,212 | $10,393 | $10,136 |
| 2/29/16 | $10,195 | $10,467 | $10,148 |
| 3/31/16 | $10,296 | $10,563 | $10,166 |
| 4/30/16 | $10,348 | $10,604 | $10,169 |
| 5/31/16 | $10,400 | $10,607 | $10,158 |
| 6/30/16 | $10,417 | $10,797 | $10,219 |
| 7/31/16 | $10,486 | $10,865 | $10,213 |
| 8/31/16 | $10,512 | $10,853 | $10,197 |
| 9/30/16 | $10,534 | $10,847 | $10,208 |
| 10/31/16 | $10,553 | $10,764 | $10,202 |
| 11/30/16 | $10,508 | $10,509 | $10,161 |
| 12/31/16 | $10,530 | $10,524 | $10,164 |
| 1/31/17 | $10,550 | $10,544 | $10,177 |
| 2/28/17 | $10,580 | $10,615 | $10,187 |
| 3/31/17 | $10,598 | $10,610 | $10,191 |
| 4/30/17 | $10,626 | $10,692 | $10,205 |
| 5/31/17 | $10,654 | $10,774 | $10,217 |
| 6/30/17 | $10,681 | $10,763 | $10,208 |
| 7/31/17 | $10,689 | $10,809 | $10,230 |
| 8/31/17 | $10,712 | $10,906 | $10,249 |
| 9/30/17 | $10,740 | $10,854 | $10,233 |
| 10/31/17 | $10,772 | $10,861 | $10,226 |
| 11/30/17 | $10,765 | $10,847 | $10,206 |
| 12/31/17 | $10,755 | $10,897 | $10,207 |
| 1/31/18 | $10,739 | $10,771 | $10,178 |
| 2/28/18 | $10,745 | $10,669 | $10,174 |
| 3/31/18 | $10,740 | $10,737 | $10,194 |
| 4/30/18 | $10,755 | $10,658 | $10,178 |
| 5/31/18 | $10,781 | $10,734 | $10,215 |
| 6/30/18 | $10,798 | $10,720 | $10,216 |
| 7/31/18 | $10,824 | $10,723 | $10,216 |
| 8/31/18 | $10,852 | $10,792 | $10,248 |
| 9/30/18 | $10,875 | $10,722 | $10,236 |
| 10/31/18 | $10,897 | $10,638 | $10,252 |
| 11/30/18 | $10,894 | $10,701 | $10,287 |
| 12/31/18 | $10,900 | $10,898 | $10,369 |
| 1/31/19 | $10,958 | $11,014 | $10,396 |
| 2/28/19 | $11,016 | $11,007 | $10,407 |
| 3/31/19 | $11,064 | $11,219 | $10,471 |
| 4/30/19 | $11,108 | $11,221 | $10,492 |
| 5/31/19 | $11,144 | $11,421 | $10,566 |
| 6/30/19 | $11,193 | $11,564 | $10,621 |
| 7/31/19 | $11,242 | $11,589 | $10,609 |
| 8/31/19 | $11,288 | $11,890 | $10,694 |
| 9/30/19 | $11,298 | $11,826 | $10,682 |
| 10/31/19 | $11,327 | $11,862 | $10,717 |
| 11/30/19 | $11,335 | $11,856 | $10,714 |
| 12/31/19 | $11,373 | $11,848 | $10,737 |
| 1/31/20 | $11,478 | $12,076 | $10,795 |
| 2/29/20 | $11,581 | $12,293 | $10,889 |
| 3/31/20 | $11,258 | $12,221 | $11,038 |
| 4/30/20 | $11,464 | $12,438 | $11,043 |
| 5/31/20 | $11,575 | $12,496 | $11,050 |
| 6/30/20 | $11,726 | $12,575 | $11,053 |
| 7/31/20 | $11,769 | $12,762 | $11,064 |
| 8/31/20 | $11,790 | $12,659 | $11,061 |
| 9/30/20 | $11,818 | $12,652 | $11,064 |
| 10/31/20 | $11,866 | $12,596 | $11,060 |
| 11/30/20 | $11,848 | $12,720 | $11,065 |
| 12/31/20 | $11,883 | $12,737 | $11,070 |
| 1/31/21 | $11,915 | $12,646 | $11,072 |
| 2/28/21 | $11,909 | $12,463 | $11,063 |
| 3/31/21 | $11,902 | $12,308 | $11,065 |
| 4/30/21 | $11,912 | $12,405 | $11,070 |
| 5/31/21 | $11,921 | $12,445 | $11,078 |
| 6/30/21 | $11,909 | $12,533 | $11,061 |
| 7/31/21 | $11,921 | $12,673 | $11,079 |
| 8/31/21 | $11,923 | $12,649 | $11,079 |
| 9/30/21 | $11,931 | $12,539 | $11,068 |
| 10/31/21 | $11,891 | $12,536 | $11,034 |
| 11/30/21 | $11,863 | $12,573 | $11,036 |
| 12/31/21 | $11,846 | $12,541 | $11,009 |
| 1/31/22 | $11,766 | $12,271 | $10,936 |
| 2/28/22 | $11,686 | $12,134 | $10,896 |
| 3/31/22 | $11,495 | $11,797 | $10,751 |
| 4/30/22 | $11,452 | $11,349 | $10,700 |
| 5/31/22 | $11,499 | $11,422 | $10,759 |
| 6/30/22 | $11,384 | $11,243 | $10,696 |
| 7/31/22 | $11,420 | $11,518 | $10,732 |
| 8/31/22 | $11,375 | $11,192 | $10,655 |
| 9/30/22 | $11,268 | $10,709 | $10,530 |
| 10/31/22 | $11,197 | $10,570 | $10,519 |
| 11/30/22 | $11,266 | $10,959 | $10,585 |
| 12/31/22 | $11,324 | $10,909 | $10,607 |
| 1/31/23 | $11,407 | $11,245 | $10,680 |
| 2/28/23 | $11,353 | $10,954 | $10,603 |
| 3/31/23 | $11,463 | $11,232 | $10,772 |
| 4/30/23 | $11,504 | $11,300 | $10,800 |
| 5/31/23 | $11,486 | $11,177 | $10,762 |
| 6/30/23 | $11,445 | $11,137 | $10,710 |
| 7/31/23 | $11,512 | $11,130 | $10,748 |
| 8/31/23 | $11,564 | $11,059 | $10,790 |
| 9/30/23 | $11,578 | $10,778 | $10,789 |
| 10/31/23 | $11,611 | $10,607 | $10,826 |
| 11/30/23 | $11,731 | $11,088 | $10,936 |
| 12/31/23 | $11,875 | $11,512 | $11,058 |
| 1/31/24 | $11,952 | $11,481 | $11,101 |
| 2/29/24 | $11,923 | $11,318 | $11,055 |
| 3/31/24 | $11,981 | $11,423 | $11,091 |
| 4/30/24 | $11,950 | $11,134 | $11,055 |
| 5/31/24 | $12,041 | $11,323 | $11,131 |
| 6/30/24 | $12,104 | $11,430 | $11,195 |
The table below shows the average annual total returns of the Fund, a regulatory index, and one or more supplemental index(es) for certain periods ended June 30, 2024.
Average Annual Total Returns (%)
| Fund/Index Name | 1 Year | 5 Years | 10 Years |
|---|
| PIMCO Enhanced Low Duration Active Exchange-Traded Fund (at NAV) | 5.76% | 1.58% | 1.93% |
| PIMCO Enhanced Low Duration Active Exchange-Traded Fund (at Market Price) | 5.76% | 1.55% | 1.77% |
| Bloomberg U.S. Aggregate Index | 2.63% | (0.23%) | 1.35% |
| ICE BofA 1-3 Year U.S. Treasury Index | 4.53% | 1.06% | 1.14% |
All Fund returns are net of fees and expenses and include applicable fee waivers and/or expense limitations. Absent any applicable fee waivers and/or expense limitations, performance would have been lower and there can be no assurance that any such waivers or limitations will continue in the future.
Performance quoted represents past performance. Past performance is not a guarantee or a reliable indicator of future results.Current performance may be lower or higher than performance shown. Investment return and the principal value of an investment will fluctuate. Shares may be worth more or less than original cost when redeemed. Returns shown do not reflect the deduction of taxes that a shareholder would pay on Fund distributions or the redemption of Fund shares.Differences in the Fund’s performance versus an index and related attribution information with respect to particular categories of securities or individual positions may be attributable, in part, to differences in the pricing methodologies used by the Fund and the index. For performance current to the most recent month-end, visit www.pimco.com/literature or via 888.400.4ETF (888.400.4383).
Key Fund StatisticsFootnote Reference* (as of the end of the reporting period)
| Total Net Assets | $870,154 |
| # of Portfolio Holdings | 488 |
| Portfolio Turnover Rate | 183% |
| Total Net Management Fees Paid During the Reporting Period | $4,336 |
| Footnote | Description |
Footnote* | Dollar amounts displayed in 000's |
What did the Fund invest in?
Allocation Breakdown (% of Net Assets)Footnote Reference*
| Footnote | Description |
Footnote* | % of Net Assets includes derivatives instruments, if any, valued at the value used for determining the Fund’s net asset value. The notional exposure of such derivatives investments therefore may be greater than what is depicted. |
| Corporate Bonds & Notes | 30.4% |
| Asset-Backed Securities | 29.0% |
| U.S. Treasury Obligations | 22.2% |
| Non-Agency Mortgage-Backed Securities | 13.4% |
| U.S. Government Agencies | 8.8% |
| Municipal Bonds & Notes | 0.7% |
| Sovereign Issues | 0.3% |
| Short-Term Instruments | 0.5% |
| Other Investments | 0.0% |
| Other Assets and Liabilities, Net | (5.3%) |
| Total | 100.0% |
For additional information about the Fund, including the Fund's prospectus, financial information, holdings and proxy voting information, please visit www.pimco.com/literature or contact 888.400.4ETF (888.400.4383). For tax information about the Fund, please visit: https://www.pimco.com/tax.
PIMCO Enhanced Low Duration Active Exchange-Traded Fund
Annual Shareholder Report |
June 30, 2024
LDUR | Principal Listing Exchange: NYSE Arca
PIMCO Enhanced Short Maturity Active ESG Exchange-Traded Fund
EMNT | Principal Listing Exchange: NYSE Arca
Annual Shareholder Report | June 30, 2024
This annual shareholder report contains important information about the PIMCO Enhanced Short Maturity Active ESG Exchange-Traded Fund (the "Fund") for the period of July 1, 2023 to June 30, 2024 (the "reporting period"). You can find additional information about the Fund at www.pimco.com/literature. You can also request this information by contacting us at 888.400.4ETF (888.400.4383).
What were the Fund costs for the last year?
(based on a hypothetical $10,000 investment)
| Fund Name | Cost of a $10,000 investment | Costs paid as a percentage of a $10,000 investment |
|---|
| PIMCO Enhanced Short Maturity Active ESG Exchange-Traded Fund | $25 | 0.24% |
How did the Fund perform during the reporting period and what affected its performance?
The following affected performance (on a gross basis) during the reporting period:
• Overweight exposure to investment grade corporate credit, particularly in the financial sector, contributed to relative performance, as
spreads tightened.
• Overweight exposure to U.S. duration, particularly in the 1 year part of the curve, contributed to relative performance, as
interest rates fell.
• Overweight exposure to select securitized credit, particularly asset-backed securities, contributed to relative performance, as spreads
tightened.
• There were no material detractors for this Fund.
In addition to the Fund's performance, the tables in this section include performance of: (i) a broad-based securities market index (i.e., a regulatory index) and (ii) one or more supplemental index(es). Effective July 24, 2024, the Fund's regulatory index is the Bloomberg U.S. Aggregate Index. The Fund's regulatory index is shown in connection with certain regulatory requirements to provide a broad measure of market performance.
The table below illustrates cumulative returns for the 10-year period ended June 30, 2024 or the life of the Fund, if shorter. Cumulative returns are based on a hypothetical initial investment equal to the greater of either $10,000 or the investment minimum applicable to the share class.
Cumulative Returns Based on $10,000 Investment
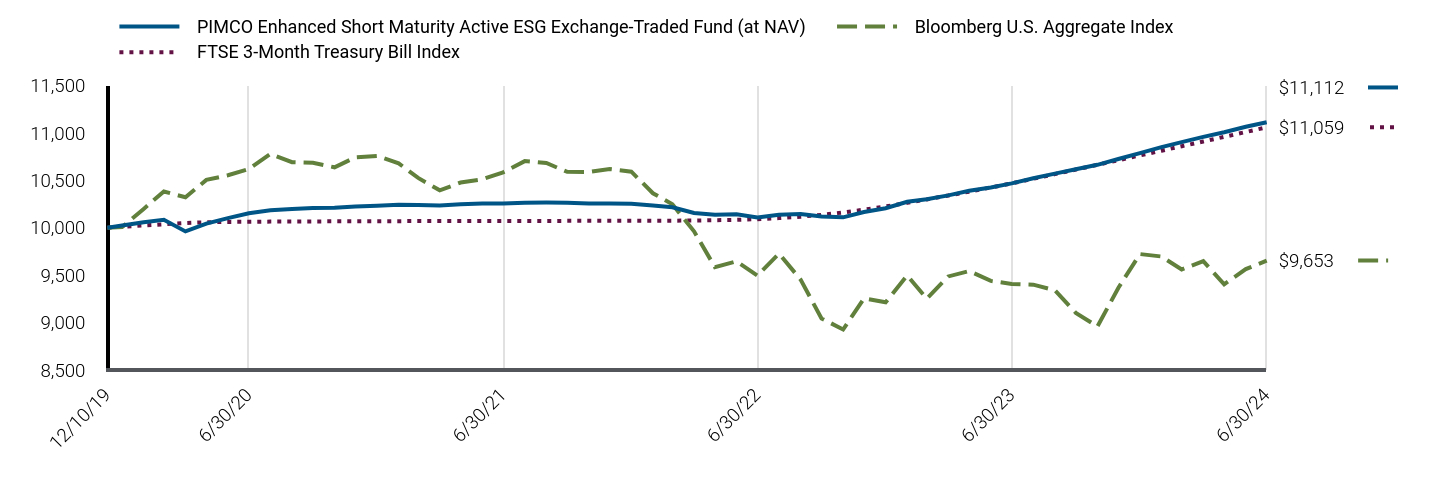
| PIMCO Enhanced Short Maturity Active ESG Exchange-Traded Fund (at NAV) | Bloomberg U.S. Aggregate Index | FTSE 3-Month Treasury Bill Index |
|---|
| 12/10/19 | $10,000 | $10,000 | $10,000 |
| 12/31/19 | $10,023 | $10,006 | $10,010 |
| 1/31/20 | $10,058 | $10,198 | $10,024 |
| 2/29/20 | $10,084 | $10,382 | $10,036 |
| 3/31/20 | $9,961 | $10,321 | $10,049 |
| 4/30/20 | $10,043 | $10,504 | $10,057 |
| 5/31/20 | $10,101 | $10,553 | $10,061 |
| 6/30/20 | $10,153 | $10,619 | $10,062 |
| 7/31/20 | $10,183 | $10,778 | $10,064 |
| 8/31/20 | $10,196 | $10,691 | $10,065 |
| 9/30/20 | $10,207 | $10,685 | $10,066 |
| 10/31/20 | $10,210 | $10,637 | $10,067 |
| 11/30/20 | $10,223 | $10,742 | $10,067 |
| 12/31/20 | $10,232 | $10,757 | $10,068 |
| 1/31/21 | $10,241 | $10,679 | $10,069 |
| 2/28/21 | $10,239 | $10,525 | $10,070 |
| 3/31/21 | $10,235 | $10,394 | $10,070 |
| 4/30/21 | $10,246 | $10,476 | $10,070 |
| 5/31/21 | $10,256 | $10,510 | $10,071 |
| 6/30/21 | $10,255 | $10,584 | $10,071 |
| 7/31/21 | $10,264 | $10,702 | $10,071 |
| 8/31/21 | $10,265 | $10,682 | $10,071 |
| 9/30/21 | $10,264 | $10,589 | $10,072 |
| 10/31/21 | $10,256 | $10,587 | $10,072 |
| 11/30/21 | $10,254 | $10,618 | $10,072 |
| 12/31/21 | $10,252 | $10,591 | $10,073 |
| 1/31/22 | $10,235 | $10,363 | $10,073 |
| 2/28/22 | $10,216 | $10,247 | $10,074 |
| 3/31/22 | $10,156 | $9,962 | $10,076 |
| 4/30/22 | $10,137 | $9,584 | $10,079 |
| 5/31/22 | $10,141 | $9,646 | $10,083 |
| 6/30/22 | $10,108 | $9,495 | $10,090 |
| 7/31/22 | $10,136 | $9,727 | $10,101 |
| 8/31/22 | $10,144 | $9,452 | $10,116 |
| 9/30/22 | $10,117 | $9,043 | $10,135 |
| 10/31/22 | $10,109 | $8,926 | $10,161 |
| 11/30/22 | $10,165 | $9,255 | $10,190 |
| 12/31/22 | $10,205 | $9,213 | $10,224 |
| 1/31/23 | $10,273 | $9,496 | $10,262 |
| 2/28/23 | $10,301 | $9,251 | $10,298 |
| 3/31/23 | $10,341 | $9,486 | $10,339 |
| 4/30/23 | $10,389 | $9,543 | $10,380 |
| 5/31/23 | $10,424 | $9,439 | $10,424 |
| 6/30/23 | $10,467 | $9,406 | $10,468 |
| 7/31/23 | $10,522 | $9,399 | $10,516 |
| 8/31/23 | $10,570 | $9,339 | $10,565 |
| 9/30/23 | $10,617 | $9,102 | $10,613 |
| 10/31/23 | $10,663 | $8,958 | $10,663 |
| 11/30/23 | $10,725 | $9,364 | $10,711 |
| 12/31/23 | $10,787 | $9,722 | $10,762 |
| 1/31/24 | $10,849 | $9,696 | $10,812 |
| 2/29/24 | $10,903 | $9,559 | $10,859 |
| 3/31/24 | $10,958 | $9,647 | $10,909 |
| 4/30/24 | $11,007 | $9,403 | $10,958 |
| 5/31/24 | $11,064 | $9,563 | $11,009 |
| 6/30/24 | $11,112 | $9,653 | $11,059 |
The table below shows the average annual total returns of the Fund, a regulatory index, and one or more supplemental index(es) for certain periods ended June 30, 2024.
Average Annual Total Returns (%)
| Fund/Index Name | 1 Year | Since Inception 12/10/19 |
|---|
| PIMCO Enhanced Short Maturity Active ESG Exchange-Traded Fund (at NAV) | 6.16% | 2.34% |
| PIMCO Enhanced Short Maturity Active ESG Exchange-Traded Fund (at Market Price) | 6.14% | 2.33% |
| Bloomberg U.S. Aggregate Index | 2.63% | (0.77%) |
| FTSE 3-Month Treasury Bill Index | 5.64% | 2.23% |
All Fund returns are net of fees and expenses and include applicable fee waivers and/or expense limitations. Absent any applicable fee waivers and/or expense limitations, performance would have been lower and there can be no assurance that any such waivers or limitations will continue in the future.
Performance quoted represents past performance. Past performance is not a guarantee or a reliable indicator of future results.Current performance may be lower or higher than performance shown. Investment return and the principal value of an investment will fluctuate. Shares may be worth more or less than original cost when redeemed. Returns shown do not reflect the deduction of taxes that a shareholder would pay on Fund distributions or the redemption of Fund shares.Differences in the Fund’s performance versus an index and related attribution information with respect to particular categories of securities or individual positions may be attributable, in part, to differences in the pricing methodologies used by the Fund and the index. For performance current to the most recent month-end, visit www.pimco.com/literature or via 888.400.4ETF (888.400.4383).
Key Fund StatisticsFootnote Reference* (as of the end of the reporting period)
| Total Net Assets | $166,877 |
| # of Portfolio Holdings | 186 |
| Portfolio Turnover Rate | 73% |
| Total Net Management Fees Paid During the Reporting Period | $391 |
| Footnote | Description |
Footnote* | Dollar amounts displayed in 000's |
What did the Fund invest in?
Allocation Breakdown (% of Net Assets)Footnote Reference*
| Footnote | Description |
Footnote* | % of Net Assets includes derivatives instruments, if any, valued at the value used for determining the Fund’s net asset value. The notional exposure of such derivatives investments therefore may be greater than what is depicted. |
| Corporate Bonds & Notes | 45.2% |
| Asset-Backed Securities | 26.6% |
| Non-Agency Mortgage-Backed Securities | 2.5% |
| U.S. Government Agencies | 2.2% |
| U.S. Treasury Obligations | 1.6% |
| Sovereign Issues | 0.8% |
| Short-Term Instruments | 33.5% |
| Other Investments | 0.0% |
| Other Assets and Liabilities, Net | (12.4%) |
| Total | 100.0% |
For additional information about the Fund, including the Fund's prospectus, financial information, holdings and proxy voting information, please visit www.pimco.com/literature or contact 888.400.4ETF (888.400.4383). For tax information about the Fund, please visit: https://www.pimco.com/tax.
PIMCO Enhanced Short Maturity Active ESG Exchange-Traded Fund
Annual Shareholder Report |
June 30, 2024
EMNT | Principal Listing Exchange: NYSE Arca
PIMCO Enhanced Short Maturity Active Exchange-Traded Fund
MINT | Principal Listing Exchange: NYSE Arca
Annual Shareholder Report | June 30, 2024
This annual shareholder report contains important information about the PIMCO Enhanced Short Maturity Active Exchange-Traded Fund (the "Fund") for the period of July 1, 2023 to June 30, 2024 (the "reporting period"). You can find additional information about the Fund at www.pimco.com/literature. You can also request this information by contacting us at 888.400.4ETF (888.400.4383).
What were the Fund costs for the last year?
(based on a hypothetical $10,000 investment)
| Fund Name | Cost of a $10,000 investment | Costs paid as a percentage of a $10,000 investment |
|---|
| PIMCO Enhanced Short Maturity Active Exchange-Traded Fund | $36 | 0.35% |
How did the Fund perform during the reporting period and what affected its performance?
The following affected performance (on a gross basis) during the reporting period:
• Overweight exposure to select securitized credit, particularly commercial mortgage-backed securities, collateralized loan obligations,
and asset-backed securities, contributed to relative performance, as spreads tightened.
• Overweight exposure to U.S. duration in the 1 year part of the curve contributed to relative performance, as interest rates fell.
• Overweight exposure to investment grade corporate credit, particularly in the financial sector, contributed to relative performance, as
spreads tightened.
• There were no material detractors for this Fund.
In addition to the Fund's performance, the tables in this section include performance of: (i) a broad-based securities market index (i.e., a regulatory index) and (ii) one or more supplemental index(es). Effective July 24, 2024, the Fund's regulatory index is the Bloomberg U.S. Aggregate Index. The Fund's regulatory index is shown in connection with certain regulatory requirements to provide a broad measure of market performance.
The table below illustrates cumulative returns for the 10-year period ended June 30, 2024 or the life of the Fund, if shorter. Cumulative returns are based on a hypothetical initial investment equal to the greater of either $10,000 or the investment minimum applicable to the share class.
Cumulative Returns Based on $10,000 Investment
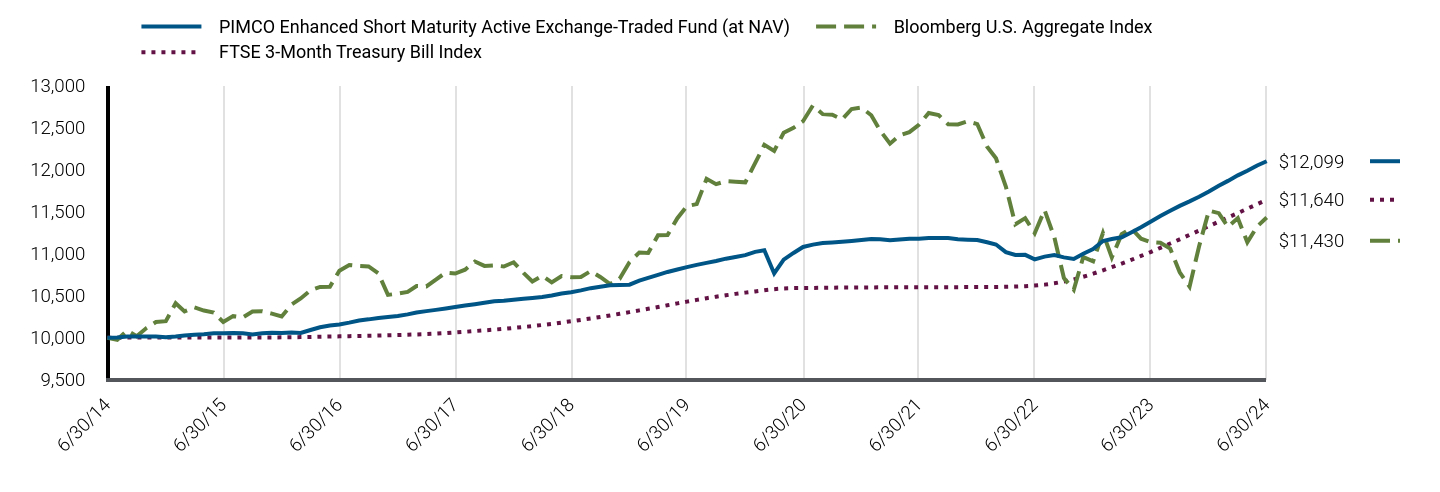
| PIMCO Enhanced Short Maturity Active Exchange-Traded Fund (at NAV) | Bloomberg U.S. Aggregate Index | FTSE 3-Month Treasury Bill Index |
|---|
| 6/30/14 | $10,000 | $10,000 | $10,000 |
| 7/31/14 | $10,002 | $9,975 | $10,000 |
| 8/31/14 | $10,013 | $10,085 | $10,001 |
| 9/30/14 | $10,014 | $10,017 | $10,001 |
| 10/31/14 | $10,014 | $10,115 | $10,001 |
| 11/30/14 | $10,015 | $10,187 | $10,001 |
| 12/31/14 | $10,004 | $10,196 | $10,001 |
| 1/31/15 | $10,013 | $10,410 | $10,001 |
| 2/28/15 | $10,026 | $10,312 | $10,002 |
| 3/31/15 | $10,034 | $10,360 | $10,002 |
| 4/30/15 | $10,042 | $10,323 | $10,002 |
| 5/31/15 | $10,054 | $10,298 | $10,002 |
| 6/30/15 | $10,053 | $10,186 | $10,002 |
| 7/31/15 | $10,056 | $10,257 | $10,002 |
| 8/31/15 | $10,053 | $10,242 | $10,003 |
| 9/30/15 | $10,037 | $10,311 | $10,003 |
| 10/31/15 | $10,052 | $10,313 | $10,003 |
| 11/30/15 | $10,060 | $10,286 | $10,003 |
| 12/31/15 | $10,056 | $10,252 | $10,004 |
| 1/31/16 | $10,062 | $10,393 | $10,005 |
| 2/29/16 | $10,057 | $10,467 | $10,007 |
| 3/31/16 | $10,091 | $10,563 | $10,009 |
| 4/30/16 | $10,124 | $10,604 | $10,012 |
| 5/31/16 | $10,146 | $10,607 | $10,014 |
| 6/30/16 | $10,156 | $10,797 | $10,016 |
| 7/31/16 | $10,179 | $10,865 | $10,018 |
| 8/31/16 | $10,205 | $10,853 | $10,021 |
| 9/30/16 | $10,218 | $10,847 | $10,023 |
| 10/31/16 | $10,235 | $10,764 | $10,025 |
| 11/30/16 | $10,246 | $10,509 | $10,028 |
| 12/31/16 | $10,257 | $10,524 | $10,031 |
| 1/31/17 | $10,277 | $10,544 | $10,035 |
| 2/28/17 | $10,300 | $10,615 | $10,039 |
| 3/31/17 | $10,316 | $10,610 | $10,043 |
| 4/30/17 | $10,331 | $10,692 | $10,048 |
| 5/31/17 | $10,347 | $10,774 | $10,054 |
| 6/30/17 | $10,364 | $10,763 | $10,062 |
| 7/31/17 | $10,382 | $10,809 | $10,070 |
| 8/31/17 | $10,398 | $10,906 | $10,079 |
| 9/30/17 | $10,415 | $10,854 | $10,087 |
| 10/31/17 | $10,433 | $10,861 | $10,096 |
| 11/30/17 | $10,439 | $10,847 | $10,105 |
| 12/31/17 | $10,451 | $10,897 | $10,116 |
| 1/31/18 | $10,463 | $10,771 | $10,127 |
| 2/28/18 | $10,472 | $10,669 | $10,138 |
| 3/31/18 | $10,483 | $10,737 | $10,151 |
| 4/30/18 | $10,502 | $10,658 | $10,164 |
| 5/31/18 | $10,525 | $10,734 | $10,180 |
| 6/30/18 | $10,540 | $10,720 | $10,195 |
| 7/31/18 | $10,563 | $10,723 | $10,212 |
| 8/31/18 | $10,589 | $10,792 | $10,229 |
| 9/30/18 | $10,607 | $10,722 | $10,246 |
| 10/31/18 | $10,623 | $10,638 | $10,265 |
| 11/30/18 | $10,628 | $10,701 | $10,284 |
| 12/31/18 | $10,631 | $10,898 | $10,304 |
| 1/31/19 | $10,678 | $11,014 | $10,325 |
| 2/28/19 | $10,712 | $11,007 | $10,344 |
| 3/31/19 | $10,747 | $11,219 | $10,365 |
| 4/30/19 | $10,782 | $11,221 | $10,386 |
| 5/31/19 | $10,811 | $11,421 | $10,408 |
| 6/30/19 | $10,839 | $11,564 | $10,429 |
| 7/31/19 | $10,866 | $11,589 | $10,450 |
| 8/31/19 | $10,890 | $11,890 | $10,470 |
| 9/30/19 | $10,913 | $11,826 | $10,488 |
| 10/31/19 | $10,940 | $11,862 | $10,505 |
| 11/30/19 | $10,960 | $11,856 | $10,521 |
| 12/31/19 | $10,982 | $11,848 | $10,536 |
| 1/31/20 | $11,021 | $12,076 | $10,550 |
| 2/29/20 | $11,039 | $12,293 | $10,564 |
| 3/31/20 | $10,764 | $12,221 | $10,577 |
| 4/30/20 | $10,929 | $12,438 | $10,586 |
| 5/31/20 | $11,008 | $12,496 | $10,590 |
| 6/30/20 | $11,079 | $12,575 | $10,591 |
| 7/31/20 | $11,107 | $12,762 | $10,592 |
| 8/31/20 | $11,125 | $12,659 | $10,594 |
| 9/30/20 | $11,132 | $12,652 | $10,595 |
| 10/31/20 | $11,140 | $12,596 | $10,596 |
| 11/30/20 | $11,150 | $12,720 | $10,596 |
| 12/31/20 | $11,161 | $12,737 | $10,597 |
| 1/31/21 | $11,173 | $12,646 | $10,598 |
| 2/28/21 | $11,170 | $12,463 | $10,599 |
| 3/31/21 | $11,158 | $12,308 | $10,599 |
| 4/30/21 | $11,168 | $12,405 | $10,600 |
| 5/31/21 | $11,178 | $12,445 | $10,600 |
| 6/30/21 | $11,177 | $12,533 | $10,600 |
| 7/31/21 | $11,185 | $12,673 | $10,600 |
| 8/31/21 | $11,187 | $12,649 | $10,600 |
| 9/30/21 | $11,185 | $12,539 | $10,601 |
| 10/31/21 | $11,172 | $12,536 | $10,601 |
| 11/30/21 | $11,166 | $12,573 | $10,602 |
| 12/31/21 | $11,161 | $12,541 | $10,602 |
| 1/31/22 | $11,135 | $12,271 | $10,603 |
| 2/28/22 | $11,108 | $12,134 | $10,603 |
| 3/31/22 | $11,018 | $11,797 | $10,605 |
| 4/30/22 | $10,984 | $11,349 | $10,608 |
| 5/31/22 | $10,985 | $11,422 | $10,613 |
| 6/30/22 | $10,932 | $11,243 | $10,620 |
| 7/31/22 | $10,964 | $11,518 | $10,631 |
| 8/31/22 | $10,982 | $11,192 | $10,647 |
| 9/30/22 | $10,955 | $10,709 | $10,668 |
| 10/31/22 | $10,936 | $10,570 | $10,694 |
| 11/30/22 | $10,999 | $10,959 | $10,725 |
| 12/31/22 | $11,054 | $10,909 | $10,761 |
| 1/31/23 | $11,150 | $11,245 | $10,801 |
| 2/28/23 | $11,174 | $10,954 | $10,839 |
| 3/31/23 | $11,195 | $11,232 | $10,882 |
| 4/30/23 | $11,252 | $11,300 | $10,925 |
| 5/31/23 | $11,314 | $11,177 | $10,972 |
| 6/30/23 | $11,379 | $11,137 | $11,018 |
| 7/31/23 | $11,448 | $11,130 | $11,069 |
| 8/31/23 | $11,509 | $11,059 | $11,120 |
| 9/30/23 | $11,568 | $10,778 | $11,170 |
| 10/31/23 | $11,621 | $10,607 | $11,223 |
| 11/30/23 | $11,676 | $11,088 | $11,274 |
| 12/31/23 | $11,739 | $11,512 | $11,327 |
| 1/31/24 | $11,808 | $11,481 | $11,380 |
| 2/29/24 | $11,865 | $11,318 | $11,430 |
| 3/31/24 | $11,931 | $11,423 | $11,482 |
| 4/30/24 | $11,986 | $11,134 | $11,534 |
| 5/31/24 | $12,048 | $11,323 | $11,588 |
| 6/30/24 | $12,099 | $11,430 | $11,640 |
The table below shows the average annual total returns of the Fund, a regulatory index, and one or more supplemental index(es) for certain periods ended June 30, 2024.
Average Annual Total Returns (%)
| Fund/Index Name | 1 Year | 5 Years | 10 Years |
|---|
| PIMCO Enhanced Short Maturity Active Exchange-Traded Fund (at NAV) | 6.33% | 2.22% | 1.92% |
| PIMCO Enhanced Short Maturity Active Exchange-Traded Fund (at Market Price) | 6.36% | 2.23% | 1.93% |
| Bloomberg U.S. Aggregate Index | 2.63% | (0.23%) | 1.35% |
| FTSE 3-Month Treasury Bill Index | 5.64% | 2.22% | 1.53% |
All Fund returns are net of fees and expenses and include applicable fee waivers and/or expense limitations. Absent any applicable fee waivers and/or expense limitations, performance would have been lower and there can be no assurance that any such waivers or limitations will continue in the future.
Performance quoted represents past performance. Past performance is not a guarantee or a reliable indicator of future results.Current performance may be lower or higher than performance shown. Investment return and the principal value of an investment will fluctuate. Shares may be worth more or less than original cost when redeemed. Returns shown do not reflect the deduction of taxes that a shareholder would pay on Fund distributions or the redemption of Fund shares.Differences in the Fund’s performance versus an index and related attribution information with respect to particular categories of securities or individual positions may be attributable, in part, to differences in the pricing methodologies used by the Fund and the index. For performance current to the most recent month-end, visit www.pimco.com/literature or via 888.400.4ETF (888.400.4383).
Key Fund StatisticsFootnote Reference* (as of the end of the reporting period)
| Total Net Assets | $12,049,316 |
| # of Portfolio Holdings | 829 |
| Portfolio Turnover Rate | 57% |
| Total Net Management Fees Paid During the Reporting Period | $36,569 |
| Footnote | Description |
Footnote* | Dollar amounts displayed in 000's |
What did the Fund invest in?
Allocation Breakdown (% of Net Assets)Footnote Reference*
| Footnote | Description |
Footnote* | % of Net Assets includes derivatives instruments, if any, valued at the value used for determining the Fund’s net asset value. The notional exposure of such derivatives investments therefore may be greater than what is depicted. |
| Corporate Bonds & Notes | 53.5% |
| Asset-Backed Securities | 26.4% |
| U.S. Government Agencies | 4.8% |
| Non-Agency Mortgage-Backed Securities | 3.4% |
| Sovereign Issues | 2.0% |
| Short-Term Instruments | 10.9% |
| Other Investments | 0.0% |
| Other Assets and Liabilities, Net | (1.0%) |
| Total | 100.0% |
For additional information about the Fund, including the Fund's prospectus, financial information, holdings and proxy voting information, please visit www.pimco.com/literature or contact 888.400.4ETF (888.400.4383). For tax information about the Fund, please visit: https://www.pimco.com/tax.
PIMCO Enhanced Short Maturity Active Exchange-Traded Fund
Annual Shareholder Report |
June 30, 2024
MINT | Principal Listing Exchange: NYSE Arca
PIMCO Intermediate Municipal Bond Active Exchange-Traded Fund
MUNI | Principal Listing Exchange: NYSE Arca
Annual Shareholder Report | June 30, 2024
This annual shareholder report contains important information about the PIMCO Intermediate Municipal Bond Active Exchange-Traded Fund (the "Fund") for the period of July 1, 2023 to June 30, 2024 (the "reporting period"). You can find additional information about the Fund at www.pimco.com/literature. You can also request this information by contacting us at 888.400.4ETF (888.400.4383).
What were the Fund costs for the last year?
(based on a hypothetical $10,000 investment)
| Fund Name | Cost of a $10,000 investment | Costs paid as a percentage of a $10,000 investment |
|---|
| PIMCO Intermediate Municipal Bond Active Exchange-Traded Fund | $36 | 0.35% |
How did the Fund perform during the reporting period and what affected its performance?
The following affected performance (on a gross basis) during the reporting period:
• Overweight exposure to the healthcare sector contributed to performance, as the sector outperformed the broader municipal market.
• Overweight exposure to the industrial revenue sector contributed to performance, as the sector outperformed the broader municipal
market.
• Security selection within the housing sector contributed to performance, as the Fund's holdings outperformed the broader municipal
market.
• Yield curve strategies detracted from performance, as rates broadly rose.
• Underweight exposure to the transportation sector detracted from performance, as the sector outperformed the broader municipal
market.
• Security selection within the education sector detracted from performance, as the Fund's holdings underperformed the broader
municipal market.
In addition to the Fund's performance, the tables in this section include performance of: (i) a broad-based securities market index (i.e., a regulatory index) and (ii) one or more supplemental index(es). Effective July 24, 2024, the Fund's regulatory index is the Bloomberg Municipal Bond Index. The Fund's regulatory index is shown in connection with certain regulatory requirements to provide a broad measure of market performance.
The table below illustrates cumulative returns for the 10-year period ended June 30, 2024 or the life of the Fund, if shorter. Cumulative returns are based on a hypothetical initial investment equal to the greater of either $10,000 or the investment minimum applicable to the share class.
Cumulative Returns Based on $10,000 Investment
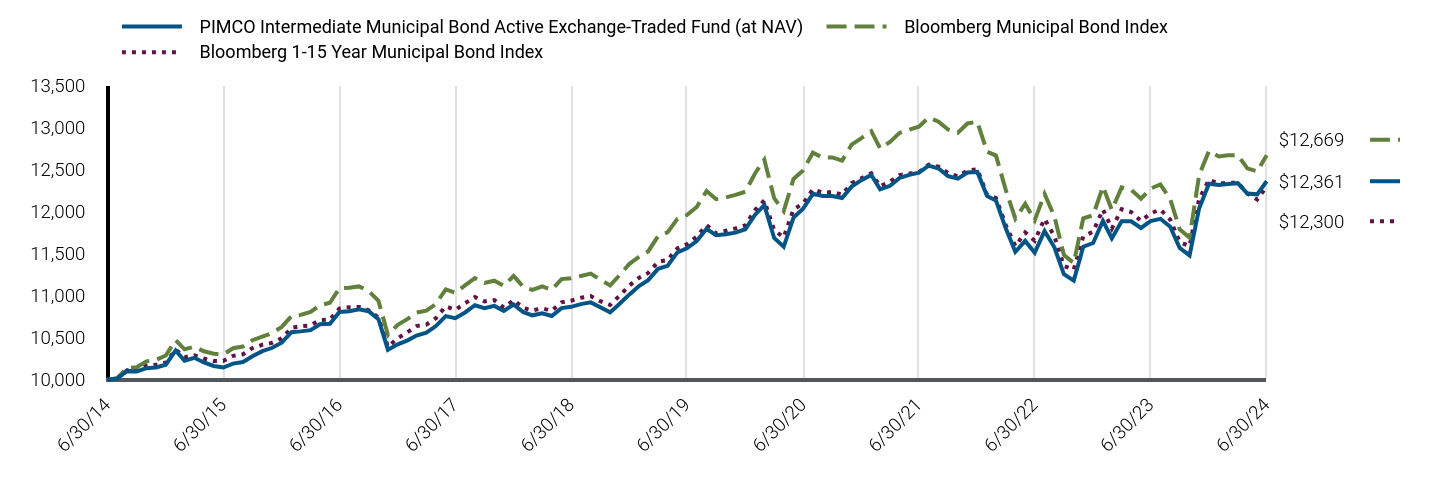
| PIMCO Intermediate Municipal Bond Active Exchange-Traded Fund (at NAV) | Bloomberg Municipal Bond Index | Bloomberg 1-15 Year Municipal Bond Index |
|---|
| 6/30/14 | $10,000 | $10,000 | $10,000 |
| 7/31/14 | $10,015 | $10,018 | $10,019 |
| 8/31/14 | $10,105 | $10,139 | $10,113 |
| 9/30/14 | $10,098 | $10,149 | $10,113 |
| 10/31/14 | $10,137 | $10,219 | $10,166 |
| 11/30/14 | $10,145 | $10,236 | $10,177 |
| 12/31/14 | $10,178 | $10,288 | $10,204 |
| 1/31/15 | $10,348 | $10,470 | $10,359 |
| 2/28/15 | $10,226 | $10,362 | $10,268 |
| 3/31/15 | $10,261 | $10,392 | $10,290 |
| 4/30/15 | $10,205 | $10,338 | $10,252 |
| 5/31/15 | $10,164 | $10,309 | $10,223 |
| 6/30/15 | $10,145 | $10,300 | $10,222 |
| 7/31/15 | $10,192 | $10,375 | $10,284 |
| 8/31/15 | $10,211 | $10,395 | $10,303 |
| 9/30/15 | $10,280 | $10,470 | $10,376 |
| 10/31/15 | $10,340 | $10,512 | $10,416 |
| 11/30/15 | $10,377 | $10,554 | $10,438 |
| 12/31/15 | $10,441 | $10,628 | $10,492 |
| 1/31/16 | $10,566 | $10,755 | $10,617 |
| 2/29/16 | $10,575 | $10,771 | $10,636 |
| 3/31/16 | $10,590 | $10,806 | $10,646 |
| 4/30/16 | $10,659 | $10,885 | $10,710 |
| 5/31/16 | $10,665 | $10,915 | $10,715 |
| 6/30/16 | $10,806 | $11,088 | $10,847 |
| 7/31/16 | $10,815 | $11,095 | $10,862 |
| 8/31/16 | $10,839 | $11,110 | $10,866 |
| 9/30/16 | $10,815 | $11,054 | $10,827 |
| 10/31/16 | $10,719 | $10,938 | $10,739 |
| 11/30/16 | $10,357 | $10,531 | $10,393 |
| 12/31/16 | $10,421 | $10,654 | $10,494 |
| 1/31/17 | $10,468 | $10,724 | $10,567 |
| 2/28/17 | $10,525 | $10,799 | $10,638 |
| 3/31/17 | $10,559 | $10,822 | $10,656 |
| 4/30/17 | $10,638 | $10,901 | $10,732 |
| 5/31/17 | $10,757 | $11,074 | $10,873 |
| 6/30/17 | $10,732 | $11,034 | $10,831 |
| 7/31/17 | $10,800 | $11,123 | $10,910 |
| 8/31/17 | $10,886 | $11,208 | $10,983 |
| 9/30/17 | $10,852 | $11,151 | $10,932 |
| 10/31/17 | $10,878 | $11,178 | $10,947 |
| 11/30/17 | $10,819 | $11,118 | $10,858 |
| 12/31/17 | $10,894 | $11,235 | $10,948 |
| 1/31/18 | $10,803 | $11,102 | $10,853 |
| 2/28/18 | $10,766 | $11,069 | $10,825 |
| 3/31/18 | $10,789 | $11,110 | $10,849 |
| 4/30/18 | $10,758 | $11,070 | $10,820 |
| 5/31/18 | $10,852 | $11,197 | $10,921 |
| 6/30/18 | $10,867 | $11,207 | $10,940 |
| 7/31/18 | $10,899 | $11,234 | $10,975 |
| 8/31/18 | $10,920 | $11,263 | $10,995 |
| 9/30/18 | $10,863 | $11,190 | $10,934 |
| 10/31/18 | $10,801 | $11,121 | $10,889 |
| 11/30/18 | $10,903 | $11,244 | $11,000 |
| 12/31/18 | $11,015 | $11,379 | $11,121 |
| 1/31/19 | $11,117 | $11,465 | $11,215 |
| 2/28/19 | $11,185 | $11,526 | $11,270 |
| 3/31/19 | $11,319 | $11,708 | $11,401 |
| 4/30/19 | $11,354 | $11,752 | $11,424 |
| 5/31/19 | $11,514 | $11,914 | $11,563 |
| 6/30/19 | $11,563 | $11,958 | $11,610 |
| 7/31/19 | $11,650 | $12,055 | $11,702 |
| 8/31/19 | $11,796 | $12,245 | $11,838 |
| 9/30/19 | $11,718 | $12,147 | $11,742 |
| 10/31/19 | $11,730 | $12,168 | $11,772 |
| 11/30/19 | $11,750 | $12,199 | $11,800 |
| 12/31/19 | $11,790 | $12,236 | $11,837 |
| 1/31/20 | $11,963 | $12,456 | $12,019 |
| 2/29/20 | $12,076 | $12,617 | $12,132 |
| 3/31/20 | $11,686 | $12,159 | $11,778 |
| 4/30/20 | $11,581 | $12,006 | $11,694 |
| 5/31/20 | $11,929 | $12,388 | $12,026 |
| 6/30/20 | $12,033 | $12,490 | $12,096 |
| 7/31/20 | $12,211 | $12,701 | $12,265 |
| 8/31/20 | $12,185 | $12,641 | $12,224 |
| 9/30/20 | $12,184 | $12,644 | $12,234 |
| 10/31/20 | $12,162 | $12,606 | $12,203 |
| 11/30/20 | $12,297 | $12,796 | $12,338 |
| 12/31/20 | $12,374 | $12,874 | $12,397 |
| 1/31/21 | $12,436 | $12,956 | $12,456 |
| 2/28/21 | $12,265 | $12,750 | $12,299 |
| 3/31/21 | $12,306 | $12,829 | $12,357 |
| 4/30/21 | $12,400 | $12,936 | $12,434 |
| 5/31/21 | $12,437 | $12,975 | $12,452 |
| 6/30/21 | $12,462 | $13,010 | $12,468 |
| 7/31/21 | $12,547 | $13,118 | $12,559 |
| 8/31/21 | $12,512 | $13,070 | $12,534 |
| 9/30/21 | $12,421 | $12,976 | $12,457 |
| 10/31/21 | $12,391 | $12,938 | $12,420 |
| 11/30/21 | $12,465 | $13,048 | $12,486 |
| 12/31/21 | $12,472 | $13,069 | $12,504 |
| 1/31/22 | $12,186 | $12,711 | $12,199 |
| 2/28/22 | $12,131 | $12,666 | $12,161 |
| 3/31/22 | $11,798 | $12,255 | $11,837 |
| 4/30/22 | $11,521 | $11,916 | $11,589 |
| 5/31/22 | $11,651 | $12,093 | $11,752 |
| 6/30/22 | $11,511 | $11,895 | $11,654 |
| 7/31/22 | $11,768 | $12,210 | $11,914 |
| 8/31/22 | $11,575 | $11,942 | $11,708 |
| 9/30/22 | $11,254 | $11,484 | $11,353 |
| 10/31/22 | $11,179 | $11,388 | $11,309 |
| 11/30/22 | $11,582 | $11,921 | $11,705 |
| 12/31/22 | $11,626 | $11,955 | $11,761 |
| 1/31/23 | $11,889 | $12,298 | $12,025 |
| 2/28/23 | $11,681 | $12,020 | $11,798 |
| 3/31/23 | $11,886 | $12,287 | $12,028 |
| 4/30/23 | $11,885 | $12,259 | $11,994 |
| 5/31/23 | $11,805 | $12,153 | $11,888 |
| 6/30/23 | $11,886 | $12,274 | $11,978 |
| 7/31/23 | $11,914 | $12,323 | $12,025 |
| 8/31/23 | $11,819 | $12,146 | $11,904 |
| 9/30/23 | $11,567 | $11,790 | $11,637 |
| 10/31/23 | $11,479 | $11,689 | $11,589 |
| 11/30/23 | $12,037 | $12,431 | $12,149 |
| 12/31/23 | $12,331 | $12,720 | $12,379 |
| 1/31/24 | $12,317 | $12,655 | $12,331 |
| 2/29/24 | $12,329 | $12,671 | $12,343 |
| 3/31/24 | $12,338 | $12,671 | $12,343 |
| 4/30/24 | $12,214 | $12,514 | $12,216 |
| 5/31/24 | $12,205 | $12,477 | $12,143 |
| 6/30/24 | $12,361 | $12,669 | $12,300 |
The table below shows the average annual total returns of the Fund, a regulatory index, and one or more supplemental index(es) for certain periods ended June 30, 2024.
Average Annual Total Returns (%)
| Fund/Index Name | 1 Year | 5 Years | 10 Years |
|---|
| PIMCO Intermediate Municipal Bond Active Exchange-Traded Fund (at NAV) | 3.99% | 1.34% | 2.14% |
| PIMCO Intermediate Municipal Bond Active Exchange-Traded Fund (at Market Price) | 3.87% | 1.29% | 2.13% |
| Bloomberg Municipal Bond Index | 3.21% | 1.16% | 2.39% |
| Bloomberg 1-15 Year Municipal Bond Index | 2.69% | 1.16% | 2.09% |
All Fund returns are net of fees and expenses and include applicable fee waivers and/or expense limitations. Absent any applicable fee waivers and/or expense limitations, performance would have been lower and there can be no assurance that any such waivers or limitations will continue in the future.
Performance quoted represents past performance. Past performance is not a guarantee or a reliable indicator of future results.Current performance may be lower or higher than performance shown. Investment return and the principal value of an investment will fluctuate. Shares may be worth more or less than original cost when redeemed. Returns shown do not reflect the deduction of taxes that a shareholder would pay on Fund distributions or the redemption of Fund shares.Differences in the Fund’s performance versus an index and related attribution information with respect to particular categories of securities or individual positions may be attributable, in part, to differences in the pricing methodologies used by the Fund and the index. For performance current to the most recent month-end, visit www.pimco.com/literature or via 888.400.4ETF (888.400.4383).
Key Fund StatisticsFootnote Reference* (as of the end of the reporting period)
| Total Net Assets | $1,505,332 |
| # of Portfolio Holdings | 432 |
| Portfolio Turnover Rate | 29% |
| Total Net Management Fees Paid During the Reporting Period | $4,346 |
| Footnote | Description |
Footnote* | Dollar amounts displayed in 000's |
What did the Fund invest in?
Sector Allocation (% of Net Assets)Footnote Reference*
| Footnote | Description |
Footnote* | % of Net Assets includes derivatives instruments, if any, valued at the value used for determining the Fund’s net asset value. The notional exposure of such derivatives investments therefore may be greater than what is depicted. |
| Health, Hospital & Nursing Home Revenue | 16.5% |
| Ad Valorem Property Tax | 9.6% |
| Local or Guaranteed Housing | 7.5% |
| Short-Term Instruments | 6.7% |
| Electric Power & Light Revenue | 6.6% |
| Natural Gas Revenue | 6.0% |
| Highway Revenue Tolls | 5.9% |
| Income Tax Revenue | 5.4% |
| Water Revenue | 4.9% |
| Industrial Revenue | 4.0% |
| Miscellaneous Revenue | 4.0% |
| Sales Tax Revenue | 3.5% |
| Tobacco Settlement Funded | 3.2% |
| Sewer Revenue | 2.7% |
| Other Investments | 14.4% |
| Other Assets and Liabilities, Net | (0.9%) |
| Total | 100.0% |
For additional information about the Fund, including the Fund's prospectus, financial information, holdings and proxy voting information, please visit www.pimco.com/literature or contact 888.400.4ETF (888.400.4383). For tax information about the Fund, please visit: https://www.pimco.com/tax.
PIMCO Intermediate Municipal Bond Active Exchange-Traded Fund
Annual Shareholder Report |
June 30, 2024
MUNI | Principal Listing Exchange: NYSE Arca
PIMCO Investment Grade Corporate Bond Index Exchange-Traded Fund
CORP | Principal Listing Exchange: NYSE Arca
Annual Shareholder Report | June 30, 2024
This annual shareholder report contains important information about the PIMCO Investment Grade Corporate Bond Index Exchange-Traded Fund (the "Fund") for the period of July 1, 2023 to June 30, 2024 (the "reporting period"). You can find additional information about the Fund at www.pimco.com/literature. You can also request this information by contacting us at 888.400.4ETF (888.400.4383).
This report describes changes to the Fund that occurred during the reporting period.
What were the Fund costs for the last year?
(based on a hypothetical $10,000 investment)
| Fund Name | Cost of a $10,000 investment | Costs paid as a percentage of a $10,000 investment |
|---|
| PIMCO Investment Grade Corporate Bond Index Exchange-Traded Fund | $37 | 0.36% |
How did the Fund perform during the reporting period and what affected its performance?
The following affected performance (on a gross basis) during the reporting period:
• Security selection within specialty finance, specifically overweight exposure to a large public alternative asset manager, contributed to
performance, as spreads tightened amid positive fee related earning results.
• Security selection within technology, specifically overweight exposure to a semiconductor production company, contributed to
performance, as spreads tightened amid positive earnings results driven by artificial intelligence-related demand.
• Security selection within healthcare, specifically overweight exposure to a branded pharmaceutical company, contributed to
performance, as spreads tightened amid growth in next-generation products.
• Duration positioning detracted from performance, as interest rates remained volatile.
• Security selection within chemicals, specifically overweight exposure to a corporation focused on pharmaceuticals, detracted from
performance, as spreads widened amid weak earnings results.
• Security selection within aerospace and defense, specifically overweight exposure to a commercial aircraft manufacturer and defense
contractor, detracted from performance, as spreads widened amid production slowdowns.
In addition to the Fund's performance, the tables in this section include performance of: (i) a broad-based securities market index (i.e., a regulatory index) and (ii) one or more supplemental index(es). Effective July 24, 2024, the Fund's regulatory index is the Bloomberg U.S. Aggregate Index. The Fund's regulatory index is shown in connection with certain regulatory requirements to provide a broad measure of market performance.
The table below illustrates cumulative returns for the 10-year period ended June 30, 2024 or the life of the Fund, if shorter. Cumulative returns are based on a hypothetical initial investment equal to the greater of either $10,000 or the investment minimum applicable to the share class.
Cumulative Returns Based on $10,000 Investment
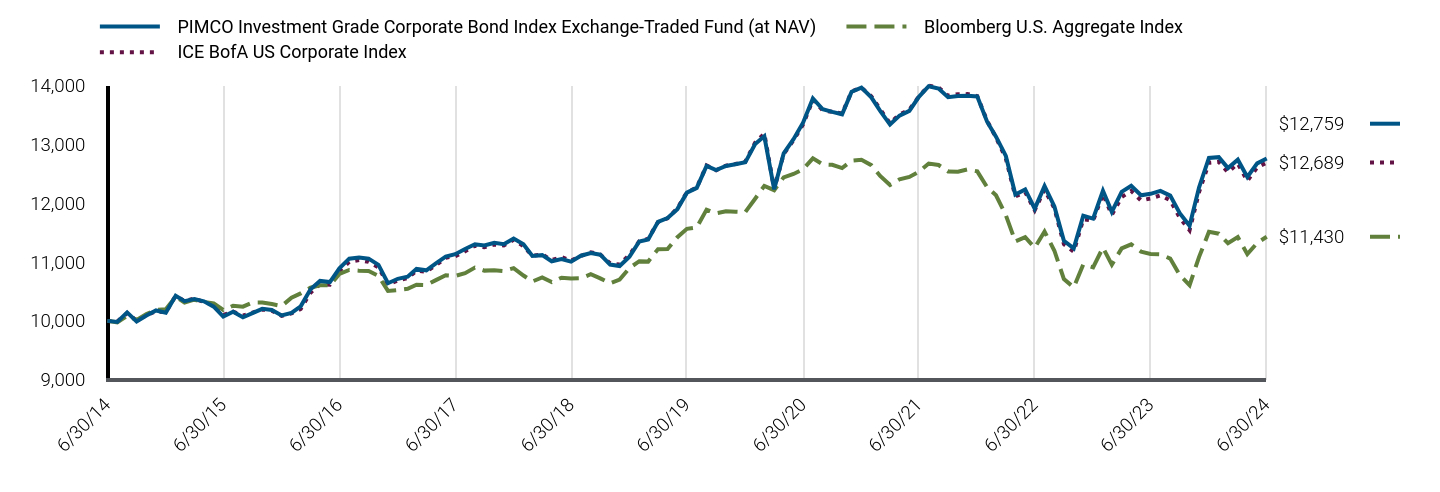
| PIMCO Investment Grade Corporate Bond Index Exchange-Traded Fund (at NAV) | Bloomberg U.S. Aggregate Index | ICE BofA US Corporate Index |
|---|
| 6/30/14 | $10,000 | $10,000 | $10,000 |
| 7/31/14 | $9,982 | $9,975 | $9,988 |
| 8/31/14 | $10,144 | $10,085 | $10,131 |
| 9/30/14 | $9,991 | $10,017 | $10,005 |
| 10/31/14 | $10,090 | $10,115 | $10,098 |
| 11/30/14 | $10,177 | $10,187 | $10,162 |
| 12/31/14 | $10,140 | $10,196 | $10,148 |
| 1/31/15 | $10,427 | $10,410 | $10,426 |
| 2/28/15 | $10,336 | $10,312 | $10,339 |
| 3/31/15 | $10,372 | $10,360 | $10,377 |
| 4/30/15 | $10,333 | $10,323 | $10,322 |
| 5/31/15 | $10,241 | $10,298 | $10,270 |
| 6/30/15 | $10,074 | $10,186 | $10,102 |
| 7/31/15 | $10,155 | $10,257 | $10,156 |
| 8/31/15 | $10,060 | $10,242 | $10,088 |
| 9/30/15 | $10,131 | $10,311 | $10,141 |
| 10/31/15 | $10,204 | $10,313 | $10,195 |
| 11/30/15 | $10,185 | $10,286 | $10,172 |
| 12/31/15 | $10,093 | $10,252 | $10,084 |
| 1/31/16 | $10,134 | $10,393 | $10,128 |
| 2/29/16 | $10,248 | $10,467 | $10,203 |
| 3/31/16 | $10,538 | $10,563 | $10,480 |
| 4/30/16 | $10,679 | $10,604 | $10,622 |
| 5/31/16 | $10,659 | $10,607 | $10,615 |
| 6/30/16 | $10,894 | $10,797 | $10,847 |
| 7/31/16 | $11,057 | $10,865 | $11,004 |
| 8/31/16 | $11,076 | $10,853 | $11,034 |
| 9/30/16 | $11,057 | $10,847 | $11,002 |
| 10/31/16 | $10,952 | $10,764 | $10,911 |
| 11/30/16 | $10,640 | $10,509 | $10,619 |
| 12/31/16 | $10,715 | $10,524 | $10,685 |
| 1/31/17 | $10,751 | $10,544 | $10,729 |
| 2/28/17 | $10,883 | $10,615 | $10,851 |
| 3/31/17 | $10,859 | $10,610 | $10,837 |
| 4/30/17 | $10,976 | $10,692 | $10,945 |
| 5/31/17 | $11,091 | $10,774 | $11,073 |
| 6/30/17 | $11,133 | $10,763 | $11,100 |
| 7/31/17 | $11,221 | $10,809 | $11,183 |
| 8/31/17 | $11,302 | $10,906 | $11,277 |
| 9/30/17 | $11,280 | $10,854 | $11,252 |
| 10/31/17 | $11,328 | $10,861 | $11,297 |
| 11/30/17 | $11,304 | $10,847 | $11,281 |
| 12/31/17 | $11,399 | $10,897 | $11,377 |
| 1/31/18 | $11,300 | $10,771 | $11,272 |
| 2/28/18 | $11,104 | $10,669 | $11,104 |
| 3/31/18 | $11,117 | $10,737 | $11,128 |
| 4/30/18 | $11,013 | $10,658 | $11,033 |
| 5/31/18 | $11,049 | $10,734 | $11,082 |
| 6/30/18 | $11,007 | $10,720 | $11,023 |
| 7/31/18 | $11,107 | $10,723 | $11,104 |
| 8/31/18 | $11,153 | $10,792 | $11,165 |
| 9/30/18 | $11,125 | $10,722 | $11,128 |
| 10/31/18 | $10,957 | $10,638 | $10,978 |
| 11/30/18 | $10,932 | $10,701 | $10,957 |
| 12/31/18 | $11,091 | $10,898 | $11,122 |
| 1/31/19 | $11,350 | $11,014 | $11,354 |
| 2/28/19 | $11,383 | $11,007 | $11,395 |
| 3/31/19 | $11,683 | $11,219 | $11,679 |
| 4/30/19 | $11,747 | $11,221 | $11,744 |
| 5/31/19 | $11,899 | $11,421 | $11,912 |
| 6/30/19 | $12,179 | $11,564 | $12,186 |
| 7/31/19 | $12,259 | $11,589 | $12,266 |
| 8/31/19 | $12,632 | $11,890 | $12,639 |
| 9/30/19 | $12,561 | $11,826 | $12,560 |
| 10/31/19 | $12,632 | $11,862 | $12,637 |
| 11/30/19 | $12,661 | $11,856 | $12,665 |
| 12/31/19 | $12,694 | $11,848 | $12,705 |
| 1/31/20 | $13,004 | $12,076 | $13,029 |
| 2/29/20 | $13,136 | $12,293 | $13,180 |
| 3/31/20 | $12,236 | $12,221 | $12,241 |
| 4/30/20 | $12,845 | $12,438 | $12,835 |
| 5/31/20 | $13,087 | $12,496 | $13,069 |
| 6/30/20 | $13,368 | $12,575 | $13,338 |
| 7/31/20 | $13,779 | $12,762 | $13,758 |
| 8/31/20 | $13,595 | $12,659 | $13,578 |
| 9/30/20 | $13,551 | $12,652 | $13,552 |
| 10/31/20 | $13,510 | $12,596 | $13,522 |
| 11/30/20 | $13,893 | $12,720 | $13,898 |
| 12/31/20 | $13,963 | $12,737 | $13,962 |
| 1/31/21 | $13,798 | $12,646 | $13,816 |
| 2/28/21 | $13,569 | $12,463 | $13,594 |
| 3/31/21 | $13,336 | $12,308 | $13,357 |
| 4/30/21 | $13,487 | $12,405 | $13,507 |
| 5/31/21 | $13,568 | $12,445 | $13,586 |
| 6/30/21 | $13,808 | $12,533 | $13,814 |
| 7/31/21 | $13,987 | $12,673 | $13,996 |
| 8/31/21 | $13,948 | $12,649 | $13,964 |
| 9/30/21 | $13,800 | $12,539 | $13,825 |
| 10/31/21 | $13,821 | $12,536 | $13,851 |
| 11/30/21 | $13,826 | $12,573 | $13,853 |
| 12/31/21 | $13,813 | $12,541 | $13,819 |
| 1/31/22 | $13,385 | $12,271 | $13,398 |
| 2/28/22 | $13,131 | $12,134 | $13,116 |
| 3/31/22 | $12,803 | $11,797 | $12,760 |
| 4/30/22 | $12,146 | $11,349 | $12,115 |
| 5/31/22 | $12,233 | $11,422 | $12,190 |
| 6/30/22 | $11,907 | $11,243 | $11,880 |
| 7/31/22 | $12,290 | $11,518 | $12,232 |
| 8/31/22 | $11,944 | $11,192 | $11,913 |
| 9/30/22 | $11,359 | $10,709 | $11,303 |
| 10/31/22 | $11,231 | $10,570 | $11,177 |
| 11/30/22 | $11,786 | $10,959 | $11,727 |
| 12/31/22 | $11,737 | $10,909 | $11,702 |
| 1/31/23 | $12,210 | $11,245 | $12,157 |
| 2/28/23 | $11,853 | $10,954 | $11,803 |
| 3/31/23 | $12,192 | $11,232 | $12,105 |
| 4/30/23 | $12,294 | $11,300 | $12,208 |
| 5/31/23 | $12,134 | $11,177 | $12,046 |
| 6/30/23 | $12,159 | $11,137 | $12,080 |
| 7/31/23 | $12,209 | $11,130 | $12,133 |
| 8/31/23 | $12,129 | $11,059 | $12,050 |
| 9/30/23 | $11,831 | $10,778 | $11,754 |
| 10/31/23 | $11,617 | $10,607 | $11,540 |
| 11/30/23 | $12,270 | $11,088 | $12,191 |
| 12/31/23 | $12,768 | $11,512 | $12,685 |
| 1/31/24 | $12,782 | $11,481 | $12,703 |
| 2/29/24 | $12,596 | $11,318 | $12,526 |
| 3/31/24 | $12,739 | $11,423 | $12,674 |
| 4/30/24 | $12,445 | $11,134 | $12,379 |
| 5/31/24 | $12,676 | $11,323 | $12,609 |
| 6/30/24 | $12,759 | $11,430 | $12,689 |
The table below shows the average annual total returns of the Fund, a regulatory index, and one or more supplemental index(es) for certain periods ended June 30, 2024.
Average Annual Total Returns (%)
| Fund/Index Name | 1 Year | 5 Years | 10 Years |
|---|
| PIMCO Investment Grade Corporate Bond Index Exchange-Traded Fund (at NAV) | 4.93% | 0.93% | 2.47% |
| PIMCO Investment Grade Corporate Bond Index Exchange-Traded Fund (at Market Price) | 4.81% | 0.91% | 2.47% |
| Bloomberg U.S. Aggregate Index | 2.63% | (0.23%) | 1.35% |
| ICE BofA US Corporate Index | 5.04% | 0.81% | 2.41% |
All Fund returns are net of fees and expenses and include applicable fee waivers and/or expense limitations. Absent any applicable fee waivers and/or expense limitations, performance would have been lower and there can be no assurance that any such waivers or limitations will continue in the future.
Performance quoted represents past performance. Past performance is not a guarantee or a reliable indicator of future results.Current performance may be lower or higher than performance shown. Investment return and the principal value of an investment will fluctuate. Shares may be worth more or less than original cost when redeemed. Returns shown do not reflect the deduction of taxes that a shareholder would pay on Fund distributions or the redemption of Fund shares.Differences in the Fund’s performance versus an index and related attribution information with respect to particular categories of securities or individual positions may be attributable, in part, to differences in the pricing methodologies used by the Fund and the index. For performance current to the most recent month-end, visit www.pimco.com/literature or via 888.400.4ETF (888.400.4383).
Key Fund StatisticsFootnote Reference* (as of the end of the reporting period)
| Total Net Assets | $1,129,828 |
| # of Portfolio Holdings | 1,428 |
| Portfolio Turnover Rate | 23% |
| Total Net Management Fees Paid During the Reporting Period | $1,941 |
| Footnote | Description |
Footnote* | Dollar amounts displayed in 000's |
What did the Fund invest in?
Sector Allocation (% of Net Assets)Footnote Reference*
| Footnote | Description |
Footnote* | % of Net Assets includes derivatives instruments, if any, valued at the value used for determining the Fund’s net asset value. The notional exposure of such derivatives investments therefore may be greater than what is depicted. |
| Industrials | 42.2% |
| Banking & Finance | 39.7% |
| Utilities | 12.9% |
| U.S. Treasury Obligations | 8.2% |
| Short-Term Instruments | 0.4% |
| Sovereign Issues | 0.1% |
| Other Investments | 0.4% |
| Other Assets and Liabilities, Net | (3.9%) |
| Total | 100.0% |
This is a summary of certain changes and planned changes of the Fund since the beginning of the reporting period. For more information, you may refer to the Fund's next prospectus, which we expect to be available by October 31, 2024 or upon request at 888.400.4ETF (888.400.4383).
Changes to Total Annual Fund Operating Expenses. Annual fund operating expenses increased during the year by 0.13% as a result of higher expenses related to interest.
For additional information about the Fund, including the Fund's prospectus, financial information, holdings and proxy voting information, please visit www.pimco.com/literature or contact 888.400.4ETF (888.400.4383). For tax information about the Fund, please visit: https://www.pimco.com/tax.
PIMCO Investment Grade Corporate Bond Index Exchange-Traded Fund
Annual Shareholder Report |
June 30, 2024
CORP | Principal Listing Exchange: NYSE Arca
PIMCO Municipal Income Opportunities Active Exchange-Traded Fund
MINO | Principal Listing Exchange: NYSE Arca
Annual Shareholder Report | June 30, 2024
This annual shareholder report contains important information about the PIMCO Municipal Income Opportunities Active Exchange-Traded Fund (the "Fund") for the period of July 1, 2023 to June 30, 2024 (the "reporting period"). You can find additional information about the Fund at www.pimco.com/literature. You can also request this information by contacting us at 888.400.4ETF (888.400.4383).
What were the Fund costs for the last year?
(based on a hypothetical $10,000 investment)
| Fund Name | Cost of a $10,000 investment | Costs paid as a percentage of a $10,000 investment |
|---|
| PIMCO Municipal Income Opportunities Active Exchange-Traded Fund | $40 | 0.39% |
How did the Fund perform during the reporting period and what affected its performance?
The following affected performance (on a gross basis) during the reporting period:
• Security selection within the special tax sector contributed to performance, as the Fund's holdings outperformed the broader
municipal market.
• Overweight exposure to the healthcare sector contributed to performance, as the sector outperformed the broader municipal
market.
• Overweight exposure to the industrial revenue sector contributed to performance, as the sector outperformed the broader municipal
market.
• Security selection within the education sector detracted from performance, as the Fund's holdings underperformed the broader
municipal market.
• Underweight exposure to the lease-backed sector detracted from performance, as the sector outperformed the broader municipal
market.
• There are no other material detractors for this Fund.
In addition to the Fund's performance, the tables in this section include performance of a broad-based securities market index (i.e., a regulatory index). The Fund's regulatory index is shown in connection with certain regulatory requirements to provide a broad measure of market performance.
The table below illustrates cumulative returns for the 10-year period ended June 30, 2024 or the life of the Fund, if shorter. Cumulative returns are based on a hypothetical initial investment equal to the greater of either $10,000 or the investment minimum applicable to the share class.
Cumulative Returns Based on $10,000 Investment
| PIMCO Municipal Income Opportunities Active Exchange-Traded Fund (at NAV) | Bloomberg Municipal Bond Index |
|---|
| 9/8/2021 | $10,000 | $10,000 |
| 9/30/2021 | $9,918 | $9,932 |
| 10/31/2021 | $9,886 | $9,903 |
| 11/30/2021 | $9,998 | $9,987 |
| 12/31/2021 | $10,031 | $10,003 |
| 1/31/2022 | $9,714 | $9,730 |
| 2/28/2022 | $9,648 | $9,695 |
| 3/31/2022 | $9,322 | $9,381 |
| 4/30/2022 | $9,032 | $9,121 |
| 5/31/2022 | $9,143 | $9,257 |
| 6/30/2022 | $8,911 | $9,105 |
| 7/31/2022 | $9,192 | $9,346 |
| 8/31/2022 | $8,997 | $9,141 |
| 9/30/2022 | $8,669 | $8,790 |
| 10/31/2022 | $8,542 | $8,717 |
| 11/30/2022 | $8,974 | $9,124 |
| 12/31/2022 | $8,983 | $9,151 |
| 1/31/2023 | $9,274 | $9,413 |
| 2/28/2023 | $9,084 | $9,201 |
| 3/31/2023 | $9,218 | $9,405 |
| 4/30/2023 | $9,288 | $9,383 |
| 5/31/2023 | $9,238 | $9,302 |
| 6/30/2023 | $9,345 | $9,395 |
| 7/31/2023 | $9,381 | $9,432 |
| 8/31/2023 | $9,304 | $9,296 |
| 9/30/2023 | $9,065 | $9,024 |
| 10/31/2023 | $8,939 | $8,947 |
| 11/30/2023 | $9,501 | $9,515 |
| 12/31/2023 | $9,753 | $9,736 |
| 1/31/2024 | $9,771 | $9,687 |
| 2/29/2024 | $9,816 | $9,699 |
| 3/31/2024 | $9,841 | $9,699 |
| 4/30/2024 | $9,750 | $9,579 |
| 5/31/2024 | $9,769 | $9,551 |
| 6/30/2024 | $9,910 | $9,697 |
The table below shows the average annual total returns of the Fund and a regulatory index(es) for certain periods ended June 30, 2024.
Average Annual Total Returns (%)
| Fund/Index Name | 1 Year | Since Inception 9/8/21 |
|---|
| PIMCO Municipal Income Opportunities Active Exchange-Traded Fund (at NAV) | 6.05% | (0.32%) |
| PIMCO Municipal Income Opportunities Active Exchange-Traded Fund (at Market Price) | 6.09% | (0.32%) |
| Bloomberg Municipal Bond Index | 3.21% | (1.09%) |
All Fund returns are net of fees and expenses and include applicable fee waivers and/or expense limitations. Absent any applicable fee waivers and/or expense limitations, performance would have been lower and there can be no assurance that any such waivers or limitations will continue in the future.
Performance quoted represents past performance. Past performance is not a guarantee or a reliable indicator of future results.Current performance may be lower or higher than performance shown. Investment return and the principal value of an investment will fluctuate. Shares may be worth more or less than original cost when redeemed. Returns shown do not reflect the deduction of taxes that a shareholder would pay on Fund distributions or the redemption of Fund shares.Differences in the Fund’s performance versus an index and related attribution information with respect to particular categories of securities or individual positions may be attributable, in part, to differences in the pricing methodologies used by the Fund and the index. For performance current to the most recent month-end, visit www.pimco.com/literature or via 888.400.4ETF (888.400.4383).
Key Fund StatisticsFootnote Reference* (as of the end of the reporting period)
| Total Net Assets | $158,121 |
| # of Portfolio Holdings | 250 |
| Portfolio Turnover Rate | 39% |
| Total Net Management Fees Paid During the Reporting Period | $426 |
| Footnote | Description |
Footnote* | Dollar amounts displayed in 000's |
What did the Fund invest in?
Sector Allocation (% of Net Assets)Footnote Reference*
| Footnote | Description |
Footnote* | % of Net Assets includes derivatives instruments, if any, valued at the value used for determining the Fund’s net asset value. The notional exposure of such derivatives investments therefore may be greater than what is depicted. |
| Health, Hospital & Nursing Home Revenue | 17.2% |
| Local or Guaranteed Housing | 9.0% |
| Port, Airport & Marina Revenue | 8.7% |
| Electric Power & Light Revenue | 7.7% |
| Ad Valorem Property Tax | 7.2% |
| Miscellaneous Revenue | 5.5% |
| Industrial Revenue | 4.1% |
| Short-Term Instruments | 4.0% |
| Sales Tax Revenue | 3.8% |
| Natural Gas Revenue | 3.7% |
| Tobacco Settlement Funded | 3.7% |
| Highway Revenue Tolls | 3.7% |
| Water Revenue | 3.6% |
| Income Tax Revenue | 3.6% |
| Other Investments | 16.4% |
| Other Assets and Liabilities, Net | (1.9%) |
| Total | 100.0% |
For additional information about the Fund, including the Fund's prospectus, financial information, holdings and proxy voting information, please visit www.pimco.com/literature or contact 888.400.4ETF (888.400.4383). For tax information about the Fund, please visit: https://www.pimco.com/tax.
PIMCO Municipal Income Opportunities Active Exchange-Traded Fund
Annual Shareholder Report |
June 30, 2024
MINO | Principal Listing Exchange: NYSE Arca
PIMCO Senior Loan Active Exchange-Traded Fund
LONZ | Principal Listing Exchange: NYSE Arca
Annual Shareholder Report | June 30, 2024
This annual shareholder report contains important information about the PIMCO Senior Loan Active Exchange-Traded Fund (the "Fund") for the period of July 1, 2023 to June 30, 2024 (the "reporting period"). You can find additional information about the Fund at www.pimco.com/literature. You can also request this information by contacting us at 888.400.4ETF (888.400.4383).
What were the Fund costs for the last year?
(based on a hypothetical $10,000 investment)
| Fund Name | Cost of a $10,000 investment | Costs paid as a percentage of a $10,000 investment |
|---|
| PIMCO Senior Loan Active Exchange-Traded Fund | $64 | 0.61% |
How did the Fund perform during the reporting period and what affected its performance?
The following affected performance (on a gross basis) during the reporting period:
• Duration positioning contributed to performance, as rates rose.
• Underweight exposure to the cable and satellite sector contributed to performance, as the sector underperformed the broader market.
• Security selection within the wirelines sector, particularly underweight exposure to a large telecommunication services provider,
contributed to performance, as prices fell.
• Security selection within the healthcare sector, particularly underweight exposure to a specialty pharmaceutical company, detracted
from performance, as prices rose.
• Security selection within the building materials sector, particularly overweight exposure to a specialty hardware company, detracted
from performance, as prices fell.
• Security selection within the cable and satellite sector, particularly overweight exposure to a French cable operator, detracted from
performance, as prices fell.
In addition to the Fund's performance, the tables in this section include performance of: (i) a broad-based securities market index (i.e., a regulatory index) and (ii) one or more supplemental index(es). Effective July 24, 2024, the Fund's regulatory index is the Bloomberg U.S. Aggregate Index. The Fund's regulatory index is shown in connection with certain regulatory requirements to provide a broad measure of market performance.
The table below illustrates cumulative returns for the 10-year period ended June 30, 2024 or the life of the Fund, if shorter. Cumulative returns are based on a hypothetical initial investment equal to the greater of either $10,000 or the investment minimum applicable to the share class.
Cumulative Returns Based on $10,000 Investment
| PIMCO Senior Loan Active Exchange-Traded Fund (at NAV) | Bloomberg U.S. Aggregate Index | iBoxx USD Liquid Leveraged Loans Index |
|---|
| 6/8/2022 | $10,000 | $10,000 | $10,000 |
| 6/30/2022 | $9,636 | $9,915 | $9,665 |
| 7/31/2022 | $9,918 | $10,157 | $9,940 |
| 8/31/2022 | $10,028 | $9,870 | $10,044 |
| 9/30/2022 | $9,810 | $9,444 | $9,799 |
| 10/31/2022 | $9,912 | $9,321 | $9,939 |
| 11/30/2022 | $10,022 | $9,664 | $10,037 |
| 12/31/2022 | $10,082 | $9,621 | $10,109 |
| 1/31/2023 | $10,322 | $9,917 | $10,375 |
| 2/28/2023 | $10,384 | $9,660 | $10,405 |
| 3/31/2023 | $10,385 | $9,906 | $10,442 |
| 4/30/2023 | $10,469 | $9,966 | $10,560 |
| 5/31/2023 | $10,456 | $9,857 | $10,497 |
| 6/30/2023 | $10,690 | $9,822 | $10,731 |
| 7/31/2023 | $10,835 | $9,815 | $10,854 |
| 8/31/2023 | $10,954 | $9,752 | $10,960 |
| 9/30/2023 | $11,014 | $9,505 | $11,026 |
| 10/31/2023 | $10,985 | $9,355 | $11,001 |
| 11/30/2023 | $11,179 | $9,778 | $11,121 |
| 12/31/2023 | $11,389 | $10,153 | $11,303 |
| 1/31/2024 | $11,411 | $10,125 | $11,317 |
| 2/29/2024 | $11,538 | $9,982 | $11,443 |
| 3/31/2024 | $11,657 | $10,074 | $11,549 |
| 4/30/2024 | $11,735 | $9,819 | $11,629 |
| 5/31/2024 | $11,848 | $9,986 | $11,720 |
| 6/30/2024 | $11,876 | $10,080 | $11,745 |
The table below shows the average annual total returns of the Fund, a regulatory index, and one or more supplemental index(es) for certain periods ended June 30, 2024.
Average Annual Total Returns (%)
| Fund/Index Name | 1 Year | Since Inception 6/8/22 |
|---|
| PIMCO Senior Loan Active Exchange-Traded Fund (at NAV) | 11.09% | 8.70% |
| PIMCO Senior Loan Active Exchange-Traded Fund (at Market Price) | 11.15% | 8.76% |
| Bloomberg U.S. Aggregate Index | 2.63% | 0.54% |
| iBoxx USD Liquid Leveraged Loans Index | 9.45% | 8.09% |
All Fund returns are net of fees and expenses and include applicable fee waivers and/or expense limitations. Absent any applicable fee waivers and/or expense limitations, performance would have been lower and there can be no assurance that any such waivers or limitations will continue in the future.
Performance quoted represents past performance. Past performance is not a guarantee or a reliable indicator of future results.Current performance may be lower or higher than performance shown. Investment return and the principal value of an investment will fluctuate. Shares may be worth more or less than original cost when redeemed. Returns shown do not reflect the deduction of taxes that a shareholder would pay on Fund distributions or the redemption of Fund shares.Differences in the Fund’s performance versus an index and related attribution information with respect to particular categories of securities or individual positions may be attributable, in part, to differences in the pricing methodologies used by the Fund and the index. For performance current to the most recent month-end, visit www.pimco.com/literature or via 888.400.4ETF (888.400.4383).
Key Fund StatisticsFootnote Reference* (as of the end of the reporting period)
| Total Net Assets | $392,348 |
| # of Portfolio Holdings | 302 |
| Portfolio Turnover Rate | 65% |
| Total Net Management Fees Paid During the Reporting Period | $1,565 |
| Footnote | Description |
Footnote* | Dollar amounts displayed in 000's |
What did the Fund invest in?
Allocation Breakdown (% of Net Assets)Footnote Reference*
| Footnote | Description |
Footnote* | % of Net Assets includes derivatives instruments, if any, valued at the value used for determining the Fund’s net asset value. The notional exposure of such derivatives investments therefore may be greater than what is depicted. |
| Loan Participations and Assignments | 85.6% |
| Corporate Bonds & Notes | 2.8% |
| Short-Term Instruments | 34.4% |
| Other Investments | 0.4% |
| Other Assets and Liabilities, Net | (23.2%) |
| Total | 100.0% |
For additional information about the Fund, including the Fund's prospectus, financial information, holdings and proxy voting information, please visit www.pimco.com/literature or contact 888.400.4ETF (888.400.4383). For tax information about the Fund, please visit: https://www.pimco.com/tax.
PIMCO Senior Loan Active Exchange-Traded Fund
Annual Shareholder Report |
June 30, 2024
LONZ | Principal Listing Exchange: NYSE Arca
PIMCO Short Term Municipal Bond Active Exchange-Traded Fund
SMMU | Principal Listing Exchange: NYSE Arca
Annual Shareholder Report | June 30, 2024
This annual shareholder report contains important information about the PIMCO Short Term Municipal Bond Active Exchange-Traded Fund (the "Fund") for the period of July 1, 2023 to June 30, 2024 (the "reporting period"). You can find additional information about the Fund at www.pimco.com/literature. You can also request this information by contacting us at 888.400.4ETF (888.400.4383).
What were the Fund costs for the last year?
(based on a hypothetical $10,000 investment)
| Fund Name | Cost of a $10,000 investment | Costs paid as a percentage of a $10,000 investment |
|---|
| PIMCO Short Term Municipal Bond Active Exchange-Traded Fund | $36 | 0.35% |
How did the Fund perform during the reporting period and what affected its performance?
The following affected performance (on a gross basis) during the reporting period:
• Overweight exposure to the industrial revenue sector contributed to performance, as the sector outperformed the broader municipal
market.
• Overweight exposure to the healthcare sector contributed to performance, as the sector outperformed the broader municipal market.
• Tactical allocation to taxable municipals contributed to performance, as taxable municipals outperformed the broader municipal
market.
• Overweight exposure to a select duration position detracted from performance, as rates broadly rose.
• Select exposure within the water and sewer sector detracted from performance, as the Fund's holdings underperformed the broader
municipal market.
• Underweight exposure to the lease-backed sector detracted from performance, as the sector outperformed the broader municipal
market.
In addition to the Fund's performance, the tables in this section include performance of: (i) a broad-based securities market index (i.e., a regulatory index) and (ii) one or more supplemental index(es). Effective July 24, 2024, the Fund's regulatory index is the Bloomberg Municipal Bond Index. The Fund's regulatory index is shown in connection with certain regulatory requirements to provide a broad measure of market performance.
The table below illustrates cumulative returns for the 10-year period ended June 30, 2024 or the life of the Fund, if shorter. Cumulative returns are based on a hypothetical initial investment equal to the greater of either $10,000 or the investment minimum applicable to the share class.
Cumulative Returns Based on $10,000 Investment
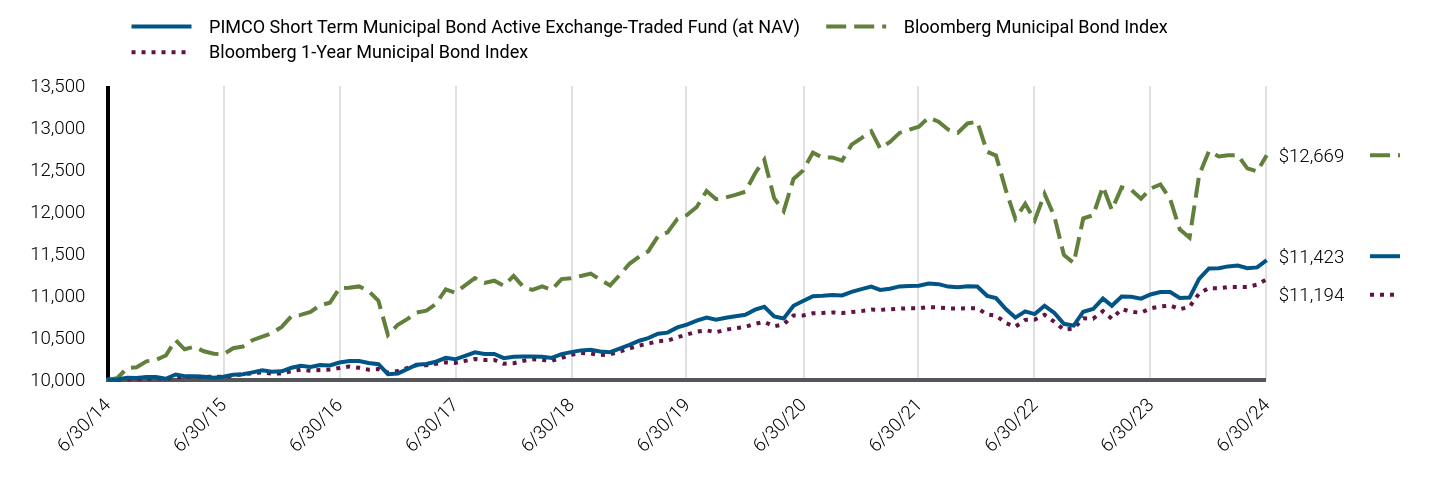
| PIMCO Short Term Municipal Bond Active Exchange-Traded Fund (at NAV) | Bloomberg Municipal Bond Index | Bloomberg 1-Year Municipal Bond Index |
|---|
| 6/30/14 | $10,000 | $10,000 | $10,000 |
| 7/31/14 | $10,004 | $10,018 | $10,000 |
| 8/31/14 | $10,024 | $10,139 | $10,007 |
| 9/30/14 | $10,020 | $10,149 | $10,007 |
| 10/31/14 | $10,031 | $10,219 | $10,011 |
| 11/30/14 | $10,032 | $10,236 | $10,017 |
| 12/31/14 | $10,011 | $10,288 | $10,012 |
| 1/31/15 | $10,062 | $10,470 | $10,031 |
| 2/28/15 | $10,041 | $10,362 | $10,034 |
| 3/31/15 | $10,041 | $10,392 | $10,034 |
| 4/30/15 | $10,036 | $10,338 | $10,035 |
| 5/31/15 | $10,023 | $10,309 | $10,034 |
| 6/30/15 | $10,037 | $10,300 | $10,034 |
| 7/31/15 | $10,059 | $10,375 | $10,048 |
| 8/31/15 | $10,066 | $10,395 | $10,064 |
| 9/30/15 | $10,087 | $10,470 | $10,077 |
| 10/31/15 | $10,111 | $10,512 | $10,087 |
| 11/30/15 | $10,096 | $10,554 | $10,074 |
| 12/31/15 | $10,100 | $10,628 | $10,073 |
| 1/31/16 | $10,142 | $10,755 | $10,104 |
| 2/29/16 | $10,166 | $10,771 | $10,120 |
| 3/31/16 | $10,151 | $10,806 | $10,105 |
| 4/30/16 | $10,175 | $10,885 | $10,116 |
| 5/31/16 | $10,169 | $10,915 | $10,122 |
| 6/30/16 | $10,205 | $11,088 | $10,139 |
| 7/31/16 | $10,222 | $11,095 | $10,157 |
| 8/31/16 | $10,223 | $11,110 | $10,142 |
| 9/30/16 | $10,199 | $11,054 | $10,120 |
| 10/31/16 | $10,185 | $10,938 | $10,127 |
| 11/30/16 | $10,066 | $10,531 | $10,083 |
| 12/31/16 | $10,075 | $10,654 | $10,103 |
| 1/31/17 | $10,127 | $10,724 | $10,140 |
| 2/28/17 | $10,179 | $10,799 | $10,173 |
| 3/31/17 | $10,188 | $10,822 | $10,173 |
| 4/30/17 | $10,214 | $10,901 | $10,189 |
| 5/31/17 | $10,260 | $11,074 | $10,208 |
| 6/30/17 | $10,243 | $11,034 | $10,200 |
| 7/31/17 | $10,285 | $11,123 | $10,224 |
| 8/31/17 | $10,326 | $11,208 | $10,247 |
| 9/30/17 | $10,305 | $11,151 | $10,235 |
| 10/31/17 | $10,306 | $11,178 | $10,236 |
| 11/30/17 | $10,257 | $11,118 | $10,190 |
| 12/31/17 | $10,274 | $11,235 | $10,196 |
| 1/31/18 | $10,277 | $11,102 | $10,225 |
| 2/28/18 | $10,275 | $11,069 | $10,242 |
| 3/31/18 | $10,273 | $11,110 | $10,235 |
| 4/30/18 | $10,259 | $11,070 | $10,225 |
| 5/31/18 | $10,304 | $11,197 | $10,259 |
| 6/30/18 | $10,328 | $11,207 | $10,295 |
| 7/31/18 | $10,349 | $11,234 | $10,317 |
| 8/31/18 | $10,355 | $11,263 | $10,313 |
| 9/30/18 | $10,335 | $11,190 | $10,293 |
| 10/31/18 | $10,328 | $11,121 | $10,302 |
| 11/30/18 | $10,370 | $11,244 | $10,335 |
| 12/31/18 | $10,415 | $11,379 | $10,373 |
| 1/31/19 | $10,464 | $11,465 | $10,406 |
| 2/28/19 | $10,494 | $11,526 | $10,429 |
| 3/31/19 | $10,548 | $11,708 | $10,458 |
| 4/30/19 | $10,560 | $11,752 | $10,466 |
| 5/31/19 | $10,622 | $11,914 | $10,505 |
| 6/30/19 | $10,656 | $11,958 | $10,537 |
| 7/31/19 | $10,702 | $12,055 | $10,572 |
| 8/31/19 | $10,740 | $12,245 | $10,587 |
| 9/30/19 | $10,713 | $12,147 | $10,564 |
| 10/31/19 | $10,737 | $12,168 | $10,595 |
| 11/30/19 | $10,754 | $12,199 | $10,613 |
| 12/31/19 | $10,773 | $12,236 | $10,629 |
| 1/31/20 | $10,833 | $12,456 | $10,666 |
| 2/29/20 | $10,868 | $12,617 | $10,688 |
| 3/31/20 | $10,754 | $12,159 | $10,635 |
| 4/30/20 | $10,728 | $12,006 | $10,659 |
| 5/31/20 | $10,880 | $12,388 | $10,765 |
| 6/30/20 | $10,937 | $12,490 | $10,764 |
| 7/31/20 | $10,993 | $12,701 | $10,791 |
| 8/31/20 | $10,998 | $12,641 | $10,793 |
| 9/30/20 | $11,007 | $12,644 | $10,801 |
| 10/31/20 | $11,003 | $12,606 | $10,793 |
| 11/30/20 | $11,046 | $12,796 | $10,806 |
| 12/31/20 | $11,078 | $12,874 | $10,816 |
| 1/31/21 | $11,108 | $12,956 | $10,834 |
| 2/28/21 | $11,068 | $12,750 | $10,830 |
| 3/31/21 | $11,083 | $12,829 | $10,838 |
| 4/30/21 | $11,110 | $12,936 | $10,845 |
| 5/31/21 | $11,115 | $12,975 | $10,850 |
| 6/30/21 | $11,118 | $13,010 | $10,849 |
| 7/31/21 | $11,144 | $13,118 | $10,863 |
| 8/31/21 | $11,137 | $13,070 | $10,860 |
| 9/30/21 | $11,108 | $12,976 | $10,849 |
| 10/31/21 | $11,099 | $12,938 | $10,847 |
| 11/30/21 | $11,111 | $13,048 | $10,850 |
| 12/31/21 | $11,108 | $13,069 | $10,849 |
| 1/31/22 | $10,998 | $12,711 | $10,777 |
| 2/28/22 | $10,971 | $12,666 | $10,763 |
| 3/31/22 | $10,840 | $12,255 | $10,674 |
| 4/30/22 | $10,739 | $11,916 | $10,631 |
| 5/31/22 | $10,813 | $12,093 | $10,712 |
| 6/30/22 | $10,781 | $11,895 | $10,715 |
| 7/31/22 | $10,879 | $12,210 | $10,773 |
| 8/31/22 | $10,794 | $11,942 | $10,688 |
| 9/30/22 | $10,665 | $11,484 | $10,595 |
| 10/31/22 | $10,643 | $11,388 | $10,609 |
| 11/30/22 | $10,809 | $11,921 | $10,731 |
| 12/31/22 | $10,841 | $11,955 | $10,726 |
| 1/31/23 | $10,966 | $12,298 | $10,816 |
| 2/28/23 | $10,879 | $12,020 | $10,725 |
| 3/31/23 | $10,989 | $12,287 | $10,840 |
| 4/30/23 | $10,986 | $12,259 | $10,808 |
| 5/31/23 | $10,964 | $12,153 | $10,797 |
| 6/30/23 | $11,014 | $12,274 | $10,848 |
| 7/31/23 | $11,042 | $12,323 | $10,871 |
| 8/31/23 | $11,043 | $12,146 | $10,883 |
| 9/30/23 | $10,973 | $11,790 | $10,838 |
| 10/31/23 | $10,977 | $11,689 | $10,868 |
| 11/30/23 | $11,200 | $12,431 | $11,026 |
| 12/31/23 | $11,323 | $12,720 | $11,090 |
| 1/31/24 | $11,327 | $12,655 | $11,086 |
| 2/29/24 | $11,348 | $12,671 | $11,103 |
| 3/31/24 | $11,359 | $12,671 | $11,103 |
| 4/30/24 | $11,327 | $12,514 | $11,104 |
| 5/31/24 | $11,336 | $12,477 | $11,131 |
| 6/30/24 | $11,423 | $12,669 | $11,194 |
The table below shows the average annual total returns of the Fund, a regulatory index, and one or more supplemental index(es) for certain periods ended June 30, 2024.
Average Annual Total Returns (%)
| Fund/Index Name | 1 Year | 5 Years | 10 Years |
|---|
| PIMCO Short Term Municipal Bond Active Exchange-Traded Fund (at NAV) | 3.71% | 1.40% | 1.34% |
| PIMCO Short Term Municipal Bond Active Exchange-Traded Fund (at Market Price) | 3.79% | 1.38% | 1.34% |
| Bloomberg Municipal Bond Index | 3.21% | 1.16% | 2.39% |
| Bloomberg 1-Year Municipal Bond Index | 3.19% | 1.22% | 1.13% |
All Fund returns are net of fees and expenses and include applicable fee waivers and/or expense limitations. Absent any applicable fee waivers and/or expense limitations, performance would have been lower and there can be no assurance that any such waivers or limitations will continue in the future.
Performance quoted represents past performance. Past performance is not a guarantee or a reliable indicator of future results.Current performance may be lower or higher than performance shown. Investment return and the principal value of an investment will fluctuate. Shares may be worth more or less than original cost when redeemed. Returns shown do not reflect the deduction of taxes that a shareholder would pay on Fund distributions or the redemption of Fund shares.Differences in the Fund’s performance versus an index and related attribution information with respect to particular categories of securities or individual positions may be attributable, in part, to differences in the pricing methodologies used by the Fund and the index. For performance current to the most recent month-end, visit www.pimco.com/literature or via 888.400.4ETF (888.400.4383).
Key Fund StatisticsFootnote Reference* (as of the end of the reporting period)
| Total Net Assets | $586,508 |
| # of Portfolio Holdings | 252 |
| Portfolio Turnover Rate | 29% |
| Total Net Management Fees Paid During the Reporting Period | $1,921 |
| Footnote | Description |
Footnote* | Dollar amounts displayed in 000's |
What did the Fund invest in?
Sector Allocation (% of Net Assets)Footnote Reference*
| Footnote | Description |
Footnote* | % of Net Assets includes derivatives instruments, if any, valued at the value used for determining the Fund’s net asset value. The notional exposure of such derivatives investments therefore may be greater than what is depicted. |
| Health, Hospital & Nursing Home Revenue | 17.3% |
| Electric Power & Light Revenue | 11.7% |
| Ad Valorem Property Tax | 10.3% |
| Short-Term Instruments | 7.1% |
| Natural Gas Revenue | 6.6% |
| General Fund | 5.4% |
| Highway Revenue Tolls | 4.7% |
| Sales Tax Revenue | 4.2% |
| Industrial Revenue | 4.1% |
| Water Revenue | 4.1% |
| Income Tax Revenue | 3.1% |
| College & University Revenue | 3.1% |
| Economic Development Revenue | 2.9% |
| Local or Guaranteed Housing | 2.3% |
| Other Investments | 16.3% |
| Other Assets and Liabilities, Net | (3.2%) |
| Total | 100.0% |
For additional information about the Fund, including the Fund's prospectus, financial information, holdings and proxy voting information, please visit www.pimco.com/literature or contact 888.400.4ETF (888.400.4383). For tax information about the Fund, please visit: https://www.pimco.com/tax.
PIMCO Short Term Municipal Bond Active Exchange-Traded Fund
Annual Shareholder Report |
June 30, 2024
SMMU | Principal Listing Exchange: NYSE Arca
As of the end of the period covered by this report, the Registrant has adopted a code of ethics (the “Code”) that applies to the Registrant’s principal executive officer and principal financial officer. The Registrant did not grant any waivers, including implicit waivers, from any provisions of the Code to the principal executive officer or principal financial officer during the period covered by this report.
A copy of the Code is included as an exhibit to this report.
| Item 3. | Audit Committee Financial Expert. |
The Board of Trustees has determined that Peter B. McCarthy, who serves on the Board’s Audit Committee, qualifies as an “audit committee financial expert” as such term is defined in the instructions to this Item 3. The Board has also determined that Mr. McCarthy is “independent” as such term is interpreted under this Item 3.
| Item 4. | Principal Accountant Fees and Services. |
| | | | | | |
(a) | | Fiscal Year Ended | | Audit Fees | | |
| | June 30, 2024 | | $ 863,095 | | |
| | June 30, 2023 | | $ 735,393 | | |
| | | |
(b) | | Fiscal Year Ended | | Audit-Related Fees(1) | | |
| | June 30, 2024 | | $ — | | |
| | June 30, 2023 | | $ — | | |
| | | |
(c) | | Fiscal Year Ended | | Tax Fees(2) | | |
| | June 30, 2024 | | $ — | | |
| | June 30, 2023 | | $ — | | |
| | | |
(d) | | Fiscal Year Ended | | All Other Fees(3) | | |
| | June 30, 2024 | | $ — | | |
| | June 30, 2023 | | $ — | | |
“Audit Fees” represents aggregate fees billed for each of the last two fiscal years for professional services rendered for the audit of the PIMCO ETF Trust (the “Trust” or “Registrant”) annual financial statements or services that are normally provided by the accountant in connection with statutory or regulatory filings or engagements for those fiscal years.
“Audit-Related Fees” represents aggregate fees billed for each of the last two fiscal years for assurance and related services reasonably related to the performance of the audit of the Trust’s annual financial statements for those years.
“Tax Fees” represents aggregate fees billed for each of the last two fiscal years for professional services related to tax compliance, tax advice and tax planning, including review of federal and state income tax returns, review of excise tax distribution requirements and preparation of excise tax returns.
“All Other Fees” represents aggregate fees, if any, billed for other products and services rendered by the principal accountant to the Trust for the last two fiscal years.
| | (1) | There were no “Audit-Related Fees” for the last two fiscal years. |
| | (2) | There were no “Tax Fees” for the last two fiscal years. |
| | (3) | There were no “All Other Fees” for the last two fiscal years. |
| | (e) | Pre-approval policies and procedures |
(1) The Registrant’s Audit Committee has adopted pre-approval policies and procedures (the “Procedures”) to govern the Audit Committee’s pre-approval of (i) all audit services and permissible non-audit services to be provided to the Registrant by its independent accountant, and (ii) all permissible non-audit services to be provided by such independent accountant to the Registrant’s investment adviser and to any entity controlling, controlled by, or under common control with the investment adviser that provides ongoing services to the Registrant (collectively, the “Service Affiliates”) if the services provided directly relate to the Registrant’s operations and financial reporting. In accordance with the Procedures, the Audit Committee is responsible for the engagement of the independent accountant to certify the Registrant’s financial statements for each fiscal year. With respect to the pre-approval of non-audit services provided to the Registrant and its Service Affiliates, the Procedures provide that the Audit Committee may annually pre-approve a list of types or categories of non-audit services that may be provided to the Registrant or its Service Affiliates, or the Audit Committee may pre-approve such services on a project-by-project basis as they arise. Unless a type of service has received general pre-approval, it will require specific pre-approval by the Audit Committee if it is to be provided by the independent accountant. The Procedures also permit the Audit Committee to delegate authority to one or more of its members to pre-approve any proposed non-audit services that have not been previously pre-approved by the Audit Committee, subject to the ratification by the full Audit Committee no later than its next scheduled meeting.
(2) With respect to the services described in paragraphs (b) through (d) of this Item 4, no amount was approved by the Audit Committee pursuant to paragraph (c)(7)(i)(C) of Rule 2-01 of Regulation S-X.
| | | | | | | | |
| | | Aggregate Non-Audit Fees Billed to Entity | |
Entity | | June 30, 2024 | | | June 30, 2023 | |
PIMCO ETF Trust | | $ | — | | | $ | — | |
Pacific Investment Management Company LLC (“PIMCO”) | | | 12,040,579 | | | | 37,330,351 | |
| | | | |
Totals | | $ | 12,040,579 | | | $ | 37,330,351 | |
| | | | | | | | |
| | (h) | The Registrant’s Audit Committee has considered whether the provision of non-audit services that were rendered to the Registrant’s investment adviser, and any entity controlling, controlled by, or under common control with the investment adviser that provides ongoing services to the Registrant which were not pre-approved (not requiring pre-approval) is compatible with maintaining the principal accountant’s independence. |
Item 5. | Audit Committee of Listed Registrants. |
The Registrant has a separately-designated standing audit committee (known as the Audit Oversight Committee) established in accordance with Section 3(a)(58)(A) of the Securities Exchange Act of 1934, as amended. The Audit Oversight Committee is comprised of:
George E. Borst
Jennifer Holden Dunbar
Kym M. Hubbard
Gary F. Kennedy
Peter B. McCarthy (Chair)
Ronald C. Parker
The information required by this Item 6 is included as part of the annual Financial Statements and Financial Highlights filed under Item 7(a) of this Form N-CSR.
Item 7. | Financial Statements and Financial Highlights for Open-End Management Investment Companies. |
| | (a) | The following is a copy of the report(s) of the Funds’ Financial Statements and Financial Highlights. |
PIMCO ETF Trust

PIMCO ETF TRUST
Annual Financial and Other Information
June 30, 2024
Index Exchange-Traded Funds
PIMCO 25+ Year Zero Coupon U.S. Treasury Index Exchange-Traded Fund | ZROZ | NYSE Arca
PIMCO 1-5 Year U.S. TIPS Index Exchange-Traded Fund | STPZ | NYSE Arca
PIMCO 15+ Year U.S. TIPS Index Exchange-Traded Fund | LTPZ | NYSE Arca
PIMCO Broad U.S. TIPS Index Exchange-Traded Fund | TIPZ | NYSE Arca
PIMCO 0-5 Year High Yield Corporate Bond Index Exchange-Traded Fund | HYS | NYSE Arca
PIMCO Investment Grade Corporate Bond Index Exchange-Traded Fund | CORP | NYSE Arca
Actively-Managed Exchange-Traded Funds
PIMCO Active Bond Exchange-Traded Fund | BOND | NYSE
PIMCO Enhanced Low Duration Active Exchange-Traded Fund | LDUR | NYSE Arca
PIMCO Enhanced Short Maturity Active ESG Exchange-Traded Fund | EMNT | NYSE Arca
PIMCO Enhanced Short Maturity Active Exchange-Traded Fund | MINT | NYSE Arca
PIMCO Intermediate Municipal Bond Active Exchange-Traded Fund | MUNI | NYSE Arca
PIMCO Multisector Bond Active Exchange-Traded Fund | PYLD | NYSE Arca
PIMCO Municipal Income Opportunities Active Exchange-Traded Fund | MINO | NYSE Arca
PIMCO Preferred and Capital Securities Active Exchange-Traded Fund | PRFD | NYSE Arca
PIMCO Senior Loan Active Exchange-Traded Fund | LONZ | NYSE Arca
PIMCO Short Term Municipal Bond Active Exchange-Traded Fund | SMMU | NYSE Arca
PIMCO Ultra Short Government Active Exchange-Traded Fund | BILZ | NYSE Arca
PIMCO Commodity Strategy Active Exchange-Traded Fund | CMDT | NYSE Arca
Table of Contents
| | (1) | Consolidated Schedule of Investments |
This material is authorized for use only when preceded or accompanied by the current PIMCO ETF Trust prospectus.
| | | | |
| Important Information About the Funds | | | | |
PIMCO ETF Trust (the “Trust”) is an open-end management investment company that includes the PIMCO 25+ Year Zero Coupon U.S. Treasury Index Exchange-Traded Fund, PIMCO 1-5 Year U.S. TIPS Index Exchange-Traded Fund, PIMCO 15+ Year U.S. TIPS Index Exchange-Traded Fund, PIMCO Broad U.S. TIPS Index Exchange-Traded Fund, PIMCO 0-5 Year High Yield Corporate Bond Index Exchange-Traded Fund and PIMCO Investment Grade Corporate Bond Index Exchange-Traded Fund, which are exchange-traded funds (“ETFs”) that seek to provide total return that closely corresponds, before fees and expenses, to the total return of a specified index (collectively, the “Index Funds”). Each Index Fund employs a representative sampling strategy in seeking to achieve its investment objective. In using this strategy, PIMCO seeks to invest in a combination of instruments such that the portfolio effectively provides exposure to the underlying index. An Index Fund may not track its underlying index with the same degree of accuracy as a fund that replicates the composition and weighting of the underlying index. The PIMCO Active Bond Exchange-Traded Fund, PIMCO Enhanced Low Duration Active Exchange-Traded Fund, PIMCO Enhanced Short Maturity Active ESG Exchange-Traded Fund, PIMCO Enhanced Short Maturity Active Exchange-Traded Fund, PIMCO Intermediate Municipal Bond Active Exchange-Traded Fund, PIMCO Multisector Bond Active Exchange-Traded Fund, PIMCO Municipal Income Opportunities Active Exchange-Traded Fund, PIMCO Preferred and Capital Securities Active Exchange-Traded Fund, PIMCO Senior Loan Active Exchange-Traded Fund, PIMCO Short Term Municipal Bond Active Exchange-Traded Fund, PIMCO Ultra Short Government Active Exchange-Traded Fund and PIMCO Commodity Strategy Active Exchange-Traded Fund, unlike the Index Funds, are actively managed ETFs that do not seek to track the performance of a specified index (collectively, the “Active Funds” and together with the Index Funds, a “Fund” or the “Funds”). Shares of the Funds, except PIMCO Active Bond Exchange-Traded Fund, are listed and traded at market prices on NYSE Arca, Inc. (“NYSE Arca”), and the shares of the PIMCO Active Bond Exchange-Traded Fund are listed and traded at market prices on the New York Stock Exchange (“NYSE”), each a national securities exchange, and other secondary markets. The market price for each Fund’s shares may be different from the Fund’s net asset value (“NAV”). Each Fund issues and redeems shares at its NAV only in blocks of a specified number of shares (“Creation Units”). Only certain large institutional investors may purchase or redeem Creation Units directly with the Funds at NAV (“Authorized Participants”). These transactions are in exchange for certain securities similar to a Fund’s portfolio and/or cash. Except when aggregated in Creation Units, shares of a Fund are not redeemable securities. Shareholders who are not Authorized Participants may not redeem shares from the Funds at NAV.
We believe that bond funds have an important role to play in a well-diversified investment portfolio. It is important to note, however, that in
an environment where interest rates may trend upward, rising rates would negatively impact the performance of most bond funds, and fixed income securities and other instruments held by the Funds are likely to decrease in value. A wide variety of factors can cause interest rates to rise (e.g., central bank monetary policies, inflation rates, general economic conditions, etc.). In addition, changes in interest rates can be sudden and unpredictable, and there is no guarantee that Fund management will anticipate such movement accurately. The Funds may lose money as a result of movements in interest rates.
As of the date of this report, interest rates in the United States and many parts of the world, including certain European countries, remain high. In efforts to combat inflation, the U.S. Federal Reserve (the “Fed”) raised interest rates multiple times in 2022 and 2023. In the second half of 2023 and the beginning of 2024, however, the Fed paused the rate hikes, keeping interest rates steady. It is uncertain whether rates will remain steady, increase or decrease in the future. As such, the Funds may face a heightened level of risk associated with rising interest rates and/or bond yields. This could be driven by a variety of factors, including but not limited to central bank monetary policies, changing inflation or real growth rates, general economic conditions, increasing bond issuances or reduced market demand for low yielding investments. Further, while bond markets have steadily grown over the past three decades, dealer inventories of corporate bonds are near historic lows in relation to market size. As a result, there has been a significant reduction in the ability of dealers to “make markets”.
Bond funds and individual bonds with a longer duration (a measure used to determine the sensitivity of a security’s price to changes in interest rates) tend to be more sensitive to changes in interest rates, usually making them more volatile than securities or funds with shorter durations. All of the factors mentioned above, individually or collectively, could lead to increased volatility and/or lower liquidity in the fixed income markets, or negatively impact a Fund’s performance or cause a Fund to incur losses. As a result, there could be increased sales of shares, which, among other things, could further reduce the market price for a Fund’s shares.
The Funds may be subject to various risks as described in each Fund’s prospectus and in the Principal and Other Risks in the Notes to Financial Statements.
Classifications of the Funds’ portfolio holdings in this report are made according to financial reporting standards. The classification of a particular portfolio holding as shown in the Schedule of Investments sections of this report may differ from the classification used for the Funds’ compliance calculations, including those used in the Funds’ prospectuses, investment objectives, regulatory and other investment limitations and policies, which may be based on different asset class,
sector or geographical classifications. The Funds are separately monitored for compliance with respect to prospectus and regulatory requirements.
The geographical classification of foreign (non-U.S.) securities in this report, if any, are classified by the country of incorporation of a holding. In certain instances, a security’s country of incorporation may be different from its country of economic exposure.
In February 2022, Russia launched an invasion of Ukraine. As a result, Russia and other countries, persons and entities that provided material aid to Russia’s aggression against Ukraine, have been the subject of economic sanctions and import and export controls imposed by countries throughout the world, including the United States. Such measures have had and may continue to have an adverse effect on the Russian, Belarusian and other securities and economies, which may, in turn, negatively impact a Fund. The extent, duration and impact of Russia’s military action in Ukraine, related sanctions and retaliatory actions are difficult to ascertain, but could be significant and have severe adverse effects on the region, including significant adverse effects on the regional, European and global economies and the markets for certain securities and commodities, such as oil and natural gas, as well as other sectors. Further, a Fund may have investments in securities and instruments that are economically tied to the region and may have been negatively impacted by the sanctions and counter-sanctions by Russia, including declines in value and reductions in liquidity. The sanctions may cause a Fund to sell portfolio holdings at a disadvantageous time or price or to continue to hold investments that a Fund may no longer seek to hold. PIMCO will continue to actively manage these positions in the best interests of a Fund and its shareholders.
The United States’ enforcement of restrictions on U.S. investments in certain issuers and tariffs on goods from certain other countries has contributed to and may continue to contribute to international trade tensions and may impact portfolio securities (and/or portfolio securities of Underlying PIMCO Funds, as applicable). The United States’ enforcement of sanctions or other similar measures on various Russian entities and persons, and the Russian government’s response, may also negatively impact securities and instruments that are economically tied to Russia.
A Fund may invest in certain instruments that rely in some fashion upon the London Interbank Offered Rate (“LIBOR”). LIBOR was traditionally an average interest rate, determined by the ICE Benchmark Administration, that banks charge one another for the use of short-term money. The United Kingdom’s Financial Conduct Authority, which regulates LIBOR, announced plans to ultimately phase out the use of LIBOR. Although the transition process away from LIBOR for many instruments has been completed, some LIBOR use is continuing and there are potential effects related to the transition away from LIBOR or continued use of LIBOR on a Fund, or on certain instruments in which a
Fund invests, which can be difficult to ascertain, and may vary depending on factors that include, but are not limited to: (i) existing fallback or termination provisions in individual contracts and (ii) whether, how and when industry participants adopt new reference rates for affected instruments. The transition of investments from LIBOR to a replacement rate as a result of amendment, application of existing fallbacks, statutory requirements or otherwise may also result in a reduction in the value of certain instruments held by a Fund or a reduction in the effectiveness of related Fund transactions such as hedges. In addition, an instrument’s transition to a replacement rate could result in variations in the reported yields of a Fund that holds such instrument. Any such effects of the transition away from LIBOR, as well as other unforeseen effects, could result in losses to a Fund.
Engaging in a responsible investment strategy, which may select or exclude securities of certain issuers for reasons other than performance, carries the risk that a Fund, to the extent a fund engages in a responsible investment strategy, may underperform funds that do not utilize a responsible investment strategy. The application of this strategy may affect a Fund’s exposure to certain sectors or types of investments, which could negatively impact the Fund’s performance. Responsible investing is qualitative and subjective by nature, and there is no guarantee that the criteria utilized or any judgment exercised in pursuing a responsible investment strategy will reflect the beliefs or values of any particular investor. In evaluating a company, the information and data obtained through voluntary or third-party reporting may be incomplete, inaccurate or unavailable, which could cause an incorrect assessment of a company’s business practices with respect to the environment, social responsibility and corporate governance (“ESG practices”). Socially responsible norms differ by region, and a company’s ESG practices or the assessment of a company’s ESG practices may change over time.
U.S. and global markets have experienced increased volatility, including as a result of the failures of certain U.S. and non-U.S. banks in 2023, which could be harmful to the Funds and issuers in which they invest. For example, if a bank at which a Fund or issuer has an account fails, any cash or other assets in bank or custody accounts, which may be substantial in size, could be temporarily inaccessible or permanently lost by the Fund or issuer. If a bank that provides a subscription line credit facility, asset-based facility, other credit facility and/or other services to an issuer or to a fund fails, the issuer or fund could be unable to draw funds under its credit facilities or obtain replacement credit facilities or other services from other lending institutions with similar terms.
Issuers in which a Fund may invest can be affected by volatility in the banking sector. Even if banks used by issuers in which the Funds invest remain solvent, volatility in the banking sector could contribute to, cause or intensify an economic recession, increase the costs of capital
| | | | | | | | | | | | |
| | | | ANNUAL FINANCIAL AND OTHER INFORMATION | | | | | | | JUNE 30, 2024 | | | 3 |
| | | | |
| Important Information About the Funds | | (Cont.) | | |
and banking services or result in the issuers being unable to obtain or refinance indebtedness at all or on as favorable terms as could otherwise have been obtained. Potential impacts to the Funds and issuers resulting from changes in the banking sector, market conditions and potential legislative or regulatory responses are uncertain. Such conditions and responses, as well as a changing interest rate environment, can contribute to decreased market liquidity and erode the value of certain holdings, including those of U.S. and non-U.S. banks. Continued market volatility and uncertainty and/or a downturn in market and economic and financial conditions, as a result of developments in the banking sector or otherwise (including as a result of delayed access to cash or credit facilities), could have an adverse impact on the Funds and issuers in which they invest.
The following table discloses the inception dates of each Fund along with each Fund’s diversification status as of period end:
| | | | | | | | | | | | |
| Fund Name | | | | | Fund
Inception | | | Diversification
Status | |
PIMCO 25+ Year Zero Coupon U.S. Treasury Index Exchange-Traded Fund | | | | | | | 10/30/09 | | | | Diversified | |
PIMCO 1-5 Year U.S. TIPS Index Exchange-Traded Fund | | | | | | | 08/20/09 | | | | Diversified | |
PIMCO 15+ Year U.S. TIPS Index Exchange-Traded Fund | | | | | | | 09/03/09 | | | | Diversified | |
PIMCO Broad U.S. TIPS Index Exchange-Traded Fund | | | | | | | 09/03/09 | | | | Diversified | |
PIMCO 0-5 Year High Yield Corporate Bond Index Exchange-Traded Fund | | | | | | | 06/16/11 | | | | Diversified | |
PIMCO Investment Grade Corporate Bond Index Exchange-Traded Fund | | | | | | | 09/20/10 | | | | Diversified | |
PIMCO Active Bond Exchange-Traded Fund | | | | | | | 02/29/12 | | | | Diversified | |
PIMCO Enhanced Low Duration Active Exchange-Traded Fund | | | | | | | 01/22/14 | | | | Diversified | |
PIMCO Enhanced Short Maturity Active ESG Exchange-Traded Fund | | | | | | | 12/10/19 | | | | Diversified | |
PIMCO Enhanced Short Maturity Active Exchange-Traded Fund | | | | | | | 11/16/09 | | | | Diversified | |
PIMCO Intermediate Municipal Bond Active Exchange-Traded Fund | | | | | | | 11/30/09 | | | | Diversified | |
PIMCO Multisector Bond Active Exchange-Traded Fund | | | | | | | 06/21/23 | | | | Diversified | |
PIMCO Municipal Income Opportunities Active Exchange-Traded Fund | | | | | | | 09/08/21 | | | | Diversified | |
PIMCO Preferred and Capital Securities Active Exchange-Traded Fund | | | | | | | 01/18/23 | | | | Diversified | |
PIMCO Senior Loan Active Exchange-Traded Fund | | | | | | | 06/08/22 | | | | Diversified | |
PIMCO Short Term Municipal Bond Active Exchange-Traded Fund | | | | | | | 02/01/10 | | | | Diversified | |
PIMCO Ultra Short Government Active Exchange-Traded Fund | | | | | | | 06/21/23 | | | | Diversified | |
PIMCO Commodity Strategy Active Exchange-Traded Fund | | | | | | | 05/09/23 | | | | Non-diversified | |
An investment in a Fund is not a bank deposit and is not guaranteed or insured by the Federal Deposit Insurance Corporation or any other government agency. It is possible to lose money on investments in a Fund.
The Trustees are responsible generally for overseeing the management of the Trust. The Trustees authorize the Trust to enter into service agreements with the Adviser, the Distributor, the Administrator and other service providers in order to provide, and in some cases authorize service providers to procure through other parties, necessary or desirable services on behalf of the Trust and the Funds. Shareholders are not parties to or third-party beneficiaries of such service agreements. Neither a Fund’s prospectus nor a Fund’s summary prospectus, the Trust’s Statement of Additional Information (“SAI”), any contracts filed as exhibits to the Trust’s registration statement, nor any other communications, disclosure documents or regulatory filings (including this report) from or on behalf of the Trust or a Fund creates a contract between or among any shareholder of a Fund, on the one hand, and the Trust, a Fund, a service provider to the Trust or a Fund, and/or the Trustees or officers of the Trust, on the other hand. The Trustees (or the Trust and its officers, service providers or other delegates acting under authority of the Trustees) may amend the most
recent prospectus or use a new prospectus, summary prospectus or SAI with respect to a Fund or the Trust, and/or amend, file and/or issue any other communications, disclosure documents or regulatory filings, and may amend or enter into any contracts to which the Trust or a Fund is a party, and interpret the investment objective(s), policies, restrictions and contractual provisions applicable to any Fund, without shareholder input or approval, except in circumstances in which shareholder approval is specifically required by law (such as changes to fundamental investment policies) or where a shareholder approval requirement is specifically disclosed in the Trust’s then-current prospectus or SAI.
On each business day, before commencement of trading on NYSE Arca, each Fund will disclose on www.pimcoetfs.com the identities and quantities of the Fund’s portfolio holdings. The frequency at which the daily market prices were at a discount or premium to each Fund’s NAV is disclosed on www.pimcoetfs.com. Please see “Disclosure of Portfolio Holdings” in the SAI for information about the availability of the complete schedule of each Fund’s holdings. Fund fact sheets provide additional information regarding a Fund and may be requested by calling (888) 400-4ETF and are available on the Funds’ website at www.pimcoetfs.com.
PIMCO has adopted written proxy voting policies and procedures (“Proxy Policy”) as required by Rule 206(4)-6 under the Investment Advisers Act of 1940, as amended. The Proxy Policy has been adopted by the Trust as the policies and procedures that PIMCO will use when voting proxies on behalf of the Funds. A description of the policies and procedures that PIMCO uses to vote proxies relating to portfolio securities of each Fund, and information about how each Fund voted proxies relating to portfolio securities held during the most recent twelve-month period ended June 30, are available without charge, upon request, by calling the Trust at (888) 400-4ETF, on the Funds’ website at www.pimcoetfs.com, and on the Securities and Exchange Commission’s (“SEC”) website at www.sec.gov.
The Funds file portfolio holdings information with the SEC on Form N-PORT within 60 days of the end of each fiscal quarter. The Funds’ complete schedules of securities holdings as of the end of each fiscal quarter will be made available to the public on the SEC’s website at www.sec.gov and on PIMCO’s website at www.pimcoetfs.com, and will be made available, upon request, by calling PIMCO at (888) 400-4ETF.
Paper copies of the Funds’ shareholder reports are required to be provided free of charge by the Fund or financial intermediary upon request.
In October 2022, the SEC adopted changes to the mutual fund and ETF shareholder report and registration statement disclosure requirements and the registered fund advertising rules, which impact the disclosures provided to shareholders. The rule amendments were effective as of January 2023, and compliance with the rule amendments was required as of July 2024. As such, the Funds have made significant updates to the content of their shareholder reports. In addition, shareholder reports are now mailed to shareholders who have not opted to receive shareholder report documents electronically.
In September 2023, the SEC adopted amendments to Rule 35d-1 under the Investment Company Act of 1940, as amended, the rule governing fund naming conventions (the “Names Rule”). In general, the Names Rule requires funds with certain types of names to adopt a policy to invest at least 80% of their assets in the type of investment suggested by the name. The amendments expand the scope of the current rule to include any term used in a fund name that suggests the fund makes investments that have, or whose issuers have, particular characteristics. Additionally, the amendments modify the circumstances under which a fund may deviate from its 80% investment policy and address the calculation methodology of derivatives instruments for purposes of the rule. The amendments became effective December 11, 2023, and fund groups with $1 billion or more in net assets will have 24 months to comply with the amendments (fund groups with net assets of less than $1 billion have 30 months to comply).
| | | | | | | | | | | | |
| | | | ANNUAL FINANCIAL AND OTHER INFORMATION | | | | | | | JUNE 30, 2024 | | | 5 |
| | | | | | | | | | | | | | | | | | | | | | | | | | | | | | | | |
| | | | | | Investment Operations | | | Less Distributions(c) | |
| | | | | | | | | | | | | | | | | | | | | | | | | |
| Selected Per Share Data for the Year or Period Ended^: | | Net Asset
Value
Beginning
of Year
or Period(a) | | | Net
Investment
Income (Loss)(b) | | | Net
Realized/
Unrealized
Gain (Loss) | | | Total | | | From Net
Investment
Income | | | From Net
Realized
Capital
Gains | | | Tax Basis
Return of
Capital | | | Total | |
| | | | | | | | |
PIMCO 25+ Year Zero Coupon U.S. Treasury Index Exchange-Traded Fund | | | | | | | | | | | | | | | | | | | | | | | | | | | | | | | | |
| | | | | | | | |
06/30/2024 | | $ | 91.83 | | | $ | 3.22 | | | $ | (16.84 | ) | | $ | (13.62 | ) | | $ | (3.04 | ) | | $ | 0.00 | | | $ | 0.00 | | | $ | (3.04 | ) |
| | | | | | | | |
06/30/2023 | | | 108.27 | | | | 3.12 | | | | (16.97 | ) | | | (13.85 | ) | | | (2.59 | ) | | | 0.00 | | | | 0.00 | | | | (2.59 | ) |
| | | | | | | | |
06/30/2022 | | | 145.38 | | | | 2.59 | | | | (37.32 | ) | | | (34.73 | ) | | | (2.38 | ) | | | 0.00 | | | | 0.00 | | | | (2.38 | ) |
| | | | | | | | |
06/30/2021 | | | 173.14 | | | | 2.49 | | | | (27.75 | ) | | | (25.26 | ) | | | (2.50 | ) | | | 0.00 | | | | 0.00 | | | | (2.50 | ) |
| | | | | | | | |
06/30/2020 | | | 128.17 | | | | 2.99 | | | | 45.06 | | | | 48.05 | | | | (3.08 | ) | | | 0.00 | | | | 0.00 | | | | (3.08 | ) |
| | | | | | | | |
PIMCO 1-5 Year U.S. TIPS Index Exchange-Traded Fund | | | | | | | | | | | | | | | | | | | | | | | | | | | | | | | | |
| | | | | | | | |
06/30/2024 | | $ | 50.30 | | | $ | 1.12 | | | $ | 1.37 | | | $ | 2.49 | | | $ | (1.14 | ) | | $ | 0.00 | | | $ | 0.00 | | | $ | (1.14 | ) |
| | | | | | | | |
06/30/2023 | | | 52.31 | | | | 1.66 | | | | (2.01 | ) | | | (0.35 | ) | | | (1.66 | ) | | | 0.00 | | | | 0.00 | | | | (1.66 | ) |
| | | | | | | | |
06/30/2022 | | | 55.05 | | | | 2.97 | | | | (2.83 | ) | | | 0.14 | | | | (2.88 | ) | | | 0.00 | | | | 0.00 | | | | (2.88 | ) |
| | | | | | | | |
06/30/2021 | | | 53.21 | | | | 1.85 | | | | 1.35 | | | | 3.20 | | | | (1.36 | ) | | | 0.00 | | | | 0.00 | | | | (1.36 | ) |
| | | | | | | | |
06/30/2020 | | | 52.62 | | | | 0.26 | | | | 1.56 | | | | 1.82 | | | | (1.07 | ) | | | 0.00 | | | | (0.16 | ) | | | (1.23 | ) |
| | | | | | | | |
PIMCO 15+ Year U.S. TIPS Index Exchange-Traded Fund | | | | | | | | | | | | | | | | | | | | | | | | | | | | | | | | |
| | | | | | | | |
06/30/2024 | | $ | 60.01 | | | $ | 2.34 | | | $ | (5.85 | ) | | $ | (3.51 | ) | | $ | (2.41 | ) | | $ | 0.00 | | | $ | 0.00 | | | $ | (2.41 | ) |
| | | | | | | | |
06/30/2023 | | | 65.19 | | | | 3.08 | | | | (5.12 | ) | | | (2.04 | ) | | | (3.14 | ) | | | 0.00 | | | | 0.00 | | | | (3.14 | ) |
| | | | | | | | |
06/30/2022 | | | 86.49 | | | | 4.78 | | | | (21.26 | ) | | | (16.48 | ) | | | (4.82 | ) | | | 0.00 | | | | 0.00 | | | | (4.82 | ) |
| | | | | | | | |
06/30/2021 | | | 83.31 | | | | 2.10 | | | | 2.85 | | | | 4.95 | | | | (1.77 | ) | | | 0.00 | | | | 0.00 | | | | (1.77 | ) |
| | | | | | | | |
06/30/2020 | | | 69.61 | | | | 0.19 | | | | 15.22 | | | | 15.41 | | | | (1.71 | ) | | | 0.00 | | | | 0.00 | | | | (1.71 | ) |
| | | | | | | | |
PIMCO Broad U.S. TIPS Index Exchange-Traded Fund | | | | | | | | | | | | | | | | | | | | | | | | | | | | | | | | |
| | | | | | | | |
06/30/2024 | | $ | 54.08 | | | $ | 2.54 | | | $ | (1.39 | ) | | $ | 1.15 | | | $ | (2.71 | ) | | $ | 0.00 | | | $ | 0.00 | | | $ | (2.71 | ) |
| | | | | | | | |
06/30/2023 | | | 57.62 | | | | 3.34 | | | | (3.90 | ) | | | (0.56 | ) | | | (2.98 | ) | | | 0.00 | | | | 0.00 | | | | (2.98 | ) |
| | | | | | | | |
06/30/2022 | | | 65.77 | | | | 3.65 | | | | (7.47 | ) | | | (3.82 | ) | | | (3.79 | ) | | | (0.54 | ) | | | 0.00 | | | | (4.33 | ) |
| | | | | | | | |
06/30/2021 | | | 63.20 | | | | 2.07 | | | | 1.89 | | | | 3.96 | | | | (1.39 | ) | | | 0.00 | | | | 0.00 | | | | (1.39 | ) |
| | | | | | | | |
06/30/2020 | | | 59.46 | | | | 0.22 | | | | 4.82 | | | | 5.04 | | | | (1.09 | ) | | | 0.00 | | | | (0.21 | ) | | | (1.30 | ) |
| | | | | | | | |
PIMCO 0-5 Year High Yield Corporate Bond Index Exchange-Traded Fund | | | | | | | | | | | | | | | | | | | | | | | | | | | | | | | | |
| | | | | | | | |
06/30/2024 | | $ | 90.98 | | | $ | 6.35 | | | $ | 2.01 | | | $ | 8.36 | | | $ | (6.48 | ) | | $ | 0.00 | | | $ | 0.00 | | | $ | (6.48 | ) |
| | | | | | | | |
06/30/2023 | | | 88.56 | | | | 5.18 | | | | 2.56 | | | | 7.74 | | | | (5.32 | ) | | | 0.00 | | | | 0.00 | | | | (5.32 | ) |
| | | | | | | | |
06/30/2022 | | | 99.99 | | | | 3.33 | | | | (11.31 | ) | | | (7.98 | ) | | | (3.45 | ) | | | 0.00 | | | | 0.00 | | | | (3.45 | ) |
| | | | | | | | |
06/30/2021 | | | 91.45 | | | | 3.70 | | | | 9.16 | | | | 12.86 | | | | (4.32 | ) | | | 0.00 | | | | 0.00 | | | | (4.32 | ) |
| | | | | | | | |
06/30/2020 | | | 100.71 | | | | 4.08 | | | | (8.54 | ) | | | (4.46 | ) | | | (4.80 | ) | | | 0.00 | | | | 0.00 | | | | (4.80 | ) |
| | | | | | | | |
PIMCO Investment Grade Corporate Bond Index Exchange-Traded Fund | | | | | | | | | | | | | | | | | | | | | | | | | | | | | | | | |
| | | | | | | | |
06/30/2024 | | $ | 94.77 | | | $ | 4.27 | | | $ | 0.27 | | | $ | 4.54 | | | $ | (4.21 | ) | | $ | 0.00 | | | $ | 0.00 | | | $ | (4.21 | ) |
| | | | | | | | |
06/30/2023 | | | 96.33 | | | | 3.67 | | | | (1.69 | ) | | | 1.98 | | | | (3.54 | ) | | | 0.00 | | | | 0.00 | | | | (3.54 | ) |
| | | | | | | | |
06/30/2022 | | | 114.60 | | | | 2.64 | | | | (18.11 | ) | | | (15.47 | ) | | | (2.72 | ) | | | (0.08 | ) | | | 0.00 | | | | (2.80 | ) |
| | | | | | | | |
06/30/2021 | | | 114.04 | | | | 2.92 | | | | 0.79 | | | | 3.71 | | | | (3.01 | ) | | | (0.14 | ) | | | 0.00 | | | | (3.15 | ) |
| | | | | | | | |
06/30/2020 | | | 107.27 | | | | 3.40 | | | | 6.88 | | | | 10.28 | | | | (3.51 | ) | | | 0.00 | | | | 0.00 | | | | (3.51 | ) |
| | | | | | | | |
PIMCO Active Bond Exchange-Traded Fund | | | | | | | | | | | | | | | | | | | | | | | | | | | | | | | | |
| | | | | | | | |
06/30/2024 | | $ | 91.62 | | | $ | 4.40 | | | $ | (0.88 | ) | | $ | 3.52 | | | $ | (4.11 | ) | | $ | 0.00 | | | $ | 0.00 | | | $ | (4.11 | ) |
| | | | | | | | |
06/30/2023 | | | 95.16 | | | | 3.65 | | | | (3.80 | ) | | | (0.15 | ) | | | (3.39 | ) | | | 0.00 | | | | 0.00 | | | | (3.39 | ) |
| | | | | | | | |
06/30/2022 | | | 111.01 | | | | 2.52 | | | | (15.52 | ) | | | (13.00 | ) | | | (2.85 | ) | | | 0.00 | | | | 0.00 | | | | (2.85 | ) |
| | | | | | | | |
06/30/2021 | | | 111.39 | | | | 2.27 | | | | 0.16 | | | | 2.43 | | | | (2.81 | ) | | | 0.00 | | | | 0.00 | | | | (2.81 | ) |
| | | | | | | | |
06/30/2020 | | | 107.54 | | | | 2.88 | | | | 4.42 | | | | 7.30 | | | | (3.45 | ) | | | 0.00 | | | | 0.00 | | | | (3.45 | ) |
| | | | | | | | |
PIMCO Enhanced Low Duration Active Exchange-Traded Fund | | | | | | | | | | | | | | | | | | | | | | | | | | | | | | | | |
| | | | | | | | |
06/30/2024 | | $ | 93.86 | | | $ | 4.60 | | | $ | 0.68 | | | $ | 5.28 | | | $ | (4.15 | ) | | $ | 0.00 | | | $ | (0.20 | ) | | $ | (4.35 | ) |
| | | | | | | | |
06/30/2023 | | | 96.16 | | | | 3.30 | | | | (2.83 | ) | | | 0.47 | | | | (2.77 | ) | | | 0.00 | | | | 0.00 | | | | (2.77 | ) |
| | | | | | | | |
06/30/2022 | | | 101.78 | | | | 1.43 | | | | (5.87 | ) | | | (4.44 | ) | | | (1.18 | ) | | | 0.00 | | | | 0.00 | | | | (1.18 | ) |
| | | | | | | | |
06/30/2021 | | | 101.79 | | | | 1.16 | | | | 0.43 | | | | 1.59 | | | | (1.60 | ) | | | 0.00 | | | | 0.00 | | | | (1.60 | ) |
| | | | | | | | |
06/30/2020 | | | 100.15 | | | | 2.61 | | | | 2.06 | | | | 4.67 | | | | (3.03 | ) | | | 0.00 | | | | 0.00 | | | | (3.03 | ) |
| | | | | | |
| 6 | | PIMCO ETF TRUST | | | See Accompanying Notes | |
| | | | | | | | | | | | | | | | | | | | | | | | | | | | | | | | | | |
| | | | | | | Ratios/Supplemental Data | |
| | | | | | | | | | Ratios to Average Net Assets(f) | | | | |
Net Asset
Value End of
Year or
Period(a) | | | Total
Return(d) | | | Net Assets
End of Year
or Period
(000s) | | | Expenses | | | Expenses
Excluding
Waivers | | | Expenses
Excluding
Interest
Expense | | | Expenses
Excluding
Interest
Expense and
Waivers | | | Net
Investment
Income (Loss) | | | Portfolio
Turnover
Rate(e) | |
| | | | | | | | |
| | | | | | | | | | | | | | | | | | | | | | | | | | | | | | | | | | |
| | | | | | | | |
| $ | 75.17 | | | | (15.00 | )% | | $ | 1,388,401 | | | | 0.15 | % | | | 0.15 | % | | | 0.15 | % | | | 0.15 | % | | | 4.19 | % | | | 22 | % |
| | | | | | | | |
| | 91.83 | | | | (12.87 | ) | | | 947,726 | | | | 0.15 | | | | 0.15 | | | | 0.15 | | | | 0.15 | | | | 3.30 | | | | 26 | |
| | | | | | | | |
| | 108.27 | | | | (24.29 | ) | | | 435,244 | | | | 0.15 | | | | 0.15 | | | | 0.15 | | | | 0.15 | | | | 1.90 | | | | 12 | |
| | | | | | | | |
| | 145.38 | | | | (14.70 | ) | | | 395,447 | | | | 0.15 | | | | 0.15 | | | | 0.15 | | | | 0.15 | | | | 1.59 | | | | 25 | |
| | | | | | | | |
| | 173.14 | | | | 37.97 | | | | 375,713 | | | | 0.15 | | | | 0.15 | | | | 0.15 | | | | 0.15 | | | | 1.98 | | | | 14 | |
| | | | | | | | |
| | | | | | | | | | | | | | | | | | | | | | | | | | | | | | | | | | |
| | | | | | | | |
| $ | 51.65 | | | | 5.01 | % | | $ | 491,717 | | | | 0.20 | % | | | 0.20 | % | | | 0.20 | % | | | 0.20 | % | | | 2.23 | % | | | 25 | % |
| | | | | | | | |
| | 50.30 | | | | (0.71 | ) | | | 833,417 | | | | 0.20 | | | | 0.20 | | | | 0.20 | | | | 0.20 | | | | 3.26 | | | | 25 | |
| | | | | | | | |
| | 52.31 | | | | 0.18 | | | | 1,575,509 | | | | 0.20 | | | | 0.20 | | | | 0.20 | | | | 0.20 | | | | 5.46 | | | | 23 | |
| | | | | | | | |
| | 55.05 | | | | 6.07 | | | | 972,716 | | | | 0.20 | | | | 0.20 | | | | 0.20 | | | | 0.20 | | | | 3.40 | | | | 26 | |
| | | | | | | | |
| | 53.21 | | | | 3.52 | | | | 628,978 | | | | 0.20 | | | | 0.20 | | | | 0.20 | | | | 0.20 | | | | 0.49 | | | | 30 | |
| | | | | | | | |
| | | | | | | | | | | | | | | | | | | | | | | | | | | | | | | | | | |
| | | | | | | | |
| $ | 54.09 | | | | (5.81 | )% | | $ | 706,924 | | | | 0.20 | % | | | 0.20 | % | | | 0.20 | % | | | 0.20 | % | | | 4.30 | % | | | 4 | % |
| | | | | | | | |
| | 60.01 | | | | (3.33 | ) | | | 670,356 | | | | 0.20 | | | | 0.20 | | | | 0.20 | | | | 0.20 | | | | 4.99 | | | | 5 | |
| | | | | | | | |
| | 65.19 | | | | (20.04 | ) | | | 620,606 | | | | 0.20 | | | | 0.20 | | | | 0.20 | | | | 0.20 | | | | 5.69 | | | | 4 | |
| | | | | | | | |
| | 86.49 | | | | 6.00 | | | | 602,828 | | | | 0.20 | | | | 0.20 | | | | 0.20 | | | | 0.20 | | | | 2.46 | | | | 4 | |
| | | | | | | | |
| | 83.31 | | | | 22.47 | | | | 614,024 | | | | 0.20 | | | | 0.20 | | | | 0.20 | | | | 0.20 | | | | 0.25 | | | | 9 | |
| | | | | | | | |
| | | | | | | | | | | | | | | | | | | | | | | | | | | | | | | | | | |
| | | | | | | | |
| $ | 52.52 | | | | 2.26 | % | | $ | 98,743 | | | | 0.20 | % | | | 0.20 | % | | | 0.20 | % | | | 0.20 | % | | | 4.86 | % | | | 125 | % |
| | | | | | | | |
| | 54.08 | | | | (1.06 | ) | | | 131,420 | | | | 0.20 | | | | 0.20 | | | | 0.20 | | | | 0.20 | | | | 5.95 | | | | 213 | |
| | | | | | | | |
| | 57.62 | | | | (6.25 | ) | | | 194,771 | | | | 0.20 | | | | 0.20 | | | | 0.20 | | | | 0.20 | | | | 5.70 | | | | 177 | |
| | | | | | | | |
| | 65.77 | | | | 6.31 | | | | 176,261 | | | | 0.20 | | | | 0.20 | | | | 0.20 | | | | 0.20 | | | | 3.19 | | | | 5 | |
| | | | | | | | |
| | 63.20 | | | | 8.61 | | | | 61,936 | | | | 0.20 | | | | 0.20 | | | | 0.20 | | | | 0.20 | | | | 0.35 | | | | 10 | |
| | | | | | | | |
| | | | | | | | | | | | | | | | | | | | | | | | | | | | | | | | | | |
| | | | | | | | |
| $ | 92.86 | | | | 9.54 | % | | $ | 1,230,384 | | | | 0.57 | % | | | 0.57 | % | | | 0.55 | % | | | 0.55 | % | | | 6.96 | % | | | 49 | % |
| | | | | | | | |
| | 90.98 | | | | 8.98 | | | | 1,100,838 | | | | 0.56 | | | | 0.56 | | | | 0.55 | | | | 0.55 | | | | 5.71 | | | | 42 | |
| | | | | | | | |
| | 88.56 | | | | (8.24 | ) | | | 1,115,806 | | | | 0.55 | | | | 0.55 | | | | 0.55 | | | | 0.55 | | | | 3.43 | | | | 45 | |
| | | | | | | | |
| | 99.99 | | | | 14.35 | | | | 2,239,839 | | | | 0.55 | | | | 0.55 | | | | 0.55 | | | | 0.55 | | | | 3.81 | | | | 65 | |
| | | | | | | | |
| | 91.45 | | | | (4.56 | ) | | | 1,156,826 | | | | 0.56 | | | | 0.56 | | | | 0.55 | | | | 0.55 | | | | 4.22 | | | | 36 | |
| | | | | | | | |
| | | | | | | | | | | | | | | | | | | | | | | | | | | | | | | | | | |
| | | | | | | | |
| $ | 95.10 | | | | 4.93 | % | | $ | 1,129,828 | | | | 0.36 | % | | | 0.36 | % | | | 0.20 | % | | | 0.20 | % | | | 4.55 | % | | | 23 | % |
| | | | | | | | |
| | 94.77 | | | | 2.12 | | | | 742,059 | | | | 0.23 | | | | 0.23 | | | | 0.20 | | | | 0.20 | | | | 3.85 | | | | 17 | |
| | | | | | | | |
| | 96.33 | | | | (13.77 | ) | | | 580,883 | | | | 0.20 | | | | 0.20 | | | | 0.20 | | | | 0.20 | | | | 2.42 | | | | 41 | |
| | | | | | | | |
| | 114.60 | | | | 3.29 | | | | 794,189 | | | | 0.20 | | | | 0.20 | | | | 0.20 | | | | 0.20 | | | | 2.55 | | | | 21 | |
| | | | | | | | |
| | 114.04 | | | | 9.76 | | | | 659,123 | | | | 0.20 | | | | 0.20 | | | | 0.20 | | | | 0.20 | | | | 3.10 | | | | 18 | |
| | | | | | | | |
| | | | | | | | | | | | | | | | | | | | | | | | | | | | | | | | | | |
| | | | | | | | |
| $ | 91.03 | | | | 3.98 | % | | $ | 4,326,761 | | | | 0.69 | % | | | 0.70 | % | | | 0.54 | % | | | 0.55 | % | | | 4.90 | % | | | 351 | % |
| | | | | | | | |
| | 91.62 | | | | (0.13 | ) | | | 3,478,849 | | | | 0.58 | | | | 0.58 | | | | 0.55 | | | | 0.55 | | | | 3.93 | | | | 352 | |
| | | | | | | | |
| | 95.16 | | | | (11.96 | ) | | | 3,224,915 | | | | 0.56 | | | | 0.56 | | | | 0.55 | | | | 0.55 | | | | 2.37 | | | | 368 | |
| | | | | | | | |
| | 111.01 | | | | 2.20 | | | | 4,282,895 | | | | 0.55 | | | | 0.55 | | | | 0.55 | | | | 0.55 | | | | 2.04 | | | | 273 | |
| | | | | | | | |
| | 111.39 | | | | 6.92 | | | | 3,400,704 | | | | 0.57 | | | | 0.57 | | | | 0.55 | | | | 0.55 | | | | 2.65 | | | | 146 | |
| | | | | | | | |
| | | | | | | | | | | | | | | | | | | | | | | | | | | | | | | | | | |
| | | | | | | | |
| $ | 94.79 | | | | 5.76 | % | | $ | 870,154 | | | | 0.50 | % | | | 0.50 | % | | | 0.46 | % | | | 0.46 | % | | | 4.90 | % | | | 183 | % |
| | | | | | | | |
| | 93.86 | | | | 0.51 | | | | 1,041,832 | | | | 0.51 | | | | 0.51 | | | | 0.46 | | | | 0.46 | | | | 3.47 | | | | 133 | |
| | | | | | | | |
| | 96.16 | | | | (4.38 | ) | | | 1,444,341 | | | | 0.53 | | | | 0.53 | | | | 0.46 | | | | 0.46 | | | | 1.44 | | | | 269 | |
| | | | | | | | |
| | 101.78 | | | | 1.57 | | | | 1,129,706 | | | | 0.47 | | | | 0.49 | | | | 0.44 | | | | 0.46 | | | | 1.13 | | | | 73 | |
| | | | | | | | |
| | 101.79 | | | | 4.77 | | | | 496,743 | | | | 0.49 | | | | 0.56 | | | | 0.39 | | | | 0.46 | | | | 2.61 | | | | 378 | |
| | | | | | | | | | | | |
| | | | ANNUAL FINANCIAL AND OTHER INFORMATION | | | | | | | JUNE 30, 2024 | | | 7 |
| | | | |
| Financial Highlights | | (Cont.) | | |
| | | | | | | | | | | | | | | | | | | | | | | | | | | | | | | | |
| | | | | | Investment Operations | | | Less Distributions(c) | |
| | | | | | | | | | | | | | | | | | | | | | | | | |
| Selected Per Share Data for the Year or Period Ended^: | | Net Asset
Value
Beginning
of Year
or Period(a) | | | Net
Investment
Income (Loss)(b) | | | Net
Realized/
Unrealized
Gain (Loss) | | | Total | | | From Net
Investment
Income | | | From Net
Realized
Capital
Gains | | | Tax Basis
Return of
Capital | | | Total | |
| | | | | | | | |
PIMCO Enhanced Short Maturity Active ESG Exchange-Traded Fund | | | | | | | | | | | | | | | | | | | | | | | | | | | | | | | | |
| | | | | | | | |
06/30/2024 | | $ | 97.94 | | | $ | 5.10 | | | $ | 0.77 | | | $ | 5.87 | | | $ | (5.07 | ) | | $ | 0.00 | | | $ | 0.00 | | | $ | (5.07 | ) |
| | | | | | | | |
06/30/2023 | | | 98.43 | | | | 3.15 | | | | 0.27 | | | | 3.42 | | | | (3.91 | ) | | | 0.00 | | | | 0.00 | | | | (3.91 | ) |
| | | | | | | | |
06/30/2022 | | | 100.66 | | | | 0.67 | | | | (2.11 | ) | | | (1.44 | ) | | | (0.71 | ) | | | (0.08 | ) | | | 0.00 | | | | (0.79 | ) |
| | | | | | | | |
06/30/2021 | | | 100.64 | | | | 0.74 | | | | 0.26 | | | | 1.00 | | | | (0.98 | ) | | | 0.00 | | | | 0.00 | | | | (0.98 | ) |
| | | | | | | | |
12/10/2019 - 06/30/2020 | | | 100.00 | | | | 1.04 | | | | 0.49 | | | | 1.53 | | | | (0.89 | ) | | | 0.00 | | | | 0.00 | | | | (0.89 | ) |
| | | | | | | | |
PIMCO Enhanced Short Maturity Active Exchange-Traded Fund | | | | | | | | | | | | | | | | | | | | | | | | | | | | | | | | |
| | | | | | | | |
06/30/2024 | | $ | 99.78 | | | $ | 5.33 | | | $ | 0.81 | | | $ | 6.14 | | | $ | (5.28 | ) | | $ | 0.00 | | | $ | 0.00 | | | $ | (5.28 | ) |
| | | | | | | | |
06/30/2023 | | | 99.13 | | | | 3.48 | | | | 0.49 | | | | 3.97 | | | | (3.32 | ) | | | 0.00 | | | | 0.00 | | | | (3.32 | ) |
| | | | | | | | |
06/30/2022 | | | 101.99 | | | | 0.67 | | | | (2.90 | ) | | | (2.23 | ) | | | (0.62 | ) | | | (0.01 | ) | | | 0.00 | | | | (0.63 | ) |
| | | | | | | | |
06/30/2021 | | | 101.65 | | | | 0.52 | | | | 0.39 | | | | 0.91 | | | | (0.57 | ) | | | 0.00 | | | | 0.00 | | | | (0.57 | ) |
| | | | | | | | |
06/30/2020 | | | 101.75 | | | | 2.06 | | | | 0.15 | | | | 2.21 | | | | (2.31 | ) | | | 0.00 | | | | 0.00 | | | | (2.31 | ) |
| | | | | | | | |
PIMCO Intermediate Municipal Bond Active Exchange-Traded Fund | | | | | | | | | | | | | | | | | | | | | | | | | | | | | | | | |
| | | | | | | | |
06/30/2024 | | $ | 51.82 | | | $ | 1.78 | | | $ | 0.25 | | | $ | 2.03 | | | $ | (1.74 | ) | | $ | 0.00 | | | $ | 0.00 | | | $ | (1.74 | ) |
| | | | | | | | |
06/30/2023 | | | 51.56 | | | | 1.48 | | | | 0.17 | | | | 1.65 | | | | (1.39 | ) | | | 0.00 | | | | 0.00 | | | | (1.39 | ) |
| | | | | | | | |
06/30/2022 | | | 56.72 | | | | 0.92 | | | | (5.19 | ) | | | (4.27 | ) | | | (0.89 | ) | | | 0.00 | | | | 0.00 | | | | (0.89 | ) |
| | | | | | | | |
06/30/2021 | | | 55.73 | | | | 0.97 | | | | 1.00 | | | | 1.97 | | | | (0.98 | ) | | | 0.00 | | | | 0.00 | | | | (0.98 | ) |
| | | | | | | | |
06/30/2020 | | | 54.77 | | | | 1.24 | | | | 0.96 | | | | 2.20 | | | | (1.24 | ) | | | 0.00 | | | | 0.00 | | | | (1.24 | ) |
| | | | | | | | |
PIMCO Multisector Bond Active Exchange-Traded Fund | | | | | | | | | | | | | | | | | | | | | | | | | | | | | | | | |
| | | | | | | | |
06/30/2024 | | $ | 25.02 | | | $ | 1.40 | | | $ | 0.46 | | | $ | 1.86 | | | $ | (1.30 | ) | | $ | 0.00 | | | $ | 0.00 | | | $ | (1.30 | ) |
| | | | | | | | |
06/21/2023 - 06/30/2023 | | | 25.00 | | | | 0.04 | | | | (0.02 | ) | | | 0.02 | | | | 0.00 | | | | 0.00 | | | | 0.00 | | | | 0.00 | |
| | | | | | | | |
PIMCO Municipal Income Opportunities Active Exchange-Traded Fund | | | | | | | | | | | | | | | | | | | | | | | | | | | | | | | | |
| | | | | | | | |
06/30/2024 | | $ | 44.58 | | | $ | 1.85 | | | $ | 0.77 | | | $ | 2.62 | | | $ | (1.76 | ) | | $ | 0.00 | | | $ | 0.00 | | | $ | (1.76 | ) |
| | | | | | | | |
06/30/2023 | | | 44.06 | | | | 1.69 | | | | 0.40 | | | | 2.09 | | | | (1.57 | ) | | | 0.00 | | | | 0.00 | | | | (1.57 | ) |
| | | | | | | | |
09/08/2021 - 06/30/2022 | | | 50.00 | | | | 0.66 | | | | (6.07 | ) | | | (5.41 | ) | | | (0.53 | ) | | | 0.00 | | | | 0.00 | | | | (0.53 | ) |
| | | | | | | | |
PIMCO Preferred and Capital Securities Active Exchange-Traded Fund | | | | | | | | | | | | | | | | | | | | | | | | | | | | | | | | |
| | | | | | | | |
06/30/2024 | | $ | 46.61 | | | $ | 2.71 | | | $ | 3.09 | | | $ | 5.80 | | | $ | (2.79 | ) | | $ | 0.00 | | | $ | 0.00 | | | $ | (2.79 | ) |
| | | | | | | | |
01/18/2023 - 06/30/2023 | | | 50.00 | | | | 1.11 | | | | (3.69 | ) | | | (2.58 | ) | | | (0.81 | ) | | | 0.00 | | | | 0.00 | | | | (0.81 | ) |
| | | | | | | | |
PIMCO Senior Loan Active Exchange-Traded Fund | | | | | | | | | | | | | | | | | | | | | | | | | | | | | | | | |
| | | | | | | | |
06/30/2024 | | $ | 49.87 | | | $ | 4.42 | | | $ | 0.88 | | | $ | 5.30 | | | $ | (4.08 | ) | | $ | 0.00 | | | $ | 0.00 | | | $ | (4.08 | ) |
| | | | | | | | |
06/30/2023 | | | 48.18 | | | | 3.93 | | | | 1.18 | | | | 5.11 | | | | (3.42 | ) | | | 0.00 | | | | 0.00 | | | | (3.42 | ) |
| | | | | | | | |
06/08/2022 - 06/30/2022 | | | 50.00 | | | | 0.06 | | | | (1.88 | ) | | | (1.82 | ) | | | 0.00 | | | | 0.00 | | | | 0.00 | | | | 0.00 | |
| | | | | | | | |
PIMCO Short Term Municipal Bond Active Exchange-Traded Fund | | | | | | | | | | | | | | | | | | | | | | | | | | | | | | | | |
| | | | | | | | |
06/30/2024 | | $ | 49.57 | | | $ | 1.50 | | | $ | 0.31 | | | $ | 1.81 | | | $ | (1.51 | ) | | $ | 0.00 | | | $ | 0.00 | | | $ | (1.51 | ) |
| | | | | | | | |
06/30/2023 | | | 49.56 | | | | 1.12 | | | | (0.06 | ) | | | 1.06 | | | | (1.05 | ) | | | 0.00 | | | | 0.00 | | | | (1.05 | ) |
| | | | | | | | |
06/30/2022 | | | 51.41 | | | | 0.34 | | | | (1.89 | ) | | | (1.55 | ) | | | (0.30 | ) | | | 0.00 | | | | 0.00 | | | | (0.30 | ) |
| | | | | | | | |
06/30/2021 | | | 51.04 | | | | 0.42 | | | | 0.42 | | | | 0.84 | | | | (0.47 | ) | | | 0.00 | | | | 0.00 | | | | (0.47 | ) |
| | | | | | | | |
06/30/2020 | | | 50.53 | | | | 0.81 | | | | 0.51 | | | | 1.32 | | | | (0.81 | ) | | | 0.00 | | | | 0.00 | | | | (0.81 | ) |
| | | | | | | | |
PIMCO Ultra Short Government Active Exchange-Traded Fund | | | | | | | | | | | | | | | | | | | | | | | | | | | | | | | | |
| | | | | | | | |
06/30/2024 | | $ | 100.15 | | | $ | 5.28 | | | $ | 0.04 | | | $ | 5.32 | | | $ | (4.36 | ) | | $ | 0.00 | | | $ | 0.00 | | | $ | (4.36 | ) |
| | | | | | | | |
06/21/2023 - 06/30/2023 | | | 100.00 | | | | 0.18 | | | | (0.03 | ) | | | 0.15 | | | | 0.00 | | | | 0.00 | | | | 0.00 | | | | 0.00 | |
| | | | | | | | |
PIMCO Commodity Strategy Active Exchange-Traded Fund (Consolidated) | | | | | | | | | | | | | | | | | | | | | | | | | | | | | | | | |
| | | | | | | | |
06/30/2024 | | $ | 25.23 | | | $ | 1.21 | | | $ | 1.78 | | | $ | 2.99 | | | $ | (0.94 | ) | | $ | (0.03 | ) | | $ | 0.00 | | | $ | (0.97 | ) |
| | | | | | | | |
05/09/2023 - 06/30/2023 | | | 25.00 | | | | 0.18 | | | | 0.05 | | | | 0.23 | | | | 0.00 | | | | 0.00 | | | | 0.00 | | | | 0.00 | |
| ^ | A zero balance may reflect actual amounts rounding to less than $0.01 or 0.01%. |
| * | Annualized, except for organizational expense, if any. |
| (a) | Includes adjustments required by U.S. GAAP and may differ from net asset values and performance reported elsewhere by the Funds. |
| (b) | Per share amounts based on average number of shares outstanding during the year or period. |
| (c) | The tax characterization of distributions is determined in accordance with Federal income tax regulations. See Note 2, Distributions to Shareholders, in the Notes to Financial Statements for more information. |
| (d) | Includes adjustments required by U.S. GAAP and may differ from net asset values and performance reported elsewhere by the Funds. Additionally, excludes initial sales charges and contingent deferred sales charges. |
| (e) | Portfolio turnover rate excludes securities received or delivered from in-kind processing of creation or redemptions. |
| (f) | Ratios shown do not include expenses of the investment companies in which a Fund may invest. See Note 9, Fees and Expenses, in the Notes to Financial Statements for more information regarding the expenses and any applicable fee waivers associated with these investments. |
| | | | | | |
| 8 | | PIMCO ETF TRUST | | | See Accompanying Notes | |
| | | | | | | | | | | | | | | | | | | | | | | | | | | | | | | | | | |
| | | | | | | Ratios/Supplemental Data | |
| | | | | | | | | | Ratios to Average Net Assets(f) | | | | |
Net Asset
Value End of
Year or
Period(a) | | | Total
Return(d) | | | Net Assets
End of Year
or Period
(000s) | | | Expenses | | | Expenses
Excluding
Waivers | | | Expenses
Excluding
Interest
Expense | | | Expenses
Excluding
Interest
Expense and
Waivers | | | Net
Investment
Income (Loss) | | | Portfolio
Turnover
Rate(e) | |
| | | | | | | | |
| | | | | | | | | | | | | | | | | | | | | | | | | | | | | | | | | | |
| | | | | | | | |
| $ | 98.74 | | | | 6.16 | % | | $ | 166,877 | | | | 0.24 | % | | | 0.36 | % | | | 0.24 | % | | | 0.36 | % | | | 5.22 | % | | | 73 | % |
| | | | | | | | |
| | 97.94 | | | | 3.56 | | | | 150,823 | | | | 0.24 | | | | 0.36 | | | | 0.24 | | | | 0.36 | | | | 3.20 | | | | 53 | |
| | | | | | | | |
| | 98.43 | | | | (1.43 | ) | | | 184,071 | | | | 0.25 | | | | 0.37 | | | | 0.24 | | | | 0.36 | | | | 0.67 | | | | 75 | |
| | | | | | | | |
| | 100.66 | | | | 0.99 | | | | 153,000 | | | | 0.25 | | | | 0.37 | | | | 0.25 | | | | 0.37 | | | | 0.74 | | | | 120 | |
| | | | | | | | |
| | 100.64 | | | | 1.54 | | | | 87,553 | | | | 0.27 | * | | | 0.51 | * | | | 0.24 | * | | | 0.48 | * | | | 1.87 | * | | | 102 | |
| | | | | | | | |
| | | | | | | | | | | | | | | | | | | | | | | | | | | | | | | | | | |
| | | | | | | | |
| $ | 100.64 | | | | 6.33 | % | | $ | 12,049,316 | | | | 0.35 | % | | | 0.35 | % | | | 0.35 | % | | | 0.35 | % | | | 5.35 | % | | | 57 | % |
| | | | | | | | |
| | 99.78 | | | | 4.09 | | | | 9,257,897 | | | | 0.35 | | | | 0.35 | | | | 0.35 | | | | 0.35 | | | | 3.49 | | | | 35 | |
| | | | | | | | |
| | 99.13 | | | | (2.20 | ) | | | 11,757,526 | | | | 0.36 | | | | 0.36 | | | | 0.35 | | | | 0.35 | | | | 0.67 | | | | 100 | |
| | | | | | | | |
| | 101.99 | | | | 0.89 | | | | 14,024,433 | | | | 0.35 | | | | 0.35 | | | | 0.35 | | | | 0.35 | | | | 0.51 | | | | 71 | |
| | | | | | | | |
| | 101.65 | | | | 2.21 | | | | 13,914,440 | | | | 0.37 | | | | 0.37 | | | | 0.35 | | | | 0.35 | | | | 2.03 | | | | 81 | |
| | | | | | | | |
| | | | | | | | | | | | | | | | | | | | | | | | | | | | | | | | | | |
| | | | | | | | |
| $ | 52.11 | | | | 3.99 | % | | $ | 1,505,332 | | | | 0.35 | % | | | 0.35 | % | | | 0.35 | % | | | 0.35 | % | | | 3.46 | % | | | 29 | % |
| | | | | | | | |
| | 51.82 | | | | 3.26 | | | | 981,032 | | | | 0.35 | | | | 0.35 | | | | 0.35 | | | | 0.35 | | | | 2.86 | | | | 47 | |
| | | | | | | | |
| | 51.56 | | | | (7.63 | ) | | | 847,128 | | | | 0.35 | | | | 0.35 | | | | 0.35 | | | | 0.35 | | | | 1.68 | | | | 50 | |
| | | | | | | | |
| | 56.72 | | | | 3.56 | | | | 647,152 | | | | 0.35 | | | | 0.35 | | | | 0.35 | | | | 0.35 | | | | 1.72 | | | | 16 | |
| | | | | | | | |
| | 55.73 | | | | 4.06 | | | | 468,662 | | | | 0.35 | | | | 0.35 | | | | 0.35 | | | | 0.35 | | | | 2.25 | | | | 34 | |
| | | | | | | | |
| | | | | | | | | | | | | | | | | | | | | | | | | | | | | | | | | | |
| | | | | | | | |
| $ | 25.58 | | | | 7.66 | % | | $ | 1,005,834 | | | | 0.69 | % | | | 0.79 | % | | | 0.55 | % | | | 0.65 | % | | | 5.57 | % | | | 398 | % |
| | | | | | | | |
| | 25.02 | | | | 0.08 | | | | 65,053 | | | | 0.55 | * | | | 0.82 | * | | | 0.55 | * | | | 0.82 | * | | | 4.29 | * | | | 20 | |
| | | | | | | | |
| | | | | | | | | | | | | | | | | | | | | | | | | | | | | | | | | | |
| | | | | | | | |
| $ | 45.44 | | | | 6.05 | % | | $ | 158,121 | | | | 0.39 | % | | | 0.49 | % | | | 0.39 | % | | | 0.49 | % | | | 4.16 | % | | | 39 | % |
| | | | | | | | |
| | 44.58 | | | | 4.87 | | | | 74,899 | | | | 0.39 | | | | 0.49 | | | | 0.39 | | | | 0.49 | | | | 3.80 | | | | 84 | |
| | | | | | | | |
| | 44.06 | | | | (10.89 | ) | | | 42,296 | | | | 0.40 | * | | | 0.68 | * | | | 0.40 | * | | | 0.68 | * | | | 1.71 | * | | | 238 | |
| | | | | | | | |
| | | | | | | | | | | | | | | | | | | | | | | | | | | | | | | | | | |
| | | | | | | | |
| $ | 49.62 | | | | 12.91 | % | | $ | 116,116 | | | | 0.74 | % | | | 0.89 | % | | | 0.69 | % | | | 0.84 | % | | | 5.73 | % | | | 64 | % |
| | | | | | | | |
| | 46.61 | | | | (5.18 | ) | | | 93,214 | | | | 0.74 | * | | | 1.04 | * | | | 0.69 | * | | | 0.99 | * | | | 5.18 | * | | | 22 | |
| | | | | | | | |
| | | | | | | | | | | | | | | | | | | | | | | | | | | | | | | | | | |
| | | | | | | | |
| $ | 51.09 | | | | 11.09 | % | | $ | 392,348 | | | | 0.61 | % | | | 0.74 | % | | | 0.58 | % | | | 0.71 | % | | | 8.78 | % | | | 65 | % |
| | | | | | | | |
| | 49.87 | | | | 10.94 | | | | 165,559 | | | | 0.52 | | | | 0.72 | | | | 0.50 | | | | 0.70 | | | | 7.98 | | | | 46 | |
| | | | | | | | |
| | 48.18 | | | | (3.64 | ) | | | 64,557 | | | | 0.50 | * | | | 0.95 | * | | | 0.50 | * | | | 0.95 | * | | | 1.95 | * | | | 0 | |
| | | | | | | | |
| | | | | | | | | | | | | | | | | | | | | | | | | | | | | | | | | | |
| | | | | | | | |
| $ | 49.87 | | | | 3.71 | % | | $ | 586,508 | | | | 0.35 | % | | | 0.35 | % | | | 0.35 | % | | | 0.35 | % | | | 3.04 | % | | | 29 | % |
| | | | | | | | |
| | 49.57 | | | | 2.16 | | | | 525,450 | | | | 0.35 | | | | 0.35 | | | | 0.35 | | | | 0.35 | | | | 2.26 | | | | 64 | |
| | | | | | | | |
| | 49.56 | | | | (3.03 | ) | | | 562,994 | | | | 0.35 | | | | 0.35 | | | | 0.35 | | | | 0.35 | | | | 0.67 | | | | 64 | |
| | | | | | | | |
| | 51.41 | | | | 1.66 | | | | 452,932 | | | | 0.35 | | | | 0.35 | | | | 0.35 | | | | 0.35 | | | | 0.83 | | | | 27 | |
| | | | | | | | |
| | 51.04 | | | | 2.64 | | | | 176,581 | | | | 0.35 | | | | 0.35 | | | | 0.35 | | | | 0.35 | | | | 1.60 | | | | 55 | |
| | | | | | | | |
| | | | | | | | | | | | | | | | | | | | | | | | | | | | | | | | | | |
| | | | | | | | |
| $ | 101.11 | | | | 5.43 | % | | $ | 362,970 | | | | 0.14 | % | | | 0.15 | % | | | 0.14 | % | | | 0.15 | % | | | 5.27 | % | | | 0 | % |
| | | | | | | | |
| | 100.15 | | | | 0.15 | | | | 13,019 | | | | 0.14 | * | | | 0.69 | * | | | 0.14 | * | | | 0.69 | * | | | 5.01 | * | | | 0 | |
| | | | | | | | |
| | | | | | | | | | | | | | | | | | | | | | | | | | | | | | | | | | |
| | | | | | | | |
| $ | 27.25 | | | | 12.01 | % | | $ | 302,502 | | | | 0.64 | % | | | 0.89 | % | | | 0.63 | % | | | 0.88 | % | | | 4.53 | % | | | 50 | % |
| | | | | | | | |
| | 25.23 | | | | 0.92 | | | | 198,722 | | | | 0.64 | * | | | 1.13 | * | | | 0.63 | * | | | 1.12 | * | | | 4.10 | * | | | 7 | |
| | | | | | | | | | | | |
| | | | ANNUAL FINANCIAL AND OTHER INFORMATION | | | | | | | JUNE 30, 2024 | | | 9 |
| | | | | | |
| Statements of Assets and Liabilities | | | | | | |
| | | | | | | | | | | | | | | | | | | | | | | | | | | | |
| (Amounts in thousands†, except per share amounts) | | PIMCO 25+ Year Zero
Coupon U.S.
Treasury Index
Exchange-
Traded Fund | | | PIMCO 1-5 Year U.S. TIPS Index
Exchange-
Traded Fund | | | PIMCO 15+ Year U.S. TIPS Index
Exchange-
Traded Fund | | | PIMCO
Broad U.S.
TIPS Index
Exchange-
Traded Fund | | | PIMCO 0-5 Year High
Yield Corporate
Bond Index
Exchange-
Traded Fund | | | PIMCO
Investment
Grade Corporate
Bond Index
Exchange-
Traded Fund | | | PIMCO Active Bond
Exchange-
Traded Fund | |
| | | | | | | |
Assets: | | | | | | | | | | | | | | | | | | | | | | | | | | | | |
| | | | | | | |
Investments, at value | | | | | | | | | | | | | | | | | | | | | | | | | | | | |
Investments in securities*^ | | $ | 1,388,529 | | | $ | 490,588 | | | $ | 703,855 | | | $ | 98,352 | | | $ | 1,229,014 | | | $ | 1,166,382 | | | $ | 5,196,659 | |
Investments in Affiliates | | | 0 | | | | 0 | | | | 0 | | | | 0 | | | | 41,111 | | | | 3,565 | | | | 81,242 | |
Financial Derivative Instruments | | | | | | | | | | | | | | | | | | | | | | | | | | | | |
Exchange-traded or centrally cleared | | | 0 | | | | 0 | | | | 0 | | | | 0 | | | | 9 | | | | 117 | | | | 3,532 | |
Over the counter | | | 0 | | | | 0 | | | | 0 | | | | 0 | | | | 0 | | | | 0 | | | | 5 | |
Cash | | | 19 | | | | 15 | | | | 0 | | | | 0 | | | | 5,471 | | | | 0 | | | | 0 | |
Deposits with counterparty | | | 0 | | | | 0 | | | | 0 | | | | 0 | | | | 8,859 | | | | 3,978 | | | | 6,431 | |
Foreign currency, at value | | | 0 | | | | 0 | | | | 0 | | | | 0 | | | | 0 | | | | 1 | | | | 316 | |
Receivable for investments sold | | | 0 | | | | 0 | | | | 8,080 | | | | 0 | | | | 5,015 | | | | 0 | | | | 11,108 | |
Receivable for TBA investments sold | | | 0 | | | | 0 | | | | 0 | | | | 0 | | | | 0 | | | | 0 | | | | 1,799,811 | |
Receivable for Fund shares sold | | | 11,275 | | | | 0 | | | | 0 | | | | 5,252 | | | | 0 | | | | 0 | | | | 0 | |
Interest and/or dividends receivable | | | 0 | | | | 1,190 | | | | 3,216 | | | | 396 | | | | 21,214 | | | | 13,516 | | | | 36,691 | |
Reimbursement receivable from PIMCO | | | 0 | | | | 0 | | | | 0 | | | | 0 | | | | 0 | | | | 0 | | | | 34 | |
Prepaid expenses | | | 0 | | | | 0 | | | | 0 | | | | 0 | | | | 0 | | | | 0 | | | | 0 | |
Total Assets | | | 1,399,823 | | | | 491,793 | | | | 715,151 | | | | 104,000 | | | | 1,310,693 | | | | 1,187,559 | | | | 7,135,829 | |
| | | | | | | |
Liabilities: | | | | | | | | | | | | | | | | | | | | | | | | | | | | |
| | | | | | | |
Borrowings & Other Financing Transactions | | | | | | | | | | | | | | | | | | | | | | | | | | | | |
Payable for reverse repurchase agreements | | $ | 0 | | | $ | 0 | | | $ | 0 | | | $ | 0 | | | $ | 1,992 | | | $ | 42,036 | | | $ | 150,465 | |
Payable for sale-buyback transactions | | | 0 | | | | 0 | | | | 0 | | | | 0 | | | | 0 | | | | 9,995 | | | | 0 | |
Payable for short sales | | | 0 | | | | 0 | | | | 0 | | | | 0 | | | | 0 | | | | 0 | | | | 484,617 | |
Financial Derivative Instruments | | | | | | | | | | | | | | | | | | | | | | | | | | | | |
Exchange-traded or centrally cleared | | | 0 | | | | 0 | | | | 0 | | | | 0 | | | | 50 | | | | 79 | | | | 1,716 | |
Over the counter | | | 0 | | | | 0 | | | | 0 | | | | 0 | | | | 0 | | | | 0 | | | | 514 | |
Payable for investments purchased | | | 11,262 | | | | 0 | | | | 0 | | | | 5,243 | | | | 35,880 | | | | 1,681 | | | | 51,315 | |
Payable for investments purchased on a delayed-delivery basis | | | 0 | | | | 0 | | | | 0 | | | | 0 | | | | 490 | | | | 0 | | | | 0 | |
Payable for TBA investments purchased | | | 0 | | | | 0 | | | | 0 | | | | 0 | | | | 0 | | | | 0 | | | | 2,111,973 | |
Payable for unfunded loan commitments | | | 0 | | | | 0 | | | | 0 | | | | 0 | | | | 0 | | | | 0 | | | | 0 | |
Payable upon return of securities loaned | | | 0 | | | | 0 | | | | 0 | | | | 0 | | | | 41,384 | | | | 3,565 | | | | 0 | |
Deposits from counterparty | | | 0 | | | | 0 | | | | 0 | | | | 0 | | | | 0 | | | | 201 | | | | 6,658 | |
Payable for Fund shares redeemed | | | 0 | | | | 0 | | | | 8,113 | | | | 0 | | | | 0 | | | | 0 | | | | 0 | |
Overdraft due to custodian | | | 0 | | | | 0 | | | | 0 | | | | 0 | | | | 0 | | | | 4 | | | | 0 | |
Accrued management fees | | | 160 | | | | 76 | | | | 114 | | | | 14 | | | | 513 | | | | 169 | | | | 1,810 | |
Accrued reimbursement to PIMCO | | | 0 | | | | 0 | | | | 0 | | | | 0 | | | | 0 | | | | 0 | | | | 0 | |
Foreign capital gains tax payable | | | 0 | | | | 0 | | | | 0 | | | | 0 | | | | 0 | | | | 1 | | | | 0 | |
Other liabilities | | | 0 | | | | 0 | | | | 0 | | | | 0 | | | | 0 | | | | 0 | | | | 0 | |
Total Liabilities | | | 11,422 | | | | 76 | | | | 8,227 | | | | 5,257 | | | | 80,309 | | | | 57,731 | | | | 2,809,068 | |
| | | | | | | |
Commitments and Contingent Liabilities^^ | | | | | | | | | | | | | | | | | | | | | | | | | | | | |
| | | | | | | |
Net Assets | | $ | 1,388,401 | | | $ | 491,717 | | | $ | 706,924 | | | $ | 98,743 | | | $ | 1,230,384 | | | $ | 1,129,828 | | | $ | 4,326,761 | |
| | | | | | | |
Net Assets Consist of: | | | | | | | | | | | | | | | | | | | | | | | | | | | | |
| | | | | | | |
Paid in capital | | $ | 1,866,764 | | | $ | 557,130 | | | $ | 1,052,142 | | | $ | 133,662 | | | $ | 1,489,287 | | | $ | 1,209,596 | | | $ | 4,990,612 | |
Distributable earnings (accumulated loss) | | | (478,363 | ) | | | (65,413 | ) | | | (345,218 | ) | | | (34,919 | ) | | | (258,903 | ) | | | (79,768 | ) | | | (663,851 | ) |
| | | | | | | |
Net Assets | | $ | 1,388,401 | | | $ | 491,717 | | | $ | 706,924 | | | $ | 98,743 | | | $ | 1,230,384 | | | $ | 1,129,828 | | | $ | 4,326,761 | |
| | | | | | | |
Shares Issued and Outstanding | | | 18,470 | | | | 9,520 | | | | 13,070 | | | | 1,880 | | | | 13,250 | | | | 11,880 | | | | 47,530 | |
| | | | | | | |
Net Asset Value Per Share Outstanding(a): | | $ | 75.17 | | | $ | 51.65 | | | $ | 54.09 | | | $ | 52.52 | | | $ | 92.86 | | | $ | 95.10 | | | $ | 91.03 | |
| | | | | | | |
Cost of investments in securities | | $ | 1,655,565 | | | $ | 516,689 | | | $ | 991,818 | | | $ | 101,743 | | | $ | 1,247,844 | | | $ | 1,212,763 | | | $ | 5,260,154 | |
Cost of investments in Affiliates | | $ | 0 | | | $ | 0 | | | $ | 0 | | | $ | 0 | | | $ | 41,111 | | | $ | 3,565 | | | $ | 79,322 | |
Cost of foreign currency held | | $ | 0 | | | $ | 0 | | | $ | 0 | | | $ | 0 | | | $ | 0 | | | $ | 1 | | | $ | 412 | |
Proceeds received on short sales | | $ | 0 | | | $ | 0 | | | $ | 0 | | | $ | 0 | | | $ | 0 | | | $ | 0 | | | $ | 485,545 | |
Cost or premiums of financial derivative instruments, net | | $ | 0 | | | $ | 0 | | | $ | 0 | | | $ | 0 | | | $ | 860 | | | $ | 4,015 | | | $ | 1,114 | |
| | | | | | | |
* Includes repurchase agreements of: | | $ | 893 | | | $ | 116 | | | $ | 845 | | | $ | 102 | | | $ | 58,302 | | | $ | 1,092 | | | $ | 68,862 | |
^ Includes securities on loan of: | | $ | 0 | | | $ | 0 | | | $ | 0 | | | $ | 0 | | | $ | 40,532 | | | $ | 3,485 | | | $ | 0 | |
| † | A zero balance may reflect actual amounts rounding to less than one thousand. |
| ^^ | See Note 9, Fees and Expenses, in the Notes to Financial Statements for more information. |
| (a) | Includes adjustments required by U.S. GAAP and may differ from net asset values and performance reported elsewhere by the Funds. |
| | | | | | |
| 10 | | PIMCO ETF TRUST | | | See Accompanying Notes | |
| | | | | | | | | | | | | | | | | | | | | | | | | | | | | | | | | | | | | | |
PIMCO
Enhanced Low
Duration Active
Exchange-
Traded Fund | | | PIMCO
Enhanced Short
Maturity Active
ESG Exchange-
Traded Fund | | | PIMCO
Enhanced Short
Maturity Active
Exchange-
Traded Fund | | | PIMCO
Intermediate
Municipal Bond Active
Exchange-
Traded Fund | | | PIMCO
Multisector
Bond Active
Exchange-
Traded Fund | | | PIMCO Municipal Income
Opportunities
Active Exchange- Traded Fund | | | PIMCO Preferred and
Capital Securities Active
Exchange-
Traded Fund | | | PIMCO Senior Loan
Active
Exchange-
Traded Fund | | | PIMCO Short Term
Municipal Bond
Active
Exchange-
Traded Fund | | | PIMCO Ultra Short
Government
Active
Exchange-
Traded Fund | |
| | | | | | | | | |
| | | | | | | | | | | | | | | | | | | | | | | | | | | | | | | | | | | | | | |
| | | | | | | | | |
| | | | | | | | | | | | | | | | | | | | | | | | | | | | | | | | | | | | | | | |
| $ | 916,286 | | | $ | 187,608 | | | $ | 12,167,231 | | | $ | 1,520,402 | | | $ | 1,447,826 | | | $ | 161,384 | | | $ | 114,697 | | | $ | 481,943 | | | $ | 605,070 | | | $ | 400,015 | |
| | 0 | | | | 0 | | | | 0 | | | | 0 | | | | 3,386 | | | | 0 | | | | 0 | | | | 0 | | | | 0 | | | | 0 | |
| | | | | | | | | | | | | | | | | | | | | | | | | | | | | | | | | | | | | | | |
| | 825 | | | | 6 | | | | 877 | | | | 155 | | | | 57 | | | | 90 | | | | 65 | | | | 14 | | | | 0 | | | | 0 | |
| | 199 | | | | 27 | | | | 0 | | | | 0 | | | | 2,071 | | | | 0 | | | | 14 | | | | 1,190 | | | | 0 | | | | 0 | |
| | 802 | | | | 1 | | | | 5,102 | | | | 0 | | | | 0 | | | | 1 | | | | 6 | | | | 0 | | | | 10 | | | | 44 | |
| | 4,125 | | | | 240 | | | | 18,018 | | | | 1,101 | | | | 9,062 | | | | 516 | | | | 1,413 | | | | 386 | | | | 0 | | | | 0 | |
| | 113 | | | | 28 | | | | 3 | | | | 0 | | | | 1,011 | | | | 0 | | | | 18 | | | | 0 | | | | 0 | | | | 0 | |
| | 101,220 | | | | 0 | | | | 53,942 | | | | 0 | | | | 273 | | | | 411 | | | | 1 | | | | 8,203 | | | | 0 | | | | 0 | |
| | 45,435 | | | | 0 | | | | 0 | | | | 0 | | | | 252,323 | | | | 0 | | | | 0 | | | | 0 | | | | 0 | | | | 0 | |
| | 0 | | | | 0 | | | | 14,090 | | | | 0 | | | | 6,139 | | | | 0 | | | | 0 | | | | 0 | | | | 0 | | | | 0 | |
| | 7,455 | | | | 905 | | | | 81,914 | | | | 13,085 | | | | 7,895 | | | | 1,511 | | | | 1,397 | | | | 3,051 | | | | 5,031 | | | | 0 | |
| | 0 | | | | 15 | | | | 0 | | | | 0 | | | | 72 | | | | 12 | | | | 12 | | | | 29 | | | | 0 | | | | 0 | |
| | 0 | | | | 0 | | | | 0 | | | | 0 | | | | 0 | | | | 0 | | | | 0 | | | | 3 | | | | 0 | | | | 0 | |
| | 1,076,460 | | | | 188,830 | | | | 12,341,177 | | | | 1,534,743 | | | | 1,730,115 | | | | 163,925 | | | | 117,623 | | | | 494,819 | | | | 610,111 | | | | 400,059 | |
| | | | | | | | | |
| | | | | | | | | | | | | | | | | | | | | | | | | | | | | | | | | | | | | | |
| | | | | | | | | |
| | | | | | | | | | | | | | | | | | | | | | | | | | | | | | | | | | | | | | | |
| $ | 7,551 | | | $ | 0 | | | $ | 0 | | | $ | 0 | | | $ | 2,857 | | | $ | 0 | | | $ | 0 | | | $ | 0 | | | $ | 0 | | | $ | 0 | |
| | 0 | | | | 0 | | | | 0 | | | | 0 | | | | 0 | | | | 0 | | | | 0 | | | | 0 | | | | 0 | | | | 0 | |
| | 30,341 | | | | 0 | | | | 0 | | | | 0 | | | | 76,345 | | | | 0 | | | | 0 | | | | 0 | | | | 0 | | | | 0 | |
| | | | | | | | | | | | | | | | | | | | | | | | | | | | | | | | | | | | | | | |
| | 62 | | | | 0 | | | | 0 | | | | 0 | | | | 288 | | | | 0 | | | | 254 | | | | 4 | | | | 0 | | | | 0 | |
| | 48 | | | | 7 | | | | 0 | | | | 0 | | | | 980 | | | | 0 | | | | 1 | | | | 5 | | | | 0 | | | | 0 | |
| | 82,227 | | | | 21,900 | | | | 288,661 | | | | 29,009 | | | | 42,206 | | | | 5,745 | | | | 1,182 | | | | 100,795 | | | | 23,447 | | | | 37,049 | |
| | 0 | | | | 0 | | | | 0 | | | | 0 | | | | 0 | | | | 0 | | | | 0 | | | | 0 | | | | 0 | | | | 0 | |
| | 84,755 | | | | 0 | | | | 0 | | | | 0 | | | | 598,655 | | | | 0 | | | | 0 | | | | 0 | | | | 0 | | | | 0 | |
| | 0 | | | | 0 | | | | 0 | | | | 0 | | | | 116 | | | | 0 | | | | 0 | | | | 74 | | | | 0 | | | | 0 | |
| | 0 | | | | 0 | | | | 0 | | | | 0 | | | | 0 | | | | 0 | | | | 0 | | | | 0 | | | | 0 | | | | 0 | |
| | 1,013 | | | | 0 | | | | 0 | | | | 0 | | | | 2,360 | | | | 0 | | | | 0 | | | | 552 | | | | 0 | | | | 0 | |
| | 0 | | | | 0 | | | | 0 | | | | 0 | | | | 0 | | | | 0 | | | | 0 | | | | 0 | | | | 0 | | | | 0 | |
| | 0 | | | | 0 | | | | 0 | | | | 0 | | | | 3 | | | | 0 | | | | 0 | | | | 830 | | | | 0 | | | | 0 | |
| | 309 | | | | 46 | | | | 3,200 | | | | 402 | | | | 471 | | | | 59 | | | | 70 | | | | 207 | | | | 156 | | | | 39 | |
| | 0 | | | | 0 | | | | 0 | | | | 0 | | | | 0 | | | | 0 | | | | 0 | | | | 0 | | | | 0 | | | | 1 | |
| | 0 | | | | 0 | | | | 0 | | | | 0 | | | | 0 | | | | 0 | | | | 0 | | | | 0 | | | | 0 | | | | 0 | |
| | 0 | | | | 0 | | | | 0 | | | | 0 | | | | 0 | | | | 0 | | | | 0 | | | | 4 | | | | 0 | | | | 0 | |
| | 206,306 | | | | 21,953 | | | | 291,861 | | | | 29,411 | | | | 724,281 | | | | 5,804 | | | | 1,507 | | | | 102,471 | | | | 23,603 | | | | 37,089 | |
| | | | | | | | | |
| | | | | | | | | | | | | | | | | | | | | | | | | | | | | | | | | | | | | | | |
| | | | | | | | | |
| $ | 870,154 | | | $ | 166,877 | | | $ | 12,049,316 | | | $ | 1,505,332 | | | $ | 1,005,834 | | | $ | 158,121 | | | $ | 116,116 | | | $ | 392,348 | | | $ | 586,508 | | | $ | 362,970 | |
| | | | | | | | | |
| | | | | | | | | | | | | | | | | | | | | | | | | | | | | | | | | | | | | | |
| | | | | | | | | |
| $ | 957,452 | | | $ | 169,901 | | | $ | 12,259,794 | | | $ | 1,523,782 | | | $ | 995,991 | | | $ | 159,860 | | | $ | 114,454 | | | $ | 385,521 | | | $ | 599,606 | | | $ | 361,463 | |
| | (87,298 | ) | | | (3,024 | ) | | | (210,478 | ) | | | (18,450 | ) | | | 9,843 | | | | (1,739 | ) | | | 1,662 | | | | 6,827 | | | | (13,098 | ) | | | 1,507 | |
| | | | | | | | | |
| $ | 870,154 | | | $ | 166,877 | | | $ | 12,049,316 | | | $ | 1,505,332 | | | $ | 1,005,834 | | | $ | 158,121 | | | $ | 116,116 | | | $ | 392,348 | | | $ | 586,508 | | | $ | 362,970 | |
| | | | | | | | | |
| | 9,180 | | | | 1,690 | | | | 119,730 | | | | 28,890 | | | | 39,320 | | | | 3,480 | | | | 2,340 | | | | 7,680 | | | | 11,760 | | | | 3,590 | |
| | | | | | | | | |
| $ | 94.79 | | | $ | 98.74 | | | $ | 100.64 | | | $ | 52.11 | | | $ | 25.58 | | | $ | 45.44 | | | $ | 49.62 | | | $ | 51.09 | | | $ | 49.87 | | | $ | 101.11 | |
| | | | | | | | | |
| $ | 923,298 | | | $ | 188,645 | | | $ | 12,193,586 | | | $ | 1,500,916 | | | $ | 1,443,152 | | | $ | 158,395 | | | $ | 111,914 | | | $ | 478,887 | | | $ | 605,877 | | | $ | 399,996 | |
| $ | 0 | | | $ | 0 | | | $ | 0 | | | $ | 0 | | | $ | 3,366 | | | $ | 0 | | | $ | 0 | | | $ | 0 | | | $ | 0 | | | $ | 0 | |
| $ | 122 | | | $ | 29 | | | $ | 4 | | | $ | 0 | | | $ | 1,015 | | | $ | 0 | | | $ | 18 | | | $ | 0 | | | $ | 0 | | | $ | 0 | |
| $ | 30,207 | | | $ | 0 | | | $ | 0 | | | $ | 0 | | | $ | 76,233 | | | $ | 0 | | | $ | 0 | | | $ | 0 | | | $ | 0 | | | $ | 0 | |
| $ | 76 | | | $ | 0 | | | $ | 0 | | | $ | 0 | | | $ | 15,890 | | | $ | 0 | | | $ | 503 | | | $ | (787 | ) | | $ | 0 | | | $ | 0 | |
| | | | | | | | | |
| $ | 0 | | | $ | 44,195 | | | $ | 147,005 | | | $ | 639 | | | $ | 16,812 | | | $ | 6,425 | | | $ | 1,519 | | | $ | 135,200 | | | $ | 790 | | | $ | 225 | |
| $ | 0 | | | $ | 0 | | | $ | 0 | | | $ | 0 | | | $ | 0 | | | $ | 0 | | | $ | 0 | | | $ | 0 | | | $ | 0 | | | $ | 0 | |
| | | | | | | | | | | | |
| | | | ANNUAL FINANCIAL AND OTHER INFORMATION | | | | | | | JUNE 30, 2024 | | | 11 |
| | | | | | |
| Consolidated Statement of Assets and Liabilities | | | | June 30, 2024 | | |
| | | | |
| (Amounts in thousands†, except per share amounts) | | PIMCO Commodity Strategy
Active Exchange-
Traded Fund | |
| |
Assets: | | | | |
| |
Investments, at value | | | | |
Investments in securities* | | $ | 302,410 | |
Investments in Affiliates | | | 20,289 | |
Financial Derivative Instruments | | | | |
Exchange-traded or centrally cleared | | | 757 | |
Over the counter | | | 690 | |
Cash | | | 1 | |
Deposits with counterparty | | | 18,938 | |
Foreign currency, at value | | | 23 | |
Receivable for investments sold | | | 6,000 | |
Receivable for Fund shares sold | | | 1,363 | |
Interest and/or dividends receivable | | | 1,791 | |
Reimbursement receivable from PIMCO | | | 62 | |
Total Assets | | | 352,324 | |
| |
Liabilities: | | | | |
| |
Financial Derivative Instruments | | | | |
Exchange-traded or centrally cleared | | $ | 3,712 | |
Over the counter | | | 142 | |
Payable for investments purchased | | | 45,703 | |
Deposits from counterparty | | | 70 | |
Accrued management fees | | | 195 | |
Total Liabilities | | | 49,822 | |
| |
Commitments and Contingent Liabilities^ | | | | |
| |
Net Assets | | $ | 302,502 | |
| |
Net Assets Consist of: | | | | |
| |
Paid in capital | | $ | 286,487 | |
Distributable earnings (accumulated loss) | | | 16,015 | |
| |
Net Assets | | $ | 302,502 | |
| |
Shares Issued and Outstanding | | | 11,100 | |
| |
Net Asset Value Per Share Outstanding(a): | | $ | 27.25 | |
| |
Cost of investments in securities | | $ | 300,587 | |
Cost of investments in Affiliates | | $ | 20,185 | |
Cost of foreign currency held | | $ | 23 | |
Cost or premiums of financial derivative instruments, net | | $ | (167 | ) |
| |
* Includes repurchase agreements of: | | $ | 64,067 | |
| † | A zero balance may reflect actual amounts rounding to less than one thousand. |
| ^ | See Note 9, Fees and Expenses, in the Notes to Financial Statements for more information. |
| (a) | Includes adjustments required by U.S. GAAP and may differ from net asset values and performance reported elsewhere by the Funds. |
| | | | | | |
| 12 | | PIMCO ETF TRUST | | | See Accompanying Notes | |
| | | | | | | | | | | | | | | | |
| Year Ended June 30, 2024 | |
| (Amounts in thousands†) | | PIMCO
25+ Year Zero
Coupon U.S.
Treasury Index
Exchange-
Traded Fund | | | PIMCO
1-5 Year
U.S. TIPS Index
Exchange-
Traded Fund | | | PIMCO
15+ Year
U.S. TIPS Index
Exchange-
Traded Fund | | | PIMCO
Broad U.S.
TIPS Index
Exchange-
Traded Fund | |
| | | | |
Investment Income: | | | | | | | | | | | | | | | | |
| | | | |
Interest | | $ | 49,078 | | | $ | 14,426 | | | $ | 31,563 | | | $ | 5,562 | |
Dividends | | | 0 | | | | 0 | | | | 0 | | | | 0 | |
Dividends from Investments in Affiliates | | | 0 | | | | 0 | | | | 0 | | | | 0 | |
Securities lending income | | | 0 | | | | 0 | | | | 0 | | | | 0 | |
Miscellaneous income | | | 0 | | | | 0 | | | | 0 | | | | 0 | |
Total Income | | | 49,078 | | | | 14,426 | | | | 31,563 | | | | 5,562 | |
| | | | |
Expenses: | | | | | | | | | | | | | | | | |
| | | | |
Management fees | | | 1,697 | | | | 1,189 | | | | 1,400 | | | | 220 | |
Trustee fees | | | 16 | | | | 12 | | | | 11 | | | | 2 | |
Interest expense | | | 0 | | | | 0 | | | | 0 | | | | 0 | |
Organizational expense | | | 0 | | | | 0 | | | | 0 | | | | 0 | |
Miscellaneous expense | | | 0 | | | | 0 | | | | 0 | | | | 0 | |
Total Expenses | | | 1,713 | | | | 1,201 | | | | 1,411 | | | | 222 | |
Waiver and/or Reimbursement by PIMCO | | | 0 | | | | 0 | | | | 0 | | | | 0 | |
Net Expenses | | | 1,713 | | | | 1,201 | | | | 1,411 | | | | 222 | |
| | | | |
Net Investment Income (Loss) | | | 47,365 | | | | 13,225 | | | | 30,152 | | | | 5,340 | |
| | | | |
Net Realized Gain (Loss): | | | | | | | | | | | | | | | | |
| | | | |
Investments in securities | | | (114,304 | ) | | | (7,352 | ) | | | (19,592 | ) | | | (7,569 | ) |
In-kind redemptions | | | 43,529 | | | | (23,867 | ) | | | 7,113 | | | | (563 | ) |
Exchange-traded or centrally cleared financial derivative instruments | | | 0 | | | | 0 | | | | 0 | | | | 0 | |
Over the counter financial derivative instruments | | | 0 | | | | 0 | | | | 0 | | | | 0 | |
Short sales | | | 0 | | | | 0 | | | | 0 | | | | 0 | |
Foreign currency | | | 0 | | | | 0 | | | | 0 | | | | 0 | |
| | | | |
Net Realized Gain (Loss) | | | (70,775 | ) | | | (31,219 | ) | | | (12,479 | ) | | | (8,132 | ) |
| | | | |
Net Change in Unrealized Appreciation (Depreciation): | | | | | | | | | | | | | | | | |
| | | | |
Investments in securities | | | (86,070 | ) | | | 45,835 | | | | (45,533 | ) | | | 5,136 | |
| | | | |
Investments in Affiliates | | | 0 | | | | 0 | | | | 0 | | | | 0 | |
Exchange-traded or centrally cleared financial derivative instruments | | | 0 | | | | 0 | | | | 0 | | | | 0 | |
Over the counter financial derivative instruments | | | 0 | | | | 0 | | | | 0 | | | | 0 | |
Short sales | | | 0 | | | | 0 | | | | 0 | | | | 0 | |
Foreign currency assets and liabilities | | | 0 | | | | 0 | | | | 0 | | | | 0 | |
| | | | |
Net Change in Unrealized Appreciation (Depreciation) | | | (86,070 | ) | | | 45,835 | | | | (45,533 | ) | | | 5,136 | |
| | | | |
Net Increase (Decrease) in Net Assets Resulting from Operations | | $ | (109,480 | ) | | $ | 27,841 | | | $ | (27,860 | ) | | $ | 2,344 | |
| † | A zero balance may reflect actual amounts rounding to less than one thousand. |
| | | | | | | | | | | | |
| | | | ANNUAL FINANCIAL AND OTHER INFORMATION | | | | | | | JUNE 30, 2024 | | | 13 |
| | | | |
| Statements of Operations | | (Cont.) | | |
| | | | | | | | | | | | | | | | |
| Year Ended June 30, 2024 | |
| (Amounts in thousands†) | | PIMCO
0-5 Year High
Yield Corporate
Bond Index
Exchange-
Traded Fund | | | PIMCO
Investment
Grade Corporate
Bond Index
Exchange-
Traded Fund | | | PIMCO
Active Bond
Exchange-
Traded Fund | | | PIMCO
Enhanced Low
Duration Active
Exchange-
Traded Fund | |
| | | | |
Investment Income: | | | | | | | | | | | | | | | | |
| | | | |
Interest | | $ | 89,309 | | | $ | 47,680 | | | $ | 213,030 | | | $ | 51,201 | |
Dividends | | | 184 | | | | 0 | | | | 0 | | | | 0 | |
Dividends from Investments in Affiliates | | | 0 | | | | 0 | | | | 3,587 | | | | 0 | |
Securities lending income | | | 670 | | | | 87 | | | | 0 | | | | 0 | |
Miscellaneous income | | | 85 | | | | 0 | | | | 56 | | | | 0 | |
Total Income | | | 90,248 | | | | 47,767 | | | | 216,673 | | | | 51,201 | |
| | | | |
Expenses: | | | | | | | | | | | | | | | | |
| | | | |
Management fees | | | 6,595 | | | | 1,941 | | | | 21,298 | | | | 4,353 | |
Trustee fees | | | 19 | | | | 14 | | | | 59 | | | | 16 | |
Interest expense | | | 184 | | | | 1,575 | | | | 5,733 | | | | 421 | |
Organizational expense | | | 0 | | | | 0 | | | | 0 | | | | 0 | |
Miscellaneous expense | | | 0 | | | | 0 | | | | 19 | | | | 47 | |
Total Expenses | | | 6,798 | | | | 3,530 | | | | 27,109 | | | | 4,837 | |
Waiver and/or Reimbursement by PIMCO | | | 0 | | | | 0 | | | | (287 | ) | | | (17 | ) |
Net Expenses | | | 6,798 | | | | 3,530 | | | | 26,822 | | | | 4,820 | |
| | | | |
Net Investment Income (Loss) | | | 83,450 | | | | 44,237 | | | | 189,851 | | | | 46,381 | |
| | | | |
Net Realized Gain (Loss): | | | | | | | | | | | | | | | | |
| | | | |
Investments in securities | | | (18,874 | ) | | | (9,326 | ) | | | (193,827 | ) | | | (2,636 | ) |
In-kind redemptions | | | 4,720 | | | | (389 | ) | | | 0 | | | | 0 | |
Exchange-traded or centrally cleared financial derivative instruments | | | 5,840 | | | | 237 | | | | 9,662 | | | | (6,699 | ) |
Over the counter financial derivative instruments | | | 3 | | | | 0 | | | | 3,871 | | | | (1,151 | ) |
Short sales | | | 0 | | | | 0 | | | | 0 | | | | (97 | ) |
Foreign currency | | | 0 | | | | 0 | | | | 9 | | | | 286 | |
| | | | |
Net Realized Gain (Loss) | | | (8,311 | ) | | | (9,478 | ) | | | (180,285 | ) | | | (10,297 | ) |
| | | | |
Net Change in Unrealized Appreciation (Depreciation): | | | | | | | | | | | | | | | | |
| | | | |
Investments in securities | | | 34,191 | | | | 13,972 | | | | 144,493 | | | | 11,443 | |
Investments in Affiliates | | | 0 | | | | 0 | | | | 1,663 | | | | 0 | |
Exchange-traded or centrally cleared financial derivative instruments | | | 62 | | | | (178 | ) | | | 1,310 | | | | 4,775 | |
Over the counter financial derivative instruments | | | 0 | | | | 0 | | | | 267 | | | | 915 | |
Short sales | | | 0 | | | | 0 | | | | 0 | | | | (2 | ) |
Foreign currency assets and liabilities | | | 0 | | | | 0 | | | | (97 | ) | | | 13 | |
| | | | |
Net Change in Unrealized Appreciation (Depreciation) | | | 34,253 | | | | 13,794 | | | | 147,636 | | | | 17,144 | |
| | | | |
Net Increase (Decrease) in Net Assets Resulting from Operations | | $ | 109,392 | | | $ | 48,553 | | | $ | 157,202 | | | $ | 53,228 | |
| † | A zero balance may reflect actual amounts rounding to less than one thousand. |
| | | | | | |
| 14 | | PIMCO ETF TRUST | | | See Accompanying Notes | |
| | | | | | | | | | | | | | | | | | | | | | | | | | | | | | | | | | |
| | | | | | | | | | | | | | | | | | | | | | | | | | |
PIMCO
Enhanced Short
Maturity Active
ESG Exchange-
Traded Fund | | | PIMCO
Enhanced Short
Maturity Active
Exchange-
Traded Fund | | | PIMCO
Intermediate
Municipal
Bond Active
Exchange-
Traded Fund | | | PIMCO
Multisector
Bond Active
Exchange-
Traded Fund | | | PIMCO
Municipal Income
Opportunities
Active
Exchange-
Traded Fund | | | PIMCO
Preferred and
Capital
Securities Active
Exchange-
Traded Fund | | | PIMCO
Senior Loan Active Exchange- Traded Fund | | | PIMCO
Short Term
Municipal Bond
Active
Exchange-
Traded Fund | | | PIMCO
Ultra Short
Government
Active
Exchange-
Traded Fund | |
| | | | | | | | |
| | | | | | | | | | | | | | | | | | | | | | | | | | | | | | | | | | |
| | | | | | | | |
| $ | 8,964 | | | $ | 596,872 | | | $ | 47,319 | | | $ | 22,679 | | | $ | 4,991 | | | $ | 5,664 | | | $ | 24,791 | | | $ | 18,634 | | | $ | 8,617 | |
| | 0 | | | | 0 | | | | 0 | | | | 0 | | | | 0 | | | | 49 | | | | 0 | | | | 0 | | | | 0 | |
| | 0 | | | | 0 | | | | 0 | | | | 112 | | | | 0 | | | | 0 | | | | 0 | | | | 0 | | | | 0 | |
| | 0 | | | | 7 | | | | 0 | | | | 0 | | | | 0 | | | | 0 | | | | 0 | | | | 0 | | | | 0 | |
| | 0 | | | | 0 | | | | 0 | | | | 7 | | | | 0 | | | | 0 | | | | 778 | | | | 0 | | | | 0 | |
| | | | | | | | |
| | 8,964 | | | | 596,879 | | | | 47,319 | | | | 22,798 | | | | 4,991 | | | | 5,713 | | | | 25,569 | | | | 18,634 | | | | 8,617 | |
| | | | | | | | |
| | | | | | | | | | | | | | | | | | | | | | | | | | | | | | | | | | |
| | | | | | | | |
| | 590 | | | | 36,569 | | | | 4,346 | | | | 2,346 | | | | 537 | | | | 740 | | | | 1,908 | | | | 1,921 | | | | 222 | |
| | | | | | | | |
| | 3 | | | | 157 | | | | 18 | | | | 5 | | | | 1 | | | | 1 | | | | 3 | | | | 9 | | | | 3 | |
| | | | | | | | |
| | 0 | | | | 122 | | | | 0 | | | | 522 | | | | 0 | | | | 42 | | | | 87 | | | | 0 | | | | 6 | |
| | | | | | | | |
| | 0 | | | | 0 | | | | 0 | | | | 0 | | | | 0 | | | | 0 | | | | 0 | | | | 0 | | | | 8 | |
| | | | | | | | |
| | 8 | | | | 0 | | | | 0 | | | | 18 | | | | 5 | | | | 10 | | | | 36 | | | | 0 | | | | 8 | |
| | | | | | | | |
| | 601 | | | | 36,848 | | | | 4,364 | | | | 2,891 | | | | 543 | | | | 793 | | | | 2,034 | | | | 1,930 | | | | 247 | |
| | | | | | | | |
| | (199 | ) | | | 0 | | | | 0 | | | | (370 | ) | | | (111 | ) | | | (134 | ) | | | (343 | ) | | | 0 | | | | (11 | ) |
| | | | | | | | |
| | 402 | | | | 36,848 | | | | 4,364 | | | | 2,521 | | | | 432 | | | | 659 | | | | 1,691 | | | | 1,930 | | | | 236 | |
| | | | | | | | |
| | 8,562 | | | | 560,031 | | | | 42,955 | | | | 20,277 | | | | 4,559 | | | | 5,054 | | | | 23,878 | | | | 16,704 | | | | 8,381 | |
| | | | | | | | |
| | | | | | | | | | | | | | | | | | | | | | | | | | | | | | | | | | |
| | 36 | | | | 873 | | | | (6,754 | ) | | | (1,482 | ) | | | (143 | ) | | | 241 | | | | (686 | ) | | | (2,237 | ) | | | 40 | |
| | 0 | | | | 0 | | | | 0 | | | | 0 | | | | 0 | | | | (584 | ) | | | 0 | | | | 0 | | | | 2 | |
| | 195 | | | | 19,884 | | | | 200 | | | | 5,663 | | | | 264 | | | | (814 | ) | | | 504 | | | | 0 | | | | 0 | |
| | 73 | | | | 0 | | | | 0 | | | | (888 | ) | | | 0 | | | | 78 | | | | (868 | ) | | | 0 | | | | 0 | |
| | 0 | | | | 3 | | | | 0 | | | | 0 | | | | 0 | | | | 0 | | | | 0 | | | | 0 | | | | 0 | |
| | 66 | | | | 0 | | | | 0 | | | | (71 | ) | | | 0 | | | | (16 | ) | | | 0 | | | | 0 | | | | 0 | |
| | | | | | | | |
| | 370 | | | | 20,760 | | | | (6,554 | ) | | | 3,222 | | | | 121 | | | | (1,095 | ) | | | (1,050 | ) | | | (2,237 | ) | | | 42 | |
| | | | | | | | |
| | | | | | | | | | | | | | | | | | | | | | | | | | | | | | | | | | |
| | | | | | | | |
| | 1,078 | | | | 69,250 | | | | 19,242 | | | | 4,685 | | | | 2,272 | | | | 5,108 | | | | 2,603 | | | | 5,602 | | | | 19 | |
| | | | | | | | |
| | 0 | | | | 0 | | | | 0 | | | | 20 | | | | 0 | | | | 0 | | | | 0 | | | | 0 | | | | 0 | |
| | | | | | | | |
| | (79 | ) | | | (8,735 | ) | | | (810 | ) | | | (1,173 | ) | | | (261 | ) | | | 49 | | | | (189 | ) | | | 0 | | | | 0 | |
| | | | | | | | |
| | (58 | ) | | | 0 | | | | 0 | | | | 1,196 | | | | 0 | | | | 31 | | | | 2,259 | | | | 0 | | | | 0 | |
| | | | | | | | |
| | 0 | | | | 0 | | | | 0 | | | | 0 | | | | 0 | | | | 0 | | | | 0 | | | | 0 | | | | 0 | |
| | | | | | | | |
| | (5 | ) | | | 0 | | | | 0 | | | | (7 | ) | | | 0 | | | | 0 | | | | 0 | | | | 0 | | | | 0 | |
| | | | | | | | |
| | 936 | | | | 60,515 | | | | 18,432 | | | | 4,721 | | | | 2,011 | | | | 5,188 | | | | 4,673 | | | | 5,602 | | | | 19 | |
| | | | | | | | |
| $ | 9,868 | | | $ | 641,306 | | | $ | 54,833 | | | $ | 28,220 | | | $ | 6,691 | | | $ | 9,147 | | | $ | 27,501 | | | $ | 20,069 | | | $ | 8,442 | |
| | | | | | | | | | | | |
| | | | ANNUAL FINANCIAL AND OTHER INFORMATION | | | | | | | JUNE 30, 2024 | | | 15 |
| | | | |
| Consolidated Statement of Operations | | | | |
| | | | |
| (Amounts in thousands†) | | PIMCO Commodity Strategy
Active Exchange-
Traded Fund | |
| |
Investment Income: | | | | |
| |
Interest | | $ | 11,071 | |
Dividends from Investments in Affiliates | | | 447 | |
Total Income | | | 11,518 | |
| |
Expenses: | | | | |
| |
Management fees | | | 1,960 | |
Trustee fees | | | 5 | |
Interest expense | | | 15 | |
Miscellaneous expense | | | 11 | |
Total Expenses | | | 1,991 | |
Waiver and/or Reimbursement by PIMCO | | | (561 | ) |
Net Expenses | | | 1,430 | |
| |
Net Investment Income (Loss) | | | 10,088 | |
| |
Net Realized Gain (Loss): | | | | |
| |
Investments in securities | | | 1,625 | |
Exchange-traded or centrally cleared financial derivative instruments | | | 11,615 | |
Over the counter financial derivative instruments | | | 1,149 | |
Foreign currency | | | (14 | ) |
| |
Net Realized Gain (Loss) | | | 14,375 | |
| |
Net Change in Unrealized Appreciation (Depreciation): | | | | |
| |
Investments in securities | | | 1,859 | |
Investments in Affiliates | | | 103 | |
Exchange-traded or centrally cleared financial derivative instruments | | | (3,507 | ) |
Over the counter financial derivative instruments | | | 650 | |
Foreign currency assets and liabilities | | | 1 | |
| |
Net Change in Unrealized Appreciation (Depreciation) | | | (894 | ) |
| |
Net Increase (Decrease) in Net Assets Resulting from Operations | | $ | 23,569 | |
| † | A zero balance may reflect actual amounts rounding to less than one thousand. |
| | | | | | |
| 16 | | PIMCO ETF TRUST | | | See Accompanying Notes | |
| | | | |
| Statements of Changes in Net Assets | | | | |
| | | | | | | | | | | | | | | | | | | | | | | | | | | | | | | | |
| | | PIMCO 25+ Year Zero Coupon U.S. Treasury Index Exchange-Traded Fund | | | PIMCO 1-5 Year U.S. TIPS Index Exchange-Traded Fund | | | PIMCO 15+ Year U.S. TIPS Index Exchange-Traded Fund | | | PIMCO Broad U.S. TIPS Index Exchange-Traded Fund | |
| | | | | | | | |
| (Amounts in thousands†) | | Year Ended
June 30, 2024 | | | Year Ended
June 30, 2023 | | | Year Ended
June 30, 2024 | | | Year Ended
June 30, 2023 | | | Year Ended
June 30, 2024 | | | Year Ended
June 30, 2023 | | | Year Ended
June 30, 2024 | | | Year Ended
June 30, 2023 | |
| | | | | | | | |
Increase (Decrease) in Net Assets from: | | | | | | | | | | | | | | | | | | | | | | | | | | | | | | | | |
| | | | | | | | |
Operations: | | | | | | | | | | | | | | | | | | | | | | | | | | | | | | | | |
| | | | | | | | |
Net investment income (loss) | | $ | 47,365 | | | $ | 23,539 | | | $ | 13,225 | | | $ | 38,492 | | | $ | 30,152 | | | $ | 33,329 | | | $ | 5,340 | | | $ | 11,267 | |
Net realized gain (loss) | | | (70,775 | ) | | | (65,687 | ) | | | (31,219 | ) | | | (55,574 | ) | | | (12,479 | ) | | | (14,974 | ) | | | (8,132 | ) | | | (28,375 | ) |
Net change in unrealized appreciation (depreciation) | | | (86,070 | ) | | | (23,073 | ) | | | 45,835 | | | | 6,387 | | | | (45,533 | ) | | | (35,660 | ) | | | 5,136 | | | | 10,856 | |
| | | | | | | | |
Net Increase (Decrease) in Net Assets Resulting from Operations | | | (109,480 | ) | | | (65,221 | ) | | | 27,841 | | | | (10,695 | ) | | | (27,860 | ) | | | (17,305 | ) | | | 2,344 | | | | (6,252 | ) |
| | | | | | | | |
Distributions to Shareholders: | | | | | | | | | | | | | | | | | | | | | | | | | | | | | | | | |
| | | | | | | | |
From net investment income and/or net realized capital gains | | | (41,421 | ) | | | (17,750 | ) | | | (13,367 | ) | | | (43,653 | ) | | | (30,656 | ) | | | (33,083 | ) | | | (5,707 | ) | | | (11,385 | ) |
| | | | | | | | |
Total Distributions(a) | | | (41,421 | ) | | | (17,750 | ) | | | (13,367 | ) | | | (43,653 | ) | | | (30,656 | ) | | | (33,083 | ) | | | (5,707 | ) | | | (11,385 | ) |
| | | | | | | | |
Fund Share Transactions: | | | | | | | | | | | | | | | | | | | | | | | | | | | | | | | | |
| | | | | | | | |
Receipts for shares sold | | | 1,174,759 | | | | 975,442 | | | | 136,149 | | | | 197,650 | | | | 373,436 | | | | 310,521 | | | | 18,186 | | | | 170,980 | |
Cost of shares redeemed | | | (583,183 | ) | | | (379,989 | ) | | | (492,323 | ) | | | (885,394 | ) | | | (278,352 | ) | | | (210,383 | ) | | | (47,500 | ) | | | (216,694 | ) |
Net increase (decrease) resulting from Fund share transactions | | | 591,576 | | | | 595,453 | | | | (356,174 | ) | | | (687,744 | ) | | | 95,084 | | | | 100,138 | | | | (29,314 | ) | | | (45,714 | ) |
| | | | | | | | |
Total Increase (Decrease) in Net Assets | | | 440,675 | | | | 512,482 | | | | (341,700 | ) | | | (742,092 | ) | | | 36,568 | | | | 49,750 | | | | (32,677 | ) | | | (63,351 | ) |
| | | | | | | | |
Net Assets: | | | | | | | | | | | | | | | | | | | | | | | | | | | | | | | | |
| | | | | | | | |
Beginning of year | | | 947,726 | | | | 435,244 | | | | 833,417 | | | | 1,575,509 | | | | 670,356 | | | | 620,606 | | | | 131,420 | | | | 194,771 | |
End of year | | $ | 1,388,401 | | | $ | 947,726 | | | $ | 491,717 | | | $ | 833,417 | | | $ | 706,924 | | | $ | 670,356 | | | $ | 98,743 | | | $ | 131,420 | |
| | | | | | | | |
Shares of Beneficial Interest: | | | | | | | | | | | | | | | | | | | | | | | | | | | | | | | | |
| | | | | | | | |
Shares sold | | | 15,600 | | | | 10,450 | | | | 2,650 | | | | 3,900 | | | | 6,900 | | | | 5,100 | | | | 350 | | | | 2,950 | |
Shares redeemed | | | (7,450 | ) | | | (4,150 | ) | | | (9,700 | ) | | | (17,450 | ) | | | (5,000 | ) | | | (3,450 | ) | | | (900 | ) | | | (3,900 | ) |
Net increase (decrease) in shares outstanding | | | 8,150 | | | | 6,300 | | | | (7,050 | ) | | | (13,550 | ) | | | 1,900 | | | | 1,650 | | | | (550 | ) | | | (950 | ) |
| † | A zero balance may reflect actual amounts rounding to less than one thousand. |
| (a) | The tax characterization of distributions is determined in accordance with Federal income tax regulations. See Note 2, Distributions to Shareholders, in the Notes to Financial Statements for more information. |
| | | | | | | | | | | | |
| | | | ANNUAL FINANCIAL AND OTHER INFORMATION | | | | | | | JUNE 30, 2024 | | | 17 |
| | | | |
| Statements of Changes in Net Assets | | (Cont.) | | |
| | | | | | | | | | | | | | | | | | | | | | | | | | | | | | | | |
| | | PIMCO 0-5 Year High Yield Corporate Bond Index Exchange-Traded Fund | | | PIMCO Investment Grade Corporate Bond Index Exchange-Traded Fund | | | PIMCO Active Bond Exchange-Traded Fund | | | PIMCO Enhanced Low Duration Active Exchange-Traded Fund | |
| | | | | | | | |
| (Amounts in thousands†) | | Year Ended
June 30, 2024 | | | Year Ended
June 30, 2023 | | | Year Ended
June 30, 2024 | | | Year Ended
June 30, 2023 | | | Year Ended
June 30, 2024 | | | Year Ended
June 30, 2023 | | | Year Ended
June 30, 2024 | | | Year Ended
June 30, 2023 | |
| | | | | | | | |
Increase (Decrease) in Net Assets from: | | | | | | | | | | | | | | | | | | | | | | | | | | | | | | | | |
| | | | | | | | |
Operations: | | | | | | | | | | | | | | | | | | | | | | | | | | | | | | | | |
| | | | | | | | |
Net investment income (loss) | | $ | 83,450 | | | $ | 72,686 | | | $ | 44,237 | | | $ | 27,816 | | | $ | 189,851 | | | $ | 127,910 | | | $ | 46,381 | | | $ | 47,058 | |
Net realized gain (loss) | | | (8,311 | ) | | | (46,065 | ) | | | (9,478 | ) | | | (14,539 | ) | | | (180,285 | ) | | | (191,923 | ) | | | (10,297 | ) | | | (65,320 | ) |
Net change in unrealized appreciation (depreciation) | | | 34,253 | | | | 76,273 | | | | 13,794 | | | | 13,248 | | | | 147,636 | | | | 58,999 | | | | 17,144 | | | | 25,434 | |
| | | | | | | | |
Net Increase (Decrease) in Net Assets Resulting from Operations | | | 109,392 | | | | 102,894 | | | | 48,553 | | | | 26,525 | | | | 157,202 | | | | (5,014 | ) | | | 53,228 | | | | 7,172 | |
| | | | | | | | |
Distributions to Shareholders: | | | | | | | | | | | | | | | | | | | | | | | | | | | | | | | | |
| | | | | | | | |
From net investment income and/or net realized capital gains | | | (84,984 | ) | | | (74,597 | ) | | | (43,066 | ) | | | (26,827 | ) | | | (176,461 | ) | | | (118,150 | ) | | | (42,143 | ) | | | (39,335 | ) |
| | | | | | | | |
Tax Basis Return of Capital | | | 0 | | | | 0 | | | | 0 | | | | 0 | | | | 0 | | | | 0 | | | | (2,039 | ) | | | 0 | |
| | | | | | | | |
Total Distributions(a) | | | (84,984 | ) | | | (74,597 | ) | | | (43,066 | ) | | | (26,827 | ) | | | (176,461 | ) | | | (118,150 | ) | | | (44,182 | ) | | | (39,335 | ) |
| | | | | | | | |
Fund Share Transactions: | | | | | | | | | | | | | | | | | | | | | | | | | | | | | | | | |
| | | | | | | | |
Receipts for shares sold | | | 417,462 | | | | 924,963 | | | | 433,128 | | | | 466,947 | | | | 876,140 | | | | 571,460 | | | | 79,286 | | | | 106,412 | |
Cost of shares redeemed | | | (312,324 | ) | | | (968,228 | ) | | | (50,846 | ) | | | (305,469 | ) | | | (8,969 | ) | | | (194,362 | ) | | | (260,010 | ) | | | (476,758 | ) |
Net increase (decrease) resulting from Fund share transactions | | | 105,138 | | | | (43,265 | ) | | | 382,282 | | | | 161,478 | | | | 867,171 | | | | 377,098 | | | | (180,724 | ) | | | (370,346 | ) |
| | | | | | | | |
Total Increase (Decrease) in Net Assets | | | 129,546 | | | | (14,968 | ) | | | 387,769 | | | | 161,176 | | | | 847,912 | | | | 253,934 | | | | (171,678 | ) | | | (402,509 | ) |
| | | | | | | | |
Net Assets: | | | | | | | | | | | | | | | | | | | | | | | | | | | | | | | | |
| | | | | | | | |
Beginning of year | | | 1,100,838 | | | | 1,115,806 | | | | 742,059 | | | | 580,883 | | | | 3,478,849 | | | | 3,224,915 | | | | 1,041,832 | | | | 1,444,341 | |
End of year | | $ | 1,230,384 | | | $ | 1,100,838 | | | $ | 1,129,828 | | | $ | 742,059 | | | $ | 4,326,761 | | | $ | 3,478,849 | | | $ | 870,154 | | | $ | 1,041,832 | |
| | | | | | | | |
Shares of Beneficial Interest: | | | | | | | | | | | | | | | | | | | | | | | | | | | | | | | | |
| | | | | | | | |
Shares sold | | | 4,550 | | | | 10,250 | | | | 4,600 | | | | 5,000 | | | | 9,660 | | | | 6,200 | | | | 840 | | | | 1,120 | |
Shares redeemed | | | (3,400 | ) | | | (10,750 | ) | | | (550 | ) | | | (3,200 | ) | | | (100 | ) | | | (2,120 | ) | | | (2,760 | ) | | | (5,040 | ) |
Net increase (decrease) in shares outstanding | | | 1,150 | | | | (500 | ) | | | 4,050 | | | | 1,800 | | | | 9,560 | | | | 4,080 | | | | (1,920 | ) | | | (3,920 | ) |
| † | A zero balance may reflect actual amounts rounding to less than one thousand. |
| (a) | The tax characterization of distributions is determined in accordance with Federal income tax regulations. See Note 2, Distributions to Shareholders, in the Notes to Financial Statements for more information. |
| (b) | Inception date of the Fund was January 18, 2023. |
| (c) | Inception date of the Fund was June 21, 2023. |
| | | | | | |
| 18 | | PIMCO ETF TRUST | | | See Accompanying Notes | |
| | | | | | | | | | | | | | | | | | | | | | | | | | | | | | | | | | | | | | |
PIMCO Enhanced Short Maturity Active ESG Exchange-Traded Fund | | | PIMCO Enhanced Short Maturity Active Exchange-Traded Fund | | | PIMCO Intermediate Municipal Bond Active Exchange-Traded Fund | | | PIMCO Multisector Bond Active Exchange-Traded Fund | | | PIMCO Municipal Income Opportunities Active Exchange-Traded Fund | |
| | | | | | | | | |
Year Ended
June 30, 2024 | | | Year Ended
June 30, 2023 | | | Year Ended
June 30, 2024 | | | Year Ended
June 30, 2023 | | | Year Ended
June 30, 2024 | | | Year Ended
June 30, 2023 | | | Year Ended
June 30, 2024 | | | Inception date through
June 30, 2023(c) | | | Year Ended
June 30, 2024 | | | Year Ended
June 30, 2023 | |
| | | | | | | | | |
| | | | | | | | | | | | | | | | | | | | | | | | | | | | | | | | | | | | | | |
| | | | | | | | | |
| | | | | | | | | | | | | | | | | | | | | | | | | | | | | | | | | | | | | | |
| | | | | | | | | |
| $ | 8,562 | | | $ | 5,318 | | | $ | 560,031 | | | $ | 337,248 | | | $ | 42,955 | | | $ | 26,111 | | | $ | 20,277 | | | $ | 78 | | | $ | 4,559 | | | $ | 2,091 | |
| | 370 | | | | (965 | ) | | | 20,760 | | | | (136,411 | ) | | | (6,554 | ) | | | (14,961 | ) | | | 3,222 | | | | (28 | ) | | | 121 | | | | (1,248 | ) |
|
936 |
| | | 1,101 | | | | 60,515 | | | | 155,516 | | | | 18,432 | | | | 22,905 | | | | 4,721 | | | | (20 | ) | | | 2,011 | | | | 1,841 | |
| | | | | | | | | |
|
9,868 |
| | | 5,454 | | | | 641,306 | | | | 356,353 | | | | 54,833 | | | | 34,055 | | | | 28,220 | | | | 30 | | | | 6,691 | | | | 2,684 | |
| | | | | | | | | |
| | | | | | | | | | | | | | | | | | | | | | | | | | | | | | | | | | | | | | |
| | | | | | | | | |
|
(8,508 |
) | | | (6,454 | ) | | | (549,101 | ) | | | (312,603 | ) | | | (41,621 | ) | | | (24,441 | ) | | | (18,406 | ) | | | 0 | | | | (4,242 | ) | | | (1,943 | ) |
| | | | | | | | | |
| | 0 | | | | 0 | | | | 0 | | | | 0 | | | | 0 | | | | 0 | | | | 0 | | | | 0 | | | | 0 | | | | 0 | |
| | | | | | | | | |
| | (8,508 | ) | | | (6,454 | ) | | | (549,101 | ) | | | (312,603 | ) | | | (41,621 | ) | | | (24,441 | ) | | | (18,406 | ) | | | 0 | | | | (4,242 | ) | | | (1,943 | ) |
| | | | | | | | | |
| | | | | | | | | | | | | | | | | | | | | | | | | | | | | | | | | | | | | | |
| | | | | | | | | |
| | 29,427 | | | | 24,464 | | | | 4,771,200 | | | | 2,822,438 | | | | 595,181 | | | | 421,766 | | | | 930,967 | | | | 65,023 | | | | 100,364 | | | | 55,524 | |
| | (14,733 | ) | | | (56,712 | ) | | | (2,071,986 | ) | | | (5,365,817 | ) | | | (84,093 | ) | | | (297,476 | ) | | | 0 | | | | 0 | | | | (19,591 | ) | | | (23,662 | ) |
|
14,694 |
| | | (32,248 | ) | | | 2,699,214 | | | | (2,543,379 | ) | | | 511,088 | | | | 124,290 | | | | 930,967 | | | | 65,023 | | | | 80,773 | | | | 31,862 | |
| | | | | | | | | |
|
16,054 |
| | | (33,248 | ) | | | 2,791,419 | | | | (2,499,629 | ) | | | 524,300 | | | | 133,904 | | | | 940,781 | | | | 65,053 | | | | 83,222 | | | | 32,603 | |
| | | | | | | | | |
| | | | | | | | | | | | | | | | | | | | | | | | | | | | | | | | | | | | | | |
| | | | | | | | | |
| | 150,823 | | | | 184,071 | | | | 9,257,897 | | | | 11,757,526 | | | | 981,032 | | | | 847,128 | | | | 65,053 | | | | 0 | | | | 74,899 | | | | 42,296 | |
| $ | 166,877 | | | $ | 150,823 | | | $ | 12,049,316 | | | $ | 9,257,897 | | | $ | 1,505,332 | | | $ | 981,032 | | | $ | 1,005,834 | | | $ | 65,053 | | | $ | 158,121 | | | $ | 74,899 | |
| | | | | | | | | |
| | | | | | | | | | | | | | | | | | | | | | | | | | | | | | | | | | | | | | |
| | | | | | | | | |
| | 300 | | | | 250 | | | | 47,670 | | | | 28,420 | | | | 11,580 | | | | 8,220 | | | | 36,720 | | | | 2,600 | | | | 2,240 | | | | 1,260 | |
| | (150 | ) | | | (580 | ) | | | (20,720 | ) | | | (54,250 | ) | | | (1,620 | ) | | | (5,720 | ) | | | 0 | | | | 0 | | | | (440 | ) | | | (540 | ) |
|
150 |
| | | (330 | ) | | | 26,950 | | | | (25,830 | ) | | | 9,960 | | | | 2,500 | | | | 36,720 | | | | 2,600 | | | | 1,800 | | | | 720 | |
| | | | | | | | | | | | |
| | | | ANNUAL FINANCIAL AND OTHER INFORMATION | | | | | | | JUNE 30, 2024 | | | 19 |
| | | | |
| Statements of Changes in Net Assets | | (Cont.) | | |
| | | | | | | | | | | | | | | | | | | | | | | | | | | | | | | | |
| | | PIMCO Preferred and Capital Securities Active Exchange-Traded Fund | | | PIMCO Senior Loan Active Exchange-Traded Fund | | | PIMCO Short Term Municipal Bond Active Exchange-Traded Fund | | | PIMCO Ultra Short Government Active Exchange-Traded Fund | |
| | | | | | | | |
| (Amounts in thousands†) | | Year Ended
June 30, 2024 | | | Inception date through
June 30, 2023(b) | | | Year Ended
June 30, 2024 | | | Year Ended
June 30, 2023 | | | Year Ended
June 30, 2024 | | | Year Ended
June 30, 2023 | | | Year Ended
June 30, 2024 | | | Inception date through
June 30, 2023(c) | |
| | | | | | | | |
Increase (Decrease) in Net Assets from: | | | | | | | | | | | | | | | | | | | | | | | | | | | | | | | | |
| | | | | | | | |
Operations: | | | | | | | | | | | | | | | | | | | | | | | | | | | | | | | | |
| | | | | | | | |
Net investment income (loss) | | $ | 5,054 | | | $ | 1,358 | | | $ | 23,878 | | | $ | 9,534 | | | $ | 16,704 | | | $ | 12,559 | | | $ | 8,381 | | | $ | 12 | |
Net realized gain (loss) | | | (1,095 | ) | | | (1,166 | ) | | | (1,050 | ) | | | (1,264 | ) | | | (2,237 | ) | | | (4,077 | ) | | | 42 | | | | 1 | |
Net change in unrealized appreciation (depreciation) | | | 5,188 | | | | (2,240 | ) | | | 4,673 | | | | 3,251 | | | | 5,602 | | | | 3,177 | | | | 19 | | | | (1 | ) |
| | | | | | | | |
Net Increase (Decrease) in Net Assets Resulting from Operations | | | 9,147 | | | | (2,048 | ) | | | 27,501 | | | | 11,521 | | | | 20,069 | | | | 11,659 | | | | 8,442 | | | | 12 | |
| | | | | | | | |
Distributions to Shareholders: | | | | | | | | | | | | | | | | | | | | | | | | | | | | | | | | |
| | | | | | | | |
From net investment income and/or net realized capital gains | | | (5,098 | ) | | | (928 | ) | | | (21,266 | ) | | | (8,533 | ) | | | (16,689 | ) | | | (11,652 | ) | | | (6,945 | ) | | | 0 | |
| | | | | | | | |
Total Distributions(a) | | | (5,098 | ) | | | (928 | ) | | | (21,266 | ) | | | (8,533 | ) | | | (16,689 | ) | | | (11,652 | ) | | | (6,945 | ) | | | 0 | |
| | | | | | | | |
Fund Share Transactions: | | | | | | | | | | | | | | | | | | | | | | | | | | | | | | | | |
| | | | | | | | |
Receipts for shares sold | | | 53,491 | | | | 96,190 | | | | 224,596 | | | | 122,579 | | | | 102,236 | | | | 73,279 | | | | 439,232 | | | | 13,007 | |
Cost of shares redeemed | | | (34,638 | ) | | | 0 | | | | (4,042 | ) | | | (24,565 | ) | | | (44,558 | ) | | | (110,830 | ) | | | (90,778 | ) | | | 0 | |
Net increase (decrease) resulting from Fund share transactions | | | 18,853 | | | | 96,190 | | | | 220,554 | | | | 98,014 | | | | 57,678 | | | | (37,551 | ) | | | 348,454 | | | | 13,007 | |
| | | | | | | | |
Total Increase (Decrease) in Net Assets | | | 22,902 | | | | 93,214 | | | | 226,789 | | | | 101,002 | | | | 61,058 | | | | (37,544 | ) | | | 349,951 | | | | 13,019 | |
| | | | | | | | |
Net Assets: | | | | | | | | | | | | | | | | | | | | | | | | | | | | | | | | |
| | | | | | | | |
Beginning of year | | | 93,214 | | | | 0 | | | | 165,559 | | | | 64,557 | | | | 525,450 | | | | 562,994 | | | | 13,019 | | | | 0 | |
End of year | | $ | 116,116 | | | $ | 93,214 | | | $ | 392,348 | | | $ | 165,559 | | | $ | 586,508 | | | $ | 525,450 | | | $ | 362,970 | | | $ | 13,019 | |
| | | | | | | | |
Shares of Beneficial Interest: | | | | | | | | | | | | | | | | | | | | | | | | | | | | | | | | |
| | | | | | | | |
Shares sold | | | 1,100 | | | | 2,000 | | | | 4,440 | | | | 2,480 | | | | 2,060 | | | | 1,480 | | | | 4,360 | | | | 130 | |
Shares redeemed | | | (760 | ) | | | 0 | | | | (80 | ) | | | (500 | ) | | | (900 | ) | | | (2,240 | ) | | | (900 | ) | | | 0 | |
Net increase (decrease) in shares outstanding | | | 340 | | | | 2,000 | | | | 4,360 | | | | 1,980 | | | | 1,160 | | | | (760 | ) | | | 3,460 | | | | 130 | |
| † | A zero balance may reflect actual amounts rounding to less than one thousand. |
| (a) | The tax characterization of distributions is determined in accordance with Federal income tax regulations. See Note 2, Distributions to Shareholders, in the Notes to Financial Statements for more information. |
| (b) | Inception date of the Fund was January 18, 2023. |
| (c) | Inception date of the Fund was June 21, 2023. |
| | | | | | |
| 20 | | PIMCO ETF TRUST | | | See Accompanying Notes | |
| | | | |
| Consolidated Statements of Changes in Net Assets | | | | |
| | | | | | | | |
| | | PIMCO Commodity Strategy Active Exchange- Traded Fund | |
| | |
| (Amounts in thousands†) | | Year Ended
June 30, 2024 | | | Inception date through June 30, 2023(b) | |
| | |
Increase (Decrease) in Net Assets from: | | | | | | | | |
| | |
Operations: | | | | | | | | |
| | |
Net investment income (loss) | | $ | 10,088 | | | $ | 267 | |
Net realized gain (loss) | | | 14,375 | | | | (169 | ) |
Net change in unrealized appreciation (depreciation) | | | (894 | ) | | | (909 | ) |
| | |
Net Increase (Decrease) in Net Assets Resulting from Operations | | | 23,569 | | | | (811 | ) |
| | |
Distributions to Shareholders: | | | | | | | | |
| | |
From net investment income and/or net realized capital gains | | | (7,599 | ) | | | 0 | |
| | |
Total Distributions(a) | | | (7,599 | ) | | | 0 | |
| | |
Fund Share Transactions: | | | | | | | | |
| | |
Receipts for shares sold | | | 116,372 | | | | 205,797 | |
Cost of shares redeemed | | | (28,562 | ) | | | (6,264 | ) |
Net increase (decrease) resulting from Fund share transactions | | | 87,810 | | | | 199,533 | |
| | |
Total Increase (Decrease) in Net Assets | | | 103,780 | | | | 198,722 | |
| | |
Net Assets: | | | | | | | | |
| | |
Beginning of year | | | 198,722 | | | | 0 | |
End of year | | $ | 302,502 | | | $ | 198,722 | |
| | |
Shares of Beneficial Interest: | | | | | | | | |
| | |
Shares sold | | | 4,275 | | | | 8,125 | |
Shares redeemed | | | (1,050 | ) | | | (250 | ) |
Net increase (decrease) in shares outstanding | | | 3,225 | | | | 7,875 | |
| † | A zero balance may reflect actual amounts rounding to less than one thousand. |
| (a) | The tax characterization of distributions is determined in accordance with Federal income tax regulations. See Note 2, Distributions to Shareholders, in the Notes to Financial Statements for more information. |
| (b) | Inception date of the Fund was May 09, 2023. |
| | | | | | | | | | | | |
| | | | ANNUAL FINANCIAL AND OTHER INFORMATION | | | | | | | JUNE 30, 2024 | | | 21 |
| | | | | | |
| Schedule of Investments | | PIMCO 25+ Year Zero Coupon U.S. Treasury Index Exchange-Traded Fund | | | | June 30, 2024 |
(Amounts in thousands*, except number of shares, contracts, units and ounces, if any)
| | | | | | | | | | | | |
| | | | | PRINCIPAL
AMOUNT
(000S) | | | | | MARKET
VALUE
(000S) | |
| INVESTMENTS IN SECURITIES 100.0% | |
| |
| U.S. TREASURY OBLIGATIONS 99.9% | |
| | | | |
U.S. Treasury STRIPS (a) | | | | | | | | | | | | |
0.000% due 02/15/2049 | | $ | | | 641 | | | $ | | | 207 | |
0.000% due 05/15/2049 | | | | | 180,290 | | | | | | 57,654 | |
0.000% due 08/15/2049 | | | | | 232,962 | | | | | | 73,873 | |
0.000% due 11/15/2049 | | | | | 235,415 | | | | | | 74,046 | |
0.000% due 02/15/2050 | | | | | 225,365 | | | | | | 70,237 | |
0.000% due 05/15/2050 | | | | | 236,945 | | | | | | 73,489 | |
0.000% due 08/15/2050 | | | | | 210,299 | | | | | | 64,470 | |
0.000% due 11/15/2050 | | | | | 210,592 | | | | | | 63,967 | |
0.000% due 02/15/2051 | | | | | 240,534 | | | | | | 72,475 | |
0.000% due 05/15/2051 | | | | | 225,098 | | | | | | 67,254 | |
0.000% due 08/15/2051 | | | | | 215,434 | | | | | | 63,807 | |
| | | | | | | | | | | | |
| | | | | PRINCIPAL
AMOUNT
(000S) | | | | | MARKET
VALUE
(000S) | |
0.000% due 11/15/2051 | | $ | | | 225,002 | | | $ | | | 66,122 | |
0.000% due 02/15/2052 | | | | | 238,763 | | | | | | 69,544 | |
0.000% due 05/15/2052 | | | | | 235,106 | | | | | | 67,897 | |
0.000% due 08/15/2052 | | | | | 262,083 | | | | | | 75,158 | |
0.000% due 11/15/2052 | | | | | 260,893 | | | | | | 74,896 | |
0.000% due 02/15/2053 | | | | | 268,242 | | | | | | 75,875 | |
0.000% due 05/15/2053 | | | | | 286,505 | | | | | | 80,406 | |
0.000% due 08/15/2053 | | | | | 287,471 | | | | | | 80,275 | |
0.000% due 11/15/2053 | | | | | 243,361 | | | | | | 68,031 | |
0.000% due 02/15/2054 | | | | | 174,538 | | | | | | 47,953 | |
| | | | | | | | | | | | |
Total U.S. Treasury Obligations
(Cost $1,654,672) | | | 1,387,636 | |
| | | | |
| | | | | | | | | | | | |
| | | | | | | | | | MARKET
VALUE
(000S) | |
| SHORT-TERM INSTRUMENTS 0.1% | |
| |
| REPURCHASE AGREEMENTS (b) 0.1% | |
| | | | | | | | $ | | | 893 | |
| | | | | | | | | | | | |
Total Short-Term Instruments
(Cost $893) | | | 893 | |
| | | | |
| | | | |
| | | | | | | | | | | | |
Total Investments in Securities
(Cost $1,655,565) | | | 1,388,529 | |
| |
| | | | |
Total Investments 100.0%
(Cost $1,655,565) | | | $ | | | 1,388,529 | |
| |
| Other Assets and Liabilities, net 0.0% | | | (128 | ) |
| | | | |
| Net Assets 100.0% | | | $ | | | 1,388,401 | |
| | | | | | | |
NOTES TO SCHEDULE OF INVESTMENTS:
| * | A zero balance may reflect actual amounts rounding to less than one thousand. |
BORROWINGS AND OTHER FINANCING TRANSACTIONS
(b) REPURCHASE AGREEMENTS:
| | | | | | | | | | | | | | | | | | | | | | | | | | | | | | |
| Counterparty | | Lending
Rate | | | Settlement
Date | | | Maturity
Date | | | Principal
Amount | | | Collateralized By | | Collateral
(Received) | | | Repurchase
Agreements,
at Value | | | Repurchase
Agreement
Proceeds
to be
Received(1) | |
| FICC | | | 2.600 | % | | | 06/28/2024 | | | | 07/01/2024 | | | $ | 893 | | | U.S. Treasury Notes 4.500% due 03/31/2026 | | $ | (911 | ) | | $ | 893 | | | $ | 893 | |
| | | | | | | | | | | | | | | | | | | | | | | | | | | | | | |
Total Repurchase Agreements | | | | | $ | (911 | ) | | $ | 893 | | | $ | 893 | |
| | | | | | | | | | | | | | | | | | | | | | | | | | | | | | |
BORROWINGS AND OTHER FINANCING TRANSACTIONS SUMMARY
The following is a summary by counterparty of the market value of Borrowings and Other Financing Transactions and collateral pledged/(received) as of June 30, 2024:
| | | | | | | | | | | | | | | | | | | | | | | | | | | | |
| Counterparty | | Repurchase
Agreement
Proceeds
to be
Received(1) | | | Payable for
Reverse
Repurchase
Agreements | | | Payable for
Sale-Buyback
Transactions | | | Securities
Out on Loan | | | Total
Borrowings and
Other Financing
Transactions | | | Collateral
Pledged/(Received) | | | Net Exposure(2) | |
Global/Master Repurchase Agreement | |
FICC | | $ | 893 | | | $ | 0 | | | $ | 0 | | | $ | 0 | | | $ | 893 | | | $ | (911 | ) | | $ | (18 | ) |
| | | | | | | | | | | | | | | | | | | | | | | | | | | | |
Total Borrowings and Other Financing Transactions | | $ | 893 | | | $ | 0 | | | $ | 0 | | | $ | 0 | | | | | | | | | | | | | |
| | | | | | | | | | | | | | | | | | | | | | | | | | | | |
| (1) | Includes accrued interest. |
| (2) | Net Exposure represents the net receivable/(payable) that would be due from/to the counterparty in the event of default. Exposure from borrowings and other financing transactions can only be netted across transactions governed under the same master agreement with the same legal entity. See Note 8, Master Netting Arrangements, in the Notes to Financial Statements for more information. |
FAIR VALUE MEASUREMENTS
The following is a summary of the fair valuations according to the inputs used as of June 30, 2024 in valuing the Fund’s assets and liabilities:
| | | | | | | | | | | | | | | | |
| Category and Subcategory | | Level 1 | | | Level 2 | | | Level 3 | | | Fair
Value at
06/30/2024 | |
Investments in Securities, at Value | |
U.S. Treasury Obligations | | $ | 0 | | | $ | 1,387,636 | | | $ | 0 | | | $ | 1,387,636 | |
Short-Term Instruments | |
Repurchase Agreements | | | 0 | | | | 893 | | | | 0 | | | | 893 | |
| | | | | | | | | | | | | | | | |
| | | | |
Total Investments | | $ | 0 | | | $ | 1,388,529 | | | $ | 0 | | | $ | 1,388,529 | |
| | | | | | | | | | | | | | | | |
There were no significant transfers into or out of Level 3 during the period ended June 30, 2024.
| | | | | | |
| 22 | | PIMCO ETF TRUST | | | See Accompanying Notes | |
| | | | | | |
| Schedule of Investments | | PIMCO 1-5 Year U.S. TIPS Index Exchange-Traded Fund | | | | June 30, 2024 |
(Amounts in thousands*, except number of shares, contracts, units and ounces, if any)
| | | | | | | | | | | | |
| | | | | PRINCIPAL
AMOUNT
(000S) | | | | | MARKET
VALUE
(000S) | |
| INVESTMENTS IN SECURITIES 99.8% | |
| |
| U.S. TREASURY OBLIGATIONS 99.8% | |
|
U.S. Treasury Inflation Protected Securities (a) | |
0.125% due 04/15/2025 | | $ | | | 24,659 | | | $ | | | 23,989 | |
0.125% due 10/15/2025 | | | | | 6,962 | | | | | | 6,734 | |
0.125% due 04/15/2026 | | | | | 59,306 | | | | | | 56,664 | |
0.125% due 07/15/2026 | | | | | 15,817 | | | | | | 15,122 | |
0.125% due 10/15/2026 | | | | | 18,243 | | | | | | 17,368 | |
0.125% due 04/15/2027 | | | | | 6,024 | | | | | | 5,669 | |
0.125% due 01/15/2030 | | | | | 42,539 | | | | | | 38,299 | |
0.125% due 07/15/2030 | | | | | 14,013 | | | | | | 12,543 | |
0.125% due 01/15/2032 | | | | | 4,962 | | | | | | 4,298 | |
0.250% due 07/15/2029 | | | | | 5,979 | | | | | | 5,492 | |
0.375% due 07/15/2025 | | | | | 38,893 | | | | | | 37,919 | |
| | | | | | | | | | | | |
| | | | | PRINCIPAL
AMOUNT
(000S) | | | | | MARKET
VALUE
(000S) | |
0.375% due 01/15/2027 | | $ | | | 36,939 | | | $ | | | 35,119 | |
0.375% due 07/15/2027 | | | | | 16,447 | | | | | | 15,611 | |
0.500% due 01/15/2028 | | | | | 38,441 | | | | | | 36,231 | |
0.625% due 01/15/2026 | | | | | 61,326 | | | | | | 59,339 | |
0.750% due 07/15/2028 | | | | | 18,361 | | | | | | 17,452 | |
0.875% due 01/15/2029 | | | | | 22,809 | | | | | | 21,615 | |
1.250% due 04/15/2028 | | | | | 13,811 | | | | | | 13,342 | |
1.625% due 10/15/2027 | | | | | 19,443 | | | | | | 19,130 | |
1.750% due 01/15/2028 | | | | | 21,540 | | | | | | 21,203 | |
2.125% due 04/15/2029 | | | | | 4,183 | | | | | | 4,189 | |
2.375% due 10/15/2028 | | | | | 4,701 | | | | | | 4,764 | |
2.500% due 01/15/2029 | | | | | 18,058 | | | | | | 18,380 | |
| | | | | | | | | | | | |
Total U.S. Treasury Obligations
(Cost $516,573) | | | | | | 490,472 | |
| | | | | | | | | | | | |
| | | | | | | | | | | | |
| | | | | | | | | | | MARKET
VALUE
(000S) |
| SHORT-TERM INSTRUMENTS 0.0% |
|
| REPURCHASE AGREEMENTS (b) 0.0% |
| | | | | | | | $ | | | | 116 |
| | | | | | | | | | | | |
Total Short-Term Instruments
(Cost $116) | | | | | | | 116 |
| | | | | | | | | | | | |
| | | | |
| | | | | | | | | | | | |
Total Investments in Securities
(Cost $516,689) | | | 490,588 |
| | | | |
| | | | | | | | | | | | |
Total Investments 99.8%
(Cost $516,689) | | | | | | $ | | | | 490,588 |
|
| Other Assets and Liabilities, net 0.2% | | | 1,129 |
| | | | | | | | | | | | |
| Net Assets 100.0% | | | | | | | | $ | | | | 491,717 |
| | | | | | | | | | | | |
NOTES TO SCHEDULE OF INVESTMENTS:
| * | A zero balance may reflect actual amounts rounding to less than one thousand. |
| (a) | Principal amount of security is adjusted for inflation. |
BORROWINGS AND OTHER FINANCING TRANSACTIONS
(b) REPURCHASE AGREEMENTS:
| | | | | | | | | | | | | | | | | | | | | | | | | | | | | | |
| Counterparty | | Lending
Rate | | | Settlement
Date | | | Maturity
Date | | | Principal
Amount | | | Collateralized By | | Collateral
(Received) | | | Repurchase
Agreements,
at Value | | | Repurchase
Agreement
Proceeds
to be
Received(1) | |
| FICC | | | 2.600 | % | | | 06/28/2024 | | | | 07/01/2024 | | | $ | 116 | | | U.S. Treasury Notes 4.500% due 03/31/2026 | | $ | (119 | ) | | $ | 116 | | | $ | 116 | |
| | | | | | | | | | | | | | | | | | | | | | | | | | | | | | |
Total Repurchase Agreements | | | | | $ | (119 | ) | | $ | 116 | | | $ | 116 | |
| | | | | | | | | | | | | | | |
BORROWINGS AND OTHER FINANCING TRANSACTIONS SUMMARY
The following is a summary by counterparty of the market value of Borrowings and Other Financing Transactions and collateral pledged/(received) as of June 30, 2024:
| | | | | | | | | | | | | | | | | | | | | | | | | | | | |
| Counterparty | | Repurchase
Agreement
Proceeds
to be
Received(1) | | | Payable for
Reverse
Repurchase
Agreements | | | Payable for
Sale-Buyback
Transactions | | | Securities
Out on Loan | | | Total
Borrowings and
Other Financing
Transactions | | | Collateral
Pledged/(Received) | | | Net Exposure(2) | |
Global/Master Repurchase Agreement | |
FICC | | $ | 116 | | | $ | 0 | | | $ | 0 | | | $ | 0 | | | $ | 116 | | | $ | (119 | ) | | $ | (3 | ) |
| | | | | | | | | | | | | | | | | | | | | | | | | | | | |
Total Borrowings and Other Financing Transactions | | $ | 116 | | | $ | 0 | | | $ | 0 | | | $ | 0 | | | | | | | | | | | | | |
| | | | | | | | | | | | | | | | | | | | | | | | | | | | |
| (1) | Includes accrued interest. |
| (2) | Net Exposure represents the net receivable/(payable) that would be due from/to the counterparty in the event of default. Exposure from borrowings and other financing transactions can only be netted across transactions governed under the same master agreement with the same legal entity. See Note 8, Master Netting Arrangements, in the Notes to Financial Statements for more information. |
FAIR VALUE MEASUREMENTS
The following is a summary of the fair valuations according to the inputs used as of June 30, 2024 in valuing the Fund’s assets and liabilities:
| | | | | | | | | | | | | | | | |
| Category and Subcategory | | Level 1 | | | Level 2 | | | Level 3 | | | Fair
Value at
06/30/2024 | |
Investments in Securities, at Value | |
U.S. Treasury Obligations | | $ | 0 | | | $ | 490,472 | | | $ | 0 | | | $ | 490,472 | |
Short-Term Instruments | |
Repurchase Agreements | | | 0 | | | | 116 | | | | 0 | | | | 116 | |
| | | | | | | | | | | | | | | | |
| | | | |
Total Investments | | $ | 0 | | | $ | 490,588 | | | $ | 0 | | | $ | 490,588 | |
| | | | | | | | | | | | | | | | |
There were no significant transfers into or out of Level 3 during the period ended June 30, 2024.
| | | | | | | | | | | | |
| See Accompanying Notes | | | ANNUAL FINANCIAL AND OTHER INFORMATION | | | | | | | JUNE 30, 2024 | | | 23 |
| | | | | | |
| Schedule of Investments | | PIMCO 15+ Year U.S. TIPS Index Exchange-Traded Fund | | | | June 30, 2024 |
(Amounts in thousands*, except number of shares, contracts, units and ounces, if any)
| | | | | | | | | | | | |
| | | | | PRINCIPAL
AMOUNT
(000S) | | | | | MARKET
VALUE
(000S) | |
| INVESTMENTS IN SECURITIES 99.6% | |
| |
| U.S. TREASURY OBLIGATIONS 99.5% | |
|
U.S. Treasury Inflation Protected Securities (a) | |
0.125% due 02/15/2051 | | $ | | | 35,180 | | | $ | | | 20,371 | |
0.125% due 02/15/2052 | | | | | 31,978 | | | | | | 18,184 | |
0.250% due 02/15/2050 | | | | | 50,968 | | | | | | 31,158 | |
0.625% due 02/15/2043 | | | | | 94,815 | | | | | | 71,273 | |
0.750% due 02/15/2042 | | | | | 89,401 | | | | | | 69,916 | |
0.750% due 02/15/2045 | | | | | 98,883 | | | | | | 74,152 | |
0.875% due 02/15/2047 | | | | | 87,303 | | | | | | 65,628 | |
1.000% due 02/15/2046 | | | | | 88,118 | | | | | | 68,835 | |
1.000% due 02/15/2048 | | | | | 81,984 | | | | | | 62,839 | |
1.000% due 02/15/2049 | | | | | 55,597 | | | | | | 42,278 | |
1.375% due 02/15/2044 | | | | | 102,528 | | | | | | 87,959 | |
1.500% due 02/15/2053 | | | | | 14,951 | | | | | | 12,574 | |
2.125% due 02/15/2040 | | | | | 11,302 | | | | | | 11,197 | |
2.125% due 02/15/2041 | | | | | 63,514 | | | | | | 63,032 | |
2.125% due 02/15/2054 | | | | | 3,713 | | | | | | 3,614 | |
| | | | | | | | | | | | |
Total U.S. Treasury Obligations
(Cost $990,973) | | | 703,010 | |
| | | | | | | | | | | | |
| | | | | | | | | | | | |
| | | | | | | | | | MARKET
VALUE
(000S) | |
| SHORT-TERM INSTRUMENTS 0.1% | |
| |
| REPURCHASE AGREEMENTS (b) 0.1% | |
| | | | | | | | $ | | | 845 | |
| | | | | | | | | | | | |
Total Short-Term Instruments
(Cost $845) | | | | | | 845 | |
| | | | | | | | | | | | |
| | | | |
| | | | | | | | | | | | |
Total Investments in Securities
(Cost $991,818) | | | | | | 703,855 | |
| | | | |
| | | | | | | | | | | | |
Total Investments 99.6%
(Cost $991,818) | | | $ | | | 703,855 | |
| |
| Other Assets and Liabilities, net 0.4% | | | | | | 3,069 | |
| | | | | | | | | | | | |
| Net Assets 100.0% | | | | | | | | $ | | | 706,924 | |
| | | | | | | | | | | | |
NOTES TO SCHEDULE OF INVESTMENTS:
| * | A zero balance may reflect actual amounts rounding to less than one thousand. |
| (a) | Principal amount of security is adjusted for inflation. |
BORROWINGS AND OTHER FINANCING TRANSACTIONS
(b) REPURCHASE AGREEMENTS:
| | | | | | | | | | | | | | | | | | | | | | | | | | | | | | |
| Counterparty | | Lending
Rate | | | Settlement
Date | | | Maturity
Date | | | Principal
Amount | | | Collateralized By | | Collateral
(Received) | | | Repurchase
Agreements,
at Value | | | Repurchase
Agreement
Proceeds
to be
Received(1) | |
| FICC | | | 2.600 | % | | | 06/28/2024 | | | | 07/01/2024 | | | $ | 845 | | | U.S. Treasury Notes 4.500% due 03/31/2026 | | $ | (862 | ) | | $ | 845 | | | $ | 845 | |
| | | | | | | | | | | | | | | | | | | | | | | | | | | | | | |
Total Repurchase Agreements | | | | | $ | (862 | ) | | $ | 845 | | | $ | 845 | |
| | | | | | | | | | | | | | | | | | | | | | | | | | | | | | |
BORROWINGS AND OTHER FINANCING TRANSACTIONS SUMMARY
The following is a summary by counterparty of the market value of Borrowings and Other Financing Transactions and collateral pledged/(received) as of June 30, 2024:
| | | | | | | | | | | | | | | | | | | | | | | | | | | | |
| Counterparty | | Repurchase
Agreement
Proceeds
to be
Received(1) | | | Payable for
Reverse
Repurchase
Agreements | | | Payable for
Sale-Buyback
Transactions | | | Securities
Out on Loan | | | Total
Borrowings and
Other Financing
Transactions | | | Collateral
Pledged/(Received) | | | Net Exposure(2) | |
Global/Master Repurchase Agreement | |
FICC | | $ | 845 | | | $ | 0 | | | $ | 0 | | | $ | 0 | | | $ | 845 | | | $ | (862 | ) | | $ | (17 | ) |
| | | | | | | | | | | | | | | | | | | | | | | | | | | | |
Total Borrowings and Other Financing Transactions | | $ | 845 | | | $ | 0 | | | $ | 0 | | | $ | 0 | | | | | | | | | | | | | |
| | | | | | | | | | | | | | | | | | | | | | | | | | | | |
| (1) | Includes accrued interest. |
| (2) | Net Exposure represents the net receivable/(payable) that would be due from/to the counterparty in the event of default. Exposure from borrowings and other financing transactions can only be netted across transactions governed under the same master agreement with the same legal entity. See Note 8, Master Netting Arrangements, in the Notes to Financial Statements for more information. |
FAIR VALUE MEASUREMENTS
The following is a summary of the fair valuations according to the inputs used as of June 30, 2024 in valuing the Fund’s assets and liabilities:
| | | | | | | | | | | | | | | | |
| Category and Subcategory | | Level 1 | | | Level 2 | | | Level 3 | | | Fair
Value at
06/30/2024 | |
Investments in Securities, at Value | |
U.S. Treasury Obligations | | $ | 0 | | | $ | 703,010 | | | $ | 0 | | | $ | 703,010 | |
Short-Term Instruments | |
Repurchase Agreements | | | 0 | | | | 845 | | | | 0 | | | | 845 | |
| | | | | | | | | | | | | | | | |
| | | | |
Total Investments | | $ | 0 | | | $ | 703,855 | | | $ | 0 | | | $ | 703,855 | |
| | | | | | | | | | | | | | | | |
There were no significant transfers into or out of Level 3 during the period ended June 30, 2024.
| | | | | | |
| 24 | | PIMCO ETF TRUST | | | See Accompanying Notes | |
| | | | | | |
| Schedule of Investments | | PIMCO Broad U.S. TIPS Index Exchange-Traded Fund | | | | June 30, 2024 |
(Amounts in thousands*, except number of shares, contracts, units and ounces, if any)
| | | | | | | | | | | | |
| | | | | PRINCIPAL
AMOUNT
(000S) | | | | | MARKET
VALUE
(000S) | |
| INVESTMENTS IN SECURITIES 99.6% | |
| |
| U.S. TREASURY OBLIGATIONS 99.5% | |
|
U.S. Treasury Inflation Protected Securities (a) | |
0.125% due 10/15/2025 | | $ | | | 4,669 | | | $ | | | 4,516 | |
0.125% due 04/15/2026 | | | | | 4,422 | | | | | | 4,225 | |
0.125% due 07/15/2026 | | | | | 2,982 | | | | | | 2,851 | |
0.125% due 10/15/2026 | | | | | 4,697 | | | | | | 4,472 | |
0.125% due 04/15/2027 | | | | | 472 | | | | | | 444 | |
0.125% due 01/15/2030 | | | | | 975 | | | | | | 878 | |
0.125% due 07/15/2030 | | | | | 993 | | | | | | 889 | |
0.125% due 01/15/2031 | | | | | 3,850 | | | | | | 3,400 | |
0.125% due 07/15/2031 | | | | | 1,109 | | | | | | 974 | |
0.125% due 01/15/2032 | | | | | 4,138 | | | | | | 3,584 | |
0.250% due 07/15/2029 | | | | | 788 | | | | | | 724 | |
0.375% due 07/15/2025 | | | | | 5,004 | | | | | | 4,879 | |
0.375% due 01/15/2027 | | | | | 950 | | | | | | 903 | |
0.375% due 07/15/2027 | | | | | 707 | | | | | | 672 | |
0.500% due 01/15/2028 | | | | | 916 | | | | | | 864 | |
0.625% due 01/15/2026 | | | | | 5,548 | | | | | | 5,368 | |
0.625% due 07/15/2032 | | | | | 1,353 | | | | | | 1,214 | |
| | | | | | | | | | | | |
| | | | | PRINCIPAL
AMOUNT
(000S) | | | | | MARKET
VALUE
(000S) | |
0.625% due 02/15/2043 | | $ | | | 46 | | | $ | | | 35 | |
0.750% due 07/15/2028 | | | | | 658 | | | | | | 626 | |
0.750% due 02/15/2042 | | | | | 774 | | | | | | 605 | |
0.750% due 02/15/2045 | | | | | 2,534 | | | | | | 1,900 | |
0.875% due 01/15/2029 | | | | | 4,397 | | | | | | 4,166 | |
0.875% due 02/15/2047 | | | | | 4,098 | | | | | | 3,080 | |
1.000% due 02/15/2046 | | | | | 4,151 | | | | | | 3,242 | |
1.000% due 02/15/2048 | | | | | 4,103 | | | | | | 3,145 | |
1.125% due 01/15/2033 | | | | | 5,406 | | | | | | 5,004 | |
1.250% due 04/15/2028 | | | | | 430 | | | | | | 415 | |
1.375% due 07/15/2033 | | | | | 5,115 | | | | | | 4,832 | |
1.375% due 02/15/2044 | | | | | 4,193 | | | | | | 3,597 | |
1.500% due 02/15/2053 | | | | | 33 | | | | | | 27 | |
1.625% due 10/15/2027 | | | | | 4,664 | | | | | | 4,589 | |
1.750% due 01/15/2034 | | | | | 4,887 | | | | | | 4,745 | |
2.000% due 01/15/2026 | | | | | 3,895 | | | | | | 3,848 | |
2.125% due 04/15/2029 | | | | | 109 | | | | | | 110 | |
2.125% due 02/15/2041 | | | | | 136 | | | | | | 135 | |
2.125% due 02/15/2054 | | | | | 2,398 | | | | | | 2,334 | |
2.375% due 01/15/2027 | | | | | 3,411 | | | | | | 3,410 | |
2.375% due 10/15/2028 | | | | | 4,565 | | | | | | 4,626 | |
3.375% due 04/15/2032 | | | | | 2,155 | | | | | | 2,353 | |
| | | | | | | | | | | | |
| | | | | PRINCIPAL
AMOUNT
(000S) | | | | | MARKET
VALUE
(000S) | |
3.625% due 04/15/2028 | | $ | | | 107 | | | $ | | | 112 | |
3.875% due 04/15/2029 | | | | | 423 | | | | | | 457 | |
| | | | | | | | | | | | |
Total U.S. Treasury Obligations (Cost $101,641) | | | | | | | | | 98,250 | |
| | | | | | | | | | | | |
| | | | | | | | | | |
| SHORT-TERM INSTRUMENTS 0.1% | | | | | | | | | | |
| | | | | | | | | | |
| REPURCHASE AGREEMENTS (b) 0.1% | |
| | | | | | | | | | | 102 | |
| | | | | | | | | | | | |
| Total Short-Term Instruments (Cost $102) | | | | | | | | | 102 | |
| | | | | | | | | | | | |
|
| |
| Total Investments in Securities (Cost $101,743) | | | | | | | | | 98,352 | |
| | | | |
| | | | | | | | | | | | |
| Total Investments 99.6% (Cost $101,743) | | | | | | $ | | | 98,352 | |
| |
| Other Assets and Liabilities, net 0.4% | | | | | | 391 | |
| | | | | | | | | | | | |
| Net Assets 100.0% | | | | | | $ | | | 98,743 | |
| | | | | | | | | | | | |
NOTES TO SCHEDULE OF INVESTMENTS:
| * | A zero balance may reflect actual amounts rounding to less than one thousand. |
| (a) | Principal amount of security is adjusted for inflation. |
BORROWINGS AND OTHER FINANCING TRANSACTIONS
(b) REPURCHASE AGREEMENTS:
| | | | | | | | | | | | | | | | | | | | | | | | | | | | | | |
| Counterparty | | Lending
Rate | | | Settlement
Date | | | Maturity
Date | | | Principal
Amount | | | Collateralized By | | Collateral
(Received) | | | Repurchase
Agreements,
at Value | | | Repurchase
Agreement
Proceeds
to be
Received(1) | |
| FICC | | | 2.600 | % | | | 06/28/2024 | | | | 07/01/2024 | | | $ | 102 | | | U.S. Treasury Notes 4.500% due 03/31/2026 | | $ | (104 | ) | | $ | 102 | | | $ | 102 | |
| | | | | | | | | | | | | | | | | | | | | | | | | | | | | | |
Total Repurchase Agreements | | | | | $ | (104 | ) | | $ | 102 | | | $ | 102 | |
| | | | | | | | | | | | | | | | | | | | | | | | | | | | | | |
BORROWINGS AND OTHER FINANCING TRANSACTIONS SUMMARY
The following is a summary by counterparty of the market value of Borrowings and Other Financing Transactions and collateral pledged/(received) as of June 30, 2024:
| | | | | | | | | | | | | | | | | | | | | | | | |
| Counterparty | | Repurchase
Agreement
Proceeds
to be
Received(1) | | | Payable for
Reverse
Repurchase
Agreements | | | Payable for
Sale-Buyback
Transactions | | | Total
Borrowings and
Other Financing
Transactions | | | Collateral
Pledged/(Received) | | | Net Exposure(2) | |
Global/Master Repurchase Agreement | |
FICC | | $ | 102 | | | $ | 0 | | | $ | 0 | | | $ | 102 | | | $ | (104 | ) | | $ | (2 | ) |
| | | | | | | | | | | | | | | | | | | | | | | | |
Total Borrowings and Other Financing Transactions | | $ | 102 | | | $ | 0 | | | $ | 0 | | | | | | | | | | | | | |
| | | | | | | | | | | | | | | | | | | | | | | | |
| (1) | Includes accrued interest. |
| (2) | Net Exposure represents the net receivable/(payable) that would be due from/to the counterparty in the event of default. Exposure from borrowings and other financing transactions can only be netted across transactions governed under the same master agreement with the same legal entity. See Note 8, Master Netting Arrangements, in the Notes to Financial Statements for more information. |
FAIR VALUE MEASUREMENTS
The following is a summary of the fair valuations according to the inputs used as of June 30, 2024 in valuing the Fund’s assets and liabilities:
| | | | | | | | | | | | | | | | |
| Category and Subcategory | | Level 1 | | | Level 2 | | | Level 3 | | | Fair Value at 06/30/2024 | |
Investments in Securities, at Value | |
U.S. Treasury Obligations | | $ | 0 | | | $ | 98,250 | | | $ | 0 | | | $ | 98,250 | |
Short-Term Instruments | |
Repurchase Agreements | | | 0 | | | | 102 | | | | 0 | | | | 102 | |
| | | | | | | | | | | | | | | | |
| | | | |
Total Investments | | $ | 0 | | | $ | 98,352 | | | $ | 0 | | | $ | 98,352 | |
| | | | | | | | | | | | | | | | |
There were no significant transfers into or out of Level 3 during the period ended June 30, 2024.
| | | | | | | | | | | | |
| See Accompanying Notes | | | ANNUAL FINANCIAL AND OTHER INFORMATION | | | | | | | JUNE 30, 2024 | | | 25 |
| | | | | | |
| Schedule of Investments | | PIMCO 0-5 Year High Yield Corporate Bond Index Exchange-Traded Fund | | | | |
(Amounts in thousands*, except number of shares, contracts, units and ounces, if any)
| | | | | | | | | | | | |
| | | | | PRINCIPAL
AMOUNT
(000S) | | | | | MARKET
VALUE
(000S) | |
| INVESTMENTS IN SECURITIES 99.8% | |
| |
| LOAN PARTICIPATIONS AND ASSIGNMENTS 0.6% | |
|
American Airlines, Inc. | |
10.336% due 04/20/2028 | | $ | | | 800 | | | $ | | | 827 | |
|
Cengage Learning, Inc. | |
9.538% due 03/22/2031 | | | | | 950 | | | | | | 954 | |
|
Envision Healthcare Corp. | |
11.186% due 11/03/2028 « | | | | | 628 | | | | | | 628 | |
14.311% due 07/20/2026 « | | | | | 2,339 | | | | | | 2,339 | |
|
Level 3 Financing, Inc. | |
11.904% due 04/15/2029 | | | | | 500 | | | | | | 491 | |
11.904% due 04/15/2030 | | | | | 500 | | | | | | 488 | |
|
LifePoint Health, Inc. | |
9.329% due 05/17/2031 | | | | | 600 | | | | | | 602 | |
|
MH SUB I, LLC | |
9.594% due 05/03/2028 | | | | | 990 | | | | | | 990 | |
|
Wesco Aircraft Holdings, Inc. | |
TBD% - 13.928% due 07/15/2024 « | | | | | 376 | | | | | | 404 | |
| | | | | | | | | |
Total Loan Participations and Assignments (Cost $7,610) | | | 7,723 | |
| | | | |
| |
| CORPORATE BONDS & NOTES 94.1% | |
| |
| BANKING & FINANCE 15.7% | |
|
Acrisure LLC | |
8.250% due 02/01/2029 | | | | | 1,450 | | | | | | 1,458 | |
|
AerCap Holdings NV | |
5.875% due 10/10/2079 • | | | | | 474 | | | | | | 472 | |
|
AG TTMT Escrow Issuer LLC | |
8.625% due 09/30/2027 | | | | | 1,763 | | | | | | 1,830 | |
|
Alliant Holdings Intermediate LLC | |
4.250% due 10/15/2027 | | | | | 710 | | | | | | 666 | |
6.750% due 10/15/2027 | | | | | 3,325 | | | | | | 3,283 | |
6.750% due 04/15/2028 | | | | | 2,263 | | | | | | 2,269 | |
|
Allied Universal Holdco LLC | |
4.625% due 06/01/2028 | | | | | 2,642 | | | | | | 2,411 | |
9.750% due 07/15/2027 | | | | | 2,229 | | | | | | 2,218 | |
|
Ally Financial, Inc. | |
5.750% due 11/20/2025 | | | | | 2,248 | | | | | | 2,235 | |
|
AmWINS Group, Inc. | |
4.875% due 06/30/2029 | | | | | 760 | | | | | | 708 | |
6.375% due 02/15/2029 | | | | | 1,048 | | | | | | 1,051 | |
|
Apollo Commercial Real Estate Finance, Inc. | |
4.625% due 06/15/2029 | | | | | 2,950 | | | | | | 2,476 | |
|
Armor Holdco, Inc. | |
8.500% due 11/15/2029 | | | | | 600 | | | | | | 572 | |
|
AssuredPartners, Inc. | |
5.625% due 01/15/2029 | | | | | 1,125 | | | | | | 1,053 | |
|
Brandywine Operating Partnership LP | |
3.950% due 11/15/2027 | | | | | 386 | | | | | | 350 | |
8.050% due 03/15/2028 | | | | | 3,050 | | | | | | 3,175 | |
8.875% due 04/12/2029 | | | | | 1,812 | | | | | | 1,889 | |
|
Bread Financial Holdings, Inc. | |
9.750% due 03/15/2029 | | | | | 298 | | | | | | 313 | |
|
Brookfield Property REIT, Inc. | |
4.500% due 04/01/2027 | | | | | 2,358 | | | | | | 2,197 | |
5.750% due 05/15/2026 | | | | | 1,528 | | | | | | 1,498 | |
|
Burford Capital Global Finance LLC | |
6.250% due 04/15/2028 | | | | | 1,540 | | | | | | 1,490 | |
|
Castlelake Aviation Finance DAC | |
5.000% due 04/15/2027 | | | | | 1,047 | | | | | | 1,014 | |
|
Coinbase Global, Inc. | |
3.375% due 10/01/2028 | | | | | 1,556 | | | | | | 1,336 | |
|
Compass Group Diversified Holdings LLC | |
5.250% due 04/15/2029 | | | | | 1,012 | | | | | | 961 | |
|
Credit Acceptance Corp. | |
6.625% due 03/15/2026 (f) | | | | | 1,490 | | | | | | 1,489 | |
9.250% due 12/15/2028 | | | | | 3,107 | | | | | | 3,288 | |
|
Cushman & Wakefield U.S. Borrower LLC | |
6.750% due 05/15/2028 | | | | | 2,195 | | | | | | 2,181 | |
8.875% due 09/01/2031 | | | | | 106 | | | | | | 112 | |
| | | | | | | | | | | | |
| | | | | PRINCIPAL
AMOUNT
(000S) | | | | | MARKET
VALUE
(000S) | |
|
Diversified Healthcare Trust | |
0.000% due 01/15/2026 (d) | | $ | | | 852 | | | $ | | | 744 | |
4.750% due 02/15/2028 (f) | | | | | 498 | | | | | | 411 | |
9.750% due 06/15/2025 | | | | | 1,804 | | | | | | 1,803 | |
|
Encore Capital Group, Inc. | |
8.500% due 05/15/2030 | | | | | 925 | | | | | | 943 | |
|
Enova International, Inc. | |
8.500% due 09/15/2025 | | | | | 935 | | | | | | 937 | |
|
Five Point Operating Co. LP | |
10.500% due 01/15/2028 þ | | | | | 1,151 | | | | | | 1,181 | |
|
Fortress Transportation & Infrastructure Investors LLC | |
5.500% due 05/01/2028 | | | | | 2,259 | | | | | | 2,192 | |
9.750% due 08/01/2027 | | | | | 1,157 | | | | | | 1,189 | |
|
Freedom Mortgage Corp. | |
6.625% due 01/15/2027 | | | | | 1,220 | | | | | | 1,179 | |
7.625% due 05/01/2026 | | | | | 1,095 | | | | | | 1,088 | |
12.000% due 10/01/2028 | | | | | 3,339 | | | | | | 3,589 | |
|
Freedom Mortgage Holdings LLC | |
9.250% due 02/01/2029 | | | | | 2,460 | | | | | | 2,460 | |
|
GGAM Finance Ltd. | |
6.875% due 04/15/2029 | | | | | 1,386 | | | | | | 1,414 | |
7.750% due 05/15/2026 | | | | | 837 | | | | | | 855 | |
8.000% due 02/15/2027 | | | | | 2,918 | | | | | | 3,016 | |
8.000% due 06/15/2028 | | | | | 354 | | | | | | 373 | |
|
Global Aircraft Leasing Co. Ltd. (6.500% Cash or 7.250% PIK) | |
6.500% due 09/15/2024 (a) | | | | | 161 | | | | | | 155 | |
|
Global Atlantic Fin Co. | |
4.700% due 10/15/2051 • | | | | | 2,714 | | | | | | 2,521 | |
|
GTCR AP Finance, Inc. | |
8.000% due 05/15/2027 | | | | | 1,154 | | | | | | 1,157 | |
|
HAT Holdings LLC | |
3.375% due 06/15/2026 | | | | | 3,139 | | | | | | 2,963 | |
6.000% due 04/15/2025 | | | | | 853 | | | | | | 853 | |
8.000% due 06/15/2027 | | | | | 797 | | | | | | 830 | |
|
Howard Hughes Corp. | |
5.375% due 08/01/2028 | | | | | 1,818 | | | | | | 1,730 | |
|
Hudson Pacific Properties LP | |
5.950% due 02/15/2028 (f) | | | | | 2,242 | | | | | | 1,908 | |
|
Icahn Enterprises LP | |
5.250% due 05/15/2027 | | | | | 3,367 | | | | | | 3,163 | |
6.250% due 05/15/2026 | | | | | 3,273 | | | | | | 3,250 | |
9.000% due 06/15/2030 | | | | | 1,750 | | | | | | 1,743 | |
|
Intesa Sanpaolo SpA | |
5.710% due 01/15/2026 | | | | | 3,448 | | | | | | 3,417 | |
|
Iron Mountain, Inc. | |
4.875% due 09/15/2027 | | | | | 3,624 | | | | | | 3,517 | |
5.000% due 07/15/2028 | | | | | 356 | | | | | | 341 | |
5.250% due 03/15/2028 | | | | | 642 | | | | | | 622 | |
|
Jefferies Finance LLC | |
5.000% due 08/15/2028 | | | | | 2,691 | | | | | | 2,485 | |
|
Jefferson Capital Holdings LLC | |
6.000% due 08/15/2026 | | | | | 1,754 | | | | | | 1,731 | |
9.500% due 02/15/2029 | | | | | 1,352 | | | | | | 1,395 | |
|
Kennedy-Wilson, Inc. | |
4.750% due 03/01/2029 | | | | | 1,222 | | | | | | 1,047 | |
|
Ladder Capital Finance Holdings LLLP | |
4.250% due 02/01/2027 | | | | | 3,681 | | | | | | 3,490 | |
5.250% due 10/01/2025 | | | | | 1,154 | | | | | | 1,145 | |
|
LD Holdings Group LLC | |
6.125% due 04/01/2028 | | | | | 618 | | | | | | 464 | |
8.750% due 11/01/2027 | | | | | 273 | | | | | | 242 | |
|
LFS Topco LLC | |
5.875% due 10/15/2026 | | | | | 1,533 | | | | | | 1,416 | |
|
Liberty Mutual Group, Inc. | |
4.125% due 12/15/2051 • | | | | | 3,312 | | | | | | 3,103 | |
|
Macquarie Airfinance Holdings Ltd. | |
6.400% due 03/26/2029 | | | | | 1,417 | | | | | | 1,442 | |
|
Midcap Financial Issuer Trust | |
6.500% due 05/01/2028 | | | | | 4,705 | | | | | | 4,455 | |
|
MPT Operating Partnership LP | |
5.250% due 08/01/2026 (f) | | | | | 900 | | | | | | 819 | |
|
Nationstar Mortgage Holdings, Inc. | |
5.000% due 02/01/2026 | | | | | 1,078 | | | | | | 1,056 | |
6.000% due 01/15/2027 | | | | | 2,911 | | | | | | 2,883 | |
| | | | | | | | | | | | |
| | | | | PRINCIPAL
AMOUNT
(000S) | | | | | MARKET
VALUE
(000S) | |
|
Navient Corp. | |
5.000% due 03/15/2027 | | $ | | | 1,727 | | | $ | | | 1,650 | |
5.875% due 10/25/2024 | | | | | 534 | | | | | | 534 | |
6.750% due 06/25/2025 | | | | | 1,167 | | | | | | 1,167 | |
6.750% due 06/15/2026 | | | | | 2,334 | | | | | | 2,350 | |
|
NCL Finance Ltd. | |
6.125% due 03/15/2028 | | | | | 909 | | | | | | 898 | |
|
Necessity Retail REIT, Inc. | |
4.500% due 09/30/2028 | | | | | 668 | | | | | | 588 | |
|
Newmark Group, Inc. | |
7.500% due 01/12/2029 | | | | | 1,522 | | | | | | 1,566 | |
|
Office Properties Income Trust | |
4.500% due 02/01/2025 | | | | | 328 | | | | | | 264 | |
9.000% due 09/30/2029 | | | | | 152 | | | | | | 120 | |
|
OneMain Finance Corp. | |
3.500% due 01/15/2027 | | | | | 2,483 | | | | | | 2,329 | |
6.625% due 01/15/2028 | | | | | 1,564 | | | | | | 1,571 | |
7.125% due 03/15/2026 | | | | | 4,298 | | | | | | 4,371 | |
|
Osaic Holdings, Inc. | |
10.750% due 08/01/2027 | | | | | 356 | | | | | | 367 | |
|
Oxford Finance LLC | |
6.375% due 02/01/2027 | | | | | 1,654 | | | | | | 1,595 | |
|
Park Intermediate Holdings LLC | |
5.875% due 10/01/2028 | | | | | 20 | | | | | | 20 | |
7.000% due 02/01/2030 | | | | | 1,425 | | | | | | 1,443 | |
|
PennyMac Financial Services, Inc. | |
4.250% due 02/15/2029 | | | | | 260 | | | | | | 237 | |
5.375% due 10/15/2025 | | | | | 1,940 | | | | | | 1,924 | |
|
Popular, Inc. | |
7.250% due 03/13/2028 | | | | | 1,633 | | | | | | 1,678 | |
|
PRA Group, Inc. | |
7.375% due 09/01/2025 | | | | | 1,423 | | | | | | 1,426 | |
8.375% due 02/01/2028 | | | | | 1,923 | | | | | | 1,918 | |
|
Provident Funding Associates LP | |
6.375% due 06/15/2025 | | | | | 1,406 | | | | | | 1,367 | |
|
Radian Group, Inc. | |
6.200% due 05/15/2029 | | | | | 24 | | | | | | 24 | |
|
RHP Hotel Properties LP | |
4.750% due 10/15/2027 | | | | | 1,175 | | | | | | 1,133 | |
7.250% due 07/15/2028 | | | | | 1,473 | | | | | | 1,524 | |
|
Rithm Capital Corp. | |
8.000% due 04/01/2029 | | | | | 500 | | | | | | 486 | |
|
RLJ Lodging Trust LP | |
3.750% due 07/01/2026 | | | | | 1,927 | | | | | | 1,834 | |
|
Rocket Mortgage LLC | |
2.875% due 10/15/2026 | | | | | 4,808 | | | | | | 4,494 | |
3.625% due 03/01/2029 | | | | | 797 | | | | | | 724 | |
|
SBA Communications Corp. | |
3.125% due 02/01/2029 | | | | | 1,332 | | | | | | 1,189 | |
3.875% due 02/15/2027 | | | | | 2,162 | | | | | | 2,062 | |
|
Service Properties Trust | |
4.750% due 10/01/2026 | | | | | 1,732 | | | | | | 1,624 | |
5.500% due 12/15/2027 | | | | | 1,785 | | | | | | 1,660 | |
8.375% due 06/15/2029 | | | | | 2,700 | | | | | | 2,656 | |
|
SLM Corp. | |
3.125% due 11/02/2026 | | | | | 2,372 | | | | | | 2,212 | |
4.200% due 10/29/2025 | | | | | 1,243 | | | | | | 1,211 | |
|
Starwood Property Trust, Inc. | |
3.625% due 07/15/2026 | | | | | 1,291 | | | | | | 1,216 | |
3.750% due 12/31/2024 | | | | | 1,448 | | | | | | 1,430 | |
4.375% due 01/15/2027 | | | | | 2,068 | | | | | | 1,960 | |
4.750% due 03/15/2025 | | | | | 353 | | | | | | 349 | |
|
UniCredit SpA | |
5.861% due 06/19/2032 • | | | | | 1,806 | | | | | | 1,764 | |
|
United Wholesale Mortgage LLC | |
5.500% due 11/15/2025 | | | | | 760 | | | | | | 755 | |
5.750% due 06/15/2027 | | | | | 931 | | | | | | 910 | |
|
Uniti Group LP | |
10.500% due 02/15/2028 | | | | | 5,157 | | | | | | 5,056 | |
|
Vornado Realty LP | |
2.150% due 06/01/2026 | | | | | 2,110 | | | | | | 1,947 | |
3.500% due 01/15/2025 | | | | | 1,044 | | | | | | 1,028 | |
|
Voyager Aviation Holdings LLC | |
8.500% due 05/09/2026 ^«(b) | | | | | 612 | | | | | | 70 | |
| | | | | | |
| 26 | | PIMCO ETF TRUST | | | See Accompanying Notes | |
| | | | | | | | | | | | |
| | | | | PRINCIPAL
AMOUNT
(000S) | | | | | MARKET
VALUE
(000S) | |
|
XHR LP | |
4.875% due 06/01/2029 | | $ | | | 600 | | | $ | | | 563 | |
6.375% due 08/15/2025 | | | | | 1,085 | | | | | | 1,085 | |
| | | | | | | | | | | | |
| | | | | | | | | | | 193,061 | |
| | | | | | | | | | | | |
| |
| INDUSTRIALS 74.2% | |
|
Acadia Healthcare Co., Inc. | |
5.500% due 07/01/2028 | | | | | 1,113 | | | | | | 1,090 | |
|
ACCO Brands Corp. | |
4.250% due 03/15/2029 | | | | | 130 | | | | | | 116 | |
|
ACI Worldwide, Inc. | |
5.750% due 08/15/2026 | | | | | 250 | | | | | | 249 | |
|
Acushnet Co. | |
7.375% due 10/15/2028 | | | | | 381 | | | | | | 395 | |
|
AdaptHealth LLC | |
6.125% due 08/01/2028 | | | | | 1,178 | | | | | | 1,126 | |
|
Adient Global Holdings Ltd. | |
4.875% due 08/15/2026 | | | | | 2,018 | | | | | | 1,964 | |
7.000% due 04/15/2028 | | | | | 374 | | | | | | 383 | |
|
Advance Auto Parts, Inc. | |
1.750% due 10/01/2027 | | | | | 200 | | | | | | 175 | |
|
Advantage Sales & Marketing, Inc. | |
6.500% due 11/15/2028 | | | | | 2,189 | | | | | | 1,983 | |
|
AECOM | |
5.125% due 03/15/2027 | | | | | 966 | | | | | | 950 | |
|
AerCap Global Aviation Trust | |
6.500% due 06/15/2045 • | | | | | 110 | | | | | | 110 | |
|
Ahead DB Holdings LLC | |
6.625% due 05/01/2028 | | | | | 1,396 | | | | | | 1,323 | |
|
Ahlstrom Holding Oy | |
4.875% due 02/04/2028 | | | | | 997 | | | | | | 934 | |
|
Air Canada | |
3.875% due 08/15/2026 | | | | | 1,371 | | | | | | 1,306 | |
|
Albertsons Cos., Inc. | |
3.250% due 03/15/2026 | | | | | 1,247 | | | | | | 1,199 | |
3.500% due 03/15/2029 | | | | | 1,270 | | | | | | 1,143 | |
4.625% due 01/15/2027 | | | | | 1,481 | | | | | | 1,432 | |
5.875% due 02/15/2028 | | | | | 2,549 | | | | | | 2,521 | |
6.500% due 02/15/2028 | | | | | 868 | | | | | | 873 | |
7.500% due 03/15/2026 | | | | | 1,089 | | | | | | 1,105 | |
|
Albion Financing SARL | |
6.125% due 10/15/2026 | | | | | 2,182 | | | | | | 2,156 | |
8.750% due 04/15/2027 | | | | | 1,928 | | | | | | 1,945 | |
|
Alcoa Nederland Holding BV | |
5.500% due 12/15/2027 | | | | | 250 | | | | | | 246 | |
6.125% due 05/15/2028 | | | | | 876 | | | | | | 873 | |
|
Allegiant Travel Co. | |
7.250% due 08/15/2027 (f) | | | | | 2,855 | | | | | | 2,720 | |
|
Allen Media LLC | |
10.500% due 02/15/2028 | | | | | 468 | | | | | | 206 | |
|
Alta Equipment Group, Inc. | |
9.000% due 06/01/2029 | | | | | 2,500 | | | | | | 2,322 | |
|
Alteryx, Inc. | |
8.750% due 03/15/2028 (f) | | | | | 1,166 | | | | | | 1,195 | |
|
Altice Financing SA | |
5.000% due 01/15/2028 | | | | | 3,739 | | | | | | 2,848 | |
|
Altice France Holding SA | |
6.000% due 02/15/2028 | | | | | 738 | | | | | | 241 | |
10.500% due 05/15/2027 | | | | | 7,710 | | | | | | 3,086 | |
|
Altice France SA | |
5.125% due 01/15/2029 | | | | | 600 | | | | | | 392 | |
5.125% due 07/15/2029 | | | | | 1,356 | | | | | | 894 | |
5.500% due 01/15/2028 | | | | | 2,324 | | | | | | 1,594 | |
8.125% due 02/01/2027 | | | | | 3,311 | | | | | | 2,486 | |
|
AMC Entertainment Holdings, Inc. | |
7.500% due 02/15/2029 | | | | | 1,400 | | | | | | 950 | |
|
AMC Entertainment Holdings, Inc. (10.000% Cash or 12.000% PIK) | |
10.000% due 06/15/2026 (a)(f) | | | | | 2,685 | | | | | | 2,330 | |
|
AMC Networks, Inc. | |
10.250% due 01/15/2029 | | | | | 1,964 | | | | | | 1,937 | |
|
Amer Sports Co. | |
6.750% due 02/16/2031 | | | | | 420 | | | | | | 419 | |
| | | | | | | | | | | | |
| | | | | PRINCIPAL
AMOUNT
(000S) | | | | | MARKET
VALUE
(000S) | |
|
American Airlines, Inc. | |
5.500% due 04/20/2026 | | $ | | | 4,244 | | | $ | | | 4,210 | |
5.750% due 04/20/2029 | | | | | 3,200 | | | | | | 3,116 | |
7.250% due 02/15/2028 | | | | | 871 | | | | | | 873 | |
8.500% due 05/15/2029 | | | | | 779 | | | | | | 810 | |
|
American Axle & Manufacturing, Inc. | |
6.500% due 04/01/2027 | | | | | 547 | | | | | | 547 | |
6.875% due 07/01/2028 | | | | | 1,248 | | | | | | 1,247 | |
|
American Builders & Contractors Supply Co., Inc. | |
3.875% due 11/15/2029 | | | | | 778 | | | | | | 697 | |
4.000% due 01/15/2028 | | | | | 1,486 | | | | | | 1,389 | |
|
Amkor Technology, Inc. | |
6.625% due 09/15/2027 | | | | | 250 | | | | | | 251 | |
|
AMN Healthcare, Inc. | |
4.625% due 10/01/2027 | | | | | 250 | | | | | | 238 | |
|
ams-OSRAM AG | |
12.250% due 03/30/2029 | | | | | 1,806 | | | | | | 1,872 | |
|
ANGI Group LLC | |
3.875% due 08/15/2028 | | | | | 568 | | | | | | 489 | |
|
APX Group, Inc. | |
6.750% due 02/15/2027 | | | | | 385 | | | | | | 384 | |
|
Aramark Services, Inc. | |
5.000% due 04/01/2025 | | | | | 450 | | | | | | 447 | |
5.000% due 02/01/2028 | | | | | 2,237 | | | | | | 2,166 | |
|
Arches Buyer, Inc. | |
4.250% due 06/01/2028 | | | | | 1,613 | | | | | | 1,442 | |
|
ARD Finance SA (6.500% Cash or 7.250% PIK) | |
6.500% due 06/30/2027 (a) | | | | | 3,265 | | | | | | 831 | |
|
Ardagh Metal Packaging Finance USA LLC | |
6.000% due 06/15/2027 | | | | | 1,790 | | | | | | 1,761 | |
|
Ardagh Packaging Finance PLC | |
4.125% due 08/15/2026 (f) | | | | | 2,743 | | | | | | 2,384 | |
5.250% due 08/15/2027 (f) | | | | | 2,551 | | | | | | 1,592 | |
|
Artera Services LLC | |
8.500% due 02/15/2031 | | | | | 818 | | | | | | 843 | |
|
Ascent Resources Utica Holdings LLC | |
5.875% due 06/30/2029 | | | | | 876 | | | | | | 857 | |
7.000% due 11/01/2026 | | | | | 1,547 | | | | | | 1,550 | |
|
Aston Martin Capital Holdings Ltd. | |
10.000% due 03/31/2029 | | | | | 2,708 | | | | | | 2,671 | |
|
ATP Tower Holdings LLC | |
4.050% due 04/27/2026 | | | | | 1,310 | | | | | | 1,242 | |
|
Avantor Funding, Inc. | |
4.625% due 07/15/2028 | | | | | 1,613 | | | | | | 1,536 | |
|
Avient Corp. | |
5.750% due 05/15/2025 | | | | | 1,285 | | | | | | 1,283 | |
|
Avis Budget Car Rental LLC | |
4.750% due 04/01/2028 (f) | | | | | 1,303 | | | | | | 1,197 | |
|
Axalta Coating Systems LLC | |
3.375% due 02/15/2029 | | | | | 628 | | | | | | 563 | |
4.750% due 06/15/2027 | | | | | 1,240 | | | | | | 1,207 | |
|
B&G Foods, Inc. | |
5.250% due 04/01/2025 | | | | | 333 | | | | | | 332 | |
5.250% due 09/15/2027 (f) | | | | | 3,625 | | | | | | 3,362 | |
8.000% due 09/15/2028 | | | | | 1,647 | | | | | | 1,676 | |
|
B.C. Unlimited Liability Co. | |
3.875% due 01/15/2028 | | | | | 200 | | | | | | 188 | |
4.375% due 01/15/2028 | | | | | 4,474 | | | | | | 4,223 | |
5.750% due 04/15/2025 | | | | | 317 | | | | | | 316 | |
6.125% due 06/15/2029 | | | | | 1,850 | | | | | | 1,858 | |
|
Ball Corp. | |
2.875% due 08/15/2030 | | | | | 900 | | | | | | 765 | |
|
Bath & Body Works, Inc. | |
6.694% due 01/15/2027 | | | | | 635 | | | | | | 644 | |
7.500% due 06/15/2029 | | | | | 700 | | | | | | 724 | |
9.375% due 07/01/2025 | | | | | 881 | | | | | | 912 | |
|
Bausch & Lomb Escrow Corp. | |
8.375% due 10/01/2028 | | | | | 3,384 | | | | | | 3,469 | |
|
Bausch Health Americas, Inc. | |
9.250% due 04/01/2026 (f) | | | | | 824 | | | | | | 747 | |
|
Bausch Health Cos., Inc. | |
4.875% due 06/01/2028 | | | | | 2,580 | | | | | | 1,934 | |
5.000% due 01/30/2028 | | | | | 794 | | | | | | 418 | |
5.500% due 11/01/2025 | | | | | 2,356 | | | | | | 2,197 | |
| | | | | | | | | | | | |
| | | | | PRINCIPAL
AMOUNT
(000S) | | | | | MARKET
VALUE
(000S) | |
5.750% due 08/15/2027 | | $ | | | 704 | | | $ | | | 562 | |
6.125% due 02/01/2027 (f) | | | | | 1,897 | | | | | | 1,581 | |
9.000% due 12/15/2025 (f) | | | | | 1,173 | | | | | | 1,064 | |
11.000% due 09/30/2028 | | | | | 2,613 | | | | | | 2,332 | |
|
BC Ltd. | |
9.000% due 01/30/2028 | | | | | 281 | | | | | | 271 | |
|
BCPE Empire Holdings, Inc. | |
7.625% due 05/01/2027 | | | | | 3,322 | | | | | | 3,222 | |
|
BCPE Ulysses Intermediate, Inc. (7.750% Cash or 8.500% PIK) | |
7.750% due 04/01/2027 (a) | | | | | 1,300 | | | | | | 1,269 | |
|
Beacon Roofing Supply, Inc. | |
4.500% due 11/15/2026 (f) | | | | | 1,457 | | | | | | 1,418 | |
|
Beazer Homes USA, Inc. | |
7.500% due 03/15/2031 | | | | | 884 | | | | | | 883 | |
|
Benteler International AG | |
10.500% due 05/15/2028 | | | | | 250 | | | | | | 269 | |
|
Berry Global, Inc. | |
4.500% due 02/15/2026 | | | | | 470 | | | | | | 460 | |
5.625% due 07/15/2027 | | | | | 125 | | | | | | 123 | |
|
Blackstone Mortgage Trust, Inc. | |
3.750% due 01/15/2027 | | | | | 510 | | | | | | 460 | |
|
Block Communications, Inc. | |
4.875% due 03/01/2028 | | | | | 385 | | | | | | 345 | |
|
Block, Inc. | |
2.750% due 06/01/2026 | | | | | 1,635 | | | | | | 1,546 | |
|
Bombardier, Inc. | |
6.000% due 02/15/2028 | | | | | 1,750 | | | | | | 1,732 | |
7.875% due 04/15/2027 | | | | | 1,237 | | | | | | 1,241 | |
|
Borr IHC Ltd. | |
10.000% due 11/15/2028 | | | | | 1,250 | | | | | | 1,310 | |
|
Boxer Parent Co., Inc. | |
7.125% due 10/02/2025 | | | | | 1,723 | | | | | | 1,729 | |
9.125% due 03/01/2026 | | | | | 620 | | | | | | 623 | |
|
Boyd Gaming Corp. | |
4.750% due 12/01/2027 | | | | | 1,974 | | | | | | 1,904 | |
|
Brink’s Co. | |
5.500% due 07/15/2025 | | | | | 500 | | | | | | 500 | |
6.500% due 06/15/2029 | | | | | 375 | | | | | | 379 | |
6.750% due 06/15/2032 | | | | | 150 | | | | | | 151 | |
|
Buckeye Partners LP | |
3.950% due 12/01/2026 | | | | | 898 | | | | | | 853 | |
4.125% due 03/01/2025 | | | | | 363 | | | | | | 359 | |
4.350% due 10/15/2024 | | | | | 87 | | | | | | 87 | |
4.500% due 03/01/2028 | | | | | 1,472 | | | | | | 1,384 | |
|
Cablevision Lightpath LLC | |
3.875% due 09/15/2027 | | | | | 694 | | | | | | 614 | |
5.625% due 09/15/2028 | | | | | 694 | | | | | | 560 | |
|
Caesars Entertainment, Inc. | |
8.125% due 07/01/2027 | | | | | 2,420 | | | | | | 2,471 | |
|
Calderys Financing LLC | |
11.250% due 06/01/2028 | | | | | 330 | | | | | | 350 | |
|
California Resources Corp. | |
8.250% due 06/15/2029 | | | | | 550 | | | | | | 562 | |
|
Calumet Specialty Products Partners LP | |
8.125% due 01/15/2027 | | | | | 642 | | | | | | 606 | |
9.750% due 07/15/2028 | | | | | 572 | | | | | | 542 | |
|
Camelot Finance SA | |
4.500% due 11/01/2026 | | | | | 733 | | | | | | 710 | |
|
Camelot Return Merger Sub, Inc. | |
8.750% due 08/01/2028 | | | | | 961 | | | | | | 943 | |
|
Cargo Aircraft Management, Inc. | |
4.750% due 02/01/2028 | | | | | 3,429 | | | | | | 3,185 | |
|
Carnival Corp. | |
4.000% due 08/01/2028 | | | | | 4,022 | | | | | | 3,780 | |
5.750% due 03/01/2027 | | | | | 6,070 | | | | | | 6,001 | |
7.625% due 03/01/2026 | | | | | 2,647 | | | | | | 2,675 | |
|
Carnival Holdings Bermuda Ltd. | |
10.375% due 05/01/2028 | | | | | 2,621 | | | | | | 2,839 | |
|
Carvana Co. (12.000% PIK) | |
12.000% due 12/01/2028 (a) | | | | | 1,866 | | | | | | 1,924 | |
|
Cascades, Inc. | |
5.375% due 01/15/2028 | | | | | 843 | | | | | | 813 | |
| | | | | | | | | | | | |
| See Accompanying Notes | | | ANNUAL FINANCIAL AND OTHER INFORMATION | | | | | | | JUNE 30, 2024 | | | 27 |
| | | | | | |
| Schedule of Investments | | PIMCO 0-5 Year High Yield Corporate Bond Index Exchange-Traded Fund | | (Cont.) | | |
| | | | | | | | | | | | |
| | | | | PRINCIPAL
AMOUNT
(000S) | | | | | MARKET
VALUE
(000S) | |
|
Catalent Pharma Solutions, Inc. | |
5.000% due 07/15/2027 | | $ | | | 1,275 | | | $ | | | 1,251 | |
|
CCO Holdings LLC | |
5.000% due 02/01/2028 | | | | | 4,976 | | | | | | 4,656 | |
5.125% due 05/01/2027 | | | | | 5,241 | | | | | | 5,036 | |
5.375% due 06/01/2029 | | | | | 2,692 | | | | | | 2,452 | |
5.500% due 05/01/2026 | | | | | 1,109 | | | | | | 1,099 | |
|
CD&R Smokey Buyer, Inc. | |
6.750% due 07/15/2025 | | | | | 2,525 | | | | | | 2,511 | |
|
CEC Entertainment LLC | |
6.750% due 05/01/2026 | | | | | 1,264 | | | | | | 1,255 | |
|
Cedar Fair LP | |
6.500% due 10/01/2028 | | | | | 412 | | | | | | 414 | |
|
Century Communities, Inc. | |
6.750% due 06/01/2027 | | | | | 246 | | | | | | 248 | |
|
Champions Financing, Inc. | |
8.750% due 02/15/2029 | | | | | 950 | | | | | | 975 | |
|
Charles River Laboratories International, Inc. | |
4.250% due 05/01/2028 | | | | | 200 | | | | | | 189 | |
|
Chemours Co. | |
5.375% due 05/15/2027 | | | | | 1,378 | | | | | | 1,309 | |
|
Cheplapharm Arzneimittel GmbH | |
5.500% due 01/15/2028 | | | | | 1,229 | | | | | | 1,139 | |
|
Chesapeake Energy Corp. | |
5.500% due 02/01/2026 | | | | | 1,058 | | | | | | 1,049 | |
|
Chobani LLC | |
4.625% due 11/15/2028 | | | | | 250 | | | | | | 236 | |
7.625% due 07/01/2029 | | | | | 399 | | | | | | 411 | |
|
Churchill Downs, Inc. | |
5.500% due 04/01/2027 | | | | | 2,464 | | | | | | 2,426 | |
|
Cimpress PLC | |
7.000% due 06/15/2026 | | | | | 804 | | | | | | 804 | |
|
Cinemark USA, Inc. | |
5.250% due 07/15/2028 (f) | | | | | 3,168 | | | | | | 3,031 | |
5.875% due 03/15/2026 | | | | | 408 | | | | | | 404 | |
|
Citgo Petroleum Corp. | |
6.375% due 06/15/2026 | | | | | 827 | | | | | | 823 | |
7.000% due 06/15/2025 | | | | | 1,796 | | | | | | 1,797 | |
8.375% due 01/15/2029 | | | | | 1,510 | | | | | | 1,558 | |
|
Civitas Resources, Inc. | |
5.000% due 10/15/2026 | | | | | 512 | | | | | | 499 | |
8.375% due 07/01/2028 | | | | | 1,911 | | | | | | 2,005 | |
|
Clarios Global LP | |
6.250% due 05/15/2026 | | | | | 2,095 | | | | | | 2,095 | |
6.750% due 05/15/2025 | | | | | 899 | | | | | | 900 | |
8.500% due 05/15/2027 | | | | | 1,727 | | | | | | 1,740 | |
|
Clarivate Science Holdings Corp. | |
4.875% due 07/01/2029 | | | | | 1,400 | | | | | | 1,301 | |
|
Clean Harbors, Inc. | |
4.875% due 07/15/2027 | | | | | 43 | | | | | | 42 | |
|
Clear Channel Outdoor Holdings, Inc. | |
5.125% due 08/15/2027 | | | | | 1,881 | | | | | | 1,798 | |
7.500% due 06/01/2029 | | | | | 600 | | | | | | 502 | |
7.750% due 04/15/2028 | | | | | 2,522 | | | | | | 2,210 | |
9.000% due 09/15/2028 (f) | | | | | 2,011 | | | | | | 2,107 | |
|
Cleveland-Cliffs, Inc. | |
5.875% due 06/01/2027 | | | | | 420 | | | | | | 417 | |
|
Cloud Software Group, Inc. | |
6.500% due 03/31/2029 | | | | | 5,413 | | | | | | 5,202 | |
9.000% due 09/30/2029 | | | | | 500 | | | | | | 486 | |
|
Clydesdale Acquisition Holdings, Inc. | |
8.750% due 04/15/2030 | | | | | 800 | | | | | | 784 | |
|
CMG Media Corp. | |
8.875% due 12/15/2027 | | | | | 797 | | | | | | 457 | |
|
CNX Midstream Partners LP | |
4.750% due 04/15/2030 | | | | | 700 | | | | | | 631 | |
|
CNX Resources Corp. | |
6.000% due 01/15/2029 | | | | | 780 | | | | | | 764 | |
|
Cogent Communications Group, Inc. | |
7.000% due 06/15/2027 | | | | | 3,109 | | | | | | 3,083 | |
|
CommScope Technologies LLC | |
6.000% due 06/15/2025 (f) | | | | | 3,000 | | | | | | 2,448 | |
| | | | | | | | | | | | |
| | | | | PRINCIPAL
AMOUNT
(000S) | | | | | MARKET
VALUE
(000S) | |
|
CommScope, Inc. | |
6.000% due 03/01/2026 | | $ | | | 3,509 | | | $ | | | 3,084 | |
7.125% due 07/01/2028 | | | | | 668 | | | | | | 278 | |
8.250% due 03/01/2027 | | | | | 1,902 | | | | | | 905 | |
|
Community Health Systems, Inc. | |
5.625% due 03/15/2027 | | | | | 4,854 | | | | | | 4,524 | |
6.000% due 01/15/2029 | | | | | 3,469 | | | | | | 3,065 | |
8.000% due 12/15/2027 | | | | | 1,644 | | | | | | 1,632 | |
|
Compass Minerals International, Inc. | |
6.750% due 12/01/2027 | | | | | 360 | | | | | | 344 | |
|
Comstock Resources, Inc. | |
6.750% due 03/01/2029 | | | | | 3,213 | | | | | | 3,116 | |
|
Connect Finco SARL | |
6.750% due 10/01/2026 | | | | | 5,548 | | | | | | 5,359 | |
|
Consensus Cloud Solutions, Inc. | |
6.500% due 10/15/2028 | | | | | 286 | | | | | | 267 | |
|
Consolidated Communications, Inc. | |
6.500% due 10/01/2028 | | | | | 2,179 | | | | | | 1,868 | |
|
Consolidated Energy Finance SA | |
5.625% due 10/15/2028 | | | | | 800 | | | | | | 681 | |
|
Constellium SE | |
3.750% due 04/15/2029 | | | | | 400 | | | | | | 363 | |
|
Cooper-Standard Automotive, Inc. | |
5.625% due 11/15/2026 | | | | | 297 | | | | | | 262 | |
|
CoreLogic, Inc. | |
4.500% due 05/01/2028 | | | | | 2,518 | | | | | | 2,288 | |
|
Coty, Inc. | |
4.750% due 01/15/2029 | | | | | 1,822 | | | | | | 1,733 | |
5.000% due 04/15/2026 | | | | | 725 | | | | | | 716 | |
|
Cougar JV Subsidiary LLC | |
8.000% due 05/15/2032 | | | | | 150 | | | | | | 155 | |
|
CPI CG, Inc. | |
8.625% due 03/15/2026 | | | | | 265 | | | | | | 271 | |
|
CQP Holdco LP | |
5.500% due 06/15/2031 | | | | | 402 | | | | | | 381 | |
|
Crescent Energy Finance LLC | |
9.250% due 02/15/2028 | | | | | 1,450 | | | | | | 1,533 | |
|
Crown Americas LLC | |
4.250% due 09/30/2026 | | | | | 682 | | | | | | 658 | |
4.750% due 02/01/2026 | | | | | 1,000 | | | | | | 984 | |
|
Crown Cork & Seal Co., Inc. | |
7.375% due 12/15/2026 | | | | | 1,383 | | | | | | 1,431 | |
|
CSC Holdings LLC | |
5.375% due 02/01/2028 | | | | | 2,071 | | | | | | 1,576 | |
5.500% due 04/15/2027 | | | | | 3,738 | | | | | | 3,036 | |
6.500% due 02/01/2029 | | | | | 2,304 | | | | | | 1,684 | |
7.500% due 04/01/2028 | | | | | 1,910 | | | | | | 1,016 | |
11.250% due 05/15/2028 | | | | | 1,639 | | | | | | 1,429 | |
11.750% due 01/31/2029 | | | | | 2,816 | | | | | | 2,403 | |
|
CVR Energy, Inc. | |
8.500% due 01/15/2029 | | | | | 674 | | | | | | 677 | |
|
CVR Partners LP | |
6.125% due 06/15/2028 | | | | | 1,589 | | | | | | 1,528 | |
|
Dana, Inc. | |
5.375% due 11/15/2027 | | | | | 1,068 | | | | | | 1,045 | |
|
Dave & Buster’s, Inc. | |
7.625% due 11/01/2025 | | | | | 238 | | | | | | 239 | |
|
Dealer Tire LLC | |
8.000% due 02/01/2028 | | | | | 287 | | | | | | 277 | |
|
Delek Logistics Partners LP | |
7.125% due 06/01/2028 | | | | | 1,459 | | | | | | 1,442 | |
8.625% due 03/15/2029 | | | | | 1,684 | | | | | | 1,734 | |
|
Delta Air Lines, Inc. | |
2.900% due 10/28/2024 | | | | | 1,151 | | | | | | 1,140 | |
7.375% due 01/15/2026 | | | | | 1,580 | | | | | | 1,613 | |
|
Deluxe Corp. | |
8.000% due 06/01/2029 | | | | | 700 | | | | | | 658 | |
|
Directv Financing LLC | |
5.875% due 08/15/2027 | | | | | 7,207 | | | | | | 6,785 | |
8.875% due 02/01/2030 | | | | | 387 | | | | | | 379 | |
|
DISH DBS Corp. | |
5.250% due 12/01/2026 | | | | | 4,530 | | | | | | 3,582 | |
5.750% due 12/01/2028 | | | | | 3,690 | | | | | | 2,565 | |
5.875% due 11/15/2024 | | | | | 4,155 | | | | | | 3,949 | |
7.750% due 07/01/2026 | | | | | 3,521 | | | | | | 2,189 | |
| | | | | | | | | | | | |
| | | | | PRINCIPAL
AMOUNT
(000S) | | | | | MARKET
VALUE
(000S) | |
|
DISH Network Corp. | |
11.750% due 11/15/2027 | | $ | | | 7,276 | | | $ | | | 7,141 | |
|
Domtar Corp. | |
6.750% due 10/01/2028 | | | | | 1,060 | | | | | | 946 | |
|
DT Midstream, Inc. | |
4.125% due 06/15/2029 | | | | | 700 | | | | | | 647 | |
|
Dye & Durham Ltd. | |
8.625% due 04/15/2029 | | | | | 1,878 | | | | | | 1,907 | |
|
Eco Material Technologies, Inc. | |
7.875% due 01/31/2027 | | | | | 763 | | | | | | 766 | |
|
Edgewell Personal Care Co. | |
5.500% due 06/01/2028 | | | | | 1,875 | | | | | | 1,831 | |
|
eG Global Finance PLC | |
12.000% due 11/30/2028 | | | | | 1,840 | | | | | | 1,961 | |
|
Elanco Animal Health, Inc. | |
6.650% due 08/28/2028 | | | | | 1,007 | | | | | | 1,023 | |
|
Element Solutions, Inc. | |
3.875% due 09/01/2028 | | | | | 1,686 | | | | | | 1,551 | |
|
Encino Acquisition Partners Holdings LLC | |
8.500% due 05/01/2028 | | | | | 472 | | | | | | 481 | |
|
Encompass Health Corp. | |
4.500% due 02/01/2028 | | | | | 1,114 | | | | | | 1,061 | |
|
Enerflex Ltd. | |
9.000% due 10/15/2027 | | | | | 1,882 | | | | | | 1,912 | |
|
Energean PLC | |
6.500% due 04/30/2027 | | | | | 1,540 | | | | | | 1,519 | |
|
Energizer Holdings, Inc. | |
4.750% due 06/15/2028 | | | | | 456 | | | | | | 427 | |
6.500% due 12/31/2027 | | | | | 739 | | | | | | 739 | |
|
EnLink Midstream Partners LP | |
4.150% due 06/01/2025 | | | | | 199 | | | | | | 196 | |
4.850% due 07/15/2026 | | | | | 249 | | | | | | 245 | |
|
EnQuest PLC | |
11.625% due 11/01/2027 | | | | | 162 | | | | | | 165 | |
|
Entegris, Inc. | |
4.375% due 04/15/2028 | | | | | 1,200 | | | | | | 1,133 | |
4.750% due 04/15/2029 | | | | | 700 | | | | | | 670 | |
|
Enviri Corp. | |
5.750% due 07/31/2027 | | | | | 513 | | | | | | 488 | |
|
EQM Midstream Partners LP | |
4.000% due 08/01/2024 | | | | | 639 | | | | | | 637 | |
4.125% due 12/01/2026 | | | | | 930 | | | | | | 897 | |
4.500% due 01/15/2029 | | | | | 770 | | | | | | 727 | |
6.000% due 07/01/2025 | | | | | 1,809 | | | | | | 1,811 | |
6.375% due 04/01/2029 | | | | | 600 | | | | | | 606 | |
7.500% due 06/01/2027 | | | | | 2,185 | | | | | | 2,233 | |
|
EquipmentShare.com, Inc. | |
9.000% due 05/15/2028 | | | | | 1,074 | | | | | | 1,110 | |
|
ESAB Corp. | |
6.250% due 04/15/2029 | | | | | 788 | | | | | | 794 | |
|
FAGE International SA | |
5.625% due 08/15/2026 (f) | | | | | 432 | | | | | | 428 | |
|
Fair Isaac Corp. | |
4.000% due 06/15/2028 | | | | | 140 | | | | | | 131 | |
5.250% due 05/15/2026 | | | | | 309 | | | | | | 306 | |
|
Ferrellgas LP | |
5.375% due 04/01/2026 | | | | | 500 | | | | | | 490 | |
|
Fertitta Entertainment LLC | |
4.625% due 01/15/2029 | | | | | 1,904 | | | | | | 1,735 | |
6.750% due 01/15/2030 | | | | | 608 | | | | | | 534 | |
|
First Quantum Minerals Ltd. | |
9.375% due 03/01/2029 | | | | | 30 | | | | | | 31 | |
| | | | |
Fluor Corp.
| | | | | | | | | | | | |
4.250% due 09/15/2028 | | | | | 284 | | | | | | 270 | |
|
Flutter Treasury Designated Activity Co.
|
|
6.375% due 04/29/2029 | | | | | 700 | | | | | | 705 | |
| | | | |
FMG Resources Pty. Ltd.
| | | | | | | | | | | | |
4.500% due 09/15/2027 | | | | | 645 | | | | | | 617 | |
| | | | |
Foundation Building Materials, Inc. | | | | | | | | | | | | |
6.000% due 03/01/2029 | | | | | 1,204 | | | | | | 1,070 | |
|
Frontier Communications Holdings LLC | |
5.000% due 05/01/2028 | | | | | 2,504 | | | | | | 2,362 | |
5.875% due 10/15/2027 | | | | | 2,938 | | | | | | 2,871 | |
6.750% due 05/01/2029 | | | | | 620 | | | | | | 569 | |
| | | | | | |
| 28 | | PIMCO ETF TRUST | | | See Accompanying Notes | |
| | | | | | | | | | | | |
| | | | | PRINCIPAL
AMOUNT
(000S) | | | | | MARKET
VALUE
(000S) | |
| | | | |
FTAI Infra Escrow Holdings LLC
| | | | | | | | | | | | |
10.500% due 06/01/2027 | | $ | | | 645 | | | $ | | | 684 | |
| | | | |
Full House Resorts, Inc.
| | | | | | | | | | | | |
8.250% due 02/15/2028 | | | | | 846 | | | | | | 813 | |
| | | | |
FXI Holdings, Inc.
| | | | | | | | | | | | |
12.250% due 11/15/2026 | | | | | 838 | | | | | | 832 | |
| | | | |
Gannett Holdings LLC
| | | | | | | | | | | | |
6.000% due 11/01/2026 | | | | | 928 | | | | | | 889 | |
|
Garda World Security Corp. | |
4.625% due 02/15/2027 | | | | | 1,555 | | | | | | 1,488 | |
9.500% due 11/01/2027 | | | | | 3,753 | | | | | | 3,774 | |
| | | | |
Gates Corp.
| | | | | | | | | | | | |
6.875% due 07/01/2029 | | | | | 1,400 | | | | | | 1,426 | |
| | | | |
GCI LLC
| | | | | | | | | | | | |
4.750% due 10/15/2028 | | | | | 250 | | | | | | 228 | |
|
Gen Digital, Inc. | |
5.000% due 04/15/2025 | | | | | 931 | | | | | | 926 | |
6.750% due 09/30/2027 | | | | | 1,241 | | | | | | 1,258 | |
|
GFL Environmental, Inc. | |
3.500% due 09/01/2028 | | | | | 1,467 | | | | | | 1,354 | |
3.750% due 08/01/2025 | | | | | 1,394 | | | | | | 1,383 | |
4.000% due 08/01/2028 | | | | | 1,354 | | | | | | 1,259 | |
5.125% due 12/15/2026 | | | | | 515 | | | | | | 511 | |
| | | | |
Global Medical Response, Inc.
| | | | | | | | | | | | |
10.000% due 10/31/2028 | | | | | 757 | | | | | | 739 | |
|
Global Partners LP | |
7.000% due 08/01/2027 | | | | | 946 | | | | | | 951 | |
8.250% due 01/15/2032 | | | | | 386 | | | | | | 397 | |
| | | | |
GN Bondco LLC
| | | | | | | | | | | | |
9.500% due 10/15/2031 (f) | | | | | 778 | | | | | | 726 | |
|
Go Daddy Operating Co. LLC | |
3.500% due 03/01/2029 | | | | | 568 | | | | | | 513 | |
5.250% due 12/01/2027 | | | | | 747 | | | | | | 732 | |
|
goeasy Ltd. | |
4.375% due 05/01/2026 | | | | | 749 | | | | | | 727 | |
7.625% due 07/01/2029 | | | | | 310 | | | | | | 316 | |
9.250% due 12/01/2028 | | | | | 2,541 | | | | | | 2,700 | |
|
Goodyear Tire & Rubber Co. | |
4.875% due 03/15/2027 | | | | | 1,547 | | | | | | 1,496 | |
5.000% due 05/31/2026 | | | | | 1,527 | | | | | | 1,502 | |
5.000% due 07/15/2029 | | | | | 210 | | | | | | 196 | |
9.500% due 05/31/2025 | | | | | 234 | | | | | | 234 | |
| | | | |
GrafTech Finance, Inc.
| | | | | | | | | | | | |
4.625% due 12/15/2028 (f) | | | | | 718 | | | | | | 456 | |
| | | | |
Graham Holdings Co.
| | | | | | | | | | | | |
5.750% due 06/01/2026 | | | | | 250 | | | | | | 248 | |
| | | | |
Graham Packaging Co., Inc.
| | | | | | | | | | | | |
7.125% due 08/15/2028 | | | | | 1,730 | | | | | | 1,636 | |
| | | | |
Gran Tierra Energy, Inc.
| | | | | | | | | | | | |
9.500% due 10/15/2029 | | | | | 950 | | | | | | 906 | |
|
Graphic Packaging International LLC | |
3.500% due 03/15/2028 | | | | | 260 | | | | | | 240 | |
4.750% due 07/15/2027 | | | | | 639 | | | | | | 625 | |
|
Gray Television, Inc. | |
7.000% due 05/15/2027 (k) | | | | | 2,539 | | | | | | 2,340 | |
10.500% due 07/15/2029 | | | | | 2,300 | | | | | | 2,315 | |
| | | | |
Griffon Corp.
| | | | | | | | | | | | |
5.750% due 03/01/2028 | | | | | 1,759 | | | | | | 1,699 | |
| | | | |
Grifols SA
| | | | | | | | | | | | |
4.750% due 10/15/2028 (f) | | | | | 1,061 | | | | | | 917 | |
| | | | |
Group 1 Automotive, Inc.
| | | | | | | | | | | | |
4.000% due 08/15/2028 | | | | | 792 | | | | | | 732 | |
| | | | |
GrubHub Holdings, Inc.
| | | | | | | | | | | | |
5.500% due 07/01/2027 | | | | | 705 | | | | | | 640 | |
| | | | |
Gulfport Energy Corp.
| | | | | | | | | | | | |
8.000% due 05/17/2026 | | | | | 330 | | | | | | 334 | |
| | | | |
H&E Equipment Services, Inc
| | | | | | | | | | | | |
3.875% due 12/15/2028 | | | | | 1,973 | | | | | | 1,782 | |
| | | | |
Hanesbrands, Inc.
| | | | | | | | | | | | |
4.875% due 05/15/2026 | | | | | 1,414 | | | | | | 1,384 | |
| | | | |
Harbour Energy PLC
| | | | | | | | | | | | |
5.500% due 10/15/2026 | | | | | 1,410 | | | | | | 1,383 | |
| | | | |
Harvest Midstream LP
| | | | | | | | | | | | |
7.500% due 09/01/2028 | | | | | 2,064 | | | | | | 2,099 | |
| | | | | | | | | | | | |
| | | | | PRINCIPAL
AMOUNT
(000S) | | | | | MARKET
VALUE
(000S) | |
|
Hawaiian Brand Intellectual Property Ltd.
|
|
5.750% due 01/20/2026 | | $ | | | 2,569 | | | $ | | | 2,447 | |
| | | | |
Heartland Dental LLC
| | | | | | | | | | | | |
10.500% due 04/30/2028 | | | | | 1,477 | | | | | | 1,570 | |
|
Herc Holdings, Inc. | |
5.500% due 07/15/2027 | | | | | 1,192 | | | | | | 1,174 | |
6.625% due 06/15/2029 | | | | | 425 | | | | | | 431 | |
| | | | |
Hertz Corp. | | | | | | | | | | | | |
4.625% due 12/01/2026 (f) | | | | | 759 | | | | | | 551 | |
| | | | |
Hess Midstream Operations LP | | | | | | | | | | | | |
5.625% due 02/15/2026 | | | | | 1,125 | | | | | | 1,117 | |
| | | | |
Hillenbrand, Inc. | | | | | | | | | | | | |
5.000% due 09/15/2026 | | | | | 726 | | | | | | 714 | |
| | | | |
Hilton Domestic Operating Co., Inc. | | | | | | | | | | | | |
5.375% due 05/01/2025 | | | | | 739 | | | | | | 738 | |
| | | | |
Hilton Worldwide Finance LLC | | | | | | | | | | | | |
4.875% due 04/01/2027 | | | | | 1,060 | | | | | | 1,044 | |
|
Hologic, Inc. | |
3.250% due 02/15/2029 | | | | | 270 | | | | | | 242 | |
4.625% due 02/01/2028 | | | | | 620 | | | | | | 594 | |
|
Howard Midstream Energy Partners LLC | |
7.375% due 07/15/2032 | | | | | 450 | | | | | | 457 | |
8.875% due 07/15/2028 | | | | | 538 | | | | | | 570 | |
| | | | |
Hudbay Minerals, Inc. | | | | | | | | | | | | |
4.500% due 04/01/2026 | | | | | 1,861 | | | | | | 1,822 | |
|
Hughes Satellite Systems Corp. | |
5.250% due 08/01/2026 | | | | | 1,546 | | | | | | 1,198 | |
6.625% due 08/01/2026 (f) | | | | | 2,386 | | | | | | 1,112 | |
|
Husky Injection Molding Systems Ltd. | |
9.000% due 02/15/2029 | | | | | 1,917 | | | | | | 1,987 | |
|
iHeartCommunications, Inc. | |
4.750% due 01/15/2028 | | | | | 108 | | | | | | 55 | |
5.250% due 08/15/2027 (f) | | | | | 1,427 | | | | | | 759 | |
6.375% due 05/01/2026 (f) | | | | | 1,429 | | | | | | 1,112 | |
8.375% due 05/01/2027 (f) | | | | | 1,958 | | | | | | 726 | |
|
IHO Verwaltungs GmbH (4.750% Cash or 5.500% PIK) | |
4.750% due 09/15/2026 (a) | | | | | 963 | | | | | | 934 | |
|
IHO Verwaltungs GmbH (6.000% Cash or 6.750% PIK) | |
6.000% due 05/15/2027 (a) | | | | | 967 | | | | | | 953 | |
| | | | |
Illuminate Buyer LLC | | | | | | | | | | | | |
9.000% due 07/01/2028 | | | | | 680 | | | | | | 686 | |
|
INEOS Finance PLC | |
6.750% due 05/15/2028 | | | | | 468 | | | | | | 469 | |
7.500% due 04/15/2029 | | | | | 412 | | | | | | 417 | |
| | | | |
INEOS Quattro Finance 2 PLC | | | | | | | | | | | | |
9.625% due 03/15/2029 | | | | | 350 | | | | | | 372 | |
| | | | |
Ingevity Corp. | | | | | | | | | | | | |
3.875% due 11/01/2028 | | | | | 1,502 | | | | | | 1,365 | |
| | | | |
Installed Building Products, Inc. | | | | | | | | | | | | |
5.750% due 02/01/2028 | | | | | 684 | | | | | | 670 | |
|
Intelligent Packaging Ltd. Finco, Inc. | |
6.000% due 09/15/2028 | | | | | 1,944 | | | | | | 1,884 | |
| | | | |
Intelsat Jackson Holdings SA | | | | | | | | | | | | |
6.500% due 03/15/2030 | | | | | 1,901 | | | | | | 1,773 | |
|
International Game Technology PLC | |
4.125% due 04/15/2026 | | | | | 1,680 | | | | | | 1,637 | |
5.250% due 01/15/2029 | | | | | 732 | | | | | | 709 | |
6.250% due 01/15/2027 | | | | | 1,122 | | | | | | 1,126 | |
6.500% due 02/15/2025 | | | | | 457 | | | | | | 458 | |
|
IQVIA, Inc. | |
5.000% due 10/15/2026 | | | | | 1,714 | | | | | | 1,683 | |
5.000% due 05/15/2027 | | | | | 2,149 | | | | | | 2,099 | |
| | | | |
IRB Holding Corp. | | | | | | | | | | | | |
7.000% due 06/15/2025 | | | | | 1,105 | | | | | | 1,106 | |
| | | | |
Ithaca Energy North Sea PLC | | | | | | | | | | | | |
9.000% due 07/15/2026 | | | | | 904 | | | | | | 916 | |
|
Jaguar Land Rover Automotive PLC | |
4.500% due 10/01/2027 | | | | | 765 | | | | | | 726 | |
5.875% due 01/15/2028 | | | | | 989 | | | | | | 971 | |
7.750% due 10/15/2025 | | | | | 1,145 | | | | | | 1,152 | |
| | | | |
Jazz Securities DAC | | | | | | | | | | | | |
4.375% due 01/15/2029 | | | | | 2,674 | | | | | | 2,485 | |
| | | | |
JELD-WEN, Inc. | | | | | | | | | | | | |
4.875% due 12/15/2027 | | | | | 1,801 | | | | | | 1,703 | |
| | | | | | | | | | | | |
| | | | | PRINCIPAL
AMOUNT
(000S) | | | | | MARKET
VALUE
(000S) | |
| | | | |
Kaiser Aluminum Corp. | | | | | | | | | | | | |
4.625% due 03/01/2028 | | $ | | | 1,345 | | | $ | | | 1,260 | |
| | | | |
KeHE Distributors LLC | | | | | | | | | | | | |
9.000% due 02/15/2029 | | | | | 438 | | | | | | 449 | |
| | | | |
Kinetik Holdings LP | | | | | | | | | | | | |
6.625% due 12/15/2028 | | | | | 1,147 | | | | | | 1,166 | |
| | | | |
Kodiak Gas Services LLC | | | | | | | | | | | | |
7.250% due 02/15/2029 | | | | | 1,000 | | | | | | 1,026 | |
|
Kronos Acquisition Holdings, Inc. | |
5.000% due 12/31/2026 | | | | | 268 | | | | | | 274 | |
7.000% due 12/31/2027 | | | | | 402 | | | | | | 416 | |
|
LABL, Inc. | |
5.875% due 11/01/2028 | | | | | 200 | | | | | | 183 | |
6.750% due 07/15/2026 | | | | | 1,247 | | | | | | 1,233 | |
10.500% due 07/15/2027 | | | | | 3,350 | | | | | | 3,282 | |
| | | | |
LBM Acquisition LLC | | | | | | | | | | | | |
6.250% due 01/15/2029 | | | | | 814 | | | | | | 720 | |
|
LCPR Senior Secured Financing DAC | |
6.750% due 10/15/2027 | | | | | 3,188 | | | | | | 2,989 | |
| | | | |
Legacy LifePoint Health LLC | | | | | | | | | | | | |
4.375% due 02/15/2027 | | | | | 1,923 | | | | | | 1,839 | |
|
Legends Hospitality Holding Co. LLC | |
5.000% due 02/01/2026 | | | | | 742 | | | | | | 736 | |
|
Level 3 Financing, Inc. | |
10.500% due 04/15/2029 | | | | | 1,872 | | | | | | 1,877 | |
11.000% due 11/15/2029 | | | | | 1,636 | | | | | | 1,676 | |
|
Life Time, Inc. | |
5.750% due 01/15/2026 | | | | | 1,752 | | | | | | 1,745 | |
8.000% due 04/15/2026 | | | | | 1,830 | | | | | | 1,853 | |
|
LifePoint Health, Inc. | |
5.375% due 01/15/2029 | | | | | 3,013 | | | | | | 2,651 | |
10.000% due 06/01/2032 | | | | | 1,750 | | | | | | 1,791 | |
| | | | |
Light & Wonder International, Inc. | | | | | | | | | | | | |
7.000% due 05/15/2028 | | | | | 1,013 | | | | | | 1,019 | |
| | | | |
Lindblad Expeditions Holdings, Inc. | | | | | | | | | | | | |
9.000% due 05/15/2028 | | | | | 680 | | | | | | 700 | |
| | | | |
Lindblad Expeditions LLC | | | | | | | | | | | | |
6.750% due 02/15/2027 | | | | | 1,441 | | | | | | 1,424 | |
|
Live Nation Entertainment, Inc. | |
3.750% due 01/15/2028 | | | | | 1,661 | | | | | | 1,547 | |
4.750% due 10/15/2027 | | | | | 1,873 | | | | | | 1,796 | |
4.875% due 11/01/2024 | | | | | 1,246 | | | | | | 1,243 | |
5.625% due 03/15/2026 | | | | | 531 | | | | | | 524 | |
6.500% due 05/15/2027 | | | | | 2,723 | | | | | | 2,741 | |
| | | | |
LSB Industries, Inc. | | | | | | | | | | | | |
6.250% due 10/15/2028 | | | | | 250 | | | | | | 241 | |
| | | | |
Madison IAQ LLC | | | | | | | | | | | | |
4.125% due 06/30/2028 | | | | | 1,138 | | | | | | 1,062 | |
| | | | |
Magnolia Oil & Gas Operating LLC | | | | | | | | | | | | |
6.000% due 08/01/2026 | | | | | 386 | | | | | | 383 | |
| | | | |
MajorDrive Holdings LLC | | | | | | | | | | | | |
6.375% due 06/01/2029 | | | | | 2,100 | | | | | | 1,979 | |
| | | | |
Manitowoc Co., Inc. | | | | | | | | | | | | |
9.000% due 04/01/2026 | | | | | 1,365 | | | | | | 1,366 | |
| | | | |
Marriott Ownership Resorts, Inc. | | | | | | | | | | | | |
4.750% due 01/15/2028 | | | | | 2,097 | | | | | | 1,981 | |
| | | | |
Matador Resources Co. | | | | | | | | | | | | |
6.875% due 04/15/2028 | | | | | 642 | | | | | | 652 | |
| | | | |
Match Group Holdings LLC | | | | | | | | | | | | |
5.000% due 12/15/2027 | | | | | 1,982 | | | | | | 1,902 | |
| | | | |
Matthews International Corp. | | | | | | | | | | | | |
5.250% due 12/01/2025 | | | | | 328 | | | | | | 320 | |
|
Mauser Packaging Solutions Holding Co. | |
7.875% due 04/15/2027 | | | | | 4,502 | | | | | | 4,598 | |
9.250% due 04/15/2027 | | | | | 3,833 | | | | | | 3,840 | |
|
Maxim Crane Works Holdings Capital LLC | |
11.500% due 09/01/2028 | | | | | 2,348 | | | | | | 2,424 | |
| | | | |
McGraw-Hill Education, Inc. | | | | | | | | | | | | |
5.750% due 08/01/2028 | | | | | 2,984 | | | | | | 2,880 | |
| | | | |
Mclaren Finance PLC | | | | | | | | | | | | |
7.500% due 08/01/2026 | | | | | 1,557 | | | | | | 1,362 | |
|
Medline Borrower LP | |
3.875% due 04/01/2029 | | | | | 5,628 | | | | | | 5,187 | |
6.250% due 04/01/2029 | | | | | 1,150 | | | | | | 1,164 | |
| | | | | | | | | | | | |
| See Accompanying Notes | | | ANNUAL FINANCIAL AND OTHER INFORMATION | | | | | | | JUNE 30, 2024 | | | 29 |
| | | | | | |
| Schedule of Investments | | PIMCO 0-5 Year High Yield Corporate Bond Index Exchange-Traded Fund | | (Cont.) | | |
| | | | | | | | | | | | |
| | | | | PRINCIPAL
AMOUNT
(000S) | | | | | MARKET
VALUE
(000S) | |
| | | | |
MEG Energy Corp. | | | | | | | | | | | | |
7.125% due 02/01/2027 | | $ | | | 252 | | | $ | | | 256 | |
| | | | |
Melco Resorts Finance Ltd. | | | | | | | | | | | | |
5.250% due 04/26/2026 | | | | | 1,422 | | | | | | 1,375 | |
|
Mercer International, Inc. | |
5.125% due 02/01/2029 | | | | | 630 | | | | | | 555 | |
5.500% due 01/15/2026 | | | | | 40 | | | | | | 39 | |
| | | | |
Merlin Entertainments Ltd. | | | | | | | | | | | | |
5.750% due 06/15/2026 | | | | | 630 | | | | | | 621 | |
| | | | |
Methanex Corp. | | | | | | | | | | | | |
5.125% due 10/15/2027 | | | | | 440 | | | | | | 425 | |
| | | | |
MGM China Holdings Ltd. | | | | | | | | | | | | |
7.125% due 06/26/2031 | | | | | 150 | | | | | | 151 | |
|
MGM Resorts International | |
4.625% due 09/01/2026 | | | | | 1,636 | | | | | | 1,598 | |
5.500% due 04/15/2027 | | | | | 2,468 | | | | | | 2,437 | |
5.750% due 06/15/2025 | | | | | 384 | | | | | | 383 | |
|
Michaels Cos., Inc. | |
5.250% due 05/01/2028 | | | | | 1,929 | | | | | | 1,545 | |
7.875% due 05/01/2029 | | | | | 1,884 | | | | | | 1,211 | |
| | | | |
MicroStrategy, Inc. | | | | | | | | | | | | |
6.125% due 06/15/2028 | | | | | 200 | | | | | | 194 | |
| | | | |
Millennium Escrow Corp. | | | | | | | | | | | | |
6.625% due 08/01/2026 (f) | | | | | 641 | | | | | | 337 | |
|
Mineral Resources Ltd. | |
8.000% due 11/01/2027 | | | | | 1,007 | | | | | | 1,031 | |
8.125% due 05/01/2027 | | | | | 2,300 | | | | | | 2,320 | |
9.250% due 10/01/2028 | | | | | 1,844 | | | | | | 1,938 | |
| | | | |
Mohegan Tribal Gaming Authority | | | | | | | | | | | | |
8.000% due 02/01/2026 | | | | | 1,201 | | | | | | 1,140 | |
| | | | |
Molina Healthcare, Inc. | | | | | | | | | | | | |
4.375% due 06/15/2028 | | | | | 1,248 | | | | | | 1,176 | |
| | | | |
Moog, Inc. | | | | | | | | | | | | |
4.250% due 12/15/2027 | | | | | 658 | | | | | | 624 | |
|
Moss Creek Resources Holdings, Inc. | |
7.500% due 01/15/2026 | | | | | 476 | | | | | | 477 | |
10.500% due 05/15/2027 | | | | | 386 | | | | | | 396 | |
| | | | |
Motion Bondco DAC | | | | | | | | | | | | |
6.625% due 11/15/2027 | | | | | 902 | | | | | | 875 | |
|
MPH Acquisition Holdings LLC | |
5.500% due 09/01/2028 | | | | | 3,490 | | | | | | 2,639 | |
5.750% due 11/01/2028 (f) | | | | | 1,597 | | | | | | 861 | |
| | | | |
Murphy Oil Corp. | | | | | | | | | | | | |
5.875% due 12/01/2027 | | | | | 662 | | | | | | 662 | |
| | | | |
Murphy Oil USA, Inc. | | | | | | | | | | | | |
5.625% due 05/01/2027 | | | | | 259 | | | | | | 257 | |
|
Nabors Industries Ltd. | |
7.250% due 01/15/2026 | | | | | 1,400 | | | | | | 1,421 | |
7.500% due 01/15/2028 (f) | | | | | 651 | | | | | | 622 | |
| | | | |
Nabors Industries, Inc. | | | | | | | | | | | | |
7.375% due 05/15/2027 | | | | | 2,256 | | | | | | 2,297 | |
|
NCL Corp. Ltd. | |
3.625% due 12/15/2024 | | | | | 1,208 | | | | | | 1,197 | |
5.875% due 03/15/2026 | | | | | 4,900 | | | | | | 4,848 | |
5.875% due 02/15/2027 | | | | | 2,210 | | | | | | 2,183 | |
7.750% due 02/15/2029 (f) | | | | | 520 | | | | | | 541 | |
8.375% due 02/01/2028 | | | | | 402 | | | | | | 420 | |
| | | | |
NCR Atleos Corp. | | | | | | | | | | | | |
9.500% due 04/01/2029 | | | | | 1,150 | | | | | | 1,244 | |
|
NCR Corp. | |
5.000% due 10/01/2028 | | | | | 3,077 | | | | | | 2,908 | |
5.125% due 04/15/2029 | | | | | 1,700 | | | | | | 1,603 | |
| | | | |
Neptune Bidco U.S., Inc. | | | | | | | | | | | | |
9.290% due 04/15/2029 | | | | | 6,532 | | | | | | 6,275 | |
| | | | |
Nesco Holdings, Inc. | | | | | | | | | | | | |
5.500% due 04/15/2029 | | | | | 2,382 | | | | | | 2,209 | |
|
New Enterprise Stone & Lime Co., Inc. | |
5.250% due 07/15/2028 | | | | | 536 | | | | | | 507 | |
|
New Fortress Energy, Inc. | |
6.500% due 09/30/2026 | | | | | 3,894 | | | | | | 3,586 | |
6.750% due 09/15/2025 | | | | | 2,147 | | | | | | 2,086 | |
8.750% due 03/15/2029 (f) | | | | | 1,896 | | | | | | 1,732 | |
| | | | | | | | | | | | |
| | | | | PRINCIPAL
AMOUNT
(000S) | | | | | MARKET
VALUE
(000S) | |
|
Newell Brands, Inc. | |
4.875% due 06/01/2025 | | $ | | | 1,300 | | | $ | | | 1,282 | |
5.700% due 04/01/2026 | | | | | 3,391 | | | | | | 3,352 | |
6.375% due 09/15/2027 (f) | | | | | 1,248 | | | | | | 1,235 | |
|
Newfold Digital Holdings Group, Inc. | |
6.000% due 02/15/2029 | | | | | 2,095 | | | | | | 1,514 | |
11.750% due 10/15/2028 | | | | | 2,022 | | | | | | 2,098 | |
|
Nexstar Media, Inc. | |
4.750% due 11/01/2028 | | | | | 2,430 | | | | | | 2,163 | |
5.625% due 07/15/2027 | | | | | 3,311 | | | | | | 3,148 | |
|
NextEra Energy Operating Partners LP | |
3.875% due 10/15/2026 | | | | | 2,295 | | | | | | 2,185 | |
4.250% due 07/15/2024 | | | | | 1,032 | | | | | | 1,031 | |
4.500% due 09/15/2027 | | | | | 1,273 | | | | | | 1,206 | |
7.250% due 01/15/2029 | | | | | 1,488 | | | | | | 1,527 | |
| | | | |
Nordstrom, Inc. | | | | | | | | | | | | |
4.000% due 03/15/2027 | | | | | 250 | | | | | | 238 | |
| | | | |
Northern Oil & Gas, Inc. | | | | | | | | | | | | |
8.125% due 03/01/2028 | | | | | 1,146 | | | | | | 1,160 | |
| | | | |
NOVA Chemicals Corp. | | | | | | | | | | | | |
5.250% due 06/01/2027 | | | | | 1,788 | | | | | | 1,712 | |
| | | | |
Novelis Corp. | | | | | | | | | | | | |
3.250% due 11/15/2026 | | | | | 2,423 | | | | | | 2,282 | |
|
NuStar Logistics LP | |
5.625% due 04/28/2027 | | | | | 1,507 | | | | | | 1,495 | |
5.750% due 10/01/2025 | | | | | 1,156 | | | | | | 1,150 | |
6.000% due 06/01/2026 | | | | | 521 | | | | | | 521 | |
| | | | |
Odeon Finco PLC | | | | | | | | | | | | |
12.750% due 11/01/2027 | | | | | 1,251 | | | | | | 1,313 | |
|
Olympus Water U.S. Holding Corp. | |
7.125% due 10/01/2027 | | | | | 2,206 | | | | | | 2,217 | |
9.750% due 11/15/2028 | | | | | 2,838 | | | | | | 3,006 | |
| | | | |
ON Semiconductor Corp. | | | | | | | | | | | | |
3.875% due 09/01/2028 | | | | | 1,255 | | | | | | 1,159 | |
| | | | |
Open Text Corp. | | | | | | | | | | | | |
3.875% due 02/15/2028 | | | | | 2,302 | | | | | | 2,133 | |
| | | | |
Organon & Co. | | | | | | | | | | | | |
4.125% due 04/30/2028 | | | | | 4,783 | | | | | | 4,446 | |
| | | | |
Oriflame Investment Holding PLC | | | | | | | | | | | | |
5.125% due 05/04/2026 | | | | | 724 | | | | | | 193 | |
| | | | |
Outfront Media Capital LLC | | | | | | | | | | | | |
5.000% due 08/15/2027 | | | | | 1,644 | | | | | | 1,593 | |
| | | | |
Pactiv Evergreen Group Issuer, Inc. | | | | | | | | | | | | |
4.000% due 10/15/2027 | | | | | 1,947 | | | | | | 1,825 | |
|
Paramount Global | |
3.375% due 02/15/2028 | | | | | 100 | | | | | | 89 | |
3.700% due 06/01/2028 | | | | | 876 | | | | | | 790 | |
4.200% due 05/19/2032 | | | | | 886 | | | | | | 724 | |
4.950% due 01/15/2031 | | | | | 100 | | | | | | 88 | |
6.875% due 04/30/2036 | | | | | 271 | | | | | | 254 | |
| | | | |
Park-Ohio Industries, Inc. | | | | | | | | | | | | |
6.625% due 04/15/2027 | | | | | 500 | | | | | | 482 | |
| | | | |
Parkland Corp. | | | | | | | | | | | | |
5.875% due 07/15/2027 | | | | | 1,017 | | | | | | 1,005 | |
| | | | |
Penn Entertainment, Inc. | | | | | | | | | | | | |
5.625% due 01/15/2027 | | | | | 600 | | | | | | 580 | |
| | | | |
Penske Automotive Group, Inc. | | | | | | | | | | | | |
3.500% due 09/01/2025 | | | | | 287 | | | | | | 280 | |
|
Perenti Finance Pty. Ltd. | |
6.500% due 10/07/2025 (f) | | | | | 402 | | | | | | 402 | |
7.500% due 04/26/2029 | | | | | 100 | | | | | | 102 | |
| | | | |
Performance Food Group, Inc. | | | | | | | | | | | | |
5.500% due 10/15/2027 | | | | | 1,672 | | | | | | 1,637 | |
|
Permian Resources Operating LLC | |
5.375% due 01/15/2026 | | | | | 872 | | | | | | 864 | |
7.750% due 02/15/2026 | | | | | 945 | | | | | | 954 | |
8.000% due 04/15/2027 | | | | | 1,219 | | | | | | 1,248 | |
|
Perrigo Finance Unlimited Co. | |
3.900% due 12/15/2024 | | | | | 1,232 | | | | | | 1,217 | |
4.375% due 03/15/2026 | | | | | 1,106 | | | | | | 1,071 | |
|
PetSmart, Inc. | |
4.750% due 02/15/2028 | | | | | 1,818 | | | | | | 1,691 | |
7.750% due 02/15/2029 | | | | | 2,319 | | | | | | 2,261 | |
| | | | | | | | | | | | |
| | | | | PRINCIPAL
AMOUNT
(000S) | | | | | MARKET
VALUE
(000S) | |
| | | | |
Phinia, Inc. | | | | | | | | | | | | |
6.750% due 04/15/2029 | | $ | | | 100 | | | $ | | | 102 | |
| | | | |
Pike Corp. | | | | | | | | | | | | |
5.500% due 09/01/2028 | | | | | 2,632 | | | | | | 2,529 | |
| | | | |
Playtika Holding Corp. | | | | | | | | | | | | |
4.250% due 03/15/2029 | | | | | 428 | | | | | | 376 | |
| | | | |
PM General Purchaser LLC | | | | | | | | | | | | |
9.500% due 10/01/2028 | | | | | 412 | | | | | | 421 | |
| | | | |
Post Holdings, Inc. | | | | | | | | | | | | |
5.625% due 01/15/2028 | | | | | 1,471 | | | | | | 1,449 | |
| | | | |
Prime Healthcare Services, Inc. | | | | | | | | | | | | |
7.250% due 11/01/2025 | | | | | 3,778 | | | | | | 3,775 | |
|
Prime Security Services Borrower LLC | |
5.750% due 04/15/2026 | | | | | 4,192 | | | | | | 4,164 | |
6.250% due 01/15/2028 | | | | | 2,448 | | | | | | 2,415 | |
| | | | |
PTC, Inc. | | | | | | | | | | | | |
3.625% due 02/15/2025 | | | | | 744 | | | | | | 736 | |
|
QVC, Inc. | |
4.450% due 02/15/2025 | | | | | 849 | | | | | | 836 | |
4.750% due 02/15/2027 | | | | | 386 | | | | | | 326 | |
| | | | |
Rackspace Finance LLC | | | | | | | | | | | | |
3.500% due 05/15/2028 (f) | | | | | 408 | | | | | | 176 | |
| | | | |
Raising Cane’s Restaurants LLC | | | | | | | | | | | | |
9.375% due 05/01/2029 | | | | | 571 | | | | | | 617 | |
|
Rakuten Group, Inc. | |
9.750% due 04/15/2029 | | | | | 1,257 | | | | | | 1,298 | |
11.250% due 02/15/2027 | | | | | 4,020 | | | | | | 4,301 | |
| | | | |
Rand Parent LLC | | | | | | | | | | | | |
8.500% due 02/15/2030 (f) | | | | | 385 | | | | | | 390 | |
| | | | |
Range Resources Corp. | | | | | | | | | | | | |
4.875% due 05/15/2025 | | | | | 900 | | | | | | 895 | |
| | | | |
Rayonier AM Products, Inc. | | | | | | | | | | | | |
7.625% due 01/15/2026 | | | | | 712 | | | | | | 668 | |
| | | | |
Real Hero Merger Sub 2, Inc. | | | | | | | | | | | | |
6.250% due 02/01/2029 | | | | | 1,036 | | | | | | 889 | |
|
Resorts World Las Vegas LLC | |
4.625% due 04/16/2029 | | | | | 260 | | | | | | 233 | |
8.450% due 07/27/2030 | | | | | 508 | | | | | | 538 | |
| | | | |
Ritchie Bros Holdings, Inc. | | | | | | | | | | | | |
6.750% due 03/15/2028 | | | | | 1,117 | | | | | | 1,139 | |
| | | | |
Rivian Holdings LLC | | | | | | | | | | | | |
11.310% due 10/15/2026 • | | | | | 1,020 | | | | | | 1,034 | |
| | | | |
Rocket Software, Inc. | | | | | | | | | | | | |
6.500% due 02/15/2029 | | | | | 438 | | | | | | 382 | |
| | | | |
Rockies Express Pipeline LLC | | | | | | | | | | | | |
3.600% due 05/15/2025 | | | | | 608 | | | | | | 594 | |
|
Royal Caribbean Cruises Ltd. | |
3.700% due 03/15/2028 | | | | | 1,708 | | | | | | 1,597 | |
4.250% due 07/01/2026 | | | | | 1,611 | | | | | | 1,560 | |
5.375% due 07/15/2027 | | | | | 3,189 | | | | | | 3,142 | |
5.500% due 08/31/2026 | | | | | 1,817 | | | | | | 1,798 | |
7.500% due 10/15/2027 | | | | | 926 | | | | | | 977 | |
9.250% due 01/15/2029 | | | | | 620 | | | | | | 662 | |
| | | | |
RXO, Inc. | | | | | | | | | | | | |
7.500% due 11/15/2027 | | | | | 474 | | | | | | 487 | |
|
Sabre Global, Inc. | |
8.625% due 06/01/2027 | | | | | 3,666 | | | | | | 3,381 | |
11.250% due 12/15/2027 (f) | | | | | 1,420 | | | | | | 1,381 | |
| | | | |
Saturn Oil & Gas, Inc. | | | | | | | | | | | | |
9.625% due 06/15/2029 | | | | | 925 | | | | | | 934 | |
| | | | |
SCIH Salt Holdings, Inc. | | | | | | | | | | | | |
4.875% due 05/01/2028 | | | | | 1,512 | | | | | | 1,408 | |
| | | | |
SCIL LLC | | | | | | | | | | | | |
5.375% due 11/01/2026 | | | | | 2,664 | | | | | | 2,579 | |
|
Scripps Escrow, Inc. | |
3.875% due 01/15/2029 | | | | | 1,108 | | | | | | 773 | |
5.875% due 07/15/2027 | | | | | 2,817 | | | | | | 1,705 | |
| | | | |
Seagate HDD Cayman | | | | | | | | | | | | |
4.750% due 01/01/2025 | | | | | 1,246 | | | | | | 1,238 | |
| | | | |
Sealed Air Corp. | | | | | | | | | | | | |
6.125% due 02/01/2028 | | | | | 2,256 | | | | | | 2,253 | |
| | | | |
Select Medical Corp. | | | | | | | | | | | | |
6.250% due 08/15/2026 | | | | | 1,527 | | | | | | 1,536 | |
| | | | | | |
| 30 | | PIMCO ETF TRUST | | | See Accompanying Notes | |
| | | | | | | | | | | | |
| | | | | PRINCIPAL
AMOUNT
(000S) | | | | | MARKET
VALUE
(000S) | |
| | | | |
Sensata Technologies BV | | | | | | | | | | | | |
5.000% due 10/01/2025 | | $ | | | 736 | | | $ | | | 743 | |
| | | | |
Shelf Drilling Holdings Ltd. | | | | | | | | | | | | |
9.625% due 04/15/2029 | | | | | 688 | | | | | | 659 | |
| | | | |
Shift4 Payments LLC | | | | | | | | | | | | |
4.625% due 11/01/2026 | | | | | 2,436 | | | | | | 2,361 | |
| | | | |
Shutterfly Finance LLC | | | | | | | | | | | | |
9.750% due 10/01/2027 | | | | | 247 | | | | | | 249 | |
|
Shutterfly Finance LLC (4.250% Cash and 4.250% PIK) | |
8.500% due 10/01/2027 (a) | | | | | 1,655 | | | | | | 1,444 | |
| | | | |
Sigma Holdco BV | | | | | | | | | | | | |
7.875% due 05/15/2026 | | | | | 761 | | | | | | 754 | |
| | | | |
Silgan Holdings, Inc. | | | | | | | | | | | | |
4.125% due 02/01/2028 | | | | | 100 | | | | | | 95 | |
| | | | |
Simmons Foods, Inc. | | | | | | | | | | | | |
4.625% due 03/01/2029 | | | | | 2,718 | | | | | | 2,393 | |
| | | | |
Sinclair Television Group, Inc. | | | | | | | | | | | | |
4.125% due 12/01/2030 | | | | | 860 | | | | | | 577 | |
|
Sirius XM Radio, Inc. | |
3.125% due 09/01/2026 | | | | | 2,611 | | | | | | 2,459 | |
4.000% due 07/15/2028 | | | | | 2,132 | | | | | | 1,928 | |
5.000% due 08/01/2027 | | | | | 2,241 | | | | | | 2,147 | |
5.500% due 07/01/2029 | | | | | 600 | | | | | | 564 | |
|
Sitio Royalties Operating Partnership LP | |
7.875% due 11/01/2028 | | | | | 2,127 | | | | | | 2,201 | |
| | | | |
Six Flags Entertainment Corp. | | | | | | | | | | | | |
5.500% due 04/15/2027 | | | | | 330 | | | | | | 327 | |
| | | | |
Six Flags Theme Parks, Inc. | | | | | | | | | | | | |
7.000% due 07/01/2025 | | | | | 390 | | | | | | 392 | |
|
SM Energy Co. | |
5.625% due 06/01/2025 | | | | | 645 | | | | | | 643 | |
6.500% due 07/15/2028 | | | | | 258 | | | | | | 256 | |
6.625% due 01/15/2027 | | | | | 545 | | | | | | 543 | |
6.750% due 09/15/2026 | | | | | 798 | | | | | | 799 | |
| | | | |
Smyrna Ready Mix Concrete LLC | | | | | | | | | | | | |
6.000% due 11/01/2028 | | | | | 1,020 | | | | | | 998 | |
| | | | |
Solaris Midstream Holdings LLC | | | | | | | | | | | | |
7.625% due 04/01/2026 | | | | | 770 | | | | | | 773 | |
| | | | |
Sotera Health Holdings LLC | | | | | | | | | | | | |
7.375% due 06/01/2031 | | | | | 1,150 | | | | | | 1,153 | |
| | | | |
Sotheby’s | | | | | | | | | | | | |
7.375% due 10/15/2027 | | | | | 1,996 | | | | | | 1,669 | |
| | | | |
Southwestern Energy Co. | | | | | | | | | | | | |
5.700% due 01/23/2025 | | | | | 735 | | | | | | 734 | |
|
Specialty Building Products Holdings LLC | |
6.375% due 09/30/2026 | | | | | 1,183 | | | | | | 1,163 | |
| | | | |
Speedway Motorsports LLC | | | | | | | | | | | | |
4.875% due 11/01/2027 | | | | | 597 | | | | | | 571 | |
|
Spirit AeroSystems, Inc. | |
3.850% due 06/15/2026 | | | | | 382 | | | | | | 368 | |
4.600% due 06/15/2028 (f) | | | | | 3,679 | | | | | | 3,449 | |
| | | | |
Spirit Airlines Pass-Through Trust | | | | | | | | | | | | |
4.100% due 10/01/2029 | | | | | 54 | | | | | | 51 | |
| | | | |
Spirit Loyalty Cayman Ltd. | | | | | | | | | | | | |
8.000% due 09/20/2025 | | | | | 4,048 | | | | | | 2,958 | |
| | | | |
SS&C Technologies, Inc. | | | | | | | | | | | | |
5.500% due 09/30/2027 | | | | | 3,710 | | | | | | 3,656 | |
|
Standard Industries, Inc. | |
4.750% due 01/15/2028 | | | | | 1,401 | | | | | | 1,334 | |
5.000% due 02/15/2027 | | | | | 2,120 | | | | | | 2,063 | |
|
Staples, Inc. | |
10.750% due 09/01/2029 | | | | | 1,450 | | | | | | 1,380 | |
12.750% due 01/15/2030 | | | | | 1,274 | | | | | | 992 | |
| | | | |
Station Casinos LLC | | | | | | | | | | | | |
4.500% due 02/15/2028 | | | | | 2,758 | | | | | | 2,598 | |
| | | | |
Strathcona Resources Ltd. | | | | | | | | | | | | |
6.875% due 08/01/2026 | | | | | 2,617 | | | | | | 2,592 | |
| | | | |
Studio City Finance Ltd. | | | | | | | | | | | | |
5.000% due 01/15/2029 | | | | | 1,105 | | | | | | 974 | |
|
Sugarhouse HSP Gaming Prop Mezz LP | |
5.875% due 05/15/2025 | | | | | 1,306 | | | | | | 1,299 | |
| | | | |
Summer BC Bidco B LLC | | | | | | | | | | | | |
5.500% due 10/31/2026 | | | | | 707 | | | | | | 691 | |
| | | | | | | | | | | | |
| | | | | PRINCIPAL
AMOUNT
(000S) | | | | | MARKET
VALUE
(000S) | |
| | | | |
Summit Materials LLC | | | | | | | | | | | | |
5.250% due 01/15/2029 | | $ | | | 420 | | | $ | | | 405 | |
| | | | |
Sunnova Energy Corp. | | | | | | | | | | | | |
5.875% due 09/01/2026 | | | | | 481 | | | | | | 374 | |
|
Sunoco LP | |
4.500% due 04/30/2030 | | | | | 1,200 | | | | | | 1,111 | |
5.875% due 03/15/2028 | | | | | 386 | | | | | | 385 | |
7.000% due 09/15/2028 | | | | | 1,299 | | | | | | 1,332 | |
7.000% due 05/01/2029 | | | | | 600 | | | | | | 615 | |
| | | | |
Sunrise HoldCo BV | | | | | | | | | | | | |
5.500% due 01/15/2028 | | | | | 1,234 | | | | | | 1,195 | |
| | | | |
Talos Production, Inc. | | | | | | | | | | | | |
9.000% due 02/01/2029 | | | | | 420 | | | | | | 441 | |
| | | | |
Taseko Mines Ltd. | | | | | | | | | | | | |
8.250% due 05/01/2030 | | | | | 992 | | | | | | 1,016 | |
| | | | |
Taylor Morrison Communities, Inc. | | | | | | | | | | | | |
5.750% due 01/15/2028 | | | | | 468 | | | | | | 464 | |
|
TEGNA, Inc. | |
4.625% due 03/15/2028 | | | | | 2,802 | | | | | | 2,535 | |
4.750% due 03/15/2026 | | | | | 806 | | | | | | 789 | |
|
Teleflex, Inc. | |
4.250% due 06/01/2028 | | | | | 478 | | | | | | 451 | |
4.625% due 11/15/2027 | | | | | 1,018 | | | | | | 984 | |
| | | | |
Telesat Canada | | | | | | | | | | | | |
5.625% due 12/06/2026 | | | | | 1,156 | | | | | | 546 | |
| | | | |
Tempo Acquisition LLC | | | | | | | | | | | | |
5.750% due 06/01/2025 | | | | | 371 | | | | | | 371 | |
|
Tenet Healthcare Corp. | |
5.125% due 11/01/2027 | | | | | 1,587 | | | | | | 1,554 | |
6.125% due 10/01/2028 | | | | | 2,367 | | | | | | 2,357 | |
6.250% due 02/01/2027 | | | | | 3,367 | | | | | | 3,368 | |
| | | | |
Tenneco, Inc. | | | | | | | | | | | | |
8.000% due 11/17/2028 | | | | | 2,898 | | | | | | 2,641 | |
| | | | |
Titan International, Inc. | | | | | | | | | | | | |
7.000% due 04/30/2028 | | | | | 553 | | | | | | 532 | |
| | | | |
TK Elevator Holdco GmbH | | | | | | | | | | | | |
7.625% due 07/15/2028 | | | | | 640 | | | | | | 636 | |
| | | | |
TK Elevator U.S. Newco, Inc. | | | | | | | | | | | | |
5.250% due 07/15/2027 | | | | | 3,056 | | | | | | 2,966 | |
| | | | |
TopBuild Corp. | | | | | | | | | | | | |
3.625% due 03/15/2029 | | | | | 760 | | | | | | 683 | |
| | | | |
Townsquare Media, Inc. | | | | | | | | | | | | |
6.875% due 02/01/2026 | | | | | 200 | | | | | | 197 | |
|
TransDigm, Inc. | |
5.500% due 11/15/2027 | | | | | 4,987 | | | | | | 4,901 | |
6.375% due 03/01/2029 | | | | | 4,479 | | | | | | 4,507 | |
6.750% due 08/15/2028 | | | | | 3,617 | | | | | | 3,666 | |
| | | | |
Transocean Aquila Ltd. | | | | | | | | | | | | |
8.000% due 09/30/2028 | | | | | 392 | | | | | | 399 | |
| | | | |
Transocean Titan Financing Ltd. | | | | | | | | | | | | |
8.375% due 02/01/2028 | | | | | 1,155 | | | | | | 1,193 | |
|
Transocean, Inc. | |
8.000% due 02/01/2027 | | | | | 1,650 | | | | | | 1,646 | |
8.250% due 05/15/2029 | | | | | 1,263 | | | | | | 1,267 | |
|
Travel & Leisure Co. | |
6.600% due 10/01/2025 | | | | | 252 | | | | | | 254 | |
6.625% due 07/31/2026 | | | | | 1,934 | | | | | | 1,950 | |
| | | | |
TreeHouse Foods, Inc. | | | | | | | | | | | | |
4.000% due 09/01/2028 | | | | | 1,217 | | | | | | 1,094 | |
| | | | |
Trident TPI Holdings, Inc. | | | | | | | | | | | | |
12.750% due 12/31/2028 | | | | | 1,540 | | | | | | 1,684 | |
| | | | |
TriNet Group, Inc. | | | | | | | | | | | | |
3.500% due 03/01/2029 | | | | | 452 | | | | | | 403 | |
| | | | |
Trinity Industries, Inc. | | | | | | | | | | | | |
7.750% due 07/15/2028 | | | | | 385 | | | | | | 399 | |
| | | | |
TripAdvisor, Inc. | | | | | | | | | | | | |
7.000% due 07/15/2025 | | | | | 1,130 | | | | | | 1,134 | |
| | | | |
Triton Water Holdings, Inc. | | | | | | | | | | | | |
6.250% due 04/01/2029 | | | | | 500 | | | | | | 483 | |
| | | | |
Triumph Group, Inc. | | | | | | | | | | | | |
9.000% due 03/15/2028 | | | | | 2,722 | | | | | | 2,857 | |
|
Trivium Packaging Finance BV | |
5.500% due 08/15/2026 | | | | | 1,855 | | | | | | 1,820 | |
8.500% due 08/15/2027 | | | | | 843 | | | | | | 838 | |
| | | | | | | | | | | | |
| | | | | PRINCIPAL
AMOUNT
(000S) | | | | | MARKET
VALUE
(000S) | |
| | | | |
Tronox, Inc. | | | | | | | | | | | | |
4.625% due 03/15/2029 | | $ | | | 438 | | | $ | | | 396 | |
| | | | |
Tutor Perini Corp. | | | | | | | | | | | | |
11.875% due 04/30/2029 | | | | | 992 | | | | | | 1,068 | |
| | | | |
Twilio, Inc. | | | | | | | | | | | | |
3.625% due 03/15/2029 | | | | | 400 | | | | | | 360 | |
| | | | |
U.S. Acute Care Solutions LLC | | | | | | | | | | | | |
9.750% due 05/15/2029 | | | | | 2,600 | | | | | | 2,564 | |
| | | | |
U.S. Foods, Inc. | | | | | | | | | | | | |
6.875% due 09/15/2028 | | | | | 1,900 | | | | | | 1,945 | |
| | | | |
U.S. Renal Care, Inc. | | | | | | | | | | | | |
10.625% due 06/28/2028 | | | | | 326 | | | | | | 286 | |
| | | | |
Uber Technologies, Inc. | | | | | | | | | | | | |
7.500% due 09/15/2027 | | | | | 2,467 | | | | | | 2,517 | |
| | | | |
Under Armour, Inc. | | | | | | | | | | | | |
3.250% due 06/15/2026 | | | | | 1,347 | | | | | | 1,280 | |
| | | | |
Unisys Corp. | | | | | | | | | | | | |
6.875% due 11/01/2027 | | | | | 385 | | | | | | 338 | |
| | | | |
United Airlines, Inc. | | | | | | | | | | | | |
4.375% due 04/15/2026 | | | | | 4,708 | | | | | | 4,553 | |
| | | | |
United Natural Foods, Inc. | | | | | | | | | | | | |
6.750% due 10/15/2028 | | | | | 465 | | | | | | 420 | |
|
United Rentals North America, Inc. | |
3.875% due 11/15/2027 | | | | | 393 | | | | | | 372 | |
4.875% due 01/15/2028 | | | | | 2,494 | | | | | | 2,419 | |
5.500% due 05/15/2027 | | | | | 870 | | | | | | 864 | |
|
Univision Communications, Inc. | |
4.500% due 05/01/2029 | | | | | 400 | | | | | | 337 | |
6.625% due 06/01/2027 | | | | | 4,000 | | | | | | 3,833 | |
8.000% due 08/15/2028 | | | | | 2,646 | | | | | | 2,583 | |
8.500% due 07/31/2031 | | | | | 250 | | | | | | 243 | |
| | | | |
Urban One, Inc. | | | | | | | | | | | | |
7.375% due 02/01/2028 | | | | | 1,396 | | | | | | 1,074 | |
|
USA Compression Partners LP | |
6.875% due 09/01/2027 | | | | | 1,147 | | | | | | 1,150 | |
7.125% due 03/15/2029 | | | | | 2,658 | | | | | | 2,680 | |
| | | | |
Velocity Vehicle Group LLC | | | | | | | | | | | | |
8.000% due 06/01/2029 | | | | | 2,000 | | | | | | 2,059 | |
|
Venture Global LNG, Inc. | |
8.125% due 06/01/2028 | | | | | 5,559 | | | | | | 5,731 | |
9.500% due 02/01/2029 | | | | | 5,229 | | | | | | 5,730 | |
| | | | |
Vericast Corp. | | | | | | | | | | | | |
11.000% due 09/15/2026 | | | | | 1,669 | | | | | | 1,790 | |
| | | | |
Veritas U.S., Inc. | | | | | | | | | | | | |
7.500% due 09/01/2025 | | | | | 1,142 | | | | | | 989 | |
| | | | |
Vertiv Group Corp. | | | | | | | | | | | | |
4.125% due 11/15/2028 | | | | | 570 | | | | | | 533 | |
|
Viasat, Inc. | |
5.625% due 09/15/2025 | | | | | 1,126 | | | | | | 1,093 | |
5.625% due 04/15/2027 | | | | | 300 | | | | | | 269 | |
6.500% due 07/15/2028 (f) | | | | | 1,359 | | | | | | 1,030 | |
| | | | |
Victoria’s Secret & Co. | | | | | | | | | | | | |
4.625% due 07/15/2029 | | | | | 2,200 | | | | | | 1,831 | |
| | | | |
Victra Holdings LLC | | | | | | | | | | | | |
7.750% due 02/15/2026 | | | | | 1,661 | | | | | | 1,653 | |
|
Viking Cruises Ltd. | |
5.875% due 09/15/2027 | | | | | 1,911 | | | | | | 1,892 | |
6.250% due 05/15/2025 | | | | | 463 | | | | | | 463 | |
7.000% due 02/15/2029 | | | | | 520 | | | | | | 523 | |
| | | | |
Viper Energy Partners LP | | | | | | | | | | | | |
5.375% due 11/01/2027 | | | | | 100 | | | | | | 98 | |
| | | | |
Viridien | | | | | | | | | | | | |
8.750% due 04/01/2027 (f) | | | | | 2,802 | | | | | | 2,673 | |
|
VistaJet Malta Finance PLC | |
7.875% due 05/01/2027 | | | | | 385 | | | | | | 341 | |
9.500% due 06/01/2028 (f) | | | | | 1,164 | | | | | | 1,022 | |
| | | | |
Vmed O2 U.K. Financing PLC | | | | | | | | | | | | |
7.750% due 04/15/2032 | | | | | 1,404 | | | | | | 1,371 | |
| | | | |
VOC Escrow Ltd. | | | | | | | | | | | | |
5.000% due 02/15/2028 | | | | | 1,896 | | | | | | 1,839 | |
|
Walgreens Boots Alliance, Inc. | |
3.450% due 06/01/2026 | | | | | 1,100 | | | | | | 1,036 | |
3.800% due 11/18/2024 | | | | | 1,100 | | | | | | 1,088 | |
| | | | | | | | | | | | |
| See Accompanying Notes | | | ANNUAL FINANCIAL AND OTHER INFORMATION | | | | | | | JUNE 30, 2024 | | | 31 |
| | | | | | |
| Schedule of Investments | | PIMCO 0-5 Year High Yield Corporate Bond Index Exchange-Traded Fund | | (Cont.) | | |
| | | | | | | | | | | | |
| | | | | PRINCIPAL
AMOUNT
(000S) | | | | | MARKET
VALUE
(000S) | |
|
WASH Multifamily Acquisition, Inc. | |
5.750% due 04/15/2026 | | $ | | | 728 | | | $ | | | 712 | |
| | | | |
Waste Pro USA, Inc. | | | | | | | | | | | | |
5.500% due 02/15/2026 | | | | | 1,232 | | | | | | 1,216 | |
|
Wesco Aircraft Holdings, Inc. (7.500% Cash and 3.000% PIK) | |
10.500% due 11/15/2026 ^«(a)(b) | | | | | 1,533 | | | | | | 1,395 | |
|
WESCO Distribution, Inc. | |
6.375% due 03/15/2029 | | | | | 1,774 | | | | | | 1,783 | |
7.250% due 06/15/2028 | | | | | 1,157 | | | | | | 1,179 | |
| | | | |
Western Digital Corp. | | | | | | | | | | | | |
4.750% due 02/15/2026 | | | | | 4,540 | | | | | | 4,448 | |
| | | | |
White Cap Buyer LLC | | | | | | | | | | | | |
6.875% due 10/15/2028 | | | | | 1,791 | | | | | | 1,730 | |
|
White Cap Parent LLC (8.250% Cash or 9.000% PIK) | |
8.250% due 03/15/2026 (a)(f) | | | | | 2,000 | | | | | | 2,002 | |
| | | | |
William Carter Co. | | | | | | | | | | | | |
5.625% due 03/15/2027 | | | | | 271 | | | | | | 268 | |
|
Williams Scotsman, Inc. | |
6.125% due 06/15/2025 | | | | | 1,391 | | | | | | 1,390 | |
6.625% due 06/15/2029 | | | | | 975 | | | | | | 984 | |
| | | | |
Windstream Escrow LLC | | | | | | | | | | | | |
7.750% due 08/15/2028 | | | | | 1,280 | | | | | | 1,207 | |
| | | | |
Winnebago Industries, Inc. | | | | | | | | | | | | |
6.250% due 07/15/2028 | | | | | 249 | | | | | | 245 | |
| | | | |
WR Grace Holdings LLC | | | | | | | | | | | | |
4.875% due 06/15/2027 | | | | | 1,188 | | | | | | 1,147 | |
| | | | |
Wynn Las Vegas LLC | | | | | | | | | | | | |
5.250% due 05/15/2027 | | | | | 1,969 | | | | | | 1,922 | |
| | | | |
Wynn Macau Ltd. | | | | | | | | | | | | |
5.500% due 10/01/2027 | | | | | 1,112 | | | | | | 1,061 | |
|
Xerox Holdings Corp. | |
5.000% due 08/15/2025 | | | | | 630 | | | | | | 619 | |
5.500% due 08/15/2028 | | | | | 450 | | | | | | 388 | |
|
Zayo Group Holdings, Inc. | |
4.000% due 03/01/2027 (f) | | | | | 2,751 | | | | | | 2,204 | |
6.125% due 03/01/2028 (f) | | | | | 2,341 | | | | | | 1,570 | |
|
ZF North America Capital, Inc. | |
4.750% due 04/29/2025 | | | | | 2,336 | | | | | | 2,308 | |
6.875% due 04/14/2028 | | | | | 1,282 | | | | | | 1,308 | |
| | | | |
Ziggo Bond Co. BV | | | | | | | | | | | | |
6.000% due 01/15/2027 | | | | | 325 | | | | | | 319 | |
| | | | | | | | | | | | |
| | | | | | | | | | | 913,448 | |
| | | | | | | | | | | | |
| |
| UTILITIES 4.2% | |
| | | | |
Aethon United BR LP | | | | | | | | | | | | |
8.250% due 02/15/2026 | | | 707 | | | | | | 715 | |
|
AmeriGas Partners LP | |
5.500% due 05/20/2025 | | | | | 346 | | | | | | 345 | |
5.875% due 08/20/2026 | | | | | 1,212 | | | | | | 1,175 | |
9.375% due 06/01/2028 | | | | | 244 | | | | | | 251 | |
|
Antero Midstream Partners LP | |
5.375% due 06/15/2029 | | | | | 1,100 | | | | | | 1,067 | |
5.750% due 03/01/2027 | | | | | 793 | | | | | | 787 | |
|
Archrock Partners LP | |
6.250% due 04/01/2028 | | | | | 546 | | | | | | 541 | |
6.875% due 04/01/2027 | | | | | 913 | | | | | | 917 | |
|
Atlantica Sustainable Infrastructure PLC | |
4.125% due 06/15/2028 | | | | | 120 | | | | | | 118 | |
| | | | |
Blue Racer Midstream LLC | | | | | | | | | | | | |
6.625% due 07/15/2026 | | | | | 1,379 | | | | | | 1,381 | |
|
Calpine Corp. | |
4.500% due 02/15/2028 | | | | | 1,604 | | | | | | 1,525 | |
5.125% due 03/15/2028 | | | | | 3,482 | | | | | | 3,351 | |
5.250% due 06/01/2026 | | | | | 704 | | | | | | 697 | |
| | | | | | | | | | | | |
| | | | | PRINCIPAL
AMOUNT
(000S) | | | | | MARKET
VALUE
(000S) | |
|
Clearway Energy Operating LLC | |
4.750% due 03/15/2028 | | $ | | | 1,695 | | | $ | | | 1,621 | |
| | | | |
CrownRock LP | | | | | | | | | | | | |
5.625% due 10/15/2025 | | | | | 1,179 | | | | | | 1,177 | |
| | | | |
DPL, Inc. | | | | | | | | | | | | |
4.125% due 07/01/2025 | | | | | 263 | | | | | | 258 | |
|
Endeavor Energy Resources LP | |
5.750% due 01/30/2028 | | | | | 1,979 | | | | | | 1,999 | |
|
Genesis Energy LP | |
7.750% due 02/01/2028 | | | | | 1,300 | | | | | | 1,315 | |
8.000% due 01/15/2027 | | | | | 2,999 | | | | | | 3,069 | |
8.250% due 01/15/2029 | | | | | 878 | | | | | | 907 | |
| | | | |
Hilcorp Energy LP | | | | | | | | | | | | |
6.250% due 11/01/2028 | | | | | 1,139 | | | | | | 1,126 | |
|
Iliad Holding SASU | |
6.500% due 10/15/2026 | | | | | 1,263 | | | | | | 1,259 | |
7.000% due 10/15/2028 | | | | | 896 | | | | | | 889 | |
|
Lumen Technologies, Inc. | |
4.125% due 04/15/2029 | | | | | 397 | | | | | | 260 | |
4.125% due 04/15/2030 | | | | | 417 | | | | | | 263 | |
|
Millicom International Cellular SA | |
5.125% due 01/15/2028 | | | | | 596 | | | | | | 563 | |
| | | | |
NGL Energy Operating LLC | | | | | | | | | | | | |
8.125% due 02/15/2029 | | | | | 1,156 | | | | | | 1,179 | |
|
NRG Energy, Inc. | |
5.250% due 06/15/2029 | | | | | 500 | | | | | | 480 | |
5.750% due 01/15/2028 | | | | | 901 | | | | | | 895 | |
| | | | |
Pattern Energy Operations LP | | | | | | | | | | | | |
4.500% due 08/15/2028 | | | | | 1,901 | | | | | | 1,761 | |
| | | | |
PBF Holding Co. LLC | | | | | | | | | | | | |
6.000% due 02/15/2028 | | | | | 1,894 | | | | | | 1,848 | |
| | | | |
PG&E Corp. | | | | | | | | | | | | |
5.000% due 07/01/2028 | | | | | 1,120 | | | | | | 1,079 | |
| | | | |
Qwest Corp. | | | | | | | | | | | | |
7.250% due 09/15/2025 | | | | | 709 | | | | | | 692 | |
|
Summit Midstream Holdings LLC | |
10.000% due 10/15/2026 þ | | | | | 860 | | | | | | 885 | |
|
Tallgrass Energy Partners LP | |
5.500% due 01/15/2028 | | | | | 3,551 | | | | | | 3,400 | |
6.000% due 03/01/2027 | | | | | 882 | | | | | | 870 | |
7.375% due 02/15/2029 | | | | | 920 | | | | | | 925 | |
|
TerraForm Power Operating LLC | |
5.000% due 01/31/2028 | | | | | 2,015 | | | | | | 1,927 | |
| | | | |
Transocean Poseidon Ltd. | | | | | | | | | | | | |
6.875% due 02/01/2027 | | | | | 1,418 | | | | | | 1,417 | |
|
Vistra Operations Co. LLC | |
4.375% due 05/01/2029 | | | | | 500 | | | | | | 466 | |
5.000% due 07/31/2027 | | | | | 210 | | | | | | 203 | |
5.500% due 09/01/2026 | | | | | 1,736 | | | | | | 1,713 | |
5.625% due 02/15/2027 | | | | | 4,310 | | | | | | 4,241 | |
| | | | | | | | | | | | |
| | | | | | | | | | | 51,557 | |
| | | | | | | | | | | | |
Total Corporate Bonds & Notes (Cost $1,167,941) | | | 1,158,066 | |
| | | | |
| |
| | | | | SHARES | | | | | | |
| COMMON STOCKS 0.4% | |
| |
| FINANCIALS 0.3% | |
| | | | |
Bruin Blocker LLC «(c)(h) | | | | | 182,994 | | | | | | 0 | |
| | | | |
Intelsat Emergence SA «(h) | | | | | 90,881 | | | | | | 3,380 | |
| | | | |
Jerset Newco «(c) | | | | | 5,855 | | | | | | 419 | |
| | | | | | | | | | | | |
| | | | | | | | | | | 3,799 | |
| | | | | | | | | | | | |
| |
| | | | | | | | | | | | |
| | | | | SHARES | | | | | MARKET
VALUE
(000S) | |
| HEALTH CARE 0.1% | |
| | | | |
Amsurg Equity «(c)(h) | | | | | 21,155 | | | $ | | | 1,047 | |
| | | | | | | | | | | | |
| |
| INDUSTRIALS 0.0% | |
| | | | |
Voyager Aviation Holdings LLC «(c) | | | | | 530 | | | | | | 0 | |
| | | | | | | | | | | | |
| |
| INFORMATION TECHNOLOGY 0.0% | |
| | | | |
Riverbed Technology, Inc.
«(c)(h) | | | | | 22,812 | | | | | | 6 | |
| | | | | | | | | | | | |
Total Common Stocks (Cost $9,654) | | | 4,852 | |
| | | | |
| |
| WARRANTS 0.0% | |
| |
| FINANCIALS 0.0% | |
| | | | |
Intelsat Emergence SA - Exp. 02/17/2027 « | | | | | 28,334 | | | | | | 71 | |
| | | | | | | | | | | | |
Total Warrants (Cost $3,296) | | | 71 | |
| | | | |
| |
| PREFERRED SECURITIES 0.0% | |
| |
| INDUSTRIALS 0.0% | |
|
Voyager Aviation Holdings LLC | |
9.500% « | | | | | 3,178 | | | | | | 0 | |
| | | | | | | | | | | | |
Total Preferred Securities (Cost $1,041) | | | 0 | |
| | | | |
| |
| SHORT-TERM INSTRUMENTS 4.7% | |
| | | | | | | | | | | | |
| REPURCHASE AGREEMENTS (i) 4.7% | | | | |
| | | | | | | | | | | 58,302 | |
| | | | | | | | | | | | |
| Total Short-Term Instruments (Cost $58,302) | | | 58,302 | |
| | | | |
| | | | |
| | | | | | | | | | | | |
| Total Investments in Securities (Cost $1,247,844) | | | 1,229,014 | |
| | | | |
| |
| INVESTMENTS IN AFFILIATES 3.4% | |
| |
| SHORT-TERM INSTRUMENTS 3.4% | |
| |
| MUTUAL FUNDS 3.4% | |
|
PIMCO Government Money Market Fund | |
5.470% (e)(f)(g) | | | 41,110,803 | | | | | | 41,111 | |
| | | | | | | | | | | | |
| Total Short-Term Instruments (Cost $41,111) | | | 41,111 | |
| | | | |
| | | | |
| | | | | | | | | | | | |
| Total Investments in Affiliates (Cost $41,111) | | | 41,111 | |
| |
| | | | |
| Total Investments 103.2% (Cost $1,288,955) | | | $ | | | 1,270,125 | |
| |
Financial Derivative Instruments (k) (0.0)% (Cost or Premiums, net $860) | | | | | | (41 | ) |
| |
| Other Assets and Liabilities, net (3.2)% | | | (39,700 | ) |
| | | | |
| Net Assets 100.0% | | | $ | | | 1,230,384 | |
| | | | | | | | | | | | |
NOTES TO SCHEDULE OF INVESTMENTS:
| * | A zero balance may reflect actual amounts rounding to less than one thousand. |
| « | Security valued using significant unobservable inputs (Level 3). |
| | | | | | |
| 32 | | PIMCO ETF TRUST | | | See Accompanying Notes | |
| • | Rate shown is the rate in effect as of period end. The rate may be based on a fixed rate, a capped rate or a floor rate and may convert to a variable or floating rate in the future. These securities do not indicate a reference rate and spread in their description. |
| þ | Coupon represents a rate which changes periodically based on a predetermined schedule or event. Rate shown is the rate in effect as of period end. |
| (a) | Payment in-kind security. |
| (b) | Security is not accruing income as of the date of this report. |
| (c) | Security did not produce income within the last twelve months. |
| (e) | Institutional Class Shares of each Fund. |
| (f) | Securities with an aggregate market value of $40,532 were out on loan in exchange for $41,384 of cash collateral as of June 30, 2024. See Note 5, Securities Lending, in the Notes to Financial Statements for more information regarding securities on loan and cash collateral. |
| (g) | Coupon represents a 7-Day Yield. |
(h) RESTRICTED SECURITIES:
| | | | | | | | | | | | | | | | | | | | | | | | |
| Issuer Description | | | | | | | | Acquisition
Date | | | Cost | | | Market
Value | | | Market Value
as Percentage
of Net Assets | |
Amsurg Equity | | | | | | | | | | | 11/02/2023 - 11/06/2023 | | | $ | 884 | | | $ | 1,047 | | | | 0.09 | % |
Bruin Blocker LLC | | | | | | | | | | | 04/20/2021 | | | | 0 | | | | 0 | | | | 0.00 | |
Intelsat Emergence SA | | | | | | | | | | | 10/02/2018 - 07/03/2023 | | | | 6,884 | | | | 3,380 | | | | 0.27 | |
Riverbed Technology, Inc. | | | | | | | | | | | 04/24/2018 - 12/07/2021 | | | | 1,634 | | | | 6 | | | | 0.00 | |
| | | | | | | | | | | | | | | | | | | | | | | | |
| | | $ | 9,402 | | | $ | 4,433 | | | | 0.36 | % |
| | | | | | | | | | | | | |
BORROWINGS AND OTHER FINANCING TRANSACTIONS
(i) REPURCHASE AGREEMENTS:
| | | | | | | | | | | | | | | | | | | | | | | | | | | | | | |
| Counterparty | | Lending
Rate | | | Settlement
Date | | | Maturity
Date | | | Principal
Amount | | | Collateralized By | | Collateral
(Received) | | | Repurchase
Agreements,
at Value | | | Repurchase
Agreement
Proceeds
to be
Received(1) | |
| BPS | | | 5.340 | % | | | 06/28/2024 | | | | 07/01/2024 | | | $ | 30,100 | | | U.S. Treasury Notes 0.625% due 07/31/2026 | | $ | (30,691 | ) | | $ | 30,100 | | | $ | 30,113 | |
| | | 5.400 | | | | 07/01/2024 | | | | 07/02/2024 | | | | 100 | | | U.S. Treasury Notes 1.375% due 11/15/2031 | | | (102 | ) | | | 100 | | | | 100 | |
| DEU | | | 5.410 | | | | 07/01/2024 | | | | 07/02/2024 | | | | 26,700 | | | U.S. Treasury Notes 1.875% due 02/28/2029 | | | (27,255 | ) | | | 26,700 | | | | 26,700 | |
| FICC | | | 2.600 | | | | 06/28/2024 | | | | 07/01/2024 | | | | 1,402 | | | U.S. Treasury Notes 4.500% due 03/31/2026 | | | (1,431 | ) | | | 1,402 | | | | 1,403 | |
| | | | | | | | | | | | | | | | | | | | | | | | | | | | | | |
Total Repurchase Agreements | | | | | $ | (59,479 | ) | | $ | 58,302 | | | $ | 58,316 | |
| | | | | | | | | | | | | | | |
REVERSE REPURCHASE AGREEMENTS:
| | | | | | | | | | | | | | | | | | | | |
| Counterparty | | Borrowing Rate(2) | | | Settlement Date | | | Maturity Date | | | Amount
Borrowed(2) | | | Payable for
Reverse
Repurchase
Agreements | |
BRC | | | 4.500 | % | | | 06/18/2024 | | | | TBD | (3) | | $ | (1,989 | ) | | $ | (1,992 | ) |
| | | | | | | | | | | | | | | | | | | | |
Total Reverse Repurchase Agreements | | | | | | | | | | | $ | (1,992 | ) |
| | | | | | | | | | | | | | | | | | | | |
BORROWINGS AND OTHER FINANCING TRANSACTIONS SUMMARY
The following is a summary by counterparty of the market value of Borrowings and Other Financing Transactions and collateral pledged/(received) as of June 30, 2024:
| | | | | | | | | | | | | | | | | | | | | | | | | | | | |
| Counterparty | | Repurchase
Agreement
Proceeds
to be
Received(1) | | | Payable for
Reverse
Repurchase
Agreements | | | Payable for
Sale-Buyback
Transactions | | | Securities
Out on Loan | | | Total
Borrowings and
Other Financing
Transactions | | | Collateral
Pledged/(Received) | | | Net Exposure(4) | |
Global/Master Repurchase Agreement | |
BPS | | $ | 30,213 | | | $ | 0 | | | $ | 0 | | | $ | 0 | | | $ | 30,213 | | | $ | (30,793 | ) | | $ | (580 | ) |
BRC | | | 0 | | | | (1,992 | ) | | | 0 | | | | 0 | | | | (1,992 | ) | | | 2,340 | | | | 348 | |
DEU | | | 26,700 | | | | 0 | | | | 0 | | | | 0 | | | | 26,700 | | | | (27,255 | ) | | | (555 | ) |
FICC | | | 1,403 | | | | 0 | | | | 0 | | | | 0 | | | | 1,403 | | | | (1,431 | ) | | | (28 | ) |
|
Master Securities Lending Agreement | |
BCY | | | 0 | | | | 0 | | | | 0 | | | | 14,702 | | | | 14,702 | | | | (15,000 | ) | | | (298 | ) |
BMO | | | 0 | | | | 0 | | | | 0 | | | | 1,626 | | | | 1,626 | | | | (1,658 | ) | | | (32 | ) |
BOS | | | 0 | | | | 0 | | | | 0 | | | | 4,127 | | | | 4,127 | | | | (4,208 | ) | | | (81 | ) |
BPG | | | 0 | | | | 0 | | | | 0 | | | | 1,016 | | | | 1,016 | | | | (1,037 | ) | | | (21 | ) |
BSN | | | 0 | | | | 0 | | | | 0 | | | | 858 | | | | 858 | | | | (875 | ) | | | (17 | ) |
GSC | | | 0 | | | | 0 | | | | 0 | | | | 9,580 | | | | 9,580 | | | | (9,772 | ) | | | (192 | ) |
RDR | | | 0 | | | | 0 | | | | 0 | | | | 8,623 | | | | 8,623 | | | | (8,834 | ) | | | (211 | ) |
| | | | | | | | | | | | | | | | | | | | | | | | | | | | |
Total Borrowings and Other Financing Transactions | | $ | 58,316 | | | $ | (1,992 | ) | | $ | 0 | | | $ | 40,532 | | | | | | | | | | | | | |
| | | | | | | | | | | | | | | | | | | | | | | | | | | | |
| | | | | | | | | | | | |
| See Accompanying Notes | | | ANNUAL FINANCIAL AND OTHER INFORMATION | | | | | | | JUNE 30, 2024 | | | 33 |
| | | | | | |
| Schedule of Investments | | PIMCO 0-5 Year High Yield Corporate Bond Index Exchange-Traded Fund | | (Cont.) | | |
CERTAIN TRANSFERS ACCOUNTED FOR AS SECURED BORROWINGS
Remaining Contractual Maturity of the Agreements
| | | | | | | | | | | | | | | | | | | | |
| | | Overnight and Continuous | | | Up to 30 days | | | 31-90 days | | | Greater Than 90 days | | | Total | |
Securities Lending Transactions(5) | |
Corporate Bonds & Notes | | $ | 41,384 | | | $ | 0 | | | $ | 0 | | | $ | 0 | | | $ | 41,384 | |
| | | | | | | | | | | | | | | | | | | | |
Total | | $ | 41,384 | | | $ | 0 | | | $ | 0 | | | $ | 0 | | | $ | 41,384 | |
| | | | | | | | | | | | | | | | | | | | |
Reverse Repurchase Agreements | |
Corporate Bonds & Notes | | | 0 | | | | 0 | | | | 0 | | | | (1,992 | ) | | | (1,992 | ) |
| | | | | | | | | | | | | | | | | | | | |
Total | | $ | 0 | | | $ | 0 | | | $ | 0 | | | $ | (1,992 | ) | | $ | (1,992 | ) |
| | | | | | | | | | | | | | | | | | | | |
Total Borrowings | | $ | 41,384 | | | $ | 0 | | | $ | 0 | | | $ | (1,992 | ) | | $ | 39,392 | |
| | | | | | | | | | | | | | | | | | | | |
Payable for reverse repurchase agreements and securities on loan - cash collateral | | | $ | 39,392 | |
| | | | | |
| (j) | Securities with an aggregate market value of $2,340 have been pledged as collateral under the terms of the above master agreements as of June 30, 2024. |
| (1) | Includes accrued interest. |
| (2) | The average amount of borrowings outstanding during the period ended June 30, 2024 was $(952) at a weighted average interest rate of 3.593%. Average borrowings may include reverse repurchase agreements and sale-buyback transactions, if held during the period. |
| (3) | Open maturity reverse repurchase agreement. |
| (4) | Net Exposure represents the net receivable/(payable) that would be due from/to the counterparty in the event of default. Exposure from borrowings and other financing transactions can only be netted across transactions governed under the same master agreement with the same legal entity. See Note 8, Master Netting Arrangements, in the Notes to Financial Statements for more information. |
| (5) | Includes cash collateral as described in Note 5 in the Notes to Financial Statements. |
(k) FINANCIAL DERIVATIVE INSTRUMENTS: EXCHANGE-TRADED OR CENTRALLY CLEARED
FUTURES CONTRACTS:
LONG FUTURES CONTRACTS
| | | | | | | | | | | | | | | | | | | | | | | | |
| Description | | Expiration
Month | | | # of
Contracts | | | Notional
Amount | | | Unrealized
Appreciation/
(Depreciation) | | | Variation Margin | |
| | Asset | | | Liability | |
U.S. Treasury 2-Year Note September Futures | | | 09/2024 | | | | 136 | | | $ | 27,774 | | | $ | 47 | | | $ | 0 | | | $ | (3 | ) |
U.S. Treasury 5-Year Note September Futures | | | 09/2024 | | | | 304 | | | | 32,400 | | | | 100 | | | | 0 | | | | (25 | ) |
| | | | | | | | | | | | | | | | | | | | | | | | |
Total Futures Contracts | | | $ | 147 | | | $ | 0 | | | $ | (28 | ) |
| | | | | | | | | | | | | |
SWAP AGREEMENTS:
CREDIT DEFAULT SWAPS ON CORPORATE ISSUES - SELL PROTECTION(1)
| | | | | | | | | | | | | | | | | | | | | | | | | | | | | | | | | | | | | | | | |
| Reference Entity | | Fixed
Receive Rate | | | Payment
Frequency | | | Maturity
Date | | | Implied
Credit Spread at
June 30, 2024(2) | | | Notional
Amount(3) | | | Premiums
Paid/(Received) | | | Unrealized
Appreciation/
(Depreciation) | | | Market
Value(4) | | | Variation Margin | |
| | Asset | | | Liability | |
Calpine Corp. | | | 5.000 | % | | | Quarterly | | | | 06/20/2028 | | | | 1.547 | % | | $ | 2,500 | | | $ | 100 | | | $ | 209 | | | $ | 309 | | | $ | 1 | | | $ | 0 | |
Carnival Corp. | | | 1.000 | | | | Quarterly | | | | 12/20/2027 | | | | 1.509 | | | | 1,000 | | | | (100 | ) | | | 84 | | | | (16 | ) | | | 0 | | | | 0 | |
Dish DBS Copr. | | | 5.000 | | | | Quarterly | | | | 12/20/2024 | | | | 20.815 | | | | 3,000 | | | | (218 | ) | | | 11 | | | | (207 | ) | | | 7 | | | | 0 | |
Transocean, Inc. | | | 1.000 | | | | Quarterly | | | | 12/20/2028 | | | | 3.538 | | | | 600 | | | | (89 | ) | | | 31 | | | | (58 | ) | | | 1 | | | | 0 | |
| | | | | | | | | | | | | | | | | | | | | | | | | | | | | | | | | | | | | | | | |
| | | | | | | | | | | | | | | $ | (307 | ) | | $ | 335 | | | $ | 28 | | | $ | 9 | | | $ | 0 | |
| | | | | | | | | | | | | | | | | | | | | | | | | | | | | | | | | |
CREDIT DEFAULT SWAPS ON CREDIT INDICES - SELL PROTECTION(1)
| | | | | | | | | | | | | | | | | | | | | | | | | | | | | | | | | | | | |
| Index/Tranches | | Fixed
Receive Rate | | | Payment
Frequency | | | Maturity
Date | | | Notional
Amount(3) | | | Premiums
Paid/(Received) | | | Unrealized
Appreciation/
(Depreciation) | | | Market
Value(4) | | | Variation Margin | |
| | Asset | | | Liability | |
CDX.HY-36 5-Year Index | | | 5.000 | % | | | Quarterly | | | | 06/20/2026 | | | $ | 4,850 | | | $ | 182 | | | $ | 113 | | | $ | 295 | | | $ | 0 | | | $ | (4 | ) |
CDX.HY-40 5-Year Index | | | 5.000 | | | | Quarterly | | | | 06/20/2028 | | | | 594 | | | | 14 | | | | 24 | | | | 38 | | | | 0 | | | | 0 | |
CDX.HY-41 5-Year Index | | | 5.000 | | | | Quarterly | | | | 12/20/2028 | | | | 14,454 | | | | 34 | | | | 906 | | | | 940 | | | | 0 | | | | (9 | ) |
CDX.HY-42 5-Year Index | | | 5.000 | | | | Quarterly | | | | 06/20/2029 | | | | 14,200 | | | | 937 | | | | (29 | ) | | | 908 | | | | 0 | | | | (9 | ) |
| | | | | | | | | | | | | | | | | | | | | | | | | | | | | | | | | | | | |
| | | | | | | | | | | | | | | $ | 1,167 | | | $ | 1,014 | | | $ | 2,181 | | | $ | 0 | | | $ | (22 | ) |
| | | | | | | | | | | | | | | | | | | | | | | | | | | | | | | | | |
Total Swap Agreements | | | $ | 860 | | | $ | 1,349 | | | $ | 2,209 | | | $ | 9 | | | $ | (22 | ) |
| | | | | | | | | | | | | | | | | | | | | |
| | | | | | |
| 34 | | PIMCO ETF TRUST | | | See Accompanying Notes | |
FINANCIAL DERIVATIVE INSTRUMENTS: EXCHANGE-TRADED OR CENTRALLY CLEARED SUMMARY
The following is a summary of the market value and variation margin of Exchange-Traded or Centrally Cleared Financial Derivative Instruments as of June 30, 2024:
| | | | | | | | | | | | | | | | | | | | | | | | | | | | | | | | | | | | |
| | | Financial Derivative Assets | | | | | | Financial Derivative Liabilities | |
| | | Market Value | | | Variation Margin
Asset | | | Total | | | | | | Market Value | | | Variation Margin
Liability | | | Total | |
| | | Purchased
Options | | | Futures | | | Swap
Agreements | | | | | | Written
Options | | | Futures | | | Swap
Agreements | |
Total Exchange-Traded or Centrally Cleared | | $ | 0 | | | $ | 0 | | | $ | 9 | | | $ | 9 | | | | | | | $ | 0 | | | $ | (28 | ) | | $ | (22 | ) | | $ | (50 | ) |
| | | | | | | | | | | | | | | | | | | | | | | | | | | | | | | | | | | | |
Cash of $8,859 has been pledged as collateral for exchange-traded and centrally cleared financial derivative instruments as of June 30, 2024. See Note 8, Master Netting Arrangements, in the Notes to Financial Statements for more information.
| (1) | If the Fund is a seller of protection and a credit event occurs, as defined under the terms of that particular swap agreement, the Fund will either (i) pay to the buyer of protection an amount equal to the notional amount of the swap and take delivery of the referenced obligation or underlying securities comprising the referenced index or (ii) pay a net settlement amount in the form of cash, securities or other deliverable obligations equal to the notional amount of the swap less the recovery value of the referenced obligation or underlying securities comprising the referenced index. |
| (2) | Implied credit spreads, represented in absolute terms, utilized in determining the market value of credit default swap agreements on issues as of period end serve as indicators of the current status of the payment/performance risk and represent the likelihood or risk of default for the credit derivative. The implied credit spread of a particular referenced entity reflects the cost of buying/selling protection and may include upfront payments required to be made to enter into the agreement. Wider credit spreads represent a deterioration of the referenced entity’s credit soundness and a greater likelihood or risk of default or other credit event occurring as defined under the terms of the agreement. |
| (3) | The maximum potential amount the Fund could be required to pay as a seller of credit protection or receive as a buyer of credit protection if a credit event occurs as defined under the terms of that particular swap agreement. |
| (4) | The prices and resulting values for credit default swap agreements serve as indicators of the current status of the payment/performance risk and represent the likelihood of an expected liability (or profit) for the credit derivative should the notional amount of the swap agreement be closed/sold as of the period end. Increasing market values, in absolute terms when compared to the notional amount of the swap, represent a deterioration of the underlying referenced instrument’s credit soundness and a greater likelihood or risk of default or other credit event occurring as defined under the terms of the agreement. |
FAIR VALUE OF FINANCIAL DERIVATIVE INSTRUMENTS
The following is a summary of the fair valuation of the Fund’s derivative instruments categorized by risk exposure. See Note 7, Principal and Other Risks, in the Notes to Financial Statements on risks of the Fund.
Fair Values of Financial Derivative Instruments on the Statements of Assets and Liabilities as of June 30, 2024:
| | | | | | | | | | | | | | | | | | | | | | | | |
| | | Derivatives not accounted for as hedging instruments | |
| | | Commodity
Contracts | | | Credit
Contracts | | | Equity
Contracts | | | Foreign
Exchange
Contracts | | | Interest
Rate Contracts | | | Total | |
Financial Derivative Instruments - Assets | |
Exchange-traded or centrally cleared | |
Swap Agreements | | $ | 0 | | | $ | 9 | | | $ | 0 | | | $ | 0 | | | $ | 0 | | | $ | 9 | |
| | | | | | | | | | | | | | | | | | | | | | | | |
|
Financial Derivative Instruments - Liabilities | |
Exchange-traded or centrally cleared | |
Futures | | $ | 0 | | | $ | 0 | | | $ | 0 | | | $ | 0 | | | $ | 28 | | | $ | 28 | |
Swap Agreements | | | 0 | | | | 22 | | | | 0 | | | | 0 | | | | 0 | | | | 22 | |
| | | | | | | | | | | | | | | | | | | | | | | | |
| | $ | 0 | | | $ | 22 | | | $ | 0 | | | $ | 0 | | | $ | 28 | | | $ | 50 | |
| | | | | | | | | | | | | | | | | | | | | | | | |
|
The effect of Financial Derivative Instruments on the Statements of Operations for the period ended June 30, 2024: | |
| | | Derivatives not accounted for as hedging instruments | |
| | | Commodity
Contracts | | | Credit
Contracts | | | Equity
Contracts | | | Foreign
Exchange
Contracts | | | Interest
Rate Contracts | | | Total | |
Net Realized Gain (Loss) on Financial Derivative Instruments | |
Exchange-traded or centrally cleared | |
Futures | | $ | 0 | | | $ | 0 | | | $ | 0 | | | $ | 0 | | | $ | 39 | | | $ | 39 | |
Swap Agreements | | | 0 | | | | 5,809 | | | | 0 | | | | 0 | | | | (8 | ) | | | 5,801 | |
| | | | | | | | | | | | | | | | | | | | | | | | |
| | $ | 0 | | | $ | 5,809 | | | $ | 0 | | | $ | 0 | | | $ | 31 | | | $ | 5,840 | |
| | | | | | | | | | | | | | | | | | | | | | | | |
Over the counter | |
Swap Agreements | | $ | 0 | | | $ | 3 | | | $ | 0 | | | $ | 0 | | | $ | 0 | | | $ | 3 | |
| | | | | | | | | | | | | | | | | | | | | | | | |
| | $ | 0 | | | $ | 5,812 | | | $ | 0 | | | $ | 0 | | | $ | 31 | | | $ | 5,843 | |
| | | | | | | | | | | | | | | | | | | | | | | | |
| | | | | | | | | | | | |
| See Accompanying Notes | | | ANNUAL FINANCIAL AND OTHER INFORMATION | | | | | | | JUNE 30, 2024 | | | 35 |
| | | | | | |
| Schedule of Investments | | PIMCO 0-5 Year High Yield Corporate Bond Index Exchange-Traded Fund | | (Cont.) | | June 30, 2024 |
| | | | | | | | | | | | | | | | | | | | | | | | |
| | | Derivatives not accounted for as hedging instruments | |
| | | Commodity
Contracts | | | Credit
Contracts | | | Equity
Contracts | | | Foreign
Exchange
Contracts | | | Interest
Rate Contracts | | | Total | |
Net Change in Unrealized Appreciation (Depreciation) on Financial Derivative Instruments | |
Exchange-traded or centrally cleared | |
Futures | | $ | 0 | | | $ | 0 | | | $ | 0 | | | $ | 0 | | | $ | 419 | | | $ | 419 | |
Swap Agreements | | | 0 | | | | (357 | ) | | | 0 | | | | 0 | | | | 0 | | | | (357 | ) |
| | | | | | | | | | | | | | | | | | | | | | | | |
| | $ | 0 | | | $ | (357 | ) | | $ | 0 | | | $ | 0 | | | $ | 419 | | | $ | 62 | |
| | | | | | | | | | | | | | | | | | | | | | | | |
FAIR VALUE MEASUREMENTS
The following is a summary of the fair valuations according to the inputs used as of June 30, 2024 in valuing the Fund’s assets and liabilities:
| | | | | | | | | | | | | | | | |
| Category and Subcategory | | Level 1 | | | Level 2 | | | Level 3 | | | Fair
Value at 06/30/2024 | |
Investments in Securities, at Value | |
Loan Participations and Assignments | | $ | 0 | | | $ | 4,352 | | | $ | 3,371 | | | $ | 7,723 | |
Corporate Bonds & Notes | |
Banking & Finance | | | 0 | | | | 192,991 | | | | 70 | | | | 193,061 | |
Industrials | | | 0 | | | | 912,053 | | | | 1,395 | | | | 913,448 | |
Utilities | | | 0 | | | | 51,557 | | | | 0 | | | | 51,557 | |
Common Stocks | |
Financials | | | 0 | | | | 0 | | | | 3,799 | | | | 3,799 | |
Health Care | | | 0 | | | | 0 | | | | 1,047 | | | | 1,047 | |
Information Technology | | | 0 | | | | 0 | | | | 6 | | | | 6 | |
Warrants | |
Financials | | | 0 | | | | 0 | | | | 71 | | | | 71 | |
Short-Term Instruments | |
Repurchase Agreements | | | 0 | | | | 58,302 | | | | 0 | | | | 58,302 | |
| | | | | | | | | | | | | | | | |
| | $ | 0 | | | $ | 1,219,255 | | | $ | 9,759 | | | $ | 1,229,014 | |
| | | | | | | | | | | | | | | | |
|
Investments in Affiliates, at Value | |
Short-Term Instruments | |
Mutual Funds | | | 41,111 | | | | 0 | | | | 0 | | | | 41,111 | |
| | | | | | | | | | | | | | | | |
| | | | |
Total Investments | | $ | 41,111 | | | $ | 1,219,255 | | | $ | 9,759 | | | $ | 1,270,125 | |
| | | | | | | | | | | | | | | | |
| | | | | | | | | | | | | | | | |
| Category and Subcategory | | Level 1 | | | Level 2 | | | Level 3 | | | Fair
Value at 06/30/2024 | |
Financial Derivative Instruments - Assets | |
Exchange-traded or centrally cleared | | $ | 0 | | | $ | 9 | | | $ | 0 | | | $ | 9 | |
| | | | | | | | | | | | | | | | |
|
Financial Derivative Instruments - Liabilities | |
Exchange-traded or centrally cleared | | $ | 0 | | | $ | (50 | ) | | $ | 0 | | | $ | (50 | ) |
| | | | | | | | | | | | | | | | |
| | | | |
Total Financial Derivative Instruments | | $ | 0 | | | $ | (41 | ) | | $ | 0 | | | $ | (41 | ) |
| | | | | | | | | | | | | | | | |
| | | | |
Totals | | $ | 41,111 | | | $ | 1,219,214 | | | $ | 9,759 | | | $ | 1,270,084 | |
| | | | | | | | | | | | | | | | |
There were no significant transfers into or out of Level 3 during the period ended June 30, 2024.
| | | | | | |
| 36 | | PIMCO ETF TRUST | | | See Accompanying Notes | |
| | | | | | |
| Schedule of Investments | | PIMCO Investment Grade Corporate Bond Index Exchange-Traded Fund | | | | June 30, 2024 |
(Amounts in thousands*, except number of shares, contracts, units and ounces, if any)
| | | | | | | | | | | | |
| | | | | PRINCIPAL
AMOUNT
(000S) | | | | | MARKET
VALUE
(000S) | |
| INVESTMENTS IN SECURITIES 103.3% | |
| |
| CORPORATE BONDS & NOTES 94.8% | |
| |
| BANKING & FINANCE 39.6% | |
|
ABN AMRO Bank NV | |
6.339% due 09/18/2027 • | | $ | | | 742 | | | $ | | | 752 | |
|
AerCap Ireland Capital DAC | |
2.450% due 10/29/2026 | | | | | 3,744 | | | | | | 3,494 | |
3.000% due 10/29/2028 | | | | | 210 | | | | | | 191 | |
3.300% due 01/30/2032 | | | | | 2,674 | | | | | | 2,298 | |
3.400% due 10/29/2033 | | | | | 146 | | | | | | 123 | |
3.850% due 10/29/2041 | | | | | 63 | | | | | | 49 | |
4.450% due 10/01/2025 | | | | | 766 | | | | | | 756 | |
|
Aflac, Inc. | |
4.750% due 01/15/2049 | | | | | 51 | | | | | | 45 | |
|
AIA Group Ltd. | |
4.950% due 04/04/2033 | | | | | 2,301 | | | | | | 2,259 | |
|
AIB Group PLC | |
7.583% due 10/14/2026 • | | | | | 303 | | | | | | 310 | |
|
Aircastle Ltd. | |
4.250% due 06/15/2026 | | | | | 872 | | | | | | 850 | |
6.500% due 07/18/2028 | | | | | 120 | | | | | | 122 | |
|
Alexandria Real Estate Equities, Inc. | |
1.875% due 02/01/2033 | | | | | 1,957 | | | | | | 1,473 | |
|
Alleghany Corp. | |
3.250% due 08/15/2051 | | | | | 1,585 | | | | | | 1,071 | |
|
Ally Financial, Inc. | |
2.200% due 11/02/2028 | | | | | 1,695 | | | | | | 1,468 | |
4.750% due 06/09/2027 | | | | | 110 | | | | | | 107 | |
5.800% due 05/01/2025 | | | | | 130 | | | | | | 130 | |
|
American Express Co. | |
3.950% due 08/01/2025 | | | | | 839 | | | | | | 825 | |
4.050% due 12/03/2042 | | | | | 123 | | | | | | 103 | |
4.420% due 08/03/2033 • | | | | | 1,356 | | | | | | 1,280 | |
6.489% due 10/30/2031 • | | | | | 140 | | | | | | 149 | |
|
American Homes 4 Rent LP | |
4.250% due 02/15/2028 | | | | | 125 | | | | | | 120 | |
|
American Tower Corp. | |
2.750% due 01/15/2027 | | | | | 646 | | | | | | 606 | |
2.900% due 01/15/2030 | | | | | 2,312 | | | | | | 2,039 | |
2.950% due 01/15/2051 | | | | | 2,325 | | | | | | 1,456 | |
3.125% due 01/15/2027 | | | | | 333 | | | | | | 316 | |
3.600% due 01/15/2028 | | | | | 1,073 | | | | | | 1,013 | |
5.900% due 11/15/2033 | | | | | 120 | | | | | | 123 | |
|
ANZ New Zealand International Ltd. | |
1.250% due 06/22/2026 | | | | | 136 | | | | | | 126 | |
|
Aon Corp. | |
2.800% due 05/15/2030 | | | | | 2,042 | | | | | | 1,791 | |
2.900% due 08/23/2051 | | | | | 1,506 | | | | | | 920 | |
3.900% due 02/28/2052 | | | | | 70 | | | | | | 52 | |
|
Arch Capital Group Ltd. | |
3.635% due 06/30/2050 | | | | | 242 | | | | | | 174 | |
|
Ares Capital Corp. | |
2.875% due 06/15/2027 | | | | | 729 | | | | | | 668 | |
2.875% due 06/15/2028 | | | | | 90 | | | | | | 80 | |
|
Ares Management Corp. | |
6.375% due 11/10/2028 | | | | | 972 | | | | | | 1,013 | |
|
Arthur J Gallagher & Co. | |
3.500% due 05/20/2051 | | | | | 20 | | | | | | 14 | |
5.750% due 07/15/2054 | | | | | 2,278 | | | | | | 2,216 | |
|
ASB Bank Ltd. | |
2.375% due 10/22/2031 | | | | | 125 | | | | | | 103 | |
|
Assured Guaranty U.S. Holdings, Inc. | |
3.150% due 06/15/2031 | | | | | 181 | | | | | | 157 | |
|
Athene Global Funding | |
0.914% due 08/19/2024 | | | | | 479 | | | | | | 476 | |
1.450% due 01/08/2026 | | | | | 586 | | | | | | 550 | |
1.608% due 06/29/2026 | | | | | 1,426 | | | | | | 1,321 | |
1.716% due 01/07/2025 | | | | | 41 | | | | | | 40 | |
2.673% due 06/07/2031 | | | | | 10 | | | | | | 8 | |
|
Australia & New Zealand Banking Group Ltd. | |
2.570% due 11/25/2035 •(g) | | | | | 704 | | | | | | 578 | |
2.950% due 07/22/2030 • | | | | | 234 | | | | | | 227 | |
4.400% due 05/19/2026 (g) | | | | | 490 | | | | | | 480 | |
| | | | | | | | | | | | |
| | | | | PRINCIPAL
AMOUNT
(000S) | | | | | MARKET
VALUE
(000S) | |
|
AvalonBay Communities, Inc. | |
5.350% due 06/01/2034 | | $ | | | 1,735 | | | $ | | | 1,737 | |
|
Aviation Capital Group LLC | |
1.950% due 01/30/2026 | | | | | 168 | | | | | | 158 | |
6.250% due 04/15/2028 | | | | | 2,583 | | | | | | 2,637 | |
|
Avolon Holdings Funding Ltd. | |
2.125% due 02/21/2026 | | | | | 45 | | | | | | 42 | |
2.528% due 11/18/2027 | | | | | 1,814 | | | | | | 1,632 | |
2.875% due 02/15/2025 | | | | | 1,520 | | | | | | 1,489 | |
5.500% due 01/15/2026 | | | | | 2,072 | | | | | | 2,056 | |
|
AXIS Specialty Finance PLC | |
4.000% due 12/06/2027 | | | | | 120 | | | | | | 115 | |
|
Banco Bilbao Vizcaya Argentaria SA | |
5.862% due 09/14/2026 • | | | | | 117 | | | | | | 117 | |
6.138% due 09/14/2028 • | | | | | 606 | | | | | | 618 | |
7.883% due 11/15/2034 • | | | | | 1,980 | | | | | | 2,159 | |
|
Banco de Credito e Inversiones SA | |
3.500% due 10/12/2027 | | | | | 826 | | | | | | 780 | |
|
Banco Santander Chile | |
2.700% due 01/10/2025 | | | | | 125 | | | | | | 123 | |
|
Banco Santander Mexico SA Institucion de Banca Multiple Grupo Financiero Santand | |
5.375% due 04/17/2025 | | | | | 147 | | | | | | 146 | |
|
Banco Santander SA | |
1.849% due 03/25/2026 | | | | | 86 | | | | | | 81 | |
4.379% due 04/12/2028 | | | | | 120 | | | | | | 116 | |
5.147% due 08/18/2025 | | | | | 823 | | | | | | 817 | |
5.294% due 08/18/2027 | | | | | 120 | | | | | | 119 | |
|
Bank of America Corp. | |
1.530% due 12/06/2025 • | | | | | 1,011 | | | | | | 992 | |
2.572% due 10/20/2032 • | | | | | 3,935 | | | | | | 3,263 | |
2.592% due 04/29/2031 • | | | | | 170 | | | | | | 147 | |
2.687% due 04/22/2032 • | | | | | 645 | | | | | | 545 | |
2.884% due 10/22/2030 • | | | | | 130 | | | | | | 116 | |
2.972% due 02/04/2033 • | | | | | 180 | | | | | | 152 | |
3.384% due 04/02/2026 • | | | | | 1,327 | | | | | | 1,303 | |
3.419% due 12/20/2028 • | | | | | 2,933 | | | | | | 2,759 | |
3.970% due 03/05/2029 • | | | | | 100 | | | | | | 96 | |
4.271% due 07/23/2029 • | | | | | 2,430 | | | | | | 2,342 | |
4.827% due 07/22/2026 • | | | | | 867 | | | | | | 859 | |
4.948% due 07/22/2028 • | | | | | 956 | | | | | | 949 | |
5.015% due 07/22/2033 • | | | | | 3,168 | | | | | | 3,098 | |
5.080% due 01/20/2027 • | | | | | 1,310 | | | | | | 1,303 | |
5.288% due 04/25/2034 • | | | | | 1,902 | | | | | | 1,883 | |
5.468% due 01/23/2035 • | | | | | 3,270 | | | | | | 3,268 | |
5.872% due 09/15/2034 • | | | | | 140 | | | | | | 144 | |
|
Bank of Ireland Group PLC | |
2.029% due 09/30/2027 • | | | | | 913 | | | | | | 842 | |
6.253% due 09/16/2026 • | | | | | 120 | | | | | | 121 | |
|
Bank of New York Mellon Corp. | |
4.706% due 02/01/2034 • | | | | | 120 | | | | | | 115 | |
5.802% due 10/25/2028 • | | | | | 46 | | | | | | 47 | |
5.834% due 10/25/2033 • | | | | | 1,855 | | | | | | 1,921 | |
|
Bank of New Zealand | |
1.000% due 03/03/2026 | | | | | 110 | | | | | | 102 | |
|
Bank of Nova Scotia | |
1.050% due 03/02/2026 | | | | | 53 | | | | | | 49 | |
5.250% due 06/12/2028 | | | | | 407 | | | | | | 409 | |
|
Barclays PLC | |
2.852% due 05/07/2026 • | | | | | 243 | | | | | | 237 | |
4.375% due 01/12/2026 | | | | | 3,835 | | | | | | 3,772 | |
5.304% due 08/09/2026 • | | | | | 546 | | | | | | 543 | |
5.829% due 05/09/2027 • | | | | | 120 | | | | | | 120 | |
6.496% due 09/13/2027 • | | | | | 546 | | | | | | 555 | |
7.325% due 11/02/2026 • | | | | | 120 | | | | | | 122 | |
7.385% due 11/02/2028 • | | | | | 140 | | | | | | 148 | |
7.437% due 11/02/2033 • | | | | | 44 | | | | | | 48 | |
|
Berkshire Hathaway Finance Corp. | |
2.850% due 10/15/2050 | | | | | 1,133 | | | | | | 729 | |
3.850% due 03/15/2052 | | | | | 1,934 | | | | | | 1,496 | |
4.200% due 08/15/2048 | | | | | 372 | | | | | | 313 | |
4.250% due 01/15/2049 | | | | | 531 | | | | | | 454 | |
5.750% due 01/15/2040 | | | | | 700 | | | | | | 744 | |
|
Berkshire Hathaway, Inc. | |
4.500% due 02/11/2043 | | | | | 633 | | | | | | 587 | |
|
BGC Group, Inc. | |
6.600% due 06/10/2029 | | | | | 2,000 | | | | | | 1,991 | |
| | | | | | | | | | | | |
| | | | | PRINCIPAL
AMOUNT
(000S) | | | | | MARKET
VALUE
(000S) | |
|
Blackstone Holdings Finance Co. LLC | |
2.800% due 09/30/2050 | | $ | | | 75 | | | $ | | | 45 | |
2.850% due 08/05/2051 | | | | | 1,698 | | | | | | 1,040 | |
3.500% due 09/10/2049 | | | | | 560 | | | | | | 394 | |
|
Blackstone Secured Lending Fund | |
2.750% due 09/16/2026 | | | | | 1,113 | | | | | | 1,031 | |
3.625% due 01/15/2026 | | | | | 251 | | | | | | 241 | |
|
Block Financial LLC | |
3.875% due 08/15/2030 | | | | | 1,130 | | | | | | 1,036 | |
|
Blue Owl Capital Corp. | |
2.875% due 06/11/2028 | | | | | 157 | | | | | | 139 | |
3.400% due 07/15/2026 | | | | | 126 | | | | | | 119 | |
4.250% due 01/15/2026 | | | | | 10 | | | | | | 10 | |
|
Blue Owl Finance LLC | |
3.125% due 06/10/2031 | | | | | 606 | | | | | | 505 | |
4.125% due 10/07/2051 | | | | | 466 | | | | | | 335 | |
|
BNP Paribas SA | |
1.323% due 01/13/2027 • | | | | | 1,423 | | | | | | 1,329 | |
2.219% due 06/09/2026 • | | | | | 936 | | | | | | 905 | |
4.400% due 08/14/2028 | | | | | 2,756 | | | | | | 2,648 | |
|
BPCE SA | |
1.000% due 01/20/2026 | | | | | 325 | | | | | | 304 | |
1.652% due 10/06/2026 • | | | | | 2,437 | | | | | | 2,307 | |
3.500% due 10/23/2027 | | | | | 369 | | | | | | 345 | |
5.281% due 05/30/2029 | | | | | 682 | | | | | | 680 | |
5.975% due 01/18/2027 • | | | | | 847 | | | | | | 848 | |
6.612% due 10/19/2027 • | | | | | 318 | | | | | | 323 | |
|
Brandywine Operating Partnership LP | |
3.950% due 11/15/2027 | | | | | 386 | | | | | | 350 | |
|
Brighthouse Financial Global Funding | |
1.550% due 05/24/2026 | | | | | 468 | | | | | | 433 | |
|
Brookfield Finance, Inc. | |
3.625% due 02/15/2052 | | | | | 696 | | | | | | 485 | |
3.900% due 01/25/2028 | | | | | 1,058 | | | | | | 1,010 | |
4.850% due 03/29/2029 | | | | | 2,215 | | | | | | 2,177 | |
|
Brown & Brown, Inc. | |
2.375% due 03/15/2031 | | | | | 146 | | | | | | 121 | |
4.950% due 03/17/2052 | | | | | 2,674 | | | | | | 2,278 | |
|
CaixaBank SA | |
6.684% due 09/13/2027 • | | | | | 1,226 | | | | | | 1,250 | |
|
Cantor Fitzgerald LP | |
7.200% due 12/12/2028 | | | | | 972 | | | | | | 1,000 | |
|
Capital One Financial Corp. | |
1.878% due 11/02/2027 • | | | | | 1,889 | | | | | | 1,733 | |
2.636% due 03/03/2026 • | | | | | 2,319 | | | | | | 2,270 | |
4.985% due 07/24/2026 • | | | | | 240 | | | | | | 238 | |
5.247% due 07/26/2030 • | | | | | 178 | | | | | | 175 | |
5.268% due 05/10/2033 • | | | | | 145 | | | | | | 140 | |
5.468% due 02/01/2029 • | | | | | 120 | | | | | | 119 | |
5.700% due 02/01/2030 • | | | | | 1,692 | | | | | | 1,700 | |
|
CBRE Services, Inc. | |
5.950% due 08/15/2034 | | | | | 5,590 | | | | | | 5,662 | |
|
Charles Schwab Corp. | |
1.650% due 03/11/2031 | | | | | 4,008 | | | | | | 3,221 | |
1.950% due 12/01/2031 | | | | | 164 | | | | | | 131 | |
2.000% due 03/20/2028 | | | | | 1,177 | | | | | | 1,057 | |
2.300% due 05/13/2031 | | | | | 10 | | | | | | 8 | |
2.900% due 03/03/2032 | | | | | 100 | | | | | | 86 | |
5.875% due 08/24/2026 | | | | | 1,450 | | | | | | 1,467 | |
|
Chubb INA Holdings, Inc. | |
1.375% due 09/15/2030 | | | | | 150 | | | | | | 122 | |
3.050% due 12/15/2061 | | | | | 50 | | | | | | 32 | |
|
CI Financial Corp. | |
7.500% due 05/30/2029 | | | | | 1,584 | | | | | | 1,570 | |
|
Citibank NA | |
5.570% due 04/30/2034 | | | | | 4,804 | | | | | | 4,883 | |
|
Citigroup, Inc. | |
2.561% due 05/01/2032 • | | | | | 1,590 | | | | | | 1,326 | |
2.572% due 06/03/2031 • | | | | | 500 | | | | | | 429 | |
3.057% due 01/25/2033 • | | | | | 2,652 | | | | | | 2,253 | |
3.070% due 02/24/2028 • | | | | | 130 | | | | | | 123 | |
3.668% due 07/24/2028 • | | | | | 509 | | | | | | 485 | |
3.980% due 03/20/2030 • | | | | | 1,107 | | | | | | 1,045 | |
4.075% due 04/23/2029 • | | | | | 411 | | | | | | 394 | |
4.412% due 03/31/2031 • | | | | | 80 | | | | | | 76 | |
4.910% due 05/24/2033 • | | | | | 150 | | | | | | 144 | |
6.270% due 11/17/2033 • | | | | | 1,071 | | | | | | 1,122 | |
| | | | | | | | | | | | |
| See Accompanying Notes | | | ANNUAL FINANCIAL AND OTHER INFORMATION | | | | | | | JUNE 30, 2024 | | | 37 |
| | | | | | |
| Schedule of Investments | | PIMCO Investment Grade Corporate Bond Index Exchange-Traded Fund | | (Cont.) | | |
| | | | | | | | | | | | |
| | | | | PRINCIPAL
AMOUNT
(000S) | | | | | MARKET
VALUE
(000S) | |
|
Citizens Bank NA | |
3.750% due 02/18/2026 | | $ | | | 659 | | | $ | | | 637 | |
4.575% due 08/09/2028 • | | | | | 485 | | | | | | 468 | |
|
Citizens Financial Group, Inc. | |
2.850% due 07/27/2026 | | | | | 897 | | | | | | 847 | |
3.250% due 04/30/2030 | | | | | 10 | | | | | | 9 | |
|
CNO Global Funding | |
5.875% due 06/04/2027 | | | | | 298 | | | | | | 299 | |
|
Commonwealth Bank of Australia | |
2.688% due 03/11/2031 (g) | | | | | 1,437 | | | | | | 1,193 | |
5.316% due 03/13/2026 | | | | | 974 | | | | | | 978 | |
|
Cooperatieve Rabobank UA | |
1.980% due 12/15/2027 • | | | | | 110 | | | | | | 101 | |
3.750% due 07/21/2026 | | | | | 935 | | | | | | 900 | |
5.800% due 09/30/2110 | | | | | 3 | | | | | | 3 | |
|
Corebridge Financial, Inc. | |
3.500% due 04/04/2025 | | | | | 1,067 | | | | | | 1,049 | |
3.650% due 04/05/2027 | | | | | 1,289 | | | | | | 1,234 | |
3.850% due 04/05/2029 | | | | | 1,309 | | | | | | 1,228 | |
3.900% due 04/05/2032 | | | | | 196 | | | | | | 176 | |
4.400% due 04/05/2052 | | | | | 100 | | | | | | 79 | |
|
Credit Agricole SA | |
1.247% due 01/26/2027 • | | | | | 1,028 | | | | | | 959 | |
1.907% due 06/16/2026 • | | | | | 51 | | | | | | 49 | |
5.301% due 07/12/2028 | | | | | 51 | | | | | | 51 | |
6.316% due 10/03/2029 • | | | | | 699 | | | | | | 718 | |
|
Crown Castle, Inc. | |
1.350% due 07/15/2025 | | | | | 23 | | | | | | 22 | |
2.100% due 04/01/2031 | | | | | 20 | | | | | | 16 | |
2.250% due 01/15/2031 | | | | | 1,016 | | | | | | 836 | |
2.500% due 07/15/2031 | | | | | 10 | | | | | | 8 | |
2.900% due 03/15/2027 | | | | | 629 | | | | | | 591 | |
2.900% due 04/01/2041 | | | | | 172 | | | | | | 119 | |
3.100% due 11/15/2029 | | | | | 1,662 | | | | | | 1,485 | |
3.250% due 01/15/2051 | | | | | 27 | | | | | | 18 | |
3.300% due 07/01/2030 | | | | | 100 | | | | | | 89 | |
4.300% due 02/15/2029 | | | | | 692 | | | | | | 661 | |
4.450% due 02/15/2026 | | | | | 1,068 | | | | | | 1,050 | |
|
CubeSmart LP | |
3.000% due 02/15/2030 | | | | | 56 | | | | | | 50 | |
|
DAE Sukuk Difc Ltd. | |
3.750% due 02/15/2026 | | | | | 1,371 | | | | | | 1,323 | |
|
Danske Bank AS | |
3.244% due 12/20/2025 • | | | | | 1,523 | | | | | | 1,503 | |
4.375% due 06/12/2028 | | | | | 522 | | | | | | 503 | |
|
Deutsche Bank AG | |
2.129% due 11/24/2026 • | | | | | 1,871 | | | | | | 1,776 | |
3.961% due 11/26/2025 • | | | | | 457 | | | | | | 453 | |
5.414% due 05/10/2029 | | | | | 992 | | | | | | 991 | |
6.720% due 01/18/2029 • | | | | | 140 | | | | | | 145 | |
7.079% due 02/10/2034 • | | | | | 884 | | | | | | 900 | |
|
Digital Realty Trust LP | |
3.600% due 07/01/2029 | | | | | 865 | | | | | | 803 | |
3.700% due 08/15/2027 | | | | | 51 | | | | | | 49 | |
5.550% due 01/15/2028 | | | | | 299 | | | | | | 302 | |
|
Discover Bank | |
4.650% due 09/13/2028 | | | | | 2,247 | | | | | | 2,159 | |
|
Discover Financial Services | |
4.100% due 02/09/2027 | | | | | 110 | | | | | | 106 | |
|
DNB Bank ASA | |
1.535% due 05/25/2027 • | | | | | 2,001 | | | | | | 1,856 | |
|
DOC DR LLC | |
3.950% due 01/15/2028 | | | | | 257 | | | | | | 246 | |
|
Empower Finance LP | |
1.776% due 03/17/2031 | | | | | 61 | | | | | | 48 | |
3.075% due 09/17/2051 | | | | | 2,873 | | | | | | 1,837 | |
|
Enstar Group Ltd. | |
3.100% due 09/01/2031 | | | | | 414 | | | | | | 343 | |
|
EPR Properties | |
3.750% due 08/15/2029 | | | | | 2,676 | | | | | | 2,387 | |
4.950% due 04/15/2028 | | | | | 60 | | | | | | 57 | |
|
Equinix, Inc. | |
1.450% due 05/15/2026 | | | | | 10 | | | | | | 9 | |
2.150% due 07/15/2030 | | | | | 549 | | | | | | 461 | |
2.625% due 11/18/2024 | | | | | 50 | | | | | | 49 | |
| | | | | | | | | | | | |
| | | | | PRINCIPAL
AMOUNT
(000S) | | | | | MARKET
VALUE
(000S) | |
3.000% due 07/15/2050 | | $ | | | 784 | | | $ | | | 497 | |
3.200% due 11/18/2029 | | | | | 1,383 | | | | | | 1,247 | |
|
Equitable Financial Life Global Funding | |
1.300% due 07/12/2026 | | | | | 642 | | | | | | 590 | |
|
Essex Portfolio LP | |
2.650% due 03/15/2032 | | | | | 3,170 | | | | | | 2,629 | |
3.500% due 04/01/2025 | | | | | 50 | | | | | | 49 | |
|
Extra Space Storage LP | |
2.350% due 03/15/2032 | | | | | 1,933 | | | | | | 1,541 | |
|
F&G Global Funding | |
1.750% due 06/30/2026 | | | | | 135 | | | | | | 124 | |
2.300% due 04/11/2027 | | | | | 489 | | | | | | 443 | |
|
Fairfax Financial Holdings Ltd. | |
5.625% due 08/16/2032 | | | | | 1,358 | | | | | | 1,340 | |
|
Fidelity National Financial, Inc. | |
3.200% due 09/17/2051 | | | | | 313 | | | | | | 193 | |
|
Fifth Third Bacorp | |
4.055% due 04/25/2028 • | | | | | 2,289 | | | | | | 2,196 | |
|
Fifth Third Bancorp | |
6.361% due 10/27/2028 • | | | | | 433 | | | | | | 443 | |
|
First American Financial Corp. | |
4.000% due 05/15/2030 | | | | | 53 | | | | | | 48 | |
|
First-Citizens Bank & Trust Co. | |
2.969% due 09/27/2025 • | | | | | 50 | | | | | | 49 | |
|
Ford Motor Credit Co. LLC | |
2.900% due 02/16/2028 | | | | | 972 | | | | | | 880 | |
3.815% due 11/02/2027 | | | | | 615 | | | | | | 577 | |
4.125% due 08/17/2027 | | | | | 944 | | | | | | 897 | |
4.389% due 01/08/2026 | | | | | 1,895 | | | | | | 1,856 | |
4.542% due 08/01/2026 | | | | | 980 | | | | | | 954 | |
5.850% due 05/17/2027 | | | | | 1,190 | | | | | | 1,190 | |
6.050% due 03/05/2031 | | | | | 3,336 | | | | | | 3,342 | |
6.798% due 11/07/2028 | | | | | 980 | | | | | | 1,013 | |
6.800% due 05/12/2028 | | | | | 120 | | | | | | 124 | |
6.950% due 03/06/2026 | | | | | 822 | | | | | | 836 | |
|
FS KKR Capital Corp. | |
1.650% due 10/12/2024 | | | | | 254 | | | | | | 251 | |
3.125% due 10/12/2028 | | | | | 183 | | | | | | 159 | |
3.400% due 01/15/2026 | | | | | 266 | | | | | | 253 | |
|
GA Global Funding Trust | |
0.800% due 09/13/2024 | | | | | 134 | | | | | | 133 | |
1.950% due 09/15/2028 | | | | | 181 | | | | | | 159 | |
2.250% due 01/06/2027 | | | | | 662 | | | | | | 612 | |
|
GAIF Bond Issuer Pty. Ltd. | |
3.400% due 09/30/2026 | | | | | 396 | | | | | | 379 | |
|
GATX Corp. | |
3.500% due 06/01/2032 | | | | | 50 | | | | | | 43 | |
4.700% due 04/01/2029 | | | | | 1,715 | | | | | | 1,679 | |
|
General Motors Financial Co., Inc. | |
1.250% due 01/08/2026 | | | | | 2,305 | | | | | | 2,159 | |
1.500% due 06/10/2026 | | | | | 1,506 | | | | | | 1,395 | |
2.350% due 01/08/2031 | | | | | 150 | | | | | | 123 | |
2.750% due 06/20/2025 | | | | | 10 | | | | | | 10 | |
4.300% due 04/06/2029 | | | | | 132 | | | | | | 125 | |
5.850% due 04/06/2030 | | | | | 100 | | | | | | 101 | |
|
Global Atlantic Fin Co. | |
3.125% due 06/15/2031 | | | | | 100 | | | | | | 83 | |
|
Globe Life, Inc. | |
4.800% due 06/15/2032 | | | | | 100 | | | | | | 92 | |
|
GLP Capital LP | |
3.250% due 01/15/2032 | | | | | 100 | | | | | | 84 | |
4.000% due 01/15/2030 | | | | | 1,537 | | | | | | 1,409 | |
4.000% due 01/15/2031 | | | | | 497 | | | | | | 446 | |
5.300% due 01/15/2029 | | | | | 1,779 | | | | | | 1,754 | |
|
Goldman Sachs Group, Inc. | |
1.431% due 03/09/2027 • | | | | | 2,072 | | | | | | 1,934 | |
1.948% due 10/21/2027 • | | | | | 2,617 | | | | | | 2,417 | |
1.992% due 01/27/2032 • | | | | | 5,154 | | | | | | 4,185 | |
2.600% due 02/07/2030 | | | | | 10 | | | | | | 9 | |
2.615% due 04/22/2032 • | | | | | 2,966 | | | | | | 2,495 | |
2.640% due 02/24/2028 • | | | | | 1,289 | | | | | | 1,203 | |
3.102% due 02/24/2033 • | | | | | 1,951 | | | | | | 1,667 | |
3.615% due 03/15/2028 • | | | | | 51 | | | | | | 49 | |
4.482% due 08/23/2028 • | | | | | 1,726 | | | | | | 1,687 | |
5.851% due 04/25/2035 • | | | | | 546 | | | | | | 560 | |
6.484% due 10/24/2029 • | | | | | 70 | | | | | | 73 | |
| | | | | | | | | | | | |
| | | | | PRINCIPAL
AMOUNT
(000S) | | | | | MARKET
VALUE
(000S) | |
6.561% due 10/24/2034 • | | $ | | | 496 | | | $ | | | 533 | |
|
Goodman U.S. Finance Five LLC | |
4.625% due 05/04/2032 | | | | | 2,378 | | | | | | 2,205 | |
|
Guardian Life Global Funding | |
1.625% due 09/16/2028 | | | | | 630 | | | | | | 552 | |
|
Guardian Life Insurance Co. of America | |
4.850% due 01/24/2077 | | | | | 1,463 | | | | | | 1,227 | |
|
HAT Holdings LLC | |
8.000% due 06/15/2027 | | | | | 594 | | | | | | 618 | |
|
Highwoods Realty LP | |
3.050% due 02/15/2030 | | | | | 2,024 | | | | | | 1,718 | |
|
Host Hotels & Resorts LP | |
4.500% due 02/01/2026 | | | | | 498 | | | | | | 489 | |
5.700% due 07/01/2034 | | | | | 1,882 | | | | | | 1,851 | |
|
HSBC Holdings PLC | |
2.206% due 08/17/2029 • | | | | | 230 | | | | | | 202 | |
2.357% due 08/18/2031 • | | | | | 1,279 | | | | | | 1,069 | |
2.871% due 11/22/2032 • | | | | | 61 | | | | | | 51 | |
3.973% due 05/22/2030 • | | | | | 1,582 | | | | | | 1,479 | |
4.041% due 03/13/2028 • | | | | | 210 | | | | | | 202 | |
4.292% due 09/12/2026 • | | | | | 170 | | | | | | 167 | |
4.583% due 06/19/2029 • | | | | | 1,114 | | | | | | 1,077 | |
4.755% due 06/09/2028 • | | | | | 110 | | | | | | 108 | |
6.254% due 03/09/2034 • | | | | | 1,966 | | | | | | 2,048 | |
|
Hudson Pacific Properties LP | |
5.950% due 02/15/2028 | | | | | 520 | | | | | | 443 | |
|
Huntington National Bank | |
5.699% due 11/18/2025 • | | | | | 393 | | | | | | 392 | |
|
ING Groep NV | |
4.017% due 03/28/2028 • | | | | | 140 | | | | | | 135 | |
6.114% due 09/11/2034 • | | | | | 1,103 | | | | | | 1,138 | |
|
Intercontinental Exchange, Inc. | |
5.200% due 06/15/2062 | | | | | 100 | | | | | | 93 | |
5.250% due 06/15/2031 | | | | | 892 | | | | | | 898 | |
|
Intesa Sanpaolo SpA | |
6.625% due 06/20/2033 | | | | | 968 | | | | | | 999 | |
7.000% due 11/21/2025 | | | | | 100 | | | | | | 102 | |
7.778% due 06/20/2054 • | | | | | 1,100 | | | | | | 1,150 | |
8.248% due 11/21/2033 • | | | | | 585 | | | | | | 646 | |
|
Invitation Homes Operating Partnership LP | |
2.000% due 08/15/2031 | | | | | 2,294 | | | | | | 1,822 | |
|
Jackson National Life Global Funding | |
1.750% due 01/12/2025 | | | | | 200 | | | | | | 196 | |
|
Jefferies Financial Group, Inc. | |
5.875% due 07/21/2028 | | | | | 120 | | | | | | 121 | |
|
JPMorgan Chase & Co. | |
1.045% due 11/19/2026 • | | | | | 100 | | | | | | 94 | |
1.470% due 09/22/2027 • | | | | | 1,392 | | | | | | 1,279 | |
1.561% due 12/10/2025 • | | | | | 424 | | | | | | 416 | |
2.005% due 03/13/2026 • | | | | | 2,288 | | | | | | 2,229 | |
2.522% due 04/22/2031 • | | | | | 90 | | | | | | 78 | |
2.580% due 04/22/2032 • | | | | | 4,432 | | | | | | 3,745 | |
2.947% due 02/24/2028 • | | | | | 1,411 | | | | | | 1,329 | |
2.963% due 01/25/2033 • | | | | | 334 | | | | | | 285 | |
3.509% due 01/23/2029 • | | | | | 784 | | | | | | 742 | |
4.005% due 04/23/2029 • | | | | | 50 | | | | | | 48 | |
4.080% due 04/26/2026 • | | | | | 371 | | | | | | 366 | |
4.323% due 04/26/2028 • | | | | | 931 | | | | | | 908 | |
4.565% due 06/14/2030 • | | | | | 1,020 | | | | | | 990 | |
4.586% due 04/26/2033 • | | | | | 423 | | | | | | 404 | |
4.851% due 07/25/2028 • | | | | | 639 | | | | | | 633 | |
4.912% due 07/25/2033 • | | | | | 3,278 | | | | | | 3,185 | |
5.336% due 01/23/2035 • | | | | | 1,458 | | | | | | 1,450 | |
5.571% due 04/22/2028 • | | | | | 390 | | | | | | 393 | |
5.766% due 04/22/2035 • | | | | | 1,584 | | | | | | 1,626 | |
|
Key Corp. | |
6.619% (SOFRINDX + 1.250%) due 05/23/2025 ~ | | | | | 76 | | | | | | 76 | |
|
Kilroy Realty LP | |
4.375% due 10/01/2025 | | | | | 348 | | | | | | 341 | |
|
KKR Group Finance Co. LLC | |
3.250% due 12/15/2051 | | | | | 2,287 | | | | | | 1,501 | |
|
Liberty Mutual Group, Inc. | |
3.951% due 10/15/2050 | | | | | 1,509 | | | | | | 1,099 | |
5.500% due 06/15/2052 | | | | | 654 | | | | | | 609 | |
| | | | | | |
| 38 | | PIMCO ETF TRUST | | | See Accompanying Notes | |
| | | | | | | | | | | | |
| | | | | PRINCIPAL
AMOUNT
(000S) | | | | | MARKET
VALUE
(000S) | |
|
Lloyds Banking Group PLC | |
3.574% due 11/07/2028 • | | $ | | | 180 | | | $ | | | 169 | |
3.750% due 03/18/2028 • | | | | | 51 | | | | | | 49 | |
3.870% due 07/09/2025 • | | | | | 726 | | | | | | 726 | |
5.871% due 03/06/2029 • | | | | | 253 | | | | | | 257 | |
7.953% due 11/15/2033 • | | | | | 1,980 | | | | | | 2,223 | |
|
LPL Holdings, Inc. | |
6.750% due 11/17/2028 | | | | | 1,469 | | | | | | 1,543 | |
|
Lseg U.S. Fin Corp. | |
4.875% due 03/28/2027 | | | | | 200 | | | | | | 198 | |
|
LSEGA Financing PLC | |
2.000% due 04/06/2028 | | | | | 1,750 | | | | | | 1,569 | |
3.200% due 04/06/2041 | | | | | 1,354 | | | | | | 1,017 | |
|
Macquarie Group Ltd. | |
1.935% due 04/14/2028 • | | | | | 1,081 | | | | | | 980 | |
3.763% due 11/28/2028 • | | | | | 60 | | | | | | 57 | |
|
Manulife Financial Corp. | |
4.150% due 03/04/2026 | | | | | 850 | | | | | | 832 | |
|
Marsh & McLennan Cos., Inc. | |
2.375% due 12/15/2031 | | | | | 190 | | | | | | 158 | |
4.350% due 01/30/2047 | | | | | 1,583 | | | | | | 1,337 | |
6.250% due 11/01/2052 | | | | | 110 | | | | | | 119 | |
|
MassMutual Global Funding | |
4.150% due 08/26/2025 | | | | | 385 | | | | | | 380 | |
5.150% due 05/30/2029 | | | | | 1,090 | | | | | | 1,092 | |
|
Meiji Yasuda Life Insurance Co. | |
5.200% due 10/20/2045 • | | | | | 49 | | | | | | 49 | |
|
MET Tower Global Funding | |
1.250% due 09/14/2026 | | | | | 111 | | | | | | 102 | |
|
MetLife, Inc. | |
4.125% due 08/13/2042 | | | | | 130 | | | | | | 108 | |
5.000% due 07/15/2052 | | | | | 100 | | | | | | 91 | |
5.300% due 12/15/2034 | | | | | 100 | | | | | | 100 | |
9.250% due 04/08/2068 | | | | | 163 | | | | | | 189 | |
|
Metropolitan Life Global Funding | |
1.875% due 01/11/2027 | | | | | 2,841 | | | | | | 2,623 | |
5.150% due 03/28/2033 | | | | | 2,327 | | | | | | 2,300 | |
|
Mitsubishi HC Capital, Inc. | |
5.080% due 09/15/2027 | | | | | 1,272 | | | | | | 1,266 | |
|
Mitsubishi UFJ Financial Group, Inc. | |
2.309% due 07/20/2032 • | | | | | 164 | | | | | | 135 | |
2.341% due 01/19/2028 • | | | | | 1,731 | | | | | | 1,609 | |
3.195% due 07/18/2029 | | | | | 1,202 | | | | | | 1,097 | |
3.751% due 07/18/2039 | | | | | 120 | | | | | | 100 | |
4.788% due 07/18/2025 • | | | | | 1,123 | | | | | | 1,122 | |
5.017% due 07/20/2028 • | | | | | 755 | | | | | | 751 | |
5.719% due 02/20/2026 • | | | | | 966 | | | | | | 966 | |
|
Mizuho Financial Group, Inc. | |
1.979% due 09/08/2031 • | | | | | 80 | | | | | | 65 | |
3.170% due 09/11/2027 | | | | | 60 | | | | | | 56 | |
5.414% due 09/13/2028 • | | | | | 1,416 | | | | | | 1,420 | |
5.748% due 07/06/2034 • | | | | | 50 | | | | | | 51 | |
|
Morgan Stanley | |
1.928% due 04/28/2032 • | | | | | 2,798 | | | | | | 2,249 | |
2.511% due 10/20/2032 • | | | | | 119 | | | | | | 98 | |
2.630% due 02/18/2026 • | | | | | 300 | | | | | | 294 | |
3.622% due 04/01/2031 • | | | | | 3,741 | | | | | | 3,434 | |
4.210% due 04/20/2028 • | | | | | 1,532 | | | | | | 1,489 | |
4.679% due 07/17/2026 • | | | | | 1,923 | | | | | | 1,905 | |
4.889% due 07/20/2033 • | | | | | 2,376 | | | | | | 2,291 | |
5.050% due 01/28/2027 • | | | | | 599 | | | | | | 596 | |
5.123% due 02/01/2029 • | | | | | 1,824 | | | | | | 1,817 | |
5.164% due 04/20/2029 • | | | | | 130 | | | | | | 130 | |
5.652% due 04/13/2028 • | | | | | 892 | | | | | | 901 | |
5.831% due 04/19/2035 • | | | | | 1,090 | | | | | | 1,118 | |
6.296% due 10/18/2028 • | | | | | 46 | | | | | | 47 | |
6.627% due 11/01/2034 • | | | | | 972 | | | | | | 1,050 | |
|
Nasdaq, Inc. | |
5.550% due 02/15/2034 | | | | | 681 | | | | | | 682 | |
|
National Australia Bank Ltd. | |
2.990% due 05/21/2031 (g) | | | | | 100 | | | | | | 84 | |
3.347% due 01/12/2037 •(g) | | | | | 110 | | | | | | 93 | |
|
Nationwide Building Society | |
2.972% due 02/16/2028 • | | | | | 50 | | | | | | 47 | |
3.960% due 07/18/2030 • | | | | | 3,033 | | | | | | 2,808 | |
| | | | | | | | | | | | |
| | | | | PRINCIPAL
AMOUNT
(000S) | | | | | MARKET
VALUE
(000S) | |
|
Nationwide Mutual Insurance Co. | |
4.350% due 04/30/2050 | | $ | | | 1,620 | | | $ | | | 1,247 | |
4.950% due 04/22/2044 | | | | | 54 | | | | | | 46 | |
|
New York Life Global Funding | |
2.350% due 07/14/2026 | | | | | 100 | | | | | | 95 | |
|
New York Life Insurance Co. | |
3.750% due 05/15/2050 | | | | | 135 | | | | | | 101 | |
4.450% due 05/15/2069 | | | | | 169 | | | | | | 136 | |
6.750% due 11/15/2039 | | | | | 684 | | | | | | 760 | |
|
Nippon Life Insurance Co. | |
5.100% due 10/16/2044 • | | | | | 318 | | | | | | 318 | |
|
Nissan Motor Acceptance Co. LLC | |
1.125% due 09/16/2024 | | | | | 100 | | | | | | 99 | |
1.850% due 09/16/2026 | | | | | 125 | | | | | | 114 | |
2.000% due 03/09/2026 | | | | | 2,709 | | | | | | 2,537 | |
2.450% due 09/15/2028 | | | | | 100 | | | | | | 87 | |
|
NMI Holdings, Inc. | |
6.000% due 08/15/2029 | | | | | 2,278 | | | | | | 2,260 | |
|
Nomura Holdings, Inc. | |
2.172% due 07/14/2028 | | | | | 57 | | | | | | 50 | |
2.329% due 01/22/2027 | | | | | 2,788 | | | | | | 2,578 | |
2.648% due 01/16/2025 | | | | | 1,550 | | | | | | 1,524 | |
|
NongHyup Bank | |
1.250% due 07/20/2025 | | | | | 37 | | | | | | 35 | |
|
Nordea Bank Abp | |
1.500% due 09/30/2026 | | | | | 55 | | | | | | 51 | |
5.375% due 09/22/2027 | | | | | 1,753 | | | | | | 1,763 | |
|
Norinchukin Bank | |
4.867% due 09/14/2027 (f) | | | | | 702 | | | | | | 682 | |
5.071% due 09/14/2032 | | | | | 47 | | | | | | 45 | |
5.430% due 03/09/2028 (f) | | | | | 1,178 | | | | | | 1,166 | |
|
Northwestern Mutual Global Funding | |
0.800% due 01/14/2026 | | | | | 325 | | | | | | 304 | |
4.000% due 07/01/2025 | | | | | 20 | | | | | | 20 | |
|
Nuveen Finance LLC | |
4.125% due 11/01/2024 | | | | | 833 | | | | | | 828 | |
|
Oaktree Strategic Credit Fund | |
8.400% due 11/14/2028 | | | | | 972 | | | | | | 1,028 | |
|
Old Republic International Corp. | |
3.875% due 08/26/2026 | | | | | 739 | | | | | | 715 | |
|
Omega Healthcare Investors, Inc. | |
3.375% due 02/01/2031 | | | | | 2,576 | | | | | | 2,201 | |
|
Pacific Life Global Funding | |
1.600% due 09/21/2028 | | | | | 3,135 | | | | | | 2,716 | |
|
Pacific LifeCorp | |
5.400% due 09/15/2052 | | | | | 1,086 | | | | | | 1,039 | |
|
Phillips Edison Grocery Center Operating Partnership I LP | |
5.750% due 07/15/2034 | | | | | 1,486 | | | | | | 1,468 | |
|
PNC Financial Services Group, Inc. | |
2.307% due 04/23/2032 • | | | | | 260 | | | | | | 215 | |
5.068% due 01/24/2034 • | | | | | 3,058 | | | | | | 2,957 | |
5.354% due 12/02/2028 • | | | | | 47 | | | | | | 47 | |
5.492% due 05/14/2030 • | | | | | 1,570 | | | | | | 1,579 | |
6.875% due 10/20/2034 • | | | | | 208 | | | | | | 227 | |
|
Popular, Inc. | |
7.250% due 03/13/2028 | | | | | 1,663 | | | | | | 1,709 | |
|
Pricoa Global Funding | |
0.800% due 09/01/2025 | | | | | 1,272 | | | | | | 1,206 | |
|
Principal Life Global Funding | |
3.000% due 04/18/2026 | | | | | 820 | | | | | | 787 | |
|
Progressive Corp. | |
3.000% due 03/15/2032 | | | | | 821 | | | | | | 713 | |
3.700% due 03/15/2052 | | | | | 100 | | | | | | 75 | |
|
Prologis LP | |
4.000% due 09/15/2028 | | | | | 1,602 | | | | | | 1,542 | |
|
Protective Life Global Funding | |
1.303% due 09/20/2026 | | | | | 701 | | | | | | 643 | |
1.646% due 01/13/2025 | | | | | 556 | | | | | | 544 | |
|
Prudential Financial, Inc. | |
3.000% due 03/10/2040 | | | | | 172 | | | | | | 127 | |
3.905% due 12/07/2047 | | | | | 135 | | | | | | 104 | |
5.375% due 05/15/2045 • | | | | | 426 | | | | | | 423 | |
| | | | | | | | | | | | |
| | | | | PRINCIPAL
AMOUNT
(000S) | | | | | MARKET
VALUE
(000S) | |
|
Prudential Funding Asia PLC | |
3.125% due 04/14/2030 | | $ | | | 324 | | | $ | | | 290 | |
|
Raymond James Financial, Inc. | |
3.750% due 04/01/2051 | | | | | 60 | | | | | | 44 | |
|
Realty Income Corp. | |
3.250% due 01/15/2031 | | | | | 132 | | | | | | 117 | |
3.400% due 01/15/2028 | | | | | 571 | | | | | | 538 | |
4.450% due 09/15/2026 | | | | | 474 | | | | | | 463 | |
4.700% due 12/15/2028 | | | | | 1,486 | | | | | | 1,460 | |
|
Reinsurance Group of America, Inc. | |
3.950% due 09/15/2026 | | | | | 1,050 | | | | | | 1,021 | |
|
Reliance Standard Life Global Funding | |
1.512% due 09/28/2026 | | | | | 157 | | | | | | 142 | |
|
Rexford Industrial Realty LP | |
2.150% due 09/01/2031 | | | | | 1,146 | | | | | | 914 | |
|
RGA Global Funding | |
2.000% due 11/30/2026 | | | | | 53 | | | | | | 49 | |
6.000% due 11/21/2028 | | | | | 892 | | | | | | 919 | |
|
Royal Bank of Canada | |
3.625% due 05/04/2027 | | | | | 120 | | | | | | 115 | |
|
Sabra Health Care LP | |
3.200% due 12/01/2031 | | | | | 290 | | | | | | 241 | |
|
Santander Holdings USA, Inc. | |
2.490% due 01/06/2028 • | | | | | 2,165 | | | | | | 1,996 | |
4.500% due 07/17/2025 | | | | | 1,013 | | | | | | 999 | |
6.499% due 03/09/2029 • | | | | | 1,831 | | | | | | 1,866 | |
|
Santander U.K. Group Holdings PLC | |
1.673% due 06/14/2027 • | | | | | 3,065 | | | | | | 2,835 | |
|
Scentre Group Trust | |
3.500% due 02/12/2025 | | | | | 50 | | | | | | 49 | |
|
SMBC Aviation Capital Finance DAC | |
1.900% due 10/15/2026 | | | | | 1,528 | | | | | | 1,408 | |
|
Societe Generale SA | |
1.792% due 06/09/2027 • | | | | | 105 | | | | | | 97 | |
3.337% due 01/21/2033 • | | | | | 665 | | | | | | 552 | |
4.250% due 04/14/2025 | | | | | 710 | | | | | | 698 | |
6.691% due 01/10/2034 • | | | | | 564 | | | | | | 582 | |
|
Standard Chartered PLC | |
2.678% due 06/29/2032 • | | | | | 84 | | | | | | 69 | |
2.819% due 01/30/2026 • | | | | | 3,275 | | | | | | 3,217 | |
|
State Street Corp. | |
5.820% due 11/04/2028 • | | | | | 1,115 | | | | | | 1,138 | |
|
Sumitomo Mitsui Financial Group, Inc. | |
2.222% due 09/17/2031 | | | | | 3,023 | | | | | | 2,460 | |
2.472% due 01/14/2029 | | | | | 538 | | | | | | 479 | |
2.750% due 01/15/2030 | | | | | 3,256 | | | | | | 2,858 | |
4.306% due 10/16/2028 | | | | | 50 | | | | | | 49 | |
5.766% due 01/13/2033 | | | | | 47 | | | | | | 48 | |
|
Sumitomo Mitsui Trust Bank Ltd. | |
4.950% due 09/15/2027 | | | | | 1,897 | | | | | | 1,885 | |
|
Sun Communities Operating LP | |
2.300% due 11/01/2028 | | | | | 56 | | | | | | 49 | |
|
SVB Financial Group | |
1.800% due 02/02/2031 ^(b) | | | | | 1 | | | | | | 1 | |
|
Synchrony Financial | |
2.875% due 10/28/2031 | | | | | 2,556 | | | | | | 2,051 | |
5.150% due 03/19/2029 | | | | | 122 | | | | | | 117 | |
|
Teachers Insurance & Annuity Association of America | |
6.850% due 12/16/2039 | | | | | 1 | | | | | | 1 | |
|
Toronto-Dominion Bank | |
3.200% due 03/10/2032 | | | | | 3,028 | | | | | | 2,622 | |
4.108% due 06/08/2027 | | | | | 49 | | | | | | 48 | |
|
Travelers Cos., Inc. | |
3.050% due 06/08/2051 | | | | | 125 | | | | | | 84 | |
|
Truist Financial Corp. | |
1.125% due 08/03/2027 | | | | | 15 | | | | | | 13 | |
4.260% due 07/28/2026 • | | | | | 393 | | | | | | 387 | |
4.873% due 01/26/2029 • | | | | | 473 | | | | | | 464 | |
5.122% due 01/26/2034 • | | | | | 120 | | | | | | 115 | |
5.867% due 06/08/2034 • | | | | | 343 | | | | | | 346 | |
7.161% due 10/30/2029 • | | | | | 1,702 | | | | | | 1,808 | |
|
U.S. Bancorp | |
1.375% due 07/22/2030 | | | | | 70 | | | | | | 56 | |
3.900% due 04/26/2028 | | | | | 659 | | | | | | 632 | |
| | | | | | | | | | | | |
| See Accompanying Notes | | | ANNUAL FINANCIAL AND OTHER INFORMATION | | | | | | | JUNE 30, 2024 | | | 39 |
| | | | | | |
| Schedule of Investments | | PIMCO Investment Grade Corporate Bond Index Exchange-Traded Fund | | (Cont.) | | |
| | | | | | | | | | | | |
| | | | | PRINCIPAL
AMOUNT
(000S) | | | | | MARKET
VALUE
(000S) | |
4.548% due 07/22/2028 • | | $ | | | 844 | | | $ | | | 825 | |
4.653% due 02/01/2029 • | | | | | 313 | | | | | | 306 | |
5.727% due 10/21/2026 • | | | | | 788 | | | | | | 790 | |
5.775% due 06/12/2029 • | | | | | 293 | | | | | | 298 | |
5.836% due 06/12/2034 • | | | | | 190 | | | | | | 193 | |
|
UBS AG | |
1.250% due 06/01/2026 | | | | | 562 | | | | | | 520 | |
1.250% due 08/07/2026 | | | | | 343 | | | | | | 315 | |
|
UBS Group AG | |
1.305% due 02/02/2027 • | | | | | 1,024 | | | | | | 956 | |
2.193% due 06/05/2026 • | | | | | 2,603 | | | | | | 2,516 | |
3.126% due 08/13/2030 • | | | | | 1,106 | | | | | | 993 | |
4.125% due 09/24/2025 | | | | | 1,802 | | | | | | 1,768 | |
4.194% due 04/01/2031 • | | | | | 2,937 | | | | | | 2,743 | |
4.751% due 05/12/2028 • | | | | | 1,302 | | | | | | 1,276 | |
5.617% due 09/13/2030 • | | | | | 992 | | | | | | 997 | |
6.373% due 07/15/2026 • | | | | | 662 | | | | | | 665 | |
6.442% due 08/11/2028 • | | | | | 332 | | | | | | 341 | |
6.537% due 08/12/2033 • | | | | | 808 | | | | | | 848 | |
|
UDR, Inc. | |
2.100% due 08/01/2032 | | | | | 1,792 | | | | | | 1,405 | |
|
UniCredit SpA | |
1.982% due 06/03/2027 • | | | | | 1,012 | | | | | | 944 | |
2.569% due 09/22/2026 • | | | | | 1,257 | | | | | | 1,206 | |
3.127% due 06/03/2032 • | | | | | 145 | | | | | | 123 | |
|
USAA Capital Corp. | |
2.125% due 05/01/2030 | | | | | 57 | | | | | | 49 | |
|
VICI Properties LP | |
4.625% due 12/01/2029 | | | | | 4,110 | | | | | | 3,893 | |
5.125% due 05/15/2032 | | | | | 51 | | | | | | 49 | |
5.625% due 05/15/2052 | | | | | 1,204 | | | | | | 1,085 | |
|
Wells Fargo & Co. | |
2.879% due 10/30/2030 • | | | | | 1,286 | | | | | | 1,141 | |
3.068% due 04/30/2041 • | | | | | 282 | | | | | | 207 | |
3.350% due 03/02/2033 • | | | | | 90 | | | | | | 78 | |
3.526% due 03/24/2028 • | | | | | 1,470 | | | | | | 1,402 | |
3.908% due 04/25/2026 • | | | | | 1,722 | | | | | | 1,696 | |
4.150% due 01/24/2029 | | | | | 929 | | | | | | 893 | |
4.478% due 04/04/2031 • | | | | | 150 | | | | | | 144 | |
4.611% due 04/25/2053 • | | | | | 568 | | | | | | 486 | |
4.808% due 07/25/2028 • | | | | | 1,705 | | | | | | 1,682 | |
4.897% due 07/25/2033 • | | | | | 6,292 | | | | | | 6,054 | |
5.389% due 04/24/2034 • | | | | | 120 | | | | | | 119 | |
6.303% due 10/23/2029 • | | | | | 70 | | | | | | 73 | |
|
Welltower OP LLC | |
4.250% due 04/15/2028 | | | | | 1,069 | | | | | | 1,034 | |
|
Westpac Banking Corp. | |
2.150% due 06/03/2031 | | | | | 110 | | | | | | 92 | |
2.700% due 08/19/2026 | | | | | 180 | | | | | | 171 | |
2.894% due 02/04/2030 •(g) | | | | | 10 | | | | | | 10 | |
2.963% due 11/16/2040 (g) | | | | | 158 | | | | | | 111 | |
3.020% due 11/18/2036 •(g) | | | | | 60 | | | | | | 49 | |
5.405% due 08/10/2033 •(g) | | | | | 51 | | | | | | 50 | |
5.457% due 11/18/2027 | | | | | 64 | | | | | | 65 | |
|
Weyerhaeuser Co. | |
6.875% due 12/15/2033 | | | | | 345 | | | | | | 378 | |
7.375% due 03/15/2032 | | | | | 2,226 | | | | | | 2,490 | |
|
Willis North America, Inc. | |
4.650% due 06/15/2027 | | | | | 2,388 | | | | | | 2,347 | |
| | | | | | | | | | | | |
| | | | | | | | | | | 447,637 | |
| | | | | | | | | | | | |
| |
| INDUSTRIALS 42.1% | |
|
7-Eleven, Inc. | |
0.950% due 02/10/2026 | | | | | 1,719 | | | | | | 1,601 | |
|
AbbVie, Inc. | |
2.950% due 11/21/2026 | | | | | 1,697 | | | | | | 1,618 | |
3.200% due 05/14/2026 | | | | | 25 | | | | | | 24 | |
3.800% due 03/15/2025 | | | | | 210 | | | | | | 207 | |
4.400% due 11/06/2042 | | | | | 52 | | | | | | 46 | |
4.550% due 03/15/2035 | | | | | 925 | | | | | | 878 | |
|
Adobe, Inc. | |
4.800% due 04/04/2029 | | | | | 585 | | | | | | 586 | |
|
Aetna, Inc. | |
3.875% due 08/15/2047 | | | | | 1,699 | | | | | | 1,235 | |
| | | | | | | | | | | | |
| | | | | PRINCIPAL
AMOUNT
(000S) | | | | | MARKET
VALUE
(000S) | |
|
Aker BP ASA | |
2.000% due 07/15/2026 | | $ | | | 1,761 | | | $ | | | 1,639 | |
3.100% due 07/15/2031 | | | | | 80 | | | | | | 68 | |
|
Alcon Finance Corp. | |
2.600% due 05/27/2030 | | | | | 2,147 | | | | | | 1,871 | |
|
Algonquin Power & Utilities Corp. | |
5.365% due 06/15/2026 þ | | | | | 2,050 | | | | | | 2,041 | |
|
Alibaba Group Holding Ltd. | |
3.400% due 12/06/2027 | | | | | 1,079 | | | | | | 1,020 | |
3.600% due 11/28/2024 | | | | | 914 | | | | | | 907 | |
| | | | |
Alimentation Couche-Tard, Inc. | | | | | | | | | | | | |
2.950% due 01/25/2030 | | | | | 20 | | | | | | 18 | |
| | | | |
Allegion PLC | | | | | | | | | | | | |
3.500% due 10/01/2029 | | | | | 54 | | | | | | 50 | |
|
Amazon.com, Inc. | |
2.100% due 05/12/2031 | | | | | 4,333 | | | | | | 3,652 | |
2.700% due 06/03/2060 | | | | | 1,546 | | | | | | 911 | |
3.100% due 05/12/2051 | | | | | 140 | | | | | | 96 | |
3.250% due 05/12/2061 | | | | | 143 | | | | | | 95 | |
3.875% due 08/22/2037 | | | | | 1,752 | | | | | | 1,548 | |
4.100% due 04/13/2062 | | | | | 246 | | | | | | 197 | |
|
Amcor Flexibles North America, Inc. | |
2.690% due 05/25/2031 | | | | | 40 | | | | | | 34 | |
| | | | |
America Movil SAB de CV | | | | | | | | | | | | |
3.625% due 04/22/2029 | | | | | 92 | | | | | | 86 | |
|
Amgen, Inc. | |
3.000% due 02/22/2029 | | | | | 100 | | | | | | 92 | |
3.200% due 11/02/2027 | | | | | 336 | | | | | | 317 | |
4.200% due 02/22/2052 | | | | | 100 | | | | | | 79 | |
4.400% due 05/01/2045 | | | | | 2,060 | | | | | | 1,735 | |
4.400% due 02/22/2062 | | | | | 172 | | | | | | 137 | |
4.663% due 06/15/2051 | | | | | 991 | | | | | | 848 | |
5.150% due 03/02/2028 | | | | | 880 | | | | | | 880 | |
5.250% due 03/02/2025 | | | | | 410 | | | | | | 409 | |
5.750% due 03/02/2063 | | | | | 68 | | | | | | 67 | |
| | | | |
Amphenol Corp. | | | | | | | | | | | | |
2.800% due 02/15/2030 | | | | | 160 | | | | | | 142 | |
| | | | |
Anglo American Capital | | | | | | | | | | | | |
3.875% due 03/16/2029 | | | | | 366 | | | | | | 344 | |
|
AngloGold Ashanti Holdings PLC | |
3.750% due 10/01/2030 | | | | | 998 | | | | | | 872 | |
|
Anheuser-Busch Cos. LLC | |
4.700% due 02/01/2036 | | | | | 1,548 | | | | | | 1,476 | |
|
Anheuser-Busch InBev Finance, Inc. | |
4.900% due 02/01/2046 | | | | | 1,043 | | | | | | 955 | |
|
Anheuser-Busch InBev Worldwide, Inc. | |
4.900% due 01/23/2031 | | | | | 140 | | | | | | 141 | |
4.950% due 01/15/2042 | | | | | 14 | | | | | | 13 | |
| | | | |
Apache Corp. | | | | | | | | | | | | |
5.100% due 09/01/2040 | | | | | 77 | | | | | | 66 | |
|
Apple, Inc. | |
1.200% due 02/08/2028 | | | | | 10 | | | | | | 9 | |
1.650% due 05/11/2030 | | | | | 1,694 | | | | | | 1,428 | |
2.200% due 09/11/2029 | | | | | 10 | | | | | | 9 | |
2.375% due 02/08/2041 | | | | | 120 | | | | | | 83 | |
2.800% due 02/08/2061 | | | | | 73 | | | | | | 45 | |
2.850% due 08/05/2061 | | | | | 172 | | | | | | 106 | |
3.350% due 08/08/2032 | | | | | 892 | | | | | | 810 | |
3.850% due 08/04/2046 | | | | | 1,596 | | | | | | 1,303 | |
3.950% due 08/08/2052 | | | | | 985 | | | | | | 801 | |
4.650% due 02/23/2046 | | | | | 1,143 | | | | | | 1,054 | |
| | | | |
Aptiv PLC | | | | | | | | | | | | |
2.396% due 02/18/2025 | | | | | 128 | | | | | | 125 | |
|
Ashtead Capital, Inc. | |
4.250% due 11/01/2029 | | | | | 102 | | | | | | 96 | |
5.500% due 08/11/2032 | | | | | 1,353 | | | | | | 1,321 | |
|
Astrazeneca Finance LLC | |
1.750% due 05/28/2028 | | | | | 55 | | | | | | 49 | |
2.250% due 05/28/2031 | | | | | 10 | | | | | | 8 | |
|
AstraZeneca PLC | |
1.375% due 08/06/2030 | | | | | 967 | | | | | | 791 | |
4.000% due 01/17/2029 | | | | | 1,172 | | | | | | 1,130 | |
| | | | |
Atlassian Corp. | | | | | | | | | | | | |
5.250% due 05/15/2029 | | | | | 2,180 | | | | | | 2,181 | |
| | | | |
Autodesk, Inc. | | | | | | | | | | | | |
2.850% due 01/15/2030 | | | | | 55 | | | | | | 49 | |
| | | | | | | | | | | | |
| | | | | PRINCIPAL
AMOUNT
(000S) | | | | | MARKET
VALUE
(000S) | |
| | | | |
AutoNation, Inc. | | | | | | | | | | | | |
3.800% due 11/15/2027 | | $ | | | 130 | | | $ | | | 122 | |
|
Bacardi Ltd. | |
2.750% due 07/15/2026 | | | | | 100 | | | | | | 95 | |
4.450% due 05/15/2025 | | | | | 10 | | | | | | 10 | |
4.700% due 05/15/2028 | | | | | 130 | | | | | | 126 | |
5.300% due 05/15/2048 | | | | | 40 | | | | | | 36 | |
|
BAE Systems Holdings, Inc. | |
3.850% due 12/15/2025 | | | | | 387 | | | | | | 378 | |
|
BAE Systems PLC | |
1.900% due 02/15/2031 | | | | | 1,348 | | | | | | 1,096 | |
3.400% due 04/15/2030 | | | | | 1,274 | | | | | | 1,154 | |
|
Baidu, Inc. | |
1.720% due 04/09/2026 | | | | | 53 | | | | | | 50 | |
4.125% due 06/30/2025 | | | | | 46 | | | | | | 45 | |
|
BAT Capital Corp. | |
3.222% due 08/15/2024 | | | | | 250 | | | | | | 249 | |
4.540% due 08/15/2047 | | | | | 555 | | | | | | 428 | |
|
Bayer U.S. Finance LLC | |
4.250% due 12/15/2025 | | | | | 1,982 | | | | | | 1,940 | |
4.375% due 12/15/2028 | | | | | 3,535 | | | | | | 3,358 | |
4.875% due 06/25/2048 | | | | | 1,388 | | | | | | 1,117 | |
6.250% due 01/21/2029 | | | | | 396 | | | | | | 404 | |
6.500% due 11/21/2033 | | | | | 396 | | | | | | 405 | |
|
Becton Dickinson & Co. | |
1.957% due 02/11/2031 | | | | | 60 | | | | | | 49 | |
2.823% due 05/20/2030 | | | | | 3,433 | | | | | | 3,037 | |
4.298% due 08/22/2032 | | | | | 49 | | | | | | 46 | |
4.669% due 06/06/2047 | | | | | 550 | | | | | | 480 | |
|
BMW U.S. Capital LLC | |
2.550% due 04/01/2031 | | | | | 55 | | | | | | 47 | |
3.300% due 04/06/2027 | | | | | 50 | | | | | | 48 | |
3.900% due 04/09/2025 | | | | | 10 | | | | | | 10 | |
4.150% due 04/09/2030 | | | | | 1,010 | | | | | | 968 | |
| | | | |
Boardwalk Pipelines LP | | | | | | | | | | | | |
3.400% due 02/15/2031 | | | | | 2,162 | | | | | | 1,898 | |
|
Boeing Co. | |
2.196% due 02/04/2026 | | | | | 4,269 | | | | | | 4,014 | |
2.750% due 02/01/2026 | | | | | 10 | | | | | | 10 | |
3.100% due 05/01/2026 | | | | | 10 | | | | | | 10 | |
3.250% due 02/01/2028 | | | | | 1,755 | | | | | | 1,608 | |
3.600% due 05/01/2034 | | | | | 90 | | | | | | 72 | |
3.625% due 02/01/2031 | | | | | 1,761 | | | | | | 1,542 | |
3.950% due 08/01/2059 | | | | | 3,055 | | | | | | 1,948 | |
5.705% due 05/01/2040 | | | | | 1,275 | | | | | | 1,176 | |
| | | | |
Booz Allen Hamilton, Inc. | | | | | | | | | | | | |
5.950% due 08/04/2033 | | | | | 51 | | | | | | 53 | |
|
Boston Scientific Corp. | |
1.900% due 06/01/2025 | | | | | 10 | | | | | | 10 | |
6.500% due 11/15/2035 | | | | | 93 | | | | | | 103 | |
|
BP Capital Markets America, Inc. | |
2.772% due 11/10/2050 | | | | | 249 | | | | | | 153 | |
3.119% due 05/04/2026 | | | | | 243 | | | | | | 234 | |
3.379% due 02/08/2061 | | | | | 3,300 | | | | | | 2,169 | |
3.937% due 09/21/2028 | | | | | 300 | | | | | | 288 | |
|
Bristol-Myers Squibb Co. | |
3.700% due 03/15/2052 | | | | | 130 | | | | | | 95 | |
3.900% due 02/20/2028 | | | | | 2,201 | | | | | | 2,126 | |
4.350% due 11/15/2047 | | | | | 3,865 | | | | | | 3,222 | |
5.875% due 11/15/2036 | | | | | 138 | | | | | | 145 | |
|
Broadcom, Inc. | |
1.950% due 02/15/2028 | | | | | 997 | | | | | | 893 | |
2.600% due 02/15/2033 | | | | | 984 | | | | | | 798 | |
3.137% due 11/15/2035 | | | | | 958 | | | | | | 768 | |
3.187% due 11/15/2036 | | | | | 1,584 | | | | | | 1,254 | |
3.419% due 04/15/2033 | | | | | 847 | | | | | | 731 | |
3.469% due 04/15/2034 | | | | | 1,143 | | | | | | 975 | |
4.000% due 04/15/2029 | | | | | 810 | | | | | | 772 | |
4.150% due 04/15/2032 | | | | | 450 | | | | | | 415 | |
4.926% due 05/15/2037 | | | | | 1,990 | | | | | | 1,873 | |
|
Broadridge Financial Solutions, Inc. | |
2.900% due 12/01/2029 | | | | | 1,527 | | | | | | 1,361 | |
|
Cameron LNG LLC | |
3.701% due 01/15/2039 | | | | | 1,997 | | | | | | 1,619 | |
|
Canadian Natural Resources Ltd. | |
3.900% due 02/01/2025 | | | | | 1,056 | | | | | | 1,044 | |
6.450% due 06/30/2033 | | | | | 45 | | | | | | 47 | |
| | | | | | |
| 40 | | PIMCO ETF TRUST | | | See Accompanying Notes | |
| | | | | | | | | | | | |
| | | | | PRINCIPAL
AMOUNT
(000S) | | | | | MARKET
VALUE
(000S) | |
|
Canadian Pacific Railway Co. | |
2.050% due 03/05/2030 | | $ | | | 975 | | | $ | | | 832 | |
3.500% due 05/01/2050 | | | | | 2,118 | | | | | | 1,527 | |
| | | | |
Carlisle Cos., Inc. | | | | | | | | | | | | |
2.750% due 03/01/2030 | | | | | 125 | | | | | | 110 | |
|
Carrier Global Corp. | |
2.242% due 02/15/2025 | | | | | 2 | | | | | | 2 | |
2.722% due 02/15/2030 | | | | | 2,559 | | | | | | 2,262 | |
3.377% due 04/05/2040 | | | | | 130 | | | | | | 101 | |
| | | | |
Caterpillar, Inc. | | | | | | | | | | | | |
5.300% due 09/15/2035 | | | | | 30 | | | | | | 31 | |
|
CDW LLC | |
2.670% due 12/01/2026 | | | | | 930 | | | | | | 871 | |
3.250% due 02/15/2029 | | | | | 125 | | | | | | 113 | |
3.276% due 12/01/2028 | | | | | 50 | | | | | | 45 | |
4.125% due 05/01/2025 | | | | | 96 | | | | | | 95 | |
| | | | |
Cencosud SA | | | | | | | | | | | | |
5.950% due 05/28/2031 | | | | | 992 | | | | | | 997 | |
| | | | |
Cenovus Energy, Inc. | | | | | | | | | | | | |
6.750% due 11/15/2039 | | | | | 112 | | | | | | 121 | |
|
Centene Corp. | |
2.500% due 03/01/2031 | | | | | 80 | | | | | | 66 | |
2.625% due 08/01/2031 | | | | | 220 | | | | | | 181 | |
3.000% due 10/15/2030 | | | | | 176 | | | | | | 151 | |
4.250% due 12/15/2027 | | | | | 51 | | | | | | 49 | |
4.625% due 12/15/2029 | | | | | 2,802 | | | | | | 2,652 | |
|
CenterPoint Energy Resources Corp. | |
1.750% due 10/01/2030 | | | | | 149 | | | | | | 122 | |
| | | | |
CF Industries, Inc. | | | | | | | | | | | | |
5.150% due 03/15/2034 | | | | | 5,910 | | | | | | 5,671 | |
|
Charter Communications Operating LLC | |
2.250% due 01/15/2029 | | | | | 227 | | | | | | 194 | |
2.300% due 02/01/2032 | | | | | 1,367 | | | | | | 1,055 | |
3.750% due 02/15/2028 | | | | | 729 | | | | | | 678 | |
3.850% due 04/01/2061 | | | | | 1,544 | | | | | | 903 | |
3.950% due 06/30/2062 | | | | | 1,226 | | | | | | 727 | |
4.200% due 03/15/2028 | | | | | 190 | | | | | | 180 | |
4.800% due 03/01/2050 | | | | | 2,521 | | | | | | 1,851 | |
5.375% due 04/01/2038 | | | | | 380 | | | | | | 331 | |
6.100% due 06/01/2029 | | | | | 2,576 | | | | | | 2,585 | |
|
Cheniere Corpus Christi Holdings LLC | |
3.700% due 11/15/2029 | | | | | 129 | | | | | | 119 | |
|
Cheniere Energy Partners LP | |
5.750% due 08/15/2034 | | | | | 3,611 | | | | | | 3,628 | |
|
Choice Hotels International, Inc. | |
3.700% due 01/15/2031 | | | | | 50 | | | | | | 44 | |
|
Cigna Group | |
3.400% due 03/01/2027 | | | | | 3,523 | | | | | | 3,369 | |
4.800% due 08/15/2038 | | | | | 100 | | | | | | 92 | |
|
Coca-Cola Co. | |
1.375% due 03/15/2031 | | | | | 56 | | | | | | 45 | |
2.125% due 09/06/2029 | | | | | 139 | | | | | | 122 | |
2.500% due 06/01/2040 | | | | | 496 | | | | | | 349 | |
3.450% due 03/25/2030 | | | | | 249 | | | | | | 233 | |
5.000% due 05/13/2034 | | | | | 637 | | | | | | 639 | |
|
Comcast Corp. | |
2.887% due 11/01/2051 | | | | | 1,800 | | | | | | 1,124 | |
2.937% due 11/01/2056 | | | | | 150 | | | | | | 91 | |
2.987% due 11/01/2063 | | | | | 2,687 | | | | | | 1,578 | |
3.200% due 07/15/2036 | | | | | 1,121 | | | | | | 906 | |
3.250% due 11/01/2039 | | | | | 230 | | | | | | 177 | |
3.400% due 07/15/2046 | | | | | 119 | | | | | | 86 | |
3.950% due 10/15/2025 | | | | | 121 | | | | | | 119 | |
3.969% due 11/01/2047 | | | | | 210 | | | | | | 164 | |
5.500% due 11/15/2032 | | | | | 1,353 | | | | | | 1,384 | |
|
ConocoPhillips Co. | |
3.758% due 03/15/2042 | | | | | 11 | | | | | | 9 | |
3.800% due 03/15/2052 | | | | | 1,383 | | | | | | 1,033 | |
4.300% due 11/15/2044 | | | | | 125 | | | | | | 106 | |
|
Constellation Brands, Inc. | |
2.875% due 05/01/2030 | | | | | 1,242 | | | | | | 1,097 | |
3.150% due 08/01/2029 | | | | | 1,800 | | | | | | 1,633 | |
4.100% due 02/15/2048 | | | | | 179 | | | | | | 141 | |
5.250% due 11/15/2048 | | | | | 2,537 | | | | | | 2,364 | |
|
Continental Resources, Inc. | |
2.268% due 11/15/2026 | | | | | 965 | | | | | | 896 | |
| | | | | | | | | | | | |
| | | | | PRINCIPAL
AMOUNT
(000S) | | | | | MARKET
VALUE
(000S) | |
4.375% due 01/15/2028 | | $ | | | 100 | | | $ | | | 96 | |
5.750% due 01/15/2031 | | | | | 1,864 | | | | | | 1,834 | |
|
Corning, Inc. | |
4.375% due 11/15/2057 | | | | | 1,410 | | | | | | 1,111 | |
5.450% due 11/15/2079 | | | | | 856 | | | | | | 788 | |
|
Corp. Nacional del Cobre de Chile | |
3.150% due 01/14/2030 | | | | | 210 | | | | | | 187 | |
4.500% due 09/16/2025 | | | | | 12 | | | | | | 12 | |
5.950% due 01/08/2034 | | | | | 1,296 | | | | | | 1,299 | |
| | | | |
Cox Communications, Inc. | | | | | | | | | | | | |
1.800% due 10/01/2030 | | | | | 3,206 | | | | | | 2,579 | |
| | | | |
CRH America Finance, Inc. | | | | | | | | | | | | |
3.400% due 05/09/2027 | | | | | 772 | | | | | | 737 | |
| | | | |
CRH SMW Finance DAC | | | | | | | | | | | | |
5.200% due 05/21/2029 | | | | | 2,080 | | | | | | 2,079 | |
| | | | |
CSL Finanace PLC Co. | | | | | | | | | | | | |
4.050% due 04/27/2029 | | | | | 130 | | | | | | 124 | |
|
CSX Corp. | |
4.100% due 03/15/2044 | | | | | 1,060 | | | | | | 872 | |
6.220% due 04/30/2040 | | | | | 1,739 | | | | | | 1,863 | |
|
CVS Health Corp. | |
1.750% due 08/21/2030 | | | | | 10 | | | | | | 8 | |
3.000% due 08/15/2026 | | | | | 20 | | | | | | 19 | |
3.250% due 08/15/2029 | | | | | 1,303 | | | | | | 1,182 | |
3.375% due 08/12/2024 | | | | | 1,000 | | | | | | 997 | |
3.625% due 04/01/2027 | | | | | 589 | | | | | | 565 | |
3.750% due 04/01/2030 | | | | | 887 | | | | | | 817 | |
4.125% due 04/01/2040 | | | | | 164 | | | | | | 133 | |
5.050% due 03/25/2048 | | | | | 2,524 | | | | | | 2,176 | |
5.125% due 07/20/2045 | | | | | 2,131 | | | | | | 1,877 | |
| | | | |
Darden Restaurants, Inc. | | | | | | | | | | | | |
6.300% due 10/10/2033 | | | | | 1,494 | | | | | | 1,543 | |
|
DCP Midstream Operating LP | |
5.125% due 05/15/2029 | | | | | 847 | | | | | | 843 | |
5.375% due 07/15/2025 | | | | | 31 | | | | | | 31 | |
| | | | |
Dell International LLC | | | | | | | | | | | | |
8.100% due 07/15/2036 | | | | | 491 | | | | | | 586 | |
|
Delta Air Lines, Inc. | |
4.750% due 10/20/2028 | | | | | 10 | | | | | | 10 | |
7.000% due 05/01/2025 | | | | | 2,798 | | | | | | 2,820 | |
| | | | |
Devon Energy Corp. | | | | | | | | | | | | |
5.000% due 06/15/2045 | | | | | 90 | | | | | | 77 | |
| | | | |
Diageo Capital PLC | | | | | | | | | | | | |
5.300% due 10/24/2027 | | | | | 623 | | | | | | 629 | |
|
Diamondback Energy, Inc. | |
5.200% due 04/18/2027 | | | | | 863 | | | | | | 863 | |
5.900% due 04/18/2064 | | | | | 2,180 | | | | | | 2,106 | |
6.250% due 03/15/2033 | | | | | 91 | | | | | | 95 | |
|
Discovery Communications LLC | |
4.000% due 09/15/2055 | | | | | 1,170 | | | | | | 757 | |
4.650% due 05/15/2050 | | | | | 269 | | | | | | 196 | |
|
Eastern Energy Gas Holdings LLC | |
3.600% due 12/15/2024 | | | | | 336 | | | | | | 333 | |
| | | | |
eBay, Inc. | | | | | | | | | | | | |
5.900% due 11/22/2025 | | | | | 507 | | | | | | 510 | |
| | | | |
Electronic Arts, Inc. | | | | | | | | | | | | |
1.850% due 02/15/2031 | | | | | 922 | | | | | | 754 | |
|
Elevance Health, Inc. | |
2.250% due 05/15/2030 | | | | | 1,967 | | | | | | 1,686 | |
2.550% due 03/15/2031 | | | | | 50 | | | | | | 43 | |
3.700% due 09/15/2049 | | | | | 10 | | | | | | 7 | |
4.100% due 05/15/2032 | | | | | 51 | | | | | | 47 | |
4.550% due 03/01/2048 | | | | | 1,464 | | | | | | 1,246 | |
4.850% due 08/15/2054 | | | | | 844 | | | | | | 704 | |
5.350% due 10/15/2025 | | | | | 171 | | | | | | 171 | |
5.950% due 12/15/2034 | | | | | 22 | | | | | | 23 | |
|
Eli Lilly & Co. | |
4.150% due 03/15/2059 | | | | | 905 | | | | | | 740 | |
4.700% due 02/27/2033 | | | | | 71 | | | | | | 70 | |
5.950% due 11/15/2037 | | | | | 342 | | | | | | 368 | |
|
Empresa Nacional de Telecomunicaciones SA | |
4.750% due 08/01/2026 | | | | | 869 | | | | | | 853 | |
|
Enbridge, Inc. | |
2.500% due 01/15/2025 | | | | | 1,831 | | | | | | 1,799 | |
3.125% due 11/15/2029 | | | | | 40 | | | | | | 36 | |
| | | | | | | | | | | | |
| | | | | PRINCIPAL
AMOUNT
(000S) | | | | | MARKET
VALUE
(000S) | |
4.250% due 12/01/2026 | | $ | | | 47 | | | $ | | | 46 | |
|
Energy Transfer LP | |
4.050% due 03/15/2025 | | | | | 152 | | | | | | 150 | |
4.200% due 04/15/2027 | | | | | 257 | | | | | | 249 | |
4.950% due 05/15/2028 | | | | | 1,717 | | | | | | 1,692 | |
5.000% due 05/15/2050 | | | | | 1,882 | | | | | | 1,599 | |
5.250% due 04/15/2029 | | | | | 120 | | | | | | 120 | |
5.300% due 04/15/2047 | | | | | 831 | | | | | | 735 | |
5.500% due 06/01/2027 | | | | | 731 | | | | | | 733 | |
5.600% due 09/01/2034 | | | | | 2,600 | | | | | | 2,584 | |
6.250% due 04/15/2049 | | | | | 1,434 | | | | | | 1,428 | |
6.550% due 12/01/2033 | | | | | 120 | | | | | | 127 | |
7.375% due 02/01/2031 | | | | | 120 | | | | | | 125 | |
| | | | |
Entergy Louisiana LLC | | | | | | | | | | | | |
4.200% due 09/01/2048 | | | | | 3,946 | | | | | | 3,122 | |
|
Enterprise Products Operating LLC | |
3.200% due 02/15/2052 | | | | | 1,386 | | | | | | 922 | |
3.950% due 01/31/2060 | | | | | 1,578 | | | | | | 1,154 | |
4.200% due 01/31/2050 | | | | | 3,056 | | | | | | 2,452 | |
4.250% due 02/15/2048 | | | | | 100 | | | | | | 82 | |
4.850% due 08/15/2042 | | | | | 130 | | | | | | 118 | |
|
EQT Corp. | |
3.900% due 10/01/2027 | | | | | 50 | | | | | | 48 | |
5.000% due 01/15/2029 | | | | | 1,825 | | | | | | 1,792 | |
5.700% due 04/01/2028 | | | | | 817 | | | | | | 826 | |
|
Equifax, Inc. | |
5.100% due 12/15/2027 | | | | | 1,688 | | | | | | 1,681 | |
7.000% due 07/01/2037 | | | | | 375 | | | | | | 418 | |
|
Equinor ASA | |
2.375% due 05/22/2030 | | | | | 3,021 | | | | | | 2,639 | |
3.625% due 04/06/2040 | | | | | 15 | | | | | | 12 | |
3.700% due 04/06/2050 | | | | | 744 | | | | | | 565 | |
7.150% due 11/15/2025 | | | | | 26 | | | | | | 27 | |
|
ERAC USA Finance LLC | |
3.300% due 12/01/2026 | | | | | 152 | | | | | | 145 | |
7.000% due 10/15/2037 | | | | | 303 | | | | | | 343 | |
|
Essential Utilities, Inc. | |
2.704% due 04/15/2030 | | | | | 56 | | | | | | 49 | |
3.566% due 05/01/2029 | | | | | 246 | | | | | | 229 | |
| | | | |
Estee Lauder Cos., Inc. | | | | | | | | | | | | |
4.375% due 05/15/2028 | | | | | 1,604 | | | | | | 1,572 | |
| | | | |
Expedia Group, Inc. | | | | | | | | | | | | |
6.250% due 05/01/2025 | | | | | 10 | | | | | | 10 | |
|
FedEx Corp. | |
4.100% due 02/01/2045 | | | | | 160 | | | | | | 126 | |
4.550% due 04/01/2046 | | | | | 4 | | | | | | 3 | |
4.750% due 11/15/2045 | | | | | 39 | | | | | | 34 | |
|
Fidelity National Information Services, Inc. | |
1.150% due 03/01/2026 | | | | | 134 | | | | | | 125 | |
|
Fiserv, Inc. | |
2.250% due 06/01/2027 | | | | | 10 | | | | | | 9 | |
3.200% due 07/01/2026 | | | | | 983 | | | | | | 944 | |
|
Flutter Treasury Designated Activity Co. | |
6.375% due 04/29/2029 | | | | | 1,090 | | | | | | 1,098 | |
|
Fortune Brands Innovations, Inc. | |
4.000% due 03/25/2032 | | | | | 168 | | | | | | 153 | |
| | | | |
Foundry JV Holdco LLC | | | | | | | | | | | | |
5.900% due 01/25/2030 | | | | | 200 | | | | | | 203 | |
|
Fox Corp. | |
5.476% due 01/25/2039 | | | | | 100 | | | | | | 95 | |
5.576% due 01/25/2049 | | | | | 1,516 | | | | | | 1,393 | |
| | | | |
Freeport Indonesia PT | | | | | | | | | | | | |
4.763% due 04/14/2027 | | | | | 243 | | | | | | 239 | |
|
Freeport-McMoRan, Inc. | |
4.125% due 03/01/2028 | | | | | 2,516 | | | | | | 2,414 | |
4.625% due 08/01/2030 | | | | | 101 | | | | | | 97 | |
|
Fresenius Medical Care U.S. Finance, Inc. | |
2.375% due 02/16/2031 | | | | | 50 | | | | | | 40 | |
| | | | |
Gartner, Inc. | | | | | | | | | | | | |
4.500% due 07/01/2028 | | | | | 120 | | | | | | 116 | |
| | | | |
GE Capital Funding LLC | | | | | | | | | | | | |
3.450% due 05/15/2025 | | | | | 217 | | | | | | 213 | |
|
General Motors Co. | |
5.400% due 04/01/2048 | | | | | 1,541 | | | | | | 1,380 | |
6.600% due 04/01/2036 | | | | | 10 | | | | | | 10 | |
| | | | | | | | | | | | |
| See Accompanying Notes | | | ANNUAL FINANCIAL AND OTHER INFORMATION | | | | | | | JUNE 30, 2024 | | | 41 |
| | | | | | |
| Schedule of Investments | | PIMCO Investment Grade Corporate Bond Index Exchange-Traded Fund | | (Cont.) | | |
| | | | | | | | | | | | |
| | | | | PRINCIPAL
AMOUNT
(000S) | | | | | MARKET
VALUE
(000S) | |
6.750% due 04/01/2046 | | $ | | | 46 | | | $ | | | 48 | |
6.800% due 10/01/2027 | | | | | 1,671 | | | | | | 1,735 | |
| | | | |
Gilead Sciences, Inc. | | | | | | | | | | | | |
2.800% due 10/01/2050 | | | | | 181 | | | | | | 113 | |
|
Glencore Funding LLC | |
1.625% due 09/01/2025 | | | | | 10 | | | | | | 10 | |
2.850% due 04/27/2031 | | | | | 430 | | | | | | 362 | |
3.875% due 10/27/2027 | | | | | 100 | | | | | | 95 | |
3.875% due 04/27/2051 | | | | | 10 | | | | | | 7 | |
5.400% due 05/08/2028 | | | | | 2,548 | | | | | | 2,549 | |
6.414% (SOFRINDX + 1.060%) due 04/04/2027 ~ | | | | | 3,225 | | | | | | 3,226 | |
|
Global Payments, Inc. | |
2.900% due 05/15/2030 | | | | | 2,412 | | | | | | 2,101 | |
3.200% due 08/15/2029 | | | | | 170 | | | | | | 153 | |
4.150% due 08/15/2049 | | | | | 172 | | | | | | 130 | |
4.950% due 08/15/2027 | | | | | 1,104 | | | | | | 1,093 | |
5.300% due 08/15/2029 | | | | | 659 | | | | | | 655 | |
5.950% due 08/15/2052 | | | | | 100 | | | | | | 96 | |
|
Graphic Packaging International LLC | |
1.512% due 04/15/2026 | | | | | 230 | | | | | | 213 | |
| | | | |
Haleon U.S. Capital LLC | | | | | | | | | | | | |
3.375% due 03/24/2027 | | | | | 2,704 | | | | | | 2,581 | |
|
Harley-Davidson Financial Services, Inc. | |
6.500% due 03/10/2028 | | | | | 904 | | | | | | 924 | |
| | | | |
Hasbro, Inc. | | | | | | | | | | | | |
3.900% due 11/19/2029 | | | | | 1,365 | | | | | | 1,260 | |
|
HCA, Inc. | |
3.125% due 03/15/2027 | | | | | 163 | | | | | | 154 | |
3.500% due 09/01/2030 | | | | | 88 | | | | | | 79 | |
3.500% due 07/15/2051 | | | | | 200 | | | | | | 134 | |
3.625% due 03/15/2032 | | | | | 1,115 | | | | | | 982 | |
4.125% due 06/15/2029 | | | | | 1,172 | | | | | | 1,110 | |
4.375% due 03/15/2042 | | | | | 2,459 | | | | | | 2,023 | |
5.250% due 06/15/2049 | | | | | 2,624 | | | | | | 2,341 | |
5.875% due 02/01/2029 | | | | | 60 | | | | | | 61 | |
| | | | |
Health Care Service Corp. | | | | | | | | | | | | |
5.200% due 06/15/2029 | | | | | 200 | | | | | | 199 | |
| | | | |
Hess Corp. | | | | | | | | | | | | |
5.800% due 04/01/2047 | | | | | 1,555 | | | | | | 1,576 | |
|
Home Depot, Inc. | |
2.375% due 03/15/2051 | | | | | 2,872 | | | | | | 1,651 | |
3.125% due 12/15/2049 | | | | | 2,613 | | | | | | 1,784 | |
4.250% due 04/01/2046 | | | | | 7 | | | | | | 6 | |
4.500% due 12/06/2048 | | | | | 70 | | | | | | 61 | |
4.950% due 09/15/2052 | | | | | 1,269 | | | | | | 1,173 | |
| | | | |
Howmet Aerospace, Inc. | | | | | | | | | | | | |
6.750% due 01/15/2028 | | | | | 130 | | | | | | 136 | |
|
Humana, Inc. | |
5.750% due 03/01/2028 | | | | | 573 | | | | | | 583 | |
5.875% due 03/01/2033 | | | | | 1,169 | | | | | | 1,190 | |
8.150% due 06/15/2038 | | | | | 334 | | | | | | 400 | |
|
Huntington Ingalls Industries, Inc. | |
2.043% due 08/16/2028 | | | | | 1,340 | | | | | | 1,180 | |
|
Hyatt Hotels Corp. | |
1.800% due 10/01/2024 | | | | | 100 | | | | | | 99 | |
5.250% due 06/30/2029 | | | | | 2,000 | | | | | | 1,984 | |
5.375% due 04/23/2025 | | | | | 108 | | | | | | 108 | |
|
Hyundai Capital America | |
1.000% due 09/17/2024 | | | | | 810 | | | | | | 802 | |
1.500% due 06/15/2026 | | | | | 809 | | | | | | 750 | |
1.650% due 09/17/2026 | | | | | 1,492 | | | | | | 1,374 | |
1.800% due 10/15/2025 | | | | | 133 | | | | | | 127 | |
2.000% due 06/15/2028 | | | | | 824 | | | | | | 727 | |
2.100% due 09/15/2028 | | | | | 247 | | | | | | 217 | |
5.600% due 03/30/2028 | | | | | 253 | | | | | | 255 | |
| | | | |
Illumina, Inc. | | | | | | | | | | | | |
2.550% due 03/23/2031 | | | | | 1,110 | | | | | | 919 | |
|
Imperial Brands Finance PLC | |
3.500% due 07/26/2026 | | | | | 1,023 | | | | | | 983 | |
6.125% due 07/27/2027 | | | | | 381 | | | | | | 388 | |
| | | | |
Infor, Inc. | | | | | | | | | | | | |
1.750% due 07/15/2025 | | | | | 15 | | | | | | 14 | |
|
Intel Corp. | |
3.100% due 02/15/2060 | | | | | 1,555 | | | | | | 942 | |
4.875% due 02/10/2028 | | | | | 901 | | | | | | 898 | |
| | | | | | | | | | | | |
| | | | | PRINCIPAL
AMOUNT
(000S) | | | | | MARKET
VALUE
(000S) | |
|
International Business Machines Corp. | |
4.400% due 07/27/2032 | | $ | | | 607 | | | $ | | | 578 | |
4.900% due 07/27/2052 | | | | | 1,217 | | | | | | 1,087 | |
5.600% due 11/30/2039 | | | | | 29 | | | | | | 30 | |
|
International Flavors & Fragrances, Inc. | |
4.450% due 09/26/2028 | | | | | 1,099 | | | | | | 1,060 | |
| | | | |
International Paper Co. | | | | | | | | | | | | |
4.350% due 08/15/2048 | | | | | 68 | | | | | | 55 | |
| | | | |
IQVIA, Inc. | | | | | | | | | | | | |
5.700% due 05/15/2028 | | | | | 470 | | | | | | 476 | |
|
JDE Peet’s NV | |
0.800% due 09/24/2024 | | | | | 1,117 | | | | | | 1,102 | |
2.250% due 09/24/2031 | | | | | 165 | | | | | | 133 | |
|
KazMunayGas National Co. JSC | |
5.750% due 04/19/2047 | | | | | 486 | | | | | | 424 | |
| | | | |
Kenvue, Inc. | | | | | | | | | | | | |
5.050% due 03/22/2028 | | | | | 1,748 | | | | | | 1,758 | |
|
Keurig Dr Pepper, Inc. | |
4.050% due 04/15/2032 | | | | | 1,914 | | | | | | 1,777 | |
4.417% due 05/25/2025 | | | | | 34 | | | | | | 34 | |
4.500% due 04/15/2052 | | | | | 1,638 | | | | | | 1,368 | |
|
Kinder Morgan, Inc. | |
5.300% due 12/01/2034 | | | | | 125 | | | | | | 121 | |
5.450% due 08/01/2052 | | | | | 1,179 | | | | | | 1,085 | |
5.550% due 06/01/2045 | | | | | 1,919 | | | | | | 1,791 | |
|
Kraft Heinz Foods Co. | |
4.875% due 10/01/2049 | | | | | 132 | | | | | | 115 | |
5.200% due 07/15/2045 | | | | | 150 | | | | | | 138 | |
6.875% due 01/26/2039 | | | | | 1,666 | | | | | | 1,852 | |
7.125% due 08/01/2039 | | | | | 721 | | | | | | 813 | |
|
L3Harris Technologies, Inc. | |
3.850% due 12/15/2026 | | | | | 2,653 | | | | | | 2,565 | |
4.400% due 06/15/2028 | | | | | 85 | | | | | | 83 | |
| | | | |
Lafarge SA | | | | | | | | | | | | |
7.125% due 07/15/2036 | | | | | 135 | | | | | | 150 | |
| | | | |
Las Vegas Sands Corp. | | | | | | | | | | | | |
6.000% due 08/15/2029 | | | | | 2,402 | | | | | | 2,415 | |
|
Leidos, Inc. | |
2.300% due 02/15/2031 | | | | | 1,201 | | | | | | 990 | |
4.375% due 05/15/2030 | | | | | 885 | | | | | | 837 | |
| | | | |
Lennar Corp. | | | | | | | | | | | | |
5.250% due 06/01/2026 | | | | | 48 | | | | | | 48 | |
| | | | |
LKQ Corp. | | | | | | | | | | | | |
5.750% due 06/15/2028 | | | | | 507 | | | | | | 512 | |
|
Lockheed Martin Corp. | |
5.250% due 01/15/2033 | | | | | 69 | | | | | | 70 | |
5.900% due 11/15/2063 | | | | | 130 | | | | | | 137 | |
| | | | |
LYB International Finance LLC | | | | | | | | | | | | |
1.250% due 10/01/2025 | | | | | 114 | | | | | | 108 | |
| | | | |
Marathon Oil Corp. | | | | | | | | | | | | |
5.300% due 04/01/2029 | | | | | 1,808 | | | | | | 1,816 | |
| | | | |
Marathon Petroleum Corp. | | | | | | | | | | | | |
3.800% due 04/01/2028 | | | | | 2,110 | | | | | | 2,012 | |
|
Marriott International, Inc. | |
2.750% due 10/15/2033 | | | | | 160 | | | | | | 129 | |
2.850% due 04/15/2031 | | | | | 230 | | | | | | 197 | |
4.625% due 06/15/2030 | | | | | 2,546 | | | | | | 2,472 | |
|
Marvell Technology, Inc. | |
2.450% due 04/15/2028 | | | | | 79 | | | | | | 71 | |
4.875% due 06/22/2028 | | | | | 200 | | | | | | 197 | |
5.950% due 09/15/2033 | | | | | 410 | | | | | | 424 | |
| | | | |
Masco Corp. | | | | | | | | | | | | |
1.500% due 02/15/2028 | | | | | 57 | | | | | | 50 | |
|
Massachusetts Institute of Technology | |
3.885% due 07/01/2116 | | | | | 172 | | | | | | 127 | |
| | | | |
Mattel, Inc. | | | | | | | | | | | | |
3.375% due 04/01/2026 | | | | | 1,515 | | | | | | 1,457 | |
|
McDonald’s Corp. | |
3.500% due 07/01/2027 | | | | | 1,902 | | | | | | 1,823 | |
4.875% due 12/09/2045 | | | | | 2,141 | | | | | | 1,926 | |
5.700% due 02/01/2039 | | | | | 50 | | | | | | 51 | |
| | | | |
Mead Johnson Nutrition Co. | | | | | | | | | | | | |
4.125% due 11/15/2025 | | | | | 156 | | | | | | 153 | |
| | | | | | | | | | | | |
| | | | | PRINCIPAL
AMOUNT
(000S) | | | | | MARKET
VALUE
(000S) | |
| | | | |
Medtronic Global Holdings SCA | | | | | | | | | | | | |
4.250% due 03/30/2028 | | $ | | | 2,124 | | | $ | | | 2,076 | |
|
Mercedes-Benz Finance North America LLC | |
1.450% due 03/02/2026 | | | | | 660 | | | | | | 621 | |
4.950% due 03/30/2025 | | | | | 1,584 | | | | | | 1,577 | |
|
Merck & Co., Inc. | |
1.700% due 06/10/2027 | | | | | 1,711 | | | | | | 1,571 | |
2.900% due 12/10/2061 | | | | | 4,454 | | | | | | 2,671 | |
5.150% due 05/17/2063 | | | | | 243 | | | | | | 231 | |
|
Meta Platforms, Inc. | |
3.850% due 08/15/2032 | | | | | 1,035 | | | | | | 963 | |
4.450% due 08/15/2052 | | | | | 1,455 | | | | | | 1,255 | |
4.650% due 08/15/2062 | | | | | 2,012 | | | | | | 1,736 | |
|
Micron Technology, Inc. | |
4.185% due 02/15/2027 | | | | | 1,161 | | | | | | 1,129 | |
5.327% due 02/06/2029 | | | | | 100 | | | | | | 101 | |
|
Microsoft Corp. | |
1.350% due 09/15/2030 | | | | | 10 | | | | | | 8 | |
2.525% due 06/01/2050 | | | | | 3,900 | | | | | | 2,465 | |
2.675% due 06/01/2060 | | | | | 973 | | | | | | 595 | |
2.921% due 03/17/2052 | | | | | 60 | | | | | | 41 | |
|
Mondelez International Holdings Netherlands BV | |
1.250% due 09/24/2026 | | | | | 1,204 | | | | | | 1,102 | |
2.250% due 09/19/2024 | | | | | 26 | | | | | | 26 | |
4.250% due 09/15/2025 | | | | | 48 | | | | | | 47 | |
| | | | |
Mondelez International, Inc. | | | | | | | | | | | | |
6.500% due 11/01/2031 | | | | | 957 | | | | | | 1,028 | |
| | | | |
Moody’s Corp. | | | | | | | | | | | | |
3.100% due 11/29/2061 | | | | | 1,464 | | | | | | 899 | |
|
Motorola Solutions, Inc. | |
2.300% due 11/15/2030 | | | | | 669 | | | | | | 563 | |
2.750% due 05/24/2031 | | | | | 146 | | | | | | 124 | |
5.500% due 09/01/2044 | | | | | 877 | | | | | | 854 | |
|
MPLX LP | |
1.750% due 03/01/2026 | | | | | 52 | | | | | | 49 | |
4.125% due 03/01/2027 | | | | | 2,012 | | | | | | 1,954 | |
4.700% due 04/15/2048 | | | | | 40 | | | | | | 33 | |
4.950% due 03/14/2052 | | | | | 1,017 | | | | | | 863 | |
5.200% due 03/01/2047 | | | | | 983 | | | | | | 879 | |
5.500% due 02/15/2049 | | | | | 122 | | | | | | 113 | |
|
MSCI, Inc. | |
3.875% due 02/15/2031 | | | | | 55 | | | | | | 50 | |
4.000% due 11/15/2029 | | | | | 2,478 | | | | | | 2,317 | |
|
National Fuel Gas Co. | |
5.500% due 01/15/2026 | | | | | 226 | | | | | | 225 | |
5.500% due 10/01/2026 | | | | | 200 | | | | | | 200 | |
| | | | |
Nestle Capital Corp. | | | | | | | | | | | | |
4.750% due 03/12/2031 | | | | | 3,406 | | | | | | 3,367 | |
| | | | |
Nestle Holdings, Inc. | | | | | | | | | | | | |
5.000% due 03/14/2028 | | | | | 992 | | | | | | 996 | |
|
Netflix, Inc. | |
3.625% due 06/15/2025 | | | | | 999 | | | | | | 981 | |
4.375% due 11/15/2026 | | | | | 28 | | | | | | 28 | |
4.875% due 04/15/2028 | | | | | 1,866 | | | | | | 1,857 | |
5.375% due 11/15/2029 | | | | | 1,033 | | | | | | 1,043 | |
6.375% due 05/15/2029 | | | | | 45 | | | | | | 47 | |
| | | | |
Nissan Motor Co. Ltd. | | | | | | | | | | | | |
3.522% due 09/17/2025 | | | | | 128 | | | | | | 124 | |
|
Norfolk Southern Corp. | |
4.100% due 05/15/2121 | | | | | 67 | | | | | | 47 | |
5.950% due 03/15/2064 | | | | | 1,788 | | | | | | 1,824 | |
|
Northrop Grumman Corp. | |
3.850% due 04/15/2045 | | | | | 200 | | | | | | 156 | |
4.750% due 06/01/2043 | | | | | 100 | | | | | | 90 | |
4.950% due 03/15/2053 | | | | | 120 | | | | | | 108 | |
|
NTT Finance Corp. | |
1.162% due 04/03/2026 | | | | | 120 | | | | | | 112 | |
5.104% due 07/02/2027 (a) | | | | | 300 | | | | | | 300 | |
5.110% due 07/02/2029 (a) | | | | | 1,200 | | | | | | 1,196 | |
|
NXP BV | |
2.500% due 05/11/2031 | | | | | 2,627 | | | | | | 2,202 | |
3.150% due 05/01/2027 | | | | | 132 | | | | | | 125 | |
4.300% due 06/18/2029 | | | | | 132 | | | | | | 127 | |
4.400% due 06/01/2027 | | | | | 100 | | | | | | 98 | |
5.000% due 01/15/2033 | | | | | 170 | | | | | | 166 | |
| | | | | | |
| 42 | | PIMCO ETF TRUST | | | See Accompanying Notes | |
| | | | | | | | | | | | |
| | | | | PRINCIPAL
AMOUNT
(000S) | | | | | MARKET
VALUE
(000S) | |
|
Occidental Petroleum Corp. | |
6.125% due 01/01/2031 | | $ | | | 130 | | | $ | | | 133 | |
6.450% due 09/15/2036 | | | | | 2,025 | | | | | | 2,116 | |
6.625% due 09/01/2030 | | | | | 130 | | | | | | 136 | |
| | | | |
OCI NV | | | | | | | | | | | | |
6.700% due 03/16/2033 | | | | | 1,586 | | | | | | 1,566 | |
| | | | |
Open Text Corp. | | | | | | | | | | | | |
6.900% due 12/01/2027 | | | | | 693 | | | | | | 720 | |
|
Oracle Corp. | |
1.650% due 03/25/2026 | | | | | 527 | | | | | | 494 | |
2.300% due 03/25/2028 | | | | | 1,832 | | | | | | 1,657 | |
3.950% due 03/25/2051 | | | | | 3,607 | | | | | | 2,669 | |
4.125% due 05/15/2045 | | | | | 1,838 | | | | | | 1,441 | |
4.900% due 02/06/2033 | | | | | 787 | | | | | | 764 | |
5.375% due 07/15/2040 | | | | | 60 | | | | | | 57 | |
5.800% due 11/10/2025 | | | | | 70 | | | | | | 70 | |
|
Otis Worldwide Corp. | |
2.056% due 04/05/2025 | | | | | 35 | | | | | | 34 | |
2.565% due 02/15/2030 | | | | | 10 | | | | | | 9 | |
| | | | |
Ovintiv, Inc. | | | | | | | | | | | | |
5.650% due 05/15/2028 | | | | | 850 | | | | | | 860 | |
| | | | |
Owens Corning | | | | | | | | | | | | |
3.400% due 08/15/2026 | | | | | 100 | | | | | | 96 | |
|
Paramount Global | |
2.900% due 01/15/2027 | | | | | 108 | | | | | | 100 | |
3.700% due 06/01/2028 | | | | | 100 | | | | | | 90 | |
4.200% due 05/19/2032 | | | | | 60 | | | | | | 49 | |
4.900% due 08/15/2044 | | | | | 810 | | | | | | 565 | |
4.950% due 05/19/2050 | | | | | 65 | | | | | | 45 | |
|
Penske Truck Leasing Co. LP | |
1.200% due 11/15/2025 | | | | | 488 | | | | | | 460 | |
1.700% due 06/15/2026 | | | | | 2 | | | | | | 2 | |
3.400% due 11/15/2026 | | | | | 1,644 | | | | | | 1,571 | |
5.875% due 11/15/2027 | | | | | 394 | | | | | | 400 | |
|
PepsiCo, Inc. | |
3.500% due 03/19/2040 | | | | | 56 | | | | | | 45 | |
4.600% due 07/17/2045 | | | | | 701 | | | | | | 627 | |
| | | | |
Pertamina Persero PT | | | | | | | | | | | | |
1.400% due 02/09/2026 | | | | | 325 | | | | | | 304 | |
|
Pfizer Investment Enterprises Pte. Ltd. | |
4.650% due 05/19/2030 | | | | | 474 | | | | | | 467 | |
|
Philip Morris International, Inc. | |
1.750% due 11/01/2030 | | | | | 192 | | | | | | 156 | |
2.750% due 02/25/2026 | | | | | 158 | | | | | | 151 | |
3.875% due 08/21/2042 | | | | | 465 | | | | | | 362 | |
5.000% due 11/17/2025 | | | | | 334 | | | | | | 332 | |
5.625% due 11/17/2029 | | | | | 334 | | | | | | 341 | |
5.750% due 11/17/2032 | | | | | 334 | | | | | | 341 | |
6.375% due 05/16/2038 | | | | | 453 | | | | | | 487 | |
| | | | |
Phillips 66 Co. | | | | | | | | | | | | |
2.450% due 12/15/2024 | | | | | 1,461 | | | | | | 1,440 | |
|
Pioneer Natural Resources Co. | |
1.125% due 01/15/2026 | | | | | 135 | | | | | | 127 | |
5.100% due 03/29/2026 | | | | | 1,596 | | | | | | 1,593 | |
| | | | |
PRA Health Sciences, Inc. | | | | | | | | | | | | |
2.875% due 07/15/2026 | | | | | 579 | | | | | | 551 | |
|
Prosus NV | |
3.680% due 01/21/2030 | | | | | 1,584 | | | | | | 1,408 | |
4.027% due 08/03/2050 | | | | | 116 | | | | | | 79 | |
4.193% due 01/19/2032 | | | | | 180 | | | | | | 159 | |
|
Qorvo, Inc. | |
1.750% due 12/15/2024 | | | | | 52 | | | | | | 51 | |
4.375% due 10/15/2029 | | | | | 447 | | | | | | 422 | |
|
Quanta Services, Inc. | |
2.350% due 01/15/2032 | | | | | 1,376 | | | | | | 1,118 | |
2.900% due 10/01/2030 | | | | | 56 | | | | | | 49 | |
|
Ras Laffan Liquefied Natural Gas Co. Ltd. | |
5.838% due 09/30/2027 | | | | | 210 | | | | | | 212 | |
| | | | |
Regeneron Pharmaceuticals, Inc. | | | | | | | | | | | | |
2.800% due 09/15/2050 | | | | | 3,564 | | | | | | 2,186 | |
|
Reliance Industries Ltd. | |
3.625% due 01/12/2052 | | | | | 1,735 | | | | | | 1,217 | |
4.125% due 01/28/2025 | | | | | 199 | | | | | | 197 | |
| | | | |
Reliance Steel & Aluminum Co. | | | | | | | | | | | | |
1.300% due 08/15/2025 | | | | | 178 | | | | | | 170 | |
| | | | | | | | | | | | |
| | | | | PRINCIPAL
AMOUNT
(000S) | | | | | MARKET
VALUE
(000S) | |
|
RELX Capital, Inc. | |
3.000% due 05/22/2030 | | $ | | | 345 | | | $ | | | 310 | |
4.000% due 03/18/2029 | | | | | 1,418 | | | | | | 1,364 | |
|
Renesas Electronics Corp. | |
1.543% due 11/26/2024 | | | | | 462 | | | | | | 454 | |
2.170% due 11/25/2026 | | | | | 1,096 | | | | | | 1,015 | |
| | | | |
Republic Services, Inc. | | | | | | | | | | | | |
3.375% due 11/15/2027 | | | | | 897 | | | | | | 851 | |
| | | | |
Reynolds American, Inc. | | | | | | | | | | | | |
4.450% due 06/12/2025 | | | | | 793 | | | | | | 784 | |
|
Roche Holdings, Inc. | |
4.790% due 03/08/2029 | | | | | 1,029 | | | | | | 1,027 | |
5.338% due 11/13/2028 | | | | | 351 | | | | | | 357 | |
| | | | |
Rogers Communications, Inc. | | | | | | | | | | | | |
3.200% due 03/15/2027 | | | | | 763 | | | | | | 724 | |
|
Royalty Pharma PLC | |
3.350% due 09/02/2051 | | | | | 224 | | | | | | 144 | |
3.550% due 09/02/2050 | | | | | 1,745 | | | | | | 1,172 | |
5.150% due 09/02/2029 | | | | | 400 | | | | | | 397 | |
|
RTX Corp. | |
1.900% due 09/01/2031 | | | | | 59 | | | | | | 47 | |
4.050% due 05/04/2047 | | | | | 1,004 | | | | | | 791 | |
4.125% due 11/16/2028 | | | | | 50 | | | | | | 48 | |
4.150% due 05/15/2045 | | | | | 120 | | | | | | 97 | |
4.350% due 04/15/2047 | | | | | 145 | | | | | | 120 | |
4.500% due 06/01/2042 | | | | | 1,453 | | | | | | 1,259 | |
4.800% due 12/15/2043 | | | | | 1,708 | | | | | | 1,523 | |
5.375% due 02/27/2053 | | | | | 1,337 | | | | | | 1,271 | |
5.750% due 11/08/2026 | | | | | 860 | | | | | | 869 | |
| | | | |
S&P Global, Inc. | | | | | | | | | | | | |
4.250% due 05/01/2029 | | | | | 1,570 | | | | | | 1,525 | |
|
Sabine Pass Liquefaction LLC | |
4.200% due 03/15/2028 | | | | | 629 | | | | | | 607 | |
4.500% due 05/15/2030 | | | | | 202 | | | | | | 194 | |
5.900% due 09/15/2037 | | | | | 46 | | | | | | 47 | |
| | | | |
Santos Finance Ltd. | | | | | | | | | | | | |
3.649% due 04/29/2031 | | | | | 1,114 | | | | | | 975 | |
|
Saudi Arabian Oil Co. | |
3.500% due 04/16/2029 | | | | | 8 | | | | | | 7 | |
3.500% due 11/24/2070 | | | | | 3,426 | | | | | | 2,224 | |
| | | | |
Schlumberger Holdings Corp. | | | | | | | | | | | | |
5.000% due 05/29/2027 | | | | | 1,486 | | | | | | 1,482 | |
| | | | |
Schlumberger Investment SA | | | | | | | | | | | | |
5.000% due 06/01/2034 | | | | | 200 | | | | | | 197 | |
| | | | |
Seagate HDD Cayman | | | | | | | | | | | | |
4.091% due 06/01/2029 | | | | | 703 | | | | | | 653 | |
| | | | |
Sealed Air Corp. | | | | | | | | | | | | |
1.573% due 10/15/2026 | | | | | 1,271 | | | | | | 1,158 | |
|
Sherwin-Williams Co. | |
4.250% due 08/08/2025 | | | | | 998 | | | | | | 985 | |
4.550% due 08/01/2045 | | | | | 53 | | | | | | 45 | |
| | | | |
Silgan Holdings, Inc. | | | | | | | | | | | | |
1.400% due 04/01/2026 | | | | | 372 | | | | | | 345 | |
| | | | |
Sitios Latinoamerica SAB de CV | | | | | | | | | | | | |
5.375% due 04/04/2032 | | | | | 296 | | | | | | 276 | |
|
SK Hynix, Inc. | |
1.500% due 01/19/2026 | | | | | 54 | | | | | | 51 | |
5.500% due 01/16/2027 | | | | | 5 | | | | | | 5 | |
6.375% due 01/17/2028 | | | | | 386 | | | | | | 397 | |
| | | | |
Skyworks Solutions, Inc. | | | | | | | | | | | | |
1.800% due 06/01/2026 | | | | | 589 | | | | | | 548 | |
| | | | |
Smith & Nephew PLC | | | | | | | | | | | | |
2.032% due 10/14/2030 | | | | | 105 | | | | | | 87 | |
| | | | |
Smurfit Kappa Treasury ULC | | | | | | | | | | | | |
5.200% due 01/15/2030 | | | | | 785 | | | | | | 781 | |
| | | | |
South32 Treasury Ltd. | | | | | | | | | | | | |
4.350% due 04/14/2032 | | | | | 1,090 | | | | | | 987 | |
|
Southern Co. | |
3.750% due 09/15/2051 • | | | | | 210 | | | | | | 198 | |
4.400% due 07/01/2046 | | | | | 1,101 | | | | | | 920 | |
| | | | |
Southern Copper Corp. | | | | | | | | | | | | |
3.875% due 04/23/2025 | | | | | 149 | | | | | | 147 | |
| | | | |
Southwest Airlines Co. | | | | | | | | | | | | |
5.125% due 06/15/2027 | | | | | 118 | | | | | | 117 | |
| | | | | | | | | | | | |
| | | | | PRINCIPAL
AMOUNT
(000S) | | | | | MARKET
VALUE
(000S) | |
| | | | |
Stanley Black & Decker, Inc. | | | | | | | | | | | | |
4.000% due 03/15/2060 • | | $ | | | 131 | | | $ | | | 119 | |
|
Starbucks Corp. | |
2.000% due 03/12/2027 | | | | | 129 | | | | | | 119 | |
2.550% due 11/15/2030 | | | | | 10 | | | | | | 9 | |
3.000% due 02/14/2032 (f) | | | | | 3,204 | | | | | | 2,779 | |
|
Steel Dynamics, Inc. | |
2.800% due 12/15/2024 | | | | | 115 | | | | | | 113 | |
3.250% due 01/15/2031 | | | | | 50 | | | | | | 44 | |
|
Stryker Corp. | |
1.150% due 06/15/2025 | | | | | 266 | | | | | | 255 | |
3.500% due 03/15/2026 | | | | | 1,490 | | | | | | 1,447 | |
|
Sydney Airport Finance Co. Pty. Ltd. | |
3.625% due 04/28/2026 | | | | | 50 | | | | | | 48 | |
|
Sysco Corp. | |
2.400% due 02/15/2030 | | | | | 120 | | | | | | 104 | |
5.950% due 04/01/2030 | | | | | 45 | | | | | | 47 | |
6.000% due 01/17/2034 | | | | | 1,024 | | | | | | 1,075 | |
|
T-Mobile USA, Inc. | |
1.500% due 02/15/2026 | | | | | 609 | | | | | | 572 | |
2.250% due 11/15/2031 | | | | | 35 | | | | | | 29 | |
2.400% due 03/15/2029 | | | | | 165 | | | | | | 146 | |
2.625% due 04/15/2026 | | | | | 51 | | | | | | 49 | |
2.700% due 03/15/2032 | | | | | 1,478 | | | | | | 1,237 | |
3.000% due 02/15/2041 | | | | | 1,413 | | | | | | 1,012 | |
3.400% due 10/15/2052 | | | | | 1,125 | | | | | | 769 | |
3.500% due 04/15/2025 | | | | | 110 | | | | | | 108 | |
3.600% due 11/15/2060 | | | | | 2,355 | | | | | | 1,593 | |
3.750% due 04/15/2027 | | | | | 2,192 | | | | | | 2,107 | |
3.875% due 04/15/2030 | | | | | 51 | | | | | | 48 | |
4.375% due 04/15/2040 | | | | | 1,141 | | | | | | 989 | |
5.650% due 01/15/2053 | | | | | 170 | | | | | | 168 | |
5.750% due 01/15/2034 | | | | | 1,282 | | | | | | 1,318 | |
|
Take-Two Interactive Software, Inc. | |
3.700% due 04/14/2027 | | | | | 1,039 | | | | | | 999 | |
| | | | |
Takeda Pharmaceutical Co. Ltd. | | | | | | | | | | | | |
3.375% due 07/09/2060 | | | | | 1,864 | | | | | | 1,196 | |
|
Tapestry, Inc. | |
7.000% due 11/27/2026 | | | | | 1,183 | | | | | | 1,216 | |
7.350% due 11/27/2028 | | | | | 200 | | | | | | 208 | |
|
Targa Resources Corp. | |
5.200% due 07/01/2027 | | | | | 1,840 | | | | | | 1,837 | |
6.250% due 07/01/2052 | | | | | 100 | | | | | | 101 | |
| | | | |
TC PipeLines LP | | | | | | | | | | | | |
4.375% due 03/13/2025 | | | | | 343 | | | | | | 340 | |
| | | | |
TCI Communications, Inc. | | | | | | | | | | | | |
7.875% due 02/15/2026 | | | | | 1,683 | | | | | | 1,753 | |
| | | | |
TD SYNNEX Corp. | | | | | | | | | | | | |
1.750% due 08/09/2026 | | | | | 1,048 | | | | | | 968 | |
| | | | |
Teck Resources Ltd. | | | | | | | | | | | | |
6.000% due 08/15/2040 | | | | | 413 | | | | | | 407 | |
|
Telefonica Emisiones SA | |
4.103% due 03/08/2027 | | | | | 1,239 | | | | | | 1,203 | |
4.665% due 03/06/2038 | | | | | 1,814 | | | | | | 1,601 | |
|
Tencent Holdings Ltd. | |
3.290% due 06/03/2060 | | | | | 752 | | | | | | 466 | |
3.925% due 01/19/2038 | | | | | 59 | | | | | | 50 | |
3.975% due 04/11/2029 | | | | | 577 | | | | | | 549 | |
4.525% due 04/11/2049 | | | | | 212 | | | | | | 178 | |
| | | | |
Tennessee Gas Pipeline Co. LLC | | | | | | | | | | | | |
7.625% due 04/01/2037 | | | | | 1,261 | | | | | | 1,444 | |
| | | | |
Textron, Inc. | | | | | | | | | | | | |
3.900% due 09/17/2029 | | | | | 52 | | | | | | 49 | |
| | | | |
Thermo Fisher Scientific, Inc. | | | | | | | | | | | | |
1.215% due 10/18/2024 | | | | | 500 | | | | | | 494 | |
| | | | |
Tosco Corp. | | | | | | | | | | | | |
8.125% due 02/15/2030 | | | | | 176 | | | | | | 204 | |
| | | | |
TotalEnergies Capital SA | | | | | | | | | | | | |
3.883% due 10/11/2028 | | | | | 147 | | | | | | 141 | |
| | | | |
Toyota Industries Corp. | | | | | | | | | | | | |
3.566% due 03/16/2028 | | | | | 478 | | | | | | 453 | |
|
TransCanada PipeLines Ltd. | |
4.100% due 04/15/2030 | | | | | 10 | | | | | | 9 | |
4.250% due 05/15/2028 | | | | | 120 | | | | | | 116 | |
4.625% due 03/01/2034 | | | | | 430 | | | | | | 403 | |
| | | | | | | | | | | | |
| See Accompanying Notes | | | ANNUAL FINANCIAL AND OTHER INFORMATION | | | | | | | JUNE 30, 2024 | | | 43 |
| | | | | | |
| Schedule of Investments | | PIMCO Investment Grade Corporate Bond Index Exchange-Traded Fund | | (Cont.) | | |
| | | | | | | | | | | | |
| | | | | PRINCIPAL
AMOUNT
(000S) | | | | | MARKET
VALUE
(000S) | |
7.625% due 01/15/2039 | | $ | | | 1,475 | | | $ | | | 1,721 | |
| | | | |
TSMC Global Ltd. | | | | | | | | | | | | |
0.750% due 09/28/2025 | | | | | 456 | | | | | | 431 | |
|
TWDC Enterprises 18 Corp. | |
2.950% due 06/15/2027 | | | | | 76 | | | | | | 72 | |
7.000% due 03/01/2032 | | | | | 128 | | | | | | 142 | |
| | | | |
Tyson Foods, Inc. | | | | | | | | | | | | |
4.000% due 03/01/2026 | | | | | 300 | | | | | | 293 | |
| | | | |
U.S. Airways Pass-Through Trust | | | | | | | | | | | | |
4.625% due 12/03/2026 | | | | | 245 | | | | | | 242 | |
|
Union Pacific Corp. | |
2.800% due 02/14/2032 | | | | | 1,195 | | | | | | 1,032 | |
3.375% due 02/01/2035 | | | | | 120 | | | | | | 103 | |
| | | | |
United Airlines Pass-Through Trust | | | | | | | | | | | | |
5.800% due 07/15/2037 | | | | | 1,702 | | | | | | 1,734 | |
|
United Rentals North America, Inc. | |
3.875% due 11/15/2027 | | | | | 336 | | | | | | 318 | |
6.000% due 12/15/2029 | | | | | 47 | | | | | | 47 | |
|
UnitedHealth Group, Inc. | |
1.150% due 05/15/2026 | | | | | 79 | | | | | | 73 | |
2.000% due 05/15/2030 | | | | | 34 | | | | | | 29 | |
2.900% due 05/15/2050 | | | | | 146 | | | | | | 95 | |
3.050% due 05/15/2041 | | | | | 879 | | | | | | 649 | |
3.125% due 05/15/2060 | | | | | 50 | | | | | | 32 | |
3.375% due 04/15/2027 | | | | | 156 | | | | | | 150 | |
3.700% due 08/15/2049 | | | | | 1,054 | | | | | | 793 | |
4.250% due 01/15/2029 | | | | | 2,054 | | | | | | 2,001 | |
4.750% due 07/15/2045 | | | | | 1,369 | | | | | | 1,241 | |
5.050% due 04/15/2053 | | | | | 848 | | | | | | 786 | |
5.350% due 02/15/2033 | | | | | 46 | | | | | | 47 | |
5.500% due 04/15/2064 | | | | | 31 | | | | | | 30 | |
6.625% due 11/15/2037 | | | | | 41 | | | | | | 45 | |
6.875% due 02/15/2038 | | | | | 572 | | | | | | 656 | |
| | | | |
Vale Overseas Ltd. | | | | | | | | | | | | |
6.875% due 11/21/2036 | | | | | 1,364 | | | | | | 1,465 | |
| | | | |
Valero Energy Corp. | | | | | | | | | | | | |
4.350% due 06/01/2028 | | | | | 1,853 | | | | | | 1,794 | |
| | | | |
Var Energi ASA | | | | | | | | | | | | |
8.000% due 11/15/2032 | | | | | 1,980 | | | | | | 2,220 | |
| | | | |
VeriSign, Inc. | | | | | | | | | | | | |
5.250% due 04/01/2025 | | | | | 339 | | | | | | 338 | |
| | | | |
Verisk Analytics, Inc. | | | | | | | | | | | | |
4.125% due 03/15/2029 | | | | | 1,218 | | | | | | 1,172 | |
| | | | |
VF Corp. | | | | | | | | | | | | |
6.000% due 10/15/2033 | | | | | 35 | | | | | | 33 | |
| | | | |
Viatris, Inc. | | | | | | | | | | | | |
1.650% due 06/22/2025 | | | | | 250 | | | | | | 240 | |
|
VMware, Inc. | |
1.000% due 08/15/2024 | | | | | 51 | | | | | | 51 | |
1.400% due 08/15/2026 | | | | | 773 | | | | | | 712 | |
1.800% due 08/15/2028 | | | | | 35 | | | | | | 31 | |
2.200% due 08/15/2031 | | | | | 80 | | | | | | 65 | |
4.500% due 05/15/2025 | | | | | 10 | | | | | | 10 | |
|
Volkswagen Group of America Finance LLC | |
1.250% due 11/24/2025 | | | | | 1,060 | | | | | | 1,000 | |
6.200% due 11/16/2028 | | | | | 2,651 | | | | | | 2,737 | |
| | | | |
Walgreens Boots Alliance, Inc. | | | | | | | | | | | | |
3.450% due 06/01/2026 | | | | | 728 | | | | | | 685 | |
| | | | |
Walmart, Inc. | | | | | | | | | | | | |
4.500% due 04/15/2053 | | | | | 1,399 | | | | | | 1,239 | |
|
Walt Disney Co. | |
2.200% due 01/13/2028 | | | | | 78 | | | | | | 71 | |
3.500% due 05/13/2040 | | | | | 116 | | | | | | 93 | |
6.400% due 12/15/2035 | | | | | 147 | | | | | | 161 | |
|
Warnermedia Holdings, Inc. | |
5.050% due 03/15/2042 | | | | | 331 | | | | | | 269 | |
5.141% due 03/15/2052 | | | | | 1,742 | | | | | | 1,357 | |
5.391% due 03/15/2062 | | | | | 1,990 | | | | | | 1,554 | |
|
Waste Connections, Inc. | |
2.600% due 02/01/2030 | | | | | 1,644 | | | | | | 1,449 | |
2.950% due 01/15/2052 | | | | | 481 | | | | | | 307 | |
| | | | |
Weir Group PLC | | | | | | | | | | | | |
2.200% due 05/13/2026 | | | | | 897 | | | | | | 842 | |
| | | | |
Western Digital Corp. | | | | | | | | | | | | |
2.850% due 02/01/2029 | | | | | 100 | | | | | | 87 | |
| | | | | | | | | | | | |
| | | | | PRINCIPAL
AMOUNT
(000S) | | | | | MARKET
VALUE
(000S) | |
|
Western Midstream Operating LP | |
6.150% due 04/01/2033 | | $ | | | 1,736 | | | $ | | | 1,781 | |
|
Westinghouse Air Brake Technologies Corp. | |
4.700% due 09/15/2028 | | | | | 2,105 | | | | | | 2,064 | |
| | | | |
Westlake Corp. | | | | | | | | | | | | |
0.875% due 08/15/2024 | | | | | 51 | | | | | | 51 | |
|
Williams Cos., Inc. | |
3.750% due 06/15/2027 | | | | | 50 | | | | | | 48 | |
5.300% due 08/15/2052 | | | | | 100 | | | | | | 93 | |
5.400% due 03/04/2044 | | | | | 1,795 | | | | | | 1,699 | |
|
Woodside Finance Ltd. | |
3.650% due 03/05/2025 | | | | | 1,152 | | | | | | 1,136 | |
3.700% due 09/15/2026 | | | | | 1,307 | | | | | | 1,258 | |
|
Workday, Inc. | |
3.700% due 04/01/2029 | | | | | 700 | | | | | | 657 | |
3.800% due 04/01/2032 | | | | | 441 | | | | | | 396 | |
| | | | |
WRKCo, Inc. | | | | | | | | | | | | |
3.900% due 06/01/2028 | | | | | 120 | | | | | | 114 | |
| | | | |
Wyeth LLC | | | | | | | | | | | | |
5.950% due 04/01/2037 | | | | | 959 | | | | | | 1,011 | |
|
Zimmer Biomet Holdings, Inc. | |
3.550% due 03/20/2030 | | | | | 55 | | | | | | 50 | |
|
Zoetis, Inc. | |
2.000% due 05/15/2030 | | | | | 144 | | | | | | 121 | |
4.700% due 02/01/2043 | | | | | 1,811 | | | | | | 1,619 | |
| | | | | | | | | | | | |
| | | | | | | | | | | 475,908 | |
| | | | | | | | | | | | |
| |
| UTILITIES 13.1% | |
|
AEP Texas, Inc. | |
3.450% due 01/15/2050 | | | | | 935 | | | | | | 622 | |
4.700% due 05/15/2032 | | | | | 100 | | | | | | 94 | |
5.250% due 05/15/2052 | | | | | 100 | | | | | | 89 | |
5.450% due 05/15/2029 | | | | | 1,613 | | | | | | 1,622 | |
|
AES Corp. | |
2.450% due 01/15/2031 | | | | | 3,881 | | | | | | 3,197 | |
5.450% due 06/01/2028 | | | | | 120 | | | | | | 120 | |
| | | | |
Alabama Power Co. | | | | | | | | | | | | |
3.940% due 09/01/2032 | | | | | 1,027 | | | | | | 944 | |
| | | | |
Ameren Illinois Co. | | | | | | | | | | | | |
4.800% due 12/15/2043 | | | | | 51 | | | | | | 45 | |
|
American Electric Power Co., Inc. | |
2.300% due 03/01/2030 | | | | | 100 | | | | | | 85 | |
5.625% due 03/01/2033 | | | | | 140 | | | | | | 140 | |
|
American Water Capital Corp. | |
2.800% due 05/01/2030 | | | | | 3,166 | | | | | | 2,789 | |
3.000% due 12/01/2026 | | | | | 51 | | | | | | 48 | |
4.200% due 09/01/2048 | | | | | 56 | | | | | | 46 | |
| | | | |
Appalachian Power Co. | | | | | | | | | | | | |
7.000% due 04/01/2038 | | | | | 1,555 | | | | | | 1,710 | |
|
Arizona Public Service Co. | |
2.200% due 12/15/2031 | | | | | 61 | | | | | | 49 | |
4.500% due 04/01/2042 | | | | | 56 | | | | | | 48 | |
5.700% due 08/15/2034 | | | | | 1,965 | | | | | | 1,964 | |
|
AT&T, Inc. | |
1.650% due 02/01/2028 | | | | | 10 | | | | | | 9 | |
3.500% due 09/15/2053 | | | | | 3,123 | | | | | | 2,122 | |
3.650% due 06/01/2051 | | | | | 100 | | | | | | 71 | |
3.650% due 09/15/2059 | | | | | 3,692 | | | | | | 2,478 | |
4.100% due 02/15/2028 | | | | | 1,446 | | | | | | 1,396 | |
4.300% due 02/15/2030 | | | | | 2,981 | | | | | | 2,857 | |
4.350% due 03/01/2029 | | | | | 1,209 | | | | | | 1,172 | |
4.500% due 03/09/2048 | | | | | 1,666 | | | | | | 1,375 | |
4.750% due 05/15/2046 | | | | | 50 | | | | | | 43 | |
4.850% due 03/01/2039 | | | | | 374 | | | | | | 343 | |
5.400% due 02/15/2034 | | | | | 120 | | | | | | 120 | |
|
Atmos Energy Corp. | |
1.500% due 01/15/2031 | | | | | 50 | | | | | | 40 | |
4.150% due 01/15/2043 | | | | | 1,586 | | | | | | 1,332 | |
| | | | |
Avangrid, Inc. | | | | | | | | | | | | |
3.800% due 06/01/2029 | | | | | 508 | | | | | | 473 | |
|
Bell Telephone Co. of Canada | |
2.150% due 02/15/2032 | | | | | 10 | | | | | | 8 | |
|
Berkshire Hathaway Energy Co. | |
1.650% due 05/15/2031 | | | | | 1,793 | | | | | | 1,428 | |
| | | | | | | | | | | | |
| | | | | PRINCIPAL
AMOUNT
(000S) | | | | | MARKET
VALUE
(000S) | |
3.700% due 07/15/2030 | | $ | | | 5 | | | $ | | | 5 | |
4.050% due 04/15/2025 | | | | | 242 | | | | | | 239 | |
6.125% due 04/01/2036 | | | | | 637 | | | | | | 667 | |
| | | | |
BG Energy Capital PLC | | | | | | | | | | | | |
5.125% due 10/15/2041 | | | | | 110 | | | | | | 102 | |
| | | | |
Bharti Airtel Ltd. | | | | | | | | | | | | |
4.375% due 06/10/2025 | | | | | 156 | | | | | | 154 | |
|
Black Hills Corp. | |
3.150% due 01/15/2027 | | | | | 1,360 | | | | | | 1,290 | |
4.200% due 09/15/2046 | | | | | 100 | | | | | | 76 | |
6.000% due 01/15/2035 | | | | | 883 | | | | | | 889 | |
| | | | |
BP Capital Markets PLC | | | | | | | | | | | | |
4.875% due 03/22/2030 •(d) | | | | | 51 | | | | | | 48 | |
|
British Telecommunications PLC | |
9.625% due 12/15/2030 | | | | | 1,047 | | | | | | 1,279 | |
|
Brooklyn Union Gas Co. | |
3.407% due 03/10/2026 | | | | | 1,251 | | | | | | 1,203 | |
4.487% due 03/04/2049 | | | | | 58 | | | | | | 45 | |
|
CenterPoint Energy Houston Electric LLC | |
4.950% due 04/01/2033 | | | | | 2,440 | | | | | | 2,377 | |
| | | | |
CenterPoint Energy, Inc. | | | | | | | | | | | | |
1.450% due 06/01/2026 | | | | | 613 | | | | | | 570 | |
| | | | |
Cleveland Electric Illuminating Co. | | | | | | | | | | | | |
4.550% due 11/15/2030 | | | | | 120 | | | | | | 113 | |
| | | | |
CMS Energy Corp. | | | | | | | | | | | | |
4.750% due 06/01/2050 • | | | | | 967 | | | | | | 887 | |
|
Columbia Pipelines Holding Co. LLC | |
6.042% due 08/15/2028 | | | | | 967 | | | | | | 989 | |
|
Commonwealth Edison Co. | |
4.000% due 03/01/2048 | | | | | 3,212 | | | | | | 2,498 | |
5.650% due 06/01/2054 | | | | | 934 | | | | | | 929 | |
|
Consolidated Edison Co. of New York, Inc. | |
3.000% due 12/01/2060 | | | | | 283 | | | | | | 168 | |
3.600% due 06/15/2061 | | | | | 823 | | | | | | 562 | |
3.850% due 06/15/2046 | | | | | 3,068 | | | | | | 2,361 | |
6.150% due 11/15/2052 | | | | | 1,488 | | | | | | 1,580 | |
|
Constellation Energy Generation LLC | |
5.600% due 06/15/2042 | | | | | 1,135 | | | | | | 1,095 | |
| | | | |
Consumers Energy Co. | | | | | | | | | | | | |
4.600% due 05/30/2029 | | | | | 289 | | | | | | 285 | |
|
Dominion Energy, Inc. | |
1.450% due 04/15/2026 | | | | | 965 | | | | | | 899 | |
3.071% due 08/15/2024 þ | | | | | 561 | | | | | | 559 | |
3.375% due 04/01/2030 | | | | | 90 | | | | | | 81 | |
6.875% due 02/01/2055 • | | | | | 1,980 | | | | | | 2,022 | |
7.000% due 06/01/2054 • | | | | | 794 | | | | | | 828 | |
| | | | |
DTE Electric Co. | | | | | | | | | | | | |
3.000% due 03/01/2032 | | | | | 55 | | | | | | 48 | |
|
DTE Energy Co. | |
1.050% due 06/01/2025 | | | | | 249 | | | | | | 239 | |
3.400% due 06/15/2029 | | | | | 2,039 | | | | | | 1,869 | |
|
Duke Energy Carolinas LLC | |
2.550% due 04/15/2031 | | | | | 219 | | | | | | 187 | |
2.850% due 03/15/2032 | | | | | 100 | | | | | | 86 | |
3.550% due 03/15/2052 | | | | | 100 | | | | | | 71 | |
3.875% due 03/15/2046 | | | | | 60 | | | | | | 46 | |
6.000% due 12/01/2028 | | | | | 651 | | | | | | 671 | |
|
Duke Energy Corp. | |
2.450% due 06/01/2030 | | | | | 552 | | | | | | 474 | |
2.550% due 06/15/2031 | | | | | 10 | | | | | | 8 | |
3.400% due 06/15/2029 | | | | | 10 | | | | | | 9 | |
3.500% due 06/15/2051 | | | | | 146 | | | | | | 99 | |
3.750% due 09/01/2046 | | | | | 100 | | | | | | 73 | |
4.300% due 03/15/2028 | | | | | 293 | | | | | | 284 | |
4.500% due 08/15/2032 | | | | | 2,589 | | | | | | 2,422 | |
5.000% due 08/15/2052 | | | | | 178 | | | | | | 155 | |
|
Duke Energy Florida LLC | |
2.400% due 12/15/2031 | | | | | 1,030 | | | | | | 856 | |
3.400% due 10/01/2046 | | | | | 100 | | | | | | 70 | |
5.650% due 04/01/2040 | | | | | 11 | | | | | | 11 | |
5.950% due 11/15/2052 | | | | | 100 | | | | | | 102 | |
|
Duke Energy Progress LLC | |
3.400% due 04/01/2032 | | | | | 100 | | | | | | 88 | |
3.450% due 03/15/2029 | | | | | 10 | | | | | | 9 | |
| | | | | | |
| 44 | | PIMCO ETF TRUST | | | See Accompanying Notes | |
| | | | | | | | | | | | |
| | | | | PRINCIPAL
AMOUNT
(000S) | | | | | MARKET
VALUE
(000S) | |
3.600% due 09/15/2047 | | $ | | | 100 | | | $ | | | 73 | |
4.000% due 04/01/2052 | | | | | 100 | | | | | | 76 | |
5.250% due 03/15/2033 | | | | | 1,289 | | | | | | 1,287 | |
| | | | |
Duquesne Light Holdings, Inc. | | | | | | | | | | | | |
3.616% due 08/01/2027 | | | | | 53 | | | | | | 50 | |
| | | | |
East Ohio Gas Co. | | | | | | | | | | | | |
1.300% due 06/15/2025 | | | | | 10 | | | | | | 10 | |
|
Edison International | |
3.550% due 11/15/2024 | | | | | 60 | | | | | | 59 | |
5.750% due 06/15/2027 | | | | | 476 | | | | | | 480 | |
|
Electricite de France SA | |
4.875% due 01/22/2044 | | | | | 849 | | | | | | 743 | |
6.900% due 05/23/2053 | | | | | 1,977 | | | | | | 2,102 | |
| | | | |
Emera U.S. Finance LP | | | | | | | | | | | | |
4.750% due 06/15/2046 | | | | | 220 | | | | | | 181 | |
|
Enel Finance International NV | |
1.375% due 07/12/2026 | | | | | 138 | | | | | | 128 | |
4.500% due 06/15/2025 | | | | | 491 | | | | | | 485 | |
4.625% due 06/15/2027 | | | | | 1,248 | | | | | | 1,224 | |
5.000% due 06/15/2032 | | | | | 1,729 | | | | | | 1,644 | |
6.000% due 10/07/2039 | | | | | 1,376 | | | | | | 1,359 | |
|
Entergy Corp. | |
0.900% due 09/15/2025 | | | | | 10 | | | | | | 9 | |
1.900% due 06/15/2028 | | | | | 10 | | | | | | 9 | |
2.400% due 06/15/2031 | | | | | 75 | | | | | | 62 | |
|
Evergy, Inc. | |
2.450% due 09/15/2024 | | | | | 155 | | | | | | 154 | |
2.900% due 09/15/2029 | | | | | 1,006 | | | | | | 899 | |
|
Eversource Energy | |
0.800% due 08/15/2025 | | | | | 9 | | | | | | 9 | |
5.125% due 05/15/2033 | | | | | 80 | | | | | | 77 | |
| | | | |
Exelon Corp. | | | | | | | | | | | | |
4.450% due 04/15/2046 | | | | | 210 | | | | | | 173 | |
| | | | |
Fells Point Funding Trust | | | | | | | | | | | | |
3.046% due 01/31/2027 | | | | | 1,908 | | | | | | 1,797 | |
|
FirstEnergy Pennsylvania Electric Co. | |
3.600% due 06/01/2029 | | | | | 669 | | | | | | 623 | |
4.300% due 01/15/2029 | | | | | 125 | | | | | | 120 | |
5.150% due 03/30/2026 | | | | | 100 | | | | | | 99 | |
|
Florida Power & Light Co. | |
3.150% due 10/01/2049 | | | | | 3,461 | | | | | | 2,358 | |
4.125% due 02/01/2042 | | | | | 100 | | | | | | 84 | |
| | | | |
Fortis, Inc. | | | | | | | | | | | | |
3.055% due 10/04/2026 | | | | | 28 | | | | | | 27 | |
|
Galaxy Pipeline Assets Bidco Ltd. | |
1.750% due 09/30/2027 | | | | | 2 | | | | | | 2 | |
| | | | |
Idaho Power Co. | | | | | | | | | | | | |
4.200% due 03/01/2048 | | | | | 21 | | | | | | 17 | |
| | | | |
Indiana Michigan Power Co. | | | | | | | | | | | | |
4.250% due 08/15/2048 | | | | | 1,490 | | | | | | 1,186 | |
|
Interstate Power & Light Co. | |
3.100% due 11/30/2051 | | | | | 28 | | | | | | 18 | |
3.700% due 09/15/2046 | | | | | 25 | | | | | | 18 | |
6.250% due 07/15/2039 | | | | | 8 | | | | | | 8 | |
| | | | |
Jersey Central Power & Light Co. | | | | | | | | | | | | |
2.750% due 03/01/2032 | | | | | 145 | | | | | | 120 | |
|
Kentucky Utilities Co. | |
5.125% due 11/01/2040 | | | | | 100 | | | | | | 94 | |
5.450% due 04/15/2033 | | | | | 2,171 | | | | | | 2,186 | |
| | | | |
KeySpan Gas East Corp. | | | | | | | | | | | | |
2.742% due 08/15/2026 | | | | | 1,679 | | | | | | 1,584 | |
| | | | |
LLPL Capital Pte. Ltd. | | | | | | | | | | | | |
6.875% due 02/04/2039 | | | | | 207 | | | | | | 209 | |
| | | | |
MidAmerican Energy Co. | | | | | | | | | | | | |
4.250% due 07/15/2049 | | | | | 2,148 | | | | | | 1,767 | |
|
National Rural Utilities Cooperative Finance Corp. | |
4.400% due 11/01/2048 | | | | | 1,260 | | | | | | 1,057 | |
|
New York State Electric & Gas Corp. | |
2.150% due 10/01/2031 | | | | | 100 | | | | | | 80 | |
3.250% due 12/01/2026 | | | | | 1,032 | | | | | | 974 | |
|
NextEra Energy Capital Holdings, Inc. | |
1.900% due 06/15/2028 | | | | | 60 | | | | | | 53 | |
2.250% due 06/01/2030 | | | | | 58 | | | | | | 49 | |
2.750% due 11/01/2029 | | | | | 4,693 | | | | | | 4,176 | |
| | | | | | | | | | | | |
| | | | | PRINCIPAL
AMOUNT
(000S) | | | | | MARKET
VALUE
(000S) | |
4.800% due 12/01/2077 • | | $ | | | 380 | | | $ | | | 352 | |
| | | | |
NGPL PipeCo LLC | | | | | | | | | | | | |
4.875% due 08/15/2027 | | | | | 227 | | | | | | 222 | |
|
NiSource, Inc. | |
0.950% due 08/15/2025 | | | | | 10 | | | | | | 9 | |
2.950% due 09/01/2029 | | | | | 499 | | | | | | 449 | |
5.400% due 06/30/2033 | | | | | 125 | | | | | | 124 | |
| | | | |
Northern States Power Co. | | | | | | | | | | | | |
2.900% due 03/01/2050 | | | | | 849 | | | | | | 541 | |
|
NRG Energy, Inc. | |
2.000% due 12/02/2025 | | | | | 503 | | | | | | 476 | |
7.000% due 03/15/2033 | | | | | 2,080 | | | | | | 2,198 | |
| | | | |
NSTAR Electric Co. | | | | | | | | | | | | |
4.400% due 03/01/2044 | | | | | 43 | | | | | | 36 | |
|
Oklahoma Gas & Electric Co. | |
4.150% due 04/01/2047 | | | | | 10 | | | | | | 8 | |
4.550% due 03/15/2044 | | | | | 30 | | | | | | 26 | |
| | | | |
Oncor Electric Delivery Co. LLC | | | | | | | | | | | | |
3.100% due 09/15/2049 | | | | | 172 | | | | | | 115 | |
|
ONEOK, Inc. | |
3.400% due 09/01/2029 | | | | | 1,401 | | | | | | 1,286 | |
4.550% due 07/15/2028 | | | | | 573 | | | | | | 559 | |
5.200% due 07/15/2048 | | | | | 1,493 | | | | | | 1,322 | |
6.100% due 11/15/2032 | | | | | 774 | | | | | | 800 | |
|
Pacific Gas & Electric Co. | |
2.500% due 02/01/2031 | | | | | 20 | | | | | | 16 | |
3.250% due 06/01/2031 | | | | | 1,413 | | | | | | 1,216 | |
3.300% due 08/01/2040 | | | | | 150 | | | | | | 107 | |
3.450% due 07/01/2025 | | | | | 128 | | | | | | 124 | |
3.750% due 07/01/2028 | | | | | 1,773 | | | | | | 1,665 | |
3.950% due 12/01/2047 | | | | | 898 | | | | | | 644 | |
4.550% due 07/01/2030 | | | | | 103 | | | | | | 97 | |
4.650% due 08/01/2028 | | | | | 52 | | | | | | 50 | |
4.950% due 07/01/2050 | | | | | 103 | | | | | | 85 | |
5.450% due 06/15/2027 | | | | | 569 | | | | | | 570 | |
5.900% due 06/15/2032 | | | | | 100 | | | | | | 100 | |
6.100% due 01/15/2029 | | | | | 1,821 | | | | | | 1,865 | |
|
PacifiCorp | |
4.150% due 02/15/2050 | | | | | 70 | | | | | | 54 | |
5.450% due 02/15/2034 | | | | | 2,210 | | | | | | 2,184 | |
| | | | |
PECO Energy Co. | | | | | | | | | | | | |
3.000% due 09/15/2049 | | | | | 68 | | | | | | 45 | |
|
Perusahaan Perseroan Persero PT Perusahaan Listrik Negara | |
4.125% due 05/15/2027 | | | | | 294 | | | | | | 284 | |
| | | | |
Piedmont Natural Gas Co., Inc. | | | | | | | | | | | | |
2.500% due 03/15/2031 | | | | | 58 | | | | | | 49 | |
|
Pinnacle West Capital Corp. | |
1.300% due 06/15/2025 | | | | | 50 | | | | | | 48 | |
6.191% (SOFRRATE + 0.820%) due 06/10/2026 ~ | | | | | 298 | | | | | | 298 | |
|
Plains All American Pipeline LP | |
3.550% due 12/15/2029 | | | | | 198 | | | | | | 181 | |
5.150% due 06/01/2042 | | | | | 1,776 | | | | | | 1,575 | |
|
Public Service Co. of Colorado | |
1.900% due 01/15/2031 | | | | | 230 | | | | | | 187 | |
3.550% due 06/15/2046 | | | | | 52 | | | | | | 36 | |
| | | | |
Public Service Electric & Gas Co. | | | | | | | | | | | | |
4.650% due 03/15/2033 | | | | | 2,054 | | | | | | 1,982 | |
|
Public Service Enterprise Group, Inc. | |
0.800% due 08/15/2025 | | | | | 986 | | | | | | 936 | |
|
Puget Energy, Inc. | |
4.100% due 06/15/2030 | | | | | 226 | | | | | | 208 | |
4.224% due 03/15/2032 | | | | | 594 | | | | | | 533 | |
| | | | |
Puget Sound Energy, Inc. | | | | | | | | | | | | |
5.795% due 03/15/2040 | | | | | 30 | | | | | | 30 | |
| | | | |
San Diego Gas & Electric Co. | | | | | | | | | | | | |
1.700% due 10/01/2030 | | | | | 100 | | | | | | 82 | |
|
Sempra | |
3.300% due 04/01/2025 | | | | | 1,465 | | | | | | 1,439 | |
3.700% due 04/01/2029 | | | | | 1,473 | | | | | | 1,380 | |
|
Shell International Finance BV | |
2.750% due 04/06/2030 | | | | | 116 | | | | | | 103 | |
3.250% due 04/06/2050 | | | | | 230 | | | | | | 160 | |
4.125% due 05/11/2035 | | | | | 43 | | | | | | 39 | |
| | | | | | | | | | | | |
| | | | | PRINCIPAL
AMOUNT
(000S) | | | | | MARKET
VALUE
(000S) | |
|
Sinopec Group Overseas Development Ltd. | |
2.150% due 05/13/2025 | | $ | | | 243 | | | $ | | | 236 | |
4.125% due 09/12/2025 | | | | | 206 | | | | | | 203 | |
|
Southern California Edison Co. | |
2.850% due 08/01/2029 | | | | | 1,227 | | | | | | 1,103 | |
3.650% due 02/01/2050 | | | | | 1,678 | | | | | | 1,194 | |
4.125% due 03/01/2048 | | | | | 2,157 | | | | | | 1,677 | |
5.450% due 06/01/2031 | | | | | 2,674 | | | | | | 2,694 | |
5.850% due 11/01/2027 | | | | | 796 | | | | | | 812 | |
5.950% due 11/01/2032 | | | | | 100 | | | | | | 103 | |
|
Southern California Gas Co. | |
4.125% due 06/01/2048 | | | | | 1,629 | | | | | | 1,263 | |
4.450% due 03/15/2044 | | | | | 52 | | | | | | 44 | |
| | | | |
Southern Power Co. | | | | | | | | | | | | |
5.150% due 09/15/2041 | | | | | 602 | | | | | | 558 | |
|
Southwest Gas Corp. | |
4.050% due 03/15/2032 | | | | | 459 | | | | | | 416 | |
5.450% due 03/23/2028 | | | | | 1,213 | | | | | | 1,223 | |
|
Southwestern Electric Power Co. | |
4.100% due 09/15/2028 | | | | | 642 | | | | | | 613 | |
|
Southwestern Public Service Co. | |
3.150% due 05/01/2050 | | | | | 500 | | | | | | 320 | |
3.700% due 08/15/2047 | | | | | 9 | | | | | | 6 | |
6.000% due 10/01/2036 | | | | | 980 | | | | | | 972 | |
|
Tampa Electric Co. | |
4.350% due 05/15/2044 | | | | | 30 | | | | | | 25 | |
5.000% due 07/15/2052 | | | | | 100 | | | | | | 90 | |
| | | | |
Union Electric Co. | | | | | | | | | | | | |
3.900% due 04/01/2052 | | | | | 100 | | | | | | 77 | |
|
Verizon Communications, Inc. | |
2.355% due 03/15/2032 | | | | | 3,718 | | | | | | 3,041 | |
2.550% due 03/21/2031 | | | | | 1,199 | | | | | | 1,019 | |
3.150% due 03/22/2030 | | | | | 54 | | | | | | 49 | |
4.125% due 03/16/2027 | | | | | 1,502 | | | | | | 1,465 | |
4.812% due 03/15/2039 | | | | | 1,757 | | | | | | 1,630 | |
|
Virginia Electric & Power Co. | |
3.750% due 05/15/2027 | | | | | 209 | | | | | | 201 | |
4.625% due 05/15/2052 | | | | | 100 | | | | | | 84 | |
6.000% due 01/15/2036 | | | | | 60 | | | | | | 62 | |
8.875% due 11/15/2038 | | | | | 1,920 | | | | | | 2,481 | |
| | | | |
Vistra Operations Co. LLC | | | | | | | | | | | | |
4.300% due 07/15/2029 | | | | | 2,203 | | | | | | 2,083 | |
|
Vodafone Group PLC | |
5.750% due 02/10/2063 | | | | | 750 | | | | | | 713 | |
6.150% due 02/27/2037 | | | | | 243 | | | | | | 258 | |
| | | | |
WEC Energy Group, Inc. | | | | | | | | | | | | |
2.200% due 12/15/2028 | | | | | 1,182 | | | | | | 1,043 | |
| | | | |
Wisconsin Power & Light Co. | | | | | | | | | | | | |
3.950% due 09/01/2032 | | | | | 1,291 | | | | | | 1,181 | |
|
Wisconsin Public Service Corp. | |
3.671% due 12/01/2042 | | | | | 3 | | | | | | 2 | |
| | | | |
Xcel Energy, Inc. | | | | | | | | | | | | |
4.600% due 06/01/2032 | | | | | 50 | | | | | | 47 | |
| | | | | | | | | | | | |
| | | | | | | | | | | 147,438 | |
| | | | | | | | | | | | |
Total Corporate Bonds & Notes (Cost $1,114,935) | | | 1,070,983 | |
| | | | |
| |
| U.S. TREASURY OBLIGATIONS 8.2% | |
|
U.S. Treasury Bonds | |
3.000% due 08/15/2052 | | | | | 5,646 | | | | | | 4,249 | |
3.375% due 08/15/2042 | | | | | 2,402 | | | | | | 2,029 | |
3.875% due 05/15/2043 | | | | | 1,500 | | | | | | 1,354 | |
4.000% due 11/15/2042 | | | | | 3,186 | | | | | | 2,937 | |
4.000% due 11/15/2052 | | | | | 434 | | | | | | 395 | |
4.500% due 02/15/2044 (k) | | | | | 15,700 | | | | | | 15,406 | |
|
U.S. Treasury Inflation Protected Securities (c) | |
1.750% due 01/15/2034 (k)(m) | | | | | 18,970 | | | | | | 18,417 | |
|
U.S. Treasury Notes | |
2.750% due 08/15/2032 (k)(m) | | | | | 6,387 | | | | | | 5,685 | |
3.375% due 05/15/2033 (k) | | | | | 14,300 | | | | | | 13,256 | |
3.875% due 08/15/2033 | | | | | 4,100 | | | | | | 3,945 | |
4.000% due 02/15/2034 (k) | | | | | 14,200 | | | | | | 13,786 | |
4.375% due 05/15/2034 (k) | | | | | 11,000 | | | | | | 11,004 | |
| | | | | | | | | | | | |
Total U.S. Treasury Obligations (Cost $94,886) | | | 92,463 | |
| | | | |
| | | | | | | | | | | | |
| See Accompanying Notes | | | ANNUAL FINANCIAL AND OTHER INFORMATION | | | | | | | JUNE 30, 2024 | | | 45 |
| | | | | | |
| Schedule of Investments | | PIMCO Investment Grade Corporate Bond Index Exchange-Traded Fund | | (Cont.) | | |
| | | | | | | | | | | | |
| | | | | PRINCIPAL
AMOUNT
(000S) | | | | | MARKET
VALUE
(000S) | |
| SOVEREIGN ISSUES 0.2% | |
|
Korea National Oil Corp. | |
4.875% due 04/03/2029 | | $ | | | 1,365 | | | $ | | | 1,350 | |
| | | | |
Province of British Columbia | | | | | | | | | | | | |
4.750% due 06/12/2034 | | | | | 496 | | | | | | 494 | |
| | | | | | | | | | | | |
Total Sovereign Issues (Cost $1,850) | | | 1,844 | |
| | | | |
| |
| SHORT-TERM INSTRUMENTS 0.1% | |
| | | | | | | | | | | | |
| REPURCHASE AGREEMENTS (j) 0.1% | |
| | | | | | | | | | | 1,092 | |
| | | | | | | | | | | | |
Total Short-Term Instruments
(Cost $1,092) | | | 1,092 | |
| | | | |
| | | | |
| | | | | | | | | | | | |
| Total Investments in Securities (Cost $1,212,763) | | | 1,166,382 | |
| | | | |
| |
| | | | | | | | | | | | |
| | | | | SHARES | | | | | MARKET
VALUE
(000S) | |
| INVESTMENTS IN AFFILIATES 0.3% | |
| |
| SHORT-TERM INSTRUMENTS 0.3% | |
| |
| MUTUAL FUNDS 0.3% | |
|
PIMCO Government Money Market Fund | |
5.470% (e)(f)(h) | | | | | 3,565,228 | | | $ | | | 3,565 | |
| | | | | | | | | | | | |
Total Short-Term Instruments
(Cost $3,565) | | | 3,565 | |
| | | | |
| | | | |
| | | | | | | | | | | | |
| Total Investments in Affiliates (Cost $3,565) | | | 3,565 | |
| |
| | | | |
| Total Investments 103.6% (Cost $1,216,328) | | | $ | | | 1,169,947 | |
| |
Financial Derivative Instruments (l) 0.0% (Cost or Premiums, net $4,015) | | | | | | 38 | |
| |
| Other Assets and Liabilities, net (3.6)% | | | (40,157 | ) |
| | | | |
| Net Assets 100.0% | | | $ | | | 1,129,828 | |
| | | | | | | |
NOTES TO SCHEDULE OF INVESTMENTS:
| * | A zero balance may reflect actual amounts rounding to less than one thousand. |
| ~ | Variable or Floating rate security. Rate shown is the rate in effect as of period end. Certain variable rate securities are not based on a published reference rate and spread, rather are determined by the issuer or agent and are based on current market conditions. Reference rate is as of reset date, which may vary by security. These securities may not indicate a reference rate and/or spread in their description. |
| • | Rate shown is the rate in effect as of period end. The rate may be based on a fixed rate, a capped rate or a floor rate and may convert to a variable or floating rate in the future. These securities do not indicate a reference rate and spread in their description. |
| þ | Coupon represents a rate which changes periodically based on a predetermined schedule or event. Rate shown is the rate in effect as of period end. |
| (b) | Security is not accruing income as of the date of this report. |
| (c) | Principal amount of security is adjusted for inflation. |
| (d) | Perpetual maturity; date shown, if applicable, represents next contractual call date. |
| (e) | Institutional Class Shares of each Fund. |
| (f) | Securities with an aggregate market value of $3,485 were out on loan in exchange for $3,565 of cash collateral as of June 30, 2024. See Note 5, Securities Lending, in the Notes to Financial Statements for more information regarding securities on loan and cash collateral. |
| (g) | Contingent convertible security. |
| (h) | Coupon represents a 7-Day Yield. |
| (i) | Restricted Securities. |
BORROWINGS AND OTHER FINANCING TRANSACTIONS
(j) REPURCHASE AGREEMENTS:
| | | | | | | | | | | | | | | | | | | | | | | | | | | | | | |
| Counterparty | | Lending
Rate | | | Settlement
Date | | | Maturity
Date | | | Principal
Amount | | | Collateralized By | | Collateral
(Received) | | | Repurchase
Agreements,
at Value | | | Repurchase
Agreement
Proceeds
to be
Received(1) | |
| FICC | | | 2.600 | % | | | 06/28/2024 | | | | 07/01/2024 | | | $ | 1,092 | | | U.S. Treasury Notes 4.500% due 03/31/2026 | | $ | (1,114 | ) | | $ | 1,092 | | | $ | 1,092 | |
| | | | | | | | | | | | | | | | | | | | | | | | | | | | | | |
Total Repurchase Agreements | | | | | $ | (1,114 | ) | | $ | 1,092 | | | $ | 1,092 | |
| | | | | | | | | | | | | | | |
REVERSE REPURCHASE AGREEMENTS:
| | | | | | | | | | | | | | | | | | | | |
| Counterparty | | Borrowing Rate(2) | | | Settlement Date | | | Maturity Date | | | Amount
Borrowed(2) | | | Payable for
Reverse
Repurchase
Agreements | |
DEU | | | 5.460 | % | | | 06/18/2024 | | | | 07/02/2024 | | | $ | (12,556 | ) | | $ | (12,581 | ) |
| | | 5.470 | | | | 06/21/2024 | | | | 07/02/2024 | | | | (752 | ) | | | (753 | ) |
| | | 5.480 | | | | 06/20/2024 | | | | 07/02/2024 | | | | (12,315 | ) | | | (12,336 | ) |
| | | 5.500 | | | | 06/25/2024 | | | | 07/02/2024 | | | | (5,393 | ) | | | (5,398 | ) |
| | | 5.500 | | | | 06/26/2024 | | | | 07/03/2024 | | | | (10,960 | ) | | | (10,968 | ) |
| | | | | | | | | | | | | | | | | | | | |
Total Reverse Repurchase Agreements | | | | | | | | | | | $ | (42,036 | ) |
| | | | | | | | | | | | | | | | | | | | |
| | | | | | |
| 46 | | PIMCO ETF TRUST | | | See Accompanying Notes | |
SALE-BUYBACK TRANSACTIONS:
| | | | | | | | | | | | | | | | | | | | |
| Counterparty | | Borrowing Rate(2) | | | Borrowing Date | | | Maturity Date | | | Amount
Borrowed(2) | | | Payable for
Sale-Buyback
Transactions(3) | |
UBS | | | 5.390 | % | | | 05/22/2024 | | | | 07/08/2024 | | | $ | (5,142 | ) | | $ | (5,173 | ) |
| | | 5.410 | | | | 04/18/2024 | | | | 07/10/2024 | | | | (4,769 | ) | | | (4,822 | ) |
| | | | | | | | | | | | | | | | | | | | |
Total Sale-Buyback Transactions | | | | | | | | | | | $ | (9,995 | ) |
| | | | | | | | | | | | | | | | | | | | |
BORROWINGS AND OTHER FINANCING TRANSACTIONS SUMMARY
The following is a summary by counterparty of the market value of Borrowings and Other Financing Transactions and collateral pledged/(received) as of June 30, 2024:
| | | | | | | | | | | | | | | | | | | | | | | | | | | | |
| Counterparty | | Repurchase
Agreement
Proceeds
to be
Received(1) | | | Payable for
Reverse
Repurchase
Agreements | | | Payable for
Sale-Buyback
Transactions(3) | | | Securities
Out on Loan | | | Total
Borrowings and
Other Financing
Transactions | | | Collateral
Pledged/(Received) | | | Net Exposure(4) | |
Global/Master Repurchase Agreement | |
DEU | | $ | 0 | | | $ | (42,036 | ) | | $ | 0 | | | $ | 0 | | | $ | (42,036 | ) | | $ | 41,428 | | | $ | (608 | ) |
FICC | | | 1,092 | | | | 0 | | | | 0 | | | | 0 | | | | 1,092 | | | | (1,114 | ) | | | (22 | ) |
|
Master Securities Forward Transaction Agreement | |
UBS | | | 0 | | | | 0 | | | | (9,995 | ) | | | 0 | | | | (9,995 | ) | | | 9,741 | | | | (254 | ) |
|
Master Securities Lending Agreement | |
BCY | | | 0 | | | | 0 | | | | 0 | | | | 807 | | | | 807 | | | | (832 | ) | | | (25 | ) |
BMO | | | 0 | | | | 0 | | | | 0 | | | | 2,648 | | | | 2,648 | | | | (2,703 | ) | | | (55 | ) |
GSC | | | 0 | | | | 0 | | | | 0 | | | | 30 | | | | 30 | | | | (30 | ) | | | 0 | |
| | | | | | | | | | | | | | | | | | | | | | | | | | | | |
Total Borrowings and Other Financing Transactions | | $ | 1,092 | | | $ | (42,036 | ) | | $ | (9,995 | ) | | $ | 3,485 | | | | | | | | | | | | | |
| | | | | | | | | | | | | | | | | | | | | | | | | | | | |
CERTAIN TRANSFERS ACCOUNTED FOR AS SECURED BORROWINGS
Remaining Contractual Maturity of the Agreements
| | | | | | | | | | | | | | | | | | | | |
| | | Overnight and Continuous | | | Up to 30 days | | | 31-90 days | | | Greater Than 90 days | | | Total | |
Securities Lending Transactions(5) | |
Corporate Bonds & Notes | | $ | 3,565 | | | $ | 0 | | | $ | 0 | | | $ | 0 | | | $ | 3,565 | |
| | | | | | | | | | | | | | | | | | | | |
Total | | $ | 3,565 | | | $ | 0 | | | $ | 0 | | | $ | 0 | | | $ | 3,565 | |
| | | | | | | | | | | | | | | | | | | | |
Reverse Repurchase Agreements | |
U.S. Treasury Obligations | | $ | 0 | | | $ | (42,036 | ) | | $ | 0 | | | $ | 0 | | | $ | (42,036 | ) |
| | | | | | | | | | | | | | | | | | | | |
Total | | $ | 0 | | | $ | (42,036 | ) | | $ | 0 | | | $ | 0 | | | $ | (42,036 | ) |
| | | | | | | | | | | | | | | | | | | | |
|
Sale-Buyback Transactions | |
U.S. Treasury Obligations | | | 0 | | | | (9,995 | ) | | | 0 | | | | 0 | | | | (9,995 | ) |
| | | | | | | | | | | | | | | | | | | | |
Total | | $ | 0 | | | $ | (9,995 | ) | | $ | 0 | | | $ | 0 | | | $ | (9,995 | ) |
| | | | | | | | | | | | | | | | | | | | |
Total Borrowings | | $ | 3,565 | | | $ | (52,031 | ) | | $ | 0 | | | $ | 0 | | | $ | (48,466 | ) |
| | | | | | | | | | | | | | | | | | | | |
Payable for reverse repurchase agreements, sale-buyback financing transactions and securities on loan - cash collateral | | | $ | (48,466 | ) |
| | | | | |
| (k) | Securities with an aggregate market value of $51,368 have been pledged as collateral under the terms of the above master agreements as of June 30, 2024. |
| (1) | Includes accrued interest. |
| (2) | The average amount of borrowings outstanding during the period ended June 30, 2024 was $(27,881) at a weighted average interest rate of 5.297%. Average borrowings may include reverse repurchase agreements and sale-buyback transactions, if held during the period. |
| (3) | Payable for sale-buyback transactions includes $(12) of deferred price drop. |
| (4) | Net Exposure represents the net receivable/(payable) that would be due from/to the counterparty in the event of default. Exposure from borrowings and other financing transactions can only be netted across transactions governed under the same master agreement with the same legal entity. See Note 8, Master Netting Arrangements, in the Notes to Financial Statements for more information. |
| (5) | Includes cash collateral as described in Note 5 in the Notes to Financial Statements. |
| | | | | | | | | | | | |
| See Accompanying Notes | | | ANNUAL FINANCIAL AND OTHER INFORMATION | | | | | | | JUNE 30, 2024 | | | 47 |
| | | | | | |
| Schedule of Investments | | PIMCO Investment Grade Corporate Bond Index Exchange-Traded Fund | | (Cont.) | | |
(l) FINANCIAL DERIVATIVE INSTRUMENTS: EXCHANGE-TRADED OR CENTRALLY CLEARED
FUTURES CONTRACTS:
LONG FUTURES CONTRACTS
| | | | | | | | | | | | | | | | | | | | | | | | |
| Description | | Expiration
Month | | | # of
Contracts | | | Notional
Amount | | | Unrealized
Appreciation/
(Depreciation) | | | Variation Margin | |
| | Asset | | | Liability | |
U.S. Treasury 2-Year Note September Futures | | | 09/2024 | | | | 87 | | | $ | 17,767 | | | $ | 30 | | | $ | 0 | | | $ | (2 | ) |
U.S. Treasury 10-Year Ultra Long-Term Bond September Futures | | | 09/2024 | | | | 128 | | | | 14,532 | | | | 97 | | | | 0 | | | | (62 | ) |
| | | | | | | | | | | | | | | | | | | | | | | | |
| | | | | | | | | | $ | 127 | | | $ | 0 | | | $ | (64 | ) |
| | | | | | | | | | | | | | | | | | | | |
SHORT FUTURES CONTRACTS
| | | | | | | | | | | | | | | | | | | | | | | | |
| Description | | Expiration
Month | | | # of
Contracts | | | Notional
Amount | | | Unrealized
Appreciation/
(Depreciation) | | | Variation Margin | |
| | Asset | | | Liability | |
U.S. Treasury 5-Year Note September Futures | | | 09/2024 | | | | 67 | | | $ | (7,141 | ) | | $ | (31 | ) | | $ | 7 | | | $ | 0 | |
| | | | | | | | | | | | | | | | | | | | | | | | |
Total Futures Contracts | | | $ | 96 | | | $ | 7 | | | $ | (64 | ) |
| | | | | | | | | | | | | |
SWAP AGREEMENTS:
CREDIT DEFAULT SWAPS ON CORPORATE ISSUES - SELL PROTECTION(1)
| | | | | | | | | | | | | | | | | | | | | | | | | | | | | | | | | | | | |
| Reference Entity | | Fixed
Receive Rate | | Payment
Frequency | | Maturity
Date | | | Implied
Credit Spread at
June 30, 2024(2) | | | Notional
Amount(3) | | | Premiums
Paid/(Received) | | | Unrealized
Appreciation/
(Depreciation) | | | Market
Value(4) | | | Variation Margin | |
| | Asset | | | Liability | |
National Rural Utilities Cooperative Finance Corp. | | 1.000% | | Quarterly | | | 12/20/2026 | | | | 0.122 | % | | | $ 100 | | | $ | 3 | | | $ | (1 | ) | | $ | 2 | | | $ | 0 | | | $ | 0 | |
| | | | | | | | | | | | | | | | | | | | | | | | | | | | | | | | | | | | |
CREDIT DEFAULT SWAPS ON CREDIT INDICES - SELL PROTECTION(1)
| | | | | | | | | | | | | | | | | | | | | | | | | | | | | | | | | | |
| Index/Tranches | | Fixed
Receive Rate | | | Payment
Frequency | | Maturity
Date | | | Notional
Amount(3) | | | Premiums
Paid/
(Received) | | | Unrealized
Appreciation/
(Depreciation) | | | Market
Value(4) | | | Variation Margin | |
| | Asset | | | Liability | |
CDX.IG-41 5-Year Index | | | 1.000 | % | | Quarterly | | | 12/20/2028 | | | $ | 39,400 | | | $ | 772 | | | $ | 71 | | | $ | 843 | | | $ | 0 | | | $ | (3 | ) |
CDX.IG-42 5-Year Index | | | 1.000 | | | Quarterly | | | 06/20/2029 | | | | 136,100 | | | | 3,056 | | | | (229 | ) | | | 2,827 | | | | 0 | | | | (12 | ) |
| | | | | | | | | | | | | | | | | | | | | | | | | | | | | | | | | | |
| | | | | | | | | | | | | $ | 3,828 | | | $ | (158 | ) | | $ | 3,670 | | | $ | 0 | | | $ | (15 | ) |
| | | | | | | | | | | | | | | | | | | | | | | | | | | | | | | |
INTEREST RATE SWAPS
| | | | | | | | | | | | | | | | | | | | | | | | | | | | | | | | | | | | |
Pay/Receive
Floating Rate | | Floating Rate Index | | Fixed Rate | | | Payment
Frequency | | Maturity
Date | | | Notional
Amount | | | Premiums
Paid/
(Received) | | | Unrealized
Appreciation/
(Depreciation) | | | Market
Value | | | Variation Margin | |
| | Asset | | | Liability | |
Receive | | 1-Day USD-SOFR Compounded-OIS | | | 3.500 | % | | Annual | | | 06/20/2054 | | | $ | 6,300 | | | $ | 184 | | | $ | 93 | | | $ | 277 | | | $ | 110 | | | $ | 0 | |
| | | | | | | | | | | | | | | | | | | | | | | | | | | | | | | | | | | | |
Total Swap Agreements | | | $ | 4,015 | | | $ | (66 | ) | | $ | 3,949 | | | $ | 110 | | | $ | (15 | ) |
| | | | | | | | | | | | | | | | | | | | | |
FINANCIAL DERIVATIVE INSTRUMENTS: EXCHANGE-TRADED OR CENTRALLY CLEARED SUMMARY
The following is a summary of the market value and variation margin of Exchange-Traded or Centrally Cleared Financial Derivative Instruments as of June 30, 2024:
| | | | | | | | | | | | | | | | | | | | | | | | | | | | | | | | | | | | |
| | | Financial Derivative Assets | | | | | | Financial Derivative Liabilities | |
| | | Market Value | | | Variation Margin
Asset | | | Total | | | | | | Market Value | | | Variation Margin
Liability | | | Total | |
| | | Purchased
Options | | | Futures | | | Swap
Agreements | | | | | | Written
Options | | | Futures | | | Swap
Agreements | |
Total Exchange-Traded or Centrally Cleared | | $ | 0 | | | $ | 7 | | | $ | 110 | | | $ | 117 | | | | | | | $ | 0 | | | $ | (64 | ) | | $ | (15 | ) | | $ | (79 | ) |
| | | | | | | | | | | | | | | | | | | | | | | | | | | | | | | | | | | | |
| (m) | Securities with an aggregate market value of $1,928 and cash of $3,978 have been pledged as collateral for exchange-traded and centrally cleared financial derivative instruments as of June 30, 2024. See Note 8, Master Netting Arrangements, in the Notes to Financial Statements for more information. |
| (1) | If the Fund is a seller of protection and a credit event occurs, as defined under the terms of that particular swap agreement, the Fund will either (i) pay to the buyer of protection an amount equal to the notional amount of the swap and take delivery of the referenced obligation or underlying securities comprising the referenced index or (ii) pay a net settlement amount in the form of cash, securities or other deliverable obligations equal to the notional amount of the swap less the recovery value of the referenced obligation or underlying securities comprising the referenced index. |
| | | | | | |
| 48 | | PIMCO ETF TRUST | | | See Accompanying Notes | |
| (2) | Implied credit spreads, represented in absolute terms, utilized in determining the market value of credit default swap agreements on issues as of period end serve as indicators of the current status of the payment/performance risk and represent the likelihood or risk of default for the credit derivative. The implied credit spread of a particular referenced entity reflects the cost of buying/selling protection and may include upfront payments required to be made to enter into the agreement. Wider credit spreads represent a deterioration of the referenced entity’s credit soundness and a greater likelihood or risk of default or other credit event occurring as defined under the terms of the agreement. |
| (3) | The maximum potential amount the Fund could be required to pay as a seller of credit protection or receive as a buyer of credit protection if a credit event occurs as defined under the terms of that particular swap agreement. |
| (4) | The prices and resulting values for credit default swap agreements serve as indicators of the current status of the payment/performance risk and represent the likelihood of an expected liability (or profit) for the credit derivative should the notional amount of the swap agreement be closed/sold as of the period end. Increasing market values, in absolute terms when compared to the notional amount of the swap, represent a deterioration of the underlying referenced instrument’s credit soundness and a greater likelihood or risk of default or other credit event occurring as defined under the terms of the agreement. |
FAIR VALUE OF FINANCIAL DERIVATIVE INSTRUMENTS
The following is a summary of the fair valuation of the Fund’s derivative instruments categorized by risk exposure. See Note 7, Principal and Other Risks, in the Notes to Financial Statements on risks of the Fund.
Fair Values of Financial Derivative Instruments on the Statements of Assets and Liabilities as of June 30, 2024:
| | | | | | | | | | | | | | | | | | | | | | | | |
| | | Derivatives not accounted for as hedging instruments | |
| | | Commodity
Contracts | | | Credit
Contracts | | | Equity
Contracts | | | Foreign
Exchange
Contracts | | | Interest
Rate
Contracts | | | Total | |
Financial Derivative Instruments - Assets | |
Exchange-traded or centrally cleared | |
Futures | | $ | 0 | | | $ | 0 | | | $ | 0 | | | $ | 0 | | | $ | 7 | | | $ | 7 | |
Swap Agreements | | | 0 | | | | 0 | | | | 0 | | | | 0 | | | | 110 | | | | 110 | |
| | | | | | | | | | | | | | | | | | | | | | | | |
| | $ | 0 | | | $ | 0 | | | $ | 0 | | | $ | 0 | | | $ | 117 | | | $ | 117 | |
| | | | | | | | | | | | | | | | | | | | | | | | |
|
Financial Derivative Instruments - Liabilities | |
Exchange-traded or centrally cleared | |
Futures | | $ | 0 | | | $ | 0 | | | $ | 0 | | | $ | 0 | | | $ | 64 | | | $ | 64 | |
Swap Agreements | | | 0 | | | | 15 | | | | 0 | | | | 0 | | | | 0 | | | | 15 | |
| | | | | | | | | | | | | | | | | | | | | | | | |
| | $ | 0 | | | $ | 15 | | | $ | 0 | | | $ | 0 | | | $ | 64 | | | $ | 79 | |
| | | | | | | | | | | | | | | | | | | | | | | | |
The effect of Financial Derivative Instruments on the Statements of Operations for the period ended June 30, 2024:
| | | | | | | | | | | | | | | | | | | | | | | | |
| | | Derivatives not accounted for as hedging instruments | |
| | | Commodity
Contracts | | | Credit
Contracts | | | Equity
Contracts | | | Foreign
Exchange
Contracts | | | Interest
Rate Contracts | | | Total | |
Net Realized Gain (Loss) on Financial Derivative Instruments | |
Exchange-traded or centrally cleared | |
Futures | | $ | 0 | | | $ | 0 | | | $ | 0 | | | $ | 0 | | | $ | (809 | ) | | $ | (809 | ) |
Swap Agreements | | | 0 | | | | 1,049 | | | | 0 | | | | 0 | | | | (3 | ) | | | 1,046 | |
| | | | | | | | | | | | | | | | | | | | | | | | |
| | $ | 0 | | | $ | 1,049 | | | $ | 0 | | | $ | 0 | | | $ | (812 | ) | | $ | 237 | |
| | | | | | | | | | | | | | | | | | | | | | | | |
|
Net Change in Unrealized Appreciation (Depreciation) on Financial Derivative Instruments | |
Exchange-traded or centrally cleared | |
Futures | | $ | 0 | | | $ | 0 | | | $ | 0 | | | $ | 0 | | | $ | 104 | | | $ | 104 | |
Swap Agreements | | | 0 | | | | (375 | ) | | | 0 | | | | 0 | | | | 93 | | | | (282 | ) |
| | | | | | | | | | | | | | | | | | | | | | | | |
| | $ | 0 | | | $ | (375 | ) | | $ | 0 | | | $ | 0 | | | $ | 197 | | | $ | (178 | ) |
| | | | | | | | | | | | | | | | | | | | | | | | |
| | | | | | | | | | | | |
| See Accompanying Notes | | | ANNUAL FINANCIAL AND OTHER INFORMATION | | | | | | | JUNE 30, 2024 | | | 49 |
| | | | | | |
| Schedule of Investments | | PIMCO Investment Grade Corporate Bond Index Exchange-Traded Fund | | (Cont.) | | June 30, 2024 |
FAIR VALUE MEASUREMENTS
The following is a summary of the fair valuations according to the inputs used as of June 30, 2024 in valuing the Fund’s assets and liabilities:
| | | | | | | | | | | | | | | | |
| Category and Subcategory | | Level 1 | | | Level 2 | | | Level 3 | | | Fair Value at 06/30/2024 | |
Investments in Securities, at Value | |
Corporate Bonds & Notes | |
Banking & Finance | | $ | 0 | | | $ | 447,637 | | | $ | 0 | | | $ | 447,637 | |
Industrials | | | 0 | | | | 475,908 | | | | 0 | | | | 475,908 | |
Utilities | | | 0 | | | | 147,438 | | | | 0 | | | | 147,438 | |
U.S. Treasury Obligations | | | 0 | | | | 92,463 | | | | 0 | | | | 92,463 | |
Sovereign Issues | | | 0 | | | | 1,844 | | | | 0 | | | | 1,844 | |
Short-Term Instruments | |
Repurchase Agreements | | | 0 | | | | 1,092 | | | | 0 | | | | 1,092 | |
| | | | | | | | | | | | | | | | |
| | $ | 0 | | | $ | 1,166,382 | | | $ | 0 | | | $ | 1,166,382 | |
| | | | | | | | | | | | | | | | |
|
Investments in Affiliates, at Value | |
Short-Term Instruments | |
Mutual Funds | | | 3,565 | | | | 0 | | | | 0 | | | | 3,565 | |
| | | | | | | | | | | | | | | | |
| | | | |
Total Investments | | $ | 3,565 | | | $ | 1,166,382 | | | $ | 0 | | | $ | 1,169,947 | |
| | | | | | | | | | | | | | | | |
| | | | | | | | | | | | | | | | |
| Category and Subcategory | | Level 1 | | | Level 2 | | | Level 3 | | | Fair Value at 06/30/2024 | |
Financial Derivative Instruments - Assets | |
Exchange-traded or centrally cleared | | $ | 0 | | | $ | 117 | | | $ | 0 | | | $ | 117 | |
| | | | | | | | | | | | | | | | |
|
Financial Derivative Instruments - Liabilities | |
Exchange-traded or centrally cleared | | $ | 0 | | | $ | (79 | ) | | $ | 0 | | | $ | (79 | ) |
| | | | | | | | | | | | | | | | |
| | | | |
Total Financial Derivative Instruments | | $ | 0 | | | $ | 38 | | | $ | 0 | | | $ | 38 | |
| | | | | | | | | | | | | | | | |
| | | | |
Totals | | $ | 3,565 | | | $ | 1,166,420 | | | $ | 0 | | | $ | 1,169,985 | |
| | | | | | | | | | | | | | | | |
There were no significant transfers into or out of Level 3 during the period ended June 30, 2024.
| | | | | | |
| 50 | | PIMCO ETF TRUST | | | See Accompanying Notes | |
| | | | | | |
| Schedule of Investments | | PIMCO Active Bond Exchange-Traded Fund | | | | June 30, 2024 |
(Amounts in thousands*, except number of shares, contracts, units and ounces, if any)
| | | | | | | | | | | | |
| | | | | PRINCIPAL
AMOUNT
(000S) | | | | | MARKET
VALUE
(000S) | |
| INVESTMENTS IN SECURITIES 120.1% | |
| |
| LOAN PARTICIPATIONS AND ASSIGNMENTS 0.5% | |
|
American Airlines, Inc. | |
10.336% due 04/20/2028 | | $ | | | 2,960 | | | $ | | | 3,062 | |
|
Avolon TLB Borrower 1 U.S. LLC | |
7.339% due 06/22/2028 | | | | | 1,264 | | | | | | 1,267 | |
|
Broadcom Inc. | |
TBD% due 08/14/2026 « | | | | | 8,700 | | | | | | 8,657 | |
|
Castlelake LP | |
8.534% (LIBOR03M + 2.950%) due 05/13/2031 «~ | | | | | 5,111 | | | | | | 4,760 | |
|
SkyMiles IP Ltd. | |
9.075% due 10/20/2027 | | | | | 2,103 | | | | | | 2,157 | |
|
Zephyrus Capital Aviation Partners LLC | |
4.605% due 10/15/2038 | | | | | 830 | | | | | | 757 | |
| | | | | | | | | | | | |
Total Loan Participations and Assignments (Cost $20,958) | | | 20,660 | |
| | | | |
| |
| CORPORATE BONDS & NOTES 23.7% | |
| |
| BANKING & FINANCE 16.9% | |
|
AerCap Ireland Capital DAC | |
2.450% due 10/29/2026 | | | | | 7,934 | | | | | | 7,404 | |
3.000% due 10/29/2028 | | | | | 2,684 | | | | | | 2,440 | |
3.875% due 01/23/2028 | | | | | 2,100 | | | | | | 1,991 | |
5.100% due 01/19/2029 (l) | | | | | 2,700 | | | | | | 2,675 | |
|
Aircastle Ltd. | |
4.250% due 06/15/2026 | | | | | 800 | | | | | | 780 | |
5.950% due 02/15/2029 | | | | | 5,000 | | | | | | 5,001 | |
|
Ally Financial, Inc. | |
6.848% due 01/03/2030 • | | | | | 3,100 | | | | | | 3,187 | |
|
American Assets Trust LP | |
3.375% due 02/01/2031 | | | | | 2,800 | | | | | | 2,296 | |
|
American Express Co. | |
6.338% due 10/30/2026 • | | | | | 1,400 | | | | | | 1,414 | |
|
American Homes 4 Rent LP | |
4.250% due 02/15/2028 | | | | | 2,900 | | | | | | 2,780 | |
|
American Tower Corp. | |
3.650% due 03/15/2027 | | | | | 3,000 | | | | | | 2,874 | |
5.800% due 11/15/2028 | | | | | 1,600 | | | | | | 1,632 | |
|
Antares Holdings LP | |
3.750% due 07/15/2027 | | | | | 3,700 | | | | | | 3,387 | |
3.950% due 07/15/2026 | | | | | 1,000 | | | | | | 946 | |
6.500% due 02/08/2029 | | | | | 1,000 | | | | | | 985 | |
|
Ares Capital Corp. | |
3.250% due 07/15/2025 | | | | | 1,800 | | | | | | 1,749 | |
5.875% due 03/01/2029 | | | | | 3,000 | | | | | | 2,958 | |
|
Ares Management Corp. | |
6.375% due 11/10/2028 | | | | | 6,000 | | | | | | 6,255 | |
|
Athene Global Funding | |
5.516% due 03/25/2027 | | | | | 2,000 | | | | | | 2,006 | |
5.684% due 02/23/2026 | | | | | 7,800 | | | | | | 7,822 | |
|
Aviation Capital Group LLC | |
6.750% due 10/25/2028 | | | | | 5,000 | | | | | | 5,213 | |
|
Avolon Holdings Funding Ltd. | |
4.250% due 04/15/2026 | | | | | 1,800 | | | | | | 1,749 | |
5.750% due 03/01/2029 | | | | | 3,000 | | | | | | 2,984 | |
|
Banco Bilbao Vizcaya Argentaria SA | |
5.381% due 03/13/2029 | | | | | 6,000 | | | | | | 6,022 | |
6.138% due 09/14/2028 • | | | | | 800 | | | | | | 816 | |
|
Banco Santander SA | |
2.958% due 03/25/2031 | | | | | 2,200 | | | | | | 1,882 | |
|
Bank of America Corp. | |
4.948% due 07/22/2028 • | | | | | 4,000 | | | | | | 3,969 | |
5.202% due 04/25/2029 • | | | | | 8,400 | | | | | | 8,389 | |
5.288% due 04/25/2034 • | | | | | 7,000 | | | | | | 6,931 | |
5.872% due 09/15/2034 • | | | | | 15,000 | | | | | | 15,436 | |
6.204% due 11/10/2028 • | | | | | 1,800 | | | | | | 1,854 | |
|
Barclays PLC | |
5.690% due 03/12/2030 • | | | | | 7,500 | | | | | | 7,522 | |
7.385% due 11/02/2028 • | | | | | 7,000 | | | | | | 7,378 | |
7.437% due 11/02/2033 • | | | | | 5,000 | | | | | | 5,502 | |
| | | | | | | | | | | | |
| | | | | PRINCIPAL
AMOUNT
(000S) | | | | | MARKET
VALUE
(000S) | |
|
BGC Group, Inc. | |
3.750% due 10/01/2024 | | $ | | | 3,300 | | | $ | | | 3,275 | |
6.600% due 06/10/2029 | | | | | 2,800 | | | | | | 2,787 | |
|
Blackstone Holdings Finance Co. LLC | |
1.625% due 08/05/2028 | | | | | 3,000 | | | | | | 2,623 | |
|
Blue Owl Capital Corp. | |
4.000% due 03/30/2025 | | | | | 1,700 | | | | | | 1,672 | |
5.950% due 03/15/2029 | | | | | 2,000 | | | | | | 1,969 | |
|
Blue Owl Finance LLC | |
3.125% due 06/10/2031 | | | | | 1,300 | | | | | | 1,084 | |
4.375% due 02/15/2032 | | | | | 2,000 | | | | | | 1,781 | |
|
Blue Ridge Re Ltd. | |
10.605% (T-BILL 3MO + 5.250%) due 01/08/2031 ~ | | | | | 2,000 | | | | | | 1,975 | |
13.355% (T-BILL 1MO + 8.000%) due 01/08/2031 ~ | | | | | 2,000 | | | | | | 1,971 | |
|
BNP Paribas SA | |
1.904% due 09/30/2028 • | | | | | 3,200 | | | | | | 2,859 | |
2.159% due 09/15/2029 • | | | | | 800 | | | | | | 698 | |
2.591% due 01/20/2028 • | | | | | 7,500 | | | | | | 6,974 | |
4.500% due 02/25/2030 •(g)(i) | | | | | 200 | | | | | | 159 | |
4.625% due 02/25/2031 •(g)(i) | | | | | 2,000 | | | | | | 1,607 | |
|
BPCE SA | |
5.716% due 01/18/2030 • | | | | | 5,000 | | | | | | 4,991 | |
5.975% due 01/18/2027 • | | | | | 4,000 | | | | | | 4,004 | |
|
Brandywine Operating Partnership LP | |
3.950% due 11/15/2027 | | | | | 300 | | | | | | 272 | |
8.050% due 03/15/2028 | | | | | 100 | | | | | | 104 | |
|
Brixmor Operating Partnership LP | |
4.050% due 07/01/2030 | | | | | 2,000 | | | | | | 1,857 | |
|
Brookfield Finance, Inc. | |
6.350% due 01/05/2034 (l) | | | | | 5,500 | | | | | | 5,769 | |
|
CaixaBank SA | |
5.673% due 03/15/2030 • | | | | | 4,800 | | | | | | 4,782 | |
6.037% due 06/15/2035 • | | | | | 800 | | | | | | 802 | |
|
Cantor Fitzgerald LP | |
7.200% due 12/12/2028 | | | | | 6,500 | | | | | | 6,688 | |
|
Cape Lookout Re Ltd. | |
13.355% (T-BILL 1MO + 8.000%) due 04/05/2027 ~ | | | | | 2,100 | | | | | | 2,079 | |
|
Capital One Financial Corp. | |
7.149% due 10/29/2027 • | | | | | 2,000 | | | | | | 2,067 | |
|
Carlyle Finance Subsidiary LLC | |
3.500% due 09/19/2029 | | | | | 1,500 | | | | | | 1,387 | |
|
CI Financial Corp. | |
3.200% due 12/17/2030 | | | | | 1,000 | | | | | | 789 | |
|
Citigroup, Inc. | |
2.572% due 06/03/2031 • | | | | | 10,000 | | | | | | 8,587 | |
2.976% due 11/05/2030 • | | | | | 4,700 | | | | | | 4,188 | |
3.785% due 03/17/2033 • | | | | | 4,500 | | | | | | 4,011 | |
4.075% due 04/23/2029 • | | | | | 3,000 | | | | | | 2,877 | |
6.270% due 11/17/2033 • | | | | | 7,000 | | | | | | 7,335 | |
|
Constellation Insurance, Inc. | |
6.800% due 01/24/2030 | | | | | 3,300 | | | | | | 3,229 | |
|
Corebridge Financial, Inc. | |
5.750% due 01/15/2034 | | | | | 2,000 | | | | | | 2,014 | |
|
Credit Suisse AG AT1 Claim | |
1.000% due 12/31/2060 | | | | | 8,900 | | | | | | 1,068 | |
|
Crown Castle, Inc. | |
3.100% due 11/15/2029 | | | | | 2,200 | | | | | | 1,965 | |
|
Deutsche Bank AG | |
2.311% due 11/16/2027 • | | | | | 4,500 | | | | | | 4,156 | |
2.552% due 01/07/2028 • | | | | | 6,500 | | | | | | 6,012 | |
3.961% due 11/26/2025 • | | | | | 2,300 | | | | | | 2,281 | |
5.706% due 02/08/2028 • | | | | | 1,500 | | | | | | 1,498 | |
6.720% due 01/18/2029 • | | | | | 2,500 | | | | | | 2,581 | |
6.819% due 11/20/2029 • | | | | | 1,500 | | | | | | 1,560 | |
|
Discover Financial Services | |
7.964% due 11/02/2034 • | | | | | 2,000 | | | | | | 2,251 | |
|
DOC DR LLC | |
4.300% due 03/15/2027 | | | | | 2,000 | | | | | | 1,958 | |
|
Doctors Co. An Interinsurance Exchange | |
4.500% due 01/18/2032 | | | | | 7,800 | | | | | | 6,188 | |
| | | | | | | | | | | | |
| | | | | PRINCIPAL
AMOUNT
(000S) | | | | | MARKET
VALUE
(000S) | |
|
Equitable Holdings, Inc. | |
5.594% due 01/11/2033 | | $ | | | 1,000 | | | $ | | | 1,014 | |
|
Essex Portfolio LP | |
5.500% due 04/01/2034 | | | | | 1,500 | | | | | | 1,487 | |
|
Extra Space Storage LP | |
5.400% due 02/01/2034 | | | | | 1,500 | | | | | | 1,469 | |
5.900% due 01/15/2031 | | | | | 2,100 | | | | | | 2,146 | |
|
Fairfax Financial Holdings Ltd. | |
5.625% due 08/16/2032 | | | | | 2,000 | | | | | | 1,974 | |
6.350% due 03/22/2054 | | | | | 2,000 | | | | | | 2,004 | |
|
Farmers Insurance Exchange | |
4.747% due 11/01/2057 • | | | | | 2,000 | | | | | | 1,495 | |
|
Fidelity National Financial, Inc. | |
3.400% due 06/15/2030 | | | | | 1,800 | | | | | | 1,598 | |
|
First American Financial Corp. | |
2.400% due 08/15/2031 | | | | | 1,500 | | | | | | 1,199 | |
4.000% due 05/15/2030 | | | | | 1,000 | | | | | | 899 | |
|
Ford Motor Credit Co. LLC | |
4.950% due 05/28/2027 | | | | | 5,000 | | | | | | 4,883 | |
5.800% due 03/08/2029 | | | | | 4,400 | | | | | | 4,387 | |
6.050% due 03/05/2031 | | | | | 5,000 | | | | | | 5,008 | |
6.798% due 11/07/2028 | | | | | 10,000 | | | | | | 10,337 | |
6.950% due 03/06/2026 | | | | | 1,500 | | | | | | 1,525 | |
|
FS KKR Capital Corp. | |
1.650% due 10/12/2024 | | | | | 1,000 | | | | | | 987 | |
3.400% due 01/15/2026 | | | | | 1,900 | | | | | | 1,808 | |
6.875% due 08/15/2029 | | | | | 3,800 | | | | | | 3,769 | |
7.875% due 01/15/2029 | | | | | 1,500 | | | | | | 1,549 | |
|
GA Global Funding Trust | |
2.250% due 01/06/2027 | | | | | 4,500 | | | | | | 4,163 | |
3.850% due 04/11/2025 | | | | | 1,000 | | | | | | 984 | |
5.500% due 01/08/2029 | | | | | 3,000 | | | | | | 3,002 | |
|
Global Atlantic Fin Co. | |
4.400% due 10/15/2029 | | | | | 3,000 | | | | | | 2,796 | |
|
GLP Capital LP | |
3.250% due 01/15/2032 | | | | | 1,500 | | | | | | 1,262 | |
4.000% due 01/15/2030 | | | | | 2,100 | | | | | | 1,926 | |
5.300% due 01/15/2029 | | | | | 600 | | | | | | 592 | |
5.375% due 04/15/2026 | | | | | 600 | | | | | | 596 | |
5.750% due 06/01/2028 | | | | | 3,000 | | | | | | 3,004 | |
6.750% due 12/01/2033 | | | | | 1,500 | | | | | | 1,578 | |
|
Goldman Sachs Group, Inc. | |
2.650% due 10/21/2032 • | | | | | 10,600 | | | | | | 8,816 | |
3.102% due 02/24/2033 • | | | | | 10,000 | | | | | | 8,544 | |
4.482% due 08/23/2028 • | | | | | 10,000 | | | | | | 9,776 | |
7.222% (SOFRRATE + 1.850%) due 03/15/2028 ~ | | | | | 3,000 | | | | | | 3,070 | |
|
Golub Capital BDC, Inc. | |
6.000% due 07/15/2029 | | | | | 6,000 | | | | | | 5,888 | |
|
Goodman U.S. Finance Five LLC | |
4.625% due 05/04/2032 | | | | | 1,500 | | | | | | 1,391 | |
|
Goodman U.S. Finance Three LLC | |
3.700% due 03/15/2028 | | | | | 2,000 | | | | | | 1,875 | |
|
Hannon Armstrong Sustainable Infrastructure Capital, Inc. | |
6.375% due 07/01/2034 (c) | | | | | 2,500 | | | | | | 2,450 | |
|
Healthcare Realty Holdings LP | |
3.750% due 07/01/2027 | | | | | 4,600 | | | | | | 4,357 | |
|
Host Hotels & Resorts LP | |
2.900% due 12/15/2031 | | | | | 2,000 | | | | | | 1,673 | |
|
HSBC Holdings PLC | |
2.848% due 06/04/2031 • | | | | | 7,000 | | | | | | 6,053 | |
4.755% due 06/09/2028 • | | | | | 2,500 | | | | | | 2,458 | |
5.402% due 08/11/2033 • | | | | | 4,200 | | | | | | 4,157 | |
5.546% due 03/04/2030 • | | | | | 4,000 | | | | | | 4,008 | |
5.719% due 03/04/2035 • | | | | | 4,000 | | | | | | 4,023 | |
6.254% due 03/09/2034 •(l) | | | | | 7,000 | | | | | | 7,292 | |
|
ING Groep NV | |
3.875% due 05/16/2027 •(g)(i) | | | | | 600 | | | | | | 510 | |
4.250% due 05/16/2031 •(g)(i) | | | | | 600 | | | | | | 469 | |
5.335% due 03/19/2030 • | | | | | 10,000 | | | | | | 9,964 | |
|
Integrity Re Ltd. | |
22.355% (T-BILL 1MO + 17.000%) due 06/06/2026 ~ | | | | | 2,000 | | | | | | 1,955 | |
| | | | | | | | | | | | |
| See Accompanying Notes | | | ANNUAL FINANCIAL AND OTHER INFORMATION | | | | | | | JUNE 30, 2024 | | | 51 |
| | | | | | |
| Schedule of Investments | | PIMCO Active Bond Exchange-Traded Fund | | (Cont.) | | |
| | | | | | | | | | | | |
| | | | | PRINCIPAL
AMOUNT
(000S) | | | | | MARKET
VALUE
(000S) | |
|
Invitation Homes Operating Partnership LP | |
5.450% due 08/15/2030 | | $ | | | 5,000 | | | $ | | | 5,011 | |
|
Jane Street Group | |
7.125% due 04/30/2031 | | | | | 1,500 | | | | | | 1,539 | |
|
Jones Lang LaSalle, Inc. | |
6.875% due 12/01/2028 | | | | | 3,600 | | | | | | 3,793 | |
|
JPMorgan Chase & Co. | |
2.963% due 01/25/2033 • | | | | | 2,500 | | | | | | 2,132 | |
4.323% due 04/26/2028 • | | | | | 9,500 | | | | | | 9,270 | |
4.565% due 06/14/2030 • | | | | | 12,000 | | | | | | 11,651 | |
5.350% due 06/01/2034 • | | | | | 17,500 | | | | | | 17,432 | |
|
Kilroy Realty LP | |
3.050% due 02/15/2030 | | | | | 2,000 | | | | | | 1,688 | |
|
Kizuna RE Pte Ltd. | |
8.105% (T-BILL 3MO + 2.750%) due��04/09/2029 ~ | | | | | 603 | | | | | | 608 | |
|
KKR Financial Holdings LLC | |
5.400% due 05/23/2033 | | | | | 6,000 | | | | | | 5,718 | |
|
KKR Group Finance Co. LLC | |
4.850% due 05/17/2032 | | | | | 1,500 | | | | | | 1,442 | |
|
Lazard Group LLC | |
6.000% due 03/15/2031 | | | | | 1,500 | | | | | | 1,518 | |
|
Liberty Mutual Group, Inc. | |
4.125% due 12/15/2051 • | | | | | 4,000 | | | | | | 3,748 | |
4.300% due 02/01/2061 | | | | | 4,800 | | | | | | 2,992 | |
|
Lloyds Banking Group PLC | |
4.976% due 08/11/2033 •(l) | | | | | 8,500 | | | | | | 8,126 | |
5.871% due 03/06/2029 • | | | | | 5,000 | | | | | | 5,073 | |
7.500% due 09/27/2025 •(g)(i) | | | | | 5,000 | | | | | | 5,011 | |
|
Low Income Investment Fund | |
3.711% due 07/01/2029 | | | | | 2,500 | | | | | | 2,280 | |
|
LPL Holdings, Inc. | |
6.750% due 11/17/2028 | | | | | 5,000 | | | | | | 5,253 | |
|
Lseg U.S. Fin Corp. | |
4.875% due 03/28/2027 | | | | | 1,500 | | | | | | 1,485 | |
5.297% due 03/28/2034 | | | | | 1,500 | | | | | | 1,497 | |
|
LXP Industrial Trust | |
2.375% due 10/01/2031 | | | | | 3,500 | | | | | | 2,797 | |
|
Main Street Capital Corp. | |
6.950% due 03/01/2029 | | | | | 3,100 | | | | | | 3,136 | |
|
Maple Grove Funding Trust | |
4.161% due 08/15/2051 | | | | | 5,500 | | | | | | 3,730 | |
|
Massachusetts Mutual Life Insurance Co. | |
5.077% due 02/15/2069 • | | | | | 3,250 | | | | | | 2,859 | |
|
Mitsubishi UFJ Financial Group, Inc. | |
3.195% due 07/18/2029 | | | | | 1,500 | | | | | | 1,368 | |
5.354% due 09/13/2028 • | | | | | 2,500 | | | | | | 2,509 | |
|
MMcapS Funding Ltd. | |
5.892% (US0003M + 0.290%) due 12/26/2039 ~ | | | | | 521 | | | | | | 503 | |
|
Morgan Stanley | |
0.000% due 04/02/2032 þ(j) | | | | | 9,000 | | | | | | 5,710 | |
2.511% due 10/20/2032 • | | | | | 1,700 | | | | | | 1,406 | |
3.622% due 04/01/2031 • | | | | | 3,000 | | | | | | 2,754 | |
5.164% due 04/20/2029 • | | | | | 2,000 | | | | | | 1,994 | |
5.173% due 01/16/2030 • | | | | | 3,000 | | | | | | 2,993 | |
6.296% due 10/18/2028 • | | | | | 19,500 | | | | | | 20,126 | |
|
Nationstar Mortgage Holdings, Inc. | |
7.125% due 02/01/2032 | | | | | 1,500 | | | | | | 1,510 | |
|
NatWest Group PLC | |
4.600% due 06/28/2031 •(g)(i) | | | | | 200 | | | | | | 158 | |
|
Nissan Motor Acceptance Co. LLC | |
1.850% due 09/16/2026 | | | | | 4,500 | | | | | | 4,122 | |
|
NMI Holdings, Inc. | |
6.000% due 08/15/2029 | | | | | 4,500 | | | | | | 4,465 | |
|
Nomura Holdings, Inc. | |
1.653% due 07/14/2026 | | | | | 3,000 | | | | | | 2,774 | |
5.842% due 01/18/2028 | | | | | 1,500 | | | | | | 1,522 | |
6.070% due 07/12/2028 | | | | | 3,100 | | | | | | 3,173 | |
|
Nordea Bank Abp | |
3.750% due 03/01/2029 •(g)(i) | | | | | 5,000 | | | | | | 4,181 | |
6.125% due 09/23/2024 •(g)(i) | | | | | 550 | | | | | | 548 | |
6.625% due 03/26/2026 •(g)(i) | | | | | 5,600 | | | | | | 5,571 | |
| | | | | | | | | | | | |
| | | | | PRINCIPAL
AMOUNT
(000S) | | | | | MARKET
VALUE
(000S) | |
|
Omega Healthcare Investors, Inc. | |
4.750% due 01/15/2028 | | $ | | | 3,350 | | | $ | | | 3,243 | |
|
Pacific Life Insurance Co. | |
9.250% due 06/15/2039 | | | | | 5,000 | | | | | | 6,605 | |
|
Polestar Re Ltd. | |
18.605% (T-BILL 3MO + 13.250%) due 01/07/2027 ~ | | | | | 2,300 | | | | | | 2,340 | |
|
Preferred Term Securities Ltd. | |
5.908% (US0003M + 0.300%) due 03/22/2037 ~ | | | | | 1,703 | | | | | | 1,533 | |
|
Prologis Targeted U.S. Logistics Fund LP | |
5.250% due 04/01/2029 | | | | | 4,400 | | | | | | 4,405 | |
|
Prudential Financial, Inc. | |
6.500% due 03/15/2054 • | | | | | 2,800 | | | | | | 2,834 | |
|
Realty Income Corp. | |
3.250% due 01/15/2031 | | | | | 2,100 | | | | | | 1,859 | |
4.450% due 09/15/2026 | | | | | 700 | | | | | | 683 | |
|
Sammons Financial Group, Inc. | |
6.875% due 04/15/2034 | | | | | 6,500 | | | | | | 6,669 | |
|
Santander Holdings USA, Inc. | |
6.499% due 03/09/2029 • | | | | | 1,700 | | | | | | 1,732 | |
6.565% due 06/12/2029 • | | | | | 3,000 | | | | | | 3,071 | |
|
Santander U.K. Group Holdings PLC | |
3.823% due 11/03/2028 • | | | | | 2,000 | | | | | | 1,891 | |
6.534% due 01/10/2029 • | | | | | 8,000 | | | | | | 8,223 | |
6.833% due 11/21/2026 • | | | | | 3,000 | | | | | | 3,041 | |
|
Societe Generale SA | |
6.446% due 01/10/2029 • | | | | | 3,300 | | | | | | 3,354 | |
|
Sumitomo Mitsui Financial Group, Inc. | |
5.520% due 01/13/2028 | | | | | 4,000 | | | | | | 4,045 | |
5.766% due 01/13/2033 | | | | | 3,000 | | | | | | 3,083 | |
|
Torrey Pines Re Ltd. | |
11.355% (T-BILL 1MO + 6.000%) due 06/07/2032 ~ | | | | | 600 | | | | | | 603 | |
12.605% (T-BILL 1MO + 7.250%) due 06/07/2032 ~ | | | | | 300 | | | | | | 301 | |
14.355% (T-BILL 1MO + 9.000%) due 06/05/2031 ~ | | | | | 250 | | | | | | 251 | |
|
Trust Fibra Uno | |
4.869% due 01/15/2030 | | | | | 4,900 | | | | | | 4,304 | |
6.950% due 01/30/2044 | | | | | 300 | | | | | | 263 | |
|
UBS AG | |
5.000% due 07/09/2027 | | | | | 3,500 | | | | | | 3,472 | |
|
UBS Group AG | |
5.125% due 07/29/2026 •(g)(i) | | | | | 800 | | | | | | 764 | |
6.301% due 09/22/2034 • | | | | | 13,000 | | | | | | 13,526 | |
6.373% due 07/15/2026 • | | | | | 1,600 | | | | | | 1,608 | |
7.000% due 02/19/2025 •(g)(i) | | | | | 200 | | | | | | 200 | |
|
VICI Properties LP | |
3.750% due 02/15/2027 | | | | | 100 | | | | | | 95 | |
4.125% due 08/15/2030 | | | | | 500 | | | | | | 455 | |
5.750% due 02/01/2027 | | | | | 280 | | | | | | 280 | |
5.750% due 04/01/2034 | | | | | 1,000 | | | | | | 991 | |
6.125% due 04/01/2054 | | | | | 1,000 | | | | | | 961 | |
|
Wells Fargo & Co. | |
2.879% due 10/30/2030 • | | | | | 1,000 | | | | | | 887 | |
4.897% due 07/25/2033 • | | | | | 21,000 | | | | | | 20,206 | |
5.557% due 07/25/2034 • | | | | | 17,000 | | | | | | 16,994 | |
|
Windmill Re DAC | |
0.000% due 07/05/2028 «~ | | EUR | | | 250 | | | | | | 268 | |
|
Winston RE Ltd. | |
17.105% (T-BILL 3MO + 11.750%) due 02/26/2031 ~ | | $ | | | 4,000 | | | | | | 3,943 | |
| | | | | | | | | | | | |
| | | | | | | | | | | 731,342 | |
| | | | | | | | | | | | |
| |
| INDUSTRIALS 5.0% | |
|
Air Canada | |
3.875% due 08/15/2026 | | | | | 1,000 | | | | | | 952 | |
|
Air Canada Pass-Through Trust | |
3.300% due 07/15/2031 | | | | | 647 | | | | | | 592 | |
5.250% due 10/01/2030 | | | | | 1,718 | | | | | | 1,697 | |
|
American Airlines Pass-Through Trust | |
3.375% due 11/01/2028 | | | | | 7,452 | | | | | | 7,044 | |
3.700% due 04/01/2028 | | | | | 1,566 | | | | | | 1,497 | |
| | | | | | | | | | | | |
| | | | | PRINCIPAL
AMOUNT
(000S) | | | | | MARKET
VALUE
(000S) | |
4.000% due 01/15/2027 | | $ | | | 2,082 | | | $ | | | 2,037 | |
|
American Airlines, Inc. | |
5.500% due 04/20/2026 | | | | | 600 | | | | | | 595 | |
5.750% due 04/20/2029 | | | | | 1,400 | | | | | | 1,363 | |
|
Ashtead Capital, Inc. | |
4.250% due 11/01/2029 | | | | | 2,000 | | | | | | 1,877 | |
5.800% due 04/15/2034 | | | | | 3,000 | | | | | | 2,979 | |
|
Bacardi Ltd. | |
5.150% due 05/15/2038 | | | | | 1,200 | | | | | | 1,110 | |
|
BAT International Finance PLC | |
5.931% due 02/02/2029 | | | | | 1,000 | | | | | | 1,024 | |
|
Bayer U.S. Finance LLC | |
6.375% due 11/21/2030 | | | | | 1,000 | | | | | | 1,025 | |
|
Boeing Co. | |
3.625% due 02/01/2031 | | | | | 3,000 | | | | | | 2,627 | |
6.259% due 05/01/2027 | | | | | 1,300 | | | | | | 1,309 | |
6.298% due 05/01/2029 | | | | | 1,700 | | | | | | 1,724 | |
6.388% due 05/01/2031 | | | | | 1,300 | | | | | | 1,324 | |
6.528% due 05/01/2034 | | | | | 1,100 | | | | | | 1,127 | |
6.858% due 05/01/2054 | | | | | 1,800 | | | | | | 1,849 | |
7.008% due 05/01/2064 | | | | | 1,000 | | | | | | 1,025 | |
|
Bowdoin College | |
4.693% due 07/01/2112 | | | | | 3,400 | | | | | | 2,819 | |
|
Broadcom, Inc. | |
2.450% due 02/15/2031 | | | | | 10,000 | | | | | | 8,425 | |
3.469% due 04/15/2034 | | | | | 500 | | | | | | 426 | |
4.000% due 04/15/2029 | | | | | 2,000 | | | | | | 1,906 | |
4.150% due 04/15/2032 | | | | | 2,000 | | | | | | 1,846 | |
4.926% due 05/15/2037 | | | | | 2,000 | | | | | | 1,882 | |
|
California Institute of Technology | |
4.283% due 09/01/2116 | | | | | 3,000 | | | | | | 2,309 | |
|
Centene Corp. | |
3.000% due 10/15/2030 | | | | | 1,500 | | | | | | 1,284 | |
|
Charter Communications Operating LLC | |
2.800% due 04/01/2031 | | | | | 2,100 | | | | | | 1,717 | |
5.050% due 03/30/2029 | | | | | 2,000 | | | | | | 1,924 | |
|
Cheniere Energy Partners LP | |
3.250% due 01/31/2032 | | | | | 2,000 | | | | | | 1,708 | |
|
Cheniere Energy, Inc. | |
5.650% due 04/15/2034 | | | | | 3,000 | | | | | | 3,004 | |
|
Choice Hotels International, Inc. | |
3.700% due 12/01/2029 | | | | | 3,700 | | | | | | 3,323 | |
3.700% due 01/15/2031 | | | | | 2,000 | | | | | | 1,765 | |
|
Claremont Mckenna College | |
3.775% due 01/01/2122 | | | | | 3,000 | | | | | | 1,915 | |
|
Dell International LLC | |
5.250% due 02/01/2028 | | | | | 1,500 | | | | | | 1,511 | |
5.300% due 10/01/2029 | | | | | 4,400 | | | | | | 4,426 | |
5.750% due 02/01/2033 | | | | | 1,500 | | | | | | 1,543 | |
|
Delta Air Lines Pass-Through Trust | |
2.000% due 12/10/2029 | | | | | 1,065 | | | | | | 969 | |
|
Delta Air Lines, Inc. | |
3.750% due 10/28/2029 | | | | | 3,400 | | | | | | 3,136 | |
4.500% due 10/20/2025 | | | | | 1,500 | | | | | | 1,482 | |
4.750% due 10/20/2028 | | | | | 2,000 | | | | | | 1,949 | |
|
Discovery Communications LLC | |
4.000% due 09/15/2055 | | | | | 300 | | | | | | 194 | |
|
El Paso Natural Gas Co. LLC | |
3.500% due 02/15/2032 | | | | | 1,500 | | | | | | 1,280 | |
|
Enbridge, Inc. | |
6.200% due 11/15/2030 | | | | | 2,150 | | | | | | 2,258 | |
|
Energy Transfer LP | |
5.250% due 07/01/2029 | | | | | 11,500 | | | | | | 11,436 | |
5.550% due 02/15/2028 | | | | | 2,500 | | | | | | 2,522 | |
6.000% due 06/15/2048 | | | | | 5,000 | | | | | | 4,823 | |
|
Essent Group Ltd. | |
6.250% due 07/01/2029 (c) | | | | | 2,200 | | | | | | 2,200 | |
|
Expedia Group, Inc. | |
3.250% due 02/15/2030 (l) | | | | | 2,200 | | | | | | 1,984 | |
|
Ferguson Finance PLC | |
3.250% due 06/02/2030 | | | | | 2,000 | | | | | | 1,805 | |
|
Flex Intermediate Holdco LLC | |
4.317% due 12/30/2039 | | | | | 2,700 | | | | | | 1,965 | |
| | | | | | |
| 52 | | PIMCO ETF TRUST | | | See Accompanying Notes | |
| | | | | | | | | | | | |
| | | | | PRINCIPAL
AMOUNT
(000S) | | | | | MARKET
VALUE
(000S) | |
|
Flex Ltd. | |
4.875% due 06/15/2029 | | $ | | | 2,000 | | | $ | | | 1,938 | |
|
GE Capital Funding LLC | |
4.550% due 05/15/2032 | | | | | 1,500 | | | | | | 1,435 | |
|
GE Capital International Funding Co. Unlimited Co. | |
4.418% due 11/15/2035 | | | | | 1,500 | | | | | | 1,385 | |
|
General Electric Co. | |
4.250% due 05/01/2040 | | | | | 3,000 | | | | | | 2,586 | |
|
Georgetown University | |
5.215% due 10/01/2118 | | | | | 6,560 | | | | | | 6,006 | |
|
Global Payments, Inc. | |
5.400% due 08/15/2032 | | | | | 5,100 | | | | | | 5,000 | |
|
HCA, Inc. | |
3.625% due 03/15/2032 | | | | | 3,000 | | | | | | 2,643 | |
|
Imperial Brands Finance PLC | |
3.500% due 07/26/2026 | | | | | 2,000 | | | | | | 1,921 | |
6.125% due 07/27/2027 | | | | | 3,000 | | | | | | 3,054 | |
|
Infor, Inc. | |
1.750% due 07/15/2025 | | | | | 2,600 | | | | | | 2,494 | |
|
Las Vegas Sands Corp. | |
3.500% due 08/18/2026 | | | | | 1,100 | | | | | | 1,050 | |
|
Micron Technology, Inc. | |
5.375% due 04/15/2028 | | | | | 1,900 | | | | | | 1,909 | |
|
Mileage Plus Holdings LLC | |
6.500% due 06/20/2027 | | | | | 1,260 | | | | | | 1,264 | |
|
MPLX LP | |
4.250% due 12/01/2027 | | | | | 2,000 | | | | | | 1,936 | |
|
MSCI, Inc. | |
3.875% due 02/15/2031 | | | | | 100 | | | | | | 90 | |
|
National Fuel Gas Co. | |
5.500% due 10/01/2026 | | | | | 1,500 | | | | | | 1,498 | |
|
New York & Presbyterian Hospital | |
4.763% due 08/01/2116 | | | | | 3,000 | | | | | | 2,532 | |
|
Nissan Motor Co. Ltd. | |
4.345% due 09/17/2027 | | | | | 2,500 | | | | | | 2,388 | |
|
NXP BV | |
5.000% due 01/15/2033 | | | | | 900 | | | | | | 878 | |
|
Occidental Petroleum Corp. | |
6.125% due 01/01/2031 | | | | | 5,000 | | | | | | 5,121 | |
|
Oracle Corp. | |
4.900% due 02/06/2033 | | | | | 1,000 | | | | | | 970 | |
|
Pacific National Finance Pty. Ltd. | |
4.750% due 03/22/2028 | | | | | 4,300 | | | | | | 4,104 | |
|
Petroleos Mexicanos | |
6.490% due 01/23/2027 | | | | | 311 | | | | | | 299 | |
6.700% due 02/16/2032 | | | | | 4,600 | | | | | | 3,854 | |
|
Quanta Services, Inc. | |
2.900% due 10/01/2030 | | | | | 2,000 | | | | | | 1,763 | |
|
Spirit Airlines Pass-Through Trust | |
3.375% due 08/15/2031 | | | | | 538 | | | | | | 475 | |
4.100% due 10/01/2029 | | | | | 485 | | | | | | 455 | |
|
T-Mobile USA, Inc. | |
2.700% due 03/15/2032 | | | | | 2,500 | | | | | | 2,092 | |
|
Targa Resources Corp. | |
6.125% due 03/15/2033 | | | | | 3,000 | | | | | | 3,083 | |
|
Tennessee Gas Pipeline Co. LLC | |
2.900% due 03/01/2030 | | | | | 2,000 | | | | | | 1,749 | |
|
Time Warner Cable LLC | |
6.550% due 05/01/2037 | | | | | 600 | | | | | | 569 | |
7.300% due 07/01/2038 | | | | | 2,500 | | | | | | 2,532 | |
|
Turkish Airlines Pass-Through Trust | |
4.200% due 09/15/2028 | | | | | 2,143 | | | | | | 2,034 | |
|
U.S. Airways Pass-Through Trust | |
3.950% due 05/15/2027 | | | | | 2,160 | | | | | | 2,111 | |
|
United Airlines Pass-Through Trust | |
2.700% due 11/01/2033 | | | | | 323 | | | | | | 280 | |
3.100% due 01/07/2030 | | | | | 920 | | | | | | 855 | |
3.450% due 01/07/2030 | | | | | 2,760 | | | | | | 2,534 | |
4.550% due 02/25/2033 | | | | | 1,903 | | | | | | 1,761 | |
5.875% due 04/15/2029 | | | | | 1,543 | | | | | | 1,549 | |
|
United Airlines, Inc. | |
4.375% due 04/15/2026 | | | | | 3,400 | | | | | | 3,288 | |
4.625% due 04/15/2029 | | | | | 2,500 | | | | | | 2,330 | |
| | | | | | | | | | | | |
| | | | | PRINCIPAL
AMOUNT
(000S) | | | | | MARKET
VALUE
(000S) | |
|
Vmed O2 U.K. Financing PLC | |
4.750% due 07/15/2031 | | $ | | | 3,900 | | | $ | | | 3,295 | |
|
VMware, Inc. | |
2.200% due 08/15/2031 | | | | | 2,000 | | | | | | 1,626 | |
|
Wesleyan University | |
4.781% due 07/01/2116 | | | | | 3,248 | | | | | | 2,666 | |
|
Westinghouse Air Brake Technologies Corp. | |
4.700% due 09/15/2028 | | | | | 3,130 | | | | | | 3,070 | |
5.611% due 03/11/2034 | | | | | 2,000 | | | | | | 2,012 | |
| | | | | | | | | | | | |
| | | | | | | | | | | 214,997 | |
| | | | | | | | | | | | |
| |
| UTILITIES 1.8% | |
|
Electricite de France SA | |
5.950% due 04/22/2034 | | | | | 4,000 | | | | | | 4,026 | |
6.000% due 04/22/2064 | | | | | 4,000 | | | | | | 3,722 | |
|
Enel Finance International NV | |
7.500% due 10/14/2032 | | | | | 2,000 | | | | | | 2,214 | |
|
Eversource Energy | |
5.950% due 02/01/2029 | | | | | 4,400 | | | | | | 4,498 | |
|
FirstEnergy Pennsylvania Electric Co. | |
3.250% due 03/15/2028 | | | | | 1,100 | | | | | | 1,030 | |
3.600% due 06/01/2029 | | | | | 2,000 | | | | | | 1,861 | |
4.300% due 01/15/2029 | | | | | 600 | | | | | | 578 | |
5.150% due 03/30/2026 | | | | | 900 | | | | | | 894 | |
|
NGPL PipeCo LLC | |
3.250% due 07/15/2031 | | | | | 1,500 | | | | | | 1,283 | |
|
NiSource, Inc. | |
1.700% due 02/15/2031 | | | | | 6,100 | | | | | | 4,854 | |
|
Pacific Gas & Electric Co. | |
2.500% due 02/01/2031 | | | | | 2,400 | | | | | | 1,979 | |
4.950% due 07/01/2050 | | | | | 6,700 | | | | | | 5,541 | |
5.550% due 05/15/2029 | | | | | 3,000 | | | | | | 3,008 | |
5.800% due 05/15/2034 | | | | | 3,000 | | | | | | 2,982 | |
5.900% due 06/15/2032 | | | | | 1,500 | | | | | | 1,502 | |
6.150% due 01/15/2033 | | | | | 2,200 | | | | | | 2,236 | |
6.950% due 03/15/2034 | | | | | 2,000 | | | | | | 2,155 | |
|
Puget Energy, Inc. | |
4.224% due 03/15/2032 | | | | | 3,000 | | | | | | 2,694 | |
|
Texas Electric Market Stabilization Funding N LLC | |
5.057% due 08/01/2048 | | | | | 15,500 | | | | | | 14,794 | |
|
Toledo Edison Co. | |
2.650% due 05/01/2028 | | | | | 2,918 | | | | | | 2,632 | |
|
Verizon Communications, Inc. | |
2.355% due 03/15/2032 | | | | | 7,000 | | | | | | 5,725 | |
5.050% due 05/09/2033 | | | | | 3,000 | | | | | | 2,959 | |
|
Vistra Operations Co. LLC | |
6.950% due 10/15/2033 | | | | | 5,000 | | | | | | 5,355 | |
| | | | | | | | | | | | |
| | | | | | | | | | | 78,522 | |
| | | | | | | | | | | | |
Total Corporate Bonds & Notes (Cost $1,042,970) | | | 1,024,861 | |
| | | | |
| |
| MUNICIPAL BONDS & NOTES 0.7% | |
| |
| CALIFORNIA 0.2% | |
|
Golden State, California Tobacco Securitization Corp. Revenue Bonds, Series 2021 | |
3.487% due 06/01/2036 | | | | | 3,300 | | | | | | 2,692 | |
3.714% due 06/01/2041 | | | | | 7,000 | | | | | | 5,361 | |
| | | | | | | | | | | | |
| | | | | | | | | | | 8,053 | |
| | | | | | | | | | | | |
| |
| ILLINOIS 0.1% | |
|
Illinois State General Obligation Bonds, (BABs), Series 2010 | |
7.350% due 07/01/2035 | | | | | 5,829 | | | | | | 6,259 | |
| | | | | | | | | | | | |
| |
| MINNESOTA 0.2% | |
|
Minnesota Housing Finance Agency Revenue Notes, Series 2024 | |
5.301% due 01/01/2029 | | | | | 6,945 | | | | | | 7,022 | |
| | | | | | | | | | | | |
| |
| | | | | | | | | | | | |
| | | | | PRINCIPAL
AMOUNT
(000S) | | | | | MARKET
VALUE
(000S) | |
| NEW YORK 0.0% | |
|
New York City, New York Industrial Development Agency Revenue Bonds, (AGM Insured), Series 2006 | |
6.027% due 01/01/2046 | | $ | | | 500 | | | $ | | | 511 | |
| | | | | | | | | | | | |
| |
| TEXAS 0.1% | |
|
Texas Private Activity Bond Surface Transportation Corp. Revenue Bonds, Series 2019 | |
3.922% due 12/31/2049 | | | | | 4,200 | | | | | | 3,452 | |
| | | | | | | | | | | | |
| |
| WEST VIRGINIA 0.1% | |
|
Tobacco Settlement Finance Authority, West Virginia Revenue Bonds, Series 2020 | |
4.875% due 06/01/2049 | | | | | 4,225 | | | | | | 4,040 | |
| | | | | | | | | | | | |
Total Municipal Bonds & Notes (Cost $30,295) | | | 29,337 | |
| | | | |
| |
| U.S. GOVERNMENT AGENCIES 56.9% | |
|
Fannie Mae | |
0.000% due 07/25/2031 - 02/25/2040 (b)(e) | | | | | 70 | | | | | | 58 | |
0.000% due 05/25/2042 • | | | | | 134 | | | | | | 94 | |
0.550% due 09/25/2042 •(a) | | | | | 19,562 | | | | | | 2,396 | |
0.970% due 04/25/2040 •(a) | | | | | 31 | | | | | | 2 | |
1.750% due 05/25/2036 •(a) | | | | | 634 | | | | | | 55 | |
3.000% due 03/25/2033 - 02/25/2043 | | | | | 1 | | | | | | 1 | |
3.348% due 01/25/2036 • | | | | | 69 | | | | | | 62 | |
3.500% due 06/25/2042 | | | | | 468 | | | | | | 431 | |
4.000% due 10/01/2026 - 07/01/2044 | | | | | 683 | | | | | | 653 | |
4.500% due 09/01/2024 - 06/01/2051 | | | | | 905 | | | | | | 855 | |
5.000% due 05/01/2026 - 11/01/2039 | | | | | 852 | | | | | | 841 | |
5.500% due 12/01/2031 - 04/01/2039 | | | | | 489 | | | | | | 484 | |
6.000% due 05/25/2031 - 09/01/2037 | | | | | 443 | | | | | | 446 | |
6.030% due 11/01/2035 • | | | | | 2 | | | | | | 2 | |
6.218% due 09/01/2034 • | | | | | 19 | | | | | | 19 | |
6.500% due 01/01/2036 - 05/01/2038 | | | | | 43 | | | | | | 45 | |
6.800% due 12/01/2028 • | | | | | 115 | | | | | | 115 | |
7.000% due 04/01/2037 - 03/01/2038 | | | | | 39 | | | | | | 39 | |
7.195% due 04/01/2036 • | | | | | 4 | | | | | | 4 | |
7.500% due 10/01/2037 | | | | | 56 | | | | | | 59 | |
|
Freddie Mac | |
0.000% due 01/15/2033 - 07/15/2039 (b)(e) | | | | | 300 | | | | | | 270 | |
0.000% due 12/15/2040 - 11/15/2048 •(a) | | | | | 18,684 | | | | | | 678 | |
0.000% due 05/15/2041 - 06/15/2042 • | | | | | 716 | | | | | | 554 | |
0.419% due 06/15/2040 ~(a) | | | | | 6,475 | | | | | | 415 | |
3.000% due 01/01/2043 - 04/01/2043 | | | | | 4 | | | | | | 3 | |
3.500% due 12/15/2028 (a) | | | | | 261 | | | | | | 5 | |
3.500% due 10/01/2033 - 03/01/2042 | | | | | 98 | | | | | | 94 | |
4.000% due 09/01/2033 - 06/01/2049 | | | | | 6,657 | | | | | | 6,253 | |
4.500% due 02/01/2034 - 11/01/2044 | | | | | 3,030 | | | | | | 2,930 | |
4.682% due 05/15/2033 • | | | | | 22 | | | | | | 22 | |
5.000% due 05/15/2033 - 07/15/2041 | | | | | 306 | | | | | | 299 | |
5.250% due 04/15/2033 | | | | | 20 | | | | | | 20 | |
5.500% due 08/01/2025 - 10/01/2037 | | | | | 620 | | | | | | 616 | |
6.000% due 12/01/2034 - 08/01/2037 | | | | | 79 | | | | | | 79 | |
6.105% due 07/01/2036 • | | | | | 2 | | | | | | 2 | |
6.500% due 01/01/2037 - 07/01/2037 | | | | | 18 | | | | | | 18 | |
6.936% due 12/01/2031 • | | | | | 35 | | | | | | 35 | |
| | | | | | | | | | | | |
| See Accompanying Notes | | | ANNUAL FINANCIAL AND OTHER INFORMATION | | | | | | | JUNE 30, 2024 | | | 53 |
| | | | | | |
| Schedule of Investments | | PIMCO Active Bond Exchange-Traded Fund | | (Cont.) | | |
| | | | | | | | | | | | |
| | | | | PRINCIPAL
AMOUNT
(000S) | | | | | MARKET
VALUE
(000S) | |
9.500% due 01/01/2025 | | $ | | | 1 | | | $ | | | 1 | |
|
Ginnie Mae | |
3.500% due 12/20/2040 - 03/20/2047 | | | | | 7,950 | | | | | | 7,215 | |
4.000% due 09/20/2040 - 06/15/2047 | | | | | 12,285 | | | | | | 11,529 | |
4.500% due 08/20/2038 - 02/20/2047 | | | | | 1,350 | | | | | | 1,295 | |
4.750% due 01/20/2035 | | | | | 50 | | | | | | 49 | |
5.000% due 03/20/2034 - 04/20/2040 | | | | | 273 | | | | | | 267 | |
5.500% due 04/16/2034 - 11/20/2038 | | | | | 28 | | | | | | 28 | |
6.000% due 08/20/2038 - 02/20/2039 | | | | | 51 | | | | | | 51 | |
6.500% due 12/20/2038 | | | | | 24 | | | | | | 24 | |
|
Ginnie Mae, TBA | |
2.500% due 07/01/2054 - 08/01/2054 | | | | | 95,000 | | | | | | 79,906 | |
3.000% due 07/01/2054 - 08/01/2054 | | | | | 132,000 | | | | | | 115,031 | |
3.500% due 08/01/2054 | | | | | 102,800 | | | | | | 92,367 | |
|
Tennessee Valley Authority | |
4.250% due 09/15/2065 | | | | | 10,000 | | | | | | 8,585 | |
|
Tennessee Valley Authority STRIPS | |
0.000% due 06/15/2038 (e) | | | | | 2,500 | | | | | | 1,208 | |
|
Uniform Mortgage-Backed Security | |
3.500% due 06/01/2045 - 07/01/2049 | | | | | 35,166 | | | | | | 31,839 | |
4.000% due 08/01/2024 - 05/01/2054 | | | | | 162,431 | | | | | | 149,094 | |
4.500% due 06/01/2039 - 11/01/2053 | | | | | 296,878 | | | | | | 280,186 | |
5.000% due 09/01/2052 - 10/01/2053 | | | | | 354,188 | | | | | | 342,810 | |
5.500% due 07/01/2053 - 03/01/2054 | | | | | 246,241 | | | | | | 243,004 | |
6.000% due 11/01/2053 - 02/01/2054 | | | | | 124,372 | | | | | | 124,784 | |
6.500% due 10/01/2053 - 04/01/2054 | | | | | 436,818 | | | | | | 445,056 | |
|
Uniform Mortgage-Backed Security, TBA | |
2.500% due 07/01/2054 - 08/01/2054 | | | | | 148,678 | | | | | | 121,550 | |
3.000% due 07/01/2054 - 08/01/2054 | | | | | 214,066 | | | | | | 182,290 | |
3.500% due 08/01/2054 | | | | | 132,200 | | | | | | 117,038 | |
4.000% due 08/01/2054 | | | | | 93,400 | | | | | | 85,516 | |
4.500% due 08/01/2054 | | | | | 4,900 | | | | | | 4,621 | |
| | | | | | | | | | | | |
Total U.S. Government Agencies (Cost $2,471,751) | | | 2,464,298 | |
| | | | |
| |
| U.S. TREASURY OBLIGATIONS 12.6% | |
|
U.S. Treasury Bonds | |
2.375% due 02/15/2042 (n)(p) | | | | | 150,000 | | | | | | 109,242 | |
3.875% due 02/15/2043 (l)(n) | | | | | 318,300 | | | | | | 287,813 | |
|
U.S. Treasury Inflation Protected Securities (f) | |
1.750% due 01/15/2034 (l) | | | | | 154,209 | | | | | | 149,711 | |
| | | | | | | | | | | | |
Total U.S. Treasury Obligations (Cost $528,075) | | | 546,766 | |
| | | | |
| |
| NON-AGENCY MORTGAGE-BACKED SECURITIES 7.6% | |
|
Ajax Mortgage Loan Trust | |
1.698% due 05/25/2059 þ | | | | | 893 | | | | | | 807 | |
|
American Home Mortgage Investment Trust | |
5.820% due 12/25/2046 • | | | | | 2,898 | | | | | | 2,301 | |
|
BAMLL Commercial Mortgage Securities Trust | |
2.847% due 04/20/2042 « | | | | | 12,600 | | | | | | 9,285 | |
|
Banc of America Funding Trust | |
4.981% due 08/27/2036 ~ | | | | | 6,521 | | | | | | 6,114 | |
|
BANK5 | |
5.769% due 06/15/2057 | | | | | 2,200 | | | | | | 2,233 | |
5.788% due 06/15/2057 | | | | | 4,300 | | | | | | 4,364 | |
|
Barclays Commercial Mortgage Securities Trust | |
4.314% due 12/15/2051 | | | | | 1,000 | | | | | | 960 | |
| | | | | | | | | | | | |
| | | | | PRINCIPAL
AMOUNT
(000S) | | | | | MARKET
VALUE
(000S) | |
|
BCAP LLC Trust | |
5.760% due 05/25/2047 • | | $ | | | 1,455 | | | $ | | | 1,346 | |
|
Bear Stearns ALT-A Trust | |
6.100% due 04/25/2034 «• | | | | | 8 | | | | | | 7 | |
|
Benchmark Mortgage Trust | |
6.841% due 11/15/2056 ~ | | | | | 6,700 | | | | | | 7,038 | |
|
BWAY Mortgage Trust | |
6.693% due 09/15/2036 • | | | | | 5,000 | | | | | | 4,777 | |
|
BX Trust | |
6.173% due 10/15/2036 • | | | | | 1,485 | | | | | | 1,465 | |
6.342% due 02/15/2039 • | | | | | 6,247 | | | | | | 6,182 | |
|
Chase Home Lending Mortgage Trust | |
3.250% due 03/25/2063 ~ | | | | | 3,922 | | | | | | 3,468 | |
3.250% due 09/25/2063 ~ | | | | | 2,857 | | | | | | 2,540 | |
|
Chase Mortgage Finance Trust | |
6.000% due 05/25/2036 | | | | | 3,451 | | | | | | 1,477 | |
|
ChaseFlex Trust | |
6.500% due 02/25/2037 | | | | | 3,863 | | | | | | 1,359 | |
|
CIM Trust | |
5.500% due 08/25/2064 ~ | | | | | 12,077 | | | | | | 12,093 | |
|
Citigroup Commercial Mortgage Trust | |
3.778% due 09/10/2058 | | | | | 8,100 | | | | | | 7,849 | |
|
Citigroup Mortgage Loan Trust | |
5.500% due 08/25/2034 | | | | | 994 | | | | | | 951 | |
5.780% due 09/25/2036 • | | | | | 457 | | | | | | 406 | |
6.260% due 08/25/2035 • | | | | | 234 | | | | | | 220 | |
|
COLT Mortgage Loan Trust | |
6.467% due 08/25/2067 þ | | | | | 1,629 | | | | | | 1,628 | |
|
Commercial Mortgage Trust | |
3.140% due 10/10/2036 | | | | | 1,840 | | | | | | 1,626 | |
6.743% due 12/15/2038 • | | | | | 5,261 | | | | | | 5,010 | |
|
Countrywide Alternative Loan Trust | |
5.500% due 07/25/2035 | | | | | 1,010 | | | | | | 708 | |
5.500% due 08/25/2035 | | | | | 283 | | | | | | 237 | |
5.500% due 12/25/2035 | | | | | 680 | | | | | | 462 | |
5.500% due 02/25/2036 | | | | | 1,296 | | | | | | 1,017 | |
5.710% due 06/25/2037 • | | | | | 496 | | | | | | 392 | |
5.750% due 05/25/2036 | | | | | 358 | | | | | | 133 | |
5.820% due 05/25/2047 • | | | | | 137 | | | | | | 124 | |
6.000% due 04/25/2037 | | | | | 2,746 | | | | | | 2,252 | |
6.093% due 12/20/2035 • | | | | | 2,889 | | | | | | 2,577 | |
6.250% due 08/25/2036 | | | | | 314 | | | | | | 177 | |
|
Countrywide Home Loan Mortgage Pass-Through Trust | |
4.530% due 11/25/2037 ~ | | | | | 2,117 | | | | | | 1,916 | |
4.574% due 02/20/2036 ~ | | | | | 461 | | | | | | 402 | |
4.780% due 03/20/2036 ~ | | | | | 478 | | | | | | 423 | |
6.000% due 03/25/2035 • | | | | | 56 | | | | | | 51 | |
|
Countrywide Home Loan Reperforming REMIC Trust | |
5.800% due 01/25/2036 • | | | | | 962 | | | | | | 890 | |
|
Credit Suisse First Boston Mortgage Securities Corp. | |
5.396% due 11/25/2034 «~ | | | | | 17 | | | | | | 16 | |
6.110% due 11/25/2031 «• | | | | | 25 | | | | | | 14 | |
|
Credit Suisse Mortgage Capital Certificates | |
2.436% due 02/25/2061 ~ | | | | | 1,596 | | | | | | 1,587 | |
|
Credit Suisse Mortgage Capital Mortgage-Backed Trust | |
1.926% due 07/27/2061 ~ | | | | | 2,928 | | | | | | 2,829 | |
4.052% due 12/27/2060 ~ | | | | | 1,956 | | | | | | 1,920 | |
4.080% due 03/25/2060 ~ | | | | | 4,187 | | | | | | 4,172 | |
4.713% due 08/25/2060 ~ | | | | | 3,019 | | | | | | 3,008 | |
5.500% due 03/25/2037 | | | | | 696 | | | | | | 328 | |
6.000% due 07/25/2037 | | | | | 324 | | | | | | 269 | |
6.421% due 10/25/2037 ~ | | | | | 2,860 | | | | | | 1,682 | |
6.843% due 07/15/2038 • | | | | | 1,000 | | | | | | 911 | |
|
Deutsche ALT-A Securities, Inc. Mortgage Loan Trust | |
5.940% due 01/25/2047 • | | | | | 3,571 | | | | | | 2,947 | |
|
Deutsche ALT-B Securities, Inc. Mortgage Loan Trust | |
5.431% due 02/25/2036 ~ | | | | | 123 | | | | | | 106 | |
5.665% due 02/25/2036 ~ | | | | | 1,143 | | | | | | 985 | |
|
EQUS Mortgage Trust | |
6.198% due 10/15/2038 • | | | | | 4,700 | | | | | | 4,660 | |
|
Great Hall Mortgages PLC | |
5.763% due 06/18/2039 • | | | | | 322 | | | | | | 321 | |
|
GS Mortgage Securities Corp. Trust | |
6.576% due 07/15/2035 • | | | | | 1,298 | | | | | | 978 | |
8.729% due 08/15/2039 • | | | | | 2,300 | | | | | | 2,305 | |
| | | | | | | | | | | | |
| | | | | PRINCIPAL
AMOUNT
(000S) | | | | | MARKET
VALUE
(000S) | |
|
GSMPS Mortgage Loan Trust | |
5.810% due 01/25/2036 • | | $ | | | 1,774 | | | $ | | | 1,417 | |
|
GSR Mortgage Loan Trust | |
4.375% due 11/25/2035 ~ | | | | | 6 | | | | | | 5 | |
4.619% due 01/25/2036 ~ | | | | | 862 | | | | | | 768 | |
5.970% due 09/25/2034 ~ | | | | | 94 | | | | | | 93 | |
6.000% due 03/25/2036 | | | | | 4,132 | | | | | | 1,397 | |
6.500% due 05/25/2036 | | | | | 589 | | | | | | 206 | |
|
HarborView Mortgage Loan Trust | |
5.833% due 01/19/2038 • | | | | | 2,700 | | | | | | 2,327 | |
5.863% due 12/19/2036 • | | | | | 2,094 | | | | | | 1,610 | |
5.993% due 03/19/2035 • | | | | | 753 | | | | | | 742 | |
|
IndyMac INDX Mortgage Loan Trust | |
3.969% due 09/25/2036 ~ | | | | | 1,445 | | | | | | 915 | |
|
JP Morgan Alternative Loan Trust | |
5.574% due 12/25/2035 ~ | | | | | 444 | | | | | | 314 | |
|
JP Morgan Chase Commercial Mortgage Securities Trust | |
2.287% due 03/05/2042 | | | | | 2,210 | | | | | | 1,876 | |
2.812% due 01/16/2037 | | | | | 100 | | | | | | 89 | |
3.648% due 12/15/2049 ~ | | | | | 3,700 | | | | | | 3,498 | |
5.925% due 04/15/2037 • | | | | | 976 | | | | | | 933 | |
6.517% due 07/05/2033 • | | | | | 1,777 | | | | | | 1,699 | |
7.235% due 10/05/2040 | | | | | 2,000 | | | | | | 2,105 | |
|
JP Morgan Mortgage Trust | |
4.625% due 07/25/2063 ~ | | | | | 5,308 | | | | | | 5,070 | |
5.156% due 02/25/2036 ~ | | | | | 654 | | | | | | 455 | |
5.266% due 07/25/2035 ~ | | | | | 11 | | | | | | 10 | |
6.000% due 08/25/2037 | | | | | 786 | | | | | | 362 | |
6.500% due 01/25/2036 | | | | | 4,913 | | | | | | 2,506 | |
|
Key Commercial Mortgage Securities Trust | |
2.233% due 09/16/2052 | | | | | 10,000 | | | | | | 8,424 | |
|
Legacy Mortgage Asset Trust | |
1.875% due 10/25/2068 þ | | | | | 2,623 | | | | | | 2,605 | |
2.250% due 07/25/2067 þ | | | | | 1,852 | | | | | | 1,805 | |
4.750% due 07/25/2061 þ | | | | | 1,115 | | | | | | 1,086 | |
4.892% due 10/25/2066 þ | | | | | 1,436 | | | | | | 1,412 | |
4.991% due 09/25/2060 ~ | | | | | 221 | | | | | | 221 | |
|
Lehman XS Trust | |
5.820% due 12/25/2036 • | | | | | 2,204 | | | | | | 2,079 | |
5.840% due 11/25/2046 • | | | | | 2,619 | | | | | | 2,218 | |
6.153% due 11/25/2035 «• | | | | | 8 | | | | | | 7 | |
|
Lux Trust | |
8.019% due 08/15/2040 • | | | | | 3,200 | | | | | | 3,223 | |
|
MASTR Adjustable Rate Mortgages Trust | |
4.115% due 04/25/2034 «~ | | | | | 149 | | | | | | 122 | |
7.693% due 12/25/2035 • | | | | | 2,956 | | | | | | 2,834 | |
|
Merrill Lynch Mortgage Investors Trust | |
6.020% due 07/25/2029 «• | | | | | 35 | | | | | | 32 | |
6.085% due 05/25/2029 «~ | | | | | 8 | | | | | | 7 | |
|
MFA Trust | |
1.014% due 01/26/2065 ~ | | | | | 1,592 | | | | | | 1,454 | |
1.324% due 01/26/2065 ~ | | | | | 434 | | | | | | 397 | |
1.381% due 04/25/2065 ~ | | | | | 2,531 | | | | | | 2,348 | |
1.632% due 01/26/2065 ~ | | | | | 833 | | | | | | 766 | |
1.638% due 04/25/2065 ~ | | | | | 1,046 | | | | | | 969 | |
6.775% due 10/25/2058 þ | | | | | 1,147 | | | | | | 1,153 | |
|
MHC Commercial Mortgage Trust | |
6.244% due 04/15/2038 • | | | | | 4,928 | | | | | | 4,891 | |
|
Mill City Mortgage Loan Trust | |
2.750% due 07/25/2059 ~ | | | | | 2,080 | | | | | | 1,989 | |
2.750% due 08/25/2059 ~ | | | | | 583 | | | | | | 552 | |
|
MKT Mortgage Trust | |
2.694% due 02/12/2040 | | | | | 5,000 | | | | | | 4,042 | |
|
Morgan Stanley Capital Trust | |
3.912% due 09/09/2032 | | | | | 2,100 | | | | | | 1,841 | |
|
Morgan Stanley Mortgage Loan Trust | |
6.965% due 06/25/2036 ~ | | | | | 2,119 | | | | | | 2,034 | |
|
Natixis Commercial Mortgage Securities Trust | |
6.393% due 08/15/2038 • | | | | | 900 | | | | | | 850 | |
|
New Residential Mortgage Loan Trust | |
6.864% due 10/25/2063 þ | | | | | 7,882 | | | | | | 7,978 | |
|
New York Mortgage Trust | |
1.670% due 08/25/2061 þ | | | | | 2,899 | | | | | | 2,833 | |
|
NLT Trust | |
3.200% due 10/25/2062 ~ | | | | | 3,126 | | | | | | 2,770 | |
| | | | | | |
| 54 | | PIMCO ETF TRUST | | | See Accompanying Notes | |
| | | | | | | | | | | | |
| | | | | PRINCIPAL
AMOUNT
(000S) | | | | | MARKET
VALUE
(000S) | |
|
Nomura Asset Acceptance Corp. Alternative Loan Trust | |
5.960% due 06/25/2037 • | | $ | | | 5,261 | | | $ | | | 4,199 | |
|
Nomura Resecuritization Trust | |
6.500% due 10/26/2037 | | | | | 1,780 | | | | | | 750 | |
|
OBX Trust | |
6.120% due 11/25/2062 ~ | | | | | 5,212 | | | | | | 5,213 | |
6.129% due 12/25/2063 þ | | | | | 6,991 | | | | | | 7,009 | |
6.567% due 06/25/2063 þ | | | | | 3,182 | | | | | | 3,207 | |
7.159% due 10/25/2063 þ | | | | | 3,325 | | | | | | 3,392 | |
|
One New York Plaza Trust | |
6.393% due 01/15/2036 • | | | | | 6,100 | | | | | | 5,941 | |
|
OPEN Trust | |
8.418% due 10/15/2028 • | | | | | 7,223 | | | | | | 7,323 | |
|
PRET LLC | |
7.021% due 02/25/2054 þ | | | | | 8,444 | | | | | | 8,427 | |
|
PRPM LLC | |
6.959% due 02/25/2029 þ | | | | | 2,468 | | | | | | 2,479 | |
|
RBSGC Mortgage Pass-Through Loan Trust | |
5.840% due 12/25/2034 • | | | | | 1,209 | | | | | | 1,074 | |
|
RCKT Mortgage Trust | |
6.147% due 06/25/2044 þ | | | | | 4,370 | | | | | | 4,401 | |
|
Residential Accredit Loans, Inc. Trust | |
6.000% due 06/25/2036 | | | | | 1,208 | | | | | | 909 | |
6.000% due 12/25/2036 | | | | | 966 | | | | | | 764 | |
6.500% due 07/25/2037 | | | | | 2,046 | | | | | | 1,608 | |
|
Residential Asset Securitization Trust | |
5.500% due 08/25/2034 | | | | | 1,284 | | | | | | 1,219 | |
6.010% due 08/25/2033 «• | | | | | 19 | | | | | | 17 | |
|
Residential Funding Mortgage Securities, Inc. Trust | |
6.000% due 06/25/2036 | | | | | 419 | | | | | | 341 | |
|
Sequoia Mortgage Trust | |
6.092% due 02/20/2035 «• | | | | | 276 | | | | | | 248 | |
6.153% due 07/20/2033 • | | | | | 11 | | | | | | 11 | |
|
SMRT Commercial Mortgage Trust | |
6.329% due 01/15/2039 • | | | | | 2,350 | | | | | | 2,323 | |
|
Starwood Mortgage Residential Trust | |
0.943% due 05/25/2065 ~ | | | | | 840 | | | | | | 766 | |
1.439% due 11/25/2055 ~ | | | | | 442 | | | | | | 412 | |
1.593% due 11/25/2055 ~ | | | | | 571 | | | | | | 532 | |
|
Thornburg Mortgage Securities Trust | |
5.404% due 10/25/2046 • | | | | | 751 | | | | | | 689 | |
7.017% due 06/25/2037 • | | | | | 176 | | | | | | 150 | |
|
Towd Point Mortgage Trust | |
3.250% due 07/25/2058 ~ | | | | | 3,375 | | | | | | 3,288 | |
|
Verus Securitization Trust | |
1.824% due 11/25/2066 ~ | | | | | 2,726 | | | | | | 2,393 | |
4.035% due 03/25/2060 ~ | | | | | 85 | | | | | | 85 | |
4.889% due 03/25/2060 ~ | | | | | 300 | | | | | | 293 | |
6.443% due 08/25/2068 þ | | | | | 3,966 | | | | | | 3,971 | |
6.665% due 09/25/2068 þ | | | | | 6,293 | | | | | | 6,346 | |
6.876% due 11/25/2068 ~ | | | | | 2,725 | | | | | | 2,771 | |
|
WaMu Mortgage Pass-Through Certificates Trust | |
3.767% due 01/25/2037 ~ | | | | | 2,262 | | | | | | 1,886 | |
4.387% due 07/25/2037 ~ | | | | | 1,963 | | | | | | 1,724 | |
6.653% due 10/25/2046 • | | | | | 933 | | | | | | 829 | |
|
Washington Mutual Mortgage Pass-Through Certificates Trust | |
4.141% due 10/25/2036 þ | | | | | 7,283 | | | | | | 2,467 | |
5.980% due 12/25/2035 • | | | | | 6,214 | | | | | | 5,169 | |
6.123% due 05/25/2046 • | | | | | 349 | | | | | | 290 | |
|
Wells Fargo Commercial Mortgage Trust | |
3.451% due 02/15/2048 | | | | | 3,500 | | | | | | 3,438 | |
|
Wells Fargo Mortgage-Backed Securities Trust | |
6.036% due 12/28/2037 ~ | | | | | 1,329 | | | | | | 1,159 | |
6.589% due 08/25/2036 «~ | | | | | 238 | | | | | | 203 | |
|
Worldwide Plaza Trust | |
3.526% due 11/10/2036 | | | | | 8,900 | | | | | | 6,562 | |
|
WSTN Trust | |
6.518% due 07/05/2037 ~ | | | | | 3,500 | | | | | | 3,513 | |
| | | | | | | | | | | | |
Total Non-Agency Mortgage-Backed Securities (Cost $351,765) | | | 327,435 | |
| | | | |
| |
| | | | | | | | | | | | |
| | | | | PRINCIPAL
AMOUNT
(000S) | | | | | MARKET
VALUE
(000S) | |
| ASSET-BACKED SECURITIES 15.6% | |
|
510 Asset-Backed Trust | |
5.240% due 06/25/2061 þ | | $ | | | 1,483 | | | $ | | | 1,462 | |
|
522 Funding CLO Ltd. | |
6.626% due 10/20/2031 • | | | | | 3,467 | | | | | | 3,469 | |
|
AASET Trust | |
2.798% due 01/15/2047 | | | | | 2,346 | | | | | | 2,102 | |
3.844% due 01/16/2038 | | | | | 1,360 | | | | | | 982 | |
|
ABFC Trust | |
5.740% due 10/25/2036 • | | | | | 1,067 | | | | | | 975 | |
5.780% due 01/25/2037 • | | | | | 1,792 | | | | | | 994 | |
5.940% due 09/25/2036 • | | | | | 3,913 | | | | | | 3,802 | |
|
ACE Securities Corp. Home Equity Loan Trust | |
5.960% due 10/25/2036 • | | | | | 4,373 | | | | | | 1,634 | |
|
ACHV ABS Trust | |
5.900% due 04/25/2031 | | | | | 296 | | | | | | 296 | |
|
ACREC Ltd. | |
6.596% due 10/16/2036 • | | | | | 1,383 | | | | | | 1,374 | |
|
Aegis Asset-Backed Securities Trust | |
6.180% due 08/25/2035 • | | | | | 113 | | | | | | 109 | |
|
AGL CLO Ltd. | |
6.786% due 07/20/2034 • | | | | | 4,500 | | | | | | 4,511 | |
|
ALESCO Preferred Funding Ltd. | |
5.939% due 12/23/2036 • | | | | | 293 | | | | | | 288 | |
6.359% due 09/23/2038 • | | | | | 2,092 | | | | | | 1,971 | |
|
Ameriquest Mortgage Securities, Inc. Asset-Backed Pass-Through Certificates | |
3.238% due 06/25/2033 • | | | | | 3,707 | | | | | | 3,358 | |
|
Anchorage Capital CLO Ltd. | |
6.985% due 04/20/2037 • | | | | | 9,100 | | | | | | 9,134 | |
|
Apex Credit CLO Ltd. | |
7.122% due 04/20/2036 • | | | | | 4,900 | | | | | | 4,908 | |
|
Apidos CLO | |
6.670% due 04/15/2031 • | | | | | 3,045 | | | | | | 3,046 | |
6.689% due 07/16/2031 • | | | | | 3,558 | | | | | | 3,559 | |
|
APL Finance DAC | |
7.000% due 07/21/2031 | | | | | 7,841 | | | | | | 7,830 | |
|
Ares CLO Ltd. | |
6.637% due 04/17/2033 • | | | | | 6,700 | | | | | | 6,718 | |
|
Argent Securities Trust | |
5.840% due 03/25/2036 • | | | | | 3,245 | | | | | | 2,864 | |
|
Argent Securities, Inc. Asset-Backed Pass-Through Certificates | |
5.920% due 01/25/2036 • | | | | | 4,796 | | | | | | 4,499 | |
|
Ascent Education Funding Trust | |
6.140% due 10/25/2050 | | | | | 660 | | | | | | 665 | |
|
Asset-Backed Securities Corp. Home Equity Loan Trust | |
6.165% due 11/25/2035 • | | | | | 1,632 | | | | | | 1,605 | |
6.270% due 06/25/2034 • | | | | | 2,330 | | | | | | 2,361 | |
6.285% due 04/25/2034 • | | | | | 662 | | | | | | 650 | |
8.668% due 08/15/2032 • | | | | | 312 | | | | | | 294 | |
|
Atlas Senior Loan Fund Ltd. | |
6.739% due 01/16/2030 • | | | | | 1,803 | | | | | | 1,806 | |
6.765% due 10/24/2031 • | | | | | 3,734 | | | | | | 3,738 | |
|
Avis Budget Rental Car Funding AESOP LLC | |
5.440% due 02/22/2028 | | | | | 5,000 | | | | | | 5,002 | |
6.020% due 02/20/2030 | | | | | 7,500 | | | | | | 7,700 | |
|
Ballyrock CLO Ltd. | |
6.716% due 07/20/2034 • | | | | | 6,000 | | | | | | 6,007 | |
|
Bear Stearns Asset-Backed Securities Trust | |
5.850% due 03/25/2034 • | | | | | 1,858 | | | | | | 1,848 | |
5.920% due 11/25/2036 • | | | | | 3,200 | | | | | | 3,008 | |
6.318% due 12/25/2034 • | | | | | 1,603 | | | | | | 1,610 | |
6.585% due 03/25/2035 • | | | | | 231 | | | | | | 228 | |
|
Benefit Street Partners CLO Ltd. | |
6.671% due 04/20/2034 • | | | | | 6,400 | | | | | | 6,423 | |
|
Birch Grove CLO Ltd. | |
6.912% due 07/17/2037 • | | | | | 8,300 | | | | | | 8,329 | |
|
BlueMountain CLO Ltd. | |
6.514% due 10/25/2030 • | | | | | 3,789 | | | | | | 3,795 | |
|
BSPRT Issuer Ltd. | |
6.763% due 12/15/2038 • | | | | | 4,296 | | | | | | 4,278 | |
7.625% due 07/15/2039 • | | | | | 4,000 | | | | | | 4,015 | |
| | | | | | | | | | | | |
| | | | | PRINCIPAL
AMOUNT
(000S) | | | | | MARKET
VALUE
(000S) | |
|
BXMT Ltd. | |
6.843% due 11/15/2037 • | | $ | | | 5,795 | | | $ | | | 5,688 | |
|
Capital Automotive LLC | |
5.750% due 09/15/2053 | | | | | 4,850 | | | | | | 4,805 | |
|
Carlyle Global Market Strategies CLO Ltd. | |
6.534% due 08/14/2030 • | | | | | 3,032 | | | | | | 3,034 | |
|
Carlyle U.S. CLO Ltd. | |
6.479% due 10/15/2031 • | | | | | 3,695 | | | | | | 3,704 | |
|
Carrington Mortgage Loan Trust | |
5.620% due 10/25/2036 • | | | | | 2,342 | | | | | | 1,837 | |
5.720% due 02/25/2037 • | | | | | 3,850 | | | | | | 3,557 | |
6.510% due 05/25/2035 • | | | | | 3,741 | | | | | | 3,542 | |
|
Carvana Auto Receivables Trust | |
5.900% due 08/10/2027 | | | | | 2,000 | | | | | | 2,002 | |
6.360% due 04/12/2027 | | | | | 1,591 | | | | | | 1,594 | |
|
Castlelake Aircraft Securitization Trust | |
4.125% due 06/15/2043 | | | | | 303 | | | | | | 283 | |
|
CBAM Ltd. | |
6.599% due 04/17/2031 • | | | | | 2,686 | | | | | | 2,689 | |
|
Cedar Funding CLO Ltd. | |
6.566% due 04/20/2031 • | | | | | 6,026 | | | | | | 6,031 | |
6.586% due 01/20/2031 • | | | | | 967 | | | | | | 968 | |
|
Chesapeake Funding LLC | |
6.103% due 05/15/2036 • | | | | | 4,845 | | | | | | 4,852 | |
|
CIT Mortgage Loan Trust | |
6.960% due 10/25/2037 • | | | | | 4,439 | | | | | | 4,444 | |
|
Citigroup Mortgage Loan Trust | |
5.720% due 03/25/2037 • | | | | | 213 | | | | | | 185 | |
5.780% due 09/25/2036 • | | | | | 1,072 | | | | | | 803 | |
6.135% due 10/25/2035 • | | | | | 363 | | | | | | 353 | |
6.360% due 01/25/2036 • | | | | | 1,780 | | | | | | 1,728 | |
6.664% due 05/25/2036 þ | | | | | 4,141 | | | | | | 1,522 | |
|
Countrywide Asset-Backed Certificates Trust | |
5.660% due 06/25/2047 • | | | | | 7,113 | | | | | | 6,063 | |
5.680% due 09/25/2037 • | | | | | 1,390 | | | | | | 1,423 | |
5.740% due 06/25/2035 • | | | | | 2,724 | | | | | | 2,410 | |
5.740% due 05/25/2037 • | | | | | 2,664 | | | | | | 2,457 | |
5.920% due 04/25/2047 • | | | | | 6,371 | | | | | | 5,741 | |
|
Daimler Trucks Retail Trust | |
5.390% due 01/15/2030 | | | | | 2,500 | | | | | | 2,490 | |
|
Diameter Capital CLO Ltd. | |
6.936% due 04/15/2037 • | | | | | 8,900 | | | | | | 8,934 | |
|
Diamond Infrastructure Funding LLC | |
1.760% due 04/15/2049 | | | | | 600 | | | | | | 542 | |
|
Diamond Issuer | |
2.305% due 11/20/2051 | | | | | 1,800 | | | | | | 1,625 | |
|
Dryden Senior Loan Fund | |
6.477% due 10/19/2029 • | | | | | 4,106 | | | | | | 4,111 | |
6.479% due 07/15/2030 • | | | | | 4,591 | | | | | | 4,593 | |
6.570% due 04/15/2028 • | | | | | 1,999 | | | | | | 2,001 | |
6.610% due 04/15/2029 • | | | | | 4,632 | | | | | | 4,636 | |
|
ECMC Group Student Loan Trust | |
6.450% due 01/27/2070 • | | | | | 2,795 | | | | | | 2,791 | |
|
Elmwood CLO Ltd. | |
6.947% due 01/17/2034 • | | | | | 3,300 | | | | | | 3,308 | |
|
EMC Mortgage Loan Trust | |
6.560% due 08/25/2040 • | | | | | 939 | | | | | | 926 | |
|
FHF Trust | |
6.570% due 06/15/2028 | | | | | 594 | | | | | | 598 | |
|
First Franklin Mortgage Loan Asset-Backed Certificates | |
6.285% due 05/25/2034 • | | | | | 1,293 | | | | | | 1,246 | |
|
First Franklin Mortgage Loan Trust | |
5.680% due 12/25/2037 • | | | | | 2,244 | | | | | | 2,116 | |
5.780% due 10/25/2036 • | | | | | 3,071 | | | | | | 1,990 | |
6.060% due 11/25/2035 «• | | | | | 199 | | | | | | 185 | |
6.645% due 12/25/2034 • | | | | | 1,475 | | | | | | 1,442 | |
6.885% due 10/25/2034 • | | | | | 861 | | | | | | 854 | |
|
Fremont Home Loan Trust | |
6.330% due 11/25/2034 • | | | | | 5,419 | | | | | | 4,780 | |
6.510% due 11/25/2034 • | | | | | 360 | | | | | | 334 | |
|
Galaxy CLO Ltd. | |
6.560% due 10/15/2030 • | | | | | 413 | | | | | | 413 | |
|
GLS Auto Receivables Issuer Trust | |
5.770% due 11/15/2028 | | | | | 3,000 | | | | | | 3,007 | |
| | | | | | | | | | | | |
| See Accompanying Notes | | | ANNUAL FINANCIAL AND OTHER INFORMATION | | | | | | | JUNE 30, 2024 | | | 55 |
| | | | | | |
| Schedule of Investments | | PIMCO Active Bond Exchange-Traded Fund | | (Cont.) | | |
| | | | | | | | | | | | |
| | | | | PRINCIPAL
AMOUNT
(000S) | | | | | MARKET
VALUE
(000S) | |
|
GM Financial Revolving Receivables Trust | |
5.770% due 08/11/2036 | | $ | | | 3,600 | | | $ | | | 3,701 | |
|
GoldenTree Loan Management U.S. CLO Ltd. | |
6.473% due 04/24/2031 • | | | | | 7,400 | | | | | | 7,416 | |
|
GSAA Home Equity Trust | |
5.900% due 03/25/2047 • | | | | | 2,800 | | | | | | 965 | |
|
GSAMP Trust | |
6.210% due 01/25/2034 • | | | | | 802 | | | | | | 775 | |
6.240% due 07/25/2045 • | | | | | 1,681 | | | | | | 1,634 | |
7.335% due 08/25/2034 • | | | | | 4,885 | | | | | | 4,467 | |
|
Hertz Vehicle Financing LLC | |
1.990% due 06/25/2026 | | | | | 2,300 | | | | | | 2,235 | |
|
Home Equity Mortgage Loan Asset-Backed Trust | |
5.650% due 07/25/2037 • | | | | | 7,686 | | | | | | 3,080 | |
5.700% due 11/25/2036 • | | | | | 6,129 | | | | | | 4,745 | |
|
Home Partners of America Trust | |
2.200% due 01/17/2041 | | | | | 1,759 | | | | | | 1,544 | |
|
Horizon Aircraft Finance Ltd. | |
3.721% due 07/15/2039 | | | | | 2,968 | | | | | | 2,717 | |
|
ICG U.S. CLO Ltd. | |
6.725% due 01/24/2032 • | | | | | 2,720 | | | | | | 2,722 | |
|
JP Morgan Mortgage Acquisition Corp. | |
6.045% due 05/25/2035 • | | | | | 1,508 | | | | | | 1,483 | |
|
JP Morgan Mortgage Acquisition Trust | |
4.456% due 07/25/2036 • | | | | | 1,510 | | | | | | 1,385 | |
6.030% due 07/25/2036 • | | | | | 1,100 | | | | | | 1,063 | |
|
KDAC Aviation Finance Ltd. | |
4.212% due 12/15/2042 | | | | | 2,288 | | | | | | 2,072 | |
|
KKR CLO Ltd. | |
6.540% due 07/15/2030 • | | | | | 4,925 | | | | | | 4,932 | |
6.757% due 02/09/2035 • | | | | | 6,200 | | | | | | 6,188 | |
|
KREF Ltd. | |
6.789% due 02/17/2039 • | | | | | 1,400 | | | | | | 1,399 | |
|
LAD Auto Receivables Trust | |
6.100% due 12/15/2027 | | | | | 5,000 | | | | | | 5,023 | |
6.240% due 06/15/2028 | | | | | 5,000 | | | | | | 5,063 | |
|
LCCM Trust | |
6.643% due 12/13/2038 • | | | | | 2,251 | | | | | | 2,206 | |
6.893% due 11/15/2038 • | | | | | 2,680 | | | | | | 2,643 | |
|
LCM LP | |
6.586% due 07/20/2030 • | | | | | 3,370 | | | | | | 3,373 | |
|
LCM Ltd. | |
6.425% due 07/20/2030 • | | | | | 2,035 | | | | | | 2,035 | |
|
Lehman XS Trust | |
4.857% due 06/25/2036 þ | | | | | 1,735 | | | | | | 1,614 | |
6.260% due 11/25/2035 þ | | | | | 3,099 | | | | | | 1,326 | |
|
LoanCore Issuer Ltd. | |
6.743% due 11/15/2038 • | | | | | 2,126 | | | | | | 2,115 | |
|
Lockwood Grove CLO Ltd. | |
6.755% due 01/25/2030 • | | | | | 715 | | | | | | 715 | |
|
Long Beach Mortgage Loan Trust | |
6.510% due 06/25/2035 • | | | | | 3,726 | | | | | | 3,576 | |
6.610% due 09/25/2034 • | | | | | 705 | | | | | | 709 | |
|
Lunar Aircraft Ltd. | |
3.376% due 02/15/2045 | | | | | 1,578 | | | | | | 1,501 | |
|
Magnetite Ltd. | |
6.874% due 10/25/2033 • | | | | | 8,400 | | | | | | 8,418 | |
|
Marble Point CLO Ltd. | |
6.525% due 01/20/2032 • | | | | | 493 | | | | | | 493 | |
6.630% due 10/15/2030 • | | | | | 1,541 | | | | | | 1,542 | |
|
Merrill Lynch Mortgage Investors Trust | |
4.568% due 02/25/2037 þ | | | | | 12,092 | | | | | | 1,501 | |
|
METAL LLC | |
4.581% due 10/15/2042 | | | | | 2,494 | | | | | | 1,640 | |
|
MF1 LLC | |
7.076% due 03/19/2039 • | | | | | 2,500 | | | | | | 2,498 | |
|
MF1 Ltd. | |
6.689% due 02/19/2037 • | | | | | 11,236 | | | | | | 11,166 | |
7.143% due 11/15/2035 • | | | | | 2,630 | | | | | | 2,629 | |
|
MKS CLO Ltd. | |
6.586% due 07/20/2030 • | | | | | 1,510 | | | | | | 1,510 | |
6.778% due 01/20/2031 • | | | | | 1,665 | | | | | | 1,665 | |
| | | | | | | | | | | | |
| | | | | PRINCIPAL
AMOUNT
(000S) | | | | | MARKET
VALUE
(000S) | |
|
Morgan Stanley ABS Capital, Inc. Trust | |
5.530% due 10/25/2036 • | | $ | | | 70 | | | $ | | | 31 | |
5.590% due 01/25/2037 • | | | | | 1,692 | | | | | | 772 | |
5.600% due 05/25/2037 • | | | | | 106 | | | | | | 93 | |
5.610% due 10/25/2036 • | | | | | 280 | | | | | | 149 | |
5.680% due 11/25/2036 • | | | | | 2,753 | | | | | | 1,290 | |
5.960% due 07/25/2036 • | | | | | 1,451 | | | | | | 535 | |
5.960% due 08/25/2036 • | | | | | 12,943 | | | | | | 6,451 | |
6.120% due 11/25/2035 • | | | | | 4,513 | | | | | | 4,277 | |
6.240% due 01/25/2035 • | | | | | 85 | | | | | | 83 | |
6.375% due 07/25/2034 • | | | | | 616 | | | | | | 630 | |
6.710% due 07/25/2037 • | | | | | 6,420 | | | | | | 5,432 | |
|
Morgan Stanley Mortgage Loan Trust | |
6.465% due 09/25/2046 þ | | | | | 2,705 | | | | | | 882 | |
|
Mountain View CLO LLC | |
6.679% due 10/16/2029 • | | | | | 866 | | | | | | 866 | |
|
Nassau Ltd. | |
6.840% due 01/15/2030 • | | | | | 1,555 | | | | | | 1,557 | |
|
Navient Private Education Loan Trust | |
6.893% due 07/16/2040 • | | | | | 783 | | | | | | 787 | |
|
Navient Private Education Refi Loan Trust | |
1.310% due 01/15/2069 | | | | | 843 | | | | | | 777 | |
1.330% due 04/15/2069 | | | | | 2,675 | | | | | | 2,422 | |
|
Navient Student Loan Trust | |
7.230% due 03/15/2072 | | | | | 1,600 | | | | | | 1,658 | |
|
Nelnet Student Loan Trust | |
6.640% due 02/20/2041 | | | | | 3,701 | | | | | | 3,705 | |
|
Neuberger Berman Loan Advisers CLO Ltd. | |
6.626% due 04/20/2031 • | | | | | 3,200 | | | | | | 3,204 | |
|
New Century Home Equity Loan Trust | |
6.345% due 08/25/2034 • | | | | | 636 | | | | | | 633 | |
|
Nomura Home Equity Loan, Inc. Home Equity Loan Trust | |
6.225% due 05/25/2035 • | | | | | 940 | | | | | | 923 | |
|
Octagon Investment Partners Ltd. | |
6.475% due 10/20/2030 • | | | | | 3,120 | | | | | | 3,125 | |
|
Octane Receivables Trust | |
1.210% due 09/20/2028 | | | | | 1,304 | | | | | | 1,280 | |
6.440% due 03/20/2029 | | | | | 1,671 | | | | | | 1,681 | |
|
OneMain Financial Issuance Trust | |
5.840% due 09/15/2036 | | | | | 10,200 | | | | | | 10,337 | |
|
Oportun Issuance Trust | |
6.334% due 04/08/2031 | | | | | 331 | | | | | | 331 | |
|
Option One Mortgage Loan Trust | |
5.640% due 04/25/2037 • | | | | | 2,185 | | | | | | 1,048 | |
5.740% due 07/25/2036 • | | | | | 1,936 | | | | | | 1,105 | |
|
Pagaya AI Debt Selection Trust | |
6.060% due 03/15/2030 | | | | | 2,008 | | | | | | 2,007 | |
6.093% due 11/15/2031 | | | | | 700 | | | | | | 700 | |
6.258% due 10/15/2031 | | | | | 2,620 | | | | | | 2,622 | |
6.319% due 08/15/2031 | | | | | 1,052 | | | | | | 1,053 | |
6.660% due 07/15/2031 | | | | | 362 | | | | | | 363 | |
6.811% due 05/15/2030 | | | | | 1,700 | | | | | | 1,701 | |
7.228% due 07/15/2031 | | | | | 258 | | | | | | 259 | |
7.600% due 12/16/2030 | | | | | 1,723 | | | | | | 1,732 | |
8.388% due 07/15/2030 ~ | | | | | 273 | | | | | | 277 | |
|
Palmer Square CLO Ltd. | |
6.875% due 10/20/2033 • | | | | | 8,000 | | | | | | 8,019 | |
|
Palmer Square Loan Funding Ltd. | |
6.390% due 10/15/2029 • | | | | | 2,682 | | | | | | 2,683 | |
6.486% due 04/20/2029 • | | | | | 676 | | | | | | 676 | |
|
Park Avenue Institutional Advisers CLO Ltd. | |
6.791% due 08/23/2031 • | | | | | 3,342 | | | | | | 3,346 | |
|
PRET LLC | |
1.744% due 07/25/2051 þ | | | | | 1,011 | | | | | | 986 | |
1.868% due 07/25/2051 þ | | | | | 3,036 | | | | | | 2,982 | |
2.487% due 10/25/2051 ~ | | | | | 957 | | | | | | 945 | |
4.992% due 02/25/2061 þ | | | | | 1,117 | | | | | | 1,108 | |
|
PRPM LLC | |
3.720% due 02/25/2027 þ | | | | | 3,456 | | | | | | 3,399 | |
|
Raptor Aircraft Finance LLC | |
4.213% due 08/23/2044 | | | | | 1,908 | | | | | | 1,612 | |
|
RCKT Mortgage Trust | |
6.025% due 02/25/2044 ~ | | | | | 943 | | | | | | 945 | |
| | | | | | | | | | | | |
| | | | | PRINCIPAL
AMOUNT
(000S) | | | | | MARKET
VALUE
(000S) | |
|
Reach ABS Trust | |
6.300% due 02/18/2031 | | $ | | | 563 | | | $ | | | 564 | |
|
Ready Capital Mortgage Financing LLC | |
7.897% due 10/25/2039 • | | | | | 4,469 | | | | | | 4,491 | |
|
Renaissance Home Equity Loan Trust | |
5.586% due 11/25/2036 þ | | | | | 662 | | | | | | 216 | |
5.608% due 05/25/2036 þ | | | | | 13,820 | | | | | | 5,829 | |
5.812% due 11/25/2036 þ | | | | | 12,195 | | | | | | 4,136 | |
5.840% due 11/25/2035 • | | | | | 797 | | | | | | 694 | |
5.893% due 06/25/2037 þ | | | | | 2,722 | | | | | | 698 | |
6.115% due 08/25/2036 þ | | | | | 8,664 | | | | | | 3,448 | |
6.120% due 11/25/2036 þ | | | | | 1,166 | | | | | | 416 | |
|
Research-Driven Pagaya Motor Asset Trust | |
7.090% due 06/25/2032 | | | | | 496 | | | | | | 499 | |
|
Residential Asset Mortgage Products Trust | |
5.337% due 03/25/2032 • | | | | | 853 | | | | | | 732 | |
5.970% due 03/25/2036 • | | | | | 1,140 | | | | | | 1,105 | |
|
Residential Asset Securities Corp. Trust | |
5.680% due 02/25/2037 • | | | | | 4,009 | | | | | | 3,832 | |
|
Santander Drive Auto Receivables Trust | |
5.930% due 07/17/2028 | | | | | 1,700 | | | | | | 1,712 | |
5.980% due 04/16/2029 | | | | | 1,700 | | | | | | 1,720 | |
6.400% due 03/17/2031 | | | | | 1,700 | | | | | | 1,746 | |
|
Santander Revolving Auto Lease Trust | |
2.510% due 01/26/2032 | | | | | 3,500 | | | | | | 3,453 | |
|
Sapphire Aviation Finance Ltd. | |
4.250% due 03/15/2040 | | | | | 946 | | | | | | 903 | |
|
Saranac CLO Ltd. | |
6.748% due 08/13/2031 • | | | | | 6,284 | | | | | | 6,305 | |
|
Saxon Asset Securities Trust | |
1.979% due 05/25/2035 • | | | | | 595 | | | | | | 450 | |
2.349% due 03/25/2035 • | | | | | 245 | | | | | | 219 | |
7.185% due 12/26/2034 • | | | | | 1,773 | | | | | | 1,361 | |
7.210% due 12/25/2037 • | | | | | 487 | | | | | | 455 | |
|
SCCU Auto Receivables Trust | |
5.700% due 10/16/2028 | | | | | 1,300 | | | | | | 1,308 | |
5.700% due 08/15/2029 | | | | | 600 | | | | | | 602 | |
|
Securitized Asset-Backed Receivables LLC Trust | |
6.040% due 12/25/2035 • | | | | | 1,341 | | | | | | 1,291 | |
6.240% due 02/25/2034 • | | | | | 2,028 | | | | | | 2,011 | |
|
Shackleton CLO Ltd. | |
6.476% due 04/20/2029 • | | | | | 854 | | | | | | 854 | |
|
SLM Private Credit Student Loan Trust | |
5.871% due 12/15/2039 • | | | | | 1,898 | | | | | | 1,850 | |
5.911% due 12/15/2038 • | | | | | 293 | | | | | | 289 | |
|
SLM Private Education Loan Trust | |
10.193% due 10/15/2041 • | | | | | 2,733 | | | | | | 2,860 | |
|
SLM Student Loan Trust | |
6.359% due 04/25/2049 | | | | | 337 | | | | | | 336 | |
6.509% due 07/25/2049 | | | | | 2,348 | | | | | | 2,329 | |
|
SMB Private Education Loan Trust | |
5.380% due 01/15/2053 | | | | | 588 | | | | | | 587 | |
6.310% due 09/15/2054 • | | | | | 2,056 | | | | | | 2,053 | |
|
Sound Point CLO Ltd. | |
6.565% due 07/25/2030 • | | | | | 3,937 | | | | | | 3,940 | |
6.760% due 07/15/2034 • | | | | | 5,700 | | | | | | 5,701 | |
6.796% due 07/20/2032 • | | | | | 13,000 | | | | | | 13,034 | |
|
Soundview Home Loan Trust | |
5.710% due 07/25/2037 • | | | | | 3,466 | | | | | | 2,645 | |
|
Specialty Underwriting & Residential Finance Trust | |
5.760% due 09/25/2037 • | | | | | 6,028 | | | | | | 4,036 | |
|
Starwood Commercial Mortgage Trust | |
6.646% due 04/18/2038 • | | | | | 8,846 | | | | | | 8,680 | |
|
Stonepeak ABS | |
2.301% due 02/28/2033 | | | | | 515 | | | | | | 478 | |
|
Structured Asset Investment Loan Trust | |
5.632% due 07/25/2036 • | | | | | 4,609 | | | | | | 2,655 | |
6.090% due 11/25/2035 • | | | | | 1,950 | | | | | | 1,877 | |
6.165% due 03/25/2034 • | | | | | 1,714 | | | | | | 1,701 | |
6.960% due 11/25/2034 • | | | | | 2,940 | | | | | | 3,036 | |
|
Structured Asset Securities Corp. Mortgage Loan Trust | |
6.330% due 07/25/2035 • | | | | | 1,479 | | | | | | 1,513 | |
6.495% due 07/25/2035 • | | | | | 2,915 | | | | | | 2,881 | |
| | | | | | |
| 56 | | PIMCO ETF TRUST | | | See Accompanying Notes | |
| | | | | | | | | | | | |
| | | | | PRINCIPAL
AMOUNT
(000S) | | | | | MARKET
VALUE
(000S) | |
|
Symphony CLO Ltd. | |
6.526% due 01/23/2032 • | | $ | | | 949 | | | $ | | | 952 | |
6.914% due 04/25/2034 • | | | | | 9,500 | | | | | | 9,546 | |
|
Towd Point Mortgage Trust | |
6.125% due 02/25/2064 ~ | | | | | 946 | | | | | | 946 | |
|
TPG Real Estate Finance Issuer Ltd. | |
6.643% due 03/15/2038 • | | | | | 5,437 | | | | | | 5,403 | |
6.979% due 02/15/2039 • | | | | | 4,946 | | | | | | 4,925 | |
|
Tricolor Auto Securitization Trust | |
6.610% due 10/15/2027 | | | | | 7,674 | | | | | | 7,691 | |
|
Trinitas CLO Ltd. | |
6.694% due 04/25/2033 • | | | | | 6,300 | | | | | | 6,320 | |
|
United Auto Credit Securitization Trust | |
6.170% due 08/10/2026 | | | | | 407 | | | | | | 407 | |
|
Venture CLO Ltd. | |
6.470% due 04/15/2027 • | | | | | 27 | | | | | | 27 | |
6.486% due 10/20/2028 • | | | | | 1,245 | | | | | | 1,245 | |
6.574% due 09/07/2030 • | | | | | 7,630 | | | | | | 7,632 | |
6.576% due 07/20/2030 • | | | | | 3,378 | | | | | | 3,383 | |
6.636% due 07/20/2030 • | | | | | 2,876 | | | | | | 2,880 | |
6.650% due 07/15/2031 • | | | | | 4,356 | | | | | | 4,360 | |
|
Verizon Master Trust | |
5.350% due 09/22/2031 | | | | | 7,000 | | | | | | 7,106 | |
|
Vertical Bridge Holdings LLC | |
3.706% due 02/15/2057 | | | | | 2,400 | | | | | | 2,086 | |
|
Vibrant CLO Ltd. | |
6.626% due 09/15/2030 • | | | | | 2,795 | | | | | | 2,797 | |
|
Voya CLO Ltd. | |
6.590% due 10/15/2030 • | | | | | 1,696 | | | | | | 1,699 | |
|
WaMu Asset-Backed Certificates WaMu Trust | |
5.685% due 05/25/2037 • | | | | | 1,781 | | | | | | 1,647 | |
|
WAVE LLC | |
3.597% due 09/15/2044 | | | | | 3,309 | | | | | | 2,999 | |
|
Wellfleet CLO Ltd. | |
6.476% due 07/20/2029 • | | | | | 11 | | | | | | 11 | |
|
Wells Fargo Home Equity Asset-Backed Securities Trust | |
6.210% due 12/25/2035 • | | | | | 2,814 | | | | | | 2,773 | |
8.010% due 04/25/2035 • | | | | | 131 | | | | | | 135 | |
| | | | | | | | | | | | |
| | | | | PRINCIPAL
AMOUNT
(000S) | | | | | MARKET
VALUE
(000S) | |
|
Wells Fargo Home Equity Trust Mortgage Pass-Through Certificates | |
6.060% due 04/25/2034 • | | $ | | | 60 | | | $ | | | 58 | |
|
Whitehorse Ltd. | |
6.840% due 10/15/2031 • | | | | | 6,582 | | | | | | 6,589 | |
|
Wind River CLO Ltd. | |
6.670% due 07/15/2031 • | | | | | 9,000 | | | | | | 9,005 | |
| | | | | | | | | | | | |
Total Asset-Backed Securities (Cost $703,799) | | | 677,000 | |
| | | | |
| |
| SOVEREIGN ISSUES 0.3% | |
|
Brazil Government International Bond | |
6.125% due 03/15/2034 | | | | | 8,500 | | | | | | 8,184 | |
|
Mexico Government International Bond | |
5.750% due 10/12/2110 | | | | | 4,000 | | | | | | 3,312 | |
| | | | | | | | | | | | |
Total Sovereign Issues (Cost $12,573) | | | 11,496 | |
| | | | |
| |
| | | | | SHARES | | | | | | |
| PREFERRED SECURITIES 0.6% | |
| |
| BANKING & FINANCE 0.5% | |
|
American AgCredit Corp. | |
5.250% due 06/15/2026 •(g) | | | | | 4,000,000 | | | | | | 3,805 | |
|
Capital Farm Credit ACA | |
5.000% due 03/15/2026 •(g) | | | | | 3,300,000 | | | | | | 3,277 | |
|
CoBank ACB | |
4.250% due 01/01/2027 •(g) | | | | | 1,700,000 | | | | | | 1,472 | |
7.250% due 07/01/2029 •(g) | | | | | 10,000,000 | | | | | | 10,169 | |
|
Farm Credit Bank of Texas | |
5.700% due 09/15/2025 •(g) | | | | | 4,250,000 | | | | | | 4,210 | |
|
SVB Financial Group | |
4.100% due 02/15/2031 ^(d)(g) | | | | | 2,800,000 | | | | | | 22 | |
| | | | | | | | | | | | |
| | | | | | | | | | | 22,955 | |
| | | | | | | | | | | | |
| |
| | | | | | | | | | | | |
| | | | | SHARES | | | | | MARKET
VALUE
(000S) | |
| INDUSTRIALS 0.1% | |
|
Energy Transfer LP | |
6.750% due 05/15/2025 •(g) | | | | | 3,000,000 | | | $ | | | 2,989 | |
| | | | | | | | | | | | |
Total Preferred Securities (Cost $29,106) | | | 25,944 | |
| | | | |
| |
| SHORT-TERM INSTRUMENTS 1.6% | |
| |
| REPURCHASE AGREEMENTS (k) 1.6% | |
| | | | | | | | | | | 68,862 | |
| | | | | | | | | | | | |
| Total Short-Term Instruments (Cost $68,862) | | | 68,862 | |
| | | | |
| | | | |
| | | | | | | | | | | | |
| Total Investments in Securities (Cost $5,260,154) | | | 5,196,659 | |
| | | | |
| |
| INVESTMENTS IN AFFILIATES 1.9% | |
| |
| MUTUAL FUNDS (h) 1.9% | |
| | | | |
PIMCO Enhanced Short Maturity Active Exchange-Traded Fund | | | | | 250,000 | | | | | | 25,162 | |
| | | | |
PIMCO Preferred And Capital Securities Active Exchange-Traded Fund | | | | | 402,800 | | | | | | 19,995 | |
| | | | |
PIMCO Senior Loan Active Exchange-Traded Fund | | | | | 705,400 | | | | | | 36,085 | |
| | | | | | | | | | | | |
| Total Mutual Funds (Cost $79,322) | | | 81,242 | |
| | | | |
| | | | |
| | | | | | | | | | | | |
| Total Investments in Affiliates (Cost $79,322) | | | 81,242 | |
| | | | |
| | | | | | | | | | | | |
| Total Investments 122.0% (Cost $5,339,476) | | | $ | | | 5,277,901 | |
| |
Financial Derivative
Instruments (m)(o) 0.0% (Cost or Premiums, net $1,114) | | | 1,307 | |
| |
| Other Assets and Liabilities, net (22.0)% | | | (952,447 | ) |
| | | | |
| Net Assets 100.0% | | | $ | | | 4,326,761 | |
| | | | | | | |
NOTES TO SCHEDULE OF INVESTMENTS:
| * | A zero balance may reflect actual amounts rounding to less than one thousand. |
| « | Security valued using significant unobservable inputs (Level 3). |
| ~ | Variable or Floating rate security. Rate shown is the rate in effect as of period end. Certain variable rate securities are not based on a published reference rate and spread, rather are determined by the issuer or agent and are based on current market conditions. Reference rate is as of reset date, which may vary by security. These securities may not indicate a reference rate and/or spread in their description. |
| • | Rate shown is the rate in effect as of period end. The rate may be based on a fixed rate, a capped rate or a floor rate and may convert to a variable or floating rate in the future. These securities do not indicate a reference rate and spread in their description. |
| þ | Coupon represents a rate which changes periodically based on a predetermined schedule or event. Rate shown is the rate in effect as of period end. |
| (a) | Security is an Interest Only (“IO”) or IO Strip. |
| (b) | Principal only security. |
| (d) | Security is not accruing income as of the date of this report. |
| (f) | Principal amount of security is adjusted for inflation. |
| (g) | Perpetual maturity; date shown, if applicable, represents next contractual call date. |
| (h) | Institutional Class Shares of each Fund. |
| (i) | Contingent convertible security. |
(j) RESTRICTED SECURITIES:
| | | | | | | | | | | | | | | | | | | | | | | | |
| Issuer Description | | Coupon | | | Maturity
Date | | | Acquisition
Date | | | Cost | | | Market
Value | | | Market Value
as Percentage
of Net Assets
| |
Morgan Stanley | | | 0.000% | | | | 04/02/2032 | | | | 02/11/2020 | | | $ | 7,963 | | | $ | 5,710 | | | | 0.13% | |
| | | | | | | | | | | | | | | | | | | | | | | | |
| | | | | | | | | | | | |
| See Accompanying Notes | | | ANNUAL FINANCIAL AND OTHER INFORMATION | | | | | | | JUNE 30, 2024 | | | 57 |
| | | | | | |
| Schedule of Investments | | PIMCO Active Bond Exchange-Traded Fund | | (Cont.) | | |
BORROWINGS AND OTHER FINANCING TRANSACTIONS
(k) REPURCHASE AGREEMENTS:
| | | | | | | | | | | | | | | | | | | | | | | | | | | | | | |
| Counterparty | | Lending
Rate | | | Settlement
Date | | | Maturity
Date | | | Principal
Amount | | | Collateralized By | | Collateral
(Received) | | | Repurchase
Agreements,
at Value | | | Repurchase
Agreement
Proceeds
to be
Received(1) | |
| BPS | | | 5.400 | % | | | 07/01/2024 | | | | 07/02/2024 | | | $ | 29,100 | | | U.S. Treasury Note/Bond 1.375% due 11/15/2031 | | $ | (29,735 | ) | | $ | 29,100 | | | $ | 29,100 | |
| FICC | | | 2.600 | | | | 06/28/2024 | | | | 07/01/2024 | | | | 1,762 | | | U.S. Treasury Notes 4.500% due 03/31/2026 | | | (1,798 | ) | | | 1,762 | | | | 1,762 | |
| MBC | | | 5.400 | | | | 06/28/2024 | | | | 07/01/2024 | | | | 38,000 | | | U.S. Treasury Notes 3.750% due 06/30/2030 | | | (39,057 | ) | | | 38,000 | | | | 38,017 | |
| | | | | | | | | | | | | | | | | | | | | | | | | | | | | | |
Total Repurchase Agreements | | | | | $ | (70,590 | ) | | $ | 68,862 | | | $ | 68,879 | |
| | | | | | | | | | | | | | | |
REVERSE REPURCHASE AGREEMENTS:
| | | | | | | | | | | | | | | | | | | | |
| Counterparty | | Borrowing
Rate(2) | | | Settlement
Date | | | Maturity
Date | | | Amount
Borrowed(2) | | | Payable for
Reverse
Repurchase
Agreements | |
BOO | | | 5.480 | % | | | 06/24/2024 | | | | 07/01/2024 | | | $ | (2,506 | ) | | $ | (2,509 | ) |
BOS | | | 5.250 | | | | 06/14/2024 | | | | 07/11/2024 | | | | (863 | ) | | | (865 | ) |
| | | 5.270 | | | | 06/14/2024 | | | | 07/11/2024 | | | | (908 | ) | | | (910 | ) |
BRC | | | 5.250 | | | | 02/26/2024 | | | | TBD | (3) | | | (7,125 | ) | | | (7,256 | ) |
CIB | | | 5.420 | | | | 05/23/2024 | | | | 07/09/2024 | | | | (20,896 | ) | | | (21,019 | ) |
DEU | | | 5.420 | | | | 05/30/2024 | | | | 07/10/2024 | | | | (3,094 | ) | | | (3,109 | ) |
| | | 5.460 | | | | 06/21/2024 | | | | 07/02/2024 | | | | (105,632 | ) | | | (105,792 | ) |
JPS | | | 5.250 | | | | 06/14/2024 | | | | 08/02/2024 | | | | (8,983 | ) | | | (9,005 | ) |
| | | | | | | | | | | | | | | | | | | | |
Total Reverse Repurchase Agreements | | | | | | | | | | | $ | (150,465 | ) |
| | | | | | | | | | | | | | | | | | | | |
SHORT SALES:
| | | | | | | | | | | | | | | | | | | | |
| Description | | Coupon | | | Maturity
Date | | | Principal
Amount | | | Proceeds | | | Payable for
Short Sales | |
U.S. Government Agencies (11.2)% | |
Uniform Mortgage-Backed Security, TBA | | | 2.500 | % | | | 07/15/2054 | | | $ | 95,000 | | | $ | (78,033 | ) | | $ | (77,584 | ) |
Uniform Mortgage-Backed Security, TBA | | | 6.500 | | | | 07/01/2054 | | | | 202,000 | | | | (205,459 | ) | | | (205,614 | ) |
Uniform Mortgage-Backed Security, TBA | | | 6.500 | | | | 08/01/2054 | | | | 198,000 | | | | (202,053 | ) | | | (201,419 | ) |
| | | | | | | | | | | | | | | | | | | | |
Total Short Sales (11.2)% | | | | | | | | | | | | | | $ | (485,545 | ) | | $ | (484,617 | ) |
| | | | | | | | | | | | | | | | | | | | |
BORROWINGS AND OTHER FINANCING TRANSACTIONS SUMMARY
The following is a summary by counterparty of the market value of Borrowings and Other Financing Transactions and collateral pledged/(received) as of June 30, 2024:
| | | | | | | | | | | | | | | | | | | | | | | | | | | | |
| Counterparty | | Repurchase
Agreement
Proceeds
to be
Received(1) | | | Payable for
Reverse
Repurchase
Agreements | | | Payable for
Sale-Buyback
Transactions | | | Securities
Out on Loan | | | Total
Borrowings and
Other Financing
Transactions | | | Collateral
Pledged/(Received) | | | Net Exposure(4) | |
Global/Master Repurchase Agreement | |
BOO | | $ | 0 | | | $ | (2,509 | ) | | $ | 0 | | | $ | 0 | | | $ | (2,509 | ) | | $ | 2,475 | | | $ | (34 | ) |
BOS | | | 0 | | | | (1,775 | ) | | | 0 | | | | 0 | | | | (1,775 | ) | | | 1,814 | | | | 39 | |
BPS | | | 29,100 | | | | 0 | | | | 0 | | | | 0 | | | | 29,100 | | | | (29,735 | ) | | | (635 | ) |
BRC | | | 0 | | | | (7,256 | ) | | | 0 | | | | 0 | | | | (7,256 | ) | | | 7,661 | | | | 405 | |
CIB | | | 0 | | | | (21,019 | ) | | | 0 | | | | 0 | | | | (21,019 | ) | | | 20,307 | | | | (712 | ) |
DEU | | | 0 | | | | (108,901 | ) | | | 0 | | | | 0 | | | | (108,901 | ) | | | 107,535 | | | | (1,366 | ) |
FICC | | | 1,762 | | | | 0 | | | | 0 | | | | 0 | | | | 1,762 | | | | (1,798 | ) | | | (36 | ) |
JPS | | | 0 | | | | (9,005 | ) | | | 0 | | | | 0 | | | | (9,005 | ) | | | 9,339 | | | | 334 | |
MBC | | | 38,017 | | | | 0 | | | | 0 | | | | 0 | | | | 38,017 | | | | (39,057 | ) | | | (1,040 | ) |
| | | | | | | | | | | | | | | | | | | | | | | | | | | | |
Total Borrowings and Other Financing Transactions | | $ | 68,879 | | | $ | (150,465 | ) | | $ | 0 | | | $ | 0 | | | | | | | | | | | | | |
| | | | | | | | | | | | | | | | | | | | | | | | | | | | |
CERTAIN TRANSFERS ACCOUNTED FOR AS SECURED BORROWINGS
Remaining Contractual Maturity of the Agreements
| | | | | | | | | | | | | | | | | | | | |
| | | Overnight and
Continuous | | | Up to 30 days | | | 31-90 days | | | Greater Than 90 days | | | Total | |
Reverse Repurchase Agreements | |
Corporate Bonds & Notes | | $ | 0 | | | $ | (1,775 | ) | | $ | (9,005 | ) | | $ | (7,256 | ) | | $ | (18,036 | ) |
U.S. Treasury Obligations | | | (2,509 | ) | | | (129,920 | ) | | | 0 | | | | 0 | | | | (132,429 | ) |
| | | | | | | | | | | | | | | | | | | | |
Total Borrowings | | $ | (2,509 | ) | | $ | (131,695 | ) | | $ | (9,005 | ) | | $ | (7,256 | ) | | $ | (150,465 | ) |
| | | | | | | | | | | | | | | | | | | | |
Payable for reverse repurchase agreements | | | $ | (150,465 | ) |
| | | | | |
| (l) | Securities with an aggregate market value of $149,812 have been pledged as collateral under the terms of the above master agreements as of June 30, 2024. |
| (1) | Includes accrued interest. |
| | | | | | |
| 58 | | PIMCO ETF TRUST | | | See Accompanying Notes | |
| (2) | The average amount of borrowings outstanding during the period ended June 30, 2024 was $(120,536) at a weighted average interest rate of 4.317%. Average borrowings may include reverse repurchase agreements and sale-buyback transactions, if held during the period. |
| (3) | Open maturity reverse repurchase agreement. |
| (4) | Net Exposure represents the net receivable/(payable) that would be due from/to the counterparty in the event of default. Exposure from borrowings and other financing transactions can only be netted across transactions governed under the same master agreement with the same legal entity. See Note 8, Master Netting Arrangements, in the Notes to Financial Statements for more information. |
(m) FINANCIAL DERIVATIVE INSTRUMENTS: EXCHANGE-TRADED OR CENTRALLY CLEARED
WRITTEN OPTIONS:
OPTIONS ON EXCHANGE-TRADED FUTURES CONTRACTS
| | | | | | | | | | | | | | | | | | | | | | | | |
| Description | | Strike
Price | | | Expiration
Date | | | # of
Contracts | | | Notional
Amount | | | Premiums
(Received) | | | Market
Value | |
Put - CBOT U.S. Treasury 10-Year Note August 2024 Futures | | $ | 109.000 | | | | 07/26/2024 | | | | 13 | | | $ | 13 | | | $ | (3 | ) | | $ | (5 | ) |
Call - CBOT U.S. Treasury 10-Year Note August 2024 Futures | | | 112.000 | | | | 07/26/2024 | | | | 13 | | | | 13 | | | | (4 | ) | | | (2 | ) |
| | | | | | | | | | | | | | | | | | | | | | | | |
Total Written Options | | | $ | (7 | ) | | $ | (7 | ) |
| | | | | | | | | |
FUTURES CONTRACTS:
LONG FUTURES CONTRACTS
| | | | | | | | | | | | | | | | | | | | | | | | |
| Description | | Expiration
Month | | | # of
Contracts | | | Notional
Amount | | | Unrealized
Appreciation/
(Depreciation) | | | Variation Margin | |
| | Asset | | | Liability | |
U.S. Treasury 2-Year Note September Futures | | | 09/2024 | | | | 803 | | | $ | 163,988 | | | $ | 408 | | | $ | 0 | | | $ | (16 | ) |
U.S. Treasury 5-Year Note September Futures | | | 09/2024 | | | | 1,060 | | | | 112,973 | | | | 601 | | | | 0 | | | | (178 | ) |
U.S. Treasury 10-Year Note September Futures | | | 09/2024 | | | | 1,828 | | | | 201,051 | | | | 1,730 | | | | 0 | | | | (728 | ) |
| | | | | | | | | | | | | | | | | | | | | | | | |
| | | $ | 2,739 | | | $ | 0 | | | $ | (922 | ) |
| | | | | | | | | | | | | |
SHORT FUTURES CONTRACTS
| | | | | | | | | | | | | | | | | | | | | | | | |
| Description | | Expiration
Month | | | # of
Contracts | | | Notional
Amount | | | Unrealized
Appreciation/
(Depreciation) | | | Variation Margin | |
| | Asset | | | Liability | |
U.S. Treasury 10-Year Ultra Long-Term Bond September Futures | | | 09/2024 | | | | 1,217 | | | $ | (138,168 | ) | | $ | 1,011 | | | $ | 884 | | | $ | 0 | |
U.S. Treasury Long-Term Bond September Futures | | | 09/2024 | | | | 37 | | | | (4,378 | ) | | | 24 | | | | 54 | | | | 0 | |
U.S. Treasury Ultra Long-Term Bond September Futures | | | 09/2024 | | | | 1,040 | | | | (130,358 | ) | | | (1,389 | ) | | | 2,551 | | | | 0 | |
| | | | | | | | | | | | | | | | | | | | | | | | |
| | | $ | (354 | ) | | $ | 3,489 | | | $ | 0 | |
| | | | | | | | | | | | | |
Total Futures Contracts | | | | | | | | | | | | | | $ | 2,385 | | | $ | 3,489 | | | $ | (922 | ) |
| | | | | | | | | | | | | |
SWAP AGREEMENTS:
CREDIT DEFAULT SWAPS ON CORPORATE ISSUES - SELL PROTECTION(1)
| | | | | | | | | | | | | | | | | | | | | | | | | | | | | | | | | | | | | | | | | | |
Reference Entity | | Fixed
Receive Rate | | Payment
Frequency | | | Maturity
Date | | | Implied
Credit Spread at
June 30, 2024(2) | | | Notional
Amount(3) | | | Premiums
Paid/(Received) | | | Unrealized
Appreciation/
(Depreciation) | | | Market
Value(4) | | | Variation Margin | |
| | Asset | | | Liability | |
AES Corp. | | 5.000% | | | Quarterly | | | | 06/20/2026 | | | | 0.503 | % | | | $ | | | | 3,400 | | | $ | 335 | | | $ | (41 | ) | | $ | 294 | | | $ | 1 | | | $ | 0 | |
Boeing Co. | | 1.000 | | | Quarterly | | | | 06/20/2026 | | | | 0.830 | | | | | | | | 1,500 | | | | 15 | | | | (10 | ) | | | 5 | | | | 1 | | | | 0 | |
Boeing Co. | | 1.000 | | | Quarterly | | | | 12/20/2026 | | | | 0.946 | | | | | | | | 5,300 | | | | 57 | | | | (49 | ) | | | 8 | | | | 1 | | | | 0 | |
British Telecommunications PLC | | 1.000% | | | Quarterly | | | | 12/20/2027 | | | | 0.483 | % | | | EUR | | | | 200 | | | $ | 4 | | | $ | 0 | | | $ | 4 | | | $ | 0 | | | $ | 0 | |
Devon Energy Corp. | | 1.000 | | | Quarterly | | | | 12/20/2026 | | | | 0.430 | | | | $ | | | | 2,000 | | | | 20 | | | | 7 | | | | 27 | | | | 0 | | | | 0 | |
Devon Energy Corp. | | 1.000 | | | Quarterly | | | | 06/20/2027 | | | | 0.483 | | | | | | | | 1,000 | | | | 8 | | | | 7 | | | | 15 | | | | 0 | | | | 0 | |
Energy Transfer Operating LP | | 1.000 | | | Quarterly | | | | 12/20/2025 | | | | 0.312 | | | | | | | | 1,100 | | | | 12 | | | | (1 | ) | | | 11 | | | | 0 | | | | 0 | |
Ford Motor Credit Co. LLC | | 5.000 | | | Quarterly | | | | 06/20/2027 | | | | 0.915 | | | | | | | | 300 | | | | 33 | | | | 1 | | | | 34 | | | | 0 | | | | 0 | |
General Motors Co. | | 5.000 | | | Quarterly | | | | 06/20/2028 | | | | 0.844 | | | | | | | | 7,735 | | | | 1,140 | | | | 35 | | | | 1,175 | | | | 4 | | | | 0 | |
Valeo SA | | 1.000 | | | Quarterly | | | | 06/20/2026 | | | | 0.680 | | | | EUR | | | | 1,800 | | | | (11 | ) | | | 24 | | | | 13 | | | | 0 | | | | 0 | |
Valeo SA | | 1.000 | | | Quarterly | | | | 06/20/2028 | | | | 1.565 | | | | | | | | 2,500 | | | | (125 | ) | | | 70 | | | | (55 | ) | | | 0 | | | | (2 | ) |
Verizon Communications, Inc. | | 1.000 | | | Quarterly | | | | 12/20/2024 | | | | 0.236 | | | | $ | | | | 4,300 | | | | 23 | | | | (6 | ) | | | 17 | | | | 0 | | | | 0 | |
Verizon Communications, Inc. | | 1.000 | | | Quarterly | | | | 06/20/2026 | | | | 0.355 | | | | | | | | 900 | | | | 10 | | | | 1 | | | | 11 | | | | 0 | | | | 0 | |
Verizon Communications, Inc. | | 1.000 | | | Quarterly | | | | 12/20/2026 | | | | 0.404 | | | | | | | | 5,600 | | | | 68 | | | | 12 | | | | 80 | | | | 1 | | | | 0 | |
Verizon Communications, Inc. | | 1.000 | | | Quarterly | | | | 06/20/2028 | | | | 0.523 | | | | | | | | 1,200 | | | | 16 | | | | 5 | | | | 21 | | | | 1 | | | | 0 | |
Verizon Communications, Inc. | | 1.000 | | | Quarterly | | | | 12/20/2028 | | | | 0.580 | | | | | | | | 300 | | | | 4 | | | | 1 | | | | 5 | | | | 0 | | | | 0 | |
Williams Cos., Inc. | | 1.000 | | | Quarterly | | | | 12/20/2026 | | | | 0.314 | | | | | | | | 2,600 | | | | 42 | | | | 1 | | | | 43 | | | | 0 | | | | (1 | ) |
| | | | | | | | | | | | | | | | | | | | | | | | | | | | | | | | | | | | | | | | | | |
| | | | | | | | | | | | | | $ | 1,651 | | | $ | 57 | | | $ | 1,708 | | | $ | 9 | | | $ | (3 | ) |
| | | | | | | | | | | | | | | | | | | | | | | | | | | | | | | | |
| | | | | | | | | | | | |
| See Accompanying Notes | | | ANNUAL FINANCIAL AND OTHER INFORMATION | | | | | | | JUNE 30, 2024 | | | 59 |
| | | | | | |
| Schedule of Investments | | PIMCO Active Bond Exchange-Traded Fund | | (Cont.) | | |
INTEREST RATE SWAPS
| | | | | | | | | | | | | | | | | | | | | | | | | | | | | | | | | | | | | | | | | | |
Pay/Receive
Floating Rate | | Floating Rate Index | | Fixed Rate | | | Payment
Frequency | | | Maturity
Date | | | Notional
Amount | | | Premiums
Paid/(Received) | | | Unrealized
Appreciation/
(Depreciation) | | | Market
Value | | | Variation Margin | |
| | Asset | | | Liability | |
Pay | | 1-Day USD-SOFR Compounded-OIS | | | 3.940 | % | | | Annual | | | | 02/22/2029 | | | $ | | | | | 13,900 | | | $ | (33 | ) | | $ | (135 | ) | | $ | (168 | ) | | $ | 0 | | | $ | (23 | ) |
Pay | | 1-Day USD-SOFR Compounded-OIS | | | 3.970 | | | | Annual | | | | 02/27/2029 | | | | | | | | 4,700 | | | | (11 | ) | | | (38 | ) | | | (49 | ) | | | 0 | | | | (8 | ) |
Pay | | 1-Day USD-SOFR Compounded-OIS | | | 4.170 | | | | Annual | | | | 10/03/2033 | | | | | | | | 7,500 | | | | 248 | | | | (200 | ) | | | 48 | | | | 0 | | | | (42 | ) |
Pay | | 1-Day USD-SOFR Compounded-OIS | | | 4.030 | | | | Annual | | | | 10/04/2033 | | | | | | | | 10,400 | | | | 226 | | | | (281 | ) | | | (55 | ) | | | 0 | | | | (58 | ) |
Pay | | 1-Day USD-SOFR Compounded-OIS | | | 3.655 | | | | Annual | | | | 01/24/2034 | | | | | | | | 2,300 | | | | (9 | ) | | | (64 | ) | | | (73 | ) | | | 0 | | | | (13 | ) |
Pay | | 1-Day USD-SOFR Compounded-OIS | | | 3.665 | | | | Annual | | | | 01/24/2034 | | | | | | | | 4,700 | | | | (19 | ) | | | (126 | ) | | | (145 | ) | | | 0 | | | | (27 | ) |
Pay | | 1-Day USD-SOFR Compounded-OIS | | | 3.685 | | | | Annual | | | | 01/24/2034 | | | | | | | | 4,700 | | | | (19 | ) | | | (119 | ) | | | (138 | ) | | | 0 | | | | (27 | ) |
Pay | | 1-Day USD-SOFR Compounded-OIS | | | 3.620 | | | | Annual | | | | 01/31/2034 | | | | | | | | 2,300 | | | | (10 | ) | | | (69 | ) | | | (79 | ) | | | 0 | | | | (14 | ) |
Pay | | 1-Day USD-SOFR Compounded-OIS | | | 3.725 | | | | Annual | | | | 02/07/2034 | | | | | | | | 2,300 | | | | (12 | ) | | | (46 | ) | | | (58 | ) | | | 0 | | | | (14 | ) |
Pay | | 1-Day USD-SOFR Compounded-OIS | | | 3.783 | | | | Annual | | | | 02/07/2034 | | | | | | | | 1,900 | | | | (10 | ) | | | (29 | ) | | | (39 | ) | | | 0 | | | | (11 | ) |
Pay | | 1-Day USD-SOFR Compounded-OIS | | | 3.860 | | | | Annual | | | | 02/21/2034 | | | | | | | | 9,400 | | | | (42 | ) | | | (85 | ) | | | (127 | ) | | | 0 | | | | (56 | ) |
Pay | | 1-Day USD-SOFR Compounded-OIS | | | 3.650 | | | | Annual | | | | 03/05/2034 | | | | | | | | 4,700 | | | | (20 | ) | | | (123 | ) | | | (143 | ) | | | 0 | | | | (28 | ) |
Pay | | 1-Day USD-SOFR Compounded-OIS | | | 3.700 | | | | Annual | | | | 03/05/2034 | | | | | | | | 2,400 | | | | (9 | ) | | | (54 | ) | | | (63 | ) | | | 0 | | | | (14 | ) |
Pay | | 1-Day USD-SOFR Compounded-OIS | | | 3.710 | | | | Annual | | | | 03/05/2034 | | | | | | | | 4,700 | | | | (18 | ) | | | (101 | ) | | | (119 | ) | | | 0 | | | | (28 | ) |
Pay | | 1-Day USD-SOFR Compounded-OIS | | | 3.900 | | | | Annual | | | | 04/10/2034 | | | | | | | | 4,600 | | | | (17 | ) | | | (20 | ) | | | (37 | ) | | | 0 | | | | (28 | ) |
Pay | | 1-Day USD-SOFR Compounded-OIS | | | 3.900 | | | | Annual | | | | 04/15/2034 | | | | | | | | 1,000 | | | | (4 | ) | | | (4 | ) | | | (8 | ) | | | 0 | | | | (6 | ) |
Pay | | 1-Day USD-SOFR Compounded-OIS | | | 4.080 | | | | Annual | | | | 04/17/2034 | | | | | | | | 4,500 | | | | (15 | ) | | | 47 | | | | 32 | | | | 0 | | | | (27 | ) |
Pay | | 1-Day USD-SOFR Compounded-OIS | | | 4.085 | | | | Annual | | | | 04/22/2034 | | | | | | | | 4,500 | | | | (18 | ) | | | 52 | | | | 34 | | | | 0 | | | | (28 | ) |
Pay | | 1-Day USD-SOFR Compounded-OIS | | | 4.150 | | | | Annual | | | | 04/22/2034 | | | | | | | | 4,600 | | | | (16 | ) | | | 76 | | | | 60 | | | | 0 | | | | (28 | ) |
Pay | | 1-Day USD-SOFR Compounded-OIS | | | 4.105 | | | | Annual | | | | 04/24/2034 | | | | | | | | 16,100 | | | | (54 | ) | | | 206 | | | | 152 | | | | 0 | | | | (98 | ) |
Pay | | 1-Day USD-SOFR Compounded-OIS | | | 4.078 | | | | Annual | | | | 04/29/2034 | | | | | | | | 4,400 | | | | (13 | ) | | | 46 | | | | 33 | | | | 0 | | | | (27 | ) |
Pay | | 1-Day USD-SOFR Compounded-OIS | | | 4.200 | | | | Annual | | | | 05/06/2034 | | | | | | | | 10,400 | | | | (34 | ) | | | 219 | | | | 185 | | | | 0 | | | | (64 | ) |
Receive | | 1-Day USD-SOFR Compounded-OIS | | | 4.080 | | | | Annual | | | | 06/05/2034 | | | | | | | | 5,500 | | | | (22 | ) | | | (28 | ) | | | (50 | ) | | | 34 | | | | 0 | |
Receive(5) | | 1-Day USD-SOFR Compounded-OIS | | | 3.994 | | | | Annual | | | | 07/02/2034 | | | | | | | | 2,200 | | | | (7 | ) | | | 0 | | | | (7 | ) | | | 0 | | | | (7 | ) |
Pay | | 1-Day USD-SOFR Compounded-OIS | | | 3.830 | | | | Annual | | | | 10/12/2053 | | | | | | | | 1,400 | | | | 42 | | | | (42 | ) | | | 0 | | | | 0 | | | | (25 | ) |
Pay | | 1-Day USD-SOFR Compounded-OIS | | | 3.880 | | | | Annual | | | | 10/16/2053 | | | | | | | | 1,400 | | | | 54 | | | | (41 | ) | | | 13 | | | | 0 | | | | (25 | ) |
Pay | | 1-Day USD-SOFR Compounded-OIS | | | 3.870 | | | | Annual | | | | 10/17/2053 | | | | | | | | 1,400 | | | | 52 | | | | (41 | ) | | | 11 | | | | 0 | | | | (25 | ) |
Pay | | 1-Day USD-SOFR Compounded-OIS | | | 3.555 | | | | Annual | | | | 03/05/2054 | | | | | | | | 1,900 | | | | (16 | ) | | | (61 | ) | | | (77 | ) | | | 0 | | | | (33 | ) |
| | | | | | | | | | | | | | | | | | | | | |
| | | | | | | $ | 194 | | | $ | (1,061 | ) | | $ | (867 | ) | | $ | 34 | | | $ | (784 | ) |
| | | | | | | | | | | | | | | | | | | | | |
Total Swap Agreements | | | | | | | $ | 1,845 | | | $ | (1,004 | ) | | $ | 841 | | | $ | 43 | | | $ | (787 | ) |
| | | | | | | | | | | | | | | | | | | | | |
FINANCIAL DERIVATIVE INSTRUMENTS: EXCHANGE-TRADED OR CENTRALLY CLEARED SUMMARY
The following is a summary of the market value and variation margin of Exchange-Traded or Centrally Cleared Financial Derivative Instruments as of June 30, 2024:
| | | | | | | | | | | | | | | | | | | | | | | | | | | | | | | | | | | | |
| | | Financial Derivative Assets | | | | | | Financial Derivative Liabilities | |
| | | Market Value | | | Variation Margin
Asset | | | Total | | | | | | Market Value | | | Variation Margin
Liability | | | Total | |
| | | Purchased
Options | | | Futures | | | Swap
Agreements | | | | | | Written
Options | | | Futures | | | Swap
Agreements | |
Total Exchange-Traded or Centrally Cleared | | $ | 0 | | | $ | 3,489 | | | $ | 43 | | | $ | 3,532 | | | | | | | $ | | (7) | | $ | (922) | | | $ | (787) | | | $ | (1,716) | |
| | | | | | | | | | | | | | | | | | | | | | | | | | | | | | | | | | | | |
| (n) | Securities with an aggregate market value of $22,208 and cash of $6,431 have been pledged as collateral for exchange-traded and centrally cleared financial derivative instruments as of June 30, 2024. See Note 8, Master Netting Arrangements, in the Notes to Financial Statements for more information. |
| (1) | If the Fund is a seller of protection and a credit event occurs, as defined under the terms of that particular swap agreement, the Fund will either (i) pay to the buyer of protection an amount equal to the notional amount of the swap and take delivery of the referenced obligation or underlying securities comprising the referenced index or (ii) pay a net settlement amount in the form of cash, securities or other deliverable obligations equal to the notional amount of the swap less the recovery value of the referenced obligation or underlying securities comprising the referenced index. |
| (2) | Implied credit spreads, represented in absolute terms, utilized in determining the market value of credit default swap agreements on issues as of period end serve as indicators of the current status of the payment/performance risk and represent the likelihood or risk of default for the credit derivative. The implied credit spread of a particular referenced entity reflects the cost of buying/selling protection and may include upfront payments required to be made to enter into the agreement. Wider credit spreads represent a deterioration of the referenced entity’s credit soundness and a greater likelihood or risk of default or other credit event occurring as defined under the terms of the agreement. |
| (3) | The maximum potential amount the Fund could be required to pay as a seller of credit protection or receive as a buyer of credit protection if a credit event occurs as defined under the terms of that particular swap agreement. |
| (4) | The prices and resulting values for credit default swap agreements serve as indicators of the current status of the payment/performance risk and represent the likelihood of an expected liability (or profit) for the credit derivative should the notional amount of the swap agreement be closed/sold as of the period end. Increasing market values, in absolute terms when compared to the notional amount of the swap, represent a deterioration of the underlying referenced instrument’s credit soundness and a greater likelihood or risk of default or other credit event occurring as defined under the terms of the agreement. |
| (5) | This instrument has a forward starting effective date. See Note 2, Securities Transactions and Investment Income, in the Notes to Financial Statements for further information. |
| | | | | | |
| 60 | | PIMCO ETF TRUST | | | See Accompanying Notes | |
(o) FINANCIAL DERIVATIVE INSTRUMENTS: OVER THE COUNTER
FORWARD FOREIGN CURRENCY CONTRACTS:
| | | | | | | | | | | | | | | | | | | | | | | | |
Counterparty | | Settlement
Month | | | Currency to
be Delivered | | | Currency to
be Received | | | Unrealized Appreciation/
(Depreciation) | |
| | Asset | | | Liability | |
| | | | | | | |
BPS | | | 07/2024 | | | CAD | | | 1,055 | | | $ | | | 773 | | | $ | 2 | | | $ | 0 | |
| | | | | | | |
CBK | | | 07/2024 | | | GBP | | | 454 | | | | | | 577 | | | | 3 | | | | 0 | |
| | | | | | | | | | | | | | | | | | | | | | | | |
Total Forward Foreign Currency Contracts | | | $ | 5 | | | $ | 0 | |
| | | | | | | | | |
WRITTEN OPTIONS:
INTEREST RATE SWAPTIONS
| | | | | | | | | | | | | | | | | | | | | | | | | | | | | | |
| Counterparty | | Description | | Floating Rate Index | | Pay/Receive
Floating Rate | | Exercise
Rate | | | Expiration
Date | | | Notional
Amount(1) | | | Premiums
(Received) | | | Market
Value | |
| CBK | | Call - OTC 10-Year Interest Rate Swap | | 3-Month USD-LIBOR | | Receive | | | 3.710 | % | | | 07/26/2024 | | | | | | | | 3,100 | | | | $ (12 | ) | | $ | (9 | ) |
| | Put - OTC 10-Year Interest Rate Swap | | 3-Month USD-LIBOR | | Pay | | | 4.060 | | | | 07/26/2024 | | | | | | | | 3,100 | | | | (12 | ) | | | (15 | ) |
| | | | | | | | | |
| FAR | | Call - OTC 10-Year Interest Rate Swap | | 3-Month USD-LIBOR | | Receive | | | 3.885 | | | | 07/10/2024 | | | | | | | | 10,400 | | | | (35 | ) | | | (40 | ) |
| | Put - OTC 10-Year Interest Rate Swap | | 3-Month USD-LIBOR | | Pay | | | 4.235 | | | | 07/10/2024 | | | | | | | | 10,400 | | | | (35 | ) | | | (5 | ) |
| | Call - OTC 10-Year Interest Rate Swap | | 3-Month USD-LIBOR | | Receive | | | 3.586 | | | | 07/15/2024 | | | | | | | | 10,200 | | | | (38 | ) | | | (6 | ) |
| | Put - OTC 10-Year Interest Rate Swap | | 3-Month USD-LIBOR | | Pay | | | 3.986 | | | | 07/15/2024 | | | | | | | | 10,200 | | | | (38 | ) | | | (57 | ) |
| | | | | | | | | |
| GLM | | Call - OTC 5-Year Interest Rate Swap | | 3-Month USD-LIBOR | | Receive | | | 3.689 | | | | 07/15/2024 | | | | | | | | 20,400 | | | | (42 | ) | | | (9 | ) |
| | Put - OTC 5-Year Interest Rate Swap | | 3-Month USD-LIBOR | | Pay | | | 4.139 | | | | 07/15/2024 | | | | | | | | 20,400 | | | | (42 | ) | | | (48 | ) |
| | Call - OTC 10-Year Interest Rate Swap | | 3-Month USD-LIBOR | | Receive | | | 3.844 | | | | 07/03/2024 | | | | | | | | 6,700 | | | | (23 | ) | | | (11 | ) |
| | Put - OTC 10-Year Interest Rate Swap | | 3-Month USD-LIBOR | | Pay | | | 4.194 | | | | 07/03/2024 | | | | | | | | 6,700 | | | | (23 | ) | | | (2 | ) |
| | Call - OTC 10-Year Interest Rate Swap | | 3-Month USD-LIBOR | | Receive | | | 3.880 | | | | 07/08/2024 | | | | | | | | 20,500 | | | | (63 | ) | | | (58 | ) |
| | Put - OTC 10-Year Interest Rate Swap | | 3-Month USD-LIBOR | | Pay | | | 4.230 | | | | 07/08/2024 | | | | | | | | 20,500 | | | | (63 | ) | | | (5 | ) |
| | Call - OTC 10-Year Interest Rate Swap | | 3-Month USD-LIBOR | | Receive | | | 3.628 | | | | 07/18/2024 | | | | | | | | 8,800 | | | | (34 | ) | | | (10 | ) |
| | Put - OTC 10-Year Interest Rate Swap | | 3-Month USD-LIBOR | | Pay | | | 3.978 | | | | 07/18/2024 | | | | | | | | 8,800 | | | | (34 | ) | | | (57 | ) |
| | Call - OTC 10-Year Interest Rate Swap | | 3-Month USD-LIBOR | | Receive | | | 3.680 | | | | 07/22/2024 | | | | | | | | 4,400 | | | | (17 | ) | | | (8 | ) |
| | Put - OTC 10-Year Interest Rate Swap | | 3-Month USD-LIBOR | | Pay | | | 4.030 | | | | 07/22/2024 | | | | | | | | 4,400 | | | | (17 | ) | | | (23 | ) |
| | Call - OTC 10-Year Interest Rate Swap | | 3-Month USD-LIBOR | | Receive | | | 3.710 | | | | 07/29/2024 | | | | | | | | 4,400 | | | | (14 | ) | | | (12 | ) |
| | Put - OTC 10-Year Interest Rate Swap | | 3-Month USD-LIBOR | | Pay | | | 4.110 | | | | 07/29/2024 | | | | | | | | 4,400 | | | | (14 | ) | | | (15 | ) |
| | | | | | | | | |
| JPM | | Call - OTC 5-Year Interest Rate Swap | | 3-Month USD-LIBOR | | Receive | | | 3.850 | | | | 07/05/2024 | | | | | | | | 9,500 | | | | (23 | ) | | | (3 | ) |
| | Put - OTC 5-Year Interest Rate Swap | | 3-Month USD-LIBOR | | Pay | | | 4.250 | | | | 07/05/2024 | | | | | | | | 9,500 | | | | (23 | ) | | | (3 | ) |
| | Call - OTC 10-Year Interest Rate Swap | | 3-Month USD-LIBOR | | Receive | | | 3.800 | | | | 07/05/2024 | | | | | | | | 2,100 | | | | (8 | ) | | | (2 | ) |
| | Put - OTC 10-Year Interest Rate Swap | | 3-Month USD-LIBOR | | Pay | | | 4.150 | | | | 07/05/2024 | | | | | | | | 2,100 | | | | (8 | ) | | | (1 | ) |
| | Call - OTC 10-Year Interest Rate Swap | | 3-Month USD-LIBOR | | Receive | | | 3.675 | | | | 07/22/2024 | | | | | | | | 4,400 | | | | (17 | ) | | | (8 | ) |
| | Put - OTC 10-Year Interest Rate Swap | | 3-Month USD-LIBOR | | Pay | | | 4.025 | | | | 07/22/2024 | | | | | | | | 4,400 | | | | (17 | ) | | | (23 | ) |
| | Call - OTC 10-Year Interest Rate Swap | | 3-Month USD-LIBOR | | Receive | | | 3.640 | | | | 07/23/2024 | | | | | | | | 2,200 | | | | (9 | ) | | | (4 | ) |
| | Put - OTC 10-Year Interest Rate Swap | | 3-Month USD-LIBOR | | Pay | | | 3.990 | | | | 07/23/2024 | | | | | | | | 2,200 | | | | (9 | ) | | | (15 | ) |
| | | | | | | | | |
| MYC | | Call - OTC 10-Year Interest Rate Swap | | 3-Month USD-LIBOR | | Receive | | | 3.630 | | | | 07/29/2024 | | | | | | | | 4,400 | | | | (11 | ) | | | (9 | ) |
| | Call - OTC 10-Year Interest Rate Swap | | 3-Month USD-LIBOR | | Receive | | | 3.690 | | | | 07/29/2024 | | | | | | | | 4,400 | | | | (16 | ) | | | (12 | ) |
| | Put - OTC 10-Year Interest Rate Swap | | 3-Month USD-LIBOR | | Pay | | | 4.040 | | | | 07/29/2024 | | | | | | | | 4,400 | | | | (16 | ) | | | (25 | ) |
| | Put - OTC 10-Year Interest Rate Swap | | 3-Month USD-LIBOR | | Pay | | | 4.090 | | | | 07/29/2024 | | | | | | | | 4,400 | | | | (11 | ) | | | (19 | ) |
| | | | | | | | | | | | | | | | | | | | | | | | | | | | | | |
Total Written Options | | | $ | (724 | ) | | $ | (514 | ) |
| | | | | | | | | |
FINANCIAL DERIVATIVE INSTRUMENTS: OVER THE COUNTER SUMMARY
The following is a summary by counterparty of the market value of OTC financial derivative instruments and collateral pledged/(received) as of June 30, 2024:
| | | | | | | | | | | | | | | | | | | | | | | | | | | | | | | | | | | | | | | | | | | | | | | | |
| | | Financial Derivative Assets | | | | | | Financial Derivative Liabilities | | | | | | | | | | |
| Counterparty | | Forward
Foreign
Currency
Contracts | | | Purchased
Options | | | Swap
Agreements | | | Total
Over the
Counter | | | | | | Forward
Foreign
Currency
Contracts | | | Written
Options | | | Swap
Agreements | | | Total
Over the
Counter | | | Net Market
Value of OTC
Derivatives | | | Collateral
Pledged/ (Received) | | | Net
Exposure(2) | |
BPS | | $ | 2 | | | $ | 0 | | | $ | 0 | | | $ | 2 | | | | | | | $ | 0 | | | $ | 0 | | | $ | 0 | | | $ | 0 | | | $ | 2 | | | $ | 0 | | | $ | 2 | |
CBK | | | 3 | | | | 0 | | | | 0 | | | | 3 | | | | | | | | 0 | | | | (24 | ) | | | 0 | | | | (24 | ) | | | (21 | ) | | | 0 | | | | (21 | ) |
FAR | | | 0 | | | | 0 | | | | 0 | | | | 0 | | | | | | | | 0 | | | | (108 | ) | | | 0 | | | | (108 | ) | | | (108 | ) | | | 0 | | | | (108 | ) |
GLM | | | 0 | | | | 0 | | | | 0 | | | | 0 | | | | | | | | 0 | | | | (258 | ) | | | 0 | | | | (258 | ) | | | (258 | ) | | | 293 | | | | 35 | |
JPM | | | 0 | | | | 0 | | | | 0 | | | | 0 | | | | | | | | 0 | | | | (59 | ) | | | 0 | | | | (59 | ) | | | (59 | ) | | | 0 | | | | (59 | ) |
MYC | | | 0 | | | | 0 | | | | 0 | | | | 0 | | | | | | | | 0 | | | | (65 | ) | | | 0 | | | | (65 | ) | | | (65 | ) | | | 0 | | | | (65 | ) |
| | | | | | | | | | | | | | | | | | | | | | | | | | | | | | | | | | | | | | | | | | | | | | | | |
Total Over the Counter | | $ | 5 | | | $ | 0 | | | $ | 0 | | | $ | 5 | | | | | | | $ | 0 | | | $ | (514 | ) | | $ | 0 | | | $ | (514 | ) | | | | | | | | | | | | |
| | | | | | | | | | | | | | | | | | | | | | | | | | | | | | | | | | | | | | | | | | | | | | | | |
| (p) | Securities with an aggregate market value of $293 have been pledged as collateral for financial derivative instruments as governed by International Swaps and Derivatives Association, Inc. master agreements as of June 30, 2024. |
| | | | | | | | | | | | |
| See Accompanying Notes | | | ANNUAL FINANCIAL AND OTHER INFORMATION | | | | | | | JUNE 30, 2024 | | | 61 |
| | | | | | |
| Schedule of Investments | | PIMCO Active Bond Exchange-Traded Fund | | (Cont.) | | |
| (1) | Notional Amount represents the number of contracts. |
| (2) | Net Exposure represents the net receivable/(payable) that would be due from/to the counterparty in the event of default. Exposure from OTC financial derivative instruments can only be netted across transactions governed under the same master agreement with the same legal entity. See Note 8, Master Netting Arrangements, in the Notes to Financial Statements for more information. |
FAIR VALUE OF FINANCIAL DERIVATIVE INSTRUMENTS
The following is a summary of the fair valuation of the Fund’s derivative instruments categorized by risk exposure. See Note 7, Principal and Other Risks, in the Notes to Financial Statements on risks of the Fund.
Fair Values of Financial Derivative Instruments on the Statements of Assets and Liabilities as of June 30, 2024:
| | | | | | | | | | | | | | | | | | | | | | | | |
| | | Derivatives not accounted for as hedging instruments | |
| | | Commodity
Contracts | | | Credit
Contracts | | | Equity
Contracts | | | Foreign
Exchange
Contracts | | | Interest
Rate Contracts | | | Total | |
Financial Derivative Instruments - Assets | |
Exchange-traded or centrally cleared | |
Futures | | $ | 0 | | | $ | 0 | | | $ | 0 | | | $ | 0 | | | $ | 3,489 | | | $ | 3,489 | |
Swap Agreements | | | 0 | | | | 9 | | | | 0 | | | | 0 | | | | 34 | | | | 43 | |
| | | | | | | | | | | | | | | | | | | | | | | | |
| | $ | 0 | | | $ | 9 | | | $ | 0 | | | $ | 0 | | | $ | 3,523 | | | $ | 3,532 | |
| | | | | | | | | | | | | | | | | | | | | | | | |
Over the counter | |
Forward Foreign Currency Contracts | | $ | 0 | | | $ | 0 | | | $ | 0 | | | $ | 5 | | | $ | 0 | | | $ | 5 | |
| | | | | | | | | | | | | | | | | | | | | | | | |
| | $ | 0 | | | $ | 9 | | | $ | 0 | | | $ | 5 | | | $ | 3,523 | | | $ | 3,537 | |
| | | | | | | | | | | | | | | | | | | | | | | | |
Financial Derivative Instruments - Liabilities | |
Exchange-traded or centrally cleared | |
Written Options | | $ | 0 | | | $ | 0 | | | $ | 0 | | | $ | 0 | | | $ | 7 | | | $ | 7 | |
Futures | | | 0 | | | | 0 | | | | 0 | | | | 0 | | | | 922 | | | | 922 | |
Swap Agreements | | | 0 | | | | 3 | | | | 0 | | | | 0 | | | | 784 | | | | 787 | |
| | | | | | | | | | | | | | | | | | | | | | | | |
| | $ | 0 | | | $ | 3 | | | $ | 0 | | | $ | 0 | | | $ | 1,713 | | | $ | 1,716 | |
| | | | | | | | | | | | | | | | | | | | | | | | |
Over the counter | |
Written Options | | $ | 0 | | | $ | 0 | | | $ | 0 | | | $ | 0 | | | $ | 514 | | | $ | 514 | |
| | | | | | | | | | | | | | | | | | | | | | | | |
| | $ | 0 | | | $ | 3 | | | $ | 0 | | | $ | 0 | | | $ | 2,227 | | | $ | 2,230 | |
| | | | | | | | | | | | | | | | | | | | | | | | |
The effect of Financial Derivative Instruments on the Statements of Operations for the period ended June 30, 2024:
| | | | | | | | | | | | | | | | | | | | | | | | |
| | | Derivatives not accounted for as hedging instruments | |
| | | Commodity
Contracts | | | Credit
Contracts | | | Equity
Contracts | | | Foreign
Exchange
Contracts | | | Interest
Rate Contracts | | | Total | |
Net Realized Gain (Loss) on Financial Derivative Instruments | |
Exchange-traded or centrally cleared | |
Written Options | | $ | 0 | | | $ | 0 | | | $ | 0 | | | $ | 0 | | | $ | 663 | | | $ | 663 | |
Futures | | | 0 | | | | 0 | | | | 0 | | | | 0 | | | | 4,182 | | | | 4,182 | |
Swap Agreements | | | 0 | | | | 2,423 | | | | 0 | | | | 0 | | | | 2,394 | | | | 4,817 | |
| | | | | | | | | | | | | | | | | | | | | | | | |
| | $ | 0 | | | $ | 2,423 | | | $ | 0 | | | $ | 0 | | | $ | 7,239 | | | $ | 9,662 | |
| | | | | | | | | | | | | | | | | | | | | | | | |
Over the counter | |
Forward Foreign Currency Contracts | | $ | 0 | | | $ | 0 | | | $ | 0 | | | $ | 28 | | | $ | 0 | | | $ | 28 | |
Purchased Options | | | 0 | | | | 0 | | | | 0 | | | | 0 | | | | 779 | | | | 779 | |
Written Options | | | 0 | | | | 0 | | | | 0 | | | | 0 | | | | 3,063 | | | | 3,063 | |
Swap Agreements | | | 0 | | | | 1 | | | | 0 | | | | 0 | | | | 0 | | | | 1 | |
| | | | | | | | | | | | | | | | | | | | | | | | |
| | $ | 0 | | | $ | 1 | | | $ | 0 | | | $ | 28 | | | $ | 3,842 | | | $ | 3,871 | |
| | | | | | | | | | | | | | | | | | | | | | | | |
| | $ | 0 | | | $ | 2,424 | | | $ | 0 | | | $ | 28 | | | $ | 11,081 | | | $ | 13,533 | |
| | | | | | | | | | | | | | | | | | | | | | | | |
|
Net Change in Unrealized Appreciation (Depreciation) on Financial Derivative Instruments | |
Exchange-traded or centrally cleared | |
Written Options | | $ | 0 | | | $ | 0 | | | $ | 0 | | | $ | 0 | | | $ | 1 | | | $ | 1 | |
Futures | | | 0 | | | | 0 | | | | 0 | | | | 0 | | | | 2,385 | | | | 2,385 | |
Swap Agreements | | | 0 | | | | (15 | ) | | | 0 | | | | 0 | | | | (1,061 | ) | | | (1,076 | ) |
| | | | | | | | | | | | | | | | | | | | | | | | |
| | $ | 0 | | | $ | (15 | ) | | $ | 0 | | | $ | 0 | | | $ | 1,325 | | | $ | 1,310 | |
| | | | | | | | | | | | | | | | | | | | | | | | |
Over the counter | |
Forward Foreign Currency Contracts | | $ | 0 | | | $ | 0 | | | $ | 0 | | | $ | 57 | | | $ | 0 | | | $ | 57 | |
Written Options | | | 0 | | | | 0 | | | | 0 | | | | 0 | | | | 210 | | | | 210 | |
| | | | | | | | | | | | | | | | | | | | | | | | |
| | $ | 0 | | | $ | 0 | | | $ | 0 | | | $ | 57 | | | $ | 210 | | | $ | 267 | |
| | | | | | | | | | | | | | | | | | | | | | | | |
| | $ | 0 | | | $ | (15 | ) | | $ | 0 | | | $ | 57 | | | $ | 1,535 | | | $ | 1,577 | |
| | | | | | | | | | | | | | | | | | | | | | | | |
| | | | | | |
| 62 | | PIMCO ETF TRUST | | | See Accompanying Notes | |
FAIR VALUE MEASUREMENTS
The following is a summary of the fair valuations according to the inputs used as of June 30, 2024 in valuing the Fund’s assets and liabilities:
| | | | | | | | | | | | | | | | |
| Category and Subcategory | | Level 1 | | | Level 2 | | | Level 3 | | | Fair
Value at
06/30/2024 | |
Investments in Securities, at Value | |
Loan Participations and Assignments | | $ | 0 | | | $ | 7,243 | | | $ | 13,417 | | | $ | 20,660 | |
Corporate Bonds & Notes | |
Banking & Finance | | | 0 | | | | 731,074 | | | | 268 | | | | 731,342 | |
Industrials | | | 0 | | | | 214,997 | | | | 0 | | | | 214,997 | |
Utilities | | | 0 | | | | 78,522 | | | | 0 | | | | 78,522 | |
Municipal Bonds & Notes | |
California | | | 0 | | | | 8,053 | | | | 0 | | | | 8,053 | |
Illinois | | | 0 | | | | 6,259 | | | | 0 | | | | 6,259 | |
Minnesota | | | 0 | | | | 7,022 | | | | 0 | | | | 7,022 | |
New York | | | 0 | | | | 511 | | | | 0 | | | | 511 | |
Texas | | | 0 | | | | 3,452 | | | | 0 | | | | 3,452 | |
West Virginia | | | 0 | | | | 4,040 | | | | 0 | | | | 4,040 | |
U.S. Government Agencies | | | 0 | | | | 2,464,298 | | | | 0 | | | | 2,464,298 | |
U.S. Treasury Obligations | | | 0 | | | | 546,766 | | | | 0 | | | | 546,766 | |
Non-Agency Mortgage-Backed Securities | | | 0 | | | | 317,477 | | | | 9,958 | | | | 327,435 | |
Asset-Backed Securities | | | 0 | | | | 676,815 | | | | 185 | | | | 677,000 | |
Sovereign Issues | | | 0 | | | | 11,496 | | | | 0 | | | | 11,496 | |
Preferred Securities | |
Banking & Finance | | | 0 | | | | 22,955 | | | | 0 | | | | 22,955 | |
Industrials | | | 0 | | | | 2,989 | | | | 0 | | | | 2,989 | |
Short-Term Instruments | |
Repurchase Agreements | | | 0 | | | | 68,862 | | | | 0 | | | | 68,862 | |
| | | | | | | | | | | | | | | | |
| | $ | 0 | | | $ | 5,172,831 | | | $ | 23,828 | | | $ | 5,196,659 | |
| | | | | | | | | | | | | | | | |
| | | | | | | | | | | | | | | | |
| Category and Subcategory | | Level 1 | | | Level 2 | | | Level 3 | | | Fair
Value at
06/30/2024 | |
|
Investments in Affiliates, at Value | |
Mutual Funds | | $ | 81,242 | | | $ | 0 | | | $ | 0 | | | $ | 81,242 | |
| | | | | | | | | | | | | | | | |
| | | | |
Total Investments | | $ | 81,242 | | | $ | 5,172,831 | | | $ | 23,828 | | | $ | 5,277,901 | |
| | | | | | | | | | | | | | | | |
|
Short Sales, at Value - Liabilities | |
U.S. Government Agencies | | $ | 0 | | | $ | (484,617 | ) | | $ | 0 | | | $ | (484,617 | ) |
| | | | | | | | | | | | | | | | |
|
Financial Derivative Instruments - Assets | |
Exchange-traded or centrally cleared | | | 0 | | | | 3,532 | | | | 0 | | | | 3,532 | |
Over the counter | | | 0 | | | | 5 | | | | 0 | | | | 5 | |
| | | | | | | | | | | | | | | | |
| | $ | 0 | | | $ | 3,537 | | | $ | 0 | | | $ | 3,537 | |
| | | | | | | | | | | | | | | | |
|
Financial Derivative Instruments - Liabilities | |
Exchange-traded or centrally cleared | | | 0 | | | | (1,716 | ) | | | 0 | | | | (1,716 | ) |
Over the counter | | | 0 | | | | (514 | ) | | | 0 | | | | (514 | ) |
| | | | | | | | | | | | | | | | |
| | $ | 0 | | | $ | (2,230 | ) | | $ | 0 | | | $ | (2,230 | ) |
| | | | | | | | | | | | | | | | |
| | | | |
Total Financial Derivative Instruments | | $ | 0 | | | $ | 1,307 | | | $ | 0 | | | $ | 1,307 | |
| | | | | | | | | | | | | | | | |
| | | | |
Totals | | $ | 81,242 | | | $ | 4,689,521 | | | $ | 23,828 | | | $ | 4,794,591 | |
| | | | | | | | | | | | | | | | |
There were no significant transfers into or out of Level 3 during the period ended June 30, 2024.
| | | | | | | | | | | | |
| See Accompanying Notes | | | ANNUAL FINANCIAL AND OTHER INFORMATION | | | | | | | JUNE 30, 2024 | | | 63 |
| | | | | | |
| Schedule of Investments | | PIMCO Enhanced Low Duration Active Exchange-Traded Fund | | | | |
(Amounts in thousands*, except number of shares, contracts, units and ounces, if any)
| | | | | | | | | | | | |
| | | | | PRINCIPAL
AMOUNT
(000S) | | | | | MARKET
VALUE
(000S) | |
| INVESTMENTS IN SECURITIES 105.3% | |
| |
| CORPORATE BONDS & NOTES 30.4% | |
| |
| BANKING & FINANCE 22.0% | |
|
ABN AMRO Bank NV | |
6.575% due 10/13/2026 • | | $ | | | 2,200 | | | $ | | | 2,223 | |
|
Athene Global Funding | |
5.516% due 03/25/2027 | | | | | 2,000 | | | | | | 2,006 | |
5.684% due 02/23/2026 | | | | | 3,900 | | | | | | 3,911 | |
5.927% (SOFRINDX + 0.560%) due 08/19/2024 ~ | | | | | 1,255 | | | | | | 1,256 | |
6.585% (SOFRINDX + 1.210%) due 03/25/2027 ~ | | | | | 1,500 | | | | | | 1,509 | |
|
Bank of America Corp. | |
4.827% due 07/22/2026 • | | | | | 5,000 | | | | | | 4,953 | |
6.684% (SOFRRATE + 1.330%) due 04/02/2026 ~ | | | | | 3,000 | | | | | | 3,020 | |
|
Barclays PLC | |
2.852% due 05/07/2026 • | | | | | 800 | | | | | | 780 | |
4.375% due 01/12/2026 | | | | | 400 | | | | | | 393 | |
5.304% due 08/09/2026 • | | | | | 7,700 | | | | | | 7,651 | |
|
BNP Paribas SA | |
3.375% due 01/09/2025 | | | | | 4,000 | | | | | | 3,948 | |
|
BPCE SA | |
2.375% due 01/14/2025 | | | | | 582 | | | | | | 571 | |
6.612% due 10/19/2027 • | | | | | 2,400 | | | | | | 2,438 | |
|
Corebridge Financial, Inc. | |
3.500% due 04/04/2025 | | | | | 7,700 | | | | | | 7,573 | |
|
Danske Bank AS | |
6.466% due 01/09/2026 • | | | | | 3,878 | | | | | | 3,889 | |
|
Deutsche Bank AG | |
3.961% due 11/26/2025 • | | | | | 9,000 | | | | | | 8,924 | |
|
Ford Motor Credit Co. LLC | |
4.134% due 08/04/2025 | | | | | 10,625 | | | | | | 10,430 | |
5.125% due 06/16/2025 | | | | | 1,839 | | | | | | 1,826 | |
|
FS KKR Capital Corp. | |
1.650% due 10/12/2024 | | | | | 5,000 | | | | | | 4,937 | |
|
GA Global Funding Trust | |
0.800% due 09/13/2024 | | | | | 2,153 | | | | | | 2,129 | |
5.872% (SOFRRATE + 0.500%) due 09/13/2024 ~ | | | | | 1,110 | | | | | | 1,110 | |
6.715% (SOFRRATE + 1.360%) due 04/11/2025 ~ | | | | | 3,000 | | | | | | 3,018 | |
|
Goldman Sachs Group, Inc. | |
3.272% due 09/29/2025 • | | | | | 500 | | | | | | 497 | |
|
HSBC Holdings PLC | |
6.985% (US0003M + 1.380%) due 09/12/2026 ~ | | | | | 4,850 | | | | | | 4,904 | |
|
ING Groep NV | |
3.869% due 03/28/2026 • | | | | | 1,500 | | | | | | 1,478 | |
|
JPMorgan Chase & Co. | |
2.005% due 03/13/2026 • | | | | | 3,000 | | | | | | 2,923 | |
2.595% due 02/24/2026 • | | | | | 1,000 | | | | | | 980 | |
5.040% due 01/23/2028 • | | | | | 5,000 | | | | | | 4,974 | |
|
KKR Financial Holdings LLC | |
5.400% due 05/23/2033 | | | | | 5,500 | | | | | | 5,241 | |
|
Lloyds Banking Group PLC | |
3.511% due 03/18/2026 • | | | | | 2,500 | | | | | | 2,459 | |
3.870% due 07/09/2025 • | | | | | 672 | | | | | | 672 | |
4.716% due 08/11/2026 • | | | | | 6,369 | | | | | | 6,297 | |
|
Mitsubishi UFJ Financial Group, Inc. | |
5.541% due 04/17/2026 • | | | | | 6,800 | | | | | | 6,795 | |
6.306% (SOFRRATE + 0.940%) due 02/20/2026 ~ | | | | | 3,500 | | | | | | 3,512 | |
|
Morgan Stanley | |
4.679% due 07/17/2026 • | | | | | 5,000 | | | | | | 4,952 | |
|
Nissan Motor Acceptance Co. LLC | |
1.850% due 09/16/2026 | | | | | 4,745 | | | | | | 4,346 | |
|
Nomura Holdings, Inc. | |
5.594% due 07/02/2027 (a) | | | | | 2,300 | | | | | | 2,301 | |
|
Pacific Life Global Funding | |
5.991% (SOFRRATE + 0.620%) due 06/04/2026 ~ | | | | | 1,496 | | | | | | 1,499 | |
| | | | | | | | | | | | |
| | | | | PRINCIPAL
AMOUNT
(000S) | | | | | MARKET
VALUE
(000S) | |
|
Santander U.K. Group Holdings PLC | |
6.833% due 11/21/2026 • | | $ | | | 5,000 | | | $ | | | 5,068 | |
|
Societe Generale SA | |
2.226% due 01/21/2026 • | | | | | 2,000 | | | | | | 1,957 | |
2.625% due 01/22/2025 | | | | | 6,824 | | | | | | 6,692 | |
|
Standard Chartered PLC | |
3.971% due 03/30/2026 • | | | | | 2,300 | | | | | | 2,268 | |
6.266% due 11/23/2025 | | | | | 2,000 | | | | | | 2,002 | |
7.116% (SOFRRATE + 1.740%) due 03/30/2026 ~ | | | | | 5,000 | | | | | | 5,033 | |
|
Synchrony Bank | |
5.400% due 08/22/2025 | | | | | 7,200 | | | | | | 7,148 | |
|
UBS Group AG | |
4.488% due 05/12/2026 • | | | | | 12,000 | | | | | | 11,861 | |
6.373% due 07/15/2026 • | | | | | 1,900 | | | | | | 1,910 | |
|
VICI Properties LP | |
4.375% due 05/15/2025 | | | | | 1,700 | | | | | | 1,679 | |
|
Wells Fargo & Co. | |
2.406% due 10/30/2025 • | | | | | 7,000 | | | | | | 6,921 | |
5.707% due 04/22/2028 • | | | | | 6,400 | | | | | | 6,457 | |
| | | | | | | | | | | | |
| | | | | | | | | | | 191,321 | |
| | | | | | | | | | | | |
| |
| INDUSTRIALS 6.3% | |
|
American Airlines Pass-Through Trust | |
4.000% due 01/15/2027 | | | | | 368 | | | | | | 360 | |
|
Bayer U.S. Finance LLC | |
4.375% due 12/15/2028 | | | | | 1,500 | | | | | | 1,425 | |
6.125% due 11/21/2026 | | | | | 2,200 | | | | | | 2,224 | |
6.250% due 01/21/2029 | | | | | 2,000 | | | | | | 2,043 | |
|
Berry Global, Inc. | |
4.875% due 07/15/2026 | | | | | 931 | | | | | | 915 | |
|
Boeing Co. | |
2.196% due 02/04/2026 | | | | | 2,400 | | | | | | 2,257 | |
2.750% due 02/01/2026 | | | | | 300 | | | | | | 285 | |
6.259% due 05/01/2027 | | | | | 600 | | | | | | 604 | |
|
Canadian Pacific Railway Co. | |
3.125% due 06/01/2026 | | | | | 700 | | | | | | 671 | |
|
Daimler Truck Finance North America LLC | |
6.121% (SOFRRATE + 0.750%) due 12/13/2024 ~ | | | | | 750 | | | | | | 752 | |
|
Dell International LLC | |
4.900% due 10/01/2026 | | | | | 1,700 | | | | | | 1,684 | |
|
Illumina, Inc. | |
5.800% due 12/12/2025 | | | | | 1,700 | | | | | | 1,702 | |
|
Imperial Brands Finance PLC | |
3.125% due 07/26/2024 | | | | | 8,100 | | | | | | 8,085 | |
4.250% due 07/21/2025 | | | | | 1,841 | | | | | | 1,814 | |
|
Las Vegas Sands Corp. | |
5.900% due 06/01/2027 | | | | | 3,000 | | | | | | 3,017 | |
|
Renesas Electronics Corp. | |
1.543% due 11/26/2024 | | | | | 9,700 | | | | | | 9,526 | |
|
Rolls-Royce PLC | |
3.625% due 10/14/2025 | | | | | 8,642 | | | | | | 8,409 | |
|
Sands China Ltd. | |
5.125% due 08/08/2025 | | | | | 2,800 | | | | | | 2,778 | |
|
SK Hynix, Inc. | |
1.500% due 01/19/2026 | | | | | 3,100 | | | | | | 2,911 | |
|
Warnermedia Holdings, Inc. | |
3.788% due 03/15/2025 | | | | | 3,300 | | | | | | 3,252 | |
| | | | | | | | | | | | |
| | | | | | | | | | | 54,714 | |
| | | | | | | | | | | | |
| |
| UTILITIES 2.1% | |
|
Chugoku Electric Power Co., Inc. | |
2.401% due 08/27/2024 | | | | | 1,000 | | | | | | 995 | |
|
Enel Finance International NV | |
5.125% due 06/26/2029 | | | | | 1,000 | | | | | | 984 | |
6.800% due 10/14/2025 | | | | | 2,500 | | | | | | 2,540 | |
|
FirstEnergy Corp. | |
4.150% due 07/15/2027 | | | | | 901 | | | | | | 865 | |
|
Israel Electric Corp. Ltd. | |
5.000% due 11/12/2024 | | | | | 9,600 | | | | | | 9,537 | |
| | | | | | | | | | | | |
| | | | | PRINCIPAL
AMOUNT
(000S) | | | | | MARKET
VALUE
(000S) | |
|
Pacific Gas & Electric Co. | |
4.950% due 06/08/2025 | | $ | | | 3,500 | | | $ | | | 3,470 | |
| | | | | | | | | | | | |
| | | | | | | | | | | 18,391 | |
| | | | | | | | | | | | |
Total Corporate Bonds & Notes (Cost $265,099) | | | 264,426 | |
| | | | |
| |
| MUNICIPAL BONDS & NOTES 0.7% | |
| |
| LOUISIANA 0.7% | |
|
Tulane University, Louisiana Revenue Bonds, (NPFGC Insured), Series 2007 | |
5.884% (US0003M + 0.300%) due 02/15/2036 ~ | | | | | 6,500 | | | | | | 5,984 | |
| | | | | | | | | | | | |
Total Municipal Bonds & Notes (Cost $5,983) | | | 5,984 | |
| | | | |
| |
| U.S. GOVERNMENT AGENCIES 8.8% | |
|
Fannie Mae | |
4.000% due 06/01/2042 - 03/01/2047 | | | | | 423 | | | | | | 397 | |
5.000% due 07/01/2033 - 07/01/2044 | | | | | 1,224 | | | | | | 1,184 | |
5.150% due 05/01/2035 | | | | | 36 | | | | | | 35 | |
5.350% due 02/01/2035 - 01/01/2038 | | | | | 274 | | | | | | 271 | |
5.450% due 04/01/2036 | | | | | 81 | | | | | | 80 | |
5.500% due 12/01/2031 - 03/01/2050 | | | | | 944 | | | | | | 935 | |
6.000% due 09/01/2028 - 04/01/2048 | | | | | 598 | | | | | | 600 | |
6.500% due 07/01/2036 - 09/01/2048 | | | | | 297 | | | | | | 301 | |
|
Freddie Mac | |
2.000% due 02/01/2028 - 04/01/2028 | | | | | 3 | | | | | | 2 | |
2.500% due 10/25/2048 | | | | | 138 | | | | | | 122 | |
5.000% due 10/01/2033 - 02/01/2038 | | | | | 267 | | | | | | 264 | |
5.400% due 09/01/2037 - 11/01/2038 | | | | | 313 | | | | | | 313 | |
5.500% due 08/01/2033 - 06/01/2047 | | | | | 1,023 | | | | | | 1,023 | |
5.520% due 05/28/2025 | | | | | 15,700 | | | | | | 15,698 | |
5.550% due 06/01/2037 - 07/01/2037 | | | | | 85 | | | | | | 86 | |
6.000% due 09/01/2031 - 05/01/2033 | | | | | 26 | | | | | | 26 | |
6.500% due 11/01/2036 - 10/17/2038 | | | | | 289 | | | | | | 290 | |
7.000% due 05/01/2029 | | | | | 11 | | | | | | 11 | |
|
Ginnie Mae | |
2.500% due 10/20/2049 | | | | | 117 | | | | | | 100 | |
3.000% due 11/20/2046 | | | | | 80 | | | | | | 70 | |
3.500% due 05/20/2042 | | | | | 59 | | | | | | 53 | |
3.700% due 04/15/2042 | | | | | 106 | | | | | | 99 | |
3.740% due 03/20/2042 - 07/20/2042 | | | | | 72 | | | | | | 66 | |
3.750% due 04/15/2042 - 03/20/2044 | | | | | 127 | | | | | | 118 | |
4.000% due 04/20/2040 - 06/20/2043 | | | | | 536 | | | | | | 497 | |
4.500% due 08/20/2038 - 11/20/2048 | | | | | 468 | | | | | | 451 | |
5.350% due 12/15/2036 - 01/15/2038 | | | | | 297 | | | | | | 299 | |
5.400% due 06/20/2039 | | | | | 81 | | | | | | 81 | |
5.500% due 03/20/2034 - 08/20/2041 | | | | | 327 | | | | | | 324 | |
6.000% due 09/20/2038 | | | | | 38 | | | | | | 38 | |
6.083% due 10/20/2072 • | | | | | 1,139 | | | | | | 1,135 | |
6.233% due 01/20/2074 • | | | | | 2,628 | | | | | | 2,638 | |
6.313% due 09/20/2073 • | | | | | 7,876 | | | | | | 7,930 | |
6.443% due 08/16/2039 • | | | | | 3 | | | | | | 3 | |
6.500% due 09/20/2025 - 07/20/2039 | | | | | 30 | | | | | | 31 | |
7.000% due 05/15/2026 - 06/20/2039 | | | | | 558 | | | | | | 562 | |
| | | | | | |
| 64 | | PIMCO ETF TRUST | | | See Accompanying Notes | |
| | | | | | | | | | | | |
| | | | | PRINCIPAL
AMOUNT
(000S) | | | | | MARKET
VALUE
(000S) | |
|
Uniform Mortgage-Backed Security | |
4.250% due 01/01/2036 | | $ | | | 78 | | | $ | | | 75 | |
4.750% due 09/01/2034 - 04/01/2036 | | | | | 298 | | | | | | 291 | |
5.340% due 09/01/2029 | | | | | 42 | | | | | | 43 | |
6.000% due 06/01/2031 | | | | | 1 | | | | | | 1 | |
|
Uniform Mortgage-Backed Security, TBA | |
5.000% due 07/01/2054 | | | | | 41,300 | | | | | | 39,919 | |
| | | | | | | | | | | | |
Total U.S. Government Agencies (Cost $76,857) | | | 76,462 | |
| | | | |
| |
| U.S. TREASURY OBLIGATIONS 22.2% | |
|
U.S. Treasury Inflation Protected Securities (b) | |
2.125% due 04/15/2029 (c) | | | | | 29,394 | | | | | | 29,437 | |
|
U.S. Treasury Notes | |
5.000% due 08/31/2025 | | | | | 163,700 | | | | | | 163,594 | |
| | | | | | | | | | | | |
Total U.S. Treasury Obligations (Cost $193,383) | | | 193,031 | |
| | | | |
| |
| NON-AGENCY MORTGAGE-BACKED SECURITIES 13.4% | |
|
Angel Oak Mortgage Trust | |
1.469% due 06/25/2065 ~ | | | | | 428 | | | | | | 399 | |
|
Bear Stearns ALT-A Trust | |
5.310% due 05/25/2035 ~ | | | | | 24 | | | | | | 23 | |
5.780% due 02/25/2034 • | | | | | 625 | | | | | | 571 | |
|
Beneria Cowen & Pritzer Collateral Funding Corp. | |
6.242% due 06/15/2038 • | | | | | 5,600 | | | | | | 5,260 | |
|
BFLD Trust | |
6.593% due 10/15/2035 • | | | | | 2,000 | | | | | | 1,631 | |
|
BWAY Mortgage Trust | |
6.693% due 09/15/2036 • | | | | | 3,000 | | | | | | 2,866 | |
|
BX Trust | |
6.143% due 01/15/2034 • | | | | | 2,912 | | | | | | 2,887 | |
|
Chase Mortgage Finance Trust | |
5.779% due 02/25/2037 «~ | | | | | 294 | | | | | | 275 | |
|
Chevy Chase Funding LLC Mortgage-Backed Certificates | |
5.660% due 01/25/2036 • | | | | | 24 | | | | | | 22 | |
5.690% due 10/25/2035 • | | | | | 153 | | | | | | 141 | |
5.760% due 08/25/2035 «• | | | | | 16 | | | | | | 15 | |
|
Citigroup Commercial Mortgage Trust | |
6.623% due 10/15/2036 • | | | | | 1,950 | | | | | | 1,936 | |
|
Citigroup Mortgage Loan Trust | |
5.000% due 05/25/2051 • | | | | | 3,658 | | | | | | 3,388 | |
|
Countrywide Alternative Loan Trust | |
5.740% due 06/25/2037 • | | | | | 52 | | | | | | 45 | |
|
Credit Suisse Mortgage Capital Mortgage-Backed Trust | |
3.180% due 12/26/2059 ~ | | | | | 916 | | | | | | 930 | |
|
DROP Mortgage Trust | |
6.593% due 10/15/2043 • | | | | | 6,000 | | | | | | 5,725 | |
|
Extended Stay America Trust | |
6.523% due 07/15/2038 • | | | | | 5,084 | | | | | | 5,068 | |
|
First Horizon Alternative Mortgage Securities Trust | |
6.824% due 02/25/2035 ~ | | | | | 159 | | | | | | 147 | |
|
GCAT Trust | |
1.348% due 05/25/2066 ~ | | | | | 2,433 | | | | | | 2,029 | |
1.503% due 05/25/2066 ~ | | | | | 2,198 | | | | | | 1,841 | |
2.650% due 10/25/2068 ~ | | | | | 300 | | | | | | 284 | |
2.885% due 12/27/2066 ~ | | | | | 1,784 | | | | | | 1,621 | |
|
GCT Commercial Mortgage Trust | |
6.243% due 02/15/2038 • | | | | | 800 | | | | | | 660 | |
|
Ginnie Mae | |
6.333% due 05/20/2073 • | | | | | 11,120 | | | | | | 11,216 | |
|
GS Mortgage Securities Corp. Trust | |
8.729% due 08/15/2039 • | | | | | 7,300 | | | | | | 7,316 | |
|
GS Mortgage-Backed Securities Trust | |
5.000% due 12/25/2051 • | | | | | 2,424 | | | | | | 2,245 | |
5.000% due 02/25/2052 • | | | | | 3,994 | | | | | | 3,699 | |
|
GSR Mortgage Loan Trust | |
6.455% due 09/25/2035 «~ | | | | | 2 | | | | | | 2 | |
7.693% due 08/25/2033 «• | | | | | 53 | | | | | | 48 | |
|
Impac CMB Trust | |
6.100% due 03/25/2035 • | | | | | 69 | | | | | | 64 | |
| | | | | | | | | | | | |
| | | | | PRINCIPAL
AMOUNT
(000S) | | | | | MARKET
VALUE
(000S) | |
|
InTown Mortgage Trust | |
7.818% due 08/15/2039 • | | $ | | | 2,900 | | | $ | | | 2,910 | |
|
JP Morgan Chase Commercial Mortgage Securities Trust | |
3.379% due 09/15/2050 | | | | | 199 | | | | | | 196 | |
6.493% due 04/15/2038 • | | | | | 945 | | | | | | 945 | |
6.826% due 12/15/2031 • | | | | | 572 | | | | | | 516 | |
|
JP Morgan Mortgage Trust | |
5.266% due 07/25/2035 ~ | | | | | 167 | | | | | | 154 | |
|
JPMBB Commercial Mortgage Securities Trust | |
3.801% due 09/15/2047 | | | | | 3,217 | | | | | | 3,208 | |
|
Legacy Mortgage Asset Trust | |
4.991% due 09/25/2060 ~ | | | | | 349 | | | | | | 349 | |
|
MASTR Adjustable Rate Mortgages Trust | |
6.415% due 04/21/2034 «~ | | | | | 14 | | | | | | 13 | |
|
Merrill Lynch Mortgage Investors Trust | |
5.920% due 04/25/2029 • | | | | | 93 | | | | | | 86 | |
5.925% due 12/25/2035 ~ | | | | | 155 | | | | | | 144 | |
|
MFA Trust | |
1.131% due 07/25/2060 ~ | | | | | 2,214 | | | | | | 1,958 | |
6.105% due 12/25/2068 þ | | | | | 955 | | | | | | 958 | |
|
Morgan Stanley Mortgage Loan Trust | |
6.540% due 11/25/2035 • | | | | | 755 | | | | | | 749 | |
|
Morgan Stanley Residential Mortgage Loan Trust | |
5.000% due 09/25/2051 • | | | | | 800 | | | | | | 740 | |
|
New Residential Mortgage Loan Trust | |
0.941% due 10/25/2058 ~ | | | | | 1,103 | | | | | | 1,012 | |
2.464% due 01/26/2060 ~ | | | | | 4,400 | | | | | | 4,044 | |
3.500% due 12/25/2057 ~ | | | | | 954 | | | | | | 905 | |
3.500% due 10/25/2059 ~ | | | | | 379 | | | | | | 348 | |
4.500% due 05/25/2058 ~ | | | | | 91 | | | | | | 88 | |
|
NYO Commercial Mortgage Trust | |
6.538% due 11/15/2038 • | | | | | 6,000 | | | | | | 5,773 | |
|
OBX Trust | |
1.957% due 10/25/2061 ~ | | | | | 218 | | | | | | 179 | |
6.520% due 07/25/2063 þ | | | | | 2,252 | | | | | | 2,262 | |
|
One New York Plaza Trust | |
6.393% due 01/15/2036 • | | | | | 3,700 | | | | | | 3,604 | |
|
ONE Park Mortgage Trust | |
6.143% due 03/15/2036 • | | | | | 3,914 | | | | | | 3,806 | |
|
PRKCM Trust | |
6.333% due 03/25/2059 þ | | | | | 376 | | | | | | 377 | |
|
PRPM Trust | |
6.221% due 11/25/2068 þ | | | | | 641 | | | | | | 641 | |
|
RESIMAC Premier | |
6.094% due 02/03/2053 • | | | | | 1,151 | | | | | | 1,149 | |
|
Sequoia Mortgage Trust | |
5.853% due 07/20/2036 • | | | | | 455 | | | | | | 389 | |
6.113% due 06/20/2033 «• | | | | | 1 | | | | | | 1 | |
|
Starwood Mortgage Residential Trust | |
1.486% due 04/25/2065 ~ | | | | | 284 | | | | | | 271 | |
|
Starwood Mortgage Trust | |
6.543% due 04/15/2034 • | | | | | 1,656 | | | | | | 1,643 | |
|
Structured Asset Mortgage Investments Trust | |
6.033% due 07/19/2034 «• | | | | | 2 | | | | | | 2 | |
6.113% due 09/19/2032 • | | | | | 3 | | | | | | 3 | |
|
Thornburg Mortgage Securities Trust | |
5.589% due 04/25/2045 «~ | | | | | 33 | | | | | | 30 | |
|
Towd Point Mortgage Trust | |
2.250% due 11/25/2061 ~ | | | | | 687 | | | | | | 628 | |
2.250% due 12/25/2061 ~ | | | | | 2,388 | | | | | | 2,274 | |
3.750% due 05/25/2058 ~ | | | | | 1,837 | | | | | | 1,777 | |
6.060% due 02/25/2057 • | | | | | 40 | | | | | | 41 | |
6.460% due 05/25/2058 • | | | | | 682 | | | | | | 698 | |
6.460% due 10/25/2059 • | | | | | 455 | | | | | | 463 | |
|
Verus Securitization Trust | |
5.712% due 01/25/2069 þ | | | | | 1,862 | | | | | | 1,851 | |
6.259% due 12/25/2068 þ | | | | | 4,535 | | | | | | 4,552 | |
6.476% due 06/25/2068 þ | | | | | 2,394 | | | | | | 2,399 | |
|
WaMu Mortgage Pass-Through Certificates Trust | |
3.973% due 07/25/2037 ~ | | | | | 354 | | | | | | 295 | |
6.080% due 01/25/2045 • | | | | | 6 | | | | | | 6 | |
6.133% due 06/25/2046 • | | | | | 22 | | | | | | 19 | |
6.260% due 06/25/2044 • | | | | | 357 | | | | | | 326 | |
| | | | | | | | | | | | |
| | | | | PRINCIPAL
AMOUNT
(000S) | | | | | MARKET
VALUE
(000S) | |
6.292% due 06/25/2033 «~ | | $ | | | 1 | | | $ | | | 1 | |
6.320% due 10/25/2045 • | | | | | 54 | | | | | | 51 | |
| | | | | | | | | | | | |
Total Non-Agency Mortgage-Backed Securities (Cost $121,537) | | | 117,188 | |
| | | | |
| |
| ASSET-BACKED SECURITIES 29.0% | |
|
Anchorage Capital CLO Ltd. | |
6.432% due 10/15/2031 (a) | | | | | 2,500 | | | | | | 2,500 | |
6.765% due 04/22/2034 • | | | | | 1,700 | | | | | | 1,703 | |
|
AREIT LLC | |
7.571% due 06/17/2039 • | | | | | 7,200 | | | | | | 7,229 | |
|
Ascent Education Funding Trust | |
6.140% due 10/25/2050 | | | | | 2,261 | | | | | | 2,281 | |
|
Asset-Backed Securities Corp. Home Equity Loan Trust | |
6.270% due 06/25/2034 • | | | | | 62 | | | | | | 63 | |
|
Atlas Static Senior Loan Fund Ltd. | |
7.079% due 07/15/2030 • | | | | | 4,193 | | | | | | 4,213 | |
|
Avis Budget Rental Car Funding AESOP LLC | |
5.900% due 08/21/2028 | | | | | 8,100 | | | | | | 8,205 | |
|
Bank of America Auto Trust | |
5.530% due 02/15/2028 | | | | | 3,600 | | | | | | 3,609 | |
|
Bear Stearns Asset-Backed Securities Trust | |
6.195% due 09/25/2035 • | | | | | 714 | | | | | | 710 | |
6.260% due 10/27/2032 «• | | | | | 10 | | | | | | 10 | |
6.360% due 08/25/2034 • | | | | | 433 | | | | | | 417 | |
|
Benefit Street Partners CLO Ltd. | |
6.540% due 10/15/2030 • | | | | | 832 | | | | | | 833 | |
6.609% due 01/17/2032 • | | | | | 388 | | | | | | 389 | |
|
BXMT Ltd. | |
6.843% due 11/15/2037 • | | | | | 3,013 | | | | | | 2,958 | |
|
Carlyle U.S. CLO Ltd. | |
6.586% due 04/20/2031 • | | | | | 3,550 | | | | | | 3,553 | |
|
CarMax Auto Owner Trust | |
6.080% due 12/15/2026 | | | | | 5,933 | | | | | | 5,952 | |
|
Carvana Auto Receivables Trust | |
5.380% due 03/12/2029 | | | | | 2,500 | | | | | | 2,505 | |
5.820% due 08/10/2028 | | | | | 2,700 | | | | | | 2,717 | |
|
Chase Funding Trust | |
6.060% due 07/25/2033 «• | | | | | 210 | | | | | | 200 | |
|
Citizens Auto Receivables Trust | |
5.830% due 02/15/2028 | | | | | 5,000 | | | | | | 5,033 | |
|
Countrywide Asset-Backed Certificates Trust | |
3.645% due 03/25/2036 • | | | | | 126 | | | | | | 123 | |
5.760% due 09/25/2046 • | | | | | 73 | | | | | | 72 | |
|
CQS U.S. CLO Ltd. | |
7.175% due 07/20/2031 • | | | | | 1,128 | | | | | | 1,131 | |
|
DLLAD LLC | |
5.190% due 04/20/2026 | | | | | 3,112 | | | | | | 3,107 | |
|
Dryden CLO Ltd. | |
6.640% due 07/15/2031 • | | | | | 7,011 | | | | | | 7,021 | |
|
Dryden Senior Loan Fund | |
6.570% due 04/15/2028 • | | | | | 854 | | | | | | 855 | |
6.610% due 04/15/2029 • | | | | | 1,895 | | | | | | 1,896 | |
|
Elevation CLO Ltd. | |
6.535% due 10/25/2030 • | | | | | 3,258 | | | | | | 3,261 | |
|
ELFI Graduate Loan Program LLC | |
1.530% due 12/26/2046 | | | | | 4,148 | | | | | | 3,572 | |
|
Enterprise Fleet Financing LLC | |
5.510% due 01/22/2029 | | | | | 5,191 | | | | | | 5,183 | |
5.760% due 10/22/2029 | | | | | 4,680 | | | | | | 4,684 | |
|
Finance America Mortgage Loan Trust | |
6.285% due 08/25/2034 • | | | | | 113 | | | | | | 106 | |
|
First Franklin Mortgage Loan Trust | |
5.780% due 04/25/2036 • | | | | | 983 | | | | | | 947 | |
6.210% due 11/25/2034 • | | | | | 85 | | | | | | 83 | |
|
Ford Credit Auto Owner Trust | |
4.850% due 08/15/2035 | | | | | 6,100 | | | | | | 6,056 | |
|
GECU Auto Receivables Trust | |
5.630% due 08/15/2028 | | | | | 2,400 | | | | | | 2,404 | |
|
GM Financial Automobile Leasing Trust | |
5.090% due 03/22/2027 | | | | | 2,500 | | | | | | 2,489 | |
5.270% due 06/20/2025 | | | | | 263 | | | | | | 263 | |
| | | | | | | | | | | | |
| See Accompanying Notes | | | ANNUAL FINANCIAL AND OTHER INFORMATION | | | | | | | JUNE 30, 2024 | | | 65 |
| | | | | | |
| Schedule of Investments | | PIMCO Enhanced Low Duration Active Exchange-Traded Fund | | (Cont.) | | |
| | | | | | | | | | | | |
| | | | | PRINCIPAL
AMOUNT
(000S) | | | | | MARKET
VALUE
(000S) | |
|
GM Financial Consumer Automobile Receivables Trust | |
5.953% due 03/16/2026 • | | $ | | | 1,783 | | | $ | | | 1,784 | |
|
Golden Credit Card Trust | |
4.310% due 09/15/2027 | | | | | 10,000 | | | | | | 9,862 | |
|
Greenwood Park CLO Ltd. | |
6.600% due 04/15/2031 • | | | | | 2,738 | | | | | | 2,741 | |
|
Greystone Commercial Real Estate Notes Ltd. | |
6.623% due 09/15/2037 • | | | | | 76 | | | | | | 76 | |
|
GSAA Home Equity Trust | |
6.000% due 07/25/2037 «• | | | | | 100 | | | | | | 91 | |
|
GSAMP Trust | |
5.980% due 06/25/2036 • | | | | | 484 | | | | | | 460 | |
|
HERA Commercial Mortgage Ltd. | |
6.496% due 02/18/2038 • | | | | | 2,386 | | | | | | 2,360 | |
|
Home Equity Asset Trust | |
6.510% due 11/25/2034 • | | | | | 871 | | | | | | 859 | |
|
Huntington Auto Trust | |
5.230% due 01/16/2029 | | | | | 3,000 | | | | | | 2,994 | |
|
Hyundai Auto Lease Securitization Trust | |
5.200% due 04/15/2025 | | | | | 219 | | | | | | 219 | |
|
Hyundai Auto Receivables Trust | |
5.350% due 11/17/2025 | | | | | 443 | | | | | | 443 | |
|
KKR CLO Ltd. | |
6.529% due 07/18/2030 • | | | | | 319 | | | | | | 320 | |
6.540% due 07/15/2030 • | | | | | 1,182 | | | | | | 1,184 | |
|
LAD Auto Receivables Trust | |
5.610% due 08/15/2028 | | | | | 2,700 | | | | | | 2,704 | |
6.210% due 10/15/2026 | | | | | 3,171 | | | | | | 3,176 | |
|
LCCM Trust | |
6.643% due 12/13/2038 • | | | | | 3,105 | | | | | | 3,043 | |
|
LCM LP | |
6.586% due 07/20/2030 • | | | | | 1,651 | | | | | | 1,653 | |
|
LCM Ltd. | |
6.666% due 04/20/2031 • | | | | | 1,100 | | | | | | 1,101 | |
|
MF1 Ltd. | |
7.143% due 11/15/2035 • | | | | | 711 | | | | | | 710 | |
|
MF1 Multifamily Housing Mortgage Loan Trust | |
6.293% due 07/15/2036 • | | | | | 789 | | | | | | 787 | |
|
MidOcean Credit CLO | |
6.616% due 01/29/2030 • | | | | | 40 | | | | | | 40 | |
|
MKS CLO Ltd. | |
6.586% due 07/20/2030 • | | | | | 1,827 | | | | | | 1,828 | |
|
Mountain View CLO LLC | |
6.679% due 10/16/2029 • | | | | | 67 | | | | | | 67 | |
|
Navient Private Education Loan Trust | |
2.460% due 11/15/2068 | | | | | 615 | | | | | | 579 | |
6.893% due 07/16/2040 • | | | | | 1,424 | | | | | | 1,430 | |
|
Navient Private Education Refi Loan Trust | |
0.840% due 05/15/2069 | | | | | 1,007 | | | | | | 890 | |
1.170% due 09/16/2069 | | | | | 1,366 | | | | | | 1,236 | |
1.310% due 01/15/2069 | | | | | 504 | | | | | | 464 | |
1.690% due 05/15/2069 | | | | | 1,839 | | | | | | 1,684 | |
2.230% due 07/15/2070 | | | | | 4,247 | | | | | | 3,751 | |
6.443% due 04/15/2069 • | | | | | 1,486 | | | | | | 1,488 | |
|
Navient Student Loan Trust | |
6.480% due 03/15/2072 | | | | | 6,740 | | | | | | 6,838 | |
|
New Century Home Equity Loan Trust | |
6.390% due 11/25/2034 • | | | | | 317 | | | | | | 312 | |
|
NovaStar Mortgage Funding Trust | |
6.120% due 01/25/2036 • | | | | | 146 | | | | | | 144 | |
| | | | | | | | | | | | |
| | | | | PRINCIPAL
AMOUNT
(000S) | | | | | MARKET
VALUE
(000S) | |
|
Oaktree CLO Ltd. | |
6.696% due 04/22/2030 • | | $ | | | 1,600 | | | $ | | | 1,602 | |
|
Palmer Square Loan Funding Ltd. | |
6.390% due 10/15/2029 • | | | | | 92 | | | | | | 93 | |
|
PFP Ltd. | |
6.444% due 08/09/2037 • | | | | | 305 | | | | | | 302 | |
7.605% due 08/19/2035 • | | | | | 6,000 | | | | | | 6,009 | |
|
PFS Financing Corp. | |
5.520% due 10/15/2028 | | | | | 5,000 | | | | | | 5,029 | |
|
PRET LLC | |
2.487% due 07/25/2051 þ | | | | | 1,459 | | | | | | 1,436 | |
4.992% due 02/25/2061 þ | | | | | 1,251 | | | | | | 1,241 | |
|
RAAC Trust | |
6.010% due 01/25/2046 • | | | | | 323 | | | | | | 320 | |
|
Ready Capital Mortgage Financing LLC | |
7.719% due 10/25/2039 • | | | | | 1,661 | | | | | | 1,671 | |
|
Renaissance Home Equity Loan Trust | |
4.284% due 08/25/2033 • | | | | | 681 | | | | | | 612 | |
|
Residential Asset Securities Corp. Trust | |
6.160% due 06/25/2035 «• | | | | | 156 | | | | | | 151 | |
6.555% due 03/25/2035 • | | | | | 233 | | | | | | 230 | |
|
Saranac CLO Ltd. | |
6.748% due 08/13/2031 • | | | | | 3,844 | | | | | | 3,857 | |
|
Saxon Asset Securities Trust | |
1.979% due 05/25/2035 • | | | | | 120 | | | | | | 112 | |
|
SBA Tower Trust | |
3.869% due 10/15/2049 þ | | | | | 1,000 | | | | | | 994 | |
|
Securitized Asset-Backed Receivables LLC Trust | |
6.135% due 01/25/2035 • | | | | | 97 | | | | | | 84 | |
|
SLM Student Loan Trust | |
6.359% due 04/25/2049 | | | | | 46 | | | | | | 45 | |
|
SMB Private Education Loan Trust | |
1.600% due 09/15/2054 | | | | | 799 | | | | | | 729 | |
2.230% due 09/15/2037 | | | | | 1,324 | | | | | | 1,245 | |
4.480% due 05/16/2050 | | | | | 2,462 | | | | | | 2,397 | |
5.380% due 07/05/2053 | | | | | 2,500 | | | | | | 2,502 | |
5.670% due 11/15/2052 | | | | | 4,322 | | | | | | 4,367 | |
6.043% due 03/17/2053 • | | | | | 362 | | | | | | 357 | |
6.310% due 09/15/2054 • | | | | | 3,176 | | | | | | 3,169 | |
|
SoFi Consumer Loan Program Trust | |
5.810% due 05/15/2031 | | | | | 768 | | | | | | 768 | |
|
SoFi Professional Loan Program LLC | |
3.020% due 02/25/2040 | | | | | 45 | | | | | | 43 | |
|
SoFi Professional Loan Program Trust | |
1.950% due 02/15/2046 | | | | | 490 | | | | | | 448 | |
|
Sound Point CLO Ltd. | |
6.565% due 07/25/2030 • | | | | | 781 | | | | | | 781 | |
|
Soundview Home Loan Trust | |
6.135% due 06/25/2035 • | | | | | 159 | | | | | | 155 | |
|
Structured Asset Investment Loan Trust | |
6.010% due 09/25/2034 • | | | | | 1,513 | | | | | | 1,419 | |
6.165% due 03/25/2034 • | | | | | 351 | | | | | | 348 | |
|
Structured Asset Securities Corp. Mortgage Loan Trust | |
5.730% due 07/25/2036 • | | | | | 99 | | | | | | 98 | |
|
Synchrony Card Funding LLC | |
5.540% due 07/15/2029 | | | | | 8,000 | | | | | | 8,059 | |
|
Tesla Auto Lease Trust | |
6.130% due 09/21/2026 | | | | | 4,200 | | | | | | 4,224 | |
|
TIAA CLO Ltd. | |
0.000% due 01/20/2032 •(a) | | | | | 2,600 | | | | | | 2,600 | |
| | | | | | | | | | | | |
| | | | | PRINCIPAL
AMOUNT
(000S) | | | | | MARKET
VALUE
(000S) | |
|
Towd Point Asset Trust | |
6.153% due 11/20/2061 • | | $ | | | 957 | | | $ | | | 951 | |
|
Toyota Auto Receivables Owner Trust | |
5.160% due 04/17/2028 | | | | | 3,000 | | | | | | 2,993 | |
5.270% due 01/15/2026 | | | | | 1,283 | | | | | | 1,282 | |
5.280% due 05/15/2026 | | | | | 3,367 | | | | | | 3,363 | |
|
Trillium Credit Card Trust | |
6.196% due 08/26/2028 • | | | | | 10,000 | | | | | | 10,045 | |
|
Venture CLO Ltd. | |
6.636% due 07/20/2030 • | | | | | 6,584 | | | | | | 6,593 | |
6.686% due 01/20/2029 • | | | | | 339 | | | | | | 340 | |
6.716% due 04/20/2032 • | | | | | 1,100 | | | | | | 1,101 | |
|
Verdelite Static CLO Ltd. | |
0.000% due 07/20/2032 •(a) | | | | | 4,000 | | | | | | 4,000 | |
|
Vibrant CLO Ltd. | |
6.706% due 07/20/2032 • | | | | | 300 | | | | | | 300 | |
|
VMC Finance LLC | |
6.546% due 06/16/2036 • | | | | | 241 | | | | | | 240 | |
|
Voya CLO Ltd. | |
6.529% due 04/17/2030 • | | | | | 2,188 | | | | | | 2,191 | |
6.590% due 10/15/2030 • | | | | | 1,979 | | | | | | 1,982 | |
|
Wells Fargo Home Equity Trust Mortgage Pass-Through Certificates | |
6.060% due 04/25/2034 • | | | | | 849 | | | | | | 824 | |
|
World Omni Auto Receivables Trust | |
5.510% due 03/16/2026 | | | | | 609 | | | | | | 609 | |
|
World Omni Automobile Lease Securitization Trust | |
5.470% due 11/17/2025 | | | | | 2,307 | | | | | | 2,306 | |
| | | | | | | | | | | | |
Total Asset-Backed Securities
(Cost $253,577) | | | 252,268 | |
| | | | |
| |
| SOVEREIGN ISSUES 0.3% | |
|
Cassa Depositi e Prestiti SpA | |
5.875% due 04/30/2029 | | | | | 2,800 | | | | | | 2,844 | |
| | | | | | | | | | | | |
Total Sovereign Issues (Cost $2,777) | | | 2,844 | |
| | | | |
| |
| SHORT-TERM INSTRUMENTS 0.5% | |
| |
| COMMERCIAL PAPER 0.5% | |
|
Crown Castle, Inc. | |
5.840% due 07/30/2024 | | | | | 1,150 | | | | | | 1,144 | |
5.840% due 08/01/2024 | | | | | 1,950 | | | | | | 1,939 | |
|
Huntington Ingalls Industries, Inc. | |
5.880% due 07/02/2024 | | | | | 1,000 | | | | | | 1,000 | |
| | | | | | | | | | | | |
| | | | | | | | | | | 4,083 | |
| | | | | | | | | | | | |
Total Short-Term Instruments
(Cost $4,085) | | | 4,083 | |
| | | | |
| | | | |
| | | | | | | | | | | | |
| Total Investments in Securities (Cost $923,298) | | | 916,286 | |
| |
| | | | |
Total Investments 105.3%
(Cost $923,298) | | | $ | | | 916,286 | |
| |
Financial Derivative Instruments (d)(e) 0.1% (Cost or Premiums, net $76) | | | | | | | | | | | 914 | |
| |
| Other Assets and Liabilities, net (5.4)% | | | (47,046 | ) |
| | | | |
| Net Assets 100.0% | | | $ | | | 870,154 | |
| | | | | | | |
NOTES TO SCHEDULE OF INVESTMENTS:
| * | A zero balance may reflect actual amounts rounding to less than one thousand. |
| « | Security valued using significant unobservable inputs (Level 3). |
| ~ | Variable or Floating rate security. Rate shown is the rate in effect as of period end. Certain variable rate securities are not based on a published reference rate and spread, rather are determined by the issuer or agent and are based on current market conditions. Reference rate is as of reset date, which may vary by security. These securities may not indicate a reference rate and/or spread in their description. |
| • | Rate shown is the rate in effect as of period end. The rate may be based on a fixed rate, a capped rate or a floor rate and may convert to a variable or floating rate in the future. These securities do not indicate a reference rate and spread in their description. |
| | | | | | |
| 66 | | PIMCO ETF TRUST | | | See Accompanying Notes | |
| þ | Coupon represents a rate which changes periodically based on a predetermined schedule or event. Rate shown is the rate in effect as of period end. |
| (b) | Principal amount of security is adjusted for inflation. |
BORROWINGS AND OTHER FINANCING TRANSACTIONS
REVERSE REPURCHASE AGREEMENTS:
| | | | | | | | | | | | | | | | | | | | |
| Counterparty | | Borrowing
Rate(1) | | | Settlement
Date | | | Maturity
Date | | | Amount
Borrowed(1) | | | Payable for
Reverse
Repurchase
Agreements | |
JPS | | | 5.460 | % | | | 06/28/2024 | | | | 07/01/2024 | | | $ | (7,548 | ) | | $ | (7,551 | ) |
| | | | | | | | | | | | | | | | | | | | |
Total Reverse Repurchase Agreements | | | | | | | | | | | $ | (7,551 | ) |
| | | | | | | | | | | | | | | | | | | | |
SHORT SALES:
| | | | | | | | | | | | | | | | | | | | |
| Description | | Coupon | | | Maturity
Date | | | Principal
Amount | | | Proceeds | | | Payable for
Short Sales(2) | |
U.S. Treasury Obligations (3.5)% | |
U.S. Treasury Notes | | | 4.500% | | | | 05/31/2029 | | | $ | 30,000 | | | $ | (30,207 | ) | | $ | (30,341 | ) |
| | | | | | | | | | | | | | | | | | | | |
Total Short Sales (3.5)% | | | | | | | | | | | | | | $ | (30,207 | ) | | $ | (30,341 | ) |
| | | | | | | | | | | | | | | | | | | | |
BORROWINGS AND OTHER FINANCING TRANSACTIONS SUMMARY
The following is a summary by counterparty of the market value of Borrowings and Other Financing Transactions and collateral pledged/(received) as of June 30, 2024:
| | | | | | | | | | | | | | | | | | | | | | | | | | | | |
| Counterparty | | Repurchase
Agreement
Proceeds
to be
Received | | | Payable for
Reverse
Repurchase
Agreements | | | Payable for
Sale-Buyback
Transactions | | | Short Sales(2) | | | Total
Borrowings and
Other Financing
Transactions | | | Collateral
Pledged/(Received) | | | Net Exposure(3) | |
Global/Master Repurchase Agreement | |
JPS | | $ | 0 | | | $ | (7,551 | ) | | $ | 0 | | | $ | 0 | | | $ | (7,551 | ) | | $ | 7,512 | | | $ | (39 | ) |
|
Master Securities Forward Transaction Agreement | |
BPG | | | 0 | | | | 0 | | | | 0 | | | | (30,341 | ) | | | (30,341 | ) | | | 0 | | | | (30,341 | ) |
| | | | | | | | | | | | | | | | | | | | | | | | | | | | |
Total Borrowings and Other Financing Transactions | | $ | 0 | | | $ | (7,551 | ) | | $ | 0 | | | $ | (30,341 | ) | | | | | | | | | | | | |
| | | | | | | | | | | | | | | | | | | | | | | | | | | | |
CERTAIN TRANSFERS ACCOUNTED FOR AS SECURED BORROWINGS
Remaining Contractual Maturity of the Agreements
| | | | | | | | | | | | | | | | | | | | |
| | | Overnight and
Continuous | | | Up to 30 days | | | 31-90 days | | | Greater Than 90 days | | | Total | |
Reverse Repurchase Agreements | |
U.S. Treasury Obligations | | $ | (7,551 | ) | | $ | 0 | | | $ | 0 | | | $ | 0 | | | $ | (7,551 | ) |
| | | | | | | | | | | | | | | | | | | | |
Total Borrowings | | $ | (7,551 | ) | | $ | 0 | | | $ | 0 | | | $ | 0 | | | $ | (7,551 | ) |
| | | | | | | | | | | | | | | | | | | | |
Payable for reverse repurchase agreements | | | $ | (7,551 | ) |
| | | | | | | | | | | | | | | | | | | | |
| (c) | Securities with an aggregate market value of $7,512 have been pledged as collateral under the terms of the above master agreements as of June 30, 2024. |
| (1) | The average amount of borrowings outstanding during the period ended June 30, 2024 was $(9,696) at a weighted average interest rate of 4.143%. Average borrowings may include reverse repurchase agreements and sale-buyback transactions, if held during the period. |
| (2) | Payable for short sales includes $133 of accrued interest expense. |
| (3) | Net Exposure represents the net receivable/(payable) that would be due from/to the counterparty in the event of default. Exposure from borrowings and other financing transactions can only be netted across transactions governed under the same master agreement with the same legal entity. See Note 8, Master Netting Arrangements, in the Notes to Financial Statements for more information. |
| | | | | | | | | | | | |
| See Accompanying Notes | | | ANNUAL FINANCIAL AND OTHER INFORMATION | | | | | | | JUNE 30, 2024 | | | 67 |
| | | | | | |
| Schedule of Investments | | PIMCO Enhanced Low Duration Active Exchange-Traded Fund | | (Cont.) | | |
(d) FINANCIAL DERIVATIVE INSTRUMENTS: EXCHANGE-TRADED OR CENTRALLY CLEARED
FUTURES CONTRACTS:
| | | | | | | | | | | | | | | | | | | | | | | | | | | | |
| LONG FUTURES CONTRACTS | | | | | | | | | | | | | | | | | | | | | |
| | | | | |
| Description | | Expiration
Month | | | # of
Contracts | | | Notional
Amount | | | Unrealized
Appreciation/
(Depreciation) | | | Variation Margin | |
| | Asset | | | Liability | |
U.S. Treasury 2-Year Note September Futures | | | 09/2024 | | | | 3,173 | | | $ | | | | | 647,986 | | | $ | 983 | | | $ | 0 | | | $ | (62 | ) |
| | | | | | | | | | | | | | | | | | | | | | | | | | | | |
| | | | | | | | | | | | | | | | | | | | | | | | | | | | |
| SHORT FUTURES CONTRACTS | | | | | | | | | | | | | | | | | | | | | |
| | | | | |
| Description | | Expiration
Month | | | # of
Contracts | | | Notional
Amount | | | Unrealized
Appreciation/
(Depreciation) | | | Variation Margin | |
| | Asset | | | Liability | |
U.S. Treasury 5-Year Note September Futures | | | 09/2024 | | | | 591 | | | $ | | | | | (62,988 | ) | | $ | (70 | ) | | $ | 99 | | | $ | 0 | |
U.S. Treasury 10-Year Note September Futures | | | 09/2024 | | | | 84 | | | | | | | | (9,239 | ) | | | (70 | ) | | | 34 | | | | 0 | |
U.S. Treasury 10-Year Ultra Long-Term Bond September Futures | | | 09/2024 | | | | 514 | | | | | | | | (58,355 | ) | | | (764 | ) | | | 373 | | | | 0 | |
U.S. Treasury Ultra Long-Term Bond September Futures | | | 09/2024 | | | | 130 | | | | | | | | (16,295 | ) | | | (80 | ) | | | 319 | | | | 0 | |
| | | | | | | | | | | | | | | | | | | | | | | | | | | | |
| | | | | | | | | | | | | | | | | | $ | (984 | ) | | $ | 825 | | | $ | 0 | |
| | | | | | | | | | | | | | | | | | | | | | | | | | | | |
Total Futures Contracts | | | $ | (1 | ) | | $ | 825 | | | $ | (62 | ) |
| | | | | | | | | | | | | | | | | | | | | | | | | | | | |
FINANCIAL DERIVATIVE INSTRUMENTS: EXCHANGE-TRADED OR CENTRALLY CLEARED SUMMARY
The following is a summary of the market value and variation margin of Exchange-Traded or Centrally Cleared Financial Derivative Instruments as of June 30, 2024:
| | | | | | | | | | | | | | | | | | | | | | | | | | | | | | | | | | | | |
| | | Financial Derivative Assets | | | | | | Financial Derivative Liabilities | |
| | | Market Value | | | Variation Margin
Asset | | | | | | | | | Market Value | | | Variation Margin
Liability | | | | |
| | | Purchased
Options | | | Futures | | | Swap
Agreements | | | Total | | | | | | Written
Options | | | Futures | | | Swap
Agreements | | | Total | |
Total Exchange-Traded or Centrally Cleared | | $ | 0 | | | $ | 825 | | | $ | 0 | | | $ | 825 | | | | | | | $ | 0 | | | $ | (62) | | | $ | 0 | | | $ | (62) | |
| | | | | | | | | | | | | | | | | | | | | | | | | | | | | | | | | | | | |
Cash of $4,125 has been pledged as collateral for exchange-traded and centrally cleared financial derivative instruments as of June 30, 2024. See Note 8, Master Netting Arrangements, in the Notes to Financial Statements for more information.
(e) FINANCIAL DERIVATIVE INSTRUMENTS: OVER THE COUNTER
FORWARD FOREIGN CURRENCY CONTRACTS:
| | | | | | | | | | | | | | | | | | | | | | | | |
| Counterparty | | Settlement
Month | | | Currency to
be Delivered | | | Currency to
be Received | | | Unrealized Appreciation/
(Depreciation) | |
| | Asset | | | Liability | |
BPS | | | 07/2024 | | | AUD | | | 10,037 | | | $ | | | 6,688 | | | $ | 0 | | | $ | (8 | ) |
| | | 07/2024 | | | CAD | | | 6,388 | | | | | | 4,680 | | | | 11 | | | | 0 | |
| | | 07/2024 | | | EUR | | | 4,037 | | | | | | 4,370 | | | | 47 | | | | 0 | |
| | | 08/2024 | | | $ | | | 6,693 | | | AUD | | | 10,037 | | | | 8 | | | | 0 | |
| | | | | | | |
BRC | | | 07/2024 | | | | | | 1,759 | | | | | | 2,658 | | | | 14 | | | | 0 | |
| | | | | | | |
CBK | | | 07/2024 | | | CHF | | | 174 | | | $ | | | 191 | | | | 0 | | | | (3 | ) |
| | | 07/2024 | | | $ | | | 22 | | | SEK | | | 230 | | | | 0 | | | | 0 | |
| | | | | | | |
FAR | | | 07/2024 | | | | | | 4,916 | | | AUD | | | 7,379 | | | | 6 | | | | 0 | |
| | | | | | | |
JPM | | | 07/2024 | | | | | | 4,475 | | | CHF | | | 4,016 | | | | 0 | | | | (5 | ) |
| | | 08/2024 | | | CHF | | | 4,001 | | | $ | | | 4,475 | | | | 5 | | | | 0 | |
| | | | | | | |
MBC | | | 07/2024 | | | $ | | | 4,669 | | | CAD | | | 6,392 | | | | 4 | | | | 0 | |
| | | 08/2024 | | | CAD | | | 6,388 | | | $ | | | 4,669 | | | | 0 | | | | (4 | ) |
| | | | | | | |
MYI | | | 07/2024 | | | CHF | | | 2,005 | | | | | | 2,219 | | | | 0 | | | | (12 | ) |
| | | 07/2024 | | | SEK | | | 230 | | | | | | 22 | | | | 0 | | | | 0 | |
| | | 08/2024 | | | $ | | | 22 | | | SEK | | | 229 | | | | 0 | | | | 0 | |
| | | | | | | |
SCX | | | 07/2024 | | | EUR | | | 4,181 | | | $ | | | 4,492 | | | | 14 | | | | 0 | |
| | | 07/2024 | | | $ | | | 8,805 | | | EUR | | | 8,218 | | | | 0 | | | | (4 | ) |
| | | 08/2024 | | | EUR | | | 8,218 | | | $ | | | 8,818 | | | | 4 | | | | 0 | |
| | | | | | | |
UAG | | | 07/2024 | | | CHF | | | 1,839 | | | | | | 2,035 | | | | 0 | | | | (12 | ) |
| | | | | | | | | | | | | | | | | | | | | | | | |
Total Forward Foreign Currency Contracts | | | $ | 113 | | | $ | (48 | ) |
| | | | | | | | | | | | | | | | | | | | | | | | |
| | | | | | |
| 68 | | PIMCO ETF TRUST | | | See Accompanying Notes | |
PURCHASED OPTIONS:
INTEREST RATE SWAPTIONS
| | | | | | | | | | | | | | | | | | | | | | | | | | |
| Counterparty | | Description | | Floating Rate Index | | Pay/Receive
Floating Rate | | Exercise
Rate | | | Expiration
Date | | | Notional
Amount(1) | | Cost | | | Market
Value | |
| FAR | | Put - OTC 1-Year Interest Rate Swap | | 3-Month USD-LIBOR | | Receive | | | 4.900% | | | | 09/09/2024 | | | 84,700 | | $ | 76 | | | $ | 86 | |
| | | | | | | | | | | | | | | | | | | | | | | | | | |
Total Purchased Options | | $ | 76 | | | $ | 86 | |
| | | | | | | | | | | | | | | | | | | | | | | | | | |
FINANCIAL DERIVATIVE INSTRUMENTS: OVER THE COUNTER SUMMARY
The following is a summary by counterparty of the market value of OTC financial derivative instruments and collateral pledged/(received) as of June 30, 2024:
| | | | | | | | | | | | | | | | | | | | | | | | | | | | | | | | | | | | | | | | | | | | | | | | |
| | | Financial Derivative Assets | | | | | | Financial Derivative Liabilities | | | | | | | | | | |
| Counterparty | | Forward
Foreign
Currency
Contracts | | | Purchased
Options | | | Swap
Agreements | | | Total
Over the
Counter | | | | | | Forward
Foreign
Currency
Contracts | | | Written
Options | | | Swap
Agreements | | | Total
Over the
Counter | | | Net Market
Value of OTC
Derivatives | | | Collateral
Pledged/
(Received) | | | Net
Exposure(2) | |
BPS | | $ | 66 | | | $ | 0 | | | $ | 0 | | | $ | 66 | | | | | | | $ | (8 | ) | | $ | 0 | | | $ | 0 | | | $ | (8 | ) | | $ | 58 | | | $ | 0 | | | $ | 58 | |
BRC | | | 14 | | | | 0 | | | | 0 | | | | 14 | | | | | | | | 0 | | | | 0 | | | | 0 | | | | 0 | | | | 14 | | | | 0 | | | | 14 | |
CBK | | | 0 | | | | 0 | | | | 0 | | | | 0 | | | | | | | | (3 | ) | | | 0 | | | | 0 | | | | (3 | ) | | | (3 | ) | | | 0 | | | | (3 | ) |
FAR | | | 6 | | | | 86 | | | | 0 | | | | 92 | | | | | | | | 0 | | | | 0 | | | | 0 | | | | 0 | | | | 92 | | | | (290 | ) | | | (198 | ) |
JPM | | | 5 | | | | 0 | | | | 0 | | | | 5 | | | | | | | | (5 | ) | | | 0 | | | | 0 | | | | (5 | ) | | | 0 | | | | 0 | | | | 0 | |
MBC | | | 4 | | | | 0 | | | | 0 | | | | 4 | | | | | | | | (4 | ) | | | 0 | | | | 0 | | | | (4 | ) | | | 0 | | | | 0 | | | | 0 | |
MYI | | | 0 | | | | 0 | | | | 0 | | | | 0 | | | | | | | | (12 | ) | | | 0 | | | | 0 | | | | (12 | ) | | | (12 | ) | | | 0 | | | | (12 | ) |
SCX | | | 18 | | | | 0 | | | | 0 | | | | 18 | | | | | | | | (4 | ) | | | 0 | | | | 0 | | | | (4 | ) | | | 14 | | | | 0 | | | | 14 | |
UAG | | | 0 | | | | 0 | | | | 0 | | | | 0 | | | | | | | | (12 | ) | | | 0 | | | | 0 | | | | (12 | ) | | | (12 | ) | | | 0 | | | | (12 | ) |
| | | | | | | | | | | | | | | | | | | | | | | | | | | | | | | | | | | | | | | | | | | | | | | | |
Total Over the Counter | | $ | 113 | | | $ | 86 | | | $ | 0 | | | $ | 199 | | | | | | | $ | (48 | ) | | $ | 0 | | | $ | 0 | | | $ | (48 | ) | | | | | | | | | | | | |
| | | | | | | | | | | | | | | | | | | | | | | | | | | | | | | | | | | | | | | | | | | | | | | | |
| (1) | Notional Amount represents the number of contracts. |
| (2) | Net Exposure represents the net receivable/(payable) that would be due from/to the counterparty in the event of default. Exposure from OTC financial derivative instruments can only be netted across transactions governed under the same master agreement with the same legal entity. See Note 8, Master Netting Arrangements, in the Notes to Financial Statements for more information. |
FAIR VALUE OF FINANCIAL DERIVATIVE INSTRUMENTS
The following is a summary of the fair valuation of the Fund’s derivative instruments categorized by risk exposure. See Note 7, Principal and Other Risks, in the Notes to Financial Statements on risks of the Fund.
Fair Values of Financial Derivative Instruments on the Statements of Assets and Liabilities as of June 30, 2024:
| | | | | | | | | | | | | | | | | | | | | | | | |
| | | Derivatives not accounted for as hedging instruments | |
| | | Commodity
Contracts | | | Credit
Contracts | | | Equity
Contracts | | | Foreign
Exchange
Contracts | | | Interest
Rate Contracts | | | Total | |
Financial Derivative Instruments - Assets | |
Exchange-traded or centrally cleared | |
Futures | | $ | 0 | | | $ | 0 | | | $ | 0 | | | $ | 0 | | | $ | 825 | | | $ | 825 | |
| | | | | | | | | | | | | | | | | | | | | | | | |
Over the counter | |
Forward Foreign Currency Contracts | | $ | 0 | | | $ | 0 | | | $ | 0 | | | $ | 113 | | | $ | 0 | | | $ | 113 | |
Purchased Options | | | 0 | | | | 0 | | | | 0 | | | | 0 | | | | 86 | | | | 86 | |
| | | | | | | | | | | | | | | | | | | | | | | | |
| | $ | 0 | | | $ | 0 | | | $ | 0 | | | $ | 113 | | | $ | 86 | | | $ | 199 | |
| | | | | | | | | | | | | | | | | | | | | | | | |
| | $ | 0 | | | $ | 0 | | | $ | 0 | | | $ | 113 | | | $ | 911 | | | $ | 1,024 | |
| | | | | | | | | | | | | | | | | | | | | | | | |
|
Financial Derivative Instruments - Liabilities | |
Exchange-traded or centrally cleared | |
Futures | | $ | 0 | | | $ | 0 | | | $ | 0 | | | $ | 0 | | | $ | 62 | | | $ | 62 | |
| | | | | | | | | | | | | | | | | | | | | | | | |
Over the counter | |
Forward Foreign Currency Contracts | | $ | 0 | | | $ | 0 | | | $ | 0 | | | $ | 48 | | | $ | 0 | | | $ | 48 | |
| | | | | | | | | | | | | | | | | | | | | | | | |
| | $ | 0 | | | $ | 0 | | | $ | 0 | | | $ | 48 | | | $ | 62 | | | $ | 110 | |
| | | | | | | | | | | | | | | | | | | | | | | | |
| | | | | | | | | | | | |
| See Accompanying Notes | | | ANNUAL FINANCIAL AND OTHER INFORMATION | | | | | | | JUNE 30, 2024 | | | 69 |
| | | | | | |
| Schedule of Investments | | PIMCO Enhanced Low Duration Active Exchange-Traded Fund | | (Cont.) | | June 30, 2024 |
The effect of Financial Derivative Instruments on the Statements of Operations for the period ended June 30, 2024:
| | | | | | | | | | | | | | | | | | | | | | | | |
| | | Derivatives not accounted for as hedging instruments | |
| | | Commodity
Contracts | | | Credit
Contracts | | | Equity
Contracts | | | Foreign
Exchange
Contracts | | | Interest
Rate Contracts | | | Total | |
Net Realized Gain (Loss) on Financial Derivative Instruments | |
Exchange-traded or centrally cleared | |
Futures | | $ | 0 | | | $ | 0 | | | $ | 0 | | | $ | 0 | | | $ | (4,302 | ) | | $ | (4,302 | ) |
Swap Agreements | | | 0 | | | | (2,385 | ) | | | 0 | | | | 0 | | | | (12 | ) | | | (2,397 | ) |
| | | | | | | | | | | | | | | | | | | | | | | | |
| | $ | 0 | | | $ | (2,385 | ) | | $ | 0 | | | $ | 0 | | | $ | (4,314 | ) | | $ | (6,699 | ) |
| | | | | | | | | | | | | | | | | | | | | | | | |
Over the counter | |
Forward Foreign Currency Contracts | | $ | 0 | | | $ | 0 | | | $ | 0 | | | $ | (1,820 | ) | | $ | 0 | | | $ | (1,820 | ) |
Purchased Options | | | 0 | | | | 0 | | | | 0 | | | | 0 | | | | 395 | | | | 395 | |
Written Options | | | 0 | | | | 0 | | | | 0 | | | | 0 | | | | 274 | | | | 274 | |
| | | | | | | | | | | | | | | | | | | | | | | | |
| | $ | 0 | | | $ | 0 | | | $ | 0 | | | $ | (1,820 | ) | | $ | 669 | | | $ | (1,151 | ) |
| | | | | | | | | | | | | | | | | | | | | | | | |
| | $ | 0 | | | $ | (2,385 | ) | | $ | 0 | | | $ | (1,820 | ) | | $ | (3,645 | ) | | $ | (7,850 | ) |
| | | | | | | | | | | | | | | | | | | | | | | | |
|
Net Change in Unrealized Appreciation (Depreciation) on Financial Derivative Instruments | |
Exchange-traded or centrally cleared | |
Futures | | $ | 0 | | | $ | 0 | | | $ | 0 | | | $ | 0 | | | $ | 3,265 | | | $ | 3,265 | |
Swap Agreements | | | 0 | | | | 1,510 | | | | 0 | | | | 0 | | | | 0 | | | | 1,510 | |
| | | | | | | | | | | | | | | | | | | | | | | | |
| | $ | 0 | | | $ | 1,510 | | | $ | 0 | | | $ | 0 | | | $ | 3,265 | | | $ | 4,775 | |
| | | | | | | | | | | | | | | | | | | | | | | | |
Over the counter | |
Forward Foreign Currency Contracts | | $ | 0 | | | $ | 0 | | | $ | 0 | | | $ | 905 | | | $ | 0 | | | $ | 905 | |
Purchased Options | | | 0 | | | | 0 | | | | 0 | | | | 0 | | | | 10 | | | | 10 | |
| | | | | | | | | | | | | | | | | | | | | | | | |
| | $ | 0 | | | $ | 0 | | | $ | 0 | | | $ | 905 | | | $ | 10 | | | $ | 915 | |
| | | | | | | | | | | | | | | | | | | | | | | | |
| | $ | 0 | | | $ | 1,510 | | | $ | 0 | | | $ | 905 | | | $ | 3,275 | | | $ | 5,690 | |
| | | | | | | | | | | | | | | | | | | | | | | | |
FAIR VALUE MEASUREMENTS
The following is a summary of the fair valuations according to the inputs used as of June 30, 2024 in valuing the Fund’s assets and liabilities:
| | | | | | | | | | | | | | | | |
| Category and Subcategory | | Level 1 | | | Level 2 | | | Level 3 | | | Fair
Value at
06/30/2024 | |
Investments in Securities, at Value | |
Corporate Bonds & Notes | |
Banking & Finance | | $ | 0 | | | $ | 191,321 | | | $ | 0 | | | $ | 191,321 | |
Industrials | | | 0 | | | | 54,714 | | | | 0 | | | | 54,714 | |
Utilities | | | 0 | | | | 18,391 | | | | 0 | | | | 18,391 | |
Municipal Bonds & Notes | |
Louisiana | | | 0 | | | | 5,984 | | | | 0 | | | | 5,984 | |
U.S. Government Agencies | | | 0 | | | | 76,462 | | | | 0 | | | | 76,462 | |
U.S. Treasury Obligations | | | 0 | | | | 193,031 | | | | 0 | | | | 193,031 | |
Non-Agency Mortgage-Backed Securities | | | 0 | | | | 116,801 | | | | 387 | | | | 117,188 | |
Asset-Backed Securities | | | 2,600 | | | | 249,216 | | | | 452 | | | | 252,268 | |
Sovereign Issues | | | 0 | | | | 2,844 | | | | 0 | | | | 2,844 | |
Short-Term Instruments | |
Commercial Paper | | | 0 | | | | 4,083 | | | | 0 | | | | 4,083 | |
| | | | | | | | | | | | | | | | |
| | | | |
Total Investments | | $ | 2,600 | | | $ | 912,847 | | | $ | 839 | | | $ | 916,286 | |
| | | | | | | | | | | | | | | | |
| | | | | | | | | | | | | | | | |
| Category and Subcategory | | Level 1 | | | Level 2 | | | Level 3 | | | Fair
Value at
06/30/2024 | |
Short Sales, at Value - Liabilities | |
U.S. Treasury Obligations | | $ | 0 | | | $ | (30,341 | ) | | $ | 0 | | | $ | (30,341 | ) |
| | | | | | | | | | | | | | | | |
|
Financial Derivative Instruments - Assets | |
Exchange-traded or centrally cleared | | | 0 | | | | 825 | | | | 0 | | | | 825 | |
Over the counter | | | 0 | | | | 199 | | | | 0 | | | | 199 | |
| | | | | | | | | | | | | | | | |
| | $ | 0 | | | $ | 1,024 | | | $ | 0 | | | $ | 1,024 | |
| | | | | | | | | | | | | | | | |
|
Financial Derivative Instruments - Liabilities | |
Exchange-traded or centrally cleared | | | 0 | | | | (62 | ) | | | 0 | | | | (62 | ) |
Over the counter | | | 0 | | | | (48 | ) | | | 0 | | | | (48 | ) |
| | | | | | | | | | | | | | | | |
| | $ | 0 | | | $ | (110 | ) | | $ | 0 | | | $ | (110 | ) |
| | | | | | | | | | | | | | | | |
| | | | |
Total Financial Derivative Instruments | | $ | 0 | | | $ | 914 | | | $ | 0 | | | $ | 914 | |
| | | | | | | | | | | | | | | | |
| | | | |
Totals | | $ | 2,600 | | | $ | 883,420 | | | $ | 839 | | | $ | 886,859 | |
| | | | | | | | | | | | | | | | |
There were no significant transfers into or out of Level 3 during the period ended June 30, 2024.
| | | | | | |
| 70 | | PIMCO ETF TRUST | | | See Accompanying Notes | |
| | | | | | |
| Schedule of Investments | | PIMCO Enhanced Short Maturity Active ESG Exchange-Traded Fund | | | | June 30, 2024 |
(Amounts in thousands*, except number of shares, contracts, units and ounces, if any)
| | | | | | | | | | | | |
| | | | | PRINCIPAL
AMOUNT
(000S) | | | | | MARKET
VALUE
(000S) | |
| INVESTMENTS IN SECURITIES 112.4% | |
| |
| CORPORATE BONDS & NOTES 45.2% | |
| |
| BANKING & FINANCE 19.9% | |
|
AerCap Ireland Capital DAC | |
1.650% due 10/29/2024 | | $ | | | 700 | | | $ | | | 691 | |
2.875% due 08/14/2024 | | | | | 1,200 | | | | | | 1,195 | |
|
Ally Financial, Inc. | |
4.625% due 03/30/2025 | | | | | 1,500 | | | | | | 1,486 | |
|
American Tower Corp. | |
2.400% due 03/15/2025 | | | | | 1,500 | | | | | | 1,465 | |
|
Bank of America Corp. | |
0.981% due 09/25/2025 • | | | | | 1,000 | | | | | | 989 | |
2.456% due 10/22/2025 • | | | | | 1,500 | | | | | | 1,485 | |
|
Bank of Nova Scotia | |
0.650% due 07/31/2024 | | | | | 1,577 | | | | | | 1,571 | |
|
Barclays PLC | |
2.852% due 05/07/2026 • | | | | | 1,000 | | | | | | 975 | |
|
Citigroup, Inc. | |
6.048% (SOFRRATE + 0.686%) due 10/30/2024 ~ | | | | | 1,500 | | | | | | 1,501 | |
|
Cooperatieve Rabobank UA | |
1.106% due 02/24/2027 • | | | | | 500 | | | | | | 465 | |
2.625% due 07/22/2024 | | | | | 810 | | | | | | 809 | |
|
Crown Castle, Inc. | |
3.200% due 09/01/2024 | | | | | 2,000 | | | | | | 1,990 | |
|
DBS Group Holdings Ltd. | |
5.981% (SOFRRATE + 0.610%) due 09/12/2025 ~ | | | | | 1,000 | | | | | | 1,003 | |
|
Deutsche Bank AG | |
3.961% due 11/26/2025 • | | | | | 1,300 | | | | | | 1,289 | |
|
DNB Bank ASA | |
0.856% due 09/30/2025 • | | | | | 500 | | | | | | 494 | |
|
Ford Motor Credit Co. LLC | |
2.300% due 02/10/2025 | | | | | 800 | | | | | | 782 | |
6.950% due 03/06/2026 | | | | | 1,000 | | | | | | 1,017 | |
|
GA Global Funding Trust | |
0.800% due 09/13/2024 | | | | | 500 | | | | | | 494 | |
|
HAT Holdings LLC | |
6.000% due 04/15/2025 | | | | | 1,300 | | | | | | 1,300 | |
|
HSBC Holdings PLC | |
2.099% due 06/04/2026 • | | | | | 500 | | | | | | 483 | |
|
LeasePlan Corp. NV | |
2.875% due 10/24/2024 | | | | | 1,700 | | | | | | 1,685 | |
|
Lloyds Banking Group PLC | |
3.870% due 07/09/2025 • | | | | | 1,500 | | | | | | 1,499 | |
|
Mizuho Financial Group, Inc. | |
2.839% due 07/16/2025 • | | | | | 500 | | | | | | 499 | |
|
Nomura Holdings, Inc. | |
2.648% due 01/16/2025 | | | | | 1,700 | | | | | | 1,671 | |
|
Nuveen Finance LLC | |
4.125% due 11/01/2024 | | | | | 1,500 | | | | | | 1,491 | |
|
Royal Bank of Canada | |
3.970% due 07/26/2024 | | | | | 1,500 | | | | | | 1,498 | |
|
SBA Tower Trust | |
2.836% due 01/15/2050 | | | | | 400 | | | | | | 393 | |
|
UBS Group AG | |
2.593% due 09/11/2025 • | | | | | 1,500 | | | | | | 1,490 | |
|
Weyerhaeuser Co. | |
4.750% due 05/15/2026 | | | | | 500 | | | | | | 494 | |
7.950% due 03/15/2025 | | | | | 977 | | | | | | 990 | |
| | | | | | | | | | |
| | | | | | | | | 33,194 | |
| | | | | | | | | | |
| |
| INDUSTRIALS 22.3% | |
|
American Honda Finance Corp. | |
5.822% due 06/13/2025 ~ | | | | | 2,000 | | | | | | 2,001 | |
|
Analog Devices, Inc. | |
2.950% due 04/01/2025 | | | | | 36 | | | | | | 35 | |
|
Aptiv PLC | |
2.396% due 02/18/2025 | | | | | 1,500 | | | | | | 1,468 | |
| | | | | | | | | | | | |
| | | | | PRINCIPAL
AMOUNT
(000S) | | | | | MARKET
VALUE
(000S) | |
|
Arrow Electronics, Inc. | |
3.250% due 09/08/2024 | | $ | | | 1,500 | | | $ | | | 1,491 | |
4.000% due 04/01/2025 | | | | | 400 | | | | | | 395 | |
|
Berry Global, Inc. | |
4.875% due 07/15/2026 | | | | | 893 | | | | | | 877 | |
|
Carrier Global Corp. | |
2.242% due 02/15/2025 | | | | | 1,000 | | | | | | 979 | |
|
Central Japan Railway Co. | |
2.200% due 10/02/2024 | | | | | 1,529 | | | | | | 1,514 | |
|
CommonSpirit Health | |
2.760% due 10/01/2024 | | | | | 1,000 | | | | | | 992 | |
|
Cox Communications, Inc. | |
3.150% due 08/15/2024 | | | | | 2,127 | | | | | | 2,119 | |
|
Dell International LLC | |
4.000% due 07/15/2024 | | | | | 1,500 | | | | | | 1,499 | |
|
Fiserv, Inc. | |
2.750% due 07/01/2024 | | | | | 1,500 | | | | | | 1,500 | |
|
HCA, Inc. | |
5.375% due 02/01/2025 | | | | | 1,500 | | | | | | 1,495 | |
|
Honda Motor Co. Ltd. | |
2.271% due 03/10/2025 | | | | | 200 | | | | | | 196 | |
|
Hyundai Capital America | |
5.800% due 06/26/2025 | | | | | 2,000 | | | | | | 2,002 | |
|
JDE Peet’s NV | |
0.800% due 09/24/2024 | | | | | 2,000 | | | | | | 1,973 | |
|
John Lewis PLC | |
6.125% due 01/21/2025 | | GBP | | | 1,300 | | | | | | 1,646 | |
|
Microchip Technology, Inc. | |
0.983% due 09/01/2024 | | $ | | | 1,700 | | | | | | 1,686 | |
|
NetApp, Inc. | |
3.300% due 09/29/2024 | | | | | 1,213 | | | | | | 1,205 | |
|
Panasonic Holdings Corp. | |
2.679% due 07/19/2024 | | | | | 1,509 | | | | | | 1,507 | |
|
Quanta Services, Inc. | |
0.950% due 10/01/2024 | | | | | 1,500 | | | | | | 1,481 | |
|
Renesas Electronics Corp. | |
1.543% due 11/26/2024 | | | | | 2,117 | | | | | | 2,079 | |
|
Revvity, Inc. | |
0.850% due 09/15/2024 | | | | | 1,700 | | | | | | 1,681 | |
|
Rogers Communications, Inc. | |
2.950% due 03/15/2025 | | | | | 1,000 | | | | | | 980 | |
|
Take-Two Interactive Software, Inc. | |
3.550% due 04/14/2025 | | | | | 1,402 | | | | | | 1,379 | |
|
VMware, Inc. | |
1.000% due 08/15/2024 | | | | | 1,500 | | | | | | 1,491 | |
|
Walgreens Boots Alliance, Inc. | |
3.800% due 11/18/2024 | | | | | 1,200 | | | | | | 1,187 | |
|
Westinghouse Air Brake Technologies Corp. | |
3.200% due 06/15/2025 | | | | | 305 | | | | | | 298 | |
| | | | | | | | | | | | |
| | | | | | | | 37,156 | |
| | | | | | | | | |
| |
| UTILITIES 3.0% | |
|
Avangrid, Inc. | |
3.150% due 12/01/2024 | | | | | 2,100 | | | | | | 2,077 | |
|
Electricite de France SA | |
3.625% due 10/13/2025 | | | | | 1,500 | | | | | | 1,463 | |
|
Enel Finance International NV | |
2.650% due 09/10/2024 | | | | | 1,500 | | | | | | 1,490 | |
| | | | | | | | | | | | |
| | | | | | | | 5,030 | |
| | | | | | | | | |
Total Corporate Bonds & Notes
(Cost $75,476) | | | 75,380 | |
| | | | |
| |
| U.S. GOVERNMENT AGENCIES 2.2% | |
|
Fannie Mae | |
2.680% due 05/01/2025 | | | | | 1,440 | | | | | | 1,405 | |
5.793% due 08/25/2044 • | | | | | 712 | | | | | | 702 | |
5.950% due 05/25/2046 • | | | | | 215 | | | | | | 211 | |
|
Freddie Mac | |
6.048% due 01/15/2054 • | | | | | 429 | | | | | | 425 | |
| | | | | | | | | | | | |
| | | | | PRINCIPAL
AMOUNT
(000S) | | | | | MARKET
VALUE
(000S) | |
|
Ginnie Mae | |
3.000% due 06/20/2051 • | | $ | | | 1,090 | | | $ | | | 922 | |
| | | | | | | | | | | | |
Total U.S. Government Agencies
(Cost $3,846) | | | 3,665 | |
| | | | |
| |
| U.S. TREASURY OBLIGATIONS 1.6% | |
|
U.S. Treasury Inflation Protected Securities (a) | |
0.375% due 07/15/2025 | | | | | 2,776 | | | | | | 2,707 | |
| | | | | | | | | | | | |
Total U.S. Treasury Obligations
(Cost $2,733) | | | 2,707 | |
| | | | |
| |
| NON-AGENCY MORTGAGE-BACKED SECURITIES 2.5% | |
|
280 Park Avenue Mortgage Trust | |
6.507% due 09/15/2034 • | | | | | 500 | | | | | | 485 | |
|
Beast Mortgage Trust | |
6.629% due 02/15/2037 • | | | | | 500 | | | | | | 443 | |
|
GCAT Trust | |
2.885% due 12/27/2066 ~ | | | | | 223 | | | | | | 202 | |
|
Gemgarto PLC | |
5.823% due 12/16/2067 • | | GBP | | | 137 | | | | | | 173 | |
|
Hilton USA Trust | |
2.828% due 11/05/2035 | | $ | | | 800 | | | | | | 698 | |
|
OBX Trust | |
2.305% due 11/25/2061 ~ | | | | | 593 | | | | | | 516 | |
2.783% due 01/25/2062 þ | | | | | 451 | | | | | | 419 | |
|
One Market Plaza Trust | |
3.614% due 02/10/2032 | | | | | 438 | | | | | | 393 | |
|
RESIMAC Premier | |
6.142% due 07/10/2052 • | | | | | 72 | | | | | | 72 | |
|
Starwood Mortgage Residential Trust | |
1.027% due 11/25/2055 ~ | | | | | 129 | | | | | | 119 | |
|
Towd Point Mortgage Trust | |
3.750% due 05/25/2058 ~ | | | | | 262 | | | | | | 254 | |
|
VASA Trust | |
6.343% due 07/15/2039 • | | | | | 500 | | | | | | 463 | |
| | | | | | | | | | | | |
Total Non-Agency Mortgage-Backed Securities
(Cost $4,672) | | | 4,237 | |
| | | | |
| |
| ASSET-BACKED SECURITIES 26.6% | |
|
ACAS CLO Ltd. | |
6.479% due 10/18/2028 • | | | | | 216 | | | | | | 216 | |
|
Allegro CLO Ltd. | |
6.577% due 01/19/2033 • | | | | | 600 | | | | | | 599 | |
|
Ares CLO Ltd. | |
6.460% due 01/15/2029 • | | | | | 244 | | | | | | 244 | |
|
ARI Fleet Lease Trust | |
5.540% due 04/15/2033 | | | | | 1,000 | | | | | | 1,001 | |
|
Avis Budget Rental Car Funding AESOP LLC | |
3.350% due 09/22/2025 | | | | | 250 | | | | | | 249 | |
|
Barings CLO Ltd. | |
6.576% due 01/20/2031 • | | | | | 213 | | | | | | 213 | |
|
Benefit Street Partners CLO Ltd. | |
6.540% due 10/15/2030 • | | | | | 388 | | | | | | 389 | |
|
BMW Canada Auto Trust | |
4.844% due 07/20/2027 | | CAD | | | 600 | | | | | | 446 | |
5.025% due 04/20/2026 | | | | | 500 | | | | | | 368 | |
5.430% due 01/20/2026 | | | | | 391 | | | | | | 286 | |
|
BMW Vehicle Lease Trust | |
5.950% due 08/25/2025 | | $ | | | 582 | | | | | | 583 | |
|
BofA Auto Trust | |
5.570% due 12/15/2026 | | | | | 400 | | | | | | 400 | |
|
Capital One Multi-Asset Execution Trust | |
1.040% due 11/15/2026 | | | | | 300 | | | | | | 295 | |
|
Carlyle Global Market Strategies CLO Ltd. | |
6.545% due 07/20/2032 • | | | | | 800 | | | | | | 803 | |
|
CarMax Auto Owner Trust | |
3.490% due 02/16/2027 | | | | | 681 | | | | | | 672 | |
|
Carvana Auto Receivables Trust | |
5.770% due 04/12/2027 | | | | | 666 | | | | | | 666 | |
| | | | | | | | | | | | |
| See Accompanying Notes | | | ANNUAL FINANCIAL AND OTHER INFORMATION | | | | | | | JUNE 30, 2024 | | | 71 |
| | | | | | |
| Schedule of Investments | | PIMCO Enhanced Short Maturity Active ESG Exchange-Traded Fund | | (Cont.) | | |
| | | | | | | | | | | | |
| | | | | PRINCIPAL
AMOUNT
(000S) | | | | | MARKET
VALUE
(000S) | |
|
Citizens Auto Receivables Trust | |
6.063% due 10/15/2026 • | | $ | | | 445 | | | $ | | | 445 | |
6.130% due 07/15/2026 | | | | | 478 | | | | | | 479 | |
|
College Avenue Student Loans LLC | |
6.660% due 12/26/2047 • | | | | | 494 | | | | | | 493 | |
|
Commonbond Student Loan Trust | |
1.980% due 08/25/2050 | | | | | 1,115 | | | | | | 974 | |
3.560% due 09/25/2045 | | | | | 495 | | | | | | 460 | |
|
Crown Point CLO Ltd. | |
6.556% due 10/20/2031 • | | | | | 800 | | | | | | 801 | |
|
Dryden Senior Loan Fund | |
6.570% due 04/15/2028 • | | | | | 137 | | | | | | 137 | |
|
Ent Auto Receivables Trust | |
6.220% due 08/16/2027 | | | | | 334 | | | | | | 334 | |
|
Enterprise Fleet Financing LLC | |
5.740% due 12/20/2026 | | | | | 800 | | | | | | 802 | |
|
Ford Auto Securitization Trust | |
5.410% due 04/15/2026 | | CAD | | | 829 | | | | | | 607 | |
5.889% due 05/15/2026 | | | | | 491 | | | | | | 365 | |
|
GMF Canada Leasing Trust Asset-Backed Notes | |
4.883% due 12/21/2026 | | | | | 1,000 | | | | | | 748 | |
|
Golub Capital Partners Static Ltd. | |
6.557% due 04/20/2033 • | | $ | | | 600 | | | | | | 600 | |
|
Halseypoint CLO Ltd. | |
6.686% due 07/20/2031 • | | | | | 595 | | | | | | 595 | |
|
Harley Davidson Motorcycle Trust | |
5.650% due 02/16/2027 | | | | | 800 | | | | | | 801 | |
|
Kubota Credit Owner Trust | |
5.450% due 04/15/2027 | | | | | 600 | | | | | | 601 | |
|
LAD Auto Receivables Trust | |
5.680% due 10/15/2026 | | | | | 324 | | | | | | 324 | |
5.700% due 03/15/2027 | | | | | 400 | | | | | | 400 | |
|
M&T Equipment Notes | |
6.090% due 07/15/2030 | | | | | 583 | | | | | | 583 | |
|
Madison Park Funding Ltd. | |
6.340% due 04/15/2029 • | | | | | 588 | | | | | | 589 | |
6.507% due 10/18/2030 • | | | | | 832 | | | | | | 833 | |
|
Marble Point CLO Ltd. | |
6.630% due 10/15/2030 • | | | | | 367 | | | | | | 367 | |
|
Master Credit Card Trust | |
6.083% due 01/21/2028 • | | | | | 1,500 | | | | | | 1,507 | |
6.183% due 01/21/2027 • | | | | | 1,000 | | | | | | 1,004 | |
|
MBarc Credit Canada, Inc. | |
5.445% due 10/15/2025 | | CAD | | | 887 | | | | | | 649 | |
|
Nassau Ltd. | |
6.840% due 01/15/2030 • | | $ | | | 146 | | | | | | 146 | |
|
Navient Private Education Refi Loan Trust | |
1.060% due 10/15/2069 | | | | | 883 | | | | | | 778 | |
1.310% due 01/15/2069 | | | | | 117 | | | | | | 108 | |
2.400% due 10/15/2068 | | | | | 110 | | | | | | 103 | |
2.600% due 08/15/2068 | | | | | 715 | | | | | | 670 | |
3.130% due 02/15/2068 | | | | | 610 | | | | | | 590 | |
6.443% due 04/15/2069 • | | | | | 212 | | | | | | 213 | |
| | | | | | | | | | | | |
| | | | | PRINCIPAL
AMOUNT
(000S) | | | | | MARKET
VALUE
(000S) | |
|
Neuberger Berman CLO Ltd. | |
6.616% due 01/28/2030 • | | $ | | | 289 | | | $ | | | 289 | |
|
Northwoods Capital Ltd. | |
6.574% due 11/13/2031 • | | | | | 1,000 | | | | | | 1,003 | |
|
OCP CLO Ltd. | |
6.706% due 07/20/2029 • | | | | | 252 | | | | | | 253 | |
|
Oscar U.S. Funding LLC | |
5.480% due 02/10/2027 | | | | | 1,570 | | | | | | 1,569 | |
|
OSD CLO Ltd. | |
6.449% due 04/17/2031 • | | | | | 709 | | | | | | 710 | |
|
Palmer Square Loan Funding Ltd. | |
6.390% due 10/15/2029 • | | | | | 832 | | | | | | 833 | |
|
PRET LLC | |
1.868% due 07/25/2051 þ | | | | | 337 | | | | | | 331 | |
|
Regatta Funding Ltd. | |
6.523% due 10/25/2031 • | | | | | 900 | | | | | | 901 | |
|
SBNA Auto Lease Trust | |
5.670% due 11/20/2026 | | | | | 400 | | | | | | 400 | |
|
SFS Auto Receivables Securitization Trust | |
5.710% due 10/20/2027 | | | | | 500 | | | | | | 500 | |
|
SMB Private Education Loan Trust | |
5.380% due 01/15/2053 | | | | | 628 | | | | | | 627 | |
6.243% due 01/15/2053 • | | | | | 685 | | | | | | 682 | |
|
Symphony Static CLO Ltd. | |
6.415% due 10/25/2029 • | | | | | 1,032 | | | | | | 1,033 | |
|
Tesla Auto Lease Trust | |
5.834% due 06/22/2026 • | | | | | 2,000 | | | | | | 2,000 | |
5.860% due 08/20/2025 | | | | | 1,058 | | | | | | 1,059 | |
6.020% due 09/22/2025 | | | | | 1,208 | | | | | | 1,210 | |
|
Tesla Electric Vehicle Trust | |
5.853% due 12/21/2026 • | | | | | 1,000 | | | | | | 1,001 | |
|
Towd Point HE Trust | |
0.918% due 02/25/2063 ~ | | | | | 64 | | | | | | 62 | |
|
Toyota Auto Receivables Owner Trust | |
6.019% due 01/15/2026 • | | | | | 231 | | | | | | 231 | |
|
Trillium Credit Card Trust | |
6.096% due 12/26/2028 • | | | | | 1,000 | | | | | | 1,003 | |
6.196% due 08/26/2028 • | | | | | 1,500 | | | | | | 1,507 | |
|
Venture CLO Ltd. | |
6.636% due 07/20/2030 • | | | | | 303 | | | | | | 303 | |
|
Voya CLO Ltd. | |
6.525% due 07/20/2032 • | | | | | 800 | | | | | | 802 | |
|
Wellfleet CLO Ltd. | |
6.476% due 07/20/2029 • | | | | | 2 | | | | | | 2 | |
|
World Omni Auto Receivables Trust | |
5.913% due 02/16/2027 • | | | | | 636 | | | | | | 637 | |
| | | | | | | | | | | | |
Total Asset-Backed Securities
(Cost $44,774) | | | 44,484 | |
| | | | |
| |
| | | | | | | | | | | | |
| | | | | PRINCIPAL
AMOUNT
(000S) | | | | | MARKET
VALUE
(000S) | |
| SOVEREIGN ISSUES 0.8% | |
|
Development Bank of Japan, Inc. | |
1.750% due 02/18/2025 | | $ | | | 1,300 | | | $ | | | 1,270 | |
| | | | | | | | | | | | |
Total Sovereign Issues (Cost $1,273) | | | 1,270 | |
| | | | |
| |
| SHORT-TERM INSTRUMENTS 33.5% | |
| |
| COMMERCIAL PAPER 7.0% | |
|
Campbell Soup Co. | |
5.550% due 07/01/2024 | | | | | 250 | | | | | | 250 | |
5.550% due 08/01/2024 | | | | | 400 | | | | | | 398 | |
5.550% due 08/05/2024 | | | | | 400 | | | | | | 398 | |
5.550% due 08/07/2024 | | | | | 300 | | | | | | 298 | |
5.550% due 08/08/2024 | | | | | 250 | | | | | | 248 | |
|
Crown Castle, Inc. | |
5.840% due 07/09/2024 | | | | | 1,000 | | | | | | 998 | |
|
Global Payments, Inc. | |
5.970% due 07/01/2024 | | | | | 1,700 | | | | | | 1,699 | |
6.030% due 07/18/2024 | | | | | 800 | | | | | | 797 | |
|
Intel Corp. | |
5.520% due 07/08/2024 | | | | | 1,200 | | | | | | 1,198 | |
5.520% due 07/09/2024 | | | | | 1,300 | | | | | | 1,298 | |
|
Intercontinental Exchange, Inc. | |
5.510% due 07/08/2024 | | | | | 300 | | | | | | 300 | |
5.510% due 07/15/2024 | | | | | 300 | | | | | | 299 | |
5.510% due 07/16/2024 | | | | | 500 | | | | | | 499 | |
5.510% due 07/19/2024 | | | | | 250 | | | | | | 249 | |
5.510% due 07/22/2024 | | | | | 250 | | | | | | 249 | |
|
Keurig Dr Pepper, Inc. | |
5.510% due 07/19/2024 | | | | | 2,500 | | | | | | 2,492 | |
| | | | | | | | | | | | |
| | | | | | | | | | | 11,670 | |
| | | | | | | | | | | | |
| |
| REPURCHASE AGREEMENTS (b) 26.5% | |
| | | | | | | | | | | 44,195 | |
| | | | | | | | | | | | |
Total Short-Term Instruments
(Cost $55,871) | | | 55,865 | |
| | | | |
| | | | |
| | | | | | | | | | | | |
Total Investments in Securities
(Cost $188,645) | | | 187,608 | |
| |
| | | | |
Total Investments 112.4%
(Cost $188,645) | | | $ | | | 187,608 | |
| |
Financial Derivative
Instruments (c)(d) 0.0% (Cost or Premiums, net $0) | | | | | | | | | | | 26 | |
| |
| Other Assets and Liabilities, net (12.4)% | | | (20,757 | ) |
| | | | |
| Net Assets 100.0% | | | $ | | | 166,877 | |
| | | | | | | |
NOTES TO SCHEDULE OF INVESTMENTS:
| * | A zero balance may reflect actual amounts rounding to less than one thousand. |
| ~ | Variable or Floating rate security. Rate shown is the rate in effect as of period end. Certain variable rate securities are not based on a published reference rate and spread, rather are determined by the issuer or agent and are based on current market conditions. Reference rate is as of reset date, which may vary by security. These securities may not indicate a reference rate and/or spread in their description. |
| • | Rate shown is the rate in effect as of period end. The rate may be based on a fixed rate, a capped rate or a floor rate and may convert to a variable or floating rate in the future. These securities do not indicate a reference rate and spread in their description. |
| þ | Coupon represents a rate which changes periodically based on a predetermined schedule or event. Rate shown is the rate in effect as of period end. |
| (a) | Principal amount of security is adjusted for inflation. |
| | | | | | |
| 72 | | PIMCO ETF TRUST | | | See Accompanying Notes | |
BORROWINGS AND OTHER FINANCING TRANSACTIONS
(b) REPURCHASE AGREEMENTS:
| | | | | | | | | | | | | | | | | | | | | | | | | | | | | | |
| Counterparty | | Lending
Rate | | | Settlement
Date | | | Maturity
Date | | | Principal
Amount | | | Collateralized By | | Collateral
(Received) | | | Repurchase
Agreements,
at Value | | | Repurchase
Agreement
Proceeds
to be
Received(1) | |
| BPS | | | 5.340 | % | | | 06/28/2024 | | | | 07/01/2024 | | | $ | 22,100 | | | U.S. Treasury Notes 0.625% due 07/31/2026 | | $ | (22,534 | ) | | $ | 22,100 | | | $ | 22,110 | |
| FICC | | | 2.600 | | | | 06/28/2024 | | | | 07/01/2024 | | | | 195 | | | U.S. Treasury Inflation Protected Securities 0.625% due 01/15/2026 | | | (199 | ) | | | 195 | | | | 195 | |
| JPS | | | 5.440 | | | | 07/01/2024 | | | | 07/02/2024 | | | | 21,900 | | | U.S. Treasury Inflation Protected Securities 0.125% due 04/15/2025 | | | (22,339 | ) | | | 21,900 | | | | 21,900 | |
| | | | | | | | | | | | | | | | | | | | | | | | | | | | | | |
Total Repurchase Agreements | | | | | $ | (45,072 | ) | | $ | 44,195 | | | $ | 44,205 | |
| | | | | | | | | | | | | | | |
BORROWINGS AND OTHER FINANCING TRANSACTIONS SUMMARY
The following is a summary by counterparty of the market value of Borrowings and Other Financing Transactions and collateral pledged/(received) as of June 30, 2024:
| | | | | | | | | | | | | | | | | | | | | | | | | | | | |
| Counterparty | | Repurchase
Agreement
Proceeds
to be
Received(1) | | | Payable for
Reverse
Repurchase
Agreements | | | Payable for
Sale-Buyback
Transactions | | | Securities
Out on Loan | | | Total
Borrowings and
Other Financing
Transactions | | | Collateral
Pledged/(Received) | | | Net Exposure(2) | |
Global/Master Repurchase Agreement | |
BPS | | $ | 22,110 | | | $ | 0 | | | $ | 0 | | | $ | 0 | | | $ | 22,110 | | | $ | (22,534 | ) | | $ | (424 | ) |
FICC | | | 195 | | | | 0 | | | | 0 | | | | 0 | | | | 195 | | | | (199 | ) | | | (4 | ) |
JPS | | | 21,900 | | | | 0 | | | | 0 | | | | 0 | | | | 21,900 | | | | (22,339 | ) | | | (439 | ) |
| | | | | | | | | | | | | | | | | | | | | | | | | | | | |
Total Borrowings and Other Financing Transactions | | $ | 44,205 | | | $ | 0 | | | $ | 0 | | | $ | 0 | | | | | | | | | | | | | |
| | | | | | | | | | | | | | | | | | | | | | | | | | | | |
| (1) | Includes accrued interest. |
| (2) | Net Exposure represents the net receivable/(payable) that would be due from/to the counterparty in the event of default. Exposure from borrowings and other financing transactions can only be netted across transactions governed under the same master agreement with the same legal entity. See Note 8, Master Netting Arrangements, in the Notes to Financial Statements for more information. |
(c) FINANCIAL DERIVATIVE INSTRUMENTS: EXCHANGE-TRADED OR CENTRALLY CLEARED
FUTURES CONTRACTS:
| | | | | | | | | | | | | | | | | | | | | | | | | | | | |
| SHORT FUTURES CONTRACTS | | | | | | | | | | | | | | | | | | | | | |
| | | | | |
| Description | | Expiration
Month | | | # of
Contracts | | | Notional
Amount | | | Unrealized
Appreciation/
(Depreciation) | | | Variation Margin | |
| | Asset | | | Liability | |
U.S. Treasury 2-Year Note September Futures | | | 09/2024 | | | | 31 | | | $ | | | | | (6,331 | ) | | $ | (19 | ) | | $ | 1 | | | $ | 0 | |
U.S. Treasury 5-Year Note September Futures | | | 09/2024 | | | | 44 | | | | | | | | (4,689 | ) | | | (20 | ) | | | 5 | | | | 0 | |
| | | | | | | | | | | | | | | | | | | | | | | | | | | | |
Total Futures Contracts | | | | | | | $ | (39 | ) | | $ | 6 | | | $ | 0 | |
| | | | | | | | | | | | | | | | | |
FINANCIAL DERIVATIVE INSTRUMENTS: EXCHANGE-TRADED OR CENTRALLY CLEARED SUMMARY
The following is a summary of the market value and variation margin of Exchange-Traded or Centrally Cleared Financial Derivative Instruments as of June 30, 2024:
| | | | | | | | | | | | | | | | | | | | | | | | | | | | | | | | | | | | |
| | | Financial Derivative Assets | | | | | | Financial Derivative Liabilities | |
| | | Market Value | | | Variation Margin
Asset | | | Total | | | | | | Market Value | | | Variation Margin
Liability | | | Total | |
| | | Purchased
Options | | | Futures | | | Swap
Agreements | | | | | | Written
Options | | | Futures | | | Swap
Agreements | |
Total Exchange-Traded or Centrally Cleared | | $ | 0 | | | $ | 6 | | | $ | 0 | | | $ | 6 | | | | | | | $ | 0 | | | $ | 0 | | | $ | 0 | | | $ | 0 | |
| | | | | | | | | | | | | | | | | | | | | | | | | | | | | | | | | | | | |
Cash of $240 has been pledged as collateral for exchange-traded and centrally cleared financial derivative instruments as of June 30, 2024. See Note 8, Master Netting Arrangements, in the Notes to Financial Statements for more information.
| | | | | | | | | | | | |
| See Accompanying Notes | | | ANNUAL FINANCIAL AND OTHER INFORMATION | | | | | | | JUNE 30, 2024 | | | 73 |
| | | | | | |
| Schedule of Investments | | PIMCO Enhanced Short Maturity Active ESG Exchange-Traded Fund | | (Cont.) | | |
(d) FINANCIAL DERIVATIVE INSTRUMENTS: OVER THE COUNTER
FORWARD FOREIGN CURRENCY CONTRACTS:
| | | | | | | | | | | | | | | | | | | | | | | | |
| Counterparty | | Settlement
Month | | | Currency to
be Delivered | | | Currency to
be Received | | | Unrealized Appreciation/
(Depreciation) | |
| | Asset | | | Liability | |
BRC | | | 07/2024 | | | $ | | | 289 | | | CAD | | | 396 | | | $ | 0 | | | $ | 0 | |
| | | | | | | |
CBK | | | 07/2024 | | | CAD | | | 1,017 | | | $ | | | 740 | | | | 0 | | | | (3 | ) |
| | | 07/2024 | | | GBP | | | 1,140 | | | | | | 1,450 | | | | 9 | | | | 0 | |
| | | | | | | |
GLM | | | 07/2024 | | | CAD | | | 1,000 | | | | | | 732 | | | | 2 | | | | 0 | |
| | | | | | | |
MBC | | | 07/2024 | | | | | | 2,978 | | | | | | 2,187 | | | | 10 | | | | 0 | |
| | | 07/2024 | | | $ | | | 3,361 | | | CAD | | | 4,602 | | | | 3 | | | | 0 | |
| | | 07/2024 | | | | | | 1,443 | | | GBP | | | 1,140 | | | | 0 | | | | (1 | ) |
| | | 08/2024 | | | CAD | | | 4,599 | | | $ | | | 3,361 | | | | 0 | | | | (3 | ) |
| | | 08/2024 | | | GBP | | | 1,140 | | | | | | 1,443 | | | | 1 | | | | 0 | |
| | | 01/2025 | | | | | | 306 | | | | | | 390 | | | | 2 | | | | 0 | |
| | | | | | | | | | | | | | | | | | | | | | | | |
Total Forward Foreign Currency Contracts | | | $ | 27 | | | $ | (7 | ) |
| | | | | | | | | |
FINANCIAL DERIVATIVE INSTRUMENTS: OVER THE COUNTER SUMMARY
The following is a summary by counterparty of the market value of OTC financial derivative instruments and collateral pledged/(received) as of June 30, 2024:
| | | | | | | | | | | | | | | | | | | | | | | | | | | | | | | | | | | | | | | | | | | | | | | | |
| | | Financial Derivative Assets | | | | | | Financial Derivative Liabilities | | | | | | | | | | |
| Counterparty | | Forward
Foreign
Currency
Contracts | | | Purchased
Options | | | Swap
Agreements | | | Total
Over the
Counter | | | | | | Forward
Foreign
Currency
Contracts | | | Written
Options | | | Swap
Agreements | | | Total
Over the
Counter | | | Net Market
Value of OTC
Derivatives | | | Collateral
Pledged/
(Received) | | | Net
Exposure(1) | |
CBK | | $ | 9 | | | $ | 0 | | | $ | 0 | | | $ | 9 | | | | | | | $ | (3 | ) | | $ | 0 | | | $ | 0 | | | $ | (3 | ) | | $ | 6 | | | $ | 0 | | | $ | 6 | |
GLM | | | 2 | | | | 0 | | | | 0 | | | | 2 | | | | | | | | 0 | | | | 0 | | | | 0 | | | | 0 | | | | 2 | | | | 0 | | | | 2 | |
MBC | | | 16 | | | | 0 | | | | 0 | | | | 16 | | | | | | | | (4 | ) | | | 0 | | | | 0 | | | | (4 | ) | | | 12 | | | | 0 | | | | 12 | |
| | | | | | | | | | | | | | | | | | | | | | | | | | | | | | | | | | | | | | | | | | | | | | | | |
Total Over the Counter | | $ | 27 | | | $ | 0 | | | $ | 0 | | | $ | 27 | | | | | | | $ | (7 | ) | | $ | 0 | | | $ | 0 | | | $ | (7 | ) | | | | | | | | | | | | |
| | | | | | | | | | | | | | | | | | | | | | | | | | | | | | | | | | | | | | | | | | | | | | | | |
| (1) | Net Exposure represents the net receivable/(payable) that would be due from/to the counterparty in the event of default. Exposure from OTC financial derivative instruments can only be netted across transactions governed under the same master agreement with the same legal entity. See Note 8, Master Netting Arrangements, in the Notes to Financial Statements for more information. |
FAIR VALUE OF FINANCIAL DERIVATIVE INSTRUMENTS
The following is a summary of the fair valuation of the Fund’s derivative instruments categorized by risk exposure. See Note 7, Principal and Other Risks, in the Notes to Financial Statements on risks of the Fund.
Fair Values of Financial Derivative Instruments on the Statements of Assets and Liabilities as of June 30, 2024:
| | | | | | | | | | | | | | | | | | | | | | | | |
| | | Derivatives not accounted for as hedging instruments | |
| | | Commodity
Contracts | | | Credit
Contracts | | | Equity
Contracts | | | Foreign
Exchange
Contracts | | | Interest
Rate Contracts | | | Total | |
Financial Derivative Instruments - Assets | |
Exchange-traded or centrally cleared | |
Futures | | $ | 0 | | | $ | 0 | | | $ | 0 | | | $ | 0 | | | $ | 6 | | | $ | 6 | |
| | | | | | | | | | | | | | | | | | | | | | | | |
Over the counter | |
Forward Foreign Currency Contracts | | $ | 0 | | | $ | 0 | | | $ | 0 | | | $ | 27 | | | $ | 0 | | | $ | 27 | |
| | | | | | | | | | | | | | | | | | | | | | | | |
| | $ | 0 | | | $ | 0 | | | $ | 0 | | | $ | 27 | | | $ | 6 | | | $ | 33 | |
| | | | | | | | | | | | | | | | | | | | | | | | |
|
Financial Derivative Instruments - Liabilities | |
Over the counter | |
Forward Foreign Currency Contracts | | $ | 0 | | | $ | 0 | | | $ | 0 | | | $ | 7 | | | $ | 0 | | | $ | 7 | |
| | | | | | | | | | | | | | | | | | | | | | | | |
| | | | | | |
| 74 | | PIMCO ETF TRUST | | | See Accompanying Notes | |
The effect of Financial Derivative Instruments on the Statements of Operations for the period ended June 30, 2024:
| | | | | | | | | | | | | | | | | | | | | | | | |
| | | Derivatives not accounted for as hedging instruments | |
| | | Commodity
Contracts | | | Credit
Contracts | | | Equity
Contracts | | | Foreign
Exchange
Contracts | | | Interest
Rate Contracts | | | Total | |
Net Realized Gain (Loss) on Financial Derivative Instruments | |
Exchange-traded or centrally cleared | |
Futures | | $ | 0 | | | $ | 0 | | | $ | 0 | | | $ | 0 | | | $ | 195 | | | $ | 195 | |
| | | | | | | | | | | | | | | | | | | | | | | | |
Over the counter | |
Forward Foreign Currency Contracts | | $ | 0 | | | $ | 0 | | | $ | 0 | | | $ | 73 | | | $ | 0 | | | $ | 73 | |
| | | | | | | | | | | | | | | | | | | | | | | | |
| | $ | 0 | | | $ | 0 | | | $ | 0 | | | $ | 73 | | | $ | 195 | | | $ | 268 | |
| | | | | | | | | | | | | | | | | | | | | | | | |
|
Net Change in Unrealized Appreciation (Depreciation) on Financial Derivative Instruments | |
Exchange-traded or centrally cleared | |
Futures | | $ | 0 | | | $ | 0 | | | $ | 0 | | | $ | 0 | | | $ | (79 | ) | | $ | (79 | ) |
| | | | | | | | | | | | | | | | | | | | | | | | |
Over the counter | |
Forward Foreign Currency Contracts | | $ | 0 | | | $ | 0 | | | $ | 0 | | | $ | (58 | ) | | $ | 0 | | | $ | (58 | ) |
| | | | | | | | | | | | | | | | | | | | | | | | |
| | $ | 0 | | | $ | 0 | | | $ | 0 | | | $ | (58 | ) | | $ | (79 | ) | | $ | (137 | ) |
| | | | | | | | | | | | | | | | | | | | | | | | |
FAIR VALUE MEASUREMENTS
The following is a summary of the fair valuations according to the inputs used as of June 30, 2024 in valuing the Fund’s assets and liabilities:
| | | | | | | | | | | | | | | | |
| Category and Subcategory | | Level 1 | | | Level 2 | | | Level 3 | | | Fair Value at
06/30/2024 | |
Investments in Securities, at Value | |
Corporate Bonds & Notes | |
Banking & Finance | | $ | 0 | | | $ | 33,194 | | | $ | 0 | | | $ | 33,194 | |
Industrials | | | 0 | | | | 37,156 | | | | 0 | | | | 37,156 | |
Utilities | | | 0 | | | | 5,030 | | | | 0 | | | | 5,030 | |
U.S. Government Agencies | | | 0 | | | | 3,665 | | | | 0 | | | | 3,665 | |
U.S. Treasury Obligations | | | 0 | | | | 2,707 | | | | 0 | | | | 2,707 | |
Non-Agency Mortgage-Backed Securities | | | 0 | | | | 4,237 | | | | 0 | | | | 4,237 | |
Asset-Backed Securities | | | 0 | | | | 44,484 | | | | 0 | | | | 44,484 | |
Sovereign Issues | | | 0 | | | | 1,270 | | | | 0 | | | | 1,270 | |
Short-Term Instruments | |
Commercial Paper | | | 0 | | | | 11,670 | | | | 0 | | | | 11,670 | |
Repurchase Agreements | | | 0 | | | | 44,195 | | | | 0 | | | | 44,195 | |
| | | | | | | | | | | | | | | | |
| | | | |
Total Investments | | $ | 0 | | | $ | 187,608 | | | $ | 0 | | | $ | 187,608 | |
| | | | | | | | | | | | | | | | |
| | | | | | | | | | | | | | | | |
| Category and Subcategory | | Level 1 | | | Level 2 | | | Level 3 | | | Fair Value at
06/30/2024 | |
Financial Derivative Instruments - Assets | |
Exchange-traded or centrally cleared | | | 0 | | | | 6 | | | | 0 | | | | 6 | |
Over the counter | | | 0 | | | | 27 | | | | 0 | | | | 27 | |
| | | | | | | | | | | | | | | | |
| | $ | 0 | | | $ | 33 | | | $ | 0 | | | $ | 33 | |
| | | | | | | | | | | | | | | | |
|
Financial Derivative Instruments - Liabilities | |
Over the counter | | $ | 0 | | | $ | (7 | ) | | $ | 0 | | | $ | (7 | ) |
| | | | | | | | | | | | | | | | |
| | | | |
Total Financial Derivative Instruments | | $ | 0 | | | $ | 26 | | | $ | 0 | | | $ | 26 | |
| | | | | | | | | | | | | | | | |
| | | | |
Totals | | $ | 0 | | | $ | 187,634 | | | $ | 0 | | | $ | 187,634 | |
| | | | | | | | | | | | | | | | |
There were no significant transfers into or out of Level 3 during the period ended June 30, 2024.
| | | | | | | | | | | | |
| See Accompanying Notes | | | ANNUAL FINANCIAL AND OTHER INFORMATION | | | | | | | JUNE 30, 2024 | | | 75 |
| | | | | | |
| Schedule of Investments | | PIMCO Enhanced Short Maturity Active Exchange-Traded Fund | | | | |
(Amounts in thousands*, except number of shares, contracts, units and ounces, if any)
| | | | | | | | | | | | |
| | | | | PRINCIPAL
AMOUNT
(000S) | | | | | MARKET
VALUE
(000S) | |
| INVESTMENTS IN SECURITIES 101.0% | |
| |
| CORPORATE BONDS & NOTES 53.6% | |
| |
| BANKING & FINANCE 32.5% | |
|
AerCap Ireland Capital DAC | |
1.650% due 10/29/2024 | | $ | | | 27,315 | | | $ | | | 26,947 | |
1.750% due 10/29/2024 | | | | | 6,400 | | | | | | 6,315 | |
2.875% due 08/14/2024 | | | | | 27,800 | | | | | | 27,690 | |
3.500% due 01/15/2025 | | | | | 15,479 | | | | | | 15,288 | |
4.450% due 10/01/2025 | | | | | 100 | | | | | | 99 | |
6.500% due 07/15/2025 | | | | | 9,562 | | | | | | 9,638 | |
|
Ally Financial, Inc. | |
4.625% due 03/30/2025 | | | | | 56,792 | | | | | | 56,278 | |
5.125% due 09/30/2024 | | | | | 27,934 | | | | | | 27,865 | |
5.800% due 05/01/2025 | | | | | 4,803 | | | | | | 4,800 | |
|
American Express Co. | |
6.125% (SOFRRATE + 0.760%) due 02/13/2026 ~ | | | | | 2,816 | | | | | | 2,830 | |
6.301% (SOFRINDX + 0.930%) due 03/04/2025 ~ | | | | | 3,219 | | | | | | 3,227 | |
|
American Honda Finance Corp. | |
5.914% due 02/12/2025 • | | | | | 73,250 | | | | | | 73,356 | |
5.966% (SOFRRATE + 0.600%) due 08/14/2025 ~ | | | | | 6,673 | | | | | | 6,685 | |
6.025% due 01/10/2025 • | | | | | 15,500 | | | | | | 15,530 | |
6.069% (SOFRINDX + 0.700%) due 11/22/2024 ~ | | | | | 2,800 | | | | | | 2,806 | |
6.139% (SOFRINDX + 0.780%) due 04/23/2025 ~ | | | | | 20,694 | | | | | | 20,758 | |
6.144% (SOFRINDX + 0.790%) due 10/03/2025 ~ | | | | | 7,900 | | | | | | 7,933 | |
|
American Tower Corp. | |
1.300% due 09/15/2025 | | | | | 1,400 | | | | | | 1,331 | |
2.400% due 03/15/2025 | | | | | 6,805 | | | | | | 6,644 | |
2.950% due 01/15/2025 | | | | | 53,700 | | | | | | 52,868 | |
4.000% due 06/01/2025 | | | | | 30,969 | | | | | | 30,483 | |
|
Aozora Bank Ltd. | |
1.050% due 09/09/2024 | | | | | 54,755 | | | | | | 54,191 | |
|
Athene Global Funding | |
0.914% due 08/19/2024 | | | | | 687 | | | | | | 682 | |
1.450% due 01/08/2026 | | | | | 9,300 | | | | | | 8,735 | |
1.716% due 01/07/2025 | | | | | 10,934 | | | | | | 10,701 | |
2.500% due 01/14/2025 | | | | | 2,385 | | | | | | 2,343 | |
2.550% due 06/29/2025 | | | | | 1,390 | | | | | | 1,348 | |
5.927% (SOFRINDX + 0.560%) due 08/19/2024 ~ | | | | | 11,980 | | | | | | 11,985 | |
6.214% (SOFRINDX + 0.850%) due 05/08/2026 ~ | | | | | 61,326 | | | | | | 61,347 | |
|
Avolon Holdings Funding Ltd. | |
2.875% due 02/15/2025 | | | | | 7,349 | | | | | | 7,201 | |
|
Bank of America Corp. | |
2.015% due 02/13/2026 • | | | | | 1,000 | | | | | | 977 | |
2.456% due 10/22/2025 • | | | | | 18,656 | | | | | | 18,464 | |
3.093% due 10/01/2025 • | | | | | 27,380 | | | | | | 27,191 | |
3.366% due 01/23/2026 • | | | | | 15,283 | | | | | | 15,074 | |
3.384% due 04/02/2026 • | | | | | 46,300 | | | | | | 45,479 | |
6.359% (US0003M + 0.770%) due 02/05/2026 ~ | | | | | 3,600 | | | | | | 3,611 | |
6.684% (SOFRRATE + 1.330%) due 04/02/2026 ~ | | | | | 1,702 | | | | | | 1,713 | |
|
Bank of America NA | |
6.148% (SOFRRATE + 0.780%) due 08/18/2025 ~ | | | | | 1,275 | | | | | | 1,281 | |
|
Bank of Montreal | |
6.082% (SOFRINDX + 0.710%) due 12/12/2024 ~ | | | | | 9,175 | | | | | | 9,191 | |
|
Bank of Nova Scotia | |
5.815% (SOFRRATE + 0.460%) due 01/10/2025 ~ | | | | | 159 | | | | | | 159 | |
|
Banque Federative du Credit Mutuel SA | |
0.998% due 02/04/2025 | | | | | 2,000 | | | | | | 1,944 | |
2.375% due 11/21/2024 | | | | | 1,650 | | | | | | 1,628 | |
5.772% (SOFRINDX + 0.410%) due 02/04/2025 ~ | | | | | 23,250 | | | | | | 23,254 | |
6.756% (SOFRINDX + 1.400%) due 07/13/2026 ~ | | | | | 10,730 | | | | | | 10,883 | |
6.756% due 07/13/2026 ~ | | | | | 4,200 | | | | | | 4,260 | |
| | | | | | | | | | | | |
| | | | | PRINCIPAL
AMOUNT
(000S) | | | | | MARKET
VALUE
(000S) | |
|
Barclays PLC | |
2.852% due 05/07/2026 • | | $ | | | 33,736 | | | $ | | | 32,897 | |
3.650% due 03/16/2025 | | | | | 23,600 | | | | | | 23,244 | |
7.325% due 11/02/2026 • | | | | | 1,390 | | | | | | 1,415 | |
|
BNP Paribas SA | |
2.219% due 06/09/2026 • | | | | | 1,100 | | | | | | 1,063 | |
2.819% due 11/19/2025 • | | | | | 91,006 | | | | | | 89,883 | |
3.375% due 01/09/2025 | | | | | 29,393 | | | | | | 29,013 | |
|
BPCE SA | |
5.926% (SOFRRATE + 0.570%) due 01/14/2025 ~ | | | | | 6,292 | | | | | | 6,299 | |
6.334% (SOFRRATE + 0.960%) due 09/25/2025 ~ | | | | | 22,700 | | | | | | 22,856 | |
|
Caterpillar Financial Services Corp. | |
5.642% (SOFRRATE + 0.270%) due 09/13/2024 ~ | | | | | 125 | | | | | | 125 | |
|
Citibank NA | |
5.951% (SOFRINDX + 0.590%) due 04/30/2026 ~ | | | | | 14,500 | | | | | | 14,519 | |
6.181% (SOFRRATE + 0.805%) due 09/29/2025 ~ | | | | | 2,310 | | | | | | 2,321 | |
|
Citigroup, Inc. | |
3.106% due 04/08/2026 • | | | | | 34,000 | | | | | | 33,317 | |
6.048% (SOFRRATE + 0.686%) due 10/30/2024 ~ | | | | | 86,771 | | | | | | 86,854 | |
|
Cooperatieve Rabobank UA | |
6.057% (SOFRINDX + 0.700%) due 07/18/2025 ~ | | | | | 10,000 | | | | | | 10,039 | |
6.064% (SOFRINDX + 0.710%) due 01/09/2026 ~ | | | | | 41,000 | | | | | | 41,160 | |
6.081% (SOFRINDX + 0.710%) due 03/05/2027 ~ | | | | | 70,100 | | | | | | 70,323 | |
|
Credit Agricole SA | |
3.250% due 10/04/2024 | | | | | 61,000 | | | | | | 60,613 | |
|
Danske Bank AS | |
3.244% due 12/20/2025 • | | | | | 17,500 | | | | | | 17,271 | |
|
DBS Group Holdings Ltd. | |
5.981% (SOFRRATE + 0.610%) due 09/12/2025 ~ | | | | | 50,000 | | | | | | 50,168 | |
|
Deutsche Bank AG | |
3.961% due 11/26/2025 • | | | | | 51,016 | | | | | | 50,587 | |
4.162% due 05/13/2025 | | | | | 1,075 | | | | | | 1,062 | |
6.119% due 07/14/2026 • | | | | | 53,816 | | | | | | 53,876 | |
|
DNB Bank ASA | |
0.856% due 09/30/2025 • | | | | | 19,300 | | | | | | 19,059 | |
|
F&G Global Funding | |
0.900% due 09/20/2024 | | | | | 2,988 | | | | | | 2,954 | |
|
Federation des Caisses Desjardins du Quebec | |
2.050% due 02/10/2025 | | | | | 2,530 | | | | | | 2,475 | |
5.278% due 01/23/2026 • | | | | | 901 | | | | | | 898 | |
|
Ford Motor Credit Co. LLC | |
2.300% due 02/10/2025 | | | | | 38,008 | | | | | | 37,168 | |
3.375% due 11/13/2025 | | | | | 10,445 | | | | | | 10,113 | |
4.063% due 11/01/2024 | | | | | 20,684 | | | | | | 20,562 | |
4.134% due 08/04/2025 | | | | | 25,065 | | | | | | 24,605 | |
4.389% due 01/08/2026 | | | | | 27,552 | | | | | | 26,981 | |
4.687% due 06/09/2025 | | | | | 9,540 | | | | | | 9,433 | |
5.125% due 06/16/2025 | | | | | 16,768 | | | | | | 16,647 | |
6.950% due 03/06/2026 | | | | | 11,200 | | | | | | 11,386 | |
8.321% (SOFRRATE + 2.950%) due 03/06/2026 ~ | | | | | 2,424 | | | | | | 2,511 | |
|
GA Global Funding Trust | |
3.850% due 04/11/2025 | | | | | 14,614 | | | | | | 14,384 | |
5.872% (SOFRRATE + 0.500%) due 09/13/2024 ~ | | | | | 63,540 | | | | | | 63,523 | |
6.715% (SOFRRATE + 1.360%) due 04/11/2025 ~ | | | | | 17,100 | | | | | | 17,204 | |
|
General Motors Financial Co., Inc. | |
1.200% due 10/15/2024 | | | | | 7,945 | | | | | | 7,842 | |
2.750% due 06/20/2025 | | | | | 12,200 | | | | | | 11,862 | |
2.900% due 02/26/2025 | | | | | 21,005 | | | | | | 20,614 | |
3.500% due 11/07/2024 | | | | | 22,223 | | | | | | 22,039 | |
3.800% due 04/07/2025 | | | | | 5,800 | | | | | | 5,714 | |
4.000% due 01/15/2025 | | | | | 7,098 | | | | | | 7,030 | |
4.350% due 04/09/2025 | | | | | 30,300 | | | | | | 29,981 | |
5.976% (SOFRRATE + 0.620%) due 10/15/2024 ~ | | | | | 12,495 | | | | | | 12,500 | |
| | | | | | | | | | | | |
| | | | | PRINCIPAL
AMOUNT
(000S) | | | | | MARKET
VALUE
(000S) | |
6.653% (SOFRINDX + 1.300%) due 04/07/2025 ~ | | $ | | | 25,318 | | | $ | | | 25,452 | |
|
Goldman Sachs Group, Inc. | |
3.272% due 09/29/2025 • | | | | | 6,161 | | | | | | 6,122 | |
5.700% due 11/01/2024 | | | | | 2,400 | | | | | | 2,401 | |
5.844% (SOFRRATE + 0.486%) due 10/21/2024 ~ | | | | | 24,490 | | | | | | 24,494 | |
5.848% (SOFRRATE + 0.490%) due 10/21/2024 ~ | | | | | 32,640 | | | | | | 32,648 | |
5.871% (SOFRRATE + 0.500%) due 09/10/2024 ~ | | | | | 16,024 | | | | | | 16,028 | |
5.876% (SOFRRATE + 0.505%) due 09/10/2024 ~ | | | | | 45,209 | | | | | | 45,210 | |
6.430% (SOFRRATE + 1.065%) due 08/10/2026 ~ | | | | | 10,700 | | | | | | 10,751 | |
|
HSBC Holdings PLC | |
1.645% due 04/18/2026 • | | | | | 15,305 | | | | | | 14,816 | |
2.099% due 06/04/2026 • | | | | | 20,552 | | | | | | 19,873 | |
4.292% due 09/12/2026 • | | | | | 1,500 | | | | | | 1,474 | |
6.801% (SOFRRATE + 1.430%) due 03/10/2026 ~ | | | | | 10,107 | | | | | | 10,172 | |
6.985% (US0003M + 1.380%) due 09/12/2026 ~ | | | | | 7,074 | | | | | | 7,153 | |
|
ING Groep NV | |
3.869% due 03/28/2026 • | | | | | 58,847 | | | | | | 58,002 | |
6.385% (SOFRRATE + 1.010%) due 04/01/2027 ~ | | | | | 16,716 | | | | | | 16,770 | |
7.016% (SOFRINDX + 1.640%) due 03/28/2026 ~ | | | | | 14,491 | | | | | | 14,614 | |
|
Jackson National Life Global Funding | |
1.750% due 01/12/2025 | | | | | 13,340 | | | | | | 13,045 | |
|
John Deere Capital Corp. | |
5.837% due 10/22/2025 • | | | | | 16,500 | | | | | | 16,537 | |
|
JPMorgan Chase & Co. | |
2.005% due 03/13/2026 • | | | | | 2,000 | | | | | | 1,949 | |
2.301% due 10/15/2025 • | | | | | 33,100 | | | | | | 32,770 | |
5.546% due 12/15/2025 • | | | | | 15,000 | | | | | | 14,987 | |
5.971% (SOFRRATE + 0.600%) due 12/10/2025 ~ | | | | | 5,525 | | | | | | 5,534 | |
6.289% (SOFRRATE + 0.920%) due 02/24/2026 ~ | | | | | 25,987 | | | | | | 26,100 | |
|
LeasePlan Corp. NV | |
2.875% due 10/24/2024 | | | | | 61,904 | | | | | | 61,328 | |
|
Lloyds Banking Group PLC | |
2.438% due 02/05/2026 • | | | | | 30,073 | | | | | | 29,470 | |
3.511% due 03/18/2026 • | | | | | 14,060 | | | | | | 13,830 | |
3.870% due 07/09/2025 • | | | | | 118,595 | | | | | | 118,542 | |
4.450% due 05/08/2025 | | | | | 1,300 | | | | | | 1,287 | |
|
Mitsubishi UFJ Financial Group, Inc. | |
4.788% due 07/18/2025 • | | | | | 21,986 | | | | | | 21,973 | |
5.063% due 09/12/2025 • | | | | | 42,044 | | | | | | 41,972 | |
5.541% due 04/17/2026 • | | | | | 12,781 | | | | | | 12,771 | |
5.719% due 02/20/2026 • | | | | | 3,972 | | | | | | 3,971 | |
6.306% (SOFRRATE + 0.940%) due 02/20/2026 ~ | | | | | 24,011 | | | | | | 24,095 | |
6.756% (SOFRRATE + 1.385%) due 09/12/2025 ~ | | | | | 26,830 | | | | | | 26,891 | |
6.796% (SOFRRATE + 1.440%) due 04/17/2026 ~ | | | | | 11,366 | | | | | | 11,456 | |
7.007% (SOFRRATE + 1.650%) due 07/18/2025 ~ | | | | | 2,363 | | | | | | 2,364 | |
|
Mizuho Financial Group, Inc. | |
2.226% due 05/25/2026 • | | | | | 17,084 | | | | | | 16,559 | |
2.555% due 09/13/2025 • | | | | | 2,500 | | | | | | 2,483 | |
2.839% due 07/16/2025 • | | | | | 12,723 | | | | | | 12,706 | |
6.327% (SOFRRATE + 0.960%) due 05/22/2026 ~ | | | | | 44,470 | | | | | | 44,664 | |
|
Morgan Stanley | |
2.188% due 04/28/2026 • | | | | | 40,857 | | | | | | 39,685 | |
2.720% due 07/22/2025 • | | | | | 13,300 | | | | | | 13,275 | |
5.869% (SOFRRATE + 0.509%) due 01/22/2025 ~ | | | | | 12,117 | | | | | | 12,124 | |
6.318% (SOFRRATE + 0.950%) due 02/18/2026 ~ | | | | | 66,700 | | | | | | 66,955 | |
|
National Bank of Canada | |
5.853% (SOFRRATE + 0.490%) due 08/06/2024 ~ | | | | | 7,112 | | | | | | 7,113 | |
| | | | | | |
| 76 | | PIMCO ETF TRUST | | | See Accompanying Notes | |
| | | | | | | | | | | | |
| | | | | PRINCIPAL
AMOUNT
(000S) | | | | | MARKET
VALUE
(000S) | |
|
NatWest Markets PLC | |
0.800% due 08/12/2024 | | $ | | | 8,540 | | | $ | | | 8,490 | |
3.479% due 03/22/2025 | | | | | 6,805 | | | | | | 6,703 | |
5.894% due 08/12/2024 ~ | | | | | 1,680 | | | | | | 1,681 | |
6.136% (SOFRRATE + 0.760%) due 09/29/2026 ~ | | | | | 1,995 | | | | | | 1,988 | |
6.824% due 03/22/2025 ~ | | | | | 40,633 | | | | | | 40,917 | |
6.824% (SOFRRATE + 1.450%) due 03/22/2025 ~ | | | | | 3,880 | | | | | | 3,907 | |
|
Nissan Motor Acceptance Co. LLC | |
1.125% due 09/16/2024 | | | | | 8,600 | | | | | | 8,508 | |
|
Nomura Holdings, Inc. | |
1.851% due 07/16/2025 | | | | | 594 | | | | | | 571 | |
2.648% due 01/16/2025 | | | | | 126,905 | | | | | | 124,750 | |
|
Nordea Bank Abp | |
6.331% (SOFRRATE + 0.960%) due 06/06/2025 ~ | | | | | 43,340 | | | | | | 43,579 | |
|
Nuveen Finance LLC | |
4.125% due 11/01/2024 | | | | | 9,496 | | | | | | 9,438 | |
|
ORIX Corp. | |
3.250% due 12/04/2024 | | | | | 902 | | | | | | 893 | |
|
Protective Life Global Funding | |
6.422% due 12/11/2024 • | | | | | 1,130 | | | | | | 1,133 | |
|
Royal Bank of Canada | |
5.883% (SOFRRATE + 0.525%) due 01/20/2026 ~ | | | | | 31,476 | | | | | | 31,520 | |
|
Skandinaviska Enskilda Banken AB | |
6.331% (SOFRRATE + 0.960%) due 06/09/2025 ~ | | | | | 43,850 | | | | | | 44,076 | |
6.331% due 06/09/2025 ~ | | | | | 500 | | | | | | 503 | |
|
Societe Generale SA | |
2.625% due 10/16/2024 | | | | | 43,951 | | | | | | 43,545 | |
2.625% due 01/22/2025 | | | | | 5,930 | | | | | | 5,816 | |
|
Standard Chartered PLC | |
1.822% due 11/23/2025 • | | | | | 17,531 | | | | | | 17,249 | |
2.819% due 01/30/2026 • | | | | | 21,060 | | | | | | 20,689 | |
3.971% due 03/30/2026 • | | | | | 32,751 | | | | | | 32,291 | |
3.971% due 03/30/2026 | | | | | 1,200 | | | | | | 1,183 | |
6.266% due 11/23/2025 | | | | | 900 | | | | | | 901 | |
6.299% (SOFRRATE + 0.930%) due 11/23/2025 ~ | | | | | 51,615 | | | | | | 51,666 | |
7.094% due 03/30/2026 | | | | | 7,500 | | | | | | 7,550 | |
7.116% (SOFRRATE + 1.740%) due 03/30/2026 ~ | | | | | 5,400 | | | | | | 5,436 | |
7.776% due 11/16/2025 • | | | | | 14,876 | | | | | | 14,978 | |
7.776% due 11/16/2025 | | | | | 8,358 | | | | | | 8,415 | |
|
Sumitomo Mitsui Financial Group, Inc. | |
2.696% due 07/16/2024 | | | | | 4,000 | | | | | | 3,995 | |
6.655% (SOFRRATE + 1.300%) due 07/13/2026 ~ | | | | | 2,500 | | | | | | 2,535 | |
6.785% (SOFRRATE + 1.430%) due 01/13/2026 ~ | | | | | 520 | | | | | | 528 | |
|
Sumitomo Mitsui Trust Bank Ltd. | |
5.762% due 09/16/2024 | | | | | 4,100 | | | | | | 4,102 | |
5.811% (SOFRRATE + 0.440%) due 09/16/2024 ~ | | | | | 3,000 | | | | | | 3,002 | |
6.475% due 09/14/2026 | | | | | 2,850 | | | | | | 2,885 | |
6.522% (SOFRRATE + 1.150%) due 09/14/2026 ~ | | | | | 2,237 | | | | | | 2,264 | |
|
Swedbank AB | |
6.264% (SOFRINDX + 0.910%) due 04/04/2025 ~ | | | | | 5,300 | | | | | | 5,320 | |
6.264% due 04/04/2025 ~ | | | | | 935 | | | | | | 938 | |
6.752% due 06/15/2026 • | | | | | 8,700 | | | | | | 8,848 | |
|
Toyota Motor Credit Corp. | |
5.816% (SOFRRATE + 0.450%) due 05/15/2026 ~ | | | | | 13,261 | | | | | | 13,278 | |
5.860% due 08/22/2024 • | | | | | 94,200 | | | | | | 94,247 | |
6.003% (SOFRRATE + 0.650%) due 01/05/2026 ~ | | | | | 8,000 | | | | | | 8,032 | |
|
UBS AG | |
3.625% due 09/09/2024 | | | | | 19,234 | | | | | | 19,143 | |
3.700% due 02/21/2025 | | | | | 30,000 | | | | | | 29,615 | |
4.750% due 08/09/2024 | | | | | 33,667 | | | | | | 33,626 | |
6.302% (SOFRRATE + 0.930%) due 09/11/2025 ~ | | | | | 4,308 | | | | | | 4,337 | |
| | | | | | | | | | | | |
| | | | | PRINCIPAL
AMOUNT
(000S) | | | | | MARKET
VALUE
(000S) | |
|
UBS Group AG | |
2.593% due 09/11/2025 • | | $ | | | 24,170 | | | $ | | | 24,011 | |
2.593% due 09/11/2025 | | | | | 6,940 | | | | | | 6,894 | |
4.490% due 08/05/2025 • | | | | | 37,800 | | | | | | 37,741 | |
6.944% (SOFRRATE + 1.580%) due 05/12/2026 ~ | | | | | 21,200 | | | | | | 21,379 | |
|
Ventas Realty LP | |
3.500% due 02/01/2025 | | | | | 1,074 | | | | | | 1,059 | |
|
VICI Properties LP | |
4.375% due 05/15/2025 | | | | | 42,717 | | | | | | 42,185 | |
4.625% due 06/15/2025 | | | | | 8,369 | | | | | | 8,267 | |
|
Wells Fargo & Co. | |
2.164% due 02/11/2026 • | | | | | 3,717 | | | | | | 3,637 | |
2.188% due 04/30/2026 • | | | | | 11,600 | | | | | | 11,266 | |
2.406% due 10/30/2025 • | | | | | 121,776 | | | | | | 120,405 | |
3.908% due 04/25/2026 • | | | | | 15,300 | | | | | | 15,073 | |
|
Wells Fargo Bank NA | |
6.066% (SOFRRATE + 0.710%) due 01/15/2026 ~ | | | | | 16,800 | | | | | | 16,870 | |
6.162% (SOFRRATE + 0.800%) due 08/01/2025 ~ | | | | | 9,875 | | | | | | 9,922 | |
| | | | | | | | | | | | |
| | | | | | | | | | | 3,915,599 | |
| | | | | | | | | | | | |
| |
| INDUSTRIALS 17.0% | |
|
American Honda Finance Corp. | |
5.822% due 06/13/2025 ~ | | | | | 35,700 | | | | | | 35,716 | |
|
APA Infrastructure Ltd. | |
4.200% due 03/23/2025 | | | | | 14,493 | | | | | | 14,329 | |
|
Aptiv PLC | |
2.396% due 02/18/2025 | | | | | 652 | | | | | | 638 | |
|
Arrow Electronics, Inc. | |
3.250% due 09/08/2024 | | | | | 2,228 | | | | | | 2,215 | |
4.000% due 04/01/2025 | | | | | 4,878 | | | | | | 4,813 | |
|
Bacardi Ltd. | |
4.450% due 05/15/2025 | | | | | 24,258 | | | | | | 23,972 | |
|
BAT Capital Corp. | |
2.789% due 09/06/2024 | | | | | 13,400 | | | | | | 13,315 | |
3.222% due 08/15/2024 | | | | | 108,873 | | | | | | 108,469 | |
|
Baxter International, Inc. | |
1.322% due 11/29/2024 | | | | | 31,304 | | | | | | 30,741 | |
5.811% (SOFRINDX + 0.440%) due 11/29/2024 ~ | | | | | 62,095 | | | | | | 62,060 | |
|
Bayer U.S. Finance LLC | |
3.375% due 07/15/2024 | | | | | 8,031 | | | | | | 8,022 | |
3.375% due 10/08/2024 | | | | | 65,986 | | | | | | 65,516 | |
4.250% due 12/15/2025 | | | | | 34,723 | | | | | | 33,986 | |
5.500% due 08/15/2025 | | | | | 2,145 | | | | | | 2,133 | |
6.125% due 11/21/2026 | | | | | 400 | | | | | | 404 | |
|
Berry Global, Inc. | |
1.570% due 01/15/2026 | | | | | 4,670 | | | | | | 4,390 | |
|
Boeing Co. | |
2.196% due 02/04/2026 | | | | | 11,067 | | | | | | 10,407 | |
2.600% due 10/30/2025 | | | | | 3,010 | | | | | | 2,880 | |
2.850% due 10/30/2024 | | | | | 150 | | | | | | 148 | |
|
Broadcom, Inc. | |
3.625% due 10/15/2024 | | | | | 38,883 | | | | | | 38,636 | |
|
Carrier Global Corp. | |
2.242% due 02/15/2025 | | | | | 12,000 | | | | | | 11,747 | |
|
CommonSpirit Health | |
2.760% due 10/01/2024 | | | | | 47,551 | | | | | | 47,171 | |
|
Cox Communications, Inc. | |
3.150% due 08/15/2024 | | | | | 21,565 | | | | | | 21,484 | |
3.850% due 02/01/2025 | | | | | 1,595 | | | | | | 1,576 | |
|
Daimler Truck Finance North America LLC | |
6.121% (SOFRRATE + 0.750%) due 12/13/2024 ~ | | | | | 5,155 | | | | | | 5,167 | |
|
Dell International LLC | |
4.000% due 07/15/2024 | | | | | 382 | | | | | | 382 | |
|
Discovery Communications LLC | |
3.450% due 03/15/2025 | | | | | 12,626 | | | | | | 12,418 | |
3.950% due 06/15/2025 | | | | | 505 | | | | | | 496 | |
|
Energy Transfer LP | |
2.900% due 05/15/2025 | | | | | 51,646 | | | | | | 50,396 | |
4.050% due 03/15/2025 | | | | | 25,447 | | | | | | 25,173 | |
| | | | | | | | | | | | |
| | | | | PRINCIPAL
AMOUNT
(000S) | | | | | MARKET
VALUE
(000S) | |
5.750% due 04/01/2025 | | $ | | | 39,264 | | | $ | | | 39,174 | |
|
Fiserv, Inc. | |
2.750% due 07/01/2024 | | | | | 22,904 | | | | | | 22,904 | |
|
Flex Ltd. | |
4.750% due 06/15/2025 | | | | | 10,283 | | | | | | 10,190 | |
|
Fox Corp. | |
3.050% due 04/07/2025 | | | | | 12,296 | | | | | | 12,051 | |
|
General Motors Co. | |
4.000% due 04/01/2025 | | | | | 14,782 | | | | | | 14,588 | |
6.125% due 10/01/2025 | | | | | 9,245 | | | | | | 9,296 | |
|
Global Payments, Inc. | |
1.500% due 11/15/2024 | | | | | 2,920 | | | | | | 2,876 | |
2.650% due 02/15/2025 | | | | | 15,393 | | | | | | 15,097 | |
|
Haleon U.K. Capital PLC | |
3.125% due 03/24/2025 | | | | | 84,723 | | | | | | 83,200 | |
|
HCA, Inc. | |
5.250% due 04/15/2025 | | | | | 53,729 | | | | | | 53,491 | |
5.375% due 02/01/2025 | | | | | 84,158 | | | | | | 83,890 | |
|
Home Depot, Inc. | |
5.704% (SOFRRATE + 0.330%) due 12/24/2025 ~ | | | | | 6,800 | | | | | | 6,810 | |
|
Huntington Ingalls Industries, Inc. | |
3.844% due 05/01/2025 | | | | | 91,470 | | | | | | 90,029 | |
|
Hyatt Hotels Corp. | |
1.800% due 10/01/2024 | | | | | 3,148 | | | | | | 3,115 | |
|
Hyundai Capital America | |
1.000% due 09/17/2024 | | | | | 48,129 | | | | | | 47,633 | |
1.800% due 10/15/2025 | | | | | 1,993 | | | | | | 1,899 | |
5.800% due 06/26/2025 | | | | | 14,500 | | | | | | 14,515 | |
6.250% due 11/03/2025 | | | | | 9,562 | | | | | | 9,638 | |
6.414% (SOFRRATE + 1.040%) due 03/19/2027 ~ | | | | | 1,365 | | | | | | 1,370 | |
6.512% due 08/04/2025 • | | | | | 45,655 | | | | | | 45,851 | |
6.682% (SOFRRATE + 1.320%) due 11/03/2025 ~ | | | | | 480 | | | | | | 483 | |
|
Imperial Brands Finance PLC | |
3.125% due 07/26/2024 | | | | | 65,947 | | | | | | 65,823 | |
4.250% due 07/21/2025 | | | | | 17,733 | | | | | | 17,470 | |
|
JDE Peet’s NV | |
0.800% due 09/24/2024 | | | | | 7,675 | | | | | | 7,570 | |
|
Leidos, Inc. | |
3.625% due 05/15/2025 | | | | | 19,688 | | | | | | 19,343 | |
|
Mercedes-Benz Finance North America LLC | |
5.931% due 08/01/2025 ~ | | | | | 5,000 | | | | | | 5,010 | |
6.023% (SOFRRATE + 0.670%) due 01/09/2026 ~ | | | | | 64,200 | | | | | | 64,516 | |
|
Microchip Technology, Inc. | |
0.983% due 09/01/2024 | | | | | 1,242 | | | | | | 1,232 | |
|
Mitsubishi Corp. | |
2.500% due 07/09/2024 | | | | | 5,000 | | | | | | 4,997 | |
|
NetApp, Inc. | |
3.300% due 09/29/2024 | | | | | 7,300 | | | | | | 7,255 | |
|
Nissan Motor Co. Ltd. | |
3.522% due 09/17/2025 | | | | | 1,160 | | | | | | 1,126 | |
|
Oracle Corp. | |
2.950% due 05/15/2025 | | | | | 24,292 | | | | | | 23,743 | |
|
Panasonic Holdings Corp. | |
2.679% due 07/19/2024 | | | | | 16,835 | | | | | | 16,810 | |
|
Penske Truck Leasing Co. LP | |
2.700% due 11/01/2024 | | | | | 1,625 | | | | | | 1,607 | |
3.450% due 07/01/2024 | | | | | 32,222 | | | | | | 32,222 | |
3.950% due 03/10/2025 | | | | | 3,525 | | | | | | 3,483 | |
|
Quanta Services, Inc. | |
0.950% due 10/01/2024 | | | | | 21,803 | | | | | | 21,524 | |
|
Revvity, Inc. | |
0.850% due 09/15/2024 | | | | | 12,694 | | | | | | 12,551 | |
|
Reynolds American, Inc. | |
4.450% due 06/12/2025 | | | | | 28,200 | | | | | | 27,878 | |
|
Rogers Communications, Inc. | |
2.950% due 03/15/2025 | | | | | 62,025 | | | | | | 60,821 | |
|
Rolls-Royce PLC | |
3.625% due 10/14/2025 | | | | | 450 | | | | | | 438 | |
|
Sabine Pass Liquefaction LLC | |
5.625% due 03/01/2025 | | | | | 22,389 | | | | | | 22,348 | |
| | | | | | | | | | | | |
| See Accompanying Notes | | | ANNUAL FINANCIAL AND OTHER INFORMATION | | | | | | | JUNE 30, 2024 | | | 77 |
| | | | | | |
| Schedule of Investments | | PIMCO Enhanced Short Maturity Active Exchange-Traded Fund | | (Cont.) | | |
| | | | | | | | | | | | |
| | | | | PRINCIPAL
AMOUNT
(000S) | | | | | MARKET
VALUE
(000S) | |
|
Southwest Airlines Co. | |
5.250% due 05/04/2025 | | $ | | | 3,500 | | | $ | | | 3,485 | |
|
Sydney Airport Finance Co. Pty. Ltd. | |
3.625% due 04/28/2026 | | | | | 12,300 | | | | | | 11,910 | |
|
T-Mobile USA, Inc. | |
3.500% due 04/15/2025 | | | | | 121,742 | | | | | | 119,717 | |
|
Take-Two Interactive Software, Inc. | |
3.550% due 04/14/2025 | | | | | 17,005 | | | | | | 16,730 | |
|
Tyson Foods, Inc. | |
3.950% due 08/15/2024 | | | | | 32,282 | | | | | | 32,200 | |
|
VMware, Inc. | |
1.000% due 08/15/2024 | | | | | 37,470 | | | | | | 37,242 | |
4.500% due 05/15/2025 | | | | | 27,574 | | | | | | 27,315 | |
|
Volkswagen Group of America Finance LLC | |
2.850% due 09/26/2024 | | | | | 2,100 | | | | | | 2,085 | |
6.204% (SOFRRATE + 0.830%) due 03/20/2026 ~ | | | | | 7,400 | | | | | | 7,427 | |
6.204% due 03/20/2026 ~ | | | | | 10,672 | | | | | | 10,711 | |
6.302% (SOFRRATE + 0.930%) due 09/12/2025 ~ | | | | | 27,659 | | | | | | 27,835 | |
|
Warnermedia Holdings, Inc. | |
3.638% due 03/15/2025 | | | | | 102,434 | | | | | | 100,865 | |
3.788% due 03/15/2025 | | | | | 3,525 | | | | | | 3,474 | |
|
Westinghouse Air Brake Technologies Corp. | |
3.200% due 06/15/2025 | | | | | 10,129 | | | | | | 9,886 | |
|
Woodside Finance Ltd. | |
3.650% due 03/05/2025 | | | | | 2,262 | | | | | | 2,230 | |
|
Zimmer Biomet Holdings, Inc. | |
1.450% due 11/22/2024 | | | | | 4,625 | | | | | | 4,549 | |
3.550% due 04/01/2025 | | | | | 6,350 | | | | | | 6,246 | |
| | | | | | | | | | | | |
| | | | | | | | | | | 2,048,574 | |
| | | | | | | | | | | | |
| |
| UTILITIES 4.1% | |
|
AES Corp. | |
3.300% due 07/15/2025 | | | | | 200 | | | | | | 195 | |
|
Avangrid, Inc. | |
3.150% due 12/01/2024 | | | | | 3,100 | | | | | | 3,066 | |
3.200% due 04/15/2025 | | | | | 39,723 | | | | | | 38,902 | |
|
Black Hills Corp. | |
1.037% due 08/23/2024 | | | | | 35,348 | | | | | | 35,094 | |
|
Dominion Energy, Inc. | |
3.071% due 08/15/2024 þ | | | | | 29,904 | | | | | | 29,787 | |
|
DTE Energy Co. | |
4.220% due 11/01/2024 þ | | | | | 2,234 | | | | | | 2,221 | |
|
Edison International | |
3.550% due 11/15/2024 | | | | | 3,627 | | | | | | 3,594 | |
|
Electricite de France SA | |
3.625% due 10/13/2025 | | | | | 2,175 | | | | | | 2,121 | |
|
Enel Finance International NV | |
2.650% due 09/10/2024 | | | | | 59,380 | | | | | | 58,987 | |
4.500% due 06/15/2025 | | | | | 7,215 | | | | | | 7,121 | |
6.800% due 10/14/2025 | | | | | 9,352 | | | | | | 9,502 | |
|
Eversource Energy | |
2.900% due 10/01/2024 | | | | | 11,803 | | | | | | 11,717 | |
3.150% due 01/15/2025 | | | | | 2,000 | | | | | | 1,973 | |
|
Georgia Power Co. | |
6.114% (SOFRINDX + 0.750%) due 05/08/2025 ~ | | | | | 92,481 | | | | | | 92,908 | |
|
Jersey Central Power & Light Co. | |
4.300% due 01/15/2026 | | | | | 1,075 | | | | | | 1,056 | |
|
NextEra Energy Capital Holdings, Inc. | |
4.255% due 09/01/2024 | | | | | 1,300 | | | | | | 1,296 | |
6.121% (SOFRINDX + 0.760%) due 01/29/2026 ~ | | | | | 60,550 | | | | | | 60,712 | |
|
Pacific Gas & Electric Co. | |
3.400% due 08/15/2024 | | | | | 11,881 | | | | | | 11,842 | |
4.950% due 06/08/2025 | | | | | 3,900 | | | | | | 3,866 | |
|
Pinnacle West Capital Corp. | |
1.300% due 06/15/2025 | | | | | 23,367 | | | | | | 22,373 | |
6.191% (SOFRRATE + 0.820%) due 06/10/2026 ~ | | | | | 17,400 | | | | | | 17,403 | |
|
Sempra | |
3.300% due 04/01/2025 | | | | | 63,822 | | | | | | 62,696 | |
| | | | | | | | | | | | |
| | | | | PRINCIPAL
AMOUNT
(000S) | | | | | MARKET
VALUE
(000S) | |
|
Spire Missouri, Inc. | |
5.871% (SOFRRATE + 0.500%) due 12/02/2024 ~ | | $ | | | 10,000 | | | $ | | | 10,001 | |
| | | | | | | | | | | | |
| | | | | | | | | | | 488,433 | |
| | | | | | | | | | | | |
Total Corporate Bonds & Notes (Cost $6,445,104) | | | 6,452,606 | |
| | | | |
| |
| U.S. GOVERNMENT AGENCIES 4.8% | |
|
Fannie Mae | |
2.000% due 12/25/2044 | | | | | 807 | | | | | | 696 | |
5.700% due 05/25/2037 • | | | | | 9 | | | | | | 8 | |
5.738% due 01/25/2037 • | | | | | 195 | | | | | | 192 | |
5.743% due 06/25/2048 • | | | | | 6,324 | | | | | | 6,249 | |
5.750% due 12/25/2045 • | | | | | 1,451 | | | | | | 1,399 | |
5.763% due 08/25/2044 • | | | | | 2,246 | | | | | | 2,184 | |
5.780% due 02/25/2037 • | | | | | 15 | | | | | | 15 | |
5.793% due 08/25/2044 - 10/25/2044 • | | | | | 7,177 | | | | | | 7,070 | |
5.800% due 11/25/2036 • | | | | | 33 | | | | | | 33 | |
5.843% due 07/25/2044 - 03/25/2060 • | | | | | 17,288 | | | | | | 17,184 | |
5.848% due 04/18/2028 - 09/18/2031 • | | | | | 104 | | | | | | 104 | |
5.850% due 06/25/2026 • | | | | | 27 | | | | | | 27 | |
5.860% due 09/25/2035 • | | | | | 183 | | | | | | 181 | |
5.870% due 03/25/2037 • | | | | | 129 | | | | | | 127 | |
5.893% due 07/25/2046 • | | | | | 4,387 | | | | | | 4,347 | |
5.900% due 02/25/2038 - 06/25/2059 • | | | | | 4,896 | | | | | | 4,744 | |
5.943% due 07/25/2046 • | | | | | 2,695 | | | | | | 2,637 | |
5.948% due 05/18/2032 • | | | | | 36 | | | | | | 37 | |
5.950% due 06/25/2031 • | | | | | 39 | | | | | | 39 | |
5.998% due 03/18/2032 • | | | | | 54 | | | | | | 54 | |
6.130% due 12/25/2037 • | | | | | 215 | | | | | | 215 | |
6.150% due 05/25/2037 • | | | | | 45 | | | | | | 45 | |
6.200% due 03/25/2037 - 02/25/2040 • | | | | | 43 | | | | | | 43 | |
6.230% due 02/25/2038 • | | | | | 556 | | | | | | 559 | |
6.300% due 07/25/2038 • | | | | | 11 | | | | | | 11 | |
6.336% due 05/01/2038 • | | | | | 172 | | | | | | 177 | |
6.350% due 03/25/2032 • | | | | | 7 | | | | | | 7 | |
6.618% due 01/01/2036 • | | | | | 1,312 | | | | | | 1,352 | |
|
Federal Home Loan Bank | |
5.500% due 02/20/2026 | | | | | 73,500 | | | | | | 73,471 | |
|
Freddie Mac | |
1.000% due 08/15/2044 | | | | | 4,068 | | | | | | 3,253 | |
5.500% due 02/13/2026 | | | | | 99,500 | | | | | | 99,416 | |
5.520% due 05/28/2025 | | | | | 11,800 | | | | | | 11,798 | |
5.550% due 02/20/2026 | | | | | 60,000 | | | | | | 59,982 | |
5.650% due 03/06/2026 | | | | | 82,500 | | | | | | 82,492 | |
5.698% due 11/15/2036 - 01/15/2040 • | | | | | 7 | | | | | | 7 | |
5.763% due 05/15/2038 • | | | | | 1,470 | | | | | | 1,490 | |
5.768% due 02/15/2037 • | | | | | 495 | | | | | | 487 | |
5.773% due 05/15/2041 • | | | | | 1,514 | | | | | | 1,486 | |
5.793% due 03/15/2037 - 03/15/2043 • | | | | | 25,741 | | | | | | 25,453 | |
5.843% due 12/15/2042 - 11/15/2044 • | | | | | 3,817 | | | | | | 3,823 | |
5.863% due 06/15/2044 • | | | | | 4,946 | | | | | | 5,062 | |
5.868% due 04/15/2041 • | | | | | 140 | | | | | | 139 | |
5.893% due 12/15/2037 • | | | | | 812 | | | | | | 790 | |
5.898% due 09/15/2048 - 04/15/2049 • | | | | | 3,516 | | | | | | 3,451 | |
5.929% due 02/25/2026 • | | | | | 2,260 | | | | | | 2,264 | |
5.948% due 07/15/2039 • | | | | | 20 | | | | | | 19 | |
6.427% due 09/01/2037 • | | | | | 956 | | | | | | 983 | |
|
Ginnie Mae | |
2.500% due 01/20/2049 - 10/20/2049 | | | | | 2,508 | | | | | | 2,161 | |
3.000% due 07/20/2046 | | | | | 239 | | | | | | 229 | |
5.630% due 05/20/2063 • | | | | | 115 | | | | | | 114 | |
5.633% due 01/20/2068 • | | | | | 1,052 | | | | | | 1,028 | |
5.837% due 11/20/2070 • | | | | | 2,530 | | | | | | 2,486 | |
5.903% due 03/20/2049 - 06/20/2049 • | | | | | 12,127 | | | | | | 11,918 | |
5.907% due 06/20/2067 • | | | | | 644 | | | | | | 640 | |
| | | | | | | | | | | | |
| | | | | PRINCIPAL
AMOUNT
(000S) | | | | | MARKET
VALUE
(000S) | |
5.937% due 03/20/2061 - 07/20/2067 • | | $ | | | 1,444 | | | $ | | | 1,441 | |
6.000% due 12/15/2033 | | | | | 8 | | | | | | 8 | |
6.000% due 09/20/2040 - 05/20/2041 • | | | | | 14,770 | | | | | | 14,267 | |
6.037% due 05/20/2065 - 05/20/2069 • | | | | | 5,997 | | | | | | 5,978 | |
6.084% due 12/20/2068 • | | | | | 4,737 | | | | | | 4,690 | |
6.087% due 12/20/2064 - 10/20/2065 • | | | | | 10,672 | | | | | | 10,644 | |
6.137% due 04/20/2070 • | | | | | 32,598 | | | | | | 32,399 | |
6.143% due 01/16/2040 • | | | | | 2,020 | | | | | | 2,018 | |
6.187% due 11/20/2065 - 02/20/2067 • | | | | | 2,378 | | | | | | 2,375 | |
6.193% due 02/20/2040 • | | | | | 1,728 | | | | | | 1,728 | |
6.217% due 09/20/2066 • | | | | | 822 | | | | | | 821 | |
6.223% due 04/20/2040 • | | | | | 3,605 | | | | | | 3,609 | |
6.237% due 07/20/2066 • | | | | | 1,869 | | | | | | 1,868 | |
6.253% due 03/20/2040 • | | | | | 3,771 | | | | | | 3,780 | |
6.263% due 01/20/2074 • | | | | | 14,851 | | | | | | 14,956 | |
6.267% due 08/20/2066 • | | | | | 585 | | | | | | 585 | |
6.283% due 09/20/2073 • | | | | | 10,184 | | | | | | 10,250 | |
6.337% due 09/20/2069 • | | | | | 671 | | | | | | 671 | |
6.357% due 07/20/2065 • | | | | | 2,508 | | | | | | 2,511 | |
6.437% due 01/20/2066 - 12/20/2066 • | | | | | 3,972 | | | | | | 3,983 | |
6.487% due 02/20/2066 • | | | | | 6,709 | | | | | | 6,727 | |
6.500% due 11/15/2033 - 09/15/2034 | | | | | 13 | | | | | | 13 | |
6.522% due 04/20/2067 • | | | | | 1,059 | | | | | | 1,075 | |
6.723% due 06/20/2067 • | | | | | 4,148 | | | | | | 4,182 | |
7.000% due 08/15/2024 - 07/15/2032 | | | | | 7 | | | | | | 7 | |
7.500% due 09/15/2027 - 06/15/2028 | | | | | 10 | | | | | | 9 | |
| | | | | | | | | | | | |
Total U.S. Government Agencies (Cost $577,947) | | | 574,773 | |
| | | | |
| |
| NON-AGENCY MORTGAGE-BACKED SECURITIES 3.4% | |
|
Arroyo Mortgage Trust | |
1.175% due 10/25/2048 ~ | | | | | 11,483 | | | | | | 9,888 | |
|
Ashford Hospitality Trust | |
6.401% due 04/15/2035 • | | | | | 1,484 | | | | | | 1,473 | |
6.626% due 06/15/2035 • | | | | | 1,741 | | | | | | 1,730 | |
|
Bear Stearns Adjustable Rate Mortgage Trust | |
5.455% due 08/25/2033 «~ | | | | | 258 | | | | | | 236 | |
|
Beast Mortgage Trust | |
6.493% due 03/15/2036 • | | | | | 600 | | | | | | 555 | |
6.629% due 02/15/2037 • | | | | | 8,000 | | | | | | 7,085 | |
|
Beneria Cowen & Pritzer Collateral Funding Corp. | |
6.242% due 06/15/2038 • | | | | | 5,500 | | | | | | 5,166 | |
|
COLT Mortgage Loan Trust | |
1.397% due 10/25/2066 ~ | | | | | 23,865 | | | | | | 19,621 | |
|
Commercial Mortgage Trust | |
6.743% due 12/15/2038 • | | | | | 8,221 | | | | | | 7,827 | |
|
Credit Suisse Mortgage Capital Mortgage-Backed Trust | |
6.194% due 07/15/2032 • | | | | | 3,095 | | | | | | 3,026 | |
7.043% due 10/15/2037 • | | | | | 8,700 | | | | | | 8,491 | |
|
CRSNT Commercial Mortgage Trust | |
6.264% due 04/15/2036 • | | | | | 52,400 | | | | | | 51,194 | |
|
DBCG Mortgage Trust | |
8.500% due 06/15/2034 • | | | | | 76,639 | | | | | | 76,634 | |
|
Extended Stay America Trust | |
6.523% due 07/15/2038 • | | | | | 2,179 | | | | | | 2,172 | |
|
GCAT Trust | |
2.650% due 10/25/2068 ~ | | | | | 1,427 | | | | | | 1,351 | |
2.885% due 12/27/2066 ~ | | | | | 21,038 | | | | | | 19,108 | |
|
Hilton USA Trust | |
2.828% due 11/05/2035 | | | | | 11,600 | | | | | | 10,119 | |
|
JP Morgan Chase Commercial Mortgage Securities Trust | |
6.943% due 09/15/2029 • | | | | | 23,237 | | | | | | 21,886 | |
|
Legacy Mortgage Asset Trust | |
4.892% due 10/25/2066 þ | | | | | 4,718 | | | | | | 4,641 | |
|
MAD Mortgage Trust | |
3.294% due 08/15/2034 ~ | | | | | 3,528 | | | | | | 3,279 | |
| | | | | | |
| 78 | | PIMCO ETF TRUST | | | See Accompanying Notes | |
| | | | | | | | | | | | |
| | | | | PRINCIPAL
AMOUNT
(000S) | | | | | MARKET
VALUE
(000S) | |
|
Mellon Residential Funding Corp. Mortgage Pass-Through Certificates | |
6.143% due 11/15/2031 • | | $ | | | 184 | | | $ | | | 173 | |
|
MF1 Ltd. | |
6.399% due 12/15/2034 • | | | | | 2,700 | | | | | | 2,679 | |
|
Mill City Mortgage Loan Trust | |
2.750% due 07/25/2059 ~ | | | | | 421 | | | | | | 403 | |
|
Morgan Stanley Capital Trust | |
6.476% due 11/15/2034 • | | | | | 4,332 | | | | | | 4,314 | |
6.528% due 07/15/2035 • | | | | | 2,300 | | | | | | 2,299 | |
6.613% due 12/15/2038 • | | | | | 47,200 | | | | | | 44,739 | |
|
Natixis Commercial Mortgage Securities Trust | |
6.393% due 08/15/2038 • | | | | | 3,000 | | | | | | 2,832 | |
|
OBX Trust | |
2.783% due 01/25/2062 þ | | | | | 40,289 | | | | | | 37,423 | |
|
RESIMAC Premier | |
6.094% due 02/03/2053 • | | | | | 8,390 | | | | | | 8,377 | |
6.142% due 07/10/2052 • | | | | | 1,795 | | | | | | 1,794 | |
|
Starwood Mortgage Residential Trust | |
1.027% due 11/25/2055 ~ | | | | | 3,070 | | | | | | 2,846 | |
|
Starwood Mortgage Trust | |
6.301% due 11/15/2036 • | | | | | 17,200 | | | | | | 16,994 | |
|
Towd Point Mortgage Trust | |
2.900% due 10/25/2059 ~ | | | | | 12,415 | | | | | | 11,619 | |
3.750% due 03/25/2058 ~ | | | | | 8,334 | | | | | | 7,947 | |
6.060% due 02/25/2057 • | | | | | 299 | | | | | | 306 | |
6.460% due 10/25/2059 • | | | | | 1,138 | | | | | | 1,157 | |
|
Verus Securitization Trust | |
0.820% due 10/25/2063 ~ | | | | | 4,442 | | | | | | 4,098 | |
| | | | | | | | | | | | |
Total Non-Agency Mortgage-Backed Securities (Cost $428,363) | | | 405,482 | |
| | | | |
| |
| ASSET-BACKED SECURITIES 26.4% | |
|
ACAS CLO Ltd. | |
6.479% due 10/18/2028 • | | | | | 7,177 | | | | | | 7,183 | |
|
AGL CLO Ltd. | |
6.786% due 07/20/2034 • | | | | | 400 | | | | | | 401 | |
|
Allegro CLO Ltd. | |
6.557% due 10/16/2031 • | | | | | 908 | | | | | | 908 | |
6.577% due 01/19/2033 • | | | | | 3,700 | | | | | | 3,696 | |
|
Anchorage Capital CLO Ltd. | |
6.765% due 04/22/2034 • | | | | | 2,600 | | | | | | 2,604 | |
|
Apidos CLO | |
6.489% due 07/18/2029 • | | | | | 12,378 | | | | | | 12,390 | |
6.509% due 07/17/2030 • | | | | | 8,633 | | | | | | 8,644 | |
6.596% due 04/20/2031 • | | | | | 7,228 | | | | | | 7,233 | |
6.689% due 07/16/2031 • | | | | | 847 | | | | | | 847 | |
|
AREIT Trust | |
6.523% due 11/17/2038 • | | | | | 11,251 | | | | | | 11,207 | |
6.583% due 01/20/2037 • | | | | | 32,062 | | | | | | 31,822 | |
|
Ares CLO Ltd. | |
6.460% due 01/15/2029 • | | | | | 2,355 | | | | | | 2,357 | |
6.637% due 04/17/2033 • | | | | | 24,800 | | | | | | 24,867 | |
|
ARI Fleet Lease Trust | |
5.540% due 04/15/2033 | | | | | 12,800 | | | | | | 12,815 | |
5.568% due 03/14/2025 | | | | | 20,211 | | | | | | 20,214 | |
5.924% due 10/15/2024 | | | | | 2,229 | | | | | | 2,230 | |
|
Atlas Senior Loan Fund Ltd. | |
6.666% due 04/22/2031 • | | | | | 1,418 | | | | | | 1,419 | |
|
Avis Budget Rental Car Funding AESOP LLC | |
3.350% due 09/22/2025 | | | | | 7,855 | | | | | | 7,829 | |
|
Bank of America Auto Trust | |
5.830% due 05/15/2026 | | | | | 11,462 | | | | | | 11,471 | |
5.850% due 08/17/2026 | | | | | 18,444 | | | | | | 18,460 | |
|
Barings CLO Ltd. | |
6.536% due 07/20/2029 • | | | | | 706 | | | | | | 706 | |
6.656% due 01/20/2032 • | | | | | 3,785 | | | | | | 3,792 | |
|
Benefit Street Partners CLO Ltd. | |
6.540% due 10/15/2030 • | | | | | 12,779 | | | | | | 12,797 | |
6.609% due 01/17/2032 • | | | | | 16,097 | | | | | | 16,128 | |
|
BlueMountain CLO Ltd. | |
6.514% due 10/25/2030 • | | | | | 9,283 | | | | | | 9,298 | |
6.522% due 11/15/2030 • | | | | | 5,836 | | | | | | 5,846 | |
| | | | | | | | | | | | |
| | | | | PRINCIPAL
AMOUNT
(000S) | | | | | MARKET
VALUE
(000S) | |
6.766% due 10/22/2030 • | | $ | | | 2,044 | | | $ | | | 2,046 | |
|
BMW Vehicle Lease Trust | |
5.950% due 08/25/2025 | | | | | 29,102 | | | | | | 29,135 | |
|
BXMT Ltd. | |
6.843% due 11/15/2037 • | | | | | 44,736 | | | | | | 43,909 | |
|
Capital One Multi-Asset Execution Trust | |
1.040% due 11/15/2026 | | | | | 4,700 | | | | | | 4,620 | |
2.800% due 03/15/2027 | | | | | 13,000 | | | | | | 12,757 | |
6.023% due 07/15/2027 • | | | | | 38,600 | | | | | | 38,640 | |
|
Capital One Prime Auto Receivables Trust | |
5.923% due 10/15/2026 • | | | | | 26,623 | | | | | | 26,669 | |
5.983% due 09/15/2025 • | | | | | 856 | | | | | | 857 | |
|
CARDS Trust | |
6.187% due 07/15/2028 • | | | | | 12,600 | | | | | | 12,637 | |
|
Carlyle Global Market Strategies CLO Ltd. | |
6.534% due 08/14/2030 • | | | | | 12,539 | | | | | | 12,549 | |
6.636% due 07/27/2031 • | | | | | 3,366 | | | | | | 3,366 | |
|
Carlyle U.S. CLO Ltd. | |
6.586% due 04/20/2031 • | | | | | 6,339 | | | | | | 6,345 | |
|
CarMax Auto Owner Trust | |
3.490% due 02/16/2027 | | | | | 7,033 | | | | | | 6,934 | |
4.750% due 10/15/2027 | | | | | 1,600 | | | | | | 1,588 | |
5.300% due 03/15/2027 | | | | | 6,700 | | | | | | 6,687 | |
5.650% due 05/17/2027 | | | | | 13,100 | | | | | | 13,118 | |
5.720% due 11/16/2026 | | | | | 10,212 | | | | | | 10,212 | |
5.913% due 05/17/2027 • | | | | | 4,400 | | | | | | 4,402 | |
5.933% due 11/16/2026 • | | | | | 19,231 | | | | | | 19,249 | |
5.953% due 03/15/2027 • | | | | | 25,000 | | | | | | 25,039 | |
6.033% due 01/15/2026 • | | | | | 4,431 | | | | | | 4,433 | |
6.133% due 12/15/2026 • | | | | | 24,918 | | | | | | 24,994 | |
6.183% due 06/15/2026 • | | | | | 8,065 | | | | | | 8,078 | |
6.233% due 12/15/2025 • | | | | | 2,504 | | | | | | 2,505 | |
|
Carvana Auto Receivables Trust | |
3.210% due 12/11/2028 | | | | | 1,700 | | | | | | 1,639 | |
5.620% due 01/10/2029 | | | | | 1,000 | | | | | | 1,002 | |
5.630% due 11/10/2027 | | | | | 12,350 | | | | | | 12,358 | |
5.634% due 04/10/2025 | | | | | 1,890 | | | | | | 1,890 | |
5.770% due 04/12/2027 | | | | | 833 | | | | | | 832 | |
5.980% due 12/10/2027 | | | | | 13,308 | | | | | | 13,342 | |
6.090% due 11/10/2026 | | | | | 3,431 | | | | | | 3,435 | |
6.160% due 10/10/2028 | | | | | 1,900 | | | | | | 1,919 | |
6.230% due 01/11/2027 | | | | | 10,804 | | | | | | 10,823 | |
|
Catamaran CLO Ltd. | |
6.686% due 04/22/2030 • | | | | | 9,747 | | | | | | 9,762 | |
|
CBAM Ltd. | |
6.836% due 07/20/2030 • | | | | | 3,248 | | | | | | 3,249 | |
|
Chase Auto Owner Trust | |
5.480% due 04/26/2027 | | | | | 10,500 | | | | | | 10,493 | |
5.530% due 09/27/2027 | | | | | 11,300 | | | | | | 11,304 | |
5.660% due 05/26/2027 | | | | | 21,600 | | | | | | 21,613 | |
5.900% due 03/25/2027 | | | | | 34,634 | | | | | | 34,682 | |
|
Chesapeake Funding LLC | |
6.103% due 05/15/2036 • | | | | | 10,271 | | | | | | 10,287 | |
6.583% due 05/15/2035 • | | | | | 9,244 | | | | | | 9,308 | |
|
CIFC Funding Ltd. | |
6.535% due 10/24/2030 • | | | | | 27,886 | | | | | | 27,926 | |
|
Citibank Credit Card Issuance Trust | |
5.230% due 12/08/2027 | | | | | 11,600 | | | | | | 11,594 | |
5.969% due 12/08/2027 • | | | | | 35,000 | | | | | | 35,148 | |
6.052% due 08/07/2027 • | | | | | 34,100 | | | | | | 34,264 | |
6.215% due 05/14/2029 • | | | | | 5,550 | | | | | | 5,618 | |
|
Citizens Auto Receivables Trust | |
5.840% due 01/18/2028 | | | | | 8,000 | | | | | | 8,038 | |
5.873% due 11/16/2026 • | | | | | 19,400 | | | | | | 19,408 | |
6.063% due 10/15/2026 • | | | | | 28,831 | | | | | | 28,875 | |
6.283% due 07/15/2026 • | | | | | 7,969 | | | | | | 7,983 | |
|
CNH Equipment Trust | |
5.900% due 02/16/2027 | | | | | 28,832 | | | | | | 28,870 | |
|
Commonbond Student Loan Trust | |
6.310% due 05/25/2041 • | | | | | 209 | | | | | | 207 | |
|
Crestline Denali CLO Ltd. | |
6.616% due 04/20/2030 • | | | | | 9,649 | | | | | | 9,657 | |
|
Daimler Trucks Retail Trust | |
6.030% due 09/15/2025 | | | | | 15,656 | | | | | | 15,673 | |
|
Dell Equipment Finance Trust | |
5.840% due 01/22/2029 | | | | | 15,340 | | | | | | 15,348 | |
6.100% due 04/23/2029 | | | | | 19,716 | | | | | | 19,749 | |
| | | | | | | | | | | | |
| | | | | PRINCIPAL
AMOUNT
(000S) | | | | | MARKET
VALUE
(000S) | |
|
Discover Card Execution Note Trust | |
4.930% due 06/15/2028 | | $ | | | 1,000 | | | $ | | | 996 | |
|
DLLAD LLC | |
5.190% due 04/20/2026 | | | | | 9,078 | | | | | | 9,062 | |
|
DLLMT LLC | |
1.000% due 07/21/2025 | | | | | 787 | | | | | | 779 | |
|
DLLST LLC | |
5.330% due 01/20/2026 | | | | | 18,600 | | | | | | 18,559 | |
|
Dryden CLO Ltd. | |
6.567% due 01/17/2033 • | | | | | 3,400 | | | | | | 3,402 | |
|
Dryden Senior Loan Fund | |
6.477% due 10/19/2029 • | | | | | 12,127 | | | | | | 12,142 | |
6.479% due 07/15/2030 • | | | | | 1,836 | | | | | | 1,837 | |
6.570% due 04/15/2028 • | | | | | 1,640 | | | | | | 1,641 | |
|
Elevation CLO Ltd. | |
6.535% due 10/25/2030 • | | | | | 6,516 | | | | | | 6,522 | |
|
ELFI Graduate Loan Program LLC | |
1.530% due 12/26/2046 | | | | | 5,925 | | | | | | 5,102 | |
|
Enterprise Fleet Financing LLC | |
3.030% due 01/20/2028 | | | | | 7,283 | | | | | | 7,210 | |
5.548% due 02/20/2025 | | | | | 16,186 | | | | | | 16,189 | |
5.613% due 05/20/2025 | | | | | 13,858 | | | | | | 13,866 | |
5.740% due 12/20/2026 | | | | | 25,660 | | | | | | 25,739 | |
|
FCCU Auto Receivables Trust | |
5.760% due 11/15/2027 | | | | | 6,700 | | | | | | 6,702 | |
|
Fifth Third Auto Trust | |
5.863% due 11/16/2026 • | | | | | 35,611 | | | | | | 35,630 | |
|
Ford Credit Auto Lease Trust | |
5.506% due 02/15/2025 | | | | | 5,966 | | | | | | 5,967 | |
5.923% due 02/15/2026 • | | | | | 43,657 | | | | | | 43,701 | |
|
Ford Credit Auto Owner Trust | |
0.000% due 04/15/2027 • | | | | | 32,500 | | | | | | 32,513 | |
6.053% due 03/15/2026 • | | | | | 14,375 | | | | | | 14,387 | |
|
Galaxy CLO Ltd. | |
6.560% due 10/15/2030 • | | | | | 4,072 | | | | | | 4,075 | |
|
Gallatin CLO Ltd. | |
6.680% due 07/15/2031 • | | | | | 5,680 | | | | | | 5,683 | |
|
GECU Auto Receivables Trust | |
5.950% due 03/15/2027 | | | | | 7,420 | | | | | | 7,423 | |
|
GM Financial Automobile Leasing Trust | |
5.783% due 06/22/2026 • | | | | | 46,450 | | | | | | 46,511 | |
6.153% due 10/20/2025 • | | | | | 6,789 | | | | | | 6,798 | |
|
GM Financial Consumer Automobile Receivables Trust | |
5.733% due 02/16/2027 • | | | | | 8,250 | | | | | | 8,251 | |
5.803% due 09/16/2026 • | | | | | 8,809 | | | | | | 8,814 | |
5.863% due 11/16/2026 • | | | | | 15,220 | | | | | | 15,235 | |
5.953% due 03/16/2026 • | | | | | 6,807 | | | | | | 6,811 | |
5.983% due 11/17/2025 • | | | | | 1,285 | | | | | | 1,285 | |
6.083% due 05/18/2026 • | | | | | 10,619 | | | | | | 10,630 | |
|
Golden Credit Card Trust | |
4.310% due 09/15/2027 | | | | | 14,760 | | | | | | 14,557 | |
|
GoldenTree Loan Management U.S. CLO Ltd. | |
6.473% due 04/24/2031 • | | | | | 17,500 | | | | | | 17,537 | |
|
Golub Capital Partners CLO Ltd. | |
6.641% due 10/25/2034 • | | | | | 6,600 | | | | | | 6,600 | |
|
Golub Capital Partners Static Ltd. | |
6.557% due 04/20/2033 • | | | | | 7,000 | | | | | | 6,995 | |
|
GPMT Ltd. | |
6.696% due 07/16/2035 • | | | | | 20,029 | | | | | | 19,818 | |
|
GreenState Auto Receivables Trust | |
5.530% due 08/16/2027 | | | | | 8,500 | | | | | | 8,487 | |
|
Halseypoint CLO Ltd. | |
6.686% due 07/20/2031 • | | | | | 7,886 | | | | | | 7,886 | |
|
Harley Davidson Motorcycle Trust | |
5.320% due 06/15/2026 | | | | | 1,128 | | | | | | 1,128 | |
5.863% due 06/15/2026 • | | | | | 973 | | | | | | 974 | |
|
Hertz Vehicle Financing LLC | |
1.210% due 12/26/2025 | | | | | 16,500 | | | | | | 16,284 | |
1.990% due 06/25/2026 | | | | | 11,500 | | | | | | 11,175 | |
|
Honda Auto Receivables Owner Trust | |
5.410% due 04/15/2026 | | | | | 5,638 | | | | | | 5,632 | |
5.710% due 03/18/2026 | | | | | 48,206 | | | | | | 48,229 | |
5.870% due 06/22/2026 | | | | | 31,067 | | | | | | 31,123 | |
| | | | | | | | | | | | |
| See Accompanying Notes | | | ANNUAL FINANCIAL AND OTHER INFORMATION | | | | | | | JUNE 30, 2024 | | | 79 |
| | | | | | |
| Schedule of Investments | | PIMCO Enhanced Short Maturity Active Exchange-Traded Fund | | (Cont.) | | |
| | | | | | | | | | | | |
| | | | | PRINCIPAL
AMOUNT
(000S) | | | | | MARKET
VALUE
(000S) | |
|
Huntington Auto Trust | |
5.500% due 03/15/2027 | | $ | | | 7,300 | | | $ | | | 7,294 | |
|
Hyundai Auto Lease Securitization Trust | |
5.833% due 06/15/2026 • | | | | | 28,689 | | | | | | 28,714 | |
5.933% due 03/16/2026 • | | | | | 23,565 | | | | | | 23,594 | |
|
Hyundai Auto Receivables Trust | |
5.753% due 04/15/2027 • | | | | | 24,500 | | | | | | 24,513 | |
5.813% due 05/15/2026 • | | | | | 9,169 | | | | | | 9,177 | |
5.963% due 01/15/2027 • | | | | | 42,507 | | | | | | 42,579 | |
6.083% due 12/15/2025 • | | | | | 8,920 | | | | | | 8,929 | |
|
ICG U.S. CLO Ltd. | |
6.615% due 04/25/2031 • | | | | | 1,282 | | | | | | 1,283 | |
|
KKR CLO Ltd. | |
6.529% due 07/18/2030 • | | | | | 2,129 | | | | | | 2,132 | |
|
Kubota Credit Owner Trust | |
5.400% due 02/17/2026 | | | | | 5,454 | | | | | | 5,450 | |
5.450% due 04/15/2027 | | | | | 23,080 | | | | | | 23,102 | |
5.610% due 07/15/2026 | | | | | 29,754 | | | | | | 29,752 | |
|
LAD Auto Receivables Trust | |
5.210% due 06/15/2027 | | | | | 1,435 | | | | | | 1,430 | |
5.680% due 10/15/2026 | | | | | 389 | | | | | | 389 | |
5.700% due 03/15/2027 | | | | | 1,500 | | | | | | 1,501 | |
5.930% due 06/15/2027 | | | | | 7,243 | | | | | | 7,251 | |
|
LCM Loan Income Fund Ltd. | |
6.616% due 04/20/2031 • | | | | | 5,557 | | | | | | 5,562 | |
|
LCM LP | |
6.586% due 07/20/2030 • | | | | | 270 | | | | | | 270 | |
|
LCM Ltd. | |
6.656% due 01/20/2031 • | | | | | 8,404 | | | | | | 8,413 | |
6.660% due 04/15/2031 • | | | | | 1,000 | | | | | | 1,000 | |
6.746% due 10/20/2028 • | | | | | 955 | | | | | | 956 | |
|
Lockwood Grove CLO Ltd. | |
6.755% due 01/25/2030 • | | | | | 315 | | | | | | 316 | |
|
M&T Equipment Notes | |
6.090% due 07/15/2030 | | | | | 18,216 | | | | | | 18,228 | |
|
Madison Park Funding Ltd. | |
6.507% due 10/18/2030 • | | | | | 17,965 | | | | | | 17,985 | |
6.556% due 07/27/2031 • | | | | | 7,090 | | | | | | 7,093 | |
6.576% due 04/20/2032 • | | | | | 4,500 | | | | | | 4,509 | |
6.586% due 07/21/2030 • | | | | | 3,285 | | | | | | 3,288 | |
6.705% due 04/25/2032 • | | | | | 6,800 | | | | | | 6,811 | |
|
Magnetite Ltd. | |
6.479% due 10/15/2031 • | | | | | 12,746 | | | | | | 12,759 | |
|
Marathon CLO Ltd. | |
6.534% due 04/15/2032 • | | | | | 11,700 | | | | | | 11,712 | |
6.705% due 01/20/2033 • | | | | | 13,700 | | | | | | 13,722 | |
|
Marathon Static CLO Ltd. | |
6.475% due 07/20/2030 • | | | | | 8,046 | | | | | | 8,038 | |
|
Marble Point CLO Ltd. | |
6.630% due 10/15/2030 • | | | | | 990 | | | | | | 991 | |
6.769% due 12/18/2030 • | | | | | 2,920 | | | | | | 2,923 | |
|
Master Credit Card Trust | |
6.083% due 01/21/2028 • | | | | | 50,700 | | | | | | 50,919 | |
6.183% due 01/21/2027 • | | | | | 77,200 | | | | | | 77,531 | |
|
Mercedes-Benz Auto Receivables Trust | |
5.090% due 01/15/2026 | | | | | 2,161 | | | | | | 2,159 | |
5.920% due 11/16/2026 | | | | | 29,698 | | | | | | 29,745 | |
|
MMAF Equipment Finance LLC | |
5.200% due 09/13/2027 | | | | | 9,000 | | | | | | 8,962 | |
5.790% due 11/13/2026 | | | | | 12,824 | | | | | | 12,835 | |
|
Mountain View CLO LLC | |
6.629% due 01/16/2031 • | | | | | 11,384 | | | | | | 11,387 | |
6.679% due 10/16/2029 • | | | | | 2,220 | | | | | | 2,221 | |
|
Nassau Ltd. | |
6.840% due 01/15/2030 • | | | | | 2,114 | | | | | | 2,116 | |
|
Navient Private Education Refi Loan Trust | |
0.840% due 05/15/2069 | | | | | 4,004 | | | | | | 3,541 | |
1.310% due 01/15/2069 | | | | | 10,330 | | | | | | 9,518 | |
1.580% due 04/15/2070 | | | | | 28,788 | | | | | | 25,166 | |
1.690% due 05/15/2069 | | | | | 6,002 | | | | | | 5,515 | |
2.230% due 07/15/2070 | | | | | 22,961 | | | | | | 20,279 | |
3.130% due 02/15/2068 | | | | | 1,749 | | | | | | 1,692 | |
4.000% due 12/15/2059 | | | | | 473 | | | | | | 460 | |
6.443% due 04/15/2069 • | | | | | 7,219 | | | | | | 7,226 | |
| | | | | | | | | | | | |
| | | | | PRINCIPAL
AMOUNT
(000S) | | | | | MARKET
VALUE
(000S) | |
|
Navient Student Loan Trust | |
6.250% due 07/26/2066 • | | $ | | | 4,448 | | | $ | | | 4,452 | |
6.500% due 12/27/2066 • | | | | | 12,059 | | | | | | 12,110 | |
|
Nelnet Student Loan Trust | |
1.420% due 04/20/2062 | | | | | 607 | | | | | | 554 | |
5.735% due 12/24/2035 • | | | | | 1,261 | | | | | | 1,248 | |
6.250% due 09/25/2065 • | | | | | 6,486 | | | | | | 6,469 | |
6.260% due 08/25/2067 • | | | | | 10,846 | | | | | | 10,816 | |
6.300% due 02/25/2066 • | | | | | 5,796 | | | | | | 5,780 | |
|
Neuberger Berman CLO Ltd. | |
6.510% due 10/15/2029 • | | | | | 812 | | | | | | 813 | |
6.616% due 01/28/2030 • | | | | | 6,700 | | | | | | 6,710 | |
|
Neuberger Berman Loan Advisers CLO Ltd. | |
6.608% due 04/19/2030 • | | | | | 1,143 | | | | | | 1,143 | |
6.626% due 04/20/2031 • | | | | | 850 | | | | | | 851 | |
|
Newark BSL CLO Ltd. | |
6.555% due 07/25/2030 • | | | | | 3,077 | | | | | | 3,079 | |
|
Nissan Auto Lease Trust | |
5.953% due 08/15/2025 • | | | | | 15,655 | | | | | | 15,665 | |
|
Nissan Auto Receivables Owner Trust | |
5.893% due 05/15/2026 • | | | | | 33,750 | | | | | | 33,788 | |
5.983% due 02/17/2026 • | | | | | 5,590 | | | | | | 5,595 | |
|
Octagon Investment Partners Ltd. | |
6.475% due 10/20/2030 • | | | | | 13,031 | | | | | | 13,050 | |
6.584% due 02/14/2031 • | | | | | 3,728 | | | | | | 3,730 | |
|
Oscar U.S. Funding LLC | |
5.480% due 02/10/2027 | | | | | 8,300 | | | | | | 8,296 | |
5.627% due 03/10/2025 | | | | | 4,676 | | | | | | 4,675 | |
|
OZLM Ltd. | |
6.475% due 07/20/2030 • | | | | | 5,900 | | | | | | 5,904 | |
6.525% due 10/20/2031 • | | | | | 1,399 | | | | | | 1,400 | |
6.559% due 10/17/2029 • | | | | | 11,287 | | | | | | 11,295 | |
|
Palmer Square Loan Funding Ltd. | |
6.486% due 04/20/2029 • | | | | | 563 | | | | | | 563 | |
|
PHEAA Student Loan Trust | |
6.400% due 11/25/2065 • | | | | | 3,171 | | | | | | 3,165 | |
|
PRET LLC | |
1.868% due 07/25/2051 þ | | | | | 3,778 | | | | | | 3,711 | |
|
Race Point CLO Ltd. | |
6.530% due 10/15/2030 • | | | | | 4,454 | | | | | | 4,458 | |
|
Rad CLO Ltd. | |
0.000% due 04/25/2032 • | | | | | 13,250 | | | | | | 13,275 | |
|
Ready Capital Mortgage Financing LLC | |
6.985% due 01/25/2037 • | | | | | 20,322 | | | | | | 20,288 | |
|
Romark CLO Ltd. | |
6.618% due 10/23/2030 • | | | | | 25,706 | | | | | | 25,742 | |
|
Saranac CLO Ltd. | |
6.748% due 08/13/2031 • | | | | | 12,124 | | | | | | 12,165 | |
|
SBNA Auto Lease Trust | |
5.450% due 01/20/2026 | | | | | 20,757 | | | | | | 20,737 | |
5.670% due 11/20/2026 | | | | | 3,700 | | | | | | 3,704 | |
6.270% due 04/20/2026 | | | | | 22,679 | | | | | | 22,755 | |
|
SFS Auto Receivables Securitization Trust | |
5.890% due 03/22/2027 | | | | | 539 | | | | | | 539 | |
6.133% due 03/22/2027 • | | | | | 2,587 | | | | | | 2,592 | |
|
SLM Private Credit Student Loan Trust | |
5.911% due 12/15/2038 • | | | | | 3,435 | | | | | | 3,384 | |
|
SLM Student Loan Trust | |
6.100% due 12/27/2038 • | | | | | 1,510 | | | | | | 1,494 | |
6.150% due 01/25/2029 • | | | | | 1,773 | | | | | | 1,734 | |
|
SMB Private Education Loan Trust | |
1.290% due 07/15/2053 | | | | | 11,510 | | | | | | 10,553 | |
2.340% due 09/15/2034 | | | | | 724 | | | | | | 713 | |
6.043% due 03/17/2053 • | | | | | 4,703 | | | | | | 4,644 | |
6.343% due 09/15/2034 • | | | | | 2,058 | | | | | | 2,060 | |
6.543% due 09/15/2034 • | | | | | 565 | | | | | | 566 | |
6.543% due 07/15/2053 • | | | | | 1,451 | | | | | | 1,452 | |
|
SoFi Consumer Loan Program Trust | |
5.810% due 05/15/2031 | | | | | 1,240 | | | | | | 1,240 | |
|
SoFi Professional Loan Program LLC | |
2.650% due 09/25/2040 | | | | | 612 | | | | | | 593 | |
6.760% due 02/25/2040 • | | | | | 54 | | | | | | 54 | |
|
SoFi Professional Loan Program Trust | |
1.950% due 02/15/2046 | | | | | 9,795 | | | | | | 8,957 | |
| | | | | | | | | | | | |
| | | | | PRINCIPAL
AMOUNT
(000S) | | | | | MARKET
VALUE
(000S) | |
|
Sound Point CLO Ltd. | |
6.565% due 07/25/2030 • | | $ | | | 9,549 | | | $ | | | 9,556 | |
6.566% due 10/20/2030 • | | | | | 2,271 | | | | | | 2,273 | |
6.670% due 04/15/2030 • | | | | | 879 | | | | | | 880 | |
6.686% due 07/26/2031 • | | | | | 541 | | | | | | 542 | |
6.706% due 01/21/2031 • | | | | | 7,357 | | | | | | 7,361 | |
6.739% due 04/18/2031 • | | | | | 885 | | | | | | 886 | |
|
Starwood Mortgage Trust | |
6.683% due 11/15/2038 • | | | | | 23,200 | | | | | | 22,800 | |
|
Steele Creek CLO Ltd. | |
6.656% due 04/21/2031 • | | | | | 709 | | | | | | 710 | |
|
Symphony Static CLO Ltd. | |
6.415% due 10/25/2029 • | | | | | 2,436 | | | | | | 2,439 | |
|
TCW CLO Ltd. | |
6.555% due 04/25/2031 • | | | | | 11,114 | | | | | | 11,130 | |
|
Tesla Auto Lease Trust | |
5.834% due 06/22/2026 • | | | | | 14,000 | | | | | | 14,000 | |
6.020% due 09/22/2025 | | | | | 23,521 | | | | | | 23,553 | |
|
Tesla Electric Vehicle Trust | |
5.853% due 12/21/2026 • | | | | | 11,800 | | | | | | 11,806 | |
|
TIAA CLO Ltd. | |
6.739% due 01/16/2031 • | | | | | 1,193 | | | | | | 1,194 | |
|
Towd Point HE Trust | |
0.918% due 02/25/2063 ~ | | | | | 4,326 | | | | | | 4,156 | |
|
Toyota Auto Receivables Owner Trust | |
3.760% due 04/15/2027 | | | | | 8,100 | | | | | | 7,985 | |
5.733% (SOFR30A + 0.400%) due 08/17/2026 ~ | | | | | 24,864 | | | | | | 24,871 | |
5.903% due 08/15/2025 • | | | | | 411 | | | | | | 411 | |
|
Toyota Lease Owner Trust | |
5.884% due 04/20/2026 • | | | | | 31,140 | | | | | | 31,174 | |
|
Trestles CLO Ltd. | |
6.756% due 10/20/2034 • | | | | | 7,700 | | | | | | 7,718 | |
|
Trillium Credit Card Trust | |
6.096% due 12/26/2028 • | | | | | 67,700 | | | | | | 67,927 | |
6.196% due 08/26/2028 • | | | | | 95,000 | | | | | | 95,430 | |
|
USAA Auto Owner Trust | |
5.830% due 07/15/2026 | | | | | 13,182 | | | | | | 13,191 | |
|
Venture CLO Ltd. | |
6.576% due 07/20/2030 • | | | | | 23,241 | | | | | | 23,252 | |
6.636% due 07/20/2030 • | | | | | 6,432 | | | | | | 6,442 | |
|
Verizon Master Trust | |
6.013% due 09/08/2028 • | | | | | 26,000 | | | | | | 26,215 | |
|
VMC Finance LLC | |
6.546% due 06/16/2036 • | | | | | 1,219 | | | | | | 1,217 | |
|
Volkswagen Auto Lease Trust | |
5.804% due 12/21/2026 • | | | | | 31,300 | | | | | | 31,342 | |
5.904% due 01/20/2026 • | | | | | 23,049 | | | | | | 23,073 | |
|
Volkswagen Auto Loan Enhanced Trust | |
5.854% due 12/21/2026 • | | | | | 26,463 | | | | | | 26,484 | |
5.963% due 03/22/2027 • | | | | | 36,730 | | | | | | 36,805 | |
|
Voya CLO Ltd. | |
6.529% due 04/17/2030 • | | | | | 13,348 | | | | | | 13,366 | |
6.570% due 06/07/2030 • | | | | | 4,481 | | | | | | 4,486 | |
6.590% due 10/15/2030 • | | | | | 8,198 | | | | | | 8,210 | |
|
Wellfleet CLO Ltd. | |
6.476% due 07/20/2029 • | | | | | 224 | | | | | | 224 | |
|
Wellman Park CLO Ltd. | |
6.690% due 07/15/2034 • | | | | | 15,000 | | | | | | 15,025 | |
|
Wind River CLO Ltd. | |
6.670% due 07/15/2031 • | | | | | 4,200 | | | | | | 4,202 | |
|
World Omni Auto Receivables Trust | |
5.743% due 12/15/2026 • | | | | | 25,492 | | | | | | 25,501 | |
5.763% due 07/15/2026 • | | | | | 7,669 | | | | | | 7,671 | |
5.910% due 02/16/2027 | | | | | 11,363 | | | | | | 11,385 | |
5.913% due 02/16/2027 • | | | | | 14,818 | | | | | | 14,837 | |
6.043% due 11/16/2026 • | | | | | 10,728 | | | | | | 10,737 | |
|
World Omni Automobile Lease Securitization Trust | |
5.763% due 02/16/2027 • | | | | | 26,000 | | | | | | 26,021 | |
| | | | | | | | | | | | |
Total Asset-Backed Securities (Cost $3,191,679) | | | 3,184,103 | |
| | | | |
| |
| | | | | | |
| 80 | | PIMCO ETF TRUST | | | See Accompanying Notes | |
| | | | | | | | | | | | |
| | | | | PRINCIPAL
AMOUNT
(000S) | | | | | MARKET
VALUE
(000S) | |
| SOVEREIGN ISSUES 2.0% | |
|
CDP Financial, Inc. | |
5.766% (SOFRINDX + 0.400%) due 05/19/2025 ~ | | $ | | | 9,250 | | | $ | | | 9,263 | |
5.766% due 05/19/2025 ~ | | | | | 24,000 | | | | | | 24,033 | |
|
CPPIB Capital, Inc. | |
6.604% (SOFRINDX + 1.250%) due 04/04/2025 ~ | | | | | 98,750 | | | | | | 99,502 | |
6.621% (SOFRRATE + 1.250%) due 03/11/2026 ~ | | | | | 36,000 | | | | | | 36,606 | |
| | | | |
PSP Capital, Inc. | | | | | | | | | | | | |
5.611% (SOFRINDX + 0.240%) due 03/03/2025 ~ | | | | | 71,847 | | | | | | 71,847 | |
| | | | | | | | | | | | |
Total Sovereign Issues (Cost $241,003) | | | 241,251 | |
| | | | |
| |
| SHORT-TERM INSTRUMENTS 10.8% | |
| |
| COMMERCIAL PAPER 9.2% | |
| | | | |
AES Corp.
| | | | | | | | | | | | |
5.900% due 07/23/2024 | | | | | 54,950 | | | | | | 54,720 | |
| | | | |
Alimentation Couche-Tard, Inc.
| | | | | | | | | | | | |
5.510% due 07/12/2024 | | | | | 14,650 | | | | | | 14,618 | |
|
Bacardi-Martini BV | |
5.830% due 08/08/2024 | | | | | 15,850 | | | | | | 15,744 | |
5.830% due 08/15/2024 | | | | | 7,450 | | | | | | 7,392 | |
5.850% due 07/10/2024 | | | | | 14,850 | | | | | | 14,822 | |
|
Campbell Soup Co. | |
5.550% due 08/01/2024 | | | | | 4,550 | | | | | | 4,525 | |
5.550% due 08/05/2024 | | | | | 4,700 | | | | | | 4,672 | |
|
Canadian Natural Resources Ltd. | |
5.850% due 07/25/2024 (a) | | | | | 120,700 | | | | | | 120,249 | |
| | | | |
Conagra Brands, Inc.
| | | | | | | | | | | | |
5.800% due 07/09/2024 | | | | | 23,950 | | | | | | 23,908 | |
|
Constellation Brands, Inc. | |
5.610% due 07/09/2024 | | | | | 4,600 | | | | | | 4,592 | |
5.610% due 07/23/2024 | | | | | 6,450 | | | | | | 6,424 | |
5.640% due 07/01/2024 | | | | | 5,000 | | | | | | 4,998 | |
5.640% due 07/15/2024 | | | | | 24,200 | | | | | | 24,134 | |
5.650% due 07/16/2024 | | | | | 250 | | | | | | 249 | |
5.650% due 07/26/2024 | | | | | 1,500 | | | | | | 1,493 | |
5.650% due 07/30/2024 | | | | | 12,950 | | | | | | 12,883 | |
5.660% due 07/19/2024 | | | | | 13,550 | | | | | | 13,504 | |
5.670% due 07/16/2024 | | | | | 500 | | | | | | 499 | |
5.680% due 07/22/2024 | | | | | 13,750 | | | | | | 13,697 | |
5.680% due 07/29/2024 (a) | | | | | 2,300 | | | | | | 2,288 | |
| | | | | | | | | | | | |
| | | | | PRINCIPAL
AMOUNT
(000S) | | | | | MARKET
VALUE
(000S) | |
|
Crown Castle, Inc. | |
5.840% due 07/09/2024 | | $ | | | 79,850 | | | $ | | | 79,710 | |
5.840% due 07/11/2024 | | | | | 13,850 | | | | | | 13,821 | |
5.840% due 07/30/2024 | | | | | 7,400 | | | | | | 7,362 | |
5.840% due 08/01/2024 | | | | | 13,900 | | | | | | 13,823 | |
|
Discovery Communications LLC
|
|
6.000% due 07/15/2024 (a) | | | | | 32,000 | | | | | | 31,911 | |
|
Dominion Resources Services, Inc.
|
|
5.580% due 07/17/2024 | | | | | 18,500 | | | | | | 18,447 | |
|
Entergy Corp. | |
5.550% due 07/25/2024 | | | | | 20,300 | | | | | | 20,216 | |
5.600% due 07/02/2024 | | | | | 18,700 | | | | | | 18,689 | |
|
Global Payments, Inc. | |
5.970% due 07/01/2024 | | | | | 40,550 | | | | | | 40,530 | |
6.030% due 07/18/2024 | | | | | 14,450 | | | | | | 14,401 | |
|
Huntington Ingalls Industries, Inc.
|
|
5.880% due 07/02/2024 | | | | | 17,400 | | | | | | 17,389 | |
|
Keurig Dr Pepper, Inc. | |
5.510% due 07/19/2024 | | | | | 80,250 | | | | | | 79,993 | |
5.520% due 08/01/2024 | | | | | 7,050 | | | | | | 7,013 | |
|
L3Harris Technologies, Inc. | |
5.520% due 07/24/2024 | | | | | 23,450 | | | | | | 23,357 | |
5.550% due 07/29/2024 | | | | | 14,050 | | | | | | 13,983 | |
| | | | |
Marathon Oil Corp.
| | | | | | | | | | | | |
5.830% due 07/05/2024 | | | | | 31,750 | | | | | | 31,715 | |
| | | | |
Marriott International, Inc.
| | | | | | | | | | | | |
5.530% due 08/13/2024 | | | | | 13,850 | | | | | | 13,751 | |
|
NextEra Energy Capital Holdings, Inc. | |
5.570% due 07/08/2024 | | | | | 2,700 | | | | | | 2,696 | |
5.570% due 08/12/2024 | | | | | 13,300 | | | | | | 13,207 | |
5.570% due 08/13/2024 (a) | | | | | 19,750 | | | | | | 19,610 | |
5.580% due 08/12/2024 | | | | | 22,150 | | | | | | 21,996 | |
|
Penske Truck Leasing Co. LP | |
5.540% due 08/20/2024 | | | | | 14,400 | | | | | | 14,280 | |
|
Southern California Edison Co. | |
5.600% due 07/02/2024 | | | | | 22,500 | | | | | | 22,486 | |
5.600% due 07/08/2024 | | | | | 42,350 | | | | | | 42,284 | |
5.600% due 07/12/2024 (a) | | | | | 34,650 | | | | | | 34,574 | |
5.600% due 07/18/2024 (a) | | | | | 17,400 | | | | | | 17,345 | |
|
Targa Resources Corp. | |
6.000% due 07/08/2024 | | | | | 750 | | | | | | 749 | |
6.000% due 07/19/2024 | | | | | 24,050 | | | | | | 23,967 | |
6.000% due 07/22/2024 | | | | | 69,100 | | | | | | 68,827 | |
6.000% due 07/26/2024 | | | | | 27,100 | | | | | | 26,974 | |
| | | | | | | | | | | | |
| | | | | PRINCIPAL
AMOUNT
(000S) | | | | | MARKET
VALUE
(000S) | |
|
VW Credit, Inc. | |
5.570% due 08/21/2024 | | $ | | | 8,800 | | | $ | | | 8,726 | |
5.570% due 08/26/2024 | | | | | 5,300 | | | | | | 5,252 | |
| | | | | | | | | | | | |
| | | | | | | | | | | 1,114,495 | |
| | | | | | | | | | | | |
| |
| REPURCHASE AGREEMENTS (c) 1.2% | |
| | | | | | | | | | | 147,005 | |
| | | | | | | | | | | | |
| |
| SHORT-TERM NOTES 0.4% | |
CarMax Auto Owner Trust | |
5.511% due 01/15/2025 | | | | | 2,450 | | | | | | 2,450 | |
|
Citizens Auto Receivables Trust | |
5.616% due 01/15/2025 | | | | | 1,701 | | | | | | 1,701 | |
DLLST LLC | |
5.562% due 01/21/2025 | | | | | 5,083 | | | | | | 5,084 | |
|
GM Financial Consumer Automobile Receivables Trust | |
5.529% due 01/16/2025 | | | | | 691 | | | | | | 691 | |
|
Huntington Auto Trust | |
5.625% due 02/18/2025 | | | | | 2,724 | | | | | | 2,725 | |
|
Kubota Credit Owner Trust | |
5.531% due 02/18/2025 | | | | | 15,386 | | | | | | 15,389 | |
|
M&T Bank Auto Receivables Trust | |
5.643% due 03/17/2025 | | | | | 2,033 | | | | | | 2,033 | |
|
Volkswagen Auto Lease Trust | |
5.516% due 03/20/2025 | | | | | 17,440 | | | | | | 17,443 | |
| | | | | | | | | | | | |
| | | | | | | | | | | 47,516 | |
| | | | | | | | | | | | |
| Total Short-Term Instruments (Cost $1,309,490) | | | 1,309,016 | |
| | | | |
| | | | |
| | | | | | | | | | | | |
| Total Investments in Securities (Cost $12,193,586) | | | 12,167,231 | |
| |
| | | | |
| Total Investments 101.0% (Cost $12,193,586) | | | $ | | | 12,167,231 | |
| |
Financial Derivative Instruments (d) 0.0% (Cost or Premiums, net $0) | | | | | | | | | | | 877 | |
| |
| Other Assets and Liabilities, net (1.0)% | | | (118,792 | ) |
| | | | |
| Net Assets 100.0% | | | $ | | | 12,049,316 | |
| | | | | | | |
NOTES TO SCHEDULE OF INVESTMENTS:
| * | A zero balance may reflect actual amounts rounding to less than one thousand. |
| « | Security valued using significant unobservable inputs (Level 3). |
| ~ | Variable or Floating rate security. Rate shown is the rate in effect as of period end. Certain variable rate securities are not based on a published reference rate and spread, rather are determined by the issuer or agent and are based on current market conditions. Reference rate is as of reset date, which may vary by security. These securities may not indicate a reference rate and/or spread in their description. |
| • | Rate shown is the rate in effect as of period end. The rate may be based on a fixed rate, a capped rate or a floor rate and may convert to a variable or floating rate in the future. These securities do not indicate a reference rate and spread in their description. |
| þ | Coupon represents a rate which changes periodically based on a predetermined schedule or event. Rate shown is the rate in effect as of period end. |
| (b) | Restricted Securities. |
| | | | | | | | | | | | |
| See Accompanying Notes | | | ANNUAL FINANCIAL AND OTHER INFORMATION | | | | | | | JUNE 30, 2024 | | | 81 |
| | | | | | |
| Schedule of Investments | | PIMCO Enhanced Short Maturity Active Exchange-Traded Fund | | (Cont.) | | |
BORROWINGS AND OTHER FINANCING TRANSACTIONS
(c) REPURCHASE AGREEMENTS:
| | | | | | | | | | | | | | | | | | | | | | | | | | | | | | |
| Counterparty | | Lending
Rate | | | Settlement
Date | | | Maturity
Date | | | Principal
Amount | | | Collateralized By | | Collateral
(Received) | | | Repurchase
Agreements,
at Value | | | Repurchase
Agreement
Proceeds
to be
Received(1) | |
| FICC | | | 2.600 | % | | | 06/28/2024 | | | | 07/01/2024 | | | $ | 605 | | | U.S. Treasury Notes 4.500% due 03/31/2026 | | $ | (618 | ) | | $ | 605 | | | $ | 605 | |
| SAL | | | 5.270 | | | | 06/28/2024 | | | | 07/01/2024 | | | | 4,000 | | | U.S. Treasury Notes 4.875% due 11/30/2025 | | | (4,096 | ) | | | 4,000 | | | | 4,002 | |
| | | 5.340 | | | | 06/28/2024 | | | | 07/01/2024 | | | | 112,600 | | | U.S. Treasury Notes 5.000% due 09/30/2025 | | | (116,256 | ) | | | 112,600 | | | | 112,650 | |
| | | 5.370 | | | | 06/28/2024 | | | | 07/01/2024 | | | | 29,800 | | | U.S. Treasury Notes 0.750% due 04/30/2026 | | | (30,421 | ) | | | 29,800 | | | | 29,813 | |
| | | | | | | | | | | | | | | | | | | | | | | | | | | | | | |
Total Repurchase Agreements | | | | | $ | (151,391 | ) | | $ | 147,005 | | | $ | 147,070 | |
| | | | | | | | | | | | | | | |
BORROWINGS AND OTHER FINANCING TRANSACTIONS SUMMARY
The following is a summary by counterparty of the market value of Borrowings and Other Financing Transactions and collateral pledged/(received) as of June 30, 2024:
| | | | | | | | | | | | | | | | | | | | | | | | |
| Counterparty | | Repurchase
Agreement
Proceeds
to be
Received(1) | | | Payable for
Reverse
Repurchase
Agreements | | | Payable for
Sale-Buyback
Transactions | | | Total
Borrowings and
Other Financing
Transactions | | | Collateral
Pledged/(Received) | | | Net Exposure(2) | |
Global/Master Repurchase Agreement | |
FICC | | $ | 605 | | | $ | 0 | | | $ | 0 | | | $ | 605 | | | $ | (618 | ) | | $ | (13 | ) |
SAL | | | 146,465 | | | | 0 | | | | 0 | | | | 146,465 | | | | (150,773 | ) | | | (4,308 | ) |
| | | | | | | | | | | | | | | | | | | | | | | | |
Total Borrowings and Other Financing Transactions | | $ | 147,070 | | | $ | 0 | | | $ | 0 | | | | | | | | | | | | | |
| | | | | | | | | | | | | | | | | | | | | | | | |
| (1) | Includes accrued interest. |
| (2) | Net Exposure represents the net receivable/(payable) that would be due from/to the counterparty in the event of default. Exposure from borrowings and other financing transactions can only be netted across transactions governed under the same master agreement with the same legal entity. See Note 8, Master Netting Arrangements, in the Notes to Financial Statements for more information. |
The average amount of borrowings outstanding during the period ended June 30, 2024 was $(2,234) at a weighted average interest rate of 5.383%. Average borrowings may include reverse repurchase agreements and sale-buyback transactions, if held during the period.
(d) FINANCIAL DERIVATIVE INSTRUMENTS: EXCHANGE-TRADED OR CENTRALLY CLEARED
FUTURES CONTRACTS:
SHORT FUTURES CONTRACTS
| | | | | | | | | | | | | | | | | | | | | | | | |
| Description | | Expiration
Month | | | # of
Contracts | | | Notional
Amount | | | Unrealized
Appreciation/
(Depreciation) | | | Variation Margin | |
| | Asset | | | Liability | |
U.S. Treasury 2-Year Note September Futures | | | 09/2024 | | | | 438 | | | $ | (89,448 | ) | | $ | (279 | ) | | $ | 10 | | | $ | 0 | |
U.S. Treasury 5-Year Note September Futures | | | 09/2024 | | | | 7,922 | | | | (844,312 | ) | | | (989 | ) | | | 867 | | | | 0 | |
| | | | | | | | | | | | | | | | | | | | | | | | |
Total Futures Contracts | | | $ | (1,268 | ) | | $ | 877 | | | $ | 0 | |
| | | | | | | | | | | | | |
FINANCIAL DERIVATIVE INSTRUMENTS: EXCHANGE-TRADED OR CENTRALLY CLEARED SUMMARY
The following is a summary of the market value and variation margin of Exchange-Traded or Centrally Cleared Financial Derivative Instruments as of June 30, 2024:
| | | | | | | | | | | | | | | | | | | | | | | | | | | | | | | | | | | | |
| | | Financial Derivative Assets | | | | | | Financial Derivative Liabilities | |
| | | Market Value | | | Variation Margin
Asset | | | Total | | | | | | Market Value | | | Variation Margin
Liability | | | Total | |
| | | Purchased
Options | | | Futures | | | Swap
Agreements | | | | | | Written
Options | | | Futures | | | Swap
Agreements | |
Total Exchange-Traded or Centrally Cleared | | $ | 0 | | | $ | 877 | | | $ | 0 | | | $ | 877 | | | | | | | $ | 0 | | | $ | 0 | | | $ | 0 | | | $ | 0 | |
| | | | | | | | | | | | | | | | | | | | | | | | | | | | | | | | | | | | |
Cash of $18,018 has been pledged as collateral for exchange-traded and centrally cleared financial derivative instruments as of June 30, 2024. See Note 8, Master Netting Arrangements, in the Notes to Financial Statements for more information.
| | | | | | |
| 82 | | PIMCO ETF TRUST | | | See Accompanying Notes | |
FAIR VALUE OF FINANCIAL DERIVATIVE INSTRUMENTS
The following is a summary of the fair valuation of the Fund’s derivative instruments categorized by risk exposure. See Note 7, Principal and Other Risks, in the Notes to Financial Statements on risks of the Fund.
Fair Values of Financial Derivative Instruments on the Statements of Assets and Liabilities as of June 30, 2024:
| | | | | | | | | | | | | | | | | | | | | | | | |
| | | Derivatives not accounted for as hedging instruments | |
| | | Commodity
Contracts | | | Credit
Contracts | | | Equity
Contracts | | | Foreign
Exchange
Contracts | | | Interest
Rate Contracts | | | Total | |
|
Financial Derivative Instruments - Assets | |
Exchange-traded or centrally cleared | |
Futures | | $ | 0 | | | $ | 0 | | | $ | 0 | | | $ | 0 | | | $ | 877 | | | $ | 877 | |
| | | | | | | | | | | | | | | | | | | | | | | | |
The effect of Financial Derivative Instruments on the Statements of Operations for the period ended June 30, 2024:
| | | | | | | | | | | | | | | | | | | | | | | | |
| | | Derivatives not accounted for as hedging instruments | |
| | | Commodity
Contracts | | | Credit
Contracts | | | Equity
Contracts | | | Foreign
Exchange
Contracts | | | Interest
Rate Contracts | | | Total | |
Net Realized Gain (Loss) on Financial Derivative Instruments | |
Exchange-traded or centrally cleared | |
Futures | | $ | 0 | | | $ | 0 | | | $ | 0 | | | $ | 0 | | | $ | 19,884 | | | $ | 19,884 | |
| | | | | | | | | | | | | | | | | | | | | | | | |
|
Net Change in Unrealized Appreciation (Depreciation) on Financial Derivative Instruments | |
Exchange-traded or centrally cleared | |
Futures | | $ | 0 | | | $ | 0 | | | $ | 0 | | | $ | 0 | | | $ | (8,735 | ) | | $ | (8,735 | ) |
| | | | | | | | | | | | | | | | | | | | | | | | |
FAIR VALUE MEASUREMENTS
The following is a summary of the fair valuations according to the inputs used as of June 30, 2024 in valuing the Fund’s assets and liabilities:
| | | | | | | | | | | | | | | | |
| Category and Subcategory | | Level 1 | | | Level 2 | | | Level 3 | | | Fair
Value at
06/30/2024 | |
Investments in Securities, at Value | |
Corporate Bonds & Notes | |
Banking & Finance | | $ | 0 | | | $ | 3,915,599 | | | $ | 0 | | | $ | 3,915,599 | |
Industrials | | | 0 | | | | 2,048,574 | | | | 0 | | | | 2,048,574 | |
Utilities | | | 0 | | | | 488,433 | | | | 0 | | | | 488,433 | |
U.S. Government Agencies | | | 0 | | | | 574,773 | | | | 0 | | | | 574,773 | |
Non-Agency Mortgage-Backed Securities | | | 0 | | | | 405,246 | | | | 236 | | | | 405,482 | |
Asset-Backed Securities | | | 0 | | | | 3,184,103 | | | | 0 | | | | 3,184,103 | |
Sovereign Issues | | | 0 | | | | 241,251 | | | | 0 | | | | 241,251 | |
Short-Term Instruments | |
Commercial Paper | | | 120,249 | | | | 994,246 | | | | 0 | | | | 1,114,495 | |
Repurchase Agreements | | | 0 | | | | 147,005 | | | | 0 | | | | 147,005 | |
Short-Term Notes | | | 0 | | | | 47,516 | | | | 0 | | | | 47,516 | |
| | | | | | | | | | | | | | | | |
| | | | |
Total Investments | | $ | 120,249 | | | $ | 12,046,746 | | | $ | 236 | | | $ | 12,167,231 | |
| | | | | | | | | | | | | | | | |
| | | | | | | | | | | | | | | | |
| Category and Subcategory | | Level 1 | | | Level 2 | | | Level 3 | | | Fair
Value at
06/30/2024 | |
|
Financial Derivative Instruments - Assets | |
Exchange-traded or centrally cleared | | $ | 0 | | | $ | 877 | | | $ | 0 | | | $ | 877 | |
| | | | | | | | | | | | | | | | |
| | | | |
Total Financial Derivative Instruments | | $ | 0 | | | $ | 877 | | | $ | 0 | | | $ | 877 | |
| | | | | | | | | | | | | | | | |
| | | | |
Totals | | $ | 120,249 | | | $ | 12,047,623 | | | $ | 236 | | | $ | 12,168,108 | |
| | | | | | | | | | | | | | | | |
There were no significant transfers into or out of Level 3 during the period ended June 30, 2024.
| | | | | | | | | | | | |
| See Accompanying Notes | | | ANNUAL FINANCIAL AND OTHER INFORMATION | | | | | | | JUNE 30, 2024 | | | 83 |
| | | | | | |
| Schedule of Investments | | PIMCO Intermediate Municipal Bond Active Exchange-Traded Fund | | | | |
(Amounts in thousands*, except number of shares, contracts, units and ounces, if any)
| | | | | | | | | | | | |
| | | | | PRINCIPAL
AMOUNT
(000S) | | | | | MARKET
VALUE
(000S) | |
| INVESTMENTS IN SECURITIES 101.0% | |
| |
| MUNICIPAL BONDS & NOTES 93.6% | |
| |
| ALABAMA 3.1% | |
|
Black Belt Energy Gas District, Alabama Revenue Bonds, Series 2021 | |
4.230% (MUNIPSA) due 10/01/2052 ~ | | $ | | | 2,000 | | | $ | | | 1,973 | |
|
Black Belt Energy Gas District, Alabama Revenue Bonds, Series 2022 | |
5.250% due 02/01/2053 | | | | | 5,000 | | | | | | 5,279 | |
|
Black Belt Energy Gas District, Alabama Revenue Bonds, Series 2023 | |
5.500% due 06/01/2049 | | | | | 2,800 | | | | | | 2,973 | |
5.500% due 10/01/2054 | | | | | 5,000 | | | | | | 5,479 | |
|
Chatom Industrial Development Board, Alabama Revenue Notes, (AGM Insured), Series 2020 | |
5.000% due 08/01/2027 | | | | | 1,000 | | | | | | 1,040 | |
|
Energy Southeast A Cooperative District, Alabama Revenue Bonds, Series 2023 | |
5.750% due 04/01/2054 | | | | | 1,500 | | | | | | 1,649 | |
|
Energy Southeast A Cooperative District, Alabama Revenue Bonds, Series 2024 | |
5.250% due 07/01/2054 | | | | | 4,700 | | | | | | 5,031 | |
|
Healthcare Authority of Baptist Health, Alabama Revenue Bonds, Series 2023 | |
5.000% due 11/15/2035 | | | | | 1,500 | | | | | | 1,605 | |
5.000% due 11/15/2036 | | | | | 1,220 | | | | | | 1,301 | |
5.000% due 11/15/2037 | | | | | 875 | | | | | | 929 | |
|
Jefferson County, Alabama Sewer Revenue Notes, Series 2024 | |
5.000% due 10/01/2031 | | | | | 3,500 | | | | | | 3,856 | |
|
Selma Industrial Development Board, Alabama Revenue Bonds, Series 2019 | |
2.000% due 11/01/2033 | | | | | 1,350 | | | | | | 1,340 | |
|
Southeast Alabama Gas Supply District Revenue Bonds, Series 2024 | |
5.000% due 06/01/2049 | | | | | 4,400 | | | | | | 4,641 | |
|
Southeast Energy Authority A Cooperative District, Alabama Revenue Bonds, Series 2023 | |
5.000% due 01/01/2054 | | | | | 5,950 | | | | | | 6,285 | |
|
West Jefferson Industrial Development Board, Alabama Revenue Bonds, Series 1998 | |
3.650% due 06/01/2028 | | | | | 3,600 | | | | | | 3,581 | |
| | | | | | | | | | | | |
| | | | | | | | | | | 46,962 | |
| | | | | | | | | | | | |
| |
| ALASKA 0.4% | |
|
Alaska Housing Finance Corp. Revenue Bonds, Series 2022 | |
5.000% due 12/01/2033 | | | | | 1,905 | | | | | | 2,090 | |
|
Alaska Municipal Bond Bank, Revenue Bonds, Series 2023 | |
5.000% due 12/01/2042 | | | | | 1,000 | | | | | | 1,077 | |
|
Northern Tobacco Securitization Corp., Alaska Revenue Bonds, Series 2021 | |
5.000% due 06/01/2033 | | | | | 2,890 | | | | | | 3,127 | |
| | | | | | | | | | | | |
| | | | | | | | | | | 6,294 | |
| | | | | | | | | | | | |
| |
| ARIZONA 0.4% | |
|
Maricopa County, Arizona Industrial Development Authority Revenue Bonds, Series 2023 | |
5.000% due 01/01/2053 | | | | | 2,000 | | | | | | 2,108 | |
|
Phoenix Civic Improvement Corp., Arizona Revenue Bonds, Series 2014 | |
4.750% due 07/01/2044 | | | | | 2,200 | | | | | | 2,200 | |
|
Phoenix Civic Improvement Corp., Arizona Revenue Bonds, Series 2017 | |
3.125% due 07/01/2034 | | | | | 425 | | | | | | 409 | |
|
Phoenix, Arizona General Obligation Refunding Notes, Series 2022 | |
5.000% due 07/01/2026 | | | | | 1,500 | | | | | | 1,553 | |
| | | | | | | | | | | | |
| | | | | | | | | | | 6,270 | |
| | | | | | | | | | | | |
| |
| | | | | | | | | | | | |
| | | | | PRINCIPAL
AMOUNT
(000S) | | | | | MARKET
VALUE
(000S) | |
| CALIFORNIA 5.5% | |
|
Bay Area Toll Authority, California Revenue Bonds, Series 2021 | |
4.330% (MUNIPSA) due 04/01/2056 ~ | | $ | | | 2,000 | | | $ | | | 1,990 | |
|
California Community Choice Financing Authority Revenue Bonds, Series 2023 | |
5.000% due 02/01/2054 | | | | | 4,700 | | | | | | 4,984 | |
5.250% due 01/01/2054 | | | | | 2,000 | | | | | | 2,109 | |
5.250% due 11/01/2054 | | | | | 7,750 | | | | | | 8,284 | |
5.500% due 10/01/2054 | | | | | 1,900 | | | | | | 2,079 | |
|
California Community Choice Financing Authority Revenue Bonds, Series 2024 | |
5.000% due 05/01/2054 | | | | | 2,600 | | | | | | 2,779 | |
|
California Health Facilities Financing Authority Revenue Bonds, Series 2016 | |
4.000% due 10/01/2036 | | | | | 1,000 | | | | | | 992 | |
|
California Health Facilities Financing Authority Revenue Bonds, Series 2020 | |
4.000% due 04/01/2040 | | | | | 3,250 | | | | | | 3,184 | |
|
California Health Facilities Financing Authority Revenue Bonds, Series 2024 | |
5.250% due 12/01/2040 | | | | | 2,500 | | | | | | 2,793 | |
|
California Municipal Finance Authority Revenue Bonds, (FNMA Insured),Series 2024 | |
4.450% due 12/01/2042 | | | | | 1,100 | | | | | | 1,112 | |
|
California State General Obligation Bonds, Series 2016 | |
4.000% due 09/01/2037 | | | | | 4,495 | | | | | | 4,510 | |
|
California State General Obligation Bonds, Series 2019 | |
5.000% due 11/01/2036 | | | | | 5,000 | | | | | | 5,377 | |
|
California State General Obligation Bonds, Series 2023 | |
4.000% due 09/01/2043 | | | | | 3,100 | | | | | | 3,154 | |
|
California State General Obligation Notes, Series 2022 | |
5.000% due 11/01/2026 | | | | | 6,400 | | | | | | 6,669 | |
|
California Statewide Communities Development Authority Revenue Bonds, Series 2006 | |
4.500% due 11/01/2033 | | | | | 3,500 | | | | | | 3,706 | |
|
Chino Valley Unified School District, California General Obligation Bonds, Series 2022 | |
0.000% due 08/01/2041 (c) | | | | | 1,500 | | | | | | 728 | |
|
Foothill-Eastern Transportation Corridor Agency, California Revenue Bonds, Series 2021 | |
4.000% due 01/15/2033 | | | | | 1,111 | | | | | | 1,142 | |
|
Golden State, California Tobacco Securitization Corp. Revenue Bonds, Series 2021 | |
2.746% due 06/01/2034 | | | | | 3,000 | | | | | | 2,508 | |
|
Golden State, California Tobacco Securitization Corp. Revenue Notes, Series 2021 | |
2.687% due 06/01/2030 | | | | | 6,000 | | | | | | 5,228 | |
|
Long Beach, California Senior Airport Revenue Refunding Bonds, (AGM Insured), Series 2022 | |
5.000% due 06/01/2038 | | | | | 1,000 | | | | | | 1,135 | |
|
Los Angeles Community College District, California General Obligation Notes, Series 2024 | |
5.000% due 08/01/2032 | | | | | 7,500 | | | | | | 8,654 | |
|
Los Angeles, California Wastewater System Revenue Bonds, Series 2015 | |
5.000% due 06/01/2029 | | | | | 1,350 | | | | | | 1,369 | |
|
Riverside Unified School District, California Special Tax Bonds, Series 2024 | |
5.000% due 09/01/2039 | | | | | 500 | | | | | | 531 | |
5.000% due 09/01/2044 | | | | | 690 | | | | | | 717 | |
|
San Francisco, California City & County Certificates of Participation Bonds, Series 2017 | |
4.000% due 04/01/2036 | | | | | 6,320 | | | | | | 6,332 | |
| | | | | | | | | | | | |
| | | | | | | | | | | 82,066 | |
| | | | | | | | | | | | |
| |
| COLORADO 2.7% | |
|
Colorado Bridge & Tunnel Enterprise Revenue Bonds, (AGM Insured), Series 2024 | |
5.000% due 12/01/2042 | | | | | 1,000 | | | | | | 1,105 | |
5.000% due 12/01/2043 | | | | | 1,000 | | | | | | 1,099 | |
5.000% due 12/01/2044 | | | | | 1,000 | | | | | | 1,095 | |
| | | | | | | | | | | | |
| | | | | PRINCIPAL
AMOUNT
(000S) | | | | | MARKET
VALUE
(000S) | |
|
Colorado Health Facilities Authority Revenue Bonds, Series 2018 | |
5.000% due 11/15/2048 | | $ | | | 2,500 | | | $ | | | 2,542 | |
|
Colorado Health Facilities Authority Revenue Bonds, Series 2019 | |
4.000% due 11/15/2043 | | | | | 7,000 | | | | | | 6,857 | |
5.000% due 11/15/2049 | | | | | 1,360 | | | | | | 1,403 | |
|
Colorado Health Facilities Authority Revenue Bonds, Series 2022 | |
5.250% due 11/01/2035 | | | | | 1,200 | | | | | | 1,365 | |
5.250% due 11/01/2037 | | | | | 1,450 | | | | | | 1,632 | |
|
Colorado Health Facilities Authority Revenue Bonds, Series 2024 | |
5.000% due 12/01/2034 | | | | | 6,500 | | | | | | 7,413 | |
5.000% due 11/15/2059 | | | | | 5,800 | | | | | | 6,255 | |
|
Colorado Health Facilities Authority Revenue Notes, Series 2024 | |
5.000% due 05/15/2033 | | | | | 4,500 | | | | | | 5,075 | |
|
E-470 Public Highway Authority, Colorado Revenue Bonds, Series 2020 | |
5.000% due 09/01/2034 | | | | | 1,300 | | | | | | 1,424 | |
|
E-470 Public Highway Authority, Colorado Revenue Bonds, Series 2024 | |
4.328% (SOFRRATE) due 09/01/2039 ~ | | | | | 3,400 | | | | | | 3,401 | |
| | | | | | | | | | | | |
| | | | | | | | | | | 40,666 | |
| | | | | | | | | | | | |
| |
| CONNECTICUT 1.6% | |
|
Bridgeport, Connecticut General Obligation Notes, Series 2017 | |
5.000% due 08/15/2027 | | | | | 2,690 | | | | | | 2,819 | |
|
Connecticut Special Tax State Revenue Bonds, Series 2018 | |
5.000% due 10/01/2033 | | | | | 1,020 | | | | | | 1,085 | |
5.000% due 01/01/2035 | | | | | 4,290 | | | | | | 4,515 | |
|
Connecticut Special Tax State Revenue Bonds, Series 2022 | |
5.000% due 07/01/2039 | | | | | 5,000 | | | | | | 5,606 | |
|
Connecticut State General Obligation Bonds, Series 2018 | |
5.000% due 09/15/2030 | | | | | 3,640 | | | | | | 3,882 | |
|
Connecticut State General Obligation Notes, Series 2022 | |
5.000% due 09/15/2028 | | | | | 2,725 | | | | | | 2,933 | |
|
Connecticut State Health & Educational Facilities Authority Revenue Bonds, Series 2018 | |
5.000% due 07/01/2029 | | | | | 1,200 | | | | | | 1,263 | |
|
Metropolitan District, Connecticut General Obligation Bonds, Series 2018 | |
5.000% due 07/15/2029 | | | | | 1,845 | | | | | | 1,982 | |
| | | | | | | | | | | | |
| | | | | | | | | | | 24,085 | |
| | | | | | | | | | | | |
| |
| DELAWARE 0.1% | |
|
Delaware State Economic Development Authority Revenue Bonds, Series 2020 | |
1.250% due 10/01/2045 | | | | | 2,000 | | | | | | 1,898 | |
| | | | | | | | | | | | |
| |
| DISTRICT OF COLUMBIA 0.5% | |
|
Washington Metropolitan Area Transit Authority, District of Columbia Revenue Bonds, Series 2017 | |
5.000% due 07/01/2031 | | | | | 2,075 | | | | | | 2,158 | |
5.000% due 07/01/2033 | | | | | 5,000 | | | | | | 5,198 | |
| | | | | | | | | | | | |
| | | | | | | | | | | 7,356 | |
| | | | | | | | | | | | |
| |
| FLORIDA 2.9% | |
|
Florida’s Turnpike Enterprise Revenue Bonds, Series 2018 | |
4.000% due 07/01/2048 | | | | | 4,500 | | | | | | 4,359 | |
|
Jacksonville Housing Authority, Florida Revenue Notes, Series 2024 | |
5.000% due 02/01/2034 | | | | | 1,500 | | | | | | 1,591 | |
| | | | | | |
| 84 | | PIMCO ETF TRUST | | | See Accompanying Notes | |
| | | | | | | | | | | | |
| | | | | PRINCIPAL
AMOUNT
(000S) | | | | | MARKET
VALUE
(000S) | |
|
JEA Water & Sewer System, Florida Revenue Bonds, Series 2020 | |
4.000% due 10/01/2039 | | $ | | | 1,000 | | | $ | | | 1,005 | |
|
Miami-Dade County, Florida Aviation Revenue Bonds, Series 2020 | |
5.000% due 10/01/2032 | | | | | 1,000 | | | | | | 1,092 | |
|
Miami-Dade County, Florida Transit System Revenue Bonds, Series 2017 | |
4.000% due 07/01/2033 | | | | | 3,000 | | | | | | 3,009 | |
|
Miami-Dade County, Florida Water & Sewer System Revenue Notes, Series 2024 | |
5.000% due 10/01/2032 | | | | | 2,750 | | | | | | 3,122 | |
5.000% due 10/01/2033 | | | | | 9,000 | | | | | | 10,337 | |
|
Orange County Health Facilities Authority, Florida Revenue Notes, Series 2023 | |
5.000% due 10/01/2028 | | | | | 1,450 | | | | | | 1,546 | |
|
Orange County, Florida School Board Certificates of Participation Notes, Series 2024 | |
5.000% due 08/01/2033 | | | | | 6,340 | | | | | | 7,300 | |
5.000% due 08/01/2034 | | | | | 3,960 | | | | | | 4,617 | |
|
Orlando Utilities Commission, Florida Revenue Bonds, Series 2021 | |
1.250% due 10/01/2046 | | | | | 3,500 | | | | | | 3,071 | |
|
Osceola County, Florida Transportation Revenue Bonds, Series 2020 | |
0.000% due 10/01/2034 (c) | | | | | 1,850 | | | | | | 1,208 | |
|
Osceola County, Florida Transportation Revenue Notes, Series 2020 | |
0.000% due 10/01/2027 (c) | | | | | 350 | | | | | | 307 | |
0.000% due 10/01/2029 (c) | | | | | 700 | | | | | | 565 | |
|
Tampa, Florida Revenue Bonds, Series 2020 | |
0.000% due 09/01/2033 (c) | | | | | 200 | | | | | | 136 | |
| | | | | | | | | | | | |
| | | | | | | | | | | 43,265 | |
| | | | | | | | | | | | |
| |
| GEORGIA 3.8% | |
|
Bartow County, Georgia Development Authority Revenue Bonds, Series 1997 | |
1.800% due 09/01/2029 | | | | | 2,000 | | | | | | 1,703 | |
|
Brookhaven Development Authority, Georgia Revenue Bonds, Series 2019 | |
5.000% due 07/01/2038 | | | | | 1,800 | | | | | | 1,928 | |
|
Burke County, Georgia Development Authority Revenue Bonds, Series 2017 | |
3.250% due 11/01/2045 | | | | | 3,750 | | | | | | 3,719 | |
|
Cobb County, Georgia Kennestone Hospital Authority Revenue Bonds, Series 2017 | |
5.000% due 04/01/2028 | | | | | 600 | | | | | | 619 | |
|
Cobb County, Georgia Kennestone Hospital Authority Revenue Bonds, Series 2023 | |
5.000% due 04/01/2042 | | | | | 2,875 | | | | | | 3,075 | |
5.000% due 04/01/2043 | | | | | 3,375 | | | | | | 3,597 | |
|
Development Authority of Burke County, Georgia Revenue Bonds, Series 2008 | |
3.375% due 11/01/2048 | | | | | 4,500 | | | | | | 4,469 | |
|
Development Authority of Monroe County, Georgia Revenue Bonds, Series 2013 | |
1.500% due 01/01/2039 | | | | | 1,250 | | | | | | 1,221 | |
|
Fulton County, Georgia Development Authority Revenue Bonds, Series 2019 | |
5.000% due 07/01/2030 | | | | | 1,000 | | | | | | 1,084 | |
|
LaGrange-Troup County, Georgia Hospital Authority Revenue Bonds, Series 2017 | |
5.000% due 04/01/2028 | | | | | 700 | | | | | | 723 | |
|
Main Street Natural Gas Inc, Georgia Revenue Bonds, Series 2024 | |
5.000% due 12/01/2054 | | | | | 6,500 | | | | | | 6,892 | |
|
Main Street Natural Gas, Inc., Georgia Revenue Bonds, Series 2021 | |
4.000% due 07/01/2052 | | | | | 700 | | | | | | 703 | |
|
Main Street Natural Gas, Inc., Georgia Revenue Bonds, Series 2022 | |
4.000% due 09/01/2052 | | | | | 1,915 | | | | | | 1,922 | |
5.000% due 12/01/2052 | | | | | 3,000 | | | | | | 3,146 | |
| | | | | | | | | | | | |
| | | | | PRINCIPAL
AMOUNT
(000S) | | | | | MARKET
VALUE
(000S) | |
|
Main Street Natural Gas, Inc., Georgia Revenue Bonds, Series 2023 | |
5.000% due 06/01/2053 | | $ | | | 1,000 | | | $ | | | 1,058 | |
5.000% due 12/01/2053 | | | | | 7,600 | | | | | | 8,129 | |
|
Main Street Natural Gas, Inc., Georgia Revenue Bonds, Series 2024 | |
5.000% due 05/01/2054 | | | | | 6,000 | | | | | | 6,375 | |
|
Municipal Electric Authority of Georgia Revenue Bonds, Series 2015 | |
5.000% due 01/01/2035 | | | | | 2,400 | | | | | | 2,410 | |
|
Municipal Electric Authority of Georgia Revenue Bonds, Series 2019 | |
5.000% due 01/01/2031 | | | | | 1,200 | | | | | | 1,265 | |
|
Municipal Electric Authority of Georgia Revenue Bonds, Series 2022 | |
4.500% due 07/01/2063 | | | | | 2,000 | | | | | | 1,976 | |
|
Municipal Electric Authority of Georgia Revenue Notes, Series 2019 | |
5.000% due 01/01/2026 | | | | | 400 | | | | | | 409 | |
5.000% due 01/01/2029 | | | | | 1,000 | | | | | | 1,052 | |
|
Municipal Electric Authority of Georgia Revenue Notes, Series 2021 | |
5.000% due 01/01/2027 | | | | | 200 | | | | | | 204 | |
5.000% due 01/01/2029 | | | | | 165 | | | | | | 172 | |
| | | | | | | | | | | | |
| | | | | | | | | | | 57,851 | |
| | | | | | | | | | | | |
| |
| HAWAII 0.7% | |
|
City & County Honolulu, Hawaii General Obligation Bonds, Series 2015 | |
5.000% due 10/01/2030 | | | | | 2,000 | | | | | | 2,037 | |
|
City & County Honolulu, Hawaii Wastewater System Revenue Bonds, Series 2015 | |
4.000% due 07/01/2034 | | | | | 8,475 | | | | | | 8,478 | |
| | | | | | | | | | | | |
| | | | | | | | | | | 10,515 | |
| | | | | | | | | | | | |
| |
| IDAHO 0.2% | |
|
Idaho Housing & Finance Association Revenue Bonds, (GNMA/FNMA/FHLMC Insured), Series 2024 | |
4.450% due 01/01/2044 | | | | | 2,500 | | | | | | 2,521 | |
| | | | | | | | | | | | |
| |
| ILLINOIS 4.6% | |
|
Chicago Transit Authority Sales Tax Receipts Fund, Illinois Revenue Bonds, Series 2014 | |
5.000% due 12/01/2044 | | | | | 2,500 | | | | | | 2,505 | |
|
Illinois Finance Authority Revenue Bonds, Series 2016 | |
5.000% due 02/15/2041 | | | | | 3,620 | | | | | | 3,706 | |
|
Illinois Finance Authority Revenue Bonds, Series 2020 | |
4.700% due 08/15/2049 | | | | | 7,600 | | | | | | 7,600 | |
|
Illinois Sales Tax State Revenue Bonds, Series 2024 | |
5.000% due 06/15/2040 | | | | | 1,195 | | | | | | 1,303 | |
|
Illinois State General Obligation Bonds, Series 2021 | |
5.000% due 03/01/2037 | | | | | 5,860 | | | | | | 6,327 | |
|
Illinois State General Obligation Bonds, Series 2023 | |
5.000% due 12/01/2043 | | | | | 6,100 | | | | | | 6,547 | |
|
Illinois State General Obligation Bonds, Series 2024 | |
5.000% due 05/01/2036 | | | | | 8,000 | | | | | | 8,923 | |
|
Illinois State General Obligation Notes, Series 2020 | |
5.500% due 05/01/2030 | | | | | 7,000 | | | | | | 7,454 | |
|
Illinois State General Obligation Notes, Series 2024 | |
5.000% due 05/01/2032 | | | | | 5,000 | | | | | | 5,494 | |
|
Illinois State Revenue Bonds, Series 2013 | |
5.000% due 06/15/2026 | | | | | 1,500 | | | | | | 1,502 | |
|
Illinois State Toll Highway Authority Revenue Bonds, Series 2015 | |
5.000% due 01/01/2040 | | | | | 2,100 | | | | | | 2,115 | |
|
Illinois State Toll Highway Authority Revenue Bonds, Series 2019 | |
5.000% due 01/01/2030 | | | | | 2,500 | | | | | | 2,688 | |
|
Illinois State Toll Highway Authority Revenue Bonds, Series 2024 | |
5.000% due 01/01/2035 | | | | | 2,600 | | | | | | 3,022 | |
5.000% due 01/01/2036 | | | | | 5,000 | | | | | | 5,790 | |
| | | | | | | | | | | | |
| | | | | PRINCIPAL
AMOUNT
(000S) | | | | | MARKET
VALUE
(000S) | |
|
Metropolitan Pier & Exposition Authority, Illinois Revenue Bonds, Series 2022 | |
0.000% due 06/15/2036 (c) | | $ | | | 500 | | | $ | | | 303 | |
0.000% due 06/15/2037 (c) | | | | | 1,500 | | | | | | 865 | |
|
Sales Tax Securitization Corp., Illinois Revenue Bonds, Series 2018 | |
5.000% due 01/01/2037 | | | | | 1,350 | | | | | | 1,413 | |
|
Sales Tax Securitization Corp., Illinois Revenue Bonds, Series 2023 | |
5.000% due 01/01/2037 | | | | | 1,000 | | | | | | 1,082 | |
| | | | | | | | | | | | |
| | | | | | | | | | | 68,639 | |
| | | | | | | | | | | | |
| |
| INDIANA 1.5% | |
|
Indiana Finance Authority Midwestern Disaster Relief Revenue Bonds, Series 2012 | |
4.250% due 11/01/2030 | | | | | 1,500 | | | | | | 1,508 | |
|
Indiana Finance Authority Revenue Bonds, Series 2010 | |
2.500% due 11/01/2030 | | | | | 3,825 | | | | | | 3,421 | |
|
Indiana Finance Authority Revenue Bonds, Series 2012 | |
3.000% due 11/01/2030 | | | | | 2,100 | | | | | | 1,970 | |
|
Indiana Finance Authority Revenue Bonds, Series 2018 | |
5.000% due 02/01/2030 | | | | | 1,500 | | | | | | 1,596 | |
|
Indiana Finance Authority Revenue Bonds, Series 2023 | |
5.000% due 10/01/2036 | | | | | 1,000 | | | | | | 1,136 | |
5.000% due 10/01/2037 | | | | | 800 | | | | | | 905 | |
|
Indiana University Revenue Notes, Series 2024 | |
5.000% due 06/01/2034 | | | | | 4,600 | | | | | | 5,378 | |
|
Indianapolis Local Public Improvement Bond Bank, Indiana Revenue Bonds, Series 2023 | |
6.000% due 02/01/2048 | | | | | 4,000 | | | | | | 4,633 | |
|
Rockport, Indiana Revenue Bonds, Series 2009 | |
3.050% due 06/01/2025 | | | | | 1,500 | | | | | | 1,486 | |
| | | | | | | | | | | | |
| | | | | | | | | | | 22,033 | |
| | | | | | | | | | | | |
| |
| IOWA 0.8% | |
|
Iowa Finance Authority Midwestern Disaster Area Revenue Refunding Bonds, Series 2012 | |
4.750% due 08/01/2042 | | | | | 8,000 | | | | | | 7,961 | |
|
Iowa Finance Authority Midwestern Disaster Area Revenue Refunding Bonds, Series 2022 | |
4.000% due 12/01/2050 | | | | | 3,000 | | | | | | 3,146 | |
5.000% due 12/01/2050 | | | | | 800 | | | | | | 846 | |
| | | | | | | | | | | | |
| | | | | | | | | | | 11,953 | |
| | | | | | | | | | | | |
| |
| KENTUCKY 0.2% | |
|
Kentucky Economic Development Finance Authority Revenue Bonds, Series 2015 | |
5.000% due 07/01/2040 | | | | | 1,650 | | | | | | 1,655 | |
|
Kentucky Public Energy Authority Revenue Bonds, Series 2020 | |
4.000% due 12/01/2050 | | | | | 1,000 | | | | | | 1,004 | |
| | | | | | | | | | | | |
| | | | | | | | | | | 2,659 | |
| | | | | | | | | | | | |
| |
| LOUISIANA 1.6% | |
|
East Baton Rouge Sewerage Commission, Louisiana Revenue Bonds, Series 2019 | |
4.000% due 02/01/2045 | | | | | 13,100 | | | | | | 12,899 | |
|
Louisiana Local Government Environmental Facilities & Community Development Auth Revenue Notes, Series 2022 | |
5.000% due 08/15/2027 | | | | | 1,200 | | | | | | 1,245 | |
5.000% due 08/15/2028 | | | | | 1,200 | | | | | | 1,245 | |
|
Louisiana Public Facilities Authority Revenue Bonds, Series 2020 | |
4.000% due 04/01/2050 | | | | | 1,980 | | | | | | 1,919 | |
|
Louisiana Public Facilities Authority Revenue Bonds, Series 2023 | |
5.000% due 10/15/2036 | | | | | 1,000 | | | | | | 1,120 | |
|
Parish of St John the Baptist, Louisiana Revenue Bonds, Series 2017 | |
2.100% due 06/01/2037 | | | | | 2,900 | | | | | | 2,900 | |
| | | | | | | | | | | | |
| See Accompanying Notes | | | ANNUAL FINANCIAL AND OTHER INFORMATION | | | | | | | JUNE 30, 2024 | | | 85 |
| | | | | | |
| Schedule of Investments | | PIMCO Intermediate Municipal Bond Active Exchange-Traded Fund | | (Cont.) | | |
| | | | | | | | | | | | |
| | | | | PRINCIPAL
AMOUNT
(000S) | | | | | MARKET
VALUE
(000S) | |
|
Tangipahoa Parish Hospital Service District No 1, Louisiana Revenue Bonds, Series 2021 | |
4.000% due 02/01/2037 | | $ | | | 2,000 | | | $ | | | 1,968 | |
| | | | | | | | | | | | |
| | | | | | | | | | | 23,296 | |
| | | | | | | | | | | | |
| |
| MARYLAND 1.0% | |
|
Maryland Department of Transportation State Revenue Bonds, Series 2019 | |
4.000% due 10/01/2032 | | | | | 1,450 | | | | | | 1,471 | |
|
Maryland Health & Higher Educational Facilities Authority Revenue Bonds, Series 2021 | |
4.000% due 06/01/2037 | | | | | 225 | | | | | | 216 | |
5.000% due 06/01/2033 | | | | | 445 | | | | | | 466 | |
|
Maryland Health & Higher Educational Facilities Authority Revenue Notes, Series 2021 | |
5.000% due 06/01/2031 | | | | | 350 | | | | | | 368 | |
|
Maryland State General Obligation Bonds, Series 2022 | |
5.000% due 06/01/2036 | | | | | 8,000 | | | | | | 9,117 | |
5.000% due 06/01/2037 | | | | | 3,490 | | | | | | 3,966 | |
| | | | | | | | | | | | |
| | | | | | | | | | | 15,604 | |
| | | | | | | | | | | | |
| |
| MASSACHUSETTS 1.2% | |
|
Commonwealth of Massachusetts General Obligation Bonds, Series 2022 | |
5.000% due 10/01/2037 | | | | | 3,400 | | | | | | 3,850 | |
|
Commonwealth of Massachusetts General Obligation Bonds, Series 2023 | |
5.000% due 10/01/2046 | | | | | 8,900 | | | | | | 9,722 | |
|
Massachusetts Bay Transportation Authority Sales Tax Revenue Notes, Series 2023 | |
5.000% due 07/01/2033 | | | | | 1,500 | | | | | | 1,720 | |
|
Massachusetts Development Finance Agency Revenue Bonds, Series 2018 | |
5.000% due 07/01/2030 | | | | | 1,500 | | | | | | 1,566 | |
|
Massachusetts Development Finance Agency Revenue Bonds, Series 2019 | |
4.480% (MUNIPSA) due 07/01/2049 ~ | | | | | 1,000 | | | | | | 997 | |
| | | | | | | | | | | | |
| | | | | | | | | | | 17,855 | |
| | | | | | | | | | | | |
| |
| MICHIGAN 2.7% | |
|
Detroit City School District, Michigan General Obligation Bonds, (AGM/Q-SBLF Insured), Series 2001 | |
6.000% due 05/01/2029 | | | | | 3,290 | | | | | | 3,505 | |
|
Detroit Downtown Development Authority, Michigan Tax Allocation Bonds, Series 2024 | |
5.000% due 07/01/2048 | | | | | 3,000 | | | | | | 3,145 | |
|
Detroit, Michigan Sewage Disposal System Revenue Bonds, (AGM Insured), Series 2006 | |
4.328% (TSFR3M) due 07/01/2032 ~ | | | | | 3,000 | | | | | | 2,866 | |
|
Grand Traverse County, Michigan Hospital Finance Authority Revenue Notes, Series 2021 | |
5.000% due 07/01/2029 | | | | | 1,175 | | | | | | 1,248 | |
5.000% due 07/01/2030 | | | | | 1,715 | | | | | | 1,841 | |
|
Great Lakes Water Authority Sewage Disposal System, Michigan Revenue Bonds, Series 2023 | |
5.000% due 07/01/2037 | | | | | 5,000 | | | | | | 5,709 | |
|
Michigan Finance Authority Hospital Revenue Refunding Bonds, Series 2022 | |
4.630% (MUNIPSA) due 04/15/2047 ~ | | | | | 3,500 | | | | | | 3,501 | |
|
Michigan Finance Authority Hospital Revenue Refunding Notes, Series 2022 | |
5.000% due 04/15/2030 | | | | | 2,000 | | | | | | 2,176 | |
|
Michigan Finance Authority Revenue Bonds, Series 2015 | |
5.000% due 07/01/2030 | | | | | 1,200 | | | | | | 1,215 | |
|
Michigan Finance Authority Revenue Bonds, Series 2020 | |
5.000% due 06/01/2040 | | | | | 5,000 | | | | | | 5,214 | |
| | | | | | | | | | | | |
| | | | | PRINCIPAL
AMOUNT
(000S) | | | | | MARKET
VALUE
(000S) | |
|
Michigan Finance Authority Revenue Bonds, Series 2024 | |
5.000% due 02/28/2039 | | $ | | | 1,290 | | | $ | | | 1,412 | |
|
Michigan Finance Authority Revenue Notes, Series 2024 | |
5.000% due 08/31/2034 | | | | | 1,930 | | | | | | 2,158 | |
|
Michigan State Building Authority Revenue Bonds, Series 2015 | |
5.000% due 04/15/2034 | | | | | 2,000 | | | | | | 2,030 | |
|
Michigan State Building Authority Revenue Bonds, Series 2023 | |
5.000% due 10/15/2037 | | | | | 1,000 | | | | | | 1,140 | |
|
Michigan State Hospital Finance Authority Revenue Bonds, Series 2010 | |
5.000% due 11/15/2047 | | | | | 1,500 | | | | | | 1,562 | |
|
Michigan Trunk Line State Revenue Bonds, Series 2023 | |
5.000% due 11/15/2038 | | | | | 1,800 | | | | | | 2,062 | |
| | | | | | | | | | | | |
| | | | | | | | | | | 40,784 | |
| | | | | | | | | | | | |
| |
| MINNESOTA 0.2% | |
|
Minneapolis, Minnesota Revenue Bonds, Series 2023 | |
5.000% due 11/15/2052 | | | | | 3,060 | | | | | | 3,230 | |
| | | | | | | | | | | | |
| |
| MISSISSIPPI 0.1% | |
|
Mississippi Business Finance Corp. Revenue Bonds, Series 2002 | |
3.200% due 09/01/2028 | | | | | 1,500 | | | | | | 1,467 | |
| | | | | | | | | | | | |
| |
| MISSOURI 0.3% | |
|
Health & Educational Facilities Authority of the State of Missouri Revenue Notes, Series 2023 | |
5.000% due 05/01/2033 | | | | | 4,000 | | | | | | 4,555 | |
| | | | | | | | | | | | |
| |
| MULTI-STATE 2.2% | |
|
Freddie Mac Multifamily ML Certificates, Revenue Bonds, Series 2023 | |
4.033% due 12/25/2036 | | | | | 8,530 | | | | | | 8,369 | |
4.141% due 01/25/2040 | | | | | 10,896 | | | | | | 10,678 | |
4.549% due 08/25/2040 | | | | | 13,260 | | | | | | 13,372 | |
| | | | | | | | | | | | |
| | | | | | | | | | | 32,419 | |
| | | | | | | | | | | | |
| |
| NEBRASKA 0.5% | |
|
Douglas County, Nebraska Revenue Bonds, Series 2021 | |
4.410% (MUNIPSA) due 07/01/2035 ~ | | | | | 1,960 | | | | | | 1,936 | |
|
Omaha Public Power District, Nebraska Revenue Bonds, Series 2024 | |
5.000% due 02/01/2042 (a) | | | | | 3,625 | | | | | | 4,035 | |
|
Public Power Generation Agency, Nebraska Revenue Notes, Series 2015 | |
5.000% due 01/01/2025 | | | | | 1,905 | | | | | | 1,916 | |
| | | | | | | | | | | | |
| | | | | | | | | | | 7,887 | |
| | | | | | | | | | | | |
| |
| NEVADA 2.2% | |
|
Clark County, Nevada Revenue Bonds, Series 2010 | |
2.100% due 06/01/2031 | | | | | 5,000 | | | | | | 4,314 | |
|
Clark County, Nevada School District General Obligation Notes, (AGM Insured), Series 2020 | |
5.000% due 06/15/2028 | | | | | 1,000 | | | | | | 1,067 | |
5.000% due 06/15/2029 | | | | | 2,030 | | | | | | 2,204 | |
|
Humboldt County, Nevada Revenue Bonds, Series 2016 | |
3.550% due 10/01/2029 | | | | | 5,000 | | | | | | 4,973 | |
|
Las Vegas Redevelopment Agency, Nevada Tax Allocation Bonds, Series 2016 | |
5.000% due 06/15/2031 | | | | | 1,465 | | | | | | 1,486 | |
|
Las Vegas Valley Water District, Nevada General Obligation Bonds, Series 2015 | |
5.000% due 06/01/2034 | | | | | 1,500 | | | | | | 1,510 | |
| | | | | | | | | | | | |
| | | | | PRINCIPAL
AMOUNT
(000S) | | | | | MARKET
VALUE
(000S) | |
|
Nevada State General Obligation Bonds, Series 2023 | |
5.000% due 05/01/2040 | | $ | | | 10,000 | | | $ | | | 11,321 | |
|
Washoe County School District, Nevada General Obligation Bonds, Series 2023 | |
4.125% due 06/01/2041 | | | | | 4,235 | | | | | | 4,276 | |
|
Washoe County, Nevada Revenue Bonds, Series 2016 | |
3.625% due 03/01/2036 | | | | | 2,500 | | | | | | 2,488 | |
| | | | | | | | | | | | |
| | | | | | | | | | | 33,639 | |
| | | | | | | | | | | | |
| |
| NEW HAMPSHIRE 0.7% | |
|
New Hampshire Business Finance Authority Revenue Bonds, Series 2023 | |
3.875% due 01/20/2038 | | | | | 4,949 | | | | | | 4,667 | |
|
New Hampshire Business Finance Authority Revenue Notes, Series 2021 | |
4.000% due 01/01/2025 | | | | | 285 | | | | | | 284 | |
|
New Hampshire Housing Finance Authority Revenue Bonds, (GNMA/FNMA/FHLMC Insured), Series 2024 | |
6.500% due 07/01/2055 (a) | | | | | 5,325 | | | | | | 6,011 | |
| | | | | | | | | | | | |
| | | | | | | | | | | 10,962 | |
| | | | | | | | | | | | |
| |
| NEW JERSEY 4.0% | |
|
Federal Home Loan Mortgage Corp. Enhanced Receipt, New Jersey Revenue Bonds, Series 2019 | |
3.870% due 11/15/2035 (d) | | | | | 12,616 | | | | | | 11,427 | |
|
New Jersey Economic Development Authority Revenue Bonds, Series 2015 | |
5.250% due 06/15/2027 | | | | | 2,100 | | | | | | 2,135 | |
|
New Jersey Economic Development Authority Revenue Bonds, Series 2021 | |
4.000% due 06/15/2034 | | | | | 500 | | | | | | 512 | |
|
New Jersey Economic Development Authority Revenue Bonds, Series 2022 | |
5.000% due 11/01/2036 | | | | | 2,500 | | | | | | 2,780 | |
|
New Jersey State General Obligation Notes, Series 2020 | |
5.000% due 06/01/2026 | | | | | 2,000 | | | | | | 2,067 | |
|
New Jersey Transportation Trust Fund Authority Revenue Bonds, Series 2009 | |
0.000% due 12/15/2034 (c) | | | | | 1,500 | | | | | | 1,011 | |
|
New Jersey Transportation Trust Fund Authority Revenue Bonds, Series 2018 | |
5.000% due 12/15/2036 | | | | | 1,380 | | | | | | 1,453 | |
|
New Jersey Transportation Trust Fund Authority Revenue Bonds, Series 2023 | |
5.000% due 06/15/2036 | | | | | 6,500 | | | | | | 7,315 | |
5.000% due 06/15/2037 | | | | | 10,985 | | | | | | 12,325 | |
|
New Jersey Turnpike Authority Revenue Bonds, Series 2017 | |
4.000% due 01/01/2034 | | | | | 7,500 | | | | | | 7,626 | |
5.000% due 01/01/2030 | | | | | 2,250 | | | | | | 2,335 | |
|
South Jersey Transportation Authority LLC, New Jersey Revenue Bonds, Series 2014 | |
5.000% due 11/01/2039 | | | | | 1,300 | | | | | | 1,302 | |
|
Tobacco Settlement Financing Corp., New Jersey Revenue Bonds, Series 2018 | |
5.000% due 06/01/2031 | | | | | 7,870 | | | | | | 8,302 | |
| | | | | | | | | | | | |
| | | | | | | | | | | 60,590 | |
| | | | | | | | | | | | |
| |
| NEW MEXICO 1.3% | |
|
Farmington, New Mexico Revenue Bonds, Series 2005 | |
1.800% due 04/01/2029 | | | | | 5,000 | | | | | | 4,442 | |
|
Farmington, New Mexico Revenue Bonds, Series 2010 | |
3.875% due 06/01/2040 | | | | | 7,000 | | | | | | 7,050 | |
|
New Mexico Hospital Equipment Loan Council Revenue Bonds, Series 2017 | |
4.000% due 08/01/2039 | | | | | 7,950 | | | | | | 7,809 | |
| | | | | | | | | | | | |
| | | | | | | | | | | 19,301 | |
| | | | | | | | | | | | |
| |
| | | | | | |
| 86 | | PIMCO ETF TRUST | | | See Accompanying Notes | |
| | | | | | | | | | | | |
| | | | | PRINCIPAL
AMOUNT
(000S) | | | | | MARKET
VALUE
(000S) | |
| NEW YORK 15.7% | |
|
Battery Park City Authority, New York Revenue Bonds, Series 2019 | |
5.000% due 11/01/2040 | | $ | | | 2,500 | | | $ | | | 2,711 | |
|
Freddie Mac Multifamily ML Certificates, Revenue Bonds, Series 2024 | |
4.563% due 04/25/2042 ~ | | | | | 5,000 | | | | | | 5,237 | |
4.617% due 08/25/2041 ~ | | | | | 6,696 | | | | | | 6,854 | |
|
Freddie Mac Structured Pass-Through Certificates, Revenue Bonds, Series 2024 | |
4.683% due 10/25/2040 | | | | | 6,497 | | | | | | 6,702 | |
|
Long Island Power Authority, New York Revenue Bonds, Series 2023 | |
5.000% due 09/01/2042 | | | | | 2,375 | | | | | | 2,645 | |
|
Metropolitan Transportation Authority, New York Revenue Bonds, Series 2014 | |
5.000% due 11/15/2029 | | | | | 3,000 | | | | | | 3,017 | |
|
Monroe County, New York Industrial Development Agency Revenue Bonds, (FNMA Insured),Series 2023 | |
4.720% due 01/01/2044 | | | | | 1,800 | | | | | | 1,822 | |
|
Nassau County, New York General Obligation Notes, Series 2016 | |
5.000% due 04/01/2026 | | | | | 1,360 | | | | | | 1,403 | |
|
New York City Industrial Development Agency, New York Revenue Notes, (AGM Insured), Series 2021 | |
5.000% due 01/01/2030 | | | | | 2,005 | | | | | | 2,162 | |
|
New York City Transitional Finance Authority Building Aid, New York Revenue Bonds, Series 2018 | |
5.000% due 07/15/2031 | | | | | 1,520 | | | | | | 1,616 | |
|
New York City Transitional Finance Authority Building Aid, New York Revenue Bonds, Series 2022 | |
5.000% due 07/15/2035 | | | | | 5,000 | | | | | | 5,688 | |
|
New York City Transitional Finance Authority Future Tax Secured, New York Revenue Bonds, Series 2014 | |
4.900% due 11/01/2042 | | | | | 20,000 | | | | | | 20,000 | |
5.000% due 08/01/2031 | | | | | 5,000 | | | | | | 5,005 | |
|
New York City Transitional Finance Authority Future Tax Secured, New York Revenue Bonds, Series 2019 | |
4.900% due 11/01/2044 | | | | | 8,000 | | | | | | 8,000 | |
|
New York City Transitional Finance Authority Future Tax Secured, New York Revenue Bonds, Series 2022 | |
5.000% due 08/01/2035 | | | | | 2,000 | | | | | | 2,275 | |
5.250% due 08/01/2040 | | | | | 4,890 | | | | | | 5,517 | |
|
New York City, New York General Obligation Bonds, Series 2015 | |
4.900% due 06/01/2044 | | | | | 5,000 | | | | | | 5,000 | |
|
New York City, New York General Obligation Bonds, Series 2018 | |
4.900% due 12/01/2047 | | | | | 10,000 | | | | | | 10,000 | |
|
New York City, New York Municipal Water Finance Authority Revenue Bonds, Series 2013 | |
4.650% due 06/15/2048 | | | | | 20,000 | | | | | | 20,000 | |
|
New York City, New York Municipal Water Finance Authority Revenue Bonds, Series 2021 | |
5.000% due 06/15/2032 | | | | | 5,000 | | | | | | 5,663 | |
|
New York City, New York Municipal Water Finance Authority Revenue Notes, Series 2022 | |
5.000% due 06/15/2028 | | | | | 2,000 | | | | | | 2,154 | |
|
New York City, New York Transitional Finance Authority Future Tax Secured Revenue Bonds, Series 2022 | |
5.000% due 02/01/2040 | | | | | 2,450 | | | | | | 2,701 | |
|
New York City, New York Transitional Finance Authority Future Tax Secured Revenue Bonds, Series 2023 | |
5.000% due 02/01/2039 | | | | | 3,000 | | | | | | 3,367 | |
|
New York City, New York Transitional Finance Authority Revenue Bonds, Series 2023 | |
5.000% due 05/01/2037 | | | | | 2,000 | | | | | | 2,295 | |
|
New York City, New York Transitional Finance Authority Revenue Bonds, Series 2024 | |
5.000% due 11/01/2036 | | | | | 5,000 | | | | | | 5,780 | |
5.000% due 11/01/2037 | | | | | 4,500 | | | | | | 5,178 | |
| | | | | | | | | | | | |
| | | | | PRINCIPAL
AMOUNT
(000S) | | | | | MARKET
VALUE
(000S) | |
|
New York Liberty Development Corp. Revenue Bonds, Series 2014 | |
5.000% due 11/15/2044 | | $ | | | 9,525 | | | $ | | | 9,535 | |
|
New York Power Authority Revenue Bonds, (AGM Insured), Series 2023 | |
5.000% due 11/15/2036 | | | | | 1,000 | | | | | | 1,164 | |
5.000% due 11/15/2037 | | | | | 1,000 | | | | | | 1,156 | |
|
New York State Dormitory Authority Northwell Health Obligated Group Revenue Bonds, Series 2022 | |
4.000% due 05/01/2045 | | | | | 4,740 | | | | | | 4,563 | |
|
New York State Dormitory Authority Revenue Bonds, (AGM Insured), Series 2024 | |
5.000% due 10/01/2035 | | | | | 12,025 | | | | | | 13,680 | |
|
New York State Dormitory Authority Revenue Bonds, Series 2015 | |
5.000% due 03/15/2030 | | | | | 3,500 | | | | | | 3,551 | |
|
New York State Dormitory Authority Revenue Bonds, Series 2018 | |
5.000% due 03/15/2031 | | | | | 3,000 | | | | | | 3,219 | |
|
New York State Dormitory Authority Revenue Bonds, Series 2020 | |
4.000% due 03/15/2034 | | | | | 4,705 | | | | | | 4,821 | |
4.000% due 02/15/2047 | | | | | 5,000 | | | | | | 4,899 | |
|
New York State Dormitory Authority Revenue Bonds, Series 2022 | |
4.000% due 07/01/2051 | | | | | 8,000 | | | | | | 7,701 | |
|
New York State Energy Research & Development Authority Revenue Bonds, Series 1994 | |
3.500% due 10/01/2029 | | | | | 3,000 | | | | | | 2,921 | |
|
New York State Housing Finance Agency Revenue Bonds, (FHA Insured), Series 2020 | |
4.200% due 11/01/2054 (d) | | | | | 6,500 | | | | | | 6,111 | |
|
New York State Urban Development Corp. Revenue Bonds, Series 2015 | |
5.000% due 03/15/2035 | | | | | 2,500 | | | | | | 2,535 | |
|
New York State Urban Development Corp. Revenue Bonds, Series 2023 | |
5.000% due 03/15/2037 | | | | | 4,900 | | | | | | 5,636 | |
5.000% due 03/15/2046 | | | | | 2,500 | | | | | | 2,742 | |
|
New York Transportation Development Corp. Revenue Notes, Series 2020 | |
5.000% due 12/01/2026 | | | | | 1,070 | | | | | | 1,104 | |
|
Riverhead IDA Economic Job Development Corp., New York Revenue Bonds, (FNMA Insured), Series 2023 | |
4.500% due 02/01/2041 | | | | | 3,000 | | | | | | 3,039 | |
|
Triborough Bridge & Tunnel Authority Sales Tax, New York Revenue Bonds, Series 2022 | |
5.250% due 05/15/2062 | | | | | 5,000 | | | | | | 5,431 | |
|
Triborough Bridge & Tunnel Authority, New York Revenue Notes, Series 2022 | |
5.000% due 11/15/2032 | | | | | 4,200 | | | | | | 4,763 | |
|
TSASC, Inc., New York Revenue Notes, Series 2017 | |
5.000% due 06/01/2026 | | | | | 1,270 | | | | | | 1,302 | |
5.000% due 06/01/2027 | | | | | 2,800 | | | | | | 2,911 | |
| | | | | | | | | | | | |
| | | | | | | | | | | 235,576 | |
| | | | | | | | | | | | |
| |
| NORTH CAROLINA 1.6% | |
|
Charlotte-Mecklenburg Hospital Authority, North Carolina Revenue Bonds, Series 2007 | |
4.650% due 01/15/2037 | | | | | 17,765 | | | | | | 17,765 | |
|
Charlotte-Mecklenburg Hospital Authority, North Carolina Revenue Bonds, Series 2021 | |
5.000% due 01/15/2049 | | | | | 2,000 | | | | | | 2,200 | |
|
Charlotte-Mecklenburg Hospital Authority, North Carolina Revenue Notes, Series 2022 | |
5.000% due 01/15/2028 | | | | | 1,000 | | | | | | 1,059 | |
|
Inlivian, North Carolina Revenue Bonds, (FNMA Insured), Series 2024 | |
4.450% due 06/01/2041 | | | | | 3,000 | | | | | | 3,003 | |
| | | | | | | | | | | | |
| | | | | | | | | | | 24,027 | |
| | | | | | | | | | | | |
| |
| | | | | | | | | | | | |
| | | | | PRINCIPAL
AMOUNT
(000S) | | | | | MARKET
VALUE
(000S) | |
| NORTH DAKOTA 0.1% | |
|
Grand Forks, North Dakota Revenue Bonds, (AGM Insured), Series 2023 | |
5.000% due 12/01/2036 | | $ | | | 1,050 | | | $ | | | 1,145 | |
| | | | | | | | | | | | |
| |
| OHIO 1.9% | |
|
Buckeye Tobacco Settlement Financing Authority, Ohio Revenue Bonds, Series 2020 | |
5.000% due 06/01/2035 | | | | | 1,000 | | | | | | 1,071 | |
5.000% due 06/01/2036 | | | | | 2,065 | | | | | | 2,205 | |
|
Butler County, Ohio Revenue Bonds, Series 2017 | |
5.000% due 11/15/2030 | | | | | 1,235 | | | | | | 1,251 | |
|
Cuyahoga County, Ohio Certificates of Participation Bonds, Series 2014 | |
5.000% due 12/01/2025 | | | | | 3,000 | | | | | | 3,002 | |
|
Kent State University, Ohio Revenue Bonds, Series 2022 | |
5.000% due 05/01/2033 | | | | | 510 | | | | | | 575 | |
|
Northeast Ohio Medical University Revenue Notes, Series 2021 | |
5.000% due 12/01/2029 | | | | | 115 | | | | | | 120 | |
|
Ohio Air Quality Development Authority Revenue Bonds, Series 2014 | |
2.400% due 12/01/2038 | | | | | 3,200 | | | | | | 2,829 | |
|
Ohio Higher Educational Facility Commission Revenue Bonds, Series 2008 | |
4.850% due 01/01/2043 | | | | | 8,000 | | | | | | 8,000 | |
|
Ohio Water Development Authority Revenue Bonds, Series 2023 | |
5.000% due 12/01/2038 | | | | | 1,250 | | | | | | 1,433 | |
|
Ohio Water Development Authority Water Pollution Control Loan Fund Revenue Bonds, Series 2023 | |
5.000% due 12/01/2037 | | | | | 4,985 | | | | | | 5,711 | |
|
Port of Greater Cincinnati Development Authority, Ohio Revenue Bonds, (AGM Insured), Series 2024 | |
5.000% due 12/01/2036 | | | | | 380 | | | | | | 421 | |
5.000% due 12/01/2039 | | | | | 430 | | | | | | 469 | |
5.000% due 12/01/2040 | | | | | 410 | | | | | | 445 | |
5.000% due 12/01/2041 | | | | | 460 | | | | | | 496 | |
|
Worthington City School District, Ohio General Obligation Notes, Series 2023 | |
0.000% due 12/01/2031 (c) | | | | | 845 | | | | | | 640 | |
0.000% due 12/01/2032 (c) | | | | | 880 | | | | | | 639 | |
| | | | | | | | | | | | |
| | | | | | | | | | | 29,307 | |
| | | | | | | | | | | | |
| |
| OKLAHOMA 0.5% | |
|
Grand River Dam Authority, Oklahoma Revenue Bonds, Series 2023 | |
5.000% due 06/01/2036 | | | | | 1,850 | | | | | | 2,106 | |
5.000% due 06/01/2037 | | | | | 1,100 | | | | | | 1,246 | |
|
Grand River Dam Authority, Oklahoma Revenue Bonds, Series 2024 | |
5.000% due 06/01/2036 (a) | | | | | 4,000 | | | | | | 4,603 | |
| | | | | | | | | | | | |
| | | | | | | | | | | 7,955 | |
| | | | | | | | | | | | |
| |
| OREGON 0.6% | |
|
Medford Hospital Facilities Authority, Oregon Revenue Bonds, Series 2020 | |
5.000% due 08/15/2035 | | | | | 1,500 | | | | | | 1,614 | |
5.000% due 08/15/2036 | | | | | 1,500 | | | | | | 1,611 | |
5.000% due 08/15/2037 | | | | | 1,600 | | | | | | 1,713 | |
5.000% due 08/15/2038 | | | | | 1,000 | | | | | | 1,066 | |
|
Oregon Department of Transportation State Revenue Bonds, Series 2024 | |
5.000% due 05/15/2037 (a) | | | | | 1,000 | | | | | | 1,153 | |
5.000% due 05/15/2038 (a) | | | | | 2,250 | | | | | | 2,583 | |
| | | | | | | | | | | | |
| | | | | | | | | | | 9,740 | |
| | | | | | | | | | | | |
| |
| | | | | | | | | | | | |
| See Accompanying Notes | | | ANNUAL FINANCIAL AND OTHER INFORMATION | | | | | | | JUNE 30, 2024 | | | 87 |
| | | | | | |
| Schedule of Investments | | PIMCO Intermediate Municipal Bond Active Exchange-Traded Fund | | (Cont.) | | |
| | | | | | | | | | | | |
| | | | | PRINCIPAL
AMOUNT
(000S) | | | | | MARKET
VALUE
(000S) | |
| PENNSYLVANIA 4.5% | |
|
Allegheny County, Pennsylvania Hospital Development Authority Revenue Bonds, Series 2017 | |
4.580% (MUNIPSA) due 11/15/2047 ~ | | $ | | | 10,000 | | | $ | | | 9,977 | |
|
Commonwealth Financing Authority, Pennsylvania Revenue Bonds, (AGM Insured), Series 2018 | |
4.000% due 06/01/2039 | | | | | 2,250 | | | | | | 2,265 | |
|
Commonwealth Financing Authority, Pennsylvania Revenue Notes, Series 2018 | |
5.000% due 06/01/2025 | | | | | 1,500 | | | | | | 1,518 | |
|
Commonwealth of Pennsylvania General Obligation Notes, Series 2016 | |
5.000% due 01/15/2027 | | | | | 2,000 | | | | | | 2,089 | |
|
Commonwealth of Pennsylvania, General Obligation Bonds, Series 2022 | |
5.000% due 10/01/2033 | | | | | 5,000 | | | | | | 5,717 | |
|
Delaware Valley Regional Finance Authority, Pennsylvania Revenue Bonds, Series 2007 | |
4.508% (TSFR3M) due 06/01/2037 ~ | | | | | 4,000 | | | | | | 3,731 | |
|
Delaware Valley Regional Finance Authority, Pennsylvania Revenue Bonds, Series 2023 | |
4.000% due 03/01/2035 | | | | | 1,100 | | | | | | 1,116 | |
|
Delaware Valley Regional Finance Authority, Pennsylvania Revenue Notes, Series 2023 | |
4.000% due 03/01/2033 | | | | | 600 | | | | | | 619 | |
|
Geisinger Authority, Pennsylvania Revenue Bonds, Series 2020 | |
4.000% due 04/01/2050 | | | | | 1,250 | | | | | | 1,181 | |
5.000% due 04/01/2043 | | | | | 4,500 | | | | | | 4,631 | |
|
Lehigh County, Pennsylvania Industrial Development Authority Revenue Bonds, Series 2016 | |
3.000% due 09/01/2029 | | | | | 3,500 | | | | | | 3,336 | |
|
Monroeville Finance Authority, Pennsylvania Revenue Bonds, Series 2022 | |
4.000% due 02/15/2042 | | | | | 4,060 | | | | | | 3,944 | |
|
Montgomery County Industrial Development Authority, Pennsylvania Revenue Notes, Series 2023 | |
4.100% due 06/01/2029 | | | | | 5,500 | | | | | | 5,645 | |
|
Pennsylvania Higher Educational Facilities Authority Revenue Bonds, Series 2015 | |
5.000% due 08/15/2029 | | | | | 340 | | | | | | 346 | |
5.000% due 08/15/2031 | | | | | 300 | | | | | | 305 | |
5.000% due 08/15/2033 | | | | | 1,000 | | | | | | 1,017 | |
|
Pennsylvania Higher Educational Facilities Authority Revenue Bonds, Series 2017 | |
5.000% due 08/15/2029 | | | | | 1,250 | | | | | | 1,306 | |
|
Pennsylvania Turnpike Commission Revenue Bonds, Series 2021 | |
5.000% due 12/01/2036 | | | | | 8,170 | | | | | | 9,053 | |
|
Philadelphia, Pennsylvania General Obligation Bonds, Series 2019 | |
5.000% due 02/01/2031 | | | | | 2,500 | | | | | | 2,683 | |
|
School District of Philadelphia, Pennsylvania General Obligation Bonds, Series 2019 | |
4.000% due 09/01/2038 | | | | | 2,200 | | | | | | 2,212 | |
|
Southeastern Pennsylvania Transportation Authority Revenue Bonds, Series 2022 | |
5.250% due 06/01/2042 | | | | | 3,750 | | | | | | 4,187 | |
|
Southeastern Pennsylvania Transportation Authority Revenue Notes, Series 2022 | |
5.000% due 06/01/2031 | | | | | 1,000 | | | | | | 1,121 | |
| | | | | | | | | | | | |
| | | | | | | | | | | 67,999 | |
| | | | | | | | | | | | |
| |
| PUERTO RICO 1.7% | |
|
Puerto Rico Electric Power Authority Revenue Bonds, (AGM Insured), Series 2007 | |
4.245% (0.67*US0003M + 0.520%) due 07/01/2029 ~ | | | | | 1,280 | | | | | | 1,252 | |
|
Puerto Rico Sales Tax Financing Corp. Sales Tax Revenue Bonds, Series 2018 | |
0.000% due 07/01/2051 (c) | | | | | 26,355 | | | | | | 6,201 | |
4.500% due 07/01/2034 | | | | | 8,671 | | | | | | 8,686 | |
5.000% due 07/01/2058 | | | | | 3,000 | | | | | | 3,001 | |
| | | | | | | | | | | | |
| | | | | PRINCIPAL
AMOUNT
(000S) | | | | | MARKET
VALUE
(000S) | |
|
Puerto Rico Sales Tax Financing Corp. Sales Tax Revenue Bonds, Series 2019 | |
4.329% due 07/01/2040 | | $ | | | 7,000 | | | $ | | | 6,930 | |
| | | | | | | | | | | | |
| | | | | | | | | | | 26,070 | |
| | | | | | | | | | | | |
| |
| RHODE ISLAND 1.4% | |
|
Rhode Island Health and Educational Building Corp. Revenue Bonds, Series 2024 | |
5.000% due 05/15/2037 | | | | | 1,000 | | | | | | 1,100 | |
|
Rhode Island Health and Educational Building Corp. Revenue Notes, Series 2024 | |
5.000% due 05/15/2034 | | | | | 6,500 | | | | | | 7,202 | |
|
Tobacco Settlement Financing Corp., Rhode Island Revenue Bonds, Series 2015 | |
5.000% due 06/01/2035 | | | | | 11,000 | | | | | | 11,105 | |
5.000% due 06/01/2040 | | | | | 2,000 | | | | | | 2,011 | |
| | | | | | | | | | | | |
| | | | | | | | | | | 21,418 | |
| | | | | | | | | | | | |
| |
| SOUTH CAROLINA 0.2% | |
|
Patriots Energy Group Financing Agency, South Carolina Revenue Bonds, Series 2023 | |
5.250% due 02/01/2054 | | | | | 2,800 | | | | | | 3,033 | |
| | | | | | | | | | | | |
| |
| SOUTH DAKOTA 0.1% | |
|
South Dakota Health & Educational Facilities Authority Revenue Bonds, Series 2014 | |
5.000% due 11/01/2027 | | | | | 925 | | | | | | 928 | |
|
South Dakota Health & Educational Facilities Authority Revenue Bonds, Series 2015 | |
5.000% due 11/01/2028 | | | | | 900 | | | | | | 919 | |
| | | | | | | | | | | | |
| | | | | | | | | | | 1,847 | |
| | | | | | | | | | | | |
| |
| TENNESSEE 1.8% | |
|
Knox County, Tennessee Health Educational & Housing Facility Board Revenue Notes, Series 2022 | |
3.950% due 12/01/2027 | | | | | 3,500 | | | | | | 3,502 | |
|
Metropolitan Government of Nashville & Davidson County Sports Auth, Tennessee Revenue Bonds, Series 2023 | |
5.000% due 07/01/2036 | | | | | 760 | | | | | | 856 | |
5.000% due 07/01/2038 | | | | | 500 | | | | | | 555 | |
|
Metropolitan Government of Nashville & Davidson County, Tennessee Health & Educational Facs Bd Revenue Bonds, Series 2023 | |
4.875% due 10/01/2038 | | | | | 3,295 | | | | | | 3,403 | |
|
Tennergy Corp., Tennessee Revenue Bonds, Series 2019 | |
5.000% due 02/01/2050 | | | | | 1,500 | | | | | | 1,505 | |
|
Tennergy Corp., Tennessee Revenue Bonds, Series 2021 | |
4.000% due 12/01/2051 | | | | | 2,000 | | | | | | 2,002 | |
|
Tennergy Corp., Tennessee Revenue Bonds, Series 2022 | |
5.500% due 10/01/2053 | | | | | 6,000 | | | | | | 6,414 | |
|
Tennessee Energy Acquisition Corp. Revenue Bonds, Series 2006 | |
5.000% due 02/01/2027 | | | | | 3,000 | | | | | | 3,047 | |
5.250% due 09/01/2026 | | | | | 1,745 | | | | | | 1,787 | |
|
Tennessee Energy Acquisition Corp. Revenue Bonds, Series 2021 | |
5.000% due 05/01/2052 | | | | | 3,400 | | | | | | 3,610 | |
| | | | | | | | | | | | |
| | | | | | | | | | | 26,681 | |
| | | | | | | | | | | | |
| |
| TEXAS 11.2% | |
|
Central Texas Turnpike System Revenue Bonds, (BHAC/CR/AMBAC Insured), Series 2002 | |
0.000% due 08/15/2026 (c) | | | | | 3,000 | | | | | | 2,776 | |
|
Central Texas Turnpike System Revenue Bonds, Series 2015 | |
0.000% due 08/15/2037 (c) | | | | | 5,000 | | | | | | 2,762 | |
|
Corpus Christi Independent School District, Texas General Obligation Notes, (PSF Insured), Series 2016 | |
5.000% due 08/15/2025 | | | | | 2,115 | | | | | | 2,154 | |
| | | | | | | | | | | | |
| | | | | PRINCIPAL
AMOUNT
(000S) | | | | | MARKET
VALUE
(000S) | |
|
Cypress-Fairbanks Independent School District, Texas General Obligation Bonds, (PSF Insured), Series 2023 | |
5.000% due 02/15/2037 | | $ | | | 1,350 | | | $ | | | 1,528 | |
|
Dallas Fort Worth International Airport, Texas Revenue Bonds, Series 2022 | |
5.000% due 11/01/2034 | | | | | 3,000 | | | | | | 3,388 | |
|
Denton Independent School District, Texas General Obligation Bonds, (PSF Insured), Series 2023 | |
5.000% due 08/15/2036 | | | | | 2,550 | | | | | | 2,929 | |
|
EP Tuscany Zaragosa PFC, Texas Revenue Notes, Series 2023 | |
4.000% due 12/01/2033 | | | | | 5,000 | | | | | | 4,852 | |
|
Grand Parkway Transportation Corp., Texas Revenue Bonds, Series 2023 | |
5.000% due 10/01/2052 | | | | | 5,000 | | | | | | 5,258 | |
|
Greenwood Independent School District, Texas General Obligation Bonds, (PSF Insured), Series 2024 | |
5.000% due 02/15/2049 | | | | | 3,000 | | | | | | 3,233 | |
|
Harris County, Texas Cultural Education Facilities Finance Corp. Revenue Bonds, Series 2014 | |
5.000% due 12/01/2025 | | | | | 500 | | | | | | 503 | |
|
Harris County, Texas Cultural Education Facilities Finance Corp. Revenue Bonds, Series 2024 | |
5.000% due 07/01/2054 | | | | | 6,000 | | | | | | 6,430 | |
|
Harris County, Texas Municipal Utility District No 383, Revenue Bonds, (BAM Insured), Series 2023 | |
5.000% due 08/15/2035 | | | | | 2,960 | | | | | | 3,391 | |
|
Harris County, Texas Toll Road Revenue Bonds, Series 2024 | |
5.000% due 08/15/2037 | | | | | 5,000 | | | | | | 5,752 | |
5.000% due 08/15/2038 | | | | | 6,000 | | | | | | 6,880 | |
|
Hays Consolidated Independent School District, Texas General Obligation Bonds, (PSF Insured), Series 2023 | |
5.000% due 02/15/2036 | | | | | 1,540 | | | | | | 1,722 | |
|
Houston, Texas Airport System Revenue Bonds, Series 2018 | |
5.000% due 07/01/2030 | | | | | 3,300 | | | | | | 3,517 | |
|
Katy Independent School District, Texas General Obligation Bonds, (PSF Insured), Series 2018 | |
5.000% due 02/15/2029 | | | | | 1,435 | | | | | | 1,526 | |
|
Lamar Consolidated Independent School District, Texas General Obligation Bonds, (PSF Insured), Series 2023 | |
5.000% due 02/15/2037 | | | | | 1,500 | | | | | | 1,699 | |
5.000% due 02/15/2038 | | | | | 2,000 | | | | | | 2,254 | |
5.000% due 02/15/2039 | | | | | 5,000 | | | | | | 5,592 | |
|
Liberty Hill Independent School District, Texas General Obligation Notes, (PSF Insured), Series 2022 | |
5.000% due 02/01/2030 | | | | | 2,290 | | | | | | 2,506 | |
|
Lower Colorado River Authority, Texas Revenue Bonds, (AGM Insured), Series 2024 | |
5.000% due 05/15/2040 | | | | | 1,250 | | | | | | 1,398 | |
|
Midland County, Texas Hospital District Revenue Bonds, (BAM Insured), Series 2024 | |
4.000% due 05/15/2042 | | | | | 1,335 | | | | | | 1,304 | |
4.000% due 05/15/2044 | | | | | 720 | | | | | | 693 | |
5.000% due 05/15/2037 | | | | | 950 | | | | | | 1,067 | |
5.000% due 05/15/2039 | | | | | 1,000 | | | | | | 1,112 | |
|
Midland Independent School District, Texas General Obligation Bonds, (PSF Insured), Series 2024 | |
5.000% due 02/15/2050 | | | | | 2,000 | | | | | | 2,072 | |
|
New Hope Cultural Education Facilities Finance Corp., Texas Revenue Bonds, Series 2017 | |
4.000% due 08/15/2040 | | | | | 2,000 | | | | | | 1,952 | |
|
North Texas Tollway Authority Revenue Bonds, Series 2016 | |
5.000% due 01/01/2028 | | | | | 2,875 | | | | | | 2,925 | |
|
North Texas Tollway Authority Revenue Notes, Series 2023 | |
5.000% due 01/01/2031 | | | | | 4,300 | | | | | | 4,739 | |
|
Permanent University Fund - University of Texas System Revenue Bonds, Series 2023 | |
5.000% due 07/01/2040 | | | | | 1,090 | | | | | | 1,228 | |
|
San Antonio Education Facilities Corp., Texas Revenue Notes, Series 2024 | |
5.000% due 06/01/2034 | | | | | 11,000 | | | | | | 12,616 | |
| | | | | | |
| 88 | | PIMCO ETF TRUST | | | See Accompanying Notes | |
| | | | | | | | | | | | |
| | | | | PRINCIPAL
AMOUNT
(000S) | | | | | MARKET
VALUE
(000S) | |
|
San Antonio, Texas Electric & Gas Systems Revenue Bonds, Series 2015 | |
1.125% due 12/01/2045 | | $ | | | 2,500 | | | $ | | | 2,277 | |
|
San Antonio, Texas Electric & Gas Systems Revenue Bonds, Series 2024 | |
5.000% due 02/01/2036 | | | | | 3,500 | | | | | | 4,036 | |
5.000% due 02/01/2040 | | | | | 4,380 | | | | | | 4,914 | |
5.000% due 02/01/2041 | | | | | 3,000 | | | | | | 3,342 | |
|
Southwest Independent School District, Texas General Obligation Bonds, (PSF Insured), Series 2023 | |
4.000% due 02/01/2043 | | | | | 2,500 | | | | | | 2,511 | |
|
Tarrant County, Texas Cultural Education Facilities Finance Corp. Revenue Bonds, Series 2022 | |
5.000% due 07/01/2053 | | | | | 5,000 | | | | | | 5,544 | |
|
Tarrant County, Texas Cultural Education Facilities Finance Corp. Revenue Notes, Series 2024 | |
5.000% due 07/01/2032 | | | | | 7,000 | | | | | | 7,734 | |
|
Texas Municipal Gas Acquisition & Supply Corp. Revenue Bonds, Series 2006 | |
5.203% (TSFR3M) due 12/15/2026 ~ | | | | | 2,500 | | | | | | 2,500 | |
|
Texas Municipal Gas Acquisition & Supply Corp. Revenue Bonds, Series 2023 | |
5.500% due 01/01/2054 | | | | | 4,200 | | | | | | 4,501 | |
|
Texas Private Activity Bond Surface Transportation Corp. Revenue Bonds, Series 2020 | |
4.000% due 06/30/2037 | | | | | 2,950 | | | | | | 2,970 | |
|
Texas State University System Revenue Bonds, Series 2024 | |
5.000% due 03/15/2040 | | | | | 2,000 | | | | | | 2,250 | |
5.000% due 03/15/2041 | | | | | 2,000 | | | | | | 2,240 | |
|
Texas Transportation Commission Revenue Bonds, Series 2019 | |
0.000% due 08/01/2046 (c) | | | | | 2,950 | | | | | | 1,004 | |
|
Texas Water Development Board Revenue Bonds, Series 2022 | |
4.800% due 10/15/2052 | | | | | 8,400 | | | | | | 8,740 | |
5.000% due 10/15/2047 | | | | | 5,860 | | | | | | 6,363 | |
|
Texas Water Development Board Revenue Bonds, Series 2023 | |
4.600% due 10/15/2039 | | | | | 2,045 | | | | | | 2,208 | |
|
Texas Water Development Board Revenue Notes, Series 2022 | |
5.000% due 10/15/2029 | | | | | 1,200 | | | | | | 1,314 | |
5.000% due 10/15/2030 | | | | | 1,775 | | | | | | 1,972 | |
| | | | | | | | | | | | |
| | | | | | | | | | | 168,178 | |
| | | | | | | | | | | | |
| |
| UTAH 0.2% | |
|
Intermountain Power Agency, Utah Power Supply Revenue Bonds, Series 2023 | |
5.000% due 07/01/2036 | | | | | 2,500 | | | | | | 2,823 | |
| | | | | | | | | | | | |
| |
| VIRGINIA 1.0% | |
|
Arlington County, Virginia Industrial Development Authority Revenue Bonds, Series 2023 | |
5.000% due 07/01/2053 | | | | | 3,000 | | | | | | 3,216 | |
|
Isle of Wight County Economic Development Authority, Virginia Revenue Bonds, (AGM Insured), Series 2023 | |
5.000% due 07/01/2036 | | | | | 925 | | | | | | 1,013 | |
5.000% due 07/01/2038 | | | | | 600 | | | | | | 650 | |
| | | | | | | | | | | | |
| | | | | PRINCIPAL
AMOUNT
(000S) | | | | | MARKET
VALUE
(000S) | |
|
Roanoke Economic Development Authority, Virginia Revenue Bonds, Series 2020 | |
5.000% due 07/01/2053 | | $ | | | 6,700 | | | $ | | | 7,132 | |
|
Virginia Public Building Authority Revenue Bonds, Series 2015 | |
4.000% due 08/01/2030 | | | | | 3,300 | | | | | | 3,298 | |
| | | | | | | | | | | | |
| | | | | | | | | | | 15,309 | |
| | | | | | | | | | | | |
| |
| WASHINGTON 1.9% | |
|
Energy Northwest, Washington Revenue Bonds, Series 2022 | |
5.000% due 07/01/2035 | | | | | 3,000 | | | | | | 3,418 | |
|
Energy Northwest, Washington Revenue Bonds, Series 2023 | |
5.000% due 07/01/2039 | | | | | 5,000 | | | | | | 5,645 | |
|
Grant County, Washington Public Utility District No 2, Revenue Bonds, Series 2023 | |
5.000% due 01/01/2036 | | | | | 1,265 | | | | | | 1,436 | |
|
Pierce County, Washington School District No 401, Peninsula General Obligation Bonds, Series 2020 | |
4.000% due 12/01/2037 | | | | | 2,135 | | | | | | 2,173 | |
|
Seattle, Washington Municipal Light & Power Revenue Bonds, Series 2017 | |
4.000% due 09/01/2037 | | | | | 5,000 | | | | | | 5,053 | |
|
Snohomish County, Washington Housing Authority Revenue Bonds, Series 2019 | |
4.000% due 04/01/2044 | | | | | 2,000 | | | | | | 1,849 | |
|
Washington Health Care Facilities Authority Revenue Bonds, Series 2020 | |
5.000% due 09/01/2032 | | | | | 450 | | | | | | 485 | |
|
Washington State General Obligation Bonds, Series 2016 | |
5.000% due 07/01/2033 | | | | | 5,000 | | | | | | 5,108 | |
|
Washington State Housing Finance Commission Revenue Bonds, Series 2023 | |
3.375% due 04/20/2037 | | | | | 4,180 | | | | | | 3,747 | |
| | | | | | | | | | | | |
| | | | | | | | | | | 28,914 | |
| | | | | | | | | | | | |
| |
| WEST VIRGINIA 0.2% | |
|
West Virginia Hospital Finance Authority Revenue Bonds, Series 2023 | |
5.750% due 09/01/2041 | | | | | 2,400 | | | | | | 2,741 | |
| | | | | | | | | | | | |
| |
| WISCONSIN 2.0% | |
|
Public Finance Authority, Wisconsin Revenue Bonds, Series 2021 | |
4.000% due 10/01/2041 | | | | | 2,250 | | | | | | 2,259 | |
|
Public Finance Authority, Wisconsin Revenue Notes, Series 2021 | |
4.000% due 10/01/2030 | | | | | 265 | | | | | | 268 | |
|
University of Wisconsin Hospitals & Clinics Revenue Bonds, Series 2018 | |
4.850% due 04/01/2048 | | | | | 9,370 | | | | | | 9,370 | |
|
University of Wisconsin Hospitals & Clinics Revenue Bonds, Series 2021 | |
4.000% due 04/01/2046 | | | | | 4,440 | | | | | | 4,222 | |
|
Wisconsin Center District Revenue Notes, (AGM Insured), Series 2020 | |
0.000% due 12/15/2028 (c) | | | | | 1,075 | | | | | | 907 | |
| | | | | | | | | | | | |
| | | | | PRINCIPAL
AMOUNT
(000S) | | | | | MARKET
VALUE
(000S) | |
|
Wisconsin Health & Educational Facilities Authority Revenue Bonds, Series 2016 | |
4.000% due 11/15/2046 | | $ | | | 4,000 | | | $ | | | 3,790 | |
|
Wisconsin Health & Educational Facilities Authority Revenue Bonds, Series 2021 | |
4.000% due 08/15/2040 | | | | | 2,000 | | | | | | 1,974 | |
|
Wisconsin Health & Educational Facilities Authority Revenue Notes, Series 2018 | |
5.000% due 04/01/2029 | | | | | 1,925 | | | | | | 2,025 | |
|
Wisconsin State General Obligation Notes, Series 2022 | |
4.300% (MUNIPSA) due 05/01/2025 ~ | | | | | 4,520 | | | | | | 4,502 | |
| | | | | | | | | | | | |
| | | | | | | | | | | 29,317 | |
| | | | | | | | | | | | |
Total Municipal Bonds & Notes (Cost $1,389,123) | | | 1,408,702 | |
| | | | |
| |
| U.S. GOVERNMENT AGENCIES 0.6% | |
|
Freddie Mac | |
3.800% due 01/01/2040 | | | | | 9,976 | | | | | | 9,480 | |
| | | | | | | | | | | | |
Total U.S. Government Agencies (Cost $9,575) | | | 9,480 | |
| | | | |
| |
| NON-AGENCY MORTGAGE-BACKED SECURITIES 0.1% | |
|
Multifamily Tax-Exempt Mortgage-backed Securities | |
4.500% due 08/01/2041 (a) | | | | | 1,000 | | | | | | 1,004 | |
| | | | | | | | | | | | |
Total Non-Agency Mortgage-Backed Securities (Cost $1,000) | | | 1,004 | |
| | | | |
| |
| SHORT-TERM INSTRUMENTS 6.7% | |
| |
| REPURCHASE AGREEMENTS (e) 0.0% | |
| | | | | | | | | | | 639 | |
| | | | | | | | | | | | |
| |
| U.S. TREASURY BILLS 6.0% | |
5.382% due 07/05/2024 - 09/05/2024 (b)(c)(g) | | | | | 91,400 | | | | | | 90,919 | |
| | | | | | | | | | | | |
| |
| MUNICIPAL BONDS & NOTES 0.7% | |
|
Los Angeles County, California Revenue Notes, Series 2024 | |
5.000% due 06/30/2025 (a) | | | | | 9,500 | | | | | | 9,658 | |
| | | | | | | | | | | | |
Total Municipal Bonds & Notes (Cost $9,660) | | | 9,658 | |
| | | | | | | | | | | | |
| Total Short-Term Instruments (Cost $101,218) | | | 101,216 | |
| | | | |
| | | | |
| | | | | | | | | | | | |
| Total Investments in Securities (Cost $1,500,916) | | | 1,520,402 | |
| |
| | | | |
| Total Investments 101.0% (Cost $1,500,916) | | | $ | | | 1,520,402 | |
| |
Financial Derivative Instruments (f) 0.0% (Cost or Premiums, net $0) | | | | | | 155 | |
| |
| Other Assets and Liabilities, net (1.0)% | | | (15,225 | ) |
| | | | |
| Net Assets 100.0% | | | $ | | | 1,505,332 | |
| | | | | | | |
NOTES TO SCHEDULE OF INVESTMENTS:
| * | A zero balance may reflect actual amounts rounding to less than one thousand. |
| ~ | Variable or Floating rate security. Rate shown is the rate in effect as of period end. Certain variable rate securities are not based on a published reference rate and spread, rather are determined by the issuer or agent and are based on current market conditions. Reference rate is as of reset date, which may vary by security. These securities may not indicate a reference rate and/or spread in their description. |
| (b) | Coupon represents a weighted average yield to maturity. |
| | | | | | | | | | | | |
| See Accompanying Notes | | | ANNUAL FINANCIAL AND OTHER INFORMATION | | | | | | | JUNE 30, 2024 | | | 89 |
| | | | | | |
| Schedule of Investments | | PIMCO Intermediate Municipal Bond Active Exchange-Traded Fund | | (Cont.) | | |
(d) RESTRICTED SECURITIES:
| | | | | | | | | | | | | | | | | | | | | | | | |
| Issuer Description | | Coupon | | | Maturity
Date | | | Acquisition
Date | | | Cost | | | Market
Value | | | Market Value
as Percentage
of Net Assets
| |
Federal Home Loan Mortgage Corp. Enhanced Receipt, New Jersey Revenue Bonds, Series 2019 | | | 3.870 | % | | | 11/15/2035 | | | | 11/28/2023 | | | $ | 11,054 | | | $ | 11,427 | | | | 0.76 | % |
New York State Housing Finance Agency Revenue Bonds, (FHA Insured), Series 2020 | | | 4.200 | | | | 11/01/2054 | | | | 11/28/2023 | | | | 5,822 | | | | 6,111 | | | | 0.41 | |
| | | | | | | | | | | | | | | | | | | | | | | | |
| | | | | | | | | | $ | 16,876 | | | $ | 17,538 | | | | 1.17 | % |
| | | | | | | | | | | | | | | | | | | | |
BORROWINGS AND OTHER FINANCING TRANSACTIONS
(e) REPURCHASE AGREEMENTS:
| | | | | | | | | | | | | | | | | | | | | | | | | | | | | | |
| Counterparty | | Lending
Rate | | | Settlement
Date | | | Maturity
Date | | | Principal
Amount | | | Collateralized By | | Collateral
(Received) | | | Repurchase
Agreements,
at Value | | | Repurchase
Agreement
Proceeds
to be
Received(1) | |
| FICC | | | 2.600 | % | | | 06/28/2024 | | | | 07/01/2024 | | | $ | 639 | | | U.S. Treasury Notes 4.500% due 03/31/2026 | | $ | (652 | ) | | $ | 639 | | | $ | 639 | |
| | | | | | | | | | | | | | | | | | | | | | | | | | | | | | |
Total Repurchase Agreements | | | | | $ | (652 | ) | | $ | 639 | | | $ | 639 | |
| | | | | | | | | | | | | | | |
BORROWINGS AND OTHER FINANCING TRANSACTIONS SUMMARY
The following is a summary by counterparty of the market value of Borrowings and Other Financing Transactions and collateral pledged/(received) as of June 30, 2024:
| | | | | | | | | | | | | | | | | | | | | | | | | | | | |
| Counterparty | | Repurchase
Agreement
Proceeds
to be
Received(1) | | | Payable for
Reverse
Repurchase
Agreements | | | Payable for
Sale-Buyback
Transactions | | | Securities
Out on
Loan | | | Total
Borrowings and
Other Financing
Transactions | | | Collateral
Pledged/(Received) | | | Net Exposure(2) | |
Global/Master Repurchase Agreement | |
FICC | | $ | 639 | | | $ | 0 | | | $ | 0 | | | $ | 0 | | | $ | 639 | | | $ | (652 | ) | | $ | (13 | ) |
| | | | | | | | | | | | | | | | | | | | | | | | | | | | |
Total Borrowings and Other Financing Transactions | | $ | 639 | | | $ | 0 | | | $ | 0 | | | $ | 0 | | | | | | | | | | | | | |
| | | | | | | | | | | | | | | | | | | | | | | | | | | | |
| (1) | Includes accrued interest. |
| (2) | Net Exposure represents the net receivable/(payable) that would be due from/to the counterparty in the event of default. Exposure from borrowings and other financing transactions can only be netted across transactions governed under the same master agreement with the same legal entity. See Note 8, Master Netting Arrangements, in the Notes to Financial Statements for more information. |
(f) FINANCIAL DERIVATIVE INSTRUMENTS: EXCHANGE-TRADED OR CENTRALLY CLEARED
FUTURES CONTRACTS:
SHORT FUTURES CONTRACTS
| | | | | | | | | | | | | | | | | | | | | | | | |
| Description | | Expiration
Month | | | # of
Contracts | | | Notional
Amount | | | Unrealized
Appreciation/
(Depreciation) | | | Variation Margin | |
| | Asset | | | Liability | |
U.S. Treasury 10-Year Note September Futures | | | 09/2024 | | | | 585 | | | $ | (64,341 | ) | | $ | (810 | ) | | $ | 155 | | | $ | 0 | |
| | | | | | | | | | | | | | | | | | | | | | | | |
Total Futures Contracts | | | $ | (810 | ) | | $ | 155 | | | $ | 0 | |
| | | | | | | | | | | | | |
FINANCIAL DERIVATIVE INSTRUMENTS: EXCHANGE-TRADED OR CENTRALLY CLEARED SUMMARY
The following is a summary of the market value and variation margin of Exchange-Traded or Centrally Cleared Financial Derivative Instruments as of June 30, 2024:
| | | | | | | | | | | | | | | | | | | | | | | | | | | | | | | | | | | | |
| | | Financial Derivative Assets | | | | | | Financial Derivative Liabilities | |
| | | Market Value | | | Variation Margin
Asset | | | Total | | | | | | Market Value | | | Variation Margin
Liability | | | Total | |
| | | Purchased
Options | | | Futures | | | Swap
Agreements | | | | | | Written
Options | | | Futures | | | Swap
Agreements | |
Total Exchange-Traded or Centrally Cleared | | $ | 0 | | | $ | 155 | | | $ | 0 | | | $ | 155 | | | | | | | $ | 0 | | | $ | 0 | | | $ | 0 | | | $ | 0 | |
| | | | | | | | | | | | | | | | | | | | | | | | | | | | | | | | | | | | |
| (g) | Securities with an aggregate market value of $1,256 and cash of $1,101 have been pledged as collateral for exchange-traded and centrally cleared financial derivative instruments as of June 30, 2023. See Note 8, Master Netting Arrangements, in the Notes to Financial Statements for more information. |
| | | | | | |
| 90 | | PIMCO ETF TRUST | | | See Accompanying Notes | |
FAIR VALUE OF FINANCIAL DERIVATIVE INSTRUMENTS
The following is a summary of the fair valuation of the Fund’s derivative instruments categorized by risk exposure. See Note 7, Principal and Other Risks, in the Notes to Financial Statements on risks of the Fund.
Fair Values of Financial Derivative Instruments on the Statements of Assets and Liabilities as of June 30, 2024:
| | | | | | | | | | | | | | | | | | | | | | | | |
| | | Derivatives not accounted for as hedging instruments | |
| | | Commodity
Contracts | | | Credit
Contracts | | | Equity
Contracts | | | Foreign
Exchange
Contracts | | | Interest
Rate Contracts | | | Total | |
|
Financial Derivative Instruments - Assets | |
Exchange-traded or centrally cleared | |
Futures | | $ | 0 | | | $ | 0 | | | $ | 0 | | | $ | 0 | | | $ | 155 | | | $ | 155 | |
| | | | | | | | | | | | | | | | | | | | | | | | |
The effect of Financial Derivative Instruments on the Statements of Operations for the period ended June 30, 2024:
| | | | | | | | | | | | | | | | | | | | | | | | |
| | | Derivatives not accounted for as hedging instruments | |
| | | Commodity
Contracts | | | Credit
Contracts | | | Equity
Contracts | | | Foreign
Exchange
Contracts | | | Interest
Rate Contracts | | | Total | |
Net Realized Gain (Loss) on Financial Derivative Instruments | |
Exchange-traded or centrally cleared | |
Futures | | $ | 0 | | | $ | 0 | | | $ | 0 | | | $ | 0 | | | $ | 200 | | | $ | 200 | |
| | | | | | | | | | | | | | | | | | | | | | | | |
|
Net Change in Unrealized Appreciation (Depreciation) on Financial Derivative Instruments | |
Exchange-traded or centrally cleared | |
Futures | | $ | 0 | | | $ | 0 | | | $ | 0 | | | $ | 0 | | | $ | (810 | ) | | $ | (810 | ) |
| | | | | | | | | | | | | | | | | | | | | | | | |
FAIR VALUE MEASUREMENTS
The following is a summary of the fair valuations according to the inputs used as of June 30, 2024 in valuing the Fund’s assets and liabilities:
| | | | | | | | | | | | | | | | |
| Category and Subcategory | | Level 1 | | | Level 2 | | | Level 3 | | | Fair
Value at
06/30/2024 | |
Investments in Securities, at Value | |
Municipal Bonds & Notes | |
Alabama | | $ | 0 | | | $ | 46,962 | | | $ | 0 | | | $ | 46,962 | |
Alaska | | | 0 | | | | 6,294 | | | | 0 | | | | 6,294 | |
Arizona | | | 0 | | | | 6,270 | | | | 0 | | | | 6,270 | |
California | | | 0 | | | | 82,066 | | | | 0 | | | | 82,066 | |
Colorado | | | 0 | | | | 40,666 | | | | 0 | | | | 40,666 | |
Connecticut | | | 0 | | | | 24,085 | | | | 0 | | | | 24,085 | |
Delaware | | | 0 | | | | 1,898 | | | | 0 | | | | 1,898 | |
District of Columbia | | | 0 | | | | 7,356 | | | | 0 | | | | 7,356 | |
Florida | | | 0 | | | | 43,265 | | | | 0 | | | | 43,265 | |
Georgia | | | 0 | | | | 57,851 | | | | 0 | | | | 57,851 | |
Hawaii | | | 0 | | | | 10,515 | | | | 0 | | | | 10,515 | |
Idaho | | | 0 | | | | 2,521 | | | | 0 | | | | 2,521 | |
Illinois | | | 0 | | | | 68,639 | | | | 0 | | | | 68,639 | |
Indiana | | | 0 | | | | 22,033 | | | | 0 | | | | 22,033 | |
Iowa | | | 0 | | | | 11,953 | | | | 0 | | | | 11,953 | |
Kentucky | | | 0 | | | | 2,659 | | | | 0 | | | | 2,659 | |
Louisiana | | | 0 | | | | 23,296 | | | | 0 | | | | 23,296 | |
Maryland | | | 0 | | | | 15,604 | | | | 0 | | | | 15,604 | |
Massachusetts | | | 0 | | | | 17,855 | | | | 0 | | | | 17,855 | |
Michigan | | | 0 | | | | 40,784 | | | | 0 | | | | 40,784 | |
Minnesota | | | 0 | | | | 3,230 | | | | 0 | | | | 3,230 | |
Mississippi | | | 0 | | | | 1,467 | | | | 0 | | | | 1,467 | |
Missouri | | | 0 | | | | 4,555 | | | | 0 | | | | 4,555 | |
Multi-State | | | 0 | | | | 32,419 | | | | 0 | | | | 32,419 | |
Nebraska | | | 0 | | | | 7,887 | | | | 0 | | | | 7,887 | |
Nevada | | | 0 | | | | 33,639 | | | | 0 | | | | 33,639 | |
New Hampshire | | | 0 | | | | 10,962 | | | | 0 | | | | 10,962 | |
New Jersey | | | 0 | | | | 60,590 | | | | 0 | | | | 60,590 | |
New Mexico | | | 0 | | | | 19,301 | | | | 0 | | | | 19,301 | |
New York | | | 0 | | | | 235,576 | | | | 0 | | | | 235,576 | |
North Carolina | | | 0 | | | | 24,027 | | | | 0 | | | | 24,027 | |
| | | | | | | | | | | | | | | | |
| Category and Subcategory | | Level 1 | | | Level 2 | | | Level 3 | | | Fair
Value at
06/30/2024 | |
North Dakota | | $ | 0 | | | $ | 1,145 | | | $ | 0 | | | $ | 1,145 | |
Ohio | | | 0 | | | | 29,307 | | | | 0 | | | | 29,307 | |
Oklahoma | | | 0 | | | | 7,955 | | | | 0 | | | | 7,955 | |
Oregon | | | 0 | | | | 9,740 | | | | 0 | | | | 9,740 | |
Pennsylvania | | | 0 | | | | 67,999 | | | | 0 | | | | 67,999 | |
Puerto Rico | | | 0 | | | | 26,070 | | | | 0 | | | | 26,070 | |
Rhode Island | | | 0 | | | | 21,418 | | | | 0 | | | | 21,418 | |
South Carolina | | | 0 | | | | 3,033 | | | | 0 | | | | 3,033 | |
South Dakota | | | 0 | | | | 1,847 | | | | 0 | | | | 1,847 | |
Tennessee | | | 0 | | | | 26,681 | | | | 0 | | | | 26,681 | |
Texas | | | 0 | | | | 168,178 | | | | 0 | | | | 168,178 | |
Utah | | | 0 | | | | 2,823 | | | | 0 | | | | 2,823 | |
Virginia | | | 0 | | | | 15,309 | | | | 0 | | | | 15,309 | |
Washington | | | 0 | | | | 28,914 | | | | 0 | | | | 28,914 | |
West Virginia | | | 0 | | | | 2,741 | | | | 0 | | | | 2,741 | |
Wisconsin | | | 0 | | | | 29,317 | | | | 0 | | | | 29,317 | |
U.S. Government Agencies | | | 0 | | | | 9,480 | | | | 0 | | | | 9,480 | |
Non-Agency Mortgage-Backed Securities | | | 0 | | | | 1,004 | | | | 0 | | | | 1,004 | |
Short-Term Instruments | |
Repurchase Agreements | | | 0 | | | | 639 | | | | 0 | | | | 639 | |
U.S. Treasury Bills | | | 0 | | | | 90,919 | | | | 0 | | | | 90,919 | |
Municipal Bonds & Notes | | | 0 | | | | 9,658 | | | | 0 | | | | 9,658 | |
| | | | | | | | | | | | | | | | |
| | | | |
Total Investments | | $ | 0 | | | $ | 1,520,402 | | | $ | 0 | | | $ | 1,520,402 | |
| | | | | | | | | | | | | | | | |
|
Financial Derivative Instruments - Assets | |
Exchange-traded or centrally cleared | | $ | 0 | | | $ | 155 | | | $ | 0 | | | $ | 155 | |
| | | | | | | | | | | | | | | | |
| | | | |
Total Financial Derivative Instruments | | $ | 0 | | | $ | 155 | | | $ | 0 | | | $ | 155 | |
| | | | | | | | | | | | | | | | |
| | | | |
Totals | | $ | 0 | | | $ | 1,520,557 | | | $ | 0 | | | $ | 1,520,557 | |
| | | | | | | | | | | | | | | | |
There were no significant transfers into or out of Level 3 during the period ended June 30, 2024.
| | | | | | | | | | | | |
| See Accompanying Notes | | | ANNUAL FINANCIAL AND OTHER INFORMATION | | | | | | | JUNE 30, 2024 | | | 91 |
| | | | | | |
| Schedule of Investments | | PIMCO Multisector Bond Active Exchange-Traded Fund | | | | |
(Amounts in thousands*, except number of shares, contracts, units and ounces, if any)
| | | | | | | | | | | | |
| | | | | PRINCIPAL
AMOUNT
(000S) | | | | | MARKET
VALUE
(000S) | |
| INVESTMENTS IN SECURITIES 143.9% | |
| |
| LOAN PARTICIPATIONS AND ASSIGNMENTS 1.7% | |
|
Altice France SA | |
10.829% due 08/15/2028 | | $ | | | 1,000 | | | $ | | | 738 | |
|
Asurion LLC | |
9.694% due 08/19/2028 | | | | | 149 | | | | | | 148 | |
|
B.C. Unlimited Liability Co. | |
7.094% due 09/20/2030 | | | | | 1,100 | | | | | | 1,099 | |
|
Broadcom Inc. | |
TBD% due 08/14/2026 « | | | | | 1,500 | | | | | | 1,493 | |
|
Caesars Entertainment Corp. | |
8.097% due 02/06/2031 | | | | | 500 | | | | | | 501 | |
|
Carnival Corp. | |
8.094% due 10/18/2028 | | | | | 192 | | | | | | 193 | |
|
Cohesity | |
TBD% due 03/08/2031 «µ | | | | | 116 | | | | | | 116 | |
TBD% due 03/08/2031 « | | | | | 1,100 | | | | | | 1,100 | |
|
Concentra Health Services Inc. | |
TBD% due 06/26/2031 « | | | | | 1,000 | | | | | | 1,005 | |
|
Cotiviti, Inc. | |
8.579% due 05/01/2031 | | | | | 998 | | | | | | 995 | |
|
FinCo LLC | |
8.330% due 06/27/2029 | | | | | 99 | | | | | | 100 | |
|
Global Medical Response, Inc. | |
TBD% due 10/31/2028 | | | | | 200 | | | | | | 194 | |
|
LifePoint Health, Inc. | |
9.329% due 05/17/2031 | | | | | 800 | | | | | | 802 | |
|
Medline Borrower LP | |
TBD% due 10/23/2028 | | | | | 1,000 | | | | | | 1,001 | |
|
Modena Buyer LLC | |
TBD% due 04/18/2031 | | | | | 2,000 | | | | | | 1,955 | |
|
SLM Student Loan Trust | |
TBD% due 07/25/2039 • | | EUR | | | 1,409 | | | | | | 1,412 | |
|
Station Casinos LLC | |
7.594% due 03/14/2031 | | $ | | | 998 | | | | | | 998 | |
|
TransDigm, Inc. | |
7.843% due 02/28/2031 | | | | | 1,097 | | | | | | 1,101 | |
|
Triton Water Holdings, Inc. | |
9.335% due 03/31/2028 | | | | | 998 | | | | | | 1,002 | |
|
Truist Insurance Holdings LLC | |
8.585% due 05/06/2031 | | | | | 1,000 | | | | | | 1,003 | |
|
UKG, Inc. | |
8.576% due 02/10/2031 | | | | | 900 | | | | | | 905 | |
| | | | | | | | | | | | |
Total Loan Participations and Assignments (Cost $17,850) | | | 17,861 | |
| | | | |
| |
| CORPORATE BONDS & NOTES 24.9% | |
| |
| BANKING & FINANCE 9.4% | |
|
AerCap Ireland Capital DAC | |
2.875% due 08/14/2024 | | | | | 305 | | | | | | 304 | |
3.000% due 10/29/2028 | | | | | 1,350 | | | | | | 1,227 | |
|
Ally Financial, Inc. | |
5.800% due 05/01/2025 | | | | | 300 | | | | | | 300 | |
6.992% due 06/13/2029 • | | | | | 900 | | | | | | 934 | |
|
American Tower Corp. | |
2.750% due 01/15/2027 | | | | | 575 | | | | | | 540 | |
3.650% due 03/15/2027 | | | | | 200 | | | | | | 192 | |
3.800% due 08/15/2029 | | | | | 1,000 | | | | | | 930 | |
3.900% due 05/16/2030 | | EUR | | | 1,500 | | | | | | 1,603 | |
5.550% due 07/15/2033 | | $ | | | 400 | | | | | | 400 | |
|
Athene Global Funding | |
5.339% due 01/15/2027 | | | | | 500 | | | | | | 500 | |
|
Banco Santander SA | |
3.490% due 05/28/2030 | | | | | 365 | | | | | | 327 | |
|
Bank of America Corp. | |
3.705% due 04/24/2028 • | | | | | 500 | | | | | | 479 | |
5.202% due 04/25/2029 • | | | | | 750 | | | | | | 749 | |
5.288% due 04/25/2034 • | | | | | 1,150 | | | | | | 1,139 | |
5.468% due 01/23/2035 • | | | | | 1,250 | | | | | | 1,249 | |
5.819% due 09/15/2029 • | | | | | 500 | | | | | | 511 | |
| | | | | | | | | | | | |
| | | | | PRINCIPAL
AMOUNT
(000S) | | | | | MARKET
VALUE
(000S) | |
|
Barclays PLC | |
5.690% due 03/12/2030 • | | $ | | | 625 | | | $ | | | 627 | |
6.496% due 09/13/2027 • | | | | | 300 | | | | | | 305 | |
7.385% due 11/02/2028 • | | | | | 590 | | | | | | 622 | |
|
BGC Group, Inc. | |
6.600% due 06/10/2029 | | | | | 1,000 | | | | | | 995 | |
|
Boost Newco Borrower LLC | |
7.500% due 01/15/2031 | | | | | 900 | | | | | | 939 | |
|
BPCE SA | |
6.612% due 10/19/2027 • | | | | | 250 | | | | | | 254 | |
|
Brandywine Operating Partnership LP | |
8.875% due 04/12/2029 | | | | | 600 | | | | | | 626 | |
|
Brookfield Finance, Inc. | |
4.350% due 04/15/2030 | | | | | 90 | | | | | | 85 | |
|
Brookfield Property REIT, Inc. | |
4.500% due 04/01/2027 | | | | | 245 | | | | | | 228 | |
|
Burford Capital Global Finance LLC | |
9.250% due 07/01/2031 | | | | | 1,120 | | | | | | 1,180 | |
|
CaixaBank SA | |
5.673% due 03/15/2030 • | | | | | 1,250 | | | | | | 1,245 | |
|
Cantor Fitzgerald LP | |
7.200% due 12/12/2028 | | | | | 850 | | | | | | 875 | |
|
Charles Schwab Corp. | |
5.853% due 05/19/2034 • | | | | | 430 | | | | | | 439 | |
|
CI Financial Corp. | |
7.500% due 05/30/2029 | | | | | 1,000 | | | | | | 991 | |
|
Citibank NA | |
5.803% due 09/29/2028 | | | | | 1,800 | | | | | | 1,850 | |
|
Credicorp Capital Sociedad Titulizadora SA | |
10.100% due 12/15/2043 | | PEN | | | 2,500 | | | | | | 667 | |
|
Credit Acceptance Corp. | |
6.625% due 03/15/2026 | | $ | | | 60 | | | | | | 60 | |
9.250% due 12/15/2028 | | | | | 500 | | | | | | 529 | |
|
Credit Suisse USA, Inc. | |
7.125% due 07/15/2032 | | | | | 1,615 | | | | | | 1,777 | |
|
Crown Castle, Inc. | |
1.050% due 07/15/2026 | | | | | 475 | | | | | | 435 | |
5.600% due 06/01/2029 | | | | | 625 | | | | | | 631 | |
|
Encore Capital Group, Inc. | |
8.500% due 05/15/2030 | | | | | 800 | | | | | | 815 | |
9.250% due 04/01/2029 | | | | | 1,250 | | | | | | 1,304 | |
|
Equinix, Inc. | |
2.625% due 11/18/2024 | | | | | 245 | | | | | | 242 | |
|
Equitable Holdings, Inc. | |
4.350% due 04/20/2028 | | | | | 60 | | | | | | 58 | |
|
Everglades Re II Ltd. | |
16.855% (T-BILL 1MO + 11.500%) due 05/13/2031 ~ | | | | | 400 | | | | | | 398 | |
|
Ford Motor Credit Co. LLC | |
5.800% due 03/05/2027 | | | | | 1,125 | | | | | | 1,125 | |
|
Fortress Transportation & Infrastructure Investors LLC | |
5.500% due 05/01/2028 | | | | | 1,380 | | | | | | 1,339 | |
7.000% due 05/01/2031 | | | | | 1,925 | | | | | | 1,969 | |
|
Freedom Mortgage Corp. | |
6.625% due 01/15/2027 | | | | | 60 | | | | | | 58 | |
12.000% due 10/01/2028 | | | | | 250 | | | | | | 269 | |
|
Freedom Mortgage Holdings LLC | |
9.125% due 05/15/2031 | | | | | 1,000 | | | | | | 974 | |
9.250% due 02/01/2029 | | | | | 300 | | | | | | 300 | |
|
GLP Capital LP | |
5.300% due 01/15/2029 | | | | | 130 | | | | | | 128 | |
5.375% due 04/15/2026 | | | | | 780 | | | | | | 774 | |
|
Goldman Sachs Group, Inc. | |
2.650% due 10/21/2032 • | | | | | 3,790 | | | | | | 3,152 | |
4.482% due 08/23/2028 • | | | | | 300 | | | | | | 293 | |
5.727% due 04/25/2030 • | | | | | 1,600 | | | | | | 1,629 | |
6.484% due 10/24/2029 • | | | | | 300 | | | | | | 313 | |
|
Hannon Armstrong Sustainable Infrastructure Capital, Inc. | |
6.375% due 07/01/2034 (a) | | | | | 1,700 | | | | | | 1,666 | |
|
HAT Holdings LLC | |
3.375% due 06/15/2026 | | | | | 60 | | | | | | 57 | |
8.000% due 06/15/2027 | | | | | 650 | | | | | | 677 | |
| | | | | | | | | | | | |
| | | | | PRINCIPAL
AMOUNT
(000S) | | | | | MARKET
VALUE
(000S) | |
|
Host Hotels & Resorts LP | |
3.500% due 09/15/2030 | | $ | | | 100 | | | $ | | | 88 | |
|
HSBC Holdings PLC | |
4.755% due 06/09/2028 • | | | | | 1,625 | | | | | | 1,598 | |
5.546% due 03/04/2030 • | | | | | 1,300 | | | | | | 1,303 | |
|
Hudson Pacific Properties LP | |
5.950% due 02/15/2028 | | | | | 675 | | | | | | 575 | |
|
Intesa Sanpaolo SpA | |
4.198% due 06/01/2032 • | | | | | 300 | | | | | | 254 | |
|
Jane Street Group | |
7.125% due 04/30/2031 | | | | | 1,100 | | | | | | 1,129 | |
|
JPMorgan Chase & Co. | |
5.040% due 01/23/2028 • | | | | | 1,000 | | | | | | 995 | |
5.336% due 01/23/2035 • | | | | | 1,250 | | | | | | 1,243 | |
5.350% due 06/01/2034 • | | | | | 1,800 | | | | | | 1,793 | |
5.581% due 04/22/2030 • | | | | | 2,000 | | | | | | 2,032 | |
6.070% due 10/22/2027 • | | | | | 500 | | | | | | 509 | |
|
KBC Group NV | |
5.796% due 01/19/2029 • | | | | | 350 | | | | | | 353 | |
|
Kilroy Realty LP | |
6.250% due 01/15/2036 | | | | | 400 | | | | | | 380 | |
|
Ladder Capital Finance Holdings LLLP | |
7.000% due 07/15/2031 (a) | | | | | 1,200 | | | | | | 1,211 | |
|
Lazard Group LLC | |
6.000% due 03/15/2031 | | | | | 1,000 | | | | | | 1,012 | |
|
Liberty Mutual Group, Inc. | |
4.125% due 12/15/2051 • | | | | | 90 | | | | | | 84 | |
|
Lloyds Banking Group PLC | |
5.679% due 01/05/2035 • | | | | | 1,600 | | | | | | 1,595 | |
|
Mitsubishi UFJ Financial Group, Inc. | |
5.406% due 04/19/2034 • | | | | | 465 | | | | | | 468 | |
|
Morgan Stanley | |
3.125% due 07/27/2026 | | | | | 250 | | | | | | 239 | |
3.955% due 03/21/2035 • | | EUR | | | 1,000 | | | | | | 1,065 | |
5.164% due 04/20/2029 • | | $ | | | 718 | | | | | | 716 | |
5.173% due 01/16/2030 • | | | | | 1,250 | | | | | | 1,247 | |
5.250% due 04/21/2034 • | | | | | 950 | | | | | | 936 | |
5.831% due 04/19/2035 • | | | | | 1,500 | | | | | | 1,538 | |
6.407% due 11/01/2029 • | | | | | 500 | | | | | | 522 | |
|
Nationstar Mortgage Holdings, Inc. | |
5.750% due 11/15/2031 | | | | | 245 | | | | | | 230 | |
7.125% due 02/01/2032 | | | | | 1,600 | | | | | | 1,611 | |
|
Nationwide Building Society | |
6.557% due 10/18/2027 • | | | | | 250 | | | | | | 255 | |
|
NatWest Group PLC | |
5.778% due 03/01/2035 • | | | | | 1,300 | | | | | | 1,305 | |
5.808% due 09/13/2029 • | | | | | 685 | | | | | | 694 | |
6.016% due 03/02/2034 • | | | | | 300 | | | | | | 307 | |
|
Newmark Group, Inc. | |
7.500% due 01/12/2029 | | | | | 725 | | | | | | 746 | |
|
Nomura Holdings, Inc. | |
5.783% due 07/03/2034 (a) | | | | | 2,200 | | | | | | 2,194 | |
|
OneMain Finance Corp. | |
3.500% due 01/15/2027 | | | | | 975 | | | | | | 914 | |
7.500% due 05/15/2031 | | | | | 1,000 | | | | | | 1,013 | |
9.000% due 01/15/2029 | | | | | 335 | | | | | | 354 | |
|
Panama Infrastructure Receivable Purchaser PLC | |
0.000% due 04/05/2032 (b) | | | | | 1,300 | | | | | | 850 | |
|
PennyMac Financial Services, Inc. | |
5.750% due 09/15/2031 | | | | | 155 | | | | | | 145 | |
7.125% due 11/15/2030 | | | | | 1,000 | | | | | | 998 | |
7.875% due 12/15/2029 | | | | | 350 | | | | | | 361 | |
|
Piedmont Operating Partnership LP | |
6.875% due 07/15/2029 | | | | | 1,000 | | | | | | 988 | |
|
Realty Income Corp. | |
3.250% due 01/15/2031 | | | | | 360 | | | | | | 319 | |
|
Sammons Financial Group, Inc. | |
6.875% due 04/15/2034 | | | | | 600 | | | | | | 616 | |
|
Santander Holdings USA, Inc. | |
6.174% due 01/09/2030 • | | | | | 500 | | | | | | 504 | |
|
Santander U.K. Group Holdings PLC | |
3.823% due 11/03/2028 • | | | | | 800 | | | | | | 756 | |
6.534% due 01/10/2029 • | | | | | 700 | | | | | | 720 | |
| | | | | | |
| 92 | | PIMCO ETF TRUST | | | See Accompanying Notes | |
| | | | | | | | | | | | |
| | | | | PRINCIPAL
AMOUNT
(000S) | | | | | MARKET
VALUE
(000S) | |
|
SLM Corp. | |
3.125% due 11/02/2026 | | $ | | | 850 | | | $ | | | 793 | |
|
Synchrony Bank | |
5.400% due 08/22/2025 | | | | | 185 | | | | | | 184 | |
|
Ter Finance Jersey Ltd. | |
0.000% due 01/02/2025 « | | | | | 1,000 | | | | | | 964 | |
|
UBS Group AG | |
4.988% due 08/05/2033 • | | | | | 200 | | | | | | 191 | |
5.699% due 02/08/2035 • | | | | | 1,325 | | | | | | 1,324 | |
6.442% due 08/11/2028 • | | | | | 550 | | | | | | 564 | |
6.537% due 08/12/2033 • | | | | | 60 | | | | | | 63 | |
|
UniCredit SpA | |
7.296% due 04/02/2034 • | | | | | 300 | | | | | | 306 | |
|
VFH Parent LLC | |
7.500% due 06/15/2031 | | | | | 1,000 | | | | | | 1,006 | |
|
VICI Properties LP | |
4.950% due 02/15/2030 | | | | | 600 | | | | | | 579 | |
5.750% due 04/01/2034 | | | | | 1,325 | | | | | | 1,313 | |
|
Wells Fargo & Co. | |
5.198% due 01/23/2030 • | | | | | 1,250 | | | | | | 1,245 | |
5.389% due 04/24/2034 • | | | | | 1,020 | | | | | | 1,009 | |
5.574% due 07/25/2029 • | | | | | 1,200 | | | | | | 1,211 | |
|
Weyerhaeuser Co. | |
7.375% due 03/15/2032 | | | | | 190 | | | | | | 212 | |
|
Willis North America, Inc. | |
4.650% due 06/15/2027 | | | | | 60 | | | | | | 59 | |
| | | | | | | | | | | | |
| | | | | | | | | | | 94,072 | |
| | | | | | | | | | | | |
| |
| INDUSTRIALS 14.0% | |
|
AAR Escrow Issuer LLC | |
6.750% due 03/15/2029 | | | | | 850 | | | | | | 867 | |
|
AbbVie, Inc. | |
3.200% due 11/21/2029 | | | | | 1,675 | | | | | | 1,537 | |
|
Acadia Healthcare Co., Inc. | |
5.000% due 04/15/2029 | | | | | 365 | | | | | | 347 | |
|
Air Canada Pass-Through Trust | |
3.300% due 07/15/2031 | | | | | 1,236 | | | | | | 1,132 | |
3.600% due 09/15/2028 | | | | | 359 | | | | | | 341 | |
|
Altice France SA | |
5.500% due 10/15/2029 | | | | | 1,360 | | | | | | 898 | |
|
Amer Sports Co. | |
6.750% due 02/16/2031 | | | | | 775 | | | | | | 774 | |
|
American Airlines Pass-Through Trust | |
3.200% due 12/15/2029 | | | | | 150 | | | | | | 139 | |
3.600% due 03/22/2029 | | | | | 311 | | | | | | 295 | |
3.650% due 08/15/2030 | | | | | 861 | | | | | | 814 | |
|
American Airlines, Inc. | |
5.500% due 04/20/2026 | | | | | 183 | | | | | | 182 | |
|
Amgen, Inc. | |
5.150% due 03/02/2028 | | | | | 1,000 | | | | | | 1,000 | |
|
Ashtead Capital, Inc. | |
5.800% due 04/15/2034 | | | | | 800 | | | | | | 794 | |
|
Aston Martin Capital Holdings Ltd. | |
10.000% due 03/31/2029 | | | | | 750 | | | | | | 740 | |
|
Axalta Coating Systems LLC | |
3.375% due 02/15/2029 | | | | | 685 | | | | | | 614 | |
|
B.C. Unlimited Liability Co. | |
3.500% due 02/15/2029 | | | | | 1,120 | | | | | | 1,018 | |
4.000% due 10/15/2030 | | | | | 790 | | | | | | 696 | |
|
Bausch & Lomb Escrow Corp. | |
8.375% due 10/01/2028 | | | | | 250 | | | | | | 256 | |
|
Becton Dickinson & Co. | |
1.957% due 02/11/2031 | | | | | 60 | | | | | | 49 | |
5.110% due 02/08/2034 | | | | | 950 | | | | | | 936 | |
|
Berry Global, Inc. | |
5.650% due 01/15/2034 | | | | | 400 | | | | | | 391 | |
|
Block, Inc. | |
6.500% due 05/15/2032 | | | | | 2,000 | | | | | | 2,029 | |
|
Boeing Co. | |
2.196% due 02/04/2026 | | | | | 400 | | | | | | 376 | |
3.250% due 02/01/2028 | | | | | 675 | | | | | | 618 | |
3.625% due 02/01/2031 | | | | | 300 | | | | | | 263 | |
5.150% due 05/01/2030 | | | | | 900 | | | | | | 865 | |
| | | | | | | | | | | | |
| | | | | PRINCIPAL
AMOUNT
(000S) | | | | | MARKET
VALUE
(000S) | |
5.930% due 05/01/2060 | | $ | | | 800 | | | $ | | | 716 | |
6.528% due 05/01/2034 | | | | | 800 | | | | | | 820 | |
6.858% due 05/01/2054 | | | | | 600 | | | | | | 616 | |
|
Boston Scientific Corp. | |
2.650% due 06/01/2030 | | | | | 60 | | | | | | 53 | |
|
British Airways Pass-Through Trust | |
3.300% due 06/15/2034 | | | | | 141 | | | | | | 127 | |
4.250% due 05/15/2034 | | | | | 1,445 | | | | | | 1,358 | |
|
Broadcom Corp. | |
3.500% due 01/15/2028 | | | | | 100 | | | | | | 95 | |
|
Broadcom, Inc. | |
2.450% due 02/15/2031 | | | | | 300 | | | | | | 253 | |
3.187% due 11/15/2036 | | | | | 620 | | | | | | 491 | |
4.926% due 05/15/2037 | | | | | 520 | | | | | | 489 | |
|
Camelot Finance SA | |
4.500% due 11/01/2026 | | | | | 120 | | | | | | 116 | |
|
Capstone Borrower, Inc. | |
8.000% due 06/15/2030 | | | | | 600 | | | | | | 620 | |
|
Cargo Aircraft Management, Inc. | |
4.750% due 02/01/2028 | | | | | 1,100 | | | | | | 1,022 | |
|
Carnival Corp. | |
4.000% due 08/01/2028 | | | | | 2,200 | | | | | | 2,067 | |
|
CDW LLC | |
3.569% due 12/01/2031 | | | | | 1,605 | | | | | | 1,403 | |
|
Centene Corp. | |
3.000% due 10/15/2030 | | | | | 3,425 | | | | | | 2,931 | |
|
CGI, Inc. | |
1.450% due 09/14/2026 | | | | | 400 | | | | | | 366 | |
|
Charter Communications Operating LLC | |
2.250% due 01/15/2029 | | | | | 1,000 | | | | | | 855 | |
2.800% due 04/01/2031 | | | | | 100 | | | | | | 82 | |
3.850% due 04/01/2061 | | | | | 1,660 | | | | | | 970 | |
3.950% due 06/30/2062 | | | | | 350 | | | | | | 208 | |
|
Chobani LLC | |
7.625% due 07/01/2029 | | | | | 500 | | | | | | 516 | |
|
Churchill Downs, Inc. | |
5.500% due 04/01/2027 | | | | | 60 | | | | | | 59 | |
|
Cloud Software Group, Inc. | |
6.500% due 03/31/2029 | | | | | 650 | | | | | | 625 | |
|
CMA CGM SA | |
5.500% due 07/15/2029 (a) | | EUR | | | 1,000 | | | | | | 1,071 | |
|
Cogent Communications Group, Inc. | |
7.000% due 06/15/2027 | | $ | | | 90 | | | | | | 89 | |
|
Concentra Escrow Issuer Corp. | |
6.875% due 07/15/2032 (a) | | | | | 1,000 | | | | | | 1,014 | |
|
Constellation Brands, Inc. | |
2.250% due 08/01/2031 | | | | | 475 | | | | | | 390 | |
3.150% due 08/01/2029 | | | | | 450 | | | | | | 408 | |
3.600% due 02/15/2028 | | | | | 200 | | | | | | 190 | |
|
Coty, Inc. | |
5.000% due 04/15/2026 | | | | | 152 | | | | | | 150 | |
|
Cougar JV Subsidiary LLC | |
8.000% due 05/15/2032 | | | | | 500 | | | | | | 517 | |
|
CQP Holdco LP | |
5.500% due 06/15/2031 | | | | | 1,500 | | | | | | 1,423 | |
|
Crowdstrike Holdings, Inc. | |
3.000% due 02/15/2029 | | | | | 1,110 | | | | | | 1,002 | |
|
CVS Health Corp. | |
4.300% due 03/25/2028 | | | | | 630 | | | | | | 608 | |
|
Delta Air Lines Pass-Through Trust | |
2.000% due 12/10/2029 | | | | | 647 | | | | | | 588 | |
|
Directv Financing LLC | |
8.875% due 02/01/2030 | | | | | 400 | | | | | | 392 | |
|
Elevance Health, Inc. | |
1.500% due 03/15/2026 | | | | | 725 | | | | | | 680 | |
|
Emrld Borrower LP | |
6.750% due 07/15/2031 (a) | | | | | 1,000 | | | | | | 1,013 | |
|
Enbridge, Inc. | |
5.700% due 03/08/2033 | | | | | 590 | | | | | | 595 | |
|
Energy Transfer LP | |
3.750% due 05/15/2030 | | | | | 675 | | | | | | 621 | |
6.550% due 12/01/2033 | | | | | 1,000 | | | | | | 1,060 | |
| | | | | | | | | | | | |
| | | | | PRINCIPAL
AMOUNT
(000S) | | | | | MARKET
VALUE
(000S) | |
|
Eni SpA | |
5.500% due 05/15/2034 | | $ | | | 1,000 | | | $ | | | 991 | |
|
EnLink Midstream LLC | |
6.500% due 09/01/2030 | | | | | 300 | | | | | | 307 | |
|
Entergy Louisiana LLC | |
4.000% due 03/15/2033 | | | | | 495 | | | | | | 446 | |
5.350% due 03/15/2034 | | | | | 625 | | | | | | 621 | |
|
Enterprise Products Operating LLC | |
2.800% due 01/31/2030 | | | | | 400 | | | | | | 357 | |
|
EQM Midstream Partners LP | |
4.500% due 01/15/2029 | | | | | 172 | | | | | | 162 | |
|
ESAB Corp. | |
6.250% due 04/15/2029 | | | | | 500 | | | | | | 504 | |
|
Essent Group Ltd. | |
6.250% due 07/01/2029 (a) | | | | | 2,000 | | | | | | 2,000 | |
|
First Student Bidco, Inc. | |
4.000% due 07/31/2029 | | | | | 350 | | | | | | 316 | |
|
Fiserv, Inc. | |
5.450% due 03/15/2034 | | | | | 800 | | | | | | 795 | |
|
Flutter Treasury Designated Activity Co. | |
5.000% due 04/29/2029 | | EUR | | | 1,000 | | | | | | 1,089 | |
|
Ford Motor Co. | |
3.250% due 02/12/2032 | | $ | | | 185 | | | | | | 153 | |
5.291% due 12/08/2046 | | | | | 200 | | | | | | 175 | |
|
Fortress Intermediate 3, Inc. | |
7.500% due 06/01/2031 | | | | | 1,000 | | | | | | 1,026 | |
|
Garda World Security Corp. | |
4.625% due 02/15/2027 | | | | | 90 | | | | | | 86 | |
|
Gartner, Inc. | |
3.750% due 10/01/2030 | | | | | 1,035 | | | | | | 929 | |
|
GFL Environmental, Inc. | |
4.000% due 08/01/2028 | | | | | 60 | | | | | | 56 | |
|
Global Payments, Inc. | |
1.200% due 03/01/2026 | | | | | 300 | | | | | | 279 | |
2.650% due 02/15/2025 | | | | | 90 | | | | | | 88 | |
5.400% due 08/15/2032 | | | | | 1,375 | | | | | | 1,348 | |
|
goeasy Ltd. | |
7.625% due 07/01/2029 | | | | | 550 | | | | | | 561 | |
9.250% due 12/01/2028 | | | | | 250 | | | | | | 266 | |
|
Graphic Packaging International LLC | |
3.750% due 02/01/2030 | | | | | 1,100 | | | | | | 984 | |
|
GXO Logistics, Inc. | |
6.250% due 05/06/2029 | | | | | 1,000 | | | | | | 1,018 | |
|
HCA, Inc. | |
3.625% due 03/15/2032 | | | | | 1,325 | | | | | | 1,168 | |
|
HEICO Corp. | |
5.250% due 08/01/2028 | | | | | 250 | | | | | | 250 | |
|
Hilton Domestic Operating Co., Inc. | |
3.625% due 02/15/2032 | | | | | 114 | | | | | | 99 | |
|
Hologic, Inc. | |
3.250% due 02/15/2029 | | | | | 700 | | | | | | 629 | |
|
Howard Midstream Energy Partners LLC | |
7.375% due 07/15/2032 | | | | | 600 | | | | | | 610 | |
8.875% due 07/15/2028 | | | | | 150 | | | | | | 159 | |
|
Howmet Aerospace, Inc. | |
5.950% due 02/01/2037 | | | | | 425 | | | | | | 438 | |
6.750% due 01/15/2028 | | | | | 60 | | | | | | 63 | |
|
Imola Merger Corp. | |
4.750% due 05/15/2029 | | | | | 1,300 | | | | | | 1,216 | |
|
IPD 3 BV | |
7.085% due 06/15/2031 • | | EUR | | | 1,000 | | | | | | 1,071 | |
|
IQVIA, Inc. | |
5.000% due 05/15/2027 | | $ | | | 280 | | | | | | 273 | |
5.700% due 05/15/2028 | | | | | 60 | | | | | | 61 | |
6.250% due 02/01/2029 | | | | | 850 | | | | | | 874 | |
|
Jazz Securities DAC | |
4.375% due 01/15/2029 | | | | | 260 | | | | | | 242 | |
|
JetBlue Pass-Through Trust | |
2.750% due 11/15/2033 | | | | | 1,585 | | | | | | 1,372 | |
4.000% due 05/15/2034 | | | | | 742 | | | | | | 696 | |
|
Kodiak Gas Services LLC | |
7.250% due 02/15/2029 | | | | | 750 | | | | | | 769 | |
| | | | | | | | | | | | |
| See Accompanying Notes | | | ANNUAL FINANCIAL AND OTHER INFORMATION | | | | | | | JUNE 30, 2024 | | | 93 |
| | | | | | |
| Schedule of Investments | | PIMCO Multisector Bond Active Exchange-Traded Fund | | (Cont.) | | |
| | | | | | | | | | | | |
| | | | | PRINCIPAL
AMOUNT
(000S) | | | | | MARKET
VALUE
(000S) | |
|
LABL, Inc. | |
6.750% due 07/15/2026 | | $ | | | 625 | | | $ | | | 618 | |
|
Las Vegas Sands Corp. | |
3.500% due 08/18/2026 | | | | | 2,800 | | | | | | 2,673 | |
3.900% due 08/08/2029 | | | | | 2,175 | | | | | | 1,991 | |
|
Legacy LifePoint Health LLC | |
4.375% due 02/15/2027 | | | | | 120 | | | | | | 115 | |
|
LifePoint Health, Inc. | |
11.000% due 10/15/2030 | | | | | 775 | | | | | | 855 | |
|
Live Nation Entertainment, Inc. | |
3.750% due 01/15/2028 | | | | | 1,000 | | | | | | 931 | |
|
Marvell Technology, Inc. | |
5.750% due 02/15/2029 | | | | | 1,100 | | | | | | 1,124 | |
|
Masterbrand, Inc. | |
7.000% due 07/15/2032 | | | | | 1,000 | | | | | | 1,012 | |
|
Matador Resources Co. | |
6.500% due 04/15/2032 | | | | | 1,000 | | | | | | 1,001 | |
|
Mauser Packaging Solutions Holding Co. | |
7.875% due 04/15/2027 | | | | | 425 | | | | | | 434 | |
|
Medline Borrower LP | |
6.250% due 04/01/2029 | | | | | 1,850 | | | | | | 1,873 | |
|
MGM China Holdings Ltd. | |
7.125% due 06/26/2031 | | | | | 1,100 | | | | | | 1,107 | |
|
Molina Healthcare, Inc. | |
3.875% due 05/15/2032 | | | | | 1,200 | | | | | | 1,041 | |
|
Mondelez International, Inc. | |
2.625% due 03/17/2027 | | | | | 60 | | | | | | 56 | |
|
MPH Acquisition Holdings LLC | |
5.500% due 09/01/2028 | | | | | 240 | | | | | | 181 | |
|
MPLX LP | |
1.750% due 03/01/2026 | | | | | 460 | | | | | | 432 | |
|
National Football League | |
5.480% due 10/05/2028 «(f) | | | | | 1,600 | | | | | | 1,598 | |
|
NCL Corp. Ltd. | |
5.875% due 02/15/2027 | | | | | 60 | | | | | | 59 | |
8.125% due 01/15/2029 | | | | | 200 | | | | | | 210 | |
|
Neptune Bidco U.S., Inc. | |
9.290% due 04/15/2029 | | | | | 185 | | | | | | 178 | |
|
Netflix, Inc. | |
4.375% due 11/15/2026 | | | | | 465 | | | | | | 457 | |
|
New Fortress Energy, Inc. | |
8.750% due 03/15/2029 | | | | | 750 | | | | | | 685 | |
|
Newfold Digital Holdings Group, Inc. | |
11.750% due 10/15/2028 | | | | | 200 | | | | | | 207 | |
|
NextEra Energy Operating Partners LP | |
4.500% due 09/15/2027 | | | | | 800 | | | | | | 758 | |
7.250% due 01/15/2029 | | | | | 650 | | | | | | 667 | |
|
Noble Finance LLC | |
8.000% due 04/15/2030 | | | | | 300 | | | | | | 312 | |
|
NXP BV | |
2.500% due 05/11/2031 | | | | | 1,350 | | | | | | 1,132 | |
3.875% due 06/18/2026 | | | | | 245 | | | | | | 238 | |
|
Occidental Petroleum Corp. | |
6.450% due 09/15/2036 | | | | | 1,000 | | | | | | 1,045 | |
8.875% due 07/15/2030 | | | | | 625 | | | | | | 720 | |
|
Olympus Water U.S. Holding Corp. | |
4.250% due 10/01/2028 | | | | | 290 | | | | | | 264 | |
7.250% due 06/15/2031 | | | | | 1,000 | | | | | | 995 | |
9.750% due 11/15/2028 | | | | | 100 | | | | | | 106 | |
|
Oracle Corp. | |
2.300% due 03/25/2028 | | | | | 700 | | | | | | 633 | |
|
Organon & Co. | |
4.125% due 04/30/2028 | | | | | 1,000 | | | | | | 930 | |
6.750% due 05/15/2034 | | | | | 500 | | | | | | 500 | |
7.875% due 05/15/2034 | | | | | 750 | | | | | | 772 | |
|
Perenti Finance Pty. Ltd. | |
7.500% due 04/26/2029 | | | | | 600 | | | | | | 612 | |
|
PetSmart, Inc. | |
4.750% due 02/15/2028 | | | | | 550 | | | | | | 512 | |
|
Post Holdings, Inc. | |
4.625% due 04/15/2030 | | | | | 200 | | | | | | 184 | |
|
Raising Cane’s Restaurants LLC | |
9.375% due 05/01/2029 | | | | | 400 | | | | | | 433 | |
| | | | | | | | | | | | |
| | | | | PRINCIPAL
AMOUNT
(000S) | | | | | MARKET
VALUE
(000S) | |
|
Rand Parent LLC | |
8.500% due 02/15/2030 | | $ | | | 260 | | | $ | | | 263 | |
|
Resorts World Las Vegas LLC | |
4.625% due 04/16/2029 | | | | | 200 | | | | | | 180 | |
|
Rivian Holdings LLC | |
11.310% due 10/15/2026 • | | | | | 1,300 | | | | | | 1,318 | |
|
Rogers Communications, Inc. | |
2.950% due 03/15/2025 | | | | | 60 | | | | | | 59 | |
|
Rolls-Royce PLC | |
5.750% due 10/15/2027 | | | | | 1,325 | | | | | | 1,332 | |
|
Royal Caribbean Cruises Ltd. | |
5.500% due 04/01/2028 | | | | | 850 | | | | | | 840 | |
9.250% due 01/15/2029 | | | | | 675 | | | | | | 721 | |
|
Royalty Pharma PLC | |
1.200% due 09/02/2025 | | | | | 155 | | | | | | 147 | |
|
RTX Corp. | |
3.500% due 03/15/2027 | | | | | 60 | | | | | | 58 | |
|
Sabine Pass Liquefaction LLC | |
4.500% due 05/15/2030 | | | | | 600 | | | | | | 576 | |
|
Santos Finance Ltd. | |
6.875% due 09/19/2033 | | | | | 300 | | | | | | 318 | |
|
Seadrill Finance Ltd. | |
8.375% due 08/01/2030 | | | | | 1,000 | | | | | | 1,046 | |
|
Seagate HDD Cayman | |
8.250% due 12/15/2029 | | | | | 60 | | | | | | 64 | |
9.625% due 12/01/2032 | | | | | 500 | | | | | | 571 | |
|
Sensata Technologies BV | |
4.000% due 04/15/2029 | | | | | 220 | | | | | | 202 | |
|
Sensata Technologies, Inc. | |
4.375% due 02/15/2030 | | | | | 475 | | | | | | 437 | |
|
Sirius XM Radio, Inc. | |
3.875% due 09/01/2031 | | | | | 155 | | | | | | 127 | |
5.000% due 08/01/2027 | | | | | 100 | | | | | | 96 | |
|
Sitio Royalties Operating Partnership LP | |
7.875% due 11/01/2028 | | | | | 300 | | | | | | 310 | |
|
Southern Co. | |
3.250% due 07/01/2026 | | | | | 200 | | | | | | 192 | |
|
Spirit AeroSystems, Inc. | |
9.375% due 11/30/2029 | | | | | 250 | | | | | | 269 | |
9.750% due 11/15/2030 | | | | | 300 | | | | | | 331 | |
|
Spirit Airlines Pass-Through Trust | |
3.375% due 08/15/2031 | | | | | 673 | | | | | | 594 | |
4.100% due 10/01/2029 | | | | | 485 | | | | | | 455 | |
|
SS&C Technologies, Inc. | |
6.500% due 06/01/2032 | | | | | 1,500 | | | | | | 1,514 | |
|
Stagwell Global LLC | |
5.625% due 08/15/2029 | | | | | 200 | | | | | | 185 | |
|
Standard Industries, Inc. | |
4.375% due 07/15/2030 | | | | | 1,025 | | | | | | 927 | |
|
Star Parent, Inc. | |
9.000% due 10/01/2030 | | | | | 250 | | | | | | 263 | |
|
Stryker Corp. | |
1.950% due 06/15/2030 | | | | | 60 | | | | | | 51 | |
|
Sysco Corp. | |
3.300% due 07/15/2026 | | | | | 60 | | | | | | 58 | |
|
T-Mobile USA, Inc. | |
3.750% due 04/15/2027 | | | | | 555 | | | | | | 534 | |
3.875% due 04/15/2030 | | | | | 1,425 | | | | | | 1,332 | |
|
Tapestry, Inc. | |
7.700% due 11/27/2030 | | | | | 600 | | | | | | 627 | |
|
Time Warner Cable LLC | |
4.500% due 09/15/2042 | | | | | 300 | | | | | | 220 | |
|
TopBuild Corp. | |
4.125% due 02/15/2032 | | | | | 335 | | | | | | 295 | |
|
TransDigm, Inc. | |
7.125% due 12/01/2031 | | | | | 325 | | | | | | 335 | |
|
Transocean Aquila Ltd. | |
8.000% due 09/30/2028 | | | | | 250 | | | | | | 254 | |
|
Transocean Titan Financing Ltd. | |
8.375% due 02/01/2028 | | | | | 185 | | | | | | 191 | |
|
U.S. Airways Pass-Through Trust | |
3.950% due 05/15/2027 | | | | | 662 | | | | | | 647 | |
4.625% due 12/03/2026 | | | | | 1,204 | | | | | | 1,191 | |
| | | | | | | | | | | | |
| | | | | PRINCIPAL
AMOUNT
(000S) | | | | | MARKET
VALUE
(000S) | |
|
U.S. Foods, Inc. | |
4.750% due 02/15/2029 | | $ | | | 215 | | | $ | | | 204 | |
|
UKG, Inc. | |
6.875% due 02/01/2031 | | | | | 500 | | | | | | 507 | |
|
United Airlines Pass-Through Trust | |
2.700% due 11/01/2033 | | | | | 1,939 | | | | | | 1,682 | |
3.500% due 09/01/2031 | | | | | 882 | | | | | | 816 | |
5.875% due 04/15/2029 | | | | | 160 | | | | | | 160 | |
|
United Airlines, Inc. | |
4.625% due 04/15/2029 | | | | | 300 | | | | | | 280 | |
|
Valaris Ltd. | |
8.375% due 04/30/2030 | | | | | 490 | | | | | | 508 | |
|
Vale Overseas Ltd. | |
3.750% due 07/08/2030 | | | | | 1,260 | | | | | | 1,134 | |
6.400% due 06/28/2054 | | | | | 1,000 | | | | | | 990 | |
|
Vallourec SACA | |
7.500% due 04/15/2032 | | | | | 600 | | | | | | 622 | |
|
Venture Global Calcasieu Pass LLC | |
3.875% due 11/01/2033 | | | | | 1,075 | | | | | | 917 | |
|
Venture Global LNG, Inc. | |
8.375% due 06/01/2031 | | | | | 2,050 | | | | | | 2,128 | |
|
Viking Cruises Ltd. | |
9.125% due 07/15/2031 | | | | | 75 | | | | | | 81 | |
|
Vmed O2 U.K. Financing PLC | |
4.250% due 01/31/2031 | | | | | 830 | | | | | | 690 | |
5.625% due 04/15/2032 | | EUR | | | 1,000 | | | | | | 1,043 | |
|
VMware, Inc. | |
1.400% due 08/15/2026 | | $ | | | 60 | | | | | | 55 | |
2.200% due 08/15/2031 | | | | | 4,000 | | | | | | 3,252 | |
|
VOC Escrow Ltd. | |
5.000% due 02/15/2028 | | | | | 155 | | | | | | 150 | |
|
Wand NewCo 3, Inc. | |
7.625% due 01/30/2032 | | | | | 1,000 | | | | | | 1,034 | |
|
Western Digital Corp. | |
2.850% due 02/01/2029 | | | | | 219 | | | | | | 190 | |
4.750% due 02/15/2026 | | | | | 147 | | | | | | 144 | |
|
Western Midstream Operating LP | |
3.100% due 02/01/2025 | | | | | 60 | | | | | | 59 | |
|
Westinghouse Air Brake Technologies Corp. | |
3.450% due 11/15/2026 | | | | | 60 | | | | | | 57 | |
|
WMG Acquisition Corp. | |
3.000% due 02/15/2031 | | | | | 735 | | | | | | 634 | |
|
Wynn Las Vegas LLC | |
5.250% due 05/15/2027 | | | | | 345 | | | | | | 337 | |
|
Wynn Resorts Finance LLC | |
7.125% due 02/15/2031 | | | | | 500 | | | | | | 519 | |
|
Yinson Boronia Production BV | |
8.947% due 07/31/2042 | | | | | 1,000 | | | | | | 1,011 | |
|
ZF North America Capital, Inc. | |
6.750% due 04/23/2030 | | | | | 750 | | | | | | 765 | |
6.875% due 04/23/2032 | | | | | 750 | | | | | | 776 | |
7.125% due 04/14/2030 | | | | | 90 | | | | | | 93 | |
|
Zoetis, Inc. | |
5.600% due 11/16/2032 | | | | | 500 | | | | | | 512 | |
| | | | | | | | | | | | |
| | | | | | | | | | | 141,318 | |
| | | | | | | | | | | | |
| |
| UTILITIES 1.5% | |
|
AES Corp. | |
5.450% due 06/01/2028 | | | | | 310 | | | | | | 309 | |
|
Antero Midstream Partners LP | |
5.750% due 03/01/2027 | | | | | 260 | | | | | | 258 | |
6.625% due 02/01/2032 | | | | | 400 | | | | | | 404 | |
|
AT&T, Inc. | |
1.650% due 02/01/2028 | | | | | 1,380 | | | | | | 1,226 | |
|
Berkshire Hathaway Energy Co. | |
3.700% due 07/15/2030 | | | | | 200 | | | | | | 186 | |
|
Calpine Corp. | |
4.500% due 02/15/2028 | | | | | 300 | | | | | | 285 | |
|
Clearway Energy Operating LLC | |
3.750% due 02/15/2031 | | | | | 185 | | | | | | 162 | |
|
Constellation Energy Generation LLC | |
3.250% due 06/01/2025 | | | | | 120 | | | | | | 117 | |
| | | | | | |
| 94 | | PIMCO ETF TRUST | | | See Accompanying Notes | |
| | | | | | | | | | | | |
| | | | | PRINCIPAL
AMOUNT
(000S) | | | | | MARKET
VALUE
(000S) | |
|
Electricite de France SA | |
4.875% due 09/21/2038 | | $ | | | 100 | | | $ | | | 90 | |
6.000% due 04/22/2064 | | | | | 1,000 | | | | | | 931 | |
9.125% due 03/15/2033 •(d) | | | | | 120 | | | | | | 131 | |
|
Exelon Corp. | |
3.400% due 04/15/2026 | | | | | 305 | | | | | | 295 | |
|
FirstEnergy Corp. | |
2.250% due 09/01/2030 | | | | | 90 | | | | | | 75 | |
3.400% due 03/01/2050 | | | | | 650 | | | | | | 435 | |
|
Georgia Power Co. | |
4.950% due 05/17/2033 | | | | | 90 | | | | | | 88 | |
5.250% due 03/15/2034 | | | | | 500 | | | | | | 499 | |
|
MidAmerican Energy Co. | |
3.650% due 04/15/2029 | | | | | 335 | | | | | | 317 | |
|
ONEOK, Inc. | |
5.200% due 07/15/2048 | | | | | 100 | | | | | | 89 | |
|
Pacific Gas & Electric Co. | |
3.300% due 12/01/2027 | | | | | 600 | | | | | | 560 | |
4.550% due 07/01/2030 | | | | | 365 | | | | | | 346 | |
5.800% due 05/15/2034 | | | | | 2,025 | | | | | | 2,013 | |
6.950% due 03/15/2034 | | | | | 250 | | | | | | 269 | |
|
PacifiCorp | |
5.300% due 02/15/2031 | | | | | 500 | | | | | | 499 | |
5.500% due 05/15/2054 | | | | | 390 | | | | | | 363 | |
|
Southern California Edison Co. | |
5.200% due 06/01/2034 | | | | | 925 | | | | | | 904 | |
5.875% due 12/01/2053 | | | | | 585 | | | | | | 584 | |
|
Sprint Capital Corp. | |
6.875% due 11/15/2028 | | | | | 600 | | | | | | 636 | |
8.750% due 03/15/2032 | | | | | 500 | | | | | | 602 | |
|
Tallgrass Energy Partners LP | |
6.000% due 12/31/2030 | | | | | 545 | | | | | | 508 | |
7.375% due 02/15/2029 | | | | | 500 | | | | | | 503 | |
|
Targa Resources Partners LP | |
5.000% due 01/15/2028 | | | | | 60 | | | | | | 59 | |
|
Yinson Production Financial Services Pte Ltd. | |
9.625% due 05/03/2029 | | | | | 1,000 | | | | | | 997 | |
| | | | | | | | | | | | |
| | | | | | | | | | | 14,740 | |
| | | | | | | | | | | | |
Total Corporate Bonds & Notes (Cost $247,544) | | | 250,130 | |
| | | | |
| |
| MUNICIPAL BONDS & NOTES 0.3% | |
| |
| CALIFORNIA 0.0% | |
|
California State General Obligation Bonds, Series 2023 | |
5.125% due 03/01/2038 | | | | | 155 | | | | | | 154 | |
|
California State University Revenue Bonds, Series 2020 | |
2.975% due 11/01/2051 | | | | | 215 | | | | | | 147 | |
| | | | | | | | | | | | |
| | | | | | | | | | | 301 | |
| | | | | | | | | | | | |
| |
| IOWA 0.3% | |
|
Iowa Finance Authority Revenue Notes, Series 2024 | |
5.000% due 08/01/2034 | | | | | 2,200 | | | | | | 2,571 | |
| | | | | | | | | | | | |
Total Municipal Bonds & Notes
(Cost $2,863) | | | 2,872 | |
| | | | |
| |
| U.S. GOVERNMENT AGENCIES 42.1% | |
|
Uniform Mortgage-Backed Security | |
6.000% due 10/01/2053 | | | | | 169 | | | | | | 170 | |
|
Uniform Mortgage-Backed Security, TBA | |
4.500% due 07/01/2054 - 08/01/2054 | | | | | 67,800 | | | | | | 63,926 | |
5.000% due 07/01/2054 - 09/01/2054 | | | | | 76,350 | | | | | | 73,798 | |
5.500% due 07/01/2054 - 08/01/2054 | | | | | 169,230 | | | | | | 166,909 | |
6.000% due 08/01/2054 | | | | | 118,190 | | | | | | 118,481 | |
| | | | | | | | | | | | |
Total U.S. Government Agencies (Cost $423,449) | | | 423,284 | |
| | | | |
| |
| | | | | | | | | | | | |
| | | | | PRINCIPAL
AMOUNT
(000S) | | | | | MARKET
VALUE
(000S) | |
| U.S. TREASURY OBLIGATIONS 9.8% | |
|
U.S. Treasury Bonds | |
4.375% due 08/15/2043 | | $ | | | 1,041 | | | $ | | | 1,005 | |
|
U.S. Treasury Inflation Protected Securities (c) | |
1.125% due 01/15/2033 | | | | | 1,368 | | | | | | 1,267 | |
1.250% due 04/15/2028 | | | | | 2,927 | | | | | | 2,828 | |
1.750% due 01/15/2034 | | | | | 29,883 | | | | | | 29,011 | |
2.125% due 04/15/2029 (h) | | | | | 52,098 | | | | | | 52,175 | |
|
U.S. Treasury Notes | |
3.625% due 05/31/2028 (j)(l) | | | | | 12,388 | | | | | | 12,036 | |
| | | | | | | | | | | | |
Total U.S. Treasury Obligations (Cost $98,142) | | | 98,322 | |
| | | | |
| |
| NON-AGENCY MORTGAGE-BACKED SECURITIES 23.9% | |
|
American Home Mortgage Assets Trust | |
6.073% due 11/25/2046 • | | | | | 502 | | | | | | 125 | |
|
Angel Oak Mortgage Trust | |
4.800% due 11/25/2067 þ | | | | | 2,325 | | | | | | 2,255 | |
5.985% due 01/25/2069 þ | | | | | 1,899 | | | | | | 1,892 | |
6.197% due 01/25/2069 þ | | | | | 3,847 | | | | | | 3,852 | |
6.500% due 12/25/2067 þ | | | | | 859 | | | | | | 863 | |
|
Avon Finance PLC | |
6.134% due 12/28/2049 • | | GBP | | | 867 | | | | | | 1,096 | |
|
BAMLL Commercial Mortgage Securities Trust | |
2.847% due 04/20/2042 « | | $ | | | 2,790 | | | | | | 2,055 | |
|
Banc of America Alternative Loan Trust | |
5.707% due 10/25/2036 ~ | | | | | 4,051 | | | | | | 1,175 | |
6.359% due 10/25/2036 þ | | | | | 5,316 | | | | | | 1,544 | |
|
Benchmark Mortgage Trust | |
2.732% due 02/15/2053 | | | | | 1,400 | | | | | | 1,227 | |
3.944% due 07/15/2051 | | | | | 1,300 | | | | | | 1,232 | |
|
BINOM Securitization Trust | |
4.441% due 08/25/2057 ~ | | | | | 6,263 | | | | | | 5,941 | |
|
BX Trust | |
6.342% due 02/15/2039 • | | | | | 237 | | | | | | 235 | |
|
Chase Home Lending Mortgage Trust | |
3.250% due 03/25/2063 ~ | | | | | 1,052 | | | | | | 930 | |
3.250% due 03/25/2064 ~ | | | | | 3,893 | | | | | | 3,401 | |
3.250% due 08/25/2064 ~ | | | | | 4,965 | | | | | | 4,325 | |
3.250% due 09/25/2064 ~ | | | | | 8,700 | | | | | | 7,623 | |
|
CIM Trust | |
3.250% due 10/25/2058 ~ | | | | | 1,189 | | | | | | 1,054 | |
6.639% due 12/25/2067 þ | | | | | 433 | | | | | | 433 | |
|
COLT Mortgage Loan Trust | |
5.162% due 04/25/2067 þ | | | | | 754 | | | | | | 742 | |
6.393% due 06/25/2069 þ | | | | | 4,590 | | | | | | 4,622 | |
6.421% due 05/25/2069 þ | | | | | 1,976 | | | | | | 1,991 | |
|
Credit Suisse Mortgage Capital Mortgage-Backed Trust | |
2.000% due 01/25/2060 ~ | | | | | 10,974 | | | | | | 9,590 | |
3.650% due 07/25/2058 ~ | | | | | 727 | | | | | | 701 | |
|
Cross Mortgage Trust | |
6.093% due 04/25/2069 þ | | | | | 978 | | | | | | 977 | |
6.147% due 07/25/2069 þ | | | | | 4,300 | | | | | | 4,312 | |
6.272% due 06/25/2069 þ | | | | | 5,540 | | | | | | 5,558 | |
6.615% due 03/25/2068 þ | | | | | 422 | | | | | | 425 | |
|
DC Commercial Mortgage Trust | |
6.314% due 09/12/2040 | | | | | 500 | | | | | | 513 | |
|
Deutsche ALT-A Securities, Inc. Mortgage Loan Trust | |
5.940% due 12/25/2036 • | | | | | 19,563 | | | | | | 4,057 | |
|
GCAT Trust | |
4.250% due 05/25/2067 ~ | | | | | 3,033 | | | | | | 2,807 | |
6.007% due 01/25/2059 þ | | | | | 915 | | | | | | 914 | |
6.085% due 06/25/2059 þ | | | | | 2,907 | | | | | | 2,912 | |
|
HarborView Mortgage Loan Trust | |
6.073% due 11/19/2035 • | | | | | 1,569 | | | | | | 1,028 | |
6.133% due 06/20/2035 • | | | | | 3,977 | | | | | | 3,628 | |
|
ILPT Commercial Mortgage Trust | |
7.574% due 10/15/2039 • | | | | | 1,878 | | | | | | 1,870 | |
|
Independence Plaza Trust | |
3.763% due 07/10/2035 | | | | | 1,000 | | | | | | 956 | |
|
JP Morgan Chase Commercial Mortgage Securities Trust | |
6.426% due 02/15/2035 • | | | | | 848 | | | | | | 844 | |
| | | | | | | | | | | | |
| | | | | PRINCIPAL
AMOUNT
(000S) | | | | | MARKET
VALUE
(000S) | |
|
JP Morgan Mortgage Trust | |
4.625% due 07/25/2063 ~ | | $ | | | 1,799 | | | $ | | | 1,719 | |
5.250% due 11/25/2063 ~ | | | | | 453 | | | | | | 445 | |
5.990% due 07/25/2064 ~ | | | | | 982 | | | | | | 982 | |
|
MFA Trust | |
6.105% due 12/25/2068 þ | | | | | 2,456 | | | | | | 2,463 | |
6.775% due 10/25/2058 þ | | | | | 1,147 | | | | | | 1,153 | |
|
New York Mortgage Trust | |
3.750% due 02/25/2068 ~ | | | | | 965 | | | | | | 890 | |
|
NLT Trust | |
3.200% due 10/25/2062 ~ | | | | | 3,600 | | | | | | 3,190 | |
|
Nomura Asset Acceptance Corp. Alternative Loan Trust | |
5.978% due 08/25/2036 ~ | | | | | 9,547 | | | | | | 2,721 | |
|
OBX Trust | |
3.564% due 03/25/2053 ~ | | | | | 1,410 | | | | | | 1,368 | |
3.601% due 04/25/2053 ~ | | | | | 1,886 | | | | | | 1,812 | |
5.878% due 12/25/2063 þ | | | | | 9,269 | | | | | | 9,260 | |
6.233% due 05/25/2064 þ | | | | | 3,472 | | | | | | 3,490 | |
6.465% due 10/25/2063 þ | | | | | 921 | | | | | | 926 | |
6.520% due 07/25/2063 þ | | | | | 409 | | | | | | 411 | |
6.567% due 06/25/2063 þ | | | | | 408 | | | | | | 411 | |
6.844% due 04/25/2063 þ | | | | | 1,056 | | | | | | 1,070 | |
7.159% due 10/25/2063 þ | | | | | 1,750 | | | | | | 1,785 | |
|
OPEN Trust | |
8.418% due 10/15/2028 • | | | | | 632 | | | | | | 641 | |
|
Opteum Mortgage Acceptance Corp. Asset-Backed Pass-Through Certificates | |
6.225% due 11/25/2035 • | | | | | 3,184 | | | | | | 2,950 | |
|
PRKCM Trust | |
6.431% due 05/25/2059 þ | | | | | 2,466 | | | | | | 2,477 | |
6.584% due 09/25/2058 þ | | | | | 854 | | | | | | 858 | |
7.225% due 11/25/2058 þ | | | | | 914 | | | | | | 931 | |
|
PRPM LLC | |
3.750% due 03/25/2054 þ | | | | | 962 | | | | | | 919 | |
4.000% due 11/25/2053 þ | | | | | 1,072 | | | | | | 1,033 | |
4.000% due 01/25/2054 þ | | | | | 1,905 | | | | | | 1,829 | |
4.000% due 05/25/2054 þ | | | | | 1,000 | | | | | | 961 | |
4.200% due 12/25/2064 þ | | | | | 2,815 | | | | | | 2,707 | |
6.265% due 12/25/2068 þ | | | | | 3,862 | | | | | | 3,866 | |
6.327% due 06/25/2069 þ | | | | | 3,300 | | | | | | 3,310 | |
6.959% due 02/25/2029 þ | | | | | 1,898 | | | | | | 1,907 | |
|
PRPM Trust | |
6.221% due 11/25/2068 þ | | | | | 1,923 | | | | | | 1,922 | |
6.250% due 08/25/2068 þ | | | | | 929 | | | | | | 925 | |
|
RCKT Mortgage Trust | |
6.141% due 04/25/2044 ~ | | | | | 4,795 | | | | | | 4,794 | |
6.147% due 06/25/2044 þ | | | | | 9,932 | | | | | | 10,002 | |
|
Residential Accredit Loans, Inc. Trust | |
6.500% due 09/25/2037 | | | | | 5,817 | | | | | | 4,586 | |
|
SMRT Commercial Mortgage Trust | |
6.329% due 01/15/2039 • | | | | | 1,500 | | | | | | 1,482 | |
|
Starwood Mortgage Trust | |
6.543% due 04/15/2034 • | | | | | 855 | | | | | | 848 | |
|
Towd Point Mortgage Funding | |
0.000% due 07/20/2053 • | | GBP | | | 4,000 | | | | | | 5,064 | |
|
Towd Point Mortgage Trust | |
2.750% due 07/25/2057 ~ | | $ | | | 318 | | | | | | 314 | |
3.750% due 04/25/2057 ~ | | | | | 1,500 | | | | | | 1,443 | |
6.460% due 10/25/2048 • | | | | | 873 | | | | | | 887 | |
|
Tower Bridge Funding PLC | |
0.000% due 05/20/2066 • | | GBP | | | 3,900 | | | | | | 4,949 | |
|
Trinity Square PLC | |
0.000% due 07/15/2059 ~ | | | | | 1,000 | | | | | | 1,263 | |
|
Verus Securitization Trust | |
3.417% due 01/25/2060 þ | | $ | | | 376 | | | | | | 361 | |
5.811% due 05/25/2068 þ | | | | | 1,779 | | | | | | 1,770 | |
5.999% due 02/25/2068 þ | | | | | 948 | | | | | | 943 | |
6.116% due 03/25/2069 þ | | | | | 11,466 | | | | | | 11,471 | |
6.192% due 06/25/2069 þ | | | | | 5,800 | | | | | | 5,820 | |
6.193% due 03/25/2068 þ | | | | | 384 | | | | | | 384 | |
6.218% due 06/25/2069 þ | | | | | 5,712 | | | | | | 5,737 | |
6.259% due 12/25/2068 þ | | | | | 8,758 | | | | | | 8,791 | |
6.338% due 04/25/2069 þ | | | | | 4,023 | | | | | | 4,045 | |
6.443% due 08/25/2068 þ | | | | | 1,035 | | | | | | 1,036 | |
6.665% due 09/25/2068 þ | | | | | 1,079 | | | | | | 1,088 | |
| | | | | | | | | | | | |
| See Accompanying Notes | | | ANNUAL FINANCIAL AND OTHER INFORMATION | | | | | | | JUNE 30, 2024 | | | 95 |
| | | | | | |
| Schedule of Investments | | PIMCO Multisector Bond Active Exchange-Traded Fund | | (Cont.) | | |
| | | | | | | | | | | | |
| | | | | PRINCIPAL
AMOUNT
(000S) | | | | | MARKET
VALUE
(000S) | |
6.876% due 11/25/2068 ~ | | $ | | | 1,409 | | | $ | | | 1,433 | |
7.070% due 10/25/2068 þ | | | | | 882 | | | | | | 897 | |
|
Visio Trust | |
6.598% due 10/25/2058 þ | | | | | 939 | | | | | | 941 | |
|
WaMu Mortgage Pass-Through Certificates Trust | |
5.014% due 01/25/2036 ~ | | | | | 5,706 | | | | | | 5,308 | |
6.320% due 10/25/2045 • | | | | | 2,210 | | | | | | 2,093 | |
|
Wells Fargo Commercial Mortgage Trust | |
2.892% due 08/15/2052 | | | | | 1,400 | | | | | | 1,241 | |
3.640% due 12/15/2059 | | | | | 500 | | | | | | 477 | |
|
WSTN Trust | |
6.518% due 07/05/2037 ~ | | | | | 400 | | | | | | 402 | |
| | | | | | | | | | |
Total Non-Agency Mortgage-Backed Securities (Cost $239,418) | | | | | | 240,907 | |
| | | | | | | | | | | | |
| | | | | | | | | | | | |
| ASSET-BACKED SECURITIES 37.9% | |
|
37 Capital CLO Ltd. | |
7.167% due 01/15/2034 • | | | | | 1,700 | | | | | | 1,707 | |
|
522 Funding CLO Ltd. | |
6.666% due 04/20/2030 • | | | | | 567 | | | | | | 568 | |
|
ACE Securities Corp. Home Equity Loan Trust | |
5.820% due 07/25/2037 • | | | | | 30,378 | | | | | | 7,810 | |
7.710% due 08/25/2045 • | | | | | 7,700 | | | | | | 6,557 | |
|
ACHV ABS Trust | |
5.900% due 04/25/2031 | | | | | 946 | | | | | | 948 | |
|
Allegro CLO Ltd. | |
6.557% due 10/16/2031 • | | | | | 1,000 | | | | | | 1,000 | |
|
Ally Bank Auto Credit-Linked Notes Trust | |
5.827% due 05/17/2032 | | | | | 1,100 | | | | | | 1,100 | |
6.022% due 05/17/2032 | | | | | 1,100 | | | | | | 1,101 | |
6.315% due 05/17/2032 | | | | | 500 | | | | | | 501 | |
|
American Money Management Corp. CLO Ltd. | |
6.537% due 11/10/2030 • | | | | | 788 | | | | | | 789 | |
|
Ameriquest Mortgage Securities, Inc. Asset-Backed Pass-Through Certificates | |
6.405% due 07/25/2035 • | | | | | 280 | | | | | | 277 | |
6.510% due 08/25/2035 • | | | | | 1,922 | | | | | | 1,877 | |
|
Anchorage Capital CLO Ltd. | |
6.985% due 04/20/2037 • | | | | | 1,500 | | | | | | 1,506 | |
|
AREIT LLC | |
7.441% due 08/17/2041 • | | | | | 493 | | | | | | 495 | |
|
AREIT Trust | |
6.523% due 11/17/2038 • | | | | | 1,080 | | | | | | 1,075 | |
|
Argent Securities, Inc. Asset-Backed Pass-Through Certificates | |
5.920% due 01/25/2036 • | | | | | 384 | | | | | | 360 | |
|
Ascent Education Funding Trust | |
6.140% due 10/25/2050 | | | | | 2,167 | | | | | | 2,186 | |
|
Asset-Backed Securities Corp. Home Equity Loan Trust | |
7.485% due 05/25/2035 • | | | | | 2,778 | | | | | | 2,288 | |
|
Avis Budget Rental Car Funding AESOP LLC | |
5.200% due 10/20/2027 | | | | | 500 | | | | | | 498 | |
5.360% due 06/20/2030 | | | | | 2,000 | | | | | | 1,995 | |
5.900% due 08/21/2028 | | | | | 1,200 | | | | | | 1,216 | |
| | | | |
Barings CLO Ltd. | | | | | | | | | | | | |
6.576% due 01/20/2031 • | | | | | 1,773 | | | | | | 1,775 | |
| | | | |
Barings Euro CLO DAC | | | | | | | | | | | | |
4.862% due 07/25/2035 • | | EUR | | | 2,000 | | | | | | 2,139 | |
|
Bear Stearns Asset-Backed Securities Trust | |
6.037% due 03/25/2035 • | | $ | | | 1,559 | | | | | | 1,551 | |
|
Benefit Street Partners CLO Ltd. | |
6.540% due 10/15/2030 • | | | | | 277 | | | | | | 278 | |
| | | | |
BlueMountain CLO Ltd. | | | | | | | | | | | | |
6.522% due 11/15/2030 • | | | | | 1,853 | | | | | | 1,856 | |
|
BlueMountain Fuji EUR CLO DAC | |
4.816% due 01/15/2033 • | | EUR | | | 6,000 | | | | | | 6,400 | |
|
Carlyle Global Market Strategies Euro CLO DAC | |
4.883% due 01/16/2033 • | | | | | 500 | | | | | | 535 | |
|
Carlyle U.S. CLO Ltd. | |
6.750% due 10/15/2035 • | | $ | | | 1,200 | | | | | | 1,203 | |
| | | | | | | | | | | | |
| | | | | PRINCIPAL
AMOUNT
(000S) | | | | | MARKET
VALUE
(000S) | |
|
Carvana Auto Receivables Trust | |
5.670% due 09/10/2030 | | $ | | | 6,250 | | | $ | | | 6,267 | |
5.820% due 09/10/2030 | | | | | 3,750 | | | | | | 3,762 | |
|
Chase Funding Trust | |
5.920% due 12/25/2033 • | | | | | 1,082 | | | | | | 1,049 | |
|
CIFC Funding Ltd. | |
6.535% due 10/24/2030 • | | | | | 190 | | | | | | 190 | |
6.696% due 01/22/2031 • | | | | | 943 | | | | | | 945 | |
|
Citicorp Residential Mortgage Trust | |
4.583% due 07/25/2036 þ | | | | | 7,347 | | | | | | 6,875 | |
|
Citigroup Mortgage Loan Trust | |
5.860% due 11/25/2046 • | | | | | 503 | | | | | | 485 | |
|
College Avenue Student Loans LLC | |
6.560% due 07/25/2051 • | | | | | 2,697 | | | | | | 2,683 | |
6.860% due 12/28/2048 • | | | | | 1,559 | | | | | | 1,560 | |
|
Contego CLO DAC | |
4.726% due 01/15/2031 | | EUR | | | 9,015 | | | | | | 9,652 | |
|
Countrywide Asset-Backed Certificates Trust | |
5.456% due 07/25/2035 ~ | | $ | | | 1,059 | | | | | | 1,042 | |
7.635% due 12/25/2034 • | | | | | 3,471 | | | | | | 3,082 | |
|
CPS Auto Receivables Trust | |
5.650% due 05/15/2028 | | | | | 1,650 | | | | | | 1,648 | |
5.740% due 04/15/2030 | | | | | 1,500 | | | | | | 1,499 | |
|
CRB Securitization Trust | |
6.960% due 10/20/2033 | | | | | 338 | | | | | | 340 | |
|
Cumulus Static CLO DAC | |
5.025% due 11/15/2033 • | | EUR | | | 1,000 | | | | | | 1,070 | |
5.499% due 04/25/2033 • | | | | | 1,400 | | | | | | 1,500 | |
|
Drive Auto Receivables Trust | |
5.310% due 01/16/2029 | | $ | | | 3,000 | | | | | | 2,988 | |
|
Dryden Euro CLO DAC | |
4.904% due 10/18/2034 • | | EUR | | | 7,000 | | | | | | 7,485 | |
5.104% due 04/18/2035 • | | | | | 6,000 | | | | | | 6,401 | |
|
ECMC Group Student Loan Trust | |
6.600% due 11/25/2069 • | | $ | | | 975 | | | | | | 977 | |
|
Elevation CLO Ltd. | |
6.870% due 07/15/2029 • | | | | | 20 | | | | | | 20 | |
|
Equifirst Loan Securitization Trust | |
5.720% due 04/25/2037 • | | | | | 5,000 | | | | | | 3,702 | |
|
Exeter Automobile Receivables Trust | |
5.410% due 05/15/2030 | | | | | 1,500 | | | | | | 1,493 | |
|
FCCU Auto Receivables Trust | |
5.460% due 04/15/2030 | | | | | 1,000 | | | | | | 1,003 | |
5.540% due 04/16/2029 | | | | | 2,800 | | | | | | 2,806 | |
|
FHF Issuer Trust | |
5.690% due 02/15/2030 | | | | | 3,000 | | | | | | 2,998 | |
5.890% due 06/15/2030 | | | | | 3,500 | | | | | | 3,509 | |
|
Ford Auto Securitization Trust | |
4.972% due 03/15/2030 | | CAD | | | 3,000 | | | | | | 2,213 | |
5.053% due 07/15/2028 | | | | | 3,000 | | | | | | 2,202 | |
|
Foursight Capital Automobile Receivables Trust | |
5.490% due 01/16/2029 | | $ | | | 1,988 | | | | | | 1,982 | |
5.550% due 05/15/2029 | | | | | 1,000 | | | | | | 995 | |
|
Galaxy CLO Ltd. | |
6.608% due 05/16/2031 • | | | | | 507 | | | | | | 508 | |
|
GLS Auto Receivables Issuer Trust | |
5.240% due 03/15/2030 | | | | | 2,456 | | | | | | 2,446 | |
5.490% due 07/17/2028 | | | | | 3,000 | | | | | | 2,993 | |
5.770% due 11/15/2028 | | | | | 7,000 | | | | | | 7,017 | |
|
GLS Auto Select Receivables Trust | |
5.640% due 06/17/2030 | | | | | 3,250 | | | | | | 3,265 | |
5.640% due 08/15/2030 (a) | | | | | 800 | | | | | | 801 | |
5.920% due 08/15/2030 (a) | | | | | 1,000 | | | | | | 1,002 | |
|
GoldenTree Loan Management U.S. CLO Ltd. | |
6.995% due 01/20/2034 • | | | | | 1,000 | | | | | | 1,007 | |
|
Golub Capital Partners Static Ltd. | |
6.557% due 04/20/2033 • | | | | | 2,000 | | | | | | 1,998 | |
|
GSAA Home Equity Trust | |
5.560% due 05/25/2037 • | | | | | 8,199 | | | | | | 2,883 | |
|
GSAMP Trust | |
5.640% due 06/25/2036 • | | | | | 865 | | | | | | 472 | |
6.195% due 09/25/2035 • | | | | | 1,662 | | | | | | 1,613 | |
| | | | | | | | | | | | |
| | | | | PRINCIPAL
AMOUNT
(000S) | | | | | MARKET
VALUE
(000S) | |
|
Harvest CLO DAC | |
4.846% due 01/15/2034 • | | EUR | | | 10,000 | | | $ | | | 10,724 | |
|
Hayfin Emerald CLO | |
4.946% due 10/15/2034 • | | | | | 5,000 | | | | | | 5,347 | |
|
HSI Asset Securitization Corp. Trust | |
5.720% due 12/25/2036 • | | $ | | | 5,226 | | | | | | 2,042 | |
|
Invesco Euro CLO DAC | |
4.976% due 01/15/2034 • | | EUR | | | 10,000 | | | | | | 10,649 | |
|
IXIS Real Estate Capital Trust | |
6.060% due 03/25/2036 • | | $ | | | 156 | | | | | | 81 | |
|
JP Morgan Mortgage Acquisition Trust | |
4.609% due 11/25/2036 • | | | | | 1,290 | | | | | | 1,128 | |
|
KKR CLO Ltd. | |
6.757% due 02/09/2035 • | | | | | 2,000 | | | | | | 1,996 | |
|
KREF Ltd. | |
6.789% due 02/17/2039 • | | | | | 1,000 | | | | | | 999 | |
|
LCM LP | |
6.720% due 10/15/2031 • | | | | | 804 | | | | | | 805 | |
|
Lendmark Funding Trust | |
5.530% due 06/21/2032 | | | | | 3,100 | | | | | | 3,112 | |
|
LoanCore Issuer Ltd. | |
6.743% due 07/15/2036 • | | | | | 1,217 | | | | | | 1,215 | |
6.883% due 01/17/2037 • | | | | | 997 | | | | | | 998 | |
|
Long Beach Mortgage Loan Trust | |
6.210% due 02/25/2034 • | | | | | 1,295 | | | | | | 1,267 | |
|
Madison Park Funding Ltd. | |
6.507% due 10/18/2030 • | | | | | 3,916 | | | | | | 3,920 | |
6.526% due 10/21/2030 • | | | | | 479 | | | | | | 480 | |
|
Magnetite Ltd. | |
6.479% due 10/15/2031 • | | | | | 2,712 | | | | | | 2,715 | |
|
Marathon CLO Ltd. | |
6.534% due 04/15/2032 • | | | | | 4,000 | | | | | | 4,004 | |
|
Merrill Lynch First Franklin Mortgage Loan Trust | |
5.720% due 06/25/2037 • | | | | | 1,611 | | | | | | 1,566 | |
5.960% due 06/25/2037 «• | | | | | 296 | | | | | | 282 | |
|
MF1 LLC | |
7.076% due 03/19/2039 • | | | | | 2,000 | | | | | | 1,998 | |
|
MidOcean Credit CLO | |
6.706% due 04/21/2031 • | | | | | 706 | | | | | | 707 | |
|
Morgan Stanley ABS Capital, Inc. Trust | |
6.080% due 12/25/2035 • | | | | | 369 | | | | | | 358 | |
6.360% due 05/25/2034 • | | | | | 6,897 | | | | | | 6,628 | |
|
Nassau Ltd. | |
6.840% due 01/15/2030 • | | | | | 389 | | | | | | 389 | |
|
Navient Student Loan Trust | |
6.350% due 08/26/2069 • | | | | | 964 | | | | | | 964 | |
|
Nelnet Student Loan Trust | |
6.640% due 02/20/2041 | | | | | 378 | | | | | | 378 | |
7.533% due 02/20/2041 • | | | | | 378 | | | | | | 378 | |
|
Neuberger Berman CLO Ltd. | |
6.510% due 10/15/2029 • | | | | | 812 | | | | | | 814 | |
|
OCP CLO Ltd. | |
6.706% due 07/20/2029 • | | | | | 168 | | | | | | 168 | |
|
OneMain Direct Auto Receivables Trust | |
5.410% due 11/14/2029 | | | | | 4,000 | | | | | | 3,998 | |
|
Oportun Issuance Trust | |
6.334% due 04/08/2031 | | | | | 1,323 | | | | | | 1,324 | |
|
OZLM Ltd. | |
6.475% due 07/20/2030 • | | | | | 1,000 | | | | | | 1,001 | |
|
Pagaya AI Debt Selection Trust | |
6.093% due 11/15/2031 | | | | | 2,200 | | | | | | 2,201 | |
6.258% due 10/15/2031 | | | | | 3,742 | | | | | | 3,745 | |
6.278% due 10/15/2031 | | | | | 2,700 | | | | | | 2,703 | |
6.660% due 07/15/2031 | | | | | 2,531 | | | | | | 2,543 | |
7.037% due 03/15/2030 ~ | | | | | 1,079 | | | | | | 1,083 | |
7.128% due 06/16/2031 | | | | | 288 | | | | | | 289 | |
7.228% due 07/15/2031 | | | | | 362 | | | | | | 363 | |
7.299% due 06/16/2031 | | | | | 998 | | | | | | 1,010 | |
7.625% due 04/15/2031 | | | | | 1,100 | | | | | | 1,107 | |
7.656% due 05/15/2030 | | | | | 1,000 | | | | | | 1,006 | |
8.121% due 12/16/2030 ~ | | | | | 886 | | | | | | 894 | |
8.388% due 07/15/2030 ~ | | | | | 1,094 | | | | | | 1,108 | |
9.099% due 04/15/2031 | | | | | 1,000 | | | | | | 1,023 | |
| | | | | | |
| 96 | | PIMCO ETF TRUST | | | See Accompanying Notes | |
| | | | | | | | | | | | |
| | | | | PRINCIPAL
AMOUNT
(000S) | | | | | MARKET
VALUE
(000S) | |
9.435% due 07/15/2030 | | $ | | | 2,200 | | | $ | | | 2,246 | |
9.570% due 12/16/2030 | | | | | 2,699 | | | | | | 2,769 | |
|
PRET LLC | |
7.143% due 03/25/2054 þ | | | | | 4,744 | | | | | | 4,737 | |
|
Race Point CLO Ltd. | |
6.627% due 02/20/2030 • | | | | | 943 | | | | | | 944 | |
|
Rad CLO Ltd. | |
0.000% due 04/25/2032 • | | | | | 4,000 | | | | | | 4,008 | |
|
Reach ABS Trust | |
6.290% due 02/18/2031 | | | | | 950 | | | | | | 950 | |
6.300% due 02/18/2031 | | | | | 2,006 | | | | | | 2,011 | |
|
Regatta Funding Ltd. | |
6.523% due 10/25/2031 • | | | | | 4,000 | | | | | | 4,006 | |
|
Regional Management Issuance Trust | |
5.830% due 07/15/2036 | | | | | 1,500 | | | | | | 1,508 | |
|
Research-Driven Pagaya Motor Asset Trust | |
7.090% due 06/25/2032 | | | | | 2,480 | | | | | | 2,493 | |
7.130% due 01/26/2032 | | | | | 990 | | | | | | 996 | |
|
Residential Asset Securities Corp. Trust | |
7.485% due 03/25/2035 • | | | | | 669 | | | | | | 605 | |
|
Rockford Tower Europe CLO DAC | |
5.220% due 04/24/2037 • | | EUR | | | 4,700 | | | | | | 5,038 | |
|
Santander Drive Auto Receivables Trust | |
5.450% due 03/15/2030 | | $ | | | 1,295 | | | | | | 1,293 | |
5.470% due 12/16/2030 | | | | | 7,000 | | | | | | 6,998 | |
6.400% due 03/17/2031 | | | | | 500 | | | | | | 514 | |
6.430% due 02/18/2031 | | | | | 500 | | | | | | 515 | |
|
Saxon Asset Securities Trust | |
5.560% due 05/25/2047 • | | | | | 186 | | | | | | 130 | |
5.860% due 09/25/2047 • | | | | | 639 | | | | | | 592 | |
5.955% due 03/25/2036 • | | | | | 6,050 | | | | | | 4,390 | |
|
SCCU Auto Receivables Trust | |
5.700% due 10/16/2028 | | | | | 2,600 | | | | | | 2,617 | |
|
Securitized Asset-Backed Receivables LLC Trust | |
5.720% due 01/25/2037 • | | | | | 828 | | | | | | 778 | |
5.880% due 12/25/2036 • | | | | | 3,711 | | | | | | 1,752 | |
|
SLM Student Loan Trust | |
4.282% due 10/25/2039 • | | EUR | | | 1,371 | | | | | | 1,384 | |
|
SMB Private Education Loan Trust | |
0.000% due 07/05/2053 • | | $ | | | 5,000 | | | | | | 4,977 | |
5.380% due 01/15/2053 | | | | | 1,177 | | | | | | 1,175 | |
5.380% due 07/05/2053 | | | | | 5,000 | | | | | | 5,004 | |
5.500% due 06/17/2052 | | | | | 4,930 | | | | | | 4,976 | |
6.433% due 06/17/2052 • | | | | | 1,577 | | | | | | 1,581 | |
7.133% due 10/16/2056 • | | | | | 4,449 | | | | | | 4,550 | |
|
Sound Point CLO Ltd. | |
6.604% due 01/25/2032 • | | | | | 4,000 | | | | | | 4,000 | |
6.760% due 07/15/2034 • | | | | | 1,000 | | | | | | 1,000 | |
|
Soundview Home Loan Trust | |
5.720% due 02/25/2037 • | | | | | 11,479 | | | | | | 3,248 | |
|
St Paul’s CLO DAC | |
4.712% due 04/25/2030 • | | EUR | | | 5,905 | | | | | | 6,309 | |
|
Steele Creek CLO Ltd. | |
6.656% due 04/21/2031 • | | $ | | | 1,229 | | | | | | 1,230 | |
| | | | | | | | | | | | |
| | | | | PRINCIPAL
AMOUNT
(000S) | | | | | MARKET
VALUE
(000S) | |
|
Stream Innovations Trust | |
6.270% due 07/15/2044 «(a) | | $ | | | 2,300 | | | $ | | | 2,300 | |
|
Structured Asset Investment Loan Trust | |
6.410% due 10/25/2033 • | | | | | 1,856 | | | | | | 1,854 | |
|
Structured Asset Securities Corp. | |
4.991% due 02/25/2035 • | | | | | 825 | | | | | | 770 | |
6.120% due 02/25/2035 «• | | | | | 18 | | | | | | 18 | |
|
Symphony CLO Ltd. | |
6.847% due 04/15/2037 • | | | | | 2,000 | | | | | | 2,007 | |
7.125% due 01/20/2037 • | | | | | 1,000 | | | | | | 1,006 | |
|
TCW CLO Ltd. | |
6.926% due 01/16/2037 • | | | | | 2,000 | | | | | | 2,006 | |
|
TIAA CLO Ltd. | |
0.000% due 01/20/2032 •(a) | | | | | 1,700 | | | | | | 1,700 | |
6.739% due 01/16/2031 • | | | | | 659 | | | | | | 660 | |
6.816% due 01/20/2032 • | | | | | 1,702 | | | | | | 1,705 | |
|
Toro European CLO DAC | |
4.832% due 01/12/2032 • | | EUR | | | 500 | | | | | | 535 | |
|
Towd Point Mortgage Trust | |
6.125% due 02/25/2064 ~ | | $ | | | 2,981 | | | | | | 2,979 | |
|
Tricolor Auto Securitization Trust | |
6.360% due 12/15/2027 | | | | | 1,630 | | | | | | 1,631 | |
6.610% due 10/15/2027 | | | | | 1,535 | | | | | | 1,538 | |
|
Trinitas CLO Ltd. | |
6.686% due 07/20/2031 • | | | | | 1,413 | | | | | | 1,415 | |
6.694% due 04/25/2033 • | | | | | 2,000 | | | | | | 2,006 | |
|
Trysail CLO Ltd. | |
6.625% due 07/20/2032 • | | | | | 4,000 | | | | | | 4,005 | |
|
United Auto Credit Securitization Trust | |
6.170% due 08/10/2026 | | | | | 814 | | | | | | 815 | |
|
Upstart Pass-Through Trust | |
7.900% due 10/20/2028 | | | | | 1,481 | | | | | | 1,492 | |
|
Venture CLO Ltd. | |
6.716% due 04/20/2032 • | | | | | 500 | | | | | | 500 | |
|
Veros Auto Receivables Trust | |
6.280% due 11/15/2027 | | | | | 2,065 | | | | | | 2,066 | |
|
Voya CLO Ltd. | |
6.525% due 07/20/2032 • | | | | | 1,000 | | | | | | 1,002 | |
6.590% due 10/15/2030 • | | | | | 283 | | | | | | 283 | |
6.599% due 04/17/2030 • | | | | | 1,349 | | | | | | 1,350 | |
|
Wells Fargo Home Equity Asset-Backed Securities Trust | |
6.450% due 04/25/2035 • | | | | | 557 | | | | | | 555 | |
| | | | | | | | | | | | |
Total Asset-Backed Securities (Cost $380,373) | | | 381,051 | |
| | | | |
| |
| SOVEREIGN ISSUES 1.6% | |
|
Brazil Government International Bond | |
7.125% due 05/13/2054 | | | | | 500 | | | | | | 484 | |
|
Mexico Government International Bond | |
2.750% due 11/27/2031 (c) | | MXN | | | 2,438 | | | | | | 112 | |
4.000% due 11/30/2028 (c) | | | | | 56,897 | | | | | | 2,910 | |
| | | | | | | | | | | | |
| | | | | PRINCIPAL
AMOUNT
(000S) | | | | | MARKET
VALUE
(000S) | |
|
Panama Government International Bond | |
3.750% due 03/16/2025 | | $ | | | 400 | | | $ | | | 394 | |
7.500% due 03/01/2031 | | | | | 300 | | | | | | 314 | |
8.000% due 03/01/2038 | | | | | 500 | | | | | | 528 | |
|
Peru Government International Bond | |
6.150% due 08/12/2032 | | PEN | | | 9,400 | | | | | | 2,361 | |
6.900% due 08/12/2037 | | | | | 6,800 | | | | | | 1,701 | |
|
Romania Government International Bond | |
5.250% due 05/30/2032 | | EUR | | | 1,000 | | | | | | 1,043 | |
5.375% due 03/22/2031 | | | | | 500 | | | | | | 532 | |
5.625% due 02/22/2036 | | | | | 750 | | | | | | 785 | |
5.625% due 05/30/2037 | | | | | 1,000 | | | | | | 1,034 | |
6.375% due 09/18/2033 | | | | | 150 | | | | | | 167 | |
|
South Africa Government International Bond | |
8.000% due 01/31/2030 | | ZAR | | | 83,750 | | | | | | 4,222 | |
| | | | | | | | | | |
Total Sovereign Issues
(Cost $16,701) | | | 16,587 | |
| | | | |
| |
| SHORT-TERM INSTRUMENTS 1.7% | |
| | | | | | | | | | |
| REPURCHASE AGREEMENTS (g) 1.7% | |
| | | | | | | | | 16,812 | |
| | | | | | | | | | |
Total Short-Term Instruments
(Cost $16,812) | | | 16,812 | |
| | | | |
| | | | |
| | | | | | | | | | | | |
Total Investments in Securities
(Cost $1,443,152) | | | 1,447,826 | |
| | | | |
| |
| | | SHARES | | | | | | |
| INVESTMENTS IN AFFILIATES 0.3% | |
| |
| MUTUAL FUNDS (e) 0.3% | |
| | | |
PIMCO Senior Loan Active Exchange-Traded Fund | | | 66,200 | | | | | | 3,386 | |
| | | | | | | | | | |
Total Mutual Funds
(Cost $3,366) | | | 3,386 | |
| | | | |
| | | | |
| | | | | | | | | | | | |
Total Investments in Affiliates
(Cost $3,366) | | | 3,386 | |
| | | | |
| | | | | | | | | | | | |
Total Investments 144.2%
(Cost $1,446,518) | | | $ | | | 1,451,212 | |
| | | | |
Financial Derivative
Instruments (i)(k) 0.1% (Cost or Premiums, net $15,890) | | | | | | | | | 860 | |
| | | | |
| Other Assets and Liabilities, net (44.3)% | | | (446,238 | ) |
| | | | |
| Net Assets 100.0% | | | $ | | | 1,005,834 | |
| | | | | | | | | | | | |
NOTES TO SCHEDULE OF INVESTMENTS:
| * | A zero balance may reflect actual amounts rounding to less than one thousand. |
| « | Security valued using significant unobservable inputs (Level 3). |
| µ | All or a portion of this amount represents unfunded loan commitments. The interest rate for the unfunded portion will be determined at the time of funding. See Note 4, Securities and Other Investments, in the Notes to Financial Statements for more information regarding unfunded loan commitments. |
| ~ | Variable or Floating rate security. Rate shown is the rate in effect as of period end. Certain variable rate securities are not based on a published reference rate and spread, rather are determined by the issuer or agent and are based on current market conditions. Reference rate is as of reset date, which may vary by security. These securities may not indicate a reference rate and/or spread in their description. |
| • | Rate shown is the rate in effect as of period end. The rate may be based on a fixed rate, a capped rate or a floor rate and may convert to a variable or floating rate in the future. These securities do not indicate a reference rate and spread in their description. |
| þ | Coupon represents a rate which changes periodically based on a predetermined schedule or event. Rate shown is the rate in effect as of period end. |
| (c) | Principal amount of security is adjusted for inflation. |
| | | | | | | | | | | | |
| See Accompanying Notes | | | ANNUAL FINANCIAL AND OTHER INFORMATION | | | | | | | JUNE 30, 2024 | | | 97 |
| | | | | | |
| Schedule of Investments | | PIMCO Multisector Bond Active Exchange-Traded Fund | | (Cont.) | | |
| (d) | Perpetual maturity; date shown, if applicable, represents next contractual call date. |
| (e) | Institutional Class Shares of each Fund. |
(f) RESTRICTED SECURITIES:
| | | | | | | | | | | | | | | | | | | | | | |
| Issuer Description | | Coupon | | Maturity
Date | | | Acquisition
Date | | | Cost | | | Market
Value | | | Market Value
as Percentage
of Net Assets | |
National Football League | | 5.480% | | | 10/05/2028 | | | | 03/14/2024 | | | | $ 1,600 | | | $ | 1,598 | | | | 0.16 | % |
| | | | | | | | | | | | | | | | | | | | | | |
BORROWINGS AND OTHER FINANCING TRANSACTIONS
(g) REPURCHASE AGREEMENTS:
| | | | | | | | | | | | | | | | | | | | | | | | | | | | | | |
| Counterparty | | Lending
Rate | | | Settlement
Date | | | Maturity
Date | | | Principal
Amount | | | Collateralized By | | Collateral
(Received) | | | Repurchase
Agreements,
at Value | | | Repurchase
Agreement
Proceeds
to be
Received(1) | |
| BOS | | | 5.390 | % | | | 06/28/2024 | | | | 07/01/2024 | | | $ | 4,800 | | | U.S. Treasury Notes 3.750% due 05/31/2030 | | $ | (4,880 | ) | | $ | 4,800 | | | $ | 4,802 | |
| DEU | | | 5.230 | | | | 06/28/2024 | | | | 07/01/2024 | | | | 6,600 | | | U.S. Treasury Notes 1.125% due 08/31/2028 | | | (6,735 | ) | | | 6,600 | | | | 6,603 | |
| | | 5.410 | | | | 07/01/2024 | | | | 07/02/2024 | | | | 4,900 | | | U.S. Treasury Bonds 5.375% due 02/15/2031 | | | (5,010 | ) | | | 4,900 | | | | 4,900 | |
| FICC | | | 2.600 | | | | 06/28/2024 | | | | 07/01/2024 | | | | 512 | | | U.S. Treasury Inflation Protected Securities 0.625% due 01/15/2026 | | | (522 | ) | | | 512 | | | | 512 | |
| | | | | | | | | | | | | | | | | | | | | | | | | | | | | | |
Total Repurchase Agreements | | | | | $ | (17,147 | ) | | $ | 16,812 | | | $ | 16,817 | |
| | | | | | | | | | | | | | | |
REVERSE REPURCHASE AGREEMENTS:
| | | | | | | | | | | | | | | | | | | | | | | | |
| Counterparty | | Borrowing
Rate(2) | | | Settlement
Date | | | Maturity
Date | | | Amount
Borrowed(2) | | | Payable for
Reverse
Repurchase
Agreements | |
DEU | | | 5.460 | % | | | 06/28/2024 | | | | 07/01/2024 | | | $ | | | | | (2,856 | ) | | $ | (2,857 | ) |
| | | | | | | | | | | | | | | | | | | | | | | | |
Total Reverse Repurchase Agreements | | | | | | | | | | | | | | | $ | (2,857 | ) |
| | | | | | | | | | | | | | | | | | | | | | | | |
SHORT SALES:
| | | | | | | | | | | | | | | | | | | | |
| Description | | Coupon | | | Maturity
Date | | | Principal
Amount | | | Proceeds | | | Payable for
Short Sales | |
U.S. Government Agencies (7.6)% | |
Uniform Mortgage-Backed Security, TBA | | | 5.500 | % | | | 07/15/2054 | | | $ | 77,400 | | | $ | (76,233 | ) | | $ | (76,345 | ) |
| | | | | | | | | | | | | | | | | | | | |
Total Short Sales (7.6)% | | | $ | (76,233 | ) | | $ | (76,345 | ) |
| | | | | | | | | |
BORROWINGS AND OTHER FINANCING TRANSACTIONS SUMMARY
The following is a summary by counterparty of the market value of Borrowings and Other Financing Transactions and collateral pledged/(received) as of June 30, 2024:
| | | | | | | | | | | | | | | | | | | | | | | | | | | | |
| Counterparty | | Repurchase
Agreement
Proceeds
to be
Received(1) | | | Payable for
Reverse
Repurchase
Agreements | | | Payable for
Sale-Buyback
Transactions | | | Securities
Out on Loan | | | Total
Borrowings and
Other Financing
Transactions | | | Collateral
Pledged/(Received) | | | Net Exposure(3) | |
Global/Master Repurchase Agreement | |
BOS | | $ | 4,802 | | | $ | 0 | | | $ | 0 | | | $ | 0 | | | $ | 4,802 | | | $ | (4,880 | ) | | $ | (78 | ) |
DEU | | | 11,503 | | | | (2,857 | ) | | | 0 | | | | 0 | | | | 8,646 | | | | (8,903 | ) | | | (257 | ) |
FICC | | | 512 | | | | 0 | | | | 0 | | | | | | | | 512 | | | | (522 | ) | | | (10 | ) |
| | | | | | | | | | | | | | | | | | | | | | | | | | | | |
Total Borrowings and Other Financing Transactions | | $ | 16,817 | | | $ | (2,857 | ) | | $ | 0 | | | $ | 0 | | | | | | | | | | | | | |
| | | | | | | | | | | | | | | | | | | | | | | | | | | | |
| | | | | | |
| 98 | | PIMCO ETF TRUST | | | See Accompanying Notes | |
CERTAIN TRANSFERS ACCOUNTED FOR AS SECURED BORROWINGS
Remaining Contractual Maturity of the Agreements
| | | | | | | | | | | | | | | | | | | | |
| | | Overnight and
Continuous | | | Up to 30 days | | | 31-90 days | | | Greater Than 90 days | | | Total | |
Reverse Repurchase Agreements | |
U.S. Treasury Obligations | | $ | (2,857 | ) | | $ | 0 | | | $ | 0 | | | $ | 0 | | | $ | (2,857 | ) |
| | | | | | | | | | | | | | | | | | | | |
Total Borrowings | | $ | (2,857 | ) | | $ | 0 | | | $ | 0 | | | $ | 0 | | | $ | (2,857 | ) |
| | | | | | | | | | | | | | | | | | | | |
Payable for reverse repurchase agreements | | | $ | (2,857 | ) |
| | | | | |
| (h) | Securities with an aggregate market value of $2,842 have been pledged as collateral under the terms of the above master agreements as of June 30, 2024. |
| (1) | Includes accrued interest. |
| (2) | The average amount of borrowings outstanding during the period ended June 30, 2024 was $(3,248) at a weighted average interest rate of 5.411%. Average borrowings may include reverse repurchase agreements and sale-buyback transactions, if held during the period. |
| (3) | Net Exposure represents the net receivable/(payable) that would be due from/to the counterparty in the event of default. Exposure from borrowings and other financing transactions can only be netted across transactions governed under the same master agreement with the same legal entity. See Note 8, Master Netting Arrangements, in the Notes to Financial Statements for more information. |
(i) FINANCIAL DERIVATIVE INSTRUMENTS: EXCHANGE-TRADED OR CENTRALLY CLEARED
WRITTEN OPTIONS:
OPTIONS ON EXCHANGE-TRADED FUTURES CONTRACTS
| | | | | | | | | | | | | | | | | | | | | | | | |
| Description | | Strike
Price | | | Expiration
Date | | | # of
Contracts | | | Notional Amount | | | Premiums
(Received) | | | Market
Value | |
Put - CBOT U.S. Treasury 10-Year Note August 2024 Futures | | | $ 109.000 | | | | 07/26/2024 | | | | 2 | | | | $ 2 | | | $ | 0 | | | $ | (1 | ) |
Call - CBOT U.S. Treasury 10-Year Note August 2024 Futures | | | 112.000 | | | | 07/26/2024 | | | | 2 | | | | 2 | | | | (1 | ) | | | 0 | |
| | | | | | | | | | | | | | | | | | | | | | | | |
Total Written Options | | | $ | (1 | ) | | $ | (1 | ) |
| | | | | | | | | |
FUTURES CONTRACTS:
LONG FUTURES CONTRACTS
| | | | | | | | | | | | | | | | | | | | | | | | |
| Description | | Expiration
Month | | | # of
Contracts | | | Notional
Amount | | | Unrealized
Appreciation/
(Depreciation) | | | Variation Margin | |
| | Asset | | | Liability | |
Euro-BTP Future September Futures | | | 09/2024 | | | | 48 | | | $ | 5,927 | | | $ | (68 | ) | | $ | 0 | | | $ | (33 | ) |
U.S. Treasury 5-Year Note September Futures | | | 09/2024 | | | | 124 | | | | 13,216 | | | | (31 | ) | | | 0 | | | | (14 | ) |
U.S. Treasury 10-Year Ultra Long-Term Bond September Futures | | | 09/2024 | | | | 91 | | | | 10,331 | | | | (18 | ) | | | 0 | | | | (44 | ) |
| | | | | | | | | | | | | | | | | | | | | | | | |
| | | $ | (117 | ) | | $ | 0 | | | $ | (91 | ) |
| | | | | | | | | | | | | |
SHORT FUTURES CONTRACTS
| | | | | | | | | | | | | | | | | | | | | | | | |
Description | | Expiration
Month | | | # of
Contracts | | | Notional
Amount | | | Unrealized
Appreciation/
(Depreciation) | | | Variation Margin | |
| | Asset | | | Liability | |
Euro-Bund September Futures | | | 09/2024 | | | | 38 | | | $ | (5,356 | ) | | $ | 50 | | | $ | 17 | | | $ | (1 | ) |
U.S. Treasury 10-Year Note September Futures | | | 09/2024 | | | | 10 | | | | (1,100 | ) | | | (1 | ) | | | 3 | | | | 0 | |
U.S. Treasury Long-Term Bond September Futures | | | 09/2024 | | | | 4 | | | | (473 | ) | | | 1 | | | | 4 | | | | 0 | |
| | | | | | | | | | | | | | | | | | | | | | | | |
| | | | | | | | | | | | | | $ | 50 | | | $ | 24 | | | $ | (1 | ) |
| | | | | | | | | | | | | | | | | | | | | | | | |
Total Futures Contracts | | | $ | (67 | ) | | $ | 24 | | | $ | (92 | ) |
| | | | | | | | | | | | | |
SWAP AGREEMENTS:
CREDIT DEFAULT SWAPS ON CORPORATE ISSUES - SELL PROTECTION(1)
| | | | | | | | | | | | | | | | | | | | | | | | | | | | | | | | | | | | | | | | |
Reference Entity | | Fixed
Receive Rate | | | Payment
Frequency | | | Maturity
Date | | | Implied
Credit Spread at
June 30, 2024(2) | | | Notional
Amount(3) | | | Premiums
Paid/
(Received) | | | Unrealized
Appreciation/
(Depreciation) | | | Market
Value(4) | | | Variation Margin | |
| | Asset | | | Liability | |
AT&T, Inc. | | | 1.000% | | | | Quarterly | | | | 06/20/2028 | | | | 0.564% | | | $ | 500 | | | $ | 3 | | | $ | 5 | | | $ | 8 | | | $ | 1 | | | $ | 0 | |
Bombardier, Inc. | | | 5.000 | | | | Quarterly | | | | 06/20/2028 | | | | 1.474 | | | | 100 | | | | 4 | | | | 9 | | | | 13 | | | | 0 | | | | 0 | |
Calpine Corp. | | | 5.000 | | | | Quarterly | | | | 06/20/2028 | | | | 1.547 | | | | 425 | | | | 25 | | | | 28 | | | | 53 | | | | 0 | | | | 0 | |
CALPINE Corp. | | | 5.000 | | | | Quarterly | | | | 06/20/2029 | | | | 1.801 | | | | 1,100 | | | | 151 | | | | 1 | | | | 152 | | | | 1 | | | | 0 | |
Ford Motor Credit Co. LLC | | | 5.000 | | | | Quarterly | | | | 06/20/2028 | | | | 1.217 | | | | 200 | | | | 21 | | | | 6 | | | | 27 | | | | 0 | | | | 0 | |
Verizon Communications, Inc. | | | 1.000 | | | | Quarterly | | | | 12/20/2028 | | | | 0.580 | | | | 100 | | | | 1 | | | | 1 | | | | 2 | | | | 0 | | | | 0 | |
| | | | | | | | | | | | | | | | | | | | | | | | | | | | | | | | | | | | | | | | |
| | | | | | | | | | | | | | | $ | 205 | | | $ | 50 | | | $ | 255 | | | $ | 2 | | | $ | 0 | |
| | | | | | | | | | | | | | | | | | | | | | | | | | | | | | | | | |
| | | | | | | | | | | | |
| See Accompanying Notes | | | ANNUAL FINANCIAL AND OTHER INFORMATION | | | | | | | JUNE 30, 2024 | | | 99 |
| | | | | | |
| Schedule of Investments | | PIMCO Multisector Bond Active Exchange-Traded Fund | | (Cont.) | | |
CREDIT DEFAULT SWAPS ON CREDIT INDICES - SELL PROTECTION(1)
| | | | | | | | | | | | | | | | | | | | | | | | | | | | | | | | | | | | |
Index/Tranches | | Fixed
Receive Rate | | | Payment
Frequency | | | Maturity
Date | | | Notional
Amount(3) | | | Premiums
Paid/(Received) | | | Unrealized
Appreciation/
(Depreciation) | | | Market
Value(4) | | | Variation Margin | |
| | Asset | | | Liability | |
CDX.EM-40 5-Year Index | | | 1.000 | % | | | Quarterly | | | | 12/20/2028 | | | $ | 300 | | | $ | (14 | ) | | $ | 7 | | | $ | (7 | ) | | $ | 0 | | | $ | 0 | |
CDX.EM-41 5-Year Index | | | 1.000 | | | | Quarterly | | | | 06/20/2029 | | | | 200 | | | | (7 | ) | | | 0 | | | | (7 | ) | | | 0 | | | | 0 | |
CDX.HY-40 5-Year Index | | | 5.000 | | | | Quarterly | | | | 06/20/2028 | | | | 297 | | | | 10 | | | | 9 | | | | 19 | | | | 0 | | | | 0 | |
CDX.HY-41 5-Year Index | | | 5.000 | | | | Quarterly | | | | 12/20/2028 | | | | 20,988 | | | | 1,404 | | | | (39 | ) | | | 1,365 | | | | 0 | | | | (13 | ) |
CDX.HY-42 5-Year Index | | | 5.000 | | | | Quarterly | | | | 06/20/2029 | | | | 91,500 | | | | 6,092 | | | | (240 | ) | | | 5,852 | | | | 0 | | | | (56 | ) |
CDX.IG-42 5-Year Index | | | 1.00 0 | | | | Quarterly | | | | 06/20/2029 | | | | 376,000 | | | | 8,209 | | | | (399 | ) | | | 7,810 | | | | 0 | | | | (33 | ) |
| | | | | | | | | | | | | | | | | | | | | | | | | | | | | | | | | |
| | | $ | 15,694 | | | $ | (662 | ) | | $ | 15,032 | | | $ | 0 | | | $ | (102 | ) |
| | | | | | | | | | | | | | | | | | | | | |
INTEREST RATE SWAPS
| | | | | | | | | | | | | | | | | | | | | | | | | | | | | | | | | | | | | | | | |
Pay/ Receive
Floating Rate | | Floating Rate Index | | Fixed Rate | | | Payment
Frequency | | Maturity
Date | | | Notional
Amount | | | Premiums
Paid/
(Received) | | | Unrealized
Appreciation/
(Depreciation) | | | Market
Value | | | Variation Margin | |
| | Asset | | | Liability | |
Pay(5) | | 1-Day GBP-SONIO Compounded-OIS | | | 4.000 | % | | Annual | | | 09/18/2029 | | | | GBP | | | | 8,600 | | | $ | 84 | | | $ | (42 | ) | | $ | 42 | | | $ | 0 | | | $ | (11 | ) |
Receive | | 1-Day JPY-MUTKCALM Compounded-OIS | | | 0.850 | | | Annual | | | 09/20/2033 | | | | JPY | | | | 1,420,000 | | | | 57 | | | | (9 | ) | | | 48 | | | | 27 | | | | 0 | |
Receive | | 1-Day USD-SOFR Compounded-OIS | | | 4.060 | | | Annual | | | 07/02/2034 | | | | $ | | | | 500 | | | | (2 | ) | | | (2 | ) | | | (4 | ) | | | 0 | | | | (4 | ) |
Pay | | 1-Year BRL-CDI | | | 11.456 | | | Maturity | | | 01/02/2026 | | | | BRL | | | | 59,780 | | | | 117 | | | | (185 | ) | | | (68 | ) | | | 0 | | | | (29 | ) |
Pay | | 1-Year BRL-CDI | | | 9.815 | | | Maturity | | | 01/04/2027 | | | | | | | | 8,600 | | | | 0 | | | | (60 | ) | | | (60 | ) | | | 0 | | | | (6 | ) |
Pay | | 1-Year BRL-CDI | | | 9.832 | | | Maturity | | | 01/04/2027 | | | | | | | | 49,600 | | | | (131 | ) | | | (210 | ) | | | (341 | ) | | | 0 | | | | (33 | ) |
Pay(5) | | 6-Month AUD-BBR-BBSW | | | 4.750 | | | Semi-Annual | | | 12/20/2033 | | | | AUD | | | | 11,300 | | | | (39 | ) | | | 80 | | | | 41 | | | | 0 | | | | (5 | ) |
Pay | | 6-Month CZK-PRIBOR | | | 4.270 | | | Annual | | | 08/01/2028 | | | | CZK | | | | 48,900 | | | | 22 | | | | 35 | | | | 57 | | | | 2 | | | | 0 | |
Pay(5) | | 6-Month EUR-EURIBOR | | | 2.750 | | | Annual | | | 09/18/2034 | | | | EUR | | | | 2,400 | | | | 40 | | | | (50 | ) | | | (10 | ) | | | 0 | | | | (5 | ) |
Receive(5) | | 6-Month EUR-EURIBOR | | | 2.500 | | | Annual | | | 09/18/2054 | | | | | | | | 1,000 | | | | (52 | ) | | | 53 | | | | 1 | | | | 2 | | | | 0 | |
| | | | | | | | | | | | | | | | | | | | | |
| | | | | | | $ | 96 | | | $ | (390 | ) | | $ | (294 | ) | | $ | 31 | | | $ | (93 | ) |
| | | | | | | | | | | | | | | | | | | | | |
Total Swap Agreements | | | | | | | $ | 15,995 | | | $ | (1,002 | ) | | $ | 14,993 | | | $ | 33 | | | $ | (195 | ) |
| | | | | | | | | | | | | | | | | | | | | |
FINANCIAL DERIVATIVE INSTRUMENTS: EXCHANGE-TRADED OR CENTRALLY CLEARED SUMMARY
The following is a summary of the market value and variation margin of Exchange-Traded or Centrally Cleared Financial Derivative Instruments as of June 30, 2024:
| | | | | | | | | | | | | | | | | | | | | | | | | | | | | | | | | | | | |
| | | Financial Derivative Assets | | | | | | Financial Derivative Liabilities | |
| | | Market Value | | | Variation Margin
Asset | | | | | | | | | Market Value | | | Variation Margin
Liability | | | | |
| | | Purchased
Options | | | Futures | | | Swap
Agreements | | | Total | | | | | | Written
Options | | | Futures | | | Swap
Agreements | | | Total | |
Total Exchange-Traded or Centrally Cleared | | $ | 0 | | | $ | 24 | | | $ | 33 | | | $ | 57 | | | | | | | $ | | (1) | | $ | (92) | | | $ | (195) | | | $ | (288) | |
| | | | | | | | | | | | | | | | | | | | | | | | | | | | | | | | | | | | |
| (j) | Securities with an aggregate market value of $9,402 and cash of $9,062 have been pledged as collateral for exchange-traded and centrally cleared financial derivative instruments as of June 30, 2024. See Note 8, Master Netting Arrangements, in the Notes to Financial Statements for more information. |
| (1) | If the Fund is a seller of protection and a credit event occurs, as defined under the terms of that particular swap agreement, the Fund will either (i) pay to the buyer of protection an amount equal to the notional amount of the swap and take delivery of the referenced obligation or underlying securities comprising the referenced index or (ii) pay a net settlement amount in the form of cash, securities or other deliverable obligations equal to the notional amount of the swap less the recovery value of the referenced obligation or underlying securities comprising the referenced index. |
| (2) | Implied credit spreads, represented in absolute terms, utilized in determining the market value of credit default swap agreements on sovereign issues as of period end serve as indicators of the current status of the payment/performance risk and represent the likelihood or risk of default for the credit derivative. The implied credit spread of a particular referenced entity reflects the cost of buying/selling protection and may include upfront payments required to be made to enter into the agreement. Wider credit spreads represent a deterioration of the referenced entity’s credit soundness and a greater likelihood or risk of default or other credit event occurring as defined under the terms of the agreement. |
| (3) | The maximum potential amount the Fund could be required to pay as a seller of credit protection or receive as a buyer of credit protection if a credit event occurs as defined under the terms of that particular swap agreement. |
| (4) | The prices and resulting values for credit default swap agreements serve as indicators of the current status of the payment/performance risk and represent the likelihood of an expected liability (or profit) for the credit derivative should the notional amount of the swap agreement be closed/sold as of the period end. Increasing market values, in absolute terms when compared to the notional amount of the swap, represent a deterioration of the underlying referenced instrument’s credit soundness and a greater likelihood or risk of default or other credit event occurring as defined under the terms of the agreement. |
| (5) | This instrument has a forward starting effective date. See Note 2, Securities Transactions and Investment Income, in the Notes to Financial Statements for further information. |
| | | | | | |
| 100 | | PIMCO ETF TRUST | | | See Accompanying Notes | |
(k) FINANCIAL DERIVATIVE INSTRUMENTS: OVER THE COUNTER
FORWARD FOREIGN CURRENCY CONTRACTS:
| | | | | | | | | | | | | | | | | | | | | | | | |
| Counterparty | | Settlement
Month | | | Currency to
be Delivered | | | Currency to
be Received | | | Unrealized Appreciation/ (Depreciation) | |
| | Asset | | | Liability | |
BOA | | | 07/2024 | | | CHF | | | 21 | | | $ | | | 24 | | | $ | 0 | | | $ | 0 | |
| | | 07/2024 | | | EUR | | | 1,398 | | | | | | 1,504 | | | | 7 | | | | 0 | |
| | | 07/2024 | | | KRW | | | 2,118,637 | | | | | | 1,548 | | | | 11 | | | | 0 | |
| | | 07/2024 | | | SGD | | | 55 | | | | | | 40 | | | | 0 | | | | 0 | |
| | | 07/2024 | | | $ | | | 513 | | | PLN | | | 2,034 | | | | 0 | | | | (8 | ) |
| | | 07/2024 | | | | | | 41 | | | SGD | | | 55 | | | | 0 | | | | 0 | |
| | | 08/2024 | | | SGD | | | 55 | | | $ | | | 41 | | | | 0 | | | | 0 | |
| | | 08/2024 | | | $ | | | 13 | | | TRY | | | 452 | | | | 0 | | | | 0 | |
| | | 10/2024 | | | CNH | | | 1,163 | | | $ | | | 163 | | | | 2 | | | | 0 | |
| | | | | | | |
BPS | | | 07/2024 | | | EUR | | | 4,535 | | | | | | 4,903 | | | | 46 | | | | 0 | |
| | | 07/2024 | | | GBP | | | 7,172 | | | | | | 9,162 | | | | 96 | | | | 0 | |
| | | 07/2024 | | | JPY | | | 32,300 | | | | | | 207 | | | | 6 | | | | 0 | |
| | | 07/2024 | | | KRW | | | 2,102,202 | | | | | | 1,532 | | | | 7 | | | | 0 | |
| | | 07/2024 | | | $ | | | 4,427 | | | AUD | | | 6,644 | | | | 5 | | | | 0 | |
| | | 07/2024 | | | | | | 152 | | | ILS | | | 562 | | | | 0 | | | | (3 | ) |
| | | 07/2024 | | | | | | 1,772 | | | NZD | | | 2,885 | | | | 0 | | | | (15 | ) |
| | | 07/2024 | | | | | | 1,090 | | | PLN | | | 4,376 | | | | 3 | | | | (5 | ) |
| | | 07/2024 | | | | | | 3,133 | | | SGD | | | 4,249 | | | | 1 | | | | 0 | |
| | | 08/2024 | | | AUD | | | 6,644 | | | $ | | | 4,431 | | | | 0 | | | | (5 | ) |
| | | 08/2024 | | | SGD | | | 4,243 | | | | | | 3,133 | | | | 0 | | | | (1 | ) |
| | | 08/2024 | | | $ | | | 9 | | | TRY | | | 312 | | | | 0 | | | | 0 | |
| | | 09/2024 | | | CNH | | | 14,378 | | | $ | | | 2,006 | | | | 25 | | | | 0 | |
| | | 09/2024 | | | TWD | | | 61,665 | | | | | | 1,916 | | | | 15 | | | | 0 | |
| | | 09/2024 | | | $ | | | 5,638 | | | INR | | | 472,478 | | | | 14 | | | | 0 | |
| | | 10/2024 | | | CNH | | | 3,885 | | | $ | | | 543 | | | | 6 | | | | 0 | |
| | | 10/2024 | | | $ | | | 970 | | | CNH | | | 6,943 | | | | 0 | | | | (11 | ) |
| | | | | | | |
BRC | | | 07/2024 | | | KRW | | | 123,657 | | | $ | | | 91 | | | | 1 | | | | 0 | |
| | | 07/2024 | | | MXN | | | 11,001 | | | | | | 596 | | | | 0 | | | | (5 | ) |
| | | 07/2024 | | | NOK | | | 3,402 | | | | | | 323 | | | | 5 | | | | 0 | |
| | | 07/2024 | | | PLN | | | 10 | | | | | | 3 | | | | 0 | | | | 0 | |
| | | 07/2024 | | | SGD | | | 610 | | | | | | 452 | | | | 2 | | | | 0 | |
| | | 07/2024 | | | $ | | | 3,747 | | | PLN | | | 14,787 | | | | 0 | | | | (74 | ) |
| | | 07/2024 | | | | | | 426 | | | TRY | | | 14,499 | | | | 9 | | | | 0 | |
| | | 08/2024 | | | | | | 929 | | | | | | 32,108 | | | | 11 | | | | 0 | |
| | | 09/2024 | | | MXN | | | 19,136 | | | $ | | | 1,014 | | | | 0 | | | | (20 | ) |
| | | 09/2024 | | | $ | | | 1,091 | | | TRY | | | 39,929 | | | | 43 | | | | 0 | |
| | | 10/2024 | | | CNH | | | 37,671 | | | $ | | | 5,256 | | | | 52 | | | | 0 | |
| | | | | | | |
CBK | | | 07/2024 | | | AUD | | | 303 | | | | | | 201 | | | | 0 | | | | (2 | ) |
| | | 07/2024 | | | CHF | | | 820 | | | | | | 901 | | | | 0 | | | | (12 | ) |
| | | 07/2024 | | | EUR | | | 12,222 | | | | | | 13,123 | | | | 34 | | | | 0 | |
| | | 07/2024 | | | JPY | | | 24,000 | | | | | | 152 | | | | 3 | | | | 0 | |
| | | 07/2024 | | | $ | | | 755 | | | PLN | | | 2,985 | | | | 0 | | | | (13 | ) |
| | | 08/2024 | | | GBP | | | 138 | | | $ | | | 174 | | | | 0 | | | | 0 | |
| | | 09/2024 | | | PEN | | | 4,387 | | | | | | 1,180 | | | | 39 | | | | 0 | |
| | | 09/2024 | | | TWD | | | 23,467 | | | | | | 728 | | | | 4 | | | | 0 | |
| | | 09/2024 | | | $ | | | 2,552 | | | INR | | | 213,334 | | | | 2 | | | | (1 | ) |
| | | | | | | |
FAR | | | 07/2024 | | | AUD | | | 6,341 | | | $ | | | 4,225 | | | | 0 | | | | (5 | ) |
| | | 07/2024 | | | EUR | | | 58,455 | | | | | | 63,666 | | | | 1,064 | | | | 0 | |
| | | 07/2024 | | | NZD | | | 5,166 | | | | | | 3,155 | | | | 8 | | | | 0 | |
| | | 07/2024 | | | $ | | | 353 | | | JPY | | | 56,252 | | | | 0 | | | | (3 | ) |
| | | 08/2024 | | | JPY | | | 55,988 | | | $ | | | 353 | | | | 3 | | | | 0 | |
| | | 08/2024 | | | $ | | | 2,758 | | | NZD | | | 4,523 | | | | 0 | | | | (4 | ) |
| | | 09/2024 | | | PEN | | | 13,831 | | | $ | | | 3,693 | | | | 95 | | | | 0 | |
| | | | | | | |
GLM | | | 07/2024 | | | IDR | | | 164,100 | | | | | | 10 | | | | 0 | | | | 0 | |
| | | 07/2024 | | | MXN | | | 10,036 | | | | | | 540 | | | | 0 | | | | (7 | ) |
| | | 07/2024 | | | $ | | | 50 | | | KRW | | | 68,698 | | | | 0 | | | | 0 | |
| | | 07/2024 | | | | | | 1,032 | | | PLN | | | 4,087 | | | | 0 | | | | (17 | ) |
| | | 07/2024 | | | ZAR | | | 6,986 | | | $ | | | 382 | | | | 0 | | | | (2 | ) |
| | | 08/2024 | | | $ | | | 4,421 | | | BRL | | | 22,744 | | | | 0 | | | | (368 | ) |
| | | 08/2024 | | | | | | 491 | | | TRY | | | 16,950 | | | | 4 | | | | 0 | |
| | | 09/2024 | | | | | | 548 | | | | | | 20,830 | | | | 44 | | | | 0 | |
| | | 03/2025 | | | | | | 154 | | | | | | 7,355 | | | | 20 | | | | 0 | |
| | | | | | | |
JPM | | | 07/2024 | | | BRL | | | 1,141 | | | $ | | | 205 | | | | 1 | | | | 0 | |
| | | 07/2024 | | | CHF | | | 502 | | | | | | 555 | | | | 0 | | | | (4 | ) |
| | | 07/2024 | | | CNY | | | 102 | | | | | | 14 | | | | 0 | | | | 0 | |
| | | | | | | | | | | | |
| See Accompanying Notes | | | ANNUAL FINANCIAL AND OTHER INFORMATION | | | | | | | JUNE 30, 2024 | | | 101 |
| | | | | | |
| Schedule of Investments | | PIMCO Multisector Bond Active Exchange-Traded Fund | | (Cont.) | | |
| | | | | | | | | | | | | | | | | | | | | | | | |
| Counterparty | | Settlement
Month | | | Currency to
be Delivered | | | Currency to
be Receive d | | | Unrealized Appreciation/ (Depreciation) | |
| | Asset | | | Liability | |
| | | 07/2024 | | | KRW | | | 8,674,806 | | | $ | | | 6,296 | | | | 5 | | | | (1 | ) |
| | | 07/2024 | | | SGD | | | 3,639 | | | | | | 2,704 | | | | 20 | | | | 0 | |
| | | 07/2024 | | | $ | | | 226 | | | BRL | | | 1,141 | | | | 0 | | | | (22 | ) |
| | | 07/2024 | | | | | | 6,843 | | | CHF | | | 6,141 | | | | 0 | | | | (8 | ) |
| | | 07/2024 | | | | | | 778 | | | CNY | | | 5,548 | | | | 0 | | | | (8 | ) |
| | | 07/2024 | | | | | | 1,154 | | | IDR | | | 18,800,166 | | | | 1 | | | | (6 | ) |
| | | 07/2024 | | | | | | 349 | | | ILS | | | 1,292 | | | | 0 | | | | (7 | ) |
| | | 07/2024 | | | | | | 1,400 | | | NZD | | | 2,281 | | | | 0 | | | | (10 | ) |
| | | 07/2024 | | | | | | 724 | | | PLN | | | 2,841 | | | | 0 | | | | (18 | ) |
| | | 07/2024 | | | | | | 127 | | | TRY | | | 4,311 | | | | 2 | | | | 0 | |
| | | 07/2024 | | | ZAR | | | 13,233 | | | $ | | | 719 | | | | 0 | | | | (7 | ) |
| | | 08/2024 | | | CHF | | | 6,118 | | | | | | 6,843 | | | | 8 | | | | 0 | |
| | | 08/2024 | | | CNY | | | 5,552 | | | | | | 778 | | | | 0 | | | | 0 | |
| | | 08/2024 | | | $ | | | 544 | | | TRY | | | 19,807 | | | | 29 | | | | 0 | |
| | | 09/2024 | | | TWD | | | 39,925 | | | $ | | | 1,240 | | | | 9 | | | | 0 | |
| | | 09/2024 | | | $ | | | 302 | | | INR | | | 25,325 | | | | 1 | | | | 0 | |
| | | 09/2024 | | | | | | 4,895 | | | MXN | | | 88,586 | | | | 0 | | | | (111 | ) |
| | | 10/2024 | | | CNH | | | 23,792 | | | $ | | | 3,325 | | | | 38 | | | | 0 | |
| | | 10/2024 | | | $ | | | 457 | | | CNH | | | 3,260 | | | | 0 | | | | (6 | ) |
| | | 03/2025 | | | | | | 38 | | | TRY | | | 1,817 | | | | 6 | | | | 0 | |
| | | | | | | |
MBC | | | 07/2024 | | | CAD | | | 15,627 | | | $ | | | 11,477 | | | | 54 | | | | 0 | |
| | | 07/2024 | | | CZK | | | 3,137 | | | | | | 136 | | | | 2 | | | | 0 | |
| | | 07/2024 | | | $ | | | 11,421 | | | CAD | | | 15,636 | | | | 9 | | | | 0 | |
| | | 07/2024 | | | | | | 248 | | | NOK | | | 2,647 | | | | 0 | | | | (1 | ) |
| | | 07/2024 | | | | | | 101 | | | ZAR | | | 1,863 | | | | 1 | | | | 0 | |
| | | 08/2024 | | | CAD | | | 15,626 | | | $ | | | 11,420 | | | | 0 | | | | (10 | ) |
| | | 08/2024 | | | NOK | | | 2,645 | | | | | | 248 | | | | 1 | | | | 0 | |
| | | 09/2024 | | | TWD | | | 136 | | | | | | 4 | | | | 0 | | | | 0 | |
| | | | | | | |
MYI | | | 07/2024 | | | KRW | | | 68,835 | | | | | | 50 | | | | 0 | | | | 0 | |
| | | 07/2024 | | | $ | | | 71 | | | NOK | | | 756 | | | | 0 | | | | 0 | |
| | | 07/2024 | | | | | | 26 | | | PLN | | | 103 | | | | 0 | | | | 0 | |
| | | 07/2024 | | | | | | 114 | | | ZAR | | | 2,135 | | | | 3 | | | | 0 | |
| | | 07/2024 | | | ZAR | | | 2,129 | | | $ | | | 117 | | | | 0 | | | | 0 | |
| | | 08/2024 | | | NOK | | | 755 | | | | | | 71 | | | | 0 | | | | 0 | |
| | | 08/2024 | | | $ | | | 117 | | | ZAR | | | 2,134 | | | | 0 | | | | 0 | |
| | | 09/2024 | | | TWD | | | 15,883 | | | $ | | | 495 | | | | 5 | | | | 0 | |
| | | 09/2024 | | | $ | | | 202 | | | INR | | | 16,904 | | | | 0 | | | | 0 | |
| | | | | | | |
RBC | | | 07/2024 | | | | | | 9,095 | | | GBP | | | 7,172 | | | | 0 | | | | (29 | ) |
| | | 08/2024 | | | GBP | | | 7,172 | | | $ | | | 9,096 | | | | 29 | | | | 0 | |
| | | | | | | |
SCX | | | 07/2024 | | | CNY | | | 5,443 | | | | | | 765 | | | | 10 | | | | 0 | |
| | | 07/2024 | | | KRW | | | 917,377 | | | | | | 673 | | | | 7 | | | | 0 | |
| | | 07/2024 | | | $ | | | 82,080 | | | EUR | | | 76,610 | | | | 0 | | | | (34 | ) |
| | | 07/2024 | | | | | | 3,643 | | | ZAR | | | 67,137 | | | | 42 | | | | 0 | |
| | | 08/2024 | | | EUR | | | 76,610 | | | $ | | | 82,200 | | | | 35 | | | | 0 | |
| | | 09/2024 | | | CNH | | | 6,793 | | | | | | 947 | | | | 11 | | | | 0 | |
| | | 09/2024 | | | TWD | | | 190,211 | | | | | | 5,904 | | | | 38 | | | | 0 | |
| | | 09/2024 | | | $ | | | 2,183 | | | INR | | | 182,728 | | | | 3 | | | | 0 | |
| | | | | | | |
UAG | | | 07/2024 | | | CHF | | | 4,801 | | | $ | | | 5,312 | | | | 0 | | | | (31 | ) |
| | | 07/2024 | | | ILS | | | 1,261 | | | | | | 340 | | | | 6 | | | | 0 | |
| | | | | | | | | | | | | | | | | | | | | | | | |
Total Forward Foreign Currency Contracts | | | $ | 2,063 | | | $ | (894 | ) |
| | | | | | | | | |
PURCHASED OPTIONS:
INTEREST RATE SWAPTIONS
| | | | | | | | | | | | | | | | | | | | | | | | | | | | | | |
| Counterparty | | Description | | Floating Rate Index | | Pay/Receive
Floating Rate | | Exercise
Rate | | | Expiration
Date | | | Notional
Amount(1) | | | Cost | | | Market
Value | |
| GLM | | Call - OTC 1-Year Interest Rate Swap | | 6-Month EUR-EURIBOR | | Pay | | | 2.749% | | | | 11/13/2024 | | | | | | | | 15,600 | | | $ | 0 | | | $ | 8 | |
| | | | | | | | | | | | | | | | | | | | | | | | | | | | | | |
Total Purchased Options | | | $ | 0 | | | $ | 8 | |
| | | | | | | | | |
| | | | | | |
| 102 | | PIMCO ETF TRUST | | | See Accompanying Notes | |
WRITTEN OPTIONS:
INTEREST RATE SWAPTIONS
| | | | | | | | | | | | | | | | | | | | | | | | | | | | | | |
| Counterparty | | Description | | Floating Rate Index | | Pay/Receive
Floating Rate | | Exercise
Rate | | | Expiration
Date | | | Notional
Amount(1) | | | Premiums
(Received) | | | Market
Value | |
| BOA | | Call - OTC 10-Year Interest Rate Swap | | 3-Month USD-LIBOR | | Receive | | | 3.800% | | | | 07/08/2024 | | | | | | | | 2,000 | | | $ | (9 | ) | | $ | (3 | ) |
| | Put - OTC 10-Year Interest Rate Swap | | 3-Month USD-LIBOR | | Pay | | | 4.350 | | | | 07/08/2024 | | | | | | | | 2,000 | | | | (9 | ) | | | 0 | |
| | | | | | | | | |
| CBK | | Call - OTC 10-Year Interest Rate Swap | | 3-Month USD-LIBOR | | Receive | | | 3.710 | | | | 07/26/2024 | | | | | | | | 400 | | | | (1 | ) | | | (1 | ) |
| | Put - OTC 10-Year Interest Rate Swap | | 3-Month USD-LIBOR | | Pay | | | 4.060 | | | | 07/26/2024 | | | | | | | | 400 | | | | (2 | ) | | | (2 | ) |
| | | | | | | | | |
| FAR | | Call - OTC 10-Year Interest Rate Swap | | 3-Month USD-LIBOR | | Receive | | | 3.586 | | | | 07/15/2024 | | | | | | | | 1,400 | | | | (5 | ) | | | (1 | ) |
| | Put - OTC 10-Year Interest Rate Swap | | 3-Month USD-LIBOR | | Pay | | | 3.986 | | | | 07/15/2024 | | | | | | | | 1,400 | | | | (5 | ) | | | (8 | ) |
| | | | | | | | | |
| GLM | | Call - OTC 5-Year Interest Rate Swap | | 3-Month USD-LIBOR | | Receive | | | 3.689 | | | | 07/15/2024 | | | | | | | | 2,000 | | | | (4 | ) | | | (1 | ) |
| | Put - OTC 5-Year Interest Rate Swap | | 3-Month USD-LIBOR | | Pay | | | 4.139 | | | | 07/15/2024 | | | | | | | | 2,000 | | | | (4 | ) | | | (5 | ) |
| | Call - OTC 10-Year Interest Rate Swap | | 3-Month USD-LIBOR | | Receive | | | 3.844 | | | | 07/03/2024 | | | | | | | | 900 | | | | (3 | ) | | | (1 | ) |
| | Put - OTC 10-Year Interest Rate Swap | | 3-Month USD-LIBOR | | Pay | | | 4.194 | | | | 07/03/2024 | | | | | | | | 900 | | | | (3 | ) | | | 0 | |
| | Call - OTC 10-Year Interest Rate Swap | | 3-Month USD-LIBOR | | Receive | | | 3.628 | | | | 07/18/2024 | | | | | | | | 1,100 | | | | (4 | ) | | | (1 | ) |
| | Put - OTC 10-Year Interest Rate Swap | | 3-Month USD-LIBOR | | Pay | | | 3.978 | | | | 07/18/2024 | | | | | | | | 1,100 | | | | (4 | ) | | | (7 | ) |
| | Call - OTC 10-Year Interest Rate Swap | | 3-Month USD-LIBOR | | Receive | | | 3.680 | | | | 07/22/2024 | | | | | | | | 500 | | | | (2 | ) | | | (1 | ) |
| | Put - OTC 10-Year Interest Rate Swap | | 3-Month USD-LIBOR | | Pay | | | 4.030 | | | | 07/22/2024 | | | | | | | | 500 | | | | (2 | ) | | | (3 | ) |
| | Call - OTC 10-Year Interest Rate Swap | | 3-Month USD-LIBOR | | Receive | | | 3.540 | | | | 07/24/2024 | | | | | | | | 1,100 | | | | (5 | ) | | | (1 | ) |
| | Call - OTC 10-Year Interest Rate Swap | | 3-Month USD-LIBOR | | Receive | | | 3.648 | | | | 07/24/2024 | | | | | | | | 1,100 | | | | (4 | ) | | | (2 | ) |
| | Put - OTC 10-Year Interest Rate Swap | | 3-Month USD-LIBOR | | Pay | | | 3.998 | | | | 07/24/2024 | | | | | | | | 1,100 | | | | (4 | ) | | | (7 | ) |
| | Put - OTC 10-Year Interest Rate Swap | | 3-Month USD-LIBOR | | Pay | | | 4.000 | | | | 07/24/2024 | | | | | | | | 1,100 | | | | (5 | ) | | | (7 | ) |
| | Call - OTC 10-Year Interest Rate Swap | | 3-Month USD-LIBOR | | Receive | | | 3.710 | | | | 07/29/2024 | | | | | | | | 700 | | | | (2 | ) | | | (2 | ) |
| | Put - OTC 10-Year Interest Rate Swap | | 3-Month USD-LIBOR | | Pay | | | 4.110 | | | | 07/29/2024 | | | | | | | | 700 | | | | (2 | ) | | | (2 | ) |
| | Call - OTC 10-Year Interest Rate Swap | | 6-Month EUR-EURIBOR | | Receive | | | 2.310 | | | | 11/13/2024 | | | | | | | | 1,800 | | | | 0 | | | | (9 | ) |
| | | | | | | | | |
| JPM | | Call - OTC 10-Year Interest Rate Swap | | 3-Month USD-LIBOR | | Receive | | | 3.800 | | | | 07/05/2024 | | | | | | | | 600 | | | | (2 | ) | | | (1 | ) |
| | Put - OTC 10-Year Interest Rate Swap | | 3-Month USD-LIBOR | | Pay | | | 4.150 | | | | 07/05/2024 | | | | | | | | 600 | | | | (2 | ) | | | 0 | |
| | Call - OTC 10-Year Interest Rate Swap | | 3-Month USD-LIBOR | | Receive | | | 3.675 | | | | 07/22/2024 | | | | | | | | 500 | | | | (2 | ) | | | (1 | ) |
| | Put - OTC 10-Year Interest Rate Swap | | 3-Month USD-LIBOR | | Pay | | | 4.025 | | | | 07/22/2024 | | | | | | | | 500 | | | | (2 | ) | | | (3 | ) |
| | Call - OTC 10-Year Interest Rate Swap | | 3-Month USD-LIBOR | | Receive | | | 3.640 | | | | 07/23/2024 | | | | | | | | 300 | | | | (1 | ) | | | 0 | |
| | Put - OTC 10-Year Interest Rate Swap | | 3-Month USD-LIBOR | | Pay | | | 3.990 | | | | 07/23/2024 | | | | | | | | 300 | | | | (1 | ) | | | (2 | ) |
| | | | | | | | | |
| MYC | | Call - OTC 10-Year Interest Rate Swap | | 3-Month USD-LIBOR | | Receive | | | 3.630 | | | | 07/29/2024 | | | | | | | | 700 | | | | (2 | ) | | | (1 | ) |
| | Call - OTC 10-Year Interest Rate Swap | | 3-Month USD-LIBOR | | Receive | | | 3.690 | | | | 07/29/2024 | | | | | | | | 700 | | | | (3 | ) | | | (2 | ) |
| | Put - OTC 10-Year Interest Rate Swap | | 3-Month USD-LIBOR | | Pay | | | 4.040 | | | | 07/29/2024 | | | | | | | | 700 | | | | (3 | ) | | | (4 | ) |
| | Put - OTC 10-Year Interest Rate Swap | | 3-Month USD-LIBOR | | Pay | | | 4.090 | | | | 07/29/2024 | | | | | | | | 700 | | | | (2 | ) | | | (3 | ) |
| | | | | | | | | | | | | | | | | | | | | | | | | | | | | | |
Total Written Options | | | $ | (99 | ) | | $ | (81 | ) |
| | | | | | | | | |
SWAP AGREEMENTS:
CREDIT DEFAULT SWAPS ON SOVEREIGN ISSUES - SELL PROTECTION(2)
| | | | | | | | | | | | | | | | | | | | | | | | | | | | | | | | | | | | | | | | |
| Counterparty | | Reference Entity | | Fixed
Receive Rate | | | Payment
Frequency | | Maturity
Date | | | Implied
Credit Spread at
June 30, 2024(3) | | | Notional
Amount(4) | | | Premiums
Paid/(Received) | | | Unrealized
Appreciation/
(Depreciation) | | | Swap Agreements,
at Value(5) | |
| | Asset | | | Liability | |
| CBK | | Israel Government International Bond | | | 1.000% | | | Quarterly | | | 06/20/2027 | | | | 1.168% | | | $ | | | | | 1,000 | | | $ | (5 | ) | | $ | 0 | | | $ | 0 | | | $ | (5 | ) |
| | | | | | | | | | | | | | | | | | | | | | | | | | | | | | | | | | | | | | | | |
Total Swap Agreements | | | $ | (5 | ) | | $ | 0 | | | $ | 0 | | | $ | (5 | ) |
| | | | | | | | | | | | | | | | | |
FINANCIAL DERIVATIVE INSTRUMENTS: OVER THE COUNTER SUMMARY
The following is a summary by counterparty of the market value of OTC financial derivative instruments and collateral pledged/(received) as of June 30, 2024:
| | | | | | | | | | | | | | | | | | | | | | | | | | | | | | | | | | | | | | | | | | | | | | | | |
| | | Financial Derivative Assets | | | | | | Financial Derivative Liabilities | | | | | | | | | | |
| Counterparty | | Forward
Foreign
Currency
Contracts | | | Purchased
Options | | | Swap
Agreements | | | Total
Over the
Counter | | | | | | Forward
Foreign
Currency
Contracts | | | Written
Options | | | Swap
Agreements | | | Total
Over the
Counter | | | Net Market
Value of OTC
Derivatives | | | Collateral
Pledged/
(Received) | | | Net
Exposure(6) | |
BOA | | $ | 20 | | | $ | 0 | | | $ | 0 | | | $ | 20 | | | | | | | $ | (8 | ) | | $ | (3 | ) | | $ | 0 | | | $ | (11 | ) | | $ | 9 | | | $ | 0 | | | $ | 9 | |
BPS | | | 224 | | | | 0 | | | | 0 | | | | 224 | | | | | | | | (40 | ) | | | 0 | | | | 0 | | | | (40 | ) | | | 184 | | | | 0 | | | | 184 | |
BRC | | | 123 | | | | 0 | | | | 0 | | | | 123 | | | | | | | | (99 | ) | | | 0 | | | | 0 | | | | (99 | ) | | | 24 | | | | 0 | | | | 24 | |
CBK | | | 82 | | | | 0 | | | | 0 | | | | 82 | | | | | | | | (28 | ) | | | (3 | ) | | | (5 | ) | | | (36 | ) | | | 46 | | | | 0 | | | | 46 | |
FAR | | | 1,170 | | | | 0 | | | | 0 | | | | 1,170 | | | | | | | | (12 | ) | | | (9 | ) | | | 0 | | | | (21 | ) | | | 1,149 | | | | (1,190 | ) | | | (41 | ) |
GLM | | | 68 | | | | 8 | | | | 0 | | | | 76 | | | | | | | | (394 | ) | | | (49 | ) | | | 0 | | | | (443 | ) | | | (367 | ) | | | 264 | | | | (103 | ) |
JPM | | | 120 | | | | 0 | | | | 0 | | | | 120 | | | | | | | | (208 | ) | | | (7 | ) | | | 0 | | | | (215 | ) | | | (95 | ) | | | 0 | | | | (95 | ) |
MBC | | | 67 | | | | 0 | | | | 0 | | | | 67 | | | | | | | | (11 | ) | | | 0 | | | | 0 | | | | (11 | ) | | | 56 | | | | 0 | | | | 56 | |
MYC | | | 0 | | | | 0 | | | | 0 | | | | 0 | | | | | | | | 0 | | | | (10 | ) | | | 0 | | | | (10 | ) | | | (10 | ) | | | 0 | | | | (10 | ) |
MYI | | | 8 | | | | 0 | | | | 0 | | | | 8 | | | | | | | | 0 | | | | 0 | | | | 0 | | | | 0 | | | | 8 | | | | 0 | | | | 8 | |
RBC | | | 29 | | | | 0 | | | | 0 | | | | 29 | | | | | | | | (29 | ) | | | 0 | | | | 0 | | | | (29 | ) | | | 0 | | | | 0 | | | | 0 | |
SCX | | | 146 | | | | 0 | | | | 0 | | | | 146 | | | | | | | | (34 | ) | | | 0 | | | | 0 | | | | (34 | ) | | | 112 | | | | 0 | | | | 112 | |
UAG | | | 6 | | | | 0 | | | | 0 | | | | 6 | | | | | | | | (31 | ) | | | 0 | | | | 0 | | | | (31 | ) | | | (25 | ) | | | 0 | | | | (25 | ) |
| | | | | | | | | | | | | | | | | | | | | | | | | | | | | | | | | | | | | | | | | | | | | | | | |
Total Over the Counter | | $ | 2,063 | | | $ | 8 | | | $ | 0 | | | $ | 2,071 | | | | | | | $ | (894 | ) | | $ | (81 | ) | | $ | (5 | ) | | $ | (980 | ) | | | | | | | | | | | | |
| | | | | | | | | | | | | | | | | | | | | | | | | | | | | | | | | | | | | | | | | | | | | | | | |
| | | | | | | | | | | | |
| See Accompanying Notes | | | ANNUAL FINANCIAL AND OTHER INFORMATION | | | | | | | JUNE 30, 2024 | | | 103 |
| | | | | | |
| Schedule of Investments | | PIMCO Multisector Bond Active Exchange-Traded Fund | | (Cont.) | | |
| (l) | Securities with an aggregate market value of $264 have been pledged as collateral for financial derivative instruments as governed by International Swaps and Derivatives Association, Inc. master agreements as of June 30, 2024. |
| (1) | Notional Amount represents the number of contracts. |
| (2) | If the Fund is a seller of protection and a credit event occurs, as defined under the terms of that particular swap agreement, the Fund will either (i) pay to the buyer of protection an amount equal to the notional amount of the swap and take delivery of the referenced obligation or underlying securities comprising the referenced index or (ii) pay a net settlement amount in the form of cash, securities or other deliverable obligations equal to the notional amount of the swap less the recovery value of the referenced obligation or underlying securities comprising the referenced index. |
| (3) | Implied credit spreads, represented in absolute terms, utilized in determining the market value of credit default swap agreements on sovereign issues as of period end serve as indicators of the current status of the payment/performance risk and represent the likelihood or risk of default for the credit derivative. The implied credit spread of a particular referenced entity reflects the cost of buying/selling protection and may include upfront payments required to be made to enter into the agreement. Wider credit spreads represent a deterioration of the referenced entity’s credit soundness and a greater likelihood or risk of default or other credit event occurring as defined under the terms of the agreement. |
| (4) | The maximum potential amount the Fund could be required to pay as a seller of credit protection or receive as a buyer of credit protection if a credit event occurs as defined under the terms of that particular swap agreement. |
| (5) | The prices and resulting values for credit default swap agreements serve as indicators of the current status of the payment/performance risk and represent the likelihood of an expected liability (or profit) for the credit derivative should the notional amount of the swap agreement be closed/sold as of the period end. Increasing market values, in absolute terms when compared to the notional amount of the swap, represent a deterioration of the underlying referenced instrument’s credit soundness and a greater likelihood or risk of default or other credit event occurring as defined under the terms of the agreement. |
| (6) | Net Exposure represents the net receivable/(payable) that would be due from/to the counterparty in the event of default. Exposure from OTC financial derivative instruments can only be netted across transactions governed under the same master agreement with the same legal entity. See Note 8, Master Netting Arrangements, in the Notes to Financial Statements for more information. |
FAIR VALUE OF FINANCIAL DERIVATIVE INSTRUMENTS
The following is a summary of the fair valuation of the Fund’s derivative instruments categorized by risk exposure. See Note 7, Principal and Other Risks, in the Notes to Financial Statements on risks of the Fund.
Fair Values of Financial Derivative Instruments on the Statements of Assets and Liabilities as of June 30, 2024:
| | | | | | | | | | | | | | | | | | | | | | | | |
| | | Derivatives not accounted for as hedging instruments | |
| | | Commodity
Contracts | | | Credit
Contracts | | | Equity
Contracts | | | Foreign
Exchange
Contracts | | | Interest
Rate Contracts | | | Total | |
Financial Derivative Instruments - Assets | |
Exchange-traded or centrally cleared | |
Futures | | $ | 0 | | | $ | 0 | | | $ | 0 | | | $ | 0 | | | $ | 24 | | | $ | 24 | |
Swap Agreements | | | 0 | | | | 2 | | | | 0 | | | | 0 | | | | 31 | | | | 33 | |
| | | | | | | | | | | | | | | | | | | | | | | | |
| | $ | 0 | | | $ | 2 | | | $ | 0 | | | $ | 0 | | | $ | 55 | | | $ | 57 | |
| | | | | | | | | | | | | | | | | | | | | | | | |
Over the counter | |
Forward Foreign Currency Contracts | | $ | 0 | | | $ | 0 | | | $ | 0 | | | $ | 2,063 | | | $ | 0 | | | $ | 2,063 | |
Purchased Options | | | 0 | | | | 0 | | | | 0 | | | | 0 | | | | 8 | | | | 8 | |
| | | | | | | | | | | | | | | | | | | | | | | | |
| | $ | 0 | | | $ | 0 | | | $ | 0 | | | $ | 2,063 | | | $ | 8 | | | $ | 2,071 | |
| | | | | | | | | | | | | | | | | | | | | | | | |
| | $ | 0 | | | $ | 2 | | | $ | 0 | | | $ | 2,063 | | | $ | 63 | | | $ | 2,128 | |
| | | | | | | | | | | | | | | | | | | | | | | | |
|
Financial Derivative Instruments - Liabilities | |
Exchange-traded or centrally cleared | |
Written Options | | $ | 0 | | | $ | 0 | | | $ | 0 | | | $ | 0 | | | $ | 1 | | | $ | 1 | |
Futures | | | 0 | | | | 0 | | | | 0 | | | | 0 | | | | 92 | | | | 92 | |
Swap Agreements | | | 0 | | | | 102 | | | | 0 | | | | 0 | | | | 93 | | | | 195 | |
| | | | | | | | | | | | | | | | | | | | | | | | |
| | $ | 0 | | | $ | 102 | | | $ | 0 | | | $ | 0 | | | $ | 186 | | | $ | 288 | |
| | | | | | | | | | | | | | | | | | | | | | | | |
Over the counter | |
Forward Foreign Currency Contracts | | $ | 0 | | | $ | 0 | | | $ | 0 | | | $ | 894 | | | $ | 0 | | | $ | 894 | |
Written Options | | | 0 | | | | 0 | | | | 0 | | | | 0 | | | | 81 | | | | 81 | |
Swap Agreements | | | 0 | | | | 5 | | | | 0 | | | | 0 | | | | 0 | | | | 5 | |
| | | | | | | | | | | | | | | | | | | | | | | | |
| | $ | 0 | | | $ | 5 | | | $ | 0 | | | $ | 894 | | | $ | 81 | | | $ | 980 | |
| | | | | | | | | | | | | | | | | | | | | | | | |
| | $ | 0 | | | $ | 107 | | | $ | 0 | | | $ | 894 | | | $ | 267 | | | $ | 1,268 | |
| | | | | | | | | | | | | | | | | | | | | | | | |
| | | | | | |
| 104 | | PIMCO ETF TRUST | | | See Accompanying Notes | |
The effect of Financial Derivative Instruments on the Statements of Operations for the period ended June 30, 2024:
| | | | | | | | | | | | | | | | | | | | | | | | |
| | | Derivatives not accounted for as hedging instruments | |
| | | Commodity
Contracts | | | Credit
Contracts | | | Equity
Contracts | | | Foreign
Exchange
Contracts | | | Interest
Rate Contracts | | | Total | |
Net Realized Gain (Loss) on Financial Derivative Instruments | |
Exchange-traded or centrally cleared | |
Written Options | | $ | 0 | | | $ | 0 | | | $ | 0 | | | $ | 0 | | | $ | 24 | | | $ | 24 | |
Futures | | | 0 | | | | 0 | | | | 0 | | | | 0 | | | | 150 | | | | 150 | |
Swap Agreements | | | 0 | | | | 5,539 | | | | 0 | | | | 0 | | | | (50 | ) | | | 5,489 | |
| | | | | | | | | | | | | | | | | | | | | | | | |
| | $ | 0 | | | $ | 5,539 | | | $ | 0 | | | $ | 0 | | | $ | 124 | | | $ | 5,663 | |
| | | | | | | | | | | | | | | | | | | | | | | | |
Over the counter | |
Forward Foreign Currency Contracts | | $ | 0 | | | $ | 0 | | | $ | 0 | | | $ | (945 | ) | | $ | 0 | | | $ | (945 | ) |
Written Options | | | 0 | | | | 0 | | | | 0 | | | | 20 | | | | 34 | | | | 54 | |
Swap Agreements | | | 0 | | | | 3 | | | | 0 | | | | 0 | | | | 0 | | | | 3 | |
| | | | | | | | | | | | | | | | | | | | | | | | |
| | $ | 0 | | | $ | 3 | | | $ | 0 | | | $ | (925 | ) | | $ | 34 | | | $ | (888 | ) |
| | | | | | | | | | | | | | | | | | | | | | | | |
| | $ | 0 | | | $ | 5,542 | | | $ | 0 | | | $ | (925 | ) | | $ | 158 | | | $ | 4,775 | |
| | | | | | | | | | | | | | | | | | | | | | | | |
|
Net Change in Unrealized Appreciation (Depreciation) on Financial Derivative Instruments | |
Exchange-traded or centrally cleared | |
Futures | | $ | 0 | | | $ | 0 | | | $ | 0 | | | $ | 0 | | | $ | (67 | ) | | $ | (67 | ) |
Swap Agreements | | | 0 | | | | (716 | ) | | | 0 | | | | 0 | | | | (390 | ) | | | (1,106 | ) |
| | | | | | | | | | | | | | | | | | | | | | | | |
| | $ | 0 | | | $ | (716 | ) | | $ | 0 | | | $ | 0 | | | $ | (457 | ) | | $ | (1,173 | ) |
| | | | | | | | | | | | | | | | | | | | | | | | |
Over the counter | |
Forward Foreign Currency Contracts | | $ | 0 | | | $ | 0 | | | $ | 0 | | | $ | 1,169 | | | $ | 0 | | | $ | 1,169 | |
Purchased Options | | | 0 | | | | 0 | | | | 0 | | | | 0 | | | | 8 | | | | 8 | |
Written Options | | | 0 | | | | 0 | | | | 0 | | | | 0 | | | | 18 | | | | 18 | |
Swap Agreements | | | 0 | | | | 1 | | | | 0 | | | | 0 | | | | 0 | | | | 1 | |
| | | | | | | | | | | | | | | | | | | | | | | | |
| | $ | 0 | | | $ | 1 | | | $ | 0 | | | $ | 1,169 | | | $ | 26 | | | $ | 1,196 | |
| | | | | | | | | | | | | | | | | | | | | | | | |
| | $ | 0 | | | $ | (715 | ) | | $ | 0 | | | $ | 1,169 | | | $ | (431 | ) | | $ | 23 | |
| | | | | | | | | | | | | | | | | | | | | | | | |
FAIR VALUE MEASUREMENTS
The following is a summary of the fair valuations according to the inputs used as of June 30, 2024 in valuing the Fund’s assets and liabilities:
| | | | | | | | | | | | | | | | |
| Category and Subcategory | | Level 1 | | | Level 2 | | | Level 3 | | | Fair Value at
06/30/2024 | |
Investments in Securities, at Value | |
Loan Participations and Assignments | | $ | 0 | | | $ | 14,147 | | | $ | 3,714 | | | $ | 17,861 | |
Corporate Bonds & Notes | |
Banking & Finance | | | 0 | | | | 93,108 | | | | 964 | | | | 94,072 | |
Industrials | | | 0 | | | | 139,720 | | | | 1,598 | | | | 141,318 | |
Utilities | | | 0 | | | | 14,740 | | | | 0 | | | | 14,740 | |
Municipal Bonds & Notes | |
California | | | 0 | | | | 301 | | | | 0 | | | | 301 | |
Iowa | | | 0 | | | | 2,571 | | | | 0 | | | | 2,571 | |
U.S. Government Agencies | | | 0 | | | | 423,284 | | | | 0 | | | | 423,284 | |
U.S. Treasury Obligations | | | 0 | | | | 98,322 | | | | 0 | | | | 98,322 | |
Non-Agency Mortgage-Backed Securities | | | 0 | | | | 238,852 | | | | 2,055 | | | | 240,907 | |
Asset-Backed Securities | | | 11,352 | | | | 367,099 | | | | 2,600 | | | | 381,051 | |
Sovereign Issues | | | 0 | | | | 16,587 | | | | 0 | | | | 16,587 | |
Short-Term Instruments | |
Repurchase Agreements | | | 0 | | | | 16,812 | | | | 0 | | | | 16,812 | |
| | | | | | | | | | | | | | | | |
| | $ | 11,352 | | | $ | 1,425,543 | | | $ | 10,931 | | | $ | 1,447,826 | |
| | | | | | | | | | | | | | | | |
|
Investments in Affiliates, at Value | |
Mutual Funds | | | 3,386 | | | | 0 | | | | 0 | | | | 3,386 | |
| | | | | | | | | | | | | | | | |
| | | | |
Total Investments | | $ | 14,738 | | | $ | 1,425,543 | | | $ | 10,931 | | | $ | 1,451,212 | |
| | | | | | | | | | | | | | | | |
| | | | | | | | | | | | | | | | |
| Category and Subcategory | | Level 1 | | | Level 2 | | | Level 3 | | | Fair Value at
06/30/2024 | |
|
Short Sales, at Value - Liabilities | |
U.S. Government Agencies | | $ | 0 | | | $ | (76,345 | ) | | $ | 0 | | | $ | (76,345 | ) |
| | | | | | | | | | | | | | | | |
|
Financial Derivative Instruments - Assets | |
Exchange-traded or centrally cleared | | | 17 | | | | 40 | | | | 0 | | | | 57 | |
Over the counter | | | 0 | | | | 2,071 | | | | 0 | | | | 2,071 | |
| | | | | | | | | | | | | | | | |
| | $ | 17 | | | $ | 2,111 | | | $ | 0 | | | $ | 2,128 | |
| | | | | | | | | | | | | | | | |
|
Financial Derivative Instruments - Liabilities | |
Exchange-traded or centrally cleared | | | (34 | ) | | | (254 | ) | | | 0 | | | | (288 | ) |
Over the counter | | | 0 | | | | (980 | ) | | | 0 | | | | (980 | ) |
| | | | | | | | | | | | | | | | |
| | $ | (34 | ) | | $ | (1,234 | ) | | $ | 0 | | | $ | (1,268 | ) |
| | | | | | | | | | | | | | | | |
| | | | |
Total Financial Derivative Instruments | | $ | (17 | ) | | $ | 877 | | | $ | 0 | | | $ | 860 | |
| | | | | | | | | | | | | | | | |
| | | | |
Totals | | $ | 14,721 | | | $ | 1,350,075 | | | $ | 10,931 | | | $ | 1,375,727 | |
| | | | | | | | | | | | | | | | |
| | | | | | | | | | | | |
| See Accompanying Notes | | | ANNUAL FINANCIAL AND OTHER INFORMATION | | | | | | | JUNE 30, 2024 | | | 105 |
| | | | | | |
| Schedule of Investments | | PIMCO Multisector Bond Active Exchange-Traded Fund | | (Cont.) | | June 30, 2024 |
The following is a reconciliation of the fair valuations using significant unobservable inputs (Level 3) for the Fund during the period ended June 30, 2024:
| | | | | | | | | | | | | | | | | | | | | | | | | | | | | | | | | | | | | | | | |
| Category and Subcategory | | Beginning
Balance
at 12/31/2023 | | | Net
Purchases | | | Net
Sales/
Settlements | | | Accrued
Discounts/
(Premiums) | | | Realized
Gain/(Loss) | | | Net Change in
Unrealized
Appreciation/
(Depreciation)(1) | | | Transfers into
Level 3 | | | Transfers out
of Level 3 | | | Ending
Balance
at 06/30/2024 | | | Net Change in
Unrealized
Appreciation/
(Depreciation)
on Investments
Held at
06/30/2024(1) | |
Investments in Securities, at Value | |
Loan Participations and Assignments | | $ | 0 | | | $ | 3,711 | | | $ | 0 | | | $ | 0 | | | $ | 0 | | | $ | 3 | | | $ | 0 | | | $ | 0 | | | $ | 3,714 | | | $ | 3 | |
Corporate Bonds & Notes | | | | | | | | | | | | | | | | | | | | | | | | | | | | | | | | | | | | | | | | |
Banking & Finance | | | 0 | | | | 943 | | | | 0 | | | | 23 | | | | 0 | | | | (2 | ) | | | 0 | | | | 0 | | | | 964 | | | | (2 | ) |
Industrials | | | 0 | | | | 1,601 | | | | 0 | | | | 0 | | | | 0 | | | | (3 | ) | | | 0 | | | | 0 | | | | 1,598 | | | | (3 | ) |
Non-Agency Mortgage-Backed Securities | | | 0 | | | | 2,000 | | | | 0 | | | | 5 | | | | 0 | | | | 50 | | | | 0 | | | | 0 | | | | 2,055 | | | | 50 | |
Asset-Backed Securities | | | 0 | | | | 2,646 | | | | (41 | ) | | | 0 | | | | 0 | | | | (5 | ) | | | 0 | | | | 0 | | | | 2,600 | | | | (5 | ) |
| | | | | | | | | | | | | | | | | | | | | | | | | | | | | | | | | | | | | | | | |
| | | | | | | | | | |
Totals | | $ | 0 | | | $ | 10,901 | | | $ | (41 | ) | | $ | 28 | | | $ | 0 | | | $ | 43 | | | $ | 0 | | | $ | 0 | | | $ | 10,931 | | | $ | 43 | |
| | | | | | | | | | | | | | | | | | | | | | | | | | | | | | | | | | | | | | | | |
The following is a summary of significant unobservable inputs used in the fair valuations of assets and liabilities categorized within Level 3 of the fair value hierarchy:
| | | | | | | | | | | | | | | | |
| Category and Subcategory | | Ending
Balance
at 06/30/2024 | | | Valuation Technique | | Unobservable
Inputs | | (% Unless Noted Otherwise) | |
| | Input Value(s) | | | Weighted
Average | |
Investments in Securities, at Value | |
Loan Participations and Assignments | | $ | 1,217 | | | Recent Transaction | | Purchase Price | | | 100.000 | | | | — | |
| | | 2,497 | | | Third Party Vendor | | Broker Quote | | | 99.500-100.500 | | | | 99.902 | |
Corporate Bonds & Note | |
Banking & Finance | | | 964 | | | Discounted Cash Flow | | Discount Rate | | | 7.304 | | | | — | |
Industrials | | | 1,598 | | | Indicative Market Quotation | | Broker Quote | | | 98.143-99.815 | | | | 98.979 | |
Non-Agency Mortgage-Backed Securities | | | 2,055 | | | Discounted Cash Flow | | Discount Rate | | | 6.775-9.055 | | | | 7.331 | |
Asset-Backed Securities | | | 300 | | | Fair Valuation of
Odd Lot Positions | | Adjustment Factor | | | 2.500 | | | | — | |
| | | 2,300 | | | Proxy Pricing | | Base Price | | | 99.982 | | | | — | |
| | | | | | | | | | | | | | | | |
Total | | $ | 10,931 | | | | | | | | | | | | | |
| | | | | | | | | | | | | | | | |
| (1) | Any difference between Net Change in Unrealized Appreciation/(Depreciation) and Net Change in Unrealized Appreciation/(Depreciation) on Investments Held at June 30, 2024 may be due to an investment no longer held or categorized as Level 3 at period end. |
| | | | | | |
| 106 | | PIMCO ETF TRUST | | | See Accompanying Notes | |
| | | | | | |
| Schedule of Investments | | PIMCO Municipal Income Opportunities Active Exchange-Traded Fund | | | | June 30, 2024 |
(Amounts in thousands*, except number of shares, contracts, units and ounces, if any)
| | | | | | | | | | | | |
| | | | | PRINCIPAL
AMOUNT
(000S) | | | | | MARKET
VALUE
(000S) | |
| INVESTMENTS IN SECURITIES 102.1% | |
| |
| CORPORATE BONDS & NOTES 0.3% | |
| |
| INDUSTRIALS 0.3% | |
|
Toledo Hospital | |
5.325% due 11/15/2028 | | $ | | | 250 | | | $ | | | 240 | |
6.015% due 11/15/2048 | | | | | 200 | | | | | | 171 | |
| | | | | | | | | | | | |
Total Corporate Bonds & Notes (Cost $352) | | | 411 | |
| | | | |
| |
| MUNICIPAL BONDS & NOTES 97.0% | |
| |
| ALABAMA 1.8% | |
|
Black Belt Energy Gas District, Alabama Revenue Bonds, Series 2023 | |
5.500% due 06/01/2049 | | | | | 1,400 | | | | | | 1,486 | |
5.500% due 10/01/2054 | | | | | 400 | | | | | | 438 | |
|
Energy Southeast A Cooperative District, Alabama Revenue Bonds, Series 2024 | |
5.250% due 07/01/2054 | | | | | 500 | | | | | | 535 | |
|
Southeast Energy Authority A Cooperative District, Alabama Revenue Bonds, Series 2023 | |
5.000% due 01/01/2054 | | | | | 400 | | | | | | 423 | |
| | | | | | | | | | | | |
| | | | | | | | | | | 2,882 | |
| | | | | | | | | | | | |
| |
| ALASKA 0.2% | |
|
Municipality of Anchorage, Alaska Solid Waste Services Revenue Bonds, Series 2022 | |
5.250% due 11/01/2062 | | | | | 250 | | | | | | 266 | |
| | | | | | | | | | | | |
| |
| ARIZONA 1.5% | |
|
Arizona Industrial Development Authority Revenue Bonds, Series 2019 | |
4.250% due 01/01/2040 | | | | | 480 | | | | | | 301 | |
|
Chandler Industrial Development Authority, Arizona Revenue Bonds, Series 2019 | |
4.000% due 06/01/2049 | | | | | 1,000 | | | | | | 1,007 | |
|
Phoenix Civic Improvement Corp., Arizona Revenue Bonds, Series 2023 | |
5.000% due 07/01/2042 | | | | | 1,000 | | | | | | 1,117 | |
| | | | | | | | | | | | |
| | | | | | | | | | | 2,425 | |
| | | | | | | | | | | | |
| |
| ARKANSAS 0.7% | |
|
Arkansas Development Finance Authority Revenue Bonds, Series 2023 | |
7.375% due 07/01/2048 | | | | | 500 | | | | | | 549 | |
|
County of Pulaski Hospital, Arkansas Revenue Bonds, Series 2023 | |
4.250% due 03/01/2048 | | | | | 500 | | | | | | 487 | |
| | | | | | | | | | | | |
| | | | | | | | | | | 1,036 | |
| | | | | | | | | | | | |
| |
| CALIFORNIA 8.7% | |
|
Alameda Corridor Transportation Authority, California Revenue Bonds, Series 2022 | |
0.000% due 10/01/2047 (d) | | | | | 500 | | | | | | 287 | |
|
Burbank-Glendale-Pasadena Airport Authority Brick Campaign, California Revenue Bonds, (AGM Insured), Series 2024 | |
4.125% due 07/01/2041 | | | | | 1,000 | | | | | | 985 | |
|
California Community Choice Financing Authority Revenue Bonds, Series 2021 | |
4.000% due 02/01/2052 | | | | | 1,000 | | | | | | 1,002 | |
|
California Community Choice Financing Authority Revenue Bonds, Series 2023 | |
5.000% due 02/01/2054 | | | | | 400 | | | | | | 424 | |
5.250% due 01/01/2054 | | | | | 250 | | | | | | 264 | |
5.250% due 11/01/2054 | | | | | 700 | | | | | | 748 | |
5.500% due 10/01/2054 | | | | | 200 | | | | | | 219 | |
|
California Community Housing Agency Revenue Bonds, Series 2022 | |
4.500% due 08/01/2052 | | | | | 100 | | | | | | 87 | |
| | | | | | | | | | | | |
| | | | | PRINCIPAL
AMOUNT
(000S) | | | | | MARKET
VALUE
(000S) | |
|
California Health Facilities Financing Authority Revenue Bonds, Series 2020 | |
4.000% due 06/01/2050 | | $ | | | 500 | | | $ | | | 484 | |
|
California Health Facilities Financing Authority Revenue Bonds, Series 2024 | |
5.250% due 12/01/2040 | | | | | 500 | | | | | | 559 | |
|
California Municipal Finance Authority Revenue Bonds, (FNMA Insured), Series 2024 | |
4.450% due 12/01/2042 | | | | | 100 | | | | | | 101 | |
|
California Municipal Finance Authority Revenue Bonds, Series 2021 | |
4.000% due 11/01/2036 | | | | | 250 | | | | | | 238 | |
|
California Municipal Finance Authority Revenue Bonds, Series 2024 | |
6.000% due 01/01/2039 | | | | | 1,000 | | | | | | 1,052 | |
|
California Pollution Control Financing Authority Revenue Bonds, Series 2019 | |
7.500% due 12/01/2040 ^(b) | | | | | 250 | | | | | | 19 | |
|
California State General Obligation Bonds, Series 2015 | |
3.875% due 12/01/2030 | | | | | 600 | | | | | | 583 | |
|
California State General Obligation Bonds, Series 2023 | |
4.000% due 09/01/2043 | | | | | 400 | | | | | | 407 | |
|
California Statewide Communities Development Authority Revenue Bonds, (AGM Insured),
Series 2022 | |
5.375% due 08/15/2057 | | | | | 250 | | | | | | 270 | |
|
California Statewide Communities Development Authority Revenue Bonds, Series 2016 | |
5.250% due 12/01/2056 | | | | | 250 | | | | | | 252 | |
|
CMFA Special Finance Agency, California Revenue Bonds, Series 2021 | |
4.000% due 08/01/2045 | | | | | 500 | | | | | | 421 | |
|
CSCDA Community Improvement Authority, California Revenue Bonds, Series 2021 | |
3.500% due 10/01/2046 | | | | | 500 | | | | | | 412 | |
|
CSCDA Community Improvement Authority, California Revenue Bonds, Series 2022 | |
0.000% due 09/01/2062 (d) | | | | | 200 | | | | | | 111 | |
|
Golden State, California Tobacco Securitization Corp. Revenue Bonds, Series 2021 | |
0.000% due 06/01/2066 (c) | | | | | 8,000 | | | | | | 893 | |
3.850% due 06/01/2050 | | | | | 735 | | | | | | 690 | |
|
Golden State, California Tobacco Securitization Corp. Revenue Bonds, Series 2022 | |
5.000% due 06/01/2051 | | | | | 250 | | | | | | 259 | |
|
Irvine Facilities Financing Authority, California Special Tax Bonds, (BAM Insured), Series 2023 | |
4.000% due 09/01/2058 | | | | | 500 | | | | | | 494 | |
|
Sacramento County, California Special Tax Bonds, Series 2022 | |
5.000% due 09/01/2047 | | | | | 150 | | | | | | 154 | |
|
San Diego County, California Regional Airport Authority Revenue Bonds, Series 2023 | |
5.250% due 07/01/2058 | | | | | 900 | | | | | | 957 | |
|
San Francisco, California City & County Airport Comm-San Francisco International Airport Revenue Bonds, Series 2019 | |
5.000% due 05/01/2038 | | | | | 650 | | | | | | 681 | |
|
San Joaquin Hills Transportation Corridor Agency, California Revenue Bonds, Series 1993 | |
0.000% due 01/01/2025 (c) | | | | | 500 | | | | | | 492 | |
|
Tobacco Securitization Authority of Northern California Revenue Bonds, Series 2021 | |
0.000% due 06/01/2060 (c) | | | | | 1,000 | | | | | | 164 | |
| | | | | | | | | | | | |
| | | | | | | | | | | 13,709 | |
| | | | | | | | | | | | |
| |
| COLORADO 4.1% | |
|
Colorado Bridge & Tunnel Enterprise Revenue Bonds, (AGM Insured), Series 2024 | |
5.250% due 12/01/2049 | | | | | 300 | | | | | | 332 | |
|
Colorado Health Facilities Authority Revenue Bonds, Series 2019 | |
4.000% due 11/15/2043 | | | | | 500 | | | | | | 490 | |
| | | | | | | | | | | | |
| | | | | PRINCIPAL
AMOUNT
(000S) | | | | | MARKET
VALUE
(000S) | |
|
Colorado Health Facilities Authority Revenue Bonds, Series 2022 | |
4.430% (MUNIPSA) due 05/15/2061 ~ | | $ | | | 500 | | | $ | | | 497 | |
5.000% due 05/15/2062 | | | | | 1,500 | | | | | | 1,544 | |
|
Colorado Health Facilities Authority Revenue Bonds, Series 2024 | |
5.000% due 11/15/2059 | | | | | 500 | | | | | | 550 | |
|
Colorado School of Mines Revenue Bonds, Series 2024 | |
5.000% due 12/01/2054 | | | | | 500 | | | | | | 535 | |
|
Denver, Colorado Airport System City & County Revenue Bonds, Series 2018 | |
5.000% due 12/01/2031 | | | | | 440 | | | | | | 459 | |
|
Denver, Colorado Airport System City & County Revenue Bonds, Series 2022 | |
5.000% due 11/15/2053 | | | | | 1,000 | | | | | | 1,035 | |
|
Dominion Water & Sanitation District, Colorado Revenue Bonds, Series 2022 | |
5.875% due 12/01/2052 | | | | | 1,000 | | | | | | 1,009 | |
| | | | | | | | | | | | |
| | | | | | | | | | | 6,451 | |
| | | | | | | | | | | | |
| |
| DELAWARE 0.2% | |
|
Delaware State Economic Development Authority Revenue Bonds, Series 2020 | |
1.250% due 10/01/2045 | | | | | 250 | | | | | | 237 | |
| | | | | | | | | | | | |
| |
| DISTRICT OF COLUMBIA 1.4% | |
|
Metropolitan Washington Airports Authority Aviation, District of Columbia Revenue Bonds, Series 2024 | |
5.500% due 10/01/2054 (a) | | | | | 1,000 | | | | | | 1,096 | |
|
Washington Metropolitan Area Transit Authority Dedicated, District of Columbia Revenue Bonds, Series 2023 | |
5.000% due 07/15/2037 | | | | | 500 | | | | | | 569 | |
5.000% due 07/15/2048 | | | | | 500 | | | | | | 544 | |
| | | | | | | | | | | | |
| | | | | | | | | | | 2,209 | |
| | | | | | | | | | | | |
| |
| FLORIDA 4.4% | |
|
Collier County, Florida Industrial Development Authority Revenue Bonds, (AGM Insured), Series 2024 | |
5.000% due 10/01/2049 | | | | | 1,000 | | | | | | 1,066 | |
|
Florida Department of Transportation Turnpike System State Revenue Bonds, Series 2024 | |
4.000% due 07/01/2051 | | | | | 500 | | | | | | 482 | |
|
Florida Development Finance Corp. Revenue Bonds, Series 2024 | |
5.250% due 08/01/2049 | | | | | 1,000 | | | | | | 1,049 | |
|
Florida Development Finance Corp. Revenue Notes, Series 2023 | |
5.000% due 09/01/2026 | | | | | 500 | | | | | | 510 | |
|
Hernando County, Florida Revenue Bonds, Series 2022 | |
5.250% due 06/01/2052 | | | | | 400 | | | | | | 428 | |
|
Jacksonville, Florida Revenue Bonds, Series 2023 | |
5.000% due 10/01/2043 | | | | | 510 | | | | | | 559 | |
|
Midtown Miami Community Development District, Florida Special Assessment Bonds, Series 2014 | |
5.000% due 05/01/2029 | | | | | 500 | | | | | | 500 | |
|
Orange County, Florida School Board Certificates of Participation Notes, Series 2024 | |
5.000% due 08/01/2033 | | | | | 1,100 | | | | | | 1,267 | |
|
Palm Beach County, Florida Health Facilities Authority Revenue Notes, Series 2022 | |
5.000% due 11/01/2029 | | | | | 375 | | | | | | 389 | |
|
Village Community Development District No 13, Florida Special Assessment Bonds, Series 2020 | |
3.500% due 05/01/2051 | | | | | 500 | | | | | | 404 | |
|
Village Community Development District No. 15, Florida Special Assessment Notes, Series 2023 | |
4.250% due 05/01/2028 | | | | | 250 | | | | | | 252 | |
| | | | | | | | | | | | |
| | | | | | | | | | | 6,906 | |
| | | | | | | | | | | | |
| |
| | | | | | | | | | | | |
| See Accompanying Notes | | | ANNUAL FINANCIAL AND OTHER INFORMATION | | | | | | | JUNE 30, 2024 | | | 107 |
| | | | | | |
| Schedule of Investments | | PIMCO Municipal Income Opportunities Active Exchange-Traded Fund | | (Cont.) | | |
| | | | | | | | | | | | |
| | | | | PRINCIPAL
AMOUNT
(000S) | | | | | MARKET
VALUE
(000S) | |
| GEORGIA 2.6% | |
|
Atlanta Department of Aviation, Georgia Revenue Bonds, Series 2023 | |
5.000% due 07/01/2053 | | $ | | | 1,000 | | | $ | | | 1,046 | |
|
Columbia County Hospital Authority, Georgia Revenue Bonds, Series 2023 | |
5.750% due 04/01/2053 | | | | | 500 | | | | | | 559 | |
|
Main Street Natural Gas, Inc., Georgia Revenue Bonds, Series 2021 | |
4.000% due 07/01/2052 | | | | | 1,000 | | | | | | 1,004 | |
|
Main Street Natural Gas, Inc., Georgia Revenue Bonds, Series 2023 | |
5.000% due 12/01/2053 | | | | | 400 | | | | | | 428 | |
|
Municipal Electric Authority of Georgia Revenue Bonds, Series 2015 | |
5.000% due 01/01/2035 | | | | | 500 | | | | | | 502 | |
|
Municipal Electric Authority of Georgia Revenue Bonds, Series 2022 | |
5.500% due 07/01/2063 | | | | | 500 | | | | | | 528 | |
| | | | | | | | | | | | |
| | | | | | | | | | | 4,067 | |
| | | | | | | | | | | | |
| |
| IDAHO 0.8% | |
|
Idaho Housing & Finance Association Revenue Bonds, (GNMA/FNMA/FHLMC Insured), Series 2024 | |
4.650% due 01/01/2054 | | | | | 1,000 | | | | | | 1,000 | |
|
Spring Valley Community Infrastructure District No 1, Idaho Special Assessment Bonds, Series 2021 | |
3.750% due 09/01/2051 | | | | | 250 | | | | | | 230 | |
| | | | | | | | | | | | |
| | | | | | | | | | | 1,230 | |
| | | | | | | | | | | | |
| |
| ILLINOIS 6.6% | |
|
Chicago O’Hare International Airport, Illinois Revenue Bonds, Series 2022 | |
5.000% due 01/01/2055 | | | | | 500 | | | | | | 515 | |
5.500% due 01/01/2055 | | | | | 1,000 | | | | | | 1,072 | |
|
DeKalb County, Illinois Community Unit School District No 428, DeKalb General Obligation Debt Certificates Bonds, Series 2023 | |
5.000% due 01/01/2041 | | | | | 500 | | | | | | 532 | |
|
Illinois Finance Authority Revenue Bonds, Series 2016 | |
5.000% due 02/15/2041 | | | | | 500 | | | | | | 512 | |
|
Illinois Sales Tax State Revenue Notes, Series 2021 | |
5.000% due 06/15/2031 | | | | | 1,000 | | | | | | 1,095 | |
|
Illinois State General Obligation Bonds, Series 2016 | |
4.000% due 06/01/2033 | | | | | 1,000 | | | | | | 994 | |
|
Illinois State General Obligation Bonds, Series 2024 | |
5.250% due 05/01/2045 | | | | | 3,000 | | | | | | 3,280 | |
|
Illinois State Toll Highway Authority Revenue Bonds, Series 2020 | |
5.000% due 01/01/2045 | | | | | 1,250 | | | | | | 1,330 | |
|
Sales Tax Securitization Corp., Illinois Revenue Bonds, Series 2018 | |
5.000% due 01/01/2037 | | | | | 1,000 | | | | | | 1,047 | |
| | | | | | | | | | | | |
| | | | | | | | | | | 10,377 | |
| | | | | | | | | | | | |
| |
| INDIANA 2.6% | |
|
Indiana Finance Authority Midwestern Disaster Relief Revenue Bonds, Series 2012 | |
4.250% due 11/01/2030 | | | | | 1,750 | | | | | | 1,759 | |
|
Indiana Finance Authority Revenue Bonds, Series 2012 | |
3.000% due 11/01/2030 | | | | | 250 | | | | | | 234 | |
|
Indiana University Revenue Notes, Series 2024 | |
5.000% due 06/01/2034 | | | | | 500 | | | | | | 584 | |
|
Indianapolis Local Public Improvement Bond Bank, Indiana Revenue Bonds, Series 2023 | |
5.750% due 03/01/2043 | | | | | 300 | | | | | | 332 | |
|
Mount Vernon, Indiana Revenue Bonds, Series 2015 | |
4.250% due 09/01/2055 | | | | | 100 | | | | | | 100 | |
|
Warrick County, Indiana Revenue Bonds, Series 2015 | |
4.250% due 09/01/2055 | | | | | 100 | | | | | | 100 | |
| | | | | | | | | | | | |
| | | | | PRINCIPAL
AMOUNT
(000S) | | | | | MARKET
VALUE
(000S) | |
|
Whiting, Indiana Revenue Bonds, Series 2016 | |
4.400% due 03/01/2046 | | $ | | | 1,000 | | | $ | | | 1,002 | |
| | | | | | | | | | | | |
| | | | | | | | | | | 4,111 | |
| | | | | | | | | | | | |
| |
| IOWA 0.3% | |
|
Iowa Finance Authority Midwestern Disaster Area Revenue Refunding Bonds, Series 2022 | |
4.000% due 12/01/2050 | | | | | 500 | | | | | | 524 | |
| | | | | | | | | | | | |
| |
| KENTUCKY 0.8% | |
|
Kentucky Economic Development Finance Authority Revenue Bonds, Series 2015 | |
5.000% due 07/01/2040 | | | | | 500 | | | | | | 501 | |
|
Louisville/Jefferson County Metropolitan Government, Kentucky Revenue Bonds, Series 2023 | |
5.000% due 10/01/2038 | | | | | 700 | | | | | | 768 | |
| | | | | | | | | | | | |
| | | | | | | | | | | 1,269 | |
| | | | | | | | | | | | |
| |
| LOUISIANA 0.5% | |
|
Louisiana Local Government Environmental Facilities & Community Development Auth Revenue Notes, Series 2022 | |
5.000% due 08/15/2026 | | | | | 475 | | | | | | 487 | |
|
Louisiana Public Facilities Authority Revenue Bonds, Series 2023 | |
5.000% due 07/01/2040 | | | | | 250 | | | | | | 275 | |
| | | | | | | | | | | | |
| | | | | | | | | | | 762 | |
| | | | | | | | | | | | |
| |
| MASSACHUSETTS 1.8% | |
|
Commonwealth of Massachusetts General Obligation Bonds, Series 2022 | |
5.250% due 10/01/2047 | | | | | 1,000 | | | | | | 1,105 | |
|
Commonwealth of Massachusetts General Obligation Bonds, Series 2023 | |
5.000% due 10/01/2046 | | | | | 700 | | | | | | 765 | |
|
Massachusetts Development Finance Agency Revenue Bonds, Series 2024 | |
4.000% due 03/01/2054 | | | | | 1,000 | | | | | | 972 | |
| | | | | | | | | | | | |
| | | | | | | | | | | 2,842 | |
| | | | | | | | | | | | |
| |
| MICHIGAN 3.4% | |
|
Detroit Downtown Development Authority, Michigan Tax Allocation Bonds, Series 2024 | |
5.000% due 07/01/2048 | | | | | 500 | | | | | | 524 | |
|
Detroit, Michigan General Obligation Bonds, Series 2014 | |
4.000% due 04/01/2044 | | | | | 250 | | | | | | 197 | |
|
Detroit, Michigan General Obligation Bonds, Series 2023 | |
6.000% due 05/01/2039 | | | | | 300 | | | | | | 349 | |
|
Detroit, Michigan Sewage Disposal System Revenue Bonds, (NPFGC Insured), Series 2001 | |
5.500% due 07/01/2029 | | | | | 490 | | | | | | 506 | |
|
Great Lakes Water Authority Sewage Disposal System, Michigan Revenue Bonds, Series 2023 | |
5.250% due 07/01/2053 | | | | | 750 | | | | | | 826 | |
|
Michigan Finance Authority Revenue Bonds, Series 2020 | |
0.000% due 06/01/2065 (c) | | | | | 2,500 | | | | | | 268 | |
5.000% due 06/01/2040 | | | | | 750 | | | | | | 782 | |
|
Michigan Finance Authority Revenue Bonds, Series 2024 | |
5.500% due 02/28/2049 | | | | | 500 | | | | | | 551 | |
|
Michigan Trunk Line State Revenue Bonds, Series 2023 | |
5.000% due 11/15/2046 | | | | | 500 | | | | | | 551 | |
|
Wayne County, Michigan Airport Authority Revenue Notes, (AGM Insured), Series 2023 | |
5.000% due 12/01/2031 | | | | | 750 | | | | | | 811 | |
| | | | | | | | | | | | |
| | | | | | | | | | | 5,365 | |
| | | | | | | | | | | | |
| |
| | | | | | | | | | | | |
| | | | | PRINCIPAL
AMOUNT
(000S) | | | | | MARKET
VALUE
(000S) | |
| MINNESOTA 1.0% | |
|
Minnesota Agricultural & Economic Development Board Revenue Bonds, Series 2024 | |
5.250% due 01/01/2054 | | $ | | | 1,000 | | | $ | | | 1,079 | |
|
Minnesota Housing Finance Agency Revenue Bonds, (GNMA/FNMA/FHLMC Insured), Series 2024 | |
6.500% due 01/01/2055 (a) | | | | | 500 | | | | | | 564 | |
| | | | | | | | | | | | |
| | | | | | | | | | | 1,643 | |
| | | | | | | | | | | | |
| |
| MULTI-STATE 1.3% | |
|
Freddie Mac Multifamily ML Certificates, Revenue Bonds, Series 2023 | |
4.033% due 12/25/2036 | | | | | 694 | | | | | | 681 | |
4.141% due 01/25/2040 | | | | | 396 | | | | | | 388 | |
4.549% due 08/25/2040 | | | | | 997 | | | | | | 1,006 | |
| | | | | | | | | | | | |
| | | | | | | | | | | 2,075 | |
| | | | | | | | | | | | |
| |
| NEVADA 1.0% | |
|
Las Vegas, Nevada Revenue Bonds, Series 2016 | |
4.375% due 06/15/2035 | | | | | 500 | | | | | | 484 | |
|
Nevada Department of Business & Industry State Revenue Bonds, Series 2020 | |
8.125% due 01/01/2050 | | | | | 400 | | | | | | 416 | |
|
Reno, Nevada Revenue Bonds, Series 2018 | |
0.000% due 07/01/2058 (c) | | | | | 1,000 | | | | | | 135 | |
|
Washoe County, Nevada Revenue Bonds, Series 2016 | |
4.125% due 03/01/2036 | | | | | 500 | | | | | | 501 | |
| | | | | | | | | | | | |
| | | | | | | | | | | 1,536 | |
| | | | | | | | | | | | |
| |
| NEW HAMPSHIRE 1.4% | |
|
New Hampshire Business Finance Authority Revenue Bonds, Series 2023 | |
3.875% due 01/20/2038 | | | | | 495 | | | | | | 467 | |
|
New Hampshire Business Finance Authority Revenue Notes, Series 2022 | |
4.000% due 12/01/2028 | | | | | 1,000 | | | | | | 992 | |
|
New Hampshire Housing Finance Authority Revenue Bonds, (GNMA/FNMA/FHLMC Insured), Series 2024 | |
6.500% due 07/01/2055 (a) | | | | | 600 | | | | | | 677 | |
| | | | | | | | | | | | |
| | | | | | | | | | | 2,136 | |
| | | | | | | | | | | | |
| |
| NEW JERSEY 2.4% | |
|
Middlesex County Improvement Authority, New Jersey Revenue Bonds, Series 2023 | |
5.000% due 08/15/2053 | | | | | 500 | | | | | | 539 | |
|
New Jersey Educational Facilities Authority Revenue Bonds, Series 2023 | |
4.625% due 09/01/2048 | | | | | 250 | | | | | | 260 | |
|
New Jersey Transportation Trust Fund Authority Revenue Bonds, Series 2018 | |
5.000% due 12/15/2036 | | | | | 1,000 | | | | | | 1,053 | |
|
New Jersey Transportation Trust Fund Authority Revenue Bonds, Series 2023 | |
5.000% due 06/15/2037 | | | | | 500 | | | | | | 563 | |
|
New Jersey Turnpike Authority Revenue Bonds, Series 2024 | |
5.250% due 01/01/2054 | | | | | 1,000 | | | | | | 1,103 | |
|
Tobacco Settlement Financing Corp., New Jersey Revenue Bonds, Series 2018 | |
5.000% due 06/01/2046 | | | | | 220 | | | | | | 222 | |
| | | | | | | | | | | | |
| | | | | | | | | | | 3,740 | |
| | | | | | | | | | | | |
| |
| NEW MEXICO 0.5% | |
|
Farmington, New Mexico Revenue Bonds, Series 2010 | |
3.875% due 06/01/2040 | | | | | 500 | | | | | | 503 | |
|
New Mexico Hospital Equipment Loan Council Revenue Bonds, Series 2017 | |
4.000% due 08/01/2039 | | | | | 350 | | | | | | 344 | |
| | | | | | | | | | | | |
| | | | | | | | | | | 847 | |
| | | | | | | | | | | | |
| |
| | | | | | |
| 108 | | PIMCO ETF TRUST | | | See Accompanying Notes | |
| | | | | | | | | | | | |
| | | | | PRINCIPAL
AMOUNT
(000S) | | | | | MARKET
VALUE
(000S) | |
| NEW YORK 15.0% | |
|
Freddie Mac Multifamily ML Certificates, Revenue Bonds, Series 2024 | |
4.563% due 04/25/2042 ~ | | $ | | | 1,000 | | | $ | | | 1,048 | |
4.617% due 08/25/2041 ~ | | | | | 700 | | | | | | 716 | |
|
Freddie Mac Structured Pass-Through Certificates, Revenue Bonds, Series 2024 | |
4.683% due 10/25/2040 | | | | | 700 | | | | | | 722 | |
|
New York City Water & Sewer System, New York Revenue Bonds, Series 2013 | |
4.700% due 06/15/2050 | | | | | 1,500 | | | | | | 1,500 | |
|
New York City, New York General Obligation Bonds, Series 2022 | |
5.250% due 10/01/2041 | | | | | 250 | | | | | | 281 | |
|
New York City, New York General Obligation Bonds, Series 2024 | |
5.250% due 04/01/2054 | | | | | 500 | | | | | | 552 | |
|
New York City, New York Municipal Water Finance Authority Revenue Bonds, Series 2023 | |
5.250% due 06/15/2048 | | | | | 200 | | | | | | 222 | |
5.250% due 06/15/2053 | | | | | 300 | | | | | | 331 | |
|
New York City, New York Municipal Water Finance Authority Revenue Bonds, Series 2024 | |
5.250% due 06/15/2054 | | | | | 390 | | | | | | 432 | |
|
New York City, New York Transitional Finance Authority Future Tax Secured Revenue Bonds, Series 2022 | |
5.500% due 11/01/2045 | | | | | 500 | | | | | | 568 | |
|
New York City, New York Transitional Finance Authority Revenue Bonds, Series 2024 | |
5.000% due 05/01/2046 | | | | | 1,000 | | | | | | 1,098 | |
5.250% due 02/01/2053 | | | | | 1,000 | | | | | | 1,107 | |
|
New York Liberty Development Corp. Revenue Bonds, Series 2014 | |
5.000% due 11/15/2044 | | | | | 350 | | | | | | 350 | |
5.150% due 11/15/2034 | | | | | 235 | | | | | | 236 | |
|
New York Power Authority Revenue Bonds, (AGM Insured), Series 2023 | |
5.000% due 11/15/2038 | | | | | 1,000 | | | | | | 1,147 | |
|
New York State Dormitory Authority Revenue Bonds, Series 2020 | |
5.000% due 07/01/2050 | | | | | 500 | | | | | | 533 | |
|
New York State Dormitory Authority Revenue Bonds, Series 2022 | |
4.000% due 07/01/2051 | | | | | 1,500 | | | | | | 1,444 | |
5.000% due 03/15/2041 | | | | | 500 | | | | | | 552 | |
|
New York State Dormitory Authority Revenue Bonds, Series 2024 | |
5.000% due 03/15/2046 | | | | | 1,000 | | | | | | 1,100 | |
|
New York State Urban Development Corp. Revenue Bonds, Series 2023 | |
5.000% due 03/15/2053 | | | | | 500 | | | | | | 544 | |
5.000% due 03/15/2063 | | | | | 1,000 | | | | | | 1,074 | |
|
New York Transportation Development Corp. Revenue Bonds, (AGM Insured), Series 2023 | |
5.500% due 06/30/2044 | | | | | 500 | | | | | | 541 | |
|
New York Transportation Development Corp. Revenue Bonds, (AGM Insured), Series 2024 | |
5.000% due 06/30/2054 | | | | | 250 | | | | | | 258 | |
|
New York Transportation Development Corp. Revenue Bonds, Series 2023 | |
5.625% due 04/01/2040 | | | | | 500 | | | | | | 544 | |
6.000% due 04/01/2035 | | | | | 250 | | | | | | 283 | |
|
New York Transportation Development Corp. Revenue Bonds, Series 2024 | |
5.000% due 06/30/2060 | | | | | 1,000 | | | | | | 1,011 | |
|
New York Transportation Development Corp. Revenue Notes, Series 2018 | |
5.000% due 01/01/2027 | | | | | 250 | | | | | | 257 | |
|
New York Transportation Development Corp. Revenue Notes, Series 2020 | |
4.000% due 10/01/2030 | | | | | 550 | | | | | | 552 | |
|
Port Authority of New York & New Jersey Revenue Bonds, Series 2019 | |
4.000% due 11/01/2041 | | | | | 1,765 | | | | | | 1,710 | |
| | | | | | | | | | | | |
| | | | | PRINCIPAL
AMOUNT
(000S) | | | | | MARKET
VALUE
(000S) | |
|
Riverhead IDA Economic Job Development Corp., New York Revenue Bonds, (FNMA Insured), Series 2023 | |
4.500% due 02/01/2041 | | $ | | | 1,000 | | | $ | | | 1,013 | |
|
Suffolk Tobacco Asset Securitization Corp., New York Revenue Bonds, Series 2021 | |
0.000% due 06/01/2066 (c) | | | | | 1,500 | | | | | | 149 | |
4.000% due 06/01/2050 | | | | | 300 | | | | | | 268 | |
|
Town of Hempstead, New York General Obligation Bonds, Series 2024 | |
4.000% due 05/01/2047 | | | | | 500 | | | | | | 498 | |
|
Triborough Bridge & Tunnel Authority, New York Revenue Bonds, Series 2024 | |
5.250% due 05/15/2054 | | | | | 500 | | | | | | 555 | |
|
Utility Debt Securitization Authority, New York Revenue Bonds, Series 2023 | |
5.000% due 12/15/2041 | | | | | 500 | | | | | | 575 | |
| | | | | | | | | | | | |
| | | | | | | | | | | 23,771 | |
| | | | | | | | | | | | |
| |
| NORTH CAROLINA 0.6% | |
|
Inlivian, North Carolina Revenue Bonds, (FNMA Insured), Series 2024 | |
4.450% due 06/01/2041 | | | | | 1,000 | | | | | | 1,001 | |
| | | | | | | | | | | | |
| |
| NORTH DAKOTA 0.4% | |
|
Grand Forks, North Dakota Revenue Bonds, (AGM Insured), Series 2023 | |
5.000% due 12/01/2041 | | | | | 525 | | | | | | 559 | |
| | | | | | | | | | | | |
| |
| OHIO 3.7% | |
|
Allen County, Ohio Hospital Facilities Revenue Bonds, Series 2017 | |
5.000% due 08/01/2042 | | | | | 500 | | | | | | 514 | |
|
Buckeye Tobacco Settlement Financing Authority, Ohio Revenue Bonds, Series 2020 | |
0.000% due 06/01/2057 (c) | | | | | 7,400 | | | | | | 694 | |
4.000% due 06/01/2048 | | | | | 500 | | | | | | 461 | |
|
Cuyahoga County, Ohio Revenue Bonds, Series 2017 | |
5.000% due 02/15/2057 | | | | | 500 | | | | | | 500 | |
|
Hamilton County, Ohio Revenue Bonds, Series 2021 | |
4.750% due 08/15/2051 | | | | | 2,000 | | | | | | 2,000 | |
|
Ohio Air Quality Development Authority Duke Energy Corporation Project Revenue Bonds, Series 2022 | |
4.250% due 11/01/2039 | | | | | 500 | | | | | | 503 | |
|
Ohio Air Quality Development Authority Revenue Bonds, Series 2019 | |
5.000% due 07/01/2049 | | | | | 400 | | | | | | 374 | |
|
Port of Greater Cincinnati Development Authority, Ohio Revenue Bonds, (AGM Insured), Series 2024 | |
5.250% due 12/01/2048 | | | | | 750 | | | | | | 807 | |
| | | | | | | | | | | | |
| | | | | | | | | | | 5,853 | |
| | | | | | | | | | | | |
| |
| OKLAHOMA 1.1% | |
|
Grand River Dam Authority, Oklahoma Revenue Bonds, Series 2024 | |
5.000% due 06/01/2040 (a) | | | | | 1,000 | | | | | | 1,126 | |
|
Oklahoma Turnpike Authority Revenue Bonds, Series 2023 | |
5.500% due 01/01/2053 | | | | | 600 | | | | | | 663 | |
| | | | | | | | | | | | |
| | | | | | | | | | | 1,789 | |
| | | | | | | | | | | | |
| |
| OREGON 0.7% | |
|
Oregon State General Obligation Bonds, Series 2022 | |
4.700% due 06/01/2045 | | | | | 1,100 | | | | | | 1,100 | |
| | | | | | | | | | | | |
| |
| PENNSYLVANIA 3.9% | |
|
Allentown Neighborhood Improvement Zone Development Authority, Pennsylvania Revenue Bonds, Series 2022 | |
5.250% due 05/01/2042 | | | | | 500 | | | | | | 499 | |
| | | | | | | | | | | | |
| | | | | PRINCIPAL
AMOUNT
(000S) | | | | | MARKET
VALUE
(000S) | |
|
Commonwealth of Pennsylvania General Obligation Bonds, Series 2016 | |
4.000% due 09/15/2034 | | $ | | | 500 | | | $ | | | 505 | |
|
Geisinger Authority, Pennsylvania Revenue Bonds, Series 2020 | |
4.000% due 04/01/2050 | | | | | 1,000 | | | | | | 945 | |
|
Lehigh County, Pennsylvania Revenue Bonds, Series 2019 | |
4.980% (MUNIPSA) due 08/15/2038 ~(e) | | | | | 970 | | | | | | 963 | |
|
Montgomery County Industrial Development Authority, Pennsylvania Revenue Notes, Series 2023 | |
4.100% due 06/01/2029 | | | | | 500 | | | | | | 513 | |
|
Pennsylvania Economic Development Financing Authority Revenue Bonds, (AGM Insured), Series 2022 | |
5.000% due 12/31/2057 | | | | | 300 | | | | | | 310 | |
|
Pennsylvania Economic Development Financing Authority Revenue Bonds, Series 2015 | |
5.000% due 12/31/2030 | | | | | 250 | | | | | | 253 | |
5.000% due 12/31/2038 | | | | | 500 | | | | | | 505 | |
|
Pennsylvania Economic Development Financing Authority Revenue Bonds, Series 2022 | |
5.500% due 06/30/2039 | | | | | 500 | | | | | | 550 | |
|
Pennsylvania Higher Educational Facilities Authority Revenue Bonds, Series 2019 | |
4.000% due 08/15/2049 | | | | | 1,000 | | | | | | 962 | |
|
Pennsylvania Housing Finance Agency Revenue Bonds, Series 2024 | |
6.000% due 10/01/2054 | | | | | 200 | | | | | | 217 | |
| | | | | | | | | | | | |
| | | | | | | | | | | 6,222 | |
| | | | | | | | | | | | |
| |
| PUERTO RICO 2.6% | |
|
Commonwealth of Puerto Rico Bonds, Series 2022 | |
0.000% due 11/01/2043 | | | | | 256 | | | | | | 157 | |
0.000% due 11/01/2051 | | | | | 2,077 | | | | | | 1,240 | |
|
GDB Debt Recovery Authority of Puerto Rico Revenue Bonds, Series 2018 | |
7.500% due 08/20/2040 | | | | | 363 | | | | | | 353 | |
|
Puerto Rico Sales Tax Financing Corp. Sales Tax Revenue Bonds, Series 2018 | |
0.000% due 07/01/2046 (c) | | | | | 500 | | | | | | 162 | |
0.000% due 07/01/2051 (c) | | | | | 5,400 | | | | | | 1,271 | |
5.000% due 07/01/2058 | | | | | 750 | | | | | | 750 | |
|
Puerto Rico Sales Tax Financing Corp. Sales Tax Revenue Bonds, Series 2019 | |
4.550% due 07/01/2040 | | | | | 250 | | | | | | 251 | |
| | | | | | | | | | | | |
| | | | | | | | | | | 4,184 | |
| | | | | | | | | | | | |
| |
| RHODE ISLAND 0.6% | |
|
Tobacco Settlement Financing Corp., Rhode Island Revenue Bonds, Series 2015 | |
5.000% due 06/01/2040 | | | 750 | | | | | | 754 | |
5.000% due 06/01/2050 | | | 200 | | | | | | 201 | |
| | | | | | | | | | |
| | | | | | | | | 955 | |
| | | | | | | | | | |
| |
| SOUTH CAROLINA 1.1% | |
|
Columbia, South Carolina Waterworks & Sewer System Revenue Bonds, Series 2022 | |
4.250% due 02/01/2041 | | | 625 | | | | | | 647 | |
|
Patriots Energy Group Financing Agency, South Carolina Revenue Bonds, Series 2023 | |
5.250% due 02/01/2054 | | | 200 | | | | | | 217 | |
|
South Carolina Public Service Authority Revenue Bonds, (BAM Insured), Series 2013 | |
4.000% due 12/01/2049 | | | 1,000 | | | | | | 939 | |
| | | | | | | | | | |
| | | | | | | | | 1,803 | |
| | | | | | | | | | |
| |
| TENNESSEE 0.6% | |
|
Tennergy Corp., Tennessee Revenue Bonds, Series 2021 | |
4.000% due 12/01/2051 | | | 1,000 | | | | | | 1,001 | |
| | | | | | | | | | |
| | | | | | | | | | | | |
| See Accompanying Notes | | | ANNUAL FINANCIAL AND OTHER INFORMATION | | | | | | | JUNE 30, 2024 | | | 109 |
| | | | | | |
| Schedule of Investments | | PIMCO Municipal Income Opportunities Active Exchange-Traded Fund | | (Cont.) | | |
| | | | | | | | | | | | |
| | | | | PRINCIPAL
AMOUNT
(000S) | | | | | MARKET
VALUE
(000S) | |
| TEXAS 12.8% | |
|
Aledo Independent School District, Texas General Obligation Bonds, (PSF Insured), Series 2023 | |
5.000% due 02/15/2048 | | $ | | | 100 | | | $ | | | 107 | |
|
Angelina & Neches River Authority, Texas Revenue Bonds, Series 2021 | |
5.250% due 12/01/2045 | | | 250 | | | | | | 250 | |
|
Canutillo Independent School District, Texas General Obligation Bonds, (PSF Insured), Series2024 | |
5.250% due 02/15/2054 (a) | | | 300 | | | | | | 329 | |
|
Central Texas Turnpike System Revenue Bonds, Series 2015 | |
0.000% due 08/15/2037 (c) | | | 250 | | | | | | 138 | |
|
Denton Independent School District, Texas General Obligation Bonds, (PSF Insured), Series 2023 | |
5.000% due 08/15/2048 | | | 700 | | | | | | 763 | |
|
Grand Parkway Transportation Corp., Texas Revenue Bonds, Series 2023 | |
5.000% due 10/01/2052 | | | 500 | | | | | | 526 | |
|
Greenwood Independent School District, Texas General Obligation Bonds, (PSF Insured), Series 2024 | |
4.000% due 02/15/2054 | | | 1,000 | | | | | | 943 | |
5.000% due 02/15/2049 | | | 300 | | | | | | 323 | |
|
Harris County, Texas Cultural Education Facilities Finance Corp. Revenue Bonds, Series 2021 | |
4.600% due 10/01/2041 | | | 2,500 | | | | | | 2,500 | |
|
Harris County, Texas Cultural Education Facilities Finance Corp. Revenue Bonds, Series 2024 | |
5.000% due 07/01/2054 | | | 500 | | | | | | 536 | |
|
Harris County, Texas Toll Road Revenue Bonds, Series 2024 | |
4.000% due 08/15/2041 | | | 1,000 | | | | | | 998 | |
|
Houston, Texas Airport System Revenue Bonds,(AGM Insured), Series 2023 | |
5.000% due 07/01/2038 | | | 100 | | | | | | 108 | |
|
Hutto Independent School District, Texas General Obligation Bonds, (PSF Insured), Series 2023 | |
5.000% due 08/01/2048 | | | 500 | | | | | | 541 | |
|
Katy Independent School District, Texas General Obligation Bonds, (PSF Insured), Series 2024 | |
4.000% due 02/15/2049 (a) | | | 500 | | | | | | 483 | |
|
Lower Colorado River Authority, Texas Revenue Bonds, Series 2021 | |
5.000% due 05/15/2051 | | | 1,500 | | | | | | 1,590 | |
|
Mansfield Independent School District, Texas General Obligation Bonds, (PSF Insured), Series 2024 | |
4.000% due 02/15/2054 (a) | | | 500 | | | | | | 472 | |
|
Matagorda County, Texas Navigation District No 1, Revenue Bonds, Series 2001 | |
2.600% due 11/01/2029 | | | 250 | | | | | | 231 | |
|
Medina Valley Independent School District, Texas General Obligation Bonds, (PSF Insured), Series 2023 | |
4.500% due 02/15/2047 | | | 500 | | | | | | 514 | |
|
Midland County, Texas Hospital District Revenue Bonds, (BAM Insured), Series 2024 | |
5.250% due 05/15/2054 | | | 1,000 | | | | | | 1,091 | |
|
Midland Independent School District, Texas General Obligation Bonds, (PSF Insured), Series 2024 | |
5.000% due 02/15/2050 | | | 500 | | | | | | 518 | |
| | | | | | | | | | | | |
| | | | | PRINCIPAL
AMOUNT
(000S) | | | | | MARKET
VALUE
(000S) | |
|
Mission Economic Development Corp., Texas Revenue Bonds, Series 2024 | |
4.000% due 06/01/2054 | | $ | | | 1,000 | | | $ | | | 1,010 | |
|
New Hope Cultural Education Facilities Finance Corp., Texas Revenue Bonds, Series 2019 | |
4.000% due 12/01/2054 | | | | | 250 | | | | | | 192 | |
|
San Antonio, Texas Electric & Gas Systems Revenue Bonds, Series 2024 | |
5.000% due 02/01/2042 | | | 1,000 | | | | | | 1,109 | |
|
Texas Municipal Gas Acquisition & Supply Corp. Revenue Bonds, Series 2023 | |
5.500% due 01/01/2054 | | | 400 | | | | | | 429 | |
|
Texas Private Activity Bond Surface Transportation Corp. Revenue Bonds, Series 2020 | |
4.000% due 12/31/2037 | | | 250 | | | | | | 251 | |
|
Texas State University System Revenue Bonds, Series 2024 | |
5.000% due 03/15/2042 | | | | | 1,000 | | | | | | 1,113 | |
|
Texas Water Development Board Revenue Bonds, Series 2022 | |
4.800% due 10/15/2052 | | | | | 600 | | | | | | 624 | |
5.000% due 10/15/2057 | | | | | 250 | | | | | | 267 | |
|
Texas Water Development Board Revenue Bonds, Series 2023 | |
4.875% due 10/15/2048 | | | | | 500 | | | | | | 529 | |
5.000% due 10/15/2058 | | | | | 300 | | | | | | 322 | |
|
Waxahachie Independent School District, Texas General Obligation Bonds, (PSF Insured), Series 2024 | |
4.000% due 02/15/2049 | | | | | 1,500 | | | | | | 1,448 | |
| | | | | | | | | | | | |
| | | | | | | | | | | 20,255 | |
| | | | | | | | | | | | |
| | | | | | | | | | | | |
| UTAH 0.2% | | | | | | | | | | | | |
|
City of Salt Lake, Utah Revenue Bonds, Series 2023 | |
5.250% due 07/01/2037 | | | | | 300 | | | | | | 338 | |
| | | | | | | | | | | | |
| | | | | | | | | | | | |
| VIRGINIA 0.3% | | | | | | | | | | | | |
|
Farms New Kent Community Development Authority, Virginia Special Assessment Bonds, Series 2021 | |
3.750% due 03/01/2036 | | | | | 450 | | | | | | 425 | |
| | | | | | | | | | | | |
| | | | | | | | | | | | |
| WASHINGTON 1.3% | | | | | | | | | | | | |
|
Washington State General Obligation Bonds, Series 2023 | |
5.000% due 06/01/2040 | | | | | 1,000 | | | | | | 1,121 | |
|
Washington State General Obligation Bonds, Series 2024 | |
5.000% due 02/01/2043 | | | | | 500 | | | | | | 555 | |
|
Washington State Housing Finance Commission Revenue Bonds, Series 2023 | |
3.375% due 04/20/2037 | | | | | 498 | | | | | | 446 | |
| | | | | | | | | | | | |
| | | | | | | | | | | 2,122 | |
| | | | | | | | | | | | |
| | | | | | | | | | | | |
| WEST VIRGINIA 0.2% | | | | | | | | | | | | |
|
West Virginia Hospital Finance Authority Revenue Bonds, Series 2023 | |
6.000% due 09/01/2053 | | | | | 300 | | | | | | 339 | |
| | | | | | | | | | | | |
| | | | | | | | | | | | |
| | | | | PRINCIPAL
AMOUNT
(000S) | | | | | MARKET
VALUE
(000S) | |
| WISCONSIN 1.9% | | | | | | | | | | | | |
|
Public Finance Authority, Wisconsin Revenue Bonds, Series 2021 | |
4.000% due 10/01/2041 | | $ | | | 250 | | | $ | | | 251 | |
4.000% due 03/31/2056 | | | | | 250 | | | | | | 208 | |
|
Public Finance Authority, Wisconsin Revenue Bonds, Series 2022 | |
4.000% due 10/01/2052 | | | | | 400 | | | | | | 377 | |
|
University of Wisconsin Hospitals & Clinics Revenue Bonds, Series 2021 | |
4.000% due 04/01/2046 | | | | | 750 | | | | | | 713 | |
|
Wisconsin Center District Revenue Bonds, (AGM Insured), Series 2020 | |
0.000% due 12/15/2045 (c) | | | | | 1,000 | | | | | | 359 | |
|
Wisconsin Health & Educational Facilities Authority Revenue Bonds, Series 2021 | |
4.950% due 04/01/2035 | | | | | 900 | | | | | | 900 | |
|
Wisconsin State General Obligation Notes, Series 2022 | |
4.300% (MUNIPSA) due 05/01/2025 ~ | | | | | 215 | | | | | | 214 | |
| | | | | | | | | | | | |
| | | | | | | | | | | 3,022 | |
| | | | | | | | | | | | |
Total Municipal Bonds & Notes (Cost $150,460) | | | 153,384 | |
| | | | |
| |
| U.S. GOVERNMENT AGENCIES 0.1% | |
|
Freddie Mac | |
3.083% due 04/25/2043 ~ | | | | | 199 | | | | | | 161 | |
| | | | | | | | | | | | |
Total U.S. Government Agencies (Cost $158) | | | 161 | |
| | | | |
| |
| NON-AGENCY MORTGAGE-BACKED SECURITIES 0.6% | |
|
Multifamily Tax-Exempt Mortgage-backed Securities | |
4.500% due 08/01/2041 (a) | | | | | 1,000 | | | | | | 1,003 | |
| | | | | | | | | | | | |
Total Non-Agency Mortgage-Backed Securities (Cost $1,000) | | | 1,003 | |
| | | | |
| |
| SHORT-TERM INSTRUMENTS 4.1% | |
| | | | | | | | | | | | |
| REPURCHASE AGREEMENTS (f) 4.1% | |
| | | | | | | | | | | 6,425 | |
| | | | | | | | | | | | |
Total Short-Term Instruments
(Cost $6,425) | | | 6,425 | |
| | | | |
| |
| | | | |
| Total Investments in Securities (Cost $158,395) | | | 161,384 | |
| |
| | | | |
| Total Investments 102.1% (Cost $158,395) | | | $ | | | 161,384 | |
| |
Financial Derivative
Instruments (g) 0.0% (Cost or Premiums, net $0) | | | | | | 90 | |
| |
| Other Assets and Liabilities, net (2.1)% | | | (3,353 | ) |
| | | | |
| Net Assets 100.0% | | | $ | | | 158,121 | |
| | | | | | | |
| |
NOTES TO SCHEDULE OF INVESTMENTS:
| * | A zero balance may reflect actual amounts rounding to less than one thousand. |
| ~ | Variable or Floating rate security. Rate shown is the rate in effect as of period end. Certain variable rate securities are not based on a published reference rate and spread, rather are determined by the issuer or agent and are based on current market conditions. Reference rate is as of reset date, which may vary by security. These securities may not indicate a reference rate and/or spread in their description. |
| (b) | Security is not accruing income as of the date of this report. |
| (d) | Security becomes interest bearing at a future date. |
| | | | | | |
| 110 | | PIMCO ETF TRUST | | | See Accompanying Notes | |
(e) RESTRICTED SECURITIES:
| | | | | | | | | | | | | | | | | | | | | | | | |
| Issuer Description | | Coupon | | | Maturity
Date | | | Acquisition
Date | | | Cost | | | Market
Value | | | Market Value
as Percentage
of Net Assets | |
Lehigh County, Pennsylvania Revenue Bonds, Series 2019 | | | 4.980% | | | | 08/15/2038 | | | | 09/14/2021 | | | $ | 987 | | | $ | 963 | | | | 0.61% | |
| | | | | | | | | | | | | | | | | | | | | | | | |
BORROWINGS AND OTHER FINANCING TRANSACTIONS
(f) REPURCHASE AGREEMENTS:
| | | | | | | | | | | | | | | | | | | | | | | | | | | | | | |
| Counterparty | | Lending
Rate | | | Settlement
Date | | | Maturity
Date | | | Principal
Amount | | | Collateralized By | | Collateral
(Received) | | | Repurchase
Agreements,
at Value | | | Repurchase
Agreement
Proceeds
to be
Received(1) | |
| BPS | | | 5.340 | % | | | 06/28/2024 | | | | 07/01/2024 | | | $ | 6,200 | | | U.S. Treasury Notes 0.625% due 07/31/2026 | | $ | (6,322 | ) | | $ | 6,200 | | | $ | 6,202 | |
| FICC | | | 2.600 | | | | 06/28/2024 | | | | 07/01/2024 | | | | 225 | | | U.S. Treasury Inflation Protected Securities 0.625% due 01/15/2026 | | | (230 | ) | | | 225 | | | | 225 | |
| | | | | | | | | | | | | | | | | | | | | | | | | | | | | | |
Total Repurchase Agreements | | | | | $ | (6,552 | ) | | $ | 6,425 | | | $ | 6,427 | |
| | | | | | | | | | | | | | | | | | | | | | | | | | | | | | |
BORROWINGS AND OTHER FINANCING TRANSACTIONS SUMMARY
The following is a summary by counterparty of the market value of Borrowings and Other Financing Transactions and collateral pledged/(received) as of June 30, 2024:
| | | | | | | | | | | | | | | | | | | | | | | | | | | | |
| Counterparty | | Repurchase
Agreement
Proceeds
to be
Received(1) | | | Payable for
Reverse
Repurchase
Agreements | | | Payable for
Sale-Buyback
Transactions | | | Securities
Out on Loan | | | Total
Borrowings and
Other Financing
Transactions | | | Collateral
Pledged/(Received) | | | Net Exposure(2) | |
Global/Master Repurchase Agreement | |
BPS | | $ | 6,202 | | | $ | 0 | | | $ | 0 | | | $ | 0 | | | $ | 6,202 | | | $ | (6,322 | ) | | $ | (120 | ) |
FICC | | | 225 | | | | 0 | | | | 0 | | | | 0 | | | | 225 | | | | (230 | ) | | | (5 | ) |
| | | | | | | | | | | | | | | | | | | | | | | | | | | | |
Total Borrowings and Other Financing Transactions | | $ | 6,427 | | | $ | 0 | | | $ | 0 | | | $ | 0 | | | | | | | | | | | | | |
| | | | | | | | | | | | | | | | | | | | | | | | | | | | |
| (1) | Includes accrued interest. |
| (2) | Net Exposure represents the net receivable/(payable) that would be due from/to the counterparty in the event of default. Exposure from borrowings and other financing transactions can only be netted across transactions governed under the same master agreement with the same legal entity. See Note 8, Master Netting Arrangements, in the Notes to Financial Statements for more information. |
(g) FINANCIAL DERIVATIVE INSTRUMENTS: EXCHANGE-TRADED OR CENTRALLY CLEARED
FUTURES CONTRACTS:
SHORT FUTURES CONTRACTS
| | | | | | | | | | | | | | | | | | | | | | | | |
| Description | | Expiration
Month | | | # of
Contracts | | | Notional
Amount | | | Unrealized
Appreciation/
(Depreciation) | | | Variation Margin | |
| | Asset | | | Liability | |
U.S. Treasury 10-Year Note September Futures | | | 09/2024 | | | | 225 | | | $ | (24,746 | ) | | $ | (195 | ) | | $ | 90 | | | $ | 0 | |
| | | | | | | | | | | | | | | | | | | | | | | | |
Total Futures Contracts | | | $ | (195 | ) | | $ | 90 | | | $ | 0 | |
| | | | | | | | | | | | | | | | | | | | | | | | |
FINANCIAL DERIVATIVE INSTRUMENTS: EXCHANGE-TRADED OR CENTRALLY CLEARED SUMMARY
The following is a summary of the market value and variation margin of Exchange-Traded or Centrally Cleared Financial Derivative Instruments as of June 30, 2024:
| | | | | | | | | | | | | | | | | | | | | | | | | | | | | | | | | | | | |
| | | Financial Derivative Assets | | | | | | Financial Derivative Liabilities | |
| | | Market Value | | | Variation Margin
Asset | | | Total | | | | | | Market Value | | | Variation Margin
Liability | | | Total | |
| | | Purchased
Options | | | Futures | | | Swap
Agreements | | | | | | Written
Options | | | Futures | | | Swap
Agreements | |
Total Exchange-Traded or Centrally Cleared | | $ | 0 | | | $ | 90 | | | $ | 0 | | | $ | 90 | | | | | | | $ | 0 | | | $ | 0 | | | $ | 0 | | | $ | 0 | |
| | | | | | | | | | | | | | | | | | | | | | | | | | | | | | | | | | | | |
Cash of $516 has been pledged as collateral for exchange-traded and centrally cleared financial derivative instruments as of June 30, 2024. See Note 8, Master Netting Arrangements, in the Notes to Financial Statements for more information.
| | | | | | | | | | | | |
| See Accompanying Notes | | | ANNUAL FINANCIAL AND OTHER INFORMATION | | | | | | | JUNE 30, 2024 | | | 111 |
| | | | | | |
| Schedule of Investments | | PIMCO Municipal Income Opportunities Active Exchange-Traded Fund | | (Cont.) | | June 30, 2024 |
FAIR VALUE OF FINANCIAL DERIVATIVE INSTRUMENTS
The following is a summary of the fair valuation of the Fund’s derivative instruments categorized by risk exposure. See Note 7, Principal and Other Risks, in the Notes to Financial Statements on risks of the Fund.
Fair Values of Financial Derivative Instruments on the Statements of Assets and Liabilities as of June 30, 2024:
| | | | | | | | | | | | | | | | | | | | | | | | |
| | | Derivatives not accounted for as hedging instruments | |
| | | Commodity
Contracts | | | Credit
Contracts | | | Equity
Contracts | | | Foreign
Exchange
Contracts | | | Interest
Rate Contracts | | | Total | |
Financial Derivative Instruments - Assets | |
Exchange-traded or centrally cleared | |
Futures | | $ | 0 | | | $ | 0 | | | $ | 0 | | | $ | 0 | | | $ | 90 | | | $ | 90 | |
| | | | | | | | | | | | | | | | | | | | | | | | |
The effect of Financial Derivative Instruments on the Statements of Operations for the period ended June 30, 2024:
| | | | | | | | | | | | | | | | | | | | | | | | |
| | | Derivatives not accounted for as hedging instruments | |
| | | Commodity
Contracts | | | Credit
Contracts | | | Equity
Contracts | | | Foreign
Exchange
Contracts | | | Interest
Rate Contracts | | | Total | |
Net Realized Gain (Loss) on Financial Derivative Instruments | |
Exchange-traded or centrally cleared | |
Futures | | $ | 0 | | | $ | 0 | | | $ | 0 | | | $ | 0 | | | $ | 264 | | | $ | 264 | |
| | | | | | | | | | | | | | | | | | | | | | | | |
|
Net Change in Unrealized Appreciation (Depreciation) on Financial Derivative Instruments | |
Exchange-traded or centrally cleared | |
Futures | | $ | 0 | | | $ | 0 | | | $ | 0 | | | $ | 0 | | | $ | (261 | ) | | $ | (261 | ) |
| | | | | | | | | | | | | | | | | | | | | | | | |
FAIR VALUE MEASUREMENTS
The following is a summary of the fair valuations according to the inputs used as of June 30, 2024 in valuing the Fund’s assets and liabilities:
| | | | | | | | | | | | | | | | |
| Category and Subcategory | | Level 1 | | | Level 2 | | | Level 3 | | | Fair Value at 06/30/2024 | |
Investments in Securities, at Value | |
Corporate Bonds & Notes | |
Industrials | | $ | 0 | | | $ | 411 | | | $ | 0 | | | $ | 411 | |
Municipal Bonds & Notes | |
Alabama | | | 0 | | | | 2,882 | | | | 0 | | | | 2,882 | |
Alaska | | | 0 | | | | 266 | | | | 0 | | | | 266 | |
Arizona | | | 0 | | | | 2,425 | | | | 0 | | | | 2,425 | |
Arkansas | | | 0 | | | | 1,036 | | | | 0 | | | | 1,036 | |
California | | | 0 | | | | 13,709 | | | | 0 | | | | 13,709 | |
Colorado | | | 0 | | | | 6,451 | | | | 0 | | | | 6,451 | |
Delaware | | | 0 | | | | 237 | | | | 0 | | | | 237 | |
District of Columbia | | | 0 | | | | 2,209 | | | | 0 | | | | 2,209 | |
Florida | | | 0 | | | | 6,906 | | | | 0 | | | | 6,906 | |
Georgia | | | 0 | | | | 4,067 | | | | 0 | | | | 4,067 | |
Idaho | | | 0 | | | | 1,230 | | | | 0 | | | | 1,230 | |
Illinois | | | 0 | | | | 10,377 | | | | 0 | | | | 10,377 | |
Indiana | | | 0 | | | | 4,111 | | | | 0 | | | | 4,111 | |
Iowa | | | 0 | | | | 524 | | | | 0 | | | | 524 | |
Kentucky | | | 0 | | | | 1,269 | | | | 0 | | | | 1,269 | |
Louisiana | | | 0 | | | | 762 | | | | 0 | | | | 762 | |
Massachusetts | | | 0 | | | | 2,842 | | | | 0 | | | | 2,842 | |
Michigan | | | 0 | | | | 5,365 | | | | 0 | | | | 5,365 | |
Minnesota | | | 0 | | | | 1,643 | | | | 0 | | | | 1,643 | |
Multi-State | | | 0 | | | | 2,075 | | | | 0 | | | | 2,075 | |
Nevada | | | 0 | | | | 1,536 | | | | 0 | | | | 1,536 | |
New Hampshire | | | 0 | | | | 2,136 | | | | 0 | | | | 2,136 | |
New Jersey | | | 0 | | | | 3,740 | | | | 0 | | | | 3,740 | |
New Mexico | | | 0 | | | | 847 | | | | 0 | | | | 847 | |
New York | | | 0 | | | | 23,771 | | | | 0 | | | | 23,771 | |
North Carolina | | | 0 | | | | 1,001 | | | | 0 | | | | 1,001 | |
| | | | | | | | | | | | | | | | |
| Category and Subcategory | | Level 1 | | | Level 2 | | | Level 3 | | | Fair Value at 06/30/2024 | |
North Dakota | | $ | 0 | | | $ | 559 | | | $ | 0 | | | $ | 559 | |
Ohio | | | 0 | | | | 5,853 | | | | 0 | | | | 5,853 | |
Oklahoma | | | 0 | | | | 1,789 | | | | 0 | | | | 1,789 | |
Oregon | | | 0 | | | | 1,100 | | | | 0 | | | | 1,100 | |
Pennsylvania | | | 0 | | | | 6,222 | | | | 0 | | | | 6,222 | |
Puerto Rico | | | 0 | | | | 4,184 | | | | 0 | | | | 4,184 | |
Rhode Island | | | 0 | | | | 955 | | | | 0 | | | | 955 | |
South Carolina | | | 0 | | | | 1,803 | | | | 0 | | | | 1,803 | |
Tennessee | | | 0 | | | | 1,001 | | | | 0 | | | | 1,001 | |
Texas | | | 0 | | | | 20,255 | | | | 0 | | | | 20,255 | |
Utah | | | 0 | | | | 338 | | | | 0 | | | | 338 | |
Virginia | | | 0 | | | | 425 | | | | 0 | | | | 425 | |
Washington | | | 0 | | | | 2,122 | | | | 0 | | | | 2,122 | |
West Virginia | | | 0 | | | | 339 | | | | 0 | | | | 339 | |
Wisconsin | | | 0 | | | | 3,022 | | | | 0 | | | | 3,022 | |
U.S. Government Agencies | | | 0 | | | | 161 | | | | 0 | | | | 161 | |
Non-Agency Mortgage-Backed Securities | | | 0 | | | | 1,003 | | | | 0 | | | | 1,003 | |
Short-Term Instruments | |
Repurchase Agreements | | | 0 | | | | 6,425 | | | | 0 | | | | 6,425 | |
| | | | | | | | | | | | | | | | |
| | | | |
Total Investments | | $ | 0 | | | $ | 161,384 | | | $ | 0 | | | $ | 161,384 | |
| | | | | | | | | | | | | | | | |
|
Financial Derivative Instruments - Assets | |
Exchange-traded or centrally cleared | | $ | 0 | | | $ | 90 | | | $ | 0 | | | $ | 90 | |
| | | | | | | | | | | | | | | | |
| | | | |
Total Financial Derivative Instruments | | $ | 0 | | | $ | 90 | | | $ | 0 | | | $ | 90 | |
| | | | | | | | | | | | | | | | |
| | | | |
Totals | | $ | 0 | | | $ | 161,474 | | | $ | 0 | | | $ | 161,474 | |
| | | | | | | | | | | | | | | | |
There were no significant transfers into or out of Level 3 during the period ended June 30, 2024.
| | | | | | |
| 112 | | PIMCO ETF TRUST | | | See Accompanying Notes | |
| | | | | | |
| Schedule of Investments | | PIMCO Preferred and Capital Securities Active Exchange-Traded Fund | | | | June 30, 2024 |
(Amounts in thousands*, except number of shares, contracts, units and ounces, if any)
| | | | | | | | | | | | |
| | | | | PRINCIPAL
AMOUNT
(000S) | | | | | MARKET
VALUE
(000S) | |
| INVESTMENTS IN SECURITIES 98.8% | |
| |
| CORPORATE BONDS & NOTES 59.3% | |
| |
| BANKING & FINANCE 41.9% | |
|
Allstate Corp. | |
8.522% (TSFR3M + 3.200%) due 08/15/2053 ~ | | $ | | | 1,146 | | | $ | | | 1,147 | |
|
American International Group, Inc. | |
5.750% due 04/01/2048 • | | | | | 400 | | | | | | 393 | |
|
Banco Bilbao Vizcaya Argentaria SA | |
9.375% due 03/19/2029 •(e)(f) | | | | | 1,061 | | | | | | 1,132 | |
|
Banco Santander SA | |
9.625% due 11/21/2028 •(e)(f) | | | | | 200 | | | | | | 215 | |
9.625% due 05/21/2033 •(e)(f) | | | | | 1,400 | | | | | | 1,555 | |
|
Bank of Nova Scotia | |
3.625% due 10/27/2081 •(f) | | | | | 979 | | | | | | 832 | |
8.000% due 01/27/2084 •(f) | | | | | 200 | | | | | | 207 | |
8.625% due 10/27/2082 •(f) | | | | | 200 | | | | | | 210 | |
|
Barclays PLC | |
8.000% due 03/15/2029 •(e)(f) | | | | | 1,042 | | | | | | 1,061 | |
9.625% due 12/15/2029 •(e)(f) | | | | | 1,200 | | | | | | 1,304 | |
|
BBVA Bancomer SA | |
8.125% due 01/08/2039 •(f) | | | | | 500 | | | | | | 507 | |
|
BNP Paribas SA | |
8.000% due 08/22/2031 •(e)(f) | | | | | 1,600 | | | | | | 1,610 | |
8.500% due 08/14/2028 •(e)(f) | | | | | 699 | | | | | | 718 | |
9.250% due 11/17/2027 •(e)(f) | | | | | 969 | | | | | | 1,030 | |
|
BPCE SA | |
6.508% due 01/18/2035 • | | | | | 700 | | | | | | 701 | |
|
Burford Capital Global Finance LLC | |
9.250% due 07/01/2031 | | | | | 695 | | | | | | 732 | |
|
Commerzbank AG | |
7.000% due 04/09/2025 •(e)(f) | | | | | 200 | | | | | | 199 | |
|
Cooperatieve Rabobank UA | |
4.875% due 06/29/2029 •(e)(f) | | EUR | | | 800 | | | | | | 804 | |
|
Corebridge Financial, Inc. | |
6.875% due 12/15/2052 • | | $ | | | 1,043 | | | | | | 1,053 | |
|
Credit Agricole SA | |
8.125% due 12/23/2025 •(e)(f) | | | | | 1,000 | | | | | | 1,016 | |
| | | | |
Credit Suisse AG AT1 Claim | | | | | 800 | | | | | | 96 | |
|
Danske Bank AS | |
7.000% due 06/26/2025 •(e)(f) | | | | | 700 | | | | | | 700 | |
|
Deutsche Bank AG | |
4.789% due 04/30/2025 •(e)(f) | | | | | 600 | | | | | | 570 | |
7.500% due 04/30/2025 •(e)(f) | | | | | 600 | | | | | | 592 | |
|
Global Atlantic Fin Co. | |
4.400% due 10/15/2029 | | | | | 586 | | | | | | 546 | |
4.700% due 10/15/2051 • | | | | | 200 | | | | | | 186 | |
7.950% due 10/15/2054 • | | | | | 350 | | | | | | 353 | |
|
HSBC Holdings PLC | |
6.375% due 03/30/2025 •(e)(f) | | | | | 1,600 | | | | | | 1,597 | |
6.500% due 03/23/2028 •(e)(f) | | | | | 500 | | | | | | 493 | |
|
ING Groep NV | |
8.000% due 05/16/2030 •(e)(f) | | | | | 2,100 | | | | | | 2,144 | |
|
Intesa Sanpaolo SpA | |
7.700% due 09/17/2025 •(e)(f) | | | | | 1,300 | | | | | | 1,300 | |
8.248% due 11/21/2033 • | | | | | 1,074 | | | | | | 1,185 | |
|
Lloyds Banking Group PLC | |
7.500% due 09/27/2025 •(e)(f) | | | | | 1,100 | | | | | | 1,102 | |
8.000% due 09/27/2029 •(e)(f) | | | | | 2,133 | | | | | | 2,186 | |
|
Mitsubishi UFJ Financial Group, Inc. | |
8.200% due 01/15/2029 •(e)(f) | | | | | 800 | | | | | | 861 | |
|
NatWest Group PLC | |
6.000% due 12/29/2025 •(e)(f) | | | | | 300 | | | | | | 294 | |
8.000% due 08/10/2025 •(e)(f) | | | | | 772 | | | | | | 778 | |
8.125% due 11/10/2033 •(e)(f) | | | | | 1,900 | | | | | | 1,924 | |
|
Nippon Life Insurance Co. | |
6.250% due 09/13/2053 • | | | | | 400 | | | | | | 412 | |
|
Prudential Financial, Inc. | |
5.125% due 03/01/2052 • | | | | | 1,200 | | | | | | 1,117 | |
6.000% due 09/01/2052 • | | | | | 1,418 | | | | | | 1,402 | |
6.500% due 03/15/2054 • | | | | | 1,200 | | | | | | 1,214 | |
| | | | | | | | | | | | |
| | | | | PRINCIPAL
AMOUNT
(000S) | | | | | MARKET
VALUE
(000S) | |
|
Royal Bank of Canada | |
7.500% due 05/02/2084 •(f) | | $ | | | 2,200 | | | $ | | | 2,274 | |
|
Societe Generale SA | |
9.375% due 11/22/2027 •(e)(f) | | | | | 484 | | | | | | 491 | |
10.000% due 11/14/2028 •(e)(f) | | | | | 200 | | | | | | 208 | |
|
Sumitomo Mitsui Financial Group, Inc. | |
6.600% due 06/05/2034 •(e)(f) | | | | | 900 | | | | | | 896 | |
|
Svenska Handelsbanken AB | |
4.750% due 03/01/2031 •(e)(f) | | | | | 1,200 | | | | | | 1,033 | |
|
Swiss RE Subordinated Finance PLC | |
5.698% due 04/05/2035 • | | | | | 300 | | | | | | 298 | |
|
Toronto-Dominion Bank | |
7.250% due 07/31/2084 •(a)(f) | | | | | 300 | | | | | | 300 | |
8.125% due 10/31/2082 •(f) | | | | | 1,728 | | | | | | 1,795 | |
|
UBS Group AG | |
7.750% due 04/12/2031 •(e)(f) | | | | | 1,300 | | | | | | 1,329 | |
9.250% due 11/13/2028 •(e)(f) | | | | | 300 | | | | | | 324 | |
9.250% due 11/13/2033 •(e)(f) | | | | | 1,100 | | | | | | 1,235 | |
|
Voya Financial, Inc. | |
4.700% due 01/23/2048 • | | | | | 1,136 | | | | | | 990 | |
| | | | | | | | | | | | |
| | | | | | | | | | | 48,651 | |
| | | | | | | | | | | | |
| |
| INDUSTRIALS 3.3% | |
|
Enbridge, Inc. | |
5.750% due 07/15/2080 • | | | | | 1,215 | | | | | | 1,149 | |
7.375% due 03/15/2055 • | | | | | 300 | | | | | | 301 | |
7.625% due 01/15/2083 • | | | | | 500 | | | | | | 512 | |
|
Enterprise Products Operating LLC | |
5.375% due 02/15/2078 • | | | | | 735 | | | | | | 688 | |
8.574% (TSFR3M + 3.248%) due 08/16/2077 ~ | | | | | 489 | | | | | | 487 | |
|
Plains All American Pipeline LP | |
9.694% (TSFR3M + 4.372%) due 07/29/2024 ~(e) | | | | | 698 | | | | | | 699 | |
| | | | | | | | | | | | |
| | | | | | | | | | | 3,836 | |
| | | | | | | | | | | | |
| |
| UTILITIES 14.1% | |
|
AES Andes SA | |
8.150% due 06/10/2055 • | | | | | 200 | | | | | | 200 | |
|
AES Corp. | |
7.600% due 01/15/2055 • | | | | | 1,100 | | | | | | 1,114 | |
|
American Electric Power Co., Inc. | |
3.875% due 02/15/2062 • | | | | | 368 | | | | | | 339 | |
6.950% due 12/15/2054 • | | | | | 300 | | | | | | 299 | |
7.050% due 12/15/2054 • | | | | | 300 | | | | | | 299 | |
|
BP Capital Markets PLC | |
6.450% due 12/01/2033 •(e) | | | | | 1,500 | | | | | | 1,545 | |
|
British Telecommunications PLC | |
4.250% due 11/23/2081 | | | | | 500 | | | | | | 474 | |
4.250% due 11/23/2081 • | | | | | 500 | | | | | | 474 | |
|
CMS Energy Corp. | |
3.750% due 12/01/2050 • | | | | | 700 | | | | | | 586 | |
4.750% due 06/01/2050 • | | | | | 300 | | | | | | 275 | |
|
Dominion Energy, Inc. | |
6.875% due 02/01/2055 • | | | | | 300 | | | | | | 306 | |
7.000% due 06/01/2054 • | | | | | 1,400 | | | | | | 1,460 | |
|
Duke Energy Corp. | |
3.250% due 01/15/2082 • | | | | | 277 | | | | | | 250 | |
|
Edison International | |
7.875% due 06/15/2054 • | | | | | 500 | | | | | | 517 | |
8.125% due 06/15/2053 • | | | | | 200 | | | | | | 208 | |
|
Electricite de France SA | |
9.125% due 03/15/2033 •(e) | | | | | 1,215 | | | | | | 1,325 | |
|
NextEra Energy Capital Holdings, Inc. | |
6.700% due 09/01/2054 • | | | | | 1,300 | | | | | | 1,303 | |
6.750% due 06/15/2054 • | | | | | 1,300 | | | | | | 1,311 | |
|
Sempra | |
4.125% due 04/01/2052 • | | | | | 720 | | | | | | 666 | |
6.875% due 10/01/2054 • | | | | | 700 | | | | | | 697 | |
|
Transcanada Trust | |
5.500% due 09/15/2079 • | | | | | 600 | | | | | | 553 | |
5.600% due 03/07/2082 • | | | | | 1,036 | | | | | | 941 | |
| | | | | | | | | | | | |
| | | | | PRINCIPAL
AMOUNT
(000S) | | | | | MARKET
VALUE
(000S) | |
|
Vodafone Group PLC | |
5.125% due 06/04/2081 • | | $ | | | 300 | | | $ | | | 221 | |
7.000% due 04/04/2079 • | | | | | 1,000 | | | | | | 1,032 | |
| | | | | | | | | | | | |
| | | | | | | | | | | 16,395 | |
| | | | | | | | | | | | |
Total Corporate Bonds & Notes (Cost $66,871) | | | 68,882 | |
| | | | |
| |
| | | | | SHARES | | | | | | |
| PREFERRED SECURITIES 34.2% | |
| |
| BANKING & FINANCE 29.8% | |
|
Aircastle Ltd. | |
5.250% due 06/15/2026 •(e) | | | | | 1,071,000 | | | | | | 1,031 | |
|
Ally Financial, Inc. | |
4.700% due 05/15/2028 •(e) | | | | | 1,116,000 | | | | | | 896 | |
|
American Express Co. | |
3.550% due 09/15/2026 •(e) | | | | | 400,000 | | | | | | 373 | |
|
Bank of America Corp. | |
4.375% due 01/27/2027 •(e) | | | | | 1,533,000 | | | | | | 1,452 | |
5.875% due 03/15/2028 •(e) | | | | | 2,818,000 | | | | | | 2,807 | |
|
Bank of New York Mellon Corp. | |
4.625% due 09/20/2026 •(e) | | | | | 700,000 | | | | | | 675 | |
|
Charles Schwab Corp. | |
4.000% due 12/01/2030 •(e) | | | | | 1,636,000 | | | | | | 1,399 | |
5.375% due 06/01/2025 •(e) | | | | | 600,000 | | | | | | 594 | |
|
Citigroup, Inc. | |
7.125% due 08/15/2029 •(e) | | | | | 1,300,000 | | | | | | 1,300 | |
7.200% due 05/15/2029 •(e) | | | | | 1,200,000 | | | | | | 1,231 | |
7.375% due 05/15/2028 •(e) | | | | | 1,031,000 | | | | | | 1,060 | |
7.625% due 11/15/2028 •(e) | | | | | 610,000 | | | | | | 636 | |
|
Citizens Financial Group, Inc. | |
8.567% (TSFR3M + 3.265%) due 10/06/2024 ~(e) | | | | | 200,000 | | | | | | 197 | |
|
CoBank ACB | |
6.450% due 10/01/2027 •(e) | | | | | 400,000 | | | | | | 398 | |
|
Discover Financial Services | |
5.500% due 10/30/2027 •(e) | | | | | 1,401,000 | | | | | | 1,210 | |
|
Dresdner Funding Trust | |
8.151% due 06/30/2031 | | | | | 600,000 | | | | | | 651 | |
| | | | |
Farm Credit Bank | | | | | | | | | | | | |
7.750% due 06/15/2029 •(e) | | | | | 500,000 | | | | | | 507 | |
|
Goldman Sachs Group, Inc. | |
4.400% due 02/10/2025 •(e) | | | | | 650,000 | | | | | | 639 | |
7.500% due 05/10/2029 •(e) | | | | | 2,100,000 | | | | | | 2,163 | |
|
HSBC Capital Funding Dollar LP | |
10.176% due 06/30/2030 •(e) | | | | | 417,000 | | | | | | 506 | |
|
JPMorgan Chase & Co. | |
4.600% due 02/01/2025 •(e) | | | | | 1,082,000 | | | | | | 1,069 | |
6.875% due 06/01/2029 •(e) | | | | | 1,400,000 | | | | | | 1,450 | |
8.168% (TSFR3M + 2.842%) due 08/01/2024 ~(e) | | | | | 700,000 | | | | | | 706 | |
|
MetLife Capital Trust | |
7.875% due 12/15/2067 | | | | | 1,400,000 | | | | | | 1,503 | |
|
Morgan Stanley | |
5.875% due 09/15/2026 ~(e) | | | | | 400,000 | | | | | | 394 | |
8.761% (TSFR3M + 3.422%) due 12/15/2025 ~(e) | | | | | 400,000 | | | | | | 415 | |
|
PNC Financial Services Group, Inc. | |
6.000% due 05/15/2027 •(e) | | | | | 700,000 | | | | | | 693 | |
6.200% due 09/15/2027 •(e) | | | | | 200,000 | | | | | | 200 | |
6.250% due 03/15/2030 •(e) | | | | | 2,339,000 | | | | | | 2,280 | |
8.648% (TSFR3M + 3.302%) due 09/01/2024 ~(e) | | | | | 200,000 | | | | | | 201 | |
|
State Street Corp. | |
6.700% due 03/15/2029 •(e) | | | | | 600,000 | | | | | | 603 | |
|
SVB Financial Group | |
4.100% due 02/15/2031 ^(b)(e) | | | | | 1,200,000 | | | | | | 9 | |
|
Synchrony Financial | |
8.250% (H15T5Y + 4.044%) due 05/15/2029 ~(e) | | | | | 26,100 | | | | | | 666 | |
|
Truist Financial Corp. | |
5.100% due 03/01/2030 •(e) | | | | | 1,296,000 | | | | | | 1,218 | |
|
U.S. Bancorp | |
5.300% due 04/15/2027 •(e) | | | | | 688,000 | | | | | | 668 | |
| | | | | | | | | | | | |
| See Accompanying Notes | | | ANNUAL FINANCIAL AND OTHER INFORMATION | | | | | | | JUNE 30, 2024 | | | 113 |
| | | | | | |
| Schedule of Investments | | PIMCO Preferred and Capital Securities Active Exchange-Traded Fund | | (Cont.) | | |
| | | | | | | | | | | | |
| | | | | SHARES | | | | | MARKET
VALUE
(000S) | |
|
Voya Financial, Inc. | |
7.688% due 09/15/2028 •(e) | | | | | 425,000 | | | $ | | | 443 | |
|
Wells Fargo & Co. | |
3.900% due 03/15/2026 •(e) | | | | | 500,000 | | | | | | 479 | |
7.625% due 09/15/2028 •(e) | | | | | 1,733,000 | | | | | | 1,849 | |
| | | | | | | | | | | | |
| | | | | | | | | | | 34,571 | |
| | | | | | | | | | | | |
| |
| INDUSTRIALS 0.8% | |
|
General Motors Financial Co., Inc. | |
5.700% due 09/30/2030 •(e) | | | | | 1,020,000 | | | | | | 962 | |
| | | | | | | | | | | | |
| |
| UTILITIES 3.6% | |
|
AT&T, Inc. | |
4.750% due 02/18/2025 (e) | | | | | 30,700 | | | | | | 619 | |
|
Edison International | |
5.000% due 12/15/2026 •(e) | | | | | 719,000 | | | | | | 687 | |
|
Energy Transfer LP | |
6.625% due 02/15/2028 •(e) | | | | | 1,346,000 | | | | | | 1,312 | |
7.125% due 05/15/2030 •(e) | | | | | 1,200,000 | | | | | | 1,190 | |
|
SCE Trust | |
7.500% due 11/22/2028 (e) | | | | | 12,000 | | | | | | 314 | |
| | | | | | | | | | | | |
| | | | | | | | | | | 4,122 | |
| | | | | | | | | | | | |
Total Preferred Securities (Cost $38,883) | | | 39,655 | |
| | | | |
| |
| | | | | | | | | | | | |
| | | | | PRINCIPAL
AMOUNT
(000S) | | | | | MARKET
VALUE
(000S) | |
| SHORT-TERM INSTRUMENTS 5.3% | |
| |
| REPURCHASE AGREEMENTS (h) 1.3% | |
| | | | | | | | $ | | | 1,519 | |
| | | | | | | | | | | | |
| |
| U.S. TREASURY BILLS 4.0% | |
5.372% due 09/19/2024 - 10/08/2024 (c)(d) | | $ | | | 4,700 | | | | | | 4,641 | |
| | | | | | | | | | | | |
Total Short-Term Instruments (Cost $6,160) | | | 6,160 | |
| | | | |
| | | | |
| | | | | | | | | | | | |
| Total Investments in Securities (Cost $111,914) | | | 114,697 | |
| |
| | | | |
Total Investments 98.8%
(Cost $111,914) | | | $ | | | 114,697 | |
| |
Financial Derivative Instruments (i)(j) (0.2)% (Cost or Premiums, net $503) | | | | | | (176 | ) |
| |
| Other Assets and Liabilities, net 1.4% | | | 1,595 | |
| | | | |
| Net Assets 100.0% | | | $ | | | 116,116 | |
| | | | | | | |
NOTES TO SCHEDULE OF INVESTMENTS:
| * | A zero balance may reflect actual amounts rounding to less than one thousand. |
| ~ | Variable or Floating rate security. Rate shown is the rate in effect as of period end. Certain variable rate securities are not based on a published reference rate and spread, rather are determined by the issuer or agent and are based on current market conditions. Reference rate is as of reset date, which may vary by security. These securities may not indicate a reference rate and/or spread in their description. |
| • | Rate shown is the rate in effect as of period end. The rate may be based on a fixed rate, a capped rate or a floor rate and may convert to a variable or floating rate in the future. These securities do not indicate a reference rate and spread in their description. |
| (b) | Security is not accruing income as of the date of this report. |
| (c) | Coupon represents a weighted average yield to maturity. |
| (e) | Perpetual maturity; date shown, if applicable, represents next contractual call date. |
| (f) | Contingent convertible security. |
| (g) | Restricted Securities. |
BORROWINGS AND OTHER FINANCING TRANSACTIONS
(h) REPURCHASE AGREEMENTS:
| | | | | | | | | | | | | | | | | | | | | | | | | | | | | | |
| Counterparty | | Lending
Rate | | | Settlement
Date | | | Maturity
Date | | | Principal
Amount | | | Collateralized By | | Collateral
(Received) | | | Repurchase
Agreements,
at Value | | | Repurchase
Agreement
Proceeds
to be
Received(1) | |
| FICC | | | 2.600 | % | | | 06/28/2024 | | | | 07/01/2024 | | | $ | 1,519 | | | U.S. Treasury Inflation Protected Securities 0.625% due 01/15/2026 | | $ | (1,549 | ) | | $ | 1,519 | | | $ | 1,519 | |
| | | | | | | | | | | | | | | | | | | | | | | | | | | | | | |
Total Repurchase Agreements | | | | | $ | (1,549 | ) | | $ | 1,519 | | | $ | 1,519 | |
| | | | | | | | | | | | | | | |
| | | | | | |
| 114 | | PIMCO ETF TRUST | | | See Accompanying Notes | |
BORROWINGS AND OTHER FINANCING TRANSACTIONS SUMMARY
The following is a summary by counterparty of the market value of Borrowings and Other Financing Transactions and collateral pledged/(received) as of June 30, 2024:
| | | | | | | | | | | | | | | | | | | | | | | | | | | | |
| Counterparty | | Repurchase
Agreement
Proceeds
to be
Received(1) | | | Payable for
Reverse
Repurchase
Agreements | | | Payable for
Sale-Buyback
Transactions | | | Securities
Out on Loan | | | Total
Borrowings and
Other Financing
Transactions | | | Collateral
Pledged/(Received) | | | Net Exposure(2) | |
Global/Master Repurchase Agreement | |
FICC | | $ | 1,519 | | | $ | 0 | | | $ | 0 | | | $ | 0 | | | $ | 1,519 | | | $ | (1,549 | ) | | $ | (30 | ) |
| | | | | | | | | | | | | | | | | | | | | | | | | | | | |
Total Borrowings and Other Financing Transactions | | $ | 1,519 | | | $ | 0 | | | $ | 0 | | | $ | 0 | | | | | | | | | | | | | |
| | | | | | | | | | | | | | | | | | | | | | | | | | | | |
| (1) | Includes accrued interest. |
| (2) | Net Exposure represents the net receivable/(payable) that would be due from/to the counterparty in the event of default. Exposure from borrowings and other financing transactions can only be netted across transactions governed under the same master agreement with the same legal entity. See Note 8, Master Netting Arrangements, in the Notes to Financial Statements for more information. |
The average amount of borrowings outstanding during the period ended June 30, 2024 was $(627) at a weighted average interest rate of 5.419%. Average borrowings may include reverse repurchase agreements and sale-buyback transactions, if held during the period.
(i) FINANCIAL DERIVATIVE INSTRUMENTS: EXCHANGE-TRADED OR CENTRALLY CLEARED
FUTURES CONTRACTS:
LONG FUTURES CONTRACTS
| | | | | | | | | | | | | | | | | | | | | | | | | | | | |
| Description | | Expiration
Month | | | # of
Contracts | | | Notional
Amount | | | Unrealized
Appreciation/
(Depreciation) | | | Variation Margin | |
| | Asset | | | Liability | |
U.S. Treasury 2-Year Note September Futures | | | 09/2024 | | | | 74 | | | $ | | | | | 15,112 | | | $ | 24 | | | $ | 0 | | | $ | (2 | ) |
U.S. Treasury Long-Term Bond September Futures | | | 09/2024 | | | | 19 | | | | | | | | 2,248 | | | | (2 | ) | | | 0 | | | | (22 | ) |
U.S. Treasury Ultra Long-Term Bond September Futures | | | 09/2024 | | | | 91 | | | | | | | | 11,406 | | | | 36 | | | | 0 | | | | (223 | ) |
| | | | | | | | | | | | | | | | | | | | | | | | | | | | |
| | | | | | | | | | | | | | | | | | $ | 58 | | | $ | 0 | | | $ | (247 | ) |
| | | | | | | | | | | | | | | | | | | | | | | | | | | | |
SHORT FUTURES CONTRACTS
| | | | | | | | | | | | | | | | | | | | | | | | | | | | |
| Description | | Expiration
Month | | | # of
Contracts | | | Notional
Amount | | | Unrealized
Appreciation/
(Depreciation) | | | Variation Margin | |
| | Asset | | | Liability | |
Euro-BOBL Future September Futures | | | 09/2024 | | | | 2 | | | $ | | | | | (249 | ) | | $ | (2 | ) | | $ | 0 | | | $ | 0 | |
Euro-Bund September Futures | | | 09/2024 | | | | 2 | | | | | | | | (282 | ) | | | (4 | ) | | | 1 | | | | 0 | |
U.S. Treasury 5-Year Note September Futures | | | 09/2024 | | | | 58 | | | | | | | | (6,182 | ) | | | (6 | ) | | | 11 | | | | 0 | |
U.S. Treasury 10-Year Note September Futures | | | 09/2024 | | | | 28 | | | | | | | | (3,080 | ) | | | (2 | ) | | | 11 | | | | 0 | |
U.S. Treasury 10-Year Ultra Long-Term Bond September Futures | | | 09/2024 | | | | 39 | | | | | | | | (4,428 | ) | | | (15 | ) | | | 28 | | | | 0 | |
| | | | | | | | | | | | | | | | | | | | | | | | | | | | |
| | | | | | | | | | | | | | | | | | $ | (29 | ) | | $ | 51 | | | $ | 0 | |
| | | | | | | | | | | | | | | | | | | | | | | | | | | | |
Total Futures Contracts | | | | | | | $ | 29 | | | $ | 51 | | | $ | (247 | ) |
| | | | | | | | | | | | | | | | | |
SWAP AGREEMENTS:
CREDIT DEFAULT SWAPS ON CREDIT INDICES - SELL PROTECTION(1)
| | | | | | | | | | | | | | | | | | | | | | | | | | | | | | | | | | | | | | |
| Index/Tranches | | Fixed
Receive Rate | | | Payment
Frequency | | Maturity
Date | | | Notional
Amount(2) | | | Premiums
Paid/(Received) | | | Unrealized
Appreciation/
(Depreciation) | | | Market
Value(3) | | | Variation Margin | |
| | Asset | | | Liability | |
CDX.HY-42 5-Year Index | | | 5.000 | % | | Quarterly | | | 06/20/2029 | | | $ | | | | | 8,400 | | | $ | 505 | | | $ | 32 | | | $ | 537 | | | $ | 0 | | | $ | (5 | ) |
| | | | | | | | | | | | | | | | | | | | | | | | | | | | | | | | | | | | | | |
INTEREST RATE SWAPS
| | | | | | | | | | | | | | | | | | | | | | | | | | | | | | | | | | | | | | | | | | |
Pay/Receive
Floating Rate | | Floating Rate Index | | Fixed Rate | | | Payment
Frequency | | | Maturity
Date | | | Notional
Amount | | | Premiums
Paid(Received) | | | Unrealized
Appreciation/
(Depreciation) | | | Market
Value | | | Variation Margin | |
| | Asset | | | Liability | |
Receive | | 1-Day USD-SOFR Compounded-OIS | | | 3.750 | % | | | Annual | | | | 06/20/2029 | | | $ | | | | | 5,600 | | | $ | 4 | | | $ | 80 | | | $ | 84 | | | $ | 11 | | | $ | 0 | |
Receive | | 1-Day USD-SOFR Compounded-OIS | | | 3.750 | | | | Annual | | | | 06/20/2031 | | | | | | | | 700 | | | | (6 | ) | | | 16 | | | | 10 | | | | 2 | | | | 0 | |
Pay | | 1-Day USD-SOFR Compounded-OIS | | | 3.750 | | | | Annual | | | | 06/20/2034 | | | | | | | | 100 | | | | 1 | | | | (3 | ) | | | (2 | ) | | | 0 | | | | (1 | ) |
Pay | | 1-Day USD-SOFR Compounded-OIS | | | 3.500 | | | | Annual | | | | 06/20/2054 | | | | | | | | 100 | | | | (1 | ) | | | (3 | ) | | | (4 | ) | | | 0 | | | | (1 | ) |
| | | | | | | | | | | | | | | | | | | | | | | | | | | | | | | | | | | | | | | | | | |
| | | | | | | $ | (2 | ) | | $ | 90 | | | $ | 88 | | | $ | 13 | | | $ | (2 | ) |
| | | | | | | | | | | | | | | | | | | | | | | | | | | | | | | | | | | | | | | | | | |
Total Swap Agreements | | | | | | | $ | 503 | | | $ | 122 | | | $ | 625 | | | $ | 13 | | | $ | (7 | ) |
| | | | | | | | | | | | | | | | | | | | | | | | | |
| | | | | | | | | | | | |
| See Accompanying Notes | | | ANNUAL FINANCIAL AND OTHER INFORMATION | | | | | | | JUNE 30, 2024 | | | 115 |
| | | | | | |
| Schedule of Investments | | PIMCO Preferred and Capital Securities Active Exchange-Traded Fund | | (Cont.) | | |
FINANCIAL DERIVATIVE INSTRUMENTS: EXCHANGE-TRADED OR CENTRALLY CLEARED SUMMARY
The following is a summary of the market value and variation margin of Exchange-Traded or Centrally Cleared Financial Derivative Instruments as of June 30, 2024:
| | | | | | | | | | | | | | | | | | | | | | | | | | | | | | | | | | | | |
| | | Financial Derivative Assets | | | | | | Financial Derivative Liabilities | |
| | | Market Value | | | Variation Margin
Asset(4) | | | | | | | | | Market Value | | | Variation Margin
Liability | | | | |
| | | Purchased
Options | | | Futures | | | Swap
Agreements | | | Total | | | | | | Written
Options | | | Futures | | | Swap
Agreements | | | Total | |
Total Exchange-Traded or Centrally Cleared | | $ | 0 | | | $ | 52 | | | $ | 13 | | | $ | 65 | | | | | | | $ | 0 | | | $ | (247 | ) | | $ | (7) | | | $ | (254) | |
| | | | | | | | | | | | | | | | | | | | | | | | | | | | | | | | | | | | |
Cash of $1,413 has been pledged as collateral for exchange-traded and centrally cleared financial derivative instruments as of June 30, 2024. See Note 8, Master Netting Arrangements, in the Notes to Financial Statements for more information.
| (1) | If the Fund is a seller of protection and a credit event occurs, as defined under the terms of that particular swap agreement, the Fund will either (i) pay to the buyer of protection an amount equal to the notional amount of the swap and take delivery of the referenced obligation or underlying securities comprising the referenced index or (ii) pay a net settlement amount in the form of cash, securities or other deliverable obligations equal to the notional amount of the swap less the recovery value of the referenced obligation or underlying securities comprising the referenced index. |
| (2) | The maximum potential amount the Fund could be required to pay as a seller of credit protection or receive as a buyer of credit protection if a credit event occurs as defined under the terms of that particular swap agreement. |
| (3) | The prices and resulting values for credit default swap agreements serve as indicators of the current status of the payment/performance risk and represent the likelihood of an expected liability (or profit) for the credit derivative should the notional amount of the swap agreement be closed/sold as of the period end. Increasing market values, in absolute terms when compared to the notional amount of the swap, represent a deterioration of the underlying referenced instrument’s credit soundness and a greater likelihood or risk of default or other credit event occurring as defined under the terms of the agreement. |
| (4) | Unsettled variation margin asset of $1 for closed futures is outstanding at period end. |
(j) FINANCIAL DERIVATIVE INSTRUMENTS: OVER THE COUNTER
FORWARD FOREIGN CURRENCY CONTRACTS:
| | | | | | | | | | | | | | | | | | | | | | | | |
| Counterparty | | Settlement
Month | | | Currency to
be Delivered | | | Currency to
be Received | | | Unrealized Appreciation/
(Depreciation) | |
| | Asset | | | Liability | |
BRC | | | 08/2024 | | | EUR | | | 914 | | | $ | | | 979 | | | $ | 0 | | | $ | (1 | ) |
JPM | | | 07/2024 | | | | | | 914 | | | | | | 993 | | | | 14 | | | | 0 | |
| | | | | | | | | | | | | | | | | | | | | | | | |
Total Forward Foreign Currency Contracts | | | $ | 14 | | | $ | (1 | ) |
| | | | | | | | | |
FINANCIAL DERIVATIVE INSTRUMENTS: OVER THE COUNTER SUMMARY
The following is a summary by counterparty of the market value of OTC financial derivative instruments and collateral pledged/(received) as of June 30, 2024:
| | | | | | | | | | | | | | | | | | | | | | | | | | | | | | | | | | | | | | | | | | | | | | | | |
| | | Financial Derivative Assets | | | | | | Financial Derivative Liabilities | | | | | | | | | | |
| Counterparty | | Forward
Foreign
Currency
Contracts | | | Purchased
Options | | | Swap
Agreements | | | Total
Over the
Counter | | | | | | Forward
Foreign
Currency
Contracts | | | Written
Options | | | Swap
Agreements | | | Total
Over the
Counter | | | Net Market
Value of OTC
Derivatives | | | Collateral
Pledged/
(Received) | | | Net
Exposure(1) | |
BRC | | $ | 0 | | | $ | 0 | | | $ | 0 | | | $ | 0 | | | | | | | $ | (1 | ) | | $ | 0 | | | $ | 0 | | | $ | (1 | ) | | $ | (1 | ) | | $ | 0 | | | $ | (1 | ) |
JPM | | | 14 | | | | 0 | | | | 0 | | | | 14 | | | | | | | | 0 | | | | 0 | | | | 0 | | | | 0 | | | | 14 | | | | 0 | | | | 14 | |
| | | | | | | | | | | | | | | | | | | | | | | | | | | | | | | | | | | | | | | | | | | | | | | | |
Total Over the Counter | | $ | 14 | | | $ | 0 | | | $ | 0 | | | $ | 14 | | | | | | | $ | (1 | ) | | $ | 0 | | | $ | 0 | | | $ | (1 | ) | | | | | | | | | | | | |
| | | | | | | | | | | | | | | | | | | | | | | | | | | | | | | | | | | | | | | | | | | | | | | | |
| (1) | Net Exposure represents the net receivable/(payable) that would be due from/to the counterparty in the event of default. Exposure from OTC financial derivative instruments can only be netted across transactions governed under the same master agreement with the same legal entity. See Note 8, Master Netting Arrangements, in the Notes to Financial Statements for more information. |
| | | | | | |
| 116 | | PIMCO ETF TRUST | | | See Accompanying Notes | |
FAIR VALUE OF FINANCIAL DERIVATIVE INSTRUMENTS
The following is a summary of the fair valuation of the Fund’s derivative instruments categorized by risk exposure. See Note 7, Principal and Other Risks, in the Notes to Financial Statements on risks of the Fund.
Fair Values of Financial Derivative Instruments on the Statements of Assets and Liabilities as of June 30, 2024:
| | | | | | | | | | | | | | | | | | | | | | | | |
| | | Derivatives not accounted for as hedging instruments | |
| | | Commodity
Contracts | | | Credit
Contracts | | | Equity
Contracts | | | Foreign
Exchange
Contracts | | | Interest
Rate Contracts | | | Total | |
Financial Derivative Instruments - Assets | |
Exchange-traded or centrally cleared | |
Futures | | $ | 0 | | | $ | 0 | | | $ | 0 | | | $ | 0 | | | $ | 52 | | | $ | 52 | |
Swap Agreements | | | 0 | | | | 0 | | | | 0 | | | | 0 | | | | 13 | | | | 13 | |
| | | | | | | | | | | | | | | | | | | | | | | | |
| | $ | 0 | | | $ | 0 | | | $ | 0 | | | $ | 0 | | | $ | 65 | | | $ | 65 | |
| | | | | | | | | | | | | | | | | | | | | | | | |
Over the counter | |
Forward Foreign Currency Contracts | | $ | 0 | | | $ | 0 | | | $ | 0 | | | $ | 14 | | | $ | 0 | | | $ | 14 | |
| | | | | | | | | | | | | | | | | | | | | | | | |
| | $ | 0 | | | $ | 0 | | | $ | 0 | | | $ | 14 | | | $ | 65 | | | $ | 79 | |
| | | | | | | | | | | | | | | | | | | | | | | | |
|
Financial Derivative Instruments - Liabilities | |
Exchange-traded or centrally cleared | |
Futures | | $ | 0 | | | $ | 0 | | | $ | 0 | | | $ | 0 | | | $ | 247 | | | $ | 247 | |
Swap Agreements | | | 0 | | | | 5 | | | | 0 | | | | 0 | | | | 2 | | | | 7 | |
| | | | | | | | | | | | | | | | | | | | | | | | |
| | $ | 0 | | | $ | 5 | | | $ | 0 | | | $ | 0 | | | $ | 249 | | | $ | 254 | |
| | | | | | | | | | | | | | | | | | | | | | | | |
Over the counter | |
Forward Foreign Currency Contracts | | $ | 0 | | | $ | 0 | | | $ | 0 | | | $ | 1 | | | $ | 0 | | | $ | 1 | |
| | | | | | | | | | | | | | | | | | | | | | | | |
| | $ | 0 | | | $ | 5 | | | $ | 0 | | | $ | 1 | | | $ | 249 | | | $ | 255 | |
| | | | | | | | | | | | | | | | | | | | | | | | |
The effect of Financial Derivative Instruments on the Statements of Operations for the period ended June 30, 2024:
| | | | | | | | | | | | | | | | | | | | | | | | |
| | | Derivatives not accounted for as hedging instruments | |
| | | Commodity
Contracts | | | Credit
Contracts | | | Equity
Contracts | | | Foreign
Exchange
Contracts | | | Interest
Rate Contracts | | | Total | |
Net Realized Gain (Loss) on Financial Derivative Instruments | | | | | | | | | | | | | |
Exchange-traded or centrally cleared | | | | | | | | | | | | | | | | | | | | | | | | |
Futures | | $ | 0 | | | $ | 0 | | | $ | 0 | | | $ | 0 | | | $ | (875 | ) | | $ | (875 | ) |
Swap Agreements | | | 0 | | | | 24 | | | | 0 | | | | 0 | | | | 37 | | | | 61 | |
| | | | | | | | | | | | | | | | | | | | | | | | |
| | $ | 0 | | | $ | 24 | | | $ | 0 | | | $ | 0 | | | $ | (838 | ) | | $ | (814 | ) |
| | | | | | | | | | | | | | | | | | | | | | | | |
Over the counter | |
Forward Foreign Currency Contracts | | $ | 0 | | | $ | 0 | | | $ | 0 | | | $ | 78 | | | $ | 0 | | | $ | 78 | |
| | | | | | | | | | | | | | | | | | | | | | | | |
| | $ | 0 | | | $ | 24 | | | $ | 0 | | | $ | 78 | | | $ | (838 | ) | | $ | (736 | ) |
| | | | | | | | | | | | | | | | | | | | | | | | |
|
Net Change in Unrealized Appreciation (Depreciation) on Financial Derivative Instruments | |
Exchange-traded or centrally cleared | |
Futures | | $ | 0 | | | $ | 0 | | | $ | 0 | | | $ | 0 | | | $ | (73 | ) | | $ | (73 | ) |
Swap Agreements | | | 0 | | | | 32 | | | | 0 | | | | 0 | | | | 90 | | | | 122 | |
| | | | | | | | | | | | | | | | | | | | | | | | |
| | $ | 0 | | | $ | 32 | | | $ | 0 | | | $ | 0 | | | $ | 17 | | | $ | 49 | |
| | | | | | | | | | | | | | | | | | | | | | | | |
Over the counter | |
Forward Foreign Currency Contracts | | $ | 0 | | | $ | 0 | | | $ | 0 | | | $ | 31 | | | $ | 0 | | | $ | 31 | |
| | | | | | | | | | | | | | | | | | | | | | | | |
| | $ | 0 | | | $ | 32 | | | $ | 0 | | | $ | 31 | | | $ | 17 | | | $ | 80 | |
| | | | | | | | | | | | | | | | | | | | | | | | |
| | | | | | | | | | | | |
| See Accompanying Notes | | | ANNUAL FINANCIAL AND OTHER INFORMATION | | | | | | | JUNE 30, 2024 | | | 117 |
| | | | | | |
| Schedule of Investments | | PIMCO Preferred and Capital Securities Active Exchange-Traded Fund | | (Cont.) | | June 30, 2024 |
FAIR VALUE MEASUREMENTS
The following is a summary of the fair valuations according to the inputs used as of June 30, 2024 in valuing the Fund’s assets and liabilities:
| | | | | | | | | | | | | | | | |
| Category and Subcategory | | Level 1 | | | Level 2 | | | Level 3 | | | Fair Value at
06/30/2024 | |
Investments in Securities, at Value | |
Corporate Bonds & Notes | |
Banking & Finance | | $ | 0 | | | $ | 48,651 | | | $ | 0 | | | $ | 48,651 | |
Industrials | | | 0 | | | | 3,836 | | | | 0 | | | | 3,836 | |
Utilities | | | 0 | | | | 16,395 | | | | 0 | | | | 16,395 | |
Preferred Securities | |
Banking & Finance | | | 666 | | | | 33,905 | | | | 0 | | | | 34,571 | |
Industrials | | | 0 | | | | 962 | | | | 0 | | | | 962 | |
Utilities | | | 933 | | | | 3,189 | | | | 0 | | | | 4,122 | |
Short-Term Instruments | |
Repurchase Agreements | | | 0 | | | | 1,519 | | | | 0 | | | | 1,519 | |
U.S. Treasury Bills | | | 0 | | | | 4,641 | | | | 0 | | | | 4,641 | |
| | | | | | | | | | | | | | | | |
| | | | |
Total Investments | | $ | 1,599 | | | $ | 113,098 | | | $ | 0 | | | $ | 114,697 | |
| | | | | | | | | | | | | | | | |
| | | | | | | | | | | | | | | | |
| Category and Subcategory | | Level 1 | | | Level 2 | | | Level 3 | | | Fair
Value at
06/30/2024 | |
|
Financial Derivative Instruments - Assets | |
Exchange-traded or centrally cleared | | $ | 1 | | | $ | 63 | | | $ | 0 | | | $ | 64 | |
Over the counter | | | 0 | | | | 14 | | | | 0 | | | | 14 | |
| | | | | | | | | | | | | | | | |
| | $ | 1 | | | $ | 77 | | | $ | 0 | | | $ | 78 | |
| | | | | | | | | | | | | | | | |
|
Financial Derivative Instruments - Liabilities | |
Exchange-traded or centrally cleared | | | 0 | | | | (254 | ) | | | 0 | | | | (254 | ) |
Over the counter | | | 0 | | | | (1 | ) | | | 0 | | | | (1 | ) |
| | | | | | | | | | | | | | | | |
| | $ | 0 | | | $ | (255 | ) | | $ | 0 | | | $ | (255 | ) |
| | | | | | | | | | | | | | | | |
| | | | |
Total Financial Derivative Instruments | | $ | 1 | | | $ | (178 | ) | | $ | 0 | | | $ | (177 | ) |
| | | | | | | | | | | | | | | | |
| | | | |
Totals | | $ | 1,600 | | | $ | 112,920 | | | $ | 0 | | | $ | 114,520 | |
| | | | | | | | | | | | | | | | |
There were no significant transfers into or out of Level 3 during the period ended June 30, 2024.
| | | | | | |
| 118 | | PIMCO ETF TRUST | | | See Accompanying Notes | |
| | | | | | |
| Schedule of Investments | | PIMCO Senior Loan Active Exchange-Traded Fund | | | | June 30, 2024 |
(Amounts in thousands*, except number of shares, contracts, units and ounces, if any)
| | | | | | | | | | | | |
| | | | | PRINCIPAL
AMOUNT
(000S) | | | | | MARKET
VALUE
(000S) | |
| INVESTMENTS IN SECURITIES 122.8% | |
| |
| LOAN PARTICIPATIONS AND ASSIGNMENTS 85.5% | |
|
ABG Intermediate Holdings 2 LLC | |
8.094% due 12/21/2028 | | $ | | | 2,283 | | | $ | | | 2,287 | |
|
Acrisure LLC | |
8.594% due 11/06/2030 | | | | | 535 | | | | | | 535 | |
|
Action Nederland BV | |
TBD% due 06/20/2031 | | | | | 600 | | | | | | 601 | |
|
Advantage Sales & Marketing, Inc. | |
9.818% due 10/28/2027 | | | | | 597 | | | | | | 583 | |
|
Al Aqua Merger Sub, Inc. | |
TBD% - 9.595% due 07/31/2028 µ | | | | | 550 | | | | | | 551 | |
TBD% - 9.595% due 07/31/2028 | | | | | 4,155 | | | | | | 4,167 | |
|
Albion Financing 3 SARL | |
10.831% due 08/17/2026 | | | | | 988 | | | | | | 992 | |
|
Alliance Laundry Systems LLC | |
8.899% due 10/08/2027 | | | | | 1,290 | | | | | | 1,296 | |
|
Alliant Holdings Intermediate LLC | |
8.830% due 11/06/2030 | | | | | 1,955 | | | | | | 1,962 | |
|
Allied Universal Holdco LLC | |
9.194% due 05/12/2028 | | | | | 2,049 | | | | | | 2,043 | |
|
Altar Bidco, Inc. | |
7.947% due 02/01/2029 | | | | | 1,745 | | | | | | 1,744 | |
|
Amer Sports Co. | |
8.577% due 02/17/2031 « | | | | | 600 | | | | | | 604 | |
|
American Airlines, Inc. | |
10.336% due 04/20/2028 | | | | | 2,267 | | | | | | 2,345 | |
|
AmWINS Group, Inc. | |
7.594% due 02/19/2028 | | | | | 1,047 | | | | | | 1,048 | |
|
Amynta Agency Borrower Inc. | |
9.597% due 02/28/2028 | | | | | 794 | | | | | | 797 | |
|
AP Core Holdings LLC | |
10.958% due 09/01/2027 | | | | | 550 | | | | | | 482 | |
|
Applied Systems, Inc. | |
8.835% due 02/24/2031 | | | | | 1,893 | | | | | | 1,909 | |
|
AppLovin Corp. | |
7.844% due 08/16/2030 | | | | | 748 | | | | | | 750 | |
|
Arches Buyer, Inc. | |
8.694% due 12/06/2027 | | | | | 691 | | | | | | 663 | |
|
Armor Holding LLC | |
10.014% due 12/11/2028 « | | | | | 245 | | | | | | 246 | |
|
Artera Services LLC | |
9.835% due 02/15/2031 | | | | | 748 | | | | | | 753 | |
|
Ascend Learning LLC | |
8.944% due 12/11/2028 | | | | | 3,275 | | | | | | 3,276 | |
|
Assetmark Financial Holdings Inc. | |
TBD% due 06/03/2031 | | | | | 1,100 | | | | | | 1,102 | |
|
AssuredPartners, Inc. | |
8.844% due 02/14/2031 | | | | | 1,945 | | | | | | 1,952 | |
|
Asurion LLC | |
8.708% due 12/23/2026 | | | | | 3,279 | | | | | | 3,256 | |
9.694% due 08/19/2028 | | | | | 4,874 | | | | | | 4,844 | |
|
Athenahealth Group, Inc. | |
8.594% due 02/15/2029 | | | | | 5,382 | | | | | | 5,371 | |
|
AVSC Holding Corp. (9.944% Cash and 1.000% PIK) | |
10.944% due 10/15/2026 (a) | | | | | 300 | | | | | | 301 | |
|
B+G FOODS, Inc. | |
TBD% due 10/10/2029 | | | | | 706 | | | | | | 699 | |
|
B.C. Unlimited Liability Co. | |
7.094% due 09/20/2030 | | | | | 1,500 | | | | | | 1,498 | |
|
Bally’s Corp. | |
8.836% due 10/02/2028 | | | | | 683 | | | | | | 650 | |
|
Banff Merger Sub Inc. | |
9.344% due 12/29/2028 | | | | | 2,440 | | | | | | 2,448 | |
|
Barracuda Networks, Inc. | |
9.814% due 08/15/2029 | | | | | 497 | | | | | | 497 | |
|
Bausch & Lomb Corp. | |
8.689% due 05/10/2027 | | | | | 3,739 | | | | | | 3,704 | |
9.344% due 09/29/2028 | | | | | 844 | | | | | | 843 | |
|
Bausch Health Cos., Inc. | |
TBD% due 02/01/2027 | | | | | 3,016 | | | | | | 2,760 | |
| | | | | | | | | | | | |
| | | | | PRINCIPAL
AMOUNT
(000S) | | | | | MARKET
VALUE
(000S) | |
|
BCPE Empire Holdings, Inc. | |
9.344% due 12/11/2028 | | $ | | | 1,137 | | | $ | | | 1,139 | |
|
Berlin Packaging LLC | |
9.059% - 9.321% due 06/09/2031 | | | | | 499 | | | | | | 500 | |
|
BIP PipeCo Holdings LLC | |
TBD% due 12/06/2030 | | | | | 675 | | | | | | 678 | |
|
Birkenstock GmbH & Co. KG | |
8.840% due 04/28/2028 | | | | | 98 | | | | | | 98 | |
|
Blackhawk Network Holdings, Inc. | |
10.344% due 03/12/2029 | | | | | 700 | | | | | | 702 | |
|
Broadstreet Partners Inc. | |
TBD% due 06/14/2031 | | | | | 375 | | | | | | 374 | |
|
Caesars Entertainment Corp. | |
8.097% due 02/06/2030 | | | | | 1,135 | | | | | | 1,138 | |
8.097% due 02/06/2031 | | | | | 1,500 | | | | | | 1,503 | |
|
Carnival Corp. | |
8.094% due 08/08/2027 | | | | | 1,009 | | | | | | 1,015 | |
8.094% due 10/18/2028 | | | | | 2,000 | | | | | | 2,008 | |
|
Cast & Crew LLC | |
9.094% due 12/29/2028 | | | | | 700 | | | | | | 701 | |
|
Castlelake Aviation Ltd. | |
8.089% due 10/22/2027 | | | | | 443 | | | | | | 445 | |
|
Cengage Learning, Inc. | |
9.538% due 03/22/2031 | | | | | 1,798 | | | | | | 1,805 | |
|
Central Parent, Inc. | |
8.585% due 07/06/2029 | | | | | 3,981 | | | | | | 3,935 | |
|
Chamberlain Group, Inc. | |
8.694% due 11/03/2028 | | | | | 1,510 | | | | | | 1,510 | |
|
CHARLOTTE BUYER, Inc. | |
10.578% due 02/11/2028 | | | | | 499 | | | | | | 501 | |
|
Charter NEX US, Inc. | |
8.844% due 12/01/2027 | | | | | 1,982 | | | | | | 1,988 | |
|
Chobani, LLC | |
9.080% due 10/25/2027 | | | | | 995 | | | | | | 1,001 | |
|
Clarios Global LP | |
8.344% due 05/06/2030 | | | | | 798 | | | | | | 801 | |
|
Cloud Software Group, Inc. | |
9.335% - 9.345% due 03/30/2029 | | | | | 6,212 | | | | | | 6,215 | |
9.835% due 03/21/2031 | | | | | 1,500 | | | | | | 1,506 | |
|
Clydesdale Acquisition Holdings, Inc. | |
9.119% due 04/13/2029 | | | | | 4,066 | | | | | | 4,080 | |
|
CNT Holdings I Corp. | |
8.830% due 11/08/2027 | | | | | 1,393 | | | | | | 1,398 | |
|
Cohesity | |
TBD% due 03/08/2031 «µ | | | | | 74 | | | | | | 74 | |
TBD% due 03/08/2031 « | | | | | 700 | | | | | | 700 | |
|
Cornerstone Building Brands, Inc. | |
9.829% due 05/02/2031 | | | | | 700 | | | | | | 697 | |
|
Cornerstone OnDemand, Inc. | |
9.208% due 10/16/2028 | | | | | 245 | | | | | | 232 | |
|
Cotiviti, Inc. | |
8.579% due 05/01/2031 | | | | | 2,394 | | | | | | 2,388 | |
|
CP Atlas Buyer, Inc. | |
9.194% due 11/23/2027 | | | | | 2,294 | | | | | | 2,243 | |
|
CPI Holdco B LLC | |
7.344% due 05/17/2031 | | | | | 103 | | | | | | 103 | |
|
CQP Holdco LP | |
TBD% due 12/31/2030 | | | | | 1,325 | | | | | | 1,327 | |
|
Creative Artists Agency LLC | |
8.594% due 11/27/2028 | | | | | 2,159 | | | | | | 2,172 | |
|
Crown Subsea Communications Holding, Inc. | |
10.080% due 01/30/2031 | | | | | 575 | | | | | | 577 | |
|
Cushman & Wakefield U.S. Borrower LLC | |
9.094% due 01/31/2030 « | | | | | 200 | | | | | | 201 | |
|
Da Vinci Purchaser Corp. | |
8.844% due 01/08/2027 | | | | | 2,624 | | | | | | 2,629 | |
|
Deerfield Dakota Holding LLC | |
9.085% due 04/09/2027 | | | | | 2,335 | | | | | | 2,336 | |
|
Delta Topco, Inc. | |
8.846% due 11/30/2029 | | | | | 700 | | | | | | 701 | |
|
DexKo Global, Inc. | |
9.346% due 10/04/2028 | | | | | 997 | | | | | | 993 | |
| | | | | | | | | | | | |
| | | | | PRINCIPAL
AMOUNT
(000S) | | | | | MARKET
VALUE
(000S) | |
|
DirecTV Financing LLC | |
10.458% due 08/02/2027 | | $ | | | 185 | | | $ | | | 185 | |
10.708% due 08/02/2029 | | | | | 2,274 | | | | | | 2,267 | |
|
Dotdash Meredith, Inc. | |
9.429% due 12/01/2028 | | | | | 246 | | | | | | 246 | |
|
Drake Software LLC | |
TBD% due 06/17/2031« | | | | | 1,100 | | | | | | 1,090 | |
|
Dun & Bradstreet Corp. | |
8.096% due 01/18/2029 | | | | | 615 | | | | | | 616 | |
|
Edelman Financial Center, LLC | |
8.594% due 04/07/2028 | | | | | 2,829 | | | | | | 2,837 | |
|
Embecta Corp. | |
8.344% due 03/30/2029 | | | | | 1,694 | | | | | | 1,592 | |
|
Emerald Borrower LP | |
TBD% due 06/18/2031 | | | | | 525 | | | | | | 526 | |
|
Endo Luxembourg Finance Co. SARL | |
9.826% due 04/23/2031 | | | | | 950 | | | | | | 950 | |
|
Endure Digital, Inc. | |
8.944% due 02/10/2028 | | | | | 990 | | | | | | 922 | |
|
Ensono LP | |
9.444% - 9.458% due 05/26/2028 | | | | | 338 | | | | | | 336 | |
|
EPIC Y-Grade Services LP | |
11.058% due 06/29/2029 | | | | | 1,125 | | | | | | 1,126 | |
|
eResearchTechnology, Inc. | |
TBD% due 02/04/2027 | | | | | 2,732 | | | | | | 2,749 | |
|
Fertitta Entertainment LLC | |
9.081% due 01/27/2029 | | | | | 3,861 | | | | | | 3,870 | |
|
Fiesta Purchaser, Inc. | |
9.344% due 02/12/2031 | | | | | 875 | | | | | | 882 | |
|
First Brands Group, LLC | |
10.591% due 03/30/2027 | | | | | 796 | | | | | | 792 | |
|
First Student Bidco, Inc. | |
8.596% due 07/21/2028 | | | | | 2,432 | | | | | | 2,436 | |
|
Focus Financial Partners, LLC | |
8.094% due 06/30/2028 | | | | | 844 | | | | | | 845 | |
|
Fortrea Holdings, Inc. | |
9.094% due 06/30/2030 | | | | | 93 | | | | | | 93 | |
|
Fortress Intermediate 3, Inc. | |
TBD% due 06/27/2031 « | | | | | 1,425 | | | | | | 1,429 | |
|
Forward Air Corp. | |
9.830% due 12/19/2030 | | | | | 581 | | | | | | 543 | |
|
Foundation Building Materials Holding Co. LLC | |
8.694% - 8.841% due 01/31/2028 | | | | | 1,332 | | | | | | 1,319 | |
|
Freeport LNG Investments LLLP | |
9.086% due 12/21/2028 | | | | | 997 | | | | | | 998 | |
|
Frontier Communications Corp. | |
TBD% due 06/20/2031 « | | | | | 825 | | | | | | 825 | |
|
Garda World Security Corp. | |
9.594% due 02/01/2029 | | | | | 249 | | | | | | 251 | |
|
Global Medical Response, Inc. | |
TBD% due 10/31/2028 | | | | | 701 | | | | | | 680 | |
|
Graham Packaging Co., Inc. | |
8.458% due 08/04/2027 | | | | | 1,823 | | | | | | 1,828 | |
|
Gray Television, Inc. | |
8.444% due 12/01/2028 | | | | | 495 | | | | | | 448 | |
10.580% due 06/04/2029 | | | | | 350 | | | | | | 333 | |
|
Great Outdoors Group LLC | |
9.208% due 03/06/2028 | | | | | 792 | | | | | | 792 | |
|
Grinding Media, Inc. | |
9.555% due 10/12/2028 « | | | | | 246 | | | | | | 245 | |
|
GTCR W Merger Sub LLC | |
8.335% due 01/31/2031 | | | | | 815 | | | | | | 817 | |
|
Gulfside Supply, Inc. | |
TBD% due 05/29/2031 « | | | | | 875 | | | | | | 877 | |
|
GVC HOLDINGS (GIBRALTAR) LTD | |
8.014% due 10/31/2029 | | | | | 99 | | | | | | 100 | |
|
Hilton Grand Vacations Borrower LLC | |
8.094% due 01/17/2031 | | | | | 698 | | | | | | 699 | |
|
HUB International Ltd. | |
8.567% - 8.595% due 06/20/2030 | | | | | 1,891 | | | | | | 1,897 | |
|
Hudson River Trading LLC | |
8.458% due 03/20/2028 | | | | | 497 | | | | | | 498 | |
| | | | | | | | | | | | |
| See Accompanying Notes | | | ANNUAL FINANCIAL AND OTHER INFORMATION | | | | | | | JUNE 30, 2024 | | | 119 |
| | | | | | |
| Schedule of Investments | | PIMCO Senior Loan Active Exchange-Traded Fund | | (Cont.) | | |
| | | | | | | | | | | | |
| | | | | PRINCIPAL
AMOUNT
(000S) | | | | | MARKET
VALUE
(000S) | |
|
INEOS Enterprises Holdings U.S. Finco LLC | |
9.197% due 07/08/2030 | | $ | | | 395 | | | $ | | | 396 | |
|
INEOS U.S. Finance LLC | |
9.094% due 02/07/2031 | | | | | 750 | | | | | | 753 | |
|
Ingram Micro, Inc. | |
8.596% due 06/30/2028 | | | | | 626 | | | | | | 629 | |
|
IRB Holding Corp. | |
8.194% due 12/15/2027 | | | | | 895 | | | | | | 896 | |
|
IRIS Holdings, Inc. | |
10.180% due 06/28/2028 | | | | | 698 | | | | | | 660 | |
|
Isolved, Inc. | |
8.844% due 10/15/2030 | | | | | 748 | | | | | | 751 | |
|
Jane Street Group, LLC | |
7.958% due 01/26/2028 | | | | | 792 | | | | | | 792 | |
|
Janus International Group LLC | |
7.844% due 08/03/2030 | | | | | 336 | | | | | | 338 | |
|
Jazz Financing Lux SARL | |
8.458% due 05/05/2028 | | | | | 887 | | | | | | 889 | |
|
Johnstone Supply LLC | |
8.328% due 06/07/2031 | | | | | 700 | | | | | | 702 | |
|
Kestrel Bidco, Inc. | |
8.444% due 12/11/2026 | | | | | 114 | | | | | | 114 | |
|
Kohler Energy Co. LLC | |
10.085% due 05/01/2031 | | | | | 850 | | | | | | 855 | |
|
LABL, Inc. | |
10.444% due 10/29/2028 | | | | | 2,960 | | | | | | 2,928 | |
|
LBM Acquisition LLC | |
9.178% due 05/30/2031 | | | | | 4,498 | | | | | | 4,429 | |
|
LC Ahab U.S. Bidco LLC | |
8.844% due 05/01/2031 | | | | | 1,275 | | | | | | 1,279 | |
|
Learning Care Group U.S. No. 2 Inc. | |
9.336% - 9.345% due 08/11/2028 | | | | | 498 | | | | | | 502 | |
|
LifePoint Health, Inc. | |
9.329% due 05/17/2031 | | | | | 1,175 | | | | | | 1,178 | |
10.056% due 11/16/2028 | | | | | 970 | | | | | | 977 | |
|
LSF11 A5 Holdco LLC | |
TBD% due 10/15/2028 | | | | | 742 | | | | | | 743 | |
|
Madison IAQ LLC | |
8.094% due 06/21/2028 | | | | | 4,799 | | | | | | 4,809 | |
|
MasOrange | |
TBD% due 03/25/2031 | | | | | 700 | | | | | | 703 | |
|
Mauser Packaging Solutions Holding Co. | |
8.829% due 04/15/2027 | | | | | 745 | | | | | | 747 | |
|
Mavis Tire Express Services Corp. | |
9.094% due 05/04/2028 | | | | | 1,984 | | | | | | 1,991 | |
|
McAfee LLC | |
8.579% due 03/01/2029 | | | | | 2,084 | | | | | | 2,085 | |
|
McGraw-Hill Global Education Holdings LLC | |
10.346% due 07/28/2028 | | | | | 3,080 | | | | | | 3,089 | |
|
Medline Borrower LP | |
TBD% due 10/23/2028 | | | | | 5,240 | | | | | | 5,254 | |
|
MH SUB I, LLC | |
9.594% due 05/03/2028 | | | | | 5,287 | | | | | | 5,288 | |
|
MI Windows and Doors LLC | |
8.844% due 03/28/2031 | | | | | 650 | | | | | | 655 | |
|
MKS Instruments, Inc. | |
7.828% due 08/17/2029 | | | | | 1,040 | | | | | | 1,043 | |
|
Modena Buyer LLC | |
TBD% due 04/18/2031 | | | | | 1,100 | | | | | | 1,075 | |
|
Mosel Bidco SE | |
9.835% due 09/16/2030 « | | | | | 350 | | | | | | 352 | |
|
Motion Finco SARL | |
8.835% due 11/12/2029 | | | | | 1,097 | | | | | | 1,099 | |
|
MPH Acquisition Holdings LLC | |
9.859% due 09/01/2028 | | | | | 684 | | | | | | 571 | |
|
NCR Atleos LLC | |
10.180% due 03/27/2029 | | | | | 794 | | | | | | 804 | |
|
Neptune Bidco U.S., Inc. | |
10.406% due 04/11/2029 | | | | | 5,044 | | | | | | 4,760 | |
|
NGL Energy Partners LP | |
9.844% due 02/02/2031 | | | | | 399 | | | | | | 401 | |
| | | | | | | | | | | | |
| | | | | PRINCIPAL
AMOUNT
(000S) | | | | | MARKET
VALUE
(000S) | |
|
Nielsen Consumer LLC | |
TBD% due 03/06/2028 | | $ | | | 825 | | | $ | | | 827 | |
|
Nielsen Consumer, Inc. | |
11.594% due 03/06/2028 | | | | | 497 | | | | | | 499 | |
|
Nouryon Finance BV | |
TBD% due 04/03/2028 | | | | | 995 | | | | | | 999 | |
|
Nuvei Technologies Corp. | |
8.444% due 12/19/2030 | | | | | 498 | | | | | | 499 | |
|
Olympus Water U.S. Holding Corp. | |
8.847% due 06/20/2031 | | | | | 690 | | | | | | 693 | |
|
Omnia Partners LLC | |
8.574% due 07/25/2030 | | | | | 599 | | | | | | 600 | |
|
Ontario Gaming GTA LP | |
9.585% due 08/01/2030 | | | | | 995 | | | | | | 1,001 | |
|
Organon & Co. | |
7.829% due 05/19/2031 | | | | | 1,866 | | | | | | 1,869 | |
|
Oryx Midstream Services Permian Basin LLC | |
8.441% due 10/05/2028 | | | | | 995 | | | | | | 997 | |
|
Oscar AcquisitionCo LLC | |
9.585% due 04/29/2029 | | | | | 2,328 | | | | | | 2,329 | |
|
Packaging Coordinators Midco, Inc. | |
TBD% due 11/30/2027 | | | | | 499 | | | | | | 501 | |
|
Padagis LLC | |
10.313% due 07/06/2028 « | | | | | 275 | | | | | | 269 | |
|
Park River Holdings, Inc. | |
8.814% due 12/28/2027 | | | | | 2,082 | | | | | | 2,039 | |
|
Particle Investments SARL | |
9.323% - 9.344% due 03/28/2031 « | | | | | 698 | | | | | | 705 | |
|
Pegasus BidCo BV | |
9.072% due 07/12/2029 | | | | | 470 | | | | | | 473 | |
|
PENN Entertainment, Inc. | |
8.194% due 05/03/2029 | | | | | 696 | | | | | | 698 | |
|
Peraton Corp. | |
9.194% due 02/01/2028 | | | | | 1,492 | | | | | | 1,494 | |
|
PetSmart, Inc. | |
9.194% due 02/11/2028 | | | | | 792 | | | | | | 791 | |
|
PG Investment Company 59 SARL | |
8.835% due 03/26/2031 | | | | | 775 | | | | | | 781 | |
|
Phoenix Guarantor, Inc. | |
8.594% due 02/21/2031 | | | | | 2,622 | | | | | | 2,619 | |
|
PMHC II, Inc. | |
9.706% due 04/23/2029 | | | | | 1,188 | | | | | | 1,162 | |
|
Polaris Newco LLC | |
9.591% due 06/02/2028 | | | | | 4,915 | | | | | | 4,919 | |
|
Press Ganey Holdings, Inc. | |
8.844% due 04/30/2031 | | | | | 100 | | | | | | 100 | |
|
Prime Security Services LLC | |
TBD% due 10/13/2030 | | | | | 975 | | | | | | 976 | |
|
Project Alpha Intermediate Holding, Inc. | |
9.072% due 10/28/2030 | | | | | 2,768 | | | | | | 2,780 | |
|
Proofpoint, Inc. | |
8.344% due 08/31/2028 | | | | | 3,247 | | | | | | 3,253 | |
|
PUG LLC | |
10.094% due 03/15/2030 | | | | | 637 | | | | | | 638 | |
|
Quartz Acquireco LLC | |
TBD% due 06/28/2030 « | | | | | 273 | | | | | | 273 | |
|
Quest Software U.S. Holdings, Inc. | |
9.730% due 02/01/2029 | | | | | 2,600 | | | | | | 1,938 | |
|
Rand Parent LLC | |
TBD% due 03/18/2030 | | | | | 1,000 | | | | | | 1,000 | |
9.585% due 03/17/2030 | | | | | 422 | | | | | | 424 | |
|
RealPage, Inc. | |
8.458% due 04/24/2028 | | | | | 4,664 | | | | | | 4,542 | |
|
Red Ventures, LLC | |
8.344% due 03/03/2030 | | | | | 249 | | | | | | 246 | |
|
Renaissance Holdings Corp. | |
9.597% due 04/05/2030 | | | | | 1,590 | | | | | | 1,591 | |
|
Resideo Funding Inc. | |
7.339% due 05/21/2031 | | | | | 375 | | | | | | 375 | |
|
Restoration Hardware, Inc. | |
7.958% due 10/20/2028 | | | | | 3,600 | | | | | | 3,470 | |
| | | | | | | | | | | | |
| | | | | PRINCIPAL
AMOUNT
(000S) | | | | | MARKET
VALUE
(000S) | |
|
Reynolds Group Holdings, Inc. | |
7.845% due 09/24/2028 | | $ | | | 1,200 | | | $ | | | 1,203 | |
|
Rocket Software, Inc. | |
10.094% due 11/28/2028 | | | | | 1,297 | | | | | | 1,304 | |
|
Scientific Games Holdings LP | |
8.306% due 04/04/2029 | | | | | 644 | | | | | | 643 | |
|
SCIH Salt Holdings, Inc. | |
8.830% due 03/16/2027 | | | | | 2,005 | | | | | | 2,009 | |
|
Sedgwick Claims Management Services, Inc. | |
9.094% due 02/24/2028 | | | | | 2,079 | | | | | | 2,084 | |
|
Select Medical Corp. | |
8.344% due 03/06/2027 | | | | | 574 | | | | | | 575 | |
|
Simon & Schuster, Inc. | |
9.330% due 10/30/2030 | | | | | 200 | | | | | | 200 | |
|
Solis IV BV | |
8.836% due 02/26/2029 | | | | | 4,426 | | | | | | 4,403 | |
|
Sophia, L.P. | |
8.944% due 10/09/2029 | | | | | 695 | | | | | | 699 | |
|
SOTERA HEALTH HOLDINGS LLC | |
8.594% due 05/30/2031 | | | | | 975 | | | | | | 975 | |
|
Specialty Building Products Holdings LLC | |
9.194% due 10/15/2028 | | | | | 593 | | | | | | 591 | |
|
Spirit AeroSystems, Inc. | |
9.580% due 01/15/2027 | | | | | 295 | | | | | | 297 | |
|
Spring Education Group, Inc. | |
9.335% due 10/04/2030 | | | | | 299 | | | | | | 300 | |
|
Star Parent, Inc. | |
9.085% due 09/27/2030 | | | | | 4,693 | | | | | | 4,695 | |
|
Station Casinos LLC | |
7.594% due 03/14/2031 | | | | | 399 | | | | | | 399 | |
|
SURGERY CENTER HOLDINGS, Inc. | |
8.089% due 12/19/2030 | | | | | 1,447 | | | | | | 1,453 | |
|
Syniverse Holdings, Inc. | |
12.335% due 05/13/2027 | | | | | 2,344 | | | | | | 2,297 | |
|
Taboola.com Ltd. | |
9.458% due 09/01/2028 « | | | | | 339 | | | | | | 340 | |
|
Tacala, LLC | |
9.344% due 01/31/2031 | | | | | 499 | | | | | | 502 | |
|
Tempo Acquisition LLC | |
7.594% due 08/31/2028 | | | | | 495 | | | | | | 497 | |
|
Teneo Holdings LLC | |
10.094% due 03/13/2031 | | | | | 698 | | | | | | 701 | |
|
Tenneco, Inc. | |
10.426% - 10.435% due 11/17/2028 | | | | | 1,675 | | | | | | 1,611 | |
|
TGP Holdings III LLC | |
8.694% due 06/29/2028 | | | | | 600 | | | | | | 570 | |
|
TK Elevator U.S. Newco, Inc. | |
8.791% due 04/30/2030 | | | | | 3,040 | | | | | | 3,059 | |
|
Topgolf Callaway Brands Corp. | |
8.344% due 03/15/2030 | | | | | 1,169 | | | | | | 1,174 | |
|
Trans Union LLC | |
TBD% due 11/16/2026 | | | | | 398 | | | | | | 398 | |
TBD% due 06/24/2031 | | | | | 377 | | | | | | 377 | |
|
TransDigm, Inc. | |
7.843% due 02/28/2031 | | | | | 4,000 | | | | | | 4,013 | |
|
Travel + Leisure Co. | |
8.692% due 12/14/2029 | | | | | 798 | | | | | | 801 | |
|
Trident TPI Holdings, Inc. | |
9.302% - 9.344% due 09/15/2028 | | | | | 1,591 | | | | | | 1,595 | |
|
Triton Water Holdings, Inc. | |
8.846% due 03/31/2028 | | | | | 4,469 | | | | | | 4,476 | |
9.335% due 03/31/2028 | | | | | 299 | | | | | | 301 | |
|
Truist Insurance Holdings LLC | |
8.585% due 05/06/2031 | | | | | 3,100 | | | | | | 3,111 | |
|
UFC Holdings LLC | |
8.336% due 04/29/2026 | | | | | 1,049 | | | | | | 1,053 | |
|
UGI Energy Services LLC | |
7.844% due 02/22/2030 | | | | | 566 | | | | | | 568 | |
|
UKG, Inc. | |
8.576% due 02/10/2031 | | | | | 3,161 | | | | | | 3,176 | |
|
United Talent Agency, LLC | |
9.078% due 07/07/2028 « | | | | | 1,000 | | | | | | 1,006 | |
| | | | | | |
| 120 | | PIMCO ETF TRUST | | | See Accompanying Notes | |
| | | | | | | | | | | | |
| | | | | PRINCIPAL
AMOUNT
(000S) | | | | | MARKET
VALUE
(000S) | |
|
UPC Financing Partnership | |
8.443% due 01/31/2029 | | $ | | | 1,275 | | | $ | | | 1,270 | |
|
USI INC. | |
8.085% due 11/22/2029 | | | | | 763 | | | | | | 764 | |
8.085% due 09/27/2030 | | | | | 496 | | | | | | 497 | |
|
Virgin Media Bristol LLC | |
7.943% due 01/31/2028 | | | | | 2,900 | | | | | | 2,778 | |
8.693% due 01/31/2029 | | | | | 3,450 | | | | | | 3,305 | |
|
VS Buyer, LLC | |
8.581% due 04/14/2031 | | | | | 1,600 | | | | | | 1,606 | |
|
Wand NewCo 3, Inc. | |
9.094% due 01/30/2031 | | | | | 800 | | | | | | 806 | |
|
WaterBridge Midstream Operating LLC | |
TBD% due 06/21/2029 | | | | | 500 | | | | | | 497 | |
9.826% due 05/10/2029 | | | | | 1,000 | | | | | | 1,007 | |
|
WEC U.S. Holdings Ltd. | |
8.094% due 01/27/2031 | | | | | 2,872 | | | | | | 2,878 | |
|
Whatabrands LLC | |
8.094% due 08/03/2028 | | | | | 3,211 | | | | | | 3,216 | |
|
WHITE CAP BUYER LLC | |
8.594% due 10/19/2029 | | | | | 1,735 | | | | | | 1,740 | |
|
Windsor Holdings III, LLC | |
9.339% due 08/01/2030 | | | | | 697 | | | | | | 702 | |
|
Windstream Services LLC | |
11.694% due 09/21/2027 | | | | | 490 | | | | | | 491 | |
|
Wood Mackenzie Ltd. | |
8.823% due 02/07/2031 | | | | | 625 | | | | | | 630 | |
|
Worldwide Express Operations LLC | |
9.846% due 07/26/2028 | | | | | 839 | | | | | | 843 | |
|
Wrench Group, LLC | |
9.596% due 10/30/2028 | | | | | 1,796 | | | | | | 1,799 | |
|
WS Audiology | |
9.992% due 02/28/2029 | | | | | 575 | | | | | | 577 | |
|
Xplor Technologies LLC | |
TBD% due 06/24/2031 « | | | | | 975 | | | | | | 975 | |
|
Zayo Group Holdings, Inc. | |
8.458% due 03/09/2027 | | | | | 2,300 | | | | | | 2,009 | |
| | | | | | | | | | | | |
Total Loan Participations and Assignments (Cost $332,947) | | | 335,665 | |
| | | | |
| |
| | | | | | | | | | | | |
| | | | | PRINCIPAL
AMOUNT
(000S) | | | | | MARKET
VALUE
(000S) | |
| CORPORATE BONDS & NOTES 2.8% | |
| |
| BANKING & FINANCE 0.6% | |
|
Alliant Holdings Intermediate LLC | |
7.000% due 01/15/2031 | | $ | | | 500 | | | $ | | | 505 | |
|
Freedom Mortgage Corp. | |
12.000% due 10/01/2028 | | | | | 450 | | | | | | 484 | |
|
Panther Escrow Issuer LLC | |
7.125% due 06/01/2031 | | | | | 400 | | | | | | 405 | |
|
PRA Group, Inc. | |
8.375% due 02/01/2028 | | | | | 500 | | | | | | 499 | |
|
Starwood Property Trust, Inc. | |
3.750% due 12/31/2024 | | | | | 400 | | | | | | 395 | |
| | | | | | | | | | | | |
| | | | | | | | | | | 2,288 | |
| | | | | | | | | | | | |
| |
| INDUSTRIALS 2.2% | |
|
American Airlines Pass-Through Trust | |
3.375% due 11/01/2028 | | | | | 165 | | | | | | 156 | |
|
Community Health Systems, Inc. | |
5.250% due 05/15/2030 | | | | | 400 | | | | | | 330 | |
|
Foundation Building Materials, Inc. | |
6.000% due 03/01/2029 | | | | | 250 | | | | | | 222 | |
|
Global Partners LP | |
8.250% due 01/15/2032 | | | | | 100 | | | | | | 103 | |
|
GYP Holdings Corp. | |
4.625% due 05/01/2029 | | | | | 500 | | | | | | 463 | |
|
Lindblad Expeditions Holdings, Inc. | |
9.000% due 05/15/2028 | | | | | 800 | | | | | | 823 | |
|
Manitowoc Co., Inc. | |
9.000% due 04/01/2026 | | | | | 500 | | | | | | 501 | |
|
NCL Corp. Ltd. | |
8.125% due 01/15/2029 | | | | | 400 | | | | | | 419 | |
|
Olympus Water U.S. Holding Corp. | |
7.125% due 10/01/2027 | | | | | 50 | | | | | | 50 | |
|
Option Care Health, Inc. | |
4.375% due 10/31/2029 | | | | | 900 | | | | | | 827 | |
|
Pactiv Evergreen Group Issuer, Inc. | |
4.000% due 10/15/2027 | | | | | 850 | | | | | | 797 | |
|
Rand Parent LLC | |
8.500% due 02/15/2030 | | | | | 100 | | | | | | 101 | |
|
Spirit AeroSystems, Inc. | |
9.750% due 11/15/2030 | | | | | 250 | | | | | | 276 | |
| | | | | | | | | | | | |
| | | | | PRINCIPAL
AMOUNT
(000S) | | | | | MARKET
VALUE
(000S) | |
|
Star Parent, Inc. | |
9.000% due 10/01/2030 | | $ | | | 200 | | | $ | | | 210 | |
|
Station Casinos LLC | |
6.625% due 03/15/2032 | | | | | 400 | | | | | | 398 | |
|
Surgery Center Holdings, Inc. | |
7.250% due 04/15/2032 | | | | | 600 | | | | | | 607 | |
|
TransDigm, Inc. | |
7.125% due 12/01/2031 | | | | | 400 | | | | | | 413 | |
|
Triumph Group, Inc. | |
9.000% due 03/15/2028 | | | | | 480 | | | | | | 504 | |
|
Wand NewCo 3, Inc. | |
7.625% due 01/30/2032 | | | | | 200 | | | | | | 207 | |
|
White Cap Buyer LLC | |
6.875% due 10/15/2028 | | | | | 900 | | | | | | 869 | |
|
XPO, Inc. | |
7.125% due 02/01/2032 | | | | | 200 | | | | | | 205 | |
|
ZF North America Capital, Inc. | |
6.875% due 04/14/2028 | | | | | 150 | | | | | | 153 | |
7.125% due 04/14/2030 | | | | | 150 | | | | | | 156 | |
| | | | | | | | | | | | |
| | | | | | | | | | | 8,790 | |
| | | | | | | | | | | | |
| Total Corporate Bonds & Notes (Cost $10,740) | | | 11,078 | |
| | | | |
| |
| SHORT-TERM INSTRUMENTS 34.5% | |
| |
| REPURCHASE AGREEMENTS (b) 34.5% | |
| | | | | | | | | | | 135,200 | |
| | | | | | | | | | | | |
Total Short-Term Instruments
(Cost $135,200) | | | 135,200 | |
| | | | |
| | | | |
| | | | | | | | | | | | |
Total Investments in Securities
(Cost $478,887) | | | 481,943 | |
| | | | |
| | | | |
| | | | | | | | | | | | |
| Total Investments 122.8% (Cost $478,887) | | | $ | | | 481,943 | |
| |
Financial Derivative
Instruments (c)(d) 0.3% (Cost or Premiums, net $(787)) | | | | | | 1,195 | |
| |
| Other Assets and Liabilities, net (23.1)% | | | (90,790 | ) |
| | | | |
| Net Assets 100.0% | | | $ | | | 392,348 | |
| | | | | | | |
NOTES TO SCHEDULE OF INVESTMENTS:
| * | A zero balance may reflect actual amounts rounding to less than one thousand. |
| « | Security valued using significant unobservable inputs (Level 3). |
| µ | All or a portion of this amount represents unfunded loan commitments. The interest rate for the unfunded portion will be determined at the time of funding. See Note 4, Securities and Other Investments, in the Notes to Financial Statements for more information regarding unfunded loan commitments. |
| (a) | Payment in-kind security. |
BORROWINGS AND OTHER FINANCING TRANSACTIONS
(b) REPURCHASE AGREEMENTS:
| | | | | | | | | | | | | | | | | | | | | | | | | | | | | | |
| Counterparty | | Lending
Rate | | | Settlement
Date | | | Maturity
Date | | | Principal
Amount | | | Collateralized By | | Collateral
(Received) | | | Repurchase
Agreements,
at Value | | | Repurchase
Agreement
Proceeds
to be
Received(1) | |
| BOS | | | 5.430 | % | | | 06/28/2024 | | | | 07/01/2024 | | | $ | 62,100 | | | U.S. Treasury Bonds 2.375% due 11/15/2049 | | $ | (62,148 | ) | | $ | 62,100 | | | $ | 62,128 | |
| BPS | | | 5.340 | | | | 06/28/2024 | | | | 07/01/2024 | | | | 10,800 | | | U.S. Treasury Notes 0.625% due 07/31/2026 | | | (11,012 | ) | | | 10,800 | | | | 10,805 | |
| | | 5.400 | | | | 07/01/2024 | | | | 07/02/2024 | | | | 62,300 | | | U.S. Treasury Notes 1.875% due 02/15/2032 | | | (63,648 | ) | | | 62,300 | | | | 62,300 | |
| | | | | | | | | | | | | | | | | | | | | | | | | | | | | | |
Total Repurchase Agreements | | | | | $ | (136,808 | ) | | $ | 135,200 | | | $ | 135,233 | |
| | | | | | | | | | | | | | | | | | | | | | | | | | | | | | |
| | | | | | | | | | | | |
| See Accompanying Notes | | | ANNUAL FINANCIAL AND OTHER INFORMATION | | | | | | | JUNE 30, 2024 | | | 121 |
| | | | | | |
| Schedule of Investments | | PIMCO Senior Loan Active Exchange-Traded Fund | | (Cont.) | | |
BORROWINGS AND OTHER FINANCING TRANSACTIONS SUMMARY
The following is a summary by counterparty of the market value of Borrowings and Other Financing Transactions and collateral pledged/(received) as of June 30, 2024:
| | | | | | | | | | | | | | | | | | | | | | | | | | | | |
| Counterparty | | Repurchase
Agreement
Proceeds
to be
Received(1) | | | Payable for
Reverse
Repurchase
Agreements | | | Payable for
Sale-Buyback
Transactions | | | Securities
Out on Loan | | | Total
Borrowings and
Other Financing
Transactions | | | Collateral
Pledged/(Received) | | | Net Exposure(2) | |
Global/Master Repurchase Agreement | |
BOS | | $ | 62,128 | | | $ | 0 | | | $ | 0 | | | $ | 0 | | | $ | 62,128 | | | $ | (62,148 | ) | | $ | (20 | ) |
BPS | | | 73,105 | | | | 0 | | | | 0 | | | | 0 | | | | 73,105 | | | | (74,660 | ) | | | (1,555 | ) |
| | | | | | | | | | | | | | | | | | | | | | | | | | | | |
Total Borrowings and Other Financing Transactions | | $ | 135,233 | | | $ | 0 | | | $ | 0 | | | $ | 0 | | | | | | | | | | | | | |
| | | | | | | | | | | | | | | | | | | | | | | | | | | | |
| (1) | Includes accrued interest. |
| (2) | Net Exposure represents the net receivable/(payable) that would be due from/to the counterparty in the event of default. Exposure from borrowings and other financing transactions can only be netted across transactions governed under the same master agreement with the same legal entity. See Note 8, Master Netting Arrangements, in the Notes to Financial Statements for more information. |
The average amount of borrowings outstanding during the period ended June 30, 2024 was $(5) at a weighted average interest rate of 5.350%. Average borrowings may include reverse repurchase agreements and sale-buyback transactions, if held during the period.
(c) FINANCIAL DERIVATIVE INSTRUMENTS: EXCHANGE-TRADED OR CENTRALLY CLEARED
FUTURES CONTRACTS:
LONG FUTURES CONTRACTS
| | | | | | | | | | | | | | | | | | | | | | | | |
Description | | Expiration
Month | | | # of
Contracts | | | Notional
Amount | | | Unrealized
Appreciation/
(Depreciation) | | | Variation Margin | |
| | Asset | | | Liability | |
U.S. Treasury 10-Year Note September Futures | | | 09/2024 | | | | 14 | | | $ | 1,540 | | | $ | 8 | | | $ | 0 | | | $ | (4 | ) |
| | | | | | | | | | | | | | | | | | | | | | | | |
SHORT FUTURES CONTRACTS
| | | | | | | | | | | | | | | | | | | | | | | | |
Description | | Expiration
Month | | | # of
Contracts | | | Notional
Amount | | | Unrealized
Appreciation/
(Depreciation) | | | Variation Margin | |
| | Asset | | | Liability | |
U.S. Treasury 2-Year Note September Futures | | | 09/2024 | | | | 8 | | | $ | (1,634 | ) | | $ | (1 | ) | | $ | 0 | | | $ | 0 | |
U.S. Treasury 5-Year Note September Futures | | | 09/2024 | | | | 33 | | | | (3,517 | ) | | | (15 | ) | | | 4 | | | | 0 | |
U.S. Treasury 10-Year Ultra Long-Term Bond September Futures | | | 09/2024 | | | | 11 | | | | (1,249 | ) | | | (6 | ) | | | 5 | | | | 0 | |
| | | | | | | | | | | | | | | | | | | | | | | | |
| | | | | | | | | | | | | | $ | (22 | ) | | $ | 9 | | | $ | 0 | |
| | | | | | | | | | | | | | | | | | | | | | | | |
Total Futures Contracts | | | $ | (14 | ) | | $ | 9 | | | $ | (4 | ) |
| | | | | | | | | | | | | |
SWAP AGREEMENTS:
INTEREST RATE SWAPS
| | | | | | | | | | | | | | | | | | | | | | | | | | | | | | | | | | | | | | |
Pay/Receive
Floating Rate | | Floating Rate Index | | Fixed Rate | | | Payment
Frequency | | | Maturity
Date | | | Notional
Amount | | | Premiums
Paid/(Received) | | | Unrealized
Appreciation/
(Depreciation) | | | Market
Value | | | Variation Margin | |
| | Asset | | | Liability | |
Receive | | 1-Day USD-SOFR Compounded-OIS | | | 1.750 | % | | | Annual | | | | 06/15/2027 | | | $ | 6,000 | | | $ | 287 | | | $ | 148 | | | $ | 435 | | | $ | 5 | | | $ | 0 | |
| | | | | | | | | | | | | | | | | | | | | |
Total Swap Agreements | | | $ | 287 | | | $ | 148 | | | $ | 435 | | | $ | 5 | | | $ | 0 | |
| | | | | | | | | | | | | | | | | | | | | |
FINANCIAL DERIVATIVE INSTRUMENTS: EXCHANGE-TRADED OR CENTRALLY CLEARED SUMMARY
The following is a summary of the market value and variation margin of Exchange-Traded or Centrally Cleared Financial Derivative Instruments as of June 30, 2024:
| | | | | | | | | | | | | | | | | | | | | | | | | | | | | | | | | | | | |
| | | Financial Derivative Assets | | | | | | Financial Derivative Liabilities | |
| | | Market Value | | | Variation Margin
Asset | | | | | | | | | Market Value | | | Variation Margin
Liability | | | | |
| | | Purchased
Options | | | Futures | | | Swap
Agreements | | | Total | | | | | | Written
Options | | | Futures | | | Swap
Agreements | | | Total | |
Total Exchange-Traded or Centrally Cleared | | $ | 0 | | | $ | 9 | | | $ | 5 | | | $ | 14 | | | | | | | $ | 0 | | | $ | (4) | | | $ | 0 | | | $ | (4) | |
| | | | | | | | | | | | | | | | | | | | | | | | | | | | | | | | | | | | |
Cash of $386 has been pledged as collateral for exchange-traded and centrally cleared financial derivative instruments as of June 30, 2024. See Note 8, Master Netting Arrangements, in the Notes to Financial Statements for more information.
| | | | | | |
| 122 | | PIMCO ETF TRUST | | | See Accompanying Notes | |
(d) FINANCIAL DERIVATIVE INSTRUMENTS: OVER THE COUNTER
SWAP AGREEMENTS:
TOTAL RETURN SWAPS ON INTEREST RATE INDICES
| | | | | | | | | | | | | | | | | | | | | | | | | | | | | | | | | | |
| Counterparty | | Pay/Receive(1) | | Underlying Reference | | # of Units | | | Financing Rate | | Payment
Frequency | | Maturity
Date | | Notional
Amount | | | Premiums
Paid/(Received) | | | Unrealized
Appreciation/
(Depreciation) | | | Swap Agreements,
at Value | |
| | Asset | | | Liability | |
BPS | | Receive | | iBoxx USD Liquid Investment Grade Index | | | N/A | | | 1.148% (1-Month USD-LIBOR plus a specified spread) | | Maturity | | 09/20/2024 | | $ | 28,900 | | | $ | (361 | ) | | $ | 917 | | | $ | 556 | | | $ | 0 | |
| | | | | | | | | | | |
JPM | | Receive | | iBoxx USD Liquid Investment Grade Index | | | N/A | | | 1.144% (1-Month USD-LIBOR plus a specified spread) | | Maturity | | 09/20/2024 | | | 47,800 | | | | (412 | ) | | | 605 | | | | 198 | | | | (5 | ) |
| | Receive | | iBoxx USD Liquid Investment Grade Index | | | N/A | | | 1.148% (1-Month USD-LIBOR plus a specified spread) | | Maturity | | 09/20/2024 | | | 14,600 | | | | (156 | ) | | | 554 | | | | 398 | | | | 0 | |
| | Receive | | iBoxx USD Liquid Investment Grade Index | | | N/A | | | 1.144% (1-Month USD-LIBOR plus a specified spread) | | Maturity | | 03/20/2025 | | | 20,000 | | | | (145 | ) | | | 183 | | | | 38 | | | | 0 | |
| | | | | | | | | | | | | | | | | | | | | | | | | | | | | | | | | | |
Total Swap Agreements | | | $ | (1,074 | ) | | $ | 2,259 | | | $ | 1,190 | | | $ | (5 | ) |
| | | | | | | | | | | | | | | | | | | | | | | | | | | | | | | | | | |
FINANCIAL DERIVATIVE INSTRUMENTS: OVER THE COUNTER SUMMARY
The following is a summary by counterparty of the market value of OTC financial derivative instruments and collateral pledged/(received) as of June 30, 2024:
| | | | | | | | | | | | | | | | | | | | | | | | | | | | | | | | | | | | | | | | | | | | | | | | |
| | | Financial Derivative Assets | | | | | | Financial Derivative Liabilities | | | | | | | | | | |
| Counterparty | | Forward
Foreign
Currency
Contracts | | | Purchased
Options | | | Swap
Agreements | | | Total
Over the
Counter | | | | | | Forward
Foreign
Currency
Contracts | | | Written
Options | | | Swap
Agreements | | | Total
Over the
Counter | | | Net Market
Value of OTC
Derivatives | | | Collateral
Pledged/
(Received) | | | Net
Exposure(2) | |
BPS | | $ | 0 | | | $ | 0 | | | $ | 556 | | | $ | 556 | | | | | | | $ | 0 | | | $ | 0 | | | $ | 0 | | | $ | 0 | | | $ | 556 | | | $ | (550 | ) | | $ | 6 | |
JPM | | | 0 | | | | 0 | | | | 634 | | | | 634 | | | | | | | | 0 | | | | 0 | | | | (5 | ) | | | (5 | ) | | | 629 | | | | 0 | | | | 629 | |
| | | | | | | | | | | | | | | | | | | | | | | | | | | | | | | | | | | | | | | | | | | | | | | | |
Total Over the Counter | | $ | 0 | | | $ | 0 | | | $ | 1,190 | | | $ | 1,190 | | | | | | | $ | 0 | | | $ | 0 | | | $ | (5 | ) | | $ | (5 | ) | | | | | | | | | | | | |
| | | | | | | | | | | | | | | | | | | | | | | | | | | | | | | | | | | | | | | | | | | | | | | | |
| (1) | Receive represents that the Fund receives payments for any positive net return on the underlying reference. The Fund makes payments for any negative net return on such underlying reference. Pay represents that the Fund receives payments for any negative net return on the underlying reference. The Fund makes payments for any positive net return on such underlying reference. |
| (2) | Net Exposure represents the net receivable/(payable) that would be due from/to the counterparty in the event of default. Exposure from OTC financial derivative instruments can only be netted across transactions governed under the same master agreement with the same legal entity. See Note 8, Master Netting Arrangements, in the Notes to Financial Statements for more information. |
FAIR VALUE OF FINANCIAL DERIVATIVE INSTRUMENTS
The following is a summary of the fair valuation of the Fund’s derivative instruments categorized by risk exposure. See Note 7, Principal and Other Risks, in the Notes to Financial Statements on risks of the Fund.
Fair Values of Financial Derivative Instruments on the Statements of Assets and Liabilities as of June 30, 2024:
| | | | | | | | | | | | | | | | | | | | | | | | |
| | | Derivatives not accounted for as hedging instruments | |
| | | Commodity
Contracts | | | Credit
Contracts | | | Equity
Contracts | | | Foreign
Exchange
Contracts | | | Interest
Rate Contracts | | | Total | |
Financial Derivative Instruments - Assets | |
Exchange-traded or centrally cleared | |
Futures | | $ | 0 | | | $ | 0 | | | $ | 0 | | | $ | 0 | | | $ | 9 | | | $ | 9 | |
Swap Agreements | | | 0 | | | | 0 | | | | 0 | | | | 0 | | | | 5 | | | | 5 | |
| | | | | | | | | | | | | | | | | | | | | | | | |
| | $ | 0 | | | $ | 0 | | | $ | 0 | | | $ | 0 | | | $ | 14 | | | $ | 14 | |
| | | | | | | | | | | | | | | | | | | | | | | | |
Over the counter | |
Swap Agreements | | $ | 0 | | | $ | 0 | | | $ | 0 | | | $ | 0 | | | $ | 1,190 | | | $ | 1,190 | |
| | | | | | | | | | | | | | | | | | | | | | | | |
| | $ | 0 | | | $ | 0 | | | $ | 0 | | | $ | 0 | | | $ | 1,204 | | | $ | 1,204 | |
| | | | | | | | | | | | | | | | | | | | | | | | |
| | | | | | | | | | | | |
| See Accompanying Notes | | | ANNUAL FINANCIAL AND OTHER INFORMATION | | | | | | | JUNE 30, 2024 | | | 123 |
| | | | | | |
| Schedule of Investments | | PIMCO Senior Loan Active Exchange-Traded Fund | | (Cont.) | | |
| | | | | | | | | | | | | | | | | | | | | | | | |
| | | Derivatives not accounted for as hedging instruments | |
| | | Commodity
Contracts | | | Credit
Contracts | | | Equity
Contracts | | | Foreign
Exchange
Contracts | | | Interest
Rate Contracts | | | Total | |
|
Financial Derivative Instruments - Liabilities | |
Exchange-traded or centrally cleared | |
Futures | | $ | 0 | | | $ | 0 | | | $ | 0 | | | $ | 0 | | | $ | 4 | | | $ | 4 | |
| | | | | | | | | | | | | | | | | | | | | | | | |
Over the counter | |
Swap Agreements | | $ | 0 | | | $ | 0 | | | $ | 0 | | | $ | 0 | | | $ | 5 | | | $ | 5 | |
| | | | | | | | | | | | | | | | | | | | | | | | |
| | $ | 0 | | | $ | 0 | | | $ | 0 | | | $ | 0 | | | $ | 9 | | | $ | 9 | |
| | | | | | | | | | | | | | | | | | | | | | | | |
The effect of Financial Derivative Instruments on the Statements of Operations for the period ended June 30, 2024:
| | | | | | | | | | | | | | | | | | | | | | | | |
| | | Derivatives not accounted for as hedging instruments | |
| | | Commodity
Contracts | | | Credit
Contracts | | | Equity
Contracts | | | Foreign
Exchange
Contracts | | | Interest
Rate Contracts | | | Total | |
Net Realized Gain (Loss) on Financial Derivative Instruments | |
Exchange-traded or centrally cleared | |
Futures | | $ | 0 | | | $ | 0 | | | $ | 0 | | | $ | 0 | | | $ | 157 | | | $ | 157 | |
Swap Agreements | | | 0 | | | | 123 | | | | 0 | | | | 0 | | | | 224 | | | | 347 | |
| | | | | | | | | | | | | | | | | | | | | | | | |
| | $ | 0 | | | $ | 123 | | | $ | 0 | | | $ | 0 | | | $ | 381 | | | $ | 504 | |
| | | | | | | | | | | | | | | | | | | | | | | | |
Over the counter | |
Swap Agreements | | $ | 0 | | | $ | 0 | | | $ | 0 | | | $ | 0 | | | $ | (868 | ) | | $ | (868 | ) |
| | | | | | | | | | | | | | | | | | | | | | | | |
| | $ | 0 | | | $ | 123 | | | $ | 0 | | | $ | 0 | | | $ | (487 | ) | | $ | (364 | ) |
| | | | | | | | | | | | | | | | | | | | | | | | |
|
Net Change in Unrealized Appreciation (Depreciation) on Financial Derivative Instruments | |
Exchange-traded or centrally cleared | |
Futures | | $ | 0 | | | $ | 0 | | | $ | 0 | | | $ | 0 | | | $ | (98 | ) | | $ | (98 | ) |
Swap Agreements | | | 0 | | | | (17 | ) | | | 0 | | | | 0 | | | | (74 | ) | | | (91 | ) |
| | | | | | | | | | | | | | | | | | | | | | | | |
| | $ | 0 | | | $ | (17 | ) | | $ | 0 | | | $ | 0 | | | $ | (172 | ) | | $ | (189 | ) |
| | | | | | | | | | | | | | | | | | | | | | | | |
Over the counter | |
Swap Agreements | | $ | 0 | | | $ | 0 | | | $ | 0 | | | $ | 0 | | | $ | 2,259 | | | $ | 2,259 | |
| | | | | | | | | | | | | | | | | | | | | | | | |
| | $ | 0 | | | $ | (17 | ) | | $ | 0 | | | $ | 0 | | | $ | 2,087 | | | $ | 2,070 | |
| | | | | | | | | | | | | | | | | | | | | | | | |
FAIR VALUE MEASUREMENTS
The following is a summary of the fair valuations according to the inputs used as of June 30, 2024 in valuing the Fund’s assets and liabilities:
| | | | | | | | | | | | | | | | |
| Category and Subcategory | | Level 1 | | | Level 2 | | | Level 3 | | | Fair
Value at
06/30/2024 | |
Investments in Securities, at Value | |
Loan Participations and Assignments | | $ | 1,000 | | | $ | 324,454 | | | $ | 10,211 | | | $ | 335,665 | |
Corporate Bonds & Notes | |
Banking & Finance | | | 0 | | | | 2,288 | | | | 0 | | | | 2,288 | |
Industrials | | | 0 | | | | 8,790 | | | | 0 | | | | 8,790 | |
Short-Term Instruments | |
Repurchase Agreements | | | 0 | | | | 135,200 | | | | 0 | | | | 135,200 | |
| | | | | | | | | | | | | | | | |
| | | | |
Total Investments | | $ | 1,000 | | | $ | 470,732 | | | $ | 10,211 | | | $ | 481,943 | |
| | | | | | | | | | | | | | | | |
|
Financial Derivative Instruments - Assets | |
Exchange-traded or centrally cleared | | | 0 | | | | 14 | | | | 0 | | | | 14 | |
Over the counter | | | 0 | | | | 1,190 | | | | 0 | | | | 1,190 | |
| | | | | | | | | | | | | | | | |
| | $ | 0 | | | $ | 1,204 | | | $ | 0 | | | $ | 1,204 | |
| | | | | | | | | | | | | | | | |
| | | | | | | | | | | | | | | | |
| Category and Subcategory | | Level 1 | | | Level 2 | | | Level 3 | | | Fair
Value at
06/30/2024 | |
|
Financial Derivative Instruments - Liabilities | |
Exchange-traded or centrally cleared | | $ | 0 | | | $ | (4 | ) | | $ | 0 | | | $ | (4 | ) |
Over the counter | | | 0 | | | | (5 | ) | | | 0 | | | | (5 | ) |
| | | | | | | | | | | | | | | | |
| | $ | 0 | | | $ | (9 | ) | | $ | 0 | | | $ | (9 | ) |
| | | | | | | | | | | | | | | | |
| | | | |
Total Financial Derivative Instruments | | $ | 0 | | | $ | 1,195 | | | $ | 0 | | | $ | 1,195 | |
| | | | | | | | | | | | | | | | |
| | | | |
Totals | | $ | 1,000 | | | $ | 471,927 | | | $ | 10,211 | | | $ | 483,138 | |
| | | | | | | | | | | | | | | | |
| | | | | | |
| 124 | | PIMCO ETF TRUST | | | See Accompanying Notes | |
The following is a reconciliation of the fair valuations using significant unobservable inputs (Level 3) for the Fund during the period ended June 30, 2024:
| | | | | | | | | | | | | | | | | | | | | | | | | | | | | | | | | | | | | | | | |
| Category and Subcategory | | Beginning
Balance
at 12/31/2023 | | | Net
Purchases | | | Net
Sales/
Settlements | | | Accrued
Discounts/
(Premiums) | | | Realized
Gain/(Loss) | | | Net Change in
Unrealized
Appreciation/
(Depreciation)(1) | | | Transfers into
Level 3 | | | Transfers out
of Level 3 | | | Ending
Balance
at 06/30/2024 | | | Net Change in
Unrealized
Appreciation/
(Depreciation)
on Investments
Held at
06/30/2024(1) | |
Investments in Securities, at Value | |
Loan Participations and Assignments | | $ | 2,861 | | | $ | 9,251 | | | $ | (1,111 | ) | | $ | 22 | | | $ | 7 | | | $ | (1 | ) | | $ | 1,100 | | | $ | (1,917 | ) | | $ | 10,211 | | | $ | 58 | |
| | | | | | | | | | | | | | | | | | | | | | | | | | | | | | | | | | | | | | | | |
Totals | | $ | 2,861 | | | $ | 9,251 | | | $ | (1,111 | ) | | $ | 22 | | | $ | 7 | | | $ | (1 | ) | | $ | 1,100 | | | $ | (1,917 | ) | | $ | 10,211 | | | $ | 58 | |
| | | | | | | | | | | | | | | | | | | | | | | | | | | | | | | | | | | | | | | | |
The following is a summary of significant unobservable inputs used in the fair valuations of assets and liabilities categorized within Level 3 of the fair value hierarchy:
| | | | | | | | | | | | | | | | |
| Category and Subcategory | | Ending
Balance
at 06/30/2024 | | | Valuation
Technique | | Unobservable
Inputs | | (% Unless Noted Otherwise) | |
| | Input Value(s) | | | Weighted
Average | |
Investments in Securities, at Value | |
Loan Participations and Assignments | | $ | 773 | | | Recent Transaction | | Purchase Price | | | 100.000 | | | | — | |
| | | 9,438 | | | Third-Party Vendor | | Broker Quote | | | 98.000-100.938 | | | | 100.140 | |
| | | | | | | | | | | | | | | | |
Total | | $ | 10,211 | | | | | | | | | | | | | |
| | | | | | | | | | | | | | | | |
| (1) | Any difference between Net Change in Unrealized Appreciation/(Depreciation) and Net Change in Unrealized Appreciation/(Depreciation) on Investments Held at June 30, 2024 may be due to an investment no longer held or categorized as Level 3 at period end. |
| | | | | | | | | | | | |
| See Accompanying Notes | | | ANNUAL FINANCIAL AND OTHER INFORMATION | | | | | | | JUNE 30, 2024 | | | 125 |
| | | | | | |
| Schedule of Investments | | PIMCO Short Term Municipal Bond Active Exchange-Traded Fund | | | | |
(Amounts in thousands*, except number of shares, contracts, units and ounces, if any)
| | | | | | | | | | | | |
| | | | | PRINCIPAL
AMOUNT
(000S) | | | | | MARKET
VALUE
(000S) | |
| INVESTMENTS IN SECURITIES 103.2% | |
| |
| MUNICIPAL BONDS & NOTES 95.9% | |
| |
| ALABAMA 3.8% | |
|
Black Belt Energy Gas District, Alabama Revenue Bonds, Series 2021 | |
4.230% (MUNIPSA)
due 10/01/2052 ~ | | $ | | | 1,500 | | | $ | | | 1,479 | |
|
Black Belt Energy Gas District, Alabama Revenue Bonds, Series 2022 | |
5.250% due 02/01/2053 | | | | | 680 | | | | | | 718 | |
|
Black Belt Energy Gas District, Alabama Revenue Bonds, Series 2023 | |
5.250% due 12/01/2053 | | | | | 2,000 | | | | | | 2,163 | |
5.500% due 06/01/2049 | | | | | 1,470 | | | | | | 1,561 | |
5.500% due 10/01/2054 | | | | | 2,400 | | | | | | 2,630 | |
|
Chatom Industrial Development Board, Alabama Revenue Notes, (AGM Insured), Series 2020 | |
5.000% due 08/01/2025 | | | | | 1,000 | | | | | | 1,012 | |
|
Energy Southeast A Cooperative District, Alabama Revenue Bonds, Series 2023 | |
5.750% due 04/01/2054 | | | | | 1,000 | | | | | | 1,099 | |
|
Healthcare Authority of Baptist Health, Alabama Revenue Notes, Series 2023 | |
5.000% due 11/15/2025 | | | | | 1,000 | | | | | | 1,015 | |
|
Industrial Development Board of the City of Mobile Alabama Revenue Bonds, Series 2007 | |
1.000% due 06/01/2034 | | | | | 4,625 | | | | | | 4,489 | |
|
Jefferson County, Alabama Sewer Revenue Notes, Series 2024 | |
5.000% due 10/01/2031 | | | | | 3,000 | | | | | | 3,306 | |
|
Prattville Industrial Development Board, Alabama Revenue Bonds, Series 2019 | |
2.000% due 11/01/2033 | | | | | 450 | | | | | | 447 | |
|
Southeast Energy Authority A Cooperative District, Alabama Revenue Bonds, Series 2023 | |
5.000% due 01/01/2054 | | | | | 2,400 | | | | | | 2,535 | |
| | | | | | | | | | | | |
| | | | | | | | | | | 22,454 | |
| | | | | | | | | | | | |
| |
| ARIZONA 2.0% | |
|
Arizona Health Facilities Authority Revenue Bonds, Series 2015 | |
4.130% (MUNIPSA)
due 01/01/2046 ~ | | | | | 1,125 | | | | | | 1,116 | |
|
Coconino County, Arizona Pollution Control Corp. Revenue Bonds, Series 2017 | |
3.750% due 03/01/2039 | | | | | 1,000 | | | | | | 992 | |
|
Industrial Development Authority of the City of Phoenix, Arizona Revenue Notes, Series 2018 | |
5.000% due 07/01/2024 | | | | | 200 | | | | | | 200 | |
|
Maricopa County, Arizona Industrial Development Authority Revenue Bonds, Series 2023 | |
5.000% due 01/01/2053 | | | | | 1,500 | | | | | | 1,537 | |
|
Maricopa County, Arizona Pollution Control Corp. Revenue Bonds, Series 2003 | |
3.875% due 01/01/2038 | | | | | 3,000 | | | | | | 3,021 | |
|
Maricopa County, Arizona Special Health Care District General Obligation Notes, Series 2018 | |
5.000% due 07/01/2024 | | | | | 350 | | | | | | 350 | |
|
Phoenix Civic Improvement Corp., Arizona Revenue Bonds, Series 2014 | |
4.750% due 07/01/2044 | | | | | 1,410 | | | | | | 1,410 | |
|
Tempe, Arizona Certificates of Participation Notes, Series 2021 | |
0.623% due 07/01/2024 | | | | | 1,350 | | | | | | 1,350 | |
|
Town of Gilbert, Arizona General Obligation Notes, Series 2022 | |
5.000% due 07/15/2028 | | | | | 1,425 | | | | | | 1,534 | |
| | | | | | | | | | | | |
| | | | | | | | | | | 11,510 | |
| | | | | | | | | | | | |
| |
| | | | | | | | | | | | |
| | | | | PRINCIPAL
AMOUNT
(000S) | | | | | MARKET
VALUE
(000S) | |
| CALIFORNIA 8.0% | |
|
Bay Area Toll Authority, California Revenue Bonds, Series 2021 | |
4.290% (MUNIPSA)
due 04/01/2056 ~ | | $ | | | 2,000 | | | $ | | | 1,962 | |
4.330% (MUNIPSA)
due 04/01/2056 ~ | | | | | 1,500 | | | | | | 1,493 | |
|
California Community Choice Financing Authority Revenue Bonds, Series 2021 | |
4.000% due 02/01/2052 | | | | | 1,250 | | | | | | 1,253 | |
|
California Community Choice Financing Authority Revenue Bonds, Series 2023 | |
5.000% due 02/01/2054 | | | | | 2,500 | | | | | | 2,651 | |
5.250% due 01/01/2054 | | | | | 2,000 | | | | | | 2,109 | |
5.250% due 11/01/2054 | | | | | 3,900 | | | | | | 4,169 | |
|
California Health Facilities Financing Authority Revenue Bonds, Series 2021 | |
3.000% due 08/15/2054 | | | | | 3,000 | | | | | | 2,971 | |
|
California Infrastructure & Economic Development Bank Revenue Bonds, Series 2021 | |
4.580% (MUNIPSA)
due 12/01/2050 ~ | | | | | 1,000 | | | | | | 996 | |
|
California Infrastructure & Economic Development Bank Revenue Notes, Series 2018 | |
5.000% due 10/01/2025 | | | | | 2,250 | | | | | | 2,303 | |
|
California State General Obligation Bonds, (AGM Insured), Series 2007 | |
5.250% due 08/01/2032 | | | | | 1,000 | | | | | | 1,145 | |
|
California State General Obligation Notes, Series 2020 | |
5.000% due 11/01/2027 | | | | | 1,250 | | | | | | 1,327 | |
|
California State General Obligation Notes, Series 2023 | |
5.000% due 09/01/2025 | | | | | 5,000 | | | | | | 5,111 | |
|
California State Public Works Board Revenue Notes, Series 2021 | |
5.000% due 11/01/2029 | | | | | 1,500 | | | | | | 1,646 | |
|
California Statewide Communities Development Authority Revenue Notes, Series 2021 | |
1.462% due 02/01/2028 | | | | | 3,680 | | | | | | 3,272 | |
|
Golden State, California Tobacco Securitization Corp. Revenue Bonds, Series 2021 | |
3.850% due 06/01/2050 | | | | | 2,080 | | | | | | 1,952 | |
|
Los Angeles Unified School District, California General Obligation Bonds, Series 2014 | |
5.000% due 07/01/2025 | | | | | 2,220 | | | | | | 2,222 | |
|
Los Angeles Unified School District, California General Obligation Notes, Series 2024 | |
5.000% due 07/01/2026 | | | | | 2,300 | | | | | | 2,386 | |
|
Pasadena Unified School District, California General Obligation Notes, Series 2021 | |
2.000% due 08/01/2025 | | | | | 2,110 | | | | | | 2,070 | |
|
San Bernardino County, California Certificates of Participation Bonds, Series 1992 | |
6.875% due 08/01/2024 | | | | | 1,535 | | | | | | 1,539 | |
|
Silicon Valley Clean Water, California Revenue Notes, Series 2021 | |
0.500% due 03/01/2026 | | | | | 2,500 | | | | | | 2,321 | |
|
Southern California Public Power Authority Revenue Bonds, Series 2020 | |
0.650% due 07/01/2040 | | | | | 1,000 | | | | | | 963 | |
|
Tobacco Securitization Authority of Southern California Revenue Bonds, Series 2019 | |
5.000% due 06/01/2030 | | | | | 1,000 | | | | | | 1,076 | |
| | | | | | | | | | | | |
| | | | | | | | | | | 46,937 | |
| | | | | | | | | | | | |
| |
| COLORADO 4.4% | |
|
Colorado Health Facilities Authority Revenue Bonds, Series 2019 | |
5.000% due 08/01/2049 | | | | | 1,700 | | | | | | 1,733 | |
|
Colorado Health Facilities Authority Revenue Bonds, Series 2022 | |
4.430% (MUNIPSA)
due 05/15/2061 ~ | | | | | 5,000 | | | | | | 4,976 | |
| | | | | | | | | | | | |
| | | | | PRINCIPAL
AMOUNT
(000S) | | | | | MARKET
VALUE
(000S) | |
|
Colorado Health Facilities Authority Revenue Bonds, Series 2023 | |
5.000% due 11/15/2058 | | $ | | | 1,000 | | | $ | | | 1,062 | |
|
Colorado Health Facilities Authority Revenue Bonds, Series 2024 | |
5.000% due 12/01/2034 | | | | | 2,500 | | | | | | 2,851 | |
5.000% due 11/15/2059 | | | | | 2,200 | | | | | | 2,373 | |
|
Colorado Health Facilities Authority Revenue Notes, Series 2020 | |
2.800% due 12/01/2026 | | | | | 330 | | | | | | 311 | |
|
Colorado Health Facilities Authority Revenue Notes, Series 2022 | |
5.000% due 11/01/2026 | | | | | 500 | | | | | | 516 | |
|
E-470 Public Highway Authority, Colorado Revenue Bonds, Series 2021 | |
3.928% (SOFRRATE)
due 09/01/2039 ~ | | | | | 3,000 | | | | | | 2,999 | |
|
E-470 Public Highway Authority, Colorado Revenue Bonds, Series 2024 | |
4.328% (SOFRRATE)
due 09/01/2039 ~ | | | | | 2,900 | | | | | | 2,901 | |
|
Regional Transportation District, Colorado Revenue Notes, Series 2020 | |
5.000% due 07/15/2024 | | | | | 325 | | | | | | 325 | |
|
University of Colorado Revenue Bonds, Series 2019 | |
2.000% due 06/01/2054 | | | | | 5,500 | | | | | | 5,472 | |
| | | | | | | | | | | | |
| | | | | | | | | | | 25,519 | |
| | | | | | | | | | | | |
| |
| CONNECTICUT 2.9% | |
|
Connecticut Special Tax State Revenue Notes, Series 2018 | |
5.000% due 10/01/2025 | | | | | 1,000 | | | | | | 1,022 | |
|
Connecticut Special Tax State Revenue Notes, Series 2022 | |
5.000% due 07/01/2027 | | | | | 1,000 | | | | | | 1,054 | |
5.000% due 07/01/2029 | | | | | 3,000 | | | | | | 3,270 | |
|
Connecticut State General Obligation Notes, Series 2022 | |
5.000% due 11/15/2028 | | | | | 1,500 | | | | | | 1,620 | |
|
Connecticut State Health & Educational Facilities Authority Revenue Bonds, Series 2013 | |
4.450% due 07/01/2042 | | | | | 10,000 | | | | | | 10,000 | |
| | | | | | | | | | | | |
| | | | | | | | | | | 16,966 | |
| | | | | | | | | | | | |
| |
| DELAWARE 0.4% | |
|
Delaware State Economic Development Authority Revenue Bonds, Series 2020 | |
1.050% due 01/01/2031 | | | | | 750 | | | | | | 729 | |
1.250% due 10/01/2045 | | | | | 2,000 | | | | | | 1,898 | |
| | | | | | | | | | | | |
| | | | | | | | | | | 2,627 | |
| | | | | | | | | | | | |
| |
| DISTRICT OF COLUMBIA 0.2% | |
|
Washington Metropolitan Area Transit Authority Dedicated, District of Columbia Revenue Notes, Series 2023 | |
5.000% due 07/15/2025 | | | | | 1,000 | | | | | | 1,018 | |
| | | | | | | | | | | | |
| |
| FLORIDA 2.3% | |
|
Florida Development Finance Corp. Revenue Notes, Series 2023 | |
5.000% due 09/01/2025 | | | | | 3,800 | | | | | | 3,834 | |
5.000% due 09/01/2026 | | | | | 1,550 | | | | | | 1,582 | |
|
Lee Memorial Health System, Florida Revenue Bonds, Series 2019 | |
5.000% due 04/01/2033 | | | | | 1,000 | | | | | | 1,015 | |
|
Miami-Dade County, Florida Water & Sewer System Revenue Notes, Series 2015 | |
5.000% due 10/01/2024 | | | | | 710 | | | | | | 713 | |
|
Mid-Bay Bridge Authority, Florida Revenue Bonds, Series 2015 | |
5.000% due 10/01/2035 | | | | | 2,000 | | | | | | 2,027 | |
| | | | | | |
| 126 | | PIMCO ETF TRUST | | | See Accompanying Notes | |
| | | | | | | | | | | | |
| | | | | PRINCIPAL
AMOUNT
(000S) | | | | | MARKET
VALUE
(000S) | |
|
Orange County, Florida School Board Certificates of Participation Notes, Series 2024 | |
5.000% due 08/01/2033 | | $ | | | 4,000 | | | $ | | | 4,605 | |
| | | | | | | | | | | | |
| | | | | | | | | | | 13,776 | |
| | | | | | | | | | | | |
| |
| GEORGIA 4.0% | |
|
Bartow County, Georgia Development Authority Revenue Bonds, Series 1997 | |
1.800% due 09/01/2029 | | | | | 3,000 | | | | | | 2,555 | |
|
Cobb County, Georgia Kennestone Hospital Authority Revenue Notes, Series 2023 | |
5.000% due 04/01/2029 | | | | | 1,625 | | | | | | 1,741 | |
5.000% due 04/01/2030 | | | | | 1,500 | | | | | | 1,628 | |
|
Development Authority of Burke County, Georgia Revenue Bonds, Series 2013 | |
3.375% due 11/01/2053 | | | | | 4,350 | | | | | | 4,320 | |
|
Main Street Natural Gas Inc, Georgia Revenue Bonds, Series 2024 | |
5.000% due 12/01/2054 | | | | | 2,600 | | | | | | 2,757 | |
|
Main Street Natural Gas, Inc., Georgia Revenue Bonds, Series 2022 | |
4.000% due 09/01/2052 | | | | | 1,000 | | | | | | 1,004 | |
5.000% due 12/01/2052 | | | | | 3,000 | | | | | | 3,147 | |
|
Main Street Natural Gas, Inc., Georgia Revenue Bonds, Series 2023 | |
5.000% due 06/01/2053 | | | | | 750 | | | | | | 793 | |
|
Main Street Natural Gas, Inc., Georgia Revenue Bonds, Series 2024 | |
5.000% due 05/01/2054 | | | | | 2,600 | | | | | | 2,762 | |
|
Main Street Natural Gas, Inc., Georgia Revenue Notes, Series 2021 | |
4.000% due 12/01/2024 | | | | | 750 | | | | | | 748 | |
|
Municipal Electric Authority of Georgia Revenue Bonds, Series 2012 | |
5.000% due 01/01/2039 | | | | | 1,500 | | | | | | 1,500 | |
|
Municipal Electric Authority of Georgia Revenue Notes, (AGM Insured), Series 2021 | |
5.000% due 01/01/2025 | | | | | 200 | | | | | | 201 | |
5.000% due 01/01/2026 | | | | | 385 | | | | | | 395 | |
| | | | | | | | | | | | |
| | | | | | | | | | | 23,551 | |
| | | | | | | | | | | | |
| |
| HAWAII 0.5% | |
|
City & County Honolulu, Hawaii Wastewater System Revenue Bonds, Series 2015 | |
4.000% due 07/01/2034 | | | | | 3,000 | | | | | | 3,001 | |
| | | | | | | | | | | | |
| |
| ILLINOIS 5.0% | |
|
Chicago Midway International Airport, Illinois Revenue Notes, (BAM Insured), Series 2023 | |
5.000% due 01/01/2028 | | | | | 1,465 | | | | | | 1,554 | |
5.000% due 01/01/2029 | | | | | 2,000 | | | | | | 2,158 | |
|
Chicago, Illinois General Obligation Notes, Series 2021 | |
5.000% due 01/01/2030 | | | | | 3,000 | | | | | | 3,194 | |
|
Cook County, Illinois General Obligation Notes, Series 2021 | |
5.000% due 11/15/2024 | | | | | 1,750 | | | | | | 1,758 | |
|
Illinois Finance Authority Revenue Bonds, Series 2021 | |
4.580% (MUNIPSA)
due 05/01/2042 ~ | | | | | 1,000 | | | | | | 985 | |
|
Illinois State General Obligation Notes, Series 2020 | |
5.000% due 10/01/2028 | | | | | 3,200 | | | | | | 3,386 | |
5.500% due 05/01/2030 | | | | | 7,750 | | | | | | 8,253 | |
|
Illinois State General Obligation Notes, Series 2024 | |
5.000% due 05/01/2029 | | | | | 3,000 | | | | | | 3,196 | |
|
Illinois State Toll Highway Authority Revenue Notes, Series 2024 | |
5.000% due 01/01/2030 | | | | | 1,000 | | | | | | 1,089 | |
5.000% due 01/01/2031 | | | | | 1,250 | | | | | | 1,381 | |
|
Metropolitan Pier & Exposition Authority, Illinois Revenue Notes, Series 2022 | |
3.000% due 06/15/2025 | | | | | 1,125 | | | | | | 1,112 | |
| | | | | | | | | | | | |
| | | | | PRINCIPAL
AMOUNT
(000S) | | | | | MARKET
VALUE
(000S) | |
|
Sales Tax Securitization Corp., Illinois Revenue Notes, Series 2020 | |
2.325% due 01/01/2025 | | $ | | | 1,000 | | | $ | | | 985 | |
| | | | | | | | | | | | |
| | | | | | | | | | | 29,051 | |
| | | | | | | | | | | | |
| |
| INDIANA 1.7% | |
|
Indiana Finance Authority Revenue Bonds, Series 2010 | |
3.000% due 11/01/2030 | | | | | 2,500 | | | | | | 2,345 | |
|
Indiana Finance Authority Revenue Bonds, Series 2012 | |
3.000% due 11/01/2030 | | | | | 1,000 | | | | | | 938 | |
|
Indiana Finance Authority Revenue Bonds, Series 2023 | |
5.000% due 10/01/2062 | | | | | 2,000 | | | | | | 2,112 | |
|
Indiana Finance Authority Revenue Notes, Series 2021 | |
0.650% due 08/01/2025 | | | | | 4,500 | | | | | | 4,317 | |
| | | | | | | | | | | | |
| | | | | | | | | | | 9,712 | |
| | | | | | | | | | | | |
| |
| IOWA 1.0% | |
|
Iowa Finance Authority Revenue Bonds, Series 2018 | |
4.500% due 02/15/2041 | | | | | 6,000 | | | | | | 6,000 | |
| | | | | | | | | | | | |
| |
| KANSAS 1.4% | |
|
Burlington, Kansas Revenue Bonds, Series 2023 | |
4.300% due 03/01/2045 | | | | | 5,500 | | | | | | 5,500 | |
|
Kansas Department of Transportation State Revenue Bonds, Series 2004 | |
4.311% (0.7*US0001M + 0.500%) due 09/01/2024 ~ | | | | | 2,500 | | | | | | 2,501 | |
| | | | | | | | | | | | |
| | | | | | | | | | | 8,001 | |
| | | | | | | | | | | | |
| |
| KENTUCKY 2.0% | |
|
Kentucky Asset Liability Commission Revenue Notes, Series 2024 | |
5.000% due 09/01/2026 | | | | | 5,000 | | | | | | 5,183 | |
|
Kentucky Economic Development Finance Authority Revenue Bonds, Series 2015 | |
4.250% due 07/01/2035 | | | | | 1,000 | | | | | | 985 | |
|
Kentucky Public Energy Authority Revenue Bonds, Series 2020 | |
4.000% due 12/01/2050 | | | | | 500 | | | | | | 502 | |
|
Kentucky Public Energy Authority Revenue Notes, Series 2018 | |
4.000% due 06/01/2025 | | | | | 2,505 | | | | | | 2,505 | |
|
Kentucky State Property & Building Commission Revenue Bonds, Series 2016 | |
5.000% due 11/01/2028 | | | | | 1,810 | | | | | | 1,871 | |
|
Kentucky State Property & Building Commission Revenue Notes, Series 2022 | |
5.000% due 06/01/2031 | | | | | 500 | | | | | | 550 | |
| | | | | | | | | | | | |
| | | | | | | | | | | 11,596 | |
| | | | | | | | | | | | |
| |
| LOUISIANA 1.2% | |
|
Louisiana Local Government Environmental Facilities & Community Development Auth Revenue Bonds, Series 2020 | |
0.875% due 02/01/2046 | | | | | 1,700 | | | | | | 1,670 | |
|
Parish of St John the Baptist, Louisiana Revenue Bonds, Series 2017 | |
2.100% due 06/01/2037 | | | | | 2,925 | | | | | | 2,925 | |
2.375% due 06/01/2037 | | | | | 2,810 | | | | | | 2,722 | |
| | | | | | | | | | | | |
| | | | | | | | | | | 7,317 | |
| | | | | | | | | | | | |
| |
| MARYLAND 0.8% | |
|
Howard County, Maryland General Obligation Notes, Series 2018 | |
5.000% due 02/15/2027 | | | | | 3,000 | | | | | | 3,146 | |
|
Maryland Health & Higher Educational Facilities Authority Revenue Bonds, Series 2020 | |
5.000% due 07/01/2045 | | | | | 1,500 | | | | | | 1,509 | |
| | | | | | | | | | | | |
| | | | | | | | | | | 4,655 | |
| | | | | | | | | | | | |
| |
| | | | | | | | | | | | |
| | | | | PRINCIPAL
AMOUNT
(000S) | | | | | MARKET
VALUE
(000S) | |
| MASSACHUSETTS 1.5% | |
|
Commonwealth of Massachusetts Revenue Bonds,(BAM,NPFGC Insured), Series 2005 | |
5.500% due 01/01/2034 | | $ | | | 5,000 | | | $ | | | 5,779 | |
|
Massachusetts Bay Transportation Authority Sales Tax Revenue Notes, Series 2023 | |
5.000% due 07/01/2029 | | | | | 1,300 | | | | | | 1,416 | |
|
Massachusetts Development Finance Agency Revenue Bonds, Series 2019 | |
4.480% (MUNIPSA) due 07/01/2049 ~ | | | | | 1,750 | | | | | | 1,745 | |
| | | | | | | | | | | | |
| | | | | | | | | | | 8,940 | |
| | | | | | | | | | | | |
| |
| MICHIGAN 2.1% | |
|
Detroit, Michigan Sewage Disposal System Revenue Bonds, (AGM Insured), Series 2006 | |
4.328% (TSFR3M) due 07/01/2032 ~ | | | | | 2,000 | | | | | | 1,910 | |
|
Michigan Finance Authority Hospital Revenue Refunding Bonds, Series 2022 | |
4.630% (MUNIPSA) due 04/15/2047 ~ | | | | | 3,000 | | | | | | 3,001 | |
|
Michigan Finance Authority Revenue Bonds, Series 2015 | |
1.200% due 10/15/2030 | | | | | 2,000 | | | | | | 1,773 | |
|
Michigan Finance Authority Revenue Notes, Series 2020 | |
2.326% due 06/01/2030 | | | | | 77 | | | | | | 76 | |
|
Michigan Finance Authority Revenue Notes, Series 2024 | |
5.000% due 02/28/2029 | | | | | 900 | | | | | | 955 | |
5.000% due 02/28/2030 | | | | | 1,170 | | | | | | 1,257 | |
|
Michigan State Building Authority Revenue Bonds, Series 2020 | |
3.980% due 10/15/2042 | | | | | 1,000 | | | | | | 1,000 | |
|
Michigan State Hospital Finance Authority Revenue Bonds, Series 2010 | |
4.000% due 11/15/2047 | | | | | 500 | | | | | | 500 | |
|
Michigan Trunk Line State Revenue Notes, Series 2023 | |
5.000% due 11/15/2026 | | | | | 1,500 | | | | | | 1,564 | |
| | | | | | | | | | | | |
| | | | | | | | | | | 12,036 | |
| | | | | | | | | | | | |
| |
| MINNESOTA 0.3% | |
|
Minneapolis, Minnesota Revenue Bonds, Series 2018 | |
4.650% due 11/15/2048 | | | | | 1,900 | | | | | | 1,900 | |
| | | | | | | | | | | | |
| |
| MISSOURI 0.7% | |
|
Health & Educational Facilities Authority of the State of Missouri Revenue Notes, Series 2023 | |
5.000% due 05/01/2033 | | | | | 2,650 | | | | | | 3,017 | |
|
St Louis School District, Missouri General Obligation Bonds, (AGM Insured), Series 2023 | |
5.000% due 04/01/2034 | | | | | 1,000 | | | | | | 1,134 | |
| | | | | | | | | | | | |
| | | | | | | | | | | 4,151 | |
| | | | | | | | | | | | |
| |
| MULTI-STATE 0.8% | |
|
Freddie Mac Multifamily ML Certificates, Revenue Bonds, Series 2023 | |
4.549% due 08/25/2040 | | | | | 4,486 | | | | | | 4,524 | |
| | | | | | | | | | | | |
| |
| NEBRASKA 0.7% | |
|
Douglas County, Nebraska Revenue Bonds, Series 2021 | |
4.410% (MUNIPSA) due 07/01/2035 ~ | | | | | 2,450 | | | | | | 2,420 | |
|
Nebraska Public Power District Revenue Notes, Series 2023 | |
5.000% due 07/01/2028 | | | | | 1,750 | | | | | | 1,854 | |
| | | | | | | | | | | | |
| | | | | | | | | | | 4,274 | |
| | | | | | | | | | | | |
| |
| NEVADA 0.7% | |
|
Clark County, Nevada General Obligation Bonds, Series 2019 | |
5.000% due 07/01/2031 | | | | | 2,150 | | | | | | 2,334 | |
| | | | | | | | | | | | |
| See Accompanying Notes | | | ANNUAL FINANCIAL AND OTHER INFORMATION | | | | | | | JUNE 30, 2024 | | | 127 |
| | | | | | |
| Schedule of Investments | | PIMCO Short Term Municipal Bond Active Exchange-Traded Fund | | (Cont.) | | |
| | | | | | | | | | | | |
| | | | | PRINCIPAL
AMOUNT
(000S) | | | | | MARKET
VALUE
(000S) | |
|
Washoe County, Nevada Revenue Bonds, Series 2016 | |
3.625% due 03/01/2036 | | $ | | | 2,000 | | | $ | | | 1,991 | |
| | | | | | | | | | | | |
| | | | | | | | | | | 4,325 | |
| | | | | | | | | | | | |
| |
| NEW HAMPSHIRE 0.1% | |
|
New Hampshire Business Finance Authority Revenue Notes, Series 2021 | |
4.000% due 01/01/2026 | | | | | 265 | | | | | | 263 | |
4.000% due 01/01/2027 | | | | | 250 | | | | | | 248 | |
| | | | | | | | | | | | |
| | | | | | | | | | | 511 | |
| | | | | | | | | | | | |
| |
| NEW JERSEY 4.4% | |
|
New Jersey Economic Development Authority Revenue Notes, Series 2019 | |
5.250% due 09/01/2024 | | | | | 7,000 | | | | | | 7,016 | |
|
New Jersey Economic Development Authority Revenue Notes, Series 2022 | |
5.000% due 11/01/2024 | | | | | 825 | | | | | | 828 | |
|
New Jersey Economic Development Authority Revenue Notes, Series 2023 | |
5.000% due 03/01/2028 | | | | | 2,200 | | | | | | 2,324 | |
|
New Jersey State General Obligation Notes, Series 2020 | |
5.000% due 06/01/2025 | | | | | 3,000 | | | | | | 3,045 | |
5.000% due 06/01/2028 | | | | | 2,000 | | | | | | 2,136 | |
|
New Jersey Turnpike Authority Revenue Notes, Series 2020 | |
5.000% due 01/01/2028 | | | | | 5,000 | | | | | | 5,122 | |
|
Newark Housing Authority Scholarship Foundation A New Jersey Non Revenue Bonds, (NPFGC Insured), Series 2007 | |
5.250% due 01/01/2025 | | | | | 600 | | | | | | 602 | |
|
Tobacco Settlement Financing Corp., New Jersey Revenue Notes, Series 2018 | |
5.000% due 06/01/2026 | | | | | 4,750 | | | | | | 4,863 | |
| | | | | | | | | | | | |
| | | | | | | | | | | 25,936 | |
| | | | | | | | | | | | |
| |
| NEW YORK 13.6% | |
|
Chautauqua County, New York Capital Resource Corp. Revenue Bonds, Series 2020 | |
4.250% due 04/01/2042 | | | | | 2,000 | | | | | | 2,012 | |
|
Long Island Power Authority, New York Revenue Bonds, Series 2022 | |
4.330% (MUNIPSA)
due 09/01/2038 ~ | | | | | 2,000 | | | | | | 1,992 | |
|
Metropolitan Transportation Authority, New York Revenue Bonds, (AGM Insured), Series 2002 | |
4.378% (SOFRRATE)
due 11/01/2032 ~ | | | | | 1,500 | | | | | | 1,499 | |
|
New York City Water & Sewer System, New York Revenue Bonds, Series 2013 | |
4.700% due 06/15/2050 | | | | | 5,400 | | | | | | 5,400 | |
|
New York City Water & Sewer System, New York Revenue Bonds, Series 2014 | |
4.900% due 06/15/2050 | | | | | 4,000 | | | | | | 4,000 | |
|
New York City, New York General Obligation Bonds, Series 2012 | |
4.900% due 04/01/2042 | | | | | 6,300 | | | | | | 6,300 | |
|
New York City, New York General Obligation Bonds, Series 2015 | |
4.900% due 06/01/2044 | | | | | 2,000 | | | | | | 2,000 | |
|
New York City, New York General Obligation Bonds, Series 2018 | |
4.900% due 12/01/2047 | | | | | 5,000 | | | | | | 5,000 | |
|
New York City, New York Housing Development Corp. Revenue Bonds, (FHA Insured), Series 2021 | |
0.600% due 05/01/2061 | | | | | 1,965 | | | | | | 1,897 | |
|
New York City, New York Industrial Development Agency Revenue Bonds, Series 2007 | |
4.900% due 10/01/2042 | | | | | 17,100 | | | | | | 17,100 | |
| | | | | | | | | | | | |
| | | | | PRINCIPAL
AMOUNT
(000S) | | | | | MARKET
VALUE
(000S) | |
|
New York City, New York Municipal Water Finance Authority Revenue Bonds, Series 2013 | |
4.650% due 06/15/2048 | | $ | | | 4,700 | | | $ | | | 4,700 | |
|
New York City, New York Municipal Water Finance Authority Revenue Notes, Series 2022 | |
5.000% due 06/15/2027 | | | | | 1,250 | | | | | | 1,279 | |
|
New York City, New York Transitional Finance Authority Future Tax Secured Revenue Bonds, Series 2012 | |
4.700% due 11/01/2036 | | | | | 3,800 | | | | | | 3,800 | |
|
New York City, New York Transitional Finance Authority Revenue Notes, Series 2023 | |
5.000% due 05/01/2027 | | | | | 1,250 | | | | | | 1,313 | |
|
New York Power Authority Revenue Notes, (AGM Insured), Series 2023 | |
5.000% due 11/15/2027 | | | | | 1,700 | | | | | | 1,810 | |
|
New York State Dormitory Authority Revenue Bonds, Series 2016 | |
5.000% due 02/15/2028 | | | | | 4,565 | | | | | | 4,752 | |
5.000% due 03/15/2035 | | | | | 4,500 | | | | | | 4,633 | |
5.000% due 03/15/2036 | | | | | 1,500 | | | | | | 1,543 | |
|
New York State Urban Development Corp. Revenue Bonds, Series 2015 | |
5.000% due 03/15/2035 | | | | | 5,000 | | | | | | 5,070 | |
|
Port Authority of New York & New Jersey Revenue Bonds, Series 2017 | |
5.000% due 11/15/2029 | | | | | 1,110 | | | | | | 1,169 | |
|
Utility Debt Securitization Authority, New York Revenue Bonds, Series 2015 | |
5.000% due 12/15/2032 | | | | | 2,500 | | | | | | 2,549 | |
| | | | | | | | | | | | |
| | | | | | | | | | | 79,818 | |
| | | | | | | | | | | | |
| |
| NORTH CAROLINA 1.0% | |
|
Charlotte-Mecklenburg Hospital Authority, North Carolina Revenue Bonds, Series 2007 | |
4.650% due 01/15/2037 | | | | | 6,000 | | | | | | 6,000 | |
| | | | | | | | | | | | |
| |
| OHIO 2.4% | |
|
American Municipal Power, Inc., Ohio Revenue Bonds, Series 2021 | |
1.000% due 02/15/2048 | | | | | 2,000 | | | | | | 1,991 | |
|
Franklin County, Ohio Revenue Bonds, Series 2022 | |
4.700% due 11/01/2042 | | | | | 6,000 | | | | | | 6,000 | |
|
Ohio Air Quality Development Authority Duke Energy Corporation Project Revenue Notes, Series 2022 | |
4.000% due 09/01/2030 | | | | | 2,900 | | | | | | 2,906 | |
|
Ohio Air Quality Development Authority Revenue Bonds, Series 2009 | |
1.500% due 02/01/2026 | | | | | 2,200 | | | | | | 2,088 | |
|
Port of Greater Cincinnati Development Authority, Ohio Revenue Bonds, (AGM Insured), Series 2024 | |
5.000% due 12/01/2034 | | | | | 415 | | | | | | 466 | |
|
Worthington City School District, Ohio General Obligation Notes, Series 2023 | |
0.000% due 12/01/2029 (c) | | | | | 500 | | | | | | 410 | |
| | | | | | | | | | | | |
| | | | | | | | | | | 13,861 | |
| | | | | | | | | | | | |
| |
| OREGON 0.5% | |
|
Multnomah County School District 40, Oregon General Obligation Notes, Series 2023 | |
0.000% due 06/15/2027 (c) | | | | | 325 | | | | | | 292 | |
|
Oregon Department of Transportation State Revenue Notes, Series 2024 | |
5.000% due 05/15/2026 (a) | | | | | 1,000 | | | | | | 1,033 | |
|
Oregon State Facilities Authority Revenue Notes, Series 2020 | |
5.000% due 10/01/2026 | | | | | 145 | | | | | | 148 | |
|
Oregon State General Obligation Notes, Series 2023 | |
5.000% due 05/01/2026 | | | | | 1,625 | | | | | | 1,678 | |
| | | | | | | | | | | | |
| | | | | | | | | | | 3,151 | |
| | | | | | | | | | | | |
| |
| | | | | | | | | | | | |
| | | | | PRINCIPAL
AMOUNT
(000S) | | | | | MARKET
VALUE
(000S) | |
| PENNSYLVANIA 3.6% | |
|
Allegheny County, Pennsylvania Hospital Development Authority Revenue Bonds, Series 2017 | |
4.580% (MUNIPSA)
due 11/15/2047 ~ | | $ | | | 5,000 | | | $ | | | 4,989 | |
|
Bethlehem Area School District Authority, Pennsylvania Revenue Notes, Series 2021 | |
3.928% (SOFRRATE)
due 07/01/2031 ~ | | | | | 3,525 | | | | | | 3,484 | |
|
Commonwealth of Pennsylvania General Obligation Notes, Series 2019 | |
5.000% due 07/15/2024 | | | | | 2,500 | | | | | | 2,501 | |
|
Lehigh County, Pennsylvania Revenue Bonds, Series 2019 | |
4.980% (MUNIPSA)
due 08/15/2038 ~(d) | | | | | 2,430 | | | | | | 2,413 | |
|
Montgomery County Industrial Development Authority, Pennsylvania Revenue Notes, Series 2023 | |
4.100% due 06/01/2029 | | | | | 4,500 | | | | | | 4,619 | |
|
Pennsylvania Economic Development Financing Authority Revenue Notes, Series 2020 | |
3.000% due 01/01/2025 | | | | | 1,020 | | | | | | 1,012 | |
|
Westmoreland County Industrial Development Authority, Pennsylvania Revenue Notes, Series 2020 | |
4.000% due 07/01/2024 | | | | | 900 | | | | | | 900 | |
4.000% due 07/01/2026 | | | | | 1,250 | | | | | | 1,242 | |
| | | | | | | | | | | | |
| | | | | | | | | | | 21,160 | |
| | | | | | | | | | | | |
| |
| PUERTO RICO 0.9% | |
|
Puerto Rico Sales Tax Financing Corp. Sales Tax Revenue Bonds, Series 2018 | |
4.500% due 07/01/2034 | | | | | 4,750 | | | | | | 4,758 | |
|
Puerto Rico Sales Tax Financing Corp. Sales Tax Revenue Notes, Series 2018 | |
0.000% due 07/01/2024 (c) | | | | | 437 | | | | | | 437 | |
| | | | | | | | | | | | |
| | | | | | | | | | | 5,195 | |
| | | | | | | | | | | | |
| | | | | | | |
| SOUTH CAROLINA 0.5% | | | | | | | |
|
Patriots Energy Group Financing Agency, South Carolina Revenue Bonds, Series 2023 | |
5.250% due 02/01/2054 | | | | | 1,400 | | | | | | 1,517 | |
|
South Carolina Jobs-Economic Development Authority Revenue Bonds, Series 2020 | |
5.000% due 12/01/2048 | | | | | 1,250 | | | | | | 1,269 | |
| | | | | | | | | | | | |
| | | | | | | | | | | 2,786 | |
| | | | | | | | | | | | |
| |
| TENNESSEE 1.3% | |
|
Metropolitan Government of Nashville & Davidson County Sports Auth, Tennessee Revenue Notes, Series 2023 | |
5.000% due 07/01/2029 | | | | | 1,000 | | | | | | 1,084 | |
|
Tennergy Corp., Tennessee Revenue Bonds, Series 2019 | |
5.000% due 02/01/2050 | | | | | 1,500 | | | | | | 1,505 | |
|
Tennergy Corp., Tennessee Revenue Bonds, Series 2022 | |
5.500% due 10/01/2053 | | | | | 1,250 | | | | | | 1,336 | |
|
Tennessee Energy Acquisition Corp. Revenue Bonds, Series 2021 | |
5.000% due 05/01/2052 | | | | | 3,220 | | | | | | 3,419 | |
|
Tennessee Energy Acquisition Corp. Revenue Notes, Series 2021 | |
5.000% due 11/01/2024 | | | | | 250 | | | | | | 251 | |
| | | | | | | | | | |
| | | | | | | | | 7,595 | |
| | | | | | | | | | |
| |
| TEXAS 12.2% | |
|
Austin, Texas Electric Utility Revenue Notes, Series 2023 | |
5.000% due 11/15/2024 | | | | | 850 | | | | | | 855 | |
5.000% due 11/15/2025 | | | | | 1,200 | | | | | | 1,227 | |
| | | | | | |
| 128 | | PIMCO ETF TRUST | | | See Accompanying Notes | |
| | | | | | | | | | | | |
| | | | | PRINCIPAL
AMOUNT
(000S) | | | | | MARKET
VALUE
(000S) | |
|
Central Texas Regional Mobility Authority Revenue Notes, Series 2018 | |
5.000% due 01/01/2027 | | $ | | | 1,100 | | | $ | | | 1,137 | |
|
County of Williamson, Texas General Obligation Notes, Series 2023 | |
5.000% due 02/15/2025 | | | | | 2,500 | | | | | | 2,526 | |
|
Dallas Fort Worth International Airport, Texas Revenue Notes, Series 2023 | |
5.000% due 11/01/2028 | | | | | 2,000 | | | | | | 2,146 | |
|
Denton Independent School District, Texas General Obligation Notes, (PSF Insured), Series 2020 | |
5.000% due 08/15/2028 | | | | | 2,000 | | | | | | 2,036 | |
|
Denton Independent School District, Texas General Obligation Notes, (PSF Insured), Series 2023 | |
5.000% due 08/15/2025 | | | | | 1,500 | | | | | | 1,528 | |
|
El Paso Independent School District, Texas General Obligation Notes, (PSF Insured), Series 2020 | |
5.000% due 08/15/2024 | | | | | 400 | | | | | | 401 | |
|
EP Tuscany Zaragosa PFC, Texas Revenue Notes, Series 2023 | |
4.000% due 12/01/2033 | | | | | 2,500 | | | | | | 2,426 | |
|
Grand Parkway Transportation Corp., Texas Revenue Bonds, Series 2023 | |
5.000% due 10/01/2052 | | | | | 2,500 | | | | | | 2,629 | |
|
Harris County, Texas Cultural Education Facilities Finance Corp. Revenue Bonds, Series 2019 | |
5.000% due 07/01/2049 | | | | | 2,500 | | | | | | 2,591 | |
|
Harris County, Texas Cultural Education Facilities Finance Corp. Revenue Bonds, Series 2021 | |
4.600% due 10/01/2041 | | | | | 10,090 | | | | | | 10,090 | |
|
Harris County, Texas Cultural Education Facilities Finance Corp. Revenue Bonds, Series 2024 | |
5.000% due 07/01/2054 | | | | | 2,000 | | | | | | 2,143 | |
|
Harris County, Texas General Obligation Bonds, Series 2015 | |
5.000% due 10/01/2026 | | | | | 2,920 | | | | | | 2,974 | |
|
Harris County, Texas Toll Road Revenue Notes, Series 2024 | |
5.000% due 08/15/2027 | | | | | 2,250 | | | | | | 2,373 | |
|
Liberty Hill Independent School District, Texas General Obligation Notes, (PSF Insured), Series 2022 | |
5.000% due 02/01/2027 | | | | | 2,000 | | | | | | 2,088 | |
|
Matagorda County, Texas Navigation District No 1, Revenue Bonds, Series 2001 | |
2.600% due 11/01/2029 | | | | | 1,500 | | | | | | 1,384 | |
|
North Texas Tollway Authority Revenue Notes, Series 2023 | |
5.000% due 01/01/2027 | | | | | 2,750 | | | | | | 2,867 | |
|
Northside Independent School District, Texas General Obligation Bonds, (PSF Insured), Series 2019 | |
1.600% due 08/01/2049 | | | | | 730 | | | | | | 729 | |
|
Northside Independent School District, Texas General Obligation Bonds, (PSF Insured), Series 2020 | |
0.700% due 06/01/2050 | | | | | 1,500 | | | | | | 1,461 | |
|
Northside Independent School District, Texas General Obligation Bonds, (PSF Insured), Series 2022 | |
2.000% due 06/01/2052 | | | | | 1,300 | | | | | | 1,232 | |
|
Pasadena Texas General Obligation Bonds, (PSF Insured), Series 2015 | |
1.500% due 02/15/2044 | | | | | 750 | | | | | | 747 | |
|
San Antonio, Texas Electric & Gas Systems Revenue Bonds, Series 2015 | |
1.125% due 12/01/2045 | | | | | 2,500 | | | | | | 2,277 | |
|
San Antonio, Texas General Obligation Notes, Series 2023 | |
5.000% due 02/01/2025 | | | | | 5,000 | | | | | | 5,049 | |
|
Tarrant County, Texas Cultural Education Facilities Finance Corp. Revenue Bonds, Series 2022 | |
5.000% due 11/15/2052 | | | | | 1,900 | | | | | | 1,947 | |
|
Tarrant County, Texas Cultural Education Facilities Finance Corp. Revenue Notes, Series 2022 | |
5.000% due 10/01/2026 | | | | | 225 | | | | | | 233 | |
| | | | | | | | | | | | |
| | | | | PRINCIPAL
AMOUNT
(000S) | | | | | MARKET
VALUE
(000S) | |
|
Tarrant County, Texas Cultural Education Facilities Finance Corp. Revenue Notes, Series 2024 | |
5.000% due 07/01/2032 | | $ | | | 2,500 | | | $ | | | 2,762 | |
|
Tarrant Regional Water District, Texas Revenue Notes, Series 2021 | |
1.050% due 09/01/2027 | | | | | 5,000 | | | | | | 4,468 | |
|
Texas Municipal Gas Acquisition & Supply Corp. Revenue Bonds, Series 2006 | |
5.203% (TSFR3M) due 12/15/2026 ~ | | | | | 1,000 | | | | | | 1,000 | |
|
Texas Municipal Gas Acquisition & Supply Corp. Revenue Bonds, Series 2023 | |
5.500% due 01/01/2054 | | | | | 1,800 | | | | | | 1,929 | |
|
Texas Municipal Gas Acquisition & Supply Corp. Revenue Notes, Series 2021 | |
5.000% due 12/15/2026 | | | | | 1,750 | | | | | | 1,783 | |
|
Texas Water Development Board Revenue Notes, Series 2022 | |
5.000% due 10/15/2025 | | | | | 1,250 | | | | | | 1,279 | |
|
Travis County, Texas Housing Finance Corp. Revenue Bonds, Series 2022 | |
4.125% due 06/01/2045 | | | | | 1,000 | | | | | | 996 | |
|
Waco Educational Finance Corp., Texas Revenue Notes, Series 2021 | |
4.000% due 03/01/2026 | | | | | 525 | | | | | | 530 | |
| | | | | | | | | | | | |
| | | | | | | | | | | 71,843 | |
| | | | | | | | | | | | |
| |
| UTAH 0.1% | |
|
City of Salt Lake, Utah Revenue Notes, Series 2021 | |
5.000% due 07/01/2024 | | | | | 350 | | | | | | 350 | |
5.000% due 07/01/2025 | | | | | 450 | | | | | | 457 | |
| | | | | | | | | | | | |
| | | | | | | | | | | 807 | |
| | | | | | | | | | | | |
| |
| VIRGINIA 1.4% | |
|
Arlington County, Virginia Industrial Development Authority Revenue Bonds, Series 2023 | |
5.000% due 07/01/2053 | | | | | 1,600 | | | | | | 1,715 | |
|
Richmond Redevelopment & Housing Authority, Virginia Revenue Notes, Series 2023 | |
4.250% due 03/01/2026 | | | | | 1,500 | | | | | | 1,503 | |
|
Virginia Public Building Authority Revenue Bonds, Series 2015 | |
4.000% due 08/01/2030 | | | | | 1,300 | | | | | | 1,300 | |
|
Wise County, Virginia Industrial Development Authority Revenue Bonds, Series 2009 | |
0.750% due 10/01/2040 | | | | | 3,800 | | | | | | 3,591 | |
| | | | | | | | | | | | |
| | | | | | | | | | | 8,109 | |
| | | | | | | | | | | | |
| |
| WASHINGTON 3.1% | |
|
Central Puget Sound Regional Transit Authority Sales & Rental Car Taxes, Washington Revenue Bonds, Series 2015 | |
4.080% (MUNIPSA)
due 11/01/2045 ~ | | | | | 4,500 | | | | | | 4,458 | |
|
Energy Northwest, Washington Revenue Notes, Series 2024 | |
5.000% due 07/01/2027 | | | | | 5,000 | | | | | | 5,267 | |
|
Seattle, Washington Municipal Light & Power Revenue Bonds, Series 2021 | |
4.130% (MUNIPSA)
due 05/01/2045 ~ | | | | | 3,000 | | | | | | 2,933 | |
|
State of Washington General Obligation Refunding Notes, Series 2022 | |
4.000% due 07/01/2026 | | | | | 1,000 | | | | | | 1,015 | |
|
Washington State General Obligation Bonds, Series 2016 | |
5.000% due 07/01/2033 | | | | | 3,000 | | | | | | 3,065 | |
| | | | | | | | | | | | |
| | | | | PRINCIPAL
AMOUNT
(000S) | | | | | MARKET
VALUE
(000S) | |
|
Washington State Housing Finance Commission Revenue Bonds, Series 2023 | |
3.375% due 04/20/2037 | | $ | | | 1,344 | | | $ | | | 1,204 | |
| | | | | | | | | | | | |
| | | | | | | | | | | 17,942 | |
| | | | | | | | | | | | |
| |
| WEST VIRGINIA 0.5% | |
|
West Virginia Economic Development Authority Revenue Bonds, Series 2015 | |
3.375% due 03/01/2040 | | | | | 3,000 | | | | | | 2,952 | |
| | | | | | | | | | | | |
| |
| WISCONSIN 1.9% | |
|
Public Finance Authority, Wisconsin Revenue Bonds, Series 2022 | |
3.700% due 10/01/2046 | | | | | 2,500 | | | | | | 2,464 | |
|
Public Finance Authority, Wisconsin Revenue Notes, Series 2021 | |
4.000% due 10/01/2026 | | | | | 305 | | | | | | 304 | |
|
University of Wisconsin Hospitals & Clinics Revenue Bonds, Series 2018 | |
4.850% due 04/01/2048 | | | | | 5,000 | | | | | | 5,000 | |
|
Wisconsin Department of Transportation Revenue Notes, Series 2023 | |
5.000% due 07/01/2025 | | | | | 750 | | | | | | 763 | |
|
Wisconsin Health & Educational Facilities Authority Revenue Bonds, Series 2018 | |
4.060% (MUNIPSA)
due 08/15/2054 ~ | | | | | 2,500 | | | | | | 2,472 | |
| | | | | | | | | | | | |
| | | | | | | | | | | 11,003 | |
| | | | | | | | | | | | |
Total Municipal Bonds & Notes (Cost $563,300) | | | 562,510 | |
| | | | |
| |
| U.S. TREASURY OBLIGATIONS 0.2% | |
|
U.S. Treasury Notes | |
1.500% due 11/30/2024 | | | | | 1,100 | | | | | | 1,083 | |
| | | | | | | | | | | | |
Total U.S. Treasury Obligations (Cost $1,100) | | | 1,083 | |
| | | | |
| |
| SHORT-TERM INSTRUMENTS 7.1% | |
| | | | | | | | | | | | |
| REPURCHASE AGREEMENTS (e) 0.1% | |
| | | | | | | | | | | 790 | |
| | | | | | | | | | | | |
| |
| U.S. TREASURY BILLS 5.4% | |
5.375% due 08/08/2024 - 10/08/2024 (b)(c) | | | | | 32,000 | | | | | | 31,573 | |
| | | | | | | | | | | | |
| |
| MUNICIPAL BONDS & NOTES 1.6% | |
|
Los Angeles, California Revenue Notes, Series 2024 | |
5.000% due 06/26/2025 (a) | | | | | 5,800 | | | | | | 5,885 | |
|
Mansfield Independent School District, Texas General Obligation Notes, (PSF Insured), Series 2024 | |
5.000% due 02/15/2025 (a) | | | | | 3,200 | | | | | | 3,229 | |
| | | | | | | | | | | | |
Total Municipal Bonds & Notes
(Cost $9,115) | | | 9,114 | |
| | | | |
Total Short-Term Instruments
(Cost $41,477) | | | 41,477 | |
| | | | |
| | | | |
| | | | | | | | | | | | |
Total Investments in Securities
(Cost $605,877) | | | 605,070 | |
| | | | |
| | | | | | | | | | | | |
Total Investments 103.2%
(Cost $605,877) | | | $ | | | 605,070 | |
| |
| Other Assets and Liabilities, net (3.2)% | | | (18,562 | ) |
| | | | |
| Net Assets 100.0% | | | $ | | | 586,508 | |
| | | | | | | |
| | | | | | | | | | | | |
| See Accompanying Notes | | | ANNUAL FINANCIAL AND OTHER INFORMATION | | | | | | | JUNE 30, 2024 | | | 129 |
| | | | | | |
| Schedule of Investments | | PIMCO Short Term Municipal Bond Active Exchange-Traded Fund | | (Cont.) | | |
NOTES TO SCHEDULE OF INVESTMENTS:
| * | A zero balance may reflect actual amounts rounding to less than one thousand. |
| ~ | Variable or Floating rate security. Rate shown is the rate in effect as of period end. Certain variable rate securities are not based on a published reference rate and spread, rather are determined by the issuer or agent and are based on current market conditions. Reference rate is as of reset date, which may vary by security. These securities may not indicate a reference rate and/or spread in their description. |
| (b) | Coupon represents a weighted average yield to maturity. |
(d) RESTRICTED SECURITIES:
| | | | | | | | | | | | | | | | | | | | | | |
| Issuer Description | | Coupon | | Maturity
Date | | | Acquisition
Date | | | Cost | | | Market
Value | | | Market Value
as Percentage
of Net Assets | |
Lehigh County, Pennsylvania Revenue Bonds, Series 2019 | | 4.980% | | | 08/15/2038 | | | | 09/14/2021 | | | | $ 2,473 | | | $ | 2,413 | | | | 0.41% | |
| | | | | | | | | | | | | | | | | | | | | | |
BORROWINGS AND OTHER FINANCING TRANSACTIONS
(e) REPURCHASE AGREEMENTS:
| | | | | | | | | | | | | | | | | | | | | | | | | | | | | | |
| Counterparty | | Lending
Rate | | | Settlement
Date | | | Maturity
Date | | | Principal
Amount | | | Collateralized By | | Collateral
(Received) | | | Repurchase
Agreements,
at Value | | | Repurchase
Agreement
Proceeds
to be
Received(1) | |
| FICC | | | 2.600 | % | | | 06/28/2024 | | | | 07/01/2024 | | | $ | 790 | | | U.S. Treasury Notes 4.500% due 03/31/2026 | | $ | (805 | ) | | $ | 790 | | | $ | 790 | |
| | | | | | | | | | | | | | | | | | | | | | | | | | | | | | |
Total Repurchase Agreements | | | | | $ | (805 | ) | | $ | 790 | | | $ | 790 | |
| | | | | | | | | | | | | | | |
BORROWINGS AND OTHER FINANCING TRANSACTIONS SUMMARY
The following is a summary by counterparty of the market value of Borrowings and Other Financing Transactions and collateral pledged/(received) as of June 30, 2024:
| | | | | | | | | | | | | | | | | | | | | | | | |
| Counterparty | | Repurchase
Agreement
Proceeds
to be
Received(1) | | | Payable for
Reverse
Repurchase
Agreements | | | Payable for
Sale-Buyback
Transactions | | | Total
Borrowings and
Other Financing
Transactions | | | Collateral
Pledged/(Received) | | | Net Exposure(2) | |
Global/Master Repurchase Agreement | |
FICC | | $ | 790 | | | $ | 0 | | | $ | 0 | | | $ | 790 | | | $ | (805 | ) | | $ | (15 | ) |
| | | | | | | | | | | | | | | | | | | | | | | | |
Total Borrowings and Other Financing Transactions | | $ | 790 | | | $ | 0 | | | $ | 0 | | | | | | | | | | | | | |
| | | | | | | | | | | | | | | | | | | | | | | | |
| (1) | Includes accrued interest. |
| (2) | Net Exposure represents the net receivable/(payable) that would be due from/to the counterparty in the event of default. Exposure from borrowings and other financing transactions can only be netted across transactions governed under the same master agreement with the same legal entity. See Note 8, Master Netting Arrangements, in the Notes to Financial Statements for more information. |
| | | | | | |
| 130 | | PIMCO ETF TRUST | | | See Accompanying Notes | |
FAIR VALUE MEASUREMENTS
The following is a summary of the fair valuations according to the inputs used as of June 30, 2024 in valuing the Fund’s assets and liabilities:
| | | | | | | | | | | | | | | | |
| Category and Subcategory | | Level 1 | | | Level 2 | | | Level 3 | | | Fair Value at
06/30/2024 | |
Investments in Securities, at Value | |
Municipal Bonds & Notes | |
Alabama | | $ | 0 | | | $ | 22,454 | | | $ | 0 | | | $ | 22,454 | |
Arizona | | | 0 | | | | 11,510 | | | | 0 | | | | 11,510 | |
California | | | 0 | | | | 46,937 | | | | 0 | | | | 46,937 | |
Colorado | | | 0 | | | | 25,519 | | | | 0 | | | | 25,519 | |
Connecticut | | | 0 | | | | 16,966 | | | | 0 | | | | 16,966 | |
Delaware | | | 0 | | | | 2,627 | | | | 0 | | | | 2,627 | |
District of Columbia | | | 0 | | | | 1,018 | | | | 0 | | | | 1,018 | |
Florida | | | 0 | | | | 13,776 | | | | 0 | | | | 13,776 | |
Georgia | | | 0 | | | | 23,551 | | | | 0 | | | | 23,551 | |
Hawaii | | | 0 | | | | 3,001 | | | | 0 | | | | 3,001 | |
Illinois | | | 0 | | | | 29,051 | | | | 0 | | | | 29,051 | |
Indiana | | | 0 | | | | 9,712 | | | | 0 | | | | 9,712 | |
Iowa | | | 0 | | | | 6,000 | | | | 0 | | | | 6,000 | |
Kansas | | | 0 | | | | 8,001 | | | | 0 | | | | 8,001 | |
Kentucky | | | 0 | | | | 11,596 | | | | 0 | | | | 11,596 | |
Louisiana | | | 0 | | | | 7,317 | | | | 0 | | | | 7,317 | |
Maryland | | | 0 | | | | 4,655 | | | | 0 | | | | 4,655 | |
Massachusetts | | | 0 | | | | 8,940 | | | | 0 | | | | 8,940 | |
Michigan | | | 0 | | | | 12,036 | | | | 0 | | | | 12,036 | |
Minnesota | | | 0 | | | | 1,900 | | | | 0 | | | | 1,900 | |
Missouri | | | 0 | | | | 4,151 | | | | 0 | | | | 4,151 | |
Multi-State | | | 0 | | | | 4,524 | | | | 0 | | | | 4,524 | |
Nebraska | | | 0 | | | | 4,274 | | | | 0 | | | | 4,274 | |
| | | | | | | | | | | | | | | | |
| Category and Subcategory | | Level 1 | | | Level 2 | | | Level 3 | | | Fair Value at
06/30/2024 | |
Nevada | | $ | 0 | | | $ | 4,325 | | | $ | 0 | | | $ | 4,325 | |
New Hampshire | | | 0 | | | | 511 | | | | 0 | | | | 511 | |
New Jersey | | | 0 | | | | 25,936 | | | | 0 | | | | 25,936 | |
New York | | | 0 | | | | 79,818 | | | | 0 | | | | 79,818 | |
North Carolina | | | 0 | | | | 6,000 | | | | 0 | | | | 6,000 | |
Ohio | | | 0 | | | | 13,861 | | | | 0 | | | | 13,861 | |
Oregon | | | 0 | | | | 3,151 | | | | 0 | | | | 3,151 | |
Pennsylvania | | | 0 | | | | 21,160 | | | | 0 | | | | 21,160 | |
Puerto Rico | | | 0 | | | | 5,195 | | | | 0 | | | | 5,195 | |
South Carolina | | | 0 | | | | 2,786 | | | | 0 | | | | 2,786 | |
Tennessee | | | 0 | | | | 7,595 | | | | 0 | | | | 7,595 | |
Texas | | | 0 | | | | 71,843 | | | | 0 | | | | 71,843 | |
Utah | | | 0 | | | | 807 | | | | 0 | | | | 807 | |
Virginia | | | 0 | | | | 8,109 | | | | 0 | | | | 8,109 | |
Washington | | | 0 | | | | 17,942 | | | | 0 | | | | 17,942 | |
West Virginia | | | 0 | | | | 2,952 | | | | 0 | | | | 2,952 | |
Wisconsin | | | 0 | | | | 11,003 | | | | 0 | | | | 11,003 | |
U.S. Treasury Obligations | | | 0 | | | | 1,083 | | | | 0 | | | | 1,083 | |
Short-Term Instruments | |
Repurchase Agreements | | | 0 | | | | 790 | | | | 0 | | | | 790 | |
U.S. Treasury Bills | | | 0 | | | | 31,573 | | | | 0 | | | | 31,573 | |
Municipal Bonds & Notes | | | 0 | | | | 9,114 | | | | 0 | | | | 9,114 | |
| | | | | | | | | | | | | | | | |
| | | | |
Total Investments | | $ | 0 | | | $ | 605,070 | | | $ | 0 | | | $ | 605,070 | |
| | | | | | | | | | | | | | | | |
There were no significant transfers into or out of Level 3 during the period ended June 30, 2024.
| | | | | | | | | | | | |
| See Accompanying Notes | | | ANNUAL FINANCIAL AND OTHER INFORMATION | | | | | | | JUNE 30, 2024 | | | 131 |
| | | | | | |
| Schedule of Investments | | PIMCO Ultra Short Government Active Exchange-Traded Fund | | | | |
(Amounts in thousands*, except number of shares, contracts, units and ounces, if any)
| | | | | | | | | | | | |
| | | | | PRINCIPAL
AMOUNT
(000S) | | | | | MARKET
VALUE
(000S) | |
| INVESTMENTS IN SECURITIES 110.2% | |
| |
| SHORT-TERM INSTRUMENTS 110.2% | |
| |
| REPURCHASE AGREEMENTS (c) 0.1% | | | | | | | |
| | | | | | | | $ | | | 225 | |
| | | | | | | | | | | | |
| |
| U.S. TREASURY BILLS 110.1% | |
5.384% due 07/02/2024 - 10/29/2024 (a)(b) | | $ | | | 404,514 | | | | | | 399,790 | |
| | | | | | | | | | | | |
| Total Short-Term Instruments (Cost $399,996) | | | | | | | | | | | 400,015 | |
| | | | | | | | | | | | |
| | | | |
| | | | | | | | | | | | |
| Total Investments in Securities (Cost $399,996) | | | | | | | | | | | 400,015 | |
| | | | |
| | | | | | | | | | | | |
Total Investments 110.2% (Cost $399,996) | | | | | | | | $ | | | 400,015 | |
| |
| Other Assets and Liabilities, net (10.2)% | | | (37,045 | ) |
| | | | |
| Net Assets 100.0% | | | $ | | | 362,970 | |
| | | | | | | |
NOTES TO SCHEDULE OF INVESTMENTS:
| * | A zero balance may reflect actual amounts rounding to less than one thousand. |
| (a) | Coupon represents a weighted average yield to maturity. |
BORROWINGS AND OTHER FINANCING TRANSACTIONS
(c) REPURCHASE AGREEMENTS:
| | | | | | | | | | | | | | | | | | | | | | | | | | | | | | |
| Counterparty | | Lending
Rate | | | Settlement
Date | | | Maturity
Date | | | Principal
Amount | | | Collateralized By | | Collateral
(Received) | | | Repurchase
Agreements,
at Value | | | Repurchase
Agreement
Proceeds
to be
Received(1) | |
| FICC | | | 2.600 | % | | | 06/28/2024 | | | | 07/01/2024 | | | $ | 225 | | | U.S. Treasury Inflation Protected Securities 0.625% due 01/15/2026 | | $ | (230 | ) | | $ | 225 | | | $ | 225 | |
| | | | | | | | | | | | | | | | | | | | | | | | | | | | | | |
Total Repurchase Agreements | | | | | $ | (230 | ) | | $ | 225 | | | $ | 225 | |
| | | | | | | | | | | | | | | |
BORROWINGS AND OTHER FINANCING TRANSACTIONS SUMMARY
The following is a summary by counterparty of the market value of Borrowings and Other Financing Transactions and collateral pledged/(received) as of June 30, 2024:
| | | | | | | | | | | | | | | | | | | | | | | | |
| Counterparty | | Repurchase
Agreement
Proceeds
to be
Received(1) | | | Payable for
Reverse
Repurchase
Agreements | | | Payable for
Sale-Buyback
Transactions | | | Total
Borrowings and
Other Financing
Transactions | | | Collateral
Pledged/(Received) | | | Net Exposure(2) | |
Global/Master Repurchase Agreement | |
FICC | | $ | 225 | | | $ | 0 | | | $ | 0 | | | $ | 225 | | | $ | | (230) | | $ | | (5) |
| | | | | | | | | | | | | | | | | | | | | | | | |
Total Borrowings and Other Financing Transactions | | $ | 225 | | | $ | 0 | | | $ | 0 | | | | | | | | | | | | | |
| | | | | | | | | | | | | | | | | | | | | | | | |
| (1) | Includes accrued interest. |
| (2) | Net Exposure represents the net receivable/(payable) that would be due from/to the counterparty in the event of default. Exposure from borrowings and other financing transactions can only be netted across transactions governed under the same master agreement with the same legal entity. See Note 8, Master Netting Arrangements, in the Notes to Financial Statements for more information. |
| | | | | | |
| 132 | | PIMCO ETF TRUST | | | See Accompanying Notes | |
FAIR VALUE MEASUREMENTS
The following is a summary of the fair valuations according to the inputs used as of June 30, 2024 in valuing the Fund’s assets and liabilities:
| | | | | | | | | | | | | | | | |
| Category and Subcategory | | Level 1 | | | Level 2 | | | Level 3 | | | Fair
Value at
06/30/2024 | |
Investments in Securities, at Value | |
Short-Term Instruments | |
Repurchase Agreements | | $ | 0 | | | $ | 225 | | | $ | 0 | | | $ | 225 | |
U.S. Treasury Bills | | | 0 | | | | 399,790 | | | | 0 | | | | 399,790 | |
| | | | | | | | | | | | | | | | |
| | | | |
Total Investments | | $ | 0 | | | $ | 400,015 | | | $ | 0 | | | $ | 400,015 | |
| | | | | | | | | | | | | | | | |
There were no significant transfers into or out of Level 3 during the period ended June 30, 2024.
| | | | | | | | | | | | |
| See Accompanying Notes | | | ANNUAL FINANCIAL AND OTHER INFORMATION | | | | | | | JUNE 30, 2024 | | | 133 |
| | | | | | |
| Consolidated Schedule of Investments | | PIMCO Commodity Strategy Active Exchange-Traded Fund | | | | |
(Amounts in thousands*, except number of shares, contracts, units and ounces, if any)
| | | | | | | | | | | | |
| | | | | PRINCIPAL
AMOUNT
(000S) | | | | | MARKET
VALUE
(000S) | |
| INVESTMENTS IN SECURITIES 100.0% | |
| |
| CORPORATE BONDS & NOTES 51.5% | |
| |
| BANKING & FINANCE 30.8% | |
|
AerCap Ireland Capital DAC | |
1.650% due 10/29/2024 | | $ | | | 500 | | | $ | | | 493 | |
3.500% due 01/15/2025 | | | | | 2,000 | | | | | | 1,975 | |
|
Ally Financial, Inc. | |
5.125% due 09/30/2024 | | | | | 2,000 | | | | | | 1,995 | |
|
American Honda Finance Corp. | |
6.025% due 01/10/2025 • | | | | | 800 | | | | | | 802 | |
6.069% (SOFRINDX + 0.700%) due 11/22/2024 ~ | | | | | 100 | | | | | | 100 | |
|
American Tower Corp. | |
2.950% due 01/15/2025 | | | | | 2,000 | | | | | | 1,969 | |
|
Aozora Bank Ltd. | |
1.050% due 09/09/2024 | | | | | 1,000 | | | | | | 990 | |
|
Athene Global Funding | |
2.500% due 01/14/2025 | | | | | 500 | | | | | | 491 | |
|
Avolon Holdings Funding Ltd. | |
2.875% due 02/15/2025 | | | | | 1,500 | | | | | | 1,470 | |
|
Bank of America Corp. | |
3.093% due 10/01/2025 • | | | | | 1,900 | | | | | | 1,887 | |
6.684% (SOFRRATE + 1.330%) due 04/02/2026 ~ | | | | | 500 | | | | | | 503 | |
|
Bank of Nova Scotia | |
5.743% (SOFRRATE + 0.380%) due 07/31/2024 ~ | | | | | 3,429 | | | | | | 3,429 | |
|
Bank of Queensland Ltd. | |
5.241% due 12/18/2024 ~ | | AUD | | | 500 | | | | | | 334 | |
5.440% due 05/14/2025 ~ | | | | | 4,000 | | | | | | 2,681 | |
|
Banque Federative du Credit Mutuel SA | |
0.998% due 02/04/2025 | | $ | | | 100 | | | | | | 97 | |
5.772% (SOFRINDX + 0.410%) due 02/04/2025 ~ | | | | | 1,500 | | | | | | 1,500 | |
|
Barclays PLC | |
2.852% due 05/07/2026 • | | | | | 1,700 | | | | | | 1,658 | |
3.650% due 03/16/2025 | | | | | 1,000 | | | | | | 985 | |
|
BNP Paribas SA | |
2.819% due 11/19/2025 • | | | | | 500 | | | | | | 494 | |
3.375% due 01/09/2025 | | | | | 2,100 | | | | | | 2,073 | |
|
Cooperatieve Rabobank UA | |
1.980% due 12/15/2027 • | | | | | 1,500 | | | | | | 1,376 | |
|
Credit Agricole SA | |
3.250% due 10/04/2024 | | | | | 2,800 | | | | | | 2,782 | |
|
Danske Bank AS | |
0.976% due 09/10/2025 • | | | | | 600 | | | | | | 594 | |
|
DBS Group Holdings Ltd. | |
5.981% (SOFRRATE + 0.610%) due 09/12/2025 ~ | | | | | 1,000 | | | | | | 1,003 | |
|
Deutsche Bank AG | |
3.961% due 11/26/2025 • | | | | | 500 | | | | | | 496 | |
|
Ford Motor Credit Co. LLC | |
2.300% due 02/10/2025 | | | | | 200 | | | | | | 196 | |
3.375% due 11/13/2025 | | | | | 2,000 | | | | | | 1,936 | |
8.321% (SOFRRATE + 2.950%) due 03/06/2026 ~ | | | | | 800 | | | | | | 829 | |
|
GA Global Funding Trust | |
5.872% (SOFRRATE + 0.500%) due 09/13/2024 ~ | | | | | 1,900 | | | | | | 1,900 | |
|
General Motors Financial Co., Inc. | |
3.500% due 11/07/2024 | | | | | 1,900 | | | | | | 1,884 | |
6.653% (SOFRINDX + 1.300%) due 04/07/2025 ~ | | | | | 800 | | | | | | 804 | |
|
Goldman Sachs Group, Inc. | |
3.272% due 09/29/2025 • | | | | | 1,000 | | | | | | 994 | |
5.844% (SOFRRATE + 0.486%) due 10/21/2024 ~ | | | | | 2,000 | | | | | | 2,000 | |
|
HSBC Holdings PLC | |
4.292% due 09/12/2026 • | | | | | 3,000 | | | | | | 2,948 | |
|
ING Groep NV | |
3.869% due 03/28/2026 • | | | | | 600 | | | | | | 591 | |
6.385% (SOFRRATE + 1.010%) due 04/01/2027 ~ | | | | | 500 | | | | | | 502 | |
| | | | | | | | | | | | |
| | | | | PRINCIPAL
AMOUNT
(000S) | | | | | MARKET
VALUE
(000S) | |
7.016% (SOFRINDX + 1.640%) due 03/28/2026 ~ | | $ | | | 2,000 | | | $ | | | 2,017 | |
|
John Deere Capital Corp. | |
5.941% (SOFRRATE + 0.570%) due 03/03/2026 ~ | | | | | 45 | | | | | | 45 | |
|
JPMorgan Chase & Co. | |
2.301% due 10/15/2025 • | | | | | 500 | | | | | | 495 | |
5.971% (SOFRRATE + 0.600%) due 12/10/2025 ~ | | | | | 1,000 | | | | | | 1,002 | |
6.289% (SOFRRATE + 0.920%) due 02/24/2026 ~ | | | | | 700 | | | | | | 703 | |
|
Lloyds Banking Group PLC | |
3.511% due 03/18/2026 • | | | | | 500 | | | | | | 492 | |
3.870% due 07/09/2025 • | | | | | 2,000 | | | | | | 1,999 | |
|
Mitsubishi UFJ Financial Group, Inc. | |
4.788% due 07/18/2025 • | | | | | 1,000 | | | | | | 1,000 | |
5.063% due 09/12/2025 • | | | | | 1,000 | | | | | | 998 | |
5.541% due 04/17/2026 • | | | | | 500 | | | | | | 500 | |
|
Mizuho Bank Ltd. | |
5.195% due 02/23/2026 ~ | | AUD | | | 2,000 | | | | | | 1,340 | |
|
Mizuho Financial Group, Inc. | |
2.226% due 05/25/2026 • | | $ | | | 1,320 | | | | | | 1,279 | |
|
Morgan Stanley | |
2.188% due 04/28/2026 • | | | | | 3,000 | | | | | | 2,914 | |
|
MUFG Bank Ltd. | |
5.215% due 02/17/2026 ~ | | AUD | | | 1,000 | | | | | | 670 | |
|
National Bank of Canada | |
5.853% (SOFRRATE + 0.490%) due 08/06/2024 ~ | | $ | | | 100 | | | | | | 100 | |
|
NatWest Markets PLC | |
3.479% due 03/22/2025 | | | | | 2,000 | | | | | | 1,970 | |
|
Nissan Motor Acceptance Co. LLC | |
1.125% due 09/16/2024 | | | | | 1,000 | | | | | | 989 | |
1.850% due 09/16/2026 | | | | | 1,500 | | | | | | 1,374 | |
|
Nomura Holdings, Inc. | |
1.851% due 07/16/2025 | | | | | 1,450 | | | | | | 1,394 | |
2.648% due 01/16/2025 | | | | | 400 | | | | | | 393 | |
|
Nykredit Realkredit AS | |
2.000% due 01/01/2025 | | DKK | | | 14,550 | | | | | | 2,075 | |
|
Realkredit Danmark AS | |
1.000% due 01/01/2025 | | | | | 14,550 | | | | | | 2,063 | |
|
Skandinaviska Enskilda Banken AB | |
6.331% (SOFRRATE + 0.960%) due 06/09/2025 ~ | | $ | | | 1,500 | | | | | | 1,508 | |
|
Standard Chartered PLC | |
3.971% due 03/30/2026 • | | | | | 1,125 | | | | | | 1,109 | |
6.266% due 11/23/2025 | | | | | 1,000 | | | | | | 1,001 | |
6.536% (SOFRRATE + 1.170%) due 05/14/2028 ~ | | | | | 1,000 | | | | | | 1,004 | |
|
Sumitomo Mitsui Financial Group, Inc. | |
6.655% (SOFRRATE + 1.300%) due 07/13/2026 ~ | | | | | 3,500 | | | | | | 3,550 | |
|
Svenska Handelsbanken AB | |
6.031% (SOFRRATE + 0.660%) due 05/28/2027 ~ | | | | | 2,500 | | | | | | 2,503 | |
6.281% (SOFRRATE + 0.910%) due 06/10/2025 ~ | | | | | 250 | | | | | | 251 | |
|
Swedbank AB | |
5.337% due 09/20/2027 | | | | | 2,500 | | | | | | 2,492 | |
|
UBS AG | |
4.750% due 08/09/2024 | | | | | 2,000 | | | | | | 1,998 | |
|
UBS Group AG | |
3.750% due 03/26/2025 | | | | | 500 | | | | | | 493 | |
4.490% due 08/05/2025 • | | | | | 1,200 | | | | | | 1,198 | |
|
Wells Fargo & Co. | |
2.188% due 04/30/2026 • | | | | | 400 | | | | | | 389 | |
2.406% due 10/30/2025 • | | | | | 2,600 | | | | | | 2,571 | |
3.908% due 04/25/2026 • | | | 600 | | | | | | 591 | |
| | | | | | | | | | |
| | | | | | | | | 93,231 | |
| | | | | | | | | | |
| |
| INDUSTRIALS 14.9% | |
|
Amgen, Inc. | |
5.250% due 03/02/2025 | | | | | 1,500 | | | | | | 1,497 | |
| | | | | | | | | | | | |
| | | | | PRINCIPAL
AMOUNT
(000S) | | | | | MARKET
VALUE
(000S) | |
|
Aptiv PLC | |
2.396% due 02/18/2025 | | $ | | | 2,000 | | | $ | | | 1,957 | |
|
Arrow Electronics, Inc. | |
4.000% due 04/01/2025 | | | | | 900 | | | | | | 888 | |
|
BAT Capital Corp. | |
3.222% due 08/15/2024 | | | | | 2,160 | | | | | | 2,152 | |
|
Baxter International, Inc. | |
1.322% due 11/29/2024 | | | 1,000 | | | | | | 982 | |
5.811% (SOFRINDX + 0.440%) due 11/29/2024 ~ | | | | | 500 | | | | | | 500 | |
|
Bayer U.S. Finance LLC | |
3.375% due 10/08/2024 | | | | | 500 | | | | | | 496 | |
4.250% due 12/15/2025 | | | | | 2,000 | | | | | | 1,958 | |
|
Berry Global, Inc. | |
1.570% due 01/15/2026 | | | | | 2,500 | | | | | | 2,350 | |
4.875% due 07/15/2026 | | | | | 466 | | | | | | 458 | |
|
Carrier Global Corp. | |
2.242% due 02/15/2025 | | | | | 2,000 | | | | | | 1,958 | |
|
Dell International LLC | |
4.000% due 07/15/2024 | | | | | 700 | | | | | | 699 | |
5.850% due 07/15/2025 | | | | | 2,000 | | | | | | 2,005 | |
|
Energy Transfer LP | |
5.950% due 12/01/2025 | | | | | 1,585 | | | | | | 1,591 | |
|
Expedia Group, Inc. | |
6.250% due 05/01/2025 | | | | | 437 | | | | | | 438 | |
|
Fidelity National Information Services, Inc. | |
4.500% due 07/15/2025 | | | | | 1,000 | | | | | | 989 | |
|
HCA, Inc. | |
5.375% due 02/01/2025 | | | | | 2,200 | | | | | | 2,193 | |
|
Hyundai Capital America | |
1.000% due 09/17/2024 | | | | | 700 | | | | | | 693 | |
6.250% due 11/03/2025 | | | | | 1,500 | | | | | | 1,512 | |
|
Imperial Brands Finance PLC | |
3.125% due 07/26/2024 | | | | | 1,500 | | | | | | 1,497 | |
|
Mitsubishi Corp. | |
3.375% due 07/23/2024 | | | | | 1,000 | | | | | | 999 | |
|
Penske Truck Leasing Co. LP | |
3.450% due 07/01/2024 | | | | | 2,000 | | | | | | 2,000 | |
|
Southwest Airlines Co. | |
5.250% due 05/04/2025 | | | | | 2,800 | | | | | | 2,788 | |
|
T-Mobile USA, Inc. | |
3.500% due 04/15/2025 | | | | | 800 | | | | | | 787 | |
|
TD SYNNEX Corp. | |
1.250% due 08/09/2024 | | | | | 1,500 | | | | | | 1,492 | |
|
Tyson Foods, Inc. | |
3.950% due 08/15/2024 | | | | | 2,000 | | | | | | 1,995 | |
|
VMware, Inc. | |
1.000% due 08/15/2024 | | | | | 2,000 | | | | | | 1,988 | |
|
Volkswagen Group of America Finance LLC | |
2.850% due 09/26/2024 | | | | | 965 | | | | | | 958 | |
6.302% (SOFRRATE + 0.930%) due 09/12/2025 ~ | | | | | 1,500 | | | | | | 1,509 | |
|
Warnermedia Holdings, Inc. | |
3.638% due 03/15/2025 | | | | | 1,900 | | | | | | 1,871 | |
|
Westinghouse Air Brake Technologies Corp. | |
3.200% due 06/15/2025 | | | | | 900 | | | | | | 878 | |
|
Zimmer Biomet Holdings, Inc. | |
1.450% due 11/22/2024 | | | | | 1,000 | | | | | | 983 | |
| | | | | | | | | | | | |
| | | | | | | | | | | 45,061 | |
| | | | | | | | | | | | |
| |
| UTILITIES 5.8% | |
|
Black Hills Corp. | |
1.037% due 08/23/2024 | | | | | 2,000 | | | | | | 1,986 | |
|
DTE Energy Co. | |
4.220% due 11/01/2024 þ | | | | | 2,000 | | | | | | 1,989 | |
|
Edison International | |
3.550% due 11/15/2024 | | | | | 2,000 | | | | | | 1,981 | |
|
Electricite de France SA | |
3.625% due 10/13/2025 | | | | | 1,700 | | | | | | 1,658 | |
|
Enel Finance International NV | |
2.650% due 09/10/2024 | | | | | 1,400 | | | | | | 1,391 | |
6.800% due 10/14/2025 | | | | | 1,000 | | | | | | 1,016 | |
| | | | | | |
| 134 | | PIMCO ETF TRUST | | | See Accompanying Notes | |
| | | | | | | | | | | | |
| | | | | PRINCIPAL
AMOUNT
(000S) | | | | | MARKET
VALUE
(000S) | |
|
Georgia Power Co. | |
6.114% (SOFRINDX + 0.750%) due 05/08/2025 ~ | | $ | | | 1,400 | | | $ | | | 1,406 | |
|
KT Corp. | |
4.000% due 08/08/2025 | | | | | 1,000 | | | | | | 985 | |
|
National Rural Utilities Cooperative Finance Corp. | |
5.687% (SOFRRATE + 0.330%) due 10/18/2024 ~ | | | | | 15 | | | | | | 15 | |
|
Network Finance Co. Pty. Ltd. | |
3.500% due 12/06/2024 | | AUD | | | 4,000 | | | | | | 2,651 | |
|
NextEra Energy Capital Holdings, Inc. | |
6.051% due 03/01/2025 | | $ | | | 500 | | | | | | 501 | |
6.121% (SOFRINDX + 0.760%) due 01/29/2026 ~ | | | | | 2,000 | | | | | | 2,005 | |
| | | | | | | | | | | | |
| | | | | | | | | | | 17,584 | |
| | | | | | | | | | | | |
Total Corporate Bonds & Notes (Cost $155,657) | | | | | | 155,876 | |
| | | | | | | | | | | | |
| |
| U.S. GOVERNMENT AGENCIES 0.5% | |
|
Freddie Mac | |
5.520% due 05/28/2025 | | | | | 200 | | | | | | 200 | |
|
Ginnie Mae | |
5.610% due 04/20/2069 • | | | | | 290 | | | | | | 290 | |
6.283% due 10/20/2073 • | | | | | 1,013 | | | | | | 1,020 | |
| | | | | | | | | | | | |
Total U.S. Government Agencies (Cost $1,502) | | | | | | 1,510 | |
| | | | | | | | | | | | |
| |
| NON-AGENCY MORTGAGE-BACKED SECURITIES 0.5% | |
|
OBX Trust | |
5.988% due 12/01/2064 þ | | | | | 1,432 | | | | | | 1,433 | |
| | | | | | | | | | | | |
Total Non-Agency Mortgage-Backed Securities (Cost $1,432) | | | | | | 1,433 | |
| | | | | | | | | | | | |
| |
| ASSET-BACKED SECURITIES 10.8% | |
|
Allegro CLO Ltd. | |
6.577% due 01/19/2033 • | | | | | 1,000 | | | | | | 999 | |
|
American Express Credit Account Master Trust | |
5.230% due 09/15/2028 | | | | | 2,000 | | | | | | 2,008 | |
|
Bank of America Auto Trust | |
5.830% due 05/15/2026 | | | | | 671 | | | | | | 671 | |
|
CarMax Auto Owner Trust | |
5.300% due 03/15/2027 | | | | | 2,000 | | | | | | 1,996 | |
5.933% due 11/16/2026 • | | | | | 1,419 | | | | | | 1,421 | |
|
CarVal CLO Ltd. | |
6.554% due 07/16/2031 • | | | | | 1,000 | | | | | | 1,001 | |
|
Citibank Credit Card Issuance Trust | |
5.230% due 12/08/2027 | | | | | 2,000 | | | | | | 1,999 | |
|
Citizens Auto Receivables Trust | |
6.063% due 10/15/2026 • | | | | | 593 | | | | | | 594 | |
6.283% due 07/15/2026 • | | | | | 531 | | | | | | 532 | |
|
Cumulus Static CLO DAC | |
5.025% due 11/15/2033 • | | EUR | | | 700 | | | | | | 749 | |
| | | | | | | | | | | | |
| | | | | PRINCIPAL
AMOUNT
(000S) | | | | | MARKET
VALUE
(000S) | |
|
Evergreen Credit Card Trust | |
0.900% due 10/15/2026 | | $ | | | 1,900 | | | $ | | | 1,870 | |
|
Ford Credit Auto Lease Trust | |
5.923% due 02/15/2026 • | | | | | 961 | | | | | | 962 | |
|
Honda Auto Receivables Owner Trust | |
5.870% due 06/22/2026 | | | | | 1,973 | | | | | | 1,976 | |
|
Hyundai Auto Lease Securitization Trust | |
6.083% due 09/15/2025 • | | | | | 95 | | | | | | 95 | |
|
Kubota Credit Owner Trust | |
5.610% due 07/15/2026 | | | | | 1,583 | | | | | | 1,583 | |
|
LCM Loan Income Fund Ltd. | |
6.616% due 04/20/2031 • | | | | | 695 | | | | | | 695 | |
|
Master Credit Card Trust | |
6.183% due 01/21/2027 • | | | | | 1,600 | | | | | | 1,607 | |
|
MMAF Equipment Finance LLC | |
5.790% due 11/13/2026 | | | | | 827 | | | | | | 828 | |
|
Mountain View CLO Ltd. | |
6.789% due 04/15/2034 • | | | | | 1,000 | | | | | | 1,001 | |
|
Nassau Ltd. | |
6.840% due 01/15/2030 • | | | | | 608 | | | | | | 608 | |
|
Neuberger Berman CLO Ltd. | |
6.616% due 01/28/2030 • | | | | | 866 | | | | | | 868 | |
|
OZLM Ltd. | |
6.475% due 07/20/2030 • | | | | | 1,000 | | | | | | 1,001 | |
|
Rad CLO Ltd. | |
0.000% due 04/25/2032 • | | | | | 600 | | | | | | 601 | |
|
SCCU Auto Receivables Trust | |
5.850% due 05/17/2027 | | | | | 415 | | | | | | 415 | |
|
SFS Auto Receivables Securitization Trust | |
6.133% due 03/22/2027 • | | | | | 269 | | | | | | 270 | |
|
Tesla Auto Lease Trust | |
5.860% due 08/20/2025 | | | | | 1,411 | | | | | | 1,412 | |
|
Toyota Auto Receivables Owner Trust | |
5.733% (SOFR30A + 0.400%) due 08/17/2026 ~ | | | | | 704 | | | | | | 705 | |
|
Trillium Credit Card Trust | |
6.196% due 08/26/2028 • | | | | | 2,000 | | | | | | 2,009 | |
|
Verizon Master Trust | |
6.013% due 09/08/2028 • | | | | | 2,000 | | | | | | 2,017 | |
|
World Omni Automobile Lease Securitization Trust | |
6.093% due 11/17/2025 • | | | | | 92 | | | | | | 92 | |
| | | | | | | | | | |
Total Asset-Backed Securities
(Cost $32,532) | | | | | | 32,585 | |
| | | | | | | | | | | | |
| |
| SOVEREIGN ISSUES 3.1% | |
|
Brazil Letras do Tesouro Nacional | |
0.000% due 04/01/2025 (c) | | BRL | | | 28,900 | | | | | | 4,786 | |
|
CPPIB Capital, Inc. | |
6.604% (SOFRINDX + 1.250%) due 04/04/2025 ~ | | $ | | | 1,000 | | | | | | 1,008 | |
6.621% (SOFRRATE + 1.250%) due 03/11/2026 ~ | | | | | 1,450 | | | | | | 1,474 | |
| | | | | | | | | | | | |
| | | | | PRINCIPAL
AMOUNT
(000S) | | | | | MARKET
VALUE
(000S) | |
|
PSP Capital, Inc. | |
5.611% (SOFRINDX + 0.240%) due 03/03/2025 ~ | | $ | | | 2,100 | | | $ | | | 2,100 | |
| | | | | | | | | | |
Total Sovereign Issues (Cost $9,549) | | | | | | 9,368 | |
| | | | | | | | | | | | |
| |
| | | SHARES | | | | | | |
| COMMODITIES 11.8% | |
| | | | |
Gold Warehouse Receipts | | | | | 11,855 | | | | | | 27,468 | |
| | | | |
Silver Warehouse Receipts (a) | | | | | 279,050 | | | | | | 8,159 | |
| | | | | | | | | | | | |
Total Commodities (Cost $33,903) | | | 35,627 | |
| | | | |
| |
| | | | | PRINCIPAL
AMOUNT
(000S) | | | | | | |
| SHORT-TERM INSTRUMENTS 21.8% | |
| |
| REPURCHASE AGREEMENTS (e) 21.2% | |
| | | | | | | | $ | | | 64,067 | |
| | | | | | | | | | | | |
| |
| U.S. TREASURY BILLS 0.6% | |
5.374% due 07/16/2024 - 08/29/2024 (b)(c)(g) | | $ | | | 1,949 | | | | | | 1,944 | |
| | | | | | | | | | | | |
Total Short-Term Instruments
(Cost $66,012) | | | 66,011 | |
| | | | |
| | | | |
| | | | | | | | | | | | |
Total Investments in Securities
(Cost $300,587) | | | 302,410 | |
| | | | | | | | | | | | |
| |
| | | | | SHARES | | | | | | |
| INVESTMENTS IN AFFILIATES 6.7% | |
| |
| MUTUAL FUNDS (d) 6.7% | |
| | | | |
PIMCO Enhanced Short Maturity Active Exchange-Traded Fund | | | | | 201,575 | | | | | | 20,289 | |
| | | | | | | | | | | | |
| Total Mutual Funds (Cost $20,185) | | | 20,289 | |
| | | | |
| | | | |
| | | | | | | | | | | | |
Total Investments in Affiliates
(Cost $20,185) | | | 20,289 | |
| | | | |
| | | | | | | | | | | | |
Total Investments 106.7%
(Cost $320,772) | | | $ | | | 322,699 | |
| |
Financial Derivative
Instruments (f)(h) (0.8)% (Cost or Premiums, net $(167)) | | | | | | (2,407 | ) |
| |
| Other Assets and Liabilities, net (5.9)% | | | (17,790 | ) |
| | | | |
| Net Assets 100.0% | | | $ | | | 302,502 | |
| | | | | | | |
NOTES TO SCHEDULE OF INVESTMENTS:
| * | A zero balance may reflect actual amounts rounding to less than one thousand. |
| ~ | Variable or Floating rate security. Rate shown is the rate in effect as of period end. Certain variable rate securities are not based on a published reference rate and spread, rather are determined by the issuer or agent and are based on current market conditions. Reference rate is as of reset date, which may vary by security. These securities may not indicate a reference rate and/or spread in their description. |
| • | Rate shown is the rate in effect as of period end. The rate may be based on a fixed rate, a capped rate or a floor rate and may convert to a variable or floating rate in the future. These securities do not indicate a reference rate and spread in their description. |
| þ | Coupon represents a rate which changes periodically based on a predetermined schedule or event. Rate shown is the rate in effect as of period end. |
| (a) | Security did not produce income within the last twelve months. |
| (b) | Coupon represents a weighted average yield to maturity. |
| (d) | Institutional Class Shares of each Fund. |
| | | | | | | | | | | | |
| See Accompanying Notes | | | ANNUAL FINANCIAL AND OTHER INFORMATION | | | | | | | JUNE 30, 2024 | | | 135 |
| | | | | | |
| Consolidated Schedule of Investments | | PIMCO Commodity Strategy Active Exchange-Traded Fund | | (Cont.) | | |
BORROWINGS AND OTHER FINANCING TRANSACTIONS
(e) REPURCHASE AGREEMENTS:
| | | | | | | | | | | | | | | | | | | | | | | | | | | | | | |
| Counterparty | | Lending
Rate | | | Settlement
Date | | | Maturity
Date | | | Principal
Amount | | | Collateralized By | | Collateral
(Received) | | | Repurchase
Agreements,
at Value | | | Repurchase
Agreement
Proceeds
to be
Received(1) | |
| BOS | | | 5.220 | % | | | 06/28/2024 | | | | 07/01/2024 | | | $ | 8,400 | | | U.S. Treasury Bonds 2.000% due 11/15/2041 | | $ | (8,552 | ) | | $ | 8,400 | | | $ | 8,404 | |
| BPS | | | 5.340 | | | | 06/28/2024 | | | | 07/01/2024 | | | | 27,900 | | | U.S. Treasury Notes 0.625% due 07/31/2026 | | | (28,448 | ) | | | 27,900 | | | | 27,912 | |
| | | 5.400 | | | | 07/01/2024 | | | | 07/02/2024 | | | | 27,200 | | | U.S. Treasury Notes 1.375% due 11/15/2031 | | | (27,794 | ) | | | 27,200 | | | | 27,200 | |
| | | 5.440 | | | | 07/01/2024 | | | | 07/02/2024 | | | | 100 | | | U.S. Treasury Notes 0.500% due 05/31/2027 | | | (102 | ) | | | 100 | | | | 100 | |
| FICC | | | 2.600 | | | | 06/28/2024 | | | | 07/01/2024 | | | | 467 | | | U.S. Treasury Inflation Protected Securities 0.625% due 01/15/2026 | | | (476 | ) | | | 467 | | | | 467 | |
| | | | | | | | | | | | | | | | | | | | | | | | | | | | | | |
Total Repurchase Agreements | | | | | $ | (65,372 | ) | | $ | 64,067 | | | $ | 64,083 | |
| | | | | | | | | | | | | | | |
BORROWINGS AND OTHER FINANCING TRANSACTIONS SUMMARY
The following is a summary by counterparty of the market value of Borrowings and Other Financing Transactions and collateral pledged/(received) as of June 30, 2024:
| | | | | | | | | | | | | | | | | | | | | | | | | | | | |
| Counterparty | | Repurchase
Agreement
Proceeds
to be
Received(1) | | | Payable for
Reverse
Repurchase
Agreements | | | Payable for
Sale-Buyback
Transactions | | | Securities
Out on Loan | | | Total
Borrowings and
Other Financing
Transactions | | | Collateral
Pledged/(Received) | | | Net Exposure(2) | |
Global/Master Repurchase Agreement | |
BOS | | $ | 8,404 | | | $ | 0 | | | $ | 0 | | | $ | 0 | | | $ | 8,404 | | | $ | (8,552 | ) | | $ | (148 | ) |
BPS | | | 55,212 | | | | 0 | | | | 0 | | | | 0 | | | | 55,212 | | | | (56,344 | ) | | | (1,132 | ) |
FICC | | | 467 | | | | 0 | | | | 0 | | | | 0 | | | | 467 | | | | (476 | ) | | | (9 | ) |
| | | | | | | | | | | | | | | | | | | | | | | | | | | | |
Total Borrowings and Other Financing Transactions | | $ | 64,083 | | | $ | 0 | | | $ | 0 | | | $ | 0 | | | | | | | | | | | | | |
| | | | | | | | | | | | | | | | | | | | | | | | | | | | |
| (1) | Includes accrued interest. |
| (2) | Net Exposure represents the net receivable/(payable) that would be due from/to the counterparty in the event of default. Exposure from borrowings and other financing transactions can only be netted across transactions governed under the same master agreement with the same legal entity. See Note 8, Master Netting Arrangements, in the Notes to Financial Statements for more information. |
The average amount of borrowings outstanding during the period ended June 30, 2024 was $(162) at a weighted average interest rate of 5.389%. Average borrowings may include reverse repurchase agreements and sale-buyback transactions, if held during the period.
(f) FINANCIAL DERIVATIVE INSTRUMENTS: EXCHANGE-TRADED OR CENTRALLY CLEARED
PURCHASED OPTIONS:
COMMODITY OPTIONS
| | | | | | | | | | | | | | | | | | | | | | | | | | | | |
| Description | | Strike
Price | | | Expiration
Date | | | # of
Contracts | | | Notional
Amount | | | Cost | | | Market
Value | |
Call - CBOT Corn September 2024 Futures | | $ | 450.000 | | | | 08/23/2024 | | | | 27 | | | | | | | | 135 | | | $ | 14 | | | $ | 7 | |
| | | | | | | | | | | | | | | | | | | | | | | | | | | | |
Total Purchased Options | | | $ | 14 | | | $ | 7 | |
| | | | | | | | | |
WRITTEN OPTIONS:
COMMODITY OPTIONS
| | | | | | | | | | | | | | | | | | | | | | | | | | | | |
| Description | | Strike
Price | | | Expiration
Date | | | # of
Contracts | | | Notional
Amount | | | Premiums
(Received) | | | Market
Value | |
Put - CBOT Corn December 2024 Futures | | $ | 400.000 | | | | 11/22/2024 | | | | 83 | | | | | | | | 415 | | | $ | (31 | ) | | $ | (59 | ) |
Put - NYMEX Natural Gas September 2024 Futures | | | 2.800 | | | | 08/27/2024 | | | | 78 | | | | | | | | 780 | | | | (150 | ) | | | (277 | ) |
| | | | | | | | | | | | | | | | | | | | | | | | | | | | |
Total Written Options | | | $ | (181 | ) | | $ | (336 | ) |
| | | | | | | | | |
| | | | | | |
| 136 | | PIMCO ETF TRUST | | | See Accompanying Notes | |
FUTURES CONTRACTS:
LONG FUTURES CONTRACTS
| | | | | | | | | | | | | | | | | | | | | | | | | | | | |
| Description | | Expiration
Month | | | # of
Contracts | | | Notional
Amount | | | Unrealized
Appreciation/
(Depreciation) | | | Variation Margin | |
| | Asset | | | Liability | |
Aluminum January Futures | | | 01/2025 | | | | 186 | | | $ | | | | | 11,964 | | | $ | (83 | ) | | $ | 57 | | | $ | (137 | ) |
Aluminum July Futures | | | 07/2024 | | | | 5 | | | | | | | | 311 | | | | 16 | | | | 0 | | | | 0 | |
Aluminum November Futures | | | 11/2024 | | | | 190 | | | | | | | | 12,117 | | | | (258 | ) | | | 0 | | | | 0 | |
Aluminum September Futures | | | 09/2024 | | | | 58 | | | | | | | | 3,659 | | | | 50 | | | | 0 | | | | 0 | |
Arabica Coffee December Futures | | | 12/2024 | | | | 162 | | | | | | | | 13,638 | | | | 503 | | | | 18 | | | | 0 | |
Brent Crude March Futures | | | 01/2025 | | | | 518 | | | | | | | | 42,144 | | | | 1,109 | | | | 0 | | | | (155 | ) |
Brent Crude October Futures | | | 08/2024 | | | | 38 | | | | | | | | 3,199 | | | | (8 | ) | | | 0 | | | | (10 | ) |
California Carbon Allowance December Futures | | | 12/2024 | | | | 224 | | | | | | | | 8,478 | | | | (179 | ) | | | 22 | | | | 0 | |
California Carbon Allowance December Futures | | | 12/2025 | | | | 73 | | | | | | | | 2,950 | | | | 105 | | | | 9 | | | | 0 | |
Cocoa December Futures | | | 12/2024 | | | | 21 | | | | | | | | 1,384 | | | | 112 | | | | 75 | | | | 0 | |
Copper August Futures | | | 08/2024 | | | | 24 | | | | | | | | 5,728 | | | | 8 | | | | 8 | | | | 0 | |
Copper December Futures | | | 12/2024 | | | | 74 | | | | | | | | 8,160 | | | | (348 | ) | | | 75 | | | | 0 | |
Copper July Futures | | | 07/2024 | | | | 105 | | | | | | | | 24,910 | | | | (1,087 | ) | | | 0 | | | | (680 | ) |
Copper Septmeber Futures | | | 09/2024 | | | | 39 | | | | | | | | 9,352 | | | | (219 | ) | | | 29 | | | | (149 | ) |
Corn December Futures | | | 12/2024 | | | | 137 | | | | | | | | 2,882 | | | | (275 | ) | | | 0 | | | | (88 | ) |
Cotton No. 2 December Futures | | | 12/2024 | | | | 344 | | | | | | | | 12,503 | | | | (99 | ) | | | 0 | | | | (320 | ) |
European Climate Exchange December Futures | | | 12/2024 | | | | 36 | | | | | | | | 2,601 | | | | 160 | | | | 31 | | | | (10 | ) |
Gas Oil December Futures | | | 12/2024 | | | | 157 | | | | | | | | 12,132 | | | | (137 | ) | | | 0 | | | | (75 | ) |
Gold 100 oz. December Futures | | | 12/2024 | | | | 62 | | | | | | | | 14,791 | | | | (61 | ) | | | 20 | | | | 0 | |
Hard Red Winter Wheat December Futures | | | 12/2024 | | | | 56 | | | | | | | | 1,689 | | | | (343 | ) | | | 0 | | | | (23 | ) |
Iron Ore September Futures | | | 09/2024 | | | | 430 | | | | | | | | 4,559 | | | | (370 | ) | | | 39 | | | | 0 | |
Lean Hogs December Futures | | | 12/2024 | | | | 209 | | | | | | | | 5,839 | | | | (464 | ) | | | 68 | | | | 0 | |
Live Cattle October Futures | | | 10/2024 | | | | 59 | | | | | | | | 4,363 | | | | 66 | | | | 0 | | | | (21 | ) |
Natural Gas January Futures | | | 12/2024 | | | | 92 | | | | | | | | 3,518 | | | | (161 | ) | | | 0 | | | | (35 | ) |
Natural Gas September Futures | | | 08/2024 | | | | 117 | | | | | | | | 3,040 | | | | (309 | ) | | | 0 | | | | (90 | ) |
New York Harbor December Futures | | | 11/2024 | | | | 82 | | | | | | | | 8,788 | | | | (61 | ) | | | 0 | | | | (68 | ) |
Nickel January Futures | | | 01/2025 | | | | 77 | | | | | | | | 8,141 | | | | (145 | ) | | | 18 | | | | (157 | ) |
Nickel July Futures | | | 07/2024 | | | | 27 | | | | | | | | 2,769 | | | | (88 | ) | | | 0 | | | | 0 | |
Nickel November Futures | | | 11/2024 | | | | 78 | | | | | | | | 8,169 | | | | (767 | ) | | | 0 | | | | 0 | |
Nickel September Futures | | | 09/2024 | | | | 60 | | | | | | | | 6,218 | | | | (537 | ) | | | 1 | | | | (336 | ) |
RBOB Gasoline December Futures | | | 11/2024 | | | | 261 | | | | | | | | 23,960 | | | | (412 | ) | | | 0 | | | | (165 | ) |
Silver December Futures | | | 12/2024 | | | | 38 | | | | | | | | 5,698 | | | | 223 | | | | 58 | | | | 0 | |
Silver July Futures | | | 07/2024 | | | | 31 | | | | | | | | 4,532 | | | | 44 | | | | 49 | | | | 0 | |
Soybean January Futures | | | 01/2025 | | | | 133 | | | | | | | | 7,435 | | | | (246 | ) | | | 2 | | | | 0 | |
Soybean Meal December Futures | | | 12/2024 | | | | 212 | | | | | | | | 7,113 | | | | (723 | ) | | | 0 | | | | (63 | ) |
Soybean November Futures | | | 11/2024 | | | | 157 | | | | | | | | 8,666 | | | | (754 | ) | | | 0 | | | | (6 | ) |
Sugar No. 11 March Futures | | | 02/2025 | | | | 291 | | | | | | | | 6,711 | | | | 494 | | | | 46 | | | | 0 | |
Sugar No. 11 October Futures | | | 09/2024 | | | | 86 | | | | | | | | 1,955 | | | | 15 | | | | 9 | | | | 0 | |
WTI Crude December Futures | | | 11/2024 | | | | 358 | | | | | | | | 28,046 | | | | (42 | ) | | | 0 | | | | (93 | ) |
Zinc January Futures | | | 01/2025 | | | | 22 | | | | | | | | 1,632 | | | | 23 | | | | 22 | | | | 0 | |
Zinc July Futures | | | 07/2024 | | | | 6 | | | | | | | | 434 | | | | 43 | | | | 0 | | | | 0 | |
Zinc November Futures | | | 11/2024 | | | | 65 | | | | | | | | 4,804 | | | | 91 | | | | 0 | | | | 0 | |
Zinc September Futures | | | 09/2024 | | | | 15 | | | | | | | | 1,101 | | | | 101 | | | | 0 | | | | 0 | |
| | | | | | | | | | | | | | | | | | | | | | | | | | | | |
| | | | | | | | | | | | | | | | | | $ | (5,013 | ) | | $ | 656 | | | $ | (2,681 | ) |
| | | | | | | | | | | | | | | | | | | | | | | | | | | | |
| SHORT FUTURES CONTRACTS | | | | | | | | | | | | | | | | | | | | | |
| | | | | |
| Description | | Expiration
Month | | | # of
Contracts | | | Notional
Amount | | | Unrealized
Appreciation/
(Depreciation) | | | Variation Margin | |
| | Asset | | | Liability | |
Aluminum January Futures | | | 01/2025 | | | | 1 | | | $ | | | | | (64 | ) | | $ | (1 | ) | | $ | 0 | | | $ | 0 | |
Aluminum July Futures | | | 07/2024 | | | | 5 | | | | | | | | (311 | ) | | | (29 | ) | | | 0 | | | | 0 | |
Aluminum November Futures | | | 11/2024 | | | | 190 | | | | | | | | (12,117 | ) | | | 127 | | | | 0 | | | | 0 | |
Aluminum September Futures | | | 09/2024 | | | | 58 | | | | | | | | (3,659 | ) | | | 116 | | | | 0 | | | | 0 | |
Cocoa September Futures | | | 09/2024 | | | | 21 | | | | | | | | (1,624 | ) | | | 6 | | | | 0 | | | | (96 | ) |
Copper July Futures | | | 07/2024 | | | | 38 | | | | | | | | (9,015 | ) | | | (37 | ) | | | 0 | | | | 0 | |
Copper September Futures | | | 09/2024 | | | | 213 | | | | | | | | (23,385 | ) | | | 60 | | | | 0 | | | | (229 | ) |
Copper Septmeber Futures | | | 09/2024 | | | | 10 | | | | | | | | (2,398 | ) | | | 127 | | | | 0 | | | | 0 | |
Gold 100 oz. August Futures | | | 08/2024 | | | | 105 | | | | | | | | (24,566 | ) | | | 46 | | | | 0 | | | | (31 | ) |
Natural Gas August Futures | | | 07/2024 | | | | 30 | | | | | | | | (780 | ) | | | 77 | | | | 25 | | | | 0 | |
Nickel January Futures | | | 01/2025 | | | | 1 | | | | | | | | (106 | ) | | | 2 | | | | 0 | | | | 0 | |
Nickel July Futures | | | 07/2024 | | | | 27 | | | | | | | | (2,769 | ) | | | 437 | | | | 0 | | | | 0 | |
Nickel November Futures | | | 11/2024 | | | | 78 | | | | | | | | (8,169 | ) | | | 265 | | | | 0 | | | | 0 | |
Nickel September Futures | | | 09/2024 | | | | 32 | | | | | | | | (3,316 | ) | | | 236 | | | | 0 | | | | 0 | |
RBOB Gasoline October Futures | | | 09/2024 | | | | 38 | | | | | | | | (3,645 | ) | | | 27 | | | | 30 | | | | 0 | |
Silver September Futures | | | 09/2024 | | | | 82 | | | | | | | | (12,120 | ) | | | (112 | ) | | | 0 | | | | (125 | ) |
| | | | | | | | | | | | |
| See Accompanying Notes | | | ANNUAL FINANCIAL AND OTHER INFORMATION | | | | | | | JUNE 30, 2024 | | | 137 |
| | | | | | |
| Consolidated Schedule of Investments | | PIMCO Commodity Strategy Active Exchange-Traded Fund | | (Cont.) | | |
| | | | | | | | | | | | | | | | | | | | | | | | | | | | |
| Description | | Expiration
Month | | | # of
Contracts | | | Notional
Amount | | | Unrealized
Appreciation/
(Depreciation) | | | Variation Margin | |
| | Asset | | | Liability | |
U.S. Treasury 2-Year Note September Futures | | | 09/2024 | | | | 10 | | | $ | | | | | (2,042 | ) | | $ | (6 | ) | | $ | 0 | | | $ | 0 | |
U.S. Treasury 5-Year Note September Futures | | | 09/2024 | | | | 95 | | | | | | | | (10,125 | ) | | | (43 | ) | | | 10 | | | | 0 | |
U.S. Treasury 10-Year Ultra Long-Term Bond September Futures | | | 09/2024 | | | | 18 | | | | | | | | (2,044 | ) | | | (20 | ) | | | 9 | | | | 0 | |
Wheat December Futures | | | 12/2024 | | | | 56 | | | | | | | | (1,672 | ) | | | (33 | ) | | | 13 | | | | 0 | |
Zinc January Futures | | | 01/2025 | | | | 11 | | | | | | | | (816 | ) | | | (46 | ) | | | 0 | | | | 0 | |
Zinc July Futures | | | 07/2024 | | | | 6 | | | | | | | | (434 | ) | | | (50 | ) | | | 0 | | | | 0 | |
Zinc November Futures | | | 11/2024 | | | | 65 | | | | | | | | (4,804 | ) | | | (177 | ) | | | 0 | | | | 0 | |
Zinc September Futures | | | 09/2024 | | | | 15 | | | | | | | | (1,101 | ) | | | (78 | ) | | | 0 | | | | 0 | |
| | | | | | | | | | | | | | | | | | | | | | | | | | | | |
| | | | | | | | | | | | | | | | | | $ | 894 | | | $ | 87 | | | $ | (481 | ) |
| | | | | | | | | | | | | | | | | | | | | | | | | | | | |
Total Futures Contracts | | | $ | (4,119 | ) | | $ | 743 | | | $ | (3,162 | ) |
| | | | | | | | | | | | | |
FINANCIAL DERIVATIVE INSTRUMENTS: EXCHANGE-TRADED OR CENTRALLY CLEARED SUMMARY
The following is a summary of the market value and variation margin of Exchange-Traded or Centrally Cleared Financial Derivative Instruments as of June 30, 2024:
| | | | | | | | | | | | | | | | | | | | | | | | | | | | | | | | | | | | |
| | | Financial Derivative Assets | | | | | | Financial Derivative Liabilities | |
| | | Market Value | | | Variation Margin
Asset(1) | | | | | | | | | Market Value | | | Variation Margin
Liability(1) | | | | |
| | | Purchased
Options | | | Futures | | | Swap
Agreements | | | Total | | | | | | Written
Options | | | Futures | | | Swap
Agreements | | | Total | |
Total Exchange-Traded or Centrally Cleared | | $ | 7 | | | $ | 750 | | | $ | 0 | | | $ | 757 | | | | | | | $ | (336) | | | $ | (3,376) | | | $ | 0 | | | $ | (3,712) | |
| | | | | | | | | | | | | | | | | | | | | | | | | | | | | | | | | | | | |
| (g) | Securities with an aggregate market value of $996 and cash of $18,938 have been pledged as collateral for exchange-traded and centrally cleared financial derivative instruments as of June 30, 2024. See Note 8, Master Netting Arrangements, in the Notes to Financial Statements for more information. |
| (1) | Unsettled variation margin asset of $7 and liability of $(214) for closed futures is outstanding at period end. |
(h) FINANCIAL DERIVATIVE INSTRUMENTS: OVER THE COUNTER
FORWARD FOREIGN CURRENCY CONTRACTS:
| | | | | | | | | | | | | | | | | | | | | | | | |
| Counterparty | | Settlement
Month | | | Currency to
be Delivered | | | Currency to
be Received | | | Unrealized Appreciation/ (Depreciation) | |
| | Asset | | | Liability | |
BOA | | | 04/2025 | | | BRL | | | 15,000 | | | $ | | | 2,717 | | | $ | 116 | | | $ | 0 | |
| | | | | | | |
BPS | | | 07/2024 | | | EUR | | | 134 | | | | | | 145 | | | | 2 | | | | 0 | |
| | | 07/2024 | | | $ | | | 5,593 | | | AUD | | | 8,394 | | | | 7 | | | | 0 | |
| | | 07/2024 | | | | | | 2,048 | | | EUR | | | 1,915 | | | | 3 | | | | 0 | |
| | | 08/2024 | | | AUD | | | 8,394 | | | $ | | | 5,598 | | | | 0 | | | | (7 | ) |
| | | 08/2024 | | | EUR | | | 1,915 | | | | | | 2,051 | | | | 0 | | | | (2 | ) |
| | | | | | | |
BRC | | | 07/2024 | | | $ | | | 2,097 | | | AUD | | | 3,168 | | | | 17 | | | | 0 | |
| | | 08/2024 | | | EUR | | | 386 | | | $ | | | 414 | | | | 0 | | | | 0 | |
| | | | | | | |
CBK | | | 07/2024 | | | AUD | | | 3,999 | | | | | | 2,661 | | | | 0 | | | | (7 | ) |
| | | 07/2024 | | | BRL | | | 2,201 | | | | | | 396 | | | | 2 | | | | 0 | |
| | | 07/2024 | | | $ | | | 404 | | | BRL | | | 2,201 | | | | 0 | | | | (10 | ) |
| | | 08/2024 | | | BRL | | | 2,208 | | | $ | | | 404 | | | | 10 | | | | 0 | |
| | | | | | | |
FAR | | | 07/2024 | | | AUD | | | 6,049 | | | | | | 4,030 | | | | 0 | | | | (5 | ) |
| | | | | | | |
GLM | | | 07/2024 | | | | | | 1,008 | | | | | | 671 | | | | 0 | | | | (2 | ) |
| | | 07/2024 | | | BRL | | | 12,800 | | | | | | 2,481 | | | | 191 | | | | 0 | |
| | | 07/2024 | | | EUR | | | 74 | | | | | | 79 | | | | 0 | | | | 0 | |
| | | 07/2024 | | | $ | | | 2,369 | | | BRL | | | 12,800 | | | | 0 | | | | (79 | ) |
| | | 07/2024 | | | | | | 20 | | | EUR | | | 18 | | | | 0 | | | | 0 | |
| | | 04/2025 | | | BRL | | | 13,700 | | | $ | | | 2,459 | | | | 83 | | | | 0 | |
| | | | | | | |
JPM | | | 07/2024 | | | | | | 6,896 | | | | | | 1,354 | | | | 120 | | | | 0 | |
| | | 07/2024 | | | EUR | | | 139 | | | | | | 151 | | | | 2 | | | | 0 | |
| | | 07/2024 | | | $ | | | 1,241 | | | BRL | | | 6,896 | | | | 0 | | | | (8 | ) |
| | | 07/2024 | | | | | | 1,444 | | | CHF | | | 1,296 | | | | 0 | | | | (2 | ) |
| | | 08/2024 | | | CHF | | | 1,291 | | | $ | | | 1,444 | | | | 2 | | | | 0 | |
| | | 09/2024 | | | $ | | | 368 | | | BRL | | | 2,009 | | | | 0 | | | | (11 | ) |
| | | 04/2025 | | | BRL | | | 200 | | | $ | | | 36 | | | | 1 | | | | 0 | |
| | | | | | | |
MBC | | | 07/2024 | | | AUD | | | 506 | | | | | | 337 | | | | 0 | | | | (1 | ) |
| | | 07/2024 | | | EUR | | | 1,915 | | | | | | 2,084 | | | | 33 | | | | 0 | |
| | | | | | |
| 138 | | PIMCO ETF TRUST | | | See Accompanying Notes | |
| | | | | | | | | | | | | | | | | | | | | | | | |
| Counterparty | | Settlement
Month | | | Currency to
be Delivered | | | Currency to
be Received | | | Unrealized Appreciation/ (Depreciation) | |
| | Asset | | | Liability | |
| | | | | | | |
MYI | | | 07/2024 | | | CHF | | | 1,297 | | | $ | | | 1,436 | | | $ | 0 | | | $ | (8 | ) |
| | | 07/2024 | | | EUR | | | 118 | | | | | | 126 | | | | 0 | | | | 0 | |
| | | 07/2024 | | | $ | | | 65 | | | EUR | | | 61 | | | | 0 | | | | 0 | |
| | | | | | | |
RYL | | | 01/2025 | | | DKK | | | 29,100 | | | $ | | | 4,265 | | | | 40 | | | | 0 | |
| | | | | | | | | | | | | | | | | | | | | | | | |
Total Forward Foreign Currency Contracts | | | $ | 629 | | | $ | (142 | ) |
| | | | | | | | | |
SWAP AGREEMENTS:
TOTAL RETURN SWAPS ON COMMODITY INDICES
| | | | | | | | | | | | | | | | | | | | | | | | | | | | | | | | | | | | |
| Counterparty | | Pay/Receive(1) | | Underlying Reference | | # of Units | | | Financing Rate | | Payment
Frequency | | Maturity
Date | | | Notional
Amount | | | Premiums
Paid/(Received) | | | Unrealized
Appreciation/
(Depreciation) | | | Swap Agreements,
at Value | |
| | Asset | | | Liability | |
| CIB | | Receive | | PIMCODB Index(3) | | | 22,397 | | | 0.000% | | Monthly | | | 02/18/2025 | | | $ | 4,493 | | | $ | 0 | | | $ | 21 | | | $ | 21 | | | $ | 0 | |
| GST | | Receive | | PIMCODB Index(4) | | | 58,549 | | | 0.000% | | Monthly | | | 02/18/2025 | | | | 6,108 | | | | 0 | | | | 29 | | | | 29 | | | | 0 | |
| JPM | | Receive | | JMABNIC5 Index(5) | | | 29,696 | | | 0.000% | | Monthly | | | 02/18/2025 | | | | 5,505 | | | | 0 | | | | 11 | | | | 11 | | | | 0 | |
| | | | | | | | | | | | | | | | | | | | | | | | | | | | | | | | | | | | |
Total Swap Agreements | | | $ | 0 | | | $ | 61 | | | $ | 61 | | | $ | 0 | |
| | | | | | | | | | | | | | | | | |
FINANCIAL DERIVATIVE INSTRUMENTS: OVER THE COUNTER SUMMARY
The following is a summary by counterparty of the market value of OTC financial derivative instruments and collateral pledged/(received) as of June 30, 2024:
| | | | | | | | | | | | | | | | | | | | | | | | | | | | | | | | | | | | | | | | | | | | | | | | |
| | | Financial Derivative Assets | | | | | | Financial Derivative Liabilities | | | | | | | | | | |
| Counterparty | | Forward
Foreign
Currency
Contracts | | | Purchased
Options | | | Swap
Agreements | | | Total
Over the
Counter | | | | | | Forward
Foreign
Currency
Contracts | | | Written
Options | | | Swap
Agreements | | | Total
Over the
Counter | | | Net Market
Value of OTC
Derivatives | | | Collateral
Pledged/
(Received) | | | Net
Exposure(2) | |
BOA | | $ | 116 | | | $ | 0 | | | $ | 0 | | | $ | 116 | | | | | | | $ | 0 | | | $ | 0 | | | $ | 0 | | | $ | 0 | | | $ | 116 | | | $ | 0 | | | $ | 116 | |
BPS | | | 12 | | | | 0 | | | | 0 | | | | 12 | | | | | | | | (9 | ) | | | 0 | | | | 0 | | | | (9 | ) | | | 3 | | | | 0 | | | | 3 | |
BRC | | | 17 | | | | 0 | | | | 0 | | | | 17 | | | | | | | | 0 | | | | 0 | | | | 0 | | | | 0 | | | | 17 | | | | 0 | | | | 17 | |
CBK | | | 12 | | | | 0 | | | | 0 | | | | 12 | | | | | | | | (17 | ) | | | 0 | | | | 0 | | | | (17 | ) | | | (5 | ) | | | 0 | | | | (5 | ) |
CIB | | | 0 | | | | 0 | | | | 21 | | | | 21 | | | | | | | | 0 | | | | 0 | | | | 0 | | | | 0 | | | | 21 | | | | 0 | | | | 21 | |
FAR | | | 0 | | | | 0 | | | | 0 | | | | 0 | | | | | | | | (5 | ) | | | 0 | | | | 0 | | | | (5 | ) | | | (5 | ) | | | 0 | | | | (5 | ) |
GLM | | | 274 | | | | 0 | | | | 0 | | | | 274 | | | | | | | | (81 | ) | | | 0 | | | | 0 | | | | (81 | ) | | | 193 | | | | 0 | | | | 193 | |
GST | | | 0 | | | | 0 | | | | 29 | | | | 29 | | | | | | | | 0 | | | | 0 | | | | 0 | | | | 0 | | | | 29 | | | | (70 | ) | | | (41 | ) |
JPM | | | 125 | | | | 0 | | | | 11 | | | | 136 | | | | | | | | (21 | ) | | | 0 | | | | 0 | | | | (21 | ) | | | 115 | | | | 0 | | | | 115 | |
MBC | | | 33 | | | | 0 | | | | 0 | | | | 33 | | | | | | | | (1 | ) | | | 0 | | | | 0 | | | | (1 | ) | | | 32 | | | | 0 | | | | 32 | |
MYI | | | 0 | | | | 0 | | | | 0 | | | | 0 | | | | | | | | (8 | ) | | | 0 | | | | 0 | | | | (8 | ) | | | (8 | ) | | | 0 | | | | (8 | ) |
RYL | | | 40 | | | | 0 | | | | 0 | | | | 40 | | | | | | | | 0 | | | | 0 | | | | 0 | | | | 0 | | | | 40 | | | | 0 | | | | 40 | |
| | | | | | | | | | | | | | | | | | | | | | | | | | | | | | | | | | | | | | | | | | | | | | | | |
Total Over the Counter | | $ | 629 | | | $ | 0 | | | $ | 61 | | | $ | 690 | | | | | | | $ | (142 | ) | | $ | 0 | | | $ | 0 | | | $ | (142 | ) | | | | | | | | | | | | |
| | | | | | | | | | | | | | | | | | | | | | | | | | | | | | | | | | | | | | | | | | | | | | | | |
| (1) | Receive represents that the Fund receives payments for any positive net return on the underlying reference. The Fund makes payments for any negative net return on such underlying reference. Pay represents that the Fund receives payments for any negative net return on the underlying reference. The Fund makes payments for any positive net return on such underlying reference. |
| (2) | Net Exposure represents the net receivable/(payable) that would be due from/to the counterparty in the event of default. Exposure from OTC financial derivative instruments can only be netted across transactions governed under the same master agreement with the same legal entity. See Note 8, Master Netting Arrangements, in the Notes to Financial Statements for more information. |
| (3) | The following table represents the individual positions within the total return swap as of June 30, 2024: |
| | | | | | | | |
| Referenced Commodity — Long Futures Contracts | | % of Index | | | Notional Amount* | |
Aluminum November 2024 Futures | | | 5.7 | % | | $ | 255 | |
Arabica Coffee December 2024 Futures | | | 6.4 | | | | 289 | |
Brent Crude January 2025 Futures | | | 13.8 | | | | 620 | |
Copper December 2024 Futures | | | 3.9 | | | | 175 | |
Corn December 2024 Futures | | | 1.4 | | | | 61 | |
Cotton No. 02 December 2024 Futures | | | 5.5 | | | | 245 | |
Gas Oil November 2024 Futures | | | 4.8 | | | | 216 | |
Gold 100 oz. December 2024 Futures | | | 1.3 | | | | 58 | |
Lean Hogs December 2024 Futures | | | 2.8 | | | | 126 | |
New York Harbor ULSD November 2024 Futures | | | 2.8 | | | | 126 | |
Nickel November 2024 Futures | | | 3.9 | | | | 174 | |
NYMEX — Natural Gas November 2024 Futures | | | 1.6 | | | | 71 | |
RBOB Gasoline November 2024 Futures | | | 9.9 | | | | 447 | |
Silver December 2024 Futures | | | 2.7 | | | | 123 | |
Soybeans November 2024 Futures | | | 3.5 | | | | 158 | |
| | | | | | | | | | | | |
| See Accompanying Notes | | | ANNUAL FINANCIAL AND OTHER INFORMATION | | | | | | | JUNE 30, 2024 | | | 139 |
| | | | | | |
| Consolidated Schedule of Investments | | PIMCO Commodity Strategy Active Exchange-Traded Fund
| | (Cont.) | | |
| | | | | | | | |
| Referenced Commodity — Long Futures Contracts | | % of Index | | | Notional Amount* | |
Sugar No. 11 March 2025 Futures | | | 3.3 | % | | | 149 | |
WTI Crude November 2024 Futures | | | 13.5 | | | | 606 | |
Zinc November 2024 Futures | | | 0.4 | | | | 18 | |
| | | | | | | | |
Total Long Futures Contracts | | | | | | $ | 3,917 | |
| | | | | | | | |
Cash | | | 12.8 | % | | $ | 576 | |
| | | | | | | | |
Total Notional Amount | | | | | | $ | 4,493 | |
| | | | | | | | |
| * | The notional amount is indicative of the quantity and proportionate value of each commodity futures contract. |
| (4) | The following table represents the individual positions within the total return swap as of June 30, 2024: |
| | | | | | | | |
| Referenced Commodity — Long Futures Contracts | | % of Index | | | Notional Amount* | |
Aluminum November 2024 Futures | | | 5.7 | % | | $ | 348 | |
Arabica Coffee December 2024 Futures | | | 6.3 | | | | 384 | |
Brent Crude December 2024 Futures | | | 13.8 | | | | 843 | |
Copper December 2024 Futures | | | 3.9 | | | | 236 | |
Corn December 2024 Futures | | | 1.3 | | | | 81 | |
Cotton No. 02 December 2024 Futures | | | 5.5 | | | | 343 | |
Gas Oil November 2024 Futures | | | 4.9 | | | | 297 | |
Gold 100 oz. December 2024 Futures | | | 1.3 | | | | 79 | |
Lean Hogs December 2024 Futures | | | 2.8 | | | | 171 | |
New York Harbor ULSD November 2024 Futures | | | 2.8 | | | | 171 | |
Nickel November 2024 Futures | | | 3.9 | | | | 236 | |
NYMEX — Natural Gas November 2024 Futures | | | 1.6 | | | | 96 | |
RBOB Gasoline November 2024 Futures | | | 10.0 | | | | 610 | |
Silver December 2024 Futures | | | 2.7 | | | | 164 | |
Soybeans November 2024 Futures | | | 3.5 | | | | 213 | |
Sugar No. 11 March 2025 Futures | | | 3.3 | | | | 202 | |
WTI Crude November 2024 Futures | | | 13.5 | | | | 823 | |
Zinc November 2024 Futures | | | 0.4 | | | | 25 | |
| | | | | | | | |
Total Long Futures Contracts | | | | | | $ | 5,322 | |
| | | | | | | | |
Cash | | | 12.8 | % | | $ | 786 | |
| | | | | | | | |
Total Notional Amount | | | | | | $ | 6,108 | |
| | | | | | | | |
| * | The notional amount is indicative of the quantity and proportionate value of each commodity futures contract. |
| (5) | The following table represents the individual positions within the total return swap as of June 30, 2024: |
| | | | | | | | |
| Referenced Commodity — Long Futures Contracts | | % of Index | | | Notional Amount* | |
Brent Crude December 2024 Futures | | | 19.3 | % | | $ | 1,065 | |
Cotton No. 02 December 2024 Futures | | | 1.5 | | | | 84 | |
Gas Oil November 2024 Futures | | | 3.1 | | | | 170 | |
Gold 100 oz. August 2024 Futures | | | 17.5 | | | | 961 | |
Live Cattle August 2024 Futures | | | 6.4 | | | | 351 | |
LME — Copper August 2024 Futures | | | 7.8 | | | | 430 | |
New York Harbor ULSD November 2024 Futures | | | 4.3 | | | | 237 | |
Nickel August 2024 Futures | | | 4.2 | | | | 232 | |
RBOB Gasoline November 2024 Futures | | | 4.7 | | | | 261 | |
Silver September 2024 Futures | | | 6.1 | | | | 333 | |
Soybean Meal December 2024 Futures | | | 10.0 | | | | 552 | |
Soybeans November 2024 Futures | | | 12.2 | | | | 671 | |
Sugar No. 11 October 2024 Futures | | | 2.9 | | | | 158 | |
| | | | | | | | |
Total Long Futures Contracts | | | | | | $ | 5,505 | |
| | | | | | | | |
Total Notional Amount | | | | | | $ | 5,505 | |
| | | | | | | | |
| * | The notional amount is indicative of the quantity and proportionate value of each commodity futures contract. |
| | | | | | |
| 140 | | PIMCO ETF TRUST | | | See Accompanying Notes | |
FAIR VALUE OF FINANCIAL DERIVATIVE INSTRUMENTS
The following is a summary of the fair valuation of the Fund’s derivative instruments categorized by risk exposure. See Note 7, Principal and Other Risks, in the Notes to Financial Statements on risks of the Fund.
Fair Values of Financial Derivative Instruments on the Statements of Assets and Liabilities as of June 30, 2024:
| | | | | | | | | | | | | | | | | | | | | | | | |
| | | Derivatives not accounted for as hedging instruments | |
| | | Commodity
Contracts | | | Credit
Contracts | | | Equity
Contracts | | | Foreign
Exchange
Contracts | | | Interest
Rate Contracts | | | Total | |
Financial Derivative Instruments - Assets | |
Exchange-traded or centrally cleared | |
Purchased Options | | $ | 7 | | | $ | 0 | | | $ | 0 | | | $ | 0 | | | $ | 0 | | | $ | 7 | |
Futures | | | 731 | | | | 0 | | | | 0 | | | | 0 | | | | 19 | | | | 750 | |
| | | | | | | | | | | | | | | | | | | | | | | | |
| | $ | 738 | | | $ | 0 | | | $ | 0 | | | $ | 0 | | | $ | 19 | | | $ | 757 | |
| | | | | | | | | | | | | | | | | | | | | | | | |
Over the counter | |
Forward Foreign Currency Contracts | | $ | 0 | | | $ | 0 | | | $ | 0 | | | $ | 629 | | | $ | 0 | | | $ | 629 | |
Swap Agreements | | | 61 | | | | 0 | | | | 0 | | | | 0 | | | | 0 | | | | 61 | |
| | | | | | | | | | | | | | | | | | | | | | | | |
| | $ | 61 | | | $ | 0 | | | $ | 0 | | | $ | 629 | | | $ | 0 | | | $ | 690 | |
| | | | | | | | | | | | | | | | | | | | | | | | |
| | $ | 799 | | | $ | 0 | | | $ | 0 | | | $ | 629 | | | $ | 19 | | | $ | 1,447 | |
| | | | | | | | | | | | | | | | | | | | | | | | |
|
Financial Derivative Instruments - Liabilities | |
Exchange-traded or centrally cleared | |
Written Options | | $ | 336 | | | $ | 0 | | | $ | 0 | | | $ | 0 | | | $ | 0 | | | $ | 336 | |
Futures | | | 3,372 | | | | 0 | | | | 0 | | | | 0 | | | | 4 | | | | 3,376 | |
| | | | | | | | | | | | | | | | | | | | | | | | |
| | $ | 3,708 | | | $ | 0 | | | $ | 0 | | | $ | 0 | | | $ | 4 | | | $ | 3,712 | |
| | | | | | | | | | | | | | | | | | | | | | | | |
Over the counter | |
Forward Foreign Currency Contracts | | $ | 0 | | | $ | 0 | | | $ | 0 | | | $ | 142 | | | $ | 0 | | | $ | 142 | |
| | | | | | | | | | | | | | | | | | | | | | | | |
| | $ | 3,708 | | | $ | 0 | | | $ | 0 | | | $ | 142 | | | $ | 4 | | | $ | 3,854 | |
| | | | | | | | | | | | | | | | | | | | | | | | |
The effect of Financial Derivative Instruments on the Statements of Operations for the period ended June 30, 2024:
| | | | | | | | | | | | | | | | | | | | | | | | |
| | | Derivatives not accounted for as hedging instruments | |
| | | Commodity
Contracts | | | Credit
Contracts | | | Equity
Contracts | | | Foreign
Exchange
Contracts | | | Interest
Rate Contracts | | | Total | |
Net Realized Gain (Loss) on Financial Derivative Instruments | |
Exchange-traded or centrally cleared | |
Purchased Options | | $ | (180 | ) | | $ | 0 | | | $ | 0 | | | $ | 0 | | | $ | 0 | | | $ | (180 | ) |
Written Options | | | 731 | | | | 0 | | | | 0 | | | | 0 | | | | 0 | | | | 731 | |
Futures | | | 10,930 | | | | 0 | | | | 0 | | | | 0 | | | | 134 | | | | 11,064 | |
| | | | | | | | | | | | | | | | | | | | | | | | |
| | $ | 11,481 | | | $ | 0 | | | $ | 0 | | | $ | 0 | | | $ | 134 | | | $ | 11,615 | |
| | | | | | | | | | | | | | | | | | | | | | | | |
Over the counter | |
Forward Foreign Currency Contracts | | $ | 0 | | | $ | 0 | | | $ | 0 | | | $ | (111 | ) | | $ | 0 | | | $ | (111 | ) |
Swap Agreements | | | 1,260 | | | | 0 | | | | 0 | | | | 0 | | | | 0 | | | | 1,260 | |
| | | | | | | | | | | | | | | | | | | | | | | | |
| | $ | 1,260 | | | $ | 0 | | | $ | 0 | | | $ | (111 | ) | | $ | 0 | | | $ | 1,149 | |
| | | | | | | | | | | | | | | | | | | | | | | | |
| | $ | 12,741 | | | $ | 0 | | | $ | 0 | | | $ | (111 | ) | | $ | 134 | | | $ | 12,764 | |
| | | | | | | | | | | | | | | | | | | | | | | | |
|
Net Change in Unrealized Appreciation (Depreciation) on Financial Derivative Instruments | |
Exchange-traded or centrally cleared | |
Purchased Options | | $ | (7 | ) | | $ | 0 | | | $ | 0 | | | $ | 0 | | | $ | 0 | | | $ | (7 | ) |
Written Options | | | (163 | ) | | | 0 | | | | 0 | | | | 0 | | | | 0 | | | | (163 | ) |
Futures | | | (3,268 | ) | | | 0 | | | | 0 | | | | 0 | | | | (69 | ) | | | (3,337 | ) |
| | | | | | | | | | | | | | | | | | | | | | | | |
| | $ | (3,438 | ) | | $ | 0 | | | $ | 0 | | | $ | 0 | | | $ | (69 | ) | | $ | (3,507 | ) |
| | | | | | | | | | | | | | | | | | | | | | | | |
Over the counter | |
Forward Foreign Currency Contracts | | $ | 0 | | | $ | 0 | | | $ | 0 | | | $ | 489 | | | $ | 0 | | | $ | 489 | |
Swap Agreements | | | 161 | | | | 0 | | | | 0 | | | | 0 | | | | 0 | | | | 161 | |
| | | | | | | | | | | | | | | | | | | | | | | | |
| | $ | 161 | | | $ | 0 | | | $ | 0 | | | $ | 489 | | | $ | 0 | | | $ | 650 | |
| | | | | | | | | | | | | | | | | | | | | | | | |
| | $ | (3,277 | ) | | $ | 0 | | | $ | 0 | | | $ | 489 | | | $ | (69 | ) | | $ | (2,857 | ) |
| | | | | | | | | | | | | | | | | | | | | | | | |
| | | | | | | | | | | | |
| See Accompanying Notes | | | ANNUAL FINANCIAL AND OTHER INFORMATION | | | | | | | JUNE 30, 2024 | | | 141 |
| | | | | | |
| Schedule of Investments | | PIMCO Commodity Strategy Active Exchange-Traded Fund | | (Cont.) | | June 30, 2024 |
FAIR VALUE MEASUREMENTS
The following is a summary of the fair valuations according to the inputs used as of June 30, 2024 in valuing the Fund’s assets and liabilities:
| | | | | | | | | | | | | | | | |
| Category and Subcategory | | Level 1 | | | Level 2 | | | Level 3 | | | Fair Value at
06/30/2024 | |
Investments in Securities, at Value | |
Corporate Bonds & Notes | |
Banking & Finance | | $ | 0 | | | $ | 93,231 | | | $ | 0 | | | $ | 93,231 | |
Industrials | | | 0 | | | | 45,061 | | | | 0 | | | | 45,061 | |
Utilities | | | 0 | | | | 17,584 | | | | 0 | | | | 17,584 | |
U.S. Government Agencies | | | 0 | | | | 1,510 | | | | 0 | | | | 1,510 | |
Non-Agency Mortgage-Backed Securities | | | 0 | | | | 1,433 | | | | 0 | | | | 1,433 | |
Asset-Backed Securities | | | 0 | | | | 32,585 | | | | 0 | | | | 32,585 | |
Sovereign Issues | | | 0 | | | | 9,368 | | | | 0 | | | | 9,368 | |
Commodities | | | 0 | | | | 35,627 | | | | 0 | | | | 35,627 | |
Short-Term Instruments | |
Repurchase Agreements | | | 0 | | | | 64,067 | | | | 0 | | | | 64,067 | |
U.S. Treasury Bills | | | 0 | | | | 1,944 | | | | 0 | | | | 1,944 | |
| | | | | | | | | | | | | | | | |
| | $ | 0 | | | $ | 302,410 | | | $ | 0 | | | $ | 302,410 | |
| | | | | | | | | | | | | | | | |
|
Investments in Affiliates, at Value | |
Mutual Funds | | | 20,289 | | | | 0 | | | | 0 | | | | 20,289 | |
| | | | | | | | | | | | | | | | |
| | | | |
Total Investments | | $ | 20,289 | | | $ | 302,410 | | | $ | 0 | | | $ | 322,699 | |
| | | | | | | | | | | | | | | | |
| | | | | | | | | | | | | | | | |
| Category and Subcategory | | Level 1 | | | Level 2 | | | Level 3 | | | Fair Value at
06/30/2024 | |
|
Financial Derivative Instruments - Assets | |
Exchange-traded or centrally cleared | | $ | 731 | | | $ | 19 | | | $ | 0 | | | $ | 750 | |
Over the counter | | | 0 | | | | 690 | | | | 0 | | | | 690 | |
| | | | | | | | | | | | | | | | |
| | $ | 731 | | | $ | 709 | | | $ | 0 | | | $ | 1,440 | |
| | | | | | | | | | | | | | | | |
|
Financial Derivative Instruments - Liabilities | |
Exchange-traded or centrally cleared | | | (3,498 | ) | | | 0 | | | | 0 | | | | (3,498 | ) |
Over the counter | | | 0 | | | | (142 | ) | | | 0 | | | | (142 | ) |
| | | | | | | | | | | | | | | | |
| | $ | (3,498 | ) | | $ | (142 | ) | | $ | 0 | | | $ | (3,640 | ) |
| | | | | | | | | | | | | | | | |
| | | | |
Total Financial Derivative Instruments | | $ | (2,767 | ) | | $ | 567 | | | $ | 0 | | | $ | (2,200 | ) |
| | | | | | | | | | | | | | | | |
| | | | |
Totals | | $ | 17,522 | | | $ | 302,977 | | | $ | 0 | | | $ | 320,499 | |
| | | | | | | | | | | | | | | | |
There were no significant transfers into or out of Level 3 during the period ended June 30, 2024.
| | | | | | |
| 142 | | PIMCO ETF TRUST | | | See Accompanying Notes | |
| | | | |
| Notes to Financial Statements | | | | June 30, 2024 |
1. ORGANIZATION
PIMCO ETF Trust (the “Trust”) was established as a Delaware statutory trust on November 14, 2008. The Trust is registered under the Investment Company Act of 1940, as amended (the “Act”), as an open-end management investment company. Information presented in these financial statements pertains to the funds (each, a “Fund” and collectively, the “Funds”) offered by the Trust. Pacific Investment Management Company LLC (“PIMCO” or “Manager”) serves as the investment adviser for the Funds.
The PIMCO Commodity Strategy Active Exchange-Traded Fund has established a Cayman Islands exempted company, the “Commodity Subsidiary”, which is wholly-owned and controlled by the Fund. See Note 16, Basis for Consolidation, in the Notes to Financial Statements for more information regarding the Subsidiary.
Each Fund is an exchange-traded fund (“ETF”). ETFs are funds that trade like other publicly-traded securities and may be designed to track an index or to be actively managed. Unlike shares of a mutual fund, which can be bought from and redeemed by the issuing fund by all shareholders at a price based on net asset value (“NAV”), shares of a Fund may be directly purchased from and redeemed by a Fund at NAV solely by a member or participant of a clearing agency registered with the Securities and Exchange Commission, which has a written agreement with the Fund’s Distributor that allows such member or participant to place orders for the purchase and redemption of Creation Units (“Authorized Participant“). Also, unlike shares of a mutual fund, shares of each Fund are listed on a national securities exchange and trade in the secondary market at market prices that change throughout the day. Each Fund offers and issues shares only in aggregations of a specified number of shares (“Creation Units”).
Hereinafter, the Board of Trustees of the Funds shall be collectively referred to as the “Board.”
2. SIGNIFICANT ACCOUNTING POLICIES
The following is a summary of significant accounting policies consistently followed by the Trust in the preparation of its financial statements in conformity with accounting principles generally accepted in the United States of America (“U.S. GAAP”). Each Fund is treated as an investment company under the reporting requirements of U.S. GAAP. The functional and reporting currency for the Funds is the U.S. dollar. The preparation of financial statements in accordance with U.S. GAAP requires management to make estimates and assumptions that affect the reported amounts of assets and liabilities and disclosure of contingent assets and liabilities at the date of the financial statements and the reported amounts of increases and decreases in net assets from operations during the reporting period. Actual results could differ from those estimates.
(a) Securities Transactions and Investment Income Securities transactions are recorded as of the trade date for financial reporting purposes. Securities purchased or sold on a when-issued or delayed-delivery basis may be settled beyond a standard settlement period for the security after the trade date. Realized gains (losses) from securities sold are recorded on the identified cost basis. Dividend income is recorded on the ex-dividend date, except certain dividends from foreign securities where the ex-dividend date may have passed, which are recorded as soon as a Fund is informed of the ex-dividend date. Interest income, adjusted for the accretion of discounts and amortization of premiums, is recorded on the accrual basis from settlement date, with the exception of securities with a forward starting effective date, where interest income is recorded on the accrual basis from effective date. For convertible securities, premiums attributable to the conversion feature are not amortized. Estimated tax liabilities on certain foreign securities are recorded on an accrual basis and are reflected as components of interest income or net change in unrealized appreciation (depreciation) on investments on the Statements of Operations, as appropriate. Tax liabilities realized as a result of such security sales are reflected as a component of net realized gain (loss) on investments on the Statements of Operations. Paydown gains (losses) on mortgage-related and other asset-backed securities, if any, are recorded as components of interest income on the Statements of Operations. Income or short-term capital gain distributions received from registered investment companies, if any, are recorded as dividend income. Long-term capital gain distributions received from registered investment companies, if any, are recorded as realized gains.
Debt obligations may be placed on non-accrual status and related interest income may be reduced by ceasing current accruals and writing off interest receivable when the collection of all or a portion of interest has become doubtful based on consistently applied procedures. A debt obligation is removed from non-accrual status when the issuer resumes interest payments or when collectability of interest is probable. A debt obligation may be granted, in certain situations, a contractual or non-contractual forbearance for interest payments that are expected to be paid after agreed upon pay dates.
(b) Foreign Taxes A Fund may be subject to foreign taxes on income, stock dividends, capital gains on investments, or certain foreign currency transactions. All foreign taxes are recorded in accordance with the applicable foreign tax regulations and rates that exist in the foreign jurisdictions in which the Fund invests. These foreign taxes, if any, are paid by the Fund and are reflected in its Statements of Operations as follows: foreign taxes withheld at source are presented as a reduction of income, foreign taxes on securities lending income are presented as a reduction of securities lending income, foreign taxes on stock
| | | | | | | | | | | | |
| | | | ANNUAL FINANCIAL AND OTHER INFORMATION | | | | | | | JUNE 30, 2024 | | | 143 |
| | | | |
| Notes to Financial Statements | | (Cont.) | | |
dividends are presented as “other foreign taxes”, and foreign taxes on capital gains from sales of investments and foreign taxes on foreign currency transactions are included in their respective net realized gain (loss) categories. Foreign taxes payable as of June 30, 2024, if any, are disclosed in the Statements of Assets and Liabilities.
(c) Foreign Currency Translation The market values of foreign securities, currency holdings and other assets and liabilities denominated in foreign currencies are translated into U.S. dollars based on the current exchange rates each business day. Purchases and sales of securities and income and expense items denominated in foreign currencies, if any, are translated into U.S. dollars at the exchange rate in effect on the transaction date. The Funds do not separately report the effects of changes in foreign exchange rates from changes in market prices on securities held. Such changes are included in net realized gain (loss) and net change in unrealized appreciation (depreciation) from investments on the Statements of Operations. The Funds may invest in foreign currency-denominated securities and may engage in foreign currency transactions either on a spot (cash) basis at the rate prevailing in the currency exchange market at the time or through a forward foreign currency contract. Realized foreign exchange gains (losses) arising from sales of spot foreign currencies, currency gains (losses) realized between the trade and settlement dates on securities transactions and the difference between the recorded amounts of dividends, interest and foreign withholding taxes and the U.S. dollar equivalent of the amounts actually received or paid are included in net realized gain (loss) on foreign currency transactions on the Statements of Operations. Net unrealized foreign exchange gains (losses) arising from changes in foreign exchange rates on foreign denominated assets and liabilities other than investments in securities held at the end of the reporting period are included in net change in unrealized appreciation (depreciation) on foreign currency assets and liabilities on the Statements of Operations.
(d) Distributions to Shareholders The following table shows the anticipated frequency of distributions from net investment income, if any, for each Fund.
| | | | | | | | | | | | |
| | | | Distribution Frequency | |
| | | |
| Fund Name | | | | | Declared | | | Distributed | |
| | | |
PIMCO 1-5 Year U.S. TIPS Index
Exchange-Traded Fund | | | | | | | Monthly | | | | Monthly | |
| | | |
PIMCO 15+ Year U.S. TIPS Index
Exchange-Traded Fund | | | | | | | Monthly | | | | Monthly | |
| | | |
PIMCO Broad U.S. TIPS Index Exchange-Traded Fund | | | | | | | Monthly | | | | Monthly | |
| | | |
PIMCO 0-5 Year High Yield Corporate Bond Index Exchange-Traded Fund | | | | | | | Monthly | | | | Monthly | |
| | | |
PIMCO Investment Grade Corporate Bond Index Exchange-Traded Fund | | | | | | | Monthly | | | | Monthly | |
| | | |
PIMCO Active Bond Exchange-Traded Fund | | | | | | | Monthly | | | | Monthly | |
| | | |
PIMCO Enhanced Low Duration Active Exchange-Traded Fund | | | | | | | Monthly | | | | Monthly | |
| | | | | | | | | | | | |
| | | | Distribution Frequency | |
| | | |
| Fund Name | | | | | Declared | | | Distributed | |
| | | |
PIMCO Enhanced Short Maturity Active ESG Exchange-Traded Fund | | | | | | | Monthly | | | | Monthly | |
| | | |
PIMCO Enhanced Short Maturity Active Exchange-Traded Fund | | | | | | | Monthly | | | | Monthly | |
| | | |
PIMCO Intermediate Municipal Bond Active Exchange-Traded Fund | | | | | | | Monthly | | | | Monthly | |
| | | |
PIMCO Multisector Bond Active Exchange-Traded Fund | | | | | | | Monthly | | | | Monthly | |
| | | |
PIMCO Municipal Income Opportunities Active Exchange-Traded Fund | | | | | | | Monthly | | | | Monthly | |
| | | |
PIMCO Preferred and Capital Securities Active Exchange-Traded Fund | | | | | | | Monthly | | | | Monthly | |
| | | |
PIMCO Senior Loan Active Exchange-Traded Fund | | | | | | | Monthly | | | | Monthly | |
| | | |
PIMCO Short Term Municipal Bond Active Exchange-Traded Fund | | | | | | | Monthly | | | | Monthly | |
| | | |
PIMCO Ultra Short Government Active Exchange-Traded Fund | | | | | | | Monthly | | | | Monthly | |
| | | |
PIMCO 25+ Year Zero Coupon U.S. Treasury Index Exchange-Traded Fund | | | | | | | Quarterly | | | | Quarterly | |
| | | |
PIMCO Commodity Strategy Active Exchange-Traded Fund | | | | | | | Quarterly | | | | Quarterly | |
In addition, each Fund distributes any net capital gains it earns from the sale of portfolio securities to shareholders no less frequently than annually. Net short-term capital gains may be paid more frequently. A Fund may revise its distribution policy or postpone the payment of distributions at any time.
Income distributions and capital gain distributions are determined in accordance with income tax regulations which may differ from U.S. GAAP. Differences between tax regulations and U.S. GAAP may cause timing differences between income and capital gain recognition. Further, the character of investment income and capital gains may be different for certain transactions under the two methods of accounting. As a result, income distributions and capital gain distributions declared during a fiscal period may differ significantly from the net investment income (loss) and realized gains (losses) reported on each Fund’s annual financial statements presented under U.S. GAAP.
Separately, if a Fund determines or estimates, as applicable, that a portion of a distribution may be comprised of amounts from sources other than net investment income in accordance with its policies, accounting records (if applicable) and accounting practices, the Fund will notify shareholders of the estimated composition of such distribution through a Section 19 Notice. For these purposes, a Fund determines or estimates, as applicable, the source or sources from which a distribution is paid, to the close of the period as of which it is paid, in reference to its internal accounting records and related accounting practices. If, based on such accounting records and practices, it is determined or estimated, as applicable, that a particular distribution does not include capital gains or paid-in surplus or other capital sources, a Section 19 Notice generally would not be issued. It is important to note that differences exist between a
Fund’s daily internal accounting records and practices, a Fund’s financial statements presented in accordance with U.S. GAAP, and recordkeeping practices under income tax regulations. For instance, a Fund’s internal accounting records and practices may take into account, among other factors, tax-related characteristics of certain sources of distributions that differ from treatment under U.S. GAAP. Examples of such differences may include but are not limited to, for certain Funds, the treatment of periodic payments under interest rate swap contracts. Accordingly, among other consequences, it is possible that a Fund may not issue a Section 19 Notice in situations where the Fund’s financial statements prepared later and in accordance with U.S. GAAP and/or the final tax character of those distributions might later report that the sources of those distributions included capital gains and/or a return of capital. Please visit www.pimco.com for the most recent Section 19 Notice, if applicable, for additional information regarding the estimated composition of distributions. Final determination of a distribution’s tax character will be provided to shareholders when such information is available.
Distributions classified as a tax basis return of capital at a Fund’s fiscal year end, if any, are reflected on the Statements of Changes in Net Assets and have been recorded to paid in capital on the Statements of Assets and Liabilities. In addition, other amounts have been reclassified between distributable earnings (accumulated loss) and paid in capital on the Statements of Assets and Liabilities to more appropriately conform U.S. GAAP to tax characterizations of distributions.
(e) New Accounting Pronouncements and Regulatory Updates In March 2020, the Financial Accounting Standards Board (“FASB”) issued an Accounting Standards Update (“ASU”), ASU 2020-04, Reference Rate Reform (Topic 848), which provides optional guidance to ease the potential accounting burden associated with transitioning away from the London Interbank Offered Rate and other reference rates that are expected to be discontinued. ASU 2020-04 is effective for certain reference rate-related contract modifications that occurred or will occur during the period March 12, 2020 through December 31, 2024. In January 2021 and December 2022, FASB issued ASU 2021-01 and ASU 2022-06, which include additional amendments to Topic 848. Management is continuously evaluating the potential effect a discontinuation of LIBOR could have on the Funds’ investments and has determined that it is unlikely the ASU’s adoption will have a material impact on the Funds’ financial statements.
In June 2022, the FASB issued ASU 2022-03, Fair Value Measurement (Topic 820), which affects all entities that have investments in equity securities measured at fair value that are subject to a contractual sale restriction. The amendments in ASU 2022-03 clarify that a contractual restriction on the sale of an equity security is not considered part of the unit of account of the equity security and, therefore, is not considered
in measuring the fair value. The amendments also require additional disclosures for equity securities subject to contractual sale restrictions that are measured at fair value in accordance with Topic 820. The effective date for the amendments in ASU 2022-03 is for fiscal years beginning after December 15, 2023 and interim periods within those fiscal years. Management has implemented changes in connection with the amendments and has determined that there was no material impact to the Funds’ financial statements.
In October 2022, the U.S. Securities and Exchange Commission (“SEC”) adopted changes to the mutual fund and ETF shareholder report and registration statement disclosure requirements and the registered fund advertising rules, which change the disclosures provided to shareholders. The rule amendments were effective as of January 2023, and compliance with the rule amendments was required as of July 2024. As such, the Funds have made significant updates to the content of their shareholder reports. In addition, shareholder reports are now mailed to shareholders who have not opted to receive shareholder report documents electronically. Management has implemented format and content changes to the Funds’ annual and semiannual financial and other information in connection with the rule amendments and has determined that there was no material impact to the Funds’ financial statements.
The SEC made a final ruling on February 15, 2023 to adopt proposed amendments to the Settlement Cycle Rule (Rule 15c6-1) and other related rules under the Securities Exchange Act of 1934, as amended, to shorten the standard settlement cycle for most broker-dealer transactions from two business days after the trade date (T+2) to one business day after the trade date (T+1). The effective date was May 5, 2023, and compliance with the amendments was required as of May 28, 2024. Management has implemented changes in connection with the rule and has determined that there was no material impact to the Funds’ financial statements.
In September 2023, the SEC adopted amendments to Rule 35d-1 under the Act, the rule governing fund naming conventions (the “Names Rule”). In general, the Names Rule requires funds with certain types of names to adopt a policy to invest at least 80% of their assets in the type of investment suggested by the name. The amendments expand the scope of the current rule to include any term used in a fund name that suggests the fund makes investments that have, or whose issuers have, particular characteristics. Additionally, the amendments modify the circumstances under which a fund may deviate from its 80% investment policy and address the calculation methodology of derivatives instruments for purposes of the rule. The amendments became effective December 11, 2023, and fund groups with $1 billion or more in net assets will have 24 months to comply with the amendments (fund groups with net assets of less than $1 billion have
| | | | | | | | | | | | |
| | | | ANNUAL FINANCIAL AND OTHER INFORMATION | | | | | | | JUNE 30, 2024 | | | 145 |
| | | | |
| Notes to Financial Statements | | (Cont.) | | |
30 months to comply). At this time, management is evaluating the implications of these changes on the financial statements.
3. INVESTMENT VALUATION AND FAIR VALUE MEASUREMENTS
(a) Investment Valuation Policies The NAV of a Fund’s shares, or each of their respective share classes, as applicable, is determined by dividing the total value of portfolio investments and other assets attributable to the Fund or class, less any liabilities, as applicable, by the total number of shares outstanding.
On each day that the New York Stock Exchange (“NYSE”) is open, each Fund’s shares are ordinarily valued as of the close of regular trading (normally 4:00 p.m., Eastern time) (“NYSE Close”). Information that becomes known to the Funds or their agents after the time as of which NAV has been calculated on a particular day will not generally be used to retroactively adjust the price of a security or the NAV determined earlier that day. If regular trading on the NYSE closes earlier than scheduled, each Fund may calculate its NAV as of the earlier closing time or calculate its NAV as of the NYSE Close for that day. Each Fund generally does not calculate its NAV on days on which the NYSE is not open for business. If the NYSE is closed on a day it would normally be open for business, each Fund may calculate its NAV as of the NYSE Close for such day or such other time that each Fund may determine.
For purposes of calculating NAV, portfolio securities and other assets for which market quotations are readily available are valued at market value. A market quotation is readily available only when that quotation is a quoted price (unadjusted) in active markets for identical investments that a Fund can access at the measurement date, provided that a quotation will not be readily available if it is not reliable. Market value is generally determined on the basis of official closing prices or the last reported sales prices. The Funds will normally use pricing data for domestic equity securities received shortly after the NYSE Close and do not normally take into account trading, clearances or settlements that take place after the NYSE Close. A foreign (non-U.S.) equity security traded on a foreign exchange or on more than one exchange is typically valued using pricing information from the exchange considered by PIMCO to be the primary exchange. If market value pricing is used, a foreign (non-U.S.) equity security will be valued as of the close of trading on the foreign exchange or the NYSE Close if the NYSE Close occurs before the end of trading on the foreign exchange.
Investments for which market quotations are not readily available are valued at fair value as determined in good faith pursuant to Rule 2a-5 under the Act. As a general principle, the fair value of a security or other asset is the price that would be received to sell an asset or paid to transfer a liability in an orderly transaction between market
participants at the measurement date. Pursuant to Rule 2a-5, the Board has designated PIMCO as the valuation designee (“Valuation Designee”) for each Fund to perform the fair value determination relating to all Fund investments. PIMCO may carry out its designated responsibilities as Valuation Designee through various teams and committees. The Valuation Designee’s policies and procedures govern the Valuation Designee’s selection and application of methodologies for determining and calculating the fair value of Fund portfolio investments. The Valuation Designee may value Fund portfolio securities for which market quotations are not readily available and other Fund assets utilizing inputs from pricing services, quotation reporting systems, valuation agents and other third-party sources (together, “Pricing Sources”).
Domestic and foreign (non-U.S.) fixed income securities, non-exchange traded derivatives and equity options are normally valued on the basis of quotes obtained from brokers and dealers or Pricing Sources using data reflecting the earlier closing of the principal markets for those securities. Prices obtained from Pricing Sources may be based on, among other things, information provided by market makers or estimates of market values obtained from yield data relating to investments or securities with similar characteristics. Certain fixed income securities purchased on a delayed-delivery basis are marked to market daily until settlement at the forward settlement date. Common stocks, ETFs, exchange-traded notes and financial derivative instruments, such as futures contracts, rights and warrants, or options on futures that are traded on a national securities exchange, are stated at the last reported sale or settlement price on the day of valuation. Exchange-traded options, except equity options, futures and options on futures are valued at the settlement price determined by the relevant exchange. Swap agreements are valued on the basis of bid quotes obtained from brokers and dealers or market-based prices supplied by Pricing Sources. With respect to any portion of a Fund’s assets that are invested in one or more open-end management investment companies (other than ETFs), a Fund’s NAV will be calculated based on the NAVs of such investments. Open-end management investment companies may include affiliated funds.
If a foreign (non-U.S.) equity security’s value has materially changed after the close of the security’s primary exchange or principal market but before the NYSE Close, the security may be valued at fair value. Foreign (non-U.S.) equity securities that do not trade when the NYSE is open are also valued at fair value. With respect to foreign (non-U.S.) equity securities, a Fund may determine the fair value of investments based on information provided by Pricing Sources, which may recommend fair value or adjustments with reference to other securities, indexes or assets. In considering whether fair valuation is required and in determining fair values, the Valuation Designee may, among other things, consider significant events (which may be considered to include
changes in the value of U.S. securities or securities indexes) that occur after the close of the relevant market and before the NYSE Close. A Fund may utilize modeling tools provided by third-party vendors to determine fair values of foreign (non-U.S.) securities. For these purposes, unless otherwise determined by the Valuation Designee, any movement in the applicable reference index or instrument (“zero trigger”) between the earlier close of the applicable foreign market and the NYSE Close may be deemed to be a significant event, prompting the application of the pricing model (effectively resulting in daily fair valuations). Foreign exchanges may permit trading in foreign (non-U.S.) equity securities on days when the Trust is not open for business, which may result in a Fund’s portfolio investments being affected when shareholders are unable to buy or sell shares.
Senior secured floating rate loans for which an active secondary market exists to a reliable degree are valued at the mean of the last available bid/ask prices in the market for such loans, as provided by a Pricing Source. Senior secured floating rate loans for which an active secondary market does not exist to a reliable degree are valued at fair value, which is intended to approximate market value. In valuing a senior secured floating rate loan at fair value, the factors considered may include, but are not limited to, the following: (a) the creditworthiness of the borrower and any intermediate participants, (b) the terms of the loan, (c) recent prices in the market for similar loans, if any, and (d) recent prices in the market for instruments of similar quality, rate, period until next interest rate reset and maturity.
Investments valued in currencies other than the U.S. dollar are converted to the U.S. dollar using exchange rates obtained from Pricing Sources. As a result, the value of such investments and, in turn, the NAV of a Fund’s shares may be affected by changes in the value of currencies in relation to the U.S. dollar. The value of investments traded in markets outside the United States or denominated in currencies other than the U.S. dollar may be affected significantly on a day that the Trust is not open for business. As a result, to the extent that a Fund holds foreign (non-U.S.) investments, the value of those investments may change at times when shareholders are unable to buy or sell shares and the value of such investments will be reflected in each Fund’s next calculated NAV.
Whole loans may be fair valued using inputs that take into account borrower- or loan-level data (e.g., credit risk of the borrower) that is updated periodically throughout the life of each individual loan; any new borrower- or loan-level data received in any written reports periodically by a Fund normally will be taken into account in calculating the NAV. A Fund’s whole loan investments, including those originated by the Fund or through an alternative lending platform, generally are fair valued in accordance with procedures approved by the Board.
Fair valuation may require subjective determinations about the value of a security. While the Trust’s and Valuation Designee’s policies and procedures are intended to result in a calculation of a Fund’s NAV that fairly reflects security values as of the time of pricing, the Trust cannot ensure that fair values accurately reflect the price that a Fund could obtain for a security if it were to dispose of that security as of the time of pricing (for instance, in a forced or distressed sale). The prices used by a Fund may differ from the value that would be realized if the securities were sold.
(b) Fair Value Hierarchy U.S. GAAP describes fair value as the price that a Fund would receive to sell an asset or pay to transfer a liability in an orderly transaction between market participants at the measurement date. It establishes a fair value hierarchy that prioritizes inputs to valuation methods and requires disclosure of the fair value hierarchy, separately for each major category of assets and liabilities, that segregates fair value measurements into levels (Level 1, 2 or 3). The inputs or methodology used for valuing securities are not necessarily an indication of the risks associated with investing in those securities. Levels 1, 2 and 3 of the fair value hierarchy are defined as follows:
| ∎ | | Level 1 — Quoted prices (unadjusted) in active markets or exchanges for identical assets and liabilities. |
| ∎ | | Level 2 — Significant other observable inputs, which may include, but are not limited to, quoted prices for similar assets or liabilities in markets that are active, quoted prices for identical or similar assets or liabilities in markets that are not active, inputs other than quoted prices that are observable for the assets or liabilities (such as interest rates, yield curves, volatilities, prepayment speeds, loss severities, credit risks and default rates) or other market corroborated inputs. |
| ∎ | | Level 3 — Significant unobservable inputs based on the best information available in the circumstances, to the extent observable inputs are not available, which may include assumptions made by the Valuation Designee that are used in determining the fair value of investments. |
Assets or liabilities categorized as Level 2 or 3 as of period end have been transferred between Levels 2 and 3 since the prior period due to changes in the method utilized in valuing the investments. Transfers from Level 2 to Level 3 are a result of a change, in the normal course of business, from the use of methods used by Pricing Sources (Level 2) to the use of a Broker Quote or valuation technique which utilizes significant unobservable inputs due to an absence of current or reliable market-based data (Level 3). Transfers from Level 3 to Level 2 are a result of the availability of current and reliable market-based data provided by Pricing Sources or other valuation techniques which utilize significant observable inputs. In accordance with the requirements of U.S. GAAP, the amounts of transfers into and out of Level 3, if
| | | | | | | | | | | | |
| | | | ANNUAL FINANCIAL AND OTHER INFORMATION | | | | | | | JUNE 30, 2024 | | | 147 |
| | | | |
| Notes to Financial Statements | | (Cont.) | | |
material, are disclosed in the Notes to Schedule of Investments for each respective Fund.
For fair valuations using significant unobservable inputs, U.S. GAAP requires a reconciliation of the beginning to ending balances for reported fair values that presents changes attributable to realized gain (loss), unrealized appreciation (depreciation), purchases and sales, accrued discounts (premiums), and transfers into and out of the Level 3 category during the period. The end of period value is used for the transfers between Levels of a Fund’s assets and liabilities. Additionally, U.S. GAAP requires quantitative information regarding the significant unobservable inputs used in the determination of fair value of assets or liabilities categorized as Level 3 in the fair value hierarchy. In accordance with the requirements of U.S. GAAP, a fair value hierarchy and, if material, a Level 3 reconciliation and details of significant unobservable inputs, have been included in the Notes to Schedule of Investments for each respective Fund.
(c) Valuation Techniques and the Fair Value Hierarchy
Level 1, Level 2 and Level 3 trading assets and trading liabilities, at fair value The valuation methods (or “techniques”) and significant inputs used in determining the fair values of portfolio securities or other assets and liabilities categorized as Level 1, Level 2 and Level 3 of the fair value hierarchy are as follows:
Common stocks, ETFs, exchange-traded notes and financial derivative instruments, such as futures contracts, rights and warrants, or options on futures that are traded on a national securities exchange, are stated at the last reported sale or settlement price on the day of valuation. To the extent these securities are actively traded and valuation adjustments are not applied, they are categorized as Level 1 of the fair value hierarchy.
Investments in registered open-end investment companies (other than ETFs) will be valued based upon the NAVs of such investments and are categorized as Level 1 of the fair value hierarchy. Investments in unregistered open-end investment companies will be calculated based upon the NAVs of such investments and are considered Level 1 provided that the NAVs are observable, calculated daily and are the value at which both purchases and sales will be conducted.
Fixed income securities including corporate, convertible and municipal bonds and notes, U.S. government agencies, U.S. treasury obligations, sovereign issues, bank loans, convertible preferred securities, non-U.S. bonds and short-term debt instruments (such as commercial paper, time deposits and certificates of deposit) are normally valued on the basis of quotes obtained from brokers and dealers or Pricing Sources that use broker-dealer quotations, reported trades or valuation estimates from their internal pricing models. The Pricing Sources’ internal models use inputs that are observable such as issuer details,
interest rates, yield curves, prepayment speeds, credit risks/spreads, default rates and quoted prices for similar assets. Securities that use similar valuation techniques and inputs as described above are categorized as Level 2 of the fair value hierarchy.
Fixed income securities purchased on a delayed-delivery basis or as a repurchase commitment in a sale-buyback transaction are marked to market daily until settlement at the forward settlement date and are categorized as Level 2 of the fair value hierarchy.
Mortgage-related and asset-backed securities are usually issued as separate tranches, or classes, of securities within each deal. These securities are also normally valued by Pricing Sources that use broker-dealer quotations, reported trades or valuation estimates from their internal pricing models. The pricing models for these securities usually consider tranche-level attributes, current market data, estimated cash flows and market-based yield spreads for each tranche, and incorporate deal collateral performance, as available. Mortgage-related and asset-backed securities that use similar valuation techniques and inputs as described above are categorized as Level 2 of the fair value hierarchy.
Valuation adjustments may be applied to certain securities that are solely traded on a foreign exchange to account for the market movement between the close of the foreign market and the NYSE Close. These securities are valued using Pricing Sources that consider the correlation of the trading patterns of the foreign security to the intraday trading in the U.S. markets for investments. Securities using these valuation adjustments are categorized as Level 2 of the fair value hierarchy. Preferred securities and other equities traded on inactive markets or valued by reference to similar instruments are also categorized as Level 2 of the fair value hierarchy.
Valuation adjustments may be applied to certain exchange traded futures and options to account for market movement between the exchange settlement and the NYSE Close. These securities are valued using quotes obtained from a quotation reporting system, established market makers or Pricing Sources. Financial derivatives using these valuation adjustments are categorized as Level 2 of the fair value hierarchy.
Equity exchange-traded options and over the counter financial derivative instruments, such as forward foreign currency contracts and options contracts derive their value from underlying asset prices, indexes, reference rates and other inputs or a combination of these factors. These contracts are normally valued on the basis of quotes obtained from a quotation reporting system, established market makers or Pricing Sources (normally determined as of the NYSE Close). Depending on the product and the terms of the transaction, financial derivative instruments can be valued by Pricing Sources using a series of techniques, including simulation pricing models. The pricing models use inputs that are observed from actively
quoted markets such as quoted prices, issuer details, indexes, bid/ask spreads, interest rates, implied volatilities, yield curves, dividends and exchange rates. Financial derivative instruments that use similar valuation techniques and inputs as described above are categorized as Level 2 of the fair value hierarchy.
Centrally cleared swaps and over the counter swaps derive their value from underlying asset prices, indexes, reference rates and other inputs or a combination of these factors. They are valued using a broker-dealer bid quotation or on market-based prices provided by Pricing Sources (normally determined as of the NYSE Close). Centrally cleared swaps and over the counter swaps can be valued by Pricing Sources using a series of techniques, including simulation pricing models. The pricing models may use inputs that are observed from actively quoted markets such as the overnight index swap rate, LIBOR forward rate, interest rates, yield curves and credit spreads. These securities are categorized as Level 2 of the fair value hierarchy.
Proxy pricing procedures set the base price of a fixed income security and subsequently adjust the price proportionally to market value changes of a pre-determined security deemed to be comparable in duration, generally a U.S. Treasury or sovereign note based on country of issuance. The base price may be a broker-dealer quote, transaction price, or an internal value as derived by analysis of market data. The base price of the security may be reset on a periodic basis based on the availability of market data and procedures approved by the Valuation Oversight Committee. Significant changes in the unobservable inputs of the proxy pricing process (the base price) would result in direct and proportional changes in the fair value of the security. These securities are categorized as Level 3 of the fair value hierarchy.
If third-party evaluated vendor pricing is not available or not deemed to be indicative of fair value, the Manager may elect to obtain Broker Quotes directly from the broker-dealer or passed through from a thirdparty vendor. In the event that fair value is based upon a single sourced Broker Quote, these securities are categorized as Level 3 of the fair value hierarchy. Broker Quotes are typically received from established market participants. Although independently received, the Manager does not have the transparency to view the underlying inputs which support the market quotation. Significant changes in the Broker Quote would have direct and proportional changes in the fair value of the security.
The Discounted Cash Flow model is based on future cash flows generated by the investment and may be normalized based on expected investment performance. Future cash flows are discounted to present value using an appropriate rate of return, typically calibrated to the initial transaction date and adjusted based on Capital Asset Pricing Model and/or other market-based inputs. Significant changes in the unobservable inputs would result in direct and proportional changes in the fair value of the security. These securities are categorized as Level 3 of the fair value hierarchy.
Securities may be valued based on purchase prices of privately negotiated transactions. Significant changes in the unobservable inputs would result in direct and proportional changes in the fair value of the security. These securities are categorized as Level 3 of the fair value hierarchy.
Securities that are smaller in size than institutional-sized or round lot positions of the particular security/instrument type may apply an adjustment factor to the daily vendor-provided price for the corresponding round lot position to arrive at a fair value for the applicable odd lot positions. The adjustment factor is determined by comparing the prices of internal trades with vendor prices, calculating the weighted average differences, and using that difference as an adjustment factor to vendor prices. These securities are categorized as Level 3 of the fair value hierarchy.
Short-term debt instruments (such as commercial paper, time deposits and certificates of deposit) having a remaining maturity of 60 days or less may be valued at amortized cost, so long as the amortized cost value of such short-term debt instruments is approximately the same as the fair value of the instrument as determined without the use of amortized cost valuation. These securities are categorized as Level 2 or Level 3 of the fair value hierarchy depending on the source of the base price.
When a fair valuation method is applied by PIMCO that uses significant unobservable inputs, investments will be priced by a method that the Valuation Designee believes reflects fair value and are categorized as Level 3 of the fair value hierarchy.
Physical commodities are valued using spot prices from established commodity exchanges as published by a third-party pricing service as of the reporting date.
4. SECURITIES AND OTHER INVESTMENTS
(a) Investments in Affiliates
Each Fund eligible to participate in securities lending may invest the cash collateral received for securities out on loan in the PIMCO Government Money Market Fund under the Securities Lending Agreement. All or a portion of Dividend Income as shown in the table below represents the income earned on the cash collateral invested in PIMCO Government Money Market Fund is included on the Statements of Operations as a component of Securities Lending Income. PIMCO Government Money Market Fund is considered to be affiliated with the Funds. A complete
| | | | | | | | | | | | |
| | | | ANNUAL FINANCIAL AND OTHER INFORMATION | | | | | | | JUNE 30, 2024 | | | 149 |
| | | | |
| Notes to Financial Statements | | (Cont.) | | |
schedule of portfolio holdings for each affiliate fund is filed with the SEC for the first and third quarters of each fiscal year on Form N-PORT and is available at the SEC’s website at www.sec.gov. A copy of each affiliate fund’s shareholder report is also available at the SEC’s website at www.sec.gov, on the Funds’ website at www.pimco.com, or upon request, as applicable. The table below shows the Funds’ transactions in and earnings from investments in the affiliated fund for the period ended June 30, 2024 (amounts in thousands†):
Investments in PIMCO Government Money Market Fund
| | | | | | | | | | | | | | | | | | | | | | | | | | | | | | | | | | | | |
| Fund Name | | | | | Market Value
06/30/2023 | | | Purchases at Cost | | | Proceeds
from Sales | | | Net
Realized
Gain (Loss) | | | Change in
Unrealized
Appreciation
(Depreciation) | | | Market Value
06/30/2024 | | | Dividend
Income(1) | | | Realized Net
Capital Gain
Distributions(1) | |
| | | | | | | | | |
PIMCO 0-5 Year High Yield Corporate Bond Index Exchange-Traded Fund | | | | | | $ | 25,063 | | | $ | 142,724 | | | $ | (126,676 | ) | | $ | 0 | | | $ | 0 | | | $ | 41,111 | | | $ | 1,686 | | | $ | 0 | |
| | | | | | | | | |
PIMCO Investment Grade Corporate Bond Index Exchange-Traded Fund | | | | | | | 2,928 | | | | 28,861 | | | | (28,224 | ) | | | 0 | | | | 0 | | | | 3,565 | | | | 273 | | | | 0 | |
| | | | | | | | | |
PIMCO Enhanced Short Maturity Active
Exchange-Traded Fund | | | | | | | 149 | | | | 26,061 | | | | (26,210 | ) | | | 0 | | | | 0 | | | | 0 | | | | 13 | | | | 0 | |
| † | A zero balance may reflect actual amounts rounding to less than one thousand. |
| (1) | The tax characterization of distributions is determined in accordance with Federal income tax regulations and may contain a return of capital. The actual tax characterization of distributions received is determined at the end of the fiscal year of the affiliated fund. See Note 2, Distributions to Shareholders, in the Notes to Financial Statements for more information. |
The tables below show the Funds’ transactions in and earnings from investments in the affiliated fund for the period ended June 30, 2024 (amounts in thousands†):
PIMCO Active Bond Exchange-Traded Fund
| | | | | | | | | | | | | | | | | | | | | | | | | | | | | | | | | | | | |
| Underlying PIMCO Fund | | | | | Market Value
06/30/2023 | | | Purchases
at Cost | | | Proceeds
from Sales | | | Net
Realized
Gain (Loss) | | | Change in
Unrealized
Appreciation
(Depreciation) | | | Market Value
06/30/2024 | | | Dividend
Income(1) | | | Realized Net
Capital Gain
Distributions(1) | |
| | | | | | | | | |
PIMCO Preferred and Capital Securities Active Exchange-Traded Fund | | | | | | $ | 0 | | | $ | 19,257 | | | $ | 0 | | | $ | 0 | | | $ | 738 | | | $ | 19,995 | | | $ | 496 | | | $ | 0 | |
| | | | | | | | | |
PIMCO Senior Loan Active Exchange-Traded Fund | | | | | | | 18,827 | | | | 16,451 | | | | 0 | | | | 0 | | | | 807 | | | | 36,085 | | | | 2,541 | | | | 0 | |
| | | | | | | | | |
PIMCO Enhanced Short Maturity Active Exchange-Traded Fund | | | | | | | 0 | | | | 25,044 | | | | 0 | | | | 0 | | | | 118 | | | | 25,162 | | | | 550 | | | | 0 | |
PIMCO Commodity Strategy Active Exchange-Traded Fund
| | | | | | | | | | | | | | | | | | | | | | | | | | | | | | | | | | | | |
| Underlying PIMCO Fund | | | | | Market Value
06/30/2023 | | | Purchases
at Cost | | | Proceeds
from Sales | | | Net
Realized
Gain (Loss) | | | Change in
Unrealized
Appreciation
(Depreciation) | | | Market Value
06/30/2024 | | | Dividend
Income(1) | | | Realized Net
Capital Gain
Distributions(1) | |
| | | | | | | | | |
PIMCO Enhanced Short Maturity Active Exchange-Traded Fund | | | | | | $ | 0 | | | $ | 20,186 | | | $ | 0 | | | $ | 0 | | | $ | 103 | | | $ | 20,289 | | | $ | 447 | | | $ | 0 | |
PIMCO Multisector Bond Active Exchange-Traded Fund
| | | | | | | | | | | | | | | | | | | | | | | | | | | | | | | | | | | | |
| Underlying PIMCO Fund | | | | | Market Value
06/30/2023 | | | Purchases
at Cost | | | Proceeds
from Sales | | | Net
Realized
Gain (Loss) | | | Change in
Unrealized
Appreciation
(Depreciation) | | | Market Value
06/30/2024 | | | Dividend
Income(1) | | | Realized Net
Capital Gain
Distributions(1) | |
| | | | | | | | | |
PIMCO Senior Loan Active Exchange-Traded Fund | | | | | | $ | 0 | | | $ | 3,366 | | | $ | 0 | | | $ | 0 | | | $ | 20 | | | $ | 3,386 | | | $ | 112 | | | $ | 0 | |
| † | A zero balance may reflect actual amounts rounding to less than one thousand. |
| (1) | The tax characterization of distributions is determined in accordance with Federal income tax regulations and may contain a return of capital. The actual tax characterization of distributions received is determined at the end of the fiscal year of the affiliated fund. See Note 2, Distributions to Shareholders, in the Notes to Financial Statements for more information. |
(b) Investments in Securities
The Funds may utilize the investments and strategies described below to the extent permitted by each Fund’s respective investment policies.
Delayed-Delivery Transactions involve a commitment by a Fund to purchase or sell securities for a predetermined price or yield, with
payment and delivery taking place beyond the customary settlement period. When delayed-delivery transactions are outstanding, a Fund will designate or receive as collateral liquid assets in an amount sufficient to meet the purchase price or respective obligations. When purchasing a security on a delayed- delivery basis, a Fund assumes the
rights and risks of ownership of the security, including the risk of price and yield fluctuations, and takes such fluctuations into account when determining its NAV. A Fund may dispose of or renegotiate a delayed-delivery transaction after it is entered into, which may result in a realized gain (loss). When a Fund has sold a security on a delayed-delivery basis, the Fund does not participate in future gains (losses) with respect to the security.
Exchange-Traded Funds typically are index-based investment companies that hold substantially all of their assets in securities representing their specific index, but may also be actively-managed investment companies. Shares of ETFs trade throughout the day on an exchange and represent an investment in a portfolio of securities and other assets. As a shareholder of another investment company, a Fund would bear a pro rata portion of the other investment company’s expenses, including advisory fees, in addition to the expenses a Fund bears directly in connection with its own operations. Investments in ETFs entail certain risks; in particular, investments in index ETFs involve the risk that the ETF’s performance may not track the performance of the index the ETF is designed to track.
Inflation-Indexed Bonds are fixed income securities whose principal value is periodically adjusted according to the rate of inflation. The interest rate on these bonds is generally fixed at issuance at a rate lower than typical bonds. Over the life of an inflation-indexed bond, however, interest will be paid based on a principal value which is adjusted for inflation. Any increase or decrease in the principal amount of an inflation-indexed bond will be included as interest income on the Statements of Operations, even though investors do not receive their principal until maturity. Repayment of the original bond principal upon maturity (as adjusted for inflation) is guaranteed in the case of U.S. Treasury Inflation-Protected Securities (“TIPS”). For bonds that do not provide a similar guarantee, the adjusted principal value of the bond repaid at maturity may be less than the original principal.
Loans and Other Indebtedness, Loan Participations and Assignments are direct debt instruments which are interests in amounts owed to lenders or lending syndicates by corporate, governmental or other borrowers. A Fund’s investments in loans may be in the form of participations in loans or assignments of all or a portion of loans from third parties or investments in or originations of loans by the Fund or Funds. A loan is often administered by a bank or other financial institution (the “agent”) that acts as agent for all holders. The agent administers the terms of the loan, as specified in the loan agreement. A Fund may invest in multiple series or tranches of a loan, which may have varying terms and carry different associated risks. When a Fund purchases assignments from agents it acquires direct rights against the borrowers of the loans. These loans may include participations in bridge loans, which are loans taken out by borrowers
for a short period (typically less than one year) pending arrangement of more permanent financing through, for example, the issuance of bonds, frequently high yield bonds issued for the purpose of acquisitions.
The types of loans and related investments in which the Funds may invest include, among others, senior loans, subordinated loans (including second lien loans, B-Notes and mezzanine loans), whole loans, commercial real estate and other commercial loans and structured loans. The Funds may originate loans or acquire direct interests in loans through primary loan distributions and/or in private transactions. In the case of subordinated loans, there may be significant indebtedness ranking ahead of the borrower’s obligation to the holder of such a loan, including in the event of the borrower’s insolvency. Mezzanine loans are typically secured by a pledge of an equity interest in the mortgage borrower that owns the real estate rather than an interest in a mortgage.
Investments in loans may include unfunded loan commitments, which are contractual obligations for funding. Unfunded loan commitments may include revolving credit facilities, which may obligate a Fund to supply additional cash to the borrower on demand. Unfunded loan commitments represent a future obligation in full, even though a percentage of the committed amount may not be utilized by the borrower. When investing in a loan participation, a Fund has the right to receive payments of principal, interest and any fees to which it is entitled only from the agent selling the loan agreement and only upon receipt of payments by the agent from the borrower. A Fund may receive a commitment fee based on the undrawn portion of the underlying line of credit portion of a loan. In certain circumstances, a Fund may receive a penalty fee upon the prepayment of a loan by a borrower. Fees earned or paid are recorded as a component of interest income or interest expense, respectively, on the Statements of Operations. Unfunded loan commitments are reflected as a liability on the Statements of Assets and Liabilities.
Mortgage-Related and Other Asset-Backed Securities directly or indirectly represent a participation in, or are secured by and payable from, loans on real property. Mortgage-related securities are interests in pools of residential or commercial mortgage loans, including mortgage loans made by savings and loan institutions, mortgage bankers, commercial banks and others. These securities provide a monthly payment which consists of both interest and principal payments. Interest may be determined by fixed or adjustable rates. The rate of prepayments on underlying mortgages will affect the price and volatility of a mortgage-related security, and may have the effect of shortening or extending the effective duration of the security relative to what was anticipated at the time of purchase. The timely payment of principal and interest of certain mortgage-related securities is
| | | | | | | | | | | | |
| | | | ANNUAL FINANCIAL AND OTHER INFORMATION | | | | | | | JUNE 30, 2024 | | | 151 |
| | | | |
| Notes to Financial Statements | | (Cont.) | | |
guaranteed with the full faith and credit of the U.S. Government. Pools created and guaranteed by non-governmental issuers, including government-sponsored corporations, may be supported by various forms of insurance or guarantees, but there can be no assurance that private insurers or guarantors can meet their obligations under the insurance policies or guarantee arrangements. Many of the risks of investing in mortgage-related securities secured by commercial mortgage loans reflect the effects of local and other economic conditions on real estate markets, the ability of tenants to make lease payments and the ability of a property to attract and retain tenants. These securities may be less liquid and may exhibit greater price volatility than other types of mortgage-related or other asset-backed securities. Other asset-backed securities are created from many types of assets, including, but not limited to, auto loans, accounts receivable such as credit card receivables and hospital account receivables, home equity loans, student loans, boat loans, mobile home loans, recreational vehicle loans, manufactured housing loans, aircraft leases, computer leases, syndicated bank loans, peer-to-peer loans and litigation finance loans.
Collateralized Debt Obligations (“CDOs”) include Collateralized Bond Obligations (“CBOs”), Collateralized Loan Obligations (“CLOs”) and other similarly structured securities. CBOs, CLOs and other CDOs are types of asset-backed securities. A CBO is a trust which is backed by a diversified pool of high risk, below investment grade fixed income securities. A CLO is a trust typically collateralized by a pool of loans, which may include, among others, domestic and foreign senior secured loans, senior unsecured loans, and subordinate corporate loans, including loans that may be rated below investment grade or equivalent unrated loans. Other CDOs are trusts backed by other types of assets representing obligations of various parties. The risks of an investment in a CDO depend largely on the type of the collateral securities and the class of the CDO in which a Fund invests. In addition to the normal risks associated with fixed income securities discussed elsewhere in this report and each Fund’s prospectus and statement of additional information (e.g., prepayment risk, credit risk, liquidity risk, market risk, structural risk, legal risk and interest rate risk (which may be exacerbated if the interest rate payable on a structured financing changes based on multiples of changes in interest rates or inversely to changes in interest rates)), CBOs, CLOs and other CDOs carry additional risks including, but not limited to: (i) the possibility that distributions from collateral securities will not be adequate to make interest or other payments, (ii) the quality of the collateral may decline in value or default, (iii) risks related to the capability of the servicer of the securitized assets, (iv) the risk that a Fund may invest in CBOs, CLOs, or other CDOs that are subordinate to other classes, (v) the structure and complexity of the transaction and the legal documents may not be fully understood at the time of investment and could lead to disputes with the issuer or among investors regarding the characterization of proceeds or unexpected investment results, and (vi) the CDO’s manager may perform poorly.
Collateralized Mortgage Obligations (“CMOs”) are debt obligations of a legal entity that are collateralized by whole mortgage loans or private mortgage bonds and divided into classes. CMOs are structured into multiple classes, often referred to as “tranches,” with each class bearing a different stated maturity and entitled to a different schedule for payments of principal and interest, including prepayments. CMOs may be less liquid and may exhibit greater price volatility than other types of mortgage-related or asset-backed securities.
Stripped Mortgage-Backed Securities (“SMBS”) are derivative multi-class mortgage securities. SMBS are usually structured with two classes that receive different proportions of the interest and principal distributions on a pool of mortgage assets. An SMBS will have one class that will receive all of the interest (the interest-only or “IO” class), while the other class will receive the entire principal (the principal-only or “PO” class). Payments received for IOs are included in interest income on the Statements of Operations. Because no principal will be received at the maturity of an IO class, adjustments are made to the cost of the security on a monthly basis until maturity. These adjustments are included in interest income on the Statements of Operations. Payments received for POs are treated as reductions to the cost and par value of the securities.
Payment In-Kind Securities may give the issuer the option at each interest payment date of making interest payments in either cash and/or additional debt securities. Those additional debt securities usually have the same terms, including maturity dates and interest rates, and associated risks as the original bonds. The daily market quotations of the original bonds may include the accrued interest (referred to as a dirty price) and require a pro rata adjustment from the unrealized appreciation (depreciation) on investments to interest receivable on the Statements of Assets and Liabilities.
Perpetual Bonds are fixed income securities with no maturity date but pay a coupon in perpetuity (with no specified ending or maturity date). Unlike typical fixed income securities, there is no obligation for perpetual bonds to repay principal. The coupon payments, however, are mandatory. While perpetual bonds have no maturity date, they may have a callable date in which the perpetuity is eliminated and the issuer may return the principal received on the specified call date. Additionally, a perpetual bond may have additional features, such as interest rate increases at periodic dates or an increase as of a predetermined point in the future.
Restricted Investments are subject to legal or contractual restrictions on resale and may generally be sold privately, but may be required to be registered or exempted from such registration before being sold to the public. Private placement securities are generally considered to be restricted except for those securities traded between qualified institutional investors under the provisions of Rule 144A of the Securities Act of 1933. Disposal of restricted investments may involve time-consuming negotiations and expenses, and prompt sale at an
acceptable price may be difficult to achieve. Restricted investments held by the Funds as of June 30, 2024, as applicable, are disclosed in the Notes to Schedules of Investments.
Securities Issued by U.S. Government Agencies or Government-Sponsored Enterprises are obligations of and, in certain cases, guaranteed by, the U.S. Government, its agencies or instrumentalities. Some U.S. Government securities, such as Treasury bills, notes and bonds, and securities guaranteed by the Government National Mortgage Association, are supported by the full faith and credit of the U.S. Government; others, such as those of the Federal Home Loan Banks, are supported by the right of the issuer to borrow from the U.S. Department of the Treasury (the “U.S. Treasury”); and others, such as those of the Federal National Mortgage Association (“FNMA” or “Fannie Mae”), are supported by the discretionary authority of the U.S. Government to purchase the agency’s obligations. U.S. Government securities may include zero coupon securities which do not distribute interest on a current basis and tend to be subject to a greater risk than interest-paying securities of similar maturities.
Government-related guarantors (i.e., not backed by the full faith and credit of the U.S. Government) include FNMA and the Federal Home Loan Mortgage Corporation (“FHLMC” or “Freddie Mac”). FNMA is a government-sponsored corporation. FNMA purchases conventional (i.e., not insured or guaranteed by any government agency) residential mortgages from a list of approved seller/servicers which include state and federally chartered savings and loan associations, mutual savings banks, commercial banks and credit unions and mortgage bankers. Pass-through securities issued by FNMA are guaranteed as to timely payment of principal and interest by FNMA, but are not backed by the full faith and credit of the U.S. Government. FHLMC is a government sponsored corporation that issues Participation Certificates (“PCs”), which are pass-through securities, each representing an undivided interest in a pool of residential mortgages. FHLMC guarantees the timely payment of interest and ultimate collection of principal, but PCs are not backed by the full faith and credit of the U.S. Government.
In June 2019, FNMA and FHLMC started issuing Uniform Mortgage-Backed Securities in place of their current offerings of TBA-eligible securities (the “Single Security Initiative”). The Single Security Initiative seeks to support the overall liquidity of the TBA market and aligns the characteristics of FNMA and FHLMC certificates. The long-term effects that the Single Security Initiative may have on the market for TBA and other mortgage-backed securities are uncertain.
Roll-timing strategies can be used where a Fund seeks to extend the expiration or maturity of a position, such as a TBA security on an underlying asset, by closing out the position before expiration and contemporaneously opening a new position with respect to substantially the same underlying asset with a later expiration date. TBA securities purchased or sold are reflected on the Statements of Assets and Liabilities as an asset or liability,
respectively. Recently finalized FINRA rules include mandatory margin requirements for the TBA market that require the Funds to post collateral in connection with their TBA transactions. There is no similar requirement applicable to the Funds’ TBA counterparties. The required collateralization of TBA trades could increase the cost of TBA transactions to the Funds and impose added operational complexity.
Separate Trading of Registered Interest and Principal of Securities (“STRIPS”) are U.S. Treasury fixed income securities in which the principal is separated, or stripped, from the interest and each takes the form of zero coupon securities. A STRIP is sold at a significant discount to face value and offers no interest payments; rather, investors receive payment at maturity. Zero coupon securities do not distribute interest on a current basis and tend to be subject to greater risk than interest-paying securities.
Warrants are securities that are usually issued together with a debt security or preferred security and that give the holder the right to buy a proportionate amount of common stock at a specified price. Warrants normally have a life that is measured in years and entitle the holder to buy common stock of a company at a price that is usually higher than the market price at the time the warrant is issued. Warrants may entail greater risks than certain other types of investments. Generally, warrants do not carry the right to receive dividends or exercise voting rights with respect to the underlying securities, and they do not represent any rights in the assets of the issuer. In addition, their value does not necessarily change with the value of the underlying securities, and they cease to have value if they are not exercised on or before their expiration date. If the market price of the underlying stock does not exceed the exercise price during the life of the warrant, the warrant will expire worthless. Warrants may increase the potential profit or loss to be realized from the investment as compared with investing the same amount in the underlying securities. Similarly, the percentage increase or decrease in the value of an equity security warrant may be greater than the percentage increase or decrease in the value of the underlying common stock. Warrants may relate to the purchase of equity or debt securities. Debt obligations with warrants attached to purchase equity securities have many characteristics of convertible securities and their prices may, to some degree, reflect the performance of the underlying stock. Debt obligations also may be issued with warrants attached to purchase additional debt securities at the same coupon rate. A decline in interest rates would permit a Fund to sell such warrants at a profit. If interest rates rise, these warrants would generally expire with no value.
When-Issued Transactions are purchases or sales made on a when-issued basis. These transactions are made conditionally because a security, although authorized, has not yet been issued in the market. Transactions to purchase or sell securities on a when-issued basis involve a commitment by a Fund to purchase or sell these securities for a predetermined price or yield, with payment and delivery taking place beyond the customary settlement period. A Fund may sell when-issued securities before they are delivered, which may result in a realized gain (loss).
| | | | | | | | | | | | |
| | | | ANNUAL FINANCIAL AND OTHER INFORMATION | | | | | | | JUNE 30, 2024 | | | 153 |
| | | | |
| Notes to Financial Statements | | (Cont.) | | |
c) The funds may acquire and hold physical commodities. Physical commodities are pursuant to warehouse receipts providing proof of ownership of such commodities. Warehouse receipts may be negotiable or non-negotiable. Negotiable warehouse receipts allow transfer of ownership of that commodity without having to deliver the physical commodity.
5. BORROWINGS AND OTHER FINANCING TRANSACTIONS
The Funds may enter into the borrowings and other financing transactions described below to the extent permitted by each Fund’s respective investment policies.
The following disclosures contain information on a Fund’s ability to lend or borrow cash or securities to the extent permitted under the Act, which may be viewed as borrowing or financing transactions by a Fund. The location of these instruments in each Fund’s financial statements is described below.
(a) Line of Credit The PIMCO Senior Loan Active Exchange-Traded Fund entered into a 360-day liquidity loan facility agreement with State Street Bank & Trust Company. State Street Bank & Trust Company serves as both a bank and as an agent for the other banks that are parties to the agreement. The Fund pays financing charges based on a combination of an overnight bank funding rate based on variable rate plus a credit spread. The Fund also pays a fee of 0.15% per annum on the unused commitment amounts. As of June 30, 2024, if applicable, any outstanding borrowings would be disclosed as a payable for line of credit on the Statements of Assets and Liabilities. Interest on outstanding borrowings and commitment and upfront fees, if any, paid by the Fund are disclosed as part of the interest expense on the Statements of Operations. Commitment and Upfront Fees incurred by the Fund in connection with its line of credit agreement was recorded as a prepaid expense and disclosed on the Statements of Assets and Liabilities. Such fees are amortized through the expiration date of the agreement and included as part of the interest expense on the Statements of Operations. Legal costs related to the annual renewal of the line of credit are included in Miscellaneous Expenses on the Statements of Operations.
As of June 30, 2024, the maximum available commitment and related fees for the revolving credit agreement are:
| | | | | | | | | | |
Maximum Available
Commitment* | | | Expiration Date | | | Commitment
and Upfront Fees | |
| $ | 10,000,000 | | | | 08/27/2024 | | | $ | 22,512 | |
| * | Maximum available commitment prior to renewal on August 29, 2023, for the Fund was $5,000,000. |
(b) Repurchase Agreements Under the terms of a typical repurchase agreement, a Fund purchases an underlying debt obligation (collateral) subject to an obligation of the seller to repurchase, and a Fund to resell, the obligation at an agreed-upon price and time. In an open maturity repurchase agreement, there is no pre-determined repurchase date and the agreement can be terminated by a Fund or counterparty at any time. The underlying securities for all repurchase agreements are held by a Fund’s custodian or designated subcustodians (in the case of tri-party repurchase agreements) and in certain instances will remain in custody with the counterparty. Traditionally, a Fund has used bilateral repurchase agreements wherein the underlying securities will be held by a Fund’s custodian. The market value of the collateral must be equal to or exceed the total amount of the repurchase obligations, including interest. Repurchase agreements, if any, including accrued interest, are included on the Statements of Assets and Liabilities. Interest earned is recorded as a component of interest income on the Statements of Operations. In periods of increased demand for collateral, a Fund may pay a fee for the receipt of collateral, which may result in interest expense to the Fund.
(c) Reverse Repurchase Agreements In a reverse repurchase agreement, a Fund delivers a security in exchange for cash to a financial institution, the counterparty, with a simultaneous agreement to repurchase the same or substantially the same security at an agreed upon price and date. In an open maturity reverse repurchase agreement, there is no pre-determined repurchase date and the agreement can be terminated by a Fund or counterparty at any time. A Fund is entitled to receive principal and interest payments, if any, made on the security delivered to the counterparty during the term of the agreement. Cash received in exchange for securities delivered plus accrued interest payments to be made by a Fund to counterparties are reflected as a liability on the Statements of Assets and Liabilities. Interest payments made by a Fund to counterparties are recorded as a component of interest expense on the Statements of Operations. In periods of increased demand for the security, a Fund may receive a fee for use of the security by the counterparty, which may result in interest income to the Fund. A Fund will segregate assets determined to be liquid by the Manager or will otherwise cover its obligations under reverse repurchase agreements.
(d) Sale-Buybacks A sale-buyback financing transaction consists of a sale of a security by a Fund to a financial institution, the counterparty, with a simultaneous agreement to repurchase the same or substantially the same security at an agreed-upon price and date. A Fund is not entitled to receive principal and interest payments, if any, made on the security sold to the counterparty during the term of the agreement. The agreed-upon proceeds for securities to be repurchased by a Fund are reflected as a liability on the Statements of Assets and Liabilities. A
Fund will recognize net income represented by the price differential between the price received for the transferred security and the agreed-upon repurchase price. This is commonly referred to as the ‘price drop’. A price drop consists of (i) the foregone interest and inflationary income adjustments, if any, a Fund would have otherwise received had the security not been sold and (ii) the negotiated financing terms between a Fund and counterparty. Foregone interest and inflationary income adjustments, if any, are recorded as components of interest income on the Statements of Operations. Interest payments based upon negotiated financing terms made by a Fund to counterparties are recorded as a component of interest expense on the Statements of Operations. In periods of increased demand for the security, a Fund may receive a fee for use of the security by the counterparty, which may result in interest income to the Fund. A Fund will segregate assets determined to be liquid by the Manager or will otherwise cover its obligations under sale-buyback transactions.
(e) Securities Lending The Funds listed below may seek to earn additional income by lending their securities to certain qualified broker-dealers and institutions on a short-term or long-term basis via a lending agent.
|
| Fund Name |
|
PIMCO 25+ Year Zero Coupon U.S. Treasury Index Exchange-Traded Fund |
|
PIMCO 1-5 Year U.S. TIPS Index Exchange-Traded Fund |
|
PIMCO 15+ Year U.S. TIPS Index Exchange-Traded Fund |
|
PIMCO Broad U.S. TIPS Index Exchange-Traded Fund |
|
PIMCO 0-5 Year High Yield Corporate Bond Index Exchange-Traded Fund |
|
PIMCO Investment Grade Corporate Bond Index Exchange-Traded Fund |
|
PIMCO Enhanced Low Duration Active Exchange-Traded Fund |
|
PIMCO Enhanced Short Maturity Active ESG Exchange-Traded Fund |
|
PIMCO Enhanced Short Maturity Active Exchange-Traded Fund |
|
PIMCO Senior Loan Active Exchange-Traded Fund |
Securities on loan are required to be secured by cash collateral at least equal to 102% of the domestic, or 105% of the foreign security’s market value. If the market value of the collateral at the close of trading on a business day is less than 100% of the market value of the loaned securities at the close of trading on that day, the borrower shall be required to deliver, by the close of business on the following business day, an additional amount of collateral, so that the total amount of posted collateral is equal to at least 100% of the market value of all the loaned securities as of such preceding day. The Funds will then invest the cash collateral received in the PIMCO Government Money Market Fund and record a liability for the return of the collateral during the period the securities are on loan. For financial reporting purposes, the Fund does not offset financial instruments’ payables and receivables and related collateral on the Statement of Assets and Liabilities. Each Fund is subject to a lending limit of 33.33% of total assets (including the value of collateral).
The loans are subject to termination at the option of the borrower or a Fund. Upon termination of the loan, the borrower will return to the lender securities identical to the loaned securities. Should the borrower of the securities fail to return loaned securities, a Fund has the right to repurchase the securities using the collateral in the open market.
The borrower pays fees at the Funds’ direction to the lending agent. The lending agent may retain a portion of the fees and interest earned on the cash collateral invested as compensation for its services. Investments made with the cash collateral are disclosed on the Schedules of Investments, if applicable. The lending fees and the Funds’ portion of the interest income earned on cash collateral are included on the Statements of Operations as securities lending income, if applicable.
(f) Short Sales Short sales are transactions in which a Fund sells a security that it does not own in anticipation that the market price of that security will decline. A Fund may make short sales of securities to (i) offset potential declines in long positions in similar securities, (ii) to increase the flexibility of a Fund, (iii) for investment return, (iv) as part of a risk arbitrage strategy, and (v) as part of its overall portfolio management strategies involving the use of derivative instruments. When a Fund makes a short sale, it will often borrow the security sold short and deliver it to the counterparty. A Fund will ordinarily have to pay a fee or premium to borrow a security and be obligated to repay the lender of the security any dividend or interest that accrues on the security during the period of the loan. Securities sold in short sale transactions and the dividend or interest payable on such securities, if any, are reflected as payable for short sales on the Statements of Assets and Liabilities. Short sales expose a Fund to the risk that it will be required to cover its short position at a time when the security or other asset has appreciated in value, thus resulting in losses to a Fund. A short sale is “against the box” if a Fund holds in its portfolio or has the right to acquire the security sold short, or securities identical to the security sold short, at no additional cost. A Fund will be subject to additional risks to the extent that it engages in short sales that are not “against the box.” A Fund’s loss on a short sale could theoretically be unlimited in cases where the Fund is unable, for whatever reason, to close out its short position.
(g) Interfund Lending In accordance with an exemptive order (the “Order”) from the SEC, the Funds of the Trust may participate in a joint lending and borrowing facility for temporary purposes (the “Interfund Lending Program”), subject to compliance with the terms and conditions of the Order, and to the extent permitted by each Fund’s investment policies and restrictions. The Funds are currently permitted to borrow under the Interfund Lending Program. A lending fund may lend in aggregate up to 15% of its current net assets at the time of the interfund loan, but may not lend more than 5% of its net assets to any one borrowing fund through the Interfund Lending Program. A
| | | | | | | | | | | | |
| | | | ANNUAL FINANCIAL AND OTHER INFORMATION | | | | | | | JUNE 30, 2024 | | | 155 |
| | | | |
| Notes to Financial Statements | | (Cont.) | | |
borrowing fund may not borrow through the Interfund Lending Program or from any other source if its total outstanding borrowings immediately after the borrowing would be more than 33 1/3% of its total assets (or any lower threshold provided for by the fund’s investment restrictions). If a borrowing fund’s total outstanding borrowings exceed 10% of its total assets, each of its outstanding interfund loans will be subject to collateralization of at least 102% of the outstanding principal value of the loan. All interfund loans are for temporary or emergency purposes and the interfund loan rate to be charged will be the average of the highest current overnight repurchase agreement rate available to a lending fund and the bank loan rate, as calculated according to a formula established by the Board.
During the period ended June 30, 2024, the Funds did not participate in the Interfund Lending Program.
6. FINANCIAL DERIVATIVE INSTRUMENTS
The Funds may enter into the financial derivative instruments described below to the extent permitted by each Fund’s respective investment policies.
The following disclosures contain information on how and why the Funds use financial derivative instruments, and how financial derivative instruments affect the Funds’ financial position, results of operations and cash flows. The location and fair value amounts of these instruments on the Statements of Assets and Liabilities and the net realized gain (loss) and net change in unrealized appreciation (depreciation) on the Statements of Operations, each categorized by type of financial derivative contract and related risk exposure, are included in a table in the Notes to Schedules of Investments. The financial derivative instruments outstanding as of period end and the amounts of net realized gain (loss) and net change in unrealized appreciation (depreciation) on financial derivative instruments during the period, as disclosed in the Notes to Schedules of Investments, serve as indicators of the volume of financial derivative activity for the Funds.
(a) Forward Foreign Currency Contracts may be engaged, in connection with settling planned purchases or sales of securities, to hedge the currency exposure associated with some or all of a Fund’s securities or as part of an investment strategy. A forward foreign currency contract is an agreement between two parties to buy and sell a currency at a set price on a future date. The market value of a forward foreign currency contract fluctuates with changes in foreign currency exchange rates. Forward foreign currency contracts are marked to market daily, and the change in value is recorded by a Fund as an unrealized gain (loss). Realized gains (losses) are equal to the difference between the value of the contract at the time it was opened and the value at the time it was closed and are recorded upon delivery or receipt of the currency. These contracts may involve market risk in
excess of the unrealized gain (loss) reflected on the Statements of Assets and Liabilities. In addition, a Fund could be exposed to risk if the counterparties are unable to meet the terms of the contracts or if the value of the currency changes unfavorably to the U.S. dollar. To mitigate such risk, cash or securities may be exchanged as collateral pursuant to the terms of the underlying contracts.
(b) Futures Contracts are agreements to buy or sell a security or other asset for a set price on a future date and are traded on an exchange. A Fund may use futures contracts to manage its exposure to the securities markets or to movements in interest rates and currency values. The primary risks associated with the use of futures contracts are the imperfect correlation between the change in market value of the securities held by a Fund and the prices of futures contracts and the possibility of an illiquid market. Futures contracts are valued based upon their quoted daily settlement prices. Upon entering into a futures contract, a Fund is required to deposit with its futures broker an amount of cash, U.S. Government and Agency Obligations, or select sovereign debt, in accordance with the initial margin requirements of the broker or exchange. Futures contracts are marked to market daily and based on such movements in the price of the contracts, an appropriate payable or receivable for the change in value may be posted or collected by a Fund (“Futures Variation Margin”). Futures Variation Margins, if any, are disclosed within centrally cleared financial derivative instruments on the Statements of Assets and Liabilities. Gains (losses) are recognized but not considered realized until the contracts expire or close. Futures contracts involve, to varying degrees, risk of loss in excess of the Futures Variation Margin included within exchange traded or centrally cleared financial derivative instruments on the Statements of Assets and Liabilities.
(c) Options Contracts may be written or purchased to enhance returns or to hedge an existing position or future investment. A Fund may write call and put options on securities and financial derivative instruments it owns or in which it may invest. Writing put options tends to increase a Fund’s exposure to the underlying instrument. Writing call options tends to decrease a Fund’s exposure to the underlying instrument. When a Fund writes a call or put, an amount equal to the premium received is recorded and subsequently marked to market to reflect the current value of the option written. These amounts are included on the Statements of Assets and Liabilities. Premiums received from writing options which expire are treated as realized gains. Premiums received from writing options which are exercised or closed are added to the proceeds or offset against amounts paid on the underlying futures, swap, security or currency transaction to determine the realized gain (loss). Certain options may be written with premiums to be determined on a future date. The premiums for these options are based upon implied volatility parameters at specified terms. A Fund as a writer of
an option has no control over whether the underlying instrument may be sold (“call”) or purchased (“put”) and as a result bears the market risk of an unfavorable change in the price of the instrument underlying the written option. There is the risk a Fund may not be able to enter into a closing transaction because of an illiquid market.
Purchasing call options tends to increase a Fund’s exposure to the underlying instrument. Purchasing put options tends to decrease a Fund’s exposure to the underlying instrument. A Fund pays a premium which is included as an asset on the Statements of Assets and Liabilities and subsequently marked to market to reflect the current value of the option. Premiums paid for purchasing options which expire are treated as realized losses. Certain options may be purchased with premiums to be determined on a future date. The premiums for these options are based upon implied volatility parameters at specified terms. The risk associated with purchasing put and call options is limited to the premium paid. Premiums paid for purchasing options which are exercised or closed are added to the amounts paid or offset against the proceeds on the underlying investment transaction to determine the realized gain (loss) when the underlying transaction is executed.
Commodity Options are options on commodity futures contracts (“Commodity Option”). The underlying instrument for the Commodity Option is not the commodity itself, but rather a futures contract for that commodity. The exercise of a Commodity Option will not include physical delivery of the underlying commodity but will result in a cash transfer for the amount of the difference between the current market value of the underlying futures contract and the strike price. For an option that is in-the-money, a Fund will normally offset its position rather than exercise the option to retain any remaining time value.
Foreign Currency Options may be written or purchased to be used as a short or long hedge against possible variations in foreign exchange rates or to gain exposure to foreign currencies.
Interest Rate Swaptions may be written or purchased to enter into a pre-defined swap agreement or to shorten, extend, cancel or otherwise modify an existing swap agreement, by some specified date in the future. The writer of the swaption becomes the counterparty to the swap if the buyer exercises. The interest rate swaption agreement will specify whether the buyer of the swaption will be a fixed-rate receiver or a fixed-rate payer upon exercise.
Options on Exchange-Traded Futures Contracts (“Futures Option”) may be written or purchased to hedge an existing position or future investment, for speculative purposes or to manage exposure to market movements. A Futures Option is an option contract in which the underlying instrument is a single futures contract.
(d) Swap Agreements are bilaterally negotiated agreements between a Fund and a counterparty to exchange or swap investment cash flows, assets, foreign currencies or market-linked returns at specified, future intervals. Swap agreements may be privately negotiated in the over the counter market (“OTC swaps”) or may be cleared through a third party, known as a central counterparty or derivatives clearing organization (“Centrally Cleared Swaps”). A Fund may enter into asset, credit default, cross-currency, interest rate, total return, variance and other forms of swap agreements to manage its exposure to credit, currency, interest rate, commodity, equity and inflation risk. In connection with these agreements, securities or cash may be identified as collateral or margin in accordance with the terms of the respective swap agreements to provide assets of value and recourse in the event of default or bankruptcy/insolvency.
Centrally Cleared Swaps are marked to market daily based upon valuations as determined from the underlying contract or in accordance with the requirements of the central counterparty or derivatives clearing organization. Changes in market value, if any, are reflected as a component of net change in unrealized appreciation (depreciation) on the Statements of Operations. Daily changes in valuation of centrally cleared swaps (“Swap Variation Margin”), if any, are disclosed within centrally cleared financial derivative instruments on the Statements of Assets and Liabilities. Centrally Cleared and OTC swap payments received or paid at the beginning of the measurement period are included on the Statements of Assets and Liabilities and represent premiums paid or received upon entering into the swap agreement to compensate for differences between the stated terms of the swap agreement and prevailing market conditions (credit spreads, currency exchange rates, interest rates, and other relevant factors). Upfront premiums received (paid) are initially recorded as liabilities (assets) and subsequently marked to market to reflect the current value of the swap. These upfront premiums are recorded as realized gain (loss) on the Statements of Operations upon termination or maturity of the swap. A liquidation payment received or made at the termination of the swap is recorded as realized gain (loss) on the Statements of Operations. Net periodic payments received or paid by a Fund are included as part of realized gain (loss) on the Statements of Operations.
For purposes of applying certain of a Fund’s investment policies and restrictions, swap agreements, like other derivative instruments, may be valued by a Fund at market value, notional value or full exposure value. In the case of a credit default swap, in applying certain of a Fund’s investment policies and restrictions, the Funds will value the credit default swap at its notional value or its full exposure value (i.e., the sum of the notional amount for the contract plus the market value), but may value the credit default swap at market value for purposes of applying certain of a Fund’s other investment policies and restrictions.
| | | | | | | | | | | | |
| | | | ANNUAL FINANCIAL AND OTHER INFORMATION | | | | | | | JUNE 30, 2024 | | | 157 |
| | | | |
| Notes to Financial Statements | | (Cont.) | | |
For example, a Fund may value credit default swaps at full exposure value for purposes of a Fund’s credit quality guidelines (if any) because such value in general better reflects a Fund’s actual economic exposure during the term of the credit default swap agreement. As a result, a Fund may, at times, have notional exposure to an asset class (before netting) that is greater or lesser than the stated limit or restriction noted in a Fund’s prospectus. In this context, both the notional amount and the market value may be positive or negative depending on whether a Fund is selling or buying protection through the credit default swap. The manner in which certain securities or other instruments are valued by a Fund for purposes of applying investment policies and restrictions may differ from the manner in which those investments are valued by other types of investors.
Entering into swap agreements involves, to varying degrees, elements of interest, credit, market and documentation risk in excess of the amounts recognized on the Statements of Assets and Liabilities. Such risks involve the possibility that there will be no liquid market for these agreements, that the counterparty to the agreements may fail to perform or meet an obligation or disagree as to the meaning of contractual terms in the agreements and that there may be unfavorable changes in interest rates or the values of the asset upon which the swap is based.
A Fund’s maximum risk of loss from counterparty credit risk is the discounted net value of the cash flows to be received from the counterparty over the contract’s remaining life, to the extent that amount is positive. The risk may be mitigated by having a master netting arrangement between a Fund and the counterparty and by the posting of collateral to a Fund to cover a Fund’s exposure to the counterparty.
To the extent a Fund has a policy to limit the net amount owed to or to be received from a single counterparty under existing swap agreements, such limitation only applies to counterparties to OTC swaps and does not apply to centrally cleared swaps where the counterparty is a central counterparty or derivatives clearing organization.
Asset Swap Agreements convert the cash flows from an underlying security from fixed coupon to floating coupon, floating coupon to fixed coupon, or from one currency to another. The terms and conditions of the asset swap are the same as for an interest rate swap. However, an asset swap is unique in that one interest payment is tied to cash flows from an investment, such as corporate bonds or sovereign issues. The other payment is typically tied to an alternative index, such as a floating rate or a rate denominated in a different currency.
Credit Default Swap Agreements on corporate, loan, sovereign, U.S. municipal or U.S. Treasury issues are entered into to provide a measure of protection against defaults of the issuers (i.e., to reduce risk where a
Fund owns or has exposure to the referenced obligation) or to take an active long or short position with respect to the likelihood of a particular issuer’s default. Credit default swap agreements involve one party making a stream of payments (referred to as the buyer of protection) to another party (the seller of protection) in exchange for the right to receive a specified return in the event that the referenced entity, obligation or index, as specified in the swap agreement, undergoes a certain credit event. As a seller of protection on credit default swap agreements, a Fund will generally receive from the buyer of protection a fixed rate of income throughout the term of the swap provided that there is no credit event. As the seller, a Fund would effectively add leverage to its portfolio because, in addition to its total net assets, a Fund would be subject to investment exposure on the notional amount of the swap.
If a Fund is a seller of protection and a credit event occurs, as defined under the terms of that particular swap agreement, a Fund will either (i) pay to the buyer of protection an amount equal to the notional amount of the swap and take delivery of the referenced obligation or underlying securities comprising the referenced index or (ii) pay a net settlement amount in the form of cash, securities or other deliverable obligations equal to the notional amount of the swap less the recovery value of the referenced obligation or underlying securities comprising the referenced index. If a Fund is a buyer of protection and a credit event occurs, as defined under the terms of that particular swap agreement, a Fund will either (i) receive from the seller of protection an amount equal to the notional amount of the swap and deliver the referenced obligation, other deliverable obligations or underlying securities comprising the referenced index or (ii) receive a net settlement amount in the form of cash, securities or other deliverable obligations equal to the notional amount of the swap less the recovery value of the referenced obligation or underlying securities comprising the referenced index. Recovery values are estimated by market makers considering either industry standard recovery rates or entity specific factors and considerations until a credit event occurs. If a credit event has occurred, the recovery value is determined by a facilitated auction whereby a minimum number of allowable broker bids, together with a specified valuation method, are used to calculate the settlement value. The ability to deliver other obligations may result in a cheapest-to-deliver option (the buyer of protection’s right to choose the deliverable obligation with the lowest value following a credit event).
Credit default swap agreements on credit indexes involve one party making a stream of payments to another party in exchange for the right to receive a specified return in the event of a write-down, principal shortfall, interest shortfall or default of all or part of the referenced entities comprising the credit index. A credit index is a basket of credit instruments or exposures designed to be representative of some part of the credit market as a whole. These indexes are made up of reference
credits that are judged by a poll of dealers to be the most liquid entities in the credit default swap market based on the sector of the index. Components of the indexes may include, but are not limited to, investment grade securities, high yield securities, asset-backed securities, emerging markets and/or various credit ratings within each sector. Credit indexes are traded using credit default swaps with standardized terms including a fixed spread and standard maturity dates. An index credit default swap references all the names in the index, and if there is a default, the credit event is settled based on that name’s weight in the index. The composition of the indexes changes periodically, usually every six months, and for most indexes, each name has an equal weight in the index. Credit default swaps on credit indexes may be used to hedge a portfolio of credit default swaps or bonds, which is less expensive than it would be to buy many credit default swaps to achieve a similar effect. Credit default swaps on indexes are instruments for protecting investors owning bonds against default, and traders use them to speculate on changes in credit quality.
Implied credit spreads, represented in absolute terms, utilized in determining the market value of credit default swap agreements on corporate, loan, sovereign, U.S. municipal or U.S. Treasury issues as of period end, if any, are disclosed in the Notes to Schedules of Investments. They serve as an indicator of the current status of payment/performance risk and represent the likelihood or risk of default for the reference entity. The implied credit spread of a particular referenced entity reflects the cost of buying/selling protection and may include upfront payments required to be made to enter into the agreement. Wider credit spreads represent a deterioration of the referenced entity’s credit soundness and a greater likelihood or risk of default or other credit event occurring as defined under the terms of the agreement. For credit default swap agreements on asset-backed securities and credit indexes, the quoted market prices and resulting values serve as the indicator of the current status of the payment/performance risk. Increasing market values, in absolute terms when compared to the notional amount of the swap, represent a deterioration of the referenced entity’s credit soundness and a greater likelihood or risk of default or other credit event occurring as defined under the terms of the agreement.
The maximum potential amount of future payments (undiscounted) that a Fund as a seller of protection could be required to make under a credit default swap agreement equals the notional amount of the agreement. Notional amounts of each individual credit default swap agreement outstanding as of period end for which a Fund is the seller of protection are disclosed in the Notes to Schedules of Investments. These potential amounts would be partially offset by any recovery values of the respective referenced obligations, upfront payments received upon entering into the agreement, or net amounts received
from the settlement of buy protection credit default swap agreements entered into by a Fund for the same referenced entity or entities.
Interest Rate Swap Agreements may be entered into to help hedge against interest rate risk exposure and to maintain a Fund’s ability to generate income at prevailing market rates. The value of the fixed rate bonds that the Funds hold may decrease if interest rates rise. To help hedge against this risk and to maintain its ability to generate income at prevailing market rates, a Fund may enter into interest rate swap agreements. Interest rate swap agreements involve the exchange by a Fund with another party for their respective commitment to pay or receive interest on the notional amount of principal. Certain forms of interest rate swap agreements may include: (i) interest rate caps, under which, in return for a premium, one party agrees to make payments to the other to the extent that interest rates exceed a specified rate, or “cap”, (ii) interest rate floors, under which, in return for a premium, one party agrees to make payments to the other to the extent that interest rates fall below a specified rate, or “floor”, (iii) interest rate collars, under which a party sells a cap and purchases a floor or vice versa in an attempt to protect itself against interest rate movements exceeding given minimum or maximum levels, (iv) callable interest rate swaps, under which the buyer pays an upfront fee in consideration for the right to early terminate the swap transaction in whole, at zero cost and at a predetermined date and time prior to the maturity date, (v) spreadlocks, which allow the interest rate swap users to lock in the forward differential (or spread) between the interest rate swap rate and a specified benchmark, or (vi) basis swaps, under which two parties can exchange variable interest rates based on different segments of money markets.
Total Return Swap Agreements are entered into to gain or mitigate exposure to the underlying reference asset. Total return swap agreements involve commitments where single or multiple cash flows are exchanged based on the price of an underlying reference asset and on a fixed or variable interest rate. Total return swap agreements may involve commitments to pay interest in exchange for a market-linked return. One counterparty pays out the total return of a specific underlying reference asset, which may include a single security, a basket of securities, or an index, and in return receives a fixed or variable rate. At the maturity date, a net cash flow is exchanged where the total return is equivalent to the return of the underlying reference asset less a financing rate, if any. As a receiver, a Fund would receive payments based on any net positive total return and would owe payments in the event of a net negative total return. As the payer, a Fund would owe payments on any net positive total return and would receive payments in the event of a net negative total return.
| | | | | | | | | | | | |
| | | | ANNUAL FINANCIAL AND OTHER INFORMATION | | | | | | | JUNE 30, 2024 | | | 159 |
| | | | |
| Notes to Financial Statements | | (Cont.) | | |
7. PRINCIPAL AND OTHER RISKS
(a) Principal Risks
The principal risks of investing in a Fund, which could adversely affect its net asset value, yield and total return, are listed below.
| | | | | | | | | | | | | | | | | | | | | | | | | | | | | | | | | | | | | | | | | | | | | | | | | | | | | | | | | | | | |
| Risks | | | | | PIMCO 25+
Year Zero
Coupon U.S.
Treasury
Index
Exchange-
Traded
Fund | | | PIMCO 1-5
Year U.S.
TIPS Index
Exchange-
Traded
Fund | | | PIMCO 15+
Year U.S.
TIPS Index
Exchange-
Traded
Fund | | | PIMCO
Broad U.S.
TIPS Index
Exchange-
Traded
Fund | | | PIMCO 0-5
Year High
Yield
Corporate
Bond Index
Exchange-
Traded
Fund | | | PIMCO
Investment
Grade
Corporate
Bond Index
Exchange-
Traded
Fund | | | PIMCO
Active Bond
Exchange-
Traded
Fund | | | PIMCO
Enhanced
Low
Duration
Active
Exchange-
Traded
Fund | | | PIMCO
Enhanced
Short
Maturity
Active ESG
Exchange-
Traded
Fund | | | PIMCO
Enhanced
Short
Maturity
Active
Exchange-
Traded
Fund | | | PIMCO
Intermediate
Municipal
Bond Active
Exchange-
Traded
Fund | | | PIMCO
Municipal
Income
Opportunities
Active
Exchange-
Traded
Fund | | | PIMCO
Senior
Loan
Active
Exchange-
Traded
Fund | | | PIMCO
Short Term
Municipal
Bond Active
Exchange-
Traded
Fund | |
| | | | | | | | | | | | | | | |
New Fund | | | | | | | — | | | | — | | | | — | | | | — | | | | — | | | | — | | | | — | | | | — | | | | X | | | | — | | | | — | | | | X | | | | X | | | | — | |
| | | | | | | | | | | | | | | |
Small Fund | | | | | | | — | | | | — | | | | — | | | | — | | | | — | | | | — | | | | — | | | | — | | | | — | | | | — | | | | — | | | | X | | | | — | | | | — | |
| | | | | | | | | | | | | | | |
Senior Loan | | | | | | | — | | | | — | | | | — | | | | — | | | | — | | | | — | | | | — | | | | — | | | | — | | | | — | | | | — | | | | — | | | | X | | | | — | |
| | | | | | | | | | | | | | | |
Market Trading | | | | | | | X | | | | X | | | | X | | | | X | | | | X | | | | X | | | | X | | | | X | | | | X | | | | X | | | | X | | | | X | | | | X | | | | X | |
| | | | | | | | | | | | | | | |
Interest Rate | | | | | | | X | | | | X | | | | X | | | | X | | | | X | | | | X | | | | X | | | | X | | | | X | | | | X | | | | X | | | | X | | | | X | | | | X | |
| | | | | | | | | | | | | | | |
Call | | | | | | | X | | | | X | | | | X | | | | X | | | | X | | | | X | | | | X | | | | X | | | | X | | | | X | | | | X | | | | X | | | | X | | | | X | |
| | | | | | | | | | | | | | | |
Inflation-Indexed Security | | | | | | | — | | | | X | | | | X | | | | X | | | | — | | | | — | | | | — | | | | — | | | | — | | | | — | | | | — | | | | — | | | | — | | | | — | |
| | | | | | | | | | | | | | | |
Credit | | | | | | | X | | | | X | | | | X | | | | X | | | | X | | | | X | | | | X | | | | X | | | | X | | | | X | | | | X | | | | X | | | | X | | | | X | |
| | | | | | | | | | | | | | | |
Collateralized Loan Obligations | | | | | | | — | | | | — | | | | — | | | | — | | | | — | | | | — | | | | X | | | | X | | | | X | | | | X | | | | — | | | | — | | | | X | | | | — | |
| | | | | | | | | | | | | | | |
High Yield | | | | | | | — | | | | — | | | | — | | | | — | | | | X | | | | — | | | | X | | | | X | | | | — | | | | — | | | | — | | | | X | | | | X | | | | — | |
| | | | | | | | | | | | | | | |
Market | | | | | | | X | | | | X | | | | X | | | | X | | | | X | | | | X | | | | X | | | | X | | | | X | | | | X | | | | X | | | | X | | | | X | | | | X | |
| | | | | | | | | | | | | | | |
Municipal Bond | | | | | | | — | | | | — | | | | — | | | | — | | | | — | | | | — | | | | — | | | | — | | | | — | | | | — | | | | X | | | | X | | | | — | | | | X | |
| | | | | | | | | | | | | | | |
Issuer | | | | | | | — | | | | — | | | | — | | | | — | | | | X | | | | X | | | | X | | | | X | | | | X | | | | X | | | | X | | | | X | | | | X | | | | X | |
| | | | | | | | | | | | | | | |
Liquidity | | | | | | | X | | | | X | | | | X | | | | X | | | | X | | | | X | | | | X | | | | X | | | | X | | | | X | | | | X | | | | X | | | | X | | | | X | |
| | | | | | | | | | | | | | | |
Derivatives | | | | | | | X | | | | X | | | | X | | | | X | | | | X | | | | X | | | | X | | | | X | | | | — | | | | — | | | | X | | | | X | | | | X | | | | X | |
| | | | | | | | | | | | | | | |
Equity | | | | | | | — | | | | — | | | | — | | | | — | | | | — | | | | — | | | | X | | | | — | | | | — | | | | — | | | | — | | | | — | | | | X | | | | — | |
| | | | | | | | | | | | | | | |
Mortgage-Related and Other Asset Backed Securities | | | | | | | — | | | | — | | | | — | | | | — | | | | X | | | | — | | | | X | | | | X | | | | X | | | | X | | | | — | | | | — | | | | — | | | | — | |
| | | | | | | | | | | | | | | |
Foreign (Non-U.S.) Investment | | | | | | | — | | | | — | | | | — | | | | — | | | | X | | | | X | | | | X | | | | X | | | | X | | | | X | | | | — | | | | — | | | | X | | | | — | |
| | | | | | | | | | | | | | | |
Emerging Markets | | | | | | | — | | | | — | | | | — | | | | — | | | | X | | | | X | | | | X | | | | X | | | | — | | | | — | | | | — | | | | — | | | | — | | | | — | |
| | | | | | | | | | | | | | | |
Sovereign Debt | | | | | | | — | | | | — | | | | — | | | | — | | | | X | | | | X | | | | — | | | | — | | | | — | | | | — | | | | — | | | | — | | | | — | | | | — | |
| | | | | | | | | | | | | | | |
Environmental, Social and Governance | | | | | | | — | | | | — | | | | — | | | | — | | | | — | | | | — | | | | — | | | | — | | | | X | | | | — | | | | — | | | | — | | | | — | | | | — | |
| | | | | | | | | | | | | | | |
AMT Bonds | | | | | | | — | | | | — | | | | — | | | | — | | | | — | | | | — | | | | — | | | | — | | | | — | | | | — | | | | — | | | | X | | | | — | | | | — | |
| | | | | | | | | | | | | | | |
Currency | | | | | | | — | | | | — | | | | — | | | | — | | | | — | | | | — | | | | X | | | | X | | | | X | | | | — | | | | — | | | | — | | | | X | | | | — | |
| | | | | | | | | | | | | | | |
Leveraging | | | | | | | X | | | | X | | | | X | | | | X | | | | X | | | | X | | | | X | | | | X | | | | X | | | | X | | | | X | | | | X | | | | X | | | | X | |
| | | | | | | | | | | | | | | |
Management and Tracking Error | | | | | | | X | | | | X | | | | X | | | | X | | | | X | | | | X | | | | — | | | | — | | | | — | | | | — | | | | — | | | | — | | | | — | | | | — | |
| | | | | | | | | | | | | | | |
Indexing | | | | | | | X | | | | X | | | | X | | | | X | | | | X | | | | X | | | | — | | | | — | | | | — | | | | — | | | | — | | | | — | | | | — | | | | — | |
| | | | | | | | | | | | | | | |
Management | | | | | | | — | | | | — | | | | — | | | | — | | | | — | | | | — | | | | X | | | | X | | | | X | | | | X | | | | X | | | | X | | | | X | | | | X | |
| | | | | | | | | | | | | | | |
Asset-Backed Securities | | | | | | | — | | | | — | | | | — | | | | — | | | | — | | | | — | | | | — | | | | — | | | | — | | | | — | | | | — | | | | — | | | | X | | | | — | |
| | | | | | | | | | | | | | | |
California State-Specific | | | | | | | — | | | | — | | | | — | | | | — | | | | — | | | | — | | | | — | | | | — | | | | — | | | | — | | | | X | | | | X | | | | — | | | | — | |
| | | | | | | | | | | | | | | |
New York State-Specific | | | | | | | — | | | | — | | | | — | | | | — | | | | — | | | | — | | | | — | | | | — | | | | — | | | | — | | | | X | | | | X | | | | — | | | | — | |
| | | | | | | | | | | | | | | |
Puerto Rico-Specific | | | | | | | — | | | | — | | | | — | | | | — | | | | — | | | | — | | | | — | | | | — | | | | — | | | | — | | | | — | | | | X | | | | — | | | | — | |
| | | | | | | | | | | | | | | |
Municipal Project-Specific | | | | | | | — | | | | — | | | | — | | | | — | | | | — | | | | — | | | | — | | | | — | | | | — | | | | — | | | | X | | | | X | | | | — | | | | X | |
| | | | | | | | | | | | | | | |
Short Exposure | | | | | | | — | | | | — | | | | — | | | | — | | | | — | | | | — | | | | X | | | | X | | | | X | | | | X | | | | — | | | | — | | | | X | | | | — | |
| | | | | | | | | | | | | | | |
Convertible Securities | | | | | | | — | | | | — | | | | — | | | | — | | | | — | | | | — | | | | X | | | | — | | | | — | | | | — | | | | — | | | | — | | | | — | | | | — | |
| | | | | | | | | | | | | | | |
Tax-Efficient Investing | | | | | | | — | | | | — | | | | — | | | | — | | | | — | | | | — | | | | X | | | | X | | | | — | | | | — | | | | — | | | | — | | | | — | | | | — | |
| | | | | | | | | | | | | | | |
Distribution Rate | | | | | | | — | | | | — | | | | — | | | | — | | | | — | | | | — | | | | X | | | | X | | | | — | | | | — | | | | — | | | | — | | | | — | | | | — | |
| | | | | | | | | | | | | | | |
LIBOR Transition | | | | | | | — | | | | — | | | | — | | | | — | | | | — | | | | — | | | | X | | | | X | | | | X | | | | X | | | | X | | | | X | | | | X | | | | X | |
| | | | | | | | | | | | | | | |
Futures Contract | | | | | | | — | | | | — | | | | — | | | | — | | | | — | | | | — | | | | — | | | | — | | | | X | | | | X | | | | — | | | | — | | | | — | | | | — | |
| | | | | | | | | | | | | | | |
Capital Securities | | | | | | | — | | | | — | | | | — | | | | — | | | | — | | | | — | | | | — | | | | — | | | | — | | | | — | | | | — | | | | — | | | | — | | | | — | |
| | | | | | | | | | | | | | | |
Preferred Securities | | | | | | | — | | | | — | | | | — | | | | — | | | | — | | | | — | | | | — | | | | — | | | | — | | | | — | | | | — | | | | — | | | | — | | | | — | |
| | | | | | | | | | | | | | | |
Concentration in Banking Industries | | | | | | | — | | | | — | | | | — | | | | — | | | | — | | | | — | | | | — | | | | — | | | | — | | | | — | | | | — | | | | — | | | | — | | | | — | |
| | | | | | | | | | | | | | | | | | | | | | | | | | | | | | | | | | | | | | | | | | | | | | | | | | | | | | | | | | | | |
| Risks | | | | | PIMCO 25+
Year Zero
Coupon U.S.
Treasury
Index
Exchange-
Traded
Fund | | | PIMCO 1-5
Year U.S.
TIPS Index
Exchange-
Traded
Fund | | | PIMCO 15+
Year U.S.
TIPS Index
Exchange-
Traded
Fund | | | PIMCO
Broad U.S.
TIPS Index
Exchange-
Traded
Fund | | | PIMCO 0-5
Year High
Yield
Corporate
Bond Index
Exchange-
Traded
Fund | | | PIMCO
Investment
Grade
Corporate
Bond Index
Exchange-
Traded
Fund | | | PIMCO
Active Bond
Exchange-
Traded
Fund | | | PIMCO
Enhanced
Low
Duration
Active
Exchange-
Traded
Fund | | | PIMCO
Enhanced
Short
Maturity
Active ESG
Exchange-
Traded
Fund | | | PIMCO
Enhanced
Short
Maturity
Active
Exchange-
Traded
Fund | | | PIMCO
Intermediate
Municipal
Bond Active
Exchange-
Traded
Fund | | | PIMCO
Municipal
Income
Opportunities
Active
Exchange-
Traded
Fund | | | PIMCO
Senior
Loan
Active
Exchange-
Traded
Fund | | | PIMCO
Short Term
Municipal
Bond Active
Exchange-
Traded
Fund | |
| | | | | | | | | | | | | | | |
Contingent Convertible Securities | | | | | | | — | | | | — | | | | — | | | | — | | | | — | | | | — | | | | — | | | | — | | | | — | | | | — | | | | — | | | | — | | | | — | | | | — | |
| | | | | | | | | | | | | | | |
Commodity | | | | | | | — | | | | — | | | | — | | | | — | | | | — | | | | — | | | | — | | | | — | | | | — | | | | — | | | | — | | | | — | | | | — | | | | — | |
| | | | | | | | | | | | | | | |
Issuer Non-Diversification | | | | | | | — | | | | — | | | | — | | | | — | | | | — | | | | — | | | | — | | | | — | | | | — | | | | — | | | | — | | | | — | | | | — | | | | — | |
| | | | | | | | | | | | | | | |
Model | | | | | | | — | | | | — | | | | — | | | | — | | | | — | | | | — | | | | — | | | | — | | | | — | | | | — | | | | — | | | | — | | | | — | | | | — | |
| | | | | | | | | | | | | | | |
Tax | | | | | | | — | | | | — | | | | — | | | | — | | | | — | | | | — | | | | — | | | | — | | | | — | | | | — | | | | — | | | | — | | | | — | | | | — | |
| | | | | | | | | | | | | | | |
Subsidiary | | | | | | | — | | | | — | | | | — | | | | — | | | | — | | | | — | | | | — | | | | — | | | | — | | | | — | | | | — | | | | — | | | | — | | | | — | |
| | | | | | | | | | | | | | | |
Oil-Related | | | | | | | — | | | | — | | | | — | | | | — | | | | — | | | | — | | | | — | | | | — | | | | — | | | | — | | | | — | | | | — | | | | — | | | | — | |
| | | | | | | | | | | | | | | | | | | | |
| Risks | | | | | PIMCO
Multisector
Bond Active
Exchange-
Traded
Fund | | | PIMCO
Preferred
and Capital
Securities
Active
Exchange-
Traded
Fund | | | PIMCO Ultra Short
Government
Active
Exchange-
Traded Fund | | | PIMCO
Commodity
Strategy
Active
Exchange-
Traded
Fund | |
| | | | | |
New Fund | | | | | | | X | | | | X | | | | X | | | | X | |
| | | | | |
Small Fund | | | | | | | — | | | | X | | | | X | | | | — | |
| | | | | |
Senior Loan | | | | | | | — | | | | — | | | | — | | | | — | |
| | | | | |
Market Trading | | | | | | | X | | | | X | | | | X | | | | X | |
| | | | | |
Interest Rate | | | | | | | X | | | | X | | | | X | | | | X | |
| | | | | |
Call | | | | | | | X | | | | X | | | | X | | | | X | |
| | | | | |
Inflation-Indexed Security | | | | | | | — | | | | — | | | | — | | | | — | |
| | | | | |
Credit | | | | | | | X | | | | X | | | | X | | | | X | |
| | | | | |
Collateralized Loan Obligations | | | | | | | X | | | | — | | | | — | | | | — | |
| | | | | |
High Yield | | | | | | | X | | | | X | | | | — | | | | — | |
| | | | | |
Market | | | | | | | X | | | | X | | | | X | | | | X | |
| | | | | |
Municipal Bond | | | | | | | — | | | | — | | | | — | | | | — | |
| | | | | |
Issuer | | | | | | | X | | | | X | | | | — | | | | X | |
| | | | | |
Liquidity | | | | | | | X | | | | X | | | | — | | | | X | |
| | | | | |
Derivatives | | | | | | | X | | | | X | | | | — | | | | X | |
| | | | | |
Equity | | | | | | | X | | | | X | | | | — | | | | — | |
| | | | | |
Mortgage-Related and Other Asset Backed Securities | | | | | | | X | | | | — | | | | — | | | | X | |
| | | | | |
Foreign (Non-U.S.) Investment | | | | | | | X | | | | X | | | | — | | | | X | |
| | | | | |
Emerging Markets | | | | | | | X | | | | X | | | | — | | | | — | |
| | | | | |
Sovereign Debt | | | | | | | X | | | | — | | | | — | | | | X | |
| | | | | |
Environmental, Social and Governance | | | | | | | — | | | | — | | | | — | | | | — | |
| | | | | |
AMT Bonds | | | | | | | — | | | | — | | | | — | | | | — | |
| | | | | |
Currency | | | | | | | X | | | | X | | | | — | | | | X | |
| | | | | |
Leveraging | | | | | | | X | | | | X | | | | — | | | | X | |
| | | | | |
Management and Tracking Error | | | | | | | — | | | | — | | | | — | | | | — | |
| | | | | |
Indexing | | | | | | | — | | | | — | | | | — | | | | — | |
| | | | | |
Management | | | | | | | X | | | | X | | | | X | | | | X | |
| | | | | |
Asset-Backed Securities | | | | | | | — | | | | — | | | | — | | | | — | |
| | | | | |
California State-Specific | | | | | | | — | | | | — | | | | — | | | | — | |
| | | | | |
New York State-Specific | | | | | | | — | | | | — | | | | — | | | | — | |
| | | | | |
Puerto Rico-Specific | | | | | | | — | | | | — | | | | — | | | | — | |
| | | | | |
Municipal Project-Specific | | | | | | | — | | | | — | | | | — | | | | — | |
| | | | | |
Short Exposure | | | | | | | X | | | | X | | | | — | | | | X | |
| | | | | |
Convertible Securities | | | | | | | — | | | | — | | | | — | | | | — | |
| | | | | |
Tax-Efficient Investing | | | | | | | — | | | | — | | | | — | | | | — | |
| | | | | |
Distribution Rate | | | | | | | — | | | | — | | | | — | | | | — | |
| | | | | |
LIBOR Transition | | | | | | | X | | | | X | | | | — | | | | X | |
| | | | | | | | | | | | |
| | | | ANNUAL FINANCIAL AND OTHER INFORMATION | | | | | | | JUNE 30, 2024 | | | 161 |
| | | | |
| Notes to Financial Statements | | (Cont.) | | |
| | | | | | | | | | | | | | | | | | | | |
| Risks | | | | | PIMCO
Multisector
Bond Active
Exchange-
Traded
Fund | | | PIMCO
Preferred
and Capital
Securities
Active
Exchange-
Traded
Fund | | | PIMCO Ultra Short
Government
Active
Exchange-
Traded Fund | | | PIMCO
Commodity
Strategy
Active
Exchange-
Traded
Fund | |
| | | | | |
Futures Contract | | | | | | | — | | | | — | | | | — | | | | — | |
| | | | | |
Capital Securities | | | | | | | — | | | | X | | | | — | | | | — | |
| | | | | |
Preferred Securities | | | | | | | — | | | | X | | | | — | | | | — | |
| | | | | |
Concentration in Banking Industries | | | | | | | — | | | | X | | | | — | | | | — | |
| | | | | |
Contingent Convertible Securities | | | | | | | X | | | | X | | | | — | | | | — | |
| | | | | |
Commodity | | | | | | | — | | | | — | | | | — | | | | X | |
| | | | | |
Issuer Non-Diversification | | | | | | | — | | | | — | | | | — | | | | X | |
| | | | | |
Model | | | | | | | — | | | | — | | | | — | | | | X | |
| | | | | |
Tax | | | | | | | — | | | | — | | | | — | | | | X | |
| | | | | |
Subsidiary | | | | | | | — | | | | — | | | | — | | | | X | |
| | | | | |
Oil-Related | | | | | | | — | | | | — | | | | — | | | | X | |
Please see “Description of Principal Risks” in a Fund’s prospectus for a more detailed description of the risks of investing in a Fund.
New Fund Risk is the risk that a new fund’s performance may not represent how the fund is expected to or may perform in the long term. In addition, new funds have limited operating histories for investors to evaluate and new funds may not attract sufficient assets to achieve investment and trading efficiencies.
Small Fund Risk is the risk that a smaller fund may not achieve investment or trading efficiencies. Additionally, a smaller fund may be more adversely affected by large purchases or redemptions of fund shares.
Senior Loan Risk is the risk that investing in senior loans, including bank loans, exposes the Fund to heightened credit risk, call risk, settlement risk and liquidity risk. If an issuer of a senior loan prepays or redeems the loan prior to maturity, the Fund may have to reinvest the proceeds in instruments that pay lower interest rates. To the extent the Fund invests in senior loans that are covenant-lite obligations, the Fund may have fewer rights against a borrower (e.g., covenant-lite obligations may contain fewer maintenance covenants than other obligations, or no maintenance covenants) and may have a greater risk of loss on such investments as compared to investments in
traditional loans.
Market Trading Risk is the risk that an active secondary trading market for Fund shares does not continue once developed, that a Fund may not continue to meet a listing exchange’s trading or listing requirements, that trading in Fund shares may be halted or become less liquid or that Fund shares trade at prices other than a Fund’s net asset value, and are subject to trading costs, which may be exacerbated if the creation/redemption process becomes less effective, particularly during times of market stress.
Interest Rate Risk is the risk that fixed income securities will fluctuate in value because of a change in interest rates; a fund with a longer
average portfolio duration will be more sensitive to changes in interest rates than a fund with a shorter average portfolio duration.
Call Risk is the risk that an issuer may exercise its right to redeem a fixed income security earlier than expected (a call). Issuers may call outstanding securities prior to their maturity for a number of reasons (e.g., declining interest rates, changes in credit spreads and improvements in the issuer’s credit quality). If an issuer calls a security that a Fund has invested in, a Fund may not recoup the full amount of its initial investment or may not realize the full anticipated earnings from the investment and may be forced to reinvest in lower-yielding securities, securities with greater credit risks or securities with other, less favorable features.
Inflation-Indexed Security Risk is the risk that inflation-indexed debt securities are subject to the effects of changes in market interest rates caused by factors other than inflation (real interest rates). In general, the value of an inflation-indexed security, including TIPS, tends to decrease when real interest rates increase and can increase when real interest rates decrease. Interest payments on inflation-indexed securities are unpredictable and will fluctuate as the principal and interest are adjusted for inflation. There can be no assurance that the inflation index used will accurately measure the real rate of inflation in the prices of goods and services. Any increase in the principal amount of an inflation-indexed debt security will be considered taxable ordinary income, even though the Fund will not receive the principal until maturity.
Credit Risk is the risk that a Fund could lose money if the issuer or guarantor of a fixed income security, or the counterparty to a derivative contract, or the issuer or guarantor of collateral, is unable or unwilling, or is perceived (whether by market participants, rating agencies, pricing services or otherwise) as unable or unwilling, to meet its financial obligations.
Collateralized Loan Obligations Risk is the risk that investing in collateralized loan obligations (“CLOs”) and other similarly structured investments exposes a Fund to heightened credit risk, interest rate risk, liquidity risk, market risk and prepayment and extension risk, as well as the risk of default on the underlying asset. In addition, investments in CLOs carry additional risks including, but not limited to: (i) the possibility that distributions from collateral securities will not be adequate to make interest or other payments; (ii) the quality of the collateral may decline in value or default; (iii) risks related to the capability of the servicer of the securitized assets; (iv) the risk that a Fund may invest in tranches of CLOs that are subordinate to other tranches; (v) the structure and complexity of the transaction and the legal documents may not be fully understood at the time of investment and could lead to disputes with the issuer or among investors regarding the characterization of proceeds or unexpected investment results; and (vi) the CLO’s manager may perform poorly.
High Yield Risk is the risk that high yield securities and unrated securities of similar credit quality (commonly known as “junk bonds”) are subject to greater levels of credit, call and liquidity risks. High yield securities are considered primarily speculative with respect to the issuer’s continuing ability to make principal and interest payments, and may be more volatile than higher-rated securities of similar maturity.
Market Risk is the risk that the value of securities owned by a Fund may go up or down, sometimes rapidly or unpredictably, due to factors affecting securities markets generally or particular industries.
Municipal Bond Risk is the risk that by investing in municipal bonds a Fund may be affected significantly by the economic, regulatory or political developments affecting the ability of issuers of municipal bonds to pay interest or repay principal.
Issuer Risk is the risk that the value of a security may decline for a reason directly related to the issuer, such as management performance, changes in financial condition or credit rating, financial leverage, reputation or reduced demand for the issuer’s goods or services.
Liquidity Risk is the risk that a particular investment may be difficult to purchase or sell and that a Fund may be unable to sell illiquid investments at an advantageous time or price or achieve its desired level of exposure to a certain sector. Liquidity risk may result from the lack of an active market, reduced number and capacity of traditional market participants to make a market in fixed income securities, and may be magnified in a rising interest rate environment or other circumstances where investor redemptions from fixed income funds may be higher than normal, causing increased supply in the market due to selling activity.
Derivatives Risk is the risk of investing in derivative instruments (such as forwards, futures, swaps and structured securities) and other similar investments, including leverage, liquidity, interest rate, market, counterparty (including credit), operational, legal and management risks, and valuation complexity. Changes in the value of a derivative or other similar investment may not correlate perfectly with, and may be more sensitive to market events than, the underlying asset, rate or index, and a Fund could lose more than the initial amount invested. Changes in the value of a derivative or other similar instrument may also create margin delivery or settlement payment obligations for the Fund. A Fund’s use of derivatives or other similar investments may result in losses to a Fund, a reduction in a Fund’s returns and/or increased volatility. Non-centrally-cleared over-the-counter (“OTC”) derivatives or other similar investments are also subject to the risk that a counterparty to the transaction will not fulfill its contractual obligations to the other party, as many of the protections afforded to centrally-cleared derivative transactions might not be available for non-centrally-cleared OTC derivatives or other similar investments. The primary credit risk on derivatives or other similar investments that are exchange-traded or traded through a central clearing counterparty resides with a Fund’s clearing broker or the clearinghouse. Changes in regulation relating to a registered fund’s use of derivatives and related instruments could potentially limit or impact a Fund’s ability to invest in derivatives, limit a Fund’s ability to employ certain strategies that use derivatives or other similar investments and/or adversely affect the value of derivatives or other similar investments and a Fund’s performance.
Equity Risk is the risk that the value of equity or equity-related securities, such as common stocks and preferred securities, may decline due to general market conditions which are not specifically related to a particular company or to factors affecting a particular industry or industries. Equity or equity-related securities generally have greater price volatility than fixed income securities. In addition, preferred securities may be subject to greater credit risk or other risks, such as risks related to deferred and omitted distributions, limited voting rights, liquidity, interest rates, regulatory changes and special redemption rights.
Asset-Backed Securities Risk is the risk of investing in asset-backed securities, including interest rate risk, extension risk, prepayment risk and credit risk.
Mortgage-Related and Other Asset-Backed Securities Risk is the risk of investing in mortgage-related and other asset-backed securities, including interest rate risk, extension risk, prepayment risk and credit risk. A Fund may invest in any tranche of mortgage-related and other asset-backed securities, including junior and/or equity tranches (to the
| | | | | | | | | | | | |
| | | | ANNUAL FINANCIAL AND OTHER INFORMATION | | | | | | | JUNE 30, 2024 | | | 163 |
| | | | |
| Notes to Financial Statements | | (Cont.) | | |
extent consistent with other of the Fund’s guidelines), which generally carry higher levels of the foregoing risks.
Foreign (Non-U.S.) Investment Risk is the risk that investing in foreign (non-U.S.) securities may result in a Fund experiencing more rapid and extreme changes in value than a fund that invests exclusively in securities of U.S. companies, due to smaller markets, differing reporting, accounting and auditing standards, increased risk of delayed settlement of portfolio transactions or loss of certificates of portfolio securities, and the risk of unfavorable foreign government actions, including nationalization, expropriation or confiscatory taxation, currency blockage, political changes, diplomatic developments or the imposition of sanctions and other similar measures. Foreign securities may also be less liquid and more difficult to value than securities of U.S. issuers.
Emerging Markets Risk is the risk of investing in emerging market securities, primarily increased foreign (non-U.S.) investment risk.
Sovereign Debt Risk is the risk that investments in fixed income instruments issued by sovereign entities may decline in value as a result of default or other adverse credit event resulting from an issuer’s inability or unwillingness to make principal or interest payments in a timely fashion.
Currency Risk is the risk that foreign (non-U.S.) currencies will change in value relative to the U.S. dollar and affect a Fund’s investments in foreign (non-U.S.) currencies or in securities that trade in, and receive revenues in, or in derivatives that provide exposure to, foreign (non-U.S.) currencies.
Leveraging Risk is the risk that certain transactions of a Fund, such as reverse repurchase agreements, loans of portfolio securities, and the use of when-issued, delayed delivery or forward commitment transactions, or derivative instruments, may give rise to leverage, magnifying gains and losses and causing a Fund to be more volatile than if it had not been leveraged. This means that leverage entails a heightened risk of loss.
Management and Tracking Error Risk is the risk that the portfolio manager’s investment decisions may not produce the desired results or that a Fund’s portfolio may not closely track the underlying index for a number of reasons. A Fund incurs operating expenses, which are not applicable to the underlying index, and the costs of buying and selling securities, especially when rebalancing a Fund’s portfolio to reflect changes in the composition of the underlying index. Performance of a Fund and the underlying index may vary due to asset valuation differences and differences between a Fund’s portfolio and the underlying index due to legal restrictions, cost or liquidity restraints. The risk that performance of a Fund and the underlying index may vary may be heightened during periods of increased market volatility or
other unusual market conditions. In addition, a Fund’s use of a representative sampling approach may cause a Fund to be less correlated to the return of the underlying index than if a Fund held all of the securities in the underlying index.
Indexing Risk is the risk that a Fund is negatively affected by general declines in the asset classes represented by the underlying index.
Management Risk is the risk that the investment techniques and risk analyses applied by PIMCO will not produce the desired results and that actual or potential conflicts of interest, legislative, regulatory or tax restrictions, policies or developments may affect the investment techniques available to PIMCO and the individual portfolio managers in connection with managing a Fund and may cause PIMCO to restrict or prohibit participation in certain investments. There is no guarantee that the investment objective of a Fund will be achieved.
Environmental, Social and Governance Risk is the risk that, because the Fund’s ESG strategy may select or typically exclude securities of certain issuers for reasons in addition to performance, the Fund’s performance may differ from funds that do not utilize an ESG investing strategy. ESG investing is qualitative and subjective by nature, and there is no guarantee that the factors utilized by PIMCO or any judgment exercised by PIMCO will reflect the opinions of any particular investor.
California State-Specific Risk is the risk that by concentrating its investments in California municipal bonds, a Fund may be affected significantly by economic, regulatory or political developments affecting the ability of California issuers to pay interest or repay principal.
New York State-Specific Risk is the risk that by concentrating its investments in New York municipal bonds, a Fund may be affected significantly by economic, regulatory or political developments affecting the ability of New York issuers to pay interest or repay principal.
Puerto Rico-Specific Risk is the risk that by investing in municipal bonds issued by Puerto Rico or its instrumentalities, a Fund may be affected by certain developments, such as political, economic, environmental, social, regulatory or debt restructuring developments, that impact the ability or obligation of Puerto Rico municipal issuers to pay interest or repay principal.
Municipal Project-Specific Risk is the risk that a Fund may be more sensitive to adverse economic, business or political developments if it invests a substantial portion of its assets in the bonds of specific projects (such as those relating to education, health care, housing, transportation, and utilities), industrial development bonds, or in bonds from issuers in a single state.
Short Exposure Risk is the risk of entering into short sales or other short positions, including the potential loss of more money than the
actual cost of the investment, and the risk that the third party to the short sale or other short position will not fulfill its contractual obligations, causing a loss to a Fund.
Convertible Securities Risk is the risk that arises because convertible securities share both fixed income and equity characteristics. Convertible securities are subject to risks to which fixed income and equity investments are subject. These risks include equity risk, interest rate risk and credit risk.
Tax-Efficient Investing Risk is the risk that investment strategies intended to manage capital gain distributions may not succeed, and that such strategies may reduce investment returns or result in investment losses.
Distribution Rate Risk is the risk that a Fund’s distribution rate may change unexpectedly as a result of numerous factors, including changes in realized and projected market returns, fluctuations in market interest rates, Fund performance and other factors.
LIBOR Transition Risk is the risk related to the discontinuation and replacement of the London Interbank Offered Rate (“LIBOR”). Certain instruments held by a Fund rely or relied in some fashion upon LIBOR. Although the transition process away from LIBOR for most instruments has been completed, some LIBOR use is continuing and there are potential effects related to the transition away from LIBOR or the continued use of LIBOR on a Fund, or on certain instruments in which the Fund invests, which can be difficult to ascertain and could result in losses to a Fund.
AMT Bonds Risk is the risk that “AMT Bonds,” which are municipal securities that pay interest that is taxable under the federal alternative minimum tax applicable to noncorporate taxpayers, may expose the Fund to certain risks in addition to those typically associated with municipal bonds. Interest or principal on AMT Bonds paid out of current or anticipated revenues from a specific project or specific asset may be adversely impacted by declines in revenue from the project or asset. Declines in general business activity could also affect the economic viability of facilities that are the sole source of revenue to support AMT Bonds. In this regard, AMT Bonds may entail greater risks than general obligation municipal bonds. For shareholders subject to the federal alternative minimum tax, a portion of the Fund’s distributions may not be exempt from gross federal income, which may give rise to alternative minimum tax liability.
Futures Contract Risk is the risk that, while the value of a futures contract tends to correlate with the value of the underlying asset that it represents, differences between the futures market and the market for the underlying asset may result in an imperfect correlation. Futures contracts may involve risks different from, and possibly greater than,
the risks associated with investing directly in the underlying assets. The purchase or sale of a futures contract may result in losses in excess of the amount invested in the futures contract.
Capital Securities Risk is the risk that the value of securities, which may be in the form of debt, equity or a hybrid thereof, issued by U.S. and non-U.S. financial institutions that can be used to satisfy their regulatory capital requirements, may decline in response to changes in legislation and regulations applicable to financial institutions and financial markets, increased competition, adverse changes in general or industry-specific economic conditions, or unfavorable interest rates. Subordinated and hybrid securities in particular are also subject to the risk of ranking junior to other creditors in the event of a liquidation or other bankruptcy-related event, the risk that principal amount due can be written down to a lesser amount (including potentially to zero), and the general risks applicable to fixed income investments, including interest rate risk, credit risk, market risk and liquidity risk, and equity investments, any of which could result in losses to the Fund. By investing under normal circumstances at least 80% of its assets in a combination of preferred securities and capital securities, the Fund will be more susceptible to these risks than a fund that does not invest in capital securities to the same extent as the Fund.
Preferred Securities Risk is the risk that preferred securities may be subject to greater credit or other risks than senior debt instruments. In addition, preferred securities are subject to other risks, such as risks related to deferred and omitted distributions, limited voting rights, liquidity, interest rate, regulatory changes and special redemption rights.
Concentration in Banking Industries Risk is the risk of concentrating in industries related to banking, including interest rate risk, market risk, the risk of heightened competition and the risk that legislation and other government actions could adversely affect such industries.
Contingent Convertible Securities Risk is the risk of investing in contingent convertible securities, including the risk that interest payments will be cancelled by the issuer or a regulatory authority, the risk of ranking junior to other creditors in the event of a liquidation or other bankruptcy-related event as a result of holding subordinated debt, the risk of a Fund’s investment becoming further subordinated as a result of conversion from debt to equity, the risk that principal amount due can be written down to a lesser amount (including potentially zero), and the general risks applicable to fixed income investments, including interest rate risk, credit risk, market risk and liquidity risk, any of which could result in losses to a Fund.
Issuer Non-Diversification Risk is the risk of focusing investments in a small number of issuers, including being more susceptible to risks associated with a single economic, political or regulatory occurrence
| | | | | | | | | | | | |
| | | | ANNUAL FINANCIAL AND OTHER INFORMATION | | | | | | | JUNE 30, 2024 | | | 165 |
| | | | |
| Notes to Financial Statements | | (Cont.) | | |
than a more diversified portfolio might be. Funds that are “non-diversified” may invest a greater percentage of their assets in the securities of a single issuer (such as bonds issued by a particular state) than funds that are “diversified”.
Commodity Risk is the risk that investing in commodity-linked derivative instruments and commodities, either directly or indirectly through a subsidiary, may subject the Fund to greater volatility than investments in traditional securities. The value of commodity-linked derivative instruments or commodities may be affected by changes in overall market movements, foreign currency exchange rates, commodity index volatility, changes in inflation, interest rates, or supply and demand factors affecting a particular industry or commodity market, such as drought, floods, weather, livestock disease, pandemics and public health emergencies, embargoes, taxation, war, terrorism, cyber hacking, economic and political developments, environmental proceedings, tariffs, changes in storage costs, availability of transportation systems, and international economic, political and regulatory developments. Investments in commodities can also present risks associated with delivery, custody, storage and maintenance, illiquidity, and the unavailability of accurate market valuations of the commodity.
Model Risk is the risk that the Fund’s investment models used in making investment allocation decisions may not adequately take into account certain factors or may contain design flaws or faulty assumptions, and may rely on incomplete or inaccurate data inputs, any of which may result in a decline in the value of an investment in the Fund.
Tax Risk is the risk that the tax treatment of swap agreements and other derivative instruments, such as commodity-linked derivative instruments, including commodity index-linked notes, swap agreements, commodity options, futures, and options on futures, may be affected by future regulatory or legislative changes that could affect whether income from such investments is “qualifying income” under Subchapter M of the Internal Revenue Code, or otherwise affect the character, timing and/or amount of the Fund’s taxable income or gains and distributions.
Subsidiary Risk is the risk that, by investing in the Subsidiary, the Fund is indirectly exposed to the risks associated with the Subsidiary’s investments. The Subsidiary is not registered under the Act and may not be subject to all the investor protections of the Act. There is no guarantee that the investment objective of the Subsidiary will be achieved.
Oil-Related Risk is the risk that investments in or tied to the price of oil may fluctuate substantially over short periods of time or be more volatile than other types of investments due to, among other things,
national and international political changes, policies of Organization of the Petroleum Exporting Countries (“OPEC”) and other oil exporting countries, changes in relationships among OPEC and other oil exporting countries and oil importing countries, regulatory changes, taxation policies and the economies of key energy-consuming countries.
(b) Other Risks
In general, a Fund may be subject to additional risks, including, but not limited to, risks related to government regulation and intervention in financial markets, operational risks, risks associated with financial, economic and global market disruptions, and cyber security risks. Please see a Fund’s prospectus and Statement of Additional Information for a more detailed description of the risks of investing in a Fund. Please see the Important Information section of this report for additional discussion of certain regulatory and market developments that may impact a Fund’s performance.
Market Disruptions Risk A Fund is subject to investment and operational risks associated with financial, economic and other global market developments and disruptions, including those arising from war, military conflicts, terrorism, market manipulation, government interventions, defaults and shutdowns, political changes or diplomatic developments, public health emergencies (such as the spread of infectious diseases, pandemics and epidemics), bank failures and natural/environmental disasters, which can all negatively impact the securities markets and cause a Fund to lose value. These events can also impair the technology and other operational systems upon which a Fund’s service providers, including PIMCO as a Fund’s investment adviser, rely, and could otherwise disrupt a Fund’s service providers’ ability to fulfill their obligations to a Fund.
Government Intervention in Financial Markets Federal, state, and other governments, their regulatory agencies, or self-regulatory organizations may take actions that affect the regulation of the instruments in which a Fund invests, or the issuers of such instruments, in ways that are unforeseeable. Legislation or regulation may also change the way in which a Fund itself is regulated. Such legislation or regulation could limit or preclude a Fund’s ability to achieve its investment objective. Furthermore, volatile financial markets can expose a Fund to greater market and liquidity risk and potential difficulty in valuing portfolio instruments held by the Fund. The value of a Fund’s holdings is also generally subject to the risk of future local, national, or global economic disturbances based on unknown weaknesses in the markets in which a Fund invests. In addition, it is not certain that the U.S. Government will intervene in response to a future market disturbance and the effect of any such future intervention cannot be predicted. It is difficult for issuers to prepare for the impact
of future financial downturns, although companies can seek to identify and manage future uncertainties through risk management programs.
Regulatory Risk Financial entities, such as investment companies and investment advisers, are generally subject to extensive government regulation and intervention. Government regulation and/or intervention may change the way a Fund is regulated, affect the expenses incurred directly by a Fund and the value of its investments, and limit and/or preclude a Fund’s ability to achieve its investment objective.
Government regulation may change frequently and may have significant adverse consequences. Moreover, government regulation may have unpredictable and unintended effects.
Operational Risk An investment in a Fund, like any fund, can involve operational risks arising from factors such as processing errors, human errors, inadequate or failed internal or external processes, failures in systems and technology, changes in personnel and errors caused by third-party service providers. The occurrence of any of these failures, errors or breaches could result in a loss of information, regulatory scrutiny, reputational damage or other events, any of which could have a material adverse effect on a Fund. While a Fund seeks to minimize such events through controls and oversight, there may still be failures that could cause losses to the Fund.
Cyber Security Risk As the use of technology, including cloud-based technology, has become more prevalent in the course of business, the Funds have become potentially more susceptible to operational and information security risks resulting from breaches in cyber security. A breach in cyber security refers to both intentional and unintentional cyber events that may, among other things, cause a Fund to lose proprietary information, suffer data corruption and/ or destruction or lose operational capacity, result in the unauthorized release or other misuse of confidential information, or otherwise disrupt normal business operations. Cyber security failures or breaches may result in financial losses to a Fund and its shareholders. These failures or breaches may also result in disruptions to business operations, potentially resulting in financial losses; interference with a Fund’s ability to calculate its net asset value, process shareholder transactions or otherwise transact business with shareholders; impediments to trading; violations of applicable privacy and other laws; regulatory fines; penalties; third-party claims in litigation; reputational damage; reimbursement or other compensation costs; additional compliance and cyber security risk management costs and other adverse consequences. In addition, substantial costs may be incurred in order to prevent any cyber incidents in the future. There is also a risk that cyber security breaches may not be detected. The Funds and their shareholders may suffer losses as a result of a cyber security breach related to the Funds, their service providers, trading counterparties or the issuers in which a Fund invests.
8. MASTER NETTING ARRANGEMENTS
A Fund may be subject to various netting arrangements (“Master Agreements”) with select counterparties. Master Agreements govern the terms of certain transactions, and are intended to reduce the counterparty risk associated with relevant transactions by specifying credit protection mechanisms and providing standardization that is intended to improve legal certainty. Each type of Master Agreement governs certain types of transactions. Different types of transactions may be traded out of different legal entities or affiliates of a particular organization, resulting in the need for multiple agreements with a single counterparty. As the Master Agreements are specific to unique operations of different asset types, they allow a Fund to close out and net its total exposure to a counterparty in the event of a default with respect to all the transactions governed under a single Master Agreement with a counterparty. For financial reporting purposes the Statements of Assets and Liabilities generally present derivative assets and liabilities on a gross basis, which reflects the full risks and exposures prior to netting.
Master Agreements can also help limit counterparty risk by specifying collateral posting arrangements at pre-arranged exposure levels. Under most Master Agreements, collateral is routinely transferred if the total net exposure to certain transactions (net of existing collateral already in place) governed under the relevant Master Agreement with a counterparty in a given account exceeds a specified threshold, which typically ranges from zero to $250,000 depending on the counterparty and the type of Master Agreement. United States Treasury Bills and U.S. dollar cash are generally the preferred forms of collateral, although other securities may be used depending on the terms outlined in the applicable Master Agreement. Securities and cash pledged as collateral are reflected as assets on the Statements of Assets and Liabilities as either a component of Investments at value (securities) or Deposits with counterparty. Cash collateral received is not typically held in a segregated account and as such is reflected as a liability on the Statements of Assets and Liabilities as Deposits from counterparty. The market value of any securities received as collateral is not reflected as a component of NAV. A Fund’s overall exposure to counterparty risk can change substantially within a short period, as it is affected by each transaction subject to the relevant Master Agreement.
The Funds lend their securities through Securities Finance Trust Company (“Securities Lending Agent”), an unaffiliated securities lending agent, and receives collateral in the form of cash or securities with a value at least equal to the value of the securities on loan. The value of the loaned securities is determined at the close of each business day, and any increases or decreases in the required collateral are exchanged between the Fund and the counterparty on the next business day. Cash collateral received is invested in the PIMCO
| | | | | | | | | | | | |
| | | | ANNUAL FINANCIAL AND OTHER INFORMATION | | | | | | | JUNE 30, 2024 | | | 167 |
| | | | |
| Notes to Financial Statements | | (Cont.) | | |
Government Money Market Fund or another cash sweep vehicle agreed by the Fund. The Securities Lending Agent administers the Funds’ securities lending program, providing services that include marketing the Funds’ available securities, soliciting bids from potential borrowers, monitoring the daily value of the loaned securities, and investing cash collateral in accordance with specific instructions provided by the Funds.
Master Repurchase Agreements and Global Master Repurchase Agreements (individually and collectively “Master Repo Agreements”) govern repurchase, reverse repurchase and certain sale-buyback transactions between a Fund and select counterparties. Master Repo Agreements maintain provisions for, among other things, initiation, income payments, events of default and maintenance of collateral. The market value of transactions under the Master Repo Agreement, collateral pledged or received, and the net exposure by counterparty as of period end are disclosed in the Notes to Schedules of Investments.
Master Securities Forward Transaction Agreements (“Master Forward Agreements”) govern certain forward settling transactions, such as TBA securities, delayed-delivery or certain sale-buyback transactions by and between a Fund and select counterparties. The Master Forward Agreements maintain provisions for, among other things, transaction initiation and confirmation, payment and transfer, events of default, termination and maintenance of collateral. The market value of forward settling transactions, collateral pledged or received, and the net exposure by counterparty as of period end is disclosed in the Notes to Schedules of Investments.
Customer Account Agreements and related addenda govern cleared derivatives transactions such as futures, options on futures and cleared OTC derivatives. Such transactions require posting of initial margin as determined by each relevant clearing agency which is segregated in an account at a futures commission merchant (“FCM”) registered with the Commodity Futures Trading Commission. In the United States, counterparty risk may be reduced as creditors of an FCM cannot have a claim to Fund assets in the segregated account. FCM customers, such as the Funds, are permitted to transfer their customer account (and cleared derivative transactions held in such customer account) from one FCM to another FCM. Upon completion of the transfer, the customer maintains the same economic position with respect to the outstanding exposure. As such, these transfers are not recognized as dispositions and reacquisitions of the affected derivative positions. Variation margin, which reflects changes in market value, is generally exchanged daily, but may not be netted between futures and cleared OTC derivatives unless the parties have agreed to a separate arrangement in respect of portfolio margining. The porting of exposure between FCMs has no impact on the market value or accumulated unrealized
appreciation (depreciation), initial margin posted, and any unsettled variation margin; these values as of period end are disclosed in the Notes to Schedules of Investments.
Prime Broker Arrangements may be entered into to facilitate execution and/or clearing of listed equity option transactions or short sales of equity securities between a Fund and selected counterparties. The arrangements provide guidelines surrounding the rights, obligations and other events, including, but not limited to, margin, execution and settlement. These agreements maintain provisions for, among other things, payments, maintenance of collateral, events of default and termination. Margin and other assets delivered as collateral are typically in the possession of the prime broker and would offset any obligations due to the prime broker. The market values of listed options and securities sold short and related collateral are disclosed in the Notes to Schedules of Investments.
International Swaps and Derivatives Association, Inc. Master Agreements and Credit Support Annexes (“ISDA Master Agreements”) govern bilateral OTC derivative transactions entered into by a Fund with select counterparties. ISDA Master Agreements maintain provisions for general obligations, representations, agreements, collateral posting and events of default or termination. Events of termination include conditions that may entitle counterparties to elect to terminate early and cause settlement of all outstanding transactions under the applicable ISDA Master Agreement. Any election to terminate early could be material to the financial statements. The ISDA Master Agreement may contain additional provisions that add counterparty protection beyond coverage of existing daily exposure if the counterparty has a decline in credit quality below a predefined level or as required by regulation. Similarly, if required by regulation, the Funds may be required to post additional collateral beyond coverage of daily exposure. These amounts, if any, may (or if required by law, will) be segregated with a third-party custodian. To the extent the Funds are required by regulation to post additional collateral beyond coverage of daily exposure, they could potentially incur costs, including in procuring eligible assets to meet collateral requirements, associated with such posting. The market value of OTC financial derivative instruments, collateral received or pledged, and net exposure by counterparty as of period end are disclosed in the Notes to Schedules of Investments.
9. FEES AND EXPENSES
(a) Management Fee PIMCO, a majority-owned subsidiary of Allianz Asset Management of America LLC (“Allianz Asset Management”), serves as the Manager to the Trust, pursuant to an investment management agreement. Each Fund pays PIMCO fees in return for providing investment advisory, supervisory and administrative services under an all-in fee structure. Each Fund will pay monthly management
fees to PIMCO at an annual rate based on average daily net assets (the “Management Fee”), at an annual rate as noted in the table below.
| | | | | | | | |
| Fund Name | | | | | Management Fee | |
| | |
PIMCO 25+ Year Zero Coupon U.S. Treasury Index Exchange-Traded Fund | | | | | | | 0.15% | |
| | |
PIMCO 1-5 Year U.S. TIPS Index Exchange-Traded Fund | | | | | | | 0.20% | |
| | |
PIMCO 15+ Year U.S. TIPS Index Exchange-Traded Fund | | | | | | | 0.20% | |
| | |
PIMCO Broad U.S. TIPS Index Exchange-Traded Fund | | | | | | | 0.20% | |
| | |
PIMCO 0-5 Year High Yield Corporate Bond Index Exchange-Traded Fund | | | | | | | 0.55% | |
| | |
PIMCO Investment Grade Corporate Bond Index Exchange-Traded Fund | | | | | | | 0.20% | |
| | |
PIMCO Active Bond Exchange-Traded Fund(1) | | | | | | | 0.55% | |
| | |
PIMCO Enhanced Low Duration Active Exchange-Traded Fund | | | | | | | 0.46% | |
| | |
PIMCO Enhanced Short Maturity Active ESG Exchange-Traded Fund(2) | | | | | | | 0.36% | |
| | |
PIMCO Enhanced Short Maturity Active Exchange-Traded Fund | | | | | | | 0.35% | |
| | |
PIMCO Intermediate Municipal Bond Active Exchange-Traded Fund | | | | | | | 0.35% | |
| | |
PIMCO Multisector Bond Active Exchange-Traded Fund(3) | | | | | | | 0.65% | |
| | |
PIMCO Municipal Income Opportunities Active Exchange-Traded Fund(4) | | | | | | | 0.49% | |
| | |
PIMCO Preferred and Capital Securities Active Exchange-Traded Fund(5) | | | | | | | 0.84% | |
| | |
PIMCO Senior Loan Active Exchange-Traded Fund(6) | | | | | | | 0.70% | |
| | |
PIMCO Short Term Municipal Bond Active Exchange-Traded Fund | | | | | | | 0.35% | |
| | |
PIMCO Ultra Short Government Active Exchange-Traded Fund | | | | | | | 0.14% | |
| | |
PIMCO Commodity Strategy Active Exchange-Traded Fund(5) | | | | | | | 0.79% | |
| (1) | PIMCO has contractually agreed, through October 31, 2024, to waive or reduce its Management Fee in an amount equivalent to the Fund’s expenses or costs attributable to the SEC’s investigation and related settlement proceedings identified in Investment Advisers Act of 1940 Release No. 4577, dated December 1, 2016. |
| (2) | PIMCO has contractually agreed, through October 31, 2024, to waive or reduce its management fee by 0.12% of the average daily net assets attributable to the Fund. |
| (3) | PIMCO has contractually agreed, through October 31, 2025, to waive or reduce its management fee by 0.10% of the average daily net assets attributable to the Fund. |
| (4) | PIMCO has contractually agreed, through October 31, 2024, to waive or reduce its management fee by 0.10% of the average daily net assets attributable to the Fund. |
| (5) | PIMCO has contractually agreed, through October 31, 2024, to waive or reduce its management fee by 0.15% of the average daily net assets attributable to the Fund. |
| (6) | PIMCO has contractually agreed, through October 31, 2025, to reduce its management fee by 0.10% of the average daily net assets attributable to the Fund. Prior to November 1, 2023, PIMCO contractually agreed to reduce its management fee by 0.20% of the average daily net assets attributable to the Fund. |
(b) Distribution and Servicing Fees PIMCO Investments LLC, a wholly-owned subsidiary of PIMCO, serves as the distributor (“Distributor”) of each Fund’s Creation Units. The Distributor does not maintain a secondary market in shares of the Funds. During the period ended June 30, 2024, each Fund was permitted to compensate the Distributor at an annual rate of up to 0.25% of a Fund’s average daily net assets (the “12b-1 Plan Fee”). However, the Board of Trustees has determined not to authorize
payment of a 12b-1 Plan Fee at this time. The 12b-1 Plan Fee may only be imposed or increased when the Board determines that it is in the best interests of shareholders to do so. Because these fees are paid out of a Fund’s assets on an ongoing basis, to the extent that a fee is authorized, over time it will increase the cost of an investment in the Fund. The 12b-1 Plan Fee may cost an investor more than other types of sales charges.
(c) Fund Expenses PIMCO provides or procures supervisory and administrative services for shareholders and also bears the costs of various third-party services required by the Funds, including audit, custodial, portfolio accounting, legal, transfer agency and printing costs. The Funds bear other expenses which are not covered under the Management Fee which may vary and affect the total level of expenses paid by shareholders, such as (i) salaries and other compensation of any of the Trust’s executive officers and employees who are not officers, directors, stockholders, or employees of PIMCO or its subsidiaries or affiliates; (ii) taxes and governmental fees; (iii) brokerage fees and commissions and other portfolio transaction expenses; (iv) costs of borrowing money, including interest expenses; (v) securities lending fees and expenses; (vi) fees and expenses of the Trustees who are not “interested persons” of PIMCO or the Trust, and any counsel retained exclusively for their benefit; (vii) extraordinary expenses, including costs of litigation and indemnification expenses; and (viii) organizational and offering expenses of the Trust and the Funds, and any other expenses, which are capitalized in accordance with generally accepted accounting principles. The ratio of expenses to average net assets, as disclosed on the Financial Highlights, may differ from the annual fund operating expenses as disclosed in the prospectus.
(d) Remuneration Paid to Directors, Officers and Others (N-CSR Item 10) The Trust pays no compensation directly to any Trustee or any other officer who is affiliated with the Administrator, all of whom receive remuneration for their services to the Trust from the Administrator or its affiliates. The pro rata share of Trustee fees for each Fund is reflected on the Statements of Operations as Trustee fees.
(e) Expense Limitation Pursuant to the Expense Limitation Agreement, PIMCO has contractually agreed, through October 31, 2024 (October 31, 2025 for the PIMCO Multisector Bond Active Exchange-Traded Fund), to waive a portion of each Fund’s Management Fee or reimburse each Fund, to the extent that each Fund’s organizational expenses, pro rata share of expenses related to obtaining or maintaining a Legal Entity Identifier and pro rata share of Trustee fees exceed 0.0049% (the “Expense Limit”) (calculated as a percentage of each Fund’s average daily net assets). The Expense Limitation Agreement will automatically renew for one-year terms unless PIMCO provides written notice to the Trust at least 30 days prior to the end of the then current term.
Pursuant to a Fee Waiver Agreement, PIMCO has contractually agreed, through October 31, 2024, to waive or reduce its Management Fee for the PIMCO Commodity Strategy Active Exchange-Traded Fund.
| | | | | | | | | | | | |
| | | | ANNUAL FINANCIAL AND OTHER INFORMATION | | | | | | | JUNE 30, 2024 | | | 169 |
| | | | |
| Notes to Financial Statements | | (Cont.) | | |
Pursuant to a Fee Waiver Agreement, PIMCO has contractually agreed, through October 31, 2024, to waive or reduce its Management Fee for the PIMCO Enhanced Short Maturity Active ESG Exchange-Traded Fund. This Fee Waiver Agreement will automatically renew for one-year terms unless PIMCO provides written notice to the Trust at least 30 days prior to the end of the then current term.
Pursuant to a Fee Waiver Agreement, PIMCO has contractually agreed, through October 31, 2025, to waive or reduce its Management Fee for the PIMCO Multisector Bond Active Exchange-Traded Fund.
Pursuant to a Fee Waiver Agreement, PIMCO has contractually agreed, through October 31, 2024, to waive or reduce its Management Fee for the PIMCO Municipal Income Opportunities Active Exchange-Traded Fund.
Pursuant to a Fee Waiver Agreement, PIMCO has contractually agreed, through October 31, 2024, to waive or reduce its Management Fee for the PIMCO Preferred and Capital Securities Active Exchange-Traded Fund.
Pursuant to a Fee Waiver Agreement, PIMCO has contractually agreed, through October 31, 2025, to waive or reduce its Management Fee for the PIMCO Senior Loan Active Exchange-Traded Fund.
Each waiver is reflected on the Statements of Operations as a component of Waiver and/or Reimbursement by PIMCO.
In any month in which the investment management agreement is in effect, PIMCO is entitled to reimbursement by each Fund of any portion of the Management Fee and/or other expenses waived or reimbursed pursuant to the Expense Limitation Agreement (the “Reimbursement Amount”) within thirty-six months of the time of the waiver, provided that such amount paid to PIMCO will not: i) together with any organizational expenses, pro rata share of expenses related to obtaining or maintaining a Legal Entity Identifier and pro rata Trustee fees, exceed, for such month, the Expense Limit (or the amount of the expense limit in place at the time the amount being recouped was originally waived if lower than the Expense Limit); ii) exceed the total Reimbursement Amount; or iii) include any amounts previously reimbursed to PIMCO. The total recoverable amounts to PIMCO as of June 30, 2024, were as follows (amounts in thousands†):
| | | | | | | | | | | | | | | | | | | | |
| | | | Expiring within | |
| Fund Name | | | | | 12 months | | | 13-24 months | | | 25-36 months | | | Total | |
| | | | | |
PIMCO Enhanced Low Duration Active Exchange-Traded Fund | | | | | | $ | 0 | | | $ | 10 | | | $ | 17 | | | $ | 27 | |
| | | | | |
PIMCO Enhanced Short Maturity Active ESG Exchange-Traded Fund | | | | | | | 210 | | | | 203 | | | | 199 | | | | 612 | |
| | | | | |
PIMCO Multisector Bond Active Exchange-Traded Fund | | | | | | | 0 | | | | 71 | | | | 361 | | | | 437 | |
| | | | | |
PIMCO Municipal Income Opportunities Active Exchange-Traded Fund | | | | | | | 103 | | | | 56 | | | | 111 | | | | 270 | |
| | | | | |
PIMCO Preferred and Capital Securities Active Exchange-Traded Fund | | | | | | | 0 | | | | 126 | | | | 134 | | | | 260 | |
| | | | | |
PIMCO Senior Loan Active Exchange-Traded Fund | | | | | | | 148 | | | | 250 | | | | 343 | | | | 741 | |
| | | | | |
PIMCO Ultra Short Government Active Exchange-Traded Fund | | | | | | | 0 | | | | 31 | | | | 11 | | | | 42 | |
| | | | | |
PIMCO Commodity Strategy Active Exchange-Traded Fund | | | | | | | 0 | | | | 105 | | | | 339 | | | | 444 | |
| † | A zero balance may reflect actual amounts rounding to less than one thousand. |
(e) Acquired Fund Fees and Expenses PIMCO has contractually agreed, through October 31, 2024, for the PIMCO Active Bond Exchange-Traded Fund, PIMCO Intermediate Municipal Bond Active Exchange-Traded Fund, PIMCO Multisector Bond Active Exchange-Traded Fund, PIMCO Municipal Income Opportunities Active Exchange-Traded Fund, PIMCO Preferred and Capital Securities Active Exchange-Traded Fund, PIMCO Senior Loan Active Exchange-Traded Fund, PIMCO Short Term Municipal Bond Active Exchange-Traded Fund and PIMCO Commodity Strategy Active Exchange-Traded Fund to waive its Management Fee in an amount equal to the expenses attributable to Investment Advisory, Supervisory and Administrative, and Management Fees of other series of the Trust indirectly incurred by the Fund’s investments in other series of the Trust. The waiver will automatically renew for one-year terms unless PIMCO provides written notice to the Trust at least 30 days prior to the end of the of the then current term. The waiver amounts for the AFFE Fees and Expense are shown below.
| | | | | | | | |
| Fund Name | | | | | Waived
Amount | |
| | |
PIMCO Active Bond Exchange-Traded Fund | | | | | | $ | 287 | |
| | |
PIMCO Multisector Active Exchange-Traded Fund | | | | | | | 9 | |
| | |
PIMCO Commodity Strategy Active Exchange-Traded Fund | | | | | | | 21 | |
| † | A zero balance may reflect actual amounts rounding to less than one thousand. |
The Commodity Subsidiary has entered into a separate contract with PIMCO for the management of the Commodity Subsidiary’s portfolio pursuant to which the Commodity Subsidiary pays PIMCO a management fee at the annual rate of 0.69% of its average daily net assets. PIMCO has contractually agreed to waive the Fund’s management fee in an amount equal to the management fee paid by the Commodity Subsidiary to PIMCO. This waiver may not be terminated by PIMCO and will remain in effect for as long as PIMCO’s contract with the Subsidiary is in place. PIMCO may not seek reimbursement from the Fund with respect to the management fees
waived. The waiver, if any, is reflected on the Consolidated Statements of Operations as a component of Waiver and/ or Reimbursement by
PIMCO. See Note 16, Basis for Consolidation, in the Notes to Financial Statements for more information regarding the Commodity Subsidiary.
10. RELATED PARTY TRANSACTIONS
The Manager and Distributor are related parties. Fees paid to these parties are disclosed in Note 9, Fees and Expenses, and the accrued related party fee amounts are disclosed on the Statements of Assets and Liabilities.
Certain Funds are permitted to purchase or sell securities from or to certain related affiliated funds under specified conditions outlined in procedures adopted by the Board. The procedures have been designed to ensure that any purchase or sale of securities by the Funds from or to another fund or portfolio that are, or could be, considered an affiliate, or an affiliate of an affiliate, by virtue of having a common investment adviser (or affiliated investment advisers), common Trustees and/or common officers complies with applicable SEC rules and interpretations under the Act. Further, as defined under the procedures, each transaction is effected at the current market price. Purchases and sales of securities pursuant to applicable SEC rules and interpretations under the Act for the period ended June 30, 2024, were as follows (amounts in thousands†):
| | | | | | | | | | | | | | | | |
| Fund Name | | | | | Purchases | | | Sales | | | Realized
Gain/(Loss) | |
| | | | |
PIMCO Active Bond Exchange-Traded Fund | | | | | | $ | 5,614 | | | $ | 28,757 | | | $ | (7,233 | ) |
| | | | |
PIMCO Intermediate Municipal Bond Active Exchange-Traded Fund | | | | | | | 82,529 | | | | 31,698 | | | | (2,346 | ) |
| | | | |
PIMCO Municipal Income Opportunities Active Exchange-Traded Fund | | | | | | | 1,247 | | | | 70 | | | | (28 | ) |
| | | | |
PIMCO Short Term Municipal Bond Active Exchange-Traded Fund | | | | | | | 401 | | | | 437 | | | | (18 | ) |
| † | A zero balance may reflect actual amounts rounding to less than one thousand. |
11. GUARANTEES AND INDEMNIFICATIONS
Under the Trust’s organizational documents, each Trustee or officer of the Trust is indemnified and each employee or other agent of the Trust (including the Trust’s investment manager) may be indemnified, to the extent permitted by the Act, against certain liabilities that may arise out of performance of their duties to the Funds. Additionally, in the normal course of business, the Funds enter into contracts that contain a variety of indemnification clauses. The Funds’ maximum exposure under these arrangements is unknown as this would involve future claims that may be made against the Funds that have not yet occurred. However, the Funds have not had prior claims or losses pursuant to these contracts.
12. PURCHASES AND SALES OF SECURITIES
The length of time a Fund has held a particular security is not generally a consideration in investment decisions. A change in the securities held by a
Fund is known as “portfolio turnover.” Each Fund may engage in frequent and active trading of portfolio securities to achieve its investment objective(s), particularly during periods of volatile market movements. High portfolio turnover may involve correspondingly greater transaction costs, including brokerage commissions or dealer mark-ups and other transaction costs on the sale of securities and reinvestments in other securities, which are borne by a Fund. Such sales may also result in realization of taxable capital gains, including short-term capital gains (which are generally taxed at ordinary income tax rates when distributed to shareholders). The transaction costs associated with portfolio turnover may adversely affect a Fund’s performance. The portfolio turnover rates are reported in the Financial Highlights.
Purchases and sales of securities (excluding short-term investments) for the period ended June 30, 2024, were as follows (amounts in thousands†):
| | | | | | | | | | | | | | | | | | | | |
| | | | U.S. Government/Agency | | | All Other | |
| | | | |
| Fund Name | | | Purchases | | | Sales | | | Purchases | | | Sales | |
| | | | | |
PIMCO 25+ Year Zero Coupon U.S. Treasury Index Exchange-Traded Fund | | | | | | $ | 247,334 | | | $ | 286,181 | | | $ | 0 | | | $ | 0 | |
| | | | | |
PIMCO 1-5 Year U.S. TIPS Index Exchange-Traded Fund | | | | | | | 147,908 | | | | 158,278 | | | | 0 | | | | 0 | |
| | | | | |
PIMCO 15+ Year U.S. TIPS Index Exchange-Traded Fund | | | | | | | 27,628 | | | | 51,460 | | | | 0 | | | | 0 | |
| | | | | |
PIMCO Broad U.S. TIPS Index Exchange-Traded Fund | | | | | | | 138,214 | | | | 141,997 | | | | 0 | | | | 0 | |
| | | | | |
PIMCO 0-5 Year High Yield Corporate Bond Index Exchange-Traded Fund | | | | | | | 35,606 | | | | 45,359 | | | | 575,506 | | | | 517,558 | |
| | | | | |
PIMCO Investment Grade Corporate Bond Index Exchange-Traded Fund | | | | | | | 72,205 | | | | 9,303 | | | | 185,296 | | | | 218,947 | |
| | | | | |
PIMCO Active Bond Exchange-Traded Fund | | | | | | | 16,316,291 | | | | 15,210,506 | | | | 1,040,852 | | | | 422,764 | |
| | | | | |
PIMCO Enhanced Low Duration Active Exchange-Traded Fund | | | | | | | 1,566,282 | | | | 1,697,230 | | | | 257,365 | | | | 155,196 | |
| | | | | |
PIMCO Enhanced Short Maturity Active ESG Exchange-Traded Fund | | | | | | | 7,452 | | | | 9,689 | | | | 86,502 | | | | 49,295 | |
| | | | | | | | | | | | |
| | | | ANNUAL FINANCIAL AND OTHER INFORMATION | | | | | | | JUNE 30, 2024 | | | 171 |
| | | | |
| Notes to Financial Statements | | (Cont.) | | |
| | | | | | | | | | | | | | | | | | | | |
| | | | U.S. Government/Agency | | | All Other | |
| | | | |
| Fund Name | | | Purchases | | | Sales | | | Purchases | | | Sales | |
| | | | | |
PIMCO Enhanced Short Maturity Active Exchange-Traded Fund | | | | | | $ | 1,145,047 | | | $ | 1,148,458 | | | $ | 6,930,845 | | | $ | 3,022,921 | |
| | | | | |
PIMCO Intermediate Municipal Bond Active Exchange-Traded Fund | | | | | | | 57,927 | | | | 0 | | | | 770,740 | | | | 340,234 | |
| | | | | |
PIMCO Multisector Bond Active Exchange - Traded Fund | | | | | | | 2,413,688 | | | | 1,920,169 | | | | 1,004,147 | | | | 102,913 | |
| | | | | |
PIMCO Municipal Income Opportunities Active Exchange-Traded Fund | | | | | | | 3,590 | | | | 0 | | | | 125,120 | | | | 39,609 | |
| | | | | |
PIMCO Preferred and Capital Securities Active Exchange-Traded Fund | | | | | | | 1,895 | | | | 3,008 | | | | 90,809 | | | | 52,306 | |
| | | | | |
PIMCO Senior Loan Active Exchange-Traded Fund | | | | | | | 0 | | | | 0 | | | | 391,757 | | | | 168,820 | |
| | | | | |
PIMCO Short Term Municipal Bond Active Exchange-Traded Fund | | | | | | | 4,344 | | | | 0 | | | | 236,569 | | | | 150,469 | |
| | | | | |
PIMCO Ultra Short Government Active Exchange-Traded Fund | | | | | | | 0 | | | | 0 | | | | 0 | | | | 0 | |
| | | | | |
PIMCO Commodity Strategy Active Exchange-Traded Fund | | | | | | | 10,486 | | | | 8,600 | | | | 249,923 | | | | 52,774 | |
| † | A zero balance may reflect actual amounts rounding to less than one thousand. |
13. SHARES OF BENEFICIAL INTEREST
The following table discloses the number of shareholders that own 10% or more of the outstanding shares of a Fund along with their respective percent ownership, if any, as of June 30, 2024. Some of these shareholders may be considered related parties, which may include, but are not limited to, the investment adviser and its affiliates, affiliated broker dealers, fund of funds and directors or employees of the Trust or Adviser.
| | | | | | | | | | | | | | | | | | | | |
| | | | | | Shareholders that own 10% or more of outstanding shares | | | Total percentage of portfolio held by shareholders that own 10% or more
of outstanding shares | |
| | | | | |
| Fund Name | | | | | Non-Related Parties | | | Related Parties | | | Non-Related Parties | | | Related Parties | |
| | | | | |
PIMCO Preferred and Capital Securities Active Exchange-Traded Fund | | | | | | | 0 | | | | 1 | | | | 0% | | | | 15% | |
14. CAPITAL SHARE TRANSACTIONS
Capital shares are issued and redeemed by a Fund only in Creation Units. Except when aggregated in Creation Units, shares of a Fund are not redeemable. Transactions in capital shares for a Fund are disclosed in detail on the Statements of Changes in Net Assets.
The consideration for the purchase of Creation Units of a Fund generally consists of a basket of cash and/or securities that a Fund specifies each business day. Authorized Participants may be charged transaction fees as set forth below. To offset transfer and other transaction costs associated with the issuance and redemption of Creation Units, Authorized Participants are subject to standard creation and redemption transaction fees payable directly to State Street Bank and Trust Company, the custodian of the Funds. These standard transaction fees are not payable to the Funds, and therefore, generally do not impact the Funds’ financial statements. PIMCO may, from time to time, at its own expense, compensate purchasers of Creation Units who have purchased substantial amounts of Creation Units and other financial institutions for administrative or marketing services. Creations and redemptions for cash (when cash creations and redemptions are available or specified) may be subject to an additional variable charge up to the maximum amount shown in the table below. To the extent a variable transaction fee is not charged, certain costs may be borne by a Fund.
| | | | | | | | | | |
Standard Creation/
Redemption
Transaction Fee* | | | Maximum
Variable Charge
for Cash Creations** | | | Maximum
Variable Charge
for Cash Redemptions** | |
| $ | 500 | | | | 3.00 | % | | | 2.00 | % |
| * | Applicable to in-kind contributions or redemptions only. |
| ** | As a percentage of the net asset value per Creation Unit purchased or redeemed, inclusive of the standard creation transaction fee (if imposed). |
15. INVESTMENT TRANSACTIONS
For the period ended June 30, 2024, certain Funds had in-kind contributions and in-kind redemptions as follows (amounts in thousands†):
| | | | | | | | | | | | |
| Fund Name | | | | | Contributions | | | Redemptions | |
| | | |
PIMCO 25+ Year Zero Coupon U.S. Treasury Index Exchange-Traded Fund | | | | | | $ | 1,172,400 | | | $ | 582,266 | |
| | | |
PIMCO 1-5 Year U.S. TIPS Index Exchange-Traded Fund | | | | | | | 136,069 | | | | 491,516 | |
| | | |
PIMCO 15+ Year U.S. TIPS Index Exchange-Traded Fund | | | | | | | 371,154 | | | | 276,357 | |
| | | |
PIMCO Broad U.S. TIPS Index Exchange-Traded Fund | | | | | | | 18,149 | | | | 47,319 | |
| | | |
PIMCO 0-5 Year High Yield Corporate Bond Index Exchange-Traded Fund | | | | | | | 414,037 | | | | 301,887 | |
| | | |
PIMCO Investment Grade Corporate Bond Index Exchange-Traded Fund | | | | | | | 430,847 | | | | 49,885 | |
| | | |
PIMCO Preferred and Capital Securities Active Exchange-Traded Fund | | | | | | | 4,376 | | | | 26,976 | |
| | | |
PIMCO Ultra Short Government Active Exchange-Traded Fund | | | | | | | 19,643 | | | | 67,434 | |
| † | A zero balance may reflect actual amounts rounding to less than one thousand. |
The in-kind contributions and in-kind redemptions in this table may not agree with the Fund Share Transactions on the Statements of Changes in Net Assets. The table represents the accumulation of each Fund’s daily net shareholder transactions which were executed in kind while the Statements of Changes in Net Assets reflect gross shareholder transactions including any cash component of the transactions.
16. BASIS FOR CONSOLIDATION
The Commodity Subsidiary, PIMCO Cayman Commodity Fund CMDT, Ltd., a Cayman Islands exempted company, was incorporated on January 19, 2023, as a wholly owned subsidiary acting as an investment vehicle for the PIMCO Commodity Strategy Active Exchange-Traded Fund in order to effect certain investments for the Fund consistent with the Fund’s investment objectives and policies as specified in its prospectus and statement of additional information. The Fund’s investment portfolio has been consolidated and includes the portfolio holdings of the Fund and the Commodity Subsidiary. The consolidated financial statements include the accounts of the Fund and the Commodity Subsidiary, if any. All inter-company transactions and balances have been eliminated. A subscription agreement was entered into between the Fund and the Commodity Subsidiary, comprising the entire issued share capital of the Commodity Subsidiary, with the intent that the Fund will remain the sole shareholder and retain all rights. Under the Memorandum and Articles of Association, shares issued by the Commodity Subsidiary confer upon a shareholder the right to receive notice of, to attend and to vote at general meetings of the Commodity Subsidiary and shall confer upon the shareholder rights in a winding-up or repayment of capital and the right to participate in the profits or assets of the Commodity Subsidiary. The net assets of the Commodity Subsidiary as of period end represented 16.2% of the Fund’s consolidated net assets.
17. REGULATORY AND LITIGATION MATTERS
The Funds are not named as defendants in any material litigation or arbitration proceedings and are not aware of any material litigation or claim pending or threatened against them.
The foregoing speaks only as of the date of this report.
18. FEDERAL INCOME TAX MATTERS
Each Fund intends to qualify as a regulated investment company under Subchapter M of the Internal Revenue Code (the “Code”) and distribute all of its income and net realized gains, if applicable, to shareholders. Accordingly, no provision for Federal income taxes has been made.
A Fund may be subject to local withholding taxes, including those imposed on realized capital gains. Any applicable foreign capital gains tax is accrued daily based upon net unrealized gains, and may be payable following the sale of any applicable investments.
In accordance with U.S. GAAP, the Manager has reviewed the Funds’ tax positions for all open tax years. As of June 30, 2024, the Funds have recorded no liability for net unrecognized tax benefits relating to uncertain income tax positions they have taken or expect to take in future tax returns.
The Funds file U.S. federal, state and local tax returns as required. The Funds’ tax returns are subject to examination by relevant tax authorities until expiration of the applicable statute of limitations, which is generally three years after the filing of the tax return but which can be extended to six years in certain circumstances. Tax returns for open years have incorporated no uncertain tax positions that require a provision for income taxes.
One of the requirements for favorable tax treatment as a regulated investment company under the Code is that a Fund derive at least 90% of its gross income from certain qualifying sources of income. The IRS has issued a revenue ruling which holds that income derived from commodity index-linked derivatives, if earned directly by a Fund, is not qualifying income under Subchapter M of the Code. As such, the Funds’ ability to utilize direct investments in commodity-linked swaps as part of its investment strategy is limited to a maximum of 10% of its gross income. However, in a subsequent revenue ruling, the IRS provides that income
| | | | | | | | | | | | |
| | | | ANNUAL FINANCIAL AND OTHER INFORMATION | | | | | | | JUNE 30, 2024 | | | 173 |
| | | | |
| Notes to Financial Statements | | (Cont.) | | |
from alternative investment instruments (such as certain commodity index-linked notes) that create commodity exposure may be considered qualifying income under the Code. The IRS has issued private letter rulings in which the IRS specifically concluded that income derived from an investment in a subsidiary that provides commodity-linked exposure through its investments will constitute qualifying income.
PIMCO Commodity Strategy Active Exchange-Traded Fund will continue to seek to gain exposure to the commodity markets primarily through investments in its Subsidiary and perhaps through commodity-linked notes. The Subsidiary will be treated as a controlled foreign corporation. As a result, a Fund with the Subsidiary will be required to include in gross income for U.S. federal income tax purposes all of its Subsidiary’s subpart F income, whether or not such income is distributed by the Subsidiary. It is expected that all of the Subsidiary’s income and realized gains and mark-to-market gains will be subpart F income. PIMCO Commodity Strategy Active Exchange-Traded Fund’s recognition of its Subsidiary’s subpart F income will increase the Fund’s tax basis in its Subsidiary. Distributions by the Subsidiary to PIMCO Commodity Strategy Active Exchange-Traded Fund will be tax-free, to the extent of its previously undistributed subpart F income, and will correspondingly reduce PIMCO Commodity Strategy Active Exchange-Traded Fund’s tax basis in its Subsidiary. Subpart F income is generally treated by PIMCO Commodity Strategy Active Exchange-Traded Fund as ordinary income, regardless of the character of the Subsidiary’s underlying income or gains.
If a net loss is realized by Subsidiary, such loss is not generally available to offset the income earned by such Subsidiary’s parent Fund, and such loss cannot be carried forward to offset taxable income of the parent Fund or the Subsidiary in future periods.
Under IRS regulations, income derived from a controlled foreign corporation will be considered qualifying income if distributed to a Fund or if the Funds’ income from in the subsidiary is derived with respect to the Funds’ business of investing in securities. A subsidiary may pay such a distribution at any time. An IRS revenue procedure states that the IRS will not in the future issue private letter rulings that would require a determination of whether an asset (such as a commodity index-linked note) is a “security” under the Act.
There can be no assurance that the IRS will not change its position with respect to some or all of these conclusions or that future legislation will not adversely impact the tax treatment of PIMCO Commodity Strategy Active Exchange-Traded Fund’s commodity-linked investments. If the IRS were to change or reverse its position, or if future legislation adversely affected the tax treatment of a Fund’s commodity-linked investments, there would likely be a significant adverse impact on PIMCO Commodity Strategy Active Exchange-Traded Fund, including the possibility of failing to qualify as a regulated investment company.
If PIMCO Commodity Strategy Active Exchange-Traded Fund did not qualify as a regulated investment company for any taxable year, its taxable income would be subject to tax at the Fund level at regular corporate tax rates (without reduction for distributions to shareholders) and to a further tax at the shareholder level when such income is distributed. Furthermore, the tax treatment of PIMCO Commodity Strategy Active Exchange-Traded Fund’s investments in its Subsidiary may otherwise be adversely affected by future legislation, court decisions, Treasury Regulations and/or guidance issued by the IRS. Such developments could affect the character, timing and/or amount of a Fund’s taxable income or any distributions made by PIMCO Commodity Strategy Active Exchange-Traded Fund or result in the inability of PIMCO Commodity Strategy Active Exchange-Traded Fund to operate as described in the Fund’s Prospectus.
As of June 30, 2024, the components of distributable taxable earnings are as follows (amounts in thousands†):
| | | | | | | | | | | | | | | | | | | | | | | | | | | | | | | | | | | | | | | | |
| | | | | | Undistributed
Tax Exempt
Income | | | Undistributed
Ordinary
Income(1) | | | Undistributed
Long-Term
Capital Gains | | | Net Tax Basis
Unrealized
Appreciation/
(Depreciation)(2) | | | Other
Book-to-Tax
Accounting
Differences(3) | | | Accumulated
Capital
Losses(4) | | | Qualified
Late-Year
Loss
Deferral -
Capital(5) | | | Qualified
Late-Year
Loss
Deferral -
Ordinary(6) | | | Total
Components
of Distributable
Earnings | |
| | | | | | | | | | |
PIMCO 25+ Year Zero Coupon U.S. Treasury Index Exchange-Traded Fund | | | | | | $ | 0 | | | $ | 14,177 | | | $ | 0 | | | $ | (267,035 | ) | | $ | (1 | ) | | $ | (225,504 | ) | | $ | 0 | | | $ | 0 | | | $ | (478,363 | ) |
| | | | | | | | | | |
PIMCO 1-5 Year U.S. TIPS Index Exchange-Traded Fund | | | | | | | 0 | | | | 1,577 | | | | 0 | | | | (26,102 | ) | | | 0 | | | | (40,888 | ) | | | 0 | | | | 0 | | | | (65,413 | ) |
| | | | | | | | | | |
PIMCO 15+ Year U.S. TIPS Index Exchange-Traded Fund | | | | | | | 0 | | | | 3,557 | | | | 0 | | | | (289,006 | ) | | | (1 | ) | | | (59,768 | ) | | | 0 | | | | 0 | | | | (345,218 | ) |
| | | | | | | | | | |
PIMCO Broad U.S. TIPS Index Exchange-Traded Fund | | | | | | | 0 | | | | 501 | | | | 0 | | | | (3,707 | ) | | | (1 | ) | | | (31,712 | ) | | | 0 | | | | 0 | | | | (34,919 | ) |
| | | | | | | | | | |
PIMCO 0-5 Year High Yield Corporate Bond Index Exchange-Traded Fund | | | | | | | 0 | | | | 7,730 | | | | 0 | | | | (28,026 | ) | | | (9 | ) | | | (238,598 | ) | | | 0 | | | | 0 | | | | (258,903 | ) |
| | | | | | | | | | |
PIMCO Investment Grade Corporate Bond Index Exchange-Traded Fund | | | | | | | 0 | | | | 4,305 | | | | 0 | | | | (46,708 | ) | | | (6 | ) | | | (37,359 | ) | | | 0 | | | | 0 | | | | (79,768 | ) |
| | | | | | | | | | |
PIMCO Active Bond Exchange-Traded Fund | | | | | | | 0 | | | | 3,732 | | | | 0 | | | | (66,087 | ) | | | (18 | ) | | | (601,478 | ) | | | 0 | | | | 0 | | | | (663,851 | ) |
| | | | | | | | | | | | | | | | | | | | | | | | | | | | | | | | | | | | | | | | |
| | | | | | Undistributed
Tax Exempt
Income | | | Undistributed
Ordinary
Income(1) | | | Undistributed
Long-Term
Capital Gains | | | Net Tax Basis
Unrealized
Appreciation/
(Depreciation)(2) | | | Other
Book-to-Tax
Accounting
Differences(3) | | | Accumulated
Capital
Losses(4) | | | Qualified
Late-Year
Loss
Deferral -
Capital(5) | | | Qualified
Late-Year
Loss
Deferral -
Ordinary(6) | | | Total
Components
of Distributable
Earnings | |
| | | | | | | | | | |
PIMCO Enhanced Low Duration Active Exchange-Traded Fund | | | | | | $ | 0 | | | $ | 0 | | | $ | 0 | | | $ | (6,921 | ) | | $ | (7 | ) | | $ | (80,370 | ) | | $ | 0 | | | $ | 0 | | | $ | (87,298 | ) |
| | | | | | | | | | |
PIMCO Enhanced Short Maturity Active ESG Exchange-Traded Fund | | | | | | | 0 | | | | 757 | | | | 0 | | | | (1,038 | ) | | | 0 | | | | (2,743 | ) | | | 0 | | | | 0 | | | | (3,024 | ) |
| | | | | | | | | | |
PIMCO Enhanced Short Maturity Active Exchange-Traded Fund | | | | | | | 0 | | | | 49,124 | | | | 0 | | | | (26,364 | ) | | | (2 | ) | | | (233,236 | ) | | | 0 | | | | 0 | | | | (210,478 | ) |
| | | | | | | | | | |
PIMCO Intermediate Municipal Bond Active Exchange-Traded Fund | | | | | | | 4,388 | | | | 0 | | | | 0 | | | | 19,485 | | | | (2 | ) | | | (42,321 | ) | | | 0 | | | | 0 | | | | (18,450 | ) |
| | | | | | | | | | |
PIMCO Multisector Bond Active Exchange-Traded Fund | | | | | | | 0 | | | | 6,016 | | | | 0 | | | | 3,827 | | | | 0 | | | | 0 | | | | 0 | | | | 0 | | | | 9,843 | |
| | | | | | | | | | |
PIMCO Municipal Income Opportunities Active Exchange-Traded Fund | | | | | | | 588 | | | | 0 | | | | 0 | | | | 2,972 | | | | 0 | | | | (5,299 | ) | | | 0 | | | | 0 | | | | (1,739 | ) |
| | | | | | | | | | |
PIMCO Preferred and Capital Securities Active Exchange-Traded Fund | | | | | | | 0 | | | | 660 | | | | 0 | | | | 2,680 | | | | 0 | | | | (1,678 | ) | | | 0 | | | | 0 | | | | 1,662 | |
| | | | | | | | | | |
PIMCO Senior Loan Active Exchange-Traded Fund | | | | | | | 0 | | | | 5,249 | | | | 0 | | | | 3,042 | | | | 0 | | | | (1,464 | ) | | | 0 | | | | 0 | | | | 6,827 | |
| | | | | | | | | | |
PIMCO Short Term Municipal Bond Active Exchange-Traded Fund | | | | | | | 1,468 | | | | 0 | | | | 0 | | | | (808 | ) | | | (3 | ) | | | (13,755 | ) | | | 0 | | | | 0 | | | | (13,098 | ) |
| | | | | | | | | | |
PIMCO Ultra Short Government Active Exchange-Traded Fund | | | | | | | 0 | | | | 1,488 | | | | 0 | | | | 19 | | | | 0 | | | | 0 | | | | 0 | | | | 0 | | | | 1,507 | |
| | | | | | | | | | |
PIMCO Commodity Strategy Active Exchange-Traded Fund | | | | | | | 0 | | | | 17,552 | | | | 0 | | | | (242 | ) | | | 0 | | | | 0 | | | | (1,295 | ) | | | 0 | | | | 16,015 | |
| † | A zero balance may reflect actual amounts rounding to less than one thousand. |
| (1) | Includes undistributed short-term capital gains, if any. |
| (2) | Adjusted for open wash sale loss deferrals and the accelerated recognition of unrealized gain or loss on certain futures, options, and/or forward contracts for federal income tax purposes. Also adjusted for differences between book and tax realized and unrealized gain (loss) on hyperinflationary investments, swap contracts, straddle loss deferrals, treasury inflation-protected securities (TIPS), passive foreign investment companies (PFICs), interest accrued on defaulted securities, controlled foreign corporation (CFC) transactions, and short positions. |
| (3) | Represents differences in income tax regulations and financial accounting principles generally accepted in the United States of America, mainly due to organizational expenditures. |
| (4) | Capital losses available to offset future net capital gains as shown below. |
| (5) | Capital losses realized during the period November 1, 2023 through June 30, 2024 which the Funds elected to defer to the following taxable year pursuant to income tax regulations. |
| (6) | Specified losses realized during the period November 1, 2023 through June 30, 2024 and Ordinary losses realized during the period January 1, 2024 through June 30, 2024 which the Funds elected to defer to the following taxable year pursuant to income tax regulations. |
Under the Regulated Investment Company Modernization Act of 2010, a fund is permitted to carry forward any new capital losses for an unlimited period. Additionally, such capital losses that are carried forward will retain their character as either short-term or long-term capital losses rather than being considered all short-term under previous law.
As of June 30, 2024, the Funds had the following post-effective capital losses with no expiration (amounts in thousands†):
| | | | | | | | | | | | |
| | | | | | Short-Term | | | Long-Term | |
| | | |
PIMCO 25+ Year Zero Coupon U.S. Treasury Index Exchange-Traded Fund | | | | | | $ | 43,769 | | | $ | 181,735 | |
| | | |
PIMCO 1-5 Year U.S. TIPS Index Exchange-Traded Fund | | | | | | | 9,877 | | | | 31,011 | |
| | | |
PIMCO 15+ Year U.S. TIPS Index Exchange-Traded Fund | | | | | | | 19,518 | | | | 40,250 | |
| | | |
PIMCO Broad U.S. TIPS Index Exchange-Traded Fund | | | | | | | 22,929 | | | | 8,783 | |
| | | |
PIMCO 0-5 Year High Yield Corporate Bond Index Exchange-Traded Fund | | | | | | | 48,328 | | | | 190,270 | |
| | | |
PIMCO Investment Grade Corporate Bond Index Exchange-Traded Fund | | | | | | | 13,070 | | | | 24,289 | |
| | | |
PIMCO Active Bond Exchange-Traded Fund | | | | | | | 391,856 | | | | 209,622 | |
| | | |
PIMCO Enhanced Low Duration Active Exchange-Traded Fund | | | | | | | 55,048 | | | | 25,322 | |
| | | |
PIMCO Enhanced Short Maturity Active ESG Exchange-Traded Fund | | | | | | | 1,302 | | | | 1,441 | |
| | | |
PIMCO Enhanced Short Maturity Active Exchange-Traded Fund | | | | | | | 74,209 | | | | 159,027 | |
| | | |
PIMCO Intermediate Municipal Bond Active Exchange-Traded Fund | | | | | | | 25,355 | | | | 16,966 | |
| | | |
PIMCO Multisector Bond Active Exchange-Traded Fund | | | | | | | 0 | | | | 0 | |
| | | |
PIMCO Municipal Income Opportunities Active Exchange-Traded Fund | | | | | | | 5,207 | | | | 92 | |
| | | | | | | | | | | | |
| | | | ANNUAL FINANCIAL AND OTHER INFORMATION | | | | | | | JUNE 30, 2024 | | | 175 |
| | | | |
| Notes to Financial Statements | | (Cont.) | | |
| | | | | | | | | | | | |
| | | | | | Short-Term | | | Long-Term | |
| | | |
PIMCO Preferred and Capital Securities Active Exchange-Traded Fund | | | | | | | 1,394 | | | | 284 | |
| | | |
PIMCO Senior Loan Active Exchange-Traded Fund | | | | | | | 980 | | | | 484 | |
| | | |
PIMCO Short Term Municipal Bond Active Exchange-Traded Fund | | | | | | | 5,694 | | | | 8,061 | |
| | | |
PIMCO Ultra Short Government Active Exchange-Traded Fund | | | | | | | 0 | | | | 0 | |
| | | |
PIMCO Commodity Strategy Active Exchange-Traded Fund | | | | | | | 0 | | | | 0 | |
| † | A zero balance may reflect actual amounts rounding to less than one thousand. |
As of June 30, 2024, the aggregate cost and the net unrealized appreciation/(depreciation) of investments for federal income tax purposes are as follows (amounts in thousands†):
| | | | | | | | | | | | | | | | | | | | |
| | | | | | Federal
Tax Cost | | | Unrealized
Appreciation | | | Unrealized
(Depreciation) | | | Net Unrealized
Appreciation/
(Depreciation)(7) | |
| | | | | |
PIMCO 25+ Year Zero Coupon U.S. Treasury Index Exchange-Traded Fund | | | | | | $ | 1,655,565 | | | $ | 1,095 | | | $ | (268,131 | ) | | $ | (267,036 | ) |
| | | | | |
PIMCO 1-5 Year U.S. TIPS Index Exchange-Traded Fund | | | | | | | 516,689 | | | | 328 | | | | (26,430 | ) | | | (26,102 | ) |
| | | | | |
PIMCO 15+ Year U.S. TIPS Index Exchange-Traded Fund | | | | | | | 992,861 | | | | 0 | | | | (289,007 | ) | | | (289,007 | ) |
| | | | | |
PIMCO Broad U.S. TIPS Index Exchange-Traded Fund | | | | | | | 102,059 | | | | 90 | | | | (3,797 | ) | | | (3,707 | ) |
| | | | | |
PIMCO 0-5 Year High Yield Corporate Bond Index Exchange-Traded Fund | | | | | | | 1,300,504 | | | | 18,957 | | | | (46,981 | ) | | | (28,024 | ) |
| | | | | |
PIMCO Investment Grade Corporate Bond Index Exchange-Traded Fund | | | | | | | 1,220,701 | | | | 4,355 | | | | (51,063 | ) | | | (46,708 | ) |
| | | | | |
PIMCO Active Bond Exchange-Traded Fund | | | | | | | 4,861,982 | | | | 69,112 | | | | (135,099 | ) | | | (65,987 | ) |
| | | | | |
PIMCO Enhanced Low Duration Active Exchange-Traded Fund | | | | | | | 894,041 | | | | 3,782 | | | | (10,828 | ) | | | (7,046 | ) |
| | | | | |
PIMCO Enhanced Short Maturity Active ESG Exchange-Traded Fund | | | | | | | 188,626 | | | | 255 | | | | (1,292 | ) | | | (1,037 | ) |
| | | | | |
PIMCO Enhanced Short Maturity Active Exchange-Traded Fund | | | | | | | 12,192,327 | | | | 17,563 | | | | (43,926 | ) | | | (26,363 | ) |
| | | | | |
PIMCO Intermediate Municipal Bond Active Exchange-Traded Fund | | | | | | | 1,500,107 | | | | 28,883 | | | | (9,397 | ) | | | 19,486 | |
| | | | | |
PIMCO Multisector Bond Active Exchange-Traded Fund | | | | | | | 1,387,049 | | | | 8,790 | | | | (4,955 | ) | | | 3,835 | |
| | | | | |
PIMCO Municipal Income Opportunities Active Exchange-Traded Fund | | | | | | | 158,218 | | | | 4,134 | | | | (1,163 | ) | | | 2,971 | |
| | | | | |
PIMCO Preferred and Capital Securities Active Exchange-Traded Fund | | | | | | | 112,685 | | | | 3,549 | | | | (869 | ) | | | 2,680 | |
| | | | | |
PIMCO Senior Loan Active Exchange-Traded Fund | | | | | | | 480,507 | | | | 3,816 | | | | (774 | ) | | | 3,042 | |
| | | | | |
PIMCO Short Term Municipal Bond Active Exchange-Traded Fund | | | | | | | 605,877 | | | | 3,003 | | | | (3,811 | ) | | | (808 | ) |
| | | | | |
PIMCO Ultra Short Government Active Exchange-Traded Fund | | | | | | | 399,996 | | | | 19 | | | | 0 | | | | 19 | |
| | | | | |
PIMCO Commodity Strategy Active Exchange-Traded Fund | | | | | | | 319,044 | | | | 7,570 | | | | (7,814 | ) | | | (244 | ) |
| † | A zero balance may reflect actual amounts rounding to less than one thousand. |
| (7) | Adjusted for open wash sale loss deferrals and the accelerated recognition of unrealized gain or loss on certain futures, options, and/or forward contracts for federal income tax purposes. Also adjusted for differences between book and tax realized and unrealized gain (loss) on hyperinflationary investments, swap contracts, straddle loss deferrals, treasury inflation-protected securities (TIPS), passive foreign investment companies (PFICs), interest accrued on defaulted securities, controlled foreign corporation (CFC) transactions, and short positions. |
For the fiscal years ended June 30, 2024 and June 30, 2023, respectively, the Funds made the following tax basis distributions (amounts in thousands†):
| | | | | | | | | | | | | | | | | | | | | | | | | | | | | | | | | | |
| | | | | June 30, 2024 | | | June 30, 2023 | |
| | | | | | | | | |
| | | | | Tax-Exempt
Income
Distributions | | | Ordinary
Income
Distributions(8) | | | Long-Term
Capital Gain
Distributions | | | Return of
Capital(9) | | | Tax-Exempt
Income
Distributions | | | Ordinary
Income
Distributions(8) | | | Long-Term
Capital Gain
Distributions | | | Return of
Capital(9) | |
| | | | | | | | | |
PIMCO 25+ Year Zero Coupon U.S. Treasury Index Exchange-Traded Fund | | | | $ | 0 | | | $ | 41,421 | | | $ | 0 | | | $ | 0 | | | $ | 0 | | | $ | 17,750 | | | $ | 0 | | | $ | 0 | |
| | | | | | | | | |
PIMCO 1-5 Year U.S. TIPS Index Exchange-Traded Fund | | | | | 0 | | | | 13,367 | | | | 0 | | | | 0 | | | | 0 | | | | 43,653 | | | | 0 | | | | 0 | |
| | | | | | | | | |
PIMCO 15+ Year U.S. TIPS Index Exchange-Traded Fund | | | | | 0 | | | | 30,656 | | | | 0 | | | | 0 | | | | 0 | | | | 33,083 | | | | 0 | | | | 0 | |
| | | | | | | | | |
PIMCO Broad U.S. TIPS Index Exchange-Traded Fund | | | | | 0 | | | | 5,707 | | | | 0 | | | | 0 | | | | 0 | | | | 11,385 | | | | 0 | | | | 0 | |
| | | | | | | | | |
PIMCO 0-5 Year High Yield Corporate Bond Index Exchange-Traded Fund | | | | | 0 | | | | 84,984 | | | | 0 | | | | 0 | | | | 0 | | | | 74,597 | | | | 0 | | | | 0 | |
| | | | | | | | | |
PIMCO Investment Grade Corporate Bond Index Exchange-Traded Fund | | | | | 0 | | | | 43,066 | | | | 0 | | | | 0 | | | | 0 | | | | 26,827 | | | | 0 | | | | 0 | |
| | | | | | | | | |
PIMCO Active Bond Exchange-Traded Fund | | | | | 0 | | | | 176,461 | | | | 0 | | | | 0 | | | | 0 | | | | 118,150 | | | | 0 | | | | 0 | |
| | | | | | | | | |
PIMCO Enhanced Low Duration Active Exchange-Traded Fund | | | | | 0 | | | | 42,143 | | | | 0 | | | | 2,039 | | | | 0 | | | | 39,335 | | | | 0 | | | | 0 | |
| | | | | | | | | | | | | | | | | | | | | | | | | | | | | | | | | | |
| | | | | June 30, 2024 | | | June 30, 2023 | |
| | | | | | | | | |
| | | | | Tax-Exempt
Income
Distributions | | | Ordinary
Income
Distributions(8) | | | Long-Term
Capital Gain
Distributions | | | Return of
Capital(9) | | | Tax-Exempt
Income
Distributions | | | Ordinary
Income
Distributions(8) | | | Long-Term
Capital Gain
Distributions | | | Return of
Capital(9) | |
| | | | | | | | | |
PIMCO Enhanced Short Maturity Active ESG Exchange-Traded Fund | | | | $ | 0 | | | $ | 8,508 | | | $ | 0 | | | $ | 0 | | | $ | 0 | | | $ | 6,454 | | | $ | 0 | | | $ | 0 | |
| | | | | | | | | |
PIMCO Enhanced Short Maturity Active Exchange-Traded Fund | | | | | 0 | | | | 549,101 | | | | 0 | | | | 0 | | | | 0 | | | | 312,603 | | | | 0 | | | | 0 | |
| | | | | | | | | |
PIMCO Intermediate Municipal Bond Active Exchange-Traded Fund | | | | | 35,326 | | | | 6,295 | | | | 0 | | | | 0 | | | | 21,270 | | | | 3,171 | | | | 0 | | | | 0 | |
| | | | | | | | | |
PIMCO Multisector Bond Active Exchange-Traded Fund | | | | | 0 | | | | 18,406 | | | | 0 | | | | 0 | | | | 0 | | | | 0 | | | | 0 | | | | 0 | |
| | | | | | | | | |
PIMCO Municipal Income Opportunities Active Exchange-Traded Fund | | | | | 3,467 | | | | 775 | | | | 0 | | | | 0 | | | | 1,616 | | | | 327 | | | | 0 | | | | 0 | |
| | | | | | | | | |
PIMCO Preferred and Capital Securities Active Exchange-Traded Fund | | | | | 0 | | | | 5,098 | | | | 0 | | | | 0 | | | | 0 | | | | 928 | | | | 0 | | | | 0 | |
| | | | | | | | | |
PIMCO Senior Loan Active Exchange-Traded Fund | | | | | 0 | | | | 21,266 | | | | 0 | | | | 0 | | | | 0 | | | | 8,533 | | | | 0 | | | | 0 | |
| | | | | | | | | |
PIMCO Short Term Municipal Bond Active Exchange-Traded Fund | | | | | 14,269 | | | | 2,420 | | | | 0 | | | | 0 | | | | 9,832 | | | | 1,820 | | | | 0 | | | | 0 | |
| | | | | | | | | |
PIMCO Ultra Short Government Active Exchange-Traded Fund | | | | | 0 | | | | 6,945 | | | | 0 | | | | 0 | | | | 0 | | | | 0 | | | | 0 | | | | 0 | |
| | | | | | | | | |
PIMCO Commodity Strategy Active Exchange-Traded Fund | | | | | 0 | | | | 7,460 | | | | 139 | | | | 0 | | | | 0 | | | | 0 | | | | 0 | | | | 0 | |
| | | | | | | | | | | | | | | | | | | | | | | | | | | | | | | | | | |
| † | A zero balance may reflect actual amounts rounding to less than one thousand. |
| (8) | Includes short-term capital gains distributed, if any. |
| (9) | A portion of the distributions made represents a tax return of capital. Return of capital distributions have been reclassified from undistributed net investment income to paid-in capital to more appropriately conform financial accounting to tax accounting. |
| | | | | | | | | | | | |
| | | | ANNUAL FINANCIAL AND OTHER INFORMATION | | | | | | | JUNE 30, 2024 | | | 177 |
| | | | |
| Report of Independent Registered Public Accounting Firm | | | | |
To the Board of Trustees of PIMCO ETF Trust and Shareholders of PIMCO 25+ Year Zero Coupon U.S. Treasury Index Exchange-Traded Fund, PIMCO 1-5 Year U.S. TIPS Index Exchange-Traded Fund, PIMCO 15+ Year U.S. TIPS Index Exchange-Traded Fund, PIMCO Broad U.S. TIPS Index Exchange-Traded Fund, PIMCO 0-5 Year High Yield Corporate Bond Index Exchange-Traded Fund, PIMCO Investment Grade Corporate Bond Index Exchange-Traded Fund, PIMCO Active Bond Exchange-Traded Fund, PIMCO Enhanced Low Duration Active Exchange-Traded Fund, PIMCO Enhanced Short Maturity Active ESG Exchange-Traded Fund, PIMCO Enhanced Short Maturity Active Exchange-Traded Fund, PIMCO Intermediate Municipal Bond Active Exchange-Traded Fund, PIMCO Multisector Bond Active Exchange-Traded Fund, PIMCO Municipal Income Opportunities Active Exchange-Traded Fund, PIMCO Preferred and Capital Securities Active Exchange-Traded Fund, PIMCO Senior Loan Active Exchange-Traded Fund, PIMCO Short Term Municipal Bond Active Exchange-Traded Fund, PIMCO Ultra Short Government Active Exchange-Traded Fund and PIMCO Commodity Strategy Active Exchange-Traded Fund
Opinions on the Financial Statements
We have audited the accompanying statements of assets and liabilities, including the schedules of investments, of each of the funds listed in the table below (constituting PIMCO ETF Trust, hereafter collectively referred to as the “Funds”) as of June 30, 2024, the related statements of operations and of changes in net assets for each of the periods indicated in the table below, including the related notes, and the financial highlights for each of the periods indicated therein (collectively referred to as the “financial statements”). In our opinion, the financial statements present fairly, in all material respects, the financial position of each of the Funds listed in the table below as of June 30, 2024, the results of each of their operations and the changes in each of their net assets, for the periods indicated in the table below, and each of the financial highlights for each of the periods indicated therein, in conformity with accounting principles generally accepted in the United States of America.
PIMCO 25+ Year Zero Coupon U.S. Treasury Index Exchange-Traded Fund(1)
PIMCO 1-5 Year U.S. TIPS Index Exchange-Traded Fund(1)
PIMCO 15+ Year U.S. TIPS Index Exchange-Traded Fund(1)
PIMCO Broad U.S. TIPS Index Exchange-Traded Fund(1)
PIMCO 0-5 Year High Yield Corporate Bond Index Exchange-Traded Fund(1)
PIMCO Investment Grade Corporate Bond Index Exchange-Traded Fund(1)
PIMCO Active Bond Exchange-Traded Fund(1)
PIMCO Enhanced Low Duration Active Exchange-Traded Fund(1)
PIMCO Enhanced Short Maturity Active ESG Exchange-Traded Fund(1)
PIMCO Enhanced Short Maturity Active Exchange-Traded Fund(1)
PIMCO Intermediate Municipal Bond Active Exchange-Traded Fund(1)
PIMCO Multisector Bond Active Exchange-Traded Fund(2)
PIMCO Municipal Income Opportunities Active Exchange-Traded Fund(1)
PIMCO Preferred and Capital Securities Active Exchange-Traded Fund(3)
PIMCO Senior Loan Active Exchange-Traded Fund(1)
PIMCO Short Term Municipal Bond Active Exchange-Traded Fund(1)
PIMCO Ultra Short Government Active Exchange-Traded Fund(2)
PIMCO Commodity Strategy Active Exchange-Traded Fund(4)*
| (1) | Statement of operations for the year ended June 30, 2024 and statement of changes in net assets for the years ended June 30, 2024 and 2023 |
| (2) | Statement of operations for the year ended June 30, 2024, and statement of changes in net assets for the year ended June 30, 2024 and the period June 21, 2023 (inception date) through June 30, 2023 |
| (3) | Statement of operations for the year ended June 30, 2024, and statement of changes in net assets for the year ended June 30, 2024 and the period January 18, 2023 (inception date) through June 30, 2023 |
| (4) | Statement of operations for the year ended June 30, 2024, and statement of changes in net assets for the year ended June 30, 2024 and the period May 9, 2023 (inception date) through June 30, 2023 |
| * | The financial statements for PIMCO Commodity Strategy Active Exchange-Traded Fund are presented on a consolidated basis |
Basis for Opinions
These financial statements are the responsibility of the Funds’ management. Our responsibility is to express an opinion on the Funds’ financial statements based on our audits. We are a public accounting firm registered with the Public Company Accounting Oversight Board (United States) (PCAOB) and are required to be independent with respect to the Funds in accordance with the U.S. federal securities laws and the applicable rules and regulations of the Securities and Exchange Commission and the PCAOB.
We conducted our audits of these financial statements in accordance with the standards of the PCAOB. Those standards require that we plan and perform the audit to obtain reasonable assurance about whether the financial statements are free of material misstatement, whether due to error or fraud.
Our audits included performing procedures to assess the risks of material misstatement of the financial statements, whether due to error or fraud, and performing procedures that respond to those risks. Such procedures included examining, on a test basis, evidence regarding the amounts and disclosures in the financial statements. Our audits also included evaluating the accounting principles used and significant estimates made by management, as well as evaluating the overall presentation of the financial statements. Our procedures included confirmation of securities owned as of June 30, 2024 by correspondence with the custodian, transfer agent, brokers and agent banks; when replies were not received from brokers or agent banks, we performed other auditing procedures. We believe that our audits provide a reasonable basis for our opinions.
/s/ PricewaterhouseCoopers LLP
Kansas City, Missouri
August 27, 2024
We have served as the auditor of one or more investment companies in PIMCO ETF Trust since 2009.
| | | | | | | | | | | | |
| | | | ANNUAL FINANCIAL AND OTHER INFORMATION | | | | | | | JUNE 30, 2024 | | | 179 |
| | | | | | |
| Glossary: | | (abbreviations that may be used in the preceding statements) | | | | (Unaudited) |
| | | | | | | | | | |
| | | | |
Counterparty Abbreviations: | | | | | | | | |
| | | | | |
| BCY | | Barclays Capital, Inc. | | CIB | | Canadian Imperial Bank of Commerce | | MYC | | Morgan Stanley Capital Services LLC |
| | | | | |
| BMO | | BMO Capital Markets Corporation | | DEU | | Deutsche Bank Securities, Inc. | | MYI | | Morgan Stanley & Co. International PLC |
| | | | | |
| BOA | | Bank of America N.A. | | FAR | | Wells Fargo Bank National Association | | RBC | | Royal Bank of Canada |
| | | | | |
| BOO | | BoA Securities, Inc (Repo Only) | | FICC | | Fixed Income Clearing Corporation | | RDR | | RBC Capital Markets LLC |
| | | | | |
| BOS | | BofA Securities, Inc. | | GLM | | Goldman Sachs Bank USA | | RYL | | NatWest Markets Plc |
| | | | | |
| BPG | | BNP Paribas Securities Corp. | | GSC | | Goldman Sachs & Co. LLC | | SAL | | Citigroup Global Markets, Inc. |
| | | | | |
| BPS | | BNP Paribas S.A. | | GST | | Goldman Sachs International | | SCX | | Standard Chartered Bank, London |
| | | | | |
| BRC | | Barclays Bank PLC | | JPM | | JP Morgan Chase Bank N.A. | | UAG | | UBS AG Stamford |
| | | | | |
| BSN | | The Bank of Nova Scotia - Toronto | | JPS | | J.P. Morgan Securities LLC | | UBS | | UBS Securities LLC |
| | | | | |
| CBK | | Citibank N.A. | | MBC | | HSBC Bank Plc | | | | |
| | | | |
Currency Abbreviations: | | | | | | | | |
| | | | | |
| AUD | | Australian Dollar | | GBP | | British Pound | | PEN | | Peruvian New Sol |
| | | | | |
| BRL | | Brazilian Real | | IDR | | Indonesian Rupiah | | PLN | | Polish Zloty |
| | | | | |
| CAD | | Canadian Dollar | | ILS | | Israeli Shekel | | SEK | | Swedish Krona |
| | | | | |
| CHF | | Swiss Franc | | INR | | Indian Rupee | | SGD | | Singapore Dollar |
| | | | | |
| CNH | | Chinese Renminbi (Offshore) | | JPY | | Japanese Yen | | TRY | | Turkish New Lira |
| | | | | |
| CNY | | Chinese Renminbi (Mainland) | | KRW | | South Korean Won | | TWD | | Taiwanese Dollar |
| | | | | |
| CZK | | Czech Koruna | | MXN | | Mexican Peso | | USD (or $) | | United States Dollar |
| | | | | |
| DKK | | Danish Krone | | NOK | | Norwegian Krone | | ZAR | | South African Rand |
| | | | | |
| EUR | | Euro | | NZD | | New Zealand Dollar | | | | |
| | | | |
Exchange Abbreviations: | | | | | | | | |
| | | | | |
| CBOT | | Chicago Board of Trade | | NYMEX | | New York Mercantile Exchange | | OTC | | Over the Counter |
| | | | |
Index/Spread Abbreviations: | | | | | | | | |
| | | | | |
| BRENT | | Brent Crude | | JMABNIC5 | | J.P. Morgan Custom Commodity Index | | SOFRINDX | | Secured Overnight Financing Rate Index |
| | | | | |
| CDX.EM | | Credit Derivatives Index - Emerging Markets | | LIBOR03M | | 3 Month USD-LIBOR | | SOFR30A | | Secured Overnight Financing Rate 30-Day Average |
| | | | | |
| CDX.HY | | Credit Derivatives Index - High Yield | | MUNIPSA | | Securities Industry and Financial Markets Association (SIFMA) Municipal Swap Index | | SONIO | | Sterling Overnight Interbank Average Rate |
| | | | | |
| CDX.IG | | Credit Derivatives Index - Investment Grade | | MUTKCALM | | Tokyo Overnight Average Rate | | TSFR3M | | Term SOFR 3-Month |
| | | | | |
| H15T5Y | | 5 Year US Treasury Yield Curve Constant Maturity Rate | | PIMCODB | | PIMCO Custom Commodity Basket | | US0003M | | ICE 3-Month USD LIBOR |
| | | | | |
| JMABNIC | | J.P. Morgan Nic Custom Index | | SOFR | | Secured Overnight Financing Rate | | | | |
| | | | |
Municipal Bond or Agency Abbreviations: | | | | | | | | |
| | | | | |
| ACA | | American Capital Access Holding Ltd. | | CR | | Custodial Receipts | | GNMA | | Government National Mortgage Association |
| | | | | |
| AGM | | Assured Guaranty Municipal | | FHA | | Federal Housing Administration | | NPFGC | | National Public Finance Guarantee Corp. |
| | | | | |
| AMBAC | | American Municipal Bond Assurance Corp. | | FHLMC | | Federal Home Loan Mortgage Corp. | | PSF | | Public School Fund |
| | | | | |
| BAM | | Build America Mutual Assurance | | FNMA | | Federal National Mortgage Association | | Q-SBLF | | Qualified School Bond Loan Fund |
| | | | |
| BHAC | | Berkshire Hathaway Assurance Corporation | | | | | | |
| | | | |
Other Abbreviations: | | | | | | | | |
| | | | | |
| ABS | | Asset-Backed Security | | DAC | | Designated Activity Company | | RBOB | | Reformulated Blendstock for Oxygenate Blending |
| | | | | |
| ALT | | Alternate Loan Trust | | EURIBOR | | Euro Interbank Offered Rate | | REIT | | Real Estate Investment Trust |
| | | | | |
| BABs | | Build America Bonds | | JSC | | Joint Stock Company | | REMIC | | Real Estate Mortgage Investment Conduit |
| | | | | |
| BBR | | Bank Bill Rate | | LIBOR | | London Interbank Offered Rate | | TBA | | To-Be-Announced |
| | | | | |
| BBSW | | Bank Bill Swap Reference Rate | | OIS | | Overnight Index Swap | | TBD | | To-Be-Determined |
| | | | | |
| BRL-CDI | | Brazil Interbank Deposit Rate | | oz. | | Ounce | | TBD% | | Interest rate to be determined when loan settles or at the time of funding |
| | | | | |
| BTP | | Buoni del Tesoro Poliennali “Long-term Treasury Bond” | | PIK | | Payment-in-Kind | | WTI | | West Texas Intermediate |
| | | | | |
| CLO | | Collateralized Loan Obligation | | PRIBOR | | Prague Interbank Offered Rate | | | | |
| | | | | | |
| Federal Income Tax Information | | | | | | (Unaudited) |
As required by the Internal Revenue Code (“Code”) and Treasury Regulations, if applicable, shareholders must be notified within 60 days of the Funds’ fiscal year end regarding the status of qualified dividend income and the dividend received deduction.
Dividend Received Deduction. Corporate shareholders are generally entitled to take the dividend received deduction on the portion of a fund’s dividend distribution that qualifies under tax law. The percentage of the following Funds’ fiscal 2024 ordinary income dividend that qualifies for the corporate dividend received deduction is set forth below.
Qualified Dividend Income. Under the Jobs and Growth Tax Relief Reconciliation Act of 2003, the following percentage of ordinary dividends paid during the fiscal year ended June 30, 2024 was designated as ‘‘qualified dividend income’’ as defined in the Jobs and Growth Tax Relief Reconciliation Act of 2003 subject to reduced tax rates in 2024.
Qualified Interest Income and Qualified Short-Term Capital Gain (for non-U.S. resident shareholders only). Under the American Jobs Creation Act of 2004, the following amounts of ordinary dividends paid during the fiscal year ended June 30, 2024 are considered to be derived from “qualified interest income,” as defined in Section 871(k)(1)(E) of the Code, and therefore are designated as interest-related dividends, as defined in Section 871(k)(1)(C) of the Code. Further, the following amounts of ordinary dividends paid during the fiscal year ended June 30, 2024 are considered to be derived from “qualified short-term capital gain,” as defined in Section 871(k)(2)(D) of the Code, and therefore are designated as qualified short-term gain dividends, as defined by Section 871(k)(2)(C) of the Code.
Section 163(j) Interest Dividends. The Funds intend to pass through the maximum amount allowable as Section 163(j) Interest defined in Proposed Treasury Section 1.163(j)-1(b). The 163(j) amount of ordinary income distributions are as follows:
| | | | | | | | | | | | | | | | | | | | | | | | |
| | | | | | Dividend
Received
Deduction
% | | | Qualified
Dividend
Income
% | | | Qualified
Interest
Income
(000s)† | | | Qualified
Short-Term
Capital Gains
(000s)† | | | 163(j)
Interest
Dividends
(000s)† | |
| | | | | | |
PIMCO 25+ Year Zero Coupon U.S. Treasury Index Exchange-Traded Fund | | | | | | | 0.00% | | | | 0.00% | | | $ | 41,421 | | | $ | 0 | | | $ | 30,745 | |
| | | | | | |
PIMCO 1-5 Year U.S. TIPS Index Exchange-Traded Fund | | | | | | | 0.00% | | | | 0.00% | | | | 13,367 | | | | 0 | | | | 13,528 | |
| | | | | | |
PIMCO 15+ Year U.S. TIPS Index Exchange-Traded Fund | | | | | | | 0.00% | | | | 0.00% | | | | 30,656 | | | | 0 | | | | 23,939 | |
| | | | | | |
PIMCO Broad U.S. TIPS Index Exchange-Traded Fund | | | | | | | 0.00% | | | | 0.00% | | | | 5,707 | | | | 0 | | | | 5,354 | |
| | | | | | |
PIMCO 0-5 Year High Yield Corporate Bond Index Exchange-Traded Fund | | | | | | | 0.00% | | | | 0.00% | | | | 84,134 | | | | 0 | | | | 64,163 | |
| | | | | | |
PIMCO Investment Grade Corporate Bond Index Exchange-Traded Fund | | | | | | | 0.00% | | | | 0.00% | | | | 41,344 | | | | 0 | | | | 29,364 | |
| | | | | | |
PIMCO Active Bond Exchange-Traded Fund | | | | | | | 0.00% | | | | 1.04% | | | | 172,932 | | | | 0 | | | | 125,148 | |
| | | | | | |
PIMCO Enhanced Low Duration Active Exchange-Traded Fund | | | | | | | 0.00% | | | | 0.00% | | | | 37,929 | | | | 0 | | | | 40,676 | |
| | | | | | |
PIMCO Enhanced Short Maturity Active ESG Exchange-Traded Fund | | | | | | | 0.00% | | | | 0.00% | | | | 6,806 | | | | 0 | | | | 6,217 | |
| | | | | | |
PIMCO Enhanced Short Maturity Active Exchange-Traded Fund | | | | | | | 0.00% | | | | 0.00% | | | | 494,191 | | | | 0 | | | | 392,996 | |
| | | | | | |
PIMCO Intermediate Municipal Bond Active Exchange-Traded Fund | | | | | | | 0.00% | | | | 0.00% | | | | 41,621 | | | | 0 | | | | 1,599 | |
| | | | | | |
PIMCO Multisector Bond Active Exchange-Traded Fund | | | | | | | 0.00% | | | | 0.00% | | | | 18,406 | | | | 0 | | | | 2,730 | |
| | | | | | |
PIMCO Municipal Income Opportunities Active Exchange-Traded Fund | | | | | | | 0.00% | | | | 0.00% | | | | 4,242 | | | | 0 | | | | 254 | |
| | | | | | |
PIMCO Preferred and Capital Securities Active Exchange-Traded Fund | | | | | | | 31.66% | | | | 53.35% | | | | 1,886 | | | | 0 | | | | 3,360 | |
| | | | | | |
PIMCO Senior Loan Active Exchange-Traded Fund | | | | | | | 0.00% | | | | 0.00% | | | | 21,053 | | | | 0 | | | | 13,239 | |
| | | | | | |
PIMCO Short Term Municipal Bond Active Exchange-Traded Fund | | | | | | | 0.00% | | | | 0.00% | | | | 16,689 | | | | 0 | | | | 1,118 | |
| | | | | | |
PIMCO Ultra Short Government Active Exchange-Traded Fund | | | | | | | 0.00% | | | | 0.00% | | | | 6,945 | | | | 0 | | | | 868 | |
| | | | | | |
PIMCO Commodity Strategy Active Exchange-Traded Fund | | | | | | | 0.00% | | | | 0.00% | | | | 7,276 | | | | 104 | | | | 4,240 | |
| † | A zero balance may reflect actual amounts rounding to less than one thousand. |
Shareholders are advised to consult their own tax advisor with respect to the tax consequences of their investment in the Trust. In January 2025, you will be advised on IRS Form 1099-DIV as to the federal tax status of the dividends and distributions received by you in calendar year 2024.
Section 199A Dividends. Non-corporate fund shareholders of the funds below meeting certain holding period requirements may be able to deduct up to 20 percent of qualified REIT dividends passed through and reported to the shareholders by the funds as IRC section 199A dividends. The IRC section 199A percentage of ordinary dividends are as follows:
| | | | | | | | |
| | | | | | 199A Dividends | |
| | |
PIMCO 25+ Year Zero Coupon U.S. Treasury Index Exchange-Traded Fund | | | | | | | 0% | |
| | |
PIMCO 1-5 Year U.S. TIPS Index Exchange-Traded Fund | | | | | | | 0% | |
| | | | | | | | | | | | |
| | | | ANNUAL FINANCIAL AND OTHER INFORMATION | | | | | | | JUNE 30, 2024 | | | 181 |
| | | | | | |
| Federal Income Tax Information | | (Cont.) | | | | (Unaudited) |
| | | | | | | | |
| | | | | | 199A Dividends | |
| | |
PIMCO 15+ Year U.S. TIPS Index Exchange-Traded Fund | | | | | | | 0% | |
| | |
PIMCO Broad U.S. TIPS Index Exchange-Traded Fund | | | | | | | 0% | |
| | |
PIMCO 0-5 Year High Yield Corporate Bond Index Exchange-Traded Fund | | | | | | | 0% | |
| | |
PIMCO Investment Grade Corporate Bond Index Exchange-Traded Fund | | | | | | | 0% | |
| | |
PIMCO Active Bond Exchange-Traded Fund | | | | | | | 0% | |
| | |
PIMCO Enhanced Low Duration Active Exchange-Traded Fund | | | | | | | 0% | |
| | |
PIMCO Enhanced Short Maturity Active ESG Exchange-Traded Fund | | | | | | | 0% | |
| | |
PIMCO Enhanced Short Maturity Active Exchange-Traded Fund | | | | | | | 0% | |
| | |
PIMCO Intermediate Municipal Bond Active Exchange-Traded Fund | | | | | | | 0% | |
| | |
PIMCO Multisector Bond Active Exchange-Traded Fund | | | | | | | 0% | |
| | |
PIMCO Municipal Income Opportunities Active Exchange-Traded Fund | | | | | | | 0% | |
| | |
PIMCO Preferred and Capital Securities Active Exchange-Traded Fund | | | | | | | 0% | |
| | |
PIMCO Senior Loan Active Exchange-Traded Fund | | | | | | | 0% | |
| | |
PIMCO Short Term Municipal Bond Active Exchange-Traded Fund | | | | | | | 0% | |
| | |
PIMCO Ultra Short Government Active Exchange-Traded Fund | | | | | | | 0% | |
| | |
PIMCO Commodity Strategy Active Exchange-Traded Fund | | | | | | | 0% | |
| | | | |
| Distribution Information | | | | (Unaudited) |
For purposes of Section 19 of the Investment Company Act of 1940 (the “Act”), the Funds estimated the periodic sources of any dividends paid during the period covered by this report in accordance with good accounting practice. Pursuant to Rule 19a-1(e) under the Act, the table below sets forth the actual source information for dividends paid during the six month period ended June 30, 2024 calculated as of each distribution period pursuant to Section 19 of the Act. The information below is not provided for U.S. federal income tax reporting purposes. The tax character of all dividends and distributions is reported on Form 1099-DIV (for shareholders who receive U.S. federal tax reporting) at the end of each calendar year. See the Financial Highlights section of this report for the tax characterization of distributions determined in accordance with federal income tax regulations for the fiscal year.
| | | | | | | | | | | | | | | | | | | | |
PIMCO Multisector Bond Active Exchange-Traded
Fund | | | | | Net Investment
Income* | | | Net Realized
Capital Gains* | | | Paid-in Surplus or
Other Capital
Sources** | | | Total (per
common share) | |
| | | | | |
January 2024 | | | | | | $ | 0.0000 | | | $ | 0.0000 | | | $ | 0.0000 | | | $ | 0.0000 | |
| | | | | |
February 2024 | | | | | | $ | 0.1096 | | | $ | 0.0000 | | | $ | 0.0004 | | | $ | 0.1100 | |
| | | | | |
March 2024 | | | | | | $ | 0.1170 | | | $ | 0.0000 | | | $ | 0.0000 | | | $ | 0.1170 | |
| | | | | |
April 2024 | | | | | | $ | 0.1164 | | | $ | 0.0000 | | | $ | 0.0006 | | | $ | 0.1170 | |
| | | | | |
May 2024 | | | | | | $ | 0.1180 | | | $ | 0.0000 | | | $ | 0.0000 | | | $ | 0.1180 | |
| | | | | |
June 2024 | | | | | | $ | 0.1350 | | | $ | 0.0000 | | | $ | 0.0000 | | | $ | 0.1350 | |
| | | | | |
PIMCO Ultra Short Government Active Exchange-
Traded Fund | | | | | Net Investment
Income* | | | Net Realized
Capital Gains* | | | Paid-in Surplus or
Other Capital
Sources** | | | Total (per
common share) | |
| | | | | |
January 2024 | | | | | | $ | 0.0000 | | | $ | 0.0000 | | | $ | 0.0000 | | | $ | 0.0000 | |
| | | | | |
February 2024 | | | | | | $ | 0.4060 | | | $ | 0.0000 | | | $ | 0.0000 | | | $ | 0.4060 | |
| | | | | |
March 2024 | | | | | | $ | 0.3970 | | | $ | 0.0000 | | | $ | 0.0000 | | | $ | 0.3970 | |
| | | | | |
April 2024 | | | | | | $ | 0.4312 | | | $ | 0.0000 | | | $ | 0.0028 | | | $ | 0.4340 | |
| | | | | |
May 2024 | | | | | | $ | 0.4524 | | | $ | 0.0000 | | | $ | 0.0036 | | | $ | 0.4560 | |
| | | | | |
June 2024 | | | | | | $ | 0.4283 | | | $ | 0.0000 | | | $ | 0.0017 | | | $ | 0.4300 | |
| * | The source of dividends provided in the table differs, in some respects, from information presented in this report prepared in accordance with generally accepted accounting principles, or U.S. GAAP. For example, net earnings from certain interest rate swap contracts are included as a source of net investment income for purposes of Section 19(a). Accordingly, the information in the table may differ from information in the accompanying financial statements that are presented on the basis of U.S. GAAP and may differ from tax information presented in the footnotes. Amounts shown may include accumulated, as well as fiscal period net income and net profits. |
| ** | Occurs when a fund distributes an amount greater than its accumulated net income and net profits. Amounts are not reflective of a funds net income, yield, earnings or investment performance. |
| | | | | | | | | | | | |
| | | | ANNUAL FINANCIAL AND OTHER INFORMATION | | | | | | | JUNE 30, 2024 | | | 183 |
General Information
Investment Manager
Pacific Investment Management Company LLC
650 Newport Center Drive
Newport Beach, CA 92660
Distributor
PIMCO Investments LLC
1633 Broadway
New York, NY 10019
Custodian
State Street Bank & Trust Co
State Street Financial Center
One Congress Street, Suite 1
Boston, MA 02114-2016
Transfer Agent
State Street Bank and Trust Company
1776 Heritage Drive
North Quincy, MA 02171
Legal Counsel
Dechert LLP
1900 K Street N.W.
Washington, D.C. 20006
Independent Registered Public Accounting Firm
PricewaterhouseCoopers LLP
1100 Walnut Street, Suite 1300
Kansas City, MO 64106
This report is submitted for the general information of the shareholders of the PIMCO ETF Trust.

ETF3001FSAR_063024
| Item 8. | Changes in and Disagreements with Accountant for Open-End Management Investment Companies. |
Not applicable.
| Item 9. | Proxy Disclosures for Open-End Management Investment Companies. |
Not applicable.
| Item 10. | Remuneration Paid to Directors, Officers, and Others of Open-End Management Investment Companies. |
The information required by this Item 10 is included as part of the Financial Statements and Financial Highlights filed under Item 7(a) of this Form N-CSR.
| Item 11. | Statement Regarding Basis for Approval of Investment Advisory Contract. |
Not applicable.
| Item 12. | Disclosure of Proxy Voting Policies and Procedures for Closed-End Management Investment Companies. |
Not applicable to open-end investment companies.
| Item 13. | Portfolio Managers of Closed-End Management Investment Companies. |
Not applicable to open-end investment companies.
| Item 14. | Purchases of Equity Securities by Closed-End Management Investment Company and Affiliated Purchasers. |
Not applicable to open-end investment companies.
| Item 15. | Submission of Matters to a Vote of Security Holders. |
There have been no material changes to the procedures by which shareholders may recommend nominees to the Trust’s Board of Trustees since the Trust last provided disclosure in response to this item.
| Item 16. | Controls and Procedures. |
| | (a) | The principal executive officer and principal financial & accounting officer have concluded that the Registrant’s disclosure controls and procedures (as defined in Rule 30a-3(c) under the Act) provide reasonable assurances that material information relating to the Registrant is made known to them by the appropriate persons, based on their evaluation of these controls and procedures as of a date within 90 days of the filing of this report. |
| | (b) | There were no changes in the Registrant’s internal control over financial reporting (as defined in Rule 30a-3(d) under the Act) that occurred during the period covered by this report that have materially affected, or are reasonably likely to materially affect, the Registrant’s internal control over financial reporting. |
| Item 17. | Disclosure of Securities Lending Activities for Closed-End Management Investment Companies. |
Not applicable to open-end investment companies.
| Item 18. | Recovery of Erroneously Awarded Compensation |
(a)(1) Exhibit 99.CODE—Code of Ethics pursuant to Section 406 of the Sarbanes-Oxley Act of 2002.
(a)(2) Not applicable.
(a)(3) Exhibit 99.CERT—Certifications pursuant to Section 302 of the Sarbanes-Oxley Act of 2002.
(a)(4) Not applicable for open-end investment companies.
(a)(5) There was no change in the Registrant’s independent public accountant for the period covered by the report.
(b) Exhibit 99.906CERT—Certifications pursuant to Section 906 of the Sarbanes-Oxley Act of 2002.
Signatures
Pursuant to the requirements of the Securities Exchange Act of 1934 and the Investment Company Act of 1940, the registrant has duly caused this report to be signed on its behalf by the undersigned, thereunto duly authorized.
| | |
| PIMCO ETF Trust |
| |
| By: | | /s/ Joshua D. Ratner |
| | Joshua D. Ratner |
| | President (Principal Executive Officer) |
|
| Date: September 4, 2024 |
Pursuant to the requirements of the Securities Exchange Act of 1934 and the Investment Company Act of 1940, this report has been signed below by the following persons on behalf of the registrant and in the capacities and on the dates indicated.
| | |
| By: | | /s/ Joshua D. Ratner |
| | Joshua D. Ratner |
| | President (Principal Executive Officer) |
|
| Date: September 4, 2024 |
| | |
| By: | | /s/ Bijal Y. Parikh |
| | Bijal Y. Parikh |
| | Treasurer (Principal Financial & Accounting Officer) |
|
| Date: September 4, 2024 |