Exhibit 99.2
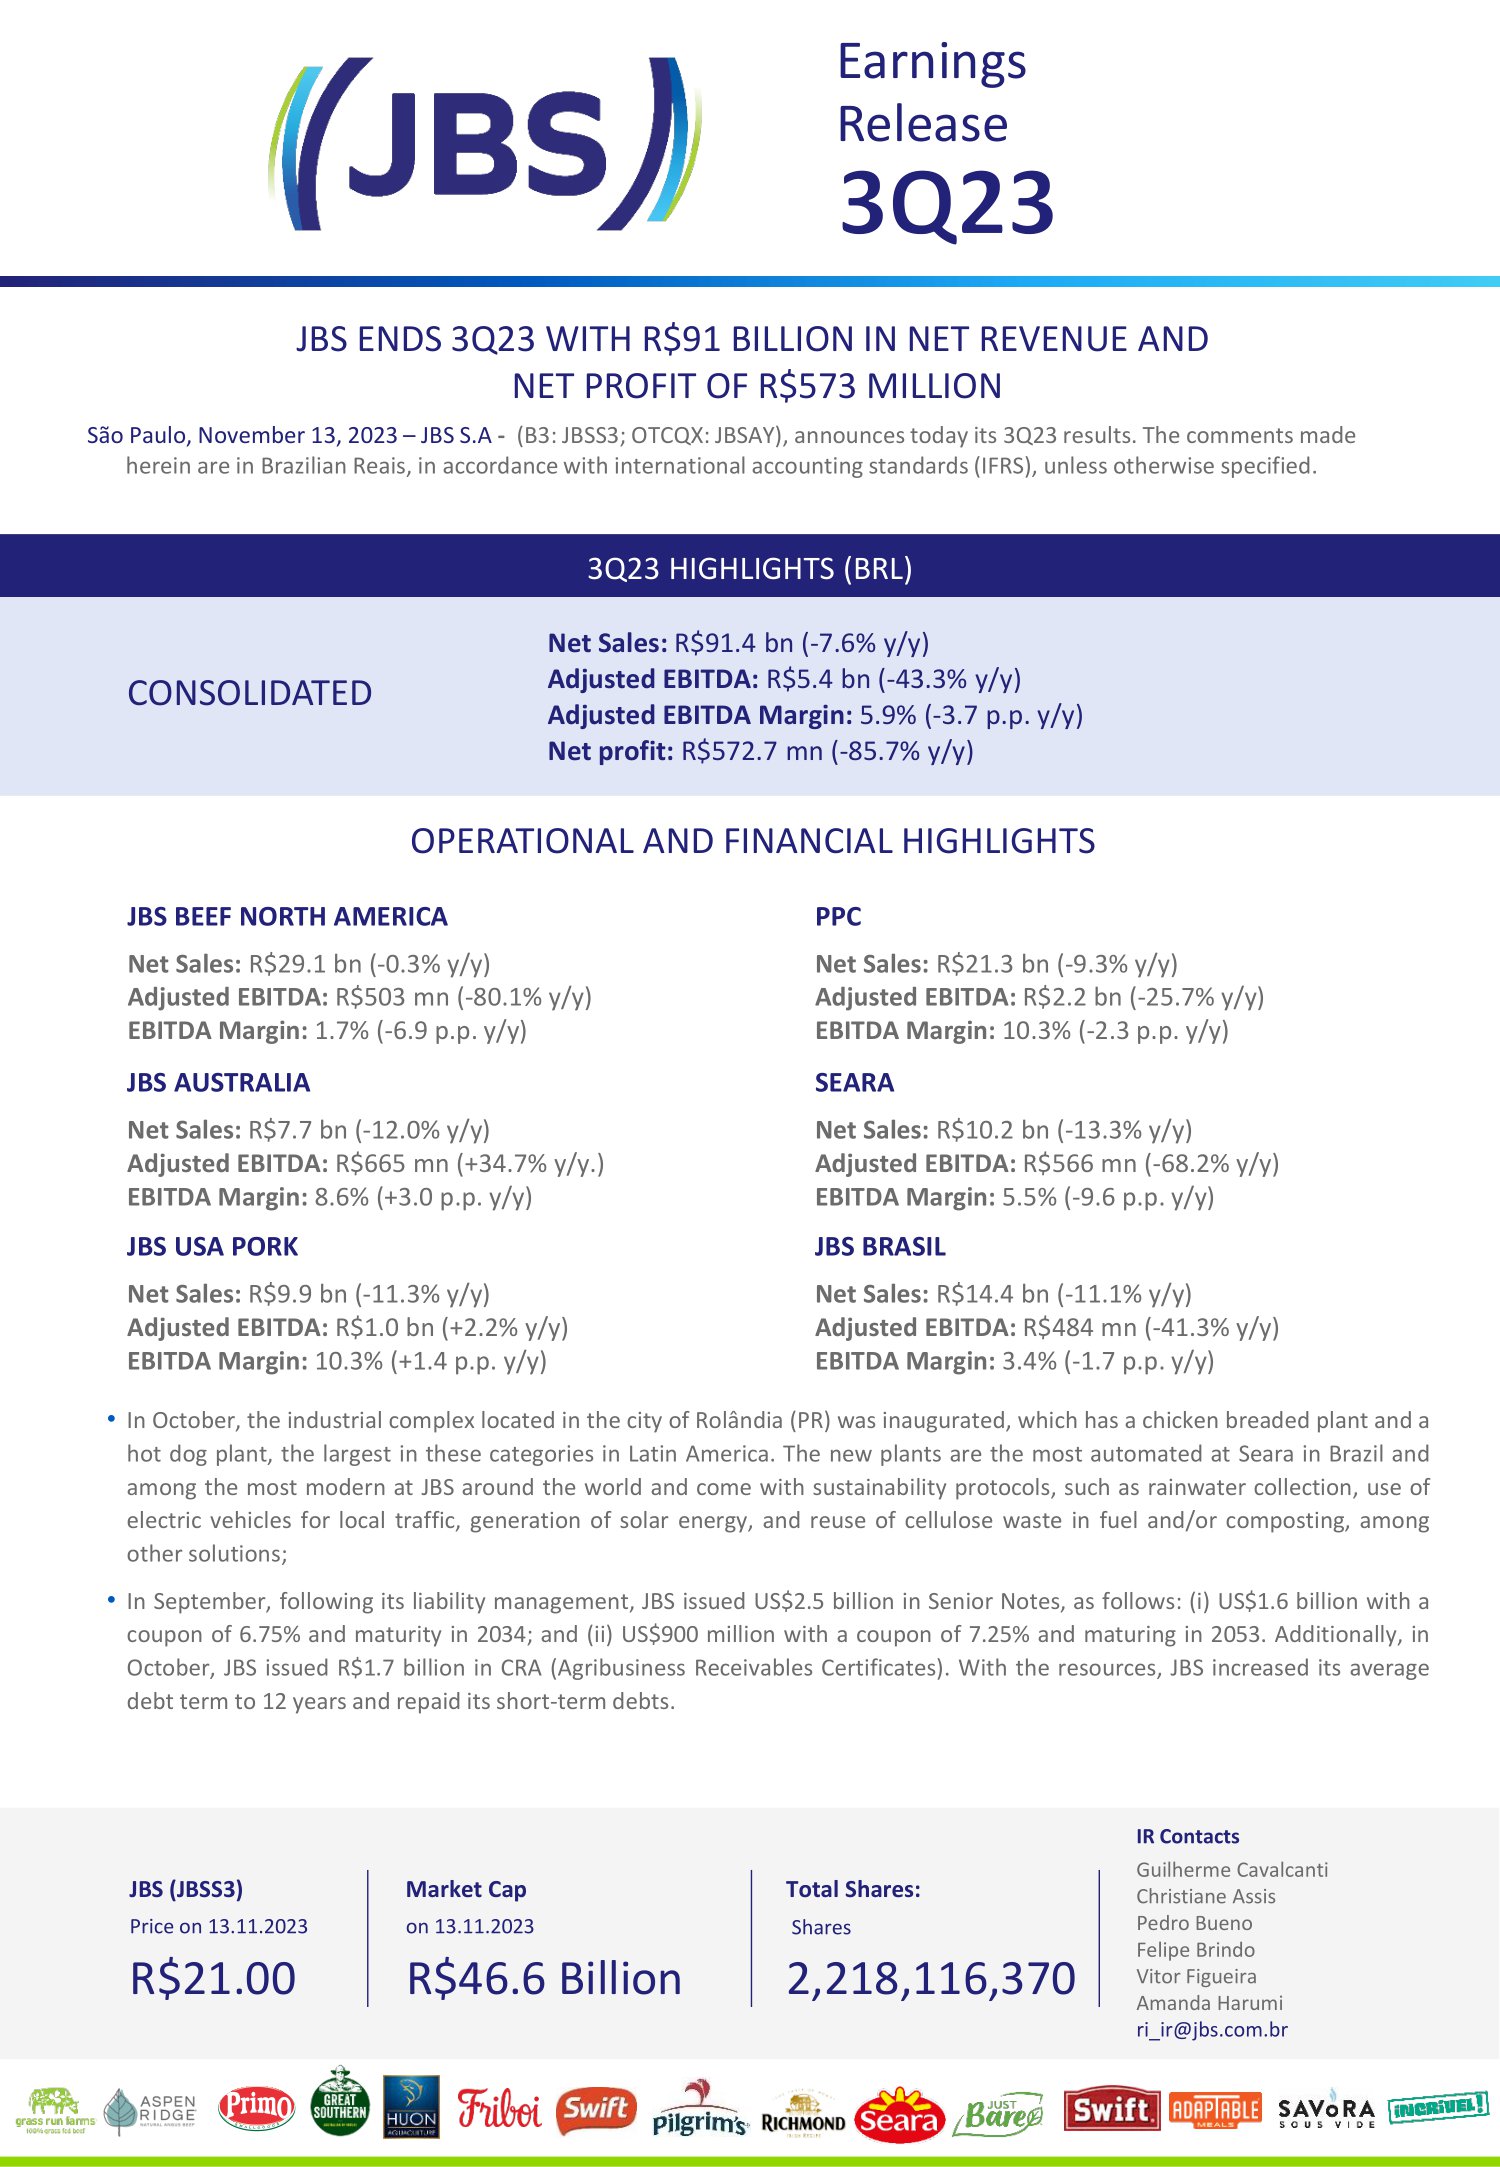
JBS ENDS 3Q23 WITH R$91 BILLION IN NET REVENUE AND NET PROFIT OF R$573 MILLION São Paulo, November 13, 2023 – JBS S.A - (B3: JBSS3; OTCQX: JBSAY), announces today its 3Q23 results. The comments made herein are in Brazilian Reais , in accordance with international accounting standards (IFRS), unless otherwise specified. Earnings Release 3Q23 HIGHLIGHTS (BRL) Net Sales : R $ 91 . 4 bn ( - 7 . 6 % y/y) Adjusted EBITDA : R $ 5 . 4 bn ( - 43 . 3 % y/y) Adjusted EBITDA Margin : 5 . 9 % ( - 3 . 7 p . p . y/y) Net profit : R $ 572 . 7 mn ( - 85 . 7 % y/y) OPERATIONAL AND FINANCIAL HIGHLIGHTS JBS BEEF NORTH AMERICA Net Sales : R $ 29 . 1 bn ( - 0 . 3 % y/y) Adjusted EBITDA : R $ 503 mn ( - 80 . 1 % y/y) EBITDA Margin : 1 . 7 % ( - 6 . 9 p . p . y/y) JBS USA PORK Net Sales : R $ 9 . 9 bn ( - 11 . 3 % y/y) Adjusted EBITDA : R $ 1 . 0 bn (+ 2 . 2 % y/y) EBITDA Margin : 10 . 3 % (+ 1 . 4 p . p . y/y) PPC Net Sales : R $ 21 . 3 bn ( - 9 . 3 % y/y) Adjusted EBITDA : R $ 2 . 2 bn ( - 25 . 7 % y/y) EBITDA Margin : 10 . 3 % ( - 2 . 3 p . p . y/y) SEARA Net Sales : R $ 10 . 2 bn ( - 13 . 3 % y/y) Adjusted EBITDA : R $ 566 mn ( - 68 . 2 % y/y) EBITDA Margin : 5 . 5 % ( - 9 . 6 p . p . y/y) JBS BRASIL Net Sales : R $ 14 . 4 bn ( - 11 . 1 % y/y) Adjusted EBITDA : R $ 484 mn ( - 41 . 3 % y/y) EBITDA Margin : 3 . 4 % ( - 1 . 7 p . p . y/y) JBS AUSTRALIA Net Sales : R $ 7 . 7 bn ( - 12 . 0 % y/y) Adjusted EBITDA : R $ 665 mn (+ 34 . 7 % y/y . ) EBITDA Margin : 8 . 6 % (+ 3 . 0 p . p . y/y) • In October, the industrial complex located in the city of Rolândia (PR) was inaugurated, which has a chicken breaded plant and a hot dog plant, the largest in these categories in Latin America . The new plants are the most automated at Seara in Brazil and among the most modern at JBS around the world and come with sustainability protocols, such as rainwater collection, use of electric vehicles for local traffic, generation of solar energy, and reuse of cellulose waste in fuel and/or composting, among other solutions ; • In September, following its liability management, JBS issued US $ 2 . 5 billion in Senior Notes, as follows : ( i ) US $ 1 . 6 billion with a coupon of 6 . 75 % and maturity in 2034 ; and (ii) US $ 900 million with a coupon of 7 . 25 % and maturing in 2053 . Additionally, in October, JBS issued R $ 1 . 7 billion in CRA (Agribusiness Receivables Certificates) . With the resources, JBS increased its average debt term to 12 years and repaid its short - term debts . JBS (JBSS3) Price on 13.11.2023 R$21.00 Market Cap on 13.11.2023 R$46.6 Billion Total Shares : 2,218,116,370 Shares IR Contacts Guilherme Cavalcanti Christiane Assis Pedro Bueno Felipe Brindo Vitor Figueira Amanda Harumi ri_ir@jbs.com.br CONSOLIDATED
The results in the third quarter of 2023 demonstrate that we are on a path of consistent recovery, as we have indicated in previous quarters . Thanks to the strength of our globally diversified platform across geographies and proteins, and the implementation of significant improvements in managing our operations in Brazil and the United States, we have nearly added 1 percentage point to our consolidated EBITDA margin compared to the second quarter of this year, reaching 5 . 92 % . This evolution in our cash generation also reflects our commitment to the fundamentals of our debt policy . We continue to work toward restoring the profitability of two of our businesses that were performing below potential . In Seara , we have executed the majority of our previously identified adjustments . This should positively impact our results in the coming quarters . There's still room for improvement in results with the ramp up from the new facilities, which are not yet operating at full capacity . We are very optimistic about the prospects of this business . In our U . S . beef business, operational measures adopted since March this year in the commercial and industrial areas are helping us navigate through the lowest point of the cattle cycle . The margins of the operation are showing gradual recovery, even in a scenario of tighter spreads and reduced cattle supply, demonstrating our commitment to operational excellence . Our chicken and pork businesses are already benefiting from the reduction in grain prices, as seen in the results of Pilgrim’s and U . S . pork . The margins of our U . S . pork business have shown strong evolution, increasing from 1 . 5 % in the second quarter of 2023 to 9 . 4 % in the third quarter, also boosted by strong consumer demand . Similarly, our beef operations in Brazil and Australia are increasingly ready to capture the opportunities presented by more favorable cycles in both markets, and this movement is expected to intensify from the next quarter onward . As anticipated in a more challenging scenario during 2023 , our leverage reached 4 . 87 x in dollars . Nevertheless, reinforcing the strong cash generation capacity of our businesses, we have reduced our net debt by $ 600 million . This once again shows that we are prepared to face this period with confidence . We have extended the average term of our debt to 12 years, expanded liquidity, and reduced the cost of borrowing, reaffirming our commitment to financial discipline in reducing our debt . Beginning in this last quarter of 2023 , we will enter a structural process of deleveraging the company . Our long - term vision for JBS remains unchanged . We have a unique multi - geographic and multi - protein platform that makes us more resilient in the face of challenging scenarios associated with specific geographies or businesses . We will continue to focus on growth through diversification, innovation, value - added products and strong brands, as demonstrated by the opening of a facility in Paraná (Brazil) two weeks ago, a R $ 1 billion - investment . Dedicated to producing a wide range of breaded products and sausages, it is one of the most modern and sustainable JBS plants in the world . We continue working to unlock value for JBS with the dual listing of our shares in Brazil and the United States . We believe this is another way to generate even more value for all our shareholders, team members and society . Amidst the celebrations of our 70 th anniversary, we have updated our brand to commemorate this new era for JBS . It represents a celebration of our past, a reflection of our present, and a vision of our future, being shaped every day with innovation and socio - environmental responsibility, an ongoing focus on our culture and values, and the continuous pursuit of excellence and leadership in everything we do . This evolution of our brand is not just a simple change of logo or colors ; it demonstrates our determination to continue growing, innovating, positively impacting the regions where we operate, and generating value for all our stakeholders . MESSAGE FROM THE CEO Gilberto Tomazoni , CEO Global JBS 2

R $3.4Bn CONSOLIDATED HIGHLIGHTS Note: graphs in millions . 4,014 573 NET REVENUE ADJUSTED EBITDA - 48,5% 98,928 91,409 3Q22 3Q23 9,546 5,409 9.6% 5.9% 3Q22 3Q23 3Q22 3Q23 NET PROFIT 3,227 3,430 3T22 3T23 3 Q22 3 Q23 FREE CASH FLOW 3 R $572.7Mn R$5.4Bn R$91.4Bn
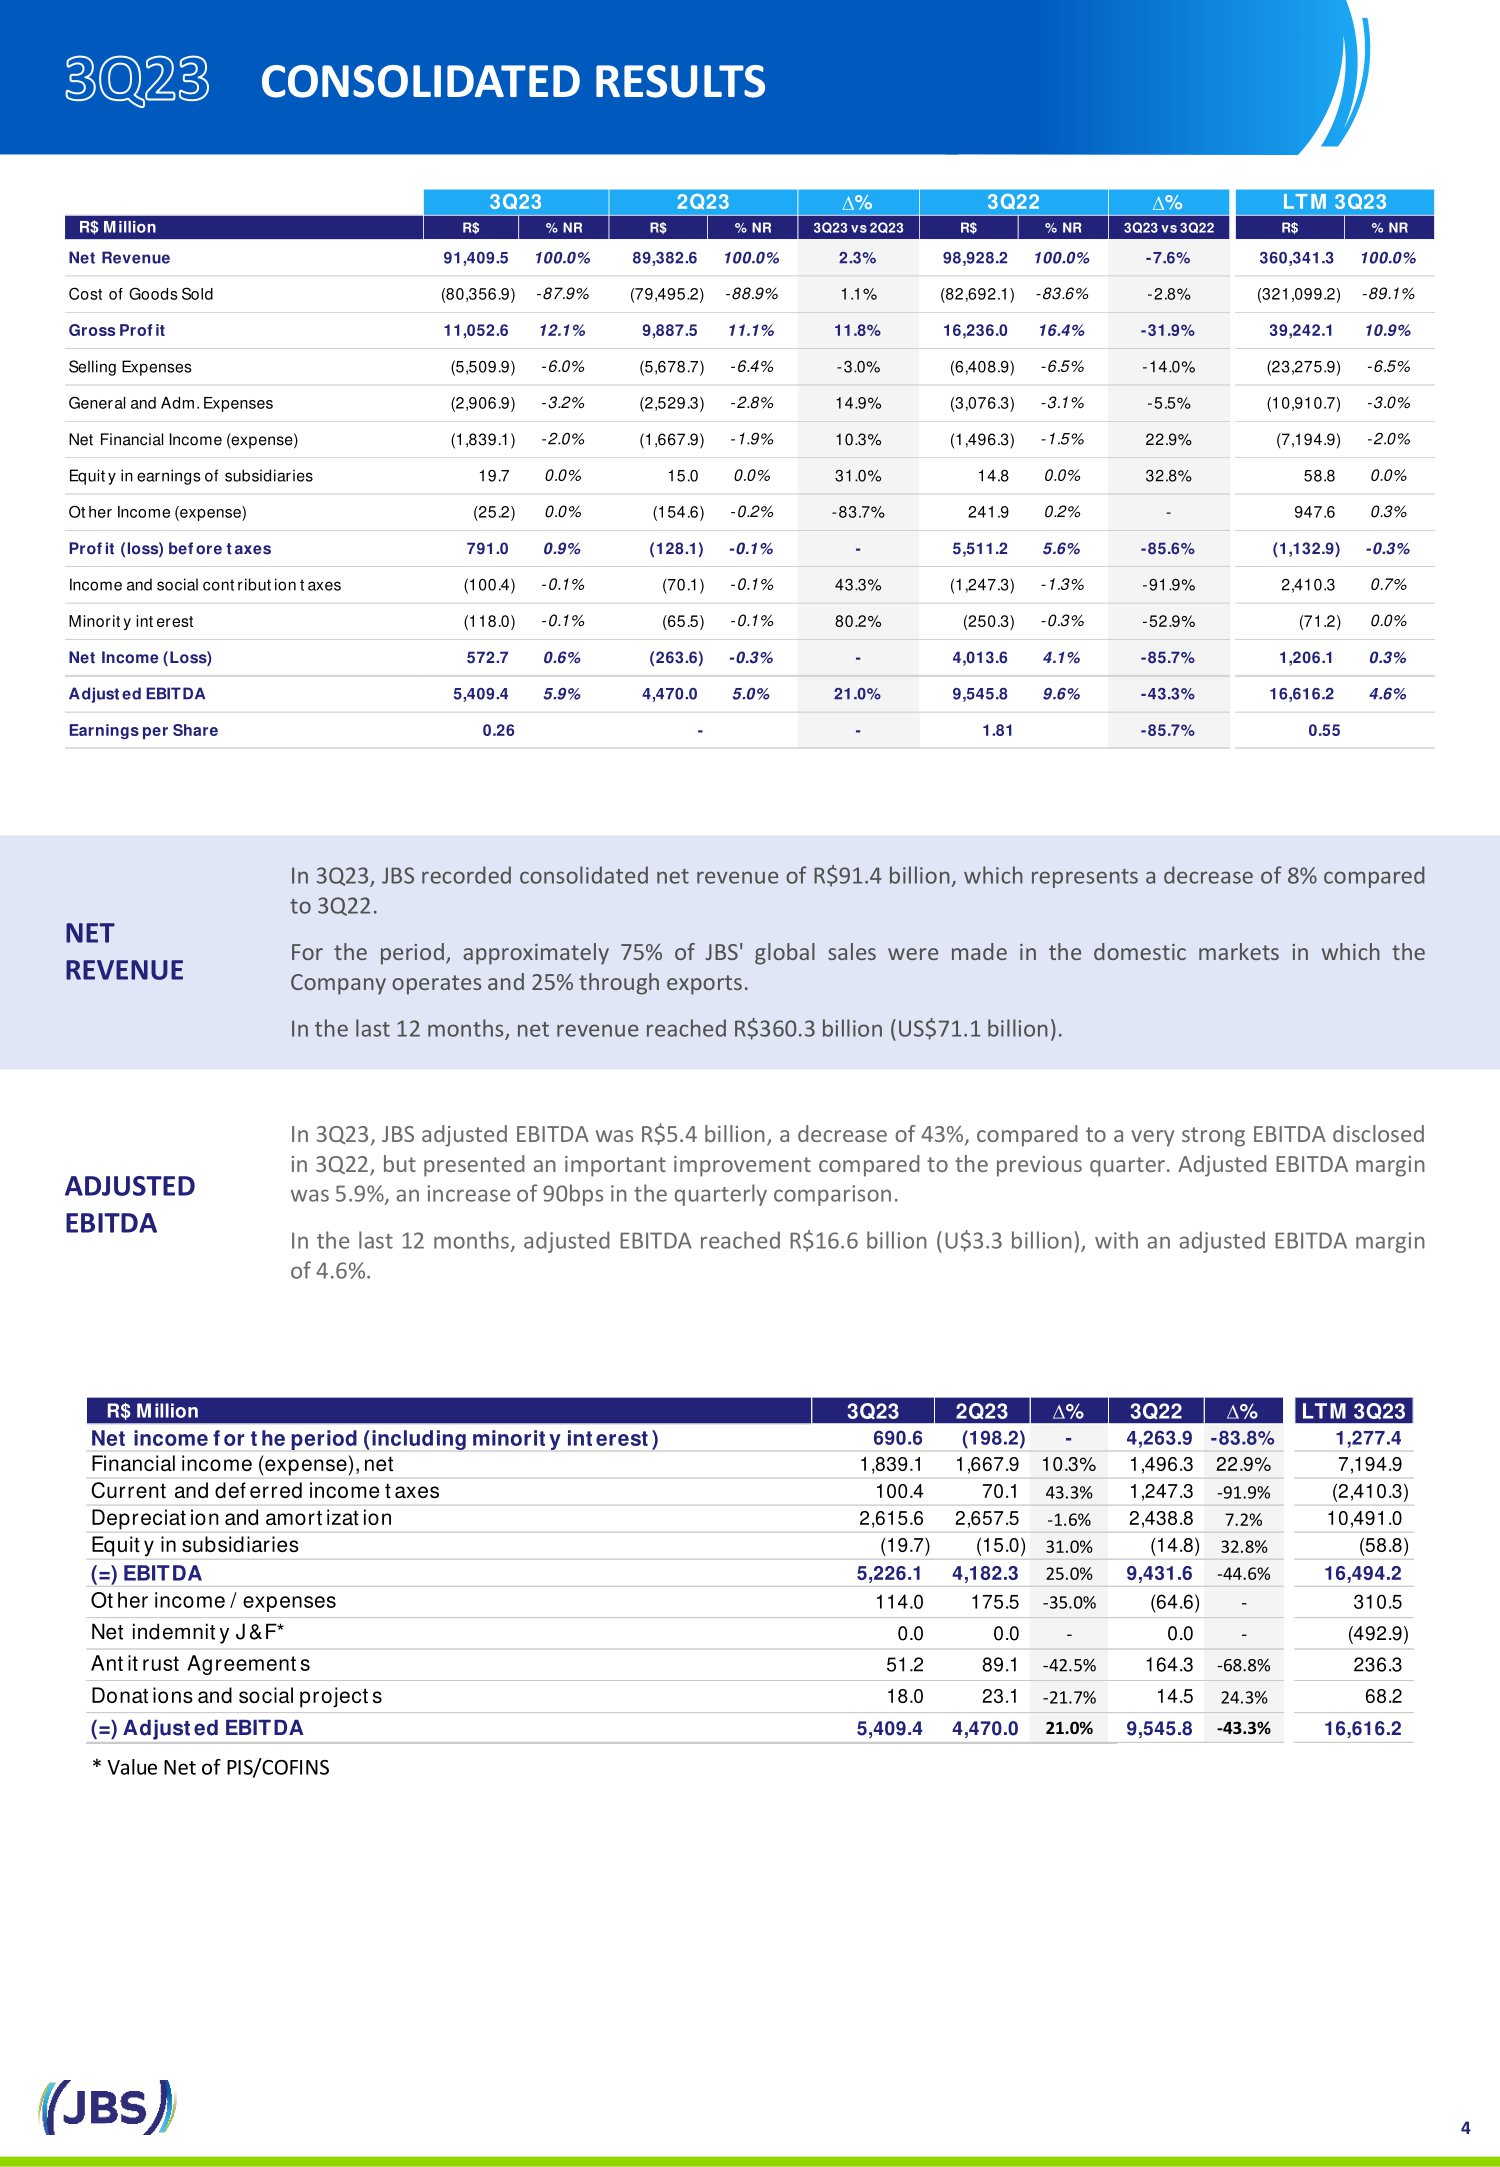
NET REVENUE ADJUSTED EBITDA In 3 Q 23 , JBS recorded consolidated net revenue of R $ 91 . 4 billion, which represents a decrease of 8 % compared to 3 Q 22 . For the period, approximately 75 % of JBS' global sales were made in the domestic markets in which the Company operates and 25 % through exports . In the last 12 months, net revenue reached R $ 360 . 3 billion (US $ 71 . 1 billion) . In 3 Q 23 , JBS adjusted EBITDA was R $ 5 . 4 billion, a decrease of 43 % , compared to a very strong EBITDA disclosed in 3 Q 22 , but presented an important improvement compared to the previous quarter . Adjusted EBITDA margin was 5 . 9 % , an increase of 90 bps in the quarterly comparison . In the last 12 months, adjusted EBITDA reached R $ 16 . 6 billion (U $ 3 . 3 billion), with an adjusted EBITDA margin of 4 . 6 % . CONSOLIDATED RESULTS 4 R$ Million 3Q23 2Q23 ∆% 3Q22 ∆% LTM 3Q23 Net income for the period (including minority interest) 690.6 (198.2) - 4,263.9 -83.8% 1,277.4 Financial income (expense), net 1,839.1 1,667.9 10.3% 1,496.3 22.9% 7,194.9 Current and deferred income taxes 100.4 70.1 43.3% 1,247.3 -91.9% (2,410.3) Depreciation and amortization 2,615.6 2,657.5 -1.6% 2,438.8 7.2% 10,491.0 Equity in subsidiaries (19.7) (15.0) 31.0% (14.8) 32.8% (58.8) (=) EBITDA 5,226.1 4,182.3 25.0% 9,431.6 -44.6% 16,494.2 Other income / expenses 114.0 175.5 -35.0% (64.6) - 310.5 Net indemnity J&F* 0.0 0.0 - 0.0 - (492.9) Antitrust Agreements 51.2 89.1 -42.5% 164.3 -68.8% 236.3 Donations and social projects 18.0 23.1 -21.7% 14.5 24.3% 68.2 (=) Adjusted EBITDA 5,409.4 4,470.0 21.0% 9,545.8 -43.3% 16,616.2 * Value Net of PIS/COFINS ∆ % ∆ % R$ Million R$ % NR R$ % NR 3Q23 vs 2Q23 R$ % NR 3Q23 vs 3Q22 R$ % NR Net Revenue 91,409.5 100.0% 89,382.6 100.0% 2.3% 98,928.2 100.0% -7.6% 360,341.3 100.0% Cost of Goods Sold (80,356.9) -87.9% (79,495.2) -88.9% 1.1% (82,692.1) -83.6% -2.8% (321,099.2) -89.1% Gross Profit 11,052.6 12.1% 9,887.5 11.1% 11.8% 16,236.0 16.4% -31.9% 39,242.1 10.9% Selling Expenses (5,509.9) -6.0% (5,678.7) -6.4% -3.0% (6,408.9) -6.5% -14.0% (23,275.9) -6.5% General and Adm. Expenses (2,906.9) -3.2% (2,529.3) -2.8% 14.9% (3,076.3) -3.1% -5.5% (10,910.7) -3.0% Net Financial Income (expense) (1,839.1) -2.0% (1,667.9) -1.9% 10.3% (1,496.3) -1.5% 22.9% (7,194.9) -2.0% Equity in earnings of subsidiaries 19.7 0.0% 15.0 0.0% 31.0% 14.8 0.0% 32.8% 58.8 0.0% Other Income (expense) (25.2) 0.0% (154.6) -0.2% -83.7% 241.9 0.2% - 947.6 0.3% Profit (loss) before taxes 791.0 0.9% (128.1) -0.1% - 5,511.2 5.6% -85.6% (1,132.9) -0.3% Income and social contribution taxes (100.4) -0.1% (70.1) -0.1% 43.3% (1,247.3) -1.3% -91.9% 2,410.3 0.7% Minority interest (118.0) -0.1% (65.5) -0.1% 80.2% (250.3) -0.3% -52.9% (71.2) 0.0% Net Income (Loss) 572.7 0.6% (263.6) -0.3% - 4,013.6 4.1% -85.7% 1,206.1 0.3% Adjusted EBITDA 5,409.4 5.9% 4,470.0 5.0% 21.0% 9,545.8 9.6% -43.3% 16,616.2 4.6% Earnings per Share 0.26 - - 1.81 -85.7% 0.55 3Q23 2Q23 3Q22 LTM 3Q23
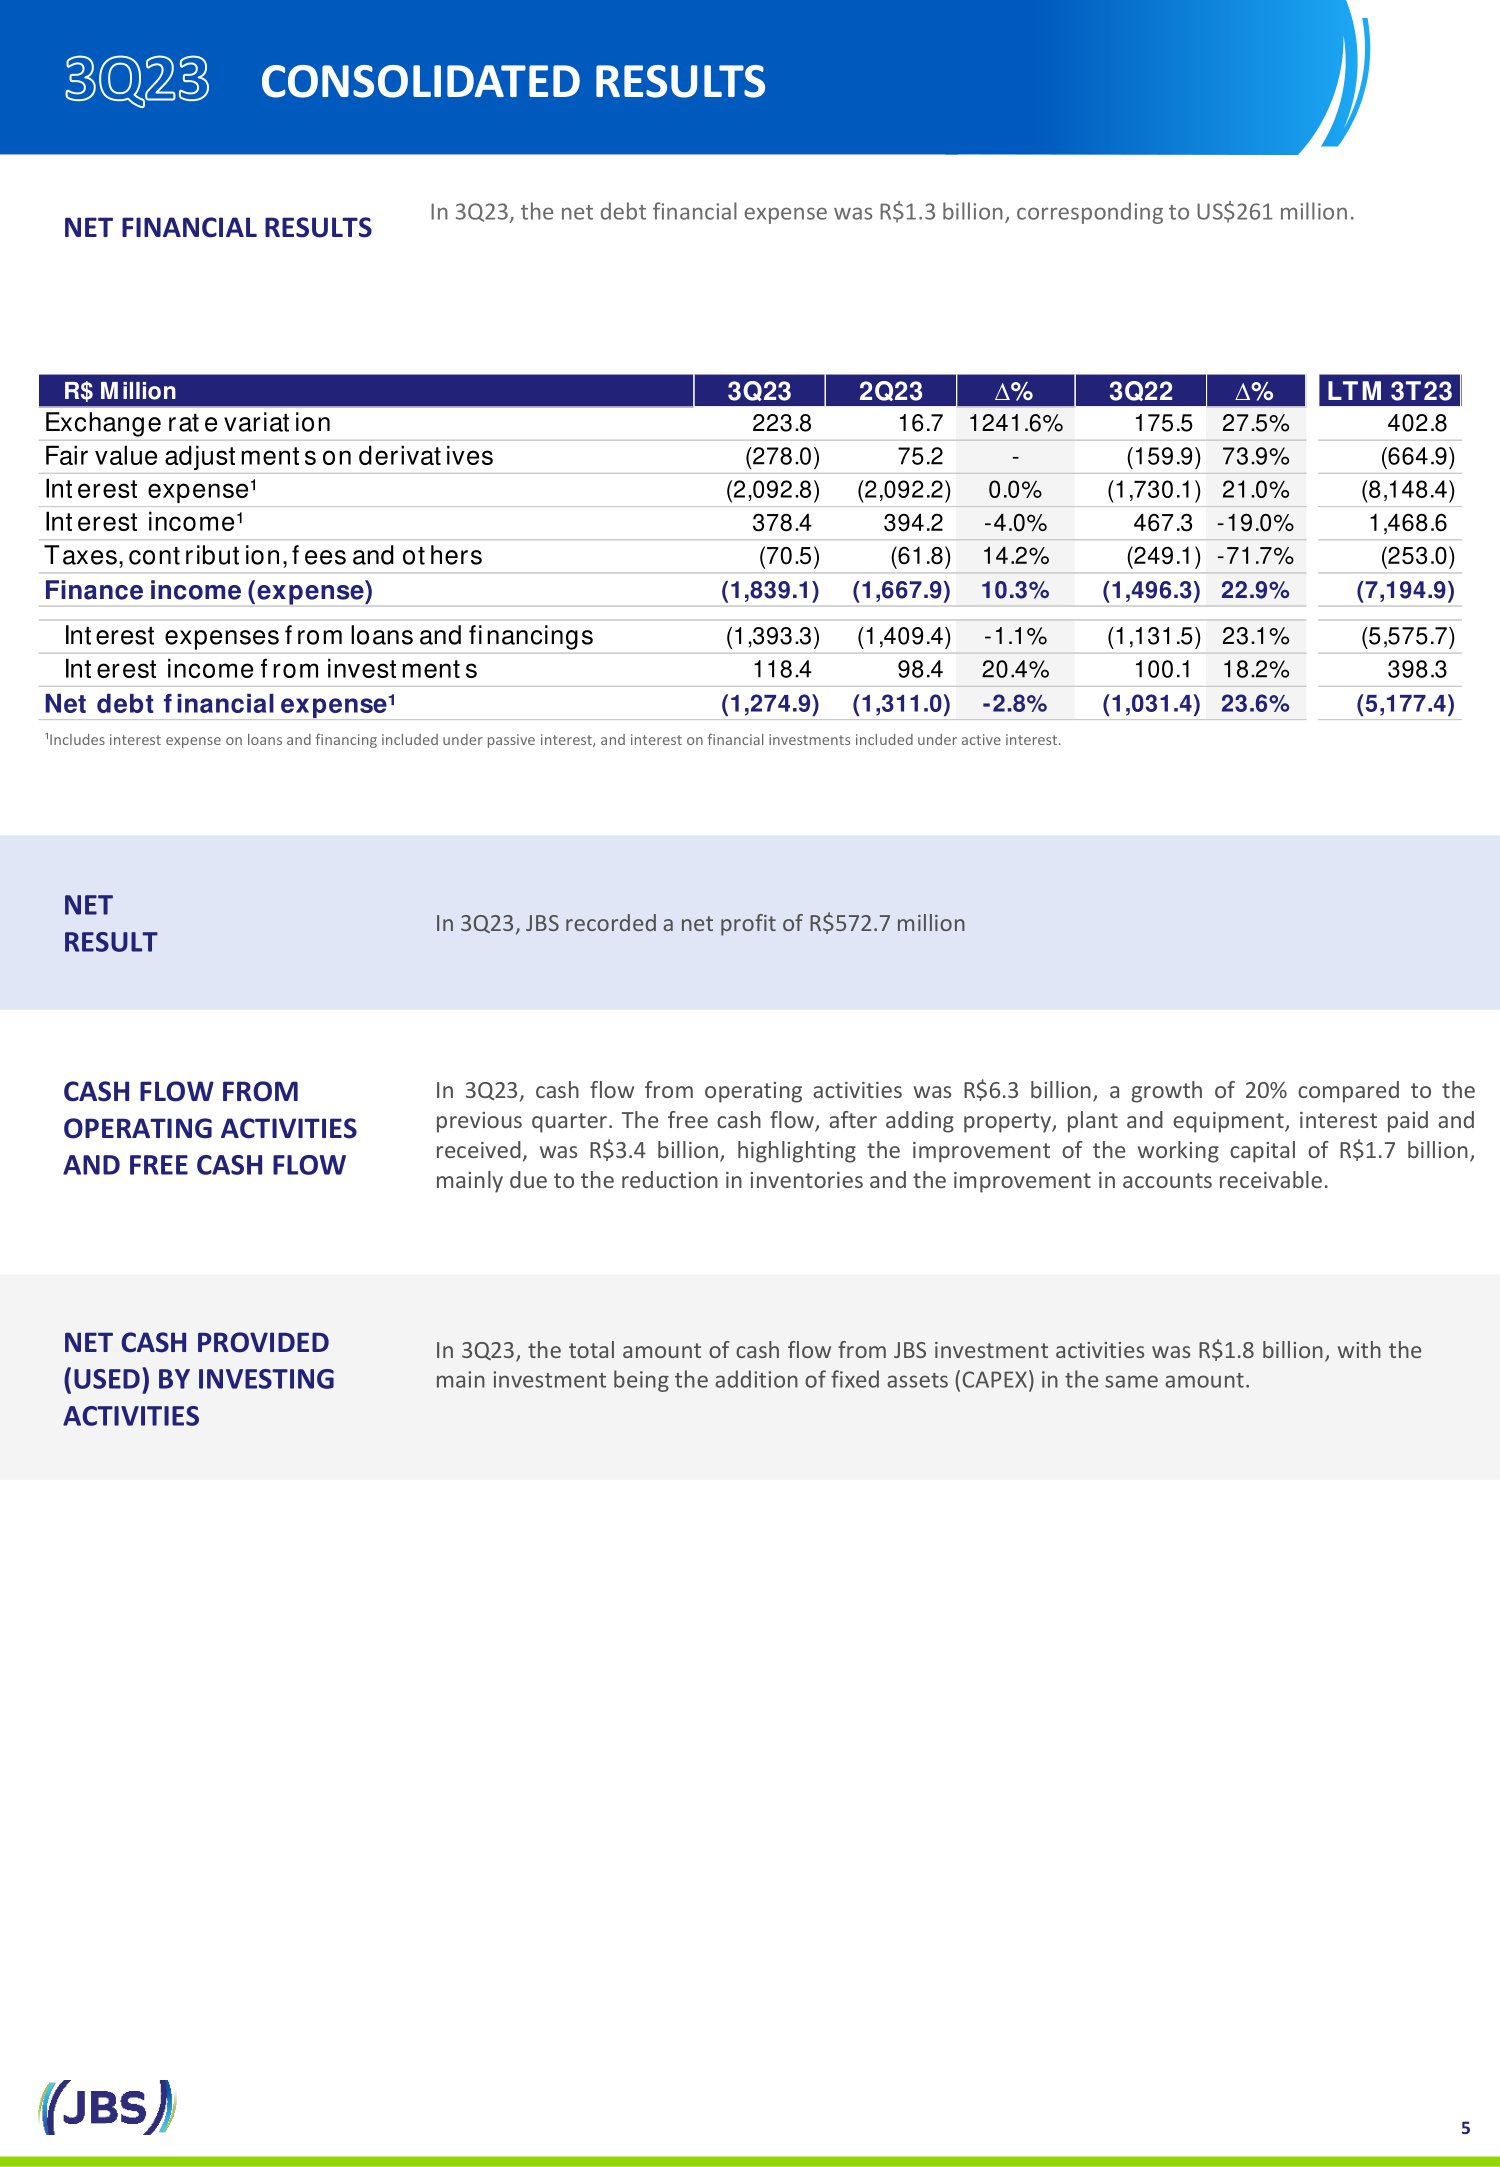
NET FINANCIAL RESULTS In 3 Q 23 , the net debt financial expense was R $ 1 . 3 billion, corresponding to US $ 261 million . NET RESULT In 3 Q 23 , JBS recorded a net profit of R $ 572 . 7 million CASH FLOW FROM OPERATING ACTIVITIES AND FREE CASH FLOW In 3 Q 23 , cash flow from operating activities was R $ 6 . 3 billion, a growth of 20 % compared to the previous quarter . The free cash flow, after adding property, plant and equipment, interest paid and received, was R $ 3 . 4 billion, highlighting the improvement of the working capital of R $ 1 . 7 billion, mainly due to the reduction in inventories and the improvement in accounts receivable . NET CASH PROVIDED (USED) BY INVESTING ACTIVITIES In 3 Q 23 , the total amount of cash flow from JBS investment activities was R $ 1 . 8 billion, with the main investment being the addition of fixed assets (CAPEX) in the same amount . 5 CONSOLIDATED RESULTS R$ Million 3Q23 2Q23 ∆% 3Q22 ∆% LTM 3T23 Exchange rate variation 223.8 16.7 1241.6% 175.5 27.5% 402.8 Fair value adjustments on derivatives (278.0) 75.2 - (159.9) 73.9% (664.9) Interest expense¹ (2,092.8) (2,092.2) 0.0% (1,730.1) 21.0% (8,148.4) Interest income¹ 378.4 394.2 -4.0% 467.3 -19.0% 1,468.6 Taxes, contribution, fees and others (70.5) (61.8) 14.2% (249.1) -71.7% (253.0) Finance income (expense) (1,839.1) (1,667.9) 10.3% (1,496.3) 22.9% (7,194.9) Interest expenses from loans and financings (1,393.3) (1,409.4) -1.1% (1,131.5) 23.1% (5,575.7) Interest income from investments 118.4 98.4 20.4% 100.1 18.2% 398.3 Net debt financial expense¹ (1,274.9) (1,311.0) -2.8% (1,031.4) 23.6% (5,177.4) ¹Includes interest expense on loans and financing included under passive interest, and interest on financial investments incl ude d under active interest.
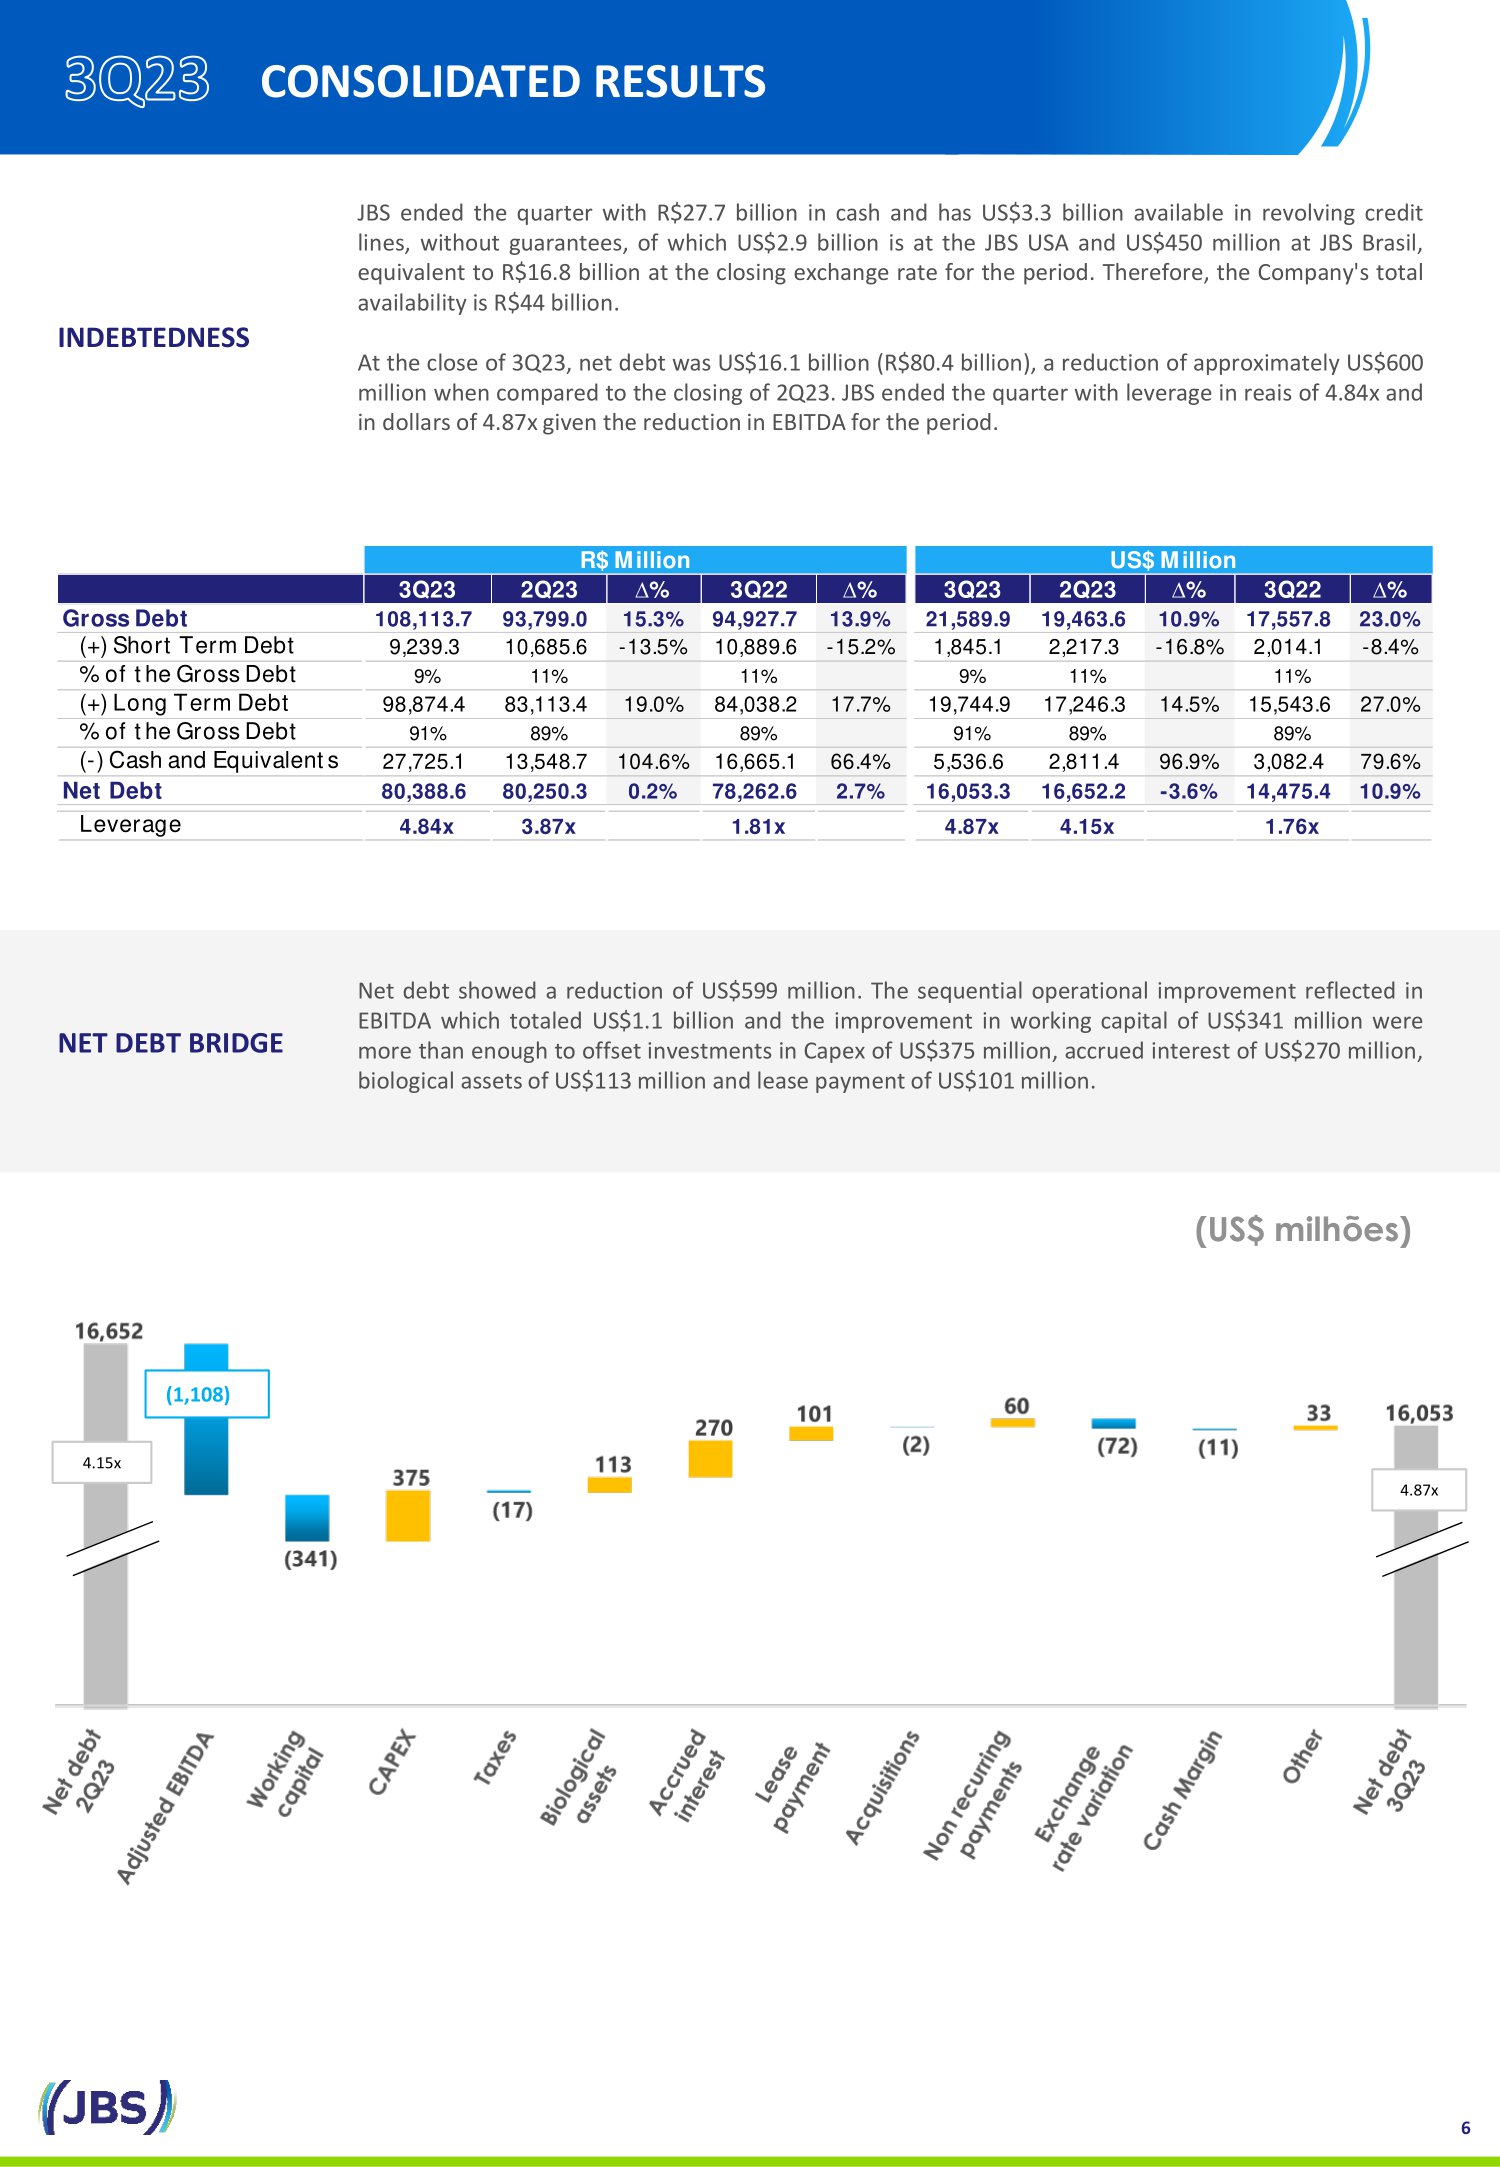
NET DEBT BRIDGE Net debt showed a reduction of US $ 599 million . The sequential operational improvement reflected in EBITDA which totaled US $ 1 . 1 billion and the improvement in working capital of US $ 341 million were more than enough to offset investments in Capex of US $ 375 million, accrued interest of US $ 270 million, biological assets of US $ 113 million and lease payment of US $ 101 million . (US$ milhões) 4.15x (1,108) 4.87x INDEBTEDNESS JBS ended the quarter with R $ 27 . 7 billion in cash and has US $ 3 . 3 billion available in revolving credit lines, without guarantees, of which US $ 2 . 9 billion is at the JBS USA and US $ 450 million at JBS Brasil, equivalent to R $ 16 . 8 billion at the closing exchange rate for the period . Therefore, the Company's total availability is R $ 44 billion . At the close of 3 Q 23 , net debt was US $ 16 . 1 billion (R $ 80 . 4 billion), a reduction of approximately US $ 600 million when compared to the closing of 2 Q 23 . JBS ended the quarter with leverage in reais of 4 . 84 x and in dollars of 4 . 87 x given the reduction in EBITDA for the period . 6 CONSOLIDATED RESULTS 3Q23 2Q23 ∆% 3Q22 ∆% 3Q23 2Q23 ∆% 3Q22 ∆% Gross Debt 108,113.7 93,799.0 15.3% 94,927.7 13.9% 21,589.9 19,463.6 10.9% 17,557.8 23.0% (+) Short Term Debt 9,239.3 10,685.6 -13.5% 10,889.6 -15.2% 1,845.1 2,217.3 -16.8% 2,014.1 -8.4% % of the Gross Debt 9% 11% 11% 9% 11% 11% (+) Long Term Debt 98,874.4 83,113.4 19.0% 84,038.2 17.7% 19,744.9 17,246.3 14.5% 15,543.6 27.0% % of the Gross Debt 91% 89% 89% 91% 89% 89% (-) Cash and Equivalents 27,725.1 13,548.7 104.6% 16,665.1 66.4% 5,536.6 2,811.4 96.9% 3,082.4 79.6% Net Debt 80,388.6 80,250.3 0.2% 78,262.6 2.7% 16,053.3 16,652.2 -3.6% 14,475.4 10.9% Leverage 4.84x 3.87x 1.81x 4.87x 4.15x 1.76x R$ Million US$ Million
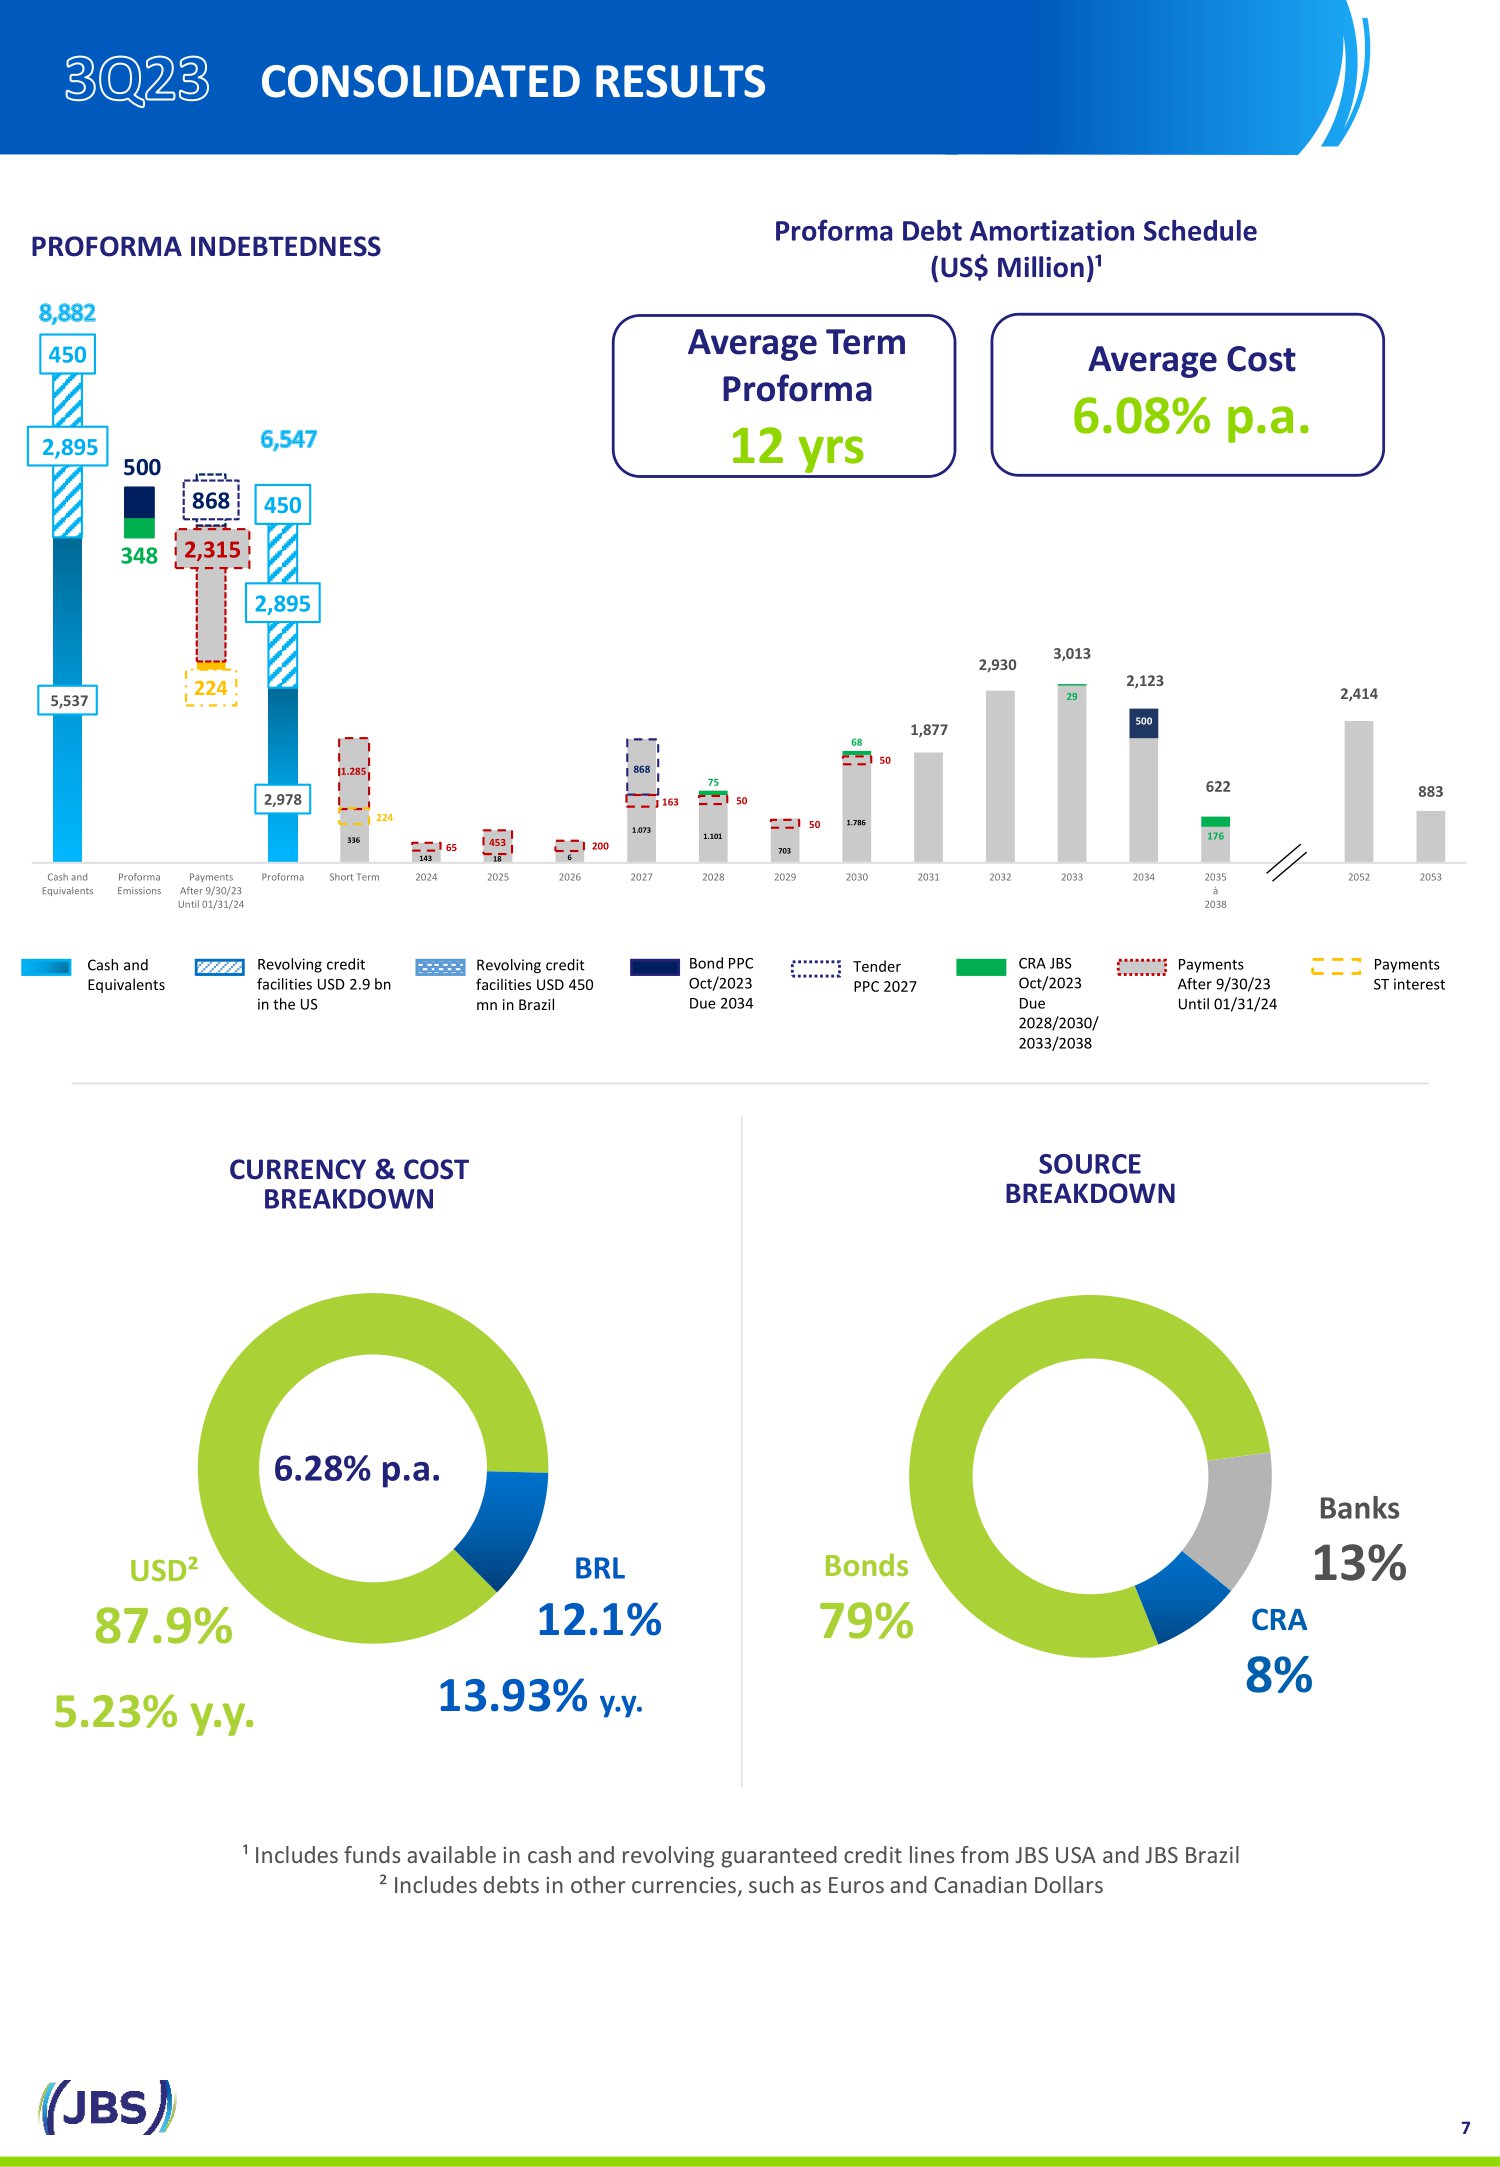
USD² 87.9% BRL 12.1% 13.93% y.y . 5.23% y.y . Bonds 79% Banks 13% CRA 8% SOURCE BREAKDOWN CURRENCY & COST BREAKDOWN ¹ Includes funds available in cash and revolving guaranteed credit lines from JBS USA and JBS Brazil ² Includes debts in other currencies, such as Euros and Canadian Dollars 6.28% p.a. 7 CONSOLIDATED RESULTS Proforma Debt Amortization Schedule (US$ Million)¹ PROFORMA INDEBTEDNESS 5,537 2,978 1,877 2,930 3,013 2,123 622 2,414 883 224 75 68 29 176 2,895 348 2,315 2,895 450 500 868 450 500 Cash and Equivalents Proforma Emissions Payments After 9/30/23 Until 01/31/24 Proforma Short Term 2024 2025 2026 2027 2028 2029 2030 2031 2032 2033 2034 2035 à 2038 2039 à 2051 2052 2053 Cash and Equivalents Revolving credit facilities USD 2.9 bn in the US Revolving credit facilities USD 450 mn in Brazil Average Term Proforma 12 yrs Average Cost 6.08% p.a . 1.285 CRA JBS Oct /2023 Due 2028/2030/ 2033/2038 Payments After 9/30/23 Until 01/31/24 65 453 200 Bond PPC Oct /2023 Due 2034 1.073 868 Tender PPC 2027 336 143 18 6 163 50 1.101 50 703 50 1.786 224 Payments ST interest
BUSINESS UNITS – IFRS R$ BUSINESS UNITS – USGAAP US$ BUSINESS UNITS 8 Million 3Q23 2Q23 ∆% 3Q22 ∆% LTM 3Q23 Net Revenue Seara R$ 10,207.8 10,310.4 -1.0% 11,767.6 -13.3% 41,880.1 JBS Brazil R$ 14,441.1 13,986.2 3.3% 16,240.2 -11.1% 54,898.3 JBS Beef North America R$ 29,054.2 28,770.2 1.0% 29,155.8 -0.3% 113,844.6 JBS Australia R$ 7,687.9 7,471.4 2.9% 8,736.4 -12.0% 30,640.7 JBS USA Pork R$ 9,890.5 8,798.0 12.4% 11,154.8 -11.3% 38,676.6 Pilgrim's Pride R$ 21,261.4 21,314.7 -0.3% 23,441.1 -9.3% 85,872.0 Others R$ 686.7 1,272.2 -46.0% 1,191.2 -42.4% 4,223.3 Eliminations R$ -1,820.1 -2,540.5 -28.4% -2,758.9 -34.0% -9,694.3 Total R$ 91,409.5 89,382.6 2.3% 98,928.2 -7.6% 360,341.3 Adjusted EBITDA Seara R$ 566.4 419.9 34.9% 1,780.3 -68.2% 1,837.2 JBS Brazil R$ 484.4 675.7 -28.3% 825.7 -41.3% 1,796.5 JBS Beef North America R$ 502.7 433.5 16.0% 2,525.4 -80.1% 2,079.1 JBS Australia R$ 664.6 710.4 -6.4% 493.4 34.7% 1,988.5 JBS USA Pork R$ 1,020.9 386.3 164.2% 999.2 2.2% 2,649.1 Pilgrim's Pride R$ 2,195.0 1,858.5 18.1% 2,955.1 -25.7% 6,341.9 Others R$ -21.7 -11.3 91.7% -30.5 -29.0% -64.1 Eliminations R$ -3.0 -3.0 0.0% -2.7 9.9% -12.0 Total R$ 5,409.4 4,470.0 21.0% 9,545.8 -43.3% 16,616.2 Adjusted EBITDA Margin Seara % 5.5% 4.1% 1.5 p.p. 15.1% -9.6 p.p. 4.4% JBS Brazil % 3.4% 4.8% -1.5 p.p. 5.1% -1.7 p.p. 3.3% JBS Beef North America % 1.7% 1.5% 0.2 p.p. 8.7% -6.9 p.p. 1.8% JBS Australia % 8.6% 9.5% -0.9 p.p. 5.6% 3.0 p.p. 6.5% JBS USA Pork % 10.3% 4.4% 5.9 p.p. 9.0% 1.4 p.p. 6.8% Pilgrim's Pride % 10.3% 8.7% 1.6 p.p. 12.6% -2.3 p.p. 7.4% Others % -3.2% -0.9% -2.3 p.p. -2.6% -0.6 p.p. -1.5% Total % 5.9% 5.0% 0.9 p.p. 9.6% -3.7 p.p. 4.6% Million 3Q23 2Q23 ∆% 3Q22 ∆% LTM 3Q23 Net Revenue JBS Beef North America US$ 5,953.2 5,810.5 2.5% 5,554.1 7.2% 22,483.7 JBS Australia US$ 1,575.2 1,509.0 4.4% 1,664.3 -5.4% 6,046.0 JBS USA Pork US$ 2,026.6 1,776.9 14.1% 2,125.0 -4.6% 7,627.4 Pilgrim's Pride US$ 4,360.2 4,308.1 1.2% 4,469.0 -2.4% 16,961.3 Adjusted EBITDA JBS Beef North America US$ 93.2 83.4 11.8% 403.1 -76.9% 266.2 JBS Australia US$ 103.6 129.5 -20.0% 59.4 74.3% 330.0 JBS USA Pork US$ 190.3 27.0 604.8% 92.7 105.3% 380.2 Pilgrim's Pride US$ 324.0 248.7 30.3% 460.5 -29.6% 787.5 Adjusted EBITDA Margin JBS Beef North America % 1.6% 1.4% 0.1 p.p. 7.3% -5.7 p.p. 1.2% JBS Australia % 6.6% 8.6% -2.0 p.p. 3.6% 3.0 p.p. 5.5% JBS USA Pork % 9.4% 1.5% 7.9 p.p. 4.4% 5.0 p.p. 5.0% Pilgrim's Pride % 7.4% 5.8% 1.7 p.p. 10.3% -2.9 p.p. 4.6%
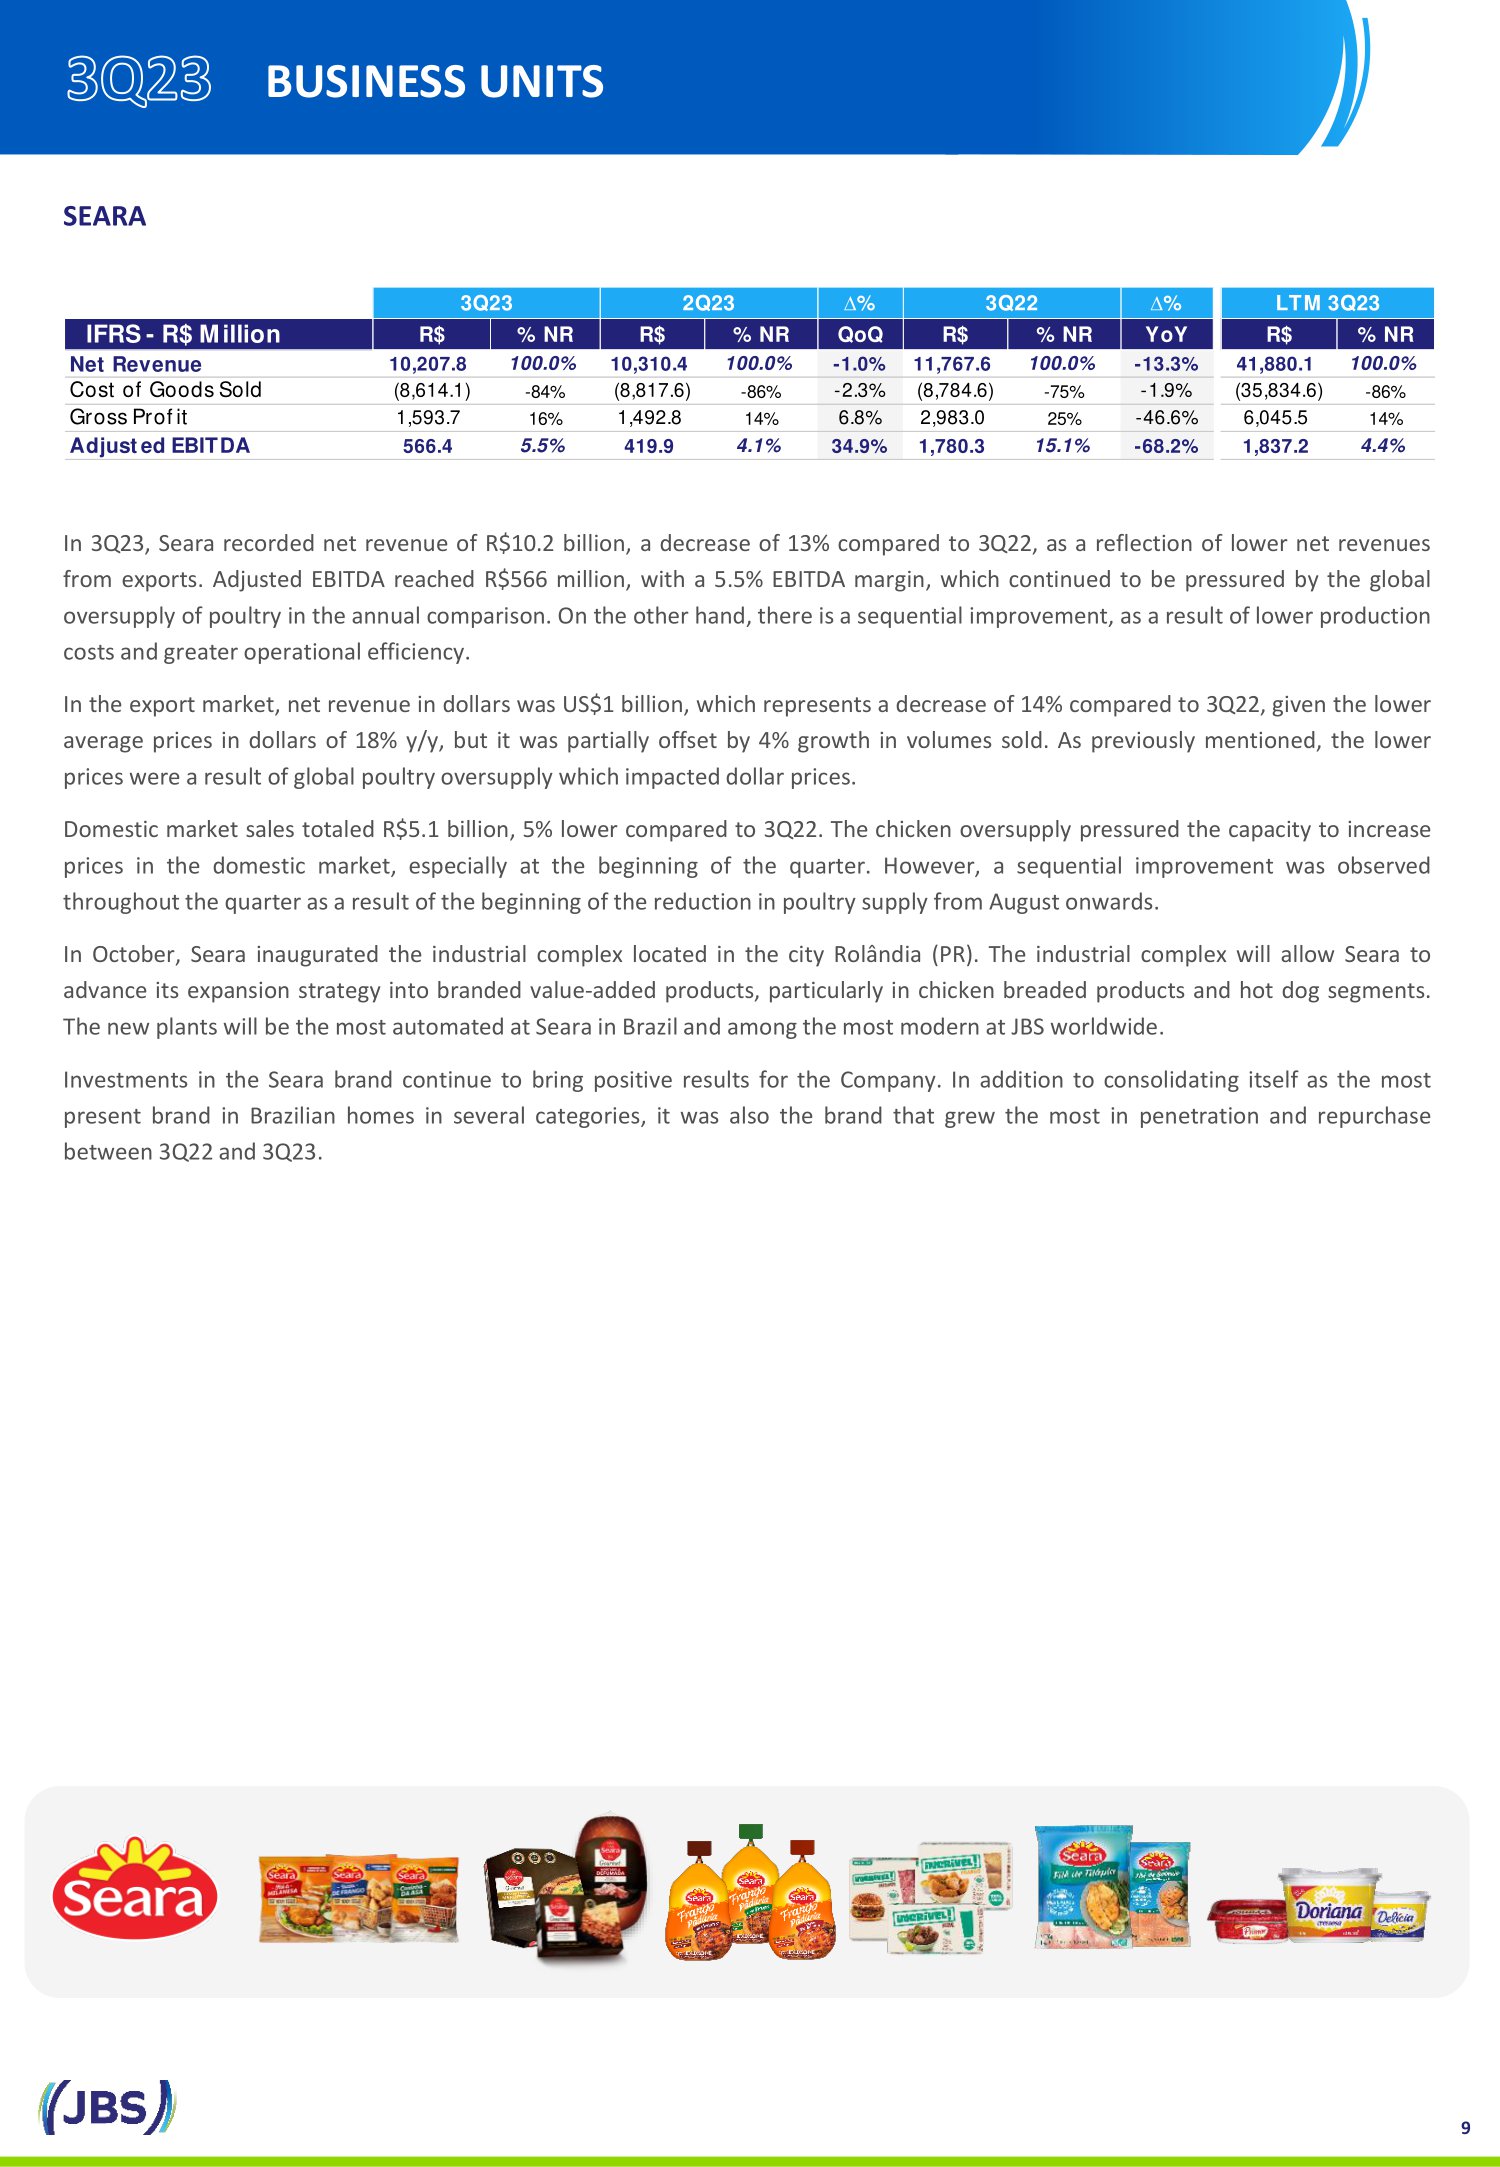
In 3 Q 23 , Seara recorded net revenue of R $ 10 . 2 billion, a decrease of 13 % compared to 3 Q 22 , as a reflection of lower net revenues from exports . Adjusted EBITDA reached R $ 566 million, with a 5 . 5 % EBITDA margin, which continued to be pressured by the global oversupply of poultry in the annual comparison . On the other hand, there is a sequential improvement, as a result of lower production costs and greater operational efficiency . In the export market, net revenue in dollars was US $ 1 billion, which represents a decrease of 14 % compared to 3 Q 22 , given the lower average prices in dollars of 18 % y/y, but it was partially offset by 4 % growth in volumes sold . As previously mentioned, the lower prices were a result of global poultry oversupply which impacted dollar prices . Domestic market sales totaled R $ 5 . 1 billion, 5 % lower compared to 3 Q 22 . The chicken oversupply pressured the capacity to increase prices in the domestic market, especially at the beginning of the quarter . However, a sequential improvement was observed throughout the quarter as a result of the beginning of the reduction in poultry supply from August onwards . In October, Seara inaugurated the industrial complex located in the city Rolândia (PR) . The industrial complex will allow Seara to advance its expansion strategy into branded value - added products, particularly in chicken breaded products and hot dog segments . The new plants will be the most automated at Seara in Brazil and among the most modern at JBS worldwide . Investments in the Seara brand continue to bring positive results for the Company . In addition to consolidating itself as the most present brand in Brazilian homes in several categories, it was also the brand that grew the most in penetration and repurchase between 3 Q 22 and 3 Q 23 . SEARA 9 BUSINESS UNITS IFRS - R$ Million ∆% ∆% IFRS - R$ Million R$ % NR R$ % NR QoQ R$ % NR YoY R$ % NR Net Revenue 10,207.8 100.0% 10,310.4 100.0% -1.0% 11,767.6 100.0% -13.3% 41,880.1 100.0% Cost of Goods Sold (8,614.1) -84% (8,817.6) -86% -2.3% (8,784.6) -75% -1.9% (35,834.6) -86% Gross Profit 1,593.7 16% 1,492.8 14% 6.8% 2,983.0 25% -46.6% 6,045.5 14% Adjusted EBITDA 566.4 5.5% 419.9 4.1% 34.9% 1,780.3 15.1% -68.2% 1,837.2 4.4% LTM 3Q233Q23 2Q23 3Q22

Note : On March 1 , 2020 , through a corporate restructuring process, Swift stores were transferred to the direct subsidiary Seara Alimentos . Although the Swift stores are part of the corporate structure of Seara Alimentos, for the purposes of analysis and presentation of results, the Company's Management decided to allocate Swift's results to the JBS Brasil operating segment . In 3 Q 23 , JBS Brasil recorded net revenue of R $ 14 . 4 billion, 11 % lower compared to the previous year, but with a 3 % growth in the quarterly comparison . In the export market, net revenue in dollars from in natura beef decreased by 10 % when compared to 3 Q 22 , as a result of lower beef export prices, mainly to China . Therefore, according to the Brazil’s Foreign Trade Bureau ( Secex ), prices went from approximately US $ 6 , 200 per ton in 3 Q 22 to US $ 4 , 600 per ton in 3 Q 23 . In the domestic market, revenue in the in natura beef category grew 3 % year - on - year, impacted by the sales volume increase . This growth is attributed to the greater availability of animals for processing, higher demand driven by falling retail prices, and the continued focus on commercial execution . EBITDA totaled R $ 484 million, with an EBITDA margin of 3 . 4 % in 3 Q 23 . According to data published by CEPEA - ESALQ, the live cattle price in the quarter was around R $ 227 /arroba, lower 27 % compared to the same period of the previous year . Hence, despite better cost, profitability was pressured by the worsening in export prices, as mentioned previously . In a survey carried out by the Datafolha Institute in thousands of Brazilian homes, the Friboi brand was once again Top of Mind, that is, the most remembered and preferred brand by the Brazilian consumer . Friboi wins the meat category for the fourth time and consolidates itself as the absolute leader . JBS BRASIL 10 BUSINESS UNITS IFRS - R$ Million ∆% ∆% IFRS - R$ Million R$ % NR R$ % NR QoQ R$ % NR YoY R$ % NR Net Revenue 14,441.1 100.0% 13,986.2 100.0% 3.3% 16,240.2 100.0% -11.1% 54,898.3 100.0% Cost of Goods Sold (12,240.6) -85% (11,852.9) -85% 3.3% (13,550.5) -83% -9.7% (47,043.8) -86% Gross Profit 2,200.6 15% 2,133.3 15% 3.2% 2,689.6 17% -18.2% 7,854.5 14% Adjusted EBITDA 484.4 3.4% 675.7 4.8% -28.3% 825.7 5.1% -41.3% 1,796.5 3.3% 3Q23 LTM 3Q232Q23 3Q22
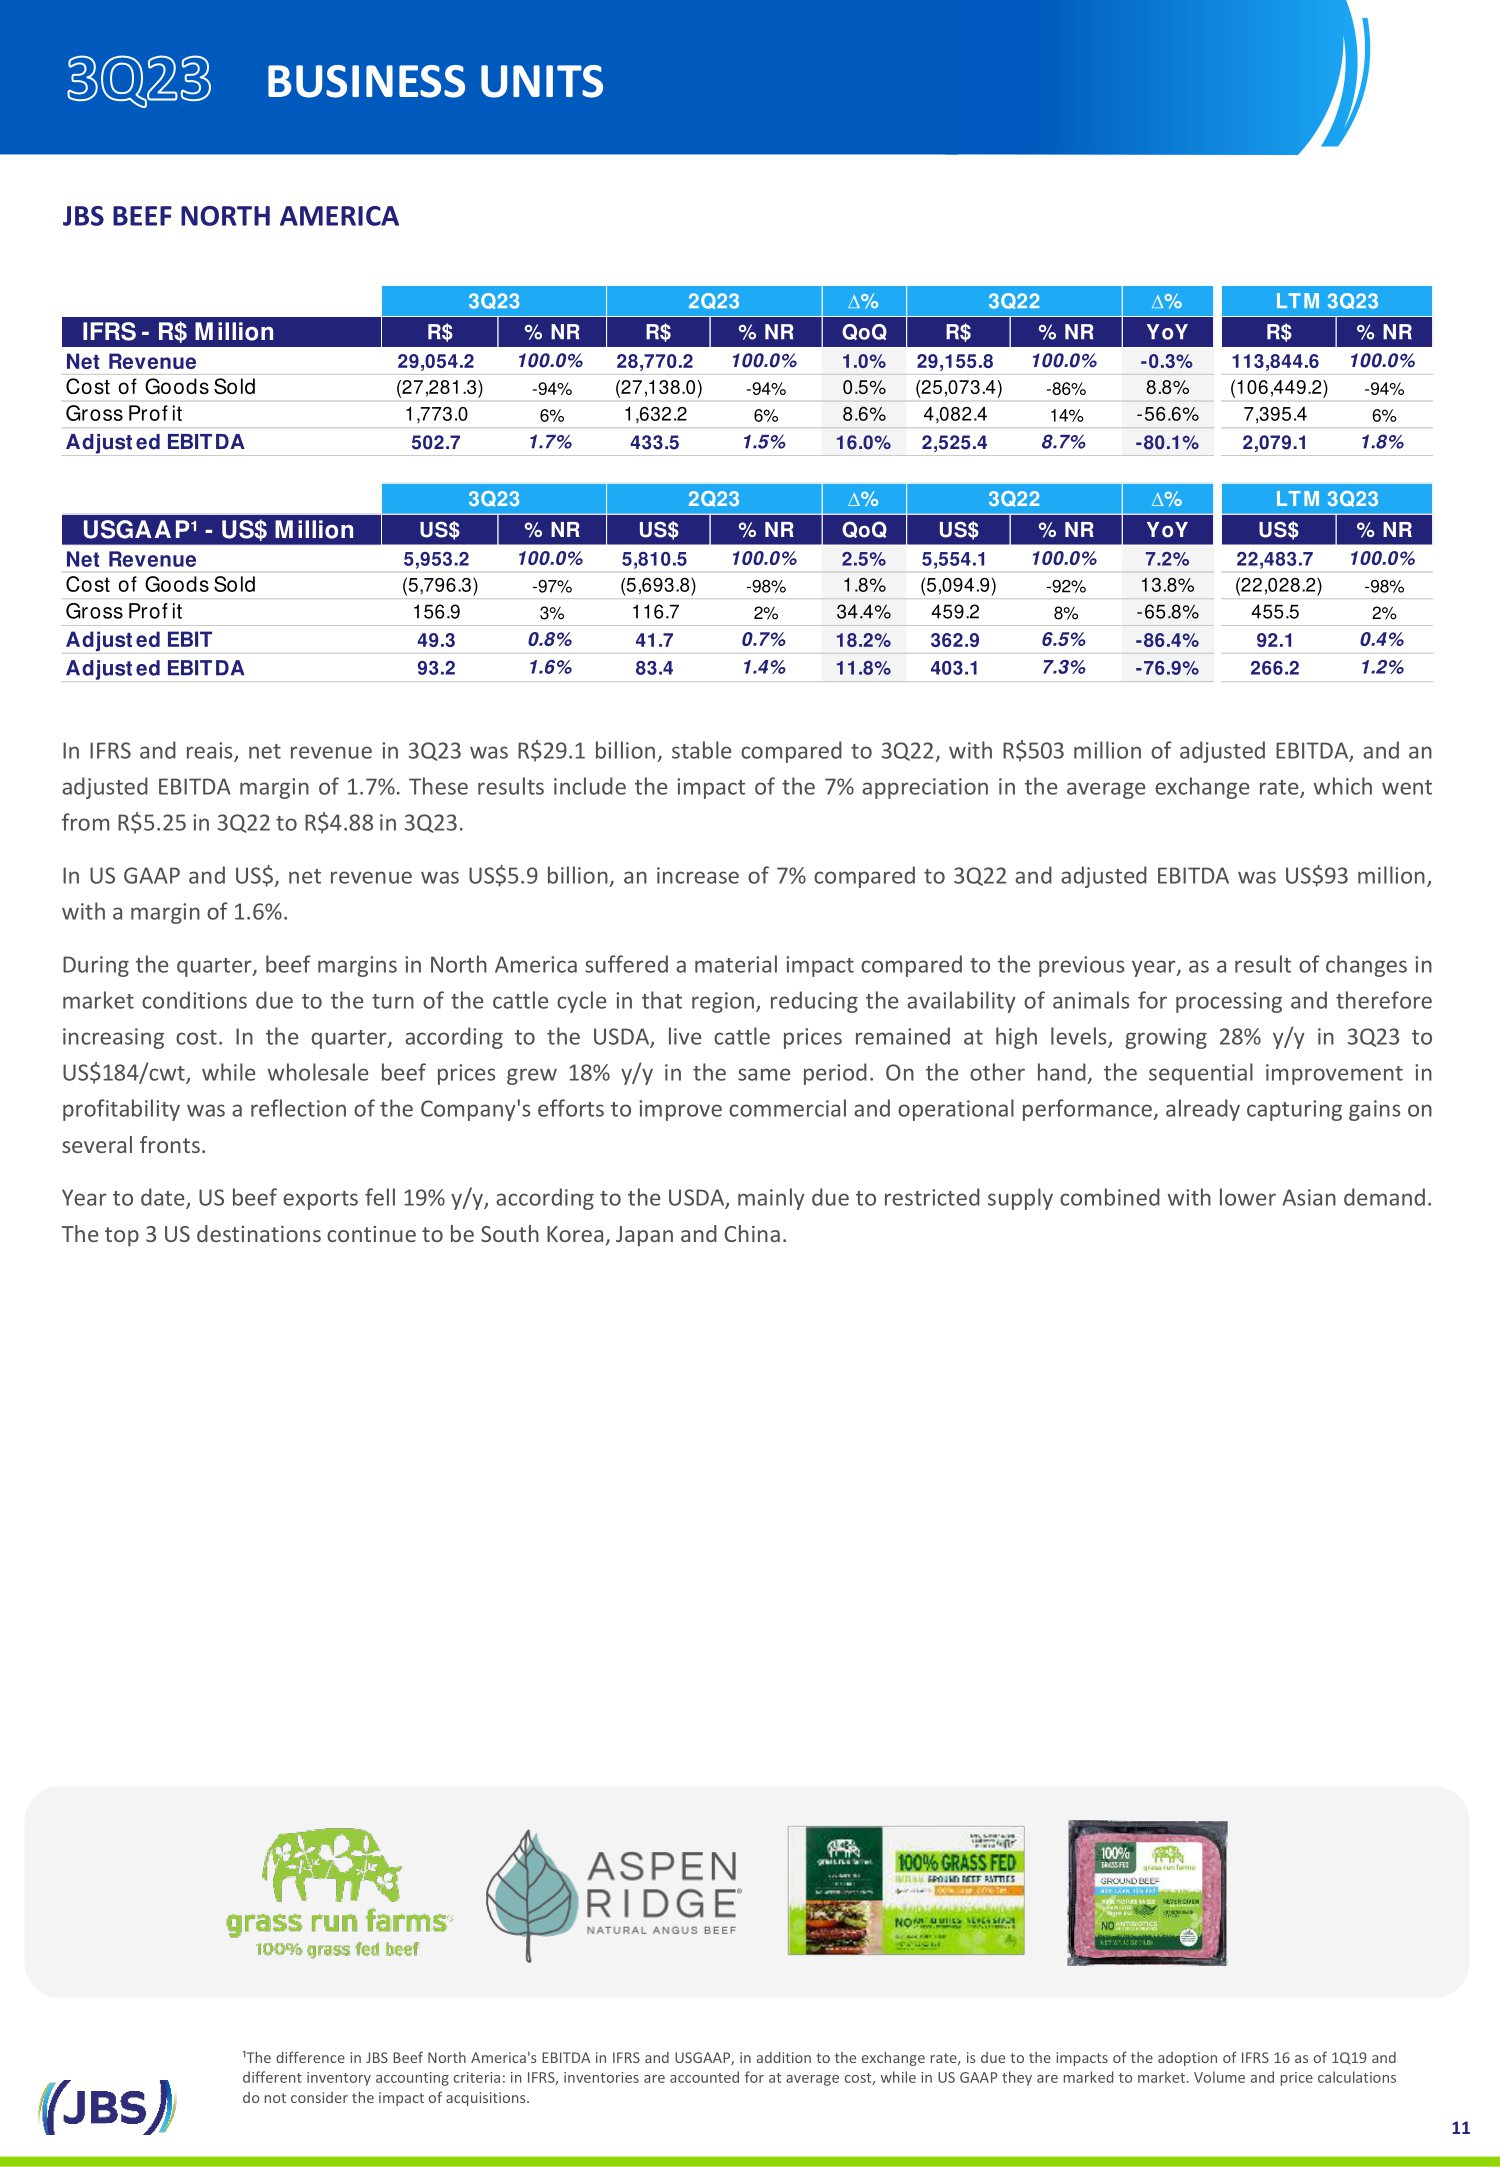
JBS BEEF NORTH AMERICA In IFRS and reais , net revenue in 3 Q 23 was R $ 29 . 1 billion, stable compared to 3 Q 22 , with R $ 503 million of adjusted EBITDA, and an adjusted EBITDA margin of 1 . 7 % . These results include the impact of the 7 % appreciation in the average exchange rate, which went from R $ 5 . 25 in 3 Q 22 to R $ 4 . 88 in 3 Q 23 . In US GAAP and US $ , net revenue was US $ 5 . 9 billion, an increase of 7 % compared to 3 Q 22 and adjusted EBITDA was US $ 93 million, with a margin of 1 . 6 % . During the quarter, beef margins in North America suffered a material impact compared to the previous year, as a result of changes in market conditions due to the turn of the cattle cycle in that region, reducing the availability of animals for processing and therefore increasing cost . In the quarter, according to the USDA, live cattle prices remained at high levels, growing 28 % y/y in 3 Q 23 to US $ 184 /cwt, while wholesale beef prices grew 18 % y/y in the same period . On the other hand, the sequential improvement in profitability was a reflection of the Company's efforts to improve commercial and operational performance, already capturing gains on several fronts . Year to date, US beef exports fell 19 % y/y, according to the USDA, mainly due to restricted supply combined with lower Asian demand . The top 3 US destinations continue to be South Korea, Japan and China . ¹The difference in JBS Beef North America's EBITDA in IFRS and USGAAP, in addition to the exchange rate, is due to the impacts of the adoption of IFRS 16 as of 1 Q 19 and different inventory accounting criteria : in IFRS, inventories are accounted for at average cost, while in US GAAP they are marked to market . Volume and price calculations do not consider the impact of acquisitions . 11 BUSINESS UNITS IFRS - R$ Million ∆% ∆% IFRS - R$ Million R$ % NR R$ % NR QoQ R$ % NR YoY R$ % NR Net Revenue 29,054.2 100.0% 28,770.2 100.0% 1.0% 29,155.8 100.0% -0.3% 113,844.6 100.0% Cost of Goods Sold (27,281.3) -94% (27,138.0) -94% 0.5% (25,073.4) -86% 8.8% (106,449.2) -94% Gross Profit 1,773.0 6% 1,632.2 6% 8.6% 4,082.4 14% -56.6% 7,395.4 6% Adjusted EBITDA 502.7 1.7% 433.5 1.5% 16.0% 2,525.4 8.7% -80.1% 2,079.1 1.8% USGAAP¹ - US$ Million ∆% ∆% USGAAP¹ - US$ Million US$ % NR US$ % NR QoQ US$ % NR YoY US$ % NR Net Revenue 5,953.2 100.0% 5,810.5 100.0% 2.5% 5,554.1 100.0% 7.2% 22,483.7 100.0% Cost of Goods Sold (5,796.3) -97% (5,693.8) -98% 1.8% (5,094.9) -92% 13.8% (22,028.2) -98% Gross Profit 156.9 3% 116.7 2% 34.4% 459.2 8% -65.8% 455.5 2% Adjusted EBIT 49.3 0.8% 41.7 0.7% 18.2% 362.9 6.5% -86.4% 92.1 0.4% Adjusted EBITDA 93.2 1.6% 83.4 1.4% 11.8% 403.1 7.3% -76.9% 266.2 1.2% 3Q23 2Q23 3Q22 LTM 3Q23 3Q23 2Q23 3Q22 LTM 3Q23
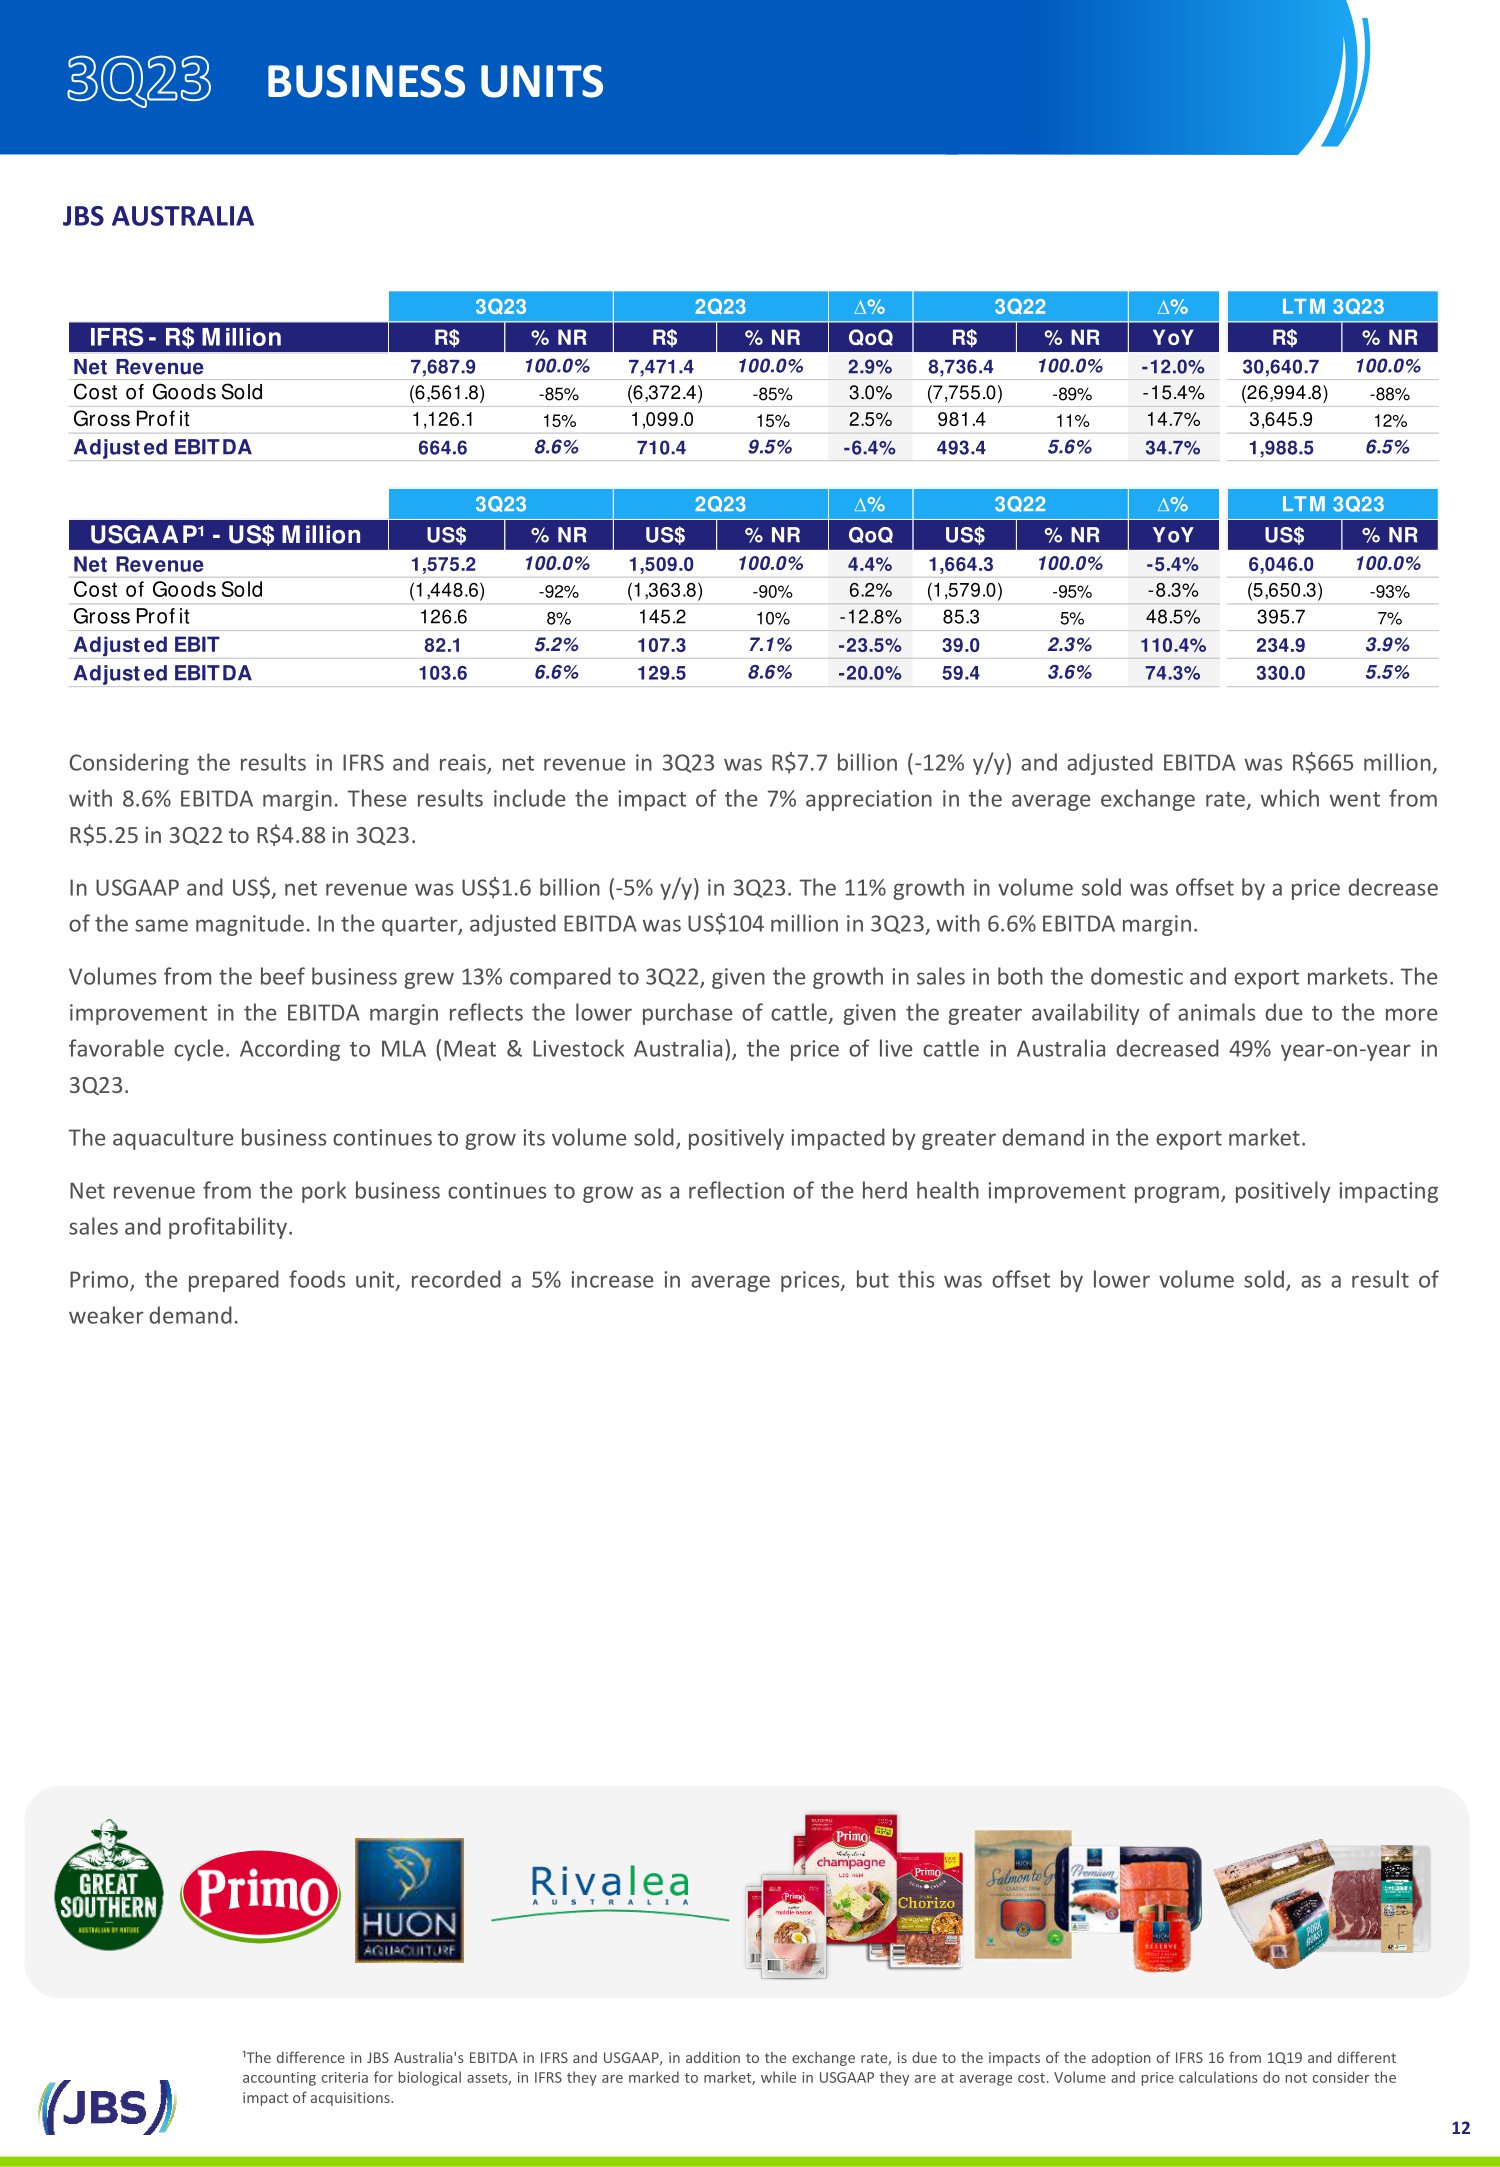
JBS AUSTRALIA Considering the results in IFRS and reais , net revenue in 3 Q 23 was R $ 7 . 7 billion ( - 12 % y/y) and adjusted EBITDA was R $ 665 million, with 8 . 6 % EBITDA margin . These results include the impact of the 7 % appreciation in the average exchange rate, which went from R $ 5 . 25 in 3 Q 22 to R $ 4 . 88 in 3 Q 23 . In USGAAP and US $ , net revenue was US $ 1 . 6 billion ( - 5 % y/y) in 3 Q 23 . The 11 % growth in volume sold was offset by a price decrease of the same magnitude . In the quarter, adjusted EBITDA was US $ 104 million in 3 Q 23 , with 6 . 6 % EBITDA margin . Volumes from the beef business grew 13 % compared to 3 Q 22 , given the growth in sales in both the domestic and export markets . The improvement in the EBITDA margin reflects the lower purchase of cattle, given the greater availability of animals due to the more favorable cycle . According to MLA (Meat & Livestock Australia), the price of live cattle in Australia decreased 49 % year - on - year in 3 Q 23 . The aquaculture business continues to grow its volume sold, positively impacted by greater demand in the export market . Net revenue from the pork business continues to grow as a reflection of the herd health improvement program, positively impacting sales and profitability . Primo, the prepared foods unit, recorded a 5 % increase in average prices, but this was offset by lower volume sold, as a result of weaker demand . ¹The difference in JBS Australia's EBITDA in IFRS and USGAAP, in addition to the exchange rate, is due to the impacts of the adoption of IFRS 16 from 1 Q 19 and different accounting criteria for biological assets, in IFRS they are marked to market, while in USGAAP they are at average cost . Volume and price calculations do not consider the impact of acquisitions . 12 BUSINESS UNITS IFRS - R$ Million ∆% ∆% IFRS - R$ Million R$ % NR R$ % NR QoQ R$ % NR YoY R$ % NR Net Revenue 7,687.9 100.0% 7,471.4 100.0% 2.9% 8,736.4 100.0% -12.0% 30,640.7 100.0% Cost of Goods Sold (6,561.8) -85% (6,372.4) -85% 3.0% (7,755.0) -89% -15.4% (26,994.8) -88% Gross Profit 1,126.1 15% 1,099.0 15% 2.5% 981.4 11% 14.7% 3,645.9 12% Adjusted EBITDA 664.6 8.6% 710.4 9.5% -6.4% 493.4 5.6% 34.7% 1,988.5 6.5% USGAAP¹ - US$ Million ∆% ∆% USGAAP¹ - US$ Million US$ % NR US$ % NR QoQ US$ % NR YoY US$ % NR Net Revenue 1,575.2 100.0% 1,509.0 100.0% 4.4% 1,664.3 100.0% -5.4% 6,046.0 100.0% Cost of Goods Sold (1,448.6) -92% (1,363.8) -90% 6.2% (1,579.0) -95% -8.3% (5,650.3) -93% Gross Profit 126.6 8% 145.2 10% -12.8% 85.3 5% 48.5% 395.7 7% Adjusted EBIT 82.1 5.2% 107.3 7.1% -23.5% 39.0 2.3% 110.4% 234.9 3.9% Adjusted EBITDA 103.6 6.6% 129.5 8.6% -20.0% 59.4 3.6% 74.3% 330.0 5.5% 3Q23 2Q23 3Q22 LTM 3Q23 3Q23 2Q23 3Q22 LTM 3Q23
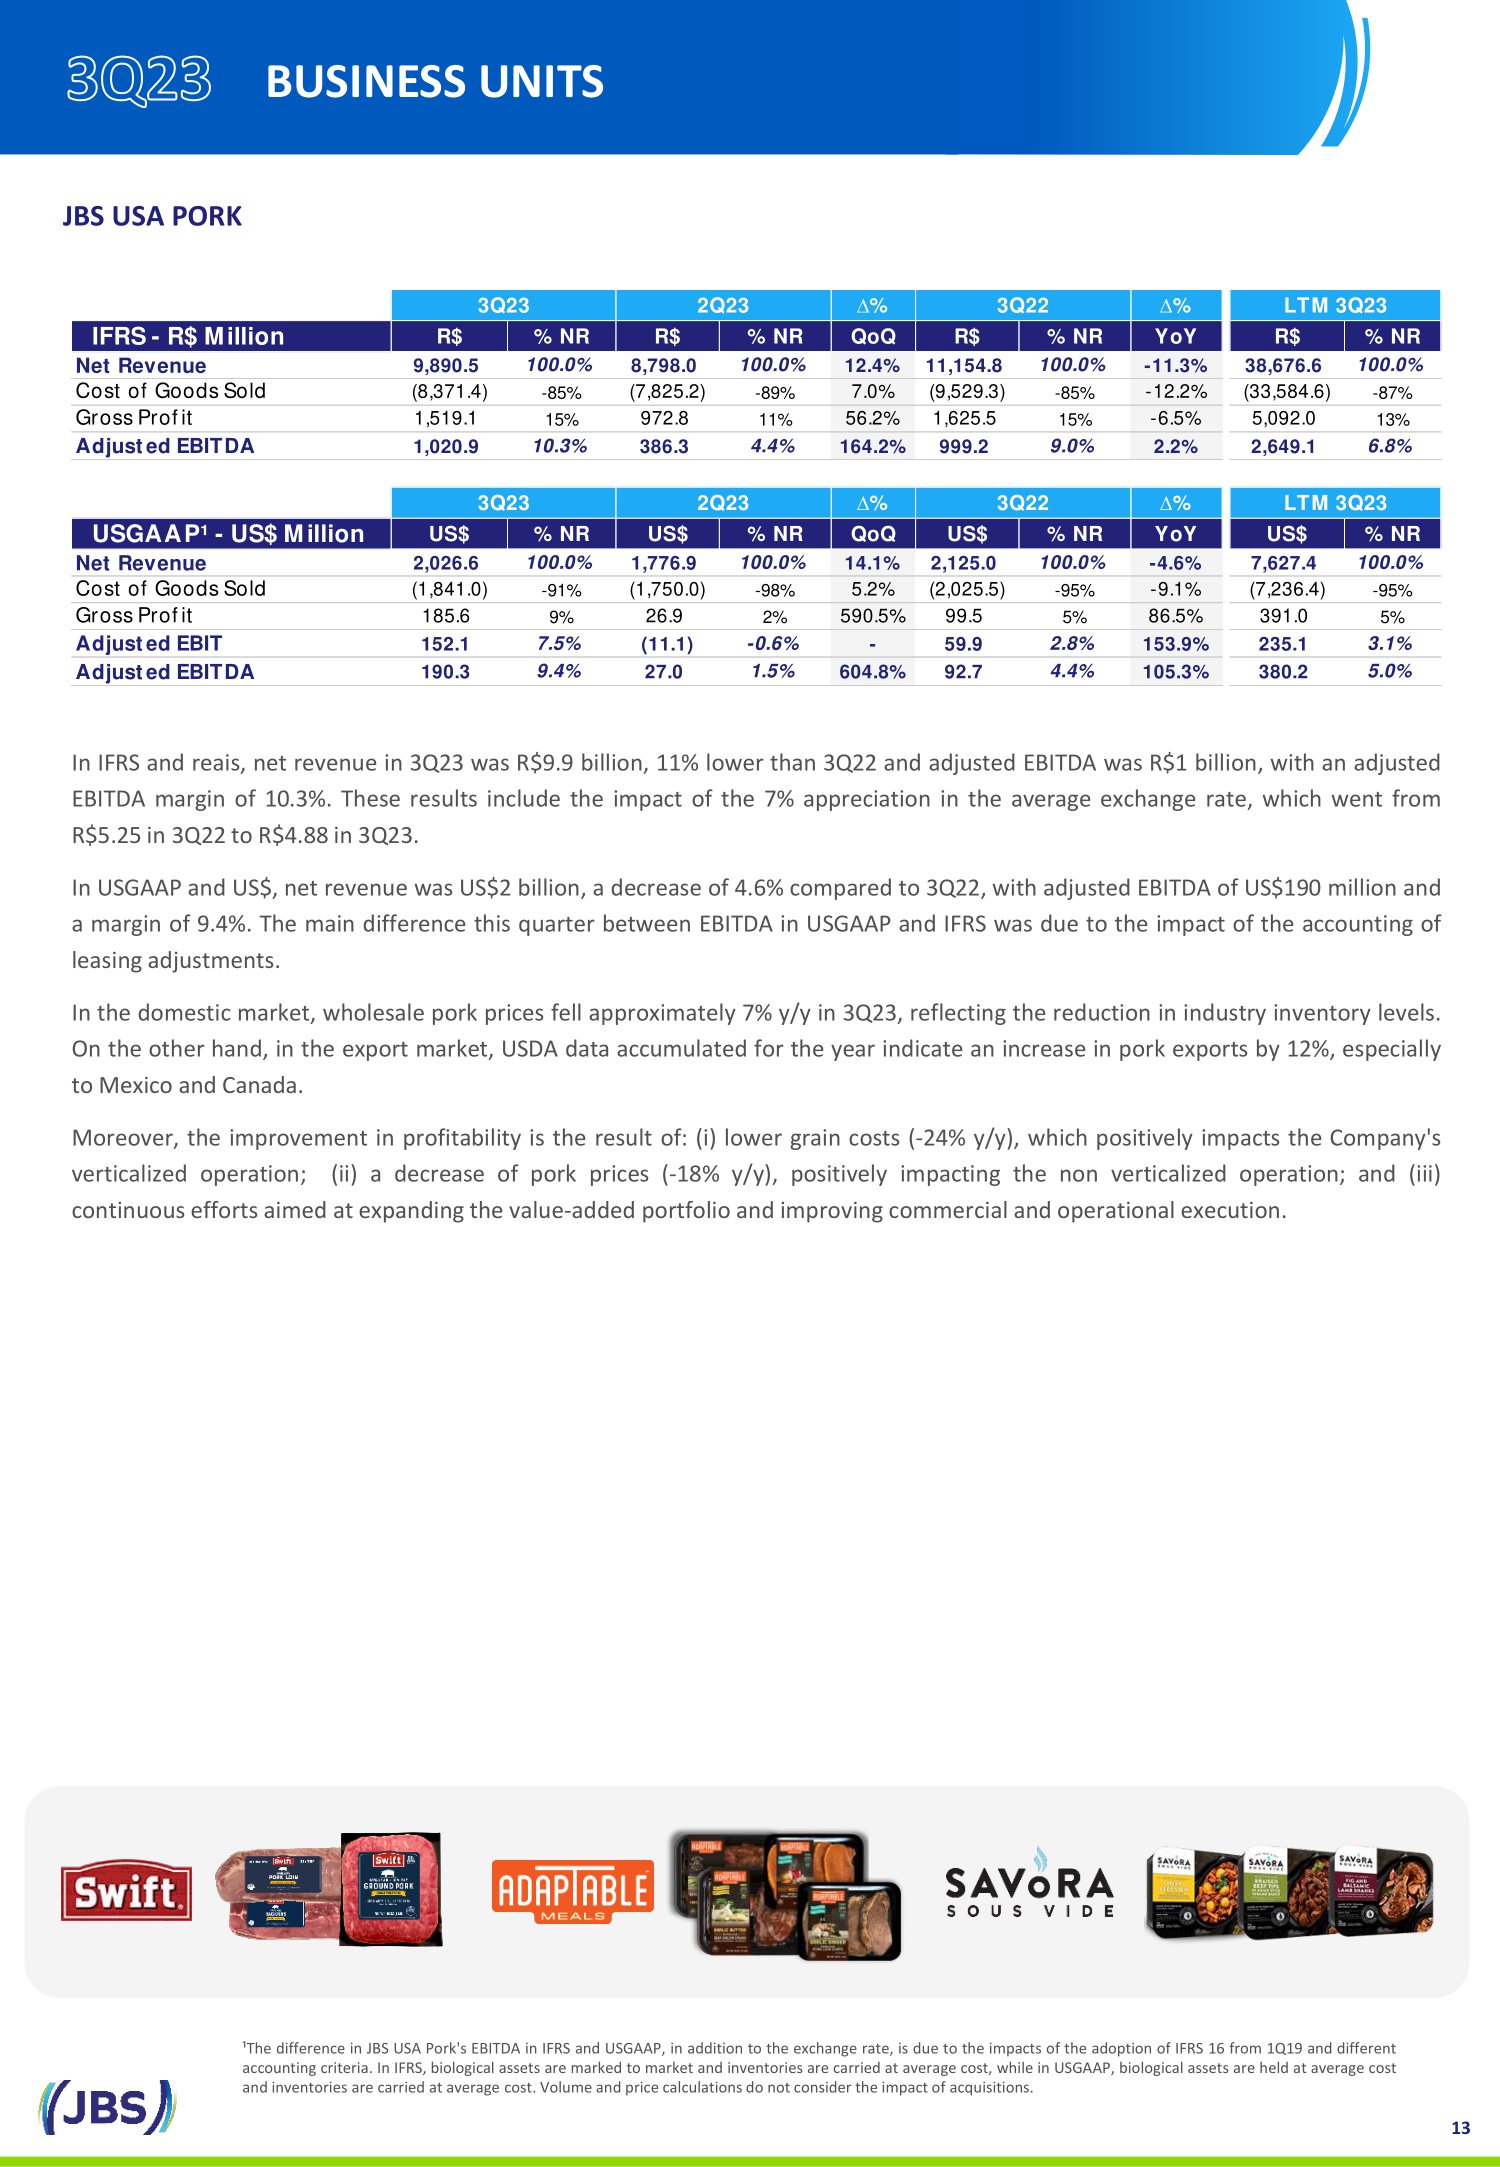
JBS USA PORK ¹The difference in JBS USA Pork's EBITDA in IFRS and USGAAP, in addition to the exchange rate, is due to the impacts of the adoption of IFRS 16 from 1 Q 19 and different accounting criteria . In IFRS, biological assets are marked to market and inventories are carried at average cost, while in USGAAP, biological assets are held at average cost and inventories are carried at average cost . Volume and price calculations do not consider the impact of acquisitions . In IFRS and reais , net revenue in 3 Q 23 was R $ 9 . 9 billion, 11 % lower than 3 Q 22 and adjusted EBITDA was R $ 1 billion, with an adjusted EBITDA margin of 10 . 3 % . These results include the impact of the 7 % appreciation in the average exchange rate, which went from R $ 5 . 25 in 3 Q 22 to R $ 4 . 88 in 3 Q 23 . In USGAAP and US $ , net revenue was US $ 2 billion, a decrease of 4 . 6 % compared to 3 Q 22 , with adjusted EBITDA of US $ 190 million and a margin of 9 . 4 % . The main difference this quarter between EBITDA in USGAAP and IFRS was due to the impact of the accounting of leasing adjustments . In the domestic market, wholesale pork prices fell approximately 7 % y/y in 3 Q 23 , reflecting the reduction in industry inventory levels . On the other hand, in the export market, USDA data accumulated for the year indicate an increase in pork exports by 12 % , especially to Mexico and Canada . Moreover, the improvement in profitability is the result of : ( i ) lower grain costs ( - 24 % y/y), which positively impacts the Company's verticalized operation ; (ii) a decrease of pork prices ( - 18 % y/y), positively impacting the non verticalized operation ; and (iii) continuous efforts aimed at expanding the value - added portfolio and improving commercial and operational execution . 13 BUSINESS UNITS IFRS - R$ Million ∆% ∆% IFRS - R$ Million R$ % NR R$ % NR QoQ R$ % NR YoY R$ % NR Net Revenue 9,890.5 100.0% 8,798.0 100.0% 12.4% 11,154.8 100.0% -11.3% 38,676.6 100.0% Cost of Goods Sold (8,371.4) -85% (7,825.2) -89% 7.0% (9,529.3) -85% -12.2% (33,584.6) -87% Gross Profit 1,519.1 15% 972.8 11% 56.2% 1,625.5 15% -6.5% 5,092.0 13% Adjusted EBITDA 1,020.9 10.3% 386.3 4.4% 164.2% 999.2 9.0% 2.2% 2,649.1 6.8% USGAAP¹ - US$ Million ∆% ∆% USGAAP¹ - US$ Million US$ % NR US$ % NR QoQ US$ % NR YoY US$ % NR Net Revenue 2,026.6 100.0% 1,776.9 100.0% 14.1% 2,125.0 100.0% -4.6% 7,627.4 100.0% Cost of Goods Sold (1,841.0) -91% (1,750.0) -98% 5.2% (2,025.5) -95% -9.1% (7,236.4) -95% Gross Profit 185.6 9% 26.9 2% 590.5% 99.5 5% 86.5% 391.0 5% Adjusted EBIT 152.1 7.5% (11.1) -0.6% - 59.9 2.8% 153.9% 235.1 3.1% Adjusted EBITDA 190.3 9.4% 27.0 1.5% 604.8% 92.7 4.4% 105.3% 380.2 5.0% 3Q23 2Q23 3Q22 LTM 3Q23 3Q23 2Q23 3Q22 LTM 3Q23
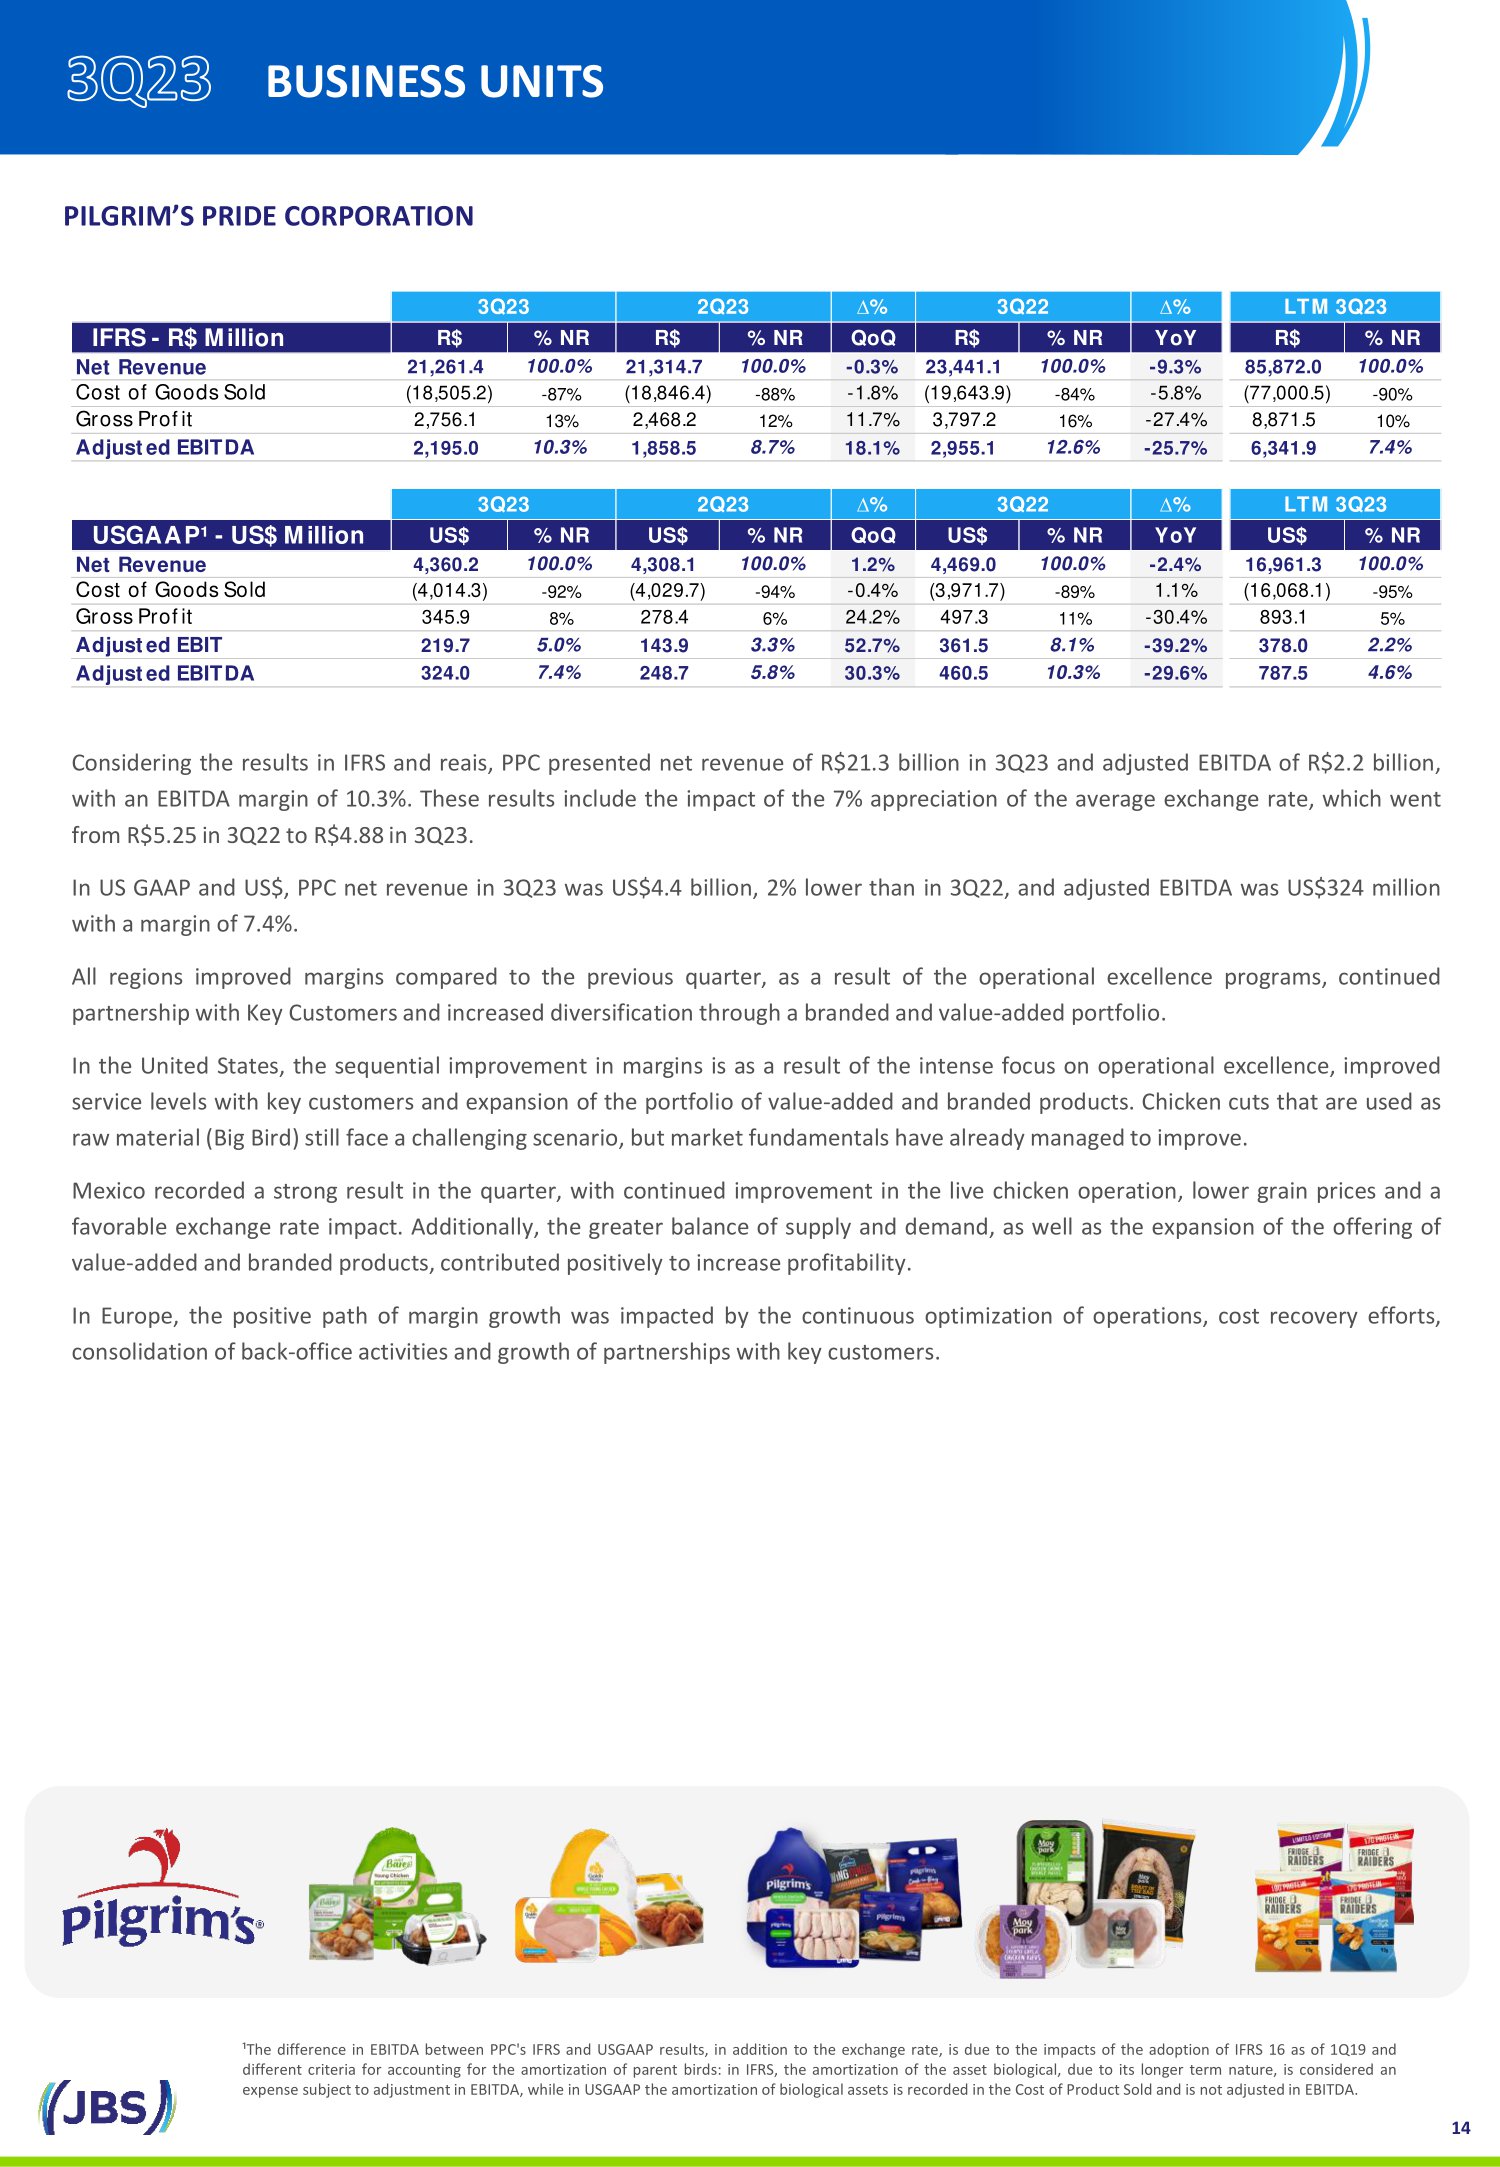
14 PILGRIM’S PRIDE CORPORATION ¹The difference in EBITDA between PPC's IFRS and USGAAP results, in addition to the exchange rate, is due to the impacts of the adoption of IFRS 16 as of 1 Q 19 and different criteria for accounting for the amortization of parent birds : in IFRS, the amortization of the asset biological, due to its longer term nature, is considered an expense subject to adjustment in EBITDA, while in USGAAP the amortization of biological assets is recorded in the Cost of Product Sold and is not adjusted in EBITDA . Considering the results in IFRS and reais , PPC presented net revenue of R $ 21 . 3 billion in 3 Q 23 and adjusted EBITDA of R $ 2 . 2 billion, with an EBITDA margin of 10 . 3 % . These results include the impact of the 7 % appreciation of the average exchange rate, which went from R $ 5 . 25 in 3 Q 22 to R $ 4 . 88 in 3 Q 23 . In US GAAP and US $ , PPC net revenue in 3 Q 23 was US $ 4 . 4 billion, 2 % lower than in 3 Q 22 , and adjusted EBITDA was US $ 324 million with a margin of 7 . 4 % . All regions improved margins compared to the previous quarter, as a result of the operational excellence programs, continued partnership with Key Customers and increased diversification through a branded and value - added portfolio . In the United States, the sequential improvement in margins is as a result of the intense focus on operational excellence, improved service levels with key customers and expansion of the portfolio of value - added and branded products . Chicken cuts that are used as raw material (Big Bird) still face a challenging scenario, but market fundamentals have already managed to improve . Mexico recorded a strong result in the quarter, with continued improvement in the live chicken operation, lower grain prices and a favorable exchange rate impact . Additionally, the greater balance of supply and demand, as well as the expansion of the offering of value - added and branded products, contributed positively to increase profitability . In Europe, the positive path of margin growth was impacted by the continuous optimization of operations, cost recovery efforts, consolidation of back - office activities and growth of partnerships with key customers . BUSINESS UNITS IFRS - R$ Million ∆% ∆% IFRS - R$ Million R$ % NR R$ % NR QoQ R$ % NR YoY R$ % NR Net Revenue 21,261.4 100.0% 21,314.7 100.0% -0.3% 23,441.1 100.0% -9.3% 85,872.0 100.0% Cost of Goods Sold (18,505.2) -87% (18,846.4) -88% -1.8% (19,643.9) -84% -5.8% (77,000.5) -90% Gross Profit 2,756.1 13% 2,468.2 12% 11.7% 3,797.2 16% -27.4% 8,871.5 10% Adjusted EBITDA 2,195.0 10.3% 1,858.5 8.7% 18.1% 2,955.1 12.6% -25.7% 6,341.9 7.4% USGAAP¹ - US$ Million ∆% ∆% USGAAP¹ - US$ Million US$ % NR US$ % NR QoQ US$ % NR YoY US$ % NR Net Revenue 4,360.2 100.0% 4,308.1 100.0% 1.2% 4,469.0 100.0% -2.4% 16,961.3 100.0% Cost of Goods Sold (4,014.3) -92% (4,029.7) -94% -0.4% (3,971.7) -89% 1.1% (16,068.1) -95% Gross Profit 345.9 8% 278.4 6% 24.2% 497.3 11% -30.4% 893.1 5% Adjusted EBIT 219.7 5.0% 143.9 3.3% 52.7% 361.5 8.1% -39.2% 378.0 2.2% Adjusted EBITDA 324.0 7.4% 248.7 5.8% 30.3% 460.5 10.3% -29.6% 787.5 4.6% 3Q23 2Q23 3Q22 LTM 3Q23 3Q23 2Q23 3Q22 LTM 3Q23
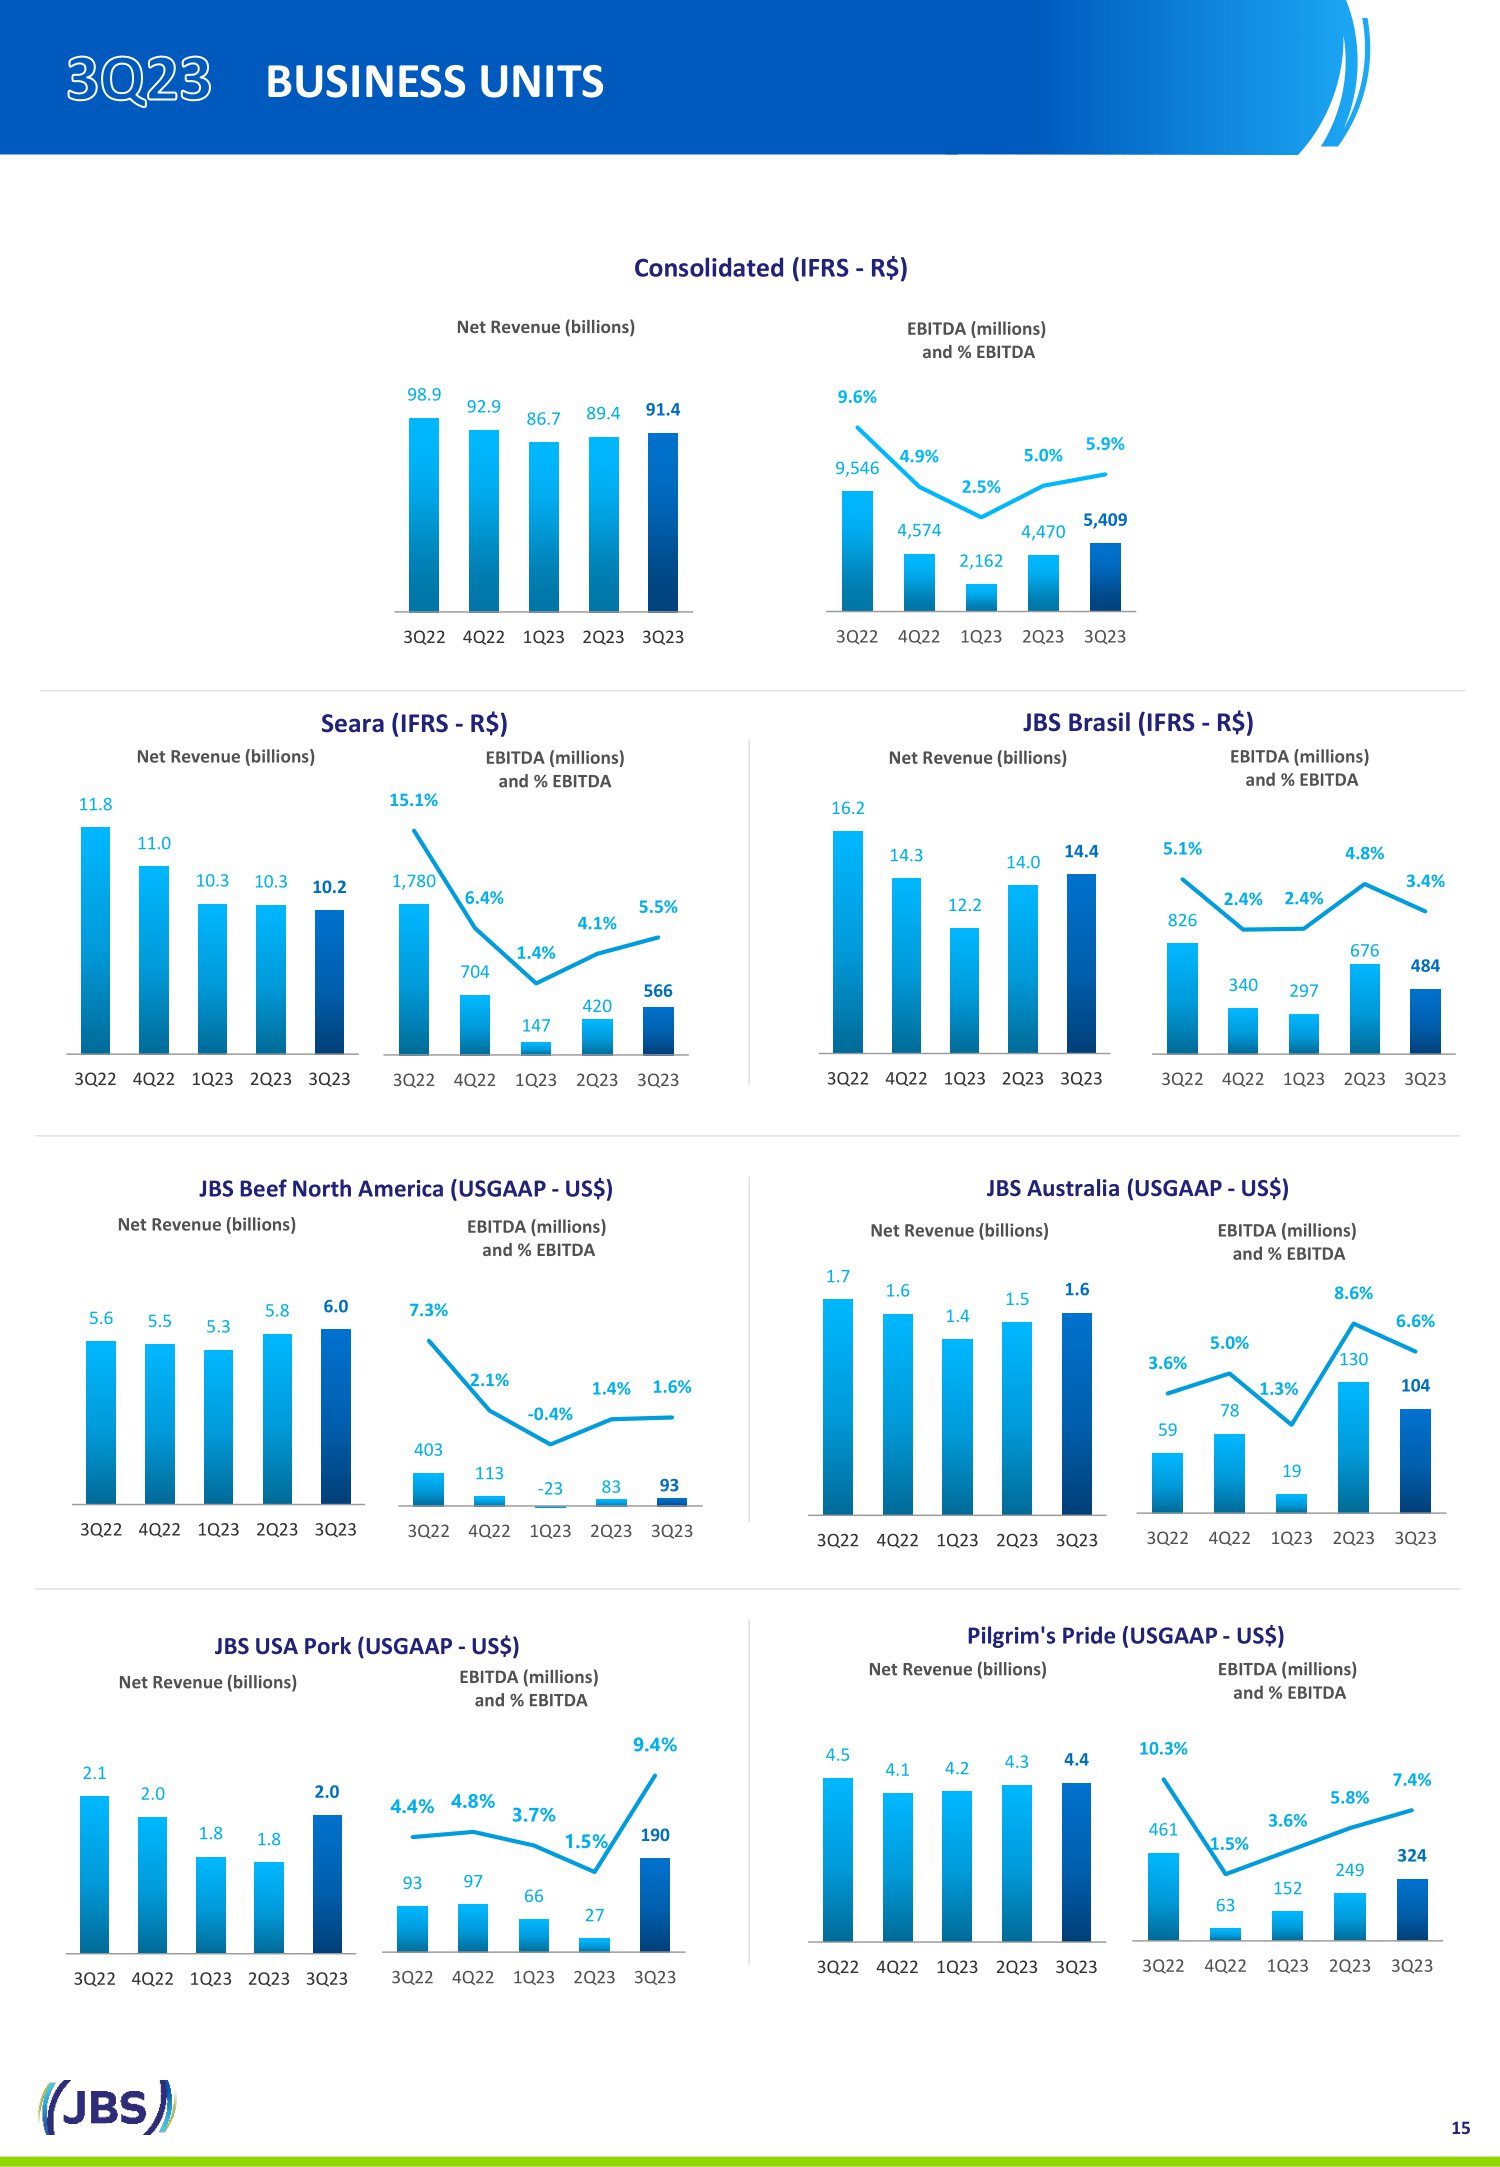
16.2 14.3 12.2 14.0 14.4 3Q22 4Q22 1Q23 2Q23 3Q23 Net Revenue ( billions ) EBITDA ( millions ) and % EBITDA JBS Brasil (IFRS - R$) 11.8 11.0 10.3 10.3 10.2 3Q22 4Q22 1Q23 2Q23 3Q23 Net Revenue ( billions ) EBITDA ( millions ) and % EBITDA Seara (IFRS - R$) 461 63 152 249 324 10.3% 1.5% 3.6% 5.8% 7.4% 3Q22 4Q22 1Q23 2Q23 3Q23 4.5 4.1 4.2 4.3 4.4 3Q22 4Q22 1Q23 2Q23 3Q23 Net Revenue ( billions ) EBITDA ( millions ) and % EBITDA Pilgrim's Pride (USGAAP - US$) Net Revenue ( billions ) JBS USA Pork (USGAAP - US$) 93 97 66 27 190 4.4% 4.8% 3.7% 1.5% 9.4% 3Q22 4Q22 1Q23 2Q23 3Q23 2.1 2.0 1.8 1.8 2.0 3Q22 4Q22 1Q23 2Q23 3Q23 Net Revenue ( billions ) EBITDA ( millions ) and % EBITDA 1.7 1.6 1.4 1.5 1.6 3Q22 4Q22 1Q23 2Q23 3Q23 JBS Australia (USGAAP - US$) 403 113 - 23 83 93 7.3% 2.1% - 0.4% 1.4% 1.6% 3Q22 4Q22 1Q23 2Q23 3Q23 Net Revenue ( billions ) EBITDA ( millions ) and % EBITDA 5.6 5.5 5.3 5.8 6.0 3Q22 4Q22 1Q23 2Q23 3Q23 JBS Beef North America (USGAAP - US$) 1,780 704 147 420 566 15.1% 6.4% 1.4% 4.1% 5.5% 3Q22 4Q22 1Q23 2Q23 3Q23 826 340 297 676 484 5.1% 2.4% 2.4% 4.8% 3.4% 3Q22 4Q22 1Q23 2Q23 3Q23 59 78 19 130 104 3.6% 5.0% 1.3% 8.6% 6.6% 3Q22 4Q22 1Q23 2Q23 3Q23 15 BUSINESS UNITS EBITDA ( millions ) and % EBITDA Net Revenue ( billions ) EBITDA ( millions ) and % EBITDA 98.9 92.9 86.7 89.4 91.4 3Q22 4Q22 1Q23 2Q23 3Q23 9,546 4,574 2,162 4,470 5,409 9.6% 4.9% 2.5% 5.0% 5.9% 3Q22 4Q22 1Q23 2Q23 3Q23 Consolidated (IFRS - R$)
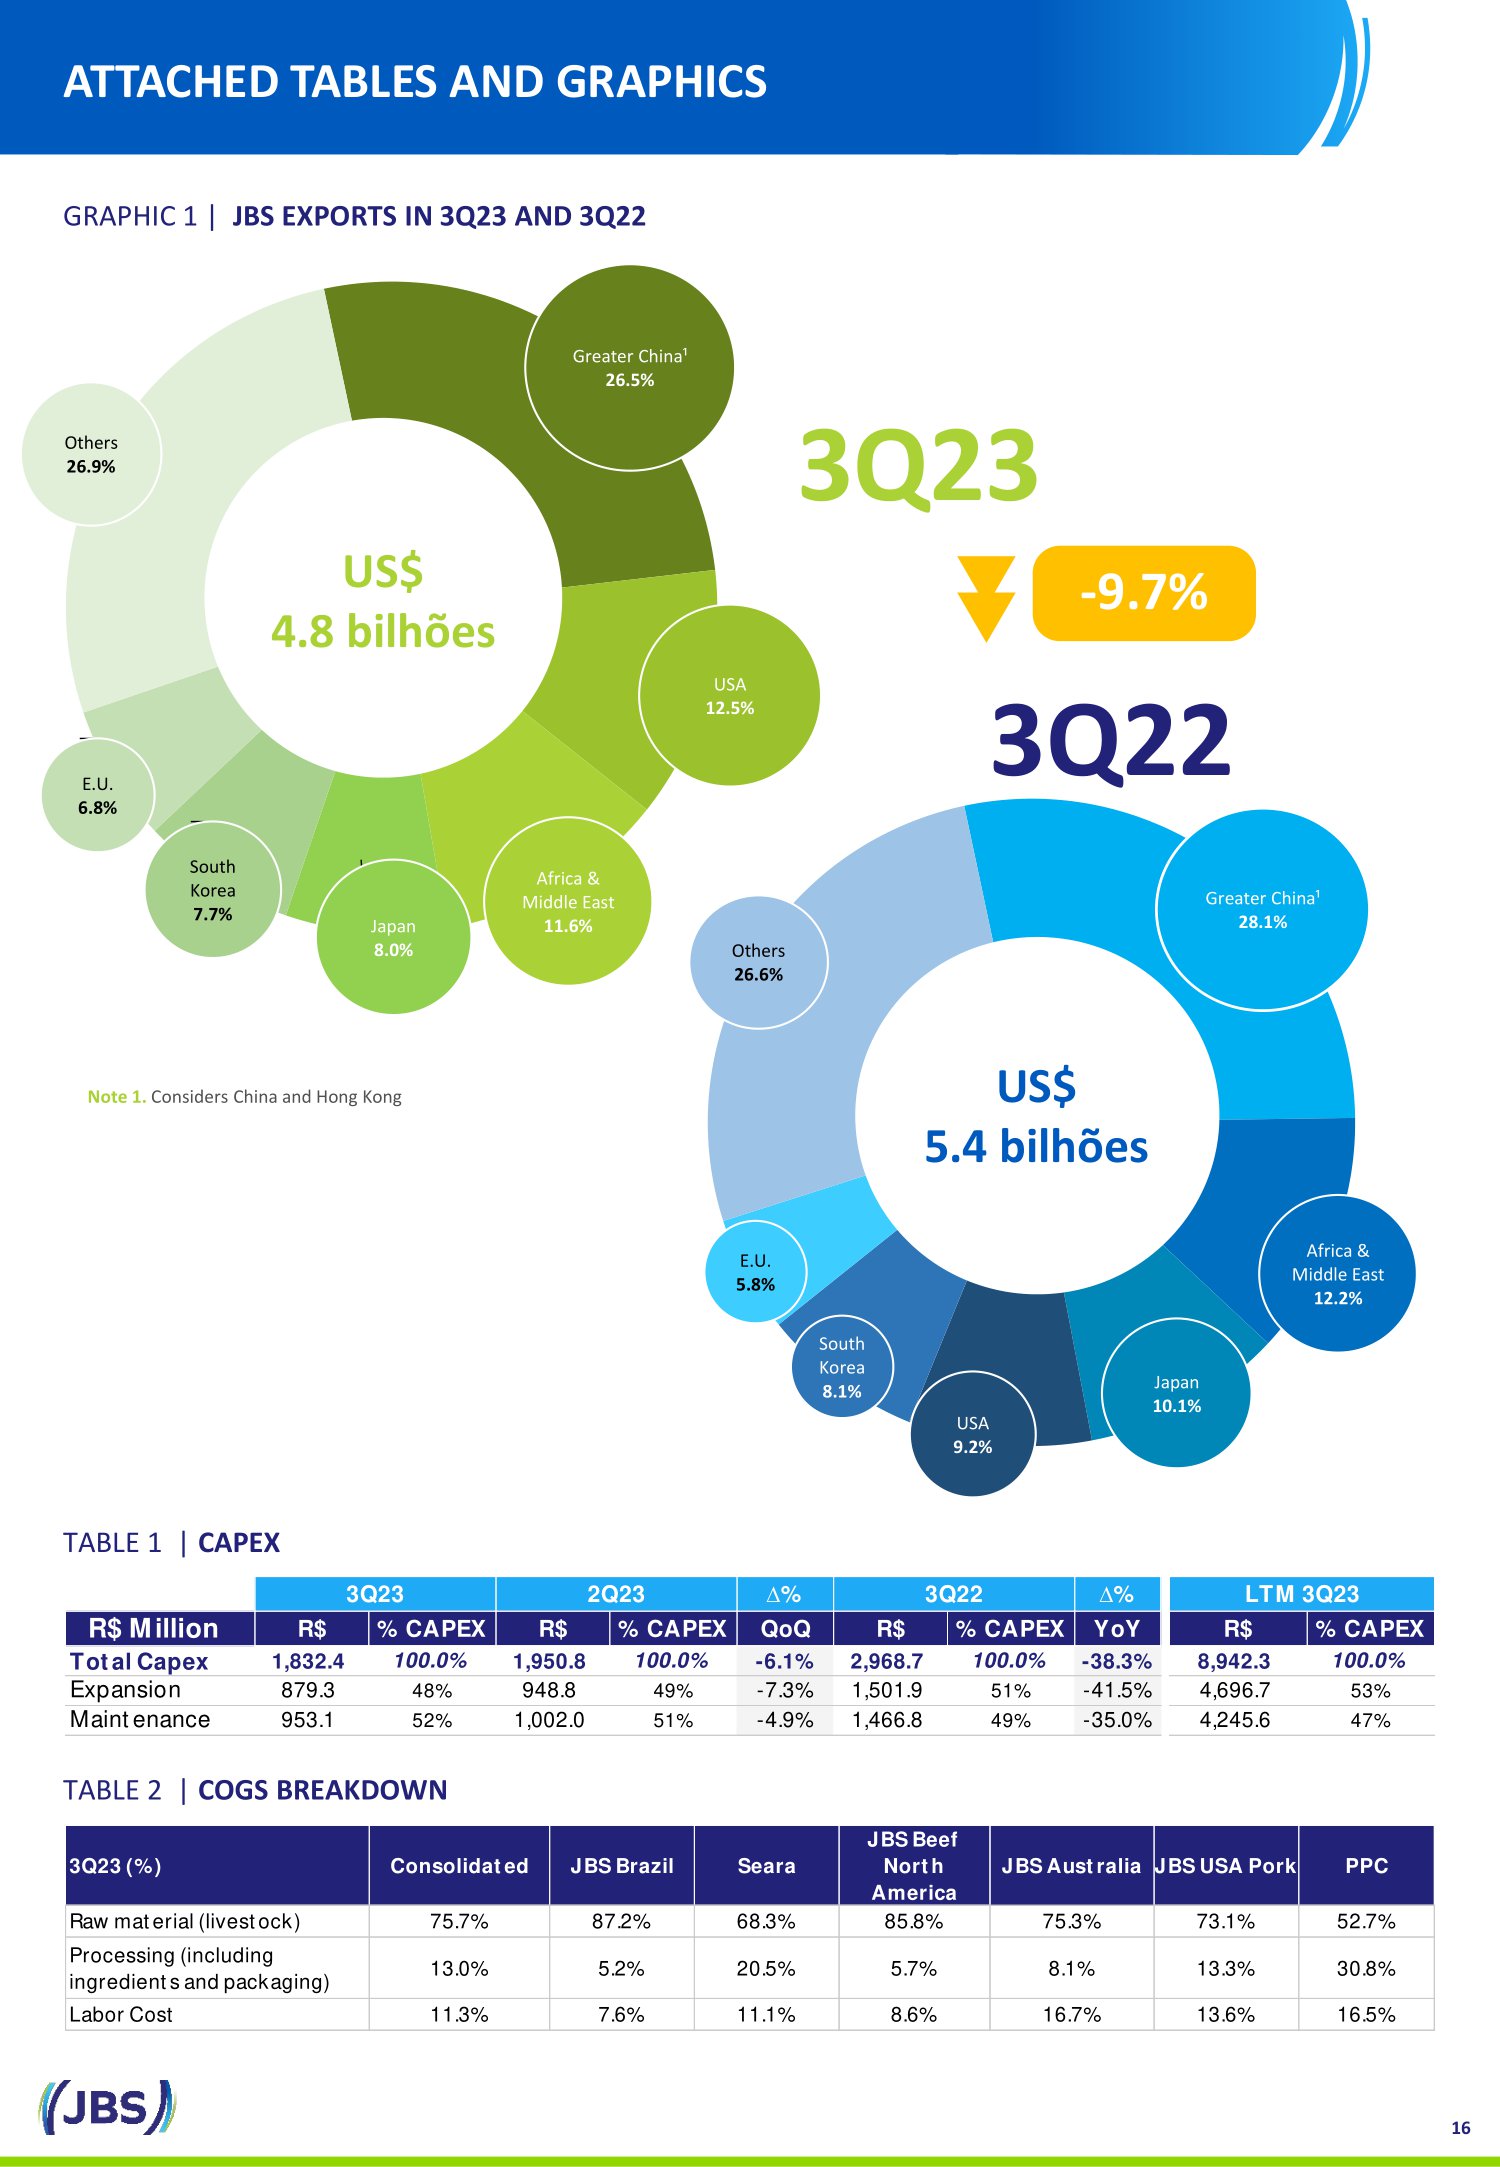
Greater China¹ 26.5% USA 12.5% Africa & Middle East 11.6% Japan 8.0% South Korea 7.7% E.U. 6.8% Others 26.9% US$ 4.8 bilhões 3Q23 Greater China¹ 28.1% Africa & Middle East 12.2% Japan 10.1% USA 9.2% South Korea 8.1% E.U. 5.8% Others 26.6% US$ 5.4 bilhões 3Q22 Note 1. Considers China and Hong Kong 16 ATTACHED TABLES AND GRAPHICS GRAPHIC 1 | JBS EXPORTS IN 3Q23 AND 3Q22 TABLE 1 | CAPEX TABLE 2 | COGS BREAKDOWN - 9.7 % ∆% ∆% R$ Million R$ % CAPEX R$ % CAPEX QoQ R$ % CAPEX YoY R$ % CAPEX Total Capex 1,832.4 100.0% 1,950.8 100.0% -6.1% 2,968.7 100.0% -38.3% 8,942.3 100.0% Expansion 879.3 48% 948.8 49% -7.3% 1,501.9 51% -41.5% 4,696.7 53% Maintenance 953.1 52% 1,002.0 51% -4.9% 1,466.8 49% -35.0% 4,245.6 47% 3Q23 2Q23 3Q22 LTM 3Q23 3Q23 (%) Consolidated JBS Brazil Seara JBS Beef North America JBS Australia JBS USA Pork PPC Raw material (livestock) 75.7% 87.2% 68.3% 85.8% 75.3% 73.1% 52.7% Processing (including ingredients and packaging) 13.0% 5.2% 20.5% 5.7% 8.1% 13.3% 30.8% Labor Cost 11.3% 7.6% 11.1% 8.6% 16.7% 13.6% 16.5%
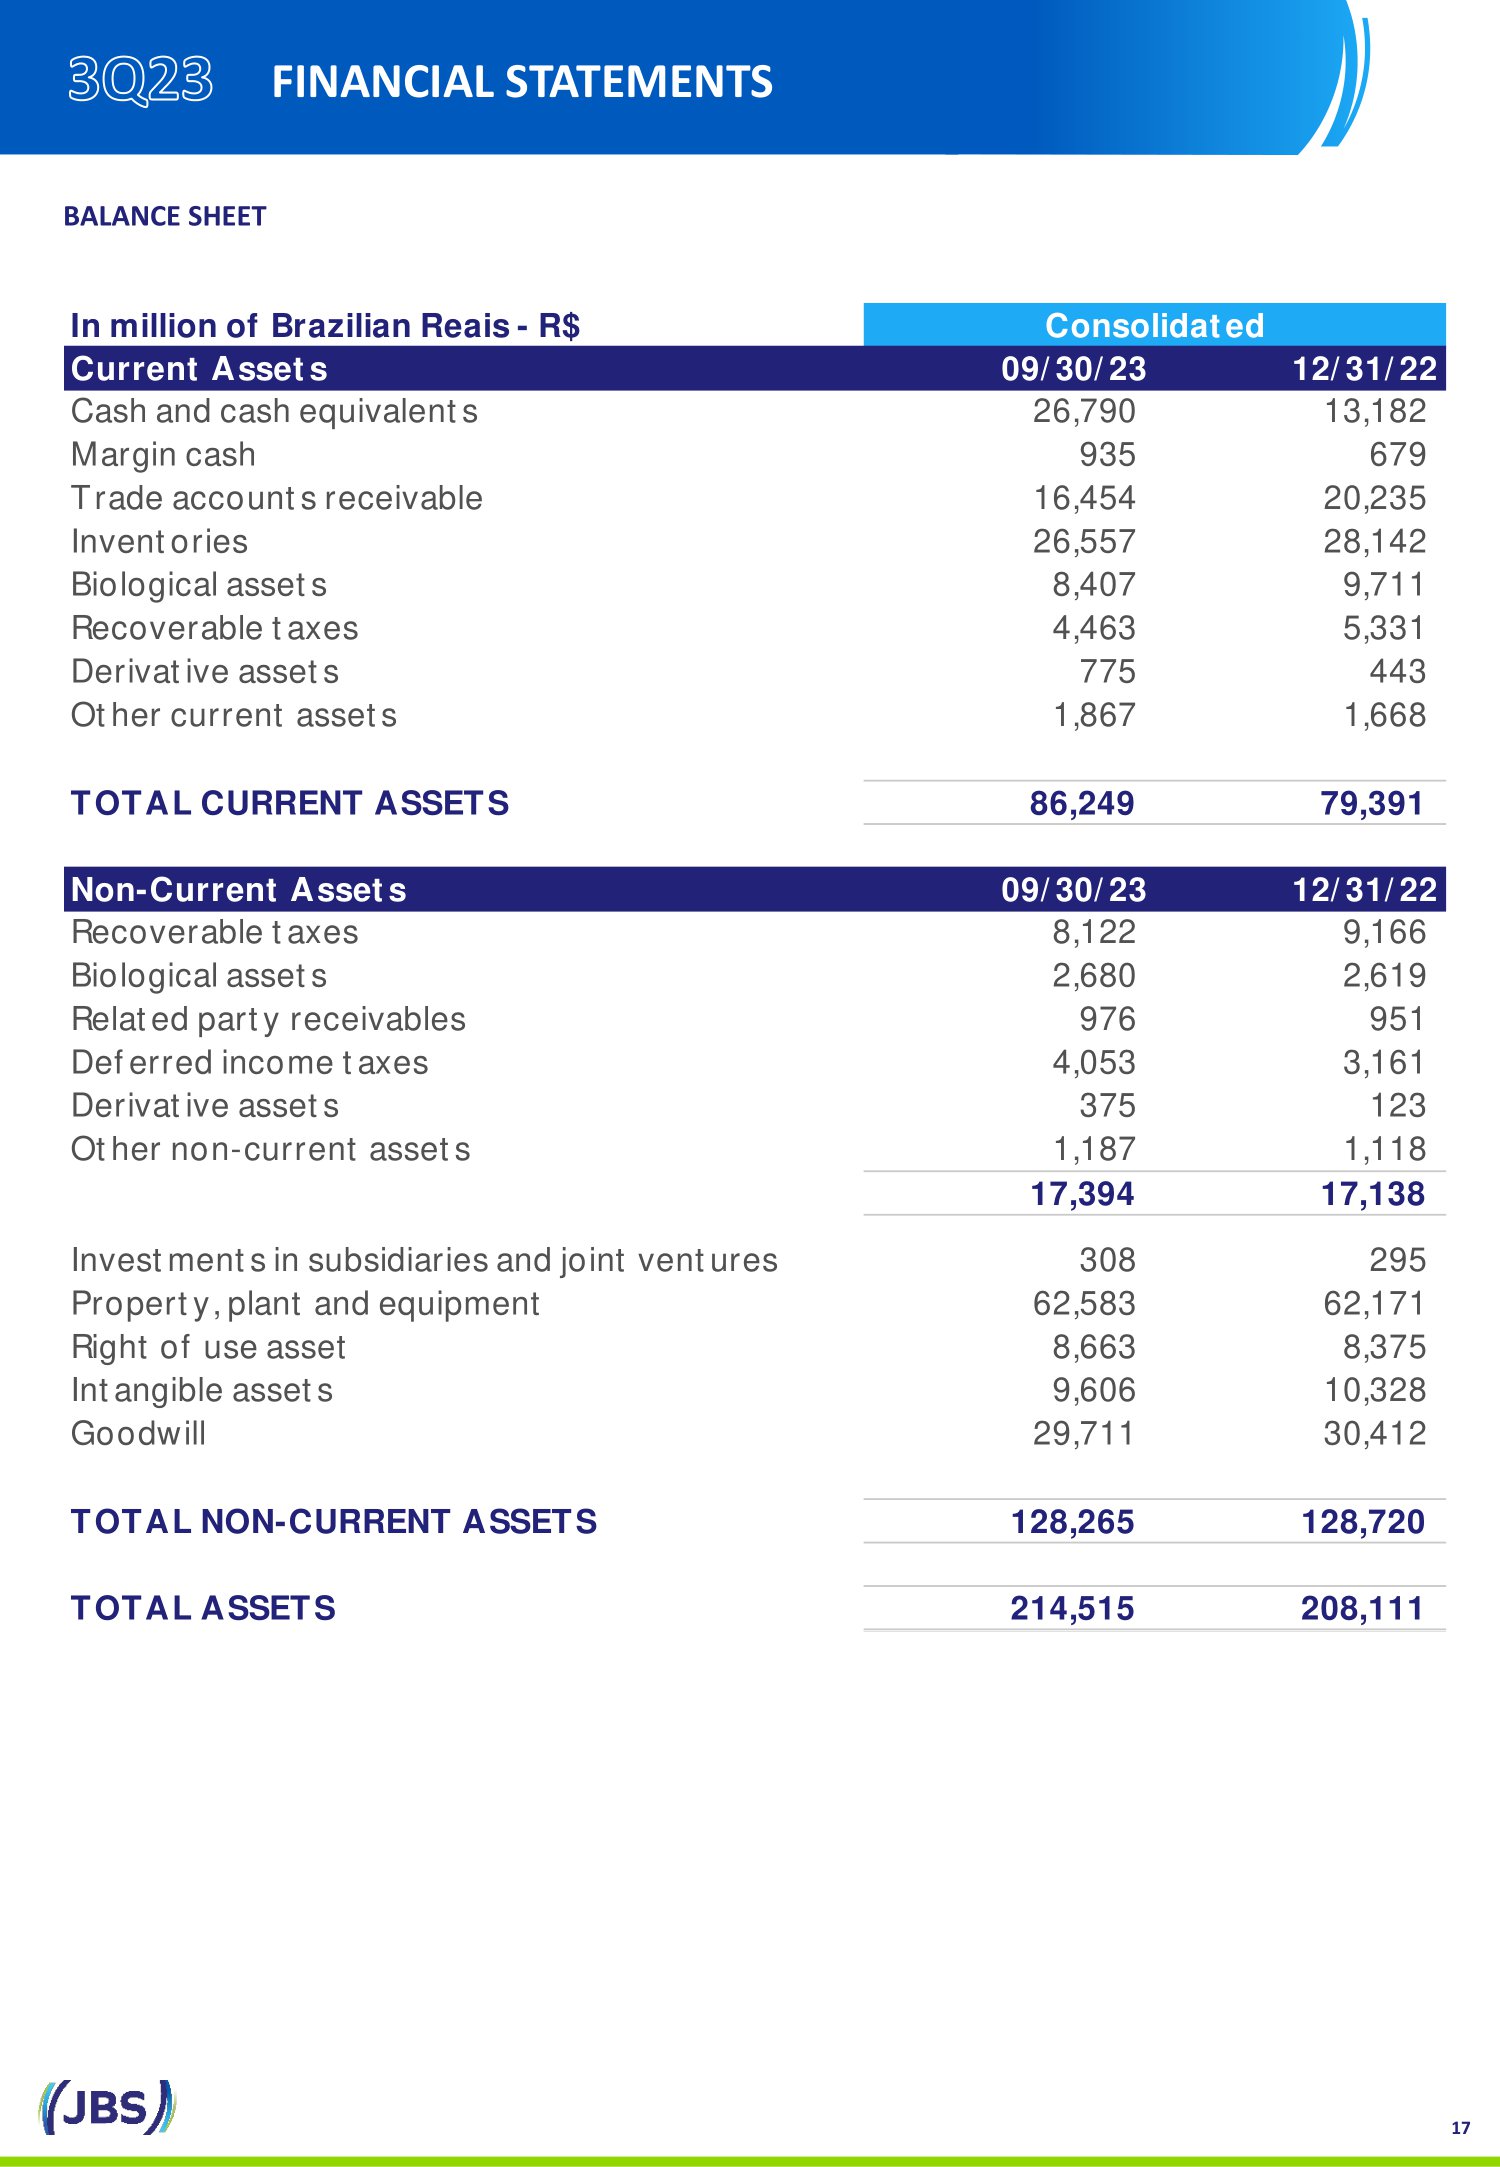
17 BALANCE SHEET FINANCIAL STATEMENTS In million of Brazilian Reais - R$ Current Assets 09/30/23 12/31/22 Cash and cash equivalents 26,790 13,182 Margin cash 935 679 Trade accounts receivable 16,454 20,235 Inventories 26,557 28,142 Biological assets 8,407 9,711 Recoverable taxes 4,463 5,331 Derivative assets 775 443 Other current assets 1,867 1,668 TOTAL CURRENT ASSETS 86,249 79,391 Non-Current Assets 09/30/23 12/31/22 Recoverable taxes 8,122 9,166 Biological assets 2,680 2,619 Related party receivables 976 951 Deferred income taxes 4,053 3,161 Derivative assets 375 123 Other non-current assets 1,187 1,118 17,394 17,138 Investments in subsidiaries and joint ventures 308 295 Property, plant and equipment 62,583 62,171 Right of use asset 8,663 8,375 Intangible assets 9,606 10,328 Goodwill 29,711 30,412 TOTAL NON-CURRENT ASSETS 128,265 128,720 TOTAL ASSETS 214,515 208,111 Consolidated

18 BALANCE SHEET FINANCIAL STATEMENTS In million of Brazilian Reais - R$ Current Liabilities 09/30/23 12/31/22 Trade accounts payable 25,166 31,010 Supply chain finance 3,577 3,071 Loans and financing 9,239 8,229 Income taxes 158 475 Accrued income taxes and other taxes 674 726 Accrued payroll and social charges 6,038 6,251 Lease liabilities 1,747 1,788 Dividends payable 2 0 Provision for contingencies 632 909 Derivative liabilities 1,019 560 Other current liabilities 2,600 2,142 TOTAL CURRENT LIABILITIES 50,853 55,160 Non-Current Liabilities 09/30/23 12/31/22 Loans and financing 98,874 84,126 Accrued income taxes and other taxes 527 606 Accrued payroll and social charges 2,414 2,379 Lease liabilities 7,551 7,196 Deferred income taxes 6,674 7,112 Provision for contingencies 1,574 1,321 Other non-current liabilities 528 402 TOTAL NON-CURRENT LIABILITIES 118,143 103,141 Equity 09/30/23 12/31/22 Share capital - common shares 23,576 23,576 Capital reserve (782) (808) Other reserves 32 36 Profit reserves 18,653 18,653 Accumulated other comprehensive income 3,850 4,886 Accumulated losses (3,357) - Attributable to company shareholders 41,972 46,344 Attributable to non-controlling interest 3,546 3,465 TOTAL EQUITY 45,518 49,809 TOTAL LIABILITIES AND EQUITY 214,515 208,111 Consolidated

19 INCOME STATEMENT FINANCIAL STATEMENTS In million of Brazilian Reais - R$ 3T23 3T22 NET REVENUE 91,409 98,928 Cost of sales (80,357) (82,692) GROSS PROFIT 11,053 16,236 General and administrative expenses (2,907) (3,076) Selling expenses (5,510) (6,409) Other expenses (113) (87) Other income 87 328 OPERATING EXPENSES (8,442) (9,243) OPERATING PROFIT 2,611 6,993 Finance income 602 643 Finance expense (2,441) (2,139) (1,839) (1,496) Share of profit of equity-accounted investees, net of tax 20 15 PROFIT BEFORE TAXES 791 5,511 Current income taxes (479) (1,317) Deferred income taxes 378 70 (100) (1,247) NET INCOME 691 4,264 ATTRIBUTABLE TO: Company shareholders 573 4,014 Non-controlling interest 118 250 691 4,264 Basic earnings per share - common shares (R$) 0.26 1.81 Consolidated
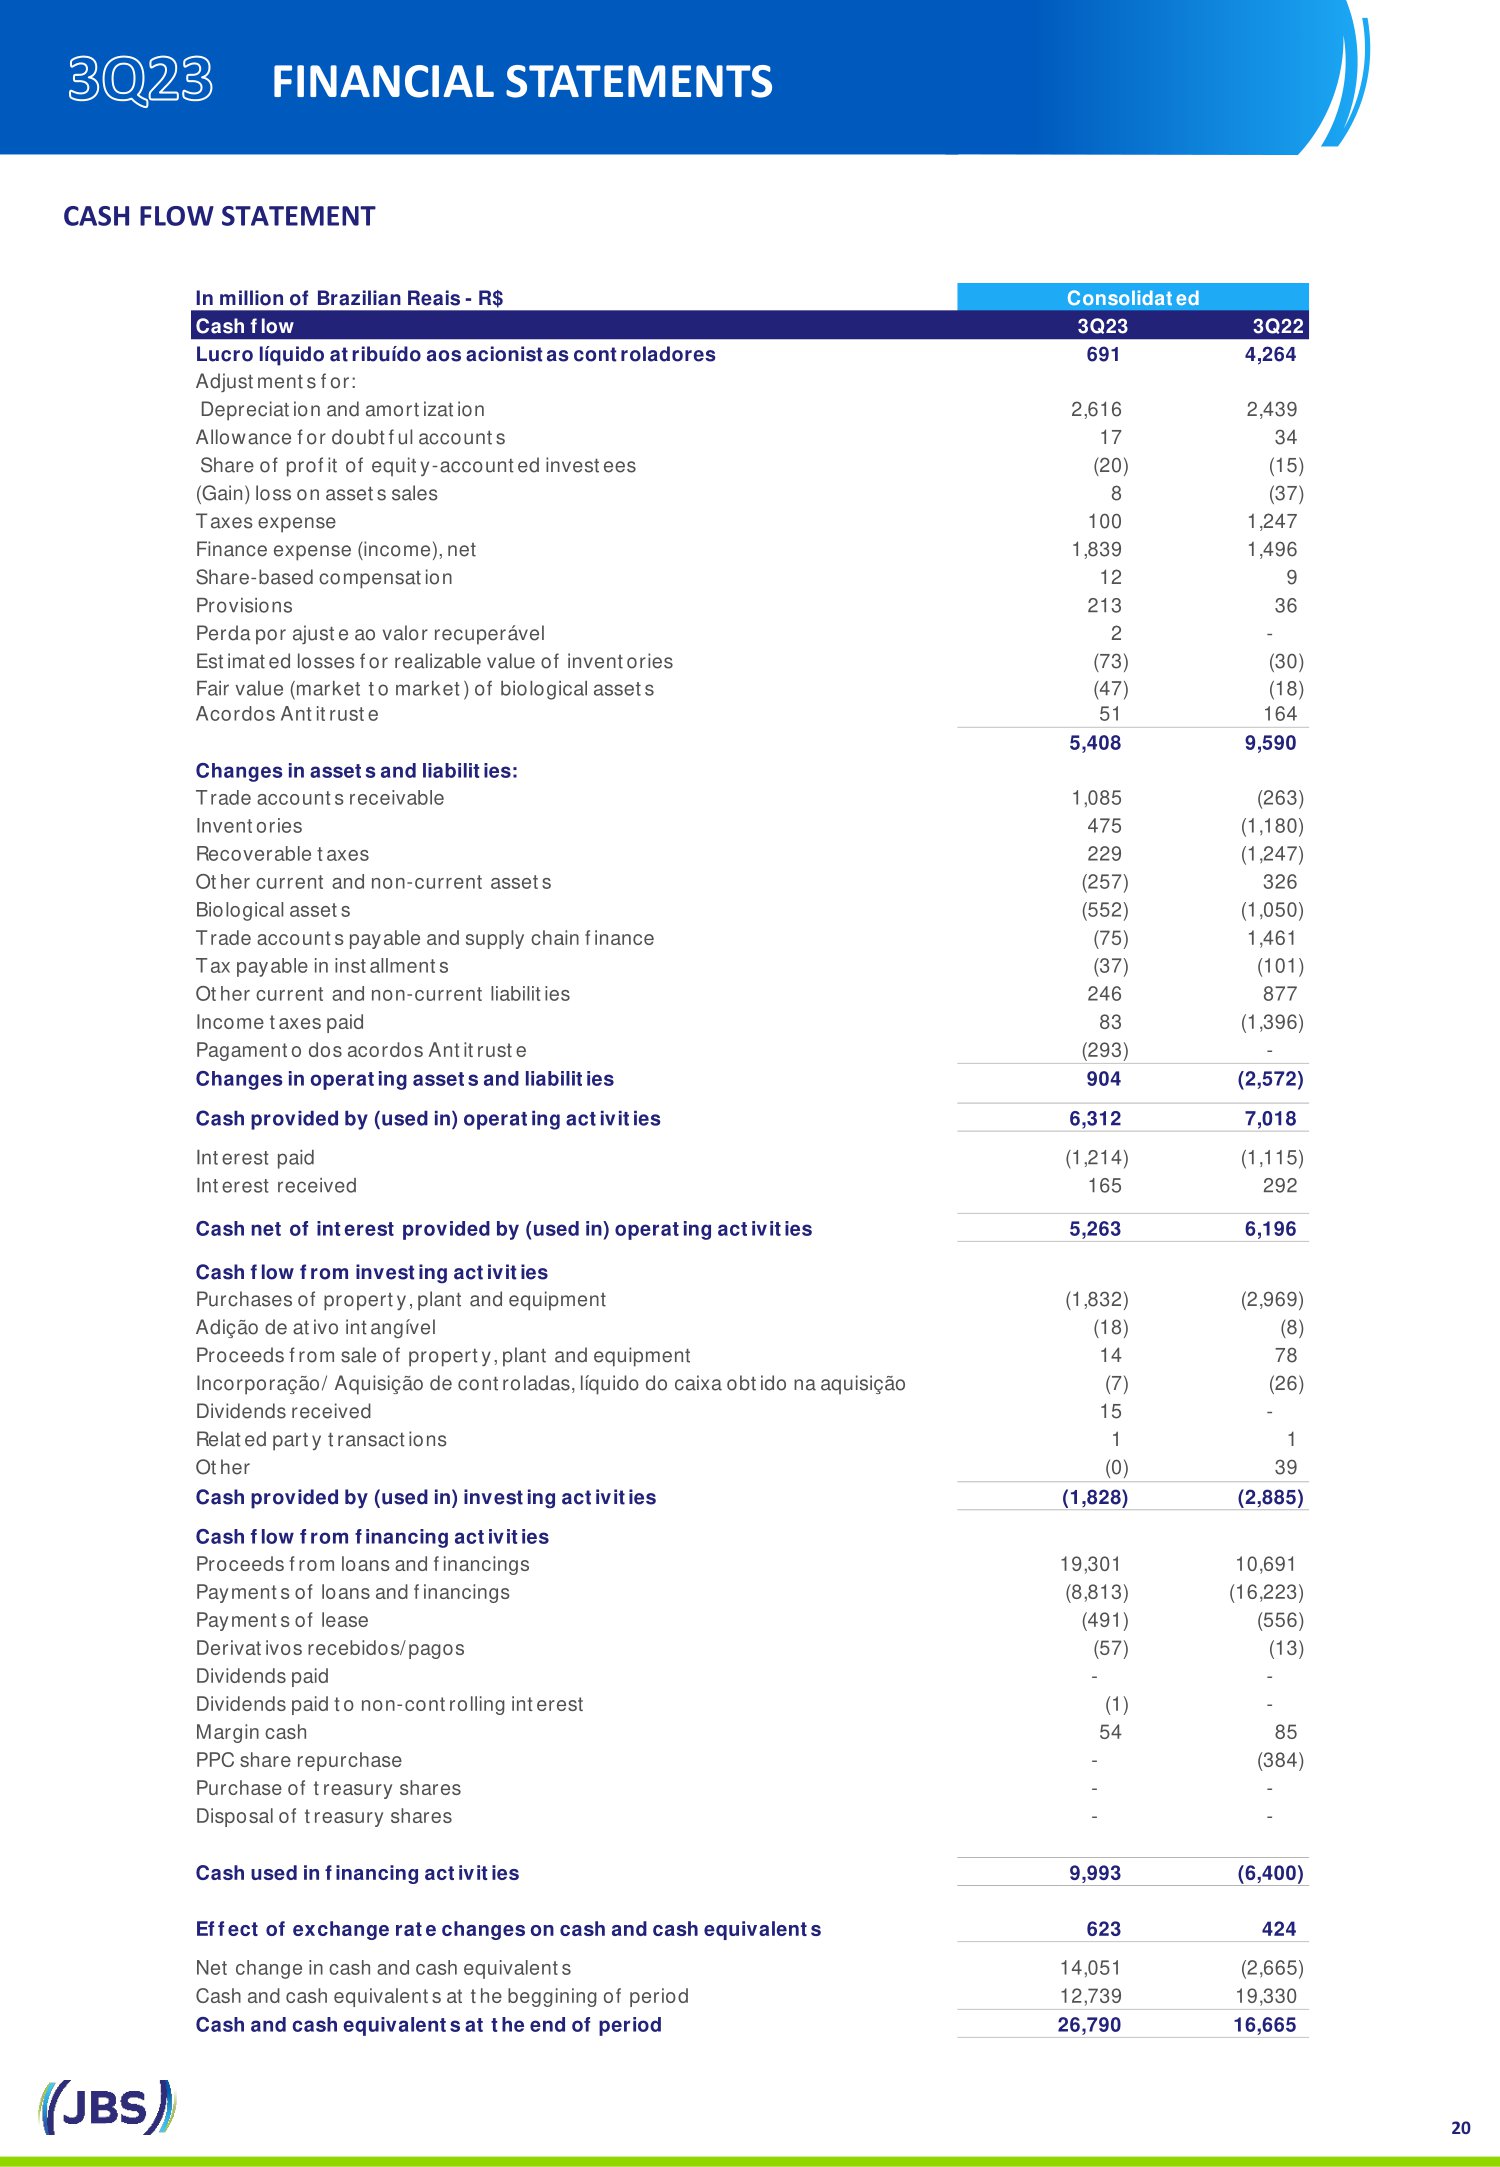
20 CASH FLOW STATEMENT FINANCIAL STATEMENTS In million of Brazilian Reais - R$ Cash flow 3Q23 3Q22 Lucro líquido atribuído aos acionistas controladores 691 4,264 Adjustments for: Depreciation and amortization 2,616 2,439 Allowance for doubtful accounts 17 34 Share of profit of equity-accounted investees (20) (15) (Gain) loss on assets sales 8 (37) Taxes expense 100 1,247 Finance expense (income), net 1,839 1,496 Share-based compensation 12 9 Provisions 213 36 Perda por ajuste ao valor recuperável 2 - Estimated losses for realizable value of inventories (73) (30) Fair value (market to market) of biological assets (47) (18) Acordos Antitruste 51 164 5,408 9,590 Changes in assets and liabilities: Trade accounts receivable 1,085 (263) Inventories 475 (1,180) Recoverable taxes 229 (1,247) Other current and non-current assets (257) 326 Biological assets (552) (1,050) Trade accounts payable and supply chain finance (75) 1,461 Tax payable in installments (37) (101) Other current and non-current liabilities 246 877 Income taxes paid 83 (1,396) Pagamento dos acordos Antitruste (293) - Changes in operating assets and liabilities 904 (2,572) Cash provided by (used in) operating activities 6,312 7,018 Interest paid (1,214) (1,115) Interest received 165 292 Cash net of interest provided by (used in) operating activities 5,263 6,196 Cash flow from investing activities Purchases of property, plant and equipment (1,832) (2,969) Adição de ativo intangível (18) (8) Proceeds from sale of property, plant and equipment 14 78 Incorporação/ Aquisição de controladas, líquido do caixa obtido na aquisição (7) (26) Dividends received 15 - Related party transactions 1 1 Other (0) 39 Cash provided by (used in) investing activities (1,828) (2,885) Cash flow from financing activities Proceeds from loans and financings 19,301 10,691 Payments of loans and financings (8,813) (16,223) Payments of lease (491) (556) Derivativos recebidos/pagos (57) (13) Dividends paid - - Dividends paid to non-controlling interest (1) - Margin cash 54 85 PPC share repurchase - (384) Purchase of treasury shares - - Disposal of treasury shares - - Cash used in financing activities 9,993 (6,400) Effect of exchange rate changes on cash and cash equivalents 623 424 Net change in cash and cash equivalents 14,051 (2,665) Cash and cash equivalents at the beggining of period 12,739 19,330 Cash and cash equivalents at the end of period 26,790 16,665 Consolidated

DISCLAIMER We make statements about future events that are subject to risks and uncertainties . Such statements are based on the beliefs and assumptions of our Management and information to which the Company currently has access . Statements about future events include information about our current intentions, beliefs or expectations, as well as those of the members of the Company's Board of Directors and Officers . Disclaimers with respect to forward - looking statements and information also include information on possible or presumed operating results, as well as statements that are preceded, followed or that include the words "believe,“ "may," "will," "continue," “expects,“ "predicts," "intends," "plans," "estimates," or similar expressions . Forward - looking statements and information are not guarantees of performance . They involve risks, uncertainties and assumptions because they refer to future events, depending, therefore, on circumstances that may or may not occur . Future results and shareholder value creation may differ materially from those expressed or implied by the forward - looking statements . Many of the factors that will determine these results and values are beyond our ability to control or predict 21