Exhibit 99.1

Results 2Q24 JBS 1

G l obal Lead ersh i p Aquaculture Plant - based and prote i ns business # 3 Eur o pe a n pr o du c e r o f pl a n t - ba se d p r o t e in #2 sa lmo n pr o duc e r in Australia P r epared Foods # 1 B r a zil i a n pr o du c e r o f plant - based # 2 in pr e pa r e d foo ds in B r az il # 1 in pr e pa r e d fo o ds in t h e U n ited Kingdom # 1 in foo d in A us t r al i a MARK E T LEAD E R NEW AVE N U ES OF GRO WT H Beef #1 Glo bal b e ef prod uc e r C a n a d a | U S A | B r a z il | A u st r a li a 2 Poultry #1 Gl o bal p o ultry prod uc e r U S A | M e xic o | B r a z il | E u rop e Pork #2 Gl o bal po rk prod uc e r U S A | B r a z il | A u st r a li a | E u rop e In 2024, w e w i ll comp l e t e a n e w cu l t i v a t e d p r o t e in f a ci li t y in S pain

1 . En h a n ce Sca le in E xisti n g C a t e go r ies a n d Geo g r a p h ies 2 . In c r eas e a n d D iv e r si fy V a lu e - Ad d e d a n d B r a n d Portfolio Lon g Ter m Growt h Strategy Pursuing additional value - enhancing growth opportunities with financial discipline Improve operational performance Capture significant synergies Enhance growth and margin profile Realize benefits of vertical integration 3 . N e w p r ot e i n s C l ose to the F i n a l Co n su m e r - M ul tic h a nn el 3

I n co m e Origi n Unite d Stat e s Brazil Australia Europe Canada Mexico 4 8% 29% 8% 7% 5% 3% B e e f P o r k L a m b P o u l t r y Aquaculture Leather Plant Bas ed C e n ter f o r In n o v a t i o n Cultivated Protein Prepared Foods South A m er i c a 1% M exic o & Cen tr al A m er i c a 6 % Brazil 14% Asi a 1 3 % Afr i c a & M i d d l e E ast 4% USA 49% 3 % Ca na da A u st r ali a & Ne w Zea land 3% Ne t r e v e nue L TM 1 Q 2 4 ( b y d es t ina t ion ) Europe 9% Strategy Geographic & Protein Diversification 4

16 . 5 31. 1 36. 9 38. 6 42. 9 51. 2 48. 9 49. 0 51. 1 49 . 7 51. 7 52.3 65. 0 72.6 72. 9 75. 5 0. 7 17.6 0 . 6 2. 1 1. 9 2. 2 2 . 8 4. 7 4. 0 3 . 3 4. 2 4. 0 5. 0 5. 6 8. 5 6. 7 3. 5 5. 3 2008 2009 2010 2011 2012 2013 2014 2015 2016 2017 2018 2019 2020 2021 2022 2023 L TM 2Q24 Net S a l es E B I T D A 3. 8 % 3. 7 % 6. 9 % 5.1% 5. 8 % 6. 6 % 9.2% 8. 2 % 6. 6 % 8. 2 % 8. 2 % 9. 7 % 10. 9 % 13. 0 % 9. 2 % 4. 7 % EBIT D A M argin U SD Bil l i o n Stability of Res u lts Geographic & Protein Diversification Leading to lower results volatility 2Q24 9.8% PPC 5 7 . 1 % JBS US A P or k Seara JBS A u s t r a l i a Consolidated JBS B r az i l JBS Bee f Nor t h A m .
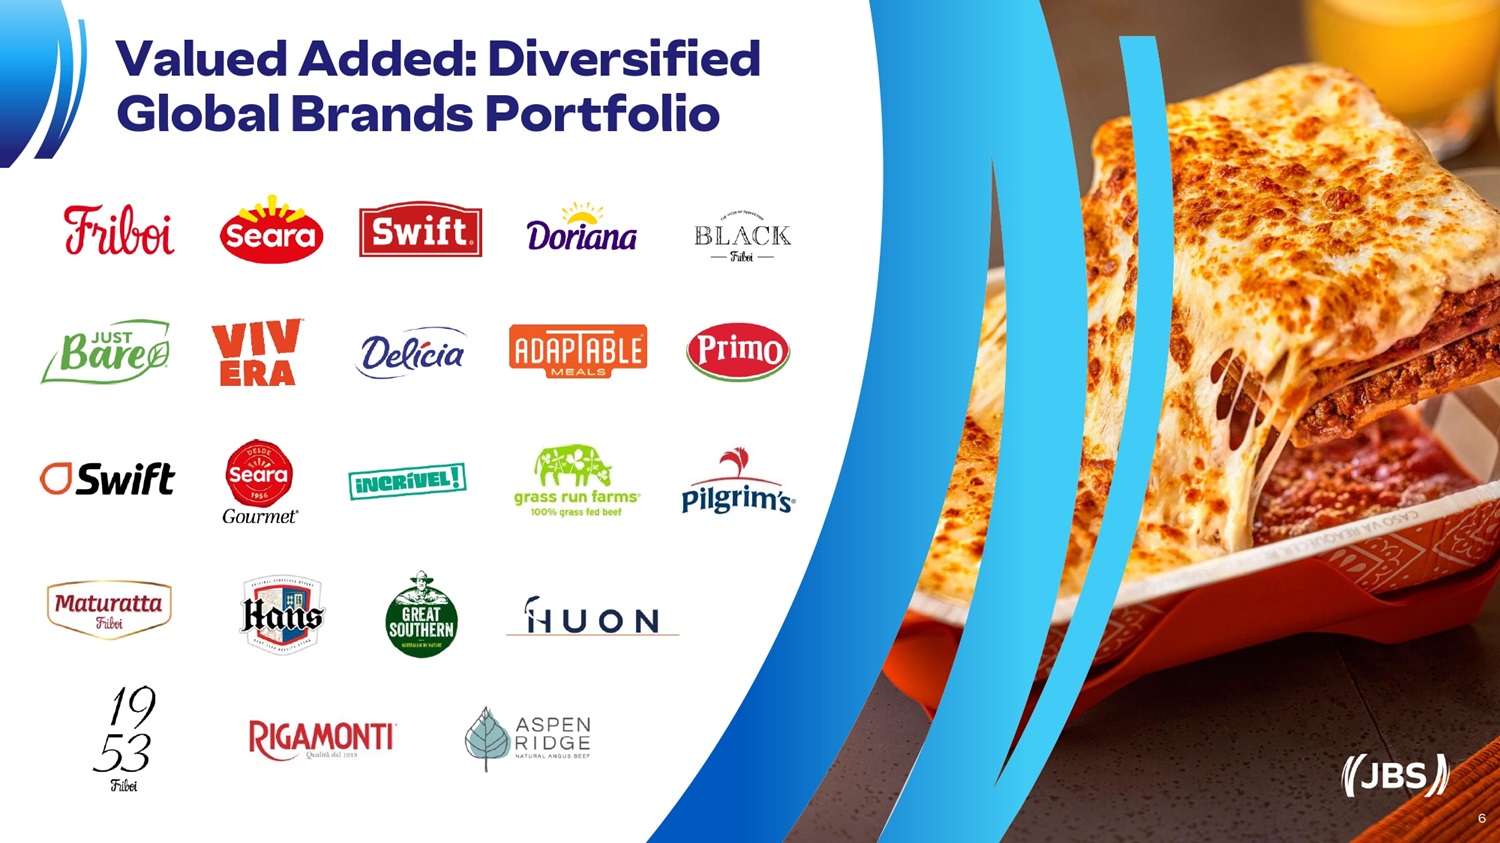
Valued Added: Diversified Globa l Brands P o rtfolio 6
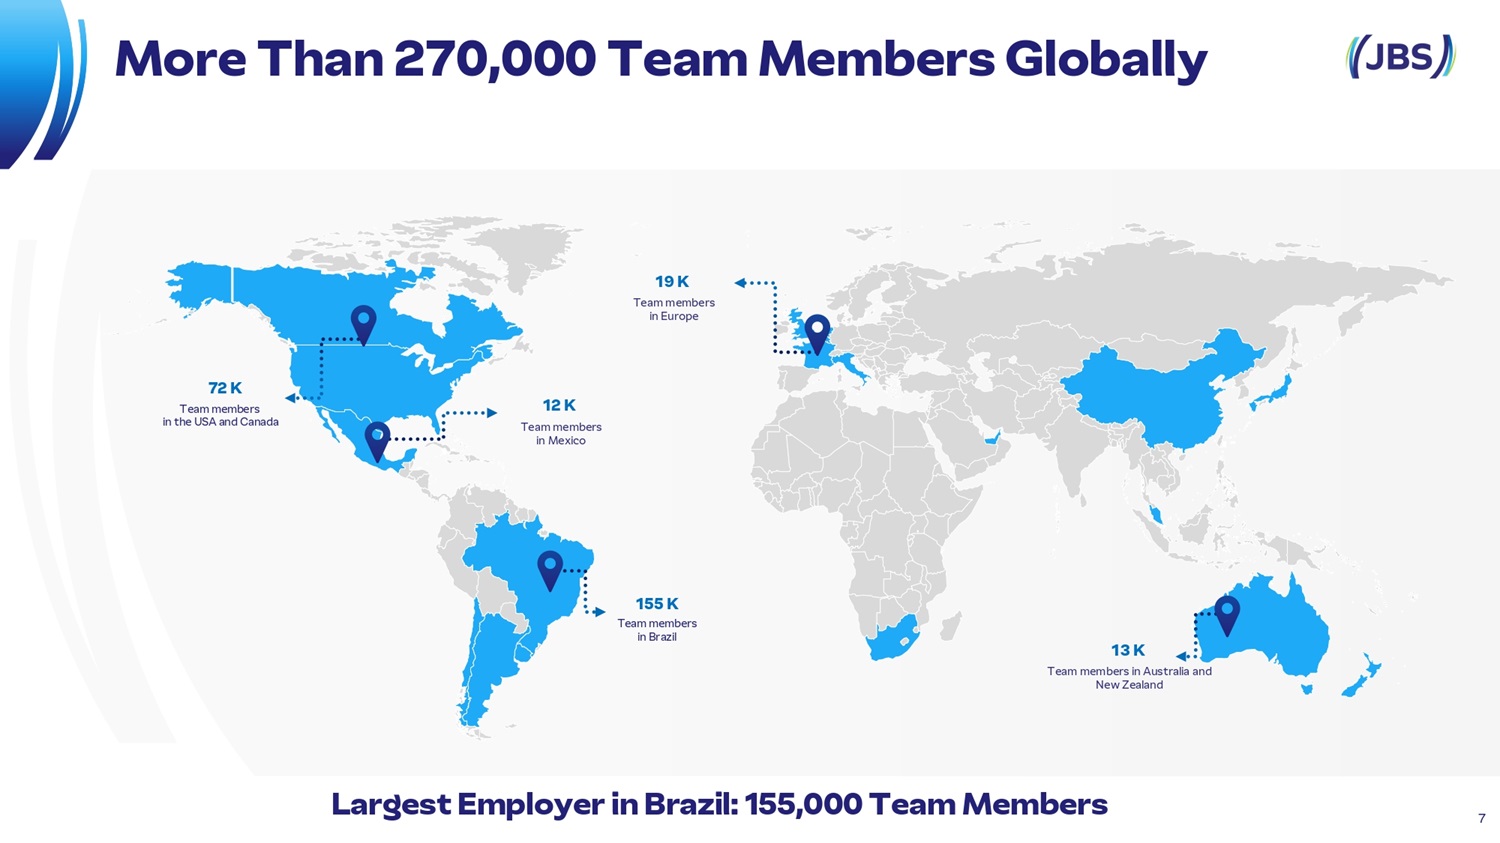
13 K T e a m m e m b e r s i n A u s t r a l i a a n d N e w Z e a l a n d 155 K T e am m e m b e rs i n Br a z i l 12 K T e a m m e m b e r s i n M e x i c o 19 K T e a m m e m b e r s i n E u r o pe 72 K T e am m e m b e rs i n t he U S A a n d C a n ad a La rgest Em p l o ye r in B r azi l : 155,000 Te a m Members More Tha n 270,000 Tea m Members Glob a lly 7
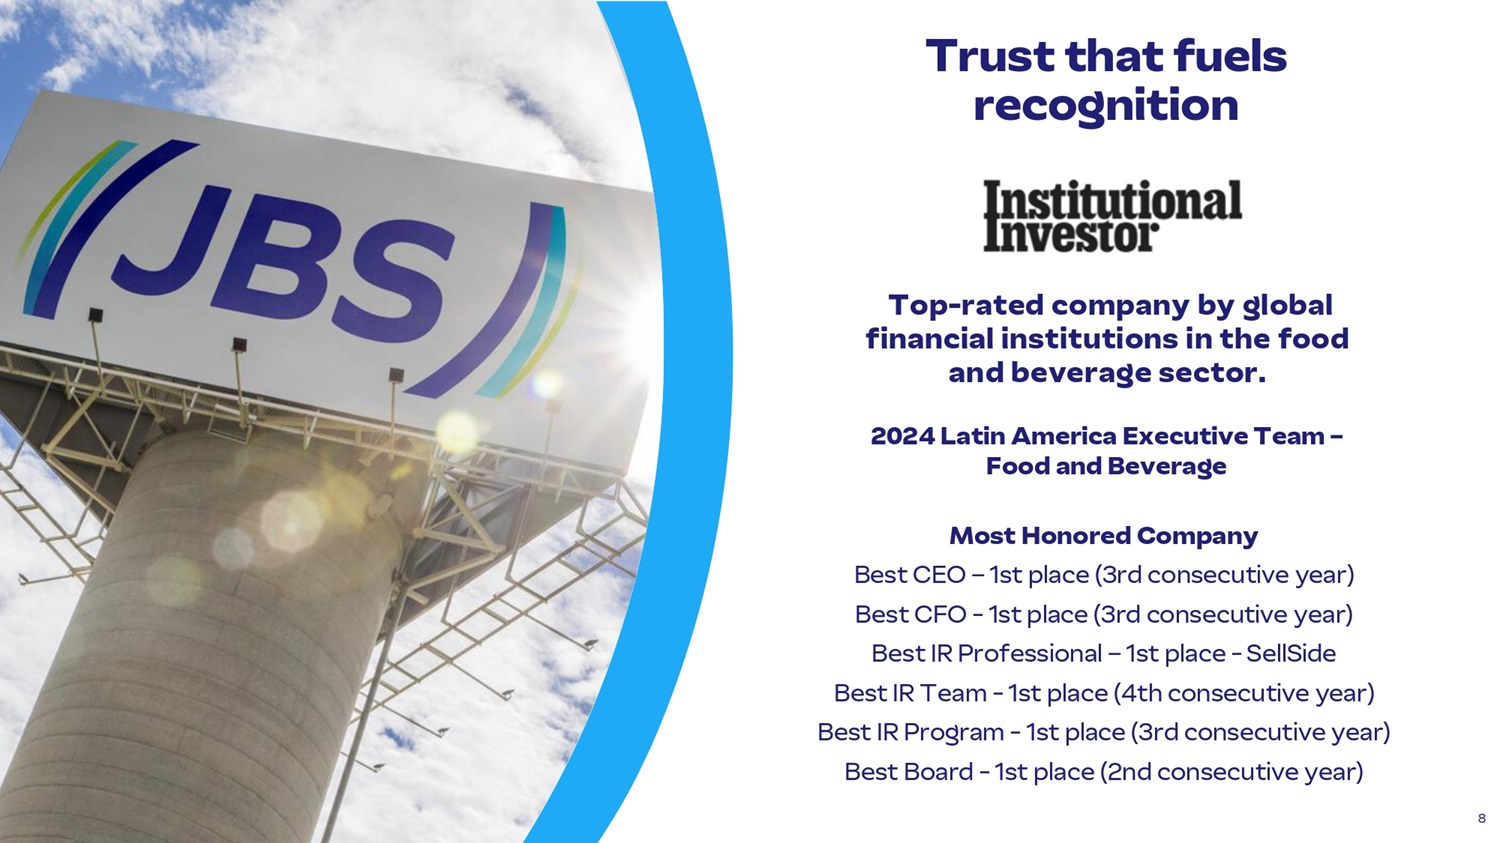
Top - rated company by global financial institutions in the food and beverage sector. 2024 L a t i n Am e rica E x e cutive T e a m – Fo o d a n d B e ver a ge M o st H o nore d C o m pany Be s t C EO – 1st place ( 3r d c on secu t i ve y ea r ) Be s t C FO - 1st p l ace (3 r d c on secu t i ve y ea r ) B e st I R Pro fessi o n a l – 1st pl a ce - S e l l S i de Best I R Team - 1st p l ace ( 4 t h con s ecut i v e y ea r ) Best I R Prog r am - 1st p l ace ( 3 r d c on secu t i ve y ea r ) Best Board - 1st p l ace ( 2 nd con s ecut i v e y ea r ) 8 Tr u st that f u e l s recognition
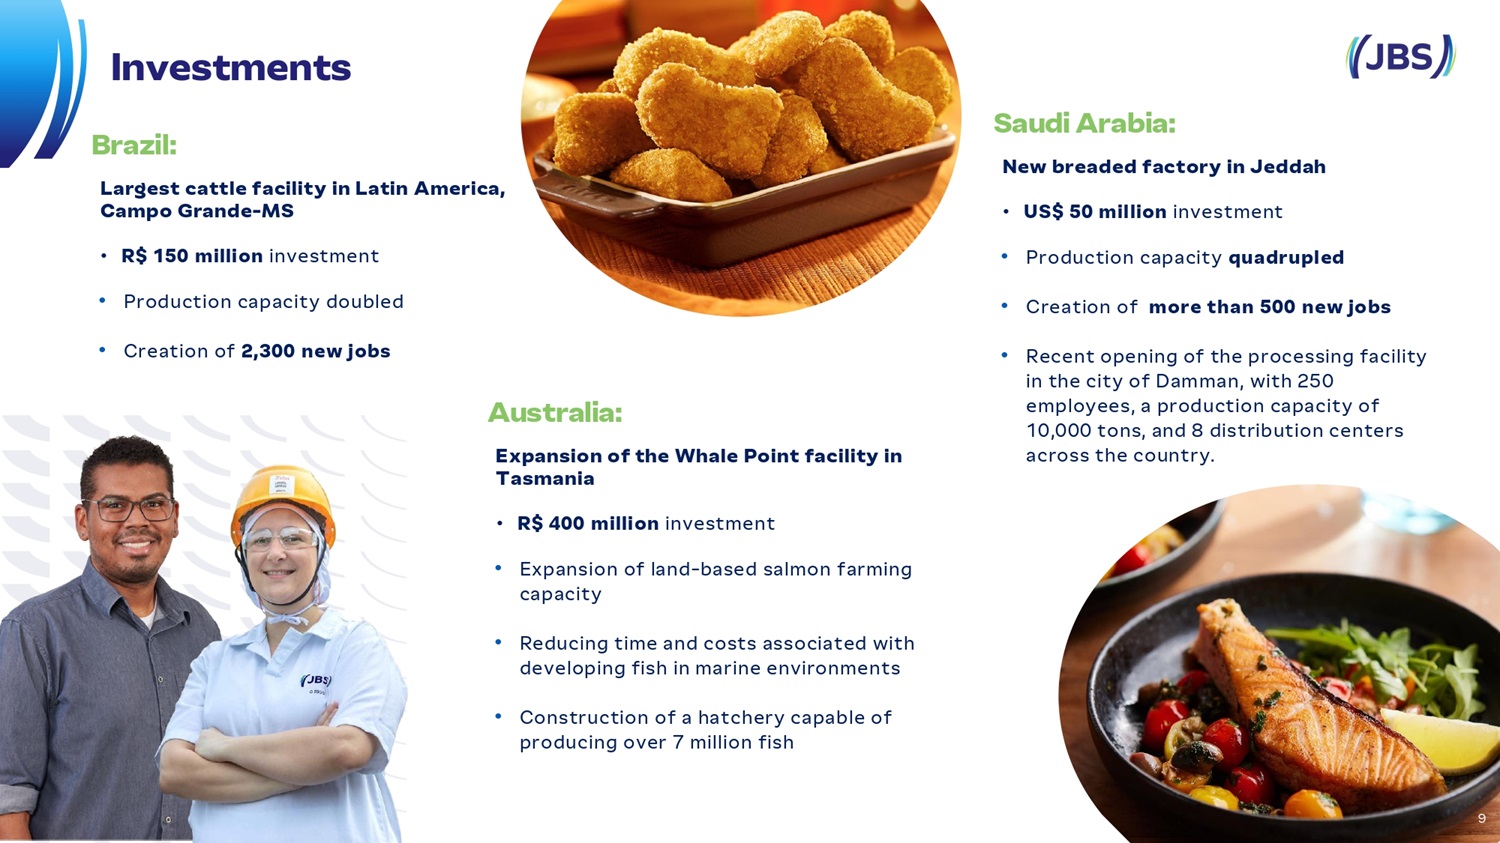
Investments Brazil: Largest cattle facility in Latin America, Campo Grande - MS • R$ 150 million investment • Production capacity doubled • Creation of 2,300 new jobs Australia: Expansion of the Whale Point facility in Tasmania • R$ 400 million investment • Expansion of land - based salmon farming capacity • Reducing time and costs associated with developing fish in marine environments • Construction of a hatchery capable of producing over 7 million fish Sa u di A r abia: New breaded factory in Jeddah • US$ 50 million investment • Production capacity quadrupled • Creation of more than 500 new jobs • Recent opening of the processing facility in the city of Damman, with 250 employees, a production capacity of 10,000 tons, and 8 distribution centers across the country. 9
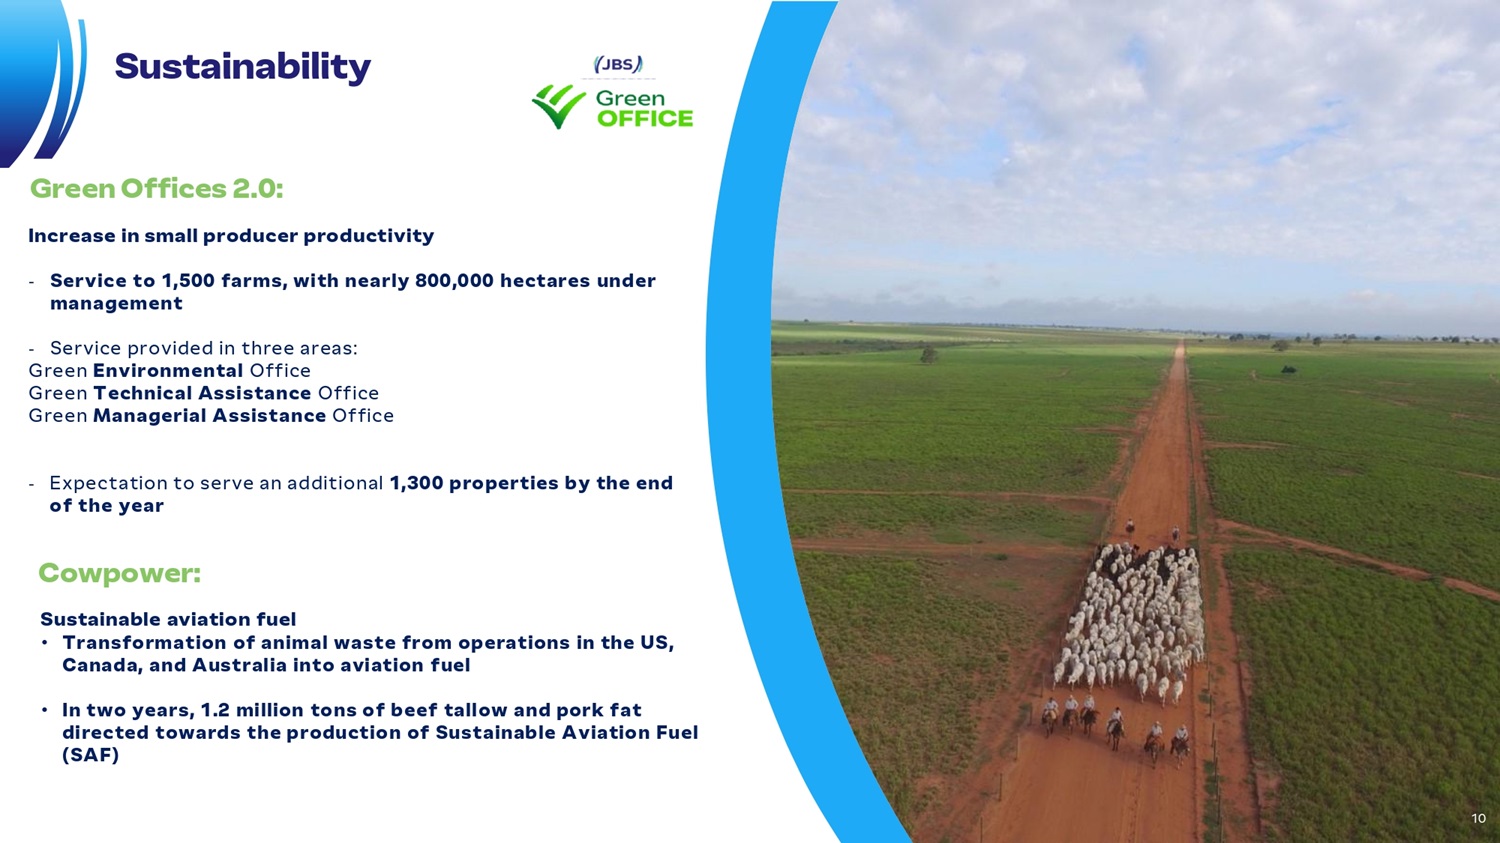
Sustainability Gree n Offices 2.0: Increase in small producer productivity - Service to 1,500 farms, with nearly 800,000 hectares under management - Service provided in three areas: Green Environmental Office Green Technical Assistance Office Green Managerial Assistance Office - Expectation to serve an additional 1,300 properties by the end of the year Cowpower: Sustainable aviation fuel • Transformation of animal waste from operations in the US, Canada, and Australia into aviation fuel • In two years, 1.2 million tons of beef tallow and pork fat directed towards the production of Sustainable Aviation Fuel (SAF) 10
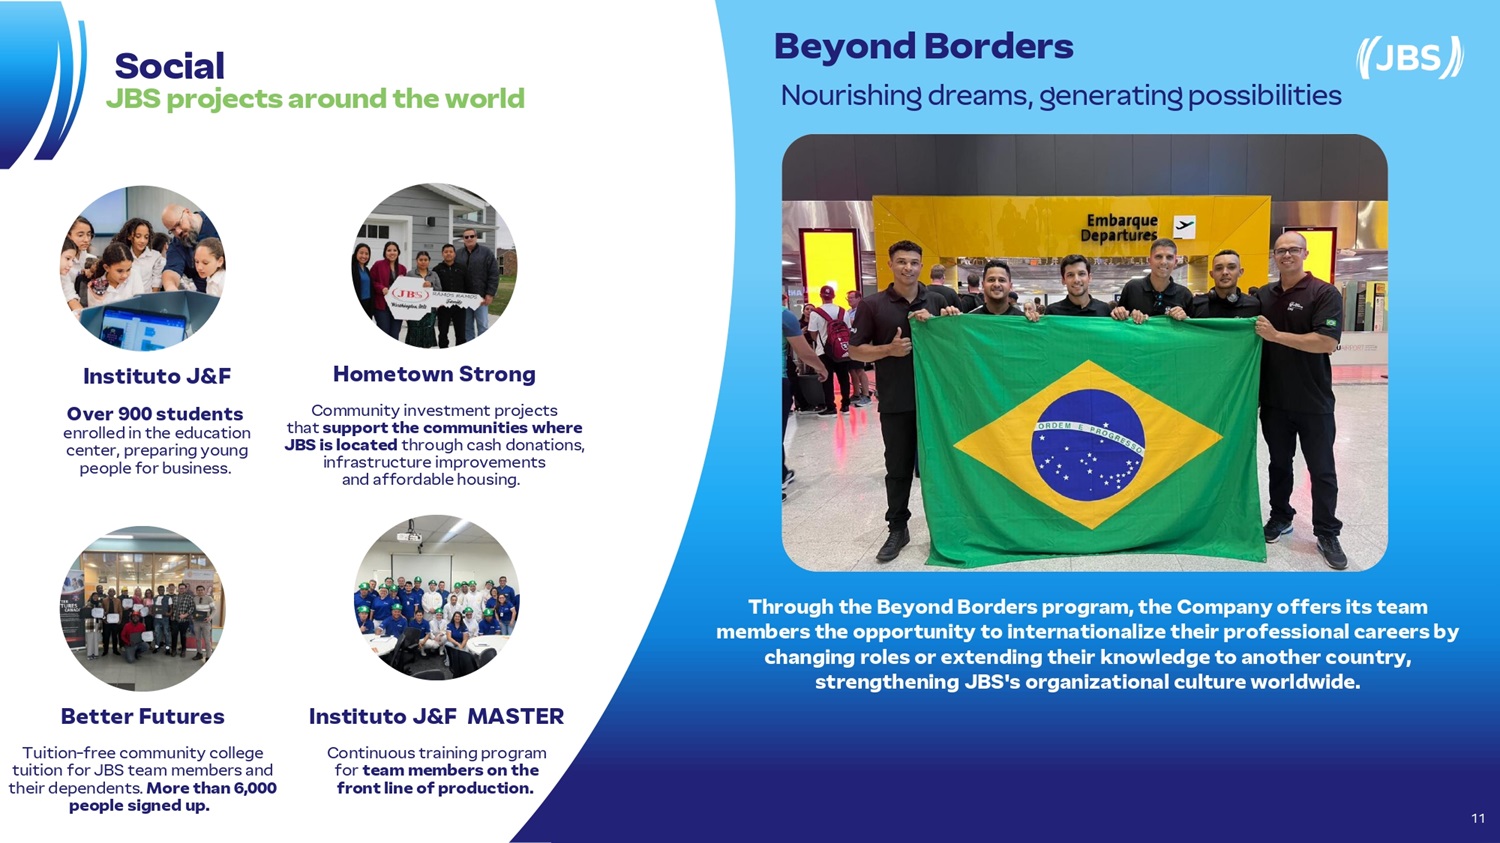
Be y ond B o rders Through the Beyond Borders program, the Company offers its team members the opportunity to internationalize their professional careers by changing roles or extending their knowledge to another country, strengthening JBS's organizational culture worldwide. I n s ti t uto J&F Over 900 st u d ent s e n roll e d in t h e e d uca tion c e n t e r, p reparing y ou n g p e op le for b usin e s s . Bett e r Futur es Tuition - fr e e c omm u n ity c oll e ge tui t ion for J B S t e am mem b e rs a n d t h e ir d e p e n d e n t s . M ore than 6 , 0 00 p e ople signe d u p. I n s ti t uto J&F M A S T ER Continuous training program for team m e m b ers on the fr ont li ne of p r od u c tion. H o m etown Str o n g C o mm u n ity i n v e s t me n t p roj e c ts t h at su p port the c o m m un iti es w h ere J B S is loc a t ed t h rou g h c a s h do n a t ion s , i n fras t ru c ture im pro v e me n ts a n d af f or d a b le h ousi n g. Social JBS proje c ts aroun d th e world 11 No u ri shing drea m s , ge n er a t i ng poss i bil i ties

Fina n cial & Operating 12
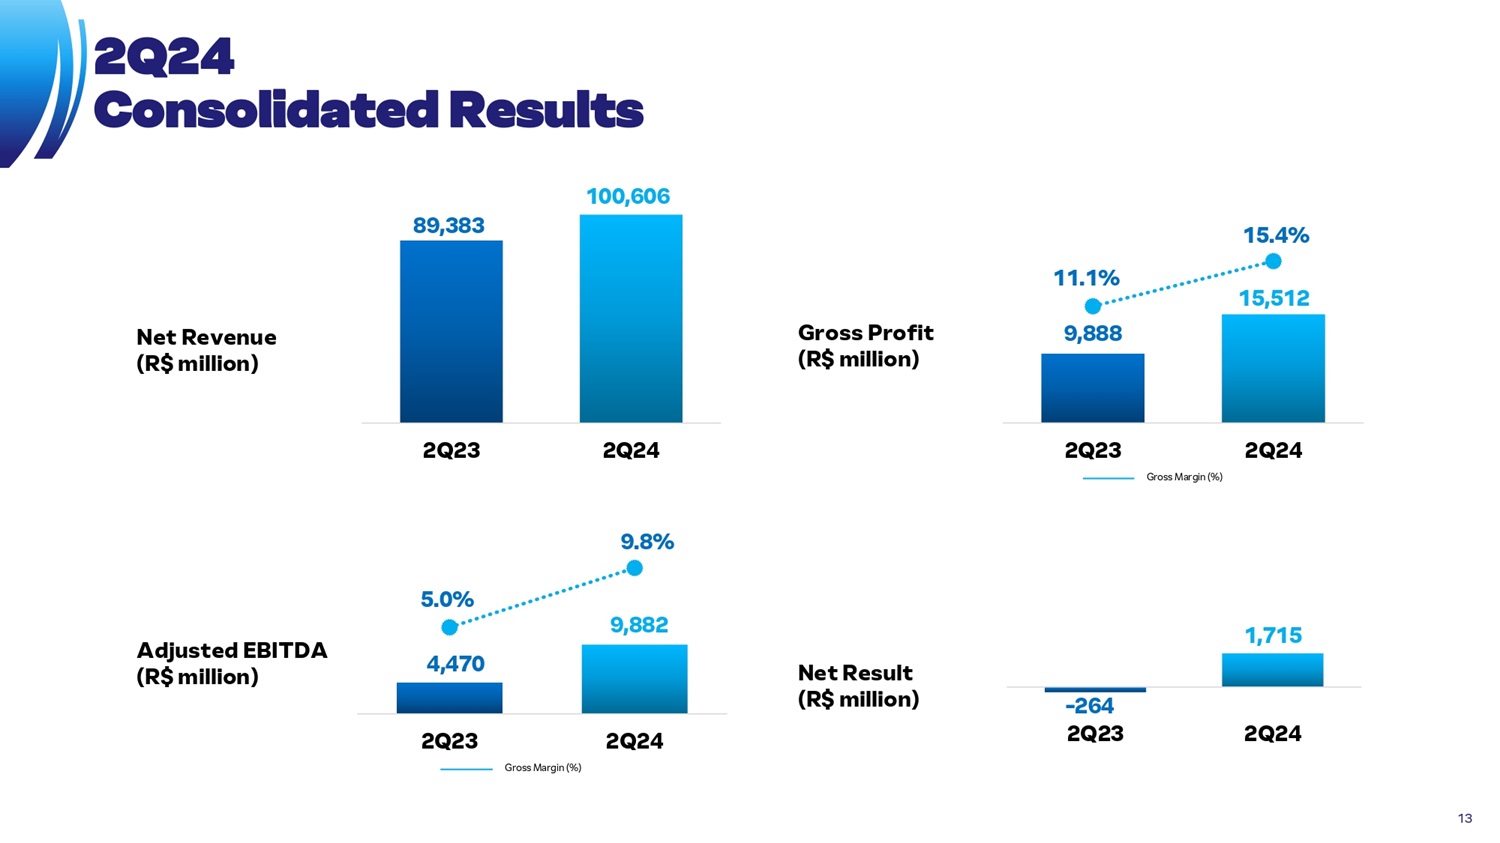
- 264 2Q23 2Q24 1, 7 15 89,383 1 0 0, 6 06 2 Q 23 2Q 24 9, 8 88 11.1% 15,512 1 5 .4 % 2Q23 Gr o ss Ma r g i n ( % ) 2Q 24 Ne t R esult ( R $ m i ll i on) 2Q24 Con s olida ted R e sults A d ju s t ed E B I TDA ( R $ m i ll i on) 4, 4 70 9, 8 82 5. 0 % 9. 8 % 2Q23 Gr o ss Ma r g i n ( % ) 2Q 24 Ne t R e v e n u e ( R $ m i ll i on) Gross Pro f i t ( R $ m i ll i on) 13

Ope r ati n g C ash F l ow ( R $ m i ll i on) Fr e e Cas h F l ow ( R $ m i ll i on) 5, 2 61 9, 5 95 2Q 23 2Q 24 1, 2 59 5, 5 10 2Q 23 2Q 24 63 % - M aint ena nce 37 % - Expans i o n 51 % - M aint ena nce 49 % - Expans i o n 2Q24 Consolida ted Re s ults CAPEX ( R $ m i ll i o n ) 1, 9 51 14 1, 8 03 2 T 23 2T24
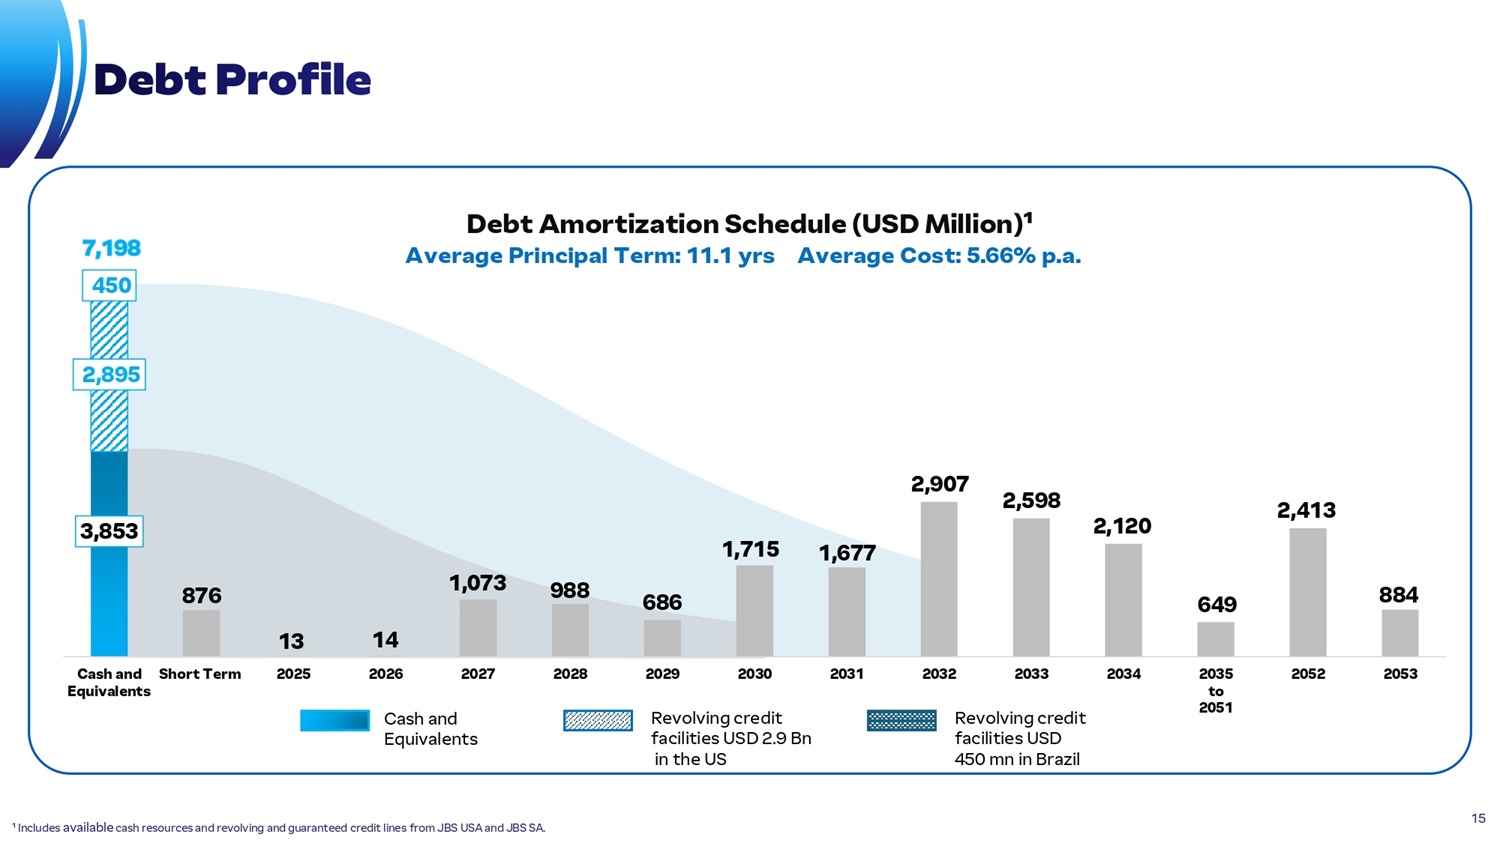
876 13 14 1, 0 73 988 686 1, 7 15 1, 6 77 2, 9 07 2, 5 98 2, 1 20 649 2, 4 13 884 450 2,895 3,853 C a s h a nd Eq u ivalent s S hort T er m 2025 2028 2031 2034 2035 to 2051 2052 2053 7, 1 98 2026 2027 C a sh a nd Eq u i va l e nts 2029 2030 Revo l v i ng cre d i t fac i l i t i es U S D 2 . 9 Bn i n the US 2032 2033 Revo l v i ng cre d i t fac i l i t i es U S D 45 0 m n i n B r a zil Deb t Profi l e Debt A mor t i z a t i on Sched u l e (USD M i l l i on)¹ Ave rage Pr i n c i p al Te r m : 11 . 1 y rs A v e ra ge Cos t : 5 . 6 6 % p .a . 15 ¹ Includes available cash resources and revolving and guaranteed credit lines from JBS USA and JBS SA.

N et Debt / Lever a g e / Intere s t Cover a g e Sou r c e Breakd o w n Curr e ncy and C ost Breakd o w n Sho r t Te r m and L ong Te r m LT 95. 3% ST 4. 7% ¹ Inclui dívidas em outras moedas, como Euros e dólares canadenses. Bo n ds 86% Ba n ks 3% CRA 11% E ntity Breakd o w n JB S U S A 87. 1 % JBS SA 11.7% S ea r a 1.2% USD¹ 8 7 .4% 5. 0 8 % p .a. BRL 12.6% 9. 69 % p . a. Deb t Profi l e 16,652 16,053 15,297 15,866 14, 7 59 3. 2 1 x 3. 2 0 x 4. 0 0 x 4. 9 5 x 4.21x 4. 1 5 x 4. 8 7 x 4. 4 2 x 3. 6 6 x 2. 7 7 x 2Q 23 4Q 23 1Q 24 3Q23 N e t D e bt (US D Mi l li o n s ) In t e r e st C o v e r . 2Q 24 Lev e r a g e (U S D ) 20

2, 0 19 4. 1 % 420 1 7 .4 % 2Q 23 2Q 24 10,310 11,595 2Q 23 2Q 24 Sea r a Prod u cts Se a ra N e t Re v e n ue (R$ m i ll i o n ) A dju s t e d EBITDA (R$ m i ll i on and % ) 2 Q24 17
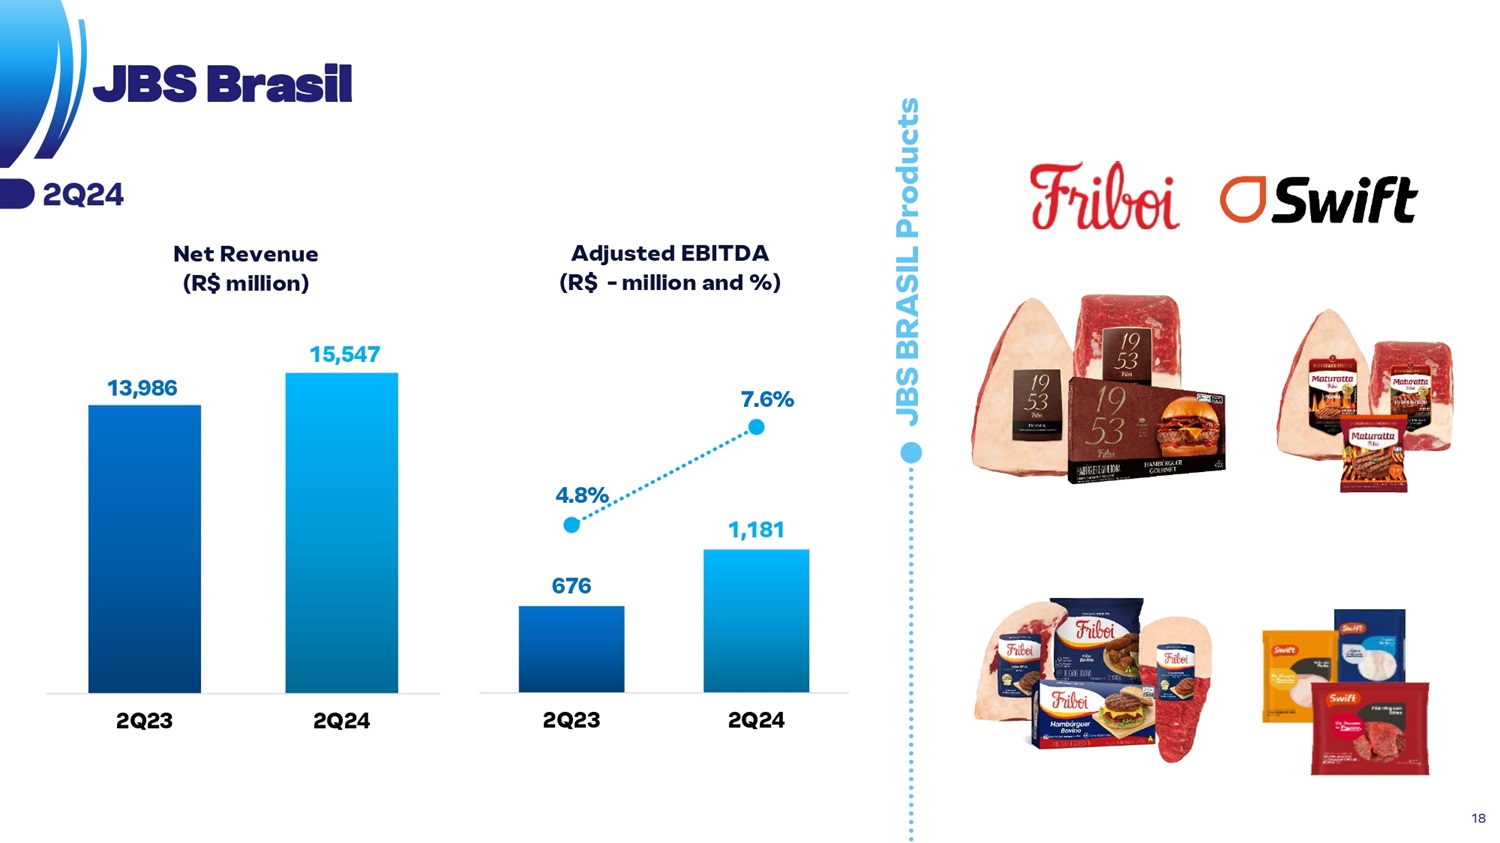
JBS BRA S IL Prod u cts 4.8% 1, 1 81 676 7. 6 % 2Q 23 2Q 24 13,986 15,547 2Q 23 2Q 24 J B S Br a sil N e t Re v e n ue (R$ m i ll i o n ) A dju s t e d EBITDA (R$ - m i ll i on and % ) 2 Q24 18
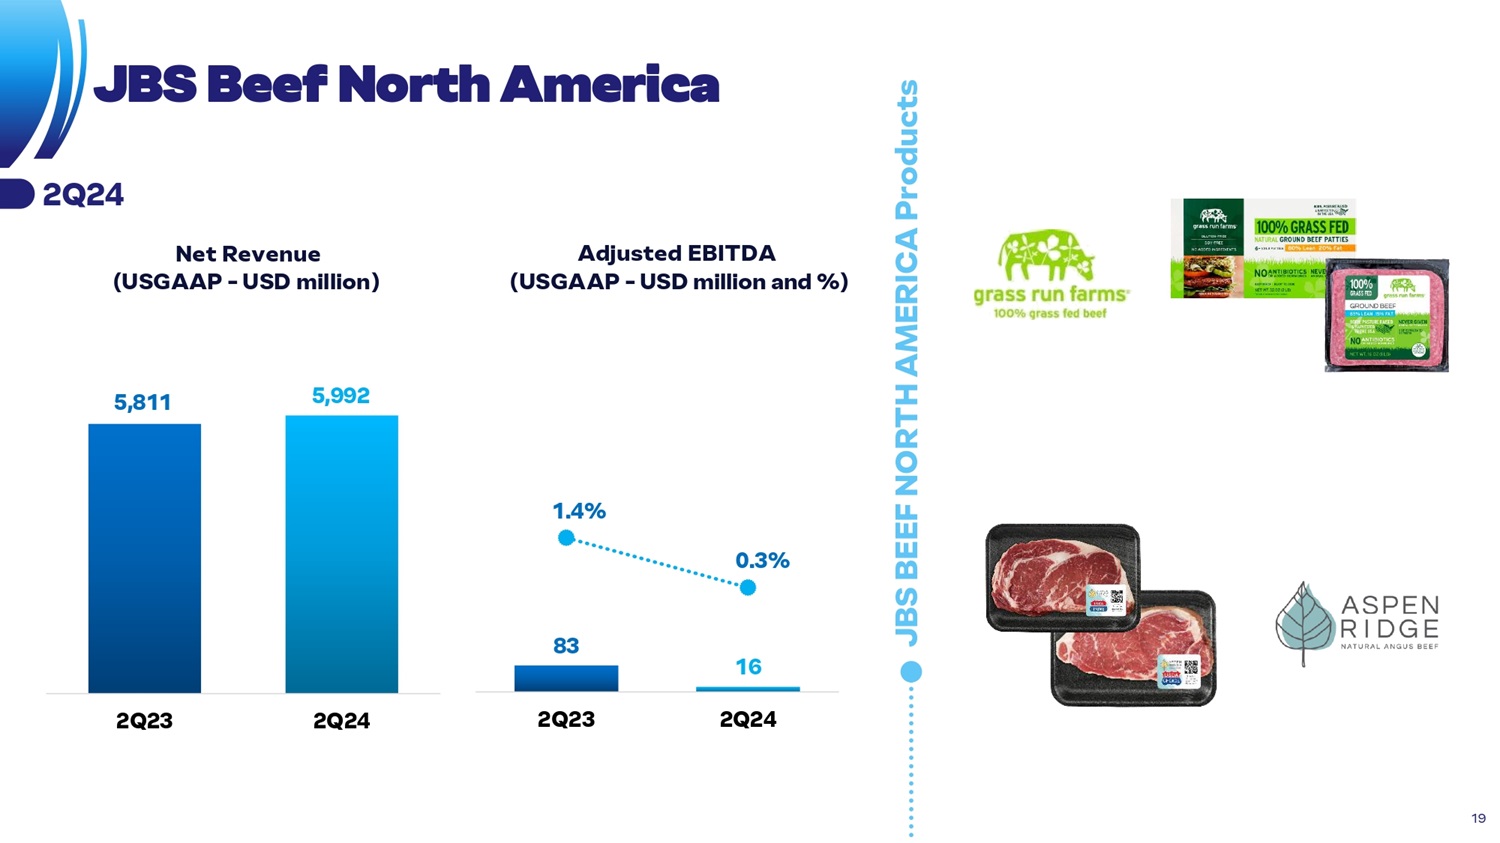
5, 8 11 5, 9 92 2Q 23 2Q 24 83 16 1. 4 % 0. 3 % 2Q 23 2Q 24 JBS BEE F N ORTH A MERICA Pro du cts J B S Beef North America N e t Re v e n ue ( U S G A A P - U S D m i ll i o n ) Adjusted EBITDA ( U S G A A P - U S D m i ll i o n a n d %) 2 Q24 19

JBS A USTR A LIA Prod u cts 130 202 8. 6 % 1 2 .2 % 2Q 23 2Q 24 J B S A u stralia 1, 5 09 1, 6 52 2Q 23 2Q 24 N e t Re v e n ue ( U S G A A P - U S D m i ll i o n ) Adjusted EBITDA ( U S G A A P - U S D m i ll i o n a n d %) 2 Q24 20
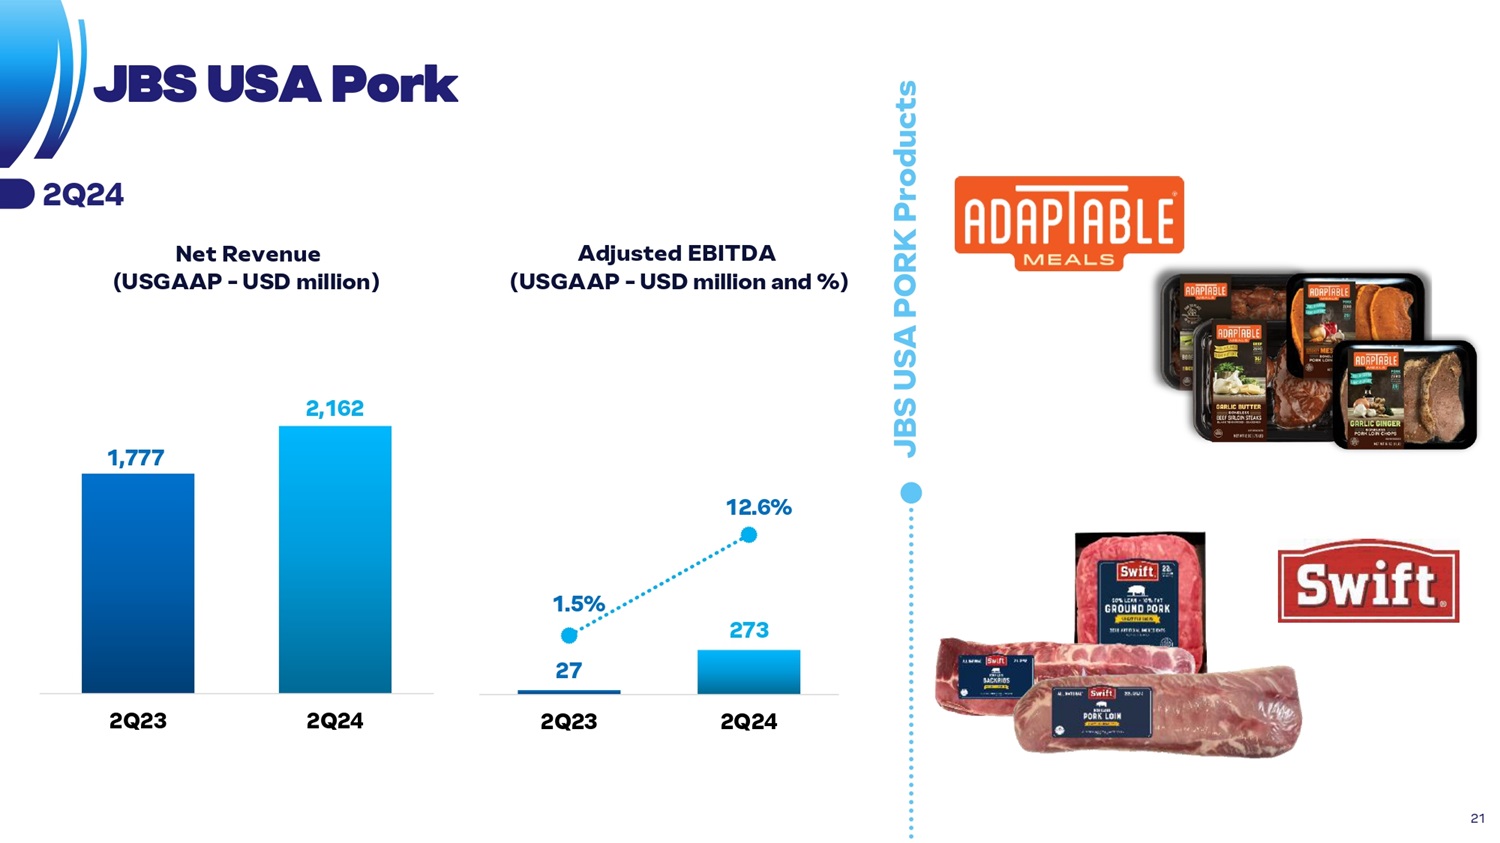
27 273 1. 5 % 1 2 .6 % 2Q 23 2Q 24 JBS U S A PORK Pro du cts J B S USA Pork 1, 7 77 2, 1 62 2Q 23 2Q 24 N e t Re v e n ue ( U S G A A P - U S D m i ll i o n ) Adjusted EBITDA ( U S G A A P - U S D m i ll i o n a n d %) 2 Q24 21

4, 3 08 4, 5 59 2Q 23 2Q 24 249 656 5. 8 % 1 4 .4 % 2Q 23 2Q 24 PPC Prod u cts Pil g rim’s Pride N e t Re v e n ue ( U S G A A P - U S D m i ll i o n ) Adjusted EBITDA ( U S G A A P - U S D m i ll i o n a n d %) 2 Q24 22
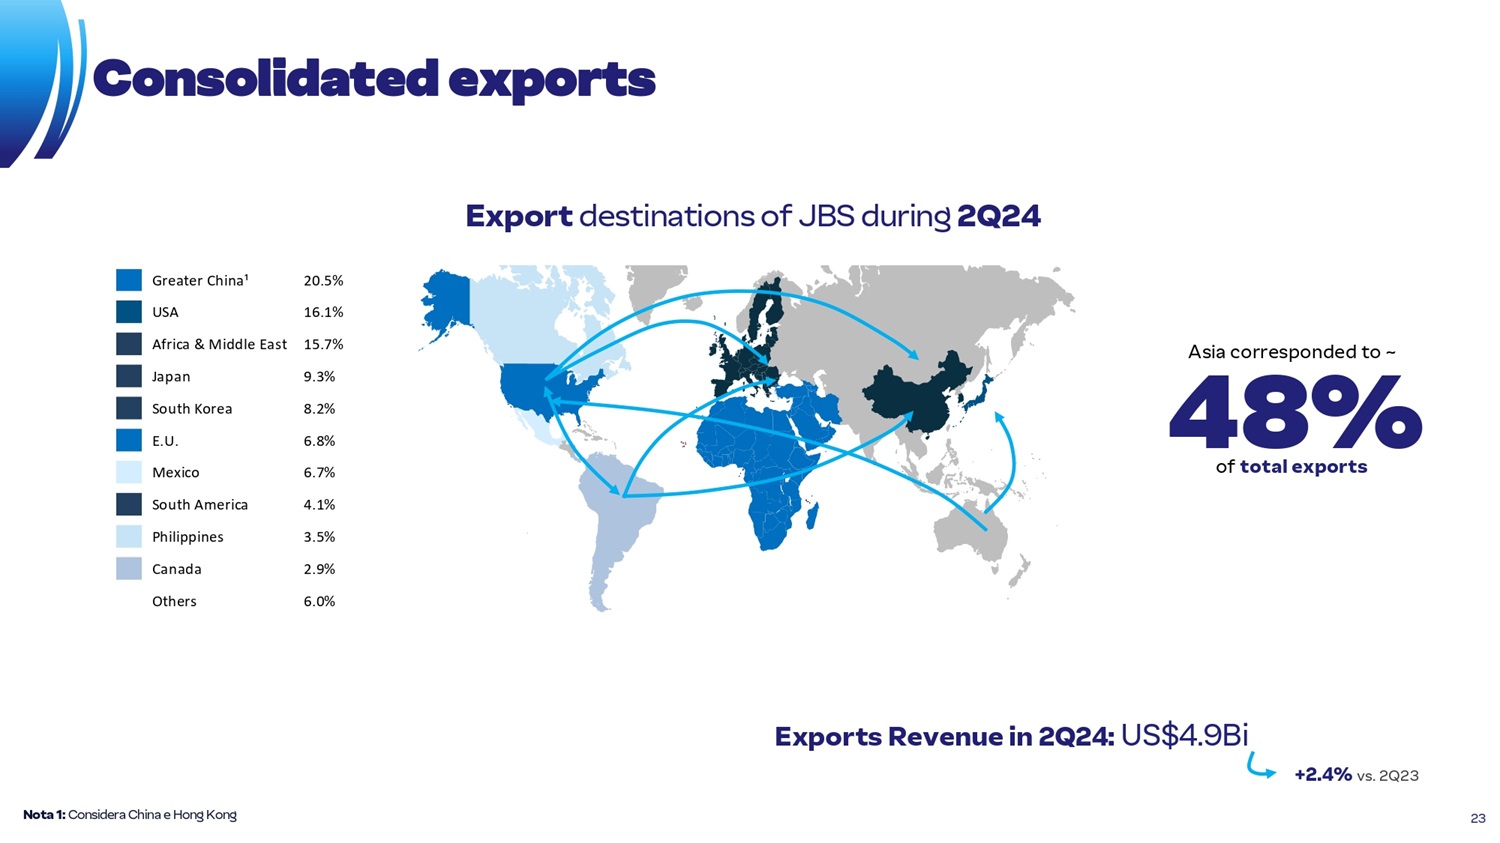
No t a 1: C o n s i d e ra C h i n a e H o n g K o n g E x po r t desti n ation s o f J BS during 2 Q 2 4 Consolida ted exports E x port s Revenu e in 2Q24: US$ 4 . 9 Bi +2 . 4 % vs . 2 Q 23 A s i a corresp o nded t o ~ 48% o f to t a l export s 20.5% Greater China¹ 16.1% USA 15.7% Africa & Middle East 9.3% Japan 8.2% South Korea 6.8% E.U. 6.7% Mexico 4.1% South America 3.5% Philippines 2.9% Canada 6.0% Others 23

JBS Bringing more to the table