J. Garrett Stevens
(a) A copy of the report transmitted to stockholders pursuant to Rule 30e-1 under the Investment Company Act of 1940, as amended (the “Act”) (17 CFR § 270.30e-1) is attached hereto.
(b) Not applicable.
The Registrant has adopted a code of ethics that applies to the Registrant's principal executive officer, principal financial officer, controller or principal accounting officer or any person who performs a similar function.
(a)(1) The Registrant’s Board of Trustees has determined that the Registrant has an audit committee financial expert serving on the audit committee.
(a)(2) The audit committee financial expert Timothy Jacoby is an independent trustee as defined in Form N-CSR Item 3 (a)(2).
Fees billed by Cohen & Company, Ltd (Cohen) related to the Registrant.
Cohen billed the Registrant aggregate fees for services rendered to the Registrant for the last two fiscal years as follows:
(e)(1) The Trust’s Audit Committee has adopted, and the Board of Trustees has ratified, an Audit and Non-Audit Services Pre-Approval Policy (the “Policy”), which sets forth the procedures and the conditions pursuant to which services proposed to be performed by the independent auditor of the Trust may be pre-approved.
(e)(2) Percentage of fees billed applicable to non-audit services pursuant to waiver of pre-approval requirement were as follows:
(f) Not Applicable.
(g) The aggregate non-audit fees and services billed by Cohen for the fiscal years 2024 and 2023 were $35,000 and $24,000, respectively.
(h) During the past fiscal year, Registrant's principal accountant provided certain non-audit services to Registrant's investment adviser or to entities controlling, controlled by, or under common control with Registrant's investment adviser that provide ongoing services to Registrant that were not subject to pre-approval pursuant to paragraph (c)(7)(ii) of Rule 2-01 of Regulation S-X. The Audit Committee of Registrant's Board of Trustees reviewed and considered these non-audit services provided by Registrant's principal accountant to Registrant's affiliates, including whether the provision of these non-audit services is compatible with maintaining the principal accountant's independence.
(i) Not applicable. The Registrant has not retained, for the preparation of the audit report on the financial statements included in the Form N-CSR, a registered public accounting firm that has a branch or office that is located in a foreign jurisdiction and that the Public Company Accounting Oversight Board (the “PCAOB”) has determined that the PCAOB is unable to inspect or investigate completely because of a position taken by an authority in the foreign jurisdiction.
(j) Not applicable. The Registrant is not a “foreign issuer,” as defined in 17 CFR 240.3b-4.
The Registrant has a separately-designated standing Audit Committee, which is composed of the Registrant's Independent Trustees: Timothy Jacoby, Stuart Strauss, Linda Petrone and Mark Zurack.
(a) The Schedule of Investments is included as part of the Financial Statements and Other Information filed under Item 7 of this form.
(b) Not Applicable.
Financial statements and financial highlights are filed herein.

EXCHANGE TRADED CONCEPTS TRUST
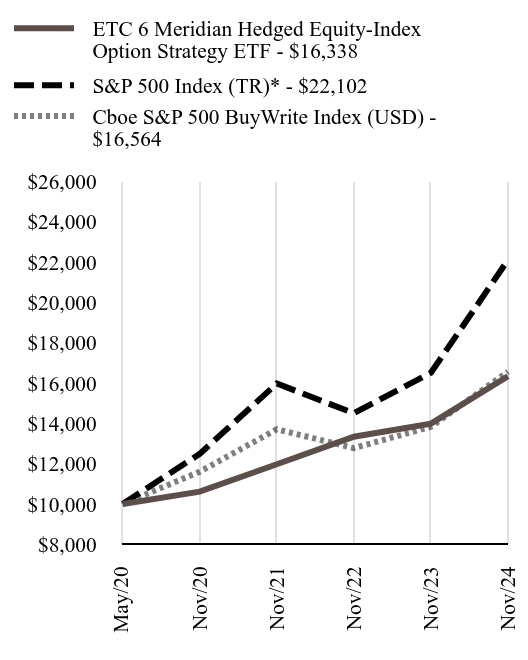
ETC 6 Meridian Hedged Equity-Index Option Strategy ETF
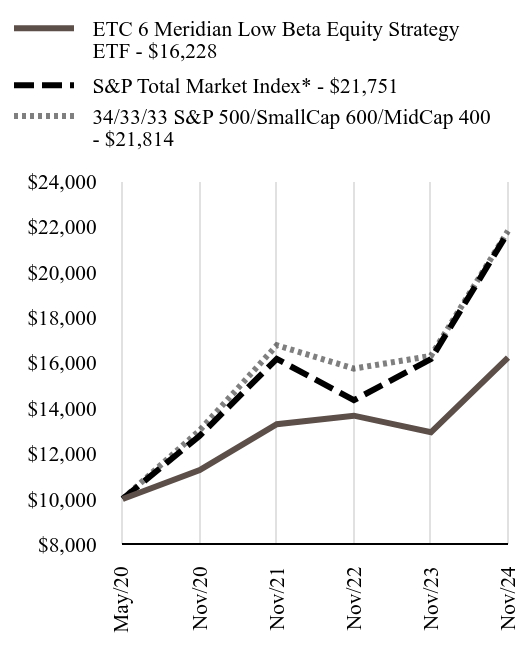
ETC 6 Meridian Low Beta Equity Strategy ETF
ETC 6 Meridian Mega Cap Equity ETF
ETC 6 Meridian Small Cap Equity ETF
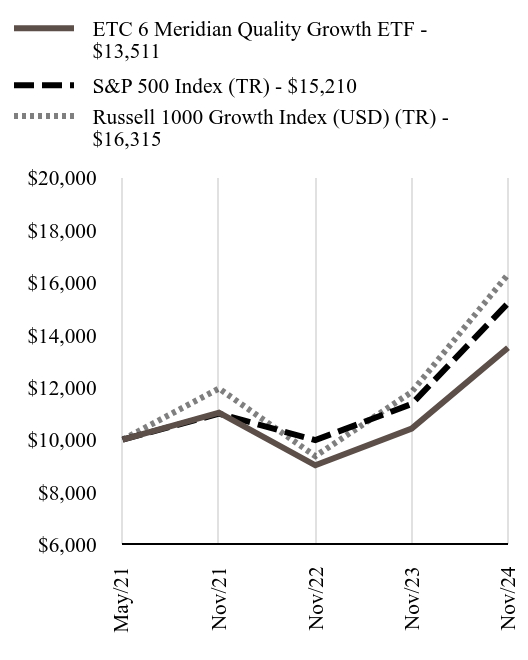
ETC 6 Meridian Quality Growth ETF
Annual Financials and Other Information
November 30, 2024

ETC 6 Meridian
Table of Contents
For additional information about the Funds; including each Fund’s prospectus, financial information, holdings, and proxy voting information, call or visit: • 866-SIXM-ETF (749-6383) • https://6meridianfunds.com/investor-materials |
ETC 6 Meridian
Hedged Equity-Index Option Strategy ETF
Schedule of Investments
November 30, 2024
Description | | Shares | | Fair Value |
COMMON STOCK — 100.2% | | | | | |
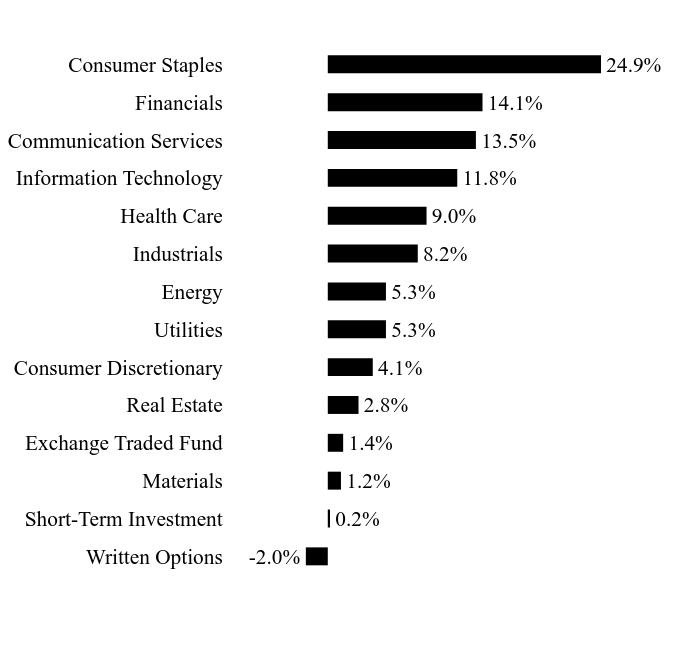
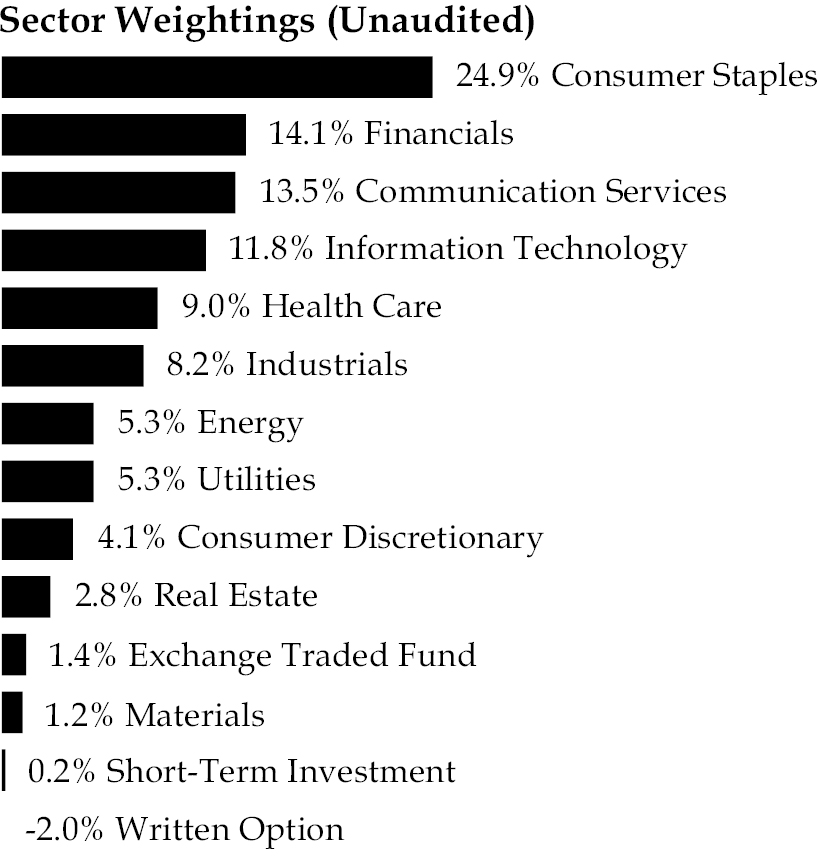
Communication Services — 13.5% | | | | | |
Alphabet, Cl A(A) | | 33,524 | | $ | 5,663,880 |
AT&T(A) | | 778,834 | | | 18,037,796 |
Meta Platforms, Cl A(A) | | 20,246 | | | 11,627,682 |
Netflix* | | 7,594 | | | 6,734,435 |
Verizon Communications(A) | | 416,533 | | | 18,469,073 |
| | | | | | 60,532,866 |
Consumer Discretionary — 4.1% | | | | | |
Amazon.com(A)* | | 29,010 | | | 6,030,889 |
General Motors | | 225,370 | | | 12,528,318 |
| | | | | | 18,559,207 |
Consumer Staples — 24.9% | | | | | |
Altria Group(A) | | 426,402 | | | 24,620,452 |
Coca-Cola(A) | | 88,330 | | | 5,660,187 |
Colgate-Palmolive(A) | | 123,056 | | | 11,890,901 |
Costco Wholesale(A) | | 13,088 | | | 12,719,965 |
Kraft Heinz(A) | | 342,936 | | | 10,963,664 |
PepsiCo(A) | | 104,036 | | | 17,004,684 |
Philip Morris International | | 43,952 | | | 5,848,253 |
Procter & Gamble | | 34,778 | | | 6,234,304 |
Target | | 76,137 | | | 10,073,686 |
Walmart(A) | | 69,867 | | | 6,462,698 |
| | | | | | 111,478,794 |
Energy — 5.3% | | | | | |
Chevron | | 75,029 | | | 12,149,446 |
Exxon Mobil(A) | | 99,912 | | | 11,785,620 |
| | | | | | 23,935,066 |
Description | | Shares | | Fair Value |
Financials — 14.1% | | | | | |
American Express(A) | | 42,116 | | $ | 12,831,903 |
American International Group | | 75,838 | | | 5,830,426 |
Bank of New York Mellon | | 76,248 | | | 6,242,424 |
Berkshire Hathaway, Cl B* | | 12,697 | | | 6,132,905 |
BlackRock Funding | | 5,828 | | | 5,960,878 |
Capital One Financial(A) | | 35,035 | | | 6,727,070 |
JPMorgan Chase | | 25,755 | | | 6,431,539 |
PayPal Holdings* | | 74,333 | | | 6,449,874 |
US Bancorp | | 120,031 | | | 6,396,452 |
| | | | | | 63,003,471 |
Health Care — 9.0% | | | | | |
Eli Lilly | | 14,021 | | | 11,151,602 |
Gilead Sciences(A) | | 128,307 | | | 11,878,662 |
Johnson & Johnson(A) | | 35,861 | | | 5,558,814 |
Merck(A) | | 56,362 | | | 5,728,634 |
UnitedHealth Group | | 10,116 | | | 6,172,783 |
| | | | | | 40,490,495 |
Industrials — 8.2% | | | | | |
Caterpillar(A) | | 30,252 | | | 12,285,640 |
Deere | | 14,339 | | | 6,680,540 |
General Electric(A) | | 33,445 | | | 6,092,341 |
Lockheed Martin | | 10,528 | | | 5,573,628 |
RTX | | 48,355 | | | 5,891,090 |
| | | | | | 36,523,239 |
Information Technology — 11.8% | | | | | |
Advanced Micro Devices* | | 40,476 | | | 5,552,295 |
Apple(A) | | 25,759 | | | 6,113,383 |
International Business Machines | | 27,573 | | | 6,270,376 |
Intuit | | 9,234 | | | 5,925,735 |
NVIDIA(A) | | 84,822 | | | 11,726,642 |
Oracle | | 33,772 | | | 6,242,416 |
QUALCOMM(A) | | 69,490 | | | 11,016,250 |
| | | | | | 52,847,097 |
Materials — 1.2% | | | | | |
Dow | | 117,261 | | | 5,184,109 |
Real Estate — 2.8% | | | | | |
Simon Property Group‡(A) | | 68,483 | | | 12,573,479 |
Utilities — 5.3% | | | | | |
Duke Energy(A) | | 101,924 | | | 11,930,204 |
Southern | | 129,713 | | | 11,561,320 |
| | | | | | 23,491,524 |
| | | | | | |
Total Common Stock
(Cost $389,289,622) | | | | | 448,619,347 |
The accompanying notes are an integral part of the financial statements.
1
ETC 6 Meridian
Hedged Equity-Index Option Strategy ETF
Schedule of Investments
November 30, 2024 (Concluded)
Description | | Shares | | Fair Value |
EXCHANGE TRADED FUND — 1.4% | |
SPDR Bloomberg 1-3 Month T-Bill ETF | | 68,220 | | $ | 6,261,232 | |
| | | | | | | |
Total Exchange Traded Fund
(Cost $6,240,406) | | | | | 6,261,232 | |
SHORT-TERM INVESTMENT — 0.2% | |
Invesco Government & Agency Portfolio, Institutional Class, 4.57%(B) | | 824,471 | | | 824,471 | |
| | | | | | | |
Total Short-Term Investment
(Cost $824,471) | | | | | 824,471 | |
| | | | | | | |
Total Investments – 101.8%
(Cost $396,354,499) | | | | $ | 455,705,050 | |
WRITTEN OPTIONS — -2.0% | | | | | | |
Total Written Options
(Premiums Received $7,311,968) | | | | $ | (8,920,825 | ) |
A list of the Exchange Traded Option Contracts held by the Fund at November 30, 2024, is as follows:
Description | | Number of
Contracts | | Notional
Amount | | Exercise
Price | | Expiration
Date | |
Value
|
WRITTEN OPTIONS — (2.0)% | | | | | | | | | | | | | | | |
| | | | | | | | | | | | | | | | |
Call Options | | | | | | | | | | | | | | | |
S&P 500 Index* | | (191 | ) | | $ | 115,218,458 | | $ | 6,100 | | 01/17/25 | | $ | (1,513,675 | ) |
S&P 500 Index* | | (570 | ) | | | 343,845,660 | | | 5,950 | | 12/20/24 | | | (7,407,150 | ) |
| | | | | | | | | | | | | | | | |
Total Written Options
(Premiums Received $7,311,968) | | | | | | | | | | | | | $ | (8,920,825 | ) |
Percentages are based on Net Assets of $447,476,351.
Cl — Class
ETF — Exchange Traded Fund
S&P — Standard & Poor’s
SPDR — Standard & Poor’s Depositary Receipts
As of November 30, 2024, all of the Fund’s investments were considered Level 1 of the fair value hierarchy, in accordance with the authoritative guidance on fair value measurements and disclosure under U.S. Generally Accepted Accounting Principles.
The accompanying notes are an integral part of the financial statements.
2
ETC 6 Meridian
Low Beta Equity Strategy ETF
Schedule of Investments
November 30, 2024

Description | | Shares | | Fair Value |
COMMON STOCK — 99.7% | | | | | |
Communication Services — 2.6% | | | | | |
AT&T | | 35,153 | | $ | 814,144 |
Madison Square Garden Sports* | | 3,640 | | | 837,018 |
New York Times, Cl A | | 13,909 | | | 754,702 |
TKO Group Holdings, Cl A* | | 6,382 | | | 880,461 |
T-Mobile US | | 3,817 | | | 942,570 |
Verizon Communications | | 17,913 | | | 794,262 |
| | | | | | 5,023,157 |
Consumer Discretionary — 6.4% | | | | | |
Adtalem Global Education* | | 10,561 | | | 965,381 |
Aramark | | 20,101 | | | 817,910 |
Capri Holdings* | | 21,201 | | | 496,315 |
Grand Canyon Education* | | 5,362 | | | 882,531 |
H&R Block | | 11,715 | | | 694,465 |
Monarch Casino & Resort | | 9,798 | | | 823,130 |
Murphy USA | | 1,449 | | | 793,762 |
Ollie’s Bargain Outlet Holdings* | | 8,441 | | | 835,237 |
O’Reilly Automotive* | | 657 | | | 816,796 |
Perdoceo Education | | 34,560 | | | 948,672 |
Strategic Education | | 7,990 | | | 789,492 |
Stride* | | 9,271 | | | 990,792 |
Sturm Ruger | | 17,964 | | | 684,249 |
Texas Roadhouse, Cl A | | 4,554 | | | 934,800 |
Wendy’s | | 43,387 | | | 796,585 |
| | | | | | 12,270,117 |
Description | | Shares | | Fair Value |
Consumer Staples — 17.3% | | | | | |
Altria Group | | 13,727 | | $ | 792,597 |
BellRing Brands* | | 13,069 | | | 1,025,394 |
BJ’s Wholesale Club Holdings* | | 9,593 | | | 923,806 |
Boston Beer, Cl A* | | 2,591 | | | 819,378 |
Bunge Global | | 7,486 | | | 671,794 |
Cal-Maine Foods | | 10,682 | | | 1,042,670 |
Casey’s General Stores | | 1,971 | | | 829,574 |
Church & Dwight | | 7,008 | | | 771,791 |
Coca-Cola | | 10,361 | | | 663,933 |
Coca-Cola Consolidated | | 551 | | | 718,664 |
Colgate-Palmolive | | 6,834 | | | 660,369 |
Conagra Brands | | 22,516 | | | 620,316 |
Edgewell Personal Care | | 19,336 | | | 707,311 |
Flowers Foods | | 31,449 | | | 711,376 |
Fresh Del Monte Produce | | 25,262 | | | 852,592 |
General Mills | | 9,819 | | | 650,607 |
Hershey | | 3,690 | | | 649,920 |
Hormel Foods | | 22,631 | | | 733,923 |
Ingredion | | 5,451 | | | 803,150 |
J & J Snack Foods | | 4,450 | | | 773,365 |
John B Sanfilippo & Son | | 7,736 | | | 668,004 |
Kellanova | | 9,203 | | | 748,112 |
Keurig Dr Pepper | | 19,999 | | | 652,967 |
Kimberly-Clark | | 5,014 | | | 698,701 |
Kraft Heinz | | 20,569 | | | 657,591 |
Kroger | | 14,101 | | | 861,289 |
Lancaster Colony | | 4,149 | | | 771,050 |
McCormick | | 8,891 | | | 697,143 |
Mondelez International, Cl A | | 9,787 | | | 635,666 |
National Beverage | | 16,362 | | | 808,119 |
PepsiCo | | 4,155 | | | 679,135 |
Philip Morris International | | 5,859 | | | 779,598 |
Pilgrim’s Pride* | | 16,280 | | | 840,211 |
Post Holdings* | | 6,354 | | | 765,530 |
Procter & Gamble | | 4,196 | | | 752,175 |
Simply Good Foods* | | 22,570 | | | 898,060 |
SpartanNash | | 33,372 | | | 633,401 |
Sprouts Farmers Market* | | 7,457 | | | 1,151,957 |
Tootsie Roll Industries | | 23,357 | | | 773,117 |
TreeHouse Foods* | | 17,579 | | | 603,663 |
Universal | | 14,106 | | | 805,735 |
Walmart | | 9,616 | | | 889,480 |
WD-40 | | 2,818 | | | 780,840 |
| | | | | | 32,974,074 |
The accompanying notes are an integral part of the financial statements.
3
ETC 6 Meridian
Low Beta Equity Strategy ETF
Schedule of Investments
November 30, 2024 (Continued)
Description | | Shares | | Fair Value |
Energy — 4.6% | | | | | |
Antero Midstream | | 51,584 | | $ | 823,796 |
Chesapeake Energy | | 10,404 | | | 1,029,580 |
Chevron | | 5,319 | | | 861,306 |
Chord Energy | | 5,485 | | | 699,447 |
ConocoPhillips | | 6,950 | | | 752,963 |
CVR Energy | | 31,911 | | | 617,478 |
Dorian LPG | | 20,559 | | | 503,079 |
DT Midstream | | 9,811 | | | 1,041,143 |
EOG Resources | | 6,123 | | | 815,951 |
Exxon Mobil | | 6,542 | | | 771,694 |
Magnolia Oil & Gas, Cl A | | 31,275 | | | 867,569 |
| | | | | | 8,784,006 |
Financials — 18.6% | | | | | |
Aflac | | 6,766 | | | 771,324 |
Allstate | | 3,975 | | | 824,375 |
Ambac Financial Group* | | 68,382 | | | 878,025 |
American Financial Group | | 5,497 | | | 807,289 |
AMERISAFE | | 15,192 | | | 896,632 |
Arch Capital Group | | 6,673 | | | 672,105 |
Arthur J Gallagher | | 2,502 | | | 781,225 |
Assured Guaranty | | 9,457 | | | 882,149 |
BGC Group, Cl A | | 77,678 | | | 756,584 |
Cboe Global Markets | | 3,487 | | | 752,669 |
Chubb | | 2,563 | | | 740,015 |
CME Group, Cl A | | 3,342 | | | 795,396 |
Donnelley Financial Solutions* | | 11,398 | | | 686,729 |
Employers Holdings | | 15,512 | | | 827,720 |
Erie Indemnity, Cl A | | 1,454 | | | 640,574 |
EZCORP, Cl A* | | 63,934 | | | 818,355 |
Federated Hermes, Cl B | | 21,904 | | | 936,396 |
FirstCash Holdings | | 6,208 | | | 675,803 |
Hanover Insurance Group | | 5,064 | | | 835,611 |
HCI Group | | 7,500 | | | 914,025 |
Horace Mann Educators | | 21,107 | | | 883,750 |
Kinsale Capital Group | | 1,596 | | | 811,470 |
Marsh & McLennan | | 3,233 | | | 754,033 |
Mercury General | | 11,885 | | | 938,440 |
Morningstar | | 2,417 | | | 855,981 |
Old Republic International | | 21,090 | | | 821,877 |
Palomar Holdings* | | 7,799 | | | 844,632 |
Primerica | | 2,887 | | | 874,039 |
Progressive | | 2,963 | | | 796,691 |
Reinsurance Group of America, Cl A | | 3,470 | | | 792,548 |
RenaissanceRe Holdings | | 2,851 | | | 815,814 |
RLI | | 4,869 | | | 856,457 |
Description | | Shares | | Fair Value |
Financials (continued) |
Ryan Specialty Holdings, Cl A | | 11,583 | | $ | 873,358 |
Safety Insurance Group | | 8,821 | | | 757,195 |
Selective Insurance Group | | 8,259 | | | 843,161 |
SiriusPoint* | | 51,984 | | | 801,593 |
Travelers | | 3,143 | | | 836,164 |
United Fire Group | | 36,729 | | | 1,123,907 |
Unum Group | | 13,615 | | | 1,046,994 |
Virtu Financial, Cl A | | 23,681 | | | 883,538 |
Western Union | | 60,670 | | | 667,977 |
Willis Towers Watson PLC | | 2,532 | | | 815,304 |
WR Berkley | | 12,559 | | | 810,683 |
| | | | | | 35,398,607 |
Health Care — 16.3% | | | | | |
Abbott Laboratories | | 6,473 | | | 768,798 |
AbbVie | | 3,809 | | | 696,780 |
Addus HomeCare* | | 5,833 | | | 716,526 |
Alkermes PLC* | | 27,443 | | | 796,396 |
Amedisys* | | 7,586 | | | 693,436 |
ANI Pharmaceuticals* | | 12,180 | | | 697,061 |
BioMarin Pharmaceutical* | | 8,767 | | | 578,885 |
Cardinal Health | | 6,596 | | | 806,295 |
Centene* | | 10,405 | | | 624,300 |
Chemed | | 1,287 | | | 736,666 |
Cigna Group | | 2,082 | | | 703,300 |
Collegium Pharmaceutical* | | 19,821 | | | 604,541 |
Dynavax Technologies* | | 66,832 | | | 859,460 |
Elevance Health | | 1,360 | | | 553,466 |
Encompass Health | | 8,041 | | | 827,740 |
Ensign Group | | 4,944 | | | 722,862 |
Exelixis* | | 29,311 | | | 1,068,679 |
Gilead Sciences | | 9,364 | | | 866,919 |
HealthEquity* | | 9,666 | | | 981,486 |
HealthStream | | 26,012 | | | 860,997 |
Hologic* | | 9,035 | | | 718,282 |
Incyte* | | 12,034 | | | 897,616 |
Innoviva* | | 38,656 | | | 734,078 |
Integer Holdings* | | 5,713 | | | 802,677 |
Jazz Pharmaceuticals PLC* | | 6,879 | | | 836,418 |
Johnson & Johnson | | 4,484 | | | 695,065 |
Masimo* | | 6,609 | | | 1,140,317 |
McKesson | | 1,460 | | | 917,610 |
Merck | | 6,255 | | | 635,758 |
Merit Medical Systems* | | 7,631 | | | 792,861 |
Molina Healthcare* | | 2,249 | | | 669,977 |
National HealthCare | | 5,711 | | | 715,017 |
Neurocrine Biosciences* | | 6,132 | | | 777,231 |
The accompanying notes are an integral part of the financial statements.
4
ETC 6 Meridian
Low Beta Equity Strategy ETF
Schedule of Investments
November 30, 2024 (Continued)
Description | | Shares | | Fair Value |
Health Care (continued) |
Patterson | | 35,610 | | $ | 765,259 |
Premier, Cl A | | 36,062 | | | 825,820 |
Prestige Consumer Healthcare* | | 9,916 | | | 840,579 |
Quest Diagnostics | | 4,817 | | | 783,533 |
Supernus Pharmaceuticals* | | 21,783 | | | 796,604 |
United Therapeutics* | | 2,129 | | | 788,773 |
UnitedHealth Group | | 1,234 | | | 752,987 |
| | | | | | 31,051,055 |
Industrials — 10.2% | | | | | |
AeroVironment* | | 4,107 | | | 798,811 |
Brady, Cl A | | 10,209 | | | 764,552 |
BWX Technologies | | 7,697 | | | 1,007,152 |
CACI International, Cl A* | | 1,579 | | | 726,150 |
CoreCivic* | | 56,442 | | | 1,260,350 |
Curtiss-Wright | | 2,506 | | | 936,317 |
FTI Consulting* | | 3,384 | | | 685,328 |
KBR | | 11,881 | | | 722,721 |
Kelly Services, Cl A | | 36,837 | | | 539,662 |
L3Harris Technologies | | 3,241 | | | 798,096 |
Liquidity Services* | | 34,953 | | | 893,748 |
Lockheed Martin | | 1,298 | | | 687,174 |
MSA Safety | | 4,391 | | | 763,200 |
National Presto Industries | | 9,966 | | | 794,490 |
Northrop Grumman | | 1,430 | | | 700,200 |
RB Global | | 8,914 | | | 871,433 |
Republic Services, Cl A | | 3,632 | | | 792,865 |
Robert Half | | 12,140 | | | 905,765 |
RTX | | 6,224 | | | 758,270 |
Schneider National, Cl B | | 27,649 | | | 929,283 |
Verisk Analytics, Cl A | | 2,710 | | | 797,309 |
Verra Mobility, Cl A* | | 28,210 | | | 667,449 |
Waste Management | | 3,599 | | | 821,364 |
Woodward | | 4,621 | | | 833,259 |
| | | | | | 19,454,948 |
Information Technology — 4.3% | | | | | |
A10 Networks | | 55,551 | | | 947,145 |
Box, Cl A* | | 22,738 | | | 797,876 |
Dolby Laboratories, Cl A | | 10,763 | | | 842,958 |
Dropbox, Cl A* | | 31,911 | | | 882,658 |
Dynatrace* | | 14,688 | | | 825,319 |
Juniper Networks | | 19,194 | | | 689,448 |
LiveRamp Holdings* | | 29,580 | | | 898,049 |
Manhattan Associates* | | 2,940 | | | 839,194 |
N-able* | | 58,832 | | | 614,206 |
Progress Software | | 12,784 | | | 874,553 |
| | | | | | 8,211,406 |
Description | | Shares | | Fair Value |
Materials — 2.1% | | | | | |
AptarGroup | | 4,834 | | $ | 836,089 |
Clearwater Paper* | | 24,121 | | | 654,161 |
Crown Holdings | | 8,067 | | | 742,890 |
NewMarket | | 1,377 | | | 734,712 |
United States Steel | | 23,573 | | | 961,071 |
| | | | | | 3,928,923 |
Real Estate — 5.0% | | | | | |
Agree Realty‡ | | 9,821 | | | 754,253 |
American Homes 4 Rent, Cl A‡ | | 18,708 | | | 716,329 |
American Tower, Cl A‡ | | 3,121 | | | 652,289 |
Equity LifeStyle Properties‡ | | 9,978 | | | 711,731 |
Essential Properties Realty Trust‡ | | 22,978 | | | 783,550 |
Four Corners Property Trust‡ | | 25,271 | | | 750,801 |
Gaming and Leisure Properties‡ | | 14,306 | | | 738,333 |
Getty Realty‡ | | 23,284 | | | 765,578 |
LTC Properties‡ | | 20,101 | | | 775,698 |
NNN REIT‡ | | 15,300 | | | 672,894 |
Omega Healthcare Investors‡ | | 18,593 | | | 755,062 |
Phillips Edison‡ | | 19,879 | | | 785,220 |
WP Carey‡ | | 11,987 | | | 683,978 |
| | | | | | 9,545,716 |
Utilities — 12.3% | | | | | |
ALLETE | | 11,609 | | | 753,192 |
Ameren | | 8,862 | | | 836,484 |
American Electric Power | | 7,223 | | | 721,289 |
American States Water | | 9,100 | | | 776,321 |
Atmos Energy | | 5,636 | | | 852,840 |
Avista | | 19,189 | | | 742,422 |
California Water Service Group | | 13,581 | | | 695,211 |
Chesapeake Utilities | | 6,230 | | | 820,802 |
CMS Energy | | 10,836 | | | 755,378 |
Consolidated Edison | | 7,135 | | | 717,710 |
DTE Energy | | 5,981 | | | 752,290 |
Duke Energy | | 6,320 | | | 739,756 |
Entergy | | 6,047 | | | 944,360 |
Essential Utilities | | 18,967 | | | 759,249 |
Evergy | | 12,333 | | | 797,082 |
FirstEnergy | | 16,678 | | | 709,649 |
MGE Energy | | 8,528 | | | 889,300 |
National Fuel Gas | | 12,501 | | | 799,689 |
New Jersey Resources | | 16,013 | | | 825,951 |
Northwest Natural Holding | | 18,793 | | | 823,509 |
Northwestern Energy Group | | 13,598 | | | 751,154 |
OGE Energy | | 18,612 | | | 818,183 |
Pinnacle West Capital | | 8,394 | | | 786,518 |
The accompanying notes are an integral part of the financial statements.
5
ETC 6 Meridian
Low Beta Equity Strategy ETF
Schedule of Investments
November 30, 2024 (Concluded)
Description | | Shares | | Fair Value |
Utilities (continued) |
PPL | | 22,985 | | $ | 802,866 |
Sempra | | 8,978 | | | 840,969 |
SJW Group | | 12,512 | | | 697,169 |
Southern | | 8,334 | | | 742,809 |
Unitil | | 12,648 | | | 759,133 |
WEC Energy Group | | 7,869 | | | 795,162 |
Xcel Energy | | 11,716 | | | 850,113 |
| | | | | | 23,556,560 |
| | | | | | |
Total Common Stock
(Cost $160,947,711) | | | | | 190,198,569 |
SHORT-TERM INVESTMENT — 0.2% |
Invesco Government & Agency Portfolio, Institutional Class, 4.57%(A) | | 329,981 | | | 329,981 |
| | | | | | |
Total Short-Term Investment
(Cost $329,981) | | | | | 329,981 |
| | | | | | |
Total Investments — 99.9%
(Cost $161,277,692) | | | | $ | 190,528,550 |
Percentages are based on Net Assets $190,697,834.
As of November 30, 2024, all of the Fund’s investments were considered Level 1 of the fair value hierarchy, in accordance with the authoritative guidance on fair value measurements and disclosure under U.S. Generally Accepted Accounting Principles.
The accompanying notes are an integral part of the financial statements.
6
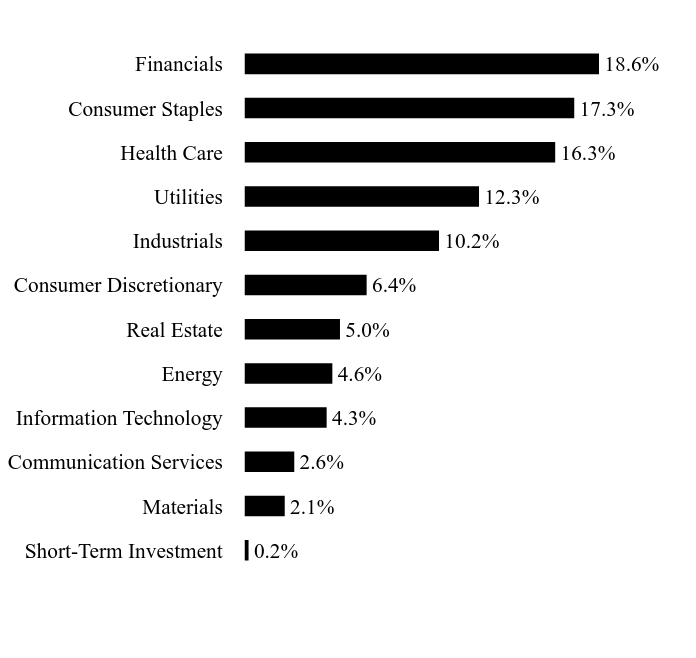
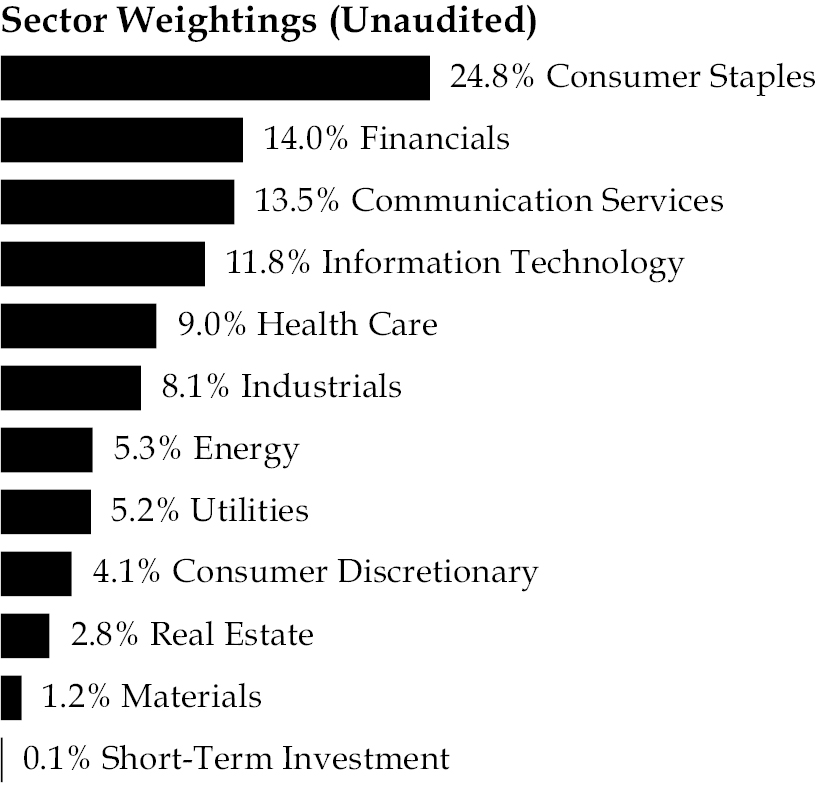
ETC 6 Meridian
Mega Cap Equity ETF
Schedule of Investments
November 30, 2024
Description | | Shares | | Fair Value |
COMMON STOCK — 99.8% |
Communication Services — 13.5% |
Alphabet, Cl A | | 21,783 | | $ | 3,680,238 |
AT&T | | 506,093 | | | 11,721,114 |
Meta Platforms, Cl A | | 13,158 | | | 7,556,902 |
Netflix* | | 4,934 | | | 4,375,521 |
Verizon Communications | | 270,666 | | | 12,001,330 |
| | | | | | 39,335,105 |
Consumer Discretionary — 4.1% | | | | | |
Amazon.com* | | 18,852 | | | 3,919,143 |
General Motors | | 146,453 | | | 8,141,322 |
| | | | | | 12,060,465 |
Consumer Staples — 24.8% | | | | | |
Altria Group | | 277,078 | | | 15,998,484 |
Coca-Cola | | 57,398 | | | 3,678,064 |
Colgate-Palmolive | | 79,965 | | | 7,727,018 |
Costco Wholesale | | 8,505 | | | 8,265,839 |
Kraft Heinz | | 222,850 | | | 7,124,515 |
PepsiCo | | 67,605 | | | 11,050,037 |
Philip Morris International | | 28,559 | | | 3,800,060 |
Procter & Gamble | | 22,601 | | | 4,051,455 |
Target | | 49,478 | | | 6,546,434 |
Walmart | | 45,399 | | | 4,199,408 |
| | | | | | 72,441,314 |
Energy — 5.3% | | | | | |
Chevron | | 48,757 | | | 7,895,221 |
Exxon Mobil | | 64,925 | | | 7,658,553 |
| | | | | | 15,553,774 |
Description | | Shares | | Fair Value |
Financials — 14.0% | | | | | |
American Express | | 27,369 | | $ | 8,338,787 |
American International Group | | 49,280 | | | 3,788,647 |
Bank of New York Mellon | | 49,548 | | | 4,056,495 |
Berkshire Hathaway, Cl B* | | 8,251 | | | 3,985,398 |
BlackRock Funding | | 3,788 | | | 3,874,366 |
Capital One Financial | | 22,766 | | | 4,371,300 |
JPMorgan Chase | | 16,736 | | | 4,179,314 |
PayPal Holdings* | | 48,303 | | | 4,191,251 |
US Bancorp | | 77,998 | | | 4,156,513 |
| | | | | | 40,942,071 |
Health Care — 9.0% | | | | | |
Eli Lilly | | 9,113 | | | 7,248,024 |
Gilead Sciences | | 83,379 | | | 7,719,228 |
Johnson & Johnson | | 23,301 | | | 3,611,888 |
Merck | | 36,625 | | | 3,722,565 |
UnitedHealth Group | | 6,574 | | | 4,011,455 |
| | | | | | 26,313,160 |
Industrials — 8.1% | | | | | |
Caterpillar | | 19,659 | | | 7,983,717 |
Deere | | 9,319 | | | 4,341,722 |
General Electric | | 21,732 | | | 3,958,701 |
Lockheed Martin | | 6,842 | | | 3,622,223 |
RTX | | 31,423 | | | 3,828,264 |
| | | | | | 23,734,627 |
Information Technology — 11.8% | | | | | |
Advanced Micro Devices* | | 26,303 | | | 3,608,114 |
Apple | | 16,739 | | | 3,972,667 |
International Business Machines | | 17,918 | | | 4,074,732 |
Intuit | | 6,000 | | | 3,850,380 |
NVIDIA | | 55,119 | | | 7,620,202 |
Oracle | | 21,947 | | | 4,056,684 |
QUALCOMM | | 45,156 | | | 7,158,580 |
| | | | | | 34,341,359 |
Materials — 1.2% | | | | | |
Dow | | 76,199 | | | 3,368,758 |
Real Estate — 2.8% | | | | | |
Simon Property Group‡ | | 44,503 | | | 8,170,751 |
Utilities — 5.2% | | | | | |
Duke Energy | | 66,233 | | | 7,752,572 |
Southern | | 84,291 | | | 7,512,857 |
| | | | | | 15,265,429 |
| | | | | | |
Total Common Stock
(Cost $253,782,755) | | | | | 291,526,813 |
The accompanying notes are an integral part of the financial statements.
7
ETC 6 Meridian
Mega Cap Equity ETF
Schedule of Investments
November 30, 2024 (Concluded)
Description | | Shares | | Fair Value |
SHORT-TERM INVESTMENT — 0.1% |
Invesco Government & Agency Portfolio, Institutional Class, 4.57%(A) | | 205,681 | | $ | 205,681 |
| | | | | | |
Total Short-Term Investment (Cost $205,681) | | | | | 205,681 |
| | | | | | |
Total Investments — 99.9%
(Cost $253,988,436) | | | | $ | 291,732,494 |
Percentages are based on Net Assets of $292,084,722.
‡ Real Estate Investment Trust
Cl — Class
As of November 30, 2024, all of the Fund’s investments were considered Level 1 of the fair value hierarchy, in accordance with the authoritative guidance on fair value measurements and disclosure under U.S. Generally Accepted Accounting Principles.
The accompanying notes are an integral part of the financial statements.
8
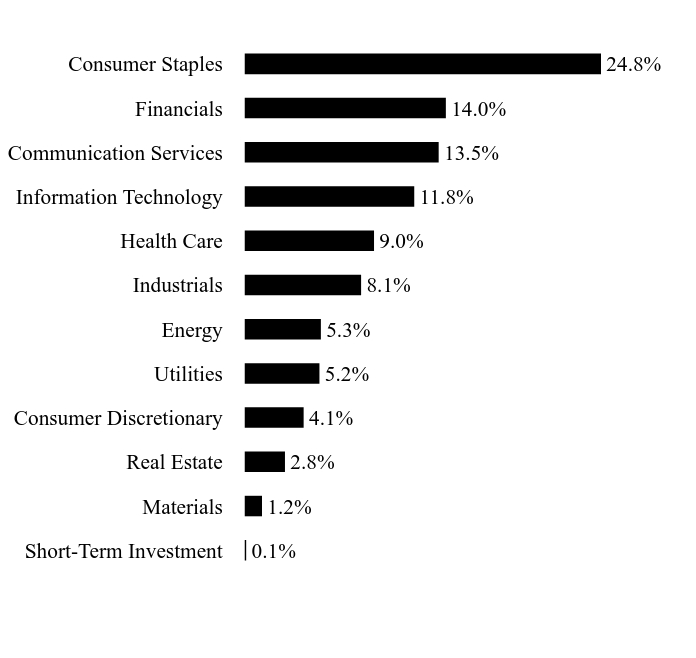
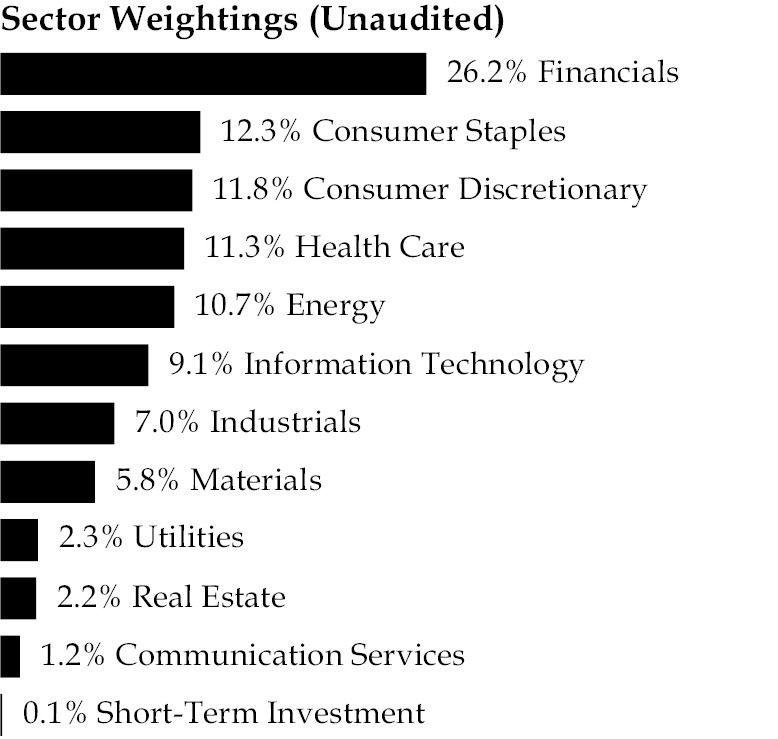
ETC 6 Meridian
Small Cap Equity ETF
Schedule of Investments
November 30, 2024
Description | | Shares | | Fair Value |
COMMON STOCK†† — 99.9% | | | | | |
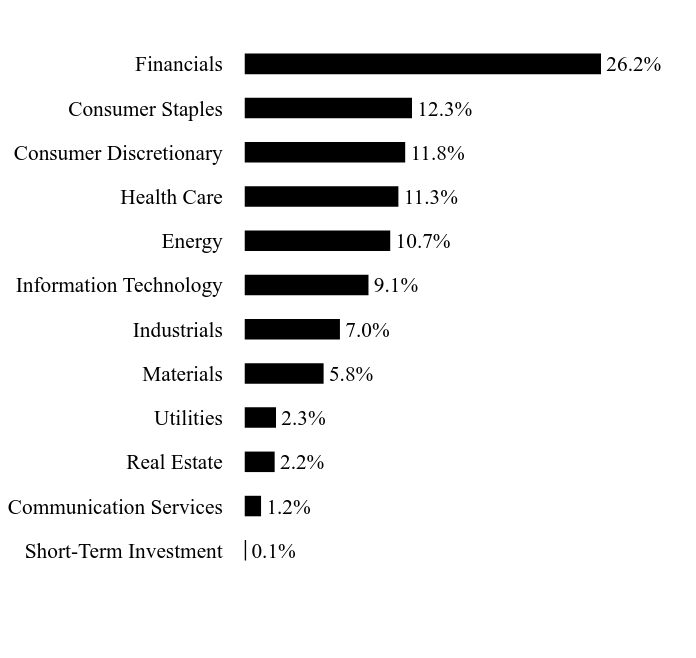
Communication Services — 1.2% | | | | | |
Madison Square Garden Sports* | | 4,965 | | $ | 1,141,702 |
Consumer Discretionary — 11.8% | | | | | |
Adtalem Global Education* | | 14,095 | | | 1,288,424 |
Buckle | | 24,166 | | | 1,258,807 |
G-III Apparel Group* | | 33,247 | | | 985,109 |
Golden Entertainment | | 31,377 | | | 1,058,660 |
M* | | 6,501 | | | 1,072,860 |
Movado Group | | 52,707 | | | 1,072,587 |
Perdoceo Education | | 93,653 | | | 2,570,775 |
Stride* | | 12,493 | | | 1,335,127 |
Sturm Ruger | | 24,628 | | | 938,080 |
| | | | | | 11,580,429 |
Consumer Staples — 12.3% | | | | | |
Andersons | | 20,676 | | | 987,072 |
Cal-Maine Foods | | 29,673 | | | 2,896,382 |
Fresh Del Monte Produce | | 34,050 | | | 1,149,187 |
J & J Snack Foods | | 6,062 | | | 1,053,515 |
John B Sanfilippo & Son | | 10,664 | | | 920,836 |
National Beverage | | 22,644 | | | 1,118,387 |
Simply Good Foods* | | 30,192 | | | 1,201,340 |
SpartanNash | | 45,918 | | | 871,524 |
Tootsie Roll Industries | | 32,575 | | | 1,078,232 |
TreeHouse Foods* | | 24,091 | | | 827,285 |
| | | | | | 12,103,760 |
Energy — 10.7% | | | | | |
CONSOL Energy | | 10,893 | | | 1,423,715 |
CVR Energy | | 44,706 | | | 865,061 |
Dorian LPG | | 28,428 | | | 695,633 |
Helmerich & Payne | | 33,126 | | | 1,147,153 |
Description | | Shares | | Fair Value |
Energy (continued) | | | | | |
Liberty Energy, Cl A | | 52,600 | | $ | 967,840 |
ProPetro Holding* | | 137,816 | | | 1,157,655 |
REX American Resources* | | 23,892 | | | 1,034,762 |
RPC | | 171,863 | | | 1,106,798 |
SM Energy | | 24,508 | | | 1,107,517 |
World Kinect | | 36,144 | | | 1,046,369 |
| | | | | | 10,552,503 |
Financials — 26.2% | | | | | |
Ambac Financial Group* | | 93,786 | | | 1,204,212 |
AMERISAFE | | 20,732 | | | 1,223,603 |
Assured Guaranty | | 25,878 | | | 2,413,900 |
Axos Financial* | | 15,416 | | | 1,277,216 |
Bread Financial Holdings | | 17,905 | | | 1,053,351 |
Customers Bancorp* | | 20,808 | | | 1,174,612 |
Employers Holdings | | 21,160 | | | 1,129,097 |
Enova International* | | 12,563 | | | 1,325,522 |
EZCORP, Cl A* | | 85,567 | | | 1,095,258 |
HCI Group | | 20,503 | | | 2,498,701 |
Horace Mann Educators | | 28,595 | | | 1,197,273 |
Mercury General | | 16,066 | | | 1,268,571 |
PennyMac Mortgage Investment Trust‡ | | 73,019 | | | 992,328 |
Preferred Bank | | 12,738 | | | 1,201,575 |
Radian Group | | 28,749 | | | 1,028,927 |
Safety Insurance Group | | 12,040 | | | 1,033,513 |
SiriusPoint* | | 70,192 | | | 1,082,361 |
Virtu Financial, Cl A | | 32,304 | | | 1,205,262 |
Virtus Investment Partners | | 5,031 | | | 1,242,506 |
World Acceptance* | | 8,755 | | | 1,058,655 |
| | | | | | 25,706,443 |
Health Care — 11.3% | | | | | |
Collegium Pharmaceutical* | | 54,245 | | | 1,654,472 |
Dynavax Technologies* | | 93,614 | | | 1,203,876 |
Ensign Group | | 6,696 | | | 979,022 |
HealthStream | | 34,976 | | | 1,157,706 |
Innoviva* | | 105,136 | | | 1,996,533 |
Merit Medical Systems* | | 10,427 | | | 1,083,365 |
Organon | | 47,552 | | | 754,650 |
Premier, Cl A | | 49,641 | | | 1,136,779 |
Prestige Consumer Healthcare* | | 13,527 | | | 1,146,684 |
| | | | | | 11,113,087 |
Industrials — 7.0% | | | | | |
Brady, Cl A | | 14,143 | | | 1,059,169 |
DNOW* | | 83,596 | | | 1,258,120 |
Heidrick & Struggles
International | | 27,698 | | | 1,277,986 |
The accompanying notes are an integral part of the financial statements.
9
ETC 6 Meridian
Small Cap Equity ETF
Schedule of Investments
November 30, 2024 (Concluded)
Description | | Shares | | Fair Value |
Industrials (continued) | | | | | |
Masterbrand* | | 63,761 | | $ | 1,103,065 |
National Presto Industries | | 13,621 | | | 1,085,866 |
Wabash National | | 53,767 | | | 1,066,200 |
| | | | | | 6,850,406 |
Information Technology — 9.1% | | | | | |
A10 Networks | | 75,515 | | | 1,287,531 |
Box, Cl A* | | 31,022 | | | 1,088,562 |
DXC Technology* | | 48,092 | | | 1,082,070 |
LiveRamp Holdings* | | 39,629 | | | 1,203,136 |
N-able* | | 80,804 | | | 843,594 |
Photronics* | | 44,391 | | | 1,105,780 |
Progress Software | | 17,607 | | | 1,204,495 |
ScanSource* | | 21,236 | | | 1,070,506 |
| | | | | | 8,885,674 |
Materials — 5.8% | | | | | |
Alpha Metallurgical Resources | | 4,989 | | | 1,225,149 |
Clearwater Paper* | | 33,487 | | | 908,167 |
Metallus* | | 66,170 | | | 1,103,054 |
Olympic Steel | | 26,856 | | | 1,135,472 |
Warrior Met Coal | | 18,911 | | | 1,329,821 |
| | | | | | 5,701,663 |
Real Estate — 2.2% | | | | | |
Getty Realty‡ | | 32,041 | | | 1,053,508 |
LTC Properties‡ | | 27,652 | | | 1,067,091 |
| | | | | | 2,120,599 |
Utilities — 2.3% | | | | | |
American States Water | | 12,495 | | | 1,065,948 |
MGE Energy | | 11,659 | | | 1,215,801 |
| | | | | | 2,281,749 |
| | | | | | |
Total Common Stock
(Cost $86,294,293) | | | | | 98,038,015 |
Description | | Shares | | Fair Value |
SHORT-TERM INVESTMENT — 0.1% |
Invesco Government & Agency Portfolio, Institutional Class, 4.57%(A) | | 112,994 | | $ | 112,994 |
| | | | | | |
Total Short-Term Investment
(Cost $112,994) | | | | | 112,994 |
| | | | | | |
Total Investments — 100.0%
(Cost $86,407,287) | | | | $ | 98,151,009 |
Percentages are based on Net Assets of $98,149,507.
As of November 30, 2024, all of the Fund’s investments were considered Level 1 of the fair value hierarchy, in accordance with the authoritative guidance on fair value measurements and disclosure under U.S. Generally Accepted Accounting Principles.
The accompanying notes are an integral part of the financial statements.
10
ETC 6 Meridian
Quality Growth ETF
Schedule of Investments
November 30, 2024

Description | | Shares | | Fair Value |
COMMON STOCK†† — 99.8% |
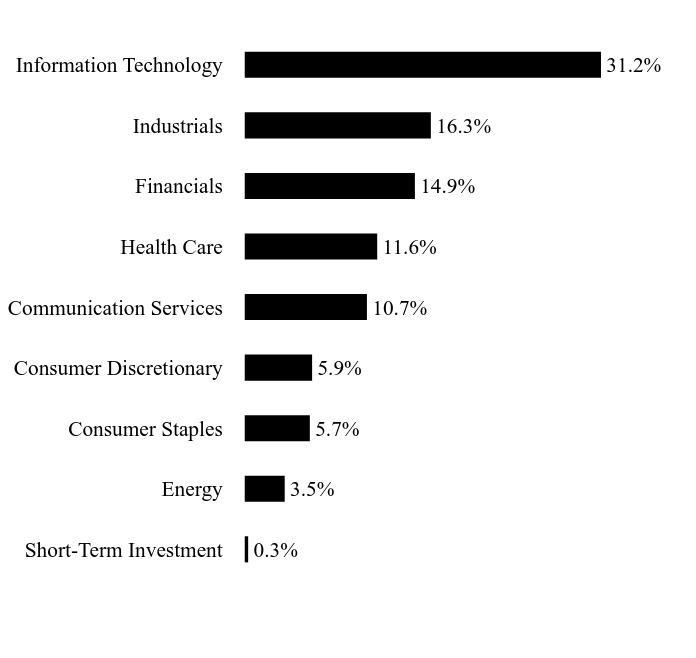
Communication Services — 10.7% |
Alphabet, Cl A | | 14,721 | | $ | 2,487,113 |
Meta Platforms, Cl A | | 4,334 | | | 2,489,103 |
Pinterest, Cl A* | | 12,703 | | | 385,155 |
Yelp, Cl A* | | 1,186 | | | 45,329 |
| | | | | | 5,406,700 |
Consumer Discretionary — 5.9% | | | | | |
Crocs* | | 1,109 | | | 117,110 |
Deckers Outdoor* | | 2,684 | | | 525,957 |
Grand Canyon Education* | | 537 | | | 88,385 |
H&R Block | | 2,527 | | | 149,800 |
Steven Madden | | 1,254 | | | 57,157 |
Stride* | | 772 | | | 82,504 |
TJX | | 15,043 | | | 1,890,755 |
United Parks & Resorts* | | 575 | | | 33,718 |
YETI Holdings* | | 1,586 | | | 64,027 |
| | | | | | 3,009,413 |
Consumer Staples — 5.7% | | | | | |
Cal-Maine Foods | | 786 | | | 76,721 |
Lancaster Colony | | 353 | | | 65,602 |
Procter & Gamble | | 11,077 | | | 1,985,663 |
Sysco | | 8,945 | | | 689,749 |
WD-40 | | 252 | | | 69,827 |
| | | | | | 2,887,562 |
Energy — 3.5% | | | | | |
Cheniere Energy | | 4,050 | | | 907,241 |
Gulfport Energy* | | 228 | | | 40,082 |
Kinetik Holdings, Cl A | | 1,837 | | | 108,420 |
Liberty Energy, Cl A | | 2,835 | | | 52,164 |
Magnolia Oil & Gas, Cl A | | 3,814 | | | 105,800 |
Texas Pacific Land | | 358 | | | 572,832 |
| | | | | | 1,786,539 |
Description | | Shares | | Fair Value |
Financials — 14.9% | | | | | |
Apollo Global Management | | 7,505 | | $ | 1,313,600 |
Mastercard, Cl A | | 4,036 | | | 2,150,946 |
Progressive | | 7,114 | | | 1,912,812 |
Visa, Cl A | | 6,902 | | | 2,174,682 |
| | | | | | 7,552,040 |
Health Care — 11.6% | | | | | |
Alkermes PLC* | | 2,988 | | | 86,712 |
Catalyst Pharmaceuticals* | | 2,073 | | | 45,751 |
Chemed | | 270 | | | 154,545 |
CONMED | | 572 | | | 42,351 |
CorVel* | | 172 | | | 62,849 |
Exelixis* | | 4,904 | | | 178,800 |
Halozyme Therapeutics* | | 2,323 | | | 111,969 |
IDEXX Laboratories* | | 1,414 | | | 596,354 |
Incyte* | | 2,884 | | | 215,118 |
Inspire Medical Systems* | | 489 | | | 94,260 |
Intuitive Surgical* | | 3,661 | | | 1,984,262 |
Lantheus Holdings* | | 1,308 | | | 116,765 |
Medpace Holdings* | | 482 | | | 164,184 |
Neurocrine Biosciences* | | 1,850 | | | 234,487 |
Progyny* | | 1,415 | | | 22,032 |
Protagonist Therapeutics* | | 993 | | | 43,493 |
Regeneron Pharmaceuticals* | | 1,560 | | | 1,170,343 |
Veeva Systems, Cl A* | | 2,579 | | | 587,625 |
| | | | | | 5,911,900 |
Industrials — 16.3% | | | | | |
AAON | | 1,214 | | | 165,517 |
Cintas | | 5,976 | | | 1,349,321 |
Copart* | | 16,016 | | | 1,015,254 |
CSW Industrials | | 254 | | | 107,287 |
Enerpac Tool Group, Cl A | | 982 | | | 47,391 |
Expeditors International of Washington | | 2,564 | | | 311,885 |
Fastenal | | 9,947 | | | 831,171 |
Franklin Electric | | 721 | | | 78,084 |
Illinois Tool Works | | 5,070 | | | 1,407,027 |
Mueller Industries | | 2,008 | | | 162,186 |
Old Dominion Freight Line | | 3,433 | | | 772,905 |
Paychex | | 5,688 | | | 831,984 |
Rollins | | 5,278 | | | 265,642 |
WW Grainger | | 778 | | | 937,755 |
| | | | | | 8,283,409 |
Information Technology — 31.2% | | | | | |
Adobe* | | 3,428 | | | 1,768,608 |
Agilysys* | | 488 | | | 65,538 |
Appfolio, Cl A* | | 622 | | | 157,832 |
The accompanying notes are an integral part of the financial statements.
11
ETC 6 Meridian
Quality Growth ETF
Schedule of Investments
November 30, 2024 (Concluded)
Description | | Shares | | Fair Value |
Information Technology (continued) |
Apple | | 9,942 | | $ | 2,359,535 |
Arista Networks* | | 4,406 | | | 1,788,043 |
Autodesk* | | 3,854 | | | 1,124,983 |
Badger Meter | | 524 | | | 113,614 |
Clearwater Analytics Holdings, Cl A* | | 4,791 | | | 148,713 |
CommVault Systems* | | 786 | | | 134,870 |
Datadog, Cl A* | | 5,788 | | | 884,117 |
DocuSign, Cl A* | | 3,977 | | | 316,927 |
Dynatrace* | | 5,112 | | | 287,243 |
Fortinet* | | 11,454 | | | 1,088,703 |
Manhattan Associates* | | 1,072 | | | 305,992 |
Microsoft | | 5,283 | | | 2,237,139 |
Napco Security Technologies | | 633 | | | 24,832 |
NVIDIA | | 20,244 | | | 2,798,733 |
Qualys* | | 659 | | | 101,222 |
SPS Commerce* | | 679 | | | 131,095 |
| | | | | | 15,837,739 |
| | | | | | |
Total Common Stock
(Cost $41,033,343) | | | | | 50,675,302 |
Description | | Shares | | Fair Value |
SHORT-TERM INVESTMENT — 0.3% |
Invesco Government & Agency Portfolio, Institutional Class, 4.57%(A) | | 166,613 | | $ | 166,613 |
| | | | | | |
Total Short-Term Investment
(Cost $166,613) | | | | | 166,613 |
| | | | | | |
Total Investments — 100.1%
(Cost $41,199,956) | | | | $ | 50,841,915 |
The accompanying notes are an integral part of the financial statements.
12
ETC 6 Meridian
Statements of Assets and Liabilities
November 30, 2024
| | ETC
6 Meridian
Hedged
Equity-Index
Option
Strategy ETF | | ETC
6 Meridian
Low Beta
Equity
Strategy ETF | | ETC
6 Meridian
Mega Cap
Equity ETF |
Assets: | | | | | | | | | | | | |
Investments, at Cost | | $ | 396,354,499 | | | $ | 161,277,692 | | | $ | 253,988,436 | |
Investments, at Fair Value | | $ | 455,705,050 | | | $ | 190,528,550 | | | $ | 291,732,494 | |
Receivable for Investment Securities Sold | | | 5,201,234 | | | | — | | | | — | |
Dividends Receivable | | | 908,500 | | | | 327,883 | | | | 589,963 | |
Deposits at Broker for Options | | | 44,896 | | | | — | | | | — | |
Reclaims Receivable | | | — | | | | 1,277 | | | | — | |
Total Assets | | | 461,859,680 | | | | 190,857,710 | | | | 292,322,457 | |
| | | | | | | | | | | | | |
Liabilities: | | | | | | | | | | | | |
Options Written, at Value (Premiums Received $7,311,968, $— and $—, respectively) | | | 8,920,825 | | | | — | | | | — | |
Payable for Investment Securities Purchased | | | 5,039,398 | | | | — | | | | — | |
Advisory Fees Payable | | | 220,977 | | | | 92,509 | | | | 143,248 | |
Payable due to Administrator | | | 25,358 | | | | 10,616 | | | | 16,438 | |
Audit Fees Payable | | | 17,500 | | | | 17,500 | | | | 17,500 | |
Transfer Agent Fees Payable | | | 13,658 | | | | 15,577 | | | | 20,145 | |
Payable for Trustees’ Fee | | | 13,164 | | | | 5,344 | | | | 8,411 | |
Chief Compliance Officer Fees Payable | | | 3,781 | | | | 1,535 | | | | 2,416 | |
Other Accrued Expenses | | | 128,668 | | | | 16,795 | | | | 29,577 | |
| | | | | | | | | | | | | |
Total Liabilities | | | 14,383,329 | | | | 159,876 | | | | 237,735 | |
| | | | | | | | | | | | | |
Net Assets | | $ | 447,476,351 | | | $ | 190,697,834 | | | $ | 292,084,722 | |
| | | | | | | | | | | | | |
Net Assets Consist of: | | | | | | | | | | | | |
Paid-in Capital | | $ | 533,364,452 | | | $ | 192,487,791 | | | $ | 304,013,855 | |
Total Distributable Earnings (Accumulated Losses) | | | (85,888,101 | ) | | | (1,789,957 | ) | | | (11,929,133 | ) |
| | | | | | | | | | | | | |
Net Assets | | $ | 447,476,351 | | | $ | 190,697,834 | | | $ | 292,084,722 | |
Outstanding Shares of Beneficial Interest
(unlimited authorization – no par value) | | | 11,775,000 | | | | 4,850,000 | | | | 6,275,000 | |
Net Asset Value, Offering and Redemption Price Per Share | | $ | 38.00 | | | $ | 39.32 | | | $ | 46.55 | |
The accompanying notes are an integral part of the financial statements.
13
ETC 6 Meridian
Statements of Assets and Liabilities
November 30, 2024
| | ETC
6 Meridian
Small Cap
Equity ETF | | ETC
6 Meridian
Quality
Growth ETF |
Assets: | | | | | | | |
Investments, at Cost | | $ | 86,407,287 | | | $ | 41,199,956 |
Investments, at Fair Value | | $ | 98,151,009 | | | $ | 50,841,915 |
Dividends Receivable | | | 96,035 | | | | 20,115 |
Total Assets | | | 98,247,044 | | | | 50,862,030 |
| | | | | | | | |
Liabilities: | | | | | | | |
Advisory Fees Payable | | | 46,117 | | | | 33,314 |
Audit Fees Payable | | | 17,500 | | | | 17,500 |
Transfer Agent Fees Payable | | | 15,565 | | | | 15,560 |
Payable due to Administrator | | | 5,292 | | | | 2,812 |
Payable for Trustees’ Fee | | | 2,590 | | | | 1,411 |
Chief Compliance Officer Fees Payable | | | 744 | | | | 405 |
Other Accrued Expenses | | | 9,729 | | | | 5,205 |
| | | | | | | | |
Total Liabilities | | | 97,537 | | | | 76,207 |
| | | | | | | | |
Net Assets | | $ | 98,149,507 | | | $ | 50,785,823 |
| | | | | | | | |
Net Assets Consist of: | | | | | | | |
Paid-in Capital | | $ | 109,193,063 | | | $ | 49,113,468 |
Total Distributable Earnings (Accumulated Losses) | | | (11,043,556 | ) | | | 1,672,355 |
| | | | | | | | |
Net Assets | | $ | 98,149,507 | | | $ | 50,785,823 |
Outstanding Shares of Beneficial Interest
(unlimited authorization – no par value) | | | 1,875,000 | | | | 1,550,000 |
Net Asset Value, Offering and Redemption Price Per Share | | $ | 52.35 | | | $ | 32.77 |
The accompanying notes are an integral part of the financial statements.
14
ETC 6 Meridian
Statements of Operations
For the Year Ended November 30, 2024
| | ETC
6 Meridian
Hedged
Equity-Index
Option
Strategy ETF | | ETC
6 Meridian
Low Beta
Equity
Strategy ETF | | ETC
6 Meridian
Mega Cap
Equity ETF |
Investment Income: | | | | | | | | | | | |
Dividend Income | | $ | 10,684,868 | | | $ | 3,367,068 | | | $ | 6,114,118 |
Less: Reclaims Withheld | | | — | | | | (1,151 | ) | | | — |
| | | | | | | | | | | | |
Total Investment Income | | | 10,684,868 | | | | 3,365,917 | | | | 6,114,118 |
| | | | | | | | | | | | |
Expenses: | | | | | | | | | | | |
Advisory Fees | | | 2,465,421 | | | | 985,850 | | | | 1,483,948 |
Interest Expense on Broker Account | | | 1,124,303 | | | | — | | | | — |
Administration Fees | | | 282,919 | | | | 113,131 | | | | 170,290 |
Trustees’ Fees | | | 80,579 | | | | 32,214 | | | | 48,235 |
Custodian Fees | | | 44,162 | | | | 13,814 | | | | 27,754 |
Transfer Agent Fees | | | 32,900 | | | | 37,064 | | | | 47,520 |
Legal Fees | | | 27,809 | | | | 11,292 | | | | 17,300 |
Chief Compliance Officer Fees | | | 23,510 | | | | 9,383 | | | | 14,038 |
Audit Fees | | | 17,500 | | | | 17,500 | | | | 17,500 |
Printing Fees | | | 10,447 | | | | 4,265 | | | | 6,920 |
Registration Fees | | | 8,594 | | | | 10,452 | | | | 11,750 |
Pricing Fees | | | 949 | | | | 343 | | | | 648 |
Other Fees | | | 56,167 | | | | 15,289 | | | | 22,617 |
Total Expenses | | | 4,175,260 | | | | 1,250,597 | | | | 1,868,520 |
| | | | | | | | | | | | |
Net Investment Income (Loss) | | | 6,509,608 | | | | 2,115,320 | | | | 4,245,598 |
| | | | | | | | | | | | |
Net Realized Gain (Loss) on: | | | | | | | | | | | |
Investments(1) | | | 69,319,330 | | | | 5,348,393 | | | | 38,033,297 |
Written Options | | | (61,277,737 | ) | | | — | | | | — |
| | | | | | | | | | | | |
Net Realized Gain (Loss) | | | 8,041,593 | | | | 5,348,393 | | | | 38,033,297 |
| | | | | | | | | | | | |
Net Change in Unrealized Appreciation (Depreciation) on: | | | | | | | | | | | |
Investments | | | 40,870,921 | | | | 29,941,041 | | | | 27,873,938 |
Written Options | | | 6,640,933 | | | | — | | | | — |
| | | | | | | | | | | | |
Net Unrealized Appreciation (Depreciation) | | | 47,511,854 | | | | 29,941,041 | | | | 27,873,938 |
| | | | | | | | | | | | |
Net Realized and Unrealized Gain (Loss) | | | 55,553,447 | | | | 35,289,434 | | | | 65,907,235 |
| | | | | | | | | | | | |
Net Increase (Decrease) in Net Assets Resulting from Operations | | $ | 62,063,055 | | | $ | 37,404,754 | | | $ | 70,152,833 |
The accompanying notes are an integral part of the financial statements.
15
ETC 6 Meridian
Statements of Operations
For the Year Ended November 30, 2024
| | ETC
6 Meridian
Small Cap
Equity ETF | | ETC
6 Meridian
Quality
Growth ETF |
Investment Income: | | | | | | | |
Dividend Income | | $ | 1,484,285 | | $ | 234,672 | |
Total Investment Income | | | 1,484,285 | | | 234,672 | |
| | | | | | | | |
Expenses: | | | | | | | |
Advisory Fees | | | 480,256 | | | 247,761 | |
Administration Fees | | | 55,112 | | | 28,432 | |
Transfer Agent Fees | | | 36,766 | | | 37,256 | |
Audit Fees | | | 17,500 | | | 17,500 | |
Trustees’ Fees | | | 15,549 | | | 8,074 | |
Registration Fees | | | 10,901 | | | 10,266 | |
Custodian Fees | | | 6,959 | | | 2,948 | |
Legal Fees | | | 5,502 | | | 2,936 | |
Chief Compliance Officer Fees | | | 4,526 | | | 2,347 | |
Printing Fees | | | 2,694 | | | 1,126 | |
Pricing Fees | | | 185 | | | 112 | |
Other Fees | | | 7,371 | | | 3,791 | |
Advisory Waiver Recapture (Note 3) | | | — | | | 42,591 | |
Total Expenses | | | 643,321 | | | 405,140 | |
| | | | | | | | |
Net Investment Income (Loss) | | | 840,964 | | | (170,468 | ) |
| | | | | | | | |
Net Realized Gain (Loss) on: | | | | | | | |
Investments(1) | | | 3,283,513 | | | 4,894,015 | |
| | | | | | | | |
Net Realized Gain (Loss) | | | 3,283,513 | | | 4,894,015 | |
| | | | | | | | |
Net Change in Unrealized Appreciation (Depreciation) on: | | | | | | | |
Investments | | | 11,659,855 | | | 6,004,224 | |
| | | | | | | | |
Net Unrealized Appreciation (Depreciation) | | | 11,659,855 | | | 6,004,224 | |
| | | | | | | | |
Net Realized and Unrealized Gain (Loss) | | | 14,943,368 | | | 10,898,239 | |
| | | | | | | | |
Net Increase (Decrease) in Net Assets Resulting from Operations | | $ | 15,784,332 | | $ | 10,727,771 | |
The accompanying notes are an integral part of the financial statements.
16
ETC 6 Meridian
Statements of Changes in Net Assets
| | ETC 6 Meridian Hedged Equity-Index
Option Strategy ETF |
| | | Year Ended
November 30,
2024 | | Year Ended
November 30,
2023 |
Operations: | | | | | | | | |
Net Investment Income (Loss) | | $ | 6,509,608 | | | $ | 7,391,093 | |
Net Realized Gain (Loss)(1) | | | 8,041,593 | | | | 9,111,703 | |
Net Change in Unrealized Appreciation (Depreciation) | | | 47,511,854 | | | | 451,536 | |
Net Increase (Decrease) in Net Assets Resulting from Operations | | | 62,063,055 | | | | 16,954,332 | |
| | | | | | | | | |
Distributions: | | | (6,609,357 | ) | | | (7,207,938 | ) |
| | | | | | | | | |
Capital Share Transactions: | | | | | | | | |
Issued | | | 534,744,248 | | | | 392,485,217 | |
Redeemed | | | (505,706,320 | ) | | | (354,122,280 | ) |
Increase (Decrease) in Net Assets from Capital Share Transactions | | | 29,037,928 | | | | 38,362,937 | |
| | | | | | | | | |
Total Increase (Decrease) in Net Assets | | | 84,491,626 | | | | 48,109,331 | |
| | | | | | | | | |
Net Assets: | | | | | | | | |
Beginning of Year | | | 362,984,725 | | | | 314,875,394 | |
End of Year | | $ | 447,476,351 | | | $ | 362,984,725 | |
| | | | | | | | | |
Share Transactions: | | | | | | | | |
Issued | | | 15,050,000 | | | | 12,300,000 | |
Redeemed | | | (14,250,000) | | | | (11,100,000) | |
| | | | | | | | | |
Net Increase (Decrease) in Shares Outstanding from Share Transactions | | | 800,000 | | | | 1,200,000 | |
The accompanying notes are an integral part of the financial statements.
17
ETC 6 Meridian
Statements of Changes in Net Assets
| | ETC 6 Meridian Low Beta Equity
Strategy ETF |
| | | Year Ended
November 30,
2024 | | Year Ended
November 30,
2023 |
Operations: | | | | | | | | |
Net Investment Income (Loss) | | $ | 2,115,320 | | | $ | 2,389,513 | |
Net Realized Gain (Loss)(1) | | | 5,348,393 | | | | (2,422,750 | ) |
Net Change in Unrealized Appreciation (Depreciation) | | | 29,941,041 | | | | (8,378,666 | ) |
Net Increase (Decrease) in Net Assets Resulting from Operations | | | 37,404,754 | | | | (8,411,903 | ) |
| | | | | | | | | |
Distributions: | | | (2,172,352 | ) | | | (2,332,485 | ) |
| | | | | | | | | |
Capital Share Transactions: | | | | | | | | |
Issued | | | 85,327,684 | | | | 42,924,208 | |
Redeemed | | | (69,631,940 | ) | | | (49,309,011 | ) |
Increase (Decrease) in Net Assets from Capital Share Transactions | | | 15,695,744 | | | | (6,384,803 | ) |
| | | | | | | | | |
Total Increase (Decrease) in Net Assets | | | 50,928,146 | | | | (17,129,191 | ) |
| | | | | | | | | |
Net Assets: | | | | | | | | |
Beginning of Year | | | 139,769,688 | | | | 156,898,879 | |
End of Year | | $ | 190,697,834 | | | $ | 139,769,688 | |
| | | | | | | | | |
Share Transactions: | | | | | | | | |
Issued | | | 2,425,000 | | | | 1,300,000 | |
Redeemed | | | (1,975,000 | ) | | | (1,500,000 | ) |
| | | | | | | | | |
Net Increase (Decrease) in Shares Outstanding from Share Transactions | | | 450,000 | | | | (200,000) | |
The accompanying notes are an integral part of the financial statements.
18
ETC 6 Meridian
Statements of Changes in Net Assets
| | ETC 6 Meridian Mega Cap
Equity ETF |
| | | Year Ended
November 30,
2024 | | Year Ended
November 30,
2023 |
Operations: | | | | | | | | |
Net Investment Income (Loss) | | $ | 4,245,598 | | | $ | 4,055,579 | |
Net Realized Gain (Loss)(1) | | | 38,033,297 | | | | 1,540,827 | |
Net Change in Unrealized Appreciation (Depreciation) | | | 27,873,938 | | | | 595,665 | |
Net Increase (Decrease) in Net Assets Resulting from Operations | | | 70,152,833 | | | | 6,192,071 | |
| | | | | | | | | |
Distributions: | | | (4,297,958 | ) | | | (3,928,312 | ) |
| | | | | | | | | |
Capital Share Transactions: | | | | | | | | |
Issued | | | 326,599,050 | | | | 199,380,193 | |
Redeemed | | | (291,211,869 | ) | | | (188,481,751 | ) |
Increase (Decrease) in Net Assets from Capital Share Transactions | | | 35,387,181 | | | | 10,898,442 | |
| | | | | | | | | |
Total Increase (Decrease) in Net Assets | | | 101,242,056 | | | | 13,162,201 | |
| | | | | | | | | |
Net Assets: | | | | | | | | |
Beginning of Year | | | 190,842,666 | | | | 177,680,465 | |
End of Year | | $ | 292,084,722 | | | $ | 190,842,666 | |
| | | | | | | | | |
Share Transactions: | | | | | | | | |
Issued | | | 7,975,000 | | | | 5,825,000 | |
Redeemed | | | (7,125,000 | ) | | | (5,525,000 | ) |
| | | | | | | | | |
Net Increase (Decrease) in Shares Outstanding from Share Transactions | | | 850,000 | | | | 300,000 | |
The accompanying notes are an integral part of the financial statements.
19
ETC 6 Meridian
Statements of Changes in Net Assets
| | ETC 6 Meridian Small Cap
Equity ETF |
| | | Year Ended
November 30,
2024 | | Year Ended
November 30,
2023 |
Operations: | | | | | | | | |
Net Investment Income (Loss) | | $ | 840,964 | | | $ | 1,252,645 | |
Net Realized Gain (Loss)(1) | | | 3,283,513 | | | | (1,479,582 | ) |
Net Change in Unrealized Appreciation (Depreciation) | | | 11,659,855 | | | | (127,104 | ) |
Net Increase (Decrease) in Net Assets Resulting from Operations | | | 15,784,332 | | | | (354,041 | ) |
| | | | | | | | | |
Distributions: | | | (955,142 | ) | | | (1,166,152 | ) |
| | | | | | | | | |
Capital Share Transactions: | | | | | | | | |
Issued | | | 65,928,828 | | | | 39,304,120 | |
Redeemed | | | (46,494,189 | ) | | | (39,212,642 | ) |
Increase (Decrease) in Net Assets from Capital Share Transactions | | | 19,434,639 | | | | 91,478 | |
| | | | | | | | | |
Total Increase (Decrease) in Net Assets | | | 34,263,829 | | | | (1,428,715 | ) |
| | | | | | | | | |
Net Assets: | | | | | | | | |
Beginning of Year | | | 63,885,678 | | | | 65,314,393 | |
End of Year | | $ | 98,149,507 | | | $ | 63,885,678 | |
| | | | | | | | | |
Share Transactions: | | | | | | | | |
Issued | | | 1,400,000 | | | | 875,000 | |
Redeemed | | | (1,000,000 | ) | | | (875,000 | ) |
| | | | | | | | | |
Net Increase (Decrease) in Shares Outstanding from Share Transactions | | | 400,000 | | | | — | |
The accompanying notes are an integral part of the financial statements.
20
ETC 6 Meridian
Statements of Changes in Net Assets
| | ETC 6 Meridian Quality
Growth ETF |
| | | Year Ended
November 30,
2024 | | Year Ended
November 30,
2023 |
Operations: | | | | | | | | |
Net Investment Income (Loss) | | $ | (170,468 | ) | | $ | (74,704 | ) |
Net Realized Gain (Loss)(1) | | | 4,894,015 | | | | 47,007 | |
Net Change in Unrealized Appreciation (Depreciation) | | | 6,004,224 | | | | 4,110,525 | |
Net Increase (Decrease) in Net Assets Resulting from Operations | | | 10,727,771 | | | | 4,082,828 | |
| | | | | | | | | |
Distributions: | | | — | | | | (12,666 | ) |
Return of Capital | | | — | | | | (6,245 | ) |
| | | | | | | | | |
Capital Share Transactions: | | | | | | | | |
Issued | | | 33,844,556 | | | | 11,518,982 | |
Redeemed | | | (24,743,931 | ) | | | (13,630,937 | ) |
Increase (Decrease) in Net Assets from Capital Share Transactions | | | 9,100,625 | | | | (2,111,955 | ) |
| | | | | | | | | |
Total Increase (Decrease) in Net Assets | | | 19,828,396 | | | | 1,951,962 | |
Net Assets: | | | | | | | | |
Beginning of Year | | | 30,957,427 | | | | 29,005,465 | |
End of Year | | $ | 50,785,823 | | | $ | 30,957,427 | |
| | | | | | | | | |
Share Transactions: | | | | | | | | |
Issued | | | 1,175,000 | | | | 500,000 | |
Redeemed | | | (850,000 | ) | | | (600,000 | ) |
| | | | | | | | | |
Net Increase (Decrease) in Shares Outstanding from Share Transactions | | | 325,000 | | | | (100,000 | ) |
The accompanying notes are an integral part of the financial statements.
21
ETC 6 Meridian
ETC 6 Meridian Hedged Equity-Index Option Strategy ETF
Financial Highlights
Selected Per Share Data & Ratios
For a Share Outstanding Throughout the Year/Period
| |
Years Ended November 30,
| | Period Ended
November 30,
2020† |
| | | 2024 | | 2023 | | 2022 | | 2021 | |
Net Asset Value, beginning of year/period | | $ | 33.07 | | | $ | 32.21 | | | $ | 29.54 | | | $ | 26.65 | | | $ | 25.34 | |
Investment Activities | | | | | | | | | | | | | | | | | | | | |
Net Investment income* | | | 0.57 | | | | 0.69 | | | | 0.67 | | | | 0.50 | | | | 0.25 | |
Net realized and unrealized gain (loss) | | | 4.95 | | | | 0.84 | | | | 2.66 | | | | 2.88 | | | | 1.30 | |
Total from investment activities | | | 5.52 | | | | 1.53 | | | | 3.33 | | | | 3.38 | | | | 1.55 | |
Distributions to shareholders from: | | | | | | | | | | | | | | | | | | | | |
Net Investment Income | | | (0.59 | ) | | | (0.67 | ) | | | (0.66 | ) | | | (0.49 | ) | | | (0.24 | ) |
Total Distributions | | | (0.59 | ) | | | (0.67 | ) | | | (0.66 | ) | | | (0.49 | ) | | | (0.24 | ) |
Net Asset Value, end of year/period | | $ | 38.00 | | | $ | 33.07 | | | $ | 32.21 | | | $ | 29.54 | | | $ | 26.65 | |
Net Asset Value, Total Return (%)(1) | | | 16.81 | | | | 4.86 | | | | 11.44 | | | | 12.76 | | | | 6.14 | |
Ratios to Average Net Assets | | | | | | | | | | | | | | | | | | | | |
Expenses (%) | | | 1.03 | (2) | | | 1.01 | (3) | | | 0.82 | (4) | | | 0.84 | (5) | | | 0.87 | (6)(7) |
Expenses excluding waivers (%) | | | 1.03 | (2) | | | 1.01 | (3) | | | 0.82 | (4) | | | 0.84 | (5) | | | 0.87 | (6)(7) |
Net investment income (loss) (%) | | | 1.61 | (2) | | | 2.15 | (3) | | | 2.22 | (4) | | | 1.72 | (5) | | | 1.71 | (6)(7) |
Supplemental Data | | | | | | | | | | | | | | | | | | | | |
Net Assets end of year/period (000) | | $ | 447,476 | | | $ | 362,985 | | | $ | 314,875 | | | $ | 246,619 | | | $ | 202,524 | |
Portfolio turnover rate(%)(8) | | | 159 | | | | 160 | | | | 164 | | | | 171 | | | | 49 | |
The accompanying notes are an integral part of the financial statements.
22
ETC 6 Meridian
ETC 6 Meridian Low Beta Equity Strategy ETF
Financial Highlights
Selected Per Share Data & Ratios
For a Share Outstanding Throughout the Year/Period
| |
Years Ended November 30,
| | Period Ended
November 30,
2020† |
| | | 2024 | | 2023 | | 2022 | | 2021 | |
Net Asset Value, beginning of year/period | | $ | 31.77 | | | $ | 34.11 | | | $ | 33.63 | | | $ | 28.70 | | | $ | 25.54 | |
Investment Activities | | | | | | | | | | | | | | | | | | | | |
Net Investment income* | | | 0.46 | | | | 0.53 | | | | 0.44 | | | | 0.21 | | | | 0.10 | |
Net realized and unrealized gain (loss) | | | 7.56 | | | | (2.36 | ) | | | 0.49 | | | | 4.94 | | | | 3.15 | |
Total from investment activities | | | 8.02 | | | | (1.83 | ) | | | 0.93 | | | | 5.15 | | | | 3.25 | |
Distributions to shareholders from: | | | | | | | | | | | | | | | | | | | | |
Net Investment Income | | | (0.47 | ) | | | (0.51 | ) | | | (0.45 | ) | | | (0.22 | ) | | | (0.09 | ) |
Total Distributions | | | (0.47 | ) | | | (0.51 | ) | | | (0.45 | ) | | | (0.22 | ) | | | (0.09 | ) |
Net Asset Value, end of year/period | | $ | 39.32 | | | $ | 31.77 | | | $ | 34.11 | | | $ | 33.63 | | | $ | 28.70 | |
Net Asset Value, Total Return (%)(1) | | | 25.43 | | | | (5.35 | ) | | | 2.80 | | | | 17.96 | | | | 12.72 | |
Ratios to Average Net Assets | | | | | | | | | | | | | | | | | | | | |
Expenses (%) | | | 0.77 | | | | 0.79 | | | | 0.80 | | | | 0.82 | | | | 0.88 | (2) |
Expenses excluding waivers (%) | | | 0.77 | | | | 0.79 | | | | 0.80 | | | | 0.82 | | | | 0.88 | (2) |
Net investment income (loss) (%) | | | 1.31 | | | | 1.64 | | | | 1.32 | | | | 0.64 | | | | 0.65 | (2) |
Supplemental Data | | | | | | | | | | | | | | | | | | | | |
Net Assets end of year/period (000) | | $ | 190,698 | | | $ | 139,770 | | | $ | 156,899 | | | $ | 137,049 | | | $ | 93,283 | |
Portfolio turnover rate(%)(3) | | | 56 | | | | 59 | | | | 73 | | | | 70 | | | | 13 | |
The accompanying notes are an integral part of the financial statements.
23
ETC 6 Meridian
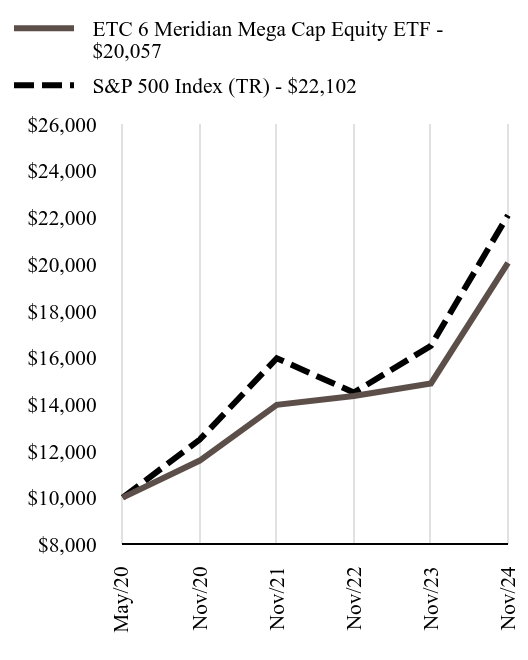
ETC 6 Meridian Mega Cap Equity ETF
Financial Highlights
Selected Per Share Data & Ratios
For a Share Outstanding Throughout the Year/Period
| |
Years Ended November 30,
| | Period Ended
November 30,
2020† |
| | | 2024 | | 2023 | | 2022 | | 2021 | |
Net Asset Value, beginning of year/period | | $ | 35.18 | | | $ | 34.67 | | | $ | 34.50 | | | $ | 29.14 | | | $ | 25.38 | |
Investment Activities | | | | | | | | | | | | | | | | | | | | |
Net Investment income* | | | 0.72 | | | | 0.77 | | | | 0.77 | | | | 0.58 | | | | 0.27 | |
Net realized and unrealized gain (loss) | | | 11.38 | | | | 0.48 | | | | 0.14 | | | | 5.39 | | | | 3.74 | |
Total from investment activities | | | 12.10 | | | | 1.25 | | | | 0.91 | | | | 5.97 | | | | 4.01 | |
Distributions to shareholders from: | | | | | | | | | | | | | | | | | | | | |
Net Investment Income | | | (0.73 | ) | | | (0.74 | ) | | | (0.74 | ) | | | (0.58 | ) | | | (0.25 | ) |
Net realized capital gains | | | — | | | | — | | | | — | | | | (0.03 | ) | | | — | |
Total Distributions | | | (0.73 | ) | | | (0.74 | ) | | | (0.74 | ) | | | (0.61 | ) | | | (0.25 | ) |
Net Asset Value, end of year/period | | $ | 46.55 | | | $ | 35.18 | | | $ | 34.67 | | | $ | 34.50 | | | $ | 29.14 | |
Net Asset Value, Total Return (%)(1) | | | 34.68 | | | | 3.74 | | | | 2.73 | | | | 20.59 | | | | 15.88 | |
Ratios to Average Net Assets | | | | | | | | | | | | | | | | | | | | |
Expenses (%) | | | 0.77 | | | | 0.78 | | | | 0.80 | | | | 0.82 | | | | 0.86 | (2) |
Expenses excluding waivers (%) | | | 0.77 | | | | 0.78 | | | | 0.80 | | | | 0.82 | | | | 0.86 | (2) |
Net investment income (loss) (%) | | | 1.75 | | | | 2.26 | | | | 2.27 | | | | 1.76 | | | | 1.72 | (2) |
Supplemental Data | | | | | | | | | | | | | | | | | | | | |
Net Assets end of year/period (000) | | $ | 292,085 | | | $ | 190,843 | | | $ | 177,680 | | | $ | 158,680 | | | $ | 115,827 | |
Portfolio turnover rate(%)(3) | | | 153 | | | | 144 | | | | 160 | | | | 166 | | | | 38 | |
The accompanying notes are an integral part of the financial statements.
24
ETC 6 Meridian
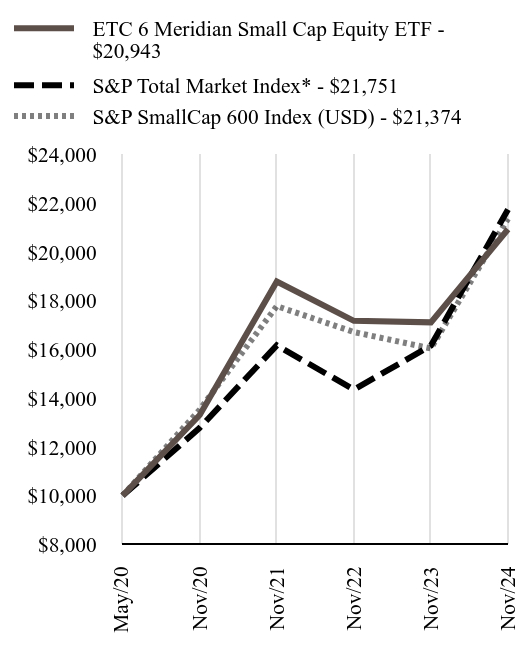
ETC 6 Meridian Small Cap Equity ETF
Financial Highlights
Selected Per Share Data & Ratios
For a Share Outstanding Throughout the Year/Period
| |
Years Ended November 30,
| | Period Ended
November 30,
2020† |
| | | 2024 | | 2023 | | 2022 | | 2021 | |
Net Asset Value, beginning of year/period | | $ | 43.31 | | | $ | 44.28 | | | $ | 49.08 | | | $ | 35.05 | | | $ | 26.43 | |
Investment Activities | | | | | | | | | | | | | | | | | | | | |
Net Investment income* | | | 0.50 | | | | 0.83 | | | | 0.56 | | | | 0.40 | | | | 0.13 | |
Net realized and unrealized gain (loss) | | | 9.12 | | | | (1.02 | ) | | | (4.76 | ) | | | 14.00 | | | | 8.60 | |
Total from investment activities | | | 9.62 | | | | (0.19 | ) | | | (4.20 | ) | | | 14.40 | | | | 8.73 | |
Distributions to shareholders from: | | | | | | | | | | | | | | | | | | | | |
Net Investment Income | | | (0.58 | ) | | | (0.78 | ) | | | (0.60 | ) | | | (0.37 | ) | | | (0.11 | ) |
Total Distributions | | | (0.58 | ) | | | (0.78 | ) | | | (0.60 | ) | | | (0.37 | ) | | | (0.11 | ) |
Net Asset Value, end of year/period | | $ | 52.35 | | | $ | 43.31 | | | $ | 44.28 | | | $ | 49.08 | | | $ | 35.05 | |
Net Asset Value, Total Return (%)(1) | | | 22.35 | | | | (0.37 | ) | | | (8.58 | ) | | | 41.20 | | | | 33.11 | |
Ratios to Average Net Assets | | | | | | | | | | | | | | | | | | | | |
Expenses (%) | | | 0.82 | | | | 0.85 | | | | 0.89 | | | | 0.88 | | | | 1.00 | (2) |
Expenses excluding waivers (%) | | | 0.82 | | | | 0.85 | | | | 0.89 | | | | 0.88 | | | | 1.10 | (2) |
Net investment income (loss) (%) | | | 1.07 | | | | 1.96 | | | | 1.24 | | | | 0.87 | | | | 0.76 | (2) |
Supplemental Data | | | | | | | | | | | | | | | | | | | | |
Net Assets end of year/period (000) | | $ | 98,150 | | | $ | 63,886 | | | $ | 65,314 | | | $ | 62,572 | | | $ | 32,423 | |
Portfolio turnover rate(%)(3) | | | 86 | | | | 98 | | | | 91 | | | | 104 | | | | 29 | |
The accompanying notes are an integral part of the financial statements.
25
ETC 6 Meridian
ETC 6 Meridian Quality Growth ETF
Financial Highlights
Selected Per Share Data & Ratios
For a Share Outstanding Throughout the Year/Period
| |
Years Ended November 30,
| | Period Ended
November 30,
2021† |
| | | 2024 | | 2023 | | 2022 | |
Net Asset Value, beginning of year/period | | $ | 25.27 | | | $ | 21.89 | | | $ | 26.78 | | | $ | 24.28 | |
Investment Activities | | | | | | | | | | | | | | | | |
Net Investment income (loss)* | | | (0.12 | ) | | | (0.06 | ) | | | 0.02 | | | | (0.03 | ) |
Net realized and unrealized gain (loss) | | | 7.62 | | | | 3.46 | | | | (4.90 | ) | | | 2.53 | |
Total from investment activities | | | 7.50 | | | | 3.40 | | | | (4.88 | ) | | | 2.50 | |
Distributions to shareholders from: | | | | | | | | | | | | | | | | |
Net Investment Income | | | — | | | | (0.01 | ) | | | (0.01 | ) | | | — | |
Return of Capital | | | — | | | | (0.01 | ) | | | — | | | | — | (1) |
Total Distributions | | | — | | | | (0.02 | ) | | | (0.01 | ) | | | — | |
Net Asset Value, end of year/period | | $ | 32.77 | | | $ | 25.27 | | | $ | 21.89 | | | $ | 26.78 | |
Net Asset Value, Total Return (%)(2) | | | 29.68 | | | | 15.52 | | | | (18.23 | ) | | | 10.30 | |
Ratios to Average Net Assets | | | | | | | | | | | | | | | | |
Expenses (%) | | | 1.00 | | | | 1.00 | | | | 1.00 | | | | 1.00 | (3) |
Expenses excluding waivers (%) | | | 1.00 | | | | 1.01 | | | | 1.08 | | | | 1.52 | (3) |
Net investment income (loss) (%) | | | (0.42 | ) | | | (0.26 | ) | | | 0.07 | | | | (0.18 | )(3) |
Supplemental Data | | | | | | | | | | | | | | | | |
Net Assets end of year/period (000) | | $ | 50,786 | | | $ | 30,957 | | | $ | 29,005 | | | $ | 25,443 | |
Portfolio turnover rate(%)(4) | | | 74 | | | | 59 | | | | 84 | | | | 40 | |
Amounts designated as “—” are $0 or have been rounded to $0.
The accompanying notes are an integral part of the financial statements.
26
ETC 6 Meridian
Notes to Financial Statements
November 30, 2024
1. ORGANIZATION
Exchange Traded Concepts Trust (the “Trust”) is a Delaware statutory trust formed on July 17, 2009. The Trust is registered with the Securities and Exchange Commission (the “Commission”) under the Investment Company Act of 1940 (the “1940 Act”) as an open-end management investment company with multiple investment portfolios. The financial statements herein are those of the ETC 6 Meridian Hedged Equity-Index Option Strategy ETF, ETC 6 Meridian Low Beta Equity Strategy ETF, ETC 6 Meridian Mega Cap Equity ETF, ETC 6 Meridian Small Cap Equity ETF and ETC 6 Meridian Quality Growth ETF (each, a “Fund” and collectively, the “Funds”). Each Fund seeks to provide capital appreciation. Exchange Traded Concepts, LLC (the “Adviser”), an Oklahoma limited liability company, serves as the investment adviser for the Funds. The ETC 6 Meridian Low Beta Equity Strategy ETF and ETC 6 Meridian Small Equity ETF are classified as “diversified” under the 1940 Act. The ETC 6 Meridian Hedged Equity-Index Option Strategy ETF, ETC 6 Meridian Mega Cap Equity ETF and ETC 6 Meridian Quality Growth ETF are classified as “non-diversified” under the 1940 Act (see “Non-Diversification Risk” under Note 6). The Funds, other than the ETC 6 Meridian Quality Growth ETF, commenced operations on May 8, 2020. The ETC 6 Meridian Quality Growth ETF commenced operations on May 10, 2021.
Shares of the Funds are listed and traded on the NYSE Arca, Inc. (the “Exchange”). Market prices for shares of a Fund may be different from their net asset value (“NAV”). The Funds issue and redeem shares on a continuous basis to certain institutional investors (typically market makers or other broker-dealers) at NAV only in large blocks of shares called “Creation Units.” Creation Units are available for purchase and redemption on each business day and are offered and redeemed on an in-kind basis, together with a specified cash amount, or for an all cash amount. Once created, shares trade in a secondary market at market prices that change throughout the day in share amounts less than a Creation Unit.
2. SIGNIFICANT ACCOUNTING POLICIES
The following significant accounting policies, which are consistently followed in the preparation of the financial statements of the Trust, are in conformity with accounting principles generally accepted in the United States of America (“U.S. GAAP”) for investment companies. The accompanying financial statements have been prepared in accordance with U.S. GAAP on the accrual basis of accounting. Management has reviewed Financial Accounting Standards Board (“FASB”) Accounting Standards Codification (“ASC”) Topic 946, Financial Services — Investment Companies (“ASC 946”), and concluded that the Funds meet the criteria of an “investment company,” and therefore, the Funds prepare their financial statements in accordance with investment company accounting as outlined in ASC 946.
Use of Estimates and Indemnifications — Each Fund is an investment company in conformity with U.S. GAAP. Therefore, the Funds follow the accounting and reporting guidelines for investment companies. The preparation of financial statements in conformity with U.S. GAAP requires management to make estimates and assumptions that affect the reported amounts of assets and liabilities and disclosure of contingent assets and liabilities at the date of the financial statements and the reported amounts of increases and decreases in net assets from operations during the reporting period. Actual results could differ from those estimates.
In the normal course of business, the Trust, on behalf of the Funds, enters into contracts that contain a variety of representations which provide general indemnifications. Each Fund’s maximum exposure under these arrangements cannot be known; however, the Funds expect any risk of loss to be remote.
Security Valuation — The Funds record their investments at fair value. Securities listed on a securities exchange, market or automated quotation system for which quotations are readily available (except for securities traded on the NASDAQ Stock Market (“NASDAQ”)), including securities traded over the counter, are valued at the last quoted sale price on the primary exchange or market (foreign or domestic) on which they are traded (or at approximately 4:00 pm Eastern Time if a security’s primary exchange is normally open at that time), or, if there is
27
ETC 6 Meridian
Notes to Financial Statements
November 30, 2024 (Continued)
2. SIGNIFICANT ACCOUNTING POLICIES (continued)
no such reported sale, at the most recent quoted bid price for long positions and at the most recent quoted ask price for short positions. For securities traded on NASDAQ, the NASDAQ Official Closing Price will be used. If available, debt securities are priced based upon valuations provided by independent, third-party pricing agents. Such values generally reflect the last reported sales price if the security is actively traded.
The third-party pricing agents may also value debt securities at an evaluated bid price by employing methodologies that utilize actual market transactions, broker-supplied valuations, or other methodologies designed to identify the fair value for such securities. Debt obligations with remaining maturities of sixty days or less when acquired will be valued at their market value. If a market value is not available from a pricing vendor or from an independent broker, the security shall be fair valued according to the Trust’s fair value procedures. Prices for most securities held in the Funds are provided daily by recognized independent pricing agents. If a security price cannot be obtained from an independent, third-party pricing agent, the Funds seek to obtain a bid price from at least one independent broker.
Options are valued at the last quoted sales price. If there is no such reported sale on the valuation date, long positions are valued at the most recent bid price, and short positions are valued at the most recent ask price.
Rule 2a-5 under the 1940 Act, establishes requirements to determine fair value in good faith for purposes of the 1940 Act. The rule permits fund boards to designate a fund’s investment adviser to perform fair-value determinations, subject to board oversight and certain other conditions. The rule also defines when market quotations are “readily available” for purposes of the 1940 Act and requires a fund to fair value a portfolio investment when a market quotation is not readily available.
Pursuant to the requirements of Rule 2a-5, the Trust’s Board of Trustees (the “Board”) (i) has designated the Adviser as the Board’s valuation designee to perform fair-value determinations for a Fund through the Adviser’s Valuation Committee and (ii) approved the Adviser’s Valuation Procedures.
Some of the more common reasons that may necessitate that a security be valued using fair value procedures include: the security’s trading has been halted or suspended; the security has been de-listed from a national exchange; the security’s primary trading market is temporarily closed at a time, when under normal conditions, it would be open; the security has not been traded for an extended period of time; the security’s primary pricing source is not able or willing to provide a price; or trading of the security is subject to local government-imposed restrictions. In addition, a Fund may fair value its securities if an event that may materially affect the value of the Fund’s securities that traded outside of the United States (a ‘‘Significant Event’’) has occurred between the time of the security’s last close and the time that the Fund calculates its NAV. A Significant Event may relate to a single issuer or to an entire market sector. Events that may be Significant Events include, but are not limited to, government actions, natural disasters, armed conflict, acts of terrorism and significant market fluctuations. If the Adviser becomes aware of a Significant Event that has occurred with respect to a security or group of securities after the closing of the exchange or market on which the security or securities principally trade, but before the time at which the Fund calculates its NAV, it may request that a Committee meeting be called. When a security is valued in accordance with the fair value procedures, the Committee will determine the value after taking into consideration relevant information reasonably available to the Committee.
In accordance with the authoritative guidance on fair value measurements and disclosure under U.S. GAAP, the Funds disclose fair value of its investments in a hierarchy that prioritizes the inputs to valuation techniques used to measure the fair value. The objective of a fair value measurement is to determine the price that would be received to sell an asset, or paid to transfer a liability, in an orderly transaction between market participants at the measurement date (an exit price). Accordingly, the fair value hierarchy gives the highest priority to quoted prices (unadjusted) in active markets for identical assets or liabilities (Level 1) and the lowest priority to unobservable inputs (Level 3).
28
ETC 6 Meridian
Notes to Financial Statements
November 30, 2024 (Continued)
2. SIGNIFICANT ACCOUNTING POLICIES (continued)
The three levels of the fair value hierarchy are described below:
• Level 1 — Unadjusted quoted prices in active markets for identical, unrestricted assets or liabilities that the Funds have the ability to access at the measurement date;
• Level 2 — Quoted prices which are not active, or inputs that are observable (either directly or indirectly) for substantially the full term of the asset or liability; and
• Level 3 — Prices, inputs or exotic modeling techniques which are both significant to the fair value measurement and unobservable (supported by little or no market activity).
The valuation techniques used by the Funds to measure fair value during the year ended November 30, 2024 maximized the use of observable inputs and minimized the use of unobservable inputs. Investments are classified within the level of the lowest significant input considered in determining fair value.
Federal Income Taxes — It is each Fund’s intention to qualify as a regulated investment company for Federal income tax purposes by complying with the appropriate provisions of Subchapter M of the Internal Revenue Code of 1986, as amended. Accordingly, no provisions for Federal income taxes have been made in the financial statements.
The Funds’ policy is to classify interest and penalties associated with underpayment of federal and state income taxes, if any, as income tax expense on their Statements of Operations. As of and for the year ended November 30, 2024, the Funds did not have any interest or penalties associated with the underpayment of any income taxes. Current tax years remain open and subject to examination by tax jurisdictions. The Funds have reviewed all major jurisdictions and concluded that there is no impact on the Funds’ net assets and no tax liability resulting from unrecognized tax benefits relating to uncertain income tax positions taken or expected to be taken on its tax returns.
Security Transactions and Investment Income — Security transactions are accounted for on trade date. Costs used in determining realized gains and losses on the sale of investment securities are based on specific identification. Dividend income is recorded on the ex-dividend date. Interest income is recognized on the accrual basis. Withholding taxes and reclaims on foreign dividends, if any, have been provided for in accordance with the Funds’ understanding of the applicable country’s tax rules and rates.
Counterparty Risk and Collateral — The ETC 6 Meridian Hedged Equity-Index Option Strategy ETF invests in exchange-traded derivatives, such as futures and exchange-traded options. Counterparty risk on these derivatives is minimal because the clearinghouse provides protection against counterparty defaults. For futures, the Fund is required to deposit collateral in the amount specified by the clearinghouse and the clearing firm (“margin requirement”), and the margin requirement must be maintained over the life of the contract. Collateral for exchange-traded derivatives may be in the form of cash or debt securities issued by the U.S. government or related agencies, although other securities may be used. Cash posted by the Fund, if any, is reflected as cash deposits in the accompanying financial statements and generally is restricted from withdrawal by the Fund. Securities posted by the Fund, if any, are noted in the accompanying schedule of investments. Both forms of collateral remain in the Fund’s assets. Exchange-traded derivatives may only be closed out on the exchange or clearinghouse where the contracts were cleared. This ability is subject to the liquidity of underlying positions.
Options — The ETC 6 Meridian Hedged Equity-Index Option Strategy ETF may purchase and sell put and call options. A call option gives a holder the right to purchase a specific security or an index at a specified price (“exercise price”) within a specified period of time. A put option gives a holder the right to sell a specific security or an index at a specified price within a specified period of time. The initial purchaser of a call option pays the “writer,” i.e., the party selling the option, a premium which is paid at the time of purchase and is retained by the writer whether or not such option is exercised. The Fund may purchase put options to hedge its portfolio against the risk of a decline in the market value of securities held and may purchase call options to hedge against an increase in the price of securities it is committed to purchase. The Fund may write put and call options along with a long position in
29
ETC 6 Meridian
Notes to Financial Statements
November 30, 2024 (Continued)
2. SIGNIFICANT ACCOUNTING POLICIES (continued)
options to increase its ability to hedge against a change in the market value of the securities it holds or is committed to purchase. The ETC 6 Meridian Hedge Equity-Index Option Strategy ETF entered into written and purchased options during the year ended November 30, 2024. These options were index options composed entirely of equity risk.
Options may relate to particular securities and may or may not be listed on a national securities exchange and issued by the Options Clearing Corporation. Options trading is a highly specialized activity that entails greater than ordinary investment risk. Options on particular securities may be more volatile than the underlying securities, and therefore, on a percentage basis, an investment in options may be subject to greater fluctuation than an investment in the underlying securities themselves. Refer to the Fund’s Schedule of Investments for details regarding open option contracts as of November 30, 2024, if applicable. The amount of realized gain (loss) on Written Options are presented on the Statements of Operations as “Net Realized Gain (Loss) on Written Options”. The change in the net fair value of the Written Options are included in the Statement of Operations as “Net Change in Unrealized Appreciation (Depreciation) on Written Options”.
For the year ended November 30, 2024, the average quarterly notional amount of options held in the ETC 6 Meridian Hedged Equity-Index Option Strategy ETF were as follows:
Average Quarterly Notional Balance Long | | $ | — | |
Average Quarterly Notional Balance Short | | $ | (420,300,501 | ) |
Cash and Cash Equivalents — Idle cash may be swept into various overnight demand deposits and is classified as Cash and Cash equivalents on the Statements of Assets and Liabilities, if any. The Funds maintain cash in bank deposit accounts which, at times, may exceed United States federally insured limits. Amounts swept overnight are available on the next business day.
Dividends and Distributions to Shareholders — Each Fund pays out dividends from its net investment income monthly and distributes its net capital gains, if any, to investors at least annually. All distributions are recorded on ex-dividend date.
Creation Units — The Funds issue and redeem shares at NAV and only in Creation Units, or multiples thereof. Purchasers of Creation Units (“Authorized Participants”) at NAV must pay a standard creation transaction fee, regardless of the number of Creation Units created in a given transaction. An Authorized Participant who holds Creation Units and wishes to redeem at NAV would also pay a standard minimum redemption transaction fee to the custodian on the date of such redemption, regardless of the number of Creation Units redeemed in a given transaction. The Funds may charge, either in lieu of or in addition to the fixed creation transaction fee, a variable fee for creations and redemptions in order to cover certain non-standard brokerage, tax, foreign exchange, execution, market impact and other costs and expenses related to the execution of trades resulting from such transactions. In all cases, such fees will be limited in accordance with the requirements of the Commission applicable to management investment companies offering redeemable securities.
The Adviser may retain all or a portion of the transaction fee to the extent the Adviser bears the expenses that otherwise would be borne by the Trust in connection with the purchase or redemption of a Creation Unit, which the transaction fee is designed to cover.
Except when aggregated in Creation Units, shares are not redeemable securities of the Funds. Shares of the Funds may only be purchased or redeemed by certain Authorized Participants. An Authorized Participant is either (i) a broker-dealer or other participant in the clearing process through the Continuous Net Settlement System of the National Securities Clearing Corporation or (ii) a Depository Trust Company (“DTC”) participant and, in each case, must have executed an Authorized Participant Agreement with the Funds’ distributor. Most retail investors will
30
ETC 6 Meridian
Notes to Financial Statements
November 30, 2024 (Continued)
2. SIGNIFICANT ACCOUNTING POLICIES (concluded)
not qualify as Authorized Participants or have the resources to buy and sell whole Creation Units. Therefore, they will be unable to purchase or redeem the shares directly from the Funds. Rather, most retail investors will purchase and sell shares in the secondary market with the assistance of a broker and will be subject to customary brokerage commissions or fees.
To the extent contemplated by an Authorized Participant Agreement, in the event an Authorized Participant has submitted a redemption request in proper form but is unable to transfer all or part of the shares comprising a Creation Unit to be redeemed to SEI Investments Distribution Co. (the “Distributor”), on behalf of a Fund, by the time as set forth in the Authorized Participant Agreement, the Distributor may nonetheless accept the redemption request in reliance on the undertaking by the Authorized Participant to deliver the missing shares as soon as possible, which undertaking shall be secured by the Authorized Participant’s delivery and maintenance of collateral equal to a percentage of the value of the missing shares as specified in the Authorized Participant Agreement. An Authorized Participant Agreement may permit a Fund to use such collateral to purchase the missing shares, and could subject an Authorized Participant to liability for any shortfall between the cost of a Fund acquiring such shares and the value of the collateral. Amounts are disclosed as Segregated Cash Balance from Authorized Participants for Deposit Securities and Collateral Payable upon Return of Deposit Securities on the Statements of Assets and Liabilities, when applicable.
3. SERVICE PROVIDERS
Investment Advisory and Administrative Services
The Adviser is an Oklahoma limited liability company located at 10900 Hefner Pointe Drive, Suite 400, Oklahoma City, Oklahoma 73120, its principal place of business, and 295 Madison Avenue, New York, New York 10017. The Adviser serves as the investment adviser to each Fund pursuant to an investment advisory agreement with the Trust (the “Advisory Agreement”). Under the Advisory Agreement, the Adviser provides investment advisory services to the Funds and is responsible for, among other things, overseeing the Sub-Adviser (as defined below), including regular review of the Sub-Adviser’s performance, trading portfolio securities on behalf of each Fund, and selecting broker-dealers to execute purchase and sale transactions, subject to the oversight of the Board.
For the services it provides to the Funds, the Adviser receives a fee, which is calculated daily and paid monthly, at an annual rate of 0.61% of the average daily net assets of each Fund.
ETC Platform Services, LLC (“ETC Platform Services”), a direct wholly owned subsidiary of the Adviser, administers each Fund’s business affairs and provides office facilities and equipment, certain clerical, bookkeeping and administrative services, paying agent services under each Fund’s fee arrangement, and its officers and employees to serve as officers or Trustees of the Trust. ETC Platform Services also arranges for transfer agency, custody, fund administration and accounting, and other non-distribution related services necessary for each Fund to operate. For the services it provides to each Fund, ETC Platform Services is paid a fee calculated daily and paid monthly based on a percentage of each Fund’s average daily net assets.
A Trustee and certain officers of the Trust are affiliated with the Adviser and receive no compensation from the Trust for serving as officers and/or Trustee.
The Adviser has contractually agreed to waive its fees and reimburse expenses to the extent necessary to keep total annual operating expenses of each Fund (excluding amounts payable pursuant to any plan adopted in accordance with Rule 12b-1, interest expense, taxes, brokerage commissions, acquired fund fees and expenses, other expenditures which are capitalized in accordance with generally accepted accounting principles, and extraordinary expenses) from exceeding 1.00% of each Fund’s average daily net assets until at least April 1, 2025 (“Expense Cap”). The expense limitation agreement may be terminated, without payment of any penalty: (i) by the Trust for any reason and at any time and (ii) by the Adviser, for any reason, upon ninety (90) days’ prior written notice to the Trust, such termination to be effective as of the close of business on the last day of the then-current one-year period.
31
ETC 6 Meridian
Notes to Financial Statements
November 30, 2024 (Continued)
3. SERVICE PROVIDERS (concluded)
If it becomes unnecessary for the Adviser to waive fees or reimburse expenses, the Board may permit the Adviser to retain the difference between a Fund’s total annual operating expenses and the expense limitation currently in effect, or, if lower, the expense limitation that was in effect at the time of the waiver and/or reimbursement, to recapture all or a portion of its prior fee waivers or expense reimbursements within three years of the date they were waived or reimbursed. The fees which were waived and/or reimbursed to a Fund by the Adviser, which may be subject to possible future recapture, up to the expense cap in place at the time the expenses were waived and reimbursed to the Adviser are as follows:
| | Reimbursement
Amount | | Expiration
Date |
ETC 6 Meridian Quality Growth ETF | | $ | 14,626 | | November 30, 2025 |
ETC 6 Meridian Quality Growth ETF | | | 4,093 | | November 30, 2026 |
During the year ended November 30, 2024, the Adviser recaptured previously waived fees of $42,591 for ETC 6 Meridian Quality Growth ETF.
Sub-Advisory Agreement
Madison Avenue Financial Solutions, LLC (the “Sub-Adviser”), a Delaware limited liability company, serves as the Funds’ sub-adviser pursuant to a sub-advisory agreement (“Sub-Advisory Agreement”). Under the Sub-Advisory Agreement, the Sub-Adviser makes investment decisions for the Funds and continuously reviews and administers the investment program of the Funds, subject to the supervision of the Adviser and the oversight of the Board.
Under the Sub-Advisory Agreement, with respect to each Fund, the Adviser pays the Sub-Adviser a fee out of the fee the Adviser receives from the Funds.
Pursuant to an arrangement between the Adviser and the Sub-Adviser, the Sub-Adviser has agreed to assume the Adviser’s obligation to pay Fund expenses above the Expense Cap and has agreed, to the extent applicable, to pay the Adviser a minimum fee.
Distribution Arrangement
The Distributor serves as the underwriter and distributor of each Fund’s shares pursuant to a distribution agreement (the “Distribution Agreement”). Under the Distribution Agreement, the Distributor, as agent, receives orders to purchase shares in Creation Units and transmits such orders to the Funds’ custodian and transfer agent. The Distributor has no obligation to sell any specific quantity of a Fund’s shares. The Distributor bears the following costs and expenses relating to the distribution of shares: (i) the expenses of maintaining its registration or qualification as a dealer or broker under federal or state laws; (ii) filing fees; and (iii) all other expenses incurred in connection with the distribution services, that are not reimbursed by the Adviser, as contemplated in the Distribution Agreement. The Distributor does not maintain any secondary market in any Fund’s shares.
The Funds have adopted a Distribution and Service Plan (the “Plan”) pursuant to Rule 12b-1 under the 1940 Act. In accordance with the Plan, the Funds are authorized to pay an amount up to 0.25% of its average daily net assets each year for certain distribution-related activities. For the year ended November 30, 2024, no fees were charged by the Distributor under the Plan and the Plan will only be implemented with approval of the Board.
Administrator, Custodian and Transfer Agent
SEI Investments Global Funds Services serves as the Funds’ administrator pursuant to an administration agreement. The Bank of New York Mellon serves as the Funds’ custodian and transfer agent pursuant to a custodian agreement and transfer agency services agreement.
An officer of the Trust is affiliated with the administrator and receives no compensation from the Trust for serving as an officer.
32
ETC 6 Meridian
Notes to Financial Statements
November 30, 2024 (Continued)
4. INVESTMENT TRANSACTIONS
For the year ended November 30, 2024, the purchases and sales of investments in securities, excluding in-kind transactions, long-term U.S. Government and short-term securities were:
| | Purchases | | Sales and
Maturities |
ETC 6 Meridian Hedged Equity-Index Option Strategy ETF | | $ | 652,949,006 | | $ | 724,264,669 |
ETC 6 Meridian Low Beta Equity Strategy ETF | | | 89,811,588 | | | 90,465,655 |
ETC 6 Meridian Mega Cap Equity ETF | | | 369,769,253 | | | 374,262,072 |
ETC 6 Meridian Small Cap Equity ETF | | | 68,085,498 | | | 67,507,953 |
ETC 6 Meridian Quality Growth ETF | | | 29,740,221 | | | 30,380,304 |
For the year ended November 30, 2024, there were no purchases or sales of long-term U.S. Government securities by any of the Funds.
For the year ended November 30, 2024, the in-kind transactions associated with creations and redemptions were:
| | Purchases | | Sales | | Net Realized
Gain (Loss) |
ETC 6 Meridian Hedged Equity-Index Option Strategy ETF | | $ | 539,445,364 | | $ | 498,054,913 | | $ | 85,208,183 |
ETC 6 Meridian Low Beta Equity Strategy ETF | | | 83,336,449 | | | 66,936,762 | | | 14,867,920 |
ETC 6 Meridian Mega Cap Equity ETF | | | 323,612,786 | | | 283,705,850 | | | 47,765,312 |
ETC 6 Meridian Small Cap Equity ETF | | | 65,619,627 | | | 45,960,129 | | | 9,910,068 |
ETC 6 Meridian Quality Growth ETF | | | 33,065,847 | | | 23,600,835 | | | 6,257,609 |
5. TAX INFORMATION
The amount and character of income and capital gain distributions to be paid, if any, are determined in accordance with Federal income tax regulations, which may differ from U.S. GAAP. As a result, net investment income (loss) and net realized gain (loss) on investment transactions for a reporting period may differ significantly from distributions during such period. These book/tax differences may be temporary or permanent. To the extent these differences are permanent in nature, they are charged or credited to paid-in capital or total distributable earnings (accumulated losses) as appropriate, in the period that the differences arise.
Accordingly, the following permanent differences primarily attributable to redemptions in-kind and net operating losses have been reclassified within the components of net assets for the year ended November 30, 2024:
Fund Name | | Total
Distributable
Earnings
(Accumulated
Losses) | | Paid-in
Capital |
ETC 6 Meridian Hedged Equity-Index Option Strategy ETF | | $ | (79,267,650 | ) | | $ | 79,267,650 |
ETC 6 Meridian Low Beta Equity Strategy ETF | | | (14,668,463 | ) | | | 14,668,463 |
ETC 6 Meridian Mega Cap Equity ETF | | | (44,379,041 | ) | | | 44,379,041 |
ETC 6 Meridian Small Cap Equity ETF | | | (9,738,451 | ) | | | 9,738,451 |
ETC 6 Meridian Quality Growth ETF | | | (5,830,826 | ) | | | 5,830,826 |
33
ETC 6 Meridian
Notes to Financial Statements
November 30, 2024 (Continued)
5. TAX INFORMATION (continued)
The tax character of dividends and distributions paid during the years ended November 30, 2024 and November 30, 2023, were as follows:
| | Ordinary
Income | | Return of
Capital | | Totals |
ETC 6 Meridian Hedged Equity-Index Option Strategy ETF | | | | | | | | | |
2024 | | $ | 6,609,357 | | $ | — | | $ | 6,609,357 |
2023 | | | 7,207,938 | | | — | | | 7,207,938 |
ETC 6 Meridian Low Beta Equity Strategy ETF | | | | | | | | | |
2024 | | $ | 2,172,352 | | $ | — | | $ | 2,172,352 |
2023 | | | 2,332,485 | | | — | | | 2,332,485 |
ETC 6 Meridian Mega Cap Equity ETF | | | | | | | | | |
2024 | | $ | 4,297,958 | | $ | — | | $ | 4,297,958 |
2023 | | | 3,928,312 | | | — | | | 3,928,312 |
ETC 6 Meridian Small Cap Equity ETF | | | | | | | | | |
2024 | | $ | 955,142 | | $ | — | | $ | 955,142 |
2023 | | | 1,166,152 | | | — | | | 1,166,152 |
ETC 6 Meridian Quality Growth ETF | | | | | | | | | |
2024 | | $ | — | | $ | — | | $ | — |
2023 | | | 12,666 | | | 6,245 | | | 18,911 |
As of November 30, 2024, the components of Distributable Earnings (Accumulated Losses) on a tax basis were as follows:
| | ETC
6 Meridian
Hedged
Equity-Index
Option
Strategy ETF | | ETC
6 Meridian
Low Beta
Equity
Strategy ETF | | ETC
6 Meridian
Mega Cap
Equity ETF | | ETC
6 Meridian
Small Cap
Equity ETF | | ETC
6 Meridian
Quality
Growth ETF |
Undistributed Ordinary Income | | $ | 216,328 | | | $ | 86,605 | | | $ | 151,998 | | | $ | 14,987 | | | $ | — | |
Post-October Losses | | | (11,967,587 | ) | | | — | | | | (1,455,159 | ) | | | — | | | | — | |
Capital Loss Carryforwards | | | (126,903,772 | ) | | | (29,770,009 | ) | | | (44,271,369 | ) | | | (22,274,525 | ) | | | (7,449,611 | ) |
Deferred Late-Year Losses | | | — | | | | — | | | | — | | | | — | | | | (155,739 | ) |
Unrealized Appreciation (Depreciation) | | | 52,834,208 | | | | 27,893,446 | | | | 33,645,398 | | | | 11,215,980 | | | | 9,277,704 | |
Other Temporary Differences | | | (67,278 | ) | | | 1 | | | | (1 | ) | | | 2 | | | | 1 | |
Total Distributable Earnings (Accumulated Losses) | | $ | (85,888,101 | ) | | $ | (1,789,957 | ) | | $ | (11,929,133 | ) | | $ | (11,043,556 | ) | | $ | 1,672,355 | |
Post-October capital losses represent capital losses realized on investment transactions from November 1, 2024 through November 30, 2024, that, in accordance with Federal income tax regulations, the Funds may elect to defer and treat as having arisen in the following fiscal year.
Deferred late-year losses (including currency and specified gain/loss items) represent ordinary losses realized on investment transactions from January 1, 2024 through November 30, 2024 and specified losses realized on investment transactions from November 1, 2024 through November 30, 2024, that, in accordance with Federal income tax regulations, the Funds may elect to defer and treat as having arisen in the following fiscal year.
34
ETC 6 Meridian
Notes to Financial Statements
November 30, 2024 (Continued)
5. TAX INFORMATION (concluded)
The Funds are permitted to utilize capital losses that are carried forward and will retain their character as either short-term or long-term capital losses. As of November 30, 2024, the following Funds have capital loss carryforwards to offset capital gains for an unlimited period:
| | Non-Expiring
Short-Term | | Non-Expiring
Long-Term | | Total
Capital Loss
Carryforwards |
ETC 6 Meridian Hedged Equity-Index Option Strategy ETF | | $ | 83,329,098 | | $ | 43,574,674 | | $ | 126,903,772 |
ETC 6 Meridian Low Beta Equity Strategy ETF | | | 16,202,146 | | | 13,567,863 | | | 29,770,009 |
ETC 6 Meridian Mega Cap Equity ETF | | | 37,419,661 | | | 6,851,708 | | | 44,271,369 |
ETC 6 Meridian Small Cap Equity ETF | | | 15,335,513 | | | 6,939,012 | | | 22,274,525 |
ETC 6 Meridian Quality Growth ETF | | | 5,625,842 | | | 1,823,769 | | | 7,449,611 |
For Federal income tax purposes, the cost of securities owned at November 30, 2024, and the net realized gains or losses on securities sold for the period, were different from amounts reported for financial reporting purposes primarily due to wash sales, which cannot be used for Federal income tax purposes in the current period and have been deferred for use in future years. The Federal tax cost and aggregate gross unrealized appreciation and depreciation on investments and foreign currency transactions held by the Funds at November 30, 2024, were as follows:
| | Federal Tax
Cost | | Aggregated
Gross
Unrealized
Appreciation | | Aggregated
Gross
Unrealized
Depreciation | | Net Unrealized
Appreciation
(Depreciation) |
ETC 6 Meridian Hedged Equity-Index Option Strategy ETF | | $ | 402,870,842 | | $ | 64,624,679 | | $ | (11,790,471 | ) | | $ | 52,834,208 |
ETC 6 Meridian Low Beta Equity Strategy ETF | | | 162,635,104 | | | 33,343,489 | | | (5,450,043 | ) | | | 27,893,446 |
ETC 6 Meridian Mega Cap Equity ETF | | | 258,087,096 | | | 41,194,355 | | | (7,548,957 | ) | | | 33,645,398 |
ETC 6 Meridian Small Cap Equity ETF | | | 86,935,029 | | | 14,808,499 | | | (3,592,519 | ) | | | 11,215,980 |
ETC 6 Meridian Quality Growth ETF | | | 41,564,211 | | | 9,889,940 | | | (612,236 | ) | | | 9,277,704 |
6. PRINCIPAL RISKS OF INVESTING IN THE FUNDS
As with all exchange traded funds (“ETFs”), each shareholder of a Fund is subject to the risk that his or her investment could lose money. The Funds are subject to the principal risks noted below, any of which may adversely affect a Fund’s NAV, trading price, yield, total return and ability to meet its investment objective. Risk information is applicable to each Fund unless otherwise noted. Additional principal risks are disclosed in the Funds’ prospectus. Please refer to the Funds’ prospectus for a complete description of the principal risks of investing in a Fund.
Limited Authorized Participants, Market Makers and Liquidity Providers Risk. Because each Fund is an ETF, only a limited number of institutional investors (known as “Authorized Participants”) are authorized to purchase and redeem shares directly from the Funds. In addition, there may be a limited number of market makers and/or liquidity providers in the marketplace. To the extent either of the following events occurs, the risk of which is higher during periods of market stress, shares of the Funds may trade at a material discount to their NAV per share and possibly face delisting: (i) Authorized Participants exit the business or otherwise become unable to process creation and/or redemption orders and no other Authorized Participants step forward to perform these services, or (ii) market makers and/or liquidity providers exit the business or significantly reduce their business activities and no other entities step forward to perform their functions.
Market Risk. The market price of an investment could decline, sometimes rapidly or unpredictably, due to general market conditions that are not specifically related to a particular company, such as real or perceived adverse economic or political conditions throughout the world, changes in the general outlook for corporate earnings, changes in interest or currency rates, or adverse investor sentiment generally. The market value of an investment
35
ETC 6 Meridian
Notes to Financial Statements
November 30, 2024 (Continued)
6. PRINCIPAL RISKS OF INVESTING IN THE FUNDS (concluded)
also may decline because of factors that affect a particular industry or industries such as labor shortages, increased production costs, and competitive conditions. Local, regional, or global events such as war, acts of terrorism, the spread of infectious illness or other public health issues, recessions, or other events could have a significant impact on the market generally and on specific investments. For example, in recent years, the COVID-19 pandemic, the large expansion of government deficits and debt as a result of government actions to mitigate the effects of the pandemic, Russia’s invasion of Ukraine, and the rise of inflation have resulted in extreme volatility in the global economy and in global financial markets. Economies and financial markets throughout the world are becoming increasingly interconnected. As a result, whether or not a Fund invests in securities of issuers located in or with significant exposure to countries experiencing economic and financial difficulties, the value and liquidity of the Fund’s investments may be negatively affected.
Models and Data Risk. The Sub-Adviser relies heavily on quantitative models as well as data and information supplied by third parties that are utilized by the models. To the extent the models do not perform as designed or as intended, the Funds’ strategy may not be successfully implemented and the Funds may lose value. If the models or data are incorrect or incomplete, any decisions made in reliance thereon may lead to the inclusion or exclusion of securities that would have been excluded or included had the models or data been correct and complete.
Non-Diversification Risk (ETC 6 Meridian Mega Cap Equity ETF, ETC 6 Meridian Hedged Equity-Index Option Strategy ETF and ETC 6 Meridian Quality Growth ETF only). Each Fund is a non-diversified investment company under the 1940 Act, meaning that, as compared to a diversified fund, it can invest a greater percentage of its assets in securities issued by or representing a small number of issuers. As a result, the performance of these issuers can have a substantial impact on the Fund’s performance.
Options Risk (ETC 6 Meridian Hedged Equity-Index Strategy ETF only). Options give the holder of the option the right to buy (or to sell) a position in a security or in a contract to the writer of the option, at a certain price. They are subject to correlation risk because there may be an imperfect correlation between the options and the securities markets that cause a given transaction to fail to achieve its objectives. The successful use of options depends on the Sub-Adviser’s ability to correctly predict future price fluctuations and the degree of correlation between the options and securities markets. Exchanges can limit the number of positions that can be held or controlled by the Fund or the Sub-Adviser, thus limiting the ability to implement the Fund’s strategies. Options are also particularly subject to leverage risk and can be subject to liquidity risk.
Sector Focus Risk (ETC 6 Meridian Quality Growth ETF only). Each Fund may invest a significant portion of its assets in one or more sectors and thus will be more susceptible to the risks affecting those sectors. While each Fund’s sector exposure is expected to vary over time, each Fund anticipates that it may be subject to some or all of the risks described below. The list below is not a comprehensive list of the sectors to which the Funds may have exposure over time and should not be relied on as such.
Information Technology Sector Risk (ETC 6 Meridian Quality Growth ETF only). The Fund is subject to the risk that market or economic factors impacting technology companies and companies that rely heavily on technology advances could have a major effect on the value of the Fund’s investments. The value of stocks of technology companies and companies that rely heavily on technology is particularly vulnerable to rapid changes in technology product cycles, rapid product obsolescence, the loss of patent, copyright and trademark protections, government regulation and competition, both domestically and internationally, including competition from foreign competitors with lower production costs. Technology companies and companies that rely heavily on technology, especially those of smaller, less-seasoned companies, tend to be more volatile than the overall market. Technology companies are heavily dependent on patent and intellectual property rights, the loss or impairment of which may adversely affect profitability. Additionally, companies in the Information Technology Sector may face dramatic and often unpredictable changes in growth rates and competition for the services of qualified personnel.
36
ETC 6 Meridian
Notes to Financial Statements
November 30, 2024 (Concluded)
7. OTHER
At November 30, 2024, the records of the Trust, reflected that 100% of the Funds’ total shares outstanding were held by Authorized Participants, in the form of Creation Units, as shown in the table below. However, the individual shares comprising such Creation Units are listed and traded on the Exchange and have been purchased and sold by persons other than Authorized Participants.
| | Number of
Authorized
Participants |
ETC 6 Meridian Hedged Equity-Index Option Strategy ETF | | 2 |
ETC 6 Meridian Low Beta Equity Strategy ETF | | 3 |
ETC 6 Meridian Mega Cap Equity ETF | | 3 |
ETC 6 Meridian Small Cap Equity ETF | | 2 |
ETC 6 Meridian Quality Growth ETF | | 2 |
8. RECENT MARKET EVENTS
Local, regional, or global events such as war, acts of terrorism, the spread of infectious illness or other public health issues, recessions, or other events could have a significant impact on the market generally and on specific securities. Periods of market volatility may occur in response to such events and other economic, political, and global macro factors.
Governments and central banks, including the Federal Reserve in the United States, took extraordinary and unprecedented actions to support local and global economies and the financial markets in response to the COVID-19 pandemic, including by keeping interest rates at historically low levels for an extended period. The Federal Reserve concluded its market support activities in 2022 and began to raise interest rates in an effort to fight inflation. However, the Federal Reserve had recently lowered interest rates and may continue to do so. This and other government intervention into the economy and financial markets to address the pandemic, inflation, or other significant events in the future may not work as intended, particularly if the efforts are perceived by investors as being unlikely to achieve the desired results.
9. SUBSEQUENT EVENTS
At a meeting held on December 11, 2024, the Funds’ Board of Trustees approved an Advisory Fee reduction for the Funds effective January 1, 2025. Effective January 1, 2025, the Advisory Fee that each Fund pays the Adviser will be reduced from an annual rate of 0.61% of each Fund’s average daily net assets to an annual rate of 0.31% of each Fund’s average daily net assets.
The Funds have evaluated the need for additional disclosures and/or adjustments resulting from subsequent events through the date the financial statements were issued. Based on this evaluation, no additional disclosures and/or adjustments were required to the financial statements.
37
ETC 6 Meridian
Report of Independent Registered Public Accounting Firm
To the Shareholders of ETC 6 Meridian Hedged Equity-Index Option Strategy ETF, ETC 6 Meridian Low Beta Equity Strategy ETF, ETC 6 Meridian Mega Cap Equity ETF, ETC 6 Meridian Small Cap Equity ETF, and ETC 6 Meridian Quality Growth ETF and Board of Trustees of Exchange Traded Concepts Trust
Opinion on the Financial Statements
We have audited the accompanying statements of assets and liabilities, including the schedules of investments, of the funds listed below (the “Funds”), each a series of Exchange Traded Concepts Trust, as of November 30, 2024, the related statements of operations, the statements of changes in net assets, the financial highlights for each of the periods indicated below, and the related notes (collectively referred to as the “financial statements”). In our opinion, the financial statements present fairly, in all material respects, the financial position of each of the Funds as of November 30, 2024, the results of their operations, the changes in net assets, and the financial highlights for each of the periods indicated below in conformity with accounting principles generally accepted in the United States of America.
Fund Name | Statements of
Operations | Statements of
Changes in
Net Assets | Financial
Highlights |
ETC 6 Meridian Hedged Equity-Index Option Strategy ETF, ETC 6 Meridian Low Beta Equity Strategy ETF, ETC 6 Meridian Mega Cap Equity ETF, and ETC 6 Meridian Small Cap Equity ETF | For the year ended November 30, 2024 | For the years ended November 30, 2024 and 2023 | For the years ended November 30, 2024, 2023, 2022 and 2021 and for the period May 8, 2020 (commencement of operations) through November 30, 2020 |
ETC 6 Meridian Quality Growth ETF | For the year ended November 30, 2024 | For the years ended November 30, 2024 and 2023 | For the years ended November 30, 2024, 2023 and 2022 and for the period May 10, 2021 (commencement of operations) through November 30, 2021 |
Basis for Opinion
These financial statements are the responsibility of the Funds’ management. Our responsibility is to express an opinion on the Funds’ financial statements based on our audits. We are a public accounting firm registered with the Public Company Accounting Oversight Board (United States) (“PCAOB”) and are required to be independent with respect to the Funds in accordance with the U.S. federal securities laws and the applicable rules and regulations of the Securities and Exchange Commission and the PCAOB.
We conducted our audits in accordance with the standards of the PCAOB. Those standards require that we plan and perform the audit to obtain reasonable assurance about whether the financial statements are free of material misstatement whether due to error or fraud.
Our audits included performing procedures to assess the risks of material misstatement of the financial statements, whether due to error or fraud, and performing procedures that respond to those risks. Such procedures included examining, on a test basis, evidence regarding the amounts and disclosures in the financial statements. Our
38
ETC 6 Meridian
Report of Independent Registered Public Accounting Firm
(Concluded)
procedures included confirmation of securities owned as of November 30, 2024, by correspondence with the custodian and brokers. Our audits also included evaluating the accounting principles used and significant estimates made by management, as well as evaluating the overall presentation of the financial statements. We believe that our audits provide a reasonable basis for our opinion.
We have served as the auditor of one or more investment companies advised by Exchange Traded Concepts, LLC since 2012.

COHEN & COMPANY, LTD.
Cleveland, Ohio
January 24, 2025
39
ETC 6 Meridian
Notice to Shareholders
(Unaudited)
For shareholders that do not have a November 30, 2024 tax year end, this notice is for informational purposes only. For shareholders with a November 30, 2024 tax year end, please consult your tax advisor as to the pertinence of this notice.
For the fiscal year ended November 30, 2024, the Funds is designating the following items with regard to distributions paid during the year.
Fund Name | | Return
of
Capital | | Ordinary
Income
Distributions | | Total
Distributions | | Qualifying
For
Corporate
Dividend
Received
Deduction(1) | | Qualifying
Dividend
Income(2) | | U.S.
Government
Interest(3) | | Interest
Related
Dividends(4) | | Qualified
Short-Term
Capital
Gain(5) | | Foreign
Tax
Credit |
ETC 6 Meridian Hedged Equity-Index Option Strategy ETF | | 0.00 | % | | 100.00 | % | | 100.00 | % | | 100.00 | % | | 100.00 | % | | 0.00 | % | | 0.00 | % | | 0.00 | % | | 0.00 | % |
ETC 6 Meridian Low Beta Equity Strategy ETF | | 0.00 | % | | 100.00 | % | | 100.00 | % | | 100.00 | % | | 100.00 | % | | 0.00 | % | | 0.00 | % | | 0.00 | % | | 0.00 | % |
ETC 6 Meridian Mega Cap Equity ETF | | 0.00 | % | | 100.00 | % | | 100.00 | % | | 100.00 | % | | 100.00 | % | | 0.00 | % | | 0.00 | % | | 0.00 | % | | 0.00 | % |
ETC 6 Meridian Small Cap Equity ETF | | 0.00 | % | | 100.00 | % | | 100.00 | % | | 100.00 | % | | 100.00 | % | | 0.00 | % | | 0.00 | % | | 0.00 | % | | 0.00 | % |
ETC 6 Meridian Quality Growth ETF | | 0.00 | % | | 0.00 | % | | 0.00 | % | | 0.00 | % | | 0.00 | % | | 0.00 | % | | 0.00 | % | | 0.00 | % | | 0.00 | % |
40
ETC 6 Meridian
Board Consideration of Approval of Advisory Agreement
(Form N-CSR Item 11)
(Unaudited)
At a meeting held on September 17, 2024 (the “Meeting”), the Board of Trustees (the “Board”) of Exchange Traded Concepts Trust (the “Trust”) considered and approved the continuance of the following agreements (together, the “Agreements”) with respect to the 6 Meridian Mega Cap Equity ETF (“SIXA”), ETC 6 Meridian Hedged Equity-Index Option ETF (“SIXH”), ETC 6 Meridian Low Beta Equity ETF (“SIXL”), ETC 6 Meridian Small Cap Equity ETF (“SIXS”), ETC 6 Meridian Quality Growth ETF (“SXQG”), ETC 6 Meridian Quality Value ETF (“SXQV”), and ETC 6 Meridian Quality Dividend Yield ETF (“SXQY”) (each, a “Fund” and collectively, the “Funds”):
• the investment advisory agreement between the Trust, on behalf of the Fund, and Exchange Traded Concepts, LLC (“ETC”) pursuant to which ETC provides advisory services to the Funds; and
• the sub-advisory agreement between ETC and Madison Avenue Financial Solutions, LLC1 (“Madison Avenue”) pursuant to which Madison Avenue provides sub-advisory services to the Funds.
Pursuant to Section 15 of the Investment Company Act of 1940 (the “1940 Act”), the Agreements must be approved by a vote of (i) the Trustees or the shareholders of the Fund and (ii) a majority of the Trustees who are not parties to the Agreements or “interested persons” of any party thereto, as defined in the 1940 Act (the “Independent Trustees”), cast in person at a meeting called for the purpose of voting on such approval. In connection with its consideration of such approval, the Board must request and evaluate, and ETC and Madison Avenue are required to furnish, such information as may be reasonably necessary to evaluate the terms of the Agreements. In addition, rules under the 1940 Act require the Fund to disclose in its shareholder reports the material factors and the conclusions with respect thereto that formed the basis for the Board’s approval of the Agreements.
Consistent with these responsibilities, prior to the Meeting, the Board reviewed materials from ETC and Madison Avenue and, at the Meeting, representatives from ETC presented additional information to help the Board evaluate the Agreements. Among other things, the Board was provided an overview of ETC’s and Madison Avenue’s advisory business, including investment personnel and investment processes. During the Meeting, the Board discussed the materials it received, including a memorandum from legal counsel to the Independent Trustees on the responsibilities of Trustees in considering the approval of investment advisory agreements under the 1940 Act, considered ETC’s oral presentations, and deliberated on the approval of the Agreements in light of this information. Throughout the process, the Trustees were afforded the opportunity to ask questions of and request additional materials from ETC and Madison Avenue. The Independent Trustees were assisted in their review by independent legal counsel and met with counsel separately and without management present.
In considering whether to approve the continuance of the Agreements, the Board took into account the materials provided for the Meeting, the extensive discussion before and during the Meeting, including the discussion the Independent Trustees had during their executive session with independent legal counsel. In particular, the Board took into consideration (i) the nature, extent, and quality of the services provided by ETC and Madison Avenue to each Fund; (ii) each Fund’s performance; (iii) ETC’s and Madison Avenue’s costs of and profits realized from providing advisory and sub-advisory services to each Fund, including any fall-out benefits to ETC and Madison Avenue or their respective affiliates; (iv) comparative fee and expense data; (v) the extent to which the advisory fee reflect economies of scale shared with Fund shareholders; and (vi) other factors the Board deemed to be relevant.
Nature, Extent and Quality of Services. With respect to the nature, extent, and quality of the services provided to each Fund, the Board considered ETC’s and Madison Avenue’s specific responsibilities in all aspects of day-to-day management of each Fund.
41
ETC 6 Meridian
Board Consideration of Approval of Advisory Agreement
(Form N-CSR Item 11)
(Unaudited) (Continued)
The Board considered that beyond portfolio management, ETC’s responsibilities, including through its affiliates, include overseeing the activities of Madison Avenue, including regular review of Madison Avenue’s performance and compliance functions; trading portfolio securities and other investment instruments on behalf of each Fund based on instructions from Madison Avenue; selecting broker-dealers to execute purchase and sale transactions; determining the daily baskets of deposit securities and cash components; executing portfolio securities trades for purchases and redemptions of Fund shares conducted on a cash-in-lieu basis; monitoring compliance with various policies and procedures and applicable securities regulations; quarterly reporting to the Board; and implementing Board directives as they relate to the Funds, and (ii) subject to the supervision of ETC and oversight of the Board, Madison Avenue’s responsibilities include developing, implementing, and maintaining each Fund’s investment program; providing security selection instructions to ETC; overseeing general portfolio compliance with relevant law; quarterly reporting to the Board; and implementing Board directives as they relate to the Funds. The Board noted that it had been provided with ETC’s and Madison Avenue’s registration forms on Form ADV as well as their responses to a detailed series of questions, which included a description of their operations, services, personnel, compliance programs, risk management programs, and financial conditions, and whether there had been material changes to such information since it was last presented to the Board. The Board noted no material changes to ETC’s staffing, management, or overall condition over the past year. The Board considered the qualifications, experience, and responsibilities of ETC’s and Madison Avenue’s investment personnel, the quality of ETC’s and Madison Avenue’s compliance infrastructures, and the determination of the Trust’s Chief Compliance Officer that each has appropriate compliance policies and procedures in place. The Board considered ETC’s and Madison Avenue’s experience working with ETFs, including the Funds, and noted ETC’s experience managing other series of the Trust and other ETFs outside of the Trust.
The Board also considered other services provided to the Funds by ETC, including through its affiliates, such as arranging for transfer agency, custody, fund administration and accounting, and other non-distribution related services necessary for the Funds to operate; administering each Fund’s business affairs; providing office facilities and equipment and certain clerical, bookkeeping and administrative services; liaising with and reporting to the Board on matters relating to Fund operations, portfolio management and other matters essential to each Fund’s business activities; supervising each Fund’s registration as an investment company and the offering of Fund shares to the public, including oversight and preparation of regulatory filings; working with ETF market participants, including authorized participants, market makers, and exchanges, to help facilitate an orderly trading environment for each Fund’s shares; and providing its officers and employees to serve as officers or Trustees of the Trust.
Performance. The Board noted that performance information was not available for SXQY and SXQV because those Funds had not yet commenced operations. The Board reviewed the performance of each of the other Funds in light of each Fund’s stated investment objective, noting that each Fund is actively managed. The Board was provided reports regarding each Fund’s past performance, including a report prepared by ISS, an independent third party, comparing the Fund’s performance to the performance of a group of peer funds (each a “Peer Group”) for various time periods ended June 30, 2024. The Board reviewed this information for each Fund in turn, noting its observations with respect to each Fund.
ETC 6 Meridian Mega Cap Equity ETF (SIXA)
The Board found that SIXA underperformed both the mean and median for the June 30, 2024 year-to-date and 1 year periods (annualized) relative to its Peer Group, but had outperformed for the 3 year period. The Board found that its returns were generally in line with certain other competitors within the Peer Group. The Fund also underperformed its benchmark index (S&P 500) for the one-year, three-year and since inception periods ended June 30, 2024.
42
ETC 6 Meridian
Board Consideration of Approval of Advisory Agreement
(Form N-CSR Item 11)
(Unaudited) (Continued)
ETC 6 Meridian Low Beta Equity Strategy ETF (SIXL)
The Board found that SIXL underperformed both the mean and median for the June 30, 2024 year-to-date, 1 year and 3 year periods (annualized) relative to its Peer Group. The Fund also underperformed its new benchmark index (the S&P Total Markets Index) and former benchmark (Equal Weight Blended return of the S&P 500 Index, S&P SmallCap 600 Index, and S&P MidCap 400 Index) for the one-year, three-year and since inception periods June 30, 2024.
ETC 6 Meridian Hedged Equity-Index Option Strategy ETF (SIXH)
The Board found that SIXH underperformed both the mean and median for the June 30, 2024 year-to-date period relative to its Peer Group, but outperformed both for the 1 year period and outperformed the mean and was at the median for the 3 year period (annualized). The Fund also outperformed its secondary and former primary benchmark (CBOE S&P 500 Buy/Write Index) for the one-year, three-year and since inception periods ended June 30, 2024.
ETC 6 Meridian Small Cap Equity ETF (SIXS)
The Board found that SIXS underperformed both the mean and median for the June 30, 2024 year-to-date, 1 year and 3 year periods (annualized) relative to its Peer Group, however, its returns were generally in line with certain other competitors within the Peer Group and approximate to the median for the three-year period. The Fund also underperformed its current benchmark index (S&P Total Markets Index) in all periods but has outperformed its secondary (and former) benchmark (SmallCap 600 Index) for the one-year and since inception period ended June 30, 2024.
ETC 6 Meridian Quality Growth ETF (SXQG)
The Board found that SXQG underperformed both the mean and median for the 6/24 YTD June 30, 2024 year-to-date, 1 year and 3 year periods (annualized). The Fund also underperformed its new benchmark index (the S&P 500 Index) and former benchmark (Russell 1000 Growth Index) for each of the one-year, three-year and since inception periods June 30, 2024.
The Board considered ETC’s observation that although returns for the year ended June 30, 2024 varied across the Funds and generally underperformed each Fund’s benchmark, the ISS reports focus on a different period for measurement and reflect that for the year ended December 31, 2023, each of SIXH, SXQG, and SIXS underperformed the mean and median of the net total returns of each Fund’s peer group, but were within the range of returns of other funds in each peer group, reflecting that although Madison Avenue has potentially struggled with underperformance for the most recent six months ended June 30, 2024, performance measured for the most recent calendar year does not reflect the same for three of the Funds.
Based on the information presented, the Adviser believes that the performance of Madison Avenue is satisfactory for the period with respect to each of the Funds. The Board noted that, based on the experience of Madison Avenue and with oversight by ETC, each of ETC and Madison Avenue are expected to continue to provide satisfactory performance for the Fund and its shareholders.
Cost of Advisory Services and Profitability. The Board reviewed the advisory fee paid or to be paid by each Fund to ETC and the sub-advisory fee paid or to be paid by ETC to Madison Avenue under the Agreements. The Board reviewed a report prepared by ISS, an independent third party, comparing each Fund’s advisory fee to those paid by a group of peer funds. The Board noted that the report included mutual funds in each Fund’s peer group, except for SIXS, which were intended to enhance the Board’s ability to evaluate the quality of fees and expenses on a broader scale. The Board took into account the differences in operations and fee structures between ETFs and mutual funds, noting that, unlike most ETFs, the Funds’ advisory fee was not structured as a unitary fee, and gave such weight to the mutual fund data as it deemed appropriate. The Board noted that ISS selected the particular mutual funds that were included in its report. In support of its review of the statistical information, the Board was provided with a description of the methodology used by ISS to prepare this information.
43
ETC 6 Meridian
Board Consideration of Approval of Advisory Agreement
(Form N-CSR Item 11)
(Unaudited) (Concluded)
The Board noted that certain of the Fund’s advisory fee were at the high end of its respective peer group range, where SIXL’s net total expenses were the highest among its peer ETFs and second highest among its entire peer group; and where SXQG’s, SXQY’s, SXQV’s actual and estimated net total expenses were the highest of its peer group. SIXA’s, SIXH’s, and SIXS’s net total expenses were higher than the median of its Peer Group.
The Board considered that ETC would, contractually, agree to reduce the management fee for the services to the Funds, effective January 1, 2025, would be reduced from an annual rate of 0.61% of each Fund’s average daily net assets to an annual rate of 0.31% of each Fund’s average daily assets. Because of operational issues at Madison Avenue and certain related factors, the implementation of the reduced advisory fee would occur not immediately but rather at the be implemented at the beginning of the next calendar year. In addition, the Board considered that the sub-advisory fee is paid by ETC, not the Funds, and that the sub-advisory fee reflects an arm’s length negotiation between ETC and Madison Avenue. The Board considered that the Sub-Adviser would, contractually, agree to reduce the sub-advisory fee paid by the Adviser to the Sub-Adviser for its services to the Funds, effective January 1, 2025, would be reduced from an annual rate of 0.49% of each Fund’s average daily net assets to an annual rate of 0.19% of each Fund’s average daily assets. Similarly, for the same reasons noted above, the implementation of the reduced sub-advisory fee would occur not immediately but rather at the be implemented at the beginning of the next calendar year. The Board further found that the sub-advisory fee reflected a reasonable allocation of the advisory fee between ETC and Madison Avenue given the work performed by each firm. The Board considered information provided about the costs and expenses incurred by ETC and Madison Avenue in providing advisory and sub-advisory services, evaluated the compensation and benefits received by each of ETC and Madison Avenue from its relationship with the Funds, and reviewed profitability information from ETC and Madison Avenue with respect to each Fund. The Board considered the risks borne by ETC associated with providing services to the Funds, including the entrepreneurial risk associated with sponsoring new funds, as well as the enterprise risk emanating from litigation and reputational risks, operational and business risks, and other risks associated with the ongoing management of the Funds. Based on the foregoing information, the Board concluded that the advisory and sub-advisory fees appeared reasonable in light of the services rendered.
Economies of Scale. The Board considered whether economies of scale have been realized with respect to the Funds. The Board concluded that no significant economies of scale have been realized and that the Board will have the opportunity to periodically reexamine whether such economies have been achieved.
Conclusion. No single factor was determinative of the Board’s decision to approve the continuance of the Agreements on behalf of each Fund; rather, the Board based its determination on the total mix of information available to it. Based on a consideration of all the factors in their totality, the Board, including the Independent Trustees, determined that the Agreements, including the compensation payable thereunder, were fair and reasonable to each Fund. The Board, including the Independent Trustees, therefore, determined that the approval of the continuance of the Agreements was in the best interests of each Fund and its shareholders.
44
10900 Hefner Pointe Drive, Suite 400
Oklahoma City, OK 73120
Investment Adviser:
Exchange Traded Concepts, LLC
10900 Hefner Pointe Drive, Suite 400
Oklahoma City, OK 73120
Sub-Adviser:
Madison Avenue Financial Solutions, LLC
8301 E 21st St. North, Suite 150
Wichita, KS 67206
Distributor:
SEI Investments Distribution Co.
One Freedom Valley Drive
Oaks, PA 19456
Administrator:
SEI Investments Global Funds Services
One Freedom Valley Drive
Oaks, PA 19456
Legal Counsel:
Chapman and Cutler LLP
320 South Canal Street
Chicago, IL 60606
Independent Registered Public Accounting Firm:
Cohen & Company, Ltd.
1350 Euclid Avenue, Suite 800
Cleveland, OH 44115
This information must be preceded or accompanied by a current prospectus for the Funds.
For additional information about the Funds; including each Fund’s prospectus, financial information, holdings, and proxy voting information, call or visit: • 866-SIXM-ETF (749-6383) • https://6meridianfunds.com/investor-materials |
MER-AR-001-0400
There were no changes in or disagreements with accountants on accounting and financial disclosure during the period covered by the report.
There were no matters submitted to a vote of shareholders during the period covered by this report.
Remuneration was paid by the company during the period covered by the report to Trustees on the company’s Board of Trustees. The Board of Trustees’ expenses are $18,185 for each Fund in the Trust for the period. Amounts for Trustees’ Expenses shown on each ETC 6 Meridian Fund’s Statement of Operations are inclusive of Trustees’ Fees, Independent Trustee Counsel Fees, and other reimbursable expenses of the Trustees in connection with Trust business and board governance.
The disclosure regarding the Approval of Advisory Agreement, if applicable, is included as part of the financial statements included above in Item 7.
Not applicable to open-end management investment companies.
Not applicable to open-end management investment companies.
Not applicable to open-end management investment companies.
There have been no changes to the procedures by which shareholders may recommend nominees to the Registrant’s Board of Trustees during the period covered by this report.
(a) The Registrant’s principal executive and principal financial officers, or persons performing similar functions, have concluded that the Registrant’s disclosure controls and procedures (as defined in Rule 30a-3(c) under the Act are effective based on the evaluation of these controls and procedures required by Rule 30a-3(b) under the Act and Rules 13a-15(b) or 15d-15(b) under the Securities Exchange Act of 1934 as of a date within 90 days of the filing date of this report.
(b) There were no changes in the Registrant's internal control over financial reporting (as defined in Rule 30a-3(d) under the Act) that occurred during the period covered by this report that have materially affected, or are reasonably likely to materially affect, the Registrant's internal control over financial reporting.
Pursuant to the requirements of the Securities Exchange Act of 1934 and the Investment Company Act of 1940, the Registrant has duly caused this report to be signed on its behalf by the undersigned, thereunto duly authorized.
Pursuant to the requirements of the Securities Exchange Act of 1934 and the Investment Company Act of 1940, this report has been signed below by the following persons on behalf of the Registrant and in the capacities and on the dates indicated.