UNITED STATES
SECURITIES AND EXCHANGE COMMISSION
Washington, D.C. 20549
FORM N-CSR
CERTIFIED SHAREHOLDER REPORT OF REGISTERED MANAGEMENT
INVESTMENT COMPANIES
Investment Company Act File Number 811-22263
Exchange Traded Concepts Trust
(Exact name of registrant as specified in charter)
10900 Hefner Pointe Drive
Suite 400
Oklahoma City, OK 73120
(Address of principal executive offices) (Zip code)
J. Garrett Stevens
Exchange Traded Concepts Trust
10900 Hefner Pointe Drive
Suite 400
Oklahoma City, OK 73120
(Name and address of agent for service)
Copy to:
Chapman and Cutler LLP
320 South Canal Street
Chicago, IL 60606
Registrant’s telephone number, including area code: 1-405-778-8377
Date of fiscal year end: November 30, 2024
Date of reporting period: November 30, 2024
| Item 1. | Reports to Stockholders. |
(a) A copy of the report transmitted to stockholders pursuant to Rule 30e-1 under the Investment Company Act of 1940, as amended (the “Act”) (17 CFR § 270.30e-1) is attached hereto.
Exchange Traded Concepts Trust
Range Global Coal Index ETF
Principal Listing Exchange: NYSE Arca, Inc.
Annual Shareholder Report: November 30, 2024
This annual shareholder report contains important information about the Range Global Coal Index ETF (the "Fund") for the period from January 23, 2024 (commencement of operations) to November 30, 2024. You can find additional information about the Fund at https://rangeetfs.com/investor-materials. You can also request this information by contacting us at 855-726-4388.
What were the Fund costs for the period?
(based on a hypothetical $10,000 investment)
| Fund Name | Costs of a $10,000 investmentFootnote Reference* | Costs paid as an annualized percentage of a $10,000 investment |
|---|
| Range Global Coal Index ETF | $71 | 0.85% |
|---|
| Footnote | Description |
Footnote* | Costs shown not annualized. If the Fund had been open for the full fiscal year, costs shown would have been higher for the period ended. |
How did the Fund perform in the period?
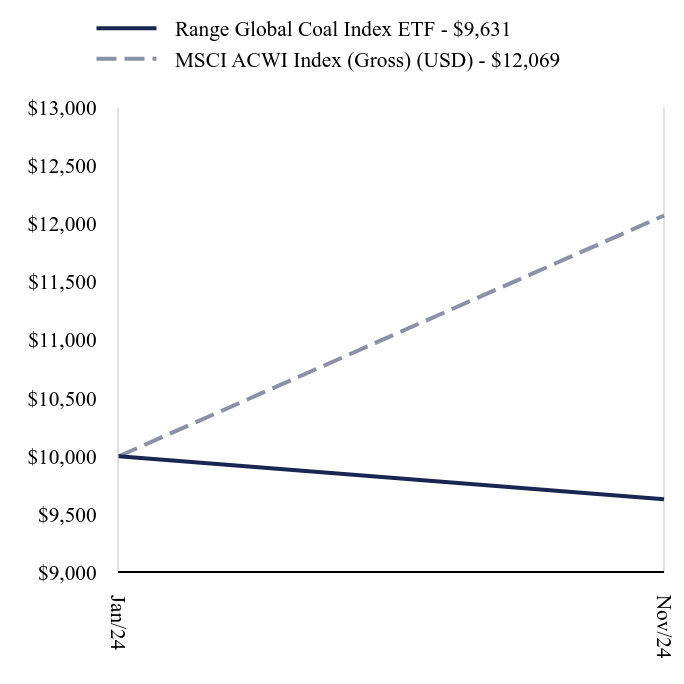
The Fund seeks to track the performance, before fees and expenses, of the Range Global Coal Index, which tracks the performance of a portfolio of stocks that are involved in the metallurgical and thermal coal industry. As of November 30, 2024, the Fund had achieved a return of -3.69% for its focused strategy since its inception on January 23, 2024. In comparison, the Fund’s broad-based index, the MSCI ACWI Index, delivered a return of 20.69% over the same period. The Fund benefitted from strong performers such as Yancoal Australia Ltd (+24.85%), Alliance Resource Partners (+33.29%), Consol Energy Inc. (+30.01%), and Arch Resources Inc. (+3.60%) but returns were tempered by underperformers like Alpha Metallurgical Resources (-27.54%).
Global coal markets are transitioning to oversupply, driven by increased export capacity, reduced Chinese imports, and declining demand in developed economies. In Europe, policy-driven reductions in coal-fired generation and renewable energy expansion are cutting imports, while China’s domestic production and high inventories are reducing import demand despite rising consumption. These shifts highlight challenges in the coal market, though the Fund’s exposure to key performers reflects the ongoing importance of coal in specific regions during this transitional phase.
How did the Fund perform since inception?
Total Return Based on $10,000 Investment
Average Annual Total Returns as of November 30, 2024
| Range Global Coal Index ETF - $9631 | MSCI ACWI Index (Gross) (USD) - $12069 |
|---|
| Jan/24 | $10000 | $10000 |
|---|
| Nov/24 | $9631 | $12069 |
|---|
| Fund/Index Name | Cumulative Since Inception |
|---|
| Range Global Coal Index ETF | -3.69% |
|---|
| MSCI ACWI Index (Gross) (USD) | 20.69% |
|---|
Since its inception on January 23, 2024. The line graph represents historical performance of a hypothetical investment of $10,000 in the Fund since inception. Returns shown are total returns, which assume the reinvestment of dividends and capital gains. The table and graph presented above do not reflect the deduction of taxes a shareholder would pay on Fund distributions or the redemption of Fund shares. Past performance is not indicative of future performance.Call 855-726-4388 or visit https://rangeetfs.com/investor-materials for current month-end performance.
Key Fund Statistics as of November 30, 2024
| Total Net Assets | Number of Holdings | Total Advisory Fees Paid | Portfolio Turnover Rate |
|---|
| $11,283,616 | 29 | $55,651 | 18% |
|---|
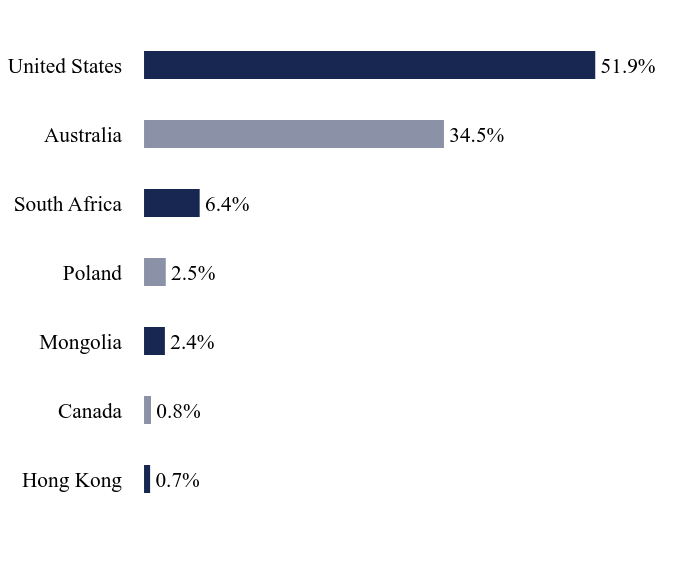
What did the Fund invest in?
Country WeightingsFootnote Reference*
| Value | Value |
|---|
| Hong Kong | 0.7% |
| Canada | 0.8% |
| Mongolia | 2.4% |
| Poland | 2.5% |
| South Africa | 6.4% |
| Australia | 34.5% |
| United States | 51.9% |
| Footnote | Description |
Footnote* | Percentages are calculated based on total net assets. |
| Holding Name | | | Percentage of Total Net Assets |
|---|
| Warrior Met Coal | | | 9.9% |
| Alpha Metallurgical Resources | | | 8.6% |
| Yancoal Australia | | | 8.6% |
| Arch Resources | | | 8.4% |
| Whitehaven Coal | | | 5.7% |
| CONSOL Energy | | | 5.4% |
| Stanmore Resources | | | 4.8% |
| Alliance Resource Partners LP | | | 4.8% |
| New Hope | | | 4.3% |
| Peabody Energy | | | 4.3% |
There were no material changes during the reporting period.
Changes in and Disagreements with Accountants
There were no changes in or disagreements with accountants during the reporting period.
For additional information about the Fund, including its prospectus, financial information, holdings, and proxy voting information, call or visit:
Rule 30e-1 of the Investment Company Act of 1940 permits funds to transmit only one copy of a proxy statement, annual report or semi-annual report to shareholders (who need not be related) with the same residential, commercial or electronic address, provided that the shareholders have consented in writing and the reports are addressed either to each shareholder individually or to the shareholders as a group. This process is known as “householding” and is designed to reduce the duplicate copies of materials that shareholders receive and to lower printing and mailing costs for funds. Once implemented, if you would like to discontinue householding for your accounts, please call toll-free at 855-726-4388 to request individual copies of these documents. Once the Fund receives notice to stop householding, we will begin sending individual copies 30 days after receiving your request.
Exchange Traded Concepts Trust
Range Global Coal Index ETF: COAL
Principal Listing Exchange: NYSE Arca, Inc.
Annual Shareholder Report - November 30, 2024
RAN-AR-TSR-2024-2
Exchange Traded Concepts Trust
Range Global LNG Ecosystem Index ETF
Principal Listing Exchange: NYSE Arca, Inc.
Annual Shareholder Report: November 30, 2024
This annual shareholder report contains important information about the Range Global LNG Ecosystem Index ETF (the "Fund") for the period from January 23, 2024 (commencement of operations) to November 30, 2024. You can find additional information about the Fund at https://rangeetfs.com/investor-materials. You can also request this information by contacting us at 855-726-4388.
What were the Fund costs for the period?
(based on a hypothetical $10,000 investment)
| Fund Name | Costs of a $10,000 investmentFootnote Reference* | Costs paid as an annualized percentage of a $10,000 investment |
|---|
| Range Global LNG Ecosystem Index ETF | $78 | 0.85% |
|---|
| Footnote | Description |
Footnote* | Costs shown not annualized. If the Fund had been open for the full fiscal year, costs shown would have been higher for the period ended. |
How did the Fund perform in the period?
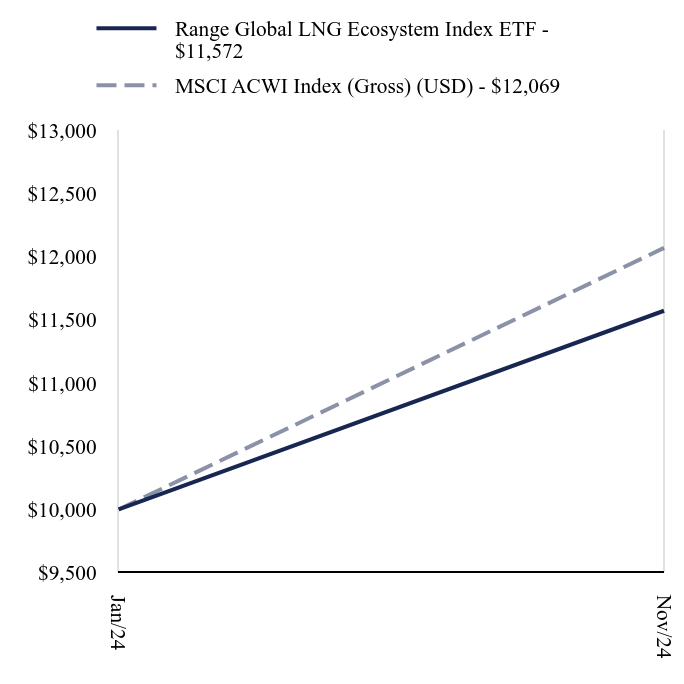
The Fund seeks to track the performance, before fees and expenses, of the Range Global LNG Ecosystem Index, which tracks the performance of a portfolio of stocks that are involved in the liquified natural gas (LNG) industry. As of November 30, 2024, the Fund had achieved a return of 15.72% for its focused strategy since its inception on January 23, 2024. In comparison, the Fund's broad-based index, the MSCI ACWI Index, delivered a return of 20.69% over the same period. The Fund benefited from strong performance in the LNG sector, driven by growing demand for infrastructure and energy diversification globally. Top contributors included Golar LNG Ltd (+71.25%) and Excelerate Energy Inc. (+100.32%), each of which capitalized on robust industry trends and innovation.
Despite these gains, the Fund faced headwinds from detractors such as New Fortress Energy (-71.72%), Flex LNG Ltd (-16.93%), Aspen Aerogels (-6.78%), and Woodside Energy Group (-23.95%), which tempered overall performance. Additionally, several key LNG projects across the Americas, including Plaquemines LNG and Golden Pass LNG, experienced delays, reducing the anticipated LNG supply for global markets. This has tightened the gas balance in Europe, which is already facing the loss of residual Russian gas flows through Ukraine by the end of 2025.
The delays have also impacted the U.S. natural gas market by postponing demand growth, easing storage concerns, and lowering Henry Hub price forecasts. The Fund’s strategy of investing across the LNG ecosystem allowed it to capitalize on emerging opportunities in the sector while navigating broader market challenges, including these supply chain disruptions and shifting market dynamics.
How did the Fund perform since inception?
Total Return Based on $10,000 Investment
Average Annual Total Returns as of November 30, 2024
| Range Global LNG Ecosystem Index ETF - $11572 | MSCI ACWI Index (Gross) (USD) - $12069 |
|---|
| Jan/24 | $10000 | $10000 |
|---|
| Nov/24 | $11572 | $12069 |
|---|
| Fund/Index Name | Cumulative Since Inception |
|---|
| Range Global LNG Ecosystem Index ETF | 15.72% |
|---|
| MSCI ACWI Index (Gross) (USD) | 20.69% |
|---|
Since its inception on January 23, 2024. The line graph represents historical performance of a hypothetical investment of $10,000 in the Fund since inception. Returns shown are total returns, which assume the reinvestment of dividends and capital gains. The table and graph presented above do not reflect the deduction of taxes a shareholder would pay on Fund distributions or the redemption of Fund shares. Past performance is not indicative of future performance.Call 855-726-4388 or visit https://rangeetfs.com/investor-materials for current month-end performance.
Key Fund Statistics as of November 30, 2024
| Total Net Assets | Number of Holdings | Total Advisory Fees Paid | Portfolio Turnover Rate |
|---|
| $1,157,244 | 28 | $3,086 | 13% |
|---|
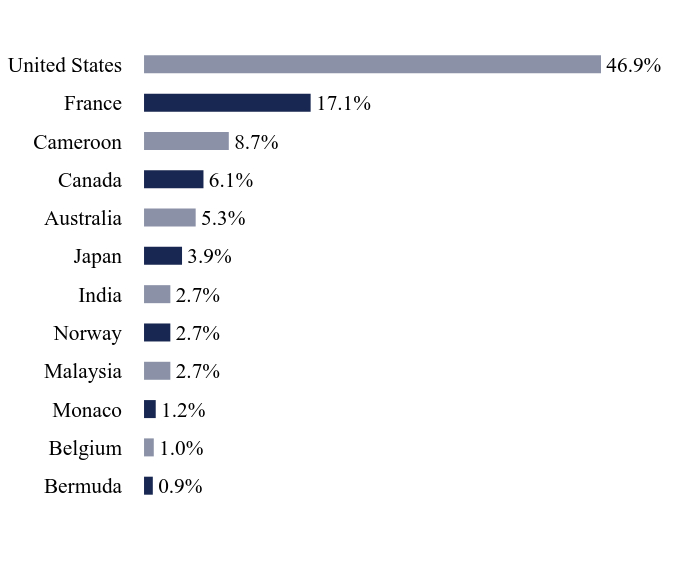
What did the Fund invest in?
Country WeightingsFootnote Reference*
| Value | Value |
|---|
| Bermuda | 0.9% |
| Belgium | 1.0% |
| Monaco | 1.2% |
| Malaysia | 2.7% |
| Norway | 2.7% |
| India | 2.7% |
| Japan | 3.9% |
| Australia | 5.3% |
| Canada | 6.1% |
| Cameroon | 8.7% |
| France | 17.1% |
| United States | 46.9% |
| Footnote | Description |
Footnote* | Percentages are calculated based on total net assets. |
| Holding Name | | | Percentage of Total Net Assets |
|---|
| Cheniere Energy | | | 11.4% |
| Gaztransport Et Technigaz | | | 9.4% |
| Golar LNG | | | 8.7% |
| Excelerate Energy, Cl A | | | 7.0% |
| New Fortress Energy, Cl A | | | 4.6% |
| NextDecade | | | 4.0% |
| Tokyo Gas | | | 3.9% |
| Chesapeake Energy | | | 3.8% |
| Baker Hughes, Cl A | | | 3.6% |
| Chevron | | | 3.2% |
There were no material changes during the reporting period.
Changes in and Disagreements with Accountants
There were no changes in or disagreements with accountants during the reporting period.
For additional information about the Fund, including its prospectus, financial information, holdings, and proxy voting information, call or visit:
Rule 30e-1 of the Investment Company Act of 1940 permits funds to transmit only one copy of a proxy statement, annual report or semi-annual report to shareholders (who need not be related) with the same residential, commercial or electronic address, provided that the shareholders have consented in writing and the reports are addressed either to each shareholder individually or to the shareholders as a group. This process is known as “householding” and is designed to reduce the duplicate copies of materials that shareholders receive and to lower printing and mailing costs for funds. Once implemented, if you would like to discontinue householding for your accounts, please call toll-free at 855-726-4388 to request individual copies of these documents. Once the Fund receives notice to stop householding, we will begin sending individual copies 30 days after receiving your request.
Exchange Traded Concepts Trust
Range Global LNG Ecosystem Index ETF: LNGZ
Principal Listing Exchange: NYSE Arca, Inc.
Annual Shareholder Report - November 30, 2024
RAN-AR-TSR-2024-3
Exchange Traded Concepts Trust
Range Global Offshore Oil Services Index ETF
Principal Listing Exchange: NYSE Arca, Inc.
Annual Shareholder Report: November 30, 2024
This annual shareholder report contains important information about the Range Global Offshore Oil Services Index ETF (the "Fund") for the period from January 23, 2024 (commencement of operations) to November 30, 2024. You can find additional information about the Fund at https://rangeetfs.com/investor-materials. You can also request this information by contacting us at 855-726-4388.
What were the Fund costs for the period?
(based on a hypothetical $10,000 investment)
| Fund Name | Costs of a $10,000 investmentFootnote Reference* | Costs paid as an annualized percentage of a $10,000 investment |
|---|
| Range Global Offshore Oil Services Index ETF | $72 | 0.85% |
|---|
| Footnote | Description |
Footnote* | Costs shown not annualized. If the Fund had been open for the full fiscal year, costs shown would have been higher for the period ended. |
How did the Fund perform in the period?
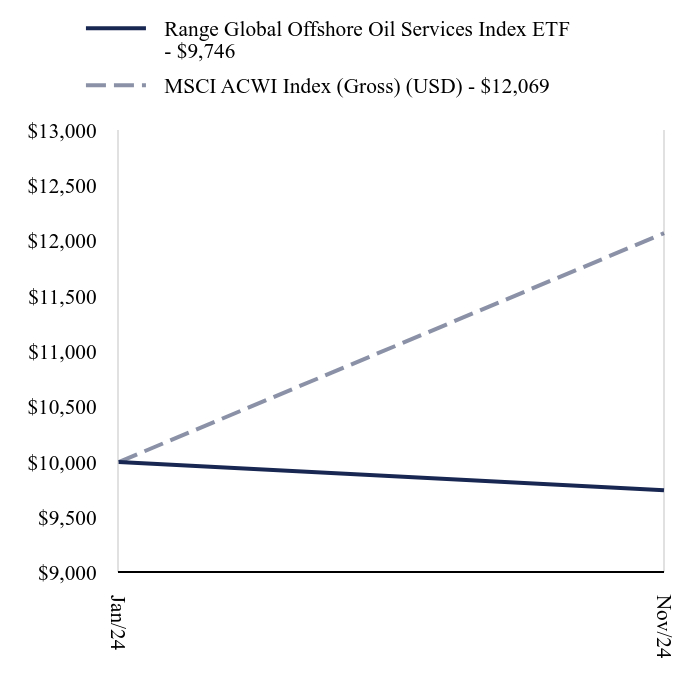
The Fund seeks to track the performance, before fees and expenses, of the Range Global Offshore Oil Services Index, which tracks the performance of a portfolio of stocks that are involved in the global offshore oil industry. As of November 30, 2024, the Fund had achieved a return of -2.54% for its focused strategy since its inception on January 23, 2024. In comparison, the Fund’s broad-based index, the MSCI ACWI Index, delivered a return of 20.69% over the same period. The Fund benefitted from strong performers such as Samsung Heavy Industries (+49.94%), Saipem SPA (+66.05%), and Subsea 7 SA (+17.61%), which were driven by robust demand for subsea and offshore energy projects, higher-margin contracts, and improved operational efficiencies.
However, the Fund faced challenges from detractors, including Transocean Ltd (-30.71%), Valaris Ltd (-32.64%), and Nobel Corp PLC (-23.64%), which weighed on overall returns. The offshore oil services sector has seen growth fueled by record order backlogs, expanding global project opportunities, and innovation in vessel technologies. While such trends supported the Fund’s top performers, the drag from key detractors moderated the Fund’s overall performance.
How did the Fund perform since inception?
Total Return Based on $10,000 Investment
Average Annual Total Returns as of November 30, 2024
| Range Global Offshore Oil Services Index ETF - $9746 | MSCI ACWI Index (Gross) (USD) - $12069 |
|---|
| Jan/24 | $10000 | $10000 |
|---|
| Nov/24 | $9746 | $12069 |
|---|
| Fund/Index Name | Cumulative Since Inception |
|---|
| Range Global Offshore Oil Services Index ETF | -2.54% |
|---|
| MSCI ACWI Index (Gross) (USD) | 20.69% |
|---|
Since its inception on January 23, 2024. The line graph represents historical performance of a hypothetical investment of $10,000 in the Fund since inception. Returns shown are total returns, which assume the reinvestment of dividends and capital gains. The table and graph presented above do not reflect the deduction of taxes a shareholder would pay on Fund distributions or the redemption of Fund shares. Past performance is not indicative of future performance.Call 855-726-4388 or visit https://rangeetfs.com/investor-materials for current month-end performance.
Key Fund Statistics as of November 30, 2024
| Total Net Assets | Number of Holdings | Total Advisory Fees Paid | Portfolio Turnover Rate |
|---|
| $2,206,151 | 31 | $50,928 | 28% |
|---|
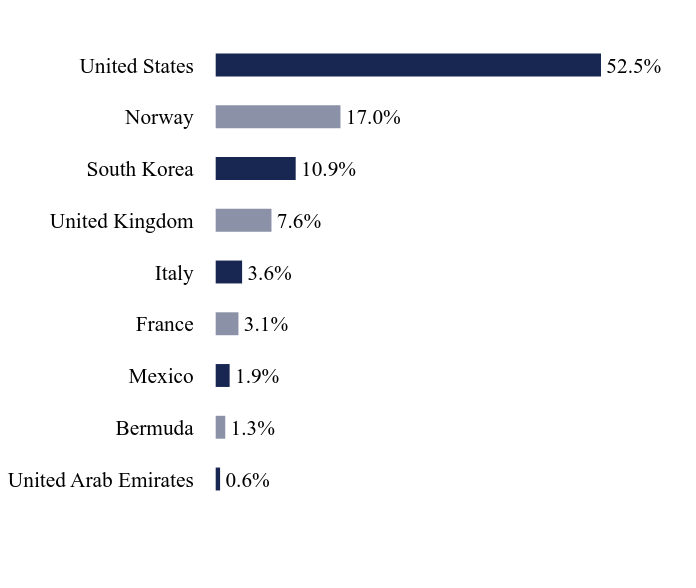
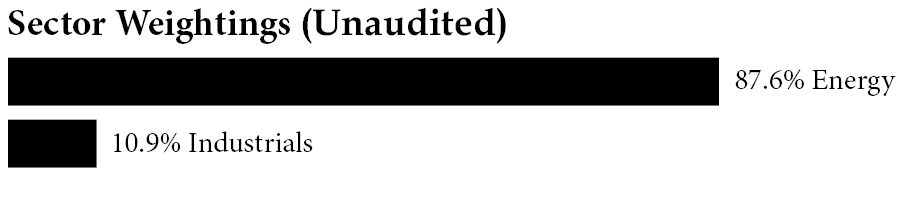
What did the Fund invest in?
Country WeightingsFootnote Reference*
| Value | Value |
|---|
| United Arab Emirates | 0.6% |
| Bermuda | 1.3% |
| Mexico | 1.9% |
| France | 3.1% |
| Italy | 3.6% |
| United Kingdom | 7.6% |
| South Korea | 10.9% |
| Norway | 17.0% |
| United States | 52.5% |
| Footnote | Description |
Footnote* | Percentages are calculated based on total net assets. |
| Holding Name | | | Percentage of Total Net Assets |
|---|
| Samsung Heavy Industries | | | 10.9% |
| Noble PLC | | | 9.6% |
| Transocean | | | 7.1% |
| Valaris | | | 6.2% |
| Tidewater | | | 5.0% |
| Seadrill | | | 4.9% |
| Baker Hughes, Cl A | | | 4.0% |
| TechnipFMC PLC | | | 3.8% |
| Saipem | | | 3.6% |
| Halliburton | | | 3.4% |
There were no material changes during the reporting period.
Changes in and Disagreements with Accountants
There were no changes in or disagreements with accountants during the reporting period.
For additional information about the Fund, including its prospectus, financial information, holdings, and proxy voting information, call or visit:
Rule 30e-1 of the Investment Company Act of 1940 permits funds to transmit only one copy of a proxy statement, annual report or semi-annual report to shareholders (who need not be related) with the same residential, commercial or electronic address, provided that the shareholders have consented in writing and the reports are addressed either to each shareholder individually or to the shareholders as a group. This process is known as “householding” and is designed to reduce the duplicate copies of materials that shareholders receive and to lower printing and mailing costs for funds. Once implemented, if you would like to discontinue householding for your accounts, please call toll-free at 855-726-4388 to request individual copies of these documents. Once the Fund receives notice to stop householding, we will begin sending individual copies 30 days after receiving your request.
Exchange Traded Concepts Trust
Range Global Offshore Oil Services Index ETF: OFOS
Principal Listing Exchange: NYSE Arca, Inc.
Annual Shareholder Report - November 30, 2024
RAN-AR-TSR-2024-4
Exchange Traded Concepts Trust
Range Nuclear Renaissance Index ETF
Principal Listing Exchange: NYSE Arca, Inc.
Annual Shareholder Report: November 30, 2024
This annual shareholder report contains important information about the Range Nuclear Renaissance Index ETF (the "Fund") for the period from January 23, 2024 (commencement of operations) to November 30, 2024. You can find additional information about the Fund at https://rangeetfs.com/investor-materials. You can also request this information by contacting us at 855-726-4388.
What were the Fund costs for the period?
(based on a hypothetical $10,000 investment)
| Fund Name | Costs of a $10,000 investmentFootnote Reference* | Costs paid as an annualized percentage of a $10,000 investment |
|---|
| Range Nuclear Renaissance Index ETF | $103 | 0.85% |
|---|
| Footnote | Description |
Footnote* | Costs shown not annualized. If the Fund had been open for the full fiscal year, costs shown would have been higher for the period ended. |
How did the Fund perform in the period?
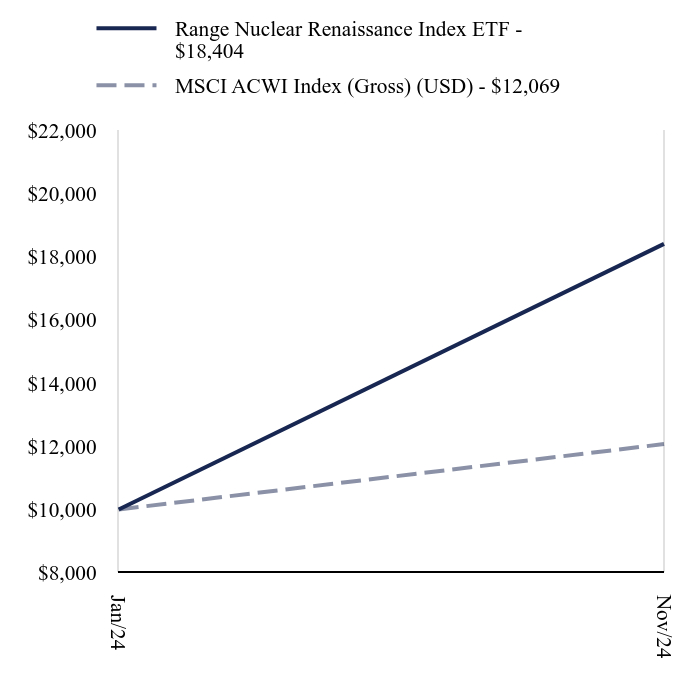
The Fund seeks to track the performance, before fees and expenses, of the Range Nuclear Renaissance Index, which tracks the performance of a portfolio of stocks that are involved in the nuclear fuel and energy industry. As of November 30, 2024, the Fund had achieved a return of 84.04% for its focused strategy since its inception on January 23, 2024. In comparison, the Fund’s broad-based index, the MSCI ACWI Index, delivered a return of 20.69% over the same period. The Fund has benefited from a continuous stream of positive news flow around the nuclear renaissance theme, with numerous sell-side firms, including Goldman Sachs and BCA Research, highlighting nuclear power as a critical solution for clean energy and global energy security.
The Fund’s performance was driven by standout contributors such as Constellation Energy, which delivered a return of 119.49%, and NuScale Power Corp., the Fund’s top performer, with an impressive 801.22%. Vistra Corp. also made substantial contributions, returning 314.95%.
Additional positive contributors included Rolls-Royce Holdings, with a return of 86.39%, alongside BWX Technologies Inc. and General Electric, further showcasing the Fund’s broad-based exposure to leading companies in the nuclear and clean energy sectors. The combined strength of these holdings, coupled with favorable sentiment from influential research firms, underscored the nuclear sector’s growing importance, helping the Fund achieve strong performance despite broader market challenges.
How did the Fund perform since inception?
Total Return Based on $10,000 Investment
Average Annual Total Returns as of November 30, 2024
| Range Nuclear Renaissance Index ETF - $18404 | MSCI ACWI Index (Gross) (USD) - $12069 |
|---|
| Jan/24 | $10000 | $10000 |
|---|
| Nov/24 | $18404 | $12069 |
|---|
| Fund/Index Name | Cumulative Since Inception |
|---|
| Range Nuclear Renaissance Index ETF | 84.04% |
|---|
| MSCI ACWI Index (Gross) (USD) | 20.69% |
|---|
Since its inception on January 23, 2024. The line graph represents historical performance of a hypothetical investment of $10,000 in the Fund since inception. Returns shown are total returns, which assume the reinvestment of dividends and capital gains. The table and graph presented above do not reflect the deduction of taxes a shareholder would pay on Fund distributions or the redemption of Fund shares. Past performance is not indicative of future performance.Call 855-726-4388 or visit https://rangeetfs.com/investor-materials for current month-end performance.
Key Fund Statistics as of November 30, 2024
| Total Net Assets | Number of Holdings | Total Advisory Fees Paid | Portfolio Turnover Rate |
|---|
| $111,418,935 | 38 | $130,011 | 13% |
|---|
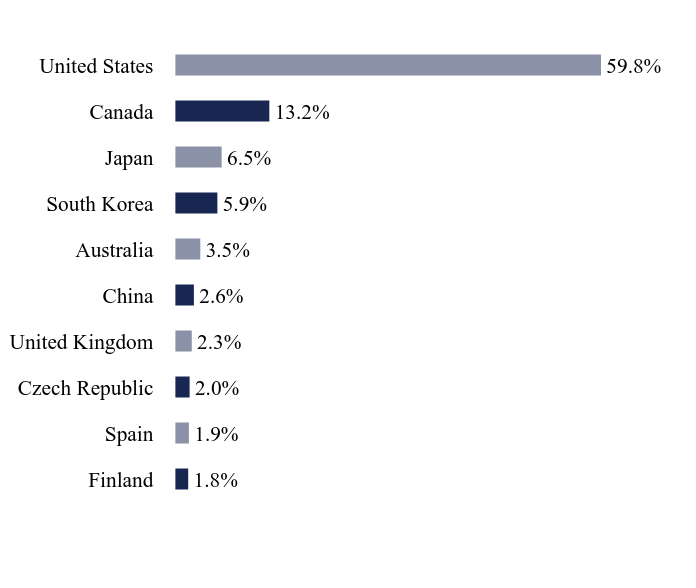
What did the Fund invest in?
Country WeightingsFootnote Reference*
| Value | Value |
|---|
| Finland | 1.8% |
| Spain | 1.9% |
| Czech Republic | 2.0% |
| United Kingdom | 2.3% |
| China | 2.6% |
| Australia | 3.5% |
| South Korea | 5.9% |
| Japan | 6.5% |
| Canada | 13.2% |
| United States | 59.8% |
| Footnote | Description |
Footnote* | Percentages are calculated based on total net assets. |
| Holding Name | | | Percentage of Total Net Assets |
|---|
| Cameco | | | 10.4% |
| Oklo, Cl A | | | 8.7% |
| Constellation Energy | | | 8.0% |
| NuScale Power | | | 7.1% |
| Centrus Energy, Cl A | | | 5.3% |
| Silex Systems | | | 3.5% |
| Vistra | | | 3.4% |
| GE Vernova | | | 3.1% |
| Shanghai Electric Group, Cl H | | | 2.6% |
| Honeywell International | | | 2.4% |
There were no material changes during the reporting period.
Changes in and Disagreements with Accountants
There were no changes in or disagreements with accountants during the reporting period.
For additional information about the Fund, including its prospectus, financial information, holdings, and proxy voting information, call or visit:
Rule 30e-1 of the Investment Company Act of 1940 permits funds to transmit only one copy of a proxy statement, annual report or semi-annual report to shareholders (who need not be related) with the same residential, commercial or electronic address, provided that the shareholders have consented in writing and the reports are addressed either to each shareholder individually or to the shareholders as a group. This process is known as “householding” and is designed to reduce the duplicate copies of materials that shareholders receive and to lower printing and mailing costs for funds. Once implemented, if you would like to discontinue householding for your accounts, please call toll-free at 855-726-4388 to request individual copies of these documents. Once the Fund receives notice to stop householding, we will begin sending individual copies 30 days after receiving your request.
Exchange Traded Concepts Trust
Range Nuclear Renaissance Index ETF: NUKZ
Principal Listing Exchange: NYSE Arca, Inc.
Annual Shareholder Report - November 30, 2024
RAN-AR-TSR-2024-1
(b) Not applicable.
The Registrant has adopted a code of ethics that applies to the Registrant's principal executive officer, principal financial officer, controller or principal accounting officer or any person who performs a similar function.
| Item 3. | Audit Committee Financial Expert. |
(a)(1) The Registrant’s Board of Trustees has determined that the Registrant has an audit committee financial expert serving on the audit committee.
(a)(2) The audit committee financial expert Timothy Jacoby is an independent trustee as defined in Form N-CSR Item 3 (a)(2).
| Item 4. | Principal Accountant Fees and Services. |
Fees billed by Cohen & Company, Ltd (Cohen) related to the Registrant.
Cohen billed the Registrant aggregate fees for services rendered to the Registrant for the last two fiscal years as follows:
| | | 2024 | | 2023 | |
| | | | | All fees and services to the Trust that were pre-approved | | | All fees and services to service affiliates that were pre-approved | | All other fees and services to service affiliates that did not require pre-approval | | All fees and services to the Trust that were pre-approved | | All fees and services to service affiliates that were pre-approved | | | All other fees and services to service affiliates that did not require pre-approval | |
| (a) | | Audit Fees | | $ | 144,025 | | | | N/A | | | N/A | | $ | 100,450 | | | N/A | | | | N/A | |
| (b) | | Audit-Related Fees | | | N/A | | | | N/A | | | N/A | | | N/A | | | N/A | | | | N/A | |
| (c) | | Tax Fees | | $ | 35,000 | (1) | | | N/A | | | N/A | | $ | 24,000 | (1) | | N/A | | | | N/A | |
| (d) | | All Other Fees | | | N/A | | | | N/A | | | N/A | | | N/A | | | N/A | | | | N/A | |
Notes:
| (1) | Tax fees include review of Federal Form 1120 RIC, State returns (if requested), and excise tax returns and review of dividend calculation, if requested. |
(e)(1) The Trust’s Audit Committee has adopted, and the Board of Trustees has ratified, an Audit and Non-Audit Services Pre-Approval Policy (the “Policy”), which sets forth the procedures and the conditions pursuant to which services proposed to be performed by the independent auditor of the Trust may be pre-approved.
(e)(2) Percentage of fees billed applicable to non-audit services pursuant to waiver of pre-approval requirement were as follows:
| | | 2024 | | | 2023 | |
| Audit-Related Fees | | | 0 | % | | | 0 | % |
| Tax Fees | | | 0 | % | | | 0 | % |
| All Other Fees | | | 0 | % | | | 0 | % |
(f) Not Applicable.
(g) The aggregate non-audit fees and services billed by Cohen for the fiscal years 2024 and 2023 were $35,000 and $24,000, respectively.
(h) During the past fiscal year, Registrant's principal accountant provided certain non-audit services to Registrant's investment adviser or to entities controlling, controlled by, or under common control with Registrant's investment adviser that provide ongoing services to Registrant that were not subject to pre-approval pursuant to paragraph (c)(7)(ii) of Rule 2-01 of Regulation S-X. The Audit Committee of Registrant's Board of Trustees reviewed and considered these non-audit services provided by Registrant's principal accountant to Registrant's affiliates, including whether the provision of these non-audit services is compatible with maintaining the principal accountant's independence.
(i) Not applicable. The Registrant has not retained, for the preparation of the audit report on the financial statements included in the Form N-CSR, a registered public accounting firm that has a branch or office that is located in a foreign jurisdiction and that the Public Company Accounting Oversight Board (the “PCAOB”) has determined that the PCAOB is unable to inspect or investigate completely because of a position taken by an authority in the foreign jurisdiction.
(j) Not applicable. The Registrant is not a “foreign issuer,” as defined in 17 CFR 240.3b-4.
| Item 5. | Audit Committee of Listed Registrants. |
The Registrant has a separately-designated standing Audit Committee, which is composed of the Registrant's Independent Trustees: Timothy Jacoby, Stuart Strauss, Linda Petrone and Mark Zurack.
(a) The Schedule of Investments is included as part of the Financial Statements and Other Information filed under Item 7 of this form.
(b) Not Applicable.
| Item 7. | Financial Statements and Financial Highlights for Open-End Management Investment Companies. |
Financial statements and financial highlights are filed herein.

EXCHANGE TRADED CONCEPTS TRUST
Range Global Coal Index ETF
Range Global LNG Ecosystem Index ETF
Range Global Offshore Oil Services Index ETF
Range Nuclear Renaissance Index ETF
Annual Financials and Other Information
November 30, 2024

Range ETFs
Table of Contents
For additional information about the Funds; including each Fund’s prospectus, financial information, holdings, and proxy voting information, call or visit: • 855-726-4388 • https://rangeetfs.com/investor-materials |
Range ETFs
Range Global Coal Index ETF
Schedule of Investments
November 30, 2024

Description | | Shares | | Fair Value |
COMMON STOCK†† — 99.2% | | | | | |
Australia — 34.5% | | | | | |
Energy — 19.1% | | | | | |
New Hope | | 158,890 | | $ | 486,491 |
Terracom | | 430,803 | | | 54,726 |
Whitehaven Coal | | 150,833 | | | 646,551 |
Yancoal Australia | | 239,961 | | | 966,072 |
| | | | | | 2,153,840 |
| | | | | | |
Materials — 15.4% | | | | | |
Bathurst Resources* | | 103,770 | | | 50,701 |
BHP Group ADR | | 7,153 | | | 376,605 |
Coronado Global Resources, CDI | | 526,431 | | | 317,222 |
Glencore PLC | | 76,829 | | | 371,035 |
Metro Mining* | | 2,027,364 | | | 83,206 |
Stanmore Resources | | 252,915 | | | 545,359 |
| | | | | | 1,744,128 |
| | | | | | 3,897,968 |
| | | | | | |
Canada — 0.8% | | | | | |
Materials — 0.8% | | | | | |
Colonial Coal International* | | 56,970 | | | 87,480 |
| | | | | | |
Hong Kong — 0.7% | | | | | |
Energy — 0.7% | | | | | |
SouthGobi Resources* | | 171,239 | | | 84,388 |
| | | | | | |
Mongolia — 2.4% | | | | | |
Materials — 2.4% | | | | | |
Mongolian Mining* | | 255,000 | | | 271,334 |
| | | | | | |
Poland — 2.5% | | | | | |
Energy — 0.4% | | | | | |
Lubelski Wegiel Bogdanka | | 8,662 | | | 49,657 |
| | | | | | |
Materials — 2.1% | | | | | |
Jastrzebska Spolka Weglowa* | | 36,851 | | | 231,387 |
| | | | | | 281,044 |
| | | | | | |
South Africa — 6.4% | | | | | |
Energy — 6.4% | | | | | |
Exxaro Resources | | 51,815 | | | 478,802 |
Thungela Resources | | 34,203 | | | 242,041 |
| | | | | | 720,843 |
| | | | | | |
United States — 51.9% | | | | | |
Energy — 20.2% | | | | | |
Alliance Resource Partners LP | | 19,294 | | | 544,670 |
CONSOL Energy | | 4,686 | | | 612,460 |
Description | | Shares | | Fair Value |
United States — continued | | | | | |
Energy — continued | | | | | |
Hallador Energy* | | 10,357 | | $ | 126,355 |
NACCO Industries, Cl A | | 1,828 | | | 58,880 |
Natural Resource Partners LP | | 4,090 | | | 447,814 |
Peabody Energy | | 20,293 | | | 483,988 |
| | | | | | 2,274,167 |
| | | | | | |
Materials — 31.7% | | | | | |
Alpha Metallurgical Resources | | 3,964 | | | 973,439 |
Arch Resources | | 5,513 | | | 947,795 |
Novusterra(A)* | | 525 | | | — |
Ramaco Resources, Cl A | | 16,413 | | | 209,266 |
SunCoke Energy | | 26,360 | | | 328,446 |
Warrior Met Coal | | 15,932 | | | 1,120,338 |
| | | | | | 3,579,284 |
| | | | | | 5,853,451 |
Total Common Stock
(Cost $11,289,184) | | | | | 11,196,508 |
| | | | | | |
Total Investments — 99.2%
(Cost $11,289,184) | | | | $ | 11,196,508 |
Percentages are based on Net Assets of $11,283,616.
ADR — American Depositary Receipt
CDI — CHESS Depositary Interest
Cl — Class
LP — Limited Partnership
PLC — Public Limited Company
The following is a summary of the inputs used as of November 30, 2024 in valuing the Fund’s investments carried at value:
| | Level 1 | | Level 2 | | Level 3(1) | | Total |
Investments in Securities Common Stock | | $ | 11,196,508 | | $ | — | | $ | —^ | | $ | 11,196,508 |
Total Investments in Securities | | $ | 11,196,508 | | $ | — | | $ | —^ | | $ | 11,196,508 |
Amounts designated as “—“ are $0 or have been rounded to $0.
The accompanying notes are an integral part of the financial statements.
1
Range ETFs
Range Global LNG Ecosystem Index ETF
Schedule of Investments
November 30, 2024

Description | | Shares | | Fair Value |
COMMON STOCK†† — 99.2% | | | | | |
Australia — 5.3% | | | | | |
Energy — 5.3% | | | | | |
Santos | | 6,816 | | $ | 29,350 |
Woodside Energy Group | | 1,980 | | | 31,615 |
| | | | | | 60,965 |
| | | | | | |
Belgium — 1.0% | | | | | |
Energy — 1.0% | | | | | |
Exmar | | 1,372 | | | 12,028 |
| | | | | | |
Bermuda — 0.9% | | | | | |
Energy — 0.9% | | | | | |
Cool | | 1,291 | | | 10,744 |
| | | | | | |
Cameroon — 8.7% | | | | | |
Energy — 8.7% | | | | | |
Golar LNG | | 2,552 | | | 100,472 |
| | | | | | |
Canada — 6.1% | | | | | |
Energy — 6.1% | | | | | |
Enbridge | | 780 | | | 33,742 |
South Bow, Cl W* | | 135 | | | 3,564 |
TC Energy | | 688 | | | 33,541 |
| | | | | | 70,847 |
| | | | | | |
France — 17.1% | | | | | |
Energy — 14.6% | | | | | |
Gaztransport Et Technigaz | | 748 | | | 108,789 |
Technip Energies | | 1,328 | | | 32,625 |
Total Energies | | 472 | | | 27,404 |
| | | | | | 168,818 |
| | | | | | |
Utilities — 2.5% | | | | | |
Engie | | 1,808 | | | 28,806 |
| | | | | | 197,624 |
| | | | | | |
India — 2.7% | | | | | |
Energy — 2.7% | | | | | |
Petronet LNG | | 8,024 | | | 31,632 |
| | | | | | |
Japan — 3.9% | | | | | |
Utilities — 3.9% | | | | | |
Tokyo Gas | | 1,500 | | | 45,044 |
Description | | Shares | | Fair Value |
Malaysia — 2.7% | | | | | |
Utilities — 2.7% | | | | | |
Petronas Gas | | 7,688 | | $ | 30,856 |
| | | | | | |
Monaco — 1.2% | | | | | |
Energy — 1.2% | | | | | |
Dynagas LNG Partners LP* | | 2,899 | | | 13,509 |
| | | | | | |
Norway — 2.7% | | | | | |
Energy — 2.7% | | | | | |
FLEX LNG | | 1,291 | | | 31,165 |
| | | | | | |
United States — 46.9% | | | | | |
Energy — 43.1% | | | | | |
Baker Hughes, Cl A | | 947 | | | 41,621 |
Cheniere Energy | | 587 | | | 131,493 |
Chesapeake Energy | | 440 | | | 43,542 |
Chevron | | 227 | | | 36,758 |
Excelerate Energy, Cl A | | 2,612 | | | 80,894 |
Exxon Mobil | | 287 | | | 33,855 |
New Fortress Energy, Cl A | | 5,004 | | | 53,393 |
NextDecade* | | 6,332 | | | 45,844 |
Shell PLC | | 960 | | | 30,890 |
| | | | | | 498,290 |
| | | | | | |
Industrials — 2.1% | | | | | |
Capital Clean Energy Carriers | | 1,343 | | | 24,577 |
| | | | | | |
Materials — 1.7% | | | | | |
Aspen Aerogels* | | 1,335 | | | 19,758 |
| | | | | | 542,625 |
Total Common Stock
(Cost $1,099,460) | | | | | 1,147,511 |
| | | | | | |
Total Investments — 99.2%
(Cost $1,099,460) | | | | $ | 1,147,511 |
Percentages are based on Net Assets of $1,157,244.
Cl — Class
LP — Limited Partnership
PLC — Public Limited Company
As of November 30, 2024, all of the Fund’s investments were considered Level 1 of the fair value hierarchy, in accordance with the authoritative guidance on fair value measurements and disclosure under U.S. Generally Accepted Accounting Principles.
The accompanying notes are an integral part of the financial statements.
2
Range ETFs
Range Global Offshore Oil Services Index ETF
Schedule of Investments
November 30, 2024
Description | | Shares | | Fair Value |
COMMON STOCK†† — 98.5% | | | | | |
Bermuda — 1.3% | | | | | |
Energy — 1.3% | | | | | |
Northern Ocean* | | 37,393 | | $ | 29,631 |
| | | | | | |
France — 3.1% | | | | | |
Energy — 3.1% | | | | | |
Technip Energies | | 2,785 | | | 68,420 |
| | | | | | |
Italy — 3.6% | | | | | |
Energy — 3.6% | | | | | |
Saipem* | | 30,955 | | | 79,808 |
| | | | | | |
Mexico — 1.9% | | | | | |
Energy — 1.9% | | | | | |
Borr Drilling | | 11,012 | | | 40,965 |
| | | | | | |
Norway — 17.0% | | | | | |
Energy — 17.0% | | | | | |
Aker Solutions | | 17,603 | | | 50,095 |
BW Offshore | | 8,853 | | | 22,343 |
Deep Value Driller | | 11,676 | | | 17,639 |
Eidesvik Offshore | | 15,535 | | | 18,578 |
Odfjell Drilling | | 10,133 | | | 44,639 |
Sea1 offshore | | 8,329 | | | 21,737 |
Seadrill* | | 2,677 | | | 108,793 |
Solstad Offshore* | | 6,907 | | | 26,204 |
TGS | | 6,729 | | | 65,739 |
| | | | | | 375,767 |
| | | | | | |
South Korea — 10.9% | | | | | |
Industrials — 10.9% | | | | | |
Samsung Heavy Industries* | | 28,864 | | | 240,421 |
| | | | | | |
United Arab Emirates — 0.6% | | | | | |
Energy — 0.6% | | | | | |
Shelf Drilling* | | 13,417 | | | 12,452 |
| | | | | | |
United Kingdom — 7.6% | | | | | |
Energy — 7.6% | | | | | |
Odfjell Technology | | 4,825 | | | 20,535 |
Subsea 7 | | 3,909 | | | 61,633 |
TechnipFMC PLC | | 2,694 | | | 84,511 |
| | | | | | 166,679 |
Description | | Shares | | Fair Value |
United States — 52.5% | | | | | |
Energy — 52.5% | | | | | |
Baker Hughes, Cl A | | 1,986 | | $ | 87,285 |
ChampionX | | 2,316 | | | 71,680 |
Halliburton | | 2,370 | | | 75,508 |
Helix Energy Solutions Group* | | 6,942 | | | 74,210 |
Noble PLC | | 6,332 | | | 211,932 |
Noram Drilling | | 6,564 | | | 20,485 |
NOV | | 4,192 | | | 67,156 |
Schlumberger | | 1,671 | | | 73,424 |
SEACOR Marine Holdings* | | 2,245 | | | 15,423 |
Tidewater* | | 2,126 | | | 109,957 |
Transocean* | | 35,477 | | | 156,099 |
Valaris* | | 2,948 | | | 136,168 |
Weatherford International PLC | | 721 | | | 59,338 |
| | | | | | 1,158,665 |
Total Common Stock
(Cost $2,662,320) | | | | | 2,172,808 |
| | | | | | |
Total Investments — 98.5%
(Cost $2,662,320) | | | | $ | 2,172,808 |
Percentages are based on Net Assets of $2,206,151.
Cl — Class
PLC — Public Limited Company
As of November 30, 2024, all of the Fund’s investments were considered Level 1 of the fair value hierarchy, in accordance with the authoritative guidance on fair value measurements and disclosure under U.S. Generally Accepted Accounting Principles.
The accompanying notes are an integral part of the financial statements.
3
Range ETFs
Range Nuclear Renaissance Index ETF
Schedule of Investments
November 30, 2024

Description | | Shares | | Fair Value |
COMMON STOCK†† — 99.5% | | | | | |
Australia — 3.5% | | | | | |
Industrials — 3.5% | | | | | |
Silex Systems* | | 1,073,892 | | $ | 3,924,676 |
| | | | | | |
Canada — 13.2% | | | | | |
Energy — 10.4% | | | | | |
Cameco | | 194,697 | | | 11,574,737 |
| | | | | | |
Industrials — 2.8% | | | | | |
Aecon Group | | 54,486 | | | 1,119,956 |
AtkinsRealis Group | | 36,130 | | | 1,961,649 |
| | | | | | 3,081,605 |
| | | | | | 14,656,342 |
| | | | | | |
China — 2.6% | | | | | |
Industrials — 2.6% | | | | | |
Shanghai Electric Group, Cl H* | | 7,742,000 | | | 2,905,159 |
| | | | | | |
Czech Republic — 2.0% | | | | | |
Utilities — 2.0% | | | | | |
CEZ | | 55,225 | | | 2,220,139 |
| | | | | | |
Finland — 1.8% | | | | | |
Utilities — 1.8% | | | | | |
Fortum | | 133,992 | | | 2,018,817 |
| | | | | | |
Japan — 6.5% | | | | | |
Industrials — 5.0% | | | | | |
Fuji Electric | | 30,100 | | | 1,688,133 |
Hitachi | | 72,900 | | | 1,820,741 |
Mitsubishi Heavy Industries | | 144,500 | | | 2,114,317 |
| | | | | | 5,623,191 |
| | | | | | |
Utilities — 1.5% | | | | | |
Tokyo Electric Power Holdings* | | 458,500 | | | 1,636,966 |
| | | | | | 7,260,157 |
| | | | | | |
South Korea — 5.9% | | | | | |
Industrials — 4.0% | | | | | |
Doosan | | 6,534 | | | 903,955 |
KEPCO Engineering & Construction | | 14,709 | | | 716,972 |
Samsung C&T | | 16,172 | | | 1,379,497 |
Samsung Heavy Industries* | | 177,147 | | | 1,475,537 |
| | | | | | 4,475,961 |
| | | | | | |
Utilities — 1.9% | | | | | |
Korea Electric Power* | | 124,869 | | | 2,139,256 |
| | | | | | 6,615,217 |
Description | | Shares | | Fair Value |
Spain — 1.9% | | | | | |
Utilities — 1.9% | | | | | |
Endesa | | 94,729 | | $ | 2,075,095 |
| | | | | | |
United Kingdom — 2.3% | | | | | |
Industrials — 2.3% | | | | | |
Rolls-Royce Holdings* | | 362,213 | | | 2,571,747 |
| | | | | | |
United States — 59.8% | | | | | |
Energy — 5.3% | | | | | |
Centrus Energy, Cl A* | | 64,365 | | | 5,857,215 |
| | | | | | |
Industrials — 29.5% | | | | | |
Amentum Holdings* | | 12,062 | | | 293,709 |
BWX Technologies | | 18,803 | | | 2,460,373 |
Emerson Electric | | 17,823 | | | 2,363,330 |
Flowserve | | 27,005 | | | 1,647,845 |
Fluor* | | 39,505 | | | 2,217,416 |
GE Vernova* | | 10,347 | | | 3,457,140 |
Graham* | | 26,988 | | | 1,209,602 |
Honeywell International | | 11,571 | | | 2,695,233 |
Jacobs Solutions | | 12,547 | | | 1,772,013 |
Lockheed Martin | | 4,108 | | | 2,174,816 |
MasTec* | | 16,127 | | | 2,323,255 |
NuScale Power* | | 265,308 | | | 7,866,382 |
Quanta Services | | 6,737 | | | 2,321,031 |
| | | | | | 32,802,145 |
| | | | | | |
Information Technology — 1.2% | | | | | |
Mirion Technologies, Cl A* | | 80,480 | | | 1,357,698 |
| | | | | | |
Utilities — 23.8% | | | | | |
Constellation Energy | | 34,956 | | | 8,968,311 |
Dominion Energy | | 35,684 | | | 2,096,435 |
Duke Energy | | 17,815 | | | 2,085,246 |
Oklo, Cl A* | | 413,346 | | | 9,730,165 |
Vistra | | 23,381 | | | 3,737,219 |
| | | | | | 26,617,376 |
| | | | | | 66,634,434 |
Total Common Stock
(Cost $98,003,709) | | | | | 110,881,783 |
| | | | | | |
Total Investments — 99.5%
(Cost $98,003,709) | | | | $ | 110,881,783 |
Percentages are based on Net Assets of $111,418,935.
Cl — Class
As of November 30, 2024, all of the Fund’s investments were considered Level 1 of the fair value hierarchy, in accordance with the authoritative guidance on fair value measurements and disclosure under U.S. Generally Accepted Accounting Principles.
The accompanying notes are an integral part of the financial statements.
4
Range ETFs
Statements of Assets and Liabilities
November 30, 2024
| | Range
Global Coal
Index ETF | | Range
Global LNG
Ecosystem
Index ETF |
Assets: | | | | | | |
Investments, at Cost | | $ | 11,289,184 | | $ | 1,099,460 |
Investments, at Fair Value | | $ | 11,196,508 | | $ | 1,147,511 |
Cash and Cash Equivalents | | | 83,892 | | | 7,019 |
Dividends Receivable | | | 7,128 | | | 2,795 |
Reclaims Receivable | | | 3,913 | | | 415 |
Total Assets | | | 11,291,441 | | | 1,157,740 |
| | | | | | | |
Liabilities: | | | | | | |
Advisory Fees Payable | | | 7,825 | | | 496 |
Total Liabilities | | | 7,825 | | | 496 |
| | | | | | | |
Net Assets | | $ | 11,283,616 | | $ | 1,157,244 |
| | | | | | | |
Net Assets Consist of: | | | | | | |
Paid-in Capital | | $ | 11,253,853 | | $ | 1,093,472 |
Total Distributable Earnings (Accumulated Losses) | | | 29,763 | | | 63,772 |
Net Assets | | $ | 11,283,616 | | $ | 1,157,244 |
| | | | | | | |
Outstanding Shares of Beneficial Interest
(unlimited authorization — no par value) | | | 470,000 | | | 40,000 |
Net Asset Value, Offering and Redemption Price Per Share | | $ | 24.01 | | $ | 28.93 |
Amounts designated as “—” are $0 or have been rounded to $0.
The accompanying notes are an integral part of the financial statements.
5
Range ETFs
Statements of Assets and Liabilities
November 30, 2024
| | Range
Global
Offshore Oil
Services
Index ETF | | Range
Nuclear
Renaissance
Index ETF |
Assets: | | | | | | | |
Investments, at Cost | | $ | 2,662,320 | | | $ | 98,003,709 |
Foreign Currency, at Cost | | | 1,146 | | | | 3,068 |
Investments, at Fair Value | | $ | 2,172,808 | | | $ | 110,881,783 |
Cash and Cash Equivalents | | | 7,710 | | | | 473,830 |
Foreign Currency, at Value | | | 1,147 | | | | 3,072 |
Dividends Receivable | | | 26,241 | | | | 91,465 |
Reclaims Receivable | | | 36 | | | | 10,234 |
Receivable for Capital Shares Sold | | | — | | | | 2,961,373 |
Total Assets | | | 2,207,942 | | | | 114,421,757 |
| | | | | | | | |
Liabilities: | | | | | | | |
Advisory Fees Payable | | | 1,791 | | | | 58,218 |
Payable for Investment Securities Purchased | | | — | | | | 2,944,604 |
Total Liabilities | | | 1,791 | | | | 3,002,822 |
| | | | | | | | |
Net Assets | | $ | 2,206,151 | | | $ | 111,418,935 |
| | | | | | | | |
Net Assets Consist of: | | | | | | | |
Paid-in Capital | | $ | 2,462,914 | | | $ | 98,554,868 |
Total Distributable Earnings (Accumulated Losses) | | | (256,763 | ) | | | 12,864,067 |
Net Assets | | $ | 2,206,151 | | | $ | 111,418,935 |
| | | | | | | | |
Outstanding Shares of Beneficial Interest
(unlimited authorization — no par value) | | | 90,000 | | | | 2,410,000 |
Net Asset Value, Offering and Redemption Price Per Share | | $ | 24.51 | | | $ | 46.23 |
Amounts designated as “—” are $0 or have been rounded to $0.
The accompanying notes are an integral part of the financial statements.
6
Range ETFs
Statements of Operations
For the Period Ended November 30, 2024
| | Range
Global Coal
Index ETF† | | Range
Global LNG
Ecosystem
Index ETF† |
Investment Income: | | | | | | | | |
Dividend Income | | $ | 247,916 | | | $ | 13,651 | |
Interest Income | | | 1,233 | | | | 127 | |
Less: Foreign Taxes Withheld | | | (11,569 | ) | | | (638 | ) |
Total Investment Income | | | 237,580 | | | | 13,140 | |
| | | | | | | | | |
Expenses: | | | | | | | | |
Advisory Fees | | | 55,651 | | | | 3,086 | |
Total Expenses | | | 55,651 | | | | 3,086 | |
Net Investment Income (Loss) | | | 181,929 | | | | 10,054 | |
| | | | | | | | | |
Net Realized Gain (Loss) on: | | | | | | | | |
Investments(1) | | | (59,219 | ) | | | 5,035 | |
Foreign Currency Transactions | | | (269 | ) | | | 648 | |
Net Realized Gain (Loss) | | | (59,488 | ) | | | 5,683 | |
| | | | | | | | | |
Net Change in Unrealized Appreciation (Depreciation) on: | | | | | | | | |
Investments | | | (92,676 | ) | | | 48,051 | |
Foreign Currency Translations | | | (2 | ) | | | (16 | ) |
Net Unrealized Appreciation (Depreciation) | | | (92,678 | ) | | | 48,035 | |
| | | | | | | | | |
Net Realized and Unrealized Gain (Loss) | | | (152,166 | ) | | | 53,718 | |
| | | | | | | | | |
Net Increase (Decrease) in Net Assets Resulting from Operations | | $ | 29,763 | | | $ | 63,772 | |
Amounts designated as “—” are $0 or have been rounded to $0.
The accompanying notes are an integral part of the financial statements.
7
Range ETFs
Statements of Operations
For the Period Ended November 30, 2024
| | Range
Global
Offshore Oil
Services
Index ETF† | | Range
Nuclear
Renaissance
Index ETF† |
Investment Income: | | | | | | | | |
Dividend Income | | $ | 179,367 | | | $ | 186,503 | |
Interest Income | | | 2,261 | | | | 2,109 | |
Less: Foreign Taxes Withheld | | | (19,113 | ) | | | (13,118 | ) |
Total Investment Income | | | 162,515 | | | | 175,494 | |
| | | | | | | | | |
Expenses: | | | | | | | | |
Advisory Fees | | | 50,928 | | | | 130,011 | |
Total Expenses | | | 50,928 | | | | 130,011 | |
Net Investment Income (Loss) | | | 111,587 | | | | 45,483 | |
| | | | | | | | | |
Net Realized Gain (Loss) on: | | | | | | | | |
Investments(1) | | | (138,179 | ) | | | 859,353 | |
Foreign Currency Transactions | | | (7,289 | ) | | | (6,619 | ) |
Net Realized Gain (Loss) | | | (145,468 | ) | | | 852,734 | |
| | | | | | | | | |
Net Change in Unrealized Appreciation (Depreciation) on: | | | | | | | | |
Investments | | | (489,512 | ) | | | 12,878,074 | |
Foreign Currency Translations | | | 99 | | | | (567 | ) |
Net Unrealized Appreciation (Depreciation) | | | (489,413 | ) | | | 12,877,507 | |
| | | | | | | | | |
Net Realized and Unrealized Gain (Loss) | | | (634,881 | ) | | | 13,730,241 | |
| | | | | | | | | |
Net Increase (Decrease) in Net Assets Resulting from Operations | | $ | (523,294 | ) | | $ | 13,775,724 | |
Amounts designated as “—” are $0 or have been rounded to $0.
The accompanying notes are an integral part of the financial statements.
8
Range ETFs
Statements of Changes in Net Assets
| | Range
Global Coal
Index ETF | | Range
Global LNG
Ecosystem
Index ETF |
| | | Period Ended
November 30,
2024† | | Period Ended
November 30,
2024† |
Operations: | | | | | | | |
Net Investment Income (Loss) | | $ | 181,929 | | | $ | 10,054 |
Net Realized Gain (Loss)(1) | | | (59,488 | ) | | | 5,683 |
Net Change in Unrealized Appreciation (Depreciation) | | | (92,678 | ) | | | 48,035 |
Net Increase (Decrease) in Net Assets Resulting from Operations | | | 29,763 | | | | 63,772 |
| | | | | | | | |
Capital Share Transactions: | | | | | | | |
Issued | | | 11,253,853 | | | | 1,093,472 |
Increase (Decrease) in Net Assets from Capital Share Transactions | | | 11,253,853 | | | | 1,093,472 |
| | | | | | | | |
Total Increase (Decrease) in Net Assets | | | 11,283,616 | | | | 1,157,244 |
| | | | | | | | |
Net Assets: | | | | | | | |
Beginning of Period | | | — | | | | — |
End of Period | | $ | 11,283,616 | | | $ | 1,157,244 |
| | | | | | | | |
Share Transactions: | | | | | | | |
Issued | | | 470,000 | | | | 40,000 |
Net Increase (Decrease) in Shares Outstanding from Share Transactions | | | 470,000 | | | | 40,000 |
The accompanying notes are an integral part of the financial statements.
9
Range ETFs
Statements of Changes in Net Assets
| | Range
Global
Offshore Oil
Services
Index ETF | | Range
Nuclear
Renaissance
Index ETF |
| | | Period Ended
November 30,
2024† | | Period Ended
November 30,
2024† |
Operations: | | | | | | | | |
Net Investment Income (Loss) | | $ | 111,587 | | | $ | 45,483 | |
Net Realized Gain (Loss)(1) | | | (145,468 | ) | | | 852,734 | |
Net Change in Unrealized Appreciation (Depreciation) | | | (489,413 | ) | | | 12,877,507 | |
Net Increase (Decrease) in Net Assets Resulting from Operations | | | (523,294 | ) | | | 13,775,724 | |
| | | | | | | | | |
Capital Share Transactions: | | | | | | | | |
Issued | | | 16,389,657 | | | | 103,739,214 | |
Redeemed | | | (13,660,212 | ) | | | (6,096,003 | ) |
Increase (Decrease) in Net Assets from Capital Share Transactions | | | 2,729,445 | | | | 97,643,211 | |
| | | | | | | | | |
Total Increase (Decrease) in Net Assets | | | 2,206,151 | | | | 111,418,935 | |
| | | | | | | | | |
Net Assets: | | | | | | | | |
Beginning of Period | | | — | | | | — | |
End of Period | | $ | 2,206,151 | | | $ | 111,418,935 | |
| | | | | | | | | |
Share Transactions: | | | | | | | | |
Issued | | | 610,000 | | | | 2,590,000 | |
Redeemed | | | (520,000 | ) | | | (180,000 | ) |
Net Increase (Decrease) in Shares Outstanding from Share Transactions | | | 90,000 | | | | 2,410,000 | |
The accompanying notes are an integral part of the financial statements.
10
Range ETFs
Range Global Coal Index ETF
Financial Highlights
Selected Per Share Data & Ratios
For a Share Outstanding Throughout the Period
| | Period Ended
November 30,
2024† |
Net Asset Value, beginning of period | | $ | 24.93 | |
Investment Activities | | | | |
Net investment income (loss)* | | | 0.55 | |
Net realized and unrealized gain (loss) | | | (1.47 | ) |
Total from investment activities | | | (0.92 | ) |
Net Asset Value, end of period | | $ | 24.01 | |
| | | | | |
Net Asset Value, Total Return (%)(1) | | | (3.69 | ) |
Ratios to Average Net Assets | | | | |
Expenses (%) | | | 0.85 | (2) |
Net investment income (loss) (%) | | | 2.78 | (2) |
| | | | | |
Supplemental Data | | | | |
Net Assets end of period (000) | | $ | 11,284 | |
Portfolio turnover rate (%)(3) | | | 18 | |
The accompanying notes are an integral part of the financial statements.
11
Range ETFs
Range Global LNG Ecosystem Index ETF
Financial Highlights
Selected Per Share Data & Ratios
For a Share Outstanding Throughout the Period
| | Period Ended
November 30,
2024† |
Net Asset Value, beginning of period | | $ | 25.00 | |
Investment Activities | | | | |
Net investment income (loss)* | | | 0.63 | |
Net realized and unrealized gain (loss) | | | 3.30 | |
Total from investment activities | | | 3.93 | |
Net Asset Value, end of period | | $ | 28.93 | |
| | | | | |
Net Asset Value, Total Return (%)(1) | | | 15.72 | |
Ratios to Average Net Assets | | | | |
Expenses (%) | | | 0.85 | (2) |
Net investment income (loss) (%) | | | 2.77 | (2) |
| | | | | |
Supplemental Data | | | | |
Net Assets end of period (000) | | $ | 1,157 | |
Portfolio turnover rate (%)(3) | | | 13 | |
The accompanying notes are an integral part of the financial statements.
12
Range ETFs
Range Global Offshore Oil Services Index ETF
Financial Highlights
Selected Per Share Data & Ratios
For a Share Outstanding Throughout the Period
| | Period Ended
November 30,
2024† |
Net Asset Value, beginning of period | | $ | 25.15 | |
Investment Activities | | | | |
Net investment income (loss)* | | | 0.43 | |
Net realized and unrealized gain (loss) | | | (1.07 | ) |
Total from investment activities | | | (0.64 | ) |
Net Asset Value, end of period | | $ | 24.51 | |
| | | | | |
Net Asset Value, Total Return (%)(1) | | | (2.54 | ) |
Ratios to Average Net Assets | | | | |
Expenses (%) | | | 0.85 | (2) |
Net investment income (loss) (%) | | | 1.86 | (2) |
| | | | | |
Supplemental Data | | | | |
Net Assets end of period (000) | | $ | 2,206 | |
Portfolio turnover rate (%)(3) | | | 28 | |
The accompanying notes are an integral part of the financial statements.
13
Range ETFs
Range Nuclear Renaissance Index ETF
Financial Highlights
Selected Per Share Data & Ratios
For a Share Outstanding Throughout the Period
| | Period Ended
November 30,
2024† |
Net Asset Value, beginning of period | | $ | 25.12 | |
Investment Activities | | | | |
Net investment income (loss)* | | | 0.10 | |
Net realized and unrealized gain (loss) | | | 21.01 | |
Total from investment activities | | | 21.11 | |
Net Asset Value, end of period | | $ | 46.23 | |
| | | | | |
Net Asset Value, Total Return (%)(1) | | | 84.04 | |
Ratios to Average Net Assets | | | | |
Expenses (%) | | | 0.85 | (2) |
Net investment income (loss) (%) | | | 0.30 | (2) |
| | | | | |
Supplemental Data | | | | |
Net Assets end of period (000) | | $ | 111,419 | |
Portfolio turnover rate (%)(3) | | | 13 | |
The accompanying notes are an integral part of the financial statements.
14
Range ETFs
Notes to Financial Statements
November 30, 2024
1. ORGANIZATION
Exchange Traded Concepts Trust (the “Trust”) is a Delaware statutory trust formed on July 17, 2009. The Trust is registered with the Securities and Exchange Commission (the “Commission) under the Investment Company Act of 1940 (the “1940 Act”) as an open-end management investment company with multiple investment portfolios. The financial statements herein are those of the Range Global Coal Index ETF, Range Global LNG Ecosystem Index ETF, Range Global Offshore Oil Services Index ETF and Range Nuclear Renaissance Index ETF (each a “Fund”, and together the “Funds”). The Range Global Coal Index ETF seeks to provide investment results that, before fees and expenses, correspond generally to the total return performance of the Range Global Coal Index. The Range Global LNG Ecosystem Index ETF seeks to provide investment results that, before fees and expenses, correspond generally to the total return performance of the Range Global LNG Ecosystem Index. The Range Global Offshore Oil Services Index ETF seeks to provide investment results that, before fees and expenses, correspond generally to the total return performance of the Range Global Offshore Oil Services Index. The Range Nuclear Renaissance Index ETF seeks to provide investment results that, before fees and expenses, correspond generally to the total return performance of the Range Nuclear Renaissance Index. Exchange Traded Concepts, LLC (the “Adviser”), an Oklahoma limited liability company, serves as the investment adviser for each Fund. Each Fund is classified as “non-diversified” under the 1940 Act (see “Non-Diversification Risk” under Note 6). The Funds commenced operations on January 23, 2024.
Shares of the Funds are listed and traded on the NYSE Arca, Inc. (the “Exchange”). Market prices for shares of a Fund may be different from their net asset value (“NAV”). The Funds issue and redeem shares on a continuous basis to certain institutional investors (typically market makers or other broker-dealers) at NAV only in large blocks of shares called “Creation Units.” Creation Units are available for purchase and redemption on each business day and are offered and redeemed on an in-kind basis, together with a specified cash amount, or for an all cash amount. Once created, shares trade in a secondary market at market prices that change throughout the day in share amounts less than a Creation Unit.
2. SIGNIFICANT ACCOUNTING POLICIES
The following significant accounting policies, which are consistently followed in the preparation of the financial statements of the Trust, are in conformity with accounting principles generally accepted in the United States of America (“U.S. GAAP”) for investment companies. The accompanying financial statements have been prepared in accordance with U.S. GAAP on the accrual basis of accounting. Management has reviewed Financial Accounting Standards Board (“FASB”) Accounting Standards Codification (“ASC”) Topic 946, Financial Services — Investment Companies (“ASC 946”), and concluded that the Funds meet the criteria of an “investment company,” and therefore, the Funds prepare their financial statements in accordance with investment company accounting as outlined in ASC 946.
Use of Estimates and Indemnifications — Each Fund is an investment company in conformity with U.S. GAAP. Therefore, the Funds follow the accounting and reporting guidelines for investment companies. The preparation of financial statements in conformity with U.S. GAAP requires management to make estimates and assumptions that affect the reported amounts of assets and liabilities and disclosure of contingent assets and liabilities at the date of the financial statements and the reported amounts of increases and decreases in net assets from operations during the reporting period. Actual results could differ from those estimates.
In the normal course of business, the Trust, on behalf of the Funds, enters into contracts that contain a variety of representations which provide general indemnifications. Each Fund’s maximum exposure under these arrangements cannot be known; however, the Funds expect any risk of loss to be remote.
Security Valuation — The Funds record their investments at fair value. Securities listed on a securities exchange, market or automated quotation system for which quotations are readily available (except for securities traded on the NASDAQ Stock Market (“NASDAQ”), including securities traded over the counter, are valued at the last quoted sale price on the primary exchange or market (foreign or domestic) on which they are traded (or at approximately 4:00 pm Eastern Time if a security’s primary exchange is normally open at that time), or, if there is no such reported sale, at the most recent quoted bid price for long positions and at the most recent quoted ask price
15
Range ETFs
Notes to Financial Statements
November 30, 2024 (Continued)
2. SIGNIFICANT ACCOUNTING POLICIES (continued)
for short positions. For securities traded on NASDAQ, the NASDAQ Official Closing Price will be used. If available, debt securities are priced based upon valuations provided by independent, third-party pricing agents. Such values generally reflect the last reported sales price if the security is actively traded.
The third-party pricing agents may also value debt securities at an evaluated bid price by employing methodologies that utilize actual market transactions, broker-supplied valuations, or other methodologies designed to identify the fair value for such securities. Debt obligations with remaining maturities of sixty days or less when acquired will be valued at their market value. If a market value is not available from a pricing vendor or from an independent broker, the security shall be fair valued according to the Trust’s fair value procedures. Prices for most securities held in the Funds are provided daily by recognized independent pricing agents. If a security price cannot be obtained from an independent, third-party pricing agent, the Funds seek to obtain a bid price from at least one independent broker.
Rule 2a-5 under the 1940 Act, establishes requirements to determine fair value in good faith for purposes of the 1940 Act. The rule permits fund boards to designate a fund’s investment adviser to perform fair-value determinations, subject to board oversight and certain other conditions. The rule also defines when market quotations are “readily available” for purposes of the 1940 Act and requires a fund to fair value a portfolio investment when a market quotation is not readily available.
Pursuant to the requirements of Rule 2a-5, the Trust’s Board of Trustees (the “Board”) (i) has designated the Adviser as the Board’s valuation designee to perform fair-value determinations for a Fund through the Adviser’s Valuation Committee and (ii) approved the Adviser’s Valuation Procedures.
Some of the more common reasons that may necessitate that a security be valued using fair value procedures include: the security’s trading has been halted or suspended; the security has been de-listed from a national exchange; the security’s primary trading market is temporarily closed at a time, when under normal conditions, it would be open; the security has not been traded for an extended period of time; the security’s primary pricing source is not able or willing to provide a price; or trading of the security is subject to local government-imposed restrictions. In addition, a Fund may fair value its securities if an event that may materially affect the value of the Fund’s securities that traded outside of the United States (a ‘‘Significant Event’’) has occurred between the time of the security’s last close and the time that the Fund calculates its NAV. A Significant Event may relate to a single issuer or to an entire market sector. Events that may be Significant Events include, but are not limited to, government actions, natural disasters, armed conflict, acts of terrorism and significant market fluctuations. If the Adviser becomes aware of a Significant Event that has occurred with respect to a security or group of securities after the closing of the exchange or market on which the security or securities principally trade, but before the time at which the Fund calculates its NAV, it may request that a Committee meeting be called. When a security is valued in accordance with the fair value procedures, the Committee will determine the value after taking into consideration relevant information reasonably available to the Committee.
In accordance with the authoritative guidance on fair value measurements and disclosure under U.S. GAAP, the Funds disclose fair value of its investments in a hierarchy that prioritizes the inputs to valuation techniques used to measure the fair value. The objective of a fair value measurement is to determine the price that would be received to sell an asset, or paid to transfer a liability, in an orderly transaction between market participants at the measurement date (an exit price). Accordingly, the fair value hierarchy gives the highest priority to quoted prices (unadjusted) in active markets for identical assets or liabilities (Level 1) and the lowest priority to unobservable inputs (Level 3).
The three levels of the fair value hierarchy are described below:
• Level 1 — Unadjusted quoted prices in active markets for identical, unrestricted assets or liabilities that the Funds have the ability to access at the measurement date;
• Level 2 — Quoted prices which are not active, or inputs that are observable (either directly or indirectly) for substantially the full term of the asset or liability; and
• Level 3 — Prices, inputs or exotic modeling techniques which are both significant to the fair value measurement and unobservable (supported by little or no market activity).
16
Range ETFs
Notes to Financial Statements
November 30, 2024 (Continued)
2. SIGNIFICANT ACCOUNTING POLICIES (continued)
The valuation techniques used by the Funds to measure fair value during the period ended November 30, 2024 maximized the use of observable inputs and minimized the use of unobservable inputs. Investments are classified within the level of the lowest significant input considered in determining fair value.
Federal Income Taxes — It is each Fund’s intention to qualify as a regulated investment company for Federal income tax purposes by complying with the appropriate provisions of Subchapter M of the Internal Revenue Code of 1986, as amended. Accordingly, no provisions for Federal income taxes have been made in the financial statements.
The Funds’ policy is to classify interest and penalties associated with underpayment of federal and state income taxes, if any, as income tax expense on their Statements of Operations. As of and during the period ended November 30, 2024, the Funds did not have any interest or penalties associated with the underpayment of any income taxes. Current tax years remain open and subject to examination by tax jurisdictions. The Funds have reviewed all major jurisdictions and concluded that there is no impact on the Funds’ net assets and no tax liability resulting from unrecognized tax benefits relating to uncertain income tax positions taken or expected to be taken on its tax returns.
Foreign Taxes — The Funds may be subject to taxes imposed by countries in which it invests. Such taxes are generally based on either income or gains earned or repatriated. The Funds accrue and apply such taxes to net investment income, net realized gains and net unrealized gains as income and/or capital gains earned.
Security Transactions and Investment Income — Security transactions are accounted for on trade date. Costs used in determining realized gains and losses on the sale of investment securities are based on specific identification. Dividend income is recorded on the ex-dividend date. Interest income is recognized on the accrual basis. Withholding taxes and reclaims on foreign dividends, if any, have been provided for in accordance with the Funds’ understanding of the applicable country’s tax rules and rates.
Foreign Currency Translation — The books and records of the Funds are maintained in U.S. dollars. Investment securities and other assets and liabilities denominated in a foreign currency are translated into U.S. dollars on the date of valuation. Purchases and sales of investment securities, income and expenses are translated into U.S. dollars at the relevant rates of exchange prevailing on the respective dates of such transactions. The Funds do not isolate that portion of realized or unrealized gains and losses resulting from changes in the foreign exchange rate from fluctuations arising from changes in the market prices of the securities. These gains and losses are included in net realized and unrealized gains and losses on investments on the Statements of Operations. Net realized and unrealized gains and losses on foreign currency transactions represent net foreign exchange gains or losses from foreign currency exchange contracts, disposition of foreign currencies, currency gains or losses realized between trade and settlement dates on securities transactions and the difference between the amount of the investment income and foreign withholding taxes recorded on the Funds’ books and the U.S. dollar equivalent amounts actually received or paid. The Funds may be subject to foreign taxes related to foreign income received, capital gain on the sale of securities and certain foreign currency transactions (a portion of which may be reclaimable). All foreign taxes are recorded in accordance with the applicable regulations and rates that exist in the foreign jurisdictions in which the Funds invest.
Cash and Cash Equivalents — Idle cash may be swept into various overnight demand deposits and is classified as Cash and Cash equivalents on the Statements of Assets and Liabilities, if any. The Funds maintain cash in bank deposit accounts which, at times, may exceed United States federally insured limits. Amounts swept overnight are available on the next business day.
Dividends and Distributions to Shareholders — Each Fund pays out dividends from its net investment income and distributes its net capital gains, if any, to investors at least annually. All distributions are recorded on ex-dividend date.
17
Range ETFs
Notes to Financial Statements
November 30, 2024 (Continued)
2. SIGNIFICANT ACCOUNTING POLICIES (concluded)
Creation Units — The Funds issue and redeem shares at NAV and only in Creation Units, or multiples thereof. Purchasers of Creation Units (“Authorized Participants”) at NAV must pay a standard creation transaction fee, regardless of the number of Creation Units created in a given transaction. An Authorized Participant who holds Creation Units and wishes to redeem at NAV would also pay a standard minimum redemption transaction fee to the custodian on the date of such redemption, regardless of the number of Creation Units redeemed in a given transaction. The Funds may charge, either in lieu of or in addition to the fixed creation transaction fee, a variable fee for creations and redemptions in order to cover certain non-standard brokerage, tax, foreign exchange, execution, market impact and other costs and expenses related to the execution of trades resulting from such transactions. In all cases, such fees will be limited in accordance with the requirements of the Commission applicable to management investment companies offering redeemable securities.
The Adviser may retain all or a portion of the transaction fee to the extent the Adviser bears the expenses that otherwise would be borne by the Trust in connection with the purchase or redemption of a Creation Unit, which the transaction fee is designed to cover.
Except when aggregated in Creation Units, shares are not redeemable securities of the Funds. Shares of the Funds may only be purchased or redeemed by certain Authorized Participants. An Authorized Participant is either (i) a broker-dealer or other participant in the clearing process through the Continuous Net Settlement System of the National Securities Clearing Corporation or (ii) a Depository Trust Company (“DTC”) participant and, in each case, must have executed an Authorized Participant Agreement with the Funds’ distributor. Most retail investors will not qualify as Authorized Participants or have the resources to buy and sell whole Creation Units. Therefore, they will be unable to purchase or redeem the shares directly from the Funds. Rather, most retail investors will purchase and sell shares in the secondary market with the assistance of a broker and will be subject to customary brokerage commissions or fees.
To the extent contemplated by an Authorized Participant Agreement, in the event an Authorized Participant has submitted a redemption request in proper form but is unable to transfer all or part of the shares comprising a Creation Unit to be redeemed to SEI Investments Distribution Co. (the “Distributor”), on behalf of the Fund, by the time as set forth in the Authorized Participant Agreement, the Distributor may nonetheless accept the redemption request in reliance on the undertaking by the Authorized Participant to deliver the missing shares as soon as possible, which undertaking shall be secured by the Authorized Participant’s delivery and maintenance of collateral equal to a percentage of the value of the missing shares as specified in the Authorized Participant Agreement. An Authorized Participant Agreement may permit a Fund to use such collateral to purchase the missing shares, and could subject an Authorized Participant to liability for any shortfall between the cost of a Fund acquiring such shares and the value of the collateral. Amounts are disclosed as Segregated Cash Balance from Authorized Participants for Deposit Securities and Collateral Payable upon Return of Deposit Securities on the Statements of Assets and Liabilities, when applicable.
3. SERVICE PROVIDERS
Investment Advisory and Administrative Services
The Adviser is an Oklahoma limited liability company located at 10900 Hefner Pointe Drive, Suite 400, Oklahoma City, Oklahoma 73120, its principal place of business, and 295 Madison Avenue, New York, New York 10017. The Adviser serves as the investment adviser to each Fund pursuant to an investment advisory agreement with the Trust (the “Advisory Agreement”). Under the Advisory Agreement, the Adviser provides investment advisory services to the Funds and is responsible for the day-to-day management of the Funds, including, among other things, implementing changes to each Fund’s portfolio in connection with any rebalancing or reconstitution of an Index, trading portfolio securities on behalf of each Fund, and selecting broker-dealers to execute purchase and sale transactions, subject to the oversight of the Board. For the services it provides to the Funds, the Adviser receives a fee, which is calculated daily and paid monthly, at an annual rate of 0.85% of the average daily net assets of each Fund.
18
Range ETFs
Notes to Financial Statements
November 30, 2024 (Continued)
3. SERVICE PROVIDERS (concluded)
ETC Platform Services, LLC (“ETC Platform Services”), a direct wholly owned subsidiary of the Adviser, administers each Funds’ business affairs and provides office facilities and equipment, certain clerical, bookkeeping and administrative services, paying agent services under the Funds’ unitary fee arrangement, as described below, and its officers and employees to serve as officers or Trustees of the Trust. ETC Platform Services also arranges for transfer agency, custody, fund administration and accounting, and other non-distribution related services necessary for the Funds to operate. For the services it provides to the Funds, ETC Platform Services is paid a fee calculated daily and paid monthly based on a percentage of each Fund’s average daily net assets.
Under the Advisory Agreement, the Adviser has agreed to pay all expenses incurred by the Funds (including the fee charged by ETC Platform Services), except for the advisory fee, interest, taxes, brokerage commissions and other expenses incurred in placing orders for the purchase and sale of securities and other investment instruments, acquired fund fees and expenses, accrued deferred tax liability, extraordinary expenses, and distribution fees and expenses paid by the Funds under any distribution plan adopted pursuant to Rule 12b-1 under the 1940 Act (“Excluded Expenses”).
Range Fund Holdings, LLC is the sponsor of each Fund’s Index and each Fund (the “Sponsor”). In connection with an arrangement between the Adviser and the Sponsor, the Sponsor has agreed to assume the obligation of the Adviser to pay all expenses of the Funds (except Excluded Expenses) and, to the extent applicable, pay the Adviser a minimum fee. For its services, the Sponsor is entitled to a fee from the Adviser, which is calculated daily and paid monthly, based on a percentage of the average daily net assets of each Fund. The Sponsor does not make investment decisions, provide investment advice, or otherwise act in the capacity of an investment adviser to any Fund.
A Trustee and certain officers of the Trust are affiliated with the Adviser and receive no compensation from the Trust for serving as officers and/or Trustee.
Distribution Arrangement
The Distributor serves as the underwriter and distributor of each Fund’s shares pursuant to a distribution agreement (the “Distribution Agreement”). Under the Distribution Agreement, the Distributor, as agent, receives orders to purchase shares in Creation Units and transmits such orders to the Funds’ custodian and transfer agent. The Distributor has no obligation to sell any specific quantity of a Fund’s shares. The Distributor bears the following costs and expenses relating to the distribution of shares: (i) the expenses of maintaining its registration or qualification as a dealer or broker under federal or state laws; (ii) filing fees; and (iii) all other expenses incurred in connection with the distribution services, that are not reimbursed by the Adviser, as contemplated in the Distribution Agreement. The Distributor does not maintain any secondary market in any Fund’s shares.
The Funds have adopted a Distribution and Service Plan (the “Plan”) pursuant to Rule 12b-1 under the 1940 Act. In accordance with the Plan, the Funds are authorized to pay an amount up to 0.25% of its average daily net assets each year for certain distribution-related activities. For the period ended November 30, 2024, no fees were charged by the Distributor under the Plan and the Plan will only be implemented with approval of the Board.
Administrator, Custodian and Transfer Agent
SEI Investments Global Funds Services serves as the Funds’ administrator pursuant to an administration agreement. Brown Brothers Harriman & Co. serves as the Funds’ custodian and transfer agent pursuant to a custodian agreement and transfer agency services agreement. The Adviser pays these fees.
An officer of the Trust is affiliated with the administrator and receives no compensation from the Trust for serving as an officer.
19
Range ETFs
Notes to Financial Statements
November 30, 2024 (Continued)
4. INVESTMENT TRANSACTIONS
For the period ended November 30, 2024, the purchases and sales of investments in securities, excluding in-kind transactions, long-term U.S. Government and short-term securities were:
| | Purchases | | Sales and
Maturities |
Range Global Coal Index ETF | | $ | 1,873,765 | | $ | 1,399,748 |
Range Global LNG Ecosystem Index ETF | | | 368,150 | | | 58,072 |
Range Global Offshore Oil Services Index ETF | | | 2,212,781 | | | 2,020,046 |
Range Nuclear Renaissance Index ETF | | | 11,708,868 | | | 3,092,593 |
For the period ended November 30, 2024, there were no purchases of long-term U.S. Government securities by the Funds.
For the period ended November 30, 2024, in-kind transactions associated with creations and redemptions were:
| | Purchases | | Sales | | Net Realized
Gain (Loss) |
Range Global Coal Index ETF | | $ | 10,874,413 | | $ | — | | $ | — | |
Range Global LNG Ecosystem Index ETF | | | 784,397 | | | — | | | — | |
Range Global Offshore Oil Services Index ETF | | | 14,919,425 | | | 12,311,435 | | | (266,531 | ) |
Range Nuclear Renaissance Index ETF | | | 94,239,225 | | | 5,711,048 | | | 911,657 | |
5. TAX INFORMATION
The amount and character of income and capital gain distributions to be paid, if any, are determined in accordance with Federal income tax regulations, which may differ from U.S. GAAP. As a result, net investment income (loss) and net realized gain (loss) on investment transactions for a reporting period may differ significantly from distributions during such period. These book/tax differences may be temporary or permanent. To the extent these differences are permanent in nature, they are charged or credited to paid-in capital or total distributable earnings (accumulated losses) as appropriate, in the period that the differences arise.
At November 30, 2024, the Fund reclassified the following permanent amount between paid-in capital and distributable earnings (accumulated losses), the reclassification is primarily related to in-kind redemptions:
| | Paid-in
Capital | | Distributable
Earnings
(Accumulated
Losses) |
Range Global Coal Index ETF | | $ | — | | | $ | — | |
Range Global LNG Ecosystem Index ETF | | | — | | | | — | |
Range Global Offshore Oil Services Index ETF | | | (266,531 | ) | | | 266,531 | |
Range Nuclear Renaissance Index ETF | | | 911,657 | | | | (911,657 | ) |
As of November 30, 2024, the components of Distributable Earnings (Accumulated Losses) on a tax basis were as follows:
| | Range Global
Coal Index ETF | | Range Global
LNG Ecosystem
Index ETF | | Range Global
Offshore Oil
Services Index
ETF | | Range Nuclear
Renaissance
Index ETF |
Undistributed Ordinary Income | | $ | 131,480 | | | $ | 15,769 | | $ | 232,972 | | | $ | 65,114 |
Capital Loss Carryforwards | | | (16,965 | ) | | | — | | | — | | | | — |
Unrealized Appreciation (Depreciation) | | | (84,753 | ) | | | 48,002 | | | (489,734 | ) | | | 12,798,953 |
Other Temporary Differences | | | 1 | | | | 1 | | | (1 | ) | | | — |
Total Distributable Earnings (Accumulated Losses) | | $ | 29,763 | | | $ | 63,772 | | $ | (256,763 | ) | | $ | 12,864,067 |
20
Range ETFs
Notes to Financial Statements
November 30, 2024 (Continued)
5. TAX INFORMATION (concluded)
The Funds are permitted to utilize capital losses that are carried forward and will retain their character as either short-term or long-term capital losses. As of November 30, 2024, the following Fund had capital loss carryforwards to offset capital gains for an unlimited period:
| | Non-Expiring
Short-Term | | Non-Expiring
Long-Term | | Total
Capital Loss
Carryforwards |
Range Global Coal Index ETF | | $ | 16,965 | | $ | — | | $ | 16,965 |
The Federal tax cost and aggregate gross unrealized appreciation and depreciation on investments held by the Funds at November 30, 2024, were as follows:
| | Federal Tax
Cost | | Aggregated
Gross
Unrealized
Appreciation | | Aggregated
Gross
Unrealized
Depreciation | | Net
Unrealized
Appreciation
(Depreciation) |
Range Global Coal Index ETF | | $ | 11,281,259 | | $ | 739,642 | | $ | (824,395 | ) | | $ | (84,753 | ) |
Range Global LNG Ecosystem Index ETF | | | 1,099,493 | | | 92,053 | | | (44,051 | ) | | | 48,002 | |
Range Global Offshore Oil Services Index ETF | | | 2,662,641 | | | 121,813 | | | (611,547 | ) | | | (489,734 | ) |
Range Nuclear Renaissance Index ETF | | | 98,082,316 | | | 13,598,924 | | | (799,971 | ) | | | 12,798,953 | |
6. PRINCIPAL RISKS OF INVESTING IN THE FUNDS
As with all exchange traded funds (“ETFs”), each shareholder of a Fund is subject to the risk that his or her investment could lose money. The Funds are subject to the principal risks noted below, any of which may adversely affect a Fund’s NAV, trading price, yield, total return and ability to meet its investment objective. Risk information is applicable to each Fund unless otherwise noted. Additional principal risks are disclosed in the Funds’ prospectus. Please refer to the Funds’ prospectus for a complete description of the principal risks of investing in a Fund.
Currency Exchange Rate Risk. Changes in currency exchange rates and the relative value of non-U.S. currencies will affect the value of a Fund’s investments and the value of your shares. Because each Fund’s NAV is determined on the basis of U.S. dollars, the U.S. dollar value of your investment in a Fund may go down if the value of the local currency of the non-U.S. markets in which that Fund invests depreciates against the U.S. dollar. This is true even if the local currency value of securities in a Fund’s holdings goes up. Conversely, the dollar value of your investment in a Fund may go up if the value of the local currency appreciates against the U.S. dollar. The value of the U.S. dollar measured against other currencies is influenced by a variety of factors. These factors include: national debt levels and trade deficits, changes in balances of payments and trade, domestic and foreign interest and inflation rates, global or regional political, economic or financial events, monetary policies of governments, actual or potential government intervention, and global energy prices. Political instability, the possibility of government intervention and restrictive or opaque business and investment policies may also reduce the value of a country’s currency. Government monetary policies and the buying or selling of currency by a country’s government may also influence exchange rates. Currency exchange rates can be very volatile and can change quickly and unpredictably. As a result, the value of an investment in a Fund may change quickly and without warning, and you may lose money.
Emerging Markets Securities Risk. Emerging markets are subject to greater market volatility, lower trading volume, political and economic instability, uncertainty regarding the existence of trading markets and more governmental limitations on foreign investment than more developed markets. In addition, securities in emerging markets may be subject to greater price fluctuations than securities in more developed markets. Differences in regulatory,
21
Range ETFs
Notes to Financial Statements
November 30, 2024 (Continued)
6. PRINCIPAL RISKS OF INVESTING IN THE FUNDS (continued)
accounting, auditing, and financial reporting and recordkeeping standards could impede the Adviser’s ability to evaluate local companies and impact a Fund’s performance. Investments in securities of issuers in emerging markets may also be exposed to risks related to a lack of liquidity, greater potential for market manipulation, issuers’ limited reliable access to capital, and foreign investment structures. Additionally, a Fund may have limited rights and remedies available to it to pursue claims against issuers in emerging markets.
Foreign Securities Risk. Investments in non-U.S. securities involve certain risks that may not be present with investments in U.S. securities. For example, investments in non-U.S. securities may be subject to risk of loss due to foreign currency fluctuations or to political or economic instability. There may be less information publicly available about a non-U.S. issuer than a U.S. issuer. Non-U.S. issuers may be subject to inconsistent and potentially less stringent accounting, auditing, financial reporting and investor protection standards than U.S. issuers. Investments in non-U.S. securities may be subject to withholding or other taxes and may be subject to additional trading, settlement, custodial, and operational risks. With respect to certain countries, there is the possibility of government intervention and expropriation or nationalization of assets. Because legal systems differ, there is also the possibility that it will be difficult to obtain or enforce legal judgments in certain countries. Because foreign exchanges may be open on days when a Fund does not price its shares, the value of the securities investments in a Fund more volatile and potentially less liquid than other types of investments. These factors can also cause the Fund’s shares to trade at a premium or discount to NAV.
Industry Concentration Risk. Because each Fund’s assets will be concentrated in an industry or group of industries to the extent the Fund’s Index concentrates in a particular industry or group of industries, the Funds are subject to loss due to adverse occurrences that may affect that industry or group of industries. To the extent a Fund concentrates in the securities of issuers in a particular industry, that Fund may face more risks than if it were diversified more broadly over numerous industries. Such industry-based risks, any of which may adversely affect a Fund may include, but are not limited to, the following: general economic conditions or cyclical market patterns that could negatively affect supply and demand in a particular industry; competition for resources, adverse labor relations, political or world events; obsolescence of technologies; and increased competition or new product introductions that may affect the profitability or viability of companies in an industry. In addition, at times, an industry may be out of favor and underperform other industries or the market as a whole.
Sector Focus Risk. A Fund may invest a significant portion of its assets in one or more sectors and thus will be more susceptible to the risks affecting those sectors. While each Fund’s sector exposure is expected to vary over time based on the composition of its Index, each Fund anticipates that it may be subject to some or all of the risks described below.
Energy Sector Risk. The market value of securities in the energy sector may decline for many reasons including, fluctuations in energy prices and supply and demand of energy fuels caused by geopolitical events, the success of exploration projects, weather or meteorological events, taxes, increased governmental or environmental regulation, resource depletion, rising interest rates, declines in domestic or foreign production, accidents or catastrophic events that result in injury, loss of life or property, pollution or other environmental damage claims, terrorist threats or attacks, among others. Markets for various energy-related commodities can have significant volatility and are subject to control or manipulation by large producers or purchasers. Companies in the energy sector may need to make substantial expenditures, and may incur significant amounts of debt, to maintain or expand their reserves through exploration of new sources of supply, through the development of existing sources, through acquisitions, or through long-term contracts to acquire reserves. Factors adversely affecting producers, refiners, distributors, or others in the energy sector may adversely affect companies that service or supply those entities, either because demand for those services or products is curtailed, or those services or products come under price pressure. Issuers in the energy sector may also be impacted by changing investor and consumer preferences arising from the sector’s potential exposure to sustainability and environmental concerns.
22
Range ETFs
Notes to Financial Statements
November 30, 2024 (Continued)
6. PRINCIPAL RISKS OF INVESTING IN THE FUNDS (continued)
Industrials Sector Risk. Stock prices for industrials companies are affected by supply and demand both for their specific product or service and for industrials sector products in general. Government regulation, world events, exchange rates and economic conditions, technological developments and liabilities for environmental damage and general civil liabilities will likewise affect the performance of these companies.
Materials Sector Risk. Companies in the materials sector may be adversely impacted by the volatility of commodity prices, changes in exchange rates, depletion of resources, over-production, litigation and changes in government regulations, among other factors.
Utilities Sector Risk. The utilities sector is subject to significant government regulation and oversight. Deregulation, however, may subject utility companies to greater competition and may reduce their profitability. Companies in the utilities sector may be adversely affected due to increases in fuel and operating costs, rising costs of financing capital construction and the cost of complying with U.S. federal and state regulations, among other factors.
Risk of Investing in Nuclear Companies (NUKZ). The Fund will be sensitive to, and its performance will depend to a greater extent on, the overall condition of nuclear companies. Nuclear companies may face considerable risk as a result of, among other risks, incidents and accidents, breaches of security, ill-intentioned acts of terrorism, air crashes, natural disasters (such as floods or earthquakes), equipment malfunctions or mishandling in storage handling, transportation, treatment or conditioning of substances and nuclear materials. Such events could have serious consequences, especially in case of radioactive contamination and irradiation of the environment, for the general population, as well as a material, negative impact on the Fund’s portfolio companies and thus the Fund’s financial situation. In addition, nuclear companies are subject to competitive risk associated with the prices of other energy sources, such as natural gas and oil. Consumers of nuclear energy may have the ability to switch between nuclear energy and other energy sources and, as a result, during periods when competing energy sources are less expensive, the revenues of nuclear energy companies may decline with a corresponding impact on earnings.
Risk of Investing in Coal Companies (OFOS). Companies involved in activities relating to the exploration for, mining of, and other related activities for coalface risks due to supply and demand variability. Weather conditions, a strong or weak domestic economy, the price levels of competing sources of fuel, political instability and conservation efforts may affect the demand for coal. The productivity of mining operations may be reduced by geological conditions, regulatory permits for mining activities and the availability of coal that meets standards set forth in the Clean Air Act, as amended in 1990.Companies involved in activities relating to the exploration for, mining of, and other related activities for coal are also impacted by the level and volatility of commodity prices, the exchange value of the dollar, import controls, worldwide competition, liability for environmental damage, depletion of resources and mandated expenditures for safety and pollution control devices. In addition, companies in this industry may be significantly affected by the occurrence of certain events relating to international political and economic developments, the success of exploration projects and tax and other government regulations. A primary risk of the coal industry is the competitive risk associated with the prices of alternative fuels, such as natural gas and oil. For example, consumers of coal often have the ability to switch between the use of coal, oil or natural gas. As a result, during periods when competing fuels are less expensive, the revenues of companies in the coal industry may decline with a corresponding impact on earnings.
Market Risk. Market risk, including political, regulatory, market, and economic or other developments, and developments that impact specific economic sectors, industries or segments of the market, can affect the value of a Fund’s shares. The market price of an investment could decline, sometimes rapidly or unpredictably, due to general market conditions that are not specifically related to a particular company, such as real or perceived adverse economic or political conditions throughout the world, changes in the general outlook for corporate earnings, changes in interest or currency rates, or adverse investor sentiment generally. The market value of an investment also may decline because of factors that affect a particular industry or industries such as labor shortages, increased production costs, and competitive conditions. Different types of investments may go through interest rates generally do not have the same impact on all types of investments. Local, regional, or global events such
23
Range ETFs
Notes to Financial Statements
November 30, 2024 (Concluded)
6. PRINCIPAL RISKS OF INVESTING IN THE FUNDS (concluded)
as war, acts of terrorism, the spread of infectious illness or other public health issues, recessions, or other events could have a significant impact on the market generally and on specific investments. For example, in recent years, the COVID-19 pandemic, the large expansion of government deficits and debt as a result of government actions to mitigate the effects of the pandemic, Russia’s invasion of Ukraine, and the rise of inflation have resulted in extreme volatility in the global economy and in global financial markets. Economies and financial markets throughout the world are becoming increasingly interconnected. As a result, whether or not a Fund invests in securities of issuers located in or with significant exposure to countries experiencing economic and financial difficulties, the value and liquidity of the Fund’s investments may be negatively affected.
Non-Diversification Risk. As non-diversified investment companies under the 1940 Act, each Fund may hold a smaller number of portfolio securities than many other funds and may be more sensitive to any single economic, business, political or regulatory occurrence than a diversified fund. To the extent a Fund invests in a relatively small number of issuers, a decline in the market value of a particular security held by the Fund may affect its value more than if it invested in a larger number of issuers. The value of a Fund’s shares may be more volatile than the values of shares of more diversified funds.
7. OTHER
At November 30, 2024, the records of the Trust, reflected that 100% of the Funds’ total shares outstanding were held by Authorized Participants, in the form of Creation Units, as shown in the table below. However, the individual shares comprising such Creation Units are listed and traded on the Exchange and have been purchased and sold by persons other than Authorized Participants.
| | Number of
Authorized
Participants |
Range Global Coal Index ETF | | 3 |
Range Global LNG Ecosystem Index ETF | | 1 |
Range Global Offshore Oil Services Index ETF | | 3 |
Range Nuclear Renaissance Index ETF | | 3 |
8. RECENT MARKET EVENTS
Local, regional, or global events such as war, acts of terrorism, the spread of infectious illness or other public health issues, recessions, or other events could have a significant impact on the market generally and on specific securities. Periods of market volatility may occur in response to such events and other economic, political, and global macro factors.
Governments and central banks, including the Federal Reserve in the United States, took extraordinary and unprecedented actions to support local and global economies and the financial markets in response to the COVID-19 pandemic, including by keeping interest rates at historically low levels for an extended period. The Federal Reserve concluded its market support activities in 2022 and began to raise interest rates in an effort to fight inflation. However, the Federal Reserve has recently lowered interest rates and may continue to do so. This and other government intervention into the economy and financial markets to address the pandemic, inflation, or other significant events in the future may not work as intended, particularly if the efforts are perceived by investors as being unlikely to achieve the desired results.
9. SUBSEQUENT EVENTS
The Funds have evaluated the need for additional disclosures and/or adjustments resulting from subsequent events through the date the financial statements were issued. Based on this evaluation, no additional disclosure and/or adjustments were required to the financial statements.
24
Range ETFs
Report of Independent Registered Public Accounting Firm
November 30, 2024
To the Shareholders of Range Global Coal Index ETF, Range Global LNG Ecosystem Index ETF, Range Global Offshore Oil Services Index ETF, and Range Nuclear Renaissance Index ETF and
Board of Trustees of Exchange Traded Concepts Trust
Opinion on the Financial Statements
We have audited the accompanying statements of assets and liabilities, including the schedules of investments, of Range Global Coal Index ETF, Range Global LNG Ecosystem Index ETF, Range Global Offshore Oil Services Index ETF, and Range Nuclear Renaissance Index ETF (the “Funds”), each a series of Exchange Traded Concepts Trust, as of November 30, 2024, the related statements of operations and changes in net assets, the financial highlights, and the related notes for the period from January 23, 2024 (commencement of operations) through November 30, 2024 (collectively referred to as the “financial statements”). In our opinion, the financial statements present fairly, in all material respects, the financial position of each of the Funds as of November 30, 2024, the results of their operations, the changes in net assets and the financial highlights for the period from January 23, 2024 (commencement of operations) through November 30, 2024, in conformity with accounting principles generally accepted in the United States of America.
Basis for Opinion
These financial statements are the responsibility of the Funds’ management. Our responsibility is to express an opinion on the Funds’ financial statements based on our audits. We are a public accounting firm registered with the Public Company Accounting Oversight Board (United States) (“PCAOB”) and are required to be independent with respect to the Funds in accordance with the U.S. federal securities laws and the applicable rules and regulations of the Securities and Exchange Commission and the PCAOB.
We conducted our audits in accordance with the standards of the PCAOB. Those standards require that we plan and perform the audit to obtain reasonable assurance about whether the financial statements are free of material misstatement whether due to error or fraud.
Our audits included performing procedures to assess the risks of material misstatement of the financial statements, whether due to error or fraud, and performing procedures that respond to those risks. Such procedures included examining, on a test basis, evidence regarding the amounts and disclosures in the financial statements. Our procedures included confirmation of securities owned as of November 30, 2024, by correspondence with the custodian and brokers; when replies were not received from brokers, we performed other auditing procedures. Our audits also included evaluating the accounting principles used and significant estimates made by management, as well as evaluating the overall presentation of the financial statements. We believe that our audits provide a reasonable basis for our opinion.
We have served as the auditor of one or more investment companies advised by Exchange Traded Concepts, LLC since 2012.

COHEN & COMPANY, LTD.
Cleveland, Ohio
January 24, 2024
25
Range ETFs
Notice to Shareholders (Unaudited)
November 30, 2024
For shareholders that do not have a November 30, 2024 tax year end, this notice is for informational purposes only. For shareholders with a November 30, 2024 tax year end, please consult your tax advisor as to the pertinence of this notice.
For the fiscal year ended November 30, 2024, the Funds are designating the following items with regard to distributions paid during the year.
Fund Name | | Long-Term
Capital Gain
Distributions | | Ordinary
Income
Distributions | | Total
Distributions | | Qualifying
For Corporate
Dividend
Received
Deduction(1) | | Qualifying
Dividend
Income(2) | | Qualifying
Business
Income(3) | | U.S.
Government
Interest(4) | | Foreign
Investors
Interest
Related
Dividends(5) | | Short-Term
Capital Gain
Dividends(6) |
Range Global Coal Index ETF | | 0.00% | | 0.00% | | 0.00% | | 0.00% | | 0.00% | | 0.00% | | 0.00% | | 0.00% | | 0.00% |
Range Global LNG Ecosystem Index ETF | | 0.00% | | 0.00% | | 0.00% | | 0.00% | | 0.00% | | 0.00% | | 0.00% | | 0.00% | | 0.00% |
Range Global Offshore Oil Services Index ETF | | 0.00% | | 0.00% | | 0.00% | | 0.00% | | 0.00% | | 0.00% | | 0.00% | | 0.00% | | 0.00% |
Range Nuclear Renaissance Index ETF | | 0.00% | | 0.00% | | 0.00% | | 0.00% | | 0.00% | | 0.00% | | 0.00% | | 0.00% | | 0.00% |
The information reported herein may differ from the information and distributions taxable to the shareholders for the calendar year ending December 31, 2024. Complete information will be computed and reported in conjunction with your 2024 Form 1099-DIV.
26
10900 Hefner Pointe Drive, Suite 400
Oklahoma City, OK 73120
Investment Adviser:
Exchange Traded Concepts, LLC
10900 Hefner Pointe Drive, Suite 400
Oklahoma City, OK 73120
Distributor:
SEI Investments Distribution Co.
One Freedom Valley Drive
Oaks, PA 19456
Administrator:
SEI Investments Global Funds Services
One Freedom Valley Drive
Oaks, PA 19456
Legal Counsel:
Chapman and Cutler LLP
320 South Canal Street
Chicago, IL 60606
Independent Registered Public Accounting Firm:
Cohen & Company, Ltd.
1350 Euclid Avenue, Suite 800
Cleveland, OH 44115
This information must be preceded or accompanied by a current prospectus for the Funds.
For additional information about the Funds; including each Fund’s prospectus, financial information, holdings, and proxy voting information, call or visit: • 855-726-4388 • https://rangeetfs.com/investor-materials |
RAN-AR-001-0100
| Item 8. | Changes in and Disagreements with Accountants for Open-End Investment Companies. |
There were no changes in or disagreements with accountants on accounting and financial disclosure during the period covered by the report.
| Item 9. | Proxy Disclosures for Open-End Management Investment Companies. |
There were no matters submitted to a vote of shareholders during the period covered by this report.
| Item 10. | Remuneration Paid to Directors, Officers, and Others of Open-End Investment Companies. |
Remuneration was paid by the company during the period covered by the report to Trustees on the company’s Board of Trustees. The Board of Trustees’ expenses are $18,185 for each Fund in the Trust for the period. Amounts for Trustees’ Expenses shown on each ETC 6 Meridian Fund’s Statement of Operations are inclusive of Trustees’ Fees, Independent Trustee Counsel Fees, and other reimbursable expenses of the Trustees in connection with Trust business and board governance.
| Item 11. | Statement Regarding Basis for Approval of Investment Advisory Contract. |
The disclosure regarding the Approval of Advisory Agreement, if applicable, is included as part of the financial statements included above in Item 7.
| Item 12. | Disclosure of Proxy Voting Policies and Procedures for Closed-End Management Investment Companies. |
Not applicable to open-end management investment companies.
| Item 13. | Portfolio Managers of Closed-End Management Investment Companies. |
Not applicable to open-end management investment companies.
| Item 14. | Purchases of Equity Securities by Closed End Management Investment Company and Affiliated Purchasers. |
Not applicable to open-end management investment companies.
| Item 15. | Submission of Matters to a Vote of Security Holders. |
There have been no changes to the procedures by which shareholders may recommend nominees to the Registrant’s Board of Trustees during the period covered by this report.
| Item 16. | Controls and Procedures. |
(a) The Registrant’s principal executive and principal financial officers, or persons performing similar functions, have concluded that the Registrant’s disclosure controls and procedures (as defined in Rule 30a-3(c) under the Act are effective based on the evaluation of these controls and procedures required by Rule 30a-3(b) under the Act and Rules 13a-15(b) or 15d-15(b) under the Securities Exchange Act of 1934 as of a date within 90 days of the filing date of this report.
(b) There were no changes in the Registrant's internal control over financial reporting (as defined in Rule 30a-3(d) under the Act) that occurred during the period covered by this report that have materially affected, or are reasonably likely to materially affect, the Registrant's internal control over financial reporting.
| Item 17. | Disclosure of Securities Lending Activities for Closed-End Management Investment Companies. |
Not applicable to open-end management investment companies.
| Item 18. | Recovery of Erroneously Awarded Compensation. |
| (a)(4) | Not applicable to open-end management investment companies. |
SIGNATURES
Pursuant to the requirements of the Securities Exchange Act of 1934 and the Investment Company Act of 1940, the Registrant has duly caused this report to be signed on its behalf by the undersigned, thereunto duly authorized.
| Exchange Traded Concepts Trust |
| | |
| By | /s/ J. Garrett Stevens |
| | J. Garrett Stevens, Principal Executive Officer |
| | |
| Date: January 31, 2025 | |
Pursuant to the requirements of the Securities Exchange Act of 1934 and the Investment Company Act of 1940, this report has been signed below by the following persons on behalf of the Registrant and in the capacities and on the dates indicated.
| By | /s/ J. Garrett Stevens |
| | J. Garrett Stevens, Principal Executive Officer |
| | |
| Date: January 31, 2025 | |
| | |
| By | /s/ Christopher W. Roleke |
| | Christopher W. Roleke, Principal Financial Officer |
| | |
| Date: January 31, 2025 | |