UNITED STATES
SECURITIES AND EXCHANGE COMMISSION
Washington, D.C. 20549
FORM N-CSRS
CERTIFIED SHAREHOLDER REPORT OF REGISTERED
MANAGEMENT INVESTMENT COMPANIES
Investment Company Act file number: 811-22311
Schwab Strategic Trust – Schwab U.S. REIT ETF and Fundamental Index ETFs
(Exact name of registrant as specified in charter)
211 Main Street, San Francisco, California 94105
(Address of principal executive offices) (Zip code)
Marie Chandoha
Schwab Strategic Trust
211 Main Street, San Francisco, California 94105
(Name and address of agent for service)
Registrant’s telephone number, including area code: (415) 627-7000
Date of fiscal year end: February 28
Date of reporting period: August 31, 2015
Item 1: Report(s) to Shareholders.
Semiannual report dated August 31, 2015, enclosed.
Schwab U.S. REIT ETF™
Go paperless today.
Simplify your financial life
by viewing these documents online.
Sign up at schwab.com/paperless
This wrapper is not part of the shareholder report.
Schwab U.S. REIT ETF
Semiannual Report
August 31, 2015
This page is intentionally left blank.
Fund investment adviser: Charles Schwab Investment Management, Inc. (CSIM).
Distributor: SEI Investments Distribution Co. (SIDCO)
The Sector/Industry classifications in this report use the Global Industry Classification Standard (GICS), which was developed by and is the exclusive property of Morgan Stanley Capital International Inc. (MSCI) and Standard & Poor’s (S&P). GICS is a service mark of MSCI and S&P and has been licensed for use by Charles Schwab & Co., Inc. The Industry classifications used in the schedule of Portfolio Holdings are sub-categories of Sector classifications.
The performance data quoted represents past performance. Past performance does not guarantee future results. Investment return and principal value of an investment will fluctuate so that an investor’s shares, when sold or redeemed, may be worth more or less than the original cost. Current performance may be lower or higher than the performance quoted. To obtain performance information current to the most recent month end, please visit www.csimfunds.com.
| Total Returns for the 6 Months Ended August 31, 2015 |
| Schwab U.S. REIT ETF (Ticker Symbol: SCHH) | |
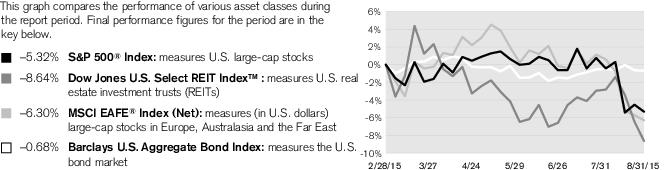
| Market Price Return1 | -8.92% |
| NAV Return1 | -8.65% |
| Dow Jones U.S. Select REIT Index | -8.64% |
| ETF Category: Morningstar Real Estate2 | -9.32% |
| Performance Details | page 6 |
All total returns on this page assume dividends and distributions were reinvested. Index figures do not include trading and management costs, which would lower performance. Indices are unmanaged and cannot be invested in directly. Performance results less than one year are not annualized.
For index definitions, please see the Glossary.
Small-company stocks are subject to greater volatility than many other asset classes.
The fund is subject to risks associated with the direct ownership of real estate securities and an investment in the fund will be closely linked to the performance of the real estate markets.
Performance does not reflect the deduction of taxes that a shareholder would pay on fund distributions or on the redemption of fund shares.
Shares are bought and sold at market price, which may be higher or lower than the net asset value (NAV). Brokerage commissions will reduce returns.
Index ownership — Dow Jones® is a registered trademark of Dow Jones Trademark Holdings LLC (Dow Jones). The Dow Jones U.S. Select REIT Index is a product of S&P Dow Jones Indices LLC and/or its affiliates, and has been licensed for use by CSIM. The Schwab U.S. REIT ETF is not sponsored, endorsed, sold or promoted by S&P Dow Jones Indices LLC, Dow Jones, or any of their respective affiliates and neither S&P Dow Jones Indices LLC, Dow Jones, nor any of their respective affiliates make any representation regarding the advisability of investing in such product.
| 1 | ETF performance must be shown based on both a market price and NAV basis. The fund’s per share net asset value (NAV) is the value of one share of the fund. NAV is calculated by taking the fund’s total assets (including the market value of securities owned), subtracting liabilities, and dividing by the number of shares outstanding. The NAV Return is based on the NAV of the fund, and the Market Price Return is based on the market price per share of the fund. The price used to calculate market return (Market Price) is determined by using the midpoint between the highest bid and the lowest offer on the primary stock exchange on which the shares of the fund are listed for trading, as of the time that the fund’s NAV is calculated. Market Price and NAV returns assume that dividends and capital gain distributions have been reinvested in the fund at Market Price and NAV, respectively. |
| 2 | Source for category information: Morningstar, Inc. The Morningstar Category return represents all passively- and actively-managed ETFs within the category as of the report date. |
Marie Chandoha is President and CEO of Charles Schwab Investment Management, Inc. and the fund covered in this report.
Dear Shareholder,
At Charles Schwab Investment Management, our goal is to provide foundational products with consistent performance that help investors to build well-diversified portfolios. The Schwab U.S. REIT ETF represents an important part of our product line-up, providing the potential for both current income and capital appreciation, and may add diversification to an income stream. The fund tracks the Dow Jones U.S. Select REIT Index and provides the benefits of ETF investing, including transparency, intraday trading, and potential tax efficiency, at one of the lowest operating expense ratios in the industry.
For the six-month reporting period ended August 31, 2015, the fund closely tracked the return of the Dow Jones U.S. Select REIT Index. After a strong performance in 2014, U.S. REITs stumbled during the reporting period and generated disappointing returns that trailed those of the broader market. Though the U.S. economy has been generally improving, concerns surrounding the timing of a potential short-term interest rate rise in the U.S. have negatively affected many income-focused investments, including REITs. Fluctuating commodity prices, the debt crisis in Greece, and the deceleration of the Chinese economy contributed to heightened market volatility, especially in the second half of the reporting period. These factors weighed heavily on most markets and created a difficult environment for real estate investors during the period.
In this environment, the performance of U.S. REITs was mostly negative across sub-industries. Specialized REITs, which include REITs that do not generate a majority of their revenues and income from real estate rental and
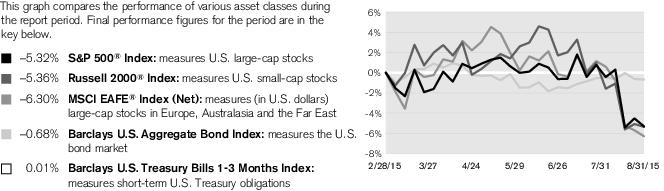
Asset Class Performance Comparison % returns during the six months ended 8/31/2015
For index definitions, please see the Glossary.
Data source: Index provider websites and CSIM.
Nothing in this report represents a recommendation of a security by the investment adviser.
Management views and portfolio holdings may have changed since the report date.
From the President continued
For the six-month reporting period ended August 31, 2015, the fund closely tracked the return of the Dow Jones U.S. Select REIT Index.
leasing operations, were the only sub-industry to produce positive returns for the six-month reporting period. Hotel and Resort REITs and Office REITs underperformed by comparison, with both sub-industries generating returns of approximately -15% for the reporting period.
For more information about the performance, holdings, and portfolio characteristics of the Schwab U.S. REIT ETF, please continue reading this report. In addition, you can find further details about this ETF by visiting our website at www.csimfunds.com. We are also happy to hear from you at 1-800-435-4000.
Sincerely,
Index figures assume dividends and distributions were reinvested. Index figures do not include trading and management costs, which would lower performance. Indices are unmanaged and cannot be invested in directly. Past performance is not an indication of future results.
 | Agnes Hong, CFA, Vice President and Head of Passive Equity Products, leads the portfolio management teams of Schwab’s passive equity funds and equity ETFs. She also has overall responsibility for all aspects of the management of the fund. Prior to joining CSIM in 2009, Ms. Hong spent five years as a portfolio manager at Barclays Global Investors (currently BlackRock), where she managed institutional index funds and quantitative active funds. Prior to that, Ms. Hong worked in management consulting and product management, servicing global financial services clients. |
 | Ferian Juwono, CFA, Managing Director and Senior Portfolio Manager, is responsible for the day-to-day co-management of the fund. Prior to joining CSIM in 2010, Mr. Juwono worked at BlackRock (formerly Barclays Global Investors), where he spent over three years as a portfolio manager, managing equity index funds for institutional clients, and nearly two years as a senior business analyst. Prior to that, Mr. Juwono worked for over four years as a senior financial analyst with Union Bank of California. |
 | Chuck Craig, CFA, Managing Director and Senior Portfolio Manager, is responsible for the day-to-day co-management of the fund. Prior to joining CSIM in 2012, Mr. Craig worked at Guggenheim Funds (formerly Claymore Group), where he spent over five years as a managing director of portfolio management and supervision, and three years as vice president of product research and development. Prior to that, he worked as an equity research analyst at First Trust Portfolios (formerly Niké Securities), and a trader and analyst at PMA Securities, Inc. |
Schwab U.S. REIT ETF
Performance and Fund Facts as of 08/31/15
The performance data quoted represents past performance. Past performance does not guarantee future results. Investment return and principal value of an investment will fluctuate so that an investor’s shares, when sold or redeemed, may be worth more or less than the original cost. Current performance may be lower or higher than the performance quoted. To obtain performance information current to the most recent month end, please visit www.csimfunds.com.
Average Annual Total Returns1
| Fund and Inception Date | 6 Months | 1 Year | 3 Years | Since Inception* |
| Fund: Schwab U.S. REIT ETF (1/13/11) | | | | |
| Market Price Return2 | -8.92% | 1.83% | 7.87% | 10.73% |
| NAV Return2 | -8.65% | 1.78% | 7.90% | 10.72% |
| Dow Jones U.S. Select REIT Index | -8.64% | 1.87% | 7.99% | 10.85% |
| ETF Category: Morningstar Real Estate3 | -9.32% | -1.44% | 6.87% | 9.63% |
Fund Expense Ratio4: 0.07%
| Statistics |
| Number of Holdings | 94 |
| Weighted Average Market Cap (millions) | $17,298 |
| Price/Earnings Ratio (P/E) | 38.4 |
| Price/Book Ratio (P/B) | 2.3 |
| Portfolio Turnover Rate5,6 | 4% |
| Sector Weightings % of Investments |
| Specialized REIT | 28.6% |
| Retail REIT | 26.3% |
| Residential REIT | 20.3% |
| Office REIT | 15.4% |
| Industrial REIT | 5.0% |
| Diversified REIT | 3.0% |
| Other | 1.4% |
| Total | 100.0% |
| Top Equity Holdings % of Net Assets7 |
| Simon Property Group, Inc. | 10.2% |
| Public Storage | 5.3% |
| Equity Residential | 4.8% |
| Health Care REIT, Inc. | 4.1% |
| AvalonBay Communities, Inc. | 4.0% |
| Prologis, Inc. | 3.6% |
| Ventas, Inc. | 3.3% |
| Boston Properties, Inc. | 3.2% |
| HCP, Inc. | 3.1% |
| General Growth Properties, Inc. | 2.9% |
| Total | 44.5% |
All total returns on this page assume dividends and distributions were reinvested. Index figures do not include trading and management costs, which would lower performance. Indices are unmanaged and cannot be invested in directly. Performance results less than one year are not annualized.
For index definitions, please see the Glossary.
Small-company stocks are subject to greater volatility than many other asset classes.
The fund is subject to risks associated with the direct ownership of real estate securities, and an investment in the fund will be closely linked to the performance of the real estate markets.
Shares are bought and sold at market price, which may be higher or lower than the net asset value (NAV). Brokerage commissions will reduce returns.
Index ownership — Dow Jones® is a registered trademark of Dow Jones Trademark Holdings LLC (Dow Jones). The Dow Jones U.S. Select REIT Index is a product of S&P Dow Jones Indices LLC and/or its affiliates, and has been licensed for use by CSIM. The Schwab U.S. REIT ETF is not sponsored, endorsed, sold or promoted by S&P Dow Jones Indices LLC, Dow Jones, or any of their respective affiliates and neither S&P Dow Jones Indices LLC, Dow Jones, nor any of their respective affiliates make any representation regarding the advisability of investing in such product.
Portfolio holdings may have changed since the report date.
An index is a statistical composite of a specified financial market or sector. Unlike the fund, an index does not actually hold a portfolio of securities and its return is not inclusive of trading and management costs incurred by the fund.
Source of Sector Classification: S&P and MSCI.
| * | Inception (1/13/11) represents the date that the shares began trading in the secondary market. |
| 1 | Performance does not reflect the deduction of taxes that a shareholder would pay on fund distributions or on the redemption of fund shares. |
| 2 | ETF performance must be shown based on both a market price and NAV basis. The fund’s per share net asset value (NAV) is the value of one share of the fund. NAV is calculated by taking the fund’s total assets (including the market value of securities owned), subtracting liabilities, and dividing by the number of shares outstanding. The NAV Return is based on the NAV of the fund, and the Market Price Return is based on the market price per share of the fund. The price used to calculate market return (Market Price) is determined by using the midpoint between the highest bid and the lowest offer on the primary stock exchange on which the shares of the fund are listed for trading, as of the time that the fund’s NAV is calculated. NAV is used as a proxy for purposes of calculating Market Price Return on inception date. Market Price and NAV returns assume that dividends and capital gain distributions have been reinvested in the fund at Market Price and NAV, respectively. |
| 3 | Source for category information: Morningstar, Inc. The Morningstar Category return represents all passively- and actively-managed ETFs within the category as of the report date. |
| 4 | As stated in the prospectus. |
| 5 | Not annualized. |
| 6 | Portfolio turnover rate excludes securities received or delivered from processing of in-kind creations or redemptions. |
| 7 | This list is not a recommendation of any security by the investment adviser. |
Fund Expenses (Unaudited)
Examples for a $1,000 Investment
As a fund shareholder, you may incur two types of costs: (1) transaction costs, including brokerage commissions on purchases and sales of fund shares; and, (2) ongoing costs, including management fees and other fund expenses.
The expense examples below are intended to help you understand your ongoing cost (in dollars) of investing in a fund and to compare this cost with the ongoing cost of investing in other mutual funds. These examples are based on an investment of $1,000 invested for six months beginning March 1, 2015 and held through August 31, 2015.
Actual Return line in the table below provides information about actual account values and actual expenses. You may use this information, together with the amount you invested, to estimate the expenses that you paid over the period. To do so, simply divide your account value by $1,000 (for example, an $8,600 account value ÷ $1,000 = 8.6), then multiply the result by the number given for the fund under the heading entitled “Expenses Paid During Period.”
Hypothetical Return line in the table below provides information about hypothetical account values and hypothetical expenses based on the fund’s actual expense ratio and an assumed return of 5% per year before expenses. Because the return used is not an actual return, it may not be used to estimate the actual ending account value or expenses you paid for the period.
You may use this information to compare the ongoing costs of investing in the fund and other funds. To do so, compare this 5% hypothetical example with the 5% hypothetical examples that appear in the shareholder reports of the other funds.
Please note that the expenses shown in the table are meant to highlight your ongoing costs only, and do not reflect any transactional costs, including any brokerage commissions you may pay when purchasing or selling shares of a fund. Therefore, the hypothetical return lines of the table are useful in comparing ongoing costs only, and will not help you determine the relative total costs of owning different funds. In addition, if these transactional costs were included, your costs would have been higher.
| | Expense Ratio1
(Annualized) | Beginning
Account Value
at 3/1/15 | Ending
Account Value
(Net of Expenses)
at 8/31/15 | Expenses Paid
During Period2
3/1/15–8/31/15 |
| Schwab U.S. REIT ETF | | | | |
| Actual Return | 0.07% | $1,000.00 | $ 913.50 | $ 0.34 |
| Hypothetical 5% Return | 0.07% | $1,000.00 | $1,024.75 | $0.36 |
| 1 | Based on the most recent six-month expense ratio; may differ from the expense ratio provided in the Financial Highlights. |
| 2 | Expenses for the fund are equal to its annualized expense ratio, multiplied by the average account value over the period, multiplied by 184 days of the period, and divided by 366 days of the fiscal year. |
Schwab U.S. REIT ETF
Financial Statements
Financial Highlights
| | 3/1/15–
8/31/15* | 3/1/14–
2/28/15 | 3/1/13–
2/28/14 | 3/1/12–
2/28/13 | 3/1/11–
2/29/12 | 1/12/11 1–
2/28/11 |
| Per-Share Data ($) |
| Net asset value at beginning of period | 40.04 | 33.06 | 31.96 | 28.30 | 27.28 | 25.00 |
| Income (loss) from investment operations: | | | | | | |
| Net investment income (loss) | 0.66 2 | 0.92 | 0.80 | 0.72 | 0.65 | 0.06 |
| Net realized and unrealized gains (losses) | (4.09) | 6.91 | 1.08 | 3.71 | 0.98 | 2.22 |
| Total from investment operations | (3.43) | 7.83 | 1.88 | 4.43 | 1.63 | 2.28 |
| Less distributions: | | | | | | |
| Distributions from net investment income | (0.40) | (0.85) | (0.78) | (0.77) | (0.61) | — |
| Net asset value at end of period | 36.21 | 40.04 | 33.06 | 31.96 | 28.30 | 27.28 |
| Total return (%) | (8.65) 3 | 24.04 | 6.08 | 15.83 | 6.15 | 9.12 3 |
| Ratios/Supplemental Data (%) |
| Ratios to average net assets: | | | | | | |
| Total expenses | 0.07 4 | 0.07 | 0.07 | 0.10 5 | 0.13 | 0.13 4 |
| Net investment income (loss) | 3.39 4 | 2.56 | 2.52 | 2.43 | 2.50 | 3.82 4 |
| Portfolio turnover rate6 | 4 3 | 15 | 11 | 7 | 5 | — 3 |
| Net assets, end of period ($ x 1,000) | 1,493,542 | 1,269,306 | 790,052 | 466,567 | 277,370 | 69,566 |
| |
1
Commencement of operations.
2
Calculated based on the average shares outstanding during the period.
3
Not annualized.
4
Annualized.
5
Effective September 20, 2012, the annual operating expense ratio was reduced. The ratio presented for the period ended 2/28/13 is a blended ratio.
6
Portfolio turnover rate excludes securities received or delivered from processing of in-kind creations or redemptions.
Portfolio Holdings as of August 31, 2015 (Unaudited)
This section shows all the securities in the fund's portfolio and their values as of the report date.
The fund files its complete schedule of portfolio holdings with the SEC for the first and third quarters of each fiscal year on Form N-Q. The fund's Form N-Q is available on the SEC's website at www.sec.gov and may be viewed and copied at the SEC's Public Reference Room in Washington, D.C. Call 1-800-SEC-0330 for information on the operation of the Public Reference Room. The fund also makes available its complete schedule of portfolio holdings on a daily basis on the fund's website at www.csimfunds.com/schwabetfs_prospectus.
| Holdings by Category | Cost
($) | Value
($) |
| 99.7% | Common Stock | 1,479,722,332 | 1,488,700,800 |
| 0.2% | Other Investment Companies | 4,210,949 | 4,054,078 |
| 99.9% | Total Investments | 1,483,933,281 | 1,492,754,878 |
| 0.1% | Other Assets and
Liabilities, Net | | 787,061 |
| 100.0% | Net Assets | | 1,493,541,939 |
| Security | Number
of Shares | Value
($) |
| Common Stock 99.7% of net assets |
| Diversified REITs 3.0% |
| Cousins Properties, Inc. | 556,505 | 5,103,151 |
| Duke Realty Corp. | 943,901 | 17,046,852 |
| First Potomac Realty Trust | 170,583 | 1,792,827 |
| Liberty Property Trust | 405,715 | 12,471,679 |
| PS Business Parks, Inc. | 54,462 | 3,973,548 |
| Washington Real Estate Investment Trust | 187,412 | 4,610,335 |
| | | 44,998,392 |
| Health Care REITs 0.5% |
| Care Capital Properties, Inc. * | 226,102 | 7,187,783 |
| Hotel & Resort REITs 0.6% |
| Hersha Hospitality Trust | 131,434 | 3,212,247 |
| Xenia Hotels & Resorts, Inc. | 304,144 | 5,626,664 |
| | | 8,838,911 |
| Industrial REITs 5.0% |
| DCT Industrial Trust, Inc. | 238,158 | 7,647,253 |
| EastGroup Properties, Inc. | 88,292 | 4,767,768 |
| First Industrial Realty Trust, Inc. | 302,942 | 5,874,045 |
| Prologis, Inc. | 1,429,197 | 54,309,486 |
| Rexford Industrial Realty, Inc. | 152,991 | 1,976,644 |
| | | 74,575,196 |
| Office REITs 15.4% |
| Alexandria Real Estate Equities, Inc. | 198,396 | 17,060,072 |
| BioMed Realty Trust, Inc. | 558,885 | 10,339,373 |
| Boston Properties, Inc. | 420,590 | 47,686,494 |
| Brandywine Realty Trust | 494,248 | 5,990,286 |
| Columbia Property Trust, Inc. | 337,380 | 7,213,184 |
| Security | Number
of Shares | Value
($) |
| Corporate Office Properties Trust | 256,237 | 5,388,664 |
| Douglas Emmett, Inc. | 375,426 | 10,373,020 |
| Equity Commonwealth * | 352,002 | 9,042,931 |
| Franklin Street Properties Corp. | 243,402 | 2,533,815 |
| Highwoods Properties, Inc. | 256,147 | 9,718,217 |
| Kilroy Realty Corp. | 240,946 | 15,627,758 |
| Mack-Cali Realty Corp. | 234,753 | 4,396,924 |
| New York REIT, Inc. | 454,273 | 4,351,935 |
| Parkway Properties, Inc. | 230,233 | 3,646,891 |
| Piedmont Office Realty Trust, Inc., Class A | 415,890 | 7,053,494 |
| SL Green Realty Corp. | 271,425 | 28,095,202 |
| Vornado Realty Trust | 477,420 | 41,626,250 |
| | | 230,144,510 |
| Residential REITs 20.3% |
| American Campus Communities, Inc. | 307,278 | 10,524,271 |
| American Homes 4 Rent, Class A | 381,329 | 6,093,637 |
| Apartment Investment & Management Co., Class A | 424,077 | 15,279,494 |
| AvalonBay Communities, Inc. | 360,729 | 59,541,929 |
| Camden Property Trust | 236,981 | 17,069,741 |
| Education Realty Trust, Inc. | 132,011 | 3,861,322 |
| Equity LifeStyle Properties, Inc. | 218,109 | 12,161,758 |
| Equity Residential | 997,947 | 71,103,724 |
| Essex Property Trust, Inc. | 179,318 | 38,485,229 |
| Home Properties, Inc. | 157,630 | 11,697,722 |
| Mid-America Apartment Communities, Inc. | 206,342 | 16,216,418 |
| Post Properties, Inc. | 147,221 | 8,150,155 |
| Silver Bay Realty Trust Corp. | 105,326 | 1,649,405 |
| Sun Communities, Inc. | 139,171 | 9,075,341 |
| UDR, Inc. | 705,406 | 22,784,614 |
| | | 303,694,760 |
| Retail REITs 26.3% |
| Acadia Realty Trust | 186,692 | 5,516,749 |
| Brixmor Property Group, Inc. | 457,958 | 10,450,602 |
| CBL & Associates Properties, Inc. | 468,160 | 6,966,221 |
| Cedar Realty Trust, Inc. | 212,552 | 1,330,575 |
| DDR Corp. | 814,558 | 12,454,592 |
| Equity One, Inc. | 223,446 | 5,253,215 |
| Federal Realty Investment Trust | 188,538 | 24,336,485 |
| General Growth Properties, Inc. | 1,721,485 | 43,691,289 |
| Inland Real Estate Corp. | 245,918 | 2,068,170 |
| Kimco Realty Corp. | 1,125,369 | 25,939,755 |
| Kite Realty Group Trust | 231,265 | 5,437,040 |
| Pennsylvania Real Estate Investment Trust | 189,882 | 3,767,259 |
| Ramco-Gershenson Properties Trust | 215,822 | 3,345,241 |
| Regency Centers Corp. | 258,709 | 15,344,031 |
| Rouse Properties, Inc. | 96,683 | 1,502,454 |
| Saul Centers, Inc. | 31,557 | 1,557,022 |
| Simon Property Group, Inc. | 850,165 | 152,451,588 |
| Tanger Factory Outlet Centers, Inc. | 264,375 | 8,364,825 |
| Taubman Centers, Inc. | 168,026 | 11,592,114 |
| The Macerich Co. | 384,109 | 29,261,424 |
| Urban Edge Properties | 251,189 | 5,252,362 |
Portfolio Holdings (Unaudited) continued
| Security | Number
of Shares | Value
($) |
| Weingarten Realty Investors | 311,574 | 9,858,201 |
| WP GLIMCHER, Inc. | 510,860 | 6,186,515 |
| | | 391,927,729 |
| Specialized REITs 28.6% |
| Ashford Hospitality Prime, Inc. | 78,430 | 1,084,687 |
| Ashford Hospitality Trust, Inc. | 251,248 | 1,944,659 |
| CubeSmart | 450,896 | 11,403,160 |
| DiamondRock Hospitality Co. | 543,217 | 6,388,232 |
| Digital Realty Trust, Inc. | 372,401 | 23,580,431 |
| DuPont Fabros Technology, Inc. | 181,830 | 4,860,316 |
| Extra Space Storage, Inc. | 335,560 | 24,656,949 |
| FelCor Lodging Trust, Inc. | 349,835 | 2,823,168 |
| HCP, Inc. | 1,261,710 | 46,758,973 |
| Health Care REIT, Inc. | 959,458 | 60,781,664 |
| Healthcare Realty Trust, Inc. | 278,530 | 6,378,337 |
| Hospitality Properties Trust | 409,748 | 10,538,719 |
| Host Hotels & Resorts, Inc. | 2,075,752 | 36,803,083 |
| LaSalle Hotel Properties | 308,749 | 9,713,244 |
| LTC Properties, Inc. | 97,621 | 3,981,961 |
| Pebblebrook Hotel Trust | 198,054 | 7,537,935 |
| Public Storage | 396,777 | 79,859,307 |
| Senior Housing Properties Trust | 643,424 | 10,101,757 |
| Sovran Self Storage, Inc. | 97,586 | 8,756,392 |
| Strategic Hotels & Resorts, Inc. * | 750,080 | 10,118,579 |
| Sunstone Hotel Investors, Inc. | 568,574 | 7,863,378 |
| Universal Health Realty Income Trust | 35,610 | 1,638,060 |
| Ventas, Inc. | 904,408 | 49,760,528 |
| | | 427,333,519 |
| Total Common Stock |
| (Cost $1,479,722,332) | | 1,488,700,800 |
| Security | Number
of Shares | Value
($) |
| Other Investment Companies 0.2% of net assets |
| Equity Fund 0.2% |
| SPDR Dow Jones REIT ETF | 45,000 | 3,784,050 |
| Money Market Fund 0.0% |
| State Street Institutional U.S. Government Money Market Fund, Premier Class 0.00% (a) | 270,028 | 270,028 |
| Total Other Investment Companies |
| (Cost $4,210,949) | | 4,054,078 |
End of Investments
At 08/31/15, the tax basis cost of the fund's investments was $1,485,236,947 and the unrealized appreciation and depreciation were $68,311,021 and ($60,793,090), respectively, with a net unrealized appreciation of $7,517,931.
| * | Non-income producing security. |
| (a) | The rate shown is the 7-day yield. |
| | |
| ETF — | Exchange Traded Fund |
| REIT — | Real Estate Investment Trust |
The following is a summary of the inputs used to value the fund’s investments as of August 31, 2015 (see financial note 2(a) for additional information):
| Description | | Quoted Prices in
Active Markets for
Identical Assets
(Level 1) | | Other Significant
Observable Inputs
(Level 2) | | Significant
Unobservable
Inputs
(Level 3) | | Total | |
| Common Stock1 | | $1,488,700,800 | | $— | | $— | | $1,488,700,800 | |
| Other Investment Companies1 | | 4,054,078 | | — | | — | | 4,054,078 | |
| Total | | $1,492,754,878 | | $— | | $— | | $1,492,754,878 | |
| 1 | As categorized in Portfolio Holdings. |
The fund's policy is to recognize transfers between Level 1, Level 2 and Level 3 as of the beginning of the fiscal year. There were no transfers between Level 1, Level 2 and Level 3 for the period ended August 31, 2015.
Statement of
Assets and Liabilities
As of August 31, 2015; unaudited
| Assets |
| Investments, at value (cost $1,483,933,281) | | $1,492,754,878 |
| Cash | | 1,678,334 |
| Receivables: | | |
| Investments sold | | 16,225,439 |
| Fund shares sold | | 3,710,723 |
| Dividends | + | 860,380 |
| Total assets | | 1,515,229,754 |
| Liabilities |
| Payables: | | |
| Investments bought | | 5,374,157 |
| Investment adviser fees | | 20,473 |
| Fund shares redeemed | + | 16,293,185 |
| Total liabilities | | 21,687,815 |
| Net Assets |
| Total assets | | 1,515,229,754 |
| Total liabilities | – | 21,687,815 |
| Net assets | | $1,493,541,939 |
| Net Assets by Source | | |
| Capital received from investors | | 1,452,312,153 |
| Net investment income not yet distributed | | 14,379,052 |
| Net realized capital gains | | 18,029,137 |
| Net unrealized capital appreciation | | 8,821,597 |
| Net Asset Value (NAV) |
| Net Assets | ÷ | Shares
Outstanding | = | NAV |
| $1,493,541,939 | | 41,250,000 | | $36.21 |
| | | | | |
Statement of
Operations
For the period March 1, 2015 through August 31, 2015; unaudited
| Investment Income |
| Dividends | | $24,798,177 |
| Expenses |
| Investment adviser fees | | 501,231 |
| Total expenses | – | 501,231 |
| Net investment income | | 24,296,946 |
| Realized and Unrealized Gains (Losses) |
| Net realized losses on investments | | (1,036,004) |
| Net realized gains on in-kind redemptions | + | 20,225,111 |
| Net realized gains | | 19,189,107 |
| Net change in unrealized appreciation (depreciation) on investments | + | (176,647,669) |
| Net realized and unrealized losses | | (157,458,562) |
| Decrease in net assets resulting from operations | | ($133,161,616) |
Statement of
Changes in Net Assets
For the current and prior report periods
Figures for the current period are unaudited
| Operations | |
| | 3/1/15-8/31/15 | 3/1/14-2/28/15 |
| Net investment income | | $24,296,946 | $26,973,906 |
| Net realized gains | | 19,189,107 | 50,557,126 |
| Net change in unrealized appreciation (depreciation) | + | (176,647,669) | 145,570,492 |
| Increase (Decrease) in net assets resulting from operations | | (133,161,616) | 223,101,524 |
| Distributions to Shareholders | |
| Distributions from net investment income | | ($14,261,320) | ($24,242,790) |
| Transactions in Fund Shares | | | |
| | | 3/1/15-8/31/15 | 3/1/14-2/28/15 |
| | | SHARES | VALUE | SHARES | VALUE |
| Shares sold | | 12,150,000 | $470,397,764 | 12,800,000 | $470,767,488 |
| Shares redeemed | + | (2,600,000) | (98,738,439) | (5,000,000) | (190,372,676) |
| Net transactions in fund shares | | 9,550,000 | $371,659,325 | 7,800,000 | $280,394,812 |
| Shares Outstanding and Net Assets | | | |
| | | 3/1/15-8/31/15 | 3/1/14-2/28/15 |
| | | SHARES | NET ASSETS | SHARES | NET ASSETS |
| Beginning of period | | 31,700,000 | $1,269,305,550 | 23,900,000 | $790,052,004 |
| Total increase | + | 9,550,000 | 224,236,389 | 7,800,000 | 479,253,546 |
| End of period | | 41,250,000 | $1,493,541,939 | 31,700,000 | $1,269,305,550 |
| Net investment income not yet distributed | | | $14,379,052 | | $4,343,426 |
Financial Notes, unaudited
1. Business Structure of the Fund:
Schwab U.S. REIT ETF is a series of Schwab Strategic Trust (the trust), a no-load, open-end management investment company. The trust is organized as a Delaware statutory trust and is registered under the Investment Company Act of 1940, as amended (the 1940 Act). The list below shows all the operational funds in the trust as of the end of the period, including the fund discussed in this report, which is highlighted:
| Schwab Strategic Trust (organized January 27, 2009) | Schwab Emerging Markets Equity ETF |
| Schwab U.S. REIT ETF | Schwab U.S. TIPS ETF |
| Schwab U.S. Broad Market ETF | Schwab Short-Term U.S. Treasury ETF |
| Schwab U.S. Large-Cap ETF | Schwab Intermediate-Term U.S. Treasury ETF |
| Schwab U.S. Large-Cap Growth ETF | Schwab U.S. Aggregate Bond ETF |
| Schwab U.S. Large-Cap Value ETF | Schwab Fundamental U.S. Broad Market Index ETF |
| Schwab U.S. Mid-Cap ETF | Schwab Fundamental U.S. Large Company Index ETF |
| Schwab U.S. Small-Cap ETF | Schwab Fundamental U.S. Small Company Index ETF |
| Schwab U.S. Dividend Equity ETF | Schwab Fundamental International Large Company Index ETF |
| Schwab International Equity ETF | Schwab Fundamental International Small Company Index ETF |
| Schwab International Small-Cap Equity ETF | Schwab Fundamental Emerging Markets Large Company Index ETF |
The fund issues and redeems shares at its net assets value per share (NAV) only in large blocks of shares, typically 50,000 shares or more (Creation Units). These transactions are usually in exchange for a basket of securities and/or an amount of cash. As a practical matter, only institutions or large investors purchase or redeem Creation Units. Except when aggregated in Creation Units, shares of the fund are not redeemable securities.
Individual shares of the fund trade on national securities exchanges and elsewhere during the trading day and can only be bought and sold at market prices throughout the trading day through a broker-dealer. Because fund shares trade at market prices rather than NAV, shares may trade at a price greater than NAV (premium) or less than NAV (discount).
The fund maintains its own account for purposes of holding assets and accounting, and is considered a separate entity for tax purposes. Within its account, the fund may also keep certain assets in segregated accounts, as required by securities law.
2. Significant Accounting Policies:
The following is a summary of the significant accounting policies the fund uses in its preparation of financial statements. The fund follows the investment company accounting and reporting guidance of the Financial Accounting Standards Board Accounting Standard Codification Topic 946 Financial Services — Investment Companies. The accounting policies are in conformity with accounting principles generally accepted in the United States of America (GAAP).
The fund invests in certain other investment companies (underlying funds). For more information about the underlying funds' operations and policies, please refer to those funds' semiannual and annual reports, which are filed with the U.S. Securities and Exchange Commission (SEC).
(a) Security Valuation:
Under procedures approved by the fund's Board of Trustees (the Board), the investment adviser has formed a Pricing Committee to administer the pricing and valuation of portfolio securities and other assets and to ensure that prices used for internal purposes or provided by third parties reasonably reflect fair market value. Among other things, these procedures allow the fund to utilize independent pricing services, quotations from securities and financial instrument dealers and other market sources to determine fair value.
The fund values the securities in its portfolio every business day. The fund uses the following policies to value various types of securities:
• Securities traded on an exchange or over-the-counter: Traded securities are valued at the closing value for the day, or, on days when no closing value has been reported, at halfway between the most recent bid and ask quotes. Securities that are primarily traded on foreign exchanges are valued at the official closing price or the last sales price on the exchange where the securities are principally traded with these values then translated into U.S. dollars at the current exchange rate, unless these securities are fair valued as discussed below.
• Securities for which no quoted value is available: The Board has adopted procedures to fair value the fund’s securities when market prices are not “readily available” or are unreliable. For example, a fund may fair value a security when it is
Financial Notes, unaudited (continued)
2. Significant Accounting Policies (continued):
de-listed or its trading is halted or suspended; when a security’s primary pricing source is unable or unwilling to provide a price; or when a security’s primary trading market is closed during regular market hours. The fund makes fair value determinations in good faith in accordance with the fund’s valuation procedures. The Pricing Committee considers a number of factors, including unobservable market inputs when arriving at fair value. The Pricing Committee may employ techniques such as the review of related or comparable assets or liabilities, related market activities, recent transactions, market multiples, book values, transactional back-testing, disposition analysis and other relevant information. The Pricing Committee regularly reviews these inputs and assumptions to calibrate the valuations. Due to the subjective and variable nature of fair value pricing, there can be no assurance that the fund could obtain the fair value assigned to the security upon the sale of such security. The Board convenes on a regular basis to review fair value determinations made by the fund pursuant to the valuation procedures.
• Short-term securities (60 days or less to maturity): A short-term security may be valued at its amortized cost when it approximates the security's market value.
• Underlying funds: Mutual funds are valued at their respective NAVs. Exchange traded funds (ETFs) traded on a recognized securities exchange are valued at the last reported sale price that day or the official closing price, if applicable.
In accordance with the authoritative guidance on fair value measurements and disclosures under GAAP, the fund discloses the fair value of its investments in a hierarchy that prioritizes the significant inputs to valuation techniques used to measure the fair value. The hierarchy gives the highest priority to valuations based upon unadjusted quoted prices in active markets for identical assets or liabilities (Level 1 measurements) and the lowest priority to valuations based upon unobservable inputs that are significant to the valuation (Level 3 measurements). If inputs used to measure the financial instruments fall within different levels of the hierarchy, the categorization is based on the lowest level input that is significant to the valuation. If the fund determines that either the volume and/or level of activity for an asset or liability has significantly decreased (from normal conditions for that asset or liability) or price quotations or observable inputs are not associated with orderly transactions, increased analysis and management judgment will be required to estimate fair value.
The three levels of the fair value hierarchy are as follows:
• Level 1—quoted prices in active markets for identical securities—Investments whose values are based on quoted market prices in active markets, and whose values are therefore classified as Level 1 prices, include active listed equities and ETFs. Investments in mutual funds are valued daily at their NAV, and investments in ETFs are valued daily at the last reported sale price or the official closing price, which are classified as Level 1 prices, without consideration to the classification level of the specific investments held by an underlying fund.
• Level 2—other significant observable inputs (including quoted prices for similar securities, interest rates, prepayment speeds, credit risk, etc.)—Investments that trade in markets that are not considered to be active, but whose values are based on quoted market prices, dealer quotations or valuations provided by alternative pricing sources supported by observable inputs are classified as Level 2 prices. These generally include U.S. government and sovereign obligations, most government agency securities, investment-grade corporate bonds, certain mortgage products, less liquid listed equities, and state, municipal and provincial obligations. As investments whose values are classified as Level 2 prices include positions that are not traded in active markets and/or are subject to transfer restrictions, valuations may be adjusted to reflect illiquidity and/or non-transferability, which are generally based on available market information.
• Level 3—significant unobservable inputs (including the fund's own assumptions in determining the fair value of investments)—Investments whose values are classified as Level 3 prices have significant unobservable inputs, as they may trade infrequently or not at all. When observable prices are not available for these securities, the fund uses one or more valuation techniques for which sufficient and reliable data is available. The inputs used by the fund in estimating the value of Level 3 prices may include the original transaction price, quoted prices for similar securities or assets in active markets, completed or pending third-party transactions in the underlying investment or comparable issuers, and changes in financial ratios or cash flows. Level 3 prices may also be adjusted to reflect illiquidity and/or non-transferability, with the amount of such discount estimated by the fund in the absence of market information. Assumptions used by the fund due to the lack of observable inputs may significantly impact the resulting fair value and therefore the fund’s results of operations.
Financial Notes, unaudited (continued)
2. Significant Accounting Policies (continued):
The inputs or methodology used for valuing securities are not necessarily an indication of the risk associated with investing in those securities.
The levels associated with valuing the fund's investments as of August 31, 2015 are disclosed in the Portfolio Holdings.
(b) Security Transactions:
Security transactions are recorded as of the date the order to buy or sell the security is executed. Realized gains and losses from security transactions are based on the identified costs of the securities involved.
When the fund closes out a futures contract position, it calculates the difference between the value of the position at the beginning and at the end of the contract, and records a realized gain or loss accordingly.
(c) Real Estate Investment Trusts:
The fund invests in real estate investment trusts (REITs) which report information on the source of their distributions annually. Certain distributions received from REITs during the year, which are known to be a return of capital or realized gains, are recorded as a reduction to the cost of the individual REITs or realized gains on investments, respectively.
(d) Investment Income:
Interest income is recorded as it accrues. Dividends and distributions from portfolio securities and underlying funds are recorded on the date they are effective (the ex-dividend date), although the fund records certain foreign security dividends on the day it learns of the ex-dividend date. Any distributions from underlying funds are recorded in accordance with the character of the distributions as designated by the underlying funds.
(e) Expenses:
Pursuant to the Investment Advisory Agreement (Advisory Agreement) between Charles Schwab Investment Management, Inc. (CSIM or the investment adviser) and the trust, the investment adviser will pay the operating expenses of the fund, excluding interest expense, taxes, any brokerage expenses, and extraordinary or non-routine expenses. Interest expense, taxes, any brokerage expenses and extraordinary or non-routine expenses that are specific to the fund are charged directly to the fund.
(f) Distributions to Shareholders:
The fund makes distributions from net investment income, if any, quarterly and from net realized capital gains, if any, once a year.
(g) Accounting Estimates:
The accounting policies described in this report conform to GAAP. Notwithstanding this, shareholders should understand that in order to follow these principles, fund management has to make estimates and assumptions that affect the information reported in the financial statements. It’s possible that once the results are known, they may turn out to be different from these estimates and these differences may be material.
(h) Federal Income Taxes:
The fund intends to meet federal income and excise tax requirements for regulated investment companies. Accordingly, the fund distributes substantially all of its net investment income and realized net capital gains, if any, to its respective shareholders each year. As long as the fund meets the tax requirements, it is not required to pay federal income tax.
(i) Indemnification:
Under the fund's organizational documents, the officers and trustees are indemnified against certain liabilities arising out of the performance of their duties to the fund. In addition, in the normal course of business the fund enters into contracts with its vendors and others that provide general indemnifications. The fund's maximum exposure under these arrangements is unknown as this would involve future claims that may be made against the fund. However, based on experience, the fund expects the risk of loss attributable to these arrangements to be remote.
Financial Notes, unaudited (continued)
3. Risk Factors:
Investing in the fund may involve certain risks, as discussed in the fund’s prospectus, including, but not limited to, those described below. Any of these risks could cause an investor to lose money.
Market Risk. Stock and bond markets and the values of securities held by the fund rise and fall daily. As with any investment whose performance is tied to these markets, the value of an investment in the fund will fluctuate, which means that the investors could lose money.
Investment Style Risk. The fund is not actively managed. Therefore, the fund follows the securities included in the index during upturns as well as downturns. Because of its indexing strategy, the fund does not take steps to reduce market exposure or to lessen the effects of a declining market. In addition, because of the fund's expenses, the fund’s performance may be below that of its respective index.
Equity Risk. The prices of equity securities rise and fall daily. These price movements may result from factors affecting individual companies, industries or the securities market as a whole. In addition, equity markets tend to move in cycles, which may cause stock prices to fall over short or extended periods of time.
Large-Cap Risk. The fund will invest in large-cap segments of the U.S. stock market. Large-cap stocks tend to go in and out of favor based on market and economic conditions. During a period when large-cap U.S. stocks fall behind other types of investments—mid- or small-cap stocks, for instance—the fund’s large-cap holdings could reduce performance.
Small- and Mid-Cap Risk. Even larger REITs and other real estate companies may be small- to medium- sized companies in relation to the equity markets as a whole. Historically, small- and mid-cap stocks have been riskier than large-cap stocks. Small- and mid-cap companies themselves may be more vulnerable to adverse business or economic events than larger, more established companies. Stock prices of smaller companies may be based in substantial part on future expectations rather than current achievements and may move sharply, especially during market upturns and downturns. During a period when small- and mid-cap stocks fall behind other types of investments—bonds or large-cap stocks, for instance—the fund’s small- and mid-cap holdings could reduce performance.
REITs Risk. In addition to the risks associated with investing in securities of real estate companies and real estate related companies, REITs are subject to certain additional risks. Equity REITs may be affected by changes in the value of the underlying properties owned by the trusts. Further, REITs are dependent upon specialized management skills and may have their investments in relatively few properties, or in a small geographic area or a single property type. Failure of a company to qualify as a REIT under federal tax law may have adverse consequences to the fund. In addition, REITs have their own expenses, and the fund will bear a proportionate share of those expenses.
Real Estate Investment Risk. Due to the composition of the index, the fund concentrates its investments in real estate companies and companies related to the real estate industry. As such, the fund is subject to risks associated with the direct ownership of real estate securities and an investment in the fund will be closely linked to the performance of the real estate markets. These risks include, among others: declines in the value of real estate; risks related to general and local economic conditions; possible lack of availability of mortgage funds or other limits to accessing the credit or capital markets; defaults by borrowers or tenants, particularly during an economic downturn; and changes in interest rates.
Tracking Error Risk. As an index fund, the fund seeks to track the performance of its benchmark index, although it may not be successful in doing so. The divergence between the performance of the fund and its benchmark index, positive or negative, is called “tracking error.” Tracking error can be caused by many factors and it may be significant.
Derivatives Risk. The principal types of derivatives used by the fund are futures contracts. A futures contract is an agreement to buy or sell a financial instrument at a specific price on a specific day. The fund’s use of derivative instruments involves risks different from, or possibly greater than, the risks associated with investing directly in securities and other traditional investments. Certain of these risks, such as leverage risk, market risk and liquidity risk, are discussed elsewhere in this section.
The fund’s use of derivatives is also subject to credit risk, lack-of-availability risk, valuation risk, correlation risk and tax risk. Credit risk is the risk that the counterparty to a derivative transaction may not fulfill its contractual obligations. Lack-of-availability risk is the risk that suitable derivative transactions may not be available in all circumstances for risk management or other purposes. Valuation risk is the risk that a particular derivative may be valued incorrectly. Correlation risk is the risk that changes in the value of the derivative may not correlate perfectly with the underlying asset, rate or index. Tax risk is the risk that the use of derivatives may cause the fund to realize higher amounts of short-term capital gain. These
Financial Notes, unaudited (continued)
3. Risk Factors (continued):
risks could cause the fund to lose more than the initial amount invested. The fund’s use of derivatives could reduce the fund’s performance, increase the fund’s volatility, and cause the fund to lose more than the initial amount invested. Furthermore, the use of derivatives subject to regulation by the Commodity Futures Trading Commission (CFTC) could cause the fund to become a commodity pool, which would require the fund to comply with certain CFTC rules.
Concentration Risk. To the extent that the fund's or the index's portfolio is concentrated in the securities of issuers in a particular market, industry, group of industries, sector or asset class (including the real estate industry, as described above), the fund may be adversely affected by the performance of those securities, may be subject to increased price volatility and may be more susceptible to adverse economic, market, political or regulatory occurrences affecting that market, industry, group of industries, sector or asset class.
Liquidity Risk. A particular investment may be difficult to purchase or sell. The fund may be unable to sell illiquid securities at an advantageous time or price.
Market Trading Risk. Although fund shares are listed on national securities exchanges, there can be no assurance that an active trading market for fund shares will develop or be maintained. If an active market is not maintained, investors may find it difficult to buy or sell fund shares.
Shares of the Fund May Trade at Prices Other Than NAV. Fund shares may be bought and sold in the secondary market at market prices. Although it is expected that the market price of the shares of the fund will approximate the fund’s NAV, there may be times when the market price and the NAV vary significantly. Investors may pay more than NAV when they buy shares of the fund in the secondary market, and may receive less than NAV when they sell those shares in the secondary market. The market price of fund shares may deviate, sometimes significantly, from NAV during periods of market volatility.
Please refer to the fund’s prospectus for a more complete description of the principal risks of investing in the fund.
4. Affiliates and Affiliated Transactions:
CSIM, a wholly owned subsidiary of The Charles Schwab Corporation, serves as the fund’s investment adviser pursuant to an Advisory Agreement between CSIM and the trust.
For its advisory services to the fund, CSIM is entitled to receive an annual fee, payable monthly, equal to 0.07% of the fund's average daily net assets.
Certain Schwab funds may own shares of other Schwab Funds. The table below reflects the percentage of shares of the fund that are owned by other Schwab funds as of August 31, 2015.
| | |
| Schwab VIT Balanced Portfolio | 0.2% |
| Schwab VIT Balanced with Growth Portfolio | 0.5% |
| Schwab VIT Growth Portfolio | 0.5% |
Pursuant to an exemptive order issued by the SEC, the fund may enter into interfund borrowing and lending transactions with other funds in the Fund Complex (for definition refer to Trustees and Officers section). All loans are for temporary or emergency purposes and the interest rate to be charged will be the average of the overnight repurchase agreement rate and the short-term bank loan rate. All loans are subject to numerous conditions designed to ensure fair and equitable treatment of all participating funds/portfolios. The interfund lending facility is subject to the oversight and periodic review of the Board. The fund had no interfund borrowing or lending activity during the period.
5. Other Service Providers:
SEI Investments Distribution Co. is the principal underwriter and distributor of shares of the fund.
State Street Bank and Trust Company (State Street) serves as the fund’s transfer agent. As part of these services, the transfer agent maintains records pertaining to the sale, redemption and transfer of the fund’s shares.
State Street also serves as custodian and accountant for the fund. The custodian is responsible for the daily safekeeping of securities and cash held by the fund. The fund’s accountant maintains all books and records related to the fund’s transactions.
Financial Notes, unaudited (continued)
6. Board of Trustees:
The Board may include people who are officers and/or directors of CSIM or its affiliates. Federal securities law limits the percentage of such “interested persons” who may serve on a trust’s board, and the trust was in compliance with these limitations throughout the report period. The trust did not pay any of these interested persons for their services as trustees. For information regarding the trustees please refer to the Trustees and Officers table at the end of this report.
7. Borrowing from Banks:
The fund has access to custodian overdraft facilities. During the period, the fund also had access to an uncommitted line of credit of $100 million with State Street. The fund pays interest on the amounts it borrows at rates that are negotiated periodically.
There were no borrowings from the line of credit by the fund during the period. However, the fund may have utilized its overdraft facility and incurred an interest expense, which is disclosed in the fund's Statement of Operations, if any. The interest expense is determined based on a negotiated rate above the current Federal Funds Rate.
Effective October 8, 2015, the existing line of credit was terminated and the fund became a participant in a syndicated, committed line of credit of $530 million with State Street, as agent.
8. Purchases and Sales/Maturities of Investment Securities:
For the period ended August 31, 2015, purchases and sales/maturities of securities (excluding in-kind transactions and short-term obligations) were as follows:
| | Purchases of Securities | | Sales/Maturities of Securities |
| Schwab U.S. REIT ETF | $63,208,258 | | $52,281,908 |
9. In-Kind Transactions:
The consideration for the purchase of Creation Units of the fund generally consists of the in-kind deposit of a designated portfolio of equity securities, which constitutes an optimized representation of the securities involved in a relevant fund’s underlying index, and an amount of cash. Investors purchasing and redeeming Creation Units are subject to a standard creation transaction fee and a standard redemption transaction fee paid to the custodian to offset transfer and other transaction costs associated with the issuance and redemption of Creation Units. Purchasers and redeemers of Creation Units for cash are subject to an additional variable charge paid to the fund that will offset the transaction costs to the fund of buying or selling portfolio securities. In addition, purchasers and redeemers of shares in Creation Units are responsible for payment of the costs of transferring securities to or out of the fund. From time to time, CSIM may cover the cost of any transaction fees when believed to be in the best interests of the fund.
The in-kind transactions for the period ended August 31, 2015 were as follows:
| | In-Kind Purchases of Securities | | In-Kind Sales of Securities |
| Schwab U.S. REIT ETF | $461,012,149 | | $90,648,496 |
For the period ended August 31, 2015, the fund realized net capital gains or losses resulting from in-kind redemptions of Creation Units. Because such gains or losses are not taxable to the fund and are not distributed to existing fund shareholders, the gains or losses are reclassified from accumulated net realized gains or losses to capital received from investors at the end of the fund's tax year. These reclassifications have no effect on net assets or net asset values per share. The net realized in-kind gains or losses for the period ended August 31, 2015 are disclosed in the fund's Statement of Operations.
10. Federal Income Taxes
As of February 28, 2015, the fund had no capital loss carryforwards.
For tax purposes, net realized capital losses and late-year ordinary losses incurred after October 31 may be deferred and treated as occurring on the first day of the following fiscal year. For the year ended February 28, 2015, the fund had capital losses carryforwards utilized in the amount of $876,325.
Financial Notes, unaudited (continued)
10. Federal Income Taxes (continued):
As of February 28, 2015, management has reviewed the tax positions for open periods (for federal purposes, three years from the date of filing and for state purposes, four years from the date of filing) as applicable to the fund, and has determined that no provision for income tax is required in the fund's financial statements. The fund recognizes interest and penalties, if any, related to unrecognized tax benefits as income tax expense in the Statement of Operations. During the period ended February 28, 2015, the fund did not incur any interest or penalties.
11. Subsequent Events:
Management has determined there are no subsequent events or transactions through the date the financial statements were issued that would have materially impacted the financial statements as presented.
Trustees and Officers
The tables below give information about the trustees and officers for the Schwab Strategic Trust, which includes the fund covered in this report. The “Fund Complex” includes The Charles Schwab Family of Funds, Schwab Capital Trust, Schwab Investments, Schwab Annuity Portfolios, Schwab Strategic Trust, Laudus Trust and Laudus Institutional Trust. The Fund Complex includes 95 funds.
The address for all trustees and officers is 211 Main Street, San Francisco, CA 94105. You can find more information about the trustees and officers in the Statement of Additional Information, which is available free by calling 1-800-435-4000.
| Independent Trustees |
Name, Year of Birth,
and Position(s) with
the trust; (Terms of
office, and length of
Time Served1) | Principal Occupations
During the Past Five Years | Number of
Portfolios in
Fund Complex
Overseen by
the Trustee | Other Directorships |
Robert W. Burns
1959
Trustee
(Trustee Schwab Strategic Trust since 2009) | Retired/Private Investor (Jan. 2009 – present); Formerly, Managing Director, Pacific Investment Management Company, LLC (PIMCO) and President, PIMCO Funds. | 21 | Director, PS Business Parks, Inc. (2005 – 2012). |
Stephen Timothy Kochis
1946
Trustee
(Trustee Schwab Strategic Trust since 2012) | CEO and Owner, Kochis Global (wealth management consulting) (May 2012 – present); Chairman and CEO, Aspiriant, LLC (wealth management) (Jan. 2008 – April 2012). | 21 | None |
Charles A. Ruffel
1956
Trustee
(Trustee Schwab Strategic Trust since 2009; The Charles Schwab Family of Funds, Schwab Investments, Schwab Capital Trust, Schwab Annuity Portfolios, Laudus Trust and Laudus Institutional Trust since 2015) | Co-Chief Executive Officer, Kudu Investment Management, LLC (financial services) (Jan. 2015 – present); Partner, Kudu Advisors, LLC (financial services) (June 2008 – Jan. 2015); Advisor, Asset International, Inc. (publisher of financial services information) (Aug. 2008 – Jan. 2015). | 95 | None |
| Interested Trustees |
Name, Year of Birth,
and Position(s) with
the trust; (Terms of
office, and length of
Time Served) | Principal Occupations
During the Past Five Years | Number of
Portfolios in
Fund Complex
Overseen by
the Trustee | Other Directorships |
Walter W. Bettinger II2
1960
Trustee
(Trustee of The Charles Schwab Family of Funds, Schwab Investments, Schwab Capital Trust and Schwab Annuity Portfolios since 2008; Schwab Strategic Trust since 2009; Laudus Trust and Laudus Institutional Trust since 2010) | Director, President and Chief Executive Officer, The Charles Schwab Corporation and Charles Schwab & Co., Inc. (2008 – present); Director, Charles Schwab Bank (2006 – present); and Director, Schwab Holdings, Inc. (2008 – present). | 95 | Director, The Charles Schwab Corporation (2008 – present) |
| Officers of the Trust |
Name, Year of Birth, and Position(s)
with the trust; (Terms of office, and
length of Time Served3) | Principal Occupations During the Past Five Years |
Marie Chandoha
1961
President and Chief Executive Officer
(Officer since 2010) | Director, President and Chief Executive Officer (Dec. 2010 – present), Chief Investment Officer (Sept. 2010 – Oct. 2011), Charles Schwab Investment Management, Inc.; President, Chief Executive Officer (Dec. 2010 – present), and Chief Investment Officer (Sept. 2010 – Oct. 2011), Schwab Funds, Laudus Funds and Schwab ETFs; Director, Charles Schwab Worldwide Funds plc and Charles Schwab Asset Management (Ireland) Limited (January 2011 – present); Global Head of Fixed Income Business Division, BlackRock, Inc. (formerly Barclays Global Investors) (March 2007 – August 2010). |
George Pereira
1964
Treasurer and Principal Financial Officer
(Officer since 2009) | Senior Vice President and Chief Financial Officer (Nov. 2004 – present), Chief Operating Officer (Jan. 2011 – present), Charles Schwab Investment Management, Inc.; Treasurer and Chief Financial Officer, Laudus Funds (June 2006 – present); Treasurer and Principal Financial Officer, Schwab Funds (Nov. 2004 – present) and Schwab ETFs (Oct. 2009 – present); Director, Charles Schwab Worldwide Funds plc and Charles Schwab Asset Management (Ireland) Limited (April 2005 – present). |
Omar Aguilar
1970
Senior Vice President and Chief Investment Officer – Equities
(Officer since 2011) | Senior Vice President and Chief Investment Officer – Equities, Charles Schwab Investment Management, Inc. (April 2011 – present); Senior Vice President and Chief Investment Officer – Equities, Schwab Funds, Laudus Funds and Schwab ETFs (June 2011 – present); Head of the Portfolio Management Group and Vice President of Portfolio Management, Financial Engines, Inc. (May 2009 – April 2011); Head of Quantitative Equity, ING Investment Management (July 2004 – Jan. 2009). |
Brett Wander
1961
Senior Vice President and Chief Investment Officer – Fixed Income
(Officer since 2011) | Senior Vice President and Chief Investment Officer – Fixed Income, Charles Schwab Investment Management, Inc. (April 2011 – present); Senior Vice President and Chief Investment Officer – Fixed Income, Schwab Funds, Laudus Funds and Schwab ETFs (June 2011 – present); Senior Managing Director, Global Head of Active Fixed-Income Strategies, State Street Global Advisors (Jan. 2008 – Oct. 2010); Director of Alpha Strategies Loomis, Sayles & Company (April 2006 – Jan. 2008). |
David Lekich
1964
Chief Legal Officer and Secretary
(Officer since 2011) | Senior Vice President (Sept. 2011 – present), Vice President (March 2004 – Sept. 2011), Charles Schwab & Co., Inc.; Senior Vice President and Chief Counsel (Sept. 2011 – present), Vice President (Jan. 2011 – Sept. 2011), Charles Schwab Investment Management, Inc.; Secretary (April 2011 – present) and Chief Legal Officer (Dec. 2011 – present), Schwab Funds; Vice President and Assistant Clerk, Laudus Funds (April 2011 – present); Secretary (May 2011 – present) and Chief Legal Officer (Nov. 2011 – present), Schwab ETFs. |
Catherine MacGregor
1964
Vice President and Assistant Secretary
(Officer since 2009) | Vice President, Charles Schwab & Co., Inc., Charles Schwab Investment Management, Inc. (July 2005 – present); Vice President (Dec. 2005 – present), Chief Legal Officer and Clerk (March 2007 – present), Laudus Funds; Vice President (Nov. 2005 – present) and Assistant Secretary (June 2007 – present), Schwab Funds; Vice President and Assistant Secretary, Schwab ETFs (Oct. 2009 – present). |
| 1 | Each Trustee shall hold office until the election and qualification of his or her successor, or until he or she dies, resigns or is removed. The Schwab ETF’s retirement policy requires that independent trustees retire by December 31 of the year in which the Trustee turns 72 or the Trustee’s twentieth year of service as an independent trustee, whichever comes first. |
| 2 | Mr. Bettinger is an Interested Trustee because he owns stock of The Charles Schwab Corporation, the parent company of the investment adviser. |
| 3 | The President, Treasurer and Secretary hold office until their respective successors are chosen and qualified or until he or she sooner dies, resigns, is removed or becomes disqualified. Each of the other officers serves at the pleasure of the Board. |
Glossary
ask See “offer.”
asset allocation The practice of dividing a portfolio among different asset classes, with each asset class assigned a particular percentage to help offset risks and rewards, based on your goals, time horizon and risk tolerance.
asset class A group of securities with similar structure and basic characteristics. Stocks, bonds and cash are the three main examples of asset classes.
authorized participant (AP) A large institutional investor that places orders for creation units with the funds’ distributor.
Barclays U.S. Aggregate Bond Index A broad-based benchmark that measures the investment grade, U.S. dollar-denominated, fixed-rate taxable bond market, including Treasuries, government-related and corporate securities, mortgage-backed securities (agency fixed-rate and hybrid ARM pass-throughs), asset-backed securities, and commercial mortgage-backed securities.
beta A historical measure of an investment’s volatility relative to a market index (usually the S&P 500®). The index is defined as having a beta of 1.00. Investments with a beta higher than 1.00 have been more volatile than the index; those with a beta of less than 1.00 have been less volatile.
bid The highest price at which someone is willing to buy a security.
cap, capitalization See “market cap.”
capital gain, capital loss The difference between the amount paid for an investment and its value at a later time. If the investment has been sold, the capital gain or loss is considered a realized gain or loss. If the investment is still held, the gain or loss is still “on paper” and is considered unrealized.
commencement of operations The date that the first NAV was calculated.
creation unit (C.U.) A basket of securities that is delivered by an authorized participant (AP) to the fund equal to the current holdings of the ETF, plus a designated cash component. In return, the APs receive a large block of ETF shares (typically 50,000 shares), which investors can then buy and sell in the secondary market.
Dow Jones U.S. Select REIT Index A float-adjusted market capitalization weighted index comprised of real estate investment trusts (REITs).
exchange A marketplace, or any organization or group that provides or maintains a marketplace for trading securities, options, futures, or commodities.
expense ratio The amount that is taken from the fund’s assets each year to cover the operating expenses. An expense ratio of 0.50% means that a fund’s expenses amount to half of one percent of its average net assets a year.
inception date The date that the shares began trading in the secondary market.
indicative optimized portfolio value (IOPV) A calculation disseminated by the stock exchange that approximates the fund’s NAV every 15 seconds throughout the trading day.
liquidity The ability to convert a security or asset quickly into cash.
market cap, market capitalization The value of a company as determined by the total value of all shares of its stock outstanding.
market price return The return based on the change in market price per share of the fund over a given time period. Market price returns assume that dividends and capital gain distributions have been reinvested in the fund at market price.
median market cap The midpoint of the range of market caps of the stocks held by a fund. There are different ways of calculating median market cap. With a simple median, half of the stocks in the fund’s portfolio would be larger than the median, and half would be smaller. With a weighted median (the type that is calculated for these funds), half of the fund’s assets are invested in stocks that are larger than the median market cap, and half in stocks that are smaller.
MSCI EAFE (Europe, Australasia, Far East) Index A free float-adjusted market capitalization index that is designed to measure the equity market performance of developed markets, excluding the U.S. & Canada. The Net version of the index reflects reinvested dividends net of withholding taxes, but reflects no deductions for expenses or other taxes; returns are calculated applying dividend withholding rates applicable to non-resident persons who do not benefit from double taxation treaties.
net asset value (NAV) The value of one share of a fund. NAV is calculated by taking the fund’s total assets, subtracting liabilities, and dividing by the number of shares outstanding.
NAV return The return based on the change in NAV of the fund over a given time period. NAV returns assume that dividends and capital gain distributions have been reinvested in the fund.
offer (ask) The lowest price at which an individual is willing to sell a security.
open The price at which a security opened for trading on a given day.
outstanding shares, shares outstanding When speaking of the fund, indicates all shares currently held by investors.
price-to-book ratio (P/B) The market price of a company’s stock compared with its “book value.” A mutual fund’s P/B is the weighted average of the P/B of all stocks in the fund’s portfolio.
price-to-earnings ratio (P/E) The market price of a company’s stock compared with earnings over the past year. A mutual fund’s P/E is the weighted average of the P/E of all stocks in the fund’s portfolio.
primary market The market that deals with the issuance of new securities.
real estate investment trust (REIT) Real estate companies that own and commonly operate income producing commercial and/or residential real estate.
S&P 500 Index A market capitalization index that is designed to measure the performance of 500 leading publicly held companies in leading industries of the U.S. economy.
sampling If a fund uses a sampling method, the fund will not fully replicate the benchmark index and may hold securities not included in the index. A fund that utilizes a sampling approach may not track the return of the index.
secondary market The market in which investors purchase securities from other investors rather than directly from the issuing companies. Organized exchanges facilitate the trading of securities in the secondary market.
spread The gap between bid and ask prices of a security.
stock A share of ownership, or equity, in the issuing company.
total return The percentage that an investor would have earned or lost on an investment in the fund assuming dividends and distributions were reinvested.
tracking error The difference between the performance of the fund and its benchmark index, positive or negative.
Schwab ETFs™ are designed to be low-cost, diversified investments. The funds follow broad market indices and provide exposure to specific segments of the market, making each an investment option for the core portions of an investor portfolio. The list to the right shows all currently available Schwab ETFs.
Investors should carefully consider information contained in the prospectus, including investment objectives, risks, charges and expenses before investing. Please call 1-800-435-4000 for a prospectus and brochure for any Schwab ETF. Please read the prospectus carefully before you invest. This report must be preceded or accompanied by a current prospectus.
Proxy Voting Policies, Procedures and Results
A description of the proxy voting policies and procedures used to determine how to vote proxies on behalf of the funds is available without charge, upon request, by visiting the Schwab ETFs’ website at www.csimfunds.com/schwabetfs_prospectus, the SEC’s website at www.sec.gov, or by contacting Schwab ETFs at 1-800-435-4000.
Information regarding how a fund voted proxies relating to portfolio securities during the most recent twelve-month period ended June 30 is available, without charge, by visiting the fund’s website at www.csimfunds.com/schwabetfs_prospectus or the SEC’s website at www.sec.gov.
Schwab ETFs™
U.S. ETFs
Schwab U.S. Broad Market ETF™
Schwab U.S. Large-Cap ETF™
Schwab U.S. Large-Cap Growth ETF™
Schwab U.S. Large-Cap Value ETF™
Schwab U.S. Mid-Cap ETF™
Schwab U.S. Small-Cap ETF™
Schwab U.S. Dividend Equity ETF™
Schwab U.S. REIT ETF™
International ETFs
Schwab International Equity ETF™
Schwab International Small-Cap Equity ETF™
Schwab Emerging Markets Equity ETF™
Fixed Income ETFs
Schwab U.S. Aggregate Bond ETF™
Schwab Short-Term U.S. Treasury ETF™
Schwab Intermediate-Term U.S. Treasury ETF™
Schwab U.S. TIPS ETF™
Fundamental Index* ETFs
Schwab Fundamental U.S. Broad Market Index ETF
Schwab Fundamental U.S. Large Company Index ETF
Schwab Fundamental U.S. Small Company Index ETF
Schwab Fundamental International Large Company Index ETF
Schwab Fundamental International Small Company Index ETF
Schwab Fundamental Emerging Markets Large Company Index ETF
| * | FUNDAMENTAL INDEX is a registered trademark of Research Affiliates LLC. |
Investment Adviser
Charles Schwab Investment Management, Inc.
211 Main Street, San Francisco, CA 94105
Schwab ETFs™
1-800-435-4000
This report is not authorized for distribution to prospective investors unless preceded or accompanied by a current prospectus.
© 2015 Charles Schwab Investment Management, Inc. All rights reserved.
Printed on recycled paper.
MFR63740-04
00153422
Semiannual report dated August 31, 2015, enclosed.
Schwab Fundamental Index* ETFs
Schwab Fundamental
U.S. Broad Market Index ETF
Schwab Fundamental
U.S. Large Company Index ETF
Schwab Fundamental
U.S. Small Company Index ETF
Schwab Fundamental
International Large Company
Index ETF
Schwab Fundamental
International Small Company
Index ETF
Schwab Fundamental
Emerging Markets Large
Company Index ETF
Go paperless today.
Simplify your financial life
by viewing these documents online.
Sign up at schwab.com/paperless
| * | SCHWAB is a registered trademark of Charles Schwab & Co., Inc.
FUNDAMENTAL INDEX is a registered trademark of Research
Affiliates LLC. |
This wrapper is not part of the shareholder report.
Schwab Fundamental Index* ETFs
Semiannual Report
August 31, 2015
Schwab Fundamental
U.S. Broad Market Index ETF
Schwab Fundamental
U.S. Large Company Index ETF
Schwab Fundamental
U.S. Small Company Index ETF
Schwab Fundamental
International Large Company
Index ETF
Schwab Fundamental
International Small Company
Index ETF
Schwab Fundamental
Emerging Markets Large
Company Index ETF
| * | SCHWAB is a registered trademark of Charles Schwab & Co., Inc.
FUNDAMENTAL INDEX is a registered trademark of Research
Affiliates LLC. |
This page is intentionally left blank.
| 2 |
| 3 |
| 5 |
| 6 |
| 6 |
| 7 |
| 8 |
| 9 |
| 11 |
| 13 |
| 15 |
| 16 |
| 16 |
| 23 |
| 30 |
| 37 |
| 44 |
| 51 |
| 58 |
| 68 |
| 70 |
Fund investment adviser: Charles Schwab Investment Management, Inc. (CSIM).
Distributor: SEI Investments Distribution Co. (SIDCO)
The Sector/Industry classifications in this report use the Global Industry Classification Standard (GICS), which was developed by and is the exclusive property of Morgan Stanley Capital International Inc. (MSCI) and Standard & Poor’s (S&P). GICS is a service mark of MSCI and S&P and has been licensed for use by Charles Schwab & Co., Inc. The Industry classifications used in the schedules of Portfolio Holdings are sub-categories of Sector classifications.
The performance data quoted represents past performance. Past performance does not guarantee future results. Investment return and principal value of an investment will fluctuate so that an investor’s shares, when sold or redeemed, may be worth more or less than the original cost. Current performance may be lower or higher than the performance quoted. To obtain performance information current to the most recent month end, please visit www.csimfunds.com.
| Total Returns for the 6 Months Ended August 31, 2015 |
Schwab Fundamental U.S. Broad Market Index ETF
(Ticker Symbol: FNDB) | |
| Market Price Return1 | -7.16% |
| NAV Return1 | -7.11% |
| Russell Fundamental U.S. Index | -6.99% |
| ETF Category: Morningstar Large Value2 | -6.70% |
| Performance Details | page 6 |
| |
Schwab Fundamental U.S. Large Company Index ETF
(Ticker Symbol: FNDX) | |
| Market Price Return1 | -7.25% |
| NAV Return1 | -7.20% |
| Russell Fundamental U.S. Large Company Index | -7.05% |
| ETF Category: Morningstar Large Value2 | -6.70% |
| Performance Details | page 7 |
| |
Schwab Fundamental U.S. Small Company Index ETF
(Ticker Symbol: FNDA) | |
| Market Price Return1 | -6.47% |
| NAV Return1 | -6.54% |
| Russell Fundamental U.S. Small Company Index | -6.39% |
| ETF Category: Morningstar Small Blend2 | -5.93% |
| Performance Details | page 8 |
| Total Returns for the 6 Months Ended August 31, 2015 |
Schwab Fundamental International Large Company Index ETF
(Ticker Symbol: FNDF) | |
| Market Price Return1 | -8.03% |
| NAV Return1 | -7.66% |
| Russell Fundamental Developed ex-U.S. Large Company Index (Net)* | -7.67% |
| ETF Category: Morningstar Foreign Large Value2 | -9.88% |
| Performance Details | pages 9-10 |
| |
Schwab Fundamental International Small Company Index ETF
(Ticker Symbol: FNDC) | |
| Market Price Return1 | -3.21% |
| NAV Return1 | -2.83% |
| Russell Fundamental Developed ex-U.S. Small Company Index (Net)* | -2.68% |
| ETF Category: Morningstar Foreign Small/Mid Blend2 | -2.39% |
| Performance Details | pages 11-12 |
| |
Schwab Fundamental Emerging Markets Large Company Index ETF
(Ticker Symbol: FNDE) | |
| Market Price Return1 | -17.58% |
| NAV Return1 | -17.51% |
| Russell Fundamental Emerging Markets Large Company Index (Net)* | -17.24% |
| ETF Category: Morningstar Diversified Emerging Markets2 | -15.81% |
| Performance Details | pages 13-14 |
All total returns on this page assume dividends and distributions were reinvested. Index figures do not include trading and management costs, which would lower performance. Indices are unmanaged and cannot be invested in directly. Performance results less than one year are not annualized.
For index definitions, please see the Glossary.
Performance does not reflect the deduction of taxes that a shareholder would pay on fund distributions or on the redemption of fund shares.
Shares are bought and sold at market price, which may be higher or lower than the net asset value (NAV). Brokerage commissions will reduce returns.
Index ownership — each of the names identifying a Russell Fundamental Index is a joint trademark of Frank Russell Company (Russell) and Research Affiliates LLC (RA) and is used by the funds under license. “Research Affiliates” and “Fundamental Index” are trademarks of RA. Subject to RA’s intellectual property rights in certain content, Russell is the owner of all copyrights related to the Russell Fundamental Index Series. Russell is the owner of the trademarks and copyrights related to the Russell Indexes. Schwab Fundamental Index ETFs are not sponsored, endorsed, sold or promoted by Russell or RA, and Russell and RA do not make any representation regarding the advisability of investing in shares of the funds.
| * | The total return cited for the index is calculated net of foreign withholding taxes. |
| 1 | ETF performance must be shown based on both a market price and NAV basis. The fund’s per share net asset value (NAV) is the value of one share of the fund. NAV is calculated by taking the fund’s total assets (including the market value of securities owned), subtracting liabilities, and dividing by the number of shares outstanding. The NAV Return is based on the NAV of the fund, and the Market Price Return is based on the market price per share of the fund. The price used to calculate market return (Market Price) is determined by using the midpoint between the highest bid and the lowest offer on the primary stock exchange on which the shares of the fund are listed for trading, as of the time that the fund’s NAV is calculated. Market Price and NAV returns assume that dividends and capital gain distributions have been reinvested in the fund at Market Price and NAV, respectively. |
| 2 | Source for category information: Morningstar, Inc. The Morningstar Category return represents all passively- and actively-managed ETFs within the category as of the report date. |
2Schwab Fundamental Index ETFs
Marie Chandoha is President and CEO of Charles Schwab Investment Management, Inc. and the funds covered in this report.
Dear Shareholder,
At Charles Schwab Investment Management, our goal is to provide foundational products with consistent performance that help investors to build well-diversified portfolios. The Schwab Fundamental Index ETFs represent an important part of our product line-up.
In recent years, fundamentally weighted strategies have experienced considerable asset growth. Unlike traditional equity indices that are often weighted by market capitalization, fundamentally weighted indices select and weight stocks by objective non-price measures, such as dividends, cash flow, and sales. By using this weighting methodology, the Schwab Fundamental Index ETFs can serve as effective complements to capitalization-weighted index funds and actively managed investment vehicles. These funds also provide the benefits of ETF investing, including transparency, intraday trading, and potential tax efficiency.
For the six-month reporting period ended August 31, 2015, the funds produced negative returns that closely tracked their respective indices amid a broad decline in global equity indices. Internationally, emerging markets suffered the steepest losses of the period as a result of falling commodity prices and the deceleration of China’s economy, with the Russell Fundamental Emerging Markets Large Company Index posting a return of -17.2%1 during the period. Both emerging and developed markets struggled against a strong U.S. dollar. When the U.S. dollar rises against foreign currencies, returns on overseas investments will generally be reduced in U.S. dollar terms. Meanwhile, in the U.S., fears of an increasingly overvalued stock market and
Asset Class Performance Comparison % returns during the 6 months ended 8/31/2015
For index definitions, please see the Glossary.
Data source: Index provider websites and CSIM.
Nothing in this report represents a recommendation of a security by the investment adviser.
Management views and portfolio holdings may have changed since the report date.
Schwab Fundamental Index ETFs3
From the President continued
For the six-month reporting period ended August 31, 2015, the funds produced negative returns that closely tracked their respective indices amid a broad decline in global equity indices.
anticipation of a Federal Reserve move on short-term interest rates outweighed relatively stable economic conditions. The Russell Fundamental U.S. Large Company Index returned -7.1%, while the Russell Fundamental Developed ex-U.S. Large Company Index returned -7.7%.1
For more information about the performance, holdings, and portfolio characteristics of the Schwab Fundamental Index ETFs, please continue reading this report. In addition, you can find further details about these ETFs by visiting our website at www.csimfunds.com. We are also happy to hear from you at 1-800-435-4000.
Sincerely,
Index figures assume dividends and distributions were reinvested. Index figures do not include trading and management costs, which would lower performance. Indices are unmanaged and cannot be invested in directly. Past performance is not an indication of future results.
| 1 | The total returns cited for the Russell Fundamental Emerging Markets Large Company Index and Russell Fundamental Developed ex-U.S. Large Company Index are net of foreign withholding taxes. |
4Schwab Fundamental Index ETFs
 | Agnes Hong, CFA, Vice President and Head of Passive Equity Products, leads the portfolio management teams of Schwab’s passive equity funds and equity ETFs. She also has overall responsibility for all aspects of the management of the funds. Prior to joining CSIM in 2009, Ms. Hong spent five years as a portfolio manager at Barclays Global Investors (currently BlackRock), where she managed institutional index funds and quantitative active funds. Prior to that, Ms. Hong worked in management consulting and product management, servicing global financial services clients. |
 | Chuck Craig, CFA, Managing Director and Senior Portfolio Manager, is responsible for the day-to-day co-management of the funds. Prior to joining CSIM in 2012, Mr. Craig worked at Guggenheim Funds (formerly Claymore Group), where he spent over five years as a managing director of portfolio management and supervision, and three years as vice president of product research and development. Prior to that, he worked as an equity research analyst at First Trust Portfolios (formerly Niké Securities), and a trader and analyst at PMA Securities, Inc. |
 | Jane Qin, Portfolio Manager, is responsible for the day-to-day co-management of the funds. Prior to joining CSIM in 2012, Ms. Qin worked at The Bank of New York Mellon Corporation, where she spent more than two years as an associate equity portfolio manager, and nearly two years as a performance analyst. Prior to that, Ms. Qin worked at Wells Fargo Fund Management as a mutual fund analyst and at CIGNA Reinsurance as a risk analyst. |
Schwab Fundamental Index ETFs5
Schwab Fundamental U.S. Broad Market Index ETF
Performance and Fund Facts as of 08/31/15
The performance data quoted represents past performance. Past performance does not guarantee future results. Investment return and principal value of an investment will fluctuate so that an investor’s shares, when sold or redeemed, may be worth more or less than the original cost. Current performance may be lower or higher than the performance quoted. To obtain performance information current to the most recent month end, please visit www.csimfunds.com.
Average Annual Total Returns1
| Fund and Inception Date | 6 Months | 1 Year | Since Inception* |
| Fund: Schwab Fundamental U.S. Broad Market Index ETF (8/15/13) | | | |
| Market Price Return2 | -7.16% | -3.11% | 7.77% |
| NAV Return2 | -7.11% | -3.21% | 7.76% |
| Russell Fundamental U.S. Index | -6.99% | -2.95% | 8.10% |
| ETF Category: Morningstar Large Value3 | -6.70% | -2.02% | 7.44% |
Fund Expense Ratio4: 0.32%
| Statistics |
| Number of Holdings | 1,499 |
| Weighted Average Market Cap (millions) | $98,086 |
| Price/Earnings Ratio (P/E) | 21.3 |
| Price/Book Ratio (P/B) | 2.1 |
| Portfolio Turnover Rate5,6 | 6% |
| Sector Weightings % of Investments |
| Financials | 14.6% |
| Information Technology | 13.7% |
| Consumer Discretionary | 13.3% |
| Energy | 12.5% |
| Health Care | 11.3% |
| Consumer Staples | 11.3% |
| Industrials | 10.9% |
| Utilities | 4.3% |
| Telecommunication Services | 3.9% |
| Materials | 3.7% |
| Other | 0.5% |
| Total | 100.0% |
| Top Equity Holdings % of Net Assets7 |
| Exxon Mobil Corp. | 3.9% |
| AT&T, Inc. | 2.4% |
| Chevron Corp. | 1.9% |
| Microsoft Corp. | 1.7% |
| JPMorgan Chase & Co. | 1.3% |
| General Electric Co. | 1.2% |
| International Business Machines Corp. | 1.2% |
| The Procter & Gamble Co. | 1.2% |
| Wal-Mart Stores, Inc. | 1.2% |
| Apple, Inc. | 1.2% |
| Total | 17.2% |
All total returns on this page assume dividends and distributions were reinvested. Index figures do not include trading and management costs, which would lower performance. Indices are unmanaged and cannot be invested in directly. Performance results less than one year are not annualized.
For index definitions, please see the Glossary.
Shares are bought and sold at market price, which may be higher or lower than the net asset value (NAV). Brokerage commissions will reduce returns.
Index ownership — “Russell Fundamental U.S. Index” is a joint trademark of Frank Russell Company (Russell) and Research Affiliates LLC (RA) and is used by the fund under license. “Research Affiliates” and “Fundamental Index” are trademarks of RA. Subject to RA’s intellectual property rights in certain content, Russell is the owner of all copyrights related to the Russell Fundamental Index Series. Russell is the owner of the trademarks and copyrights related to the Russell Indexes. Schwab Fundamental U.S. Broad Market Index ETF is not sponsored, endorsed, sold or promoted by Russell or RA, and Russell and RA do not make any representation regarding the advisability of investing in shares of the fund.
Portfolio holdings may have changed since the report date.
An index is a statistical composite of a specified financial market or sector. Unlike the fund, an index does not actually hold a portfolio of securities and its return is not inclusive of trading and management costs incurred by the fund.
Source of Sector Classification: S&P and MSCI.
| * | Inception (8/15/13) represents the date that the shares began trading in the secondary market. |
| 1 | Performance does not reflect the deduction of taxes that a shareholder would pay on fund distributions or on the redemption of fund shares. |
| 2 | ETF performance must be shown based on both a market price and NAV basis. The fund’s per share net asset value (NAV) is the value of one share of the fund. NAV is calculated by taking the fund’s total assets (including the market value of securities owned), subtracting liabilities, and dividing by the number of shares outstanding. The NAV Return is based on the NAV of the fund, and the Market Price Return is based on the market price per share of the fund. The price used to calculate market return (Market Price) is determined by using the midpoint between the highest bid and the lowest offer on the primary stock exchange on which the shares of the fund are listed for trading, as of the time that the fund’s NAV is calculated. NAV is used as a proxy for purposes of calculating Market Price Return on inception date. Market Price and NAV returns assume that dividends and capital gain distributions have been reinvested in the fund at Market Price and NAV, respectively. |
| 3 | Source for category information: Morningstar, Inc. The Morningstar Category return represents all passively- and actively-managed ETFs within the category as of the report date. |
| 4 | As stated in the prospectus. |
| 5 | Not annualized. |
| 6 | Portfolio turnover rate excludes securities received or delivered from processing of in-kind creations or redemptions. |
| 7 | This list is not a recommendation of any security by the investment adviser. |
6Schwab Fundamental Index ETFs
Schwab Fundamental U.S. Large Company Index ETF
Performance and Fund Facts as of 08/31/15
The performance data quoted represents past performance. Past performance does not guarantee future results. Investment return and principal value of an investment will fluctuate so that an investor’s shares, when sold or redeemed, may be worth more or less than the original cost. Current performance may be lower or higher than the performance quoted. To obtain performance information current to the most recent month end, please visit www.csimfunds.com.
Average Annual Total Returns1
| Fund and Inception Date | 6 Months | 1 Year | Since Inception* |
| Fund: Schwab Fundamental U.S. Large Company Index ETF (8/15/13) | | | |
| Market Price Return2 | -7.25% | -3.34% | 7.73% |
| NAV Return2 | -7.20% | -3.40% | 7.69% |
| Russell Fundamental U.S. Large Company Index | -7.05% | -3.09% | 8.06% |
| ETF Category: Morningstar Large Value3 | -6.70% | -2.02% | 7.44% |
Fund Expense Ratio4: 0.32%
| Statistics |
| Number of Holdings | 638 |
| Weighted Average Market Cap (millions) | $107,391 |
| Price/Earnings Ratio (P/E) | 20.4 |
| Price/Book Ratio (P/B) | 2.1 |
| Portfolio Turnover Rate5,6 | 6% |
| Sector Weightings % of Investments |
| Financials | 13.9% |
| Information Technology | 13.8% |
| Energy | 13.3% |
| Consumer Discretionary | 12.9% |
| Consumer Staples | 12.0% |
| Health Care | 11.8% |
| Industrials | 10.0% |
| Utilities | 4.3% |
| Telecommunication Services | 4.2% |
| Materials | 3.5% |
| Other | 0.3% |
| Total | 100.0% |
| Top Equity Holdings % of Net Assets7 |
| Exxon Mobil Corp. | 4.3% |
| AT&T, Inc. | 2.6% |
| Chevron Corp. | 2.1% |
| Microsoft Corp. | 1.9% |
| JPMorgan Chase & Co. | 1.4% |
| International Business Machines Corp. | 1.4% |
| General Electric Co. | 1.4% |
| Apple, Inc. | 1.4% |
| The Procter & Gamble Co. | 1.4% |
| Wal-Mart Stores, Inc. | 1.4% |
| Total | 19.3% |
All total returns on this page assume dividends and distributions were reinvested. Index figures do not include trading and management costs, which would lower performance. Indices are unmanaged and cannot be invested in directly. Performance results less than one year are not annualized.
For index definitions, please see the Glossary.
Shares are bought and sold at market price, which may be higher or lower than the net asset value (NAV). Brokerage commissions will reduce returns.
Index ownership — “Russell Fundamental U.S. Large Company Index” is a joint trademark of Frank Russell Company (Russell) and Research Affiliates LLC (RA) and is used by the fund under license. “Research Affiliates” and “Fundamental Index” are trademarks of RA. Subject to RA’s intellectual property rights in certain content, Russell is the owner of all copyrights related to the Russell Fundamental Index Series. Russell is the owner of the trademarks and copyrights related to the Russell Indexes. Schwab Fundamental U.S. Large Company Index ETF is not sponsored, endorsed, sold or promoted by Russell or RA, and Russell and RA do not make any representation regarding the advisability of investing in shares of the fund.
Portfolio holdings may have changed since the report date.
An index is a statistical composite of a specified financial market or sector. Unlike the fund, an index does not actually hold a portfolio of securities and its return is not inclusive of trading and management costs incurred by the fund.
Source of Sector Classification: S&P and MSCI.
| * | Inception (8/15/13) represents the date that the shares began trading in the secondary market. |
| 1 | Performance does not reflect the deduction of taxes that a shareholder would pay on fund distributions or on the redemption of fund shares. |
| 2 | ETF performance must be shown based on both a market price and NAV basis. The fund’s per share net asset value (NAV) is the value of one share of the fund. NAV is calculated by taking the fund’s total assets (including the market value of securities owned), subtracting liabilities, and dividing by the number of shares outstanding. The NAV Return is based on the NAV of the fund, and the Market Price Return is based on the market price per share of the fund. The price used to calculate market return (Market Price) is determined by using the midpoint between the highest bid and the lowest offer on the primary stock exchange on which the shares of the fund are listed for trading, as of the time that the fund’s NAV is calculated. NAV is used as a proxy for purposes of calculating Market Price Return on inception date. Market Price and NAV returns assume that dividends and capital gain distributions have been reinvested in the fund at Market Price and NAV, respectively. |
| 3 | Source for category information: Morningstar, Inc. The Morningstar Category return represents all passively- and actively-managed ETFs within the category as of the report date. |
| 4 | As stated in the prospectus. |
| 5 | Not annualized. |
| 6 | Portfolio turnover rate excludes securities received or delivered from processing of in-kind creations or redemptions. |
| 7 | This list is not a recommendation of any security by the investment adviser. |
Schwab Fundamental Index ETFs7
Schwab Fundamental U.S. Small Company Index ETF
Performance and Fund Facts as of 08/31/15
The performance data quoted represents past performance. Past performance does not guarantee future results. Investment return and principal value of an investment will fluctuate so that an investor’s shares, when sold or redeemed, may be worth more or less than the original cost. Current performance may be lower or higher than the performance quoted. To obtain performance information current to the most recent month end, please visit www.csimfunds.com.
Average Annual Total Returns1
| Fund and Inception Date | 6 Months | 1 Year | Since Inception* |
| Fund: Schwab Fundamental U.S. Small Company Index ETF (8/15/13) | | | |
| Market Price Return2 | -6.47% | -1.77% | 7.98% |
| NAV Return2 | -6.54% | -1.94% | 7.91% |
| Russell Fundamental U.S. Small Company Index | -6.39% | -1.67% | 8.28% |
| ETF Category: Morningstar Small Blend3 | -5.93% | -1.17% | 6.81% |
Fund Expense Ratio4: 0.32%
| Statistics |
| Number of Holdings | 892 |
| Weighted Average Market Cap (millions) | $4,251 |
| Price/Earnings Ratio (P/E) | 35.6 |
| Price/Book Ratio (P/B) | 1.8 |
| Portfolio Turnover Rate5,6 | 15% |
| Sector Weightings % of Investments |
| Financials | 21.9% |
| Industrials | 20.1% |
| Consumer Discretionary | 16.5% |
| Information Technology | 12.9% |
| Health Care | 7.2% |
| Materials | 5.6% |
| Energy | 5.0% |
| Consumer Staples | 3.9% |
| Utilities | 3.9% |
| Telecommunication Services | 1.1% |
| Other | 1.9% |
| Total | 100.0% |
| Top Equity Holdings % of Net Assets7 |
| Sealed Air Corp. | 0.4% |
| Endurance Specialty Holdings Ltd. | 0.4% |
| Sears Holdings Corp. | 0.3% |
| Netflix, Inc. | 0.3% |
| Service Corp. International | 0.3% |
| D.R. Horton, Inc. | 0.3% |
| Masco Corp. | 0.3% |
| StanCorp Financial Group, Inc. | 0.3% |
| SkyWest, Inc. | 0.3% |
| Western Refining, Inc. | 0.3% |
| Total | 3.2% |
All total returns on this page assume dividends and distributions were reinvested. Index figures do not include trading and management costs, which would lower performance.Indices are unmanaged and cannot be invested in directly. Performance results less than one year are not annualized.
For index definitions, please see the Glossary.
Shares are bought and sold at market price, which may be higher or lower than the net asset value (NAV). Brokerage commissions will reduce returns.
Investments in smaller companies typically exhibit higher volatility.
Index ownership — “Russell Fundamental U.S. Small Company Index” is a joint trademark of Frank Russell Company (Russell) and Research Affiliates LLC (RA) and is used by the fund under license. “Research Affiliates” and “Fundamental Index” are trademarks of RA. Subject to RA’s intellectual property rights in certain content, Russell is the owner of all copyrights related to the Russell Fundamental Index Series. Russell is the owner of the trademarks and copyrights related to the Russell Indexes. Schwab Fundamental U.S. Small Company Index ETF is not sponsored, endorsed, sold or promoted by Russell or RA, and Russell and RA do not make any representation regarding the advisability of investing in shares of the fund.
Portfolio holdings may have changed since the report date.
An index is a statistical composite of a specified financial market or sector. Unlike the fund, an index does not actually hold a portfolio of securities and its return is not inclusive of trading and management costs incurred by the fund.
Source of Sector Classification: S&P and MSCI.
| * | Inception (8/15/13) represents the date that the shares began trading in the secondary market. |
| 1 | Performance does not reflect the deduction of taxes that a shareholder would pay on fund distributions or on the redemption of fund shares. |
| 2 | ETF performance must be shown based on both a market price and NAV basis. The fund’s per share net asset value (NAV) is the value of one share of the fund. NAV is calculated by taking the fund’s total assets (including the market value of securities owned), subtracting liabilities, and dividing by the number of shares outstanding. The NAV Return is based on the NAV of the fund, and the Market Price Return is based on the market price per share of the fund. The price used to calculate market return (Market Price) is determined by using the midpoint between the highest bid and the lowest offer on the primary stock exchange on which the shares of the fund are listed for trading, as of the time that the fund’s NAV is calculated. NAV is used as a proxy for purposes of calculating Market Price Return on inception date. Market Price and NAV returns assume that dividends and capital gain distributions have been reinvested in the fund at Market Price and NAV, respectively. |
| 3 | Source for category information: Morningstar, Inc. The Morningstar Category return represents all passively- and actively-managed ETFs within the category as of the report date. |
| 4 | As stated in the prospectus. |
| 5 | Not annualized. |
| 6 | Portfolio turnover rate excludes securities received or delivered from processing of in-kind creations or redemptions. |
| 7 | This list is not a recommendation of any security by the investment adviser. |
8Schwab Fundamental Index ETFs
Schwab Fundamental International Large Company Index ETF
Performance and Fund Facts as of 08/31/15
The performance data quoted represents past performance. Past performance does not guarantee future results. Investment return and principal value of an investment will fluctuate so that an investor’s shares, when sold or redeemed, may be worth more or less than the original cost. Current performance may be lower or higher than the performance quoted. To obtain performance information current to the most recent month end, please visit www.csimfunds.com.
Average Annual Total Returns1
| Fund and Inception Date | 6 Months | 1 Year | Since Inception* |
| Fund: Schwab Fundamental International Large Company Index ETF (8/15/13) | | | |
| Market Price Return2 | -8.03% | -11.37% | 0.97% |
| NAV Return2 | -7.66% | -11.05% | 0.99% |
| Russell Fundamental Developed ex-U.S. Large Company Index (Net) | -7.67% | -10.93% | 1.26% |
| ETF Category: Morningstar Foreign Large Value3 | -9.88% | -15.57% | -1.51% |
Fund Expense Ratio4: 0.32%
All total returns on this page assume dividends and distributions were reinvested. Index figures do not include trading and management costs, which would lower performance. Indices are unmanaged. Indices are unmanaged and cannot be invested in directly. Performance results less than one year are not annualized.
For index definitions, please see the Glossary.
Shares are bought and sold at market price, which may be higher or lower than the net asset value (NAV). Brokerage commissions will reduce returns.
International investing may involve risk of capital loss from unfavorable fluctuation in currency values, from differences in generally accepted accounting principles, or from economic or political instability in other nations.
Index ownership — “Russell Fundamental Developed ex-U.S. Large Company Index” is a joint trademark of Frank Russell Company (Russell) and Research Affiliates LLC (RA) and is used by the fund under license. “Research Affiliates” and “Fundamental Index” are trademarks of RA. Subject to RA’s intellectual property rights in certain content, Russell is the owner of all copyrights related to the Russell Fundamental Series. Russell is the owner of the trademarks and copyrights related to the Russell Indexes. Schwab Fundamental International Large Company Index ETF is not sponsored, endorsed, sold or promoted by Russell or RA, and Russell and RA do not make any representation regarding the advisability of investing in shares of the fund.
| * | Inception (8/15/13) represents the date that the shares began trading in the secondary market. |
| 1 | Performance does not reflect the deduction of taxes that a shareholder would pay on fund distributions or on the redemption of fund shares. |
| 2 | ETF performance must be shown based on both a market price and NAV basis. The fund’s per share net asset value (NAV) is the value of one share of the fund. NAV is calculated by taking the fund’s total assets (including the market value of securities owned), subtracting liabilities, and dividing by the number of shares outstanding. The NAV Return is based on the NAV of the fund, and the Market Price Return is based on the market price per share of the fund. The price used to calculate market return (Market Price) is determined by using the midpoint between the highest bid and the lowest offer on the primary stock exchange on which the shares of the fund are listed for trading, as of the time that the fund’s NAV is calculated. NAV is used as a proxy for purposes of calculating Market Price Return on inception date. Market Price and NAV returns assume that dividends and capital gain distributions have been reinvested in the fund at Market Price and NAV, respectively. |
| 3 | Source for category information: Morningstar, Inc. The Morningstar Category return represents all passively- and actively-managed ETFs within the category as of the report date. |
| 4 | As stated in the prospectus. |
Schwab Fundamental Index ETFs9
Schwab Fundamental International Large Company Index ETF
Performance and Fund Facts as of 08/31/15 continued
| Statistics |
| Number of Holdings | 838 |
| Weighted Average Market Cap (millions) | $52,423 |
| Price/Earnings Ratio (P/E) | 23.3 |
| Price/Book Ratio (P/B) | 1.3 |
| Portfolio Turnover Rate1,2 | 5% |
| Sector Weightings % of Investments |
| Financials | 19.2% |
| Industrials | 12.7% |
| Energy | 12.0% |
| Consumer Discretionary | 11.2% |
| Consumer Staples | 10.1% |
| Materials | 8.8% |
| Telecommunication Services | 7.8% |
| Health Care | 7.4% |
| Utilities | 6.2% |
| Information Technology | 4.2% |
| Other | 0.4% |
| Total | 100.0% |
| Top Equity Holdings % of Net Assets3 |
| BP plc | 2.1% |
| Royal Dutch Shell plc, A Shares | 1.9% |
| Total S.A. | 1.7% |
| Royal Dutch Shell plc, B Shares | 1.2% |
| HSBC Holdings plc | 1.2% |
| Nestle S.A. – Reg'd | 1.1% |
| Telefonica S.A. | 1.1% |
| Banco Santander S.A. | 1.1% |
| Vodafone Group plc | 1.0% |
| Eni S.p.A. | 1.0% |
| Total | 13.4% |
Country Weightings % of Investments
| Japan | 22.9% |
| United Kingdom | 16.8% |
| France | 11.1% |
| Germany | 8.8% |
| Canada | 5.9% |
| Switzerland | 5.7% |
| Netherlands | 5.3% |
| Australia | 4.9% |
| Spain | 4.3% |
| Italy | 4.0% |
| Other Countries | 10.3% |
| Total | 100.0% |
Portfolio holdings may have changed since the report date.
An index is a statistical composite of a specified financial market or sector. Unlike the fund, an index does not actually hold a portfolio of securities and its return is not inclusive of trading and management costs incurred by the fund.
Source of Sector Classification: S&P and MSCI.
| 1 | Not annualized. |
| 2 | Portfolio turnover rate excludes securities received or delivered from processing of in-kind creations or redemptions. |
| 3 | This list is not a recommendation of any security by the investment adviser. |
10Schwab Fundamental Index ETFs
Schwab Fundamental International Small Company Index ETF
Performance and Fund Facts as of 08/31/15
The performance data quoted represents past performance. Past performance does not guarantee future results. Investment return and principal value of an investment will fluctuate so that an investor’s shares, when sold or redeemed, may be worth more or less than the original cost. Current performance may be lower or higher than the performance quoted. To obtain performance information current to the most recent month end, please visit www.csimfunds.com.
Average Annual Total Returns1
| Fund and Inception Date | 6 Months | 1 Year | Since Inception* |
| Fund: Schwab Fundamental International Small Company Index ETF (8/15/13) | | | |
| Market Price Return2 | -3.21% | -5.42% | 3.70% |
| NAV Return2 | -2.83% | -5.16% | 3.57% |
| Russell Fundamental Developed ex-U.S. Small Company Index (Net) | -2.68% | -4.80% | 4.21% |
| ETF Category: Morningstar Foreign Small/Mid Blend3 | -2.39% | -5.59% | 3.90% |
Fund Expense Ratio4: 0.46%
All total returns on this page assume dividends and distributions were reinvested. Index figures do not include trading and management costs, which would lower performance. Indices are unmanaged and cannot be invested in directly. Performance results less than one year are not annualized.
For index definitions, please see the Glossary.
Shares are bought and sold at market price, which may be higher or lower than the net asset value (NAV). Brokerage commissions will reduce returns.
International investing may involve risk of capital loss from unfavorable fluctuation in currency values, from differences in generally accepted accounting principles, or from economic or political instability in other nations.
Small-company stocks are subject to greater volatility than many other asset classes.
Index ownership — “Russell Fundamental Developed ex-U.S. Small Company Index” is a joint trademark of Frank Russell Company (Russell) and Research Affiliates LLC (RA) and is used by the fund under license. “Research Affiliates” and “Fundamental Index” are trademarks of RA. Subject to RA’s intellectual property rights in certain content, Russell is the owner of all copyrights related to the Russell Fundamental Index Series. Russell is the owner of the trademarks and copyrights related to the Russell Indexes. Schwab Fundamental International Small Company Index ETF is not sponsored, endorsed, sold or promoted by Russell or RA, and Russell and RA do not make any representation regarding the advisability of investing in shares of the fund.
| * | Inception (8/15/13) represents the date that the shares began trading in the secondary market. |
| 1 | Performance does not reflect the deduction of taxes that a shareholder would pay on fund distributions or on the redemption of fund shares. |
| 2 | ETF performance must be shown based on both a market price and NAV basis. The fund’s per share net asset value (NAV) is the value of one share of the fund. NAV is calculated by taking the fund’s total assets (including the market value of securities owned), subtracting liabilities, and dividing by the number of shares outstanding. The NAV Return is based on the NAV of the fund, and the Market Price Return is based on the market price per share of the fund. The price used to calculate market return (Market Price) is determined by using the midpoint between the highest bid and the lowest offer on the primary stock exchange on which the shares of the fund are listed for trading, as of the time that the fund’s NAV is calculated. NAV is used as a proxy for purposes of calculating Market Price Return on inception date. Market Price and NAV returns assume that dividends and capital gain distributions have been reinvested in the fund at Market Price and NAV, respectively. |
| 3 | Source for category information: Morningstar, Inc. The Morningstar Category return represents all passively- and actively-managed ETFs within the category as of the report date. |
| 4 | As stated in the prospectus. |
Schwab Fundamental Index ETFs11
Schwab Fundamental International Small Company Index ETF
Performance and Fund Facts as of 08/31/15 continued
| Statistics |
| Number of Holdings | 1,375 |
| Weighted Average Market Cap (millions) | $3,046 |
| Price/Earnings Ratio (P/E) | 25.3 |
| Price/Book Ratio (P/B) | 1.4 |
| Portfolio Turnover Rate1,2 | 13% |
| Sector Weightings % of Investments |
| Industrials | 24.5% |
| Consumer Discretionary | 19.0% |
| Financials | 15.7% |
| Materials | 10.8% |
| Information Technology | 9.1% |
| Consumer Staples | 9.0% |
| Health Care | 5.1% |
| Energy | 3.1% |
| Telecommunication Services | 1.7% |
| Utilities | 1.3% |
| Other | 0.7% |
| Total | 100.0% |
| Top Equity Holdings % of Net Assets3 |
| Koninklijke BAM Groep N.V. | 0.3% |
| Alps Electric Co., Ltd. | 0.2% |
| IT Holdings Corp. | 0.2% |
| Kikkoman Corp. | 0.2% |
| Ryohin Keikaku Co., Ltd. | 0.2% |
| Matsumotokiyoshi Holdings Co., Ltd. | 0.2% |
| Greene King plc | 0.2% |
| iShares MSCI EAFE Small-Cap ETF | 0.2% |
| Banca Popolare di Milano Scarl | 0.2% |
| Nichirei Corp. | 0.2% |
| Total | 2.1% |
Country Weightings % of Investments
| Japan | 40.9% |
| United Kingdom | 13.1% |
| Canada | 6.9% |
| Australia | 4.9% |
| France | 4.3% |
| Germany | 3.6% |
| Italy | 3.0% |
| Switzerland | 2.8% |
| Other Countries | 20.5% |
| Total | 100.0% |
Portfolio holdings may have changed since the report date.
An index is a statistical composite of a specified financial market or sector. Unlike the fund, an index does not actually hold a portfolio of securities and its return is not inclusive of trading and management costs incurred by the fund.
Source of Sector Classification: S&P and MSCI.
| 1 | Not annualized. |
| 2 | Portfolio turnover rate excludes securities received or delivered from processing of in-kind creations or redemptions. |
| 3 | This list is not a recommendation of any security by the investment adviser. |
12Schwab Fundamental Index ETFs
Schwab Fundamental Emerging Markets Large Company Index ETF
Performance and Fund Facts as of 08/31/15
The performance data quoted represents past performance. Past performance does not guarantee future results. Investment return and principal value of an investment will fluctuate so that an investor’s shares, when sold or redeemed, may be worth more or less than the original cost. Current performance may be lower or higher than the performance quoted. To obtain performance information current to the most recent month end, please visit www.csimfunds.com.
Average Annual Total Returns1
| Fund and Inception Date | 6 Months | 1 Year | Since Inception* |
| Fund: Schwab Fundamental Emerging Markets Large Company Index ETF (8/15/13) | | | |
| Market Price Return2 | -17.58% | -29.38% | -9.53% |
| NAV Return2 | -17.51% | -29.72% | -9.84% |
| Russell Fundamental Emerging Markets Large Company Index (Net) | -17.24% | -29.47% | -9.34% |
| ETF Category: Morningstar Diversified Emerging Markets3 | -15.81% | -23.69% | -7.19% |
Fund Expense Ratio4: 0.48%
All total returns on this page assume dividends and distributions were reinvested. Index figures do not include trading and management costs, which would lower performance. Indices are unmanaged and cannot be invested in directly. Performance results less than one year are not annualized.
For index definitions, please see the Glossary.
Shares are bought and sold at market price, which may be higher or lower than the net asset value (NAV). Brokerage commissions will reduce returns.
International investing may involve risk of capital loss from unfavorable fluctuation in currency values, from differences in generally accepted accounting principles, or from economic or political instability in other nations.
Emerging markets involve heightened risks related to the same factors as international investing, as well as increased volatility and lower trading volume.
Index ownership — “Russell Fundamental Emerging Markets Large Company Index” is a joint trademark of Frank Russell Company (Russell) and Research Affiliates LLC (RA) and is used by the fund under license. “Research Affiliates” and “Fundamental Index” are trademarks of RA. Subject to RA’s intellectual property rights in certain content, Russell is the owner of all copyrights related to the Russell Fundamental Index Series. Russell is the owner of the trademarks and copyrights related to the Russell Indexes. Schwab Fundamental Emerging Markets Large Company Index ETF is not sponsored, endorsed, sold or promoted by Russell or RA, and Russell and RA do not make any representation regarding the advisability of investing in shares of the fund.
| * | Inception (8/15/13) represents the date that the shares began trading in the secondary market. |
| 1 | Performance does not reflect the deduction of taxes that a shareholder would pay on fund distributions or on the redemption of fund shares. |
| 2 | ETF performance must be shown based on both a market price and NAV basis. The fund’s per share net asset value (NAV) is the value of one share of the fund. NAV is calculated by taking the fund’s total assets (including the market value of securities owned), subtracting liabilities, and dividing by the number of shares outstanding. The NAV Return is based on the NAV of the fund, and the Market Price Return is based on the market price per share of the fund. The price used to calculate market return (Market Price) is determined by using the midpoint between the highest bid and the lowest offer on the primary stock exchange on which the shares of the fund are listed for trading, as of the time that the fund’s NAV is calculated. NAV is used as a proxy for purposes of calculating Market Price Return on inception date. Market Price and NAV returns assume that dividends and capital gain distributions have been reinvested in the fund at Market Price and NAV, respectively. |
| 3 | Source for category information: Morningstar, Inc. The Morningstar Category return represents all passively- and actively-managed ETFs within the category as of the report date. |
| 4 | As stated in the prospectus. |
Schwab Fundamental Index ETFs13
Schwab Fundamental Emerging Markets Large Company Index ETF
Performance and Fund Facts as of 08/31/15 continued
| Statistics |
| Number of Holdings | 283 |
| Weighted Average Market Cap (millions) | $47,461 |
| Price/Earnings Ratio (P/E) | 13.9 |
| Price/Book Ratio (P/B) | 0.9 |
| Portfolio Turnover Rate1,2 | 10% |
| Sector Weightings % of Investments |
| Energy | 26.0% |
| Financials | 18.9% |
| Information Technology | 14.5% |
| Telecommunication Services | 9.9% |
| Materials | 9.7% |
| Consumer Discretionary | 6.3% |
| Industrials | 5.2% |
| Consumer Staples | 4.1% |
| Utilities | 3.4% |
| Other | 2.0% |
| Total | 100.0% |
| Top Equity Holdings % of Net Assets3 |
| Gazprom PAO | 4.6% |
| Samsung Electronics Co., Ltd. | 4.0% |
| LUKOIL PJSC | 2.9% |
| China Mobile Ltd. | 2.4% |
| China Construction Bank Corp., H Shares | 2.2% |
| Taiwan Semiconductor Manufacturing Co., Ltd. | 1.9% |
| Hon Hai Precision Industry Co., Ltd. | 1.8% |
| Industrial & Commercial Bank of China Ltd., H Shares | 1.8% |
| Petroleo Brasileiro S.A., Preferred Stock | 1.6% |
| China Petroleum & Chemical Corp., H Shares | 1.6% |
| Total | 24.8% |
Country Weightings % of Investments
| Republic of Korea | 17.9% |
| China | 17.0% |
| Russia | 14.1% |
| Taiwan | 12.2% |
| Brazil | 12.1% |
| South Africa | 6.6% |
| Mexico | 3.9% |
| Poland | 2.7% |
| Other Countries | 13.5% |
| Total | 100.0% |
Portfolio holdings may have changed since the report date.
An index is a statistical composite of a specified financial market or sector. Unlike the fund, an index does not actually hold a portfolio of securities and its return is not inclusive of trading and management costs incurred by the fund.
Source of Sector Classification: S&P and MSCI.
| 1 | Not annualized. |
| 2 | Portfolio turnover rate excludes securities received or delivered from processing of in-kind creations or redemptions. |
| 3 | This list is not a recommendation of any security by the investment adviser. |
14Schwab Fundamental Index ETFs
Fund Expenses (Unaudited)
Examples for a $1,000 Investment
As a fund shareholder, you may incur two types of costs: (1) transaction costs, including brokerage commissions on purchases and sales of fund shares; and, (2) ongoing costs, including management fees and other fund expenses.
The expense examples below are intended to help you understand your ongoing cost (in dollars) of investing in a fund and to compare this cost with the ongoing cost of investing in other mutual funds. These examples are based on an investment of $1,000 invested for six months beginning March 1, 2015 and held through August 31, 2015.
Actual Return lines in the table below provide information about actual account values and actual expenses. You may use this information, together with the amount you invested, to estimate the expenses that you paid over the period. To do so, simply divide your account value by $1,000 (for example, an $8,600 account value ÷ $1,000 = 8.6), then multiply the result by the number given for your fund under the heading entitled “Expenses Paid During Period.”
Hypothetical Return lines in the table below provide information about hypothetical account values and hypothetical expenses based on a fund’s actual expense ratio and an assumed return of 5% per year before expenses. Because the return used is not an actual return, it may not be used to estimate the actual ending account value or expenses you paid for the period.
You may use this information to compare the ongoing costs of investing in a fund and other funds. To do so, compare this 5% hypothetical example with the 5% hypothetical examples that appear in the shareholder reports of the other funds.
Please note that the expenses shown in the table are meant to highlight your ongoing costs only, and do not reflect any transactional costs, including any brokerage commissions you may pay when purchasing or selling shares of a fund. Therefore, the hypothetical return lines of the table are useful in comparing ongoing costs only, and will not help you determine the relative total costs of owning different funds. In addition, if these transactional costs were included, your costs would have been higher.
| | Expense Ratio1
(Annualized) | Beginning
Account Value
at 3/1/15 | Ending
Account Value
(Net of Expenses)
at 8/31/15 | Expenses Paid
During Period2
3/1/15–8/31/15 |
| Schwab Fundamental U.S. Broad Market Index ETF | | | | |
| Actual Return | 0.32% | $1,000.00 | $ 928.90 | $1.55 |
| Hypothetical 5% Return | 0.32% | $1,000.00 | $1,023.49 | $1.63 |
| Schwab Fundamental U.S. Large Company Index ETF | | | | |
| Actual Return | 0.32% | $1,000.00 | $ 928.00 | $1.55 |
| Hypothetical 5% Return | 0.32% | $1,000.00 | $1,023.49 | $1.63 |
| Schwab Fundamental U.S. Small Company Index ETF | | | | |
| Actual Return | 0.32% | $1,000.00 | $ 934.60 | $1.56 |
| Hypothetical 5% Return | 0.32% | $1,000.00 | $1,023.49 | $1.63 |
| Schwab Fundamental International Large Company Index ETF | | | | |
| Actual Return | 0.32% | $1,000.00 | $ 923.40 | $1.55 |
| Hypothetical 5% Return | 0.32% | $1,000.00 | $1,023.49 | $1.63 |
| Schwab Fundamental International Small Company Index ETF | | | | |
| Actual Return | 0.46% | $1,000.00 | $ 971.70 | $2.28 |
| Hypothetical 5% Return | 0.46% | $1,000.00 | $ 1,022.79 | $2.34 |
| Schwab Fundamental Emerging Markets Large Company Index ETF | | | | |
| Actual Return | 0.46% | $1,000.00 | $ 824.90 | $2.11 |
| Hypothetical 5% Return | 0.46% | $1,000.00 | $ 1,022.79 | $2.34 |
| 1 | Based on the most recent six-month expense ratio; may differ from the expense ratio provided in the Financial Highlights. |
| 2 | Expenses for each fund are equal to the annualized expense ratio, multiplied by the average account value over the period, multiplied by 184 days of the period, and divided by 366 days of the fiscal year. |
Schwab Fundamental Index ETFs15
Schwab Fundamental U.S. Broad Market Index ETF
Financial Statements
Financial Highlights
| | 3/1/15–
8/31/15* | 3/1/14–
2/28/15 | 8/14/13 1–
2/28/14 | | | |
| Per-Share Data ($) |
| Net asset value at beginning of period | 30.54 | 27.36 | 25.00 | | | |
| Income (loss) from investment operations: | | | | | | |
| Net investment income (loss) | 0.31 2 | 0.54 | 0.21 | | | |
| Net realized and unrealized gains (losses) | (2.46) | 3.14 | 2.28 | | | |
| Total from investment operations | (2.15) | 3.68 | 2.49 | | | |
| Less distributions: | | | | | | |
| Distributions from net investment income | (0.31) | (0.50) | (0.13) | | | |
| Net asset value at end of period | 28.08 | 30.54 | 27.36 | | | |
| Total return (%) | (7.11) 3 | 13.54 | 9.99 3 | | | |
| Ratios/Supplemental Data (%) |
| Ratios to average net assets: | | | | | | |
| Total expenses | 0.32 4 | 0.32 | 0.32 4 | | | |
| Net investment income (loss) | 2.07 4 | 2.14 | 2.11 4 | | | |
| Portfolio turnover rate5 | 6 3 | 10 | 5 3 | | | |
| Net assets, end of period ($ x 1,000) | 220,421 | 212,247 | 58,823 | | | |
| |
1
Commencement of operations.
2
Calculated based on the average shares outstanding during the period.
3
Not annualized.
4
Annualized.
5
Portfolio turnover rate excludes securities received or delivered from processing of in-kind creations or redemptions.
Schwab Fundamental U.S. Broad Market Index ETF
Condensed Portfolio Holdings as of August 31, 2015 (Unaudited)
This section shows the fund's 50 largest portfolio holdings in unaffiliated issuers, any holdings exceeding 1% of the fund's net assets as of the report date, and any affiliated issuers. The remaining securities held by the fund are grouped as "Other Securities" in each category. You can request a complete schedule of portfolio holdings as of the report date, free of charge, by calling Schwab ETFs™ at 1-800-435-4000. This complete schedule, filed on the fund's Form N-CSR, is also available on the SEC's website at www.sec.gov.
In addition, the fund files its complete schedule of portfolio holdings with the SEC for the first and third quarters of each fiscal year on Form N-Q. The fund's Form N-Q is available on the SEC's website and may be viewed and copied at the SEC's Public Reference Room in Washington, D.C. Call 1-800-SEC-0330 for information on the operation of the Public Reference Room. The fund also makes available its complete schedule of portfolio holdings on a daily basis on the fund's website at www.csimfunds.com/schwabetfs_prospectus.
| Holdings by Category | Cost
($) | Value
($) |
| 99.5% | Common Stock | 222,526,397 | 219,198,227 |
| 0.0% | Rights | 1,852 | 1,852 |
| 0.5% | Other Investment Companies | 1,188,415 | 1,188,415 |
| 100.0% | Total Investments | 223,716,664 | 220,388,494 |
| 0.0% | Other Assets and
Liabilities, Net | | 32,312 |
| 100.0% | Net Assets | | 220,420,806 |
| Security | Number
of Shares | % of Net
Assets | Value
($) | |
| Common Stock 99.5% of net assets | |
| Automobiles & Components 1.2% | |
| Other Securities | | 1.2 | 2,551,330 | |
| Banks 5.7% | |
| Bank of America Corp. | 134,510 | 1.0 | 2,197,893 | |
| Citigroup, Inc. | 28,393 | 0.7 | 1,518,458 | |
| JPMorgan Chase & Co. | 45,050 | 1.3 | 2,887,705 | |
| Wells Fargo & Co. | 40,785 | 1.0 | 2,175,064 | |
| Other Securities | | 1.7 | 3,774,393 | |
| | | 5.7 | 12,553,513 | |
| Capital Goods 7.9% | |
| 3M Co. | 5,725 | 0.4 | 813,751 | |
| General Electric Co. | 110,816 | 1.2 | 2,750,453 | |
| United Technologies Corp. | 10,444 | 0.4 | 956,775 | |
| Other Securities | | 5.9 | 12,927,015 | |
| | | 7.9 | 17,447,994 | |
| Commercial & Professional Services 1.2% | |
| Other Securities | | 1.2 | 2,664,799 | |
| Consumer Durables & Apparel 1.4% | |
| Other Securities | | 1.4 | 3,006,147 | |
| Security | Number
of Shares | % of Net
Assets | Value
($) | |
| Consumer Services 2.0% | |
| McDonald's Corp. | 14,431 | 0.6 | 1,371,234 | |
| Other Securities | | 1.4 | 3,058,340 | |
| | | 2.0 | 4,429,574 | |
| Diversified Financials 3.3% | |
| Berkshire Hathaway, Inc., Class B * | 12,040 | 0.7 | 1,613,842 | |
| The Charles Schwab Corp. (a) | 3,482 | 0.0 | 105,783 | |
| The Goldman Sachs Group, Inc. | 4,669 | 0.4 | 880,573 | |
| Other Securities | | 2.2 | 4,677,633 | |
| | | 3.3 | 7,277,831 | |
| Energy 12.5% | |
| Chevron Corp. | 52,468 | 1.9 | 4,249,383 | |
| ConocoPhillips | 38,904 | 0.9 | 1,912,132 | |
| Exxon Mobil Corp. | 114,531 | 3.9 | 8,617,313 | |
| Occidental Petroleum Corp. | 12,622 | 0.4 | 921,532 | |
| Phillips 66 | 20,220 | 0.7 | 1,598,795 | |
| Schlumberger Ltd. | 11,786 | 0.4 | 911,883 | |
| Valero Energy Corp. | 18,595 | 0.5 | 1,103,427 | |
| Other Securities | | 3.8 | 8,256,176 | |
| | | 12.5 | 27,570,641 | |
| Food & Staples Retailing 4.0% | |
| Costco Wholesale Corp. | 7,110 | 0.5 | 995,755 | |
| CVS Health Corp. | 20,745 | 1.0 | 2,124,288 | |
| Wal-Mart Stores, Inc. | 42,099 | 1.2 | 2,725,068 | |
| Walgreens Boots Alliance, Inc. | 13,707 | 0.5 | 1,186,341 | |
| Other Securities | | 0.8 | 1,684,561 | |
| | | 4.0 | 8,716,013 | |
| Food, Beverage & Tobacco 5.3% | |
| Altria Group, Inc. | 18,498 | 0.4 | 991,123 | |
| PepsiCo, Inc. | 16,368 | 0.7 | 1,521,078 | |
| Philip Morris International, Inc. | 22,957 | 0.8 | 1,831,969 | |
| The Coca-Cola Co. | 38,027 | 0.7 | 1,495,222 | |
| Other Securities | | 2.7 | 5,962,222 | |
| | | 5.3 | 11,801,614 | |
| Health Care Equipment & Services 5.9% | |
| Anthem, Inc. | 9,150 | 0.6 | 1,290,607 | |
| Medtronic plc | 11,750 | 0.4 | 849,407 | |
| UnitedHealth Group, Inc. | 15,128 | 0.8 | 1,750,310 | |
| Other Securities | | 4.1 | 9,057,744 | |
| | | 5.9 | 12,948,068 | |
| Household & Personal Products 2.0% | |
| The Procter & Gamble Co. | 38,643 | 1.2 | 2,730,901 | |
| Other Securities | | 0.8 | 1,616,910 | |
| | | 2.0 | 4,347,811 | |
| Insurance 3.6% | |
| The Travelers Cos., Inc. | 10,290 | 0.5 | 1,024,369 | |
| Other Securities | | 3.1 | 6,995,195 | |
| | | 3.6 | 8,019,564 | |
Schwab Fundamental U.S. Broad Market Index ETF
Condensed Portfolio Holdings (Unaudited) continued
| Security | Number
of Shares | % of Net
Assets | Value
($) | |
| Materials 3.7% | |
| Other Securities | | 3.7 | 8,231,501 | |
| Media 3.2% | |
| Comcast Corp., Class A | 20,914 | 0.5 | 1,178,086 | |
| The Walt Disney Co. | 13,032 | 0.6 | 1,327,700 | |
| Time Warner, Inc. | 12,490 | 0.4 | 888,039 | |
| Other Securities | | 1.7 | 3,658,412 | |
| | | 3.2 | 7,052,237 | |
| Pharmaceuticals, Biotechnology & Life Sciences 5.5% | |
| Amgen, Inc. | 6,933 | 0.5 | 1,052,291 | |
| Eli Lilly & Co. | 10,597 | 0.4 | 872,663 | |
| Johnson & Johnson | 25,174 | 1.1 | 2,365,852 | |
| Merck & Co., Inc. | 27,596 | 0.7 | 1,486,045 | |
| Pfizer, Inc. | 82,765 | 1.2 | 2,666,688 | |
| Other Securities | | 1.6 | 3,601,063 | |
| | | 5.5 | 12,044,602 | |
| Real Estate 1.9% | |
| Other Securities | | 1.9 | 4,276,425 | |
| Retailing 5.5% | |
| Lowe's Cos., Inc. | 16,518 | 0.5 | 1,142,550 | |
| Target Corp. | 15,684 | 0.6 | 1,218,804 | |
| The Home Depot, Inc. | 14,816 | 0.8 | 1,725,471 | |
| Other Securities | | 3.6 | 8,063,416 | |
| | | 5.5 | 12,150,241 | |
| Semiconductors & Semiconductor Equipment 2.2% | |
| Intel Corp. | 77,541 | 1.0 | 2,213,020 | |
| Other Securities | | 1.2 | 2,620,121 | |
| | | 2.2 | 4,833,141 | |
| Software & Services 6.8% | |
| International Business Machines Corp. | 18,563 | 1.2 | 2,745,282 | |
| Microsoft Corp. | 85,703 | 1.7 | 3,729,795 | |
| Oracle Corp. | 30,702 | 0.5 | 1,138,737 | |
| Other Securities | | 3.4 | 7,376,625 | |
| | | 6.8 | 14,990,439 | |
| Technology Hardware & Equipment 4.7% | |
| Apple, Inc. | 24,046 | 1.2 | 2,711,427 | |
| Cisco Systems, Inc. | 61,984 | 0.7 | 1,604,146 | |
| Hewlett-Packard Co. | 62,697 | 0.8 | 1,759,278 | |
| Other Securities | | 2.0 | 4,284,703 | |
| | | 4.7 | 10,359,554 | |
| Telecommunication Services 3.9% | |
| AT&T, Inc. | 158,136 | 2.4 | 5,250,115 | |
| Verizon Communications, Inc. | 54,146 | 1.1 | 2,491,257 | |
| Other Securities | | 0.4 | 844,179 | |
| | | 3.9 | 8,585,551 | |
| Transportation 1.8% | |
| Other Securities | | 1.8 | 3,896,810 | |
| Security | Number
of Shares | % of Net
Assets | Value
($) | |
| Utilities 4.3% | |
| Other Securities | | 4.3 | 9,442,827 | |
| Total Common Stock |
| (Cost $222,526,397) | | | 219,198,227 | |
|
| Rights 0.0% of net assets | |
| Telecommunication Services 0.0% | |
| Other Securities | | 0.0 | 1,852 | |
| Total Rights |
| (Cost $1,852) | | | 1,852 | |
|
| Other Investment Companies 0.5% of net assets | |
| Money Market Fund 0.2% | |
| Other Securities | | 0.2 | 441,752 | |
| Securities Lending Collateral 0.3% | |
| Other Securities | | 0.3 | 746,663 | |
| Total Other Investment Companies |
| (Cost $1,188,415) | | | 1,188,415 | |
End of Investments.
At 08/31/15, the tax basis cost of the fund's investments was $223,731,993 and the unrealized appreciation and depreciation were $15,078,711 and ($18,422,210), respectively, with a net unrealized depreciation of ($3,343,499).
For the following notes, please refer to the complete schedule of portfolio holdings.
| * | Non-income producing security. |
| (a) | Issuer is affiliated with the fund's adviser. |
| (b) | All or a portion of this security is on loan. Securities on loan were valued at $749,488. Non-cash collateral pledged to the fund for securities on loan amounted to $27,521. |
| (c) | The rate shown is the 7-day yield. |
| (d) | Fair-valued by management in accordance with procedures approved by the Board of Trustees. |
| (e) | Illiquid security. At the period end, the value of these amounted to $1,852 or 0.0% of net assets. |
| | |
| CVR — | Contingent Value Rights |
| REIT — | Real Estate Investment Trust |
In addition to the above, the fund held the following at 08/31/15:
| | Number of
Contracts | Contract
Value
($) | Unrealized
Depreciation
($) |
| Futures Contracts | | | |
| S&P 500 Index, e-mini, Long, expires 09/18/15 | 6 | 590,760 | (23,189) |
Schwab Fundamental U.S. Broad Market Index ETF
Condensed Portfolio Holdings (Unaudited) continued
The following is a summary of the inputs used to value the fund’s investments as of August 31, 2015 (see financial note 2(a) for additional information):
Assets Valuation Input
| Description | | Quoted Prices in
Active Markets for
Identical Assets
(Level 1) | | Other Significant
Observable Inputs
(Level 2) | | Significant
Unobservable
Inputs
(Level 3) | | Total | |
| Common Stock1 | | $219,198,227 | | $— | | $— | | $219,198,227 | |
| Rights 1 | | — | | — | | 1,852 | | 1,852 | |
| Other Investment Companies1 | | 1,188,415 | | — | | — | | 1,188,415 | |
| Total | | $220,386,642 | | $— | | $1,852 | | $220,388,494 | |
Liabilities Valuation Input
| | | | | | | | | |
| | | | | | | | | |
| Other Financial Instruments | | | | | | | | | |
| Futures Contracts2 | | ($23,189) | | $— | | $— | | ($23,189) | |
| 1 | As categorized in the complete schedule of portfolio holdings. |
| 2 | Futures contracts are not included in Investments in the schedule of condensed portfolio holdings and are valued at unrealized appreciation or depreciation. |
The following is a reconciliation of Level 3 investments for which significant unobservable inputs were used to determine fair value:
| Investments in Securities | | Balance
as of
February 28,
2015 | | Realized
Gains
(Losses) | | Change in
Unrealized
Appreciation
(Depreciation) | | Gross
Purchases | | Gross
Sales | | Gross
Transfers
in | | Gross
Transfers
out | | Balance
as of
August 31,
2015 |
| Rights | | $1,852 | | $— | | $— | | $— | | $— | | $— | | $— | | $1,852 |
| Total | | $1,852 | | $— | | $— | | $— | | $— | | $— | | $— | | $1,852 |
The fund's policy is to recognize transfers between Level 1, Level 2 and Level 3 as of the beginning of the fiscal year. There were no transfers between Level 1, Level 2 and Level 3 for the period ended August 31, 2015.
Schwab Fundamental U.S. Broad Market Index ETF
Statement of
Assets and Liabilities
As of August 31, 2015; unaudited
| Assets |
| Investments in affiliated issuers, at value (cost $87,986) | | $105,783 |
| Investments in unaffiliated issuers, at value (cost $222,882,015) including securities on loan of $749,488 | | 219,536,048 |
| Collateral invested for securities on loan, at value (cost $746,663) | + | 746,663 |
| Total investments, at value (cost $223,716,664) | | 220,388,494 |
| Cash | | 102,396 |
| Deposit with broker for futures contracts | | 27,600 |
| Receivables: | | |
| Investments sold | | 225 |
| Fund shares sold | | 1,403,954 |
| Dividends | | 632,040 |
| Income from securities on loan | + | 2,825 |
| Total assets | | 222,557,534 |
| Liabilities |
| Collateral held for securities on loan | | 746,663 |
| Payables: | | |
| Investments bought | | 1,370,717 |
| Investment adviser fees | | 13,198 |
| Variation margin on futures contracts | + | 6,150 |
| Total liabilities | | 2,136,728 |
| Net Assets |
| Total assets | | 222,557,534 |
| Total liabilities | – | 2,136,728 |
| Net assets | | $220,420,806 |
| Net Assets by Source | | |
| Capital received from investors | | 223,140,244 |
| Net investment income not yet distributed | | 859,994 |
| Net realized capital losses | | (228,073) |
| Net unrealized capital depreciation | | (3,351,359) |
| Net Asset Value (NAV) |
| Net Assets | ÷ | Shares
Outstanding | = | NAV |
| $220,420,806 | | 7,850,001 | | $28.08 |
| | | | | |
Schwab Fundamental U.S. Broad Market Index ETF
Statement of
Operations
For the period March 1, 2015 through August 31, 2015; unaudited
| Investment Income |
| Dividends received from affiliated issuer | | $458 |
| Dividends received from unaffiliated issuers (net of foreign withholding tax of $588) | | 2,659,900 |
| Securities on loan | + | 15,118 |
| Total investment income | | 2,675,476 |
| Expenses |
| Investment adviser fees | | 358,289 |
| Total expenses | – | 358,289 |
| Net investment income | | 2,317,187 |
| Realized and Unrealized Gains (Losses) |
| Net realized gains on affiliated issuer | | 3,077 |
| Net realized losses on unaffiliated investments | | (128,866) |
| Net realized losses on futures contracts | | (18,755) |
| Net realized losses on foreign currency transactions | + | (1) |
| Net realized losses | | (144,545) |
| Net change in unrealized appreciation (depreciation) on affiliated issuer | | 3,410 |
| Net change in unrealized appreciation (depreciation) on unaffiliated investments | | (18,961,912) |
| Net change in unrealized appreciation (depreciation) on futures contracts | + | (23,565) |
| Net change in unrealized appreciation (depreciation) | + | (18,982,067) |
| Net realized and unrealized losses | | (19,126,612) |
| Decrease in net assets resulting from operations | | ($16,809,425) |
Schwab Fundamental U.S. Broad Market Index ETF
Statement of
Changes in Net Assets
For the current and prior report periods
Figures for the current period are unaudited
| Operations | |
| | 3/1/15-8/31/15 | 3/1/14-2/28/15 |
| Net investment income | | $2,317,187 | $2,720,571 |
| Net realized losses | | (144,545) | (55,475) |
| Net change in unrealized appreciation (depreciation) | + | (18,982,067) | 12,915,457 |
| Increase (decrease) in net assets resulting from operations | | (16,809,425) | 15,580,553 |
| Distributions to Shareholders | |
| Distributions from net investment income | | ($2,276,300) | ($2,041,330) |
| Transactions in Fund Shares | | | |
| | | 3/1/15-8/31/15 | 3/1/14-2/28/15 |
| | | SHARES | VALUE | SHARES | VALUE |
| Shares sold | | 900,000 | $27,259,536 | 4,800,000 | $139,884,389 |
| Shares redeemed | + | — | — | — | — |
| Net transactions in fund shares | | 900,000 | $27,259,536 | 4,800,000 | $139,884,389 |
| Shares Outstanding and Net Assets | | | |
| | | 3/1/15-8/31/15 | 3/1/14-2/28/15 |
| | | SHARES | NET ASSETS | SHARES | NET ASSETS |
| Beginning of period | | 6,950,001 | $212,246,995 | 2,150,001 | $58,823,383 |
| Total increase | + | 900,000 | 8,173,811 | 4,800,000 | 153,423,612 |
| End of period | | 7,850,001 | $220,420,806 | 6,950,001 | $212,246,995 |
| Net investment income not yet distributed | | | $859,994 | | $819,107 |
Schwab Fundamental U.S. Large Company Index ETF
Financial Statements
Financial Highlights
| | 3/1/15–
8/31/15* | 3/1/14–
2/28/15 | 8/14/13 1–
2/28/14 | | | |
| Per-Share Data ($) |
| Net asset value at beginning of period | 30.55 | 27.27 | 25.00 | | | |
| Income (loss) from investment operations: | | | | | | |
| Net investment income (loss) | 0.33 2 | 0.52 | 0.21 | | | |
| Net realized and unrealized gains (losses) | (2.51) | 3.25 | 2.18 | | | |
| Total from investment operations | (2.18) | 3.77 | 2.39 | | | |
| Less distributions: | | | | | | |
| Distributions from net investment income | (0.26) | (0.49) | (0.12) | | | |
| Net asset value at end of period | 28.11 | 30.55 | 27.27 | | | |
| Total return (%) | (7.20) 3 | 13.92 | 9.59 3 | | | |
| Ratios/Supplemental Data (%) |
| Ratios to average net assets: | | | | | | |
| Total expenses | 0.32 4 | 0.32 | 0.32 4 | | | |
| Net investment income (loss) | 2.18 4 | 2.24 | 2.20 4 | | | |
| Portfolio turnover rate5 | 6 3 | 10 | 6 3 | | | |
| Net assets, end of period ($ x 1,000) | 690,093 | 336,043 | 72,259 | | | |
| |
1
Commencement of operations.
2
Calculated based on the average shares outstanding during the period.
3
Not annualized.
4
Annualized.
5
Portfolio turnover rate excludes securities received or delivered from processing of in-kind creations or redemptions.
Schwab Fundamental U.S. Large Company Index ETF
Condensed Portfolio Holdings as of August 31, 2015 (Unaudited)
This section shows the fund's 50 largest portfolio holdings in unaffiliated issuers, any holdings exceeding 1% of the fund's net assets as of the report date, and any affiliated issuers. The remaining securities held by the fund are grouped as "Other Securities" in each category. You can request a complete schedule of portfolio holdings as of the report date, free of charge, by calling Schwab ETFs™ at 1-800-435-4000. This complete schedule, filed on the fund's Form N-CSR, is also available on the SEC's website at www.sec.gov.
In addition, the fund files its complete schedule of portfolio holdings with the SEC for the first and third quarters of each fiscal year on Form N-Q. The fund's Form N-Q is available on the SEC's website and may be viewed and copied at the SEC's Public Reference Room in Washington, D.C. Call 1-800-SEC-0330 for information on the operation of the Public Reference Room. The fund also makes available its complete schedule of portfolio holdings on a daily basis on the fund's website at www.csimfunds.com/schwabetfs_prospectus.
| Holdings by Category | Cost
($) | Value
($) |
| 99.5% | Common Stock | 736,722,324 | 686,681,938 |
| 0.3% | Other Investment Companies | 2,093,038 | 2,093,038 |
| 99.8% | Total Investments | 738,815,362 | 688,774,976 |
| 0.2% | Other Assets and
Liabilities, Net | | 1,318,433 |
| 100.0% | Net Assets | | 690,093,409 |
| Security | Number
of Shares | % of Net
Assets | Value
($) | |
| Common Stock 99.5% of net assets | |
| Automobiles & Components 1.2% | |
| Other Securities | | 1.2 | 8,129,682 | |
| Banks 5.8% | |
| Bank of America Corp. | 467,172 | 1.1 | 7,633,590 | |
| Citigroup, Inc. | 98,936 | 0.8 | 5,291,097 | |
| JPMorgan Chase & Co. | 155,511 | 1.4 | 9,968,255 | |
| Wells Fargo & Co. | 139,544 | 1.1 | 7,441,881 | |
| Other Securities | | 1.4 | 9,350,972 | |
| | | 5.8 | 39,685,795 | |
| Capital Goods 7.5% | |
| 3M Co. | 20,027 | 0.4 | 2,846,638 | |
| General Electric Co. | 380,045 | 1.4 | 9,432,717 | |
| United Technologies Corp. | 36,162 | 0.5 | 3,312,801 | |
| Other Securities | | 5.2 | 36,309,545 | |
| | | 7.5 | 51,901,701 | |
| Commercial & Professional Services 0.8% | |
| Other Securities | | 0.8 | 5,784,918 | |
| Consumer Durables & Apparel 1.1% | |
| Other Securities | | 1.1 | 7,877,296 | |
| Security | Number
of Shares | % of Net
Assets | Value
($) | |
| Consumer Services 1.8% | |
| McDonald's Corp. | 49,840 | 0.7 | 4,735,797 | |
| Other Securities | | 1.1 | 7,398,075 | |
| | | 1.8 | 12,133,872 | |
| Diversified Financials 3.3% | |
| Berkshire Hathaway, Inc., Class B * | 40,774 | 0.8 | 5,465,347 | |
| The Charles Schwab Corp. (a) | 13,004 | 0.1 | 395,062 | |
| The Goldman Sachs Group, Inc. | 16,254 | 0.4 | 3,065,504 | |
| Other Securities | | 2.0 | 13,652,338 | |
| | | 3.3 | 22,578,251 | |
| Energy 13.3% | |
| Chevron Corp. | 181,258 | 2.1 | 14,680,085 | |
| ConocoPhillips | 134,092 | 1.0 | 6,590,622 | |
| Exxon Mobil Corp. | 394,109 | 4.3 | 29,652,761 | |
| Occidental Petroleum Corp. | 43,223 | 0.5 | 3,155,711 | |
| Phillips 66 | 69,736 | 0.8 | 5,514,026 | |
| Schlumberger Ltd. | 40,716 | 0.5 | 3,150,197 | |
| Valero Energy Corp. | 64,722 | 0.6 | 3,840,603 | |
| Other Securities | | 3.5 | 24,832,297 | |
| | | 13.3 | 91,416,302 | |
| Food & Staples Retailing 4.3% | |
| Costco Wholesale Corp. | 24,403 | 0.5 | 3,417,640 | |
| CVS Health Corp. | 71,534 | 1.1 | 7,325,082 | |
| Wal-Mart Stores, Inc. | 144,078 | 1.4 | 9,326,169 | |
| Walgreens Boots Alliance, Inc. | 47,688 | 0.6 | 4,127,396 | |
| Other Securities | | 0.7 | 5,098,438 | |
| | | 4.3 | 29,294,725 | |
| Food, Beverage & Tobacco 5.6% | |
| Altria Group, Inc. | 63,059 | 0.5 | 3,378,701 | |
| PepsiCo, Inc. | 56,322 | 0.8 | 5,234,003 | |
| Philip Morris International, Inc. | 78,713 | 0.9 | 6,281,297 | |
| The Coca-Cola Co. | 128,466 | 0.7 | 5,051,283 | |
| Other Securities | | 2.7 | 18,841,664 | |
| | | 5.6 | 38,786,948 | |
| Health Care Equipment & Services 6.0% | |
| Anthem, Inc. | 30,960 | 0.6 | 4,366,908 | |
| Medtronic plc | 39,851 | 0.4 | 2,880,829 | |
| UnitedHealth Group, Inc. | 51,897 | 0.9 | 6,004,483 | |
| Other Securities | | 4.1 | 27,940,450 | |
| | | 6.0 | 41,192,670 | |
| Household & Personal Products 2.1% | |
| The Procter & Gamble Co. | 132,128 | 1.4 | 9,337,486 | |
| Other Securities | | 0.7 | 5,264,363 | |
| | | 2.1 | 14,601,849 | |
| Insurance 3.6% | |
| The Travelers Cos., Inc. | 35,655 | 0.5 | 3,549,455 | |
| Other Securities | | 3.1 | 21,438,003 | |
| | | 3.6 | 24,987,458 | |
Schwab Fundamental U.S. Large Company Index ETF
Condensed Portfolio Holdings (Unaudited) continued
| Security | Number
of Shares | % of Net
Assets | Value
($) | |
| Materials 3.5% | |
| Other Securities | | 3.5 | 24,447,432 | |
| Media 3.3% | |
| Comcast Corp., Class A | 71,468 | 0.6 | 4,025,793 | |
| The Walt Disney Co. | 44,829 | 0.7 | 4,567,179 | |
| Time Warner, Inc. | 43,307 | 0.4 | 3,079,128 | |
| Other Securities | | 1.6 | 11,295,326 | |
| | | 3.3 | 22,967,426 | |
| Pharmaceuticals, Biotechnology & Life Sciences 5.8% | |
| Amgen, Inc. | 24,176 | 0.5 | 3,669,433 | |
| Eli Lilly & Co. | 36,932 | 0.4 | 3,041,350 | |
| Johnson & Johnson | 86,469 | 1.2 | 8,126,357 | |
| Merck & Co., Inc. | 95,093 | 0.7 | 5,120,758 | |
| Pfizer, Inc. | 285,964 | 1.3 | 9,213,760 | |
| Other Securities | | 1.7 | 10,693,211 | |
| | | 5.8 | 39,864,869 | |
| Real Estate 1.2% | |
| Other Securities | | 1.2 | 8,349,196 | |
| Retailing 5.5% | |
| Lowe's Cos., Inc. | 57,904 | 0.6 | 4,005,220 | |
| Target Corp. | 54,201 | 0.6 | 4,211,960 | |
| The Home Depot, Inc. | 51,487 | 0.9 | 5,996,176 | |
| Other Securities | | 3.4 | 23,739,254 | |
| | | 5.5 | 37,952,610 | |
| Semiconductors & Semiconductor Equipment 2.1% | |
| Intel Corp. | 268,304 | 1.1 | 7,657,396 | |
| Other Securities | | 1.0 | 6,970,149 | |
| | | 2.1 | 14,627,545 | |
| Software & Services 6.9% | |
| International Business Machines Corp. | 63,883 | 1.4 | 9,447,657 | |
| Microsoft Corp. | 295,543 | 1.9 | 12,862,031 | |
| Oracle Corp. | 106,056 | 0.6 | 3,933,617 | |
| Other Securities | | 3.0 | 21,435,413 | |
| | | 6.9 | 47,678,718 | |
| Technology Hardware & Equipment 4.7% | |
| Apple, Inc. | 82,932 | 1.4 | 9,351,412 | |
| Cisco Systems, Inc. | 212,991 | 0.8 | 5,512,207 | |
| Hewlett-Packard Co. | 216,346 | 0.9 | 6,070,669 | |
| Other Securities | | 1.6 | 11,664,973 | |
| | | 4.7 | 32,599,261 | |
| Telecommunication Services 4.2% | |
| AT&T, Inc. | 544,275 | 2.6 | 18,069,930 | |
| Verizon Communications, Inc. | 185,955 | 1.2 | 8,555,790 | |
| Other Securities | | 0.4 | 2,123,194 | |
| | | 4.2 | 28,748,914 | |
| Security | Number
of Shares | % of Net
Assets | Value
($) | |
| Transportation 1.6% | |
| Other Securities | | 1.6 | 11,329,040 | |
| Utilities 4.3% | |
| Other Securities | | 4.3 | 29,745,460 | |
| Total Common Stock |
| (Cost $736,722,324) | | | 686,681,938 | |
|
| Other Investment Companies 0.3% of net assets | |
| Money Market Fund 0.1% | |
| Other Securities | | 0.1 | 580,860 | |
| Securities Lending Collateral 0.2% | |
| Other Securities | | 0.2 | 1,512,178 | |
| Total Other Investment Companies |
| (Cost $2,093,038) | | | 2,093,038 | |
End of Investments.
At 08/31/15, the tax basis cost of the fund's investments was $738,903,410 and the unrealized appreciation and depreciation were $11,560,225 and ($61,688,659), respectively, with a net unrealized depreciation of ($50,128,434).
For the following notes, please refer to the complete schedule of portfolio holdings.
| * | Non-income producing security. |
| (a) | Issuer is affiliated with the fund's adviser. |
| (b) | All or a portion of this security is on loan. Securities on loan were valued at $1,599,205. Non-cash collateral pledged to the fund for securities on loan amounted to $103,264. |
| (c) | The rate shown is the 7-day yield. |
| | |
| REIT — | Real Estate Investment Trust |
In addition to the above, the fund held the following at 08/31/15:
| | Number of
Contracts | Contract
Value
($) | Unrealized
Depreciation
($) |
| Futures Contracts | | | |
| S&P 500 Index, e-mini, Long, expires 09/18/15 | 17 | 1,673,820 | (55,525) |
Schwab Fundamental U.S. Large Company Index ETF
Condensed Portfolio Holdings (Unaudited) continued
The following is a summary of the inputs used to value the fund’s investments as of August 31, 2015 (see financial note 2(a) for additional information):
Assets Valuation Input
| Description | | Quoted Prices in
Active Markets for
Identical Assets
(Level 1) | | Other Significant
Observable Inputs
(Level 2) | | Significant
Unobservable
Inputs
(Level 3) | | Total | |
| Common Stock1 | | $686,681,938 | | $— | | $— | | $686,681,938 | |
| Other Investment Companies1 | | 2,093,038 | | — | | — | | 2,093,038 | |
| Total | | $688,774,976 | | $— | | $— | | $688,774,976 | |
Liabilities Valuation Input
| | | | | | | | | |
| | | | | | | | | |
| Other Financial Instruments | | | | | | | | | |
| Futures Contracts2 | | ($55,525) | | $— | | $— | | ($55,525) | |
| 1 | As categorized in the complete schedule of portfolio holdings. |
| 2 | Futures contracts are not included in Investments in the schedule of condensed portfolio holdings and are valued at unrealized appreciation or depreciation. |
The fund's policy is to recognize transfers between Level 1, Level 2 and Level 3 as of the beginning of the fiscal year. There were no transfers between Level 1, Level 2 and Level 3 for the period ended August 31, 2015.
Schwab Fundamental U.S. Large Company Index ETF
Statement of
Assets and Liabilities
As of August 31, 2015; unaudited
| Assets |
| Investments in affiliated issuers, at value (cost $387,554) | | $395,062 |
| Investments in unaffiliated issuers, at value (cost $736,915,630) including securities on loan of $1,599,205 | | 686,867,736 |
| Collateral invested for securities on loan, at value (cost $1,512,178) | + | 1,512,178 |
| Total investments, at value (cost $738,815,362) | | 688,774,976 |
| Cash | | 306,552 |
| Deposit with broker for futures contracts | | 165,600 |
| Receivables: | | |
| Investments sold | | 5,724 |
| Fund shares sold | | 16,918,747 |
| Dividends | | 2,175,642 |
| Income from securities on loan | + | 4,664 |
| Total assets | | 708,351,905 |
| Liabilities |
| Collateral held for securities on loan | | 1,512,178 |
| Payables: | | |
| Investments bought | | 13,863,619 |
| Investment adviser fees | | 40,955 |
| Fund shares redeemed | | 2,824,319 |
| Variation margin on futures contracts | + | 17,425 |
| Total liabilities | | 18,258,496 |
| Net Assets |
| Total assets | | 708,351,905 |
| Total liabilities | – | 18,258,496 |
| Net assets | | $690,093,409 |
| Net Assets by Source | | |
| Capital received from investors | | 727,347,586 |
| Net investment income not yet distributed | | 2,889,110 |
| Net realized capital gains | | 9,952,624 |
| Net unrealized capital depreciation | | (50,095,911) |
| Net Asset Value (NAV) |
| Net Assets | ÷ | Shares
Outstanding | = | NAV |
| $690,093,409 | | 24,550,001 | | $28.11 |
| | | | | |
Schwab Fundamental U.S. Large Company Index ETF
Statement of
Operations
For the period March 1, 2015 through August 31, 2015; unaudited
| Investment Income |
| Dividends received from affiliated issuer | | $1,375 |
| Dividends received from unaffiliated issuers (net of foreign withholding tax of $1,809) | | 7,363,070 |
| Securities on loan | + | 20,054 |
| Total investment income | | 7,384,499 |
| Expenses |
| Investment adviser fees | | 944,499 |
| Total expenses | – | 944,499 |
| Net investment income | | 6,440,000 |
| Realized and Unrealized Gains (Losses) |
| Net realized gains on affiliated issuer | | 13,616 |
| Net realized losses on unaffiliated investments | | (355,347) |
| Net realized gains on in-kind redemptions | | 10,557,683 |
| Net realized losses on futures contracts | + | (100,059) |
| Net realized gains | | 10,115,893 |
| Net change in unrealized appreciation (depreciation) on affiliated issuer | | (16,351) |
| Net change in unrealized appreciation (depreciation) on unaffiliated investments | | (70,952,959) |
| Net change in unrealized appreciation (depreciation) on futures contracts | + | (55,377) |
| Net change in unrealized appreciation (depreciation) | + | (71,024,687) |
| Net realized and unrealized losses | | (60,908,794) |
| Decrease in net assets resulting from operations | | ($54,468,794) |
Schwab Fundamental U.S. Large Company Index ETF
Statement of
Changes in Net Assets
For the current and prior report periods
Figures for the current period are unaudited
| Operations | |
| | 3/1/15-8/31/15 | 3/1/14-2/28/15 |
| Net investment income | | $6,440,000 | $3,875,641 |
| Net realized gains | | 10,115,893 | 1,653,873 |
| Net change in unrealized appreciation (depreciation) | + | (71,024,687) | 17,970,076 |
| Increase (decrease) in net assets resulting from operations | | (54,468,794) | 23,499,590 |
| Distributions to Shareholders | |
| Distributions from net investment income | | ($4,815,930) | ($2,790,460) |
| Transactions in Fund Shares | | | |
| | | 3/1/15-8/31/15 | 3/1/14-2/28/15 |
| | | SHARES | VALUE | SHARES | VALUE |
| Shares sold | | 17,650,000 | $531,090,439 | 8,700,000 | $253,334,704 |
| Shares redeemed | + | (4,100,000) | (117,755,726) | (350,000) | (10,258,984) |
| Net transactions in fund shares | | 13,550,000 | $413,334,713 | 8,350,000 | $243,075,720 |
| Shares Outstanding and Net Assets | | | |
| | | 3/1/15-8/31/15 | 3/1/14-2/28/15 |
| | | SHARES | NET ASSETS | SHARES | NET ASSETS |
| Beginning of period | | 11,000,001 | $336,043,420 | 2,650,001 | $72,258,570 |
| Total increase | + | 13,550,000 | 354,049,989 | 8,350,000 | 263,784,850 |
| End of period | | 24,550,001 | $690,093,409 | 11,000,001 | $336,043,420 |
| Net investment income not yet distributed | | | $2,889,110 | | $1,265,040 |
Schwab Fundamental U.S. Small Company Index ETF
Financial Statements
Financial Highlights
| | 3/1/15–
8/31/15* | 3/1/14–
2/28/15 | 8/14/13 1–
2/28/14 | | | |
| Per-Share Data ($) |
| Net asset value at beginning of period | 30.68 | 28.44 | 25.00 | | | |
| Income (loss) from investment operations: | | | | | | |
| Net investment income (loss) | 0.21 2 | 0.34 | 0.12 | | | |
| Net realized and unrealized gains (losses) | (2.21) | 2.22 | 3.41 | | | |
| Total from investment operations | (2.00) | 2.56 | 3.53 | | | |
| Less distributions: | | | | | | |
| Distributions from net investment income | (0.16) | (0.32) | (0.09) | | | |
| Net asset value at end of period | 28.52 | 30.68 | 28.44 | | | |
| Total return (%) | (6.54) 3 | 9.06 | 14.14 3 | | | |
| Ratios/Supplemental Data (%) |
| Ratios to average net assets: | | | | | | |
| Total expenses | 0.32 4 | 0.32 | 0.32 4 | | | |
| Net investment income (loss) | 1.40 4 | 1.32 | 1.16 4 | | | |
| Portfolio turnover rate5 | 15 3 | 22 | 9 3 | | | |
| Net assets, end of period ($ x 1,000) | 413,512 | 187,141 | 55,465 | | | |
| |
1
Commencement of operations.
2
Calculated based on the average shares outstanding during the period.
3
Not annualized.
4
Annualized.
5
Portfolio turnover rate excludes securities received or delivered from processing of in-kind creations or redemptions.
Schwab Fundamental U.S. Small Company Index ETF
Condensed Portfolio Holdings as of August 31, 2015 (Unaudited)
This section shows the fund's 50 largest portfolio holdings in unaffiliated issuers, any holdings exceeding 1% of the fund's net assets as of the report date, and any affiliated issuers. The remaining securities held by the fund are grouped as "Other Securities" in each category. You can request a complete schedule of portfolio holdings as of the report date, free of charge, by calling Schwab ETFs™ at 1-800-435-4000. This complete schedule, filed on the fund's Form N-CSR, is also available on the SEC's website at www.sec.gov.
In addition, the fund files its complete schedule of portfolio holdings with the SEC for the first and third quarters of each fiscal year on Form N-Q. The fund's Form N-Q is available on the SEC's website and may be viewed and copied at the SEC's Public Reference Room in Washington, D.C. Call 1-800-SEC-0330 for information on the operation of the Public Reference Room. The fund also makes available its complete schedule of portfolio holdings on a daily basis on the fund's website at www.csimfunds.com/schwabetfs_prospectus.
| Holdings by Category | Cost
($) | Value
($) |
| 99.9% | Common Stock | 442,086,639 | 412,967,310 |
| 0.0% | Rights | 14,969 | 14,969 |
| 1.9% | Other Investment Companies | 8,019,751 | 8,019,751 |
| 101.8% | Total Investments | 450,121,359 | 421,002,030 |
| (1.8%) | Other Assets and
Liabilities, Net | | (7,490,273) |
| 100.0% | Net Assets | | 413,511,757 |
| Security | Number
of Shares | % of Net
Assets | Value
($) | |
| Common Stock 99.9% of net assets | |
| Automobiles & Components 1.0% | |
| Other Securities | | 1.0 | 4,303,230 | |
| Banks 5.2% | |
| Zions Bancorp | 41,869 | 0.3 | 1,214,201 | |
| Other Securities | | 4.9 | 20,446,446 | |
| | | 5.2 | 21,660,647 | |
| Capital Goods 12.1% | |
| Acuity Brands, Inc. | 5,066 | 0.2 | 987,211 | |
| Lennox International, Inc. | 10,489 | 0.3 | 1,238,122 | |
| Masco Corp. | 52,046 | 0.3 | 1,365,167 | |
| Orbital ATK, Inc. | 15,527 | 0.3 | 1,175,549 | |
| Spirit AeroSystems Holdings, Inc., Class A * | 20,279 | 0.3 | 1,036,460 | |
| WABCO Holdings, Inc. * | 8,471 | 0.2 | 976,876 | |
| Other Securities | | 10.5 | 43,258,692 | |
| | | 12.1 | 50,038,077 | |
| Commercial & Professional Services 5.2% | |
| ABM Industries, Inc. | 32,758 | 0.3 | 1,048,584 | |
| Copart, Inc. * | 30,275 | 0.3 | 1,060,231 | |
| Other Securities | | 4.6 | 19,226,888 | |
| | | 5.2 | 21,335,703 | |
| Security | Number
of Shares | % of Net
Assets | Value
($) | |
| Consumer Durables & Apparel 3.6% | |
| D.R. Horton, Inc. | 45,539 | 0.3 | 1,383,019 | |
| Harman International Industries, Inc. | 10,155 | 0.2 | 992,550 | |
| Other Securities | | 3.1 | 12,674,628 | |
| | | 3.6 | 15,050,197 | |
| Consumer Services 4.6% | |
| Service Corp. International | 47,928 | 0.3 | 1,421,065 | |
| Other Securities | | 4.3 | 17,421,538 | |
| | | 4.6 | 18,842,603 | |
| Diversified Financials 3.6% | |
| E*TRADE Financial Corp. * | 43,907 | 0.3 | 1,154,315 | |
| Federated Investors, Inc., Class B | 31,631 | 0.2 | 980,561 | |
| SEI Investments Co. | 21,917 | 0.3 | 1,108,562 | |
| Other Securities | | 2.8 | 11,596,167 | |
| | | 3.6 | 14,839,605 | |
| Energy 5.1% | |
| McDermott International, Inc. * | 229,368 | 0.3 | 1,165,189 | |
| SEACOR Holdings, Inc. * | 17,129 | 0.3 | 1,104,992 | |
| Western Refining, Inc. | 28,942 | 0.3 | 1,245,085 | |
| WPX Energy, Inc. * | 148,458 | 0.3 | 1,085,228 | |
| Other Securities | | 3.9 | 16,304,367 | |
| | | 5.1 | 20,904,861 | |
| Food & Staples Retailing 1.0% | |
| SUPERVALU, Inc. * | 127,284 | 0.3 | 1,048,820 | |
| Other Securities | | 0.7 | 3,049,238 | |
| | | 1.0 | 4,098,058 | |
| Food, Beverage & Tobacco 2.6% | |
| Flowers Foods, Inc. | 43,229 | 0.2 | 1,003,345 | |
| Universal Corp. | 21,556 | 0.3 | 1,060,771 | |
| Other Securities | | 2.1 | 8,587,893 | |
| | | 2.6 | 10,652,009 | |
| Health Care Equipment & Services 5.0% | |
| MEDNAX, Inc. * | 12,959 | 0.3 | 1,043,848 | |
| Other Securities | | 4.7 | 19,819,582 | |
| | | 5.0 | 20,863,430 | |
| Household & Personal Products 0.4% | |
| Other Securities | | 0.4 | 1,730,981 | |
| Insurance 4.0% | |
| Allied World Assurance Co. Holdings AG | 24,141 | 0.2 | 964,192 | |
| Aspen Insurance Holdings Ltd. | 21,614 | 0.2 | 992,299 | |
| CNO Financial Group, Inc. | 60,425 | 0.3 | 1,081,003 | |
| Endurance Specialty Holdings Ltd. | 22,826 | 0.4 | 1,455,157 | |
| StanCorp Financial Group, Inc. | 11,962 | 0.3 | 1,360,199 | |
| Other Securities | | 2.6 | 10,585,152 | |
| | | 4.0 | 16,438,002 | |
Schwab Fundamental U.S. Small Company Index ETF
Condensed Portfolio Holdings (Unaudited) continued
| Security | Number
of Shares | % of Net
Assets | Value
($) | |
| Materials 5.7% | |
| Crown Holdings, Inc. * | 22,272 | 0.3 | 1,104,023 | |
| Martin Marietta Materials, Inc. | 7,123 | 0.3 | 1,195,239 | |
| Sealed Air Corp. | 34,149 | 0.4 | 1,756,966 | |
| Other Securities | | 4.7 | 19,565,585 | |
| | | 5.7 | 23,621,813 | |
| Media 1.9% | |
| Other Securities | | 1.9 | 8,010,790 | |
| Pharmaceuticals, Biotechnology & Life Sciences 2.3% | |
| Endo International plc * | 15,527 | 0.3 | 1,195,579 | |
| Other Securities | | 2.0 | 8,304,339 | |
| | | 2.3 | 9,499,918 | |
| Real Estate 9.5% | |
| Apartment Investment & Management Co., Class A | 27,608 | 0.2 | 994,716 | |
| Jones Lang LaSalle, Inc. | 6,778 | 0.2 | 1,009,041 | |
| Rayonier, Inc. | 44,032 | 0.2 | 1,012,736 | |
| UDR, Inc. | 30,300 | 0.2 | 978,690 | |
| Other Securities | | 8.7 | 35,163,171 | |
| | | 9.5 | 39,158,354 | |
| Retailing 5.7% | |
| GNC Holdings, Inc., Class A | 21,541 | 0.2 | 1,008,119 | |
| Group 1 Automotive, Inc. | 12,051 | 0.3 | 1,053,257 | |
| Netflix, Inc. * | 12,404 | 0.3 | 1,426,832 | |
| Sears Holdings Corp. *(d) | 53,676 | 0.3 | 1,432,076 | |
| The Men's Wearhouse, Inc. | 19,972 | 0.3 | 1,127,419 | |
| Other Securities | | 4.3 | 17,450,359 | |
| | | 5.7 | 23,498,062 | |
| Semiconductors & Semiconductor Equipment 2.9% | |
| Other Securities | | 2.9 | 11,795,937 | |
| Software & Services 5.6% | |
| Convergys Corp. | 49,740 | 0.3 | 1,124,124 | |
| EarthLink Holdings Corp. | 123,121 | 0.2 | 1,032,985 | |
| Science Applications International Corp. | 21,885 | 0.3 | 1,067,331 | |
| VeriSign, Inc. * | 17,114 | 0.3 | 1,179,839 | |
| Other Securities | | 4.5 | 18,745,797 | |
| | | 5.6 | 23,150,076 | |
| Technology Hardware & Equipment 4.6% | |
| F5 Networks, Inc. * | 7,982 | 0.2 | 969,095 | |
| Other Securities | | 4.4 | 18,249,143 | |
| | | 4.6 | 19,218,238 | |
| Telecommunication Services 1.1% | |
| Level 3 Communications, Inc. * | 21,814 | 0.2 | 975,740 | |
| Other Securities | | 0.9 | 3,753,944 | |
| | | 1.1 | 4,729,684 | |
| Security | Number
of Shares | % of Net
Assets | Value
($) | |
| Transportation 3.2% | |
| SkyWest, Inc. | 78,646 | 0.3 | 1,250,471 | |
| Other Securities | | 2.9 | 11,863,509 | |
| | | 3.2 | 13,113,980 | |
| Utilities 4.0% | |
| WGL Holdings, Inc. | 17,729 | 0.2 | 960,912 | |
| Other Securities | | 3.8 | 15,452,143 | |
| | | 4.0 | 16,413,055 | |
| Total Common Stock |
| (Cost $442,086,639) | | | 412,967,310 | |
|
| Rights 0.0% of net assets | |
| Telecommunication Services 0.0% | |
| Other Securities | | 0.0 | 14,969 | |
| Total Rights |
| (Cost $14,969) | | | 14,969 | |
|
| Other Investment Companies 1.9% of net assets | |
| Money Market Fund 0.2% | |
| Other Securities | | 0.2 | 923,861 | |
| Securities Lending Collateral 1.7% | |
| State Street Institutional U.S. Government Money Market Fund, Premier Class 0.00% (c) | | 1.7 | 7,095,890 | |
| Total Other Investment Companies |
| (Cost $8,019,751) | | | 8,019,751 | |
End of Investments.
At 08/31/15, the tax basis cost of the fund's investments was $450,152,866 and the unrealized appreciation and depreciation were $12,067,277 and ($41,218,113), respectively, with a net unrealized depreciation of ($29,150,836).
For the following notes, please refer to the complete schedule of portfolio holdings.
| * | Non-income producing security. |
| (a) | Fair-valued by management in accordance with procedures approved by the Board of Trustees. |
| (b) | Illiquid security. At the period end, the value of these amounted to $14,969 or 0.0% of net assets. |
| (c) | The rate shown is the 7-day yield. |
| (d) | All or a portion of this security is on loan. Securities on loan were valued at $6,774,318. Non-cash collateral pledged to the fund for securities on loan amounted to $10,965. |
| | |
| CVR — | Contingent Value Rights |
| REIT — | Real Estate Investment Trust |
Schwab Fundamental U.S. Small Company Index ETF
Condensed Portfolio Holdings (Unaudited) continued
In addition to the above, the fund held the following at 08/31/15:
| | Number of
Contracts | Contract
Value
($) | Unrealized
Appreciation
($) |
| Futures Contracts | | | |
| Russell 2000 Index, e-mini, Long, expires 09/18/15 | 1 | 115,750 | 2,958 |
The following is a summary of the inputs used to value the fund’s investments as of August 31, 2015 (see financial note 2(a) for additional information):
| Description | | Quoted Prices in
Active Markets for
Identical Assets
(Level 1) | | Other Significant
Observable Inputs
(Level 2) | | Significant
Unobservable
Inputs
(Level 3) | | Total | |
| Common Stock1 | | $412,967,310 | | $— | | $— | | $412,967,310 | |
| Rights 1 | | — | | — | | 14,969 | | 14,969 | |
| Other Investment Companies1 | | 8,019,751 | | — | | — | | 8,019,751 | |
| Total | | $420,987,061 | | $— | | $14,969 | | $421,002,030 | |
| Other Financial Instruments | | | | | | | | | |
| Futures Contracts2 | | $2,958 | | $— | | $— | | $2,958 | |
| 1 | As categorized in the complete schedule of portfolio holdings. |
| 2 | Futures contracts are not included in Investments in the schedule of condensed portfolio holdings and are valued at unrealized appreciation or depreciation. |
The following is a reconciliation of Level 3 investments for which significant unobservable inputs were used to determine fair value:
| Investments in Securities | | Balance
as of
February 28,
2015 | | Realized
Gains
(Losses) | | Change in
Unrealized
Appreciation
(Depreciation) | | Gross
Purchases | | Gross
Sales | | Gross
Transfers
in | | Gross
Transfers
out | | Balance
as of
August 31,
2015 |
| Rights | | $14,969 | | $— | | $— | | $— | | $— | | $— | | $— | | $14,969 |
| Total | | $14,969 | | $— | | $— | | $— | | $— | | $— | | $— | | $14,969 |
The fund's policy is to recognize transfers between Level 1, Level 2 and Level 3 as of the beginning of the fiscal year. There were no transfers between Level 1, Level 2 and Level 3 for the period ended August 31, 2015.
Schwab Fundamental U.S. Small Company Index ETF
Statement of
Assets and Liabilities
As of August 31, 2015; unaudited
| Assets |
| Investments, at value (cost $443,025,469) including securities on loan of $6,774,318 | | $413,906,140 |
| Collateral invested for securities on loan, at value (cost $7,095,890) | + | 7,095,890 |
| Total investments, at value (cost $450,121,359) | | 421,002,030 |
| Deposit with broker for futures contracts | | 40,800 |
| Receivables: | | |
| Investments sold | | 7,738 |
| Fund shares sold | | 4,289,020 |
| Dividends | | 440,429 |
| Income from securities on loan | + | 31,655 |
| Total assets | | 425,811,672 |
| Liabilities |
| Collateral held for securities on loan | | 7,095,890 |
| Payables: | | |
| Investments bought | | 5,178,653 |
| Investment adviser fees | | 24,722 |
| Variation margin on futures contracts | + | 650 |
| Total liabilities | | 12,299,915 |
| Net Assets |
| Total assets | | 425,811,672 |
| Total liabilities | – | 12,299,915 |
| Net assets | | $413,511,757 |
| Net Assets by Source | | |
| Capital received from investors | | 436,653,217 |
| Net investment income not yet distributed | | 923,088 |
| Net realized capital gains | | 5,051,823 |
| Net unrealized capital depreciation | | (29,116,371) |
| Net Asset Value (NAV) |
| Net Assets | ÷ | Shares
Outstanding | = | NAV |
| $413,511,757 | | 14,500,001 | | $28.52 |
| | | | | |
Schwab Fundamental U.S. Small Company Index ETF
Statement of
Operations
For the period March 1, 2015 through August 31, 2015; unaudited
| Investment Income |
| Dividends (net of foreign withholding tax of $900) | | $2,882,665 |
| Securities on loan | + | 153,383 |
| Total investment income | | 3,036,048 |
| Expenses |
| Investment adviser fees | | 565,828 |
| Total expenses | – | 565,828 |
| Net investment income | | 2,470,220 |
| Realized and Unrealized Gains (Losses) |
| Net realized losses on investments | | (4,316,661) |
| Net realized gains on in-kind redemptions | | 9,611,251 |
| Net realized losses on futures contracts | | (57,945) |
| Net realized losses on foreign currency transactions | + | (22) |
| Net realized gains | | 5,236,623 |
| Net change in unrealized appreciation (depreciation) on investments | | (41,986,716) |
| Net change in unrealized appreciation (depreciation) on futures contracts | | 3,025 |
| Net change in unrealized appreciation (depreciation) on foreign currency translations | + | 4 |
| Net change in unrealized appreciation (depreciation) | + | (41,983,687) |
| Net realized and unrealized losses | | (36,747,064) |
| Decrease in net assets resulting from operations | | ($34,276,844) |
Schwab Fundamental U.S. Small Company Index ETF
Statement of
Changes in Net Assets
For the current and prior report periods
Figures for the current period are unaudited
| Operations | |
| | 3/1/15-8/31/15 | 3/1/14-2/28/15 |
| Net investment income | | $2,470,220 | $1,309,944 |
| Net realized gains | | 5,236,623 | 1,015,667 |
| Net change in unrealized appreciation (depreciation) | + | (41,983,687) | 9,506,145 |
| Increase (decrease) in net assets resulting from operations | | (34,276,844) | 11,831,756 |
| Distributions to Shareholders | |
| Distributions from net investment income | | ($1,794,435) | ($1,067,580) |
| Transactions in Fund Shares | | | |
| | | 3/1/15-8/31/15 | 3/1/14-2/28/15 |
| | | SHARES | VALUE | SHARES | VALUE |
| Shares sold | | 11,000,000 | $338,181,256 | 4,550,000 | $132,596,467 |
| Shares redeemed | + | (2,600,000) | (75,739,658) | (400,000) | (11,684,208) |
| Net transactions in fund shares | | 8,400,000 | $262,441,598 | 4,150,000 | $120,912,259 |
| Shares Outstanding and Net Assets | | | |
| | | 3/1/15-8/31/15 | 3/1/14-2/28/15 |
| | | SHARES | NET ASSETS | SHARES | NET ASSETS |
| Beginning of period | | 6,100,001 | $187,141,438 | 1,950,001 | $55,465,003 |
| Total increase | + | 8,400,000 | 226,370,319 | 4,150,000 | 131,676,435 |
| End of period | | 14,500,001 | $413,511,757 | 6,100,001 | $187,141,438 |
| Net investment income not yet distributed | | | $923,088 | | $247,303 |
Schwab Fundamental International Large Company Index ETF
Financial Statements
Financial Highlights
| | 3/1/15–
8/31/15* | 3/1/14–
2/28/15 | 8/14/13 1–
2/28/14 | | | |
| Per-Share Data ($) |
| Net asset value at beginning of period | 27.17 | 28.26 | 25.00 | | | |
| Income (loss) from investment operations: | | | | | | |
| Net investment income (loss) | 0.50 2 | 0.30 | 0.36 | | | |
| Net realized and unrealized gains (losses) | (2.58) | (0.92) 3 | 3.04 | | | |
| Total from investment operations | (2.08) | (0.62) | 3.40 | | | |
| Less distributions: | | | | | | |
| Distributions from net investment income | — | (0.47) | (0.14) | | | |
| Net asset value at end of period | 25.09 | 27.17 | 28.26 | | | |
| Total return (%) | (7.66) 4 | (2.11) | 13.60 4 | | | |
| Ratios/Supplemental Data (%) |
| Ratios to average net assets: | | | | | | |
| Total expenses | 0.32 5 | 0.32 | 0.32 5 | | | |
| Net investment income (loss) | 3.70 5 | 2.50 | 4.00 5 | | | |
| Portfolio turnover rate6 | 5 4 | 11 | 8 4 | | | |
| Net assets, end of period ($ x 1,000) | 699,997 | 290,670 | 62,164 | | | |
| |
1
Commencement of operations.
2
Calculated based on the average shares outstanding during the period.
3
The per share amount does not accord with the change in aggregate gains and losses in securities during the period because of the timing of sales and repurchases of fund shares in relation to fluctuating market values.
4
Not annualized.
5
Annualized.
6
Portfolio turnover rate excludes securities received or delivered from processing of in-kind creations or redemptions.
Schwab Fundamental International Large Company Index ETF
Condensed Portfolio Holdings as of August 31, 2015 (Unaudited)
This section shows the fund's 50 largest portfolio holdings in unaffiliated issuers, any holdings exceeding 1% of the fund's net assets as of the report date, and any affiliated issuers. The remaining securities held by the fund are grouped as "Other Securities" in each category. You can request a complete schedule of portfolio holdings as of the report date, free of charge, by calling Schwab ETFs™ at 1-800-435-4000. This complete schedule, filed on the fund's Form N-CSR, is also available on the SEC's website at www.sec.gov.
In addition, the fund files its complete schedule of portfolio holdings with the SEC for the first and third quarters of each fiscal year on Form N-Q. The fund's Form N-Q is available on the SEC's website and may be viewed and copied at the SEC's Public Reference Room in Washington, D.C. Call 1-800-SEC-0330 for information on the operation of the Public Reference Room. The fund also makes available its complete schedule of portfolio holdings on a daily basis on the fund's website at www.csimfunds.com/schwabetfs_prospectus.
| Holdings by Category | Cost
($) | Value
($) |
| 99.0% | Common Stock | 753,063,762 | 692,719,251 |
| 0.4% | Preferred Stock | 3,713,046 | 3,078,011 |
| 0.0% | Rights | — | 5,499 |
| 0.4% | Other Investment Companies | 2,961,888 | 2,961,888 |
| 99.8% | Total Investments | 759,738,696 | 698,764,649 |
| 0.2% | Other Assets and
Liabilities, Net | | 1,232,392 |
| 100.0% | Net Assets | | 699,997,041 |
| Security | Number
of Shares | % of Net
Assets | Value
($) | |
| Common Stock 99.0% of net assets | |
| Australia 4.9% | |
| BHP Billiton Ltd. | 226,015 | 0.6 | 4,034,674 | |
| Commonwealth Bank of Australia | 54,043 | 0.4 | 2,876,599 | |
| Westpac Banking Corp. | 120,631 | 0.4 | 2,659,713 | |
| Other Securities | | 3.5 | 24,570,669 | |
| | | 4.9 | 34,141,655 | |
| Austria 0.4% | |
| Other Securities | | 0.4 | 2,611,476 | |
| Belgium 1.0% | |
| Other Securities | | 1.0 | 6,935,670 | |
| Canada 5.9% | |
| Royal Bank of Canada | 48,323 | 0.4 | 2,663,667 | |
| Other Securities | | 5.5 | 38,489,129 | |
| | | 5.9 | 41,152,796 | |
| Denmark 0.8% | |
| Other Securities | | 0.8 | 5,967,300 | |
| Finland 1.0% | |
| Other Securities | | 1.0 | 6,807,681 | |
| Security | Number
of Shares | % of Net
Assets | Value
($) | |
| France 11.1% | |
| AXA S.A. | 113,923 | 0.4 | 2,868,949 | |
| BNP Paribas S.A. | 70,523 | 0.6 | 4,446,511 | |
| Compagnie de Saint-Gobain | 61,683 | 0.4 | 2,831,328 | |
| Engie | 217,373 | 0.6 | 3,893,409 | |
| Orange S.A. | 346,239 | 0.8 | 5,466,366 | |
| Sanofi | 60,015 | 0.8 | 5,929,149 | |
| Total S.A. | 261,445 | 1.7 | 11,953,785 | |
| Vivendi S.A. | 132,874 | 0.5 | 3,282,176 | |
| Other Securities | | 5.3 | 36,860,859 | |
| | | 11.1 | 77,532,532 | |
| Germany 8.4% | |
| Allianz SE - Reg'd | 23,717 | 0.5 | 3,780,278 | |
| BASF SE | 65,725 | 0.8 | 5,289,172 | |
| Bayer AG - Reg'd | 27,074 | 0.5 | 3,669,188 | |
| Daimler AG - Reg'd | 61,382 | 0.7 | 4,928,668 | |
| Deutsche Telekom AG - Reg'd | 308,699 | 0.8 | 5,273,202 | |
| E.ON SE | 357,128 | 0.6 | 4,043,635 | |
| Siemens AG - Reg'd | 45,576 | 0.6 | 4,517,466 | |
| Other Securities | | 3.9 | 27,449,637 | |
| | | 8.4 | 58,951,246 | |
| Hong Kong 0.9% | |
| Other Securities | | 0.9 | 6,217,120 | |
| Ireland 0.7% | |
| Other Securities | | 0.7 | 4,767,989 | |
| Israel 0.5% | |
| Other Securities | | 0.5 | 3,392,290 | |
| Italy 3.9% | |
| Enel S.p.A. | 927,420 | 0.6 | 4,173,322 | |
| Eni S.p.A. | 420,774 | 1.0 | 6,897,710 | |
| Intesa Sanpaolo S.p.A. | 851,529 | 0.4 | 3,104,765 | |
| UniCredit S.p.A. | 489,820 | 0.5 | 3,199,755 | |
| Other Securities | | 1.4 | 10,089,002 | |
| | | 3.9 | 27,464,554 | |
| Japan 22.9% | |
| Canon, Inc. | 89,399 | 0.4 | 2,734,679 | |
| Honda Motor Co., Ltd. | 122,333 | 0.6 | 3,860,225 | |
| KDDI Corp. | 115,893 | 0.4 | 2,886,208 | |
| Mitsubishi UFJ Financial Group, Inc. | 512,914 | 0.5 | 3,386,413 | |
| Nippon Telegraph & Telephone Corp. | 109,213 | 0.6 | 4,172,146 | |
| Sumitomo Mitsui Financial Group, Inc. | 64,760 | 0.4 | 2,652,710 | |
| Tokyo Electric Power Co., Inc. * | 394,675 | 0.4 | 2,703,142 | |
| Toyota Motor Corp. | 104,202 | 0.9 | 6,184,105 | |
| Other Securities | | 18.7 | 131,505,479 | |
| | | 22.9 | 160,085,107 | |
| Luxembourg 0.4% | |
| Other Securities | | 0.4 | 2,998,417 | |
Schwab Fundamental International Large Company Index ETF
Condensed Portfolio Holdings (Unaudited) continued
| Security | Number
of Shares | % of Net
Assets | Value
($) | |
| Netherlands 5.3% | |
| Royal Dutch Shell plc, A Shares | 498,510 | 1.9 | 13,003,749 | |
| Royal Dutch Shell plc, B Shares | 309,874 | 1.2 | 8,132,945 | |
| Other Securities | | 2.2 | 15,854,278 | |
| | | 5.3 | 36,990,972 | |
| New Zealand 0.1% | |
| Other Securities | | 0.1 | 892,579 | |
| Norway 0.8% | |
| Statoil A.S.A. | 181,306 | 0.4 | 2,678,904 | |
| Other Securities | | 0.4 | 3,127,890 | |
| | | 0.8 | 5,806,794 | |
| Portugal 0.2% | |
| Other Securities | | 0.2 | 1,614,696 | |
| Singapore 0.8% | |
| Other Securities | | 0.8 | 5,386,166 | |
| Spain 4.3% | |
| Banco Bilbao Vizcaya Argentaria S.A. | 366,382 | 0.5 | 3,392,217 | |
| Banco Santander S.A. | 1,234,891 | 1.1 | 7,554,974 | |
| Iberdrola S.A. | 409,860 | 0.4 | 2,780,747 | |
| Telefonica S.A. | 553,817 | 1.1 | 7,812,747 | |
| Other Securities | | 1.2 | 8,327,713 | |
| | | 4.3 | 29,868,398 | |
| Sweden 2.3% | |
| Other Securities | | 2.3 | 16,030,327 | |
| Switzerland 5.6% | |
| Nestle S.A. - Reg'd | 107,815 | 1.1 | 7,949,133 | |
| Novartis AG - Reg'd | 68,269 | 1.0 | 6,685,357 | |
| Roche Holding AG | 17,791 | 0.7 | 4,856,858 | |
| Other Securities | | 2.8 | 20,069,666 | |
| | | 5.6 | 39,561,014 | |
| United Kingdom 16.8% | |
| AstraZeneca plc | 78,463 | 0.7 | 4,971,855 | |
| Barclays plc | 995,036 | 0.6 | 4,001,141 | |
| BP plc | 2,609,627 | 2.1 | 14,469,052 | |
| British American Tobacco plc | 74,640 | 0.6 | 3,993,764 | |
| GlaxoSmithKline plc | 276,095 | 0.8 | 5,692,221 | |
| HSBC Holdings plc | 1,006,299 | 1.1 | 8,027,858 | |
| Rio Tinto plc | 81,830 | 0.4 | 3,005,407 | |
| Tesco plc | 1,277,738 | 0.5 | 3,760,336 | |
| Vodafone Group plc | 2,070,499 | 1.0 | 7,219,098 | |
| Other Securities | | 9.0 | 62,401,740 | |
| | | 16.8 | 117,542,472 | |
| Total Common Stock |
| (Cost $753,063,762) | | | 692,719,251 | |
|
| Security | Number
of Shares | % of Net
Assets | Value
($) | |
| Preferred Stock 0.4% of net assets | |
| Germany 0.4% | |
| Other Securities | | 0.4 | 2,858,047 | |
| Italy 0.0% | |
| Other Securities | | 0.0 | 219,964 | |
| Total Preferred Stock |
| (Cost $3,713,046) | | | 3,078,011 | |
|
| Rights 0.0% of net assets | |
| Australia 0.0% | |
| Other Securities | | 0.0 | 5,499 | |
| Total Rights |
| (Cost $—) | | | 5,499 | |
|
| Other Investment Companies 0.4% of net assets | |
| United States 0.4% | |
| Money Market Fund 0.2% | |
| Other Securities | | 0.2 | 1,615,091 | |
| Securities Lending Collateral 0.2% | |
| Other Securities | | 0.2 | 1,346,797 | |
| Total Other Investment Companies |
| (Cost $2,961,888) | | | 2,961,888 | |
End of Investments.
At 08/31/15, the tax basis cost of the fund's investments was $759,828,882 and the unrealized appreciation and depreciation were $15,396,008 and ($76,460,241), respectively, with a net unrealized depreciation of ($61,064,233).
For the following notes, please refer to the complete schedule of portfolio holdings.
| * | Non-income producing security. |
| (a) | The rate shown is the 7-day yield. |
| (b) | All or a portion of this security is on loan. Securities on loan were valued at $1,548,083. Non-cash collateral pledged to the fund for securities on loan amounted to $265,345. |
| | |
| ADR — | American Depositary Receipt |
| CDI — | CHESS Depositary Interest |
| CVA — | Dutch Certificate |
| Reg'd — | Registered |
| REIT — | Real Estate Investment Trust |
| RSP — | Risparmio (Convertible Savings Shares) |
Schwab Fundamental International Large Company Index ETF
Condensed Portfolio Holdings (Unaudited) continued
In addition to the above, the fund held the following at 08/31/15:
| | Number of
Contracts | Contract
Value
($) | Unrealized
Depreciation
($) |
| Futures Contracts | | | |
| MSCI EAFE, e-mini, Long, expires 09/18/15 | 20 | 1,732,700 | (91,161) |
The following is a summary of the inputs used to value the fund’s investments as of August 31, 2015 (see financial note 2(a) for additional information):
Assets Valuation Input
| Description | | Quoted Prices in
Active Markets for
Identical Assets
(Level 1) | | Other Significant
Observable Inputs
(Level 2) | | Significant
Unobservable
Inputs
(Level 3) | | Total | |
| Common Stock1 | | $692,719,251 | | $— | | $— | | $692,719,251 | |
| Preferred Stock1 | | 3,078,011 | | — | | — | | 3,078,011 | |
| Rights 1 | | 5,499 | | — | | — | | 5,499 | |
| Other Investment Companies1 | | 2,961,888 | | — | | — | | 2,961,888 | |
| Total | | $698,764,649 | | $— | | $— | | $698,764,649 | |
Liabilities Valuation Input
| | | | | | | | | |
| | | | | | | | | |
| Other Financial Instruments | | | | | | | | | |
| Futures Contracts2 | | ($91,161) | | $— | | $— | | ($91,161) | |
| 1 | As categorized in the complete schedule of portfolio holdings. |
| 2 | Futures contracts are not included in Investments in the schedule of condensed portfolio holdings and are valued at unrealized appreciation or depreciation. |
The following is a reconciliation of Level 3 investments for which significant unobservable inputs were used to determine fair value:
| Investments in Securities | | Balance
as of
February 28,
2015 | | Realized
Gains
(Losses) | | Change in
Unrealized
Appreciation
(Depreciation) | | Gross
Purchases | | Gross
Sales | | Gross
Transfers
in | | Gross
Transfers
out | | Balance
as of
August 31,
2015 |
| Common Stock | | | | | | | | | | | | | | | | |
| Netherlands | | $29,564 | | ($808) | | ($4,053) | | $— | | ($24,703) | | $— | | $— | | $— |
| Total | | $29,564 | | ($808) | | ($4,053) | | $— | | ($24,703) | | $— | | $— | | $— |
The fund's policy is to recognize transfers between Level 1, Level 2 and Level 3 as of the beginning of the fiscal year. There were no transfers between Level 1, Level 2 and Level 3 for the period ended August 31, 2015.
Schwab Fundamental International Large Company Index ETF
Statement of
Assets and Liabilities
As of August 31, 2015; unaudited
| Assets |
| Investments, at value (cost $758,391,899) including securities on loan of $1,548,083 | | $697,417,852 |
| Collateral invested for securities on loan, at value (cost $1,346,797) | + | 1,346,797 |
| Total investments, at value (cost $759,738,696) | | 698,764,649 |
| Deposit with broker for futures contracts | | 79,200 |
| Foreign currency, at value (cost $386,869) | | 381,143 |
| Receivables: | | |
| Dividends | | 1,938,346 |
| Foreign tax reclaims | | 233,499 |
| Income from securities on loan | + | 963 |
| Total assets | | 701,397,800 |
| Liabilities |
| Collateral held for securities on loan | | 1,346,797 |
| Payables: | | |
| Investment adviser fees | | 42,362 |
| Variation margin on futures contracts | + | 11,600 |
| Total liabilities | | 1,400,759 |
| Net Assets |
| Total assets | | 701,397,800 |
| Total liabilities | – | 1,400,759 |
| Net assets | | $699,997,041 |
| Net Assets by Source | | |
| Capital received from investors | | 753,533,311 |
| Net investment income not yet distributed | | 10,767,870 |
| Net realized capital losses | | (3,218,195) |
| Net unrealized capital depreciation | | (61,085,945) |
| Net Asset Value (NAV) |
| Net Assets | ÷ | Shares
Outstanding | = | NAV |
| $699,997,041 | | 27,900,001 | | $25.09 |
| | | | | |
Schwab Fundamental International Large Company Index ETF
Statement of
Operations
For the period March 1, 2015 through August 31, 2015; unaudited
| Investment Income |
| Dividends (net of foreign withholding tax of $1,040,324) | | $11,026,306 |
| Securities on loan | + | 83,537 |
| Total investment income | | 11,109,843 |
| Expenses |
| Investment adviser fees | | 884,400 |
| Total expenses | – | 884,400 |
| Net investment income | | 10,225,443 |
| Realized and Unrealized Gains (Losses) |
| Net realized losses on investments | | (1,708,407) |
| Net realized gains on futures contracts | | 69,818 |
| Net realized losses on foreign currency transactions | + | (64,748) |
| Net realized losses | | (1,703,337) |
| Net change in unrealized appreciation (depreciation) on investments | | (66,010,263) |
| Net change in unrealized appreciation (depreciation) on futures contracts | | (93,932) |
| Net change in unrealized appreciation (depreciation) on foreign currency translations | + | (15,327) |
| Net change in unrealized appreciation (depreciation) | + | (66,119,522) |
| Net realized and unrealized losses | | (67,822,859) |
| Decrease in net assets resulting from operations | | ($57,597,416) |
Schwab Fundamental International Large Company Index ETF
Statement of
Changes in Net Assets
For the current and prior report periods
Figures for the current period are unaudited
| Operations | |
| | 3/1/15-8/31/15 | 3/1/14-2/28/15 |
| Net investment income | | $10,225,443 | $3,605,434 |
| Net realized losses | | (1,703,337) | (1,488,508) |
| Net change in unrealized appreciation (depreciation) | + | (66,119,522) | 2,252,137 |
| Increase (decrease) in net assets resulting from operations | | (57,597,416) | 4,369,063 |
| Distributions to Shareholders | |
| Distributions from net investment income | | ($—) | ($3,534,000) |
| Transactions in Fund Shares | | | |
| | | 3/1/15-8/31/15 | 3/1/14-2/28/15 |
| | | SHARES | VALUE | SHARES | VALUE |
| Shares sold | | 17,200,000 | $466,924,214 | 8,500,000 | $227,670,907 |
| Shares redeemed | + | — | — | — | — |
| Net transactions in fund shares | | 17,200,000 | $466,924,214 | 8,500,000 | $227,670,907 |
| Shares Outstanding and Net Assets | | | |
| | | 3/1/15-8/31/15 | 3/1/14-2/28/15 |
| | | SHARES | NET ASSETS | SHARES | NET ASSETS |
| Beginning of period | | 10,700,001 | $290,670,243 | 2,200,001 | $62,164,273 |
| Total increase | + | 17,200,000 | 409,326,798 | 8,500,000 | 228,505,970 |
| End of period | | 27,900,001 | $699,997,041 | 10,700,001 | $290,670,243 |
| Net investment income not yet distributed | | | $10,767,870 | | $542,427 |
Schwab Fundamental International Small Company Index ETF
Financial Statements
Financial Highlights
| | 3/1/15–
8/31/15* | 3/1/14–
2/28/15 | 8/14/13 1–
2/28/14 | | | |
| Per-Share Data ($) |
| Net asset value at beginning of period | 27.22 | 27.75 | 25.00 | | | |
| Income (loss) from investment operations: | | | | | | |
| Net investment income (loss) | 0.28 2 | 0.41 | 0.15 | | | |
| Net realized and unrealized gains (losses) | (1.05) | (0.53) 3 | 2.78 | | | |
| Total from investment operations | (0.77) | (0.12) | 2.93 | | | |
| Less distributions: | | | | | | |
| Distributions from net investment income | — | (0.41) | (0.18) | | | |
| Net asset value at end of period | 26.45 | 27.22 | 27.75 | | | |
| Total return (%) | (2.83) 4 | (0.32) | 11.73 4 | | | |
| Ratios/Supplemental Data (%) |
| Ratios to average net assets: | | | | | | |
| Total expenses | 0.46 5 | 0.46 | 0.46 5 | | | |
| Net investment income (loss) | 2.03 5 | 1.73 | 1.09 5 | | | |
| Portfolio turnover rate6 | 13 4 | 21 | 18 4 | | | |
| Net assets, end of period ($ x 1,000) | 312,111 | 68,046 | 24,977 | | | |
| |
1
Commencement of operations.
2
Calculated based on the average shares outstanding during the period.
3
The per share amount does not accord with the change in aggregate gains and losses in securities during the period because of the timing of sales and repurchases of fund shares in relation to fluctuating market values.
4
Not annualized.
5
Annualized.
6
Portfolio turnover rate excludes securities received or delivered from processing of in-kind creations or redemptions.
Schwab Fundamental International Small Company Index ETF
Condensed Portfolio Holdings as of August 31, 2015 (Unaudited)
This section shows the fund's 50 largest portfolio holdings in unaffiliated issuers, any holdings exceeding 1% of the fund's net assets as of the report date, and any affiliated issuers. The remaining securities held by the fund are grouped as "Other Securities" in each category. You can request a complete schedule of portfolio holdings as of the report date, free of charge, by calling Schwab ETFs™ at 1-800-435-4000. This complete schedule, filed on the fund's Form N-CSR, is also available on the SEC's website at www.sec.gov.
In addition, the fund files its complete schedule of portfolio holdings with the SEC for the first and third quarters of each fiscal year on Form N-Q. The fund's Form N-Q is available on the SEC's website and may be viewed and copied at the SEC's Public Reference Room in Washington, D.C. Call 1-800-SEC-0330 for information on the operation of the Public Reference Room. The fund also makes available its complete schedule of portfolio holdings on a daily basis on the fund's website at www.csimfunds.com/schwabetfs_prospectus.
| Holdings by Category | Cost
($) | Value
($) |
| 99.3% | Common Stock | 324,181,328 | 310,023,650 |
| 0.3% | Preferred Stock | 958,756 | 924,869 |
| 0.8% | Other Investment Companies | 2,357,250 | 2,348,544 |
| 100.4% | Total Investments | 327,497,334 | 313,297,063 |
| (0.4%) | Other Assets and
Liabilities, Net | | (1,186,015) |
| 100.0% | Net Assets | | 312,111,048 |
| Security | Number
of Shares | % of Net
Assets | Value
($) | |
| Common Stock 99.3% of net assets | |
| Australia 4.9% | |
| Other Securities | | 4.9 | 15,344,456 | |
| Austria 1.0% | |
| Wienerberger AG | 32,749 | 0.2 | 582,353 | |
| Other Securities | | 0.8 | 2,495,616 | |
| | | 1.0 | 3,077,969 | |
| Belgium 1.1% | |
| Bekaert N.V. | 22,350 | 0.2 | 647,867 | |
| Other Securities | | 0.9 | 2,777,148 | |
| | | 1.1 | 3,425,015 | |
| Canada 6.9% | |
| Other Securities | | 6.9 | 21,609,435 | |
| Denmark 1.6% | |
| Other Securities | | 1.6 | 5,088,058 | |
| Finland 1.7% | |
| Huhtamaki Oyj | 17,673 | 0.2 | 574,473 | |
| Other Securities | | 1.5 | 4,815,789 | |
| | | 1.7 | 5,390,262 | |
| Security | Number
of Shares | % of Net
Assets | Value
($) | |
| France 4.4% | |
| Societe BIC S.A. | 3,542 | 0.2 | 561,388 | |
| Other Securities | | 4.2 | 13,027,409 | |
| | | 4.4 | 13,588,797 | |
| Germany 3.4% | |
| Telefonica Deutschland Holding AG | 101,376 | 0.2 | 616,008 | |
| Other Securities | | 3.2 | 9,968,381 | |
| | | 3.4 | 10,584,389 | |
| Hong Kong 2.1% | |
| Other Securities | | 2.1 | 6,678,790 | |
| Ireland 0.8% | |
| Other Securities | | 0.8 | 2,407,638 | |
| Israel 1.0% | |
| Other Securities | | 1.0 | 3,051,023 | |
| Italy 3.0% | |
| Banca Popolare di Milano Scarl | 645,528 | 0.2 | 684,616 | |
| Italcementi S.p.A. | 55,246 | 0.2 | 617,174 | |
| Other Securities | | 2.6 | 7,936,826 | |
| | | 3.0 | 9,238,616 | |
| Japan 41.0% | |
| Alps Electric Co., Ltd. | 23,528 | 0.2 | 738,739 | |
| Aoyama Trading Co., Ltd. | 15,598 | 0.2 | 583,067 | |
| Autobacs Seven Co., Ltd. | 34,064 | 0.2 | 627,114 | |
| Calsonic Kansei Corp. | 78,540 | 0.2 | 549,589 | |
| Credit Saison Co., Ltd. | 28,566 | 0.2 | 572,805 | |
| Dena Co., Ltd. | 34,779 | 0.2 | 635,972 | |
| Don Quijote Holdings Co., Ltd. | 15,027 | 0.2 | 584,042 | |
| FamilyMart Co., Ltd. | 11,718 | 0.2 | 543,427 | |
| Fujikura Ltd. | 127,809 | 0.2 | 633,851 | |
| Fukuoka Financial Group, Inc. | 111,779 | 0.2 | 556,197 | |
| IT Holdings Corp. | 31,039 | 0.2 | 728,175 | |
| Kikkoman Corp. | 22,553 | 0.2 | 726,736 | |
| Koito Manufacturing Co., Ltd. | 16,408 | 0.2 | 563,249 | |
| Matsumotokiyoshi Holdings Co., Ltd. | 14,589 | 0.2 | 701,851 | |
| Megmilk Snow Brand Co., Ltd. | 32,156 | 0.2 | 610,827 | |
| Morinaga Milk Industry Co., Ltd. | 136,117 | 0.2 | 661,574 | |
| NGK Insulators Ltd. | 24,011 | 0.2 | 541,503 | |
| Nichirei Corp. | 108,488 | 0.2 | 664,258 | |
| Otsuka Corp. | 11,465 | 0.2 | 605,487 | |
| Ryohin Keikaku Co., Ltd. | 3,202 | 0.2 | 712,348 | |
| Santen Pharmaceutical Co., Ltd. | 39,008 | 0.2 | 609,978 | |
| Shimadzu Corp. | 38,867 | 0.2 | 572,493 | |
| Sohgo Security Services Co., Ltd. | 14,472 | 0.2 | 632,930 | |
| Toho Holdings Co., Ltd. | 27,991 | 0.2 | 616,248 | |
| Toyota Boshoku Corp. | 36,844 | 0.2 | 614,751 | |
| Tsuruha Holdings, Inc. | 7,460 | 0.2 | 606,970 | |
| Valor Co., Ltd. | 22,900 | 0.2 | 644,378 | |
| Other Securities | | 35.6 | 111,184,803 | |
| | | 41.0 | 128,023,362 | |
| Luxembourg 0.6% | |
| Other Securities | | 0.6 | 1,722,439 | |
Schwab Fundamental International Small Company Index ETF
Condensed Portfolio Holdings (Unaudited) continued
| Security | Number
of Shares | % of Net
Assets | Value
($) | |
| Netherlands 2.1% | |
| Koninklijke BAM Groep N.V. * | 171,573 | 0.3 | 949,318 | |
| Other Securities | | 1.8 | 5,517,192 | |
| | | 2.1 | 6,466,510 | |
| New Zealand 0.7% | |
| Other Securities | | 0.7 | 2,315,416 | |
| Norway 0.9% | |
| Other Securities | | 0.9 | 2,915,026 | |
| Portugal 0.3% | |
| Other Securities | | 0.3 | 1,078,253 | |
| Singapore 1.4% | |
| Other Securities | | 1.4 | 4,360,091 | |
| Spain 2.2% | |
| Gamesa Corp. Tecnologica S.A. | 37,573 | 0.2 | 565,410 | |
| Other Securities | | 2.0 | 6,368,561 | |
| | | 2.2 | 6,933,971 | |
| Sweden 2.2% | |
| Other Securities | | 2.2 | 6,791,500 | |
| Switzerland 2.8% | |
| Galenica AG - Reg'd | 441 | 0.2 | 567,297 | |
| Other Securities | | 2.6 | 8,234,591 | |
| | | 2.8 | 8,801,888 | |
| United Kingdom 13.2% | |
| Cable & Wireless Communications plc | 691,726 | 0.2 | 638,325 | |
| Debenhams plc | 473,378 | 0.2 | 551,138 | |
| Greene King plc | 54,467 | 0.2 | 687,754 | |
| Hammerson plc | 58,066 | 0.2 | 560,839 | |
| Hays plc | 243,342 | 0.2 | 597,693 | |
| London Stock Exchange Group plc | 14,347 | 0.2 | 556,055 | |
| National Express Group plc | 136,325 | 0.2 | 620,617 | |
| Provident Financial plc | 13,156 | 0.2 | 596,901 | |
| Segro plc | 85,456 | 0.2 | 551,486 | |
| SIG plc | 189,289 | 0.2 | 546,736 | |
| The British Land Co. plc | 49,133 | 0.2 | 619,646 | |
| Other Securities | | 11.0 | 34,603,556 | |
| | | 13.2 | 41,130,746 | |
| Total Common Stock |
| (Cost $324,181,328) | | | 310,023,650 | |
|
| Preferred Stock 0.3% of net assets | |
| Germany 0.2% | |
| Other Securities | | 0.2 | 763,601 | |
| Security | Number
of Shares | % of Net
Assets | Value
($) | |
| Sweden 0.1% | |
| Other Securities | | 0.1 | 161,268 | |
| Total Preferred Stock |
| (Cost $958,756) | | | 924,869 | |
|
| Other Investment Companies 0.8% of net assets | |
| United States 0.8% | |
| Equity Fund 0.2% | |
| iShares MSCI EAFE Small-Cap ETF | 14,000 | 0.2 | 686,840 | |
| Money Market Fund 0.1% | |
| Other Securities | | 0.1 | 141,362 | |
| Securities Lending Collateral 0.5% | |
| State Street Institutional U.S. Government Money Market Fund, Premier Class 0.00% (a) | | 0.5 | 1,520,342 | |
| Total Other Investment Companies |
| (Cost $2,357,250) | | | 2,348,544 | |
End of Investments.
At 08/31/15, the tax basis cost of the fund's investments was $327,520,607 and the unrealized appreciation and depreciation were $13,068,732 and ($27,292,276), respectively, with a net unrealized depreciation of ($14,223,544).
For the following notes, please refer to the complete schedule of portfolio holdings.
| * | Non-income producing security. |
| (a) | The rate shown is the 7-day yield. |
| (b) | All or a portion of this security is on loan. Securities on loan were valued at $1,438,877. Non-cash collateral pledged to the fund for securities on loan amounted to $50,359. |
| (c) | Securities exempt from registration under Rule 144A of the Securities Act of 1933, as amended. These securities may be resold in transactions exempt from registrations, normally to qualified institutional buyers. At the period end, the value of these amounted to $160,836 or 0.1% of net assets. |
| (d) | Fair-valued by management in accordance with procedures approved by the Board of Trustees. |
| (e) | Illiquid security. At the period end, the value of these amounted to $97,855 or 0.0% of net assets. |
| | |
| ADR — | American Depositary Receipt |
| CDI — | CHESS Depositary Interest |
| ETF — | Exchange Traded Fund |
| GDR — | Global Depositary Receipt |
| Reg'd — | Registered |
| REIT — | Real Estate Investment Trust |
Schwab Fundamental International Small Company Index ETF
Condensed Portfolio Holdings (Unaudited) continued
The following is a summary of the inputs used to value the fund’s investments as of August 31, 2015 (see financial note 2(a) for additional information):
| Description | | Quoted Prices in
Active Markets for
Identical Assets
(Level 1) | | Other Significant
Observable Inputs
(Level 2) | | Significant
Unobservable
Inputs
(Level 3) | | Total | |
| Common Stock1 | | $305,663,559 | | $— | | $— | | $305,663,559 | |
| Singapore 1 | | 3,478,919 | | — | | — | | 3,478,919 | |
| Capital Goods | | 783,317 | | — | | 97,855 | | 881,172 | |
| Preferred Stock1 | | 924,869 | | — | | — | | 924,869 | |
| Other Investment Companies1 | | 2,348,544 | | — | | — | | 2,348,544 | |
| Total | | $313,199,208 | | $— | | $97,855 | | $313,297,063 | |
| 1 | As categorized in the complete schedule of portfolio holdings. |
The following is a reconciliation of Level 3 investments for which significant unobservable inputs were used to determine fair value:
| Investments in Securities | | Balance
as of
February 28,
2015 | | Realized
Gains
(Losses) | | Change in
Unrealized
Appreciation
(Depreciation) | | Gross
Purchases | | Gross
Sales | | Gross
Transfers
in | | Gross
Transfers
out | | Balance
as of
August 31,
2015 |
| Common Stock | | | | | | | | | | | | | | | | |
| Singapore | | $— | | $— | | ($36,760) | | $114,543 | | $— | | $20,072 | | $— | | $97,855 |
| Rights | | 1,854 | | 1,722 | | (1,854) | | — | | (1,722) | | — | | — | | — |
| Total | | $1,854 | | $1,722 | | ($38,614) | | $114,543 | | ($1,722) | | $20,072 | | $— | | $97,855 |
All net realized and change in unrealized gains (losses) in the table above are reflected on the accompanying Statement of Operations. The change in net unrealized appreciation (depreciation) for Level 3 Investments held by the fund at August 31, 2015 was ($36,760).
The fund's policy is to recognize transfers between Level 1, Level 2 and Level 3 as of the beginning of the fiscal year. There were security transfers out of Level 1 to Level 3 due to the result of fair valued securities for which no quoted value was available. There were no transfers between Level 1 and Level 2 for the period ended August 31, 2015.
Schwab Fundamental International Small Company Index ETF
Statement of
Assets and Liabilities
As of August 31, 2015; unaudited
| Assets |
| Investments, at value (cost $325,976,992) including securities on loan of $1,438,877 | | $311,776,721 |
| Collateral invested for securities on loan, at value (cost $1,520,342) | + | 1,520,342 |
| Total investments, at value (cost $327,497,334) | | 313,297,063 |
| Foreign currency, at value (cost $104,886) | | 104,403 |
| Receivables: | | |
| Investments sold | | 47 |
| Dividends | | 411,896 |
| Foreign tax reclaims | | 37,854 |
| Income from securities on loan | + | 4,588 |
| Total assets | | 313,855,851 |
| Liabilities |
| Collateral held for securities on loan | | 1,520,342 |
| Payables: | | |
| Investments bought | | 197,419 |
| Investment adviser fees | + | 27,042 |
| Total liabilities | | 1,744,803 |
| Net Assets |
| Total assets | | 313,855,851 |
| Total liabilities | – | 1,744,803 |
| Net assets | | $312,111,048 |
| Net Assets by Source | | |
| Capital received from investors | | 325,440,826 |
| Net investment income not yet distributed | | 2,108,688 |
| Net realized capital losses | | (1,234,958) |
| Net unrealized capital depreciation | | (14,203,508) |
| Net Asset Value (NAV) |
| Net Assets | ÷ | Shares
Outstanding | = | NAV |
| $312,111,048 | | 11,800,001 | | $26.45 |
| | | | | |
Schwab Fundamental International Small Company Index ETF
Statement of
Operations
For the period March 1, 2015 through August 31, 2015; unaudited
| Investment Income |
| Dividends (net of foreign withholding tax of $265,505) | | $2,643,541 |
| Securities on loan | + | 25,076 |
| Total investment income | | 2,668,617 |
| Expenses |
| Investment adviser fees | | 492,504 |
| Total expenses | – | 492,504 |
| Net investment income | | 2,176,113 |
| Realized and Unrealized Gains (Losses) |
| Net realized losses on investments | | (1,734,897) |
| Net realized gains on in-kind redemptions | | 913,079 |
| Net realized losses on futures contracts | | (23,523) |
| Net realized losses on foreign currency transactions | + | (18,705) |
| Net realized losses | | (864,046) |
| Net change in unrealized appreciation (depreciation) on investments | | (16,158,920) |
| Net change in unrealized appreciation (depreciation) on foreign currency translations | + | (2,918) |
| Net change in unrealized appreciation (depreciation) | + | (16,161,838) |
| Net realized and unrealized losses | | (17,025,884) |
| Decrease in net assets resulting from operations | | ($14,849,771) |
Schwab Fundamental International Small Company Index ETF
Statement of
Changes in Net Assets
For the current and prior report periods
Figures for the current period are unaudited
| Operations | |
| | 3/1/15-8/31/15 | 3/1/14-2/28/15 |
| Net investment income | | $2,176,113 | $657,000 |
| Net realized gains (losses) | | (864,046) | 41,533 |
| Net change in unrealized appreciation (depreciation) | + | (16,161,838) | 594,456 |
| Increase (decrease) in net assets resulting from operations | | (14,849,771) | 1,292,989 |
| Distributions to Shareholders | |
| Distributions from net investment income | | ($—) | ($704,650) |
| Transactions in Fund Shares | | | |
| | | 3/1/15-8/31/15 | 3/1/14-2/28/15 |
| | | SHARES | VALUE | SHARES | VALUE |
| Shares sold | | 9,600,000 | $267,391,791 | 1,700,000 | $45,347,254 |
| Shares redeemed | + | (300,000) | (8,476,621) | (100,000) | (2,866,746) |
| Net transactions in fund shares | | 9,300,000 | $258,915,170 | 1,600,000 | $42,480,508 |
| Shares Outstanding and Net Assets | | | |
| | | 3/1/15-8/31/15 | 3/1/14-2/28/15 |
| | | SHARES | NET ASSETS | SHARES | NET ASSETS |
| Beginning of period | | 2,500,001 | $68,045,649 | 900,001 | $24,976,802 |
| Total increase | + | 9,300,000 | 244,065,399 | 1,600,000 | 43,068,847 |
| End of period | | 11,800,001 | $312,111,048 | 2,500,001 | $68,045,649 |
| Net investment income not yet distributed/Distributions in excess of net investment income | | | $2,108,688 | | ($67,425) |
Schwab Fundamental Emerging Markets Large Company Index ETF
Financial Statements
Financial Highlights
| | 3/1/15–
8/31/15* | 3/1/14–
2/28/15 | 8/14/13 1–
2/28/14 | | | |
| Per-Share Data ($) |
| Net asset value at beginning of period | 24.16 | 24.98 | 25.00 | | | |
| Income (loss) from investment operations: | | | | | | |
| Net investment income (loss) | 0.48 2 | 0.37 | 0.12 | | | |
| Net realized and unrealized gains (losses) | (4.71) | (0.87) | (0.00) 3 | | | |
| Total from investment operations | (4.23) | (0.50) | 0.12 | | | |
| Less distributions: | | | | | | |
| Distributions from net investment income | — | (0.32) | (0.14) | | | |
| Net asset value at end of period | 19.93 | 24.16 | 24.98 | | | |
| Total return (%) | (17.51) 4 | (1.98) | 0.45 4 | | | |
| Ratios/Supplemental Data (%) |
| Ratios to average net assets: | | | | | | |
| Total expenses | 0.46 5 | 0.46 | 0.46 5 | | | |
| Net investment income (loss) | 4.12 5 | 2.20 | 1.01 5 | | | |
| Portfolio turnover rate6 | 10 4 | 13 | 6 4 | | | |
| Net assets, end of period ($ x 1,000) | 267,078 | 96,642 | 22,482 | | | |
| |
1
Commencement of operations.
2
Calculated based on the average shares outstanding during the period.
3
Per-share amount was less than $0.005.
4
Not annualized.
5
Annualized.
6
Portfolio turnover rate excludes securities received or delivered from processing of in-kind creations or redemptions.
Schwab Fundamental Emerging Markets Large Company Index ETF
Condensed Portfolio Holdings as of August 31, 2015 (Unaudited)
This section shows the fund's 50 largest portfolio holdings in unaffiliated issuers, any holdings exceeding 1% of the fund's net assets as of the report date, and any affiliated issuers. The remaining securities held by the fund are grouped as "Other Securities" in each category. You can request a complete schedule of portfolio holdings as of the report date, free of charge, by calling Schwab ETFs™ at 1-800-435-4000. This complete schedule, filed on the fund's Form N-CSR, is also available on the SEC's website at www.sec.gov.
In addition, the fund files its complete schedule of portfolio holdings with the SEC for the first and third quarters of each fiscal year on Form N-Q. The fund's Form N-Q is available on the SEC's website and may be viewed and copied at the SEC's Public Reference Room in Washington, D.C. Call 1-800-SEC-0330 for information on the operation of the Public Reference Room. The fund also makes available its complete schedule of portfolio holdings on a daily basis on the fund's website at www.csimfunds.com/schwabetfs_prospectus.
| Holdings by Category | Cost
($) | Value
($) |
| 89.3% | Common Stock | 285,248,224 | 238,619,586 |
| 8.7% | Preferred Stock | 32,907,918 | 23,130,982 |
| 2.0% | Other Investment Companies | 5,867,245 | 5,460,380 |
| 100.0% | Total Investments | 324,023,387 | 267,210,948 |
| (0.0%) | Other Assets and
Liabilities, Net | | (133,041) |
| 100.0% | Net Assets | | 267,077,907 |
| Security | Number
of Shares | % of Net
Assets | Value
($) | |
| Common Stock 89.3% of net assets | |
| Brazil 6.1% | |
| Ambev S.A. | 319,565 | 0.6 | 1,674,925 | |
| Banco do Brasil S.A. | 282,226 | 0.5 | 1,381,588 | |
| Petroleo Brasileiro S.A. * | 1,161,884 | 1.3 | 3,387,798 | |
| Vale S.A. | 541,440 | 1.0 | 2,663,904 | |
| Other Securities | | 2.7 | 7,185,778 | |
| | | 6.1 | 16,293,993 | |
| Chile 0.9% | |
| Other Securities | | 0.9 | 2,285,158 | |
| China 17.0% | |
| Bank of China Ltd., H Shares | 8,287,132 | 1.4 | 3,785,324 | |
| China Construction Bank Corp., H Shares | 8,344,528 | 2.2 | 5,868,050 | |
| China Mobile Ltd. | 536,326 | 2.4 | 6,498,153 | |
| China Petroleum & Chemical Corp., H Shares | 6,354,840 | 1.6 | 4,231,066 | |
| CNOOC Ltd. | 2,222,478 | 1.0 | 2,755,855 | |
| Industrial & Commercial Bank of China Ltd., H Shares | 7,921,499 | 1.8 | 4,681,320 | |
| PetroChina Co., Ltd., H Shares | 3,258,477 | 1.0 | 2,707,672 | |
| Other Securities | | 5.6 | 14,888,287 | |
| | | 17.0 | 45,415,727 | |
| Colombia 0.3% | |
| Other Securities | | 0.3 | 807,215 | |
| Security | Number
of Shares | % of Net
Assets | Value
($) | |
| Czech Republic 0.3% | |
| Other Securities | | 0.3 | 893,057 | |
| Greece 0.5% | |
| Other Securities | | 0.5 | 1,443,994 | |
| Hungary 0.7% | |
| Other Securities | | 0.7 | 1,770,599 | |
| India 2.5% | |
| Infosys Ltd. ADR | 95,452 | 0.6 | 1,637,002 | |
| Reliance Industries Ltd. GDR (a) | 106,091 | 1.0 | 2,768,975 | |
| Other Securities | | 0.9 | 2,115,421 | |
| | | 2.5 | 6,521,398 | |
| Indonesia 1.2% | |
| Other Securities | | 1.2 | 3,230,195 | |
| Malaysia 1.9% | |
| Other Securities | | 1.9 | 5,164,759 | |
| Mexico 3.9% | |
| America Movil S.A.B. de C.V., Series L | 3,449,400 | 1.2 | 3,138,995 | |
| Other Securities | | 2.7 | 7,346,870 | |
| | | 3.9 | 10,485,865 | |
| Peru 0.1% | |
| Other Securities | | 0.1 | 338,958 | |
| Philippines 0.2% | |
| Other Securities | | 0.2 | 534,685 | |
| Poland 2.7% | |
| Polski Koncern Naftowy Orlen S.A. | 131,207 | 1.0 | 2,567,695 | |
| Other Securities | | 1.7 | 4,491,305 | |
| | | 2.7 | 7,059,000 | |
| Republic of Korea 16.9% | |
| Hyundai Mobis Co., Ltd. | 7,597 | 0.5 | 1,326,384 | |
| Hyundai Motor Co. | 21,935 | 1.0 | 2,763,319 | |
| Kia Motors Corp. | 42,152 | 0.6 | 1,735,618 | |
| Korea Electric Power Corp. | 33,255 | 0.5 | 1,349,601 | |
| LG Chem Ltd. | 6,738 | 0.5 | 1,333,073 | |
| LG Corp. | 29,140 | 0.5 | 1,433,902 | |
| LG Electronics, Inc. | 34,995 | 0.5 | 1,316,658 | |
| POSCO | 15,901 | 1.0 | 2,554,377 | |
| Samsung Electronics Co., Ltd. | 11,539 | 4.0 | 10,624,368 | |
| Shinhan Financial Group Co., Ltd. | 45,188 | 0.6 | 1,511,042 | |
| SK Holdings Co., Ltd. | 13,847 | 1.2 | 3,161,014 | |
| SK Innovation Co., Ltd. * | 27,741 | 0.9 | 2,343,121 | |
| Other Securities | | 5.1 | 13,726,840 | |
| | | 16.9 | 45,179,317 | |
| Russia 12.5% | |
| Gazprom PAO | 5,535,731 | 4.6 | 12,295,263 | |
| LUKOIL PJSC * | 202,029 | 2.9 | 7,663,900 | |
| MMC Norilsk Nickel PJSC * | 8,374 | 0.5 | 1,326,511 | |
Schwab Fundamental Emerging Markets Large Company Index ETF
Condensed Portfolio Holdings (Unaudited) continued
| Security | Number
of Shares | % of Net
Assets | | Value
($) |
| Surgutneftegas OAO * | 6,827,613 | 1.3 | | 3,509,489 |
| Tatneft PAO * | 367,039 | 0.7 | | 1,776,882 |
| Other Securities | | 2.5 | | 6,814,857 |
| | | 12.5 | | 33,386,902 |
| South Africa 6.6% | |
| MTN Group Ltd. | 195,405 | 1.0 | | 2,607,070 |
| Sasol Ltd. | 103,486 | 1.2 | | 3,315,094 |
| Standard Bank Group Ltd. | 126,771 | 0.5 | | 1,396,519 |
| Other Securities | | 3.9 | | 10,309,546 |
| | | 6.6 | | 17,628,229 |
| Taiwan 12.2% | |
| Asustek Computer, Inc. | 136,176 | 0.5 | | 1,238,877 |
| Chunghwa Telecom Co., Ltd. | 507,764 | 0.6 | | 1,541,894 |
| Formosa Chemicals & Fibre Corp. | 563,882 | 0.5 | | 1,206,239 |
| Formosa Plastics Corp. | 531,704 | 0.4 | | 1,171,723 |
| Hon Hai Precision Industry Co., Ltd. | 1,648,738 | 1.8 | | 4,687,370 |
| Taiwan Semiconductor Manufacturing Co., Ltd. | 1,249,352 | 1.9 | | 4,953,480 |
| Other Securities | | 6.5 | | 17,799,869 |
| | | 12.2 | | 32,599,452 |
| Thailand 1.4% | |
| PTT PCL NVDR | 189,400 | 0.5 | | 1,416,075 |
| Other Securities | | 0.9 | | 2,340,570 |
| | | 1.4 | | 3,756,645 |
| Turkey 1.4% | |
| Other Securities | | 1.4 | | 3,824,438 |
| Total Common Stock |
| (Cost $285,248,224) | | | | 238,619,586 |
|
| Preferred Stock 8.7% of net assets | |
| Brazil 6.0% | |
| Banco Bradesco S.A. | 294,948 | 0.7 | | 1,866,580 |
| Itau Unibanco Holding S.A. | 399,471 | 1.1 | | 2,911,923 |
| Petroleo Brasileiro S.A. * | 1,740,585 | 1.6 | | 4,391,784 |
| Vale S.A. | 768,596 | 1.1 | | 2,985,966 |
| Other Securities | | 1.5 | | 3,935,493 |
| | | 6.0 | | 16,091,746 |
| Colombia 0.1% | |
| Other Securities | | 0.1 | | 322,922 |
| Republic of Korea 1.0% | |
| Samsung Electronics Co., Ltd. | 2,094 | 0.6 | | 1,540,292 |
| Other Securities | | 0.4 | | 1,002,347 |
| | | 1.0 | | 2,542,639 |
| Russia 1.6% | |
| AK Transneft OAO * | 1,332 | 1.2 | | 3,152,320 |
| Other Securities | | 0.4 | | 1,021,355 |
| | | 1.6 | | 4,173,675 |
| Total Preferred Stock |
| (Cost $32,907,918) | | | | 23,130,982 |
| Security | Number
of Shares | % of Net
Assets | Value
($) | |
| Other Investment Companies 2.0% of net assets | |
| United States 2.0% | |
| Equity Funds 1.6% | |
| iShares India 50 ETF | 80,374 | 0.8 | 2,203,855 | |
| WisdomTree India Earnings Fund | 108,466 | 0.8 | 2,131,357 | |
| | | 1.6 | 4,335,212 | |
| Money Market Fund 0.4% | |
| Other Securities | | 0.4 | 1,089,252 | |
| Securities Lending Collateral 0.0% | |
| Other Securities | | 0.0 | 35,916 | |
| Total Other Investment Companies |
| (Cost $5,867,245) | | | 5,460,380 | |
End of Investments.
At 08/31/15, the tax basis cost of the fund's investments was $327,064,737 and the unrealized appreciation and depreciation were $0 and ($59,853,789), respectively, with a net unrealized depreciation of ($59,853,789).
For the following notes, please refer to the complete schedule of portfolio holdings.
| * | Non-income producing security. |
| (a) | Securities exempt from registration under Rule 144A of the Securities Act of 1933, as amended. These securities may be resold in transactions exempt from registrations, normally to qualified institutional buyers. At the period end, the value of these amounted to $2,768,975 or 1.0% of net assets. |
| (b) | All or a portion of this security is on loan. Securities on loan were valued at $32,961. |
| (c) | The rate shown is the 7-day yield. |
| (d) | Illiquid security. At the period end, the value of these amounted to $0 or 0.0% of net assets. |
| (e) | Fair-valued by management in accordance with procedures approved by the Board of Trustees. |
| | |
| ADR — | American Depositary Receipt |
| ETF — | Exchange Traded Fund |
| GDR — | Global Depositary Receipt |
| NVDR — | Non-Voting Depositary Receipt |
| Reg'd — | Registered |
In addition to the above, the fund held the following at 08/31/15:
| | Number of
Contracts | Contract
Value
($) | Unrealized
Appreciation
($) |
| Futures Contracts | | | |
| MSCI EAFE, e-mini, Long, expires 09/18/15 | 14 | 572,250 | 17,606 |
Schwab Fundamental Emerging Markets Large Company Index ETF
Condensed Portfolio Holdings (Unaudited) continued
The following is a summary of the inputs used to value the fund’s investments as of August 31, 2015 (see financial note 2(a) for additional information):
| Description | | Quoted Prices in
Active Markets for
Identical Assets
(Level 1) | | Other Significant
Observable Inputs
(Level 2) | | Significant
Unobservable
Inputs
(Level 3) | | Total | |
| Common Stock1 | | $238,619,586 | | $— | | $— | | $238,619,586 | |
| Preferred Stock1 | | 23,130,982 | | — | | — | | 23,130,982 | |
| Other Investment Companies1 | | 5,460,380 | | — | | — | | 5,460,380 | |
| Total | | $267,210,948 | | $— | | $— | | $267,210,948 | |
| Other Financial Instruments | | | | | | | | | |
| Futures Contracts2 | | $17,606 | | $— | | $— | | $17,606 | |
| 1 | As categorized in the complete schedule of portfolio holdings. |
| 2 | Futures contracts are not included in Investments in the schedule of condensed portfolio holdings and are valued at unrealized appreciation or depreciation. |
Level 3 investments at the beginning and/or end of the period in relation to net assets were not significant and accordingly, a reconciliation of Level 3 assets for the six months ended August 31, 2015 is not presented.
The fund's policy is to recognize transfers between Level 1, Level 2 and Level 3 as of the beginning of the fiscal year. There were no transfers between Level 1, Level 2 and Level 3 for the period ended August 31, 2015.
Schwab Fundamental Emerging Markets Large Company Index ETF
Statement of
Assets and Liabilities
As of August 31, 2015; unaudited
| Assets |
| Investments, at value (cost $323,987,471) including securities on loan of $32,961 | | $267,175,032 |
| Collateral invested for securities on loan, at value (cost $35,916) | + | 35,916 |
| Total investments, at value (cost $324,023,387) | | 267,210,948 |
| Deposit with broker for futures contracts | | 49,950 |
| Foreign currency, at value (cost $296,932) | | 294,415 |
| Receivables: | | |
| Dividends | | 335,101 |
| Variation margin on futures contracts | | 840 |
| Foreign tax reclaims | | 104 |
| Income from securities on loan | + | 27 |
| Total assets | | 267,891,385 |
| Liabilities |
| Collateral held for securities on loan | | 35,916 |
| Payables: | | |
| Investments bought | | 754,710 |
| Investment adviser fees | + | 22,852 |
| Total liabilities | | 813,478 |
| Net Assets |
| Total assets | | 267,891,385 |
| Total liabilities | – | 813,478 |
| Net assets | | $267,077,907 |
| Net Assets by Source | | |
| Capital received from investors | | 323,670,801 |
| Net investment income not yet distributed | | 4,460,815 |
| Net realized capital losses | | (4,245,485) |
| Net unrealized capital depreciation | | (56,808,224) |
| Net Asset Value (NAV) |
| Net Assets | ÷ | Shares
Outstanding | = | NAV |
| $267,077,907 | | 13,400,001 | | $19.93 |
| | | | | |
Schwab Fundamental Emerging Markets Large Company Index ETF
Statement of
Operations
For the period March 1, 2015 through August 31, 2015; unaudited
| Investment Income |
| Dividends (net of foreign withholding tax of $675,054) | | $4,872,003 |
| Securities on loan | + | 844 |
| Total investment income | | 4,872,847 |
| Expenses |
| Investment adviser fees | | 489,111 |
| Total expenses | – | 489,111 |
| Net investment income | | 4,383,736 |
| Realized and Unrealized Gains (Losses) |
| Net realized losses on investments | | (3,963,869) |
| Net realized gains on in-kind redemptions | | 304,843 |
| Net realized losses on futures contracts | | (107,471) |
| Net realized losses on foreign currency transactions | + | (82,071) |
| Net realized losses | | (3,848,568) |
| Net change in unrealized appreciation (depreciation) on investments | | (54,200,271) |
| Net change in unrealized appreciation (depreciation) on futures contracts | | 15,630 |
| Net change in unrealized appreciation (depreciation) on foreign currency translations | + | (12,338) |
| Net change in unrealized appreciation (depreciation) | + | (54,196,979) |
| Net realized and unrealized losses | | (58,045,547) |
| Decrease in net assets resulting from operations | | ($53,661,811) |
Schwab Fundamental Emerging Markets Large Company Index ETF
Statement of
Changes in Net Assets
For the current and prior report periods
Figures for the current period are unaudited
| Operations | |
| | 3/1/15-8/31/15 | 3/1/14-2/28/15 |
| Net investment income | | $4,383,736 | $999,175 |
| Net realized losses | | (3,848,568) | (439,509) |
| Net change in unrealized appreciation (depreciation) | + | (54,196,979) | (2,090,161) |
| Decrease in net assets resulting from operations | | (53,661,811) | (1,530,495) |
| Distributions to Shareholders | |
| Distributions from net investment income | | ($—) | ($826,020) |
| Transactions in Fund Shares | | | |
| | | 3/1/15-8/31/15 | 3/1/14-2/28/15 |
| | | SHARES | VALUE | SHARES | VALUE |
| Shares sold | | 9,700,000 | $230,784,552 | 3,100,000 | $76,516,387 |
| Shares redeemed | + | (300,000) | (6,686,539) | — | — |
| Net transactions in fund shares | | 9,400,000 | $224,098,013 | 3,100,000 | $76,516,387 |
| Shares Outstanding and Net Assets | | | |
| | | 3/1/15-8/31/15 | 3/1/14-2/28/15 |
| | | SHARES | NET ASSETS | SHARES | NET ASSETS |
| Beginning of period | | 4,000,001 | $96,641,705 | 900,001 | $22,481,833 |
| Total increase | + | 9,400,000 | 170,436,202 | 3,100,000 | 74,159,872 |
| End of period | | 13,400,001 | $267,077,907 | 4,000,001 | $96,641,705 |
| Net investment income not yet distributed | | | $4,460,815 | | $77,079 |
Schwab Fundamental Index ETFs
Financial Notes, unaudited
1. Business Structure of the Funds:
Each of the funds in this report is a series of Schwab Strategic Trust (the trust), a no-load, open-end management investment company. The trust is organized as a Delaware statutory trust and is registered under the Investment Company Act of 1940, as amended (the 1940 Act). The list below shows all the operational funds in the trust as of the end of the period, including the funds discussed in this report, which are highlighted:
| Schwab Strategic Trust (organized January 27, 2009) | Schwab U.S. Mid-Cap ETF |
| Schwab Fundamental U.S. Broad Market Index ETF | Schwab U.S. Small-Cap ETF |
| Schwab Fundamental U.S. Large Company Index ETF | Schwab U.S. Dividend Equity ETF |
| Schwab Fundamental U.S. Small Company Index ETF | Schwab U.S. REIT ETF |
| Schwab Fundamental International Large Company Index ETF | Schwab International Equity ETF |
| Schwab Fundamental International Small Company Index ETF | Schwab International Small-Cap Equity ETF |
| Schwab Fundamental Emerging Markets Large Company Index ETF | Schwab Emerging Markets Equity ETF |
| Schwab U.S. Broad Market ETF | Schwab U.S. TIPS ETF |
| Schwab U.S. Large-Cap ETF | Schwab Short-Term U.S. Treasury ETF |
| Schwab U.S. Large-Cap Growth ETF | Schwab Intermediate-Term U.S. Treasury ETF |
| Schwab U.S. Large-Cap Value ETF | Schwab U.S. Aggregate Bond ETF |
The funds issue and redeem shares at their net assets value per share (NAV) only in large blocks of shares, typically 50,000 shares or more (Creation Units). These transactions are usually in exchange for a basket of securities and/or an amount of cash. As a practical matter, only institutions or large investors purchase or redeem Creation Units. Except when aggregated in Creation Units, shares of the fund are not redeemable securities.
Individual shares of the funds trade on national securities exchanges and elsewhere during the trading day and can only be bought and sold at market prices throughout the trading day through a broker-dealer. Because fund shares trade at market prices rather than NAV, shares may trade at a price greater than NAV (premium) or less than NAV (discount).
Each fund maintains its own account for purposes of holding assets and accounting, and is considered a separate entity for tax purposes. Within its account, each fund may also keep certain assets in segregated accounts, as required by securities law.
2. Significant Accounting Policies:
The following is a summary of the significant accounting policies the funds use in their preparation of financial statements. The funds follow the investment company accounting and reporting guidance of the Financial Accounting Standards Board Accounting Standard Codification Topic 946 Financial Services — Investment Companies. The accounting policies are in conformity with accounting principles generally accepted in the United States of America (GAAP).
The funds invest in certain other investment companies (underlying funds). For specific investments in underlying funds, please refer to the complete schedule of portfolio holdings on Form N-CSR, which is filed with the U.S. Securities and Exchange Commission (SEC). For more information about the underlying funds’ operations and policies, please refer to those funds’ semiannual and annual reports, which are filed with the SEC.
(a) Security Valuation:
Under procedures approved by the funds’ Board of Trustees (the Board), the investment adviser has formed a Pricing Committee to administer the pricing and valuation of portfolio securities and other assets and to ensure that prices used for internal purposes or provided by third parties reasonably reflect fair market value. Among other things, these procedures allow the funds to utilize independent pricing services, quotations from securities and financial instrument dealers and other market sources to determine fair value.
The funds value the securities in their portfolios every business day. The funds use the following policies to value various types of securities:
• Securities traded on an exchange or over-the-counter: Traded securities are valued at the closing value for the day, or, on days when no closing value has been reported, at halfway between the most recent bid and ask quotes. Securities that are primarily traded on foreign exchanges are valued at the official closing price or the last sales price on the exchange where the securities are principally traded with these values then translated into U.S. dollars at the current exchange rate, unless these securities are fair valued as discussed below.
Schwab Fundamental Index ETFs
Financial Notes, unaudited (continued)
2. Significant Accounting Policies (continued):
• Securities for which no quoted value is available: The Board has adopted procedures to fair value each fund’s securities when market prices are not “readily available” or are unreliable. For example, a fund may fair value a security when it is de-listed or its trading is halted or suspended; when a security’s primary pricing source is unable or unwilling to provide a price; or when a security’s primary trading market is closed during regular market hours. Each fund makes fair value determinations in good faith in accordance with the fund’s valuation procedures. The Pricing Committee considers a number of factors, including unobservable market inputs when arriving at fair value. The Pricing Committee may employ techniques such as the review of related or comparable assets or liabilities, related market activities, recent transactions, market multiples, book values, transactional back-testing, disposition analysis and other relevant information. The Pricing Committee regularly reviews these inputs and assumptions to calibrate the valuations. Due to the subjective and variable nature of fair value pricing, there can be no assurance that a fund could obtain the fair value assigned to the security upon the sale of such security. The Board convenes on a regular basis to review fair value determinations made by the funds pursuant to the valuation procedures.
• Futures contracts: Futures contracts are valued at their settlement prices as of the close of their exchanges.
• Short-term securities (60 days or less to maturity): A short-term security may be valued at its amortized cost when it approximates the security's market value.
• Underlying funds: Mutual funds are valued at their respective NAVs. Exchange traded funds (ETFs) traded on a recognized securities exchange are valued at the last reported sale price that day or the official closing price, if applicable.
In accordance with the authoritative guidance on fair value measurements and disclosures under GAAP, the funds disclose the fair value of their investments in a hierarchy that prioritizes the significant inputs to valuation techniques used to measure the fair value. The hierarchy gives the highest priority to valuations based upon unadjusted quoted prices in active markets for identical assets or liabilities (Level 1 measurements) and the lowest priority to valuations based upon unobservable inputs that are significant to the valuation (Level 3 measurements). If inputs used to measure the financial instruments fall within different levels of the hierarchy, the categorization is based on the lowest level input that is significant to the valuation. If the funds determine that either the volume and/or level of activity for an asset or liability has significantly decreased (from normal conditions for that asset or liability) or price quotations or observable inputs are not associated with orderly transactions, increased analysis and management judgment will be required to estimate fair value.
The three levels of the fair value hierarchy are as follows:
• Level 1—quoted prices in active markets for identical securities—Investments whose values are based on quoted market prices in active markets, and whose values are therefore classified as Level 1 prices, include active listed equities, ETFs and futures contracts. Investments in mutual funds are valued daily at their NAVs, and investments in ETFs are valued daily at the last reported sale price or the official closing price, which are classified as Level 1 prices, without consideration to the classification level of the specific investments held by an underlying fund.
• Level 2—other significant observable inputs (including quoted prices for similar securities, interest rates, prepayment speeds, credit risk, etc.)—Investments that trade in markets that are not considered to be active, but whose values are based on quoted market prices, dealer quotations or valuations provided by alternative pricing sources supported by observable inputs are classified as Level 2 prices. These generally include U.S. government and sovereign obligations, most government agency securities, investment-grade corporate bonds, certain mortgage products, less liquid listed equities, and state, municipal and provincial obligations. As investments whose values are classified as Level 2 prices include positions that are not traded in active markets and/or are subject to transfer restrictions, valuations may be adjusted to reflect illiquidity and/or non-transferability, which are generally based on available market information.
• Level 3—significant unobservable inputs (including the funds’ own assumptions in determining the fair value of investments)—Investments whose values are classified as Level 3 prices have significant unobservable inputs, as they may trade infrequently or not at all. When observable prices are not available for these securities, the funds use one or more valuation techniques for which sufficient and reliable data is available. The inputs used by the funds in estimating the value of Level 3 prices may include the original transaction price, quoted prices for similar securities or assets in active markets, completed or pending third-party transactions in the underlying investment or comparable issuers, and
Schwab Fundamental Index ETFs
Financial Notes, unaudited (continued)
2. Significant Accounting Policies (continued):
changes in financial ratios or cash flows. Level 3 prices may also be adjusted to reflect illiquidity and/or non-transferability, with the amount of such discount estimated by the funds in the absence of market information. Assumptions used by the funds due to the lack of observable inputs may significantly impact the resulting fair value and therefore the funds’ results of operations.
The inputs or methodology used for valuing securities are not necessarily an indication of the risk associated with investing in those securities.
The levels associated with valuing the funds' investments as of August 31, 2015 are disclosed in the Condensed Portfolio Holdings.
(b) Accounting Policies for certain Portfolio Investments (if held):
Futures Contracts: Futures contracts are instruments that represent an agreement between two parties that obligates one party to buy, and the other party to sell, specific instruments at an agreed upon price on a stipulated future date. A fund must give the broker a deposit of cash and/or securities (initial margin) whenever it enters into a futures contract. The amount of the deposit may vary from one contract to another. Subsequent payments (variation margin) are made or received by a fund depending on the daily fluctuations in the value of the futures contract and are accounted for as unrealized appreciation or depreciation until the contract is closed, at which time the gains or losses are realized. Futures contracts are traded publicly on exchanges, and their market value may change daily.
Securities Lending: Under the trust's Securities Lending Program, a fund (lender) may make short-term loans of its securities to another party (borrower) to generate additional revenue for the fund. The borrower pledges collateral in the form of cash, securities issued or fully guaranteed by the U.S. government or foreign governments, or letters of credit issued by a bank. Collateral at the individual loan level is required to be maintained on a daily marked-to-market basis in an amount at least equal to the current value of the securities loaned. The lending agent provides a fund with indemnification against borrower default (the borrower fails to return the security on loan) reducing the risk of loss as a result of default. The cash collateral of securities loaned is currently invested in money market portfolios operating under Rule 2a-7 of the 1940 Act. Each fund bears the risk of loss with respect to the investment of cash collateral. The terms of the securities lending agreement allow the funds to terminate any loans at any given time. Securities lending income, as disclosed in each fund’s Statement of Operations, if applicable, represents the income earned from the investment of the cash collateral plus any fees paid by borrowers, less the fees paid to the lending agent and broker rebates which are subject to adjustments pursuant to the securities lending agreement. On loans not collateralized by cash, a fee is received from the borrower, and is allocated between a fund and the lending agent. A fund retains the right to recall a security on loan. The aggregate market value of securities loaned will not at any time exceed one-third of the total assets of a fund, including collateral received from the loan (at market value computed at the time of the loan). Total costs and expenses, including agent fees, associated with securities lending activities under the trust's Securities Lending Program paid to the unaffiliated lending agent are approximately 15% of the gross lending revenues.
The value of the securities on loan and the related collateral as of August 31, 2015, if any, are disclosed in each fund's Condensed Portfolio Holdings. The value of the securities on loan and the investments of cash collateral are also disclosed in each fund's Statement of Assets and Liabilities.
(c) Security Transactions:
Security transactions are recorded as of the date the order to buy or sell the security is executed. Realized gains and losses from security transactions are based on the identified costs of the securities involved.
Assets and liabilities denominated in foreign currencies are reported in U.S. dollars. For assets and liabilities held on a given date, the dollar value is based on market exchange rates in effect on that date. Transactions involving foreign currencies, including purchases, sales, income receipts and expense payments, are calculated using exchange rates in effect on the transaction date. Realized foreign exchange gains or losses arise from sales of foreign currencies, currency gains or losses realized between the trade and settlement dates on securities transactions and the difference between the recorded amounts of dividends, interest, and foreign withholding taxes and the U.S. dollar equivalent of the amounts actually received or paid. Net unrealized foreign exchange appreciation or depreciation arises from changes in foreign exchange rates on foreign denominated assets and liabilities other than investments in securities held at the end of the reporting period. These realized
Schwab Fundamental Index ETFs
Financial Notes, unaudited (continued)
2. Significant Accounting Policies (continued):
and unrealized foreign exchange gains or losses are reported in foreign currency transactions or translations on the Statement of Operations. The funds do not isolate the portion of the fluctuations on investments resulting from changes in foreign currency exchange rates from the fluctuations in market prices of investments held. Such fluctuations are included with the net realized and unrealized gain or loss from investments.
Gains realized by the funds on the sale of securities in certain foreign countries may be subject to non-U.S. taxes. In those instances, the funds record a liability based on unrealized gains to provide for potential non-U.S. taxes payable upon the sale of these securities.
When a fund closes out a futures contract position, it calculates the difference between the value of the position at the beginning and at the end of the contract, and records a realized gain or loss accordingly.
(d) Investment Income:
Interest income is recorded as it accrues. Dividends and distributions from portfolio securities and underlying funds are recorded on the date they are effective (the ex-dividend date), although the funds record certain foreign security dividends on the day they learn of the ex-dividend date. Any distributions from underlying funds are recorded in accordance with the character of the distributions as designated by the underlying funds.
Income received from foreign sources may result in withholding tax. Withholding taxes are accrued at the same time as the related income if the tax rate is fixed and known, unless a tax withheld is reclaimable from the local tax authorities in which case it is recorded as receivable. If the tax rate is not known or estimable, such expense or reclaim receivable is recorded when the net proceeds are received.
(e) Expenses:
Pursuant to the Investment Advisory Agreement (Advisory Agreement) between Charles Schwab Investment Management, Inc. (CSIM or the investment adviser) and the trust, the investment adviser will pay the operating expenses of each fund, excluding interest expense, taxes, any brokerage expenses, and extraordinary or non-routine expenses. Interest expense, taxes, any brokerage expenses and extraordinary or non-routine expenses that are specific to a fund are charged directly to the fund.
(f) Distributions to Shareholders:
Schwab Fundamental U.S. Broad Market Index ETF, Schwab Fundamental U.S. Large Company Index ETF, and Schwab Fundamental U.S. Small Company Index ETF generally make distributions from net investment income, if any, quarterly. Schwab Fundamental International Large Company Index ETF, Schwab Fundamental International Small Company Index ETF, and Schwab Fundamental Emerging Markets Large Company Index ETF generally make distributions from net investment income, if any, annually. All funds generally make distributions from net realized capital gains, if any, once a year.
(g) Accounting Estimates:
The accounting policies described in this report conform to GAAP. Notwithstanding this, shareholders should understand that in order to follow these principles, fund management has to make estimates and assumptions that affect the information reported in the financial statements. It’s possible that once the results are known, they may turn out to be different from these estimates and these differences may be material.
(h) Federal Income Taxes:
The funds intend to meet federal income and excise tax requirements for regulated investment companies. Accordingly, the funds distribute substantially all of their net investment income and net realized capital gains, if any, to their respective shareholders each year. As long as a fund meets the tax requirements, it is not required to pay federal income tax.
Schwab Fundamental Index ETFs
Financial Notes, unaudited (continued)
2. Significant Accounting Policies (continued):
(i) Foreign Taxes:
The funds may be subject to foreign taxes (a portion of which may be reclaimable) on income, corporate events, foreign currency exchanges and capital gains on investments. All foreign taxes are recorded in accordance with the applicable foreign tax regulations and rates that exist in foreign markets in which the funds invest. These foreign taxes, if any, are paid by the funds and are disclosed in the Statement of Operations. Foreign taxes payable as of August 31, 2015, if any, are reflected in each fund's Statement of Assets and Liabilities.
(j) Indemnification:
Under the funds’ organizational documents, the officers and trustees are indemnified against certain liabilities arising out of the performance of their duties to the funds. In addition, in the normal course of business the funds enter into contracts with their vendors and others that provide general indemnifications. The funds’ maximum exposure under these arrangements is unknown as this would involve future claims that may be made against the funds. However, based on experience, the funds expect the risk of loss attributable to these arrangements to be remote.
(k) New Accounting Pronouncements:
In June 2014, Accounting Standards Update (ASU) No. 2014-11, Topic 806 Transfers and Servicing — Repurchase-to-Maturity Transactions, Repurchase Financings and Disclosures, was issued and is effective for interim periods beginning after March 15, 2015 and annual periods beginning after December 15, 2014. The ASU modifies accounting guidance and enhances disclosure requirements for repurchase agreement and securities lending transactions. Management is currently evaluating the impact the adoption of ASU 2014-11 may have on the funds’ financial statement disclosures.
3. Risk Factors:
Investing in the funds may involve certain risks, as discussed in the funds’ prospectus, including, but not limited to, those described below. Any of these risks could cause an investor to lose money.
Market Risk. Equity markets rise and fall daily. As with any investment whose performance is tied to these markets, the value of the investment in a fund will fluctuate, which means that the investors could lose money.
Investment Style Risk. The funds are not actively managed. Therefore, the funds follow the securities included in the index during upturns as well as downturns. Because of their indexing strategies, the funds do not take steps to reduce market exposure or to lessen the effects of a declining market. In addition, because of the funds' expenses, the funds' performance may be below that of their respective index.
Equity Risk. The prices of equity securities rise and fall daily. These price movements may result from factors affecting individual companies, industries or the securities market as a whole. In addition, equity markets tend to move in cycles, which may cause stock prices to fall over short or extended periods of time.
Large-Cap Risk. Certain funds invest in large-cap stocks. Large-cap stocks tend to go in and out of favor based on market and economic conditions. During a period when large-cap U.S. stocks fall behind other types of investments—mid- or small-cap stocks, for instance—a fund’s large-cap holdings could reduce performance.
Mid-Cap Risk. Certain funds invest in mid-cap stocks. Mid-cap stocks tend to go in and out of favor based on market and economic conditions. Stocks of mid-cap companies may be more vulnerable to adverse business or economic events than larger, more established companies. During a period when mid-cap stocks fall behind other types of investments—bonds or large-cap stocks, for instance—a fund’s mid-cap holdings could reduce performance.
Small-Cap Risk. Certain funds invest in small-cap stocks. Historically, small-cap stocks have been riskier than large- and mid-cap stocks, and their prices may move sharply, especially during market upturns and downturns. Small-cap companies may be more vulnerable to adverse business or economic events than larger, more established companies. During a period when small-cap stocks fall behind other types of investments—large-cap and mid-cap stocks, for instance—a fund’s small-cap holdings could reduce performance.
Foreign Investment Risk. A fund’s investments in securities of foreign issuers may involve certain risks that are greater than those associated with investments in securities of U.S. issuers. These include risks of adverse changes in foreign economic, political, regulatory and other conditions; changes in currency exchange rates or exchange control regulations (including
Schwab Fundamental Index ETFs
Financial Notes, unaudited (continued)
3. Risk Factors (continued):
limitations on currency movements and exchanges); the imposition of economic sanctions or other government restrictions; differing accounting, auditing, financial reporting and legal standards and practices; differing securities market structures; and higher transaction costs. These risks may negatively impact the value or liquidity of a fund's investments, and could impair the fund's ability to meet its investment objective or invest in accordance with its investment strategy. These risks may be heightened in connection with investments in emerging markets. Foreign securities also include American Depositary receipts (ADRs), Global Depositary receipts (GDRs), and European Depositary receipts (EDRs), which are receipts issued by U.S. and foreign banks that represent shares of foreign-based corporations. Investment in ADRs, GDRs and EDRs may be less liquid than the underlying shares in their primary trading market and GDRs, many of which are issued by companies in emerging markets, may be more volatile. To the extent a fund's investments in a single country or a limited number of countries represent a larger percentage of the fund's assets, the fund's performance may be adversely affected by the economic, political and social conditions in those countries and the fund may be subject to increased price volatility.
Emerging Markets Risk. Certain funds invest in emerging markets. Emerging market countries may be more likely to experience political turmoil or rapid changes in market or economic conditions than more developed countries. Such countries often have less uniformity in accounting and reporting requirements and greater risk associated with the custody of securities. In addition, the financial stability of issuers (including governments) in emerging market countries may be more precarious than in other countries. As a result, there will tend to be an increased risk of price volatility associated with a fund’s investments in emerging market countries, which may be magnified by currency fluctuations relative to the U.S. dollar and, at times, it may be difficult to value such investments.
Sampling Index Tracking Risk. Certain funds may not fully replicate the index and may hold securities not included in the index. As a result, a fund is subject to the risk that the investment adviser’s investment management strategy, the implementation of which is subject to a number of constraints, may not produce the intended results. Because certain funds utilize a sampling approach they may not track the return of their respective index as well as they would if the funds purchased all of the securities in their respective index.
Tracking Error Risk. As an index fund, each fund seeks to track the performance of the index, although it may not be successful in doing so. The divergence between the performance of a fund and the index, positive or negative, is called “tracking error.” Tracking error can be caused by many factors and it may be significant.
Derivatives Risk. Each fund may use derivatives to enhance returns or hedge against market declines. Examples of derivatives are options, futures, options on futures and swaps. An option is the right to buy or sell an instrument at a specific price before a specific date. A future is an agreement to buy or sell a financial instrument at a specific price on a specific day. A swap is an agreement whereby two parties agree to exchange payment streams calculated in relation to a rate, index, instrument or certain securities and a predetermined amount.
A fund’s use of derivative instruments involves risks different from, or possibly greater than the risks associated with investing directly in securities and other traditional investments. Certain of these risks, such as liquidity risk and market risk, are discussed elsewhere in this section. The fund’s use of derivatives is also subject to credit risk, leverage risk, lack of availability risk, valuation risk, correlation risk and tax risk. Lack of availability risk is the risk that suitable derivative transactions may not be available in all circumstances for risk management or other purposes. Credit risk is the risk that the counterparty to a derivatives transaction may not fulfill its obligations. Leverage risk is the risk that a small percentage of assets invested in derivatives can have a disproportionately large impact on the fund. Valuation risk is the risk that a particular derivative may be valued incorrectly. Correlation risk is the risk that changes in the value of the derivative may not correlate perfectly with the underlying asset, rate or index. Tax risk is the risk that the use of derivatives may cause the fund to realize higher amounts of short-term capital gain. These risks could cause the fund to lose more than the initial amount invested. The use of derivatives, subject to regulation by the Commodity Futures Trading Commission (CFTC), could cause the fund to become a commodity pool, which would require the fund to comply with certain CFTC rules.
Liquidity Risk. A particular investment may be difficult to purchase or sell. A fund may be unable to sell a security at an advantageous time or price.
Securities Lending Risk. Securities lending involves the risk of loss of rights in the collateral or delay in recovery of the collateral if the borrower fails to return the security loaned or becomes insolvent.
Schwab Fundamental Index ETFs
Financial Notes, unaudited (continued)
3. Risk Factors (continued):
Concentration Risk. To the extent that a fund's or an index's portfolio is concentrated in the securities of issuers in a particular market, industry, group of industries, sector or asset class, the fund may be adversely affected by the performance of those securities, may be subject to increased price volatility and may be more susceptible to adverse economic, market, political or regulatory occurrences affecting that market, industry, group of industries, sector or asset class.
Market Trading Risk. Although fund shares are listed on national securities exchanges, there can be no assurance that an active trading market for fund shares will develop or be maintained. If an active market is not maintained, investors may find it difficult to buy or sell fund shares.
Shares of the Fund May Trade at Prices Other Than NAV. Fund shares may be bought and sold in the secondary market at market prices. Although it is expected that the market price of the shares of a fund will approximate the fund’s NAV, there may be times when the market price and the NAV vary significantly. Investors may pay more than NAV when they buy shares of a fund in the secondary market, and may receive less than NAV when they sell those shares in the secondary market. The market price of fund shares may deviate, sometimes significantly, from NAV during periods of market volatility or as a result of other factors impacting foreign securities, including liquidity, irregular trading activity and timing differences between foreign markets where securities trade and the secondary market where fund shares are sold.
Please refer to the funds’ prospectus for a more complete description of the principal risks of investing in the funds.
4. Affiliates and Affiliated Transactions:
CSIM, a wholly owned subsidiary of The Charles Schwab Corporation, serves as each fund’s investment adviser pursuant to an Advisory Agreement between CSIM and the trust.
For its advisory services to the funds, CSIM is entitled to receive an annual fee, payable monthly, based on a percentage of each fund’s average daily net assets as follows:
Schwab
Fundamental
U.S. Broad
Market
Index ETF | | Schwab
Fundamental
U.S. Large
Company
Index ETF | | Schwab
Fundamental
U.S. Small
Company
Index ETF | | Schwab
Fundamental
International
Large
Company
Index ETF | | Schwab
Fundamental
International
Small
Company
Index ETF | | Schwab
Fundamental
Emerging
Markets Large
Company
Index ETF |
| 0.32% | | 0.32% | | 0.32% | | 0.32% | | 0.46% | | 0.46% |
The funds may engage in certain transactions involving affiliates. For instance, a fund may own shares of The Charles Schwab Corporation if that company is included in its index. Below is the summary of investment activities involving The Charles Schwab Corporation shares owned by the funds during the report period:
| Fund | | Balance
of Shares
Held at
02/28/15 | | Gross
Purchases | | Gross
Sales | | Balance
of Shares
Held at
8/31/15 | | Market
Value at
8/31/15 | | Realized
Gains (Losses)
3/1/15
to 8/31/15 | | Dividends
Received
3/1/15
to 8/31/15 |
| Schwab Fundamental U.S. Broad Market Index ETF | | 3,997 | | 486 | | (1,001) | | 3,482 | | $105,783 | | $3,077 | | $458 |
| Schwab Fundamental U.S. Large Company Index ETF | | 7,089 | | 9,020 | | (3,105) | | 13,004 | | 395,062 | | 13,616 | | 1,375 |
Pursuant to an exemptive order issued by the SEC, the funds may enter into interfund borrowing and lending transactions with other funds in the Fund Complex (for definition refer to Trustees and Officers section). All loans are for temporary or emergency purposes and the interest rate to be charged will be the average of the overnight repurchase agreement rate and the short-term bank loan rate. All loans are subject to numerous conditions designed to ensure fair and equitable treatment of all participating funds/portfolios. The interfund lending facility is subject to the oversight and periodic review of the Board. The funds had no interfund borrowing or lending activity during the period.
5. Other Service Providers:
SEI Investments Distribution Co. is the principal underwriter and distributor of shares of the funds.
Schwab Fundamental Index ETFs
Financial Notes, unaudited (continued)
5. Other Service Providers (continued):
State Street Bank and Trust Company (State Street) serves as the funds’ transfer agent. As part of these services, the transfer agent maintains records pertaining to the sale, redemption and transfer of the funds’ shares.
State Street also serves as custodian and accountant for the funds. The custodian is responsible for the daily safekeeping of securities and cash held by the funds. The funds’ accountant maintains all books and records related to the funds’ transactions.
The funds may engage in direct transactions with certain other Schwab funds when practical. When one fund is seeking to sell a security that another is seeking to buy, an interfund transaction can allow both funds to benefit by reducing transaction costs. This practice is limited to funds that share the same investment adviser, trustees and/or officers. For the period ended August 31, 2015, each fund's total aggregate security transactions with other Schwab funds were as follows:
| | |
| Schwab Fundamental U.S. Broad Market Index ETF | $526,919 |
| Schwab Fundamental U.S. Large Company Index ETF | 11,548,547 |
| Schwab Fundamental U.S. Small Company Index ETF | — |
| Schwab Fundamental International Large Company Index ETF | — |
| Schwab Fundamental International Small Company Index ETF | — |
| Schwab Fundamental Emerging Markets Large Company Index ETF | 44,437 |
6. Board of Trustees:
The Board may include people who are officers and/or directors of CSIM or its affiliates. Federal securities law limits the percentage of such “interested persons” who may serve on a trust’s board, and the trust was in compliance with these limitations throughout the report period. The trust did not pay any of these interested persons for their services as trustees. For information regarding the trustees please refer to the Trustees and Officers table at the end of this report.
7. Borrowing from Banks:
The funds have access to custodian overdraft facilities. During the period, the funds also had access to an uncommitted line of credit of $100 million with State Street. The funds pay interest on the amounts they borrow at rates that are negotiated periodically.
There were no borrowings from the line of credit by the funds during the period. However, the funds may have utilized their overdraft facility and incurred an interest expense, which is disclosed on a fund's Statement of Operations, if any. The interest expense is determined based on a negotiated rate above the current Federal Funds Rate.
Effective October 8, 2015, the existing line of credit was terminated and the funds became participants in a syndicated, committed line of credit of $530 million with State Street, as agent.
8. Derivatives:
Certain funds entered into equity index futures contracts during the report period. The funds invested in futures contracts to equitize available cash. The fair value and variation margin for futures contracts held at August 31, 2015 are presented on the Condensed Portfolio Holdings and Statement of Assets and Liabilities, respectively. The net realized and change in unrealized gains (losses) on futures contracts are presented on the Statement of Operations. Refer to financial note 2(b) for the funds’
Schwab Fundamental Index ETFs
Financial Notes, unaudited (continued)
8. Derivatives (continued):
accounting policies with respect to futures contracts and financial note 3 for disclosures concerning the risks of investing in futures contracts. During the period, the month-end average contract values of futures contracts held by the funds and the month-end average number of contracts held were as follows:
| | Contract Values | | Number of Contracts |
| Schwab Fundamental U.S. Broad Market Index ETF | $444,288 | | 4 |
| Schwab Fundamental U.S. Large Company Index ETF | 914,945 | | 9 |
| Schwab Fundamental U.S. Small Company Index ETF | 579,875 | | 5 |
| Schwab Fundamental International Large Company Index ETF | 1,019,233 | | 11 |
| Schwab Fundamental International Small Company Index ETF | 76,417 | | 1 |
| Schwab Fundamental Emerging Markets Large Company Index ETF | 387,561 | | 8 |
9. Purchases and Sales/Maturities of Investment Securities:
For the period ended August 31, 2015, purchases and sales/maturities of securities (excluding in-kind transactions and short-term obligations) were as follows:
| | Purchases of Securities | | Sales/Maturities of Securities |
| Schwab Fundamental U.S. Broad Market Index ETF | $13,522,976 | | $12,209,740 |
| Schwab Fundamental U.S. Large Company Index ETF | 42,671,724 | | 34,618,572 |
| Schwab Fundamental U.S. Small Company Index ETF | 59,706,939 | | 50,726,824 |
| Schwab Fundamental International Large Company Index ETF | 41,467,477 | | 29,334,133 |
| Schwab Fundamental International Small Company Index ETF | 33,180,517 | | 27,241,244 |
| Schwab Fundamental Emerging Markets Large Company Index ETF | 160,322,740 | | 21,496,109 |
10. In-Kind Transactions:
The consideration for the purchase of Creation Units of a fund generally consists of the in-kind deposit of a designated portfolio of equity securities, which constitutes an optimized representation of the securities involved in a relevant fund’s underlying index, and an amount of cash. Investors purchasing and redeeming Creation Units are subject to a standard creation transaction fee and a standard redemption transaction fee paid to the custodian to offset transfer and other transaction costs associated with the issuance and redemption of Creation Units. Purchasers and redeemers of Creation Units for cash are subject to an additional variable charge paid to the fund that will offset the transaction costs to the fund of buying or selling portfolio securities. In addition, purchasers and redeemers of shares in Creation Units are responsible for payment of the costs of transferring securities to or out of the fund. From time to time, CSIM may cover the cost of any transaction fees when believed to be in the best interests of a fund.
The in-kind transactions for the period ended August 31, 2015 were as follows:
| | In-Kind Purchases of Securities | | In-Kind Sales of Securities |
| Schwab Fundamental U.S. Broad Market Index ETF | $26,729,110 | | $— |
| Schwab Fundamental U.S. Large Company Index ETF | 496,062,080 | | 88,368,736 |
| Schwab Fundamental U.S. Small Company Index ETF | 330,228,720 | | 74,280,839 |
| Schwab Fundamental International Large Company Index ETF | 461,072,250 | | — |
| Schwab Fundamental International Small Company Index ETF | 263,106,771 | | 8,209,633 |
| Schwab Fundamental Emerging Markets Large Company Index ETF | 91,181,252 | | 2,406,006 |
Schwab Fundamental Index ETFs
Financial Notes, unaudited (continued)
10. In-Kind Transactions (continued):
For the period ended August 31, 2015, the funds realized net capital gains or losses resulting from in-kind redemptions of Creation Units. Because such gains or losses are not taxable to the funds and are not distributed to existing fund shareholders, the gains or losses are reclassified from accumulated net realized gains or losses to capital received from investors at the end of the funds' tax year. These reclassifications have no effect on net assets or net asset values per share. The net realized in-kind gains or losses for the period ended August 31, 2015 are disclosed in the funds' Statements of Operations.
11. Federal Income Taxes
Capital loss carryforwards may be used to offset future realized capital gains for federal income tax purposes. As of February 28, 2015, the funds had capital loss carryforwards available to offset future net capital gains before the expiration dates as follows:
| Expiration Date | | Schwab
Fundamental
U.S. Broad
Market
Index ETF | | Schwab
Fundamental
U.S. Large
Company
Index ETF | | Schwab
Fundamental
U.S. Small
Company
Index ETF | | Schwab
Fundamental
International
Large
Company
Index ETF | | Schwab
Fundamental
International
Small
Company
Index ETF | | Schwab
Fundamental
Emerging
Markets Large
Company
Index ETF |
| No expiration* | | $100,125 | | $187,754 | | $223,286 | | $1,471,155 | | $364,566 | | $84,642 |
| Total | | $100,125 | | $187,754 | | $223,286 | | $1,471,155 | | $364,566 | | $84,642 |
| * | As a result of the passage of the Regulated Investment Company Modernization Act of 2010, capital losses incurred after December 31, 2010 may now be carried forward indefinitely, but must retain the character of the original loss. |
For tax purposes, net realized capital losses and late-year ordinary losses incurred after October 31 may be deferred and treated as occurring on the first day of the following fiscal year. For the year ended February 28, 2015, the funds had no capital losses deferred and no capital loss carryforwards utilized.
As of February 28, 2015, management has reviewed the tax positions for open periods (for federal purposes, three years from the date of filing and for state purposes, four years from the date of filing) as applicable to the funds, and has determined that no provision for income tax is required in the funds' financial statements. The funds recognize interest and penalties, if any, related to unrecognized tax benefits as income tax expense in the Statement of Operations. During the period ended February 28, 2015, the funds did not incur any interest or penalties.
12. Other:
As a result of recent political and military actions undertaken by the Russian Federation, the U.S. and the European Union have instituted various economic sanctions against Russian individuals and entities. The U.S. and/or the European Union may impose additional economic sanctions, or take other actions, against individuals and/or companies in specific sectors of the Russian economy, including, but not limited to, the financial services, energy, metals and mining, engineering, and defense and defense related materials sectors. These sanctions, and the threat of additional sanctions, could have adverse consequences for the Russian economy, including continued weakening of the Russian currency, downgrades in Russia’s credit rating, and a significant decline in the value and liquidity of securities issued by Russian companies or the Russian government. Any of these events could negatively impact a fund's investment in Russian securities. These sanctions have the possibility of impairing a fund’s ability to invest in accordance with its investment strategy and/or to meet its investment objective.
In addition, as index based products, the funds will generally maintain exposure to Russian securities to the extent the indexes which they track include such securities. For this reason, the sanction instituted against Russia, and any continued disruption of the Russian economy, could negatively impact a fund’s performance to the extent its index and its portfolio contain securities of Russian issuers, and, depending on the fund’s exposure to Russian issuers, the impact could be significant.
13. Subsequent Events:
Management has determined there are no subsequent events or transactions through the date the financial statements were issued that would have materially impacted the financial statements as presented.
Trustees and Officers
The tables below give information about the trustees and officers for the Schwab Strategic Trust, which includes the funds covered in this report. The “Fund Complex” includes The Charles Schwab Family of Funds, Schwab Capital Trust, Schwab Investments, Schwab Annuity Portfolios, Schwab Strategic Trust, Laudus Trust and Laudus Institutional Trust. The Fund Complex includes 95 funds.
The address for all trustees and officers is 211 Main Street, San Francisco, CA 94105. You can find more information about the trustees and officers in the Statement of Additional Information, which is available free by calling 1-800-435-4000.
| Independent Trustees |
Name, Year of Birth,
and Position(s) with
the trust; (Terms of
office, and length of
Time Served1) | Principal Occupations
During the Past Five Years | Number of
Portfolios in
Fund Complex
Overseen by
the Trustee | Other Directorships |
Robert W. Burns
1959
Trustee
(Trustee Schwab Strategic Trust since 2009) | Retired/Private Investor (Jan. 2009 – present); Formerly, Managing Director, Pacific Investment Management Company, LLC (PIMCO) and President, PIMCO Funds. | 21 | Director, PS Business Parks, Inc. (2005 – 2012). |
Stephen Timothy Kochis
1946
Trustee
(Trustee Schwab Strategic Trust since 2012) | CEO and Owner, Kochis Global (wealth management consulting) (May 2012 – present); Chairman and CEO, Aspiriant, LLC (wealth management) (Jan. 2008 – April 2012). | 21 | None |
Charles A. Ruffel
1956
Trustee
(Trustee Schwab Strategic Trust since 2009; The Charles Schwab Family of Funds, Schwab Investments, Schwab Capital Trust, Schwab Annuity Portfolios, Laudus Trust and Laudus Institutional Trust since 2015) | Co-Chief Executive Officer, Kudu Investment Management, LLC (financial services) (Jan. 2015 – present); Partner, Kudu Advisors, LLC (financial services) (June 2008 – Jan. 2015); Advisor, Asset International, Inc. (publisher of financial services information) (Aug. 2008 – Jan. 2015). | 95 | None |
| Interested Trustees |
Name, Year of Birth,
and Position(s) with
the trust; (Terms of
office, and length of
Time Served) | Principal Occupations
During the Past Five Years | Number of
Portfolios in
Fund Complex
Overseen by
the Trustee | Other Directorships |
Walter W. Bettinger II2
1960
Trustee
(Trustee of The Charles Schwab Family of Funds, Schwab Investments, Schwab Capital Trust and Schwab Annuity Portfolios since 2008; Schwab Strategic Trust since 2009; Laudus Trust and Laudus Institutional Trust since 2010) | Director, President and Chief Executive Officer, The Charles Schwab Corporation and Charles Schwab & Co., Inc. (2008 – present); Director, Charles Schwab Bank (2006 – present); and Director, Schwab Holdings, Inc. (2008 – present). | 95 | Director, The Charles Schwab Corporation (2008 – present) |
| Officers of the Trust |
Name, Year of Birth, and Position(s)
with the trust; (Terms of office, and
length of Time Served3) | Principal Occupations During the Past Five Years |
Marie Chandoha
1961
President and Chief Executive Officer
(Officer since 2010) | Director, President and Chief Executive Officer (Dec. 2010 – present), Chief Investment Officer (Sept. 2010 – Oct. 2011), Charles Schwab Investment Management, Inc.; President, Chief Executive Officer (Dec. 2010 – present), and Chief Investment Officer (Sept. 2010 – Oct. 2011), Schwab Funds, Laudus Funds and Schwab ETFs; Director, Charles Schwab Worldwide Funds plc and Charles Schwab Asset Management (Ireland) Limited (January 2011 – present); Global Head of Fixed Income Business Division, BlackRock, Inc. (formerly Barclays Global Investors) (March 2007 – August 2010). |
George Pereira
1964
Treasurer and Principal Financial Officer
(Officer since 2009) | Senior Vice President and Chief Financial Officer (Nov. 2004 – present), Chief Operating Officer (Jan. 2011 – present), Charles Schwab Investment Management, Inc.; Treasurer and Chief Financial Officer, Laudus Funds (June 2006 – present); Treasurer and Principal Financial Officer, Schwab Funds (Nov. 2004 – present) and Schwab ETFs (Oct. 2009 – present); Director, Charles Schwab Worldwide Funds plc and Charles Schwab Asset Management (Ireland) Limited (April 2005 – present). |
Omar Aguilar
1970
Senior Vice President and Chief Investment Officer – Equities
(Officer since 2011) | Senior Vice President and Chief Investment Officer – Equities, Charles Schwab Investment Management, Inc. (April 2011 – present); Senior Vice President and Chief Investment Officer – Equities, Schwab Funds, Laudus Funds and Schwab ETFs (June 2011 – present); Head of the Portfolio Management Group and Vice President of Portfolio Management, Financial Engines, Inc. (May 2009 – April 2011); Head of Quantitative Equity, ING Investment Management (July 2004 – Jan. 2009). |
Brett Wander
1961
Senior Vice President and Chief Investment Officer – Fixed Income
(Officer since 2011) | Senior Vice President and Chief Investment Officer – Fixed Income, Charles Schwab Investment Management, Inc. (April 2011 – present); Senior Vice President and Chief Investment Officer – Fixed Income, Schwab Funds, Laudus Funds and Schwab ETFs (June 2011 – present); Senior Managing Director, Global Head of Active Fixed-Income Strategies, State Street Global Advisors (Jan. 2008 – Oct. 2010); Director of Alpha Strategies Loomis, Sayles & Company (April 2006 – Jan. 2008). |
David Lekich
1964
Chief Legal Officer and Secretary
(Officer since 2011) | Senior Vice President (Sept. 2011 – present), Vice President (March 2004 – Sept. 2011), Charles Schwab & Co., Inc.; Senior Vice President and Chief Counsel (Sept. 2011 – present), Vice President (Jan. 2011 – Sept. 2011), Charles Schwab Investment Management, Inc.; Secretary (April 2011 – present) and Chief Legal Officer (Dec. 2011 – present), Schwab Funds; Vice President and Assistant Clerk, Laudus Funds (April 2011 – present); Secretary (May 2011 – present) and Chief Legal Officer (Nov. 2011 – present), Schwab ETFs. |
Catherine MacGregor
1964
Vice President and Assistant Secretary
(Officer since 2009) | Vice President, Charles Schwab & Co., Inc., Charles Schwab Investment Management, Inc. (July 2005 – present); Vice President (Dec. 2005 – present), Chief Legal Officer and Clerk (March 2007 – present), Laudus Funds; Vice President (Nov. 2005 – present) and Assistant Secretary (June 2007 – present), Schwab Funds; Vice President and Assistant Secretary, Schwab ETFs (Oct. 2009 – present). |
| 1 | Each Trustee shall hold office until the election and qualification of his or her successor, or until he or she dies, resigns or is removed. The Schwab ETF’s retirement policy requires that independent trustees retire by December 31 of the year in which the Trustee turns 72 or the Trustee’s twentieth year of service as an independent trustee, whichever comes first. |
| 2 | Mr. Bettinger is an Interested Trustee because he owns stock of The Charles Schwab Corporation, the parent company of the investment adviser. |
| 3 | The President, Treasurer and Secretary hold office until their respective successors are chosen and qualified or until he or she sooner dies, resigns, is removed or becomes disqualified. Each of the other officers serves at the pleasure of the Board. |
Glossary
144A securities These securities may be sold only to qualified institutional buyers under Securities Act Rule 144A.
American Depositary Receipt (ADR) U.S. dollar-denominated receipts issued by U.S. banks or trust companies that represent shares of foreign-based corporations.
ask See “offer.”
asset allocation The practice of dividing a portfolio among different asset classes, with each asset class assigned a particular percentage to help offset risks and rewards, based on your goals, time horizon and risk tolerance.
asset class A group of securities with similar structure and basic characteristics. Stocks, bonds and cash are the three main examples of asset classes.
authorized participant (AP) A large institutional investor that places orders for creation units with the funds’ distributor.
Barclays U.S. Treasury Bills 1 – 3 Months Index An index that includes all publicly issued zero-coupon U.S. Treasury Bills that have a remaining maturity of less than 3 months and more than 1 month, are rated investment grade, and have $250 million or more of outstanding face value.
Barclays U.S. Aggregate Bond Index A broad-based benchmark that measures the investment grade, U.S. dollar-denominated, fixed-rate taxable bond market, including Treasuries, government-related and corporate securities, mortgage-backed securities (agency fixed-rate and hybrid ARM pass-throughs), asset-backed securities, and commercial mortgage-backed securities.
beta A historical measure of an investment’s volatility relative to a market index (usually the S&P 500®). The index is defined as having a beta of 1.00. Investments with a beta higher than 1.00 have been more volatile than the index; those with a beta of less than 1.00 have been less volatile.
bid The highest price at which someone is willing to buy a security.
cap, capitalization See “market cap.”
capital gain, capital loss The difference between the amount paid for an investment and its value at a later time. If the investment has been sold, the capital gain or loss is considered a realized gain or loss. If the investment is still held, the gain or loss is still “on paper” and is considered unrealized.
commencement of operations The date that the first NAV was calculated.
creation unit (C.U.) A basket of securities that is delivered by an authorized participant (AP) to the fund equal to the current holdings of the ETF, plus a designated cash component. In return, the APs receive a large block of ETF shares (typically 50,000 shares), which investors can then buy and sell in the secondary market.
European Depositary Receipt (EDR) A negotiable security (receipt) that is issued by a European bank, and that represents shares of foreign-based corporations.
exchange A marketplace, or any organization or group that provides or maintains a marketplace for trading securities, options, futures, or commodities.
expense ratio The amount that is taken from the fund’s assets each year to cover the operating expenses. An expense ratio of 0.50% means that a fund’s expenses amount to half of one percent of its average net assets a year.
Global Depositary Receipt (GDR) A negotiable security (receipt) that is issued by a foreign bank, and that represents shares of foreign-based corporations.
gross domestic product (GDP) The output of goods and services produced by labor and property located in the United States.
inception date The date that the shares began trading in the secondary market.
indicative optimized portfolio value (IOPV) A calculation disseminated by the stock exchange that approximates the fund’s NAV every 15 seconds throughout the trading day.
liquidity The ability to convert a security or asset quickly into cash.
market cap, market capitalization The value of a company as determined by the total value of all shares of its stock outstanding.
market price return The return based on the change in market price per share of the fund over a given time period. Market price returns assume that dividends and capital gain distributions have been reinvested in the fund at market price.
median market cap The midpoint of the range of market caps of the stocks held by a fund. There are different ways of calculating median market cap. With a simple median, half of the stocks in the fund’s portfolio would be larger than the median, and half would be smaller. With a weighted median (the type that is calculated for these funds), half of the fund’s assets are invested in stocks that are larger than the median market cap, and half in stocks that are smaller.
MSCI EAFE (Europe, Australasia, Far East) Index A free float-adjusted market capitalization index that is designed to measure the equity market performance of developed markets, excluding the U.S. & Canada. The Net version of the index reflects reinvested dividends net of withholding taxes, but reflects no deductions for expenses or other taxes; returns are calculated applying dividend withholding rates applicable to non-resident persons who do not benefit from double taxation treaties.
net asset value (NAV) The value of one share of a fund. NAV is calculated by taking the fund’s total assets, subtracting liabilities, and dividing by the number of shares outstanding.
NAV return The return based on the change in NAV of the fund over a given time period. NAV returns assume that dividends and capital gain distributions have been reinvested in the fund.
offer (ask) The lowest price at which an individual is willing to sell a security.
open The price at which a security opened for trading on a given day.
outstanding shares, shares outstanding When speaking of the fund, indicates all shares currently held by investors.
price-to-book ratio (P/B) The market price of a company’s stock compared with its “book value.” A mutual fund’s P/B is the weighted average of the P/B of all stocks in the fund’s portfolio.
price-to-earnings ratio (P/E) The market price of a company’s stock compared with earnings over the past year. A mutual fund’s P/E is the weighted average of the P/E of all stocks in the fund’s portfolio.
primary market The market that deals with the issuance of new securities.
Russell 2000 Index An index that measures the performance of the small-cap segment of the U.S. equity universe. It includes approximately 2000 of the smallest securities based on a combination of their market cap and current index membership.
Russell Fundamental Developed ex-U.S. Large Company Index An index that ranks companies in the Russell Developed ex-U.S. Index by fundamental measures of size and tracks the performance of those companies whose fundamental scores are in the top 87.5% of the Russell Developed ex-U.S. Index. The index uses a partial quarterly reconstitution methodology in which the index is split into four equal segments at the annual reconstitution and each segment is then rebalanced on a rolling quarterly basis. The Net series reduces index performance by adjusting for local taxes. The Russell Developed ex-U.S. Index measures the performance of the largest investable securities in developed countries globally, excluding companies assigned to the United States.
Russell Fundamental Developed ex-U.S. Small Company Index An index that ranks companies in the Russell Developed ex-U.S. Index by fundamental measures of size and tracks the performance of those companies whose fundamental scores are in the bottom 12.5% of the Russell Developed ex-U.S. Index. The index uses a partial quarterly reconstitution methodology in which the index is split into four equal segments at the annual reconstitution and each segment is then rebalanced on a rolling quarterly basis. The Net series reduces index performance by adjusting for local taxes. The Russell Developed ex-U.S. Index measures the performance of the largest investable securities in developed countries globally, excluding companies assigned to the United States.
Russell Fundamental Emerging Markets Large Company Index An index that ranks companies in the Russell Emerging Markets Index by measures of fundamental size and tracks the performance of those companies whose fundamental scores are in the top 87.5% of the Russell Emerging Markets Index. The index uses a partial quarterly reconstitution methodology in which the index is split into four equal segments at the annual reconstitution and each segment is then rebalanced on a rolling quarterly basis. The Net series reduces index performance by adjusting for local taxes. The Russell Emerging Markets Index measures the performance of the investable securities in emerging countries globally.
Russell Fundamental U.S. Index An index that selects, ranks, and weights securities by fundamental measures of company size as opposed to market capitalization. The fundamental overall company scores are created using as the universe the members of the Russell 3000 Index. Securities are grouped in order of decreasing company score for each index and each company receives a weight as a percentage of the sum of the weights of the individual securities within each index.
Russell Fundamental U.S. Large Company Index An index that ranks companies in the Russell 3000 Index by fundamental measures of size, and tracks the performance of those companies whose fundamental scores are in the top 87.5% of the Russell 3000 Index. The index uses a partial quarterly reconstitution methodology in which the index is split into four equal segments at the annual reconstitution and each segment is then rebalanced on a rolling quarterly basis. The Russell 3000 Index measures the performance of the largest 3000 U.S. companies representing approximately 98% of the investable U.S. equity market.
Russell Fundamental U.S. Small Company Index An index that ranks companies in the Russell 3000 Index by fundamental measures of size and tracks the performance of those companies whose fundamental scores are in the bottom 12.5% of the Russell 3000 Index. The index uses a partial quarterly reconstitution methodology in which the index is split into four equal segments at the annual reconstitution and each segment is then rebalanced on a rolling quarterly basis. The Russell 3000 Index measures the performance of the largest 3000 U.S. companies representing approximately 98% of the investable U.S. equity market.
S&P 500 Index A market capitalization index that is designed to measure the performance of 500 leading publicly held companies in leading industries of the U.S. economy.
sampling If a fund uses a sampling method, the fund will not fully replicate the benchmark index and may hold securities not included in the index. A fund that utilizes a sampling approach may not track the return of the index.
secondary market The market in which investors purchase securities from other investors rather than directly from the issuing companies. Organized exchanges facilitate the trading of securities in the secondary market.
spread The gap between bid and ask prices of a security.
stock A share of ownership, or equity, in the issuing company.
total return The percentage that an investor would have earned or lost on an investment in the fund assuming dividends and distributions were reinvested.
tracking error The difference between the performance of the fund and its benchmark index, positive or negative.
Schwab ETFs™ are designed to be low-cost, diversified investments. The funds follow broad market indices and provide exposure to specific segments of the market, making each an investment option for the core portions of an investor portfolio. The list to the right shows all currently available Schwab ETFs.
Investors should carefully consider information contained in the prospectus, including investment objectives, risks, charges and expenses before investing. Please call 1-800-435-4000 for a prospectus and brochure for any Schwab ETF. Please read the prospectus carefully before you invest. This report must be preceded or accompanied by a current prospectus.
Proxy Voting Policies, Procedures and Results
A description of the proxy voting policies and procedures used to determine how to vote proxies on behalf of the funds is available without charge, upon request, by visiting the Schwab ETFs’ website at www.csimfunds.com/schwabetfs_prospectus, the SEC’s website at www.sec.gov, or by contacting Schwab ETFs at 1-800-435-4000.
Information regarding how a fund voted proxies relating to portfolio securities during the most recent twelve-month period ended June 30 is available, without charge, by visiting the fund’s website at www.csimfunds.com/schwabetfs_prospectus or the SEC’s website at www.sec.gov.
Schwab ETFs™
U.S. ETFs
Schwab U.S. Broad Market ETF™
Schwab U.S. Large-Cap ETF™
Schwab U.S. Large-Cap Growth ETF™
Schwab U.S. Large-Cap Value ETF™
Schwab U.S. Mid-Cap ETF™
Schwab U.S. Small-Cap ETF™
Schwab U.S. Dividend Equity ETF™
Schwab U.S. REIT ETF™
International ETFs
Schwab International Equity ETF™
Schwab International Small-Cap Equity ETF™
Schwab Emerging Markets Equity ETF™
Fixed Income ETFs
Schwab U.S. Aggregate Bond ETF™
Schwab Short-Term U.S. Treasury ETF™
Schwab Intermediate-Term U.S. Treasury ETF™
Schwab U.S. TIPS ETF™
Fundamental Index* ETFs
Schwab Fundamental U.S. Broad Market Index ETF
Schwab Fundamental U.S. Large Company Index ETF
Schwab Fundamental U.S. Small Company Index ETF
Schwab Fundamental International Large Company Index ETF
Schwab Fundamental International Small Company Index ETF
Schwab Fundamental Emerging Markets Large Company Index ETF
| * | FUNDAMENTAL INDEX is a registered trademark of Research Affiliates LLC. |
Investment Adviser
Charles Schwab Investment Management, Inc.
211 Main Street, San Francisco, CA 94105
Schwab ETFs™
1-800-435-4000
This report is not authorized for distribution to prospective investors unless preceded or accompanied by a current prospectus.
© 2015 Charles Schwab Investment Management, Inc. All rights reserved.
Printed on recycled paper.
MFR76318-02
00153423
Item 2: Code of Ethics.
Not applicable to this semi-annual report.
Item 3: Audit Committee Financial Expert.
Not applicable to this semi-annual report.
Item 4: Principal Accountant Fees and Services.
Not applicable to this semi-annual report.
Item 5: Audit Committee of Listed Registrants.
Not applicable.
Item 6: Schedule of Investments.
Except as noted below, the schedules of investments are included as part of the report to shareholders filed under Item 1 of this Form. The schedules of investments for the Schwab Fundamental U.S. Broad Market Index ETF, Schwab Fundamental U.S. Large Company Index ETF, Schwab Fundamental U.S. Small Company Index ETF, Schwab Fundamental International Large Company Index ETF, Schwab Fundamental International Small Company Index ETF, and Schwab Fundamental Emerging Markets Large Company Index ETF are filed under this Item.
Schwab Fundamental U.S. Broad Market Index ETF
Portfolio Holdings as of August 31, 2015 (Unaudited)
This section shows all the securities in the fund's portfolio and their values as of the report date.
The fund files its complete schedule of portfolio holdings with the SEC for the first and third quarters of each fiscal year on Form N-Q. The fund's Form N-Q is available on the SEC's website at www.sec.gov and may be viewed and copied at the SEC's Public Reference Room in Washington, D.C. Call 1-800-SEC-0330 for information on the operation of the Public Reference Room. The fund also makes available its complete schedule of portfolio holdings on a daily basis on the fund's website at www.csimfunds.com/schwabetfs_prospectus.
| Holdings by Category | Cost
($) | Value
($) |
| 99.5% | Common Stock | 222,526,397 | 219,198,227 |
| 0.0% | Rights | 1,852 | 1,852 |
| 0.5% | Other Investment Companies | 1,188,415 | 1,188,415 |
| 100.0% | Total Investments | 223,716,664 | 220,388,494 |
| 0.0% | Other Assets and
Liabilities, Net | | 32,312 |
| 100.0% | Net Assets | | 220,420,806 |
| Security | Number
of Shares | Value
($) |
| Common Stock 99.5% of net assets |
| Automobiles & Components 1.2% |
| American Axle & Manufacturing Holdings, Inc. * | 127 | 2,565 |
| BorgWarner, Inc. | 1,596 | 69,649 |
| Cooper Tire & Rubber Co. | 960 | 37,056 |
| Cooper-Standard Holding, Inc. * | 70 | 4,019 |
| Dana Holding Corp. | 2,752 | 48,270 |
| Delphi Automotive plc | 1,611 | 121,663 |
| Dorman Products, Inc. * | 56 | 2,820 |
| Drew Industries, Inc. | 314 | 17,352 |
| Ford Motor Co. | 47,519 | 659,089 |
| General Motors Co. | 22,981 | 676,561 |
| Gentex Corp. | 2,512 | 38,936 |
| Harley-Davidson, Inc. | 2,115 | 118,546 |
| Johnson Controls, Inc. | 8,538 | 351,253 |
| Lear Corp. | 1,413 | 145,242 |
| Modine Manufacturing Co. * | 884 | 7,850 |
| Remy International, Inc. | 159 | 4,659 |
| Standard Motor Products, Inc. | 453 | 16,036 |
| Tenneco, Inc. * | 320 | 15,056 |
| The Goodyear Tire & Rubber Co. | 2,868 | 85,380 |
| Thor Industries, Inc. | 655 | 35,750 |
| Tower International, Inc. * | 595 | 14,548 |
| Visteon Corp. * | 793 | 79,030 |
| | | 2,551,330 |
| Banks 5.7% |
| Associated Banc-Corp. | 2,198 | 40,355 |
| Astoria Financial Corp. | 1,884 | 30,464 |
| BancorpSouth, Inc. | 1,099 | 26,112 |
| Bank of America Corp. | 134,510 | 2,197,893 |
| Bank of Hawaii Corp. | 628 | 38,974 |
| Bank of the Ozarks, Inc. | 53 | 2,215 |
| Security | Number
of Shares | Value
($) |
| BankUnited, Inc. | 473 | 16,858 |
| BB&T Corp. | 7,826 | 288,936 |
| BOK Financial Corp. | 157 | 9,935 |
| Capitol Federal Financial, Inc. | 2,904 | 34,993 |
| Cathay General Bancorp | 628 | 18,608 |
| CIT Group, Inc. | 1,732 | 75,238 |
| Citigroup, Inc. | 28,393 | 1,518,458 |
| Citizens Financial Group, Inc. | 860 | 21,345 |
| City National Corp. | 314 | 27,563 |
| Comerica, Inc. | 1,884 | 82,896 |
| Commerce Bancshares, Inc. | 654 | 29,306 |
| Community Bank System, Inc. | 157 | 5,599 |
| Cullen/Frost Bankers, Inc. | 551 | 35,628 |
| CVB Financial Corp. | 785 | 12,756 |
| East West Bancorp, Inc. | 628 | 25,378 |
| EverBank Financial Corp. | 431 | 8,525 |
| F.N.B. Corp. | 1,099 | 13,803 |
| Fifth Third Bancorp | 9,496 | 189,160 |
| First Citizens BancShares, Inc., Class A | 35 | 8,301 |
| First Financial Bancorp | 796 | 14,678 |
| First Financial Bankshares, Inc. (b) | 571 | 17,781 |
| First Horizon National Corp. | 2,983 | 43,343 |
| First Niagara Financial Group, Inc. | 3,941 | 36,454 |
| First Republic Bank | 631 | 38,056 |
| FirstMerit Corp. | 1,256 | 22,558 |
| Fulton Financial Corp. | 1,884 | 22,909 |
| Glacier Bancorp, Inc. | 451 | 11,731 |
| Great Western Bancorp, Inc. | 125 | 3,146 |
| Hancock Holding Co. | 414 | 11,625 |
| Hudson City Bancorp, Inc. | 9,106 | 84,686 |
| Huntington Bancshares, Inc. | 7,561 | 82,491 |
| IBERIABANK Corp. | 157 | 9,561 |
| International Bancshares Corp. | 628 | 16,108 |
| JPMorgan Chase & Co. | 45,050 | 2,887,705 |
| KeyCorp | 9,907 | 136,122 |
| M&T Bank Corp. | 954 | 112,801 |
| MB Financial, Inc. | 471 | 15,515 |
| NBT Bancorp, Inc. | 314 | 8,133 |
| New York Community Bancorp, Inc. | 6,123 | 108,132 |
| Northwest Bancshares, Inc. | 1,833 | 23,536 |
| Ocwen Financial Corp. *(b) | 365 | 2,716 |
| Old National Bancorp | 628 | 8,666 |
| People's United Financial, Inc. | 3,140 | 48,670 |
| Popular, Inc. * | 2,041 | 59,924 |
| PrivateBancorp, Inc. | 73 | 2,763 |
| Prosperity Bancshares, Inc. | 227 | 11,729 |
| Regions Financial Corp. | 17,436 | 167,211 |
| Signature Bank * | 93 | 12,415 |
| SunTrust Banks, Inc. | 6,131 | 247,508 |
| SVB Financial Group * | 157 | 19,638 |
| Synovus Financial Corp. | 1,581 | 48,110 |
| TCF Financial Corp. | 2,198 | 34,113 |
| The PNC Financial Services Group, Inc. | 4,710 | 429,175 |
| Trustmark Corp. | 628 | 14,463 |
| U.S. Bancorp | 14,306 | 605,859 |
| UMB Financial Corp. | 222 | 11,129 |
| Umpqua Holdings Corp. | 785 | 13,117 |
| United Bankshares, Inc. | 471 | 17,625 |
| Valley National Bancorp | 2,198 | 20,793 |
| Washington Federal, Inc. | 942 | 21,374 |
| Webster Financial Corp. | 628 | 22,219 |
| Wells Fargo & Co. | 40,785 | 2,175,064 |
Schwab Fundamental U.S. Broad Market Index ETF
Portfolio Holdings (Unaudited) continued
| Security | Number
of Shares | Value
($) |
| Westamerica Bancorp | 266 | 12,007 |
| Wintrust Financial Corp. | 157 | 8,007 |
| Zions Bancorp | 2,512 | 72,848 |
| | | 12,553,513 |
| Capital Goods 7.9% |
| 3M Co. | 5,725 | 813,751 |
| A.O. Smith Corp. | 471 | 30,384 |
| AAR Corp. | 942 | 22,919 |
| Actuant Corp., Class A | 628 | 13,464 |
| Acuity Brands, Inc. | 314 | 61,189 |
| AECOM * | 2,858 | 78,595 |
| Aegion Corp. * | 471 | 8,666 |
| AGCO Corp. | 2,041 | 100,091 |
| Air Lease Corp. | 163 | 5,244 |
| Aircastle Ltd. | 1,842 | 38,277 |
| Alamo Group, Inc. | 45 | 2,317 |
| Albany International Corp., Class A | 471 | 15,025 |
| Allegion plc | 1,064 | 63,425 |
| Allison Transmission Holdings, Inc. | 511 | 14,615 |
| AMETEK, Inc. | 942 | 50,698 |
| Apogee Enterprises, Inc. | 471 | 24,563 |
| Applied Industrial Technologies, Inc. | 628 | 26,590 |
| Armstrong World Industries, Inc. * | 1,023 | 56,889 |
| Astec Industries, Inc. | 314 | 12,406 |
| AZZ, Inc. | 174 | 8,804 |
| B/E Aerospace, Inc. | 471 | 22,961 |
| Barnes Group, Inc. | 628 | 24,260 |
| Beacon Roofing Supply, Inc. * | 471 | 17,074 |
| Briggs & Stratton Corp. | 1,099 | 21,958 |
| BWX Technologies, Inc. | 785 | 20,818 |
| Carlisle Cos., Inc. | 628 | 63,240 |
| Caterpillar, Inc. | 8,200 | 626,808 |
| Chart Industries, Inc. * | 253 | 6,467 |
| Chicago Bridge & Iron Co. N.V. (b) | 841 | 37,239 |
| CIRCOR International, Inc. | 157 | 7,103 |
| CLARCOR, Inc. | 471 | 26,550 |
| Colfax Corp. * | 183 | 7,099 |
| Comfort Systems USA, Inc. | 727 | 20,152 |
| Crane Co. | 471 | 24,746 |
| Cubic Corp. | 391 | 16,469 |
| Cummins, Inc. | 2,252 | 274,181 |
| Curtiss-Wright Corp. | 628 | 41,266 |
| Danaher Corp. | 3,121 | 271,589 |
| Deere & Co. | 5,584 | 456,660 |
| DigitalGlobe, Inc. * | 471 | 10,861 |
| Donaldson Co., Inc. | 942 | 29,494 |
| Dover Corp. | 2,045 | 126,688 |
| Dycom Industries, Inc. * | 670 | 47,630 |
| Eaton Corp. plc | 4,245 | 242,220 |
| EMCOR Group, Inc. | 1,256 | 57,889 |
| Emerson Electric Co. | 10,702 | 510,699 |
| Encore Wire Corp. | 471 | 15,293 |
| EnerSys | 471 | 25,184 |
| EnPro Industries, Inc. | 157 | 7,448 |
| ESCO Technologies, Inc. | 477 | 17,224 |
| Esterline Technologies Corp. * | 314 | 25,657 |
| Fastenal Co. | 2,052 | 79,084 |
| Flowserve Corp. | 2,005 | 90,486 |
| Fluor Corp. | 5,136 | 234,304 |
| Fortune Brands Home & Security, Inc. | 1,455 | 69,622 |
| Security | Number
of Shares | Value
($) |
| Franklin Electric Co., Inc. | 314 | 9,197 |
| GATX Corp. | 785 | 38,912 |
| Generac Holdings, Inc. * | 851 | 26,313 |
| General Cable Corp. | 2,826 | 41,118 |
| General Dynamics Corp. | 4,125 | 585,874 |
| General Electric Co. | 110,816 | 2,750,453 |
| Graco, Inc. | 471 | 32,494 |
| Granite Construction, Inc. | 942 | 32,499 |
| Griffon Corp. | 1,041 | 17,322 |
| H&E Equipment Services, Inc. | 622 | 12,882 |
| Harsco Corp. | 3,701 | 42,784 |
| HD Supply Holdings, Inc. * | 336 | 11,088 |
| HEICO Corp. | 159 | 8,093 |
| Hexcel Corp. | 471 | 22,730 |
| Hillenbrand, Inc. | 628 | 16,931 |
| Honeywell International, Inc. | 5,586 | 554,522 |
| Hubbell, Inc., Class B | 471 | 46,474 |
| Huntington Ingalls Industries, Inc. | 379 | 42,668 |
| Hyster-Yale Materials Handling, Inc. | 165 | 10,025 |
| IDEX Corp. | 471 | 33,832 |
| Illinois Tool Works, Inc. | 4,488 | 379,371 |
| Ingersoll-Rand plc | 3,435 | 189,921 |
| ITT Corp. | 1,043 | 39,019 |
| Jacobs Engineering Group, Inc. * | 3,470 | 140,223 |
| Joy Global, Inc. | 2,218 | 53,720 |
| Kaman Corp. | 314 | 12,193 |
| KBR, Inc. | 8,328 | 145,240 |
| Kennametal, Inc. | 1,340 | 40,870 |
| KLX, Inc. * | 320 | 12,512 |
| L-3 Communications Holdings, Inc. | 2,594 | 273,589 |
| Lennox International, Inc. | 539 | 63,624 |
| Lincoln Electric Holdings, Inc. | 785 | 46,040 |
| Lindsay Corp. (b) | 77 | 5,870 |
| Lockheed Martin Corp. | 3,322 | 668,320 |
| Masco Corp. | 3,237 | 84,907 |
| Masonite International Corp. * | 157 | 10,370 |
| MasTec, Inc. * | 1,343 | 22,240 |
| Moog, Inc., Class A * | 471 | 29,720 |
| MRC Global, Inc. * | 3,077 | 39,970 |
| MSC Industrial Direct Co., Inc., Class A | 490 | 33,168 |
| Mueller Industries, Inc. | 1,490 | 47,397 |
| MYR Group, Inc. * | 680 | 19,509 |
| Navistar International Corp. * | 500 | 8,920 |
| Nordson Corp. | 314 | 20,887 |
| Northrop Grumman Corp. | 4,242 | 694,585 |
| NOW, Inc. *(b) | 927 | 15,815 |
| Orbital ATK, Inc. | 880 | 66,625 |
| Oshkosh Corp. | 1,967 | 82,712 |
| Owens Corning | 2,291 | 101,468 |
| PACCAR, Inc. | 3,460 | 204,036 |
| Parker-Hannifin Corp. | 2,060 | 221,780 |
| Pentair plc | 1,564 | 86,474 |
| Precision Castparts Corp. | 840 | 193,410 |
| Primoris Services Corp. | 148 | 2,719 |
| Quanex Building Products Corp. | 628 | 11,273 |
| Quanta Services, Inc. * | 2,443 | 59,218 |
| Raven Industries, Inc. | 890 | 16,127 |
| Raytheon Co. | 5,501 | 564,183 |
| RBC Bearings, Inc. * | 109 | 6,743 |
| Regal Beloit Corp. | 884 | 58,936 |
| Rexnord Corp. * | 562 | 11,268 |
| Rockwell Automation, Inc. | 942 | 105,344 |
Schwab Fundamental U.S. Broad Market Index ETF
Portfolio Holdings (Unaudited) continued
| Security | Number
of Shares | Value
($) |
| Rockwell Collins, Inc. | 1,570 | 128,504 |
| Roper Technologies, Inc. | 471 | 76,344 |
| Rush Enterprises, Inc., Class A * | 628 | 16,027 |
| Simpson Manufacturing Co., Inc. | 471 | 16,443 |
| Snap-on, Inc. | 471 | 75,252 |
| Spirit AeroSystems Holdings, Inc., Class A * | 1,188 | 60,719 |
| SPX Corp. | 891 | 52,328 |
| Standex International Corp. | 92 | 7,362 |
| Stanley Black & Decker, Inc. | 1,429 | 145,072 |
| TAL International Group, Inc. | 314 | 5,756 |
| Teledyne Technologies, Inc. * | 314 | 30,744 |
| Tennant Co. | 157 | 8,999 |
| Terex Corp. | 1,570 | 36,628 |
| Textron, Inc. | 3,253 | 126,216 |
| The Boeing Co. | 4,347 | 568,066 |
| The Greenbrier Cos., Inc. (b) | 314 | 13,094 |
| The Manitowoc Co., Inc. | 1,413 | 24,134 |
| The Middleby Corp. * | 166 | 18,019 |
| The Timken Co. | 2,161 | 68,612 |
| The Toro Co. | 628 | 44,776 |
| Titan International, Inc. | 1,032 | 9,474 |
| TransDigm Group, Inc. * | 211 | 48,494 |
| TriMas Corp. * | 390 | 7,114 |
| Trinity Industries, Inc. | 1,299 | 35,060 |
| Triumph Group, Inc. | 528 | 26,078 |
| Tutor Perini Corp. * | 1,280 | 22,656 |
| United Rentals, Inc. * | 706 | 48,947 |
| United Technologies Corp. | 10,444 | 956,775 |
| Universal Forest Products, Inc. | 785 | 47,147 |
| Valmont Industries, Inc. | 245 | 26,041 |
| Veritiv Corp. * | 171 | 6,144 |
| W.W. Grainger, Inc. | 732 | 163,558 |
| WABCO Holdings, Inc. * | 471 | 54,316 |
| Wabtec Corp. | 471 | 45,103 |
| Watsco, Inc. | 314 | 38,452 |
| Watts Water Technologies, Inc., Class A | 314 | 17,223 |
| WESCO International, Inc. * | 785 | 43,936 |
| Woodward, Inc. | 471 | 21,478 |
| Xylem, Inc. | 1,727 | 56,041 |
| | | 17,447,994 |
| Commercial & Professional Services 1.2% |
| ABM Industries, Inc. | 1,413 | 45,230 |
| ACCO Brands Corp. * | 1,188 | 9,029 |
| Brady Corp., Class A | 1,211 | 26,594 |
| CEB, Inc. | 314 | 22,489 |
| Cintas Corp. | 1,199 | 101,903 |
| Civeo Corp. | 3,057 | 5,961 |
| Clean Harbors, Inc. * | 524 | 25,739 |
| Copart, Inc. * | 1,309 | 45,841 |
| Covanta Holding Corp. | 1,256 | 24,869 |
| Deluxe Corp. | 628 | 36,430 |
| Equifax, Inc. | 942 | 92,222 |
| Essendant, Inc. | 1,117 | 38,537 |
| FTI Consulting, Inc. * | 789 | 31,450 |
| G&K Services, Inc., Class A | 314 | 21,230 |
| Healthcare Services Group, Inc. | 471 | 15,750 |
| Herman Miller, Inc. | 942 | 25,538 |
| HNI Corp. | 942 | 44,029 |
| Huron Consulting Group, Inc. * | 157 | 11,365 |
| Security | Number
of Shares | Value
($) |
| ICF International, Inc. * | 314 | 10,742 |
| IHS, Inc., Class A * | 157 | 18,215 |
| Insperity, Inc. | 471 | 20,908 |
| Interface, Inc. | 471 | 11,417 |
| KAR Auction Services, Inc. | 630 | 23,335 |
| Kelly Services, Inc., Class A | 1,727 | 24,955 |
| Kforce, Inc. | 628 | 16,824 |
| Knoll, Inc. | 628 | 15,022 |
| Korn/Ferry International | 628 | 21,396 |
| ManpowerGroup, Inc. | 2,228 | 193,613 |
| Matthews International Corp., Class A | 471 | 23,917 |
| McGrath RentCorp | 314 | 8,054 |
| Mobile Mini, Inc. | 157 | 5,340 |
| MSA Safety, Inc. | 314 | 14,281 |
| Navigant Consulting, Inc. * | 1,099 | 17,353 |
| Nielsen Holdings plc | 1,790 | 80,962 |
| On Assignment, Inc. * | 157 | 5,649 |
| Pitney Bowes, Inc. | 4,877 | 96,613 |
| Quad/Graphics, Inc. | 1,530 | 22,093 |
| R.R. Donnelley & Sons Co. | 6,831 | 107,247 |
| Republic Services, Inc. | 3,935 | 161,256 |
| Resources Connection, Inc. | 1,099 | 17,243 |
| Robert Half International, Inc. | 1,796 | 91,650 |
| Rollins, Inc. | 471 | 13,150 |
| Steelcase, Inc., Class A | 2,075 | 36,582 |
| Stericycle, Inc. * | 314 | 44,318 |
| Team, Inc. * | 157 | 6,569 |
| Tetra Tech, Inc. | 1,453 | 37,749 |
| The ADT Corp. | 3,011 | 98,701 |
| The Brink's Co. | 1,256 | 35,997 |
| The Dun & Bradstreet Corp. | 628 | 66,549 |
| Towers Watson & Co., Class A | 314 | 37,281 |
| TrueBlue, Inc. * | 942 | 22,608 |
| Tyco International plc | 4,105 | 148,970 |
| UniFirst Corp. | 157 | 17,020 |
| Verisk Analytics, Inc. * | 698 | 51,010 |
| Viad Corp. | 471 | 12,877 |
| Waste Connections, Inc. | 628 | 29,868 |
| Waste Management, Inc. | 7,324 | 366,639 |
| West Corp. | 272 | 6,620 |
| | | 2,664,799 |
| Consumer Durables & Apparel 1.4% |
| Arctic Cat, Inc. | 506 | 13,374 |
| Brunswick Corp. | 314 | 15,609 |
| Carter's, Inc. | 444 | 43,650 |
| Coach, Inc. | 6,476 | 195,899 |
| Columbia Sportswear Co. | 314 | 19,270 |
| Crocs, Inc. * | 628 | 9,250 |
| D.R. Horton, Inc. | 2,263 | 68,727 |
| Deckers Outdoor Corp. * | 475 | 30,585 |
| Fossil Group, Inc. * | 677 | 41,690 |
| G-III Apparel Group Ltd. * | 314 | 21,770 |
| Garmin Ltd. | 1,570 | 59,048 |
| Hanesbrands, Inc. | 1,916 | 57,691 |
| Harman International Industries, Inc. | 506 | 49,456 |
| Hasbro, Inc. | 1,709 | 127,474 |
| Helen of Troy Ltd. * | 314 | 26,734 |
| Iconix Brand Group, Inc. * | 685 | 9,515 |
| Jarden Corp. * | 1,624 | 83,376 |
| La-Z-Boy, Inc. | 942 | 26,009 |
Schwab Fundamental U.S. Broad Market Index ETF
Portfolio Holdings (Unaudited) continued
| Security | Number
of Shares | Value
($) |
| Leggett & Platt, Inc. | 1,872 | 83,154 |
| Lennar Corp., Class A | 640 | 32,576 |
| lululemon athletica, Inc. * | 397 | 25,412 |
| M.D.C Holdings, Inc. | 314 | 8,946 |
| Mattel, Inc. | 6,491 | 152,084 |
| Meritage Homes Corp. * | 314 | 13,232 |
| Michael Kors Holdings Ltd. * | 231 | 10,039 |
| Mohawk Industries, Inc. * | 474 | 93,364 |
| Newell Rubbermaid, Inc. | 2,210 | 93,107 |
| NIKE, Inc., Class B | 5,667 | 633,287 |
| NVR, Inc. * | 50 | 75,998 |
| Oxford Industries, Inc. | 104 | 8,753 |
| Polaris Industries, Inc. | 314 | 40,779 |
| PulteGroup, Inc. | 1,884 | 38,980 |
| PVH Corp. | 546 | 64,963 |
| Quiksilver, Inc. *(b) | 17,534 | 7,541 |
| Ralph Lauren Corp. | 918 | 102,072 |
| Skechers U.S.A., Inc., Class A * | 378 | 53,200 |
| Smith & Wesson Holding Corp. * | 193 | 3,489 |
| Steven Madden Ltd. * | 471 | 19,245 |
| Sturm Ruger & Co., Inc. | 203 | 12,767 |
| Tempur Sealy International, Inc. * | 547 | 39,942 |
| Toll Brothers, Inc. * | 942 | 34,826 |
| Tupperware Brands Corp. | 694 | 35,554 |
| Under Armour, Inc., Class A * | 314 | 29,996 |
| VF Corp. | 2,389 | 173,035 |
| Whirlpool Corp. | 1,181 | 198,526 |
| Wolverine World Wide, Inc. | 822 | 22,153 |
| | | 3,006,147 |
| Consumer Services 2.0% |
| Apollo Education Group, Inc. * | 5,142 | 57,128 |
| Aramark | 534 | 16,736 |
| Ascent Capital Group, Inc., Class A * | 60 | 1,685 |
| Bloomin' Brands, Inc. | 546 | 11,302 |
| Bob Evans Farms, Inc. | 722 | 32,627 |
| Boyd Gaming Corp. * | 2,198 | 35,388 |
| Brinker International, Inc. | 1,321 | 70,185 |
| Buffalo Wild Wings, Inc. * | 80 | 15,174 |
| Capella Education Co. | 373 | 18,184 |
| Career Education Corp. * | 3,670 | 13,616 |
| Carnival Corp. | 5,988 | 294,789 |
| Chipotle Mexican Grill, Inc. * | 107 | 75,971 |
| Choice Hotels International, Inc. | 472 | 24,072 |
| Churchill Downs, Inc. | 49 | 6,511 |
| Cracker Barrel Old Country Store, Inc. (b) | 161 | 23,213 |
| Darden Restaurants, Inc. | 1,949 | 132,551 |
| DeVry Education Group, Inc. | 1,335 | 34,924 |
| DineEquity, Inc. | 157 | 14,993 |
| Domino's Pizza, Inc. | 336 | 35,596 |
| Dunkin' Brands Group, Inc. | 365 | 18,308 |
| Graham Holdings Co., Class B | 76 | 50,278 |
| H&R Block, Inc. | 2,512 | 85,458 |
| Hilton Worldwide Holdings, Inc. | 489 | 12,142 |
| Houghton Mifflin Harcourt Co. * | 472 | 10,658 |
| Hyatt Hotels Corp., Class A * | 314 | 16,086 |
| International Speedway Corp., Class A | 471 | 15,114 |
| Jack in the Box, Inc. | 554 | 43,312 |
| K12, Inc. * | 182 | 2,406 |
| Las Vegas Sands Corp. | 2,199 | 101,660 |
| Security | Number
of Shares | Value
($) |
| Marriott International, Inc., Class A | 1,341 | 94,755 |
| Marriott Vacations Worldwide Corp. | 379 | 26,913 |
| McDonald's Corp. | 14,431 | 1,371,234 |
| MGM Resorts International * | 2,826 | 57,735 |
| Norwegian Cruise Line Holdings Ltd. * | 317 | 18,259 |
| Panera Bread Co., Class A * | 221 | 39,404 |
| Papa John's International, Inc. | 314 | 21,116 |
| Penn National Gaming, Inc. * | 1,003 | 18,214 |
| Pinnacle Entertainment, Inc. * | 628 | 23,720 |
| Red Robin Gourmet Burgers, Inc. * | 314 | 24,740 |
| Regis Corp. * | 1,570 | 17,019 |
| Royal Caribbean Cruises Ltd. | 1,486 | 131,006 |
| Ruby Tuesday, Inc. * | 2,355 | 15,496 |
| SeaWorld Entertainment, Inc. | 2,289 | 40,744 |
| Service Corp. International | 2,826 | 83,791 |
| Six Flags Entertainment Corp. | 314 | 14,121 |
| Sotheby's | 471 | 16,584 |
| Starbucks Corp. | 6,000 | 328,260 |
| Starwood Hotels & Resorts Worldwide, Inc. | 1,443 | 103,131 |
| Steiner Leisure Ltd. * | 157 | 9,996 |
| Strayer Education, Inc. * | 628 | 32,807 |
| Texas Roadhouse, Inc. | 628 | 22,602 |
| The Cheesecake Factory, Inc. | 785 | 42,602 |
| The Wendy's Co. | 4,396 | 40,047 |
| Vail Resorts, Inc. | 314 | 33,884 |
| Weight Watchers International, Inc. *(b) | 2,375 | 14,606 |
| Wyndham Worldwide Corp. | 1,632 | 124,815 |
| Wynn Resorts Ltd. | 1,015 | 76,176 |
| Yum! Brands, Inc. | 3,958 | 315,730 |
| | | 4,429,574 |
| Diversified Financials 3.3% |
| Affiliated Managers Group, Inc. * | 157 | 29,271 |
| Ally Financial, Inc. * | 5,800 | 126,788 |
| American Express Co. | 8,495 | 651,736 |
| Ameriprise Financial, Inc. | 1,516 | 170,808 |
| Berkshire Hathaway, Inc., Class B * | 12,040 | 1,613,842 |
| BGC Partners, Inc., Class A | 1,780 | 15,611 |
| BlackRock, Inc. | 576 | 174,223 |
| Capital One Financial Corp. | 6,356 | 494,179 |
| Cash America International, Inc. | 475 | 13,110 |
| CBOE Holdings, Inc. | 475 | 30,049 |
| CME Group, Inc. | 2,068 | 195,302 |
| Credit Acceptance Corp. * | 14 | 2,853 |
| Discover Financial Services | 4,102 | 220,400 |
| E*TRADE Financial Corp. * | 2,041 | 53,658 |
| Eaton Vance Corp. | 1,123 | 38,934 |
| Evercore Partners, Inc., Class A | 51 | 2,671 |
| Ezcorp, Inc., Class A * | 953 | 6,023 |
| Federated Investors, Inc., Class B | 1,727 | 53,537 |
| First Cash Financial Services, Inc. * | 169 | 6,975 |
| Franklin Resources, Inc. | 4,379 | 177,700 |
| Greenhill & Co., Inc. | 314 | 11,025 |
| Intercontinental Exchange, Inc. | 177 | 40,429 |
| Invesco Ltd. | 2,862 | 97,623 |
| Janus Capital Group, Inc. | 1,541 | 22,930 |
| Lazard Ltd., Class A | 471 | 23,423 |
| Legg Mason, Inc. | 2,073 | 91,896 |
| Leucadia National Corp. | 2,778 | 59,616 |
| LPL Financial Holdings, Inc. (b) | 773 | 31,090 |
Schwab Fundamental U.S. Broad Market Index ETF
Portfolio Holdings (Unaudited) continued
| Security | Number
of Shares | Value
($) |
| MarketAxess Holdings, Inc. | 27 | 2,441 |
| McGraw Hill Financial, Inc. | 2,181 | 211,535 |
| Moody's Corp. | 803 | 82,155 |
| Morgan Stanley | 8,612 | 296,683 |
| MSCI, Inc. | 393 | 23,784 |
| Nelnet, Inc., Class A | 419 | 15,775 |
| Northern Trust Corp. | 1,884 | 131,579 |
| PHH Corp. * | 2,796 | 45,295 |
| PRA Group, Inc. * | 157 | 8,367 |
| Raymond James Financial, Inc. | 628 | 33,278 |
| Santander Consumer USA Holdings, Inc. * | 1,848 | 41,506 |
| SEI Investments Co. | 1,256 | 63,529 |
| SLM Corp. * | 5,453 | 46,241 |
| Springleaf Holdings, Inc. * | 75 | 3,357 |
| State Street Corp. | 2,860 | 205,691 |
| Stifel Financial Corp. * | 157 | 7,316 |
| Synchrony Financial * | 377 | 12,422 |
| T. Rowe Price Group, Inc. | 1,906 | 137,003 |
| TD Ameritrade Holding Corp. | 1,263 | 42,260 |
| The Bank of New York Mellon Corp. | 7,613 | 302,997 |
| The Charles Schwab Corp. (a) | 3,482 | 105,783 |
| The Goldman Sachs Group, Inc. | 4,669 | 880,573 |
| The NASDAQ OMX Group, Inc. | 1,261 | 64,551 |
| Voya Financial, Inc. | 532 | 22,919 |
| Waddell & Reed Financial, Inc., Class A | 628 | 24,536 |
| Walter Investment Management Corp. *(b) | 283 | 4,653 |
| World Acceptance Corp. *(b) | 157 | 5,900 |
| | | 7,277,831 |
| Energy 12.5% |
| Alon USA Energy, Inc. | 800 | 14,832 |
| Anadarko Petroleum Corp. | 4,819 | 344,944 |
| Apache Corp. | 7,633 | 345,317 |
| Atwood Oceanics, Inc. | 1,026 | 19,607 |
| Baker Hughes, Inc. | 6,197 | 347,032 |
| Basic Energy Services, Inc. * | 1,342 | 6,992 |
| Bill Barrett Corp. *(b) | 2,866 | 15,677 |
| Bristow Group, Inc. | 642 | 23,793 |
| Cabot Oil & Gas Corp. | 942 | 22,297 |
| California Resources Corp. | 4,439 | 17,223 |
| Cameron International Corp. * | 2,723 | 181,788 |
| CARBO Ceramics, Inc. (b) | 349 | 9,570 |
| Chesapeake Energy Corp. (b) | 11,877 | 92,759 |
| Chevron Corp. | 52,468 | 4,249,383 |
| Cimarex Energy Co. | 482 | 53,266 |
| Cloud Peak Energy, Inc. * | 4,846 | 23,164 |
| Concho Resources, Inc. * | 420 | 45,427 |
| ConocoPhillips | 38,904 | 1,912,132 |
| CONSOL Energy, Inc. (b) | 3,390 | 51,630 |
| Continental Resources, Inc. * | 184 | 5,906 |
| CVR Energy, Inc. | 203 | 8,163 |
| Delek US Holdings, Inc. | 1,464 | 45,033 |
| Denbury Resources, Inc. | 9,904 | 42,983 |
| Devon Energy Corp. | 7,504 | 320,121 |
| Diamond Offshore Drilling, Inc. (b) | 3,775 | 89,505 |
| Dril-Quip, Inc. * | 157 | 10,824 |
| Energen Corp. | 785 | 40,820 |
| Energy XXI Ltd. (b) | 6,734 | 12,795 |
| Ensco plc, Class A | 5,074 | 91,890 |
| Security | Number
of Shares | Value
($) |
| EOG Resources, Inc. | 2,968 | 232,424 |
| EQT Corp. | 628 | 48,871 |
| Exterran Holdings, Inc. | 959 | 21,405 |
| Exxon Mobil Corp. | 114,531 | 8,617,313 |
| FMC Technologies, Inc. * | 1,909 | 66,395 |
| Forum Energy Technologies, Inc. * | 524 | 8,237 |
| Frontline Ltd. *(b) | 19,417 | 51,649 |
| Golar LNG Ltd. | 386 | 15,031 |
| Green Plains, Inc. | 498 | 10,588 |
| Gulfmark Offshore, Inc., Class A (b) | 922 | 8,326 |
| Halliburton Co. | 11,655 | 458,624 |
| Helix Energy Solutions Group, Inc. * | 996 | 6,922 |
| Helmerich & Payne, Inc. | 1,025 | 60,485 |
| Hess Corp. | 7,869 | 467,812 |
| HollyFrontier Corp. | 5,462 | 255,949 |
| Hornbeck Offshore Services, Inc. *(b) | 567 | 11,198 |
| Key Energy Services, Inc. * | 16,501 | 11,736 |
| Kinder Morgan, Inc. | 5,330 | 172,745 |
| Marathon Oil Corp. | 19,027 | 328,977 |
| Marathon Petroleum Corp. | 13,797 | 652,736 |
| Matrix Service Co. * | 471 | 9,420 |
| McDermott International, Inc. * | 11,725 | 59,563 |
| Murphy Oil Corp. | 7,580 | 234,980 |
| Nabors Industries Ltd. | 9,251 | 106,757 |
| National Oilwell Varco, Inc. | 6,660 | 281,918 |
| Newfield Exploration Co. * | 2,061 | 68,652 |
| Newpark Resources, Inc. * | 1,235 | 9,053 |
| Noble Corp. plc | 8,636 | 112,441 |
| Noble Energy, Inc. | 2,847 | 95,118 |
| Nordic American Tankers Ltd. (b) | 1,256 | 17,119 |
| North Atlantic Drilling Ltd. (b) | 9,130 | 7,934 |
| Oasis Petroleum, Inc. *(b) | 202 | 2,254 |
| Occidental Petroleum Corp. | 12,622 | 921,532 |
| Oceaneering International, Inc. | 884 | 38,737 |
| Oil States International, Inc. * | 1,012 | 28,710 |
| ONEOK, Inc. | 2,499 | 89,989 |
| Parker Drilling Co. * | 2,927 | 9,864 |
| Patterson-UTI Energy, Inc. | 3,483 | 56,703 |
| PBF Energy, Inc., Class A | 837 | 25,043 |
| PDC Energy, Inc. * | 157 | 8,820 |
| Peabody Energy Corp. (b) | 20,127 | 54,343 |
| Phillips 66 | 20,220 | 1,598,795 |
| Pioneer Energy Services Corp. * | 1,947 | 6,445 |
| Pioneer Natural Resources Co. | 481 | 59,192 |
| QEP Resources, Inc. | 2,281 | 32,025 |
| Range Resources Corp. | 750 | 28,965 |
| Renewable Energy Group, Inc. * | 315 | 2,652 |
| Rowan Cos. plc, Class A | 2,214 | 39,786 |
| RPC, Inc. | 821 | 9,540 |
| SandRidge Energy, Inc. *(b) | 15,843 | 8,446 |
| Schlumberger Ltd. | 11,786 | 911,883 |
| SEACOR Holdings, Inc. * | 850 | 54,834 |
| Seadrill Ltd. (b) | 15,611 | 125,512 |
| SemGroup Corp., Class A | 379 | 20,845 |
| Seventy Seven Energy, Inc. * | 2,014 | 5,780 |
| Ship Finance International Ltd. | 628 | 10,550 |
| SM Energy Co. | 794 | 29,140 |
| Southwestern Energy Co. * | 3,258 | 52,910 |
| Spectra Energy Corp. | 6,610 | 192,153 |
| Stone Energy Corp. * | 2,015 | 11,425 |
| Superior Energy Services, Inc. | 2,373 | 37,754 |
| Targa Resources Corp. | 314 | 20,743 |
Schwab Fundamental U.S. Broad Market Index ETF
Portfolio Holdings (Unaudited) continued
| Security | Number
of Shares | Value
($) |
| Teekay Corp. | 903 | 33,194 |
| Tesco Corp. | 222 | 1,885 |
| Tesoro Corp. | 3,201 | 294,524 |
| TETRA Technologies, Inc. * | 1,655 | 12,727 |
| The Williams Cos., Inc. | 3,955 | 190,631 |
| Tidewater, Inc. (b) | 1,757 | 31,503 |
| Unit Corp. * | 422 | 6,414 |
| Valero Energy Corp. | 18,595 | 1,103,427 |
| W&T Offshore, Inc. (b) | 2,021 | 7,215 |
| Weatherford International plc * | 13,336 | 135,360 |
| Western Refining, Inc. | 1,369 | 58,894 |
| Whiting Petroleum Corp. * | 1,380 | 26,675 |
| World Fuel Services Corp. | 4,210 | 162,717 |
| WPX Energy, Inc. * | 7,504 | 54,854 |
| | | 27,570,641 |
| Food & Staples Retailing 4.0% |
| Casey's General Stores, Inc. | 785 | 83,100 |
| Costco Wholesale Corp. | 7,110 | 995,755 |
| CVS Health Corp. | 20,745 | 2,124,288 |
| Ingles Markets, Inc., Class A | 550 | 27,335 |
| PriceSmart, Inc. | 157 | 13,347 |
| Rite Aid Corp. * | 6,437 | 53,105 |
| SpartanNash Co. | 805 | 22,782 |
| Sprouts Farmers Market, Inc. * | 106 | 2,159 |
| SUPERVALU, Inc. * | 7,497 | 61,775 |
| Sysco Corp. | 13,863 | 552,718 |
| The Andersons, Inc. | 739 | 26,146 |
| The Fresh Market, Inc. * | 196 | 4,220 |
| The Kroger Co. | 19,069 | 657,880 |
| United Natural Foods, Inc. * | 850 | 40,928 |
| Wal-Mart Stores, Inc. | 42,099 | 2,725,068 |
| Walgreens Boots Alliance, Inc. | 13,707 | 1,186,341 |
| Whole Foods Market, Inc. | 4,245 | 139,066 |
| | | 8,716,013 |
| Food, Beverage & Tobacco 5.3% |
| Altria Group, Inc. | 18,498 | 991,123 |
| Archer-Daniels-Midland Co. | 16,986 | 764,200 |
| B&G Foods, Inc. | 321 | 9,755 |
| Brown-Forman Corp., Class B | 1,275 | 125,077 |
| Bunge Ltd. | 5,692 | 412,385 |
| Cal-Maine Foods, Inc. (b) | 314 | 16,680 |
| Campbell Soup Co. | 2,826 | 135,620 |
| Coca-Cola Enterprises, Inc. | 4,269 | 219,811 |
| ConAgra Foods, Inc. | 6,862 | 286,008 |
| Constellation Brands, Inc., Class A | 799 | 102,272 |
| Darling Ingredients, Inc. * | 2,086 | 26,784 |
| Dean Foods Co. | 1,580 | 26,007 |
| Dr. Pepper Snapple Group, Inc. | 2,669 | 204,792 |
| Flowers Foods, Inc. | 1,727 | 40,084 |
| Fresh Del Monte Produce, Inc. | 1,099 | 43,509 |
| General Mills, Inc. | 8,273 | 469,575 |
| Hormel Foods Corp. | 1,413 | 86,334 |
| Ingredion, Inc. | 952 | 82,196 |
| J&J Snack Foods Corp. | 157 | 17,892 |
| Kellogg Co. | 3,235 | 214,416 |
| Keurig Green Mountain, Inc. | 205 | 11,603 |
| Lancaster Colony Corp. | 314 | 29,777 |
| Security | Number
of Shares | Value
($) |
| McCormick & Co., Inc. Non-Voting Shares | 1,099 | 87,129 |
| Mead Johnson Nutrition Co. | 628 | 49,198 |
| Molson Coors Brewing Co., Class B | 1,183 | 80,550 |
| Mondelez International, Inc., Class A | 18,342 | 776,967 |
| Monster Beverage Corp. * | 569 | 78,784 |
| PepsiCo, Inc. | 16,368 | 1,521,078 |
| Philip Morris International, Inc. | 22,957 | 1,831,969 |
| Pilgrim's Pride Corp. (b) | 353 | 7,404 |
| Pinnacle Foods, Inc. | 354 | 15,873 |
| Post Holdings, Inc. * | 628 | 40,996 |
| Reynolds American, Inc. | 4,599 | 385,166 |
| Sanderson Farms, Inc. (b) | 327 | 22,576 |
| Seaboard Corp. * | 4 | 13,281 |
| Snyder's-Lance, Inc. | 471 | 15,906 |
| The Boston Beer Co., Inc., Class A * | 10 | 2,051 |
| The Coca-Cola Co. | 38,027 | 1,495,222 |
| The Hain Celestial Group, Inc. * | 314 | 19,110 |
| The Hershey Co. | 913 | 81,732 |
| The J.M. Smucker Co. | 1,565 | 184,232 |
| The Kraft Heinz Co. | 4,899 | 355,961 |
| The WhiteWave Foods Co. * | 573 | 26,438 |
| TreeHouse Foods, Inc. * | 314 | 24,922 |
| Tyson Foods, Inc., Class A | 7,363 | 311,308 |
| Universal Corp. | 862 | 42,419 |
| Vector Group Ltd. | 648 | 15,442 |
| | | 11,801,614 |
| Health Care Equipment & Services 5.9% |
| Abbott Laboratories | 11,102 | 502,810 |
| Aetna, Inc. | 5,699 | 652,649 |
| Air Methods Corp. * | 191 | 7,153 |
| Alere, Inc. * | 785 | 40,796 |
| Align Technology, Inc. * | 98 | 5,547 |
| Allscripts Healthcare Solutions, Inc. * | 1,759 | 24,221 |
| Amedisys, Inc. * | 873 | 33,733 |
| AmerisourceBergen Corp. | 3,551 | 355,242 |
| Amsurg Corp. * | 314 | 24,624 |
| Analogic Corp. | 157 | 12,651 |
| Anthem, Inc. | 9,150 | 1,290,607 |
| Baxter International, Inc. | 6,941 | 266,881 |
| Becton Dickinson & Co. | 2,751 | 387,946 |
| Boston Scientific Corp. * | 11,586 | 193,950 |
| Brookdale Senior Living, Inc. * | 785 | 21,525 |
| C.R. Bard, Inc. | 834 | 161,621 |
| Cardinal Health, Inc. | 6,875 | 565,606 |
| Centene Corp. * | 916 | 56,536 |
| Cerner Corp. * | 628 | 38,785 |
| Chemed Corp. | 314 | 42,814 |
| Cigna Corp. | 1,597 | 224,842 |
| Community Health Systems, Inc. * | 2,463 | 132,263 |
| CONMED Corp. | 314 | 16,661 |
| DaVita HealthCare Partners, Inc. * | 1,425 | 107,787 |
| DENTSPLY International, Inc. | 1,099 | 57,599 |
| Edwards Lifesciences Corp. * | 347 | 48,885 |
| Envision Healthcare Holdings, Inc. * | 238 | 9,751 |
| Express Scripts Holding Co. * | 6,917 | 578,261 |
| Greatbatch, Inc. * | 314 | 17,841 |
| Haemonetics Corp. * | 314 | 11,339 |
| Halyard Health, Inc. * | 253 | 7,954 |
| Hanger, Inc. * | 502 | 9,001 |
Schwab Fundamental U.S. Broad Market Index ETF
Portfolio Holdings (Unaudited) continued
| Security | Number
of Shares | Value
($) |
| HCA Holdings, Inc. * | 6,252 | 541,548 |
| Health Net, Inc. * | 2,931 | 187,760 |
| HealthSouth Corp. | 471 | 20,112 |
| Henry Schein, Inc. * | 868 | 118,751 |
| Hill-Rom Holdings, Inc. | 942 | 49,775 |
| Humana, Inc. | 2,786 | 509,253 |
| IDEXX Laboratories, Inc. * | 628 | 44,883 |
| IMS Health Holdings, Inc. * | 117 | 3,495 |
| Integra LifeSciences Holdings Corp. * | 157 | 9,417 |
| Intuitive Surgical, Inc. * | 124 | 63,358 |
| Invacare Corp. | 1,884 | 33,140 |
| Kindred Healthcare, Inc. | 2,601 | 52,228 |
| Laboratory Corp. of America Holdings * | 914 | 107,678 |
| LifePoint Health, Inc. * | 942 | 73,598 |
| Magellan Health, Inc. * | 979 | 54,824 |
| Masimo Corp. * | 314 | 12,758 |
| McKesson Corp. | 3,398 | 671,377 |
| MEDNAX, Inc. * | 628 | 50,585 |
| Medtronic plc | 11,750 | 849,407 |
| Molina Healthcare, Inc. * | 628 | 46,843 |
| Orthofix International N.V. * | 203 | 7,608 |
| Owens & Minor, Inc. | 2,310 | 78,517 |
| Patterson Cos., Inc. | 1,413 | 64,758 |
| PharMerica Corp. * | 1,099 | 35,959 |
| Quality Systems, Inc. | 882 | 11,986 |
| Quest Diagnostics, Inc. | 3,297 | 223,537 |
| ResMed, Inc. | 942 | 48,927 |
| Select Medical Holdings Corp. | 1,737 | 22,407 |
| Sirona Dental Systems, Inc. * | 157 | 14,975 |
| St. Jude Medical, Inc. | 3,178 | 225,034 |
| STERIS Corp. | 785 | 50,279 |
| Stryker Corp. | 2,983 | 294,273 |
| Team Health Holdings, Inc. * | 213 | 12,512 |
| Teleflex, Inc. | 328 | 42,902 |
| Tenet Healthcare Corp. * | 1,474 | 72,565 |
| The Cooper Cos., Inc. | 157 | 25,500 |
| Thoratec Corp. * | 318 | 19,977 |
| Triple-S Management Corp., Class B * | 612 | 12,876 |
| UnitedHealth Group, Inc. | 15,128 | 1,750,310 |
| Universal Health Services, Inc., Class B | 707 | 96,958 |
| Varian Medical Systems, Inc. * | 942 | 76,538 |
| VCA, Inc. * | 668 | 36,994 |
| WellCare Health Plans, Inc. * | 792 | 71,811 |
| West Pharmaceutical Services, Inc. | 628 | 35,074 |
| Zimmer Biomet Holdings, Inc. | 2,000 | 207,120 |
| | | 12,948,068 |
| Household & Personal Products 2.0% |
| Avon Products, Inc. | 15,790 | 81,950 |
| Church & Dwight Co., Inc. | 989 | 85,331 |
| Colgate-Palmolive Co. | 8,336 | 523,584 |
| Edgewell Personal Care Co. | 628 | 55,302 |
| Elizabeth Arden, Inc. *(b) | 902 | 9,949 |
| Herbalife Ltd. * | 1,617 | 93,091 |
| Kimberly-Clark Corp. | 3,967 | 422,604 |
| Nu Skin Enterprises, Inc., Class A | 983 | 44,903 |
| Spectrum Brands Holdings, Inc. | 157 | 15,430 |
| The Clorox Co. | 1,504 | 167,200 |
| The Estee Lauder Cos., Inc., Class A | 1,309 | 104,419 |
| Security | Number
of Shares | Value
($) |
| The Procter & Gamble Co. | 38,643 | 2,730,901 |
| WD-40 Co. | 157 | 13,147 |
| | | 4,347,811 |
| Insurance 3.6% |
| ACE Ltd. | 2,853 | 291,462 |
| Aflac, Inc. | 5,743 | 336,540 |
| Alleghany Corp. * | 57 | 26,778 |
| Allied World Assurance Co. Holdings AG | 1,431 | 57,154 |
| Ambac Financial Group, Inc. * | 573 | 9,311 |
| American Equity Investment Life Holding Co. | 640 | 15,526 |
| American Financial Group, Inc. | 1,256 | 86,739 |
| American International Group, Inc. | 9,978 | 602,073 |
| Aon plc | 2,018 | 188,562 |
| Arch Capital Group Ltd. * | 1,749 | 119,422 |
| Argo Group International Holdings Ltd. | 348 | 19,481 |
| Arthur J. Gallagher & Co. | 942 | 41,184 |
| Aspen Insurance Holdings Ltd. | 1,256 | 57,663 |
| Assurant, Inc. | 1,910 | 142,009 |
| Assured Guaranty Ltd. | 950 | 23,997 |
| Axis Capital Holdings Ltd. | 2,065 | 115,640 |
| Brown & Brown, Inc. | 785 | 25,167 |
| Cincinnati Financial Corp. | 1,908 | 99,846 |
| CNA Financial Corp. | 69 | 2,483 |
| CNO Financial Group, Inc. | 2,709 | 48,464 |
| Employers Holdings, Inc. | 676 | 14,906 |
| Endurance Specialty Holdings Ltd. | 1,253 | 79,879 |
| Everest Re Group Ltd. | 524 | 92,124 |
| First American Financial Corp. | 1,413 | 54,909 |
| FNF Group | 3,027 | 110,213 |
| Genworth Financial, Inc., Class A * | 10,702 | 55,436 |
| HCC Insurance Holdings, Inc. | 1,270 | 98,133 |
| Horace Mann Educators Corp. | 471 | 15,647 |
| Infinity Property & Casualty Corp. | 314 | 24,266 |
| Kemper Corp. | 1,115 | 39,493 |
| Lincoln National Corp. | 1,699 | 86,292 |
| Loews Corp. | 5,941 | 216,549 |
| Maiden Holdings Ltd. | 166 | 2,379 |
| Markel Corp. * | 35 | 28,831 |
| Marsh & McLennan Cos., Inc. | 4,138 | 222,335 |
| MBIA, Inc. * | 780 | 5,476 |
| Mercury General Corp. | 471 | 23,955 |
| MetLife, Inc. | 6,956 | 348,496 |
| Old Republic International Corp. | 2,866 | 45,025 |
| PartnerRe Ltd. | 1,131 | 156,542 |
| Primerica, Inc. | 956 | 40,620 |
| Principal Financial Group, Inc. | 2,069 | 104,174 |
| ProAssurance Corp. | 471 | 22,716 |
| Prudential Financial, Inc. | 3,750 | 302,625 |
| Reinsurance Group of America, Inc. | 970 | 88,154 |
| RenaissanceRe Holdings Ltd. | 1,231 | 125,500 |
| RLI Corp. | 628 | 32,725 |
| Safety Insurance Group, Inc. | 157 | 8,255 |
| Selective Insurance Group, Inc. | 669 | 20,284 |
| StanCorp Financial Group, Inc. | 638 | 72,547 |
| Stewart Information Services Corp. | 316 | 12,242 |
| Symetra Financial Corp. | 628 | 19,763 |
| The Allstate Corp. | 4,915 | 286,446 |
| The Chubb Corp. | 4,798 | 579,646 |
Schwab Fundamental U.S. Broad Market Index ETF
Portfolio Holdings (Unaudited) continued
| Security | Number
of Shares | Value
($) |
| The Hanover Insurance Group, Inc. | 638 | 50,338 |
| The Hartford Financial Services Group, Inc. | 6,186 | 284,247 |
| The Progressive Corp. | 10,108 | 302,836 |
| The Travelers Cos., Inc. | 10,290 | 1,024,369 |
| Torchmark Corp. | 1,622 | 94,822 |
| Unum Group | 4,553 | 152,708 |
| Validus Holdings Ltd. | 1,111 | 49,195 |
| W.R. Berkley Corp. | 1,906 | 103,458 |
| White Mountains Insurance Group Ltd. | 131 | 94,230 |
| XL Group plc | 3,145 | 117,277 |
| | | 8,019,564 |
| Materials 3.7% |
| A. Schulman, Inc. | 628 | 21,559 |
| Air Products & Chemicals, Inc. | 1,888 | 263,433 |
| Airgas, Inc. | 792 | 76,444 |
| Albemarle Corp. | 1,507 | 68,131 |
| Alcoa, Inc. | 19,782 | 186,940 |
| Allegheny Technologies, Inc. | 2,198 | 42,443 |
| AptarGroup, Inc. | 785 | 52,878 |
| Ashland, Inc. | 728 | 76,418 |
| Avery Dennison Corp. | 1,884 | 109,423 |
| Axalta Coating Systems Ltd. * | 203 | 5,926 |
| Axiall Corp. | 471 | 11,897 |
| Ball Corp. | 2,198 | 144,870 |
| Bemis Co., Inc. | 1,570 | 66,599 |
| Berry Plastics Group, Inc. * | 407 | 12,047 |
| Boise Cascade Co. * | 454 | 14,732 |
| Cabot Corp. | 1,251 | 42,371 |
| Calgon Carbon Corp. | 395 | 6,423 |
| Carpenter Technology Corp. | 471 | 18,369 |
| Celanese Corp., Series A | 1,413 | 85,684 |
| Century Aluminum Co. * | 663 | 3,713 |
| CF Industries Holdings, Inc. | 2,617 | 150,163 |
| Chemtura Corp. * | 1,256 | 34,163 |
| Clearwater Paper Corp. * | 157 | 8,801 |
| Cliffs Natural Resources, Inc. (b) | 16,450 | 65,307 |
| Coeur Mining, Inc. * | 3,343 | 11,232 |
| Commercial Metals Co. | 4,396 | 69,017 |
| Compass Minerals International, Inc. | 314 | 25,434 |
| Crown Holdings, Inc. * | 942 | 46,695 |
| Cytec Industries, Inc. | 1,082 | 80,284 |
| Domtar Corp. | 2,968 | 119,343 |
| E.I. du Pont de Nemours & Co. | 7,630 | 392,945 |
| Eagle Materials, Inc. | 110 | 9,001 |
| Eastman Chemical Co. | 1,586 | 114,922 |
| Ecolab, Inc. | 1,183 | 129,113 |
| Ferro Corp. * | 1,448 | 17,810 |
| FMC Corp. | 1,054 | 44,595 |
| Freeport-McMoRan, Inc. | 31,051 | 330,383 |
| Globe Specialty Metals, Inc. | 942 | 12,943 |
| Graphic Packaging Holding Co. | 3,611 | 50,915 |
| Greif, Inc., Class A | 818 | 23,951 |
| H.B. Fuller Co. | 628 | 22,759 |
| Hecla Mining Co. | 5,230 | 10,774 |
| Huntsman Corp. | 3,140 | 51,904 |
| Innophos Holdings, Inc. | 314 | 15,094 |
| Innospec, Inc. | 569 | 27,938 |
| International Flavors & Fragrances, Inc. | 628 | 68,797 |
| International Paper Co. | 6,230 | 268,762 |
| Security | Number
of Shares | Value
($) |
| Intrepid Potash, Inc. * | 644 | 5,094 |
| Kaiser Aluminum Corp. | 314 | 26,244 |
| KapStone Paper & Packaging Corp. | 628 | 13,684 |
| Koppers Holdings, Inc. | 977 | 20,322 |
| Kraton Performance Polymers, Inc. * | 471 | 9,943 |
| Louisiana-Pacific Corp. * | 942 | 15,487 |
| LSB Industries, Inc. * | 252 | 6,025 |
| LyondellBasell Industries N.V., Class A | 6,452 | 550,872 |
| Martin Marietta Materials, Inc. | 471 | 79,034 |
| Materion Corp. | 314 | 9,721 |
| Minerals Technologies, Inc. | 471 | 25,335 |
| Monsanto Co. | 3,928 | 383,569 |
| Myers Industries, Inc. | 628 | 8,955 |
| Neenah Paper, Inc. | 100 | 5,772 |
| NewMarket Corp. | 47 | 18,012 |
| Newmont Mining Corp. | 14,302 | 244,135 |
| Nucor Corp. | 6,280 | 271,861 |
| Olin Corp. | 1,550 | 30,938 |
| OM Group, Inc. | 785 | 26,298 |
| Owens-Illinois, Inc. * | 2,669 | 55,649 |
| P.H. Glatfelter Co. | 785 | 14,177 |
| Packaging Corp. of America | 789 | 52,950 |
| PolyOne Corp. | 785 | 25,489 |
| PPG Industries, Inc. | 2,276 | 216,880 |
| Praxair, Inc. | 2,935 | 310,376 |
| Quaker Chemical Corp. | 71 | 5,635 |
| Reliance Steel & Aluminum Co. | 2,006 | 116,589 |
| Royal Gold, Inc. | 203 | 9,768 |
| RPM International, Inc. | 1,413 | 61,960 |
| Schnitzer Steel Industries, Inc., Class A | 2,636 | 45,629 |
| Schweitzer-Mauduit International, Inc. | 314 | 11,094 |
| Sealed Air Corp. | 1,537 | 79,079 |
| Sensient Technologies Corp. | 628 | 40,914 |
| Sigma-Aldrich Corp. | 857 | 119,474 |
| Silgan Holdings, Inc. | 628 | 32,882 |
| Sonoco Products Co. | 1,727 | 67,906 |
| Southern Copper Corp. | 2,550 | 67,983 |
| Steel Dynamics, Inc. | 4,710 | 91,751 |
| Stepan Co. | 536 | 24,136 |
| Stillwater Mining Co. * | 785 | 7,497 |
| SunCoke Energy, Inc. | 746 | 8,564 |
| The Dow Chemical Co. | 14,384 | 629,444 |
| The Mosaic Co. | 6,761 | 276,052 |
| The Scotts Miracle-Gro Co., Class A | 628 | 39,055 |
| The Sherwin-Williams Co. | 365 | 93,371 |
| The Valspar Corp. | 785 | 57,541 |
| Tronox Ltd., Class A | 801 | 6,448 |
| United States Steel Corp. | 4,640 | 76,003 |
| Vulcan Materials Co. | 817 | 76,488 |
| W.R. Grace & Co. * | 157 | 15,534 |
| Westlake Chemical Corp. | 314 | 17,342 |
| WestRock Co. | 3,186 | 189,089 |
| Worthington Industries, Inc. | 942 | 24,106 |
| | | 8,231,501 |
| Media 3.2% |
| AMC Networks, Inc., Class A * | 157 | 11,364 |
| Cablevision Systems Corp., Class A | 4,651 | 117,066 |
| CBS Corp., Class B Non-Voting Shares | 5,825 | 263,523 |
| Charter Communications, Inc., Class A *(b) | 785 | 142,564 |
Schwab Fundamental U.S. Broad Market Index ETF
Portfolio Holdings (Unaudited) continued
| Security | Number
of Shares | Value
($) |
| Cinemark Holdings, Inc. | 1,381 | 49,094 |
| Comcast Corp., Class A | 20,914 | 1,178,086 |
| Comcast Corp., Special Class A | 814 | 46,593 |
| Discovery Communications, Inc., Class A * | 4,528 | 120,445 |
| Discovery Communications, Inc., Class C * | 5,345 | 135,549 |
| DISH Network Corp., Class A * | 1,479 | 87,660 |
| DreamWorks Animation SKG, Inc., Class A *(b) | 1,143 | 22,791 |
| John Wiley & Sons, Inc., Class A | 471 | 24,285 |
| Liberty Media Corp., Class A * | 817 | 30,433 |
| Liberty Media Corp., Class C * | 750 | 27,165 |
| Lions Gate Entertainment Corp. | 314 | 11,521 |
| Live Nation Entertainment, Inc. * | 1,038 | 25,556 |
| Loral Space & Communications, Inc. * | 434 | 23,527 |
| Meredith Corp. | 499 | 23,563 |
| Morningstar, Inc. | 94 | 7,499 |
| National CineMedia, Inc. | 953 | 12,532 |
| News Corp., Class A * | 8,698 | 118,554 |
| News Corp., Class B * | 814 | 11,258 |
| Omnicom Group, Inc. | 3,297 | 220,833 |
| Regal Entertainment Group, Class A | 1,570 | 29,861 |
| Scholastic Corp. | 942 | 40,704 |
| Scripps Networks Interactive, Inc., Class A | 724 | 38,437 |
| Sinclair Broadcast Group, Inc., Class A | 337 | 9,025 |
| Sirius XM Holdings, Inc. * | 6,793 | 25,915 |
| Starz, Class A * | 103 | 3,874 |
| TEGNA, Inc. | 3,430 | 81,600 |
| The Interpublic Group of Cos., Inc. | 4,463 | 84,261 |
| The Madison Square Garden Co., Class A * | 314 | 22,118 |
| The New York Times Co., Class A | 1,786 | 21,718 |
| The Walt Disney Co. | 13,032 | 1,327,700 |
| Thomson Reuters Corp. | 5,299 | 205,707 |
| Time Warner Cable, Inc. | 4,227 | 786,306 |
| Time Warner, Inc. | 12,490 | 888,039 |
| Time, Inc. | 1,441 | 29,930 |
| Tribune Media Co., Class A | 94 | 3,754 |
| Twenty-First Century Fox, Inc., Class A | 15,357 | 420,628 |
| Twenty-First Century Fox, Inc., Class B | 677 | 18,726 |
| Viacom, Inc., Class B | 7,419 | 302,473 |
| | | 7,052,237 |
| Pharmaceuticals, Biotechnology & Life Sciences 5.5% |
| AbbVie, Inc. | 6,852 | 427,633 |
| Agilent Technologies, Inc. | 2,694 | 97,819 |
| Alexion Pharmaceuticals, Inc. * | 157 | 27,034 |
| Allergan plc * | 452 | 137,290 |
| Amgen, Inc. | 6,933 | 1,052,291 |
| Bio-Rad Laboratories, Inc., Class A * | 278 | 38,734 |
| Bio-Techne Corp. | 157 | 14,833 |
| Biogen, Inc. * | 576 | 171,245 |
| Bristol-Myers Squibb Co. | 13,355 | 794,222 |
| Bruker Corp. * | 504 | 9,264 |
| Celgene Corp. * | 1,981 | 233,916 |
| Charles River Laboratories International, Inc. * | 843 | 58,074 |
| Eli Lilly & Co. | 10,597 | 872,663 |
| Endo International plc * | 799 | 61,523 |
| Security | Number
of Shares | Value
($) |
| Gilead Sciences, Inc. | 4,510 | 473,866 |
| Hospira, Inc. * | 1,114 | 100,227 |
| Illumina, Inc. * | 161 | 31,815 |
| Impax Laboratories, Inc. * | 471 | 19,292 |
| Jazz Pharmaceuticals plc * | 18 | 3,039 |
| Johnson & Johnson | 25,174 | 2,365,852 |
| Mallinckrodt plc * | 382 | 32,944 |
| Merck & Co., Inc. | 27,596 | 1,486,045 |
| Mettler-Toledo International, Inc. * | 206 | 61,089 |
| Mylan N.V. * | 2,208 | 109,495 |
| Myriad Genetics, Inc. *(b) | 417 | 15,662 |
| PAREXEL International Corp. * | 314 | 20,636 |
| PDL BioPharma, Inc. | 1,884 | 10,645 |
| PerkinElmer, Inc. | 1,099 | 53,499 |
| Perrigo Co., plc | 314 | 57,453 |
| Pfizer, Inc. | 82,765 | 2,666,688 |
| QIAGEN N.V. * | 942 | 24,699 |
| Quintiles Transnational Holdings, Inc. * | 198 | 14,753 |
| Regeneron Pharmaceuticals, Inc. * | 8 | 4,108 |
| Thermo Fisher Scientific, Inc. | 2,200 | 275,814 |
| United Therapeutics Corp. * | 157 | 23,647 |
| Waters Corp. * | 628 | 76,227 |
| Zoetis, Inc. | 2,687 | 120,566 |
| | | 12,044,602 |
| Real Estate 1.9% |
| Alexandria Real Estate Equities, Inc. | 512 | 44,027 |
| Altisource Portfolio Solutions S.A. *(b) | 84 | 2,260 |
| American Campus Communities, Inc. | 473 | 16,200 |
| American Capital Agency Corp. | 2,687 | 51,402 |
| American Tower Corp. | 1,170 | 107,862 |
| Annaly Capital Management, Inc. | 21,765 | 218,956 |
| Anworth Mortgage Asset Corp. | 1,570 | 7,897 |
| Apartment Investment & Management Co., Class A | 1,562 | 56,279 |
| AvalonBay Communities, Inc. | 471 | 77,743 |
| BioMed Realty Trust, Inc. | 1,589 | 29,396 |
| Boston Properties, Inc. | 797 | 90,364 |
| Brandywine Realty Trust | 1,727 | 20,931 |
| Brixmor Property Group, Inc. | 214 | 4,883 |
| Camden Property Trust | 471 | 33,926 |
| Capstead Mortgage Corp. | 942 | 9,816 |
| CBL & Associates Properties, Inc. | 1,643 | 24,448 |
| CBRE Group, Inc., Class A * | 1,413 | 45,244 |
| Chambers Street Properties | 318 | 2,153 |
| Chimera Investment Corp. | 1,368 | 19,166 |
| Columbia Property Trust, Inc. | 979 | 20,931 |
| Corporate Office Properties Trust | 1,262 | 26,540 |
| Corrections Corp. of America | 1,268 | 37,254 |
| Crown Castle International Corp. | 984 | 82,056 |
| CubeSmart | 110 | 2,782 |
| DCT Industrial Trust, Inc. | 395 | 12,683 |
| DDR Corp. | 1,570 | 24,005 |
| DiamondRock Hospitality Co. | 1,570 | 18,463 |
| Digital Realty Trust, Inc. | 785 | 49,706 |
| Douglas Emmett, Inc. | 628 | 17,352 |
| Duke Realty Corp. | 2,512 | 45,367 |
| EastGroup Properties, Inc. | 157 | 8,478 |
| EPR Properties | 314 | 15,979 |
| Equinix, Inc. | 159 | 42,893 |
| Equity Commonwealth * | 1,570 | 40,333 |
Schwab Fundamental U.S. Broad Market Index ETF
Portfolio Holdings (Unaudited) continued
| Security | Number
of Shares | Value
($) |
| Equity LifeStyle Properties, Inc. | 560 | 31,226 |
| Equity One, Inc. | 696 | 16,363 |
| Equity Residential | 1,648 | 117,420 |
| Essex Property Trust, Inc. | 194 | 41,636 |
| Extra Space Storage, Inc. | 314 | 23,073 |
| Federal Realty Investment Trust | 314 | 40,531 |
| Forest City Enterprises, Inc., Class A * | 110 | 2,368 |
| Franklin Street Properties Corp. | 1,015 | 10,566 |
| General Growth Properties, Inc. | 2,379 | 60,379 |
| Government Properties Income Trust | 476 | 7,540 |
| Hatteras Financial Corp. | 948 | 15,386 |
| HCP, Inc. | 2,602 | 96,430 |
| Health Care REIT, Inc. | 949 | 60,119 |
| Healthcare Realty Trust, Inc. | 471 | 10,786 |
| Healthcare Trust of America, Inc., Class A | 488 | 11,717 |
| Hersha Hospitality Trust | 688 | 16,815 |
| Highwoods Properties, Inc. | 785 | 29,783 |
| Home Properties, Inc. | 314 | 23,302 |
| Hospitality Properties Trust | 1,884 | 48,456 |
| Host Hotels & Resorts, Inc. | 5,338 | 94,643 |
| Invesco Mortgage Capital, Inc. | 1,293 | 17,585 |
| Investors Real Estate Trust | 1,333 | 8,918 |
| Iron Mountain, Inc. | 2,697 | 76,433 |
| Jones Lang LaSalle, Inc. | 269 | 40,046 |
| Kilroy Realty Corp. | 314 | 20,366 |
| Kimco Realty Corp. | 2,983 | 68,758 |
| Lamar Advertising Co., Class A | 373 | 19,896 |
| LaSalle Hotel Properties | 628 | 19,757 |
| Lexington Realty Trust | 1,256 | 10,136 |
| Liberty Property Trust | 1,099 | 33,783 |
| Mack-Cali Realty Corp. | 1,727 | 32,347 |
| Medical Properties Trust, Inc. | 674 | 7,866 |
| MFA Financial, Inc. | 5,168 | 36,744 |
| Mid-America Apartment Communities, Inc. | 479 | 37,645 |
| National Retail Properties, Inc. | 475 | 16,506 |
| New Residential Investment Corp. | 339 | 4,800 |
| NorthStar Realty Finance Corp. | 628 | 8,823 |
| Omega Healthcare Investors, Inc. | 471 | 15,910 |
| Outfront Media, Inc. | 624 | 14,121 |
| Pennsylvania Real Estate Investment Trust | 628 | 12,460 |
| PennyMac Mortgage Investment Trust | 390 | 5,877 |
| Piedmont Office Realty Trust, Inc., Class A | 2,377 | 40,314 |
| Plum Creek Timber Co., Inc. | 1,948 | 74,979 |
| Post Properties, Inc. | 273 | 15,113 |
| Potlatch Corp. | 628 | 20,737 |
| Prologis, Inc. | 2,498 | 94,924 |
| PS Business Parks, Inc. | 157 | 11,455 |
| Public Storage | 628 | 126,398 |
| Rayonier, Inc. | 2,061 | 47,403 |
| Realogy Holdings Corp. * | 255 | 10,277 |
| Realty Income Corp. | 840 | 37,540 |
| Redwood Trust, Inc. | 942 | 13,744 |
| Regency Centers Corp. | 807 | 47,863 |
| Retail Properties of America, Inc., Class A | 1,126 | 15,370 |
| RLJ Lodging Trust | 839 | 23,106 |
| Ryman Hospitality Properties, Inc. | 314 | 16,086 |
| Sabra Health Care REIT, Inc. | 785 | 18,816 |
| Security | Number
of Shares | Value
($) |
| Senior Housing Properties Trust | 1,327 | 20,834 |
| Simon Property Group, Inc. | 1,277 | 228,992 |
| SL Green Realty Corp. | 314 | 32,502 |
| Sovran Self Storage, Inc. | 157 | 14,088 |
| Spirit Realty Capital, Inc. | 258 | 2,477 |
| Starwood Property Trust, Inc. | 1,316 | 28,004 |
| Sun Communities, Inc. | 157 | 10,238 |
| Sunstone Hotel Investors, Inc. | 1,106 | 15,296 |
| Tanger Factory Outlet Centers, Inc. | 314 | 9,935 |
| Taubman Centers, Inc. | 314 | 21,663 |
| The Geo Group, Inc. | 471 | 14,144 |
| The Macerich Co. | 628 | 47,841 |
| Two Harbors Investment Corp. | 1,306 | 12,355 |
| UDR, Inc. | 1,771 | 57,203 |
| Ventas, Inc. | 1,413 | 77,743 |
| Vornado Realty Trust | 1,257 | 109,598 |
| Washington Real Estate Investment Trust | 471 | 11,587 |
| Weingarten Realty Investors | 942 | 29,805 |
| Weyerhaeuser Co. | 11,627 | 324,858 |
| WP Carey, Inc. | 314 | 18,046 |
| | | 4,276,425 |
| Retailing 5.5% |
| Aaron's, Inc. | 2,041 | 76,844 |
| Abercrombie & Fitch Co., Class A (b) | 3,756 | 74,594 |
| Advance Auto Parts, Inc. | 523 | 91,656 |
| Amazon.com, Inc. * | 735 | 376,974 |
| American Eagle Outfitters, Inc. | 7,634 | 129,931 |
| Asbury Automotive Group, Inc. * | 322 | 25,944 |
| Ascena Retail Group, Inc. * | 3,073 | 37,086 |
| AutoNation, Inc. * | 1,278 | 76,476 |
| AutoZone, Inc. * | 157 | 112,410 |
| Barnes & Noble, Inc. | 1,201 | 18,748 |
| Bed Bath & Beyond, Inc. * | 3,646 | 226,453 |
| Best Buy Co., Inc. | 10,186 | 374,234 |
| Big Lots, Inc. | 2,217 | 106,394 |
| Burlington Stores, Inc. * | 352 | 18,688 |
| Cabela's, Inc. * | 388 | 17,448 |
| Caleres, Inc. | 1,099 | 36,597 |
| CarMax, Inc. * | 1,570 | 95,770 |
| Chico's FAS, Inc. | 3,232 | 48,189 |
| Conn's, Inc. *(b) | 62 | 1,851 |
| Core-Mark Holding Co., Inc. | 1,461 | 87,821 |
| CST Brands, Inc. | 4,462 | 154,921 |
| Dick's Sporting Goods, Inc. | 1,208 | 60,557 |
| Dillard's, Inc., Class A | 628 | 58,096 |
| Dollar General Corp. | 3,140 | 233,899 |
| Dollar Tree, Inc. * | 2,392 | 182,414 |
| DSW, Inc., Class A | 1,099 | 32,629 |
| Expedia, Inc. | 740 | 85,093 |
| Express, Inc. * | 1,727 | 35,231 |
| Five Below, Inc. * | 210 | 8,121 |
| Foot Locker, Inc. | 2,202 | 155,880 |
| Fred's, Inc., Class A | 1,570 | 20,598 |
| GameStop Corp., Class A (b) | 4,507 | 191,457 |
| Genesco, Inc. * | 314 | 18,805 |
| Genuine Parts Co. | 2,356 | 196,702 |
| GNC Holdings, Inc., Class A | 692 | 32,386 |
| Group 1 Automotive, Inc. | 628 | 54,887 |
| Guess?, Inc. | 2,648 | 58,547 |
Schwab Fundamental U.S. Broad Market Index ETF
Portfolio Holdings (Unaudited) continued
| Security | Number
of Shares | Value
($) |
| Haverty Furniture Cos., Inc. | 117 | 2,704 |
| Hibbett Sports, Inc. * | 191 | 7,544 |
| HSN, Inc. | 314 | 19,094 |
| J.C. Penney Co., Inc. * | 23,241 | 211,725 |
| Kohl's Corp. | 6,792 | 346,596 |
| L Brands, Inc. | 2,259 | 189,530 |
| Lands' End, Inc. * | 121 | 3,078 |
| Liberty Interactive Corp. QVC Group, Class A * | 5,846 | 158,076 |
| Liberty TripAdvisor Holdings, Inc., Class A * | 100 | 2,537 |
| Lithia Motors, Inc., Class A | 314 | 33,472 |
| LKQ Corp. * | 1,488 | 44,625 |
| Lowe's Cos., Inc. | 16,518 | 1,142,550 |
| Lumber Liquidators Holdings, Inc. *(b) | 357 | 5,394 |
| Macy's, Inc. | 5,224 | 306,179 |
| Monro Muffler Brake, Inc. | 157 | 9,952 |
| Murphy USA, Inc. * | 4,210 | 215,173 |
| Netflix, Inc. * | 485 | 55,790 |
| Nordstrom, Inc. | 1,923 | 140,148 |
| Nutrisystem, Inc. | 996 | 27,868 |
| O'Reilly Automotive, Inc. * | 785 | 188,455 |
| Office Depot, Inc. * | 8,702 | 69,007 |
| Outerwall, Inc. (b) | 402 | 24,763 |
| Penske Automotive Group, Inc. | 785 | 39,721 |
| Pier 1 Imports, Inc. | 2,284 | 23,251 |
| Pool Corp. | 314 | 21,880 |
| Rent-A-Center, Inc. | 2,547 | 68,489 |
| Restoration Hardware Holdings, Inc. * | 27 | 2,497 |
| Ross Stores, Inc. | 3,566 | 173,379 |
| Sally Beauty Holdings, Inc. * | 632 | 16,520 |
| Sears Holdings Corp. *(b) | 3,140 | 83,775 |
| Select Comfort Corp. * | 314 | 7,646 |
| Signet Jewelers Ltd. | 693 | 95,634 |
| Sonic Automotive, Inc., Class A | 1,099 | 23,639 |
| Stage Stores, Inc. | 942 | 10,117 |
| Staples, Inc. | 27,456 | 390,150 |
| Stein Mart, Inc. | 665 | 7,142 |
| Target Corp. | 15,684 | 1,218,804 |
| The Buckle, Inc. (b) | 655 | 27,641 |
| The Cato Corp., Class A | 471 | 16,546 |
| The Children's Place, Inc. | 634 | 37,989 |
| The Finish Line, Inc., Class A | 942 | 24,841 |
| The Gap, Inc. | 6,323 | 207,458 |
| The Home Depot, Inc. | 14,816 | 1,725,471 |
| The Men's Wearhouse, Inc. | 1,099 | 62,039 |
| The Pep Boys-Manny, Moe & Jack * | 1,413 | 17,097 |
| The Priceline Group, Inc. * | 97 | 121,118 |
| The TJX Cos., Inc. | 7,496 | 527,119 |
| Tiffany & Co. | 799 | 65,718 |
| Tractor Supply Co. | 1,099 | 93,756 |
| Travelport Worldwide Ltd. (b) | 317 | 4,200 |
| TripAdvisor, Inc. * | 157 | 10,974 |
| Tuesday Morning Corp. * | 913 | 7,240 |
| Ulta Salon, Cosmetics & Fragrance, Inc. * | 327 | 51,695 |
| Urban Outfitters, Inc. * | 1,643 | 50,703 |
| Vitamin Shoppe, Inc. * | 323 | 11,563 |
| Williams-Sonoma, Inc. | 1,129 | 85,838 |
| | | 12,150,241 |
| Security | Number
of Shares | Value
($) |
| Semiconductors & Semiconductor Equipment 2.2% |
| Advanced Micro Devices, Inc. *(b) | 17,393 | 31,481 |
| Altera Corp. | 2,041 | 99,091 |
| Analog Devices, Inc. | 2,453 | 137,025 |
| Applied Materials, Inc. | 14,078 | 226,445 |
| Atmel Corp. | 5,237 | 42,786 |
| Avago Technologies Ltd. | 696 | 87,675 |
| Broadcom Corp., Class A | 3,757 | 194,124 |
| Brooks Automation, Inc. | 1,256 | 13,037 |
| Cabot Microelectronics Corp. * | 697 | 30,236 |
| Cirrus Logic, Inc. * | 501 | 15,110 |
| Cree, Inc. *(b) | 402 | 10,942 |
| Cypress Semiconductor Corp. | 4,613 | 46,130 |
| Diodes, Inc. * | 471 | 9,274 |
| Entegris, Inc. * | 1,570 | 21,556 |
| Fairchild Semiconductor International, Inc. * | 2,116 | 28,778 |
| First Solar, Inc. * | 638 | 30,522 |
| Freescale Semiconductor Ltd. * | 357 | 12,756 |
| Integrated Device Technology, Inc. * | 1,195 | 22,693 |
| Intel Corp. | 77,541 | 2,213,020 |
| Intersil Corp., Class A | 2,364 | 24,917 |
| KLA-Tencor Corp. | 1,429 | 71,607 |
| Lam Research Corp. | 1,135 | 82,594 |
| Linear Technology Corp. | 1,570 | 63,240 |
| Marvell Technology Group Ltd. | 7,260 | 81,820 |
| Maxim Integrated Products, Inc. | 3,140 | 105,724 |
| Microchip Technology, Inc. | 1,727 | 73,397 |
| Micron Technology, Inc. * | 5,841 | 95,851 |
| Microsemi Corp. * | 793 | 25,186 |
| MKS Instruments, Inc. | 628 | 21,164 |
| NVIDIA Corp. | 4,038 | 90,774 |
| OmniVision Technologies, Inc. * | 628 | 15,009 |
| ON Semiconductor Corp. * | 4,082 | 39,003 |
| Photronics, Inc. * | 1,256 | 11,442 |
| PMC-Sierra, Inc. * | 1,413 | 8,888 |
| Silicon Laboratories, Inc. * | 471 | 20,479 |
| Skyworks Solutions, Inc. | 543 | 47,431 |
| Synaptics, Inc. * | 215 | 15,069 |
| Teradyne, Inc. | 1,570 | 28,323 |
| Texas Instruments, Inc. | 11,661 | 557,862 |
| Xilinx, Inc. | 1,926 | 80,680 |
| | | 4,833,141 |
| Software & Services 6.8% |
| Accenture plc, Class A | 5,882 | 554,496 |
| ACI Worldwide, Inc. * | 477 | 10,174 |
| Activision Blizzard, Inc. | 6,083 | 174,156 |
| Acxiom Corp. * | 1,256 | 26,326 |
| Adobe Systems, Inc. * | 1,968 | 154,626 |
| Akamai Technologies, Inc. * | 793 | 56,549 |
| Alliance Data Systems Corp. * | 359 | 92,331 |
| Amdocs Ltd. | 2,198 | 125,748 |
| ANSYS, Inc. * | 345 | 30,567 |
| Autodesk, Inc. * | 1,256 | 58,718 |
| Automatic Data Processing, Inc. | 3,390 | 262,115 |
| AVG Technologies N.V. * | 128 | 2,961 |
| Booz Allen Hamilton Holding Corp. | 1,470 | 39,249 |
| Broadridge Financial Solutions, Inc. | 1,570 | 82,880 |
| CA, Inc. | 4,765 | 130,037 |
Schwab Fundamental U.S. Broad Market Index ETF
Portfolio Holdings (Unaudited) continued
| Security | Number
of Shares | Value
($) |
| CACI International, Inc., Class A * | 634 | 49,718 |
| Cadence Design Systems, Inc. * | 785 | 15,716 |
| Cardtronics, Inc. * | 65 | 2,242 |
| Cimpress N.V. * | 314 | 21,974 |
| Citrix Systems, Inc. * | 785 | 53,466 |
| Cognizant Technology Solutions Corp., Class A * | 2,230 | 140,356 |
| Computer Sciences Corp. | 2,846 | 176,424 |
| Convergys Corp. | 2,355 | 53,223 |
| CoreLogic, Inc. * | 2,428 | 92,143 |
| CSG Systems International, Inc. | 785 | 24,264 |
| DST Systems, Inc. | 628 | 64,320 |
| EarthLink Holdings Corp. | 8,095 | 67,917 |
| eBay, Inc. * | 6,814 | 184,728 |
| Electronic Arts, Inc. * | 1,278 | 84,540 |
| Euronet Worldwide, Inc. * | 316 | 20,373 |
| Everi Holdings, Inc. * | 1,256 | 6,494 |
| Facebook, Inc., Class A * | 826 | 73,869 |
| FactSet Research Systems, Inc. | 314 | 49,587 |
| Fair Isaac Corp. | 424 | 36,282 |
| Fidelity National Information Services, Inc. | 3,140 | 216,848 |
| Fiserv, Inc. * | 2,230 | 190,152 |
| FleetCor Technologies, Inc. * | 67 | 9,994 |
| Gartner, Inc. * | 314 | 26,850 |
| Genpact Ltd. * | 1,103 | 25,369 |
| Global Payments, Inc. | 471 | 52,465 |
| Google, Inc., Class A * | 865 | 560,364 |
| Google, Inc., Class C * | 858 | 530,458 |
| Heartland Payment Systems, Inc. | 314 | 18,708 |
| IAC/InterActiveCorp | 1,137 | 79,363 |
| International Business Machines Corp. | 18,563 | 2,745,282 |
| Intuit, Inc. | 1,906 | 163,439 |
| j2 Global, Inc. | 314 | 21,848 |
| Jack Henry & Associates, Inc. | 471 | 32,009 |
| Leidos Holdings, Inc. | 2,752 | 115,804 |
| LinkedIn Corp., Class A * | 15 | 2,709 |
| Manhattan Associates, Inc. * | 628 | 36,725 |
| ManTech International Corp., Class A | 628 | 17,201 |
| MasterCard, Inc., Class A | 3,311 | 305,837 |
| MAXIMUS, Inc. | 471 | 28,519 |
| Mentor Graphics Corp. | 471 | 12,171 |
| Microsoft Corp. | 85,703 | 3,729,795 |
| Monster Worldwide, Inc. * | 6,294 | 45,757 |
| NeuStar, Inc., Class A *(b) | 1,728 | 48,298 |
| Nuance Communications, Inc. * | 1,105 | 18,199 |
| Oracle Corp. | 30,702 | 1,138,737 |
| Paychex, Inc. | 2,669 | 119,198 |
| Progress Software Corp. * | 471 | 12,759 |
| PTC, Inc. * | 628 | 20,799 |
| Rackspace Hosting, Inc. * | 316 | 9,610 |
| Red Hat, Inc. * | 342 | 24,696 |
| Rovi Corp. * | 1,103 | 12,210 |
| salesforce.com, Inc. * | 314 | 21,779 |
| Science Applications International Corp. | 938 | 45,746 |
| Solera Holdings, Inc. | 520 | 25,048 |
| SS&C Technologies Holdings, Inc. | 42 | 2,845 |
| Sykes Enterprises, Inc. * | 785 | 19,743 |
| Symantec Corp. | 9,770 | 200,187 |
| Synopsys, Inc. * | 947 | 44,443 |
| Take-Two Interactive Software, Inc. * | 785 | 22,867 |
| Security | Number
of Shares | Value
($) |
| Teradata Corp. * | 1,665 | 48,668 |
| The Western Union Co. | 10,606 | 195,575 |
| Total System Services, Inc. | 2,041 | 93,539 |
| Unisys Corp. * | 942 | 12,406 |
| United Online, Inc. * | 239 | 2,603 |
| Vantiv, Inc., Class A * | 317 | 13,961 |
| VeriFone Systems, Inc. * | 826 | 25,804 |
| VeriSign, Inc. * | 942 | 64,941 |
| Visa, Inc., Class A | 4,710 | 335,823 |
| VMware, Inc., Class A * | 157 | 12,427 |
| WebMD Health Corp. * | 350 | 14,395 |
| WEX, Inc. * | 157 | 14,841 |
| Xerox Corp. | 25,007 | 254,321 |
| Yahoo! Inc. * | 3,962 | 127,735 |
| | | 14,990,439 |
| Technology Hardware & Equipment 4.7% |
| ADTRAN, Inc. | 942 | 15,091 |
| Amphenol Corp., Class A | 1,886 | 98,751 |
| Anixter International, Inc. * | 628 | 39,978 |
| Apple, Inc. | 24,046 | 2,711,427 |
| ARRIS Group, Inc. * | 1,099 | 29,036 |
| Arrow Electronics, Inc. * | 3,140 | 175,589 |
| Avnet, Inc. | 5,001 | 212,042 |
| AVX Corp. | 187 | 2,442 |
| Belden, Inc. | 320 | 16,125 |
| Benchmark Electronics, Inc. * | 1,884 | 40,261 |
| Brocade Communications Systems, Inc. | 4,239 | 45,145 |
| CDW Corp. | 489 | 19,438 |
| Cisco Systems, Inc. | 61,984 | 1,604,146 |
| Cognex Corp. | 314 | 11,166 |
| Coherent, Inc. * | 314 | 18,306 |
| CommScope Holding Co., Inc. * | 426 | 13,781 |
| Comtech Telecommunications Corp. | 471 | 12,566 |
| Corning, Inc. | 14,444 | 248,581 |
| Diebold, Inc. | 1,099 | 34,201 |
| Dolby Laboratories, Inc., Class A | 820 | 26,699 |
| EchoStar Corp., Class A * | 471 | 21,007 |
| Electronics For Imaging, Inc. * | 504 | 22,060 |
| EMC Corp. | 17,741 | 441,219 |
| F5 Networks, Inc. * | 314 | 38,123 |
| Fabrinet * | 480 | 9,542 |
| FEI Co. | 157 | 11,850 |
| Finisar Corp. * | 628 | 9,690 |
| FLIR Systems, Inc. | 1,602 | 45,865 |
| Harmonic, Inc. * | 406 | 2,343 |
| Harris Corp. | 2,286 | 175,610 |
| Hewlett-Packard Co. | 62,697 | 1,759,278 |
| II-VI, Inc. * | 131 | 2,213 |
| Ingram Micro, Inc., Class A | 9,426 | 255,068 |
| Insight Enterprises, Inc. * | 1,413 | 35,763 |
| InterDigital, Inc. | 314 | 15,534 |
| IPG Photonics Corp. * | 27 | 2,279 |
| Itron, Inc. * | 652 | 19,560 |
| Jabil Circuit, Inc. | 6,123 | 118,480 |
| Juniper Networks, Inc. | 5,856 | 150,558 |
| Keysight Technologies, Inc. * | 793 | 25,408 |
| Knowles Corp. *(b) | 565 | 9,198 |
| Lexmark International, Inc., Class A | 1,884 | 56,482 |
| Littelfuse, Inc. | 157 | 14,091 |
Schwab Fundamental U.S. Broad Market Index ETF
Portfolio Holdings (Unaudited) continued
| Security | Number
of Shares | Value
($) |
| Motorola Solutions, Inc. | 3,217 | 208,526 |
| MTS Systems Corp. | 157 | 9,348 |
| National Instruments Corp. | 628 | 18,344 |
| NCR Corp. * | 1,413 | 35,452 |
| NetApp, Inc. | 2,642 | 84,438 |
| NETGEAR, Inc. * | 765 | 23,241 |
| OSI Systems, Inc. * | 157 | 11,467 |
| Plantronics, Inc. | 314 | 16,692 |
| Plexus Corp. * | 785 | 29,885 |
| Polycom, Inc. * | 2,940 | 31,634 |
| QLogic Corp. * | 2,983 | 30,844 |
| QUALCOMM, Inc. | 9,282 | 525,176 |
| Rofin-Sinar Technologies, Inc. * | 885 | 22,541 |
| SanDisk Corp. | 1,487 | 81,131 |
| Sanmina Corp. * | 2,061 | 39,654 |
| ScanSource, Inc. * | 628 | 23,990 |
| SYNNEX Corp. | 797 | 63,114 |
| Tech Data Corp. * | 3,140 | 204,854 |
| Trimble Navigation Ltd. * | 785 | 14,836 |
| TTM Technologies, Inc. * | 1,286 | 8,771 |
| ViaSat, Inc. * | 157 | 9,227 |
| Viavi Solutions, Inc. * | 2,512 | 13,489 |
| Vishay Intertechnology, Inc. | 3,297 | 32,574 |
| Western Digital Corp. | 2,034 | 166,707 |
| Zebra Technologies Corp., Class A * | 454 | 37,627 |
| | | 10,359,554 |
| Telecommunication Services 3.9% |
| AT&T, Inc. | 158,136 | 5,250,115 |
| CenturyLink, Inc. | 12,770 | 345,301 |
| Cincinnati Bell, Inc. * | 8,660 | 29,704 |
| Consolidated Communications Holdings, Inc. | 628 | 12,252 |
| Frontier Communications Corp. | 30,314 | 153,692 |
| General Communication, Inc., Class A * | 157 | 2,645 |
| Inteliquent, Inc. | 494 | 9,050 |
| Intelsat S.A. *(b) | 956 | 9,245 |
| Level 3 Communications, Inc. * | 1,341 | 59,983 |
| NTELOS Holdings Corp. * | 1,695 | 15,543 |
| SBA Communications Corp., Class A * | 314 | 37,115 |
| T-Mobile US, Inc. * | 628 | 24,875 |
| Telephone & Data Systems, Inc. | 3,783 | 107,589 |
| Verizon Communications, Inc. | 54,146 | 2,491,257 |
| Vonage Holdings Corp. * | 3,690 | 20,479 |
| Windstream Holdings, Inc. (b) | 1,950 | 14,021 |
| Zayo Group Holdings, Inc. * | 96 | 2,685 |
| | | 8,585,551 |
| Transportation 1.8% |
| Alaska Air Group, Inc. | 942 | 70,518 |
| Allegiant Travel Co. | 66 | 13,415 |
| AMERCO | 26 | 9,739 |
| American Airlines Group, Inc. | 854 | 33,289 |
| ArcBest Corp. | 640 | 18,483 |
| Atlas Air Worldwide Holdings, Inc. * | 480 | 19,829 |
| Avis Budget Group, Inc. * | 1,824 | 80,493 |
| C.H. Robinson Worldwide, Inc. | 2,844 | 191,771 |
| Con-way, Inc. | 1,099 | 38,685 |
| Copa Holdings S.A., Class A (b) | 134 | 6,870 |
| CSX Corp. | 13,606 | 372,532 |
| Security | Number
of Shares | Value
($) |
| Delta Air Lines, Inc. | 1,117 | 48,902 |
| Expeditors International of Washington, Inc. | 2,754 | 134,863 |
| FedEx Corp. | 3,968 | 597,620 |
| Forward Air Corp. | 314 | 14,136 |
| Genesee & Wyoming, Inc., Class A * | 157 | 10,736 |
| Hawaiian Holdings, Inc. * | 496 | 11,239 |
| Heartland Express, Inc. | 785 | 15,888 |
| Hertz Global Holdings, Inc. * | 7,624 | 140,510 |
| Hub Group, Inc., Class A * | 628 | 23,669 |
| J.B. Hunt Transport Services, Inc. | 785 | 57,132 |
| JetBlue Airways Corp. * | 3,161 | 70,554 |
| Kansas City Southern | 438 | 40,620 |
| Kirby Corp. * | 286 | 20,172 |
| Knight Transportation, Inc. | 785 | 21,352 |
| Landstar System, Inc. | 628 | 41,574 |
| Macquarie Infrastructure Corp. | 100 | 7,872 |
| Matson, Inc. | 721 | 27,167 |
| Navios Maritime Holdings, Inc. | 2,289 | 6,432 |
| Norfolk Southern Corp. | 3,026 | 235,756 |
| Old Dominion Freight Line, Inc. * | 226 | 15,027 |
| Republic Airways Holdings, Inc. * | 1,671 | 5,147 |
| Ryder System, Inc. | 1,276 | 104,594 |
| Saia, Inc. * | 212 | 7,961 |
| SkyWest, Inc. | 4,167 | 66,255 |
| Southwest Airlines Co. | 1,016 | 37,287 |
| Spirit Airlines, Inc. * | 215 | 11,019 |
| Swift Transportation Co. * | 942 | 18,360 |
| Union Pacific Corp. | 6,866 | 588,691 |
| United Continental Holdings, Inc. * | 820 | 46,715 |
| United Parcel Service, Inc., Class B | 5,652 | 551,918 |
| UTi Worldwide, Inc. * | 4,024 | 28,651 |
| Werner Enterprises, Inc. | 1,099 | 29,113 |
| Wesco Aircraft Holdings, Inc. * | 303 | 4,254 |
| | | 3,896,810 |
| Utilities 4.3% |
| AES Corp. | 19,796 | 237,552 |
| AGL Resources, Inc. | 1,267 | 77,274 |
| ALLETE, Inc. | 471 | 22,504 |
| Alliant Energy Corp. | 1,598 | 90,559 |
| Ameren Corp. | 5,495 | 221,394 |
| American Electric Power Co., Inc. | 7,696 | 417,816 |
| American States Water Co. | 314 | 11,854 |
| American Water Works Co., Inc. | 1,920 | 99,725 |
| Aqua America, Inc. | 943 | 23,914 |
| Atmos Energy Corp. | 1,727 | 94,622 |
| Avista Corp. | 942 | 29,569 |
| Black Hills Corp. | 471 | 18,736 |
| California Water Service Group | 471 | 9,717 |
| Calpine Corp. * | 5,726 | 91,272 |
| CenterPoint Energy, Inc. | 8,371 | 155,868 |
| Cleco Corp. | 903 | 48,383 |
| CMS Energy Corp. | 3,998 | 131,054 |
| Consolidated Edison, Inc. | 5,338 | 335,814 |
| Dominion Resources, Inc. | 6,636 | 462,861 |
| DTE Energy Co. | 2,862 | 223,408 |
| Duke Energy Corp. | 7,370 | 522,607 |
| Dynegy, Inc. * | 491 | 12,643 |
| Edison International | 4,934 | 288,540 |
| El Paso Electric Co. | 471 | 16,673 |
Schwab Fundamental U.S. Broad Market Index ETF
Portfolio Holdings (Unaudited) continued
| Security | Number
of Shares | Value
($) |
| Entergy Corp. | 4,919 | 321,358 |
| Eversource Energy | 2,596 | 122,635 |
| Exelon Corp. | 19,668 | 604,988 |
| FirstEnergy Corp. | 11,518 | 368,115 |
| Great Plains Energy, Inc. | 2,366 | 58,961 |
| Hawaiian Electric Industries, Inc. | 1,615 | 45,656 |
| IDACORP, Inc. | 471 | 27,963 |
| ITC Holdings Corp. | 945 | 30,902 |
| MDU Resources Group, Inc. | 2,968 | 53,157 |
| MGE Energy, Inc. | 316 | 12,153 |
| National Fuel Gas Co. | 785 | 42,359 |
| New Jersey Resources Corp. | 1,256 | 35,507 |
| NextEra Energy, Inc. | 4,463 | 439,204 |
| NiSource, Inc. | 3,547 | 59,554 |
| Northwest Natural Gas Co. | 471 | 20,715 |
| NorthWestern Corp. | 471 | 24,322 |
| NRG Energy, Inc. | 7,527 | 149,938 |
| OGE Energy Corp. | 2,284 | 64,043 |
| ONE Gas, Inc. | 277 | 11,903 |
| Otter Tail Corp. | 1,121 | 28,933 |
| Pepco Holdings, Inc. | 4,714 | 108,328 |
| PG&E Corp. | 7,626 | 378,097 |
| Piedmont Natural Gas Co., Inc. | 942 | 36,342 |
| Pinnacle West Capital Corp. | 1,727 | 102,808 |
| PNM Resources, Inc. | 1,256 | 32,166 |
| Portland General Electric Co. | 1,270 | 43,866 |
| PPL Corp. | 8,878 | 275,129 |
| Public Service Enterprise Group, Inc. | 9,577 | 385,474 |
| Questar Corp. | 1,657 | 31,997 |
| SCANA Corp. | 2,041 | 107,949 |
| Sempra Energy | 2,724 | 258,371 |
| South Jersey Industries, Inc. | 628 | 15,135 |
| Southwest Gas Corp. | 628 | 34,597 |
| TECO Energy, Inc. | 4,239 | 89,316 |
| The Empire District Electric Co. | 628 | 13,596 |
| The Laclede Group, Inc. | 471 | 24,935 |
| The Southern Co. | 13,739 | 596,410 |
| UGI Corp. | 2,590 | 88,267 |
| UIL Holdings Corp. | 751 | 34,193 |
| Vectren Corp. | 1,256 | 50,529 |
| WEC Energy Group, Inc. | 3,987 | 189,981 |
| Westar Energy, Inc. | 2,086 | 76,243 |
| WGL Holdings, Inc. | 889 | 48,184 |
| Xcel Energy, Inc. | 7,536 | 254,189 |
| | | 9,442,827 |
| Total Common Stock |
| (Cost $222,526,397) | | 219,198,227 |
|
| Rights 0.0% of net assets |
| Telecommunication Services 0.0% |
| Leap Wireless CVR *(d)(e) | 735 | 1,852 |
| Total Rights |
| (Cost $1,852) | | 1,852 |
|
| Security | Number
of Shares | Value
($) |
| Other Investment Companies 0.5% of net assets |
| Money Market Fund 0.2% |
| State Street Institutional U.S. Government Money Market Fund, Premier Class 0.01% (c) | 441,752 | 441,752 |
| Securities Lending Collateral 0.3% |
| State Street Institutional U.S. Government Money Market Fund, Premier Class 0.00% (c) | 746,663 | 746,663 |
| Total Other Investment Companies |
| (Cost $1,188,415) | | 1,188,415 |
End of Investments.
At 08/31/15, the tax basis cost of the fund's investments was $223,731,993 and the unrealized appreciation and depreciation were $15,078,711 and ($18,422,210), respectively, with a net unrealized depreciation of ($3,343,499).
| * | Non-income producing security. |
| (a) | Issuer is affiliated with the fund's adviser. |
| (b) | All or a portion of this security is on loan. Securities on loan were valued at $749,488. Non-cash collateral pledged to the fund for securities on loan amounted to $27,521. |
| (c) | The rate shown is the 7-day yield. |
| (d) | Fair-valued by management in accordance with procedures approved by the Board of Trustees. |
| (e) | Illiquid security. At the period end, the value of these amounted to $1,852 or 0.0% of net assets. |
| | |
| CVR — | Contingent Value Rights |
| REIT — | Real Estate Investment Trust |
In addition to the above, the fund held the following at 08/31/15:
| | Number of
Contracts | Contract
Value
($) | Unrealized
Depreciation
($) |
| Futures Contracts | | | |
| S&P 500 Index, e-mini, Long, expires 09/18/15 | 6 | 590,760 | (23,189) |
Schwab Fundamental U.S. Large Company Index ETF
Portfolio Holdings as of August 31, 2015 (Unaudited)
This section shows all the securities in the fund's portfolio and their values as of the report date.
The fund files its complete schedule of portfolio holdings with the SEC for the first and third quarters of each fiscal year on Form N-Q. The fund's Form N-Q is available on the SEC's website at www.sec.gov and may be viewed and copied at the SEC's Public Reference Room in Washington, D.C. Call 1-800-SEC-0330 for information on the operation of the Public Reference Room. The fund also makes available its complete schedule of portfolio holdings on a daily basis on the fund's website at www.csimfunds.com/schwabetfs_prospectus.
| Holdings by Category | Cost
($) | Value
($) |
| 99.5% | Common Stock | 736,722,324 | 686,681,938 |
| 0.3% | Other Investment Companies | 2,093,038 | 2,093,038 |
| 99.8% | Total Investments | 738,815,362 | 688,774,976 |
| 0.2% | Other Assets and
Liabilities, Net | | 1,318,433 |
| 100.0% | Net Assets | | 690,093,409 |
| Security | Number
of Shares | Value
($) |
| Common Stock 99.5% of net assets |
| Automobiles & Components 1.2% |
| BorgWarner, Inc. | 6,045 | 263,804 |
| Dana Holding Corp. | 8,536 | 149,721 |
| Delphi Automotive plc | 5,852 | 441,943 |
| Ford Motor Co. | 162,322 | 2,251,406 |
| General Motors Co. | 79,254 | 2,333,238 |
| Harley-Davidson, Inc. | 7,065 | 395,993 |
| Johnson Controls, Inc. | 31,103 | 1,279,577 |
| Lear Corp. | 4,482 | 460,705 |
| The Goodyear Tire & Rubber Co. | 10,337 | 307,733 |
| Visteon Corp. * | 2,464 | 245,562 |
| | | 8,129,682 |
| Banks 5.8% |
| Bank of America Corp. | 467,172 | 7,633,590 |
| BB&T Corp. | 27,081 | 999,830 |
| CIT Group, Inc. | 6,272 | 272,456 |
| Citigroup, Inc. | 98,936 | 5,291,097 |
| Citizens Financial Group, Inc. | 1,757 | 43,609 |
| Comerica, Inc. | 6,077 | 267,388 |
| Fifth Third Bancorp | 32,413 | 645,667 |
| Hudson City Bancorp, Inc. | 27,152 | 252,514 |
| Huntington Bancshares, Inc. | 20,910 | 228,128 |
| JPMorgan Chase & Co. | 155,511 | 9,968,255 |
| KeyCorp | 33,955 | 466,542 |
| M&T Bank Corp. | 3,828 | 452,623 |
| New York Community Bancorp, Inc. | 20,622 | 364,185 |
| People's United Financial, Inc. | 12,939 | 200,554 |
| Popular, Inc. * | 5,259 | 154,404 |
| Regions Financial Corp. | 57,485 | 551,281 |
| SunTrust Banks, Inc. | 21,169 | 854,593 |
| The PNC Financial Services Group, Inc. | 16,371 | 1,491,725 |
| Security | Number
of Shares | Value
($) |
| U.S. Bancorp | 49,716 | 2,105,473 |
| Wells Fargo & Co. | 139,544 | 7,441,881 |
| | | 39,685,795 |
| Capital Goods 7.5% |
| 3M Co. | 20,027 | 2,846,638 |
| AECOM * | 9,714 | 267,135 |
| AGCO Corp. | 7,213 | 353,725 |
| AMETEK, Inc. | 4,446 | 239,284 |
| Armstrong World Industries, Inc. * | 4,074 | 226,555 |
| Carlisle Cos., Inc. | 1,994 | 200,796 |
| Caterpillar, Inc. | 27,528 | 2,104,240 |
| Chicago Bridge & Iron Co. N.V. (b) | 3,315 | 146,788 |
| Cummins, Inc. | 7,366 | 896,810 |
| Danaher Corp. | 11,354 | 988,025 |
| Deere & Co. | 19,559 | 1,599,535 |
| Dover Corp. | 7,567 | 468,776 |
| Eaton Corp. plc | 13,996 | 798,612 |
| EMCOR Group, Inc. | 4,428 | 204,087 |
| Emerson Electric Co. | 37,643 | 1,796,324 |
| Fastenal Co. | 7,687 | 296,257 |
| Flowserve Corp. | 6,650 | 300,114 |
| Fluor Corp. | 16,703 | 761,991 |
| Fortune Brands Home & Security, Inc. | 4,575 | 218,914 |
| General Dynamics Corp. | 14,123 | 2,005,890 |
| General Electric Co. | 380,045 | 9,432,717 |
| Honeywell International, Inc. | 19,479 | 1,933,680 |
| Hubbell, Inc., Class B | 1,968 | 194,183 |
| Illinois Tool Works, Inc. | 14,968 | 1,265,245 |
| Ingersoll-Rand plc | 11,072 | 612,171 |
| Jacobs Engineering Group, Inc. * | 10,909 | 440,833 |
| Joy Global, Inc. | 6,455 | 156,340 |
| KBR, Inc. | 26,851 | 468,281 |
| Kennametal, Inc. | 5,470 | 166,835 |
| L-3 Communications Holdings, Inc. | 9,334 | 984,457 |
| Lincoln Electric Holdings, Inc. | 2,958 | 173,487 |
| Lockheed Martin Corp. | 11,474 | 2,308,339 |
| Northrop Grumman Corp. | 14,996 | 2,455,445 |
| NOW, Inc. *(b) | 2,226 | 37,976 |
| Oshkosh Corp. | 6,484 | 272,652 |
| Owens Corning | 8,135 | 360,299 |
| PACCAR, Inc. | 12,838 | 757,057 |
| Parker-Hannifin Corp. | 7,373 | 793,777 |
| Pentair plc | 4,521 | 249,966 |
| Precision Castparts Corp. | 2,814 | 647,923 |
| Quanta Services, Inc. * | 9,471 | 229,577 |
| Raytheon Co. | 18,640 | 1,911,718 |
| Rockwell Automation, Inc. | 3,276 | 366,355 |
| Rockwell Collins, Inc. | 5,233 | 428,321 |
| Roper Technologies, Inc. | 1,476 | 239,245 |
| Snap-on, Inc. | 1,476 | 235,821 |
| SPX Corp. | 3,095 | 181,769 |
| Stanley Black & Decker, Inc. | 5,427 | 550,949 |
| Textron, Inc. | 10,696 | 415,005 |
| The Boeing Co. | 15,281 | 1,996,921 |
| The Timken Co. | 5,764 | 183,007 |
| TransDigm Group, Inc. * | 775 | 178,118 |
| Trinity Industries, Inc. | 5,325 | 143,722 |
| United Rentals, Inc. * | 2,972 | 206,049 |
| United Technologies Corp. | 36,162 | 3,312,801 |
| W.W. Grainger, Inc. | 2,505 | 559,717 |
Schwab Fundamental U.S. Large Company Index ETF
Portfolio Holdings (Unaudited) continued
| Security | Number
of Shares | Value
($) |
| WESCO International, Inc. * | 2,481 | 138,862 |
| Xylem, Inc. | 5,904 | 191,585 |
| | | 51,901,701 |
| Commercial & Professional Services 0.8% |
| Cintas Corp. | 4,472 | 380,075 |
| Equifax, Inc. | 2,542 | 248,862 |
| ManpowerGroup, Inc. | 7,950 | 690,855 |
| Nielsen Holdings plc | 6,266 | 283,411 |
| Pitney Bowes, Inc. | 16,704 | 330,906 |
| R.R. Donnelley & Sons Co. | 22,861 | 358,918 |
| Republic Services, Inc. | 13,766 | 564,131 |
| Robert Half International, Inc. | 5,932 | 302,710 |
| The ADT Corp. | 9,855 | 323,047 |
| The Dun & Bradstreet Corp. | 1,971 | 208,867 |
| Towers Watson & Co., Class A | 1,433 | 170,140 |
| Tyco International plc | 13,823 | 501,636 |
| Verisk Analytics, Inc. * | 2,475 | 180,873 |
| Waste Management, Inc. | 24,780 | 1,240,487 |
| | | 5,784,918 |
| Consumer Durables & Apparel 1.1% |
| Coach, Inc. | 22,669 | 685,737 |
| Fossil Group, Inc. * | 2,527 | 155,613 |
| Garmin Ltd. | 5,415 | 203,658 |
| Hasbro, Inc. | 5,970 | 445,302 |
| Jarden Corp. * | 5,651 | 290,122 |
| Leggett & Platt, Inc. | 7,604 | 337,770 |
| Mattel, Inc. | 20,861 | 488,773 |
| Mohawk Industries, Inc. * | 1,640 | 323,031 |
| Newell Rubbermaid, Inc. | 9,408 | 396,359 |
| NIKE, Inc., Class B | 19,562 | 2,186,054 |
| NVR, Inc. * | 191 | 290,310 |
| Polaris Industries, Inc. | 1,223 | 158,831 |
| PVH Corp. | 1,877 | 223,326 |
| Ralph Lauren Corp. | 2,909 | 323,452 |
| Tupperware Brands Corp. | 2,623 | 134,376 |
| VF Corp. | 8,393 | 607,905 |
| Whirlpool Corp. | 3,728 | 626,677 |
| | | 7,877,296 |
| Consumer Services 1.8% |
| Apollo Education Group, Inc. * | 19,051 | 211,657 |
| Aramark | 2,400 | 75,216 |
| Brinker International, Inc. | 3,979 | 211,404 |
| Carnival Corp. | 20,622 | 1,015,221 |
| Chipotle Mexican Grill, Inc. * | 308 | 218,683 |
| Darden Restaurants, Inc. | 6,971 | 474,098 |
| DeVry Education Group, Inc. | 4,444 | 116,255 |
| Graham Holdings Co., Class B | 235 | 155,467 |
| H&R Block, Inc. | 8,367 | 284,645 |
| Las Vegas Sands Corp. | 7,281 | 336,601 |
| Marriott International, Inc., Class A | 4,578 | 323,481 |
| McDonald's Corp. | 49,840 | 4,735,797 |
| MGM Resorts International * | 10,271 | 209,836 |
| Royal Caribbean Cruises Ltd. | 4,566 | 402,538 |
| Starbucks Corp. | 21,959 | 1,201,377 |
| Starwood Hotels & Resorts Worldwide, Inc. | 4,926 | 352,061 |
| Wyndham Worldwide Corp. | 5,423 | 414,751 |
| Security | Number
of Shares | Value
($) |
| Wynn Resorts Ltd. | 3,379 | 253,594 |
| Yum! Brands, Inc. | 14,306 | 1,141,190 |
| | | 12,133,872 |
| Diversified Financials 3.3% |
| Ally Financial, Inc. * | 20,091 | 439,189 |
| American Express Co. | 29,270 | 2,245,594 |
| Ameriprise Financial, Inc. | 4,927 | 555,125 |
| Berkshire Hathaway, Inc., Class B * | 40,774 | 5,465,347 |
| BlackRock, Inc. | 1,967 | 594,958 |
| Capital One Financial Corp. | 21,302 | 1,656,231 |
| CME Group, Inc. | 6,971 | 658,341 |
| Discover Financial Services | 13,085 | 703,057 |
| Franklin Resources, Inc. | 14,368 | 583,053 |
| Invesco Ltd. | 8,887 | 303,136 |
| Legg Mason, Inc. | 6,957 | 308,404 |
| Leucadia National Corp. | 9,846 | 211,295 |
| McGraw Hill Financial, Inc. | 7,599 | 737,027 |
| Moody's Corp. | 2,977 | 304,577 |
| Morgan Stanley | 30,233 | 1,041,527 |
| Northern Trust Corp. | 5,516 | 385,237 |
| PHH Corp. * | 9,963 | 161,401 |
| SLM Corp. * | 23,641 | 200,476 |
| State Street Corp. | 9,840 | 707,693 |
| T. Rowe Price Group, Inc. | 7,957 | 571,949 |
| The Bank of New York Mellon Corp. | 24,291 | 966,782 |
| The Charles Schwab Corp. (a) | 13,004 | 395,062 |
| The Goldman Sachs Group, Inc. | 16,254 | 3,065,504 |
| The NASDAQ OMX Group, Inc. | 5,121 | 262,144 |
| Voya Financial, Inc. | 1,280 | 55,142 |
| | | 22,578,251 |
| Energy 13.3% |
| Anadarko Petroleum Corp. | 15,889 | 1,137,335 |
| Apache Corp. | 26,085 | 1,180,085 |
| Baker Hughes, Inc. | 21,191 | 1,186,696 |
| California Resources Corp. | 13,933 | 54,060 |
| Cameron International Corp. * | 8,751 | 584,217 |
| Chesapeake Energy Corp. (b) | 44,544 | 347,889 |
| Chevron Corp. | 181,258 | 14,680,085 |
| Cimarex Energy Co. | 1,876 | 207,317 |
| ConocoPhillips | 134,092 | 6,590,622 |
| CONSOL Energy, Inc. (b) | 10,932 | 166,494 |
| Delek US Holdings, Inc. | 4,964 | 152,693 |
| Denbury Resources, Inc. | 30,840 | 133,846 |
| Devon Energy Corp. | 25,680 | 1,095,509 |
| Diamond Offshore Drilling, Inc. (b) | 12,410 | 294,241 |
| Energen Corp. | 2,721 | 141,492 |
| Ensco plc, Class A | 16,076 | 291,136 |
| EOG Resources, Inc. | 10,346 | 810,195 |
| EQT Corp. | 2,533 | 197,118 |
| Exxon Mobil Corp. | 394,109 | 29,652,761 |
| FMC Technologies, Inc. * | 6,527 | 227,009 |
| Halliburton Co. | 39,657 | 1,560,503 |
| Helmerich & Payne, Inc. | 3,577 | 211,079 |
| Hess Corp. | 26,293 | 1,563,119 |
| HollyFrontier Corp. | 18,624 | 872,721 |
| Kinder Morgan, Inc. | 17,237 | 558,651 |
| Marathon Oil Corp. | 65,837 | 1,138,322 |
| Marathon Petroleum Corp. | 48,241 | 2,282,282 |
Schwab Fundamental U.S. Large Company Index ETF
Portfolio Holdings (Unaudited) continued
| Security | Number
of Shares | Value
($) |
| Murphy Oil Corp. | 26,218 | 812,758 |
| Nabors Industries Ltd. | 30,487 | 351,820 |
| National Oilwell Varco, Inc. | 22,293 | 943,663 |
| Newfield Exploration Co. * | 6,966 | 232,037 |
| Noble Corp. plc | 27,946 | 363,857 |
| Noble Energy, Inc. | 10,329 | 345,092 |
| Occidental Petroleum Corp. | 43,223 | 3,155,711 |
| Oceaneering International, Inc. | 3,118 | 136,631 |
| ONEOK, Inc. | 8,060 | 290,241 |
| Patterson-UTI Energy, Inc. | 12,969 | 211,135 |
| Peabody Energy Corp. (b) | 79,080 | 213,516 |
| Phillips 66 | 69,736 | 5,514,026 |
| Pioneer Natural Resources Co. | 1,637 | 201,449 |
| QEP Resources, Inc. | 12,365 | 173,605 |
| Schlumberger Ltd. | 40,716 | 3,150,197 |
| Seadrill Ltd. (b) | 52,113 | 418,989 |
| Southwestern Energy Co. * | 11,077 | 179,890 |
| Spectra Energy Corp. | 23,274 | 676,575 |
| Superior Energy Services, Inc. | 7,495 | 119,245 |
| Tesoro Corp. | 11,151 | 1,026,003 |
| The Williams Cos., Inc. | 13,866 | 668,341 |
| Valero Energy Corp. | 64,722 | 3,840,603 |
| Weatherford International plc * | 43,550 | 442,032 |
| Whiting Petroleum Corp. * | 4,454 | 86,096 |
| World Fuel Services Corp. | 14,109 | 545,313 |
| | | 91,416,302 |
| Food & Staples Retailing 4.3% |
| Casey's General Stores, Inc. | 2,952 | 312,499 |
| Costco Wholesale Corp. | 24,403 | 3,417,640 |
| CVS Health Corp. | 71,534 | 7,325,082 |
| Sysco Corp. | 46,826 | 1,866,953 |
| The Kroger Co. | 66,477 | 2,293,456 |
| United Natural Foods, Inc. * | 3,100 | 149,265 |
| Wal-Mart Stores, Inc. | 144,078 | 9,326,169 |
| Walgreens Boots Alliance, Inc. | 47,688 | 4,127,396 |
| Whole Foods Market, Inc. | 14,538 | 476,265 |
| | | 29,294,725 |
| Food, Beverage & Tobacco 5.6% |
| Altria Group, Inc. | 63,059 | 3,378,701 |
| Archer-Daniels-Midland Co. | 58,540 | 2,633,715 |
| Brown-Forman Corp., Class B | 3,928 | 385,337 |
| Bunge Ltd. | 19,384 | 1,404,371 |
| Campbell Soup Co. | 8,898 | 427,015 |
| Coca-Cola Enterprises, Inc. | 15,959 | 821,729 |
| ConAgra Foods, Inc. | 23,730 | 989,066 |
| Constellation Brands, Inc., Class A | 2,493 | 319,104 |
| Dr. Pepper Snapple Group, Inc. | 8,287 | 635,862 |
| General Mills, Inc. | 28,098 | 1,594,843 |
| Hormel Foods Corp. | 4,920 | 300,612 |
| Ingredion, Inc. | 3,460 | 298,736 |
| Kellogg Co. | 10,964 | 726,694 |
| McCormick & Co., Inc. Non-Voting Shares | 4,010 | 317,913 |
| Mead Johnson Nutrition Co. | 2,455 | 192,325 |
| Molson Coors Brewing Co., Class B | 3,763 | 256,223 |
| Mondelez International, Inc., Class A | 63,370 | 2,684,353 |
| Monster Beverage Corp. * | 1,770 | 245,074 |
| PepsiCo, Inc. | 56,322 | 5,234,003 |
| Security | Number
of Shares | Value
($) |
| Philip Morris International, Inc. | 78,713 | 6,281,297 |
| Reynolds American, Inc. | 15,861 | 1,328,359 |
| The Coca-Cola Co. | 128,466 | 5,051,283 |
| The Hershey Co. | 3,437 | 307,680 |
| The J.M. Smucker Co. | 5,722 | 673,594 |
| The Kraft Heinz Co. | 16,809 | 1,221,342 |
| Tyson Foods, Inc., Class A | 25,490 | 1,077,717 |
| | | 38,786,948 |
| Health Care Equipment & Services 6.0% |
| Abbott Laboratories | 38,464 | 1,742,035 |
| Aetna, Inc. | 20,142 | 2,306,662 |
| AmerisourceBergen Corp. | 11,731 | 1,173,569 |
| Anthem, Inc. | 30,960 | 4,366,908 |
| Baxter International, Inc. | 24,519 | 942,755 |
| Becton Dickinson & Co. | 9,005 | 1,269,885 |
| Boston Scientific Corp. * | 40,701 | 681,335 |
| C.R. Bard, Inc. | 2,970 | 575,556 |
| Cardinal Health, Inc. | 24,202 | 1,991,098 |
| Centene Corp. * | 2,978 | 183,802 |
| Cerner Corp. * | 2,617 | 161,626 |
| Cigna Corp. | 5,545 | 780,680 |
| Community Health Systems, Inc. * | 8,472 | 454,946 |
| DaVita HealthCare Partners, Inc. * | 4,056 | 306,796 |
| DENTSPLY International, Inc. | 3,936 | 206,286 |
| Express Scripts Holding Co. * | 24,384 | 2,038,502 |
| HCA Holdings, Inc. * | 22,153 | 1,918,893 |
| Health Net, Inc. * | 9,012 | 577,309 |
| Henry Schein, Inc. * | 2,952 | 403,863 |
| Humana, Inc. | 9,835 | 1,797,740 |
| Intuitive Surgical, Inc. * | 430 | 219,708 |
| Laboratory Corp. of America Holdings * | 3,475 | 409,390 |
| LifePoint Health, Inc. * | 2,841 | 221,967 |
| Magellan Health, Inc. * | 3,928 | 219,968 |
| McKesson Corp. | 11,885 | 2,348,238 |
| Medtronic plc | 39,851 | 2,880,829 |
| Owens & Minor, Inc. | 8,541 | 290,309 |
| Patterson Cos., Inc. | 4,920 | 225,484 |
| Quest Diagnostics, Inc. | 10,802 | 732,376 |
| ResMed, Inc. | 2,762 | 143,458 |
| St. Jude Medical, Inc. | 11,010 | 779,618 |
| Stryker Corp. | 9,861 | 972,788 |
| Tenet Healthcare Corp. * | 4,956 | 243,984 |
| UnitedHealth Group, Inc. | 51,897 | 6,004,483 |
| Universal Health Services, Inc., Class B | 2,198 | 301,434 |
| Varian Medical Systems, Inc. * | 3,453 | 280,556 |
| WellCare Health Plans, Inc. * | 2,952 | 267,658 |
| Zimmer Biomet Holdings, Inc. | 7,437 | 770,176 |
| | | 41,192,670 |
| Household & Personal Products 2.1% |
| Avon Products, Inc. | 56,534 | 293,411 |
| Church & Dwight Co., Inc. | 3,513 | 303,102 |
| Colgate-Palmolive Co. | 28,719 | 1,803,840 |
| Edgewell Personal Care Co. | 1,968 | 173,302 |
| Herbalife Ltd. * | 5,855 | 337,072 |
| Kimberly-Clark Corp. | 13,625 | 1,451,471 |
| The Clorox Co. | 4,935 | 548,624 |
Schwab Fundamental U.S. Large Company Index ETF
Portfolio Holdings (Unaudited) continued
| Security | Number
of Shares | Value
($) |
| The Estee Lauder Cos., Inc., Class A | 4,432 | 353,541 |
| The Procter & Gamble Co. | 132,128 | 9,337,486 |
| | | 14,601,849 |
| Insurance 3.6% |
| ACE Ltd. | 9,700 | 990,952 |
| Aflac, Inc. | 19,448 | 1,139,653 |
| Alleghany Corp. * | 226 | 106,172 |
| American Financial Group, Inc. | 4,689 | 323,822 |
| American International Group, Inc. | 34,811 | 2,100,496 |
| Aon plc | 7,365 | 688,185 |
| Arch Capital Group Ltd. * | 5,904 | 403,125 |
| Arthur J. Gallagher & Co. | 3,333 | 145,719 |
| Assurant, Inc. | 6,972 | 518,368 |
| Axis Capital Holdings Ltd. | 7,926 | 443,856 |
| Cincinnati Financial Corp. | 6,396 | 334,703 |
| Everest Re Group Ltd. | 1,980 | 348,104 |
| First American Financial Corp. | 5,338 | 207,435 |
| FNF Group | 10,820 | 393,956 |
| Genworth Financial, Inc., Class A * | 34,745 | 179,979 |
| HCC Insurance Holdings, Inc. | 4,475 | 345,783 |
| Lincoln National Corp. | 6,420 | 326,072 |
| Loews Corp. | 18,735 | 682,891 |
| Marsh & McLennan Cos., Inc. | 14,738 | 791,873 |
| MetLife, Inc. | 23,238 | 1,164,224 |
| Old Republic International Corp. | 11,592 | 182,110 |
| PartnerRe Ltd. | 3,934 | 544,505 |
| Principal Financial Group, Inc. | 6,888 | 346,811 |
| Prudential Financial, Inc. | 12,531 | 1,011,252 |
| Reinsurance Group of America, Inc. | 2,475 | 224,928 |
| RenaissanceRe Holdings Ltd. | 3,942 | 401,887 |
| The Allstate Corp. | 17,300 | 1,008,244 |
| The Chubb Corp. | 16,232 | 1,960,988 |
| The Hartford Financial Services Group, Inc. | 21,604 | 992,704 |
| The Progressive Corp. | 33,970 | 1,017,741 |
| The Travelers Cos., Inc. | 35,655 | 3,549,455 |
| Torchmark Corp. | 5,904 | 345,148 |
| Unum Group | 16,841 | 564,847 |
| Validus Holdings Ltd. | 3,774 | 167,113 |
| W.R. Berkley Corp. | 6,428 | 348,912 |
| White Mountains Insurance Group Ltd. | 416 | 299,233 |
| XL Group plc | 10,357 | 386,212 |
| | | 24,987,458 |
| Materials 3.5% |
| Air Products & Chemicals, Inc. | 6,319 | 881,690 |
| Airgas, Inc. | 2,953 | 285,023 |
| Albemarle Corp. | 4,611 | 208,463 |
| Alcoa, Inc. | 67,795 | 640,663 |
| Allegheny Technologies, Inc. | 7,886 | 152,279 |
| AptarGroup, Inc. | 3,164 | 213,127 |
| Ashland, Inc. | 2,511 | 263,580 |
| Avery Dennison Corp. | 6,061 | 352,023 |
| Ball Corp. | 6,695 | 441,267 |
| Bemis Co., Inc. | 5,931 | 251,593 |
| Celanese Corp., Series A | 4,371 | 265,057 |
| CF Industries Holdings, Inc. | 9,850 | 565,193 |
| Cliffs Natural Resources, Inc. (b) | 59,868 | 237,676 |
| Commercial Metals Co. | 15,467 | 242,832 |
| Security | Number
of Shares | Value
($) |
| Cytec Industries, Inc. | 3,153 | 233,953 |
| Domtar Corp. | 10,280 | 413,359 |
| E.I. du Pont de Nemours & Co. | 26,528 | 1,366,192 |
| Eastman Chemical Co. | 5,894 | 427,079 |
| Ecolab, Inc. | 4,162 | 454,241 |
| FMC Corp. | 4,070 | 172,202 |
| Freeport-McMoRan, Inc. | 105,437 | 1,121,850 |
| Graphic Packaging Holding Co. | 12,543 | 176,856 |
| Huntsman Corp. | 10,824 | 178,921 |
| International Flavors & Fragrances, Inc. | 2,000 | 219,100 |
| International Paper Co. | 21,617 | 932,557 |
| LyondellBasell Industries N.V., Class A | 22,884 | 1,953,836 |
| Monsanto Co. | 12,932 | 1,262,810 |
| Newmont Mining Corp. | 48,556 | 828,851 |
| Nucor Corp. | 22,849 | 989,133 |
| Owens-Illinois, Inc. * | 10,345 | 215,693 |
| Packaging Corp. of America | 2,500 | 167,775 |
| PPG Industries, Inc. | 7,906 | 753,363 |
| Praxair, Inc. | 9,927 | 1,049,780 |
| Reliance Steel & Aluminum Co. | 6,554 | 380,918 |
| RPM International, Inc. | 4,920 | 215,742 |
| Sigma-Aldrich Corp. | 2,530 | 352,707 |
| Sonoco Products Co. | 5,904 | 232,145 |
| Southern Copper Corp. | 7,921 | 211,174 |
| Steel Dynamics, Inc. | 16,236 | 316,277 |
| The Dow Chemical Co. | 48,497 | 2,122,229 |
| The Mosaic Co. | 23,579 | 962,731 |
| The Sherwin-Williams Co. | 1,494 | 382,180 |
| The Valspar Corp. | 3,243 | 237,712 |
| United States Steel Corp. | 14,181 | 232,285 |
| Vulcan Materials Co. | 3,005 | 281,328 |
| WestRock Co. | 10,143 | 601,987 |
| | | 24,447,432 |
| Media 3.3% |
| Cablevision Systems Corp., Class A | 16,109 | 405,464 |
| CBS Corp., Class B Non-Voting Shares | 19,664 | 889,599 |
| Charter Communications, Inc., Class A *(b) | 2,270 | 412,255 |
| Comcast Corp., Class A | 71,468 | 4,025,793 |
| Comcast Corp., Special Class A | 2,994 | 171,377 |
| Discovery Communications, Inc., Class A * | 15,924 | 423,578 |
| Discovery Communications, Inc., Class C * | 17,347 | 439,920 |
| DISH Network Corp., Class A * | 4,819 | 285,622 |
| Liberty Media Corp., Class A * | 3,217 | 119,833 |
| Liberty Media Corp., Class C * | 3,391 | 122,822 |
| News Corp., Class A * | 30,677 | 418,128 |
| News Corp., Class B * | 2,132 | 29,486 |
| Omnicom Group, Inc. | 11,784 | 789,292 |
| Scripps Networks Interactive, Inc., Class A | 3,138 | 166,596 |
| TEGNA, Inc. | 12,503 | 297,446 |
| The Interpublic Group of Cos., Inc. | 15,085 | 284,805 |
| The Walt Disney Co. | 44,829 | 4,567,179 |
| Thomson Reuters Corp. | 18,167 | 705,243 |
| Time Warner Cable, Inc. | 14,767 | 2,746,957 |
| Time Warner, Inc. | 43,307 | 3,079,128 |
| Time, Inc. | 3,107 | 64,532 |
Schwab Fundamental U.S. Large Company Index ETF
Portfolio Holdings (Unaudited) continued
| Security | Number
of Shares | Value
($) |
| Twenty-First Century Fox, Inc., Class A | 51,643 | 1,414,502 |
| Twenty-First Century Fox, Inc., Class B | 2,405 | 66,522 |
| Viacom, Inc., Class B | 25,542 | 1,041,347 |
| | | 22,967,426 |
| Pharmaceuticals, Biotechnology & Life Sciences 5.8% |
| AbbVie, Inc. | 22,731 | 1,418,642 |
| Agilent Technologies, Inc. | 9,921 | 360,231 |
| Allergan plc * | 1,421 | 431,615 |
| Amgen, Inc. | 24,176 | 3,669,433 |
| Biogen, Inc. * | 1,783 | 530,086 |
| Bristol-Myers Squibb Co. | 46,903 | 2,789,321 |
| Celgene Corp. * | 7,294 | 861,276 |
| Eli Lilly & Co. | 36,932 | 3,041,350 |
| Gilead Sciences, Inc. | 15,834 | 1,663,678 |
| Hospira, Inc. * | 3,520 | 316,694 |
| Johnson & Johnson | 86,469 | 8,126,357 |
| Merck & Co., Inc. | 95,093 | 5,120,758 |
| Mettler-Toledo International, Inc. * | 574 | 170,220 |
| Mylan N.V. * | 7,544 | 374,107 |
| Perrigo Co., plc | 1,082 | 197,974 |
| Pfizer, Inc. | 285,964 | 9,213,760 |
| Thermo Fisher Scientific, Inc. | 7,380 | 925,231 |
| Waters Corp. * | 2,464 | 299,080 |
| Zoetis, Inc. | 7,913 | 355,056 |
| | | 39,864,869 |
| Real Estate 1.2% |
| American Capital Agency Corp. | 9,658 | 184,758 |
| American Tower Corp. | 4,135 | 381,206 |
| Annaly Capital Management, Inc. | 74,828 | 752,770 |
| AvalonBay Communities, Inc. | 1,572 | 259,474 |
| Boston Properties, Inc. | 2,530 | 286,851 |
| Corrections Corp. of America | 5,613 | 164,910 |
| Crown Castle International Corp. | 3,455 | 288,112 |
| Digital Realty Trust, Inc. | 2,893 | 183,185 |
| Equity Residential | 6,004 | 427,785 |
| General Growth Properties, Inc. | 8,958 | 227,354 |
| HCP, Inc. | 9,822 | 364,003 |
| Health Care REIT, Inc. | 3,620 | 229,327 |
| Hospitality Properties Trust | 6,396 | 164,505 |
| Host Hotels & Resorts, Inc. | 16,495 | 292,456 |
| Iron Mountain, Inc. | 9,376 | 265,716 |
| Kimco Realty Corp. | 8,384 | 193,251 |
| Plum Creek Timber Co., Inc. | 6,493 | 249,916 |
| Prologis, Inc. | 6,476 | 246,088 |
| Public Storage | 2,062 | 415,019 |
| Simon Property Group, Inc. | 4,440 | 796,181 |
| The Macerich Co. | 2,467 | 187,936 |
| Ventas, Inc. | 5,514 | 303,380 |
| Vornado Realty Trust | 4,428 | 386,077 |
| Weyerhaeuser Co. | 39,332 | 1,098,936 |
| | | 8,349,196 |
| Retailing 5.5% |
| Aaron's, Inc. | 6,964 | 262,195 |
| Abercrombie & Fitch Co., Class A (b) | 12,158 | 241,458 |
| Advance Auto Parts, Inc. | 1,622 | 284,255 |
| Amazon.com, Inc. * | 2,468 | 1,265,812 |
| American Eagle Outfitters, Inc. | 22,216 | 378,116 |
| Security | Number
of Shares | Value
($) |
| AutoNation, Inc. * | 4,535 | 271,374 |
| AutoZone, Inc. * | 504 | 360,859 |
| Bed Bath & Beyond, Inc. * | 13,342 | 828,672 |
| Best Buy Co., Inc. | 35,093 | 1,289,317 |
| Big Lots, Inc. | 6,900 | 331,131 |
| CarMax, Inc. * | 4,821 | 294,081 |
| Chico's FAS, Inc. | 10,737 | 160,089 |
| Core-Mark Holding Co., Inc. | 4,035 | 242,544 |
| CST Brands, Inc. | 15,361 | 533,334 |
| Dick's Sporting Goods, Inc. | 4,568 | 228,994 |
| Dillard's, Inc., Class A | 2,050 | 189,645 |
| Dollar General Corp. | 11,336 | 844,419 |
| Dollar Tree, Inc. * | 9,437 | 719,666 |
| Expedia, Inc. | 2,008 | 230,900 |
| Foot Locker, Inc. | 7,006 | 495,955 |
| GameStop Corp., Class A (b) | 14,771 | 627,472 |
| Genuine Parts Co. | 7,873 | 657,317 |
| Guess?, Inc. | 9,883 | 218,513 |
| J.C. Penney Co., Inc. * | 75,375 | 686,666 |
| Kohl's Corp. | 24,292 | 1,239,621 |
| L Brands, Inc. | 8,080 | 677,912 |
| Liberty Interactive Corp. QVC Group, Class A * | 20,150 | 544,856 |
| LKQ Corp. * | 5,820 | 174,542 |
| Lowe's Cos., Inc. | 57,904 | 4,005,220 |
| Macy's, Inc. | 17,707 | 1,037,807 |
| Murphy USA, Inc. * | 13,196 | 674,447 |
| Nordstrom, Inc. | 6,384 | 465,266 |
| O'Reilly Automotive, Inc. * | 2,686 | 644,828 |
| Office Depot, Inc. * | 23,281 | 184,618 |
| Rent-A-Center, Inc. | 9,117 | 245,156 |
| Ross Stores, Inc. | 10,628 | 516,733 |
| Signet Jewelers Ltd. | 2,509 | 346,242 |
| Staples, Inc. | 95,367 | 1,355,165 |
| Target Corp. | 54,201 | 4,211,960 |
| The Gap, Inc. | 20,666 | 678,051 |
| The Home Depot, Inc. | 51,487 | 5,996,176 |
| The Priceline Group, Inc. * | 373 | 465,743 |
| The TJX Cos., Inc. | 26,070 | 1,833,242 |
| Tiffany & Co. | 2,781 | 228,737 |
| Tractor Supply Co. | 3,541 | 302,083 |
| Urban Outfitters, Inc. * | 5,903 | 182,167 |
| Williams-Sonoma, Inc. | 3,936 | 299,254 |
| | | 37,952,610 |
| Semiconductors & Semiconductor Equipment 2.1% |
| Altera Corp. | 6,106 | 296,446 |
| Analog Devices, Inc. | 7,635 | 426,491 |
| Applied Materials, Inc. | 45,475 | 731,465 |
| Avago Technologies Ltd. | 2,070 | 260,758 |
| Broadcom Corp., Class A | 11,644 | 601,646 |
| Intel Corp. | 268,304 | 7,657,396 |
| KLA-Tencor Corp. | 6,409 | 321,155 |
| Lam Research Corp. | 3,530 | 256,878 |
| Linear Technology Corp. | 5,913 | 238,176 |
| Marvell Technology Group Ltd. | 27,860 | 313,982 |
| Maxim Integrated Products, Inc. | 12,533 | 421,986 |
| Microchip Technology, Inc. | 5,904 | 250,920 |
| Micron Technology, Inc. * | 20,140 | 330,497 |
| NVIDIA Corp. | 13,031 | 292,937 |
Schwab Fundamental U.S. Large Company Index ETF
Portfolio Holdings (Unaudited) continued
| Security | Number
of Shares | Value
($) |
| Texas Instruments, Inc. | 39,134 | 1,872,171 |
| Xilinx, Inc. | 8,466 | 354,641 |
| | | 14,627,545 |
| Software & Services 6.9% |
| Accenture plc, Class A | 20,217 | 1,905,857 |
| Activision Blizzard, Inc. | 21,565 | 617,406 |
| Adobe Systems, Inc. * | 6,953 | 546,297 |
| Akamai Technologies, Inc. * | 2,517 | 179,487 |
| Alliance Data Systems Corp. * | 1,284 | 330,232 |
| Amdocs Ltd. | 7,411 | 423,983 |
| Autodesk, Inc. * | 3,517 | 164,420 |
| Automatic Data Processing, Inc. | 12,817 | 991,011 |
| Booz Allen Hamilton Holding Corp. | 7,409 | 197,820 |
| Broadridge Financial Solutions, Inc. | 4,920 | 259,727 |
| CA, Inc. | 16,288 | 444,500 |
| CACI International, Inc., Class A * | 1,966 | 154,174 |
| Citrix Systems, Inc. * | 3,537 | 240,905 |
| Cognizant Technology Solutions Corp., Class A * | 8,543 | 537,696 |
| Computer Sciences Corp. | 9,685 | 600,373 |
| CoreLogic, Inc. * | 6,433 | 244,132 |
| DST Systems, Inc. | 1,548 | 158,546 |
| eBay, Inc. * | 22,329 | 605,339 |
| Electronic Arts, Inc. * | 3,734 | 247,004 |
| Facebook, Inc., Class A * | 3,212 | 287,249 |
| Fidelity National Information Services, Inc. | 11,430 | 789,356 |
| Fiserv, Inc. * | 6,914 | 589,557 |
| Global Payments, Inc. | 1,787 | 199,054 |
| Google, Inc., Class A * | 2,946 | 1,908,478 |
| Google, Inc., Class C * | 3,015 | 1,864,024 |
| IAC/InterActiveCorp | 3,975 | 277,455 |
| International Business Machines Corp. | 63,883 | 9,447,657 |
| Intuit, Inc. | 6,712 | 575,554 |
| Leidos Holdings, Inc. | 8,390 | 353,051 |
| MasterCard, Inc., Class A | 11,748 | 1,085,163 |
| Microsoft Corp. | 295,543 | 12,862,031 |
| Oracle Corp. | 106,056 | 3,933,617 |
| Paychex, Inc. | 9,355 | 417,794 |
| Symantec Corp. | 32,414 | 664,163 |
| Teradata Corp. * | 5,936 | 173,509 |
| The Western Union Co. | 36,025 | 664,301 |
| Total System Services, Inc. | 5,294 | 242,624 |
| Visa, Inc., Class A | 17,133 | 1,221,583 |
| Xerox Corp. | 85,518 | 869,718 |
| Yahoo! Inc. * | 12,527 | 403,871 |
| | | 47,678,718 |
| Technology Hardware & Equipment 4.7% |
| Amphenol Corp., Class A | 6,894 | 360,970 |
| Anixter International, Inc. * | 2,630 | 167,426 |
| Apple, Inc. | 82,932 | 9,351,412 |
| Arrow Electronics, Inc. * | 10,965 | 613,163 |
| Avnet, Inc. | 16,214 | 687,473 |
| Cisco Systems, Inc. | 212,991 | 5,512,207 |
| Corning, Inc. | 50,899 | 875,972 |
| EMC Corp. | 61,071 | 1,518,836 |
| FLIR Systems, Inc. | 5,672 | 162,389 |
| Harris Corp. | 7,624 | 585,676 |
| Security | Number
of Shares | Value
($) |
| Hewlett-Packard Co. | 216,346 | 6,070,669 |
| Ingram Micro, Inc., Class A | 32,929 | 891,059 |
| Jabil Circuit, Inc. | 19,316 | 373,765 |
| Juniper Networks, Inc. | 20,697 | 532,120 |
| Keysight Technologies, Inc. * | 1,816 | 58,185 |
| Lexmark International, Inc., Class A | 5,964 | 178,801 |
| Motorola Solutions, Inc. | 10,874 | 704,853 |
| NetApp, Inc. | 8,257 | 263,894 |
| QUALCOMM, Inc. | 32,273 | 1,826,006 |
| SanDisk Corp. | 4,928 | 268,872 |
| SYNNEX Corp. | 3,082 | 244,063 |
| Tech Data Corp. * | 9,972 | 650,573 |
| Vishay Intertechnology, Inc. | 14,239 | 140,681 |
| Western Digital Corp. | 6,835 | 560,196 |
| | | 32,599,261 |
| Telecommunication Services 4.2% |
| AT&T, Inc. | 544,275 | 18,069,930 |
| CenturyLink, Inc. | 42,938 | 1,161,044 |
| Frontier Communications Corp. | 96,548 | 489,498 |
| Telephone & Data Systems, Inc. | 13,067 | 371,625 |
| Verizon Communications, Inc. | 185,955 | 8,555,790 |
| Windstream Holdings, Inc. (b) | 14,051 | 101,027 |
| | | 28,748,914 |
| Transportation 1.6% |
| Alaska Air Group, Inc. | 2,895 | 216,720 |
| Avis Budget Group, Inc. * | 6,922 | 305,468 |
| C.H. Robinson Worldwide, Inc. | 9,605 | 647,665 |
| CSX Corp. | 46,960 | 1,285,765 |
| Delta Air Lines, Inc. | 3,389 | 148,370 |
| Expeditors International of Washington, Inc. | 10,347 | 506,692 |
| FedEx Corp. | 13,803 | 2,078,870 |
| Hertz Global Holdings, Inc. * | 25,404 | 468,196 |
| J.B. Hunt Transport Services, Inc. | 2,460 | 179,039 |
| JetBlue Airways Corp. * | 8,713 | 194,474 |
| Kansas City Southern | 1,768 | 163,964 |
| Norfolk Southern Corp. | 10,814 | 842,519 |
| Ryder System, Inc. | 4,001 | 327,962 |
| Union Pacific Corp. | 23,456 | 2,011,117 |
| United Parcel Service, Inc., Class B | 19,992 | 1,952,219 |
| | | 11,329,040 |
| Utilities 4.3% |
| AES Corp. | 69,103 | 829,236 |
| AGL Resources, Inc. | 4,707 | 287,080 |
| Alliant Energy Corp. | 5,412 | 306,698 |
| Ameren Corp. | 18,234 | 734,648 |
| American Electric Power Co., Inc. | 26,584 | 1,443,245 |
| American Water Works Co., Inc. | 5,439 | 282,502 |
| Atmos Energy Corp. | 5,904 | 323,480 |
| Calpine Corp. * | 20,284 | 323,327 |
| CenterPoint Energy, Inc. | 26,707 | 497,284 |
| CMS Energy Corp. | 12,327 | 404,079 |
| Consolidated Edison, Inc. | 18,658 | 1,173,775 |
| Dominion Resources, Inc. | 21,697 | 1,513,366 |
| DTE Energy Co. | 9,841 | 768,188 |
| Duke Energy Corp. | 25,771 | 1,827,422 |
| Edison International | 16,332 | 955,095 |
Schwab Fundamental U.S. Large Company Index ETF
Portfolio Holdings (Unaudited) continued
| Security | Number
of Shares | Value
($) |
| Entergy Corp. | 16,724 | 1,092,579 |
| Eversource Energy | 10,039 | 474,242 |
| Exelon Corp. | 68,005 | 2,091,834 |
| FirstEnergy Corp. | 38,111 | 1,218,028 |
| Great Plains Energy, Inc. | 7,380 | 183,910 |
| MDU Resources Group, Inc. | 11,950 | 214,025 |
| National Fuel Gas Co. | 3,020 | 162,959 |
| NextEra Energy, Inc. | 15,289 | 1,504,590 |
| NiSource, Inc. | 11,617 | 195,049 |
| NRG Energy, Inc. | 24,869 | 495,390 |
| OGE Energy Corp. | 9,173 | 257,211 |
| Pepco Holdings, Inc. | 15,743 | 361,774 |
| PG&E Corp. | 25,452 | 1,261,910 |
| Pinnacle West Capital Corp. | 6,383 | 379,980 |
| PPL Corp. | 31,534 | 977,239 |
| Public Service Enterprise Group, Inc. | 32,494 | 1,307,884 |
| SCANA Corp. | 7,918 | 418,783 |
| Sempra Energy | 8,914 | 845,493 |
| TECO Energy, Inc. | 17,185 | 362,088 |
| The Southern Co. | 46,863 | 2,034,323 |
| UGI Corp. | 8,856 | 301,812 |
| Vectren Corp. | 4,468 | 179,748 |
| WEC Energy Group, Inc. | 12,980 | 618,512 |
| Westar Energy, Inc. | 5,444 | 198,978 |
| Xcel Energy, Inc. | 27,800 | 937,694 |
| | | 29,745,460 |
| Total Common Stock |
| (Cost $736,722,324) | | 686,681,938 |
|
| Other Investment Companies 0.3% of net assets |
| Money Market Fund 0.1% |
| State Street Institutional U.S. Government Money Market Fund, Premier Class 0.00% (c) | 580,860 | 580,860 |
| Securities Lending Collateral 0.2% |
| State Street Institutional U.S. Government Money Market Fund, Premier Class 0.00% (c) | 1,512,178 | 1,512,178 |
| Total Other Investment Companies |
| (Cost $2,093,038) | | 2,093,038 |
End of Investments.
At 08/31/15, the tax basis cost of the fund's investments was $738,903,410 and the unrealized appreciation and depreciation were $11,560,225 and ($61,688,659), respectively, with a net unrealized depreciation of ($50,128,434).
| * | Non-income producing security. |
| (a) | Issuer is affiliated with the fund's adviser. |
| (b) | All or a portion of this security is on loan. Securities on loan were valued at $1,599,205. Non-cash collateral pledged to the fund for securities on loan amounted to $103,264. |
| (c) | The rate shown is the 7-day yield. |
| | |
| REIT — | Real Estate Investment Trust |
In addition to the above, the fund held the following at 08/31/15:
| | Number of
Contracts | Contract
Value
($) | Unrealized
Depreciation
($) |
| Futures Contracts | | | |
| S&P 500 Index, e-mini, Long, expires 09/18/15 | 17 | 1,673,820 | (55,525) |
Schwab Fundamental U.S. Small Company Index ETF
Portfolio Holdings as of August 31, 2015 (Unaudited)
This section shows all the securities in the fund's portfolio and their values as of the report date.
The fund files its complete schedule of portfolio holdings with the SEC for the first and third quarters of each fiscal year on Form N-Q. The fund's Form N-Q is available on the SEC's website at www.sec.gov and may be viewed and copied at the SEC's Public Reference Room in Washington, D.C. Call 1-800-SEC-0330 for information on the operation of the Public Reference Room. The fund also makes available its complete schedule of portfolio holdings on a daily basis on the fund's website at www.csimfunds.com/schwabetfs_prospectus.
| Holdings by Category | Cost
($) | Value
($) |
| 99.9% | Common Stock | 442,086,639 | 412,967,310 |
| 0.0% | Rights | 14,969 | 14,969 |
| 1.9% | Other Investment Companies | 8,019,751 | 8,019,751 |
| 101.8% | Total Investments | 450,121,359 | 421,002,030 |
| (1.8%) | Other Assets and
Liabilities, Net | | (7,490,273) |
| 100.0% | Net Assets | | 413,511,757 |
| Security | Number
of Shares | Value
($) |
| Common Stock 99.9% of net assets |
| Automobiles & Components 1.0% |
| American Axle & Manufacturing Holdings, Inc. * | 3,437 | 69,427 |
| Cooper Tire & Rubber Co. | 23,809 | 919,027 |
| Cooper-Standard Holding, Inc. * | 1,364 | 78,321 |
| Dorman Products, Inc. * | 1,048 | 52,767 |
| Drew Industries, Inc. | 5,641 | 311,722 |
| Gentex Corp. | 44,264 | 686,092 |
| Modine Manufacturing Co. * | 25,376 | 225,339 |
| Remy International, Inc. | 3,160 | 92,588 |
| Standard Motor Products, Inc. | 6,272 | 222,029 |
| Tenneco, Inc. * | 11,369 | 534,911 |
| Thor Industries, Inc. | 16,835 | 918,854 |
| Tower International, Inc. * | 7,859 | 192,153 |
| | | 4,303,230 |
| Banks 5.2% |
| Associated Banc-Corp. | 33,596 | 616,823 |
| Astoria Financial Corp. | 27,634 | 446,842 |
| BancorpSouth, Inc. | 18,202 | 432,480 |
| Bank of Hawaii Corp. | 11,702 | 726,226 |
| Bank of the Ozarks, Inc. | 1,517 | 63,411 |
| BankUnited, Inc. | 16,647 | 593,299 |
| BOK Financial Corp. | 5,373 | 340,003 |
| Capitol Federal Financial, Inc. | 42,162 | 508,052 |
| Cathay General Bancorp | 9,312 | 275,915 |
| City National Corp. | 5,900 | 517,902 |
| Commerce Bancshares, Inc. | 17,088 | 765,713 |
| Community Bank System, Inc. | 6,289 | 224,266 |
| Cullen/Frost Bankers, Inc. | 8,446 | 546,118 |
| CVB Financial Corp. | 15,553 | 252,736 |
| East West Bancorp, Inc. | 15,239 | 615,808 |
| EverBank Financial Corp. | 15,333 | 303,287 |
| Security | Number
of Shares | Value
($) |
| F.N.B. Corp. | 29,617 | 371,990 |
| First Citizens BancShares, Inc., Class A | 1,571 | 372,610 |
| First Financial Bancorp | 17,818 | 328,564 |
| First Financial Bankshares, Inc. (d) | 6,623 | 206,240 |
| First Horizon National Corp. | 46,241 | 671,882 |
| First Niagara Financial Group, Inc. | 90,402 | 836,218 |
| First Republic Bank | 12,157 | 733,189 |
| FirstMerit Corp. | 29,546 | 530,646 |
| Fulton Financial Corp. | 44,802 | 544,792 |
| Glacier Bancorp, Inc. | 12,208 | 317,530 |
| Great Western Bancorp, Inc. | 3,176 | 79,940 |
| Hancock Holding Co. | 13,132 | 368,747 |
| IBERIABANK Corp. | 3,427 | 208,704 |
| International Bancshares Corp. | 13,693 | 351,225 |
| MB Financial, Inc. | 9,387 | 309,208 |
| NBT Bancorp, Inc. | 9,701 | 251,256 |
| Northwest Bancshares, Inc. | 33,010 | 423,848 |
| Ocwen Financial Corp. *(d) | 7,716 | 57,407 |
| Old National Bancorp | 18,365 | 253,437 |
| PacWest Bancorp | 1,926 | 82,125 |
| PrivateBancorp, Inc. | 1,571 | 59,462 |
| Prosperity Bancshares, Inc. | 6,777 | 350,168 |
| Signature Bank * | 2,179 | 290,875 |
| SVB Financial Group * | 3,115 | 389,624 |
| Synovus Financial Corp. | 22,380 | 681,023 |
| TCF Financial Corp. | 44,393 | 688,979 |
| Trustmark Corp. | 17,802 | 409,980 |
| UMB Financial Corp. | 5,633 | 282,382 |
| Umpqua Holdings Corp. | 15,867 | 265,138 |
| United Bankshares, Inc. | 9,406 | 351,973 |
| Valley National Bancorp | 69,135 | 654,017 |
| Washington Federal, Inc. | 22,115 | 501,789 |
| Webster Financial Corp. | 12,882 | 455,765 |
| Westamerica Bancorp | 5,917 | 267,093 |
| Wintrust Financial Corp. | 5,289 | 269,739 |
| Zions Bancorp | 41,869 | 1,214,201 |
| | | 21,660,647 |
| Capital Goods 12.1% |
| A.O. Smith Corp. | 9,626 | 620,973 |
| AAR Corp. | 18,476 | 449,521 |
| Actuant Corp., Class A | 18,890 | 405,002 |
| Acuity Brands, Inc. | 5,066 | 987,211 |
| Aegion Corp. * | 16,090 | 296,056 |
| Air Lease Corp. | 7,279 | 234,165 |
| Aircastle Ltd. | 21,493 | 446,625 |
| Alamo Group, Inc. | 948 | 48,813 |
| Albany International Corp., Class A | 7,173 | 228,819 |
| Allegion plc | 16,059 | 957,277 |
| Allison Transmission Holdings, Inc. | 21,393 | 611,840 |
| Apogee Enterprises, Inc. | 6,854 | 357,436 |
| Applied Industrial Technologies, Inc. | 19,751 | 836,257 |
| Astec Industries, Inc. | 7,833 | 309,482 |
| AZZ, Inc. | 4,748 | 240,249 |
| B/E Aerospace, Inc. | 12,512 | 609,960 |
| Barnes Group, Inc. | 13,698 | 529,154 |
| Beacon Roofing Supply, Inc. * | 18,366 | 665,767 |
| Briggs & Stratton Corp. | 30,492 | 609,230 |
| BWX Technologies, Inc. | 27,423 | 727,258 |
| Chart Industries, Inc. * | 7,490 | 191,444 |
| CIRCOR International, Inc. | 4,750 | 214,890 |
Schwab Fundamental U.S. Small Company Index ETF
Portfolio Holdings (Unaudited) continued
| Security | Number
of Shares | Value
($) |
| CLARCOR, Inc. | 10,380 | 585,121 |
| Colfax Corp. * | 5,303 | 205,703 |
| Comfort Systems USA, Inc. | 17,622 | 488,482 |
| Crane Co. | 11,737 | 616,662 |
| Cubic Corp. | 7,347 | 309,456 |
| Curtiss-Wright Corp. | 9,421 | 619,054 |
| DigitalGlobe, Inc. * | 7,556 | 174,241 |
| Donaldson Co., Inc. | 25,472 | 797,528 |
| Dycom Industries, Inc. * | 10,068 | 715,734 |
| Encore Wire Corp. | 11,634 | 377,756 |
| EnerSys | 12,205 | 652,601 |
| EnPro Industries, Inc. | 3,784 | 179,513 |
| ESCO Technologies, Inc. | 7,192 | 259,703 |
| Esterline Technologies Corp. * | 5,526 | 451,529 |
| Franklin Electric Co., Inc. | 8,451 | 247,530 |
| GATX Corp. | 14,916 | 739,386 |
| Generac Holdings, Inc. * | 15,904 | 491,752 |
| General Cable Corp. | 63,824 | 928,639 |
| Graco, Inc. | 7,190 | 496,038 |
| Granite Construction, Inc. | 19,306 | 666,057 |
| Griffon Corp. | 17,237 | 286,824 |
| H&E Equipment Services, Inc. | 13,125 | 271,819 |
| Harsco Corp. | 61,714 | 713,414 |
| HD Supply Holdings, Inc. * | 2,844 | 93,852 |
| HEICO Corp. | 5,619 | 286,007 |
| Hexcel Corp. | 12,813 | 618,355 |
| Hillenbrand, Inc. | 14,403 | 388,305 |
| Huntington Ingalls Industries, Inc. | 7,285 | 820,145 |
| Hyster-Yale Materials Handling, Inc. | 3,559 | 216,245 |
| IDEX Corp. | 11,565 | 830,714 |
| ITT Corp. | 12,576 | 470,468 |
| Kaman Corp. | 9,035 | 350,829 |
| KLX, Inc. * | 3,692 | 144,357 |
| L.B. Foster Co., Class A | 1,264 | 22,664 |
| Lennox International, Inc. | 10,489 | 1,238,122 |
| Lindsay Corp. (d) | 2,647 | 201,781 |
| Masco Corp. | 52,046 | 1,365,167 |
| Masonite International Corp. * | 6,583 | 434,807 |
| MasTec, Inc. * | 24,975 | 413,586 |
| Moog, Inc., Class A * | 9,667 | 609,988 |
| MRC Global, Inc. * | 70,497 | 915,756 |
| MSC Industrial Direct Co., Inc., Class A | 11,633 | 787,438 |
| Mueller Industries, Inc. | 28,370 | 902,450 |
| MYR Group, Inc. * | 7,911 | 226,967 |
| Navistar International Corp. * | 13,220 | 235,845 |
| Nordson Corp. | 9,094 | 604,933 |
| Orbital ATK, Inc. | 15,527 | 1,175,549 |
| Primoris Services Corp. | 3,060 | 56,212 |
| Quanex Building Products Corp. | 15,539 | 278,925 |
| Raven Industries, Inc. | 11,170 | 202,400 |
| RBC Bearings, Inc. * | 3,202 | 198,076 |
| Regal Beloit Corp. | 13,126 | 875,110 |
| Rexnord Corp. * | 11,424 | 229,051 |
| Rush Enterprises, Inc., Class A * | 11,168 | 285,007 |
| Simpson Manufacturing Co., Inc. | 10,105 | 352,766 |
| Spirit AeroSystems Holdings, Inc., Class A * | 20,279 | 1,036,460 |
| Standex International Corp. | 2,647 | 211,813 |
| TAL International Group, Inc. * | 10,304 | 188,872 |
| Teledyne Technologies, Inc. * | 6,576 | 643,856 |
| Tennant Co. | 4,102 | 235,127 |
| Terex Corp. | 37,971 | 885,863 |
| Security | Number
of Shares | Value
($) |
| The Greenbrier Cos., Inc. (d) | 4,709 | 196,365 |
| The Manitowoc Co., Inc. | 29,668 | 506,729 |
| The Middleby Corp. * | 3,790 | 411,404 |
| The Toro Co. | 13,208 | 941,730 |
| Titan International, Inc. | 24,289 | 222,973 |
| Titan Machinery, Inc. *(d) | 3,160 | 36,751 |
| TriMas Corp. * | 8,433 | 153,818 |
| Triumph Group, Inc. | 14,088 | 695,806 |
| Tutor Perini Corp. * | 29,200 | 516,840 |
| Universal Forest Products, Inc. | 12,884 | 773,813 |
| Valmont Industries, Inc. | 7,021 | 746,262 |
| Veritiv Corp. * | 3,592 | 129,061 |
| WABCO Holdings, Inc. * | 8,471 | 976,876 |
| Wabtec Corp. | 8,727 | 835,698 |
| Watsco, Inc. | 7,217 | 883,794 |
| Watts Water Technologies, Inc., Class A | 8,805 | 482,954 |
| Woodward, Inc. | 14,065 | 641,364 |
| | | 50,038,077 |
| Commercial & Professional Services 5.2% |
| ABM Industries, Inc. | 32,758 | 1,048,584 |
| ACCO Brands Corp. * | 36,182 | 274,983 |
| Brady Corp., Class A | 25,268 | 554,885 |
| CEB, Inc. | 4,094 | 293,212 |
| Civeo Corp. | 44,664 | 87,095 |
| Clean Harbors, Inc. * | 10,778 | 529,415 |
| Copart, Inc. * | 30,275 | 1,060,231 |
| Covanta Holding Corp. | 32,925 | 651,915 |
| Deluxe Corp. | 11,832 | 686,374 |
| Essendant, Inc. | 25,287 | 872,402 |
| FTI Consulting, Inc. * | 22,208 | 885,211 |
| G&K Services, Inc., Class A | 6,502 | 439,600 |
| Healthcare Services Group, Inc. | 14,809 | 495,213 |
| Herman Miller, Inc. | 14,694 | 398,354 |
| HNI Corp. | 13,014 | 608,274 |
| Huron Consulting Group, Inc. * | 3,748 | 271,318 |
| ICF International, Inc. * | 7,173 | 245,388 |
| IHS, Inc., Class A * | 4,070 | 472,202 |
| Insperity, Inc. | 8,572 | 380,511 |
| Interface, Inc. | 16,183 | 392,276 |
| KAR Auction Services, Inc. | 20,529 | 760,394 |
| Kelly Services, Inc., Class A | 47,078 | 680,277 |
| Kforce, Inc. | 13,859 | 371,283 |
| Knoll, Inc. | 14,225 | 340,262 |
| Korn/Ferry International | 9,095 | 309,867 |
| Matthews International Corp., Class A | 8,832 | 448,489 |
| McGrath RentCorp | 7,801 | 200,096 |
| Mobile Mini, Inc. | 5,385 | 183,144 |
| MSA Safety, Inc. | 7,138 | 324,636 |
| Navigant Consulting, Inc. * | 20,214 | 319,179 |
| On Assignment, Inc. * | 6,353 | 228,581 |
| Quad/Graphics, Inc. | 31,122 | 449,402 |
| Resources Connection, Inc. | 20,945 | 328,627 |
| Rollins, Inc. | 13,159 | 367,399 |
| Steelcase, Inc., Class A | 43,884 | 773,675 |
| Stericycle, Inc. * | 6,645 | 937,875 |
| Team, Inc. * | 5,805 | 242,881 |
| Tetra Tech, Inc. | 21,961 | 570,547 |
| The Brink's Co. | 26,514 | 759,891 |
| TrueBlue, Inc. * | 15,147 | 363,528 |
| UniFirst Corp. | 3,626 | 393,095 |
Schwab Fundamental U.S. Small Company Index ETF
Portfolio Holdings (Unaudited) continued
| Security | Number
of Shares | Value
($) |
| Viad Corp. | 12,555 | 343,254 |
| Waste Connections, Inc. | 15,322 | 728,714 |
| West Corp. | 10,812 | 263,164 |
| | | 21,335,703 |
| Consumer Durables & Apparel 3.6% |
| Arctic Cat, Inc. | 6,352 | 167,883 |
| Brunswick Corp. | 6,617 | 328,931 |
| Carter's, Inc. | 8,844 | 869,454 |
| Columbia Sportswear Co. | 6,744 | 413,879 |
| Crocs, Inc. * | 27,398 | 403,573 |
| D.R. Horton, Inc. | 45,539 | 1,383,019 |
| Deckers Outdoor Corp. * | 9,036 | 581,828 |
| G-III Apparel Group Ltd. * | 6,454 | 447,456 |
| Hanesbrands, Inc. | 31,077 | 935,728 |
| Harman International Industries, Inc. | 10,155 | 992,550 |
| Helen of Troy Ltd. * | 5,358 | 456,180 |
| Iconix Brand Group, Inc. * | 8,458 | 117,482 |
| La-Z-Boy, Inc. | 16,840 | 464,952 |
| Lennar Corp., Class A | 13,221 | 672,949 |
| lululemon athletica, Inc. * | 8,530 | 546,005 |
| M.D.C Holdings, Inc. | 13,566 | 386,495 |
| Meritage Homes Corp. * | 5,957 | 251,028 |
| Michael Kors Holdings Ltd. * | 11,995 | 521,303 |
| Oxford Industries, Inc. | 3,209 | 270,069 |
| PulteGroup, Inc. | 36,185 | 748,668 |
| Quiksilver, Inc. *(d) | 147,460 | 63,423 |
| Skechers U.S.A., Inc., Class A * | 5,650 | 795,181 |
| Smith & Wesson Holding Corp. * | 4,008 | 72,465 |
| Steven Madden Ltd. * | 10,755 | 439,449 |
| Sturm Ruger & Co., Inc. | 5,123 | 322,185 |
| Tempur Sealy International, Inc. * | 12,578 | 918,446 |
| Toll Brothers, Inc. * | 11,567 | 427,632 |
| Under Armour, Inc., Class A * | 6,109 | 583,593 |
| Wolverine World Wide, Inc. | 17,380 | 468,391 |
| | | 15,050,197 |
| Consumer Services 4.6% |
| Ascent Capital Group, Inc., Class A * | 1,164 | 32,685 |
| Bloomin' Brands, Inc. | 5,836 | 120,805 |
| Bob Evans Farms, Inc. | 15,974 | 721,865 |
| Boyd Gaming Corp. * | 26,919 | 433,396 |
| Buffalo Wild Wings, Inc. * | 1,973 | 374,239 |
| Caesars Entertainment Corp. *(d) | 8,148 | 77,813 |
| Capella Education Co. | 5,108 | 249,015 |
| Career Education Corp. * | 134,882 | 500,412 |
| Choice Hotels International, Inc. | 8,411 | 428,961 |
| Churchill Downs, Inc. | 1,994 | 264,943 |
| Cracker Barrel Old Country Store, Inc. (d) | 3,731 | 537,936 |
| DineEquity, Inc. | 3,732 | 356,406 |
| Domino's Pizza, Inc. | 5,622 | 595,595 |
| Dunkin' Brands Group, Inc. | 9,661 | 484,596 |
| Grand Canyon Education, Inc. * | 1,617 | 59,764 |
| Hilton Worldwide Holdings, Inc. | 16,867 | 418,808 |
| Houghton Mifflin Harcourt Co. * | 14,006 | 316,255 |
| Hyatt Hotels Corp., Class A * | 6,578 | 336,991 |
| International Speedway Corp., Class A | 9,626 | 308,898 |
| Jack in the Box, Inc. | 9,102 | 711,594 |
| K12, Inc. * | 3,808 | 50,342 |
| Security | Number
of Shares | Value
($) |
| La Quinta Holdings, Inc. * | 3,446 | 64,957 |
| Marriott Vacations Worldwide Corp. | 5,466 | 388,141 |
| Norwegian Cruise Line Holdings Ltd. * | 7,956 | 458,266 |
| Panera Bread Co., Class A * | 4,782 | 852,631 |
| Papa John's International, Inc. | 6,446 | 433,494 |
| Penn National Gaming, Inc. * | 23,965 | 435,204 |
| Pinnacle Entertainment, Inc. * | 10,598 | 400,286 |
| Red Robin Gourmet Burgers, Inc. * | 4,754 | 374,568 |
| Regis Corp. * | 36,847 | 399,421 |
| Ruby Tuesday, Inc. * | 58,888 | 387,483 |
| SeaWorld Entertainment, Inc. | 43,619 | 776,418 |
| Service Corp. International | 47,928 | 1,421,065 |
| Six Flags Entertainment Corp. | 9,966 | 448,171 |
| Sotheby's | 9,022 | 317,665 |
| Steiner Leisure Ltd. * | 5,973 | 380,301 |
| Strayer Education, Inc. * | 10,904 | 569,625 |
| Texas Roadhouse, Inc. | 16,072 | 578,431 |
| The Cheesecake Factory, Inc. | 17,402 | 944,407 |
| The Wendy's Co. | 91,430 | 832,927 |
| Vail Resorts, Inc. | 5,377 | 580,232 |
| Weight Watchers International, Inc. *(d) | 67,901 | 417,591 |
| | | 18,842,603 |
| Diversified Financials 3.6% |
| Affiliated Managers Group, Inc. * | 3,294 | 614,133 |
| BGC Partners, Inc., Class A | 29,681 | 260,302 |
| Cash America International, Inc. | 19,142 | 528,319 |
| CBOE Holdings, Inc. | 10,308 | 652,084 |
| Credit Acceptance Corp. * | 316 | 64,404 |
| E*TRADE Financial Corp. * | 43,907 | 1,154,315 |
| Eaton Vance Corp. | 24,446 | 847,543 |
| Evercore Partners, Inc., Class A | 948 | 49,656 |
| Ezcorp, Inc., Class A * | 38,411 | 242,758 |
| Federated Investors, Inc., Class B | 31,631 | 980,561 |
| First Cash Financial Services, Inc. * | 6,322 | 260,909 |
| Greenhill & Co., Inc. | 10,509 | 368,971 |
| Intercontinental Exchange, Inc. | 4,184 | 955,667 |
| Janus Capital Group, Inc. | 28,285 | 420,881 |
| Lazard Ltd., Class A | 9,976 | 496,106 |
| LPL Financial Holdings, Inc. (d) | 18,603 | 748,213 |
| MarketAxess Holdings, Inc. | 604 | 54,614 |
| MSCI, Inc. | 9,692 | 586,560 |
| Nelnet, Inc., Class A | 5,917 | 222,775 |
| PRA Group, Inc. * | 4,721 | 251,582 |
| Raymond James Financial, Inc. | 14,651 | 776,357 |
| Santander Consumer USA Holdings, Inc. * | 29,942 | 672,497 |
| SEI Investments Co. | 21,917 | 1,108,562 |
| Springleaf Holdings, Inc. * | 1,580 | 70,721 |
| Stifel Financial Corp. * | 5,917 | 275,732 |
| Synchrony Financial * | 7,128 | 234,868 |
| TD Ameritrade Holding Corp. | 28,626 | 957,826 |
| Waddell & Reed Financial, Inc., Class A | 17,824 | 696,384 |
| Walter Investment Management Corp. *(d) | 6,020 | 98,969 |
| World Acceptance Corp. *(d) | 4,985 | 187,336 |
| | | 14,839,605 |
Schwab Fundamental U.S. Small Company Index ETF
Portfolio Holdings (Unaudited) continued
| Security | Number
of Shares | Value
($) |
| Energy 5.1% |
| Alon USA Energy, Inc. | 17,889 | 331,662 |
| Atwood Oceanics, Inc. | 16,890 | 322,768 |
| Basic Energy Services, Inc. * | 30,093 | 156,785 |
| Bill Barrett Corp. *(d) | 45,075 | 246,560 |
| Bristow Group, Inc. | 9,596 | 355,628 |
| Cabot Oil & Gas Corp. | 24,588 | 581,998 |
| CARBO Ceramics, Inc. (d) | 8,465 | 232,110 |
| Cloud Peak Energy, Inc. * | 69,664 | 332,994 |
| Concho Resources, Inc. * | 7,440 | 804,710 |
| Contango Oil & Gas Co. * | 3,592 | 33,442 |
| Continental Resources, Inc. * | 4,772 | 153,181 |
| CVR Energy, Inc. | 7,286 | 292,970 |
| Dril-Quip, Inc. * | 5,433 | 374,551 |
| Energy XXI Ltd. (d) | 134,271 | 255,115 |
| Exterran Holdings, Inc. | 23,172 | 517,199 |
| Forum Energy Technologies, Inc. * | 12,419 | 195,227 |
| Frontline Ltd. *(d) | 346,090 | 920,599 |
| Golar LNG Ltd. | 6,554 | 255,213 |
| Green Plains, Inc. | 12,130 | 257,884 |
| Gulfmark Offshore, Inc., Class A (d) | 14,178 | 128,027 |
| Helix Energy Solutions Group, Inc. * | 31,963 | 222,143 |
| Hornbeck Offshore Services, Inc. *(d) | 10,767 | 212,648 |
| Key Energy Services, Inc. * | 260,066 | 184,959 |
| Matrix Service Co. * | 12,352 | 247,040 |
| McDermott International, Inc. * | 229,368 | 1,165,189 |
| Newpark Resources, Inc. * | 34,222 | 250,847 |
| Nordic American Tankers Ltd. (d) | 23,620 | 321,941 |
| North Atlantic Drilling Ltd. (d) | 201,856 | 175,413 |
| Oasis Petroleum, Inc. *(d) | 4,324 | 48,256 |
| Oil States International, Inc. * | 21,800 | 618,466 |
| Parker Drilling Co. * | 99,021 | 333,701 |
| PBF Energy, Inc., Class A | 16,418 | 491,227 |
| PDC Energy, Inc. * | 5,360 | 301,125 |
| Pioneer Energy Services Corp. * | 42,519 | 140,738 |
| Range Resources Corp. | 15,253 | 589,071 |
| Renewable Energy Group, Inc. * | 6,552 | 55,168 |
| Rowan Cos. plc, Class A | 44,700 | 803,259 |
| RPC, Inc. | 18,854 | 219,083 |
| SandRidge Energy, Inc. *(d) | 311,545 | 166,085 |
| SEACOR Holdings, Inc. * | 17,129 | 1,104,992 |
| SemGroup Corp., Class A | 7,147 | 393,085 |
| Seventy Seven Energy, Inc. * | 25,292 | 72,588 |
| Ship Finance International Ltd. | 21,963 | 368,978 |
| SM Energy Co. | 17,409 | 638,910 |
| Stone Energy Corp. * | 30,642 | 173,740 |
| Targa Resources Corp. | 6,707 | 443,064 |
| Teekay Corp. | 13,833 | 508,501 |
| Tesco Corp. | 4,756 | 40,378 |
| TETRA Technologies, Inc. * | 53,590 | 412,107 |
| Tidewater, Inc. (d) | 32,222 | 577,740 |
| Unit Corp. * | 22,485 | 341,772 |
| US Silica Holdings, Inc. (d) | 1,680 | 33,768 |
| W&T Offshore, Inc. (d) | 47,603 | 169,943 |
| Western Refining, Inc. | 28,942 | 1,245,085 |
| WPX Energy, Inc. * | 148,458 | 1,085,228 |
| | | 20,904,861 |
| Security | Number
of Shares | Value
($) |
| Food & Staples Retailing 1.0% |
| Ingles Markets, Inc., Class A | 11,055 | 549,434 |
| PriceSmart, Inc. | 3,832 | 325,758 |
| Rite Aid Corp. * | 100,972 | 833,019 |
| SpartanNash Co. | 22,771 | 644,419 |
| Sprouts Farmers Market, Inc. * | 2,212 | 45,059 |
| SUPERVALU, Inc. * | 127,284 | 1,048,820 |
| The Andersons, Inc. | 12,802 | 452,935 |
| The Fresh Market, Inc. * | 9,225 | 198,614 |
| | | 4,098,058 |
| Food, Beverage & Tobacco 2.6% |
| B&G Foods, Inc. | 10,461 | 317,910 |
| Cal-Maine Foods, Inc. (d) | 7,347 | 390,273 |
| Darling Ingredients, Inc. * | 32,918 | 422,667 |
| Dean Foods Co. | 26,569 | 437,326 |
| Flowers Foods, Inc. | 43,229 | 1,003,345 |
| Fresh Del Monte Produce, Inc. | 24,156 | 956,336 |
| J&J Snack Foods Corp. | 3,135 | 357,265 |
| Keurig Green Mountain, Inc. | 7,296 | 412,954 |
| Lancaster Colony Corp. | 5,603 | 531,332 |
| Pilgrim's Pride Corp. (d) | 9,529 | 199,871 |
| Pinnacle Foods, Inc. | 8,649 | 387,821 |
| Post Holdings, Inc. * | 10,652 | 695,362 |
| Sanderson Farms, Inc. (d) | 7,705 | 531,953 |
| Seaboard Corp. * | 137 | 454,873 |
| Snyder's-Lance, Inc. | 12,961 | 437,693 |
| The Boston Beer Co., Inc., Class A * | 200 | 41,014 |
| The Hain Celestial Group, Inc. * | 6,925 | 421,455 |
| The WhiteWave Foods Co. * | 13,465 | 621,275 |
| TreeHouse Foods, Inc. * | 7,459 | 592,021 |
| Universal Corp. | 21,556 | 1,060,771 |
| Vector Group Ltd. | 15,883 | 378,492 |
| | | 10,652,009 |
| Health Care Equipment & Services 5.0% |
| Air Methods Corp. * | 6,178 | 231,366 |
| Alere, Inc. * | 15,630 | 812,291 |
| Align Technology, Inc. * | 4,225 | 239,135 |
| Allscripts Healthcare Solutions, Inc. * | 48,495 | 667,776 |
| Amedisys, Inc. * | 16,608 | 641,733 |
| Amsurg Corp. * | 6,855 | 537,569 |
| Analogic Corp. | 3,138 | 252,860 |
| Brookdale Senior Living, Inc. * | 17,332 | 475,243 |
| Chemed Corp. | 6,381 | 870,049 |
| CONMED Corp. | 6,153 | 326,478 |
| Cyberonics, Inc. * | 832 | 54,363 |
| Edwards Lifesciences Corp. * | 6,538 | 921,074 |
| Envision Healthcare Holdings, Inc. * | 11,075 | 453,743 |
| Greatbatch, Inc. * | 4,683 | 266,088 |
| Haemonetics Corp. * | 9,426 | 340,373 |
| Halyard Health, Inc. * | 5,444 | 171,159 |
| Hanger, Inc. * | 11,897 | 213,313 |
| HealthSouth Corp. | 12,576 | 536,995 |
| Hill-Rom Holdings, Inc. | 15,429 | 815,268 |
| IDEXX Laboratories, Inc. * | 13,405 | 958,055 |
| IMS Health Holdings, Inc. * | 2,729 | 81,515 |
| Integra LifeSciences Holdings Corp. * | 3,873 | 232,303 |
| Invacare Corp. | 27,348 | 481,051 |
| Kindred Healthcare, Inc. | 44,832 | 900,227 |
Schwab Fundamental U.S. Small Company Index ETF
Portfolio Holdings (Unaudited) continued
| Security | Number
of Shares | Value
($) |
| Masimo Corp. * | 11,507 | 467,529 |
| MedAssets, Inc. * | 2,212 | 46,717 |
| MEDNAX, Inc. * | 12,959 | 1,043,848 |
| Meridian Bioscience, Inc. | 4,156 | 79,504 |
| Molina Healthcare, Inc. * | 10,666 | 795,577 |
| Orthofix International N.V. * | 7,388 | 276,902 |
| PharMerica Corp. * | 18,658 | 610,490 |
| Quality Systems, Inc. | 18,720 | 254,405 |
| Select Medical Holdings Corp. | 36,618 | 472,372 |
| Sirona Dental Systems, Inc. * | 5,402 | 515,243 |
| STERIS Corp. | 12,182 | 780,257 |
| Team Health Holdings, Inc. * | 3,780 | 222,037 |
| Teleflex, Inc. | 7,067 | 924,364 |
| The Cooper Cos., Inc. | 4,095 | 665,110 |
| Thoratec Corp. * | 9,178 | 576,562 |
| Triple-S Management Corp., Class B * | 19,289 | 405,841 |
| VCA, Inc. * | 12,799 | 708,809 |
| West Pharmaceutical Services, Inc. | 9,630 | 537,836 |
| | | 20,863,430 |
| Household & Personal Products 0.4% |
| Elizabeth Arden, Inc. *(d) | 16,954 | 187,003 |
| Nu Skin Enterprises, Inc., Class A | 19,954 | 911,499 |
| Spectrum Brands Holdings, Inc. | 3,789 | 372,383 |
| WD-40 Co. | 3,106 | 260,096 |
| | | 1,730,981 |
| Insurance 4.0% |
| Allied World Assurance Co. Holdings AG | 24,141 | 964,192 |
| Ambac Financial Group, Inc. * | 6,552 | 106,470 |
| American Equity Investment Life Holding Co. | 17,219 | 417,733 |
| AmTrust Financial Services, Inc. | 804 | 46,753 |
| Argo Group International Holdings Ltd. | 8,222 | 460,268 |
| Aspen Insurance Holdings Ltd. | 21,614 | 992,299 |
| Assured Guaranty Ltd. | 32,565 | 822,592 |
| Brown & Brown, Inc. | 19,950 | 639,597 |
| CNA Financial Corp. | 732 | 26,337 |
| CNO Financial Group, Inc. | 60,425 | 1,081,003 |
| Employers Holdings, Inc. | 15,304 | 337,453 |
| Endurance Specialty Holdings Ltd. | 22,826 | 1,455,157 |
| Horace Mann Educators Corp. | 8,759 | 290,974 |
| Infinity Property & Casualty Corp. | 5,220 | 403,402 |
| Kemper Corp. | 24,475 | 866,904 |
| Maiden Holdings Ltd. | 3,868 | 55,428 |
| Markel Corp. * | 1,060 | 873,175 |
| MBIA, Inc. * | 16,396 | 115,100 |
| Mercury General Corp. | 10,327 | 525,231 |
| Primerica, Inc. | 22,119 | 939,836 |
| ProAssurance Corp. | 13,871 | 668,998 |
| RLI Corp. | 12,052 | 628,030 |
| Safety Insurance Group, Inc. | 5,286 | 277,938 |
| Selective Insurance Group, Inc. | 12,846 | 389,491 |
| StanCorp Financial Group, Inc. | 11,962 | 1,360,199 |
| Stewart Information Services Corp. | 8,447 | 327,237 |
| Symetra Financial Corp. | 13,104 | 412,383 |
| The Hanover Insurance Group, Inc. | 12,089 | 953,822 |
| | | 16,438,002 |
| Security | Number
of Shares | Value
($) |
| Materials 5.7% |
| A. Schulman, Inc. | 13,184 | 452,607 |
| Axalta Coating Systems Ltd. * | 1,796 | 52,425 |
| Axiall Corp. | 16,173 | 408,530 |
| Berry Plastics Group, Inc. * | 14,672 | 434,291 |
| Boise Cascade Co. * | 8,474 | 274,981 |
| Cabot Corp. | 22,394 | 758,485 |
| Calgon Carbon Corp. | 12,509 | 203,396 |
| Carpenter Technology Corp. | 14,222 | 554,658 |
| Century Aluminum Co. * | 14,080 | 78,848 |
| Chemtura Corp. * | 29,017 | 789,262 |
| Clearwater Paper Corp. * | 6,290 | 352,617 |
| Coeur Mining, Inc. * | 79,508 | 267,147 |
| Compass Minerals International, Inc. | 7,160 | 579,960 |
| Crown Holdings, Inc. * | 22,272 | 1,104,023 |
| Eagle Materials, Inc. | 3,492 | 285,750 |
| Ferro Corp. * | 23,008 | 282,998 |
| Globe Specialty Metals, Inc. | 10,992 | 151,030 |
| Greif, Inc., Class A | 17,957 | 525,781 |
| H.B. Fuller Co. | 14,410 | 522,218 |
| Hecla Mining Co. | 97,074 | 199,973 |
| Innophos Holdings, Inc. | 8,386 | 403,115 |
| Innospec, Inc. | 7,153 | 351,212 |
| Intrepid Potash, Inc. * | 16,846 | 133,252 |
| Kaiser Aluminum Corp. | 6,855 | 572,941 |
| KapStone Paper & Packaging Corp. | 10,907 | 237,664 |
| Koppers Holdings, Inc. | 12,436 | 258,669 |
| Kraton Performance Polymers, Inc. * | 18,122 | 382,556 |
| Louisiana-Pacific Corp. * | 19,678 | 323,506 |
| LSB Industries, Inc. * | 6,296 | 150,537 |
| Martin Marietta Materials, Inc. | 7,123 | 1,195,239 |
| Materion Corp. | 9,226 | 285,637 |
| Minerals Technologies, Inc. | 7,846 | 422,036 |
| Myers Industries, Inc. | 11,867 | 169,223 |
| Neenah Paper, Inc. | 1,201 | 69,322 |
| NewMarket Corp. | 1,762 | 675,269 |
| Olin Corp. | 28,741 | 573,670 |
| OM Group, Inc. | 14,782 | 495,197 |
| P.H. Glatfelter Co. | 20,562 | 371,350 |
| PolyOne Corp. | 14,986 | 486,596 |
| Quaker Chemical Corp. | 2,633 | 208,955 |
| Royal Gold, Inc. | 832 | 40,036 |
| Schnitzer Steel Industries, Inc., Class A | 48,096 | 832,542 |
| Schweitzer-Mauduit International, Inc. | 8,728 | 308,360 |
| Sealed Air Corp. | 34,149 | 1,756,966 |
| Sensient Technologies Corp. | 11,609 | 756,326 |
| Silgan Holdings, Inc. | 14,322 | 749,900 |
| Stepan Co. | 9,987 | 449,715 |
| Stillwater Mining Co. * | 19,917 | 190,207 |
| SunCoke Energy, Inc. | 19,537 | 224,285 |
| The Scotts Miracle-Gro Co., Class A | 11,458 | 712,573 |
| Tronox Ltd., Class A | 19,209 | 154,633 |
| W.R. Grace & Co. * | 5,697 | 563,661 |
| Westlake Chemical Corp. | 6,576 | 363,193 |
| Worthington Industries, Inc. | 18,542 | 474,490 |
| | | 23,621,813 |
| Media 1.9% |
| AMC Networks, Inc., Class A * | 5,147 | 372,540 |
| Cinemark Holdings, Inc. | 26,131 | 928,957 |
Schwab Fundamental U.S. Small Company Index ETF
Portfolio Holdings (Unaudited) continued
| Security | Number
of Shares | Value
($) |
| DreamWorks Animation SKG, Inc., Class A *(d) | 20,630 | 411,362 |
| John Wiley & Sons, Inc., Class A | 10,616 | 547,361 |
| Liberty Broadband Corp., Class A * | 416 | 22,660 |
| Liberty Broadband Corp., Class C * | 632 | 33,831 |
| Lions Gate Entertainment Corp. | 9,595 | 352,041 |
| Live Nation Entertainment, Inc. * | 23,561 | 580,072 |
| Loral Space & Communications, Inc. * | 6,735 | 365,104 |
| Meredith Corp. | 11,544 | 545,108 |
| Morningstar, Inc. | 3,030 | 241,733 |
| National CineMedia, Inc. | 22,786 | 299,636 |
| Regal Entertainment Group, Class A | 30,116 | 572,806 |
| Scholastic Corp. | 17,078 | 737,940 |
| Sinclair Broadcast Group, Inc., Class A | 12,498 | 334,696 |
| Sirius XM Holdings, Inc. * | 179,276 | 683,938 |
| Starz, Class A * | 2,372 | 89,211 |
| The Madison Square Garden Co., Class A * | 4,865 | 342,691 |
| The New York Times Co., Class A | 38,929 | 473,377 |
| Tribune Media Co., Class A | 1,896 | 75,726 |
| | | 8,010,790 |
| Pharmaceuticals, Biotechnology & Life Sciences 2.3% |
| Alexion Pharmaceuticals, Inc. * | 2,591 | 446,144 |
| Bio-Rad Laboratories, Inc., Class A * | 4,688 | 653,179 |
| Bio-Techne Corp. | 4,756 | 449,347 |
| Bruker Corp. * | 14,728 | 270,701 |
| Charles River Laboratories International, Inc. * | 12,913 | 889,577 |
| Endo International plc * | 15,527 | 1,195,579 |
| Illumina, Inc. * | 2,870 | 567,141 |
| Impax Laboratories, Inc. * | 10,547 | 432,005 |
| Jazz Pharmaceuticals plc * | 416 | 70,229 |
| Mallinckrodt plc * | 8,471 | 730,539 |
| Myriad Genetics, Inc. *(d) | 11,235 | 421,987 |
| PAREXEL International Corp. * | 5,943 | 390,574 |
| PDL BioPharma, Inc. | 64,513 | 364,498 |
| PerkinElmer, Inc. | 18,609 | 905,886 |
| Prestige Brands Holdings, Inc. * | 1,430 | 66,524 |
| QIAGEN N.V. * | 27,461 | 720,027 |
| Quintiles Transnational Holdings, Inc. * | 5,846 | 435,585 |
| Regeneron Pharmaceuticals, Inc. * | 200 | 102,700 |
| United Therapeutics Corp. * | 2,574 | 387,696 |
| | | 9,499,918 |
| Real Estate 9.5% |
| Alexandria Real Estate Equities, Inc. | 7,969 | 685,254 |
| Altisource Portfolio Solutions S.A. *(d) | 1,796 | 48,330 |
| American Campus Communities, Inc. | 11,569 | 396,238 |
| Anworth Mortgage Asset Corp. | 68,776 | 345,943 |
| Apartment Investment & Management Co., Class A | 27,608 | 994,716 |
| BioMed Realty Trust, Inc. | 28,025 | 518,463 |
| Brandywine Realty Trust | 38,933 | 471,868 |
| Brixmor Property Group, Inc. | 4,258 | 97,168 |
| Camden Property Trust | 11,520 | 829,786 |
| Capstead Mortgage Corp. | 33,649 | 350,623 |
| CBL & Associates Properties, Inc. | 38,334 | 570,410 |
| CBRE Group, Inc., Class A * | 25,837 | 827,301 |
| Chambers Street Properties | 7,867 | 53,260 |
| Security | Number
of Shares | Value
($) |
| Chimera Investment Corp. | 33,705 | 472,207 |
| Columbia Property Trust, Inc. | 32,199 | 688,415 |
| Corporate Office Properties Trust | 21,486 | 451,851 |
| CubeSmart | 2,128 | 53,817 |
| DCT Industrial Trust, Inc. | 10,948 | 351,540 |
| DDR Corp. | 33,129 | 506,542 |
| DiamondRock Hospitality Co. | 31,120 | 365,971 |
| Douglas Emmett, Inc. | 19,023 | 525,605 |
| Duke Realty Corp. | 51,432 | 928,862 |
| DuPont Fabros Technology, Inc. | 1,264 | 33,787 |
| EastGroup Properties, Inc. | 4,626 | 249,804 |
| EPR Properties | 8,719 | 443,710 |
| Equinix, Inc. | 3,276 | 883,767 |
| Equity Commonwealth * | 31,122 | 799,524 |
| Equity LifeStyle Properties, Inc. | 6,545 | 364,949 |
| Equity One, Inc. | 7,852 | 184,601 |
| Essex Property Trust, Inc. | 3,223 | 691,720 |
| Extra Space Storage, Inc. | 6,232 | 457,927 |
| Federal Realty Investment Trust | 6,713 | 866,514 |
| Forest City Enterprises, Inc., Class A * | 1,996 | 42,974 |
| Franklin Street Properties Corp. | 19,791 | 206,024 |
| Government Properties Income Trust | 11,350 | 179,784 |
| Hatteras Financial Corp. | 26,830 | 435,451 |
| Healthcare Realty Trust, Inc. | 15,804 | 361,912 |
| Healthcare Trust of America, Inc., Class A | 10,360 | 248,744 |
| Hersha Hospitality Trust | 8,310 | 203,096 |
| Highwoods Properties, Inc. | 14,619 | 554,645 |
| Home Properties, Inc. | 8,755 | 649,709 |
| Invesco Mortgage Capital, Inc. | 30,699 | 417,506 |
| Investors Real Estate Trust | 26,885 | 179,861 |
| Jones Lang LaSalle, Inc. | 6,778 | 1,009,041 |
| Kilroy Realty Corp. | 6,877 | 446,042 |
| Lamar Advertising Co., Class A | 9,890 | 527,533 |
| LaSalle Hotel Properties | 10,887 | 342,505 |
| Lexington Realty Trust | 40,444 | 326,383 |
| Liberty Property Trust | 29,088 | 894,165 |
| Mack-Cali Realty Corp. | 46,643 | 873,623 |
| Medical Properties Trust, Inc. | 16,539 | 193,010 |
| MFA Financial, Inc. | 89,359 | 635,342 |
| Mid-America Apartment Communities, Inc. | 7,100 | 557,989 |
| National Retail Properties, Inc. | 12,122 | 421,240 |
| New Residential Investment Corp. | 6,652 | 94,192 |
| NorthStar Realty Finance Corp. | 18,349 | 257,803 |
| Omega Healthcare Investors, Inc. | 11,628 | 392,794 |
| Outfront Media, Inc. | 6,868 | 155,423 |
| Pennsylvania Real Estate Investment Trust | 13,230 | 262,483 |
| PennyMac Mortgage Investment Trust | 15,915 | 239,839 |
| Piedmont Office Realty Trust, Inc., Class A | 52,979 | 898,524 |
| Post Properties, Inc. | 5,479 | 303,317 |
| Potlatch Corp. | 9,715 | 320,789 |
| PS Business Parks, Inc. | 2,841 | 207,279 |
| Rayonier, Inc. | 44,032 | 1,012,736 |
| Realogy Holdings Corp. * | 5,225 | 210,568 |
| Realty Income Corp. | 13,763 | 615,068 |
| Redwood Trust, Inc. | 21,486 | 313,481 |
| Regency Centers Corp. | 12,493 | 740,960 |
| Retail Properties of America, Inc., Class A | 41,523 | 566,789 |
Schwab Fundamental U.S. Small Company Index ETF
Portfolio Holdings (Unaudited) continued
| Security | Number
of Shares | Value
($) |
| RLJ Lodging Trust | 13,378 | 368,430 |
| Ryman Hospitality Properties, Inc. | 5,828 | 298,568 |
| Sabra Health Care REIT, Inc. | 12,132 | 290,804 |
| Senior Housing Properties Trust | 32,454 | 509,528 |
| SL Green Realty Corp. | 6,556 | 678,612 |
| Sovran Self Storage, Inc. | 3,249 | 291,533 |
| Spirit Realty Capital, Inc. | 8,394 | 80,582 |
| Starwood Property Trust, Inc. | 17,559 | 373,656 |
| Sun Communities, Inc. | 4,286 | 279,490 |
| Sunstone Hotel Investors, Inc. | 18,170 | 251,291 |
| Tanger Factory Outlet Centers, Inc. | 10,035 | 317,507 |
| Taubman Centers, Inc. | 7,173 | 494,865 |
| The Geo Group, Inc. | 12,877 | 386,696 |
| Two Harbors Investment Corp. | 28,811 | 272,552 |
| UDR, Inc. | 30,300 | 978,690 |
| Washington Real Estate Investment Trust | 16,670 | 410,082 |
| Weingarten Realty Investors | 21,512 | 680,640 |
| Western Asset Mortgage Capital Corp. (d) | 1,996 | 25,509 |
| WP Carey, Inc. | 6,268 | 360,222 |
| | | 39,158,354 |
| Retailing 5.7% |
| Asbury Automotive Group, Inc. * | 7,166 | 577,365 |
| Ascena Retail Group, Inc. * | 64,178 | 774,624 |
| Barnes & Noble, Inc. | 25,316 | 395,183 |
| Burlington Stores, Inc. * | 11,716 | 622,002 |
| Cabela's, Inc. * | 7,200 | 323,784 |
| Caleres, Inc. | 17,859 | 594,705 |
| Citi Trends, Inc. | 1,896 | 50,073 |
| Conn's, Inc. *(d) | 1,264 | 37,730 |
| DSW, Inc., Class A | 21,526 | 639,107 |
| Express, Inc. * | 37,762 | 770,345 |
| Five Below, Inc. * | 6,579 | 254,410 |
| Fred's, Inc., Class A | 39,375 | 516,600 |
| Genesco, Inc. * | 9,676 | 579,496 |
| GNC Holdings, Inc., Class A | 21,541 | 1,008,119 |
| Group 1 Automotive, Inc. | 12,051 | 1,053,257 |
| Haverty Furniture Cos., Inc. | 2,112 | 48,808 |
| Hibbett Sports, Inc. * | 7,854 | 310,233 |
| HSN, Inc. | 9,067 | 551,364 |
| Lands' End, Inc. * | 2,644 | 67,263 |
| Liberty TripAdvisor Holdings, Inc., Class A * | 2,112 | 53,581 |
| Lithia Motors, Inc., Class A | 4,294 | 457,740 |
| Lumber Liquidators Holdings, Inc. *(d) | 7,790 | 117,707 |
| Monro Muffler Brake, Inc. | 5,289 | 335,270 |
| Netflix, Inc. * | 12,404 | 1,426,832 |
| Nutrisystem, Inc. | 16,072 | 449,695 |
| Outerwall, Inc. (d) | 9,827 | 605,343 |
| Penske Automotive Group, Inc. | 15,763 | 797,608 |
| Pier 1 Imports, Inc. | 41,971 | 427,265 |
| Pool Corp. | 9,347 | 651,299 |
| Restoration Hardware Holdings, Inc. * | 516 | 47,720 |
| Sally Beauty Holdings, Inc. * | 20,754 | 542,510 |
| Sears Holdings Corp. *(d) | 53,676 | 1,432,076 |
| Select Comfort Corp. * | 9,482 | 230,887 |
| Shutterfly, Inc. * | 948 | 36,839 |
| Sonic Automotive, Inc., Class A | 27,400 | 589,374 |
| Stage Stores, Inc. | 28,399 | 305,005 |
| Security | Number
of Shares | Value
($) |
| Stein Mart, Inc. | 18,622 | 200,000 |
| The Buckle, Inc. (d) | 12,706 | 536,193 |
| The Cato Corp., Class A | 11,503 | 404,100 |
| The Children's Place, Inc. | 13,209 | 791,483 |
| The Finish Line, Inc., Class A | 24,362 | 642,426 |
| The Men's Wearhouse, Inc. | 19,972 | 1,127,419 |
| The Michaels Cos., Inc. * | 1,580 | 41,412 |
| The Pep Boys-Manny, Moe & Jack * | 42,427 | 513,367 |
| Travelport Worldwide Ltd. (d) | 6,552 | 86,814 |
| TripAdvisor, Inc. * | 3,510 | 245,349 |
| Tuesday Morning Corp. * | 14,626 | 115,984 |
| Ulta Salon, Cosmetics & Fragrance, Inc. * | 5,066 | 800,884 |
| Vitamin Shoppe, Inc. * | 7,735 | 276,913 |
| Zumiez, Inc. * | 1,480 | 34,499 |
| | | 23,498,062 |
| Semiconductors & Semiconductor Equipment 2.9% |
| Advanced Micro Devices, Inc. *(d) | 293,227 | 530,741 |
| Amkor Technology, Inc. * | 46,792 | 252,677 |
| Atmel Corp. | 112,339 | 917,810 |
| Brooks Automation, Inc. | 22,332 | 231,806 |
| Cabot Microelectronics Corp. * | 9,654 | 418,790 |
| Cirrus Logic, Inc. * | 14,819 | 446,941 |
| Cree, Inc. *(d) | 15,203 | 413,826 |
| Cypress Semiconductor Corp. * | 78,411 | 784,110 |
| Diodes, Inc. * | 8,788 | 173,036 |
| Entegris, Inc. * | 25,097 | 344,582 |
| Fairchild Semiconductor International, Inc. * | 39,405 | 535,908 |
| First Solar, Inc. * | 17,836 | 853,274 |
| Freescale Semiconductor Ltd. * | 9,155 | 327,108 |
| Integrated Device Technology, Inc. * | 17,327 | 329,040 |
| Intersil Corp., Class A | 40,907 | 431,160 |
| Microsemi Corp. * | 9,042 | 287,174 |
| MKS Instruments, Inc. | 12,569 | 423,575 |
| OmniVision Technologies, Inc. * | 13,532 | 323,415 |
| ON Semiconductor Corp. * | 77,440 | 739,939 |
| Photronics, Inc. * | 29,931 | 272,671 |
| PMC-Sierra, Inc. * | 38,094 | 239,611 |
| Silicon Laboratories, Inc. * | 11,548 | 502,107 |
| Skyworks Solutions, Inc. | 9,499 | 829,738 |
| Synaptics, Inc. * | 4,559 | 319,540 |
| Teradyne, Inc. | 34,560 | 623,462 |
| Veeco Instruments, Inc. * | 10,572 | 243,896 |
| | | 11,795,937 |
| Software & Services 5.6% |
| ACI Worldwide, Inc. * | 10,947 | 233,500 |
| Acxiom Corp. * | 30,164 | 632,237 |
| ANSYS, Inc. * | 5,966 | 528,588 |
| AVG Technologies N.V. * | 2,528 | 58,473 |
| Cadence Design Systems, Inc. * | 16,145 | 323,223 |
| Cardtronics, Inc. * | 1,164 | 40,158 |
| Cimpress N.V. * | 7,227 | 505,745 |
| Convergys Corp. | 49,740 | 1,124,124 |
| CSG Systems International, Inc. | 10,098 | 312,129 |
| EarthLink Holdings Corp. | 123,121 | 1,032,985 |
| Euronet Worldwide, Inc. * | 6,011 | 387,529 |
| Everi Holdings, Inc. * | 28,973 | 149,790 |
Schwab Fundamental U.S. Small Company Index ETF
Portfolio Holdings (Unaudited) continued
| Security | Number
of Shares | Value
($) |
| FactSet Research Systems, Inc. | 4,379 | 691,532 |
| Fair Isaac Corp. | 7,449 | 637,411 |
| FleetCor Technologies, Inc. * | 2,203 | 328,599 |
| Gartner, Inc. * | 7,093 | 606,522 |
| Genpact Ltd. * | 33,166 | 762,818 |
| Heartland Payment Systems, Inc. | 7,937 | 472,886 |
| j2 Global, Inc. | 5,732 | 398,833 |
| Jack Henry & Associates, Inc. | 10,478 | 712,085 |
| LinkedIn Corp., Class A * | 316 | 57,070 |
| Manhattan Associates, Inc. * | 6,913 | 404,272 |
| ManTech International Corp., Class A | 19,055 | 521,916 |
| MAXIMUS, Inc. | 10,359 | 627,237 |
| Mentor Graphics Corp. | 13,847 | 357,807 |
| Monster Worldwide, Inc. * | 95,595 | 694,976 |
| NeuStar, Inc., Class A *(d) | 27,944 | 781,035 |
| Nuance Communications, Inc. * | 27,127 | 446,782 |
| Progress Software Corp. * | 17,734 | 480,414 |
| PTC, Inc. * | 12,152 | 402,474 |
| Rackspace Hosting, Inc. * | 10,300 | 313,223 |
| Red Hat, Inc. * | 9,053 | 653,717 |
| Rovi Corp. * | 16,589 | 183,640 |
| salesforce.com, Inc. * | 9,050 | 627,708 |
| Science Applications International Corp. | 21,885 | 1,067,331 |
| Solera Holdings, Inc. | 8,101 | 390,225 |
| SS&C Technologies Holdings, Inc. | 1,020 | 69,095 |
| Sykes Enterprises, Inc. * | 16,540 | 415,981 |
| Synopsys, Inc. * | 16,141 | 757,497 |
| Take-Two Interactive Software, Inc. * | 18,688 | 544,381 |
| Unisys Corp. * | 24,413 | 321,519 |
| United Online, Inc. * | 6,677 | 72,713 |
| Vantiv, Inc., Class A * | 9,143 | 402,658 |
| VeriFone Systems, Inc. * | 10,598 | 331,082 |
| Verint Systems, Inc. * | 1,026 | 54,717 |
| VeriSign, Inc. * | 17,114 | 1,179,839 |
| VMware, Inc., Class A * | 3,954 | 312,959 |
| WebMD Health Corp. * | 9,739 | 400,565 |
| WEX, Inc. * | 3,126 | 295,501 |
| Zynga, Inc., Class A * | 16,828 | 42,575 |
| | | 23,150,076 |
| Technology Hardware & Equipment 4.6% |
| ADTRAN, Inc. | 22,132 | 354,555 |
| ARRIS Group, Inc. * | 17,350 | 458,387 |
| AVX Corp. | 3,060 | 39,964 |
| Belden, Inc. | 6,678 | 336,504 |
| Benchmark Electronics, Inc. * | 35,771 | 764,426 |
| Brocade Communications Systems, Inc. | 82,992 | 883,865 |
| CDW Corp. | 12,821 | 509,635 |
| Cognex Corp. | 5,489 | 195,189 |
| Coherent, Inc. * | 6,805 | 396,731 |
| CommScope Holding Co., Inc. * | 14,228 | 460,276 |
| Comtech Telecommunications Corp. | 14,704 | 392,303 |
| Diebold, Inc. | 26,447 | 823,031 |
| Dolby Laboratories, Inc., Class A | 12,230 | 398,209 |
| EchoStar Corp., Class A * | 8,702 | 388,109 |
| Electronics For Imaging, Inc. * | 6,851 | 299,868 |
| F5 Networks, Inc. * | 7,982 | 969,095 |
| Fabrinet * | 14,102 | 280,348 |
| FEI Co. | 4,080 | 307,958 |
| Security | Number
of Shares | Value
($) |
| Finisar Corp. * | 19,368 | 298,848 |
| Harmonic, Inc. * | 7,500 | 43,275 |
| II-VI, Inc. * | 2,644 | 44,657 |
| Insight Enterprises, Inc. * | 34,702 | 878,308 |
| InterDigital, Inc. | 8,782 | 434,446 |
| IPG Photonics Corp. * | 516 | 43,561 |
| Itron, Inc. * | 16,605 | 498,150 |
| Knowles Corp. *(d) | 19,459 | 316,793 |
| Littelfuse, Inc. | 3,435 | 308,291 |
| Methode Electronics, Inc. | 1,048 | 27,845 |
| MTS Systems Corp. | 3,780 | 225,061 |
| National Instruments Corp. | 15,239 | 445,131 |
| NCR Corp. * | 33,609 | 843,250 |
| NETGEAR, Inc. * | 12,376 | 375,983 |
| OSI Systems, Inc. * | 3,426 | 250,235 |
| Plantronics, Inc. | 7,995 | 425,014 |
| Plexus Corp. * | 17,511 | 666,644 |
| Polycom, Inc. * | 53,608 | 576,822 |
| QLogic Corp. * | 60,671 | 627,338 |
| Rofin-Sinar Technologies, Inc. * | 11,353 | 289,161 |
| Sanmina Corp. * | 42,760 | 822,702 |
| ScanSource, Inc. * | 16,272 | 621,590 |
| Super Micro Computer, Inc. * | 1,364 | 37,305 |
| Trimble Navigation Ltd. * | 23,134 | 437,233 |
| TTM Technologies, Inc. * | 26,944 | 183,758 |
| ViaSat, Inc. * | 4,476 | 263,055 |
| Viavi Solutions, Inc. * | 38,785 | 208,275 |
| Zebra Technologies Corp., Class A * | 9,255 | 767,054 |
| | | 19,218,238 |
| Telecommunication Services 1.1% |
| Cincinnati Bell, Inc. * | 141,897 | 486,707 |
| Consolidated Communications Holdings, Inc. | 14,952 | 291,714 |
| General Communication, Inc., Class A * | 4,188 | 70,568 |
| Inteliquent, Inc. | 14,674 | 268,828 |
| Intelsat S.A. *(d) | 26,243 | 253,770 |
| Iridium Communications, Inc. * | 4,756 | 35,432 |
| Level 3 Communications, Inc. * | 21,814 | 975,740 |
| NTELOS Holdings Corp. * | 37,942 | 347,928 |
| SBA Communications Corp., Class A * | 6,235 | 736,977 |
| T-Mobile US, Inc. * | 20,520 | 812,797 |
| Vonage Holdings Corp. * | 71,386 | 396,192 |
| Zayo Group Holdings, Inc. * | 1,896 | 53,031 |
| | | 4,729,684 |
| Transportation 3.2% |
| Allegiant Travel Co. | 2,058 | 418,309 |
| AMERCO | 1,086 | 406,772 |
| American Airlines Group, Inc. | 22,090 | 861,068 |
| ArcBest Corp. | 10,642 | 307,341 |
| Atlas Air Worldwide Holdings, Inc. * | 10,190 | 420,949 |
| Con-way, Inc. | 21,265 | 748,528 |
| Copa Holdings S.A., Class A (d) | 7,188 | 368,529 |
| Forward Air Corp. | 6,315 | 284,301 |
| Genesee & Wyoming, Inc., Class A * | 3,423 | 234,065 |
| Hawaiian Holdings, Inc. * | 11,216 | 254,155 |
| Heartland Express, Inc. | 13,075 | 264,638 |
| Hub Group, Inc., Class A * | 15,112 | 569,571 |
| Kirby Corp. * | 8,631 | 608,744 |
Schwab Fundamental U.S. Small Company Index ETF
Portfolio Holdings (Unaudited) continued
| Security | Number
of Shares | Value
($) |
| Knight Transportation, Inc. | 14,753 | 401,282 |
| Landstar System, Inc. | 12,185 | 806,647 |
| Macquarie Infrastructure Corp. | 1,048 | 82,499 |
| Marten Transport Ltd. | 1,796 | 33,244 |
| Matson, Inc. | 10,041 | 378,345 |
| Navios Maritime Holdings, Inc. | 72,443 | 203,565 |
| Old Dominion Freight Line, Inc. * | 7,477 | 497,146 |
| Republic Airways Holdings, Inc. * | 43,560 | 134,165 |
| Saia, Inc. * | 5,964 | 223,948 |
| SkyWest, Inc. | 78,646 | 1,250,471 |
| Southwest Airlines Co. | 23,519 | 863,147 |
| Spirit Airlines, Inc. * | 5,518 | 282,798 |
| Swift Transportation Co. * | 16,254 | 316,790 |
| United Continental Holdings, Inc. * | 13,083 | 745,339 |
| UTi Worldwide, Inc. * | 67,070 | 477,538 |
| Werner Enterprises, Inc. | 23,674 | 627,124 |
| Wesco Aircraft Holdings, Inc. * | 3,060 | 42,962 |
| | | 13,113,980 |
| Utilities 4.0% |
| ALLETE, Inc. | 10,988 | 525,007 |
| American States Water Co. | 7,191 | 271,460 |
| Aqua America, Inc. | 27,376 | 694,255 |
| Avista Corp. | 21,251 | 667,069 |
| Black Hills Corp. | 13,320 | 529,870 |
| California Water Service Group | 11,834 | 244,135 |
| Cleco Corp. | 14,141 | 757,675 |
| Dynegy, Inc. * | 16,246 | 418,334 |
| El Paso Electric Co. | 14,925 | 528,345 |
| Hawaiian Electric Industries, Inc. | 32,190 | 910,011 |
| IDACORP, Inc. | 11,621 | 689,939 |
| ITC Holdings Corp. | 17,767 | 580,981 |
| MGE Energy, Inc. | 7,969 | 306,488 |
| New Jersey Resources Corp. | 25,895 | 732,052 |
| Northwest Natural Gas Co. | 10,910 | 479,822 |
| NorthWestern Corp. | 12,150 | 627,426 |
| ONE Gas, Inc. | 3,320 | 142,660 |
| Otter Tail Corp. | 13,734 | 354,474 |
| Piedmont Natural Gas Co., Inc. | 20,741 | 800,188 |
| PNM Resources, Inc. | 29,037 | 743,637 |
| Portland General Electric Co. | 27,078 | 935,274 |
| Questar Corp. | 37,319 | 720,630 |
| South Jersey Industries, Inc. | 15,672 | 377,695 |
| Southwest Gas Corp. | 15,330 | 844,530 |
| The Empire District Electric Co. | 16,495 | 357,117 |
| The Laclede Group, Inc. | 10,355 | 548,194 |
| UIL Holdings Corp. | 14,603 | 664,875 |
| WGL Holdings, Inc. | 17,729 | 960,912 |
| | | 16,413,055 |
| Total Common Stock |
| (Cost $442,086,639) | | 412,967,310 |
|
| Rights 0.0% of net assets |
| Telecommunication Services 0.0% |
| Leap Wireless CVR *(a)(b) | 5,940 | 14,969 |
| Total Rights |
| (Cost $14,969) | | 14,969 |
|
| Security | Number
of Shares | Value
($) |
| Other Investment Companies 1.9% of net assets |
| Money Market Fund 0.2% |
| State Street Institutional U.S. Government Money Market Fund, Premier Class 0.00% (c) | 923,861 | 923,861 |
| Securities Lending Collateral 1.7% |
| State Street Institutional U.S. Government Money Market Fund, Premier Class 0.00% (c) | 7,095,890 | 7,095,890 |
| Total Other Investment Companies |
| (Cost $8,019,751) | | 8,019,751 |
End of Investments.
At 08/31/15, the tax basis cost of the fund's investments was $450,152,866 and the unrealized appreciation and depreciation were $12,067,277 and ($41,218,113), respectively, with a net unrealized depreciation of ($29,150,836).
| * | Non-income producing security. |
| (a) | Fair-valued by management in accordance with procedures approved by the Board of Trustees. |
| (b) | Illiquid security. At the period end, the value of these amounted to $14,969 or 0.0% of net assets. |
| (c) | The rate shown is the 7-day yield. |
| (d) | All or a portion of this security is on loan. Securities on loan were valued at $6,774,318. Non-cash collateral pledged to the fund for securities on loan amounted to $10,965. |
| | |
| CVR — | Contingent Value Rights |
| REIT — | Real Estate Investment Trust |
In addition to the above, the fund held the following at 08/31/15:
| | Number of
Contracts | Contract
Value
($) | Unrealized
Appreciation
($) |
| Futures Contracts | | | |
| Russell 2000 Index, e-mini, Long, expires 09/18/15 | 1 | 115,750 | 2,958 |
Schwab Fundamental International Large Company Index ETF
Portfolio Holdings as of August 31, 2015 (Unaudited)
This section shows all the securities in the fund's portfolio and their values as of the report date.
The fund files its complete schedule of portfolio holdings with the SEC for the first and third quarters of each fiscal year on Form N-Q. The fund's Form N-Q is available on the SEC's website at www.sec.gov and may be viewed and copied at the SEC's Public Reference Room in Washington, D.C. Call 1-800-SEC-0330 for information on the operation of the Public Reference Room. The fund also makes available its complete schedule of portfolio holdings on a daily basis on the fund's website at www.csimfunds.com/schwabetfs_prospectus.
| Holdings by Category | Cost
($) | Value
($) |
| 99.0% | Common Stock | 753,063,762 | 692,719,251 |
| 0.4% | Preferred Stock | 3,713,046 | 3,078,011 |
| 0.0% | Rights | — | 5,499 |
| 0.4% | Other Investment Companies | 2,961,888 | 2,961,888 |
| 99.8% | Total Investments | 759,738,696 | 698,764,649 |
| 0.2% | Other Assets and
Liabilities, Net | | 1,232,392 |
| 100.0% | Net Assets | | 699,997,041 |
| Security | Number
of Shares | Value
($) |
| Common Stock 99.0% of net assets |
| Australia 4.9% |
| Banks 1.5% |
| Australia & New Zealand Banking Group Ltd. | 107,922 | 2,136,960 |
| Bendigo & Adelaide Bank Ltd. | 19,705 | 153,249 |
| Commonwealth Bank of Australia | 54,043 | 2,876,599 |
| National Australia Bank Ltd. | 109,405 | 2,417,628 |
| Westpac Banking Corp. | 120,631 | 2,659,713 |
| | | 10,244,149 |
| Capital Goods 0.1% |
| CIMIC Group Ltd. | 11,997 | 199,109 |
| UGL Ltd. | 107,632 | 152,611 |
| | | 351,720 |
| Commercial & Professional Services 0.1% |
| Brambles Ltd. | 51,414 | 358,667 |
| Downer EDI Ltd. | 65,653 | 168,492 |
| | | 527,159 |
| Consumer Services 0.1% |
| Tabcorp Holdings Ltd. | 96,844 | 317,885 |
| Tatts Group Ltd. | 113,592 | 296,354 |
| | | 614,239 |
| Diversified Financials 0.1% |
| Macquarie Group Ltd. | 9,701 | 522,210 |
| Energy 0.3% |
| Caltex Australia Ltd. | 15,946 | 360,401 |
| Origin Energy Ltd. | 69,521 | 407,110 |
| Santos Ltd. | 62,924 | 228,849 |
| Woodside Petroleum Ltd. | 28,032 | 641,112 |
| WorleyParsons Ltd. | 29,863 | 158,997 |
| | | 1,796,469 |
| Security | Number
of Shares | Value
($) |
| Food & Staples Retailing 0.7% |
| Metcash Ltd. (b) | 176,412 | 135,698 |
| Wesfarmers Ltd. | 90,750 | 2,615,950 |
| Woolworths Ltd. | 97,983 | 1,833,877 |
| | | 4,585,525 |
| Food, Beverage & Tobacco 0.0% |
| Coca-Cola Amatil Ltd. | 37,122 | 221,068 |
| Health Care Equipment & Services 0.0% |
| Sonic Healthcare Ltd. | 19,530 | 286,885 |
| Insurance 0.4% |
| AMP Ltd. | 117,180 | 494,295 |
| Insurance Australia Group Ltd. | 73,935 | 265,750 |
| Medibank Pvt Ltd. * | 42,449 | 70,120 |
| QBE Insurance Group Ltd. | 100,172 | 937,423 |
| Suncorp Group Ltd. | 101,851 | 926,419 |
| | | 2,694,007 |
| Materials 1.0% |
| Amcor Ltd. | 45,273 | 440,361 |
| Arrium Ltd. | 2,080,584 | 162,253 |
| BHP Billiton Ltd. | 226,015 | 4,034,674 |
| BlueScope Steel Ltd. | 59,725 | 182,494 |
| Boral Ltd. | 58,032 | 232,040 |
| Fortescue Metals Group Ltd. (b) | 94,698 | 128,230 |
| Incitec Pivot Ltd. | 121,365 | 302,006 |
| Newcrest Mining Ltd. * | 52,181 | 414,330 |
| Orica Ltd. | 29,317 | 329,639 |
| Rio Tinto Ltd. | 29,598 | 1,055,260 |
| | | 7,281,287 |
| Pharmaceuticals, Biotechnology & Life Sciences 0.1% |
| CSL Ltd. | 10,067 | 655,676 |
| Real Estate 0.2% |
| Lend Lease Group | 34,875 | 344,661 |
| Mirvac Group | 144,801 | 179,649 |
| Scentre Group | 16,320 | 44,082 |
| Stockland | 116,343 | 322,502 |
| Westfield Corp. | 95,139 | 657,626 |
| | | 1,548,520 |
| Telecommunication Services 0.1% |
| Telstra Corp., Ltd. | 262,286 | 1,072,918 |
| Transportation 0.1% |
| Asciano Ltd. | 55,800 | 335,859 |
| Aurizon Holdings Ltd. | 71,857 | 252,678 |
| Qantas Airways Ltd. * | 132,585 | 315,827 |
| Transurban Group | 23,157 | 158,918 |
| | | 1,063,282 |
| Utilities 0.1% |
| AGL Energy Ltd. | 33,872 | 405,589 |
| APA Group | 23,482 | 145,999 |
| DUET Group | 80,480 | 124,953 |
| | | 676,541 |
| | | 34,141,655 |
| Austria 0.4% |
| Banks 0.2% |
| Erste Group Bank AG * | 37,159 | 1,105,661 |
| Raiffeisen Bank International AG * | 18,337 | 247,998 |
| | | 1,353,659 |
Schwab Fundamental International Large Company Index ETF
Portfolio Holdings (Unaudited) continued
| Security | Number
of Shares | Value
($) |
| Energy 0.1% |
| OMV AG | 31,708 | 811,478 |
| Materials 0.1% |
| voestalpine AG | 12,219 | 446,339 |
| | | 2,611,476 |
| Belgium 1.0% |
| Banks 0.1% |
| KBC Groep N.V. | 7,283 | 482,863 |
| Diversified Financials 0.0% |
| Groupe Bruxelles Lambert S.A. | 2,344 | 181,882 |
| Food & Staples Retailing 0.3% |
| Colruyt S.A. | 6,278 | 306,036 |
| Delhaize Group S.A. | 15,708 | 1,406,480 |
| | | 1,712,516 |
| Food, Beverage & Tobacco 0.3% |
| Anheuser-Busch InBev N.V. | 18,605 | 2,031,739 |
| Insurance 0.1% |
| Ageas | 20,287 | 829,703 |
| Materials 0.1% |
| Solvay S.A. | 3,069 | 360,731 |
| Umicore S.A. | 11,160 | 445,858 |
| | | 806,589 |
| Media 0.0% |
| Telenet Group Holding N.V. * | 3,074 | 173,047 |
| Pharmaceuticals, Biotechnology & Life Sciences 0.0% |
| UCB S.A. | 3,101 | 234,679 |
| Telecommunication Services 0.1% |
| Proximus | 13,421 | 482,652 |
| | | 6,935,670 |
| Canada 5.9% |
| Automobiles & Components 0.2% |
| Magna International, Inc. | 25,684 | 1,253,217 |
| Banks 1.4% |
| Bank of Montreal | 26,083 | 1,391,878 |
| Canadian Imperial Bank of Commerce | 14,859 | 1,079,832 |
| National Bank of Canada | 11,439 | 372,273 |
| Royal Bank of Canada | 48,323 | 2,663,667 |
| The Bank of Nova Scotia | 43,021 | 1,947,181 |
| The Toronto-Dominion Bank | 53,423 | 2,107,207 |
| | | 9,562,038 |
| Capital Goods 0.1% |
| Bombardier, Inc., B Shares | 82,693 | 80,176 |
| Finning International, Inc. | 12,555 | 210,524 |
| SNC-Lavalin Group, Inc. | 6,468 | 192,022 |
| | | 482,722 |
| Diversified Financials 0.1% |
| CI Financial Corp. | 7,016 | 165,842 |
| IGM Financial, Inc. | 5,982 | 169,277 |
| Onex Corp. | 5,580 | 335,932 |
| | | 671,051 |
| Energy 1.5% |
| ARC Resources Ltd. | 13,158 | 195,614 |
| Baytex Energy Corp. | 12,479 | 71,375 |
| Bonavista Energy Corp. | 26,053 | 80,088 |
| Security | Number
of Shares | Value
($) |
| Cameco Corp. | 15,390 | 214,107 |
| Canadian Natural Resources Ltd. | 50,323 | 1,121,441 |
| Canadian Oil Sands Ltd. | 58,797 | 340,276 |
| Cenovus Energy, Inc. | 62,161 | 890,951 |
| Crescent Point Energy Corp. (b) | 17,159 | 217,695 |
| Enbridge, Inc. | 19,251 | 786,679 |
| Encana Corp. | 92,454 | 683,069 |
| Enerplus Corp. (b) | 28,396 | 178,849 |
| Gibson Energy, Inc. | 8,380 | 122,189 |
| Husky Energy, Inc. | 26,534 | 467,262 |
| Imperial Oil Ltd. | 14,508 | 506,499 |
| Inter Pipeline Ltd. | 7,059 | 149,616 |
| Pacific Exploration & Production Corp. | 53,876 | 180,599 |
| Pembina Pipeline Corp. | 6,737 | 184,818 |
| Pengrowth Energy Corp. | 99,001 | 143,609 |
| Penn West Petroleum Ltd. | 289,478 | 224,098 |
| Suncor Energy, Inc. | 91,806 | 2,570,982 |
| TransCanada Corp. | 28,790 | 993,206 |
| Vermilion Energy, Inc. | 3,482 | 119,286 |
| | | 10,442,308 |
| Food & Staples Retailing 0.4% |
| Alimentation Couche-Tard, Inc., B Shares | 14,657 | 614,151 |
| Empire Co., Ltd., A Shares | 6,561 | 434,737 |
| George Weston Ltd. | 4,871 | 399,125 |
| Loblaw Cos. Ltd. | 12,013 | 634,012 |
| Metro, Inc. | 23,267 | 607,513 |
| | | 2,689,538 |
| Food, Beverage & Tobacco 0.0% |
| Saputo, Inc. | 10,656 | 242,673 |
| Insurance 0.5% |
| Fairfax Financial Holdings Ltd. | 677 | 311,283 |
| Great-West Lifeco, Inc. | 8,928 | 225,666 |
| Intact Financial Corp. | 3,906 | 267,299 |
| Manulife Financial Corp. | 54,451 | 874,981 |
| Power Corp. of Canada | 26,505 | 573,727 |
| Power Financial Corp. | 11,718 | 284,825 |
| Sun Life Financial, Inc. | 21,204 | 666,480 |
| | | 3,204,261 |
| Materials 0.6% |
| Agrium, Inc. | 8,373 | 859,703 |
| Barrick Gold Corp. | 113,609 | 781,302 |
| First Quantum Minerals Ltd. | 22,243 | 114,684 |
| Goldcorp, Inc. | 28,749 | 394,340 |
| Kinross Gold Corp. * | 132,345 | 233,755 |
| Potash Corp. of Saskatchewan, Inc. | 41,474 | 1,067,944 |
| Teck Resources Ltd., Class B | 60,083 | 426,745 |
| Yamana Gold, Inc. | 64,315 | 119,397 |
| | | 3,997,870 |
| Media 0.1% |
| Quebecor, Inc., Class B | 6,138 | 130,095 |
| Shaw Communications, Inc., B Shares | 17,019 | 338,078 |
| Yellow Pages Ltd. * | 22,662 | 307,781 |
| | | 775,954 |
| Pharmaceuticals, Biotechnology & Life Sciences 0.1% |
| Valeant Pharmaceuticals International, Inc. * | 1,783 | 408,716 |
Schwab Fundamental International Large Company Index ETF
Portfolio Holdings (Unaudited) continued
| Security | Number
of Shares | Value
($) |
| Real Estate 0.1% |
| Brookfield Asset Management, Inc., Class A | 33,065 | 1,029,103 |
| Retailing 0.1% |
| Canadian Tire Corp., Ltd., Class A | 4,194 | 391,503 |
| RONA, Inc. | 19,174 | 204,638 |
| | | 596,141 |
| Software & Services 0.0% |
| CGI Group, Inc., Class A * | 5,665 | 206,929 |
| Technology Hardware & Equipment 0.1% |
| BlackBerry Ltd. * | 100,509 | 753,912 |
| Celestica, Inc. * | 21,853 | 264,108 |
| | | 1,018,020 |
| Telecommunication Services 0.3% |
| BCE, Inc. | 23,220 | 928,451 |
| Rogers Communications, Inc., B Shares | 19,873 | 670,798 |
| TELUS Corp. | 13,596 | 439,813 |
| | | 2,039,062 |
| Transportation 0.2% |
| Canadian National Railway Co. | 21,803 | 1,199,697 |
| Canadian Pacific Railway Ltd. | 2,511 | 360,637 |
| | | 1,560,334 |
| Utilities 0.1% |
| Atco Ltd., Class I | 4,185 | 124,874 |
| Canadian Utilities Ltd., Class A | 6,417 | 175,412 |
| Emera, Inc. | 5,022 | 171,967 |
| Fortis, Inc. | 12,276 | 329,298 |
| TransAlta Corp. (b) | 34,639 | 171,308 |
| | | 972,859 |
| | | 41,152,796 |
| Denmark 0.8% |
| Banks 0.1% |
| Danske Bank A/S | 23,169 | 716,526 |
| Capital Goods 0.1% |
| FLSmidth & Co. A/S | 3,906 | 147,654 |
| Vestas Wind Systems A/S | 6,723 | 358,806 |
| | | 506,460 |
| Commercial & Professional Services 0.0% |
| ISS A/S | 1,458 | 50,759 |
| Food, Beverage & Tobacco 0.1% |
| Carlsberg A/S, B Shares | 5,697 | 429,346 |
| Pharmaceuticals, Biotechnology & Life Sciences 0.2% |
| Novo Nordisk A/S, B Shares | 32,508 | 1,801,811 |
| Telecommunication Services 0.1% |
| TDC A/S | 98,129 | 620,060 |
| Transportation 0.2% |
| AP Moller - Maersk A/S, A Shares | 367 | 612,121 |
| AP Moller - Maersk A/S, B Shares | 582 | 989,943 |
| DSV A/S | 6,736 | 240,274 |
| | | 1,842,338 |
| | | 5,967,300 |
| Security | Number
of Shares | Value
($) |
| Finland 1.0% |
| Automobiles & Components 0.0% |
| Nokian Renkaat Oyj | 5,867 | 158,367 |
| Capital Goods 0.1% |
| Kone Oyj, B Shares | 7,944 | 314,036 |
| Metso Oyj | 9,582 | 236,206 |
| Wartsila Oyj Abp | 6,975 | 288,548 |
| | | 838,790 |
| Energy 0.1% |
| Neste Oyj | 17,577 | 450,622 |
| Food & Staples Retailing 0.1% |
| Kesko Oyj, B Shares | 14,100 | 506,675 |
| Insurance 0.1% |
| Sampo Oyj, A Shares | 13,113 | 632,245 |
| Materials 0.2% |
| Stora Enso Oyj, R Shares | 66,123 | 587,910 |
| UPM-Kymmene Oyj | 48,178 | 802,734 |
| | | 1,390,644 |
| Pharmaceuticals, Biotechnology & Life Sciences 0.0% |
| Orion Oyj, Class B | 7,254 | 287,572 |
| Technology Hardware & Equipment 0.3% |
| Nokia Oyj | 297,925 | 1,862,743 |
| Telecommunication Services 0.0% |
| Elisa Oyj | 7,294 | 242,736 |
| Utilities 0.1% |
| Fortum Oyj | 26,896 | 437,287 |
| | | 6,807,681 |
| France 11.1% |
| Automobiles & Components 0.5% |
| Faurecia | 4,464 | 160,911 |
| Peugeot S.A. * | 80,292 | 1,385,494 |
| Renault S.A. | 15,272 | 1,267,848 |
| Valeo S.A. | 3,094 | 388,285 |
| | | 3,202,538 |
| Banks 1.1% |
| BNP Paribas S.A. | 70,523 | 4,446,511 |
| Credit Agricole S.A. | 55,010 | 744,904 |
| Societe Generale S.A. | 49,050 | 2,388,309 |
| | | 7,579,724 |
| Capital Goods 1.8% |
| Airbus Group SE | 13,747 | 894,790 |
| Alstom S.A. * | 18,414 | 570,912 |
| Bouygues S.A. | 29,353 | 1,116,288 |
| Compagnie de Saint-Gobain | 61,683 | 2,831,328 |
| Eiffage S.A. | 4,746 | 303,917 |
| Legrand S.A. | 9,776 | 563,364 |
| Nexans S.A. * | 5,580 | 217,958 |
| Rexel S.A. | 35,374 | 542,030 |
| Safran S.A. | 8,658 | 675,404 |
| Schneider Electric SE | 26,178 | 1,652,296 |
| Thales S.A. | 4,464 | 307,167 |
| Vallourec S.A. | 15,276 | 195,473 |
| Vinci S.A. | 39,900 | 2,566,683 |
| Zodiac Aerospace | 5,219 | 158,507 |
| | | 12,596,117 |
Schwab Fundamental International Large Company Index ETF
Portfolio Holdings (Unaudited) continued
| Security | Number
of Shares | Value
($) |
| Commercial & Professional Services 0.0% |
| Bureau Veritas S.A. | 7,545 | 172,085 |
| Teleperformance | 2,520 | 177,213 |
| | | 349,298 |
| Consumer Durables & Apparel 0.4% |
| Christian Dior SE | 2,382 | 441,457 |
| Kering | 3,627 | 620,784 |
| LVMH Moet Hennessy Louis Vuitton SE | 9,006 | 1,500,060 |
| | | 2,562,301 |
| Consumer Services 0.1% |
| Accor S.A. | 9,830 | 465,694 |
| Sodexo S.A. | 3,999 | 351,435 |
| | | 817,129 |
| Diversified Financials 0.0% |
| Wendel S.A. | 1,395 | 178,740 |
| Energy 1.8% |
| CGG S.A. *(b) | 42,495 | 202,986 |
| Technip S.A. | 8,395 | 456,784 |
| Total S.A. | 261,445 | 11,953,785 |
| | | 12,613,555 |
| Food & Staples Retailing 0.4% |
| Carrefour S.A. | 75,888 | 2,464,241 |
| Casino Guichard Perrachon S.A. | 7,028 | 444,143 |
| Rallye S.A. | 9,126 | 222,818 |
| | | 3,131,202 |
| Food, Beverage & Tobacco 0.3% |
| Danone S.A. | 25,478 | 1,581,279 |
| Pernod-Ricard S.A. | 6,722 | 704,392 |
| | | 2,285,671 |
| Health Care Equipment & Services 0.1% |
| Essilor International S.A. | 4,464 | 532,203 |
| Household & Personal Products 0.2% |
| L'Oreal S.A. | 6,298 | 1,077,590 |
| Insurance 0.5% |
| AXA S.A. | 113,923 | 2,868,949 |
| CNP Assurances | 10,602 | 163,344 |
| SCOR SE | 8,928 | 314,520 |
| | | 3,346,813 |
| Materials 0.4% |
| Air Liquide S.A. | 13,440 | 1,609,110 |
| Arkema S.A. | 5,116 | 360,630 |
| Lafarge S.A. | 14,560 | 926,662 |
| | | 2,896,402 |
| Media 0.6% |
| Eutelsat Communications S.A. | 7,836 | 235,969 |
| Publicis Groupe S.A. | 5,580 | 397,151 |
| Vivendi S.A. | 132,874 | 3,282,176 |
| | | 3,915,296 |
| Pharmaceuticals, Biotechnology & Life Sciences 0.8% |
| Sanofi | 60,015 | 5,929,149 |
| Real Estate 0.1% |
| Klepierre | 5,650 | 248,295 |
| Unibail-Rodamco SE | 2,021 | 523,672 |
| | | 771,967 |
| Security | Number
of Shares | Value
($) |
| Software & Services 0.2% |
| Atos SE | 4,117 | 312,445 |
| Cap Gemini S.A. | 8,273 | 742,704 |
| | | 1,055,149 |
| Technology Hardware & Equipment 0.0% |
| Alcatel-Lucent * | 104,067 | 349,121 |
| Telecommunication Services 0.8% |
| Orange S.A. | 346,239 | 5,466,366 |
| Transportation 0.1% |
| Air France-KLM *(b) | 63,452 | 439,243 |
| Utilities 0.9% |
| Electricite de France S.A. | 31,937 | 690,300 |
| Engie | 217,373 | 3,893,409 |
| Suez Environnement Co. | 30,197 | 544,248 |
| Veolia Environnement S.A. | 59,756 | 1,309,001 |
| | | 6,436,958 |
| | | 77,532,532 |
| Germany 8.4% |
| Automobiles & Components 1.2% |
| Bayerische Motoren Werke AG | 20,266 | 1,867,056 |
| Continental AG | 3,906 | 829,160 |
| Daimler AG - Reg'd | 61,382 | 4,928,668 |
| Leoni AG | 2,622 | 159,031 |
| Volkswagen AG | 1,692 | 316,044 |
| | | 8,099,959 |
| Banks 0.1% |
| Commerzbank AG * | 39,929 | 447,046 |
| Capital Goods 1.0% |
| Brenntag AG | 8,370 | 464,990 |
| GEA Group AG | 7,254 | 282,858 |
| HOCHTIEF AG | 2,511 | 211,806 |
| Kloeckner & Co. SE (b) | 22,374 | 202,667 |
| MAN SE | 2,511 | 263,069 |
| MTU Aero Engines AG | 2,232 | 199,776 |
| OSRAM Licht AG | 5,914 | 312,512 |
| Rheinmetall AG | 4,472 | 275,698 |
| Siemens AG - Reg'd | 45,576 | 4,517,466 |
| | | 6,730,842 |
| Commercial & Professional Services 0.0% |
| Bilfinger SE | 3,922 | 157,437 |
| Consumer Durables & Apparel 0.1% |
| adidas AG | 12,173 | 910,050 |
| HUGO BOSS AG | 1,172 | 133,818 |
| | | 1,043,868 |
| Consumer Services 0.1% |
| TUI AG | 32,653 | 585,403 |
| Diversified Financials 0.4% |
| Deutsche Bank AG - Reg'd | 72,306 | 2,128,770 |
| Deutsche Boerse AG | 7,533 | 673,486 |
| | | 2,802,256 |
| Food & Staples Retailing 0.1% |
| METRO AG | 32,404 | 945,115 |
| Food, Beverage & Tobacco 0.0% |
| Suedzucker AG | 15,106 | 220,042 |
Schwab Fundamental International Large Company Index ETF
Portfolio Holdings (Unaudited) continued
| Security | Number
of Shares | Value
($) |
| Health Care Equipment & Services 0.2% |
| Fresenius Medical Care AG & Co. KGaA | 7,836 | 598,900 |
| Fresenius SE & Co. KGaA | 13,287 | 938,693 |
| | | 1,537,593 |
| Household & Personal Products 0.1% |
| Beiersdorf AG | 2,624 | 216,928 |
| Henkel AG & Co. KGaA | 3,348 | 306,942 |
| | | 523,870 |
| Insurance 0.8% |
| Allianz SE - Reg'd | 23,717 | 3,780,278 |
| Hannover Rueck SE | 3,069 | 311,625 |
| Muenchener Rueckversicherungs-Gesellschaft AG - Reg'd | 9,486 | 1,741,040 |
| | | 5,832,943 |
| Materials 1.4% |
| Aurubis AG | 7,030 | 466,325 |
| BASF SE | 65,725 | 5,289,172 |
| HeidelbergCement AG | 10,323 | 779,148 |
| K+S AG - Reg'd | 18,459 | 689,478 |
| LANXESS AG | 7,889 | 400,435 |
| Linde AG | 6,987 | 1,212,701 |
| Salzgitter AG | 10,648 | 331,386 |
| Symrise AG | 2,466 | 148,630 |
| ThyssenKrupp AG | 40,581 | 878,727 |
| | | 10,196,002 |
| Media 0.1% |
| ProSiebenSat.1 Media SE | 9,710 | 472,249 |
| Pharmaceuticals, Biotechnology & Life Sciences 0.6% |
| Bayer AG - Reg'd | 27,074 | 3,669,188 |
| Merck KGaA | 3,348 | 319,885 |
| | | 3,989,073 |
| Semiconductors & Semiconductor Equipment 0.1% |
| Infineon Technologies AG | 41,850 | 457,393 |
| Software & Services 0.2% |
| SAP SE | 22,125 | 1,487,215 |
| Telecommunication Services 0.8% |
| Deutsche Telekom AG - Reg'd | 308,699 | 5,273,202 |
| Freenet AG | 8,370 | 266,070 |
| | | 5,539,272 |
| Transportation 0.3% |
| Deutsche Lufthansa AG - Reg'd * | 39,410 | 479,345 |
| Deutsche Post AG - Reg'd | 66,219 | 1,821,941 |
| | | 2,301,286 |
| Utilities 0.8% |
| E.ON SE | 357,128 | 4,043,635 |
| RWE AG | 102,521 | 1,538,747 |
| | | 5,582,382 |
| | | 58,951,246 |
| Hong Kong 0.9% |
| Banks 0.1% |
| Hang Seng Bank Ltd. | 27,900 | 496,437 |
| Security | Number
of Shares | Value
($) |
| Capital Goods 0.2% |
| Jardine Matheson Holdings Ltd. | 9,276 | 463,243 |
| Jardine Strategic Holdings Ltd. | 7,000 | 199,710 |
| Noble Group Ltd. (b) | 1,091,900 | 421,957 |
| | | 1,084,910 |
| Consumer Durables & Apparel 0.0% |
| Li & Fung Ltd. | 473,480 | 312,189 |
| Consumer Services 0.1% |
| Galaxy Entertainment Group Ltd. | 24,784 | 79,468 |
| Sands China Ltd. | 36,866 | 127,960 |
| SJM Holdings Ltd. | 124,092 | 112,243 |
| | | 319,671 |
| Diversified Financials 0.0% |
| Hong Kong Exchanges & Clearing Ltd. | 7,139 | 167,835 |
| Insurance 0.1% |
| AIA Group Ltd. | 134,504 | 743,672 |
| Real Estate 0.2% |
| Hongkong Land Holdings Ltd. | 22,783 | 157,658 |
| Link REIT | 28,544 | 151,374 |
| New World Development Co., Ltd. | 173,746 | 176,659 |
| Sun Hung Kai Properties Ltd. | 22,088 | 279,875 |
| Swire Pacific Ltd., Class A | 29,360 | 322,200 |
| The Wharf Holdings Ltd. | 40,020 | 225,918 |
| Wheelock & Co., Ltd. | 33,074 | 150,006 |
| | | 1,463,690 |
| Retailing 0.0% |
| Esprit Holdings Ltd. (b) | 339,875 | 285,055 |
| Transportation 0.0% |
| MTR Corp., Ltd. | 30,730 | 136,995 |
| Utilities 0.2% |
| CLP Holdings Ltd. | 92,432 | 765,094 |
| Hong Kong & China Gas Co., Ltd. | 116,718 | 220,181 |
| Power Assets Holdings Ltd. | 25,724 | 221,391 |
| | | 1,206,666 |
| | | 6,217,120 |
| Ireland 0.7% |
| Banks 0.1% |
| Bank of Ireland * | 863,811 | 343,604 |
| Commercial & Professional Services 0.1% |
| Experian plc | 32,941 | 561,856 |
| Food, Beverage & Tobacco 0.0% |
| Kerry Group plc, A Shares | 3,729 | 277,233 |
| Materials 0.3% |
| CRH plc | 61,428 | 1,837,074 |
| Smurfit Kappa Group plc | 14,323 | 423,130 |
| | | 2,260,204 |
| Pharmaceuticals, Biotechnology & Life Sciences 0.1% |
| Shire plc | 4,321 | 333,946 |
| Technology Hardware & Equipment 0.1% |
| Seagate Technology plc | 19,283 | 991,146 |
| | | 4,767,989 |
Schwab Fundamental International Large Company Index ETF
Portfolio Holdings (Unaudited) continued
| Security | Number
of Shares | Value
($) |
| Israel 0.5% |
| Banks 0.1% |
| Bank Hapoalim B.M. | 23,624 | 119,554 |
| Bank Leumi Le-Israel * | 61,101 | 222,242 |
| | | 341,796 |
| Materials 0.0% |
| Israel Chemicals Ltd. | 40,803 | 229,204 |
| Pharmaceuticals, Biotechnology & Life Sciences 0.3% |
| Teva Pharmaceutical Industries Ltd. | 33,587 | 2,194,029 |
| Software & Services 0.0% |
| Check Point Software Technologies Ltd. * | 2,022 | 157,736 |
| Telecommunication Services 0.1% |
| Bezeq The Israeli Telecommunication Corp., Ltd. | 261,981 | 469,525 |
| | | 3,392,290 |
| Italy 3.9% |
| Automobiles & Components 0.0% |
| Pirelli & C. S.p.A. | 15,345 | 256,879 |
| Banks 1.1% |
| Banca Monte dei Paschi di Siena S.p.A. * | 115,788 | 243,004 |
| Banca Popolare dell'Emilia Romagna SC | 28,458 | 243,618 |
| Banco Popolare SC * | 19,029 | 326,653 |
| Intesa Sanpaolo S.p.A. | 851,529 | 3,104,765 |
| UniCredit S.p.A. | 489,820 | 3,199,755 |
| Unione di Banche Italiane S.C.p.A. | 59,097 | 460,878 |
| | | 7,578,673 |
| Capital Goods 0.1% |
| Finmeccanica S.p.A. * | 37,598 | 508,491 |
| Prysmian S.p.A. | 12,852 | 274,621 |
| | | 783,112 |
| Consumer Durables & Apparel 0.0% |
| Luxottica Group S.p.A. | 2,790 | 188,822 |
| Diversified Financials 0.1% |
| EXOR S.p.A. | 14,253 | 654,311 |
| Mediobanca S.p.A. | 27,400 | 274,780 |
| | | 929,091 |
| Energy 1.0% |
| Eni S.p.A. | 420,774 | 6,897,710 |
| Saipem S.p.A. *(b) | 38,258 | 368,023 |
| | | 7,265,733 |
| Insurance 0.2% |
| Assicurazioni Generali S.p.A. | 59,985 | 1,097,591 |
| Media 0.1% |
| Mediaset S.p.A. | 102,951 | 492,803 |
| Telecommunication Services 0.5% |
| Telecom Italia S.p.A. * | 1,846,436 | 2,240,652 |
| Telecom Italia S.p.A. - RSP | 965,682 | 966,809 |
| | | 3,207,461 |
| Transportation 0.1% |
| Atlantia S.p.A. | 18,496 | 494,493 |
| Security | Number
of Shares | Value
($) |
| Utilities 0.7% |
| A2A S.p.A. | 195,300 | 239,404 |
| Enel S.p.A. | 927,420 | 4,173,322 |
| Snam S.p.A. | 104,941 | 512,912 |
| Terna Rete Elettrica Nazionale S.p.A. | 52,452 | 244,258 |
| | | 5,169,896 |
| | | 27,464,554 |
| Japan 22.9% |
| Automobiles & Components 2.9% |
| Aisin Seiki Co., Ltd. | 17,908 | 647,251 |
| Bridgestone Corp. | 41,583 | 1,395,708 |
| Daihatsu Motor Co., Ltd. | 23,778 | 290,983 |
| Denso Corp. | 25,513 | 1,142,964 |
| Fuji Heavy Industries Ltd. | 15,632 | 550,864 |
| Honda Motor Co., Ltd. | 122,333 | 3,860,225 |
| Isuzu Motors Ltd. | 29,676 | 338,304 |
| Mazda Motor Corp. | 21,911 | 377,975 |
| Mitsubishi Motors Corp. | 17,609 | 135,281 |
| NGK Spark Plug Co., Ltd. | 5,174 | 127,317 |
| NHK Spring Co., Ltd. | 27,900 | 270,286 |
| Nissan Motor Co., Ltd. | 203,577 | 1,842,835 |
| Stanley Electric Co., Ltd. | 7,816 | 152,405 |
| Sumitomo Electric Industries Ltd. | 71,804 | 987,724 |
| Sumitomo Rubber Industries Ltd. | 13,728 | 194,617 |
| Suzuki Motor Corp. | 23,036 | 784,975 |
| The Yokohama Rubber Co., Ltd. | 6,474 | 127,252 |
| Toyoda Gosei Co., Ltd. | 5,903 | 115,785 |
| Toyota Industries Corp. | 8,732 | 434,492 |
| Toyota Motor Corp. | 104,202 | 6,184,105 |
| Yamaha Motor Co., Ltd. | 13,565 | 262,267 |
| | | 20,223,615 |
| Banks 1.4% |
| Mitsubishi UFJ Financial Group, Inc. | 512,914 | 3,386,413 |
| Mizuho Financial Group, Inc. | 1,054,443 | 2,163,964 |
| North Pacific Bank Ltd. | 22,440 | 90,364 |
| Resona Holdings, Inc. | 111,600 | 565,252 |
| Sumitomo Mitsui Financial Group, Inc. | 64,760 | 2,652,710 |
| Sumitomo Mitsui Trust Holdings, Inc. | 110,297 | 456,169 |
| The Bank of Yokohama Ltd. | 39,080 | 239,411 |
| | | 9,554,283 |
| Capital Goods 3.0% |
| Asahi Glass Co., Ltd. | 145,749 | 867,146 |
| Daikin Industries Ltd. | 8,152 | 486,893 |
| Ebara Corp. | 34,246 | 136,775 |
| FANUC Corp. | 3,908 | 635,774 |
| Furukawa Electric Co., Ltd. | 131,160 | 212,133 |
| Hanwa Co., Ltd. | 54,712 | 229,801 |
| Hino Motors Ltd. | 12,912 | 142,348 |
| Hitachi Construction Machinery Co., Ltd. | 8,004 | 116,244 |
| IHI Corp. | 70,344 | 218,256 |
| ITOCHU Corp. | 105,797 | 1,270,681 |
| JGC Corp. | 13,792 | 201,784 |
| JTEKT Corp. | 13,456 | 189,762 |
| Kajima Corp. | 67,624 | 380,572 |
| Kawasaki Heavy Industries Ltd. | 80,708 | 305,689 |
| Kinden Corp. | 14,825 | 186,436 |
| Komatsu Ltd. | 52,098 | 866,043 |
| Kubota Corp. | 36,360 | 569,620 |
Schwab Fundamental International Large Company Index ETF
Portfolio Holdings (Unaudited) continued
| Security | Number
of Shares | Value
($) |
| LIXIL Group Corp. | 21,340 | 440,588 |
| Makita Corp. | 5,640 | 319,733 |
| Marubeni Corp. | 157,134 | 862,529 |
| Mitsubishi Corp. | 107,002 | 1,991,084 |
| Mitsubishi Electric Corp. | 111,972 | 1,118,935 |
| Mitsubishi Heavy Industries Ltd. | 196,795 | 940,900 |
| Mitsui & Co., Ltd. | 144,978 | 1,888,417 |
| Mitsui Engineering & Shipbuilding Co., Ltd. | 107,712 | 167,988 |
| Nagase & Co., Ltd. | 15,904 | 192,394 |
| Nidec Corp. | 5,096 | 399,741 |
| NSK Ltd. | 16,768 | 206,720 |
| Obayashi Corp. | 41,628 | 360,683 |
| Shimizu Corp. | 37,434 | 366,664 |
| SMC Corp. | 1,188 | 288,851 |
| Sojitz Corp. | 344,219 | 729,994 |
| Sumitomo Corp. | 107,244 | 1,139,387 |
| Sumitomo Heavy Industries Ltd. | 42,593 | 185,577 |
| Taisei Corp. | 54,468 | 369,457 |
| Toshiba Corp. | 352,734 | 1,117,711 |
| TOTO Ltd. | 12,912 | 190,508 |
| Toyota Tsusho Corp. | 29,088 | 670,643 |
| | | 20,964,461 |
| Commercial & Professional Services 0.3% |
| Dai Nippon Printing Co., Ltd. | 79,620 | 820,279 |
| Recruit Holdings Co., Ltd. | 3,173 | 97,663 |
| Secom Co., Ltd. | 10,171 | 651,545 |
| Toppan Printing Co., Ltd. | 83,428 | 693,254 |
| | | 2,262,741 |
| Consumer Durables & Apparel 0.9% |
| Bandai Namco Holdings, Inc. | 14,468 | 335,241 |
| Iida Group Holdings Co., Ltd. | 2,444 | 43,320 |
| Nikon Corp. | 32,204 | 413,230 |
| Panasonic Corp. | 163,912 | 1,809,071 |
| Sega Sammy Holdings, Inc. | 14,272 | 150,628 |
| Sekisui Chemical Co., Ltd. | 33,812 | 373,596 |
| Sekisui House Ltd. | 48,084 | 719,167 |
| Sharp Corp. *(b) | 189,764 | 277,165 |
| Shimano, Inc. | 2,276 | 306,697 |
| Sony Corp. * | 70,342 | 1,835,387 |
| Sumitomo Forestry Co., Ltd. | 16,004 | 179,605 |
| Yamaha Corp. | 9,562 | 219,196 |
| | | 6,662,303 |
| Consumer Services 0.1% |
| Benesse Holdings, Inc. | 5,640 | 149,860 |
| Oriental Land Co., Ltd. | 3,976 | 219,527 |
| | | 369,387 |
| Diversified Financials 0.2% |
| Daiwa Securities Group, Inc. | 21,268 | 147,806 |
| Nomura Holdings, Inc. | 66,434 | 419,978 |
| ORIX Corp. | 36,904 | 497,596 |
| | | 1,065,380 |
| Energy 0.7% |
| Cosmo Oil Co., Ltd. * | 195,992 | 305,669 |
| Idemitsu Kosan Co., Ltd. | 36,064 | 618,402 |
| Inpex Corp. | 88,676 | 894,187 |
| JX Holdings, Inc. | 636,824 | 2,464,057 |
| Security | Number
of Shares | Value
($) |
| Showa Shell Sekiyu K.K. | 28,272 | 241,928 |
| TonenGeneral Sekiyu K.K. | 43,040 | 429,743 |
| | | 4,953,986 |
| Food & Staples Retailing 0.7% |
| Aeon Co., Ltd. | 109,733 | 1,648,915 |
| Lawson, Inc. | 3,389 | 242,181 |
| Seven & i Holdings Co., Ltd. | 58,237 | 2,542,177 |
| UNY Group Holdings Co., Ltd. | 48,084 | 299,174 |
| | | 4,732,447 |
| Food, Beverage & Tobacco 1.0% |
| Ajinomoto Co., Inc. | 32,933 | 726,002 |
| Asahi Group Holdings Ltd. | 21,272 | 702,572 |
| Coca-Cola West Co., Ltd. | 13,456 | 277,037 |
| Japan Tobacco, Inc. | 44,702 | 1,597,040 |
| Kewpie Corp. | 9,568 | 211,280 |
| Kirin Holdings Co., Ltd. | 75,612 | 1,111,859 |
| MEIJI Holdings Co., Ltd. | 3,627 | 591,106 |
| NH Foods Ltd. | 18,996 | 438,906 |
| Nisshin Seifun Group, Inc. | 16,813 | 230,028 |
| Nissin Foods Holdings Co., Ltd. | 4,824 | 229,288 |
| Suntory Beverage & Food Ltd. | 5,671 | 240,065 |
| Toyo Suisan Kaisha Ltd. | 7,000 | 262,821 |
| Yamazaki Baking Co., Ltd. | 14,080 | 237,600 |
| | | 6,855,604 |
| Health Care Equipment & Services 0.4% |
| Alfresa Holdings Corp. | 27,900 | 509,721 |
| Hoya Corp. | 19,912 | 780,394 |
| Medipal Holdings Corp. | 31,536 | 546,744 |
| Olympus Corp. | 5,912 | 216,117 |
| Suzuken Co., Ltd. | 13,257 | 456,176 |
| Terumo Corp. | 9,264 | 253,416 |
| | | 2,762,568 |
| Household & Personal Products 0.2% |
| Kao Corp. | 22,357 | 1,024,269 |
| Shiseido Co., Ltd. | 21,605 | 453,637 |
| Unicharm Corp. | 9,820 | 198,612 |
| | | 1,676,518 |
| Insurance 0.4% |
| MS&AD Insurance Group Holdings, Inc. | 17,908 | 565,384 |
| Sompo Japan Nipponkoa Holdings, Inc. | 17,092 | 567,406 |
| T&D Holdings, Inc. | 17,364 | 234,199 |
| The Dai-ichi Life Insurance Co., Ltd. | 31,264 | 570,664 |
| Tokio Marine Holdings, Inc. | 22,930 | 922,612 |
| | | 2,860,265 |
| Materials 1.8% |
| Air Water, Inc. | 10,908 | 174,532 |
| Asahi Kasei Corp. | 77,953 | 622,929 |
| Daicel Corp. | 18,724 | 247,521 |
| Denki Kagaku Kogyo K.K. | 49,444 | 210,938 |
| DIC Corp. | 80,708 | 195,135 |
| Hitachi Chemical Co., Ltd. | 8,172 | 125,832 |
| JFE Holdings, Inc. | 51,431 | 798,934 |
| JSR Corp. | 11,452 | 180,306 |
| Kaneka Corp. | 39,080 | 317,000 |
| Kobe Steel Ltd. | 357,160 | 480,398 |
| Kuraray Co., Ltd. | 23,800 | 281,825 |
| Mitsubishi Chemical Holdings Corp. | 144,048 | 821,009 |
Schwab Fundamental International Large Company Index ETF
Portfolio Holdings (Unaudited) continued
| Security | Number
of Shares | Value
($) |
| Mitsubishi Materials Corp. | 94,220 | 303,221 |
| Mitsui Chemicals, Inc. | 130,404 | 442,266 |
| Mitsui Mining & Smelting Co., Ltd. | 80,708 | 165,832 |
| Nippon Paper Industries Co., Ltd. | 14,892 | 244,175 |
| Nippon Steel & Sumitomo Metal Corp. | 522,496 | 1,076,596 |
| Nitto Denko Corp. | 9,149 | 616,955 |
| Oji Holdings Corp. | 106,876 | 495,641 |
| Shin-Etsu Chemical Co., Ltd. | 16,366 | 901,187 |
| Showa Denko K.K. | 216,300 | 248,098 |
| Sumitomo Chemical Co., Ltd. | 141,752 | 706,508 |
| Sumitomo Metal Mining Co., Ltd. | 31,629 | 402,197 |
| Taiheiyo Cement Corp. | 65,076 | 220,706 |
| Taiyo Nippon Sanso Corp. | 15,015 | 184,118 |
| Teijin Ltd. | 135,104 | 430,335 |
| Toray Industries, Inc. | 88,280 | 780,923 |
| Tosoh Corp. | 49,444 | 233,786 |
| Toyo Seikan Group Holdings Ltd. | 25,724 | 422,631 |
| Ube Industries Ltd. | 148,504 | 257,341 |
| | | 12,588,875 |
| Media 0.1% |
| Dentsu, Inc. | 12,400 | 636,448 |
| Hakuhodo DY Holdings, Inc. | 36,632 | 366,970 |
| | | 1,003,418 |
| Pharmaceuticals, Biotechnology & Life Sciences 1.0% |
| Astellas Pharma, Inc. | 78,148 | 1,160,758 |
| Chugai Pharmaceutical Co., Ltd. | 7,000 | 261,955 |
| Daiichi Sankyo Co., Ltd. | 47,256 | 911,506 |
| Eisai Co., Ltd. | 11,914 | 813,438 |
| Kyowa Hakko Kirin Co., Ltd. | 18,180 | 305,888 |
| Mitsubishi Tanabe Pharma Corp. | 11,887 | 213,051 |
| Ono Pharmaceutical Co., Ltd. | 2,068 | 264,163 |
| Otsuka Holdings Co., Ltd. | 23,720 | 809,457 |
| Shionogi & Co., Ltd. | 8,437 | 331,395 |
| Takeda Pharmaceutical Co., Ltd. | 44,920 | 2,209,952 |
| | | 7,281,563 |
| Real Estate 0.4% |
| Daito Trust Construction Co., Ltd. | 4,280 | 468,669 |
| Daiwa House Industry Co., Ltd. | 31,536 | 775,746 |
| Mitsubishi Estate Co., Ltd. | 25,452 | 547,958 |
| Mitsui Fudosan Co., Ltd. | 20,184 | 559,626 |
| Sumitomo Realty & Development Co., Ltd. | 9,612 | 325,278 |
| Tokyu Fudosan Holdings Corp. | 5,074 | 34,919 |
| | | 2,712,196 |
| Retailing 0.5% |
| EDION Corp. (b) | 36,088 | 262,653 |
| Fast Retailing Co., Ltd. | 966 | 392,705 |
| Isetan Mitsukoshi Holdings Ltd. | 27,219 | 436,187 |
| J Front Retailing Co., Ltd. | 21,077 | 342,457 |
| K's Holdings Corp. | 8,460 | 270,167 |
| Marui Group Co., Ltd. | 19,141 | 231,868 |
| Nitori Holdings Co., Ltd. | 3,179 | 253,145 |
| Shimamura Co., Ltd. | 3,364 | 311,181 |
| Takashimaya Co., Ltd. | 28,544 | 247,318 |
| Yamada Denki Co., Ltd. | 213,335 | 822,110 |
| | | 3,569,791 |
| Security | Number
of Shares | Value
($) |
| Semiconductors & Semiconductor Equipment 0.1% |
| Rohm Co., Ltd. | 6,144 | 334,109 |
| Tokyo Electron Ltd. | 6,480 | 341,044 |
| | | 675,153 |
| Software & Services 0.6% |
| Fujitsu Ltd. | 250,284 | 1,243,520 |
| Konami Corp. | 10,516 | 231,173 |
| Nintendo Co., Ltd. | 8,541 | 1,762,680 |
| Nomura Research Institute Ltd. | 3,859 | 156,831 |
| NTT Data Corp. | 11,724 | 564,989 |
| | | 3,959,193 |
| Technology Hardware & Equipment 1.8% |
| Brother Industries Ltd. | 17,908 | 244,862 |
| Canon, Inc. | 89,399 | 2,734,679 |
| FUJIFILM Holdings Corp. | 37,165 | 1,530,026 |
| Hitachi Ltd. | 428,437 | 2,410,433 |
| Ibiden Co., Ltd. | 13,184 | 186,579 |
| Keyence Corp. | 372 | 173,100 |
| Konica Minolta, Inc. | 44,700 | 491,318 |
| Kyocera Corp. | 21,272 | 1,045,301 |
| Murata Manufacturing Co., Ltd. | 5,054 | 731,920 |
| NEC Corp. | 315,292 | 996,467 |
| Nippon Electric Glass Co., Ltd. | 69,310 | 306,557 |
| Omron Corp. | 8,188 | 308,101 |
| Ricoh Co., Ltd. | 70,344 | 688,145 |
| Seiko Epson Corp. | 16,483 | 267,542 |
| TDK Corp. | 7,309 | 455,361 |
| | | 12,570,391 |
| Telecommunication Services 1.6% |
| KDDI Corp. | 115,893 | 2,886,208 |
| Nippon Telegraph & Telephone Corp. | 109,213 | 4,172,146 |
| NTT DOCOMO, Inc. | 124,602 | 2,610,077 |
| SoftBank Group Corp. | 29,873 | 1,741,082 |
| | | 11,409,513 |
| Transportation 1.3% |
| ANA Holdings, Inc. | 82,672 | 242,794 |
| Central Japan Railway Co. | 7,360 | 1,207,687 |
| East Japan Railway Co. | 21,037 | 1,945,122 |
| Hankyu Hanshin Holdings, Inc. | 65,076 | 390,934 |
| Kamigumi Co., Ltd. | 23,448 | 196,585 |
| Kawasaki Kisen Kaisha Ltd. | 113,036 | 251,844 |
| Keio Corp. | 15,365 | 115,378 |
| Kintetsu Group Holdings Co., Ltd. | 78,160 | 279,269 |
| Mitsui OSK Lines Ltd. | 171,952 | 485,271 |
| Nagoya Railroad Co., Ltd. | 57,260 | 228,218 |
| Nippon Express Co., Ltd. | 111,728 | 542,114 |
| Nippon Yusen K.K. | 234,652 | 617,684 |
| Odakyu Electric Railway Co., Ltd. | 20,383 | 186,363 |
| Seino Holdings Co., Ltd. | 20,728 | 230,397 |
| Tobu Railway Co., Ltd. | 51,992 | 232,105 |
| Tokyu Corp. | 57,260 | 406,823 |
| West Japan Railway Co. | 14,288 | 965,385 |
| Yamato Holdings Co., Ltd. | 28,808 | 562,562 |
| | | 9,086,535 |
| Utilities 1.5% |
| Chubu Electric Power Co., Inc. | 91,935 | 1,425,093 |
| Electric Power Development Co., Ltd. | 9,820 | 307,926 |
| Hokkaido Electric Power Co., Inc. * | 31,536 | 346,627 |
| Hokuriku Electric Power Co. | 19,710 | 284,952 |
Schwab Fundamental International Large Company Index ETF
Portfolio Holdings (Unaudited) continued
| Security | Number
of Shares | Value
($) |
| Kyushu Electric Power Co., Inc. * | 49,202 | 587,086 |
| Osaka Gas Co., Ltd. | 179,768 | 730,732 |
| Shikoku Electric Power Co., Inc. | 20,184 | 315,955 |
| The Chugoku Electric Power Co., Inc. | 31,856 | 466,333 |
| The Kansai Electric Power Co., Inc. * | 96,335 | 1,203,144 |
| Toho Gas Co., Ltd. | 36,360 | 219,327 |
| Tohoku Electric Power Co., Inc. | 51,724 | 710,653 |
| Tokyo Electric Power Co., Inc. * | 394,675 | 2,703,142 |
| Tokyo Gas Co., Ltd. | 179,768 | 983,951 |
| | | 10,284,921 |
| | | 160,085,107 |
| Luxembourg 0.4% |
| Energy 0.0% |
| Tenaris S.A. | 25,805 | 334,830 |
| Materials 0.3% |
| ArcelorMittal | 225,300 | 1,751,741 |
| Media 0.1% |
| RTL Group S.A. * | 3,101 | 269,739 |
| SES S.A. | 11,439 | 339,340 |
| | | 609,079 |
| Telecommunication Services 0.0% |
| Millicom International Cellular S.A. | 4,547 | 302,767 |
| | | 2,998,417 |
| Netherlands 5.3% |
| Banks 0.3% |
| ING Groep N.V. CVA | 124,468 | 1,903,018 |
| Capital Goods 0.2% |
| Boskalis Westminster | 3,402 | 176,988 |
| Koninklijke Philips N.V. | 60,264 | 1,547,691 |
| | | 1,724,679 |
| Commercial & Professional Services 0.1% |
| Randstad Holding N.V. | 8,370 | 528,483 |
| Energy 3.0% |
| Fugro N.V. CVA * | 9,806 | 204,699 |
| Royal Dutch Shell plc, A Shares | 498,510 | 13,003,749 |
| Royal Dutch Shell plc, B Shares | 309,874 | 8,132,945 |
| | | 21,341,393 |
| Food & Staples Retailing 0.3% |
| Koninklijke Ahold N.V. | 99,838 | 1,970,563 |
| Food, Beverage & Tobacco 0.2% |
| Heineken Holding N.V. | 6,975 | 486,123 |
| Heineken N.V. | 7,675 | 606,289 |
| | | 1,092,412 |
| Household & Personal Products 0.3% |
| Unilever N.V. CVA | 55,390 | 2,217,874 |
| Insurance 0.1% |
| Aegon N.V. | 103,805 | 638,096 |
| Delta Lloyd N.V. | 11,633 | 123,400 |
| | | 761,496 |
| Materials 0.3% |
| Akzo Nobel N.V. | 17,593 | 1,189,480 |
| Koninklijke DSM N.V. | 12,095 | 635,745 |
| | | 1,825,225 |
| Security | Number
of Shares | Value
($) |
| Media 0.1% |
| RELX N.V. | 14,652 | 225,495 |
| Wolters Kluwer N.V. | 11,493 | 363,801 |
| | | 589,296 |
| Semiconductors & Semiconductor Equipment 0.1% |
| ASML Holding N.V. | 3,540 | 323,989 |
| NXP Semiconductor N.V. * | 1,314 | 111,230 |
| | | 435,219 |
| Software & Services 0.0% |
| Gemalto N.V. | 2,138 | 153,799 |
| Telecommunication Services 0.2% |
| Koninklijke KPN N.V. | 436,405 | 1,697,779 |
| VimpelCom Ltd. ADR | 8,194 | 38,266 |
| | | 1,736,045 |
| Transportation 0.1% |
| PostNL N.V. * | 64,251 | 242,401 |
| TNT Express N.V. | 55,550 | 469,069 |
| | | 711,470 |
| | | 36,990,972 |
| New Zealand 0.1% |
| Materials 0.0% |
| Fletcher Building Ltd. | 47,713 | 217,543 |
| Telecommunication Services 0.1% |
| Spark New Zealand Ltd. | 213,194 | 456,317 |
| Utilities 0.0% |
| Meridian Energy Ltd. | 156,286 | 218,719 |
| | | 892,579 |
| Norway 0.8% |
| Banks 0.1% |
| DNB A.S.A. | 35,991 | 508,182 |
| Energy 0.4% |
| Petroleum Geo-Services A.S.A. | 37,425 | 165,045 |
| Statoil A.S.A. | 181,306 | 2,678,904 |
| | | 2,843,949 |
| Food, Beverage & Tobacco 0.1% |
| Marine Harvest A.S.A. | 16,309 | 194,103 |
| Orkla A.S.A. | 64,170 | 466,805 |
| | | 660,908 |
| Materials 0.1% |
| Norsk Hydro A.S.A. | 95,162 | 325,247 |
| Yara International A.S.A. | 13,950 | 614,366 |
| | | 939,613 |
| Telecommunication Services 0.1% |
| Telenor A.S.A. | 43,382 | 854,142 |
| | | 5,806,794 |
| Portugal 0.2% |
| Banks 0.0% |
| Banco Comercial Portugues S.A. - Reg'd * | 2,212,532 | 156,186 |
| Energy 0.1% |
| Galp Energia, SGPS, S.A. | 33,596 | 353,744 |
Schwab Fundamental International Large Company Index ETF
Portfolio Holdings (Unaudited) continued
| Security | Number
of Shares | Value
($) |
| Food & Staples Retailing 0.0% |
| Jeronimo Martins, SGPS, S.A. | 17,709 | 245,060 |
| Telecommunication Services 0.0% |
| Pharol SGPS S.A. * | 400,757 | 116,752 |
| Utilities 0.1% |
| EDP - Energias de Portugal S.A. | 212,110 | 742,954 |
| | | 1,614,696 |
| Singapore 0.8% |
| Banks 0.3% |
| DBS Group Holdings Ltd. | 48,356 | 608,950 |
| Oversea-Chinese Banking Corp., Ltd. | 80,164 | 507,598 |
| United Overseas Bank Ltd. | 42,529 | 584,423 |
| | | 1,700,971 |
| Capital Goods 0.1% |
| Keppel Corp., Ltd. | 74,036 | 359,077 |
| Sembcorp Industries Ltd. | 65,076 | 157,810 |
| | | 516,887 |
| Food, Beverage & Tobacco 0.1% |
| Golden Agri-Resources Ltd. | 550,539 | 122,966 |
| Wilmar International Ltd. | 137,320 | 277,503 |
| | | 400,469 |
| Media 0.0% |
| Singapore Press Holdings Ltd. | 75,068 | 209,720 |
| Real Estate 0.0% |
| CapitaLand Ltd. | 73,995 | 147,959 |
| Retailing 0.0% |
| Jardine Cycle & Carriage Ltd. | 6,536 | 132,546 |
| Technology Hardware & Equipment 0.1% |
| Flextronics International Ltd. * | 47,619 | 500,475 |
| Venture Corp., Ltd. | 24,364 | 138,379 |
| | | 638,854 |
| Telecommunication Services 0.1% |
| Singapore Telecommunications Ltd. | 340,696 | 903,498 |
| Transportation 0.1% |
| ComfortDelGro Corp., Ltd. | 99,060 | 197,375 |
| Hutchison Port Holdings Trust | 383,156 | 201,157 |
| Singapore Airlines Ltd. | 47,872 | 336,730 |
| | | 735,262 |
| | | 5,386,166 |
| Spain 4.3% |
| Banks 1.7% |
| Banco Bilbao Vizcaya Argentaria S.A. | 366,382 | 3,392,217 |
| Banco de Sabadell S.A. | 157,167 | 334,601 |
| Banco Popular Espanol S.A. | 118,065 | 505,487 |
| Banco Santander S.A. | 1,234,891 | 7,554,974 |
| CaixaBank S.A. | 87,142 | 376,900 |
| | | 12,164,179 |
| Capital Goods 0.2% |
| ACS, Actividades de Construccion y Servicios S.A. | 19,003 | 616,109 |
| Ferrovial S.A. | 26,423 | 631,220 |
| | | 1,247,329 |
| Security | Number
of Shares | Value
($) |
| Energy 0.3% |
| Repsol S.A. | 149,957 | 2,143,181 |
| Food & Staples Retailing 0.0% |
| Distribuidora Internacional de Alimentacion S.A. * | 25,120 | 151,037 |
| Insurance 0.0% |
| Mapfre S.A. | 68,754 | 202,612 |
| Retailing 0.2% |
| Industria de Diseno Textil S.A. | 29,204 | 973,184 |
| Software & Services 0.1% |
| Amadeus IT Holding S.A., A Shares | 8,931 | 373,368 |
| Telecommunication Services 1.1% |
| Telefonica S.A. | 553,817 | 7,812,747 |
| Transportation 0.1% |
| Abertis Infraestructuras S.A. | 21,342 | 352,966 |
| Utilities 0.6% |
| Acciona S.A. | 3,365 | 250,398 |
| Enagas S.A. | 7,533 | 206,122 |
| Endesa S.A. | 21,924 | 454,468 |
| Gas Natural SDG S.A. | 22,917 | 464,781 |
| Iberdrola S.A. | 409,860 | 2,780,747 |
| Red Electrica Corp. S.A. | 3,649 | 291,279 |
| | | 4,447,795 |
| | | 29,868,398 |
| Sweden 2.3% |
| Automobiles & Components 0.1% |
| Autoliv, Inc. (b) | 4,501 | 459,777 |
| Banks 0.5% |
| Nordea Bank AB | 107,315 | 1,267,254 |
| Skandinaviska Enskilda Banken AB, A Shares | 47,724 | 554,279 |
| Svenska Handelsbanken AB, A Shares | 51,948 | 774,452 |
| Swedbank AB, A Shares | 25,456 | 580,206 |
| | | 3,176,191 |
| Capital Goods 0.7% |
| Alfa Laval AB | 13,680 | 230,224 |
| Assa Abloy AB, B Shares | 22,740 | 434,419 |
| Atlas Copco AB, A Shares | 27,063 | 680,941 |
| Atlas Copco AB, B Shares | 12,107 | 275,663 |
| NCC AB, B Shares | 8,928 | 259,993 |
| Sandvik AB | 72,840 | 702,196 |
| Skanska AB, B Shares | 27,740 | 542,688 |
| SKF AB, B Shares | 24,885 | 474,810 |
| Trelleborg AB, B Shares | 10,328 | 168,335 |
| Volvo AB, A Shares | 16,825 | 182,224 |
| Volvo AB, B Shares | 98,573 | 1,069,924 |
| | | 5,021,417 |
| Commercial & Professional Services 0.1% |
| Securitas AB, B Shares | 23,835 | 303,371 |
| Consumer Durables & Apparel 0.1% |
| Electrolux AB, Series B | 19,261 | 542,743 |
| Husqvarna AB, B Shares | 34,317 | 222,437 |
| | | 765,180 |
| Food, Beverage & Tobacco 0.0% |
| Swedish Match AB | 9,612 | 283,537 |
Schwab Fundamental International Large Company Index ETF
Portfolio Holdings (Unaudited) continued
| Security | Number
of Shares | Value
($) |
| Health Care Equipment & Services 0.0% |
| Getinge AB, B Shares | 8,150 | 180,764 |
| Household & Personal Products 0.1% |
| Svenska Cellulosa AB SCA, B Shares | 32,408 | 921,987 |
| Materials 0.1% |
| Boliden AB | 25,123 | 414,214 |
| SSAB AB, A Shares *(b) | 40,827 | 171,098 |
| SSAB AB, B Shares * | 7,910 | 28,851 |
| | | 614,163 |
| Retailing 0.2% |
| Hennes & Mauritz AB, B Shares | 30,805 | 1,182,790 |
| Technology Hardware & Equipment 0.2% |
| Telefonaktiebolaget LM Ericsson, B Shares | 164,614 | 1,601,472 |
| Telecommunication Services 0.2% |
| Tele2 AB, B Shares | 47,493 | 468,200 |
| TeliaSonera AB | 186,732 | 1,051,478 |
| | | 1,519,678 |
| | | 16,030,327 |
| Switzerland 5.6% |
| Capital Goods 0.5% |
| ABB Ltd. - Reg'd * | 108,187 | 2,088,673 |
| Geberit AG - Reg'd | 865 | 274,872 |
| Schindler Holding AG | 1,126 | 172,675 |
| Schindler Holding AG - Reg'd | 279 | 43,449 |
| Wolseley plc | 17,309 | 1,119,956 |
| | | 3,699,625 |
| Commercial & Professional Services 0.1% |
| Adecco S.A. - Reg'd * | 9,846 | 773,284 |
| SGS S.A. - Reg'd | 157 | 276,968 |
| | | 1,050,252 |
| Consumer Durables & Apparel 0.2% |
| Cie Financiere Richemont S.A. - Reg'd | 11,245 | 841,296 |
| The Swatch Group AG | 850 | 325,480 |
| The Swatch Group AG - Reg'd | 1,763 | 130,532 |
| | | 1,297,308 |
| Diversified Financials 0.3% |
| Credit Suisse Group AG - Reg'd * | 48,444 | 1,299,955 |
| UBS Group AG * | 24,047 | 498,073 |
| | | 1,798,028 |
| Energy 0.1% |
| Transocean Ltd. (b) | 52,675 | 720,090 |
| Food, Beverage & Tobacco 1.2% |
| Aryzta AG * | 1,274 | 65,317 |
| Chocoladefabriken Lindt & Sprungli AG | 13 | 73,399 |
| Chocoladefabriken Lindt & Sprungli AG - Reg'd | 2 | 134,605 |
| Coca-Cola HBC AG CDI * | 11,176 | 229,813 |
| Nestle S.A. - Reg'd | 107,815 | 7,949,133 |
| | | 8,452,267 |
| Insurance 0.6% |
| Baloise Holding AG - Reg'd | 2,232 | 273,273 |
| Swiss Life Holding AG - Reg'd * | 1,116 | 261,271 |
| Security | Number
of Shares | Value
($) |
| Swiss Re AG | 16,259 | 1,396,319 |
| Zurich Insurance Group AG * | 8,151 | 2,239,513 |
| | | 4,170,376 |
| Materials 0.6% |
| Clariant AG - Reg'd * | 14,787 | 266,825 |
| Givaudan S.A. - Reg'd * | 172 | 296,138 |
| Glencore plc * | 646,050 | 1,473,546 |
| LafargeHolcim Ltd. - Reg'd * | 13,923 | 885,440 |
| Sika AG | 50 | 165,503 |
| Syngenta AG - Reg'd | 3,196 | 1,107,140 |
| | | 4,194,592 |
| Pharmaceuticals, Biotechnology & Life Sciences 1.7% |
| Actelion Ltd. - Reg'd * | 1,269 | 173,215 |
| Lonza Group AG - Reg'd * | 1,729 | 237,077 |
| Novartis AG - Reg'd | 68,269 | 6,685,357 |
| Roche Holding AG | 17,791 | 4,856,858 |
| Roche Holding AG, Bearer Shares | 622 | 169,964 |
| | | 12,122,471 |
| Semiconductors & Semiconductor Equipment 0.1% |
| STMicroelectronics N.V. | 53,858 | 390,451 |
| Technology Hardware & Equipment 0.1% |
| TE Connectivity Ltd. | 12,281 | 728,140 |
| Telecommunication Services 0.1% |
| Swisscom AG - Reg'd | 1,116 | 602,978 |
| Transportation 0.0% |
| Kuehne & Nagel International AG - Reg'd | 2,511 | 334,436 |
| | | 39,561,014 |
| United Kingdom 16.8% |
| Automobiles & Components 0.1% |
| Fiat Chrysler Automobiles N.V. * | 55,468 | 779,385 |
| GKN plc | 56,916 | 255,345 |
| | | 1,034,730 |
| Banks 2.3% |
| Barclays plc | 995,036 | 4,001,141 |
| HSBC Holdings plc | 1,006,299 | 8,027,858 |
| Lloyds Banking Group plc | 1,751,325 | 2,084,260 |
| Royal Bank of Scotland Group plc * | 117,618 | 609,259 |
| Standard Chartered plc | 113,056 | 1,330,183 |
| | | 16,052,701 |
| Capital Goods 0.7% |
| BAE Systems plc | 207,126 | 1,440,528 |
| Balfour Beatty plc | 104,751 | 439,017 |
| Bunzl plc | 11,816 | 316,029 |
| Carillion plc | 39,897 | 209,427 |
| CNH Industrial N.V. | 13,733 | 108,330 |
| Cobham plc | 48,825 | 211,461 |
| DCC plc | 3,089 | 230,845 |
| IMI plc | 12,860 | 205,303 |
| Meggitt plc | 25,110 | 184,368 |
| Rolls-Royce Holdings plc * | 83,312 | 952,675 |
| Smiths Group plc | 16,182 | 280,985 |
| The Weir Group plc | 7,434 | 160,526 |
| Travis Perkins plc | 11,160 | 351,520 |
| | | 5,091,014 |
Schwab Fundamental International Large Company Index ETF
Portfolio Holdings (Unaudited) continued
| Security | Number
of Shares | Value
($) |
| Commercial & Professional Services 0.2% |
| AA plc * | 6,294 | 32,196 |
| Aggreko plc | 7,830 | 128,494 |
| Babcock International Group plc | 12,329 | 183,742 |
| Capita plc | 17,298 | 328,829 |
| G4S plc | 109,096 | 430,380 |
| Intertek Group plc | 4,756 | 185,502 |
| Serco Group plc | 95,193 | 165,440 |
| | | 1,454,583 |
| Consumer Durables & Apparel 0.2% |
| Barratt Developments plc | 37,675 | 370,553 |
| Burberry Group plc | 9,486 | 205,857 |
| Persimmon plc * | 6,088 | 196,911 |
| Taylor Wimpey plc | 109,151 | 337,931 |
| | | 1,111,252 |
| Consumer Services 0.3% |
| Carnival plc | 7,599 | 388,017 |
| Compass Group plc | 68,408 | 1,088,939 |
| InterContinental Hotels Group plc | 6,143 | 232,041 |
| Thomas Cook Group plc * | 128,643 | 212,098 |
| Whitbread plc | 3,386 | 249,812 |
| William Hill plc | 29,295 | 162,201 |
| | | 2,333,108 |
| Diversified Financials 0.1% |
| 3i Group plc | 5,431 | 41,079 |
| ICAP plc | 30,411 | 212,392 |
| Man Group plc | 210,860 | 522,452 |
| | | 775,923 |
| Energy 2.6% |
| Amec Foster Wheeler plc | 27,416 | 340,067 |
| BG Group plc | 164,140 | 2,510,841 |
| BP plc | 2,609,627 | 14,469,052 |
| John Wood Group plc | 28,508 | 279,953 |
| Petrofac Ltd. | 16,248 | 222,906 |
| Subsea 7 S.A. * | 23,482 | 197,143 |
| Tullow Oil plc * | 38,987 | 133,835 |
| | | 18,153,797 |
| Food & Staples Retailing 0.9% |
| Booker Group plc | 80,951 | 210,285 |
| J Sainsbury plc | 282,439 | 1,054,267 |
| Tesco plc | 1,277,738 | 3,760,336 |
| William Morrison Supermarkets plc | 555,968 | 1,440,808 |
| | | 6,465,696 |
| Food, Beverage & Tobacco 1.4% |
| Associated British Foods plc | 10,650 | 524,478 |
| British American Tobacco plc | 74,640 | 3,993,764 |
| Diageo plc | 65,065 | 1,731,211 |
| Imperial Tobacco Group plc | 41,047 | 1,994,286 |
| SABMiller plc | 21,505 | 1,010,101 |
| Tate & Lyle plc | 32,085 | 267,459 |
| | | 9,521,299 |
| Health Care Equipment & Services 0.1% |
| Smith & Nephew plc | 27,912 | 499,260 |
| Household & Personal Products 0.5% |
| Reckitt Benckiser Group plc | 17,856 | 1,581,018 |
| Unilever plc | 46,872 | 1,890,898 |
| | | 3,471,916 |
| Security | Number
of Shares | Value
($) |
| Insurance 0.8% |
| Admiral Group plc | 9,104 | 217,030 |
| Amlin plc | 28,737 | 228,059 |
| Aviva plc | 206,744 | 1,538,350 |
| Direct Line Insurance Group plc | 79,909 | 433,960 |
| Legal & General Group plc | 126,990 | 493,550 |
| Old Mutual plc | 192,332 | 592,205 |
| Phoenix Group Holdings | 12,763 | 165,575 |
| Prudential plc | 48,825 | 1,064,817 |
| RSA Insurance Group plc | 76,488 | 604,662 |
| Standard Life plc | 54,983 | 351,870 |
| Willis Group Holdings plc | 5,859 | 252,465 |
| | | 5,942,543 |
| Materials 1.4% |
| Anglo American plc | 149,468 | 1,703,424 |
| Antofagasta plc | 25,712 | 240,829 |
| BHP Billiton plc | 151,112 | 2,630,884 |
| DS Smith plc | 34,044 | 206,664 |
| Johnson Matthey plc | 12,921 | 537,551 |
| KAZ Minerals plc * | 68,437 | 183,567 |
| Mondi plc | 18,253 | 414,921 |
| Rexam plc | 54,427 | 450,771 |
| Rio Tinto plc | 81,830 | 3,005,407 |
| Vedanta Resources plc | 23,455 | 197,504 |
| | | 9,571,522 |
| Media 0.5% |
| Informa plc | 27,900 | 248,450 |
| ITV plc | 55,800 | 214,723 |
| Liberty Global plc, Class A * | 3,526 | 169,671 |
| Liberty Global plc, Series C * | 10,875 | 487,961 |
| Pearson plc | 41,013 | 714,674 |
| RELX plc | 19,009 | 305,515 |
| Sky plc | 34,043 | 546,095 |
| WPP plc | 39,622 | 823,281 |
| | | 3,510,370 |
| Pharmaceuticals, Biotechnology & Life Sciences 1.5% |
| AstraZeneca plc | 78,463 | 4,971,855 |
| GlaxoSmithKline plc | 276,095 | 5,692,221 |
| | | 10,664,076 |
| Real Estate 0.1% |
| Land Securities Group plc | 18,172 | 349,916 |
| Retailing 0.5% |
| Home Retail Group plc | 223,479 | 522,784 |
| Inchcape plc | 35,748 | 401,632 |
| Kingfisher plc | 194,608 | 1,066,132 |
| Marks & Spencer Group plc | 123,360 | 989,430 |
| Next plc | 4,775 | 583,477 |
| | | 3,563,455 |
| Software & Services 0.1% |
| The Sage Group plc | 44,082 | 349,499 |
| Telecommunication Services 1.4% |
| BT Group plc | 311,012 | 2,092,005 |
| Inmarsat plc | 15,345 | 231,522 |
| Vodafone Group plc | 2,070,499 | 7,219,098 |
| | | 9,542,625 |
| Transportation 0.1% |
| easyJet plc | 6,812 | 176,326 |
| Firstgroup plc * | 226,118 | 379,069 |
Schwab Fundamental International Large Company Index ETF
Portfolio Holdings (Unaudited) continued
| Security | Number
of Shares | Value
($) |
| International Consolidated Airlines Group S.A. * | 31,596 | 261,925 |
| Royal Mail plc | 27,106 | 193,437 |
| | | 1,010,757 |
| Utilities 1.0% |
| Centrica plc | 490,208 | 1,833,582 |
| Drax Group plc | 44,031 | 198,148 |
| National Grid plc | 175,929 | 2,327,249 |
| Pennon Group plc | 15,136 | 179,366 |
| Severn Trent plc | 13,392 | 427,798 |
| SSE plc | 73,118 | 1,654,220 |
| United Utilities Group plc | 34,378 | 452,067 |
| | | 7,072,430 |
| | | 117,542,472 |
| Total Common Stock |
| (Cost $753,063,762) | | 692,719,251 |
|
| Preferred Stock 0.4% of net assets |
| Germany 0.4% |
| Automobiles & Components 0.3% |
| Bayerische Motoren Werke AG | 3,069 | 223,213 |
| Volkswagen AG | 10,704 | 2,032,954 |
| | | 2,256,167 |
| Household & Personal Products 0.1% |
| Henkel AG & Co. KGaA | 5,301 | 554,181 |
| Utilities 0.0% |
| RWE AG | 3,938 | 47,699 |
| | | 2,858,047 |
| Italy 0.0% |
| Banks 0.0% |
| Intesa Sanpaolo S.p.A. - RSP | 66,681 | 219,964 |
| Total Preferred Stock |
| (Cost $3,713,046) | | 3,078,011 |
|
| Rights 0.0% of net assets |
| Australia 0.0% |
| Banks 0.0% |
| Commonwealth Bank of Australia * | 2,185 | 5,499 |
| Total Rights |
| (Cost $—) | | 5,499 |
|
| Other Investment Companies 0.4% of net assets |
| United States 0.4% |
| Money Market Fund 0.2% |
| State Street Institutional U.S. Government Money Market Fund, Premier Class 0.00% (a) | 1,615,091 | 1,615,091 |
| Security | Number
of Shares | Value
($) |
| Securities Lending Collateral 0.2% |
| State Street Institutional U.S. Government Money Market Fund, Premier Class 0.00% (a) | 1,346,797 | 1,346,797 |
| Total Other Investment Companies |
| (Cost $2,961,888) | | 2,961,888 |
End of Investments.
At 08/31/15, the tax basis cost of the fund's investments was $759,828,882 and the unrealized appreciation and depreciation were $15,396,008 and ($76,460,241), respectively, with a net unrealized depreciation of ($61,064,233).
| * | Non-income producing security. |
| (a) | The rate shown is the 7-day yield. |
| (b) | All or a portion of this security is on loan. Securities on loan were valued at $1,548,083. Non-cash collateral pledged to the fund for securities on loan amounted to $265,345. |
| | |
| ADR — | American Depositary Receipt |
| CDI — | CHESS Depositary Interest |
| CVA — | Dutch Certificate |
| Reg'd — | Registered |
| REIT — | Real Estate Investment Trust |
| RSP — | Risparmio (Convertible Savings Shares) |
In addition to the above, the fund held the following at 08/31/15:
| | Number of
Contracts | Contract
Value
($) | Unrealized
Depreciation
($) |
| Futures Contracts | | | |
| MSCI EAFE, e-mini, Long, expires 09/18/15 | 20 | 1,732,700 | (91,161) |
Schwab Fundamental International Small Company Index ETF
Portfolio Holdings as of August 31, 2015 (Unaudited)
This section shows all the securities in the fund's portfolio and their values as of the report date.
The fund files its complete schedule of portfolio holdings with the SEC for the first and third quarters of each fiscal year on Form N-Q. The fund's Form N-Q is available on the SEC's website at www.sec.gov and may be viewed and copied at the SEC's Public Reference Room in Washington, D.C. Call 1-800-SEC-0330 for information on the operation of the Public Reference Room. The fund also makes available its complete schedule of portfolio holdings on a daily basis on the fund's website at www.csimfunds.com/schwabetfs_prospectus.
| Holdings by Category | Cost
($) | Value
($) |
| 99.3% | Common Stock | 324,181,328 | 310,023,650 |
| 0.3% | Preferred Stock | 958,756 | 924,869 |
| 0.8% | Other Investment Companies | 2,357,250 | 2,348,544 |
| 100.4% | Total Investments | 327,497,334 | 313,297,063 |
| (0.4%) | Other Assets and
Liabilities, Net | | (1,186,015) |
| 100.0% | Net Assets | | 312,111,048 |
| Security | Number
of Shares | Value
($) |
| Common Stock 99.3% of net assets |
| Australia 4.9% |
| Banks 0.1% |
| Bank of Queensland Ltd. | 30,920 | 277,736 |
| Capital Goods 0.2% |
| Cardno Ltd. (b) | 61,387 | 121,422 |
| GWA Group Ltd. | 81,083 | 152,332 |
| Monadelphous Group Ltd. (b) | 34,380 | 183,046 |
| Seven Group Holdings Ltd. | 21,688 | 76,264 |
| | | 533,064 |
| Commercial & Professional Services 0.4% |
| ALS Ltd. | 91,642 | 342,390 |
| Cabcharge Australia Ltd. | 25,209 | 55,760 |
| Mineral Resources Ltd. | 28,633 | 88,708 |
| Recall Holdings Ltd. | 7,497 | 37,205 |
| SAI Global Ltd. | 34,586 | 107,887 |
| Seek Ltd. | 10,698 | 93,591 |
| Spotless Group Holdings Ltd. | 24,861 | 35,074 |
| Transfield Services Ltd. * | 300,208 | 249,014 |
| Transpacific Industries Group Ltd. | 409,509 | 198,870 |
| | | 1,208,499 |
| Consumer Durables & Apparel 0.1% |
| Billabong International Ltd. * | 331,968 | 152,977 |
| G.U.D. Holdings Ltd. | 30,411 | 192,098 |
| | | 345,075 |
| Consumer Services 0.5% |
| Ardent Leisure Group | 67,938 | 118,003 |
| Aristocrat Leisure Ltd. | 28,256 | 169,071 |
| Crown Resorts Ltd. | 63,037 | 511,254 |
| Echo Entertainment Group Ltd. | 123,430 | 430,528 |
| Flight Centre Travel Group Ltd. (b) | 4,775 | 125,287 |
| Security | Number
of Shares | Value
($) |
| InvoCare Ltd. | 4,203 | 34,565 |
| Navitas Ltd. | 26,451 | 74,635 |
| | | 1,463,343 |
| Diversified Financials 0.2% |
| ASX Ltd. | 12,415 | 347,135 |
| Challenger Ltd. | 39,442 | 199,931 |
| IOOF Holdings Ltd. | 16,436 | 104,405 |
| Perpetual Ltd. | 5,593 | 171,057 |
| | | 822,528 |
| Energy 0.1% |
| AWE Ltd. * | 152,397 | 100,479 |
| Beach Energy Ltd. | 215,628 | 102,423 |
| Whitehaven Coal Ltd. *(b) | 175,889 | 145,271 |
| | | 348,173 |
| Food, Beverage & Tobacco 0.3% |
| Bega Cheese Ltd. | 26,564 | 84,746 |
| GrainCorp Ltd., Class A | 47,489 | 274,389 |
| Treasury Wine Estates Ltd. | 118,060 | 498,844 |
| | | 857,979 |
| Health Care Equipment & Services 0.5% |
| Ansell Ltd. | 17,642 | 276,786 |
| Australian Pharmaceutical Industries Ltd. | 32,859 | 37,855 |
| Cochlear Ltd. | 4,875 | 295,257 |
| Healthscope Ltd. | 19,778 | 37,298 |
| Primary Health Care Ltd. | 90,321 | 265,097 |
| Ramsay Health Care Ltd. | 7,676 | 339,901 |
| Sigma Pharmaceuticals Ltd. | 744,734 | 425,023 |
| | | 1,677,217 |
| Insurance 0.1% |
| nib Holdings Ltd. | 73,191 | 158,261 |
| Materials 0.7% |
| Adelaide Brighton Ltd. | 99,839 | 319,222 |
| CSR Ltd. | 159,103 | 350,796 |
| DuluxGroup Ltd. | 23,624 | 94,292 |
| Iluka Resources Ltd. | 83,160 | 438,045 |
| Nufarm Ltd. | 62,443 | 316,523 |
| OceanaGold Corp. | 54,437 | 94,922 |
| Orora Ltd. | 30,889 | 50,148 |
| OZ Minerals Ltd. | 162,296 | 432,625 |
| Western Areas Ltd. | 15,142 | 29,628 |
| | | 2,126,201 |
| Media 0.4% |
| Amalgamated Holdings Ltd. | 4,214 | 37,971 |
| APN News & Media Ltd. * | 197,678 | 70,773 |
| Fairfax Media Ltd. | 816,989 | 495,220 |
| Nine Entertainment Co. Holdings Ltd. | 33,785 | 39,760 |
| Seven West Media Ltd. | 247,880 | 145,860 |
| Southern Cross Media Group Ltd. | 181,163 | 120,729 |
| Ten Network Holdings Ltd. * | 975,764 | 127,977 |
| Village Roadshow Ltd. | 20,817 | 103,307 |
| | | 1,141,597 |
| Real Estate 0.5% |
| Charter Hall Retail REIT | 32,736 | 93,297 |
| Dexus Property Group | 97,496 | 509,413 |
| Federation Centres | 45,757 | 91,803 |
| Goodman Group | 103,448 | 447,371 |
Schwab Fundamental International Small Company Index ETF
Portfolio Holdings (Unaudited) continued
| Security | Number
of Shares | Value
($) |
| Investa Office Fund | 54,300 | 148,209 |
| The GPT Group | 144,001 | 458,382 |
| | | 1,748,475 |
| Retailing 0.5% |
| Automotive Holdings Group Ltd. | 73,014 | 212,229 |
| Burson Group Ltd. | 16,186 | 42,343 |
| Harvey Norman Holdings Ltd. | 92,764 | 285,420 |
| JB Hi-Fi Ltd. (b) | 22,023 | 296,651 |
| Myer Holdings Ltd. (b) | 386,581 | 331,621 |
| Premier Investments Ltd. | 19,375 | 170,325 |
| Super Retail Group Ltd. | 18,884 | 118,081 |
| | | 1,456,670 |
| Software & Services 0.1% |
| carsales.com Ltd. | 5,268 | 36,414 |
| Computershare Ltd. | 55,232 | 387,651 |
| IRESS Ltd. | 9,726 | 65,229 |
| | | 489,294 |
| Transportation 0.1% |
| Qube Holdings Ltd. | 21,606 | 33,698 |
| Sydney Airport | 104,561 | 426,239 |
| | | 459,937 |
| Utilities 0.1% |
| AusNet Services | 249,040 | 230,407 |
| | | 15,344,456 |
| Austria 1.0% |
| Capital Goods 0.4% |
| ANDRITZ AG | 9,581 | 458,621 |
| Wienerberger AG | 32,749 | 582,353 |
| Zumtobel Group AG | 7,050 | 202,860 |
| | | 1,243,834 |
| Energy 0.0% |
| Schoeller-Bleckmann Oilfield Equipment AG | 1,470 | 80,216 |
| Insurance 0.1% |
| UNIQA Insurance Group AG | 4,442 | 37,075 |
| Vienna Insurance Group AG Wiener Versicherung Gruppe | 6,569 | 215,076 |
| | | 252,151 |
| Materials 0.1% |
| Lenzing AG | 2,299 | 159,688 |
| RHI AG | 5,227 | 109,113 |
| | | 268,801 |
| Real Estate 0.1% |
| IMMOFINANZ AG * | 92,906 | 231,209 |
| Semiconductors & Semiconductor Equipment 0.0% |
| ams AG | 899 | 33,420 |
| Telecommunication Services 0.2% |
| Telekom Austria AG | 85,711 | 532,153 |
| Transportation 0.1% |
| Oesterreichische Post AG | 8,042 | 309,395 |
| Utilities 0.0% |
| Verbund AG | 8,977 | 126,790 |
| | | 3,077,969 |
| Security | Number
of Shares | Value
($) |
| Belgium 1.1% |
| Diversified Financials 0.1% |
| Ackermans & van Haaren N.V. | 1,464 | 216,862 |
| Gimv N.V. | 4,516 | 214,046 |
| | | 430,908 |
| Health Care Equipment & Services 0.0% |
| Fagron | 2,067 | 54,891 |
| Household & Personal Products 0.0% |
| Ontex Group N.V. | 1,338 | 41,798 |
| Materials 0.4% |
| Bekaert N.V. | 22,350 | 647,867 |
| Nyrstar N.V. * | 112,721 | 283,047 |
| Tessenderlo Chemie N.V. * | 10,511 | 371,288 |
| | | 1,302,202 |
| Real Estate 0.1% |
| Befimmo S.A. | 1,699 | 104,705 |
| Cofinimmo S.A. | 1,936 | 202,980 |
| | | 307,685 |
| Technology Hardware & Equipment 0.1% |
| Barco N.V. | 3,155 | 195,460 |
| EVS Broadcast Equipment S.A. | 5,327 | 149,163 |
| | | 344,623 |
| Telecommunication Services 0.2% |
| Mobistar S.A. * | 22,704 | 472,417 |
| Transportation 0.1% |
| bpost S.A. | 7,353 | 179,117 |
| Utilities 0.1% |
| Elia System Operator S.A. N.V. | 6,447 | 291,374 |
| | | 3,425,015 |
| Canada 6.9% |
| Automobiles & Components 0.1% |
| Linamar Corp. | 5,227 | 271,505 |
| Martinrea International, Inc. | 19,119 | 167,983 |
| | | 439,488 |
| Banks 0.2% |
| Canadian Western Bank | 6,998 | 129,914 |
| Genworth MI Canada, Inc. | 8,153 | 186,775 |
| Home Capital Group, Inc. | 4,137 | 85,507 |
| Laurentian Bank of Canada | 4,509 | 164,093 |
| | | 566,289 |
| Capital Goods 0.7% |
| Aecon Group, Inc. | 23,065 | 221,202 |
| Ag Growth International, Inc. | 1,034 | 29,470 |
| ATS Automation Tooling Systems, Inc. * | 6,684 | 68,372 |
| Bird Construction, Inc. | 9,858 | 89,281 |
| CAE, Inc. | 28,959 | 314,512 |
| MacDonald, Dettwiler & Associates Ltd. | 4,389 | 255,621 |
| New Flyer Industries, Inc. | 11,219 | 161,139 |
| Russel Metals, Inc. | 18,242 | 303,142 |
| Toromont Industries Ltd. | 12,540 | 330,253 |
| Wajax Corp. | 8,089 | 139,528 |
| WSP Global, Inc. | 4,875 | 154,622 |
| | | 2,067,142 |
Schwab Fundamental International Small Company Index ETF
Portfolio Holdings (Unaudited) continued
| Security | Number
of Shares | Value
($) |
| Commercial & Professional Services 0.4% |
| Horizon North Logistics, Inc. | 12,635 | 31,053 |
| Morneau Shepell, Inc. | 5,370 | 62,640 |
| Progressive Waste Solutions Ltd. | 16,680 | 455,331 |
| Ritchie Bros. Auctioneers, Inc. | 8,291 | 226,390 |
| Stantec, Inc. | 7,798 | 180,752 |
| Transcontinental, Inc., Class A | 27,265 | 294,064 |
| | | 1,250,230 |
| Consumer Durables & Apparel 0.2% |
| Dorel Industries, Inc., Class B | 12,471 | 332,091 |
| Gildan Activewear, Inc. | 14,589 | 452,857 |
| | | 784,948 |
| Consumer Services 0.0% |
| EnerCare, Inc. | 3,741 | 39,364 |
| Great Canadian Gaming Corp. * | 5,738 | 79,396 |
| | | 118,760 |
| Diversified Financials 0.1% |
| AGF Management Ltd., Class B | 45,926 | 215,392 |
| Canaccord Genuity Group, Inc. | 6,463 | 30,068 |
| Dundee Corp., Class A * | 17,004 | 132,530 |
| | | 377,990 |
| Energy 1.3% |
| AltaGas Ltd. | 10,820 | 294,145 |
| Bankers Petroleum Ltd. * | 16,407 | 28,979 |
| Bonterra Energy Corp. | 1,578 | 25,938 |
| Calfrac Well Services Ltd. | 23,681 | 81,873 |
| Canadian Energy Services & Technology Corp. | 6,853 | 39,609 |
| Canyon Services Group, Inc. | 16,853 | 71,567 |
| Crew Energy, Inc. * | 8,803 | 29,575 |
| Enbridge Income Fund Holdings, Inc. | 3,563 | 88,560 |
| Enerflex Ltd. | 21,840 | 207,648 |
| Ensign Energy Services, Inc. | 43,780 | 346,160 |
| Gran Tierra Energy, Inc. * | 53,832 | 132,304 |
| Keyera Corp. | 13,389 | 406,349 |
| MEG Energy Corp. * | 8,077 | 71,755 |
| Mullen Group Ltd. | 20,001 | 287,275 |
| Newalta Corp. | 9,980 | 99,763 |
| NuVista Energy Ltd. * | 15,704 | 67,160 |
| Parkland Fuel Corp. | 18,122 | 309,320 |
| Pason Systems, Inc. | 7,561 | 116,498 |
| Peyto Exploration & Development Corp. | 9,918 | 232,426 |
| Precision Drilling Corp. | 70,361 | 335,279 |
| Secure Energy Services, Inc. | 3,728 | 29,841 |
| ShawCor Ltd. | 9,602 | 211,453 |
| Tourmaline Oil Corp. * | 1,330 | 33,288 |
| Trican Well Service Ltd. * | 86,184 | 119,187 |
| Trinidad Drilling Ltd. | 58,817 | 122,010 |
| Veresen, Inc. | 26,550 | 271,187 |
| | | 4,059,149 |
| Food & Staples Retailing 0.2% |
| Liquor Stores N.A. Ltd. | 3,572 | 32,485 |
| The Jean Coutu Group PJC, Inc., A Shares | 12,542 | 190,699 |
| The North West Co., Inc. | 15,464 | 314,859 |
| | | 538,043 |
| Security | Number
of Shares | Value
($) |
| Food, Beverage & Tobacco 0.2% |
| Cott Corp. | 31,306 | 326,825 |
| Maple Leaf Foods, Inc. | 21,666 | 363,461 |
| | | 690,286 |
| Insurance 0.1% |
| Industrial Alliance Insurance & Financial Services, Inc. | 10,450 | 330,033 |
| Materials 1.6% |
| Agnico Eagle Mines Ltd. | 18,738 | 453,768 |
| Alamos Gold, Inc., Class A * | 14,997 | 61,093 |
| Canfor Corp. * | 8,638 | 130,495 |
| Cascades, Inc. | 43,353 | 279,571 |
| CCL Industries, Inc., Class B | 2,062 | 266,564 |
| Centerra Gold, Inc. | 49,294 | 246,377 |
| Chemtrade Logistics Income Fund | 8,761 | 125,176 |
| Dominion Diamond Corp. | 9,022 | 106,053 |
| Eldorado Gold Corp. | 59,884 | 176,884 |
| Franco-Nevada Corp. | 4,273 | 183,060 |
| HudBay Minerals, Inc. | 32,132 | 159,151 |
| IAMGOLD Corp. * | 231,061 | 383,799 |
| Interfor Corp. * | 2,538 | 24,226 |
| Labrador Iron Ore Royalty Corp. | 6,810 | 74,575 |
| Lundin Mining Corp. * | 71,206 | 239,227 |
| Major Drilling Group International, Inc. | 32,236 | 97,883 |
| Methanex Corp. | 8,880 | 359,338 |
| Nevsun Resources Ltd. | 24,109 | 71,575 |
| New Gold, Inc. * | 40,183 | 91,510 |
| Pan American Silver Corp. | 29,283 | 200,942 |
| Resolute Forest Products, Inc. * | 30,799 | 310,762 |
| SEMAFO, Inc. * | 40,187 | 98,466 |
| Sherritt International Corp. | 228,635 | 207,928 |
| Silver Wheaton Corp. | 14,875 | 180,334 |
| West Fraser Timber Co., Ltd. | 9,495 | 365,599 |
| | | 4,894,356 |
| Media 0.4% |
| Aimia, Inc. | 30,939 | 266,487 |
| Cineplex, Inc. | 8,516 | 306,333 |
| Cogeco Cable, Inc. | 3,425 | 170,954 |
| Cogeco, Inc. | 899 | 37,365 |
| Corus Entertainment, Inc., B Shares | 18,669 | 200,511 |
| Entertainment One Ltd. | 25,225 | 117,009 |
| | | 1,098,659 |
| Real Estate 0.4% |
| Artis Real Estate Investment Trust | 3,681 | 33,919 |
| Boardwalk Real Estate Investment Trust | 2,305 | 94,470 |
| Canadian Apartment Properties REIT | 1,817 | 38,238 |
| Canadian Real Estate Investment Trust | 2,670 | 82,277 |
| Colliers International Group, Inc. | 2,558 | 111,548 |
| Cominar Real Estate Investment Trust | 4,685 | 57,150 |
| Dream Office Real Estate Investment Trust | 4,979 | 79,559 |
| First Capital Realty, Inc. | 7,920 | 103,517 |
| Granite Real Estate Investment Trust | 5,959 | 172,253 |
| H&R Real Estate Investment Trust | 12,532 | 194,503 |
| RioCan Real Estate Investment Trust | 15,484 | 282,913 |
| Smart Real Estate Investment Trust | 7,041 | 154,897 |
| | | 1,405,244 |
Schwab Fundamental International Small Company Index ETF
Portfolio Holdings (Unaudited) continued
| Security | Number
of Shares | Value
($) |
| Retailing 0.2% |
| Dollarama, Inc. | 7,043 | 397,647 |
| Hudson's Bay Co. | 10,358 | 177,655 |
| Uni-Select, Inc. | 1,102 | 47,865 |
| | | 623,167 |
| Software & Services 0.2% |
| Constellation Software, Inc. | 365 | 154,233 |
| DH Corp. | 9,363 | 300,348 |
| Open Text Corp. | 4,622 | 207,286 |
| | | 661,867 |
| Telecommunication Services 0.1% |
| Manitoba Telecom Services, Inc. | 7,940 | 169,423 |
| Transportation 0.2% |
| Air Canada * | 3,662 | 30,909 |
| Exchange Income Corp. | 2,494 | 45,625 |
| TransForce, Inc. | 18,252 | 324,846 |
| Westshore Terminals Investment Corp. | 4,265 | 84,915 |
| | | 486,295 |
| Utilities 0.3% |
| Capital Power Corp. | 22,236 | 341,938 |
| Just Energy Group, Inc. (b) | 44,178 | 263,308 |
| Northland Power, Inc. | 7,798 | 96,237 |
| Superior Plus Corp. | 40,168 | 346,583 |
| | | 1,048,066 |
| | | 21,609,435 |
| Denmark 1.6% |
| Banks 0.2% |
| Jyske Bank A/S - Reg’d * | 6,315 | 352,485 |
| Sydbank A/S | 10,765 | 409,199 |
| | | 761,684 |
| Capital Goods 0.2% |
| NKT Holding A/S | 5,468 | 295,685 |
| PER Aarsleff A/S, Class B | 129 | 47,041 |
| Rockwool International A/S, B Shares | 1,472 | 200,213 |
| | | 542,939 |
| Consumer Durables & Apparel 0.2% |
| Pandora A/S | 4,169 | 480,987 |
| Food, Beverage & Tobacco 0.1% |
| Royal Unibrew A/S | 3,678 | 122,029 |
| Schouw & Co. | 3,630 | 201,362 |
| | | 323,391 |
| Health Care Equipment & Services 0.2% |
| Coloplast A/S, Class B | 4,629 | 314,875 |
| GN Store Nord A/S | 12,683 | 226,202 |
| William Demant Holding A/S * | 1,220 | 98,995 |
| | | 640,072 |
| Insurance 0.1% |
| Topdanmark A/S * | 6,081 | 169,073 |
| Tryg A/S | 11,619 | 227,982 |
| | | 397,055 |
| Materials 0.2% |
| Chr Hansen Holding A/S | 4,143 | 208,299 |
| Novozymes A/S, B Shares | 10,573 | 459,996 |
| | | 668,295 |
| Security | Number
of Shares | Value
($) |
| Pharmaceuticals, Biotechnology & Life Sciences 0.1% |
| H. Lundbeck A/S * | 13,165 | 407,339 |
| Retailing 0.0% |
| Matas A/S | 1,851 | 36,959 |
| Software & Services 0.1% |
| SimCorp A/S | 5,349 | 256,165 |
| Transportation 0.2% |
| D/S Norden A/S * | 13,292 | 313,290 |
| Dfds A/S | 1,594 | 259,882 |
| | | 573,172 |
| | | 5,088,058 |
| Finland 1.7% |
| Capital Goods 0.6% |
| Cargotec Oyj, B Shares | 8,218 | 260,225 |
| Cramo Oyj | 9,134 | 185,452 |
| Konecranes Oyj | 10,210 | 321,816 |
| Outotec Oyj (b) | 46,670 | 271,143 |
| PKC Group Oyj | 1,690 | 32,741 |
| Ramirent Oyj | 19,030 | 153,953 |
| Uponor Oyj | 11,685 | 187,754 |
| Valmet Oyj | 3,674 | 36,968 |
| YIT Oyj | 78,378 | 454,921 |
| | | 1,904,973 |
| Commercial & Professional Services 0.1% |
| Caverion Corp. | 28,340 | 295,321 |
| Lassila & Tikanoja Oyj | 2,285 | 41,990 |
| | | 337,311 |
| Consumer Durables & Apparel 0.2% |
| Amer Sports Oyj | 19,481 | 533,269 |
| Fiskars Oyj Abp | 1,818 | 37,177 |
| | | 570,446 |
| Health Care Equipment & Services 0.0% |
| Oriola-KD Oyj, B Shares * | 8,614 | 41,407 |
| Materials 0.5% |
| Huhtamaki Oyj | 17,673 | 574,473 |
| Kemira Oyj | 24,701 | 293,658 |
| Metsa Board Oyj | 38,033 | 233,535 |
| Outokumpu Oyj * | 48,089 | 206,806 |
| Tikkurila Oyj | 8,170 | 141,986 |
| | | 1,450,458 |
| Media 0.1% |
| Sanoma Oyj | 75,931 | 282,127 |
| Real Estate 0.0% |
| Sponda Oyj | 24,220 | 97,427 |
| Retailing 0.1% |
| Stockmann Oyj Abp, B Shares * | 25,163 | 235,006 |
| Software & Services 0.1% |
| Tieto Oyj | 18,368 | 471,107 |
| | | 5,390,262 |
| France 4.4% |
| Automobiles & Components 0.1% |
| Plastic Omnium S.A. | 6,194 | 160,219 |
| Banks 0.1% |
| Natixis S.A. | 71,223 | 451,698 |
Schwab Fundamental International Small Company Index ETF
Portfolio Holdings (Unaudited) continued
| Security | Number
of Shares | Value
($) |
| Capital Goods 0.1% |
| Saft Groupe S.A. | 6,081 | 221,992 |
| Tarkett S.A. | 1,823 | 42,406 |
| | | 264,398 |
| Commercial & Professional Services 0.4% |
| Derichebourg S.A. * | 61,609 | 202,473 |
| Edenred | 19,414 | 411,248 |
| Elior Participations S.C.A. (c) | 1,964 | 39,854 |
| Societe BIC S.A. | 3,542 | 561,388 |
| | | 1,214,963 |
| Consumer Durables & Apparel 0.2% |
| SEB S.A. | 5,240 | 487,210 |
| Diversified Financials 0.1% |
| Coface S.A. * | 3,445 | 32,371 |
| Eurazeo S.A. | 5,726 | 371,485 |
| | | 403,856 |
| Energy 0.1% |
| Bourbon S.A. | 11,598 | 159,196 |
| Etablissements Maurel et Prom * | 20,723 | 108,995 |
| | | 268,191 |
| Food, Beverage & Tobacco 0.1% |
| Remy Cointreau S.A. | 2,861 | 169,456 |
| Vilmorin & Cie S.A. | 1,458 | 112,512 |
| | | 281,968 |
| Health Care Equipment & Services 0.1% |
| BioMerieux | 1,938 | 219,324 |
| Orpea | 2,548 | 196,284 |
| | | 415,608 |
| Insurance 0.1% |
| Euler Hermes Group | 2,745 | 282,971 |
| Materials 0.3% |
| Eramet *(b) | 2,304 | 130,373 |
| Imerys S.A. | 6,073 | 418,291 |
| Vicat | 4,039 | 271,089 |
| | | 819,753 |
| Media 0.7% |
| Havas S.A. | 34,692 | 292,709 |
| IPSOS | 8,164 | 186,111 |
| JCDecaux S.A. | 7,907 | 283,779 |
| Metropole Television S.A. | 19,596 | 378,434 |
| Societe d'Edition de Canal | 4,897 | 43,842 |
| Societe Television Francaise 1 | 27,749 | 445,559 |
| Solocal Group * | 864,521 | 318,701 |
| Technicolor S.A. - Reg'd | 55,016 | 408,031 |
| | | 2,357,166 |
| Pharmaceuticals, Biotechnology & Life Sciences 0.1% |
| Ipsen S.A. | 3,899 | 261,125 |
| Real Estate 0.6% |
| Fonciere Des Regions | 5,347 | 445,574 |
| Gecina S.A. | 2,990 | 376,573 |
| ICADE | 5,226 | 373,888 |
| Mercialys S.A. | 6,799 | 152,747 |
| Nexity S.A. | 10,936 | 488,252 |
| | | 1,837,034 |
| Retailing 0.1% |
| Groupe Fnac S.A. * | 3,078 | 174,997 |
| Security | Number
of Shares | Value
($) |
| Software & Services 0.5% |
| Alten S.A. | 4,509 | 214,674 |
| Altran Technologies S.A. | 20,201 | 226,465 |
| Dassault Systemes S.A. | 6,336 | 439,387 |
| Sopra Steria Group | 1,700 | 178,656 |
| UBISOFT Entertainment * | 26,628 | 498,123 |
| | | 1,557,305 |
| Technology Hardware & Equipment 0.2% |
| Ingenico Group | 2,301 | 284,641 |
| Neopost S.A. | 9,607 | 331,282 |
| | | 615,923 |
| Telecommunication Services 0.1% |
| Iliad S.A. | 1,466 | 330,666 |
| Transportation 0.4% |
| Aeroports de Paris | 3,783 | 433,846 |
| Bollore S.A. | 60,845 | 328,476 |
| Groupe Eurotunnel SE - Reg'd | 32,141 | 434,509 |
| Norbert Dentressangle S.A. | 775 | 165,037 |
| Stef S.A. | 610 | 41,878 |
| | | 1,403,746 |
| | | 13,588,797 |
| Germany 3.4% |
| Automobiles & Components 0.1% |
| ElringKlinger AG | 4,890 | 116,982 |
| Grammer AG | 3,036 | 72,680 |
| Hella KGaA Hueck & Co. * | 793 | 33,356 |
| SAF-Holland S.A. | 5,741 | 81,407 |
| | | 304,425 |
| Banks 0.0% |
| Aareal Bank AG | 4,030 | 149,828 |
| Capital Goods 0.8% |
| BayWa AG | 7,010 | 236,662 |
| Deutz AG | 30,343 | 177,476 |
| DMG Mori AG | 9,052 | 346,223 |
| Duerr AG | 2,491 | 192,590 |
| Heidelberger Druckmaschinen AG *(b) | 73,425 | 177,709 |
| Indus Holding AG | 5,605 | 262,364 |
| KION Group AG * | 3,358 | 149,226 |
| Krones AG | 2,057 | 219,977 |
| KUKA AG | 488 | 38,834 |
| Norma Group SE | 2,202 | 108,415 |
| Pfeiffer Vacuum Technology AG | 1,715 | 181,481 |
| SGL Carbon SE *(b) | 8,457 | 137,024 |
| Vossloh AG * | 3,025 | 219,132 |
| Wacker Neuson SE | 1,850 | 30,804 |
| | | 2,477,917 |
| Consumer Durables & Apparel 0.1% |
| Gerry Weber International AG | 4,148 | 91,841 |
| Puma SE | 610 | 122,142 |
| | | 213,983 |
| Diversified Financials 0.0% |
| Aurelius AG | 2,561 | 123,967 |
Schwab Fundamental International Small Company Index ETF
Portfolio Holdings (Unaudited) continued
| Security | Number
of Shares | Value
($) |
| Health Care Equipment & Services 0.3% |
| Carl Zeiss Meditec AG | 1,669 | 44,369 |
| Celesio AG | 18,494 | 516,923 |
| Rhoen-Klinikum AG | 15,073 | 403,485 |
| | | 964,777 |
| Insurance 0.1% |
| Talanx AG * | 6,297 | 189,413 |
| Materials 0.3% |
| Evonik Industries AG | 12,115 | 450,753 |
| Wacker Chemie AG | 3,776 | 325,449 |
| | | 776,202 |
| Media 0.2% |
| Axel Springer SE | 6,315 | 381,889 |
| Kabel Deutschland Holding AG * | 1,939 | 262,565 |
| | | 644,454 |
| Pharmaceuticals, Biotechnology & Life Sciences 0.2% |
| Gerresheimer AG | 4,387 | 317,697 |
| STADA Arzneimittel AG | 11,304 | 388,724 |
| | | 706,421 |
| Real Estate 0.1% |
| Deutsche Annington Immobilien SE | 1,807 | 59,092 |
| Deutsche Euroshop AG | 4,387 | 195,028 |
| Deutsche Wohnen AG | 1,715 | 45,044 |
| LEG Immobilien AG * | 552 | 41,366 |
| | | 340,530 |
| Retailing 0.1% |
| Fielmann AG | 2,792 | 183,983 |
| Semiconductors & Semiconductor Equipment 0.2% |
| AIXTRON SE *(b) | 18,903 | 120,730 |
| SMA Solar Technology AG *(b) | 9,325 | 363,300 |
| | | 484,030 |
| Software & Services 0.3% |
| Bechtle AG | 3,152 | 273,151 |
| Software AG | 13,385 | 369,848 |
| United Internet AG - Reg'd | 6,210 | 301,608 |
| Wirecard AG | 2,386 | 99,227 |
| | | 1,043,834 |
| Technology Hardware & Equipment 0.2% |
| Jenoptik AG | 7,676 | 103,556 |
| Wincor Nixdorf AG | 9,097 | 387,341 |
| | | 490,897 |
| Telecommunication Services 0.2% |
| Drillisch AG | 2,420 | 109,332 |
| Telefonica Deutschland Holding AG | 101,376 | 616,008 |
| | | 725,340 |
| Transportation 0.2% |
| Fraport AG Frankfurt Airport Services Worldwide | 5,831 | 352,032 |
| Hamburger Hafen und Logistik AG | 5,710 | 103,936 |
| Sixt SE | 6,877 | 308,420 |
| | | 764,388 |
| | | 10,584,389 |
| Hong Kong 2.1% |
| Automobiles & Components 0.0% |
| Xinyi Glass Holdings Ltd. | 255,618 | 114,780 |
| Security | Number
of Shares | Value
($) |
| Banks 0.1% |
| The Bank of East Asia Ltd. | 121,713 | 418,533 |
| Capital Goods 0.1% |
| Hopewell Holdings Ltd. | 11,162 | 38,095 |
| Johnson Electric Holdings Ltd. | 44,796 | 155,195 |
| | | 193,290 |
| Consumer Durables & Apparel 0.2% |
| Global Brands Group Holding Ltd. * | 263,313 | 49,944 |
| Techtronic Industries Co., Ltd. | 117,852 | 426,546 |
| | | 476,490 |
| Consumer Services 0.2% |
| Cafe de Coral Holdings Ltd. | 40,160 | 127,734 |
| MGM China Holdings Ltd. | 67,187 | 111,139 |
| Wynn Macau Ltd. (b) | 151,190 | 233,319 |
| | | 472,192 |
| Diversified Financials 0.1% |
| First Pacific Co., Ltd. | 438,199 | 285,534 |
| Sun Hung Kai & Co., Ltd. | 43,464 | 27,761 |
| | | 313,295 |
| Energy 0.0% |
| Brightoil Petroleum Holdings Ltd. * | 76,996 | 25,334 |
| Food & Staples Retailing 0.1% |
| Dairy Farm International Holdings Ltd. | 26,758 | 173,927 |
| Food, Beverage & Tobacco 0.0% |
| Vitasoy International Holdings Ltd. | 24,830 | 36,844 |
| WH Group Ltd. *(c) | 59,000 | 30,985 |
| | | 67,829 |
| Media 0.0% |
| Television Broadcasts Ltd. | 34,692 | 130,262 |
| Real Estate 0.5% |
| China South City Holdings Ltd. | 116,747 | 30,128 |
| Great Eagle Holdings Ltd. | 28,174 | 87,611 |
| Hang Lung Group Ltd. | 69,547 | 268,764 |
| Hang Lung Properties Ltd. | 127,809 | 288,599 |
| Henderson Land Development Co., Ltd. | 49,523 | 305,124 |
| Hysan Development Co., Ltd. | 18,242 | 73,438 |
| Sino Land Co., Ltd. | 255,618 | 379,961 |
| Swire Properties Ltd. | 71,822 | 219,635 |
| | | 1,653,260 |
| Retailing 0.2% |
| Chow Sang Sang Holdings International Ltd. | 91,279 | 179,730 |
| Giordano International Ltd. | 267,787 | 145,814 |
| Luk Fook Holdings International Ltd. | 78,329 | 202,138 |
| Sa Sa International Holdings Ltd. | 79,479 | 33,227 |
| | | 560,909 |
| Technology Hardware & Equipment 0.1% |
| VTech Holdings Ltd. | 31,039 | 359,049 |
| Telecommunication Services 0.2% |
| Hutchison Telecommunications Hong Kong Holdings Ltd. | 413,861 | 167,145 |
| PCCW Ltd. | 896,800 | 473,276 |
| SmarTone Telecommunications Holding Ltd. | 23,600 | 42,328 |
| | | 682,749 |
Schwab Fundamental International Small Company Index ETF
Portfolio Holdings (Unaudited) continued
| Security | Number
of Shares | Value
($) |
| Transportation 0.3% |
| Cathay Pacific Airways Ltd. | 212,656 | 384,150 |
| Orient Overseas International Ltd. | 86,069 | 427,011 |
| Pacific Basin Shipping Ltd. | 719,927 | 225,730 |
| | | 1,036,891 |
| | | 6,678,790 |
| Ireland 0.8% |
| Capital Goods 0.1% |
| Kingspan Group plc | 16,049 | 393,826 |
| Consumer Services 0.1% |
| Paddy Power plc | 2,832 | 310,979 |
| Food & Staples Retailing 0.1% |
| Fyffes plc | 82,892 | 129,568 |
| Total Produce plc | 32,884 | 45,690 |
| | | 175,258 |
| Food, Beverage & Tobacco 0.2% |
| C&C Group plc | 62,213 | 247,469 |
| Glanbia plc | 12,781 | 255,918 |
| | | 503,387 |
| Health Care Equipment & Services 0.1% |
| UDG Healthcare plc | 51,012 | 395,813 |
| Materials 0.1% |
| James Hardie Industries plc CDI | 21,907 | 272,879 |
| Pharmaceuticals, Biotechnology & Life Sciences 0.1% |
| ICON plc * | 2,808 | 216,216 |
| Transportation 0.0% |
| Irish Continental Group plc | 27,777 | 139,280 |
| | | 2,407,638 |
| Israel 1.0% |
| Banks 0.1% |
| Israel Discount Bank Ltd., A Shares * | 123,436 | 228,094 |
| Mizrahi Tefahot Bank Ltd. | 13,743 | 159,673 |
| | | 387,767 |
| Capital Goods 0.1% |
| Elbit Systems Ltd. | 3,895 | 298,591 |
| IDB Development Corp., Ltd. * | 92,109 | 50,640 |
| Shikun & Binui Ltd. | 18,479 | 37,576 |
| | | 386,807 |
| Energy 0.2% |
| Delek Group Ltd. | 902 | 212,073 |
| Oil Refineries Ltd. * | 546,299 | 198,566 |
| Paz Oil Co., Ltd. | 1,694 | 245,429 |
| | | 656,068 |
| Food & Staples Retailing 0.1% |
| Shufersal Ltd. * | 46,436 | 121,571 |
| Insurance 0.0% |
| Harel Insurance Investments & Financial Services Ltd. | 9,008 | 41,076 |
| Materials 0.1% |
| The Israel Corp., Ltd. | 988 | 298,591 |
| Real Estate 0.0% |
| Gazit-Globe Ltd. | 3,466 | 35,539 |
| Security | Number
of Shares | Value
($) |
| Software & Services 0.1% |
| NICE-Systems Ltd. | 4,258 | 265,919 |
| Telecommunication Services 0.3% |
| B Communications Ltd. | 7,875 | 143,699 |
| Cellcom Israel Ltd. * | 59,770 | 388,313 |
| Partner Communications Co., Ltd. * | 74,841 | 325,673 |
| | | 857,685 |
| | | 3,051,023 |
| Italy 3.0% |
| Automobiles & Components 0.1% |
| Brembo S.p.A. | 955 | 39,604 |
| Piaggio & C S.p.A. | 55,997 | 158,367 |
| | | 197,971 |
| Banks 0.5% |
| Banca Carige S.p.A. * | 47,687 | 88,539 |
| Banca Popolare di Milano Scarl | 645,528 | 684,616 |
| Banca Popolare di Sondrio Scarl | 91,754 | 452,777 |
| Credito Valtellinese Scarl * | 236,645 | 328,004 |
| | | 1,553,936 |
| Capital Goods 0.2% |
| Astaldi S.p.A. (b) | 12,532 | 136,840 |
| C.I.R. - Compagnie Industriali Riunite S.p.A * | 194,998 | 180,040 |
| Danieli & C Officine Meccaniche S.p.A. | 8,739 | 135,999 |
| Interpump Group S.p.A. | 2,502 | 34,034 |
| Salini Impregilo S.p.A | 12,009 | 50,137 |
| Trevi Finanziaria Industriale S.p.A. | 17,514 | 25,002 |
| | | 562,052 |
| Consumer Durables & Apparel 0.2% |
| Brunello Cucinelli S.p.A. | 2,157 | 39,178 |
| De'Longhi S.p.A. | 6,565 | 162,275 |
| Prada S.p.A. (b) | 38,757 | 157,027 |
| Safilo Group S.p.A. * | 10,459 | 121,881 |
| Tod's S.p.A. (b) | 1,575 | 143,919 |
| | | 624,280 |
| Consumer Services 0.1% |
| Autogrill S.p.A. * | 28,701 | 248,432 |
| Diversified Financials 0.0% |
| Banca Generali S.p.A. | 1,146 | 34,311 |
| Energy 0.3% |
| ERG S.p.A. | 28,233 | 402,714 |
| Saras S.p.A. * | 201,119 | 510,652 |
| | | 913,366 |
| Food & Staples Retailing 0.0% |
| MARR S.p.A. | 5,239 | 100,382 |
| Food, Beverage & Tobacco 0.1% |
| Davide Campari-Milano S.p.A. | 24,822 | 185,235 |
| Parmalat S.p.A. | 97,481 | 252,752 |
| | | 437,987 |
| Health Care Equipment & Services 0.1% |
| DiaSorin S.p.A. | 868 | 39,915 |
| Sorin S.p.A. * | 55,667 | 174,650 |
| | | 214,565 |
Schwab Fundamental International Small Company Index ETF
Portfolio Holdings (Unaudited) continued
| Security | Number
of Shares | Value
($) |
| Insurance 0.2% |
| Mediolanum S.p.A. | 15,840 | 124,951 |
| Societa Cattolica di Assicurazioni Scarl | 20,588 | 145,680 |
| Unipol Gruppo Finanziario S.p.A. | 56,487 | 266,087 |
| UnipolSai S.p.A. | 16,120 | 36,883 |
| | | 573,601 |
| Materials 0.4% |
| Buzzi Unicem S.p.A. | 27,386 | 466,120 |
| Italcementi S.p.A. | 55,246 | 617,174 |
| | | 1,083,294 |
| Media 0.0% |
| RCS MediaGroup S.p.A. * | 107,827 | 116,350 |
| Pharmaceuticals, Biotechnology & Life Sciences 0.1% |
| Recordati S.p.A. | 10,823 | 257,459 |
| Real Estate 0.0% |
| Beni Stabili S.p.A. | 170,896 | 132,319 |
| Retailing 0.1% |
| World Duty Free S.p.A. * | 19,796 | 226,916 |
| Technology Hardware & Equipment 0.0% |
| Esprinet S.p.A. | 12,809 | 113,887 |
| Transportation 0.2% |
| Ansaldo STS S.p.A. | 15,073 | 160,195 |
| ASTM S.p.A. | 13,137 | 174,137 |
| Societa Iniziative Autostradali e Servizi S.p.A. | 17,520 | 200,434 |
| | | 534,766 |
| Utilities 0.4% |
| ACEA S.p.A. | 13,995 | 192,097 |
| Enel Green Power S.p.A. | 191,182 | 364,173 |
| Hera S.p.A. | 159,938 | 408,600 |
| Iren S.p.A. | 220,969 | 347,872 |
| | | 1,312,742 |
| | | 9,238,616 |
| Japan 41.0% |
| Automobiles & Components 2.6% |
| Aisan Industry Co., Ltd. | 14,589 | 135,314 |
| Akebono Brake Industry Co., Ltd. | 25,548 | 76,527 |
| Calsonic Kansei Corp. | 78,540 | 549,589 |
| Exedy Corp. | 12,774 | 292,510 |
| FCC Co., Ltd. | 13,379 | 204,243 |
| Futaba Industrial Co., Ltd. | 51,119 | 191,931 |
| G-Tekt Corp. | 9,726 | 100,402 |
| HI-LEX Corp. | 1,230 | 38,315 |
| Kasai Kogyo Co., Ltd. | 2,483 | 27,025 |
| Keihin Corp. | 22,272 | 308,759 |
| Koito Manufacturing Co., Ltd. | 16,408 | 563,249 |
| KYB Co., Ltd. | 79,110 | 233,704 |
| Mitsuba Corp. | 6,817 | 118,187 |
| Musashi Seimitsu Industry Co., Ltd. | 9,726 | 181,061 |
| Nifco, Inc. | 8,065 | 315,452 |
| Nippon Seiki Co., Ltd. | 12,169 | 243,510 |
| Nissan Shatai Co., Ltd. | 33,836 | 397,315 |
| Nissin Kogyo Co., Ltd. | 12,774 | 176,560 |
| NOK Corp. | 18,460 | 456,987 |
| Pacific Industrial Co., Ltd. | 12,467 | 128,492 |
| Piolax, Inc. | 861 | 40,640 |
| Press Kogyo Co., Ltd. | 51,119 | 201,211 |
| Security | Number
of Shares | Value
($) |
| Sanden Holdings Corp. | 33,637 | 126,016 |
| Showa Corp. | 18,847 | 159,411 |
| Sumitomo Riko Co., Ltd. | 24,338 | 204,649 |
| Tachi-S Co., Ltd. | 18,069 | 226,338 |
| Takata Corp. *(b) | 22,007 | 230,267 |
| Tokai Rika Co., Ltd. | 18,029 | 383,982 |
| Topre Corp. | 7,693 | 149,499 |
| Toyo Tire & Rubber Co., Ltd. | 12,913 | 289,193 |
| Toyota Boshoku Corp. | 36,844 | 614,751 |
| TS Tech Co., Ltd. | 14,074 | 378,024 |
| Unipres Corp. | 18,847 | 353,347 |
| Yorozu Corp. | 6,678 | 133,081 |
| | | 8,229,541 |
| Banks 2.4% |
| Aozora Bank Ltd. | 115,640 | 423,684 |
| Ashikaga Holdings Co., Ltd. | 9,686 | 39,964 |
| Fukuoka Financial Group, Inc. | 111,779 | 556,197 |
| Hokuhoku Financial Group, Inc. | 209,992 | 474,793 |
| Senshu Ikeda Holdings, Inc. | 18,315 | 80,402 |
| Seven Bank Ltd. | 57,369 | 245,221 |
| Shinsei Bank Ltd. | 152,147 | 328,939 |
| Suruga Bank Ltd. | 12,169 | 233,569 |
| The 77 Bank Ltd. | 36,507 | 216,599 |
| The Awa Bank Ltd. | 24,092 | 137,572 |
| The Bank of Kyoto Ltd. | 24,338 | 264,498 |
| The Chiba Bank Ltd. | 54,772 | 399,994 |
| The Chugoku Bank Ltd. | 19,475 | 289,108 |
| The Daishi Bank Ltd. | 30,411 | 130,241 |
| The Gunma Bank Ltd. | 48,676 | 325,752 |
| The Hachijuni Bank Ltd. | 36,507 | 252,448 |
| The Higo Bank Ltd. | 10,826 | 62,266 |
| The Hiroshima Bank Ltd. | 36,507 | 206,658 |
| The Hyakugo Bank Ltd. | 24,338 | 117,488 |
| The Hyakujushi Bank Ltd. | 11,162 | 38,777 |
| The Iyo Bank Ltd. | 22,900 | 256,995 |
| The Joyo Bank Ltd. | 42,603 | 228,158 |
| The Juroku Bank Ltd. | 30,411 | 124,470 |
| The Kagoshima Bank Ltd. | 12,169 | 77,522 |
| The Keiyo Bank Ltd. | 24,338 | 128,132 |
| The Kiyo Bank Ltd. | 4,328 | 66,392 |
| The Musashino Bank Ltd. | 3,025 | 106,462 |
| The Nanto Bank Ltd. | 7,449 | 23,788 |
| The Nishi-Nippon City Bank Ltd. | 73,014 | 203,043 |
| The Ogaki Kyoritsu Bank Ltd. | 60,845 | 215,896 |
| The San-In Godo Bank Ltd. | 18,242 | 162,874 |
| The Shiga Bank Ltd. | 12,169 | 62,258 |
| The Shizuoka Bank Ltd. | 48,676 | 514,134 |
| TOMONY Holdings, Inc. | 12,774 | 50,807 |
| Yamaguchi Financial Group, Inc. | 24,338 | 300,848 |
| | | 7,345,949 |
| Capital Goods 7.2% |
| Aica Kogyo Co., Ltd. | 9,726 | 207,466 |
| Amada Holdings Co., Ltd. | 46,772 | 410,271 |
| Asahi Diamond Industrial Co., Ltd. | 12,774 | 119,639 |
| Bunka Shutter Co., Ltd. | 2,483 | 18,891 |
| Central Glass Co., Ltd. | 78,540 | 325,346 |
| Chiyoda Corp. | 27,629 | 199,491 |
| Chudenko Corp. | 5,245 | 104,220 |
| CKD Corp. | 13,379 | 122,546 |
| COMSYS Holdings Corp. | 33,881 | 422,167 |
| Daifuku Co., Ltd. | 15,822 | 230,962 |
Schwab Fundamental International Small Company Index ETF
Portfolio Holdings (Unaudited) continued
| Security | Number
of Shares | Value
($) |
| Daihen Corp. | 24,338 | 117,688 |
| DMG Mori Co., Ltd. | 13,708 | 197,162 |
| Fuji Electric Co., Ltd. | 103,448 | 411,453 |
| Fuji Machine Manufacturing Co., Ltd. | 17,662 | 158,570 |
| Fujikura Ltd. | 127,809 | 633,851 |
| Fujitec Co., Ltd. | 13,379 | 118,792 |
| Furukawa Co., Ltd. | 42,603 | 103,708 |
| Futaba Corp. | 9,726 | 133,227 |
| Glory Ltd. | 12,774 | 334,147 |
| GS Yuasa Corp. | 66,941 | 250,231 |
| Hazama Ando Corp. | 14,402 | 94,480 |
| Hitachi Koki Co., Ltd. | 12,774 | 96,133 |
| Hitachi Zosen Corp. | 54,554 | 283,608 |
| Hoshizaki Electric Co., Ltd. | 5,974 | 383,034 |
| Inaba Denki Sangyo Co., Ltd. | 9,121 | 295,415 |
| Inabata & Co., Ltd. | 27,991 | 304,890 |
| Iseki & Co., Ltd. | 61,214 | 97,995 |
| Iwatani Corp. | 63,566 | 380,814 |
| Kanamoto Co., Ltd. | 984 | 26,065 |
| Kandenko Co., Ltd. | 60,845 | 406,186 |
| Kanematsu Corp. | 243,449 | 375,665 |
| Keihan Electric Railway Co., Ltd. | 66,941 | 431,967 |
| Kitz Corp. | 31,644 | 135,522 |
| Komori Corp. | 13,984 | 160,051 |
| Kumagai Gumi Co., Ltd. | 8,679 | 28,361 |
| Kurita Water Industries Ltd. | 23,723 | 494,486 |
| Kuroda Electric Co., Ltd. | 17,032 | 315,946 |
| Kyowa Exeo Corp. | 38,322 | 394,335 |
| Kyudenko Corp. | 17,239 | 339,417 |
| Mabuchi Motor Co., Ltd. | 4,248 | 198,755 |
| Maeda Corp. | 29,201 | 234,456 |
| Maeda Road Construction Co., Ltd. | 18,242 | 326,349 |
| Makino Milling Machine Co., Ltd. | 18,242 | 141,649 |
| Meidensha Corp. | 36,507 | 117,789 |
| Minebea Co., Ltd. | 29,864 | 358,067 |
| Mirait Holdings Corp. | 27,411 | 256,953 |
| MISUMI Group, Inc. | 32,162 | 373,412 |
| Miura Co., Ltd. | 18,242 | 204,420 |
| Nabtesco Corp. | 15,194 | 303,541 |
| Nachi-Fujikoshi Corp. | 30,411 | 140,530 |
| Namura Shipbuilding Co., Ltd. | 10,574 | 77,308 |
| NGK Insulators Ltd. | 24,011 | 541,503 |
| Nichias Corp. | 34,064 | 218,127 |
| Nichiha Corp. | 9,617 | 135,385 |
| Nippo Corp. | 15,194 | 258,907 |
| Nippon Densetsu Kogyo Co., Ltd. | 12,774 | 235,906 |
| Nippon Sheet Glass Co., Ltd. * | 509,245 | 462,243 |
| Nippon Steel & Sumikin Bussan Corp. | 54,772 | 182,596 |
| Nishimatsu Construction Co., Ltd. | 73,014 | 328,363 |
| Nishio Rent All Co., Ltd. | 2,450 | 62,875 |
| Nisshinbo Holdings, Inc. | 42,603 | 513,268 |
| Nitta Corp. | 3,630 | 87,047 |
| Nitto Kogyo Corp. | 6,073 | 114,910 |
| Noritz Corp. | 12,774 | 192,372 |
| NTN Corp. | 103,399 | 539,243 |
| Oiles Corp. | 7,911 | 123,772 |
| OKUMA Corp. | 20,685 | 164,033 |
| Okumura Corp. | 36,507 | 200,030 |
| OSG Corp. | 11,098 | 225,193 |
| Penta-Ocean Construction Co., Ltd. | 66,941 | 322,594 |
| Ryobi Ltd. | 59,369 | 237,113 |
| Sanki Engineering Co., Ltd. | 25,548 | 196,693 |
| Security | Number
of Shares | Value
($) |
| Sankyo Tateyama, Inc. | 12,169 | 187,277 |
| Sanwa Holdings Corp. | 38,950 | 297,304 |
| Seibu Holdings, Inc. | 2,483 | 54,543 |
| Shinmaywa Industries Ltd. | 23,406 | 245,291 |
| SHO-BOND Holdings Co., Ltd. | 2,070 | 85,919 |
| Sintokogio Ltd. | 15,620 | 127,476 |
| Tadano Ltd. | 7,911 | 107,647 |
| Taihei Dengyo Kaisha Ltd. | 2,483 | 26,308 |
| Taikisha Ltd. | 7,911 | 179,325 |
| Takara Standard Co., Ltd. | 20,685 | 141,843 |
| Takasago Thermal Engineering Co., Ltd. | 17,032 | 259,025 |
| Takuma Co., Ltd. | 3,713 | 29,015 |
| The Japan Steel Works Ltd. | 97,375 | 323,820 |
| The Nippon Road Co., Ltd. | 18,242 | 95,737 |
| THK Co., Ltd. | 16,214 | 282,175 |
| Toa Corp. | 85,206 | 177,886 |
| Toda Corp. | 66,941 | 341,375 |
| TOKAI Holdings Corp. | 7,449 | 30,673 |
| Toshiba Machine Co., Ltd. | 24,338 | 87,363 |
| Toshiba Plant Systems & Services Corp. | 7,911 | 86,496 |
| Totetsu Kogyo Co., Ltd. | 6,678 | 142,338 |
| Toyo Engineering Corp. | 42,603 | 108,982 |
| Trusco Nakayama Corp. | 8,516 | 330,985 |
| Tsubakimoto Chain Co. | 21,895 | 168,930 |
| Ushio, Inc. | 25,548 | 299,362 |
| Wakita & Co., Ltd. | 1,845 | 16,945 |
| Yamazen Corp. | 22,035 | 172,738 |
| Yuasa Trading Co., Ltd. | 8,516 | 182,709 |
| Yurtec Corp. | 3,713 | 32,386 |
| | | 22,361,473 |
| Commercial & Professional Services 1.1% |
| Aeon Delight Co., Ltd. | 4,258 | 135,275 |
| Daiseki Co., Ltd. | 6,073 | 105,990 |
| Duskin Co., Ltd. | 23,128 | 460,900 |
| Itoki Corp. | 3,713 | 26,013 |
| Kokuyo Co., Ltd. | 38,322 | 388,011 |
| Meitec Corp. | 5,017 | 193,543 |
| Moshi Moshi Hotline, Inc. | 12,774 | 130,602 |
| Nissha Printing Co., Ltd. | 9,726 | 167,096 |
| Nomura Co., Ltd. | 10,776 | 163,260 |
| Okamura Corp. | 15,822 | 141,919 |
| Park24 Co., Ltd. | 12,774 | 250,874 |
| Sato Holdings Corp. | 6,073 | 127,489 |
| Sohgo Security Services Co., Ltd. | 14,472 | 632,930 |
| Temp Holdings Co., Ltd. | 7,911 | 353,819 |
| Toppan Forms Co., Ltd. | 21,240 | 260,099 |
| | | 3,537,820 |
| Consumer Durables & Apparel 2.0% |
| Alpine Electronics, Inc. | 13,984 | 197,093 |
| Asics Corp. | 15,080 | 441,754 |
| Casio Computer Co., Ltd. (b) | 27,626 | 532,072 |
| Foster Electric Co., Ltd. | 1,845 | 36,296 |
| Fujitsu General Ltd. | 9,364 | 116,060 |
| Funai Electric Co., Ltd. | 21,667 | 218,842 |
| Gunze Ltd. | 85,206 | 266,478 |
| Haseko Corp. | 34,008 | 400,457 |
| Heiwa Corp. | 4,863 | 95,787 |
| JVC Kenwood Corp. | 20,356 | 44,681 |
| Kurabo Industries Ltd. | 105,197 | 205,732 |
Schwab Fundamental International Small Company Index ETF
Portfolio Holdings (Unaudited) continued
| Security | Number
of Shares | Value
($) |
| Misawa Homes Co., Ltd. | 11,109 | 79,661 |
| Mizuno Corp. | 36,507 | 168,098 |
| Onward Holdings Co., Ltd. | 60,845 | 383,592 |
| PanaHome Corp. | 26,758 | 178,630 |
| Pioneer Corp. * | 153,357 | 278,405 |
| Rinnai Corp. | 4,863 | 364,770 |
| Sangetsu Co., Ltd. | 19,385 | 338,160 |
| Sankyo Co., Ltd. | 12,774 | 491,733 |
| Sanyo Shokai Ltd. | 14,898 | 50,773 |
| Seiko Holdings Corp. | 7,449 | 44,318 |
| Seiren Co., Ltd. | 10,895 | 122,629 |
| Tamron Co., Ltd. | 5,468 | 109,735 |
| Token Corp. | 3,983 | 275,426 |
| Tomy Co., Ltd. | 30,411 | 152,325 |
| TSI Holdings Co., Ltd. | 33,960 | 262,858 |
| Wacoal Holdings Corp. | 30,411 | 391,226 |
| | | 6,247,591 |
| Consumer Services 1.0% |
| Accordia Golf Co., Ltd. | 25,254 | 254,447 |
| Doutor Nichires Holdings Co., Ltd. | 9,971 | 153,615 |
| Dynam Japan Holdings Co., Ltd. | 100,478 | 130,426 |
| HIS Co., Ltd. | 9,726 | 333,470 |
| McDonald's Holdings Co., Ltd. (b) | 18,847 | 415,245 |
| MOS Food Services, Inc. | 6,073 | 134,605 |
| Ohsho Food Service Corp. | 1,230 | 41,208 |
| Plenus Co., Ltd. | 7,283 | 119,235 |
| Resorttrust, Inc. | 6,678 | 177,992 |
| Round One Corp. | 39,325 | 177,504 |
| Royal Holdings Co., Ltd. | 10,746 | 196,325 |
| Saizeriya Co., Ltd. | 12,774 | 296,937 |
| Skylark Co., Ltd. | 3,221 | 49,783 |
| St Marc Holdings Co., Ltd. | 2,967 | 91,567 |
| Tokyo Dome Corp. | 24,338 | 99,613 |
| Yoshinoya Holdings Co., Ltd. | 20,080 | 239,101 |
| Zensho Holdings Co., Ltd. *(b) | 24,943 | 238,346 |
| | | 3,149,419 |
| Diversified Financials 0.8% |
| Acom Co., Ltd. * | 54,197 | 245,527 |
| AEON Financial Service Co., Ltd. | 10,822 | 246,115 |
| Century Tokyo Leasing Corp. | 5,611 | 173,398 |
| Credit Saison Co., Ltd. | 28,566 | 572,805 |
| Fuyo General Lease Co., Ltd. | 2,632 | 102,947 |
| Hitachi Capital Corp. | 6,339 | 152,793 |
| Jaccs Co., Ltd. | 29,864 | 120,752 |
| Japan Exchange Group, Inc. | 1,230 | 38,366 |
| Mitsubishi UFJ Lease & Finance Co., Ltd. | 41,975 | 202,974 |
| Okasan Securities Group, Inc. | 3,713 | 22,979 |
| Orient Corp. * | 138,243 | 225,870 |
| SBI Holdings, Inc. | 18,619 | 226,774 |
| Tokai Tokyo Financial Holdings, Inc. | 3,713 | 24,818 |
| | | 2,356,118 |
| Energy 0.1% |
| Itochu Enex Co., Ltd. | 7,449 | 64,419 |
| Japan Petroleum Exploration Co., Ltd. | 9,121 | 268,696 |
| Nippon Gas Co., Ltd. | 1,476 | 48,597 |
| | | 381,712 |
| Food & Staples Retailing 2.2% |
| Ain Pharmaciez, Inc. | 5,468 | 251,325 |
| Arcs Co., Ltd. | 16,427 | 324,514 |
| Security | Number
of Shares | Value
($) |
| Axial Retailing, Inc. | 984 | 33,048 |
| Belc Co., Ltd. | 861 | 27,780 |
| Cawachi Ltd. | 13,984 | 225,941 |
| Cocokara fine, Inc. | 11,913 | 478,250 |
| Cosmos Pharmaceutical Corp. | 1,210 | 155,263 |
| CREATE SD HOLDINGS Co., Ltd. | 615 | 35,118 |
| FamilyMart Co., Ltd. | 11,718 | 543,427 |
| Heiwado Co., Ltd. | 15,227 | 322,420 |
| Kato Sangyo Co., Ltd. | 17,637 | 397,755 |
| Matsumotokiyoshi Holdings Co., Ltd. | 14,589 | 701,851 |
| Ministop Co., Ltd. | 5,368 | 110,651 |
| Mitsubishi Shokuhin Co., Ltd. | 11,564 | 250,489 |
| San-A Co., Ltd. | 4,863 | 226,326 |
| Sugi Holdings Co., Ltd. | 8,407 | 406,527 |
| Sundrug Co., Ltd. | 7,283 | 409,870 |
| Tsuruha Holdings, Inc. | 7,460 | 606,970 |
| Valor Co., Ltd. | 22,900 | 644,378 |
| Welcia Holdings Co., Ltd. | 4,996 | 239,937 |
| Yaoko Co., Ltd. | 5,314 | 277,572 |
| Yokohama Reito Co., Ltd. | 31,644 | 262,166 |
| | | 6,931,578 |
| Food, Beverage & Tobacco 2.9% |
| Calbee, Inc. | 6,678 | 255,967 |
| Coca-Cola East Japan Co., Ltd. | 13,379 | 242,221 |
| Dydo Drinco, Inc. | 4,863 | 217,096 |
| Ezaki Glico Co., Ltd. | 10,188 | 511,144 |
| Fuji Oil Co., Ltd. | 20,080 | 278,371 |
| Hokuto Corp. | 7,283 | 132,216 |
| House Foods Group, Inc. | 18,366 | 336,449 |
| Ito En Ltd. | 18,847 | 446,194 |
| Itoham Foods, Inc. | 73,014 | 453,683 |
| J-Oil Mills, Inc. | 42,603 | 138,864 |
| Kagome Co., Ltd. | 18,242 | 308,888 |
| Kikkoman Corp. | 22,553 | 726,736 |
| Marudai Food Co., Ltd. | 8,679 | 36,740 |
| Maruha Nichiro Corp. | 2,214 | 33,287 |
| Megmilk Snow Brand Co., Ltd. | 32,156 | 610,827 |
| Mitsui Sugar Co., Ltd. | 24,338 | 100,617 |
| Morinaga & Co., Ltd. | 66,941 | 357,394 |
| Morinaga Milk Industry Co., Ltd. | 136,117 | 661,574 |
| Nichirei Corp. | 108,488 | 664,258 |
| Nippon Flour Mills Co., Ltd. | 57,265 | 365,275 |
| Nippon Suisan Kaisha Ltd. | 90,674 | 284,327 |
| Prima Meat Packers Ltd. | 66,941 | 190,573 |
| Sapporo Holdings Ltd. | 97,375 | 380,067 |
| Takara Holdings, Inc. | 38,322 | 258,358 |
| The Nisshin Oillio Group Ltd. | 73,014 | 275,343 |
| Warabeya Nichiyo Co., Ltd. | 10,045 | 235,241 |
| Yakult Honsha Co., Ltd. | 7,812 | 437,062 |
| | | 8,938,772 |
| Health Care Equipment & Services 0.9% |
| BML, Inc. | 1,353 | 41,198 |
| Hogy Medical Co., Ltd. | 2,291 | 111,350 |
| Miraca Holdings, Inc. | 10,232 | 439,895 |
| Nichii Gakkan Co. | 21,905 | 168,465 |
| Nihon Kohden Corp. | 9,526 | 190,308 |
| Nikkiso Co., Ltd. | 15,500 | 122,404 |
| Nipro Corp. | 34,064 | 389,873 |
| Paramount Bed Holdings Co., Ltd. | 4,804 | 143,900 |
| Ship Healthcare Holdings, Inc. | 8,094 | 178,063 |
Schwab Fundamental International Small Company Index ETF
Portfolio Holdings (Unaudited) continued
| Security | Number
of Shares | Value
($) |
| Sysmex Corp. | 8,893 | 540,104 |
| Toho Holdings Co., Ltd. | 27,991 | 616,248 |
| | | 2,941,808 |
| Household & Personal Products 0.7% |
| Earth Chemical Co., Ltd. | 4,869 | 185,021 |
| Fancl Corp. | 15,194 | 212,391 |
| Kobayashi Pharmaceutical Co., Ltd. | 4,258 | 331,336 |
| Kose Corp. | 4,102 | 406,527 |
| Lion Corp. | 54,772 | 479,992 |
| Mandom Corp. | 5,468 | 199,661 |
| Pigeon Corp. | 7,283 | 193,216 |
| Pola Orbis Holdings, Inc. | 4,397 | 263,417 |
| | | 2,271,561 |
| Insurance 0.1% |
| Sony Financial Holdings, Inc. | 23,498 | 440,933 |
| Materials 4.3% |
| ADEKA Corp. | 26,758 | 336,945 |
| Aichi Steel Corp. | 56,498 | 220,519 |
| Asahi Holdings, Inc. | 12,774 | 189,736 |
| Chugoku Marine Paints Ltd. | 18,242 | 123,435 |
| Daido Steel Co., Ltd. | 79,596 | 295,566 |
| Daio Paper Corp. | 30,411 | 380,686 |
| Dowa Holdings Co., Ltd. | 54,772 | 477,732 |
| FP Corp. | 5,468 | 189,960 |
| Fuji Seal International, Inc. | 5,558 | 190,105 |
| Fujimori Kogyo Co., Ltd. | 2,787 | 77,273 |
| Godo Steel Ltd. | 12,415 | 20,182 |
| Hitachi Metals Ltd. | 24,338 | 308,882 |
| Hokuetsu Kishu Paper Co., Ltd. | 60,845 | 362,504 |
| Ishihara Sangyo Kaisha Ltd. * | 158,243 | 143,638 |
| Kansai Paint Co., Ltd. | 20,963 | 327,631 |
| Konishi Co., Ltd. | 6,936 | 125,001 |
| Kureha Corp. | 42,603 | 150,465 |
| Kyoei Steel Ltd. | 9,121 | 159,186 |
| Lintec Corp. | 15,080 | 348,177 |
| Maruichi Steel Tube Ltd. | 12,169 | 310,288 |
| Mitsubishi Gas Chemical Co., Inc. | 97,375 | 475,686 |
| Mitsubishi Steel Manufacturing Co., Ltd. | 85,206 | 165,230 |
| Nihon Parkerizing Co., Ltd. | 13,169 | 112,255 |
| Nippon Denko Co., Ltd. | 60,845 | 123,010 |
| Nippon Kayaku Co., Ltd. | 30,411 | 311,927 |
| Nippon Light Metal Holdings Co., Ltd. | 247,048 | 381,219 |
| Nippon Paint Holdings Co., Ltd. | 9,356 | 192,702 |
| Nippon Shokubai Co., Ltd. | 30,411 | 469,773 |
| Nippon Soda Co., Ltd. | 39,555 | 227,176 |
| Nissan Chemical Industries Ltd. | 21,032 | 484,907 |
| Nisshin Steel Co., Ltd. | 26,668 | 251,309 |
| Nittetsu Mining Co., Ltd. | 36,507 | 171,411 |
| NOF Corp. | 36,507 | 272,330 |
| Pacific Metals Co., Ltd. * | 60,845 | 160,667 |
| Rengo Co., Ltd. | 107,307 | 431,229 |
| Sakai Chemical Industry Co., Ltd. | 11,162 | 32,422 |
| Sakata INX Corp. | 9,969 | 77,574 |
| Sanyo Chemical Industries Ltd. | 18,242 | 136,531 |
| Sanyo Special Steel Co., Ltd. | 54,202 | 216,477 |
| Sumitomo Bakelite Co., Ltd. | 66,941 | 258,517 |
| Sumitomo Osaka Cement Co., Ltd. | 109,544 | 425,756 |
| The Nippon Synthetic Chemical Industry Co., Ltd. | 12,169 | 87,764 |
| Toagosei Co., Ltd. | 45,578 | 335,107 |
| Security | Number
of Shares | Value
($) |
| Toho Zinc Co., Ltd. | 48,676 | 126,927 |
| Tokai Carbon Co., Ltd. | 88,899 | 217,873 |
| Tokuyama Corp. * | 201,865 | 341,481 |
| Tokyo Ohka Kogyo Co., Ltd. | 7,283 | 205,235 |
| Tokyo Steel Manufacturing Co., Ltd. | 42,061 | 272,458 |
| Topy Industries Ltd. | 108,488 | 239,025 |
| Toyo Ink SC Holdings Co., Ltd. | 66,371 | 252,482 |
| Toyobo Co., Ltd. | 286,052 | 410,719 |
| UACJ Corp. | 55,744 | 103,498 |
| Yamato Kogyo Co., Ltd. | 9,510 | 214,394 |
| Yodogawa Steel Works Ltd. | 54,772 | 234,120 |
| Zeon Corp. | 38,023 | 316,270 |
| | | 13,473,372 |
| Media 0.7% |
| Asatsu-DK, Inc. | 14,399 | 297,878 |
| Avex Group Holdings, Inc. | 12,169 | 155,244 |
| CyberAgent, Inc. | 3,718 | 147,573 |
| Daiichikosho Co., Ltd. | 10,470 | 396,993 |
| SKY Perfect JSAT Holdings, Inc. | 48,676 | 221,319 |
| Toei Co., Ltd. | 18,242 | 136,079 |
| Toho Co., Ltd. | 15,822 | 357,214 |
| Tokyo Broadcasting System Holdings, Inc. | 12,774 | 175,295 |
| TV Asahi Holdings Corp. | 6,608 | 98,587 |
| Zenrin Co., Ltd. | 8,878 | 115,238 |
| | | 2,101,420 |
| Pharmaceuticals, Biotechnology & Life Sciences 1.3% |
| Hisamitsu Pharmaceutical Co., Inc. | 11,564 | 401,260 |
| Kaken Pharmaceutical Co., Ltd. | 7,868 | 372,023 |
| Kissei Pharmaceutical Co., Ltd. | 5,468 | 139,424 |
| KYORIN Holdings, Inc. | 10,103 | 179,242 |
| Mochida Pharmaceutical Co., Ltd. | 3,630 | 233,942 |
| Nichi-iko Pharmaceutical Co., Ltd. | 4,863 | 146,871 |
| Nippon Shinyaku Co., Ltd. | 4,804 | 165,307 |
| Rohto Pharmaceutical Co., Ltd. | 18,529 | 320,628 |
| Santen Pharmaceutical Co., Ltd. | 39,008 | 609,978 |
| Sawai Pharmaceutical Co., Ltd. | 3,025 | 191,208 |
| Sumitomo Dainippon Pharma Co., Ltd. | 29,226 | 312,554 |
| Taisho Pharmaceutical Holdings Co., Ltd. | 8,064 | 523,027 |
| Tsumura & Co. | 13,879 | 309,109 |
| | | 3,904,573 |
| Real Estate 1.3% |
| Advance Residence Investment Corp. | 121 | 252,114 |
| Aeon Mall Co., Ltd. | 12,774 | 215,562 |
| Daikyo, Inc. | 26,083 | 40,894 |
| Frontier Real Estate Investment Corp. | 16 | 64,232 |
| Fukuoka REIT Corp. | 10 | 15,571 |
| Japan Excellent, Inc. | 121 | 130,900 |
| Japan Logistics Fund, Inc. | 10 | 18,121 |
| Japan Prime Realty Investment Corp. | 45 | 146,120 |
| Japan Real Estate Investment Corp. | 77 | 324,050 |
| Japan Retail Fund Investment Corp. | 212 | 391,164 |
| Kenedix Office Investment Corp. | 29 | 129,702 |
| Leopalace21 Corp. * | 47,853 | 232,977 |
| Mori Trust Sogo REIT, Inc. | 38 | 65,693 |
| Nippon Accommodations Fund, Inc. | 22 | 73,433 |
| Nippon Building Fund, Inc. | 108 | 454,512 |
| Nippon Prologis REIT, Inc. | 10 | 18,195 |
| Nomura Real Estate Holdings, Inc. | 24,338 | 457,499 |
| Nomura Real Estate Office Fund, Inc. | 39 | 153,992 |
Schwab Fundamental International Small Company Index ETF
Portfolio Holdings (Unaudited) continued
| Security | Number
of Shares | Value
($) |
| NTT Urban Development Corp. | 12,169 | 113,772 |
| Orix JREIT, Inc. | 122 | 154,029 |
| Premier Investment Corp. | 3 | 15,051 |
| Relo Holdings, Inc. | 1,463 | 153,441 |
| Tokyo Tatemono Co., Ltd. | 15,144 | 190,448 |
| Top REIT, Inc. | 14 | 54,933 |
| United Urban Investment Corp. | 122 | 160,875 |
| | | 4,027,280 |
| Retailing 2.9% |
| ABC-Mart, Inc. | 2,420 | 146,975 |
| Adastria Co., Ltd. | 7,626 | 410,294 |
| Alpen Co., Ltd. | 12,169 | 177,035 |
| AOKI Holdings, Inc. | 9,870 | 119,237 |
| Aoyama Trading Co., Ltd. | 15,598 | 583,067 |
| Arcland Sakamoto Co., Ltd. | 6,323 | 136,702 |
| ASKUL Corp. | 5,865 | 203,268 |
| Autobacs Seven Co., Ltd. | 34,064 | 627,114 |
| Bic Camera, Inc. (b) | 19,961 | 193,046 |
| Canon Marketing Japan, Inc. | 22,381 | 329,477 |
| Chiyoda Co., Ltd. | 10,822 | 302,732 |
| DCM Holdings Co., Ltd. | 66,336 | 523,309 |
| Don Quijote Holdings Co., Ltd. | 15,027 | 584,042 |
| Doshisha Co., Ltd. | 9,726 | 183,709 |
| Geo Holdings Corp. | 33,768 | 512,992 |
| Gulliver International Co., Ltd. | 14,589 | 128,934 |
| H2O Retailing Corp. | 26,758 | 533,901 |
| Hikari Tsushin, Inc. | 3,388 | 225,895 |
| Izumi Co., Ltd. | 7,911 | 339,458 |
| Joyful Honda Co., Ltd. | 1,968 | 38,926 |
| Kohnan Shoji Co., Ltd. | 24,338 | 318,321 |
| Komeri Co., Ltd. | 12,169 | 271,527 |
| Nojima Corp. | 1,476 | 15,895 |
| Rakuten, Inc. | 26,758 | 382,872 |
| Ryohin Keikaku Co., Ltd. | 3,202 | 712,348 |
| Sanrio Co., Ltd. | 6,626 | 218,980 |
| United Arrows Ltd. | 4,036 | 159,528 |
| USS Co., Ltd. | 23,840 | 423,744 |
| Xebio Co., Ltd. | 15,194 | 288,120 |
| | | 9,091,448 |
| Semiconductors & Semiconductor Equipment 0.3% |
| Advantest Corp. | 16,432 | 132,204 |
| Disco Corp. | 2,181 | 164,855 |
| Sanken Electric Co., Ltd. | 18,242 | 70,147 |
| SCREEN Holdings Co., Ltd. | 26,936 | 129,362 |
| Shindengen Electric Manufacturing Co., Ltd. | 8,679 | 33,231 |
| Shinko Electric Industries Co., Ltd. | 25,548 | 163,595 |
| Tokyo Seimitsu Co., Ltd. | 5,959 | 114,622 |
| Ulvac, Inc. | 9,121 | 145,487 |
| | | 953,503 |
| Software & Services 2.0% |
| Capcom Co., Ltd. | 12,774 | 300,416 |
| Dena Co., Ltd. | 34,779 | 635,972 |
| DTS Corp. | 5,468 | 123,948 |
| Fuji Soft, Inc. | 6,073 | 101,881 |
| Gree, Inc. | 41,921 | 197,869 |
| Ines Corp. | 2,483 | 21,883 |
| Internet Initiative Japan, Inc. | 4,992 | 88,442 |
| IT Holdings Corp. | 31,039 | 728,175 |
| Itochu Techno-Solutions Corp. | 13,169 | 290,145 |
| Security | Number
of Shares | Value
($) |
| NEC Networks & System Integration Corp. | 12,774 | 233,270 |
| NET One Systems Co., Ltd. | 43,208 | 262,418 |
| Nexon Co., Ltd. | 15,194 | 211,890 |
| Nihon Unisys Ltd. | 25,548 | 271,323 |
| NS Solutions Corp. | 5,468 | 211,844 |
| NSD Co., Ltd. | 9,726 | 121,108 |
| Obic Co., Ltd. | 5,382 | 240,266 |
| Oracle Corp. Japan | 984 | 41,167 |
| Otsuka Corp. | 11,465 | 605,487 |
| SCSK Corp. | 6,073 | 219,747 |
| Square Enix Holdings Co., Ltd. | 13,379 | 349,421 |
| Transcosmos, Inc. | 5,468 | 125,527 |
| Trend Micro, Inc. | 12,774 | 454,840 |
| Yahoo Japan Corp. | 104,455 | 423,216 |
| | | 6,260,255 |
| Technology Hardware & Equipment 2.7% |
| Alps Electric Co., Ltd. | 23,528 | 738,739 |
| Amano Corp. | 16,344 | 207,292 |
| Anritsu Corp. | 28,596 | 190,900 |
| Azbil Corp. | 17,523 | 446,082 |
| Canon Electronics, Inc. | 8,794 | 155,220 |
| Citizen Holdings Co., Ltd. | 62,683 | 473,801 |
| Daiwabo Holdings Co., Ltd. | 127,809 | 224,643 |
| Eizo Corp. | 7,283 | 166,352 |
| Hamamatsu Photonics K.K. | 13,169 | 326,549 |
| Hirose Electric Co., Ltd. | 3,687 | 421,684 |
| Hitachi High-Technologies Corp. | 19,614 | 441,693 |
| Hitachi Kokusai Electric, Inc. | 6,073 | 75,772 |
| Hitachi Maxell Ltd. | 2,852 | 44,174 |
| Horiba Ltd. | 7,911 | 279,074 |
| Hosiden Corp. | 69,039 | 372,583 |
| Japan Aviation Electronics Industry Ltd. | 7,936 | 145,380 |
| Japan Display, Inc. * | 27,981 | 88,202 |
| Melco Holdings, Inc. | 5,468 | 89,114 |
| Mitsumi Electric Co., Ltd. | 57,126 | 326,205 |
| Nichicon Corp. | 16,427 | 120,371 |
| Nippon Chemi-Con Corp. | 44,815 | 107,614 |
| Nippon Signal Co., Ltd. | 12,774 | 118,164 |
| Oki Electric Industry Co., Ltd. | 91,279 | 159,683 |
| Riso Kagaku Corp. | 6,073 | 118,719 |
| Ryosan Co., Ltd. | 17,523 | 422,368 |
| Ryoyo Electro Corp. | 15,194 | 193,584 |
| Shimadzu Corp. | 38,867 | 572,493 |
| Siix Corp. | 5,468 | 148,900 |
| Taiyo Yuden Co., Ltd. | 28,973 | 354,318 |
| Toshiba TEC Corp. | 42,603 | 158,551 |
| Wacom Co., Ltd. | 22,657 | 81,889 |
| Yaskawa Electric Corp. | 26,277 | 301,399 |
| Yokogawa Electric Corp. | 33,459 | 393,716 |
| | | 8,465,228 |
| Transportation 1.4% |
| Fukuyama Transporting Co., Ltd. | 48,676 | 268,313 |
| Hitachi Transport System, Ltd. | 18,242 | 308,587 |
| Japan Airport Terminal Co., Ltd. | 2,793 | 125,147 |
| Keikyu Corp. | 52,329 | 421,016 |
| Keisei Electric Railway Co., Ltd. | 27,421 | 292,798 |
| Kintetsu World Express, Inc. | 6,579 | 246,743 |
| Konoike Transport Co., Ltd. | 10,706 | 121,297 |
| Mitsubishi Logistics Corp. | 17,938 | 216,556 |
Schwab Fundamental International Small Company Index ETF
Portfolio Holdings (Unaudited) continued
| Security | Number
of Shares | Value
($) |
| Mitsui-Soko Holdings Co., Ltd. | 30,411 | 92,599 |
| Nankai Electric Railway Co., Ltd. | 69,845 | 360,795 |
| Nippon Konpo Unyu Soko Co., Ltd. | 17,032 | 301,611 |
| Nishi-Nippon Railroad Co., Ltd. | 78,540 | 398,582 |
| Sankyu, Inc. | 98,436 | 495,490 |
| Senko Co., Ltd. | 35,937 | 253,547 |
| Sotetsu Holdings, Inc. | 48,676 | 277,552 |
| The Sumitomo Warehouse Co., Ltd. | 30,411 | 154,583 |
| | | 4,335,216 |
| Utilities 0.1% |
| The Okinawa Electric Power Co., Inc. | 11,753 | 276,792 |
| | | 128,023,362 |
| Luxembourg 0.6% |
| Banks 0.0% |
| Espirito Santo Financial Group S.A. *(d)(e) | 8,470 | — |
| Commercial & Professional Services 0.1% |
| Regus plc | 69,462 | 305,328 |
| Consumer Durables & Apparel 0.1% |
| Samsonite International S.A. | 92,306 | 287,636 |
| Household & Personal Products 0.1% |
| Oriflame Holding AG * | 18,858 | 252,025 |
| Materials 0.3% |
| APERAM S.A. * | 14,750 | 498,052 |
| Ternium S.A. ADR | 21,155 | 300,824 |
| | | 798,876 |
| Pharmaceuticals, Biotechnology & Life Sciences 0.0% |
| Eurofins Scientific SE | 136 | 45,541 |
| Retailing 0.0% |
| L'Occitane International S.A. | 14,579 | 33,033 |
| | | 1,722,439 |
| Netherlands 2.1% |
| Capital Goods 0.8% |
| Aalberts Industries N.V. | 13,379 | 415,405 |
| AerCap Holdings N.V. * | 7,170 | 301,427 |
| Arcadis N.V. | 8,758 | 219,819 |
| Koninklijke BAM Groep N.V. * | 171,573 | 949,318 |
| Sensata Technologies Holding N.V. * | 5,347 | 253,448 |
| TKH Group N.V. | 3,904 | 151,355 |
| | | 2,290,772 |
| Commercial & Professional Services 0.2% |
| Brunel International N.V. | 2,010 | 35,134 |
| USG People N.V. | 30,446 | 449,632 |
| | | 484,766 |
| Consumer Durables & Apparel 0.1% |
| TomTom N.V. * | 19,382 | 194,394 |
| Diversified Financials 0.0% |
| Euronext N.V. (c) | 981 | 44,831 |
| HAL Trust | 237 | 42,455 |
| | | 87,286 |
| Energy 0.3% |
| Core Laboratories N.V. (b) | 1,828 | 211,463 |
| Koninklijke Vopak N.V. | 6,315 | 259,829 |
| Security | Number
of Shares | Value
($) |
| Nostrum Oil & Gas plc | 4,660 | 35,112 |
| SBM Offshore N.V. * | 43,838 | 523,133 |
| | | 1,029,537 |
| Food & Staples Retailing 0.1% |
| X5 Retail Group N.V. GDR - Reg’d * | 24,431 | 400,668 |
| Food, Beverage & Tobacco 0.2% |
| Corbion N.V. | 22,040 | 484,038 |
| Insurance 0.0% |
| NN Group N.V. | 2,834 | 86,453 |
| Materials 0.1% |
| Koninklijke Ten Cate N.V. | 11,094 | 298,899 |
| OCI N.V. * | 3,365 | 99,088 |
| | | 397,987 |
| Real Estate 0.2% |
| Eurocommercial Properties N.V. | 4,016 | 177,972 |
| NSI N.V. | 10,113 | 42,596 |
| Vastned Retail N.V. | 4,016 | 183,124 |
| Wereldhave N.V. | 3,553 | 203,197 |
| | | 606,889 |
| Retailing 0.0% |
| Beter Bed Holding N.V. | 1,669 | 39,824 |
| Semiconductors & Semiconductor Equipment 0.1% |
| ASM International N.V. | 6,921 | 260,684 |
| Software & Services 0.0% |
| Yandex N.V., Class A * | 8,460 | 103,212 |
| | | 6,466,510 |
| New Zealand 0.7% |
| Consumer Services 0.1% |
| SKYCITY Entertainment Group Ltd. | 85,206 | 209,352 |
| Energy 0.1% |
| Z Energy Ltd. | 45,577 | 167,109 |
| Food, Beverage & Tobacco 0.0% |
| Fonterra Co-operative Group Ltd. | 12,448 | 37,995 |
| Health Care Equipment & Services 0.1% |
| Fisher & Paykel Healthcare Corp., Ltd. | 39,931 | 183,326 |
| Materials 0.1% |
| Nuplex Industries Ltd. | 77,178 | 190,604 |
| Media 0.1% |
| SKY Network Television Ltd. | 55,256 | 177,404 |
| Real Estate 0.0% |
| Kiwi Property Group Ltd. | 115,796 | 96,059 |
| Telecommunication Services 0.1% |
| Chorus Ltd. * | 136,830 | 221,818 |
| Transportation 0.0% |
| Air New Zealand Ltd. | 121,933 | 190,719 |
| Auckland International Airport Ltd. | 56,348 | 176,628 |
| Mainfreight Ltd. | 11,697 | 104,588 |
| | | 471,935 |
| Utilities 0.1% |
| Contact Energy Ltd. | 50,523 | 166,047 |
| Genesis Energy Ltd. | 33,236 | 37,674 |
| Infratil Ltd. | 99,511 | 189,046 |
Schwab Fundamental International Small Company Index ETF
Portfolio Holdings (Unaudited) continued
| Security | Number
of Shares | Value
($) |
| Mighty River Power Ltd. | 73,794 | 129,442 |
| TrustPower Ltd. | 7,939 | 37,605 |
| | | 559,814 |
| | | 2,315,416 |
| Norway 0.9% |
| Banks 0.1% |
| SpareBank 1 SMN | 18,008 | 130,462 |
| SpareBank 1 SR-Bank A.S.A. | 23,283 | 124,669 |
| | | 255,131 |
| Capital Goods 0.0% |
| Vard Holdings Ltd. * | 274,375 | 69,065 |
| Veidekke A.S.A. | 3,699 | 41,576 |
| | | 110,641 |
| Commercial & Professional Services 0.0% |
| Tomra Systems A.S.A. | 17,032 | 146,750 |
| Diversified Financials 0.0% |
| Aker A.S.A., A Shares | 1,923 | 34,169 |
| Energy 0.2% |
| Akastor A.S.A. * | 148,855 | 210,356 |
| BW Offshore Ltd. | 66,933 | 24,744 |
| Fred. Olsen Energy A.S.A. *(b) | 31,085 | 138,976 |
| TGS Nopec Geophysical Co. A.S.A. (b) | 15,826 | 301,971 |
| | | 676,047 |
| Food, Beverage & Tobacco 0.1% |
| Austevoll Seafood A.S.A. | 21,419 | 125,161 |
| Leroy Seafood Group A.S.A. | 4,143 | 137,846 |
| Salmar A.S.A. | 5,514 | 82,853 |
| | | 345,860 |
| Insurance 0.2% |
| Gjensidige Forsikring A.S.A. | 23,380 | 342,665 |
| Storebrand A.S.A. * | 71,536 | 242,536 |
| | | 585,201 |
| Materials 0.0% |
| Borregaard A.S.A. | 13,398 | 83,084 |
| Media 0.1% |
| Schibsted A.S.A., Class A | 5,589 | 180,025 |
| Semiconductors & Semiconductor Equipment 0.1% |
| REC Silicon A.S.A. *(b) | 1,390,187 | 222,153 |
| Software & Services 0.1% |
| Atea A.S.A. | 26,808 | 230,981 |
| Transportation 0.0% |
| Norwegian Air Shuttle A.S.A. * | 1,014 | 44,984 |
| | | 2,915,026 |
| Portugal 0.3% |
| Banks 0.0% |
| Banco BPI S.A. - Reg'd * | 62,810 | 65,100 |
| Banco Espirito Santo S.A. - Reg'd *(d)(e) | 45,383 | — |
| | | 65,100 |
| Capital Goods 0.0% |
| Mota-Engil, SGPS, S.A. | 57,683 | 139,157 |
| Food & Staples Retailing 0.1% |
| Sonae, SGPS, S.A. | 241,369 | 307,236 |
| Security | Number
of Shares | Value
($) |
| Materials 0.1% |
| Portucel S.A. | 10,232 | 36,711 |
| Semapa-Sociedade de Investimento e Gestao | 13,629 | 198,450 |
| | | 235,161 |
| Media 0.1% |
| NOS, SGPS S.A. | 24,220 | 195,533 |
| Transportation 0.0% |
| CTT-Correios de Portugal S.A. | 3,854 | 39,876 |
| Utilities 0.0% |
| REN - Redes Energeticas Nacionais, SGPS, S.A. | 32,128 | 96,190 |
| | | 1,078,253 |
| Singapore 1.4% |
| Capital Goods 0.3% |
| COSCO Corp., Ltd. (b)(d)(e) | 368,014 | 97,855 |
| Sembcorp Marine Ltd. (b) | 176,239 | 298,668 |
| Singapore Technologies Engineering Ltd. | 187,670 | 408,528 |
| United Engineers Ltd. | 54,772 | 76,121 |
| | | 881,172 |
| Consumer Services 0.1% |
| Genting Singapore plc | 389,131 | 212,459 |
| Diversified Financials 0.1% |
| Singapore Exchange Ltd. | 52,329 | 269,381 |
| Energy 0.0% |
| InterOil Corp. * | 708 | 25,389 |
| Food & Staples Retailing 0.0% |
| Olam International Ltd. | 91,279 | 133,977 |
| Real Estate 0.5% |
| Ascendas Real Estate Investment Trust | 127,809 | 202,095 |
| CapitaLand Commercial Trust Ltd. | 127,809 | 120,532 |
| CapitaLand Mall Trust | 154,261 | 210,013 |
| City Developments Ltd. | 66,941 | 417,224 |
| Global Logistic Properties Ltd. | 103,934 | 163,606 |
| Mapletree Greater China Commercial Trust | 54,526 | 36,729 |
| Mapletree Industrial Trust | 36,384 | 39,601 |
| Mapletree Logistics Trust | 49,560 | 34,439 |
| Suntec Real Estate Investment Trust | 153,589 | 166,625 |
| UOL Group Ltd. | 46,256 | 205,320 |
| Wing Tai Holdings Ltd. | 28,935 | 33,750 |
| Yanlord Land Group Ltd. | 49,045 | 37,732 |
| | | 1,667,666 |
| Semiconductors & Semiconductor Equipment 0.0% |
| Kulicke & Soffa Industries, Inc. * | 8,664 | 91,492 |
| Telecommunication Services 0.1% |
| M1 Ltd. | 35,297 | 73,582 |
| StarHub Ltd. | 79,110 | 205,306 |
| | | 278,888 |
| Transportation 0.3% |
| Neptune Orient Lines Ltd. *(b) | 314,864 | 184,190 |
| SATS Ltd. | 121,713 | 307,238 |
| SIA Engineering Co., Ltd. | 14,652 | 36,363 |
Schwab Fundamental International Small Company Index ETF
Portfolio Holdings (Unaudited) continued
| Security | Number
of Shares | Value
($) |
| Singapore Post Ltd. | 127,809 | 161,313 |
| SMRT Corp., Ltd. (b) | 127,809 | 110,563 |
| | | 799,667 |
| | | 4,360,091 |
| Spain 2.2% |
| Banks 0.3% |
| Bankia S.A. | 303,335 | 366,058 |
| Bankinter S.A. | 61,452 | 462,719 |
| Liberbank S.A. * | 130,512 | 91,691 |
| | | 920,468 |
| Capital Goods 0.7% |
| Abengoa S.A., B Shares | 92,643 | 113,045 |
| Abengoa S.A., Class A (b) | 11,834 | 22,595 |
| Construcciones y Auxiliar de Ferrocarriles S.A. | 506 | 158,015 |
| Duro Felguera S.A. | 32,890 | 114,245 |
| Fomento de Construcciones y Contratas S.A. * | 52,781 | 483,952 |
| Gamesa Corp. Tecnologica S.A. | 37,573 | 565,410 |
| Obrascon Huarte Lain S.A. (b) | 13,181 | 204,555 |
| Sacyr S.A. * | 59,961 | 183,419 |
| Zardoya Otis S.A. | 24,917 | 266,073 |
| | | 2,111,309 |
| Commercial & Professional Services 0.1% |
| Prosegur Cia de Seguridad S.A. | 43,142 | 210,765 |
| Consumer Services 0.1% |
| Melia Hotels International S.A. | 7,679 | 109,490 |
| NH Hotel Group S.A. * | 21,069 | 118,393 |
| | | 227,883 |
| Diversified Financials 0.1% |
| Bolsas y Mercados Espanoles SHMSF S.A. | 7,525 | 293,004 |
| Energy 0.1% |
| Tecnicas Reunidas S.A. | 4,511 | 216,917 |
| Food, Beverage & Tobacco 0.2% |
| Ebro Foods S.A. | 17,657 | 356,718 |
| Viscofan S.A. | 6,073 | 353,849 |
| | | 710,567 |
| Insurance 0.1% |
| Grupo Catalana Occidente S.A. | 5,109 | 161,835 |
| Materials 0.1% |
| Acerinox S.A. | 28,809 | 332,327 |
| Ence Energia y Celulosa S.A. | 10,937 | 35,968 |
| Vidrala S.A. | 2,312 | 114,686 |
| | | 482,981 |
| Media 0.2% |
| Mediaset Espana Comunicacion S.A. | 29,692 | 354,158 |
| Promotora de Informaciones S.A., Class A * | 35,553 | 237,628 |
| | | 591,786 |
| Pharmaceuticals, Biotechnology & Life Sciences 0.1% |
| Almirall S.A. | 8,153 | 159,687 |
| Grifols S.A. | 5,564 | 227,901 |
| Grifols S.A., Class B | 4,512 | 138,653 |
| | | 526,241 |
| Security | Number
of Shares | Value
($) |
| Software & Services 0.1% |
| Indra Sistemas S.A. * | 37,353 | 442,816 |
| Utilities 0.0% |
| EDP Renovaveis S.A. | 5,487 | 37,399 |
| | | 6,933,971 |
| Sweden 2.2% |
| Capital Goods 0.4% |
| AddTech AB, B Shares | 2,754 | 39,596 |
| B&B Tools AB, B Shares | 8,172 | 115,570 |
| Indutrade AB | 3,304 | 157,583 |
| Nibe Industrier AB, B Shares | 5,831 | 175,715 |
| Peab AB | 54,909 | 389,561 |
| Saab AB, Class B | 10,817 | 275,867 |
| | | 1,153,892 |
| Commercial & Professional Services 0.2% |
| AF AB, B Shares | 6,580 | 90,341 |
| Intrum Justitia AB | 7,165 | 245,385 |
| Loomis AB, B Shares | 9,379 | 237,867 |
| | | 573,593 |
| Consumer Durables & Apparel 0.1% |
| JM AB | 11,066 | 290,042 |
| Consumer Services 0.1% |
| Betsson AB * | 9,762 | 172,340 |
| Diversified Financials 0.2% |
| L E Lundbergfortagen AB, B Shares | 4,984 | 239,589 |
| Ratos AB, B Shares | 56,829 | 350,608 |
| | | 590,197 |
| Energy 0.1% |
| Lundin Petroleum AB * | 15,146 | 197,419 |
| Food & Staples Retailing 0.1% |
| Axfood AB | 16,195 | 273,694 |
| ICA Gruppen AB | 1,145 | 42,439 |
| | | 316,133 |
| Food, Beverage & Tobacco 0.0% |
| AAK AB | 2,182 | 144,519 |
| Health Care Equipment & Services 0.1% |
| Elekta AB, B Shares (b) | 34,668 | 214,294 |
| Materials 0.2% |
| BillerudKorsnas AB | 15,227 | 232,391 |
| Hexpol AB | 17,229 | 172,285 |
| Holmen AB, B Shares | 12,895 | 362,296 |
| | | 766,972 |
| Media 0.1% |
| Modern Times Group MTG AB, B Shares | 12,059 | 326,443 |
| Pharmaceuticals, Biotechnology & Life Sciences 0.1% |
| Meda AB, A Shares | 27,882 | 426,843 |
| Real Estate 0.2% |
| Castellum AB | 13,025 | 184,048 |
| Fabege AB | 13,382 | 189,093 |
| Kungsleden AB | 22,022 | 147,285 |
| Wihlborgs Fastigheter AB | 2,443 | 42,539 |
| | | 562,965 |
Schwab Fundamental International Small Company Index ETF
Portfolio Holdings (Unaudited) continued
| Security | Number
of Shares | Value
($) |
| Retailing 0.1% |
| Bilia AB, A Shares | 15,611 | 310,003 |
| Clas Ohlson AB, B Shares | 6,678 | 123,168 |
| | | 433,171 |
| Technology Hardware & Equipment 0.1% |
| Hexagon AB, B Shares | 12,415 | 399,141 |
| Transportation 0.1% |
| SAS AB *(b) | 123,166 | 223,536 |
| | | 6,791,500 |
| Switzerland 2.8% |
| Banks 0.1% |
| Banque Cantonale Vaudoise - Reg'd | 293 | 174,215 |
| Valiant Holding AG - Reg'd | 2,182 | 246,168 |
| | | 420,383 |
| Capital Goods 0.7% |
| AFG Arbonia-Forster Holding AG - Reg'd * | 5,876 | 93,270 |
| Belimo Holding AG - Reg'd | 37 | 84,403 |
| Bucher Industries AG - Reg'd | 895 | 203,331 |
| Burckhardt Compression Holding AG | 83 | 28,731 |
| Conzzeta AG - Reg'd | 9 | 5,789 |
| Daetwyler Holding AG | 989 | 128,962 |
| Georg Fischer AG - Reg'd | 748 | 449,396 |
| Implenia AG - Reg'd | 2,304 | 126,987 |
| Meyer Burger Technology AG * | 16,321 | 131,979 |
| OC Oerlikon Corp. AG - Reg'd * | 21,892 | 237,698 |
| Schweiter Technologies AG | 42 | 34,007 |
| Sulzer AG - Reg'd | 4,657 | 475,066 |
| Zehnder Group AG - Reg'd | 1,070 | 36,458 |
| | | 2,036,077 |
| Commercial & Professional Services 0.2% |
| DKSH Holding AG * | 3,461 | 210,978 |
| Gategroup Holding AG * | 6,321 | 219,949 |
| Kaba Holding AG, B Shares - Reg'd * | 366 | 242,221 |
| | | 673,148 |
| Consumer Durables & Apparel 0.1% |
| Forbo Holding AG - Reg'd * | 126 | 136,156 |
| Consumer Services 0.1% |
| Kuoni Reisen Holding AG - Reg'd * | 1,115 | 233,365 |
| Diversified Financials 0.3% |
| Cembra Money Bank AG * | 662 | 40,560 |
| GAM Holding AG * | 10,980 | 202,671 |
| Julius Baer Group Ltd. * | 10,985 | 534,682 |
| Partners Group Holding AG | 732 | 236,355 |
| | | 1,014,268 |
| Food, Beverage & Tobacco 0.1% |
| Barry Callebaut AG - Reg'd * | 201 | 220,527 |
| Emmi AG - Reg'd * | 491 | 189,764 |
| | | 410,291 |
| Health Care Equipment & Services 0.2% |
| Sonova Holding AG - Reg'd | 2,787 | 362,839 |
| Straumann Holding AG - Reg'd | 610 | 182,770 |
| | | 545,609 |
| Insurance 0.1% |
| Helvetia Holding AG - Reg'd | 732 | 385,283 |
| Security | Number
of Shares | Value
($) |
| Materials 0.2% |
| EMS-Chemie Holding AG - Reg'd | 605 | 272,768 |
| Schmolz + Bickenbach AG - Reg'd * | 230,294 | 188,131 |
| | | 460,899 |
| Pharmaceuticals, Biotechnology & Life Sciences 0.2% |
| Galenica AG - Reg'd | 441 | 567,297 |
| Real Estate 0.1% |
| Allreal Holding AG - Reg'd * | 1,092 | 147,700 |
| Swiss Prime Site AG - Reg'd * | 2,783 | 218,283 |
| | | 365,983 |
| Retailing 0.1% |
| Dufry AG - Reg'd * | 1,694 | 227,724 |
| Valora Holding AG - Reg'd * | 968 | 188,685 |
| | | 416,409 |
| Software & Services 0.0% |
| Temenos Group AG - Reg'd * | 2,787 | 98,851 |
| Technology Hardware & Equipment 0.1% |
| Kudelski S.A. | 6,372 | 84,670 |
| Logitech International S.A. - Reg'd | 25,790 | 342,693 |
| | | 427,363 |
| Transportation 0.2% |
| Flughafen Zuerich AG - Reg'd | 366 | 291,233 |
| Panalpina Welttransport Holding AG - Reg'd | 2,537 | 319,273 |
| | | 610,506 |
| | | 8,801,888 |
| United Kingdom 13.2% |
| Banks 0.0% |
| The Paragon Group of Cos. plc | 19,210 | 121,666 |
| Capital Goods 2.0% |
| Ashtead Group plc | 29,455 | 428,329 |
| Bodycote plc | 27,628 | 272,373 |
| Brammer plc | 16,204 | 75,825 |
| Chemring Group plc | 58,917 | 203,882 |
| Diploma plc | 3,312 | 36,981 |
| Fenner plc | 56,835 | 149,256 |
| Galliford Try plc | 15,822 | 423,659 |
| Grafton Group plc | 41,418 | 477,120 |
| HellermannTyton Group plc | 22,363 | 163,373 |
| Interserve plc | 30,532 | 274,471 |
| Keller Group plc | 18,496 | 279,490 |
| Kier Group plc | 8,516 | 196,333 |
| Lavendon Group plc | 41,984 | 113,646 |
| Melrose Industries plc | 105,610 | 433,683 |
| Morgan Advanced Materials plc | 58,063 | 299,158 |
| QinetiQ Group plc | 141,430 | 506,603 |
| Rotork plc | 60,845 | 195,675 |
| Senior plc | 46,868 | 206,013 |
| SIG plc | 189,289 | 546,736 |
| Speedy Hire plc | 154,604 | 113,540 |
| Spirax-Sarco Engineering plc | 7,021 | 340,578 |
| Ultra Electronics Holdings plc | 8,516 | 230,125 |
| Vesuvius plc | 51,516 | 315,976 |
| | | 6,282,825 |
Schwab Fundamental International Small Company Index ETF
Portfolio Holdings (Unaudited) continued
| Security | Number
of Shares | Value
($) |
| Commercial & Professional Services 1.3% |
| Berendsen plc | 31,402 | 481,997 |
| Cape plc | 39,676 | 157,131 |
| De La Rue plc | 36,784 | 277,070 |
| Hays plc | 243,342 | 597,693 |
| HomeServe plc | 43,618 | 282,359 |
| Mears Group plc | 15,580 | 95,369 |
| Michael Page International plc | 54,772 | 427,094 |
| Mitie Group plc | 78,868 | 359,894 |
| PayPoint plc | 5,746 | 90,141 |
| Rentokil Initial plc | 222,753 | 508,067 |
| RPS Group plc | 49,454 | 177,791 |
| Shanks Group plc | 126,455 | 181,846 |
| WS Atkins plc | 11,564 | 261,090 |
| | | 3,897,542 |
| Consumer Durables & Apparel 0.5% |
| Bellway plc | 13,026 | 498,646 |
| Berkeley Group Holdings plc | 9,835 | 510,057 |
| Bovis Homes Group plc | 11,567 | 196,224 |
| Coats Group plc * | 693,549 | 267,906 |
| Crest Nicholson Holdings plc | 19,910 | 169,337 |
| Telford Homes plc | 6,110 | 37,377 |
| | | 1,679,547 |
| Consumer Services 1.0% |
| Betfair Group plc | 4,620 | 230,220 |
| Bwin.Party Digital Entertainment plc | 68,926 | 123,394 |
| Dignity plc | 2,841 | 105,828 |
| Domino's Pizza Group plc | 3,371 | 44,873 |
| Enterprise Inns plc * | 255,626 | 470,997 |
| Greene King plc | 54,467 | 687,754 |
| J.D. Wetherspoon plc | 17,879 | 206,784 |
| Ladbrokes plc | 281,104 | 432,338 |
| Marston's plc | 170,899 | 398,995 |
| Merlin Entertainments plc (c) | 7,559 | 45,166 |
| Mitchells & Butlers plc * | 47,254 | 263,089 |
| The Restaurant Group plc | 22,259 | 228,172 |
| | | 3,237,610 |
| Diversified Financials 1.6% |
| Aberdeen Asset Management plc | 54,909 | 269,311 |
| Ashmore Group plc (b) | 44,079 | 178,094 |
| Brewin Dolphin Holdings plc | 19,535 | 85,147 |
| Close Brothers Group plc | 15,590 | 357,503 |
| Hargreaves Lansdown plc | 5,360 | 92,741 |
| Henderson Group plc | 90,825 | 362,353 |
| IG Group Holdings plc | 39,558 | 441,092 |
| Intermediate Capital Group plc | 44,333 | 364,104 |
| International Personal Finance plc | 37,340 | 228,337 |
| Investec plc | 58,433 | 480,355 |
| Jupiter Fund Management plc | 32,736 | 224,703 |
| London Stock Exchange Group plc | 14,347 | 556,055 |
| Provident Financial plc | 13,156 | 596,901 |
| Schroders plc | 7,939 | 346,525 |
| Schroders plc, Non-Voting Shares | 369 | 12,650 |
| Tullett Prebon plc | 49,644 | 288,078 |
| | | 4,883,949 |
| Energy 0.2% |
| EnQuest plc * | 326,646 | 169,554 |
| Genel Energy plc * | 4,901 | 26,815 |
| Security | Number
of Shares | Value
($) |
| Hunting plc | 27,054 | 215,535 |
| Premier Oil plc * | 116,141 | 188,092 |
| | | 599,996 |
| Food & Staples Retailing 0.1% |
| Greggs plc | 23,848 | 418,132 |
| Food, Beverage & Tobacco 0.5% |
| Britvic plc | 20,806 | 214,237 |
| Cranswick plc | 11,808 | 305,281 |
| Dairy Crest Group plc | 47,708 | 429,977 |
| Devro plc | 16,943 | 75,309 |
| Greencore Group plc | 39,086 | 178,720 |
| Premier Foods plc * | 513,592 | 274,492 |
| | | 1,478,016 |
| Health Care Equipment & Services 0.0% |
| Synergy Health plc * | 5,725 | 143,082 |
| Household & Personal Products 0.1% |
| PZ Cussons plc | 39,555 | 192,788 |
| Insurance 0.6% |
| Beazley plc | 64,144 | 330,193 |
| Hiscox Ltd. | 38,727 | 536,059 |
| Jardine Lloyd Thompson Group plc | 11,927 | 193,343 |
| Lancashire Holdings Ltd. | 52,212 | 523,570 |
| Saga plc | 12,277 | 38,368 |
| St. James's Place plc | 13,636 | 192,000 |
| | | 1,813,533 |
| Materials 0.9% |
| Acacia Mining plc | 37,839 | 139,264 |
| Alent plc | 30,801 | 225,964 |
| Centamin plc | 41,613 | 38,433 |
| Croda International plc | 11,095 | 493,494 |
| Elementis plc | 42,845 | 156,436 |
| Essentra plc | 14,987 | 196,501 |
| Evraz plc * | 228,526 | 277,488 |
| Ferrexpo plc | 98,842 | 93,872 |
| Marshalls plc | 8,576 | 44,186 |
| Petropavlovsk plc * | 494,092 | 45,063 |
| Polyus Gold International Ltd. | 42,654 | 124,644 |
| Randgold Resources Ltd. | 5,226 | 318,208 |
| RPC Group plc | 24,338 | 245,740 |
| Synthomer plc | 31,530 | 166,719 |
| Victrex plc | 5,831 | 161,067 |
| | | 2,727,079 |
| Media 0.2% |
| Daily Mail & General Trust plc, A Shares | 22,274 | 281,253 |
| Markit Ltd. * | 1,562 | 44,642 |
| UBM plc | 47,950 | 363,205 |
| | | 689,100 |
| Pharmaceuticals, Biotechnology & Life Sciences 0.1% |
| Genus plc | 5,593 | 118,450 |
| Indivior plc * | 11,301 | 38,847 |
| | | 157,297 |
| Real Estate 0.9% |
| Derwent London plc | 3,777 | 209,648 |
| Hammerson plc | 58,066 | 560,839 |
| Intu Properties plc | 79,604 | 395,452 |
| Savills plc | 18,299 | 254,139 |
| Segro plc | 85,456 | 551,486 |
Schwab Fundamental International Small Company Index ETF
Portfolio Holdings (Unaudited) continued
| Security | Number
of Shares | Value
($) |
| Shaftesbury plc | 5,130 | 71,009 |
| The British Land Co. plc | 49,133 | 619,646 |
| | | 2,662,219 |
| Retailing 1.1% |
| Debenhams plc | 473,378 | 551,138 |
| Dixons Carphone plc | 74,154 | 492,007 |
| Dunelm Group plc | 5,622 | 80,543 |
| Halfords Group plc | 52,097 | 417,452 |
| Howden Joinery Group plc | 30,446 | 225,514 |
| John Menzies plc | 23,984 | 166,731 |
| Lookers plc | 77,537 | 193,188 |
| N Brown Group plc | 26,906 | 124,268 |
| Pendragon plc | 642,746 | 452,259 |
| Poundland Group plc | 8,432 | 44,741 |
| Sports Direct International plc * | 16,567 | 202,312 |
| Vertu Motors plc | 42,970 | 43,122 |
| WH Smith plc | 22,895 | 528,188 |
| | | 3,521,463 |
| Semiconductors & Semiconductor Equipment 0.1% |
| ARM Holdings plc | 20,708 | 297,310 |
| Dialog Semiconductor plc * | 727 | 34,836 |
| | | 332,146 |
| Software & Services 0.4% |
| AVEVA Group plc | 5,625 | 187,300 |
| Computacenter plc | 4,780 | 56,755 |
| Fidessa Group plc | 3,632 | 104,905 |
| Micro Focus International plc | 13,869 | 278,363 |
| Moneysupermarket.com Group plc | 28,000 | 139,140 |
| Playtech plc | 10,230 | 134,917 |
| Telecity Group plc | 6,937 | 115,973 |
| Xchanging plc | 60,119 | 87,146 |
| | | 1,104,499 |
| Technology Hardware & Equipment 0.6% |
| e2v technologies plc | 10,436 | 36,997 |
| Electrocomponents plc | 108,933 | 307,434 |
| Halma plc | 31,281 | 363,232 |
| Laird plc | 43,843 | 257,045 |
| Pace plc | 46,758 | 245,226 |
| Premier Farnell plc | 65,610 | 131,786 |
| Spectris plc | 11,057 | 310,184 |
| Spirent Communications plc | 146,051 | 175,770 |
| TT electronics plc | 69,791 | 170,668 |
| | | 1,998,342 |
| Telecommunication Services 0.4% |
| Cable & Wireless Communications plc | 691,726 | 638,325 |
| KCOM Group plc | 95,064 | 137,436 |
| TalkTalk Telecom Group plc | 73,642 | 340,803 |
| | | 1,116,564 |
| Transportation 0.6% |
| BBA Aviation plc | 79,726 | 357,311 |
| Go-Ahead Group plc | 7,443 | 289,732 |
| National Express Group plc | 136,325 | 620,617 |
| Northgate plc | 42,983 | 330,341 |
| Stagecoach Group plc | 49,052 | 273,779 |
| Stolt-Nielsen Ltd. | 9,855 | 148,081 |
| | | 2,019,861 |
| Security | Number
of Shares | Value
($) |
| Utilities 0.0% |
| Telecom Plus plc | 3,122 | 53,490 |
| | | 41,130,746 |
| Total Common Stock |
| (Cost $324,181,328) | | 310,023,650 |
|
| Preferred Stock 0.3% of net assets |
| Germany 0.2% |
| Capital Goods 0.1% |
| Jungheinrich AG | 2,914 | 203,483 |
| Health Care Equipment & Services 0.0% |
| Draegerwerk AG & Co. KGaA | 1,954 | 185,710 |
| Materials 0.1% |
| FUCHS PETROLUB SE | 7,791 | 335,661 |
| Transportation 0.0% |
| Sixt SE | 1,064 | 38,747 |
| | | 763,601 |
| Sweden 0.1% |
| Transportation 0.1% |
| SAS AB | 2,839 | 161,268 |
| Total Preferred Stock |
| (Cost $958,756) | | 924,869 |
|
| Other Investment Companies 0.8% of net assets |
| United States 0.8% |
| Equity Fund 0.2% |
| iShares MSCI EAFE Small-Cap ETF | 14,000 | 686,840 |
| Money Market Fund 0.1% |
| State Street Institutional U.S. Government Money Market Fund, Premier Class 0.00% (a) | 141,362 | 141,362 |
| Securities Lending Collateral 0.5% |
| State Street Institutional U.S. Government Money Market Fund, Premier Class 0.00% (a) | 1,520,342 | 1,520,342 |
| Total Other Investment Companies |
| (Cost $2,357,250) | | 2,348,544 |
End of Investments.
Schwab Fundamental International Small Company Index ETF
Portfolio Holdings (Unaudited) continued
At 08/31/15, the tax basis cost of the fund's investments was $327,520,607 and the unrealized appreciation and depreciation were $13,068,732 and ($27,292,276), respectively, with a net unrealized depreciation of ($14,223,544).
| * | Non-income producing security. |
| (a) | The rate shown is the 7-day yield. |
| (b) | All or a portion of this security is on loan. Securities on loan were valued at $1,438,877. Non-cash collateral pledged to the fund for securities on loan amounted to $50,359. |
| (c) | Securities exempt from registration under Rule 144A of the Securities Act of 1933, as amended. These securities may be resold in transactions exempt from registrations, normally to qualified institutional buyers. At the period end, the value of these amounted to $160,836 or 0.1% of net assets. |
| (d) | Fair-valued by management in accordance with procedures approved by the Board of Trustees. |
| (e) | Illiquid security. At the period end, the value of these amounted to $97,855 or 0.0% of net assets. |
| | |
| ADR — | American Depositary Receipt |
| CDI — | CHESS Depositary Interest |
| ETF — | Exchange Traded Fund |
| GDR — | Global Depositary Receipt |
| Reg'd — | Registered |
| REIT — | Real Estate Investment Trust |
Schwab Fundamental Emerging Markets Large Company Index ETF
Portfolio Holdings as of August 31, 2015 (Unaudited)
This section shows all the securities in the fund's portfolio and their values as of the report date.
The fund files its complete schedule of portfolio holdings with the SEC for the first and third quarters of each fiscal year on Form N-Q. The fund's Form N-Q is available on the SEC's website at www.sec.gov and may be viewed and copied at the SEC's Public Reference Room in Washington, D.C. Call 1-800-SEC-0330 for information on the operation of the Public Reference Room. The fund also makes available its complete schedule of portfolio holdings on a daily basis on the fund's website at www.csimfunds.com/schwabetfs_prospectus.
| Holdings by Category | Cost
($) | Value
($) |
| 89.3% | Common Stock | 285,248,224 | 238,619,586 |
| 8.7% | Preferred Stock | 32,907,918 | 23,130,982 |
| 2.0% | Other Investment Companies | 5,867,245 | 5,460,380 |
| 100.0% | Total Investments | 324,023,387 | 267,210,948 |
| (0.0%) | Other Assets and
Liabilities, Net | | (133,041) |
| 100.0% | Net Assets | | 267,077,907 |
| Security | Number
of Shares | Value
($) |
| Common Stock 89.3% of net assets |
| Brazil 6.1% |
| Banks 1.0% |
| Banco Bradesco S.A. | 129,583 | 895,492 |
| Banco do Brasil S.A. | 282,226 | 1,381,588 |
| Itau Unibanco Holding S.A. | 46,317 | 319,059 |
| | | 2,596,139 |
| Capital Goods 0.2% |
| Embraer S.A. | 69,680 | 439,631 |
| Diversified Financials 0.2% |
| BM&FBovespa S.A. - Bolsa de Valores Mercadorias e Futuros | 127,206 | 376,493 |
| Energy 1.7% |
| Cosan Ltd., A Shares | 47,065 | 175,553 |
| Petroleo Brasileiro S.A. * | 1,161,884 | 3,387,798 |
| Ultrapar Participacoes S.A. | 54,965 | 957,822 |
| | | 4,521,173 |
| Food, Beverage & Tobacco 1.1% |
| Ambev S.A. | 319,565 | 1,674,925 |
| BRF S.A. | 32,845 | 626,916 |
| JBS S.A. | 180,373 | 700,742 |
| | | 3,002,583 |
| Insurance 0.1% |
| Sul America S.A. | 62,540 | 300,487 |
| Materials 1.1% |
| Companhia Siderurgica Nacional S.A. | 382,230 | 367,302 |
| Vale S.A. | 541,440 | 2,663,904 |
| | | 3,031,206 |
| Software & Services 0.1% |
| Cielo S.A. | 34,572 | 364,016 |
| Security | Number
of Shares | Value
($) |
| Telecommunication Services 0.1% |
| Oi S.A. * | 81,830 | 60,661 |
| Tim Participacoes S.A. | 122,507 | 295,988 |
| | | 356,649 |
| Transportation 0.2% |
| CCR S.A. | 101,903 | 416,313 |
| Utilities 0.3% |
| Centrais Eletricas Brasileiras S.A. * | 217,912 | 297,948 |
| Companhia de Saneamento Basico do Estado de Sao Paulo | 76,797 | 331,668 |
| CPFL Energia S.A. | 60,245 | 259,687 |
| | | 889,303 |
| | | 16,293,993 |
| Chile 0.9% |
| Energy 0.3% |
| Empresas COPEC S.A. | 63,121 | 617,259 |
| Food & Staples Retailing 0.1% |
| Cencosud S.A. | 159,479 | 324,309 |
| Transportation 0.1% |
| Latam Airlines Group S.A. * | 35,476 | 198,588 |
| Utilities 0.4% |
| Empresa Nacional de Electricidad S.A. | 351,080 | 435,393 |
| Enersis S.A. | 2,556,466 | 709,609 |
| | | 1,145,002 |
| | | 2,285,158 |
| China 17.0% |
| Automobiles & Components 0.2% |
| Byd Co., Ltd., H Shares *(b) | 22,642 | 92,466 |
| Dongfeng Motor Group Co., Ltd., H Shares | 348,345 | 350,590 |
| | | 443,056 |
| Banks 6.7% |
| Agricultural Bank of China Ltd., H Shares | 2,412,000 | 974,131 |
| Bank of China Ltd., H Shares | 8,287,132 | 3,785,324 |
| Bank of Communications Co., Ltd., H Shares | 646,848 | 487,428 |
| BOC Hong Kong Holdings Ltd. | 236,400 | 799,179 |
| China CITIC Bank Corp., Ltd., H Shares * | 536,000 | 328,514 |
| China Construction Bank Corp., H Shares | 8,344,528 | 5,868,050 |
| China Merchants Bank Co., Ltd., H Shares | 309,722 | 737,733 |
| China Minsheng Banking Corp., Ltd., H Shares | 373,629 | 362,056 |
| Industrial & Commercial Bank of China Ltd., H Shares | 7,921,499 | 4,681,320 |
| | | 18,023,735 |
| Capital Goods 0.4% |
| China Communications Construction Co., Ltd., H Shares | 626,737 | 745,610 |
| CRRC Corp., Ltd., H Shares * | 163,193 | 190,777 |
| | | 936,387 |
Schwab Fundamental Emerging Markets Large Company Index ETF
Portfolio Holdings (Unaudited) continued
| Security | Number
of Shares | Value
($) |
| Consumer Durables & Apparel 0.3% |
| Belle International Holdings Ltd. | 449,200 | 410,943 |
| Yue Yuen Industrial Holdings Ltd. | 112,459 | 402,673 |
| | | 813,616 |
| Energy 4.0% |
| China Petroleum & Chemical Corp., H Shares | 6,354,840 | 4,231,066 |
| China Shenhua Energy Co., Ltd., H Shares | 508,400 | 881,658 |
| CNOOC Ltd. | 2,222,478 | 2,755,855 |
| PetroChina Co., Ltd., H Shares | 3,258,477 | 2,707,672 |
| | | 10,576,251 |
| Food & Staples Retailing 0.2% |
| China Resources Enterprise Ltd. | 176,315 | 553,967 |
| Insurance 0.8% |
| China Life Insurance Co., Ltd., H Shares | 284,026 | 982,174 |
| China Pacific Insurance (Group) Co., Ltd., H Shares | 107,200 | 390,067 |
| Ping An Insurance Group Co. of China Ltd., H Shares | 134,000 | 656,164 |
| | | 2,028,405 |
| Materials 0.2% |
| China National Building Material Co., Ltd., H Shares | 445,484 | 259,816 |
| Jiangxi Copper Co., Ltd., H Shares | 268,000 | 338,542 |
| | | 598,358 |
| Real Estate 0.2% |
| China Overseas Land & Investment Ltd. | 205,700 | 602,498 |
| Retailing 0.1% |
| GOME Electrical Appliances Holdings Ltd. | 2,412,000 | 382,805 |
| Software & Services 0.3% |
| Alibaba Group Holding Ltd. ADR * | 968 | 64,004 |
| Baidu, Inc. ADR * | 1,285 | 189,216 |
| Tencent Holdings Ltd. | 30,793 | 523,677 |
| | | 776,897 |
| Technology Hardware & Equipment 0.2% |
| Kingboard Chemical Holdings Ltd. | 176,024 | 228,489 |
| Lenovo Group Ltd. | 354,700 | 291,081 |
| | | 519,570 |
| Telecommunication Services 3.2% |
| China Mobile Ltd. | 536,326 | 6,498,153 |
| China Telecom Corp., Ltd., H Shares | 2,057,998 | 1,078,119 |
| China Unicom (Hong Kong) Ltd. | 723,076 | 949,789 |
| | | 8,526,061 |
| Utilities 0.2% |
| China Resources Power Holdings Co., Ltd. | 99,478 | 243,623 |
| Huaneng Power International, Inc., H Shares | 338,900 | 390,498 |
| | | 634,121 |
| | | 45,415,727 |
| Security | Number
of Shares | Value
($) |
| Colombia 0.3% |
| Banks 0.1% |
| Bancolombia S.A. | 28,241 | 227,863 |
| Energy 0.2% |
| Ecopetrol S.A. | 1,123,652 | 579,352 |
| | | 807,215 |
| Czech Republic 0.3% |
| Utilities 0.3% |
| CEZ A/S | 39,128 | 893,057 |
| Greece 0.5% |
| Banks 0.0% |
| National Bank of Greece S.A. * | 122,699 | 71,492 |
| Consumer Services 0.2% |
| OPAP S.A. | 81,485 | 639,127 |
| Telecommunication Services 0.2% |
| Hellenic Telecommunications Organization S.A. | 48,270 | 440,805 |
| Utilities 0.1% |
| Public Power Corp. S.A. | 64,312 | 292,570 |
| | | 1,443,994 |
| Hungary 0.7% |
| Banks 0.3% |
| OTP Bank plc | 44,365 | 854,082 |
| Energy 0.4% |
| MOL Hungarian Oil & Gas plc | 18,504 | 916,517 |
| | | 1,770,599 |
| India 2.5% |
| Automobiles & Components 0.3% |
| Mahindra & Mahindra Ltd. GDR | 19,544 | 365,473 |
| Tata Motors Ltd. ADR | 16,256 | 411,602 |
| | | 777,075 |
| Banks 0.4% |
| ICICI Bank Ltd. ADR | 63,919 | 557,373 |
| State Bank of India GDR - Reg'd | 13,143 | 494,834 |
| | | 1,052,207 |
| Energy 1.1% |
| Reliance Industries Ltd. GDR (a) | 106,091 | 2,768,975 |
| Materials 0.1% |
| Tata Steel Ltd. GDR - Reg'd | 81,521 | 286,139 |
| Software & Services 0.6% |
| Infosys Ltd. ADR | 95,452 | 1,637,002 |
| | | 6,521,398 |
| Indonesia 1.2% |
| Automobiles & Components 0.3% |
| PT Astra International Tbk | 1,785,859 | 753,111 |
Schwab Fundamental Emerging Markets Large Company Index ETF
Portfolio Holdings (Unaudited) continued
| Security | Number
of Shares | Value
($) |
| Banks 0.4% |
| PT Bank Central Asia Tbk | 415,400 | 381,399 |
| PT Bank Mandiri (Persero) Tbk | 431,900 | 279,736 |
| PT Bank Rakyat Indonesia (Persero) Tbk | 514,700 | 389,231 |
| | | 1,050,366 |
| Capital Goods 0.1% |
| PT United Tractors Tbk | 189,536 | 257,998 |
| Telecommunication Services 0.3% |
| PT Telekomunikasi Indonesia (Persero) Tbk | 4,895,462 | 999,998 |
| Utilities 0.1% |
| PT Perusahaan Gas Negara (Persero) Tbk | 852,712 | 168,722 |
| | | 3,230,195 |
| Malaysia 1.9% |
| Banks 0.6% |
| CIMB Group Holdings Berhad | 349,952 | 416,609 |
| Malayan Banking Berhad | 295,800 | 616,954 |
| Public Bank Berhad | 134,000 | 574,286 |
| | | 1,607,849 |
| Capital Goods 0.2% |
| Sime Darby Berhad | 379,240 | 672,700 |
| Consumer Services 0.1% |
| Genting Berhad | 190,000 | 309,881 |
| Materials 0.1% |
| Petronas Chemicals Group Berhad | 275,600 | 398,308 |
| Telecommunication Services 0.6% |
| Axiata Group Berhad | 383,500 | 560,641 |
| DiGi.com Berhad | 227,800 | 283,665 |
| Maxis Berhad | 174,200 | 272,499 |
| Telekom Malaysia Berhad | 241,200 | 372,711 |
| | | 1,489,516 |
| Utilities 0.3% |
| Tenaga Nasional Berhad | 257,900 | 686,505 |
| | | 5,164,759 |
| Mexico 3.9% |
| Banks 0.3% |
| Grupo Financiero Banorte S.A.B. de C.V., O Shares | 92,779 | 444,598 |
| Grupo Financiero Santander Mexico S.A.B. de C.V., B Shares | 198,968 | 309,717 |
| | | 754,315 |
| Capital Goods 0.2% |
| Alfa S.A.B. de C.V., A Shares | 226,278 | 450,263 |
| Food & Staples Retailing 0.4% |
| Wal-Mart de Mexico S.A.B. de C.V., Series V | 455,600 | 1,089,584 |
| Security | Number
of Shares | Value
($) |
| Food, Beverage & Tobacco 0.6% |
| Coca-Cola Femsa S.A.B. de C.V., Series L | 40,200 | 288,683 |
| Fomento Economico Mexicano S.A.B. de C.V. | 120,600 | 1,073,398 |
| Grupo Bimbo S.A.B. de C.V., Series A * | 145,123 | 372,580 |
| | | 1,734,661 |
| Household & Personal Products 0.1% |
| Kimberly-Clark de Mexico S.A.B. de C.V., A Shares | 134,000 | 299,863 |
| Materials 0.8% |
| Cemex S.A.B. de C.V., Series CPO * | 1,476,092 | 1,155,011 |
| Grupo Mexico S.A.B. de C.V., Series B | 294,800 | 745,785 |
| Industrias Penoles S.A.B. de C.V. | 17,366 | 246,746 |
| | | 2,147,542 |
| Media 0.3% |
| Grupo Televisa S.A.B., Series CPO | 142,600 | 870,642 |
| Telecommunication Services 1.2% |
| America Movil S.A.B. de C.V., Series L | 3,449,400 | 3,138,995 |
| | | 10,485,865 |
| Peru 0.1% |
| Banks 0.1% |
| Credicorp Ltd. | 3,082 | 338,958 |
| Philippines 0.2% |
| Telecommunication Services 0.2% |
| Philippine Long Distance Telephone Co. | 9,925 | 534,685 |
| Poland 2.7% |
| Banks 0.4% |
| Bank Pekao S.A. | 8,372 | 357,169 |
| Powszechna Kasa Oszczednosci Bank Polski S.A. | 79,866 | 629,588 |
| | | 986,757 |
| Energy 1.2% |
| Grupa Lotos S.A. * | 28,588 | 226,573 |
| Polski Koncern Naftowy Orlen S.A. | 131,207 | 2,567,695 |
| Polskie Gornictwo Naftowe i Gazownictwo S.A. | 175,753 | 316,319 |
| | | 3,110,587 |
| Insurance 0.2% |
| Powszechny Zaklad Ubezpieczen S.A. | 5,257 | 600,299 |
| Materials 0.4% |
| KGHM Polska Miedz S.A. | 46,666 | 971,381 |
| Telecommunication Services 0.2% |
| Orange Polska S.A. | 266,794 | 502,097 |
Schwab Fundamental Emerging Markets Large Company Index ETF
Portfolio Holdings (Unaudited) continued
| Security | Number
of Shares | Value
($) |
| Utilities 0.3% |
| PGE S.A. | 136,010 | 562,765 |
| Tauron Polska Energia S.A. | 350,440 | 325,114 |
| | | 887,879 |
| | | 7,059,000 |
| Republic of Korea 16.9% |
| Automobiles & Components 2.3% |
| Hankook Tire Co., Ltd. | 6,216 | 194,192 |
| Hyundai Mobis Co., Ltd. | 7,597 | 1,326,384 |
| Hyundai Motor Co. | 21,935 | 2,763,319 |
| Kia Motors Corp. | 42,152 | 1,735,618 |
| | | 6,019,513 |
| Banks 1.3% |
| Hana Financial Group, Inc. | 26,596 | 611,635 |
| Industrial Bank of Korea | 16,927 | 188,913 |
| KB Financial Group, Inc. | 28,593 | 865,466 |
| Shinhan Financial Group Co., Ltd. | 45,188 | 1,511,042 |
| Woori Bank | 43,162 | 332,815 |
| | | 3,509,871 |
| Capital Goods 2.7% |
| Daelim Industrial Co., Ltd. | 5,360 | 304,991 |
| Daewoo Shipbuilding & Marine Engineering Co., Ltd. | 21,507 | 122,378 |
| Hyundai Engineering & Construction Co., Ltd. | 8,710 | 244,491 |
| Hyundai Heavy Industries Co., Ltd. * | 13,489 | 1,043,537 |
| LG Corp. | 29,140 | 1,433,902 |
| LG International Corp. | 8,497 | 188,942 |
| Samsung Heavy Industries Co., Ltd. | 28,653 | 272,540 |
| SK Holdings Co., Ltd. | 13,847 | 3,161,014 |
| SK Networks Co., Ltd. | 66,866 | 371,431 |
| | | 7,143,226 |
| Consumer Durables & Apparel 0.5% |
| LG Electronics, Inc. | 34,995 | 1,316,658 |
| Energy 1.5% |
| GS Holdings Corp. | 24,210 | 950,796 |
| S-Oil Corp. | 15,047 | 763,323 |
| SK Innovation Co., Ltd. * | 27,741 | 2,343,121 |
| | | 4,057,240 |
| Food & Staples Retailing 0.2% |
| E-Mart Co., Ltd. | 2,884 | 557,171 |
| Food, Beverage & Tobacco 0.4% |
| KT&G Corp. | 11,256 | 1,051,607 |
| Insurance 0.4% |
| Samsung Fire & Marine Insurance Co., Ltd. | 2,453 | 558,938 |
| Samsung Life Insurance Co., Ltd. | 5,092 | 423,203 |
| | | 982,141 |
| Materials 1.8% |
| Hyundai Steel Co. | 9,246 | 413,539 |
| LG Chem Ltd. | 6,738 | 1,333,073 |
| Lotte Chemical Corp. | 2,680 | 559,679 |
| POSCO | 15,901 | 2,554,377 |
| | | 4,860,668 |
| Retailing 0.1% |
| Lotte Shopping Co., Ltd. | 1,772 | 400,769 |
| Security | Number
of Shares | Value
($) |
| Semiconductors & Semiconductor Equipment 0.3% |
| SK Hynix, Inc. | 30,700 | 929,241 |
| Technology Hardware & Equipment 4.6% |
| LG Display Co., Ltd. | 50,412 | 982,453 |
| Samsung Electro-Mechanics Co., Ltd. | 8,388 | 430,481 |
| Samsung Electronics Co., Ltd. | 11,539 | 10,624,368 |
| Samsung SDI Co., Ltd. | 4,720 | 337,214 |
| | | 12,374,516 |
| Telecommunication Services 0.2% |
| LG Uplus Corp. | 44,382 | 412,769 |
| Utilities 0.6% |
| Korea Electric Power Corp. | 33,255 | 1,349,601 |
| Korea Gas Corp. | 6,298 | 214,326 |
| | | 1,563,927 |
| | | 45,179,317 |
| Russia 12.5% |
| Banks 0.4% |
| Sberbank of Russia * | 751,170 | 838,762 |
| VTB Bank JSC * | 164,960,000 | 170,568 |
| | | 1,009,330 |
| Energy 10.1% |
| Bashneft OAO * | 9,163 | 244,868 |
| Gazprom PAO | 5,535,731 | 12,295,263 |
| LUKOIL PJSC * | 202,029 | 7,663,900 |
| NOVATEK OAO GDR - Reg'd | 9,462 | 906,460 |
| Rosneft OJSC GDR - Reg'd | 192,146 | 724,006 |
| Surgutneftegas OAO * | 6,827,613 | 3,509,489 |
| Tatneft PAO * | 367,039 | 1,776,882 |
| | | 27,120,868 |
| Food & Staples Retailing 0.2% |
| Magnit PJSC * | 2,625 | 482,942 |
| Materials 0.7% |
| MMC Norilsk Nickel PJSC * | 8,374 | 1,326,511 |
| Severstal PAO GDR - Reg'd | 43,096 | 458,972 |
| | | 1,785,483 |
| Telecommunication Services 0.9% |
| Mobile TeleSystems PJSC ADR | 133,112 | 1,015,644 |
| Rostelecom PJSC * | 370,333 | 452,315 |
| Sistema JSFC GDR - Reg'd | 115,092 | 849,379 |
| | | 2,317,338 |
| Transportation 0.1% |
| Aeroflot-Russian Airlines PJSC * | 393,156 | 235,705 |
| Globaltrans Investment plc GDR - Reg'd * | 28,221 | 95,951 |
| | | 331,656 |
| Utilities 0.1% |
| RusHydro PJSC * | 42,511,545 | 339,285 |
| | | 33,386,902 |
Schwab Fundamental Emerging Markets Large Company Index ETF
Portfolio Holdings (Unaudited) continued
| Security | Number
of Shares | Value
($) |
| South Africa 6.6% |
| Banks 0.8% |
| Barclays Africa Group Ltd. | 33,110 | 433,737 |
| Nedbank Group Ltd. | 24,120 | 429,111 |
| Standard Bank Group Ltd. | 126,771 | 1,396,519 |
| | | 2,259,367 |
| Capital Goods 0.6% |
| Barloworld Ltd. | 64,052 | 411,424 |
| The Bidvest Group Ltd. | 46,744 | 1,123,822 |
| | | 1,535,246 |
| Consumer Durables & Apparel 0.2% |
| Steinhoff International Holdings Ltd. | 105,752 | 633,511 |
| Diversified Financials 0.3% |
| African Bank Investments Ltd. *(d)(e) | 30,732 | — |
| FirstRand Ltd. | 191,510 | 763,918 |
| | | 763,918 |
| Energy 1.2% |
| Sasol Ltd. | 103,486 | 3,315,094 |
| Food & Staples Retailing 0.2% |
| Shoprite Holdings Ltd. | 41,719 | 510,690 |
| Food, Beverage & Tobacco 0.1% |
| Tiger Brands Ltd. | 16,679 | 376,981 |
| Insurance 0.2% |
| Sanlam Ltd. | 103,466 | 497,585 |
| Materials 0.9% |
| AngloGold Ashanti Ltd. * | 84,381 | 679,348 |
| Gold Fields Ltd. | 262,779 | 843,754 |
| Impala Platinum Holdings Ltd. * | 157,744 | 588,913 |
| Kumba Iron Ore Ltd. | 40,423 | 275,312 |
| | | 2,387,327 |
| Media 0.3% |
| Naspers Ltd., N Shares | 5,524 | 715,891 |
| Retailing 0.4% |
| Imperial Holdings Ltd. | 37,922 | 527,479 |
| Woolworths Holdings Ltd. | 61,814 | 463,689 |
| | | 991,168 |
| Telecommunication Services 1.4% |
| MTN Group Ltd. | 195,405 | 2,607,070 |
| Telkom S.A. SOC Ltd. | 134,556 | 644,160 |
| Vodacom Group Ltd. | 36,582 | 390,221 |
| | | 3,641,451 |
| | | 17,628,229 |
| Taiwan 12.2% |
| Automobiles & Components 0.1% |
| Cheng Shin Rubber Industry Co., Ltd. | 103,000 | 165,251 |
| Banks 0.4% |
| CTBC Financial Holding Co., Ltd. | 956,490 | 576,199 |
| Mega Financial Holding Co., Ltd. | 677,518 | 508,097 |
| | | 1,084,296 |
| Security | Number
of Shares | Value
($) |
| Capital Goods 0.3% |
| Far Eastern New Century Corp. | 551,061 | 499,641 |
| Walsin Lihwa Corp. * | 1,682,000 | 375,834 |
| | | 875,475 |
| Consumer Durables & Apparel 0.2% |
| Pou Chen Corp. | 402,000 | 649,902 |
| Diversified Financials 0.2% |
| Fubon Financial Holding Co., Ltd. | 311,116 | 534,527 |
| Energy 0.2% |
| Formosa Petrochemical Corp. | 222,704 | 498,989 |
| Food, Beverage & Tobacco 0.2% |
| Uni-President Enterprises Corp. | 366,796 | 653,865 |
| Insurance 0.1% |
| Cathay Financial Holding Co., Ltd. | 239,840 | 345,725 |
| Materials 1.8% |
| China Steel Corp. | 1,631,088 | 977,570 |
| Formosa Chemicals & Fibre Corp. | 563,882 | 1,206,239 |
| Formosa Plastics Corp. | 531,704 | 1,171,723 |
| Nan Ya Plastics Corp. | 501,588 | 914,192 |
| Taiwan Cement Corp. | 402,000 | 430,591 |
| | | 4,700,315 |
| Retailing 0.1% |
| Hotai Motor Co., Ltd. | 16,000 | 176,051 |
| Semiconductors & Semiconductor Equipment 2.6% |
| Advanced Semiconductor Engineering, Inc. | 536,000 | 553,528 |
| MediaTek, Inc. | 66,940 | 516,411 |
| Siliconware Precision Industries Co., Ltd. | 298,176 | 366,580 |
| Taiwan Semiconductor Manufacturing Co., Ltd. | 1,249,352 | 4,953,480 |
| United Microelectronics Corp. | 2,017,000 | 666,423 |
| | | 7,056,422 |
| Technology Hardware & Equipment 5.1% |
| Acer, Inc. * | 1,366,470 | 503,984 |
| Asustek Computer, Inc. | 136,176 | 1,238,877 |
| AU Optronics Corp. | 2,420,764 | 781,227 |
| Compal Electronics, Inc. | 1,789,000 | 1,044,720 |
| Delta Electronics, Inc. | 114,128 | 571,762 |
| Foxconn Technology Co., Ltd. | 140,632 | 395,495 |
| Hon Hai Precision Industry Co., Ltd. | 1,648,738 | 4,687,370 |
| HTC Corp. | 336,822 | 476,723 |
| Innolux Corp. | 1,506,000 | 532,303 |
| Inventec Corp. | 681,646 | 312,163 |
| Lite-On Technology Corp. | 499,910 | 457,872 |
| Pegatron Corp. | 275,234 | 712,279 |
| Quanta Computer, Inc. | 373,058 | 685,667 |
| Synnex Technology International Corp. | 291,646 | 310,147 |
| Wistron Corp. | 965,169 | 477,601 |
| WPG Holdings Ltd. | 402,000 | 379,933 |
| | | 13,568,123 |
Schwab Fundamental Emerging Markets Large Company Index ETF
Portfolio Holdings (Unaudited) continued
| Security | Number
of Shares | Value
($) |
| Telecommunication Services 0.9% |
| Chunghwa Telecom Co., Ltd. | 507,764 | 1,541,894 |
| Far EasTone Telecommunications Co., Ltd. | 157,588 | 345,826 |
| Taiwan Mobile Co., Ltd. | 134,000 | 402,791 |
| | | 2,290,511 |
| | | 32,599,452 |
| Thailand 1.4% |
| Banks 0.2% |
| Kasikornbank PCL NVDR | 38,300 | 192,862 |
| The Siam Commercial Bank PCL NVDR | 67,000 | 265,421 |
| | | 458,283 |
| Energy 0.8% |
| PTT Exploration & Production PCL NVDR | 134,000 | 297,196 |
| PTT PCL NVDR | 189,400 | 1,416,075 |
| Thai Oil PCL NVDR | 321,600 | 462,056 |
| | | 2,175,327 |
| Materials 0.2% |
| PTT Global Chemical PCL NVDR | 352,000 | 589,203 |
| Telecommunication Services 0.2% |
| Advanced Info Service PCL NVDR | 80,400 | 533,832 |
| | | 3,756,645 |
| Turkey 1.4% |
| Banks 0.6% |
| Akbank T.A.S. | 170,046 | 398,390 |
| Turkiye Garanti Bankasi A/S | 232,530 | 589,513 |
| Turkiye Halk Bankasi A/S | 79,055 | 302,804 |
| Turkiye Is Bankasi, C Shares | 192,232 | 321,598 |
| | | 1,612,305 |
| Capital Goods 0.2% |
| KOC Holding A/S | 163,124 | 636,021 |
| Diversified Financials 0.1% |
| Haci Omer Sabanci Holding A/S | 110,550 | 330,397 |
| Energy 0.3% |
| Tupras-Turkiye Petrol Rafinerileri A/S * | 31,281 | 807,009 |
| Telecommunication Services 0.2% |
| Turkcell Iletisim Hizmetleri A/S | 112,024 | 438,706 |
| | | 3,824,438 |
| Total Common Stock |
| (Cost $285,248,224) | | 238,619,586 |
|
| Preferred Stock 8.7% of net assets |
| Brazil 6.0% |
| Banks 1.9% |
| Banco Bradesco S.A. | 294,948 | 1,866,580 |
| Itau Unibanco Holding S.A. | 399,471 | 2,911,923 |
| Itausa - Investimentos Itau S.A. | 176,880 | 353,542 |
| | | 5,132,045 |
| Security | Number
of Shares | Value
($) |
| Energy 1.6% |
| Petroleo Brasileiro S.A. * | 1,740,585 | 4,391,784 |
| Food & Staples Retailing 0.2% |
| Cia Brasileira de Distribuicao | 23,725 | 413,628 |
| Materials 1.4% |
| Gerdau S.A. | 409,919 | 590,864 |
| Metalurgica Gerdau S.A. | 294,887 | 243,698 |
| Vale S.A. | 768,596 | 2,985,966 |
| | | 3,820,528 |
| Telecommunication Services 0.3% |
| Oi S.A. * | 158,135 | 117,225 |
| Telefonica Brasil S.A. | 55,080 | 610,799 |
| | | 728,024 |
| Utilities 0.6% |
| Centrais Eletricas Brasileiras S.A., B Shares | 175,742 | 362,365 |
| Companhia Energetica de Minas Gerais | 259,875 | 536,553 |
| Companhia Paranaense de Energia - Copel, B Shares | 29,882 | 254,332 |
| Eletropaulo Metropolitana Eletricidade de Sao Paulo S.A. * | 141,102 | 452,487 |
| | | 1,605,737 |
| | | 16,091,746 |
| Colombia 0.1% |
| Banks 0.1% |
| Bancolombia S.A. | 37,868 | 322,922 |
| Republic of Korea 1.0% |
| Automobiles & Components 0.3% |
| Hyundai Motor Co. | 3,251 | 266,622 |
| Hyundai Motor Co. 2nd | 4,861 | 410,991 |
| | | 677,613 |
| Consumer Durables & Apparel 0.0% |
| LG Electronics, Inc. | 6,710 | 125,662 |
| Materials 0.1% |
| LG Chem Ltd. | 1,361 | 199,072 |
| Technology Hardware & Equipment 0.6% |
| Samsung Electronics Co., Ltd. | 2,094 | 1,540,292 |
| | | 2,542,639 |
| Russia 1.6% |
| Banks 0.0% |
| Sberbank of Russia * | 75,636 | 61,602 |
| Energy 1.6% |
| AK Transneft OAO * | 1,332 | 3,152,320 |
| Bashneft PA0 * | 1,936 | 39,434 |
| Surgutneftegas OAO * | 1,519,892 | 920,319 |
| | | 4,112,073 |
| | | 4,173,675 |
| Total Preferred Stock |
| (Cost $32,907,918) | | 23,130,982 |
|
Schwab Fundamental Emerging Markets Large Company Index ETF
Portfolio Holdings (Unaudited) continued
| Security | Number
of Shares | Value
($) |
| Other Investment Companies 2.0% of net assets |
| United States 2.0% |
| Equity Funds 1.6% |
| iShares India 50 ETF | 80,374 | 2,203,855 |
| WisdomTree India Earnings Fund | 108,466 | 2,131,357 |
| | | 4,335,212 |
| Money Market Fund 0.4% |
| State Street Institutional U.S. Government Money Market Fund, Premier Class 0.00% (c) | 1,089,252 | 1,089,252 |
| Securities Lending Collateral 0.0% |
| State Street Institutional U.S. Government Money Market Fund, Premier Class 0.00% (c) | 35,916 | 35,916 |
| Total Other Investment Companies |
| (Cost $5,867,245) | | 5,460,380 |
End of Investments.
At 08/31/15, the tax basis cost of the fund's investments was $327,064,737 and the unrealized appreciation and depreciation were $0 and ($59,853,789), respectively, with a net unrealized depreciation of ($59,853,789).
| * | Non-income producing security. |
| (a) | Securities exempt from registration under Rule 144A of the Securities Act of 1933, as amended. These securities may be resold in transactions exempt from registrations, normally to qualified institutional buyers. At the period end, the value of these amounted to $2,768,975 or 1.0% of net assets. |
| (b) | All or a portion of this security is on loan. Securities on loan were valued at $32,961. |
| (c) | The rate shown is the 7-day yield. |
| (d) | Illiquid security. At the period end, the value of these amounted to $0 or 0.0% of net assets. |
| (e) | Fair-valued by management in accordance with procedures approved by the Board of Trustees. |
| | |
| ADR — | American Depositary Receipt |
| ETF — | Exchange Traded Fund |
| GDR — | Global Depositary Receipt |
| NVDR — | Non-Voting Depositary Receipt |
| Reg'd — | Registered |
In addition to the above, the fund held the following at 08/31/15:
| | Number of
Contracts | Contract
Value
($) | Unrealized
Appreciation
($) |
| Futures Contracts | | | |
| MSCI EAFE, e-mini, Long, expires 09/18/15 | 14 | 572,250 | 17,606 |
Item 7: Disclosure of Proxy Voting Policies and Procedures for Closed-End Management Investment Companies.
Not applicable.
Item 8: Portfolio Managers of Closed-End Management Investment Companies.
Not applicable.
Item 9: Purchases of Equity Securities by Closed-End Management Investment Company and Affiliated Purchasers.
Not applicable.
Item 10: Submission of Matters to a Vote of Security Holders.
Not applicable.
Item 11: Controls and Procedures.
| (a) | Based on their evaluation of Registrant’s disclosure controls and procedures, as of a date within 90 days of the filing date, Registrant’s Chief Executive Officer, Marie Chandoha and Registrant’s Principal Financial Officer, George Pereira, have concluded that Registrant’s disclosure controls and procedures are: (i) reasonably designed to ensure that information required to be disclosed in this report is appropriately communicated to Registrant’s officers to allow timely decisions regarding disclosures required in this report; (ii) reasonably designed to ensure that information required to be disclosed in this report is recorded, processed, summarized and reported in a timely manner; and (iii) are effective in achieving the goals described in (i) and (ii) above. |
| (b) | During the second fiscal quarter of the period covered by this report, there have been no changes in Registrant’s internal control over financial reporting that the above officers believe to have materially affected, or to be reasonably likely to materially affect, Registrant’s internal control over financial reporting. |
Item 12: Exhibits.
(a) | (1) | Code of ethics – not applicable to this semi-annual report. |
| | (2) | Separate certifications for Registrant’s principal executive officer and principal financial officer, as required by Rule 30a-2(a) under the 1940 Act, are attached. |
| (b) | A certification for Registrant’s principal executive officer and principal financial officer, as required by Rule 30a-2(b) under the 1940 Act, is attached. This certification is being furnished to the Securities and Exchange Commission solely pursuant to 18 U.S.C. section 1350 and is not being filed as part of the Form N-CSR with the Commission. |
Pursuant to the requirements of the Securities Exchange Act of 1934 and the Investment Company Act of 1940, the registrant has duly caused this report to be signed on its behalf by the undersigned, thereunto duly authorized.
(Registrant) Schwab Strategic Trust – Schwab U.S. REIT ETF and Fundamental Index ETFs
| | |
| By: | | /s/ Marie Chandoha |
| | Marie Chandoha |
| | Chief Executive Officer |
| |
| Date: | | October 14, 2015 |
Pursuant to the requirements of the Securities Exchange Act of 1934 and the Investment Company Act of 1940, this report has been signed below by the following persons on behalf of the registrant and in the capacities and on the dates indicated.
| | |
| By | | /s/ Marie Chandoha |
| | Marie Chandoha |
| | Chief Executive Officer |
| |
| Date: | | October 14, 2015 |
| |
| By: | | /s/ George Pereira |
| | George Pereira |
| | Principal Financial Officer |
| |
| Date: | | October 12, 2015 |