UNITED STATES
SECURITIES AND EXCHANGE COMMISSION
Washington, D.C. 20549
FORM N-CSR
CERTIFIED SHAREHOLDER REPORT OF REGISTERED
MANAGEMENT INVESTMENT COMPANIES
Investment Company Act file number: 811-22311
Schwab Strategic Trust – Schwab U.S. Equity ETFs and Schwab International Equity ETFs
(Exact name of registrant as specified in charter)
211 Main Street, San Francisco, California 94105
(Address of principal executive offices) (Zip code)
Jonathan de St. Paer
Schwab Strategic Trust – Schwab U.S. Equity ETFs and Schwab International Equity ETFs
211 Main Street, San Francisco, California 94105
(Name and address of agent for service)
Registrant’s telephone number, including area code: (415) 636-7000
Date of fiscal year end: August 31
Date of reporting period: August 31, 2021
Item 1: Report(s) to Shareholders.
Annual Report | August 31, 2021
Schwab International Equity ETFs
| Schwab International Equity ETF | SCHF |
| Schwab International Small-Cap Equity ETF | SCHC |
| Schwab International Dividend Equity ETF | SCHY |
| Schwab Emerging Markets Equity ETF | SCHE |
This page is intentionally left blank.
Fund investment adviser: Charles Schwab Investment Management, Inc. (CSIM)
Distributor: SEI Investments Distribution Co. (SIDCO)
The Sector/Industry classifications in this report use the Global Industry Classification Standard (GICS) which was developed by and is the exclusive property of MSCI Inc. (MSCI) and Standard & Poor’s (S&P). GICS is a service mark of MSCI and S&P and has been licensed for use by Charles Schwab & Co, Inc.
Schwab International Equity ETFs | Annual Report
Schwab International Equity ETFs
The performance data quoted represents past performance. Past performance does not guarantee future results. Investment return and principal value of an investment will fluctuate so that an investor’s shares, when sold or redeemed, may be worth more or less than the original cost. Current performance may be lower or higher than the performance quoted. To obtain performance information current to the most recent month end, please visit www.schwabassetmanagement.com/schwabetfs_prospectus.
| Total Returns for the 12 Months Ended August 31, 2021 |
| Schwab International Equity ETF (Ticker Symbol: SCHF) | |
| Market Price Return1 | 28.17% |
| NAV Return1 | 27.62% |
| FTSE Developed ex US Index (Net)* | 27.50% |
| ETF Category: Morningstar Foreign Large Blend2 | 25.94% |
| Performance Details | pages 7-9 |
| |
| Schwab International Small-Cap Equity ETF (Ticker Symbol: SCHC) | |
| Market Price Return1 | 34.15% |
| NAV Return1 | 33.01% |
| FTSE Developed Small Cap ex US Liquid Index (Net)* | 32.95% |
| ETF Category: Morningstar Foreign Small/Mid Blend2 | 34.75% |
| Performance Details | pages 10-12 |
| |
| Schwab International Dividend Equity ETF (Ticker Symbol: SCHY) | |
| Market Price Return1 | 4.56% 3 |
| NAV Return1 | 4.48% 3 |
| Dow Jones International Dividend 100 Index | 4.46% 3 |
| ETF Category: Morningstar Foreign Large Value2 | N/A |
| Performance Details | pages 13-15 |
| |
| Schwab Emerging Markets Equity ETF (Ticker Symbol: SCHE) | |
| Market Price Return1 | 19.21% |
| NAV Return1 | 19.53% |
| FTSE Emerging Index (Net)* | 20.23% |
| ETF Category: Morningstar Diversified Emerging Markets2 | 24.59% |
| Performance Details | pages 16-18 |
All total returns on this page assume dividends and distributions were reinvested. Index figures do not include trading and management costs, which would lower performance. Indices are unmanaged and cannot be invested in directly. Performance results less than one year are not annualized.
For index definitions, please see the Glossary.
Performance does not reflect the deduction of taxes that a shareholder would pay on fund distributions or on the redemption or sale of fund shares.
Shares are bought and sold at market price, which may be higher or lower than the net asset value (NAV). Brokerage commissions will reduce returns.
Index ownership — FTSE is a trademark of the London Stock Exchange Group companies (LSEG) and is used by the Schwab International Equity ETF, Schwab International Small-Cap Equity ETF, and Schwab Emerging Markets Equity ETF under license. The Schwab International Equity ETF, Schwab International Small-Cap Equity ETF, and Schwab Emerging Markets Equity ETF are not sponsored, endorsed, sold or promoted by FTSE nor LSEG and neither FTSE nor LSEG makes any representation regarding the advisability of investing in shares of the funds. Fees payable under the license are paid by the investment adviser.
Index ownership — Dow Jones® is a registered trademark of Dow Jones Trademark Holdings LLC (Dow Jones). The Dow Jones International Dividend 100 Index is a product of S&P Dow Jones Indices LLC and/or its affiliates, and has been licensed for use by CSIM. The Schwab International Dividend Equity ETF is not sponsored, endorsed, sold or promoted by S&P Dow Jones Indices LLC, Dow Jones, or any of their respective affiliates and neither S&P Dow Jones Indices LLC, Dow Jones, nor any of their respective affiliates make any representation regarding the advisability of investing in such product.
| * | The total return cited for the index is calculated net of foreign withholding taxes; the underlying tax rate information is available from FTSE. |
| 1 | ETF performance must be shown based on both a market price and NAV basis. The fund’s per share NAV is the value of one share of the fund. NAV is calculated by taking the fund’s total assets (including the fair value of securities owned), subtracting liabilities, and dividing by the number of shares outstanding. The NAV Return is based on the NAV of the fund, and the Market Price Return is based on the market price per share of the fund. The price used to calculate market return (Market Price) is determined using the Official Closing Price on the primary stock exchange (generally, 4:00 p.m. Eastern time) and may not represent the returns you would receive if shares were traded at other times. Market Price and NAV returns assume that dividends and capital gain distributions have been reinvested in the fund at Market Price and NAV, respectively. |
| 2 | Source for category information: Morningstar, Inc. The Morningstar Category return represents all passively- and actively-managed ETFs within the category as of the report date. |
| 3 | Total returns shown are since the fund’s inception date of April 29, 2021. |
Schwab International Equity ETFs | Annual Report
Schwab International Equity ETFs
Jonathan de St. Paer
President of Charles Schwab
Investment Management, Inc.
and the funds covered
in this report.
Dear Shareholder,
Despite the hopes of last winter and spring that large-scale vaccine distribution would bring the COVID-19 pandemic under control, the spread of the Delta variant of the virus continues to pose significant social, health, and economic challenges across the United States and the world. Nevertheless, during the 12-month period ended August 31, 2021, global economies made dramatic progress toward reopening and renewed growth backed by continued monetary and fiscal support by the U.S. Congress and U.S. Federal Reserve. The U.S. gross domestic product (GDP) growth rate increased by over 6% percent during the first half of 2021 after declining in 2020. U.S. equity markets rallied sharply as well, with the S&P 500® Index, a bellwether for the overall U.S. stock market, gaining 31.2% for the reporting period and repeatedly reaching new record territory. While international markets tended to lag the U.S., many still had solid returns, with the MSCI EAFE® Index (Net)*, a broad measure of developed international equity performance, returning 26.1% over the same period.
At Charles Schwab Investment Management, we believe the varied performance of asset classes during the reporting period reinforces the importance of establishing and maintaining a diversified, long-term investing plan that reflects your risk tolerance and long-term financial goals. Global diversification through investments in equity markets in the U.S., international developed markets, and key emerging markets may help enhance portfolio performance and reduce country-related risk over time. Offering simple, low-cost access to international small-, mid-, and large-cap stocks within both developed and emerging markets, the Schwab International Equity ETFs, including the Schwab International Dividend Equity ETF, which launched on April 29, 2021 with a focus on high dividend yielding international stocks, can serve as part of the core of a diversified portfolio.
Thank you for investing with Charles Schwab Investment Management. For more information about the Schwab International Equity ETFs, please continue reading this report. In addition, you can find further details about these funds by visiting our website at www.schwabassetmanagement.com. We are also happy to hear from you at 1-877-824-5615.
Sincerely,
“ Offering simple, low-cost access to international small-, mid-, and large-cap stocks within both developed and emerging markets, the Schwab International Equity ETFs, including the Schwab International Dividend Equity ETF, which launched on April 29, 2021 with a focus on high dividend yielding international stocks, can serve as part of the core of a diversified portfolio.”
Past performance is no guarantee of future results.
Diversification and asset allocation strategies do not ensure a profit and cannot protect against losses in a declining market.
Management views may have changed since the report date.
| * | The net version of the index reflects reinvested dividends net of withholding taxes, but reflects no deductions for expenses or other taxes. |
Schwab International Equity ETFs | Annual Report
Schwab International Equity ETFs
The Investment Environment
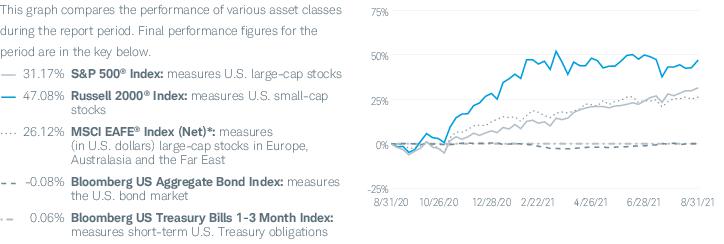
For the 12-month reporting period ended August 31, 2021, international equity markets generated solid returns, with several key equity market indices ending the reporting period just off record highs. Despite persisting COVID-19 pandemic-driven stresses on the global economy and a resurgence of COVID-19 cases in the fall and into the winter, along with the emergence and rapid spread of the Delta variant during the summer, equity markets continued to rise on global economic recovery, strong earnings, ongoing fiscal stimulus measures, and optimism related to the rapid rollout of COVID-19 vaccines that began in December 2020. Despite some volatility, the U.S. dollar, as measured against a basket of foreign currencies, ended the reporting period roughly where it began. For the reporting period, the MSCI EAFE® Index (Net)*, a broad measure of developed international equity performance, returned 26.12%, while the MSCI Emerging Markets Index (Net)* returned 21.12%. For comparison, the S&P 500® Index, a bellwether for the overall U.S. stock market, returned 31.17% for the reporting period.
Bolstered by the extensive emergency rescue and fiscal stimulus measures passed by the U.S. Congress and U.S. Federal Reserve (Fed) beginning in March 2020, the U.S. economy began to recover from the dramatic impact of the COVID-19 pandemic. Outside the U.S., global economies continue to wrestle with the fallout of the COVID-19 pandemic and the emergence and spread of the Delta variant. After plummeting demand drove oil prices to deteriorate in early 2020, prices recovered during the reporting period, hitting a one year high in June. In the eurozone, gross domestic product (GDP) growth jumped in the third quarter of 2020, regaining much of its losses from the second quarter of 2020, but turned negative for the fourth quarter of 2020 and first quarter of 2021. GDP growth turned positive for the second quarter of 2021. The United Kingdom, which has been particularly hard-hit by the COVID-19 pandemic, suffered its biggest slump in more than three centuries over the course of 2020, effectively wiping out its growth over the past seven years. After posting a loss in the first quarter of 2021, United Kingdom GDP was positive for the second quarter of 2021 as conditions began to improve. Japan’s economy rebounded sharply in the third quarter of 2020 and posted positive, although smaller, gains in the fourth quarter of 2020. Japan’s economy subsequently contracted in the first quarter of 2021 on a resurgence of COVID-19 cases and slow vaccine rollouts
Asset Class Performance Comparison % returns during the 12 months ended August 31, 2021
Index figures assume dividends and distributions were reinvested. Index figures do not include trading and management costs, which would lower performance. Indices are unmanaged and cannot be invested in directly. Performance results less than one year are not annualized. Past performance is not a guarantee of future results.
For index definitions, please see the Glossary.
Data source: Index provider websites and CSIM
Nothing in this report represents a recommendation of a security by the investment adviser.
Management views may have changed since the report date.
| * | The net version of the index reflects reinvested dividends net of withholding taxes, but reflects no deductions for expenses or other taxes. |
Schwab International Equity ETFs | Annual Report
Schwab International Equity ETFs
The Investment Environment (continued)
before posting a small gain for the second quarter of 2021. China, the only major economy to avoid contraction in the face of COVID-19 pandemic-related shocks, maintained positive GDP growth in its third and fourth quarters of 2020. China’s growth accelerated for the first quarter of 2021 and was also positive for the second quarter of 2021. India, after plunging into one of the worst recessions of any major economy, saw its first positive gain in GDP in the fourth quarter of 2020, followed by a positive gain for the first quarter of 2021 and a sharp jump in growth for the second quarter of 2021.
For the most part, central banks around the world maintained the low—and for some international central banks, negative—interest rates instituted prior to, and in response to, the COVID-19 pandemic. In the U.S., the Fed maintained the federal funds rate in a range of 0.00% to 0.25% throughout the reporting period. In developed international markets, most central banks were similarly accommodative. The European Central Bank held its interest rate at 0.00%, unchanged since March 2016, and confirmed it would continue its asset purchase program to help counter the economic impacts of the COVID-19 pandemic. The Bank of Japan upheld its short-term interest rate target of -0.1%, also unchanged since 2016, and maintained its ongoing program of purchasing exchange-traded funds (ETFs) and other assets. The Bank of England maintained its key official bank rate at 0.1% and also reiterated its commitment to its bond-buying program. Emerging markets were mixed. Central banks in China, India, and Pakistan maintained their low rates to help counter the ongoing effects of the COVID-19 pandemic. Indonesia and the Philippines lowered their policy rates. Mexico, Brazil, Russia, and Turkey raised their rates, citing a stronger-than-expected recovery or to counteract the impacts of inflation.
Schwab International Equity ETFs | Annual Report
Schwab International Equity ETFs
 | Christopher Bliss, CFA, Managing Director and Head of Passive Equity Strategies for Schwab Asset Management, leads the portfolio management team for passive equity Schwab Funds and Schwab ETFs. He also has overall responsibility for all aspects of the management of the funds. Before joining Schwab in 2016, Mr. Bliss spent 12 years at BlackRock (formerly Barclays Global Investors) managing and leading institutional index teams, most recently as a managing director and the head of the Americas institutional index team. In this role, Mr. Bliss was responsible for overseeing a team of portfolio managers managing domestic, developed international and emerging markets index strategies. Prior to BlackRock, he worked as an equity analyst and portfolio manager for Harris Bretall and before that, as a research analyst for JP Morgan. |
 | Chuck Craig, CFA, Senior Portfolio Manager, is responsible for the day-to-day co-management of the funds. Prior to joining Schwab in 2012, Mr. Craig worked at Guggenheim Funds (formerly Claymore Group), where he spent more than five years as a managing director of portfolio management and supervision, and three years as vice president of product research and development. Prior to that, he worked as an equity research analyst at First Trust Portfolios (formerly Niké Securities), and a trader and analyst at PMA Securities, Inc. |
 | Jane Qin, Portfolio Manager, is responsible for the day-to-day co-management of the funds. Prior to joining Schwab in 2012, Ms. Qin spent more than four years at The Bank of New York Mellon Corporation. During that time, Ms. Qin spent more than two years as an associate equity portfolio manager and nearly two years as a performance analyst. She also worked at Wells Fargo Funds Management as a mutual fund analyst and at CIGNA Reinsurance in the risk management group as a risk analyst. |
 | David Rios, Portfolio Manager, is responsible for the day-to-day co-management of the funds. Prior to this role, Mr. Rios was an associate portfolio manager on the equity index strategies team for four years. His first role with Schwab Asset Management was as a trade operations specialist. Prior to joining Schwab in 2008, Mr. Rios was a senior fund accountant at Investors Bank & Trust (subsequently acquired by State Street Corporation). |
Schwab International Equity ETFs | Annual Report
Schwab International Equity ETF as of August 31, 2021
The Schwab International Equity ETF (the fund) seeks to track as closely as possible, before fees and expenses, the total return of the FTSE Developed ex US Index (the index). The index is comprised of large- and mid-capitalization companies in developed countries outside the United States, as defined by the index provider. The index defines the large- and mid-capitalization universe as approximately the top 90% of the eligible universe. The fund invests in a representative sample of securities included in the index which, when taken together, are expected to perform similarly to the index as a whole. Due to the use of representative sampling, the fund may not hold all of the securities included in the index.
Market Highlights. For the 12-month reporting period ended August 31, 2021, international equity markets generated solid returns, with several key equity market indices ending the reporting period just off record highs. Despite persisting COVID-19 pandemic-driven stresses on the global economy and a resurgence of COVID-19 cases in the fall and into the winter, along with the emergence and rapid spread of the Delta variant during the summer, equity markets continued to rise on strong earnings, ongoing fiscal stimulus measures, and optimism related to the rapid rollout of COVID-19 vaccines that began in December 2020. Despite some volatility, the U.S. dollar, as measured against a basket of foreign currencies, ended the reporting period roughly where it began.
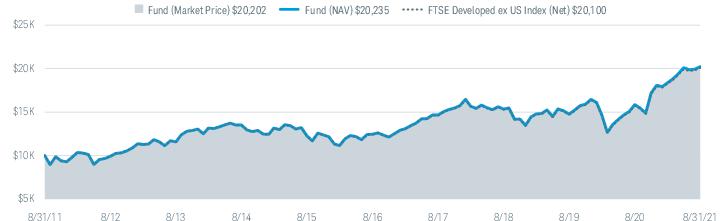
Performance. During the 12-month reporting period ended August 31, 2021, the fund generally tracked the index. The fund’s market price return was 28.17% and its NAV return was 27.62% (for an explanation of the market price and NAV returns, please refer to footnote 2 on the following page). The index returned 27.50%1 during the same period.
Contributors and Detractors. Stocks from Japan were the largest contributors to the total return of the fund. Japanese stocks represented an average weight of approximately 22% of the fund’s investments and returned approximately 20% in U.S. dollar terms for the reporting period. One example from this market is Toyota Motor Corp., which manufactures, sells, leases, and repairs passenger cars, trucks, buses, and their related parts worldwide. The fund’s holdings of Toyota Motor Corp. represented an average weight of approximately 1% of the fund’s investments and returned approximately 36% in U.S. dollar terms for the reporting period.
Stocks from the United Kingdom also contributed to the total return of the fund, representing an average weight of approximately 13% of the fund’s investments and returning approximately 28% in U.S. dollar terms for the reporting period.
Over the reporting period, no markets detracted from the returns of the index or the fund. However, the stock from South Africa, Thungela Resources Ltd., was the smallest contributor to the total return of the fund. The fund’s holdings of Thungela Resources Ltd. represented an average weight of less than 1% of the fund’s investments and returned approximately 18% in U.S. dollar terms for the reporting period. Thungela Resources Ltd. was held by the fund for a limited time in June 2021 after the South African coal business was spun off from Anglo American plc, a global mining company headquartered in the United Kingdom.
Stocks from New Zealand were another smaller contributor to the total return of the fund, representing an average weight of less than 1% of the fund’s investments and returning approximately 3% in U.S. dollar terms for the reporting period.
Management views and portfolio holdings may have changed since the report date.
| 1 | The total return cited for the index is calculated net of foreign withholding taxes; the underlying tax rate information is available from FTSE. |
Schwab International Equity ETFs | Annual Report
Schwab International Equity ETF
Performance and Fund Facts as of August 31, 2021
The performance data quoted represents past performance. Past performance does not guarantee future results. Investment return and principal value of an investment will fluctuate so that an investor’s shares, when sold or redeemed, may be worth more or less than the original cost. Current performance may be lower or higher than the performance quoted. To obtain performance information current to the most recent month end, please visit www.schwabassetmanagement.com/schwabetfs_prospectus.
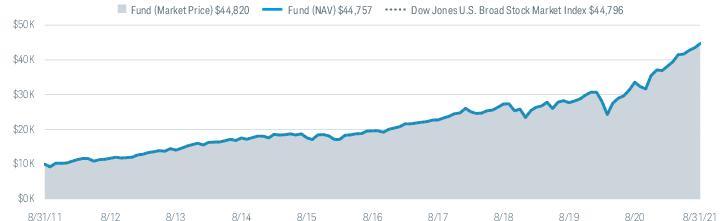
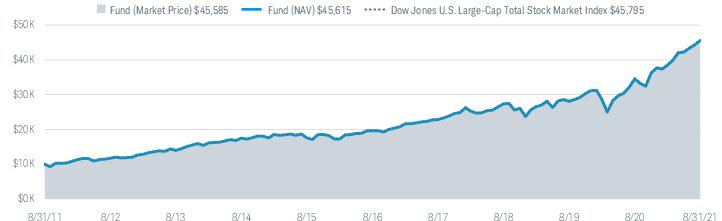
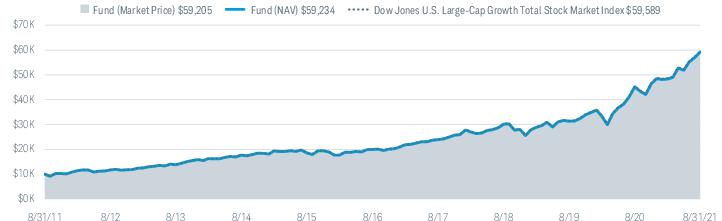
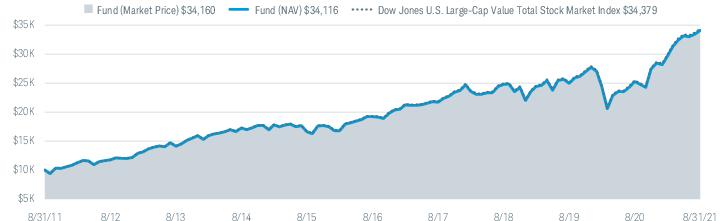
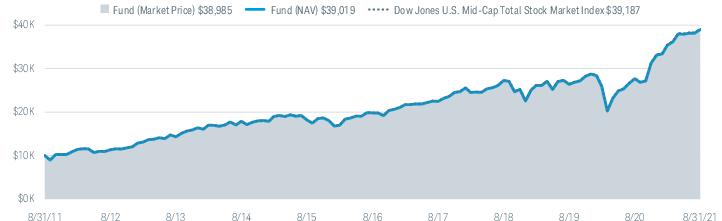
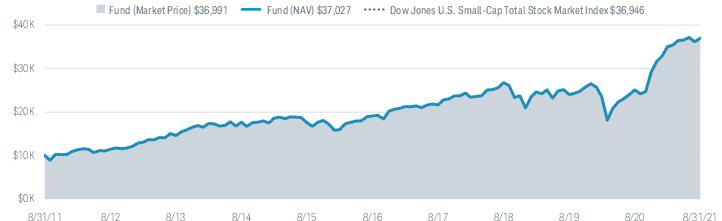
Performance of Hypothetical $10,000 Investment (August 31, 2011 – August 31, 2021)1
Average Annual Total Returns1
| Fund and Inception Date | 1 Year | 5 Years | 10 Years |
| Fund: Schwab International Equity ETF (11/3/09) | | | |
| Market Price Return2 | 28.17% | 10.15% | 7.29% |
| NAV Return2 | 27.62% | 10.20% | 7.30% |
| FTSE Developed ex US Index (Net)3 | 27.50% | 10.09% | 7.23% |
| ETF Category: Morningstar Foreign Large Blend4 | 25.94% | 9.39% | 7.15% |
| Fund Expense Ratio5: 0.06% |
All total returns on this page assume dividends and distributions were reinvested. Index figures do not include trading and management costs, which would lower performance. Indices are unmanaged and cannot be invested in directly. Performance results less than one year are not annualized.
For index definitions, please see the Glossary.
Shares are bought and sold at market price, which may be higher or lower than the net asset value (NAV). Brokerage commissions will reduce returns.
International investing may involve risk of capital loss from unfavorable fluctuations in currency values, from differences in generally accepted accounting principles, or from economic or political instability in other nations.
Index ownership — FTSE is a trademark of the London Stock Exchange Group companies (LSEG) and is used by the fund under license. The Schwab International Equity ETF is not sponsored, endorsed, sold or promoted by FTSE nor LSEG and neither FTSE nor LSEG makes any representation regarding the advisability of investing in shares of the fund. Fees payable under the license are paid by the investment adviser.
| 1 | Performance does not reflect the deduction of taxes that a shareholder would pay on fund distributions or on the redemption or sale of fund shares. |
| 2 | ETF performance must be shown based on both a market price and NAV basis. The fund’s per share NAV is the value of one share of the fund. NAV is calculated by taking the fund’s total assets (including the fair value of securities owned), subtracting liabilities, and dividing by the number of shares outstanding. The NAV Return is based on the NAV of the fund, and the Market Price Return is based on the market price per share of the fund. The price used to calculate market return (Market Price) is determined using the Official Closing Price on the primary stock exchange (generally, 4:00 p.m. Eastern time) and may not represent the returns you would receive if shares were traded at other times. NAV is used as a proxy for purposes of calculating Market Price Return on inception date. Market Price and NAV returns assume that dividends and capital gain distributions have been reinvested in the fund at Market Price and NAV, respectively. |
| 3 | The total return cited for the index is calculated net of foreign withholding taxes; the underlying tax rate information is available from FTSE. |
| 4 | Source for category information: Morningstar, Inc. The Morningstar Category return represents all passively- and actively-managed ETFs within the category as of the report date. |
| 5 | As stated in the prospectus. |
Schwab International Equity ETFs | Annual Report
Schwab International Equity ETF
Performance and Fund Facts as of August 31, 2021 (continued)
| Number of Holdings | 1,504 |
| Weighted Average Market Cap (millions) | $80,767 |
| Price/Earnings Ratio (P/E) | 16.6 |
| Price/Book Ratio (P/B) | 1.8 |
| Portfolio Turnover Rate | 6% 2 |
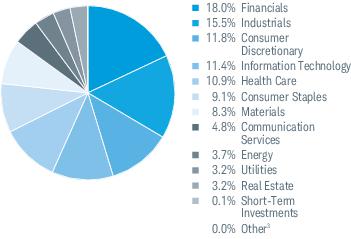
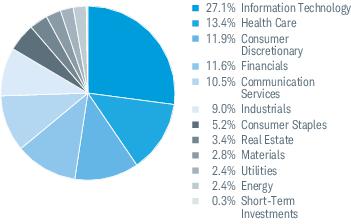
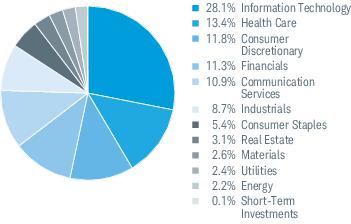
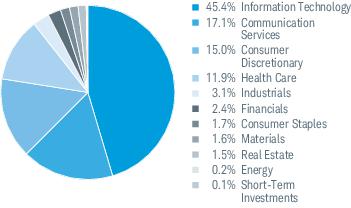
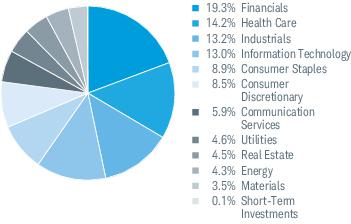
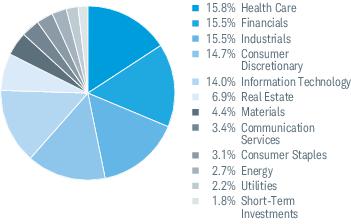
Sector Weightings % of Investments1
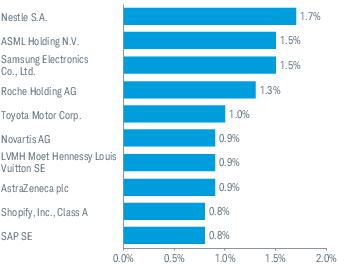
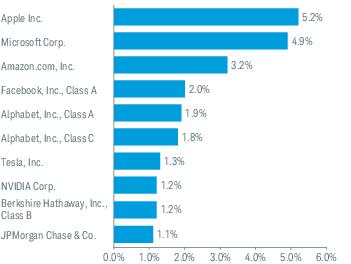
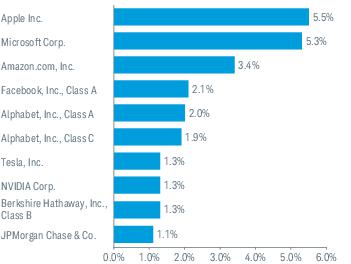
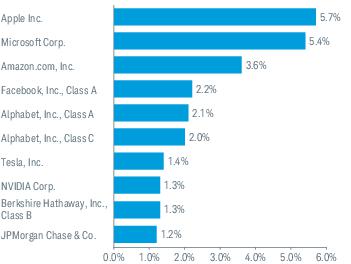
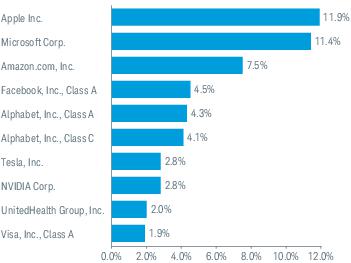
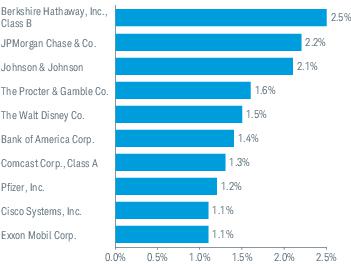
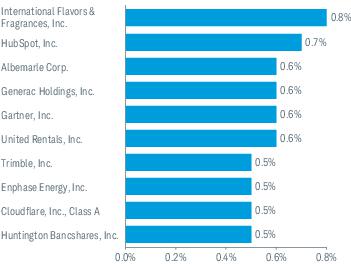
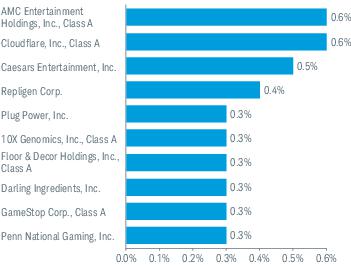
Top Equity Holdings % of Net Assets4
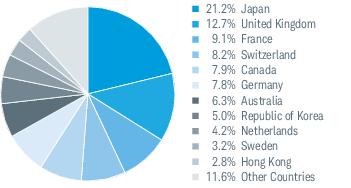
Country Weightings % of Investments5
Portfolio holdings may have changed since the report date.
An index is a statistical composite of a specified financial market or sector. Unlike the fund, an index does not actually hold a portfolio of securities and its return is not inclusive of trading and management costs incurred by the fund.
Source of Sector Classification: S&P and MSCI.
| 1 | Excludes derivatives. |
| 2 | Portfolio turnover rate excludes securities received or delivered from processing of in-kind creations or redemptions. |
| 3 | Amount is less than 0.05%. |
| 4 | This list is not a recommendation of any security by the investment adviser. |
| 5 | The percentage may differ from the Portfolio Holdings because the above calculation is based on a percentage of total investments, excluding derivatives, whereas the calculation in the Portfolio Holdings is based on a percentage of net assets. |
Schwab International Equity ETFs | Annual Report
Schwab International Small-Cap Equity ETF as of August 31, 2021
The Schwab International Small-Cap Equity ETF (the fund) seeks to track as closely as possible, before fees and expenses, the total return of the FTSE Developed Small Cap ex US Liquid Index (the index). The index is comprised of small-capitalization companies in developed countries outside the United States, as defined by the index provider. The index defines the small-capitalization universe as approximately the bottom 10% of the eligible universe with a minimum free float capitalization of $150 million. The fund invests in a representative sample of securities included in the index which, when taken together, are expected to perform similarly to the index as a whole. Due to the use of representative sampling, the fund may not hold all of the securities included in the index.
Market Highlights. For the 12-month reporting period ended August 31, 2021, international equity markets generated solid returns, with several key equity market indices ending the reporting period just off record highs. Despite persisting COVID-19 pandemic-driven stresses on the global economy and a resurgence of COVID-19 cases in the fall and into the winter, along with the emergence and rapid spread of the Delta variant during the summer, equity markets continued to rise on strong earnings, ongoing fiscal stimulus measures, and optimism related to the rapid rollout of COVID-19 vaccines that began in December 2020. Despite some volatility, the U.S. dollar, as measured against a basket of foreign currencies, ended the reporting period roughly where it began.
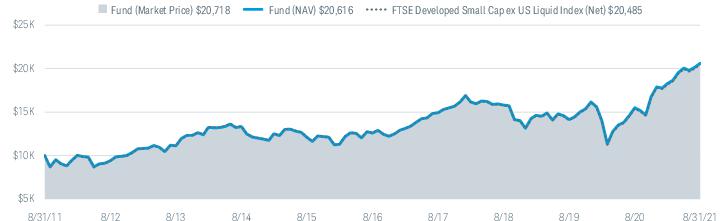
Performance. During the 12-month reporting period ended August 31, 2021, the fund generally tracked the index. The fund’s market price return was 34.15% and its NAV return was 33.01% (for an explanation of the market price and NAV returns, please refer to footnote 2 on the following page). The index returned 32.95%1 during the same period.
Contributors and Detractors. Stocks from the United Kingdom were the largest contributors to the total return of the fund. Stocks from the United Kingdom represented an average weight of approximately 14% of the fund’s investments and returned approximately 48% in U.S. dollar terms for the reporting period. One example from this market is Royal Mail plc, which provides postal and delivery services. The fund’s holdings of Royal Mail plc represented an average weight of less than 1% of the fund’s investments and returned approximately 189% in U.S. dollar terms for the reporting period.
Stocks from Canada also contributed to the total return of the fund, representing an average weight of approximately 19% of the fund’s investments and returning approximately 32% in U.S. dollar terms for the reporting period.
Over the reporting period, no markets detracted from the returns of the index or the fund. However, stocks from Portugal were the smallest contributors to the total return of the fund. Portuguese stocks represented an average weight of less than 1% of the fund’s investments and returned approximately 34% in U.S. dollar terms for the reporting period. One example from this market is Mota-Engil, SGPS, S.A., a construction and building services company. The fund’s holdings of Mota-Engil, SGPS, S.A. represented an average weight of less than 1% of the fund’s investments and returned approximately 6% in U.S. dollar terms for the reporting period.
Stocks from Hong Kong were another smaller contributor to the total return of the fund, representing an average weight of approximately 1% of the fund’s investments and returning approximately 10% in U.S. dollar terms for the reporting period.
Management views and portfolio holdings may have changed since the report date.
| 1 | The total return cited for the index is calculated net of foreign withholding taxes; the underlying tax rate information is available from FTSE. |
Schwab International Equity ETFs | Annual Report
Schwab International Small-Cap Equity ETF
Performance and Fund Facts as of August 31, 2021
The performance data quoted represents past performance. Past performance does not guarantee future results. Investment return and principal value of an investment will fluctuate so that an investor’s shares, when sold or redeemed, may be worth more or less than the original cost. Current performance may be lower or higher than the performance quoted. To obtain performance information current to the most recent month end, please visit www.schwabassetmanagement.com/schwabetfs_prospectus.
Performance of Hypothetical $10,000 Investment (August 31, 2011 – August 31, 2021)1
Average Annual Total Returns1
| Fund and Inception Date | 1 Year | 5 Years | 10 Years |
| Fund: Schwab International Small-Cap Equity ETF (1/14/10) | | | |
| Market Price Return2 | 34.15% | 10.31% | 7.56% |
| NAV Return2 | 33.01% | 10.36% | 7.50% |
| FTSE Developed Small Cap ex US Liquid Index (Net)3 | 32.95% | 10.20% | 7.43% |
| ETF Category: Morningstar Foreign Small/Mid Blend4 | 34.75% | 10.61% | 8.37% |
| Fund Expense Ratio5: 0.11% |
All total returns on this page assume dividends and distributions were reinvested. Index figures do not include trading and management costs, which would lower performance. Indices are unmanaged and cannot be invested in directly. Performance results less than one year are not annualized.
For index definitions, please see the Glossary.
Shares are bought and sold at market price, which may be higher or lower than the net asset value (NAV). Brokerage commissions will reduce returns.
International investing may involve risk of capital loss from unfavorable fluctuations in currency values, from differences in generally accepted accounting principles, or from economic or political instability in other nations.
Small-company stocks may be subject to greater volatility than many other asset classes.
Index ownership — FTSE is a trademark of the London Stock Exchange Group companies (LSEG) and is used by the fund under license. The Schwab International Small-Cap Equity ETF is not sponsored, endorsed, sold or promoted by FTSE nor LSEG and neither FTSE nor LSEG makes any representation regarding the advisability of investing in shares of the fund. Fees payable under the license are paid by the investment adviser.
| 1 | Performance does not reflect the deduction of taxes that a shareholder would pay on fund distributions or on the redemption or sale of fund shares. |
| 2 | ETF performance must be shown based on both a market price and NAV basis. The fund’s per share NAV is the value of one share of the fund. NAV is calculated by taking the fund’s total assets (including the fair value of securities owned), subtracting liabilities, and dividing by the number of shares outstanding. The NAV Return is based on the NAV of the fund, and the Market Price Return is based on the market price per share of the fund. The price used to calculate market return (Market Price) is determined using the Official Closing Price on the primary stock exchange (generally, 4:00 p.m. Eastern time) and may not represent the returns you would receive if shares were traded at other times. NAV is used as a proxy for purposes of calculating Market Price Return on inception date. Market Price and NAV returns assume that dividends and capital gain distributions have been reinvested in the fund at Market Price and NAV, respectively. |
| 3 | The total return cited for the index is calculated net of foreign withholding taxes; the underlying tax rate information is available from FTSE. |
| 4 | Source for category information: Morningstar, Inc. The Morningstar Category return represents all passively- and actively-managed ETFs within the category as of the report date. |
| 5 | As stated in the prospectus. |
Schwab International Equity ETFs | Annual Report
Schwab International Small-Cap Equity ETF
Performance and Fund Facts as of August 31, 2021 (continued)
| Number of Holdings | 2,253 |
| Weighted Average Market Cap (millions) | $3,488 |
| Price/Earnings Ratio (P/E) | 14.5 |
| Price/Book Ratio (P/B) | 1.6 |
| Portfolio Turnover Rate | 22% 2 |
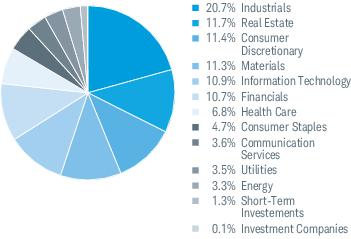
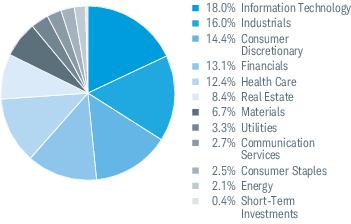
Sector Weightings % of Investments1
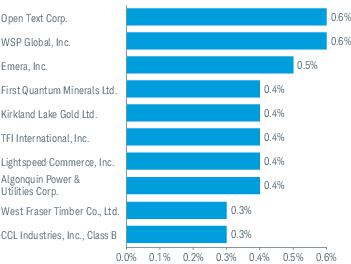
Top Equity Holdings % of Net Assets3
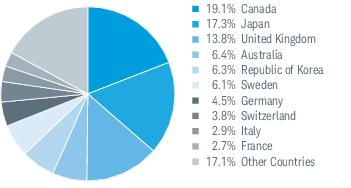
Country Weightings % of Investments4
Portfolio holdings may have changed since the report date.
An index is a statistical composite of a specified financial market or sector. Unlike the fund, an index does not actually hold a portfolio of securities and its return is not inclusive of trading and management costs incurred by the fund.
Source of Sector Classification: S&P and MSCI.
| 1 | Excludes derivatives. |
| 2 | Portfolio turnover rate excludes securities received or delivered from processing of in-kind creations or redemptions. |
| 3 | This list is not a recommendation of any security by the investment adviser. |
| 4 | The percentage may differ from the Portfolio Holdings because the above calculation is based on a percentage of total investments, excluding derivatives, whereas the calculation in the Portfolio Holdings is based on a percentage of net assets. |
Schwab International Equity ETFs | Annual Report
Schwab International Dividend Equity ETF as of August 31, 2021
The Schwab International Dividend Equity ETF (the fund) seeks to track as closely as possible, before fees and expenses, the total return of an index composed of high dividend yielding stocks issued by companies outside of the United States. To purse its goal, the fund generally invests in stocks that are included in the Dow Jones International Dividend 100 Index (the index). The 100-component index is derived from constituents of the Dow Jones Global ex-U.S. Large-Cap Index and Dow Jones Global ex-U.S. Mid-Cap Index (excluding real estate investment trusts (REITs)). The index is modified market capitalization weighted. The fund invests in a representative sample of securities included in the index which, when taken together, are expected to perform similarly to the index as a whole. Due to the use of representative sampling, the fund may not hold all of the securities included in the index.
Market Highlights. For the reporting period of fund inception, April 29, 2021*, through August 31, 2021, many international equity markets generated positive returns, with several key equity market indices ending the reporting period just off record highs. Despite persisting COVID-19 pandemic-driven stresses on the global economy, along with the emergence and rapid spread of the Delta variant during the summer, equity markets continued to rise. The U.S. dollar, as measured against a basket of foreign currencies, strengthened slightly over the reporting period, generally reducing the return of overseas investments in U.S. dollar terms.
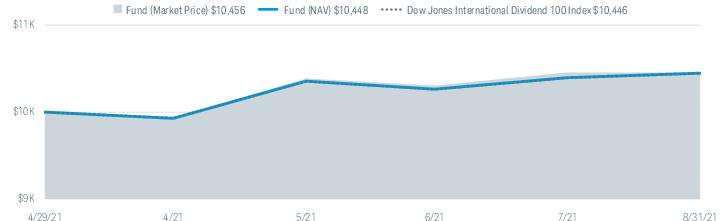
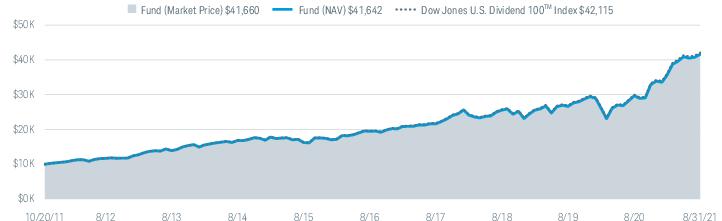
Performance. During the reporting period of fund inception of April 29, 2021* through August 31, 2021, the fund generally tracked the index. The fund’s market price return was 4.56% and its NAV return was 4.48% (for an explanation of the market price and NAV returns, please refer to footnote 2 on the following page). The index returned 4.46% during the same period.
Contributors and Detractors. Stocks from Switzerland were the largest contributors to the total of the return of the fund. Swiss stocks represented an average weight of approximately 10% of the fund’s investments and returned approximately 15% in U.S. dollar terms for the reporting period. One example from this market is Roche Holding Ltd., which develops and manufactures pharmaceutical and diagnostic products. The fund’s holdings of Roche Holding Ltd. represented an average weight of approximately 4% of the fund’s investments and returned approximately 21% in U.S. dollar terms for the reporting period.
Stocks from the United Kingdom also contributed to the total return of the fund, representing an average weight of approximately 17% of the fund’s investments and returning approximately 7% in U.S. dollar terms for the reporting period.
Stocks from Australia detracted the most from the total return of the fund. Australian stocks represented an average weight of approximately 11% of the fund’s investments and returned approximately -6% in U.S. dollar term for the reporting period. One example from this market is BHP Group Ltd., a mining company. The fund’s holdings of BHP Group Ltd. represented an average weight of approximately 4% of the fund’s investments and returned approximately -11% in U.S. dollar terms for the reporting period.
Stocks from Italy also detracted from the total return of the fund, representing an average weight of approximately 4% of the fund’s investments and returning approximately -9% in U.S. dollar term for the reporting period.
Management views and portfolio holdings may have changed since the report date.
| * | Inception represents the date that the shares began trading in the secondary market. |
Schwab International Equity ETFs | Annual Report
Schwab International Dividend Equity ETF
Performance and Fund Facts as of August 31, 2021
The performance data quoted represents past performance. Past performance does not guarantee future results. Investment return and principal value of an investment will fluctuate so that an investor’s shares, when sold or redeemed, may be worth more or less than the original cost. Current performance may be lower or higher than the performance quoted. To obtain performance information current to the most recent month end, please visit www.schwabassetmanagement.com/schwabetfs_prospectus.
Performance of Hypothetical $10,000 Investment (April 29, 2021 – August 31, 2021)1
Average Annual Total Returns1
| Fund and Inception Date | Since Inception* |
| Fund: Schwab International Dividend Equity ETF (4/29/21) | |
| Market Price Return2 | 4.56% |
| NAV Return2 | 4.48% |
| Dow Jones International Dividend 100 Index | 4.46% |
| ETF Category: Morningstar Foreign Large Value3 | N/A |
| Fund Expense Ratio4: 0.14% |
All total returns on this page assume dividends and distributions were reinvested. Index figures do not include trading and management costs, which would lower performance. Indices are unmanaged and cannot be invested in directly. Performance results less than one year are not annualized.
For index definitions, please see the Glossary.
Shares are bought and sold at market price, which may be higher or lower than the net asset value (NAV). Brokerage commissions will reduce returns.
International investing may involve risk of capital loss from unfavorable fluctuations in currency values, from differences in generally accepted accounting principles, or from economic or political instability in other nations.
The fund may underperform other funds that do not limit their investment to dividend paying stocks. Stocks held by the fund may reduce or stop paying dividends, affecting the fund’s ability to generate income. Diversification strategies do not ensure a profit and do not protect against losses in declining markets.
Index ownership — Dow Jones® is a registered trademark of Dow Jones Trademark Holdings LLC (Dow Jones). The Dow Jones International Dividend 100 Index is a product of S&P Dow Jones Indices LLC and/or its affiliates, and has been licensed for use by CSIM. The Schwab International Dividend Equity ETF is not sponsored, endorsed, sold or promoted by S&P Dow Jones Indices LLC, Dow Jones, or any of their respective affiliates and neither S&P Dow Jones Indices LLC, Dow Jones, nor any of their respective affiliates make any representation regarding the advisability of investing in such product.
| * | Inception (4/29/21) represents the date that the shares began trading in the secondary market. |
| 1 | Performance does not reflect the deduction of taxes that a shareholder would pay on fund distributions or on the redemption or sale of fund shares. |
| 2 | ETF performance must be shown based on both a market price and NAV basis. The fund’s per share NAV is the value of one share of the fund. NAV is calculated by taking the fund’s total assets (including the fair value of securities owned), subtracting liabilities, and dividing by the number of shares outstanding. The NAV Return is based on the NAV of the fund, and the Market Price Return is based on the market price per share of the fund. The price used to calculate market return (Market Price) is determined using the Official Closing Price on the primary stock exchange (generally, 4:00 p.m. Eastern time) and may not represent the returns you would receive if shares were traded at other times. NAV is used as a proxy for purposes of calculating Market Price Return on inception date. Market Price and NAV returns assume that dividends and capital gain distributions have been reinvested in the fund at Market Price and NAV, respectively. |
| 3 | Source for category information: Morningstar, Inc. The Morningstar Category return represents all passively- and actively-managed ETFs within the category as of the report date. |
| 4 | As stated in the prospectus. |
Schwab International Equity ETFs | Annual Report
Schwab International Dividend Equity ETF
Performance and Fund Facts as of August 31, 2021 (continued)
| Number of Holdings | 102 |
| Weighted Average Market Cap (millions) | $75,143 |
| Price/Earnings Ratio (P/E) | 14.3 |
| Price/Book Ratio (P/B) | 2.3 |
| Portfolio Turnover Rate | 3% 2,3 |
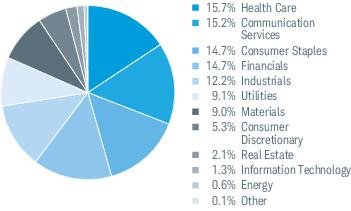
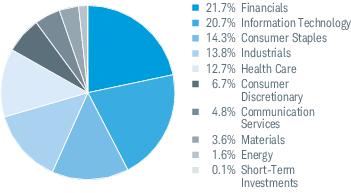
Sector Weightings % of Investments1
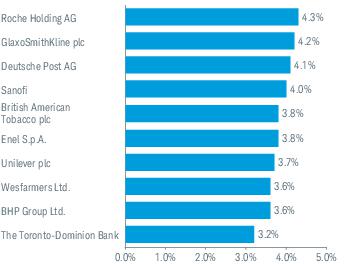
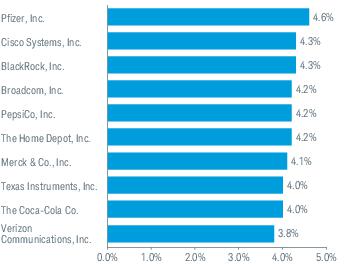
Top Equity Holdings % of Net Assets4
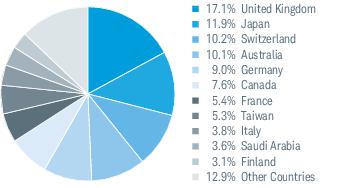
Country Weightings % of Investments5
Portfolio holdings may have changed since the report date.
An index is a statistical composite of a specified financial market or sector. Unlike the fund, an index does not actually hold a portfolio of securities and its return is not inclusive of trading and management costs incurred by the fund.
Source of Sector Classification: S&P and MSCI.
| 1 | Excludes derivatives. |
| 2 | Not annualized. |
| 3 | Portfolio turnover rate excludes securities received or delivered from processing of in-kind creations or redemptions. |
| 4 | This list is not a recommendation of any security by the investment adviser. |
| 5 | The percentage may differ from the Portfolio Holdings because the above calculation is based on a percentage of total investments, excluding derivatives, whereas the calculation in the Portfolio Holdings is based on a percentage of net assets. |
Schwab International Equity ETFs | Annual Report
Schwab Emerging Markets Equity ETF as of August 31, 2021
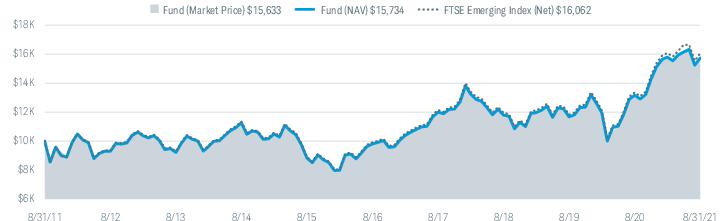
The Schwab Emerging Markets Equity ETF (the fund) seeks to track as closely as possible, before fees and expenses, the total return of the FTSE Emerging Index (the index). The index is comprised of large- and mid-capitalization companies in emerging market countries, as defined by the index provider. The index defines the large- and mid-capitalization universe as approximately the top 90% of the eligible universe. The fund invests in a representative sample of securities included in the index which, when taken together, are expected to perform similarly to the index as a whole. Due to the use of representative sampling, the fund may not hold all of the securities included in the index.
Market Highlights. For the 12-month reporting period ended August 31, 2021, international equity markets generated solid returns, with several key equity market indices ending the reporting period just off record highs. Despite persisting COVID-19 pandemic-driven stresses on the global economy and a resurgence of COVID-19 cases in the fall and into the winter, along with the emergence and rapid spread of the Delta variant during the summer, equity markets continued to rise on strong earnings, ongoing fiscal stimulus measures, and optimism related to the rapid rollout of COVID-19 vaccines that began in December 2020. Despite some volatility, the U.S. dollar, as measured against a basket of foreign currencies, ended the reporting period roughly where it began.
Performance. During the 12-month reporting period ended August 31, 2021, the fund underperformed the index. The fund’s market price return was 19.21% and its NAV return was 19.53% (for an explanation of the market price and NAV returns, please refer to footnote 2 on the following page). The index returned 20.23%1 during the same period. The fund’s underperformance relative to the index was primarily a result of the accrual of Indian capital gains tax liability.
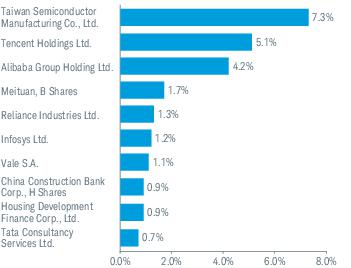
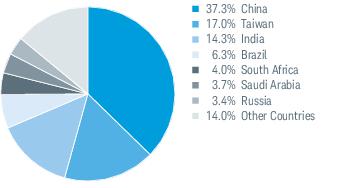
Contributors and Detractors. Stocks from China were the largest detractors from the total return of the fund. Chinese stocks represented an average weight of approximately 43% of the fund’s investments and returned approximately -5% in U.S. dollar terms for the reporting period. One example from this market is Alibaba Group Holding Ltd., a multinational technology company. The fund’s holdings of Alibaba Group Holding Ltd. represented an average weight of approximately 2% of the fund’s investments and returned approximately -30% in U.S. dollar terms for the reporting period.
Stocks from Egypt also detracted from the total return of the fund, representing an average weight of less than 1% of the fund’s investments and returning approximately -9% in U.S. dollar terms for the reporting period.
Stocks from Taiwan were the largest contributors to the total return of the fund. Taiwanese stocks represented an average weight of approximately 16% of the fund’s investments and returned approximately 53% in U.S. dollar terms for the reporting period. One example from this market is Taiwan Semiconductor Manufacturing Co., Ltd., which manufactures and markets integrated circuits. The fund’s holdings of Taiwan Semiconductor Manufacturing Co., Ltd. represented an average weight of approximately 7% of the fund’s investments and returned approximately 55% in U.S. dollar terms for the reporting period.
Stocks from India also contributed to the total return of the fund, representing an average weight of approximately 11% of the fund’s investments and returning approximately 55% in U.S. dollar term for the reporting period.
Management views and portfolio holdings may have changed since the report date.
| 1 | The total return cited for the index is calculated net of foreign withholding taxes; the underlying tax rate information is available from FTSE. |
Schwab International Equity ETFs | Annual Report
Schwab Emerging Markets Equity ETF
Performance and Fund Facts as of August 31, 2021
The performance data quoted represents past performance. Past performance does not guarantee future results. Investment return and principal value of an investment will fluctuate so that an investor’s shares, when sold or redeemed, may be worth more or less than the original cost. Current performance may be lower or higher than the performance quoted. To obtain performance information current to the most recent month end, please visit www.schwabassetmanagement.com/schwabetfs_prospectus.
Performance of Hypothetical $10,000 Investment (August 31, 2011 – August 31, 2021)1
Average Annual Total Returns1
| Fund and Inception Date | 1 Year | 5 Years | 10 Years |
| Fund: Schwab Emerging Markets Equity ETF (1/14/10) | | | |
| Market Price Return2 | 19.21% | 9.84% | 4.57% |
| NAV Return2 | 19.53% | 9.92% | 4.64% |
| FTSE Emerging Index (Net)3 | 20.23% | 10.12% | 4.85% |
| ETF Category: Morningstar Diversified Emerging Markets4 | 24.59% | 10.24% | 4.98% |
| Fund Expense Ratio5: 0.11% |
All total returns on this page assume dividends and distributions were reinvested. Index figures do not include trading and management costs, which would lower performance. Indices are unmanaged and cannot be invested in directly. Performance results less than one year are not annualized.
For index definitions, please see the Glossary.
Shares are bought and sold at market price, which may be higher or lower than the net asset value (NAV). Brokerage commissions will reduce returns.
International investing may involve risk of capital loss from unfavorable fluctuations in currency values, from differences in generally accepted accounting principles, or from economic or political instability in other nations.
Emerging markets involve heightened risks related to the same factors as international investing, as well as increased volatility and lower trading volume.
Index ownership — FTSE is a trademark of the London Stock Exchange Group companies (LSEG) and is used by the fund under license. The Schwab Emerging Markets Equity ETF is not sponsored, endorsed, sold or promoted by FTSE nor LSEG and neither FTSE nor LSEG makes any representation regarding the advisability of investing in shares of the fund. Fees payable under the license are paid by the investment adviser.
| 1 | Performance does not reflect the deduction of taxes that a shareholder would pay on fund distributions or on the redemption or sale of fund shares. |
| 2 | ETF performance must be shown based on both a market price and NAV basis. The fund’s per share NAV is the value of one share of the fund. NAV is calculated by taking the fund’s total assets (including the fair value of securities owned), subtracting liabilities, and dividing by the number of shares outstanding. The NAV Return is based on the NAV of the fund, and the Market Price Return is based on the market price per share of the fund. The price used to calculate market return (Market Price) is determined using the Official Closing Price on the primary stock exchange (generally, 4:00 p.m. Eastern time) and may not represent the returns you would receive if shares were traded at other times. NAV is used as a proxy for purposes of calculating Market Price Return on inception date. Market Price and NAV returns assume that dividends and capital gain distributions have been reinvested in the fund at Market Price and NAV, respectively. |
| 3 | The total return cited for the index is calculated net of foreign withholding taxes; the underlying tax rate information is available from FTSE. |
| 4 | Source for category information: Morningstar, Inc. The Morningstar Category return represents all passively- and actively-managed ETFs within the category as of the report date. |
| 5 | As stated in the prospectus. |
Schwab International Equity ETFs | Annual Report
Schwab Emerging Markets Equity ETF
Performance and Fund Facts as of August 31, 2021 (continued)
| Number of Holdings | 1602 |
| Weighted Average Market Cap (millions) | $135,100 |
| Price/Earnings Ratio (P/E) | 13.7 |
| Price/Book Ratio (P/B) | 2.1 |
| Portfolio Turnover Rate | 15% 2 |
Sector Weightings % of Investments1
Top Equity Holdings % of Net Assets4
Country Weightings % of Investments5
Portfolio holdings may have changed since the report date.
An index is a statistical composite of a specified financial market or sector. Unlike the fund, an index does not actually hold a portfolio of securities and its return is not inclusive of trading and management costs incurred by the fund.
Source of Sector Classification: S&P and MSCI.
| 1 | Excludes derivatives. |
| 2 | Portfolio turnover rate excludes securities received or delivered from processing of in-kind creations or redemptions. |
| 3 | Amount is less than 0.05%. |
| 4 | This list is not a recommendation of any security by the investment adviser. |
| 5 | The percentage may differ from the Portfolio Holdings because the above calculation is based on a percentage of total investments, excluding derivatives, whereas the calculation in the Portfolio Holdings is based on a percentage of net assets. |
Schwab International Equity ETFs | Annual Report
Schwab International Equity ETFs
Fund Expenses (Unaudited)
Examples for a $1,000 Investment
As a fund shareholder, you may incur two types of costs: (1) transaction costs, including brokerage commissions on purchases and sales of fund shares; and, (2) ongoing costs, including management fees.
The expense examples below are intended to help you understand your ongoing cost (in dollars) of investing in a fund and to compare this cost with the ongoing cost of investing in other mutual funds. These examples are based on an investment of $1,000 invested for six months beginning March 1, 2021 and held through August 31, 2021.
Actual Return lines in the table below provide information about actual account values and actual expenses. You may use this information, together with the amount you invested, to estimate the expenses that you paid over the period. To do so, simply divide your account value by $1,000 (for example, an $8,600 account value ÷ $1,000 = 8.6), then multiply the result by the number given for your fund under the heading entitled “Expenses Paid During Period.”
Hypothetical Return lines in the table below provide information about hypothetical account values and hypothetical expenses based on a fund’s actual expense ratio and an assumed return of 5% per year before expenses. Because the return used is not an actual return, it may not be used to estimate the actual ending account value or expenses you paid for the period.
You may use this information to compare the ongoing costs of investing in a fund and other funds. To do so, compare this 5% hypothetical example with the 5% hypothetical examples that appear in the shareholder reports of the other funds.
Please note that the expenses shown in the table are meant to highlight your ongoing costs only, and do not reflect any transactional costs, including any brokerage commissions you may pay when purchasing or selling shares of a fund. Therefore, the hypothetical return lines of the table are useful in comparing ongoing costs only, and will not help you determine the relative total costs of owning different funds. In addition, if these transactional costs were included, your costs would have been higher.
| | Expense Ratio
(Annualized)1 | Beginning
Account Value
at 3/1/21 | Ending
Account Value
(Net of Expenses)
at 8/31/21 | Expenses Paid
During Period
3/1/21-8/31/212 |
| Schwab International Equity ETF | | | | |
| Actual Return | 0.06% | $1,000.00 | $1,102.50 | $0.32 |
| Hypothetical 5% Return | 0.06% | $1,000.00 | $1,024.90 | $0.31 |
| Schwab International Small-Cap Equity ETF | | | | |
| Actual Return | 0.11% | $1,000.00 | $1,128.40 | $0.59 |
| Hypothetical 5% Return | 0.11% | $1,000.00 | $1,024.65 | $0.56 |
| Schwab International Dividend Equity ETF3,4 | | | | |
| Actual Return | 0.14% | $1,000.00 | $1,044.80 | $0.49 |
| Hypothetical 5% Return | 0.14% | $1,000.00 | $1,024.49 | $0.71 |
| Schwab Emerging Markets Equity ETF | | | | |
| Actual Return | 0.11% | $1,000.00 | $ 996.10 | $0.55 |
| Hypothetical 5% Return | 0.11% | $1,000.00 | $1,024.65 | $0.56 |
| 1 | Based on the most recent six-month expense ratio; may differ from the expense ratio provided in the Financial Highlights. |
| 2 | Expenses for the fund are equal to its annualized expense ratio, multiplied by the average account value over the period, multiplied by the 184 days of the period, and divided by 365 days of the fiscal year. |
| 3 | The expense ratio provided for the fund is for the period from 4/29/21 (commencement of operations) through 8/31/21. See financial note 4. |
| 4 | Actual expenses for the fund are equal to its annualized expense ratio, multiplied by the average account value over the period, multiplied by the 125 days of the period from commencement of operations on 4/29/21 through 8/31/21, and divided by 365 days of the fiscal year. Hypothetical expenses for the fund are equal to its annualized expense ratio, multiplied by the average account value over the period, multiplied by the 184 days of the period, and divided by 365 days of the fiscal year. |
Schwab International Equity ETFs | Annual Report
Schwab International Equity ETF
Financial Statements
Financial Highlights
| | 9/1/20–
8/31/21 | 9/1/19–
8/31/20 | 9/1/18–
8/31/19 | 9/1/17–
8/31/18 | 9/1/16–
8/31/17 | |
| Per-Share Data |
| Net asset value at beginning of period | $32.11 | $30.82 | $33.25 | $32.51 | $28.32 | |
| Income (loss) from investment operations: | | | | | | |
| Net investment income (loss)1 | 0.95 | 0.77 | 1.00 | 0.98 | 0.88 | |
| Net realized and unrealized gains (losses) | 7.84 | 1.49 | (2.30) | 0.56 | 4.02 | |
| Total from investment operations | 8.79 | 2.26 | (1.30) | 1.54 | 4.90 | |
| Less distributions: | | | | | | |
| Distributions from net investment income | (0.85) | (0.97) | (1.13) | (0.80) | (0.71) | |
| Net asset value at end of period | $40.05 | $32.11 | $30.82 | $33.25 | $32.51 | |
| Total return | 27.62% | 7.37% | (3.79%) | 4.70% | 17.76% | |
| Ratios/Supplemental Data |
| Ratios to average net assets: | | | | | | |
| Total expenses | 0.06% | 0.06% | 0.06% | 0.06% | 0.06% 2 | |
| Net investment income (loss) | 2.59% | 2.50% | 3.22% | 2.91% | 2.95% | |
| Portfolio turnover rate3 | 6% | 6% | 8% | 5% | 5% | |
| Net assets, end of period (x 1,000) | $28,338,081 | $19,843,632 | $18,138,537 | $16,294,052 | $11,413,011 | |
| |
1
Calculated based on the average shares outstanding during the period.
2
Effective October 7, 2016 and March 1, 2017, the annual operating expense ratio was reduced. The ratio presented for the period ended 8/31/17 is a blended ratio.
3
Portfolio turnover rate excludes securities received or delivered from processing of in-kind creations or redemptions.
Schwab International Equity ETFs | Annual Report
Schwab International Equity ETF
Portfolio Holdings as of August 31, 2021
This section shows all the securities in the fund’s portfolio and their values as of the report date.
The fund files its complete schedule of portfolio holdings with the U.S. Securities and Exchange Commission (SEC) for the first and third quarters of each fiscal year on Form N-PORT Part F. The fund’s Form N-PORT Part F is available on the SEC’s website at www.sec.gov. You can also obtain this information at no cost on the fund’s website at www.schwabassetmanagement.com/schwabetfs_prospectus, by calling 1-866-414-6349, or by sending an email request to orders@mysummaryprospectus.com. The fund also makes available its complete schedule of portfolio holdings on a daily basis on the fund’s website.
| Security | Number
of Shares | Value ($) |
| Common Stock 98.8% of net assets |
| |
| Australia 6.3% |
| Adbri Ltd. | 633,098 | 1,587,060 |
| Afterpay Ltd. * | 293,686 | 28,888,449 |
| AGL Energy Ltd. | 842,829 | 3,973,081 |
| ALS Ltd. | 640,449 | 5,972,600 |
| Altium Ltd. | 145,060 | 3,169,911 |
| Alumina Ltd. | 3,385,700 | 4,404,501 |
| Amcor plc | 2,038,382 | 26,055,750 |
| AMP Ltd. | 4,639,096 | 3,729,531 |
| Ampol Ltd. | 312,297 | 6,290,356 |
| Ansell Ltd. | 177,813 | 4,677,067 |
| APA Group | 1,551,782 | 10,411,219 |
| Appen Ltd. | 147,393 | 1,156,936 |
| Aristocrat Leisure Ltd. | 838,096 | 27,973,897 |
| ASX Ltd. | 255,887 | 16,414,306 |
| Atlas Arteria Ltd. | 1,300,847 | 6,521,966 |
| Aurizon Holdings Ltd. | 2,317,182 | 6,401,476 |
| AusNet Services Ltd. | 2,466,756 | 3,488,473 |
| Australia & New Zealand Banking Group Ltd. | 3,748,216 | 76,291,825 |
| Bank of Queensland Ltd. | 844,501 | 5,838,745 |
| Beach Energy Ltd. | 2,407,519 | 1,847,512 |
| Bendigo & Adelaide Bank Ltd. | 745,658 | 5,471,439 |
| BHP Group Ltd. | 3,907,972 | 130,268,589 |
| BlueScope Steel Ltd. | 665,297 | 12,253,053 |
| Boral Ltd. * | 585,875 | 2,611,939 |
| Brambles Ltd. | 1,943,580 | 17,201,834 |
| carsales.com Ltd. | 295,263 | 5,416,403 |
| Challenger Ltd. | 870,636 | 4,104,162 |
| Charter Hall Group | 591,919 | 7,726,306 |
| CIMIC Group Ltd. (a) | 128,560 | 1,987,213 |
| Cleanaway Waste Management Ltd. | 1,728,428 | 3,347,537 |
| Cochlear Ltd. | 84,376 | 14,380,556 |
| Coles Group Ltd. | 1,691,761 | 22,354,534 |
| Commonwealth Bank of Australia | 2,342,160 | 171,382,154 |
| Computershare Ltd. | 713,973 | 8,609,817 |
| Crown Resorts Ltd. * | 446,368 | 3,037,183 |
| CSL Ltd. | 600,476 | 136,897,311 |
| CSR Ltd. | 662,553 | 2,639,036 |
| Deterra Royalties Ltd. | 565,569 | 1,798,055 |
| Dexus | 1,433,272 | 11,145,471 |
| Domain Holdings Australia Ltd. | 362,653 | 1,433,893 |
| Domino's Pizza Enterprises Ltd. | 79,711 | 9,131,167 |
| Downer EDI Ltd. | 964,391 | 4,588,411 |
| Endeavour Group Ltd. * | 1,664,966 | 8,882,934 |
| Evolution Mining Ltd. | 2,334,819 | 6,672,033 |
| Flight Centre Travel Group Ltd. * | 198,362 | 2,379,004 |
| Fortescue Metals Group Ltd. | 2,093,762 | 32,134,741 |
| Goodman Group | 2,372,968 | 40,113,976 |
| Harvey Norman Holdings Ltd. | 771,394 | 3,033,100 |
| IDP Education Ltd. | 239,296 | 5,040,314 |
| IGO Ltd. | 815,647 | 5,752,515 |
| Iluka Resources Ltd. | 548,171 | 4,006,307 |
| Incitec Pivot Ltd. | 2,539,049 | 5,010,292 |
| Insurance Australia Group Ltd. | 3,280,669 | 12,563,826 |
| Security | Number
of Shares | Value ($) |
| IOOF Holdings Ltd. | 873,967 | 3,040,396 |
| James Hardie Industries plc | 585,489 | 22,696,059 |
| JB Hi-Fi Ltd. | 151,002 | 5,053,375 |
| Lendlease Corp., Ltd. | 914,141 | 7,977,112 |
| Macquarie Group Ltd. | 435,293 | 53,045,638 |
| Magellan Financial Group Ltd. | 188,960 | 5,985,315 |
| Medibank Pvt Ltd. | 3,625,987 | 9,407,686 |
| Metcash Ltd. | 1,380,701 | 4,117,068 |
| Mineral Resources Ltd. | 182,323 | 7,316,799 |
| Mirvac Group | 5,257,699 | 11,988,877 |
| National Australia Bank Ltd. | 4,335,822 | 87,871,797 |
| Newcrest Mining Ltd. | 1,080,075 | 19,529,081 |
| NEXTDC Ltd. * | 613,625 | 5,937,713 |
| Northern Star Resources Ltd. | 1,516,679 | 10,818,616 |
| Nufarm Ltd. * | 425,810 | 1,391,078 |
| Oil Search Ltd. | 2,720,782 | 7,436,927 |
| Orica Ltd. | 539,295 | 5,190,873 |
| Origin Energy Ltd. | 2,325,215 | 7,562,255 |
| Orora Ltd. | 1,118,864 | 2,788,431 |
| OZ Minerals Ltd. | 421,968 | 7,268,877 |
| Perpetual Ltd. | 81,397 | 2,514,600 |
| Platinum Asset Management Ltd. | 465,501 | 1,354,041 |
| Qantas Airways Ltd. * | 967,217 | 3,598,072 |
| QBE Insurance Group Ltd. | 1,924,739 | 16,641,206 |
| Qube Holdings Ltd. | 1,878,356 | 4,338,036 |
| Ramsay Health Care Ltd. | 231,407 | 11,652,629 |
| REA Group Ltd. | 65,389 | 7,335,695 |
| Reece Ltd. | 357,298 | 5,452,420 |
| Rio Tinto Ltd. | 489,518 | 40,091,054 |
| Santos Ltd. | 2,373,745 | 10,495,850 |
| Scentre Group | 6,913,546 | 14,400,379 |
| SEEK Ltd. | 457,292 | 10,875,252 |
| Seven Group Holdings Ltd. | 179,362 | 2,785,592 |
| Shopping Centres Australasia Property Group | 1,506,809 | 2,951,353 |
| Sims Ltd. | 213,030 | 2,360,305 |
| Sonic Healthcare Ltd. | 625,582 | 19,842,764 |
| South32 Ltd. | 6,208,395 | 14,247,451 |
| Stockland | 3,187,914 | 10,764,076 |
| Suncorp Group Ltd. | 1,688,182 | 15,397,920 |
| Sydney Airport * | 1,762,671 | 10,267,336 |
| Tabcorp Holdings Ltd. | 2,771,070 | 9,700,882 |
| Telstra Corp., Ltd. | 5,467,145 | 15,343,344 |
| The GPT Group | 2,614,857 | 9,268,680 |
| The Star Entertainment Grp Ltd. * | 1,179,994 | 3,518,586 |
| TPG Telecom Ltd. | 476,716 | 2,146,192 |
| Transurban Group | 3,597,735 | 37,363,835 |
| Treasury Wine Estates Ltd. | 977,345 | 9,021,514 |
| Vicinity Centres | 4,994,364 | 6,314,726 |
| Washington H Soul Pattinson & Co., Ltd. | 122,349 | 3,202,980 |
| Wesfarmers Ltd. | 1,489,683 | 65,269,644 |
| Westpac Banking Corp. | 4,833,696 | 91,214,476 |
| Whitehaven Coal Ltd. * | 1,137,040 | 2,102,444 |
| WiseTech Global Ltd. | 107,319 | 3,791,503 |
| Woodside Petroleum Ltd. | 1,258,516 | 17,926,635 |
| Woolworths Group Ltd. | 1,671,080 | 50,989,637 |
Schwab International Equity ETFs | Annual Report
Schwab International Equity ETF
Portfolio Holdings as of August 31, 2021 (continued)
| Security | Number
of Shares | Value ($) |
| Worley Ltd. | 425,059 | 3,255,657 |
| Xero Ltd. * | 165,427 | 18,355,388 |
| | | 1,791,045,893 |
| |
| Austria 0.2% |
| ANDRITZ AG | 88,856 | 5,103,948 |
| Erste Group Bank AG | 371,831 | 14,862,091 |
| OMV AG | 184,628 | 10,228,112 |
| Raiffeisen Bank International AG | 177,796 | 4,268,943 |
| Telekom Austria AG * | 212,774 | 1,888,790 |
| Verbund AG | 86,999 | 9,525,232 |
| voestalpine AG | 156,079 | 7,074,945 |
| | | 52,952,061 |
| |
| Belgium 0.8% |
| Ackermans & van Haaren N.V. | 29,339 | 5,402,780 |
| Ageas S.A. N.V. | 236,555 | 11,825,865 |
| Anheuser-Busch InBev S.A. | 1,107,438 | 67,965,202 |
| Argenx SE * | 67,623 | 22,814,136 |
| Elia Group S.A. N.V. | 46,265 | 5,810,875 |
| Etablissements Franz Colruyt N.V. | 66,176 | 3,701,984 |
| Groupe Bruxelles Lambert S.A. | 140,448 | 16,098,380 |
| KBC Group N.V. | 364,981 | 30,736,240 |
| Proximus SADP | 191,678 | 3,757,150 |
| Sofina S.A. | 20,412 | 9,021,293 |
| Solvay S.A. | 90,909 | 11,906,430 |
| Telenet Group Holding N.V. | 65,890 | 2,506,066 |
| UCB S.A. | 158,770 | 18,157,245 |
| Umicore S.A. | 271,668 | 17,875,279 |
| Warehouses De Pauw CVA | 180,463 | 8,295,288 |
| | | 235,874,213 |
| |
| Canada 7.8% |
| Agnico Eagle Mines Ltd. | 324,504 | 18,643,604 |
| Alimentation Couche-Tard, Inc., B Shares | 1,056,859 | 42,637,338 |
| Bank of Montreal | 853,388 | 84,795,155 |
| Barrick Gold Corp. | 2,338,144 | 46,923,857 |
| Bausch Health Cos., Inc. * | 407,988 | 11,868,507 |
| BCE, Inc. | 402,287 | 20,947,639 |
| Brookfield Asset Management Reinsurance Partners Ltd. A * | 11,812 | 720,694 |
| Brookfield Asset Management, Inc., Class A | 1,833,290 | 101,830,907 |
| Canadian Imperial Bank of Commerce | 577,418 | 66,320,934 |
| Canadian National Railway Co. | 780,790 | 91,694,089 |
| Canadian Natural Resources Ltd. | 1,544,050 | 51,014,195 |
| Canadian Pacific Railway Ltd. | 879,655 | 60,346,846 |
| Canadian Tire Corp., Ltd., Class A | 74,940 | 11,386,444 |
| Canadian Utilities Ltd., Class A | 172,040 | 4,861,748 |
| Canopy Growth Corp. * | 327,978 | 5,634,790 |
| Cenovus Energy, Inc. | 1,668,871 | 13,827,468 |
| CGI, Inc. * | 292,508 | 26,101,533 |
| Constellation Software, Inc. | 25,318 | 42,839,943 |
| Dollarama, Inc. | 388,981 | 17,709,078 |
| Enbridge, Inc. | 2,669,735 | 104,896,405 |
| Fairfax Financial Holdings Ltd. | 34,818 | 15,387,812 |
| Fortis, Inc. | 614,631 | 28,113,538 |
| Franco-Nevada Corp. | 250,524 | 36,488,697 |
| George Weston Ltd. | 97,169 | 10,457,788 |
| Great-West Lifeco, Inc. | 356,924 | 11,024,211 |
| Hydro One Ltd. | 411,296 | 10,220,151 |
| IGM Financial, Inc. | 108,267 | 3,942,045 |
| Imperial Oil Ltd. | 300,427 | 7,938,320 |
| Intact Financial Corp. | 189,216 | 25,729,423 |
| Security | Number
of Shares | Value ($) |
| Loblaw Cos. Ltd. | 215,213 | 15,138,910 |
| Magna International, Inc. | 369,486 | 29,131,397 |
| Manulife Financial Corp. | 2,561,867 | 49,812,110 |
| Metro, Inc. | 327,346 | 16,649,015 |
| National Bank of Canada | 443,621 | 35,155,468 |
| Nutrien Ltd. | 752,465 | 45,672,509 |
| Pembina Pipeline Corp. | 726,916 | 22,118,403 |
| Power Corp. of Canada | 720,286 | 24,817,989 |
| Restaurant Brands International, Inc. | 399,942 | 25,655,283 |
| Rogers Communications, Inc., B Shares | 467,722 | 23,792,324 |
| Royal Bank of Canada | 1,879,312 | 192,742,322 |
| Saputo, Inc. | 309,403 | 8,689,679 |
| Shaw Communications, Inc., B Shares | 570,658 | 16,767,722 |
| Shopify, Inc., Class A * | 148,749 | 226,786,164 |
| Sun Life Financial, Inc. | 776,401 | 39,912,166 |
| Suncor Energy, Inc. | 1,987,949 | 37,064,123 |
| TC Energy Corp. | 1,291,111 | 61,201,716 |
| Teck Resources Ltd., Class B | 606,573 | 13,656,473 |
| TELUS Corp. | 534,514 | 12,296,381 |
| The Bank of Nova Scotia | 1,600,264 | 98,967,777 |
| The Toronto-Dominion Bank | 2,404,097 | 155,872,011 |
| Thomson Reuters Corp. | 221,409 | 25,830,028 |
| Waste Connections, Inc. | 344,829 | 44,488,167 |
| Wheaton Precious Metals Corp. | 597,906 | 26,903,759 |
| | | 2,223,425,055 |
| |
| Denmark 2.2% |
| Ambu A/S, Class B | 224,384 | 7,091,415 |
| AP Moller - Maersk A/S, A Shares | 5,623 | 15,218,164 |
| AP Moller - Maersk A/S, B Shares | 7,574 | 21,484,223 |
| Carlsberg A/S, B Shares | 129,095 | 22,530,688 |
| Chr Hansen Holding A/S | 136,070 | 12,553,296 |
| Coloplast A/S, B Shares | 175,694 | 30,426,463 |
| Danske Bank A/S | 871,390 | 14,641,084 |
| Demant A/S * | 138,965 | 7,874,871 |
| DSV PANALPINA A/S | 259,899 | 66,213,941 |
| Genmab A/S * | 78,561 | 37,186,425 |
| GN Store Nord A/S | 170,970 | 12,861,049 |
| H. Lundbeck A/S | 82,403 | 2,433,562 |
| Novo Nordisk A/S, B Shares | 2,133,984 | 212,624,389 |
| Novozymes A/S, B Shares | 262,077 | 21,166,342 |
| Orsted A/S | 249,610 | 39,661,200 |
| Pandora A/S | 128,646 | 15,397,047 |
| Rockwool International A/S, B Shares | 8,208 | 4,342,526 |
| SimCorp A/S | 52,667 | 7,179,603 |
| Tryg A/S | 415,720 | 10,290,965 |
| Vestas Wind Systems A/S | 1,337,691 | 53,997,289 |
| | | 615,174,542 |
| |
| Finland 1.2% |
| Elisa Oyj | 191,835 | 12,282,730 |
| Fortum Oyj | 562,093 | 17,065,795 |
| Huhtamaki Oyj | 122,206 | 6,521,904 |
| Kesko Oyj, B Shares | 352,994 | 14,567,537 |
| Kojamo Oyj | 263,998 | 6,419,707 |
| Kone Oyj, B Shares | 517,563 | 42,913,615 |
| Metso Outotec Oyj | 808,683 | 8,633,487 |
| Neste Oyj | 551,174 | 33,533,626 |
| Nokia Oyj * | 7,415,919 | 44,470,915 |
| Nokian Renkaat Oyj | 179,431 | 6,822,375 |
| Nordea Bank Abp | 4,682,704 | 54,928,706 |
| Orion Oyj, Class B | 138,452 | 5,643,431 |
| Sampo Oyj, A Shares | 667,749 | 34,477,788 |
| Stora Enso Oyj, R Shares | 760,698 | 14,883,778 |
Schwab International Equity ETFs | Annual Report
Schwab International Equity ETF
Portfolio Holdings as of August 31, 2021 (continued)
| Security | Number
of Shares | Value ($) |
| UPM-Kymmene Oyj | 702,762 | 28,562,267 |
| Wartsila Oyj Abp | 635,252 | 9,002,343 |
| | | 340,730,004 |
| |
| France 9.0% |
| Accor S.A. * | 245,460 | 8,449,201 |
| Aeroports de Paris * | 36,111 | 4,238,850 |
| Air Liquide S.A. | 612,817 | 109,826,506 |
| Airbus SE * | 733,897 | 100,234,181 |
| ALD S.A. | 107,490 | 1,509,949 |
| Alstom S.A. | 393,518 | 16,908,822 |
| Amundi S.A. | 75,005 | 7,096,450 |
| Arkema S.A. | 87,380 | 11,593,798 |
| Atos SE | 124,093 | 6,439,503 |
| AXA S.A. | 2,533,875 | 71,128,625 |
| BioMerieux | 55,137 | 6,759,227 |
| BNP Paribas S.A. | 1,428,556 | 90,606,944 |
| Bollore S.A. | 1,341,409 | 7,933,162 |
| Bouygues S.A. | 284,427 | 11,895,682 |
| Bureau Veritas S.A. | 373,098 | 12,380,299 |
| Capgemini SE | 206,665 | 46,388,533 |
| Carrefour S.A. | 769,561 | 15,307,009 |
| Casino Guichard Perrachon S.A. *(a) | 74,582 | 2,163,150 |
| Cie de Saint-Gobain | 623,317 | 45,170,405 |
| Cie Generale des Etablissements Michelin S.C.A. | 229,911 | 37,195,137 |
| Cie Plastic Omnium S.A. | 75,396 | 2,271,310 |
| CNP Assurances | 191,599 | 3,278,377 |
| Covivio | 64,337 | 6,115,218 |
| Credit Agricole S.A. | 1,543,713 | 22,249,979 |
| Danone S.A. | 793,395 | 57,945,131 |
| Dassault Aviation S.A. | 3,550 | 4,002,019 |
| Dassault Systemes SE | 881,580 | 50,269,109 |
| Edenred | 325,804 | 18,460,566 |
| Eiffage S.A. | 101,230 | 10,518,116 |
| Electricite de France S.A. | 674,883 | 9,141,734 |
| Engie S.A. | 2,194,190 | 31,423,460 |
| EssilorLuxottica S.A. | 389,204 | 76,385,767 |
| Eurazeo SE | 57,705 | 5,933,063 |
| Eurofins Scientific SE | 160,016 | 22,682,006 |
| Euronext N.V. | 110,612 | 12,828,686 |
| Faurecia SE | 160,578 | 7,741,394 |
| Gecina S.A. | 67,948 | 10,551,517 |
| Getlink SE | 604,876 | 9,721,457 |
| Hermes International | 40,781 | 59,910,114 |
| ICADE | 43,059 | 3,700,349 |
| Iliad S.A. | 20,104 | 4,319,179 |
| Imerys S.A. | 54,365 | 2,515,665 |
| Ipsen S.A. | 45,361 | 4,534,306 |
| JCDecaux S.A. * | 100,715 | 2,808,157 |
| Kering S.A. | 97,282 | 77,399,786 |
| Klepierre S.A. | 242,264 | 5,919,794 |
| L'Oreal S.A. | 317,424 | 148,494,787 |
| La Francaise des Jeux SAEM | 116,962 | 6,048,747 |
| Legrand S.A. | 354,208 | 40,524,638 |
| LVMH Moet Hennessy Louis Vuitton SE | 329,815 | 244,031,993 |
| Neoen S.A. *(a) | 37,647 | 1,607,853 |
| Orange S.A. | 2,560,291 | 29,074,468 |
| Orpea S.A. | 65,317 | 8,219,224 |
| Pernod-Ricard S.A. | 276,254 | 58,030,183 |
| Publicis Groupe S.A. | 295,135 | 19,342,720 |
| Remy Cointreau S.A. | 31,745 | 6,250,557 |
| Renault S.A. * | 248,135 | 9,212,045 |
| Rexel S.A. * | 397,103 | 8,304,083 |
| Rubis S.C.A. | 124,528 | 4,823,037 |
| Safran S.A. | 461,125 | 57,841,008 |
| Sanofi | 1,437,653 | 148,697,853 |
| Security | Number
of Shares | Value ($) |
| Sartorius Stedim Biotech | 31,568 | 19,139,009 |
| Schneider Electric SE | 697,439 | 124,563,996 |
| SCOR SE | 217,443 | 6,671,125 |
| SEB S.A. | 39,524 | 6,214,590 |
| Societe Generale S.A. | 1,029,893 | 32,399,380 |
| Sodexo S.A. * | 114,519 | 9,465,576 |
| SOITEC * | 27,377 | 6,540,994 |
| STMicroelectronics N.V. | 836,717 | 37,251,184 |
| Suez S.A. | 495,995 | 11,505,016 |
| Technip Energies N.V. * | 152,530 | 1,992,297 |
| TechnipFMC plc * | 623,408 | 4,143,126 |
| Teleperformance | 76,382 | 33,757,808 |
| Thales S.A. | 131,583 | 13,348,809 |
| Total SE | 3,209,050 | 141,467,384 |
| Ubisoft Entertainment S.A. * | 126,364 | 8,043,047 |
| Valeo S.A. | 319,932 | 9,094,138 |
| Veolia Environnement S.A. | 674,048 | 23,114,491 |
| Vinci S.A. | 651,983 | 69,951,938 |
| Vivendi SE | 982,393 | 37,480,380 |
| Wendel SE | 37,237 | 5,402,241 |
| Worldline S.A. * | 320,973 | 28,519,230 |
| | | 2,556,420,647 |
| |
| Germany 7.3% |
| 1&1 Drillisch AG | 67,293 | 2,124,118 |
| adidas AG | 252,524 | 89,561,682 |
| Allianz SE | 542,521 | 127,430,491 |
| Aroundtown S.A. | 1,579,619 | 12,094,187 |
| Auto1 Group SE * | 90,103 | 3,919,441 |
| BASF SE | 1,204,806 | 93,183,364 |
| Bayer AG | 1,297,886 | 72,230,324 |
| Bayerische Motoren Werke AG | 418,059 | 39,662,394 |
| Bechtle AG | 111,677 | 8,070,574 |
| Beiersdorf AG | 132,649 | 16,089,153 |
| Brenntag SE | 202,682 | 20,442,019 |
| Carl Zeiss Meditec AG | 47,673 | 10,529,158 |
| Commerzbank AG * | 1,388,395 | 8,702,719 |
| Continental AG * | 142,270 | 19,115,219 |
| Covestro AG | 238,822 | 15,477,259 |
| CTS Eventim AG & Co., KGaA * | 79,324 | 5,114,506 |
| Daimler AG | 1,108,806 | 93,480,879 |
| Delivery Hero SE * | 248,197 | 35,919,838 |
| Deutsche Bank AG * | 2,694,274 | 33,483,821 |
| Deutsche Boerse AG | 242,209 | 41,772,250 |
| Deutsche Lufthansa AG *(a) | 403,354 | 4,040,039 |
| Deutsche Post AG | 1,293,469 | 90,971,195 |
| Deutsche Telekom AG | 4,259,924 | 90,555,474 |
| Deutsche Wohnen SE | 456,546 | 28,326,132 |
| DWS Group GmbH & Co. KGaA | 47,137 | 1,990,901 |
| E.ON SE | 2,840,908 | 37,485,961 |
| Evonik Industries AG | 255,132 | 8,613,474 |
| Evotec SE * | 192,132 | 9,548,369 |
| Fielmann AG | 32,419 | 2,491,311 |
| Fraport AG Frankfurt Airport Services Worldwide * | 46,828 | 3,021,500 |
| Fresenius Medical Care AG & Co. KGaA | 270,088 | 20,736,392 |
| Fresenius SE & Co. KGaA | 532,299 | 27,678,907 |
| Fuchs Petrolub SE | 38,375 | 1,513,011 |
| GEA Group AG | 221,743 | 10,237,292 |
| Hannover Rueck SE | 78,538 | 14,458,146 |
| HeidelbergCement AG | 194,722 | 16,917,657 |
| Hella GmbH & Co. KGaA * | 59,373 | 4,243,056 |
| HelloFresh SE * | 196,630 | 21,187,162 |
| Henkel AG & Co. KGaA | 126,551 | 11,383,293 |
| HOCHTIEF AG | 25,867 | 2,070,252 |
| Infineon Technologies AG | 1,716,000 | 73,055,109 |
| KION Group AG | 104,483 | 11,176,789 |
Schwab International Equity ETFs | Annual Report
Schwab International Equity ETF
Portfolio Holdings as of August 31, 2021 (continued)
| Security | Number
of Shares | Value ($) |
| Knorr-Bremse AG | 86,159 | 10,338,449 |
| LANXESS AG | 117,339 | 8,551,777 |
| LEG Immobilien SE | 94,755 | 15,100,220 |
| Merck KGaA | 171,446 | 40,719,525 |
| METRO AG | 173,311 | 2,307,717 |
| MTU Aero Engines AG | 71,064 | 16,303,527 |
| Muenchener Rueckversicherungs-Gesellschaft AG | 184,401 | 53,863,938 |
| Nemetschek SE | 73,959 | 7,248,049 |
| ProSiebenSat.1 Media SE | 209,878 | 4,004,885 |
| Puma SE | 132,522 | 16,081,571 |
| QIAGEN N.V. * | 293,089 | 16,215,929 |
| Rational AG | 4,534 | 5,184,100 |
| Rheinmetall AG | 58,519 | 5,722,481 |
| RTL Group S.A. * | 52,763 | 3,279,255 |
| RWE AG | 833,571 | 32,560,176 |
| SAP SE | 1,465,353 | 220,477,130 |
| Scout24 AG | 116,049 | 9,753,686 |
| Siemens AG | 991,956 | 164,917,142 |
| Siemens Energy AG * | 497,385 | 14,431,848 |
| Siemens Healthineers AG | 362,720 | 25,219,366 |
| Symrise AG | 167,242 | 23,808,939 |
| Talanx AG * | 75,091 | 3,410,911 |
| TeamViewer AG * | 209,699 | 6,983,077 |
| Telefonica Deutschland Holding AG | 982,880 | 2,757,891 |
| ThyssenKrupp AG * | 606,182 | 6,750,661 |
| TRATON SE | 63,018 | 1,859,739 |
| Uniper SE | 123,144 | 4,888,634 |
| United Internet AG | 143,643 | 6,207,712 |
| Varta AG (a) | 18,831 | 3,000,921 |
| Volkswagen AG | 41,912 | 14,011,319 |
| Vonovia SE | 746,011 | 50,336,710 |
| Wacker Chemie AG | 19,444 | 3,427,979 |
| Zalando SE * | 288,013 | 31,890,572 |
| | | 2,071,720,654 |
| |
| Hong Kong 2.8% |
| AAC Technologies Holdings, Inc. | 920,505 | 5,130,783 |
| AIA Group Ltd. | 16,015,025 | 191,401,515 |
| ASM Pacific Technology Ltd. | 410,785 | 4,890,958 |
| BOC Aviation Ltd. | 311,827 | 2,337,495 |
| BOC Hong Kong Holdings Ltd. | 4,765,926 | 14,461,977 |
| Brightoil Petroleum Holdings Ltd. *(b) | 2,936,732 | — |
| Budweiser Brewing Co. APAC Ltd. | 2,290,008 | 5,729,915 |
| Cathay Pacific Airways Ltd. *(a) | 1,566,736 | 1,315,459 |
| Champion REIT | 3,335,495 | 1,899,907 |
| Chow Tai Fook Jewellery Group Ltd. | 2,321,043 | 4,703,355 |
| CK Asset Holdings Ltd. | 3,161,092 | 20,606,937 |
| CK Hutchison Holdings Ltd. | 3,544,578 | 25,864,183 |
| CK Infrastructure Holdings Ltd. | 850,124 | 5,164,787 |
| CLP Holdings Ltd. | 2,202,994 | 22,023,283 |
| Dairy Farm International Holdings Ltd. | 425,771 | 1,502,972 |
| ESR Cayman Ltd. * | 2,488,704 | 7,583,854 |
| First Pacific Co., Ltd. | 3,674,345 | 1,370,081 |
| Galaxy Entertainment Group Ltd. * | 2,851,807 | 18,279,051 |
| Hang Lung Group Ltd. | 1,170,724 | 2,932,323 |
| Hang Lung Properties Ltd. | 2,719,263 | 6,531,252 |
| Hang Seng Bank Ltd. | 959,231 | 17,168,439 |
| Henderson Land Development Co., Ltd. | 1,758,962 | 7,960,997 |
| Hong Kong & China Gas Co., Ltd. | 14,598,206 | 23,500,233 |
| Hong Kong Exchanges & Clearing Ltd. | 1,675,255 | 105,719,191 |
| Hongkong Land Holdings Ltd. | 1,566,428 | 6,578,998 |
| Huabao International Holdings Ltd. | 1,130,042 | 2,699,657 |
| Hysan Development Co., Ltd. | 860,736 | 3,071,152 |
| Jardine Matheson Holdings Ltd. | 272,082 | 14,779,494 |
| Johnson Electric Holdings Ltd. | 463,765 | 1,063,803 |
| JS Global Lifestyle Co., Ltd. | 854,777 | 2,145,364 |
| Security | Number
of Shares | Value ($) |
| Kerry Logistics Network Ltd. | 806,692 | 2,567,150 |
| Kerry Properties Ltd. | 799,738 | 2,724,971 |
| L'Occitane International S.A. | 575,849 | 1,958,406 |
| Lee & Man Paper Manufacturing Ltd. | 1,963,496 | 1,724,325 |
| Lenovo Group Ltd. | 10,176,869 | 11,279,499 |
| Link REIT | 2,768,955 | 25,473,809 |
| Man Wah Holdings Ltd. | 2,021,704 | 3,779,639 |
| Melco International Development Ltd. * | 1,118,460 | 1,625,052 |
| MGM China Holdings Ltd. * | 1,122,888 | 1,124,714 |
| Microport Scientific Corp. | 628,848 | 3,893,232 |
| Minth Group Ltd. | 935,370 | 3,884,672 |
| MMG Ltd. * | 3,173,408 | 1,538,281 |
| MTR Corp., Ltd. | 1,903,969 | 10,722,655 |
| NagaCorp Ltd. | 2,096,760 | 1,684,989 |
| New World Development Co., Ltd. | 1,894,131 | 8,913,730 |
| Nexteer Automotive Group Ltd. | 1,133,760 | 1,277,008 |
| NWS Holdings Ltd. | 1,996,428 | 1,938,068 |
| PCCW Ltd. | 6,251,371 | 3,263,395 |
| Power Assets Holdings Ltd. | 1,813,708 | 11,392,008 |
| PRADA S.p.A. | 694,044 | 4,105,000 |
| Samsonite International S.A. * | 1,702,026 | 3,562,780 |
| Sands China Ltd. * | 3,207,759 | 10,290,599 |
| Shangri-La Asia Ltd. * | 1,730,523 | 1,521,955 |
| Sino Land Co., Ltd. | 4,599,448 | 6,777,331 |
| SITC International Holdings Co., Ltd. | 1,606,690 | 7,003,258 |
| SJM Holdings Ltd. * | 2,454,051 | 2,136,194 |
| Sun Art Retail Group Ltd. | 2,100,112 | 1,271,838 |
| Sun Hung Kai Properties Ltd. | 1,874,188 | 26,411,439 |
| Swire Pacific Ltd., A Shares | 586,187 | 3,972,054 |
| Swire Pacific Ltd., B Shares | 1,754,314 | 1,906,042 |
| Swire Properties Ltd. | 1,462,579 | 3,958,583 |
| Techtronic Industries Co., Ltd. | 1,655,192 | 36,711,813 |
| The Bank of East Asia Ltd. (a) | 1,743,784 | 2,923,739 |
| The Wharf Holdings Ltd. | 1,848,156 | 6,249,751 |
| Tingyi Cayman Islands Holding Corp. | 2,563,475 | 4,561,772 |
| Uni-President China Holdings Ltd. | 1,576,144 | 1,493,591 |
| United Energy Group Ltd. | 11,642,500 | 1,811,340 |
| Vitasoy International Holdings Ltd. | 1,073,264 | 2,773,773 |
| VTech Holdings Ltd. | 228,625 | 2,220,887 |
| Want Want China Holdings Ltd. | 7,214,928 | 4,907,452 |
| WH Group Ltd. | 10,306,446 | 8,945,015 |
| Wharf Real Estate Investment Co., Ltd. | 2,192,113 | 10,865,649 |
| Wynn Macau Ltd. * | 1,947,294 | 2,193,330 |
| Xinyi Glass Holdings Ltd. | 2,725,190 | 11,458,108 |
| Yue Yuen Industrial Holdings Ltd. * | 1,012,388 | 2,054,104 |
| | | 801,270,415 |
| |
| Ireland 0.2% |
| AIB Group plc * | 1,061,494 | 3,201,517 |
| Glanbia plc | 250,574 | 4,469,386 |
| Kerry Group plc, A Shares | 203,155 | 29,784,923 |
| Kingspan Group plc | 199,979 | 22,846,380 |
| | | 60,302,206 |
| |
| Israel 0.5% |
| Airport City Ltd. * | 101,456 | 1,859,538 |
| Alony Hetz Properties & Investments Ltd. | 139,677 | 2,062,184 |
| Amot Investments Ltd. | 221,885 | 1,576,310 |
| Azrieli Group Ltd. | 49,156 | 4,599,912 |
| Bank Hapoalim B.M. | 1,582,188 | 13,625,460 |
| Bank Leumi Le-Israel | 1,952,593 | 16,150,984 |
| Bezeq The Israeli Telecommunication Corp., Ltd. * | 2,717,873 | 3,232,180 |
| Big Shopping Centers Ltd. * | 14,360 | 2,111,587 |
| Elbit Systems Ltd. | 32,600 | 4,746,906 |
| Electra Ltd. | 2,478 | 1,482,739 |
Schwab International Equity ETFs | Annual Report
Schwab International Equity ETF
Portfolio Holdings as of August 31, 2021 (continued)
| Security | Number
of Shares | Value ($) |
| Enlight Renewable Energy Ltd. * | 1,350,830 | 2,926,183 |
| First International Bank of Israel Ltd. | 77,851 | 2,816,366 |
| Gav-Yam Lands Corp., Ltd. | 147,913 | 1,665,305 |
| Harel Insurance Investments & Financial Services Ltd. | 163,149 | 1,604,118 |
| ICL Group Ltd. | 937,091 | 6,636,783 |
| Israel Discount Bank Ltd., A Shares * | 1,575,783 | 8,150,048 |
| Maytronics Ltd. | 68,717 | 1,577,569 |
| Melisron Ltd. * | 23,878 | 1,930,363 |
| Mivne Real Estate KD Ltd. | 1,007,421 | 3,411,789 |
| Mizrahi Tefahot Bank Ltd. | 189,351 | 6,306,282 |
| Nice Ltd. * | 83,711 | 24,451,581 |
| Nova Measuring Instruments Ltd. * | 37,256 | 3,743,334 |
| Paz Oil Co., Ltd. * | 13,265 | 1,336,955 |
| Shapir Engineering and Industry Ltd. | 157,856 | 1,260,877 |
| Shikun & Binui Ltd. * | 293,471 | 1,712,964 |
| Shufersal Ltd. | 167,402 | 1,382,585 |
| Strauss Group Ltd. | 73,262 | 2,120,053 |
| Teva Pharmaceutical Industries Ltd. * | 1,314,669 | 12,606,050 |
| The Phoenix Holdings Ltd. | 165,902 | 1,773,074 |
| Tower Semiconductor Ltd. * | 152,308 | 4,488,778 |
| | | 143,348,857 |
| |
| Italy 2.1% |
| A2A S.p.A. | 2,110,049 | 4,632,899 |
| Amplifon S.p.A. | 171,566 | 8,967,806 |
| Assicurazioni Generali S.p.A. | 1,688,147 | 34,415,174 |
| Atlantia S.p.A. * | 644,609 | 12,079,737 |
| Banca Mediolanum S.p.A. | 399,859 | 4,148,997 |
| Buzzi Unicem S.p.A. | 131,480 | 3,489,019 |
| CNH Industrial N.V. | 1,300,794 | 21,497,301 |
| Davide Campari-Milano N.V. | 639,085 | 8,834,112 |
| DiaSorin S.p.A. | 30,112 | 6,869,205 |
| Enel S.p.A. | 10,241,810 | 93,298,055 |
| Eni S.p.A. | 3,305,855 | 40,795,633 |
| EXOR N.V. | 134,121 | 11,177,608 |
| Ferrari N.V. | 160,834 | 34,876,620 |
| FinecoBank Banca Fineco S.p.A. * | 808,788 | 14,908,161 |
| Hera S.p.A. | 1,051,882 | 4,548,323 |
| Infrastrutture Wireless Italiane S.p.A. | 475,925 | 5,657,380 |
| Intesa Sanpaolo S.p.A. | 21,831,343 | 61,785,483 |
| Italgas S.p.A. | 680,042 | 4,506,668 |
| Leonardo S.p.A. * | 525,503 | 4,279,034 |
| Mediobanca Banca di Credito Finanziario S.p.A. * | 984,796 | 11,601,768 |
| Moncler S.p.A. | 287,104 | 18,369,017 |
| Nexi S.p.A. * | 573,192 | 11,939,033 |
| Pirelli & C S.p.A. | 606,707 | 3,633,932 |
| Poste Italiane S.p.A. | 588,377 | 7,976,899 |
| Prysmian S.p.A. | 347,582 | 13,076,355 |
| Recordati Industria Chimica e Farmaceutica S.p.A. | 129,037 | 8,462,991 |
| Snam S.p.A. | 2,951,975 | 17,437,224 |
| Stellantis N.V. | 2,666,408 | 53,294,481 |
| Telecom Italia S.p.A. | 14,856,692 | 6,722,152 |
| Tenaris S.A. | 632,280 | 6,371,053 |
| Terna S.p.A. | 1,851,199 | 14,632,412 |
| UniCredit S.p.A. | 2,862,926 | 35,714,971 |
| UnipolSai Assicurazioni S.p.A. | 566,608 | 1,629,324 |
| | | 591,628,827 |
| |
| Japan 21.1% |
| ABC-Mart, Inc. | 33,207 | 1,780,350 |
| Acom Co., Ltd. | 515,726 | 1,995,117 |
| Activia Properties, Inc. | 879 | 3,692,504 |
| Advance Residence Investment Corp. | 1,762 | 6,006,454 |
| Security | Number
of Shares | Value ($) |
| Advantest Corp. | 258,297 | 22,382,919 |
| Aeon Co., Ltd. | 928,938 | 24,686,278 |
| AEON Financial Service Co., Ltd. | 150,814 | 1,777,755 |
| Aeon Mall Co., Ltd. | 152,572 | 2,330,382 |
| AGC, Inc. | 245,353 | 11,881,285 |
| Aica Kogyo Co., Ltd. | 71,147 | 2,389,700 |
| Ain Holdings, Inc. | 35,572 | 2,405,789 |
| Air Water, Inc. | 245,371 | 3,962,208 |
| Aisin Corp. | 228,552 | 8,748,054 |
| Ajinomoto Co., Inc. | 643,473 | 19,000,787 |
| Alfresa Holdings Corp. | 228,576 | 3,622,345 |
| Alps Alpine Co., Ltd. | 259,494 | 2,725,797 |
| Amada Co., Ltd. | 421,347 | 4,280,204 |
| Amano Corp. | 93,983 | 2,390,210 |
| ANA Holdings, Inc. * | 206,128 | 4,888,645 |
| Anritsu Corp. (a) | 184,161 | 3,201,780 |
| Aozora Bank Ltd. | 157,576 | 3,702,018 |
| Ariake Japan Co., Ltd. | 25,686 | 1,456,616 |
| AS One Corp. | 15,892 | 2,365,139 |
| Asahi Group Holdings Ltd. | 553,297 | 25,756,061 |
| Asahi Intecc Co., Ltd. | 242,841 | 7,360,828 |
| Asahi Kasei Corp. | 1,632,990 | 16,885,824 |
| Asics Corp. | 222,240 | 4,723,561 |
| Astellas Pharma, Inc. | 2,456,997 | 41,531,435 |
| Azbil Corp. | 178,260 | 7,747,966 |
| Bandai Namco Holdings, Inc. | 257,711 | 17,924,356 |
| BayCurrent Consulting, Inc. | 17,762 | 8,843,814 |
| Benefit One, Inc. | 78,519 | 3,155,483 |
| Benesse Holdings, Inc. | 100,788 | 2,181,630 |
| Bic Camera, Inc. | 202,825 | 1,977,295 |
| Bridgestone Corp. | 765,241 | 35,273,807 |
| Brother Industries Ltd. | 315,173 | 6,477,887 |
| Calbee, Inc. | 99,240 | 2,462,482 |
| Canon Marketing Japan, Inc. | 66,797 | 1,527,952 |
| Canon, Inc. | 1,315,111 | 31,261,718 |
| Capcom Co., Ltd. | 237,459 | 6,635,710 |
| Casio Computer Co., Ltd. | 286,800 | 4,435,401 |
| Central Japan Railway Co. | 239,065 | 35,089,415 |
| Chubu Electric Power Co., Inc. | 937,759 | 11,344,272 |
| Chugai Pharmaceutical Co., Ltd. | 861,353 | 33,776,704 |
| Coca-Cola Bottlers Japan Holdings, Inc. | 193,012 | 2,695,070 |
| COMSYS Holdings Corp. | 144,606 | 3,893,542 |
| Concordia Financial Group Ltd. | 1,476,779 | 5,739,893 |
| Cosmo Energy Holdings Co., Ltd. | 82,814 | 1,649,345 |
| Cosmos Pharmaceutical Corp. | 22,571 | 4,002,213 |
| Credit Saison Co., Ltd. | 209,588 | 2,388,532 |
| CyberAgent, Inc. | 523,832 | 9,636,487 |
| Dai Nippon Printing Co., Ltd. | 364,892 | 8,688,854 |
| Dai-ichi Life Holdings, Inc. | 1,406,885 | 27,782,969 |
| Daicel Corp. | 373,026 | 3,008,384 |
| Daido Steel Co., Ltd. | 50,268 | 2,296,972 |
| Daifuku Co., Ltd. | 126,317 | 11,176,054 |
| Daiichi Sankyo Co., Ltd. | 2,482,287 | 59,074,635 |
| Daiichikosho Co., Ltd. | 51,905 | 1,757,570 |
| Daikin Industries Ltd. | 349,208 | 87,111,280 |
| Daio Paper Corp. | 112,815 | 2,117,463 |
| Daito Trust Construction Co., Ltd. | 86,207 | 9,479,160 |
| Daiwa House Industry Co., Ltd. | 838,113 | 25,602,651 |
| Daiwa House REIT Investment Corp. | 2,734 | 8,100,464 |
| Daiwa Office Investment Corp. | 345 | 2,487,165 |
| Daiwa Securities Group, Inc. | 2,008,677 | 11,381,772 |
| DeNA Co., Ltd. | 126,219 | 2,224,285 |
| Denka Co., Ltd. | 110,167 | 3,870,787 |
| Denso Corp. | 602,794 | 42,304,221 |
| Dentsu Group, Inc. | 294,269 | 10,928,614 |
| DIC Corp. | 113,381 | 3,266,438 |
| Disco Corp. | 36,739 | 10,718,050 |
| DMG Mori Co., Ltd. | 135,608 | 2,426,773 |
Schwab International Equity ETFs | Annual Report
Schwab International Equity ETF
Portfolio Holdings as of August 31, 2021 (continued)
| Security | Number
of Shares | Value ($) |
| Dowa Holdings Co., Ltd. | 63,930 | 2,810,685 |
| East Japan Railway Co. | 477,648 | 32,308,413 |
| Ebara Corp. | 128,545 | 6,412,039 |
| Eisai Co., Ltd. | 348,059 | 28,786,311 |
| Electric Power Development Co., Ltd. | 229,899 | 3,440,324 |
| ENEOS Holdings, Inc. | 3,975,374 | 15,418,777 |
| Ezaki Glico Co., Ltd. | 77,849 | 2,947,859 |
| Fancl Corp. | 89,736 | 3,042,660 |
| FANUC Corp. | 252,994 | 55,246,005 |
| Fast Retailing Co., Ltd. | 67,568 | 44,602,506 |
| Food & Life Cos. Ltd. | 135,810 | 5,847,272 |
| FP Corp. | 59,720 | 2,291,278 |
| Fuji Electric Co., Ltd. | 165,663 | 7,185,365 |
| Fuji Kyuko Co., Ltd. | 32,224 | 1,324,334 |
| Fuji Oil Holdings, Inc. | 61,752 | 1,396,812 |
| FUJIFILM Holdings Corp. | 466,135 | 38,475,443 |
| Fujitsu General Ltd. | 79,182 | 1,982,793 |
| Fujitsu Ltd. | 247,388 | 45,712,510 |
| Fukuoka Financial Group, Inc. | 219,464 | 4,061,263 |
| Fukuyama Transporting Co., Ltd. | 42,503 | 1,791,270 |
| Furukawa Electric Co., Ltd. | 85,885 | 1,849,662 |
| Fuyo General Lease Co., Ltd. | 25,926 | 1,793,534 |
| GLP J-REIT | 5,486 | 9,972,276 |
| GMO internet, Inc. | 74,750 | 1,951,420 |
| GMO Payment Gateway, Inc. | 52,607 | 6,929,030 |
| Goldwin, Inc. | 46,927 | 2,874,738 |
| GS Yuasa Corp. | 103,118 | 2,422,607 |
| H.U. Group Holdings, Inc. | 72,140 | 2,134,125 |
| Hakuhodo DY Holdings, Inc. | 327,482 | 5,159,943 |
| Hamamatsu Photonics K.K. | 172,144 | 10,059,753 |
| Hankyu Hanshin Holdings, Inc. | 293,166 | 8,792,845 |
| Haseko Corp. | 343,844 | 4,769,873 |
| Heiwa Corp. | 82,605 | 1,509,086 |
| Hikari Tsushin, Inc. | 30,014 | 5,264,607 |
| Hino Motors Ltd. | 354,315 | 3,073,568 |
| Hirogin Holdings, Inc. | 383,477 | 2,209,548 |
| Hirose Electric Co., Ltd. | 44,793 | 7,473,655 |
| Hisamitsu Pharmaceutical Co., Inc. | 95,910 | 3,850,019 |
| Hitachi Construction Machinery Co., Ltd. | 137,971 | 3,962,302 |
| Hitachi Ltd. | 1,219,802 | 67,563,218 |
| Hitachi Metals Ltd. * | 250,215 | 4,839,859 |
| Hitachi Transport System Ltd. | 43,450 | 1,821,293 |
| Hokuriku Electric Power Co. | 226,538 | 1,226,926 |
| Honda Motor Co., Ltd. | 2,254,623 | 68,586,838 |
| Horiba Ltd. | 54,373 | 3,895,098 |
| Hoshizaki Corp. | 69,664 | 6,550,420 |
| House Foods Group, Inc. | 97,017 | 3,117,331 |
| Hoya Corp. | 470,880 | 76,208,323 |
| Hulic Co., Ltd. | 498,725 | 5,856,137 |
| Ibiden Co., Ltd. | 140,473 | 7,595,209 |
| Idemitsu Kosan Co., Ltd. | 311,591 | 7,482,041 |
| IHI Corp. * | 185,490 | 4,129,879 |
| Iida Group Holdings Co., Ltd. | 184,777 | 4,702,681 |
| Industrial & Infrastructure Fund Investment Corp. | 2,419 | 4,870,588 |
| Inpex Corp. | 1,191,436 | 8,220,540 |
| IR Japan Holdings Ltd. | 11,481 | 1,375,295 |
| Isetan Mitsukoshi Holdings Ltd. | 454,797 | 3,055,163 |
| Isuzu Motors Ltd. | 694,546 | 8,800,364 |
| Ito En Ltd. | 75,172 | 4,762,399 |
| ITOCHU Corp. | 1,784,026 | 53,767,614 |
| Itochu Techno-Solutions Corp. | 131,271 | 4,068,612 |
| Iwatani Corp. | 67,629 | 3,742,803 |
| Izumi Co., Ltd. | 54,250 | 1,770,310 |
| J Front Retailing Co., Ltd. | 336,374 | 2,911,812 |
| Japan Airlines Co., Ltd. * | 192,797 | 4,108,299 |
| Japan Airport Terminal Co., Ltd. * | 68,967 | 3,138,859 |
| Japan Exchange Group, Inc. | 714,778 | 17,039,902 |
| Security | Number
of Shares | Value ($) |
| Japan Logistics Fund, Inc. | 1,103 | 3,544,138 |
| Japan Metropolitan Fund Invest | 9,018 | 8,775,025 |
| Japan Post Bank Co., Ltd. | 549,380 | 4,815,701 |
| Japan Post Holdings Co., Ltd. * | 1,748,175 | 15,026,412 |
| Japan Post Insurance Co., Ltd. | 237,052 | 4,304,740 |
| Japan Prime Realty Investment Corp. | 1,110 | 4,157,701 |
| Japan Real Estate Investment Corp. | 1,703 | 10,556,554 |
| Japan Tobacco, Inc. | 1,573,004 | 30,533,689 |
| JCR Pharmaceuticals Co., Ltd. | 73,392 | 1,937,346 |
| JFE Holdings, Inc. | 686,751 | 11,158,297 |
| JGC Holdings Corp. | 298,172 | 2,507,837 |
| JSR Corp. | 241,432 | 8,383,971 |
| JTEKT Corp. | 305,158 | 2,763,810 |
| Justsystems Corp. | 46,946 | 2,777,617 |
| K's Holdings Corp. | 223,132 | 2,447,425 |
| Kagome Co., Ltd. | 103,904 | 2,767,369 |
| Kajima Corp. | 608,676 | 7,884,088 |
| Kakaku.com, Inc. | 172,477 | 5,385,000 |
| Kaken Pharmaceutical Co., Ltd. | 44,992 | 2,035,411 |
| Kamigumi Co., Ltd. | 142,335 | 3,080,945 |
| Kaneka Corp. | 74,809 | 3,101,720 |
| Kansai Paint Co., Ltd. | 251,525 | 6,527,378 |
| Kao Corp. | 612,153 | 37,032,303 |
| Kawasaki Heavy Industries Ltd. * | 183,289 | 3,907,362 |
| KDDI Corp. | 2,218,757 | 68,061,270 |
| Keihan Holdings Co., Ltd. | 130,293 | 3,747,732 |
| Keikyu Corp. | 338,505 | 4,135,024 |
| Keio Corp. | 150,907 | 8,131,890 |
| Keisei Electric Railway Co., Ltd. | 185,176 | 5,705,632 |
| Kenedix Office Investment Corp. | 484 | 3,559,731 |
| Kewpie Corp. | 138,511 | 3,416,756 |
| Keyence Corp. | 237,640 | 143,046,907 |
| Kikkoman Corp. | 241,938 | 18,190,496 |
| Kinden Corp. | 179,100 | 3,037,168 |
| Kintetsu Group Holdings Co., Ltd. * | 235,248 | 8,051,452 |
| Kirin Holdings Co., Ltd. | 1,011,219 | 18,354,002 |
| Kobayashi Pharmaceutical Co., Ltd. | 81,766 | 6,408,204 |
| Kobe Bussan Co., Ltd. | 60,946 | 2,374,375 |
| Kobe Steel Ltd. | 421,713 | 2,687,048 |
| Koei Tecmo Holdings Co., Ltd. | 98,588 | 4,222,251 |
| Koito Manufacturing Co., Ltd. | 150,457 | 9,216,963 |
| Kokuyo Co., Ltd. | 122,349 | 2,143,836 |
| Komatsu Ltd. | 1,203,800 | 29,174,563 |
| Konami Holdings Corp. | 123,802 | 7,865,811 |
| Konica Minolta, Inc. | 619,823 | 3,153,842 |
| Kose Corp. | 38,115 | 4,614,323 |
| Kotobuki Spirits Co., Ltd. | 23,870 | 1,581,773 |
| Kubota Corp. | 1,432,670 | 29,661,459 |
| Kuraray Co., Ltd. | 463,184 | 4,363,694 |
| Kurita Water Industries Ltd. | 145,611 | 6,839,184 |
| Kusuri no Aoki Holdings Co., Ltd. | 21,556 | 1,516,729 |
| Kyocera Corp. | 403,526 | 25,145,995 |
| Kyoritsu Maintenance Co., Ltd. | 33,872 | 1,120,742 |
| Kyowa Exeo Corp. | 140,555 | 3,533,706 |
| Kyowa Kirin Co., Ltd. | 323,538 | 10,587,285 |
| Kyudenko Corp. | 52,681 | 1,896,535 |
| Kyushu Electric Power Co., Inc. | 617,432 | 4,720,944 |
| Kyushu Financial Group, Inc. | 516,634 | 2,008,035 |
| Kyushu Railway Co. | 212,340 | 4,814,664 |
| LaSalle Logiport REIT | 2,280 | 3,984,708 |
| Lasertec Corp. | 100,437 | 22,005,449 |
| Lawson, Inc. | 64,875 | 3,129,779 |
| Lintec Corp. | 66,364 | 1,505,966 |
| Lion Corp. | 335,142 | 5,713,826 |
| Lixil Corp. | 341,912 | 9,974,768 |
| M3, Inc. | 556,546 | 37,493,145 |
| Mabuchi Motor Co., Ltd. | 66,951 | 2,346,271 |
| Maeda Corp. | 167,864 | 1,239,193 |
Schwab International Equity ETFs | Annual Report
Schwab International Equity ETF
Portfolio Holdings as of August 31, 2021 (continued)
| Security | Number
of Shares | Value ($) |
| Makita Corp. | 323,298 | 18,598,611 |
| Mani, Inc. | 85,392 | 1,692,139 |
| Marubeni Corp. | 2,057,883 | 16,401,623 |
| Marui Group Co., Ltd. | 273,223 | 4,879,515 |
| Maruichi Steel Tube Ltd. | 85,833 | 2,114,183 |
| Matsumotokiyoshi Holdings Co., Ltd. | 101,726 | 4,722,398 |
| Mazda Motor Corp. * | 738,471 | 6,419,441 |
| Mebuki Financial Group, Inc. | 1,290,004 | 2,888,594 |
| Medipal Holdings Corp. | 193,402 | 3,702,206 |
| MEIJI Holdings Co., Ltd. | 177,111 | 10,898,146 |
| MINEBEA MITSUMI, Inc. | 541,938 | 13,975,153 |
| MISUMI Group, Inc. | 371,856 | 14,774,726 |
| Mitsubishi Chemical Holdings Corp. | 1,664,288 | 14,631,070 |
| Mitsubishi Corp. | 1,579,190 | 47,594,193 |
| Mitsubishi Electric Corp. | 2,603,676 | 35,680,268 |
| Mitsubishi Estate Co., Ltd. | 1,528,475 | 23,944,161 |
| Mitsubishi Gas Chemical Co., Inc. | 242,357 | 4,577,560 |
| Mitsubishi HC Capital, Inc. | 834,252 | 4,472,733 |
| Mitsubishi Heavy Industries Ltd. | 375,126 | 9,933,020 |
| Mitsubishi Logistics Corp. | 81,732 | 2,332,330 |
| Mitsubishi Materials Corp. | 171,665 | 3,525,180 |
| Mitsubishi Motors Corp. * | 842,753 | 2,155,594 |
| Mitsubishi UFJ Financial Group, Inc. | 16,362,827 | 88,531,443 |
| Mitsui & Co., Ltd. | 2,127,437 | 47,037,543 |
| Mitsui Chemicals, Inc. | 228,670 | 7,909,576 |
| Mitsui Fudosan Co., Ltd. | 1,208,468 | 27,764,184 |
| Mitsui Fudosan Logistics Park, Inc. | 636 | 3,774,549 |
| Mitsui Mining & Smelting Co., Ltd. | 73,429 | 2,232,413 |
| Mitsui OSK Lines Ltd. | 143,574 | 11,108,493 |
| Miura Co., Ltd. | 130,421 | 5,864,553 |
| Mizuho Financial Group, Inc. | 3,342,864 | 46,951,021 |
| MonotaRO Co., Ltd. | 309,395 | 6,851,976 |
| Mori Hills REIT Investment Corp. | 2,020 | 2,932,733 |
| Morinaga & Co., Ltd. | 53,998 | 1,897,254 |
| Morinaga Milk Industry Co., Ltd. | 55,365 | 3,497,480 |
| MS&AD Insurance Group Holdings, Inc. | 625,299 | 20,234,279 |
| Murata Manufacturing Co., Ltd. | 751,993 | 62,419,663 |
| Nabtesco Corp. | 155,806 | 6,183,453 |
| Nagase & Co., Ltd. | 147,467 | 2,436,306 |
| Nagoya Railroad Co., Ltd. | 258,531 | 4,553,591 |
| Nankai Electric Railway Co., Ltd. | 141,669 | 3,047,186 |
| NEC Corp. | 346,912 | 18,251,878 |
| NEC Networks & System Integration Corp. | 85,952 | 1,642,211 |
| NET One Systems Co., Ltd. | 113,949 | 3,619,898 |
| Nexon Co., Ltd. | 544,866 | 9,968,875 |
| NGK Insulators Ltd. | 340,487 | 5,656,188 |
| NGK Spark Plug Co., Ltd. | 254,925 | 3,926,207 |
| NH Foods Ltd. | 128,945 | 5,005,920 |
| NHK Spring Co., Ltd. | 220,077 | 1,582,567 |
| Nichirei Corp. | 138,676 | 3,539,482 |
| Nidec Corp. | 610,987 | 70,186,200 |
| Nifco, Inc. | 112,025 | 3,543,481 |
| Nihon Kohden Corp. | 102,285 | 3,440,225 |
| Nihon M&A Center, Inc. | 342,178 | 10,247,275 |
| Nihon Unisys Ltd. | 81,094 | 2,210,782 |
| Nikon Corp. | 435,171 | 4,590,963 |
| Nintendo Co., Ltd. | 141,659 | 68,211,916 |
| Nippo Corp. | 73,760 | 2,171,979 |
| Nippon Accommodations Fund, Inc. | 588 | 3,537,848 |
| Nippon Building Fund, Inc. | 1,988 | 12,938,467 |
| Nippon Electric Glass Co., Ltd. | 106,366 | 2,275,260 |
| Nippon Express Co., Ltd. | 90,940 | 6,200,078 |
| Nippon Kayaku Co., Ltd. | 226,725 | 2,513,663 |
| Nippon Paint Holdings Co., Ltd. | 1,047,962 | 13,058,984 |
| Nippon Paper Industries Co., Ltd. | 132,213 | 1,473,045 |
| Nippon Prologis REIT, Inc. | 2,990 | 10,791,325 |
| Nippon Sanso Holdings Corp. | 187,986 | 4,568,748 |
| Security | Number
of Shares | Value ($) |
| Nippon Shinyaku Co., Ltd. | 66,937 | 5,440,992 |
| Nippon Shokubai Co., Ltd. | 43,358 | 2,300,902 |
| Nippon Steel Corp. | 1,069,574 | 21,886,058 |
| Nippon Telegraph & Telephone Corp. | 1,589,278 | 42,473,332 |
| Nippon Yusen K.K. | 213,937 | 17,273,086 |
| Nipro Corp. | 159,014 | 1,854,150 |
| Nishi-Nippon Railroad Co., Ltd. | 95,643 | 2,367,134 |
| Nissan Chemical Corp. | 175,581 | 9,861,048 |
| Nissan Motor Co., Ltd. * | 2,565,096 | 13,507,264 |
| Nisshin Seifun Group, Inc. | 342,186 | 5,619,002 |
| Nissin Foods Holdings Co., Ltd. | 92,189 | 7,183,123 |
| Nitori Holdings Co., Ltd. | 97,609 | 18,285,028 |
| Nitto Denko Corp. | 193,715 | 14,741,101 |
| NOF Corp. | 89,850 | 4,980,762 |
| NOK Corp. | 159,677 | 1,959,263 |
| Nomura Holdings, Inc. | 3,988,625 | 19,373,114 |
| Nomura Real Estate Holdings, Inc. | 150,841 | 3,865,077 |
| Nomura Real Estate Master Fund, Inc. | 5,809 | 8,973,123 |
| Nomura Research Institute Ltd. | 341,677 | 12,860,317 |
| NS Solutions Corp. | 47,454 | 1,611,173 |
| NSK Ltd. | 571,080 | 4,013,051 |
| NTT Data Corp. | 835,048 | 15,057,620 |
| Obayashi Corp. | 888,751 | 7,329,405 |
| Obic Co., Ltd. | 88,117 | 16,803,670 |
| Odakyu Electric Railway Co., Ltd. | 405,663 | 9,467,686 |
| Oji Holdings Corp. | 1,135,105 | 5,951,397 |
| OKUMA Corp. | 42,946 | 2,060,126 |
| Olympus Corp. | 1,398,384 | 29,422,580 |
| Omron Corp. | 245,391 | 23,185,496 |
| Ono Pharmaceutical Co., Ltd. | 569,985 | 13,717,826 |
| Open House Co., Ltd. | 99,570 | 4,857,957 |
| Oracle Corp. Japan | 43,472 | 3,577,161 |
| Oriental Land Co., Ltd. | 248,770 | 37,725,361 |
| ORIX Corp. | 1,613,988 | 30,139,235 |
| Orix JREIT, Inc. | 3,580 | 6,390,297 |
| Osaka Gas Co., Ltd. | 532,267 | 9,995,147 |
| OSG Corp. | 108,245 | 1,947,937 |
| Otsuka Corp. | 134,244 | 6,965,145 |
| Otsuka Holdings Co., Ltd. | 554,445 | 23,624,222 |
| PALTAC Corp. | 40,477 | 1,764,836 |
| Pan Pacific International Holdings Corp. | 667,502 | 12,741,231 |
| Panasonic Corp. | 2,795,321 | 33,383,043 |
| Park24 Co., Ltd. * | 143,664 | 2,776,249 |
| Penta-Ocean Construction Co., Ltd. | 386,958 | 2,462,076 |
| PeptiDream, Inc. * | 118,064 | 4,169,746 |
| Persol Holdings Co., Ltd. | 215,257 | 5,039,514 |
| Pigeon Corp. | 146,169 | 4,237,650 |
| Pola Orbis Holdings, Inc. | 100,133 | 2,191,150 |
| Rakuten Group, Inc. | 1,087,552 | 11,404,150 |
| Recruit Holdings Co., Ltd. | 1,762,743 | 104,294,825 |
| Relo Group, Inc. | 137,300 | 3,081,939 |
| Renesas Electronics Corp. * | 1,326,890 | 14,360,752 |
| Rengo Co., Ltd. | 294,673 | 2,405,987 |
| RENOVA, Inc. * | 58,648 | 2,212,780 |
| Resona Holdings, Inc. | 2,970,464 | 11,510,345 |
| Resorttrust, Inc. | 83,146 | 1,440,259 |
| Ricoh Co., Ltd. | 889,581 | 9,069,094 |
| Rinnai Corp. | 48,387 | 5,210,433 |
| Rohm Co., Ltd. | 107,871 | 10,427,726 |
| Rohto Pharmaceutical Co., Ltd. | 127,703 | 4,021,959 |
| Ryohin Keikaku Co., Ltd. | 307,970 | 6,610,170 |
| Sankyo Co., Ltd. | 64,790 | 1,652,481 |
| Sankyu, Inc. | 64,286 | 3,001,886 |
| Santen Pharmaceutical Co., Ltd. | 482,577 | 7,203,953 |
| Sanwa Holdings Corp. | 272,859 | 3,631,166 |
| Sapporo Holdings Ltd. | 87,019 | 1,878,837 |
| Sawai Group Holdings Co., Ltd. | 51,672 | 2,339,962 |
| SBI Holdings, Inc. | 320,157 | 7,780,987 |
Schwab International Equity ETFs | Annual Report
Schwab International Equity ETF
Portfolio Holdings as of August 31, 2021 (continued)
| Security | Number
of Shares | Value ($) |
| SCREEN Holdings Co., Ltd. | 51,009 | 4,383,078 |
| SCSK Corp. | 58,035 | 3,671,430 |
| Secom Co., Ltd. | 257,604 | 19,567,680 |
| Sega Sammy Holdings, Inc. | 262,142 | 3,545,813 |
| Seibu Holdings, Inc. * | 267,013 | 3,222,822 |
| Seiko Epson Corp. | 366,276 | 6,834,751 |
| Seino Holdings Co., Ltd. | 181,788 | 2,245,461 |
| Sekisui Chemical Co., Ltd. | 458,343 | 7,860,169 |
| Sekisui House Ltd. | 741,602 | 14,803,688 |
| Sekisui House Reit, Inc. | 5,139 | 4,397,105 |
| Seven & i Holdings Co., Ltd. | 1,016,601 | 44,556,106 |
| Seven Bank Ltd. | 893,811 | 2,042,113 |
| SG Holdings Co., Ltd. | 566,428 | 15,426,475 |
| Sharp Corp. | 263,507 | 3,485,124 |
| Shikoku Electric Power Co., Inc. | 208,154 | 1,460,830 |
| Shimadzu Corp. | 359,026 | 16,127,738 |
| Shimamura Co., Ltd. | 30,130 | 2,660,304 |
| Shimano, Inc. | 103,442 | 30,413,040 |
| Shimizu Corp. | 731,806 | 5,262,395 |
| Shin-Etsu Chemical Co., Ltd. | 523,344 | 86,723,808 |
| Shinko Electric Industries Co., Ltd. | 89,072 | 3,003,930 |
| Shinsei Bank Ltd. | 237,036 | 2,945,150 |
| Shionogi & Co., Ltd. | 362,463 | 22,936,854 |
| Ship Healthcare Holdings, Inc. | 105,140 | 2,677,787 |
| Shiseido Co., Ltd. | 514,131 | 34,130,324 |
| SHO-BOND Holdings Co., Ltd. | 68,743 | 3,094,248 |
| Shochiku Co., Ltd. * | 12,393 | 1,334,509 |
| Showa Denko K.K. | 195,328 | 4,350,697 |
| Skylark Holdings Co., Ltd. *(a) | 290,442 | 4,174,476 |
| SMC Corp. | 74,806 | 48,011,752 |
| SMS Co., Ltd. | 69,490 | 2,463,713 |
| Softbank Corp. | 3,591,869 | 48,176,033 |
| SoftBank Group Corp. | 1,794,227 | 100,947,725 |
| Sohgo Security Services Co., Ltd. | 86,214 | 3,912,041 |
| Sojitz Corp. | 1,658,869 | 4,877,250 |
| Sompo Holdings, Inc. | 439,741 | 19,325,228 |
| Sony Group Corp. | 1,636,767 | 169,248,800 |
| Sotetsu Holdings, Inc. | 101,134 | 2,034,463 |
| Square Enix Holdings Co., Ltd. | 99,856 | 5,826,297 |
| Stanley Electric Co., Ltd. | 188,392 | 4,712,372 |
| Subaru Corp. | 798,386 | 14,799,864 |
| Sugi Holdings Co., Ltd. | 45,339 | 3,507,933 |
| SUMCO Corp. | 299,238 | 6,327,416 |
| Sumitomo Bakelite Co., Ltd. | 43,170 | 1,866,535 |
| Sumitomo Chemical Co., Ltd. | 2,020,507 | 10,262,542 |
| Sumitomo Corp. | 1,477,034 | 20,899,776 |
| Sumitomo Dainippon Pharma Co., Ltd. | 230,733 | 4,141,685 |
| Sumitomo Electric Industries Ltd. | 985,294 | 13,188,375 |
| Sumitomo Forestry Co., Ltd. | 184,823 | 3,620,418 |
| Sumitomo Heavy Industries Ltd. | 149,594 | 3,921,634 |
| Sumitomo Metal Mining Co., Ltd. | 308,845 | 11,874,761 |
| Sumitomo Mitsui Financial Group, Inc. | 1,712,691 | 59,256,677 |
| Sumitomo Mitsui Trust Holdings, Inc. | 480,377 | 15,732,718 |
| Sumitomo Realty & Development Co., Ltd. | 524,571 | 16,960,460 |
| Sumitomo Rubber Industries Ltd. | 226,115 | 2,714,780 |
| Sundrug Co., Ltd. | 87,492 | 2,910,825 |
| Suntory Beverage & Food Ltd. | 166,366 | 6,670,692 |
| Suzuken Co., Ltd. | 102,044 | 3,037,356 |
| Suzuki Motor Corp. | 596,077 | 25,805,045 |
| Sysmex Corp. | 250,770 | 28,578,558 |
| T&D Holdings, Inc. | 718,353 | 8,729,303 |
| Taiheiyo Cement Corp. | 162,939 | 3,740,508 |
| Taisei Corp. | 215,773 | 6,766,230 |
| Taisho Pharmaceutical Holdings Co., Ltd. | 57,178 | 3,341,369 |
| Taiyo Yuden Co., Ltd. | 166,659 | 9,466,158 |
| Takara Bio, Inc. | 74,764 | 2,167,516 |
| Takara Holdings, Inc. | 236,163 | 3,063,283 |
| Security | Number
of Shares | Value ($) |
| Takashimaya Co., Ltd. | 181,705 | 1,819,366 |
| Takeda Pharmaceutical Co., Ltd. | 2,025,040 | 67,814,693 |
| TDK Corp. | 158,250 | 16,666,234 |
| TechnoPro Holdings, Inc. | 143,552 | 3,856,016 |
| Teijin Ltd. | 239,097 | 3,445,208 |
| Terumo Corp. | 867,738 | 36,309,772 |
| The Bank of Kyoto Ltd. | 94,145 | 4,173,367 |
| The Chiba Bank Ltd. | 804,161 | 5,028,751 |
| The Chugoku Bank Ltd. | 243,714 | 1,967,725 |
| The Chugoku Electric Power Co., Inc. | 400,214 | 3,737,662 |
| The Gunma Bank Ltd. | 612,271 | 1,978,484 |
| The Hachijuni Bank Ltd. | 596,480 | 2,057,764 |
| The Iyo Bank Ltd. | 369,248 | 1,979,675 |
| The Kansai Electric Power Co., Inc. | 974,146 | 9,798,210 |
| The Shizuoka Bank Ltd. | 662,081 | 5,194,919 |
| The Yokohama Rubber Co., Ltd. | 137,633 | 2,351,512 |
| THK Co., Ltd. | 147,107 | 3,418,571 |
| TIS, Inc. | 316,958 | 8,972,687 |
| Tobu Railway Co., Ltd. | 272,880 | 7,131,244 |
| Toda Corp. | 329,383 | 2,410,558 |
| Toho Co., Ltd. | 151,266 | 6,554,034 |
| Toho Gas Co., Ltd. | 120,516 | 5,627,590 |
| Tohoku Electric Power Co., Inc. | 624,438 | 4,785,880 |
| Tokai Carbon Co., Ltd. | 251,747 | 3,345,627 |
| Tokio Marine Holdings, Inc. | 849,697 | 41,587,664 |
| Tokuyama Corp. | 92,945 | 1,861,269 |
| Tokyo Century Corp. | 81,106 | 4,643,699 |
| Tokyo Electric Power Co. Holdings, Inc. * | 2,102,684 | 5,531,364 |
| Tokyo Electron Ltd. | 194,799 | 83,763,925 |
| Tokyo Gas Co., Ltd. | 553,304 | 10,657,121 |
| Tokyo Ohka Kogyo Co., Ltd. | 49,772 | 3,130,571 |
| Tokyo Tatemono Co., Ltd. | 258,310 | 3,961,882 |
| Tokyu Corp. | 664,447 | 9,162,909 |
| Tokyu Fudosan Holdings Corp. | 803,678 | 4,659,957 |
| Toppan Printing Co., Ltd. | 376,783 | 6,482,067 |
| Toray Industries, Inc. | 1,991,069 | 13,444,156 |
| Toshiba Corp. | 579,637 | 25,193,580 |
| Toshiba TEC Corp. | 31,840 | 1,365,068 |
| Tosoh Corp. | 365,870 | 6,653,998 |
| TOTO Ltd. | 190,164 | 10,368,490 |
| Toyo Seikan Group Holdings Ltd. | 208,001 | 2,900,578 |
| Toyo Suisan Kaisha Ltd. | 117,036 | 4,852,530 |
| Toyo Tire Corp. | 131,618 | 2,343,390 |
| Toyoda Gosei Co., Ltd. | 101,040 | 2,152,135 |
| Toyota Boshoku Corp. | 82,801 | 1,560,904 |
| Toyota Industries Corp. | 209,206 | 17,690,913 |
| Toyota Motor Corp. | 3,251,739 | 283,912,985 |
| Toyota Tsusho Corp. | 293,743 | 13,008,007 |
| Trend Micro, Inc. | 161,049 | 8,839,664 |
| TS Tech Co., Ltd. | 142,354 | 1,932,003 |
| Tsumura & Co. | 93,922 | 3,235,889 |
| Tsuruha Holdings, Inc. | 49,860 | 6,285,827 |
| Ube Industries Ltd. | 137,478 | 2,776,840 |
| Ulvac, Inc. | 65,784 | 3,556,863 |
| Unicharm Corp. | 536,411 | 23,944,653 |
| United Urban Investment Corp. | 3,800 | 5,382,123 |
| Ushio, Inc. | 156,510 | 2,833,592 |
| USS Co., Ltd. | 278,005 | 4,608,111 |
| Welcia Holdings Co., Ltd. | 131,844 | 4,662,424 |
| West Japan Railway Co. | 241,188 | 13,207,601 |
| Yakult Honsha Co., Ltd. | 177,312 | 10,232,642 |
| Yamada Holdings Co., Ltd. | 974,742 | 4,196,732 |
| Yamaguchi Financial Group, Inc. | 308,923 | 1,805,285 |
| Yamaha Corp. | 208,962 | 12,344,469 |
| Yamaha Motor Co., Ltd. | 366,447 | 9,339,629 |
| Yamato Holdings Co., Ltd. | 446,481 | 11,379,454 |
| Yamato Kogyo Co., Ltd. | 44,059 | 1,668,355 |
| Yamazaki Baking Co., Ltd. | 161,167 | 2,647,974 |
Schwab International Equity ETFs | Annual Report
Schwab International Equity ETF
Portfolio Holdings as of August 31, 2021 (continued)
| Security | Number
of Shares | Value ($) |
| Yaoko Co., Ltd. | 29,479 | 1,918,577 |
| Yaskawa Electric Corp. | 343,110 | 16,802,583 |
| Yokogawa Electric Corp. | 313,635 | 4,918,925 |
| Z Holdings Corp. | 3,529,911 | 23,037,923 |
| Zenkoku Hosho Co., Ltd. | 71,142 | 3,393,265 |
| Zensho Holdings Co., Ltd. | 129,304 | 3,207,295 |
| Zeon Corp. | 193,924 | 2,577,180 |
| ZOZO, Inc. | 152,587 | 5,826,529 |
| | | 5,979,443,541 |
| |
| Netherlands 4.2% |
| Aalberts N.V. | 129,054 | 8,058,877 |
| ABN AMRO Bank N.V. * | 571,081 | 7,969,591 |
| Adyen N.V. * | 38,106 | 123,003,839 |
| Aegon N.V. | 2,325,525 | 11,513,220 |
| Akzo Nobel N.V. | 252,355 | 31,099,957 |
| ArcelorMittal S.A. | 923,315 | 30,948,467 |
| ASM International N.V. | 62,849 | 24,378,855 |
| ASML Holding N.V. | 522,998 | 434,939,049 |
| ASR Nederland N.V. | 180,064 | 8,230,185 |
| Galapagos N.V. * | 64,172 | 3,811,073 |
| GrandVision N.V. * | 64,236 | 2,149,705 |
| Heineken Holding N.V. | 138,735 | 12,855,917 |
| Heineken N.V. | 315,316 | 34,504,292 |
| IMCD N.V. | 74,196 | 14,613,494 |
| ING Groep N.V. | 5,153,072 | 71,170,407 |
| InPost S.A. * | 269,508 | 5,249,319 |
| JDE Peet's N.V. | 116,157 | 3,990,118 |
| Koninklijke Ahold Delhaize N.V. | 1,309,599 | 44,166,801 |
| Koninklijke DSM N.V. | 218,423 | 46,475,173 |
| Koninklijke KPN N.V. | 4,332,729 | 13,880,936 |
| Koninklijke Philips N.V. | 1,198,702 | 55,241,875 |
| Koninklijke Vopak N.V. | 87,464 | 3,786,061 |
| NN Group N.V. | 389,912 | 20,238,133 |
| Prosus N.V. * | 1,163,804 | 102,898,499 |
| Randstad N.V. | 145,857 | 10,726,615 |
| Signify N.V. | 167,324 | 9,366,281 |
| Unibail-Rodamco-Westfield * | 179,285 | 15,703,456 |
| Wolters Kluwer N.V. | 343,672 | 39,522,067 |
| | | 1,190,492,262 |
| |
| New Zealand 0.3% |
| Auckland International Airport Ltd. * | 1,606,521 | 8,152,708 |
| Contact Energy Ltd. | 1,052,239 | 6,036,041 |
| Fisher & Paykel Healthcare Corp., Ltd. | 748,764 | 17,444,284 |
| Fletcher Building Ltd. | 1,083,290 | 5,710,929 |
| Infratil Ltd. | 667,075 | 3,509,668 |
| Kiwi Property Group Ltd. | 2,009,634 | 1,640,798 |
| Mercury NZ Ltd. | 931,359 | 4,359,322 |
| Meridian Energy Ltd. | 1,621,099 | 5,990,306 |
| Ryman Healthcare Ltd. | 563,236 | 6,136,794 |
| SKYCITY Entertainment Group Ltd. * | 1,086,247 | 2,492,450 |
| Spark New Zealand Ltd. | 2,467,499 | 8,466,654 |
| The a2 Milk Co., Ltd. * | 979,152 | 4,155,733 |
| | | 74,095,687 |
| |
| Norway 0.6% |
| Adevinta A.S.A., Class B * | 320,973 | 6,452,386 |
| Aker A.S.A., A Shares | 32,953 | 2,377,214 |
| Aker BP A.S.A. | 139,556 | 3,639,051 |
| DNB Bank A.S.A. | 1,352,558 | 28,526,096 |
| Equinor A.S.A. | 1,272,762 | 27,009,833 |
| Gjensidige Forsikring A.S.A. | 221,422 | 5,170,969 |
| Leroy Seafood Group A.S.A. | 329,258 | 2,903,254 |
| Mowi A.S.A. | 568,156 | 15,200,254 |
| Security | Number
of Shares | Value ($) |
| Norsk Hydro A.S.A. | 1,724,970 | 11,892,997 |
| Orkla A.S.A. | 1,004,038 | 8,959,280 |
| Salmar A.S.A. | 67,858 | 4,542,912 |
| Scatec A.S.A. | 157,054 | 3,243,788 |
| Schibsted A.S.A., A Shares | 104,353 | 5,562,073 |
| Schibsted A.S.A., B Shares | 127,399 | 5,921,145 |
| Telenor A.S.A. | 833,281 | 14,583,028 |
| Tomra Systems A.S.A. | 156,986 | 9,636,984 |
| Yara International A.S.A. | 229,046 | 11,487,359 |
| | | 167,108,623 |
| |
| Poland 0.3% |
| Allegro.eu S.A. * | 510,407 | 9,466,152 |
| Bank Polska Kasa Opieki S.A. * | 213,280 | 5,971,484 |
| CD Projekt S.A. | 84,181 | 3,722,714 |
| Cyfrowy Polsat S.A. | 359,268 | 3,430,536 |
| Dino Polska S.A. * | 61,601 | 5,222,442 |
| KGHM Polska Miedz S.A. | 180,122 | 8,387,942 |
| LPP S.A. | 1,489 | 5,428,970 |
| Polski Koncern Naftowy Orlen S.A. | 398,536 | 7,733,813 |
| Polskie Gornictwo Naftowe i Gazownictwo S.A. | 2,308,887 | 3,799,098 |
| Powszechna Kasa Oszczednosci Bank Polski S.A. * | 1,134,925 | 12,464,374 |
| Powszechny Zaklad Ubezpieczen S.A. * | 752,642 | 7,980,899 |
| Santander Bank Polska S.A. * | 38,080 | 3,003,594 |
| | | 76,612,018 |
| |
| Portugal 0.1% |
| Banco Espirito Santo S.A. *(b) | 505,213 | — |
| EDP - Energias de Portugal S.A. | 3,752,723 | 20,607,893 |
| EDP Renovaveis S.A. | 319,320 | 8,488,713 |
| Galp Energia, SGPS, S.A. | 668,318 | 6,843,054 |
| Jeronimo Martins, SGPS, S.A. | 309,711 | 6,562,487 |
| | | 42,502,147 |
| |
| Republic of Korea 4.7% |
| Alteogen, Inc. * | 39,378 | 2,886,826 |
| Amorepacific Corp. | 41,219 | 8,087,733 |
| AMOREPACIFIC Group | 38,307 | 1,909,651 |
| BGF retail Co., Ltd. | 8,242 | 1,268,875 |
| BNK Financial Group, Inc. | 369,280 | 2,471,528 |
| Celltrion Healthcare Co., Ltd. * | 97,751 | 10,428,909 |
| Celltrion Pharm, Inc. * | 25,631 | 3,822,157 |
| Celltrion, Inc. * | 136,986 | 34,617,187 |
| Cheil Worldwide, Inc. | 100,679 | 2,005,852 |
| CJ CheilJedang Corp. | 11,023 | 4,311,467 |
| CJ Corp. | 17,091 | 1,496,172 |
| CJ ENM Co., Ltd. | 14,244 | 1,880,854 |
| CJ Logistics Corp. * | 12,531 | 1,848,118 |
| Coway Co., Ltd. | 71,706 | 4,836,266 |
| Daewoo Engineering & Construction Co., Ltd. * | 229,779 | 1,456,618 |
| Daewoo Shipbuilding & Marine Engineering Co., Ltd. * | 58,894 | 1,424,793 |
| DB Insurance Co., Ltd. | 63,562 | 3,217,982 |
| DGB Financial Group, Inc. | 212,749 | 1,669,771 |
| DL E&C Co., Ltd. * | 21,455 | 2,609,129 |
| DL Holdings Co., Ltd. | 20,200 | 1,259,614 |
| Dongsuh Cos., Inc. | 43,128 | 1,074,992 |
| Doosan Bobcat, Inc. * | 33,999 | 1,271,169 |
| Doosan Heavy Industries & Construction Co., Ltd. * | 374,480 | 6,750,297 |
| Doosan Infracore Co., Ltd. * | 50,883 | 517,848 |
Schwab International Equity ETFs | Annual Report
Schwab International Equity ETF
Portfolio Holdings as of August 31, 2021 (continued)
| Security | Number
of Shares | Value ($) |
| E-MART, Inc. | 26,825 | 4,141,339 |
| Fila Holdings Corp. | 67,204 | 2,602,492 |
| Green Cross Corp. | 6,856 | 2,276,562 |
| GS Engineering & Construction Corp. | 81,739 | 3,154,789 |
| GS Holdings Corp. | 62,921 | 2,306,389 |
| GS Retail Co., Ltd. | 61,985 | 1,833,702 |
| Hana Financial Group, Inc. | 381,601 | 14,826,965 |
| Hanjin Kal Corp. * | 28,170 | 1,601,107 |
| Hankook Tire & Technology Co., Ltd. | 94,808 | 3,810,473 |
| Hanmi Pharm Co., Ltd. | 12,000 | 3,198,068 |
| Hanon Systems | 203,096 | 2,881,478 |
| Hanssem Co., Ltd. | 12,775 | 1,278,106 |
| Hanwha Aerospace Co., Ltd. | 46,950 | 2,061,111 |
| Hanwha Corp. | 70,394 | 2,112,822 |
| Hanwha Life Insurance Co., Ltd. | 364,447 | 1,048,282 |
| Hanwha Solutions Corp. * | 124,010 | 4,358,452 |
| HDC Hyundai Development Co-Engineering & Construction | 92,401 | 2,382,845 |
| Helixmith Co., Ltd. * | 37,859 | 857,129 |
| Hite Jinro Co., Ltd. | 39,285 | 1,129,980 |
| HLB, Inc. * | 116,310 | 5,567,472 |
| HMM Co., Ltd. * | 369,730 | 13,393,126 |
| Hotel Shilla Co., Ltd. | 39,629 | 3,069,286 |
| HYBE Co., Ltd. * | 21,664 | 5,409,227 |
| Hyundai Department Store Co., Ltd. | 20,111 | 1,401,500 |
| Hyundai Engineering & Construction Co., Ltd. | 92,517 | 4,428,560 |
| Hyundai Glovis Co., Ltd. | 27,935 | 4,674,104 |
| Hyundai Heavy Industries Holdings Co., Ltd. | 67,370 | 3,794,265 |
| Hyundai Marine & Fire Insurance Co., Ltd. | 81,377 | 1,796,758 |
| Hyundai Mipo Dockyard Co., Ltd. * | 26,462 | 1,741,387 |
| Hyundai Mobis Co., Ltd. | 88,869 | 21,269,695 |
| Hyundai Motor Co. | 184,163 | 33,752,760 |
| Hyundai Steel Co. | 103,407 | 4,548,499 |
| Hyundai Wia Corp. | 20,700 | 1,633,576 |
| Industrial Bank of Korea | 328,655 | 2,919,614 |
| Kakao Corp. | 358,944 | 47,985,096 |
| Kangwon Land, Inc. * | 149,256 | 3,565,821 |
| KB Financial Group, Inc. | 507,690 | 23,163,397 |
| KCC Corp. | 5,525 | 1,715,469 |
| Kia Corp. | 342,741 | 25,156,116 |
| Korea Aerospace Industries Ltd. | 85,241 | 2,415,082 |
| Korea Electric Power Corp. | 334,407 | 6,922,047 |
| Korea Gas Corp. * | 35,537 | 1,109,526 |
| Korea Investment Holdings Co., Ltd. | 50,210 | 4,126,968 |
| Korea Shipbuilding & Offshore Engineering Co., Ltd. * | 55,994 | 5,722,790 |
| Korea Zinc Co., Ltd. | 12,722 | 5,837,340 |
| Korean Air Lines Co., Ltd. * | 225,637 | 6,091,197 |
| KT&G Corp. | 146,448 | 10,306,746 |
| Kumho Petrochemical Co., Ltd. | 23,747 | 3,983,606 |
| LG Chem Ltd. | 60,525 | 39,568,718 |
| LG Corp. | 109,937 | 9,036,178 |
| LG Display Co., Ltd. * | 317,435 | 5,612,504 |
| LG Electronics, Inc. | 139,318 | 17,062,535 |
| LG Household & Health Care Ltd. | 11,504 | 14,495,963 |
| LG Innotek Co., Ltd. | 17,793 | 3,299,405 |
| LG Uplus Corp. | 272,530 | 3,302,468 |
| Lotte Chemical Corp. | 21,188 | 4,568,545 |
| Lotte Corp. | 38,810 | 1,188,283 |
| LOTTE Fine Chemical Co., Ltd. | 27,594 | 1,668,325 |
| Lotte Shopping Co., Ltd. | 14,337 | 1,329,275 |
| LS Corp. | 27,644 | 1,587,900 |
| Mando Corp. * | 44,889 | 2,350,047 |
| Mirae Asset Securities Co., Ltd. | 555,092 | 4,222,615 |
| Security | Number
of Shares | Value ($) |
| NAVER Corp. | 177,502 | 67,207,191 |
| NCSoft Corp. | 22,304 | 12,696,227 |
| Netmarble Corp. | 21,988 | 2,446,377 |
| NH Investment & Securities Co., Ltd. | 169,764 | 1,940,034 |
| NongShim Co., Ltd. | 5,538 | 1,425,756 |
| OCI Co., Ltd. * | 24,141 | 2,644,277 |
| Orion Corp. | 28,942 | 3,157,672 |
| POSCO | 84,467 | 24,550,760 |
| POSCO Chemical Co., Ltd. | 36,942 | 4,954,488 |
| Posco International Corp. | 66,741 | 1,309,550 |
| S-1 Corp. | 24,571 | 1,739,859 |
| S-Oil Corp. | 55,133 | 4,522,100 |
| Samsung Biologics Co., Ltd. * | 17,334 | 14,426,935 |
| Samsung C&T Corp. | 111,084 | 12,742,397 |
| Samsung Card Co., Ltd. | 43,854 | 1,289,768 |
| Samsung Electro-Mechanics Co., Ltd. | 73,492 | 11,694,574 |
| Samsung Electronics Co., Ltd. | 6,218,732 | 411,381,900 |
| Samsung Engineering Co., Ltd. * | 197,491 | 3,806,912 |
| Samsung Fire & Marine Insurance Co., Ltd. | 45,753 | 8,918,175 |
| Samsung Heavy Industries Co., Ltd. * | 552,571 | 3,002,456 |
| Samsung Life Insurance Co., Ltd. | 83,375 | 5,357,228 |
| Samsung SDI Co., Ltd. | 69,731 | 47,692,167 |
| Samsung SDS Co., Ltd. | 42,176 | 6,274,837 |
| Samsung Securities Co., Ltd. | 89,901 | 3,834,236 |
| Seegene, Inc. | 36,478 | 2,070,165 |
| Shin Poong Pharmaceutical Co., Ltd. | 40,266 | 2,451,835 |
| Shinhan Financial Group Co., Ltd. | 670,472 | 22,465,684 |
| Shinsegae, Inc. | 9,042 | 2,097,803 |
| SillaJen, Inc. *(b) | 68,458 | 188,939 |
| SK Biopharmaceuticals Co., Ltd. * | 30,851 | 3,339,342 |
| SK Chemicals Co., Ltd. | 11,424 | 2,660,296 |
| SK Holdings Co., Ltd. | 40,354 | 9,170,968 |
| SK Hynix, Inc. | 682,886 | 62,725,740 |
| SK Innovation Co., Ltd. * | 70,849 | 15,245,871 |
| SK Telecom Co., Ltd. | 29,088 | 7,476,152 |
| SKC Co., Ltd. | 25,050 | 3,446,009 |
| Woori Financial Group, Inc. | 678,377 | 6,582,208 |
| Yuhan Corp. | 59,161 | 3,189,066 |
| | | 1,329,905,644 |
| |
| Singapore 1.0% |
| Ascendas Real Estate Investment Trust | 4,373,965 | 9,885,401 |
| Ascott Residence Trust | 2,632,940 | 1,977,005 |
| CapitaLand Integrated Commercial Trust | 5,941,460 | 9,099,255 |
| CapitaLand Ltd. | 3,355,774 | 9,979,255 |
| City Developments Ltd. | 658,570 | 3,348,910 |
| ComfortDelGro Corp., Ltd. | 2,824,641 | 3,401,917 |
| DBS Group Holdings Ltd. | 2,385,668 | 53,154,762 |
| Frasers Logistics & Commercial Trust | 3,566,418 | 3,977,122 |
| Genting Singapore Ltd. | 8,196,827 | 4,661,789 |
| Golden Agri-Resources Ltd. | 9,599,936 | 1,641,503 |
| Hutchison Port Holdings Trust | 6,815,122 | 1,397,100 |
| Jardine Cycle & Carriage Ltd. | 130,488 | 1,884,902 |
| Keppel Corp., Ltd. | 1,915,324 | 7,404,420 |
| Keppel DC REIT | 1,702,440 | 3,164,151 |
| Keppel REIT | 3,035,676 | 2,369,682 |
| Mapletree Commercial Trust | 2,931,449 | 4,424,088 |
| Mapletree Industrial Trust | 2,627,475 | 5,703,834 |
| Mapletree Logistics Trust | 3,797,415 | 5,730,988 |
| Mapletree North Asia Commercial Trust | 3,207,594 | 2,360,804 |
| NetLink NBN Trust | 3,921,478 | 2,827,919 |
| Oversea-Chinese Banking Corp., Ltd. | 4,606,947 | 39,147,576 |
| SATS Ltd. * | 913,634 | 2,764,471 |
| Sembcorp Industries Ltd. | 1,281,289 | 1,838,442 |
| Sembcorp Marine Ltd. * | 9,824,695 | 620,845 |
| Singapore Airlines Ltd. * | 1,718,073 | 6,463,051 |
Schwab International Equity ETFs | Annual Report
Schwab International Equity ETF
Portfolio Holdings as of August 31, 2021 (continued)
| Security | Number
of Shares | Value ($) |
| Singapore Exchange Ltd. | 1,115,494 | 8,210,089 |
| Singapore Press Holdings Ltd. | 1,981,803 | 2,858,299 |
| Singapore Technologies Engineering Ltd. | 2,093,594 | 5,883,418 |
| Singapore Telecommunications Ltd. | 10,070,302 | 17,369,044 |
| Suntec Real Estate Investment Trust | 2,762,997 | 3,040,098 |
| United Overseas Bank Ltd. | 1,701,800 | 32,363,426 |
| UOL Group Ltd. | 658,296 | 3,425,821 |
| Venture Corp., Ltd. | 386,260 | 5,502,001 |
| Wilmar International Ltd. | 2,802,344 | 8,625,161 |
| | | 276,506,549 |
| |
| Spain 2.0% |
| Acciona S.A. | 30,371 | 4,933,157 |
| ACS, Actividades de Construccion y Servicios S.A. | 311,608 | 8,408,765 |
| Aena SME S.A. * | 93,574 | 14,934,107 |
| Amadeus IT Group S.A. * | 564,220 | 34,447,235 |
| Banco Bilbao Vizcaya Argentaria S.A. * | 8,782,830 | 57,509,556 |
| Banco Santander S.A. * | 22,586,174 | 83,384,890 |
| Bankinter S.A. | 891,629 | 5,223,671 |
| CaixaBank S.A. | 5,901,642 | 18,336,064 |
| Cellnex Telecom S.A. | 802,033 | 54,912,044 |
| Enagas S.A. | 333,303 | 7,579,763 |
| Endesa S.A. | 415,387 | 9,983,390 |
| Ferrovial S.A. | 634,036 | 18,351,931 |
| Grifols S.A. | 438,785 | 10,716,665 |
| Iberdrola S.A. | 7,790,450 | 96,514,455 |
| Industria de Diseno Textil S.A. | 1,384,536 | 47,249,772 |
| Inmobiliaria Colonial Socimi S.A. | 405,566 | 4,387,745 |
| Linea Directa Aseguradora S.A. Cia de Seguros y Reaseguros | 917,306 | 1,939,354 |
| Mapfre S.A. | 1,338,371 | 2,884,859 |
| Merlin Properties Socimi S.A. | 434,215 | 5,071,356 |
| Naturgy Energy Group S.A. | 406,912 | 10,471,391 |
| Red Electrica Corp. S.A. | 557,207 | 11,109,476 |
| Repsol S.A. | 1,769,198 | 20,268,395 |
| Siemens Gamesa Renewable Energy S.A. * | 294,914 | 8,741,571 |
| Telefonica S.A. | 6,660,254 | 32,875,341 |
| Zardoya Otis S.A. | 223,055 | 1,471,876 |
| | | 571,706,829 |
| |
| Sweden 3.2% |
| Alfa Laval AB | 412,471 | 16,711,506 |
| Assa Abloy AB, B Shares | 1,205,200 | 38,477,558 |
| Atlas Copco AB, A Shares | 835,275 | 57,279,426 |
| Atlas Copco AB, B Shares | 496,021 | 28,663,470 |
| Boliden AB | 361,753 | 12,600,519 |
| Castellum AB | 351,657 | 10,229,770 |
| Electrolux AB, Series B | 314,732 | 7,964,255 |
| Elekta AB, B Shares | 475,301 | 5,950,444 |
| Epiroc AB, A Shares | 823,181 | 18,043,250 |
| Epiroc AB, B Shares | 502,425 | 9,535,353 |
| EQT AB | 305,207 | 15,534,779 |
| Essity AB, B Shares | 808,662 | 25,911,183 |
| Evolution AB | 210,001 | 33,799,887 |
| Fastighets AB Balder, B Shares * | 131,305 | 9,375,183 |
| Getinge AB, B Shares | 293,989 | 12,047,265 |
| H & M Hennes & Mauritz AB, B Shares * | 1,162,862 | 23,282,412 |
| Hexagon AB, B Shares | 2,339,072 | 40,479,851 |
| Holmen AB, B Shares | 124,232 | 6,306,047 |
| Husqvarna AB, B Shares | 584,267 | 7,828,643 |
| ICA Gruppen AB | 109,140 | 5,423,741 |
| Industrivarden AB, A Shares | 284,764 | 10,469,350 |
| Industrivarden AB, C Shares | 209,877 | 7,307,971 |
| Indutrade AB | 370,633 | 12,227,652 |
| Security | Number
of Shares | Value ($) |
| Investment AB Latour, B Shares | 185,973 | 6,464,863 |
| Investor AB, A Shares | 711,986 | 17,060,664 |
| Investor AB, B Shares | 2,370,719 | 56,642,693 |
| Kinnevik AB, B Shares * | 337,566 | 13,211,678 |
| L E Lundbergfortagen AB, B Shares | 100,950 | 6,436,568 |
| Lifco AB, B Shares | 302,423 | 8,941,077 |
| Lundin Energy AB | 255,435 | 7,794,351 |
| Nibe Industrier AB, B Shares | 1,575,832 | 21,944,701 |
| Saab AB, B Shares | 120,841 | 3,597,820 |
| Sagax AB, B Shares | 240,180 | 8,946,991 |
| Sandvik AB | 1,425,126 | 36,293,601 |
| Securitas AB, B Shares | 406,338 | 6,738,080 |
| Sinch AB * | 680,464 | 15,249,817 |
| Skandinaviska Enskilda Banken AB, A Shares | 1,906,611 | 25,579,948 |
| Skanska AB, B Shares | 470,054 | 13,521,606 |
| SKF AB, B Shares | 505,661 | 12,877,639 |
| Svenska Cellulosa AB SCA, B Shares | 800,457 | 14,107,480 |
| Svenska Handelsbanken AB, A Shares | 2,022,779 | 22,727,038 |
| Sweco AB, B Shares | 260,943 | 4,570,237 |
| Swedbank AB, A Shares | 1,333,603 | 25,722,183 |
| Swedish Match AB | 2,029,015 | 18,714,951 |
| Swedish Orphan Biovitrum AB * | 234,534 | 5,102,726 |
| Tele2 AB, B Shares | 703,411 | 10,532,457 |
| Telefonaktiebolaget LM Ericsson, B Shares | 4,037,313 | 47,810,378 |
| Telia Co. AB | 3,430,661 | 14,709,669 |
| Trelleborg AB, B Shares | 318,684 | 7,735,935 |
| Volvo AB, A Shares | 243,763 | 5,640,722 |
| Volvo AB, B Shares | 2,023,053 | 45,699,104 |
| | | 899,824,492 |
| |
| Switzerland 8.2% |
| ABB Ltd. | 2,235,444 | 82,775,242 |
| Adecco Group AG | 202,298 | 11,258,285 |
| Alcon, Inc. | 606,785 | 49,970,919 |
| ams AG * | 330,457 | 6,720,609 |
| Baloise Holding AG | 59,542 | 9,496,301 |
| Banque Cantonale Vaudoise | 40,149 | 3,405,466 |
| Barry Callebaut AG | 4,851 | 12,359,843 |
| BKW AG | 23,849 | 2,764,875 |
| Chocoladefabriken Lindt & Sprungli AG | 131 | 16,002,292 |
| Chocoladefabriken Lindt & Sprungli AG, Participation Certificate | 1,444 | 16,977,108 |
| Cie Financiere Richemont S.A. | 673,089 | 74,212,094 |
| Clariant AG * | 300,809 | 6,331,093 |
| Credit Suisse Group AG | 3,161,255 | 33,522,658 |
| DKSH Holding AG | 48,243 | 3,757,588 |
| EMS-Chemie Holding AG | 9,576 | 10,375,176 |
| Flughafen Zuerich AG * | 24,928 | 4,141,741 |
| Geberit AG | 46,578 | 38,907,795 |
| Georg Fischer AG | 5,300 | 8,695,923 |
| Givaudan S.A. | 12,117 | 60,780,105 |
| Helvetia Holding AG | 48,667 | 5,573,024 |
| Holcim Ltd. * | 672,401 | 38,315,957 |
| Julius Baer Group Ltd. | 286,053 | 19,547,970 |
| Kuehne & Nagel International AG | 66,152 | 24,199,045 |
| Logitech International S.A. | 195,590 | 19,993,502 |
| Lonza Group AG | 97,661 | 82,623,520 |
| Nestle S.A. | 3,723,318 | 470,429,371 |
| Novartis AG | 2,800,753 | 259,238,957 |
| OC Oerlikon Corp. AG | 257,872 | 2,876,974 |
| Partners Group Holding AG | 29,494 | 52,287,818 |
| PSP Swiss Property AG | 58,142 | 7,794,157 |
| Roche Holding AG | 916,217 | 367,817,043 |
| Roche Holding AG, Bearer Shares | 35,034 | 15,680,301 |
| Schindler Holding AG | 25,228 | 7,865,419 |
Schwab International Equity ETFs | Annual Report
Schwab International Equity ETF
Portfolio Holdings as of August 31, 2021 (continued)
| Security | Number
of Shares | Value ($) |
| Schindler Holding AG, Participation Certificate | 53,385 | 17,238,451 |
| SGS S.A. | 7,739 | 24,314,003 |
| SIG Combibloc Group AG * | 448,968 | 13,742,768 |
| Sika AG | 186,490 | 67,201,953 |
| Sonova Holding AG | 70,432 | 27,140,981 |
| Straumann Holding AG | 13,197 | 25,499,361 |
| Sulzer AG | 22,917 | 3,452,373 |
| Swiss Life Holding AG | 41,212 | 21,486,656 |
| Swiss Prime Site AG | 99,809 | 10,672,225 |
| Swiss Re AG | 379,470 | 34,904,364 |
| Swisscom AG | 34,768 | 20,396,619 |
| Tecan Group AG | 15,713 | 9,579,947 |
| Temenos AG | 82,498 | 13,094,492 |
| The Swatch Group AG | 60,912 | 3,347,982 |
| The Swatch Group AG, Bearer Shares | 37,928 | 10,690,475 |
| UBS Group AG | 4,344,797 | 72,472,570 |
| VAT Group AG | 33,810 | 14,158,087 |
| Vifor Pharma AG | 68,358 | 9,730,782 |
| Zurich Insurance Group AG | 195,348 | 85,726,648 |
| | | 2,311,548,908 |
| |
| United Kingdom 12.7% |
| 3i Group plc | 1,259,910 | 23,191,602 |
| Admiral Group plc | 276,134 | 13,722,866 |
| Anglo American plc | 1,623,404 | 68,567,914 |
| Antofagasta plc | 448,049 | 8,978,098 |
| Ashmore Group plc | 628,300 | 3,451,875 |
| Ashtead Group plc | 591,201 | 46,296,148 |
| Associated British Foods plc | 460,518 | 12,549,003 |
| AstraZeneca plc | 2,044,841 | 239,602,102 |
| Auto Trader Group plc | 1,254,684 | 10,861,316 |
| Avast plc | 747,521 | 6,150,023 |
| AVEVA Group plc | 155,919 | 8,875,177 |
| Aviva plc | 5,134,856 | 28,557,130 |
| B&M European Value Retail S.A. | 1,201,790 | 9,245,658 |
| BAE Systems plc | 4,254,565 | 33,281,789 |
| Barclays plc | 22,357,873 | 56,893,785 |
| Barratt Developments plc | 1,347,565 | 13,705,396 |
| Bellway plc | 161,510 | 7,821,970 |
| Berkeley Group Holdings plc | 146,538 | 9,734,754 |
| BHP Group plc | 2,746,365 | 85,326,405 |
| BP plc | 26,264,062 | 107,335,321 |
| British American Tobacco plc | 3,014,687 | 113,225,226 |
| BT Group plc * | 11,496,021 | 26,864,742 |
| Bunzl plc | 442,751 | 16,062,102 |
| Burberry Group plc | 529,563 | 13,552,245 |
| Centrica plc * | 7,938,224 | 5,676,621 |
| Coca-Cola HBC AG * | 255,002 | 9,226,386 |
| Compass Group plc * | 2,353,386 | 48,598,918 |
| ConvaTec Group plc | 2,125,053 | 6,592,059 |
| CRH plc | 1,036,040 | 55,137,634 |
| Croda International plc | 177,910 | 22,398,759 |
| DCC plc | 132,113 | 11,236,511 |
| Derwent London plc | 128,188 | 6,691,564 |
| Diageo plc | 3,031,160 | 145,756,925 |
| Direct Line Insurance Group plc | 1,806,948 | 7,684,251 |
| Dr. Martens plc * | 547,627 | 3,185,017 |
| DS Smith plc | 1,701,427 | 10,359,192 |
| easyJet plc * | 290,343 | 3,180,694 |
| Entain plc * | 766,379 | 20,387,918 |
| Evraz plc | 750,632 | 6,099,172 |
| Experian plc | 1,206,757 | 53,212,023 |
| Ferguson plc | 294,863 | 42,629,847 |
| Flutter Entertainment plc * | 218,877 | 42,518,550 |
| Fresnillo plc | 239,147 | 2,810,737 |
| GlaxoSmithKline plc | 6,532,555 | 131,440,100 |
| Security | Number
of Shares | Value ($) |
| Glencore plc * | 15,895,001 | 71,620,388 |
| Halma plc | 500,355 | 20,679,070 |
| Hargreaves Lansdown plc | 502,947 | 10,441,550 |
| Hikma Pharmaceuticals plc | 222,459 | 7,770,322 |
| Hiscox Ltd. | 447,635 | 5,660,339 |
| HomeServe plc | 368,013 | 4,745,699 |
| Howden Joinery Group plc | 769,611 | 10,015,581 |
| HSBC Holdings plc | 26,983,775 | 143,420,889 |
| IMI plc | 349,658 | 8,772,585 |
| Imperial Brands plc | 1,247,752 | 26,470,932 |
| Informa plc * | 2,000,513 | 14,619,527 |
| InterContinental Hotels Group plc * | 241,776 | 15,416,043 |
| Intermediate Capital Group plc | 375,323 | 11,353,514 |
| International Consolidated Airlines Group S.A. * | 1,501,642 | 3,293,390 |
| Intertek Group plc | 213,518 | 15,486,117 |
| ITV plc * | 5,004,096 | 7,975,017 |
| J Sainsbury plc | 2,253,665 | 9,428,886 |
| JD Sports Fashion plc | 658,239 | 9,145,077 |
| Johnson Matthey plc | 258,320 | 10,448,527 |
| Just Eat Takeaway.com N.V. * | 239,324 | 21,603,361 |
| Kingfisher plc | 2,772,616 | 13,366,795 |
| Land Securities Group plc | 950,801 | 9,277,550 |
| Legal & General Group plc | 7,805,648 | 29,026,304 |
| Lloyds Banking Group plc | 93,478,840 | 56,316,662 |
| London Stock Exchange Group plc | 478,814 | 52,427,488 |
| M&G plc | 3,610,187 | 10,235,153 |
| Meggitt plc * | 1,017,349 | 11,609,852 |
| Melrose Industries plc | 5,773,659 | 13,328,621 |
| Mondi plc | 644,523 | 17,784,851 |
| National Grid plc | 4,673,725 | 60,546,445 |
| Natwest Group plc | 6,892,967 | 20,215,621 |
| Next plc | 167,177 | 18,199,122 |
| NMC Health plc *(b) | 136,583 | 34,606 |
| Ocado Group plc * | 643,221 | 17,819,743 |
| Pearson plc | 987,813 | 10,435,353 |
| Pennon Group plc | 365,880 | 6,284,210 |
| Persimmon plc | 416,477 | 16,851,392 |
| Phoenix Group Holdings plc | 851,972 | 7,309,532 |
| Polymetal International plc | 467,836 | 9,323,085 |
| Prudential plc | 3,449,632 | 71,925,491 |
| Quilter plc | 2,371,123 | 4,925,889 |
| Reckitt Benckiser Group plc | 838,389 | 63,910,817 |
| RELX plc | 2,453,034 | 73,664,076 |
| Renishaw plc | 47,170 | 3,505,557 |
| Rentokil Initial plc | 2,488,789 | 19,879,842 |
| Rightmove plc | 1,154,433 | 11,143,765 |
| Rio Tinto plc | 1,433,815 | 106,202,379 |
| Rolls-Royce Holdings plc * | 9,921,916 | 15,684,179 |
| Royal Dutch Shell plc, A Shares | 5,442,788 | 107,235,984 |
| Royal Dutch Shell plc, B Shares | 4,860,181 | 95,717,095 |
| Schroders plc | 147,712 | 7,684,312 |
| Segro plc | 1,578,738 | 27,897,965 |
| Severn Trent plc | 313,651 | 11,922,512 |
| Smith & Nephew plc | 1,157,685 | 22,226,038 |
| Smiths Group plc | 528,377 | 10,489,557 |
| Smurfit Kappa Group plc | 340,721 | 19,544,477 |
| Spirax-Sarco Engineering plc | 95,949 | 21,273,230 |
| SSE plc | 1,383,873 | 31,091,871 |
| St. James's Place plc | 697,433 | 15,453,463 |
| Standard Chartered plc | 3,396,076 | 21,256,673 |
| Standard Life Aberdeen plc | 2,837,198 | 10,366,964 |
| Tate & Lyle plc | 638,000 | 6,195,505 |
| Taylor Wimpey plc | 4,727,753 | 11,900,519 |
| Tesco plc | 10,089,581 | 35,429,591 |
| The British Land Co. plc | 1,245,169 | 9,085,848 |
| The Sage Group plc | 1,423,061 | 14,535,899 |
| The Weir Group plc * | 342,342 | 8,252,162 |
Schwab International Equity ETFs | Annual Report
Schwab International Equity ETF
Portfolio Holdings as of August 31, 2021 (continued)
| Security | Number
of Shares | Value ($) |
| THG plc * | 821,881 | 6,962,007 |
| Travis Perkins plc * | 292,884 | 7,261,517 |
| TUI AG *(a) | 963,701 | 4,193,741 |
| Unilever plc | 3,449,269 | 192,065,950 |
| United Utilities Group plc | 880,299 | 12,811,737 |
| Vodafone Group plc | 37,098,954 | 62,269,663 |
| Whitbread plc * | 269,459 | 11,896,645 |
| Wickes Group plc * | 327,275 | 1,089,998 |
| Wm Morrison Supermarkets plc | 2,902,412 | 11,583,892 |
| WPP plc | 1,555,276 | 21,053,457 |
| | | 3,597,024,991 |
| Total Common Stock |
| (Cost $21,633,316,767) | | 28,000,665,065 |
|
| Preferred Stock 0.8% of net assets |
| |
| Germany 0.5% |
| Bayerische Motoren Werke AG | 81,771 | 6,843,731 |
| Fuchs Petrolub SE | 95,309 | 4,822,069 |
| Henkel AG & Co. KGaA | 236,823 | 23,130,593 |
| Porsche Automobil Holding SE | 201,662 | 20,415,321 |
| Sartorius AG | 32,782 | 21,593,201 |
| Volkswagen AG | 241,559 | 57,400,328 |
| | | 134,205,243 |
| |
| Italy 0.0% |
| Telecom Italia S.p.A. - RSP | 7,459,826 | 3,600,752 |
| |
| Republic of Korea 0.3% |
| Amorepacific Corp. | 13,722 | 940,876 |
| Hanwha Corp. | 40,000 | 551,986 |
| Hyundai Motor Co., Ltd. | 28,830 | 2,548,687 |
| Hyundai Motor Co., Ltd. 2nd | 51,063 | 4,373,242 |
| LG Chem Ltd. | 10,475 | 3,125,922 |
| LG Electronics, Inc. | 24,646 | 1,485,839 |
| LG Household & Health Care Ltd. | 3,104 | 1,839,189 |
| Samsung Electronics Co., Ltd. | 1,098,761 | 67,094,121 |
| | | 81,959,862 |
| Total Preferred Stock |
| (Cost $147,733,023) | | 219,765,857 |
|
| Rights 0.0% of net assets |
| |
| Singapore 0.0% |
Sembcorp Marine Ltd.
expires 09/30/21, strike SGD 0.08 * | 14,737,042 | 32,868 |
| Total Rights |
| (Cost $233,507) | | 32,868 |
| Security | Number
of Shares | Value ($) |
| Short-Term Investments 0.1% of net assets |
| |
| United States 0.1% |
| Money Market Funds 0.1% |
| State Street Institutional U.S. Government Money Market Fund, Premier Class 0.03% (c) | 14,846,963 | 14,846,963 |
| Wells Fargo Government Money Market Fund, Select Class 0.03% (c)(d) | 19,792,050 | 19,792,050 |
| Total Short-Term Investments |
| (Cost $34,639,013) | | 34,639,013 |
| | Number of
Contracts | Notional
Amount
($) | Current Value/
Unrealized
Appreciation
($) |
| Futures Contracts | |
| Long | |
| MSCI EAFE Index, expires 09/17/21 | 937 | 110,167,775 | 1,489,928 |
| * | Non-income producing security. |
| (a) | All or a portion of this security is on loan. Securities on loan were valued at $18,766,552. |
| (b) | Fair-valued by management using significant unobservable inputs in accordance with procedures approved by the fund’s Board of Trustees. |
| (c) | The rate shown is the 7-day yield. |
| (d) | Security purchased with cash collateral received for securities on loan. |
| | |
| CVA — | Dutch Certificate |
| REIT — | Real Estate Investment Trust |
| RSP — | Risparmio (Savings Shares) |
| |
| SGD — | Singapore Dollar |
Schwab International Equity ETFs | Annual Report
Schwab International Equity ETF
Portfolio Holdings as of August 31, 2021 (continued)
The following is a summary of the inputs used to value the fund’s investments as of August 31, 2021 (see financial note 2(a) for additional information):
| Description | Quoted Prices in
Active Markets for
Identical Assets
(Level 1) | Other Significant
Observable Inputs
(Level 2) | Significant
Unobservable Inputs
(Level 3) | Total | |
| Assets | | | | | |
| Common Stock1 | $22,229,961,868 | $— | $— | $22,229,961,868 | |
| Hong Kong | 801,270,415 | — | — * | 801,270,415 | |
| Portugal | 42,502,147 | — | — * | 42,502,147 | |
| Republic of Korea | 1,329,716,705 | — | 188,939 | 1,329,905,644 | |
| United Kingdom | 3,596,990,385 | — | 34,606 | 3,597,024,991 | |
| Preferred Stock1 | 219,765,857 | — | — | 219,765,857 | |
| Rights 1 | 32,868 | — | — | 32,868 | |
| Short-Term Investments1 | 34,639,013 | — | — | 34,639,013 | |
| Futures Contracts2 | 1,489,928 | — | — | 1,489,928 | |
| Total | $28,256,369,186 | $— | $223,545 | $28,256,592,731 | |
| * | Level 3 amount shown includes securities determined to have no value at August 31, 2021. |
| 1 | As categorized in the Portfolio Holdings. |
| 2 | Futures contracts are reported at cumulative unrealized appreciation or depreciation. |
Fund investments in mutual funds are classified as Level 1, without consideration to the classification level of the underlying securities held by the mutual funds, which could be Level 1, Level 2 or Level 3.
Schwab International Equity ETFs | Annual Report
Schwab International Equity ETF
Statement of Assets and Liabilities
As of August 31, 2021
| Assets |
| Investments in securities, at value - unaffiliated (cost $21,796,130,260) including securities on loan of $18,766,552 | | $28,235,310,753 |
| Collateral invested for securities on loan, at value (cost $19,792,050) | | 19,792,050 |
| Deposit with broker for futures contracts | | 6,289,242 |
| Foreign currency, at value (cost $11,702,519) | | 11,757,082 |
| Receivables: | | |
| Investments sold | | 798,117 |
| Dividends | | 63,269,316 |
| Foreign tax reclaims | | 23,230,517 |
| Income from securities on loan | | 128,232 |
| Other assets | + | 4,021 |
| Total assets | | 28,360,579,330 |
| Liabilities |
| Collateral held for securities on loan | | 19,792,050 |
| Payables: | | |
| Investments bought | | 1,228,449 |
| Management fees | | 1,375,952 |
| Variation margin on futures contracts | + | 102,022 |
| Total liabilities | | 22,498,473 |
| Net Assets |
| Total assets | | 28,360,579,330 |
| Total liabilities | – | 22,498,473 |
| Net assets | | $28,338,080,857 |
| Net Assets by Source | | |
| Capital received from investors | | 22,848,202,757 |
| Total distributable earnings | | 5,489,878,100 |
| Net Asset Value (NAV) |
| Net Assets | ÷ | Shares
Outstanding | = | NAV |
| $28,338,080,857 | | 707,600,000 | | $40.05 |
| | | | | |
Schwab International Equity ETFs | Annual Report
Schwab International Equity ETF
Statement of Operations
For the period September 1, 2020 through August 31, 2021
| Investment Income |
| Dividends received from securities - unaffiliated (net of foreign withholding tax of $64,104,016) | | $608,113,344 |
| Income from non-cash dividends from securities - unaffiliated | | 35,337,707 |
| Securities on loan, net | + | 2,411,778 |
| Total investment income | | 645,862,829 |
| Expenses |
| Management fees | | 14,624,838 |
| Professional fees | + | 153,498* |
| Total expenses | | 14,778,336 |
| Expense reduction by CSIM | - | 153,498* |
| Net expenses | – | 14,624,838 |
| Net investment income | | 631,237,991 |
| Realized and Unrealized Gains (Losses) |
| Net realized losses on sales of securities - unaffiliated | | (219,498,245) |
| Net realized gains on in-kind redemptions - unaffiliated | | 231,337,811 |
| Net realized gains on futures contracts | | 30,635,412 |
| Net realized losses on foreign currency transactions | + | (46,858) |
| Net realized gains | | 42,428,120 |
| Net change in unrealized appreciation (depreciation) on securities - unaffiliated | | 5,108,698,080 |
| Net change in unrealized appreciation (depreciation) on futures contracts | | (2,690,378) |
| Net change in unrealized appreciation (depreciation) on foreign currency translations | + | (1,770,607) |
| Net change in unrealized appreciation (depreciation) | + | 5,104,237,095 |
| Net realized and unrealized gains | | 5,146,665,215 |
| Increase in net assets resulting from operations | | $5,777,903,206 |
| * | Professional fees associated with the filing of tax claims in the European Union deemed to be non-routine expenses of the fund. See financial notes 2 (d) and 4 for additional information. |
Schwab International Equity ETFs | Annual Report
Schwab International Equity ETF
Statement of Changes in Net Assets
For the current and prior report periods
| Operations | |
| | 9/1/20-8/31/21 | 9/1/19-8/31/20 |
| Net investment income | | $631,237,991 | $477,245,122 |
| Net realized gains | | 42,428,120 | 150,944,842 |
| Net change in unrealized appreciation (depreciation) | + | 5,104,237,095 | 778,234,781 |
| Increase in net assets resulting from operations | | 5,777,903,206 | 1,406,424,745 |
| Distributions to Shareholders | |
| Total distributions | | ($557,207,730) | ($591,185,650) |
| Transactions in Fund Shares | | | |
| | | 9/1/20-8/31/21 | 9/1/19-8/31/20 |
| | | SHARES | VALUE | SHARES | VALUE |
| Shares sold | | 102,100,000 | $3,781,481,014 | 84,700,000 | $2,479,224,662 |
| Shares redeemed | + | (12,500,000) | (507,727,175) | (55,200,000) | (1,589,369,198) |
| Net transactions in fund shares | | 89,600,000 | $3,273,753,839 | 29,500,000 | $889,855,464 |
| Shares Outstanding and Net Assets | | | |
| | | 9/1/20-8/31/21 | 9/1/19-8/31/20 |
| | | SHARES | NET ASSETS | SHARES | NET ASSETS |
| Beginning of period | | 618,000,000 | $19,843,631,542 | 588,500,000 | $18,138,536,983 |
| Total increase | + | 89,600,000 | 8,494,449,315 | 29,500,000 | 1,705,094,559 |
| End of period | | 707,600,000 | $28,338,080,857 | 618,000,000 | $19,843,631,542 |
Schwab International Equity ETFs | Annual Report
Schwab International Small-Cap Equity ETF
Financial Statements
Financial Highlights
| | 9/1/20–
8/31/21 | 9/1/19–
8/31/20 | 9/1/18–
8/31/19 | 9/1/17–
8/31/18 | 9/1/16–
8/31/17 | |
| Per-Share Data |
| Net asset value at beginning of period | $33.20 | $31.15 | $35.86 | $34.80 | $29.96 | |
| Income (loss) from investment operations: | | | | | | |
| Net investment income (loss)1 | 0.72 | 0.64 | 0.82 | 0.84 | 0.73 | |
| Net realized and unrealized gains (losses) | 10.11 | 2.36 | (4.63) | 1.22 | 4.70 | |
| Total from investment operations | 10.83 | 3.00 | (3.81) | 2.06 | 5.43 | |
| Less distributions: | | | | | | |
| Distributions from net investment income | (0.82) | (0.95) | (0.90) | (1.00) | (0.59) | |
| Net asset value at end of period | $43.21 | $33.20 | $31.15 | $35.86 | $34.80 | |
| Total return | 33.01% | 9.63% | (10.57%) | 5.93% | 18.52% | |
| Ratios/Supplemental Data |
| Ratios to average net assets: | | | | | | |
| Total expenses | 0.11% | 0.11% 2 | 0.12% | 0.12% | 0.14% 3 | |
| Net investment income (loss) | 1.87% | 2.07% | 2.54% | 2.31% | 2.31% | |
| Portfolio turnover rate4 | 22% | 17% | 20% | 16% | 12% | |
| Net assets, end of period (x 1,000) | $3,832,346 | $2,595,871 | $2,186,842 | $2,280,998 | $1,538,038 | |
| |
1
Calculated based on the average shares outstanding during the period.
2
Effective February 25, 2020, the annual operating expense ratio was reduced to 0.11%. The ratio presented for the period ended 8/31/20 is a blended ratio.
3
Effective March 1, 2017, the annual operating expense ratio was reduced. The ratio presented for the period ended 8/31/17 is a blended ratio.
4
Portfolio turnover rate excludes securities received or delivered from processing of in-kind creations or redemptions.
Schwab International Equity ETFs | Annual Report
Schwab International Small-Cap Equity ETF
Portfolio Holdings as of August 31, 2021
This section shows all the securities in the fund’s portfolio and their values as of the report date.
The fund files its complete schedule of portfolio holdings with the U.S. Securities and Exchange Commission (SEC) for the first and third quarters of each fiscal year on Form N-PORT Part F. The fund’s Form N-PORT Part F is available on the SEC’s website at www.sec.gov. You can also obtain this information at no cost on the fund’s website at www.schwabassetmanagement.com/schwabetfs_prospectus, by calling 1-866-414-6349, or by sending an email request to orders@mysummaryprospectus.com. The fund also makes available its complete schedule of portfolio holdings on a daily basis on the fund’s website.
| Security | Number
of Shares | Value ($) |
| Common Stock 99.3% of net assets |
| |
| Australia 6.5% |
| Abacus Property Group | 683,468 | 1,748,294 |
| Accent Group Ltd. | 495,699 | 778,905 |
| Alkane Resources Ltd. * | 727,178 | 520,829 |
| AMA Group Ltd. * | 775,609 | 243,747 |
| Andromeda Metals Ltd. * | 3,244,744 | 379,427 |
| APN Industria REIT | 282,658 | 729,229 |
| ARB Corp., Ltd. | 102,175 | 3,868,891 |
| Arena REIT | 500,821 | 1,526,324 |
| AUB Group Ltd. | 102,123 | 1,783,814 |
| Audinate Group Ltd. * | 99,414 | 725,114 |
| Aurelia Metals Ltd. | 1,854,440 | 481,138 |
| Austal Ltd. | 475,526 | 679,437 |
| Australian Agricultural Co., Ltd. * | 486,732 | 494,462 |
| Australian Ethical Investment Ltd. (a) | 168,566 | 1,316,970 |
| Australian Finance Group Ltd. | 305,159 | 675,767 |
| Australian Pharmaceutical Industries Ltd. | 621,928 | 611,351 |
| Australian Strategic Materials Ltd. * | 163,468 | 1,395,416 |
| Aventus Group | 641,217 | 1,560,549 |
| Baby Bunting Group Ltd. | 194,106 | 754,708 |
| Bapcor Ltd. | 507,673 | 2,689,988 |
| Bega Cheese Ltd. | 455,965 | 1,852,825 |
| Bellevue Gold Ltd. * | 1,292,378 | 911,476 |
| Blackmores Ltd. | 22,819 | 1,664,391 |
| Bravura Solutions Ltd. | 357,499 | 791,673 |
| Breville Group Ltd. | 210,842 | 4,967,986 |
| Brickworks Ltd. | 87,636 | 1,543,575 |
| BWP Trust | 745,410 | 2,211,818 |
| BWX Ltd. | 200,491 | 747,297 |
| Capricorn Metals Ltd. * | 443,821 | 801,185 |
| Carnarvon Petroleum Ltd. * | 2,432,215 | 453,284 |
| Cedar Woods Properties Ltd. | 86,310 | 411,279 |
| Centuria Capital Group | 860,628 | 2,157,435 |
| Centuria Industrial REIT | 708,395 | 2,081,276 |
| Centuria Office REIT | 599,964 | 1,100,594 |
| Chalice Mining Ltd. * | 470,799 | 2,412,025 |
| Champion Iron Ltd. * | 680,293 | 2,928,461 |
| Charter Hall Long Wale REIT | 813,623 | 3,115,894 |
| Charter Hall Retail REIT | 747,978 | 2,082,773 |
| Charter Hall Social Infrastructure REIT | 501,699 | 1,349,333 |
| City Chic Collective Ltd. * | 216,670 | 972,289 |
| Clinuvel Pharmaceuticals Ltd. | 60,475 | 1,669,806 |
| Codan Ltd. | 184,295 | 2,025,767 |
| Collins Foods Ltd. | 164,154 | 1,478,054 |
| Cooper Energy Ltd. * | 2,206,472 | 362,835 |
| Coronado Global Resources, Inc. * | 1,146,106 | 929,771 |
| Corporate Travel Management Ltd. * | 160,686 | 2,659,956 |
| Costa Group Holdings Ltd. | 666,417 | 1,534,210 |
| Credit Corp. Group Ltd. | 85,197 | 1,918,422 |
| Cromwell Property Group | 2,177,172 | 1,463,891 |
| Dacian Gold Ltd. * | 1,502,366 | 263,521 |
| Data#3 Ltd. | 215,546 | 842,795 |
| De Grey Mining Ltd. * | 1,892,036 | 1,659,353 |
| Dicker Data Ltd. (a) | 75,556 | 701,847 |
| Eagers Automotive Ltd. | 294,620 | 3,533,450 |
| Security | Number
of Shares | Value ($) |
| Eclipx Group Ltd. * | 474,606 | 874,102 |
| Elders Ltd. | 231,697 | 2,067,589 |
| Electro Optic Systems Holdings Ltd. * | 197,608 | 508,365 |
| Emeco Holdings Ltd. * | 812,371 | 673,874 |
| EML Payments Ltd. * | 450,019 | 1,358,342 |
| Estia Health Ltd. | 341,163 | 578,466 |
| Event Hospitality & Entertainment Ltd. * | 158,222 | 1,724,141 |
| Fineos Corp., Ltd. * | 199,040 | 635,697 |
| G.U.D. Holdings Ltd. | 141,692 | 1,092,511 |
| G8 Education Ltd. * | 1,313,653 | 964,884 |
| GDI Property Group | 692,620 | 612,504 |
| Genworth Mortgage Insurance Australia Ltd. | 620,706 | 1,007,087 |
| Gold Road Resources Ltd. | 1,255,431 | 1,183,616 |
| GrainCorp Ltd., Class A | 339,890 | 1,572,426 |
| Growthpoint Properties Australia Ltd. | 428,593 | 1,334,390 |
| GWA Group Ltd. | 399,023 | 822,385 |
| Hansen Technologies Ltd. | 253,423 | 1,137,215 |
| Healius Ltd. | 881,175 | 3,142,753 |
| HomeCo Daily Needs REIT | 716,233 | 832,300 |
| Hotel Property Investments | 255,015 | 637,412 |
| HUB24 Ltd. | 74,162 | 1,630,375 |
| Humm Group Ltd. * | 555,495 | 387,714 |
| Imdex Ltd. | 567,553 | 983,067 |
| Infomedia Ltd. | 572,198 | 729,743 |
| Ingenia Communities Group | 445,374 | 2,092,975 |
| Inghams Group Ltd. | 277,845 | 838,650 |
| Integral Diagnostics Ltd. | 225,092 | 760,029 |
| InvoCare Ltd. | 216,853 | 1,944,635 |
| IPH Ltd. | 252,577 | 1,735,201 |
| IRESS Ltd. | 288,145 | 3,114,637 |
| Japara Healthcare Ltd. * | 375,831 | 376,306 |
| Jumbo Interactive Ltd. | 75,170 | 842,199 |
| Jupiter Mines Ltd. | 2,324,187 | 433,151 |
| Karoon Energy Ltd. * | 772,414 | 694,358 |
| Kogan.com Ltd. (a) | 100,519 | 836,758 |
| Lifestyle Communities Ltd. | 140,672 | 2,008,910 |
| Link Administration Holdings Ltd. | 779,878 | 2,490,785 |
| Lovisa Holdings Ltd. | 81,088 | 1,169,855 |
| Lynas Rare Earths Ltd. * | 1,363,483 | 6,855,930 |
| MACA Ltd. | 485,036 | 301,315 |
| Macmahon Holdings Ltd. | 2,802,472 | 481,324 |
| Marley Spoon AG * | 345,988 | 541,132 |
| Mayne Pharma Group Ltd. * | 2,405,742 | 509,889 |
| McMillan Shakespeare Ltd. | 74,147 | 677,379 |
| Megaport Ltd. * | 204,780 | 2,560,742 |
| Mesoblast Ltd. * | 875,035 | 1,064,800 |
| Monadelphous Group Ltd. | 132,941 | 1,031,838 |
| Mount Gibson Iron Ltd. | 1,077,159 | 480,217 |
| Myer Holdings Ltd. * | 1,224,748 | 483,358 |
| MyState Ltd. | 151,252 | 592,508 |
| Nanosonics Ltd. * | 353,194 | 1,708,833 |
| National Storage REIT | 1,763,430 | 3,015,798 |
| Navigator Global Investments Ltd. | 173,483 | 233,294 |
| nearmap Ltd. * | 608,318 | 942,529 |
| Netwealth Group Ltd. | 125,293 | 1,430,329 |
| New Century Resources Ltd. * | 1,794,405 | 229,502 |
| New Hope Corp., Ltd. | 360,616 | 542,926 |
Schwab International Equity ETFs | Annual Report
Schwab International Small-Cap Equity ETF
Portfolio Holdings as of August 31, 2021 (continued)
| Security | Number
of Shares | Value ($) |
| nib Holdings Ltd. | 696,154 | 3,444,468 |
| Nickel Mines Ltd. | 1,886,540 | 1,399,459 |
| Nine Entertainment Co. Holdings Ltd. | 2,237,254 | 4,463,815 |
| NRW Holdings Ltd. | 689,838 | 957,919 |
| Nuix Ltd. * | 288,830 | 536,172 |
| OFX Group Ltd. | 320,264 | 386,207 |
| Omni Bridgeway Ltd. | 370,212 | 1,106,629 |
| oOh!media Ltd. * | 714,893 | 927,401 |
| Opthea Ltd. *(a) | 511,304 | 489,529 |
| Orocobre Ltd. * | 881,183 | 5,905,595 |
| Pact Group Holdings Ltd. | 318,559 | 931,275 |
| Paradigm Biopharmaceuticals Ltd. *(a) | 284,959 | 412,359 |
| Pendal Group Ltd. | 420,700 | 2,659,603 |
| Perenti Global Ltd. | 1,086,837 | 695,025 |
| Perseus Mining Ltd. * | 1,845,733 | 2,090,878 |
| Piedmont Lithium, Inc. *(a) | 2,219,043 | 1,297,430 |
| Pilbara Minerals Ltd. * | 3,890,551 | 6,340,802 |
| Pinnacle Investment Management Group Ltd. | 136,308 | 1,716,465 |
| PointsBet Holdings Ltd. * | 287,787 | 2,183,216 |
| PolyNovo Ltd. * | 897,289 | 1,462,397 |
| Premier Investments Ltd. | 122,991 | 2,557,313 |
| Pro Medicus Ltd. | 63,060 | 2,906,732 |
| Ramelius Resources Ltd. | 1,230,914 | 1,385,405 |
| Redbubble Ltd. * | 277,831 | 879,219 |
| Regis Healthcare Ltd. | 199,105 | 301,218 |
| Regis Resources Ltd. | 992,091 | 1,790,922 |
| Reliance Worldwide Corp., Ltd. | 1,193,077 | 5,109,687 |
| Resolute Mining Ltd. * | 1,704,956 | 579,421 |
| Rural Funds Group | 547,831 | 1,097,047 |
| Sandfire Resources Ltd. | 264,616 | 1,257,065 |
| SeaLink Travel Group Ltd. | 193,961 | 1,275,807 |
| Select Harvests Ltd. | 181,151 | 1,151,830 |
| Senex Energy Ltd. | 245,444 | 570,437 |
| Service Stream Ltd. | 625,196 | 386,101 |
| Seven West Media Ltd. * | 1,385,806 | 501,344 |
| SG Fleet Group Ltd. | 197,213 | 417,986 |
| Sigma Healthcare Ltd. | 1,522,141 | 717,535 |
| Silver Lake Resources Ltd. * | 1,234,168 | 1,240,238 |
| SmartGroup Corp., Ltd. | 126,335 | 738,655 |
| Southern Cross Media Group Ltd. * | 374,489 | 610,340 |
| St. Barbara Ltd. | 1,094,146 | 1,263,457 |
| Starpharma Holdings Ltd. * | 628,710 | 553,689 |
| Steadfast Group Ltd. | 1,323,878 | 4,828,105 |
| Super Retail Group Ltd. | 247,507 | 2,224,953 |
| Superloop Ltd. * | 585,520 | 421,508 |
| Syrah Resources Ltd. * | 750,580 | 710,387 |
| Tassal Group Ltd. | 328,789 | 860,258 |
| Technology One Ltd. | 224,761 | 1,622,954 |
| Telix Pharmaceuticals Ltd. * | 224,896 | 1,116,040 |
| Temple & Webster Group Ltd. * | 161,678 | 1,738,168 |
| Tyro Payments Ltd. * | 500,442 | 1,353,268 |
| United Malt Grp Ltd. | 409,068 | 1,348,343 |
| Uniti Group Ltd. * | 1,021,371 | 3,239,675 |
| Virgin Australia International Holdings Ltd. *(b) | 424,000 | — |
| Virtus Health Ltd. | 94,927 | 473,848 |
| Viva Energy Group Ltd. | 1,352,964 | 2,116,061 |
| Waypoint REIT | 1,204,635 | 2,456,337 |
| Webjet Ltd. * | 564,345 | 2,346,849 |
| West African Resources Ltd. * | 1,371,005 | 1,062,119 |
| Western Areas Ltd. | 478,985 | 1,081,704 |
| Westgold Resources Ltd. * | 468,965 | 606,655 |
| Zip Co., Ltd. *(a) | 703,326 | 3,510,796 |
| | | 247,894,077 |
| |
| Security | Number
of Shares | Value ($) |
| Austria 1.0% |
| Agrana Beteiligungs AG | 17,598 | 394,697 |
| AT&S Austria Technologie & Systemtechnik AG | 39,211 | 1,701,033 |
| BAWAG Group AG | 88,855 | 5,338,841 |
| CA Immobilien Anlagen AG | 64,447 | 2,803,416 |
| DO & Co. AG * | 9,724 | 769,072 |
| EVN AG | 54,737 | 1,457,052 |
| Flughafen Wien AG * | 14,555 | 482,798 |
| IMMOFINANZ AG * | 142,718 | 3,632,243 |
| Lenzing AG * | 20,121 | 2,660,204 |
| Mayr Melnhof Karton AG | 13,226 | 2,788,415 |
| Oesterreichische Post AG (a) | 50,137 | 2,299,306 |
| Palfinger AG | 14,663 | 661,201 |
| Porr AG * | 13,268 | 266,257 |
| S IMMO AG | 77,308 | 1,902,733 |
| Schoeller-Bleckmann Oilfield Equipment AG * | 16,958 | 634,573 |
| Strabag SE | 24,381 | 1,108,051 |
| UNIQA Insurance Group AG | 164,719 | 1,528,318 |
| Vienna Insurance Group AG Wiener Versicherung Gruppe | 57,880 | 1,677,364 |
| Wienerberger AG | 170,734 | 6,699,284 |
| | | 38,804,858 |
| |
| Belgium 1.6% |
| Aedifica S.A. | 54,567 | 8,025,932 |
| AGFA-Gevaert N.V. * | 247,606 | 1,261,216 |
| Barco N.V. | 103,286 | 2,533,579 |
| Befimmo S.A. | 33,063 | 1,360,168 |
| Bekaert S.A. | 53,112 | 2,527,904 |
| bpost S.A. * | 157,403 | 1,520,824 |
| Cie d'Entreprises CFE | 10,277 | 1,181,606 |
| Cofinimmo S.A. | 45,498 | 7,524,503 |
| D'Ieteren S.A. N.V. | 35,069 | 5,480,987 |
| Econocom Group S.A. N.V. | 185,808 | 787,420 |
| Euronav N.V. | 305,464 | 2,482,266 |
| Fagron | 93,537 | 1,957,670 |
| Gimv N.V. | 29,829 | 1,940,160 |
| KBC Ancora | 53,101 | 2,536,156 |
| Kinepolis Group N.V. * | 20,600 | 1,134,157 |
| Melexis N.V. | 30,946 | 3,660,325 |
| Mithra Pharmaceuticals S.A. *(a) | 32,120 | 792,445 |
| Montea C.V.A. | 18,660 | 2,766,614 |
| Ontex Group N.V. * | 116,905 | 1,302,724 |
| Orange Belgium S.A. | 23,149 | 544,885 |
| Retail Estates N.V. | 15,632 | 1,282,469 |
| Shurgard Self Storage S.A. | 38,574 | 2,308,607 |
| Tessenderlo Group S.A. * | 39,119 | 1,620,848 |
| Van de Velde N.V. | 8,386 | 257,380 |
| VGP N.V. | 11,663 | 2,781,051 |
| Xior Student Housing N.V. | 30,467 | 1,870,167 |
| | | 61,442,063 |
| |
| Canada 19.3% |
| Aecon Group, Inc. | 92,610 | 1,510,459 |
| Air Canada * | 248,945 | 4,828,585 |
| Alamos Gold, Inc., Class A | 593,197 | 4,675,537 |
| Algonquin Power & Utilities Corp. | 917,840 | 14,229,008 |
| Allied Properties Real Estate Investment Trust | 191,846 | 6,572,242 |
| AltaGas Ltd. | 424,467 | 8,488,332 |
| ARC Resources Ltd. | 1,015,321 | 7,239,380 |
| Artis Real Estate Investment Trust | 161,007 | 1,469,086 |
| Atco Ltd., Class I | 113,635 | 3,817,359 |
Schwab International Equity ETFs | Annual Report
Schwab International Small-Cap Equity ETF
Portfolio Holdings as of August 31, 2021 (continued)
| Security | Number
of Shares | Value ($) |
| ATS Automation Tooling Systems, Inc. * | 114,065 | 4,117,948 |
| Aurora Cannabis, Inc. *(a) | 299,600 | 2,219,171 |
| B2Gold Corp. | 1,588,996 | 6,136,431 |
| Ballard Power Systems, Inc. * | 385,028 | 6,477,818 |
| BlackBerry Ltd. * | 781,459 | 8,892,795 |
| Boardwalk Real Estate Investment Trust | 62,457 | 2,327,464 |
| Bombardier, Inc., B Shares * | 3,196,116 | 4,653,863 |
| Boralex, Inc., Class A | 122,800 | 3,757,904 |
| Boyd Group Services, Inc. | 32,430 | 6,320,725 |
| Brookfield Infrastructure Corp., Class A (a) | 54,775 | 3,478,569 |
| Brookfield Renewable Corp., Class A | 195,593 | 8,558,016 |
| BRP, Inc. | 59,336 | 4,963,723 |
| CAE, Inc. * | 438,742 | 12,648,574 |
| Cameco Corp. | 605,868 | 11,176,183 |
| Canada Goose Holdings, Inc. * | 80,394 | 3,079,230 |
| Canadian Apartment Properties REIT | 259,975 | 12,572,368 |
| Canadian Western Bank | 128,373 | 3,756,763 |
| Canfor Corp. * | 95,083 | 2,037,627 |
| Capital Power Corp. | 163,628 | 5,618,501 |
| Cargojet, Inc. | 25,402 | 4,206,361 |
| Cascades, Inc. | 146,936 | 1,823,255 |
| CCL Industries, Inc., Class B | 224,825 | 12,813,593 |
| Celestica, Inc. * | 166,505 | 1,577,229 |
| Centerra Gold, Inc. | 334,605 | 2,496,993 |
| Chartwell Retirement Residences | 331,995 | 3,383,924 |
| Choice Properties Real Estate Investment Trust | 389,670 | 4,600,860 |
| CI Financial Corp. | 286,724 | 5,556,816 |
| Cogeco Communications, Inc. | 16,352 | 1,501,203 |
| Colliers International Group, Inc. | 48,458 | 6,737,681 |
| Cominar Real Estate Investment Trust | 253,475 | 2,182,414 |
| Crescent Point Energy Corp. | 801,339 | 2,872,683 |
| Cronos Group, Inc. *(a) | 301,112 | 1,987,318 |
| Dream Office Real Estate Investment Trust | 53,686 | 990,747 |
| Dye & Durham Ltd. | 57,263 | 2,159,739 |
| ECN Capital Corp. | 338,617 | 2,746,666 |
| Eldorado Gold Corp. * | 267,282 | 2,339,365 |
| Element Fleet Management Corp. | 665,011 | 7,320,305 |
| Emera, Inc. | 388,576 | 18,314,871 |
| Empire Co., Ltd., A Shares | 252,595 | 8,155,641 |
| Endeavour Mining plc | 285,751 | 6,971,632 |
| Enerplus Corp. | 387,767 | 2,289,195 |
| Enghouse Systems Ltd. | 65,606 | 3,168,547 |
| Equinox Gold Corp. * | 375,316 | 2,696,846 |
| Finning International, Inc. | 246,044 | 6,394,243 |
| First Capital Real Estate Investment Trust | 330,567 | 4,713,977 |
| First Majestic Silver Corp. (a) | 331,933 | 4,268,517 |
| First National Financial Corp. | 26,776 | 981,494 |
| First Quantum Minerals Ltd. | 846,793 | 17,610,668 |
| FirstService Corp. | 57,312 | 10,627,427 |
| GFL Environmental, Inc. | 178,179 | 6,267,603 |
| Gibson Energy, Inc. | 219,763 | 3,958,221 |
| Gildan Activewear, Inc. | 297,077 | 11,402,077 |
| Granite Real Estate Investment Trust | 88,093 | 6,349,472 |
| Great Canadian Gaming Corp. * | 88,307 | 3,078,323 |
| H&R Real Estate Investment Trust | 428,450 | 5,628,354 |
| Home Capital Group, Inc. * | 79,097 | 2,475,596 |
| Hudbay Minerals, Inc. | 329,977 | 2,015,924 |
| IA Financial Corp., Inc. | 162,872 | 9,017,153 |
| IAMGOLD Corp. * | 708,726 | 1,682,569 |
| Innergex Renewable Energy, Inc. | 202,022 | 3,215,022 |
| Inter Pipeline Ltd. | 654,791 | 10,363,487 |
| Ivanhoe Mines Ltd., Class A * | 849,465 | 6,843,314 |
| Keyera Corp. | 332,339 | 7,989,917 |
| Kinaxis, Inc. * | 40,451 | 6,552,060 |
| Kinross Gold Corp. | 1,925,573 | 11,565,781 |
| Kirkland Lake Gold Ltd. | 408,171 | 16,250,610 |
| Laurentian Bank of Canada | 65,699 | 2,209,117 |
| Security | Number
of Shares | Value ($) |
| Lightspeed Commerce, Inc. * | 131,348 | 14,558,304 |
| Linamar Corp. | 68,310 | 3,864,044 |
| Lundin Mining Corp. | 981,149 | 7,919,693 |
| Maple Leaf Foods, Inc. | 113,100 | 2,463,112 |
| Martinrea International, Inc. | 116,858 | 1,117,117 |
| MEG Energy Corp. * | 461,971 | 2,939,300 |
| Methanex Corp. | 92,602 | 3,388,530 |
| Mullen Group Ltd. | 139,891 | 1,466,827 |
| NFI Group, Inc. | 97,960 | 2,358,203 |
| Northland Power, Inc. | 342,455 | 11,311,733 |
| NOVAGOLD RESOURCES, Inc. * | 353,597 | 2,549,178 |
| OceanaGold Corp. * | 1,075,826 | 2,009,219 |
| Onex Corp. | 117,068 | 8,189,618 |
| Open Text Corp. | 415,054 | 22,732,471 |
| Osisko Gold Royalties Ltd. | 252,896 | 3,084,024 |
| Pan American Silver Corp. | 317,351 | 8,227,293 |
| Parex Resources, Inc. * | 189,892 | 2,921,300 |
| Parkland Corp. | 225,901 | 6,734,215 |
| PrairieSky Royalty Ltd. | 299,667 | 3,282,073 |
| Premium Brands Holdings Corp. | 55,104 | 5,870,376 |
| Pretium Resources, Inc. * | 288,711 | 2,922,181 |
| Primo Water Corp. | 234,051 | 4,152,592 |
| Quebecor, Inc., Class B | 256,006 | 6,377,612 |
| RioCan Real Estate Investment Trust | 483,646 | 8,577,143 |
| Ritchie Bros. Auctioneers, Inc. | 168,024 | 10,511,057 |
| Russel Metals, Inc. | 93,884 | 2,548,349 |
| SmartCentres Real Estate Investment Trust | 197,719 | 4,773,796 |
| SNC-Lavalin Group, Inc. | 266,255 | 7,197,619 |
| SSR Mining, Inc. | 336,006 | 5,605,196 |
| Stantec, Inc. | 169,653 | 8,174,867 |
| Stella-Jones, Inc. | 98,638 | 3,367,422 |
| Superior Plus Corp. | 223,114 | 2,620,197 |
| TFI International, Inc. | 135,372 | 15,271,063 |
| The Descartes Systems Group, Inc. * | 128,893 | 10,088,875 |
| The North West Co., Inc. | 72,207 | 2,046,241 |
| TMX Group Ltd. | 85,593 | 9,401,581 |
| Torex Gold Resources, Inc. * | 128,970 | 1,439,067 |
| Toromont Industries Ltd. | 123,407 | 10,359,684 |
| Tourmaline Oil Corp. | 421,814 | 11,262,616 |
| TransAlta Corp. | 357,209 | 3,493,929 |
| TransAlta Renewables, Inc. | 160,939 | 2,501,359 |
| Transcontinental, Inc., Class A | 110,584 | 2,137,033 |
| Turquoise Hill Resources Ltd. * | 150,056 | 2,246,714 |
| Vermilion Energy, Inc. * | 233,140 | 1,553,467 |
| West Fraser Timber Co., Ltd. | 171,724 | 13,238,913 |
| Westshore Terminals Investment Corp. | 59,432 | 1,056,809 |
| Whitecap Resources, Inc. | 436,619 | 1,869,275 |
| Winpak Ltd. | 46,907 | 1,588,747 |
| WSP Global, Inc. | 172,592 | 22,499,173 |
| Yamana Gold, Inc. | 1,463,895 | 6,452,653 |
| | | 738,300,331 |
| |
| Denmark 1.8% |
| ALK-Abello A/S * | 10,041 | 4,905,863 |
| Alm Brand A/S (a) | 100,444 | 790,816 |
| Bavarian Nordic A/S * | 98,326 | 4,821,210 |
| Chemometec A/S | 15,410 | 2,441,198 |
| D/S Norden A/S | 36,826 | 952,822 |
| Dfds A/S * | 44,901 | 2,565,833 |
| FLSmidth & Co. A/S | 77,601 | 2,812,179 |
| ISS A/S * | 281,228 | 6,452,774 |
| Jyske Bank A/S * | 86,900 | 3,797,482 |
| Netcompany Group A/S | 49,716 | 6,415,884 |
| Nilfisk Holding A/S * | 42,297 | 1,564,355 |
| NKT A/S * | 65,092 | 2,928,176 |
| Ringkjoebing Landbobank A/S | 43,953 | 5,211,694 |
Schwab International Equity ETFs | Annual Report
Schwab International Small-Cap Equity ETF
Portfolio Holdings as of August 31, 2021 (continued)
| Security | Number
of Shares | Value ($) |
| Royal Unibrew A/S | 74,035 | 9,558,969 |
| Scandinavian Tobacco Group A/S, Class A | 95,095 | 1,929,116 |
| Schouw & Co. A/S | 19,292 | 2,091,548 |
| Spar Nord Bank A/S | 125,153 | 1,442,274 |
| Sydbank A/S | 90,508 | 2,649,218 |
| The Drilling Co. of 1972 A/S * | 31,759 | 1,165,533 |
| Topdanmark A/S | 63,914 | 3,364,188 |
| Zealand Pharma A/S * | 66,546 | 2,049,243 |
| | | 69,910,375 |
| |
| Finland 1.4% |
| Cargotec Oyj, B Shares | 73,493 | 4,077,474 |
| Citycon Oyj | 113,358 | 1,008,284 |
| F-Secure Oyj | 141,109 | 797,880 |
| Finnair Oyj * | 870,525 | 678,840 |
| Kemira Oyj | 134,338 | 2,266,097 |
| Konecranes Oyj | 109,871 | 4,971,292 |
| Metsa Board Oyj | 264,034 | 2,758,357 |
| Neles Oyj | 163,038 | 2,521,201 |
| Oriola Oyj, B Shares | 191,426 | 435,216 |
| Outokumpu Oyj * | 467,752 | 3,241,165 |
| QT Group Oyj * | 29,022 | 5,323,849 |
| Raisio Oyj, V Shares | 170,833 | 751,183 |
| Revenio Group Oyj | 35,026 | 2,681,315 |
| Sanoma Oyj | 111,194 | 2,042,388 |
| Terveystalo Oyj | 95,579 | 1,405,814 |
| TietoEVRY Oyj | 128,370 | 4,570,274 |
| Uponor Oyj | 82,803 | 2,660,612 |
| Valmet Oyj | 202,938 | 8,135,391 |
| YIT Oyj | 251,726 | 1,524,379 |
| | | 51,851,011 |
| |
| France 2.7% |
| Air France-KLM *(a) | 426,437 | 1,985,863 |
| Akka Technologies * | 19,217 | 1,066,181 |
| AKWEL | 11,754 | 321,900 |
| Albioma S.A. | 40,522 | 1,791,868 |
| Alten S.A. | 43,520 | 7,166,555 |
| Beneteau S.A. * | 54,370 | 839,488 |
| Bonduelle S.C.A. | 22,383 | 605,064 |
| Carmila S.A. | 58,759 | 822,634 |
| CGG S.A. * | 1,189,129 | 921,112 |
| Coface S.A. * | 155,904 | 1,915,823 |
| Compagnie de L'Odet S.A. | 610 | 918,095 |
| Derichebourg S.A. * | 146,214 | 1,725,982 |
| Elior Group S.A. * | 150,096 | 1,046,252 |
| Elis S.A. * | 337,426 | 5,966,748 |
| Eramet S.A. * | 13,736 | 1,114,757 |
| Eutelsat Communications S.A. | 276,229 | 3,189,659 |
| Fnac Darty S.A. | 25,642 | 1,746,526 |
| Gaztransport Et Technigaz S.A. | 39,545 | 3,293,335 |
| GL Events * | 19,298 | 347,628 |
| Guerbet | 7,349 | 299,292 |
| Interparfums S.A. | 23,519 | 1,671,332 |
| IPSOS | 58,221 | 2,817,805 |
| Jacquet Metals SACA | 20,215 | 479,642 |
| Korian S.A. | 100,715 | 3,904,313 |
| Lagardere S.C.A. * | 175,255 | 4,840,984 |
| LISI | 24,375 | 805,657 |
| Maisons du Monde S.A. | 66,324 | 1,528,262 |
| Manitou BF S.A. | 17,884 | 643,890 |
| Mercialys S.A. | 93,500 | 1,094,339 |
| Mersen S.A. | 21,901 | 851,857 |
| Metropole Television S.A. | 98,481 | 2,094,858 |
| Nexans S.A. | 45,373 | 4,539,255 |
| Nexity S.A. | 64,223 | 3,309,952 |
| Security | Number
of Shares | Value ($) |
| PEUGEOT INVEST | 7,648 | 1,038,229 |
| Pharmagest Interactive | 5,741 | 653,977 |
| Quadient S.A. | 52,616 | 1,491,895 |
| Rallye S.A. *(a) | 35,644 | 255,822 |
| Robertet S.A. | 1,054 | 1,298,938 |
| Rothschild & Co. | 43,603 | 1,724,283 |
| SES S.A. | 577,005 | 4,814,193 |
| SMCP S.A. * | 38,045 | 222,485 |
| Societe BIC S.A. | 38,473 | 2,559,159 |
| Solutions 30 SE *(a) | 130,844 | 1,432,568 |
| Sopra Steria Group S.A. | 21,637 | 4,403,335 |
| SPIE S.A. | 188,113 | 4,458,922 |
| Tarkett S.A. *(a) | 13,909 | 334,945 |
| Television Francaise 1 S.A. | 162,807 | 1,632,615 |
| Trigano S.A. | 12,188 | 2,535,045 |
| Vallourec S.A. *(a) | 61,540 | 567,720 |
| Verallia S.A. | 82,822 | 3,015,140 |
| Vicat S.A. | 22,724 | 1,130,654 |
| Vilmorin & Cie S.A. | 9,239 | 597,658 |
| Virbac S.A. | 6,677 | 2,821,706 |
| Voltalia S.A. * | 43,166 | 1,212,736 |
| X-Fab Silicon Foundries SE * | 84,464 | 889,373 |
| | | 104,758,306 |
| |
| Germany 4.3% |
| Aareal Bank AG | 91,119 | 2,409,375 |
| ADLER Group S.A. | 140,191 | 3,723,489 |
| AIXTRON SE | 160,279 | 4,622,186 |
| alstria Office REIT-AG | 270,213 | 5,499,091 |
| Atoss Software AG | 5,936 | 1,273,899 |
| Aurubis AG | 53,582 | 4,546,470 |
| BayWa AG | 20,881 | 907,082 |
| Befesa S.A. | 60,666 | 4,919,823 |
| Bertrandt AG | 7,844 | 446,768 |
| Bilfinger SE | 41,808 | 1,465,761 |
| CANCOM SE | 55,442 | 3,646,678 |
| CECONOMY AG * | 266,600 | 1,249,390 |
| CompuGroup Medical SE & Co. KgaA | 37,957 | 3,539,699 |
| Corestate Capital Holding S.A. *(a) | 17,804 | 275,529 |
| CropEnergies AG | 27,077 | 327,301 |
| Dermapharm Holding SE | 26,205 | 2,431,387 |
| Deutsche Beteiligungs AG | 20,931 | 915,431 |
| Deutsche Euroshop AG | 77,473 | 1,789,734 |
| Deutsche Pfandbriefbank AG | 191,101 | 2,190,882 |
| Deutz AG * | 188,257 | 1,720,044 |
| DIC Asset AG | 78,966 | 1,448,567 |
| Draegerwerk AG & Co., KGaA | 4,451 | 377,776 |
| Duerr AG | 74,157 | 3,648,608 |
| ElringKlinger AG * | 44,590 | 724,801 |
| Encavis AG (a) | 145,973 | 2,651,908 |
| Freenet AG | 192,535 | 4,750,107 |
| Gerresheimer AG | 48,622 | 5,162,753 |
| Global Fashion Group S.A. * | 160,996 | 2,050,614 |
| Grand City Properties S.A. | 150,431 | 4,123,319 |
| GRENKE AG (a) | 39,799 | 1,772,112 |
| Hamburger Hafen und Logistik AG | 37,143 | 818,156 |
| Hensoldt AG | 44,742 | 758,433 |
| Hornbach Baumarkt AG | 11,886 | 474,242 |
| Hornbach Holding AG & Co. KGaA | 12,673 | 1,353,865 |
| HUGO BOSS AG | 78,574 | 4,383,489 |
| Hypoport SE * | 6,147 | 4,244,890 |
| Indus Holding AG | 30,756 | 1,239,847 |
| Instone Real Estate Group AG | 70,574 | 2,241,013 |
| Jenoptik AG | 78,756 | 2,842,945 |
| K+S AG * | 294,028 | 4,189,318 |
| Kloeckner & Co. SE * | 108,743 | 1,464,652 |
| Koenig & Bauer AG * | 21,900 | 753,581 |
Schwab International Equity ETFs | Annual Report
Schwab International Small-Cap Equity ETF
Portfolio Holdings as of August 31, 2021 (continued)
| Security | Number
of Shares | Value ($) |
| Krones AG | 21,917 | 2,218,516 |
| KWS Saat SE & Co. KGaA | 15,308 | 1,281,186 |
| MorphoSys AG * | 50,692 | 2,938,112 |
| New Work SE | 4,271 | 1,237,737 |
| Nordex SE * | 155,213 | 2,907,719 |
| Norma Group SE | 48,640 | 2,454,005 |
| PATRIZIA AG | 66,405 | 1,626,546 |
| Pfeiffer Vacuum Technology AG | 10,121 | 2,119,456 |
| S&T AG (a) | 75,089 | 1,722,251 |
| Salzgitter AG * | 57,963 | 2,178,569 |
| Secunet Security Networks AG | 2,021 | 1,120,081 |
| SGL Carbon SE * | 72,132 | 801,244 |
| Shop Apotheke Europe N.V. * | 10,900 | 1,941,615 |
| Siltronic AG | 31,702 | 5,184,480 |
| Sixt SE * | 19,718 | 2,648,820 |
| SMA Solar Technology AG | 13,192 | 631,309 |
| Software AG | 74,947 | 3,797,181 |
| Stabilus S.A. | 36,984 | 2,907,605 |
| STRATEC SE | 10,769 | 1,782,259 |
| Stroeer SE & CO. KGaA | 37,353 | 3,073,305 |
| Suedzucker AG | 117,748 | 2,008,486 |
| TAG Immobilien AG | 191,820 | 6,491,857 |
| Takkt AG | 48,862 | 814,429 |
| TLG Immobilien AG | 10,933 | 395,564 |
| VERBIO Vereinigte BioEnergie AG | 30,090 | 1,822,162 |
| Vossloh AG | 12,937 | 733,031 |
| Wacker Neuson SE | 38,290 | 1,158,913 |
| Washtec AG | 15,534 | 1,091,057 |
| Wuestenrot & Wuerttembergische AG | 29,610 | 651,526 |
| Zeal Network SE | 23,077 | 1,163,201 |
| zooplus AG * | 9,362 | 4,405,075 |
| | | 164,682,312 |
| |
| Hong Kong 1.0% |
| Apollo Future Mobility Group Ltd. * | 6,748,376 | 420,833 |
| Asia Cement China Holdings Corp. | 647,246 | 477,694 |
| AsiaInfo Technologies Ltd. | 561,973 | 923,453 |
| Beijing Tong Ren Tang Chinese Medicine Co., Ltd. | 378,128 | 521,197 |
| C-Mer Eye Care Holdings Ltd. | 597,133 | 600,408 |
| Canvest Environmental Protection Group Co., Ltd. | 1,036,331 | 575,639 |
| China Animal Healthcare Ltd. *(b) | 192,752 | — |
| Chinese Estates Holdings Ltd. | 783,376 | 284,045 |
| Chow Sang Sang Holdings International Ltd. | 369,488 | 561,547 |
| CITIC Telecom International Holdings Ltd. | 2,091,832 | 726,204 |
| CMBC Capital Holdings Ltd. | 25,081,371 | 345,067 |
| Cosmopolitan International Holdings Ltd. * | 2,660,315 | 383,106 |
| Crystal International Group Ltd. | 877,302 | 358,711 |
| Digital Domain Holdings Ltd. * | 34,266,491 | 268,762 |
| Dynam Japan Holdings Co., Ltd. | 463,160 | 457,958 |
| Esprit Holdings Ltd. * | 4,229,984 | 435,108 |
| Everest Medicines Ltd. * | 149,696 | 923,889 |
| Far East Consortium International Ltd. | 1,616,026 | 585,957 |
| Fortune Real Estate Investment Trust | 1,995,973 | 2,155,769 |
| Frontage Holdings Corp. * | 895,686 | 602,318 |
| GCL New Energy Holdings Ltd. * | 11,979,128 | 539,090 |
| Giordano International Ltd. | 1,885,379 | 402,416 |
| Glory Sun Financial Group Ltd. * | 25,551,963 | 762,220 |
| Great Eagle Holdings Ltd. | 340,375 | 1,067,864 |
| HKBN Ltd. | 1,217,588 | 1,415,263 |
| Hong Kong Television Network Ltd. * | 835,089 | 1,123,137 |
| IGG, Inc. | 1,246,560 | 1,194,092 |
| IMAX China Holding, Inc. | 146,832 | 213,715 |
| K Wah International Holdings Ltd. | 1,927,360 | 845,056 |
| Lee's Pharmaceutical Holdings Ltd. | 391,569 | 203,403 |
| Security | Number
of Shares | Value ($) |
| Luk Fook Holdings International Ltd. | 524,953 | 1,457,950 |
| MH Development Ltd. *(b) | 459,925 | — |
| Pacific Basin Shipping Ltd. | 6,618,684 | 3,616,837 |
| Pacific Textiles Holdings Ltd. | 706,997 | 377,254 |
| Pou Sheng International Holdings Ltd. * | 3,031,646 | 611,993 |
| Prosperity REIT | 1,847,749 | 729,373 |
| Razer, Inc. * | 5,748,289 | 1,463,431 |
| Road King Infrastructure Ltd. | 387,744 | 440,723 |
| Sa Sa International Holdings Ltd. * | 1,664,436 | 359,538 |
| SmarTone Telecommunications Holdings Ltd. | 511,915 | 288,297 |
| Stella International Holdings Ltd. * | 630,500 | 847,979 |
| Sun Hung Kai & Co., Ltd. | 846,809 | 463,835 |
| SUNeVision Holdings Ltd. | 889,102 | 940,849 |
| Sunlight Real Estate Investment Trust | 1,647,380 | 1,010,370 |
| Superb Summit International Group Ltd. *(b) | 1,120,000 | — |
| Television Broadcasts Ltd. * | 446,100 | 379,142 |
| Texhong Textile Group Ltd. | 433,857 | 662,722 |
| Texwinca Holdings Ltd. | 906,462 | 195,807 |
| The United Laboratories International Holdings Ltd. | 803,487 | 542,384 |
| Truly International Holdings Ltd. * | 2,412,371 | 908,825 |
| Value Partners Group Ltd. | 1,393,823 | 761,667 |
| Vobile Group Ltd. * | 1,911,278 | 1,919,302 |
| VPower Group International Holdings Ltd. | 1,298,017 | 293,739 |
| VSTECS Holdings Ltd. | 975,769 | 919,643 |
| Xiabuxiabu Catering Management China Holdings Co., Ltd. * | 738,372 | 652,229 |
| | | 39,217,810 |
| |
| Ireland 0.4% |
| Bank of Ireland Group plc * | 1,393,927 | 8,763,722 |
| Cairn Homes plc * | 1,050,767 | 1,411,549 |
| Dalata Hotel Group plc * | 346,033 | 1,544,033 |
| Hibernia REIT plc | 1,033,766 | 1,547,351 |
| Irish Continental Group plc * | 242,544 | 1,225,411 |
| | | 14,492,066 |
| |
| Israel 0.8% |
| AFI Properties Ltd. * | 24,036 | 1,228,897 |
| Allot Ltd. * | 49,900 | 822,542 |
| AudioCodes Ltd. | 35,676 | 1,158,113 |
| Brack Capital Properties N.V. * | 3,788 | 454,306 |
| Cellcom Israel Ltd. * | 137,027 | 517,099 |
| Clal Insurance Enterprises Holdings Ltd. * | 71,997 | 1,512,415 |
| Compugen Ltd. * | 123,219 | 844,985 |
| Danel Adir Yeoshua Ltd. | 6,788 | 1,376,987 |
| Delek Automotive Systems Ltd. | 75,105 | 997,962 |
| Delek Group Ltd. * | 11,557 | 643,549 |
| Delta Galil Industries Ltd. | 13,190 | 683,842 |
| Equital Ltd. * | 23,988 | 665,187 |
| FIBI Holdings Ltd. * | 25,362 | 1,051,291 |
| Formula Systems 1985 Ltd. | 11,999 | 1,194,750 |
| Fox Wizel Ltd. | 10,375 | 1,376,317 |
| Gilat Satellite Networks Ltd. | 39,484 | 396,103 |
| Hilan Ltd. | 20,349 | 1,151,549 |
| IDI Insurance Co., Ltd. | 11,861 | 425,756 |
| Isracard Ltd. | 280,329 | 1,164,629 |
| Kamada Ltd. * | 50,284 | 269,803 |
| Kenon Holdings Ltd. | 23,752 | 931,916 |
| Matrix IT Ltd. | 49,573 | 1,354,853 |
| Mega Or Holdings Ltd. | 29,418 | 1,103,720 |
| Menora Mivtachim Holdings Ltd. | 33,905 | 751,916 |
Schwab International Equity ETFs | Annual Report
Schwab International Small-Cap Equity ETF
Portfolio Holdings as of August 31, 2021 (continued)
| Security | Number
of Shares | Value ($) |
| Migdal Insurance & Financial Holding Ltd. * | 497,802 | 702,633 |
| Naphtha Israel Petroleum Corp., Ltd. * | 51,792 | 237,803 |
| Oil Refineries Ltd. * | 2,345,569 | 512,493 |
| Partner Communications Co., Ltd. * | 155,313 | 736,873 |
| Rami Levy Chain Stores Hashikma Marketing 2006 Ltd. | 11,970 | 840,655 |
| Reit 1 Ltd. | 265,053 | 1,551,227 |
| Sella Capital Real Estate Ltd. | 302,133 | 875,160 |
| Summit Real Estate Holdings Ltd. * | 60,823 | 959,689 |
| The Israel Corp., Ltd. * | 5,709 | 1,734,752 |
| | | 30,229,772 |
| |
| Italy 2.9% |
| ACEA S.p.A. | 65,640 | 1,566,741 |
| Anima Holding S.p.A. | 398,082 | 2,051,652 |
| Arnoldo Mondadori Editore S.p.A. * | 187,220 | 412,835 |
| Autogrill S.p.A. * | 281,965 | 2,113,568 |
| Azimut Holding S.p.A. | 185,202 | 5,198,821 |
| Banca Generali S.p.A. * | 83,742 | 3,720,834 |
| Banca IFIS S.p.A. | 42,166 | 731,690 |
| Banca Monte dei Paschi di Siena S.p.A. *(a) | 403,995 | 536,746 |
| Banca Popolare di Sondrio Scarl | 693,656 | 3,154,117 |
| Banco BPM S.p.A. | 2,302,579 | 7,632,363 |
| BFF Bank S.p.A. | 277,640 | 2,536,707 |
| Biesse S.p.A. * | 21,052 | 754,968 |
| BPER Banca | 1,583,091 | 3,443,188 |
| Brembo S.p.A. | 220,123 | 3,180,491 |
| Brunello Cucinelli S.p.A. * | 50,876 | 2,996,822 |
| Carel Industries S.p.A. | 66,583 | 1,913,858 |
| Cementir Holding N.V. | 70,515 | 798,266 |
| Cerved Group S.p.A. * | 290,533 | 3,388,440 |
| CIR SpA-Compagnie Industriali * | 1,314,495 | 757,227 |
| Credito Emiliano S.p.A. | 109,728 | 735,721 |
| Danieli & C Officine Meccaniche S.p.A. | 18,428 | 537,307 |
| Datalogic S.p.A. | 28,947 | 692,977 |
| De'Longhi S.p.A. | 99,210 | 4,485,404 |
| doValue S.p.A. | 86,756 | 1,085,557 |
| Enav S.p.A. * | 386,284 | 1,684,422 |
| ERG S.p.A. | 86,594 | 2,551,407 |
| Falck Renewables S.p.A. | 170,560 | 1,405,335 |
| Fincantieri S.p.A. *(a) | 709,339 | 619,212 |
| Gruppo MutuiOnline S.p.A. | 25,370 | 1,530,343 |
| GVS S.p.A. | 104,814 | 2,001,913 |
| Immobiliare Grande Distribuzione SIIQ S.p.A. * | 100,856 | 471,459 |
| Interpump Group S.p.A. | 122,119 | 8,678,149 |
| Iren S.p.A. | 949,697 | 2,934,959 |
| Italmobiliare S.p.A. | 21,691 | 786,078 |
| Juventus Football Club S.p.A. *(a) | 747,972 | 668,388 |
| Maire Tecnimont S.p.A. (a) | 239,519 | 933,042 |
| MARR S.p.A. * | 49,106 | 1,188,327 |
| Mediaset S.p.A. | 412,201 | 1,284,578 |
| Piaggio & C S.p.A. | 255,323 | 966,878 |
| RAI Way S.p.A. | 135,437 | 823,364 |
| Reply S.p.A. | 34,256 | 6,910,764 |
| Saipem S.p.A. *(a) | 825,428 | 1,955,573 |
| Salvatore Ferragamo S.p.A. * | 102,070 | 2,083,246 |
| Saras S.p.A. * | 832,772 | 690,884 |
| Sesa S.p.A. * | 9,909 | 1,974,466 |
| Societa Cattolica Di Assicurazione S.p.A. * | 188,581 | 1,564,951 |
| SOL S.p.A. | 55,175 | 1,263,547 |
| Tamburi Investment Partners S.p.A. | 157,905 | 1,720,462 |
| Technogym S.p.A. | 182,467 | 2,156,085 |
| Tinexta S.p.A. | 30,635 | 1,417,592 |
| Tod's S.p.A. * | 12,866 | 702,581 |
| Security | Number
of Shares | Value ($) |
| Unipol Gruppo S.p.A. | 744,303 | 4,412,390 |
| Webuild S.p.A (a) | 491,736 | 1,313,022 |
| Zignago Vetro S.p.A. | 49,428 | 1,059,586 |
| | | 112,179,303 |
| |
| Japan 17.5% |
| Achilles Corp. | 20,181 | 243,399 |
| Adastria Co., Ltd. | 40,655 | 664,631 |
| ADEKA Corp. | 150,146 | 3,285,554 |
| Advan Co., Ltd. | 28,637 | 236,947 |
| Aeon Delight Co., Ltd. | 26,762 | 867,219 |
| Aeon Hokkaido Corp. | 79,029 | 830,862 |
| AEON REIT Investment Corp. | 2,373 | 3,261,633 |
| Ai Holdings Corp. | 52,145 | 1,060,367 |
| Aichi Corp. | 33,759 | 227,703 |
| Aichi Steel Corp. | 18,407 | 470,814 |
| Aida Engineering Ltd. | 80,941 | 783,918 |
| Aiful Corp. | 451,042 | 1,441,068 |
| Aiphone Co., Ltd. | 19,095 | 381,344 |
| Airtrip Corp. | 16,598 | 443,278 |
| Aisan Industry Co., Ltd. | 50,777 | 391,481 |
| Akatsuki, Inc. | 8,465 | 248,880 |
| Alconix Corp. | 28,490 | 412,594 |
| Alpen Co., Ltd. | 22,237 | 703,382 |
| Alpha Systems, Inc. | 9,807 | 352,163 |
| Amuse, Inc. | 15,425 | 331,358 |
| Anest Iwata Corp. | 50,784 | 471,506 |
| Anicom Holdings, Inc. | 118,936 | 958,114 |
| AOKI Holdings, Inc. | 59,126 | 337,448 |
| Aoyama Trading Co., Ltd. * | 64,039 | 376,563 |
| Arakawa Chemical Industries Ltd. | 24,239 | 278,221 |
| Arata Corp. | 18,445 | 748,814 |
| Arcland Sakamoto Co., Ltd. | 40,370 | 563,328 |
| Arcland Service Holdings Co., Ltd. | 21,690 | 437,512 |
| Arcs Co., Ltd. | 51,009 | 1,041,910 |
| Argo Graphics, Inc. | 24,118 | 720,071 |
| ARTERIA Networks Corp. | 40,552 | 662,209 |
| Aruhi Corp. | 49,326 | 602,095 |
| Asahi Co., Ltd. | 20,098 | 244,410 |
| Asahi Diamond Industrial Co., Ltd. | 81,438 | 384,729 |
| Asahi Holdings, Inc. | 111,083 | 2,251,792 |
| ASKA Pharmaceutical Holdings Co., Ltd. | 30,271 | 280,226 |
| Atom Corp. | 169,846 | 1,219,812 |
| Atrae, Inc. * | 25,508 | 635,726 |
| Autobacs Seven Co., Ltd. | 91,551 | 1,279,181 |
| Avex, Inc. | 44,539 | 608,935 |
| Axial Retailing, Inc. | 20,182 | 731,152 |
| Bando Chemical Industries Ltd. | 68,635 | 577,269 |
| Bank of the Ryukyus Ltd. | 58,118 | 424,802 |
| Base Co., Ltd. | 12,293 | 568,437 |
| Belc Co., Ltd. | 13,754 | 726,135 |
| Bell System24 Holdings, Inc. | 49,781 | 723,197 |
| Belluna Co., Ltd. | 70,103 | 524,528 |
| BeNext-Yumeshin Group Co. | 89,310 | 973,907 |
| BML, Inc. | 31,289 | 1,267,395 |
| BrainPad, Inc. * | 7,416 | 357,097 |
| Broadleaf Co., Ltd. | 123,497 | 590,169 |
| BRONCO BILLY Co., Ltd. | 13,325 | 292,553 |
| Bunka Shutter Co., Ltd. | 80,561 | 855,035 |
| Canon Electronics, Inc. | 28,889 | 419,950 |
| Cawachi Ltd. | 17,829 | 373,263 |
| Central Glass Co., Ltd. | 58,137 | 1,174,806 |
| Central Security Patrols Co., Ltd. | 10,852 | 262,756 |
| Change, Inc. *(a) | 46,921 | 1,052,797 |
| Chilled & Frozen Logistics Holdings Co., Ltd. | 32,496 | 519,120 |
| Chiyoda Co., Ltd. | 36,371 | 263,860 |
Schwab International Equity ETFs | Annual Report
Schwab International Small-Cap Equity ETF
Portfolio Holdings as of August 31, 2021 (continued)
| Security | Number
of Shares | Value ($) |
| Chiyoda Corp. * | 224,818 | 763,309 |
| Chiyoda Integre Co., Ltd. | 16,280 | 284,967 |
| Chofu Seisakusho Co., Ltd. | 30,064 | 553,609 |
| Chori Co., Ltd. | 16,983 | 283,823 |
| Chubu Shiryo Co., Ltd. | 40,600 | 415,756 |
| Chudenko Corp. | 37,751 | 785,878 |
| Chugoku Marine Paints Ltd. | 72,066 | 593,662 |
| Chuo Spring Co., Ltd. | 22,950 | 232,090 |
| CI Takiron Corp. | 61,649 | 352,408 |
| Citizen Watch Co., Ltd. | 399,458 | 1,748,947 |
| CKD Corp. | 89,617 | 1,881,908 |
| CMK Corp. * | 68,012 | 260,013 |
| Cocokara fine, Inc. (a) | 32,584 | 2,568,518 |
| COLOPL, Inc. | 73,244 | 555,364 |
| Colowide Co., Ltd. (a) | 84,767 | 1,351,056 |
| Comforia Residential REIT, Inc. | 984 | 3,161,770 |
| Computer Engineering & Consulting Ltd. | 36,946 | 524,629 |
| Comture Corp. | 33,194 | 904,330 |
| CONEXIO Corp. | 24,133 | 334,998 |
| Cosel Co., Ltd. | 28,287 | 263,919 |
| CRE Logistics REIT, Inc. | 691 | 1,431,564 |
| Create Restaurants Holdings, Inc. *(a) | 132,952 | 1,003,251 |
| Create SD Holdings Co., Ltd. | 33,755 | 1,193,684 |
| CTS Co., Ltd. | 36,772 | 254,720 |
| Curves Holdings Co., Ltd. | 90,001 | 688,156 |
| Cybozu, Inc. | 35,853 | 823,059 |
| Dai Nippon Toryo Co., Ltd. | 38,450 | 298,192 |
| Dai-Dan Co., Ltd. | 20,841 | 512,773 |
| Daibiru Corp. | 65,070 | 857,649 |
| Daido Metal Co., Ltd. | 58,738 | 313,847 |
| Daihen Corp. | 29,365 | 1,281,678 |
| Daiho Corp. | 25,406 | 923,876 |
| Daiichi Jitsugyo Co., Ltd. | 14,767 | 633,102 |
| Daiken Corp. | 23,953 | 507,143 |
| Daikokutenbussan Co., Ltd. | 7,657 | 483,703 |
| Daikyonishikawa Corp. | 85,388 | 516,867 |
| Dainichiseika Color & Chemicals Manufacturing Co., Ltd. | 18,259 | 421,323 |
| Daiseki Co., Ltd. | 70,215 | 2,847,331 |
| Daishi Hokuetsu Financial Group, Inc. | 64,099 | 1,581,179 |
| Daito Pharmaceutical Co., Ltd. | 16,902 | 555,400 |
| Daiwa Industries Ltd. | 38,437 | 427,194 |
| Daiwa Securities Living Investments Corp. | 3,027 | 3,402,826 |
| Daiwabo Holdings Co., Ltd. | 138,401 | 2,635,490 |
| DCM Holdings Co., Ltd. | 152,623 | 1,475,383 |
| Denyo Co., Ltd. | 23,770 | 443,984 |
| Descente Ltd. * | 59,112 | 1,735,265 |
| Dexerials Corp. | 71,004 | 1,391,513 |
| Digital Arts, Inc. | 14,459 | 1,150,297 |
| Digital Garage, Inc. | 47,803 | 2,188,686 |
| Digital Holdings, Inc. | 23,244 | 357,356 |
| Dip Corp. | 31,154 | 992,527 |
| Direct Marketing MiX, Inc. | 13,530 | 501,248 |
| DKK Co., Ltd. | 16,873 | 350,484 |
| DKS Co., Ltd. | 12,262 | 367,771 |
| Doshisha Co., Ltd. | 34,221 | 546,365 |
| Doutor Nichires Holdings Co., Ltd. | 37,368 | 556,812 |
| DTS Corp. | 58,772 | 1,367,923 |
| Duskin Co., Ltd. | 61,769 | 1,484,345 |
| DyDo Group Holdings, Inc. | 11,705 | 598,781 |
| Eagle Industry Co., Ltd. | 39,584 | 450,391 |
| Earth Corp. | 21,715 | 1,286,771 |
| Ebase Co., Ltd. | 40,627 | 289,189 |
| EDION Corp. | 127,919 | 1,245,889 |
| eGuarantee, Inc. | 46,350 | 1,031,125 |
| Eiken Chemical Co., Ltd. | 45,896 | 896,530 |
| Eizo Corp. | 28,298 | 1,094,725 |
| Elan Corp. | 47,302 | 553,708 |
| Security | Number
of Shares | Value ($) |
| Elematec Corp. | 21,628 | 224,234 |
| EM Systems Co., Ltd. | 56,647 | 417,659 |
| en-japan, Inc. | 46,094 | 1,562,900 |
| Enigmo, Inc. | 36,169 | 480,673 |
| Enplas Corp. | 10,464 | 299,557 |
| EPS Holdings, Inc. | 7,885 | 128,976 |
| eRex Co., Ltd. | 53,344 | 1,105,142 |
| ES-Con Japan Ltd. | 56,239 | 400,318 |
| ESPEC Corp. | 27,372 | 546,892 |
| euglena Co., Ltd. * | 120,973 | 969,017 |
| Exedy Corp. | 41,266 | 626,164 |
| FCC Co., Ltd. | 53,737 | 753,277 |
| FDK Corp. * | 21,116 | 222,962 |
| Feed One Co., Ltd. | 47,147 | 326,158 |
| FIDEA Holdings Co., Ltd. | 268,773 | 308,260 |
| Financial Products Group Co., Ltd. | 83,530 | 517,786 |
| Fixstars Corp. | 33,442 | 238,350 |
| Foster Electric Co., Ltd. | 29,976 | 237,112 |
| France Bed Holdings Co., Ltd. | 29,503 | 248,410 |
| Frontier Real Estate Investment Corp. | 715 | 3,101,197 |
| Fudo Tetra Corp. | 16,958 | 269,358 |
| Fuji Co., Ltd. | 31,545 | 564,227 |
| Fuji Corp. | 129,938 | 3,374,414 |
| Fuji Pharma Co., Ltd. | 23,558 | 247,674 |
| Fuji Seal International, Inc. | 60,604 | 1,364,224 |
| Fuji Soft, Inc. | 31,009 | 1,611,700 |
| Fujibo Holdings, Inc. | 16,936 | 654,409 |
| Fujicco Co., Ltd. | 31,748 | 549,073 |
| Fujikura Ltd. * | 400,231 | 2,309,726 |
| Fujimi, Inc. | 29,992 | 1,676,232 |
| Fujimori Kogyo Co., Ltd. | 22,213 | 927,058 |
| Fujio Food Group., Inc. | 33,177 | 403,161 |
| Fujita Kanko, Inc. * | 10,964 | 223,052 |
| Fujitec Co., Ltd. | 117,402 | 2,894,976 |
| Fujiya Co., Ltd. | 16,390 | 354,774 |
| Fukuda Corp. | 7,360 | 336,982 |
| Fukui Computer Holdings, Inc. | 10,423 | 413,182 |
| Fukuoka REIT Corp. | 1,072 | 1,712,507 |
| Fukushima Galilei Co., Ltd. | 17,238 | 761,008 |
| FULLCAST Holdings Co., Ltd. | 27,430 | 529,824 |
| Funai Soken Holdings, Inc. | 45,548 | 1,125,640 |
| Furukawa Battery Co., Ltd. | 19,281 | 283,792 |
| Furukawa Co., Ltd. | 45,500 | 513,563 |
| Furuno Electric Co., Ltd. | 35,769 | 355,867 |
| Fuso Chemical Co., Ltd. | 28,996 | 1,195,630 |
| Futaba Corp. | 55,532 | 404,384 |
| Futaba Industrial Co., Ltd. | 85,406 | 377,820 |
| Future Corp. | 28,431 | 634,560 |
| G-7 Holdings, Inc. | 12,561 | 455,059 |
| G-Tekt Corp. | 27,777 | 374,709 |
| Gakken Holdings Co., Ltd. | 45,995 | 522,918 |
| GCA Corp. | 41,622 | 521,696 |
| Genky DrugStores Co., Ltd. | 12,251 | 574,300 |
| Geo Holdings Corp. | 39,346 | 427,269 |
| Giken Ltd. | 21,425 | 923,424 |
| Global One Real Estate Investment Corp. | 1,421 | 1,625,885 |
| GLOBERIDE, Inc. | 15,523 | 1,045,605 |
| Glory Ltd. | 80,390 | 1,675,706 |
| GMO GlobalSign Holdings KK | 7,723 | 337,082 |
| Goldcrest Co., Ltd. | 22,463 | 345,349 |
| Grace Technology, Inc. | 30,766 | 342,218 |
| Gree, Inc. | 133,412 | 788,134 |
| gremz, Inc. | 22,825 | 580,702 |
| Gunze Ltd. | 24,687 | 1,002,221 |
| H2O Retailing Corp. | 126,710 | 996,518 |
| Hakuto Co., Ltd. | 21,532 | 353,771 |
| Halows Co., Ltd. | 12,486 | 340,507 |
| Hamakyorex Co., Ltd. | 23,066 | 688,663 |
Schwab International Equity ETFs | Annual Report
Schwab International Small-Cap Equity ETF
Portfolio Holdings as of August 31, 2021 (continued)
| Security | Number
of Shares | Value ($) |
| Hankyu Hanshin REIT, Inc. | 980 | 1,462,953 |
| Hanwa Co., Ltd. | 55,136 | 1,656,188 |
| Happinet Corp. | 22,425 | 297,000 |
| Hazama Ando Corp. | 276,374 | 2,065,384 |
| Heiwa Real Estate Co., Ltd. | 49,991 | 1,938,482 |
| Heiwa Real Estate REIT, Inc. | 1,338 | 2,076,543 |
| Heiwado Co., Ltd. | 43,715 | 871,833 |
| HI-LEX Corp. | 41,006 | 648,347 |
| Hibiya Engineering Ltd. | 27,835 | 479,119 |
| Hiday Hidaka Corp. | 41,398 | 614,602 |
| Hioki EE Corp. | 13,697 | 1,014,870 |
| Hirata Corp. | 13,018 | 801,035 |
| HIS Co., Ltd. * | 56,738 | 1,319,032 |
| Hitachi Zosen Corp. | 248,057 | 1,799,576 |
| Hito Communications Holdings, Inc. | 15,437 | 257,845 |
| Hochiki Corp. | 23,718 | 253,458 |
| Hodogaya Chemical Co., Ltd. | 8,914 | 411,378 |
| Hogy Medical Co., Ltd. | 33,232 | 1,040,580 |
| Hokkaido Electric Power Co., Inc. | 272,186 | 1,275,949 |
| Hokkaido Gas Co., Ltd. | 18,320 | 260,476 |
| Hokuetsu Corp. | 205,003 | 1,127,087 |
| Hokuhoku Financial Group, Inc. | 197,142 | 1,514,544 |
| Hokuto Corp. | 30,851 | 559,676 |
| Hoosiers Holdings | 41,941 | 252,348 |
| Hoshino Resorts REIT, Inc. | 333 | 2,155,134 |
| Hosiden Corp. | 80,019 | 659,905 |
| Hosokawa Micron Corp. | 9,578 | 573,669 |
| Hulic Reit, Inc. | 1,856 | 3,128,811 |
| I'll, Inc. | 26,262 | 436,744 |
| I-PEX, Inc. | 11,762 | 212,307 |
| Ichibanya Co., Ltd. | 23,964 | 1,036,128 |
| Ichigo Office REIT Investment Corp. | 1,805 | 1,596,996 |
| Ichikoh Industries Ltd. | 85,418 | 527,934 |
| Ichiyoshi Securities Co., Ltd. | 55,058 | 321,247 |
| Icom, Inc. | 13,517 | 302,551 |
| Idec Corp. | 40,458 | 841,126 |
| IDOM, Inc. | 78,531 | 671,223 |
| Iino Kaiun Kaisha Ltd. | 128,422 | 614,873 |
| Inaba Denki Sangyo Co., Ltd. | 77,918 | 1,912,842 |
| Inabata & Co., Ltd. | 63,451 | 972,037 |
| Inageya Co., Ltd. | 34,905 | 459,427 |
| Ines Corp. | 33,910 | 487,692 |
| Infocom Corp. | 30,185 | 678,929 |
| Infomart Corp. | 312,854 | 2,793,644 |
| Information Services International-Dentsu Ltd. | 36,187 | 1,414,738 |
| Insource Co., Ltd. | 34,042 | 657,848 |
| Intage Holdings, Inc. | 49,417 | 685,073 |
| Internet Initiative Japan, Inc. | 82,516 | 2,880,474 |
| Invesco Office J-Reit, Inc. | 4,332 | 894,318 |
| Invincible Investment Corp. | 7,363 | 2,865,176 |
| Iriso Electronics Co., Ltd. | 30,188 | 1,264,016 |
| Iseki & Co., Ltd. * | 23,650 | 340,133 |
| Ishihara Sangyo Kaisha Ltd. | 54,363 | 562,137 |
| Istyle, Inc. * | 87,451 | 334,329 |
| Itochu Advance Logistics Investment Corp. | 928 | 1,430,097 |
| Itochu Enex Co., Ltd. | 74,016 | 664,972 |
| Itochu-Shokuhin Co., Ltd. | 7,516 | 362,596 |
| J Trust Co., Ltd. * | 133,275 | 435,515 |
| J-Oil Mills, Inc. | 25,462 | 417,414 |
| JAC Recruitment Co., Ltd. | 23,517 | 382,745 |
| Jaccs Co., Ltd. | 38,810 | 971,840 |
| JAFCO Group Co., Ltd. | 43,214 | 2,615,812 |
| Japan Display, Inc. * | 991,131 | 324,784 |
| Japan Elevator Service Holdings Co., Ltd. | 105,224 | 2,778,580 |
| Japan Excellent, Inc. | 1,859 | 2,453,623 |
| Japan Hotel REIT Investment Corp. | 6,947 | 4,110,277 |
| Japan Lifeline Co., Ltd. | 101,975 | 1,228,044 |
| Security | Number
of Shares | Value ($) |
| Japan Material Co., Ltd. | 84,705 | 970,723 |
| Japan Medical Dynamic Marketing, Inc. | 17,515 | 366,211 |
| Japan Petroleum Exploration Co., Ltd. | 47,277 | 816,352 |
| Japan Pulp & Paper Co., Ltd. | 15,608 | 532,059 |
| Japan Securities Finance Co., Ltd. | 132,848 | 1,004,885 |
| Japan Transcity Corp. | 70,073 | 376,963 |
| JCU Corp. | 31,058 | 1,176,054 |
| JDC Corp. | 60,352 | 316,428 |
| Jeol Ltd. | 56,981 | 4,216,781 |
| JINS Holdings, Inc. | 22,050 | 1,441,098 |
| JM Holdings Co., Ltd. | 21,386 | 446,369 |
| Joshin Denki Co., Ltd. | 27,811 | 636,671 |
| Joyful Honda Co., Ltd. | 90,619 | 1,158,102 |
| JSP Corp. | 17,271 | 254,679 |
| JVC Kenwood Corp. | 227,345 | 430,437 |
| K&O Energy Group, Inc. | 23,217 | 279,382 |
| Kadokawa Corp. | 64,002 | 2,942,018 |
| Kaga Electronics Co., Ltd. | 25,860 | 682,397 |
| Kamakura Shinsho Ltd. | 29,469 | 281,117 |
| Kameda Seika Co., Ltd. | 20,506 | 870,749 |
| Kamei Corp. | 31,572 | 337,389 |
| Kanaden Corp. | 25,079 | 237,869 |
| Kanagawa Chuo Kotsu Co., Ltd. | 9,366 | 294,552 |
| Kanamoto Co., Ltd. | 43,326 | 991,852 |
| Kanematsu Corp. | 126,455 | 1,629,895 |
| Kanematsu Electronics Ltd. | 18,189 | 636,598 |
| Kansai Super Market Ltd. | 26,969 | 377,556 |
| Kanto Denka Kogyo Co., Ltd. | 72,261 | 705,114 |
| Kappa Create Co., Ltd. * | 36,226 | 460,986 |
| Katakura Industries Co., Ltd. | 29,052 | 389,264 |
| Katitas Co., Ltd. | 73,076 | 2,434,536 |
| Kato Sangyo Co., Ltd. | 31,089 | 952,253 |
| KAWADA TECHNOLOGIES, Inc. | 6,293 | 212,803 |
| Kawasaki Kisen Kaisha Ltd. * | 125,437 | 6,291,260 |
| KeePer Technical Laboratory Co., Ltd. | 18,520 | 606,881 |
| Keihanshin Building Co., Ltd. | 53,249 | 742,558 |
| Keiyo Co., Ltd. | 58,171 | 423,601 |
| Kenedix Residential Next Investment Corp. | 1,493 | 3,209,964 |
| Kenedix Retail REIT Corp. | 873 | 2,360,898 |
| Kenko Mayonnaise Co., Ltd. | 20,937 | 289,871 |
| Key Coffee, Inc. | 23,291 | 465,778 |
| KFC Holdings Japan Ltd. | 22,192 | 603,180 |
| KH Neochem Co., Ltd. | 55,030 | 1,502,731 |
| Kintetsu Department Store Co., Ltd. * | 12,722 | 279,083 |
| Kintetsu World Express, Inc. | 52,452 | 1,276,208 |
| Kisoji Co., Ltd. | 33,008 | 703,365 |
| Kissei Pharmaceutical Co., Ltd. | 45,806 | 1,009,850 |
| Kitanotatsujin Corp. | 96,460 | 450,428 |
| Kitz Corp. | 123,879 | 919,000 |
| KLab, Inc. * | 46,397 | 277,047 |
| Koa Corp. | 44,705 | 644,572 |
| Koatsu Gas Kogyo Co., Ltd. | 35,133 | 238,889 |
| Kohnan Shoji Co., Ltd. | 38,273 | 1,264,619 |
| Kojima Co., Ltd. (a) | 32,392 | 192,536 |
| Komatsu Matere Co., Ltd. | 45,982 | 412,273 |
| KOMEDA Holdings Co., Ltd. | 46,133 | 847,829 |
| Komeri Co., Ltd. | 42,921 | 986,097 |
| Komori Corp. | 72,911 | 562,130 |
| Konishi Co., Ltd. | 40,005 | 611,036 |
| Konoike Transport Co., Ltd. | 39,148 | 487,836 |
| Koshidaka Holdings Co., Ltd. (a) | 73,233 | 373,964 |
| Krosaki Harima Corp. | 6,227 | 278,588 |
| Kumagai Gumi Co., Ltd. | 52,218 | 1,278,119 |
| Kumiai Chemical Industry Co., Ltd. | 144,330 | 1,195,524 |
| Kura Sushi, Inc. | 29,640 | 1,164,178 |
| Kurabo Industries Ltd. | 29,279 | 519,165 |
| Kureha Corp. | 27,185 | 1,858,359 |
| Kurimoto Ltd. | 17,382 | 260,904 |
Schwab International Equity ETFs | Annual Report
Schwab International Small-Cap Equity ETF
Portfolio Holdings as of August 31, 2021 (continued)
| Security | Number
of Shares | Value ($) |
| KYB Corp. | 28,385 | 803,544 |
| Kyodo Printing Co., Ltd. | 11,540 | 276,473 |
| Kyoei Steel Ltd. | 31,978 | 426,140 |
| Kyokuto Kaihatsu Kogyo Co., Ltd. | 44,053 | 662,439 |
| Kyokuto Securities Co., Ltd. | 35,640 | 260,828 |
| Kyokuyo Co., Ltd. | 13,567 | 372,333 |
| KYORIN Holdings, Inc. | 57,360 | 951,823 |
| Kyosan Electric Manufacturing Co., Ltd. | 59,835 | 257,074 |
| LEC, Inc. | 38,623 | 389,183 |
| Leopalace21 Corp. * | 366,893 | 798,174 |
| Life Corp. | 29,387 | 1,163,603 |
| LIFULL Co., Ltd. | 97,408 | 308,556 |
| Link And Motivation, Inc. | 63,232 | 590,534 |
| LITALICO, Inc. | 12,466 | 629,768 |
| M&A Capital Partners Co., Ltd. * | 19,357 | 942,654 |
| Macnica Fuji Electronics Holdings, Inc. | 71,425 | 1,723,536 |
| Macromill, Inc. | 59,729 | 410,481 |
| Maeda Kosen Co., Ltd. | 31,718 | 952,753 |
| Maezawa Kyuso Industries Co., Ltd. | 21,734 | 202,779 |
| Makino Milling Machine Co., Ltd. | 30,643 | 1,144,998 |
| Mandom Corp. | 52,098 | 790,053 |
| Marudai Food Co., Ltd. | 29,794 | 482,193 |
| Maruha Nichiro Corp. | 53,484 | 1,234,621 |
| Marusan Securities Co., Ltd. | 93,310 | 532,545 |
| Maruwa Co., Ltd. | 12,040 | 1,166,080 |
| Maruzen Showa Unyu Co., Ltd. | 22,508 | 697,613 |
| Marvelous, Inc. | 52,879 | 331,637 |
| Matsuda Sangyo Co., Ltd. | 19,310 | 514,125 |
| Matsuya Co., Ltd. * | 56,991 | 482,966 |
| Matsuyafoods Holdings Co., Ltd. | 12,061 | 393,580 |
| Max Co., Ltd. | 55,380 | 971,393 |
| Maxell Holdings Ltd. * | 58,826 | 693,425 |
| Maxvalu Tokai Co., Ltd. | 16,298 | 378,892 |
| MCJ Co., Ltd. | 98,160 | 1,096,326 |
| Media Do Co., Ltd. | 9,310 | 452,534 |
| Medical Data Vision Co., Ltd. | 22,776 | 358,246 |
| MedPeer, Inc. * | 23,286 | 902,952 |
| Megachips Corp. | 26,762 | 819,717 |
| Meidensha Corp. | 59,793 | 1,337,804 |
| Meisei Industrial Co., Ltd. | 68,371 | 465,515 |
| Meitec Corp. | 36,788 | 2,149,818 |
| Melco Holdings, Inc. | 9,120 | 431,677 |
| Menicon Co., Ltd. | 37,857 | 3,111,676 |
| METAWATER Co., Ltd. | 31,193 | 540,043 |
| Micronics Japan Co., Ltd. | 47,723 | 627,271 |
| Mie Kotsu Group Holdings, Inc. | 91,246 | 416,114 |
| Milbon Co., Ltd. | 27,335 | 1,701,906 |
| Mimasu Semiconductor Industry Co., Ltd. | 22,218 | 474,251 |
| Mirai Corp. | 2,238 | 1,142,835 |
| Mirait Holdings Corp. | 130,686 | 2,606,345 |
| Miroku Jyoho Service Co., Ltd. | 28,759 | 431,149 |
| Mitsuba Corp. * | 57,575 | 345,366 |
| Mitsubishi Estate Logistics REIT Investment Corp. | 565 | 2,669,170 |
| Mitsubishi Logisnext Co., Ltd. | 101,683 | 895,025 |
| Mitsubishi Pencil Co., Ltd. | 64,885 | 860,527 |
| Mitsubishi Research Institute, Inc. | 9,294 | 361,236 |
| Mitsuboshi Belting Ltd. | 33,913 | 621,399 |
| Mitsui DM Sugar Holdings Co., Ltd. | 23,511 | 414,107 |
| Mitsui E&S Holdings Co., Ltd. * | 117,550 | 494,339 |
| Mitsui High-Tec, Inc. | 35,033 | 2,018,559 |
| Mitsui-Soko Holdings Co., Ltd. | 32,309 | 789,050 |
| Mitsuuroko Group Holdings Co., Ltd. | 66,731 | 788,429 |
| Mixi, Inc. | 60,500 | 1,392,723 |
| Mizuho Leasing Co., Ltd. | 62,511 | 2,000,056 |
| Mizuno Corp. | 27,937 | 664,985 |
| Modec, Inc. | 33,162 | 490,517 |
| Monex Group, Inc. | 264,681 | 1,414,234 |
| Security | Number
of Shares | Value ($) |
| Monogatari Corp. | 14,225 | 804,089 |
| Mori Trust Hotel Reit, Inc. | 425 | 520,321 |
| Mori Trust Sogo REIT, Inc. | 1,536 | 2,141,955 |
| Moriroku Holdings Co., Ltd. | 18,225 | 351,859 |
| Morita Holdings Corp. | 59,515 | 837,522 |
| MOS Food Services, Inc. | 36,019 | 1,083,586 |
| MTI Ltd. | 41,114 | 266,833 |
| Musashi Seimitsu Industry Co., Ltd. | 66,841 | 1,178,509 |
| Nachi-Fujikoshi Corp. | 26,580 | 1,041,570 |
| Nagaileben Co., Ltd. | 38,012 | 883,694 |
| Nagatanien Holdings Co., Ltd. | 15,401 | 299,160 |
| Neturen Co., Ltd. | 51,377 | 292,754 |
| Nextage Co., Ltd. | 55,900 | 1,115,354 |
| Nichi-iko Pharmaceutical Co., Ltd. | 71,650 | 555,669 |
| Nichias Corp. | 82,972 | 2,204,581 |
| Nichiban Co., Ltd. | 19,954 | 325,483 |
| Nichicon Corp. | 93,530 | 931,384 |
| Nichiden Corp. | 20,419 | 450,162 |
| Nichiha Corp. | 41,767 | 1,231,796 |
| Nichireki Co., Ltd. | 32,438 | 380,008 |
| Nihon Chouzai Co., Ltd. | 19,533 | 308,837 |
| Nihon Nohyaku Co., Ltd. | 48,431 | 239,819 |
| Nihon Parkerizing Co., Ltd. | 140,700 | 1,471,548 |
| Nikkiso Co., Ltd. | 88,181 | 718,387 |
| Nippn Corp. | 74,460 | 1,095,957 |
| Nippon Beet Sugar Manufacturing Co., Ltd. | 17,245 | 258,377 |
| Nippon Carbon Co., Ltd. | 16,059 | 606,634 |
| Nippon Ceramic Co., Ltd. | 26,173 | 719,484 |
| Nippon Chemi-Con Corp. * | 30,456 | 600,471 |
| Nippon Denko Co., Ltd. | 163,232 | 487,348 |
| Nippon Densetsu Kogyo Co., Ltd. | 50,582 | 857,767 |
| Nippon Gas Co., Ltd. | 163,687 | 2,328,807 |
| Nippon Holdings Co., Ltd. | 76,425 | 1,598,622 |
| Nippon Kanzai Co., Ltd. | 25,746 | 622,441 |
| Nippon Koei Co., Ltd. | 21,171 | 597,398 |
| Nippon Light Metal Holdings Co., Ltd. | 88,993 | 1,564,223 |
| Nippon Parking Development Co., Ltd. | 197,674 | 300,488 |
| NIPPON REIT Investment Corp. | 651 | 2,675,464 |
| Nippon Rietec Co., Ltd. | 21,564 | 331,920 |
| Nippon Seiki Co., Ltd. | 78,994 | 882,984 |
| Nippon Sheet Glass Co., Ltd. * | 139,880 | 725,756 |
| Nippon Signal Company Ltd. | 86,558 | 731,165 |
| Nippon Soda Co., Ltd. | 37,162 | 1,190,699 |
| Nippon Steel Trading Corp. | 22,535 | 1,031,777 |
| Nippon Suisan Kaisha Ltd. | 401,036 | 2,212,159 |
| Nippon Thompson Co., Ltd. | 94,624 | 489,227 |
| Nippon Yakin Kogyo Co., Ltd. | 21,726 | 532,174 |
| Nishi-Nippon Financial Holdings, Inc. | 223,955 | 1,416,792 |
| Nishimatsu Construction Co., Ltd. | 78,348 | 2,474,673 |
| Nishimatsuya Chain Co., Ltd. | 66,979 | 805,382 |
| Nishio Rent All Co., Ltd. | 28,220 | 750,838 |
| Nissan Shatai Co., Ltd. | 97,610 | 658,374 |
| Nissei ASB Machine Co., Ltd. | 11,706 | 451,788 |
| Nissha Co., Ltd. | 60,191 | 974,145 |
| Nisshinbo Holdings, Inc. | 212,179 | 1,763,330 |
| Nissin Electric Co., Ltd. | 70,523 | 803,061 |
| Nissin Sugar Co., Ltd. | 14,236 | 219,125 |
| Nitta Corp. | 28,060 | 703,671 |
| Nittetsu Mining Co., Ltd. | 9,288 | 563,908 |
| Nitto Boseki Co., Ltd. | 42,089 | 1,329,409 |
| Nitto Kogyo Corp. | 40,462 | 638,273 |
| Nitto Kohki Co., Ltd. | 17,145 | 309,784 |
| Nohmi Bosai Ltd. | 32,279 | 627,598 |
| Nojima Corp. | 50,907 | 1,255,298 |
| Nomura Co., Ltd. | 119,803 | 984,727 |
| Noritake Co., Ltd. | 20,141 | 779,167 |
| Noritsu Koki Co., Ltd. | 30,660 | 665,333 |
Schwab International Equity ETFs | Annual Report
Schwab International Small-Cap Equity ETF
Portfolio Holdings as of August 31, 2021 (continued)
| Security | Number
of Shares | Value ($) |
| Noritz Corp. | 52,656 | 909,234 |
| North Pacific Bank Ltd. | 420,926 | 973,195 |
| NS United Kaiun Kaisha Ltd. | 13,530 | 450,138 |
| NSD Co., Ltd. | 105,199 | 1,962,068 |
| NTN Corp. * | 642,358 | 1,473,459 |
| NTT UD REIT Investment Corp. | 1,896 | 2,749,252 |
| Obara Group, Inc. | 16,765 | 591,338 |
| Ohsho Food Service Corp. | 17,076 | 921,725 |
| Oiles Corp. | 39,682 | 586,597 |
| Oisix ra daichi, Inc. * | 35,396 | 1,200,165 |
| Okabe Co., Ltd. | 62,100 | 373,640 |
| Okamoto Industries, Inc. | 21,964 | 833,696 |
| Okamura Corp. | 112,290 | 1,729,425 |
| Okasan Securities Group, Inc. | 241,268 | 896,025 |
| Oki Electric Industry Co., Ltd. | 126,300 | 1,135,849 |
| Okumura Corp. | 52,946 | 1,455,461 |
| Okura Industrial Co., Ltd. | 13,260 | 272,418 |
| Okuwa Co., Ltd. | 37,314 | 377,691 |
| One REIT, Inc. | 343 | 1,024,067 |
| Onoken Co., Ltd. | 21,846 | 316,176 |
| Onward Holdings Co., Ltd. | 174,533 | 459,130 |
| Open Door, Inc. * | 21,079 | 430,176 |
| Optex Group Co., Ltd. | 50,589 | 677,836 |
| Optim Corp. * | 28,970 | 588,577 |
| Optorun Co., Ltd. | 14,830 | 305,752 |
| Organo Corp. | 10,365 | 600,049 |
| Oriental Shiraishi Corp. * | 135,991 | 339,173 |
| Oro Co., Ltd. | 9,610 | 324,095 |
| Osaka Organic Chemical Industry Ltd. | 24,722 | 874,249 |
| Osaka Soda Co., Ltd. | 27,868 | 676,787 |
| Osaki Electric Co., Ltd. | 54,896 | 279,827 |
| Outsourcing, Inc. | 152,614 | 2,611,636 |
| Oyo Corp. | 31,820 | 388,409 |
| Pacific Industrial Co., Ltd. | 68,743 | 786,546 |
| Pacific Metals Co., Ltd. | 20,819 | 321,969 |
| PAL GROUP Holdings Co., Ltd. | 29,664 | 454,168 |
| Paramount Bed Holdings Co., Ltd. | 60,698 | 1,175,174 |
| Pasona Group, Inc. | 29,437 | 714,891 |
| Pharma Foods International Co., Ltd. (a) | 36,501 | 996,086 |
| PIA Corp. * | 9,292 | 284,613 |
| Pilot Corp. | 54,221 | 2,092,636 |
| Piolax, Inc. | 36,708 | 509,889 |
| Plenus Co., Ltd. | 36,544 | 670,605 |
| Poletowin Pitcrew Holdings, Inc. | 43,050 | 431,049 |
| Press Kogyo Co., Ltd. | 137,496 | 433,039 |
| Pressance Corp. | 27,659 | 434,800 |
| Prestige International, Inc. | 132,779 | 912,508 |
| Prima Meat Packers Ltd. | 42,851 | 1,164,302 |
| Proto Corp. | 30,912 | 417,281 |
| Qol Holdings Co., Ltd. | 36,074 | 513,232 |
| Raito Kogyo Co., Ltd. | 65,863 | 1,154,071 |
| Raiznext Corp. | 63,979 | 645,264 |
| Raksul, Inc. * | 35,131 | 1,857,920 |
| Relia, Inc. | 61,499 | 667,835 |
| Restar Holdings Corp. | 36,712 | 643,279 |
| Retail Partners Co., Ltd. | 52,038 | 564,148 |
| Rheon Automatic Machinery Co., Ltd. | 32,670 | 442,499 |
| Ricoh Leasing Co., Ltd. | 20,977 | 696,942 |
| Riken Corp. | 13,959 | 335,443 |
| Riken Keiki Co., Ltd. | 25,349 | 655,761 |
| Riken Technos Corp. | 68,892 | 361,203 |
| Riken Vitamin Co., Ltd. | 25,232 | 418,696 |
| Ringer Hut Co., Ltd. (a) | 33,259 | 667,239 |
| Riso Kagaku Corp. | 33,638 | 713,116 |
| Riso Kyoiku Co., Ltd. | 138,742 | 503,896 |
| Rock Field Co., Ltd. | 30,232 | 424,613 |
| Rokko Butter Co., Ltd. | 17,427 | 251,427 |
| Roland Corp. | 18,240 | 835,128 |
| Security | Number
of Shares | Value ($) |
| Roland DG Corp. | 17,048 | 443,813 |
| Rorze Corp. | 14,589 | 1,154,000 |
| Round One Corp. | 92,265 | 1,090,954 |
| Royal Holdings Co., Ltd. * | 53,162 | 935,876 |
| RPA Holdings, Inc. * | 43,352 | 241,897 |
| RS Technologies Co., Ltd. | 10,684 | 607,819 |
| Ryobi Ltd. | 40,858 | 484,226 |
| Ryoden Corp. | 19,664 | 319,679 |
| Ryosan Co., Ltd. | 34,198 | 693,236 |
| Ryoyo Electro Corp. | 18,747 | 391,458 |
| S Foods, Inc. | 27,022 | 779,717 |
| S-Pool, Inc. | 85,155 | 741,793 |
| Sagami Holdings Corp. * | 29,469 | 276,557 |
| Saibu Gas Holdings Co., Ltd. | 36,625 | 815,111 |
| Saizeriya Co., Ltd. | 38,207 | 868,404 |
| Sakai Chemical Industry Co., Ltd. | 22,355 | 433,426 |
| Sakai Moving Service Co., Ltd. | 14,193 | 628,518 |
| Sakata INX Corp. | 63,624 | 660,795 |
| Sakata Seed Corp. | 47,310 | 1,550,300 |
| SAMTY Co., Ltd. | 42,467 | 894,103 |
| Samty Residential Investment Corp. | 517 | 568,013 |
| San ju San Financial Group, Inc. | 32,125 | 425,760 |
| San-A Co., Ltd. | 27,814 | 1,026,632 |
| San-Ai Oil Co., Ltd. | 82,807 | 1,034,899 |
| Sanei Architecture Planning Co., Ltd. | 13,880 | 238,029 |
| Sangetsu Corp. | 85,352 | 1,250,058 |
| Sanken Electric Co., Ltd. * | 29,685 | 1,464,525 |
| Sanki Engineering Co., Ltd. | 81,099 | 1,103,614 |
| Sankyo Seiko Co., Ltd. | 54,921 | 259,957 |
| Sankyo Tateyama, Inc. | 43,028 | 294,922 |
| Sanoh Industrial Co., Ltd. | 33,818 | 345,383 |
| Sanrio Co., Ltd. * | 86,117 | 1,711,209 |
| Sanshin Electronics Co., Ltd. | 27,568 | 409,781 |
| Sanyo Chemical Industries Ltd. | 15,186 | 814,178 |
| Sanyo Denki Co., Ltd. | 13,431 | 877,795 |
| Sanyo Electric Railway Co., Ltd. | 24,512 | 442,225 |
| Sanyo Special Steel Co., Ltd. * | 33,974 | 561,285 |
| Sato Holdings Corp. | 33,314 | 816,930 |
| SB Technology Corp. | 14,684 | 416,354 |
| SBS Holdings, Inc. | 26,804 | 966,174 |
| Seikagaku Corp. | 58,751 | 593,607 |
| Seiko Holdings Corp. | 43,009 | 855,404 |
| Seiren Co., Ltd. | 64,651 | 1,126,361 |
| Sekisui Jushi Corp. | 42,257 | 840,832 |
| Senko Group Holdings Co., Ltd. | 156,410 | 1,378,162 |
| Senshu Ikeda Holdings, Inc. | 405,719 | 620,433 |
| Shibaura Machine Co., Ltd. | 40,272 | 963,361 |
| Shibuya Corp. | 31,493 | 892,961 |
| SHIFT, Inc. * | 16,470 | 3,768,940 |
| Shikoku Chemicals Corp. | 44,797 | 562,307 |
| Shima Seiki Manufacturing Ltd. | 41,745 | 793,406 |
| Shin Nippon Air Technologies Co., Ltd. | 18,844 | 407,549 |
| Shin-Etsu Polymer Co., Ltd. | 49,025 | 432,862 |
| Shindengen Electric Manufacturing Co., Ltd. * | 11,434 | 422,556 |
| Shinko Shoji Co., Ltd. | 50,002 | 359,563 |
| Shinmaywa Industries Ltd. | 86,928 | 727,961 |
| Shinnihon Corp. | 41,950 | 329,154 |
| Shinwa Co., Ltd. | 16,459 | 341,135 |
| Shizuoka Gas Co., Ltd. | 82,321 | 959,138 |
| Shoei Co., Ltd. | 35,281 | 1,551,131 |
| Shoei Foods Corp. | 19,391 | 735,149 |
| Showa Sangyo Co., Ltd. | 37,643 | 965,574 |
| Siix Corp. | 49,079 | 572,276 |
| Sinanen Holdings Co., Ltd. | 14,512 | 461,673 |
| Sinfonia Technology Co., Ltd. | 38,326 | 417,239 |
| Sinko Industries Ltd. | 30,395 | 603,971 |
| Sintokogio Ltd. | 74,254 | 526,523 |
Schwab International Equity ETFs | Annual Report
Schwab International Small-Cap Equity ETF
Portfolio Holdings as of August 31, 2021 (continued)
| Security | Number
of Shares | Value ($) |
| Sodick Co., Ltd. | 59,085 | 481,887 |
| Solasto Corp. | 68,867 | 946,561 |
| SOSiLA Logistics REIT, Inc. | 905 | 1,536,342 |
| Sourcenext Corp. | 128,647 | 268,161 |
| Sparx Group Co., Ltd. | 151,260 | 377,255 |
| SRA Holdings | 10,199 | 257,992 |
| ST Corp. | 13,027 | 213,322 |
| St Marc Holdings Co., Ltd. | 20,913 | 286,873 |
| Star Asia Investment Corp. | 2,206 | 1,198,782 |
| Star Micronics Co., Ltd. | 48,357 | 692,826 |
| Starts Corp., Inc. | 44,552 | 1,158,612 |
| Starts Proceed Investment Corp. | 347 | 812,699 |
| Starzen Co., Ltd. | 21,392 | 435,785 |
| Stella Chemifa Corp. | 12,584 | 326,570 |
| Strike Co., Ltd. | 21,389 | 793,375 |
| Studio Alice Co., Ltd. | 12,988 | 265,529 |
| Sumida Corp. | 30,928 | 369,075 |
| Sumitomo Densetsu Co., Ltd. | 19,385 | 388,900 |
| Sumitomo Mitsui Construction Co., Ltd. | 230,037 | 1,000,889 |
| Sumitomo Osaka Cement Co., Ltd. | 51,333 | 1,395,701 |
| Sumitomo Riko Co., Ltd. | 56,930 | 362,743 |
| Sumitomo Seika Chemicals Co., Ltd. | 13,613 | 436,791 |
| Sun Frontier Fudousan Co., Ltd. | 43,957 | 457,735 |
| Suruga Bank Ltd. | 280,650 | 924,771 |
| SWCC Showa Holdings Co., Ltd. | 32,003 | 667,676 |
| Systena Corp. | 102,960 | 2,096,500 |
| T Hasegawa Co., Ltd. | 33,411 | 849,113 |
| T-Gaia Corp. | 30,715 | 550,220 |
| Tachi-S Co., Ltd. | 40,624 | 501,421 |
| Tachibana Eletech Co., Ltd. | 28,512 | 387,738 |
| Tadano Ltd. | 172,967 | 1,886,168 |
| Taihei Dengyo Kaisha Ltd. | 24,089 | 590,713 |
| Taikisha Ltd. | 43,840 | 1,412,649 |
| Taiko Pharmaceutical Co., Ltd. (a) | 41,696 | 349,934 |
| Taiyo Holdings Co., Ltd. | 25,293 | 1,374,469 |
| Takamatsu Construction Group Co., Ltd. | 23,114 | 438,253 |
| Takara Leben Co., Ltd. | 116,497 | 339,332 |
| Takara Leben Real Estate Investment Corp. | 606 | 621,666 |
| Takara Standard Co., Ltd. | 71,709 | 1,084,839 |
| Takasago International Corp. | 20,036 | 527,618 |
| Takasago Thermal Engineering Co., Ltd. | 90,672 | 1,755,501 |
| Takeuchi Manufacturing Co., Ltd. | 50,701 | 1,224,836 |
| Taki Chemical Co., Ltd. | 7,340 | 424,926 |
| Takuma Co., Ltd. | 111,163 | 1,679,689 |
| Tama Home Co., Ltd. | 22,061 | 496,001 |
| Tamron Co., Ltd. | 20,137 | 483,721 |
| Tamura Corp. | 115,784 | 779,903 |
| Tanseisha Co., Ltd. | 49,715 | 397,322 |
| Tatsuta Electric Wire & Cable Co., Ltd. | 47,290 | 227,712 |
| Tayca Corp. | 26,377 | 317,888 |
| TechMatrix Corp. | 34,636 | 622,666 |
| Teikoku Electric Manufacturing Co., Ltd. | 23,622 | 280,815 |
| Teikoku Sen-I Co., Ltd. | 32,320 | 586,914 |
| Tekken Corp. | 20,263 | 333,843 |
| Tenma Corp. | 20,409 | 513,104 |
| TerraSky Co., Ltd. * | 10,932 | 222,998 |
| The 77 Bank Ltd. | 109,603 | 1,245,081 |
| The Aichi Bank Ltd. | 12,670 | 406,533 |
| The Akita Bank Ltd. | 21,633 | 287,889 |
| The Aomori Bank Ltd. | 29,967 | 593,012 |
| The Awa Bank Ltd. | 53,476 | 1,065,529 |
| The Bank of Iwate Ltd. | 23,159 | 359,844 |
| The Bank of Nagoya Ltd. | 25,840 | 624,714 |
| The Bank of Okinawa Ltd. | 32,964 | 820,949 |
| The Bank of Saga Ltd. | 20,307 | 266,546 |
| The Chukyo Bank Ltd. | 18,015 | 222,523 |
| The Ehime Bank Ltd. | 48,554 | 345,615 |
| Security | Number
of Shares | Value ($) |
| The Fukui Bank Ltd. | 33,190 | 475,222 |
| The Hokkoku Bank Ltd. | 35,952 | 690,504 |
| The Hyakugo Bank Ltd. | 325,196 | 959,071 |
| The Hyakujushi Bank Ltd. | 39,163 | 567,518 |
| The Japan Steel Works Ltd. | 95,806 | 2,269,135 |
| The Japan Wool Textile Co., Ltd. | 97,289 | 910,369 |
| The Juroku Bank Ltd. | 53,879 | 1,139,767 |
| The Keiyo Bank Ltd. | 165,704 | 671,202 |
| The Kiyo Bank Ltd. | 94,217 | 1,346,447 |
| The Miyazaki Bank Ltd. | 24,872 | 467,284 |
| The Musashino Bank Ltd. | 49,790 | 815,331 |
| The Nanto Bank Ltd. | 48,915 | 896,730 |
| The Nippon Road Co., Ltd. | 7,901 | 597,645 |
| The Nisshin Oillio Group Ltd. | 35,633 | 992,508 |
| The Ogaki Kyoritsu Bank Ltd. | 57,265 | 1,019,573 |
| The Oita Bank Ltd. | 24,122 | 403,131 |
| The Okinawa Electric Power Co., Inc. | 67,765 | 882,068 |
| The Pack Corp. | 16,520 | 442,548 |
| The San-In Godo Bank Ltd. | 225,856 | 1,178,004 |
| The Shibusawa Warehouse Co., Ltd. | 14,391 | 284,257 |
| The Shiga Bank Ltd. | 71,575 | 1,224,189 |
| The Shikoku Bank Ltd. | 56,326 | 374,276 |
| The Shimizu Bank Ltd. | 16,879 | 250,742 |
| The Sumitomo Warehouse Co., Ltd. | 79,032 | 1,286,266 |
| The Tochigi Bank Ltd. | 154,466 | 247,461 |
| The Toho Bank Ltd. | 277,783 | 546,160 |
| The Towa Bank Ltd. | 47,153 | 215,034 |
| The Yamagata Bank Ltd. | 47,555 | 373,999 |
| The Yamanashi Chuo Bank Ltd. | 44,834 | 341,989 |
| TKC Corp. | 44,149 | 1,513,026 |
| Toa Corp. (a) | 23,534 | 493,773 |
| Toa Corp. Hyogo | 32,933 | 252,408 |
| Toagosei Co., Ltd. | 186,354 | 2,133,928 |
| TOC Co., Ltd. | 70,073 | 415,233 |
| Tocalo Co., Ltd. | 79,356 | 965,043 |
| Toei Co., Ltd. | 9,985 | 1,781,413 |
| Toenec Corp. | 11,200 | 376,698 |
| Toho Holdings Co., Ltd. | 83,297 | 1,447,424 |
| Toho Titanium Co., Ltd. | 44,852 | 465,830 |
| Toho Zinc Co., Ltd. | 19,187 | 355,063 |
| Tokai Corp. | 25,632 | 550,857 |
| TOKAI Holdings Corp. | 172,526 | 1,440,072 |
| Tokai Tokyo Financial Holdings, Inc. | 321,807 | 1,165,840 |
| Token Corp. | 10,787 | 1,029,017 |
| Tokushu Tokai Paper Co., Ltd. | 12,758 | 519,680 |
| Tokyo Electron Device Ltd. | 9,476 | 479,579 |
| Tokyo Energy & Systems, Inc. | 27,260 | 262,029 |
| Tokyo Kiraboshi Financial Group, Inc. | 36,598 | 544,339 |
| Tokyo Seimitsu Co., Ltd. | 56,559 | 2,481,471 |
| Tokyo Steel Manufacturing Co., Ltd. | 119,775 | 1,295,218 |
| Tokyotokeiba Co., Ltd. | 22,016 | 845,690 |
| Tokyu Construction Co., Ltd. | 107,674 | 736,057 |
| Tokyu REIT, Inc. | 1,408 | 2,485,083 |
| Tomoku Co., Ltd. | 14,237 | 247,392 |
| TOMONY Holdings, Inc. | 207,856 | 611,119 |
| Tomy Co., Ltd. | 134,049 | 1,317,795 |
| Tonami Holdings Co., Ltd. | 9,889 | 428,919 |
| Topcon Corp. | 156,803 | 2,666,193 |
| Toppan Forms Co., Ltd. | 58,720 | 551,602 |
| Topre Corp. | 62,764 | 766,125 |
| Topy Industries Ltd. | 27,529 | 296,940 |
| Toridoll Holdings Corp. | 62,355 | 1,318,502 |
| Torii Pharmaceutical Co., Ltd. | 18,753 | 496,734 |
| Torishima Pump Manufacturing Co., Ltd. | 32,833 | 283,022 |
| Tosei Corp. | 38,913 | 412,295 |
| Tosho Co., Ltd. | 24,699 | 376,128 |
| Totetsu Kogyo Co., Ltd. | 40,951 | 915,862 |
| Towa Corp. | 37,556 | 931,892 |
Schwab International Equity ETFs | Annual Report
Schwab International Small-Cap Equity ETF
Portfolio Holdings as of August 31, 2021 (continued)
| Security | Number
of Shares | Value ($) |
| Towa Pharmaceutical Co., Ltd. | 40,384 | 1,085,141 |
| Toyo Construction Co., Ltd. | 111,327 | 571,531 |
| Toyo Corp. | 34,936 | 380,652 |
| Toyo Ink SC Holdings Co., Ltd. | 56,004 | 1,031,277 |
| Toyo Kanetsu KK | 11,817 | 267,405 |
| Toyo Tanso Co., Ltd. | 21,924 | 549,996 |
| Toyobo Co., Ltd. | 134,311 | 1,666,356 |
| TPR Co., Ltd. | 42,725 | 578,300 |
| Trancom Co., Ltd. | 9,487 | 721,931 |
| Transcosmos, Inc. | 39,708 | 1,243,360 |
| Tri Chemical Laboratories, Inc. | 39,084 | 1,246,945 |
| Trusco Nakayama Corp. | 58,444 | 1,566,167 |
| TSI Holdings Co., Ltd. * | 115,172 | 324,989 |
| Tsubaki Nakashima Co., Ltd. | 61,613 | 867,046 |
| Tsubakimoto Chain Co. | 48,668 | 1,503,986 |
| Tsugami Corp. | 71,194 | 1,013,539 |
| Tsukishima Kikai Co., Ltd. | 51,317 | 540,449 |
| Tsurumi Manufacturing Co., Ltd. | 32,566 | 509,863 |
| UACJ Corp. * | 41,746 | 1,037,000 |
| Ubicom Holdings, Inc. | 9,210 | 253,179 |
| Uchida Yoko Co., Ltd. | 12,992 | 616,133 |
| Union Tool Co. | 13,593 | 490,590 |
| Unipres Corp. | 56,045 | 465,256 |
| United Arrows Ltd. * | 38,450 | 620,184 |
| United Super Markets Holdings, Inc. | 79,750 | 795,613 |
| Unitika Ltd. * | 73,939 | 234,887 |
| UT Group Co., Ltd. | 40,982 | 1,126,576 |
| V Technology Co., Ltd. | 12,954 | 535,328 |
| V-Cube, Inc. (a) | 28,752 | 473,704 |
| Valor Holdings Co., Ltd. | 59,143 | 1,323,261 |
| Valqua Ltd. | 23,323 | 453,680 |
| ValueCommerce Co., Ltd. | 24,565 | 1,009,566 |
| Vector, Inc. | 41,651 | 388,985 |
| Vision, Inc./Tokyo Japan * | 38,751 | 425,746 |
| Vital KSK Holdings, Inc. | 49,244 | 364,422 |
| VT Holdings Co., Ltd. | 137,215 | 673,210 |
| W-Scope Corp. * | 78,272 | 599,188 |
| Wacoal Holdings Corp. | 84,295 | 1,773,985 |
| Wacom Co., Ltd. | 219,466 | 1,432,342 |
| Wakita & Co., Ltd. | 64,959 | 599,567 |
| Warabeya Nichiyo Holdings Co., Ltd. | 19,636 | 430,576 |
| WATAMI Co., Ltd. * | 27,954 | 242,237 |
| WDB Holdings Co., Ltd. | 12,418 | 386,014 |
| Weathernews, Inc. | 10,108 | 531,806 |
| World Co., Ltd. * | 27,150 | 344,256 |
| World Holdings Co., Ltd. | 13,417 | 317,900 |
| Xebio Holdings Co., Ltd. | 33,145 | 333,381 |
| YA-MAN Ltd. | 39,596 | 402,592 |
| Yahagi Construction Co., Ltd. | 35,003 | 233,863 |
| YAKUODO Holdings Co., Ltd. | 16,322 | 369,496 |
| YAMABIKO Corp. | 47,198 | 543,898 |
| Yamashin-Filter Corp. | 52,765 | 300,183 |
| Yamazen Corp. | 92,218 | 919,158 |
| Yellow Hat Ltd. | 41,753 | 740,350 |
| Yodogawa Steel Works Ltd. | 39,393 | 890,699 |
| Yokogawa Bridge Holdings Corp. | 47,114 | 960,635 |
| Yokohama Reito Co., Ltd. | 66,341 | 542,274 |
| Yokowo Co., Ltd. | 30,673 | 744,349 |
| Yondoshi Holdings, Inc. | 31,452 | 502,728 |
| Yonex Co., Ltd. | 59,731 | 415,388 |
| Yorozu Corp. | 28,628 | 310,619 |
| Yoshinoya Holdings Co., Ltd. * | 96,590 | 1,797,984 |
| Yuasa Trading Co., Ltd. | 25,742 | 696,388 |
| Yukiguni Maitake Co., Ltd. | 29,913 | 444,366 |
| Yurtec Corp. | 49,472 | 312,971 |
| Yushin Precision Equipment Co., Ltd. | 27,952 | 216,522 |
| Zenrin Co., Ltd. | 52,214 | 494,764 |
| ZERIA Pharmaceutical Co., Ltd. | 55,511 | 1,092,434 |
| Security | Number
of Shares | Value ($) |
| ZIGExN Co., Ltd. | 88,253 | 341,412 |
| Zojirushi Corp. | 64,113 | 1,009,608 |
| Zuiko Corp. | 25,312 | 211,970 |
| Zuken, Inc. | 21,786 | 723,820 |
| | | 671,805,646 |
| |
| Netherlands 1.7% |
| Accell Group N.V. * | 31,976 | 1,524,940 |
| Alfen Beheer BV * | 16,912 | 1,814,706 |
| AMG Advanced Metallurgical Group N.V. | 47,447 | 1,679,143 |
| APERAM S.A. | 68,065 | 4,174,845 |
| Arcadis N.V. | 110,526 | 5,474,536 |
| B&S Group Sarl | 39,137 | 404,705 |
| Basic-Fit N.V * | 68,502 | 3,198,946 |
| BE Semiconductor Industries N.V. | 110,753 | 10,074,694 |
| Boskalis Westminster | 118,654 | 3,905,013 |
| Brunel International N.V. | 30,825 | 406,811 |
| Corbion N.V. | 89,337 | 4,800,439 |
| Eurocommercial Properties N.V. | 71,550 | 1,807,469 |
| Flow Traders | 39,758 | 1,619,165 |
| ForFarmers N.V. | 58,299 | 306,245 |
| Fugro N.V. CVA * | 153,765 | 1,524,699 |
| Intertrust N.V. * | 134,539 | 2,086,848 |
| Koninklijke BAM Groep N.V. * | 391,080 | 1,290,774 |
| NSI N.V. | 27,911 | 1,159,753 |
| OCI N.V. * | 146,420 | 3,570,903 |
| PostNL N.V. | 735,618 | 3,852,044 |
| SBM Offshore N.V. | 246,404 | 4,488,085 |
| Sligro Food Group N.V. * | 50,960 | 1,437,721 |
| TKH Group N.V. | 62,851 | 3,850,587 |
| TomTom N.V. * | 101,248 | 810,931 |
| Vastned Retail N.V. | 27,919 | 784,376 |
| Wereldhave N.V. | 61,012 | 967,250 |
| | | 67,015,628 |
| |
| New Zealand 0.9% |
| Argosy Property Ltd. | 1,249,634 | 1,451,266 |
| Arvida Group Ltd. | 809,612 | 1,185,279 |
| Chorus Ltd. | 685,611 | 3,392,449 |
| EBOS Group Ltd. | 141,668 | 3,583,687 |
| Freightways Ltd. | 241,948 | 2,179,778 |
| Genesis Energy Ltd. | 772,710 | 1,843,726 |
| Goodman Property Trust | 1,691,735 | 3,107,800 |
| Heartland Group Holdings Ltd. | 644,592 | 1,038,964 |
| Kathmandu Holdings Ltd. | 851,721 | 815,298 |
| Oceania Healthcare Ltd. | 1,007,124 | 1,112,917 |
| Pacific Edge Ltd. * | 777,185 | 776,771 |
| Precinct Properties New Zealand Ltd. | 1,623,065 | 1,953,495 |
| Pushpay Holdings Ltd. * | 1,087,550 | 1,354,886 |
| Restaurant Brands New Zealand Ltd. * | 47,100 | 530,421 |
| Scales Corp., Ltd. | 162,272 | 572,218 |
| Skellerup Holdings Ltd. | 275,226 | 1,055,762 |
| SKY Network Television Ltd. * | 2,498,128 | 334,078 |
| Summerset Group Holdings Ltd. | 346,489 | 3,682,532 |
| Synlait Milk Ltd. * | 156,228 | 362,872 |
| Tourism Holdings Ltd. * | 211,788 | 359,251 |
| Vector Ltd. | 373,144 | 1,108,330 |
| Vista Group International Ltd. * | 330,750 | 563,372 |
| Vital Healthcare Property Trust | 597,433 | 1,387,661 |
| Z Energy Ltd. | 702,504 | 1,735,546 |
| | | 35,488,359 |
| |
| Norway 1.8% |
| Atea A.S.A. * | 127,692 | 2,599,209 |
| Austevoll Seafood A.S.A. | 138,995 | 1,783,471 |
Schwab International Equity ETFs | Annual Report
Schwab International Small-Cap Equity ETF
Portfolio Holdings as of August 31, 2021 (continued)
| Security | Number
of Shares | Value ($) |
| Bakkafrost P/F | 77,144 | 6,772,094 |
| Bank Norwegian A.S.A. | 237,185 | 2,800,877 |
| Bonheur A.S.A. | 31,271 | 1,163,859 |
| Borregaard A.S.A. | 151,444 | 3,957,740 |
| BW Energy Ltd. * | 94,310 | 302,798 |
| BW LPG Ltd. | 128,747 | 685,341 |
| BW Offshore Ltd. | 131,745 | 409,218 |
| Crayon Group Holding A.S.A. * | 95,699 | 1,836,951 |
| DNO A.S.A. * | 810,422 | 736,007 |
| Elkem A.S.A. * | 402,443 | 1,712,336 |
| Entra A.S.A. | 255,319 | 5,774,875 |
| Frontline Ltd. | 134,552 | 949,941 |
| Grieg Seafood A.S.A. * | 84,866 | 843,752 |
| Hexagon Composites A.S.A. * | 168,162 | 635,532 |
| Kongsberg Gruppen A.S.A. | 115,034 | 3,203,115 |
| NEL A.S.A. * | 2,094,765 | 3,437,394 |
| Nordic Semiconductor A.S.A. * | 238,829 | 7,764,031 |
| Norway Royal Salmon A.S.A. | 24,564 | 564,343 |
| Ocean Yield A.S.A. | 81,998 | 297,272 |
| Sbanken A.S.A. | 127,454 | 1,490,442 |
| SpareBank 1 Oestlandet | 41,814 | 599,446 |
| SpareBank 1 SMN | 196,460 | 2,816,453 |
| SpareBank 1 SR-Bank A.S.A. | 267,632 | 3,606,200 |
| Stolt-Nielsen Ltd. | 33,040 | 411,418 |
| Storebrand A.S.A. | 716,653 | 6,357,004 |
| Subsea 7 S.A. | 355,331 | 2,702,938 |
| TGS Nopec Geophysical Co. A.S.A. | 175,638 | 1,946,971 |
| Veidekke A.S.A. | 165,961 | 2,127,571 |
| Wallenius Wilhelmsen A.S.A. * | 146,636 | 580,120 |
| | | 70,868,719 |
| |
| Poland 0.7% |
| Alior Bank S.A. * | 144,439 | 1,649,309 |
| AmRest Holdings SE * | 117,958 | 966,758 |
| Asseco Poland S.A. | 83,157 | 1,822,209 |
| Bank Handlowy w Warszawie S.A. * | 48,882 | 586,002 |
| Bank Millennium S.A. * | 922,086 | 1,589,471 |
| CCC S.A. * | 42,787 | 1,368,384 |
| Ciech S.A. | 37,709 | 462,893 |
| Enea S.A. * | 313,313 | 813,396 |
| Eurocash S.A. | 115,996 | 360,518 |
| Grupa Azoty S.A. * | 70,277 | 537,797 |
| Grupa Lotos S.A. * | 155,652 | 2,367,628 |
| Jastrzebska Spolka Weglowa S.A. * | 81,404 | 857,668 |
| Kernel Holding S.A. | 82,470 | 1,232,053 |
| KRUK S.A. | 26,297 | 2,177,222 |
| mBank S.A. * | 19,657 | 1,904,708 |
| Mercator Medical S.A. * | 6,099 | 287,523 |
| Orange Polska S.A. * | 998,700 | 2,159,746 |
| PGE Polska Grupa Energetyczna S.A. * | 1,111,492 | 2,929,104 |
| Tauron Polska Energia S.A. * | 1,408,774 | 1,335,259 |
| Warsaw Stock Exchange | 43,613 | 493,448 |
| | | 25,901,096 |
| |
| Portugal 0.3% |
| Altri, SGPS, S.A. | 105,933 | 705,274 |
| Banco Comercial Portugues S.A. * | 12,155,352 | 1,882,560 |
| Corticeira Amorim SGPS S.A. | 50,021 | 686,129 |
| CTT-Correios de Portugal S.A. | 223,722 | 1,216,146 |
| Greenvolt-Energias Renovaveis S.A. * | 1,919 | 12,097 |
| Mota-Engil, SGPS, S.A. *(a) | 141,920 | 225,997 |
| NOS, SGPS S.A. | 314,109 | 1,323,719 |
| REN - Redes Energeticas Nacionais, SGPS, S.A. | 586,620 | 1,717,338 |
| Semapa-Sociedade de Investimento e Gestao | 22,510 | 318,863 |
| Security | Number
of Shares | Value ($) |
| Sonae, SGPS, S.A. | 1,479,343 | 1,610,079 |
| The Navigator Co. S.A. | 374,664 | 1,395,810 |
| | | 11,094,012 |
| |
| Republic of Korea 6.3% |
| AbClon, Inc. * | 19,481 | 340,239 |
| ABLBio, Inc. * | 37,070 | 639,441 |
| Ace Technologies Corp. * | 45,617 | 676,711 |
| Advanced Process Systems Corp. | 16,270 | 405,540 |
| Aekyung Industrial Co., Ltd. | 9,315 | 196,029 |
| AfreecaTV Co., Ltd. | 10,543 | 1,393,973 |
| Ahnlab, Inc. | 8,149 | 473,710 |
| AK Holdings, Inc. | 7,546 | 178,977 |
| Amicogen, Inc. * | 27,219 | 870,952 |
| Ananti, Inc. * | 61,794 | 594,250 |
| Anterogen Co., Ltd. * | 7,808 | 537,391 |
| Aprogen pharmaceuticals, Inc. * | 288,607 | 281,276 |
| Asiana Airlines, Inc. * | 53,881 | 1,101,367 |
| BGF Co., Ltd. | 40,073 | 218,778 |
| BH Co., Ltd. | 35,419 | 653,729 |
| Binex Co., Ltd. * | 34,678 | 572,758 |
| Binggrae Co., Ltd. | 7,218 | 355,468 |
| Bukwang Pharmaceutical Co., Ltd. | 51,239 | 958,977 |
| Byucksan Corp. | 62,716 | 216,365 |
| Cafe24 Corp. * | 17,251 | 566,875 |
| Cellivery Therapeutics, Inc. * | 18,166 | 1,034,073 |
| Chabiotech Co., Ltd. * | 62,852 | 1,295,582 |
| Chong Kun Dang Pharmaceutical Corp. | 11,403 | 1,268,694 |
| Chongkundang Holdings Corp. | 5,178 | 410,864 |
| Chunbo Co., Ltd. | 6,103 | 1,273,816 |
| CJ CGV Co., Ltd. * | 31,730 | 829,203 |
| CMG Pharmaceutical Co., Ltd. * | 161,304 | 626,045 |
| Com2uSCorp | 14,722 | 1,310,372 |
| Cosmax, Inc. * | 11,295 | 1,271,290 |
| CosmoAM&T Co., Ltd. * | 31,277 | 1,161,305 |
| CrystalGenomics, Inc. * | 69,081 | 458,772 |
| CS Wind Corp. | 30,378 | 2,093,408 |
| Cuckoo Holdings Co., Ltd. | 9,920 | 214,750 |
| Cuckoo Homesys Co., Ltd. | 8,044 | 291,386 |
| Dae Han Flour Mills Co., Ltd. | 1,469 | 209,052 |
| Daea TI Co., Ltd. | 84,783 | 468,721 |
| Daeduck Co., Ltd. | 27,954 | 181,305 |
| Daeduck Electronics Co., Ltd. / New | 49,629 | 791,872 |
| Daejoo Electronic Materials Co., Ltd. | 15,549 | 753,680 |
| Daesang Corp. | 29,961 | 652,478 |
| Daewoong Co., Ltd. | 32,611 | 1,020,983 |
| Daewoong Pharmaceutical Co., Ltd. | 6,061 | 867,761 |
| Daishin Securities Co., Ltd. | 48,743 | 807,163 |
| Daou Technology, Inc. | 36,926 | 829,637 |
| Dawonsys Co., Ltd. | 37,929 | 686,971 |
| DB Financial Investment Co., Ltd. | 36,452 | 212,214 |
| DB HiTek Co., Ltd. | 52,948 | 2,730,855 |
| Dentium Co., Ltd. | 9,302 | 698,783 |
| DIO Corp. * | 16,252 | 679,824 |
| Dong-A Socio Holdings Co., Ltd. | 4,335 | 429,967 |
| Dong-A ST Co., Ltd. | 7,173 | 476,365 |
| Dongjin Semichem Co., Ltd. | 46,704 | 1,067,451 |
| DongKook Pharmaceutical Co., Ltd. | 34,709 | 736,419 |
| Dongkuk Steel Mill Co., Ltd. | 87,270 | 1,527,949 |
| Dongsung Pharmaceutical Co., Ltd. * | 26,451 | 237,259 |
| Dongwon F&B Co., Ltd. | 1,574 | 281,690 |
| Dongwon Industries Co., Ltd. | 2,341 | 492,651 |
| Doosan Co., Ltd. | 9,120 | 703,989 |
| Doosan Fuel Cell Co., Ltd. * | 44,773 | 2,120,003 |
| DoubleUGames Co., Ltd. | 13,552 | 739,869 |
| Duk San Neolux Co., Ltd. * | 18,860 | 1,171,176 |
| Duzone Bizon Co., Ltd. | 27,949 | 2,056,190 |
Schwab International Equity ETFs | Annual Report
Schwab International Small-Cap Equity ETF
Portfolio Holdings as of August 31, 2021 (continued)
| Security | Number
of Shares | Value ($) |
| Ecopro BM Co., Ltd. | 12,887 | 3,561,167 |
| Ecopro Co., Ltd. | 23,811 | 2,289,815 |
| Ecopro HN Co., Ltd. * | 18,816 | 1,927,932 |
| ENF Technology Co., Ltd. | 13,069 | 369,149 |
| Enzychem Lifesciences Corp. * | 9,663 | 675,064 |
| Eo Technics Co., Ltd. | 12,699 | 1,320,884 |
| Eoflow Co., Ltd. * | 13,534 | 604,650 |
| ESR Kendall Square REIT Co., Ltd. | 102,660 | 616,252 |
| Eugene Investment & Securities Co., Ltd. | 97,879 | 337,252 |
| Eugene Technology Co., Ltd. | 20,156 | 765,770 |
| Eutilex Co., Ltd. * | 12,757 | 326,228 |
| F&F Co., Ltd. * | 4,863 | 3,032,428 |
| Foosung Co., Ltd. * | 80,045 | 983,778 |
| G-treeBNT Co., Ltd. * | 32,118 | 288,091 |
| Gamevil, Inc. * | 6,491 | 183,906 |
| GemVax & Kael Co., Ltd. * | 54,931 | 1,006,756 |
| GeneOne Life Science, Inc. * | 61,805 | 1,756,414 |
| Genexine, Inc. * | 27,753 | 1,785,652 |
| GOLFZON Co., Ltd. | 4,494 | 549,226 |
| Grand Korea Leisure Co., Ltd. * | 26,152 | 351,866 |
| Green Cross Cell Corp. | 8,624 | 300,496 |
| Green Cross Holdings Corp. | 41,122 | 1,228,925 |
| Green Cross LabCell Corp. | 7,463 | 682,287 |
| Halla Holdings Corp. | 11,206 | 447,003 |
| Hana Tour Service, Inc. * | 14,152 | 944,728 |
| Hanall Biopharma Co., Ltd. * | 56,584 | 1,166,379 |
| Hancom, Inc. * | 22,586 | 432,454 |
| Handsome Co., Ltd. | 19,760 | 692,780 |
| Hanil Cement Co., Ltd. | 2,704 | 550,385 |
| Hanjin Transportation Co., Ltd. | 23,316 | 788,294 |
| Hankook & Co. Co., Ltd. | 41,083 | 611,222 |
| Hanmi Semiconductor Co., Ltd. | 34,013 | 1,013,540 |
| Hansae Co., Ltd. | 27,226 | 484,900 |
| Hansol Chemical Co., Ltd. | 12,648 | 3,168,954 |
| Hansol Paper Co., Ltd. | 26,548 | 400,699 |
| Hansol Technics Co., Ltd. * | 33,815 | 214,069 |
| Hanwha General Insurance Co., Ltd. * | 121,761 | 449,469 |
| Hanwha Investment & Securities Co., Ltd. * | 165,193 | 698,841 |
| Hanwha Systems Co., Ltd. | 93,490 | 1,592,503 |
| Harim Holdings Co., Ltd. | 41,291 | 366,810 |
| HDC Holdings Co., Ltd. | 60,614 | 614,269 |
| HLB Life Science Co., Ltd. * | 97,336 | 1,246,660 |
| HS Industries Co., Ltd. | 67,033 | 410,483 |
| Huchems Fine Chemical Corp. | 33,891 | 781,909 |
| Hugel, Inc. * | 9,469 | 1,592,527 |
| Humedix Co., Ltd. | 8,176 | 236,582 |
| Huons Co., Ltd. | 9,225 | 455,899 |
| Huons Global Co., Ltd. | 8,808 | 508,220 |
| Hyosung Advanced Materials Corp. * | 4,769 | 2,546,044 |
| Hyosung Chemical Corp. * | 3,437 | 1,144,234 |
| Hyosung Corp. | 13,381 | 1,384,898 |
| Hyosung Heavy Industries Corp. * | 9,400 | 664,798 |
| Hyosung TNC Corp. | 4,630 | 3,102,773 |
| Hyundai Autoever Corp. | 6,842 | 690,426 |
| Hyundai Bioland Co., Ltd. | 17,204 | 298,987 |
| Hyundai Bioscience Co., Ltd. * | 50,004 | 1,334,791 |
| Hyundai Construction Equipment Co., Ltd. * | 18,690 | 794,702 |
| Hyundai Electric & Energy System Co., Ltd. * | 34,669 | 746,036 |
| Hyundai Elevator Co., Ltd. | 37,164 | 1,609,067 |
| Hyundai Greenfood Co., Ltd. | 77,920 | 668,011 |
| Hyundai Home Shopping Network Corp. | 8,540 | 542,842 |
| Hyundai Livart Furniture Co., Ltd. | 11,377 | 176,623 |
| Hyundai Rotem Co., Ltd. * | 109,159 | 2,504,316 |
| i-SENS, Inc. | 12,351 | 345,140 |
| ICD Co., Ltd. | 16,389 | 199,306 |
| Security | Number
of Shares | Value ($) |
| Iljin Materials Co., Ltd. | 25,005 | 1,632,566 |
| Ilyang Pharmaceutical Co., Ltd. | 20,167 | 600,079 |
| iMarketKorea, Inc. | 26,874 | 280,457 |
| InBody Co., Ltd. | 15,218 | 387,193 |
| Innocean Worldwide, Inc. | 16,731 | 844,162 |
| Innox Advanced Materials Co., Ltd. * | 9,134 | 701,131 |
| Inscobee, Inc. * | 139,169 | 510,728 |
| Insun ENT Co., Ltd. * | 35,700 | 372,565 |
| Interpark Holdings Corp. | 78,104 | 646,011 |
| INTOPS Co., Ltd. | 19,492 | 443,821 |
| iNtRON Biotechnology, Inc. * | 38,351 | 717,768 |
| IS Dongseo Co., Ltd. | 21,217 | 925,939 |
| ITM Semiconductor Co., Ltd. | 11,516 | 456,389 |
| JB Financial Group Co., Ltd. | 220,529 | 1,576,769 |
| Jeil Pharmaceutical Co., Ltd. | 11,831 | 405,608 |
| JR Reit XXVII | 154,610 | 705,409 |
| Jusung Engineering Co., Ltd. * | 52,945 | 547,967 |
| JW Pharmaceutical Corp. | 19,998 | 468,279 |
| JYP Entertainment Corp. | 40,243 | 1,480,326 |
| Kakao Games Corp. * | 41,260 | 2,889,570 |
| KC Co., Ltd. | 10,400 | 217,517 |
| KC Tech Co., Ltd. | 12,936 | 296,777 |
| KCC Glass Corp. | 14,638 | 940,559 |
| KEPCO Engineering & Construction Co., Inc. | 17,840 | 714,708 |
| KH FEELUX Co., Ltd. * | 144,652 | 409,834 |
| KH Vatec Co., Ltd. * | 25,689 | 621,481 |
| KISCO Corp. | 34,710 | 299,067 |
| KISWIRE Ltd. | 14,276 | 333,675 |
| KIWOOM Securities Co., Ltd. | 18,550 | 1,887,878 |
| KMW Co., Ltd. * | 44,522 | 1,635,808 |
| Koh Young Technology, Inc. | 90,263 | 1,755,514 |
| Kolmar Korea Co., Ltd. | 21,836 | 908,695 |
| Kolmar Korea Holdings Co., Ltd. | 11,098 | 234,509 |
| Kolon Corp. | 9,732 | 274,052 |
| Kolon Industries, Inc. | 27,897 | 2,093,267 |
| Komipharm International Co., Ltd. * | 56,246 | 536,046 |
| Korea Asset In Trust Co., Ltd. | 78,449 | 304,472 |
| Korea Electric Terminal Co., Ltd. | 10,516 | 750,981 |
| Korea Line Corp. * | 218,661 | 555,398 |
| Korea PetroChemical Ind Co., Ltd. | 4,458 | 890,100 |
| Korea Real Estate Investment & Trust Co., Ltd. | 219,065 | 444,006 |
| Korea United Pharm, Inc. | 14,029 | 635,234 |
| Korean Reinsurance Co. | 121,347 | 986,935 |
| KTB Investment & Securities Co., Ltd. | 77,458 | 491,691 |
| Kuk-il Paper Manufacturing Co., Ltd. * | 132,771 | 605,769 |
| Kumho Tire Co., Inc. * | 208,815 | 1,064,381 |
| KUMHOE&C Co., Ltd. | 43,376 | 490,082 |
| Kwang Dong Pharmaceutical Co., Ltd. | 54,273 | 388,517 |
| L&C Bio Co., Ltd. | 18,833 | 579,877 |
| L&F Co., Ltd. | 32,537 | 3,249,631 |
| LEENO Industrial, Inc. | 13,679 | 2,102,374 |
| LegoChem Biosciences, Inc. * | 24,504 | 1,141,245 |
| LF Corp. | 27,829 | 441,635 |
| LG Hausys Ltd. | 8,759 | 665,547 |
| LG International Corp. | 35,066 | 839,261 |
| LIG Nex1 Co., Ltd. | 16,055 | 721,433 |
| Lock&Lock Co., Ltd. * | 22,342 | 232,197 |
| Lotte Confectionery Co., Ltd. | 1,913 | 228,514 |
| Lotte Food Co., Ltd. | 535 | 193,799 |
| LOTTE Himart Co., Ltd. | 17,228 | 465,822 |
| LOTTE Reit Co., Ltd. | 188,809 | 937,979 |
| Lotte Tour Development Co., Ltd. * | 46,805 | 762,960 |
| LS Electric Co., Ltd. | 25,332 | 1,498,793 |
| Lutronic Corp. * | 32,696 | 523,102 |
| Maeil Dairies Co., Ltd. | 4,716 | 296,517 |
| Mcnex Co., Ltd. | 17,600 | 654,241 |
Schwab International Equity ETFs | Annual Report
Schwab International Small-Cap Equity ETF
Portfolio Holdings as of August 31, 2021 (continued)
| Security | Number
of Shares | Value ($) |
| Medipost Co., Ltd. * | 23,665 | 564,351 |
| MedPacto, Inc. * | 18,574 | 991,617 |
| Meritz Financial Group, Inc. | 42,496 | 1,053,741 |
| Meritz Fire & Marine Insurance Co., Ltd. | 91,343 | 2,091,644 |
| Meritz Securities Co., Ltd. | 435,440 | 2,012,988 |
| Mezzion Pharma Co., Ltd. * | 7,495 | 1,189,426 |
| Mirae Asset Life Insurance Co., Ltd. | 109,621 | 408,437 |
| Modetour Network, Inc. * | 19,568 | 419,393 |
| Namhae Chemical Corp. | 32,582 | 307,709 |
| Namsun Aluminum Co., Ltd. * | 85,573 | 274,923 |
| Namyang Dairy Products Co., Ltd. | 767 | 373,759 |
| Naturecell Co., Ltd. * | 68,563 | 1,348,257 |
| Neowiz * | 16,925 | 424,056 |
| NEPES Corp. * | 23,664 | 728,625 |
| Nexen Tire Corp. | 50,721 | 366,589 |
| NHN KCP Corp. * | 18,277 | 762,954 |
| NICE Holdings Co., Ltd. | 27,246 | 424,158 |
| NICE Information Service Co., Ltd. | 51,889 | 948,766 |
| NKMax Co., Ltd. * | 44,517 | 744,862 |
| NS Shopping Co., Ltd. | 23,974 | 356,679 |
| OliX Pharmaceuticals, Inc. * | 14,289 | 577,993 |
| OptoElectronics Solutions Co., Ltd. | 10,554 | 353,181 |
| Orion Holdings Corp. | 31,582 | 434,458 |
| Oscotec, Inc. * | 36,426 | 1,198,544 |
| Osstem Implant Co., Ltd. | 14,644 | 2,024,609 |
| Pan Ocean Co., Ltd. | 291,659 | 2,090,376 |
| Park Systems Corp. | 6,815 | 714,151 |
| Partron Co., Ltd. | 53,120 | 457,232 |
| Pearl Abyss Corp. * | 47,585 | 3,870,167 |
| Peptron, Inc. * | 25,131 | 260,099 |
| Pharmicell Co., Ltd. * | 79,080 | 1,115,148 |
| PI Advanced Materials Co., Ltd. | 21,101 | 1,070,110 |
| Poongsan Corp. | 27,062 | 827,416 |
| Posco ICT Co., Ltd. | 75,922 | 479,976 |
| RFHIC Corp. | 27,687 | 784,439 |
| S&S Tech Corp. | 24,877 | 682,296 |
| S-MAC Co., Ltd. * | 369,003 | 431,238 |
| Sam Chun Dang Pharm Co., Ltd. * | 20,555 | 980,371 |
| Sambu Engineering & Construction Co., Ltd. * | 170,837 | 439,083 |
| Samchully Co., Ltd. | 3,217 | 243,054 |
| Samsung Pharmaceutical Co., Ltd. * | 83,886 | 525,983 |
| Samwha Capacitor Co., Ltd. | 11,855 | 642,110 |
| Samyang Corp. | 4,750 | 263,832 |
| Samyang Holdings Corp. | 9,065 | 824,837 |
| Sangsangin Co., Ltd. * | 54,123 | 381,842 |
| SCM Lifescience Co., Ltd. * | 14,276 | 341,063 |
| Seah Besteel Corp. | 16,524 | 416,859 |
| Sebang Global Battery Co., Ltd. | 12,188 | 879,844 |
| Seobu T&D | 33,694 | 257,475 |
| Seojin System Co., Ltd. * | 15,001 | 493,586 |
| Seoul Semiconductor Co., Ltd. | 56,913 | 809,922 |
| SFA Engineering Corp. | 28,778 | 963,031 |
| SFA Semicon Co., Ltd. * | 113,255 | 675,945 |
| Shinsegae International, Inc. | 3,769 | 643,634 |
| Shinsung E&G Co., Ltd. * | 244,975 | 488,070 |
| Silicon Works Co., Ltd. | 13,235 | 1,318,420 |
| SIMMTECH Co., Ltd. | 28,425 | 752,639 |
| SK Discovery Co., Ltd. | 16,371 | 676,330 |
| SK Gas Ltd. | 3,431 | 353,620 |
| SK Materials Co., Ltd. | 6,666 | 2,325,583 |
| SK Securities Co., Ltd. | 526,555 | 418,265 |
| SL Corp. | 23,163 | 549,383 |
| SM Entertainment Co., Ltd. * | 25,264 | 1,505,664 |
| SNT Motiv Co., Ltd. | 11,958 | 562,086 |
| Solid, Inc. * | 69,360 | 431,911 |
| SOLUM Co., Ltd. * | 54,223 | 1,337,512 |
| Songwon Industrial Co., Ltd. | 25,690 | 401,043 |
| Security | Number
of Shares | Value ($) |
| Soulbrain Co., Ltd. | 6,433 | 1,571,839 |
| Soulbrain Holdings Co., Ltd. * | 8,868 | 261,577 |
| SPC SAMLIP Co., Ltd. | 3,434 | 241,383 |
| ST Pharm Co., Ltd. * | 13,637 | 1,196,156 |
| STCUBE * | 37,897 | 301,359 |
| Studio Dragon Corp. * | 9,966 | 747,805 |
| Sungwoo Hitech Co., Ltd. | 68,476 | 367,347 |
| Taekwang Industrial Co., Ltd. | 846 | 806,270 |
| Taeyoung Engineering & Construction Co., Ltd. | 34,152 | 359,355 |
| Taihan Electric Wire Co., Ltd. * | 399,818 | 860,361 |
| Telcon RF Pharmaceutical, Inc. * | 111,282 | 465,015 |
| TES Co., Ltd. | 19,868 | 473,802 |
| Tesna, Inc. | 14,155 | 628,731 |
| Tokai Carbon Korea Co., Ltd. | 6,446 | 944,009 |
| Tongyang Life Insurance Co., Ltd. | 49,035 | 228,375 |
| Tongyang, Inc. | 296,612 | 446,408 |
| Toptec Co., Ltd. | 28,249 | 258,260 |
| TY Holdings Co., Ltd. * | 24,445 | 648,311 |
| UniTest, Inc. * | 25,812 | 552,105 |
| Vaxcell-Bio Therapeutics Co., Ltd. * | 15,105 | 1,026,585 |
| Vidente Co., Ltd. * | 61,166 | 514,355 |
| Vieworks Co., Ltd. | 10,962 | 417,888 |
| Webzen, Inc. * | 26,948 | 631,022 |
| Wemade Co., Ltd. | 12,669 | 1,034,762 |
| Wonik Holdings Co., Ltd. * | 40,613 | 198,608 |
| WONIK IPS Co., Ltd. | 52,182 | 2,038,764 |
| Woongjin Thinkbig Co., Ltd. | 65,953 | 212,174 |
| Y2 Solution Co., Ltd. *(b) | 32,067 | 13,829 |
| YG Entertainment, Inc. * | 16,530 | 863,960 |
| Youlchon Chemical Co., Ltd. | 20,599 | 365,095 |
| Young Poong Corp. | 793 | 488,337 |
| Youngone Corp. | 44,954 | 1,614,847 |
| Youngone Holdings Co., Ltd. | 7,633 | 303,161 |
| Yuanta Securities Korea Co., Ltd. | 129,181 | 489,672 |
| Yungjin Pharmaceutical Co., Ltd. * | 131,903 | 614,322 |
| Zinus, Inc. | 13,212 | 951,487 |
| | | 242,070,521 |
| |
| Singapore 0.9% |
| AEM Holdings Ltd. | 335,362 | 1,032,190 |
| AIMS APAC REIT | 881,007 | 1,015,211 |
| ARA LOGOS Logistics Trust | 1,928,206 | 1,261,483 |
| Ascendas India Trust | 1,332,369 | 1,436,276 |
| Best World International Ltd. *(b) | 321,868 | — |
| CapitaLand China Trust | 1,612,512 | 1,558,446 |
| CDL Hospitality Trusts | 1,183,603 | 1,029,526 |
| China Hongxing Sports Ltd. *(b) | 884,000 | — |
| COSCO Shipping International Singapore Co., Ltd. * | 1,408,896 | 298,517 |
| Cromwell European Real Estate Investment Trust | 395,206 | 1,147,641 |
| Eagle Hospitality Trust *(b) | 940,343 | — |
| ESR-REIT | 3,731,850 | 1,290,098 |
| Far East Hospitality Trust | 1,451,634 | 631,333 |
| First Real Estate Investment Trust | 1,757,724 | 346,292 |
| First Resources Ltd. | 753,455 | 823,417 |
| Frasers Centrepoint Trust | 1,610,889 | 2,778,427 |
| Frasers Hospitality Trust | 1,146,532 | 421,926 |
| Haw Par Corp., Ltd. | 214,590 | 2,080,331 |
| Keppel Infrastructure Trust | 5,362,456 | 2,152,796 |
| Keppel Pacific Oak US REIT | 1,165,679 | 874,259 |
| Lendlease Global Commercial REIT | 1,386,886 | 917,648 |
| Lippo Malls Indonesia Retail Trust * | 8,018,640 | 369,605 |
| Manulife US Real Estate Investment Trust | 2,210,116 | 1,613,385 |
| Nanofilm Technologies International Ltd. | 276,442 | 887,837 |
Schwab International Equity ETFs | Annual Report
Schwab International Small-Cap Equity ETF
Portfolio Holdings as of August 31, 2021 (continued)
| Security | Number
of Shares | Value ($) |
| OUE Commercial Real Estate Investment Trust | 3,326,136 | 1,013,840 |
| Parkway Life Real Estate Investment Trust | 583,680 | 2,100,224 |
| Prime US REIT | 903,478 | 740,852 |
| Raffles Medical Group Ltd. | 1,391,143 | 1,458,265 |
| Riverstone Holdings Ltd. | 836,162 | 783,261 |
| Sabana Shari'ah Compliant Industrial Real Estate Investment Trust | 1,555,676 | 520,448 |
| Sheng Siong Group Ltd. | 625,066 | 701,695 |
| SPH REIT | 883,571 | 594,478 |
| Starhill Global REIT | 2,181,913 | 973,272 |
| Thomson Medical Group Ltd. * | 10,084,704 | 644,773 |
| | | 33,497,752 |
| |
| Spain 1.6% |
| Acerinox S.A. | 288,854 | 3,928,061 |
| Aedas Homes S.A. | 32,415 | 1,052,267 |
| Almirall S.A. | 110,397 | 1,873,974 |
| Applus Services S.A. | 217,943 | 2,123,769 |
| Atresmedia Corp de Medios de Comunicaion S.A. * | 115,418 | 505,197 |
| Banco de Sabadell S.A. * | 8,522,738 | 6,096,761 |
| Cia de Distribucion Integral Logista Holdings S.A. | 95,248 | 2,067,688 |
| Cie Automotive S.A. | 79,800 | 2,292,825 |
| Construcciones y Auxiliar de Ferrocarriles S.A. | 27,866 | 1,194,067 |
| Distribuidora Internacional de Alimentacion S.A. * | 21,089,337 | 502,877 |
| Ebro Foods S.A. | 116,930 | 2,346,509 |
| Ence Energia y Celulosa S.A. * | 186,293 | 555,051 |
| Faes Farma S.A. | 447,070 | 1,744,720 |
| Fluidra S.A. | 158,688 | 6,481,381 |
| Gestamp Automocion S.A. * | 235,953 | 1,096,296 |
| Global Dominion Access S.A. | 167,984 | 890,352 |
| Grupo Catalana Occidente S.A. | 78,729 | 2,983,233 |
| Indra Sistemas S.A. * | 185,543 | 2,000,785 |
| Laboratorios Farmaceuticos Rovi S.A. | 30,037 | 1,879,229 |
| Lar Espana Real Estate Socimi S.A. | 90,604 | 592,522 |
| Let's GOWEX S.A. *(b) | 5,361 | — |
| Mediaset Espana Comunicacion S.A. * | 238,605 | 1,456,188 |
| Melia Hotels International S.A. * | 154,911 | 1,081,827 |
| Metrovacesa S.A. * | 70,187 | 604,821 |
| Neinor Homes S.A. * | 65,823 | 938,625 |
| Pharma Mar S.A. | 20,319 | 1,750,466 |
| Promotora de Informaciones S.A., Class A * | 406,476 | 307,567 |
| Prosegur Cash S.A. | 547,840 | 530,292 |
| Prosegur Cia de Seguridad S.A. | 378,390 | 1,229,237 |
| Sacyr S.A. | 585,309 | 1,445,421 |
| Solaria Energia y Medio Ambiente S.A. * | 93,614 | 1,856,511 |
| Tecnicas Reunidas S.A. *(a) | 45,919 | 441,500 |
| Unicaja Banco S.A. | 1,859,771 | 1,720,069 |
| Viscofan S.A. | 59,905 | 4,228,746 |
| | | 59,798,834 |
| |
| Sweden 6.1% |
| AAK AB | 263,707 | 6,300,652 |
| AddTech AB, B shares | 288,931 | 6,053,783 |
| AF Poyry AB | 149,698 | 5,025,371 |
| Arjo AB, B Shares | 340,461 | 4,362,838 |
| Atrium Ljungberg AB, B Shares | 67,661 | 1,665,159 |
| Attendo AB * | 159,106 | 786,077 |
| Avanza Bank Holding AB | 188,225 | 7,225,135 |
| Axfood AB | 158,991 | 4,201,773 |
| Security | Number
of Shares | Value ($) |
| Beijer Ref AB | 372,526 | 8,547,013 |
| Betsson AB, B Shares * | 180,311 | 1,709,465 |
| BHG Group AB * | 119,837 | 2,023,953 |
| Bilia AB, A Shares | 115,033 | 2,309,009 |
| BillerudKorsnas AB | 269,805 | 5,901,345 |
| Biotage AB | 97,982 | 2,733,490 |
| Bonava AB, B Shares | 134,514 | 1,426,320 |
| Boozt AB * | 93,838 | 1,910,727 |
| Bravida Holding AB | 305,639 | 4,840,040 |
| Bure Equity AB | 84,201 | 3,922,196 |
| Camurus AB * | 30,254 | 696,231 |
| Catena AB | 41,816 | 2,698,618 |
| CELLINK AB, B Shares * | 37,619 | 2,508,325 |
| Clas Ohlson AB, B Shares * | 59,760 | 709,761 |
| Cloetta AB, B Shares | 324,023 | 1,119,254 |
| Collector AB * | 117,857 | 533,168 |
| Concentric AB | 57,968 | 1,234,697 |
| Dios Fastigheter AB | 127,350 | 1,499,250 |
| Dometic Group AB | 489,933 | 7,752,813 |
| Electrolux Professional AB, B Shares * | 343,911 | 2,689,215 |
| Fabege AB | 391,412 | 7,088,655 |
| Granges AB | 160,672 | 1,997,554 |
| Hansa Biopharma AB * | 68,707 | 986,227 |
| Hexpol AB | 375,281 | 4,817,728 |
| Hufvudstaden AB, A Shares | 162,873 | 2,954,420 |
| Instalco AB | 70,781 | 3,882,092 |
| Intrum AB | 119,447 | 3,561,847 |
| Investment AB Oresund | 44,371 | 870,095 |
| INVISIO AB | 48,895 | 1,017,673 |
| JM AB | 105,434 | 4,074,001 |
| Karo Pharma AB * | 120,871 | 748,566 |
| Kungsleden AB | 285,705 | 4,279,630 |
| Lindab International AB | 104,149 | 2,934,471 |
| Loomis AB | 115,800 | 3,589,825 |
| Medicover AB, B Shares | 87,906 | 2,584,678 |
| Mekonomen AB * | 65,741 | 1,233,597 |
| MIPS AB | 33,584 | 3,730,195 |
| Modern Times Group MTG AB, B Shares * | 159,312 | 2,268,338 |
| Munters Group AB | 161,645 | 1,483,849 |
| Mycronic AB | 104,766 | 3,233,215 |
| NCC AB, B Shares | 143,844 | 2,570,947 |
| Nobia AB | 172,353 | 1,394,602 |
| Nolato AB, B Shares | 265,130 | 3,059,907 |
| Nordic Entertainment Group AB, B Shreas * | 115,585 | 6,689,992 |
| Nordnet AB publ | 239,955 | 4,348,475 |
| Nyfosa AB | 270,282 | 4,170,627 |
| Oncopeptides AB *(a) | 75,257 | 449,086 |
| Pandox AB * | 134,357 | 2,222,525 |
| Peab AB | 300,290 | 3,587,358 |
| Platzer Fastigheter Holding AB, B Shares | 81,715 | 1,608,070 |
| Ratos AB, B Shares | 293,480 | 1,938,154 |
| Resurs Holding AB | 209,358 | 1,067,553 |
| Samhallsbyggnadsbolaget i Norden AB | 1,606,955 | 9,002,442 |
| SAS AB * | 5,635,486 | 1,258,723 |
| Scandic Hotels Group AB *(a) | 198,929 | 777,648 |
| Sectra AB, B Shares | 39,833 | 4,020,811 |
| SkiStar AB * | 63,691 | 1,341,849 |
| SSAB AB, A Shares * | 358,076 | 1,947,343 |
| SSAB AB, B Shares * | 1,017,945 | 4,834,816 |
| Thule Group AB | 159,892 | 8,717,697 |
| Troax Group AB | 51,951 | 2,134,894 |
| Vitec Software Group AB, B Shares | 34,940 | 2,018,262 |
| Vitrolife AB | 98,007 | 6,029,961 |
| VNV Global AB * | 131,596 | 1,552,283 |
Schwab International Equity ETFs | Annual Report
Schwab International Small-Cap Equity ETF
Portfolio Holdings as of August 31, 2021 (continued)
| Security | Number
of Shares | Value ($) |
| Wallenstam AB, B Shares | 248,269 | 4,244,799 |
| Wihlborgs Fastigheter AB | 204,183 | 4,958,830 |
| | | 235,669,988 |
| |
| Switzerland 3.9% |
| Allreal Holding AG | 21,358 | 4,495,194 |
| ALSO Holding AG * | 3,979 | 1,279,205 |
| APG SGA S.A. * | 1,498 | 363,850 |
| Arbonia AG | 65,082 | 1,352,722 |
| Aryzta AG * | 1,396,363 | 1,946,570 |
| Ascom Holding AG * | 56,092 | 891,545 |
| Autoneum Holding AG * | 4,465 | 854,445 |
| Bachem Holding AG, Class B | 8,584 | 6,278,347 |
| Basilea Pharmaceutica AG * | 18,863 | 984,282 |
| Belimo Holding AG | 14,136 | 7,368,528 |
| Bell Food Group AG | 2,988 | 929,622 |
| Bobst Group S.A. * | 11,728 | 1,081,196 |
| Bossard Holding AG, Class A | 3,798 | 1,276,987 |
| Bucher Industries AG | 9,806 | 4,956,256 |
| Burckhardt Compression Holding AG | 4,766 | 1,880,802 |
| Bystronic AG | 2,010 | 2,826,134 |
| Cembra Money Bank AG | 44,527 | 3,254,279 |
| Comet Holding AG | 11,247 | 4,266,506 |
| COSMO Pharmaceuticals N.V. * | 10,913 | 998,318 |
| Daetwyler Holding AG | 11,175 | 3,989,111 |
| dormakaba Holding AG | 4,584 | 3,305,204 |
| Dufry AG * | 84,188 | 4,552,889 |
| EFG International AG * | 115,742 | 916,030 |
| Emmi AG | 2,936 | 3,387,754 |
| Forbo Holding AG | 1,562 | 3,345,499 |
| Galenica AG | 73,236 | 5,728,246 |
| GAM Holding AG * | 231,945 | 444,875 |
| Hiag Immobilien Holding AG | 4,567 | 506,032 |
| Huber & Suhner AG | 25,988 | 2,329,147 |
| Idorsia Ltd. * | 170,956 | 4,031,057 |
| Implenia AG * | 23,573 | 544,002 |
| Inficon Holding AG | 2,938 | 3,688,336 |
| Interroll Holding AG | 823 | 3,656,580 |
| Intershop Holding AG | 1,752 | 1,185,787 |
| Kardex Holding AG | 8,880 | 2,379,826 |
| Komax Holding AG * | 5,268 | 1,489,451 |
| Landis & Gyr Group AG * | 37,376 | 2,862,209 |
| LEM Holding S.A. | 739 | 1,903,870 |
| Leonteq AG | 15,708 | 1,054,573 |
| Medacta Group S.A. * | 9,552 | 1,491,115 |
| Mobimo Holding AG | 9,906 | 3,492,864 |
| Rieter Holding AG * | 4,722 | 1,134,043 |
| Schweiter Technologies AG | 1,448 | 2,222,464 |
| SFS Group AG | 25,958 | 3,706,464 |
| Siegfried Holding AG * | 6,281 | 6,064,674 |
| Softwareone Holding AG * | 155,296 | 4,390,772 |
| St. Galler Kantonalbank AG | 4,305 | 2,004,347 |
| Stadler Rail AG (a) | 73,288 | 3,174,573 |
| Swissquote Group Holding S.A. | 12,966 | 2,445,854 |
| u-blox Holding AG * | 10,837 | 777,832 |
| Valiant Holding AG | 24,082 | 2,429,100 |
| Valora Holding AG * | 5,684 | 1,165,280 |
| Vetropack Holding AG | 18,784 | 1,281,589 |
| Vontobel Holding AG | 41,815 | 3,911,954 |
| VP Bank AG | 3,766 | 422,624 |
| VZ Holding AG | 20,119 | 1,910,761 |
| Ypsomed Holding AG | 4,757 | 762,325 |
| Zehnder Group AG | 14,392 | 1,555,382 |
| Zur Rose Group AG * | 11,624 | 4,999,570 |
| | | 147,928,853 |
| |
| Security | Number
of Shares | Value ($) |
| United Kingdom 13.9% |
| 888 Holdings plc | 403,018 | 2,260,768 |
| AG Barr plc * | 122,703 | 940,606 |
| Airtel Africa plc | 1,537,741 | 1,967,116 |
| AJ Bell plc | 435,889 | 2,581,937 |
| Alfa Financial Software Holdings plc | 145,511 | 298,387 |
| AO World plc * | 434,507 | 1,382,554 |
| Ascential plc * | 598,469 | 3,429,650 |
| Assura plc | 4,003,295 | 4,347,024 |
| Aston Martin Lagonda Global Holdings plc * | 101,706 | 2,805,057 |
| Avon Rubber plc | 43,101 | 1,114,581 |
| Babcock International Group plc * | 389,247 | 1,945,131 |
| Bakkavor Group plc | 220,974 | 352,166 |
| Balfour Beatty plc | 1,006,903 | 3,963,247 |
| Bank of Georgia Group plc * | 59,496 | 1,367,419 |
| Beazley plc * | 913,533 | 4,922,134 |
| Big Yellow Group plc | 246,108 | 5,165,270 |
| Bodycote plc | 287,207 | 3,812,367 |
| Brewin Dolphin Holdings plc | 440,478 | 2,412,708 |
| Britvic plc | 409,896 | 5,500,165 |
| Bytes Technology Group plc * | 308,589 | 2,182,936 |
| C&C Group plc * | 592,402 | 2,012,144 |
| Cairn Energy plc | 756,838 | 2,002,994 |
| Capita plc * | 2,588,662 | 1,744,272 |
| Capital & Counties Properties plc | 1,118,398 | 2,675,122 |
| Carnival plc * | 203,311 | 4,393,527 |
| Centamin plc | 1,658,414 | 2,265,503 |
| Chemring Group plc | 423,885 | 1,939,711 |
| Cineworld Group plc *(a) | 1,528,568 | 1,394,748 |
| Clarkson plc | 38,309 | 2,014,010 |
| Close Brothers Group plc | 231,667 | 4,919,574 |
| CLS Holdings plc | 233,839 | 769,152 |
| CMC Markets plc | 172,680 | 1,001,699 |
| Coats Group plc | 2,182,682 | 2,291,989 |
| Computacenter plc | 109,749 | 4,437,617 |
| ContourGlobal plc | 287,098 | 767,321 |
| Countryside Properties plc * | 790,292 | 6,123,411 |
| Cranswick plc | 79,863 | 4,359,089 |
| Crest Nicholson Holdings plc * | 381,475 | 2,203,971 |
| Dechra Pharmaceuticals plc | 160,519 | 11,575,911 |
| Devro plc | 248,112 | 763,173 |
| Diploma plc | 185,792 | 7,839,649 |
| Dixons Carphone plc | 1,534,869 | 2,946,748 |
| Domino's Pizza Group plc | 708,654 | 4,012,324 |
| Drax Group plc | 600,775 | 3,429,636 |
| Dunelm Group plc | 174,547 | 3,089,234 |
| Electrocomponents plc | 715,980 | 10,484,312 |
| Elementis plc * | 860,284 | 1,813,836 |
| Energean plc * | 177,997 | 1,659,661 |
| Equiniti Group plc * | 508,264 | 1,250,703 |
| Essentra plc | 461,015 | 1,839,969 |
| Euromoney Institutional Investor plc | 162,118 | 2,302,546 |
| FDM Group Holdings plc | 129,326 | 2,263,969 |
| Ferrexpo plc | 439,027 | 2,298,419 |
| Finablr plc *(b) | 225,475 | — |
| Firstgroup plc * | 1,882,231 | 2,337,855 |
| Frasers Group plc * | 282,744 | 2,603,256 |
| Funding Circle Holdings plc * | 241,856 | 499,282 |
| Future plc | 172,707 | 9,150,991 |
| Games Workshop Group plc | 49,967 | 7,956,353 |
| Gamesys Group plc | 121,763 | 3,091,784 |
| Genuit Group plc | 357,115 | 3,902,348 |
| Genus plc | 99,162 | 8,099,597 |
| Grafton Group plc | 331,654 | 6,376,452 |
| Grainger plc | 999,003 | 4,391,361 |
| Great Portland Estates plc | 382,421 | 4,107,826 |
Schwab International Equity ETFs | Annual Report
Schwab International Small-Cap Equity ETF
Portfolio Holdings as of August 31, 2021 (continued)
| Security | Number
of Shares | Value ($) |
| Greencore Group plc * | 796,144 | 1,555,885 |
| Greggs plc * | 152,921 | 6,402,119 |
| Halfords Group plc | 298,548 | 1,493,948 |
| Hammerson plc (a) | 6,151,940 | 3,076,766 |
| Hays plc * | 2,349,487 | 5,147,704 |
| Helical plc | 157,686 | 1,026,483 |
| Hill & Smith Holdings plc | 120,842 | 3,080,040 |
| Hilton Food Group plc | 101,741 | 1,660,650 |
| Hochschild Mining plc | 477,530 | 992,373 |
| Hunting plc | 207,824 | 600,637 |
| Ibstock plc | 589,481 | 1,940,566 |
| IG Group Holdings plc | 552,661 | 7,123,018 |
| Inchcape plc | 599,302 | 7,583,940 |
| Indivior plc * | 1,102,805 | 2,950,478 |
| IntegraFin Holdings plc | 393,658 | 3,136,860 |
| Investec plc | 1,017,179 | 4,282,272 |
| IP Group plc | 1,528,896 | 2,672,262 |
| IWG plc * | 1,101,047 | 4,532,311 |
| J.D. Wetherspoon plc * | 131,463 | 2,013,706 |
| John Laing Group plc | 761,752 | 4,199,736 |
| John Wood Group plc * | 1,023,759 | 3,519,554 |
| Jupiter Fund Management plc | 675,259 | 2,481,299 |
| Just Group plc * | 1,558,394 | 2,005,332 |
| Kainos Group plc | 84,670 | 2,286,262 |
| Keller Group plc | 106,972 | 1,469,258 |
| Lancashire Holdings Ltd. | 373,181 | 3,209,940 |
| LondonMetric Property plc | 1,342,972 | 4,838,760 |
| Man Group plc | 2,137,902 | 6,372,997 |
| Marks & Spencer Group plc * | 2,992,628 | 7,392,896 |
| Marshalls plc | 306,100 | 3,405,970 |
| Marston's plc * | 995,044 | 1,182,502 |
| Mediclinic International plc * | 595,077 | 2,566,667 |
| Micro Focus International plc | 497,657 | 3,050,547 |
| Mitchells & Butlers plc * | 388,114 | 1,573,582 |
| Mitie Group plc * | 2,051,052 | 2,145,298 |
| Moneysupermarket.com Group plc | 783,948 | 2,738,270 |
| Moonpig Group plc * | 213,244 | 1,135,756 |
| Morgan Advanced Materials plc | 427,996 | 2,362,009 |
| National Express Group plc * | 814,921 | 2,880,103 |
| NCC Group plc | 403,048 | 1,791,665 |
| Network International Holdings plc * | 712,253 | 3,834,693 |
| Ninety One plc | 491,102 | 1,731,603 |
| OSB Group plc | 570,781 | 4,002,314 |
| Oxford Instruments plc | 80,336 | 2,891,208 |
| Pagegroup plc * | 473,233 | 4,103,109 |
| Paragon Banking Group plc | 386,057 | 2,985,968 |
| Petrofac Ltd. *(a) | 392,837 | 569,296 |
| Petropavlovsk plc * | 4,635,365 | 1,339,679 |
| Pets at Home Group plc | 725,460 | 4,997,065 |
| Playtech plc * | 471,638 | 2,653,488 |
| Plus500 Ltd. | 150,515 | 3,095,802 |
| Primary Health Properties plc | 2,013,255 | 4,668,702 |
| Provident Financial plc * | 391,159 | 1,915,388 |
| PureTech Health plc * | 237,436 | 1,150,235 |
| PZ Cussons plc | 281,072 | 934,183 |
| QinetiQ Group plc | 849,545 | 4,043,047 |
| Rank Group plc * | 312,101 | 765,421 |
| Rathbone Brothers plc | 91,779 | 2,589,373 |
| Redde Northgate plc | 372,405 | 2,239,723 |
| Redrow plc | 347,708 | 3,398,543 |
| Rhi Magnesita N.V. | 43,221 | 2,284,144 |
| Rotork plc | 1,341,375 | 6,158,482 |
| Royal Mail plc | 1,399,844 | 9,544,058 |
| Safestore Holdings plc | 311,535 | 4,952,064 |
| Sanne Group plc | 233,753 | 2,991,835 |
| Savills plc | 200,470 | 3,771,511 |
| Senior plc * | 623,999 | 1,525,191 |
| Serco Group plc | 1,812,516 | 3,325,136 |
| Security | Number
of Shares | Value ($) |
| Shaftesbury plc | 420,809 | 3,729,652 |
| SIG plc * | 1,093,460 | 795,326 |
| Sirius Real Estate Ltd. | 1,462,798 | 2,512,444 |
| Softcat plc | 190,199 | 5,533,637 |
| Spectris plc | 175,264 | 9,503,561 |
| Spire Healthcare Group plc * | 437,276 | 1,414,233 |
| Spirent Communications plc | 926,697 | 3,805,695 |
| SSP Group plc * | 1,193,102 | 4,477,753 |
| Stagecoach Group plc * | 639,623 | 631,602 |
| Synthomer plc | 504,430 | 3,714,087 |
| TBC Bank Group plc | 53,446 | 1,044,482 |
| Telecom Plus plc | 97,955 | 1,388,549 |
| The Go-Ahead Group plc * | 65,142 | 845,416 |
| The Restaurant Group plc * | 1,115,219 | 1,850,994 |
| The Unite Group plc | 483,042 | 8,127,018 |
| TI Fluid Systems plc | 433,803 | 1,823,901 |
| TP ICAP Group plc | 1,195,166 | 3,343,153 |
| Trainline plc * | 708,632 | 3,567,483 |
| Tritax Big Box REIT plc | 2,604,502 | 8,495,139 |
| Tullow Oil plc *(a) | 2,173,432 | 1,333,172 |
| Ultra Electronics Holdings plc | 107,088 | 4,719,104 |
| Vectura Group plc | 916,341 | 2,065,706 |
| Vesuvius plc | 324,499 | 2,509,846 |
| Victrex plc | 124,462 | 4,539,208 |
| Virgin Money UK plc * | 1,879,398 | 5,496,359 |
| Vistry Group plc | 334,137 | 5,564,259 |
| Watches of Switzerland Group plc * | 356,361 | 4,982,890 |
| WH Smith plc * | 189,612 | 4,258,762 |
| Wizz Air Holdings plc * | 58,145 | 3,889,073 |
| Workspace Group plc | 202,764 | 2,596,598 |
| XP Power Ltd. | 22,813 | 1,733,081 |
| | | 532,788,137 |
| Total Common Stock |
| (Cost $2,906,383,963) | | 3,807,689,829 |
|
| Preferred Stock 0.3% of net assets |
| |
| Germany 0.2% |
| Draegerwerk AG & Co. KGaA | 13,035 | 1,100,182 |
| Jungheinrich AG | 73,264 | 3,955,798 |
| Schaeffler AG | 113,277 | 972,128 |
| Sixt SE | 25,932 | 2,035,659 |
| | | 8,063,767 |
| |
| Italy 0.1% |
| Danieli & C Officine Meccaniche S.p.A. - RSP | 59,221 | 1,125,509 |
| |
| Republic of Korea 0.0% |
| Daishin Securities Co., Ltd. | 43,780 | 649,460 |
| Total Preferred Stock |
| (Cost $6,963,526) | | 9,838,736 |
|
| Warrants 0.0% of net assets |
| |
| Italy 0.0% |
Webuild S.p.A
expires 08/02/30 *(a)(b) | 44,499 | 118,820 |
| |
Schwab International Equity ETFs | Annual Report
Schwab International Small-Cap Equity ETF
Portfolio Holdings as of August 31, 2021 (continued)
| Security | Number
of Shares | Value ($) |
| Singapore 0.0% |
Ezion Holdings Ltd.
expires 04/16/23 *(b) | 802,298 | — |
| Total Warrants |
| (Cost $—) | | 118,820 |
|
| Investment Companies 0.1% of net assets |
| |
| United Kingdom 0.1% |
| BMO Commercial Property Trust Ltd. | 790,721 | 1,083,877 |
| Picton Property Income Ltd. | 824,057 | 1,122,768 |
| UK Commercial Property REIT Ltd. | 1,082,058 | 1,183,900 |
| Total Investment Companies |
| (Cost $3,158,844) | | 3,390,545 |
|
| Short-Term Investments 1.4% of net assets |
| |
| United States 1.4% |
| Money Market Funds 1.4% |
| State Street Institutional U.S. Government Money Market Fund, Premier Class 0.03% (c) | 2,107,306 | 2,107,306 |
| Wells Fargo Government Money Market Fund, Select Class 0.03% (c)(d) | 51,136,314 | 51,136,314 |
| Total Short-Term Investments |
| (Cost $53,243,620) | | 53,243,620 |
| | Number of
Contracts | Notional
Amount
($) | Current Value/
Unrealized
Appreciation
($) |
| Futures Contracts | |
| Long | |
| MSCI EAFE Index, expires 09/17/21 | 89 | 10,464,175 | 24,576 |
| * | Non-income producing security. |
| (a) | All or a portion of this security is on loan. Securities on loan were valued at $48,666,893. |
| (b) | Fair-valued by management using significant unobservable inputs in accordance with procedures approved by the fund’s Board of Trustees. |
| (c) | The rate shown is the 7-day yield. |
| (d) | Security purchased with cash collateral received for securities on loan. |
| | |
| CVA — | Dutch Certificate |
| REIT — | Real Estate Investment Trust |
| RSP — | Risparmio (Savings Shares) |
Schwab International Equity ETFs | Annual Report
Schwab International Small-Cap Equity ETF
Portfolio Holdings as of August 31, 2021 (continued)
The following is a summary of the inputs used to value the fund’s investments as of August 31, 2021 (see financial note 2(a) for additional information):
| Description | Quoted Prices in
Active Markets for
Identical Assets
(Level 1) | Other Significant
Observable Inputs
(Level 2) | Significant
Unobservable Inputs
(Level 3) | Total | |
| Assets | | | | | |
| Common Stock1 | $2,652,422,698 | $— | $— | $2,652,422,698 | |
| Australia | 247,894,077 | — | — * | 247,894,077 | |
| Hong Kong | 39,217,810 | — | — * | 39,217,810 | |
| Republic of Korea | 242,056,692 | — | 13,829 | 242,070,521 | |
| Singapore | 33,497,752 | — | — * | 33,497,752 | |
| Spain | 59,798,834 | — | — * | 59,798,834 | |
| United Kingdom | 532,788,137 | — | — * | 532,788,137 | |
| Preferred Stock1 | 9,838,736 | — | — | 9,838,736 | |
| Warrants 1 | | | | | |
| Italy | — | — | 118,820 | 118,820 | |
| Singapore | — | — | — * | — | |
| Investment Companies1 | 3,390,545 | — | — | 3,390,545 | |
| Short-Term Investments1 | 53,243,620 | — | — | 53,243,620 | |
| Futures Contracts2 | 24,576 | — | — | 24,576 | |
| Total | $3,874,173,477 | $— | $132,649 | $3,874,306,126 | |
| * | Level 3 amount shown includes securities determined to have no value at August 31, 2021. |
| 1 | As categorized in the Portfolio Holdings. |
| 2 | Futures contracts are reported at cumulative unrealized appreciation or depreciation. |
Fund investments in mutual funds are classified as Level 1, without consideration to the classification level of the underlying securities held by the mutual funds, which could be Level 1, Level 2 or Level 3.
Schwab International Equity ETFs | Annual Report
Schwab International Small-Cap Equity ETF
Statement of Assets and Liabilities
As of August 31, 2021
| Assets |
| Investments in securities, at value — unaffiliated (cost $2,918,613,639) including securities on loan of $48,666,893 | | $3,823,145,236 |
| Collateral invested for securities on loan, at value (cost $51,136,314) | | 51,136,314 |
| Deposit with broker for futures contracts | | 1,782,001 |
| Foreign currency, at value (cost $2,408,791) | | 2,415,718 |
| Receivables: | | |
| Investments sold | | 8,665,754 |
| Dividends | | 4,900,574 |
| Foreign tax reclaims | | 1,874,530 |
| Income from securities on loan | + | 178,989 |
| Total assets | | 3,894,099,116 |
| Liabilities |
| Collateral held for securities on loan | | 51,136,314 |
| Payables: | | |
| Investments bought | | 10,154,802 |
| Management fees | | 339,715 |
| Foreign capital gains tax | | 112,393 |
| Variation margin on futures contracts | + | 9,963 |
| Total liabilities | | 61,753,187 |
| Net Assets |
| Total assets | | 3,894,099,116 |
| Total liabilities | – | 61,753,187 |
| Net assets | | $3,832,345,929 |
| Net Assets by Source | | |
| Capital received from investors | | 3,120,025,270 |
| Total distributable earnings | | 712,320,659 |
| Net Asset Value (NAV) |
| Net Assets | ÷ | Shares
Outstanding | = | NAV |
| $3,832,345,929 | | 88,700,000 | | $43.21 |
| | | | | |
Schwab International Equity ETFs | Annual Report
Schwab International Small-Cap Equity ETF
Statement of Operations
For the period September 1, 2020 through August 31, 2021
| Investment Income |
| Dividends received from securities - unaffiliated (net of foreign withholding tax of $7,735,813) | | $60,941,355 |
| Securities on loan, net | + | 2,215,253 |
| Total investment income | | 63,156,608 |
| Expenses |
| Management fees | | 3,504,568 |
| Professional fees | + | 10,415* |
| Total expenses | | 3,514,983 |
| Expense reduction by CSIM | - | 10,415* |
| Net expenses | – | 3,504,568 |
| Net investment income | | 59,652,040 |
| Realized and Unrealized Gains (Losses) |
| Net realized gains on sales of securities - unaffiliated (net of foreign capital gains tax of $12,447) | | 33,089,831 |
| Net realized gains on in-kind redemptions - unaffiliated | | 48,834,537 |
| Net realized gains on futures contracts | | 2,835,527 |
| Net realized gains on foreign currency transactions | + | 17,905 |
| Net realized gains | | 84,777,800 |
| Net change in unrealized appreciation (depreciation) on securities - unaffiliated (net of change in foreign capital gains tax of ($106,405)) | | 736,780,087 |
| Net change in unrealized appreciation (depreciation) on futures contracts | | (121,298) |
| Net change in unrealized appreciation (depreciation) on foreign currency translations | + | (126,146) |
| Net change in unrealized appreciation (depreciation) | + | 736,532,643 |
| Net realized and unrealized gains | | 821,310,443 |
| Increase in net assets resulting from operations | | $880,962,483 |
| * | Professional fees associated with the filing of tax claims in the European Union deemed to be non-routine expenses of the fund. See financial notes 2 (d) and 4 for additional information. |
Schwab International Equity ETFs | Annual Report
Schwab International Small-Cap Equity ETF
Statement of Changes in Net Assets
For the current and prior report periods
| Operations | |
| | 9/1/20-8/31/21 | 9/1/19-8/31/20 |
| Net investment income | | $59,652,040 | $47,770,307 |
| Net realized gains (losses) | | 84,777,800 | (46,220,647) |
| Net change in unrealized appreciation (depreciation) | + | 736,532,643 | 263,289,976 |
| Increase in net assets resulting from operations | | 880,962,483 | 264,839,636 |
| Distributions to Shareholders | |
| Total distributions | | ($66,927,200) | ($67,564,440) |
| Transactions in Fund Shares | | | |
| | | 9/1/20-8/31/21 | 9/1/19-8/31/20 |
| | | SHARES | VALUE | SHARES | VALUE |
| Shares sold | | 12,900,000 | $508,015,311 | 13,400,000 | $367,298,269 |
| Shares redeemed | + | (2,400,000) | (85,575,957) | (5,400,000) | (155,544,663) |
| Net transactions in fund shares | | 10,500,000 | $422,439,354 | 8,000,000 | $211,753,606 |
| Shares Outstanding and Net Assets | | | |
| | | 9/1/20-8/31/21 | 9/1/19-8/31/20 |
| | | SHARES | NET ASSETS | SHARES | NET ASSETS |
| Beginning of period | | 78,200,000 | $2,595,871,292 | 70,200,000 | $2,186,842,490 |
| Total increase | + | 10,500,000 | 1,236,474,637 | 8,000,000 | 409,028,802 |
| End of period | | 88,700,000 | $3,832,345,929 | 78,200,000 | $2,595,871,292 |
Schwab International Equity ETFs | Annual Report
Schwab International Dividend Equity ETF
Financial Statements
Financial Highlights
| | 4/29/21 1–
8/31/21 | | | | | |
| Per-Share Data |
| Net asset value at beginning of period | $25.00 | | | | | |
| Income (loss) from investment operations: | | | | | | |
| Net investment income (loss)2 | 0.41 | | | | | |
| Net realized and unrealized gains (losses) | 0.71 | | | | | |
| Total from investment operations | 1.12 | | | | | |
| Less distributions: | | | | | | |
| Distributions from net investment income | (0.05) | | | | | |
| Net asset value at end of period | $26.07 | | | | | |
| Total return | 4.48% 3 | | | | | |
| Ratios/Supplemental Data |
| Ratios to average net assets: | | | | | | |
| Total expenses | 0.14% 4 | | | | | |
| Net investment income (loss) | 4.76% 4 | | | | | |
| Portfolio turnover rate5 | 3% 3 | | | | | |
| Net assets, end of period (x 1,000) | $101,664 | | | | | |
| |
1
Commencement of operations.
2
Calculated based on the average shares outstanding during the period.
3
Not annualized.
4
Annualized.
5
Portfolio turnover rate excludes securities received or delivered from processing of in-kind creations or redemptions.
Schwab International Equity ETFs | Annual Report
Schwab International Dividend Equity ETF
Portfolio Holdings as of August 31, 2021
This section shows all the securities in the fund’s portfolio and their values as of the report date.
The fund files its complete schedule of portfolio holdings with the U.S. Securities and Exchange Commission (SEC) for the first and third quarters of each fiscal year on Form N-PORT Part F. The fund’s Form N-PORT Part F is available on the SEC’s website at www.sec.gov. You can also obtain this information at no cost on the fund’s website at www.schwabassetmanagement.com/schwabetfs_prospectus, by calling 1-866-414-6349, or by sending an email request to orders@mysummaryprospectus.com. The fund also makes available its complete schedule of portfolio holdings on a daily basis on the fund’s website.
| Security | Number
of Shares | Value ($) |
| Common Stock 99.2% of net assets |
| |
| Australia 10.0% |
| AGL Energy Ltd. | 46,150 | 217,550 |
| Aurizon Holdings Ltd. | 137,071 | 378,674 |
| BHP Group Ltd. | 109,041 | 3,634,780 |
| Rio Tinto Ltd. | 27,627 | 2,262,625 |
| Wesfarmers Ltd. | 84,371 | 3,696,669 |
| | | 10,190,298 |
| |
| Belgium 0.4% |
| Etablissements Franz Colruyt N.V. | 3,675 | 205,585 |
| Proximus SADP | 9,939 | 194,818 |
| | | 400,403 |
| |
| Canada 7.6% |
| BCE, Inc. | 18,966 | 987,586 |
| Great-West Lifeco, Inc. | 7,558 | 233,442 |
| Quebecor, Inc., Class B | 10,739 | 267,530 |
| Sun Life Financial, Inc. | 16,404 | 843,274 |
| The Bank of Nova Scotia | 34,012 | 2,103,460 |
| The Toronto-Dominion Bank | 51,017 | 3,307,738 |
| | | 7,743,030 |
| |
| China 0.9% |
| China Minsheng Banking Corp., Ltd., H Shares | 162,593 | 67,944 |
| China Shenhua Energy Co., Ltd., H Shares | 250,875 | 555,468 |
| Hengan International Group Co., Ltd. | 40,602 | 235,447 |
| Jiangsu Expressway Co., Ltd., H Shares | 91,553 | 94,998 |
| | | 953,857 |
| |
| Denmark 0.2% |
| Tryg A/S | 8,583 | 212,468 |
| |
| Finland 3.1% |
| Elisa Oyj | 9,591 | 614,088 |
| Kone Oyj, B Shares | 30,012 | 2,488,438 |
| | | 3,102,526 |
| |
| France 5.4% |
| Orange S.A. | 127,815 | 1,451,457 |
| Sanofi | 38,930 | 4,026,568 |
| | | 5,478,025 |
| |
| Security | Number
of Shares | Value ($) |
| Germany 8.9% |
| Allianz SE | 11,554 | 2,713,871 |
| Deutsche Post AG | 59,413 | 4,178,586 |
| E.ON SE | 167,093 | 2,204,803 |
| | | 9,097,260 |
| |
| Italy 3.8% |
| Enel S.p.A. | 420,230 | 3,828,097 |
| |
| Japan 11.9% |
| ABC-Mart, Inc. | 2,374 | 127,279 |
| Daito Trust Construction Co., Ltd. | 5,085 | 559,137 |
| Daiwa House Industry Co., Ltd. | 49,547 | 1,513,560 |
| Japan Tobacco, Inc. | 64,389 | 1,249,859 |
| Kaken Pharmaceutical Co., Ltd. | 71,389 | 3,229,595 |
| KDDI Corp. | 104,060 | 3,192,083 |
| Matsui Securities Co., Ltd. | 3,135 | 22,915 |
| Obayashi Corp. | 53,664 | 442,559 |
| Sekisui House Ltd. | 48,390 | 965,950 |
| Seven Bank Ltd. | 20,359 | 46,515 |
| Sompo Holdings, Inc. | 10,424 | 458,102 |
| USS Co., Ltd. | 16,506 | 273,598 |
| | | 12,081,152 |
| |
| Malaysia 0.5% |
| DiGi.com Berhad | 213,500 | 225,980 |
| Petronas Gas Berhad | 57,600 | 232,783 |
| | | 458,763 |
| |
| Mexico 1.8% |
| America Movil S.A.B. de C.V., Series L | 1,493,360 | 1,473,276 |
| Arca Continental S.A.B. de C.V. | 25,792 | 166,507 |
| Coca-Cola Femsa S.A.B. de C.V. | 30,743 | 178,372 |
| | | 1,818,155 |
| |
| Netherlands 2.0% |
| Koninklijke Ahold Delhaize N.V. | 61,270 | 2,066,358 |
| |
| New Zealand 0.7% |
| Contact Energy Ltd. | 57,769 | 331,385 |
| Spark New Zealand Ltd. | 118,960 | 408,184 |
| | | 739,569 |
| |
| Norway 1.5% |
| Gjensidige Forsikring A.S.A. | 5,357 | 125,105 |
| Telenor A.S.A. | 40,962 | 716,865 |
| Yara International A.S.A. | 12,762 | 640,053 |
| | | 1,482,023 |
| |
Schwab International Equity ETFs | Annual Report
Schwab International Dividend Equity ETF
Portfolio Holdings as of August 31, 2021 (continued)
| Security | Number
of Shares | Value ($) |
| Republic of Korea 0.5% |
| Korean Reinsurance Co. | 2,188 | 17,795 |
| KT&G Corp. | 7,401 | 520,869 |
| | | 538,664 |
| |
| Russia 0.3% |
| Severstal PAO | 14,364 | 337,033 |
| |
| Saudi Arabia 3.6% |
| Advanced Petrochemical Co. | 7,883 | 150,485 |
| Al Rajhi Bank | 34,295 | 1,106,379 |
| Jarir Marketing Co. | 4,372 | 252,479 |
| Riyad Bank | 37,810 | 271,173 |
| SABIC Agri-Nutrients Co. | 14,880 | 497,494 |
| Saudi Telecom Co. | 38,149 | 1,373,108 |
| | | 3,651,118 |
| |
| Singapore 0.5% |
| Singapore Exchange Ltd. | 23,091 | 169,951 |
| Singapore Technologies Engineering Ltd. | 111,703 | 313,908 |
| | | 483,859 |
| |
| South Africa 0.6% |
| The SPAR Group Ltd. | 11,209 | 160,893 |
| Vodacom Group Ltd. | 45,583 | 452,679 |
| | | 613,572 |
| |
| Spain 0.6% |
| Red Electrica Corp. S.A. | 32,190 | 641,797 |
| |
| Sweden 0.5% |
| Tele2 AB, B Shares | 31,855 | 476,978 |
| |
| Switzerland 10.1% |
| EMS-Chemie Holding AG | 521 | 564,481 |
| Kuehne & Nagel International AG | 3,753 | 1,372,884 |
| Roche Holding AG | 10,807 | 4,338,490 |
| SGS S.A. | 383 | 1,203,290 |
| Swisscom AG | 1,613 | 946,265 |
| Zurich Insurance Group AG | 4,213 | 1,848,836 |
| | | 10,274,246 |
| |
| Taiwan 5.2% |
| Advantech Co., Ltd. | 32,000 | 445,703 |
| Asia Cement Corp. | 177,000 | 286,766 |
| Cheng Loong Corp. | 73,321 | 95,244 |
| Chicony Electronics Co., Ltd. | 49,000 | 138,795 |
| Chunghwa Telecom Co., Ltd. | 242,000 | 978,007 |
| Far EasTone Telecommunications Co., Ltd. | 102,000 | 226,720 |
| Formosa Taffeta Co., Ltd. | 71,000 | 79,932 |
| Great Wall Enterprise Co., Ltd. | 43,528 | 84,972 |
| Lite-On Technology Corp. | 164,000 | 362,163 |
| President Chain Store Corp. | 33,000 | 339,961 |
| Standard Foods Corp. | 29,973 | 56,456 |
| Synnex Technology International Corp. | 100,000 | 194,129 |
| Taiwan Cement Corp. | 377,000 | 659,089 |
| Taiwan Mobile Co., Ltd. | 105,000 | 382,666 |
| Security | Number
of Shares | Value ($) |
| Uni-President Enterprises Corp. | 299,000 | 780,042 |
| Wistron Corp. | 216,000 | 213,557 |
| | | 5,324,202 |
| |
| Thailand 0.3% |
| Intouch Holdings PCL NVDR | 96,100 | 254,915 |
| Land & Houses PCL NVDR | 265,400 | 67,107 |
| Tisco Financial Group PCL NVDR | 11,001 | 32,082 |
| | | 354,104 |
| |
| United Arab Emirates 1.3% |
| Emirates Telecommunications Group Co. PJSC | 110,722 | 711,389 |
| First Abu Dhabi Bank PJSC | 122,090 | 565,055 |
| | | 1,276,444 |
| |
| United Kingdom 17.0% |
| Admiral Group plc | 7,235 | 359,553 |
| BAE Systems plc | 239,779 | 1,875,697 |
| British American Tobacco plc | 103,307 | 3,879,991 |
| GlaxoSmithKline plc | 210,360 | 4,232,607 |
| Imperial Brands plc | 55,555 | 1,178,594 |
| Schroders plc | 3,488 | 181,454 |
| SSE plc | 78,029 | 1,753,100 |
| Unilever plc | 67,937 | 3,782,942 |
| | | 17,243,938 |
| Total Common Stock |
| (Cost $100,515,764) | | 100,867,939 |
|
| Preferred Stock 0.1% of net assets |
| |
| Russia 0.1% |
| Sberbank of Russia PJSC | 28,180 | 119,268 |
| Total Preferred Stock |
| (Cost $110,802) | | 119,268 |
|
| Investment Company 0.1% of net assets |
| |
| United States 0.1% |
| International Equity Fund 0.1% |
| iShares International Select Dividend ETF | 2,187 | 70,859 |
| Total Investment Company |
| (Cost $70,708) | | 70,859 |
|
| Short-Term Investment 0.0% of net assets |
| |
| United States 0.0% |
| Money Market Fund 0.0% |
| State Street Institutional U.S. Government Money Market Fund, Premier Class 0.03% (a) | 7,185 | 7,185 |
| Total Short-Term Investment |
| (Cost $7,185) | | 7,185 |
Schwab International Equity ETFs | Annual Report
Schwab International Dividend Equity ETF
Portfolio Holdings as of August 31, 2021 (continued)
| | Number of
Contracts | Notional
Amount
($) | Current Value/
Unrealized
Appreciation
($) |
| Futures Contracts | |
| Long | |
| MSCI EAFE Index, expires 09/17/21 | 5 | 587,875 | 6,123 |
| (a) | The rate shown is the 7-day yield. |
| | |
| ETF — | Exchange-traded fund |
| NVDR — | Non-Voting Depositary Receipt |
The following is a summary of the inputs used to value the fund’s investments as of August 31, 2021 (see financial note 2(a) for additional information):
| Description | Quoted Prices in
Active Markets for
Identical Assets
(Level 1) | Other Significant
Observable Inputs
(Level 2) | Significant
Unobservable Inputs
(Level 3) | Total | |
| Assets | | | | | |
| Common Stock1 | $100,867,939 | $— | $— | $100,867,939 | |
| Preferred Stock1 | 119,268 | — | — | 119,268 | |
| Investment Company1 | 70,859 | — | — | 70,859 | |
| Short-Term Investment1 | 7,185 | — | — | 7,185 | |
| Futures Contracts2 | 6,123 | — | — | 6,123 | |
| Total | $101,071,374 | $— | $— | $101,071,374 | |
| 1 | As categorized in the Portfolio Holdings. |
| 2 | Futures contracts are reported at cumulative unrealized appreciation or depreciation. |
Fund investments in mutual funds and ETFs are classified as Level 1, without consideration to the classification level of the underlying securities held by the mutual funds and ETFs, which could be Level 1, Level 2 or Level 3.
Schwab International Equity ETFs | Annual Report
Schwab International Dividend Equity ETF
Statement of Assets and Liabilities
As of August 31, 2021
| Assets |
| Investments in securities, at value — unaffiliated (cost $100,704,459) | | $101,065,251 |
| Deposit with broker for futures contracts | | 30,295 |
| Foreign currency, at value (cost $70,165) | | 70,458 |
| Receivables: | | |
| Dividends | | 492,411 |
| Foreign tax reclaims | | 22,565 |
| Other assets | + | 821 |
| Total assets | | 101,681,801 |
| Liabilities |
| Payables: | | |
| Investments bought | | 7,097 |
| Management fees | | 10,520 |
| Variation margin on futures contracts | + | 550 |
| Total liabilities | | 18,167 |
| Net Assets |
| Total assets | | 101,681,801 |
| Total liabilities | – | 18,167 |
| Net assets | | $101,663,634 |
| Net Assets by Source | | |
| Capital received from investors | | 100,530,629 |
| Total distributable earnings | | 1,133,005 |
| Net Asset Value (NAV) |
| Net Assets | ÷ | Shares
Outstanding | = | NAV |
| $101,663,634 | | 3,900,000 | | $26.07 |
| | | | | |
Schwab International Equity ETFs | Annual Report
Schwab International Dividend Equity ETF
Statement of Operations
For the period April 29, 2021* through August 31, 2021
| Investment Income |
| Dividends received from securities — unaffiliated (net of foreign withholding tax of $95,955) | | $924,652 |
| Expenses |
| Management fees | | 26,410 |
| Total expenses | – | 26,410 |
| Net investment income | | 898,242 |
| Realized and Unrealized Gains (Losses) |
| Net realized losses on sales of securities — unaffiliated | | (31,153) |
| Net realized losses on foreign currency transactions | + | (5,756) |
| Net realized losses | | (36,909) |
| Net change in unrealized appreciation (depreciation) on securities — unaffiliated | | 360,792 |
| Net change in unrealized appreciation (depreciation) on futures contracts | | 6,123 |
| Net change in unrealized appreciation (depreciation) on foreign currency translations | + | (53) |
| Net change in unrealized appreciation (depreciation) | + | 366,862 |
| Net realized and unrealized gains | | 329,953 |
| Increase in net assets resulting from operations | | $1,228,195 |
| * | Commencement of operations. |
Schwab International Equity ETFs | Annual Report
Schwab International Dividend Equity ETF
Statement of Changes in Net Assets
For the current period only.
| Operations |
| | 4/29/21*-8/31/21 |
| Net investment income | | $898,242 |
| Net realized losses | | (36,909) |
| Net change in unrealized appreciation (depreciation) | + | 366,862 |
| Increase in net assets resulting from operations | | 1,228,195 |
| Distributions to Shareholders |
| Total distributions | | ($95,190) |
| Transactions in Fund Shares | |
| | | 4/29/21*-8/31/21 |
| | | SHARES | VALUE |
| Shares sold | + | 3,900,000 | $100,530,629 |
| Net transactions in fund shares | | 3,900,000 | $100,530,629 |
| Shares Outstanding and Net Assets | |
| | | 4/29/21*-8/31/21 |
| | | SHARES | NET ASSETS |
| Beginning of period | | — | $— |
| Total increase | + | 3,900,000 | 101,663,634 |
| End of period | | 3,900,000 | $101,663,634 |
| * | Commencement of operations. |
Schwab International Equity ETFs | Annual Report
Schwab Emerging Markets Equity ETF
Financial Statements
Financial Highlights
| | 9/1/20–
8/31/21 | 9/1/19–
8/31/20 | 9/1/18–
8/31/19 | 9/1/17–
8/31/18 | 9/1/16–
8/31/17 | |
| Per-Share Data |
| Net asset value at beginning of period | $27.11 | $24.82 | $25.89 | $26.99 | $22.56 | |
| Income (loss) from investment operations: | | | | | | |
| Net investment income (loss)1 | 0.63 | 0.79 | 0.72 | 0.68 | 0.71 | |
| Net realized and unrealized gains (losses) | 4.64 | 2.34 | (1.00) | (1.13) | 4.21 | |
| Total from investment operations | 5.27 | 3.13 | (0.28) | (0.45) | 4.92 | |
| Less distributions: | | | | | | |
| Distributions from net investment income | (0.74) | (0.84) | (0.79) | (0.65) | (0.49) | |
| Net asset value at end of period | $31.64 | $27.11 | $24.82 | $25.89 | $26.99 | |
| Total return | 19.53% | 12.76% | (0.97%) | (1.79%) | 22.40% | |
| Ratios/Supplemental Data |
| Ratios to average net assets: | | | | | | |
| Total expenses | 0.11% | 0.12% 2 | 0.13% | 0.13% | 0.13% 3 | |
| Net investment income (loss) | 2.04% | 3.16% | 2.85% | 2.48% | 2.96% | |
| Portfolio turnover rate4 | 15% | 15% | 13% | 18% | 7% | |
| Net assets, end of period (x 1,000) | $9,505,142 | $7,195,522 | $5,804,446 | $4,900,591 | $4,248,821 | |
| |
1
Calculated based on the average shares outstanding during the period.
2
Effective February 25, 2020, the annual operating expense ratio was reduced to 0.11%. The ratio presented for the period ended 8/31/20 is a blended ratio.
3
Effective October 7, 2016, the annual operating expense ratio was reduced. The ratio presented for the period ended 8/31/17 is a blended ratio.
4
Portfolio turnover rate excludes securities received or delivered from processing of in-kind creations or redemptions.
Schwab International Equity ETFs | Annual Report
Schwab Emerging Markets Equity ETF
Portfolio Holdings as of August 31, 2021
This section shows all the securities in the fund’s portfolio and their values as of the report date.
The fund files its complete schedule of portfolio holdings with the U.S. Securities and Exchange Commission (SEC) for the first and third quarters of each fiscal year on Form N-PORT Part F. The fund’s Form N-PORT Part F is available on the SEC’s website at www.sec.gov. You can also obtain this information at no cost on the fund’s website at www.schwabassetmanagement.com/schwabetfs_prospectus, by calling 1-866-414-6349, or by sending an email request to orders@mysummaryprospectus.com. The fund also makes available its complete schedule of portfolio holdings on a daily basis on the fund’s website.
| Security | Number
of Shares | Value ($) |
| Common Stock 98.2% of net assets |
| |
| Brazil 5.0% |
| Aliansce Sonae Shopping Centers S.A. | 156,391 | 766,750 |
| Ambev S.A. | 5,670,262 | 18,939,454 |
| Americanas S.A. * | 553,744 | 4,473,606 |
| Atacadao S.A. | 341,676 | 1,211,321 |
| B3 S.A. - Brasil Bolsa Balcao | 8,006,859 | 22,005,158 |
| Banco Bradesco S.A. | 1,770,962 | 6,897,673 |
| Banco BTG Pactual S.A. * | 1,225,804 | 6,766,458 |
| Banco do Brasil S.A. | 1,107,517 | 6,582,950 |
| Banco Inter S.A. * | 324,459 | 1,503,290 |
| Banco Santander Brasil S.A. | 472,876 | 3,873,860 |
| BB Seguridade Participacoes S.A. | 884,062 | 3,291,348 |
| BR Malls Participacoes S.A. * | 1,102,749 | 1,945,058 |
| BRF S.A. * | 1,033,435 | 4,727,573 |
| CCR S.A. | 1,437,202 | 3,438,920 |
| Centrais Eletricas Brasileiras S.A. | 813,533 | 5,979,675 |
| Cia Brasileira de Distribuicao | 200,804 | 1,111,187 |
| Cia de Locacao das Americas | 448,982 | 2,185,472 |
| Cia de Saneamento Basico do Estado de Sao Paulo | 439,552 | 3,102,033 |
| Cia de Saneamento do Parana | 324,327 | 1,227,736 |
| Cia Energetica de Minas Gerais | 146,656 | 478,106 |
| Cia Paranaense de Energia | 740,208 | 860,278 |
| Cielo S.A. | 1,568,847 | 879,490 |
| Cogna Educacao * | 2,458,007 | 1,541,191 |
| Companhia Siderurgica Nacional S.A. | 820,344 | 5,585,880 |
| Cosan S.A. | 1,909,338 | 8,223,555 |
| CPFL Energia S.A. | 246,965 | 1,400,878 |
| Cyrela Brazil Realty S.A. Empreendimentos e Participacoes | 395,343 | 1,561,433 |
| Dexco S.A. | 379,378 | 1,527,279 |
| EDP - Energias do Brasil S.A. | 363,081 | 1,307,774 |
| Energisa S.A. | 332,084 | 2,878,098 |
| Eneva S.A. * | 1,227,431 | 3,756,940 |
| Engie Brasil Energia S.A. | 232,526 | 1,705,492 |
| Equatorial Energia S.A. | 1,200,234 | 5,966,531 |
| Ez Tec Empreendimentos e Participacoes S.A. | 141,653 | 741,530 |
| Fleury S.A. | 290,401 | 1,342,088 |
| Grendene S.A. | 552,978 | 1,154,659 |
| Grupo Mateus S.A. * | 526,196 | 732,834 |
| Guararapes Confeccoes S.A. | 142,661 | 429,414 |
| Hapvida Participacoes e Investimentos S.A. | 1,660,219 | 4,773,549 |
| Hypera S.A. | 541,388 | 3,761,497 |
| IRB Brasil Resseguros S.A. * | 1,412,582 | 1,473,408 |
| Itau Unibanco Holding S.A. | 605,371 | 3,385,409 |
| Itau Unibanco Holding S.A. ADR | 6,283,695 | 37,262,311 |
| JBS S.A. | 1,212,693 | 7,383,391 |
| Klabin S.A. * | 1,027,635 | 5,281,143 |
| Localiza Rent a Car S.A. | 774,875 | 8,394,208 |
| Locaweb Servicos de Internet S.A. | 561,794 | 2,687,411 |
| Lojas Americanas S.A. | 360,901 | 410,279 |
| Lojas Renner S.A. | 1,021,902 | 7,597,072 |
| M Dias Branco S.A. | 165,831 | 1,024,550 |
| Security | Number
of Shares | Value ($) |
| Magazine Luiza S.A. | 3,841,225 | 13,685,567 |
| Marfrig Alimentos S.A. | 530,726 | 2,124,127 |
| Multiplan Empreendimentos Imobiliarios S.A. | 348,586 | 1,436,682 |
| Natura & Co. Holding S.A. * | 1,248,694 | 12,590,479 |
| Neoenergia S.A. | 312,424 | 1,014,247 |
| Notre Dame Intermedica Participacoes S.A. | 676,246 | 10,559,347 |
| Odontoprev S.A. | 353,883 | 867,504 |
| Petrobras Distribuidora S.A. | 1,504,945 | 7,992,784 |
| Petroleo Brasileiro S.A. | 4,889,473 | 26,665,251 |
| Porto Seguro S.A. | 129,183 | 1,442,586 |
| Qualicorp Consultoria e Corretora de Seguros S.A. | 253,680 | 1,058,910 |
| Raia Drogasil S.A. | 1,406,125 | 7,020,257 |
| Rede D'Or Sao Luiz S.A. | 285,328 | 3,835,547 |
| Rumo S.A. * | 1,637,811 | 5,988,773 |
| Sao Martinho S.A. | 222,848 | 1,399,017 |
| Sendas Distribuidora S.A. | 1,022,320 | 3,356,779 |
| Sul America S.A. | 515,928 | 2,957,777 |
| Suzano S.A. * | 948,405 | 11,300,350 |
| Telefonica Brasil S.A. | 566,883 | 4,842,182 |
| TIM S.A. | 1,051,735 | 2,559,721 |
| TOTVS S.A. | 657,506 | 5,085,845 |
| Transmissora Alianca de Energia Eletrica S.A. | 281,659 | 2,085,670 |
| Ultrapar Participacoes S.A. | 1,043,203 | 2,942,417 |
| Usinas Siderurgicas de Minas Gerais S.A. | 274,750 | 982,103 |
| Vale S.A. | 5,239,084 | 100,984,034 |
| Via S.A. * | 2,106,423 | 4,274,933 |
| WEG S.A. | 1,951,535 | 13,555,212 |
| YDUQS Participacoes S.A. | 424,351 | 2,121,113 |
| | | 480,266,414 |
| |
| Chile 0.5% |
| AES Andes S.A. | 5,138,879 | 683,681 |
| Aguas Andinas S.A., A Shares | 3,476,734 | 776,730 |
| Banco de Chile | 57,036,012 | 5,565,602 |
| Banco de Credito e Inversiones S.A. | 60,342 | 2,610,135 |
| Banco Santander Chile | 79,108,831 | 4,174,153 |
| CAP S.A. | 98,755 | 1,401,774 |
| Cencosud S.A. | 1,767,713 | 3,330,358 |
| Cencosud Shopping S.A. | 665,843 | 945,128 |
| Cia Cervecerias Unidas S.A. | 173,781 | 1,751,377 |
| Cia Sud Americana de Vapores S.A. | 23,282,178 | 1,742,521 |
| Colbun S.A. | 9,608,880 | 1,588,233 |
| Empresa Nacional de Telecomunicaciones S.A. | 179,425 | 872,872 |
| Empresas CMPC S.A. | 1,605,745 | 3,561,876 |
| Empresas COPEC S.A. | 633,583 | 5,885,753 |
| Enel Americas S.A. | 26,282,927 | 3,687,987 |
| Enel Chile S.A. | 32,500,985 | 1,656,609 |
| Engie Energia Chile S.A. | 653,354 | 451,223 |
| Falabella S.A. | 1,049,525 | 4,150,970 |
| Itau CorpBanca Chile S.A. * | 243,452,014 | 662,861 |
Schwab International Equity ETFs | Annual Report
Schwab Emerging Markets Equity ETF
Portfolio Holdings as of August 31, 2021 (continued)
| Security | Number
of Shares | Value ($) |
| Parque Arauco S.A. * | 826,327 | 991,656 |
| Plaza S.A. | 377,125 | 475,831 |
| | | 46,967,330 |
| |
| China 37.4% |
| 3SBio, Inc. * | 1,576,133 | 1,757,035 |
| 51job, Inc. ADR * | 37,937 | 2,913,562 |
| A-Living Smart City Services Co., Ltd. | 430,075 | 1,703,191 |
| Addsino Co., Ltd., A Shares | 170,900 | 494,000 |
| AECC Aviation Power Co., Ltd., A Shares | 243,300 | 2,567,245 |
| Agile Group Holdings Ltd. | 1,795,120 | 2,058,859 |
| Agricultural Bank of China Ltd., A Shares | 12,667,600 | 5,811,546 |
| Agricultural Bank of China Ltd., H Shares | 40,091,871 | 13,454,426 |
| Aier Eye Hospital Group Co., Ltd., A Shares | 482,589 | 3,156,425 |
| Air China Ltd. * | 805,400 | 903,766 |
| Air China Ltd., H Shares * | 1,725,236 | 1,157,943 |
| Alibaba Group Holding Ltd. * | 18,566,186 | 395,083,645 |
| Alibaba Health Information Technology Ltd. * | 6,260,995 | 10,272,174 |
| Alibaba Pictures Group Ltd. * | 17,316,641 | 1,848,035 |
| Aluminum Corp. of China Ltd., A Shares * | 1,450,300 | 1,753,307 |
| Aluminum Corp. of China Ltd., H Shares * | 4,240,834 | 3,075,380 |
| Angang Steel Co., Ltd., H Shares | 2,539,984 | 1,943,195 |
| Angel Yeast Co., Ltd., A Shares | 80,200 | 498,080 |
| Anhui Anke Biotechnology Group Co., Ltd., A Shares | 148,500 | 269,289 |
| Anhui Conch Cement Co., Ltd., A Shares | 340,200 | 2,107,004 |
| Anhui Conch Cement Co., Ltd., H Shares | 1,581,179 | 8,559,167 |
| Anhui Expressway Co., Ltd., A Shares | 463,301 | 443,051 |
| Anhui Gujing Distillery Co., Ltd., A Shares | 91,104 | 2,993,498 |
| Anhui Kouzi Distillery Co., Ltd., A Shares | 53,400 | 409,687 |
| Anhui Zhongding Sealing Parts Co., Ltd., A shares | 271,700 | 750,418 |
| ANTA Sports Products Ltd. | 1,479,659 | 30,440,374 |
| Asymchem Laboratories Tianjin Co., Ltd., A Shares | 15,200 | 824,574 |
| Autohome, Inc. ADR | 79,485 | 3,518,006 |
| Avary Holding Shenzhen Co., Ltd., A Shares | 78,000 | 383,230 |
| AVIC Electromechanical Systems Co., Ltd., A Shares | 339,000 | 735,586 |
| AVIC Industry-Finance Holdings Co., Ltd., A Shares | 965,700 | 592,711 |
| AviChina Industry & Technology Co., Ltd., H Shares | 3,173,133 | 2,660,138 |
| AVICOPTER plc, A Shares | 57,300 | 557,103 |
| BAIC Motor Corp., Ltd., H Shares | 3,125,795 | 1,141,424 |
| Baidu, Inc. ADR * | 361,709 | 56,795,547 |
| Bank of Beijing Co., Ltd., A Shares | 2,055,600 | 1,382,719 |
| Bank of Changsha Co., Ltd., A Shares | 406,200 | 545,839 |
| Bank of China Ltd., A Shares | 7,216,500 | 3,389,026 |
| Bank of China Ltd., H Shares | 99,030,985 | 34,761,788 |
| Bank of Communications Co., Ltd., A Shares | 4,286,800 | 2,936,710 |
| Bank of Communications Co., Ltd., H Shares | 8,929,240 | 5,132,044 |
| Bank of Guiyang Co., Ltd., A Shares | 419,200 | 429,466 |
| Bank of Hangzhou Co., Ltd., A Shares | 571,900 | 1,186,879 |
| Bank of Jiangsu Co., Ltd., A Shares | 520,600 | 518,825 |
| Bank of Nanjing Co., Ltd., A Shares | 928,500 | 1,349,865 |
| Bank of Ningbo Co., Ltd., A Shares | 573,600 | 2,871,556 |
| Bank of Shanghai Co., Ltd., A Shares | 1,298,070 | 1,450,571 |
| Bank of Zhengzhou Co., Ltd., A Shares * | 918,800 | 487,027 |
| Security | Number
of Shares | Value ($) |
| Baoshan Iron & Steel Co., Ltd., A Shares * | 1,747,332 | 2,759,658 |
| BBMG Corp., A Shares | 1,292,300 | 542,798 |
| BBMG Corp., H Shares | 1,976,170 | 355,730 |
| Beijing Capital Eco-Environment Protection Group Co., Ltd., A Shares | 905,100 | 521,849 |
| Beijing Capital International Airport Co., Ltd., H Shares * | 2,391,803 | 1,442,337 |
| Beijing Dabeinong Technology Group Co., Ltd., A Shares | 425,000 | 490,739 |
| Beijing Enlight Media Co., Ltd., A Shares | 306,800 | 442,701 |
| Beijing Enterprises Holdings Ltd. | 688,760 | 2,373,401 |
| Beijing Enterprises Water Group Ltd. * | 7,412,328 | 3,059,342 |
| Beijing Jingneng Clean Energy Co., Ltd., H Shares | 2,629,515 | 676,198 |
| Beijing New Building Materials plc, A Shares | 140,400 | 720,279 |
| Beijing Orient National Communication Science & Technology Co., Ltd., A Shares * | 287,900 | 436,848 |
| Beijing Oriental Yuhong Waterproof Technology Co., Ltd., A Shares | 59,550 | 446,717 |
| Beijing Originwater Technology Co., Ltd., A Shares | 318,000 | 373,596 |
| Beijing Shiji Information Technology Co., Ltd., A Shares | 186,340 | 493,287 |
| Beijing Shougang Co., Ltd., A Shares *(a) | 435,100 | 556,351 |
| Beijing Shunxin Agriculture Co., Ltd., A Shares | 72,700 | 368,120 |
| Beijing Tiantan Biological Products Corp., Ltd., A Shares | 137,300 | 660,113 |
| Beijing Wantai Biological Pharmacy Enterprise Co., Ltd., A Shares | 19,320 | 696,472 |
| Beijing Yanjing Brewery Co., Ltd., A Shares | 412,700 | 426,644 |
| Beijing-Shanghai High Speed Railway Co., Ltd., A Shares | 819,700 | 603,468 |
| BGI Genomics Co., Ltd., A Shares | 26,600 | 386,673 |
| Bilibili, Inc. ADR * | 326,585 | 26,201,915 |
| Blue Moon Group Holdings Ltd. | 1,067,228 | 1,064,847 |
| Blue Sail Medical Co., Ltd., A Shares | 157,600 | 490,973 |
| Bluefocus Intelligent Communications Group Co., Ltd., A Shares | 638,100 | 574,606 |
| Bluestar Adisseo Co., A Shares | 239,000 | 422,658 |
| BOE Technology Group Co., Ltd., A Shares | 3,098,300 | 2,794,809 |
| BOE Technology Group Co., Ltd., B Shares | 1,080,600 | 525,200 |
| Bosideng International Holdings Ltd. | 3,516,694 | 2,875,809 |
| Boya Bio-pharmaceutical Group Co., Ltd., A Shares | 83,700 | 494,390 |
| Brilliance China Automotive Holdings Ltd. *(a) | 3,559,090 | 1,374,744 |
| BTG Hotels Group Co., Ltd., A Shares * | 102,500 | 365,867 |
| By-health Co., Ltd., A Shares | 147,600 | 575,347 |
| BYD Co., Ltd., A Shares | 159,400 | 6,843,428 |
| BYD Co., Ltd., H Shares | 1,039,808 | 35,215,777 |
| BYD Electronic International Co., Ltd. | 1,009,257 | 4,606,791 |
| C&S Paper Co., Ltd., A Shares | 110,900 | 315,065 |
| CanSino Biologics, Inc., A Shares * | 5,200 | 310,477 |
| CanSino Biologics, Inc., H Shares * | 96,286 | 3,805,707 |
| Central China Securities Co., Ltd., A Shares | 677,200 | 512,203 |
| CGN Power Co., Ltd., H Shares | 15,646,947 | 3,460,401 |
| Changchun High & New Technology Industry Group, Inc., A Shares | 36,500 | 1,443,934 |
Schwab International Equity ETFs | Annual Report
Schwab Emerging Markets Equity ETF
Portfolio Holdings as of August 31, 2021 (continued)
| Security | Number
of Shares | Value ($) |
| Changjiang Securities Co., Ltd., A Shares | 494,400 | 573,173 |
| Changzhou Xingyu Automotive Lighting Systems Co., Ltd., A Shares | 26,400 | 791,836 |
| Chaozhou Three-Circle Group Co., Ltd., A Shares | 172,108 | 1,002,985 |
| China Aoyuan Group Ltd. | 1,699,560 | 1,018,335 |
| China Baoan Group Co., Ltd., A Shares | 261,200 | 1,133,945 |
| China Cinda Asset Management Co., Ltd., H Shares | 11,332,030 | 2,010,736 |
| China CITIC Bank Corp., Ltd., A Shares | 1,122,400 | 798,484 |
| China CITIC Bank Corp., Ltd., H Shares | 12,132,097 | 5,584,538 |
| China Coal Energy Co., Ltd., A Shares | 317,650 | 419,956 |
| China Coal Energy Co., Ltd., H Shares | 3,046,593 | 2,177,999 |
| China Communications Services Corp., Ltd., H Shares | 3,257,555 | 1,734,045 |
| China Conch Venture Holdings Ltd. | 2,126,386 | 8,694,359 |
| China Construction Bank Corp., A Shares | 393,900 | 357,147 |
| China Construction Bank Corp., H Shares | 122,569,324 | 88,569,963 |
| China CSSC Holdings Ltd., A Shares | 545,200 | 2,018,727 |
| China East Education Holdings Ltd. * | 565,884 | 606,823 |
| China Eastern Airlines Corp., Ltd., A Shares * | 1,209,800 | 881,286 |
| China Eastern Airlines Corp., Ltd., H Shares * | 1,765,630 | 676,526 |
| China Everbright Bank Co., Ltd., A Shares | 3,619,000 | 1,879,053 |
| China Everbright Bank Co., Ltd., H Shares | 4,443,781 | 1,594,135 |
| China Everbright Environment Group Ltd. | 4,774,321 | 3,302,648 |
| China Everbright Ltd. | 1,185,079 | 1,488,710 |
| China Evergrande Group (b) | 3,337,653 | 1,871,096 |
| China Feihe Ltd. | 3,364,507 | 6,091,054 |
| China Galaxy Securities Co., Ltd., H Shares | 5,451,306 | 3,063,024 |
| China Gas Holdings Ltd. | 3,951,105 | 11,456,012 |
| China Great Wall Securities Co., Ltd., A Shares | 222,500 | 370,374 |
| China Greatwall Technology Group Co., Ltd., A Shares | 314,400 | 715,830 |
| China Hongqiao Group Ltd. | 2,837,788 | 4,232,591 |
| China Huarong Asset Management Co., Ltd., H Shares *(a) | 13,605,702 | 1,338,292 |
| China International Capital Corp., Ltd., A Shares | 68,600 | 574,360 |
| China International Capital Corp., Ltd., H Shares | 1,972,087 | 4,584,509 |
| China International Marine Containers Group Co., Ltd., A Shares | 412,900 | 1,173,040 |
| China International Marine Containers Group Co., Ltd., H Shares | 321,827 | 705,116 |
| China Jinmao Holdings Group Ltd. | 8,032,311 | 2,612,940 |
| China Jushi Co., Ltd., A Shares | 403,777 | 1,098,308 |
| China Lesso Group Holdings Ltd. | 1,259,757 | 2,695,308 |
| China Life Insurance Co., Ltd., A Shares | 510,600 | 2,282,347 |
| China Life Insurance Co., Ltd., H Shares | 9,653,061 | 16,160,113 |
| China Literature Ltd. * | 536,918 | 4,508,058 |
| China Longyuan Power Group Corp., Ltd., H Shares | 4,439,039 | 9,052,333 |
| China Medical System Holdings Ltd. | 1,583,258 | 3,102,452 |
| China Mengniu Dairy Co., Ltd. * | 4,032,326 | 24,238,493 |
| China Merchants Bank Co., Ltd., A Shares | 1,978,300 | 15,012,022 |
| China Merchants Bank Co., Ltd., H Shares | 4,877,174 | 40,291,157 |
| China Merchants Energy Shipping Co., Ltd., A Shares | 845,800 | 568,936 |
| Security | Number
of Shares | Value ($) |
| China Merchants Port Holdings Co., Ltd. | 1,803,897 | 3,038,445 |
| China Merchants Securities Co., Ltd., A Shares | 627,180 | 1,765,280 |
| China Merchants Securities Co., Ltd., H Shares | 1,599,776 | 2,418,994 |
| China Merchants Shekou Industrial Zone Holdings Co., Ltd., A Shares | 674,600 | 1,041,385 |
| China Minsheng Banking Corp., Ltd., A Shares | 3,340,400 | 2,055,392 |
| China Minsheng Banking Corp., Ltd., H Shares | 8,092,058 | 3,381,510 |
| China Molybdenum Co., Ltd., A Shares | 1,432,200 | 1,735,865 |
| China Molybdenum Co., Ltd., H Shares | 4,298,010 | 3,360,001 |
| China National Accord Medicines Corp., Ltd., B Shares | 169,345 | 456,603 |
| China National Building Material Co., Ltd., H Shares | 5,088,863 | 6,961,947 |
| China National Chemical Engineering Co., Ltd., A Shares | 445,700 | 933,953 |
| China National Medicines Corp., Ltd., A Shares | 77,100 | 348,934 |
| China National Nuclear Power Co., Ltd., A Shares | 1,401,000 | 1,189,938 |
| China National Software & Service Co., Ltd., A Shares | 46,900 | 353,858 |
| China Northern Rare Earth Group High-Tech Co., Ltd., A Shares | 356,400 | 3,205,501 |
| China Oilfield Services Ltd., A Shares | 233,329 | 505,932 |
| China Oilfield Services Ltd., H Shares | 2,263,824 | 1,979,338 |
| China Overseas Land & Investment Ltd. | 5,040,158 | 11,600,202 |
| China Pacific Insurance (Group) Co., Ltd., A Shares | 554,000 | 2,258,245 |
| China Pacific Insurance (Group) Co., Ltd., H Shares | 3,480,315 | 9,800,112 |
| China Petroleum & Chemical Corp., A Shares | 3,769,400 | 2,488,785 |
| China Petroleum & Chemical Corp., H Shares | 32,614,351 | 15,809,511 |
| China Power International Development Ltd. | 6,157,938 | 2,486,184 |
| China Railway Group Ltd., A Shares | 2,191,400 | 1,912,210 |
| China Railway Group Ltd., H Shares | 4,455,134 | 2,136,672 |
| China Railway Signal & Communication Corp., Ltd., A Shares | 675,000 | 547,156 |
| China Railway Signal & Communication Corp., Ltd., H shares | 2,100,730 | 761,707 |
| China Reinsurance Group Corp., H Shares | 9,529,033 | 992,435 |
| China Resources Beer Holdings Co., Ltd. | 2,058,164 | 16,936,681 |
| China Resources Cement Holdings Ltd. | 2,922,601 | 2,867,229 |
| China Resources Gas Group Ltd. | 1,174,884 | 7,130,260 |
| China Resources Land Ltd. | 3,614,796 | 13,455,527 |
| China Resources Mixc Lifestyle Services Ltd. | 471,184 | 2,474,862 |
| China Resources Pharmaceutical Group Ltd. | 2,277,203 | 1,185,837 |
| China Resources Power Holdings Co., Ltd. | 2,497,531 | 6,139,982 |
| China Resources Sanjiu Medical & Pharmaceutical Co., Ltd., A Shares | 142,400 | 616,875 |
| China Shenhua Energy Co., Ltd., A Shares | 626,100 | 1,940,794 |
| China Shenhua Energy Co., Ltd., H Shares | 4,423,992 | 9,795,257 |
| China Southern Airlines Co., Ltd., A Shares * | 1,340,200 | 1,196,459 |
Schwab International Equity ETFs | Annual Report
Schwab Emerging Markets Equity ETF
Portfolio Holdings as of August 31, 2021 (continued)
| Security | Number
of Shares | Value ($) |
| China Southern Airlines Co., Ltd., H Shares * | 1,684,405 | 981,100 |
| China State Construction Engineering Corp., Ltd., A Shares | 3,877,900 | 2,884,984 |
| China State Construction International Holdings Ltd. | 2,422,217 | 1,962,104 |
| China Taiping Insurance Holdings Co., Ltd. | 1,890,397 | 2,761,212 |
| China Tourism Group Duty Free Corp., Ltd., A Shares | 184,300 | 6,521,055 |
| China Tower Corp., Ltd., H Shares | 62,056,573 | 8,138,724 |
| China Traditional Chinese Medicine Holdings Co., Ltd. * | 3,260,635 | 1,551,216 |
| China United Network Communications Ltd., A Shares | 2,928,500 | 1,901,800 |
| China Vanke Co., Ltd., A Shares | 847,700 | 2,601,435 |
| China Vanke Co., Ltd., H Shares | 2,525,698 | 6,819,760 |
| China World Trade Center Co., Ltd., A Shares | 116,400 | 324,917 |
| China Yangtze Power Co., Ltd., A Shares | 1,342,800 | 4,025,070 |
| China Zheshang Bank Co., Ltd., A Shares | 805,053 | 442,954 |
| Chongqing Brewery Co., Ltd., A Shares * | 44,800 | 973,143 |
| Chongqing Changan Automobile Co., Ltd., A Shares | 557,765 | 1,782,566 |
| Chongqing Changan Automobile Co., Ltd., B Shares | 1,603,060 | 1,082,125 |
| Chongqing Fuling Zhacai Group Co., Ltd., A Shares * | 76,600 | 304,999 |
| Chongqing Rural Commercial Bank Co., Ltd., A Shares | 1,288,500 | 776,854 |
| Chongqing Rural Commercial Bank Co., Ltd., H Shares | 2,093,248 | 802,057 |
| Chongqing Zhifei Biological Products Co., Ltd., A Shares | 116,700 | 3,201,472 |
| CIFI Holdings Group Co., Ltd. | 4,611,731 | 3,107,160 |
| CITIC Ltd. | 6,413,848 | 7,982,931 |
| Citic Pacific Special Steel Group Co., Ltd., A Shares | 473,310 | 1,869,178 |
| CITIC Securities Co., Ltd., A Shares | 1,005,800 | 4,003,246 |
| CITIC Securities Co., Ltd., H Shares | 2,966,342 | 7,513,734 |
| Contemporary Amperex Technology Co., Ltd., A Shares | 74,100 | 5,683,488 |
| COSCO Shipping Development Co., Ltd., H Shares | 7,098,595 | 1,496,872 |
| COSCO Shipping Energy Transportation Co., Ltd., H Shares | 2,560,830 | 1,000,974 |
| COSCO SHIPPING Holdings Co., Ltd., A Shares * | 1,088,121 | 3,497,773 |
| COSCO SHIPPING Holdings Co., Ltd., H Shares * | 4,147,558 | 7,839,316 |
| COSCO SHIPPING Ports Ltd. | 2,521,513 | 2,097,654 |
| Country Garden Holdings Co., Ltd. | 9,936,722 | 10,987,780 |
| Country Garden Services Holdings Co., Ltd. | 1,807,871 | 13,772,860 |
| CRRC Corp., Ltd., A Shares | 3,006,800 | 3,145,676 |
| CRRC Corp., Ltd., H Shares | 3,562,904 | 1,621,719 |
| CSC Financial Co., Ltd., A Shares | 103,400 | 448,409 |
| CSC Financial Co., Ltd., H Shares | 1,322,916 | 1,449,240 |
| CSG Holding Co., Ltd., A Shares | 531,946 | 967,924 |
| CSPC Pharmaceutical Group Ltd. | 11,024,817 | 13,991,262 |
| Daan Gene Co., Ltd., A Shares | 140,160 | 406,881 |
| Dada Nexus Ltd., ADR * | 82,011 | 1,942,020 |
| Dali Foods Group Co., Ltd. | 2,859,470 | 1,603,025 |
| DaShenLin Pharmaceutical Group Co., Ltd., A Shares | 33,360 | 235,464 |
| Security | Number
of Shares | Value ($) |
| Datang International Power Generation Co., Ltd., A Shares | 2,346,600 | 989,267 |
| Dawning Information Industry Co., Ltd., A Shares | 236,600 | 1,038,517 |
| DHC Software Co., Ltd., A Shares | 376,400 | 446,290 |
| Dian Diagnostics Group Co., Ltd., A Shares | 69,500 | 323,156 |
| DiDi Global, Inc. *(b) | 418,899 | 3,443,350 |
| Do-Fluoride New Materials Co., Ltd., A Shares * | 81,500 | 713,314 |
| Dong-E-E-Jiao Co., Ltd., A Shares | 62,200 | 331,341 |
| Dongfang Electric Corp., Ltd., H Shares | 1,195,161 | 1,638,144 |
| Dongfeng Motor Group Co., Ltd., H Shares | 3,660,121 | 4,009,622 |
| Dongxing Securities Co., Ltd., A Shares | 348,100 | 599,410 |
| East Group Co., Ltd., A Shares | 528,100 | 1,102,527 |
| East Money Information Co., Ltd., A Shares | 953,916 | 4,575,899 |
| Ecovacs Robotics Co., Ltd., A Shares | 51,500 | 1,170,883 |
| ENN Ecological Holdings Co., Ltd., A Shares | 254,275 | 806,334 |
| ENN Energy Holdings Ltd. | 992,437 | 19,638,573 |
| Eternal Asia Supply Chain Management Ltd., A Shares | 470,700 | 541,320 |
| Eve Energy Co., Ltd., A Shares | 167,636 | 2,650,166 |
| Everbright Securities Co., Ltd., A Shares | 490,400 | 1,208,518 |
| Fangda Carbon New Material Co., Ltd., A Shares | 411,180 | 824,017 |
| Far East Horizon Ltd. | 2,824,368 | 3,210,273 |
| FAW Jiefang Group Co., Ltd., A Shares | 257,600 | 446,368 |
| First Capital Securities Co., Ltd., A Shares | 426,700 | 423,261 |
| Flat Glass Group Co., Ltd., A Shares (b) | 713,838 | 4,167,004 |
| Focus Media Information Technology Co., Ltd., A Shares * | 1,304,900 | 1,454,159 |
| Foshan Haitian Flavouring & Food Co., Ltd., A Shares | 131,768 | 1,939,759 |
| Fosun International Ltd. | 2,944,767 | 3,725,756 |
| Founder Securities Co., Ltd., A Shares | 685,500 | 906,279 |
| Foxconn Industrial Internet Co., Ltd., A Shares | 394,400 | 701,753 |
| Fu Jian Anjoy Foods Co., Ltd., A Shares | 19,900 | 481,924 |
| Fujian Sunner Development Co., Ltd., A Shares | 128,100 | 351,223 |
| Fuyao Glass Industry Group Co., Ltd., A Shares | 152,400 | 1,131,426 |
| Fuyao Glass Industry Group Co., Ltd., H Shares | 824,609 | 5,078,693 |
| G-bits Network Technology Xiamen Co., Ltd., A Shares | 5,800 | 329,563 |
| Gan & Lee Pharmaceuticals Co., Ltd., A Shares | 20,000 | 249,380 |
| Ganfeng Lithium Co., Ltd., A Shares | 124,100 | 4,231,556 |
| Ganfeng Lithium Co., Ltd., H Shares | 191,023 | 4,401,412 |
| Gaotu Techedu, Inc. *(b) | 183,902 | 529,638 |
| GDS Holdings Ltd. ADR * | 151,934 | 8,885,100 |
| Geely Automobile Holdings Ltd. | 6,926,638 | 25,026,330 |
| GEM Co., Ltd. | 489,800 | 1,019,531 |
| Gemdale Corp., A Shares | 397,600 | 643,358 |
| Genscript Biotech Corp. * | 1,180,505 | 5,608,550 |
| GF Securities Co., Ltd., A Shares | 447,300 | 1,316,526 |
| GF Securities Co., Ltd., H Shares | 2,261,838 | 4,025,001 |
| Gigadevice Semiconductor Beijing, Inc., A Shares | 64,384 | 1,527,274 |
| Glarun Technology Co., Ltd., A Shares | 251,200 | 575,440 |
| GoerTek, Inc., A Shares | 324,400 | 2,339,984 |
| GOME Retail Holdings Ltd. * | 17,878,583 | 1,930,993 |
Schwab International Equity ETFs | Annual Report
Schwab Emerging Markets Equity ETF
Portfolio Holdings as of August 31, 2021 (continued)
| Security | Number
of Shares | Value ($) |
| Gongniu Group Co., Ltd., A Shares | 19,100 | 521,994 |
| Gotion High-tech Co., Ltd., A Shares * | 123,800 | 1,031,347 |
| Grandjoy Holdings Group Co., Ltd., A Shares * | 853,900 | 449,978 |
| Great Wall Motor Co., Ltd., A Shares | 265,500 | 2,720,840 |
| Great Wall Motor Co., Ltd., H Shares | 4,094,106 | 18,845,622 |
| Greenland Holdings Corp., Ltd., A Shares | 714,640 | 492,893 |
| Greentown China Holdings Ltd. | 1,055,793 | 1,620,882 |
| GRG Banking Equipment Co., Ltd., A Shares | 247,500 | 408,536 |
| Guangdong Electric Power Development Co., Ltd., B Shares | 1,226,514 | 381,642 |
| Guangdong Golden Dragon Development, Inc., A Shares * | 192,900 | 465,507 |
| Guangdong Haid Group Co., Ltd., A Shares | 152,200 | 1,515,631 |
| Guangdong HEC Technology Holding Co., Ltd., A Shares * | 729,200 | 867,988 |
| Guangdong Investment Ltd. | 3,880,299 | 5,388,369 |
| Guangdong Kinlong Hardware Products Co., Ltd., A Shares | 19,100 | 478,151 |
| Guangdong LY Intelligent Manufacturing Co., Ltd., A Shares | 694,300 | 719,911 |
| Guangdong Xinbao Electrical Appliances Holdings Co., Ltd., A Shares | 72,200 | 231,416 |
| Guanghui Energy Co., Ltd., A Shares * | 652,200 | 631,781 |
| Guangshen Railway Co., Ltd., A Shares * | 1,849,200 | 610,477 |
| Guangzhou Automobile Group Co., Ltd., A Shares | 348,460 | 998,069 |
| Guangzhou Automobile Group Co., Ltd., H Shares | 3,896,973 | 3,923,354 |
| Guangzhou Baiyunshan Pharmaceutical Holdings Co., Ltd., A Shares | 168,000 | 767,092 |
| Guangzhou Baiyunshan Pharmaceutical Holdings Co., Ltd., H Shares | 223,840 | 571,591 |
| Guangzhou Haige Communications Group, Inc. Co., A Shares | 228,900 | 396,992 |
| Guangzhou Kingmed Diagnostics Group Co., Ltd., A Shares | 40,500 | 662,237 |
| Guangzhou R&F Properties Co., Ltd., H Shares | 2,114,200 | 1,805,022 |
| Guangzhou Shiyuan Electronic Technology Co., Ltd., A Shares | 24,300 | 327,779 |
| Guangzhou Tinci Materials Technology Co., Ltd., A Shares | 80,690 | 1,703,469 |
| Guangzhou Wondfo Biotech Co., Ltd., A Shares | 41,770 | 275,855 |
| Guangzhou Yuexiu Financial Holdings Group Co., Ltd., A Shares | 207,495 | 267,569 |
| Guizhou Panjiang Refined Coal Co., Ltd., A Shares | 333,400 | 522,940 |
| Guolian Securities Co., Ltd., A Shares | 171,900 | 355,949 |
| Guosen Securities Co., Ltd., A Shares | 447,700 | 846,550 |
| Guotai Junan Securities Co., Ltd., A Shares | 722,700 | 1,989,329 |
| Guotai Junan Securities Co., Ltd., H Shares | 941,057 | 1,316,477 |
| Guoyuan Securities Co., Ltd., A Shares | 498,800 | 608,425 |
| Haidilao International Holding Ltd. | 1,213,755 | 4,947,191 |
| Haier Smart Home Co., Ltd., A Shares | 580,000 | 2,432,548 |
| Haier Smart Home Co., Ltd., H Shares | 2,940,155 | 11,076,593 |
| Haisco Pharmaceutical Group Co., Ltd., A Shares | 110,600 | 288,842 |
| Haitian International Holdings Ltd. | 743,781 | 2,849,900 |
| Haitong Securities Co., Ltd., A Shares | 999,700 | 1,969,341 |
| Haitong Securities Co., Ltd., H Shares | 4,240,357 | 3,920,123 |
| Security | Number
of Shares | Value ($) |
| Han's Laser Technology Industry Group Co., Ltd., A Shares | 92,100 | 640,360 |
| Hang Zhou Great Star Industrial Co., Ltd., A Shares * | 106,000 | 549,551 |
| Hangzhou First Applied Material Co., Ltd., A Shares | 40,440 | 952,709 |
| Hangzhou Oxygen Plant Group Co., Ltd., A Shares | 68,200 | 376,305 |
| Hangzhou Robam Appliances Co., Ltd., A Shares | 75,700 | 418,861 |
| Hangzhou Tigermed Consulting Co., Ltd., A Shares | 84,700 | 1,760,164 |
| Hangzhou Tigermed Consulting Co., Ltd., H Shares | 139,069 | 2,467,617 |
| Hansoh Pharmaceutical Group Co., Ltd. | 1,249,266 | 3,413,361 |
| Health & Happiness H&H International Holdings Ltd. | 217,435 | 622,054 |
| Hefei Meiya Optoelectronic Technology, Inc., A Shares | 64,700 | 430,899 |
| Heilongjiang Agriculture Co., Ltd., A Shares | 209,600 | 471,373 |
| Hello Group, Inc. ADR | 203,278 | 2,671,073 |
| Henan Shuanghui Investment & Development Co., Ltd., A Shares | 301,300 | 1,125,439 |
| Hengan International Group Co., Ltd. | 926,232 | 5,371,118 |
| Hengli Petrochemical Co., Ltd., A Shares | 301,600 | 1,224,724 |
| HengTen Networks Group Ltd. *(b) | 3,101,435 | 1,523,331 |
| Hengyi Petrochemical Co., Ltd., A Shares | 351,500 | 638,497 |
| Hesteel Co., Ltd., A Shares | 907,100 | 438,647 |
| Hithink RoyalFlush Information Network Co., Ltd., A Shares | 44,200 | 792,682 |
| Hongfa Technology Co., Ltd., A Shares | 77,100 | 744,830 |
| Hopson Development Holdings Ltd. | 828,636 | 3,228,307 |
| Hoshine Silicon Industry Co., Ltd., A Shares | 42,200 | 1,412,313 |
| Hua Hong Semiconductor Ltd. * | 655,536 | 3,860,383 |
| Huaan Securities Co., Ltd., A Shares | 411,560 | 344,455 |
| Huadian Power International Corp., Ltd., H Shares | 3,637,462 | 1,234,726 |
| Huadong Medicine Co., Ltd., A Shares | 161,700 | 770,656 |
| Huafon Chemical Co., Ltd., A Shares | 347,600 | 748,321 |
| Huagong Tech Co., Ltd., A Shares | 114,200 | 476,836 |
| Huaibei Mining Holdings Co., Ltd., A Shares | 247,700 | 556,672 |
| Hualan Biological Engineering, Inc., A Shares | 171,980 | 784,465 |
| Huaneng Power International, Inc., H Shares | 6,868,456 | 3,311,759 |
| Huapont Life Sciences Co., Ltd., A Shares | 524,700 | 484,689 |
| Huatai Securities Co., Ltd., A Shares | 583,200 | 1,480,598 |
| Huatai Securities Co., Ltd., H Shares | 2,237,505 | 3,210,677 |
| Huaxia Bank Co., Ltd., A Shares | 1,600,600 | 1,389,237 |
| Huaxin Cement Co., Ltd., B Shares | 624,524 | 1,094,166 |
| Huayu Automotive Systems Co., Ltd., A Shares | 272,100 | 978,413 |
| Huazhu Group Ltd. ADR * | 281,605 | 13,598,705 |
| Hubei Energy Group Co., Ltd., A Shares | 737,047 | 515,202 |
| Huizhou Desay Sv Automotive Co., Ltd., A Shares | 46,700 | 637,891 |
| Humanwell Healthcare Group Co., Ltd., A Shares | 140,800 | 471,807 |
| Hunan Valin Steel Co., Ltd., A Shares | 537,900 | 650,282 |
| Hundsun Technologies, Inc., A Shares | 142,842 | 1,097,218 |
| Huolinhe Opencut Coal Industry Corp., Ltd. of Inner Mongolia , A Shares | 242,300 | 519,000 |
| Iflytek Co., Ltd., A Shares | 206,100 | 1,673,205 |
Schwab International Equity ETFs | Annual Report
Schwab Emerging Markets Equity ETF
Portfolio Holdings as of August 31, 2021 (continued)
| Security | Number
of Shares | Value ($) |
| Industrial & Commercial Bank of China Ltd., A Shares | 6,575,400 | 4,708,361 |
| Industrial & Commercial Bank of China Ltd., H Shares | 103,747,462 | 57,894,268 |
| Industrial Bank Co., Ltd., A Shares | 1,907,300 | 5,468,855 |
| Industrial Securities Co., Ltd., A Shares | 657,500 | 1,012,949 |
| Ingenic Semiconductor Co., Ltd., A Shares | 32,100 | 708,668 |
| Inmyshow Digital Technology Group Co., Ltd., A Shares | 260,800 | 360,560 |
| Inner Mongolia BaoTou Steel Union Co., Ltd., A Shares * | 3,773,500 | 2,199,064 |
| Inner Mongolia Junzheng Energy & Chemical Industry Group Co., Ltd., A Shares | 720,500 | 648,807 |
| Inner Mongolia MengDian HuaNeng Thermal Power Corp., Ltd., A Shares | 1,843,400 | 711,418 |
| Inner Mongolia Yili Industrial Group Co., Ltd., A Shares | 558,200 | 2,942,403 |
| Innovent Biologics, Inc. * | 1,703,645 | 13,734,568 |
| Inspur Electronic Information Industry Co., Ltd., A Shares | 123,628 | 574,644 |
| Intco Medical Technology Co., Ltd., A Shares | 28,850 | 456,851 |
| iQIYI, Inc. ADR * | 413,168 | 3,743,302 |
| JA Solar Technology Co., Ltd., A Shares | 149,700 | 1,805,124 |
| Jafron Biomedical Co., Ltd., A Shares | 67,450 | 512,043 |
| Jason Furniture Hangzhou Co., Ltd., A Shares | 47,300 | 504,450 |
| JCET Group Co., Ltd., A Shares | 159,900 | 846,340 |
| JD Health International, Inc. * | 258,518 | 2,403,242 |
| JD.com, Inc. ADR * | 823,999 | 64,733,361 |
| Jiangsu Eastern Shenghong Co., Ltd., A Shares | 322,700 | 1,619,502 |
| Jiangsu Expressway Co., Ltd., A Shares | 368,400 | 492,190 |
| Jiangsu Expressway Co., Ltd., H Shares | 1,368,965 | 1,420,477 |
| Jiangsu Hengli Hydraulic Co., Ltd., A Shares | 110,784 | 1,630,853 |
| Jiangsu Hengrui Medicine Co., Ltd., A Shares | 582,160 | 4,078,368 |
| Jiangsu King's Luck Brewery JSC Ltd., A Shares | 113,200 | 737,239 |
| Jiangsu Linyang Energy Co., Ltd., A Shares | 391,200 | 692,422 |
| Jiangsu Yanghe Brewery Joint-Stock Co., Ltd., A Shares | 112,600 | 2,923,900 |
| Jiangsu Yangnong Chemical Co., Ltd., A Shares | 33,700 | 627,305 |
| Jiangsu Yuyue Medical Equipment & Supply Co., Ltd., A Shares | 116,300 | 590,152 |
| Jiangsu Zhongnan Construction Group Co., Ltd., A Shares | 444,443 | 321,002 |
| Jiangsu Zhongtian Technology Co., Ltd., A Shares | 315,400 | 397,427 |
| Jiangxi Copper Co., Ltd., H Shares | 1,888,277 | 3,840,967 |
| Jiangxi Zhengbang Technology Co., Ltd., A Shares | 348,500 | 461,822 |
| Jiayuan International Group Ltd. | 1,726,157 | 685,815 |
| Jilin Aodong Pharmaceutical Group Co., Ltd., A Shares | 258,100 | 636,049 |
| Jinduicheng Molybdenum Co., Ltd., A Shares | 619,500 | 932,323 |
| Jinke Properties Group Co., Ltd., A Shares | 488,004 | 363,053 |
| Jinxin Fertility Group Ltd. * | 1,886,741 | 2,998,466 |
| JiuGui Liquor Co., Ltd., A Shares | 31,000 | 1,006,491 |
| Security | Number
of Shares | Value ($) |
| Jizhong Energy Resources Co., Ltd., A Shares | 622,400 | 484,260 |
| Joincare Pharmaceutical Group Industry Co., Ltd., A Shares | 224,300 | 383,799 |
| Jointown Pharmaceutical Group Co., Ltd., A Shares | 147,900 | 346,827 |
| Jonjee Hi-Tech Industrial & Commercial Holding Co., Ltd., A Shares | 78,800 | 367,009 |
| Joyoung Co., Ltd., A Shares | 77,400 | 252,402 |
| JOYY, Inc. ADR | 68,788 | 4,354,280 |
| Juneyao Airlines Co., Ltd., A Shares | 148,300 | 325,929 |
| Kaishan Group Co., Ltd., A Shares | 233,800 | 556,960 |
| KE Holdings, Inc. ADR * | 300,659 | 5,438,921 |
| Kingboard Holdings Ltd. | 961,723 | 4,729,876 |
| Kingboard Laminates Holdings Ltd. | 1,357,612 | 2,670,764 |
| Kingdee International Software Group Co., Ltd. * | 3,326,737 | 12,105,236 |
| Kingfa Sci & Tech Co., Ltd., A Shares | 242,400 | 609,006 |
| Kingsoft Cloud Holdings Ltd., ADR *(b) | 119,950 | 3,861,190 |
| Kingsoft Corp., Ltd. | 1,117,072 | 4,474,119 |
| Kuaishou Technology * | 345,929 | 3,758,478 |
| Kuang-Chi Technologies Co., Ltd., A Shares * | 214,000 | 757,889 |
| Kunlun Energy Co., Ltd. | 3,925,327 | 4,158,832 |
| Kunlun Tech Co., Ltd., A Shares | 87,700 | 228,765 |
| Kweichow Moutai Co., Ltd., A Shares | 114,700 | 27,697,241 |
| KWG Group Holdings Ltd. | 1,705,026 | 1,797,683 |
| KWG Living Group Holdings Ltd. | 1,067,474 | 892,152 |
| Lao Feng Xiang Co., Ltd., A Shares | 127,329 | 917,274 |
| Laobaixing Pharmacy Chain JSC, A Shares | 37,100 | 293,258 |
| LB Group Co., Ltd., A Shares | 215,000 | 1,249,612 |
| Legend Holdings Corp., H Shares | 687,483 | 1,108,480 |
| Lens Technology Co., Ltd., A Shares | 475,000 | 1,737,446 |
| Lepu Medical Technology Beijing Co., Ltd., A Shares | 157,400 | 629,893 |
| Li Auto, Inc., ADR * | 629,778 | 19,434,949 |
| Li Ning Co., Ltd. | 2,808,631 | 37,738,039 |
| Lianhe Chemical Technology Co., Ltd., A Shares | 80,400 | 283,493 |
| Liaoning Cheng Da Co., Ltd., A Shares | 146,400 | 551,383 |
| Liaoning Port Co., Ltd., A Shares | 1,256,200 | 330,989 |
| Livzon Pharmaceutical Group, Inc., A Shares | 109,500 | 669,186 |
| Livzon Pharmaceutical Group, Inc., H Shares | 126,375 | 467,162 |
| Logan Group Co., Ltd. | 1,314,288 | 1,568,220 |
| Longfor Group Holdings Ltd. | 2,423,534 | 10,501,404 |
| LONGi Green Energy Technology Co., Ltd., A Shares | 494,520 | 6,856,751 |
| Lufax Holding Ltd. * | 715,198 | 6,200,767 |
| Luxi Chemical Group Co., Ltd., A Shares | 146,700 | 526,592 |
| Luxshare Precision Industry Co., Ltd., A Shares | 639,717 | 3,357,225 |
| Luye Pharma Group Ltd. * | 2,473,334 | 1,319,773 |
| Luzhou Laojiao Co., Ltd., A Shares | 135,600 | 3,572,846 |
| Maanshan Iron & Steel Co., Ltd., A Shares | 1,171,900 | 1,111,598 |
| Mango Excellent Media Co., Ltd., A Shares | 160,070 | 1,136,269 |
| Maxscend Microelectronics Co., Ltd., A Shares | 28,280 | 1,661,209 |
| Meinian Onehealth Healthcare Holdings Co., Ltd., A Shares * | 400,700 | 439,702 |
| Meituan, B Shares * | 5,075,317 | 162,491,586 |
| Metallurgical Corp. of China Ltd., A Shares | 1,584,900 | 1,230,680 |
Schwab International Equity ETFs | Annual Report
Schwab Emerging Markets Equity ETF
Portfolio Holdings as of August 31, 2021 (continued)
| Security | Number
of Shares | Value ($) |
| Metallurgical Corp. of China Ltd., H Shares | 3,530,972 | 1,407,422 |
| Ming Yuan Cloud Group Holdings Ltd. * | 761,374 | 2,643,201 |
| MINISO Group Holding Ltd. ADR | 90,659 | 1,225,710 |
| Montage Technology Co., Ltd., A Shares | 108,000 | 1,060,415 |
| Montnets Rongxin Technology Group Co., Ltd., A Shares * | 191,200 | 627,949 |
| Muyuan Foods Co., Ltd., A Shares | 462,486 | 3,032,824 |
| Nanjing Hanrui Cobalt Co., Ltd., A Shares | 32,500 | 479,491 |
| Nanjing Iron & Steel Co., Ltd., A Shares | 502,900 | 335,163 |
| Nanjing King-Friend Biochemical Pharmaceutical Co., Ltd., A Shares | 69,654 | 310,593 |
| Nanjing Securities Co., Ltd., A Shares | 365,200 | 593,761 |
| NARI Technology Co., Ltd., A Shares | 578,320 | 3,138,094 |
| NAURA Technology Group Co., Ltd., A Shares | 44,800 | 2,470,874 |
| NavInfo Co., Ltd., A Shares * | 284,000 | 489,033 |
| NetEase, Inc. ADR | 382,342 | 37,247,758 |
| New China Life Insurance Co., Ltd., A Shares | 174,000 | 1,095,456 |
| New China Life Insurance Co., Ltd., H Shares | 1,281,029 | 3,771,923 |
| New Hope Liuhe Co., Ltd., A Shares * | 400,700 | 679,426 |
| New Oriental Education & Technology Group, Inc. ADR * | 1,947,979 | 4,402,433 |
| Nine Dragons Paper Holdings Ltd. | 2,141,639 | 2,929,923 |
| Ningbo Joyson Electronic Corp., A Shares | 130,600 | 406,455 |
| Ningbo Tuopu Group Co., Ltd., A Shares | 111,700 | 620,652 |
| Ningbo Zhoushan Port Co., Ltd., A Shares | 757,300 | 447,197 |
| Ningxia Baofeng Energy Group Co., Ltd., A Shares | 265,500 | 660,869 |
| NIO, Inc. ADR * | 1,691,501 | 66,492,904 |
| North Huajin Chemical Industries Co., Ltd., A Shares | 309,000 | 368,769 |
| Northeast Securities Co., Ltd., A Shares | 317,900 | 420,779 |
| NSFOCUS Technologies Group Co., Ltd., A Shares | 125,400 | 427,588 |
| Offcn Education Technology Co., Ltd., A Shares * | 209,200 | 340,777 |
| Offshore Oil Engineering Co., Ltd., A Shares | 462,100 | 325,160 |
| OneConnect Financial Technology Co., Ltd. * | 160,688 | 755,234 |
| Oppein Home Group, Inc., A Shares | 19,340 | 463,117 |
| Orient Securities Co., Ltd., A Shares | 643,100 | 1,492,128 |
| Orient Securities Co., Ltd., H Shares | 968,425 | 952,568 |
| Ourpalm Co., Ltd., A Shares * | 554,900 | 304,455 |
| Ovctek China, Inc., A Shares | 76,280 | 789,756 |
| Perfect World Co., Ltd., A Shares | 130,950 | 272,373 |
| PetroChina Co., Ltd., H Shares | 27,185,022 | 11,919,346 |
| Pharmaron Beijing Co., Ltd., A Shares | 22,400 | 668,320 |
| Pharmaron Beijing Co., Ltd., H Shares | 171,732 | 3,811,188 |
| PICC Property & Casualty Co., Ltd., H Shares | 8,888,264 | 8,034,163 |
| Pinduoduo, Inc. ADR * | 484,800 | 48,489,696 |
| Ping An Bank Co., Ltd., A Shares | 1,758,000 | 4,850,031 |
| Ping An Healthcare & Technology Co., Ltd. * | 513,408 | 3,789,159 |
| Ping An Insurance Group Co. of China Ltd., A Shares | 1,077,400 | 8,332,650 |
| Ping An Insurance Group Co. of China Ltd., H Shares | 7,726,464 | 60,004,812 |
| Poly Developments & Holdings Group Co., Ltd., A Shares | 1,088,000 | 1,920,694 |
| Security | Number
of Shares | Value ($) |
| Poly Property Services Co., Ltd., H Shares | 194,904 | 1,191,625 |
| Pop Mart International Group Ltd. * | 202,688 | 1,531,102 |
| Postal Savings Bank of China Co., Ltd., H Shares | 12,290,193 | 8,865,228 |
| Power Construction Corp. of China Ltd., A Shares | 1,257,800 | 1,210,623 |
| Proya Cosmetics Co., Ltd., A Shares | 13,700 | 333,773 |
| Qingdao TGOOD Electric Co., Ltd., A Shares | 113,900 | 573,207 |
| Raytron Technology Co., Ltd., A Shares | 45,400 | 875,491 |
| Red Star Macalline Group Corp., Ltd., H Shares * | 1,115,988 | 680,152 |
| Remegen Co., Ltd., H Shares * | 121,804 | 1,573,968 |
| RiseSun Real Estate Development Co., Ltd., A Shares | 421,200 | 310,090 |
| RLX Technology, Inc. ADR *(b) | 179,733 | 923,828 |
| Rongsheng Petrochemical Co., Ltd., A Shares | 265,800 | 768,727 |
| SAIC Motor Corp., Ltd., A Shares | 914,000 | 2,736,900 |
| Sanan Optoelectronics Co., Ltd., A Shares | 420,500 | 2,366,453 |
| Sangfor Technologies, Inc., A Shares | 11,600 | 489,746 |
| Sany Heavy Industry Co., Ltd., A Shares | 770,600 | 3,132,802 |
| SDIC Capital Co., Ltd., A Shares | 375,760 | 543,373 |
| SDIC Power Holdings Co., Ltd., A Shares | 655,600 | 920,604 |
| Sealand Securities Co., Ltd., A Shares | 440,000 | 282,331 |
| Seazen Group Ltd. * | 2,694,597 | 2,390,624 |
| Seazen Holdings Co., Ltd., A Shares | 197,100 | 1,026,741 |
| SF Holding Co., Ltd., A Shares | 228,000 | 2,036,169 |
| SG Micro Corp., A Shares | 23,025 | 1,141,971 |
| Shaanxi Coal Industry Co., Ltd., A Shares | 715,800 | 1,521,020 |
| Shandong Chenming Paper Holdings Ltd., A Shares | 634,250 | 772,660 |
| Shandong Chenming Paper Holdings Ltd., H Shares | 628,762 | 358,953 |
| Shandong Denghai Seeds Co., Ltd., A Shares | 187,400 | 538,209 |
| Shandong Gold Mining Co., Ltd., A Shares | 364,004 | 1,015,510 |
| Shandong Gold Mining Co., Ltd., H Shares | 832,377 | 1,346,384 |
| Shandong Hi-speed Co., Ltd., A Shares | 638,700 | 556,338 |
| Shandong Himile Mechanical Science & Technology Co., Ltd., A Shares | 93,500 | 382,434 |
| Shandong Hualu Hengsheng Chemical Co., Ltd., A Shares | 191,360 | 1,080,182 |
| Shandong Linglong Tyre Co., Ltd., A Shares | 86,400 | 400,665 |
| Shandong Nanshan Aluminum Co., Ltd., A Shares | 1,239,900 | 1,108,838 |
| Shandong Sinocera Functional Material Co., Ltd., A Shares | 55,800 | 395,754 |
| Shandong Sun Paper Industry JSC Ltd., A Shares | 183,200 | 349,250 |
| Shandong Weigao Group Medical Polymer Co., Ltd., H Shares | 2,985,162 | 4,912,994 |
| Shanghai Bailian Group Co., Ltd., A Shares | 242,500 | 519,428 |
| Shanghai Bairun Investment Holding Group Co., Ltd., A Shares | 65,520 | 727,808 |
| Shanghai Baosight Software Co., Ltd., A Shares | 237,769 | 2,590,694 |
| Shanghai Construction Group Co., Ltd., A Shares | 762,800 | 327,489 |
Schwab International Equity ETFs | Annual Report
Schwab Emerging Markets Equity ETF
Portfolio Holdings as of August 31, 2021 (continued)
| Security | Number
of Shares | Value ($) |
| Shanghai Electric Group Co., Ltd., A Shares | 1,015,600 | 769,728 |
| Shanghai Electric Group Co., Ltd., H Shares | 3,354,847 | 953,308 |
| Shanghai Environment Group Co., Ltd., A Shares | 116,300 | 211,799 |
| Shanghai Fosun Pharmaceutical Group Co., Ltd., A Shares | 155,000 | 1,520,691 |
| Shanghai Fosun Pharmaceutical Group Co., Ltd., H Shares | 727,205 | 4,665,796 |
| Shanghai Huayi Group Co., Ltd., B Shares | 715,388 | 550,133 |
| Shanghai Industrial Holdings Ltd. | 654,027 | 1,017,535 |
| Shanghai International Airport Co., Ltd., A Shares * | 166,800 | 1,118,635 |
| Shanghai International Port Group Co., Ltd., A Shares | 1,036,700 | 898,195 |
| Shanghai Jahwa United Co., Ltd., A Shares | 72,600 | 535,836 |
| Shanghai Jinjiang International Hotels Co., Ltd., A Shares | 150,275 | 1,065,108 |
| Shanghai Jinqiao Export Processing Zone Development Co., Ltd., A Shares | 310,036 | 579,516 |
| Shanghai Junshi Biosciences Co., Ltd., A Shares * | 65,230 | 566,365 |
| Shanghai Junshi Biosciences Co., Ltd., H Shares * | 167,095 | 945,332 |
| Shanghai Lingang Holdings Corp., Ltd., A Shares | 155,160 | 370,585 |
| Shanghai Lujiazui Finance & Trade Zone Development Co., Ltd., A Shares | 511,100 | 904,644 |
| Shanghai Lujiazui Finance & Trade Zone Development Co., Ltd., B Shares | 466,430 | 419,321 |
| Shanghai M&G Stationery, Inc., A Shares | 39,500 | 421,876 |
| Shanghai Mechanical & Electrical Industry Co., Ltd., A Shares | 244,470 | 591,472 |
| Shanghai Pharmaceuticals Holding Co., Ltd., A Shares | 164,900 | 490,713 |
| Shanghai Pharmaceuticals Holding Co., Ltd., H Shares | 1,107,975 | 2,199,610 |
| Shanghai Pudong Development Bank Co., Ltd., A Shares | 2,622,900 | 3,679,052 |
| Shanghai Putailai New Energy Technology Co., Ltd., A Shares | 68,240 | 1,618,214 |
| Shanghai RAAS Blood Products Co., Ltd., A Shares | 559,600 | 601,926 |
| Shanghai Waigaoqiao Free Trade Zone Group Co., Ltd., A Shares | 192,100 | 398,372 |
| Shanghai Yuyuan Tourist Mart Group Co., Ltd., A Shares | 382,200 | 603,630 |
| Shanghai Zhenhua Heavy Industry Co., Ltd., B Shares * | 1,242,083 | 329,152 |
| Shanxi Lu'an Environmental Energy Development Co., Ltd., A Shares | 342,200 | 843,301 |
| Shanxi Securities Co., Ltd., A Shares | 315,200 | 319,988 |
| Shanxi Xinghuacun Fen Wine Factory Co., Ltd., A Shares | 108,500 | 4,666,913 |
| Shanxi Xishan Coal & Electricity Power Co., Ltd., A Shares | 386,400 | 690,513 |
| Shenergy Co., Ltd., A Shares | 521,500 | 526,188 |
| Shenghe Resources Holding Co., Ltd., A Shares | 167,100 | 724,911 |
| Shengyi Technology Co., Ltd., A Shares | 235,700 | 858,486 |
| Shenwan Hongyuan Group Co., Ltd., A Shares | 1,985,200 | 1,446,131 |
| Security | Number
of Shares | Value ($) |
| Shenwan Hongyuan Group Co., Ltd., H Shares | 2,442,539 | 593,570 |
| Shenzhen Capchem Technology Co., Ltd., A Shares | 42,400 | 722,679 |
| Shenzhen Energy Group Co., Ltd., A Shares | 533,900 | 647,929 |
| Shenzhen Expressway Co., Ltd., H Shares | 1,196,893 | 1,148,054 |
| Shenzhen Hepalink Pharmaceutical Group Co., Ltd., H Shares | 373,365 | 439,261 |
| Shenzhen Huaqiang Industry Co., Ltd., A Shares | 187,500 | 437,946 |
| Shenzhen Inovance Technology Co., Ltd., A Shares | 234,600 | 2,582,345 |
| Shenzhen International Holdings Ltd. | 1,199,206 | 1,563,508 |
| Shenzhen Investment Ltd. | 3,152,073 | 936,217 |
| Shenzhen Jinjia Group Co., Ltd., A Shares | 307,400 | 500,740 |
| Shenzhen Kaifa Technology Co., Ltd., A Shares | 114,100 | 282,067 |
| Shenzhen Kangtai Biological Products Co., Ltd., A Shares * | 59,000 | 1,107,119 |
| Shenzhen Kingdom Sci-Tech Co., Ltd., A Shares | 305,800 | 585,816 |
| Shenzhen Mindray Bio-Medical Electronics Co., Ltd., A Shares | 81,500 | 4,143,211 |
| Shenzhen MTC Co., Ltd., A Shares * | 462,900 | 393,881 |
| Shenzhen Overseas Chinese Town Co., Ltd., A Shares | 838,600 | 876,033 |
| Shenzhen Salubris Pharmaceuticals Co., Ltd., A Shares * | 78,200 | 307,128 |
| Shenzhen SC New Energy Technology Corp., A Shares | 33,400 | 1,066,346 |
| Shenzhen Sunway Communication Co., Ltd., A Shares | 88,700 | 309,598 |
| Shenzhen YUTO Packaging Technology Co., Ltd., A Shares | 92,200 | 378,689 |
| Shenzhen Zhongjin Lingnan Nonfemet Co., Ltd., A Shares | 816,100 | 767,782 |
| Shenzhou International Group Holdings Ltd. | 985,051 | 21,480,922 |
| Shimao Group Holdings Ltd. | 1,811,168 | 3,744,666 |
| Shimao Services Holdings Ltd. | 1,055,320 | 2,461,443 |
| Shougang Fushan Resources Group Ltd. | 4,804,334 | 1,544,335 |
| Sichuan Chuantou Energy Co., Ltd., A Shares | 420,500 | 741,675 |
| Sichuan Kelun Pharmaceutical Co., Ltd., A Shares | 163,200 | 460,360 |
| Sichuan Road & Bridge Co., Ltd., A Shares | 459,200 | 536,635 |
| Sichuan Swellfun Co., Ltd., A Shares | 40,400 | 728,352 |
| Sino Biopharmaceutical Ltd. | 12,683,150 | 10,616,380 |
| Sino-Ocean Group Holding Ltd. | 4,377,509 | 900,566 |
| Sinolink Securities Co., Ltd., A Shares | 320,100 | 545,242 |
| Sinoma Science & Technology Co., Ltd., A Shares | 148,700 | 687,495 |
| Sinopec Engineering Group Co., Ltd., H Shares | 2,060,887 | 1,094,391 |
| Sinopec Oilfield Service Corp., A Shares * | 1,705,950 | 571,118 |
| Sinopec Shanghai Petrochemical Co., Ltd., A Shares | 1,239,700 | 651,361 |
| Sinopec Shanghai Petrochemical Co., Ltd., H Shares | 3,150,858 | 680,623 |
| Sinopharm Group Co., Ltd., H Shares | 1,619,630 | 4,160,827 |
| Sinotrans Ltd., H Shares | 3,348,238 | 1,364,721 |
| Sinotruk Hong Kong Ltd. | 869,139 | 1,712,050 |
Schwab International Equity ETFs | Annual Report
Schwab Emerging Markets Equity ETF
Portfolio Holdings as of August 31, 2021 (continued)
| Security | Number
of Shares | Value ($) |
| Skshu Paint Co., Ltd., A Shares | 34,020 | 768,245 |
| Smoore International Holdings Ltd. | 2,277,530 | 12,196,844 |
| SOHO China Ltd. * | 2,803,807 | 1,153,630 |
| Songcheng Performance Development Co., Ltd., A Shares | 239,900 | 568,145 |
| SooChow Securities Co., Ltd., A Shares | 401,950 | 589,344 |
| Southwest Securities Co., Ltd., A Shares | 749,200 | 595,691 |
| Spring Airlines Co., Ltd., A Shares * | 66,100 | 544,823 |
| STO Express Co., Ltd., A Shares * | 483,400 | 513,219 |
| Sunac China Holdings Ltd. | 3,238,543 | 8,286,499 |
| Sunac Services Holdings Ltd. | 732,448 | 1,907,086 |
| Sungrow Power Supply Co., Ltd., A Shares | 130,200 | 3,173,877 |
| Suning Universal Co., Ltd., A Shares * | 481,640 | 382,207 |
| Suning.com Co., Ltd., A Shares * | 855,300 | 699,936 |
| Sunny Optical Technology Group Co., Ltd. | 853,337 | 25,806,330 |
| Sunwoda Electronic Co., Ltd., A Shares | 161,900 | 986,406 |
| Suzhou Dongshan Precision Manufacturing Co., Ltd., A Shares | 146,200 | 434,838 |
| Suzhou Maxwell Technologies Co., Ltd., A Shares | 10,180 | 1,226,302 |
| TAL Education Group ADR * | 576,469 | 3,066,815 |
| Tangshan Jidong Cement Co., Ltd., A Shares | 389,900 | 767,472 |
| TangShan Port Group Co., Ltd., A Shares | 1,818,400 | 696,133 |
| Tangshan Sanyou Chemical Industries Co., Ltd., A Shares | 223,400 | 499,638 |
| TBEA Co., Ltd., A Shares | 352,649 | 1,340,744 |
| TCL Corp., A Shares | 1,407,400 | 1,555,295 |
| Tencent Holdings Ltd. | 7,825,656 | 484,188,788 |
| Tencent Music Entertainment Group ADR * | 772,510 | 6,828,988 |
| The People's Insurance Co. Group of China Ltd., H Shares | 10,845,882 | 3,346,913 |
| Thunder Software Technology Co., Ltd., A Shares | 41,400 | 760,690 |
| Tianfeng Securities Co., Ltd., A Shares * | 801,300 | 537,760 |
| Tianjin Capital Environmental Protection Group Co., Ltd., A Shares | 401,900 | 386,203 |
| Tianjin Zhonghuan Semiconductor Co., Ltd., A Shares | 287,200 | 2,403,720 |
| Tianma Microelectronics Co., Ltd., A Shares | 268,600 | 589,072 |
| Tianshui Huatian Technology Co., Ltd., A Shares | 252,400 | 498,776 |
| Times China Holdings Ltd. | 969,979 | 1,002,736 |
| Tongcheng-Elong Holdings Ltd. * | 1,154,880 | 2,687,719 |
| TongFu Microelectronics Co., Ltd., A Shares | 131,200 | 418,490 |
| Tonghua Dongbao Pharmaceutical Co., Ltd., A Shares | 209,400 | 340,129 |
| Tongkun Group Co., Ltd., A Shares | 224,000 | 829,758 |
| Tongling Nonferrous Metals Group Co., Ltd., A Shares | 821,600 | 541,197 |
| Tongwei Co., Ltd., A Shares | 405,500 | 3,833,772 |
| Topchoice Medical Corp., A Shares * | 28,300 | 1,030,809 |
| Topsports International Holdings Ltd. | 2,276,188 | 3,008,636 |
| TravelSky Technology Ltd., H Shares | 1,275,891 | 2,391,880 |
| Trip.com Group Ltd. ADR * | 696,393 | 21,233,023 |
| Tsingtao Brewery Co., Ltd., A Shares | 74,000 | 990,031 |
| Tsingtao Brewery Co., Ltd., H Shares | 637,310 | 5,219,856 |
| Unigroup Guoxin Microelectronics Co., Ltd., A Shares | 55,600 | 1,927,731 |
| Unisplendour Corp., Ltd., A Shares | 148,520 | 546,706 |
| Valiant Co., Ltd., A Shares | 200,700 | 635,509 |
| Vipshop Holdings Ltd. ADR * | 571,571 | 8,453,535 |
| Security | Number
of Shares | Value ($) |
| Walvax Biotechnology Co., Ltd., A Shares | 132,000 | 1,589,647 |
| Wangsu Science & Technology Co., Ltd., A Shares | 748,800 | 687,058 |
| Wanhua Chemical Group Co., Ltd., A Shares | 288,200 | 4,766,110 |
| Weibo Corp. ADR * | 74,929 | 3,785,413 |
| Weichai Power Co., Ltd., A Shares | 550,200 | 1,711,487 |
| Weichai Power Co., Ltd., H Shares | 2,528,842 | 6,379,535 |
| Weifu High-Technology Group Co., Ltd., A Shares | 173,100 | 621,357 |
| Weihai Guangwei Composites Co., Ltd., A Shares | 45,700 | 517,348 |
| Wens Foodstuffs Group Co., Ltd., A Shares | 180,320 | 362,764 |
| Western Securities Co., Ltd., A Shares | 357,800 | 451,964 |
| Western Superconducting Technologies Co., Ltd., A Shares | 45,200 | 646,755 |
| Will Semiconductor Co., Ltd ., A Shares | 54,700 | 2,052,437 |
| Wingtech Technology Co., Ltd., A Shares | 113,400 | 2,097,689 |
| Winning Health Technology Group Co., Ltd., A Shares | 216,800 | 477,148 |
| Wuchan Zhongda Group Co., Ltd., A Shares | 413,200 | 389,376 |
| Wuhan Guide Infrared Co., Ltd., A Shares | 203,840 | 865,657 |
| Wuhu Sanqi Interactive Entertainment Network Technology Group Co., Ltd., A Shares | 117,200 | 309,712 |
| Wuliangye Yibin Co., Ltd., A Shares | 359,500 | 11,237,997 |
| WUS Printed Circuit Kunshan Co., Ltd., A Shares | 154,330 | 267,662 |
| WuXi AppTec Co., Ltd., A Shares | 90,251 | 1,857,615 |
| WuXi AppTec Co., Ltd., H Shares | 409,701 | 8,165,205 |
| Wuxi Biologics Cayman, Inc. * | 4,278,461 | 66,234,219 |
| Wuxi Lead Intelligent Equipment Co., Ltd., A Shares | 84,780 | 980,252 |
| XCMG Construction Machinery Co., Ltd., A Shares | 779,200 | 787,412 |
| Xiamen C & D, Inc., A Shares | 321,300 | 387,432 |
| Xiamen ITG Group Corp., Ltd., A Shares | 674,800 | 909,913 |
| Xiamen Meiya Pico Information Co., Ltd., A Shares | 220,500 | 646,599 |
| Xiamen Tungsten Co., Ltd., A Shares | 154,700 | 736,815 |
| Xiaomi Corp., B Shares * | 17,264,396 | 55,495,754 |
| Xinfengming Group Co., Ltd., A Shares | 120,100 | 341,760 |
| Xinhua Winshare Publishing and Media Co., Ltd., H Shares | 710,892 | 498,160 |
| Xinjiang Goldwind Science & Technology Co., Ltd., A Shares | 582,900 | 1,318,120 |
| Xinjiang Goldwind Science & Technology Co., Ltd., H Shares | 612,559 | 1,170,402 |
| Xinjiang Zhongtai Chemical Co., Ltd., A Shares | 241,900 | 505,021 |
| Xinyangfeng Agricultural Technology Co., Ltd., A Shares | 153,600 | 509,461 |
| Xinyi Solar Holdings Ltd. | 5,589,569 | 13,511,530 |
| XPeng, Inc. ADR * | 678,139 | 28,820,907 |
| Xuji Electric Co., Ltd., A Shares | 324,300 | 1,005,270 |
| Yadea Group Holdings Ltd. | 1,308,905 | 2,325,865 |
| Yangtze Optical Fibre & Cable Joint Stock Ltd. Co., H Shares | 358,378 | 510,563 |
| Yangzijiang Shipbuilding Holdings Ltd. | 2,742,094 | 3,343,271 |
| Yanlord Land Group Ltd. | 846,935 | 749,277 |
| Yantai Changyu Pioneer Wine Co., Ltd., A Shares | 169,383 | 814,362 |
| Yantai Eddie Precision Machinery Co., Ltd., A Shares | 86,520 | 510,243 |
Schwab International Equity ETFs | Annual Report
Schwab Emerging Markets Equity ETF
Portfolio Holdings as of August 31, 2021 (continued)
| Security | Number
of Shares | Value ($) |
| Yantai Jereh Oilfield Services Group Co., Ltd., A Shares | 101,900 | 582,150 |
| Yanzhou Coal Mining Co., Ltd., A Shares | 296,500 | 1,173,225 |
| Yanzhou Coal Mining Co., Ltd., H Shares | 2,277,957 | 3,977,532 |
| Yatsen Holding Ltd. ADR * | 89,068 | 451,575 |
| Yealink Network Technology Corp., Ltd., A Shares | 74,950 | 999,024 |
| Yifan Pharmaceutical Co., Ltd., A Shares | 124,700 | 299,574 |
| Yifeng Pharmacy Chain Co., Ltd., A Shares | 67,860 | 545,236 |
| Yihai International Holding Ltd. * | 612,870 | 3,309,680 |
| Yihai Kerry Arawana Holdings Co., Ltd., A Shares | 122,900 | 1,287,478 |
| Yintai Gold Co., Ltd., A Shares | 275,600 | 378,459 |
| Yonghui Superstores Co., Ltd., A Shares | 910,800 | 537,841 |
| Yonyou Network Technology Co., Ltd., A Shares | 304,240 | 1,579,671 |
| Yotrio Group Co., Ltd., A Shares | 928,900 | 534,132 |
| Youngor Group Co., Ltd., A Shares | 438,700 | 439,244 |
| YTO Express Group Co., Ltd., A Shares | 243,300 | 355,975 |
| Yuan Longping High-tech Agriculture Co., Ltd., A Shares * | 148,200 | 477,998 |
| Yuexiu Property Co., Ltd. | 1,610,697 | 1,509,766 |
| Yunnan Aluminium Co., Ltd., A Shares * | 322,100 | 876,639 |
| Yunnan Baiyao Group Co., Ltd., A Shares | 103,600 | 1,424,099 |
| Yunnan Copper Co., Ltd., A Shares | 204,300 | 503,467 |
| Yunnan Energy New Material Co., Ltd., A Shares | 72,200 | 3,160,149 |
| Yunnan Tin Co., Ltd., A Shares * | 179,200 | 677,694 |
| Zai Lab Ltd. ADR * | 75,415 | 10,897,467 |
| Zhangzhou Pientzehuang Pharmaceutical Co., Ltd., A Shares | 53,800 | 2,893,876 |
| Zhaojin Mining Industry Co., Ltd., H Shares | 1,554,366 | 1,271,097 |
| Zhefu Holding Group Co., Ltd., A Shares | 500,700 | 516,842 |
| Zhejiang Century Huatong Group Co., Ltd., A Shares * | 710,400 | 688,159 |
| Zhejiang China Commodities City Group Co., Ltd., A Shares | 620,900 | 434,014 |
| Zhejiang Chint Electrics Co., Ltd., A Shares | 110,200 | 1,075,184 |
| Zhejiang Crystal-Optech Co., Ltd., A Shares | 291,400 | 610,170 |
| Zhejiang Dahua Technology Co., Ltd., A Shares | 303,700 | 1,083,567 |
| Zhejiang Expressway Co., Ltd., H Shares | 2,004,014 | 1,757,331 |
| Zhejiang Hailiang Co., Ltd., A Shares | 293,800 | 528,676 |
| Zhejiang Huahai Pharmaceutical Co., Ltd., A Shares | 140,250 | 347,799 |
| Zhejiang Huayou Cobalt Co., Ltd., A Shares | 111,500 | 2,423,034 |
| Zhejiang Jingsheng Mechanical & Electrical Co., Ltd., A Shares | 110,900 | 1,335,028 |
| Zhejiang Juhua Co., Ltd., A Shares | 318,100 | 837,650 |
| Zhejiang Longsheng Group Co., Ltd., A Shares | 325,400 | 682,372 |
| Zhejiang Medicine Co., Ltd., A Shares | 226,100 | 565,600 |
| Zhejiang NHU Co., Ltd., A Shares | 231,240 | 1,031,118 |
| Zhejiang Sanhua Intelligent Controls Co., Ltd., A Shares | 349,620 | 1,368,243 |
| Zhejiang Satellite Petrochemical Co., Ltd., A Shares | 164,360 | 1,067,627 |
| Zhejiang Supor Co., Ltd., A Shares | 46,200 | 349,364 |
| Zhejiang Wanfeng Auto Wheel Co., Ltd., A Shares | 693,400 | 574,967 |
| Zhejiang Weixing New Building Materials Co., Ltd., A Shares | 155,300 | 475,624 |
| Security | Number
of Shares | Value ($) |
| Zhejiang Wolwo Bio-Pharmaceutical Co., Ltd., A Shares | 54,100 | 429,563 |
| Zhengzhou Coal Mining Machinery Group Co., Ltd., A Shares | 162,400 | 329,230 |
| Zhengzhou Yutong Bus Co., Ltd., A Shares | 240,400 | 458,295 |
| Zheshang Securities Co., Ltd., A Shares * | 330,600 | 635,375 |
| ZhongAn Online P&C Insurance Co., Ltd., H Shares * | 472,257 | 2,301,367 |
| Zhongji Innolight Co., Ltd., A Shares | 65,400 | 359,031 |
| Zhongjin Gold Corp., Ltd., A Shares | 513,400 | 695,461 |
| Zhongsheng Group Holdings Ltd. | 816,703 | 6,825,679 |
| Zhongtai Securities Co., Ltd., A Shares | 240,800 | 366,873 |
| Zhuzhou CRRC Times Electric Co., Ltd., H Shares * | 663,058 | 3,994,197 |
| Zhuzhou Kibing Group Co., Ltd., A Shares | 203,000 | 858,314 |
| Zijin Mining Group Co., Ltd., A Shares | 1,954,300 | 3,365,200 |
| Zijin Mining Group Co., Ltd., H Shares | 7,374,021 | 10,505,397 |
| Zoomlion Heavy Industry Science & Technology Co., Ltd., A Shares | 561,700 | 686,019 |
| Zoomlion Heavy Industry Science & Technology Co., Ltd., H Shares | 2,180,123 | 2,077,149 |
| ZTE Corp., A Shares | 479,100 | 2,465,301 |
| ZTE Corp., H Shares | 806,686 | 2,836,810 |
| ZTO Express Cayman, Inc. ADR | 167,468 | 4,724,272 |
| | | 3,558,448,740 |
| |
| Colombia 0.2% |
| Bancolombia S.A. | 362,562 | 2,993,494 |
| Bancolombia S.A. ADR | 149,659 | 4,976,162 |
| Cementos Argos S.A. | 661,022 | 1,036,389 |
| Corp. Financiera Colombiana S.A. * | 172,616 | 1,310,069 |
| Ecopetrol S.A. ADR | 314,097 | 4,384,794 |
| Grupo Argos S.A. | 361,917 | 1,052,158 |
| Grupo de Inversiones Suramericana S.A. | 325,291 | 1,659,694 |
| Interconexion Electrica S.A. ESP | 572,600 | 3,454,077 |
| | | 20,866,837 |
| |
| Czech Republic 0.1% |
| CEZ A/S | 216,540 | 6,824,363 |
| Komercni Banka A/S * | 98,283 | 3,777,639 |
| Moneta Money Bank A/S * | 573,513 | 2,325,582 |
| O2 Czech Republic A/S | 64,124 | 780,362 |
| | | 13,707,946 |
| |
| Egypt 0.1% |
| Commercial International Bank Egypt SAE GDR * | 2,507,577 | 7,284,511 |
| |
| Greece 0.3% |
| Alpha Services and Holdings S.A. * | 2,704,562 | 3,752,900 |
| Eurobank Ergasias Services & Holdings S.A., A Shares * | 3,278,794 | 3,123,453 |
| FF Group *(a) | 50,437 | — |
| Hellenic Petroleum S.A. | 82,937 | 592,313 |
| Hellenic Telecommunications Organization S.A. | 294,214 | 5,787,833 |
| JUMBO S.A. | 147,919 | 2,322,325 |
| Motor Oil Hellas Corinth Refineries S.A. * | 71,558 | 1,182,588 |
| Mytilineos S.A. | 137,563 | 2,581,940 |
| National Bank of Greece S.A. * | 719,655 | 2,176,461 |
| OPAP S.A. | 269,533 | 4,225,299 |
Schwab International Equity ETFs | Annual Report
Schwab Emerging Markets Equity ETF
Portfolio Holdings as of August 31, 2021 (continued)
| Security | Number
of Shares | Value ($) |
| Public Power Corp. S.A. * | 154,195 | 1,825,655 |
| Terna Energy S.A. | 68,014 | 973,079 |
| | | 28,543,846 |
| |
| Hong Kong 0.0% |
| China Huishan Dairy Holdings Co., Ltd. *(a) | 3,872,695 | — |
| |
| Hungary 0.3% |
| Magyar Telekom Telecommunications plc | 498,472 | 726,342 |
| MOL Hungarian Oil & Gas plc | 499,146 | 4,090,565 |
| OTP Bank Nyrt * | 298,274 | 18,000,172 |
| Richter Gedeon Nyrt | 192,545 | 5,767,519 |
| | | 28,584,598 |
| |
| India 14.3% |
| 3M India Ltd. * | 3,753 | 1,253,859 |
| ABB India Ltd. | 68,659 | 1,782,835 |
| ACC Ltd. | 113,125 | 3,739,249 |
| Adani Enterprises Ltd. | 339,175 | 7,375,602 |
| Adani Green Energy Ltd. * | 506,080 | 7,405,685 |
| Adani Ports & Special Economic Zone Ltd. | 991,499 | 10,162,500 |
| Adani Power Ltd. * | 1,199,005 | 1,617,669 |
| Adani Total Gas Ltd. | 359,760 | 7,157,503 |
| Aditya Birla Capital Ltd. * | 586,803 | 866,852 |
| Alkem Laboratories Ltd. | 34,279 | 1,821,108 |
| Ambuja Cements Ltd. | 934,577 | 5,389,907 |
| Apollo Hospitals Enterprise Ltd. | 127,742 | 8,695,275 |
| Ashok Leyland Ltd. | 1,831,831 | 3,079,920 |
| Asian Paints Ltd. | 588,702 | 25,814,350 |
| Astral Ltd. | 115,047 | 3,216,415 |
| AU Small Finance Bank Ltd. * | 203,194 | 3,147,096 |
| Aurobindo Pharma Ltd. | 364,982 | 3,635,947 |
| Avenue Supermarts Ltd. * | 194,168 | 10,518,037 |
| Axis Bank Ltd. * | 2,961,068 | 31,899,188 |
| Bajaj Auto Ltd. | 90,583 | 4,625,276 |
| Bajaj Finance Ltd. | 306,100 | 31,548,121 |
| Bajaj Finserv Ltd. | 50,039 | 11,753,673 |
| Bajaj Holdings & Investment Ltd. | 34,927 | 2,084,282 |
| Balkrishna Industries Ltd. | 109,272 | 3,434,829 |
| Bandhan Bank Ltd. | 1,056,755 | 4,125,263 |
| Bank of Baroda * | 1,440,166 | 1,525,827 |
| Bank of India * | 563,313 | 511,945 |
| Bata India Ltd. | 92,581 | 2,246,824 |
| Bayer CropScience Ltd. | 17,847 | 1,354,864 |
| Berger Paints India Ltd. | 310,473 | 3,490,549 |
| Bharat Electronics Ltd. | 1,442,389 | 3,687,592 |
| Bharat Forge Ltd. | 326,617 | 3,432,258 |
| Bharat Heavy Electricals Ltd. * | 1,624,265 | 1,169,128 |
| Bharat Petroleum Corp., Ltd. | 1,283,938 | 8,294,618 |
| Bharti Airtel Ltd. * | 2,986,429 | 27,163,486 |
| Bharti Infratel Ltd. | 1,618,335 | 4,773,598 |
| Biocon Ltd. * | 577,740 | 2,839,736 |
| Bosch Ltd. | 11,392 | 2,162,572 |
| Britannia Industries Ltd. | 157,500 | 8,623,857 |
| Cadila Healthcare Ltd. | 323,824 | 2,457,927 |
| Canara Bank * | 468,203 | 1,020,321 |
| Castrol India Ltd. | 673,429 | 1,236,030 |
| Cholamandalam Investment & Finance Co., Ltd. | 513,915 | 3,900,073 |
| Cipla Ltd. | 670,083 | 8,699,170 |
| Coal India Ltd. | 2,491,657 | 4,977,683 |
| Colgate-Palmolive (India) Ltd. | 179,094 | 4,153,818 |
| Container Corp. Of India Ltd. | 363,979 | 3,387,898 |
| Security | Number
of Shares | Value ($) |
| Coromandel International Ltd. | 147,553 | 1,602,503 |
| Cummins India Ltd. | 179,880 | 2,461,762 |
| Dabur India Ltd. | 712,474 | 6,065,166 |
| Dalmia Bharat Ltd. * | 58,044 | 1,748,933 |
| Divi's Laboratories Ltd. | 165,756 | 11,746,125 |
| DLF Ltd. | 804,129 | 3,530,645 |
| Dr. Reddy's Laboratories Ltd. | 158,081 | 10,185,542 |
| Eicher Motors Ltd. | 179,202 | 6,576,406 |
| Emami Ltd. | 267,825 | 2,190,804 |
| Embassy Office Parks REIT | 611,400 | 2,994,715 |
| Exide Industries Ltd. | 586,150 | 1,293,813 |
| Federal Bank Ltd. | 1,996,175 | 2,221,542 |
| GAIL India Ltd. | 2,261,865 | 4,527,912 |
| Gillette India Ltd. | 12,281 | 978,973 |
| GlaxoSmithKline Pharmaceuticals Ltd. | 65,180 | 1,363,908 |
| Glenmark Pharmaceuticals Ltd. | 200,437 | 1,455,902 |
| GMR Infrastructure Ltd. * | 3,037,608 | 1,208,677 |
| Godrej Consumer Products Ltd. * | 478,878 | 7,210,637 |
| Godrej Industries Ltd. * | 119,259 | 912,809 |
| Godrej Properties Ltd. * | 113,630 | 2,317,503 |
| Grasim Industries Ltd. | 494,075 | 10,153,890 |
| Gujarat Gas Ltd. | 263,791 | 2,611,624 |
| Havells India Ltd. | 317,988 | 5,524,801 |
| HCL Technologies Ltd. | 1,419,586 | 22,989,097 |
| HDFC Asset Management Co., Ltd. | 83,903 | 3,533,103 |
| HDFC Life Insurance Co., Ltd. | 987,172 | 9,705,067 |
| Hero MotoCorp Ltd. | 167,683 | 6,297,458 |
| Hindalco Industries Ltd. | 1,815,824 | 11,647,439 |
| Hindustan Aeronautics Ltd. | 43,192 | 813,938 |
| Hindustan Petroleum Corp., Ltd. | 914,105 | 3,338,019 |
| Hindustan Unilever Ltd. | 1,155,069 | 43,098,633 |
| Hindustan Zinc Ltd. | 309,640 | 1,364,609 |
| Honeywell Automation India Ltd. | 3,048 | 1,653,470 |
| Housing Development Finance Corp., Ltd. | 2,276,272 | 87,253,326 |
| ICICI Bank Ltd. | 2,019,536 | 19,890,386 |
| ICICI Lombard General Insurance Co., Ltd. | 264,873 | 5,785,248 |
| ICICI Prudential Life Insurance Co., Ltd. | 475,246 | 4,290,445 |
| IDFC First Bank Ltd. * | 3,986,860 | 2,345,453 |
| Indiabulls Housing Finance Ltd. | 469,275 | 1,439,819 |
| Indian Oil Corp., Ltd. | 3,576,216 | 5,429,902 |
| Indian Railway Catering & Tourism Corp., Ltd. | 70,556 | 2,659,591 |
| Indian Railway Finance Corp., Ltd. | 2,515,845 | 790,859 |
| Indraprastha Gas Ltd. | 458,437 | 3,427,563 |
| Info Edge India Ltd. | 101,712 | 8,613,077 |
| Infosys Ltd. | 4,693,166 | 109,696,307 |
| InterGlobe Aviation Ltd. * | 128,544 | 3,352,629 |
| Ipca Laboratories Ltd. | 92,212 | 3,252,728 |
| ITC Ltd. | 3,910,486 | 11,317,819 |
| Jindal Steel & Power Ltd. * | 499,415 | 2,578,564 |
| JSW Energy Ltd. | 562,200 | 2,037,958 |
| JSW Steel Ltd. | 1,312,639 | 12,362,710 |
| Jubilant Foodworks Ltd. | 95,387 | 5,219,615 |
| Kansai Nerolac Paints Ltd. | 175,400 | 1,488,464 |
| L&T Finance Holdings Ltd. * | 1,080,837 | 1,233,212 |
| Larsen & Toubro Infotech Ltd. | 58,241 | 4,237,954 |
| Larsen & Toubro Ltd. | 899,690 | 20,606,946 |
| LIC Housing Finance Ltd. | 394,128 | 2,171,530 |
| Lupin Ltd. | 317,721 | 4,168,463 |
| Mahindra & Mahindra Financial Services Ltd. | 803,500 | 1,762,566 |
| Mahindra & Mahindra Ltd. | 1,203,541 | 13,077,685 |
| Mangalore Refinery & Petrochemicals Ltd. * | 284,373 | 167,295 |
| Marico Ltd. | 678,946 | 5,063,208 |
Schwab International Equity ETFs | Annual Report
Schwab Emerging Markets Equity ETF
Portfolio Holdings as of August 31, 2021 (continued)
| Security | Number
of Shares | Value ($) |
| Maruti Suzuki India Ltd. | 171,873 | 16,116,971 |
| Mindtree Ltd. | 59,154 | 2,938,963 |
| Motherson Sumi Systems Ltd. * | 1,593,136 | 4,770,188 |
| Mphasis Ltd. * | 120,304 | 4,775,578 |
| MRF Ltd. | 3,461 | 3,780,292 |
| Muthoot Finance Ltd. | 130,222 | 2,700,491 |
| Nestle India Ltd. | 46,951 | 12,519,677 |
| NHPC Ltd. | 2,910,128 | 1,074,245 |
| Nippon Life India Asset Management Ltd. | 199,442 | 1,158,557 |
| NMDC Ltd. | 1,163,938 | 2,455,976 |
| NTPC Ltd. | 5,702,724 | 9,057,026 |
| Oberoi Realty Ltd. * | 141,398 | 1,362,704 |
| Oil & Natural Gas Corp., Ltd. | 3,894,063 | 6,429,878 |
| Oil India Ltd. | 395,442 | 985,795 |
| Oracle Financial Services Software Ltd. | 29,705 | 1,912,134 |
| Page Industries Ltd. | 4,422 | 1,907,873 |
| Petronet LNG Ltd. | 1,002,733 | 3,126,008 |
| PI Industries Ltd. | 93,509 | 4,347,081 |
| Pidilite Industries Ltd. | 193,524 | 6,044,618 |
| Piramal Enterprises Ltd. | 157,171 | 5,611,612 |
| Power Finance Corp., Ltd. | 1,471,535 | 2,601,124 |
| Power Grid Corp. of India Ltd. | 4,072,704 | 9,781,853 |
| Punjab National Bank * | 1,469,782 | 737,835 |
| Rajesh Exports Ltd. | 187,259 | 1,503,433 |
| RBL Bank Ltd. * | 567,779 | 1,287,093 |
| REC Ltd. | 1,163,627 | 2,417,864 |
| Reliance Industries Ltd. | 4,082,003 | 126,257,920 |
| Reliance Industries Ltd., Partly P | 173,751 | 3,849,022 |
| SBI Cards & Payment Services Ltd. * | 302,324 | 4,723,017 |
| SBI Life Insurance Co., Ltd. | 547,019 | 8,931,603 |
| Shree Cement Ltd. | 17,631 | 6,831,407 |
| Shriram Transport Finance Co., Ltd. | 248,448 | 4,603,303 |
| Siemens Ltd. | 111,613 | 3,474,018 |
| SRF Ltd. | 36,677 | 5,093,937 |
| State Bank of India | 2,304,607 | 13,448,999 |
| Steel Authority of India Ltd. | 1,236,290 | 2,059,143 |
| Sun Pharmaceutical Industries Ltd. | 1,424,853 | 15,497,100 |
| Sun TV Network Ltd. | 134,647 | 889,962 |
| Tata Communications Ltd. | 150,706 | 2,929,486 |
| Tata Consultancy Services Ltd. | 1,346,130 | 69,815,484 |
| Tata Consumer Products Ltd. | 791,038 | 9,371,754 |
| Tata Motors Ltd. * | 2,481,009 | 9,763,297 |
| Tata Motors Ltd., A Shares, DVR * | 284,629 | 532,357 |
| Tata Steel Ltd. | 1,040,891 | 20,676,673 |
| Tech Mahindra Ltd. | 788,870 | 15,642,333 |
| The Tata Power Co., Ltd. | 2,617,975 | 4,627,602 |
| Titan Co., Ltd. | 542,211 | 14,271,310 |
| Torrent Pharmaceuticals Ltd. | 64,346 | 2,737,421 |
| Torrent Power Ltd. | 276,411 | 1,822,989 |
| Trent Ltd. | 245,167 | 3,381,278 |
| TVS Motor Co., Ltd. | 285,747 | 2,055,406 |
| UltraTech Cement Ltd. | 148,494 | 15,930,854 |
| Union Bank of India * | 714,069 | 346,239 |
| United Breweries Ltd. | 95,117 | 1,921,687 |
| United Spirits Ltd. * | 396,876 | 3,887,626 |
| UPL Ltd. | 700,851 | 7,115,787 |
| Varun Beverages Ltd. | 179,519 | 2,082,575 |
| Vedanta Ltd. | 1,583,338 | 6,566,925 |
| Vodafone Idea Ltd. * | 11,269,511 | 941,602 |
| Voltas Ltd. | 299,452 | 4,084,639 |
| Whirlpool of India Ltd. | 39,284 | 1,146,222 |
| Wipro Ltd. | 1,644,958 | 14,441,473 |
| Yes Bank Ltd. *(a) | 1,687,665 | 233,620 |
| Zee Entertainment Enterprises Ltd. | 1,134,163 | 2,666,563 |
| | | 1,364,364,464 |
| |
| Security | Number
of Shares | Value ($) |
| Indonesia 1.3% |
| Mayora Indah Tbk PT | 4,841,093 | 729,770 |
| PT Adaro Energy Tbk | 17,795,742 | 1,572,139 |
| PT Astra International Tbk | 26,232,336 | 9,610,093 |
| PT Bank Central Asia Tbk | 12,745,458 | 29,266,521 |
| PT Bank Mandiri (Persero) Tbk | 24,097,233 | 10,306,266 |
| PT Bank Negara Indonesia (Persero) Tbk | 9,731,490 | 3,684,490 |
| PT Bank Rakyat Indonesia (Persero) Tbk | 68,978,648 | 19,006,912 |
| PT Barito Pacific Tbk | 32,905,452 | 2,457,094 |
| PT Bukit Asam Tbk | 5,089,512 | 752,944 |
| PT Bumi Serpong Damai Tbk * | 11,130,268 | 749,171 |
| PT Charoen Pokphand Indonesia Tbk | 9,400,769 | 4,218,399 |
| PT Gudang Garam Tbk | 621,965 | 1,442,348 |
| PT Hanjaya Mandala Sampoerna Tbk | 11,349,972 | 795,791 |
| PT Indah Kiat Pulp & Paper Corp. Tbk | 3,657,170 | 2,025,707 |
| PT Indocement Tunggal Prakarsa Tbk | 1,846,367 | 1,456,381 |
| PT Indofood CBP Sukses Makmur Tbk * | 2,798,919 | 1,653,349 |
| PT Indofood Sukses Makmur Tbk * | 5,667,548 | 2,453,785 |
| PT Jasa Marga Persero Tbk * | 3,208,702 | 890,900 |
| PT Kalbe Farma Tbk | 25,445,775 | 2,399,619 |
| PT Media Nusantara Citra Tbk * | 7,240,975 | 444,232 |
| PT Perusahaan Gas Negara Tbk * | 12,026,052 | 872,706 |
| PT Sarana Menara Nusantara Tbk | 33,478,046 | 3,145,352 |
| PT Semen Indonesia (Persero) Tbk | 3,794,405 | 2,460,876 |
| PT Surya Citra Media Tbk * | 7,991,456 | 1,137,434 |
| PT Telekomunikasi Indonesia (Persero) Tbk | 60,006,788 | 14,304,861 |
| PT Tower Bersama Infrastructure Tbk | 13,026,997 | 2,858,861 |
| PT Unilever Indonesia Tbk | 7,105,122 | 2,017,581 |
| PT United Tractors Tbk | 1,945,908 | 2,738,938 |
| PT Vale Indonesia Tbk | 2,821,616 | 1,004,011 |
| PT XL Axiata Tbk | 4,969,058 | 930,229 |
| Smartfren Telecom Tbk PT * | 131,090,860 | 1,231,634 |
| | | 128,618,394 |
| |
| Kuwait 0.8% |
| Agility Public Warehousing Co. KSC | 1,626,518 | 5,401,900 |
| Ahli United Bank BSC | 8,272,145 | 7,287,628 |
| Boubyan Bank KSCP * | 1,291,841 | 3,362,738 |
| Boubyan Petrochemicals Co. KSCP | 509,855 | 1,479,732 |
| Burgan Bank SAK | 1,002,652 | 756,656 |
| Gulf Bank KSCP | 2,443,197 | 1,949,359 |
| Humansoft Holding Co. KSC | 123,546 | 1,396,875 |
| Kuwait Finance House KSCP | 5,681,138 | 15,600,465 |
| Mabanee Co. KPSC | 786,637 | 2,018,895 |
| Mobile Telecommunications Co. KSCP | 2,814,853 | 5,717,670 |
| National Bank of Kuwait SAKP | 8,958,223 | 27,875,322 |
| | | 72,847,240 |
| |
| Malaysia 1.9% |
| AirAsia Group Berhad * | 2,332,300 | 518,975 |
| Alliance Bank Malaysia Berhad | 1,390,880 | 856,544 |
| AMMB Holdings Berhad * | 2,732,372 | 1,991,601 |
| Astro Malaysia Holdings Berhad | 1,871,400 | 486,195 |
| Axiata Group Berhad | 5,925,077 | 5,900,846 |
| British American Tobacco Malaysia Berhad | 229,000 | 774,535 |
| CIMB Group Holdings Berhad | 9,140,094 | 10,795,733 |
| Dialog Group Berhad | 6,151,900 | 3,936,506 |
| DiGi.com Berhad | 4,822,700 | 5,104,614 |
| Fraser & Neave Holdings Berhad | 143,900 | 965,103 |
| Gamuda Berhad * | 2,931,437 | 2,122,595 |
| Genting Berhad | 3,031,800 | 3,683,086 |
| Genting Malaysia Berhad | 3,633,620 | 2,596,067 |
| HAP Seng Consolidated Berhad | 794,734 | 1,625,027 |
Schwab International Equity ETFs | Annual Report
Schwab Emerging Markets Equity ETF
Portfolio Holdings as of August 31, 2021 (continued)
| Security | Number
of Shares | Value ($) |
| Hartalega Holdings Berhad | 1,935,300 | 3,435,774 |
| Hong Leong Bank Berhad | 823,407 | 3,799,121 |
| Hong Leong Financial Group Berhad | 301,100 | 1,321,160 |
| IHH Healthcare Berhad | 3,887,000 | 5,984,316 |
| IJM Corp. Berhad | 4,074,836 | 1,842,841 |
| IOI Corp. Berhad | 4,223,592 | 4,185,999 |
| IOI Properties Group Berhad | 2,330,250 | 717,517 |
| Kuala Lumpur Kepong Berhad | 609,928 | 3,134,006 |
| Malayan Banking Berhad | 7,874,247 | 15,911,396 |
| Malaysia Airports Holdings Berhad * | 1,216,500 | 1,940,196 |
| Maxis Berhad | 3,541,624 | 3,995,722 |
| MISC Berhad | 2,279,400 | 3,947,962 |
| MR DIY Group M Bhd | 1,289,200 | 1,125,763 |
| Nestle Malaysia Berhad | 85,371 | 2,766,292 |
| Petronas Chemicals Group Berhad | 3,671,900 | 7,331,434 |
| Petronas Dagangan Berhad | 505,700 | 2,428,139 |
| Petronas Gas Berhad | 731,036 | 2,954,391 |
| PPB Group Berhad | 864,577 | 3,851,808 |
| Press Metal Aluminium Holdings Berhad | 4,850,064 | 6,300,300 |
| Public Bank Berhad | 20,293,070 | 20,405,348 |
| QL Resources Berhad | 1,389,250 | 1,858,126 |
| RHB Bank Berhad | 2,075,679 | 2,791,207 |
| Sime Darby Berhad | 4,635,800 | 2,631,823 |
| Sime Darby Plantation Berhad | 4,743,708 | 4,598,784 |
| Sime Darby Property Berhad | 4,563,000 | 675,065 |
| Supermax Corp. Bhd | 2,112,200 | 1,676,752 |
| Telekom Malaysia Berhad | 1,427,400 | 2,098,007 |
| Tenaga Nasional Berhad | 5,139,274 | 12,931,635 |
| Top Glove Corp. Berhad | 6,891,700 | 6,631,417 |
| Westports Holdings Berhad | 1,381,200 | 1,461,939 |
| YTL Corp. Berhad * | 5,820,436 | 945,103 |
| | | 177,036,770 |
| |
| Mexico 2.3% |
| Alfa S.A.B. de C.V., A Shares | 2,650,109 | 1,864,644 |
| Alpek S.A.B. de C.V. | 473,214 | 559,181 |
| America Movil S.A.B. de C.V., Series L | 39,349,609 | 38,820,418 |
| Arca Continental S.A.B. de C.V. | 583,481 | 3,766,807 |
| Banco Santander Mexico S.A. Institucion de Banca Multiple Grupo Financiero Santand | 850,948 | 994,496 |
| Becle S.A.B. de C.V. | 753,455 | 1,924,667 |
| Cemex S.A.B. de C.V., Series CPO * | 18,991,027 | 15,636,715 |
| Coca-Cola Femsa S.A.B. de C.V. | 699,766 | 4,060,071 |
| Concentradora Fibra Danhos S.A. de C.V. | 327,684 | 404,546 |
| El Puerto de Liverpool S.A.B. de C.V., Series C1 | 259,453 | 1,152,937 |
| Fibra Uno Administracion S.A. de C.V. | 3,883,813 | 4,428,510 |
| Fomento Economico Mexicano S.A.B. de C.V. | 2,382,075 | 20,786,619 |
| GCC S.A.B. de C.V. | 226,325 | 1,829,958 |
| Gruma S.A.B. de C.V., B Shares | 269,648 | 3,086,363 |
| Grupo Aeroportuario del Centro Norte S.A.B. de C.V. * | 365,570 | 2,211,535 |
| Grupo Aeroportuario del Pacifico S.A.B. de C.V., B Shares * | 464,551 | 5,421,751 |
| Grupo Aeroportuario del Sureste S.A.B. de C.V., B Shares * | 258,432 | 4,648,152 |
| Grupo Bimbo S.A.B. de C.V., Series A | 2,935,503 | 7,444,410 |
| Grupo Carso S.A.B. de C.V., Series A1 | 571,273 | 1,946,197 |
| Grupo Elektra S.A.B. de C.V. | 84,608 | 6,756,565 |
| Grupo Financiero Banorte S.A.B. de C.V., O Shares | 3,760,904 | 24,881,891 |
| Grupo Financiero Inbursa S.A.B. de C.V., O Shares * | 2,719,494 | 2,609,640 |
| Grupo Lala S.A.B. de C.V. | 749,685 | 644,207 |
| Security | Number
of Shares | Value ($) |
| Grupo Mexico S.A.B. de C.V., Series B | 4,105,246 | 19,164,438 |
| Grupo Televisa S.A.B., Series CPO | 3,352,694 | 8,857,088 |
| Industrias Bachoco S.A.B. de C.V., Series B | 236,016 | 865,060 |
| Industrias Penoles S.A.B. de C.V. * | 160,381 | 2,277,643 |
| Kimberly-Clark de Mexico S.A.B. de C.V., A Shares | 1,095,075 | 1,938,287 |
| Megacable Holdings S.A.B. de C.V., Series CPO | 388,548 | 1,355,880 |
| Orbia Advance Corp. S.A.B. de C.V. | 1,310,881 | 3,750,888 |
| Promotora y Operadora de Infraestructura S.A.B. de C.V. | 293,536 | 2,197,181 |
| Qualitas Controladora S.A.B. de C.V. | 223,359 | 1,061,651 |
| Telesites S.A.B. de C.V. * | 1,521,660 | 1,402,483 |
| Wal-Mart de Mexico S.A.B. de C.V. | 6,701,433 | 23,897,024 |
| | | 222,647,903 |
| |
| Philippines 0.9% |
| Aboitiz Power Corp. (a) | 1,887,011 | 1,062,016 |
| Alliance Global Group, Inc. (a) | 4,830,891 | 1,000,164 |
| Ayala Corp. (a) | 427,950 | 6,817,093 |
| Ayala Land, Inc. (a) | 10,299,976 | 6,987,421 |
| Bank of the Philippine Islands (a) | 2,403,391 | 4,021,912 |
| BDO Unibank, Inc. (a) | 2,593,610 | 5,733,391 |
| Bloomberry Resorts Corp. *(a) | 4,521,103 | 537,988 |
| DMCI Holdings, Inc. (a) | 4,911,797 | 622,984 |
| Globe Telecom, Inc. (a) | 36,553 | 1,998,476 |
| GT Capital Holdings, Inc. (a) | 128,115 | 1,391,554 |
| International Container Terminal Services, Inc. (a) | 1,443,216 | 5,400,065 |
| JG Summit Holdings, Inc. (a) | 3,866,984 | 5,051,339 |
| Jollibee Foods Corp. (a) | 572,388 | 2,322,916 |
| LT Group, Inc. (a) | 3,191,906 | 548,559 |
| Manila Electric Co. (a) | 335,956 | 1,905,278 |
| Megaworld Corp. (a) | 14,580,761 | 827,277 |
| Metro Pacific Investments Corp. (a) | 18,830,656 | 1,458,471 |
| Metropolitan Bank & Trust Co. (a) | 2,414,796 | 2,196,164 |
| PLDT, Inc. (a) | 116,216 | 3,422,240 |
| Puregold Price Club, Inc. (a) | 1,401,900 | 1,176,469 |
| San Miguel Corp. (a) | 462,162 | 986,565 |
| San Miguel Food & Beverage, Inc. (a) | 896,551 | 1,405,648 |
| Semirara Mining & Power Corp. (a) | 1,878,062 | 640,240 |
| SM Investments Corp. (a) | 623,055 | 12,642,515 |
| SM Prime Holdings, Inc. (a) | 11,815,442 | 8,074,875 |
| Universal Robina Corp. (a) | 1,188,519 | 3,602,586 |
| | | 81,834,206 |
| |
| Qatar 0.9% |
| Barwa Real Estate Co. | 2,522,537 | 2,126,940 |
| Doha Bank QPSC | 2,059,246 | 1,628,846 |
| Ezdan Holding Group QSC * | 1,848,405 | 803,125 |
| Industries Qatar QSC | 2,058,903 | 7,266,384 |
| Masraf Al Rayan QSC | 4,926,959 | 6,157,007 |
| Mesaieed Petrochemical Holding Co. | 5,633,985 | 3,094,746 |
| Ooredoo QPSC | 1,052,351 | 1,998,051 |
| Qatar Aluminum Manufacturing Co. | 3,634,954 | 1,627,293 |
| Qatar Electricity & Water Co. QSC | 587,870 | 2,680,209 |
| Qatar Fuel QSC | 660,186 | 3,318,155 |
| Qatar Gas Transport Co., Ltd. | 3,727,411 | 3,168,453 |
| Qatar Insurance Co. SAQ * | 2,091,547 | 1,430,363 |
| Qatar International Islamic Bank QSC | 1,011,857 | 2,667,901 |
| Qatar Islamic Bank SAQ | 1,491,785 | 7,497,848 |
| Qatar National Bank QPSC | 5,786,968 | 30,468,601 |
| The Commercial Bank PSQC | 2,572,311 | 4,265,755 |
Schwab International Equity ETFs | Annual Report
Schwab Emerging Markets Equity ETF
Portfolio Holdings as of August 31, 2021 (continued)
| Security | Number
of Shares | Value ($) |
| United Development Co. QSC | 2,344,794 | 975,656 |
| Vodafone Qatar QSC | 2,356,725 | 1,027,224 |
| | | 82,202,557 |
| |
| Russia 3.3% |
| Aeroflot PJSC * | 1,422,844 | 1,345,821 |
| Alrosa PJSC | 3,274,166 | 6,517,488 |
| Credit Bank of Moscow PJSC * | 17,879,910 | 1,696,083 |
| Federal Grid Co. Unified Energy System PJSC | 357,372,832 | 961,484 |
| Gazprom PJSC | 13,678,703 | 57,138,862 |
| Inter RAO UES PJSC | 48,675,350 | 3,066,590 |
| LUKOIL PJSC | 501,060 | 42,834,148 |
| M.Video PJSC | 61,633 | 525,831 |
| Magnit PJSC | 90,892 | 6,885,927 |
| Magnitogorsk Iron & Steel Works PJSC | 2,698,517 | 2,726,333 |
| MMC Norilsk Nickel PJSC | 67,919 | 22,304,917 |
| Mobile TeleSystems PJSC | 1,166,479 | 5,239,560 |
| Moscow Exchange MICEX-RTS PJSC | 1,860,033 | 4,654,590 |
| Mosenergo PJSC | 10,153,907 | 346,573 |
| Novatek PJSC | 1,377,319 | 32,610,371 |
| Novolipetsk Steel PJSC | 1,502,823 | 5,065,013 |
| PhosAgro PJSC | 47,418 | 3,149,547 |
| Polyus PJSC | 35,771 | 6,448,987 |
| Rosneft Oil Co. PJSC | 1,512,228 | 11,022,985 |
| ROSSETI PJSC | 34,316,022 | 614,873 |
| Rostelecom PJSC | 1,262,524 | 1,627,862 |
| RusHydro PJSC | 143,643,464 | 1,614,996 |
| Sberbank of Russia PJSC | 13,378,120 | 60,073,229 |
| Severstal PAO | 249,639 | 5,857,459 |
| Sistema PJSFC | 4,008,672 | 1,662,139 |
| Sovcomflot PJSC | 664,330 | 798,157 |
| Surgutneftegas PJSC | 9,361,278 | 4,321,819 |
| Tatneft PJSC | 1,974,155 | 13,058,613 |
| Unipro PJSC | 17,019,395 | 654,333 |
| United Co. RUSAL International PJSC * | 3,256,246 | 2,351,326 |
| VTB Bank PJSC GDR | 3,022,177 | 4,212,915 |
| | | 311,388,831 |
| |
| Saudi Arabia 3.8% |
| Abdullah Al Othaim Markets Co. | 60,668 | 1,863,373 |
| Advanced Petrochemical Co. | 144,587 | 2,760,133 |
| Al Rajhi Bank | 1,599,216 | 51,591,739 |
| Alinma Bank | 1,299,625 | 7,934,896 |
| Almarai Co. JSC | 335,240 | 5,184,078 |
| Arab National Bank | 830,617 | 5,066,925 |
| Arabian Centers Co., Ltd. | 203,494 | 1,356,374 |
| Bank Al-Jazira | 546,170 | 2,696,848 |
| Bank AlBilad * | 475,082 | 5,414,924 |
| Banque Saudi Fransi | 763,917 | 8,248,764 |
| BinDawood Holding Co. | 38,333 | 1,103,784 |
| Bupa Arabia for Cooperative Insurance Co. | 74,706 | 3,326,286 |
| Dallah Healthcare Co. | 44,077 | 883,726 |
| Dar Al Arkan Real Estate Development Co. * | 723,348 | 1,967,139 |
| Dr Sulaiman Al Habib Medical Services Group Co. | 120,276 | 5,887,614 |
| Emaar Economic City * | 560,129 | 1,908,563 |
| Etihad Etisalat Co. | 510,117 | 4,352,186 |
| Fawaz Abdulaziz Al Hokair & Co. * | 96,214 | 572,046 |
| Jarir Marketing Co. | 80,593 | 4,654,183 |
| Mobile Telecommunications Co. * | 587,294 | 2,267,315 |
| Mouwasat Medical Services Co. | 62,102 | 3,245,259 |
| National Industrialization Co. * | 445,600 | 2,480,638 |
| National Petrochemical Co. | 159,366 | 2,018,259 |
| Security | Number
of Shares | Value ($) |
| Rabigh Refining & Petrochemical Co. * | 309,295 | 2,030,246 |
| Riyad Bank | 1,919,633 | 13,767,597 |
| SABIC Agri-Nutrients Co. | 257,733 | 8,616,983 |
| Sahara International Petrochemical Co. | 465,074 | 4,129,086 |
| Saudi Airlines Catering Co. * | 55,807 | 1,218,597 |
| Saudi Arabian Mining Co. * | 521,369 | 10,119,621 |
| Saudi Arabian Oil Co. | 3,317,516 | 31,090,380 |
| Saudi Basic Industries Corp. | 1,171,500 | 38,418,029 |
| Saudi Cement Co. | 98,017 | 1,638,538 |
| Saudi Electricity Co. | 1,012,832 | 7,372,041 |
| Saudi Ground Services Co. * | 122,495 | 1,144,706 |
| Saudi Industrial Investment Group | 288,016 | 2,756,759 |
| Saudi Kayan Petrochemical Co. * | 961,408 | 4,772,820 |
| Saudi Research & Media Group * | 44,591 | 1,921,216 |
| Saudi Telecom Co. | 781,383 | 28,124,538 |
| Saudia Dairy & Foodstuff Co. | 20,519 | 921,268 |
| Seera Group Holding * | 179,923 | 1,032,325 |
| Southern Province Cement Co. | 90,837 | 1,799,448 |
| The Co. for Cooperative Insurance | 81,777 | 1,994,986 |
| The Qassim Cement Co. | 61,626 | 1,375,236 |
| The Saudi British Bank | 1,166,629 | 10,715,432 |
| The Saudi National Bank | 2,864,383 | 46,432,529 |
| The Savola Group | 349,807 | 3,744,568 |
| Yamama Cement Co. * | 126,897 | 1,075,886 |
| Yanbu Cement Co. | 97,281 | 1,108,796 |
| Yanbu National Petrochemical Co. | 308,038 | 5,568,288 |
| | | 359,674,971 |
| |
| South Africa 4.0% |
| Absa Group Ltd. * | 912,842 | 9,974,053 |
| African Rainbow Minerals Ltd. | 136,351 | 2,443,101 |
| Anglo American Platinum Ltd. | 76,569 | 8,725,743 |
| AngloGold Ashanti Ltd. (b) | 543,370 | 9,162,349 |
| Aspen Pharmacare Holdings Ltd. * | 502,718 | 6,815,626 |
| AVI Ltd. | 423,744 | 2,225,791 |
| Barloworld Ltd. | 256,452 | 1,913,683 |
| Bid Corp., Ltd. * | 436,056 | 9,642,972 |
| Capitec Bank Holdings Ltd. | 108,228 | 14,198,706 |
| Clicks Group Ltd. | 323,839 | 6,773,642 |
| Coronation Fund Managers Ltd. | 355,843 | 1,270,112 |
| Dis-Chem Pharmacies Ltd. | 442,041 | 952,841 |
| Discovery Ltd. * | 536,564 | 4,776,588 |
| Distell Group Holdings Ltd. * | 105,566 | 1,309,996 |
| Exxaro Resources Ltd. | 333,837 | 4,258,297 |
| FirstRand Ltd. | 6,389,317 | 27,337,354 |
| Fortress REIT Ltd., Class A | 1,878,874 | 2,091,246 |
| Gold Fields Ltd. | 1,139,713 | 10,753,407 |
| Growthpoint Properties Ltd. | 4,341,471 | 4,646,109 |
| Harmony Gold Mining Co., Ltd. | 679,104 | 2,505,619 |
| Impala Platinum Holdings Ltd. | 1,023,996 | 15,779,378 |
| Investec Ltd. | 360,038 | 1,536,975 |
| Kumba Iron Ore Ltd. | 70,102 | 3,164,646 |
| Liberty Holdings Ltd. * | 169,303 | 1,102,196 |
| Life Healthcare Group Holdings Ltd. * | 1,794,554 | 3,073,011 |
| Momentum Metropolitan Holdings | 1,243,326 | 1,699,312 |
| Mr Price Group Ltd. | 334,080 | 5,033,025 |
| MTN Group Ltd. * | 2,333,160 | 21,523,462 |
| MultiChoice Group (b) | 557,262 | 4,426,506 |
| Naspers Ltd., N Shares | 275,767 | 47,279,790 |
| Nedbank Group Ltd. * | 468,630 | 5,993,540 |
| NEPI Rockcastle plc | 641,160 | 4,649,241 |
| Netcare Ltd. * | 1,978,309 | 2,304,494 |
| Ninety One Ltd. | 165,697 | 572,751 |
| Northam Platinum Ltd. * | 446,370 | 6,171,416 |
| Old Mutual Ltd. | 5,981,505 | 6,351,602 |
| Pepkor Holdings Ltd. * | 1,545,471 | 2,459,505 |
| Pick n Pay Stores Ltd. | 473,821 | 1,926,403 |
Schwab International Equity ETFs | Annual Report
Schwab Emerging Markets Equity ETF
Portfolio Holdings as of August 31, 2021 (continued)
| Security | Number
of Shares | Value ($) |
| PSG Group Ltd. | 198,640 | 1,038,723 |
| Rand Merchant Investment Holdings Ltd. | 953,991 | 2,089,349 |
| Redefine Properties Ltd. * | 6,945,626 | 2,208,771 |
| Reinet Investments SCA * | 199,357 | 3,873,714 |
| Remgro Ltd. | 647,287 | 5,406,066 |
| Resilient REIT Ltd. (b) | 447,769 | 1,770,336 |
| Sanlam Ltd. | 2,262,550 | 10,079,414 |
| Santam Ltd. * | 50,868 | 874,761 |
| Sappi Ltd. * | 749,737 | 2,282,124 |
| Sasol Ltd. * | 720,744 | 11,161,193 |
| Shoprite Holdings Ltd. | 628,034 | 7,982,306 |
| Sibanye Stillwater Ltd. | 3,808,794 | 15,509,019 |
| Standard Bank Group Ltd. | 1,662,070 | 17,087,206 |
| Telkom S.A. SOC Ltd. * | 367,289 | 971,227 |
| The Bidvest Group Ltd. | 442,477 | 6,270,846 |
| The Foschini Group Ltd. * | 419,784 | 4,332,786 |
| The SPAR Group Ltd. | 250,984 | 3,602,614 |
| Tiger Brands Ltd. | 221,336 | 2,845,158 |
| Truworths International Ltd. | 548,421 | 2,544,006 |
| Vodacom Group Ltd. | 769,945 | 7,646,222 |
| Woolworths Holdings Ltd. * | 1,137,840 | 5,006,811 |
| | | 381,407,140 |
| |
| Taiwan 17.1% |
| Accton Technology Corp. | 693,000 | 7,014,145 |
| Acer, Inc. | 3,650,086 | 3,319,038 |
| Advantech Co., Ltd. | 531,619 | 7,404,512 |
| Airtac International Group | 191,047 | 5,825,129 |
| ASE Technology Holding Co., Ltd. * | 4,455,120 | 20,657,186 |
| Asia Cement Corp. | 3,033,286 | 4,914,375 |
| ASMedia Technology, Inc. | 51,445 | 3,851,855 |
| Asustek Computer, Inc. | 929,621 | 10,868,248 |
| AU Optronics Corp. | 11,503,530 | 7,305,542 |
| Capital Securities Corp. | 2,481,644 | 1,419,310 |
| Catcher Technology Co., Ltd. | 962,224 | 5,798,308 |
| Cathay Financial Holding Co., Ltd. | 10,711,914 | 23,036,790 |
| Chailease Holding Co., Ltd. | 1,726,788 | 16,605,229 |
| Chang Hwa Commercial Bank Ltd. | 8,517,213 | 5,070,959 |
| Cheng Shin Rubber Industry Co., Ltd. | 2,317,277 | 3,114,676 |
| Chicony Electronics Co., Ltd. | 788,118 | 2,232,387 |
| China Airlines Ltd. * | 3,298,872 | 2,053,351 |
| China Development Financial Holding Corp. | 18,272,308 | 9,362,469 |
| China Life Insurance Co., Ltd. | 2,621,408 | 2,733,639 |
| China Motor Corp. | 323,600 | 795,178 |
| China Steel Corp. | 16,094,956 | 22,156,082 |
| Chunghwa Telecom Co., Ltd. | 4,996,310 | 20,191,846 |
| Compal Electronics, Inc. | 5,381,535 | 4,446,827 |
| CTBC Financial Holding Co., Ltd. | 23,769,792 | 19,727,036 |
| Delta Electronics, Inc. | 2,804,148 | 27,370,128 |
| E.Sun Financial Holding Co., Ltd. | 16,739,489 | 16,066,913 |
| Eclat Textile Co., Ltd. | 261,510 | 5,255,961 |
| ENNOSTAR, Inc. * | 876,914 | 2,445,936 |
| Eternal Materials Co., Ltd. | 1,334,213 | 1,766,851 |
| Eva Airways Corp. | 3,177,374 | 2,201,295 |
| Evergreen Marine Corp., Ltd. | 3,406,222 | 16,715,543 |
| Far Eastern International Bank | 2,792,899 | 1,108,553 |
| Far Eastern New Century Corp. | 5,002,799 | 5,424,580 |
| Far EasTone Telecommunications Co., Ltd. | 2,123,280 | 4,719,507 |
| Feng TAY Enterprise Co., Ltd. | 578,584 | 4,509,504 |
| First Financial Holding Co., Ltd. | 13,563,733 | 11,207,876 |
| Formosa Chemicals & Fibre Corp. | 4,500,008 | 13,655,824 |
| Formosa Petrochemical Corp. | 1,798,660 | 6,347,410 |
| Formosa Plastics Corp. | 6,355,560 | 23,506,410 |
| Formosa Taffeta Co., Ltd. | 1,443,000 | 1,624,537 |
| Foxconn Technology Co., Ltd. | 1,406,355 | 3,364,474 |
| Security | Number
of Shares | Value ($) |
| Fubon Financial Holding Co., Ltd. | 9,600,114 | 29,444,483 |
| Genius Electronic Optical Co., Ltd. | 113,000 | 1,971,440 |
| Giant Manufacturing Co., Ltd. | 404,752 | 4,892,631 |
| Globalwafers Co., Ltd. | 272,451 | 8,552,957 |
| Hiwin Technologies Corp. | 341,634 | 4,018,716 |
| Hon Hai Precision Industry Co., Ltd. | 15,581,092 | 62,406,452 |
| Hotai Motor Co., Ltd. | 413,000 | 8,688,148 |
| HTC Corp. * | 974,778 | 1,250,414 |
| Hua Nan Financial Holdings Co., Ltd. * | 12,538,518 | 9,455,862 |
| Innolux Corp. | 11,058,029 | 6,882,963 |
| Inventec Corp. | 3,984,043 | 3,493,324 |
| Largan Precision Co., Ltd. | 133,456 | 12,905,699 |
| Lite-On Technology Corp. | 2,792,866 | 6,167,514 |
| MediaTek, Inc. | 1,936,713 | 62,964,924 |
| Mega Financial Holding Co., Ltd. | 14,273,901 | 16,893,714 |
| Micro-Star International Co., Ltd. | 876,095 | 4,125,441 |
| momo.com, Inc. | 76,900 | 4,758,818 |
| Nan Ya Plastics Corp. | 7,304,816 | 23,617,064 |
| Nan Ya Printed Circuit Board Corp. | 264,000 | 4,015,227 |
| Nanya Technology Corp. | 1,071,000 | 2,566,056 |
| Nien Made Enterprise Co., Ltd. | 189,752 | 2,834,623 |
| Novatek Microelectronics Corp. | 741,608 | 12,015,155 |
| OBI Pharma, Inc. * | 169,261 | 619,914 |
| Oneness Biotech Co., Ltd. * | 384,000 | 2,674,220 |
| Parade Technologies Ltd. | 89,100 | 5,626,319 |
| Pegatron Corp. | 2,609,657 | 6,101,928 |
| Pou Chen Corp. | 3,492,792 | 4,152,759 |
| Powertech Technology, Inc. | 931,000 | 3,779,295 |
| President Chain Store Corp. | 728,400 | 7,503,859 |
| Quanta Computer, Inc. | 3,461,057 | 9,791,144 |
| Realtek Semiconductor Corp. | 610,336 | 12,200,774 |
| Shin Kong Financial Holding Co., Ltd. | 16,785,672 | 5,754,015 |
| Silergy Corp. | 80,000 | 11,488,985 |
| Sino-American Silicon Products, Inc. | 682,000 | 4,749,526 |
| SinoPac Financial Holdings Co., Ltd. | 13,527,699 | 6,955,805 |
| Synnex Technology International Corp. | 1,873,956 | 3,637,896 |
| Taishin Financial Holding Co., Ltd. * | 13,684,864 | 9,554,986 |
| Taiwan Business Bank * | 7,063,361 | 2,469,698 |
| Taiwan Cement Corp. | 6,863,739 | 11,999,500 |
| Taiwan Cooperative Financial Holding Co., Ltd. | 12,517,790 | 10,095,174 |
| Taiwan Fertilizer Co., Ltd. | 944,508 | 1,925,585 |
| Taiwan Glass Industry Corp. | 2,118,311 | 2,755,520 |
| Taiwan High Speed Rail Corp. | 2,739,000 | 2,984,748 |
| Taiwan Mobile Co., Ltd. | 2,101,524 | 7,658,864 |
| Taiwan Secom Co., Ltd. | 382,000 | 1,357,714 |
| Taiwan Semiconductor Manufacturing Co., Ltd. | 31,398,500 | 695,642,160 |
| Teco Electric & Machinery Co., Ltd. | 2,348,000 | 2,643,390 |
| The Shanghai Commercial & Savings Bank Ltd. | 4,311,000 | 7,000,018 |
| TPK Holding Co., Ltd. | 487,041 | 692,421 |
| Transcend Information, Inc. | 425,000 | 1,064,283 |
| U-Ming Marine Transport Corp. | 520,000 | 1,300,305 |
| Uni-President Enterprises Corp. | 6,269,676 | 16,356,562 |
| Unimicron Technology Corp. | 1,691,348 | 9,001,888 |
| United Microelectronics Corp. | 15,202,850 | 34,614,893 |
| Vanguard International Semiconductor Corp. | 1,175,000 | 6,274,920 |
| Walsin Lihwa Corp. | 4,200,000 | 4,069,136 |
| Walsin Technology Corp. | 629,000 | 4,096,722 |
| Wan Hai Lines Ltd. * | 934,000 | 8,358,093 |
| Win Semiconductors Corp. | 523,000 | 6,237,087 |
| Winbond Electronics Corp. | 3,738,000 | 3,978,963 |
| Wistron Corp. | 3,777,080 | 3,734,353 |
| Wiwynn Corp. | 113,000 | 3,955,112 |
| Yageo Corp. | 604,000 | 10,450,430 |
| Yuanta Financial Holding Co., Ltd. | 15,437,368 | 13,925,856 |
Schwab International Equity ETFs | Annual Report
Schwab Emerging Markets Equity ETF
Portfolio Holdings as of August 31, 2021 (continued)
| Security | Number
of Shares | Value ($) |
| Yulon Motor Co., Ltd. | 660,114 | 901,558 |
| Zhen Ding Technology Holding Ltd. | 837,000 | 2,999,047 |
| | | 1,624,252,469 |
| |
| Thailand 2.3% |
| Advanced Info Service PCL NVDR | 1,460,900 | 8,520,878 |
| Airports of Thailand PCL NVDR | 5,645,600 | 11,165,966 |
| Asset World Corp. PCL NVDR * | 9,351,500 | 1,259,149 |
| B Grimm Power PCL NVDR | 983,800 | 1,411,642 |
| Bangkok Bank PCL NVDR | 1,022,200 | 3,615,320 |
| Bangkok Dusit Medical Services PCL NVDR | 11,504,300 | 8,351,838 |
| Bangkok Expressway & Metro PCL NVDR | 10,263,890 | 2,754,445 |
| Bangkok Life Assurance PCL NVDR | 556,800 | 475,048 |
| Banpu PCL NVDR | 7,417,200 | 2,531,271 |
| Berli Jucker PCL NVDR | 1,243,550 | 1,398,548 |
| BTS Group Holdings PCL NVDR | 11,156,100 | 3,253,466 |
| Bumrungrad Hospital PCL NVDR | 477,900 | 1,971,944 |
| Carabao Group PCL NVDR | 414,200 | 1,799,054 |
| Central Pattana PCL NVDR | 3,245,400 | 5,411,937 |
| Central Retail Corp. PCL NVDR | 3,521,500 | 3,741,918 |
| Charoen Pokphand Foods PCL NVDR | 4,658,000 | 3,901,838 |
| CP ALL PCL NVDR | 6,811,100 | 13,735,252 |
| Delta Electronics Thailand PCL NVDR | 367,021 | 6,649,818 |
| Digital Telecommunications Infrastructure Fund | 7,375,800 | 2,883,272 |
| Electricity Generating PCL NVDR | 353,800 | 1,986,746 |
| Energy Absolute PCL NVDR | 2,183,551 | 4,437,217 |
| Global Power Synergy PCL NVDR | 923,668 | 2,385,647 |
| Gulf Energy Development PCL NVDR | 5,469,859 | 7,084,980 |
| Home Product Center PCL NVDR | 7,453,019 | 3,306,544 |
| Indorama Ventures PCL NVDR | 2,278,100 | 3,092,124 |
| Intouch Holdings PCL NVDR | 1,816,909 | 4,819,537 |
| IRPC PCL NVDR | 12,963,200 | 1,600,668 |
| Kasikornbank PCL NVDR | 1,977,400 | 7,545,806 |
| Krung Thai Bank PCL NVDR | 8,304,200 | 2,885,505 |
| Krungthai Card PCL NVDR | 1,731,700 | 3,559,300 |
| Land & Houses PCL NVDR | 9,036,400 | 2,284,857 |
| Minor International PCL NVDR * | 4,949,280 | 5,028,742 |
| Muangthai Capital PCL NVDR | 904,515 | 1,817,028 |
| Osotspa PCL NVDR | 1,906,563 | 2,158,987 |
| PTT Exploration & Production PCL NVDR | 1,778,804 | 6,153,312 |
| PTT Global Chemical PCL NVDR | 2,640,914 | 5,243,729 |
| PTT Oil & Retail Business PCL NVDR | 3,704,900 | 3,477,025 |
| PTT PCL NVDR | 18,710,200 | 22,203,216 |
| Ratch Group PCL NVDR | 1,055,800 | 1,547,710 |
| SCG Packaging PCL NVDR | 1,584,300 | 3,440,658 |
| Siam City Cement PCL NVDR | 112,600 | 592,126 |
| Siam Makro PCL NVDR | 486,200 | 633,534 |
| Sri Trang Gloves Thailand PCL NVDR | 1,285,000 | 1,475,064 |
| Srisawad Corp. PCL NVDR | 798,100 | 1,776,582 |
| Thai Oil PCL NVDR | 1,332,200 | 2,056,215 |
| Thai Union Group PCL NVDR | 3,788,300 | 2,338,856 |
| The Siam Cement PCL NVDR | 1,092,200 | 14,570,573 |
| The Siam Commercial Bank PCL NVDR | 3,124,500 | 10,323,718 |
| TMBThanachart Bank PCL NVDR | 58,119,918 | 1,929,367 |
| Total Access Communication PCL NVDR | 960,500 | 1,102,567 |
| True Corp. PCL NVDR | 14,634,766 | 1,507,405 |
| | | 219,197,949 |
| |
| Turkey 0.5% |
| Akbank T.A.S. | 3,534,660 | 2,503,957 |
| Anadolu Efes Biracilik Ve Malt Sanayii A/S | 253,462 | 668,826 |
| Arcelik A/S | 276,094 | 1,066,587 |
| Aselsan Elektronik Sanayi Ve Ticaret A/S | 637,212 | 1,217,788 |
| Security | Number
of Shares | Value ($) |
| BIM Birlesik Magazalar A/S | 587,577 | 5,077,564 |
| Coca-Cola Icecek A/S | 92,831 | 977,492 |
| Enerjisa Enerji A/S | 358,549 | 478,669 |
| Enka Insaat ve Sanayi A/S | 867,632 | 1,144,738 |
| Eregli Demir ve Celik Fabrikalari T.A.S. | 1,793,733 | 4,051,513 |
| Ford Otomotiv Sanayi A/S | 86,275 | 1,782,674 |
| Gubre Fabrikalari TAS * | 106,304 | 662,922 |
| Haci Omer Sabanci Holding A/S | 1,138,289 | 1,438,862 |
| Iskenderun Demir ve Celik A/S | 203,522 | 302,792 |
| KOC Holding A/S | 1,111,586 | 3,080,274 |
| Koza Altin Isletmeleri A/S * | 64,756 | 805,313 |
| Petkim Petrokimya Holding A/S * | 1,648,857 | 1,229,528 |
| Sasa Polyester Sanayi * | 227,918 | 753,285 |
| TAV Havalimanlari Holding A/S * | 209,882 | 593,713 |
| Tekfen Holding A/S | 204,803 | 363,323 |
| Tofas Turk Otomobil Fabrikasi A/S | 173,570 | 877,192 |
| Turk Hava YollariI AO * | 718,842 | 1,096,268 |
| Turk Telekomunikasyon A/S | 677,843 | 604,103 |
| Turkcell Iletisim Hizmetleri A/S | 1,551,496 | 3,058,394 |
| Turkiye Garanti Bankasi A/S | 2,785,069 | 3,309,457 |
| Turkiye Halk Bankasi A/S * | 931,338 | 533,185 |
| Turkiye Is Bankasi A/S, Class C | 1,830,904 | 1,266,185 |
| Turkiye Petrol Rafinerileri A/S * | 158,434 | 1,937,908 |
| Turkiye Sise ve Cam Fabrikalari A/S | 1,810,815 | 1,938,331 |
| Turkiye Vakiflar Bankasi T.A.O., Class D * | 821,348 | 354,638 |
| Yapi ve Kredi Bankasi A/S | 2,339,129 | 742,715 |
| | | 43,918,196 |
| |
| United Arab Emirates 0.9% |
| Abu Dhabi Commercial Bank PJSC | 3,578,440 | 7,316,359 |
| Abu Dhabi Islamic Bank PJSC | 2,035,067 | 3,124,778 |
| Air Arabia PJSC * | 3,063,643 | 1,184,371 |
| Aldar Properties PJSC | 5,088,167 | 5,748,715 |
| Aramex PJSC | 354,801 | 387,338 |
| DAMAC Properties Dubai Co. PJSC * | 1,285,096 | 440,826 |
| Dana Gas PJSC | 5,315,901 | 1,577,483 |
| Dubai Financial Market PJSC * | 2,076,947 | 638,948 |
| Dubai Investments PJSC | 2,677,537 | 1,333,976 |
| Dubai Islamic Bank PJSC | 2,467,070 | 3,425,413 |
| Emaar Development PJSC * | 989,958 | 1,067,268 |
| Emaar Malls PJSC * | 2,746,500 | 1,540,310 |
| Emaar Properties PJSC | 4,536,747 | 5,187,465 |
| Emirates NBD Bank PJSC | 3,290,985 | 12,409,007 |
| Emirates Telecommunications Group Co. PJSC | 2,273,427 | 14,606,775 |
| First Abu Dhabi Bank PJSC | 5,717,315 | 26,460,764 |
| | | 86,449,796 |
| Total Common Stock |
| (Cost $6,779,179,584) | | 9,340,511,108 |
|
| Preferred Stock 1.5% of net assets |
| |
| Brazil 1.3% |
| Alpargatas S.A. * | 223,198 | 2,614,524 |
| Azul S.A. * | 357,687 | 2,636,077 |
| Banco Bradesco S.A. | 6,208,246 | 28,072,955 |
| Banco Inter S.A. * | 1,190,485 | 5,104,188 |
| Bradespar S.A. | 283,792 | 3,500,594 |
| Braskem S.A., A Shares * | 254,568 | 3,281,332 |
| Centrais Eletricas Brasileiras S.A., B Shares | 356,449 | 2,629,739 |
| Cia de Transmissao de Energia Electrica Paulista | 255,424 | 1,227,340 |
| Cia Energetica de Sao Paulo, B Shares | 261,705 | 1,198,224 |
| Companhia Energetica de Minas Gerais | 1,574,831 | 4,155,828 |
Schwab International Equity ETFs | Annual Report
Schwab Emerging Markets Equity ETF
Portfolio Holdings as of August 31, 2021 (continued)
| Security | Number
of Shares | Value ($) |
| Companhia Paranaense de Energia, B Shares | 1,421,446 | 1,899,130 |
| Gerdau S.A. | 1,396,054 | 7,722,602 |
| Itausa S.A. | 5,870,377 | 13,255,376 |
| Lojas Americanas S.A. | 1,221,227 | 1,421,709 |
| Metalurgica Gerdau S.A. | 948,545 | 2,395,657 |
| Petroleo Brasileiro S.A. | 7,263,900 | 38,578,672 |
| Usinas Siderurgicas de Minas Gerais S.A., A Shares | 537,279 | 1,940,461 |
| | | 121,634,408 |
| |
| Chile 0.1% |
| Embotelladora Andina S.A., B Shares | 516,551 | 1,225,805 |
| Sociedad Quimica y Minera de Chile S.A., B Shares | 107,089 | 5,593,999 |
| | | 6,819,804 |
| |
| Colombia 0.0% |
| Grupo Aval Acciones y Valores S.A. | 5,323,304 | 1,584,361 |
| Grupo de Inversiones Suramericana S.A. | 106,425 | 504,820 |
| | | 2,089,181 |
| |
| Russia 0.1% |
| Bashneft PJSC | 40,198 | 588,879 |
| Surgutneftegas PJSC | 10,169,326 | 5,369,632 |
| Tatneft PJSC | 166,814 | 1,041,719 |
| Transneft PJSC | 1,959 | 4,225,845 |
| | | 11,226,075 |
| Total Preferred Stock |
| (Cost $129,302,283) | | 141,769,468 |
|
| Rights 0.0% of net assets |
| |
| Thailand 0.0% |
Banpu Public Co., Ltd.
expires 09/15/21, strike THB 5.00 *(a) | 1,837,733 | 342,089 |
| Total Rights |
| (Cost $353,292) | | 342,089 |
|
| Warrants 0.0% of net assets |
| |
| Thailand 0.0% |
BTS Group Holdings PCL NVDR - R6 Warrants
expires 12/31/22 *(a) | 554,105 | 20,943 |
BTS Group Holdings PCL NVDR - R7 Warrants
expires 12/31/24 *(a) | 1,108,210 | 45,671 |
BTS Group Holdings PCL NVDR - R8 Warrants
expires 12/31/26 *(a) | 2,216,420 | 83,999 |
| Total Warrants |
| (Cost $—) | | 150,613 |
| Security | Number
of Shares | Value ($) |
| Short-Term Investments 0.8% of net assets |
| |
| United States 0.8% |
| Money Market Funds 0.8% |
| State Street Institutional U.S. Government Money Market Fund, Premier Class 0.03% (c) | 49,968,382 | 49,968,382 |
| Wells Fargo Government Money Market Fund, Select Class 0.03% (c)(d) | 24,639,514 | 24,639,514 |
| Total Short-Term Investments |
| (Cost $74,607,896) | | 74,607,896 |
| | Number of
Contracts | Notional
Amount
($) | Current Value/
Unrealized
Appreciation
($) |
| Futures Contracts | |
| Long | |
| MSCI Emerging Markets Index, expires 09/17/21 | 411 | 26,698,560 | 607,573 |
| * | Non-income producing security. |
| (a) | Fair-valued by management using significant unobservable inputs in accordance with procedures approved by the fund’s Board of Trustees. |
| (b) | All or a portion of this security is on loan. Securities on loan were valued at $23,774,990. |
| (c) | The rate shown is the 7-day yield. |
| (d) | Security purchased with cash collateral received for securities on loan. |
| | |
| ADR — | American Depositary Receipt |
| DVR — | Differential Voting Rights |
| GDR — | Global Depositary Receipt |
| NVDR — | Non-Voting Depositary Receipt |
| REIT — | Real Estate Investment Trust |
| |
| THB — | Thai Baht |
Schwab International Equity ETFs | Annual Report
Schwab Emerging Markets Equity ETF
Portfolio Holdings as of August 31, 2021 (continued)
The following is a summary of the inputs used to value the fund’s investments as of August 31, 2021 (see financial note 2(a) for additional information):
| Description | Quoted Prices in
Active Markets for
Identical Assets
(Level 1) | Other Significant
Observable Inputs
(Level 2) | Significant
Unobservable Inputs
(Level 3) | Total | |
| Assets | | | | | |
| Common Stock1 | $4,307,319,852 | $— | $— | $4,307,319,852 | |
| China | 3,555,179,353 | — | 3,269,387 | 3,558,448,740 | |
| Greece | 28,543,846 | — | — * | 28,543,846 | |
| Hong Kong | — | — | — * | — | |
| India | 1,364,130,844 | — | 233,620 | 1,364,364,464 | |
| Philippines | — | — | 81,834,206 | 81,834,206 | |
| Preferred Stock1 | 141,769,468 | — | — | 141,769,468 | |
| Rights 1 | | | | | |
| Thailand | — | — | 342,089 | 342,089 | |
| Warrants 1 | | | | | |
| Thailand | — | — | 150,613 | 150,613 | |
| Short-Term Investments1 | 74,607,896 | — | — | 74,607,896 | |
| Futures Contracts2 | 607,573 | — | — | 607,573 | |
| Total | $9,472,158,832 | $— | $85,829,915 | $9,557,988,747 | |
| * | Level 3 amount shown includes securities determined to have no value at August 31, 2021. |
| 1 | As categorized in the Portfolio Holdings. |
| 2 | Futures contracts are reported at cumulative unrealized appreciation or depreciation. |
Fund investments in mutual funds are classified as Level 1, without consideration to the classification level of the underlying securities held by the mutual funds, which could be Level 1, Level 2 or Level 3.
Schwab International Equity ETFs | Annual Report
Schwab Emerging Markets Equity ETF
Statement of Assets and Liabilities
As of August 31, 2021
| Assets |
| Investments in securities, at value — unaffiliated (cost $6,958,803,541) including securities on loan of $23,774,990 | | $9,532,741,660 |
| Collateral invested for securities on loan, at value (cost $24,639,514) | | 24,639,514 |
| Deposit with broker for futures contracts | | 3,885,165 |
| Foreign currency, at value (cost $10,842,411) | | 10,890,876 |
| Receivables: | | |
| Investments sold | | 52,998 |
| Dividends | | 11,737,030 |
| Income from securities on loan | | 921,572 |
| Variation margin on futures contracts | | 429,776 |
| Other assets | + | 97,412 |
| Total assets | | 9,585,396,003 |
| Liabilities |
| Collateral held for securities on loan | | 24,639,514 |
| Payables: | | |
| Management fees | | 829,845 |
| Foreign capital gains tax | + | 54,785,144 |
| Total liabilities | | 80,254,503 |
| Net Assets |
| Total assets | | 9,585,396,003 |
| Total liabilities | – | 80,254,503 |
| Net assets | | $9,505,141,500 |
| Net Assets by Source | | |
| Capital received from investors | | 7,777,039,935 |
| Total distributable earnings | | 1,728,101,565 |
| Net Asset Value (NAV) |
| Net Assets | ÷ | Shares
Outstanding | = | NAV |
| $9,505,141,500 | | 300,400,000 | | $31.64 |
| | | | | |
Schwab International Equity ETFs | Annual Report
Schwab Emerging Markets Equity ETF
Statement of Operations
For the period September 1, 2020 through August 31, 2021
| Investment Income |
| Dividends received from securities - unaffiliated (net of foreign withholding tax of $23,121,512) | | $185,465,544 |
| Securities on loan, net | + | 1,350,117 |
| Total investment income | | 186,815,661 |
| Expenses |
| Management fees | | 9,570,141 |
| Professional fees | + | 27,482* |
| Total expenses | | 9,597,623 |
| Expense reduction by CSIM | - | 27,482* |
| Net expenses | – | 9,570,141 |
| Net investment income | | 177,245,520 |
| Realized and Unrealized Gains (Losses) |
| Net realized losses on sales of securities - unaffiliated (net of foreign capital gains tax of $29,920) | | (154,681,582) |
| Net realized gains on futures contracts | | 1,364,613 |
| Net realized losses on foreign currency transactions | + | (1,346,951) |
| Net realized losses | | (154,663,920) |
| Net change in unrealized appreciation (depreciation) on securities - unaffiliated (net of change in foreign capital gains tax of ($47,966,521)) | | 1,383,552,172 |
| Net change in unrealized appreciation (depreciation) on futures contracts | | (28,930) |
| Net change in unrealized appreciation (depreciation) on foreign currency translations | + | 219,111 |
| Net change in unrealized appreciation (depreciation) | + | 1,383,742,353 |
| Net realized and unrealized gains | | 1,229,078,433 |
| Increase in net assets resulting from operations | | $1,406,323,953 |
| * | Professional fees associated with the filing of tax claims in the European Union deemed to be non-routine expenses of the fund. See financial notes 2 (d) and 4 for additional information. |
Schwab International Equity ETFs | Annual Report
Schwab Emerging Markets Equity ETF
Statement of Changes in Net Assets
For the current and prior report periods
| Operations | |
| | 9/1/20-8/31/21 | 9/1/19-8/31/20 |
| Net investment income | | $177,245,520 | $197,442,436 |
| Net realized losses | | (154,663,920) | (217,291,755) |
| Net change in unrealized appreciation (depreciation) | + | 1,383,742,353 | 794,019,807 |
| Increase in net assets resulting from operations | | 1,406,323,953 | 774,170,488 |
| Distributions to Shareholders | |
| Total distributions | | ($204,700,900) | ($206,667,900) |
| Transactions in Fund Shares | | | |
| | | 9/1/20-8/31/21 | 9/1/19-8/31/20 |
| | | SHARES | VALUE | SHARES | VALUE |
| Shares sold | | 35,000,000 | $1,107,996,332 | 33,000,000 | $853,017,880 |
| Shares redeemed | + | — | — | (1,500,000) | (29,444,732) |
| Net transactions in fund shares | | 35,000,000 | $1,107,996,332 | 31,500,000 | $823,573,148 |
| Shares Outstanding and Net Assets | | | |
| | | 9/1/20-8/31/21 | 9/1/19-8/31/20 |
| | | SHARES | NET ASSETS | SHARES | NET ASSETS |
| Beginning of period | | 265,400,000 | $7,195,522,115 | 233,900,000 | $5,804,446,379 |
| Total increase | + | 35,000,000 | 2,309,619,385 | 31,500,000 | 1,391,075,736 |
| End of period | | 300,400,000 | $9,505,141,500 | 265,400,000 | $7,195,522,115 |
Schwab International Equity ETFs | Annual Report
Schwab International Equity ETFs
1. Business Structure of the Funds:
Each of the funds in this report is a series of Schwab Strategic Trust (the trust), a no-load, open-end management investment company. The trust is organized as a Delaware statutory trust and is registered under the Investment Company Act of 1940, as amended (the 1940 Act). The list below shows all the operational funds in the trust as of the end of the period, including the funds discussed in this report, which are highlighted:
| SCHWAB STRATEGIC TRUST (ORGANIZED JANUARY 27, 2009) |
| Schwab International Equity ETF | Schwab U.S. TIPS ETF |
| Schwab International Small-Cap Equity ETF | Schwab Short-Term U.S. Treasury ETF |
| Schwab International Dividend Equity ETF | Schwab Intermediate-Term U.S. Treasury ETF |
| Schwab Emerging Markets Equity ETF | Schwab Long-Term U.S. Treasury ETF |
| Schwab U.S. Broad Market ETF | Schwab U.S. Aggregate Bond ETF |
| Schwab 1000 Index® ETF | Schwab 1-5 Year Corporate Bond ETF |
| Schwab U.S. Large-Cap ETF | Schwab 5-10 Year Corporate Bond ETF |
| Schwab U.S. Large-Cap Growth ETF | Schwab Fundamental U.S. Broad Market Index ETF |
| Schwab U.S. Large-Cap Value ETF | Schwab Fundamental U.S. Large Company Index ETF |
| Schwab U.S. Mid-Cap ETF | Schwab Fundamental U.S. Small Company Index ETF |
| Schwab U.S. Small-Cap ETF | Schwab Fundamental International Large Company Index ETF |
| Schwab U.S. Dividend Equity ETF | Schwab Fundamental International Small Company Index ETF |
| Schwab U.S. REIT ETF | Schwab Fundamental Emerging Markets Large Company Index ETF |
The funds issue and redeem shares at their net asset value per share (NAV) only in large blocks of shares (Creation Units). These transactions are usually in exchange for a basket of securities and/or an amount of cash. As a practical matter, only institutional investors who have entered into an authorized participant agreement purchase or redeem Creation Units. Except when aggregated in Creation Units, shares of the funds are not redeemable securities.
Individual shares of the funds trade on national securities exchanges and elsewhere during the trading day and can only be bought and sold at market prices throughout the trading day through a broker-dealer. Because fund shares trade at market prices rather than NAV, shares may trade at a price greater than NAV (premium) or less than NAV (discount). A chart showing the frequency at which each fund’s daily closing market price was at a discount or premium to each fund’s NAV can be found at www.schwabassetmanagement.com.
The Schwab International Dividend Equity ETF commenced operations on April 29, 2021.
Each fund maintains its own account for purposes of holding assets and accounting, and is considered a separate entity for tax purposes. Within its account, each fund may also keep certain assets in segregated accounts, as required by securities law.
2. Significant Accounting Policies:
The following is a summary of the significant accounting policies the funds use in their preparation of financial statements. The funds follow the investment company accounting and reporting guidance of the Financial Accounting Standards Board (FASB) Accounting Standard Codification Topic 946 Financial Services — Investment Companies. The accounting policies are in conformity with accounting principles generally accepted in the United States of America (GAAP).
The funds may invest in certain mutual funds and exchange-traded funds (ETFs) referred to as “underlying funds”. For more information about the underlying funds’ operations and policies, please refer to those funds’ semiannual and annual reports, which are filed with the U.S. Securities and Exchange Commission (SEC) and are available on the SEC’s website at www.sec.gov.
(a) Security Valuation:
Under procedures approved by the funds’ Board of Trustees (the Board), the investment adviser has formed a Pricing Committee to administer the pricing and valuation of portfolio securities and other assets and to ensure that prices used for internal purposes or provided by third parties reasonably reflect fair value. Among other things, these procedures allow the funds to utilize independent pricing services, quotations from securities and financial instrument dealers and other market sources to determine fair value.
The funds value the securities in their portfolios every business day. The funds use the following policies to value various types of securities:
Schwab International Equity ETFs | Annual Report
Schwab International Equity ETFs
Financial Notes (continued)
2. Significant Accounting Policies (continued):
• Securities traded on an exchange or over-the-counter: Traded securities are valued at the closing value for the day, or, on days when no closing value has been reported, at the mean of the most recent bid and ask quotes. Securities that are primarily traded on foreign exchanges are valued at the official closing price or the last sales price on the exchange where the securities are principally traded with these values then translated into U.S. dollars at the current exchange rate, unless these securities are fair valued as discussed below.
• Mutual funds: Mutual funds are valued at their respective NAVs.
• Futures contracts: Futures contracts are valued at their settlement prices as of the close of their exchanges.
• Securities for which no quoted value is available: The Board has adopted procedures to fair value each fund’s securities when market prices are not “readily available” or are unreliable. For example, a fund may fair value a security when it is de-listed or its trading is halted or suspended; when a security’s primary pricing source is unable or unwilling to provide a price; or when a security’s primary trading market is closed during regular market hours. Each fund makes fair value determinations in good faith in accordance with the fund’s valuation procedures. The Pricing Committee considers a number of factors, including unobservable market inputs, when arriving at fair value. The Pricing Committee may employ techniques such as the review of related or comparable assets or liabilities, related market activities, recent transactions, market multiples, book values, transactional back-testing, disposition analysis and other relevant information. The Pricing Committee regularly reviews these inputs and assumptions to calibrate the valuations. Due to the subjective and variable nature of fair value pricing, there can be no assurance that a fund could obtain the fair value assigned to the security upon the sale of such security. The Board convenes on a regular basis to review fair value determinations made by the funds pursuant to the valuation procedures.
In accordance with the authoritative guidance on fair value measurements and disclosures under GAAP, the funds disclose the fair value of their investments in a hierarchy that prioritizes the significant inputs to valuation techniques used to measure the fair value. The hierarchy gives the highest priority to valuations based upon unadjusted quoted prices in active markets for identical assets or liabilities (Level 1 measurements) and the lowest priority to valuations based upon unobservable inputs that are significant to the valuation (Level 3 measurements). If inputs used to measure the financial instruments fall within different levels of the hierarchy, the categorization is based on the lowest level input that is significant to the valuation. If the funds determine that either the volume and/or level of activity for an asset or liability has significantly decreased (from normal conditions for that asset or liability) or price quotations or observable inputs are not associated with orderly transactions, increased analysis and management judgment will be required to estimate fair value.
The three levels of the fair value hierarchy are as follows:
• Level 1—quoted prices in active markets for identical securities—Investments whose values are based on quoted market prices in active markets, and whose values are therefore classified as Level 1 prices, include active listed equities, mutual funds, ETFs and futures contracts. Investments in mutual funds are valued daily at their NAVs and investments in ETFs are valued daily at the last reported sale price or the official closing price, which are classified as Level 1 prices, without consideration to the classification level of the underlying securities held by an underlying fund.
• Level 2—other significant observable inputs (including quoted prices for similar securities, interest rates, prepayment speeds, credit risk, etc.)—Investments that trade in markets that are not considered to be active, but whose values are based on quoted market prices, dealer quotations or valuations provided by alternative pricing sources supported by observable inputs are classified as Level 2 prices. These generally include U.S. government and sovereign obligations, most government agency securities, investment-grade corporate bonds, certain mortgage products, less liquid listed equities, and state, municipal and provincial obligations.
• Level 3—significant unobservable inputs (including the funds’ own assumptions in determining the fair value of investments)—Investments whose values are classified as Level 3 prices have significant unobservable inputs, as they may trade infrequently or not at all. When observable prices are not available for these securities, the funds use one or more valuation techniques for which sufficient and reliable data is available. The inputs used by the funds in estimating the value of Level 3 prices may include the original transaction price, quoted prices for similar securities or assets in active markets, completed or pending third-party transactions in the underlying investment or comparable issuers, and changes in financial ratios or cash flows. Level 3 prices may also be adjusted to reflect illiquidity and/or non-transferability, with the amount of such discount estimated by the funds in the absence of market information. Assumptions used by the funds due to the lack of observable inputs may significantly impact the resulting fair value and therefore the funds’ results of operations.
The inputs or methodology used for valuing securities are not necessarily an indication of the risk associated with investing in those securities.
Schwab International Equity ETFs | Annual Report
Schwab International Equity ETFs
Financial Notes (continued)
2. Significant Accounting Policies (continued):
The levels associated with valuing the funds’ investments as of August 31, 2021 are disclosed in the Portfolio Holdings.
(b) Accounting Policies for certain Portfolio Investments (if held):
Futures Contracts: Futures contracts are instruments that represent an agreement between two parties that obligates one party to buy, and the other party to sell, specific instruments at an agreed upon price on a stipulated future date. A fund must give the broker a deposit of cash and/or securities (initial margin) whenever it enters into a futures contract. The amount of the deposit may vary from one contract to another. Subsequent payments (variation margin) are made or received by a fund depending on the daily fluctuations in the value of the futures contract and are accounted for as unrealized appreciation or depreciation until the contract is closed, at which time the gains or losses are realized. Futures contracts are traded publicly on exchanges, and their value may change daily.
Securities Lending: Under the trust’s Securities Lending Program, a fund (lender) may make short-term loans of its securities to another party (borrower) to generate additional revenue for the fund. The borrower pledges collateral in the form of cash, securities issued or fully guaranteed by the U.S. government or foreign governments, or letters of credit issued by a bank. Collateral at the individual loan level is required to be maintained on a daily marked-to-market basis in an amount at least equal to the current value of the securities loaned. The lending agent provides a fund with indemnification against borrower default (the borrower fails to return the security on loan) reducing the risk of loss as a result of default. The cash collateral of securities loaned is currently invested in money market portfolios operating pursuant to Rule 2a-7 under the 1940 Act. Each fund bears the risk of loss with respect to the investment of cash collateral. The terms of the securities lending agreement allow the funds or the lending agent to terminate any loan at any given time and the securities must be returned within the earlier of the standard trade settlement period or the specified time period under the relevant securities lending agreement. Securities lending income, as disclosed in each fund’s Statement of Operations, if applicable, represents the income earned from the investment of the cash collateral plus any fees paid by borrowers, less the fees paid to the lending agent and broker rebates which are subject to adjustments pursuant to the securities lending agreement. On loans not collateralized by cash, a fee is received from the borrower, and is allocated between a fund and the lending agent. The aggregate fair value of securities loaned will not at any time exceed one-third of the total assets of a fund, including collateral received from the loan. Securities lending fees paid to the unaffiliated lending agent start at 10% of gross lending revenue, with subsequent breakpoints to a low of 5%. In this context, the gross lending revenue equals the income received from the investment of cash collateral and fees paid by borrowers less any rebates paid to the borrowers. Any expenses charged by the cash collateral fund are in addition to these fees. All remaining revenue is retained by the fund, as applicable. No portion of lending revenue is paid to or retained by Charles Schwab Investment Management, Inc. (CSIM or the investment adviser) or any affiliate of CSIM.
As of August 31, 2021, Schwab International Equity ETF, Schwab International Small-Cap Equity ETF and Schwab Emerging Markets Equity ETF had securities on loan, all of which were classified as common stocks and warrants. The value of the securities on loan and the related collateral as of August 31, 2021, are disclosed in each fund’s Portfolio Holdings and Statement of Assets and Liabilities.
Passive Foreign Investment Companies: Certain funds may own shares in certain foreign corporations that meet the Internal Revenue Code, as amended, definition of a Passive Foreign Investment Company (PFIC). The funds may elect for tax purposes to mark-to-market annually the shares of each PFIC lot held and would be required to distribute as ordinary income to shareholders any such marked to- market gains (as well as any gains realized on sale).
(c) Security Transactions:
Security transactions are recorded as of the date the order to buy or sell the security is executed. Realized gains and losses from security transactions are based on the identified costs of the securities involved.
Assets and liabilities denominated in foreign currencies are reported in U.S. dollars. For assets and liabilities held on a given date, the dollar value is based on market exchange rates in effect on that date. Transactions involving foreign currencies, including purchases, sales, income receipts and expense payments, are calculated using exchange rates in effect on the transaction date. Realized foreign exchange gains or losses arise from sales of foreign currencies, currency gains or losses realized between the trade and settlement dates on securities transactions and the difference between the recorded amounts of dividends, interest, and foreign withholding taxes and the U.S. dollar equivalent of the amounts actually received or paid. Net unrealized foreign exchange appreciation or depreciation arises from changes in foreign exchange rates on foreign denominated assets and liabilities other than investments in securities held at the end of the reporting period. These realized and unrealized foreign exchange gains or losses are reported in foreign currency transactions or translations on the Statement of Operations. The funds do not isolate the portion of the fluctuations on investments resulting from changes in foreign currency exchange rates from the fluctuations in market prices of investments held. Such fluctuations are included with the net realized and unrealized gain or loss from investments.
Schwab International Equity ETFs | Annual Report
Schwab International Equity ETFs
Financial Notes (continued)
2. Significant Accounting Policies (continued):
Gains realized by the funds on the sale of securities in certain foreign countries may be subject to non-U.S. taxes. In those instances, the funds record a liability based on unrealized gains to provide for potential non-U.S. taxes payable upon the sale of these securities.
When a fund closes out a futures contract position, it calculates the difference between the value of the position at the beginning and at the end of the contract, and records a realized gain or loss accordingly.
(d) Investment Income:
Interest income is recorded as it accrues. Dividends, in the form of cash or non-cash income such as in the form of additional securities, and distributions from portfolio securities and underlying funds are recorded on the date they are effective (the ex-dividend date), although the funds record certain foreign security dividends on the date the ex-dividend is confirmed. Any distributions from underlying funds are recorded in accordance with the character of the distributions as designated by the underlying funds.
Income received from foreign sources may result in withholding tax. Withholding taxes are accrued at the same time as the related income if the tax rate is fixed and known, unless a tax withheld is reclaimable from the local tax authorities in which case it is recorded as receivable. If the tax rate is not known or estimable, such expense or reclaim receivable is recorded when the net proceeds are received.
The funds filed claims to recover taxes previously withheld in certain European Union countries on the basis that those countries had purportedly violated certain provisions in the Treaty on the Functioning of the European Union. These filings are subject to various administrative and judicial proceedings within these countries, and all professional fees associated with these filings have been paid by the investment adviser.
(e) Expenses:
Pursuant to the Amended and Restated Advisory Agreement (Advisory Agreement) between CSIM and the trust, the investment adviser will pay the operating expenses of each fund, excluding taxes, any brokerage expenses, and extraordinary or non-routine expenses. Taxes, any brokerage expenses and extraordinary or non-routine expenses that are specific to a fund are charged directly to the fund.
(f) Distributions to Shareholders:
The funds make distributions from net investment income, if any, semiannually. The funds generally make distributions from net realized capital gains, if any, once a year.
(g) Accounting Estimates:
The accounting policies described in this report conform to GAAP. Notwithstanding this, shareholders should understand that in order to follow these principles, fund management has to make estimates and assumptions that affect the information reported in the financial statements. It’s possible that once the results are known, they may turn out to be different from these estimates and these differences may be material.
(h) Federal Income Taxes:
The funds intend to meet federal income and excise tax requirements for regulated investment companies under subchapter M of the Internal Revenue Code, as amended. Accordingly, the funds distribute substantially all of their net investment income and net realized capital gains, if any, to their respective shareholders each year. As long as a fund meets the tax requirements, it is not required to pay federal income tax.
(i) Foreign Taxes:
The funds may be subject to foreign taxes (a portion of which may be reclaimable) on income, corporate events, foreign currency exchanges and capital gains on investments. All foreign taxes are recorded in accordance with the applicable foreign tax regulations and rates that exist in foreign markets in which the funds invest. These foreign taxes, if any, are paid by the funds and are disclosed in the Statement of Operations. Foreign taxes accrued as of August 31, 2021, if any, are reflected in each fund’s Statement of Assets and Liabilities.
Schwab International Equity ETFs | Annual Report
Schwab International Equity ETFs
Financial Notes (continued)
2. Significant Accounting Policies (continued):
(j) Indemnification:
Under the funds’ organizational documents, the officers and trustees are indemnified against certain liabilities arising out of the performance of their duties to the funds. In addition, in the normal course of business the funds enter into contracts with their vendors and others that provide general indemnifications. The funds’ maximum exposure under these arrangements is unknown as this would involve future claims that may be made against the funds. However, based on experience, the funds expect the risk of loss attributable to these arrangements to be remote.
3. Risk Factors:
Investing in the funds may involve certain risks, as discussed in the funds’ prospectus, including, but not limited to, those described below. Any of these risks could cause an investor to lose money.
Market Risk. Financial markets rise and fall in response to a variety of factors, sometimes rapidly and unpredictably. Markets may be impacted by economic, political, regulatory and other conditions, including economic sanctions and other government actions. In addition, the occurrence of global events, such as war, terrorism, environmental disasters, natural disasters or epidemics, may also negatively affect the financial markets. As with any investment whose performance is tied to these markets, the value of an investment in a fund will fluctuate, which means that an investor could lose money over short or long periods.
Investment Style Risk. The funds are index funds. Therefore, each fund follows the securities included in its respective index during upturns as well as downturns. Because of their indexing strategies, the funds do not take steps to reduce market exposure or to lessen the effects of a declining market. In addition, because of the funds’ expenses, the funds’ performance may be below that of their respective index. Errors relating to the index may occur from time to time and may not be identified by the index provider for a period of time. In addition, market disruptions could cause delays in the index’s rebalancing schedule. Such errors and/or market disruptions may result in losses for the fund.
Equity Risk. The prices of equity securities rise and fall daily. These price movements may result from factors affecting individual companies, industries or the securities market as a whole. In addition, equity markets tend to move in cycles, which may cause stock prices to fall over short or extended periods of time.
Market Capitalization Risk. Securities issued by companies of different market capitalizations tend to go in and out of favor based on market and economic conditions. During a period when securities of a particular market capitalization fall behind other types of investments, a fund’s performance could be impacted.
Large-Cap Company Risk. Certain funds invest in large-cap company stocks. Large-cap companies are generally more mature and the securities issued by these companies may not be able to reach the same levels of growth as the securities issued by small- or mid-cap companies.
Mid-Cap Company Risk. Certain funds invest in mid-cap company stocks. Mid-cap companies may be more vulnerable to adverse business or economic events than larger, more established companies and the value of securities issued by these companies may move sharply.
Small-Cap Company Risk. Certain funds invest in small-cap company stocks. Securities issued by small-cap companies may be riskier than those issued by larger companies, and their prices may move sharply, especially during market upturns and downturns.
Foreign Investment Risk. A fund’s investments in securities of foreign issuers involve certain risks that may be greater than those associated with investments in securities of U.S. issuers. These include risks of adverse changes in foreign economic, political, regulatory and other conditions; changes in currency exchange rates or exchange control regulations (including limitations on currency movements and exchanges); the imposition of economic sanctions or other government restrictions; differing accounting, auditing, financial reporting and legal standards and practices; differing securities market structures; and higher transaction costs. These risks may negatively impact the value or liquidity of a fund’s investments, and could impair the fund’s ability to meet its investment objective or invest in accordance with its investment strategy. There is a risk that investments in securities denominated in, and/or receiving revenues in, foreign currencies will decline in value relative to the U.S. dollar. Foreign securities also include American Depositary Receipts (ADRs), Global Depositary Receipts (GDRs), and European Depositary Receipts (EDRs), which are receipts issued by U.S. and foreign banks that represent shares of foreign-based corporations. Investment in ADRs, GDRs and EDRs may be less liquid than the underlying shares in their primary trading market and GDRs, many of which are issued by companies in emerging markets, may be more volatile. To the extent a fund’s investments in a single country or a limited number of countries represent a large percentage of the fund’s assets, the fund’s performance may be adversely affected by the economic, political, regulatory and social conditions in those countries and the fund’s price may be more volatile than the price of a fund that is geographically diversified.
Schwab International Equity ETFs | Annual Report
Schwab International Equity ETFs
Financial Notes (continued)
3. Risk Factors (continued):
Emerging Markets Risk. Certain funds invest in emerging markets. Emerging market countries may be more likely to experience political turmoil or rapid changes in market or economic conditions than more developed countries. Emerging market countries often have less uniformity in accounting, auditing, financial reporting and recordkeeping requirements and greater risk associated with the custody of securities. In addition, the financial stability of issuers (including governments) in emerging market countries may be more precarious than in developed countries. As a result, there may be an increased risk of illiquidity and price volatility associated with a fund’s investments in emerging market countries, which may be magnified by currency fluctuations relative to the U.S. dollar, and, at times, it may be difficult to value such investments.
Sampling Index Tracking Risk. Each fund uses statistical sampling techniques, and as a result, a fund may not fully replicate its respective index and may hold securities not included in the index. As a result, a fund is subject to the risk that the investment adviser’s investment management strategy, the implementation of which is subject to a number of constraints, may not produce the intended results. Because each fund utilizes a sampling approach, it may not track the return of its respective index as well as it would if a fund purchased all of the securities in its index.
Tracking Error Risk. As index funds, each fund seeks to track the performance of its respective index, although it may not be successful in doing so. The divergence between the performance of a fund and the index, positive or negative, is called “tracking error.” Tracking error can be caused by many factors and it may be significant.
Derivatives Risk. Each fund may invest in derivative instruments. The principal types of derivatives a fund may use are futures contracts. A futures contract is an agreement to buy or sell a financial instrument at a specific price on a specific day. A fund’s use of derivative instruments involves risks different from, or possibly greater than, the risks associated with investing directly in securities and other traditional investments. Certain of these risks, such as market risk, liquidity risk and leverage risk, are discussed elsewhere in this section. A fund’s use of derivatives is also subject to counterparty risk, lack of availability risk, valuation risk, correlation risk and tax risk. Counterparty risk is the risk that the counterparty to a derivative transaction may not fulfill its contractual obligations either because the financial condition of the counterparty declines, or because the counterparty is otherwise unable or unwilling to perform under the contract. Lack of availability risk is the risk that suitable derivative transactions may not be available in all circumstances for risk management or other purposes. Valuation risk is the risk that a particular derivative may be valued incorrectly. Correlation risk is the risk that changes in the value of the derivative may not correlate perfectly with the underlying asset, rate or index. Tax risk is the risk that the use of derivatives may cause a fund to realize higher amounts of short-term capital gains. A fund’s use of derivatives could reduce the fund’s performance, increase the fund’s volatility, and cause the fund to lose more than the initial amount invested. Furthermore, the use of derivatives subject to regulation by the Commodity Futures Trading Commission (CFTC) could cause the fund to become a commodity pool, which would require the fund to comply with certain CFTC rules.
Liquidity Risk. A fund may be unable to sell certain securities, such as illiquid securities, readily at a favorable time or price, or the fund may have to sell them at a loss.
Leverage Risk. Certain fund transactions, such as derivatives transactions, may give rise to a form of leverage and may expose a fund to greater risk. Leverage tends to magnify the effect of any decrease or increase in the value of a fund’s portfolio securities. The use of leverage may cause a fund to liquidate portfolio positions when it would not be advantageous to do so in order to satisfy its obligations.
Securities Lending Risk. Securities lending involves the risk of loss of rights in, or delay in recovery of, the loaned securities if the borrower fails to return the security loaned or becomes insolvent.
Concentration Risk. To the extent that a fund’s or an index’s portfolio is concentrated in the securities of issuers in a particular market, industry, group of industries, sector, country or asset class, the fund may be adversely affected by the performance of those securities, may be subject to increased price volatility and may be more vulnerable to adverse economic, market, political or regulatory occurrences affecting that market, industry, group of industries, sector, country or asset class.
Market Trading Risk. Although fund shares are listed on national securities exchanges, there can be no assurance that an active trading market for fund shares will develop or be maintained. If an active market is not maintained, investors may find it difficult to buy or sell fund shares.
Shares of the Fund May Trade at Prices Other Than NAV. Fund shares may be bought and sold in the secondary market at market prices. Although it is expected that the market price of the shares of a fund will approximate the fund’s NAV, there may be times when the market price and the NAV vary significantly. An investor may pay more than NAV when buying shares of a fund in the secondary market, and an investor may receive less than NAV when selling those shares in the secondary market. The market price of fund shares may deviate, sometimes significantly, from NAV during periods of market volatility or market disruption, or as a result
Schwab International Equity ETFs | Annual Report
Schwab International Equity ETFs
Financial Notes (continued)
3. Risk Factors (continued):
of other factors impacting foreign securities, including liquidity, irregular trading activity and timing differences between foreign markets where securities trade and the secondary market where fund shares are sold. (See the unaudited Frequency Distribution of Discounts and Premiums in Other Information for an overview showing the frequency at which the daily closing price was at a discount or a premium to a fund’s daily NAV.)
Please refer to the funds’ prospectus for a more complete description of the principal risks of investing in the funds.
4. Affiliates and Affiliated Transactions:
Investment Adviser
CSIM, a wholly owned subsidiary of The Charles Schwab Corporation, serves as each fund’s investment adviser pursuant to the Advisory Agreement between CSIM and the trust.
For its advisory services to the funds, CSIM is entitled to receive an annual management fee, payable monthly, based on a percentage of each fund’s average daily net assets as follows:
Schwab
International
Equity ETF | Schwab
International
Small-Cap
Equity ETF | Schwab
International
Dividend
Equity ETF | Schwab
Emerging
Markets
Equity ETF |
| 0.06% | 0.11% | 0.14% | 0.11% |
Investment from Affiliates
Certain funds in the Fund Complex (for definition refer to Trustees and Officers section) may own shares of other funds in the Fund Complex. The table below reflects the percentages of shares of each fund in this report that are owned by other funds in the Fund Complex as of August 31, 2021, as applicable:
| | Underlying Funds | | |
| | Schwab
International
Equity ETF | Schwab
International
Small-Cap
Equity ETF | Schwab
Emerging
Markets
Equity ETF |
| Schwab VIT Balanced Portfolio | 0.0%* | 0.0%* | 0.0%* |
| Schwab VIT Balanced with Growth Portfolio | 0.1% | 0.1% | 0.1% |
| Schwab VIT Growth Portfolio | 0.1% | 0.2% | 0.2% |
| Schwab Target 2010 Index Fund | 0.0%* | -% | -% |
| Schwab Target 2015 Index Fund | 0.0%* | -% | -% |
| Schwab Target 2020 Index Fund | 0.1% | -% | -% |
| Schwab Target 2025 Index Fund | 0.3% | -% | 0.1% |
| Schwab Target 2030 Index Fund | 0.5% | -% | 0.2% |
| Schwab Target 2035 Index Fund | 0.3% | -% | 0.2% |
| Schwab Target 2040 Index Fund | 0.4% | -% | 0.3% |
| Schwab Target 2045 Index Fund | 0.3% | -% | 0.2% |
| Schwab Target 2050 Index Fund | 0.3% | -% | 0.3% |
| Schwab Target 2055 Index Fund | 0.2% | -% | 0.2% |
| Schwab Target 2060 Index Fund | 0.3% | -% | 0.2% |
| Schwab Target 2065 Index Fund | 0.0%* | -% | 0.0%* |
Other Affiliated Transactions
The professional fees related to foreign withholding tax claims discussed in financial note 2 were non-routine expenses. The investment adviser agreed to pay these professional fees, on behalf of the funds, subject to reimbursement by the funds to the extent the funds are able to successfully recover taxes withheld in the future.
Schwab International Equity ETFs | Annual Report
Schwab International Equity ETFs
Financial Notes (continued)
4. Affiliates and Affiliated Transactions (continued):
During the year ended August 31, 2021, the professional fees incurred by the Schwab International Equity ETF, Schwab International Small Cap Equity ETF and Schwab Emerging Markets ETF were $153,498, $10,415 and $27,482, respectively.
During the year ended August 31, 2021, Schwab International Small Cap Equity ETF and Schwab Emerging Markets ETF recovered previously withheld foreign taxes from Finland and Poland, respectively. The payments received by Schwab International Small Cap Equity ETF and Schwab Emerging Markets Equity ETF amounted to $306,425 and $668,665, respectively, and are recorded in each fund’s Statement of Operations. The investment adviser had paid upfront professional fees associated with recovering these foreign taxes in the amounts of $14,911 and $45,448 for Schwab International Small Cap Equity ETF and Schwab Emerging Markets ETF, respectively. Those amounts have been reimbursed to the investment adviser by the Schwab International Small Cap Equity ETF and Schwab Emerging Markets ETF. During the year ended August 31, 2021, Schwab International Equity ETF did not recover any previously withheld foreign taxes and made no reimbursements to the investment adviser.
As of August 31, 2021, the balance of professional fees related to foreign withholding tax subject to future reimbursement by the Schwab International Equity ETF to the investment adviser was $350,139. Schwab International Small Cap Equity ETF, Schwab International Dividend Equity ETF and Schwab Emerging Markets ETF had no balance of professional fees related to foreign withholding tax subject to future reimbursement by the funds to the investment adviser.
No other amounts for additional tax reclaims are reflected in the financial statements due to the uncertainty surrounding the ultimate resolution of proceedings, the likelihood of receipt of these claims, and the potential timing of payment.
Interfund Transactions
The funds may engage in direct transactions with certain other funds in the Fund Complex in accordance with procedures adopted by the Board pursuant to Rule 17a-7 under the 1940 Act. When one fund is seeking to sell a security that another is seeking to buy, an interfund transaction can allow both funds to benefit by reducing transaction costs. This practice is limited to funds that share the same investment adviser, trustees and/or officers. For the period ended August 31, 2021, each fund’s total aggregate security transactions with other funds in the Fund Complex as well as any realized gains (losses) were as follows:
| | Total Aggregate Transactions | Realized Gains (Losses) |
| Schwab International Equity ETF | $512,837,396 | ($131,396,183) |
| Schwab International Small-Cap Equity ETF | 377,119,014 | 49,578,313 |
| Schwab International Dividend Equity ETF* | 544,543 | (6,982) |
| Schwab Emerging Markets Equity ETF | 154,004,341 | (30,798,338) |
* Since commencement of operations on April 29, 2021.
Interfund Borrowing and Lending
Pursuant to an exemptive order issued by the SEC, the funds may enter into interfund borrowing and lending transactions with other funds in the Fund Complex. All loans are for temporary or emergency purposes and the interest rate to be charged will be the average of the overnight repurchase agreement rate and the short-term bank loan rate. All loans are subject to numerous conditions designed to ensure fair and equitable treatment of all participating funds. The interfund lending facility is subject to the oversight and periodic review of the Board. The funds had no interfund borrowing or lending activity during the period.
5. Other Service Providers:
SEI Investments Distribution Co. is the principal underwriter and distributor of shares of the funds.
State Street Bank and Trust Company (State Street) serves as the funds’ transfer agent. As part of these services, the transfer agent maintains records pertaining to the sale, redemption and transfer of the funds’ shares. The transfer agent is also responsible for the order-taking function for the funds’ shares.
State Street also serves as custodian and accountant for the funds. The custodian is responsible for the daily safekeeping of securities and cash held by the funds. The funds’ accountant maintains all books and records related to the funds’ transactions.
Schwab International Equity ETFs | Annual Report
Schwab International Equity ETFs
Financial Notes (continued)
The Board may include people who are officers and/or directors of CSIM or its affiliates. Federal securities law limits the percentage of such “interested persons” who may serve on a trust’s board, and the trust was in compliance with these limitations throughout the report period. The trust does not pay any interested or non-interested trustees (independent trustees). The independent trustees are paid by CSIM. For information regarding the trustees, please refer to the Trustees and Officers table at the end of this report.
7. Borrowing from Banks:
During the period, the funds were participants with other funds in the Fund Complex in a joint, syndicated, committed $750 million line of credit (the Syndicated Credit Facility), which matured on October 1, 2020. On October 1, 2020, the Syndicated Credit Facility was further amended to run for a new 364 day period with a line of credit of $850 million, maturing on September 30, 2021. Under the terms of the Syndicated Credit Facility, in addition to CSIM paying the interest charged on any borrowings by a fund, CSIM paid a commitment fee of 0.15% per annum on the funds’ proportionate share of the unused portion of the Syndicated Credit Facility.
During the period, the funds were participants with other funds in the Fund Complex in a joint, unsecured, uncommitted $500 million line of credit (the Uncommitted Credit Facility), with State Street, which was scheduled to mature on November 27, 2020. However, on October 1, 2020, the Uncommitted Credit Facility was amended to run for a new 364 day period with a line of credit of $400 million, maturing on September 30, 2021. Under the terms of the Uncommitted Credit Facility, CSIM pays interest on the amount a fund borrows. There were no borrowings from either line of credit during the period.
The funds also have access to custodian overdraft facilities. A fund may have utilized the overdraft facility and incurred an interest expense, which is paid by CSIM. The interest expense is determined based on a negotiated rate above the current Federal Funds Rate.
8. Derivatives:
Certain funds entered into equity index futures contracts during the report period. The funds invested in futures contracts to equitize available cash. The value and variation margin for futures contracts held at August 31, 2021 are presented in the Portfolio Holdings and Statement of Assets and Liabilities, respectively. The net realized gains (losses) and net change in unrealized appreciation (depreciation) on futures contracts are presented in the Statement of Operations. Refer to financial note 2(b) for the funds’ accounting policies with respect to futures contracts and financial note 3 for disclosures concerning the risks of investing in futures contracts. During the period ended August 31, 2021, the month-end average notional amounts of futures contracts held by the funds and the month-end average number of contracts held were as follows:
| | Notional Amounts | Number of Contracts |
| Schwab International Equity ETF | $116,273,590 | 1,091 |
| Schwab International Small-Cap Equity ETF | 11,444,617 | 106 |
| Schwab International Dividend Equity ETF* | 163,963 | 1 |
| Schwab Emerging Markets Equity ETF | 23,834,998 | 379 |
* Since commencement of operations on April 29, 2021.
9. Purchases and Sales of Investment Securities:
For the period ended August 31, 2021, purchases and sales of securities (excluding in-kind transactions and short-term obligations) were as follows:
| | Purchases
of Securities | Sales
of Securities |
| Schwab International Equity ETF | $1,807,494,816 | $1,431,179,785 |
| Schwab International Small-Cap Equity ETF | 747,485,958 | 700,525,237 |
| Schwab International Dividend Equity ETF* | 14,750,513 | 1,692,579 |
| Schwab Emerging Markets Equity ETF | 2,101,356,684 | 1,302,804,960 |
* Since commencement of operations on April 29, 2021.
Schwab International Equity ETFs | Annual Report
Schwab International Equity ETFs
Financial Notes (continued)
| | 10. In-Kind Transactions: |
The consideration for the purchase of Creation Units of a fund often consists of the in-kind deposit of a designated portfolio of equity securities, which constitutes an optimized representation of the securities involved in a relevant fund’s underlying index, and an amount of cash. Investors purchasing and redeeming Creation Units are subject to a standard creation transaction fee and a standard redemption transaction fee paid to the custodian to offset transfer and other transaction costs associated with the issuance and redemption of Creation Units. Purchasers and redeemers of Creation Units for cash are subject to an additional variable charge paid to the fund that will offset the transaction costs to the fund of buying or selling portfolio securities. In addition, purchasers and redeemers of shares in Creation Units are responsible for payment of the costs of transferring securities to or out of the fund. From time to time, CSIM may cover the cost of any transaction fees when believed to be in the best interests of a fund.
The in-kind transactions for the period ended August 31, 2021, were as follows:
| | In-Kind Purchases
of Securities | In-Kind Sales
of Securities |
| Schwab International Equity ETF | $3,416,712,985 | $468,671,895 |
| Schwab International Small-Cap Equity ETF | 462,051,941 | 80,636,142 |
| Schwab International Dividend Equity ETF* | 87,670,367 | — |
| Schwab Emerging Markets Equity ETF | 244,263,466 | — |
* Since commencement of operations on April 29, 2021.
For the period ended August 31, 2021, where applicable, the funds realized net capital gains or losses resulting from in-kind redemptions of Creation Units. Because such gains or losses are not taxable to the funds and are not distributed to existing fund shareholders, the gains or losses are reclassified from accumulated net realized gains or losses to capital received from investors at the end of the funds’ tax year. These reclassifications have no effect on net assets or net asset values per share. The net realized in-kind gains or losses for the period ended August 31, 2021 are disclosed in the funds’ Statements of Operations.
11. Federal Income Taxes
As of August 31, 2021, the tax basis cost of the funds’ investments and gross unrealized appreciation and depreciation were as follows:
| | Schwab
International
Equity ETF | | Schwab
International
Small-Cap
Equity ETF | | Schwab
International
Dividend
Equity ETF | | Schwab
Emerging
Markets
Equity ETF |
| Tax cost | $22,182,410,177 | | $3,070,925,399 | | $100,716,498 | | $7,267,827,099 |
| Gross unrealized appreciation | $7,695,273,017 | | $1,070,145,620 | | $2,901,706 | | $3,264,427,648 |
| Gross unrealized depreciation | (1,621,090,463) | | (266,764,893) | | (2,546,830) | | (974,266,000) |
| Net unrealized appreciation (depreciation) | $6,074,182,554 | | $803,380,727 | | $354,876 | | $2,290,161,648 |
As of August 31, 2021, the components of distributable earnings on a tax basis were as follows:
| | Schwab
International
Equity ETF | | Schwab
International
Small-Cap
Equity ETF | | Schwab
International
Dividend
Equity ETF | | Schwab
Emerging
Markets
Equity ETF |
| Undistributed ordinary income | $368,853,739 | | $70,554,177 | | $798,067 | | $132,119,759 |
| Net unrealized appreciation (depreciation) on investments | 6,074,182,554 | | 803,380,727 | | 354,876 | | 2,290,161,648 |
| Net other unrealized appreciation (depreciation) | 711,000 | | (49,173) | | (53) | | (54,624,874) |
| Capital loss carryforwards and other losses | (953,869,193) | | (161,565,072) | | (19,885) | | (639,554,968) |
| Total | $5,489,878,100 | | $712,320,659 | | $1,133,005 | | $1,728,101,565 |
The primary difference between book basis and tax basis unrealized appreciation or unrealized depreciation of investments is the tax deferral of losses on wash sales, realization for tax purposes of unrealized appreciation or depreciation on futures contracts and the realization for tax purposes of unrealized appreciation on investments in Passive Foreign Investment Companies “PFIC”, and partnership investments. The tax cost of the funds’ investments, disclosed above, have been adjusted from their book amounts to reflect these unrealized appreciation or depreciation differences, as applicable.
Schwab International Equity ETFs | Annual Report
Schwab International Equity ETFs
Financial Notes (continued)
11. Federal Income Taxes (continued):
Capital loss carryforwards may be used to offset future realized capital gains for federal income tax purposes. As of August 31, 2021, the funds had capital loss carryforwards with no expiration available to offset future net capital gains as follows:
| Expiration Date | Schwab
International
Equity ETF | Schwab
International
Small-Cap
Equity ETF | Schwab
International
Dividend
Equity ETF | Schwab
Emerging
Markets
Equity ETF |
| No expiration | $953,869,193 | $161,565,072 | $19,885 | $639,554,968 |
For the fiscal year ended August 31, 2021, the funds had capital loss carryforwards utilized as follows:
| | Schwab
International
Equity ETF | Schwab
International
Small-Cap
Equity ETF | Schwab
International
Dividend
Equity ETF | Schwab
Emerging
Markets
Equity ETF |
| Capital loss carryforwards utilized | $— | $45,264,457 | $— | $— |
The tax basis components of distributions paid during the current and prior fiscal years were:
| | Schwab
International
Equity ETF | Schwab
International
Small-Cap
Equity ETF | Schwab
International
Dividend
Equity ETF | Schwab
Emerging
Markets
Equity ETF |
| Current fiscal year end distributions | |
| Ordinary income | $557,207,730 | $66,927,200 | $95,190 | $204,700,900 |
| Prior fiscal year end distributions | |
| Ordinary income | $591,185,650 | $67,564,440 | N/A | $206,667,900 |
Distributions paid to shareholders are based on net investment income and net realized gains determined on a tax basis, which may differ from net investment income and net realized gains for financial reporting purposes. These differences reflect the differing character of certain income items and net realized gains and losses for financial statement and tax purposes, and may result in reclassification among certain capital accounts on the financial statements. The funds may also designate a portion of the amount paid to redeeming shareholders as a distribution for tax purposes.
Permanent book and tax basis differences may result in reclassifications between components of net assets as required. The adjustments have no impact on net assets or the results of operations.
As of August 31, 2021, management has reviewed the tax positions for open periods (for federal purposes, three years from the date of filing and for state purposes, four years from the date of filing) as applicable to the funds, and has determined that no provision for income tax is required in the funds’ financial statements. The funds recognize interest and penalties, if any, related to unrecognized tax benefits as income tax expense in the Statement of Operations. During the fiscal year ended August 31, 2021, the funds did not incur any interest or penalties.
12. Subsequent Events:
Management has determined there are no subsequent events or transactions through the date the financial statements were issued that would have materially impacted the financial statements as presented.
Schwab International Equity ETFs | Annual Report
Schwab International Equity ETFs
Report of Independent Registered Public Accounting Firm
To the Board of Trustees of Schwab Strategic Trust and Shareholders of Schwab International Equity ETF, Schwab International Small-Cap Equity ETF, Schwab International Dividend Equity ETF, and Schwab Emerging Markets Equity ETF:
Opinion on the Financial Statements and Financial Highlights
We have audited the accompanying statements of assets and liabilities, including the portfolio holdings, of Schwab International Equity ETF, Schwab International Small-Cap Equity ETF, Schwab International Dividend Equity ETF, and Schwab Emerging Markets Equity ETF (the “Funds”), four of the funds constituting Schwab Strategic Trust, as of August 31, 2021; the related statements of operations for the year then ended, the related statements of changes in net assets and the financial highlights for the two years in the period then ended (excluding Schwab International Dividend Equity ETF); the related statement of operations, statement of changes in net assets, and the financial highlights for the period from April 29, 2021 (commencement of operations) through August 31, 2021, for Schwab International Dividend Equity ETF; and the related notes. In our opinion, the financial statements and financial highlights present fairly, in all material respects, the financial position of each of the Funds (excluding Schwab International Dividend Equity ETF) as of August 31, 2021, the results of their operations for the year then ended, and the changes in their net assets and the financial highlights for the two years in the period then ended in conformity with accounting principles generally accepted in the United States of America. Also, in our opinion, the financial statements and financial highlights present fairly, in all material respects, the financial position of Schwab International Dividend Equity ETF as of August 31, 2021, and the results of its operations, changes in net assets, and financial highlights for the period from April 29, 2021 (commencement of operations) through August 31, 2021 in conformity with accounting principles generally accepted in the United States of America. For each of the Funds (excluding Schwab International Dividend Equity ETF), the financial highlights for each of the three years in the period ended August 31, 2019 were audited by other auditors, whose report, dated October 17, 2019, expressed an unqualified opinion on such financial highlights.
Basis for Opinion
These financial statements and financial highlights are the responsibility of the Funds’ management. Our responsibility is to express an opinion on the Funds’ financial statements and financial highlights based on our audits. We are a public accounting firm registered with the Public Company Accounting Oversight Board (United States) (PCAOB) and are required to be independent with respect to the Funds in accordance with the U.S. federal securities laws and the applicable rules and regulations of the Securities and Exchange Commission and the PCAOB.
We conducted our audits in accordance with the standards of the PCAOB. Those standards require that we plan and perform the audit to obtain reasonable assurance about whether the financial statements and financial highlights are free of material misstatement, whether due to error or fraud. The Funds are not required to have, nor were we engaged to perform, an audit of their internal control over financial reporting. As part of our audits we are required to obtain an understanding of internal control over financial reporting but not for the purpose of expressing an opinion on the effectiveness of the Funds’ internal control over financial reporting. Accordingly, we express no such opinion.
Our audits included performing procedures to assess the risks of material misstatement of the financial statements and financial highlights, whether due to error or fraud, and performing procedures that respond to those risks. Such procedures included examining, on a test basis, evidence regarding the amounts and disclosures in the financial statements and financial highlights. Our audits also included evaluating the accounting principles used and significant estimates made by management, as well as evaluating the overall presentation of the financial statements and financial highlights. Our procedures included confirmation of securities owned as of August 31, 2021, by correspondence with the custodian and brokers; when replies were not received from brokers, we performed other auditing procedures. We believe that our audits provide a reasonable basis for our opinion.
Deloitte & Touche LLP
Denver, Colorado
October 19, 2021
We have served as the auditor of one or more investment companies in the Schwab Funds Complex since 2020.
Schwab International Equity ETFs | Annual Report
Schwab International Equity ETFs
Other Federal Tax Information (unaudited)
The funds may elect to pass on the benefits of the foreign tax credit to its shareholders for the fiscal year ended August 31, 2021, and the respective foreign source income on the funds as follows:
| | Foreign Tax Credit | Foreign Source Income |
| Schwab International Equity ETF | $52,463,995 | $708,307,033 |
| Schwab International Small-Cap Equity ETF | 5,988,828 | 68,286,161 |
| Schwab International Dividend Equity ETF | 89,311 | 1,020,292 |
| Schwab Emerging Markets Equity ETF | 21,549,954 | 207,995,946 |
For the fiscal year ended August 31, 2021, the funds designated the following amounts of the dividend distributions as qualified dividends for the purpose of the maximum rate under section 1(h)(ii) of the Internal Revenue Code. Shareholders will be notified in January 2022 via IRS form 1099 of the amount for use in preparing their 2021 income tax return.
| Schwab International Equity ETF | $476,092,821 |
| Schwab International Small-Cap Equity ETF | 38,580,177 |
| Schwab International Dividend Equity ETF | 74,055 |
| Schwab Emerging Markets Equity ETF | 79,683,219 |
Schwab International Equity ETFs | Annual Report
Schwab International Equity ETFs
Investment Advisory Agreement Approval
The Investment Company Act of 1940, as amended (the 1940 Act), requires that the continuation of a fund’s investment advisory agreement must be specifically approved (1) by the vote of the trustees or by a vote of the shareholders of the fund, and (2) by the vote of a majority of the trustees who are not parties to the investment advisory agreement or “interested persons” of any party (the Independent Trustees), cast in person at a meeting called for the purpose of voting on such approval. In connection with such approvals, the fund’s trustees must request and evaluate, and the investment adviser is required to furnish, such information as may be reasonably necessary to evaluate the terms of the investment advisory agreement.
The Board of Trustees (the Board or the Trustees, as appropriate) calls and holds one or more meetings each year that are dedicated, in whole or in part, to considering whether to renew the investment advisory agreement (the Agreement) between Schwab Strategic Trust (the Trust) and Charles Schwab Investment Management, Inc. (CSIM) with respect to the existing funds in the Trust, including Schwab International Equity ETF, Schwab International Small-Cap Equity ETF and Schwab Emerging Markets Equity ETF (the Funds), and to review certain other agreements pursuant to which CSIM provides investment advisory services to certain other registered investment companies. In preparation for the meeting(s), the Board requests and reviews a wide variety of materials provided by CSIM, including information about CSIM’s affiliates, personnel, business goals and priorities, profitability, third-party oversight, corporate structure and operations. As part of the renewal process, the Independent Trustees’ legal counsel, on behalf of the Independent Trustees, sends an information request letter to CSIM seeking certain relevant information. The responses by CSIM are provided to the Trustees in the Board materials for their review prior to their meeting, and the Trustees are provided with the opportunity to request any additional materials. The Board also receives data provided by an independent provider of investment company data. This information is in addition to the detailed information about the Funds that the Board reviews during the course of each year, including information that relates to the Funds’ operations and performance, legal and compliance matters, risk management, portfolio turnover, and sales and marketing activity. In considering the renewal, the Independent Trustees receive advice from Independent Trustees’ legal counsel, including a memorandum regarding the responsibilities of trustees for the approval of investment advisory agreements. In addition, the Independent Trustees participate in question and answer sessions with representatives of CSIM and meet in executive session outside the presence of Fund management.
The Board, including a majority of the Independent Trustees, considered information specifically relating to the continuance of the Agreement with respect to the Funds at meetings held on May 12, 2021 and June 8, 2021, and approved the renewal
of the Agreement with respect to the Funds for an additional one-year term at the meeting on June 8, 2021 called for the purpose of voting on such approval.1
The Board’s approval of the continuance of the Agreement with respect to the Funds was based on consideration and evaluation of a variety of specific factors discussed at these meetings and at prior meetings, including:
| 1. | the nature, extent and quality of the services provided to each Fund under the Agreement, including the resources of CSIM and its affiliates dedicated to the Funds; |
| 2. | each Fund’s investment performance and how it compared to that of certain other comparable exchange-traded funds and benchmark data; |
| 3. | each Fund’s expenses and how those expenses compared to those of certain other similar exchange-traded funds; |
| 4. | the profitability of CSIM and its affiliates, including Charles Schwab & Co., Inc. (Schwab), with respect to each Fund, including both direct and indirect benefits accruing to CSIM and its affiliates; and |
| 5. | the extent to which economies of scale would be realized as each Fund grows and whether fee levels in the Agreement reflect those economies of scale for the benefit of Fund investors. |
Nature, Extent and Quality of Services. The Board considered the nature, extent and quality of the services provided by CSIM to the Funds and the resources of CSIM and its affiliates dedicated to the Funds. In this regard, the Trustees evaluated, among other things, CSIM’s experience, track record, compliance program, resources dedicated to hiring and retaining skilled personnel and specialized talent, and information security resources. The Trustees also considered information provided by CSIM relating to services and support provided with respect to the Funds’ portfolio management team, portfolio strategy, and internal investment guidelines, as well as trading infrastructure, liquidity management, product design and analysis, shareholder communications, securities valuation, fund accounting and custody, and vendor and risk oversight. The Trustees also considered investments CSIM has made in its infrastructure, including modernizing CSIM’s technology and use of data, increasing expertise in key areas (including portfolio management and trade operations), and improving business continuity, cybersecurity, due diligence, risk management processes, and information security programs, which are designed to provide enhanced services to the Funds and their shareholders. The Trustees considered CSIM’s effective implementation of its business continuity plan in response to the COVID-19 pandemic and government-mandated restrictions during the prior year. The Trustees also considered Schwab’s reputation as a full service brokerage firm and its overall financial condition, including Schwab’s ability to maintain consistent operations and service
Schwab International Equity ETFs | Annual Report
Schwab International Equity ETFs
levels during recent periods of remote work and market volatility. Following such evaluation, the Board concluded, within the context of its full deliberations, that the nature, extent and quality of services provided by CSIM to the Funds and the resources of CSIM and its affiliates dedicated to the Funds supported renewal of the Agreement with respect to the Funds.
Fund Performance. The Board considered each Fund’s performance in determining whether to renew the Agreement with respect to such Fund. Specifically, the Trustees considered each Fund’s performance relative to a peer category of other exchange-traded funds and applicable indices/benchmarks, in light of total return, yield and market trends, as well as in consideration of each Fund’s investment style and strategy attributes and disclosures. As part of this review, the Trustees considered the composition of the peer category, selection criteria and the reputation of the independent provider of investment company data who prepared the peer category analysis. In evaluating the performance of each Fund, the Trustees considered the risk profile for such Fund and such Fund’s demonstrated performance in tracking its benchmark index. The Trustees further considered the level of Fund performance in the context of their review of Fund expenses and adviser profitability discussed below and also noted that the Board and a designated committee of the Board review performance throughout the year. Although the Schwab International Small-Cap Equity ETF had performance that lagged that of a relevant peer group for certain periods considered, the Board concluded that other factors relevant to performance supported renewal of the Agreement with respect to this Fund including that the underperformance was attributable, to a significant extent, to investment decisions by CSIM that were reasonable and consistent with the Fund’s investment objective and policies and that CSIM had taken steps designed to help improve performance. Following such evaluation, the Board concluded, within the context of its full deliberations, that the performance of each Fund supported renewal of the Agreement with respect to such Fund.
Fund Expenses. With respect to each Fund’s expenses, the Trustees considered the rate of compensation called for by the Agreement and each Fund’s operating expense ratio, in each case in comparison to those of other similar exchange-traded funds, such peer groups and comparisons having been selected and calculated by an independent provider of investment company data. CSIM reported to the Board, and the Board took into account, the risk assumed by CSIM in the development of the Funds and provision of services as well as the competitive marketplace for financial products. The Trustees also considered fees charged by CSIM to mutual funds and other ETFs that it manages. Following such evaluation, the Board concluded, within the context of its full deliberations, that the expenses of each Fund are reasonable and supported renewal of the Agreement with respect to such Fund.
Profitability. The Trustees considered the compensation flowing to CSIM and its affiliates, directly or indirectly and
reviewed profitability on a pre-tax basis, without regard to distribution expenses. In this connection, the Trustees reviewed management’s profitability analyses. The Trustees also reviewed profitability of CSIM relating to the Schwab fund complex as a whole, noting the benefits to Fund shareholders of being part of the Schwab fund complex, including the allocations of certain fixed costs across the Funds and other funds in the complex. The Trustees also considered any other benefits derived by CSIM from its relationship with the Funds, such as whether, by virtue of its management of the Funds, CSIM obtains investment information or other research resources that aid it in providing advisory services to other clients. The Trustees considered whether the compensation and profitability with respect to the Funds under the Agreement and other service agreements were reasonable and justified in light of the quality of all services rendered to the Funds by CSIM and its affiliates. The Trustees noted that CSIM continues to invest substantial sums in its business in order to provide enhanced research capabilities, services and systems to benefit the Funds. Based on this evaluation, the Board concluded, within the context of its full deliberations, that the profitability of CSIM with respect to each Fund is reasonable and supported renewal of the Agreement with respect to such Fund.
Economies of Scale. Although the Trustees recognized the difficulty of determining economies of scale with precision, the Trustees considered the potential existence of any economies of scale by way of the relatively low advisory fee and unitary fee structure of the Funds and whether those are passed along to a Fund’s shareholders through (i) the enhancement of services provided to the Funds in return for fees paid, including through investments by CSIM in CSIM’s infrastructure, including modernizing CSIM’s technology and use of data, increasing expertise and capabilities in key areas (including portfolio and trade operations), and improving business continuity, cybersecurity, due diligence and information security programs, which are designed to provide enhanced services to the Funds and their shareholders; (ii) graduated investment advisory fee schedules or unitary fee structures, fee waivers, or expense caps by CSIM and its affiliates for those funds in the Schwab fund complex with such features; and (iii) pricing a fund to scale and keeping overall expenses down as the fund grows. The Trustees acknowledged that CSIM has shared any economies of scale with the Funds by investing in CSIM’s infrastructure, as discussed above, over time and that CSIM’s internal costs of providing investment management, technology, administrative, legal and compliance services to the Funds continue to increase as a result of regulatory or other developments. Based on this evaluation, the Board concluded, within the context of its full deliberations, that each Fund obtains reasonable benefits from economies of scale.
In the course of their deliberations, the Trustees may have accorded different weights to various factors and did not identify any particular information or factor that was all important or controlling. Based on the Trustees’ deliberation and their evaluation of the information described above, the Board, including all of the Independent Trustees, approved the
Schwab International Equity ETFs | Annual Report
Schwab International Equity ETFs
continuation of the Agreement with respect to the Funds and concluded that the compensation under the Agreement with respect to the Funds is fair and reasonable in light of the services provided and the related expenses borne by CSIM and its affiliates and such other matters as the Trustees considered to be relevant in the exercise of their reasonable judgment.
Initial Approval of Investment Advisory Agreement
The Board of Trustees (the Board or the Trustees, as appropriate) called and held a meeting on February 24, 2021, in part, for the purpose of considering whether to appoint Charles Schwab Investment Management, Inc. (CSIM) as investment adviser to the Schwab International Dividend Equity ETF (the Fund) under the investment advisory agreement between Schwab Strategic Trust (the Trust) and CSIM (the Agreement). In preparation for the meeting, the Board requested and reviewed a wide variety of materials provided by CSIM and considered information that the Board receives from CSIM throughout the year, including information about CSIM’s affiliates, personnel, business goals and priorities, profitability, third-party oversight, corporate structure and operations. The Board also received data provided by an independent provider of investment company data. In recognition of the fact that the Fund had not yet commenced operations, the Board also considered information provided by CSIM in connection with the Board’s consideration of approval of the investment advisory agreement with respect to the other funds within the Trust. The Board also took into account the detailed information about other funds within the Trust that the Board reviews during the course of each year, including information that relates to those funds’ operations and performance, legal and compliance matters, risk management, portfolio turnover, and sales and marketing activity. The Independent Trustees received advice from Independent Trustees’ legal counsel, including with respect to the responsibilities of trustees for the approval of investment advisory agreements. In addition, the Independent Trustees participated in question and answer sessions with representatives of CSIM and met in executive session outside the presence of Fund management.
The Board, including a majority of the Independent Trustees approved the Agreement with respect to the Fund. The Board’s approval was based on consideration and evaluation of a variety of specific factors discussed at this meeting, including:
| 1. | the nature, extent and quality of the services to be provided to the Fund under the Agreement, including the resources of CSIM and its affiliates to be dedicated to the Fund; |
| 2. | CSIM’s investment performance in managing other funds having relevant investment objectives and strategies; |
| 3. | the Fund’s estimated expenses and how those expenses compared to those of certain other similar exchange-traded funds; |
| 4. | the profitability of CSIM and its affiliates, including Charles Schwab & Co., Inc. (Schwab), with respect to management of other funds, including both direct and indirect benefits accruing to CSIM and its affiliates; and |
| 5. | the extent to which economies of scale would be realized as the Fund grows and whether fee levels in the Agreement reflect those economies of scale for the benefit of Fund investors. |
Nature, Extent and Quality of Services. The Board considered the nature, extent and quality of the services to be provided by CSIM to the Fund and the resources of CSIM and its affiliates will dedicate to the Fund. In this regard, the Trustees evaluated, among other things, CSIM’s experience, track record, compliance program, resources dedicated to hiring and retaining skilled personnel and specialized talent, and information security resources. The Trustees also considered information provided by CSIM relating to services and support to be provided with respect to the Fund’s portfolio management team, portfolio strategy, and internal investment guidelines, as well as trading infrastructure, liquidity management, product design and analysis, shareholder communications, securities valuation, fund accounting and custody, and vendor and risk oversight. The Trustees also considered investments CSIM has made in its infrastructure, including modernizing CSIM’s technology and use of data, increasing expertise in key areas (including portfolio management and trade operations), and improving business continuity, cybersecurity, due diligence, risk management processes, and information security programs, which are designed to provide enhanced services to the Fund and its shareholders. The Trustees considered CSIM’s effective implementation of its business continuity plan in response to the COVID-19 pandemic and government-mandated restrictions during the prior year. The Trustees also considered Schwab’s reputation as a full service brokerage firm and its overall financial condition, including Schwab’s ability to maintain consistent operations and service levels during recent periods of remote work and market volatility. Following such evaluation, the Board concluded, within the context of its full deliberations, that the nature, extent and quality of services to be provided by CSIM to the Fund and the resources of CSIM and its affiliates dedicated to the Fund supported approval of the Agreement with respect to the Fund.
Fund Performance. Since the Fund had not commenced operations and therefore did not have any performance of its own, the Board considered performance of other funds having comparable investment strategies in determining whether to approve the Agreement. The Trustees also considered the risk profile for the Fund and the appropriateness of the benchmark that would be used to compare the performance of the Fund. Following such evaluation, the Board concluded, within the context of its full deliberations, that the expected performance of the Fund supported approval of the Agreement with respect to the Fund.
Fund Expenses. With respect to the Fund’s expenses, the Trustees considered the rate of compensation called for by the
Schwab International Equity ETFs | Annual Report
Schwab International Equity ETFs
Agreement and the Fund’s estimated net operating expense ratio, in each case, in comparison to those of other similar exchange-traded funds, such peer groups and comparisons having been selected and calculated by an independent provider of investment company data. The Board took into account the risk assumed by CSIM in the development of the Fund and the services to be provided as well as the competitive marketplace for financial products. The Trustees also considered fees charged by CSIM to mutual funds and other ETFs that it manages. The Board evaluated the Fund’s unitary fee through review of comparative information with respect to fees paid by other similar exchange-traded funds tracking equity indexes. Following such evaluation, the Board concluded, within the context of its full deliberations, that the expenses of the Fund are reasonable and supported approval of the Agreement with respect to the Fund.
Profitability. With regard to profitability, the Trustees considered the expected compensation to be flowing to CSIM and its affiliates, directly or indirectly. In this connection, the Trustees reviewed management’s profitability analyses of CSIM relating to the Schwab fund complex as a whole, noting the benefits to Fund shareholders of being part of the Schwab fund complex, including the allocations of certain fixed costs across the Fund and other funds in the complex. The Trustees also considered any other potential benefits to be derived by CSIM from its relationship with the Fund, such as whether, by virtue of its management of the Fund, CSIM obtains investment information or other research resources that aid it in providing advisory services to other clients. The Trustees considered whether the expected compensation and profitability with respect to the Fund under the Agreement and other service agreements were reasonable and justified in light of the quality of all services to be rendered to the Fund by CSIM and its affiliates. The Trustees noted that CSIM continues to invest substantial sums in its business in order to provide enhanced research capabilities, services, and systems that would benefit the Fund. Based on this evaluation, the Board concluded, within the context of its full deliberations, that the expected profitability of CSIM, albeit uncertain, is reasonable and supported approval of the Agreement with respect to the Fund.
Economies of Scale. Recognizing that the Fund had not yet commenced operations and had no assets, the Trustees considered the potential existence of any economies of scale
and whether those could be expected to be passed along to the Fund’s shareholders by way of the relatively low advisory fee and unitary fee structure of the Fund through (i) the enhancement of services provided to the Fund in return for fees paid, including through investments by CSIM in CSIM’s infrastructure, including modernizing CSIM’s technology and use of data, increasing expertise and capabilities in key areas (including portfolio and trade operations), and improving business continuity, cybersecurity, due diligence and information security programs, which are designed to provide enhanced services to the Fund and its shareholders; (ii) graduated investment advisory fee schedules or unitary fee structures, fee waivers, or expense caps by CSIM and its affiliates for those funds in the Schwab funds complex with such features; and (iii) pricing the Fund to scale and keeping overall expenses down as the Fund grows. The Trustees acknowledged that CSIM will share any economies of scale with the Fund by investing in CSIM’s infrastructure, as discussed above, over time and that CSIM’s internal costs of providing investment management, technology, administrative, legal and compliance services to the Fund may increase as a result of regulatory or other developments. The Board determined that such economies of scale will be shared by way of the relatively low advisory fee and unitary fee structure of the Fund, although the Board will continue to monitor fees as the Fund grows in size and assess whether breakpoints may be warranted. Based on this evaluation, the Board concluded, within the context of its full deliberations, that the Fund may be expected to obtain reasonable benefits from economies of scale if such economies develop.
In the course of their deliberations, the Trustees may have accorded different weights to various factors and did not identify any particular information or factor that was all important or controlling. Based on the Trustees’ deliberation and their evaluation of the information described above, the Board, including all of the Independent Trustees, unanimously approved the Agreement with respect to the Fund and concluded that the compensation under the Agreement with respect to the Fund is fair and reasonable in light of the services to be provided and the related expenses to be borne by CSIM and its affiliates and such other matters as the Trustees considered to be relevant in the exercise of their reasonable judgment.
| 1 | The meeting on June 8, 2021 was held by means of videoconference in reliance on exemptive relief from the in-person voting requirement under the 1940 Act as provided by the Securities and Exchange Commission. |
Schwab International Equity ETFs | Annual Report
Schwab International Equity ETFs
Trustees and Officers
The tables below give information about the trustees and officers of Schwab Strategic Trust, which includes the funds covered in this report. The “Fund Complex” includes The Charles Schwab Family of Funds, Schwab Capital Trust, Schwab Investments, Schwab Annuity Portfolios, Schwab Strategic Trust and Laudus Trust. The Fund Complex includes 102 funds.
The address for all trustees and officers is 211 Main Street, San Francisco, CA 94105. You can find more information about the trustees and officers in the Statement of Additional Information, which is available free by calling 1-877-824-5615.
| Independent Trustees |
Name, Year of Birth, and
Position(s) with the trust
(Terms of office, and
length of Time Served1) | Principal Occupations
During the Past Five Years | Number of
Portfolios in
Fund Complex
Overseen by
the Trustee | Other Directorships |
Robert W. Burns
1959
Trustee
(Trustee of Schwab Strategic Trust since 2009; The Charles Schwab Family of Funds, Schwab Investments, Schwab Capital Trust, Schwab Annuity Portfolios and Laudus Trust since 2016) | Retired/Private Investor (Jan. 2009 – present). Formerly, Managing Director, Pacific Investment Management Company, LLC (PIMCO) (investment management firm) and President, PIMCO Funds. | 102 | None |
John F. Cogan
1947
Trustee
(Trustee of The Charles Schwab Family of Funds, Schwab Investments, Schwab Capital Trust and Schwab Annuity Portfolios since 2008; Laudus Trust since 2010; Schwab Strategic Trust since 2016) | Senior Fellow (Oct. 1979 – present), The Hoover Institution at Stanford University (public policy think tank); Senior Fellow (2000 – present), Stanford Institute for Economic Policy Research; Professor of Public Policy (1994 – 2015), Stanford University. | 102 | Director (2005 – 2020), Gilead Sciences, Inc. |
Nancy F. Heller
1956
Trustee
(Trustee of The Charles Schwab Family of Funds, Schwab Investments, Schwab Capital Trust, Schwab Annuity Portfolios, Schwab Strategic Trust and Laudus Trust since 2018) | Retired. President and Chairman (2014 – 2016), TIAA Charitable (financial services); Senior Managing Director (2003 – 2016), TIAA (financial services). | 102 | None |
David L. Mahoney
1954
Trustee
(Trustee of The Charles Schwab Family of Funds, Schwab Investments, Schwab Capital Trust, Schwab Annuity Portfolios and Laudus Trust since 2011; Schwab Strategic Trust since 2016) | Private Investor. | 102 | Director (2004 – present), Corcept Therapeutics Incorporated
Director (2009 – present), Adamas Pharmaceuticals, Inc.
Director (2003 – 2019), Symantec Corporation |
Jane P. Moncreiff
1961
Trustee
(Trustee of The Charles Schwab Family of Funds, Schwab Investments, Schwab Capital Trust, Schwab Annuity Portfolios, Schwab Strategic Trust and Laudus Trust since 2019) | Consultant (2018 – present), Fulham Advisers LLC (management consulting); Chief Investment Officer (2009 – 2017), CareGroup Healthcare System, Inc. (healthcare). | 102 | None |
Schwab International Equity ETFs | Annual Report
Schwab International Equity ETFs
| Independent Trustees (continued) |
Name, Year of Birth, and
Position(s) with the trust
(Terms of office, and
length of Time Served1) | Principal Occupations
During the Past Five Years | Number of
Portfolios in
Fund Complex
Overseen by
the Trustee | Other Directorships |
Kiran M. Patel
1948
Trustee
(Trustee of The Charles Schwab Family of Funds, Schwab Investments, Schwab Capital Trust, Schwab Annuity Portfolios and Laudus Trust since 2011; Schwab Strategic Trust since 2016) | Retired. Executive Vice President and General Manager of Small Business Group (Dec. 2008 – Sept. 2013), Intuit, Inc. (financial software and services firm for consumers and small businesses). | 102 | Director (2008 – present), KLA-Tencor Corporation |
Kimberly S. Patmore
1956
Trustee
(Trustee of The Charles Schwab Family of Funds, Schwab Investments, Schwab Capital Trust, Schwab Annuity Portfolios, Schwab Strategic Trust and Laudus Trust since 2016) | Consultant (2008 – present), Patmore Management Consulting (management consulting). | 102 | None |
J. Derek Penn
1957
Trustee
(Trustee of The Charles Schwab Family of Funds, Schwab Investments, Schwab Capital Trust, Schwab Annuity Portfolios, Schwab Strategic Trust and Laudus Trust since 2021) | Head of Equity Sales and Trading (2006 – 2018), BNY Mellon (financial services). | 102 | None |
| Interested Trustees |
Name, Year of Birth, and
Position(s) with the trust
(Terms of office, and
length of Time Served1) | Principal Occupations
During the Past Five Years | Number of
Portfolios in
Fund Complex
Overseen by
the Trustee | Other Directorships |
Walter W. Bettinger II2
1960
Chairman and Trustee
(Trustee of The Charles Schwab Family of Funds, Schwab Investments, Schwab Capital Trust and Schwab Annuity Portfolios since 2008; Schwab Strategic Trust since 2009; Laudus Trust since 2010) | Director, President and Chief Executive Officer (Oct. 2008 – present), The Charles Schwab Corporation; President and Chief Executive Officer (Oct. 2008 – present) and Director (May 2008 – present), Charles Schwab & Co., Inc.; Director (Apr. 2006 – present), Charles Schwab Bank, SSB; Director (Nov. 2017 – present), Charles Schwab Premier Bank, SSB; Director (July 2019 – present), Charles Schwab Trust Bank; Director (May 2008 – present) and President and Chief Executive Officer (Aug. 2017 – present), Schwab Holdings, Inc.; Director (Oct. 2020 – present), TD Ameritrade Holding Corporation; Director (July 2016 – present), Charles Schwab Investment Management, Inc. | 102 | Director (2008 – present), The Charles Schwab Corporation |
Schwab International Equity ETFs | Annual Report
Schwab International Equity ETFs
| Interested Trustees (continued) |
Name, Year of Birth, and
Position(s) with the trust
(Terms of office, and
length of Time Served1) | Principal Occupations
During the Past Five Years | Number of
Portfolios in
Fund Complex
Overseen by
the Trustee | Other Directorships |
Joseph R. Martinetto2
1962
Trustee
(Trustee of The Charles Schwab Family of Funds, Schwab Investments, Schwab Capital Trust, Schwab Annuity Portfolios, Schwab Strategic Trust and Laudus Trust since 2016) | Chief Operating Officer (Feb. 2018 – present) and Senior Executive Vice President (July 2015 – Feb. 2018), The Charles Schwab Corporation; Senior Executive Vice President (July 2015 – present), Charles Schwab & Co., Inc.; Chief Financial Officer (July 2015 – Aug. 2017) and Executive Vice President and Chief Financial Officer (May 2007 – July 2015), The Charles Schwab Corporation and Charles Schwab & Co., Inc.; Director (May 2007 – present), Charles Schwab & Co., Inc.; Director (Apr. 2010 – present) and Chief Executive Officer (July 2013 – Apr. 2015), Charles Schwab Bank, SSB; Director (Nov. 2017 – present), Charles Schwab Premier Bank, SSB; Director (May 2007 – present), Chief Financial Officer (May 2007 – Aug. 2017), Senior Executive Vice President (Feb. 2016 – present), and Executive Vice President (May 2007 – Feb. 2016), Schwab Holdings, Inc.; Director (Oct. 2020 – present), TD Ameritrade Holding Corporation. | 102 | None |
| Officers of the Trust |
Name, Year of Birth, and Position(s) with the trust
(Terms of office, and length of Time Served3) | Principal Occupations During the Past Five Years |
Jonathan de St. Paer
1973
President and Chief Executive Officer
(Officer of The Charles Schwab Family of Funds, Schwab Investments, Schwab Capital Trust, Schwab Annuity Portfolios, Schwab Strategic Trust and Laudus Trust since 2018) | Director (Apr. 2019 – present), President (Oct. 2018 – present), Chief Operating Officer (Jan. 2020 – present), and Chief Executive Officer (Apr. 2019 – Nov. 2019), Charles Schwab Investment Management, Inc.; Senior Vice President (June 2020 – present) and Chief Operating Officer (Jan. 2020 – present), Charles Schwab Investment Advisory, Inc.; Chief Executive Officer (Apr. 2019 – present), President (Nov. 2018 – present) and Trustee (Apr. 2019 – Dec. 2020), Schwab Funds, Laudus Funds and Schwab ETFs; Director (Apr. 2019 – present), Charles Schwab Worldwide Funds plc and Charles Schwab Asset Management (Ireland) Limited; Senior Vice President (Apr. 2019 – present), Senior Vice President – Strategy and Product Development (CSIM) (Jan. 2014 – Mar. 2019), and Vice President (Jan. 2009 – Dec. 2013), Charles Schwab & Co., Inc. |
Mark Fischer
1970
Treasurer, Chief Financial Officer and Chief Operating Officer
(Officer of The Charles Schwab Family of Funds, Schwab Investments, Schwab Capital Trust, Schwab Annuity Portfolios, Schwab Strategic Trust and Laudus Trust since 2013) | Treasurer and Chief Financial Officer (Jan. 2016 – present) and Chief Operating Officer (Dec. 2020 – present), Schwab Funds, Laudus Funds and Schwab ETFs; Assistant Treasurer (Dec. 2013 – Dec. 2015), Schwab Funds and Laudus Funds; Assistant Treasurer (Nov. 2013 – Dec. 2015), Schwab ETFs; Chief Financial Officer (Mar. 2020 – present) and Vice President (Oct. 2013 – present), Charles Schwab Investment Management, Inc.; Executive Director (Apr. 2011 – Sept. 2013), J.P. Morgan Investor Services; Assistant Treasurer (May 2005 – Mar. 2011), Massachusetts Financial Service Investment Management. |
Omar Aguilar
1970
Senior Vice President and Chief Investment Officer
(Officer of The Charles Schwab Family of Funds, Schwab Investments, Schwab Capital Trust, Schwab Annuity Portfolios, Schwab Strategic Trust and Laudus Trust since 2011) | Senior Vice President and Chief Investment Officer (Apr. 2011 – present), Charles Schwab Investment Management, Inc.; Senior Vice President and Chief Investment Officer (June 2011 – present), Schwab Funds, Laudus Funds and Schwab ETFs; Head of the Portfolio Management Group and Vice President of Portfolio Management (May 2009 – Apr. 2011), Financial Engines, Inc. (investment management firm); Head of Quantitative Equity (July 2004 – Jan. 2009), ING Investment Management. |
Brett Wander
1961
Senior Vice President and Chief Investment Officer
(Officer of The Charles Schwab Family of Funds, Schwab Investments, Schwab Capital Trust, Schwab Annuity Portfolios, Schwab Strategic Trust and Laudus Trust since 2011) | Senior Vice President and Chief Investment Officer (Apr. 2011 – present), Charles Schwab Investment Management, Inc.; Senior Vice President and Chief Investment Officer (June 2011 – present), Schwab Funds, Laudus Funds and Schwab ETFs; Senior Managing Director and Global Head of Active Fixed-Income Strategies (Jan. 2008 – Oct. 2010), State Street Global Advisors; Director of Alpha Strategies (Apr. 2006 – Jan. 2008), Loomis, Sayles & Company (investment management firm). |
William P. McMahon, Jr.
1972
Senior Vice President and Chief Investment Officer
(Officer of The Charles Schwab Family of Funds, Schwab Investments, Schwab Capital Trust, Schwab Annuity Portfolios, Schwab Strategic Trust and Laudus Trust since 2021) | Senior Vice President and Chief Investment Officer (Jan. 2020 – present), Charles Schwab Investment Management, Inc.; Senior Vice President and Chief Investment Officer (June 2021 – present), Schwab Funds, Laudus Funds and Schwab ETFs; Senior Vice President and Chief Investment Officer – ThomasPartners Strategies (Apr. 2018 – Dec. 2019), Charles Schwab Investment Advisory, Inc.; Senior Vice President and Chief Investment Officer (May 2001 – Apr. 2018), ThomasPartners, Inc. |
Schwab International Equity ETFs | Annual Report
Schwab International Equity ETFs
| Officers of the Trust (continued) |
Name, Year of Birth, and Position(s) with the trust
(Terms of office, and length of Time Served3) | Principal Occupations During the Past Five Years |
David Lekich
1964
Vice President and Assistant Secretary, Schwab Funds and Schwab ETFs
Vice President and Assistant Clerk, Laudus Funds
(Officer of The Charles Schwab Family of Funds, Schwab Investments, Schwab Capital Trust, Schwab Annuity Portfolios, Schwab Strategic Trust and Laudus Trust since 2011) | Senior Vice President (Sept. 2011 – present) and Vice President (Mar. 2004 – Sept. 2011), Charles Schwab & Co., Inc.; Senior Vice President and Chief Counsel (Sept. 2011 – present) and Vice President (Jan. 2011 – Sept. 2011), Charles Schwab Investment Management, Inc.; Vice President and Assistant Secretary (Oct. 2021 – present), Secretary (Apr. 2011 – Oct. 2021) and Chief Legal Officer (Dec. 2011 – Oct. 2021), Schwab Funds; Vice President and Assistant Clerk (Apr. 2011 – present), Laudus Funds; Vice President and Assistant Secretary (Oct. 2021 – present), Secretary (May 2011 – Oct. 2021) and Chief Legal Officer (Nov. 2011 – Oct. 2021), Schwab ETFs. |
Catherine MacGregor
1964
Chief Legal Officer and Secretary, Schwab Funds and Schwab ETFs
Chief Legal Officer, Vice President and Clerk, Laudus Funds
(Officer of The Charles Schwab Family of Funds, Schwab Investments, Schwab Capital Trust, Schwab Annuity Portfolios and Laudus Trust since 2005; Schwab Strategic Trust since 2009) | Vice President (July 2005 – present), Charles Schwab & Co., Inc.; Vice President (Sept. 2005 – present), Charles Schwab Investment Management, Inc.; Vice President (Dec. 2005 – present) and Chief Legal Officer and Clerk (Mar. 2007 – present), Laudus Funds; Chief Legal Officer and Secretary (Oct. 2021 – present), Vice President (Nov. 2005 – Oct. 2021) and Assistant Secretary (June 2007 – Oct. 2021), Schwab Funds; Chief Legal Officer and Secretary (Oct. 2021 – present), Vice President and Assistant Secretary (Oct. 2009 – Oct. 2021), Schwab ETFs. |
| 1 | Each Trustee shall hold office until the election and qualification of his or her successor, or until he or she dies, resigns or is removed. The retirement policy requires that each independent trustee retire by December 31 of the year in which the Trustee turns 74 or the Trustee’s twentieth year of service as an independent trustee on any trust in the Fund Complex, whichever occurs first. |
| 2 | Mr. Bettinger and Mr. Martinetto are Interested Trustees. Mr. Bettinger is an Interested Trustee because he owns stock of The Charles Schwab Corporation (CSC), the parent company of Charles Schwab Investment Management, Inc. (CSIM), the investment adviser for the trusts in the Fund Complex, is an employee and director of Charles Schwab & Co., Inc. (Schwab), the principal underwriter for The Charles Schwab Family of Funds, Schwab Investments, Schwab Capital Trust, Schwab Annuity Portfolios and Laudus Trust, and is a director of CSIM. Mr. Martinetto is an Interested Trustee because he owns stock of CSC and is an employee and director of Schwab. |
| 3 | The President, Treasurer and Secretary/Clerk hold office until their respective successors are chosen and qualified or until he or she sooner dies, resigns, is removed or becomes disqualified. Each of the other officers serves at the pleasure of the Board. |
Schwab International Equity ETFs | Annual Report
Schwab International Equity ETFs
144A securities These securities may be sold only to qualified institutional buyers under Securities Act Rule 144A.
American Depositary Receipt (ADR) U.S. dollar-denominated receipts issued by U.S. banks or trust companies that represent shares of foreign-based corporations.
ask See “offer.”
asset allocation The practice of dividing a portfolio among different asset classes, with each asset class assigned a particular percentage to help offset risks and rewards, based on your goals, time horizon and risk tolerance.
asset class A group of securities with similar structure and basic characteristics. Stocks, bonds and cash are the three main examples of asset classes.
authorized participant (AP) A large institutional investor that places orders for creation units with the funds’ distributor.
beta A historical measure of an investment’s volatility relative to a market index (usually the S&P 500®). The index is defined as having a beta of 1.00. Investments with a beta higher than 1.00 have been more volatile than the index; those with a beta of less than 1.00 have been less volatile.
bid The highest price at which someone is willing to buy a security.
Bloomberg US Aggregate Bond Index An index that is a broad-based benchmark measuring the performance of the U.S. investment grade, taxable bond market, including U.S. Treasuries, government-related and corporate bonds, mortgage pass-through securities, commercial mortgage-backed securities, and asset-backed securities that are publicly available for sale in the United States. To be eligible for inclusion in the index, securities must be fixed rate, non-convertible, U.S. dollar-denominated with at least $300 million or more of outstanding face value and have one or more years remaining to maturity. The index excludes certain types of securities, including tax-exempt state and local government series bonds, structured notes embedded with swaps or other special features, private placements, floating rate securities, inflation-linked bonds and Eurobonds. The index is market capitalization weighted and the securities in the index are updated on the last business day of each month.
Bloomberg US Treasury Bills 1–3 Month Index An index that includes all publicly issued zero-coupon U.S. Treasury Bills that have a remaining maturity of less than 3 months but more than 1 month, are rated investment grade and have $300 million or more of outstanding face value. It excludes zero-coupon STRIPS.
cap, capitalization See “market cap.”
capital gain, capital loss The difference between the amount paid for an investment and its value at a later time. If the investment has been sold, the capital gain or loss is considered a realized gain or loss. If the investment is still held, the gain or loss is still “on paper” and is considered unrealized.
commencement of operations The date that the first NAV was calculated.
creation unit (C.U.) A basket of securities that is delivered by an authorized participant (AP) to the fund equal to the current holdings of the ETF, plus a designated cash component. In return, the APs receive a large block of ETF shares (typically 50,000 shares), which investors can then buy and sell in the secondary market.
Dow Jones International Dividend 100 Index An index that is designed to measure the performance of high dividend yielding stocks issued by companies in developed and emerging countries outside of the United States that have a record of consistently paying dividends, selected for fundamental strength based on financial ratios and lower volatility. The 100-component index is derived from the constituents of the Dow Jones Global ex-U.S. Large-Cap Index and the Dow Jones Global ex-U.S. Mid-Cap Index, and excludes real estate investment trusts (REITs). It is modified market capitalization weighted.
European Depositary Receipt (EDR) A negotiable security (receipt) that is issued by a European bank, and that represents shares of foreign-based corporations.
exchange A marketplace, or any organization or group that provides or maintains a marketplace for trading securities, options, futures, or commodities.
expense ratio The amount that is taken from the fund’s assets each year to cover the operating expenses. An expense ratio of 0.50% means that a fund’s expenses amount to half of one percent of its average net assets a year.
FTSE Developed ex US Index (Net) An index that is comprised of large- and mid-capitalization companies in developed countries outside the United States, as defined by the index provider. The index defines the large- and mid-capitalization universe as approximately the top 90% of the eligible universe. The Net version of the index reflects reinvested dividends net of withholding taxes, but reflects no deductions for expenses or other taxes.
FTSE Developed Small Cap ex US Liquid Index (Net) An index comprised of small-capitalization companies in developed countries outside the United States, as defined by the index provider. The index defines the small-capitalization universe as approximately the bottom 10% of the eligible universe with a minimum free float capitalization of $150 million. The Net version of the index reflects reinvested dividends net of withholding taxes, but reflects no deductions for expenses or other taxes.
FTSE Emerging Index (Net) An index that is comprised of large- and mid-capitalization companies in emerging market countries, as defined by the index provider. The index defines the large- and mid-capitalization universe as approximately the top 90% of the eligible universe. The Net version of the index reflects reinvested dividends net of withholding taxes, but reflects no deductions for expenses or other taxes.
Global Depositary Receipt (GDR) A negotiable security (receipt) that is issued by a foreign bank, and that represents shares of foreign-based corporations.
gross domestic product (GDP) The output of goods and services produced by labor and property located in the United States.
inception date The date that the shares began trading in the secondary market.
indicative optimized portfolio value (IOPV) A calculation disseminated by the stock exchange that approximates the fund’s NAV every 15 seconds throughout the trading day.
liquidity The ability to convert a security or asset quickly into cash.
Schwab International Equity ETFs | Annual Report
Schwab International Equity ETFs
market cap, market capitalization The value of a company as determined by the total value of all shares of its stock outstanding. Free-float market capitalization is a variation of market capitalization that only includes shares generally available to the public, and excludes shares of a company held by entities such as the government. Modified market capitalization weighting represents a mix between conventional market capitalization weighting and equal weighting.
market price return The return based on the change in market price per share of the fund over a given time period. Market price returns assume that dividends and capital gain distributions have been reinvested in the fund at market price.
median market cap The midpoint of the range of market caps of the stocks held by a fund. There are different ways of calculating median market cap. With a simple median, half of the stocks in the fund’s portfolio would be larger than the median, and half would be smaller. With a weighted median (the type that is calculated for these funds), half of the fund’s assets are invested in stocks that are larger than the median market cap, and half in stocks that are smaller.
MSCI EAFE Index (Net) A free float-adjusted market capitalization index that is designed to measure the equity market performance of developed markets in Europe, Australasia, and the Far East. The Net version of the index reflects reinvested dividends net of withholding taxes, but reflects no deductions for expenses or other taxes; returns are calculated applying dividend withholding rates applicable to non-resident persons who do not benefit from double taxation treaties.
MSCI Emerging Markets Index (Net) A free float-adjusted market capitalization weighted index that is designed to measure equity market performance in the global emerging markets. This series approximates the minimum possible dividend reinvestment. The returns are calculated applying dividend withholding rates applicable to non-resident persons who do not benefit from double taxation treaties.
net asset value (NAV) The value of one share of a fund. NAV is calculated by taking the fund’s total assets, subtracting liabilities, and dividing by the number of shares outstanding.
NAV return The return based on the change in NAV of the fund over a given time period. NAV returns assume that dividends and capital gain distributions have been reinvested in the fund.
offer (ask) The lowest price at which an individual is willing to sell a security.
open The price at which a security opened for trading on a given day.
outstanding shares, shares outstanding When speaking of the fund, indicates all shares currently held by investors.
price-to-book ratio (P/B) The market price of a company’s stock compared with its “book value.” A mutual fund’s P/B is the weighted average of the P/B of all stocks in the fund’s portfolio.
price-to-earnings ratio (P/E) The market price of a company’s stock compared with earnings over the past year. A mutual fund’s P/E is the weighted average of the P/E of all stocks in the fund’s portfolio.
primary market The market that deals with the issuance of new securities.
rights and warrants Rights and warrants are types of securities that entitle the holder to purchase a proportionate amount of common stock at a specified price for a specific period of time. Rights allow a shareholder to buy more shares directly from the company, usually at a price somewhat lower than the current market price of the outstanding shares. Warrants are usually issued with bonds and preferred stock. Rights and warrants can trade on the market separately from the company’s stock. The prices of rights and warrants do not necessarily move parallel to the prices of the underlying common stock. Rights usually expire within a few weeks of issuance, while warrants may not expire for several years. If a right or warrant is not exercised within the specified time period, it will become worthless and a fund will lose the purchase price it paid for the right or warrant and the right to purchase the underlying security.
Russell 2000 Index An index that measures the performance of the 2,000 smallest companies in the Russell 3000 Index. The Russell 3000 Index measures the performance of the largest 3,000 U.S. companies representing approximately 98% of the investable U.S. equity market.
S&P 500 Index An index that is designed to measure the performance of 500 leading publicly traded companies from a broad range of industries.
sampling If a fund uses a sampling method, the fund will not fully replicate the benchmark index and may hold securities not included in the index. A fund that utilizes a sampling approach may not track the return of the index.
secondary market The market in which investors purchase securities from other investors rather than directly from the issuing companies. Organized exchanges facilitate the trading of securities in the secondary market.
spread The gap between bid and ask prices of a security.
stock A share of ownership, or equity, in the issuing company.
total return The percentage that an investor would have earned or lost on an investment in the fund assuming dividends and distributions were reinvested.
tracking error The difference between the performance of the fund and its benchmark index, positive or negative.
Schwab International Equity ETFs | Annual Report
Schwab International Equity ETFs
Schwab ETFs
Schwab ETFs are designed to serve as simple low-cost core investment products for a diversified portfolio. These ETFs seek to provide consistent, repeatable performance through a variety of investment strategies that span the equity and fixed income spectrum. The list below shows all currently available Schwab ETFs.
Investors should carefully consider information contained in the prospectus, or if available, the summary prospectus, including investment objectives, risks, charges and expenses before investing. Please call 1-877-824-5615 for a prospectus for any Schwab ETF. Please read the prospectus carefully before you invest. This report must be preceded or accompanied by a current prospectus.
Proxy Voting Policies, Procedures and Results
A description of the proxy voting policies and procedures used to determine how to vote proxies on behalf of the funds is available without charge, upon request, by visiting the Schwab ETFs’ website at www.schwabassetmanagement.com/schwabetfs_prospectus, the SEC’s website at www.sec.gov, or by contacting Schwab ETFs at 1-877-824-5615.
Information regarding how a fund voted proxies relating to portfolio securities during the most recent twelve-month period ended June 30 is available, without charge, by visiting the fund’s website at www.schwabassetmanagement.com/schwabetfs_prospectus or the SEC’s website at www.sec.gov.
U.S. ETFs
Schwab U.S. Broad Market ETF
Schwab 1000 Index® ETF
Schwab U.S. Large-Cap ETF
Schwab U.S. Large-Cap Growth ETF
Schwab U.S. Large-Cap Value ETF
Schwab U.S. Mid-Cap ETF
Schwab U.S. Small-Cap ETF
Schwab U.S. Dividend Equity ETF
Schwab U.S. REIT ETF
International ETFs
Schwab International Equity ETF
Schwab International Small-Cap Equity ETF
Schwab International Dividend Equity ETF
Schwab Emerging Markets Equity ETF
Fixed-Income ETFs
Schwab U.S. TIPS ETF
Schwab Short-Term U.S. Treasury ETF
Schwab Intermediate-Term U.S. Treasury ETF
Schwab Long-Term U.S. Treasury ETF
Schwab U.S. Aggregate Bond ETF
Schwab 1-5 Year Corporate Bond ETF
Schwab 5-10 Year Corporate Bond ETF
Fundamental Index* ETFs
Schwab Fundamental U.S. Broad Market Index ETF
Schwab Fundamental U.S. Large Company Index ETF
Schwab Fundamental U.S. Small Company Index ETF
Schwab Fundamental International Large Company Index ETF
Schwab Fundamental International Small Company Index ETF
Schwab Fundamental Emerging Markets Large Company
Index ETF
Investment Adviser
Charles Schwab Investment Management, Inc.
211 Main Street, San Francisco, CA 94105
Schwab ETFs
1-877-824-5615
© 2021 Charles Schwab Investment Management, Inc. All rights reserved.
Printed on recycled paper.
| * | FUNDAMENTAL INDEX is a registered trademark of Research Affiliates LLC. |
This page is intentionally left blank.
Annual Report | August 31, 2021
Schwab U.S. Equity ETFs
| Schwab U.S. Broad Market ETF | SCHB |
| Schwab 1000 Index® ETF | SCHK |
| Schwab U.S. Large-Cap ETF | SCHX |
| Schwab U.S. Large-Cap Growth ETF | SCHG |
| Schwab U.S. Large-Cap Value ETF | SCHV |
| Schwab U.S. Mid-Cap ETF | SCHM |
| Schwab U.S. Small-Cap ETF | SCHA |
| Schwab U.S. Dividend Equity ETF | SCHD |
This page is intentionally left blank.
Fund investment adviser: Charles Schwab Investment Management, Inc. (CSIM)
Distributor: SEI Investments Distribution Co. (SIDCO)
The Sector/Industry classifications in this report use the Global Industry Classification Standard (GICS) which was developed by and is the exclusive property of MSCI Inc. (MSCI) and Standard & Poor’s (S&P). GICS is a service mark of MSCI and S&P and has been licensed for use by Charles Schwab & Co., Inc. The Industry classifications used in the Portfolio Holdings are sub-categories of Sector classifications.
Schwab U.S. Equity ETFs | Annual Report
The performance data quoted represents past performance. Past performance does not guarantee future results. Investment return and principal value of an investment will fluctuate so that an investor’s shares, when sold or redeemed, may be worth more or less than the original cost. Current performance may be lower or higher than the performance quoted. To obtain performance information current to the most recent month end, please visit www.schwabassetmanagement.com/schwabetfs_prospectus.
| Total Returns for the 12 Months Ended August 31, 2021 |
Schwab U.S. Broad Market ETF
(Ticker Symbol: SCHB) | |
| Market Price Return1 | 33.25% |
| NAV Return1 | 33.23% |
| Dow Jones U.S. Broad Stock Market Index | 33.25% |
| ETF Category: Morningstar Large Blend2 | 31.81% |
| Performance Details | pages 7-9 |
| |
Schwab 1000 Index ETF
(Ticker Symbol: SCHK) | |
| Market Price Return1 | 32.04% |
| NAV Return1 | 31.95% |
| Schwab 1000 Index® | 32.04% |
| Russell 1000® Index | 32.25% |
| ETF Category: Morningstar Large Blend2 | 31.81% |
| Performance Details | pages 10-12 |
| |
Schwab U.S. Large-Cap ETF
(Ticker Symbol: SCHX) | |
| Market Price Return1 | 32.18% |
| NAV Return1 | 32.05% |
| Dow Jones U.S. Large-Cap Total Stock Market Index | 32.09% |
| ETF Category: Morningstar Large Blend2 | 31.81% |
| Performance Details | pages 13-15 |
| |
Schwab U.S. Large-Cap Growth ETF
(Ticker Symbol: SCHG) | |
| Market Price Return1 | 31.10% |
| NAV Return1 | 31.06% |
| Dow Jones U.S. Large-Cap Growth Total Stock Market Index | 31.12% |
| ETF Category: Morningstar Large Growth2 | 28.75% |
| Performance Details | pages 16-18 |
| Total Returns for the 12 Months Ended August 31, 2021 |
Schwab U.S. Large-Cap Value ETF
(Ticker Symbol: SCHV) | |
| Market Price Return1 | 35.09% |
| NAV Return1 | 34.95% |
| Dow Jones U.S. Large-Cap Value Total Stock Market Index | 34.99% |
| ETF Category: Morningstar Large Value2 | 35.95% |
| Performance Details | pages 19-21 |
| |
Schwab U.S. Mid-Cap ETF
(Ticker Symbol: SCHM) | |
| Market Price Return1 | 41.13% |
| NAV Return1 | 40.98% |
| Dow Jones U.S. Mid-Cap Total Stock Market Index | 41.05% |
| ETF Category: Morningstar Mid-Cap Blend2 | 40.76% |
| Performance Details | pages 22-24 |
| |
Schwab U.S. Small-Cap ETF
(Ticker Symbol: SCHA) | |
| Market Price Return1 | 47.39% |
| NAV Return1 | 47.33% |
| Dow Jones U.S. Small-Cap Total Stock Market Index | 47.32% |
| ETF Category: Morningstar Small Blend2 | 49.32% |
| Performance Details | pages 25-27 |
| |
Schwab U.S. Dividend Equity ETF
(Ticker Symbol: SCHD) | |
| Market Price Return1 | 40.29% |
| NAV Return1 | 40.15% |
| Dow Jones U.S. Dividend 100TM Index | 40.31% |
| ETF Category: Morningstar Large Value2 | 35.95% |
| Performance Details | pages 28-30 |
All total returns on this page assume dividends and distributions were reinvested. Index figures do not include trading and management costs, which would lower performance. Indices are unmanaged and cannot be invested in directly. Performance results less than one year are not annualized.
For index definitions, please see the Glossary.
Performance does not reflect the deduction of taxes that a shareholder would pay on fund distributions or on the redemption or sale of fund shares.
Shares are bought and sold at market price, which may be higher or lower than the net asset value (NAV). Brokerage commissions will reduce returns.
Index ownership — Dow Jones® is a registered trademark of Dow Jones Trademark Holdings LLC (Dow Jones). The Dow Jones Indices are products of S& P Dow Jones Indices LLC and/or its affiliates, and have been licensed for use by CSIM. The Schwab U.S. Equity ETFs, based on their respective Dow Jones Indices, are not sponsored, endorsed, sold or promoted by S&P Dow Jones Indices LLC, Dow Jones, or any of their respective affiliates and neither S&P Dow Jones Indices LLC, Dow Jones, nor any of their respective affiliates make any representation regarding the advisability of investing in such products.
| 1 | ETF performance must be shown based on both a market price and NAV basis. The fund’s per share NAV is the value of one share of the fund. NAV is calculated by taking the fund’s total assets (including the fair value of securities owned), subtracting liabilities, and dividing by the number of shares outstanding. The NAV Return is based on the NAV of the fund, and the Market Price Return is based on the market price per share of the fund. The price used to calculate market return (Market Price) is determined using the Official Closing Price on the primary stock exchange (generally, 4:00 p.m. Eastern time) and may not represent the returns you would receive if shares were traded at other times. Market Price and NAV returns assume that dividends and capital gain distributions have been reinvested in the fund at Market Price and NAV, respectively. |
| 2 | Source for category information: Morningstar, Inc. The Morningstar Category return represents all passively- and actively-managed ETFs within the category as of the report date. |
Schwab U.S. Equity ETFs | Annual Report
Jonathan de St. Paer
President of Charles Schwab
Investment Management, Inc.
and the funds covered
in this report.
Dear Shareholder,
Despite the hopes of last winter and spring that large-scale vaccine distribution would bring the COVID-19 pandemic under control, the spread of the Delta variant of the virus continues to pose significant social, health, and economic challenges across the United States and the world. Nevertheless, during the 12-month period ended August 31, 2021, the U.S. economy made dramatic progress toward reopening and renewed growth backed by continued monetary and fiscal support by the U.S. Congress and U.S. Federal Reserve. The U.S. gross domestic product (GDP) growth rate increased by over 6% during the first half of 2021 after declining in 2020. U.S. equity markets rallied sharply as well, with the S&P 500® Index, a bellwether for the overall U.S. stock market, repeatedly reaching new record territory. For the 12-month reporting period ended August 31, 2021, the S&P 500® Index returned 31.2%.
At Charles Schwab Investment Management, we believe that establishing and maintaining a diversified, long-term investing plan that reflects your risk tolerance and long-term financial goals is important. We designed the Schwab U.S. Equity ETFs with this long-term investing strategy in mind. Offering simple, low-cost access to U.S. small-, mid-, and large-cap stocks, growth, value, and dividend yielding stocks, the Schwab U.S. Equity ETFs can serve as part of the core of a diversified portfolio.
Thank you for investing with Charles Schwab Investment Management. For more information about the Schwab U.S. Equity ETFs, please continue reading this report. In addition, you can find further details about these funds by visiting our website at www.schwabassetmanagement.com. We are also happy to hear from you at 1-877-824-5615.
Sincerely,
“ At Charles Schwab Investment Management, we believe that establishing and maintaining a diversified, long-term investing plan that reflects your risk tolerance and long-term financial goals is important.”
Past performance is no guarantee of future results.
Diversification and asset allocation strategies do not ensure a profit and cannot protect against losses in a declining market.
Management views may have changed since the report date.
Schwab U.S. Equity ETFs | Annual Report
The Investment Environment
For the 12-month reporting period ended August 31, 2021, U.S. equity markets generated solid returns, with several key equity market indices ending the reporting period just off record highs. Despite persisting COVID-19 pandemic-driven stresses on the U.S. economy and a resurgence of COVID-19 cases in the fall and into the winter, along with the emergence and rapid spread of the Delta variant during the summer, equity markets continued to rise on economic recovery, strong earnings, ongoing fiscal stimulus measures, and optimism related to the rapid rollout of COVID-19 vaccines that began in December 2020. For the reporting period, the S&P 500® Index, a bellwether for the overall U.S. stock market, returned 31.17%. Small- and mid-cap stocks were stronger than large-cap stocks, with the Russell 2000® Index and the Dow Jones U.S. Mid-Cap Total Stock Market Index returning 47.08% and 41.05%, respectively. Across both large- and small-cap stocks, value stocks outperformed growth.
Bolstered by the extensive emergency rescue and fiscal stimulus measures passed by the U.S. Congress and U.S. Federal Reserve (Fed) beginning in March 2020, the U.S. economy began to recover from the dramatic impact of the COVID-19 pandemic. After falling by an annualized rate of 31.4% in the second quarter of 2020, U.S. gross domestic product (GDP) jumped by an annualized rate of 33.4% for the third quarter of 2020, reflecting pent-up consumer demand and government support. GDP growth stabilized beginning in the fourth quarter of 2020, growing at an annualized rate of 4.3% for the fourth quarter of 2020, 6.3% for the first quarter of 2021, and 6.7% for the second quarter of 2021. Unemployment, which skyrocketed in April 2020 but began falling starting in May 2020, fell over the reporting period. Inflation, which had remained well below the Fed’s traditional 2% target until March 2021, when it jumped, continued to rise through June 2021 and remained elevated through August 2021, largely due to supply and demand imbalances in the labor market, supply chain bottlenecks, increased consumer demand, particularly for travel-related services over most of the reporting period, and higher energy costs.
For the most part, central banks around the world maintained the low—and for some international central banks, negative—interest rates instituted prior to, and in response to, the COVID-19 pandemic. In the U.S., despite improving economic data, the Fed reiterated several times during the reporting period its intention to continue its support of the economy for as long as is needed to achieve a full recovery, while acknowledging that it was keeping an eye on rising
Asset Class Performance Comparison % returns during the 12 months ended August 31, 2021
Index figures assume dividends and distributions were reinvested. Index figures do not include trading and management costs, which would lower performance. Indices are unmanaged and cannot be invested in directly. Performance results less than one year are not annualized. Past performance is not a guarantee of future results.
For index definitions, please see the Glossary.
Data source: Index provider websites and CSIM.
Nothing in this report represents a recommendation of a security by the investment adviser.
Management views may have changed since the report date.
| * | The net version of the index reflects reinvested dividends net of withholding taxes, but reflects no deductions for expenses or other taxes. |
Schwab U.S. Equity ETFs | Annual Report
The Investment Environment (continued)
inflation. The Fed maintained the federal funds rate in a range of 0.00% to 0.25% throughout the reporting period. By the end of the reporting period, the Fed indicated that it would likely begin reducing its bond purchases as early as late 2021 with Fed Chair Jerome Powell noting that the Fed’s bond tapering should not be seen as an indication of an imminent interest rate hike.
Among the sectors in the Dow Jones U.S. Broad Stock Market Index, all posted double-digit returns for the reporting period. Consistent with economic recovery, the strongest performers were the financials and energy sectors. The financials sector’s strength was driven in part by higher-than-expected trading revenues and lower-than-expected loan defaults, along with an improving economic outlook, ongoing fiscal and monetary stimulus measures, and the potential for a steepening yield curve that would increase banks’ profits. The energy sector’s strong performance was largely due to the recovery of oil prices, supported by rising demand, curtailed supply, and a drawdown in inventories. The weakest sector for the reporting period, although it still returned double digits, was the consumer staples sector, a defensive sector that is typically less affected by changes in economic and business cycles. Earnings within the sector have been challenged by aggressive cost-cutting and limited pricing power in the continuing low interest rate environment.
Schwab U.S. Equity ETFs | Annual Report
 | Christopher Bliss, CFA, Managing Director and Head of Passive Equity Strategies for Schwab Asset Management, leads the portfolio management team for passive equity Schwab Funds and Schwab ETFs. He also has overall responsibility for all aspects of the management of the funds. Before joining Schwab in 2016, Mr. Bliss spent 12 years at BlackRock (formerly Barclays Global Investors) managing and leading institutional index teams, most recently as a managing director and the head of the Americas institutional index team. In this role, Mr. Bliss was responsible for overseeing a team of portfolio managers managing domestic, developed international and emerging markets index strategies. Prior to BlackRock, he worked as an equity analyst and portfolio manager for Harris Bretall and before that, as a research analyst for JP Morgan. |
 | Jeremy Brown, Portfolio Manager, is responsible for the day-to-day co-management of the funds. Prior to joining Schwab in 2017, Mr. Brown spent six years with ALPS Advisors, Inc. in Denver, most recently as a senior analyst on the ETF portfolio management and research team where he performed portfolio management, trading, and analytics/research functions for ALPS ETFs and passive funds. Additionally, Mr. Brown led a number of investment research, commentary, industry trend analysis, and sales and marketing support initiatives. |
 | Ferian Juwono, CFA, Senior Portfolio Manager, is responsible for the day-to-day co-management of the funds. Prior to joining Schwab in 2010, Mr. Juwono worked at BlackRock (formerly Barclays Global Investors) where he spent more than three years as a portfolio manager, managing equity index funds for institutional clients, and two years as a senior business analyst. Prior to that, Mr. Juwono worked for more than four years as a senior financial analyst with Union Bank of California. |
 | Sabya Sinha, Portfolio Manager, is responsible for the day-to-day co-management of the funds. Prior to joining Schwab in 2015, Mr. Sinha spent a year at F-Squared Investments on the product development and analytics team. Prior to F-Squared, he worked at IndexIQ Advisors as a senior index portfolio manager for three years and for Bank of America’s Columbia Management subsidiary as a portfolio manager for three years. Mr. Sinha also spent time as a software consultant at DPM Mellon, LLC and an equity trader at Jane Street Capital. |
Schwab U.S. Equity ETFs | Annual Report
Schwab U.S. Broad Market ETF as of August 31, 2021
The Schwab U.S. Broad Market ETF (the fund) seeks to track as closely as possible, before fees and expenses, the total return of the Dow Jones U.S. Broad Stock Market Index (the index). The index includes the largest 2,500 publicly traded U.S. companies for which pricing information is readily available. The index is a float-adjusted market capitalization weighted index that reflects the shares of securities actually available to investors in the marketplace. The fund invests in a representative sample of securities included in the index that, when taken together, are expected to perform similarly to the index as a whole. Due to the use of representative sampling, the fund may not hold all of the securities in the index.
Market Highlights. For the 12-month reporting period ended August 31, 2021, U.S. equity markets generated solid returns, with several key equity market indices ending the reporting period just off record highs. Small- and mid-cap stocks outperformed large-cap stocks, and value outperformed growth. Despite persisting COVID-19 pandemic-driven stresses on the U.S. economy and a resurgence of COVID-19 cases in the fall and into the winter, along with the emergence and rapid spread of the Delta variant during the summer, equity markets continued to rise on strong earnings, ongoing fiscal stimulus measures, and optimism related to the rapid rollout of COVID-19 vaccines that began in December 2020. Within the index, stocks in the financials and energy sectors were the top performers, while consumer staples and utilities stocks underperformed by comparison, although both still returned double digits.
Performance. During the 12-month reporting period ended August 31, 2021, the fund closely tracked the index. The fund’s market price return was 33.25% and its NAV return was 33.23% (for an explanation of the market price and NAV returns, please refer to footnote 2 on the following page). The index returned 33.25% during the same period.
Contributors and Detractors. The information technology sector contributed the most to the total return of the fund. Information technology stocks represented an average weight of approximately 27% of the fund’s investments and returned approximately 31% for the reporting period. One example from this sector is Microsoft Corp., which develops, manufactures, licenses, sells, and supports software products. The fund’s holdings of Microsoft Corp. represented an average weight of approximately 5% of the fund’s investments and returned approximately 35% for the reporting period.
The financials sector also contributed to the total return of the fund, representing an average weight of approximately 11% of the fund’s investments and returning approximately 57% for the reporting period.
Over the reporting period, no sectors detracted from the returns of index or the fund. However, the utilities sector was the smallest contributor to the total return of the fund. Stocks in the utilities sector represented an average weight of approximately 3% of the fund’s investments and returned approximately 20% for the reporting period. One example from this sector is Atmos Energy Corp. which distributes natural gas to utility customers. The fund’s holdings of Atmos Energy Corp. represented an average weight of less than 1% of the fund’s investments and returned less than 1% for the reporting period.
The consumer staples sector was another smaller contributor to the total return of the fund, representing an average weight of approximately 6% of the fund’s investments and returning approximately 15% for the reporting period.
Management views and portfolio holdings may have changed since the report date.
Schwab U.S. Equity ETFs | Annual Report
Schwab U.S. Broad Market ETF
Performance and Fund Facts as of August 31, 2021
The performance data quoted represents past performance. Past performance does not guarantee future results. Investment return and principal value of an investment will fluctuate so that an investor’s shares, when sold or redeemed, may be worth more or less than the original cost. Current performance may be lower or higher than the performance quoted. To obtain performance information current to the most recent month end, please visit www.schwabassetmanagement.com/schwabetfs_prospectus.
Performance of Hypothetical $10,000 Investment (August 31, 2011 – August 31, 2021)1
Average Annual Total Returns1
| Fund and Inception Date | 1 Year | 5 Years | 10 Years |
| Fund: Schwab U.S. Broad Market ETF (11/3/09) | | | |
| Market Price Return2 | 33.25% | 17.96% | 16.18% |
| NAV Return2 | 33.23% | 17.95% | 16.17% |
| Dow Jones U.S. Broad Stock Market Index | 33.25% | 17.96% | 16.18% |
| ETF Category: Morningstar Large Blend3 | 31.81% | 16.35% | 14.73% |
| Fund Expense Ratio4: 0.03% |
All total returns on this page assume dividends and distributions were reinvested. Index figures do not include trading and management costs, which would lower performance. Indices are unmanaged and cannot be invested in directly. Performance results less than one year are not annualized.
For index definitions, please see the Glossary.
Shares are bought and sold at market price, which may be higher or lower than the net asset value (NAV). Brokerage commissions will reduce returns.
Index ownership — Dow Jones® is a registered trademark of Dow Jones Trademark Holdings LLC (Dow Jones). The Dow Jones U.S. Broad Stock Market Index is a product of S&P Dow Jones Indices LLC and/or its affiliates, and has been licensed for use by CSIM. The Schwab U.S. Broad Market ETF is not sponsored, endorsed, sold or promoted by S&P Dow Jones Indices LLC, Dow Jones, or any of their respective affiliates and neither S&P Dow Jones Indices LLC, Dow Jones, nor any of their respective affiliates make any representation regarding the advisability of investing in such product.
| 1 | Performance does not reflect the deduction of taxes that a shareholder would pay on fund distributions or on the redemption or sale of fund shares. |
| 2 | ETF performance must be shown based on both a market price and NAV basis. The fund’s per share NAV is the value of one share of the fund. NAV is calculated by taking the fund’s total assets (including the fair value of securities owned), subtracting liabilities, and dividing by the number of shares outstanding. The NAV Return is based on the NAV of the fund, and the Market Price Return is based on the market price per share of the fund. The price used to calculate market return (Market Price) is determined using the Official Closing Price on the primary stock exchange (generally, 4:00 p.m. Eastern time) and may not represent the returns you would receive if shares were traded at other times. NAV is used as a proxy for purposes of calculating Market Price Return on inception date. Market Price and NAV returns assume that dividends and capital gain distributions have been reinvested in the fund at Market Price and NAV, respectively. |
| 3 | Source for category information: Morningstar, Inc. The Morningstar Category return represents all passively- and actively-managed ETFs within the category as of the report date. |
| 4 | As stated in the prospectus. |
Schwab U.S. Equity ETFs | Annual Report
Schwab U.S. Broad Market ETF
Performance and Fund Facts as of August 31, 2021 (continued)
| Number of Holdings | 2,593 |
| Weighted Average Market Cap (millions) | $510,258 |
| Price/Earnings Ratio (P/E) | 24.5 |
| Price/Book Ratio (P/B) | 4.2 |
| Portfolio Turnover Rate | 4% 2 |
Sector Weightings % of Investments3
Top Equity Holdings % of Net Assets4
Portfolio holdings may have changed since the report date.
An index is a statistical composite of a specified financial market or sector. Unlike the fund, an index does not actually hold a portfolio of securities and its return is not inclusive of trading and management costs incurred by the fund.
Source of Sector Classification: S& P and MSCI.
| 1 | Excludes derivatives. |
| 2 | Portfolio turnover rate excludes securities received or delivered from processing of in-kind creations or redemptions. |
| 3 | The percentage may differ from the Portfolio Holdings because the above calculation is based on a percentage of total investments, excluding derivatives, whereas the calculation in the Portfolio Holdings is based on a percentage of net assets. |
| 4 | This list is not a recommendation of any security by the investment adviser. |
Schwab U.S. Equity ETFs | Annual Report
Schwab 1000 Index ETF as of August 31, 2021
The Schwab 1000 Index ETF (the fund) seeks to track as closely as possible, before fees and expenses, the total return of the Schwab 1000 Index® (the index). The index is a float-adjusted market capitalization weighted index that includes the 1,000 largest stocks of publicly traded companies in the United States, with size being determined by market capitalization (total market value of all shares outstanding). The fund generally will seek to replicate the performance of the index by giving the same weight to a given stock as the index does.
Market Highlights. For the 12-month reporting period ended August 31, 2021, U.S. equity markets generated solid returns, with several key equity market indices ending the reporting period just off record highs. Small- and mid-cap stocks outperformed large-cap stocks, and value outperformed growth. Despite persisting COVID-19 pandemic-driven stresses on the U.S. economy and a resurgence of COVID-19 cases in the fall and into the winter, along with the emergence and rapid spread of the Delta variant during the summer, equity markets continued to rise on strong earnings, ongoing fiscal stimulus measures, and optimism related to the rapid rollout of COVID-19 vaccines that began in December 2020. Within the index, stocks in the financials and energy sectors were the top performers, while consumer staples and utilities stocks underperformed by comparison, although both still returned double digits.
Performance. During the 12-month reporting period ended August 31, 2021, the fund closely tracked the index. The fund’s market price return was 32.04% and its NAV return was 31.95% (for an explanation of the market price and NAV returns, please refer to footnote 2 on the following page). The index returned 32.04% during the same period.
Contributors and Detractors. The information technology sector contributed the most to the total return of the fund. Information technology stocks represented an average weight of approximately 28% of the fund’s investments and returned approximately 30% for the reporting period. One example from this sector is Microsoft Corp., which develops, manufactures, licenses, sells, and supports software products. The fund’s holdings of Microsoft Corp. represented an average weight of approximately 5% of the fund’s investments and returned approximately 35% for the reporting period.
The financials sector also contributed to the total return of the fund, representing an average weight of approximately 11% of the fund’s investments and returning approximately 58% for the reporting period.
Over the reporting period, no sectors detracted from the returns of the index or the fund. However, the utilities sector was the smallest contributor to the total return of the fund. Stocks in the utilities sector represented an average weight of approximately 3% of the fund’s investments and returned approximately 19% for the reporting period. One example from this sector is PG&E Corp., a natural gas and electric service provider. The fund’s holdings of PG&E Corp. represented an average weight of less than 1% of the fund’s investments and returned approximately -23% for the reporting period.
The consumer staples sector was another smaller contributor to the total return of the fund, representing an average weight of approximately 6% of the fund’s investments and returning approximately 15% for the reporting period.
Management views and portfolio holdings may have changed since the report date.
Schwab U.S. Equity ETFs | Annual Report
Performance and Fund Facts as of August 31, 2021
The performance data quoted represents past performance. Past performance does not guarantee future results. Investment return and principal value of an investment will fluctuate so that an investor’s shares, when sold or redeemed, may be worth more or less than the original cost. Current performance may be lower or higher than the performance quoted. To obtain performance information current to the most recent month end, please visit www.schwabassetmanagement.com/schwabetfs_prospectus.
Performance of Hypothetical $10,000 Investment (October 11, 2017 – August 31, 2021)1
| Fund and Inception Date | 1 Year | 3 Years | Since Inception* |
| Fund: Schwab 1000 Index ETF (10/11/17) | | | |
| Market Price Return2 | 32.04% | 18.20% | 18.12% |
| NAV Return2 | 31.95% | 18.22% | 18.13% |
| Schwab 1000 Index® | 32.04% | 18.28% | 18.19% |
| Russell 1000® Index | 32.25% | 18.42% | 18.30% |
| ETF Category: Morningstar Large Blend3 | 31.81% | 16.25% | N/A |
| Fund Expense Ratio4: 0.05% |
All total returns on this page assume dividends and distributions were reinvested. Index figures do not include trading and management costs, which would lower performance. Indices are unmanaged and cannot be invested in directly. Performance results less than one year are not annualized.
For index definitions, please see the Glossary.
Shares are bought and sold at market price, which may be higher or lower than the net asset value (NAV). Brokerage commissions will reduce returns.
| * | Inception (10/11/17) represents the date that the shares began trading in the secondary market. |
| 1 | Performance does not reflect the deduction of taxes that a shareholder would pay on fund distributions or on the redemption or sale of fund shares. |
| 2 | ETF performance must be shown based on both a market price and NAV basis. The fund’s per share NAV is the value of one share of the fund. NAV is calculated by taking the fund’s total assets (including the fair value of securities owned), subtracting liabilities, and dividing by the number of shares outstanding. The NAV Return is based on the NAV of the fund, and the Market Price Return is based on the market price per share of the fund. The price used to calculate market return (Market Price) is determined using the Official Closing Price on the primary stock exchange (generally, 4:00 p.m. Eastern time) and may not represent the returns you would receive if shares were traded at other times. NAV is used as a proxy for purposes of calculating Market Price Return on inception date. Market Price and NAV returns assume that dividends and capital gain distributions have been reinvested in the fund at Market Price and NAV, respectively. |
| 3 | Source for category information: Morningstar, Inc. The Morningstar Category return represents all passively- and actively-managed ETFs within the category as of the report date. |
| 4 | As stated in the prospectus. |
Schwab U.S. Equity ETFs | Annual Report
Performance and Fund Facts as of August 31, 2021 (continued)
| Number of Holdings | 996 2 |
| Weighted Average Market Cap (millions) | $542,662 |
| Price/Earnings Ratio (P/E) | 25.2 |
| Price/Book Ratio (P/B) | 4.5 |
| Portfolio Turnover Rate | 5% 3 |
Sector Weightings % of Investments4
Top Equity Holdings % of Net Assets5
Portfolio holdings may have changed since the report date.
An index is a statistical composite of a specified financial market or sector. Unlike the fund, an index does not actually hold a portfolio of securities and its return is not inclusive of trading and management costs incurred by the fund.
Source of Sector Classification: S& P and MSCI.
| 1 | Excludes derivatives. |
| 2 | As a result of the Schwab 1000 Index®’s once per year reconstitution and the effects of certain corporate actions, the fund may hold more or less than 1,000 securities. |
| 3 | Portfolio turnover rate excludes securities received or delivered from processing of in-kind creations or redemptions. |
| 4 | The percentage may differ from the Portfolio Holdings because the above calculation is based on a percentage of total investments, excluding derivatives, whereas the calculation in the Portfolio Holdings is based on a percentage of net assets. |
| 5 | This list is not a recommendation of any security by the investment adviser. |
Schwab U.S. Equity ETFs | Annual Report
Schwab U.S. Large-Cap ETF as of August 31, 2021
The Schwab U.S. Large-Cap ETF (the fund) seeks to track as closely as possible, before fees and expenses, the total return of the Dow Jones U.S. Large-Cap Total Stock Market Index (the index). The index includes the large-cap portion of the Dow Jones U.S. Total Stock Market Index actually available to investors in the marketplace. The index includes the components ranked 1-750 by full market capitalization. The index is a float-adjusted market capitalization weighted index. The fund generally will seek to replicate the performance of the index by giving the same weight to a given stock as the index does.
Market Highlights. For the 12-month reporting period ended August 31, 2021, U.S. equity markets generated solid returns, with several key equity market indices ending the reporting period just off record highs. Small- and mid-cap stocks outperformed large-cap stocks, and value outperformed growth. Despite persisting COVID-19 pandemic-driven stresses on the U.S. economy and a resurgence of COVID-19 cases in the fall and into the winter, along with the emergence and rapid spread of the Delta variant during the summer, equity markets continued to rise on strong earnings, ongoing fiscal stimulus measures, and optimism related to the rapid rollout of COVID-19 vaccines that began in December 2020. Within the index, stocks in the financials and energy sectors were the top performers, while consumer staples and utilities stocks underperformed by comparison, although both still returned double digits.
Performance. During the 12-month reporting period ended August 31, 2021, the fund closely tracked the index. The fund’s market price return was 32.18% and its NAV return was 32.05% (for an explanation of the market price and NAV returns, please refer to footnote 2 on the following page). The index returned 32.09% during the same period.
Contributors and Detractors. The information technology sector contributed the most to the total return of the fund. Information technology stocks represented an average weight of approximately 28% of the fund’s investments and returned approximately 30% for the reporting period. One example from this sector is Microsoft Corp., which develops, manufactures, licenses, sells, and supports software products. The fund’s holdings of Microsoft Corp. represented an average weight of approximately 5% of the fund’s investments and returned approximately 35% for the reporting period.
The financials sector also contributed to the total return of the fund, representing an average weight of approximately 11% of the fund’s investments and returning approximately 57% for the reporting period.
Over the reporting period, no sectors detracted from the returns of the index or the fund. However, the utilities sector was the smallest contributor to the total return of the fund. Stocks in the utilities sector represented an average weight of approximately 3% of the fund’s investments and returned approximately 19% for the reporting period. One example from this sector is National Fuel Gas Co., a natural gas company with operations in many segments of the natural gas industry. The fund’s holdings of National Fuel Gas Co. represented an average weight of less than 1% of the fund’s investments and returned approximately -8% for the reporting period. The fund’s position in National Fuel Gas Co. was sold prior to the end of the reporting period.
The consumer staples sector was another smaller contributor to the total return of the fund, representing an average weight of approximately 6% of the fund’s investments and returning approximately 14% for the reporting period.
Management views and portfolio holdings may have changed since the report date.
Schwab U.S. Equity ETFs | Annual Report
Schwab U.S. Large-Cap ETF
Performance and Fund Facts as of August 31, 2021
The performance data quoted represents past performance. Past performance does not guarantee future results. Investment return and principal value of an investment will fluctuate so that an investor’s shares, when sold or redeemed, may be worth more or less than the original cost. Current performance may be lower or higher than the performance quoted. To obtain performance information current to the most recent month end, please visit www.schwabassetmanagement.com/schwabetfs_prospectus.
Performance of Hypothetical $10,000 Investment (August 31, 2011 – August 31, 2021)1
Average Annual Total Returns1
| Fund and Inception Date | 1 Year | 5 Years | 10 Years |
| Fund: Schwab U.S. Large-Cap ETF (11/3/09) | | | |
| Market Price Return2 | 32.18% | 18.36% | 16.38% |
| NAV Return2 | 32.05% | 18.37% | 16.39% |
| Dow Jones U.S. Large-Cap Total Stock Market Index | 32.09% | 18.39% | 16.43% |
| ETF Category: Morningstar Large Blend3 | 31.81% | 16.35% | 14.73% |
| Fund Expense Ratio4: 0.03% |
All total returns on this page assume dividends and distributions were reinvested. Index figures do not include trading and management costs, which would lower performance. Indices are unmanaged and cannot be invested in directly. Performance results less than one year are not annualized.
For index definitions, please see the Glossary.
Shares are bought and sold at market price, which may be higher or lower than the net asset value (NAV). Brokerage commissions will reduce returns.
Index ownership — Dow Jones® is a registered trademark of Dow Jones Trademark Holdings LLC (Dow Jones). The Dow Jones U.S. Large-Cap Total Stock Market Index is a product of S&P Dow Jones Indices LLC and/or its affiliates, and has been licensed for use by CSIM. The Schwab U.S. Large-Cap ETF is not sponsored, endorsed, sold or promoted by S&P Dow Jones Indices LLC, Dow Jones, or any of their respective affiliates and neither S&P Dow Jones Indices LLC, Dow Jones, nor any of their respective affiliates make any representation regarding the advisability of investing in such product.
| 1 | Performance does not reflect the deduction of taxes that a shareholder would pay on fund distributions or on the redemption or sale of fund shares. |
| 2 | ETF performance must be shown based on both a market price and NAV basis. The fund’s per share NAV is the value of one share of the fund. NAV is calculated by taking the fund’s total assets (including the fair value of securities owned), subtracting liabilities, and dividing by the number of shares outstanding. The NAV Return is based on the NAV of the fund, and the Market Price Return is based on the market price per share of the fund. The price used to calculate market return (Market Price) is determined using the Official Closing Price on the primary stock exchange (generally, 4:00 p.m. Eastern time) and may not represent the returns you would receive if shares were traded at other times. NAV is used as a proxy for purposes of calculating Market Price Return on inception date. Market Price and NAV returns assume that dividends and capital gain distributions have been reinvested in the fund at Market Price and NAV, respectively. |
| 3 | Source for category information: Morningstar, Inc. The Morningstar Category return represents all passively- and actively-managed ETFs within the category as of the report date. |
| 4 | As stated in the prospectus. |
Schwab U.S. Equity ETFs | Annual Report
Schwab U.S. Large-Cap ETF
Performance and Fund Facts as of August 31, 2021 (continued)
| Number of Holdings | 769 |
| Weighted Average Market Cap (millions) | $560,753 |
| Price/Earnings Ratio (P/E) | 25.3 |
| Price/Book Ratio (P/B) | 4.5 |
| Portfolio Turnover Rate | 4% 2 |
Sector Weightings % of Investments3
Top Equity Holdings % of Net Assets4
Portfolio holdings may have changed since the report date.
An index is a statistical composite of a specified financial market or sector. Unlike the fund, an index does not actually hold a portfolio of securities and its return is not inclusive of trading and management costs incurred by the fund.
Source of Sector Classification: S& P and MSCI.
| 1 | Excludes derivatives. |
| 2 | Portfolio turnover rate excludes securities received or delivered from processing of in-kind creations or redemptions. |
| 3 | The percentage may differ from the Portfolio Holdings because the above calculation is based on a percentage of total investments, excluding derivatives, whereas the calculation in the Portfolio Holdings is based on a percentage of net assets. |
| 4 | This list is not a recommendation of any security by the investment adviser. |
Schwab U.S. Equity ETFs | Annual Report
Schwab U.S. Large-Cap Growth ETF as of August 31, 2021
The Schwab U.S. Large-Cap Growth ETF (the fund) seeks to track as closely as possible, before fees and expenses, the total return of the Dow Jones U.S. Large-Cap Growth Total Stock Market Index (the index). The index includes the large-cap growth portion of the Dow Jones U.S. Total Stock Market Index actually available to investors in the marketplace. The index includes the components ranked 1-750 by full market capitalization and that are classified as “growth” based on a number of factors. The index is a float-adjusted market capitalization weighted index. The fund generally will seek to replicate the performance of the index by giving the same weight to a given stock as the index does.
Market Highlights. For the 12-month reporting period ended August 31, 2021, U.S. equity markets generated solid returns, with several key equity market indices ending the reporting period just off record highs. Small- and mid-cap stocks outperformed large-cap stocks, and value outperformed growth. Despite persisting COVID-19 pandemic-driven stresses on the U.S. economy and a resurgence of COVID-19 cases in the fall and into the winter, along with the emergence and rapid spread of the Delta variant during the summer, equity markets continued to rise on strong earnings, ongoing fiscal stimulus measures, and optimism related to the rapid rollout of COVID-19 vaccines that began in December 2020. Within the index, stocks in the energy and communication services sectors were the top performers, while utilities and consumer discretionary stocks underperformed by comparison, although consumer discretionary stocks still returned double digits.
Performance. During the 12-month reporting period ended August 31, 2021, the fund closely tracked the index. The fund’s market price return was 31.10% and its NAV return was 31.06% (for an explanation of the market price and NAV returns, please refer to footnote 2 on the following page). The index returned 31.12% during the same period. Differences between the return of the fund and the return of the index may be attributable to, among other things, the operational and transactional costs incurred by the fund and not the index.
Contributors and Detractors. The utilities sector was the only sector that detracted from the total return of the fund. Utilities stocks represented an average weight of less than 1% of the fund’s investments and returned approximately -6% for the reporting period. One example from this sector is NextEra Energy, Inc., which provides sustainable energy generation and distribution services. The fund’s holdings of NextEra Energy, Inc. represented an average weight of less than 1% of the fund’s investments and returned approximately -1% for the reporting period. The fund’s positions in the utilities sector were sold prior to the end of the reporting period.
While there were no additional sectors that detracted from the total return of the fund over the reporting period, the energy sector was the smallest contributor to the total return of the fund, representing an average weight of less than 1% of the fund’s investments and returning approximately 84% for the reporting period.
The information technology sector contributed the most to the total return of the fund. Information technology stocks represented an average weight of approximately 45% of the fund’s investments and returned approximately 29% for the reporting period. One example from this sector is Microsoft Corp., which develops, manufactures, licenses, sells, and supports software products. The fund’s holdings of Microsoft Corp. represented an average weight of approximately 11% of the fund’s investments and returned approximately 35% for the reporting period.
The communication services sector also contributed to the total return of the fund, representing an average weight of approximately 16% of the fund’s investments and returning approximately 51% for the reporting period.
Management views and portfolio holdings may have changed since the report date.
Schwab U.S. Equity ETFs | Annual Report
Schwab U.S. Large-Cap Growth ETF
Performance and Fund Facts as of August 31, 2021
The performance data quoted represents past performance. Past performance does not guarantee future results. Investment return and principal value of an investment will fluctuate so that an investor’s shares, when sold or redeemed, may be worth more or less than the original cost. Current performance may be lower or higher than the performance quoted. To obtain performance information current to the most recent month end, please visit www.schwabassetmanagement.com/schwabetfs_prospectus.
Performance of Hypothetical $10,000 Investment (August 31, 2011 – August 31, 2021)1
Average Annual Total Returns1
| Fund and Inception Date | 1 Year | 5 Years | 10 Years |
| Fund: Schwab U.S. Large-Cap Growth ETF (12/11/09) | | | |
| Market Price Return2 | 31.10% | 24.32% | 19.46% |
| NAV Return2 | 31.06% | 24.32% | 19.47% |
| Dow Jones U.S. Large-Cap Growth Total Stock Market Index | 31.12% | 24.37% | 19.54% |
| ETF Category: Morningstar Large Growth3 | 28.75% | 22.19% | 17.57% |
| Fund Expense Ratio4: 0.04% |
All total returns on this page assume dividends and distributions were reinvested. Index figures do not include trading and management costs, which would lower performance. Indices are unmanaged and cannot be invested in directly. Performance results less than one year are not annualized.
For index definitions, please see the Glossary.
Shares are bought and sold at market price, which may be higher or lower than the net asset value (NAV). Brokerage commissions will reduce returns.
Index ownership — Dow Jones® is a registered trademark of Dow Jones Trademark Holdings LLC (Dow Jones). The Dow Jones U.S. Large-Cap Growth Total Stock Market Index is a product of S&P Dow Jones Indices LLC and/or its affiliates, and has been licensed for use by CSIM. The Schwab U.S. Large-Cap Growth ETF is not sponsored, endorsed, sold or promoted by S& P Dow Jones Indices LLC, Dow Jones, or any of their respective affiliates and neither S&P Dow Jones Indices LLC, Dow Jones, nor any of their respective affiliates make any representation regarding the advisability of investing in such product.
| 1 | Performance does not reflect the deduction of taxes that a shareholder would pay on fund distributions or on the redemption or sale of fund shares. |
| 2 | ETF performance must be shown based on both a market price and NAV basis. The fund’s per share NAV is the value of one share of the fund. NAV is calculated by taking the fund’s total assets (including the fair value of securities owned), subtracting liabilities, and dividing by the number of shares outstanding. The NAV Return is based on the NAV of the fund, and the Market Price Return is based on the market price per share of the fund. The price used to calculate market return (Market Price) is determined using the Official Closing Price on the primary stock exchange (generally, 4:00 p.m. Eastern time) and may not represent the returns you would receive if shares were traded at other times. NAV is used as a proxy for purposes of calculating Market Price Return on inception date. Market Price and NAV returns assume that dividends and capital gain distributions have been reinvested in the fund at Market Price and NAV, respectively. |
| 3 | Source for category information: Morningstar, Inc. The Morningstar Category return represents all passively- and actively-managed ETFs within the category as of the report date. |
| 4 | As stated in the prospectus. |
Schwab U.S. Equity ETFs | Annual Report
Schwab U.S. Large-Cap Growth ETF
Performance and Fund Facts as of August 31, 2021 (continued)
| Number of Holdings | 232 |
| Weighted Average Market Cap (millions) | $1,015,916 |
| Price/Earnings Ratio (P/E) | 38.6 |
| Price/Book Ratio (P/B) | 10.3 |
| Portfolio Turnover Rate | 12% 2 |
Sector Weightings % of Investments3
Top Equity Holdings % of Net Assets4
Portfolio holdings may have changed since the report date.
An index is a statistical composite of a specified financial market or sector. Unlike the fund, an index does not actually hold a portfolio of securities and its return is not inclusive of trading and management costs incurred by the fund.
Source of Sector Classification: S& P and MSCI.
| 1 | Excludes derivatives. |
| 2 | Portfolio turnover rate excludes securities received or delivered from processing of in-kind creations or redemptions. |
| 3 | The percentage may differ from the Portfolio Holdings because the above calculation is based on a percentage of total investments, excluding derivatives, whereas the calculation in the Portfolio Holdings is based on a percentage of net assets. |
| 4 | This list is not a recommendation of any security by the investment adviser. |
Schwab U.S. Equity ETFs | Annual Report
Schwab U.S. Large-Cap Value ETF as of August 31, 2021
The Schwab U.S. Large-Cap Value ETF (the fund) seeks to track as closely as possible, before fees and expenses, the total return of the Dow Jones U.S. Large-Cap Value Total Stock Market Index (the index). The index includes the large-cap value portion of the Dow Jones U.S. Total Stock Market Index actually available to investors in the marketplace. The index includes the components ranked 1-750 by full market capitalization and that are classified as “value” based on a number of factors. The index is a float-adjusted market capitalization weighted index. The fund generally will seek to replicate the performance of the index by giving the same weight to a given stock as the index does.
Market Highlights. For the 12-month reporting period ended August 31, 2021, U.S. equity markets generated solid returns, with several key equity market indices ending the reporting period just off record highs. Small- and mid-cap stocks outperformed large-cap stocks, and value outperformed growth. Despite persisting COVID-19 pandemic-driven stresses on the U.S. economy and a resurgence of COVID-19 cases in the fall and into the winter, along with the emergence and rapid spread of the Delta variant during the summer, equity markets continued to rise on strong earnings, ongoing fiscal stimulus measures, and optimism related to the rapid rollout of COVID-19 vaccines that began in December 2020. Within the index, stocks in the financials and materials sectors were the top performers, while consumer staples and utilities stocks underperformed by comparison, although both still returned double digits.
Performance. During the 12-month reporting period ended August 31, 2021, the fund closely tracked the index. The fund’s market price return was 35.09% and its NAV return was 34.95% (for an explanation of the market price and NAV returns, please refer to footnote 2 on the following page). The index returned 34.99% during the same period.
Contributors and Detractors. The financials sector contributed the most to the total return of the fund. Financials stocks represented an average weight of approximately 18% of the fund’s investments and returned approximately 59% for the reporting period. One example from this sector is JPMorgan Chase & Co., which provides global financial services and retail banking. The fund’s holdings of JPMorgan Chase & Co. represented an average weight of approximately 2% of the fund’s investments and returned approximately 64% for the reporting period.
The industrials sector also contributed to the total return of the fund, representing an average weight of approximately 13% of the fund’s investments and returning approximately 39% for the reporting period.
Over the reporting period, no sectors detracted from the returns of the index or the fund. However, the consumer staples sector was the smallest contributor to the total return of the fund. Stocks in the consumer staples sector represented an average weight of approximately 10% of the fund’s investments and returned approximately 12% for the reporting period. One example from this sector is Kimberly-Clark Corp., a global health and hygiene company that manufactures and provides consumer products. The fund’s holdings of Kimberly-Clark Corp. represented an average weight of less than 1% of the fund’s investments and returned approximately -10% for the reporting period.
The utilities sector was another smaller contributor to the total return of the fund, representing an average weight of approximately 5% of the fund’s investments and returning approximately 19% for the reporting period.
Management views and portfolio holdings may have changed since the report date.
Schwab U.S. Equity ETFs | Annual Report
Schwab U.S. Large-Cap Value ETF
Performance and Fund Facts as of August 31, 2021
The performance data quoted represents past performance. Past performance does not guarantee future results. Investment return and principal value of an investment will fluctuate so that an investor’s shares, when sold or redeemed, may be worth more or less than the original cost. Current performance may be lower or higher than the performance quoted. To obtain performance information current to the most recent month end, please visit www.schwabassetmanagement.com/schwabetfs_prospectus.
Performance of Hypothetical $10,000 Investment (August 31, 2011 – August 31, 2021)1
Average Annual Total Returns1
| Fund and Inception Date | 1 Year | 5 Years | 10 Years |
| Fund: Schwab U.S. Large-Cap Value ETF (12/11/09) | | | |
| Market Price Return2 | 35.09% | 12.17% | 13.07% |
| NAV Return2 | 34.95% | 12.16% | 13.06% |
| Dow Jones U.S. Large-Cap Value Total Stock Market Index | 34.99% | 12.21% | 13.14% |
| ETF Category: Morningstar Large Value3 | 35.95% | 11.86% | 12.23% |
| Fund Expense Ratio4: 0.04% |
All total returns on this page assume dividends and distributions were reinvested. Index figures do not include trading and management costs, which would lower performance. Indices are unmanaged and cannot be invested in directly. Performance results less than one year are not annualized.
For index definitions, please see the Glossary.
Shares are bought and sold at market price, which may be higher or lower than the net asset value (NAV). Brokerage commissions will reduce returns.
Index ownership — Dow Jones® is a registered trademark of Dow Jones Trademark Holdings LLC (Dow Jones). The Dow Jones U.S. Large-Cap Value Total Stock Market Index is a product of S&P Dow Jones Indices LLC and/or its affiliates, and has been licensed for use by CSIM. The Schwab U.S. Large-Cap Value ETF is not sponsored, endorsed, sold or promoted by S& P Dow Jones Indices LLC, Dow Jones, or any of their respective affiliates and neither S&P Dow Jones Indices LLC, Dow Jones, nor any of their respective affiliates make any representation regarding the advisability of investing in such product.
| 1 | Performance does not reflect the deduction of taxes that a shareholder would pay on fund distributions or on the redemption or sale of fund shares. |
| 2 | ETF performance must be shown based on both a market price and NAV basis. The fund’s per share NAV is the value of one share of the fund. NAV is calculated by taking the fund’s total assets (including the fair value of securities owned), subtracting liabilities, and dividing by the number of shares outstanding. The NAV Return is based on the NAV of the fund, and the Market Price Return is based on the market price per share of the fund. The price used to calculate market return (Market Price) is determined using the Official Closing Price on the primary stock exchange (generally, 4:00 p.m. Eastern time) and may not represent the returns you would receive if shares were traded at other times. NAV is used as a proxy for purposes of calculating Market Price Return on inception date. Market Price and NAV returns assume that dividends and capital gain distributions have been reinvested in the fund at Market Price and NAV, respectively. |
| 3 | Source for category information: Morningstar, Inc. The Morningstar Category return represents all passively- and actively-managed ETFs within the category as of the report date. |
| 4 | As stated in the prospectus. |
Schwab U.S. Equity ETFs | Annual Report
Schwab U.S. Large-Cap Value ETF
Performance and Fund Facts as of August 31, 2021 (continued)
| Number of Holdings | 541 |
| Weighted Average Market Cap (millions) | $145,114 |
| Price/Earnings Ratio (P/E) | 19.2 |
| Price/Book Ratio (P/B) | 3.0 |
| Portfolio Turnover Rate | 23% 2 |
Sector Weightings % of Investments3
Top Equity Holdings % of Net Assets4
Portfolio holdings may have changed since the report date.
An index is a statistical composite of a specified financial market or sector. Unlike the fund, an index does not actually hold a portfolio of securities and its return is not inclusive of trading and management costs incurred by the fund.
Source of Sector Classification: S& P and MSCI.
| 1 | Excludes derivatives. |
| 2 | Portfolio turnover rate excludes securities received or delivered from processing of in-kind creations or redemptions. |
| 3 | The percentage may differ from the Portfolio Holdings because the above calculation is based on a percentage of total investments, excluding derivatives, whereas the calculation in the Portfolio Holdings is based on a percentage of net assets. |
| 4 | This list is not a recommendation of any security by the investment adviser. |
Schwab U.S. Equity ETFs | Annual Report
Schwab U.S. Mid-Cap ETF as of August 31, 2021
The Schwab U.S. Mid-Cap ETF (the fund) seeks to track as closely as possible, before fees and expenses, the total return of the Dow Jones U.S. Mid-Cap Total Stock Market Index (the index). The index includes the mid-cap portion of the Dow Jones U.S. Total Stock Market Index actually available to investors in the marketplace. The index includes the components ranked 501-1,000 by full market capitalization. The index is a float-adjusted market capitalization weighted index. The fund generally will seek to replicate the performance of the index by giving the same weight to a given stock as the index does.
Market Highlights. For the 12-month reporting period ended August 31, 2021, U.S. equity markets generated solid returns, with several key equity market indices ending the reporting period just off record highs. Small- and mid-cap stocks outperformed large-cap stocks, and value outperformed growth. Despite persisting COVID-19 pandemic-driven stresses on the U.S. economy and a resurgence of COVID-19 cases in the fall and into the winter, along with the emergence and rapid spread of the Delta variant during the summer, equity markets continued to rise on strong earnings, ongoing fiscal stimulus measures, and optimism related to the rapid rollout of COVID-19 vaccines that began in December 2020. Within the index, stocks in the energy and financials sectors were the top performers, while utilities and health care stocks underperformed by comparison, although both still returned double digits.
Performance. During the 12-month reporting period ended August 31, 2021, the fund closely tracked the index. The fund’s market price return was 41.13% and its NAV return was 40.98% (for an explanation of the market price and NAV returns, please refer to footnote 2 on the following page). The index returned 41.05% during the same period.
Contributors and Detractors. The information technology sector contributed the most to the total return of the fund. Information technology stocks represented an average weight of approximately 19% of the fund’s investments and returned approximately 43% for the reporting period. One example from this sector is Enphase Energy, Inc., a solar power solutions manufacturer. The fund’s holdings of Enphase Energy, Inc. represented an average weight of less than 1% of the fund’s investments and returned approximately 154% for the reporting period.
The industrials sector also contributed to the total return of the fund, representing an average weight of approximately 16% of the fund’s investments and returning approximately 45% for the reporting period.
Over the reporting period, no sectors detracted from the returns of the index or the fund. However, the utilities sector was the smallest contributor to the total return of the fund. Stocks in the utilities sector represented an average weight of approximately 4% of the fund’s investments and returned approximately 20% for the reporting period. One example from this sector is Atmos Energy Corp., which distributes natural gas to utility customers. The fund’s holdings of Atmos Energy Corp. represented an average weight of less than 1% of the fund’s investments and returned less than 1% for the reporting period.
The consumer staples sector was another smaller contributor to the total return of the fund, representing an average weight of approximately 3% of the fund’s investments and returning approximately 25% of the fund’s investments.
Management views and portfolio holdings may have changed since the report date.
Schwab U.S. Equity ETFs | Annual Report
Performance and Fund Facts as of August 31, 2021
The performance data quoted represents past performance. Past performance does not guarantee future results. Investment return and principal value of an investment will fluctuate so that an investor’s shares, when sold or redeemed, may be worth more or less than the original cost. Current performance may be lower or higher than the performance quoted. To obtain performance information current to the most recent month end, please visit www.schwabassetmanagement.com/schwabetfs_prospectus.
Performance of Hypothetical $10,000 Investment (August 31, 2011 – August 31, 2021)1
Average Annual Total Returns1
| Fund and Inception Date | 1 Year | 5 Years | 10 Years |
| Fund: Schwab U.S. Mid-Cap ETF (1/13/11) | | | |
| Market Price Return2 | 41.13% | 14.52% | 14.57% |
| NAV Return2 | 40.98% | 14.51% | 14.59% |
| Dow Jones U.S. Mid-Cap Total Stock Market Index | 41.05% | 14.56% | 14.63% |
| ETF Category: Morningstar Mid-Cap Blend3 | 40.76% | 13.20% | 12.86% |
| Fund Expense Ratio4: 0.04% |
All total returns on this page assume dividends and distributions were reinvested. Index figures do not include trading and management costs, which would lower performance. Indices are unmanaged and cannot be invested in directly. Performance results less than one year are not annualized.
For index definitions, please see the Glossary.
Shares are bought and sold at market price, which may be higher or lower than the net asset value (NAV). Brokerage commissions will reduce returns.
Index ownership — Dow Jones® is a registered trademark of Dow Jones Trademark Holdings LLC (Dow Jones). The Dow Jones U.S. Mid-Cap Total Stock Market Index is a product of S&P Dow Jones Indices LLC and/or its affiliates, and has been licensed for use by CSIM. The Schwab U.S. Mid-Cap ETF is not sponsored, endorsed, sold or promoted by S&P Dow Jones Indices LLC, Dow Jones, or any of their respective affiliates and neither S&P Dow Jones Indices LLC, Dow Jones, nor any of their respective affiliates make any representation regarding the advisability of investing in such product.
| 1 | Performance does not reflect the deduction of taxes that a shareholder would pay on fund distributions or on the redemption or sale of fund shares. |
| 2 | ETF performance must be shown based on both a market price and NAV basis. The fund’s per share NAV is the value of one share of the fund. NAV is calculated by taking the fund’s total assets (including the fair value of securities owned), subtracting liabilities, and dividing by the number of shares outstanding. The NAV Return is based on the NAV of the fund, and the Market Price Return is based on the market price per share of the fund. The price used to calculate market return (Market Price) is determined using the Official Closing Price on the primary stock exchange (generally, 4:00 p.m. Eastern time) and may not represent the returns you would receive if shares were traded at other times. NAV is used as a proxy for purposes of calculating Market Price Return on inception date. Market Price and NAV returns assume that dividends and capital gain distributions have been reinvested in the fund at Market Price and NAV, respectively. |
| 3 | Source for category information: Morningstar, Inc. The Morningstar Category return represents all passively- and actively-managed ETFs within the category as of the report date. |
| 4 | As stated in the prospectus. |
Schwab U.S. Equity ETFs | Annual Report
Performance and Fund Facts as of August 31, 2021 (continued)
| Number of Holdings | 528 |
| Weighted Average Market Cap (millions) | $13,659 |
| Price/Earnings Ratio (P/E) | 20.0 |
| Price/Book Ratio (P/B) | 3.0 |
| Portfolio Turnover Rate | 23% 2 |
Sector Weightings % of Investments3
Top Equity Holdings % of Net Assets4
Portfolio holdings may have changed since the report date.
An index is a statistical composite of a specified financial market or sector. Unlike the fund, an index does not actually hold a portfolio of securities and its return is not inclusive of trading and management costs incurred by the fund.
Source of Sector Classification: S& P and MSCI.
| 1 | Excludes derivatives. |
| 2 | Portfolio turnover rate excludes securities received or delivered from processing of in-kind creations or redemptions. |
| 3 | The percentage may differ from the Portfolio Holdings because the above calculation is based on a percentage of total investments, excluding derivatives, whereas the calculation in the Portfolio Holdings is based on a percentage of net assets. |
| 4 | This list is not a recommendation of any security by the investment adviser. |
Schwab U.S. Equity ETFs | Annual Report
Schwab U.S. Small-Cap ETF as of August 31, 2021
The Schwab U.S. Small-Cap ETF (the fund) seeks to track as closely as possible, before fees and expenses, the total return of the Dow Jones U.S. Small-Cap Total Stock Market Index (the index). The index includes the small-cap portion of the Dow Jones U.S. Total Stock Market Index actually available to investors in the marketplace. The index includes the components ranked 751-2,500 by full market capitalization. The index is a float-adjusted market capitalization weighted index. The fund generally will seek to replicate the performance of the index by giving the same weight to a given stock as the index does.
Market Highlights. For the 12-month reporting period ended August 31, 2021, U.S. equity markets generated solid returns, with several key equity market indices ending the reporting period just off record highs. Small- and mid-cap stocks outperformed large-cap stocks, and value outperformed growth. Despite persisting COVID-19 pandemic-driven stresses on the U.S. economy and a resurgence of COVID-19 cases in the fall and into the winter, along with the emergence and rapid spread of the Delta variant during the summer, equity markets continued to rise on strong earnings, ongoing fiscal stimulus measures, and optimism related to the rapid rollout of COVID-19 vaccines that began in December 2020. Within the index, stocks in the energy and materials sectors were the top performers, while utilities and health care stocks underperformed by comparison, although both still returned double digits.
Performance. During the 12-month reporting period ended August 31, 2021, the fund closely tracked the index. The fund’s market price return was 47.39% and its NAV return was 47.33% (for an explanation of the market price and NAV returns, please refer to footnote 2 on the following page). The index returned 47.32% during the same period.
Contributors and Detractors. The financials sector contributed the most to the total return of the fund. Financials stocks represented an average weight of approximately 16% of the fund’s investments and returned approximately 59% for the reporting period. One example from this sector is Western Alliance Bancorp, a multi-bank holding company. The fund’s holdings of Western Alliance Bancorp represented an average weight of less than 1% of the fund’s investments and returned approximately 180% for the reporting period.
The consumer discretionary sector also contributed to the total return of the fund, representing an average weight of approximately 15% of the fund’s investments and returning approximately 60% for the reporting period.
Over the reporting period, no sectors detracted from the returns of the index or the fund. However, the utilities sector was the smallest contributor to the total return of the fund. Stocks in the utilities sector represented an average weight of approximately 2% of the fund’s investments and returned approximately 26% for the reporting period. One example from this sector is Northwest Natural Holding Co., a holding company which, through its subsidiaries, builds and maintains natural gas distribution system, as well as invests in natural gas pipeline projects. The fund’s holdings of Northwest Natural Holding Co. represented an average weight of less than 1% of the fund’s investments and returned approximately 5% for the reporting period.
The consumer staples sector was another smaller contributor to the total return of the fund, representing an average weight of approximately 3% of the fund’s investments and returning approximately 30% for the reporting period.
Management views and portfolio holdings may have changed since the report date.
Schwab U.S. Equity ETFs | Annual Report
Schwab U.S. Small-Cap ETF
Performance and Fund Facts as of August 31, 2021
The performance data quoted represents past performance. Past performance does not guarantee future results. Investment return and principal value of an investment will fluctuate so that an investor’s shares, when sold or redeemed, may be worth more or less than the original cost. Current performance may be lower or higher than the performance quoted. To obtain performance information current to the most recent month end, please visit www.schwabassetmanagement.com/schwabetfs_prospectus.
Performance of Hypothetical $10,000 Investment (August 31, 2011 – August 31, 2021)1
Average Annual Total Returns1
| Fund and Inception Date | 1 Year | 5 Years | 10 Years |
| Fund: Schwab U.S. Small-Cap ETF (11/3/09) | | | |
| Market Price Return2 | 47.39% | 14.11% | 13.98% |
| NAV Return2 | 47.33% | 14.12% | 13.99% |
| Dow Jones U.S. Small-Cap Total Stock Market Index | 47.32% | 14.09% | 13.96% |
| ETF Category: Morningstar Small Blend3 | 49.32% | 12.63% | 12.65% |
| Fund Expense Ratio4: 0.04% |
All total returns on this page assume dividends and distributions were reinvested. Index figures do not include trading and management costs, which would lower performance. Indices are unmanaged and cannot be invested in directly. Performance results less than one year are not annualized.
For index definitions, please see the Glossary.
Shares are bought and sold at market price, which may be higher or lower than the net asset value (NAV). Brokerage commissions will reduce returns.
Small-company stocks may be subject to greater volatility than many other asset classes.
Index ownership — Dow Jones® is a registered trademark of Dow Jones Trademark Holdings LLC (Dow Jones). The Dow Jones U.S. Small-Cap Total Stock Market Index is a product of S&P Dow Jones Indices LLC and/or its affiliates, and has been licensed for use by CSIM. The Schwab U.S. Small-Cap ETF is not sponsored, endorsed, sold or promoted by S&P Dow Jones Indices LLC, Dow Jones, or any of their respective affiliates and neither S&P Dow Jones Indices LLC, Dow Jones, nor any of their respective affiliates make any representation regarding the advisability of investing in such product.
| 1 | Performance does not reflect the deduction of taxes that a shareholder would pay on fund distributions or on the redemption or sale of fund shares. |
| 2 | ETF performance must be shown based on both a market price and NAV basis. The fund’s per share NAV is the value of one share of the fund. NAV is calculated by taking the fund’s total assets (including the fair value of securities owned), subtracting liabilities, and dividing by the number of shares outstanding. The NAV Return is based on the NAV of the fund, and the Market Price Return is based on the market price per share of the fund. The price used to calculate market return (Market Price) is determined using the Official Closing Price on the primary stock exchange (generally, 4:00 p.m. Eastern time) and may not represent the returns you would receive if shares were traded at other times. NAV is used as a proxy for purposes of calculating Market Price Return on inception date. Market Price and NAV returns assume that dividends and capital gain distributions have been reinvested in the fund at Market Price and NAV, respectively. |
| 3 | Source for category information: Morningstar, Inc. The Morningstar Category return represents all passively- and actively-managed ETFs within the category as of the report date. |
| 4 | As stated in the prospectus. |
Schwab U.S. Equity ETFs | Annual Report
Schwab U.S. Small-Cap ETF
Performance and Fund Facts as of August 31, 2021 (continued)
| Number of Holdings | 1,858 |
| Weighted Average Market Cap (millions) | $5,356 |
| Price/Earnings Ratio (P/E) | 17.5 |
| Price/Book Ratio (P/B) | 2.6 |
| Portfolio Turnover Rate | 15% 2 |
Sector Weightings % of Investments3
Top Equity Holdings % of Net Assets4
Portfolio holdings may have changed since the report date.
An index is a statistical composite of a specified financial market or sector. Unlike the fund, an index does not actually hold a portfolio of securities and its return is not inclusive of trading and management costs incurred by the fund.
Source of Sector Classification: S& P and MSCI.
| 1 | Excludes derivatives. |
| 2 | Portfolio turnover rate excludes securities received or delivered from processing of in-kind creations or redemptions. |
| 3 | The percentage may differ from the Portfolio Holdings because the above calculation is based on a percentage of total investments, excluding derivatives, whereas the calculation in the Portfolio Holdings is based on a percentage of net assets. |
| 4 | This list is not a recommendation of any security by the investment adviser. |
Schwab U.S. Equity ETFs | Annual Report
Schwab U.S. Dividend Equity ETF as of August 31, 2021
The Schwab U.S. Dividend Equity ETF (the fund) seeks to track as closely as possible, before fees and expenses, the total return of the Dow Jones U.S. Dividend 100TM Index (the index). The 100-component index is a subset of the Dow Jones U.S. Broad Market Index, excluding real estate investment trusts (REITs), master limited partnerships, preferred stocks, and convertibles. The index is modified market capitalization weighted. The fund generally will seek to replicate the performance of the index by giving the same weight to a given stock as the index does.
Market Highlights. For the 12-month reporting period ended August 31, 2021, U.S. equity markets generated solid returns, with several key equity market indices ending the reporting period just off record highs. Small- and mid-cap stocks outperformed large-cap stocks, and value outperformed growth. Despite persisting COVID-19 pandemic-driven stresses on the U.S. economy and a resurgence of COVID-19 cases in the fall and into the winter, along with the emergence and rapid spread of the Delta variant during the summer, equity markets continued to rise on strong earnings, ongoing fiscal stimulus measures, and optimism related to the rapid rollout of COVID-19 vaccines that began in December 2020. Within the index, stocks in the financials and energy sectors were the top performers, while health care and consumer staples stocks underperformed by comparison, although both still returned double digits.
Performance. During the 12-month reporting period ended August 31, 2021, the fund closely tracked the index. The fund’s market price return was 40.29% and its NAV return was 40.15% (for an explanation of the market price and NAV returns, please refer to footnote 2 on the following page). The index returned 40.31% during the same period. Differences between the return of the fund and the return of the index may be attributable to, among other things, the operational and transactional costs incurred by the fund and not the index.
Contributors and Detractors. Over the reporting period, no sectors detracted from the returns of the index or the fund. However, the health care sector was the smallest contributor to the total return of the fund. Stocks in the health care sector represented an average weight of approximately 8% of the fund’s investments and returned approximately 10% for the reporting period. One example from this sector is Amgen, Inc., an independent biotechnology medicines company that discovers, develops, manufactures, and markets medicines for grievous illnesses. The fund’s holdings in Amgen, Inc. represented an average weight of approximately 2% of the fund’s investments and returned approximately -7% for the reporting period.
The consumer staples sector was another smaller contributor to the total return of the fund, representing an average weight of approximately 15% of the fund’s investments and returning approximately 12% for the reporting period.
The financials sector contributed the most to the total return of the fund. Financials stocks represented an average weight of approximately 24% of the fund’s investments and returned approximately 73% for the reporting period. One example from this sector is BlackRock, Inc., which provides investment management services to institutional clients and to retail investors through various investment vehicles. The fund’s holdings of BlackRock, Inc. represented an average weight of approximately 4% of the fund’s investments and returned approximately 62% for the reporting period.
The information technology sector also contributed to the total return of the fund, representing an average weight of approximately 17% of the fund’s investments and returning approximately 31% for the reporting period.
Management views and portfolio holdings may have changed since the report date.
Schwab U.S. Equity ETFs | Annual Report
Schwab U.S. Dividend Equity ETF
Performance and Fund Facts as of August 31, 2021
The performance data quoted represents past performance. Past performance does not guarantee future results. Investment return and principal value of an investment will fluctuate so that an investor’s shares, when sold or redeemed, may be worth more or less than the original cost. Current performance may be lower or higher than the performance quoted. To obtain performance information current to the most recent month end, please visit www.schwabassetmanagement.com/schwabetfs_prospectus.
Performance of Hypothetical $10,000 Investment (October 20, 2011 – August 31, 2021)1
Average Annual Total Returns1
| Fund and Inception Date | 1 Year | 5 Years | Since Inception* |
| Fund: Schwab U.S. Dividend Equity ETF (10/20/11) | | | |
| Market Price Return2 | 40.29% | 16.42% | 15.56% |
| NAV Return2 | 40.15% | 16.41% | 15.55% |
| Dow Jones U.S. Dividend 100TM Index | 40.31% | 16.51% | 15.69% |
| ETF Category: Morningstar Large Value3 | 35.95% | 11.86% | N/A |
| Fund Expense Ratio4: 0.06% |
All total returns on this page assume dividends and distributions were reinvested. Index figures do not include trading and management costs, which would lower performance. Indices are unmanaged and cannot be invested in directly. Performance results less than one year are not annualized.
For index definitions, please see the Glossary.
Shares are bought and sold at market price, which may be higher or lower than the net asset value (NAV). Brokerage commissions will reduce returns.
The fund may underperform other funds that do not limit their investment to dividend paying stocks. Stocks held by the fund may reduce or stop paying dividends, affecting the fund’s ability to generate income. Diversification strategies do not ensure a profit and do not protect against losses in declining markets.
Index ownership — Dow Jones® is a registered trademark of Dow Jones Trademark Holdings LLC (Dow Jones). The Dow Jones U.S. Dividend 100TM Index is a product of S&P Dow Jones Indices LLC and/or its affiliates, and has been licensed for use by CSIM. The Schwab U.S. Dividend Equity ETF is not sponsored, endorsed, sold or promoted by S&P Dow Jones Indices LLC, Dow Jones, or any of their respective affiliates and neither S&P Dow Jones Indices LLC, Dow Jones, nor any of their respective affiliates make any representation regarding the advisability of investing in such product.
| * | Inception (10/20/11) represents the date that the shares began trading in the secondary market. |
| 1 | Performance does not reflect the deduction of taxes that a shareholder would pay on fund distributions or on the redemption or sale of fund shares. |
| 2 | ETF performance must be shown based on both a market price and NAV basis. The fund’s per share NAV is the value of one share of the fund. NAV is calculated by taking the fund’s total assets (including the fair value of securities owned), subtracting liabilities, and dividing by the number of shares outstanding. The NAV Return is based on the NAV of the fund, and the Market Price Return is based on the market price per share of the fund. The price used to calculate market return (Market Price) is determined using the Official Closing Price on the primary stock exchange (generally, 4:00 p.m. Eastern time) and may not represent the returns you would receive if shares were traded at other times. NAV is used as a proxy for purposes of calculating Market Price Return on inception date. Market Price and NAV returns assume that dividends and capital gain distributions have been reinvested in the fund at Market Price and NAV, respectively. |
| 3 | Source for category information: Morningstar, Inc. The Morningstar Category return represents all passively- and actively-managed ETFs within the category as of the report date. |
| 4 | As stated in the prospectus. |
Schwab U.S. Equity ETFs | Annual Report
Schwab U.S. Dividend Equity ETF
Performance and Fund Facts as of August 31, 2021 (continued)
| Number of Holdings | 102 |
| Weighted Average Market Cap (millions) | $129,446 |
| Price/Earnings Ratio (P/E) | 17.5 |
| Price/Book Ratio (P/B) | 4.0 |
| Portfolio Turnover Rate | 46% 2 |
Sector Weightings % of Investments3
Top Equity Holdings % of Net Assets4
Portfolio holdings may have changed since the report date.
An index is a statistical composite of a specified financial market or sector. Unlike the fund, an index does not actually hold a portfolio of securities and its return is not inclusive of trading and management costs incurred by the fund.
Source of Sector Classification: S& P and MSCI.
| 1 | Excludes derivatives. |
| 2 | Portfolio turnover rate excludes securities received or delivered from processing of in-kind creations or redemptions. |
| 3 | The percentage may differ from the Portfolio Holdings because the above calculation is based on a percentage of total investments, excluding derivatives, whereas the calculation in the Portfolio Holdings is based on a percentage of net assets. |
| 4 | This list is not a recommendation of any security by the investment adviser. |
Schwab U.S. Equity ETFs | Annual Report
Fund Expenses (Unaudited)
Examples for a $1,000 Investment
As a fund shareholder, you may incur two types of costs: (1) transaction costs, including brokerage commissions on purchases and sales of fund shares; and, (2) ongoing costs, including management fees.
The expense examples below are intended to help you understand your ongoing cost (in dollars) of investing in a fund and to compare this cost with the ongoing cost of investing in other mutual funds. These examples are based on an investment of $1,000 invested for six months beginning March 1, 2021 and held through August 31, 2021.
Actual Return lines in the table below provide information about actual account values and actual expenses. You may use this information, together with the amount you invested, to estimate the expenses that you paid over the period. To do so, simply divide your account value by $1,000 (for example, an $8,600 account value ÷ $1,000 = 8.6), then multiply the result by the number given for your fund under the heading entitled “Expenses Paid During Period.”
Hypothetical Return lines in the table below provide information about hypothetical account values and hypothetical expenses based on a fund’s actual expense ratio and an assumed return of 5% per year before expenses. Because the return used is not an actual return, it may not be used to estimate the actual ending account value or expenses you paid for the period.
You may use this information to compare the ongoing costs of investing in a fund and other funds. To do so, compare this 5% hypothetical example with the 5% hypothetical examples that appear in the shareholder reports of the other funds.
Please note that the expenses shown in the table are meant to highlight your ongoing costs only, and do not reflect any transactional costs, including any brokerage commissions you may pay when purchasing or selling shares of a fund. Therefore, the hypothetical return lines of the table are useful in comparing ongoing costs only, and will not help you determine the relative total costs of owning different funds. In addition, if these transactional costs were included, your costs would have been higher.
| | Expense Ratio
(Annualized)1 | Beginning
Account Value
at 3/1/21 | Ending
Account Value
(Net of Expenses)
at 8/31/21 | Expenses Paid
During Period
3/1/21-8/31/212 |
| Schwab U.S. Broad Market ETF | | | | |
| Actual Return | 0.03% | $1,000.00 | $1,173.50 | $0.16 |
| Hypothetical 5% Return | 0.03% | $1,000.00 | $1,025.05 | $0.15 |
| Schwab 1000 Index ETF | | | | |
| Actual Return | 0.05% | $1,000.00 | $1,181.50 | $0.27 |
| Hypothetical 5% Return | 0.05% | $1,000.00 | $1,024.95 | $0.26 |
| Schwab U.S. Large-Cap ETF | | | | |
| Actual Return | 0.03% | $1,000.00 | $1,186.30 | $0.17 |
| Hypothetical 5% Return | 0.03% | $1,000.00 | $1,025.05 | $0.15 |
| Schwab U.S. Large-Cap Growth ETF | | | | |
| Actual Return | 0.04% | $1,000.00 | $1,226.10 | $0.22 |
| Hypothetical 5% Return | 0.04% | $1,000.00 | $1,025.00 | $0.20 |
| Schwab U.S. Large-Cap Value ETF | | | | |
| Actual Return | 0.04% | $1,000.00 | $1,152.00 | $0.22 |
| Hypothetical 5% Return | 0.04% | $1,000.00 | $1,025.00 | $0.20 |
| Schwab U.S. Mid-Cap ETF | | | | |
| Actual Return | 0.04% | $1,000.00 | $1,103.20 | $0.21 |
| Hypothetical 5% Return | 0.04% | $1,000.00 | $1,025.00 | $0.20 |
| Schwab U.S. Small-Cap ETF | | | | |
| Actual Return | 0.04% | $1,000.00 | $1,057.40 | $0.21 |
| Hypothetical 5% Return | 0.04% | $1,000.00 | $1,025.00 | $0.20 |
| Schwab U.S. Dividend Equity ETF | | | | |
| Actual Return | 0.06% | $1,000.00 | $1,168.80 | $0.33 |
| Hypothetical 5% Return | 0.06% | $1,000.00 | $1,024.90 | $0.31 |
| 1 | Based on the most recent six-month expense ratio. |
| 2 | Expenses for each fund are equal to its annualized expense ratio, multiplied by the average account value over the period, multiplied by 184 days of the period, and divided by 365 days of the fiscal year. |
Schwab U.S. Equity ETFs | Annual Report
Schwab U.S. Broad Market ETF
Financial Statements
Financial Highlights
| | 9/1/20–
8/31/21 | 9/1/19–
8/31/20 | 9/1/18–
8/31/19 | 9/1/17–
8/31/18 | 9/1/16–
8/31/17 | |
| Per-Share Data |
| Net asset value at beginning of period | $83.28 | $70.13 | $70.55 | $59.72 | $52.42 | |
| Income (loss) from investment operations: | | | | | | |
| Net investment income (loss)1 | 1.34 | 1.47 | 1.43 | 1.18 | 1.12 | |
| Net realized and unrealized gains (losses) | 25.97 | 13.12 | (0.55) | 10.77 | 7.20 | |
| Total from investment operations | 27.31 | 14.59 | 0.88 | 11.95 | 8.32 | |
| Less distributions: | | | | | | |
| Distributions from net investment income | (1.45) | (1.44) | (1.30) | (1.12) | (1.02) | |
| Net asset value at end of period | $109.14 | $83.28 | $70.13 | $70.55 | $59.72 | |
| Total return | 33.23% | 21.24% | 1.35% | 20.20% | 16.03% | |
| Ratios/Supplemental Data |
| Ratios to average net assets: | | | | | | |
| Total expenses | 0.03% | 0.03% | 0.03% | 0.03% | 0.03% | |
| Net investment income (loss) | 1.42% | 2.02% | 2.12% | 1.81% | 1.99% | |
| Portfolio turnover rate2 | 4% | 4% | 4% | 4% | 4% | |
| Net assets, end of period (x 1,000) | $22,368,229 | $16,548,529 | $14,877,368 | $13,326,391 | $10,215,289 | |
| |
1
Calculated based on the average shares outstanding during the period.
2
Portfolio turnover rate excludes securities received or delivered from processing of in-kind creations or redemptions.
Schwab U.S. Equity ETFs | Annual Report
Schwab U.S. Broad Market ETF
Portfolio Holdings as of August 31, 2021
This section shows all the securities in the fund’s portfolio and their values as of the report date.
The fund files its complete schedule of portfolio holdings with the U.S. Securities and Exchange Commission (SEC) for the first and third quarters of each fiscal year on Form N-PORT Part F. The fund’s Form N-PORT Part F is available on the SEC’s website at www.sec.gov. You can also obtain this information at no cost on the fund’s website at www.schwabassetmanagement.com/schwabetfs_prospectus, by calling 1-866-414-6349, or by sending an email request to orders@mysummaryprospectus.com. The fund also makes available its complete schedule of portfolio holdings on a daily basis on the fund’s website.
| Security | Number
of Shares | Value ($) |
| Common Stock 99.8% of net assets |
| |
| Automobiles & Components 1.8% |
| Adient plc * | 46,610 | 1,833,637 |
| American Axle & Manufacturing Holdings, Inc. * | 54,293 | 481,579 |
| Aptiv plc * | 130,940 | 19,927,759 |
| Autoliv, Inc. | 38,069 | 3,364,919 |
| BorgWarner, Inc. | 115,776 | 4,941,320 |
| Canoo, Inc. *(a) | 69,835 | 503,510 |
| Cooper-Standard Holding, Inc. * | 7,720 | 179,722 |
| Dana, Inc. | 71,187 | 1,655,810 |
| Dorman Products, Inc. * | 14,299 | 1,342,104 |
| Fisker, Inc. *(a) | 79,667 | 1,111,355 |
| Ford Motor Co. * | 1,904,346 | 24,813,628 |
| Fox Factory Holding Corp. * | 20,256 | 3,112,739 |
| General Motors Co. * | 619,454 | 30,359,440 |
| Gentex Corp. | 117,027 | 3,604,432 |
| Gentherm, Inc. * | 15,517 | 1,331,669 |
| Harley-Davidson, Inc. | 74,088 | 2,928,699 |
| LCI Industries | 12,106 | 1,714,936 |
| Lear Corp. | 26,947 | 4,309,903 |
| Lordstown Motors Corp., Class A *(a) | 47,807 | 314,570 |
| Luminar Technologies, Inc. * | 97,548 | 1,695,384 |
| Modine Manufacturing Co. * | 26,248 | 326,525 |
| Motorcar Parts of America, Inc. * | 8,207 | 162,663 |
| Patrick Industries, Inc. | 10,738 | 876,328 |
| QuantumScape Corp. *(a) | 83,274 | 1,832,028 |
| Standard Motor Products, Inc. | 10,352 | 443,997 |
| Stoneridge, Inc. * | 12,780 | 297,774 |
| Tenneco, Inc., Class A * | 32,931 | 513,724 |
| Tesla, Inc. * | 373,972 | 275,138,680 |
| The Goodyear Tire & Rubber Co. * | 133,093 | 2,108,193 |
| Thor Industries, Inc. | 26,677 | 3,025,972 |
| Veoneer, Inc. *(a) | 46,857 | 1,677,481 |
| Visteon Corp. * | 13,477 | 1,424,249 |
| Winnebago Industries, Inc. | 16,626 | 1,157,502 |
| Workhorse Group, Inc. *(a) | 51,388 | 504,116 |
| XL Fleet Corp. *(a) | 46,394 | 315,479 |
| XPEL, Inc. * | 7,865 | 597,583 |
| | | 399,929,409 |
| |
| Banks 4.3% |
| 1st Source Corp. | 8,494 | 399,218 |
| Allegiance Bancshares, Inc. | 9,604 | 356,981 |
| Altabancorp | 6,202 | 257,507 |
| Ameris Bancorp | 33,023 | 1,626,053 |
| Arrow Financial Corp. | 8,437 | 310,903 |
| Associated Banc-Corp. | 74,272 | 1,531,489 |
| Atlantic Union Bankshares Corp. | 38,791 | 1,435,267 |
| Axos Financial, Inc. * | 23,850 | 1,156,248 |
| Banc of California, Inc. | 21,577 | 387,739 |
| BancFirst Corp. | 9,009 | 509,549 |
| BancorpSouth Bank | 48,086 | 1,410,362 |
| Bank of America Corp. | 3,658,182 | 152,729,099 |
| Bank of Hawaii Corp. | 19,125 | 1,602,866 |
| Security | Number
of Shares | Value ($) |
| Bank of Marin Bancorp | 5,848 | 211,698 |
| Bank OZK | 58,531 | 2,483,470 |
| BankUnited, Inc. | 44,683 | 1,878,026 |
| Banner Corp. | 16,781 | 959,873 |
| Berkshire Hills Bancorp, Inc. | 23,458 | 601,229 |
| BOK Financial Corp. | 14,552 | 1,281,304 |
| Bridgewater Bancshares, Inc. * | 12,107 | 197,949 |
| Brookline Bancorp, Inc. | 36,959 | 553,276 |
| Bryn Mawr Bank Corp. | 9,671 | 394,577 |
| Byline Bancorp, Inc. | 11,459 | 281,891 |
| Cadence BanCorp | 61,078 | 1,313,788 |
| Camden National Corp. | 7,232 | 337,517 |
| Capitol Federal Financial, Inc. | 62,516 | 721,435 |
| Carter Bankshares, Inc. * | 10,761 | 131,177 |
| Cathay General Bancorp | 36,118 | 1,436,774 |
| CBTX, Inc. | 9,323 | 253,772 |
| Central Pacific Financial Corp. | 14,505 | 367,122 |
| CIT Group, Inc. | 47,733 | 2,645,363 |
| Citigroup, Inc. | 1,003,043 | 72,128,822 |
| Citizens Financial Group, Inc. | 205,512 | 8,999,370 |
| City Holding Co. | 8,044 | 626,628 |
| Columbia Banking System, Inc. | 35,436 | 1,288,453 |
| Columbia Financial, Inc. * | 24,597 | 443,484 |
| Comerica, Inc. | 67,618 | 4,997,646 |
| Commerce Bancshares, Inc. | 50,589 | 3,577,654 |
| Community Bank System, Inc. | 25,923 | 1,918,302 |
| Community Trust Bancorp, Inc. | 8,434 | 351,360 |
| ConnectOne Bancorp, Inc. | 16,074 | 459,877 |
| CrossFirst Bankshares, Inc. * | 22,628 | 299,142 |
| Cullen/Frost Bankers, Inc. | 27,077 | 3,092,735 |
| Customers Bancorp, Inc. * | 15,966 | 661,152 |
| CVB Financial Corp. | 61,791 | 1,258,065 |
| Dime Community Bancshares, Inc. | 18,676 | 616,308 |
| Eagle Bancorp, Inc. | 15,935 | 919,450 |
| East West Bancorp, Inc. | 68,576 | 5,029,364 |
| Eastern Bankshares, Inc. | 90,307 | 1,786,272 |
| Enterprise Financial Services Corp. | 18,175 | 816,239 |
| Equity Bancshares, Inc., Class A * | 7,798 | 250,160 |
| Essent Group Ltd. | 54,746 | 2,577,442 |
| F.N.B. Corp. | 156,156 | 1,823,902 |
| FB Financial Corp. | 15,146 | 623,864 |
| Federal Agricultural Mortgage Corp., Class C | 4,233 | 414,411 |
| Fifth Third Bancorp | 340,114 | 13,216,830 |
| Finance Of America Cos., Inc., Class A * | 13,341 | 73,376 |
| Financial Institutions, Inc. | 7,566 | 240,296 |
| First BanCorp | 107,484 | 1,368,271 |
| First Bancorp (North Carolina) | 15,481 | 646,487 |
| First Bancshares, Inc. | 8,979 | 363,829 |
| First Busey Corp. | 24,623 | 583,565 |
| First Citizens BancShares, Inc., Class A | 3,596 | 3,228,129 |
| First Commonwealth Financial Corp. | 49,212 | 665,346 |
| First Community Bankshares, Inc. | 9,421 | 294,312 |
| First Financial Bancorp | 46,291 | 1,088,301 |
| First Financial Bankshares, Inc. | 69,020 | 3,286,732 |
| First Financial Corp. | 5,941 | 240,195 |
| First Foundation, Inc. | 18,265 | 438,908 |
| First Hawaiian, Inc. | 63,418 | 1,769,996 |
Schwab U.S. Equity ETFs | Annual Report
Schwab U.S. Broad Market ETF
Portfolio Holdings as of August 31, 2021 (continued)
| Security | Number
of Shares | Value ($) |
| First Horizon Corp. | 269,009 | 4,409,058 |
| First Interstate BancSystem, Inc., Class A | 16,405 | 722,804 |
| First Merchants Corp. | 26,249 | 1,080,146 |
| First Mid Bancshares, Inc. | 6,408 | 262,087 |
| First Midwest Bancorp, Inc. | 55,366 | 1,037,005 |
| First Republic Bank | 85,253 | 16,960,232 |
| Flagstar Bancorp, Inc. | 22,763 | 1,125,858 |
| Flushing Financial Corp. | 13,479 | 309,073 |
| Fulton Financial Corp. | 80,285 | 1,272,517 |
| German American Bancorp, Inc. | 11,538 | 431,060 |
| Glacier Bancorp, Inc. | 46,456 | 2,474,247 |
| Great Southern Bancorp, Inc. | 4,925 | 268,265 |
| Great Western Bancorp, Inc. | 25,309 | 783,567 |
| Hancock Whitney Corp. | 41,985 | 1,929,631 |
| Hanmi Financial Corp. | 14,320 | 276,090 |
| Harborone Bancorp, Inc. | 24,873 | 351,455 |
| HBT Financial, Inc. | 4,589 | 75,030 |
| Heartland Financial USA, Inc. | 18,469 | 868,597 |
| Heritage Commerce Corp. | 28,496 | 321,150 |
| Heritage Financial Corp. | 20,095 | 511,418 |
| Hilltop Holdings, Inc. | 31,333 | 1,048,716 |
| Home BancShares, Inc. | 73,571 | 1,629,598 |
| HomeStreet, Inc. | 11,164 | 456,049 |
| HomeTrust Bancshares, Inc. | 7,067 | 196,604 |
| Hope Bancorp, Inc. | 64,804 | 893,647 |
| Horizon Bancorp, Inc. | 19,877 | 354,804 |
| Huntington Bancshares, Inc. | 715,594 | 11,113,175 |
| Independent Bank Corp. | 15,852 | 1,215,848 |
| Independent Bank Group, Inc. | 17,767 | 1,251,330 |
| International Bancshares Corp. | 26,353 | 1,103,664 |
| Investors Bancorp, Inc. | 109,800 | 1,571,238 |
| JPMorgan Chase & Co. | 1,468,273 | 234,850,266 |
| Kearny Financial Corp. | 30,118 | 382,197 |
| KeyCorp | 468,320 | 9,516,262 |
| Lakeland Bancorp, Inc. | 23,154 | 390,840 |
| Lakeland Financial Corp. | 12,304 | 817,109 |
| Live Oak Bancshares, Inc. | 15,029 | 919,925 |
| Luther Burbank Corp. | 7,049 | 91,426 |
| M&T Bank Corp. | 62,590 | 8,763,226 |
| Mercantile Bank Corp. | 8,564 | 267,197 |
| Merchants Bancorp | 8,301 | 304,398 |
| Meridian Bancorp, Inc. | 27,213 | 565,486 |
| Meta Financial Group, Inc. | 15,166 | 746,016 |
| Metrocity Bankshares, Inc. | 9,877 | 204,553 |
| MGIC Investment Corp. | 164,641 | 2,514,068 |
| Midland States Bancorp, Inc. | 10,270 | 259,831 |
| Mr Cooper Group, Inc. * | 33,355 | 1,296,842 |
| National Bank Holdings Corp., Class A | 15,438 | 578,925 |
| NBT Bancorp, Inc. | 21,820 | 782,465 |
| New York Community Bancorp, Inc. | 224,640 | 2,812,493 |
| Nicolet Bankshares, Inc. * | 4,101 | 313,357 |
| NMI Holdings, Inc., Class A * | 40,522 | 914,582 |
| Northfield Bancorp, Inc. | 20,557 | 347,413 |
| Northwest Bancshares, Inc. | 64,992 | 846,196 |
| OceanFirst Financial Corp. | 29,777 | 633,059 |
| Ocwen Financial Corp. * | 4,623 | 130,831 |
| OFG Bancorp | 25,561 | 608,607 |
| Old National Bancorp | 79,994 | 1,332,700 |
| Origin Bancorp, Inc. | 9,988 | 411,006 |
| Pacific Premier Bancorp, Inc. | 44,707 | 1,786,492 |
| PacWest Bancorp | 55,914 | 2,379,141 |
| Park National Corp. | 6,892 | 808,018 |
| Peapack-Gladstone Financial Corp. | 8,214 | 273,608 |
| PennyMac Financial Services, Inc. | 18,393 | 1,224,054 |
| People's United Financial, Inc. | 205,452 | 3,375,576 |
| Peoples Bancorp, Inc. | 9,692 | 302,778 |
| Peoples Financial Services Corp. | 2,611 | 120,341 |
| Pinnacle Financial Partners, Inc. | 37,147 | 3,600,287 |
| Security | Number
of Shares | Value ($) |
| Popular, Inc. | 38,557 | 2,928,019 |
| Preferred Bank | 7,096 | 453,363 |
| Premier Financial Corp. | 18,714 | 568,906 |
| Prosperity Bancshares, Inc. | 44,534 | 3,112,036 |
| Provident Financial Services, Inc. | 36,576 | 807,232 |
| QCR Holdings, Inc. | 8,205 | 426,250 |
| Radian Group, Inc. | 91,638 | 2,165,406 |
| Red River Bancshares, Inc. | 2,627 | 131,770 |
| Regions Financial Corp. | 469,714 | 9,596,257 |
| Renasant Corp. | 28,196 | 989,680 |
| Republic Bancorp, Inc., Class A | 3,793 | 190,143 |
| Rocket Cos., Inc., Class A | 66,521 | 1,154,139 |
| S&T Bancorp, Inc. | 19,619 | 584,646 |
| Sandy Spring Bancorp, Inc. | 21,847 | 951,874 |
| Seacoast Banking Corp. of Florida | 28,514 | 910,737 |
| ServisFirst Bancshares, Inc. | 22,084 | 1,621,407 |
| Signature Bank | 27,853 | 7,223,118 |
| Simmons First National Corp., Class A | 51,695 | 1,501,740 |
| South State Corp. | 34,390 | 2,358,466 |
| Southside Bancshares, Inc. | 15,948 | 601,080 |
| Sterling Bancorp | 91,225 | 2,088,140 |
| Stock Yards Bancorp, Inc. | 10,130 | 522,505 |
| SVB Financial Group * | 28,481 | 15,935,120 |
| Synovus Financial Corp. | 70,947 | 3,057,816 |
| Texas Capital Bancshares, Inc. * | 23,972 | 1,629,856 |
| TFS Financial Corp. | 22,946 | 458,691 |
| The Bancorp, Inc. * | 24,606 | 606,784 |
| The First of Long Island Corp. | 9,731 | 206,297 |
| The PNC Financial Services Group, Inc. | 206,289 | 39,421,828 |
| Tompkins Financial Corp. | 6,030 | 479,928 |
| Towne Bank | 32,811 | 999,751 |
| TriCo Bancshares | 14,203 | 561,729 |
| TriState Capital Holdings, Inc. * | 14,875 | 300,624 |
| Triumph Bancorp, Inc. * | 10,875 | 894,143 |
| Truist Financial Corp. | 653,599 | 37,294,359 |
| TrustCo Bank Corp. | 10,014 | 321,349 |
| Trustmark Corp. | 31,326 | 990,528 |
| U.S. Bancorp | 658,221 | 37,775,303 |
| UMB Financial Corp. | 20,981 | 1,921,440 |
| Umpqua Holdings Corp. | 106,889 | 2,081,129 |
| United Bankshares, Inc. | 65,655 | 2,385,246 |
| United Community Banks, Inc. | 41,970 | 1,266,235 |
| Univest Financial Corp. | 14,872 | 402,734 |
| UWM Holdings Corp. (a) | 26,723 | 196,414 |
| Valley National Bancorp | 195,682 | 2,551,693 |
| Veritex Holdings, Inc. | 24,352 | 874,967 |
| Walker & Dunlop, Inc. | 14,958 | 1,661,086 |
| Washington Federal, Inc. | 36,619 | 1,219,413 |
| Washington Trust Bancorp, Inc. | 9,413 | 501,336 |
| Waterstone Financial, Inc. | 10,080 | 204,422 |
| Webster Financial Corp. | 44,774 | 2,261,982 |
| Wells Fargo & Co. | 2,006,217 | 91,684,117 |
| WesBanco, Inc. | 32,811 | 1,115,574 |
| Westamerica BanCorp | 13,424 | 761,678 |
| Western Alliance Bancorp | 49,924 | 4,870,585 |
| Wintrust Financial Corp. | 28,396 | 2,125,157 |
| WSFS Financial Corp. | 24,251 | 1,101,238 |
| Zions Bancorp NA | 79,385 | 4,596,392 |
| | | 969,607,589 |
| |
| Capital Goods 6.0% |
| 3M Co. | 281,254 | 54,771,404 |
| A.O. Smith Corp. | 64,959 | 4,723,819 |
| AAON, Inc. | 19,779 | 1,347,148 |
| AAR Corp. * | 16,616 | 562,452 |
| Acuity Brands, Inc. | 17,244 | 3,182,035 |
| Advanced Drainage Systems, Inc. | 24,571 | 2,804,780 |
Schwab U.S. Equity ETFs | Annual Report
Schwab U.S. Broad Market ETF
Portfolio Holdings as of August 31, 2021 (continued)
| Security | Number
of Shares | Value ($) |
| Advent Technologies Holdings, Inc. *(a) | 17,127 | 126,740 |
| AECOM * | 71,005 | 4,655,088 |
| Aerojet Rocketdyne Holdings, Inc. | 35,812 | 1,486,914 |
| AeroVironment, Inc. * | 11,318 | 1,158,510 |
| AGCO Corp. | 29,993 | 4,127,637 |
| Air Lease Corp. | 51,772 | 2,057,419 |
| Alamo Group, Inc. | 4,571 | 708,551 |
| Albany International Corp., Class A | 14,808 | 1,159,911 |
| Allegion plc | 43,491 | 6,262,269 |
| Allison Transmission Holdings, Inc. | 53,024 | 1,960,828 |
| Altra Industrial Motion Corp. | 29,863 | 1,748,777 |
| Ameresco, Inc., Class A * | 10,763 | 744,261 |
| American Woodmark Corp. * | 8,648 | 609,338 |
| AMETEK, Inc. | 111,823 | 15,204,573 |
| API Group Corp. * | 74,701 | 1,732,316 |
| Apogee Enterprises, Inc. | 12,873 | 553,282 |
| Applied Industrial Technologies, Inc. | 18,683 | 1,659,237 |
| Arcosa, Inc. | 24,064 | 1,222,933 |
| Argan, Inc. | 6,765 | 313,220 |
| Armstrong World Industries, Inc. | 23,186 | 2,409,721 |
| Array Technologies, Inc. * | 52,771 | 1,006,343 |
| Astec Industries, Inc. | 11,050 | 675,597 |
| Astronics Corp. * | 14,250 | 190,380 |
| Atkore, Inc. * | 23,034 | 2,136,864 |
| Axon Enterprise, Inc. * | 31,467 | 5,722,903 |
| AZEK Co., Inc. * | 68,287 | 2,901,515 |
| AZZ, Inc. | 12,490 | 668,840 |
| Babcock & Wilcox Enterprises, Inc. * | 29,058 | 212,123 |
| Barnes Group, Inc. | 23,379 | 1,114,477 |
| Beacon Roofing Supply, Inc. * | 26,657 | 1,372,302 |
| Bloom Energy Corp., Class A * | 59,591 | 1,276,439 |
| Boise Cascade Co. | 19,641 | 1,136,232 |
| Builders FirstSource, Inc. * | 100,840 | 5,373,764 |
| BWX Technologies, Inc. | 45,997 | 2,641,608 |
| Byrna Technologies, Inc. * | 6,412 | 187,743 |
| CAI International, Inc. | 7,893 | 441,771 |
| Carlisle Cos., Inc. | 25,117 | 5,293,157 |
| Carrier Global Corp. | 396,343 | 22,829,357 |
| Caterpillar, Inc. | 265,839 | 56,057,470 |
| ChargePoint Holdings, Inc. *(a) | 79,066 | 1,672,246 |
| Chart Industries, Inc. * | 17,105 | 3,222,240 |
| CIRCOR International, Inc. * | 9,772 | 349,349 |
| Colfax Corp. * | 56,611 | 2,726,952 |
| Columbus McKinnon Corp. | 13,426 | 618,267 |
| Comfort Systems USA, Inc. | 17,699 | 1,344,770 |
| Construction Partners, Inc., Class A * | 17,057 | 570,898 |
| Cornerstone Building Brands, Inc. * | 19,843 | 329,791 |
| Crane Co. | 23,874 | 2,429,657 |
| CSW Industrials, Inc. | 6,654 | 883,585 |
| Cummins, Inc. | 70,801 | 16,707,620 |
| Curtiss-Wright Corp. | 19,960 | 2,430,729 |
| Deere & Co. | 151,306 | 57,198,207 |
| Desktop Metal, Inc., Class A *(a) | 72,082 | 598,281 |
| Donaldson Co., Inc. | 61,128 | 4,141,422 |
| Douglas Dynamics, Inc. | 10,602 | 421,323 |
| Dover Corp. | 69,709 | 12,154,461 |
| DXP Enterprises, Inc. * | 7,382 | 221,312 |
| Dycom Industries, Inc. * | 14,837 | 1,117,671 |
| Eaton Corp. plc | 193,054 | 32,502,571 |
| EMCOR Group, Inc. | 26,704 | 3,244,536 |
| Emerson Electric Co. | 290,560 | 30,654,080 |
| Encore Wire Corp. | 10,067 | 855,796 |
| Energy Recovery, Inc. * | 19,496 | 398,303 |
| Enerpac Tool Group Corp. | 30,869 | 776,664 |
| EnerSys | 20,809 | 1,760,233 |
| EnPro Industries, Inc. | 10,316 | 882,121 |
| Eos Energy Enterprises, Inc. *(a) | 16,034 | 207,159 |
| ESCO Technologies, Inc. | 12,985 | 1,170,208 |
| Security | Number
of Shares | Value ($) |
| Evoqua Water Technologies Corp. * | 57,511 | 2,238,328 |
| Fastenal Co. | 278,994 | 15,581,815 |
| Federal Signal Corp. | 29,124 | 1,183,308 |
| Flowserve Corp. | 62,618 | 2,433,962 |
| Fluor Corp. * | 60,574 | 1,009,163 |
| Fortive Corp. | 164,534 | 12,154,127 |
| Fortune Brands Home & Security, Inc. | 66,923 | 6,516,293 |
| Franklin Electric Co., Inc. | 19,321 | 1,641,899 |
| FTC Solar, Inc. * | 9,797 | 106,297 |
| FuelCell Energy, Inc. * | 154,801 | 965,958 |
| Gates Industrial Corp. plc * | 45,390 | 743,488 |
| GATX Corp. | 17,054 | 1,563,511 |
| Generac Holdings, Inc. * | 30,511 | 13,332,697 |
| General Dynamics Corp. | 110,973 | 22,229,002 |
| General Electric Co. | 532,501 | 56,130,930 |
| Gibraltar Industries, Inc. * | 15,851 | 1,183,436 |
| Global Industrial Co. | 8,588 | 330,552 |
| GMS, Inc. * | 20,755 | 1,025,505 |
| Graco, Inc. | 82,255 | 6,450,437 |
| GrafTech International Ltd. | 77,764 | 860,847 |
| Graham Corp. | 4,832 | 57,984 |
| Granite Construction, Inc. | 23,067 | 935,136 |
| Great Lakes Dredge & Dock Corp. * | 31,721 | 479,304 |
| Griffon Corp. | 21,991 | 532,182 |
| H&E Equipment Services, Inc. | 14,475 | 492,874 |
| HEICO Corp. | 20,688 | 2,623,652 |
| HEICO Corp., Class A | 35,351 | 4,038,498 |
| Helios Technologies, Inc. | 15,584 | 1,271,966 |
| Herc Holdings, Inc. * | 12,424 | 1,633,135 |
| Hexcel Corp. * | 41,323 | 2,343,427 |
| Hillenbrand, Inc. | 37,754 | 1,752,541 |
| Honeywell International, Inc. | 336,874 | 78,124,449 |
| Howmet Aerospace, Inc. | 189,343 | 6,011,640 |
| Hubbell, Inc. | 26,446 | 5,450,785 |
| Huntington Ingalls Industries, Inc. | 19,490 | 3,979,273 |
| Hydrofarm Holdings Group, Inc. * | 6,584 | 332,887 |
| Hyliion Holdings Corp. *(a) | 50,016 | 441,641 |
| Hyster-Yale Materials Handling, Inc. | 4,812 | 282,031 |
| IDEX Corp. | 36,906 | 8,266,944 |
| IES Holdings, Inc. * | 9,826 | 480,491 |
| Illinois Tool Works, Inc. | 139,698 | 32,530,076 |
| Ingersoll Rand, Inc. * | 188,431 | 9,990,612 |
| Insteel Industries, Inc. | 8,890 | 328,930 |
| ITT, Inc. | 42,254 | 4,042,440 |
| JELD-WEN Holding, Inc. * | 44,705 | 1,231,176 |
| John Bean Technologies Corp. | 15,364 | 2,241,454 |
| Johnson Controls International plc | 347,501 | 25,993,075 |
| Kadant, Inc. | 5,319 | 1,112,309 |
| Kaman Corp. | 14,375 | 561,775 |
| Kennametal, Inc. | 41,011 | 1,524,789 |
| Kratos Defense & Security Solutions, Inc. * | 59,674 | 1,475,141 |
| L.B. Foster Co., Class A * | 5,651 | 96,350 |
| L3Harris Technologies, Inc. | 99,444 | 23,171,446 |
| Lennox International, Inc. | 16,763 | 5,618,622 |
| Lincoln Electric Holdings, Inc. | 29,085 | 4,060,557 |
| Lindsay Corp. | 5,512 | 908,102 |
| Lockheed Martin Corp. | 118,652 | 42,690,990 |
| Lydall, Inc. * | 7,705 | 477,556 |
| Masco Corp. | 123,419 | 7,494,002 |
| Masonite International Corp. * | 11,990 | 1,434,963 |
| MasTec, Inc. * | 27,291 | 2,495,489 |
| Matrix Service Co. * | 14,682 | 165,613 |
| Maxar Technologies, Inc. | 34,476 | 1,095,992 |
| McGrath RentCorp | 12,307 | 858,782 |
| Mercury Systems, Inc. * | 27,528 | 1,386,861 |
| Meritor, Inc. * | 34,659 | 822,111 |
| Moog, Inc., Class A | 14,164 | 1,125,188 |
Schwab U.S. Equity ETFs | Annual Report
Schwab U.S. Broad Market ETF
Portfolio Holdings as of August 31, 2021 (continued)
| Security | Number
of Shares | Value ($) |
| MRC Global, Inc. * | 26,482 | 217,152 |
| MSC Industrial Direct Co., Inc., Class A | 22,694 | 1,911,062 |
| Mueller Industries, Inc. | 28,110 | 1,253,987 |
| Mueller Water Products, Inc., Class A | 76,810 | 1,276,582 |
| MYR Group, Inc. * | 7,658 | 796,509 |
| National Presto Industries, Inc. | 2,248 | 187,798 |
| Nikola Corp. *(a) | 66,898 | 697,746 |
| NN, Inc. * | 23,354 | 127,046 |
| Nordson Corp. | 26,227 | 6,257,762 |
| Northrop Grumman Corp. | 72,631 | 26,706,419 |
| NOW, Inc. * | 55,186 | 423,828 |
| NV5 Global, Inc. * | 5,600 | 591,640 |
| nVent Electric plc | 82,450 | 2,832,982 |
| Omega Flex, Inc. | 1,630 | 247,760 |
| Oshkosh Corp. | 33,119 | 3,794,775 |
| Otis Worldwide Corp. | 195,356 | 18,015,730 |
| Owens Corning | 50,270 | 4,803,299 |
| PACCAR, Inc. | 168,149 | 13,766,359 |
| PAE, Inc. * | 29,879 | 199,891 |
| Park Aerospace Corp. | 7,804 | 113,782 |
| Park-Ohio Holdings Corp. | 4,831 | 124,543 |
| Parker-Hannifin Corp. | 62,638 | 18,582,815 |
| Parsons Corp. * | 11,531 | 408,543 |
| Pentair plc | 80,811 | 6,235,377 |
| PGT Innovations, Inc. * | 30,100 | 639,023 |
| Plug Power, Inc. * | 248,191 | 6,467,857 |
| Powell Industries, Inc. | 3,838 | 97,101 |
| Preformed Line Products Co. | 1,622 | 113,735 |
| Primoris Services Corp. | 23,533 | 604,798 |
| Proto Labs, Inc. * | 13,700 | 1,015,992 |
| Quanex Building Products Corp. | 16,660 | 392,510 |
| Quanta Services, Inc. | 67,935 | 6,936,164 |
| Raven Industries, Inc. * | 17,804 | 1,038,863 |
| Raytheon Technologies Corp. | 734,846 | 62,285,547 |
| RBC Bearings, Inc. * | 12,124 | 2,806,949 |
| Regal Beloit Corp. | 19,546 | 2,920,563 |
| Resideo Technologies, Inc. * | 68,851 | 2,219,756 |
| REV Group, Inc. | 12,977 | 211,006 |
| Rexnord Corp. | 58,019 | 3,525,234 |
| Rockwell Automation, Inc. | 56,476 | 18,380,114 |
| Romeo Power, Inc. *(a) | 42,433 | 206,649 |
| Roper Technologies, Inc. | 51,071 | 24,681,593 |
| Rush Enterprises, Inc., Class A | 20,220 | 891,702 |
| Rush Enterprises, Inc., Class B | 3,395 | 143,914 |
| Sensata Technologies Holding plc * | 76,578 | 4,531,886 |
| Shoals Technologies Group, Inc., Class A * | 43,918 | 1,430,409 |
| Shyft Group, Inc. | 15,431 | 679,118 |
| Simpson Manufacturing Co., Inc. | 21,108 | 2,388,370 |
| SiteOne Landscape Supply, Inc. * | 21,384 | 4,278,938 |
| Snap-on, Inc. | 26,537 | 5,969,498 |
| Spirit AeroSystems Holdings, Inc., Class A | 51,208 | 2,009,402 |
| SPX Corp. * | 21,524 | 1,344,820 |
| SPX FLOW, Inc. | 20,362 | 1,639,752 |
| Standex International Corp. | 6,240 | 619,258 |
| Stanley Black & Decker, Inc. | 78,386 | 15,149,662 |
| Stem, Inc. * | 53,717 | 1,342,388 |
| Sunrun, Inc. * | 79,409 | 3,513,848 |
| Tennant Co. | 9,349 | 691,639 |
| Terex Corp. | 33,674 | 1,719,058 |
| Textron, Inc. | 108,691 | 7,898,575 |
| The Boeing Co. * | 266,745 | 58,550,528 |
| The Gorman-Rupp Co. | 8,934 | 313,315 |
| The Greenbrier Cos., Inc. | 15,722 | 693,340 |
| The Manitowoc Co., Inc. * | 17,486 | 424,036 |
| The Middleby Corp. * | 26,908 | 4,922,550 |
| The Timken Co. | 32,971 | 2,424,687 |
| Security | Number
of Shares | Value ($) |
| The Toro Co. | 52,013 | 5,718,309 |
| Thermon Group Holdings, Inc. * | 15,903 | 265,580 |
| Titan International, Inc. * | 26,194 | 217,672 |
| Titan Machinery, Inc. * | 9,916 | 284,788 |
| TPI Composites, Inc. * | 15,835 | 574,969 |
| Trane Technologies plc | 115,952 | 23,016,472 |
| TransDigm Group, Inc. * | 26,556 | 16,131,973 |
| Trex Co., Inc. * | 55,791 | 6,123,620 |
| TriMas Corp. * | 21,846 | 701,475 |
| Trinity Industries, Inc. | 40,991 | 1,189,969 |
| Triton International Ltd. | 33,099 | 1,811,177 |
| Triumph Group, Inc. * | 30,683 | 566,408 |
| Tutor Perini Corp. * | 20,914 | 301,580 |
| UFP Industries, Inc. | 30,285 | 2,273,798 |
| United Rentals, Inc. * | 35,028 | 12,352,624 |
| Univar Solutions, Inc. * | 82,184 | 1,940,364 |
| Valmont Industries, Inc. | 10,238 | 2,547,829 |
| Veritiv Corp. * | 5,601 | 502,242 |
| Vertiv Holdings Co. | 119,270 | 3,359,836 |
| Vicor Corp. * | 10,442 | 1,288,230 |
| View, Inc. *(a) | 29,908 | 149,839 |
| Virgin Galactic Holdings, Inc. *(a) | 64,525 | 1,749,273 |
| W.W. Grainger, Inc. | 21,247 | 9,214,824 |
| Wabash National Corp. | 24,606 | 382,377 |
| Watsco, Inc. | 15,905 | 4,428,270 |
| Watts Water Technologies, Inc., Class A | 13,467 | 2,310,533 |
| Welbilt, Inc. * | 63,812 | 1,493,201 |
| WESCO International, Inc. * | 21,687 | 2,537,813 |
| Westinghouse Air Brake Technologies Corp. | 86,012 | 7,723,018 |
| WillScot Mobile Mini Holdings Corp. * | 97,346 | 2,881,442 |
| Woodward, Inc. | 28,218 | 3,412,685 |
| Xylem, Inc. | 87,295 | 11,899,181 |
| | | 1,349,308,201 |
| |
| Commercial & Professional Services 1.2% |
| ABM Industries, Inc. | 33,170 | 1,642,578 |
| Acacia Research Corp. * | 22,417 | 136,520 |
| ACCO Brands Corp. | 51,056 | 478,395 |
| ADT, Inc. | 73,844 | 632,105 |
| ASGN, Inc. * | 25,409 | 2,850,636 |
| Barrett Business Services, Inc. | 3,846 | 298,065 |
| Booz Allen Hamilton Holding Corp. | 65,550 | 5,369,200 |
| Brady Corp., Class A | 23,383 | 1,247,015 |
| BrightView Holdings, Inc. * | 15,151 | 232,265 |
| CACI International, Inc., Class A * | 11,575 | 2,981,025 |
| Casella Waste Systems, Inc., Class A * | 23,809 | 1,761,628 |
| CBIZ, Inc. * | 24,843 | 847,395 |
| Cimpress plc * | 9,465 | 898,986 |
| Cintas Corp. | 42,824 | 16,948,454 |
| Clarivate plc * | 126,604 | 3,189,155 |
| Clean Harbors, Inc. * | 24,004 | 2,463,290 |
| Copart, Inc. * | 100,960 | 14,570,547 |
| CoreCivic, Inc. * | 59,675 | 580,041 |
| CoStar Group, Inc. * | 191,312 | 16,211,779 |
| Covanta Holding Corp. | 59,012 | 1,183,191 |
| Deluxe Corp. | 20,183 | 774,018 |
| Driven Brands Holdings, Inc. * | 21,121 | 631,095 |
| Dun & Bradstreet Holdings, Inc. * | 68,533 | 1,256,210 |
| Ennis, Inc. | 13,392 | 259,939 |
| Equifax, Inc. | 58,962 | 16,052,994 |
| Exponent, Inc. | 25,428 | 2,972,533 |
| Forrester Research, Inc. * | 5,170 | 245,833 |
| Franklin Covey Co. * | 5,138 | 223,349 |
| FTI Consulting, Inc. * | 16,510 | 2,306,612 |
| GP Strategies Corp. * | 6,252 | 129,291 |
| Harsco Corp. * | 37,347 | 681,209 |
Schwab U.S. Equity ETFs | Annual Report
Schwab U.S. Broad Market ETF
Portfolio Holdings as of August 31, 2021 (continued)
| Security | Number
of Shares | Value ($) |
| Healthcare Services Group, Inc. | 36,344 | 950,759 |
| Heidrick & Struggles International, Inc. | 8,967 | 387,554 |
| Heritage-Crystal Clean, Inc. * | 8,691 | 256,732 |
| Herman Miller, Inc. | 36,028 | 1,514,257 |
| HNI Corp. | 21,238 | 804,708 |
| Huron Consulting Group, Inc. * | 11,336 | 559,658 |
| IAA, Inc. * | 65,173 | 3,461,990 |
| ICF International, Inc. | 8,294 | 776,816 |
| IHS Markit Ltd. | 181,625 | 21,903,975 |
| Insperity, Inc. | 17,168 | 1,894,317 |
| Interface, Inc. | 27,254 | 391,913 |
| Jacobs Engineering Group, Inc. | 63,433 | 8,560,918 |
| KAR Auction Services, Inc. * | 59,060 | 998,705 |
| KBR, Inc. | 69,439 | 2,703,955 |
| Kelly Services, Inc., Class A | 15,565 | 302,584 |
| Kforce, Inc. | 8,754 | 511,409 |
| Kimball International, Inc., Class B | 18,718 | 233,413 |
| Korn Ferry | 26,640 | 1,883,182 |
| Leidos Holdings, Inc. | 64,677 | 6,345,460 |
| ManpowerGroup, Inc. | 26,404 | 3,205,974 |
| ManTech International Corp., Class A | 13,478 | 1,067,053 |
| Matthews International Corp., Class A | 14,608 | 540,934 |
| Mistras Group, Inc. * | 8,854 | 93,941 |
| MSA Safety, Inc. | 17,586 | 2,863,704 |
| Nielsen Holdings plc | 173,206 | 3,717,001 |
| Pitney Bowes, Inc. | 83,940 | 627,032 |
| Quad/Graphics, Inc. * | 23,577 | 97,609 |
| Republic Services, Inc. | 102,046 | 12,666,970 |
| Resources Connection, Inc. | 13,123 | 207,343 |
| Robert Half International, Inc. | 55,122 | 5,699,615 |
| Rollins, Inc. | 107,519 | 4,184,639 |
| Science Applications International Corp. | 28,085 | 2,365,600 |
| SP Plus Corp. * | 10,713 | 346,994 |
| Steelcase, Inc., Class A | 41,938 | 590,906 |
| Stericycle, Inc. * | 44,353 | 3,086,969 |
| Team, Inc. * | 10,789 | 48,335 |
| Tetra Tech, Inc. | 26,094 | 3,753,361 |
| The Brink's Co. | 23,881 | 1,866,539 |
| TransUnion | 92,874 | 11,286,977 |
| TriNet Group, Inc. * | 19,959 | 1,837,825 |
| TrueBlue, Inc. * | 15,883 | 434,082 |
| UniFirst Corp. | 7,608 | 1,742,765 |
| Upwork, Inc. * | 44,782 | 2,002,203 |
| US Ecology, Inc. * | 15,510 | 556,033 |
| Verisk Analytics, Inc. | 78,689 | 15,876,293 |
| Viad Corp. * | 10,208 | 440,883 |
| Vidler Water Resouces, Inc. * | 12,656 | 188,448 |
| VSE Corp. | 4,578 | 228,854 |
| Waste Management, Inc. | 188,162 | 29,185,808 |
| | | 265,308,348 |
| |
| Consumer Durables & Apparel 1.5% |
| Acushnet Holdings Corp. | 16,882 | 843,425 |
| American Outdoor Brands, Inc. * | 6,881 | 191,498 |
| AMMO, Inc. *(a) | 40,345 | 296,536 |
| Beazer Homes USA, Inc. * | 12,920 | 241,733 |
| Brunswick Corp. | 37,936 | 3,674,860 |
| Callaway Golf Co. * | 56,119 | 1,574,699 |
| Capri Holdings Ltd. * | 73,176 | 4,135,176 |
| Carter's, Inc. | 21,738 | 2,225,536 |
| Casper Sleep, Inc. * | 9,067 | 45,154 |
| Cavco Industries, Inc. * | 4,298 | 1,098,139 |
| Century Communities, Inc. | 14,154 | 992,195 |
| Columbia Sportswear Co. | 14,676 | 1,497,099 |
| Crocs, Inc. * | 32,092 | 4,583,379 |
| D.R. Horton, Inc. | 158,669 | 15,171,930 |
| Deckers Outdoor Corp. * | 13,445 | 5,626,060 |
| Security | Number
of Shares | Value ($) |
| Dream Finders Homes, Inc., Class A *(a) | 4,992 | 103,834 |
| Ethan Allen Interiors, Inc. | 12,038 | 289,153 |
| Fossil Group, Inc. * | 24,823 | 332,628 |
| G-III Apparel Group Ltd. * | 21,659 | 669,913 |
| Garmin Ltd. | 72,372 | 12,623,848 |
| GoPro, Inc., Class A * | 62,298 | 621,111 |
| Green Brick Partners, Inc. * | 23,690 | 592,013 |
| Hanesbrands, Inc. | 168,203 | 3,142,032 |
| Hasbro, Inc. | 62,151 | 6,110,065 |
| Hayward Holdings, Inc. * | 19,728 | 413,302 |
| Helen of Troy Ltd. * | 11,825 | 2,828,422 |
| Installed Building Products, Inc. | 11,442 | 1,420,868 |
| iRobot Corp. *(a) | 13,991 | 1,134,950 |
| Johnson Outdoors, Inc., Class A | 3,145 | 361,015 |
| KB Home | 43,130 | 1,855,884 |
| Kontoor Brands, Inc. | 23,095 | 1,246,206 |
| La-Z-Boy, Inc. | 23,118 | 809,361 |
| Latham Group, Inc. * | 9,732 | 213,812 |
| Legacy Housing Corp. * | 2,600 | 50,960 |
| Leggett & Platt, Inc. | 64,914 | 3,141,188 |
| Lennar Corp., Class A | 139,637 | 14,984,447 |
| Levi Strauss & Co., Class A | 41,239 | 1,080,874 |
| LGI Homes, Inc. * | 11,027 | 1,767,959 |
| Lululemon Athletica, Inc. * | 57,490 | 23,005,773 |
| M.D.C Holdings, Inc. | 27,027 | 1,412,161 |
| M/I Homes, Inc. * | 14,520 | 934,943 |
| Malibu Boats, Inc., Class A * | 9,985 | 714,926 |
| Marine Products Corp. | 14,337 | 203,299 |
| Mattel, Inc. * | 169,233 | 3,613,125 |
| Meritage Homes Corp. * | 18,355 | 2,047,317 |
| Mohawk Industries, Inc. * | 28,379 | 5,612,231 |
| Movado Group, Inc. | 8,740 | 315,864 |
| Newell Brands, Inc. | 184,762 | 4,694,802 |
| NIKE, Inc., Class B | 618,533 | 101,897,126 |
| NVR, Inc. * | 1,662 | 8,609,060 |
| Oxford Industries, Inc. | 8,310 | 750,393 |
| Peloton Interactive, Inc., Class A * | 130,416 | 13,066,379 |
| Polaris, Inc. | 28,220 | 3,379,627 |
| PulteGroup, Inc. | 128,312 | 6,910,884 |
| Purple Innovation, Inc. * | 28,688 | 699,987 |
| PVH Corp. * | 34,263 | 3,590,420 |
| Ralph Lauren Corp. | 23,572 | 2,737,416 |
| Skechers U.S.A., Inc., Class A * | 65,015 | 3,278,706 |
| Skyline Champion Corp. * | 24,700 | 1,549,184 |
| Smith & Wesson Brands, Inc. | 25,638 | 618,645 |
| Sonos, Inc. * | 48,927 | 1,943,870 |
| Steven Madden Ltd. | 37,909 | 1,534,177 |
| Sturm Ruger & Co., Inc. | 8,685 | 679,080 |
| Tapestry, Inc. * | 134,499 | 5,423,000 |
| Taylor Morrison Home Corp., Class A * | 63,229 | 1,776,103 |
| Tempur Sealy International, Inc. | 88,807 | 3,969,673 |
| Toll Brothers, Inc. | 53,905 | 3,453,154 |
| TopBuild Corp. * | 15,995 | 3,499,546 |
| Tri Pointe Homes, Inc. * | 57,057 | 1,356,245 |
| Tupperware Brands Corp. * | 24,359 | 581,449 |
| Under Armour, Inc., Class A * | 92,481 | 2,140,010 |
| Under Armour, Inc., Class C * | 94,441 | 1,894,486 |
| Unifi, Inc. * | 6,672 | 155,057 |
| Universal Electronics, Inc. * | 7,432 | 375,465 |
| Vera Bradley, Inc. * | 9,342 | 107,059 |
| VF Corp. | 155,586 | 11,897,661 |
| Vista Outdoor, Inc. * | 27,220 | 1,111,937 |
| Vizio Holding Corp., Class A *(a) | 5,838 | 119,154 |
| Whirlpool Corp. | 30,413 | 6,737,392 |
| Wolverine World Wide, Inc. | 40,244 | 1,443,150 |
| YETI Holdings, Inc. * | 36,400 | 3,615,976 |
| | | 341,447,176 |
| |
Schwab U.S. Equity ETFs | Annual Report
Schwab U.S. Broad Market ETF
Portfolio Holdings as of August 31, 2021 (continued)
| Security | Number
of Shares | Value ($) |
| Consumer Services 2.2% |
| 2U, Inc. * | 36,622 | 1,356,113 |
| Accel Entertainment, Inc. * | 26,181 | 301,605 |
| Adtalem Global Education, Inc. * | 22,866 | 846,042 |
| Airbnb, Inc., Class A * | 71,389 | 11,064,581 |
| American Public Education, Inc. * | 8,940 | 235,122 |
| Aramark | 122,722 | 4,269,498 |
| Bally's Corp. * | 14,039 | 705,319 |
| Biglari Holdings, Inc., Class B * | 634 | 110,855 |
| BJ's Restaurants, Inc. * | 11,723 | 501,275 |
| Bloomin' Brands, Inc. * | 38,488 | 1,031,094 |
| Bluegreen Vacations Holding Corp. * | 6,102 | 139,675 |
| Booking Holdings, Inc. * | 19,961 | 45,903,713 |
| Boyd Gaming Corp. * | 39,392 | 2,417,487 |
| Bright Horizons Family Solutions, Inc. * | 29,460 | 4,294,090 |
| Brinker International, Inc. * | 22,374 | 1,191,863 |
| Caesars Entertainment, Inc. * | 100,979 | 10,262,496 |
| Carnival Corp. * | 387,843 | 9,362,530 |
| Carriage Services, Inc. | 7,343 | 339,467 |
| Carrols Restaurant Group, Inc. | 14,310 | 59,386 |
| Chegg, Inc. * | 69,057 | 5,746,924 |
| Chipotle Mexican Grill, Inc. * | 13,698 | 26,071,814 |
| Choice Hotels International, Inc. | 14,049 | 1,676,889 |
| Churchill Downs, Inc. | 16,698 | 3,514,929 |
| Chuy's Holdings, Inc. * | 9,348 | 301,566 |
| Coursera, Inc. * | 7,946 | 305,683 |
| Cracker Barrel Old Country Store, Inc. | 11,288 | 1,620,731 |
| Darden Restaurants, Inc. | 63,858 | 9,620,208 |
| Dave & Buster's Entertainment, Inc. * | 24,018 | 898,754 |
| Denny's Corp. * | 28,995 | 479,577 |
| Diamond Resorts International, Inc. - Escrow *(a)(b) | 22,324 | 5,675 |
| Dine Brands Global, Inc. * | 8,556 | 707,752 |
| Domino's Pizza, Inc. | 18,886 | 9,761,985 |
| DraftKings, Inc., Class A * | 156,800 | 9,296,672 |
| El Pollo Loco Holdings, Inc. * | 7,837 | 142,163 |
| Everi Holdings, Inc. * | 41,020 | 933,205 |
| Expedia Group, Inc. * | 68,602 | 9,912,989 |
| Fiesta Restaurant Group, Inc. * | 7,695 | 92,417 |
| frontdoor, Inc. * | 41,932 | 1,829,074 |
| GAN Ltd. * | 7,388 | 126,335 |
| Golden Entertainment, Inc. * | 9,353 | 446,325 |
| Golden Nugget Online Gaming, Inc. * | 23,489 | 507,362 |
| Graham Holdings Co., Class B | 1,942 | 1,197,845 |
| Grand Canyon Education, Inc. * | 22,352 | 1,992,457 |
| H&R Block, Inc. | 88,868 | 2,279,464 |
| Hilton Grand Vacations, Inc. * | 41,954 | 1,832,970 |
| Hilton Worldwide Holdings, Inc. * | 135,480 | 16,916,033 |
| Houghton Mifflin Harcourt Co. * | 61,097 | 822,977 |
| Hyatt Hotels Corp., Class A * | 18,637 | 1,371,497 |
| Jack in the Box, Inc. | 11,400 | 1,207,944 |
| Las Vegas Sands Corp. * | 159,077 | 7,096,425 |
| Laureate Education, Inc., Class A * | 53,473 | 851,825 |
| Lindblad Expeditions Holdings, Inc. * | 15,142 | 222,739 |
| Marriott International, Inc., Class A * | 129,176 | 17,456,845 |
| Marriott Vacations Worldwide Corp. * | 20,631 | 3,085,366 |
| McDonald's Corp. | 361,864 | 85,928,225 |
| MGM Resorts International | 197,096 | 8,400,231 |
| Monarch Casino & Resort, Inc. * | 5,984 | 379,206 |
| Noodles & Co. * | 13,757 | 173,201 |
| Norwegian Cruise Line Holdings Ltd. * | 180,453 | 4,662,905 |
| OneSpaWorld Holdings Ltd. * | 27,612 | 289,926 |
| Papa John's International, Inc. | 15,844 | 2,020,585 |
| Penn National Gaming, Inc. * | 71,608 | 5,807,409 |
| Perdoceo Education Corp. * | 35,688 | 391,854 |
| Planet Fitness, Inc., Class A * | 40,497 | 3,292,406 |
| Playa Hotels & Resorts N.V. * | 44,575 | 325,843 |
| Security | Number
of Shares | Value ($) |
| PlayAGS, Inc. * | 20,914 | 171,286 |
| Red Rock Resorts, Inc., Class A * | 31,692 | 1,483,503 |
| Regis Corp. * | 13,429 | 72,785 |
| Royal Caribbean Cruises Ltd. * | 106,348 | 8,798,170 |
| Rush Street Interactive, Inc. * | 30,002 | 446,430 |
| Ruth's Hospitality Group, Inc. * | 16,915 | 346,588 |
| Scientific Games Corp., Class A * | 27,161 | 1,965,098 |
| SeaWorld Entertainment, Inc. * | 24,761 | 1,217,994 |
| Service Corp. International | 81,776 | 5,132,262 |
| Shake Shack, Inc., Class A * | 17,615 | 1,528,101 |
| Six Flags Entertainment Corp. * | 36,556 | 1,544,125 |
| Starbucks Corp. | 571,720 | 67,171,383 |
| Strategic Education, Inc. | 11,847 | 927,383 |
| Stride, Inc. * | 21,375 | 731,880 |
| Target Hospitality Corp. * | 17,988 | 71,592 |
| Terminix Global Holdings, Inc. * | 62,141 | 2,586,930 |
| Texas Roadhouse, Inc. | 31,416 | 2,984,520 |
| The Cheesecake Factory, Inc. * | 23,444 | 1,093,663 |
| The Wendy's Co. | 84,390 | 1,942,658 |
| Travel & Leisure Co. | 42,270 | 2,314,705 |
| Vail Resorts, Inc. * | 19,545 | 5,958,293 |
| Vivint Smart Home, Inc. * | 19,806 | 241,633 |
| Wingstop, Inc. | 14,506 | 2,494,017 |
| WW International, Inc. * | 23,140 | 500,981 |
| Wyndham Hotels & Resorts, Inc. | 45,331 | 3,295,564 |
| Wynn Resorts Ltd. * | 51,062 | 5,192,495 |
| Yum! Brands, Inc. | 144,504 | 18,934,359 |
| | | 485,545,816 |
| |
| Diversified Financials 5.3% |
| Affiliated Managers Group, Inc. | 20,287 | 3,451,022 |
| AGNC Investment Corp. | 257,565 | 4,200,885 |
| Alerus Financial Corp. | 6,929 | 206,900 |
| Ally Financial, Inc. | 180,687 | 9,558,342 |
| American Express Co. | 315,551 | 52,368,844 |
| Ameriprise Financial, Inc. | 56,175 | 15,330,719 |
| Annaly Capital Management, Inc. | 677,472 | 5,887,232 |
| Apollo Commercial Real Estate Finance, Inc. | 62,181 | 966,915 |
| Apollo Global Management, Inc. | 103,110 | 6,163,916 |
| Arbor Realty Trust, Inc. | 60,822 | 1,111,826 |
| Ares Management Corp., Class A | 53,198 | 4,105,822 |
| ARMOUR Residential REIT, Inc. | 38,217 | 415,037 |
| Artisan Partners Asset Management, Inc., Class A | 29,412 | 1,528,248 |
| Assetmark Financial Holdings, Inc. * | 8,485 | 227,992 |
| B. Riley Financial, Inc. | 8,210 | 538,083 |
| Berkshire Hathaway, Inc., Class B * | 919,249 | 262,693,787 |
| BGC Partners, Inc., Class A | 170,336 | 877,230 |
| BlackRock, Inc. | 68,859 | 64,954,006 |
| Blackstone Mortgage Trust, Inc., Class A | 70,769 | 2,321,931 |
| Blackstone, Inc. | 331,985 | 41,740,474 |
| Blucora, Inc. * | 23,720 | 389,245 |
| Brightsphere Investment Group, Inc. | 27,958 | 760,178 |
| BrightSpire Capital, Inc. | 42,849 | 429,347 |
| Broadmark Realty Capital, Inc. | 61,097 | 642,129 |
| Cannae Holdings, Inc. * | 41,950 | 1,339,044 |
| Capital One Financial Corp. | 218,962 | 36,341,123 |
| Capstead Mortgage Corp. | 43,186 | 297,552 |
| Cboe Global Markets, Inc. | 51,590 | 6,508,079 |
| Chimera Investment Corp. | 112,731 | 1,727,039 |
| CME Group, Inc. | 174,376 | 35,175,127 |
| Cohen & Steers, Inc. | 11,452 | 1,004,455 |
| Coinbase Global, Inc., Class A * | 13,077 | 3,386,943 |
| Cowen, Inc., Class A | 13,512 | 486,972 |
| Credit Acceptance Corp. * | 5,569 | 3,228,238 |
| Curo Group Holdings Corp. | 6,572 | 107,584 |
Schwab U.S. Equity ETFs | Annual Report
Schwab U.S. Broad Market ETF
Portfolio Holdings as of August 31, 2021 (continued)
| Security | Number
of Shares | Value ($) |
| Diamond Hill Investment Group, Inc. | 1,690 | 309,321 |
| Discover Financial Services | 147,576 | 18,922,195 |
| Donnelley Financial Solutions, Inc. * | 14,821 | 494,280 |
| Dynex Capital, Inc. | 11,976 | 212,694 |
| Ellington Financial, Inc. | 20,904 | 387,142 |
| Encore Capital Group, Inc. * | 14,516 | 714,332 |
| Enova International, Inc. * | 17,274 | 569,697 |
| Equitable Holdings, Inc. | 186,161 | 5,772,853 |
| Evercore, Inc., Class A | 19,605 | 2,737,642 |
| EZCORP, Inc., Class A * | 31,214 | 215,064 |
| FactSet Research Systems, Inc. | 18,373 | 6,985,782 |
| Federated Hermes, Inc. | 45,793 | 1,549,177 |
| FirstCash, Inc. | 20,289 | 1,738,564 |
| Focus Financial Partners, Inc., Class A * | 24,347 | 1,263,122 |
| Franklin Resources, Inc. | 131,177 | 4,255,382 |
| Granite Point Mortgage Trust, Inc. | 25,861 | 355,847 |
| Green Dot Corp., Class A * | 26,000 | 1,358,240 |
| Greenhill & Co., Inc. | 8,946 | 131,864 |
| Hamilton Lane, Inc., Class A | 15,904 | 1,368,857 |
| Hannon Armstrong Sustainable Infrastructure Capital, Inc. | 38,089 | 2,299,433 |
| Houlihan Lokey, Inc. | 24,614 | 2,220,183 |
| Interactive Brokers Group, Inc., Class A | 39,142 | 2,530,139 |
| Intercontinental Exchange, Inc. | 273,096 | 32,643,165 |
| Invesco Ltd. | 183,433 | 4,644,524 |
| Invesco Mortgage Capital, Inc. (a) | 133,456 | 416,383 |
| Janus Henderson Group plc | 83,409 | 3,616,614 |
| Jefferies Financial Group, Inc. | 97,280 | 3,595,469 |
| KKR & Co., Inc. | 281,705 | 18,110,814 |
| KKR Real Estate Finance Trust, Inc. | 14,234 | 303,611 |
| Ladder Capital Corp., Class A | 58,678 | 669,516 |
| Lazard Ltd., Class A | 53,818 | 2,550,973 |
| LendingClub Corp. * | 47,519 | 1,475,940 |
| LendingTree, Inc. * | 5,256 | 875,807 |
| LPL Financial Holdings, Inc. | 38,873 | 5,747,373 |
| MarketAxess Holdings, Inc. | 18,579 | 8,842,118 |
| MFA Financial, Inc. | 220,093 | 1,056,446 |
| Moelis & Co., Class A | 29,483 | 1,826,472 |
| Moody's Corp. | 78,176 | 29,767,076 |
| Morgan Stanley | 722,457 | 75,446,185 |
| Morningstar, Inc. | 10,511 | 2,816,843 |
| MSCI, Inc. | 40,007 | 25,387,642 |
| Nasdaq, Inc. | 55,550 | 10,875,579 |
| Navient Corp. | 87,860 | 2,039,231 |
| Nelnet, Inc., Class A | 10,538 | 852,313 |
| New Residential Investment Corp. | 222,482 | 2,429,503 |
| New York Mortgage Trust, Inc. | 176,943 | 782,088 |
| Northern Trust Corp. | 101,058 | 11,977,394 |
| OneMain Holdings, Inc. | 51,575 | 2,982,582 |
| Open Lending Corp., Class A * | 47,713 | 1,763,950 |
| Oportun Financial Corp. * | 9,401 | 237,375 |
| PennyMac Mortgage Investment Trust | 50,269 | 975,721 |
| Piper Sandler Cos. | 7,113 | 1,016,590 |
| PJT Partners, Inc., Class A | 11,452 | 904,479 |
| PRA Group, Inc. * | 21,758 | 913,836 |
| PROG Holdings, Inc. | 33,392 | 1,580,109 |
| Raymond James Financial, Inc. | 59,388 | 8,308,381 |
| Ready Capital Corp. | 27,952 | 427,945 |
| Redwood Trust, Inc. | 54,483 | 679,403 |
| S&P Global, Inc. | 116,888 | 51,877,232 |
| Safeguard Scientifics, Inc. * | 8,665 | 67,934 |
| Santander Consumer USA Holdings, Inc. | 33,348 | 1,391,612 |
| SEI Investments Co. | 57,238 | 3,595,119 |
| SLM Corp. | 159,372 | 2,988,225 |
| Starwood Property Trust, Inc. | 139,860 | 3,608,388 |
| State Street Corp. | 168,879 | 15,690,548 |
| StepStone Group, Inc., Class A | 12,332 | 590,333 |
| Stifel Financial Corp. | 50,875 | 3,515,463 |
| Security | Number
of Shares | Value ($) |
| StoneX Group, Inc. * | 8,500 | 592,365 |
| Synchrony Financial | 261,876 | 13,028,331 |
| T. Rowe Price Group, Inc. | 109,905 | 24,604,432 |
| The Bank of New York Mellon Corp. | 390,765 | 21,578,043 |
| The Carlyle Group, Inc. | 57,417 | 2,835,251 |
| The Charles Schwab Corp. (c) | 725,330 | 52,840,291 |
| The Goldman Sachs Group, Inc. | 165,077 | 68,260,990 |
| TPG RE Finance Trust, Inc. | 27,208 | 342,821 |
| Tradeweb Markets, Inc., Class A | 50,858 | 4,425,155 |
| Two Harbors Investment Corp. | 151,846 | 1,002,184 |
| Upstart Holdings, Inc. * | 8,218 | 1,882,908 |
| Virtu Financial, Inc., Class A | 37,603 | 920,521 |
| Virtus Investment Partners, Inc. | 3,623 | 1,132,912 |
| Voya Financial, Inc. | 58,250 | 3,785,085 |
| Western Asset Mortgage Capital Corp. | 29,573 | 82,213 |
| WisdomTree Investments, Inc. | 58,098 | 366,598 |
| World Acceptance Corp. * | 2,091 | 397,018 |
| | | 1,176,805,498 |
| |
| Energy 2.4% |
| Antero Midstream Corp. | 139,079 | 1,336,549 |
| Antero Resources Corp. * | 134,472 | 1,844,956 |
| APA Corp. | 182,937 | 3,563,613 |
| Arch Resources, Inc. * | 7,935 | 600,600 |
| Archrock, Inc. | 59,435 | 456,461 |
| Baker Hughes Co. | 352,409 | 8,027,877 |
| Berry Corp. | 44,477 | 266,862 |
| Bonanza Creek Energy, Inc. | 9,328 | 362,673 |
| Brigham Minerals, Inc., Class A | 16,250 | 310,700 |
| Bristow Group, Inc. * | 11,433 | 360,825 |
| Cabot Oil & Gas Corp. | 193,887 | 3,080,864 |
| Cactus, Inc., Class A | 26,430 | 991,389 |
| Callon Petroleum Co. * | 22,461 | 767,492 |
| Centennial Resource Development, Inc., Class A * | 92,247 | 470,460 |
| ChampionX Corp. * | 90,274 | 2,106,092 |
| Cheniere Energy, Inc. * | 112,084 | 9,802,867 |
| Chevron Corp. | 938,022 | 90,772,389 |
| Cimarex Energy Co. | 49,500 | 3,178,890 |
| Clean Energy Fuels Corp. * | 54,107 | 429,068 |
| CNX Resources Corp. * | 108,879 | 1,236,865 |
| Comstock Resources, Inc. * | 32,809 | 193,901 |
| ConocoPhillips | 655,261 | 36,386,643 |
| CONSOL Energy, Inc. * | 16,326 | 372,723 |
| Continental Resources, Inc. | 30,855 | 1,211,984 |
| Core Laboratories N.V. | 21,611 | 595,599 |
| CVR Energy, Inc. | 14,720 | 211,968 |
| Delek US Holdings, Inc. * | 36,718 | 628,245 |
| Denbury, Inc. * | 24,288 | 1,708,175 |
| Devon Energy Corp. | 287,811 | 8,504,815 |
| Diamondback Energy, Inc. | 87,911 | 6,781,455 |
| DMC Global, Inc. * | 9,073 | 364,462 |
| Dorian LPG Ltd. | 14,520 | 191,954 |
| Dril-Quip, Inc. * | 18,088 | 439,538 |
| DTE Midstream LLC * | 46,849 | 2,177,073 |
| EOG Resources, Inc. | 284,015 | 19,176,693 |
| EQT Corp. * | 134,276 | 2,461,279 |
| Equitrans Midstream Corp. | 195,379 | 1,705,659 |
| Exterran Corp. * | 15,700 | 62,329 |
| Exxon Mobil Corp. | 2,054,904 | 112,033,366 |
| Falcon Minerals Corp. | 13,474 | 59,825 |
| Frank's International N.V. *(a) | 57,417 | 165,361 |
| Green Plains, Inc. | 21,718 | 762,302 |
| Halliburton Co. | 431,464 | 8,620,651 |
| Helix Energy Solutions Group, Inc. * | 71,502 | 268,848 |
| Helmerich & Payne, Inc. | 53,554 | 1,441,674 |
| Hess Corp. | 133,061 | 9,147,944 |
Schwab U.S. Equity ETFs | Annual Report
Schwab U.S. Broad Market ETF
Portfolio Holdings as of August 31, 2021 (continued)
| Security | Number
of Shares | Value ($) |
| HollyFrontier Corp. | 71,941 | 2,325,853 |
| International Seaways, Inc. | 20,336 | 349,779 |
| Kinder Morgan, Inc. | 945,562 | 15,384,294 |
| Kosmos Energy Ltd. * | 195,617 | 461,656 |
| Laredo Petroleum, Inc. * | 4,370 | 236,111 |
| Liberty Oilfield Services, Inc., Class A * | 41,560 | 424,743 |
| Magnolia Oil & Gas Corp., Class A | 73,803 | 1,157,231 |
| Marathon Oil Corp. | 383,069 | 4,501,061 |
| Marathon Petroleum Corp. | 309,349 | 18,335,115 |
| Matador Resources Co. | 52,140 | 1,499,025 |
| Murphy Oil Corp. | 70,105 | 1,490,432 |
| Nabors Industries Ltd. * | 3,018 | 254,538 |
| NACCO Industries, Inc., Class A | 2,681 | 66,784 |
| New Fortress Energy, Inc. | 23,991 | 704,616 |
| Newpark Resources, Inc. * | 44,405 | 116,341 |
| NextDecade Corp. * | 52,335 | 173,752 |
| NexTier Oilfield Solutions, Inc. * | 82,846 | 298,246 |
| Northern Oil and Gas, Inc. | 23,001 | 381,817 |
| NOV, Inc. * | 188,866 | 2,487,365 |
| Oasis Petroleum, Inc. | 9,719 | 841,568 |
| Occidental Petroleum Corp. | 406,720 | 10,448,637 |
| Oceaneering International, Inc. * | 50,100 | 616,230 |
| Oil States International, Inc. * | 34,633 | 202,949 |
| ONEOK, Inc. | 215,439 | 11,314,856 |
| Overseas Shipholding Group, Inc., Class A * | 43,201 | 113,187 |
| Ovintiv, Inc. | 126,056 | 3,436,287 |
| Par Pacific Holdings, Inc. * | 21,249 | 350,396 |
| Patterson-UTI Energy, Inc. | 91,160 | 707,402 |
| PBF Energy, Inc., Class A * | 45,193 | 470,007 |
| PDC Energy, Inc. | 47,877 | 1,998,865 |
| Peabody Energy Corp. * | 33,178 | 530,184 |
| Penn Virginia Corp. * | 7,146 | 147,922 |
| Phillips 66 | 212,281 | 15,091,056 |
| Pioneer Natural Resources Co. | 112,220 | 16,795,967 |
| ProPetro Holding Corp. * | 37,699 | 291,790 |
| Range Resources Corp. * | 125,987 | 1,841,930 |
| Renewable Energy Group, Inc. * | 23,087 | 1,117,873 |
| REX American Resources Corp. * | 2,406 | 203,933 |
| RPC, Inc. * | 25,573 | 97,945 |
| Schlumberger N.V. | 676,431 | 18,967,125 |
| Select Energy Services, Inc., Class A * | 28,473 | 152,331 |
| SM Energy Co. | 54,230 | 1,035,793 |
| Southwestern Energy Co. * | 314,797 | 1,432,326 |
| Talos Energy, Inc. * | 15,773 | 195,585 |
| Targa Resources Corp. | 110,613 | 4,858,123 |
| TechnipFMC plc * | 205,270 | 1,360,940 |
| Tellurian, Inc. * | 100,483 | 320,541 |
| Texas Pacific Land Corp. | 3,786 | 5,147,976 |
| The Williams Cos., Inc. | 589,612 | 14,557,520 |
| Tidewater, Inc. * | 19,420 | 223,330 |
| Transocean Ltd. * | 285,249 | 1,015,486 |
| US Silica Holdings, Inc. * | 37,832 | 332,165 |
| Valero Energy Corp. | 198,318 | 13,150,467 |
| Vine Energy, Inc., Class A * | 10,759 | 159,986 |
| W&T Offshore, Inc. * | 46,357 | 151,124 |
| Whiting Petroleum Corp. * | 18,382 | 863,035 |
| World Fuel Services Corp. | 30,683 | 992,902 |
| | | 527,826,456 |
| |
| Food & Staples Retailing 1.2% |
| Albertsons Cos., Inc., Class A | 21,998 | 667,859 |
| BJ's Wholesale Club Holdings, Inc. * | 66,552 | 3,770,836 |
| Casey's General Stores, Inc. | 17,857 | 3,652,828 |
| Costco Wholesale Corp. | 214,432 | 97,671,632 |
| Grocery Outlet Holding Corp. * | 43,079 | 1,121,346 |
| Ingles Markets, Inc., Class A | 6,672 | 452,962 |
| Security | Number
of Shares | Value ($) |
| Natural Grocers by Vitamin Cottage, Inc. | 6,025 | 72,842 |
| Performance Food Group Co. * | 64,916 | 3,260,082 |
| PriceSmart, Inc. | 11,039 | 934,010 |
| Rite Aid Corp. * | 26,638 | 472,558 |
| SpartanNash Co. | 16,984 | 365,156 |
| Sprouts Farmers Market, Inc. * | 57,035 | 1,420,172 |
| Sysco Corp. | 247,731 | 19,731,774 |
| The Andersons, Inc. | 16,162 | 491,002 |
| The Chefs' Warehouse, Inc. * | 15,638 | 472,737 |
| The Kroger Co. | 366,389 | 16,864,886 |
| United Natural Foods, Inc. * | 27,298 | 1,004,566 |
| US Foods Holding Corp. * | 107,156 | 3,643,304 |
| Village Super Market, Inc., Class A | 4,752 | 106,397 |
| Walgreens Boots Alliance, Inc. | 347,380 | 17,629,535 |
| Walmart, Inc. | 666,461 | 98,702,874 |
| Weis Markets, Inc. | 8,358 | 475,988 |
| | | 272,985,346 |
| |
| Food, Beverage & Tobacco 2.7% |
| Alico, Inc. | 2,500 | 93,325 |
| Altria Group, Inc. | 898,364 | 45,124,824 |
| AppHarvest, Inc. *(a) | 28,924 | 242,962 |
| Archer-Daniels-Midland Co. | 271,037 | 16,262,220 |
| B&G Foods, Inc. (a) | 32,355 | 982,298 |
| Beyond Meat, Inc. * | 24,038 | 2,875,906 |
| Brown-Forman Corp., Class A | 26,601 | 1,760,986 |
| Brown-Forman Corp., Class B | 88,923 | 6,244,173 |
| Bunge Ltd. | 68,310 | 5,171,750 |
| Cal-Maine Foods, Inc. | 19,824 | 716,836 |
| Calavo Growers, Inc. | 8,206 | 385,026 |
| Campbell Soup Co. | 98,603 | 4,114,703 |
| Celsius Holdings, Inc. * | 15,936 | 1,302,927 |
| Coca-Cola Consolidated, Inc. | 2,174 | 882,992 |
| Conagra Brands, Inc. | 232,665 | 7,705,865 |
| Constellation Brands, Inc., Class A | 82,091 | 17,332,694 |
| Darling Ingredients, Inc. * | 79,513 | 5,923,718 |
| Flowers Foods, Inc. | 95,069 | 2,294,015 |
| Fresh Del Monte Produce, Inc. | 15,097 | 496,389 |
| Freshpet, Inc. * | 20,775 | 2,662,109 |
| General Mills, Inc. | 295,244 | 17,068,056 |
| Hormel Foods Corp. | 137,620 | 6,267,215 |
| Hostess Brands, Inc. * | 64,022 | 1,021,791 |
| Ingredion, Inc. | 32,742 | 2,876,712 |
| J&J Snack Foods Corp. | 7,132 | 1,167,936 |
| John B Sanfilippo & Son, Inc. | 4,284 | 364,097 |
| Kellogg Co. | 122,092 | 7,708,889 |
| Keurig Dr Pepper, Inc. | 281,312 | 10,034,399 |
| Lamb Weston Holdings, Inc. | 71,078 | 4,630,732 |
| Lancaster Colony Corp. | 9,383 | 1,663,043 |
| Landec Corp. * | 13,596 | 147,245 |
| Limoneira Co. | 8,403 | 138,229 |
| McCormick & Co., Inc. Non-Voting Shares | 120,301 | 10,380,773 |
| MGP Ingredients, Inc. | 6,276 | 409,823 |
| Mission Produce, Inc. * | 2,814 | 58,362 |
| Molson Coors Beverage Co., Class B | 90,773 | 4,314,441 |
| Mondelez International, Inc., Class A | 681,433 | 42,296,546 |
| Monster Beverage Corp. * | 179,674 | 17,530,792 |
| National Beverage Corp. | 10,732 | 499,575 |
| PepsiCo, Inc. | 670,108 | 104,798,190 |
| Philip Morris International, Inc. | 755,690 | 77,836,070 |
| Pilgrim's Pride Corp. * | 23,371 | 650,649 |
| Post Holdings, Inc. * | 28,612 | 3,201,969 |
| Sanderson Farms, Inc. | 9,738 | 1,913,517 |
| Seaboard Corp. | 126 | 536,080 |
| Seneca Foods Corp., Class A * | 3,084 | 151,023 |
| Simply Good Foods Co. * | 42,004 | 1,496,182 |
Schwab U.S. Equity ETFs | Annual Report
Schwab U.S. Broad Market ETF
Portfolio Holdings as of August 31, 2021 (continued)
| Security | Number
of Shares | Value ($) |
| Tattooed Chef, Inc. *(a) | 19,929 | 421,897 |
| The Boston Beer Co., Inc., Class A * | 4,519 | 2,576,779 |
| The Coca-Cola Co. | 1,881,679 | 105,957,344 |
| The Duckhorn Portfolio, Inc. * | 9,697 | 208,389 |
| The Hain Celestial Group, Inc. * | 39,931 | 1,493,819 |
| The Hershey Co. | 71,165 | 12,646,020 |
| The J.M. Smucker Co. | 53,374 | 6,600,763 |
| The Kraft Heinz Co. | 314,082 | 11,303,811 |
| Tootsie Roll Industries, Inc. | 8,722 | 276,051 |
| TreeHouse Foods, Inc. * | 27,635 | 1,035,483 |
| Turning Point Brands, Inc. | 6,981 | 347,375 |
| Tyson Foods, Inc., Class A | 142,799 | 11,212,577 |
| Universal Corp. | 12,722 | 643,733 |
| Utz Brands, Inc. | 28,674 | 556,849 |
| Vector Group Ltd. | 61,653 | 926,028 |
| Vital Farms, Inc. * | 7,315 | 131,524 |
| | | 598,076,496 |
| |
| Health Care Equipment & Services 6.3% |
| 1Life Healthcare, Inc. * | 37,947 | 930,081 |
| Abbott Laboratories | 862,280 | 108,966,324 |
| ABIOMED, Inc. * | 21,987 | 8,002,389 |
| Acadia Healthcare Co., Inc. * | 43,121 | 2,851,161 |
| Accelerate Diagnostics, Inc. * | 18,431 | 115,194 |
| Accolade, Inc. * | 7,274 | 344,642 |
| Accuray, Inc. * | 49,795 | 202,666 |
| Acutus Medical, Inc. * | 4,814 | 61,571 |
| AdaptHealth Corp. * | 46,614 | 1,120,601 |
| Addus HomeCare Corp. * | 7,467 | 671,433 |
| Agiliti, Inc. * | 13,364 | 285,054 |
| agilon health, Inc. * | 22,957 | 803,495 |
| Align Technology, Inc. * | 35,055 | 24,853,995 |
| Alignment Healthcare, Inc. * | 13,884 | 245,330 |
| Allscripts Healthcare Solutions, Inc. * | 67,243 | 1,032,852 |
| Amedisys, Inc. * | 15,788 | 2,896,309 |
| American Well Corp., Class A * | 26,714 | 286,107 |
| AmerisourceBergen Corp. | 71,368 | 8,721,883 |
| AMN Healthcare Services, Inc. * | 22,799 | 2,588,142 |
| AngioDynamics, Inc. * | 17,776 | 503,061 |
| Anthem, Inc. | 118,790 | 44,561,693 |
| Apollo Medical Holdings, Inc. * | 6,441 | 488,936 |
| Apria, Inc. * | 4,328 | 154,380 |
| AtriCure, Inc. * | 22,365 | 1,646,511 |
| Atrion Corp. | 662 | 459,468 |
| Avanos Medical, Inc. * | 23,093 | 762,069 |
| Aveanna Healthcare Holdings, Inc. * | 18,958 | 178,964 |
| AxoGen, Inc. * | 17,444 | 297,595 |
| Axonics, Inc. * | 16,579 | 1,243,093 |
| Baxter International, Inc. | 243,908 | 18,590,668 |
| Becton Dickinson & Co. | 141,121 | 35,520,156 |
| BioLife Solutions, Inc. * | 15,542 | 907,031 |
| Bioventus, Inc., Class A * | 5,894 | 85,522 |
| Boston Scientific Corp. * | 688,677 | 31,093,767 |
| Brookdale Senior Living, Inc. * | 90,314 | 659,292 |
| Butterfly Network, Inc. *(a) | 63,219 | 781,387 |
| Cardinal Health, Inc. | 140,829 | 7,392,114 |
| Cardiovascular Systems, Inc. * | 20,026 | 716,731 |
| Castle Biosciences, Inc. * | 8,569 | 657,499 |
| Castlight Health, Inc., Class B * | 39,760 | 71,966 |
| Centene Corp. * | 282,837 | 17,813,074 |
| Cerner Corp. | 146,651 | 11,196,804 |
| Certara, Inc. * | 21,105 | 708,495 |
| Cerus Corp. * | 76,145 | 491,135 |
| Change Healthcare, Inc. * | 111,192 | 2,427,321 |
| Chemed Corp. | 7,798 | 3,717,307 |
| Cigna Corp. | 166,623 | 35,265,758 |
| Clover Health Investments Corp. *(a) | 54,086 | 464,058 |
| Security | Number
of Shares | Value ($) |
| Community Health Systems, Inc. * | 58,846 | 724,394 |
| Computer Programs & Systems, Inc. * | 6,764 | 240,595 |
| CONMED Corp. | 14,172 | 1,861,350 |
| CorVel Corp. * | 4,852 | 799,658 |
| Covetrus, Inc. * | 46,804 | 1,057,302 |
| CryoLife, Inc. * | 18,172 | 476,833 |
| CryoPort, Inc. * | 22,808 | 1,449,905 |
| CVS Health Corp. | 638,379 | 55,149,562 |
| Danaher Corp. | 308,186 | 99,901,574 |
| DaVita, Inc. * | 33,932 | 4,437,288 |
| Dentsply Sirona, Inc. | 105,937 | 6,536,313 |
| DexCom, Inc. * | 46,853 | 24,804,915 |
| Eargo, Inc. * | 4,951 | 99,069 |
| Edwards Lifesciences Corp. * | 301,870 | 35,373,127 |
| Encompass Health Corp. | 48,161 | 3,778,230 |
| Envista Holdings Corp. * | 78,411 | 3,355,207 |
| Evolent Health, Inc., Class A * | 37,306 | 916,235 |
| Fulgent Genetics, Inc. *(a) | 8,525 | 777,821 |
| Glaukos Corp. * | 23,108 | 1,377,930 |
| Globus Medical, Inc., Class A * | 37,360 | 3,048,576 |
| GoodRx Holdings, Inc., Class A * | 30,841 | 1,172,575 |
| Guardant Health, Inc. * | 42,042 | 5,350,685 |
| Haemonetics Corp. * | 24,808 | 1,556,702 |
| Hanger, Inc. * | 17,640 | 421,243 |
| HCA Healthcare, Inc. | 127,706 | 32,307,064 |
| Health Catalyst, Inc. * | 18,595 | 1,015,473 |
| HealthEquity, Inc. * | 40,861 | 2,622,050 |
| HealthStream, Inc. * | 13,432 | 408,198 |
| Henry Schein, Inc. * | 68,059 | 5,144,580 |
| Heska Corp. * | 4,779 | 1,267,869 |
| Hill-Rom Holdings, Inc. | 32,105 | 4,673,846 |
| Hims & Hers Health, Inc. * | 32,424 | 255,501 |
| Hologic, Inc. * | 124,780 | 9,876,337 |
| Humana, Inc. | 62,619 | 25,386,995 |
| ICU Medical, Inc. * | 9,558 | 1,905,387 |
| IDEXX Laboratories, Inc. * | 41,376 | 27,877,494 |
| Inari Medical, Inc. * | 3,776 | 309,103 |
| Innovage Holding Corp. * | 8,802 | 132,294 |
| Inogen, Inc. * | 9,052 | 535,788 |
| Inovalon Holdings, Inc., Class A * | 38,526 | 1,573,787 |
| Inspire Medical Systems, Inc. * | 13,064 | 2,920,588 |
| Insulet Corp. * | 32,049 | 9,544,513 |
| Integer Holdings Corp. * | 15,830 | 1,563,846 |
| Integra LifeSciences Holdings Corp. * | 34,391 | 2,587,235 |
| Intersect ENT, Inc. * | 15,188 | 413,265 |
| Intuitive Surgical, Inc. * | 57,440 | 60,516,486 |
| Invacare Corp. * | 25,898 | 219,097 |
| iRhythm Technologies, Inc. * | 14,043 | 671,255 |
| Laboratory Corp. of America Holdings * | 47,470 | 14,401,449 |
| Lantheus Holdings, Inc. * | 32,951 | 868,918 |
| LeMaitre Vascular, Inc. | 8,184 | 463,378 |
| LHC Group, Inc. * | 15,315 | 2,860,229 |
| LivaNova plc * | 25,471 | 2,106,197 |
| Magellan Health, Inc. * | 11,531 | 1,091,063 |
| Masimo Corp. * | 24,490 | 6,650,015 |
| McKesson Corp. | 76,606 | 15,638,349 |
| MEDNAX, Inc. * | 41,653 | 1,337,478 |
| Medtronic plc | 652,632 | 87,113,319 |
| Meridian Bioscience, Inc. * | 20,107 | 406,966 |
| Merit Medical Systems, Inc. * | 23,864 | 1,712,719 |
| Mesa Laboratories, Inc. | 2,272 | 606,442 |
| ModivCare, Inc. * | 5,828 | 1,149,631 |
| Molina Healthcare, Inc. * | 28,506 | 7,661,558 |
| Multiplan Corp. * | 125,977 | 755,862 |
| National HealthCare Corp. | 5,996 | 442,805 |
| National Research Corp. | 6,052 | 326,808 |
| Natus Medical, Inc. * | 17,776 | 471,420 |
| Neogen Corp. * | 53,228 | 2,330,322 |
Schwab U.S. Equity ETFs | Annual Report
Schwab U.S. Broad Market ETF
Portfolio Holdings as of August 31, 2021 (continued)
| Security | Number
of Shares | Value ($) |
| Nevro Corp. * | 16,805 | 2,050,210 |
| NextGen Healthcare, Inc. * | 26,815 | 409,197 |
| Novocure Ltd. * | 41,475 | 5,566,360 |
| NuVasive, Inc. * | 24,723 | 1,536,287 |
| Omnicell, Inc. * | 20,825 | 3,233,498 |
| Ontrak, Inc. * | 2,573 | 31,185 |
| Option Care Health, Inc. * | 56,854 | 1,520,844 |
| OraSure Technologies, Inc. * | 32,016 | 350,575 |
| Ortho Clinical Diagnostics Holdings plc * | 38,863 | 794,360 |
| Orthofix Medical, Inc. * | 9,041 | 383,338 |
| OrthoPediatrics Corp. * | 6,379 | 447,168 |
| Outset Medical, Inc. * | 9,397 | 463,178 |
| Owens & Minor, Inc. | 35,945 | 1,340,030 |
| Patterson Cos., Inc. | 42,713 | 1,308,726 |
| Penumbra, Inc. * | 16,475 | 4,529,801 |
| PetIQ, Inc. * | 11,510 | 298,684 |
| Phreesia, Inc. * | 18,117 | 1,296,271 |
| Premier, Inc., Class A | 33,229 | 1,235,454 |
| Privia Health Group, Inc. * | 9,829 | 293,002 |
| Progyny, Inc. * | 17,571 | 981,692 |
| Pulmonx Corp. * | 4,965 | 199,543 |
| Quest Diagnostics, Inc. | 63,388 | 9,687,588 |
| Quidel Corp. * | 18,681 | 2,408,915 |
| R1 RCM, Inc. * | 68,730 | 1,355,356 |
| RadNet, Inc. * | 19,933 | 626,096 |
| ResMed, Inc. | 70,486 | 20,478,298 |
| Schrodinger, Inc. * | 17,680 | 1,055,319 |
| SeaSpine Holdings Corp. * | 14,640 | 245,659 |
| Select Medical Holdings Corp. | 52,243 | 1,806,040 |
| Shockwave Medical, Inc. * | 15,575 | 3,336,321 |
| SI-BONE, Inc. * | 12,072 | 294,678 |
| Signify Health, Inc., Class A * | 11,578 | 300,912 |
| Silk Road Medical, Inc. * | 16,443 | 974,741 |
| Simulations Plus, Inc. | 7,339 | 325,118 |
| SmileDirectClub, Inc. *(a) | 40,515 | 222,832 |
| SOC Telemed, Inc. * | 35,636 | 96,574 |
| STAAR Surgical Co. * | 22,923 | 3,540,916 |
| STERIS plc | 47,272 | 10,163,953 |
| Stryker Corp. | 159,042 | 44,070,538 |
| Surgery Partners, Inc. * | 15,403 | 757,828 |
| Surmodics, Inc. * | 6,260 | 376,038 |
| Tabula Rasa HealthCare, Inc. * | 12,122 | 379,540 |
| Tactile Systems Technology, Inc. * | 9,996 | 444,622 |
| Talis Biomedical Corp. * | 5,341 | 43,048 |
| Tandem Diabetes Care, Inc. * | 30,556 | 3,427,467 |
| Teladoc Health, Inc. * | 63,565 | 9,180,057 |
| Teleflex, Inc. | 22,704 | 8,978,524 |
| Tenet Healthcare Corp. * | 51,403 | 3,873,216 |
| The Cooper Cos., Inc. | 23,881 | 10,763,405 |
| The Ensign Group, Inc. | 24,691 | 2,016,514 |
| The Pennant Group, Inc. * | 12,345 | 377,387 |
| Tivity Health, Inc. * | 17,517 | 407,270 |
| TransMedics Group, Inc. * | 11,561 | 377,813 |
| Treace Medical Concepts, Inc. * | 5,712 | 144,228 |
| Triple-S Management Corp., Class B * | 10,760 | 381,980 |
| UnitedHealth Group, Inc. | 457,706 | 190,529,277 |
| Universal Health Services, Inc., Class B | 38,178 | 5,946,605 |
| US Physical Therapy, Inc. | 6,213 | 729,406 |
| Vapotherm, Inc. * | 10,441 | 288,694 |
| Varex Imaging Corp. * | 19,275 | 562,252 |
| Veeva Systems, Inc., Class A * | 66,826 | 22,184,895 |
| ViewRay, Inc. * | 66,758 | 403,218 |
| Vocera Communications, Inc. * | 16,634 | 806,583 |
| West Pharmaceutical Services, Inc. | 35,958 | 16,239,352 |
| Zimmer Biomet Holdings, Inc. | 101,154 | 15,218,619 |
| | | 1,404,722,247 |
| |
| Security | Number
of Shares | Value ($) |
| Household & Personal Products 1.3% |
| BellRing Brands, Inc., Class A * | 19,381 | 654,496 |
| Central Garden & Pet Co. * | 5,125 | 236,006 |
| Central Garden & Pet Co., Class A * | 18,803 | 783,521 |
| Church & Dwight Co., Inc. | 119,713 | 10,015,190 |
| Colgate-Palmolive Co. | 409,935 | 31,954,433 |
| Coty, Inc., Class A * | 135,950 | 1,328,232 |
| Edgewell Personal Care Co. | 25,251 | 1,068,117 |
| elf Beauty, Inc. * | 18,144 | 561,557 |
| Energizer Holdings, Inc. | 28,702 | 1,129,137 |
| Herbalife Nutrition Ltd. * | 42,337 | 2,173,582 |
| Inter Parfums, Inc. | 8,697 | 630,880 |
| Kimberly-Clark Corp. | 163,708 | 22,560,599 |
| LifeMD, Inc. * | 8,447 | 66,562 |
| Medifast, Inc. | 5,724 | 1,304,500 |
| Nu Skin Enterprises, Inc., Class A | 24,182 | 1,224,093 |
| Revlon, Inc., Class A * | 5,512 | 62,892 |
| Reynolds Consumer Products, Inc. | 26,387 | 746,224 |
| Spectrum Brands Holdings, Inc. | 18,884 | 1,474,085 |
| The Beauty Health Co. * | 38,717 | 995,414 |
| The Clorox Co. | 60,179 | 10,113,081 |
| The Estee Lauder Cos., Inc., Class A | 112,566 | 38,327,597 |
| The Honest Co., Inc. * | 12,600 | 128,268 |
| The Procter & Gamble Co. | 1,187,515 | 169,090,261 |
| USANA Health Sciences, Inc. * | 6,008 | 582,956 |
| WD-40 Co. | 6,755 | 1,618,701 |
| | | 298,830,384 |
| |
| Insurance 2.0% |
| Aflac, Inc. | 306,567 | 17,376,218 |
| Alleghany Corp. * | 6,739 | 4,560,214 |
| Ambac Financial Group, Inc. * | 22,099 | 311,375 |
| American Equity Investment Life Holding Co. | 40,565 | 1,285,505 |
| American Financial Group, Inc. | 33,112 | 4,567,469 |
| American International Group, Inc. | 415,318 | 22,659,750 |
| American National Group, Inc. | 4,281 | 824,093 |
| AMERISAFE, Inc. | 9,399 | 540,912 |
| Aon plc, Class A | 109,503 | 31,412,031 |
| Arch Capital Group Ltd. * | 195,233 | 8,024,076 |
| Argo Group International Holdings Ltd. | 16,877 | 892,793 |
| Arthur J. Gallagher & Co. | 99,372 | 14,271,807 |
| Assurant, Inc. | 29,244 | 4,974,697 |
| Assured Guaranty Ltd. | 36,956 | 1,842,626 |
| Athene Holding Ltd., Class A * | 60,751 | 4,068,494 |
| Axis Capital Holdings Ltd. | 39,170 | 2,004,329 |
| Brighthouse Financial, Inc. * | 41,647 | 2,039,037 |
| Brown & Brown, Inc. | 114,317 | 6,636,102 |
| BRP Group, Inc., Class A * | 22,251 | 837,750 |
| Chubb Ltd. | 218,097 | 40,112,400 |
| Cincinnati Financial Corp. | 72,388 | 8,932,679 |
| Citizens, Inc. * | 22,145 | 132,206 |
| CNA Financial Corp. | 13,413 | 594,867 |
| CNO Financial Group, Inc. | 63,549 | 1,554,409 |
| Crawford & Co., Class A | 6,951 | 69,301 |
| Crawford & Co., Class B | 7,018 | 66,320 |
| Donegal Group, Inc., Class A | 4,520 | 68,071 |
| eHealth, Inc. * | 12,693 | 490,584 |
| Employers Holdings, Inc. | 15,023 | 618,497 |
| Enstar Group Ltd. * | 6,381 | 1,471,905 |
| Erie Indemnity Co., Class A | 11,993 | 2,123,840 |
| Everest Re Group Ltd. | 19,459 | 5,154,689 |
| Fidelity National Financial, Inc. | 139,771 | 6,825,018 |
| First American Financial Corp. | 53,669 | 3,785,275 |
| Genworth Financial, Inc., Class A * | 245,450 | 920,437 |
| Globe Life, Inc. | 45,740 | 4,394,242 |
Schwab U.S. Equity ETFs | Annual Report
Schwab U.S. Broad Market ETF
Portfolio Holdings as of August 31, 2021 (continued)
| Security | Number
of Shares | Value ($) |
| GoHealth, Inc., Class A * | 24,373 | 118,453 |
| Goosehead Insurance, Inc., Class A | 8,275 | 1,214,604 |
| Greenlight Capital Re Ltd., Class A * | 15,486 | 130,547 |
| Horace Mann Educators Corp. | 21,295 | 873,095 |
| Independence Holding Co. | 4,645 | 232,157 |
| James River Group Holdings Ltd. | 17,906 | 658,762 |
| Kemper Corp. | 29,175 | 2,001,405 |
| Kinsale Capital Group, Inc. | 10,271 | 1,867,781 |
| Lemonade, Inc. *(a) | 8,442 | 637,709 |
| Lincoln National Corp. | 87,043 | 5,975,502 |
| Loews Corp. | 108,988 | 6,089,160 |
| Markel Corp. * | 6,699 | 8,509,405 |
| Marsh & McLennan Cos., Inc. | 246,943 | 38,819,440 |
| MBIA, Inc. * | 26,543 | 297,016 |
| Mercury General Corp. | 13,641 | 814,504 |
| MetLife, Inc. | 361,153 | 22,391,486 |
| MetroMile, Inc. *(a) | 34,595 | 138,380 |
| National Western Life Group, Inc., Class A | 1,192 | 264,219 |
| NI Holdings, Inc. * | 3,867 | 75,484 |
| Old Republic International Corp. | 136,545 | 3,550,170 |
| Oscar Health, Inc., Class A * | 18,718 | 291,814 |
| Palomar Holdings, Inc. * | 10,514 | 944,157 |
| Primerica, Inc. | 19,220 | 2,939,507 |
| Principal Financial Group, Inc. | 122,189 | 8,163,447 |
| ProAssurance Corp. | 27,546 | 702,423 |
| Prudential Financial, Inc. | 190,965 | 20,219,374 |
| Reinsurance Group of America, Inc. | 32,757 | 3,793,916 |
| RenaissanceRe Holdings Ltd. | 23,969 | 3,756,661 |
| RLI Corp. | 19,240 | 2,101,585 |
| Root, Inc., Class A *(a) | 27,167 | 175,227 |
| Safety Insurance Group, Inc. | 7,403 | 601,938 |
| Selective Insurance Group, Inc. | 29,238 | 2,443,420 |
| Selectquote, Inc. * | 20,590 | 196,635 |
| SiriusPoint Ltd. * | 40,792 | 400,170 |
| State Auto Financial Corp. | 9,269 | 468,826 |
| Stewart Information Services Corp. | 13,319 | 838,431 |
| The Allstate Corp. | 145,218 | 19,645,091 |
| The Hanover Insurance Group, Inc. | 16,953 | 2,395,628 |
| The Hartford Financial Services Group, Inc. | 173,574 | 11,667,644 |
| The Progressive Corp. | 283,823 | 27,343,508 |
| The Travelers Cos., Inc. | 122,072 | 19,496,119 |
| Trean Insurance Group, Inc. * | 5,876 | 59,994 |
| Trupanion, Inc. * | 16,238 | 1,487,076 |
| United Fire Group, Inc. | 11,170 | 289,973 |
| Universal Insurance Holdings, Inc. | 17,621 | 250,923 |
| Unum Group | 98,717 | 2,627,847 |
| W.R. Berkley Corp. | 68,339 | 5,146,610 |
| White Mountains Insurance Group Ltd. | 1,463 | 1,639,745 |
| Willis Towers Watson plc | 62,706 | 13,840,468 |
| | | 455,031,454 |
| |
| Materials 2.8% |
| AdvanSix, Inc. * | 13,769 | 502,568 |
| Air Products and Chemicals, Inc. | 107,373 | 28,938,097 |
| Albemarle Corp. | 56,645 | 13,410,137 |
| Alcoa Corp. * | 90,298 | 4,006,522 |
| Allegheny Technologies, Inc. * | 60,998 | 1,089,424 |
| Amcor plc | 744,618 | 9,568,341 |
| American Vanguard Corp. | 12,661 | 194,093 |
| Amyris, Inc. * | 90,934 | 1,368,557 |
| AptarGroup, Inc. | 31,935 | 4,304,838 |
| Arconic Corp. * | 47,072 | 1,623,513 |
| Ashland Global Holdings, Inc. | 26,679 | 2,430,724 |
| Avery Dennison Corp. | 40,314 | 9,086,372 |
| Avient Corp. | 44,864 | 2,336,966 |
| Security | Number
of Shares | Value ($) |
| Axalta Coating Systems Ltd. * | 100,196 | 3,059,986 |
| Balchem Corp. | 15,931 | 2,237,031 |
| Ball Corp. | 158,990 | 15,256,680 |
| Berry Global Group, Inc. * | 65,690 | 4,412,397 |
| Cabot Corp. | 27,533 | 1,470,262 |
| Carpenter Technology Corp. | 23,582 | 786,460 |
| Celanese Corp. | 55,026 | 8,727,124 |
| Century Aluminum Co. * | 23,901 | 306,411 |
| CF Industries Holdings, Inc. | 103,424 | 4,697,518 |
| Chase Corp. | 3,389 | 388,041 |
| Clearwater Paper Corp. * | 8,594 | 279,219 |
| Cleveland-Cliffs, Inc. * | 221,409 | 5,196,469 |
| Coeur Mining, Inc. * | 127,477 | 898,713 |
| Commercial Metals Co. | 58,978 | 1,923,862 |
| Compass Minerals International, Inc. | 16,616 | 1,112,109 |
| Corteva, Inc. | 357,154 | 15,704,061 |
| Crown Holdings, Inc. | 65,305 | 7,169,836 |
| Danimer Scientific, Inc. * | 29,977 | 585,751 |
| Diversey Holdings Ltd. * | 22,084 | 385,807 |
| Domtar Corp. * | 23,844 | 1,307,367 |
| Dow, Inc. | 361,703 | 22,751,119 |
| DuPont de Nemours, Inc. | 257,780 | 19,080,876 |
| Eagle Materials, Inc. | 20,590 | 3,229,336 |
| Eastman Chemical Co. | 66,042 | 7,473,313 |
| Ecolab, Inc. | 120,705 | 27,202,079 |
| Ecovyst, Inc. | 23,302 | 303,159 |
| Element Solutions, Inc. | 105,492 | 2,397,833 |
| Ferro Corp. * | 41,854 | 870,563 |
| FMC Corp. | 63,164 | 5,914,045 |
| Forterra, Inc. * | 10,340 | 238,234 |
| Freeport-McMoRan, Inc. | 710,286 | 25,847,308 |
| FutureFuel Corp. | 13,743 | 110,081 |
| Gatos Silver, Inc. *(a) | 10,808 | 154,987 |
| GCP Applied Technologies, Inc. * | 22,897 | 545,864 |
| Glatfelter Corp. | 22,481 | 355,200 |
| Graphic Packaging Holding Co. | 138,428 | 2,840,543 |
| Greif, Inc., Class A | 16,508 | 1,045,287 |
| H.B. Fuller Co. | 25,406 | 1,716,683 |
| Hawkins, Inc. | 9,912 | 375,467 |
| Haynes International, Inc. | 6,058 | 237,777 |
| Hecla Mining Co. | 257,195 | 1,581,749 |
| Huntsman Corp. | 95,218 | 2,516,612 |
| Ingevity Corp. * | 19,930 | 1,602,173 |
| Innospec, Inc. | 11,800 | 1,104,480 |
| International Flavors & Fragrances, Inc. | 120,781 | 18,298,321 |
| International Paper Co. | 189,765 | 11,402,979 |
| Kaiser Aluminum Corp. | 7,749 | 978,389 |
| Koppers Holdings, Inc. * | 9,278 | 305,246 |
| Kraton Corp. * | 15,260 | 642,751 |
| Kronos Worldwide, Inc. | 9,140 | 121,014 |
| Linde plc | 252,202 | 79,340,227 |
| Livent Corp. * | 77,146 | 1,918,621 |
| Loop Industries, Inc. *(a) | 8,207 | 74,437 |
| Louisiana-Pacific Corp. | 49,908 | 3,166,164 |
| LyondellBasell Industries N.V., Class A | 124,865 | 12,530,203 |
| Martin Marietta Materials, Inc. | 30,336 | 11,565,600 |
| Materion Corp. | 9,373 | 684,510 |
| McEwen Mining, Inc. *(a) | 151,692 | 174,446 |
| Mercer International, Inc. | 20,684 | 235,384 |
| Minerals Technologies, Inc. | 16,028 | 1,260,442 |
| MP Materials Corp. *(a) | 32,732 | 1,098,813 |
| Myers Industries, Inc. | 18,895 | 430,806 |
| Neenah, Inc. | 8,206 | 413,500 |
| NewMarket Corp. | 3,663 | 1,281,061 |
| Newmont Corp. | 389,925 | 22,611,751 |
| Nucor Corp. | 144,856 | 17,029,271 |
| O-I Glass, Inc. * | 77,298 | 1,169,519 |
| Olin Corp. | 68,897 | 3,433,826 |
Schwab U.S. Equity ETFs | Annual Report
Schwab U.S. Broad Market ETF
Portfolio Holdings as of August 31, 2021 (continued)
| Security | Number
of Shares | Value ($) |
| Orion Engineered Carbons S.A. * | 29,068 | 513,632 |
| Packaging Corp. of America | 46,018 | 6,980,931 |
| Pactiv Evergreen, Inc. | 19,610 | 269,638 |
| PPG Industries, Inc. | 114,818 | 18,319,212 |
| PureCycle Technologies, Inc. *(a) | 36,041 | 530,163 |
| Quaker Chemical Corp. | 6,336 | 1,641,784 |
| Ranpak Holdings Corp. * | 19,175 | 588,672 |
| Rayonier Advanced Materials, Inc. * | 30,708 | 216,798 |
| Reliance Steel & Aluminum Co. | 30,823 | 4,624,683 |
| Resolute Forest Products, Inc. | 41,050 | 502,862 |
| Royal Gold, Inc. | 31,972 | 3,559,443 |
| RPM International, Inc. | 62,610 | 5,152,177 |
| Schnitzer Steel Industries, Inc., Class A | 12,814 | 606,230 |
| Schweitzer-Mauduit International, Inc. | 14,855 | 568,501 |
| Sealed Air Corp. | 73,543 | 4,488,329 |
| Sensient Technologies Corp. | 20,236 | 1,757,497 |
| Silgan Holdings, Inc. | 38,584 | 1,637,119 |
| Sonoco Products Co. | 49,510 | 3,233,003 |
| Steel Dynamics, Inc. | 98,590 | 6,653,839 |
| Stepan Co. | 10,151 | 1,193,352 |
| Summit Materials, Inc., Class A * | 56,208 | 1,892,523 |
| SunCoke Energy, Inc. | 44,336 | 308,135 |
| The Chemours Co. | 79,310 | 2,657,678 |
| The Mosaic Co. | 169,900 | 5,467,382 |
| The Scotts Miracle-Gro Co. | 19,685 | 3,087,199 |
| The Sherwin-Williams Co. | 116,206 | 35,288,276 |
| TimkenSteel Corp. * | 19,420 | 265,666 |
| Tredegar Corp. | 13,465 | 178,815 |
| Trinseo S.A. | 18,525 | 962,003 |
| Tronox Holdings plc, Class A | 52,713 | 1,113,826 |
| United States Lime & Minerals, Inc. | 858 | 125,345 |
| United States Steel Corp. | 130,027 | 3,478,222 |
| Valvoline, Inc. | 89,163 | 2,689,156 |
| Venator Materials plc * | 36,979 | 120,921 |
| Verso Corp., Class A | 16,639 | 316,973 |
| Vulcan Materials Co. | 64,199 | 11,936,520 |
| W.R. Grace & Co. | 30,140 | 2,098,950 |
| Warrior Met Coal, Inc. | 25,155 | 563,220 |
| Westlake Chemical Corp. | 16,859 | 1,472,634 |
| Westrock Co. | 129,172 | 6,722,111 |
| Worthington Industries, Inc. | 16,494 | 955,827 |
| Zymergen, Inc. *(a) | 7,803 | 102,375 |
| | | 619,268,927 |
| |
| Media & Entertainment 9.3% |
| Activision Blizzard, Inc. | 377,112 | 31,062,715 |
| Advantage Solutions, Inc. * | 50,750 | 442,033 |
| Alphabet, Inc., Class A * | 145,912 | 422,262,032 |
| Alphabet, Inc., Class C * | 138,155 | 401,926,052 |
| Altice USA, Inc., Class A * | 111,705 | 3,065,185 |
| AMC Entertainment Holdings, Inc., Class A *(a) | 243,493 | 11,475,825 |
| AMC Networks, Inc., Class A * | 14,363 | 682,673 |
| Angi, Inc. * | 38,510 | 409,746 |
| Bumble, Inc., Class A * | 25,423 | 1,385,554 |
| Cable One, Inc. | 2,677 | 5,620,602 |
| Cardlytics, Inc. * | 16,103 | 1,461,830 |
| Cargurus, Inc. * | 45,199 | 1,373,146 |
| Cars.com, Inc. * | 31,609 | 402,066 |
| Charter Communications, Inc., Class A * | 66,802 | 54,554,521 |
| Cinemark Holdings, Inc. * | 53,093 | 946,648 |
| Clear Channel Outdoor Holdings, Inc. * | 237,230 | 623,915 |
| Comcast Corp., Class A | 2,224,272 | 134,968,825 |
| Discovery, Inc., Class A *(a) | 82,413 | 2,376,791 |
| Discovery, Inc., Class C * | 145,647 | 4,018,401 |
| DISH Network Corp., Class A * | 120,156 | 5,237,600 |
| Electronic Arts, Inc. | 138,961 | 20,178,527 |
| Security | Number
of Shares | Value ($) |
| Emerald Holding, Inc. * | 11,800 | 58,764 |
| Entercom Communications Corp. * | 57,470 | 204,019 |
| Eventbrite, Inc., Class A * | 37,995 | 671,752 |
| EverQuote, Inc., Class A * | 4,508 | 88,763 |
| Facebook, Inc., Class A * | 1,162,519 | 441,036,458 |
| Fox Corp., Class A | 157,932 | 5,912,974 |
| Fox Corp., Class B | 75,076 | 2,599,882 |
| fuboTV, Inc. *(a) | 46,629 | 1,359,235 |
| Gannett Co., Inc. * | 63,645 | 404,146 |
| Gray Television, Inc. | 44,620 | 1,014,659 |
| Hemisphere Media Group, Inc. * | 10,842 | 133,573 |
| IAC/InterActiveCorp * | 40,383 | 5,332,575 |
| iHeartMedia, Inc., Class A * | 54,397 | 1,353,397 |
| John Wiley & Sons, Inc., Class A | 21,568 | 1,253,101 |
| Liberty Broadband Corp., Class A * | 11,455 | 2,127,995 |
| Liberty Broadband Corp., Class C * | 77,706 | 14,866,712 |
| Liberty Media Corp. - Liberty Braves, Class A * | 5,337 | 138,762 |
| Liberty Media Corp. - Liberty Braves, Class C * | 16,911 | 437,149 |
| Liberty Media Corp. - Liberty Formula One, Class A * | 12,685 | 579,578 |
| Liberty Media Corp. - Liberty Formula One, Class C * | 98,926 | 4,999,720 |
| Liberty Media Corp. - Liberty SiriusXM, Class A * | 38,806 | 1,920,897 |
| Liberty Media Corp. - Liberty SiriusXM, Class C * | 82,694 | 4,080,949 |
| Liberty TripAdvisor Holdings, Inc., Class A * | 34,840 | 130,302 |
| Lions Gate Entertainment Corp., Class A * | 27,457 | 354,744 |
| Lions Gate Entertainment Corp., Class B * | 60,491 | 711,374 |
| Live Nation Entertainment, Inc. * | 70,044 | 6,072,815 |
| Loral Space & Communications, Inc. | 5,629 | 236,474 |
| Madison Square Garden Entertainment Corp. * | 11,740 | 941,431 |
| Madison Square Garden Sports Corp. * | 8,353 | 1,510,055 |
| Magnite, Inc. * | 62,574 | 1,815,898 |
| Match Group, Inc. * | 131,514 | 18,075,284 |
| MediaAlpha, Inc., Class A * | 10,857 | 240,808 |
| Meredith Corp. * | 19,584 | 842,308 |
| National CineMedia, Inc. | 26,036 | 66,652 |
| Netflix, Inc. * | 215,238 | 122,511,317 |
| News Corp., Class A | 189,603 | 4,260,379 |
| News Corp., Class B | 57,939 | 1,276,396 |
| Nexstar Media Group, Inc., Class A | 20,602 | 3,085,150 |
| Omnicom Group, Inc. | 103,994 | 7,614,441 |
| Pinterest, Inc., Class A * | 265,342 | 14,745,055 |
| Playtika Holding Corp. * | 33,829 | 892,747 |
| QuinStreet, Inc. * | 22,730 | 407,094 |
| Roku, Inc. * | 55,965 | 19,722,066 |
| Scholastic Corp. | 14,415 | 479,155 |
| Sciplay Corp., Class A * | 11,315 | 211,704 |
| Sinclair Broadcast Group, Inc., Class A | 23,267 | 698,243 |
| Sirius XM Holdings, Inc. | 561,104 | 3,518,122 |
| Skillz, Inc. *(a) | 122,581 | 1,442,778 |
| Snap, Inc., Class A * | 455,403 | 34,660,722 |
| Take-Two Interactive Software, Inc. * | 55,884 | 9,009,619 |
| TechTarget, Inc. * | 11,461 | 969,371 |
| TEGNA, Inc. | 105,415 | 1,867,954 |
| The E.W. Scripps Co., Class A | 27,336 | 506,809 |
| The Interpublic Group of Cos., Inc. | 190,237 | 7,082,524 |
| The Marcus Corp. * | 11,197 | 174,673 |
| The New York Times Co., Class A | 69,698 | 3,539,264 |
| The Walt Disney Co. * | 881,636 | 159,840,607 |
Schwab U.S. Equity ETFs | Annual Report
Schwab U.S. Broad Market ETF
Portfolio Holdings as of August 31, 2021 (continued)
| Security | Number
of Shares | Value ($) |
| TripAdvisor, Inc. * | 47,103 | 1,648,605 |
| TrueCar, Inc. * | 46,155 | 193,851 |
| Twitter, Inc. * | 386,894 | 24,954,663 |
| ViacomCBS, Inc., Class B | 298,250 | 12,362,463 |
| Vimeo, Inc. * | 75,030 | 2,860,144 |
| Warner Music Group Corp., Class A | 46,399 | 1,763,162 |
| WideOpenWest, Inc. * | 23,480 | 498,246 |
| World Wrestling Entertainment, Inc., Class A | 21,728 | 1,132,246 |
| Yelp, Inc. * | 33,803 | 1,301,754 |
| Zillow Group, Inc., Class A * | 17,779 | 1,699,672 |
| Zillow Group, Inc., Class C * | 77,914 | 7,461,824 |
| ZoomInfo Technologies, Inc., Class A * | 88,208 | 5,750,280 |
| Zynga, Inc., Class A * | 489,352 | 4,330,765 |
| | | 2,090,521,757 |
| |
| Pharmaceuticals, Biotechnology & Life Sciences 7.1% |
| 10X Genomics, Inc., Class A * | 36,178 | 6,364,434 |
| 4D Molecular Therapeutics, Inc. * | 4,627 | 141,355 |
| 89bio, Inc. * | 2,822 | 52,235 |
| AbbVie, Inc. | 857,341 | 103,549,646 |
| ACADIA Pharmaceuticals, Inc. * | 55,760 | 976,358 |
| Acceleron Pharma, Inc. * | 25,317 | 3,389,440 |
| Adaptive Biotechnologies Corp. * | 39,769 | 1,444,410 |
| Adverum Biotechnologies, Inc. * | 45,660 | 110,954 |
| Aerie Pharmaceuticals, Inc. * | 25,125 | 374,614 |
| Agenus, Inc. * | 95,764 | 590,864 |
| Agilent Technologies, Inc. | 146,989 | 25,792,160 |
| Agios Pharmaceuticals, Inc. * | 24,778 | 1,107,081 |
| Akebia Therapeutics, Inc. * | 70,125 | 206,168 |
| Akero Therapeutics, Inc. * | 8,661 | 205,612 |
| Akouos, Inc. * | 5,211 | 61,959 |
| Akoya Biosciences, Inc. * | 5,307 | 84,753 |
| Alector, Inc. * | 25,776 | 696,725 |
| Aligos Therapeutics, Inc. * | 5,048 | 86,068 |
| Alkermes plc * | 76,786 | 2,400,330 |
| Allakos, Inc. * | 15,587 | 1,389,737 |
| Allogene Therapeutics, Inc. * | 31,129 | 742,427 |
| Allovir, Inc. * | 7,815 | 150,439 |
| Alnylam Pharmaceuticals, Inc. * | 57,345 | 11,551,003 |
| Altimmune, Inc. * | 12,842 | 192,502 |
| ALX Oncology Holdings, Inc. * | 5,510 | 385,700 |
| Amgen, Inc. | 278,676 | 62,849,798 |
| Amicus Therapeutics, Inc. * | 128,150 | 1,459,629 |
| Amneal Pharmaceuticals, Inc. * | 52,961 | 298,700 |
| Amphastar Pharmaceuticals, Inc. * | 16,067 | 315,877 |
| AnaptysBio, Inc. * | 10,835 | 277,484 |
| ANI Pharmaceuticals, Inc. * | 5,761 | 174,731 |
| Anika Therapeutics, Inc. * | 7,467 | 322,052 |
| Annexon, Inc. * | 7,012 | 114,646 |
| Antares Pharma, Inc. * | 85,920 | 338,525 |
| Apellis Pharmaceuticals, Inc. * | 27,876 | 1,835,635 |
| Applied Molecular Transport, Inc. * | 9,153 | 275,231 |
| Arcturus Therapeutics Holdings, Inc. * | 11,487 | 629,602 |
| Arcus Biosciences, Inc. * | 22,996 | 670,793 |
| Arcutis Biotherapeutics, Inc. * | 15,073 | 319,095 |
| Arena Pharmaceuticals, Inc. * | 29,990 | 1,587,071 |
| Arrowhead Pharmaceuticals, Inc. * | 50,443 | 3,385,734 |
| Arvinas, Inc. * | 16,214 | 1,397,809 |
| Assembly Biosciences, Inc. * | 37,930 | 144,134 |
| Atara Biotherapeutics, Inc. * | 42,856 | 641,983 |
| Atea Pharmaceuticals, Inc. * | 5,977 | 177,636 |
| Athenex, Inc. * | 37,648 | 137,415 |
| Athira Pharma, Inc. * | 10,699 | 113,302 |
| Avantor, Inc. * | 250,991 | 9,899,085 |
| Avidity Biosciences, Inc. * | 7,841 | 179,088 |
| Avrobio, Inc. * | 22,440 | 149,450 |
| Security | Number
of Shares | Value ($) |
| Axsome Therapeutics, Inc. * | 12,587 | 323,234 |
| Beam Therapeutics, Inc. * | 14,561 | 1,615,106 |
| Berkeley Lights, Inc. * | 3,698 | 131,501 |
| Bio-Rad Laboratories, Inc., Class A * | 10,527 | 8,472,340 |
| Bio-Techne Corp. | 18,906 | 9,436,741 |
| BioAtla, Inc. * | 5,633 | 231,460 |
| BioCryst Pharmaceuticals, Inc. * | 87,127 | 1,387,062 |
| Biogen, Inc. * | 72,989 | 24,736,702 |
| Biohaven Pharmaceutical Holding Co., Ltd. * | 26,778 | 3,514,345 |
| BioMarin Pharmaceutical, Inc. * | 88,603 | 7,461,259 |
| Bioxcel Therapeutics, Inc. * | 7,122 | 209,743 |
| Black Diamond Therapeutics, Inc. * | 6,518 | 65,832 |
| Bluebird Bio, Inc. * | 31,924 | 584,209 |
| Blueprint Medicines Corp. * | 28,543 | 2,662,206 |
| Bolt Biotherapeutics, Inc. * | 4,778 | 84,857 |
| Bridgebio Pharma, Inc. * | 47,322 | 2,371,305 |
| Bristol-Myers Squibb Co. | 1,083,505 | 72,443,144 |
| Bruker Corp. | 49,815 | 4,399,163 |
| C4 Therapeutics, Inc. *(a) | 6,896 | 276,736 |
| Cara Therapeutics, Inc. * | 20,506 | 323,585 |
| CareDx, Inc. * | 25,567 | 1,873,550 |
| Catalent, Inc. * | 82,794 | 10,799,649 |
| Catalyst Pharmaceuticals, Inc. * | 49,874 | 274,806 |
| Cerevel Therapeutics Holdings, Inc. *(a) | 24,627 | 779,691 |
| Charles River Laboratories International, Inc. * | 24,423 | 10,840,393 |
| ChemoCentryx, Inc. * | 24,181 | 382,302 |
| Chimerix, Inc. * | 35,439 | 251,617 |
| Clene, Inc. *(a) | 11,299 | 90,392 |
| Clovis Oncology, Inc. *(a) | 46,897 | 226,044 |
| Codexis, Inc. * | 27,171 | 734,160 |
| Coherus Biosciences, Inc. * | 32,444 | 518,455 |
| Collegium Pharmaceutical, Inc. * | 16,931 | 347,593 |
| Corbus Pharmaceuticals Holdings, Inc. * | 39,189 | 50,554 |
| Corcept Therapeutics, Inc. * | 52,543 | 1,118,115 |
| Cortexyme, Inc. * | 6,382 | 614,587 |
| Crinetics Pharmaceuticals, Inc. * | 12,308 | 290,100 |
| Cue Biopharma, Inc. * | 13,312 | 159,611 |
| Cullinan Oncology, Inc. * | 6,269 | 176,911 |
| Cyclerion Therapeutics, Inc. * | 22,087 | 75,538 |
| Cymabay Therapeutics, Inc. * | 32,825 | 129,987 |
| Cytokinetics, Inc. * | 39,637 | 1,306,832 |
| CytomX Therapeutics, Inc. * | 35,945 | 184,038 |
| Deciphera Pharmaceuticals, Inc. * | 19,190 | 604,485 |
| Denali Therapeutics, Inc. * | 39,037 | 2,076,768 |
| Design Therapeutics, Inc. *(a) | 6,587 | 103,548 |
| Dicerna Pharmaceuticals, Inc. * | 31,464 | 647,529 |
| Dynavax Technologies Corp. * | 53,117 | 1,033,657 |
| Dyne Therapeutics, Inc. * | 8,986 | 152,133 |
| Eagle Pharmaceuticals, Inc. * | 6,447 | 344,076 |
| Edgewise Therapeutics, Inc. *(a) | 6,018 | 95,325 |
| Editas Medicine, Inc. * | 33,098 | 2,104,702 |
| Elanco Animal Health, Inc. * | 230,241 | 7,685,445 |
| Eli Lilly & Co. | 386,361 | 99,793,183 |
| Eloxx Pharmaceuticals, Inc. *(a) | 55,677 | 90,197 |
| Emergent BioSolutions, Inc. * | 21,792 | 1,374,639 |
| Enanta Pharmaceuticals, Inc. * | 8,383 | 479,508 |
| Endo International plc * | 114,490 | 262,182 |
| Epizyme, Inc. * | 46,528 | 240,084 |
| Esperion Therapeutics, Inc. *(a) | 14,184 | 184,676 |
| Evelo Biosciences, Inc. *(a) | 12,911 | 146,798 |
| Exact Sciences Corp. * | 83,155 | 8,679,719 |
| Exelixis, Inc. * | 151,942 | 2,912,728 |
| Fate Therapeutics, Inc. * | 38,924 | 2,851,183 |
| FibroGen, Inc. * | 39,716 | 461,897 |
| Finch Therapeutics Group, Inc. * | 4,968 | 70,297 |
| Flexion Therapeutics, Inc. * | 22,317 | 133,456 |
Schwab U.S. Equity ETFs | Annual Report
Schwab U.S. Broad Market ETF
Portfolio Holdings as of August 31, 2021 (continued)
| Security | Number
of Shares | Value ($) |
| Forma Therapeutics Holdings, Inc. * | 9,644 | 231,745 |
| Frequency Therapeutics, Inc. * | 7,964 | 61,482 |
| G1 Therapeutics, Inc. * | 17,408 | 263,209 |
| Gemini Therapeutics, Inc. *(a) | 16,228 | 79,842 |
| Generation Bio Co. * | 10,021 | 250,525 |
| Geron Corp. * | 157,562 | 228,465 |
| Gilead Sciences, Inc. | 608,747 | 44,304,607 |
| Global Blood Therapeutics, Inc. * | 29,746 | 853,413 |
| Gossamer Bio, Inc. * | 24,933 | 247,834 |
| Gritstone bio, Inc. * | 9,615 | 88,458 |
| Halozyme Therapeutics, Inc. * | 64,765 | 2,719,482 |
| Harpoon Therapeutics, Inc. * | 12,042 | 114,158 |
| Heron Therapeutics, Inc. * | 47,824 | 558,106 |
| Homology Medicines, Inc. * | 28,540 | 205,203 |
| Horizon Therapeutics plc * | 108,765 | 11,756,409 |
| Humanigen, Inc. *(a) | 24,868 | 412,311 |
| IGM Biosciences, Inc. * | 3,226 | 229,723 |
| Illumina, Inc. * | 70,968 | 32,443,731 |
| ImmunityBio, Inc. * | 36,498 | 415,347 |
| ImmunoGen, Inc. * | 100,462 | 607,795 |
| Immunovant, Inc. * | 24,076 | 208,498 |
| Incyte Corp. * | 90,347 | 6,910,642 |
| Inhibrx, Inc. * | 2,304 | 65,710 |
| Innoviva, Inc. * | 31,461 | 480,095 |
| Inovio Pharmaceuticals, Inc. *(a) | 101,461 | 876,623 |
| Inozyme Pharma, Inc. * | 5,215 | 80,415 |
| Insmed, Inc. * | 54,765 | 1,535,611 |
| Instil Bio, Inc. *(a) | 9,414 | 177,454 |
| Intellia Therapeutics, Inc. * | 32,190 | 5,167,461 |
| Intercept Pharmaceuticals, Inc. *(a) | 12,550 | 187,121 |
| Intra-Cellular Therapies, Inc. * | 34,237 | 1,136,668 |
| Invitae Corp. * | 89,686 | 2,657,396 |
| Ionis Pharmaceuticals, Inc. * | 68,117 | 2,708,332 |
| Iovance Biotherapeutics, Inc. * | 69,690 | 1,677,438 |
| IQVIA Holdings, Inc. * | 92,830 | 24,110,736 |
| Ironwood Pharmaceuticals, Inc. * | 79,275 | 1,038,503 |
| iTeos Therapeutics, Inc. * | 5,126 | 145,322 |
| Jazz Pharmaceuticals plc * | 29,118 | 3,835,132 |
| Johnson & Johnson | 1,277,347 | 221,147,086 |
| Jounce Therapeutics, Inc. * | 10,156 | 63,170 |
| Kadmon Holdings, Inc. * | 78,399 | 429,627 |
| Kaleido Biosciences, Inc. * | 7,682 | 47,167 |
| Karuna Therapeutics, Inc. * | 8,964 | 1,065,820 |
| Karyopharm Therapeutics, Inc. * | 32,910 | 190,878 |
| Keros Therapeutics, Inc. * | 5,274 | 177,417 |
| Kinnate Biopharma, Inc. *(a) | 6,803 | 150,482 |
| Kodiak Sciences, Inc. * | 15,591 | 1,468,360 |
| Kronos Bio, Inc. * | 6,427 | 134,389 |
| Krystal Biotech, Inc. * | 8,916 | 516,593 |
| Kura Oncology, Inc. * | 31,361 | 578,924 |
| Kymera Therapeutics, Inc. * | 6,757 | 419,880 |
| Lannett Co., Inc. * | 14,475 | 50,952 |
| Lexicon Pharmaceuticals, Inc. * | 37,383 | 176,448 |
| Ligand Pharmaceuticals, Inc. * | 7,876 | 1,041,995 |
| MacroGenics, Inc. * | 29,430 | 694,842 |
| Madrigal Pharmaceuticals, Inc. * | 5,146 | 425,832 |
| MannKind Corp. * | 112,697 | 540,946 |
| Maravai LifeSciences Holdings, Inc., Class A * | 47,398 | 2,805,014 |
| Medpace Holdings, Inc. * | 13,370 | 2,438,019 |
| Merck & Co., Inc. | 1,228,724 | 93,739,354 |
| Mersana Therapeutics, Inc. * | 26,756 | 372,711 |
| Mettler-Toledo International, Inc. * | 11,303 | 17,551,637 |
| MiMedx Group, Inc. *(a) | 47,241 | 697,277 |
| Mirati Therapeutics, Inc. * | 22,436 | 3,808,062 |
| Mirum Pharmaceuticals, Inc. * | 5,105 | 82,956 |
| Moderna, Inc. * | 147,993 | 55,747,483 |
| Molecular Templates, Inc. * | 17,621 | 114,889 |
| Security | Number
of Shares | Value ($) |
| Morphic Holding, Inc. * | 6,933 | 436,848 |
| Myovant Sciences Ltd. * | 20,345 | 495,197 |
| Myriad Genetics, Inc. * | 36,914 | 1,320,783 |
| NanoString Technologies, Inc. * | 22,408 | 1,304,146 |
| Natera, Inc. * | 40,800 | 4,831,944 |
| Nektar Therapeutics * | 90,424 | 1,399,764 |
| NeoGenomics, Inc. * | 56,815 | 2,762,345 |
| Neurocrine Biosciences, Inc. * | 45,919 | 4,371,489 |
| NGM Biopharmaceuticals, Inc. * | 12,970 | 283,135 |
| Nkarta, Inc. * | 7,782 | 251,670 |
| Novavax, Inc. * | 32,969 | 7,864,425 |
| Nurix Therapeutics, Inc. * | 7,546 | 242,906 |
| Nuvation Bio, Inc. * | 31,441 | 290,200 |
| Olema Pharmaceuticals, Inc. * | 5,794 | 173,356 |
| Omeros Corp. *(a) | 30,396 | 495,455 |
| OPKO Health, Inc. * | 221,661 | 855,611 |
| Organogenesis Holdings, Inc. * | 24,448 | 417,083 |
| Organon & Co. | 122,698 | 4,158,235 |
| ORIC Pharmaceuticals, Inc. * | 6,714 | 148,312 |
| Oyster Point Pharma, Inc. * | 6,040 | 79,607 |
| Pacific Biosciences of California, Inc. * | 97,320 | 3,047,089 |
| Pacira BioSciences, Inc. * | 21,023 | 1,246,454 |
| Paratek Pharmaceuticals, Inc. * | 24,674 | 137,187 |
| Passage Bio, Inc. * | 11,748 | 141,211 |
| PDL BioPharma, Inc. *(b) | 65,576 | 161,973 |
| PerkinElmer, Inc. | 54,261 | 10,027,433 |
| Perrigo Co., plc | 64,612 | 2,645,861 |
| Personalis, Inc. * | 13,118 | 277,839 |
| Pfizer, Inc. | 2,715,911 | 125,122,020 |
| Phathom Pharmaceuticals, Inc. * | 7,117 | 253,294 |
| Phibro Animal Health Corp., Class A | 10,140 | 246,301 |
| Pliant Therapeutics, Inc. * | 4,489 | 81,879 |
| PMV Pharmaceuticals, Inc. * | 5,791 | 175,757 |
| Poseida Therapeutics, Inc. * | 8,333 | 71,997 |
| PPD, Inc. * | 52,398 | 2,426,551 |
| Praxis Precision Medicines, Inc. * | 4,176 | 82,977 |
| Precigen, Inc. * | 46,904 | 283,769 |
| Precision BioSciences, Inc. * | 20,841 | 261,971 |
| Prelude Therapeutics, Inc. * | 5,574 | 198,936 |
| Prestige Consumer Healthcare, Inc. * | 24,249 | 1,391,650 |
| Prometheus Biosciences, Inc. * | 5,914 | 129,043 |
| Protagonist Therapeutics, Inc. * | 19,901 | 965,199 |
| Prothena Corp. plc * | 14,046 | 942,768 |
| Provention Bio, Inc. * | 23,388 | 156,933 |
| PTC Therapeutics, Inc. * | 33,405 | 1,458,128 |
| Puma Biotechnology, Inc. * | 24,680 | 186,828 |
| Quanterix Corp. * | 12,837 | 655,329 |
| Radius Health, Inc. * | 22,941 | 317,962 |
| RAPT Therapeutics, Inc. * | 2,858 | 93,457 |
| Reata Pharmaceuticals, Inc., Class A * | 12,667 | 1,349,162 |
| Recursion Pharmaceuticals, Inc., Class A *(a) | 12,821 | 323,346 |
| Regeneron Pharmaceuticals, Inc. * | 50,736 | 34,165,622 |
| REGENXBIO, Inc. * | 16,184 | 522,743 |
| Relay Therapeutics, Inc. * | 9,643 | 308,865 |
| Relmada Therapeutics, Inc. * | 6,138 | 146,760 |
| Repligen Corp. * | 24,870 | 7,037,713 |
| Replimune Group, Inc. * | 12,305 | 390,807 |
| Revance Therapeutics, Inc. * | 33,736 | 903,450 |
| REVOLUTION Medicines, Inc. * | 23,949 | 696,676 |
| Rhythm Pharmaceuticals, Inc. * | 17,443 | 226,933 |
| Rocket Pharmaceuticals, Inc. * | 22,803 | 780,091 |
| Royalty Pharma plc, Class A | 41,494 | 1,603,743 |
| Rubius Therapeutics, Inc. * | 21,064 | 457,510 |
| Sage Therapeutics, Inc. * | 25,606 | 1,183,253 |
| Sana Biotechnology, Inc. * | 12,340 | 296,037 |
| Sangamo Therapeutics, Inc. * | 60,543 | 599,981 |
| Sarepta Therapeutics, Inc. * | 38,439 | 3,002,855 |
Schwab U.S. Equity ETFs | Annual Report
Schwab U.S. Broad Market ETF
Portfolio Holdings as of August 31, 2021 (continued)
| Security | Number
of Shares | Value ($) |
| Seagen, Inc. * | 61,473 | 10,302,875 |
| Seer, Inc. * | 6,266 | 250,515 |
| Seres Therapeutics, Inc. * | 27,351 | 175,320 |
| Shattuck Labs, Inc. * | 5,992 | 126,611 |
| SIGA Technologies, Inc. * | 21,131 | 137,985 |
| Silverback Therapeutics, Inc. *(a) | 6,184 | 136,048 |
| Sorrento Therapeutics, Inc. *(a) | 116,757 | 1,050,813 |
| Sotera Health Co. * | 34,860 | 852,676 |
| Spectrum Pharmaceuticals, Inc. * | 75,306 | 176,969 |
| SpringWorks Therapeutics, Inc. * | 13,109 | 984,486 |
| SQZ Biotechnologies Co. * | 5,319 | 70,743 |
| Stoke Therapeutics, Inc. * | 9,610 | 251,590 |
| Supernus Pharmaceuticals, Inc. * | 26,203 | 721,369 |
| Syndax Pharmaceuticals, Inc. * | 18,458 | 322,830 |
| Syneos Health, Inc. * | 49,800 | 4,620,444 |
| Syros Pharmaceuticals, Inc. * | 29,413 | 155,889 |
| Tarsus Pharmaceuticals, Inc. * | 2,785 | 73,803 |
| Taysha Gene Therapies, Inc. *(a) | 3,886 | 77,254 |
| TCR2 Therapeutics, Inc. * | 14,802 | 248,230 |
| TG Therapeutics, Inc. * | 56,416 | 1,527,181 |
| TherapeuticsMD, Inc. *(a) | 194,419 | 154,563 |
| Theravance Biopharma, Inc. * | 23,547 | 195,440 |
| Thermo Fisher Scientific, Inc. | 190,803 | 105,886,125 |
| Translate Bio, Inc. * | 33,972 | 1,270,553 |
| Travere Therapeutics, Inc. * | 25,677 | 560,529 |
| Tricida, Inc. * | 17,810 | 77,295 |
| Turning Point Therapeutics, Inc. * | 20,558 | 1,583,377 |
| Twist Bioscience Corp. * | 20,615 | 2,333,824 |
| Ultragenyx Pharmaceutical, Inc. * | 30,371 | 2,924,424 |
| uniQure N.V. * | 18,236 | 528,844 |
| United Therapeutics Corp. * | 22,068 | 4,741,972 |
| Vanda Pharmaceuticals, Inc. * | 25,502 | 426,903 |
| Vaxart, Inc. *(a) | 57,776 | 517,095 |
| Vaxcyte, Inc. * | 9,642 | 252,910 |
| VBI Vaccines, Inc. *(a) | 106,987 | 386,223 |
| Veracyte, Inc. * | 31,699 | 1,525,039 |
| Vericel Corp. * | 22,157 | 1,200,245 |
| Vertex Pharmaceuticals, Inc. * | 125,418 | 25,119,971 |
| Viatris, Inc. | 585,567 | 8,566,845 |
| Vir Biotechnology, Inc. * | 31,693 | 1,633,457 |
| Vor BioPharma, Inc. * | 4,381 | 64,357 |
| Waters Corp. * | 29,873 | 12,368,019 |
| WaVe Life Sciences Ltd. * | 16,690 | 105,648 |
| Xencor, Inc. * | 27,820 | 942,263 |
| Y-mAbs Therapeutics, Inc. * | 11,975 | 368,591 |
| Zentalis Pharmaceuticals, Inc. * | 8,825 | 601,777 |
| ZIOPHARM Oncology, Inc. * | 105,054 | 171,238 |
| Zoetis, Inc. | 230,412 | 47,133,079 |
| Zogenix, Inc. * | 26,399 | 390,969 |
| | | 1,593,635,421 |
| |
| Real Estate 3.4% |
| Acadia Realty Trust | 43,867 | 930,858 |
| Agree Realty Corp. | 32,959 | 2,457,093 |
| Alexander & Baldwin, Inc. | 35,036 | 731,552 |
| Alexander's, Inc. | 1,052 | 280,148 |
| Alexandria Real Estate Equities, Inc. | 66,518 | 13,727,320 |
| American Assets Trust, Inc. | 23,555 | 937,960 |
| American Campus Communities, Inc. | 66,675 | 3,390,424 |
| American Finance Trust, Inc. | 52,762 | 454,808 |
| American Homes 4 Rent, Class A | 132,133 | 5,541,658 |
| American Tower Corp. | 220,605 | 64,454,163 |
| Americold Realty Trust | 122,058 | 4,484,411 |
| Apartment Income REIT Corp. | 75,697 | 3,846,922 |
| Apartment Investment & Management Co., Class A | 72,729 | 522,194 |
| Apple Hospitality REIT, Inc. | 103,292 | 1,526,656 |
| Security | Number
of Shares | Value ($) |
| Armada Hoffler Properties, Inc. | 27,388 | 367,821 |
| AvalonBay Communities, Inc. | 67,665 | 15,534,531 |
| Boston Properties, Inc. | 68,640 | 7,755,634 |
| Brandywine Realty Trust | 80,476 | 1,117,007 |
| Brixmor Property Group, Inc. | 142,426 | 3,339,890 |
| Broadstone Net Lease, Inc. | 75,361 | 2,064,891 |
| Camden Property Trust | 47,673 | 7,152,857 |
| CareTrust REIT, Inc. | 47,003 | 1,033,596 |
| CBRE Group, Inc., Class A * | 163,574 | 15,752,176 |
| Centerspace | 5,846 | 591,498 |
| Chatham Lodging Trust * | 23,180 | 278,160 |
| CIM Commercial Trust Corp. (a) | 15,379 | 107,653 |
| City Office REIT, Inc. | 20,980 | 335,051 |
| Columbia Property Trust, Inc. | 58,220 | 973,438 |
| Community Healthcare Trust, Inc. | 10,808 | 524,296 |
| CorePoint Lodging, Inc. * | 18,920 | 273,583 |
| CoreSite Realty Corp. | 20,812 | 3,087,876 |
| Corporate Office Properties Trust | 55,207 | 1,555,733 |
| Cousins Properties, Inc. | 71,868 | 2,771,230 |
| Crown Castle International Corp. | 209,743 | 40,834,865 |
| CubeSmart | 97,656 | 5,224,596 |
| Cushman & Wakefield plc * | 59,485 | 1,079,058 |
| CyrusOne, Inc. | 59,724 | 4,597,554 |
| DiamondRock Hospitality Co. * | 107,101 | 968,193 |
| Digital Realty Trust, Inc. | 136,463 | 22,367,650 |
| DigitalBridge Group, Inc. * | 239,948 | 1,655,641 |
| Diversified Healthcare Trust | 116,977 | 438,664 |
| Douglas Emmett, Inc. | 79,914 | 2,637,961 |
| Duke Realty Corp. | 182,137 | 9,564,014 |
| Easterly Government Properties, Inc. | 39,301 | 839,862 |
| EastGroup Properties, Inc. | 19,475 | 3,510,564 |
| Empire State Realty Trust, Inc., Class A | 68,001 | 698,370 |
| EPR Properties | 36,378 | 1,846,184 |
| Equinix, Inc. | 43,470 | 36,664,772 |
| Equity Commonwealth | 58,636 | 1,544,472 |
| Equity LifeStyle Properties, Inc. | 82,395 | 7,009,343 |
| Equity Residential | 167,017 | 14,041,119 |
| Essential Properties Realty Trust, Inc. | 57,028 | 1,848,277 |
| Essex Property Trust, Inc. | 31,547 | 10,433,855 |
| eXp World Holdings, Inc. | 27,804 | 1,274,813 |
| Extra Space Storage, Inc. | 64,542 | 12,063,545 |
| Federal Realty Investment Trust | 34,583 | 4,211,172 |
| First Industrial Realty Trust, Inc. | 62,559 | 3,502,678 |
| Forestar Group, Inc. * | 9,655 | 200,727 |
| Four Corners Property Trust, Inc. | 35,309 | 1,010,191 |
| Franklin Street Properties Corp. | 50,993 | 244,766 |
| FRP Holdings, Inc. * | 3,539 | 204,200 |
| Gaming & Leisure Properties, Inc. | 105,798 | 5,215,841 |
| Getty Realty Corp. | 19,244 | 608,688 |
| Gladstone Commercial Corp. | 17,988 | 407,068 |
| Global Medical REIT, Inc. | 26,529 | 409,077 |
| Global Net Lease, Inc. | 46,458 | 789,786 |
| Healthcare Realty Trust, Inc. | 67,834 | 2,037,055 |
| Healthcare Trust of America, Inc., Class A | 106,574 | 3,232,389 |
| Healthpeak Properties, Inc. | 261,192 | 9,402,912 |
| Hersha Hospitality Trust * | 18,544 | 173,943 |
| Highwoods Properties, Inc. | 51,341 | 2,345,770 |
| Host Hotels & Resorts, Inc. * | 342,913 | 5,678,639 |
| Hudson Pacific Properties, Inc. | 71,837 | 1,895,060 |
| Independence Realty Trust, Inc. | 51,640 | 1,057,587 |
| Industrial Logistics Properties Trust | 31,284 | 858,120 |
| Innovative Industrial Properties, Inc. | 11,539 | 2,837,556 |
| Invitation Homes, Inc. | 274,644 | 11,309,840 |
| Iron Mountain, Inc. | 140,814 | 6,723,869 |
| iStar, Inc. (a) | 37,152 | 982,670 |
| JBG SMITH Properties | 53,113 | 1,600,295 |
| Jones Lang LaSalle, Inc. * | 24,878 | 6,031,174 |
Schwab U.S. Equity ETFs | Annual Report
Schwab U.S. Broad Market ETF
Portfolio Holdings as of August 31, 2021 (continued)
| Security | Number
of Shares | Value ($) |
| Kennedy-Wilson Holdings, Inc. | 58,420 | 1,284,656 |
| Kilroy Realty Corp. | 51,353 | 3,371,324 |
| Kimco Realty Corp. | 290,231 | 6,324,134 |
| Kite Realty Group Trust | 42,861 | 868,364 |
| Lamar Advertising Co., Class A | 42,270 | 4,811,594 |
| Lexington Realty Trust | 129,907 | 1,757,642 |
| Life Storage, Inc. | 37,308 | 4,642,608 |
| LTC Properties, Inc. | 19,182 | 661,971 |
| Mack-Cali Realty Corp. * | 39,465 | 705,634 |
| Marcus & Millichap, Inc. * | 11,197 | 439,146 |
| Medical Properties Trust, Inc. | 284,665 | 5,829,939 |
| Mid-America Apartment Communities, Inc. | 55,627 | 10,700,966 |
| Monmouth Real Estate Investment Corp. | 46,329 | 879,324 |
| National Health Investors, Inc. | 22,857 | 1,367,306 |
| National Retail Properties, Inc. | 85,182 | 4,055,515 |
| National Storage Affiliates Trust | 37,303 | 2,135,597 |
| New Senior Investment Group, Inc. | 40,724 | 355,521 |
| Newmark Group, Inc., Class A | 79,187 | 1,078,527 |
| NexPoint Residential Trust, Inc. | 11,307 | 732,581 |
| Office Properties Income Trust | 25,306 | 671,368 |
| Omega Healthcare Investors, Inc. | 114,322 | 3,833,217 |
| One Liberty Properties, Inc. | 7,487 | 238,386 |
| Opendoor Technologies, Inc. *(a) | 164,872 | 2,923,181 |
| Outfront Media, Inc. * | 70,601 | 1,748,081 |
| Paramount Group, Inc. | 83,467 | 739,518 |
| Park Hotels & Resorts, Inc. * | 114,328 | 2,188,238 |
| Pebblebrook Hotel Trust | 65,083 | 1,433,779 |
| Physicians Realty Trust | 106,287 | 1,967,372 |
| Piedmont Office Realty Trust, Inc., Class A | 62,681 | 1,116,975 |
| PotlatchDeltic Corp. | 33,075 | 1,718,246 |
| Preferred Apartment Communities, Inc., Class A | 27,828 | 347,293 |
| Prologis, Inc. | 359,176 | 48,366,640 |
| PS Business Parks, Inc. | 9,683 | 1,522,458 |
| Public Storage | 73,954 | 23,932,254 |
| QTS Realty Trust, Inc., Class A | 33,243 | 2,592,289 |
| Rayonier, Inc. | 68,328 | 2,513,104 |
| RE/MAX Holdings, Inc., Class A | 9,672 | 323,915 |
| Realogy Holdings Corp. * | 56,357 | 989,065 |
| Realty Income Corp. | 180,603 | 13,043,149 |
| Redfin Corp. * | 50,306 | 2,443,362 |
| Regency Centers Corp. | 76,149 | 5,225,344 |
| Retail Opportunity Investments Corp. | 57,419 | 1,038,136 |
| Retail Properties of America, Inc., Class A | 103,402 | 1,366,974 |
| Retail Value, Inc. | 8,261 | 206,525 |
| Rexford Industrial Realty, Inc. | 65,062 | 4,029,290 |
| RLJ Lodging Trust | 80,137 | 1,156,377 |
| RPT Realty | 40,644 | 525,933 |
| Ryman Hospitality Properties, Inc. * | 26,967 | 2,240,149 |
| Sabra Health Care REIT, Inc. | 104,318 | 1,669,088 |
| Safehold, Inc. | 6,817 | 610,871 |
| Saul Centers, Inc. | 5,667 | 261,135 |
| SBA Communications Corp. | 53,117 | 19,067,410 |
| Seritage Growth Properties, Class A * | 18,890 | 305,451 |
| Service Properties Trust | 82,072 | 938,083 |
| Simon Property Group, Inc. | 159,074 | 21,387,499 |
| SITE Centers Corp. | 83,111 | 1,338,918 |
| SL Green Realty Corp. | 33,362 | 2,338,009 |
| Spirit Realty Capital, Inc. | 55,260 | 2,860,810 |
| STAG Industrial, Inc. | 76,723 | 3,241,547 |
| STORE Capital Corp. | 117,912 | 4,253,086 |
| Summit Hotel Properties, Inc. * | 53,047 | 494,398 |
| Sun Communities, Inc. | 54,333 | 10,947,556 |
| Sunstone Hotel Investors, Inc. * | 105,135 | 1,218,515 |
| Tanger Factory Outlet Centers, Inc. | 47,633 | 796,424 |
| Security | Number
of Shares | Value ($) |
| Tejon Ranch Co. * | 9,249 | 177,766 |
| Terreno Realty Corp. | 33,416 | 2,232,523 |
| The GEO Group, Inc. | 59,959 | 464,682 |
| The Howard Hughes Corp. * | 21,623 | 1,957,530 |
| The Macerich Co. | 81,818 | 1,397,451 |
| The RMR Group, Inc., Class A | 7,789 | 360,942 |
| The St. Joe Co. | 15,794 | 730,788 |
| UDR, Inc. | 144,446 | 7,802,973 |
| UMH Properties, Inc. | 21,910 | 519,267 |
| Uniti Group, Inc. | 112,873 | 1,475,250 |
| Universal Health Realty Income Trust | 6,325 | 374,630 |
| Urban Edge Properties | 51,154 | 968,857 |
| Urstadt Biddle Properties, Inc., Class A | 13,631 | 260,079 |
| Ventas, Inc. | 181,903 | 10,175,654 |
| VEREIT, Inc. | 111,444 | 5,631,265 |
| VICI Properties, Inc. | 261,068 | 8,069,612 |
| Vornado Realty Trust | 76,070 | 3,185,812 |
| Washington Real Estate Investment Trust | 40,740 | 1,024,204 |
| Welltower, Inc. | 202,446 | 17,720,098 |
| Weyerhaeuser Co. | 362,691 | 13,056,876 |
| Whitestone REIT | 18,544 | 181,917 |
| WP Carey, Inc. | 86,420 | 6,751,130 |
| Xenia Hotels & Resorts, Inc. * | 55,185 | 961,323 |
| | | 761,669,929 |
| |
| Retailing 6.4% |
| 1-800-Flowers.com, Inc., Class A * | 12,272 | 389,759 |
| Abercrombie & Fitch Co., Class A * | 29,934 | 1,070,440 |
| Academy Sports & Outdoors, Inc. * | 19,115 | 846,221 |
| Advance Auto Parts, Inc. | 31,609 | 6,411,886 |
| Amazon.com, Inc. * | 207,991 | 721,893,083 |
| America's Car-Mart, Inc. * | 3,259 | 421,486 |
| American Eagle Outfitters, Inc. | 72,248 | 2,205,009 |
| Arko Corp. * | 31,785 | 328,657 |
| Asbury Automotive Group, Inc. * | 9,470 | 1,763,693 |
| AutoNation, Inc. * | 26,397 | 2,879,649 |
| AutoZone, Inc. * | 10,516 | 16,290,861 |
| Bath & Body Works, Inc. | 128,163 | 8,648,439 |
| Bed Bath & Beyond, Inc. * | 51,849 | 1,427,921 |
| Best Buy Co., Inc. | 108,069 | 12,591,119 |
| Big Lots, Inc. | 15,978 | 777,489 |
| Boot Barn Holdings, Inc. * | 14,793 | 1,320,719 |
| Burlington Stores, Inc. * | 32,366 | 9,693,293 |
| Caleres, Inc. | 17,145 | 421,596 |
| Camping World Holdings, Inc., Class A | 18,775 | 749,874 |
| CarLotz, Inc. * | 33,167 | 136,316 |
| CarMax, Inc. * | 78,993 | 9,890,714 |
| CarParts.com, Inc. * | 17,025 | 294,022 |
| Carvana Co. * | 31,440 | 10,314,206 |
| Chewy, Inc., Class A * | 40,535 | 3,571,944 |
| Chico's FAS, Inc. * | 59,470 | 307,460 |
| Conn's, Inc. * | 9,493 | 233,528 |
| ContextLogic, Inc., Class A *(a) | 38,193 | 275,372 |
| Core-Mark Holding Co., Inc. | 22,564 | 1,037,944 |
| Designer Brands, Inc., Class A * | 28,721 | 416,455 |
| Dick's Sporting Goods, Inc. (a) | 32,113 | 4,521,832 |
| Dillard's, Inc., Class A | 3,313 | 630,994 |
| Dollar General Corp. | 114,768 | 25,582,935 |
| Dollar Tree, Inc. * | 112,510 | 10,186,655 |
| DoorDash, Inc., Class A * | 17,309 | 3,312,943 |
| Duluth Holdings, Inc., Class B * | 6,272 | 97,592 |
| eBay, Inc. | 314,887 | 24,164,428 |
| Etsy, Inc. * | 61,691 | 13,341,296 |
| Five Below, Inc. * | 27,156 | 5,779,068 |
| Floor & Decor Holdings, Inc., Class A * | 51,450 | 6,343,785 |
| Foot Locker, Inc. | 49,552 | 2,809,103 |
| Franchise Group, Inc. | 13,071 | 453,956 |
Schwab U.S. Equity ETFs | Annual Report
Schwab U.S. Broad Market ETF
Portfolio Holdings as of August 31, 2021 (continued)
| Security | Number
of Shares | Value ($) |
| Funko, Inc., Class A * | 8,949 | 178,443 |
| GameStop Corp., Class A * | 26,946 | 5,880,695 |
| Genesco, Inc. * | 7,560 | 468,947 |
| Genuine Parts Co. | 69,808 | 8,529,840 |
| Group 1 Automotive, Inc. | 8,322 | 1,376,792 |
| Groupon, Inc. * | 11,068 | 274,154 |
| GrowGeneration Corp. * | 25,513 | 816,161 |
| Guess?, Inc. | 19,782 | 478,527 |
| Haverty Furniture Cos., Inc. | 7,859 | 280,016 |
| Hibbett, Inc. | 7,902 | 756,142 |
| Kohl's Corp. | 75,080 | 4,309,592 |
| Lands' End, Inc. * | 7,238 | 245,006 |
| Leslie's, Inc. * | 45,444 | 1,096,109 |
| Liquidity Services, Inc. * | 13,998 | 341,551 |
| Lithia Motors, Inc., Class A | 14,368 | 4,760,118 |
| LKQ Corp. * | 134,343 | 7,078,533 |
| Lowe's Cos., Inc. | 342,923 | 69,918,570 |
| Lumber Liquidators Holdings, Inc. * | 13,052 | 272,265 |
| Macy's, Inc. * | 150,699 | 3,374,151 |
| MarineMax, Inc. * | 11,272 | 548,045 |
| Monro, Inc. | 16,806 | 956,429 |
| Murphy USA, Inc. | 12,044 | 1,870,192 |
| National Vision Holdings, Inc. * | 39,110 | 2,345,818 |
| Nordstrom, Inc. * | 52,804 | 1,510,722 |
| O'Reilly Automotive, Inc. * | 33,839 | 20,103,073 |
| Ollie's Bargain Outlet Holdings, Inc. * | 27,259 | 1,973,006 |
| Overstock.com, Inc. * | 20,822 | 1,502,307 |
| Party City Holdco, Inc. * | 53,633 | 365,241 |
| Penske Automotive Group, Inc. | 15,539 | 1,397,422 |
| Petco Health & Wellness Co., Inc. * | 34,457 | 741,859 |
| PetMed Express, Inc. | 9,536 | 262,621 |
| Pool Corp. | 19,437 | 9,607,709 |
| Porch Group, Inc. * | 36,814 | 736,280 |
| Poshmark, Inc., Class A * | 6,993 | 204,056 |
| Quotient Technology, Inc. * | 39,895 | 289,638 |
| Qurate Retail, Inc., Class A | 183,194 | 2,020,630 |
| Rent-A-Center, Inc. | 28,807 | 1,817,146 |
| RH * | 8,149 | 5,709,760 |
| Ross Stores, Inc. | 173,382 | 20,528,429 |
| Sally Beauty Holdings, Inc. * | 56,615 | 1,052,473 |
| Shift Technologies, Inc. *(a) | 28,012 | 208,409 |
| Shoe Carnival, Inc. | 9,056 | 346,664 |
| Shutterstock, Inc. | 10,821 | 1,247,228 |
| Signet Jewelers Ltd. | 25,698 | 2,035,282 |
| Sleep Number Corp. * | 12,151 | 1,124,089 |
| Sonic Automotive, Inc., Class A | 11,449 | 578,632 |
| Sportsman's Warehouse Holdings, Inc. * | 19,411 | 344,351 |
| Stamps.com, Inc. * | 8,826 | 2,902,871 |
| Stitch Fix, Inc., Class A * | 31,197 | 1,307,466 |
| Target Corp. | 240,138 | 59,309,283 |
| The Aaron's Co., Inc. | 16,668 | 442,035 |
| The Buckle, Inc. | 13,791 | 534,125 |
| The Cato Corp., Class A | 11,064 | 190,965 |
| The Children's Place, Inc. * | 6,726 | 584,086 |
| The Container Store Group, Inc. * | 9,655 | 111,998 |
| The Gap, Inc. | 100,483 | 2,685,911 |
| The Home Depot, Inc. | 515,716 | 168,216,245 |
| The ODP Corp. * | 26,069 | 1,229,675 |
| The RealReal, Inc. * | 28,714 | 357,202 |
| The TJX Cos., Inc. | 585,045 | 42,544,472 |
| Tractor Supply Co. | 55,687 | 10,817,200 |
| Ulta Beauty, Inc. * | 26,552 | 10,283,855 |
| Urban Outfitters, Inc. * | 33,200 | 1,096,264 |
| Victoria's Secret & Co. * | 42,729 | 2,832,933 |
| Vroom, Inc. * | 17,938 | 481,815 |
| Wayfair, Inc., Class A * | 35,680 | 10,017,160 |
| Weyco Group, Inc. | 2,908 | 66,797 |
| Williams-Sonoma, Inc. | 37,120 | 6,930,304 |
| Security | Number
of Shares | Value ($) |
| Winmark Corp. | 1,401 | 293,692 |
| Zumiez, Inc. * | 9,712 | 390,325 |
| | | 1,429,323,544 |
| |
| Semiconductors & Semiconductor Equipment 5.2% |
| ACM Research, Inc., Class A * | 4,763 | 424,622 |
| Advanced Micro Devices, Inc. * | 589,281 | 65,245,192 |
| Allegro MicroSystems, Inc. * | 20,181 | 606,439 |
| Ambarella, Inc. * | 17,275 | 1,789,172 |
| Amkor Technology, Inc. | 51,626 | 1,418,166 |
| Analog Devices, Inc. | 260,765 | 42,491,613 |
| Applied Materials, Inc. | 445,292 | 60,172,308 |
| Axcelis Technologies, Inc. * | 16,096 | 800,132 |
| Broadcom, Inc. | 198,194 | 98,544,039 |
| Brooks Automation, Inc. | 36,350 | 3,088,296 |
| CEVA, Inc. * | 11,493 | 554,537 |
| Cirrus Logic, Inc. * | 27,654 | 2,313,810 |
| CMC Materials, Inc. | 14,316 | 1,898,588 |
| Cohu, Inc. * | 23,113 | 824,672 |
| Cree, Inc. * | 56,131 | 4,770,012 |
| Diodes, Inc. * | 20,023 | 1,938,827 |
| Enphase Energy, Inc. * | 65,789 | 11,429,523 |
| Entegris, Inc. | 65,491 | 7,868,089 |
| First Solar, Inc. * | 41,520 | 3,902,880 |
| FormFactor, Inc. * | 38,424 | 1,493,925 |
| Ichor Holdings Ltd. * | 14,270 | 632,304 |
| Impinj, Inc. * | 10,275 | 598,930 |
| Intel Corp. | 1,959,312 | 105,920,407 |
| KLA Corp. | 74,490 | 25,323,620 |
| Kulicke & Soffa Industries, Inc. | 29,749 | 2,088,082 |
| Lam Research Corp. | 69,248 | 41,882,575 |
| Lattice Semiconductor Corp. * | 66,001 | 4,099,982 |
| MACOM Technology Solutions Holdings, Inc. * | 22,188 | 1,347,034 |
| Marvell Technology, Inc. | 397,669 | 24,333,366 |
| MaxLinear, Inc., Class A * | 32,604 | 1,702,907 |
| Microchip Technology, Inc. | 132,632 | 20,870,972 |
| Micron Technology, Inc. * | 544,348 | 40,118,448 |
| MKS Instruments, Inc. | 26,910 | 3,960,614 |
| Monolithic Power Systems, Inc. | 20,823 | 10,305,927 |
| NeoPhotonics Corp. * | 27,152 | 253,600 |
| NVIDIA Corp. | 1,209,255 | 270,691,732 |
| NXP Semiconductor N.V. | 133,623 | 28,746,316 |
| ON Semiconductor Corp. * | 206,719 | 9,170,055 |
| Onto Innovation, Inc. * | 23,572 | 1,747,392 |
| PDF Solutions, Inc. * | 12,598 | 283,707 |
| Photronics, Inc. * | 33,180 | 500,023 |
| Power Integrations, Inc. | 29,529 | 3,208,031 |
| Qorvo, Inc. * | 54,379 | 10,224,883 |
| QUALCOMM, Inc. | 547,454 | 80,306,027 |
| Rambus, Inc. * | 56,749 | 1,350,626 |
| Semtech Corp. * | 31,230 | 2,183,602 |
| Silicon Laboratories, Inc. * | 21,722 | 3,423,822 |
| SiTime Corp. * | 5,881 | 1,251,712 |
| SkyWater Technology, Inc. * | 3,713 | 123,940 |
| Skyworks Solutions, Inc. | 79,940 | 14,665,792 |
| SMART Global Holdings, Inc. * | 8,614 | 417,434 |
| SolarEdge Technologies, Inc. * | 25,444 | 7,373,162 |
| SunPower Corp. * | 39,447 | 850,083 |
| Synaptics, Inc. * | 16,934 | 3,213,735 |
| Teradyne, Inc. | 80,451 | 9,769,969 |
| Texas Instruments, Inc. | 448,231 | 85,571,780 |
| Ultra Clean Holdings, Inc. * | 21,196 | 980,103 |
| Universal Display Corp. | 20,966 | 4,373,298 |
Schwab U.S. Equity ETFs | Annual Report
Schwab U.S. Broad Market ETF
Portfolio Holdings as of August 31, 2021 (continued)
| Security | Number
of Shares | Value ($) |
| Veeco Instruments, Inc. * | 23,936 | 545,501 |
| Xilinx, Inc. | 119,739 | 18,630,191 |
| | | 1,154,616,526 |
| |
| Software & Services 14.8% |
| 8x8, Inc. * | 53,050 | 1,281,158 |
| A10 Networks, Inc. * | 31,769 | 441,271 |
| Accenture plc, Class A | 308,320 | 103,768,179 |
| ACI Worldwide, Inc. * | 56,511 | 1,821,350 |
| Adobe, Inc. * | 232,008 | 153,983,710 |
| Affirm Holdings, Inc. * | 24,571 | 2,367,170 |
| Agilysys, Inc. * | 10,139 | 576,199 |
| Akamai Technologies, Inc. * | 79,047 | 8,952,073 |
| Alarm.com Holdings, Inc. * | 21,646 | 1,825,407 |
| Alliance Data Systems Corp. | 23,906 | 2,345,418 |
| Altair Engineering, Inc., Class A * | 21,918 | 1,621,713 |
| Alteryx, Inc., Class A * | 28,455 | 2,104,816 |
| Anaplan, Inc. * | 70,740 | 4,242,985 |
| ANSYS, Inc. * | 42,185 | 15,412,712 |
| Appfolio, Inc., Class A * | 8,529 | 1,007,275 |
| Appian Corp. * | 18,851 | 2,020,827 |
| AppLovin Corp., Class A *(a) | 12,479 | 878,522 |
| Asana, Inc., Class A * | 13,689 | 1,034,204 |
| Aspen Technology, Inc. * | 33,051 | 4,280,104 |
| Autodesk, Inc. * | 106,728 | 33,095,286 |
| Automatic Data Processing, Inc. | 206,462 | 43,158,816 |
| Avalara, Inc. * | 41,714 | 7,496,006 |
| Avaya Holdings Corp. * | 36,915 | 744,576 |
| Benefitfocus, Inc. * | 15,342 | 185,178 |
| BigCommerce Holdings, Inc. * | 5,842 | 347,833 |
| Bill.com Holdings, Inc. * | 30,209 | 8,289,048 |
| Black Knight, Inc. * | 76,691 | 5,803,208 |
| Blackbaud, Inc. * | 23,425 | 1,632,488 |
| Blackline, Inc. * | 24,762 | 2,701,534 |
| BM Technologies, Inc. *(b) | 2,133 | 19,555 |
| Bottomline Technologies (DE), Inc. * | 18,857 | 797,085 |
| Box, Inc., Class A * | 67,585 | 1,742,341 |
| Broadridge Financial Solutions, Inc. | 56,308 | 9,697,364 |
| BTRS Holdings, Inc. * | 29,223 | 318,823 |
| C3.ai, Inc., Class A * | 7,971 | 410,825 |
| Cadence Design Systems, Inc. * | 135,445 | 22,142,549 |
| Cantaloupe, Inc. * | 25,841 | 264,612 |
| Cass Information Systems, Inc. | 5,680 | 256,054 |
| CDK Global, Inc. | 59,455 | 2,473,328 |
| Cerence, Inc. * | 18,100 | 1,962,764 |
| Ceridian HCM Holding, Inc. * | 63,909 | 7,180,176 |
| ChannelAdvisor Corp. * | 13,995 | 358,552 |
| Citrix Systems, Inc. | 60,350 | 6,208,204 |
| Cloudera, Inc. * | 107,409 | 1,711,025 |
| Cloudflare, Inc., Class A * | 93,363 | 11,272,649 |
| Cognizant Technology Solutions Corp., Class A | 255,521 | 19,498,808 |
| CommVault Systems, Inc. * | 22,426 | 1,815,833 |
| Concentrix Corp. * | 19,987 | 3,465,546 |
| Conduent, Inc. * | 82,074 | 599,140 |
| Cornerstone OnDemand, Inc. * | 29,462 | 1,688,173 |
| Coupa Software, Inc. * | 35,760 | 8,754,406 |
| Crowdstrike Holdings, Inc., Class A * | 96,735 | 27,182,535 |
| CSG Systems International, Inc. | 16,616 | 801,057 |
| Datadog, Inc., Class A * | 105,225 | 14,500,005 |
| Datto Holding Corp. * | 10,820 | 275,910 |
| Digimarc Corp. *(a) | 6,259 | 183,013 |
| Digital Turbine, Inc. * | 37,720 | 2,204,734 |
| DigitalOcean Holdings, Inc. * | 8,326 | 513,548 |
| DocuSign, Inc. * | 94,462 | 27,983,423 |
| Dolby Laboratories, Inc., Class A | 31,913 | 3,162,897 |
| Domo, Inc., Class B * | 14,043 | 1,256,849 |
| Security | Number
of Shares | Value ($) |
| Dropbox, Inc., Class A * | 143,591 | 4,553,271 |
| Duck Creek Technologies, Inc. * | 15,836 | 738,433 |
| DXC Technology Co. * | 123,064 | 4,518,910 |
| Dynatrace, Inc. * | 89,320 | 6,138,964 |
| E2open Parent Holdings, Inc. * | 59,980 | 716,161 |
| Ebix, Inc. | 11,520 | 331,546 |
| Elastic N.V. * | 30,627 | 4,886,538 |
| Envestnet, Inc. * | 26,366 | 2,105,852 |
| EPAM Systems, Inc. * | 27,449 | 17,370,002 |
| Euronet Worldwide, Inc. * | 25,552 | 3,404,293 |
| Everbridge, Inc. * | 18,459 | 2,897,509 |
| EVERTEC, Inc. | 28,734 | 1,328,948 |
| Evo Payments, Inc., Class A * | 24,238 | 616,615 |
| ExlService Holdings, Inc. * | 16,012 | 1,971,718 |
| Fair Isaac Corp. * | 14,050 | 6,459,347 |
| Fastly, Inc., Class A * | 41,970 | 1,829,892 |
| Fidelity National Information Services, Inc. | 300,814 | 38,435,005 |
| FireEye, Inc. * | 116,401 | 2,117,334 |
| Fiserv, Inc. * | 289,118 | 34,055,209 |
| Five9, Inc. * | 32,475 | 5,138,519 |
| FleetCor Technologies, Inc. * | 40,359 | 10,625,718 |
| Fortinet, Inc. * | 65,813 | 20,740,309 |
| Gartner, Inc. * | 41,842 | 12,918,299 |
| Genpact Ltd. | 84,820 | 4,400,462 |
| Global Payments, Inc. | 143,373 | 23,318,185 |
| GoDaddy, Inc., Class A * | 81,342 | 5,963,182 |
| GreenSky, Inc., Class A * | 20,756 | 165,010 |
| Grid Dynamics Holdings, Inc. * | 12,071 | 323,141 |
| GTY Technology Holdings, Inc. * | 18,000 | 132,840 |
| Guidewire Software, Inc. * | 40,958 | 4,851,885 |
| HubSpot, Inc. * | 21,231 | 14,531,983 |
| InterDigital, Inc. | 14,568 | 1,050,498 |
| International Business Machines Corp. | 433,729 | 60,869,528 |
| International Money Express, Inc. * | 14,175 | 258,552 |
| Intuit, Inc. | 132,525 | 75,023,728 |
| j2 Global, Inc. * | 20,770 | 2,860,029 |
| Jack Henry & Associates, Inc. | 36,143 | 6,374,902 |
| Jamf Holding Corp. * | 17,652 | 620,468 |
| Limelight Networks, Inc. * | 75,551 | 203,988 |
| LivePerson, Inc. * | 30,681 | 1,966,652 |
| LiveRamp Holdings, Inc. * | 33,172 | 1,625,428 |
| Manhattan Associates, Inc. * | 30,852 | 5,028,567 |
| Mastercard, Inc., Class A | 424,344 | 146,920,623 |
| MAXIMUS, Inc. | 29,426 | 2,562,710 |
| McAfee Corp., Class A | 16,728 | 444,296 |
| Medallia, Inc. * | 41,513 | 1,401,894 |
| Microsoft Corp. | 3,653,726 | 1,102,986,805 |
| MicroStrategy, Inc., Class A * | 3,758 | 2,609,179 |
| Mimecast Ltd. * | 28,783 | 2,009,341 |
| Model N, Inc. * | 15,308 | 519,094 |
| Momentive Global, Inc. * | 57,424 | 1,126,085 |
| MoneyGram International, Inc. * | 31,925 | 287,006 |
| MongoDB, Inc. * | 25,956 | 10,170,339 |
| N-Able, Inc. * | 17,773 | 240,469 |
| NCR Corp. * | 63,223 | 2,685,713 |
| New Relic, Inc. * | 26,502 | 2,119,365 |
| NortonLifeLock, Inc. | 283,935 | 7,541,314 |
| Nuance Communications, Inc. * | 138,828 | 7,642,481 |
| Nutanix, Inc., Class A * | 99,836 | 3,684,947 |
| Okta, Inc. * | 60,761 | 16,016,600 |
| ON24, Inc. * | 4,017 | 90,824 |
| OneSpan, Inc. * | 18,270 | 352,063 |
| Oracle Corp. | 881,535 | 78,571,215 |
| Pagerduty, Inc. * | 28,086 | 1,202,081 |
| Palantir Technologies, Inc., Class A * | 219,098 | 5,771,041 |
| Palo Alto Networks, Inc. * | 47,159 | 21,742,185 |
| Paya Holdings, Inc., Class A * | 25,395 | 245,062 |
Schwab U.S. Equity ETFs | Annual Report
Schwab U.S. Broad Market ETF
Portfolio Holdings as of August 31, 2021 (continued)
| Security | Number
of Shares | Value ($) |
| Paychex, Inc. | 155,596 | 17,811,074 |
| Paycom Software, Inc. * | 24,019 | 11,742,889 |
| Paylocity Holding Corp. * | 18,259 | 4,915,323 |
| PayPal Holdings, Inc. * | 570,102 | 164,565,643 |
| Pegasystems, Inc. | 19,193 | 2,641,533 |
| Perficient, Inc. * | 15,409 | 1,837,061 |
| Ping Identity Holding Corp. * | 17,776 | 461,287 |
| Progress Software Corp. | 22,060 | 1,027,114 |
| Proofpoint, Inc. *(b) | 27,781 | 4,889,456 |
| PROS Holdings, Inc. * | 20,815 | 900,041 |
| PTC, Inc. * | 50,841 | 6,693,726 |
| Q2 Holdings, Inc. * | 25,357 | 2,233,698 |
| QAD, Inc., Class A | 6,112 | 531,805 |
| Qualtrics International, Inc., Class A * | 27,524 | 1,246,287 |
| Qualys, Inc. * | 16,400 | 1,925,032 |
| Rackspace Technology, Inc. * | 16,073 | 224,540 |
| Rapid7, Inc. * | 27,324 | 3,320,412 |
| Repay Holdings Corp. * | 37,444 | 861,586 |
| RingCentral, Inc., Class A * | 39,086 | 9,859,834 |
| Sabre Corp. * | 154,680 | 1,737,056 |
| Sailpoint Technologies Holdings, Inc. * | 44,268 | 2,074,398 |
| salesforce.com, Inc. * | 468,761 | 124,348,230 |
| ServiceNow, Inc. * | 95,823 | 61,675,516 |
| Shift4 Payments, Inc., Class A * | 18,851 | 1,615,719 |
| Smartsheet, Inc., Class A * | 56,321 | 4,481,462 |
| Snowflake, Inc., Class A * | 30,225 | 9,198,979 |
| SolarWinds Corp. | 17,809 | 304,000 |
| Splunk, Inc. * | 79,417 | 12,140,477 |
| Sprout Social, Inc., Class A * | 13,342 | 1,622,387 |
| SPS Commerce, Inc. * | 17,492 | 2,370,691 |
| Square, Inc., Class A * | 190,255 | 51,001,658 |
| SS&C Technologies Holdings, Inc. | 108,130 | 8,181,116 |
| Sumo Logic, Inc. * | 7,232 | 150,787 |
| Switch, Inc., Class A | 44,655 | 1,107,891 |
| Synopsys, Inc. * | 73,821 | 24,526,289 |
| Telos Corp. * | 11,747 | 387,651 |
| Tenable Holdings, Inc. * | 34,389 | 1,525,840 |
| Teradata Corp. * | 52,663 | 2,880,139 |
| The Trade Desk, Inc., Class A * | 208,820 | 16,716,041 |
| The Western Union Co. | 199,532 | 4,317,872 |
| TTEC Holdings, Inc. | 9,064 | 955,889 |
| Tucows, Inc., Class A *(a) | 4,544 | 336,756 |
| Twilio, Inc., Class A * | 78,864 | 28,151,293 |
| Tyler Technologies, Inc. * | 19,815 | 9,624,145 |
| Unisys Corp. * | 34,494 | 835,100 |
| Upland Software, Inc. * | 11,940 | 465,421 |
| Varonis Systems, Inc. * | 52,127 | 3,597,284 |
| Verint Systems, Inc. * | 31,644 | 1,412,588 |
| VeriSign, Inc. * | 48,118 | 10,405,999 |
| Verra Mobility Corp. * | 64,694 | 1,003,404 |
| Viant Technology, Inc., Class A * | 4,831 | 66,426 |
| VirnetX Holding Corp. * | 29,561 | 132,729 |
| Visa, Inc., Class A | 820,511 | 187,979,070 |
| VMware, Inc., Class A *(a) | 39,097 | 5,820,370 |
| Vonage Holdings Corp. * | 115,387 | 1,626,957 |
| WEX, Inc. * | 21,804 | 4,002,560 |
| Workday, Inc., Class A * | 91,978 | 25,124,710 |
| Workiva, Inc. * | 20,553 | 2,882,969 |
| Xperi Holding Corp. | 50,891 | 1,087,541 |
| Yext, Inc. * | 46,062 | 622,758 |
| Zendesk, Inc. * | 57,724 | 7,134,686 |
| Zoom Video Communications, Inc., Class A * | 103,439 | 29,945,590 |
| Zscaler, Inc. * | 36,236 | 10,085,928 |
| Zuora, Inc., Class A * | 48,546 | 824,311 |
| | | 3,310,708,025 |
| |
| Security | Number
of Shares | Value ($) |
| Technology Hardware & Equipment 7.2% |
| 3D Systems Corp. * | 60,244 | 1,833,827 |
| 908 Devices, Inc. * | 3,151 | 113,436 |
| ADTRAN, Inc. | 26,173 | 540,734 |
| Advanced Energy Industries, Inc. | 18,525 | 1,670,584 |
| Aeva Technologies, Inc. * | 47,483 | 465,808 |
| Amphenol Corp., Class A | 289,789 | 22,206,531 |
| Apple Inc. | 7,609,981 | 1,155,423,415 |
| Applied Optoelectronics, Inc. * | 8,727 | 63,969 |
| Arista Networks, Inc. * | 26,712 | 9,870,885 |
| Arlo Technologies, Inc. * | 38,303 | 237,479 |
| Arrow Electronics, Inc. * | 36,058 | 4,370,951 |
| Avid Technology, Inc. * | 20,067 | 517,929 |
| Avnet, Inc. | 47,841 | 1,935,647 |
| Badger Meter, Inc. | 13,966 | 1,495,619 |
| Belden, Inc. | 22,296 | 1,276,446 |
| Benchmark Electronics, Inc. | 17,652 | 477,134 |
| CalAmp Corp. * | 19,204 | 217,773 |
| Calix, Inc. * | 27,061 | 1,261,043 |
| Casa Systems, Inc. * | 14,289 | 100,595 |
| CDW Corp. | 68,109 | 13,663,346 |
| Ciena Corp. * | 75,400 | 4,307,602 |
| Cisco Systems, Inc. | 2,044,748 | 120,681,027 |
| Cognex Corp. | 85,466 | 7,573,997 |
| Coherent, Inc. * | 11,989 | 3,029,261 |
| CommScope Holding Co., Inc. * | 100,965 | 1,595,247 |
| Comtech Telecommunications Corp. | 12,936 | 330,127 |
| Corning, Inc. | 375,221 | 15,005,088 |
| Corsair Gaming, Inc. *(a) | 10,237 | 296,361 |
| CTS Corp. | 16,039 | 562,648 |
| Daktronics, Inc. * | 23,346 | 142,177 |
| Dell Technologies, Inc., Class C * | 121,195 | 11,811,665 |
| Diebold Nixdorf, Inc. * | 38,716 | 421,230 |
| EchoStar Corp., Class A * | 21,365 | 576,855 |
| ePlus, Inc. * | 6,716 | 726,805 |
| Extreme Networks, Inc. * | 60,902 | 659,569 |
| F5 Networks, Inc. * | 28,810 | 5,864,852 |
| Fabrinet * | 17,880 | 1,841,998 |
| FARO Technologies, Inc. * | 9,172 | 632,318 |
| Harmonic, Inc. * | 47,277 | 436,839 |
| Hewlett Packard Enterprise Co. | 631,009 | 9,755,399 |
| HP, Inc. | 585,063 | 17,399,774 |
| II-VI, Inc. * | 50,657 | 3,190,378 |
| Infinera Corp. * | 101,325 | 858,223 |
| Inseego Corp. *(a) | 31,201 | 262,088 |
| Insight Enterprises, Inc. * | 16,819 | 1,730,507 |
| IPG Photonics Corp. * | 17,259 | 2,945,766 |
| Itron, Inc. * | 22,130 | 1,859,141 |
| Jabil, Inc. | 65,494 | 4,046,219 |
| Juniper Networks, Inc. | 157,831 | 4,573,942 |
| Keysight Technologies, Inc. * | 89,158 | 15,993,162 |
| Kimball Electronics, Inc. * | 11,364 | 274,668 |
| Knowles Corp. * | 43,214 | 864,280 |
| Littelfuse, Inc. | 12,092 | 3,451,057 |
| Lumentum Holdings, Inc. * | 36,986 | 3,204,467 |
| Methode Electronics, Inc. | 19,681 | 916,544 |
| Motorola Solutions, Inc. | 82,309 | 20,101,504 |
| Napco Security Technologies, Inc. * | 5,796 | 226,797 |
| National Instruments Corp. | 63,533 | 2,656,950 |
| NetApp, Inc. | 107,463 | 9,556,685 |
| NETGEAR, Inc. * | 15,212 | 543,525 |
| NetScout Systems, Inc. * | 36,305 | 995,483 |
| nLight, Inc. * | 19,191 | 529,863 |
| Novanta, Inc. * | 17,471 | 2,676,907 |
| OSI Systems, Inc. * | 8,410 | 832,085 |
| Ouster, Inc. *(a) | 33,970 | 285,348 |
| PAR Technology Corp. * | 11,691 | 794,170 |
Schwab U.S. Equity ETFs | Annual Report
Schwab U.S. Broad Market ETF
Portfolio Holdings as of August 31, 2021 (continued)
| Security | Number
of Shares | Value ($) |
| PC Connection, Inc. | 5,600 | 271,096 |
| Plantronics, Inc. * | 18,210 | 542,294 |
| Plexus Corp. * | 14,448 | 1,326,760 |
| Pure Storage, Inc., Class A * | 126,268 | 3,261,502 |
| Ribbon Communications, Inc. * | 54,035 | 352,849 |
| Rogers Corp. * | 8,882 | 1,886,626 |
| Sanmina Corp. * | 30,305 | 1,196,441 |
| ScanSource, Inc. * | 11,983 | 426,355 |
| Seagate Technology Holdings plc | 96,474 | 8,450,158 |
| Super Micro Computer, Inc. * | 21,835 | 797,851 |
| SYNNEX Corp. | 20,260 | 2,574,438 |
| TE Connectivity Ltd. | 160,652 | 24,133,143 |
| Teledyne Technologies, Inc. * | 22,491 | 10,421,880 |
| Trimble, Inc. * | 121,308 | 11,429,640 |
| TTM Technologies, Inc. * | 48,061 | 672,854 |
| Ubiquiti, Inc. | 3,610 | 1,174,550 |
| Velodyne Lidar, Inc. *(a) | 29,068 | 191,849 |
| ViaSat, Inc. * | 32,965 | 1,702,313 |
| Viavi Solutions, Inc. * | 109,625 | 1,785,791 |
| Vishay Intertechnology, Inc. | 64,443 | 1,415,813 |
| Vontier Corp. | 81,852 | 2,976,957 |
| Western Digital Corp. * | 148,849 | 9,407,257 |
| Xerox Holdings Corp. | 76,640 | 1,725,166 |
| Zebra Technologies Corp., Class A * | 25,978 | 15,253,502 |
| | | 1,608,140,834 |
| |
| Telecommunication Services 1.2% |
| Anterix, Inc. * | 5,463 | 322,426 |
| AT&T, Inc. | 3,463,051 | 94,956,858 |
| ATN International, Inc. | 5,385 | 245,502 |
| Bandwidth, Inc., Class A * | 11,384 | 1,171,414 |
| Cincinnati Bell, Inc. * | 25,866 | 400,664 |
| Cogent Communications Holdings, Inc. | 21,243 | 1,541,817 |
| Consolidated Communications Holdings, Inc. * | 35,831 | 332,153 |
| Globalstar, Inc. * | 333,486 | 663,637 |
| Gogo, Inc. *(a) | 25,657 | 345,087 |
| Iridium Communications, Inc. * | 56,603 | 2,519,400 |
| Liberty Global plc, Class A * | 70,149 | 2,016,082 |
| Liberty Global plc, Class C * | 166,324 | 4,820,070 |
| Liberty Latin America Ltd., Class A * | 23,815 | 339,602 |
| Liberty Latin America Ltd., Class C * | 74,160 | 1,067,162 |
| Lumen Technologies, Inc. | 479,818 | 5,901,761 |
| ORBCOMM, Inc. * | 41,050 | 471,665 |
| Radius Global Infrastructure, Inc., Class A * | 28,179 | 503,841 |
| Shenandoah Telecommunications Co. | 23,510 | 701,303 |
| Spok Holdings, Inc. | 8,676 | 85,979 |
| T-Mobile US, Inc. * | 283,862 | 38,894,771 |
| Telephone and Data Systems, Inc. | 49,639 | 1,008,665 |
| United States Cellular Corp. * | 7,636 | 243,970 |
| Verizon Communications, Inc. | 2,007,552 | 110,415,360 |
| | | 268,969,189 |
| |
| Transportation 1.8% |
| Air Transport Services Group, Inc. * | 30,157 | 826,000 |
| Alaska Air Group, Inc. * | 59,926 | 3,436,157 |
| Allegiant Travel Co. * | 7,120 | 1,370,173 |
| AMERCO | 4,320 | 2,856,168 |
| American Airlines Group, Inc. * | 310,641 | 6,194,181 |
| ArcBest Corp. | 11,637 | 776,537 |
| Atlas Air Worldwide Holdings, Inc. * | 13,076 | 956,771 |
| Avis Budget Group, Inc. * | 24,673 | 2,239,075 |
| C.H. Robinson Worldwide, Inc. | 64,563 | 5,814,544 |
| CSX Corp. | 1,100,908 | 35,812,537 |
| Daseke, Inc. * | 29,504 | 278,813 |
| Security | Number
of Shares | Value ($) |
| Delta Air Lines, Inc. * | 310,132 | 12,541,738 |
| Echo Global Logistics, Inc. * | 14,335 | 471,335 |
| Expeditors International of Washington, Inc. | 81,756 | 10,190,068 |
| FedEx Corp. | 118,520 | 31,489,579 |
| Forward Air Corp. | 13,274 | 1,170,368 |
| Frontier Group Holdings, Inc. * | 14,269 | 218,744 |
| GXO Logistics, Inc. * | 49,481 | 4,047,051 |
| Hawaiian Holdings, Inc. * | 23,514 | 475,453 |
| Heartland Express, Inc. | 23,954 | 401,948 |
| Hub Group, Inc., Class A * | 16,744 | 1,175,429 |
| J.B. Hunt Transport Services, Inc. | 40,919 | 7,259,030 |
| JetBlue Airways Corp. * | 155,527 | 2,353,123 |
| Kansas City Southern | 43,973 | 12,341,902 |
| Kirby Corp. * | 28,820 | 1,544,464 |
| Knight-Swift Transportation Holdings, Inc. | 58,814 | 3,054,211 |
| Landstar System, Inc. | 18,969 | 3,187,361 |
| Lyft, Inc., Class A * | 124,254 | 5,915,733 |
| Macquarie Infrastructure Corp. | 35,225 | 1,403,716 |
| Marten Transport Ltd. | 26,636 | 415,255 |
| Matson, Inc. | 21,292 | 1,685,688 |
| Norfolk Southern Corp. | 121,365 | 30,770,882 |
| Old Dominion Freight Line, Inc. | 46,011 | 13,284,296 |
| Ryder System, Inc. | 26,428 | 2,100,762 |
| Saia, Inc. * | 12,753 | 3,062,378 |
| Schneider National, Inc., Class B | 17,824 | 401,753 |
| SkyWest, Inc. * | 24,183 | 1,128,137 |
| Southwest Airlines Co. * | 288,158 | 14,344,505 |
| Spirit Airlines, Inc. * | 53,213 | 1,305,315 |
| Sun Country Airlines Holdings, Inc. * | 10,744 | 347,998 |
| TuSimple Holdings, Inc., Class A * | 16,216 | 678,802 |
| Uber Technologies, Inc. * | 717,876 | 28,097,667 |
| Union Pacific Corp. | 322,363 | 69,901,193 |
| United Airlines Holdings, Inc. * | 156,884 | 7,296,675 |
| United Parcel Service, Inc., Class B | 350,824 | 68,631,699 |
| Universal Logistics Holdings, Inc. | 5,305 | 116,020 |
| Werner Enterprises, Inc. | 28,446 | 1,341,513 |
| XPO Logistics, Inc. * | 49,481 | 4,300,394 |
| | | 409,013,141 |
| |
| Utilities 2.4% |
| ALLETE, Inc. | 25,540 | 1,721,907 |
| Alliant Energy Corp. | 121,445 | 7,382,642 |
| Ameren Corp. | 123,589 | 10,841,227 |
| American Electric Power Co., Inc. | 242,029 | 21,678,538 |
| American States Water Co. | 17,867 | 1,647,516 |
| American Water Works Co., Inc. | 88,433 | 16,116,914 |
| Atmos Energy Corp. | 63,831 | 6,224,161 |
| Avangrid, Inc. | 34,310 | 1,875,042 |
| Avista Corp. | 32,812 | 1,373,182 |
| Black Hills Corp. | 31,219 | 2,195,632 |
| California Water Service Group | 24,289 | 1,543,566 |
| CenterPoint Energy, Inc. | 281,963 | 7,074,452 |
| Chesapeake Utilities Corp. | 8,202 | 1,072,001 |
| Clearway Energy, Inc., Class A | 16,437 | 488,836 |
| Clearway Energy, Inc., Class C | 37,611 | 1,180,609 |
| CMS Energy Corp. | 141,439 | 9,070,483 |
| Consolidated Edison, Inc. | 165,870 | 12,514,892 |
| Dominion Energy, Inc. | 391,377 | 30,464,786 |
| DTE Energy Co. | 93,699 | 11,275,738 |
| Duke Energy Corp. | 373,491 | 39,089,568 |
| Edison International | 183,722 | 10,626,480 |
| Entergy Corp. | 97,068 | 10,736,692 |
| Essential Utilities, Inc. | 108,758 | 5,397,660 |
| Evergy, Inc. | 110,783 | 7,583,096 |
| Eversource Energy | 166,256 | 15,084,407 |
Schwab U.S. Equity ETFs | Annual Report
Schwab U.S. Broad Market ETF
Portfolio Holdings as of August 31, 2021 (continued)
| Security | Number
of Shares | Value ($) |
| Exelon Corp. | 474,813 | 23,275,333 |
| FirstEnergy Corp. | 262,923 | 10,219,817 |
| Hawaiian Electric Industries, Inc. | 53,966 | 2,352,918 |
| IDACORP, Inc. | 24,924 | 2,625,743 |
| MDU Resources Group, Inc. | 97,120 | 3,124,350 |
| MGE Energy, Inc. | 17,502 | 1,409,611 |
| Middlesex Water Co. | 8,959 | 980,204 |
| National Fuel Gas Co. | 43,633 | 2,260,626 |
| New Jersey Resources Corp. | 47,161 | 1,760,992 |
| NextEra Energy, Inc. | 951,654 | 79,929,419 |
| NiSource, Inc. | 190,151 | 4,687,222 |
| Northwest Natural Holding Co. | 15,518 | 798,401 |
| NorthWestern Corp. | 25,217 | 1,603,801 |
| NRG Energy, Inc. | 118,220 | 5,399,107 |
| OGE Energy Corp. | 98,660 | 3,493,551 |
| ONE Gas, Inc. | 25,660 | 1,842,901 |
| Ormat Technologies, Inc. | 21,613 | 1,537,333 |
| Otter Tail Corp. | 20,043 | 1,099,759 |
| PG&E Corp. * | 722,337 | 6,623,830 |
| Pinnacle West Capital Corp. | 54,670 | 4,204,123 |
| PNM Resources, Inc. | 41,641 | 2,061,230 |
| Portland General Electric Co. | 44,452 | 2,282,610 |
| PPL Corp. | 373,107 | 10,950,690 |
| Public Service Enterprise Group, Inc. | 244,451 | 15,630,197 |
| Sempra Energy | 152,743 | 20,217,064 |
| SJW Group | 13,061 | 905,519 |
| South Jersey Industries, Inc. | 53,188 | 1,319,594 |
| Southwest Gas Holdings, Inc. | 27,645 | 1,943,720 |
| Spire, Inc. | 25,361 | 1,691,579 |
| Sunnova Energy International, Inc. * | 30,356 | 1,098,887 |
| The AES Corp. | 322,497 | 7,698,003 |
| The Southern Co. | 514,089 | 33,791,070 |
| UGI Corp. | 101,535 | 4,702,086 |
| Unitil Corp. | 7,779 | 385,838 |
| Vistra Corp. | 233,219 | 4,452,151 |
| WEC Energy Group, Inc. | 153,016 | 14,456,952 |
| Xcel Energy, Inc. | 260,407 | 17,902,981 |
| York Water Co. | 5,612 | 289,411 |
| | | 535,268,650 |
| Total Common Stock |
| (Cost $12,401,958,326) | | 22,326,560,363 |
|
| Security | Number
of Shares | Value ($) |
| Rights 0.0% of net assets |
| |
| Media 0.0% |
| Media General, Inc. CVR *(b) | 42,134 | 3,586 |
| Total Rights |
| (Cost $—) | | 3,586 |
|
| Short-Term Investments 0.3% of net assets |
| |
| Money Market Funds 0.3% |
| State Street Institutional U.S. Government Money Market Fund, Premier Class 0.03% (d) | 15,194,152 | 15,194,152 |
| Wells Fargo Government Money Market Fund, Select Class 0.03% (d)(e) | 50,644,408 | 50,644,408 |
| Total Short-Term Investments |
| (Cost $65,838,560) | | 65,838,560 |
| | Number of
Contracts | Notional
Amount
($) | Current Value/
Unrealized
Appreciation
($) |
| Futures Contracts | |
| Long | |
| S&P 500 Index, e-mini, expires 09/17/21 | 214 | 48,369,350 | 922,628 |
| * | Non-income producing security. |
| (a) | All or a portion of this security is on loan. Securities on loan were valued at $49,318,760. |
| (b) | Fair-valued by management using significant unobservable inputs in accordance with procedures approved by the fund’s Board of Trustees. |
| (c) | Issuer is affiliated with the fund’s investment adviser. |
| (d) | The rate shown is the 7-day yield. |
| (e) | Security purchased with cash collateral received for securities on loan. |
| | |
| CVR — | Contingent Value Rights |
| REIT — | Real Estate Investment Trust |
The fund owns shares of an affiliate, The Charles Schwab Corp., since that company is included in its index. Below is the summary of investment activities involving The Charles Schwab Corp. shares owned by the fund during the period ended August 31, 2021:
| |
Value at
8/31/20 | Gross
Purchases | Gross
Sales | Realized
Gains(Losses) | Net change
in unrealized
appreciation
(depreciation) |
Value at
8/31/21 | Balance
of Shares
Held at
8/31/21 | Dividends
Received |
| The Charles Schwab Corp. | $19,521,781 | $9,791,481 | ($2,155,692) | $617,570 | $25,065,151 | $52,840,291 | 725,330 | $513,151 |
Schwab U.S. Equity ETFs | Annual Report
Schwab U.S. Broad Market ETF
Portfolio Holdings as of August 31, 2021 (continued)
The following is a summary of the inputs used to value the fund’s investments as of August 31, 2021 (see financial note 2(a) for additional information):
| Description | Quoted Prices in
Active Markets for
Identical Assets
(Level 1) | Other Significant
Observable Inputs
(Level 2) | Significant
Unobservable Inputs
(Level 3) | Total | |
| Assets | | | | | |
| Common Stock1 | $16,936,671,101 | $— | $— | $16,936,671,101 | |
| Consumer Services | 485,540,141 | — | 5,675 | 485,545,816 | |
| Pharmaceuticals, Biotechnology & Life Sciences | 1,593,473,448 | — | 161,973 | 1,593,635,421 | |
| Software & Services | 3,305,799,014 | — | 4,909,011 | 3,310,708,025 | |
| Rights 1 | | | | | |
| Media | — | — | 3,586 | 3,586 | |
| Short-Term Investments1 | 65,838,560 | — | — | 65,838,560 | |
| Futures Contracts2 | 922,628 | — | — | 922,628 | |
| Total | $22,388,244,892 | $— | $5,080,245 | $22,393,325,137 | |
| 1 | As categorized in the Portfolio Holdings. |
| 2 | Futures contracts are reported at cumulative unrealized appreciation or depreciation. |
Fund investments in mutual funds are classified as Level 1, without consideration to the classification level of the underlying securities held by the mutual funds, which could be Level 1, Level 2 or Level 3.
Schwab U.S. Equity ETFs | Annual Report
Schwab U.S. Broad Market ETF
Statement of Assets and Liabilities
As of August 31, 2021
| Assets |
| Investments in securities, at value - affiliated (cost $28,534,017) | | $52,840,291 |
| Investments in securities, at value - unaffiliated (cost $12,388,618,461) including securities on loan of $49,318,760 | | 22,288,917,810 |
| Collateral invested for securities on loan, at value (cost $50,644,408) | | 50,644,408 |
| Deposit with broker for futures contracts | | 2,070,000 |
| Receivables: | | |
| Dividends | | 24,809,249 |
| Fund shares sold | | 5,456,996 |
| Income from securities on loan | + | 47,925 |
| Total assets | | 22,424,786,679 |
| Liabilities |
| Collateral held for securities on loan | | 50,644,408 |
| Payables: | | |
| Investments bought | | 5,327,898 |
| Management fees | | 543,242 |
| Variation margin on futures contracts | + | 42,006 |
| Total liabilities | | 56,557,554 |
| Net Assets |
| Total assets | | 22,424,786,679 |
| Total liabilities | – | 56,557,554 |
| Net assets | | $22,368,229,125 |
| Net Assets by Source | | |
| Capital received from investors | | 12,636,603,455 |
| Total distributable earnings | | 9,731,625,670 |
| Net Asset Value (NAV) |
| Net Assets | ÷ | Shares
Outstanding | = | NAV |
| $22,368,229,125 | | 204,950,000 | | $109.14 |
| | | | | |
Schwab U.S. Equity ETFs | Annual Report
Schwab U.S. Broad Market ETF
Statement of Operations
For the period September 1, 2020 through August 31, 2021
| Investment Income |
| Dividends received from securities — affiliated | | $513,151 |
| Dividends received from securities — unaffiliated (net of foreign withholding tax of $50,550) | | 274,693,240 |
| Securities on loan, net | + | 1,162,286 |
| Total investment income | | 276,368,677 |
| Expenses |
| Management fees | | 5,721,907 |
| Total expenses | – | 5,721,907 |
| Net investment income | | 270,646,770 |
| Realized and Unrealized Gains (Losses) |
| Net realized losses on sales of securities — affiliated | | (76,227) |
| Net realized losses on sales of securities — unaffiliated | | (59,606,454) |
| Net realized gains on in-kind redemptions — affiliated | | 693,797 |
| Net realized gains on in-kind redemptions — unaffiliated | | 414,813,899 |
| Net realized gains on futures contracts | + | 6,317,288 |
| Net realized gains | | 362,142,303 |
| Net change in unrealized appreciation (depreciation) on securities — affiliated | | 25,065,151 |
| Net change in unrealized appreciation (depreciation) on securities — unaffiliated | | 4,833,328,720 |
| Net change in unrealized appreciation (depreciation) on futures contracts | + | (132,072) |
| Net change in unrealized appreciation (depreciation) | + | 4,858,261,799 |
| Net realized and unrealized gains | | 5,220,404,102 |
| Increase in net assets resulting from operations | | $5,491,050,872 |
Schwab U.S. Equity ETFs | Annual Report
Schwab U.S. Broad Market ETF
Statement of Changes in Net Assets
For the current and prior report periods
| Operations | |
| | 9/1/20-8/31/21 | 9/1/19-8/31/20 |
| Net investment income | | $270,646,770 | $305,344,570 |
| Net realized gains | | 362,142,303 | 825,670,838 |
| Net change in unrealized appreciation (depreciation) | + | 4,858,261,799 | 1,780,797,672 |
| Increase in net assets resulting from operations | | 5,491,050,872 | 2,911,813,080 |
| Distributions to Shareholders | |
| Total distributions | | ($289,355,570) | ($300,375,280) |
| Transactions in Fund Shares | | | |
| | | 9/1/20-8/31/21 | 9/1/19-8/31/20 |
| | | SHARES | VALUE | SHARES | VALUE |
| Shares sold | | 14,550,000 | $1,370,669,029 | 17,750,000 | $1,224,526,962 |
| Shares redeemed | + | (8,300,000) | (752,664,118) | (31,200,000) | (2,164,803,496) |
| Net transactions in fund shares | | 6,250,000 | $618,004,911 | (13,450,000) | ($940,276,534) |
| Shares Outstanding and Net Assets | | | |
| | | 9/1/20-8/31/21 | 9/1/19-8/31/20 |
| | | SHARES | NET ASSETS | SHARES | NET ASSETS |
| Beginning of period | | 198,700,000 | $16,548,528,912 | 212,150,000 | $14,877,367,646 |
| Total increase (decrease) | + | 6,250,000 | 5,819,700,213 | (13,450,000) | 1,671,161,266 |
| End of period | | 204,950,000 | $22,368,229,125 | 198,700,000 | $16,548,528,912 |
Schwab U.S. Equity ETFs | Annual Report
Financial Statements
Financial Highlights
| | 9/1/20–
8/31/21 | 9/1/19–
8/31/20 | 9/1/18–
8/31/19 | 10/11/17 1–
8/31/18 | | |
| Per-Share Data |
| Net asset value at beginning of period | $34.50 | $28.80 | $28.62 | $25.00 | | |
| Income (loss) from investment operations: | | | | | | |
| Net investment income (loss)2 | 0.56 | 0.61 | 0.57 | 0.44 | | |
| Net realized and unrealized gains (losses) | 10.32 | 5.67 | 0.10 | 3.47 | | |
| Total from investment operations | 10.88 | 6.28 | 0.67 | 3.91 | | |
| Less distributions: | | | | | | |
| Distributions from net investment income | (0.57) | (0.58) | (0.49) | (0.29) | | |
| Net asset value at end of period | $44.81 | $34.50 | $28.80 | $28.62 | | |
| Total return | 31.95% | 22.25% | 2.42% | 15.72% 3 | | |
| Ratios/Supplemental Data |
| Ratios to average net assets: | | | | | | |
| Total expenses | 0.05% | 0.05% | 0.05% | 0.05% 4 | | |
| Net investment income (loss) | 1.43% | 2.03% | 2.06% | 1.87% 4 | | |
| Portfolio turnover rate5 | 5% | 5% | 5% | 3% 3 | | |
| Net assets, end of period (x 1,000) | $2,090,428 | $1,145,352 | $838,213 | $486,487 | | |
| |
1
Commencement of operations.
2
Calculated based on the average shares outstanding during the period.
3
Not annualized.
4
Annualized.
5
Portfolio turnover rate excludes securities received or delivered from processing of in-kind creations or redemptions.
Schwab U.S. Equity ETFs | Annual Report
Portfolio Holdings as of August 31, 2021
This section shows all the securities in the fund’s portfolio and their values as of the report date.
The fund files its complete schedule of portfolio holdings with the U.S. Securities and Exchange Commission (SEC) for the first and third quarters of each fiscal year on Form N-PORT Part F. The fund’s Form N-PORT Part F is available on the SEC’s website at www.sec.gov. You can also obtain this information at no cost on the fund’s website at www.schwabassetmanagement.com/schwabetfs_prospectus, by calling 1-866-414-6349, or by sending an email request to orders@mysummaryprospectus.com. The fund also makes available its complete schedule of portfolio holdings on a daily basis on the fund’s website.
| Security | Number
of Shares | Value ($) |
| Common Stock 99.8% of net assets |
| |
| Automobiles & Components 1.8% |
| Aptiv plc * | 13,075 | 1,989,884 |
| Autoliv, Inc. | 3,770 | 333,230 |
| BorgWarner, Inc. | 11,503 | 490,948 |
| Ford Motor Co. * | 189,220 | 2,465,537 |
| Fox Factory Holding Corp. * | 2,005 | 308,109 |
| General Motors Co. * | 61,622 | 3,020,094 |
| Gentex Corp. | 11,604 | 357,403 |
| Harley-Davidson, Inc. | 7,361 | 290,980 |
| Lear Corp. | 2,683 | 429,119 |
| Tesla, Inc. * | 37,176 | 27,351,127 |
| Thor Industries, Inc. | 2,693 | 305,467 |
| | | 37,341,898 |
| |
| Banks 4.0% |
| Bank of America Corp. | 363,946 | 15,194,746 |
| Bank OZK | 5,797 | 245,967 |
| BOK Financial Corp. | 1,423 | 125,295 |
| Citigroup, Inc. | 99,697 | 7,169,211 |
| Citizens Financial Group, Inc. | 20,538 | 899,359 |
| Comerica, Inc. | 6,690 | 494,458 |
| Commerce Bancshares, Inc. | 5,052 | 357,277 |
| Cullen/Frost Bankers, Inc. | 2,694 | 307,709 |
| East West Bancorp, Inc. | 6,904 | 506,339 |
| Essent Group Ltd. | 5,434 | 255,833 |
| Fifth Third Bancorp | 34,119 | 1,325,864 |
| First Citizens BancShares, Inc., Class A | 349 | 313,297 |
| First Financial Bankshares, Inc. | 6,852 | 326,292 |
| First Horizon Corp. | 26,396 | 432,630 |
| First Republic Bank | 8,468 | 1,684,624 |
| Glacier Bancorp, Inc. | 4,569 | 243,345 |
| Huntington Bancshares, Inc. | 71,115 | 1,104,416 |
| JPMorgan Chase & Co. | 146,018 | 23,355,579 |
| KeyCorp | 46,746 | 949,879 |
| M&T Bank Corp. | 6,244 | 874,223 |
| New York Community Bancorp, Inc. | 22,909 | 286,821 |
| People's United Financial, Inc. | 20,653 | 339,329 |
| Pinnacle Financial Partners, Inc. | 3,708 | 359,379 |
| Popular, Inc. | 3,884 | 294,951 |
| Prosperity Bancshares, Inc. | 4,429 | 309,499 |
| Regions Financial Corp. | 46,181 | 943,478 |
| Signature Bank | 2,811 | 728,977 |
| South State Corp. | 3,410 | 233,858 |
| SVB Financial Group * | 2,826 | 1,581,147 |
| Synovus Financial Corp. | 7,164 | 308,768 |
| TFS Financial Corp. | 2,305 | 46,077 |
| The PNC Financial Services Group, Inc. | 20,527 | 3,922,710 |
| Truist Financial Corp. | 64,972 | 3,707,302 |
| U.S. Bancorp | 65,495 | 3,758,758 |
| United Bankshares, Inc. | 6,399 | 232,476 |
| Wells Fargo & Co. | 199,439 | 9,114,362 |
| Security | Number
of Shares | Value ($) |
| Western Alliance Bancorp | 5,022 | 489,946 |
| Zions Bancorp NA | 7,826 | 453,125 |
| | | 83,277,306 |
| |
| Capital Goods 5.8% |
| 3M Co. | 27,977 | 5,448,241 |
| A.O. Smith Corp. | 6,417 | 466,644 |
| Advanced Drainage Systems, Inc. | 2,395 | 273,389 |
| AECOM * | 7,029 | 460,821 |
| AGCO Corp. | 2,975 | 409,420 |
| Air Lease Corp. | 5,122 | 203,548 |
| Allegion plc | 4,303 | 619,589 |
| Allison Transmission Holdings, Inc. | 5,403 | 199,803 |
| AMETEK, Inc. | 11,150 | 1,516,065 |
| Axon Enterprise, Inc. * | 3,099 | 563,615 |
| AZEK Co., Inc. * | 6,761 | 287,275 |
| Bloom Energy Corp., Class A * | 5,801 | 124,257 |
| Builders FirstSource, Inc. * | 10,153 | 541,053 |
| BWX Technologies, Inc. | 4,578 | 262,915 |
| Carlisle Cos., Inc. | 2,539 | 535,069 |
| Carrier Global Corp. | 39,467 | 2,273,299 |
| Caterpillar, Inc. | 26,433 | 5,573,927 |
| Chart Industries, Inc. * | 1,729 | 325,709 |
| Colfax Corp. * | 5,670 | 273,124 |
| Crane Co. | 2,353 | 239,465 |
| Cummins, Inc. | 7,054 | 1,664,603 |
| Curtiss-Wright Corp. | 1,972 | 240,150 |
| Deere & Co. | 15,048 | 5,688,595 |
| Donaldson Co., Inc. | 6,029 | 408,465 |
| Dover Corp. | 6,950 | 1,211,802 |
| Eaton Corp. plc | 19,204 | 3,233,185 |
| EMCOR Group, Inc. | 2,657 | 322,826 |
| Emerson Electric Co. | 28,941 | 3,053,275 |
| Fastenal Co. | 27,745 | 1,549,558 |
| Flowserve Corp. | 6,293 | 244,609 |
| Fortive Corp. | 16,290 | 1,203,342 |
| Fortune Brands Home & Security, Inc. | 6,669 | 649,361 |
| FuelCell Energy, Inc. * | 15,254 | 95,185 |
| Generac Holdings, Inc. * | 3,041 | 1,328,856 |
| General Dynamics Corp. | 11,052 | 2,213,826 |
| General Electric Co. | 52,965 | 5,583,041 |
| Graco, Inc. | 8,139 | 638,260 |
| HEICO Corp. | 2,094 | 265,561 |
| HEICO Corp., Class A | 3,530 | 403,267 |
| Honeywell International, Inc. | 33,496 | 7,768,057 |
| Howmet Aerospace, Inc. | 18,823 | 597,630 |
| Hubbell, Inc. | 2,590 | 533,825 |
| Huntington Ingalls Industries, Inc. | 1,933 | 394,661 |
| IDEX Corp. | 3,656 | 818,944 |
| Illinois Tool Works, Inc. | 13,867 | 3,229,070 |
| Ingersoll Rand, Inc. * | 18,721 | 992,587 |
| ITT, Inc. | 4,151 | 397,126 |
| Johnson Controls International plc | 34,583 | 2,586,808 |
| L3Harris Technologies, Inc. | 9,873 | 2,300,508 |
| Lennox International, Inc. | 1,646 | 551,706 |
| Lincoln Electric Holdings, Inc. | 2,856 | 398,726 |
| Lockheed Martin Corp. | 11,787 | 4,240,963 |
Schwab U.S. Equity ETFs | Annual Report
Portfolio Holdings as of August 31, 2021 (continued)
| Security | Number
of Shares | Value ($) |
| Masco Corp. | 12,218 | 741,877 |
| MasTec, Inc. * | 2,691 | 246,065 |
| Nikola Corp. * | 6,893 | 71,894 |
| Nordson Corp. | 2,616 | 624,178 |
| Northrop Grumman Corp. | 7,215 | 2,652,955 |
| Oshkosh Corp. | 3,317 | 380,062 |
| Otis Worldwide Corp. | 19,454 | 1,794,048 |
| Owens Corning | 5,004 | 478,132 |
| PACCAR, Inc. | 16,756 | 1,371,814 |
| Parker-Hannifin Corp. | 6,215 | 1,843,804 |
| Pentair plc | 7,998 | 617,126 |
| Plug Power, Inc. * | 24,625 | 641,727 |
| Proto Labs, Inc. * | 1,302 | 96,556 |
| Quanta Services, Inc. | 6,756 | 689,788 |
| Raytheon Technologies Corp. | 73,084 | 6,194,600 |
| RBC Bearings, Inc. * | 1,240 | 287,085 |
| Regal Beloit Corp. | 1,964 | 293,461 |
| Rexnord Corp. | 5,738 | 348,641 |
| Rockwell Automation, Inc. | 5,609 | 1,825,449 |
| Roper Technologies, Inc. | 5,077 | 2,453,613 |
| Sensata Technologies Holding plc * | 7,579 | 448,525 |
| SiteOne Landscape Supply, Inc. * | 2,130 | 426,213 |
| Snap-on, Inc. | 2,605 | 585,995 |
| Stanley Black & Decker, Inc. | 7,793 | 1,506,153 |
| Sunrun, Inc. * | 7,690 | 340,283 |
| Textron, Inc. | 10,875 | 790,286 |
| The Boeing Co. * | 26,548 | 5,827,286 |
| The Middleby Corp. * | 2,687 | 491,560 |
| The Timken Co. | 3,261 | 239,814 |
| The Toro Co. | 5,125 | 563,443 |
| Trane Technologies plc | 11,535 | 2,289,697 |
| TransDigm Group, Inc. * | 2,646 | 1,607,366 |
| Trex Co., Inc. * | 5,621 | 616,961 |
| United Rentals, Inc. * | 3,488 | 1,230,043 |
| Vertiv Holdings Co. | 12,046 | 339,336 |
| Virgin Galactic Holdings, Inc. *(a) | 6,336 | 171,769 |
| W.W. Grainger, Inc. | 2,111 | 915,541 |
| Watsco, Inc. | 1,591 | 442,966 |
| Westinghouse Air Brake Technologies Corp. | 8,544 | 767,166 |
| WillScot Mobile Mini Holdings Corp. * | 9,662 | 285,995 |
| Woodward, Inc. | 2,821 | 341,172 |
| Xylem, Inc. | 8,654 | 1,179,627 |
| | | 120,465,678 |
| |
| Commercial & Professional Services 1.1% |
| ADT, Inc. | 7,180 | 61,461 |
| ASGN, Inc. * | 2,550 | 286,084 |
| Booz Allen Hamilton Holding Corp. | 6,480 | 530,777 |
| CACI International, Inc., Class A * | 1,124 | 289,475 |
| Cintas Corp. | 4,251 | 1,682,418 |
| Clean Harbors, Inc. * | 2,373 | 243,517 |
| Copart, Inc. * | 10,063 | 1,452,292 |
| CoStar Group, Inc. * | 19,070 | 1,615,992 |
| Dun & Bradstreet Holdings, Inc. * | 6,654 | 121,968 |
| Equifax, Inc. | 5,870 | 1,598,166 |
| Exponent, Inc. | 2,471 | 288,860 |
| IAA, Inc. * | 6,587 | 349,901 |
| IHS Markit Ltd. | 18,062 | 2,178,277 |
| Jacobs Engineering Group, Inc. | 6,250 | 843,500 |
| Leidos Holdings, Inc. | 6,443 | 632,123 |
| ManpowerGroup, Inc. | 2,661 | 323,099 |
| MSA Safety, Inc. | 1,725 | 280,899 |
| Nielsen Holdings plc | 17,456 | 374,606 |
| Republic Services, Inc. | 10,104 | 1,254,209 |
| Robert Half International, Inc. | 5,472 | 565,805 |
| Rollins, Inc. | 10,840 | 421,893 |
| Science Applications International Corp. | 2,859 | 240,813 |
| Security | Number
of Shares | Value ($) |
| Stericycle, Inc. * | 4,356 | 303,177 |
| Tetra Tech, Inc. | 2,581 | 371,251 |
| TransUnion | 9,237 | 1,122,573 |
| TriNet Group, Inc. * | 1,920 | 176,794 |
| Upwork, Inc. * | 4,376 | 195,651 |
| Verisk Analytics, Inc. | 7,822 | 1,578,167 |
| Waste Management, Inc. | 18,754 | 2,908,933 |
| | | 22,292,681 |
| |
| Consumer Durables & Apparel 1.4% |
| Brunswick Corp. | 3,756 | 363,844 |
| Capri Holdings Ltd. * | 7,350 | 415,348 |
| Carter's, Inc. | 2,079 | 212,848 |
| Columbia Sportswear Co. | 1,436 | 146,486 |
| Crocs, Inc. * | 3,167 | 452,311 |
| D.R. Horton, Inc. | 15,766 | 1,507,545 |
| Deckers Outdoor Corp. * | 1,351 | 565,326 |
| Garmin Ltd. | 7,237 | 1,262,350 |
| Hanesbrands, Inc. | 17,384 | 324,733 |
| Hasbro, Inc. | 6,143 | 603,918 |
| Helen of Troy Ltd. * | 1,163 | 278,178 |
| Leggett & Platt, Inc. | 6,362 | 307,857 |
| Lennar Corp., Class A | 13,335 | 1,430,979 |
| Lululemon Athletica, Inc. * | 5,710 | 2,284,971 |
| Mattel, Inc. * | 16,805 | 358,787 |
| Mohawk Industries, Inc. * | 2,825 | 558,672 |
| Newell Brands, Inc. | 18,421 | 468,078 |
| NIKE, Inc., Class B | 61,496 | 10,130,851 |
| NVR, Inc. * | 164 | 849,510 |
| Peloton Interactive, Inc., Class A * | 12,978 | 1,300,266 |
| Polaris, Inc. | 2,799 | 335,208 |
| PulteGroup, Inc. | 12,680 | 682,945 |
| PVH Corp. * | 3,417 | 358,067 |
| Ralph Lauren Corp. | 2,314 | 268,725 |
| Skechers U.S.A., Inc., Class A * | 6,444 | 324,971 |
| Tapestry, Inc. * | 13,450 | 542,304 |
| Tempur Sealy International, Inc. | 8,814 | 393,986 |
| Toll Brothers, Inc. | 5,364 | 343,618 |
| TopBuild Corp. * | 1,611 | 352,471 |
| VF Corp. | 15,460 | 1,182,226 |
| Whirlpool Corp. | 3,009 | 666,584 |
| YETI Holdings, Inc. * | 3,663 | 363,882 |
| | | 29,637,845 |
| |
| Consumer Services 2.1% |
| Airbnb, Inc., Class A * | 7,111 | 1,102,134 |
| Aramark | 12,181 | 423,777 |
| Booking Holdings, Inc. * | 1,981 | 4,555,646 |
| Boyd Gaming Corp. * | 3,893 | 238,913 |
| Bright Horizons Family Solutions, Inc. * | 2,930 | 427,077 |
| Caesars Entertainment, Inc. * | 10,012 | 1,017,520 |
| Carnival Corp. * | 38,374 | 926,348 |
| Chegg, Inc. * | 6,802 | 566,063 |
| Chipotle Mexican Grill, Inc. * | 1,355 | 2,579,012 |
| Choice Hotels International, Inc. | 1,369 | 163,404 |
| Churchill Downs, Inc. | 1,692 | 356,166 |
| Darden Restaurants, Inc. | 6,336 | 954,518 |
| Domino's Pizza, Inc. | 1,866 | 964,517 |
| DraftKings, Inc., Class A * | 15,614 | 925,754 |
| Expedia Group, Inc. * | 6,860 | 991,270 |
| Hilton Worldwide Holdings, Inc. * | 13,455 | 1,679,991 |
| Las Vegas Sands Corp. * | 15,789 | 704,347 |
| Marriott International, Inc., Class A * | 12,899 | 1,743,171 |
| Marriott Vacations Worldwide Corp. * | 2,047 | 306,129 |
| McDonald's Corp. | 35,988 | 8,545,711 |
| MGM Resorts International | 19,547 | 833,093 |
Schwab U.S. Equity ETFs | Annual Report
Portfolio Holdings as of August 31, 2021 (continued)
| Security | Number
of Shares | Value ($) |
| Norwegian Cruise Line Holdings Ltd. * | 17,816 | 460,365 |
| Penn National Gaming, Inc. * | 7,215 | 585,137 |
| Planet Fitness, Inc., Class A * | 4,009 | 325,932 |
| Royal Caribbean Cruises Ltd. * | 10,506 | 869,161 |
| Service Corp. International | 8,066 | 506,222 |
| Starbucks Corp. | 56,865 | 6,681,069 |
| Terminix Global Holdings, Inc. * | 6,333 | 263,643 |
| Texas Roadhouse, Inc. | 3,106 | 295,070 |
| The Wendy's Co. | 8,565 | 197,166 |
| Vail Resorts, Inc. * | 1,959 | 597,201 |
| Vivint Smart Home, Inc. * | 2,301 | 28,072 |
| Wyndham Hotels & Resorts, Inc. | 4,477 | 325,478 |
| Wynn Resorts Ltd. * | 5,140 | 522,687 |
| Yum! Brands, Inc. | 14,379 | 1,884,080 |
| | | 43,545,844 |
| |
| Diversified Financials 5.3% |
| Affiliated Managers Group, Inc. | 1,992 | 338,859 |
| AGNC Investment Corp. | 25,301 | 412,659 |
| Ally Financial, Inc. | 17,879 | 945,799 |
| American Express Co. | 31,381 | 5,207,991 |
| Ameriprise Financial, Inc. | 5,611 | 1,531,298 |
| Annaly Capital Management, Inc. | 67,415 | 585,836 |
| Apollo Global Management, Inc. | 10,166 | 607,724 |
| Ares Management Corp., Class A | 5,273 | 406,970 |
| Berkshire Hathaway, Inc., Class B * | 91,442 | 26,131,380 |
| BlackRock, Inc. | 6,841 | 6,453,047 |
| Blackstone, Inc. | 32,980 | 4,146,575 |
| Capital One Financial Corp. | 21,766 | 3,612,503 |
| Cboe Global Markets, Inc. | 5,117 | 645,510 |
| CME Group, Inc. | 17,332 | 3,496,211 |
| Credit Acceptance Corp. * | 552 | 319,983 |
| Discover Financial Services | 14,728 | 1,888,424 |
| Equitable Holdings, Inc. | 18,545 | 575,080 |
| Evercore, Inc., Class A | 1,971 | 275,230 |
| FactSet Research Systems, Inc. | 1,811 | 688,578 |
| Franklin Resources, Inc. | 13,130 | 425,937 |
| Hannon Armstrong Sustainable Infrastructure Capital, Inc. | 3,767 | 227,414 |
| Interactive Brokers Group, Inc., Class A | 3,866 | 249,898 |
| Intercontinental Exchange, Inc. | 27,145 | 3,244,642 |
| Invesco Ltd. | 18,533 | 469,256 |
| Janus Henderson Group plc | 8,364 | 362,663 |
| Jefferies Financial Group, Inc. | 9,690 | 358,142 |
| KKR & Co., Inc. | 28,027 | 1,801,856 |
| Lazard Ltd., Class A | 5,611 | 265,961 |
| LPL Financial Holdings, Inc. | 3,845 | 568,483 |
| MarketAxess Holdings, Inc. | 1,828 | 869,982 |
| Moody's Corp. | 7,775 | 2,960,487 |
| Morgan Stanley | 71,814 | 7,499,536 |
| Morningstar, Inc. | 1,022 | 273,886 |
| MSCI, Inc. | 3,975 | 2,522,456 |
| Nasdaq, Inc. | 5,537 | 1,084,034 |
| Northern Trust Corp. | 10,057 | 1,191,956 |
| OneMain Holdings, Inc. | 5,120 | 296,090 |
| Open Lending Corp., Class A * | 4,727 | 174,757 |
| Raymond James Financial, Inc. | 5,864 | 820,374 |
| S&P Global, Inc. | 11,614 | 5,154,526 |
| Santander Consumer USA Holdings, Inc. | 3,516 | 146,723 |
| SEI Investments Co. | 5,712 | 358,771 |
| SLM Corp. | 15,548 | 291,525 |
| Starwood Property Trust, Inc. | 13,696 | 353,357 |
| State Street Corp. | 16,831 | 1,563,768 |
| Stifel Financial Corp. | 5,055 | 349,301 |
| Synchrony Financial | 26,010 | 1,293,998 |
| T. Rowe Price Group, Inc. | 10,919 | 2,444,437 |
| The Bank of New York Mellon Corp. | 38,952 | 2,150,929 |
| Security | Number
of Shares | Value ($) |
| The Carlyle Group, Inc. | 5,669 | 279,935 |
| The Charles Schwab Corp. (b) | 72,099 | 5,252,412 |
| The Goldman Sachs Group, Inc. | 16,412 | 6,786,526 |
| Tradeweb Markets, Inc., Class A | 5,023 | 437,051 |
| Voya Financial, Inc. | 5,781 | 375,649 |
| | | 111,176,375 |
| |
| Energy 2.2% |
| APA Corp. | 18,233 | 355,179 |
| Baker Hughes Co. | 34,999 | 797,277 |
| Cabot Oil & Gas Corp. | 19,122 | 303,849 |
| Cheniere Energy, Inc. * | 11,148 | 975,004 |
| Chevron Corp. | 93,244 | 9,023,222 |
| Cimarex Energy Co. | 4,907 | 315,128 |
| ConocoPhillips | 65,114 | 3,615,780 |
| Continental Resources, Inc. | 2,980 | 117,054 |
| Devon Energy Corp. | 28,671 | 847,228 |
| Diamondback Energy, Inc. | 8,798 | 678,678 |
| DTE Midstream LLC * | 4,597 | 213,623 |
| EOG Resources, Inc. | 28,199 | 1,903,996 |
| Exxon Mobil Corp. | 204,170 | 11,131,348 |
| Halliburton Co. | 42,830 | 855,743 |
| Hess Corp. | 13,208 | 908,050 |
| Kinder Morgan, Inc. | 94,130 | 1,531,495 |
| Marathon Oil Corp. | 37,889 | 445,196 |
| Marathon Petroleum Corp. | 30,757 | 1,822,967 |
| NOV, Inc. * | 18,806 | 247,675 |
| Occidental Petroleum Corp. | 40,693 | 1,045,403 |
| ONEOK, Inc. | 21,554 | 1,132,016 |
| Ovintiv, Inc. | 12,563 | 342,467 |
| Phillips 66 | 21,198 | 1,506,966 |
| Pioneer Natural Resources Co. | 11,206 | 1,677,202 |
| Schlumberger N.V. | 67,542 | 1,893,878 |
| Targa Resources Corp. | 10,981 | 482,286 |
| TechnipFMC plc * | 20,212 | 134,006 |
| The Williams Cos., Inc. | 58,729 | 1,450,019 |
| Valero Energy Corp. | 19,655 | 1,303,323 |
| | | 47,056,058 |
| |
| Food & Staples Retailing 1.3% |
| Albertsons Cos., Inc., Class A | 2,347 | 71,255 |
| BJ's Wholesale Club Holdings, Inc. * | 6,687 | 378,886 |
| Casey's General Stores, Inc. | 1,790 | 366,163 |
| Costco Wholesale Corp. | 21,311 | 9,706,947 |
| Performance Food Group Co. * | 6,396 | 321,207 |
| Sysco Corp. | 24,617 | 1,960,744 |
| The Kroger Co. | 36,701 | 1,689,347 |
| US Foods Holding Corp. * | 10,655 | 362,270 |
| Walgreens Boots Alliance, Inc. | 34,679 | 1,759,959 |
| Walmart, Inc. | 66,201 | 9,804,368 |
| | | 26,421,146 |
| |
| Food, Beverage & Tobacco 2.7% |
| Altria Group, Inc. | 89,194 | 4,480,215 |
| Archer-Daniels-Midland Co. | 26,957 | 1,617,420 |
| Beyond Meat, Inc. * | 2,385 | 285,341 |
| Brown-Forman Corp., Class B | 8,791 | 617,304 |
| Bunge Ltd. | 6,800 | 514,828 |
| Campbell Soup Co. | 9,793 | 408,662 |
| Conagra Brands, Inc. | 23,096 | 764,940 |
| Constellation Brands, Inc., Class A | 8,132 | 1,716,990 |
| Darling Ingredients, Inc. * | 7,842 | 584,229 |
| Flowers Foods, Inc. | 9,512 | 229,525 |
| Freshpet, Inc. * | 2,057 | 263,584 |
| General Mills, Inc. | 29,341 | 1,696,203 |
Schwab U.S. Equity ETFs | Annual Report
Portfolio Holdings as of August 31, 2021 (continued)
| Security | Number
of Shares | Value ($) |
| Hormel Foods Corp. | 13,589 | 618,843 |
| Ingredion, Inc. | 3,205 | 281,591 |
| Kellogg Co. | 12,074 | 762,352 |
| Keurig Dr Pepper, Inc. | 27,943 | 996,727 |
| Lamb Weston Holdings, Inc. | 6,997 | 455,855 |
| Lancaster Colony Corp. | 952 | 168,732 |
| McCormick & Co., Inc. Non-Voting Shares | 12,048 | 1,039,622 |
| Molson Coors Beverage Co., Class B | 9,037 | 429,529 |
| Mondelez International, Inc., Class A | 67,774 | 4,206,732 |
| Monster Beverage Corp. * | 17,874 | 1,743,966 |
| PepsiCo, Inc. | 66,658 | 10,424,645 |
| Philip Morris International, Inc. | 75,199 | 7,745,497 |
| Pilgrim's Pride Corp. * | 2,353 | 65,508 |
| Post Holdings, Inc. * | 2,853 | 319,279 |
| The Boston Beer Co., Inc., Class A * | 439 | 250,322 |
| The Coca-Cola Co. | 187,281 | 10,545,793 |
| The Hershey Co. | 7,078 | 1,257,761 |
| The J.M. Smucker Co. | 5,308 | 656,440 |
| The Kraft Heinz Co. | 31,382 | 1,129,438 |
| Tyson Foods, Inc., Class A | 14,276 | 1,120,952 |
| | | 57,398,825 |
| |
| Health Care Equipment & Services 6.3% |
| 1Life Healthcare, Inc. * | 3,761 | 92,182 |
| Abbott Laboratories | 85,700 | 10,829,909 |
| ABIOMED, Inc. * | 2,170 | 789,793 |
| Acadia Healthcare Co., Inc. * | 4,267 | 282,134 |
| Align Technology, Inc. * | 3,470 | 2,460,230 |
| Amedisys, Inc. * | 1,547 | 283,797 |
| AmerisourceBergen Corp. | 7,100 | 867,691 |
| Anthem, Inc. | 11,799 | 4,426,159 |
| Baxter International, Inc. | 24,267 | 1,849,631 |
| Becton Dickinson & Co. | 14,011 | 3,526,569 |
| Boston Scientific Corp. * | 68,539 | 3,094,536 |
| Cardinal Health, Inc. | 13,936 | 731,501 |
| Centene Corp. * | 28,139 | 1,772,194 |
| Cerner Corp. | 14,564 | 1,111,961 |
| Change Healthcare, Inc. * | 11,029 | 240,763 |
| Chemed Corp. | 768 | 366,106 |
| Cigna Corp. | 16,555 | 3,503,866 |
| CVS Health Corp. | 63,543 | 5,489,480 |
| Danaher Corp. | 30,617 | 9,924,807 |
| DaVita, Inc. * | 3,408 | 445,664 |
| Dentsply Sirona, Inc. | 10,492 | 647,356 |
| DexCom, Inc. * | 4,669 | 2,471,862 |
| Edwards Lifesciences Corp. * | 29,984 | 3,513,525 |
| Encompass Health Corp. | 4,758 | 373,265 |
| Envista Holdings Corp. * | 7,719 | 330,296 |
| Globus Medical, Inc., Class A * | 3,803 | 310,325 |
| Guardant Health, Inc. * | 4,102 | 522,061 |
| Haemonetics Corp. * | 2,456 | 154,114 |
| HCA Healthcare, Inc. | 12,665 | 3,203,992 |
| HealthEquity, Inc. * | 3,965 | 254,434 |
| Henry Schein, Inc. * | 6,747 | 510,006 |
| Hill-Rom Holdings, Inc. | 3,184 | 463,527 |
| Hologic, Inc. * | 12,341 | 976,790 |
| Humana, Inc. | 6,213 | 2,518,874 |
| IDEXX Laboratories, Inc. * | 4,110 | 2,769,153 |
| Inspire Medical Systems, Inc. * | 1,326 | 296,440 |
| Insulet Corp. * | 3,205 | 954,481 |
| Integra LifeSciences Holdings Corp. * | 3,381 | 254,353 |
| Intuitive Surgical, Inc. * | 5,712 | 6,017,935 |
| iRhythm Technologies, Inc. * | 1,416 | 67,685 |
| Laboratory Corp. of America Holdings * | 4,697 | 1,424,976 |
| LHC Group, Inc. * | 1,554 | 290,225 |
| Masimo Corp. * | 2,445 | 663,915 |
| McKesson Corp. | 7,644 | 1,560,446 |
| Security | Number
of Shares | Value ($) |
| Medtronic plc | 64,902 | 8,663,119 |
| Molina Healthcare, Inc. * | 2,839 | 763,038 |
| Nevro Corp. * | 1,635 | 199,470 |
| Novocure Ltd. * | 4,115 | 552,274 |
| Oak Street Health, Inc. * | 1,363 | 63,693 |
| Omnicell, Inc. * | 2,050 | 318,303 |
| Penumbra, Inc. * | 1,640 | 450,918 |
| Quest Diagnostics, Inc. | 6,342 | 969,248 |
| Quidel Corp. * | 1,875 | 241,781 |
| ResMed, Inc. | 7,037 | 2,044,460 |
| Schrodinger, Inc. * | 1,729 | 103,204 |
| STERIS plc | 4,697 | 1,009,902 |
| Stryker Corp. | 15,808 | 4,380,397 |
| Tandem Diabetes Care, Inc. * | 3,059 | 343,128 |
| Teladoc Health, Inc. * | 6,369 | 919,811 |
| Teleflex, Inc. | 2,258 | 892,949 |
| Tenet Healthcare Corp. * | 5,202 | 391,971 |
| The Cooper Cos., Inc. | 2,370 | 1,068,183 |
| UnitedHealth Group, Inc. | 45,512 | 18,945,280 |
| Universal Health Services, Inc., Class B | 3,768 | 586,904 |
| Veeva Systems, Inc., Class A * | 6,687 | 2,219,950 |
| West Pharmaceutical Services, Inc. | 3,558 | 1,606,864 |
| Zimmer Biomet Holdings, Inc. | 10,088 | 1,517,739 |
| | | 130,891,595 |
| |
| Household & Personal Products 1.4% |
| Church & Dwight Co., Inc. | 11,929 | 997,980 |
| Colgate-Palmolive Co. | 40,783 | 3,179,035 |
| Coty, Inc., Class A * | 13,368 | 130,605 |
| Herbalife Nutrition Ltd. * | 4,155 | 213,318 |
| Kimberly-Clark Corp. | 16,253 | 2,239,826 |
| Reynolds Consumer Products, Inc. | 2,648 | 74,886 |
| The Clorox Co. | 5,971 | 1,003,427 |
| The Estee Lauder Cos., Inc., Class A | 11,174 | 3,804,635 |
| The Procter & Gamble Co. | 118,093 | 16,815,262 |
| | | 28,458,974 |
| |
| Insurance 2.0% |
| Aflac, Inc. | 30,534 | 1,730,667 |
| Alleghany Corp. * | 664 | 449,322 |
| American Financial Group, Inc. | 3,318 | 457,685 |
| American International Group, Inc. | 41,541 | 2,266,477 |
| Aon plc, Class A | 10,885 | 3,122,471 |
| Arch Capital Group Ltd. * | 19,369 | 796,066 |
| Arthur J. Gallagher & Co. | 9,917 | 1,424,280 |
| Assurant, Inc. | 2,909 | 494,850 |
| Athene Holding Ltd., Class A * | 6,078 | 407,044 |
| Brown & Brown, Inc. | 11,226 | 651,669 |
| Chubb Ltd. | 21,683 | 3,987,937 |
| Cincinnati Financial Corp. | 7,243 | 893,786 |
| CNA Financial Corp. | 1,312 | 58,187 |
| Erie Indemnity Co., Class A | 1,183 | 209,497 |
| Everest Re Group Ltd. | 1,935 | 512,581 |
| Fidelity National Financial, Inc. | 13,891 | 678,298 |
| First American Financial Corp. | 5,360 | 378,041 |
| Globe Life, Inc. | 4,619 | 443,747 |
| Kemper Corp. | 2,926 | 200,724 |
| Kinsale Capital Group, Inc. | 1,026 | 186,578 |
| Lemonade, Inc. * | 838 | 63,302 |
| Lincoln National Corp. | 8,592 | 589,841 |
| Loews Corp. | 10,749 | 600,547 |
| Markel Corp. * | 659 | 837,095 |
| Marsh & McLennan Cos., Inc. | 24,525 | 3,855,330 |
| MetLife, Inc. | 35,963 | 2,229,706 |
| Old Republic International Corp. | 13,528 | 351,728 |
| Primerica, Inc. | 1,891 | 289,210 |
Schwab U.S. Equity ETFs | Annual Report
Portfolio Holdings as of August 31, 2021 (continued)
| Security | Number
of Shares | Value ($) |
| Principal Financial Group, Inc. | 12,144 | 811,341 |
| Prudential Financial, Inc. | 19,027 | 2,014,579 |
| Reinsurance Group of America, Inc. | 3,314 | 383,827 |
| RenaissanceRe Holdings Ltd. | 2,385 | 373,801 |
| RLI Corp. | 1,925 | 210,268 |
| The Allstate Corp. | 14,439 | 1,953,308 |
| The Hartford Financial Services Group, Inc. | 17,174 | 1,154,436 |
| The Progressive Corp. | 28,227 | 2,719,389 |
| The Travelers Cos., Inc. | 12,138 | 1,938,560 |
| Unum Group | 9,801 | 260,903 |
| W.R. Berkley Corp. | 6,736 | 507,288 |
| Willis Towers Watson plc | 6,225 | 1,373,982 |
| | | 41,868,348 |
| |
| Materials 2.6% |
| Air Products and Chemicals, Inc. | 10,688 | 2,880,523 |
| Albemarle Corp. | 5,622 | 1,330,952 |
| Alcoa Corp. * | 8,999 | 399,286 |
| Amcor plc | 74,240 | 953,984 |
| AptarGroup, Inc. | 3,214 | 433,247 |
| Ashland Global Holdings, Inc. | 2,583 | 235,337 |
| Avery Dennison Corp. | 3,982 | 897,503 |
| Axalta Coating Systems Ltd. * | 9,946 | 303,751 |
| Ball Corp. | 15,880 | 1,523,845 |
| Berry Global Group, Inc. * | 6,448 | 433,112 |
| Celanese Corp. | 5,449 | 864,211 |
| CF Industries Holdings, Inc. | 10,296 | 467,644 |
| Cleveland-Cliffs, Inc. * | 22,160 | 520,095 |
| Corteva, Inc. | 35,600 | 1,565,332 |
| Crown Holdings, Inc. | 6,470 | 710,341 |
| Dow, Inc. | 36,100 | 2,270,690 |
| DuPont de Nemours, Inc. | 25,675 | 1,900,463 |
| Eagle Materials, Inc. | 2,046 | 320,895 |
| Eastman Chemical Co. | 6,547 | 740,859 |
| Ecolab, Inc. | 11,988 | 2,701,616 |
| Element Solutions, Inc. | 10,526 | 239,256 |
| FMC Corp. | 6,257 | 585,843 |
| Freeport-McMoRan, Inc. | 70,731 | 2,573,901 |
| Graphic Packaging Holding Co. | 13,607 | 279,216 |
| Huntsman Corp. | 9,553 | 252,486 |
| International Flavors & Fragrances, Inc. | 11,999 | 1,817,848 |
| International Paper Co. | 18,971 | 1,139,967 |
| Linde plc | 25,083 | 7,890,861 |
| LyondellBasell Industries N.V., Class A | 12,394 | 1,243,738 |
| Martin Marietta Materials, Inc. | 3,010 | 1,147,563 |
| NewMarket Corp. | 340 | 118,908 |
| Newmont Corp. | 38,646 | 2,241,082 |
| Nucor Corp. | 14,400 | 1,692,864 |
| Packaging Corp. of America | 4,550 | 690,235 |
| PPG Industries, Inc. | 11,447 | 1,826,369 |
| Quaker Chemical Corp. | 649 | 168,169 |
| Reliance Steel & Aluminum Co. | 3,106 | 466,024 |
| Royal Gold, Inc. | 3,146 | 350,244 |
| RPM International, Inc. | 6,212 | 511,185 |
| Sealed Air Corp. | 7,285 | 444,604 |
| Sonoco Products Co. | 4,870 | 318,011 |
| Steel Dynamics, Inc. | 9,618 | 649,119 |
| The Mosaic Co. | 16,837 | 541,815 |
| The Scotts Miracle-Gro Co. | 1,986 | 311,464 |
| The Sherwin-Williams Co. | 11,531 | 3,501,619 |
| United States Steel Corp. | 12,951 | 346,439 |
| Vulcan Materials Co. | 6,384 | 1,186,977 |
| Westlake Chemical Corp. | 1,611 | 140,721 |
| Westrock Co. | 12,783 | 665,227 |
| | | 54,795,441 |
| |
| Security | Number
of Shares | Value ($) |
| Media & Entertainment 9.6% |
| Activision Blizzard, Inc. | 37,487 | 3,087,804 |
| Alphabet, Inc., Class A * | 14,505 | 41,976,745 |
| Alphabet, Inc., Class C * | 13,731 | 39,946,774 |
| Altice USA, Inc., Class A * | 11,063 | 303,569 |
| Cable One, Inc. | 258 | 541,694 |
| Charter Communications, Inc., Class A * | 6,649 | 5,429,972 |
| Comcast Corp., Class A | 221,143 | 13,418,957 |
| Discovery, Inc., Class A *(a) | 8,124 | 234,296 |
| Discovery, Inc., Class C * | 14,416 | 397,737 |
| DISH Network Corp., Class A * | 11,952 | 520,988 |
| Electronic Arts, Inc. | 13,812 | 2,005,641 |
| Facebook, Inc., Class A * | 115,578 | 43,847,982 |
| Fox Corp., Class A | 15,713 | 588,295 |
| Fox Corp., Class B | 7,291 | 252,487 |
| IAC/InterActiveCorp * | 4,004 | 528,728 |
| Liberty Broadband Corp., Class C * | 7,742 | 1,481,199 |
| Liberty Media Corp. - Liberty Formula One, Class C * | 9,824 | 496,505 |
| Liberty Media Corp. - Liberty SiriusXM, Class C * | 8,148 | 402,104 |
| Live Nation Entertainment, Inc. * | 6,957 | 603,172 |
| Match Group, Inc. * | 13,069 | 1,796,203 |
| Netflix, Inc. * | 21,392 | 12,176,113 |
| News Corp., Class A | 18,756 | 421,447 |
| Nexstar Media Group, Inc., Class A | 2,045 | 306,239 |
| Omnicom Group, Inc. | 10,330 | 756,363 |
| Pinterest, Inc., Class A * | 26,461 | 1,470,438 |
| Roku, Inc. * | 5,541 | 1,952,648 |
| Sirius XM Holdings, Inc. | 54,628 | 342,518 |
| Snap, Inc., Class A * | 45,271 | 3,445,576 |
| Take-Two Interactive Software, Inc. * | 5,600 | 902,832 |
| The Interpublic Group of Cos., Inc. | 18,954 | 705,657 |
| The New York Times Co., Class A | 6,943 | 352,566 |
| The Walt Disney Co. * | 87,673 | 15,895,115 |
| Twitter, Inc. * | 38,522 | 2,484,669 |
| ViacomCBS, Inc., Class B | 29,169 | 1,209,055 |
| Vimeo, Inc. * | 7,411 | 282,507 |
| Zillow Group, Inc., Class A * | 1,759 | 168,160 |
| Zillow Group, Inc., Class C * | 7,729 | 740,206 |
| Zynga, Inc., Class A * | 48,842 | 432,252 |
| | | 201,905,213 |
| |
| Pharmaceuticals, Biotechnology & Life Sciences 7.1% |
| 10X Genomics, Inc., Class A * | 3,620 | 636,830 |
| AbbVie, Inc. | 85,245 | 10,295,891 |
| ACADIA Pharmaceuticals, Inc. * | 5,632 | 98,616 |
| Acceleron Pharma, Inc. * | 2,526 | 338,181 |
| Adaptive Biotechnologies Corp. * | 3,959 | 143,791 |
| Agilent Technologies, Inc. | 14,622 | 2,565,722 |
| Allakos, Inc. * | 1,499 | 133,651 |
| Alnylam Pharmaceuticals, Inc. * | 5,657 | 1,139,489 |
| Amgen, Inc. | 27,736 | 6,255,300 |
| Amicus Therapeutics, Inc. * | 13,886 | 158,161 |
| Arrowhead Pharmaceuticals, Inc. * | 4,996 | 335,331 |
| Avantor, Inc. * | 24,925 | 983,042 |
| Beam Therapeutics, Inc. * | 1,391 | 154,290 |
| Berkeley Lights, Inc. * | 372 | 13,228 |
| Bio-Rad Laboratories, Inc., Class A * | 1,042 | 838,622 |
| Bio-Techne Corp. | 1,867 | 931,894 |
| Biogen, Inc. * | 7,269 | 2,463,537 |
| Biohaven Pharmaceutical Holding Co., Ltd. * | 2,621 | 343,980 |
| BioMarin Pharmaceutical, Inc. * | 8,778 | 739,195 |
| Blueprint Medicines Corp. * | 2,799 | 261,063 |
| Bridgebio Pharma, Inc. * | 4,708 | 235,918 |
| Bristol-Myers Squibb Co. | 107,708 | 7,201,357 |
Schwab U.S. Equity ETFs | Annual Report
Portfolio Holdings as of August 31, 2021 (continued)
| Security | Number
of Shares | Value ($) |
| Bruker Corp. | 5,028 | 444,023 |
| Catalent, Inc. * | 8,257 | 1,077,043 |
| Charles River Laboratories International, Inc. * | 2,445 | 1,085,238 |
| Denali Therapeutics, Inc. * | 3,930 | 209,076 |
| Editas Medicine, Inc. * | 3,238 | 205,904 |
| Elanco Animal Health, Inc. * | 22,689 | 757,359 |
| Eli Lilly & Co. | 38,407 | 9,920,144 |
| Emergent BioSolutions, Inc. * | 2,140 | 134,991 |
| Exact Sciences Corp. * | 8,224 | 858,421 |
| Exelixis, Inc. * | 15,010 | 287,742 |
| Fate Therapeutics, Inc. * | 3,847 | 281,793 |
| Gilead Sciences, Inc. | 60,602 | 4,410,614 |
| Halozyme Therapeutics, Inc. * | 6,399 | 268,694 |
| Horizon Therapeutics plc * | 10,800 | 1,167,372 |
| Illumina, Inc. * | 7,041 | 3,218,864 |
| Immunovant, Inc. * | 2,242 | 19,416 |
| Incyte Corp. * | 9,101 | 696,135 |
| Intellia Therapeutics, Inc. * | 3,185 | 511,288 |
| Invitae Corp. * | 8,734 | 258,788 |
| Ionis Pharmaceuticals, Inc. * | 6,843 | 272,078 |
| Iovance Biotherapeutics, Inc. * | 6,896 | 165,987 |
| IQVIA Holdings, Inc. * | 9,232 | 2,397,827 |
| Jazz Pharmaceuticals plc * | 2,883 | 379,720 |
| Johnson & Johnson | 127,026 | 21,992,011 |
| Kodiak Sciences, Inc. * | 1,493 | 140,611 |
| Medpace Holdings, Inc. * | 1,365 | 248,908 |
| Merck & Co., Inc. | 122,178 | 9,320,960 |
| Mettler-Toledo International, Inc. * | 1,117 | 1,734,511 |
| Mirati Therapeutics, Inc. * | 2,195 | 372,557 |
| Moderna, Inc. * | 14,715 | 5,542,993 |
| Natera, Inc. * | 4,046 | 479,168 |
| NeoGenomics, Inc. * | 5,643 | 274,363 |
| Neurocrine Biosciences, Inc. * | 4,518 | 430,114 |
| Novavax, Inc. * | 3,270 | 780,026 |
| Organon & Co. | 12,178 | 412,712 |
| Pacific Biosciences of California, Inc. * | 9,544 | 298,823 |
| PerkinElmer, Inc. | 5,372 | 992,746 |
| Perrigo Co., plc | 6,386 | 261,507 |
| Pfizer, Inc. | 270,013 | 12,439,499 |
| PPD, Inc. * | 5,173 | 239,562 |
| Regeneron Pharmaceuticals, Inc. * | 5,059 | 3,406,731 |
| Repligen Corp. * | 2,472 | 699,527 |
| Royalty Pharma plc, Class A | 4,143 | 160,127 |
| Sage Therapeutics, Inc. * | 2,481 | 114,647 |
| Sarepta Therapeutics, Inc. * | 3,836 | 299,668 |
| Seagen, Inc. * | 6,102 | 1,022,695 |
| Syneos Health, Inc. * | 4,959 | 460,096 |
| TG Therapeutics, Inc. * | 5,636 | 152,566 |
| Thermo Fisher Scientific, Inc. | 18,954 | 10,518,522 |
| Turning Point Therapeutics, Inc. * | 2,038 | 156,967 |
| Twist Bioscience Corp. * | 2,000 | 226,420 |
| Ultragenyx Pharmaceutical, Inc. * | 3,040 | 292,722 |
| United Therapeutics Corp. * | 2,181 | 468,653 |
| Vertex Pharmaceuticals, Inc. * | 12,500 | 2,503,625 |
| Viatris, Inc. | 58,668 | 858,313 |
| Waters Corp. * | 2,980 | 1,233,780 |
| Zoetis, Inc. | 22,924 | 4,689,333 |
| | | 148,521,069 |
| |
| Real Estate 3.1% |
| Alexandria Real Estate Equities, Inc. | 6,602 | 1,362,455 |
| American Campus Communities, Inc. | 6,596 | 335,407 |
| American Homes 4 Rent, Class A | 13,186 | 553,021 |
| American Tower Corp. | 21,922 | 6,404,951 |
| Americold Realty Trust | 12,149 | 446,354 |
| Apartment Income REIT Corp. | 7,548 | 383,589 |
| Security | Number
of Shares | Value ($) |
| AvalonBay Communities, Inc. | 6,740 | 1,547,369 |
| Boston Properties, Inc. | 6,827 | 771,383 |
| Brixmor Property Group, Inc. | 14,159 | 332,029 |
| Camden Property Trust | 4,676 | 701,587 |
| CBRE Group, Inc., Class A * | 16,258 | 1,565,645 |
| CoreSite Realty Corp. | 2,125 | 315,286 |
| Cousins Properties, Inc. | 7,107 | 274,046 |
| Crown Castle International Corp. | 20,822 | 4,053,835 |
| CubeSmart | 9,707 | 519,324 |
| CyrusOne, Inc. | 5,886 | 453,104 |
| Digital Realty Trust, Inc. | 13,611 | 2,230,979 |
| Douglas Emmett, Inc. | 7,891 | 260,482 |
| Duke Realty Corp. | 18,050 | 947,805 |
| EastGroup Properties, Inc. | 1,925 | 347,001 |
| Equinix, Inc. | 4,321 | 3,644,547 |
| Equity LifeStyle Properties, Inc. | 8,211 | 698,510 |
| Equity Residential | 16,633 | 1,398,336 |
| Essex Property Trust, Inc. | 3,151 | 1,042,162 |
| eXp World Holdings, Inc. | 2,845 | 130,443 |
| Extra Space Storage, Inc. | 6,461 | 1,207,626 |
| Federal Realty Investment Trust | 3,470 | 422,542 |
| First Industrial Realty Trust, Inc. | 6,388 | 357,664 |
| Gaming & Leisure Properties, Inc. | 10,552 | 520,214 |
| Healthcare Trust of America, Inc., Class A | 10,480 | 317,858 |
| Healthpeak Properties, Inc. | 26,151 | 941,436 |
| Host Hotels & Resorts, Inc. * | 34,564 | 572,380 |
| Invitation Homes, Inc. | 27,274 | 1,123,143 |
| Iron Mountain, Inc. | 13,869 | 662,245 |
| Jones Lang LaSalle, Inc. * | 2,487 | 602,923 |
| Kilroy Realty Corp. | 5,088 | 334,027 |
| Kimco Realty Corp. | 28,964 | 631,126 |
| Lamar Advertising Co., Class A | 4,143 | 471,598 |
| Life Storage, Inc. | 3,736 | 464,908 |
| Medical Properties Trust, Inc. | 28,321 | 580,014 |
| Mid-America Apartment Communities, Inc. | 5,537 | 1,065,153 |
| National Retail Properties, Inc. | 8,489 | 404,161 |
| Omega Healthcare Investors, Inc. | 11,362 | 380,968 |
| Prologis, Inc. | 35,652 | 4,800,898 |
| Public Storage | 7,335 | 2,373,679 |
| Realty Income Corp. | 17,961 | 1,297,143 |
| Redfin Corp. * | 5,000 | 242,850 |
| Regency Centers Corp. | 7,563 | 518,973 |
| Rexford Industrial Realty, Inc. | 6,412 | 397,095 |
| SBA Communications Corp. | 5,267 | 1,890,695 |
| Simon Property Group, Inc. | 15,837 | 2,129,285 |
| STORE Capital Corp. | 11,704 | 422,163 |
| Sun Communities, Inc. | 5,413 | 1,090,665 |
| UDR, Inc. | 14,280 | 771,406 |
| Ventas, Inc. | 18,068 | 1,010,724 |
| VEREIT, Inc. | 10,974 | 554,516 |
| VICI Properties, Inc. | 26,068 | 805,762 |
| Vornado Realty Trust | 7,579 | 317,409 |
| Welltower, Inc. | 20,084 | 1,757,953 |
| Weyerhaeuser Co. | 36,050 | 1,297,800 |
| WP Carey, Inc. | 8,566 | 669,176 |
| | | 64,127,828 |
| |
| Retailing 6.5% |
| Advance Auto Parts, Inc. | 3,170 | 643,035 |
| Amazon.com, Inc. * | 20,679 | 71,772,466 |
| AutoNation, Inc. * | 2,562 | 279,489 |
| AutoZone, Inc. * | 1,042 | 1,614,214 |
| Bath & Body Works, Inc. | 12,725 | 858,683 |
| Best Buy Co., Inc. | 10,752 | 1,252,716 |
| Burlington Stores, Inc. * | 3,207 | 960,464 |
| CarMax, Inc. * | 7,847 | 982,523 |
| Carvana Co. * | 3,127 | 1,025,844 |
Schwab U.S. Equity ETFs | Annual Report
Portfolio Holdings as of August 31, 2021 (continued)
| Security | Number
of Shares | Value ($) |
| Chewy, Inc., Class A * | 3,998 | 352,304 |
| Dollar General Corp. | 11,397 | 2,540,505 |
| Dollar Tree, Inc. * | 11,224 | 1,016,221 |
| DoorDash, Inc., Class A * | 1,710 | 327,294 |
| eBay, Inc. | 31,246 | 2,397,818 |
| Etsy, Inc. * | 6,142 | 1,328,269 |
| Five Below, Inc. * | 2,713 | 577,354 |
| Floor & Decor Holdings, Inc., Class A * | 5,033 | 620,569 |
| Foot Locker, Inc. | 4,931 | 279,538 |
| Genuine Parts Co. | 6,939 | 847,876 |
| Kohl's Corp. | 7,514 | 431,304 |
| Lithia Motors, Inc., Class A | 1,438 | 476,409 |
| LKQ Corp. * | 13,469 | 709,682 |
| Lowe's Cos., Inc. | 34,117 | 6,956,115 |
| Nordstrom, Inc. * | 5,146 | 147,227 |
| O'Reilly Automotive, Inc. * | 3,362 | 1,997,297 |
| Ollie's Bargain Outlet Holdings, Inc. * | 2,694 | 194,992 |
| Penske Automotive Group, Inc. | 1,543 | 138,762 |
| Pool Corp. | 1,929 | 953,505 |
| Qurate Retail, Inc., Class A | 18,270 | 201,518 |
| RH * | 806 | 564,740 |
| Ross Stores, Inc. | 17,238 | 2,040,979 |
| Target Corp. | 23,875 | 5,896,647 |
| The Gap, Inc. | 9,999 | 267,273 |
| The Home Depot, Inc. | 51,289 | 16,729,446 |
| The TJX Cos., Inc. | 58,149 | 4,228,595 |
| Tractor Supply Co. | 5,574 | 1,082,750 |
| Ulta Beauty, Inc. * | 2,637 | 1,021,336 |
| Victoria's Secret & Co. * | 4,233 | 280,648 |
| Vroom, Inc. * | 1,690 | 45,393 |
| Wayfair, Inc., Class A * | 3,548 | 996,101 |
| Williams-Sonoma, Inc. | 3,687 | 688,363 |
| | | 135,726,264 |
| |
| Semiconductors & Semiconductor Equipment 5.4% |
| Advanced Micro Devices, Inc. * | 58,623 | 6,490,739 |
| Analog Devices, Inc. | 25,903 | 4,220,886 |
| Applied Materials, Inc. | 44,246 | 5,978,962 |
| Broadcom, Inc. | 19,695 | 9,792,551 |
| Brooks Automation, Inc. | 3,633 | 308,660 |
| Cirrus Logic, Inc. * | 2,818 | 235,782 |
| CMC Materials, Inc. | 1,433 | 190,044 |
| Cree, Inc. * | 5,518 | 468,920 |
| Enphase Energy, Inc. * | 6,536 | 1,135,499 |
| Entegris, Inc. | 6,562 | 788,359 |
| First Solar, Inc. * | 4,122 | 387,468 |
| Intel Corp. | 194,866 | 10,534,456 |
| KLA Corp. | 7,400 | 2,515,704 |
| Lam Research Corp. | 6,870 | 4,155,113 |
| Lattice Semiconductor Corp. * | 6,804 | 422,665 |
| Marvell Technology, Inc. | 39,534 | 2,419,085 |
| Microchip Technology, Inc. | 13,214 | 2,079,355 |
| Micron Technology, Inc. * | 54,067 | 3,984,738 |
| MKS Instruments, Inc. | 2,686 | 395,325 |
| Monolithic Power Systems, Inc. | 2,061 | 1,020,051 |
| NVIDIA Corp. | 120,225 | 26,912,366 |
| NXP Semiconductor N.V. | 13,300 | 2,861,229 |
| ON Semiconductor Corp. * | 20,571 | 912,530 |
| Power Integrations, Inc. | 2,913 | 316,468 |
| Qorvo, Inc. * | 5,433 | 1,021,567 |
| QUALCOMM, Inc. | 54,383 | 7,977,442 |
| Semtech Corp. * | 3,128 | 218,710 |
| Silicon Laboratories, Inc. * | 2,147 | 338,410 |
| Skyworks Solutions, Inc. | 7,963 | 1,460,892 |
| SolarEdge Technologies, Inc. * | 2,512 | 727,927 |
| SunPower Corp. * | 3,985 | 85,877 |
| Teradyne, Inc. | 7,973 | 968,241 |
| Security | Number
of Shares | Value ($) |
| Texas Instruments, Inc. | 44,534 | 8,501,986 |
| Universal Display Corp. | 2,051 | 427,818 |
| Xilinx, Inc. | 11,873 | 1,847,320 |
| | | 112,103,145 |
| |
| Software & Services 15.3% |
| Accenture plc, Class A | 30,659 | 10,318,593 |
| Adobe, Inc. * | 23,053 | 15,300,276 |
| Akamai Technologies, Inc. * | 7,833 | 887,087 |
| Alarm.com Holdings, Inc. * | 2,131 | 179,707 |
| Alteryx, Inc., Class A * | 2,832 | 209,483 |
| Amdocs Ltd. | 6,124 | 471,732 |
| Anaplan, Inc. * | 6,941 | 416,321 |
| ANSYS, Inc. * | 4,217 | 1,540,723 |
| Appian Corp. * | 1,873 | 200,786 |
| Aspen Technology, Inc. * | 3,263 | 422,559 |
| Autodesk, Inc. * | 10,602 | 3,287,574 |
| Automatic Data Processing, Inc. | 20,533 | 4,292,218 |
| Avalara, Inc. * | 4,126 | 741,442 |
| Bill.com Holdings, Inc. * | 2,995 | 821,798 |
| Black Knight, Inc. * | 7,543 | 570,779 |
| Blackline, Inc. * | 2,520 | 274,932 |
| Broadridge Financial Solutions, Inc. | 5,620 | 967,876 |
| Cadence Design Systems, Inc. * | 13,440 | 2,197,171 |
| CDK Global, Inc. | 5,860 | 243,776 |
| Ceridian HCM Holding, Inc. * | 6,398 | 718,815 |
| Citrix Systems, Inc. | 5,961 | 613,208 |
| Cloudflare, Inc., Class A * | 9,284 | 1,120,950 |
| Cognizant Technology Solutions Corp., Class A | 25,471 | 1,943,692 |
| Concentrix Corp. * | 2,008 | 348,167 |
| Coupa Software, Inc. * | 3,556 | 870,544 |
| Crowdstrike Holdings, Inc., Class A * | 9,606 | 2,699,286 |
| Datadog, Inc., Class A * | 10,576 | 1,457,373 |
| Digital Turbine, Inc. * | 3,745 | 218,895 |
| DocuSign, Inc. * | 9,390 | 2,781,694 |
| Dolby Laboratories, Inc., Class A | 3,121 | 309,322 |
| Dropbox, Inc., Class A * | 14,135 | 448,221 |
| Duck Creek Technologies, Inc. * | 1,515 | 70,644 |
| DXC Technology Co. * | 12,259 | 450,150 |
| Dynatrace, Inc. * | 8,853 | 608,467 |
| Elastic N.V. * | 3,042 | 485,351 |
| Envestnet, Inc. * | 2,575 | 205,665 |
| EPAM Systems, Inc. * | 2,714 | 1,717,446 |
| Euronet Worldwide, Inc. * | 2,510 | 334,407 |
| Everbridge, Inc. * | 1,834 | 287,883 |
| Fair Isaac Corp. * | 1,385 | 636,740 |
| Fastly, Inc., Class A * | 4,116 | 179,458 |
| Fidelity National Information Services, Inc. | 29,940 | 3,825,434 |
| FireEye, Inc. * | 11,475 | 208,730 |
| Fiserv, Inc. * | 28,700 | 3,380,573 |
| Five9, Inc. * | 3,271 | 517,570 |
| FleetCor Technologies, Inc. * | 4,026 | 1,059,965 |
| Fortinet, Inc. * | 6,547 | 2,063,222 |
| Gartner, Inc. * | 4,155 | 1,282,815 |
| Genpact Ltd. | 8,594 | 445,857 |
| Global Payments, Inc. | 14,238 | 2,315,668 |
| GoDaddy, Inc., Class A * | 8,034 | 588,973 |
| Guidewire Software, Inc. * | 4,021 | 476,328 |
| HubSpot, Inc. * | 2,127 | 1,455,868 |
| International Business Machines Corp. | 43,105 | 6,049,356 |
| Intuit, Inc. | 13,171 | 7,456,235 |
| Jack Henry & Associates, Inc. | 3,594 | 633,910 |
| LiveRamp Holdings, Inc. * | 3,236 | 158,564 |
| Manhattan Associates, Inc. * | 3,044 | 496,142 |
| Mastercard, Inc., Class A | 42,203 | 14,611,945 |
| MAXIMUS, Inc. | 2,962 | 257,961 |
Schwab U.S. Equity ETFs | Annual Report
Portfolio Holdings as of August 31, 2021 (continued)
| Security | Number
of Shares | Value ($) |
| Medallia, Inc. * | 4,136 | 139,673 |
| Microsoft Corp. | 363,345 | 109,686,589 |
| MongoDB, Inc. * | 2,568 | 1,006,219 |
| N-Able, Inc. * | 1,662 | 22,487 |
| nCino, Inc. * | 706 | 43,779 |
| NCR Corp. * | 6,239 | 265,033 |
| New Relic, Inc. * | 2,624 | 209,841 |
| NortonLifeLock, Inc. | 28,104 | 746,442 |
| Nuance Communications, Inc. * | 13,680 | 753,084 |
| Nutanix, Inc., Class A * | 9,812 | 362,161 |
| Okta, Inc. * | 6,050 | 1,594,780 |
| Oracle Corp. | 87,644 | 7,811,710 |
| Palo Alto Networks, Inc. * | 4,706 | 2,169,654 |
| Paychex, Inc. | 15,485 | 1,772,568 |
| Paycom Software, Inc. * | 2,382 | 1,164,560 |
| Paylocity Holding Corp. * | 1,817 | 489,136 |
| PayPal Holdings, Inc. * | 56,680 | 16,361,249 |
| Pegasystems, Inc. | 1,918 | 263,974 |
| Proofpoint, Inc. *(c) | 2,764 | 486,464 |
| PTC, Inc. * | 5,048 | 664,620 |
| Q2 Holdings, Inc. * | 2,509 | 221,018 |
| Qualys, Inc. * | 1,590 | 186,634 |
| Rapid7, Inc. * | 2,611 | 317,289 |
| RingCentral, Inc., Class A * | 3,882 | 979,273 |
| Sailpoint Technologies Holdings, Inc. * | 4,429 | 207,543 |
| salesforce.com, Inc. * | 46,587 | 12,358,133 |
| ServiceNow, Inc. * | 9,517 | 6,125,522 |
| Smartsheet, Inc., Class A * | 5,634 | 448,297 |
| Snowflake, Inc., Class A * | 2,986 | 908,789 |
| SolarWinds Corp. | 1,666 | 28,439 |
| Splunk, Inc. * | 7,939 | 1,213,635 |
| Square, Inc., Class A * | 18,901 | 5,066,791 |
| SS&C Technologies Holdings, Inc. | 10,790 | 816,371 |
| Synopsys, Inc. * | 7,359 | 2,444,954 |
| Tenable Holdings, Inc. * | 3,276 | 145,356 |
| The Trade Desk, Inc., Class A * | 20,760 | 1,661,838 |
| The Western Union Co. | 19,754 | 427,477 |
| Twilio, Inc., Class A * | 7,829 | 2,794,640 |
| Tyler Technologies, Inc. * | 1,978 | 960,715 |
| Varonis Systems, Inc. * | 5,086 | 350,985 |
| Verint Systems, Inc. * | 3,115 | 139,054 |
| VeriSign, Inc. * | 4,768 | 1,031,128 |
| Visa, Inc., Class A | 81,609 | 18,696,622 |
| VMware, Inc., Class A *(a) | 3,897 | 580,146 |
| WEX, Inc. * | 2,139 | 392,656 |
| Workday, Inc., Class A * | 9,115 | 2,489,853 |
| Zendesk, Inc. * | 5,717 | 706,621 |
| Zoom Video Communications, Inc., Class A * | 10,273 | 2,974,033 |
| Zscaler, Inc. * | 3,623 | 1,008,426 |
| | | 320,832,588 |
| |
| Technology Hardware & Equipment 7.4% |
| Amphenol Corp., Class A | 28,749 | 2,203,036 |
| Apple Inc. | 756,767 | 114,899,934 |
| Arista Networks, Inc. * | 2,638 | 974,820 |
| Arrow Electronics, Inc. * | 3,589 | 435,059 |
| CDW Corp. | 6,770 | 1,358,130 |
| Ciena Corp. * | 7,533 | 430,360 |
| Cisco Systems, Inc. | 203,328 | 12,000,419 |
| Cognex Corp. | 8,505 | 753,713 |
| Corning, Inc. | 37,329 | 1,492,787 |
| Dell Technologies, Inc., Class C * | 12,001 | 1,169,617 |
| F5 Networks, Inc. * | 2,867 | 583,635 |
| Hewlett Packard Enterprise Co. | 62,755 | 970,192 |
| HP, Inc. | 58,090 | 1,727,597 |
| II-VI, Inc. * | 5,043 | 317,608 |
| Security | Number
of Shares | Value ($) |
| IPG Photonics Corp. * | 1,751 | 298,861 |
| Jabil, Inc. | 6,418 | 396,504 |
| Juniper Networks, Inc. | 16,059 | 465,390 |
| Keysight Technologies, Inc. * | 8,854 | 1,588,230 |
| Littelfuse, Inc. | 1,163 | 331,920 |
| Lumentum Holdings, Inc. * | 3,636 | 315,023 |
| Motorola Solutions, Inc. | 8,176 | 1,996,743 |
| National Instruments Corp. | 6,346 | 265,390 |
| NetApp, Inc. | 10,675 | 949,328 |
| Novanta, Inc. * | 1,672 | 256,184 |
| Pure Storage, Inc., Class A * | 12,273 | 317,012 |
| Seagate Technology Holdings plc | 9,714 | 850,849 |
| TE Connectivity Ltd. | 15,946 | 2,395,408 |
| Teledyne Technologies, Inc. * | 2,246 | 1,040,751 |
| Trimble, Inc. * | 12,182 | 1,147,788 |
| Ubiquiti, Inc. | 367 | 119,407 |
| Vontier Corp. | 8,060 | 293,142 |
| Western Digital Corp. * | 14,732 | 931,062 |
| Xerox Holdings Corp. | 7,769 | 174,880 |
| Zebra Technologies Corp., Class A * | 2,579 | 1,514,311 |
| | | 154,965,090 |
| |
| Telecommunication Services 1.2% |
| AT&T, Inc. | 344,468 | 9,445,313 |
| Iridium Communications, Inc. * | 5,697 | 253,573 |
| Liberty Global plc, Class A * | 6,715 | 192,989 |
| Liberty Global plc, Class C * | 16,665 | 482,952 |
| Lumen Technologies, Inc. | 47,955 | 589,846 |
| T-Mobile US, Inc. * | 28,286 | 3,875,748 |
| Verizon Communications, Inc. | 199,688 | 10,982,840 |
| | | 25,823,261 |
| |
| Transportation 1.8% |
| Alaska Air Group, Inc. * | 5,979 | 342,836 |
| AMERCO | 431 | 284,956 |
| American Airlines Group, Inc. * | 30,839 | 614,930 |
| C.H. Robinson Worldwide, Inc. | 6,370 | 573,682 |
| CSX Corp. | 109,607 | 3,565,516 |
| Delta Air Lines, Inc. * | 30,838 | 1,247,089 |
| Expeditors International of Washington, Inc. | 8,168 | 1,018,059 |
| FedEx Corp. | 11,756 | 3,123,451 |
| GXO Logistics, Inc. * | 4,941 | 404,124 |
| J.B. Hunt Transport Services, Inc. | 4,045 | 717,583 |
| JetBlue Airways Corp. * | 15,367 | 232,503 |
| Kansas City Southern | 4,385 | 1,230,738 |
| Knight-Swift Transportation Holdings, Inc. | 5,840 | 303,271 |
| Landstar System, Inc. | 1,896 | 318,585 |
| Lyft, Inc., Class A * | 12,306 | 585,889 |
| Norfolk Southern Corp. | 12,041 | 3,052,875 |
| Old Dominion Freight Line, Inc. | 4,575 | 1,320,894 |
| Saia, Inc. * | 1,259 | 302,324 |
| Southwest Airlines Co. * | 28,615 | 1,424,455 |
| Uber Technologies, Inc. * | 71,343 | 2,792,365 |
| Union Pacific Corp. | 32,031 | 6,945,602 |
| United Airlines Holdings, Inc. * | 15,556 | 723,509 |
| United Parcel Service, Inc., Class B | 34,900 | 6,827,487 |
| XPO Logistics, Inc. * | 4,941 | 429,422 |
| | | 38,382,145 |
| |
| Utilities 2.4% |
| Alliant Energy Corp. | 11,998 | 729,358 |
| Ameren Corp. | 12,299 | 1,078,868 |
| American Electric Power Co., Inc. | 24,075 | 2,156,398 |
| American Water Works Co., Inc. | 8,786 | 1,601,249 |
| Atmos Energy Corp. | 6,331 | 617,336 |
Schwab U.S. Equity ETFs | Annual Report
Portfolio Holdings as of August 31, 2021 (continued)
| Security | Number
of Shares | Value ($) |
| Avangrid, Inc. | 3,310 | 180,892 |
| CenterPoint Energy, Inc. | 27,921 | 700,538 |
| CMS Energy Corp. | 13,912 | 892,177 |
| Consolidated Edison, Inc. | 16,552 | 1,248,848 |
| Dominion Energy, Inc. | 38,896 | 3,027,665 |
| DTE Energy Co. | 9,375 | 1,128,188 |
| Duke Energy Corp. | 37,125 | 3,885,502 |
| Edison International | 18,238 | 1,054,886 |
| Entergy Corp. | 9,724 | 1,075,572 |
| Essential Utilities, Inc. | 10,674 | 529,751 |
| Evergy, Inc. | 11,029 | 754,935 |
| Eversource Energy | 16,509 | 1,497,862 |
| Exelon Corp. | 47,166 | 2,312,077 |
| FirstEnergy Corp. | 26,149 | 1,016,412 |
| MDU Resources Group, Inc. | 9,661 | 310,794 |
| NextEra Energy, Inc. | 94,590 | 7,944,614 |
| NiSource, Inc. | 18,939 | 466,846 |
| NRG Energy, Inc. | 12,003 | 548,177 |
| OGE Energy Corp. | 9,693 | 343,229 |
| Ormat Technologies, Inc. | 2,166 | 154,068 |
| PG&E Corp. * | 71,489 | 655,554 |
| Pinnacle West Capital Corp. | 5,370 | 412,953 |
| PPL Corp. | 37,238 | 1,092,935 |
| Public Service Enterprise Group, Inc. | 24,312 | 1,554,509 |
| Sempra Energy | 15,240 | 2,017,166 |
| Sunnova Energy International, Inc. * | 3,178 | 115,044 |
| The AES Corp. | 32,061 | 765,296 |
| The Southern Co. | 51,062 | 3,356,305 |
| UGI Corp. | 10,045 | 465,184 |
| Vistra Corp. | 23,490 | 448,424 |
| WEC Energy Group, Inc. | 15,177 | 1,433,923 |
| Xcel Energy, Inc. | 26,066 | 1,792,037 |
| | | 49,365,572 |
| Total Common Stock |
| (Cost $1,436,556,256) | | 2,086,380,189 |
| Security | Number
of Shares | Value ($) |
| Short-Term Investments 0.1% of net assets |
| |
| Money Market Funds 0.1% |
| State Street Institutional U.S. Government Money Market Fund, Premier Class 0.03% (d) | 1,441,712 | 1,441,712 |
| Wells Fargo Government Money Market Fund, Select Class 0.03% (d)(e) | 748,685 | 748,685 |
| Total Short-Term Investments |
| (Cost $2,190,397) | | 2,190,397 |
| | Number of
Contracts | Notional
Amount
($) | Current Value/
Unrealized
Appreciation
($) |
| Futures Contracts | |
| Long | |
| S&P 500 Index, e-mini, expires 09/17/21 | 19 | 4,294,475 | 60,346 |
| * | Non-income producing security. |
| (a) | All or a portion of this security is on loan. Securities on loan were valued at $748,619. |
| (b) | Issuer is affiliated with the fund’s investment adviser. |
| (c) | Fair-valued by management using significant unobservable inputs in accordance with procedures approved by the fund’s Board of Trustees. |
| (d) | The rate shown is the 7-day yield. |
| (e) | Security purchased with cash collateral received for securities on loan. |
| | |
| REIT — | Real Estate Investment Trust |
The fund owns shares of an affiliate, The Charles Schwab Corp., since that company is included in its index. Below is the summary of investment activities involving The Charles Schwab Corp. shares owned by the fund during the period ended August 31, 2021:
| |
Value at
8/31/20 | Gross
Purchases | Gross
Sales | Realized
Gains(Losses) | Net change
in unrealized
appreciation
(depreciation) |
Value at
8/31/21 | Balance
of Shares
Held at
8/31/21 | Dividends
Received |
| The Charles Schwab Corp. | $1,420,845 | $1,885,270 | ($140,498) | $4,250 | $2,082,545 | $5,252,412 | 72,099 | $45,660 |
The following is a summary of the inputs used to value the fund’s investments as of August 31, 2021 (see financial note 2(a) for additional information):
| Description | Quoted Prices in
Active Markets for
Identical Assets
(Level 1) | Other Significant
Observable Inputs
(Level 2) | Significant
Unobservable Inputs
(Level 3) | Total | |
| Assets | | | | | |
| Common Stock1 | $1,765,547,601 | $— | $— | $1,765,547,601 | |
| Software & Services | 320,346,124 | — | 486,464 | 320,832,588 | |
| Short-Term Investments1 | 2,190,397 | — | — | 2,190,397 | |
| Futures Contracts2 | 60,346 | — | — | 60,346 | |
| Total | $2,088,144,468 | $— | $486,464 | $2,088,630,932 | |
| 1 | As categorized in the Portfolio Holdings. |
| 2 | Futures contracts are reported at cumulative unrealized appreciation or depreciation. |
Schwab U.S. Equity ETFs | Annual Report
Portfolio Holdings as of August 31, 2021 (continued)
Fund investments in mutual funds are classified as Level 1, without consideration to the classification level of the underlying securities held by the mutual funds, which could be Level 1, Level 2 or Level 3.
Schwab U.S. Equity ETFs | Annual Report
Statement of Assets and Liabilities
As of August 31, 2021
| Assets |
| Investments in securities, at value — affiliated (cost $3,586,834) | | $5,252,412 |
| Investments in securities, at value — unaffiliated (cost $1,434,411,134) including securities on loan of $748,619 | | 2,082,569,489 |
| Collateral invested for securities on loan, at value (cost $748,685) | | 748,685 |
| Deposit with broker for futures contracts | | 184,000 |
| Receivables: | | |
| Fund shares sold | | 4,481,089 |
| Dividends | | 2,349,739 |
| Income from securities on loan | + | 1,003 |
| Total assets | | 2,095,586,417 |
| Liabilities |
| Collateral held for securities on loan | | 748,685 |
| Payables: | | |
| Investments bought | | 4,322,203 |
| Management fees | | 83,651 |
| Variation margin on futures contracts | + | 3,734 |
| Total liabilities | | 5,158,273 |
| Net Assets |
| Total assets | | 2,095,586,417 |
| Total liabilities | – | 5,158,273 |
| Net assets | | $2,090,428,144 |
| Net Assets by Source | | |
| Capital received from investors | | 1,456,383,417 |
| Total distributable earnings | | 634,044,727 |
| Net Asset Value (NAV) |
| Net Assets | ÷ | Shares
Outstanding | = | NAV |
| $2,090,428,144 | | 46,650,000 | | $44.81 |
| | | | | |
Schwab U.S. Equity ETFs | Annual Report
Statement of Operations
For the period September 1, 2020 through August 31, 2021
| Investment Income |
| Dividends received from securities — affiliated | | $45,660 |
| Dividends received from securities — unaffiliated (net of foreign withholding tax of $2,612) | | 23,088,054 |
| Securities on loan, net | + | 10,069 |
| Total investment income | | 23,143,783 |
| Expenses |
| Management fees | | 783,197 |
| Total expenses | – | 783,197 |
| Net investment income | | 22,360,586 |
| Realized and Unrealized Gains (Losses) |
| Net realized losses on sales of securities — affiliated | | (12,365) |
| Net realized losses on sales of securities — unaffiliated | | (9,401,920) |
| Net realized gains on in-kind redemptions — affiliated | | 16,615 |
| Net realized gains on in-kind redemptions — unaffiliated | | 9,609,971 |
| Net realized gains on futures contracts | + | 477,409 |
| Net realized gains | | 689,710 |
| Net change in unrealized appreciation (depreciation) on securities — affiliated | | 2,082,545 |
| Net change in unrealized appreciation (depreciation) on securities — unaffiliated | | 419,915,695 |
| Net change in unrealized appreciation (depreciation) on futures contracts | + | (1,745) |
| Net change in unrealized appreciation (depreciation) | + | 421,996,495 |
| Net realized and unrealized gains | | 422,686,205 |
| Increase in net assets resulting from operations | | $445,046,791 |
Schwab U.S. Equity ETFs | Annual Report
Statement of Changes in Net Assets
For the current and prior report periods
| Operations | |
| | 9/1/20-8/31/21 | 9/1/19-8/31/20 |
| Net investment income | | $22,360,586 | $18,884,074 |
| Net realized gains | | 689,710 | 17,398,618 |
| Net change in unrealized appreciation (depreciation) | + | 421,996,495 | 165,208,566 |
| Increase in net assets resulting from operations | | 445,046,791 | 201,491,258 |
| Distributions to Shareholders | |
| Total distributions | | ($21,896,405) | ($17,831,170) |
| Transactions in Fund Shares | | | |
| | | 9/1/20-8/31/21 | 9/1/19-8/31/20 |
| | | SHARES | VALUE | SHARES | VALUE |
| Shares sold | | 14,150,000 | $548,005,898 | 8,400,000 | $243,101,710 |
| Shares redeemed | + | (700,000) | (26,080,295) | (4,300,000) | (119,623,083) |
| Net transactions in fund shares | | 13,450,000 | $521,925,603 | 4,100,000 | $123,478,627 |
| Shares Outstanding and Net Assets | | | |
| | | 9/1/20-8/31/21 | 9/1/19-8/31/20 |
| | | SHARES | NET ASSETS | SHARES | NET ASSETS |
| Beginning of period | | 33,200,000 | $1,145,352,155 | 29,100,000 | $838,213,440 |
| Total increase | + | 13,450,000 | 945,075,989 | 4,100,000 | 307,138,715 |
| End of period | | 46,650,000 | $2,090,428,144 | 33,200,000 | $1,145,352,155 |
Schwab U.S. Equity ETFs | Annual Report
Schwab U.S. Large-Cap ETF
Financial Statements
Financial Highlights
| | 9/1/20–
8/31/21 | 9/1/19–
8/31/20 | 9/1/18–
8/31/19 | 9/1/17–
8/31/18 | 9/1/16–
8/31/17 | |
| Per-Share Data |
| Net asset value at beginning of period | $84.28 | $70.00 | $69.53 | $59.10 | $51.75 | |
| Income (loss) from investment operations: | | | | | | |
| Net investment income (loss)1 | 1.38 | 1.51 | 1.47 | 1.19 | 1.15 | |
| Net realized and unrealized gains (losses) | 25.26 | 14.21 | 0.33 | 10.39 | 7.24 | |
| Total from investment operations | 26.64 | 15.72 | 1.80 | 11.58 | 8.39 | |
| Less distributions: | | | | | | |
| Distributions from net investment income | (1.46) | (1.44) | (1.33) | (1.15) | (1.04) | |
| Net asset value at end of period | $109.46 | $84.28 | $70.00 | $69.53 | $59.10 | |
| Total return | 32.05% | 22.92% | 2.70% | 19.79% | 16.39% | |
| Ratios/Supplemental Data |
| Ratios to average net assets: | | | | | | |
| Total expenses | 0.03% | 0.03% | 0.03% | 0.03% | 0.03% | |
| Net investment income (loss) | 1.45% | 2.06% | 2.19% | 1.86% | 2.07% | |
| Portfolio turnover rate2 | 4% | 5% | 4% | 3% | 4% | |
| Net assets, end of period (x 1,000) | $33,035,204 | $23,253,496 | $17,785,958 | $14,989,877 | $9,824,643 | |
| |
1
Calculated based on the average shares outstanding during the period.
2
Portfolio turnover rate excludes securities received or delivered from processing of in-kind creations or redemptions.
Schwab U.S. Equity ETFs | Annual Report
Schwab U.S. Large-Cap ETF
Portfolio Holdings as of August 31, 2021
This section shows all the securities in the fund’s portfolio and their values as of the report date.
The fund files its complete schedule of portfolio holdings with the U.S. Securities and Exchange Commission (SEC) for the first and third quarters of each fiscal year on Form N-PORT Part F. The fund’s Form N-PORT Part F is available on the SEC’s website at www.sec.gov. You can also obtain this information at no cost on the fund’s website at www.schwabassetmanagement.com/schwabetfs_prospectus, by calling 1-866-414-6349, or by sending an email request to orders@mysummaryprospectus.com. The fund also makes available its complete schedule of portfolio holdings on a daily basis on the fund’s website.
| Security | Number
of Shares | Value ($) |
| Common Stock 99.8% of net assets |
| |
| Automobiles & Components 1.8% |
| Aptiv plc * | 213,632 | 32,512,654 |
| Autoliv, Inc. | 61,301 | 5,418,395 |
| BorgWarner, Inc. | 187,873 | 8,018,420 |
| Ford Motor Co. * | 3,089,931 | 40,261,801 |
| General Motors Co. * | 1,007,850 | 49,394,729 |
| Gentex Corp. | 191,306 | 5,892,225 |
| Harley-Davidson, Inc. | 122,046 | 4,824,478 |
| Lear Corp. | 43,137 | 6,899,332 |
| Luminar Technologies, Inc. *(a) | 157,446 | 2,736,411 |
| QuantumScape Corp. *(a) | 134,977 | 2,969,494 |
| Tesla, Inc. * | 607,653 | 447,062,465 |
| | | 605,990,404 |
| |
| Banks 3.9% |
| Bank of America Corp. | 5,946,539 | 248,268,003 |
| BOK Financial Corp. | 24,804 | 2,183,992 |
| Citigroup, Inc. | 1,629,146 | 117,151,889 |
| Citizens Financial Group, Inc. | 334,949 | 14,667,417 |
| Comerica, Inc. | 109,556 | 8,097,284 |
| Commerce Bancshares, Inc. | 82,857 | 5,859,647 |
| Cullen/Frost Bankers, Inc. | 44,990 | 5,138,758 |
| East West Bancorp, Inc. | 112,352 | 8,239,896 |
| Fifth Third Bancorp | 556,078 | 21,609,191 |
| First Republic Bank | 138,944 | 27,641,519 |
| Huntington Bancshares, Inc. | 1,160,520 | 18,022,876 |
| JPMorgan Chase & Co. | 2,386,765 | 381,763,062 |
| KeyCorp | 764,700 | 15,538,704 |
| M&T Bank Corp. | 101,445 | 14,203,314 |
| New York Community Bancorp, Inc. | 362,713 | 4,541,167 |
| People's United Financial, Inc. | 334,940 | 5,503,064 |
| Regions Financial Corp. | 758,281 | 15,491,681 |
| Signature Bank | 45,578 | 11,819,743 |
| SVB Financial Group * | 46,201 | 25,849,459 |
| The PNC Financial Services Group, Inc. | 334,704 | 63,961,934 |
| Truist Financial Corp. | 1,059,848 | 60,474,927 |
| U.S. Bancorp | 1,070,096 | 61,412,809 |
| Wells Fargo & Co. | 3,258,624 | 148,919,117 |
| Zions Bancorp NA | 128,698 | 7,451,614 |
| | | 1,293,811,067 |
| |
| Capital Goods 5.5% |
| 3M Co. | 457,202 | 89,035,517 |
| A.O. Smith Corp. | 106,455 | 7,741,408 |
| Acuity Brands, Inc. | 28,592 | 5,276,082 |
| AGCO Corp. | 48,882 | 6,727,141 |
| Allegion plc | 71,191 | 10,250,792 |
| Allison Transmission Holdings, Inc. | 87,472 | 3,234,715 |
| AMETEK, Inc. | 181,502 | 24,678,827 |
| Carlisle Cos., Inc. | 41,397 | 8,724,004 |
| Carrier Global Corp. | 643,833 | 37,084,781 |
| Caterpillar, Inc. | 431,606 | 91,012,757 |
| Cummins, Inc. | 115,199 | 27,184,660 |
| Security | Number
of Shares | Value ($) |
| Deere & Co. | 246,025 | 93,004,831 |
| Donaldson Co., Inc. | 99,518 | 6,742,345 |
| Dover Corp. | 113,285 | 19,752,373 |
| Eaton Corp. plc | 313,922 | 52,851,908 |
| Emerson Electric Co. | 473,198 | 49,922,389 |
| Fastenal Co. | 452,234 | 25,257,269 |
| Fortive Corp. | 266,080 | 19,655,330 |
| Fortune Brands Home & Security, Inc. | 109,477 | 10,659,775 |
| Generac Holdings, Inc. * | 49,765 | 21,746,310 |
| General Dynamics Corp. | 180,517 | 36,159,360 |
| General Electric Co. | 865,353 | 91,216,860 |
| Graco, Inc. | 133,586 | 10,475,814 |
| HEICO Corp. | 33,255 | 4,217,399 |
| HEICO Corp., Class A | 58,074 | 6,634,374 |
| Honeywell International, Inc. | 547,736 | 127,025,456 |
| Howmet Aerospace, Inc. | 309,403 | 9,823,545 |
| Hubbell, Inc. | 42,686 | 8,798,011 |
| Huntington Ingalls Industries, Inc. | 31,631 | 6,458,101 |
| IDEX Corp. | 59,995 | 13,438,880 |
| Illinois Tool Works, Inc. | 226,895 | 52,834,770 |
| Ingersoll Rand, Inc. * | 305,991 | 16,223,643 |
| Johnson Controls International plc | 563,775 | 42,170,370 |
| L3Harris Technologies, Inc. | 161,738 | 37,686,571 |
| Lennox International, Inc. | 27,234 | 9,128,292 |
| Lincoln Electric Holdings, Inc. | 46,515 | 6,493,959 |
| Lockheed Martin Corp. | 192,869 | 69,394,266 |
| Masco Corp. | 198,849 | 12,074,111 |
| Nikola Corp. *(a) | 107,792 | 1,124,271 |
| Nordson Corp. | 42,708 | 10,190,129 |
| Northrop Grumman Corp. | 117,916 | 43,357,713 |
| Otis Worldwide Corp. | 317,783 | 29,305,948 |
| Owens Corning | 82,520 | 7,884,786 |
| PACCAR, Inc. | 274,330 | 22,459,397 |
| Parker-Hannifin Corp. | 101,877 | 30,223,850 |
| Pentair plc | 131,172 | 10,121,232 |
| Quanta Services, Inc. | 110,111 | 11,242,333 |
| Raytheon Technologies Corp. | 1,193,916 | 101,196,320 |
| Rockwell Automation, Inc. | 91,563 | 29,799,178 |
| Roper Technologies, Inc. | 82,945 | 40,085,660 |
| Sensata Technologies Holding plc * | 123,426 | 7,304,351 |
| Snap-on, Inc. | 42,353 | 9,527,307 |
| Stanley Black & Decker, Inc. | 127,708 | 24,682,125 |
| Textron, Inc. | 178,487 | 12,970,650 |
| The Boeing Co. * | 433,461 | 95,144,689 |
| The Middleby Corp. * | 43,825 | 8,017,346 |
| The Toro Co. | 84,850 | 9,328,409 |
| Trane Technologies plc | 188,527 | 37,422,609 |
| TransDigm Group, Inc. * | 43,362 | 26,341,114 |
| Trex Co., Inc. * | 90,977 | 9,985,636 |
| United Rentals, Inc. * | 56,917 | 20,071,780 |
| W.W. Grainger, Inc. | 34,519 | 14,970,890 |
| Watsco, Inc. | 26,091 | 7,264,256 |
| Westinghouse Air Brake Technologies Corp. | 140,593 | 12,623,845 |
| Woodward, Inc. | 45,989 | 5,561,910 |
| Xylem, Inc. | 142,201 | 19,383,418 |
| | | 1,828,388,148 |
| |
Schwab U.S. Equity ETFs | Annual Report
Schwab U.S. Large-Cap ETF
Portfolio Holdings as of August 31, 2021 (continued)
| Security | Number
of Shares | Value ($) |
| Commercial & Professional Services 1.0% |
| ADT, Inc. | 119,578 | 1,023,588 |
| Booz Allen Hamilton Holding Corp. | 107,614 | 8,814,663 |
| Cintas Corp. | 69,554 | 27,527,387 |
| Clarivate plc * | 205,785 | 5,183,724 |
| Copart, Inc. * | 163,904 | 23,654,625 |
| CoStar Group, Inc. * | 312,023 | 26,440,829 |
| Dun & Bradstreet Holdings, Inc. * | 106,959 | 1,960,558 |
| Equifax, Inc. | 95,846 | 26,095,032 |
| IAA, Inc. * | 105,192 | 5,587,799 |
| IHS Markit Ltd. | 295,515 | 35,639,109 |
| Jacobs Engineering Group, Inc. | 102,925 | 13,890,758 |
| Leidos Holdings, Inc. | 105,398 | 10,340,598 |
| ManpowerGroup, Inc. | 43,232 | 5,249,229 |
| Nielsen Holdings plc | 280,394 | 6,017,255 |
| Republic Services, Inc. | 166,466 | 20,663,425 |
| Robert Half International, Inc. | 89,421 | 9,246,131 |
| Rollins, Inc. | 173,287 | 6,744,330 |
| Stericycle, Inc. * | 71,375 | 4,967,700 |
| TransUnion | 150,319 | 18,268,268 |
| Verisk Analytics, Inc. | 127,945 | 25,814,183 |
| Waste Management, Inc. | 306,205 | 47,495,458 |
| | | 330,624,649 |
| |
| Consumer Durables & Apparel 1.3% |
| D.R. Horton, Inc. | 258,769 | 24,743,492 |
| Garmin Ltd. | 118,433 | 20,658,268 |
| Hanesbrands, Inc. | 277,004 | 5,174,435 |
| Hasbro, Inc. | 100,658 | 9,895,688 |
| Leggett & Platt, Inc. | 104,359 | 5,049,932 |
| Lennar Corp., Class A | 226,771 | 24,334,796 |
| Lululemon Athletica, Inc. * | 93,539 | 37,431,502 |
| Mohawk Industries, Inc. * | 46,052 | 9,107,243 |
| Newell Brands, Inc. | 300,472 | 7,634,994 |
| NIKE, Inc., Class B | 1,005,613 | 165,664,686 |
| NVR, Inc. * | 2,687 | 13,918,499 |
| Peloton Interactive, Inc., Class A * | 211,679 | 21,208,119 |
| Polaris, Inc. | 45,968 | 5,505,128 |
| PulteGroup, Inc. | 208,598 | 11,235,088 |
| Tapestry, Inc. * | 218,074 | 8,792,744 |
| Toll Brothers, Inc. | 87,580 | 5,610,375 |
| Under Armour, Inc., Class A * | 145,753 | 3,372,724 |
| Under Armour, Inc., Class C * | 156,039 | 3,130,142 |
| VF Corp. | 253,133 | 19,357,080 |
| Whirlpool Corp. | 49,495 | 10,964,627 |
| | | 412,789,562 |
| |
| Consumer Services 2.0% |
| Airbnb, Inc., Class A * | 115,628 | 17,921,184 |
| Aramark | 201,096 | 6,996,130 |
| Booking Holdings, Inc. * | 32,354 | 74,403,523 |
| Bright Horizons Family Solutions, Inc. * | 48,537 | 7,074,753 |
| Carnival Corp. * | 628,686 | 15,176,480 |
| Chegg, Inc. * | 112,037 | 9,323,719 |
| Chipotle Mexican Grill, Inc. * | 22,205 | 42,263,443 |
| Darden Restaurants, Inc. | 102,814 | 15,488,929 |
| Domino's Pizza, Inc. | 30,488 | 15,758,942 |
| DraftKings, Inc., Class A * | 257,252 | 15,252,471 |
| Expedia Group, Inc. * | 111,347 | 16,089,642 |
| Hilton Worldwide Holdings, Inc. * | 219,894 | 27,455,965 |
| Las Vegas Sands Corp. * | 258,595 | 11,535,923 |
| Marriott International, Inc., Class A * | 210,714 | 28,475,890 |
| McDonald's Corp. | 588,259 | 139,687,982 |
| MGM Resorts International | 322,154 | 13,730,203 |
| Norwegian Cruise Line Holdings Ltd. * | 292,158 | 7,549,363 |
| Security | Number
of Shares | Value ($) |
| Royal Caribbean Cruises Ltd. * | 172,323 | 14,256,282 |
| Service Corp. International | 133,448 | 8,375,196 |
| Starbucks Corp. | 929,456 | 109,201,785 |
| Terminix Global Holdings, Inc. * | 100,144 | 4,168,995 |
| Vail Resorts, Inc. * | 31,885 | 9,720,142 |
| Wyndham Hotels & Resorts, Inc. | 73,578 | 5,349,121 |
| Wynn Resorts Ltd. * | 83,461 | 8,487,149 |
| Yum! Brands, Inc. | 235,519 | 30,860,055 |
| | | 654,603,267 |
| |
| Diversified Financials 5.3% |
| AGNC Investment Corp. | 419,728 | 6,845,764 |
| Ally Financial, Inc. | 292,829 | 15,490,654 |
| American Express Co. | 513,022 | 85,141,131 |
| Ameriprise Financial, Inc. | 91,268 | 24,907,950 |
| Annaly Capital Management, Inc. | 1,096,510 | 9,528,672 |
| Apollo Global Management, Inc. | 167,877 | 10,035,687 |
| Berkshire Hathaway, Inc., Class B * | 1,494,303 | 427,026,968 |
| BlackRock, Inc. | 111,916 | 105,569,244 |
| Blackstone, Inc. | 539,619 | 67,846,297 |
| Capital One Financial Corp. | 356,075 | 59,097,768 |
| Cboe Global Markets, Inc. | 83,920 | 10,586,508 |
| CME Group, Inc. | 283,434 | 57,174,306 |
| Coinbase Global, Inc., Class A * | 21,169 | 5,482,771 |
| Credit Acceptance Corp. * | 9,171 | 5,316,245 |
| Discover Financial Services | 239,940 | 30,765,107 |
| Equitable Holdings, Inc. | 302,675 | 9,385,952 |
| FactSet Research Systems, Inc. | 29,897 | 11,367,437 |
| Franklin Resources, Inc. | 216,453 | 7,021,735 |
| Intercontinental Exchange, Inc. | 444,443 | 53,124,272 |
| Invesco Ltd. | 300,294 | 7,603,444 |
| Jefferies Financial Group, Inc. | 159,269 | 5,886,582 |
| KKR & Co., Inc. | 458,223 | 29,459,157 |
| MarketAxess Holdings, Inc. | 29,937 | 14,247,617 |
| Moody's Corp. | 126,908 | 48,322,759 |
| Morgan Stanley | 1,174,006 | 122,601,447 |
| Morningstar, Inc. | 17,159 | 4,598,440 |
| MSCI, Inc. | 64,905 | 41,187,415 |
| Nasdaq, Inc. | 90,356 | 17,689,898 |
| Northern Trust Corp. | 164,371 | 19,481,251 |
| Raymond James Financial, Inc. | 95,970 | 13,426,203 |
| S&P Global, Inc. | 190,047 | 84,346,660 |
| Santander Consumer USA Holdings, Inc. | 57,288 | 2,390,628 |
| SEI Investments Co. | 93,906 | 5,898,236 |
| Starwood Property Trust, Inc. | 224,978 | 5,804,432 |
| State Street Corp. | 273,779 | 25,436,807 |
| Synchrony Financial | 426,527 | 21,219,718 |
| T. Rowe Price Group, Inc. | 179,113 | 40,098,027 |
| The Bank of New York Mellon Corp. | 635,271 | 35,079,665 |
| The Carlyle Group, Inc. | 92,544 | 4,569,823 |
| The Charles Schwab Corp. (b) | 1,178,558 | 85,857,950 |
| The Goldman Sachs Group, Inc. | 268,290 | 110,940,598 |
| Voya Financial, Inc. | 96,135 | 6,246,852 |
| | | 1,754,108,077 |
| |
| Energy 2.3% |
| APA Corp. | 296,697 | 5,779,658 |
| Baker Hughes Co. | 576,393 | 13,130,233 |
| Cabot Oil & Gas Corp. | 319,346 | 5,074,408 |
| Cheniere Energy, Inc. * | 181,506 | 15,874,515 |
| Chevron Corp. | 1,523,839 | 147,461,900 |
| ConocoPhillips | 1,062,875 | 59,021,449 |
| Continental Resources, Inc. | 49,870 | 1,958,894 |
| Devon Energy Corp. | 472,746 | 13,969,644 |
| Diamondback Energy, Inc. | 142,276 | 10,975,171 |
| DTE Midstream LLC * | 75,928 | 3,528,374 |
Schwab U.S. Equity ETFs | Annual Report
Schwab U.S. Large-Cap ETF
Portfolio Holdings as of August 31, 2021 (continued)
| Security | Number
of Shares | Value ($) |
| EOG Resources, Inc. | 459,305 | 31,012,274 |
| Exxon Mobil Corp. | 3,338,070 | 181,991,576 |
| Halliburton Co. | 698,010 | 13,946,240 |
| Hess Corp. | 215,419 | 14,810,056 |
| HollyFrontier Corp. | 118,225 | 3,822,214 |
| Kinder Morgan, Inc. | 1,532,498 | 24,933,742 |
| Marathon Oil Corp. | 629,194 | 7,393,030 |
| Marathon Petroleum Corp. | 503,435 | 29,838,592 |
| NOV, Inc. * | 310,624 | 4,090,918 |
| Occidental Petroleum Corp. | 664,544 | 17,072,135 |
| ONEOK, Inc. | 352,130 | 18,493,868 |
| Phillips 66 | 345,583 | 24,567,495 |
| Pioneer Natural Resources Co. | 182,775 | 27,355,934 |
| Schlumberger N.V. | 1,100,172 | 30,848,823 |
| Targa Resources Corp. | 179,252 | 7,872,748 |
| Texas Pacific Land Corp. | 6,105 | 8,301,213 |
| The Williams Cos., Inc. | 959,771 | 23,696,746 |
| Valero Energy Corp. | 321,350 | 21,308,718 |
| | | 768,130,568 |
| |
| Food & Staples Retailing 1.3% |
| Costco Wholesale Corp. | 348,396 | 158,690,894 |
| Sysco Corp. | 402,285 | 32,042,000 |
| The Kroger Co. | 597,799 | 27,516,688 |
| US Foods Holding Corp. * | 177,036 | 6,019,224 |
| Walgreens Boots Alliance, Inc. | 566,083 | 28,728,712 |
| Walmart, Inc. | 1,082,128 | 160,263,157 |
| | | 413,260,675 |
| |
| Food, Beverage & Tobacco 2.8% |
| Altria Group, Inc. | 1,459,912 | 73,331,380 |
| Archer-Daniels-Midland Co. | 439,437 | 26,366,220 |
| Beyond Meat, Inc. * | 38,836 | 4,646,339 |
| Brown-Forman Corp., Class A | 43,699 | 2,892,874 |
| Brown-Forman Corp., Class B | 143,887 | 10,103,745 |
| Bunge Ltd. | 110,691 | 8,380,416 |
| Campbell Soup Co. | 160,147 | 6,682,934 |
| Conagra Brands, Inc. | 377,341 | 12,497,534 |
| Constellation Brands, Inc., Class A | 132,976 | 28,076,553 |
| General Mills, Inc. | 481,347 | 27,826,670 |
| Hormel Foods Corp. | 223,710 | 10,187,753 |
| Ingredion, Inc. | 52,190 | 4,585,413 |
| Kellogg Co. | 198,172 | 12,512,580 |
| Keurig Dr Pepper, Inc. | 460,486 | 16,425,536 |
| Lamb Weston Holdings, Inc. | 115,021 | 7,493,618 |
| McCormick & Co., Inc. Non-Voting Shares | 196,813 | 16,982,994 |
| Molson Coors Beverage Co., Class B | 148,209 | 7,044,374 |
| Mondelez International, Inc., Class A | 1,107,095 | 68,717,387 |
| Monster Beverage Corp. * | 291,158 | 28,408,286 |
| PepsiCo, Inc. | 1,089,255 | 170,348,589 |
| Philip Morris International, Inc. | 1,228,732 | 126,559,396 |
| Post Holdings, Inc. * | 47,367 | 5,300,841 |
| The Boston Beer Co., Inc., Class A * | 7,462 | 4,254,907 |
| The Coca-Cola Co. | 3,059,201 | 172,263,608 |
| The Hershey Co. | 115,355 | 20,498,583 |
| The J.M. Smucker Co. | 86,087 | 10,646,379 |
| The Kraft Heinz Co. | 511,418 | 18,405,934 |
| Tyson Foods, Inc., Class A | 233,719 | 18,351,616 |
| | | 919,792,459 |
| |
| Health Care Equipment & Services 6.2% |
| Abbott Laboratories | 1,401,588 | 177,118,676 |
| ABIOMED, Inc. * | 35,781 | 13,022,853 |
| agilon health, Inc. * | 36,942 | 1,292,970 |
| Security | Number
of Shares | Value ($) |
| Align Technology, Inc. * | 56,840 | 40,299,560 |
| AmerisourceBergen Corp. | 116,550 | 14,243,576 |
| Anthem, Inc. | 193,074 | 72,427,850 |
| Baxter International, Inc. | 397,408 | 30,290,438 |
| Becton Dickinson & Co. | 229,533 | 57,773,456 |
| Boston Scientific Corp. * | 1,119,688 | 50,553,913 |
| Cardinal Health, Inc. | 228,137 | 11,974,911 |
| Centene Corp. * | 459,577 | 28,944,159 |
| Cerner Corp. | 237,421 | 18,127,093 |
| Chemed Corp. | 12,550 | 5,982,585 |
| Cigna Corp. | 270,799 | 57,314,608 |
| CVS Health Corp. | 1,038,031 | 89,675,498 |
| Danaher Corp. | 500,408 | 162,212,257 |
| DaVita, Inc. * | 54,859 | 7,173,911 |
| Dentsply Sirona, Inc. | 173,042 | 10,676,691 |
| DexCom, Inc. * | 76,163 | 40,322,216 |
| Edwards Lifesciences Corp. * | 489,681 | 57,380,820 |
| Encompass Health Corp. | 77,897 | 6,111,020 |
| Guardant Health, Inc. * | 68,109 | 8,668,232 |
| Haemonetics Corp. * | 40,102 | 2,516,401 |
| HCA Healthcare, Inc. | 207,004 | 52,367,872 |
| Henry Schein, Inc. * | 110,225 | 8,331,908 |
| Hill-Rom Holdings, Inc. | 52,052 | 7,577,730 |
| Hologic, Inc. * | 202,308 | 16,012,678 |
| Humana, Inc. | 101,614 | 41,196,348 |
| IDEXX Laboratories, Inc. * | 67,209 | 45,282,736 |
| Insulet Corp. * | 52,362 | 15,593,927 |
| Intuitive Surgical, Inc. * | 93,343 | 98,342,451 |
| Laboratory Corp. of America Holdings * | 77,048 | 23,374,822 |
| Masimo Corp. * | 39,692 | 10,777,966 |
| McKesson Corp. | 124,911 | 25,499,332 |
| Medtronic plc | 1,060,608 | 141,569,956 |
| Molina Healthcare, Inc. * | 46,277 | 12,437,869 |
| Penumbra, Inc. * | 26,656 | 7,329,067 |
| Quest Diagnostics, Inc. | 102,928 | 15,730,486 |
| Quidel Corp. * | 30,255 | 3,901,382 |
| ResMed, Inc. | 114,889 | 33,378,701 |
| STERIS plc | 76,702 | 16,491,697 |
| Stryker Corp. | 258,511 | 71,633,398 |
| Teladoc Health, Inc. * | 103,507 | 14,948,481 |
| Teleflex, Inc. | 36,841 | 14,569,142 |
| The Cooper Cos., Inc. | 38,734 | 17,457,801 |
| UnitedHealth Group, Inc. | 744,127 | 309,757,746 |
| Universal Health Services, Inc., Class B | 61,288 | 9,546,219 |
| Veeva Systems, Inc., Class A * | 108,657 | 36,071,951 |
| West Pharmaceutical Services, Inc. | 58,102 | 26,240,025 |
| Zimmer Biomet Holdings, Inc. | 164,119 | 24,691,704 |
| | | 2,064,217,089 |
| |
| Household & Personal Products 1.4% |
| Church & Dwight Co., Inc. | 192,842 | 16,133,162 |
| Colgate-Palmolive Co. | 667,205 | 52,008,630 |
| Herbalife Nutrition Ltd. * | 68,716 | 3,527,879 |
| Kimberly-Clark Corp. | 265,662 | 36,610,880 |
| Reynolds Consumer Products, Inc. | 43,184 | 1,221,244 |
| The Clorox Co. | 98,216 | 16,505,199 |
| The Estee Lauder Cos., Inc., Class A | 182,991 | 62,306,606 |
| The Procter & Gamble Co. | 1,930,714 | 274,914,366 |
| | | 463,227,966 |
| |
| Insurance 2.0% |
| Aflac, Inc. | 499,272 | 28,298,737 |
| Alleghany Corp. * | 11,009 | 7,449,680 |
| American Financial Group, Inc. | 54,918 | 7,575,389 |
| American International Group, Inc. | 675,837 | 36,873,667 |
| Aon plc, Class A | 177,759 | 50,991,947 |
Schwab U.S. Equity ETFs | Annual Report
Schwab U.S. Large-Cap ETF
Portfolio Holdings as of August 31, 2021 (continued)
| Security | Number
of Shares | Value ($) |
| Arch Capital Group Ltd. * | 316,978 | 13,027,796 |
| Arthur J. Gallagher & Co. | 161,881 | 23,249,349 |
| Assurant, Inc. | 47,649 | 8,105,571 |
| Athene Holding Ltd., Class A * | 98,940 | 6,626,012 |
| Brown & Brown, Inc. | 184,951 | 10,736,406 |
| Chubb Ltd. | 354,775 | 65,250,218 |
| Cincinnati Financial Corp. | 118,404 | 14,611,054 |
| CNA Financial Corp. | 22,102 | 980,224 |
| Erie Indemnity Co., Class A | 19,281 | 3,414,472 |
| Everest Re Group Ltd. | 31,615 | 8,374,813 |
| Fidelity National Financial, Inc. | 226,795 | 11,074,400 |
| Globe Life, Inc. | 74,985 | 7,203,809 |
| Lincoln National Corp. | 141,279 | 9,698,803 |
| Loews Corp. | 175,222 | 9,789,653 |
| Markel Corp. * | 10,883 | 13,824,131 |
| Marsh & McLennan Cos., Inc. | 401,286 | 63,082,159 |
| MetLife, Inc. | 587,194 | 36,406,028 |
| Old Republic International Corp. | 224,038 | 5,824,988 |
| Principal Financial Group, Inc. | 199,209 | 13,309,153 |
| Prudential Financial, Inc. | 311,019 | 32,930,692 |
| Reinsurance Group of America, Inc. | 53,292 | 6,172,279 |
| RenaissanceRe Holdings Ltd. | 38,900 | 6,096,797 |
| The Allstate Corp. | 235,798 | 31,898,753 |
| The Hartford Financial Services Group, Inc. | 281,388 | 18,914,901 |
| The Progressive Corp. | 461,031 | 44,415,727 |
| The Travelers Cos., Inc. | 198,127 | 31,642,863 |
| W.R. Berkley Corp. | 110,921 | 8,353,461 |
| Willis Towers Watson plc | 101,823 | 22,474,373 |
| | | 658,678,305 |
| |
| Materials 2.6% |
| Air Products and Chemicals, Inc. | 174,619 | 47,061,567 |
| Albemarle Corp. | 91,876 | 21,750,724 |
| Amcor plc | 1,210,409 | 15,553,756 |
| AptarGroup, Inc. | 52,112 | 7,024,698 |
| Ashland Global Holdings, Inc. | 43,297 | 3,944,790 |
| Avery Dennison Corp. | 65,347 | 14,728,560 |
| Axalta Coating Systems Ltd. * | 165,048 | 5,040,566 |
| Ball Corp. | 258,496 | 24,805,276 |
| Berry Global Group, Inc. * | 107,349 | 7,210,632 |
| Celanese Corp. | 88,375 | 14,016,275 |
| CF Industries Holdings, Inc. | 169,698 | 7,707,683 |
| Corteva, Inc. | 580,243 | 25,513,285 |
| Crown Holdings, Inc. | 106,191 | 11,658,710 |
| Dow, Inc. | 588,909 | 37,042,376 |
| DuPont de Nemours, Inc. | 419,145 | 31,025,113 |
| Eastman Chemical Co. | 107,547 | 12,170,019 |
| Ecolab, Inc. | 196,324 | 44,243,577 |
| FMC Corp. | 101,387 | 9,492,865 |
| Freeport-McMoRan, Inc. | 1,155,011 | 42,030,850 |
| Huntsman Corp. | 155,488 | 4,109,548 |
| International Flavors & Fragrances, Inc. | 196,087 | 29,707,180 |
| International Paper Co. | 309,750 | 18,612,877 |
| Linde plc | 410,223 | 129,052,054 |
| LyondellBasell Industries N.V., Class A | 203,782 | 20,449,524 |
| Martin Marietta Materials, Inc. | 49,298 | 18,794,862 |
| NewMarket Corp. | 5,906 | 2,065,505 |
| Newmont Corp. | 632,159 | 36,658,900 |
| Nucor Corp. | 235,961 | 27,739,575 |
| Packaging Corp. of America | 74,919 | 11,365,212 |
| PPG Industries, Inc. | 187,321 | 29,887,066 |
| Reliance Steel & Aluminum Co. | 50,221 | 7,535,159 |
| Royal Gold, Inc. | 51,642 | 5,749,304 |
| RPM International, Inc. | 101,958 | 8,390,124 |
| Sealed Air Corp. | 120,705 | 7,366,626 |
| Sonoco Products Co. | 79,905 | 5,217,797 |
| Security | Number
of Shares | Value ($) |
| Steel Dynamics, Inc. | 158,115 | 10,671,181 |
| The Mosaic Co. | 273,058 | 8,787,006 |
| The Scotts Miracle-Gro Co. | 31,745 | 4,978,568 |
| The Sherwin-Williams Co. | 188,955 | 57,379,965 |
| Vulcan Materials Co. | 104,598 | 19,447,906 |
| Westlake Chemical Corp. | 26,931 | 2,352,423 |
| Westrock Co. | 209,875 | 10,921,895 |
| | | 859,261,579 |
| |
| Media & Entertainment 10.0% |
| Activision Blizzard, Inc. | 613,446 | 50,529,547 |
| Alphabet, Inc., Class A * | 237,130 | 686,242,363 |
| Alphabet, Inc., Class C * | 224,517 | 653,173,837 |
| Altice USA, Inc., Class A * | 180,769 | 4,960,301 |
| Bumble, Inc., Class A * | 42,599 | 2,321,646 |
| Cable One, Inc. | 4,297 | 9,021,938 |
| Charter Communications, Inc., Class A * | 108,566 | 88,661,510 |
| Comcast Corp., Class A | 3,615,185 | 219,369,426 |
| Discovery, Inc., Class A *(a) | 132,837 | 3,831,019 |
| Discovery, Inc., Class C * | 236,613 | 6,528,153 |
| DISH Network Corp., Class A * | 195,992 | 8,543,291 |
| Electronic Arts, Inc. | 225,189 | 32,699,695 |
| Facebook, Inc., Class A * | 1,889,247 | 716,742,527 |
| Fox Corp., Class A | 255,825 | 9,578,088 |
| Fox Corp., Class B | 121,041 | 4,191,650 |
| IAC/InterActiveCorp * | 66,128 | 8,732,202 |
| Liberty Broadband Corp., Class A * | 18,482 | 3,433,401 |
| Liberty Broadband Corp., Class C * | 125,941 | 24,095,032 |
| Liberty Media Corp. - Liberty Formula One, Class A * | 20,884 | 954,190 |
| Liberty Media Corp. - Liberty Formula One, Class C * | 160,345 | 8,103,836 |
| Liberty Media Corp. - Liberty SiriusXM, Class A * | 63,700 | 3,153,150 |
| Liberty Media Corp. - Liberty SiriusXM, Class C * | 135,360 | 6,680,016 |
| Live Nation Entertainment, Inc. * | 114,251 | 9,905,562 |
| Match Group, Inc. * | 213,080 | 29,285,715 |
| Netflix, Inc. * | 349,670 | 199,028,667 |
| News Corp., Class A | 307,983 | 6,920,378 |
| News Corp., Class B | 98,208 | 2,163,522 |
| Omnicom Group, Inc. | 170,278 | 12,467,755 |
| Pinterest, Inc., Class A * | 431,198 | 23,961,673 |
| Playtika Holding Corp. * | 54,726 | 1,444,219 |
| Roku, Inc. * | 90,705 | 31,964,442 |
| Sirius XM Holdings, Inc. | 910,897 | 5,711,324 |
| Skillz, Inc. *(a) | 198,210 | 2,332,932 |
| Snap, Inc., Class A * | 739,365 | 56,273,070 |
| Take-Two Interactive Software, Inc. * | 90,965 | 14,665,377 |
| The Interpublic Group of Cos., Inc. | 312,476 | 11,633,481 |
| The Walt Disney Co. * | 1,432,502 | 259,712,613 |
| Twitter, Inc. * | 628,489 | 40,537,541 |
| ViacomCBS, Inc., Class B | 483,933 | 20,059,023 |
| Zillow Group, Inc., Class A * | 28,652 | 2,739,131 |
| Zillow Group, Inc., Class C * | 126,301 | 12,095,847 |
| Zynga, Inc., Class A * | 803,775 | 7,113,409 |
| | | 3,301,562,499 |
| |
| Pharmaceuticals, Biotechnology & Life Sciences 6.9% |
| AbbVie, Inc. | 1,392,416 | 168,176,005 |
| Agilent Technologies, Inc. | 239,442 | 42,014,888 |
| Alnylam Pharmaceuticals, Inc. * | 92,846 | 18,701,970 |
| Amgen, Inc. | 453,093 | 102,186,064 |
| Avantor, Inc. * | 409,881 | 16,165,707 |
| Bio-Rad Laboratories, Inc., Class A * | 16,993 | 13,676,306 |
| Bio-Techne Corp. | 30,542 | 15,244,734 |
Schwab U.S. Equity ETFs | Annual Report
Schwab U.S. Large-Cap ETF
Portfolio Holdings as of August 31, 2021 (continued)
| Security | Number
of Shares | Value ($) |
| Biogen, Inc. * | 118,673 | 40,219,466 |
| BioMarin Pharmaceutical, Inc. * | 144,503 | 12,168,598 |
| Bluebird Bio, Inc. * | 51,284 | 938,497 |
| Bristol-Myers Squibb Co. | 1,761,762 | 117,791,407 |
| Catalent, Inc. * | 134,134 | 17,496,439 |
| Charles River Laboratories International, Inc. * | 39,671 | 17,608,370 |
| Elanco Animal Health, Inc. * | 372,697 | 12,440,626 |
| Eli Lilly & Co. | 627,839 | 162,164,535 |
| Exact Sciences Corp. * | 135,242 | 14,116,560 |
| Exelixis, Inc. * | 244,954 | 4,695,768 |
| Gilead Sciences, Inc. | 988,842 | 71,967,921 |
| Horizon Therapeutics plc * | 176,531 | 19,081,236 |
| Illumina, Inc. * | 115,029 | 52,586,658 |
| Incyte Corp. * | 147,187 | 11,258,334 |
| Ionis Pharmaceuticals, Inc. * | 112,612 | 4,477,453 |
| IQVIA Holdings, Inc. * | 151,292 | 39,295,071 |
| Jazz Pharmaceuticals plc * | 47,085 | 6,201,565 |
| Johnson & Johnson | 2,076,201 | 359,452,679 |
| Merck & Co., Inc. | 1,996,148 | 152,286,131 |
| Mettler-Toledo International, Inc. * | 18,296 | 28,410,578 |
| Moderna, Inc. * | 240,629 | 90,642,538 |
| Neurocrine Biosciences, Inc. * | 73,777 | 7,023,570 |
| Novavax, Inc. * | 54,091 | 12,902,867 |
| Organon & Co. | 198,735 | 6,735,129 |
| PerkinElmer, Inc. | 88,556 | 16,365,149 |
| Perrigo Co., plc | 106,801 | 4,373,501 |
| Pfizer, Inc. | 4,414,835 | 203,391,448 |
| PPD, Inc. * | 85,181 | 3,944,732 |
| Regeneron Pharmaceuticals, Inc. * | 82,567 | 55,600,618 |
| Royalty Pharma plc, Class A | 67,526 | 2,609,880 |
| Sarepta Therapeutics, Inc. * | 63,692 | 4,975,619 |
| Seagen, Inc. * | 99,852 | 16,735,195 |
| Syneos Health, Inc. * | 80,715 | 7,488,738 |
| Thermo Fisher Scientific, Inc. | 309,772 | 171,907,971 |
| Vertex Pharmaceuticals, Inc. * | 204,397 | 40,938,675 |
| Viatris, Inc. | 951,023 | 13,913,467 |
| Waters Corp. * | 48,474 | 20,069,205 |
| Zoetis, Inc. | 374,357 | 76,578,468 |
| | | 2,277,020,336 |
| |
| Real Estate 3.0% |
| Alexandria Real Estate Equities, Inc. | 107,950 | 22,277,642 |
| American Campus Communities, Inc. | 107,723 | 5,477,715 |
| American Homes 4 Rent, Class A | 216,313 | 9,072,167 |
| American Tower Corp. | 358,473 | 104,735,056 |
| Americold Realty Trust | 198,020 | 7,275,255 |
| Apartment Income REIT Corp. | 123,392 | 6,270,781 |
| Apartment Investment & Management Co., Class A | 116,046 | 833,210 |
| AvalonBay Communities, Inc. | 110,229 | 25,306,374 |
| Boston Properties, Inc. | 112,590 | 12,721,544 |
| Camden Property Trust | 76,684 | 11,505,667 |
| CBRE Group, Inc., Class A * | 264,446 | 25,466,150 |
| Crown Castle International Corp. | 341,051 | 66,399,219 |
| CubeSmart | 158,488 | 8,479,108 |
| CyrusOne, Inc. | 97,455 | 7,502,086 |
| Digital Realty Trust, Inc. | 222,230 | 36,425,719 |
| Douglas Emmett, Inc. | 127,939 | 4,223,266 |
| Duke Realty Corp. | 293,755 | 15,425,075 |
| Equinix, Inc. | 70,687 | 59,620,950 |
| Equity LifeStyle Properties, Inc. | 133,665 | 11,370,882 |
| Equity Residential | 271,831 | 22,852,832 |
| Essex Property Trust, Inc. | 51,236 | 16,945,795 |
| Extra Space Storage, Inc. | 105,310 | 19,683,492 |
| Federal Realty Investment Trust | 56,195 | 6,842,865 |
| Gaming & Leisure Properties, Inc. | 171,220 | 8,441,146 |
| Security | Number
of Shares | Value ($) |
| Healthcare Trust of America, Inc., Class A | 172,024 | 5,217,488 |
| Healthpeak Properties, Inc. | 426,516 | 15,354,576 |
| Host Hotels & Resorts, Inc. * | 561,613 | 9,300,311 |
| Invitation Homes, Inc. | 446,117 | 18,371,098 |
| Iron Mountain, Inc. | 227,066 | 10,842,402 |
| Jones Lang LaSalle, Inc. * | 40,425 | 9,800,233 |
| Kilroy Realty Corp. | 82,496 | 5,415,862 |
| Kimco Realty Corp. | 473,362 | 10,314,558 |
| Lamar Advertising Co., Class A | 69,220 | 7,879,313 |
| Medical Properties Trust, Inc. | 467,650 | 9,577,472 |
| Mid-America Apartment Communities, Inc. | 90,192 | 17,350,235 |
| National Retail Properties, Inc. | 136,952 | 6,520,285 |
| Omega Healthcare Investors, Inc. | 183,792 | 6,162,546 |
| Opendoor Technologies, Inc. *(a) | 267,197 | 4,737,403 |
| Prologis, Inc. | 582,793 | 78,478,905 |
| Public Storage | 120,192 | 38,895,333 |
| Realty Income Corp. | 295,266 | 21,324,111 |
| Regency Centers Corp. | 125,076 | 8,582,715 |
| SBA Communications Corp. | 86,354 | 30,998,495 |
| Simon Property Group, Inc. | 259,238 | 34,854,549 |
| STORE Capital Corp. | 190,200 | 6,860,514 |
| Sun Communities, Inc. | 88,445 | 17,820,783 |
| UDR, Inc. | 232,770 | 12,574,235 |
| Ventas, Inc. | 297,292 | 16,630,514 |
| VEREIT, Inc. | 179,579 | 9,074,127 |
| VICI Properties, Inc. | 421,147 | 13,017,654 |
| Vornado Realty Trust | 123,026 | 5,152,329 |
| Welltower, Inc. | 329,871 | 28,873,609 |
| Weyerhaeuser Co. | 592,358 | 21,324,888 |
| WP Carey, Inc. | 139,923 | 10,930,785 |
| | | 1,007,391,324 |
| |
| Retailing 6.5% |
| Advance Auto Parts, Inc. | 51,378 | 10,422,027 |
| Amazon.com, Inc. * | 338,005 | 1,173,144,374 |
| AutoZone, Inc. * | 17,077 | 26,454,835 |
| Bath & Body Works, Inc. | 208,116 | 14,043,668 |
| Best Buy Co., Inc. | 175,604 | 20,459,622 |
| Burlington Stores, Inc. * | 52,677 | 15,776,235 |
| CarMax, Inc. * | 129,070 | 16,160,855 |
| Carvana Co. * | 50,984 | 16,725,811 |
| ContextLogic, Inc., Class A *(a) | 59,881 | 431,742 |
| Dollar General Corp. | 186,010 | 41,463,489 |
| Dollar Tree, Inc. * | 182,728 | 16,544,193 |
| DoorDash, Inc., Class A * | 27,954 | 5,350,396 |
| eBay, Inc. | 510,627 | 39,185,516 |
| Etsy, Inc. * | 100,073 | 21,641,787 |
| Genuine Parts Co. | 114,090 | 13,940,657 |
| LKQ Corp. * | 218,121 | 11,492,795 |
| Lowe's Cos., Inc. | 557,572 | 113,683,355 |
| O'Reilly Automotive, Inc. * | 55,101 | 32,734,402 |
| Pool Corp. | 31,642 | 15,640,641 |
| Ross Stores, Inc. | 281,450 | 33,323,680 |
| Target Corp. | 390,265 | 96,387,650 |
| The Gap, Inc. | 162,260 | 4,337,210 |
| The Home Depot, Inc. | 838,274 | 273,428,213 |
| The TJX Cos., Inc. | 951,496 | 69,192,789 |
| Tractor Supply Co. | 90,682 | 17,614,978 |
| Ulta Beauty, Inc. * | 43,135 | 16,706,617 |
| Victoria's Secret & Co. * | 69,350 | 4,597,905 |
| Wayfair, Inc., Class A * | 58,040 | 16,294,730 |
| Williams-Sonoma, Inc. | 59,916 | 11,186,317 |
| | | 2,148,366,489 |
| |
Schwab U.S. Equity ETFs | Annual Report
Schwab U.S. Large-Cap ETF
Portfolio Holdings as of August 31, 2021 (continued)
| Security | Number
of Shares | Value ($) |
| Semiconductors & Semiconductor Equipment 5.4% |
| Advanced Micro Devices, Inc. * | 957,823 | 106,050,163 |
| Analog Devices, Inc. | 424,454 | 69,164,832 |
| Applied Materials, Inc. | 723,118 | 97,714,935 |
| Broadcom, Inc. | 321,915 | 160,059,357 |
| Enphase Energy, Inc. * | 106,825 | 18,558,707 |
| Entegris, Inc. | 106,759 | 12,826,026 |
| First Solar, Inc. * | 66,833 | 6,282,302 |
| Intel Corp. | 3,182,573 | 172,049,896 |
| KLA Corp. | 120,608 | 41,001,896 |
| Lam Research Corp. | 112,466 | 68,021,686 |
| Marvell Technology, Inc. | 645,460 | 39,495,697 |
| Microchip Technology, Inc. | 215,740 | 33,948,846 |
| Micron Technology, Inc. * | 885,032 | 65,226,858 |
| Monolithic Power Systems, Inc. | 34,037 | 16,845,932 |
| NVIDIA Corp. | 1,964,960 | 439,856,296 |
| NXP Semiconductor N.V. | 217,121 | 46,709,241 |
| ON Semiconductor Corp. * | 336,779 | 14,939,517 |
| Qorvo, Inc. * | 88,390 | 16,619,972 |
| QUALCOMM, Inc. | 889,464 | 130,475,474 |
| Skyworks Solutions, Inc. | 130,447 | 23,931,807 |
| SolarEdge Technologies, Inc. * | 41,241 | 11,950,817 |
| Teradyne, Inc. | 131,538 | 15,973,975 |
| Texas Instruments, Inc. | 728,168 | 139,014,553 |
| Universal Display Corp. | 34,177 | 7,128,981 |
| Xilinx, Inc. | 193,799 | 30,153,186 |
| | | 1,784,000,952 |
| |
| Software & Services 15.5% |
| Accenture plc, Class A | 501,248 | 168,700,027 |
| Adobe, Inc. * | 376,865 | 250,125,300 |
| Affirm Holdings, Inc. * | 39,483 | 3,803,792 |
| Akamai Technologies, Inc. * | 128,577 | 14,561,345 |
| Alteryx, Inc., Class A * | 46,231 | 3,419,707 |
| Anaplan, Inc. * | 114,835 | 6,887,803 |
| ANSYS, Inc. * | 68,827 | 25,146,633 |
| AppLovin Corp., Class A *(a) | 20,434 | 1,438,554 |
| Aspen Technology, Inc. * | 53,244 | 6,895,098 |
| Autodesk, Inc. * | 173,429 | 53,778,599 |
| Automatic Data Processing, Inc. | 335,676 | 70,169,711 |
| Avalara, Inc. * | 68,052 | 12,228,944 |
| Bill.com Holdings, Inc. * | 49,414 | 13,558,707 |
| Black Knight, Inc. * | 124,019 | 9,384,518 |
| Broadridge Financial Solutions, Inc. | 91,305 | 15,724,547 |
| C3.ai, Inc., Class A *(a) | 13,020 | 671,051 |
| Cadence Design Systems, Inc. * | 219,554 | 35,892,688 |
| CDK Global, Inc. | 94,830 | 3,944,928 |
| Ceridian HCM Holding, Inc. * | 104,233 | 11,710,578 |
| Citrix Systems, Inc. | 97,375 | 10,016,966 |
| Cognizant Technology Solutions Corp., Class A | 415,044 | 31,672,008 |
| Concentrix Corp. * | 33,144 | 5,746,838 |
| Coupa Software, Inc. * | 57,773 | 14,143,408 |
| Crowdstrike Holdings, Inc., Class A * | 156,938 | 44,099,578 |
| Datadog, Inc., Class A * | 171,390 | 23,617,542 |
| DocuSign, Inc. * | 153,611 | 45,505,723 |
| DXC Technology Co. * | 202,206 | 7,425,004 |
| Dynatrace, Inc. * | 146,321 | 10,056,642 |
| Elastic N.V. * | 49,548 | 7,905,383 |
| EPAM Systems, Inc. * | 44,363 | 28,073,350 |
| Euronet Worldwide, Inc. * | 41,329 | 5,506,263 |
| Fair Isaac Corp. * | 22,828 | 10,494,945 |
| Fidelity National Information Services, Inc. | 489,342 | 62,523,227 |
| Fiserv, Inc. * | 469,232 | 55,270,837 |
| Five9, Inc. * | 53,056 | 8,395,051 |
| Security | Number
of Shares | Value ($) |
| FleetCor Technologies, Inc. * | 65,929 | 17,357,787 |
| Fortinet, Inc. * | 106,738 | 33,637,413 |
| Gartner, Inc. * | 67,739 | 20,913,739 |
| Genpact Ltd. | 135,987 | 7,055,006 |
| Global Payments, Inc. | 232,378 | 37,793,958 |
| GoDaddy, Inc., Class A * | 131,597 | 9,647,376 |
| Guidewire Software, Inc. * | 66,459 | 7,872,733 |
| HubSpot, Inc. * | 34,699 | 23,750,425 |
| International Business Machines Corp. | 704,283 | 98,839,076 |
| Intuit, Inc. | 215,341 | 121,906,694 |
| Jack Henry & Associates, Inc. | 58,389 | 10,298,652 |
| Mastercard, Inc., Class A | 689,735 | 238,806,949 |
| Microsoft Corp. | 5,938,350 | 1,792,669,098 |
| MongoDB, Inc. * | 41,953 | 16,438,444 |
| NortonLifeLock, Inc. | 457,553 | 12,152,608 |
| Nuance Communications, Inc. * | 223,635 | 12,311,107 |
| Okta, Inc. * | 98,486 | 25,960,910 |
| Oracle Corp. | 1,432,445 | 127,673,823 |
| Palantir Technologies, Inc., Class A * | 355,457 | 9,362,737 |
| Palo Alto Networks, Inc. * | 76,840 | 35,426,314 |
| Paychex, Inc. | 252,758 | 28,933,208 |
| Paycom Software, Inc. * | 38,753 | 18,946,342 |
| PayPal Holdings, Inc. * | 926,278 | 267,379,407 |
| Pegasystems, Inc. | 31,235 | 4,298,873 |
| Proofpoint, Inc. *(c) | 45,192 | 7,953,792 |
| PTC, Inc. * | 83,238 | 10,959,115 |
| RingCentral, Inc., Class A * | 63,856 | 16,108,315 |
| salesforce.com, Inc. * | 761,572 | 202,022,204 |
| ServiceNow, Inc. * | 155,696 | 100,212,173 |
| Snowflake, Inc., Class A * | 48,974 | 14,905,237 |
| Splunk, Inc. * | 129,184 | 19,748,358 |
| Square, Inc., Class A * | 309,183 | 82,882,687 |
| SS&C Technologies Holdings, Inc. | 176,031 | 13,318,505 |
| Synopsys, Inc. * | 120,107 | 39,904,350 |
| The Trade Desk, Inc., Class A * | 339,637 | 27,187,942 |
| The Western Union Co. | 320,741 | 6,940,835 |
| Twilio, Inc., Class A * | 128,215 | 45,767,626 |
| Tyler Technologies, Inc. * | 31,981 | 15,533,172 |
| VeriSign, Inc. * | 78,503 | 16,977,059 |
| Visa, Inc., Class A | 1,333,904 | 305,597,406 |
| VMware, Inc., Class A *(a) | 63,771 | 9,493,589 |
| WEX, Inc. * | 35,602 | 6,535,459 |
| Workday, Inc., Class A * | 148,920 | 40,678,987 |
| Zendesk, Inc. * | 93,494 | 11,555,858 |
| Zoom Video Communications, Inc., Class A * | 168,141 | 48,676,820 |
| Zscaler, Inc. * | 58,744 | 16,350,805 |
| | | 5,117,238,268 |
| |
| Technology Hardware & Equipment 7.6% |
| Amphenol Corp., Class A | 470,070 | 36,021,464 |
| Apple Inc. | 12,368,137 | 1,877,854,241 |
| Arista Networks, Inc. * | 43,412 | 16,042,036 |
| Arrow Electronics, Inc. * | 57,755 | 7,001,061 |
| CDW Corp. | 110,728 | 22,213,144 |
| Ciena Corp. * | 122,325 | 6,988,427 |
| Cisco Systems, Inc. | 3,323,037 | 196,125,644 |
| Cognex Corp. | 139,735 | 12,383,316 |
| Corning, Inc. | 610,499 | 24,413,855 |
| Dell Technologies, Inc., Class C * | 196,823 | 19,182,370 |
| F5 Networks, Inc. * | 46,936 | 9,554,761 |
| Hewlett Packard Enterprise Co. | 1,032,013 | 15,954,921 |
| HP, Inc. | 946,147 | 28,138,412 |
| IPG Photonics Corp. * | 28,633 | 4,887,080 |
| Jabil, Inc. | 104,533 | 6,458,049 |
| Juniper Networks, Inc. | 259,673 | 7,525,323 |
| Keysight Technologies, Inc. * | 145,613 | 26,120,060 |
Schwab U.S. Equity ETFs | Annual Report
Schwab U.S. Large-Cap ETF
Portfolio Holdings as of August 31, 2021 (continued)
| Security | Number
of Shares | Value ($) |
| Motorola Solutions, Inc. | 133,950 | 32,713,269 |
| National Instruments Corp. | 103,862 | 4,343,509 |
| NetApp, Inc. | 175,306 | 15,589,963 |
| Seagate Technology Holdings plc | 157,827 | 13,824,067 |
| TE Connectivity Ltd. | 260,195 | 39,086,493 |
| Teledyne Technologies, Inc. * | 36,557 | 16,939,783 |
| Trimble, Inc. * | 197,823 | 18,638,883 |
| Ubiquiti, Inc. | 6,113 | 1,988,926 |
| Western Digital Corp. * | 241,736 | 15,277,715 |
| Zebra Technologies Corp., Class A * | 42,309 | 24,842,575 |
| | | 2,500,109,347 |
| |
| Telecommunication Services 1.3% |
| AT&T, Inc. | 5,627,997 | 154,319,678 |
| Liberty Global plc, Class A * | 112,479 | 3,232,647 |
| Liberty Global plc, Class C * | 271,081 | 7,855,927 |
| Lumen Technologies, Inc. | 784,690 | 9,651,687 |
| T-Mobile US, Inc. * | 462,499 | 63,371,613 |
| Verizon Communications, Inc. | 3,264,447 | 179,544,585 |
| | | 417,976,137 |
| |
| Transportation 1.8% |
| Alaska Air Group, Inc. * | 97,803 | 5,608,024 |
| AMERCO | 7,165 | 4,737,140 |
| American Airlines Group, Inc. * | 503,366 | 10,037,118 |
| C.H. Robinson Worldwide, Inc. | 104,715 | 9,430,633 |
| CSX Corp. | 1,790,286 | 58,238,003 |
| Delta Air Lines, Inc. * | 502,096 | 20,304,762 |
| Expeditors International of Washington, Inc. | 133,515 | 16,641,310 |
| FedEx Corp. | 192,210 | 51,068,275 |
| GXO Logistics, Inc. * | 80,449 | 6,579,924 |
| J.B. Hunt Transport Services, Inc. | 65,505 | 11,620,587 |
| Kansas City Southern | 71,957 | 20,196,171 |
| Lyft, Inc., Class A * | 201,589 | 9,597,652 |
| Norfolk Southern Corp. | 197,155 | 49,986,679 |
| Old Dominion Freight Line, Inc. | 74,833 | 21,605,784 |
| Southwest Airlines Co. * | 467,138 | 23,254,130 |
| Uber Technologies, Inc. * | 1,164,881 | 45,593,442 |
| Union Pacific Corp. | 523,845 | 113,590,550 |
| United Airlines Holdings, Inc. * | 255,561 | 11,886,142 |
| United Parcel Service, Inc., Class B | 569,990 | 111,507,144 |
| XPO Logistics, Inc. * | 80,527 | 6,998,601 |
| | | 608,482,071 |
| |
| Utilities 2.4% |
| Alliant Energy Corp. | 195,718 | 11,897,697 |
| Ameren Corp. | 202,071 | 17,725,668 |
| American Electric Power Co., Inc. | 393,882 | 35,280,011 |
| American Water Works Co., Inc. | 143,404 | 26,135,379 |
| Atmos Energy Corp. | 102,951 | 10,038,752 |
| Avangrid, Inc. | 55,051 | 3,008,537 |
| CenterPoint Energy, Inc. | 457,032 | 11,466,933 |
| CMS Energy Corp. | 228,751 | 14,669,802 |
| Consolidated Edison, Inc. | 270,594 | 20,416,317 |
| Dominion Energy, Inc. | 635,937 | 49,501,336 |
| DTE Energy Co. | 152,121 | 18,306,241 |
| Duke Energy Corp. | 606,334 | 63,458,916 |
| Security | Number
of Shares | Value ($) |
| Edison International | 298,235 | 17,249,912 |
| Entergy Corp. | 158,483 | 17,529,805 |
| Essential Utilities, Inc. | 176,170 | 8,743,317 |
| Evergy, Inc. | 181,178 | 12,401,634 |
| Eversource Energy | 271,081 | 24,595,179 |
| Exelon Corp. | 771,389 | 37,813,489 |
| FirstEnergy Corp. | 429,578 | 16,697,697 |
| NextEra Energy, Inc. | 1,546,574 | 129,896,750 |
| NiSource, Inc. | 309,813 | 7,636,890 |
| NRG Energy, Inc. | 191,893 | 8,763,753 |
| OGE Energy Corp. | 155,792 | 5,516,595 |
| PG&E Corp. * | 1,169,585 | 10,725,095 |
| Pinnacle West Capital Corp. | 88,041 | 6,770,353 |
| PPL Corp. | 608,973 | 17,873,358 |
| Public Service Enterprise Group, Inc. | 398,652 | 25,489,809 |
| Sempra Energy | 248,750 | 32,924,550 |
| The AES Corp. | 525,848 | 12,551,992 |
| The Southern Co. | 834,208 | 54,832,492 |
| UGI Corp. | 164,151 | 7,601,833 |
| Vistra Corp. | 382,252 | 7,297,191 |
| WEC Energy Group, Inc. | 249,240 | 23,548,195 |
| Xcel Energy, Inc. | 425,124 | 29,227,275 |
| | | 797,592,753 |
| Total Common Stock |
| (Cost $19,118,299,748) | | 32,986,623,991 |
|
| Short-Term Investments 0.2% of net assets |
| |
| Money Market Funds 0.2% |
| State Street Institutional U.S. Government Money Market Fund, Premier Class 0.03% (d) | 33,133,390 | 33,133,390 |
| Wells Fargo Government Money Market Fund, Select Class 0.03% (d)(e) | 23,195,370 | 23,195,370 |
| Total Short-Term Investments |
| (Cost $56,328,760) | | 56,328,760 |
| | Number of
Contracts | Notional
Amount
($) | Current Value/
Unrealized
Appreciation
($) |
| Futures Contracts | |
| Long | |
| S&P 500 Index, e-mini, expires 09/17/21 | 230 | 51,985,750 | 857,585 |
| * | Non-income producing security. |
| (a) | All or a portion of this security is on loan. Securities on loan were valued at $23,012,528. |
| (b) | Issuer is affiliated with the fund’s investment adviser. |
| (c) | Fair-valued by management using significant unobservable inputs in accordance with procedures approved by the fund’s Board of Trustees. |
| (d) | The rate shown is the 7-day yield. |
| (e) | Security purchased with cash collateral received for securities on loan. |
| | |
| REIT — | Real Estate Investment Trust |
Schwab U.S. Equity ETFs | Annual Report
Schwab U.S. Large-Cap ETF
Portfolio Holdings as of August 31, 2021 (continued)
The fund owns shares of an affiliate, The Charles Schwab Corp., since that company is included in its index. Below is the summary of investment activities involving The Charles Schwab Corp. shares owned by the fund during the period ended August 31, 2021:
| |
Value at
8/31/20 | Gross
Purchases | Gross
Sales | Realized
Gains(Losses) | Net change
in unrealized
appreciation
(depreciation) |
Value at
8/31/21 | Balance
of Shares
Held at
8/31/21 | Dividends
Received |
| The Charles Schwab Corp. | $29,793,042 | $17,967,042 | ($1,800,860) | $296,177 | $39,602,549 | $85,857,950 | 1,178,558 | $808,345 |
The following is a summary of the inputs used to value the fund’s investments as of August 31, 2021 (see financial note 2(a) for additional information):
| Description | Quoted Prices in
Active Markets for
Identical Assets
(Level 1) | Other Significant
Observable Inputs
(Level 2) | Significant
Unobservable Inputs
(Level 3) | Total | |
| Assets | | | | | |
| Common Stock1 | $27,869,385,723 | $— | $— | $27,869,385,723 | |
| Software & Services | 5,109,284,476 | — | 7,953,792 | 5,117,238,268 | |
| Short-Term Investments1 | 56,328,760 | — | — | 56,328,760 | |
| Futures Contracts2 | 857,585 | — | — | 857,585 | |
| Total | $33,035,856,544 | $— | $7,953,792 | $33,043,810,336 | |
| 1 | As categorized in the Portfolio Holdings. |
| 2 | Futures contracts are reported at cumulative unrealized appreciation or depreciation. |
Fund investments in mutual funds are classified as Level 1, without consideration to the classification level of the underlying securities held by the mutual funds, which could be Level 1, Level 2 or Level 3.
Schwab U.S. Equity ETFs | Annual Report
Schwab U.S. Large-Cap ETF
Statement of Assets and Liabilities
As of August 31, 2021
| Assets |
| Investments in securities, at value - affiliated (cost $48,949,724) | | $85,857,950 |
| Investments in securities, at value - unaffiliated (cost $19,102,483,414) including securities on loan of $23,012,528 | | 32,933,899,431 |
| Collateral invested for securities on loan, at value (cost $23,195,370) | | 23,195,370 |
| Deposit with broker for futures contracts | | 3,220,000 |
| Receivables: | | |
| Investments sold | | 10,784,397 |
| Dividends | | 38,317,782 |
| Fund shares sold | | 10,965,247 |
| Income from securities on loan | + | 24,363 |
| Total assets | | 33,106,264,540 |
| Liabilities |
| Collateral held for securities on loan | | 23,195,370 |
| Payables: | | |
| Investments bought | | 36,078,176 |
| Management fees | | 798,142 |
| Fund shares redeemed | | 10,946,058 |
| Variation margin on futures contracts | + | 43,086 |
| Total liabilities | | 71,060,832 |
| Net Assets |
| Total assets | | 33,106,264,540 |
| Total liabilities | – | 71,060,832 |
| Net assets | | $33,035,203,708 |
| Net Assets by Source | | |
| Capital received from investors | | 19,560,035,737 |
| Total distributable earnings | | 13,475,167,971 |
| Net Asset Value (NAV) |
| Net Assets | ÷ | Shares
Outstanding | = | NAV |
| $33,035,203,708 | | 301,800,000 | | $109.46 |
| | | | | |
Schwab U.S. Equity ETFs | Annual Report
Schwab U.S. Large-Cap ETF
Statement of Operations
For the period September 1, 2020 through August 31, 2021
| Investment Income |
| Dividends received from securities — affiliated | | $808,345 |
| Dividends received from securities — unaffiliated (net of foreign withholding tax of $58,750) | | 402,279,874 |
| Securities on loan, net | + | 461,610 |
| Total investment income | | 403,549,829 |
| Expenses |
| Management fees | | 8,170,277 |
| Total expenses | – | 8,170,277 |
| Net investment income | | 395,379,552 |
| Realized and Unrealized Gains (Losses) |
| Net realized losses on sales of securities — affiliated | | (183,246) |
| Net realized losses on sales of securities — unaffiliated | | (174,369,876) |
| Net realized gains on in-kind redemptions — affiliated | | 479,423 |
| Net realized gains on in-kind redemptions — unaffiliated | | 249,224,301 |
| Net realized gains on futures contracts | + | 10,140,276 |
| Net realized gains | | 85,290,878 |
| Net change in unrealized appreciation (depreciation) on securities — affiliated | | 39,602,549 |
| Net change in unrealized appreciation (depreciation) on securities — unaffiliated | | 7,179,540,420 |
| Net change in unrealized appreciation (depreciation) on futures contracts | + | (314,633) |
| Net change in unrealized appreciation (depreciation) | + | 7,218,828,336 |
| Net realized and unrealized gains | | 7,304,119,214 |
| Increase in net assets resulting from operations | | $7,699,498,766 |
Schwab U.S. Equity ETFs | Annual Report
Schwab U.S. Large-Cap ETF
Statement of Changes in Net Assets
For the current and prior report periods
| Operations | |
| | 9/1/20-8/31/21 | 9/1/19-8/31/20 |
| Net investment income | | $395,379,552 | $395,962,453 |
| Net realized gains | | 85,290,878 | 590,271,754 |
| Net change in unrealized appreciation (depreciation) | + | 7,218,828,336 | 3,242,760,704 |
| Increase in net assets resulting from operations | | 7,699,498,766 | 4,228,994,911 |
| Distributions to Shareholders | |
| Total distributions | | ($415,722,485) | ($373,490,030) |
| Transactions in Fund Shares | | | |
| | | 9/1/20-8/31/21 | 9/1/19-8/31/20 |
| | | SHARES | VALUE | SHARES | VALUE |
| Shares sold | | 32,050,000 | $3,066,699,139 | 51,250,000 | $3,697,606,445 |
| Shares redeemed | + | (6,150,000) | (568,767,235) | (29,450,000) | (2,085,573,441) |
| Net transactions in fund shares | | 25,900,000 | $2,497,931,904 | 21,800,000 | $1,612,033,004 |
| Shares Outstanding and Net Assets | | | |
| | | 9/1/20-8/31/21 | 9/1/19-8/31/20 |
| | | SHARES | NET ASSETS | SHARES | NET ASSETS |
| Beginning of period | | 275,900,000 | $23,253,495,523 | 254,100,000 | $17,785,957,638 |
| Total increase | + | 25,900,000 | 9,781,708,185 | 21,800,000 | 5,467,537,885 |
| End of period | | 301,800,000 | $33,035,203,708 | 275,900,000 | $23,253,495,523 |
Schwab U.S. Equity ETFs | Annual Report
Schwab U.S. Large-Cap Growth ETF
Financial Statements
Financial Highlights
| | 9/1/20–
8/31/21 | 9/1/19–
8/31/20 | 9/1/18–
8/31/19 | 9/1/17–
8/31/18 | 9/1/16–
8/31/17 | |
| Per-Share Data |
| Net asset value at beginning of period | $120.16 | $84.02 | $81.69 | $65.55 | $55.25 | |
| Income (loss) from investment operations: | | | | | | |
| Net investment income (loss)1 | 0.73 | 0.69 | 0.95 | 0.68 | 0.75 | |
| Net realized and unrealized gains (losses) | 36.43 | 36.18 | 2.30 | 16.17 | 10.17 | |
| Total from investment operations | 37.16 | 36.87 | 3.25 | 16.85 | 10.92 | |
| Less distributions: | | | | | | |
| Distributions from net investment income | (0.62) | (0.73) | (0.92) | (0.71) | (0.62) | |
| Net asset value at end of period | $156.70 | $120.16 | $84.02 | $81.69 | $65.55 | |
| Total return | 31.06% | 44.22% | 4.09% | 25.88% | 19.89% | |
| Ratios/Supplemental Data |
| Ratios to average net assets: | | | | | | |
| Total expenses | 0.04% | 0.04% | 0.04% | 0.04% | 0.05% 2 | |
| Net investment income (loss) | 0.55% | 0.74% | 1.21% | 0.93% | 1.25% | |
| Portfolio turnover rate3 | 12% | 7% | 14% | 5% | 5% | |
| Net assets, end of period (x 1,000) | $16,563,360 | $12,785,385 | $8,107,853 | $6,886,721 | $4,470,809 | |
| |
1
Calculated based on the average shares outstanding during the period.
2
Effective December 29, 2016, the annual operating expense ratio was reduced. The ratio presented for the period ended 8/31/17 is a blended ratio.
3
Portfolio turnover rate excludes securities received or delivered from processing of in-kind creations or redemptions.
Schwab U.S. Equity ETFs | Annual Report
Schwab U.S. Large-Cap Growth ETF
Portfolio Holdings as of August 31, 2021
This section shows all the securities in the fund’s portfolio and their values as of the report date.
The fund files its complete schedule of portfolio holdings with the U.S. Securities and Exchange Commission (SEC) for the first and third quarters of each fiscal year on Form N-PORT Part F. The fund’s Form N-PORT Part F is available on the SEC’s website at www.sec.gov. You can also obtain this information at no cost on the fund’s website at www.schwabassetmanagement.com/schwabetfs_prospectus, by calling 1-866-414-6349, or by sending an email request to orders@mysummaryprospectus.com. The fund also makes available its complete schedule of portfolio holdings on a daily basis on the fund’s website.
| Security | Number
of Shares | Value ($) |
| Common Stock 99.9% of net assets |
| |
| Automobiles & Components 2.8% |
| Tesla, Inc. * | 638,477 | 469,740,298 |
| |
| Banks 0.2% |
| SVB Financial Group * | 48,596 | 27,189,462 |
| |
| Capital Goods 1.8% |
| Generac Holdings, Inc. * | 52,133 | 22,781,078 |
| Huntington Ingalls Industries, Inc. | 33,161 | 6,770,481 |
| L3Harris Technologies, Inc. | 169,638 | 39,527,350 |
| Nordson Corp. | 44,664 | 10,656,830 |
| Northrop Grumman Corp. | 123,915 | 45,563,546 |
| Roper Technologies, Inc. | 87,136 | 42,111,086 |
| The Boeing Co. * | 455,639 | 100,012,761 |
| TransDigm Group, Inc. * | 45,466 | 27,619,231 |
| Trex Co., Inc. * | 95,769 | 10,511,606 |
| | | 305,553,969 |
| |
| Commercial & Professional Services 0.7% |
| Cintas Corp. | 73,059 | 28,914,561 |
| Copart, Inc. * | 172,395 | 24,880,046 |
| CoStar Group, Inc. * | 327,594 | 27,760,316 |
| Verisk Analytics, Inc. | 134,320 | 27,100,403 |
| | | 108,655,326 |
| |
| Consumer Durables & Apparel 0.5% |
| Lululemon Athletica, Inc. * | 98,118 | 39,263,880 |
| NVR, Inc. * | 2,832 | 14,669,590 |
| Peloton Interactive, Inc., Class A * | 222,636 | 22,305,901 |
| | | 76,239,371 |
| |
| Consumer Services 1.2% |
| Airbnb, Inc., Class A * | 121,650 | 18,854,534 |
| Booking Holdings, Inc. * | 34,039 | 78,278,467 |
| Chegg, Inc. * | 117,258 | 9,758,211 |
| Chipotle Mexican Grill, Inc. * | 23,328 | 44,400,882 |
| Domino's Pizza, Inc. | 32,238 | 16,663,500 |
| Expedia Group, Inc. * | 117,350 | 16,957,075 |
| Norwegian Cruise Line Holdings Ltd. * | 305,536 | 7,895,050 |
| | | 192,807,719 |
| |
| Diversified Financials 2.0% |
| BlackRock, Inc. | 117,538 | 110,872,420 |
| Coinbase Global, Inc., Class A * | 22,336 | 5,785,024 |
| Credit Acceptance Corp. * | 9,550 | 5,535,944 |
| FactSet Research Systems, Inc. | 31,330 | 11,912,292 |
| MarketAxess Holdings, Inc. | 31,529 | 15,005,282 |
| Moody's Corp. | 133,615 | 50,876,583 |
| Security | Number
of Shares | Value ($) |
| MSCI, Inc. | 68,265 | 43,319,604 |
| S&P Global, Inc. | 199,745 | 88,650,826 |
| | | 331,957,975 |
| |
| Energy 0.2% |
| Cheniere Energy, Inc. * | 191,243 | 16,726,113 |
| Diamondback Energy, Inc. | 149,478 | 11,530,733 |
| | | 28,256,846 |
| |
| Food & Staples Retailing 1.0% |
| Costco Wholesale Corp. | 366,462 | 166,919,776 |
| US Foods Holding Corp. * | 184,431 | 6,270,654 |
| | | 173,190,430 |
| |
| Food, Beverage & Tobacco 0.3% |
| Beyond Meat, Inc. * | 41,156 | 4,923,904 |
| Monster Beverage Corp. * | 307,429 | 29,995,847 |
| Post Holdings, Inc. * | 48,738 | 5,454,270 |
| The Boston Beer Co., Inc., Class A * | 7,669 | 4,372,940 |
| | | 44,746,961 |
| |
| Health Care Equipment & Services 7.8% |
| ABIOMED, Inc. * | 37,573 | 13,675,069 |
| agilon health, Inc. * | 39,199 | 1,371,965 |
| Align Technology, Inc. * | 59,643 | 42,286,887 |
| Boston Scientific Corp. * | 1,176,847 | 53,134,642 |
| Centene Corp. * | 482,599 | 30,394,085 |
| Chemed Corp. | 13,119 | 6,253,827 |
| Cigna Corp. | 284,446 | 60,202,996 |
| Danaher Corp. | 526,182 | 170,567,157 |
| DexCom, Inc. * | 80,069 | 42,390,130 |
| Edwards Lifesciences Corp. * | 514,997 | 60,347,348 |
| Guardant Health, Inc. * | 71,305 | 9,074,987 |
| Haemonetics Corp. * | 41,667 | 2,614,604 |
| HCA Healthcare, Inc. | 217,570 | 55,040,859 |
| Humana, Inc. | 106,814 | 43,304,532 |
| IDEXX Laboratories, Inc. * | 70,628 | 47,586,321 |
| Insulet Corp. * | 55,044 | 16,392,654 |
| Intuitive Surgical, Inc. * | 98,153 | 103,410,075 |
| Masimo Corp. * | 41,857 | 11,365,850 |
| Molina Healthcare, Inc. * | 48,527 | 13,042,602 |
| Penumbra, Inc. * | 28,009 | 7,701,075 |
| Quidel Corp. * | 31,861 | 4,108,476 |
| ResMed, Inc. | 120,615 | 35,042,276 |
| Teladoc Health, Inc. * | 109,024 | 15,745,246 |
| Teleflex, Inc. | 38,816 | 15,350,175 |
| The Cooper Cos., Inc. | 40,728 | 18,356,517 |
| UnitedHealth Group, Inc. | 781,979 | 325,514,398 |
| Veeva Systems, Inc., Class A * | 114,392 | 37,975,856 |
| West Pharmaceutical Services, Inc. | 61,121 | 27,603,466 |
| Zimmer Biomet Holdings, Inc. | 172,704 | 25,983,317 |
| | | 1,295,837,392 |
| |
Schwab U.S. Equity ETFs | Annual Report
Schwab U.S. Large-Cap Growth ETF
Portfolio Holdings as of August 31, 2021 (continued)
| Security | Number
of Shares | Value ($) |
| Household & Personal Products 0.4% |
| The Estee Lauder Cos., Inc., Class A | 192,289 | 65,472,482 |
| |
| Insurance 0.2% |
| Alleghany Corp. * | 11,549 | 7,815,093 |
| Athene Holding Ltd., Class A * | 103,076 | 6,903,000 |
| Markel Corp. * | 11,363 | 14,433,851 |
| RenaissanceRe Holdings Ltd. | 40,898 | 6,409,943 |
| | | 35,561,887 |
| |
| Materials 1.6% |
| Berry Global Group, Inc. * | 111,583 | 7,495,030 |
| Linde plc | 431,137 | 135,631,389 |
| Martin Marietta Materials, Inc. | 51,444 | 19,613,025 |
| Newmont Corp. | 663,973 | 38,503,794 |
| Royal Gold, Inc. | 54,761 | 6,096,542 |
| The Sherwin-Williams Co. | 198,238 | 60,198,934 |
| | | 267,538,714 |
| |
| Media & Entertainment 16.7% |
| Alphabet, Inc., Class A * | 249,108 | 720,906,097 |
| Alphabet, Inc., Class C * | 235,860 | 686,173,346 |
| Altice USA, Inc., Class A * | 189,804 | 5,208,222 |
| Bumble, Inc., Class A * | 43,627 | 2,377,672 |
| Cable One, Inc. | 4,488 | 9,422,960 |
| Charter Communications, Inc., Class A * | 114,211 | 93,271,555 |
| Facebook, Inc., Class A * | 1,984,962 | 753,054,884 |
| Fox Corp., Class A | 271,511 | 10,165,372 |
| Fox Corp., Class B | 125,522 | 4,346,827 |
| Liberty Broadband Corp., Class A * | 19,317 | 3,588,519 |
| Liberty Broadband Corp., Class C * | 132,748 | 25,397,347 |
| Liberty Media Corp. - Liberty SiriusXM, Class A * | 66,756 | 3,304,422 |
| Liberty Media Corp. - Liberty SiriusXM, Class C * | 140,847 | 6,950,799 |
| Live Nation Entertainment, Inc. * | 119,363 | 10,348,772 |
| Match Group, Inc. * | 224,114 | 30,802,228 |
| Netflix, Inc. * | 367,191 | 209,001,445 |
| Pinterest, Inc., Class A * | 453,687 | 25,211,387 |
| Playtika Holding Corp. * | 57,842 | 1,526,450 |
| Roku, Inc. * | 95,472 | 33,644,333 |
| Snap, Inc., Class A * | 777,235 | 59,155,356 |
| Take-Two Interactive Software, Inc. * | 96,123 | 15,496,950 |
| Twitter, Inc. * | 661,438 | 42,662,751 |
| Zillow Group, Inc., Class A * | 30,357 | 2,902,129 |
| Zillow Group, Inc., Class C * | 132,936 | 12,731,281 |
| | | 2,767,651,104 |
| |
| Pharmaceuticals, Biotechnology & Life Sciences 4.1% |
| Alnylam Pharmaceuticals, Inc. * | 97,542 | 19,647,885 |
| Avantor, Inc. * | 429,602 | 16,943,503 |
| Bio-Rad Laboratories, Inc., Class A * | 17,832 | 14,351,550 |
| Bio-Techne Corp. | 32,305 | 16,124,718 |
| BioMarin Pharmaceutical, Inc. * | 150,994 | 12,715,205 |
| Bluebird Bio, Inc. * | 55,200 | 1,010,160 |
| Charles River Laboratories International, Inc. * | 41,686 | 18,502,748 |
| Exact Sciences Corp. * | 142,410 | 14,864,756 |
| Exelixis, Inc. * | 257,610 | 4,938,384 |
| Horizon Therapeutics plc * | 185,957 | 20,100,092 |
| Illumina, Inc. * | 120,896 | 55,268,815 |
| Incyte Corp. * | 154,619 | 11,826,807 |
| Ionis Pharmaceuticals, Inc. * | 116,473 | 4,630,966 |
| Security | Number
of Shares | Value ($) |
| IQVIA Holdings, Inc. * | 158,700 | 41,219,151 |
| Mettler-Toledo International, Inc. * | 19,273 | 29,927,693 |
| Neurocrine Biosciences, Inc. * | 78,568 | 7,479,674 |
| Regeneron Pharmaceuticals, Inc. * | 86,691 | 58,377,719 |
| Sarepta Therapeutics, Inc. * | 66,589 | 5,201,933 |
| Seagen, Inc. * | 105,347 | 17,656,157 |
| Syneos Health, Inc. * | 83,748 | 7,770,139 |
| Thermo Fisher Scientific, Inc. | 325,791 | 180,797,715 |
| Vertex Pharmaceuticals, Inc. * | 214,354 | 42,932,963 |
| Zoetis, Inc. | 393,478 | 80,489,860 |
| | | 682,778,593 |
| |
| Real Estate 1.5% |
| American Tower Corp. | 376,825 | 110,096,960 |
| CBRE Group, Inc., Class A * | 277,859 | 26,757,822 |
| CyrusOne, Inc. | 101,122 | 7,784,372 |
| Equinix, Inc. | 74,191 | 62,576,399 |
| Opendoor Technologies, Inc. *(a) | 281,102 | 4,983,938 |
| SBA Communications Corp. | 90,524 | 32,495,400 |
| | | 244,694,891 |
| |
| Retailing 10.5% |
| Amazon.com, Inc. * | 355,113 | 1,232,522,649 |
| AutoZone, Inc. * | 17,897 | 27,725,138 |
| Carvana Co. * | 53,756 | 17,635,193 |
| Dollar General Corp. | 195,625 | 43,606,769 |
| Dollar Tree, Inc. * | 192,292 | 17,410,118 |
| DoorDash, Inc., Class A * | 29,196 | 5,588,115 |
| Etsy, Inc. * | 105,412 | 22,796,399 |
| O'Reilly Automotive, Inc. * | 57,754 | 34,310,496 |
| Pool Corp. | 33,206 | 16,413,726 |
| The Home Depot, Inc. | 880,863 | 287,319,893 |
| Ulta Beauty, Inc. * | 45,449 | 17,602,852 |
| Wayfair, Inc., Class A * | 61,177 | 17,175,443 |
| | | 1,740,106,791 |
| |
| Semiconductors & Semiconductor Equipment 5.1% |
| Broadcom, Inc. | 338,382 | 168,246,914 |
| Enphase Energy, Inc. * | 112,616 | 19,564,778 |
| Lam Research Corp. | 118,122 | 71,442,548 |
| Monolithic Power Systems, Inc. | 35,663 | 17,650,689 |
| NVIDIA Corp. | 2,064,765 | 462,197,645 |
| NXP Semiconductor N.V. | 228,487 | 49,154,408 |
| ON Semiconductor Corp. * | 352,839 | 15,651,938 |
| Qorvo, Inc. * | 93,366 | 17,555,609 |
| SolarEdge Technologies, Inc. * | 42,922 | 12,437,937 |
| Universal Display Corp. | 35,458 | 7,396,184 |
| | | 841,298,650 |
| |
| Software & Services 27.8% |
| Adobe, Inc. * | 396,046 | 262,855,730 |
| Affirm Holdings, Inc. * | 41,590 | 4,006,781 |
| Alteryx, Inc., Class A * | 48,636 | 3,597,605 |
| Anaplan, Inc. * | 119,430 | 7,163,411 |
| ANSYS, Inc. * | 72,257 | 26,399,818 |
| Aspen Technology, Inc. * | 56,546 | 7,322,707 |
| Autodesk, Inc. * | 182,260 | 56,517,003 |
| Avalara, Inc. * | 71,124 | 12,780,983 |
| Bill.com Holdings, Inc. * | 51,529 | 14,139,042 |
| Black Knight, Inc. * | 130,194 | 9,851,780 |
| C3.ai, Inc., Class A *(a) | 13,651 | 703,573 |
| Cadence Design Systems, Inc. * | 230,551 | 37,690,477 |
| Coupa Software, Inc. * | 60,949 | 14,920,925 |
| Crowdstrike Holdings, Inc., Class A * | 164,933 | 46,346,173 |
Schwab U.S. Equity ETFs | Annual Report
Schwab U.S. Large-Cap Growth ETF
Portfolio Holdings as of August 31, 2021 (continued)
| Security | Number
of Shares | Value ($) |
| Datadog, Inc., Class A * | 180,539 | 24,878,274 |
| DocuSign, Inc. * | 161,124 | 47,731,374 |
| Dynatrace, Inc. * | 152,612 | 10,489,023 |
| Elastic N.V. * | 52,439 | 8,366,642 |
| EPAM Systems, Inc. * | 46,765 | 29,593,360 |
| Fair Isaac Corp. * | 23,913 | 10,993,763 |
| Fiserv, Inc. * | 493,987 | 58,186,729 |
| Five9, Inc. * | 55,426 | 8,770,056 |
| FleetCor Technologies, Inc. * | 68,941 | 18,150,786 |
| Fortinet, Inc. * | 112,300 | 35,390,222 |
| Gartner, Inc. * | 71,370 | 22,034,774 |
| Global Payments, Inc. | 244,493 | 39,764,342 |
| GoDaddy, Inc., Class A * | 138,555 | 10,157,467 |
| HubSpot, Inc. * | 36,411 | 24,922,237 |
| Intuit, Inc. | 226,539 | 128,245,993 |
| Jack Henry & Associates, Inc. | 61,337 | 10,818,620 |
| Mastercard, Inc., Class A | 724,847 | 250,963,777 |
| Microsoft Corp. | 6,239,579 | 1,883,604,109 |
| MongoDB, Inc. * | 44,302 | 17,358,853 |
| Okta, Inc. * | 103,594 | 27,307,378 |
| Palantir Technologies, Inc., Class A * | 372,894 | 9,822,028 |
| Palo Alto Networks, Inc. * | 80,804 | 37,253,876 |
| Paycom Software, Inc. * | 40,709 | 19,902,630 |
| PayPal Holdings, Inc. * | 973,274 | 280,945,273 |
| Pegasystems, Inc. | 32,882 | 4,525,550 |
| Proofpoint, Inc. *(b) | 47,394 | 8,341,344 |
| PTC, Inc. * | 87,146 | 11,473,642 |
| RingCentral, Inc., Class A * | 66,968 | 16,893,348 |
| salesforce.com, Inc. * | 800,285 | 212,291,602 |
| ServiceNow, Inc. * | 163,675 | 105,347,777 |
| Snowflake, Inc., Class A * | 51,384 | 15,638,720 |
| Splunk, Inc. * | 135,953 | 20,783,135 |
| Square, Inc., Class A * | 324,920 | 87,101,304 |
| SS&C Technologies Holdings, Inc. | 184,906 | 13,989,988 |
| Synopsys, Inc. * | 126,397 | 41,994,139 |
| The Trade Desk, Inc., Class A * | 357,286 | 28,600,744 |
| Twilio, Inc., Class A * | 134,458 | 47,996,128 |
| Tyler Technologies, Inc. * | 33,795 | 16,414,231 |
| Visa, Inc., Class A | 1,401,721 | 321,134,281 |
| VMware, Inc., Class A *(a) | 67,260 | 10,012,996 |
| WEX, Inc. * | 36,928 | 6,778,873 |
| Workday, Inc., Class A * | 156,572 | 42,769,208 |
| Zendesk, Inc. * | 98,568 | 12,183,005 |
| Zoom Video Communications, Inc., Class A * | 176,486 | 51,092,697 |
| Zscaler, Inc. * | 62,125 | 17,291,872 |
| | | 4,612,602,178 |
| |
| Technology Hardware & Equipment 12.5% |
| Apple Inc. | 12,995,569 | 1,973,117,241 |
| Arista Networks, Inc. * | 45,479 | 16,805,855 |
| Ciena Corp. * | 128,251 | 7,326,980 |
| Security | Number
of Shares | Value ($) |
| Dell Technologies, Inc., Class C * | 207,549 | 20,227,725 |
| IPG Photonics Corp. * | 29,758 | 5,079,095 |
| Teledyne Technologies, Inc. * | 38,524 | 17,851,251 |
| Ubiquiti, Inc. | 6,133 | 1,995,433 |
| Zebra Technologies Corp., Class A * | 44,427 | 26,086,202 |
| | | 2,068,489,782 |
| |
| Telecommunication Services 0.4% |
| T-Mobile US, Inc. * | 486,079 | 66,602,545 |
| |
| Transportation 0.6% |
| AMERCO | 7,529 | 4,977,798 |
| GXO Logistics, Inc. * | 84,499 | 6,911,173 |
| Lyft, Inc., Class A * | 213,170 | 10,149,024 |
| Old Dominion Freight Line, Inc. | 78,897 | 22,779,142 |
| Uber Technologies, Inc. * | 1,224,765 | 47,937,302 |
| XPO Logistics, Inc. * | 84,538 | 7,347,198 |
| | | 100,101,637 |
| Total Common Stock |
| (Cost $8,617,658,675) | | 16,547,075,003 |
|
| Short-Term Investments 0.1% of net assets |
| |
| Money Market Funds 0.1% |
| State Street Institutional U.S. Government Money Market Fund, Premier Class 0.03% (c) | 10,640,371 | 10,640,371 |
| Wells Fargo Government Money Market Fund, Select Class 0.03% (c)(d) | 13,524,600 | 13,524,600 |
| Total Short-Term Investments |
| (Cost $24,164,971) | | 24,164,971 |
| | Number of
Contracts | Notional
Amount
($) | Current Value/
Unrealized
Appreciation
($) |
| Futures Contracts | |
| Long | |
| Russell 1000 Growth Index, e-mini, expires 09/17/21 | 163 | 23,832,230 | 607,188 |
| * | Non-income producing security. |
| (a) | All or a portion of this security is on loan. Securities on loan were valued at $13,229,430. |
| (b) | Fair-valued by management using significant unobservable inputs in accordance with procedures approved by the fund’s Board of Trustees. |
| (c) | The rate shown is the 7-day yield. |
| (d) | Security purchased with cash collateral received for securities on loan. |
Schwab U.S. Equity ETFs | Annual Report
Schwab U.S. Large-Cap Growth ETF
Portfolio Holdings as of August 31, 2021 (continued)
The following is a summary of the inputs used to value the fund’s investments as of August 31, 2021 (see financial note 2(a) for additional information):
| Description | Quoted Prices in
Active Markets for
Identical Assets
(Level 1) | Other Significant
Observable Inputs
(Level 2) | Significant
Unobservable Inputs
(Level 3) | Total | |
| Assets | | | | | |
| Common Stock1 | $11,934,472,825 | $— | $— | $11,934,472,825 | |
| Software & Services | 4,604,260,834 | — | 8,341,344 | 4,612,602,178 | |
| Short-Term Investments1 | 24,164,971 | — | — | 24,164,971 | |
| Futures Contracts2 | 607,188 | — | — | 607,188 | |
| Total | $16,563,505,818 | $— | $8,341,344 | $16,571,847,162 | |
| 1 | As categorized in the Portfolio Holdings. |
| 2 | Futures contracts are reported at cumulative unrealized appreciation or depreciation. |
Fund investments in mutual funds are classified as Level 1, without consideration to the classification level of the underlying securities held by the mutual funds, which could be Level 1, Level 2 or Level 3.
Schwab U.S. Equity ETFs | Annual Report
Schwab U.S. Large-Cap Growth ETF
Statement of Assets and Liabilities
As of August 31, 2021
| Assets |
| Investments in securities, at value - unaffiliated (cost $8,628,299,046) including securities on loan of $13,229,430 | | $16,557,715,374 |
| Collateral invested for securities on loan, at value (cost $13,524,600) | | 13,524,600 |
| Deposit with broker for futures contracts | | 720,000 |
| Receivables: | | |
| Fund shares sold | | 7,835,080 |
| Dividends | | 5,427,012 |
| Income from securities on loan | + | 19,313 |
| Total assets | | 16,585,241,379 |
| Liabilities |
| Collateral held for securities on loan | | 13,524,600 |
| Payables: | | |
| Investments bought | | 7,785,145 |
| Management fees | | 528,805 |
| Variation margin on futures contracts | + | 42,795 |
| Total liabilities | | 21,881,345 |
| Net Assets |
| Total assets | | 16,585,241,379 |
| Total liabilities | – | 21,881,345 |
| Net assets | | $16,563,360,034 |
| Net Assets by Source | | |
| Capital received from investors | | 8,884,860,645 |
| Total distributable earnings | | 7,678,499,389 |
| Net Asset Value (NAV) |
| Net Assets | ÷ | Shares
Outstanding | = | NAV |
| $16,563,360,034 | | 105,700,000 | | $156.70 |
| | | | | |
Schwab U.S. Equity ETFs | Annual Report
Schwab U.S. Large-Cap Growth ETF
Statement of Operations
For the period September 1, 2020 through August 31, 2021
| Investment Income |
| Dividends received from securities — unaffiliated (net of foreign withholding tax of $51,186) | | $81,924,267 |
| Securities on loan, net | + | 155,022 |
| Total investment income | | 82,079,289 |
| Expenses |
| Management fees | | 5,525,405 |
| Total expenses | – | 5,525,405 |
| Net investment income | | 76,553,884 |
| Realized and Unrealized Gains (Losses) |
| Net realized losses on sales of securities — unaffiliated | | (48,118,765) |
| Net realized gains on in-kind redemptions — unaffiliated | | 1,330,542,454 |
| Net realized gains on futures contracts | + | 1,628,605 |
| Net realized gains | | 1,284,052,294 |
| Net change in unrealized appreciation (depreciation) on securities — unaffiliated | | 2,467,170,646 |
| Net change in unrealized appreciation (depreciation) on futures contracts | + | (299,084) |
| Net change in unrealized appreciation (depreciation) | + | 2,466,871,562 |
| Net realized and unrealized gains | | 3,750,923,856 |
| Increase in net assets resulting from operations | | $3,827,477,740 |
Schwab U.S. Equity ETFs | Annual Report
Schwab U.S. Large-Cap Growth ETF
Statement of Changes in Net Assets
For the current and prior report periods
| Operations | |
| | 9/1/20-8/31/21 | 9/1/19-8/31/20 |
| Net investment income | | $76,553,884 | $69,665,773 |
| Net realized gains | | 1,284,052,294 | 348,279,092 |
| Net change in unrealized appreciation (depreciation) | + | 2,466,871,562 | 3,354,382,618 |
| Increase in net assets resulting from operations | | 3,827,477,740 | 3,772,327,483 |
| Distributions to Shareholders | |
| Total distributions | | ($64,681,390) | ($73,115,600) |
| Transactions in Fund Shares | | | |
| | | 9/1/20-8/31/21 | 9/1/19-8/31/20 |
| | | SHARES | VALUE | SHARES | VALUE |
| Shares sold | | 22,700,000 | $2,780,390,040 | 26,950,000 | $2,466,914,690 |
| Shares redeemed | + | (23,400,000) | (2,765,211,293) | (17,050,000) | (1,488,595,100) |
| Net transactions in fund shares | | (700,000) | $15,178,747 | 9,900,000 | $978,319,590 |
| Shares Outstanding and Net Assets | | | |
| | | 9/1/20-8/31/21 | 9/1/19-8/31/20 |
| | | SHARES | NET ASSETS | SHARES | NET ASSETS |
| Beginning of period | | 106,400,000 | $12,785,384,937 | 96,500,000 | $8,107,853,464 |
| Total increase (decrease) | + | (700,000) | 3,777,975,097 | 9,900,000 | 4,677,531,473 |
| End of period | | 105,700,000 | $16,563,360,034 | 106,400,000 | $12,785,384,937 |
Schwab U.S. Equity ETFs | Annual Report
Schwab U.S. Large-Cap Value ETF
Financial Statements
Financial Highlights
| | 9/1/20–
8/31/21 | 9/1/19–
8/31/20 | 9/1/18–
8/31/19 | 9/1/17–
8/31/18 | 9/1/16–
8/31/17 | |
| Per-Share Data |
| Net asset value at beginning of period | $53.91 | $55.14 | $56.37 | $50.65 | $46.01 | |
| Income (loss) from investment operations: | | | | | | |
| Net investment income (loss)1 | 1.39 | 1.93 | 1.84 | 1.47 | 1.36 | |
| Net realized and unrealized gains (losses) | 17.05 | (1.36) | (1.48) | 5.63 | 4.56 | |
| Total from investment operations | 18.44 | 0.57 | 0.36 | 7.10 | 5.92 | |
| Less distributions: | | | | | | |
| Distributions from net investment income | (1.67) | (1.80) | (1.59) | (1.38) | (1.28) | |
| Net asset value at end of period | $70.68 | $53.91 | $55.14 | $56.37 | $50.65 | |
| Total return | 34.95% | 1.21% | 0.70% | 14.20% | 13.01% | |
| Ratios/Supplemental Data |
| Ratios to average net assets: | | | | | | |
| Total expenses | 0.04% | 0.04% | 0.04% | 0.04% | 0.05% 2 | |
| Net investment income (loss) | 2.22% | 3.59% | 3.38% | 2.72% | 2.79% | |
| Portfolio turnover rate3 | 23% | 19% | 7% | 8% | 7% | |
| Net assets, end of period (x 1,000) | $9,926,875 | $6,846,889 | $5,976,674 | $4,692,419 | $3,532,689 | |
| |
1
Calculated based on the average shares outstanding during the period.
2
Effective December 29, 2016, the annual operating expense ratio was reduced. The ratio presented for the period ended 8/31/17 is a blended ratio.
3
Portfolio turnover rate excludes securities received or delivered from processing of in-kind creations or redemptions.
Schwab U.S. Equity ETFs | Annual Report
Schwab U.S. Large-Cap Value ETF
Portfolio Holdings as of August 31, 2021
This section shows all the securities in the fund’s portfolio and their values as of the report date.
The fund files its complete schedule of portfolio holdings with the U.S. Securities and Exchange Commission (SEC) for the first and third quarters of each fiscal year on Form N-PORT Part F. The fund’s Form N-PORT Part F is available on the SEC’s website at www.sec.gov. You can also obtain this information at no cost on the fund’s website at www.schwabassetmanagement.com/schwabetfs_prospectus, by calling 1-866-414-6349, or by sending an email request to orders@mysummaryprospectus.com. The fund also makes available its complete schedule of portfolio holdings on a daily basis on the fund’s website.
| Security | Number
of Shares | Value ($) |
| Common Stock 99.8% of net assets |
| |
| Automobiles & Components 0.9% |
| Aptiv plc * | 122,408 | 18,629,274 |
| Autoliv, Inc. | 35,778 | 3,162,417 |
| BorgWarner, Inc. | 108,776 | 4,642,560 |
| Ford Motor Co. * | 1,777,213 | 23,157,085 |
| General Motors Co. * | 577,900 | 28,322,879 |
| Gentex Corp. | 108,514 | 3,342,231 |
| Harley-Davidson, Inc. | 69,634 | 2,752,632 |
| Lear Corp. | 24,890 | 3,980,907 |
| Luminar Technologies, Inc. *(a) | 90,747 | 1,577,183 |
| QuantumScape Corp. *(a) | 78,162 | 1,719,564 |
| | | 91,286,732 |
| |
| Banks 7.3% |
| Bank of America Corp. | 3,416,089 | 142,621,716 |
| BOK Financial Corp. | 13,631 | 1,200,210 |
| Citigroup, Inc. | 936,325 | 67,331,131 |
| Citizens Financial Group, Inc. | 193,019 | 8,452,302 |
| Comerica, Inc. | 63,365 | 4,683,307 |
| Commerce Bancshares, Inc. | 47,500 | 3,359,200 |
| Cullen/Frost Bankers, Inc. | 25,659 | 2,930,771 |
| East West Bancorp, Inc. | 63,928 | 4,688,480 |
| Fifth Third Bancorp | 319,347 | 12,409,824 |
| First Republic Bank | 79,769 | 15,869,245 |
| Huntington Bancshares, Inc. | 669,232 | 10,393,173 |
| JPMorgan Chase & Co. | 1,371,262 | 219,333,357 |
| KeyCorp | 439,220 | 8,924,950 |
| M&T Bank Corp. | 58,288 | 8,160,903 |
| New York Community Bancorp, Inc. | 210,105 | 2,630,515 |
| People's United Financial, Inc. | 193,916 | 3,186,040 |
| Regions Financial Corp. | 435,702 | 8,901,392 |
| Signature Bank | 26,144 | 6,779,924 |
| The PNC Financial Services Group, Inc. | 192,357 | 36,759,423 |
| Truist Financial Corp. | 609,274 | 34,765,174 |
| U.S. Bancorp | 613,837 | 35,228,105 |
| Wells Fargo & Co. | 1,872,515 | 85,573,935 |
| Zions Bancorp NA | 74,235 | 4,298,206 |
| | | 728,481,283 |
| |
| Capital Goods 8.9% |
| 3M Co. | 262,641 | 51,146,708 |
| A.O. Smith Corp. | 61,121 | 4,444,719 |
| Acuity Brands, Inc. | 16,252 | 2,998,982 |
| AGCO Corp. | 28,124 | 3,870,425 |
| Allegion plc | 40,834 | 5,879,688 |
| Allison Transmission Holdings, Inc. | 49,749 | 1,839,718 |
| AMETEK, Inc. | 104,662 | 14,230,892 |
| Carlisle Cos., Inc. | 23,714 | 4,997,488 |
| Carrier Global Corp. | 369,913 | 21,306,989 |
| Caterpillar, Inc. | 248,154 | 52,328,234 |
| Cummins, Inc. | 66,197 | 15,621,168 |
| Deere & Co. | 141,316 | 53,421,687 |
| Donaldson Co., Inc. | 57,463 | 3,893,118 |
| Security | Number
of Shares | Value ($) |
| Dover Corp. | 65,213 | 11,370,539 |
| Eaton Corp. plc | 180,576 | 30,401,775 |
| Emerson Electric Co. | 271,788 | 28,673,634 |
| Fastenal Co. | 260,186 | 14,531,388 |
| Fortive Corp. | 153,330 | 11,326,487 |
| Fortune Brands Home & Security, Inc. | 62,853 | 6,119,997 |
| General Dynamics Corp. | 103,589 | 20,749,913 |
| General Electric Co. | 497,077 | 52,396,887 |
| Graco, Inc. | 76,627 | 6,009,089 |
| HEICO Corp. | 19,132 | 2,426,320 |
| HEICO Corp., Class A | 33,264 | 3,800,079 |
| Honeywell International, Inc. | 314,582 | 72,954,712 |
| Howmet Aerospace, Inc. | 177,208 | 5,626,354 |
| Hubbell, Inc. | 24,623 | 5,075,047 |
| IDEX Corp. | 34,378 | 7,700,672 |
| Illinois Tool Works, Inc. | 130,154 | 30,307,660 |
| Ingersoll Rand, Inc. * | 175,749 | 9,318,212 |
| Johnson Controls International plc | 324,408 | 24,265,718 |
| Lennox International, Inc. | 15,517 | 5,200,988 |
| Lincoln Electric Holdings, Inc. | 26,779 | 3,738,616 |
| Lockheed Martin Corp. | 110,859 | 39,887,068 |
| Masco Corp. | 115,178 | 6,993,608 |
| Nikola Corp. *(a) | 65,052 | 678,492 |
| Otis Worldwide Corp. | 182,696 | 16,848,225 |
| Owens Corning | 47,103 | 4,500,692 |
| PACCAR, Inc. | 157,217 | 12,871,356 |
| Parker-Hannifin Corp. | 58,413 | 17,329,385 |
| Pentair plc | 74,971 | 5,784,762 |
| Quanta Services, Inc. | 63,165 | 6,449,147 |
| Raytheon Technologies Corp. | 686,389 | 58,178,332 |
| Rockwell Automation, Inc. | 52,565 | 17,107,279 |
| Sensata Technologies Holding plc * | 71,506 | 4,231,725 |
| Snap-on, Inc. | 24,401 | 5,489,005 |
| Stanley Black & Decker, Inc. | 73,124 | 14,132,675 |
| Textron, Inc. | 101,942 | 7,408,125 |
| The Middleby Corp. * | 25,189 | 4,608,076 |
| The Toro Co. | 48,677 | 5,351,549 |
| Trane Technologies plc | 108,236 | 21,484,846 |
| United Rentals, Inc. * | 32,821 | 11,574,326 |
| W.W. Grainger, Inc. | 19,880 | 8,621,956 |
| Watsco, Inc. | 14,842 | 4,132,310 |
| Westinghouse Air Brake Technologies Corp. | 80,672 | 7,243,539 |
| Woodward, Inc. | 26,466 | 3,200,798 |
| Xylem, Inc. | 81,651 | 11,129,848 |
| | | 883,211,027 |
| |
| Commercial & Professional Services 1.3% |
| ADT, Inc. | 68,422 | 585,692 |
| Booz Allen Hamilton Holding Corp. | 61,473 | 5,035,253 |
| Clarivate plc * | 119,637 | 3,013,656 |
| Dun & Bradstreet Holdings, Inc. * | 62,275 | 1,141,501 |
| Equifax, Inc. | 55,146 | 15,014,050 |
| IAA, Inc. * | 61,051 | 3,243,029 |
| IHS Markit Ltd. | 169,638 | 20,458,343 |
| Jacobs Engineering Group, Inc. | 58,989 | 7,961,155 |
| Leidos Holdings, Inc. | 60,006 | 5,887,189 |
| ManpowerGroup, Inc. | 24,478 | 2,972,119 |
Schwab U.S. Equity ETFs | Annual Report
Schwab U.S. Large-Cap Value ETF
Portfolio Holdings as of August 31, 2021 (continued)
| Security | Number
of Shares | Value ($) |
| Nielsen Holdings plc | 162,132 | 3,479,353 |
| Republic Services, Inc. | 95,319 | 11,831,947 |
| Robert Half International, Inc. | 51,119 | 5,285,705 |
| Rollins, Inc. | 99,941 | 3,889,704 |
| Stericycle, Inc. * | 41,699 | 2,902,250 |
| TransUnion | 86,662 | 10,532,033 |
| Waste Management, Inc. | 176,024 | 27,303,083 |
| | | 130,536,062 |
| |
| Consumer Durables & Apparel 2.0% |
| D.R. Horton, Inc. | 148,512 | 14,200,717 |
| Garmin Ltd. | 67,972 | 11,856,356 |
| Hanesbrands, Inc. | 158,182 | 2,954,840 |
| Hasbro, Inc. | 57,654 | 5,667,965 |
| Leggett & Platt, Inc. | 60,162 | 2,911,239 |
| Lennar Corp., Class A | 124,837 | 13,396,259 |
| Lennar Corp., Class B | 6,885 | 602,575 |
| Mohawk Industries, Inc. * | 26,572 | 5,254,879 |
| Newell Brands, Inc. | 171,320 | 4,353,241 |
| NIKE, Inc., Class B | 577,537 | 95,143,445 |
| Polaris, Inc. | 26,152 | 3,131,964 |
| PulteGroup, Inc. | 119,329 | 6,427,060 |
| Tapestry, Inc. * | 126,627 | 5,105,601 |
| Toll Brothers, Inc. | 50,629 | 3,243,294 |
| Under Armour, Inc., Class A * | 86,538 | 2,002,489 |
| Under Armour, Inc., Class C * | 88,055 | 1,766,383 |
| VF Corp. | 145,571 | 11,131,814 |
| Whirlpool Corp. | 28,405 | 6,292,560 |
| | | 195,442,681 |
| |
| Consumer Services 2.7% |
| Aramark | 115,895 | 4,031,987 |
| Bright Horizons Family Solutions, Inc. * | 27,729 | 4,041,779 |
| Carnival Corp. * | 362,574 | 8,752,536 |
| Darden Restaurants, Inc. | 59,329 | 8,937,914 |
| DraftKings, Inc., Class A * | 147,226 | 8,729,030 |
| Hilton Worldwide Holdings, Inc. * | 126,066 | 15,740,601 |
| Las Vegas Sands Corp. * | 149,310 | 6,660,719 |
| Marriott International, Inc., Class A * | 120,903 | 16,338,831 |
| McDonald's Corp. | 337,962 | 80,252,457 |
| MGM Resorts International | 184,856 | 7,878,563 |
| Royal Caribbean Cruises Ltd. * | 98,861 | 8,178,771 |
| Service Corp. International | 76,099 | 4,775,973 |
| Starbucks Corp. | 533,803 | 62,716,514 |
| Terminix Global Holdings, Inc. * | 58,383 | 2,430,484 |
| Vail Resorts, Inc. * | 18,173 | 5,540,039 |
| Wyndham Hotels & Resorts, Inc. | 42,402 | 3,082,625 |
| Wynn Resorts Ltd. * | 47,460 | 4,826,207 |
| Yum! Brands, Inc. | 134,918 | 17,678,306 |
| | | 270,593,336 |
| |
| Diversified Financials 8.3% |
| AGNC Investment Corp. | 238,792 | 3,894,697 |
| Ally Financial, Inc. | 167,256 | 8,847,842 |
| American Express Co. | 294,784 | 48,922,353 |
| Ameriprise Financial, Inc. | 52,409 | 14,302,940 |
| Annaly Capital Management, Inc. | 632,481 | 5,496,260 |
| Apollo Global Management, Inc. | 96,010 | 5,739,478 |
| Berkshire Hathaway, Inc., Class B * | 858,610 | 245,364,980 |
| Blackstone, Inc. | 310,128 | 38,992,393 |
| Capital One Financial Corp. | 204,598 | 33,957,130 |
| Cboe Global Markets, Inc. | 48,479 | 6,115,626 |
| CME Group, Inc. | 162,587 | 32,797,050 |
| Discover Financial Services | 138,081 | 17,704,746 |
| Equitable Holdings, Inc. | 173,577 | 5,382,623 |
| Security | Number
of Shares | Value ($) |
| Franklin Resources, Inc. | 123,062 | 3,992,131 |
| Intercontinental Exchange, Inc. | 255,101 | 30,492,223 |
| Invesco Ltd. | 172,037 | 4,355,977 |
| Jefferies Financial Group, Inc. | 90,641 | 3,350,091 |
| KKR & Co., Inc. | 263,509 | 16,940,994 |
| Morgan Stanley | 674,317 | 70,418,924 |
| Morningstar, Inc. | 9,757 | 2,614,778 |
| Nasdaq, Inc. | 52,145 | 10,208,948 |
| Northern Trust Corp. | 94,428 | 11,191,607 |
| Raymond James Financial, Inc. | 55,489 | 7,762,911 |
| Santander Consumer USA Holdings, Inc. | 31,868 | 1,329,852 |
| SEI Investments Co. | 53,994 | 3,391,363 |
| Starwood Property Trust, Inc. | 130,254 | 3,360,553 |
| State Street Corp. | 157,541 | 14,637,134 |
| Synchrony Financial | 245,196 | 12,198,501 |
| T. Rowe Price Group, Inc. | 102,697 | 22,990,777 |
| The Bank of New York Mellon Corp. | 365,186 | 20,165,571 |
| The Carlyle Group, Inc. | 53,412 | 2,637,485 |
| The Charles Schwab Corp. (b) | 678,201 | 49,406,943 |
| The Goldman Sachs Group, Inc. | 154,123 | 63,731,402 |
| Voya Financial, Inc. | 54,384 | 3,533,872 |
| | | 826,230,155 |
| |
| Energy 4.3% |
| APA Corp. | 169,877 | 3,309,204 |
| Baker Hughes Co. | 329,856 | 7,514,120 |
| Cabot Oil & Gas Corp. | 180,708 | 2,871,450 |
| Chevron Corp. | 875,822 | 84,753,295 |
| ConocoPhillips | 611,776 | 33,971,921 |
| Continental Resources, Inc. | 28,509 | 1,119,834 |
| Devon Energy Corp. | 270,251 | 7,985,917 |
| DTE Midstream LLC * | 43,622 | 2,027,114 |
| EOG Resources, Inc. | 264,122 | 17,833,518 |
| Exxon Mobil Corp. | 1,918,241 | 104,582,499 |
| Halliburton Co. | 401,756 | 8,027,085 |
| Hess Corp. | 123,997 | 8,524,794 |
| HollyFrontier Corp. | 68,079 | 2,200,994 |
| Kinder Morgan, Inc. | 881,926 | 14,348,936 |
| Marathon Oil Corp. | 358,357 | 4,210,695 |
| Marathon Petroleum Corp. | 288,504 | 17,099,632 |
| NOV, Inc. * | 177,532 | 2,338,096 |
| Occidental Petroleum Corp. | 379,426 | 9,747,454 |
| ONEOK, Inc. | 202,121 | 10,615,395 |
| Phillips 66 | 198,207 | 14,090,536 |
| Pioneer Natural Resources Co. | 104,967 | 15,710,411 |
| Schlumberger N.V. | 632,731 | 17,741,777 |
| Targa Resources Corp. | 103,896 | 4,563,112 |
| Texas Pacific Land Corp. | 3,499 | 4,757,730 |
| The Williams Cos., Inc. | 550,357 | 13,588,314 |
| Valero Energy Corp. | 185,101 | 12,274,047 |
| | | 425,807,880 |
| |
| Food & Staples Retailing 1.4% |
| Sysco Corp. | 231,569 | 18,444,471 |
| The Kroger Co. | 342,800 | 15,779,084 |
| Walgreens Boots Alliance, Inc. | 324,923 | 16,489,842 |
| Walmart, Inc. | 621,993 | 92,117,163 |
| | | 142,830,560 |
| |
| Food, Beverage & Tobacco 5.1% |
| Altria Group, Inc. | 838,523 | 42,119,010 |
| Archer-Daniels-Midland Co. | 253,160 | 15,189,600 |
| Brown-Forman Corp., Class A | 25,360 | 1,678,832 |
| Brown-Forman Corp., Class B | 82,667 | 5,804,877 |
| Bunge Ltd. | 64,179 | 4,858,992 |
Schwab U.S. Equity ETFs | Annual Report
Schwab U.S. Large-Cap Value ETF
Portfolio Holdings as of August 31, 2021 (continued)
| Security | Number
of Shares | Value ($) |
| Campbell Soup Co. | 92,017 | 3,839,869 |
| Conagra Brands, Inc. | 216,634 | 7,174,918 |
| Constellation Brands, Inc., Class A | 76,493 | 16,150,732 |
| General Mills, Inc. | 276,033 | 15,957,468 |
| Hormel Foods Corp. | 127,702 | 5,815,549 |
| Ingredion, Inc. | 30,358 | 2,667,254 |
| Kellogg Co. | 114,458 | 7,226,878 |
| Keurig Dr Pepper, Inc. | 263,330 | 9,392,981 |
| Lamb Weston Holdings, Inc. | 66,446 | 4,328,957 |
| McCormick & Co., Inc. Non-Voting Shares | 112,829 | 9,736,014 |
| Molson Coors Beverage Co., Class B | 85,386 | 4,058,397 |
| Mondelez International, Inc., Class A | 636,510 | 39,508,176 |
| PepsiCo, Inc. | 625,837 | 97,874,648 |
| Philip Morris International, Inc. | 705,932 | 72,710,996 |
| The Coca-Cola Co. | 1,757,721 | 98,977,270 |
| The Hershey Co. | 66,414 | 11,801,768 |
| The J.M. Smucker Co. | 49,609 | 6,135,145 |
| The Kraft Heinz Co. | 293,659 | 10,568,787 |
| Tyson Foods, Inc., Class A | 133,433 | 10,477,159 |
| | | 504,054,277 |
| |
| Health Care Equipment & Services 4.8% |
| Abbott Laboratories | 804,805 | 101,703,208 |
| AmerisourceBergen Corp. | 67,013 | 8,189,659 |
| Anthem, Inc. | 110,912 | 41,606,418 |
| Baxter International, Inc. | 227,674 | 17,353,312 |
| Becton Dickinson & Co. | 131,709 | 33,151,155 |
| Cardinal Health, Inc. | 131,659 | 6,910,781 |
| Cerner Corp. | 136,126 | 10,393,220 |
| CVS Health Corp. | 596,341 | 51,517,899 |
| DaVita, Inc. * | 31,867 | 4,167,248 |
| Dentsply Sirona, Inc. | 99,144 | 6,117,185 |
| Encompass Health Corp. | 45,071 | 3,535,820 |
| Henry Schein, Inc. * | 63,829 | 4,824,834 |
| Hill-Rom Holdings, Inc. | 30,242 | 4,402,630 |
| Hologic, Inc. * | 116,272 | 9,202,929 |
| Laboratory Corp. of America Holdings * | 44,260 | 13,427,599 |
| McKesson Corp. | 71,626 | 14,621,732 |
| Medtronic plc | 609,339 | 81,334,570 |
| Quest Diagnostics, Inc. | 59,218 | 9,050,287 |
| STERIS plc | 44,086 | 9,478,931 |
| Stryker Corp. | 148,522 | 41,155,446 |
| Universal Health Services, Inc., Class B | 35,119 | 5,470,135 |
| | | 477,614,998 |
| |
| Household & Personal Products 2.3% |
| Church & Dwight Co., Inc. | 111,021 | 9,288,017 |
| Colgate-Palmolive Co. | 383,006 | 29,855,318 |
| Herbalife Nutrition Ltd. * | 39,512 | 2,028,546 |
| Kimberly-Clark Corp. | 153,002 | 21,085,205 |
| Reynolds Consumer Products, Inc. | 24,186 | 683,980 |
| The Clorox Co. | 56,414 | 9,480,373 |
| The Procter & Gamble Co. | 1,109,031 | 157,914,924 |
| | | 230,336,363 |
| |
| Insurance 3.6% |
| Aflac, Inc. | 286,156 | 16,219,322 |
| American Financial Group, Inc. | 31,352 | 4,324,695 |
| American International Group, Inc. | 388,447 | 21,193,668 |
| Aon plc, Class A | 102,258 | 29,333,730 |
| Arch Capital Group Ltd. * | 183,023 | 7,522,245 |
| Arthur J. Gallagher & Co. | 92,867 | 13,337,558 |
| Assurant, Inc. | 27,479 | 4,674,453 |
| Brown & Brown, Inc. | 105,963 | 6,151,152 |
| Chubb Ltd. | 203,824 | 37,487,310 |
| Security | Number
of Shares | Value ($) |
| Cincinnati Financial Corp. | 67,659 | 8,349,121 |
| CNA Financial Corp. | 12,462 | 552,690 |
| Erie Indemnity Co., Class A | 11,301 | 2,001,294 |
| Everest Re Group Ltd. | 18,140 | 4,805,286 |
| Fidelity National Financial, Inc. | 131,108 | 6,402,004 |
| Globe Life, Inc. | 42,985 | 4,129,569 |
| Lincoln National Corp. | 81,141 | 5,570,330 |
| Loews Corp. | 101,570 | 5,674,716 |
| Marsh & McLennan Cos., Inc. | 230,256 | 36,196,243 |
| MetLife, Inc. | 336,787 | 20,880,794 |
| Old Republic International Corp. | 128,345 | 3,336,970 |
| Principal Financial Group, Inc. | 114,764 | 7,667,383 |
| Prudential Financial, Inc. | 178,761 | 18,927,215 |
| Reinsurance Group of America, Inc. | 30,718 | 3,557,759 |
| The Allstate Corp. | 135,500 | 18,330,440 |
| The Hartford Financial Services Group, Inc. | 161,870 | 10,880,901 |
| The Progressive Corp. | 265,234 | 25,552,643 |
| The Travelers Cos., Inc. | 113,838 | 18,181,067 |
| W.R. Berkley Corp. | 63,550 | 4,785,950 |
| Willis Towers Watson plc | 58,436 | 12,897,994 |
| | | 358,924,502 |
| |
| Materials 3.5% |
| Air Products and Chemicals, Inc. | 100,275 | 27,025,115 |
| Albemarle Corp. | 52,910 | 12,525,913 |
| Amcor plc | 696,315 | 8,947,648 |
| AptarGroup, Inc. | 29,742 | 4,009,222 |
| Ashland Global Holdings, Inc. | 24,933 | 2,271,646 |
| Avery Dennison Corp. | 37,634 | 8,482,327 |
| Axalta Coating Systems Ltd. * | 94,125 | 2,874,578 |
| Ball Corp. | 148,833 | 14,282,015 |
| Celanese Corp. | 50,882 | 8,069,885 |
| CF Industries Holdings, Inc. | 97,108 | 4,410,645 |
| Corteva, Inc. | 333,816 | 14,677,890 |
| Crown Holdings, Inc. | 61,165 | 6,715,305 |
| Dow, Inc. | 338,045 | 21,263,031 |
| DuPont de Nemours, Inc. | 240,898 | 17,831,270 |
| Eastman Chemical Co. | 61,988 | 7,014,562 |
| Ecolab, Inc. | 112,770 | 25,413,847 |
| FMC Corp. | 58,096 | 5,439,528 |
| Freeport-McMoRan, Inc. | 663,178 | 24,133,047 |
| Huntsman Corp. | 89,896 | 2,375,951 |
| International Flavors & Fragrances, Inc. | 112,742 | 17,080,413 |
| International Paper Co. | 177,144 | 10,644,583 |
| LyondellBasell Industries N.V., Class A | 116,743 | 11,715,160 |
| NewMarket Corp. | 3,379 | 1,181,738 |
| Nucor Corp. | 135,527 | 15,932,554 |
| Packaging Corp. of America | 42,940 | 6,513,998 |
| PPG Industries, Inc. | 107,340 | 17,126,097 |
| Reliance Steel & Aluminum Co. | 28,692 | 4,304,948 |
| RPM International, Inc. | 58,840 | 4,841,944 |
| Sealed Air Corp. | 69,155 | 4,220,530 |
| Sonoco Products Co. | 45,818 | 2,991,915 |
| Steel Dynamics, Inc. | 90,839 | 6,130,724 |
| The Mosaic Co. | 156,607 | 5,039,613 |
| The Scotts Miracle-Gro Co. | 18,490 | 2,899,787 |
| Vulcan Materials Co. | 60,194 | 11,191,870 |
| Westlake Chemical Corp. | 15,597 | 1,362,398 |
| Westrock Co. | 120,600 | 6,276,024 |
| | | 347,217,721 |
| |
| Media & Entertainment 3.9% |
| Activision Blizzard, Inc. | 352,035 | 28,997,123 |
| Comcast Corp., Class A | 2,076,854 | 126,023,501 |
| Discovery, Inc., Class A *(a) | 76,479 | 2,205,654 |
| Discovery, Inc., Class C * | 135,198 | 3,730,113 |
Schwab U.S. Equity ETFs | Annual Report
Schwab U.S. Large-Cap Value ETF
Portfolio Holdings as of August 31, 2021 (continued)
| Security | Number
of Shares | Value ($) |
| DISH Network Corp., Class A * | 112,776 | 4,915,906 |
| Electronic Arts, Inc. | 129,540 | 18,810,503 |
| IAC/InterActiveCorp * | 37,827 | 4,995,055 |
| Liberty Media Corp. - Liberty Formula One, Class A * | 11,655 | 532,517 |
| Liberty Media Corp. - Liberty Formula One, Class C * | 91,907 | 4,644,980 |
| News Corp., Class A | 176,128 | 3,957,596 |
| News Corp., Class B | 55,325 | 1,218,810 |
| Omnicom Group, Inc. | 97,635 | 7,148,835 |
| Sirius XM Holdings, Inc. (a) | 519,533 | 3,257,472 |
| Skillz, Inc. *(a) | 114,366 | 1,346,088 |
| The Interpublic Group of Cos., Inc. | 178,489 | 6,645,146 |
| The Walt Disney Co. * | 823,028 | 149,214,976 |
| ViacomCBS, Inc., Class A | 4,056 | 186,495 |
| ViacomCBS, Inc., Class B | 273,518 | 11,337,321 |
| Zynga, Inc., Class A * | 459,197 | 4,063,893 |
| | | 383,231,984 |
| |
| Pharmaceuticals, Biotechnology & Life Sciences 9.4% |
| AbbVie, Inc. | 799,981 | 96,621,705 |
| Agilent Technologies, Inc. | 137,401 | 24,109,753 |
| Amgen, Inc. | 260,240 | 58,691,927 |
| Biogen, Inc. * | 68,257 | 23,132,980 |
| Bristol-Myers Squibb Co. | 1,011,809 | 67,649,550 |
| Catalent, Inc. * | 77,204 | 10,070,490 |
| Elanco Animal Health, Inc. * | 214,310 | 7,153,668 |
| Eli Lilly & Co. | 360,571 | 93,131,884 |
| Gilead Sciences, Inc. | 568,247 | 41,357,017 |
| Jazz Pharmaceuticals plc * | 27,062 | 3,564,336 |
| Johnson & Johnson | 1,192,859 | 206,519,679 |
| Merck & Co., Inc. | 1,146,863 | 87,494,178 |
| Moderna, Inc. * | 138,247 | 52,076,262 |
| Novavax, Inc. * | 30,939 | 7,380,189 |
| Organon & Co. | 114,988 | 3,896,943 |
| PerkinElmer, Inc. | 50,804 | 9,388,579 |
| Perrigo Co., plc | 60,294 | 2,469,039 |
| Pfizer, Inc. | 2,535,586 | 116,814,447 |
| PPD, Inc. * | 49,412 | 2,288,270 |
| Royalty Pharma plc, Class A | 39,209 | 1,515,428 |
| Viatris, Inc. | 547,720 | 8,013,144 |
| Waters Corp. * | 27,965 | 11,578,069 |
| | | 934,917,537 |
| |
| Real Estate 4.5% |
| Alexandria Real Estate Equities, Inc. | 62,165 | 12,828,991 |
| American Campus Communities, Inc. | 62,461 | 3,176,142 |
| American Homes 4 Rent, Class A | 124,238 | 5,210,542 |
| Americold Realty Trust | 114,763 | 4,216,393 |
| Apartment Income REIT Corp. | 71,229 | 3,619,858 |
| Apartment Investment & Management Co., Class A | 66,948 | 480,687 |
| AvalonBay Communities, Inc. | 63,251 | 14,521,165 |
| Boston Properties, Inc. | 64,064 | 7,238,591 |
| Camden Property Trust | 44,025 | 6,605,511 |
| Crown Castle International Corp. | 195,753 | 38,111,152 |
| CubeSmart | 91,465 | 4,893,377 |
| Digital Realty Trust, Inc. | 127,435 | 20,887,871 |
| Douglas Emmett, Inc. | 74,718 | 2,466,441 |
| Duke Realty Corp. | 169,113 | 8,880,124 |
| Equity LifeStyle Properties, Inc. | 76,398 | 6,499,178 |
| Equity Residential | 155,823 | 13,100,040 |
| Essex Property Trust, Inc. | 29,478 | 9,749,554 |
| Extra Space Storage, Inc. | 60,646 | 11,335,344 |
| Federal Realty Investment Trust | 32,115 | 3,910,643 |
| Gaming & Leisure Properties, Inc. | 99,218 | 4,891,447 |
| Security | Number
of Shares | Value ($) |
| Healthcare Trust of America, Inc., Class A | 99,310 | 3,012,072 |
| Healthpeak Properties, Inc. | 243,889 | 8,780,004 |
| Host Hotels & Resorts, Inc. * | 319,985 | 5,298,952 |
| Invitation Homes, Inc. | 257,426 | 10,600,803 |
| Iron Mountain, Inc. | 130,810 | 6,246,177 |
| Jones Lang LaSalle, Inc. * | 23,270 | 5,641,346 |
| Kilroy Realty Corp. | 47,889 | 3,143,913 |
| Kimco Realty Corp. | 271,882 | 5,924,309 |
| Lamar Advertising Co., Class A | 39,390 | 4,483,764 |
| Medical Properties Trust, Inc. | 267,063 | 5,469,450 |
| Mid-America Apartment Communities, Inc. | 51,909 | 9,985,734 |
| National Retail Properties, Inc. | 79,355 | 3,778,092 |
| Omega Healthcare Investors, Inc. | 107,150 | 3,592,739 |
| Prologis, Inc. | 335,166 | 45,133,454 |
| Public Storage | 68,889 | 22,293,169 |
| Realty Income Corp. | 169,182 | 12,218,324 |
| Regency Centers Corp. | 71,666 | 4,917,721 |
| Simon Property Group, Inc. | 148,693 | 19,991,774 |
| STORE Capital Corp. | 110,504 | 3,985,879 |
| Sun Communities, Inc. | 50,697 | 10,214,938 |
| UDR, Inc. | 134,701 | 7,276,548 |
| Ventas, Inc. | 170,199 | 9,520,932 |
| VEREIT, Inc. | 104,092 | 5,259,769 |
| VICI Properties, Inc. | 243,205 | 7,517,466 |
| Vornado Realty Trust | 70,560 | 2,955,053 |
| Welltower, Inc. | 189,029 | 16,545,708 |
| Weyerhaeuser Co. | 339,395 | 12,218,220 |
| WP Carey, Inc. | 80,777 | 6,310,299 |
| | | 444,939,660 |
| |
| Retailing 2.9% |
| Advance Auto Parts, Inc. | 29,624 | 6,009,228 |
| Bath & Body Works, Inc. | 119,719 | 8,078,638 |
| Best Buy Co., Inc. | 100,925 | 11,758,772 |
| Burlington Stores, Inc. * | 30,188 | 9,041,004 |
| CarMax, Inc. * | 73,901 | 9,253,144 |
| ContextLogic, Inc., Class A *(a) | 34,803 | 250,930 |
| eBay, Inc. | 292,920 | 22,478,681 |
| Genuine Parts Co. | 65,353 | 7,985,483 |
| LKQ Corp. * | 126,286 | 6,654,009 |
| Lowe's Cos., Inc. | 320,200 | 65,285,578 |
| Ross Stores, Inc. | 161,351 | 19,103,958 |
| Target Corp. | 224,102 | 55,348,712 |
| The Gap, Inc. | 94,368 | 2,522,457 |
| The TJX Cos., Inc. | 546,406 | 39,734,644 |
| Tractor Supply Co. | 52,260 | 10,151,505 |
| Victoria's Secret & Co. * | 39,906 | 2,645,768 |
| Williams-Sonoma, Inc. | 34,538 | 6,448,245 |
| | | 282,750,756 |
| |
| Semiconductors & Semiconductor Equipment 5.7% |
| Advanced Micro Devices, Inc. * | 550,348 | 60,934,531 |
| Analog Devices, Inc. | 243,495 | 39,677,388 |
| Applied Materials, Inc. | 415,706 | 56,174,352 |
| Entegris, Inc. | 61,418 | 7,378,758 |
| First Solar, Inc. * | 38,439 | 3,613,266 |
| Intel Corp. | 1,829,126 | 98,882,551 |
| KLA Corp. | 69,349 | 23,575,886 |
| Marvell Technology, Inc. | 370,747 | 22,686,009 |
| Microchip Technology, Inc. | 123,838 | 19,487,148 |
| Micron Technology, Inc. * | 508,188 | 37,453,456 |
| QUALCOMM, Inc. | 510,946 | 74,950,669 |
| Skyworks Solutions, Inc. | 74,777 | 13,718,588 |
| Teradyne, Inc. | 75,480 | 9,166,291 |
Schwab U.S. Equity ETFs | Annual Report
Schwab U.S. Large-Cap Value ETF
Portfolio Holdings as of August 31, 2021 (continued)
| Security | Number
of Shares | Value ($) |
| Texas Instruments, Inc. | 418,345 | 79,866,244 |
| Xilinx, Inc. | 111,347 | 17,324,480 |
| | | 564,889,617 |
| |
| Software & Services 4.2% |
| Accenture plc, Class A | 287,918 | 96,901,682 |
| Akamai Technologies, Inc. * | 73,942 | 8,373,932 |
| AppLovin Corp., Class A *(a) | 11,543 | 812,627 |
| Automatic Data Processing, Inc. | 192,845 | 40,312,319 |
| Broadridge Financial Solutions, Inc. | 52,631 | 9,064,111 |
| CDK Global, Inc. | 55,359 | 2,302,934 |
| Ceridian HCM Holding, Inc. * | 59,657 | 6,702,464 |
| Citrix Systems, Inc. | 56,363 | 5,798,062 |
| Cognizant Technology Solutions Corp., Class A | 238,853 | 18,226,872 |
| Concentrix Corp. * | 18,839 | 3,266,494 |
| DXC Technology Co. * | 115,671 | 4,247,439 |
| Euronet Worldwide, Inc. * | 23,718 | 3,159,949 |
| Fidelity National Information Services, Inc. | 281,009 | 35,904,520 |
| Genpact Ltd. | 78,877 | 4,092,139 |
| Guidewire Software, Inc. * | 38,076 | 4,510,483 |
| International Business Machines Corp. | 404,699 | 56,795,458 |
| NortonLifeLock, Inc. | 263,329 | 6,994,018 |
| Nuance Communications, Inc. * | 129,096 | 7,106,735 |
| Oracle Corp. | 822,853 | 73,340,888 |
| Paychex, Inc. | 145,227 | 16,624,135 |
| The Western Union Co. | 184,498 | 3,992,537 |
| VeriSign, Inc. * | 44,971 | 9,725,428 |
| | | 418,255,226 |
| |
| Technology Hardware & Equipment 3.1% |
| Amphenol Corp., Class A | 270,641 | 20,739,220 |
| Arrow Electronics, Inc. * | 33,296 | 4,036,141 |
| CDW Corp. | 63,558 | 12,750,370 |
| Cisco Systems, Inc. | 1,908,735 | 112,653,540 |
| Cognex Corp. | 80,096 | 7,098,108 |
| Corning, Inc. | 351,016 | 14,037,130 |
| F5 Networks, Inc. * | 27,098 | 5,516,340 |
| Hewlett Packard Enterprise Co. | 592,563 | 9,161,024 |
| HP, Inc. | 544,055 | 16,180,196 |
| Jabil, Inc. | 60,720 | 3,751,282 |
| Juniper Networks, Inc. | 148,965 | 4,317,006 |
| Keysight Technologies, Inc. * | 83,493 | 14,976,974 |
| Motorola Solutions, Inc. | 76,866 | 18,772,214 |
| National Instruments Corp. | 59,647 | 2,494,438 |
| NetApp, Inc. | 100,423 | 8,930,617 |
| Seagate Technology Holdings plc | 90,273 | 7,907,012 |
| TE Connectivity Ltd. | 149,497 | 22,457,439 |
| Trimble, Inc. * | 113,808 | 10,722,990 |
| Western Digital Corp. * | 139,157 | 8,794,722 |
| | | 305,296,763 |
| |
| Telecommunication Services 2.1% |
| AT&T, Inc. | 3,234,038 | 88,677,322 |
| Liberty Global plc, Class A * | 63,113 | 1,813,868 |
| Liberty Global plc, Class C * | 156,274 | 4,528,820 |
| Lumen Technologies, Inc. | 451,524 | 5,553,745 |
| Verizon Communications, Inc. | 1,875,266 | 103,139,630 |
| | | 203,713,385 |
| |
| Transportation 3.0% |
| Alaska Air Group, Inc. * | 56,511 | 3,240,341 |
| American Airlines Group, Inc. * | 291,132 | 5,805,172 |
| C.H. Robinson Worldwide, Inc. | 60,297 | 5,430,348 |
| Security | Number
of Shares | Value ($) |
| CSX Corp. | 1,028,698 | 33,463,546 |
| Delta Air Lines, Inc. * | 290,100 | 11,731,644 |
| Expeditors International of Washington, Inc. | 76,297 | 9,509,658 |
| FedEx Corp. | 110,598 | 29,384,783 |
| J.B. Hunt Transport Services, Inc. | 37,900 | 6,723,460 |
| Kansas City Southern | 41,207 | 11,565,569 |
| Norfolk Southern Corp. | 113,371 | 28,744,083 |
| Southwest Airlines Co. * | 267,941 | 13,338,103 |
| Union Pacific Corp. | 300,918 | 65,251,059 |
| United Airlines Holdings, Inc. * | 145,999 | 6,790,413 |
| United Parcel Service, Inc., Class B | 327,664 | 64,100,908 |
| | | 295,079,087 |
| |
| Utilities 4.6% |
| Alliant Energy Corp. | 112,685 | 6,850,121 |
| Ameren Corp. | 115,913 | 10,167,888 |
| American Electric Power Co., Inc. | 226,208 | 20,261,451 |
| American Water Works Co., Inc. | 82,122 | 14,966,735 |
| Atmos Energy Corp. | 59,326 | 5,784,878 |
| Avangrid, Inc. | 31,792 | 1,737,433 |
| CenterPoint Energy, Inc. | 261,711 | 6,566,329 |
| CMS Energy Corp. | 130,502 | 8,369,093 |
| Consolidated Edison, Inc. | 155,289 | 11,716,555 |
| Dominion Energy, Inc. | 365,535 | 28,453,244 |
| DTE Energy Co. | 87,875 | 10,574,878 |
| Duke Energy Corp. | 348,388 | 36,462,288 |
| Edison International | 172,049 | 9,951,314 |
| Entergy Corp. | 90,982 | 10,063,519 |
| Essential Utilities, Inc. | 101,453 | 5,035,112 |
| Evergy, Inc. | 103,343 | 7,073,828 |
| Eversource Energy | 155,521 | 14,110,420 |
| Exelon Corp. | 442,175 | 21,675,419 |
| FirstEnergy Corp. | 246,869 | 9,595,798 |
| NextEra Energy, Inc. | 888,575 | 74,631,414 |
| NiSource, Inc. | 177,473 | 4,374,710 |
| NRG Energy, Inc. | 111,071 | 5,072,613 |
| OGE Energy Corp. | 91,001 | 3,222,346 |
| PG&E Corp. * | 674,560 | 6,185,715 |
| Pinnacle West Capital Corp. | 51,150 | 3,933,435 |
| PPL Corp. | 348,743 | 10,235,607 |
| Public Service Enterprise Group, Inc. | 228,846 | 14,632,413 |
| Sempra Energy | 142,572 | 18,870,830 |
| The AES Corp. | 300,424 | 7,171,121 |
| The Southern Co. | 479,959 | 31,547,705 |
| UGI Corp. | 94,805 | 4,390,420 |
| Vistra Corp. | 219,103 | 4,182,676 |
| WEC Energy Group, Inc. | 143,015 | 13,512,057 |
| Xcel Energy, Inc. | 243,823 | 16,762,831 |
| | | 458,142,196 |
| Total Common Stock |
| (Cost $7,343,094,135) | | 9,903,783,788 |
|
| Short-Term Investments 0.1% of net assets |
| |
| Money Market Funds 0.1% |
| State Street Institutional U.S. Government Money Market Fund, Premier Class 0.03% (c) | 2,878,219 | 2,878,219 |
| Wells Fargo Government Money Market Fund, Select Class 0.03% (c)(d) | 7,023,045 | 7,023,045 |
| Total Short-Term Investments |
| (Cost $9,901,264) | | 9,901,264 |
Schwab U.S. Equity ETFs | Annual Report
Schwab U.S. Large-Cap Value ETF
Portfolio Holdings as of August 31, 2021 (continued)
| | Number of
Contracts | Notional
Amount
($) | Current Value/
Unrealized
Appreciation
($) |
| Futures Contracts | |
| Long | |
| Russell 1000 Value Index, e-mini, expires 09/17/21 | 261 | 20,895,660 | 144,060 |
| * | Non-income producing security. |
| (a) | All or a portion of this security is on loan. Securities on loan were valued at $6,842,129. |
| (b) | Issuer is affiliated with the fund’s investment adviser. |
| (c) | The rate shown is the 7-day yield. |
| (d) | Security purchased with cash collateral received for securities on loan. |
| | |
| REIT — | Real Estate Investment Trust |
The fund owns shares of an affiliate, The Charles Schwab Corp., since that company is included in its index. Below is the summary of investment activities involving The Charles Schwab Corp. shares owned by the fund during the period ended August 31, 2021:
| |
Value at
8/31/20 | Gross
Purchases | Gross
Sales | Realized
Gains(Losses) | Net change
in unrealized
appreciation
(depreciation) |
Value at
8/31/21 | Balance
of Shares
Held at
8/31/21 | Dividends
Received |
| The Charles Schwab Corp. | $21,879,658 | $13,398,607 | ($8,627,452) | $59,929 | $22,696,201 | $49,406,943 | 678,201 | $473,252 |
The following is a summary of the inputs used to value the fund’s investments as of August 31, 2021 (see financial note 2(a) for additional information):
| Description | Quoted Prices in
Active Markets for
Identical Assets
(Level 1) | Other Significant
Observable Inputs
(Level 2) | Significant
Unobservable Inputs
(Level 3) | Total | |
| Assets | | | | | |
| Common Stock1 | $9,903,783,788 | $— | $— | $9,903,783,788 | |
| Short-Term Investments1 | 9,901,264 | — | — | 9,901,264 | |
| Futures Contracts2 | 144,060 | — | — | 144,060 | |
| Total | $9,913,829,112 | $— | $— | $9,913,829,112 | |
| 1 | As categorized in the Portfolio Holdings. |
| 2 | Futures contracts are reported at cumulative unrealized appreciation or depreciation. |
Fund investments in mutual funds are classified as Level 1, without consideration to the classification level of the underlying securities held by the mutual funds, which could be Level 1, Level 2 or Level 3.
Schwab U.S. Equity ETFs | Annual Report
Schwab U.S. Large-Cap Value ETF
Statement of Assets and Liabilities
As of August 31, 2021
| Assets |
| Investments in securities, at value - affiliated (cost $30,983,348) | | $49,406,943 |
| Investments in securities, at value - unaffiliated (cost $7,314,989,006) including securities on loan of $6,842,129 | | 9,857,255,064 |
| Collateral invested for securities on loan, at value (cost $7,023,045) | | 7,023,045 |
| Deposit with broker for futures contracts | | 1,392,000 |
| Receivables: | | |
| Dividends | | 19,039,262 |
| Fund shares sold | | 10,601,860 |
| Income from securities on loan | + | 3,626 |
| Total assets | | 9,944,721,800 |
| Liabilities |
| Collateral held for securities on loan | | 7,023,045 |
| Payables: | | |
| Investments bought | | 10,490,575 |
| Management fees | | 322,525 |
| Variation margin on futures contracts | + | 10,491 |
| Total liabilities | | 17,846,636 |
| Net Assets |
| Total assets | | 9,944,721,800 |
| Total liabilities | – | 17,846,636 |
| Net assets | | $9,926,875,164 |
| Net Assets by Source | | |
| Capital received from investors | | 7,815,939,608 |
| Total distributable earnings | | 2,110,935,556 |
| Net Asset Value (NAV) |
| Net Assets | ÷ | Shares
Outstanding | = | NAV |
| $9,926,875,164 | | 140,450,000 | | $70.68 |
| | | | | |
Schwab U.S. Equity ETFs | Annual Report
Schwab U.S. Large-Cap Value ETF
Statement of Operations
For the period September 1, 2020 through August 31, 2021
| Investment Income |
| Dividends received from securities — affiliated | | $473,252 |
| Dividends received from securities — unaffiliated (net of foreign withholding tax of $8,551) | | 192,287,638 |
| Securities on loan, net | + | 198,279 |
| Total investment income | | 192,959,169 |
| Expenses |
| Management fees | | 3,419,864 |
| Total expenses | – | 3,419,864 |
| Net investment income | | 189,539,305 |
| Realized and Unrealized Gains (Losses) |
| Net realized losses on sales of securities — affiliated | | (1,026,910) |
| Net realized losses on sales of securities — unaffiliated | | (247,284,895) |
| Net realized gains on in-kind redemptions — affiliated | | 1,086,839 |
| Net realized gains on in-kind redemptions — unaffiliated | | 196,005,075 |
| Net realized gains on futures contracts | + | 2,852,454 |
| Net realized losses | | (48,367,437) |
| Net change in unrealized appreciation (depreciation) on securities — affiliated | | 22,696,201 |
| Net change in unrealized appreciation (depreciation) on securities — unaffiliated | | 2,337,508,172 |
| Net change in unrealized appreciation (depreciation) on futures contracts | + | (97,032) |
| Net change in unrealized appreciation (depreciation) | + | 2,360,107,341 |
| Net realized and unrealized gains | | 2,311,739,904 |
| Increase in net assets resulting from operations | | $2,501,279,209 |
Schwab U.S. Equity ETFs | Annual Report
Schwab U.S. Large-Cap Value ETF
Statement of Changes in Net Assets
For the current and prior report periods
| Operations | |
| | 9/1/20-8/31/21 | 9/1/19-8/31/20 |
| Net investment income | | $189,539,305 | $232,152,597 |
| Net realized losses | | (48,367,437) | (26,080,614) |
| Net change in unrealized appreciation (depreciation) | + | 2,360,107,341 | (166,346,101) |
| Increase in net assets resulting from operations | | 2,501,279,209 | 39,725,882 |
| Distributions to Shareholders | |
| Total distributions | | ($222,245,635) | ($214,669,300) |
| Transactions in Fund Shares | | | |
| | | 9/1/20-8/31/21 | 9/1/19-8/31/20 |
| | | SHARES | VALUE | SHARES | VALUE |
| Shares sold | | 24,200,000 | $1,476,614,672 | 36,350,000 | $1,946,459,147 |
| Shares redeemed | + | (10,750,000) | (675,662,402) | (17,750,000) | (901,300,371) |
| Net transactions in fund shares | | 13,450,000 | $800,952,270 | 18,600,000 | $1,045,158,776 |
| Shares Outstanding and Net Assets | | | |
| | | 9/1/20-8/31/21 | 9/1/19-8/31/20 |
| | | SHARES | NET ASSETS | SHARES | NET ASSETS |
| Beginning of period | | 127,000,000 | $6,846,889,320 | 108,400,000 | $5,976,673,962 |
| Total increase | + | 13,450,000 | 3,079,985,844 | 18,600,000 | 870,215,358 |
| End of period | | 140,450,000 | $9,926,875,164 | 127,000,000 | $6,846,889,320 |
Schwab U.S. Equity ETFs | Annual Report
Financial Statements
Financial Highlights
| | 9/1/20–
8/31/21 | 9/1/19–
8/31/20 | 9/1/18–
8/31/19 | 9/1/17–
8/31/18 | 9/1/16–
8/31/17 | |
| Per-Share Data |
| Net asset value at beginning of period | $57.45 | $55.72 | $58.44 | $48.77 | $43.67 | |
| Income (loss) from investment operations: | | | | | | |
| Net investment income (loss)1 | 0.93 | 0.87 | 0.84 | 0.76 | 0.71 | |
| Net realized and unrealized gains (losses) | 22.43 | 1.76 | (2.76) | 9.59 | 5.09 | |
| Total from investment operations | 23.36 | 2.63 | (1.92) | 10.35 | 5.80 | |
| Less distributions: | | | | | | |
| Distributions from net investment income | (0.80) | (0.90) | (0.80) | (0.68) | (0.70) | |
| Net asset value at end of period | $80.01 | $57.45 | $55.72 | $58.44 | $48.77 | |
| Total return | 40.98% | 4.90% | (3.24%) | 21.36% | 13.38% | |
| Ratios/Supplemental Data |
| Ratios to average net assets: | | | | | | |
| Total expenses | 0.04% | 0.04% | 0.04% 2 | 0.05% | 0.06% 3 | |
| Net investment income (loss) | 1.31% | 1.61% | 1.52% | 1.42% | 1.54% | |
| Portfolio turnover rate4 | 23% | 19% | 19% | 13% | 17% | |
| Net assets, end of period (x 1,000) | $9,985,764 | $6,678,167 | $6,254,639 | $5,358,783 | $3,555,096 | |
| |
1
Calculated based on the average shares outstanding during the period.
2
Effective March 11, 2019, the annual operating expense ratio was reduced. The ratio presented for the period ended 8/31/19 is a blended ratio.
3
Effective October 7, 2016 and March 1, 2017, the annual operating expense ratio was reduced. The ratio presented for the period ended 8/31/17 is a blended ratio.
4
Portfolio turnover rate excludes securities received or delivered from processing of in-kind creations or redemptions.
Schwab U.S. Equity ETFs | Annual Report
Portfolio Holdings as of August 31, 2021
This section shows all the securities in the fund’s portfolio and their values as of the report date.
The fund files its complete schedule of portfolio holdings with the U.S. Securities and Exchange Commission (SEC) for the first and third quarters of each fiscal year on Form N-PORT Part F. The fund’s Form N-PORT Part F is available on the SEC’s website at www.sec.gov. You can also obtain this information at no cost on the fund’s website at www.schwabassetmanagement.com/schwabetfs_prospectus, by calling 1-866-414-6349, or by sending an email request to orders@mysummaryprospectus.com. The fund also makes available its complete schedule of portfolio holdings on a daily basis on the fund’s website.
| Security | Number
of Shares | Value ($) |
| Common Stock 99.9% of net assets |
| |
| Automobiles & Components 1.2% |
| Autoliv, Inc. | 173,566 | 15,341,499 |
| BorgWarner, Inc. | 527,800 | 22,526,504 |
| Gentex Corp. | 531,719 | 16,376,945 |
| Harley-Davidson, Inc. | 337,593 | 13,345,051 |
| Lear Corp. | 120,387 | 19,254,697 |
| Luminar Technologies, Inc. * | 439,545 | 7,639,292 |
| QuantumScape Corp. *(a) | 377,888 | 8,313,536 |
| Thor Industries, Inc. | 121,631 | 13,796,604 |
| | | 116,594,128 |
| |
| Banks 3.7% |
| Bank OZK | 266,148 | 11,292,660 |
| BOK Financial Corp. | 67,564 | 5,949,010 |
| Comerica, Inc. | 307,289 | 22,711,730 |
| Commerce Bancshares, Inc. | 231,980 | 16,405,626 |
| Cullen/Frost Bankers, Inc. | 124,277 | 14,194,919 |
| East West Bancorp, Inc. | 312,150 | 22,893,081 |
| Essent Group Ltd. | 248,165 | 11,683,608 |
| First Citizens BancShares, Inc., Class A | 15,930 | 14,300,361 |
| First Horizon Corp. | 1,215,591 | 19,923,537 |
| Huntington Bancshares, Inc. | 3,247,659 | 50,436,144 |
| MGIC Investment Corp. | 746,430 | 11,397,986 |
| New York Community Bancorp, Inc. | 1,022,556 | 12,802,401 |
| People's United Financial, Inc. | 941,210 | 15,464,080 |
| Pinnacle Financial Partners, Inc. | 167,876 | 16,270,542 |
| Popular, Inc. | 177,363 | 13,468,946 |
| Prosperity Bancshares, Inc. | 204,205 | 14,269,845 |
| Radian Group, Inc. | 421,244 | 9,953,996 |
| Signature Bank | 126,798 | 32,882,525 |
| Synovus Financial Corp. | 326,456 | 14,070,254 |
| TFS Financial Corp. | 104,425 | 2,087,456 |
| Western Alliance Bancorp | 227,653 | 22,209,827 |
| Zions Bancorp NA | 360,576 | 20,877,350 |
| | | 375,545,884 |
| |
| Capital Goods 11.3% |
| A.O. Smith Corp. | 295,969 | 21,522,866 |
| Acuity Brands, Inc. | 78,713 | 14,524,910 |
| AECOM * | 322,132 | 21,118,974 |
| AGCO Corp. | 136,032 | 18,720,724 |
| Air Lease Corp. | 236,057 | 9,380,905 |
| Allegion plc | 198,017 | 28,512,468 |
| Allison Transmission Holdings, Inc. | 240,990 | 8,911,810 |
| Armstrong World Industries, Inc. | 105,298 | 10,943,621 |
| Array Technologies, Inc. * | 241,534 | 4,606,053 |
| Axon Enterprise, Inc. * | 142,333 | 25,886,103 |
| AZEK Co., Inc. * | 309,585 | 13,154,267 |
| BWX Technologies, Inc. | 209,156 | 12,011,829 |
| Carlisle Cos., Inc. | 114,859 | 24,205,386 |
| ChargePoint Holdings, Inc. *(a) | 357,465 | 7,560,385 |
| Colfax Corp. * | 259,318 | 12,491,348 |
| Crane Co. | 109,256 | 11,118,983 |
| Security | Number
of Shares | Value ($) |
| Curtiss-Wright Corp. | 90,091 | 10,971,282 |
| Desktop Metal, Inc., Class A *(a) | 318,998 | 2,647,683 |
| Donaldson Co., Inc. | 277,614 | 18,808,348 |
| EMCOR Group, Inc. | 120,407 | 14,629,451 |
| Flowserve Corp. | 286,458 | 11,134,622 |
| Fortune Brands Home & Security, Inc. | 304,667 | 29,665,426 |
| Generac Holdings, Inc. * | 138,610 | 60,569,798 |
| Graco, Inc. | 373,044 | 29,254,110 |
| Hexcel Corp. * | 184,239 | 10,448,194 |
| Howmet Aerospace, Inc. | 859,968 | 27,303,984 |
| Hubbell, Inc. | 119,570 | 24,644,573 |
| Huntington Ingalls Industries, Inc. | 88,567 | 18,082,724 |
| IDEX Corp. | 167,187 | 37,449,888 |
| ITT, Inc. | 189,487 | 18,128,221 |
| Lennox International, Inc. | 75,664 | 25,361,060 |
| Lincoln Electric Holdings, Inc. | 131,067 | 18,298,264 |
| MasTec, Inc. * | 124,098 | 11,347,521 |
| Mercury Systems, Inc. * | 123,655 | 6,229,739 |
| MSC Industrial Direct Co., Inc., Class A | 103,449 | 8,711,440 |
| Nordson Corp. | 118,939 | 28,378,845 |
| nVent Electric plc | 368,643 | 12,666,573 |
| Oshkosh Corp. | 151,025 | 17,304,444 |
| Owens Corning | 229,899 | 21,966,849 |
| Pentair plc | 365,768 | 28,222,659 |
| Plug Power, Inc. * | 1,125,522 | 29,331,103 |
| Quanta Services, Inc. | 306,609 | 31,304,779 |
| Regal Beloit Corp. | 89,299 | 13,343,057 |
| Sensata Technologies Holding plc * | 348,006 | 20,594,995 |
| SiteOne Landscape Supply, Inc. * | 97,801 | 19,569,980 |
| Snap-on, Inc. | 119,026 | 26,774,899 |
| Sunrun, Inc. * | 354,542 | 15,688,484 |
| Textron, Inc. | 496,607 | 36,088,431 |
| The Middleby Corp. * | 122,415 | 22,394,600 |
| The Timken Co. | 150,316 | 11,054,239 |
| The Toro Co. | 235,622 | 25,904,283 |
| United Rentals, Inc. * | 159,385 | 56,207,120 |
| Vertiv Holdings Co. | 543,357 | 15,306,367 |
| Watsco, Inc. | 72,434 | 20,167,074 |
| Westinghouse Air Brake Technologies Corp. | 390,983 | 35,106,364 |
| Woodward, Inc. | 129,262 | 15,632,946 |
| | | 1,131,365,051 |
| |
| Commercial & Professional Services 2.8% |
| ADT, Inc. | 335,093 | 2,868,396 |
| ASGN, Inc. * | 116,974 | 13,123,313 |
| Booz Allen Hamilton Holding Corp. | 298,020 | 24,410,818 |
| CACI International, Inc., Class A * | 51,921 | 13,371,734 |
| Clean Harbors, Inc. * | 110,472 | 11,336,637 |
| Driven Brands Holdings, Inc. * | 95,720 | 2,860,114 |
| Dun & Bradstreet Holdings, Inc. * | 304,028 | 5,572,833 |
| IAA, Inc. * | 296,626 | 15,756,773 |
| Jacobs Engineering Group, Inc. | 286,526 | 38,669,549 |
| Leidos Holdings, Inc. | 292,560 | 28,703,062 |
| ManpowerGroup, Inc. | 119,808 | 14,547,087 |
| MSA Safety, Inc. | 80,038 | 13,033,388 |
| Nielsen Holdings plc | 788,924 | 16,930,309 |
Schwab U.S. Equity ETFs | Annual Report
Portfolio Holdings as of August 31, 2021 (continued)
| Security | Number
of Shares | Value ($) |
| Robert Half International, Inc. | 248,173 | 25,661,088 |
| Science Applications International Corp. | 127,614 | 10,748,927 |
| Stericycle, Inc. * | 202,325 | 14,081,820 |
| Tetra Tech, Inc. | 119,366 | 17,169,606 |
| TriNet Group, Inc. * | 87,185 | 8,027,995 |
| | | 276,873,449 |
| |
| Consumer Durables & Apparel 3.9% |
| Brunswick Corp. | 171,517 | 16,614,852 |
| Carter's, Inc. | 96,756 | 9,905,879 |
| Columbia Sportswear Co. | 67,398 | 6,875,270 |
| Deckers Outdoor Corp. * | 61,198 | 25,608,303 |
| Hanesbrands, Inc. | 767,025 | 14,328,027 |
| Hasbro, Inc. | 281,516 | 27,675,838 |
| Hayward Holdings, Inc. * | 90,855 | 1,903,412 |
| Helen of Troy Ltd. * | 53,738 | 12,853,592 |
| Leggett & Platt, Inc. | 293,620 | 14,208,272 |
| Mattel, Inc. * | 768,542 | 16,408,372 |
| Mohawk Industries, Inc. * | 128,829 | 25,477,223 |
| Newell Brands, Inc. | 832,980 | 21,166,022 |
| Polaris, Inc. | 126,742 | 15,178,622 |
| PulteGroup, Inc. | 581,998 | 31,346,412 |
| PVH Corp. * | 157,259 | 16,479,171 |
| Ralph Lauren Corp. | 106,065 | 12,317,328 |
| Skechers U.S.A., Inc., Class A * | 295,812 | 14,917,799 |
| Tapestry, Inc. * | 613,437 | 24,733,780 |
| Toll Brothers, Inc. | 247,510 | 15,855,491 |
| TopBuild Corp. * | 72,855 | 15,939,946 |
| Under Armour, Inc., Class A * | 415,546 | 9,615,734 |
| Under Armour, Inc., Class C * | 431,655 | 8,658,999 |
| Whirlpool Corp. | 137,821 | 30,531,486 |
| | | 388,599,830 |
| |
| Consumer Services 4.7% |
| Airbnb, Inc., Class A * | 323,088 | 50,075,409 |
| Aramark | 560,942 | 19,515,172 |
| Bright Horizons Family Solutions, Inc. * | 134,307 | 19,576,588 |
| Caesars Entertainment, Inc. * | 459,184 | 46,666,870 |
| Carnival Corp. * | 1,756,643 | 42,405,362 |
| Chegg, Inc. * | 312,335 | 25,992,519 |
| Choice Hotels International, Inc. | 63,637 | 7,595,712 |
| Churchill Downs, Inc. | 76,464 | 16,095,672 |
| Coursera, Inc. * | 35,582 | 1,368,839 |
| Grand Canyon Education, Inc. * | 101,949 | 9,087,734 |
| Marriott Vacations Worldwide Corp. * | 94,174 | 14,083,722 |
| MGM Resorts International | 895,741 | 38,176,481 |
| Penn National Gaming, Inc. * | 326,839 | 26,506,643 |
| Planet Fitness, Inc., Class A * | 183,483 | 14,917,168 |
| Service Corp. International | 370,022 | 23,222,581 |
| Terminix Global Holdings, Inc. * | 283,541 | 11,803,812 |
| Texas Roadhouse, Inc. | 144,022 | 13,682,090 |
| The Wendy's Co. | 389,786 | 8,972,874 |
| Vail Resorts, Inc. * | 88,574 | 27,001,784 |
| Wingstop, Inc. | 65,438 | 11,250,755 |
| Wyndham Hotels & Resorts, Inc. | 205,978 | 14,974,601 |
| Wynn Resorts Ltd. * | 231,564 | 23,547,743 |
| | | 466,520,131 |
| |
| Diversified Financials 5.3% |
| Affiliated Managers Group, Inc. | 91,716 | 15,601,809 |
| AGNC Investment Corp. | 1,155,146 | 18,840,431 |
| Ally Financial, Inc. | 815,449 | 43,137,252 |
| Annaly Capital Management, Inc. | 3,077,155 | 26,740,477 |
| Apollo Global Management, Inc. | 465,229 | 27,811,390 |
| Ares Management Corp., Class A | 243,116 | 18,763,693 |
| Security | Number
of Shares | Value ($) |
| Blackstone Mortgage Trust, Inc., Class A | 323,522 | 10,614,757 |
| Cboe Global Markets, Inc. | 234,784 | 29,618,002 |
| Credit Acceptance Corp. * | 25,344 | 14,691,410 |
| Equitable Holdings, Inc. | 848,104 | 26,299,705 |
| FactSet Research Systems, Inc. | 83,299 | 31,671,946 |
| Invesco Ltd. | 832,341 | 21,074,874 |
| Janus Henderson Group plc | 375,915 | 16,299,674 |
| Jefferies Financial Group, Inc. | 441,068 | 16,301,873 |
| Lazard Ltd., Class A | 248,105 | 11,760,177 |
| LPL Financial Holdings, Inc. | 175,882 | 26,004,154 |
| Morningstar, Inc. | 47,185 | 12,645,108 |
| New Residential Investment Corp. | 1,026,796 | 11,212,612 |
| OneMain Holdings, Inc. | 233,622 | 13,510,360 |
| Raymond James Financial, Inc. | 269,392 | 37,687,941 |
| Santander Consumer USA Holdings, Inc. | 155,229 | 6,477,706 |
| SEI Investments Co. | 261,153 | 16,403,020 |
| Starwood Property Trust, Inc. | 632,578 | 16,320,512 |
| The Carlyle Group, Inc. | 257,207 | 12,700,882 |
| Tradeweb Markets, Inc., Class A | 230,443 | 20,050,845 |
| Upstart Holdings, Inc. * | 37,258 | 8,536,553 |
| Voya Financial, Inc. | 266,955 | 17,346,736 |
| | | 528,123,899 |
| |
| Energy 2.1% |
| Antero Midstream Corp. | 631,694 | 6,070,579 |
| APA Corp. | 833,615 | 16,238,820 |
| Cabot Oil & Gas Corp. | 877,997 | 13,951,372 |
| Continental Resources, Inc. | 138,280 | 5,431,639 |
| Devon Energy Corp. | 1,310,565 | 38,727,196 |
| Diamondback Energy, Inc. | 398,243 | 30,720,465 |
| Equitrans Midstream Corp. | 895,821 | 7,820,517 |
| HollyFrontier Corp. | 328,939 | 10,634,598 |
| Marathon Oil Corp. | 1,734,129 | 20,376,016 |
| NOV, Inc. * | 858,725 | 11,309,408 |
| Targa Resources Corp. | 503,047 | 22,093,824 |
| Texas Pacific Land Corp. | 17,064 | 23,202,604 |
| | | 206,577,038 |
| |
| Food & Staples Retailing 0.7% |
| Albertsons Cos., Inc., Class A | 101,718 | 3,088,158 |
| BJ's Wholesale Club Holdings, Inc. * | 302,286 | 17,127,525 |
| Casey's General Stores, Inc. | 81,394 | 16,649,957 |
| Performance Food Group Co. * | 294,014 | 14,765,383 |
| US Foods Holding Corp. * | 488,709 | 16,616,106 |
| | | 68,247,129 |
| |
| Food, Beverage & Tobacco 1.7% |
| Beyond Meat, Inc. * | 109,817 | 13,138,506 |
| Bunge Ltd. | 311,254 | 23,565,040 |
| Darling Ingredients, Inc. * | 359,050 | 26,749,225 |
| Flowers Foods, Inc. | 434,086 | 10,474,495 |
| Ingredion, Inc. | 147,180 | 12,931,235 |
| Lamb Weston Holdings, Inc. | 321,916 | 20,972,828 |
| Lancaster Colony Corp. | 43,062 | 7,632,309 |
| Molson Coors Beverage Co., Class B | 414,550 | 19,703,562 |
| Pilgrim's Pride Corp. * | 106,674 | 2,969,804 |
| Post Holdings, Inc. * | 130,009 | 14,549,307 |
| Seaboard Corp. | 564 | 2,399,594 |
| The Boston Beer Co., Inc., Class A * | 20,467 | 11,670,488 |
| | | 166,756,393 |
| |
| Health Care Equipment & Services 5.5% |
| 1Life Healthcare, Inc. * | 171,471 | 4,202,754 |
| ABIOMED, Inc. * | 99,678 | 36,278,805 |
Schwab U.S. Equity ETFs | Annual Report
Portfolio Holdings as of August 31, 2021 (continued)
| Security | Number
of Shares | Value ($) |
| agilon health, Inc. * | 102,502 | 3,587,570 |
| Amedisys, Inc. * | 71,678 | 13,149,329 |
| American Well Corp., Class A * | 127,982 | 1,370,687 |
| Certara, Inc. * | 86,835 | 2,915,051 |
| Chemed Corp. | 35,108 | 16,735,984 |
| DaVita, Inc. * | 154,255 | 20,171,926 |
| Dentsply Sirona, Inc. | 480,420 | 29,641,914 |
| Encompass Health Corp. | 219,442 | 17,215,225 |
| Envista Holdings Corp. * | 354,466 | 15,167,600 |
| Guardant Health, Inc. * | 189,134 | 24,071,084 |
| Haemonetics Corp. * | 112,321 | 7,048,143 |
| HealthEquity, Inc. * | 183,182 | 11,754,789 |
| Henry Schein, Inc. * | 309,601 | 23,402,739 |
| Hill-Rom Holdings, Inc. | 146,478 | 21,324,267 |
| ICU Medical, Inc. * | 43,430 | 8,657,770 |
| Insulet Corp. * | 145,957 | 43,467,454 |
| Integra LifeSciences Holdings Corp. * | 156,261 | 11,755,515 |
| iRhythm Technologies, Inc. * | 64,110 | 3,064,458 |
| LHC Group, Inc. * | 69,784 | 13,032,860 |
| Masimo Corp. * | 111,349 | 30,235,707 |
| Molina Healthcare, Inc. * | 128,493 | 34,535,064 |
| Multiplan Corp. * | 570,263 | 3,421,578 |
| Novocure Ltd. * | 188,872 | 25,348,511 |
| Penumbra, Inc. * | 74,665 | 20,529,142 |
| Quidel Corp. * | 85,107 | 10,974,548 |
| Schrodinger, Inc. * | 81,156 | 4,844,202 |
| Signify Health, Inc., Class A * | 51,429 | 1,336,640 |
| STERIS plc | 215,061 | 46,240,266 |
| Tandem Diabetes Care, Inc. * | 138,089 | 15,489,443 |
| Universal Health Services, Inc., Class B | 171,555 | 26,721,407 |
| | | 547,692,432 |
| |
| Household & Personal Products 0.2% |
| Coty, Inc., Class A * | 625,501 | 6,111,145 |
| Herbalife Nutrition Ltd. * | 192,169 | 9,865,956 |
| Reynolds Consumer Products, Inc. | 119,374 | 3,375,897 |
| | | 19,352,998 |
| |
| Insurance 4.1% |
| Alleghany Corp. * | 30,643 | 20,735,812 |
| American Financial Group, Inc. | 151,641 | 20,917,359 |
| Assurant, Inc. | 133,303 | 22,676,173 |
| Athene Holding Ltd., Class A * | 274,343 | 18,372,751 |
| Axis Capital Holdings Ltd. | 177,319 | 9,073,413 |
| Brown & Brown, Inc. | 514,797 | 29,883,966 |
| CNA Financial Corp. | 59,465 | 2,637,273 |
| Erie Indemnity Co., Class A | 54,858 | 9,714,803 |
| Everest Re Group Ltd. | 88,356 | 23,405,504 |
| Fidelity National Financial, Inc. | 636,063 | 31,058,956 |
| First American Financial Corp. | 241,727 | 17,049,005 |
| Globe Life, Inc. | 208,652 | 20,045,198 |
| Kemper Corp. | 133,638 | 9,167,567 |
| Lincoln National Corp. | 393,757 | 27,031,418 |
| Loews Corp. | 492,568 | 27,519,774 |
| Old Republic International Corp. | 624,560 | 16,238,560 |
| Primerica, Inc. | 86,667 | 13,254,851 |
| Reinsurance Group of America, Inc. | 149,715 | 17,339,991 |
| RenaissanceRe Holdings Ltd. | 109,300 | 17,130,589 |
| Selective Insurance Group, Inc. | 132,067 | 11,036,839 |
| The Hanover Insurance Group, Inc. | 79,005 | 11,164,197 |
| Unum Group | 448,901 | 11,949,745 |
| W.R. Berkley Corp. | 308,341 | 23,221,161 |
| | | 410,624,905 |
| |
| Security | Number
of Shares | Value ($) |
| Materials 6.7% |
| Albemarle Corp. | 256,981 | 60,837,682 |
| AptarGroup, Inc. | 144,645 | 19,498,146 |
| Ashland Global Holdings, Inc. | 120,271 | 10,957,891 |
| Avery Dennison Corp. | 182,654 | 41,168,385 |
| Axalta Coating Systems Ltd. * | 457,128 | 13,960,689 |
| Berry Global Group, Inc. * | 296,914 | 19,943,713 |
| CF Industries Holdings, Inc. | 472,091 | 21,442,373 |
| Crown Holdings, Inc. | 296,865 | 32,592,808 |
| Diversey Holdings Ltd. * | 98,690 | 1,724,114 |
| Eagle Materials, Inc. | 93,232 | 14,622,507 |
| Eastman Chemical Co. | 300,423 | 33,995,867 |
| FMC Corp. | 283,653 | 26,558,430 |
| Graphic Packaging Holding Co. | 625,843 | 12,842,298 |
| Huntsman Corp. | 438,705 | 11,594,973 |
| International Flavors & Fragrances, Inc. | 547,868 | 83,002,002 |
| MP Materials Corp. *(a) | 145,828 | 4,895,446 |
| NewMarket Corp. | 16,173 | 5,656,183 |
| Packaging Corp. of America | 209,160 | 31,729,572 |
| Reliance Steel & Aluminum Co. | 140,139 | 21,026,456 |
| Royal Gold, Inc. | 144,660 | 16,104,998 |
| RPM International, Inc. | 285,062 | 23,457,752 |
| Sealed Air Corp. | 334,535 | 20,416,671 |
| Sonoco Products Co. | 221,794 | 14,483,148 |
| Steel Dynamics, Inc. | 441,340 | 29,786,037 |
| The Mosaic Co. | 760,533 | 24,473,952 |
| The Scotts Miracle-Gro Co. | 89,614 | 14,054,164 |
| Valvoline, Inc. | 397,998 | 12,003,620 |
| W.R. Grace & Co. | 136,981 | 9,539,357 |
| Westlake Chemical Corp. | 76,294 | 6,664,281 |
| Westrock Co. | 585,630 | 30,476,185 |
| | | 669,509,700 |
| |
| Media & Entertainment 2.7% |
| Altice USA, Inc., Class A * | 506,752 | 13,905,275 |
| Bumble, Inc., Class A * | 116,279 | 6,337,206 |
| Cable One, Inc. | 11,951 | 25,092,200 |
| Discovery, Inc., Class A *(a) | 371,138 | 10,703,620 |
| Discovery, Inc., Class C * | 661,133 | 18,240,659 |
| DISH Network Corp., Class A * | 546,765 | 23,833,486 |
| IAC/InterActiveCorp * | 183,376 | 24,214,801 |
| Liberty Media Corp. - Liberty Formula One, Class A * | 56,492 | 2,581,120 |
| Liberty Media Corp. - Liberty Formula One, Class C * | 448,420 | 22,663,147 |
| Madison Square Garden Sports Corp. * | 38,444 | 6,949,906 |
| News Corp., Class A | 860,839 | 19,343,052 |
| News Corp., Class B | 267,978 | 5,903,555 |
| Playtika Holding Corp. * | 152,412 | 4,022,153 |
| Skillz, Inc. *(a) | 554,360 | 6,524,817 |
| The Interpublic Group of Cos., Inc. | 865,592 | 32,225,990 |
| The New York Times Co., Class A | 320,101 | 16,254,729 |
| Vimeo, Inc. * | 341,186 | 13,006,010 |
| Zynga, Inc., Class A * | 2,228,361 | 19,720,995 |
| | | 271,522,721 |
| |
| Pharmaceuticals, Biotechnology & Life Sciences 6.9% |
| 10X Genomics, Inc., Class A * | 163,225 | 28,714,542 |
| ACADIA Pharmaceuticals, Inc. * | 258,104 | 4,519,401 |
| Acceleron Pharma, Inc. * | 116,456 | 15,591,129 |
| Adaptive Biotechnologies Corp. * | 185,302 | 6,730,169 |
| Alkermes plc * | 353,188 | 11,040,657 |
| Allogene Therapeutics, Inc. * | 145,613 | 3,472,870 |
| Arrowhead Pharmaceuticals, Inc. * | 229,284 | 15,389,542 |
| Avantor, Inc. * | 1,140,065 | 44,964,164 |
Schwab U.S. Equity ETFs | Annual Report
Portfolio Holdings as of August 31, 2021 (continued)
| Security | Number
of Shares | Value ($) |
| Bio-Rad Laboratories, Inc., Class A * | 47,456 | 38,193,538 |
| Bio-Techne Corp. | 85,577 | 42,714,904 |
| Bluebird Bio, Inc. * | 147,735 | 2,703,551 |
| Bruker Corp. | 223,450 | 19,732,869 |
| Charles River Laboratories International, Inc. * | 110,573 | 49,078,932 |
| Elanco Animal Health, Inc. * | 1,041,519 | 34,765,904 |
| Emergent BioSolutions, Inc. * | 100,430 | 6,335,124 |
| Exelixis, Inc. * | 689,146 | 13,210,929 |
| FibroGen, Inc. * | 185,844 | 2,161,366 |
| Ionis Pharmaceuticals, Inc. * | 309,924 | 12,322,578 |
| Jazz Pharmaceuticals plc * | 132,255 | 17,419,306 |
| Mirati Therapeutics, Inc. * | 101,939 | 17,302,106 |
| Natera, Inc. * | 185,102 | 21,921,630 |
| Neurocrine Biosciences, Inc. * | 208,071 | 19,808,359 |
| Novavax, Inc. * | 150,006 | 35,782,431 |
| Organon & Co. | 557,094 | 18,879,916 |
| PerkinElmer, Inc. | 246,823 | 45,612,890 |
| Perrigo Co., plc | 293,447 | 12,016,655 |
| Repligen Corp. * | 112,360 | 31,795,633 |
| Sana Biotechnology, Inc. * | 53,339 | 1,279,603 |
| Sarepta Therapeutics, Inc. * | 175,344 | 13,697,873 |
| Sotera Health Co. * | 161,245 | 3,944,053 |
| Syneos Health, Inc. * | 222,825 | 20,673,703 |
| Ultragenyx Pharmaceutical, Inc. * | 139,435 | 13,426,196 |
| United Therapeutics Corp. * | 98,587 | 21,184,375 |
| Viatris, Inc. | 2,662,106 | 38,946,611 |
| Vir Biotechnology, Inc. * | 146,445 | 7,547,775 |
| | | 692,881,284 |
| |
| Real Estate 8.5% |
| American Campus Communities, Inc. | 303,927 | 15,454,688 |
| American Homes 4 Rent, Class A | 602,490 | 25,268,431 |
| Americold Realty Trust | 555,865 | 20,422,480 |
| Apartment Income REIT Corp. | 345,219 | 17,544,030 |
| Apartment Investment & Management Co., Class A | 333,903 | 2,397,423 |
| Brixmor Property Group, Inc. | 655,117 | 15,362,494 |
| Camden Property Trust | 214,933 | 32,248,547 |
| CoreSite Realty Corp. | 94,455 | 14,014,288 |
| Cousins Properties, Inc. | 326,680 | 12,596,781 |
| CubeSmart | 443,397 | 23,721,739 |
| CyrusOne, Inc. | 269,703 | 20,761,737 |
| Douglas Emmett, Inc. | 362,536 | 11,967,313 |
| EastGroup Properties, Inc. | 88,187 | 15,896,589 |
| Equity Commonwealth | 268,641 | 7,076,004 |
| Equity LifeStyle Properties, Inc. | 373,083 | 31,738,171 |
| Federal Realty Investment Trust | 155,731 | 18,963,364 |
| First Industrial Realty Trust, Inc. | 284,537 | 15,931,227 |
| Gaming & Leisure Properties, Inc. | 481,523 | 23,739,084 |
| Healthcare Realty Trust, Inc. | 311,224 | 9,346,057 |
| Healthcare Trust of America, Inc., Class A | 480,818 | 14,583,210 |
| Highwoods Properties, Inc. | 229,030 | 10,464,381 |
| Host Hotels & Resorts, Inc. * | 1,553,635 | 25,728,196 |
| Hudson Pacific Properties, Inc. | 332,350 | 8,767,393 |
| Iron Mountain, Inc. | 635,431 | 30,341,830 |
| JBG SMITH Properties | 243,261 | 7,329,454 |
| Jones Lang LaSalle, Inc. * | 112,883 | 27,366,226 |
| Kilroy Realty Corp. | 233,471 | 15,327,371 |
| Kimco Realty Corp. | 1,324,111 | 28,852,379 |
| Lamar Advertising Co., Class A | 190,731 | 21,710,910 |
| Life Storage, Inc. | 169,105 | 21,043,426 |
| Medical Properties Trust, Inc. | 1,294,706 | 26,515,579 |
| National Retail Properties, Inc. | 386,408 | 18,396,885 |
| Omega Healthcare Investors, Inc. | 518,157 | 17,373,804 |
| PS Business Parks, Inc. | 44,291 | 6,963,874 |
| Rayonier, Inc. | 305,718 | 11,244,308 |
| Security | Number
of Shares | Value ($) |
| Regency Centers Corp. | 347,591 | 23,851,694 |
| Rexford Industrial Realty, Inc. | 295,106 | 18,275,914 |
| SL Green Realty Corp. | 152,446 | 10,683,416 |
| Spirit Realty Capital, Inc. | 252,665 | 13,080,467 |
| STAG Industrial, Inc. | 352,069 | 14,874,915 |
| STORE Capital Corp. | 535,660 | 19,321,256 |
| The Howard Hughes Corp. * | 99,465 | 9,004,566 |
| UDR, Inc. | 653,366 | 35,294,831 |
| VEREIT, Inc. | 504,202 | 25,477,327 |
| VICI Properties, Inc. | 1,183,082 | 36,569,065 |
| Vornado Realty Trust | 345,884 | 14,485,622 |
| | | 847,378,746 |
| |
| Retailing 4.7% |
| Advance Auto Parts, Inc. | 144,030 | 29,216,486 |
| AutoNation, Inc. * | 118,469 | 12,923,783 |
| Bath & Body Works, Inc. | 582,608 | 39,314,388 |
| Burlington Stores, Inc. * | 146,588 | 43,901,640 |
| Chewy, Inc., Class A * | 183,682 | 16,186,058 |
| ContextLogic, Inc., Class A *(a) | 165,687 | 1,194,603 |
| DoorDash, Inc., Class A * | 77,921 | 14,914,079 |
| Five Below, Inc. * | 123,218 | 26,222,023 |
| Floor & Decor Holdings, Inc., Class A * | 230,870 | 28,466,271 |
| Foot Locker, Inc. | 226,941 | 12,865,285 |
| Kohl's Corp. | 343,941 | 19,742,213 |
| Leslie's, Inc. * | 206,881 | 4,989,970 |
| Lithia Motors, Inc., Class A | 65,485 | 21,695,181 |
| LKQ Corp. * | 611,689 | 32,229,893 |
| Ollie's Bargain Outlet Holdings, Inc. * | 124,865 | 9,037,729 |
| Overstock.com, Inc. * | 94,691 | 6,831,956 |
| Penske Automotive Group, Inc. | 70,822 | 6,369,022 |
| Petco Health & Wellness Co., Inc. * | 158,565 | 3,413,904 |
| Pool Corp. | 88,355 | 43,673,877 |
| Qurate Retail, Inc., Class A | 835,295 | 9,213,304 |
| RH * | 37,021 | 25,939,504 |
| The Gap, Inc. | 456,329 | 12,197,674 |
| Victoria's Secret & Co. * | 195,372 | 12,953,164 |
| Vroom, Inc. * | 78,636 | 2,112,163 |
| Williams-Sonoma, Inc. | 167,680 | 31,305,856 |
| | | 466,910,026 |
| |
| Semiconductors & Semiconductor Equipment 2.9% |
| Allegro MicroSystems, Inc. * | 91,306 | 2,743,745 |
| CMC Materials, Inc. | 64,388 | 8,539,137 |
| Cree, Inc. * | 254,071 | 21,590,954 |
| Enphase Energy, Inc. * | 298,757 | 51,903,054 |
| Entegris, Inc. | 298,101 | 35,813,854 |
| First Solar, Inc. * | 187,362 | 17,612,028 |
| MKS Instruments, Inc. | 121,803 | 17,926,965 |
| Monolithic Power Systems, Inc. | 94,627 | 46,833,741 |
| ON Semiconductor Corp. * | 939,393 | 41,671,473 |
| Power Integrations, Inc. | 133,712 | 14,526,472 |
| Silicon Laboratories, Inc. * | 98,715 | 15,559,458 |
| Universal Display Corp. | 94,384 | 19,687,559 |
| | | 294,408,440 |
| |
| Software & Services 10.7% |
| Alteryx, Inc., Class A * | 130,246 | 9,634,297 |
| Anaplan, Inc. * | 318,242 | 19,088,155 |
| AppLovin Corp., Class A *(a) | 57,462 | 4,045,325 |
| Aspen Technology, Inc. * | 149,667 | 19,381,876 |
| Avalara, Inc. * | 189,173 | 33,994,388 |
| Bill.com Holdings, Inc. * | 137,314 | 37,677,588 |
| Black Knight, Inc. * | 344,669 | 26,081,103 |
| Blackbaud, Inc. * | 107,569 | 7,496,484 |
Schwab U.S. Equity ETFs | Annual Report
Portfolio Holdings as of August 31, 2021 (continued)
| Security | Number
of Shares | Value ($) |
| C3.ai, Inc., Class A * | 36,250 | 1,868,325 |
| CDK Global, Inc. | 267,600 | 11,132,160 |
| Ceridian HCM Holding, Inc. * | 288,984 | 32,467,352 |
| Cloudflare, Inc., Class A * | 423,148 | 51,090,890 |
| Concentrix Corp. * | 91,756 | 15,909,573 |
| Datto Holding Corp. * | 48,951 | 1,248,251 |
| Dolby Laboratories, Inc., Class A | 143,842 | 14,256,181 |
| Dropbox, Inc., Class A * | 650,886 | 20,639,595 |
| Duck Creek Technologies, Inc. * | 72,899 | 3,399,280 |
| DXC Technology Co. * | 560,648 | 20,586,995 |
| Dynatrace, Inc. * | 405,661 | 27,881,081 |
| Elastic N.V. * | 139,445 | 22,248,450 |
| Euronet Worldwide, Inc. * | 116,361 | 15,502,776 |
| Fair Isaac Corp. * | 63,324 | 29,112,576 |
| Fastly, Inc., Class A * | 190,923 | 8,324,243 |
| Five9, Inc. * | 147,531 | 23,343,830 |
| Gartner, Inc. * | 189,446 | 58,489,558 |
| Genpact Ltd. | 383,354 | 19,888,406 |
| GoDaddy, Inc., Class A * | 369,198 | 27,065,905 |
| Guidewire Software, Inc. * | 184,277 | 21,829,453 |
| HubSpot, Inc. * | 96,700 | 66,188,249 |
| Manhattan Associates, Inc. * | 139,974 | 22,814,362 |
| MAXIMUS, Inc. | 135,127 | 11,768,210 |
| Medallia, Inc. * | 190,520 | 6,433,860 |
| MongoDB, Inc. * | 117,513 | 46,045,119 |
| N-Able, Inc. * | 79,578 | 1,076,690 |
| New Relic, Inc. * | 120,906 | 9,668,853 |
| Nuance Communications, Inc. * | 627,316 | 34,533,746 |
| Nutanix, Inc., Class A * | 450,346 | 16,622,271 |
| Paylocity Holding Corp. * | 82,763 | 22,279,800 |
| Pegasystems, Inc. | 87,529 | 12,046,616 |
| Proofpoint, Inc. *(b) | 126,076 | 22,189,376 |
| PTC, Inc. * | 231,399 | 30,465,992 |
| Q2 Holdings, Inc. * | 116,458 | 10,258,785 |
| Smartsheet, Inc., Class A * | 257,768 | 20,510,600 |
| Snowflake, Inc., Class A * | 136,846 | 41,649,080 |
| SolarWinds Corp. | 79,833 | 1,362,749 |
| The Western Union Co. | 900,885 | 19,495,151 |
| Tyler Technologies, Inc. * | 89,681 | 43,558,062 |
| WEX, Inc. * | 98,444 | 18,071,365 |
| Zendesk, Inc. * | 261,068 | 32,268,005 |
| | | 1,072,991,037 |
| |
| Technology Hardware & Equipment 4.3% |
| Arrow Electronics, Inc. * | 163,221 | 19,785,650 |
| Ciena Corp. * | 341,013 | 19,482,073 |
| Cognex Corp. | 388,622 | 34,439,682 |
| Coherent, Inc. * | 54,062 | 13,659,846 |
| F5 Networks, Inc. * | 131,195 | 26,707,366 |
| IPG Photonics Corp. * | 79,038 | 13,490,206 |
| Jabil, Inc. | 294,895 | 18,218,613 |
| Juniper Networks, Inc. | 721,426 | 20,906,926 |
| Littelfuse, Inc. | 54,146 | 15,453,268 |
| Lumentum Holdings, Inc. * | 167,321 | 14,496,691 |
| National Instruments Corp. | 289,293 | 12,098,233 |
| NetApp, Inc. | 489,787 | 43,556,758 |
| SYNNEX Corp. | 91,233 | 11,592,977 |
| Teledyne Technologies, Inc. * | 102,273 | 47,391,263 |
| Trimble, Inc. * | 552,191 | 52,027,436 |
| Ubiquiti, Inc. | 16,645 | 5,415,617 |
| Vontier Corp. | 371,028 | 13,494,288 |
| Western Digital Corp. * | 674,820 | 42,648,624 |
| Xerox Holdings Corp. | 355,040 | 7,991,950 |
| | | 432,857,467 |
| |
| Security | Number
of Shares | Value ($) |
| Transportation 2.0% |
| Alaska Air Group, Inc. * | 274,258 | 15,725,954 |
| AMERCO | 19,869 | 13,136,389 |
| American Airlines Group, Inc. * | 1,411,295 | 28,141,222 |
| GXO Logistics, Inc. * | 223,603 | 18,288,489 |
| JetBlue Airways Corp. * | 696,442 | 10,537,167 |
| Knight-Swift Transportation Holdings, Inc. | 269,588 | 13,999,705 |
| Landstar System, Inc. | 84,406 | 14,182,740 |
| Lyft, Inc., Class A * | 564,296 | 26,866,133 |
| TuSimple Holdings, Inc., Class A * | 73,801 | 3,089,310 |
| United Airlines Holdings, Inc. * | 711,901 | 33,110,516 |
| XPO Logistics, Inc. * | 223,692 | 19,441,072 |
| | | 196,518,697 |
| |
| Utilities 3.3% |
| Alliant Energy Corp. | 550,538 | 33,467,205 |
| Atmos Energy Corp. | 287,591 | 28,042,998 |
| Black Hills Corp. | 138,431 | 9,735,852 |
| Essential Utilities, Inc. | 491,914 | 24,413,692 |
| Hawaiian Electric Industries, Inc. | 240,330 | 10,478,388 |
| IDACORP, Inc. | 111,056 | 11,699,750 |
| MDU Resources Group, Inc. | 443,550 | 14,269,004 |
| National Fuel Gas Co. | 200,626 | 10,394,433 |
| NiSource, Inc. | 863,507 | 21,285,448 |
| NRG Energy, Inc. | 538,612 | 24,598,410 |
| OGE Energy Corp. | 441,022 | 15,616,589 |
| ONE Gas, Inc. | 117,281 | 8,423,121 |
| Pinnacle West Capital Corp. | 248,190 | 19,085,811 |
| Portland General Electric Co. | 197,323 | 10,132,536 |
| Southwest Gas Holdings, Inc. | 127,626 | 8,973,384 |
| The AES Corp. | 1,466,051 | 34,994,637 |
| UGI Corp. | 459,381 | 21,273,934 |
| Vistra Corp. | 1,060,934 | 20,253,230 |
| | | 327,138,422 |
| Total Common Stock |
| (Cost $6,985,083,141) | | 9,974,989,807 |
|
| Short-Term Investments 0.4% of net assets |
| |
| Money Market Funds 0.4% |
| State Street Institutional U.S. Government Money Market Fund, Premier Class 0.03% (c) | 4,374,827 | 4,374,827 |
| Wells Fargo Government Money Market Fund, Select Class 0.03% (c)(d) | 36,844,270 | 36,844,270 |
| Total Short-Term Investments |
| (Cost $41,219,097) | | 41,219,097 |
Schwab U.S. Equity ETFs | Annual Report
Portfolio Holdings as of August 31, 2021 (continued)
| | Number of
Contracts | Notional
Amount
($) | Current Value/
Unrealized
Appreciation
($) |
| Futures Contracts | |
| Long | |
| S&P Mid-Cap 400 Index, e-mini, expires 09/17/21 | 114 | 31,372,800 | 136,889 |
| * | Non-income producing security. |
| (a) | All or a portion of this security is on loan. Securities on loan were valued at $35,849,088. |
| (b) | Fair-valued by management using significant unobservable inputs in accordance with procedures approved by the fund’s Board of Trustees. |
| (c) | The rate shown is the 7-day yield. |
| (d) | Security purchased with cash collateral received for securities on loan. |
| | |
| REIT — | Real Estate Investment Trust |
The following is a summary of the inputs used to value the fund’s investments as of August 31, 2021 (see financial note 2(a) for additional information):
| Description | Quoted Prices in
Active Markets for
Identical Assets
(Level 1) | Other Significant
Observable Inputs
(Level 2) | Significant
Unobservable Inputs
(Level 3) | Total | |
| Assets | | | | | |
| Common Stock1 | $8,901,998,770 | $— | $— | $8,901,998,770 | |
| Software & Services | 1,050,801,661 | — | 22,189,376 | 1,072,991,037 | |
| Short-Term Investments1 | 41,219,097 | — | — | 41,219,097 | |
| Futures Contracts2 | 136,889 | — | — | 136,889 | |
| Total | $9,994,156,417 | $— | $22,189,376 | $10,016,345,793 | |
| 1 | As categorized in the Portfolio Holdings. |
| 2 | Futures contracts are reported at cumulative unrealized appreciation or depreciation. |
Fund investments in mutual funds are classified as Level 1, without consideration to the classification level of the underlying securities held by the mutual funds, which could be Level 1, Level 2 or Level 3.
Schwab U.S. Equity ETFs | Annual Report
Statement of Assets and Liabilities
As of August 31, 2021
| Assets |
| Investments in securities, at value - unaffiliated (cost $6,989,457,968) including securities on loan of $35,849,088 | | $9,979,364,634 |
| Collateral invested for securities on loan, at value (cost $36,844,270) | | 36,844,270 |
| Deposit with broker for futures contracts | | 675,000 |
| Receivables: | | |
| Fund shares sold | | 8,001,413 |
| Dividends | | 5,951,528 |
| Income from securities on loan | + | 24,479 |
| Total assets | | 10,030,861,324 |
| Liabilities |
| Collateral held for securities on loan | | 36,844,270 |
| Payables: | | |
| Investments bought | | 7,909,862 |
| Management fees | | 321,526 |
| Variation margin on futures contracts | + | 22,097 |
| Total liabilities | | 45,097,755 |
| Net Assets |
| Total assets | | 10,030,861,324 |
| Total liabilities | – | 45,097,755 |
| Net assets | | $9,985,763,569 |
| Net Assets by Source | | |
| Capital received from investors | | 7,552,453,393 |
| Total distributable earnings | | 2,433,310,176 |
| Net Asset Value (NAV) |
| Net Assets | ÷ | Shares
Outstanding | = | NAV |
| $9,985,763,569 | | 124,800,000 | | $80.01 |
| | | | | |
Schwab U.S. Equity ETFs | Annual Report
Statement of Operations
For the period September 1, 2020 through August 31, 2021
| Investment Income |
| Dividends received from securities - unaffiliated (net of foreign withholding tax of $30,072) | | $113,292,076 |
| Securities on loan, net | + | 1,042,296 |
| Total investment income | | 114,334,372 |
| Expenses |
| Management fees | | 3,395,137 |
| Total expenses | – | 3,395,137 |
| Net investment income | | 110,939,235 |
| Realized and Unrealized Gains (Losses) |
| Net realized losses on sales of securities - unaffiliated | | (103,652,516) |
| Net realized gains on in-kind redemptions - unaffiliated | | 433,192,508 |
| Net realized gains on futures contracts | + | 242,794 |
| Net realized gains | | 329,782,786 |
| Net change in unrealized appreciation (depreciation) on securities - unaffiliated | | 2,311,323,824 |
| Net change in unrealized appreciation (depreciation) on futures contracts | + | 141,703 |
| Net change in unrealized appreciation (depreciation) | + | 2,311,465,527 |
| Net realized and unrealized gains | | 2,641,248,313 |
| Increase in net assets resulting from operations | | $2,752,187,548 |
Schwab U.S. Equity ETFs | Annual Report
Statement of Changes in Net Assets
For the current and prior report periods
| Operations | |
| | 9/1/20-8/31/21 | 9/1/19-8/31/20 |
| Net investment income | | $110,939,235 | $100,463,260 |
| Net realized gains | | 329,782,786 | 151,568,027 |
| Net change in unrealized appreciation (depreciation) | + | 2,311,465,527 | 63,119,366 |
| Increase in net assets resulting from operations | | 2,752,187,548 | 315,150,653 |
| Distributions to Shareholders | |
| Total distributions | | ($95,570,430) | ($102,603,225) |
| Transactions in Fund Shares | | | |
| | | 9/1/20-8/31/21 | 9/1/19-8/31/20 |
| | | SHARES | VALUE | SHARES | VALUE |
| Shares sold | | 24,200,000 | $1,584,969,786 | 30,400,000 | $1,620,955,506 |
| Shares redeemed | + | (15,650,000) | (933,990,387) | (26,400,000) | (1,409,974,944) |
| Net transactions in fund shares | | 8,550,000 | $650,979,399 | 4,000,000 | $210,980,562 |
| Shares Outstanding and Net Assets | | | |
| | | 9/1/20-8/31/21 | 9/1/19-8/31/20 |
| | | SHARES | NET ASSETS | SHARES | NET ASSETS |
| Beginning of period | | 116,250,000 | $6,678,167,052 | 112,250,000 | $6,254,639,062 |
| Total increase | + | 8,550,000 | 3,307,596,517 | 4,000,000 | 423,527,990 |
| End of period | | 124,800,000 | $9,985,763,569 | 116,250,000 | $6,678,167,052 |
Schwab U.S. Equity ETFs | Annual Report
Schwab U.S. Small-Cap ETF
Financial Statements
Financial Highlights
| | 9/1/20–
8/31/21 | 9/1/19–
8/31/20 | 9/1/18–
8/31/19 | 9/1/17–
8/31/18 | 9/1/16–
8/31/17 | |
| Per-Share Data |
| Net asset value at beginning of period | $71.24 | $69.20 | $78.24 | $64.03 | $57.42 | |
| Income (loss) from investment operations: | | | | | | |
| Net investment income (loss)1 | 1.09 | 1.01 | 1.04 | 0.98 | 0.90 | |
| Net realized and unrealized gains (losses) | 32.38 | 2.02 | (9.07) | 14.10 | 6.64 | |
| Total from investment operations | 33.47 | 3.03 | (8.03) | 15.08 | 7.54 | |
| Less distributions: | | | | | | |
| Distributions from net investment income | (1.02) | (0.99) | (1.01) | (0.87) | (0.93) | |
| Net asset value at end of period | $103.69 | $71.24 | $69.20 | $78.24 | $64.03 | |
| Total return | 47.33% | 4.53% | (10.26%) | 23.71% | 13.21% | |
| Ratios/Supplemental Data |
| Ratios to average net assets: | | | | | | |
| Total expenses | 0.04% | 0.04% | 0.04% 2 | 0.05% | 0.06% 3 | |
| Net investment income (loss) | 1.18% | 1.50% | 1.49% | 1.38% | 1.46% | |
| Portfolio turnover rate4 | 15% | 12% | 11% | 9% | 11% | |
| Net assets, end of period (x 1,000) | $16,622,058 | $10,044,378 | $8,100,071 | $8,853,388 | $5,490,843 | |
| |
1
Calculated based on the average shares outstanding during the period.
2
Effective March 11, 2019, the annual operating expense ratio was reduced. The ratio presented for the period ended 8/31/19 is a blended ratio.
3
Effective October 7, 2016 and March 1, 2017, the annual operating expense ratio was reduced. The ratio presented for the period ended 8/31/17 is a blended ratio.
4
Portfolio turnover rate excludes securities received or delivered from processing of in-kind creations or redemptions.
Schwab U.S. Equity ETFs | Annual Report
Schwab U.S. Small-Cap ETF
Portfolio Holdings as of August 31, 2021
This section shows all the securities in the fund’s portfolio and their values as of the report date.
The fund files its complete schedule of portfolio holdings with the U.S. Securities and Exchange Commission (SEC) for the first and third quarters of each fiscal year on Form N-PORT Part F. The fund’s Form N-PORT Part F is available on the SEC’s website at www.sec.gov. You can also obtain this information at no cost on the fund’s website at www.schwabassetmanagement.com/schwabetfs_prospectus, by calling 1-866-414-6349, or by sending an email request to orders@mysummaryprospectus.com. The fund also makes available its complete schedule of portfolio holdings on a daily basis on the fund’s website.
| Security | Number
of Shares | Value ($) |
| Common Stock 99.8% of net assets |
| |
| Automobiles & Components 1.3% |
| Adient plc * | 373,752 | 14,703,404 |
| American Axle & Manufacturing Holdings, Inc. * | 452,228 | 4,011,262 |
| Canoo, Inc. *(a) | 565,066 | 4,074,126 |
| Cooper-Standard Holding, Inc. * | 66,647 | 1,551,542 |
| Dana, Inc. | 575,607 | 13,388,619 |
| Dorman Products, Inc. * | 113,268 | 10,631,334 |
| Fisker, Inc. *(a) | 645,664 | 9,007,013 |
| Fox Factory Holding Corp. * | 166,360 | 25,564,541 |
| Gentherm, Inc. * | 131,338 | 11,271,427 |
| LCI Industries | 100,155 | 14,187,957 |
| Lordstown Motors Corp., Class A *(a) | 419,998 | 2,763,587 |
| Modine Manufacturing Co. * | 204,824 | 2,548,011 |
| Motorcar Parts of America, Inc. * | 74,850 | 1,483,527 |
| Patrick Industries, Inc. | 88,602 | 7,230,809 |
| Standard Motor Products, Inc. | 79,189 | 3,396,416 |
| Stoneridge, Inc. * | 107,785 | 2,511,391 |
| Tenneco, Inc., Class A * | 263,085 | 4,104,126 |
| The Goodyear Tire & Rubber Co. * | 1,106,866 | 17,532,757 |
| Thor Industries, Inc. | 219,573 | 24,906,165 |
| Veoneer, Inc. *(a) | 372,447 | 13,333,603 |
| Visteon Corp. * | 110,901 | 11,720,018 |
| Winnebago Industries, Inc. | 133,216 | 9,274,498 |
| Workhorse Group, Inc. *(a) | 430,165 | 4,219,919 |
| XL Fleet Corp. *(a) | 391,533 | 2,662,424 |
| XPEL, Inc. * | 65,694 | 4,991,430 |
| | | 221,069,906 |
| |
| Banks 8.5% |
| 1st Source Corp. | 69,181 | 3,251,507 |
| Allegiance Bancshares, Inc. | 73,167 | 2,719,617 |
| Altabancorp | 58,788 | 2,440,878 |
| Ameris Bancorp | 276,597 | 13,619,636 |
| Arrow Financial Corp. | 61,189 | 2,254,815 |
| Associated Banc-Corp. | 605,125 | 12,477,677 |
| Atlantic Union Bankshares Corp. | 313,388 | 11,595,356 |
| Axos Financial, Inc. * | 204,489 | 9,913,627 |
| Banc of California, Inc. | 177,179 | 3,183,907 |
| BancFirst Corp. | 74,121 | 4,192,284 |
| BancorpSouth Bank | 382,538 | 11,219,840 |
| Bank of Hawaii Corp. | 160,181 | 13,424,770 |
| Bank of Marin Bancorp | 58,108 | 2,103,510 |
| Bank OZK | 479,336 | 20,338,226 |
| BankUnited, Inc. | 369,916 | 15,547,569 |
| Banner Corp. | 138,018 | 7,894,630 |
| Berkshire Hills Bancorp, Inc. | 203,060 | 5,204,428 |
| Bridgewater Bancshares, Inc. * | 82,483 | 1,348,597 |
| Brookline Bancorp, Inc. | 310,270 | 4,644,742 |
| Bryn Mawr Bank Corp. | 78,839 | 3,216,631 |
| Byline Bancorp, Inc. | 93,564 | 2,301,674 |
| Cadence BanCorp | 494,714 | 10,641,298 |
| Camden National Corp. | 59,279 | 2,766,551 |
| Capitol Federal Financial, Inc. | 512,418 | 5,913,304 |
| Security | Number
of Shares | Value ($) |
| Carter Bankshares, Inc. * | 97,190 | 1,184,746 |
| Cathay General Bancorp | 296,968 | 11,813,387 |
| CBTX, Inc. | 75,175 | 2,046,264 |
| Central Pacific Financial Corp. | 112,148 | 2,838,466 |
| CIT Group, Inc. | 392,914 | 21,775,294 |
| City Holding Co. | 62,155 | 4,841,875 |
| Columbia Banking System, Inc. | 284,449 | 10,342,566 |
| Columbia Financial, Inc. * | 181,515 | 3,272,715 |
| Community Bank System, Inc. | 213,653 | 15,810,322 |
| Community Trust Bancorp, Inc. | 60,132 | 2,505,099 |
| ConnectOne Bancorp, Inc. | 137,301 | 3,928,182 |
| CrossFirst Bankshares, Inc. * | 189,364 | 2,503,392 |
| Customers Bancorp, Inc. * | 117,596 | 4,869,650 |
| CVB Financial Corp. | 506,728 | 10,316,982 |
| Dime Community Bancshares, Inc. | 140,065 | 4,622,145 |
| Eagle Bancorp, Inc. | 126,782 | 7,315,321 |
| Eastern Bankshares, Inc. | 740,927 | 14,655,536 |
| Enterprise Financial Services Corp. | 148,776 | 6,681,530 |
| Equity Bancshares, Inc., Class A * | 53,490 | 1,715,959 |
| Essent Group Ltd. | 447,591 | 21,072,584 |
| F.N.B. Corp. | 1,264,694 | 14,771,626 |
| FB Financial Corp. | 133,322 | 5,491,533 |
| Federal Agricultural Mortgage Corp., Class C | 35,003 | 3,426,794 |
| Finance Of America Cos., Inc., Class A * | 82,765 | 455,208 |
| Financial Institutions, Inc. | 62,715 | 1,991,828 |
| First BanCorp | 855,231 | 10,887,091 |
| First Bancorp (North Carolina) | 113,025 | 4,719,924 |
| First Bancshares, Inc. | 83,484 | 3,382,772 |
| First Busey Corp. | 195,962 | 4,644,299 |
| First Citizens BancShares, Inc., Class A | 28,701 | 25,764,888 |
| First Commonwealth Financial Corp. | 381,763 | 5,161,436 |
| First Community Bankshares, Inc. | 61,987 | 1,936,474 |
| First Financial Bancorp | 385,892 | 9,072,321 |
| First Financial Bankshares, Inc. | 564,339 | 26,873,823 |
| First Financial Corp. | 49,380 | 1,996,433 |
| First Foundation, Inc. | 156,343 | 3,756,922 |
| First Hawaiian, Inc. | 516,901 | 14,426,707 |
| First Horizon Corp. | 2,194,948 | 35,975,198 |
| First Interstate BancSystem, Inc., Class A | 137,030 | 6,037,542 |
| First Merchants Corp. | 215,720 | 8,876,878 |
| First Mid Bancshares, Inc. | 62,191 | 2,543,612 |
| First Midwest Bancorp, Inc. | 453,371 | 8,491,639 |
| Flagstar Bancorp, Inc. | 188,247 | 9,310,697 |
| Flushing Financial Corp. | 122,847 | 2,816,882 |
| Fulton Financial Corp. | 644,910 | 10,221,823 |
| German American Bancorp, Inc. | 97,952 | 3,659,487 |
| Glacier Bancorp, Inc. | 378,760 | 20,172,758 |
| Great Southern Bancorp, Inc. | 42,385 | 2,308,711 |
| Great Western Bancorp, Inc. | 218,616 | 6,768,351 |
| Hancock Whitney Corp. | 344,021 | 15,811,205 |
| Hanmi Financial Corp. | 121,858 | 2,349,422 |
| Harborone Bancorp, Inc. | 222,884 | 3,149,351 |
| HBT Financial, Inc. | 39,281 | 642,244 |
| Heartland Financial USA, Inc. | 155,574 | 7,316,645 |
| Heritage Commerce Corp. | 238,319 | 2,685,855 |
| Heritage Financial Corp. | 142,744 | 3,632,835 |
Schwab U.S. Equity ETFs | Annual Report
Schwab U.S. Small-Cap ETF
Portfolio Holdings as of August 31, 2021 (continued)
| Security | Number
of Shares | Value ($) |
| Hilltop Holdings, Inc. | 258,127 | 8,639,511 |
| Home BancShares, Inc. | 601,642 | 13,326,370 |
| HomeStreet, Inc. | 84,775 | 3,463,059 |
| HomeTrust Bancshares, Inc. | 65,968 | 1,835,230 |
| Hope Bancorp, Inc. | 489,962 | 6,756,576 |
| Horizon Bancorp, Inc. | 155,855 | 2,782,012 |
| Independent Bank Corp. | 130,915 | 10,041,180 |
| Independent Bank Group, Inc. | 145,617 | 10,255,805 |
| International Bancshares Corp. | 221,121 | 9,260,547 |
| Investors Bancorp, Inc. | 893,840 | 12,790,850 |
| Kearny Financial Corp. | 270,812 | 3,436,604 |
| Lakeland Bancorp, Inc. | 200,861 | 3,390,534 |
| Lakeland Financial Corp. | 100,290 | 6,660,259 |
| Live Oak Bancshares, Inc. | 123,307 | 7,547,621 |
| Luther Burbank Corp. | 63,397 | 822,259 |
| Mercantile Bank Corp. | 63,832 | 1,991,558 |
| Merchants Bancorp | 63,973 | 2,345,890 |
| Meridian Bancorp, Inc. | 208,179 | 4,325,960 |
| Meta Financial Group, Inc. | 126,677 | 6,231,242 |
| Metrocity Bankshares, Inc. | 78,436 | 1,624,410 |
| MGIC Investment Corp. | 1,345,911 | 20,552,061 |
| Midland States Bancorp, Inc. | 81,142 | 2,052,893 |
| Mr Cooper Group, Inc. * | 270,108 | 10,501,799 |
| National Bank Holdings Corp., Class A | 122,077 | 4,577,888 |
| NBT Bancorp, Inc. | 172,201 | 6,175,128 |
| Nicolet Bankshares, Inc. * | 35,120 | 2,683,519 |
| NMI Holdings, Inc., Class A * | 339,557 | 7,663,801 |
| Northfield Bancorp, Inc. | 183,613 | 3,103,060 |
| Northwest Bancshares, Inc. | 504,845 | 6,573,082 |
| OceanFirst Financial Corp. | 233,627 | 4,966,910 |
| Ocwen Financial Corp. * | 30,702 | 868,867 |
| OFG Bancorp | 204,824 | 4,876,859 |
| Old National Bancorp | 657,330 | 10,951,118 |
| Origin Bancorp, Inc. | 86,686 | 3,567,129 |
| Pacific Premier Bancorp, Inc. | 375,519 | 15,005,739 |
| PacWest Bancorp | 463,704 | 19,730,605 |
| Park National Corp. | 56,370 | 6,608,819 |
| Peapack-Gladstone Financial Corp. | 63,845 | 2,126,677 |
| PennyMac Financial Services, Inc. | 150,901 | 10,042,462 |
| Peoples Bancorp, Inc. | 70,431 | 2,200,264 |
| Peoples Financial Services Corp. | 26,394 | 1,216,499 |
| Pinnacle Financial Partners, Inc. | 301,772 | 29,247,742 |
| Popular, Inc. | 319,653 | 24,274,449 |
| Preferred Bank | 53,758 | 3,434,599 |
| Premier Financial Corp. | 148,092 | 4,501,997 |
| Prosperity Bancshares, Inc. | 368,497 | 25,750,570 |
| Provident Financial Services, Inc. | 287,734 | 6,350,289 |
| QCR Holdings, Inc. | 59,071 | 3,068,738 |
| Radian Group, Inc. | 758,925 | 17,933,398 |
| Red River Bancshares, Inc. | 19,314 | 968,790 |
| Renasant Corp. | 223,410 | 7,841,691 |
| Republic Bancorp, Inc., Class A | 36,120 | 1,810,696 |
| Rocket Cos., Inc., Class A | 540,873 | 9,384,147 |
| S&T Bancorp, Inc. | 156,090 | 4,651,482 |
| Sandy Spring Bancorp, Inc. | 187,511 | 8,169,854 |
| Seacoast Banking Corp. of Florida | 219,368 | 7,006,614 |
| ServisFirst Bancshares, Inc. | 186,859 | 13,719,188 |
| Simmons First National Corp., Class A | 429,824 | 12,486,387 |
| South State Corp. | 281,856 | 19,329,684 |
| Southside Bancshares, Inc. | 122,836 | 4,629,689 |
| Sterling Bancorp | 763,060 | 17,466,443 |
| Sterling Bancorp, Inc. * | 64,659 | 343,339 |
| Stock Yards Bancorp, Inc. | 84,041 | 4,334,835 |
| Synovus Financial Corp. | 589,311 | 25,399,304 |
| Texas Capital Bancshares, Inc. * | 200,568 | 13,636,618 |
| TFS Financial Corp. | 189,472 | 3,787,545 |
| The Bancorp, Inc. * | 202,065 | 4,982,923 |
| The First of Long Island Corp. | 88,114 | 1,868,017 |
| Security | Number
of Shares | Value ($) |
| Tompkins Financial Corp. | 47,847 | 3,808,143 |
| Towne Bank | 256,544 | 7,816,896 |
| TriCo Bancshares | 107,271 | 4,242,568 |
| TriState Capital Holdings, Inc. * | 110,533 | 2,233,872 |
| Triumph Bancorp, Inc. * | 89,827 | 7,385,576 |
| TrustCo Bank Corp. | 76,526 | 2,455,719 |
| Trustmark Corp. | 251,491 | 7,952,145 |
| UMB Financial Corp. | 172,426 | 15,790,773 |
| Umpqua Holdings Corp. | 874,747 | 17,031,324 |
| United Bankshares, Inc. | 531,961 | 19,326,143 |
| United Community Banks, Inc. | 344,234 | 10,385,540 |
| Univest Financial Corp. | 116,678 | 3,159,640 |
| UWM Holdings Corp. (a) | 214,555 | 1,576,979 |
| Valley National Bancorp | 1,609,634 | 20,989,627 |
| Veritex Holdings, Inc. | 196,216 | 7,050,041 |
| Walker & Dunlop, Inc. | 117,271 | 13,022,945 |
| Washington Federal, Inc. | 287,180 | 9,563,094 |
| Washington Trust Bancorp, Inc. | 68,653 | 3,656,459 |
| Waterstone Financial, Inc. | 87,403 | 1,772,533 |
| Webster Financial Corp. | 358,600 | 18,116,472 |
| WesBanco, Inc. | 267,025 | 9,078,850 |
| Westamerica BanCorp | 106,505 | 6,043,094 |
| Western Alliance Bancorp | 411,375 | 40,133,745 |
| Wintrust Financial Corp. | 226,186 | 16,927,760 |
| WSFS Financial Corp. | 188,536 | 8,561,420 |
| | | 1,415,891,345 |
| |
| Capital Goods 11.0% |
| AAON, Inc. | 162,220 | 11,048,804 |
| AAR Corp. * | 131,647 | 4,456,251 |
| Advanced Drainage Systems, Inc. | 199,229 | 22,741,990 |
| Advent Technologies Holdings, Inc. *(a) | 138,282 | 1,023,287 |
| AECOM * | 581,592 | 38,129,171 |
| Aerojet Rocketdyne Holdings, Inc. | 296,621 | 12,315,704 |
| AeroVironment, Inc. * | 89,001 | 9,110,142 |
| Air Lease Corp. | 425,454 | 16,907,542 |
| Alamo Group, Inc. | 39,256 | 6,085,073 |
| Albany International Corp., Class A | 121,706 | 9,533,231 |
| Altra Industrial Motion Corp. | 241,530 | 14,143,997 |
| Ameresco, Inc., Class A * | 92,274 | 6,380,747 |
| American Woodmark Corp. * | 67,436 | 4,751,541 |
| API Group Corp. * | 617,051 | 14,309,413 |
| Apogee Enterprises, Inc. | 102,207 | 4,392,857 |
| Applied Industrial Technologies, Inc. | 154,103 | 13,685,887 |
| Arcosa, Inc. | 191,021 | 9,707,687 |
| Argan, Inc. | 59,350 | 2,747,905 |
| Armstrong World Industries, Inc. | 189,898 | 19,736,099 |
| Array Technologies, Inc. * | 433,044 | 8,258,149 |
| Astec Industries, Inc. | 90,145 | 5,511,465 |
| Astronics Corp. * | 97,646 | 1,304,551 |
| Atkore, Inc. * | 186,335 | 17,286,298 |
| Axon Enterprise, Inc. * | 257,087 | 46,756,413 |
| AZEK Co., Inc. * | 558,541 | 23,732,407 |
| AZZ, Inc. | 99,127 | 5,308,251 |
| Babcock & Wilcox Enterprises, Inc. * | 265,037 | 1,934,770 |
| Barnes Group, Inc. | 184,784 | 8,808,653 |
| Beacon Roofing Supply, Inc. * | 218,843 | 11,266,038 |
| Bloom Energy Corp., Class A * | 481,762 | 10,319,342 |
| Boise Cascade Co. | 155,953 | 9,021,881 |
| Builders FirstSource, Inc. * | 823,232 | 43,870,033 |
| BWX Technologies, Inc. | 377,321 | 21,669,545 |
| Byrna Technologies, Inc. * | 51,905 | 1,519,778 |
| CAI International, Inc. | 64,206 | 3,593,610 |
| ChargePoint Holdings, Inc. *(a) | 642,857 | 13,596,426 |
| Chart Industries, Inc. * | 141,142 | 26,588,330 |
| CIRCOR International, Inc. * | 80,811 | 2,888,993 |
| Colfax Corp. * | 467,934 | 22,540,381 |
Schwab U.S. Equity ETFs | Annual Report
Schwab U.S. Small-Cap ETF
Portfolio Holdings as of August 31, 2021 (continued)
| Security | Number
of Shares | Value ($) |
| Columbus McKinnon Corp. | 112,441 | 5,177,908 |
| Comfort Systems USA, Inc. | 143,880 | 10,932,002 |
| Construction Partners, Inc., Class A * | 141,628 | 4,740,289 |
| Cornerstone Building Brands, Inc. * | 168,419 | 2,799,124 |
| Crane Co. | 196,852 | 20,033,628 |
| CSW Industrials, Inc. | 54,763 | 7,271,979 |
| Curtiss-Wright Corp. | 162,315 | 19,766,721 |
| Desktop Metal, Inc., Class A *(a) | 577,654 | 4,794,528 |
| Douglas Dynamics, Inc. | 90,990 | 3,615,943 |
| DXP Enterprises, Inc. * | 70,053 | 2,100,189 |
| Dycom Industries, Inc. * | 122,065 | 9,195,156 |
| EMCOR Group, Inc. | 216,352 | 26,286,768 |
| Encore Wire Corp. | 81,797 | 6,953,563 |
| Energy Recovery, Inc. * | 164,246 | 3,355,546 |
| Enerpac Tool Group Corp. | 238,470 | 5,999,905 |
| EnerSys | 169,776 | 14,361,352 |
| EnPro Industries, Inc. | 81,692 | 6,985,483 |
| Eos Energy Enterprises, Inc. *(a) | 131,459 | 1,698,450 |
| ESCO Technologies, Inc. | 103,242 | 9,304,169 |
| Evoqua Water Technologies Corp. * | 475,533 | 18,507,744 |
| Federal Signal Corp. | 240,072 | 9,754,125 |
| Flowserve Corp. | 516,692 | 20,083,818 |
| Fluor Corp. * | 498,846 | 8,310,774 |
| Franklin Electric Co., Inc. | 152,952 | 12,997,861 |
| FTC Solar, Inc. * | 77,226 | 837,902 |
| FuelCell Energy, Inc. * | 1,278,731 | 7,979,281 |
| Gates Industrial Corp. plc * | 370,190 | 6,063,712 |
| GATX Corp. | 140,338 | 12,866,188 |
| Gibraltar Industries, Inc. * | 129,405 | 9,661,377 |
| Global Industrial Co. | 63,788 | 2,455,200 |
| GMS, Inc. * | 169,970 | 8,398,218 |
| GrafTech International Ltd. | 636,028 | 7,040,830 |
| Graham Corp. | 38,795 | 465,540 |
| Granite Construction, Inc. | 181,566 | 7,360,686 |
| Great Lakes Dredge & Dock Corp. * | 259,694 | 3,923,976 |
| Griffon Corp. | 179,915 | 4,353,943 |
| H&E Equipment Services, Inc. | 126,107 | 4,293,943 |
| Helios Technologies, Inc. | 121,438 | 9,911,770 |
| Herc Holdings, Inc. * | 98,596 | 12,960,444 |
| Hexcel Corp. * | 332,173 | 18,837,531 |
| Hillenbrand, Inc. | 298,415 | 13,852,424 |
| Hydrofarm Holdings Group, Inc. * | 56,764 | 2,869,988 |
| Hyliion Holdings Corp. *(a) | 395,284 | 3,490,358 |
| Hyster-Yale Materials Handling, Inc. | 38,603 | 2,262,522 |
| IES Holdings, Inc. * | 82,654 | 4,041,781 |
| Insteel Industries, Inc. | 76,719 | 2,838,603 |
| ITT, Inc. | 342,016 | 32,720,671 |
| JELD-WEN Holding, Inc. * | 365,591 | 10,068,376 |
| John Bean Technologies Corp. | 125,921 | 18,370,615 |
| Kadant, Inc. | 45,902 | 9,599,026 |
| Kaman Corp. | 110,234 | 4,307,945 |
| Kennametal, Inc. | 331,500 | 12,325,170 |
| Kratos Defense & Security Solutions, Inc. * | 490,912 | 12,135,345 |
| L.B. Foster Co., Class A * | 39,081 | 666,331 |
| Lindsay Corp. | 43,227 | 7,121,648 |
| Lydall, Inc. * | 68,733 | 4,260,071 |
| Masonite International Corp. * | 97,159 | 11,627,989 |
| MasTec, Inc. * | 224,608 | 20,538,156 |
| Matrix Service Co. * | 104,362 | 1,177,203 |
| Maxar Technologies, Inc. | 284,943 | 9,058,338 |
| McGrath RentCorp | 95,973 | 6,696,996 |
| Mercury Systems, Inc. * | 222,679 | 11,218,568 |
| Meritor, Inc. * | 287,831 | 6,827,351 |
| Moog, Inc., Class A | 116,087 | 9,221,951 |
| MRC Global, Inc. * | 227,094 | 1,862,171 |
| MSC Industrial Direct Co., Inc., Class A | 186,275 | 15,686,218 |
| Mueller Industries, Inc. | 226,683 | 10,112,329 |
| Security | Number
of Shares | Value ($) |
| Mueller Water Products, Inc., Class A | 628,746 | 10,449,759 |
| MYR Group, Inc. * | 66,715 | 6,939,027 |
| National Presto Industries, Inc. | 20,624 | 1,722,929 |
| NN, Inc. * | 167,867 | 913,196 |
| NOW, Inc. * | 437,203 | 3,357,719 |
| NV5 Global, Inc. * | 49,307 | 5,209,285 |
| nVent Electric plc | 664,927 | 22,846,892 |
| Omega Flex, Inc. | 11,921 | 1,811,992 |
| Oshkosh Corp. | 272,848 | 31,262,924 |
| PAE, Inc. * | 249,257 | 1,667,529 |
| Park Aerospace Corp. | 74,229 | 1,082,259 |
| Park-Ohio Holdings Corp. | 32,603 | 840,505 |
| Parsons Corp. * | 93,390 | 3,308,808 |
| PGT Innovations, Inc. * | 236,250 | 5,015,587 |
| Plug Power, Inc. * | 2,032,091 | 52,956,291 |
| Powell Industries, Inc. | 34,954 | 884,336 |
| Preformed Line Products Co. | 9,918 | 695,450 |
| Primoris Services Corp. | 200,270 | 5,146,939 |
| Proto Labs, Inc. * | 109,786 | 8,141,730 |
| Quanex Building Products Corp. | 133,299 | 3,140,524 |
| Raven Industries, Inc. * | 142,449 | 8,311,899 |
| RBC Bearings, Inc. * | 100,294 | 23,220,067 |
| Regal Beloit Corp. | 161,097 | 24,071,114 |
| Resideo Technologies, Inc. * | 570,504 | 18,393,049 |
| REV Group, Inc. | 109,318 | 1,777,511 |
| Rexnord Corp. | 475,952 | 28,918,843 |
| Romeo Power, Inc. *(a) | 355,285 | 1,730,238 |
| Rush Enterprises, Inc., Class A | 170,066 | 7,499,911 |
| Rush Enterprises, Inc., Class B | 29,377 | 1,245,291 |
| Shoals Technologies Group, Inc., Class A * | 367,261 | 11,961,691 |
| Shyft Group, Inc. | 127,465 | 5,609,735 |
| Simpson Manufacturing Co., Inc. | 172,197 | 19,484,091 |
| SiteOne Landscape Supply, Inc. * | 176,607 | 35,339,061 |
| Spirit AeroSystems Holdings, Inc., Class A | 418,127 | 16,407,303 |
| SPX Corp. * | 179,435 | 11,211,099 |
| SPX FLOW, Inc. | 167,470 | 13,486,359 |
| Standex International Corp. | 48,639 | 4,826,934 |
| Stem, Inc. * | 434,272 | 10,852,457 |
| Sunrun, Inc. * | 638,867 | 28,269,865 |
| Tennant Co. | 73,830 | 5,461,943 |
| Terex Corp. | 276,836 | 14,132,478 |
| The Gorman-Rupp Co. | 74,585 | 2,615,696 |
| The Greenbrier Cos., Inc. | 130,142 | 5,739,262 |
| The Manitowoc Co., Inc. * | 137,265 | 3,328,676 |
| The Timken Co. | 271,192 | 19,943,460 |
| Thermon Group Holdings, Inc. * | 131,454 | 2,195,282 |
| Titan International, Inc. * | 198,168 | 1,646,776 |
| Titan Machinery, Inc. * | 75,032 | 2,154,919 |
| TPI Composites, Inc. * | 129,551 | 4,703,997 |
| TriMas Corp. * | 171,235 | 5,498,356 |
| Trinity Industries, Inc. | 320,862 | 9,314,624 |
| Triton International Ltd. | 264,485 | 14,472,619 |
| Triumph Group, Inc. * | 241,785 | 4,463,351 |
| Tutor Perini Corp. * | 161,642 | 2,330,878 |
| UFP Industries, Inc. | 245,239 | 18,412,544 |
| Univar Solutions, Inc. * | 672,602 | 15,880,133 |
| Valmont Industries, Inc. | 84,248 | 20,965,957 |
| Veritiv Corp. * | 48,466 | 4,345,946 |
| Vertiv Holdings Co. | 980,322 | 27,615,671 |
| Vicor Corp. * | 84,365 | 10,408,110 |
| View, Inc. *(a) | 239,995 | 1,202,375 |
| Virgin Galactic Holdings, Inc. *(a) | 525,078 | 14,234,865 |
| Wabash National Corp. | 205,783 | 3,197,868 |
| Watts Water Technologies, Inc., Class A | 109,642 | 18,811,278 |
| Welbilt, Inc. * | 512,172 | 11,984,825 |
Schwab U.S. Equity ETFs | Annual Report
Schwab U.S. Small-Cap ETF
Portfolio Holdings as of August 31, 2021 (continued)
| Security | Number
of Shares | Value ($) |
| WESCO International, Inc. * | 175,097 | 20,489,851 |
| WillScot Mobile Mini Holdings Corp. * | 798,439 | 23,633,794 |
| | | 1,833,574,085 |
| |
| Commercial & Professional Services 3.0% |
| ABM Industries, Inc. | 266,119 | 13,178,213 |
| Acacia Research Corp. * | 197,192 | 1,200,899 |
| ACCO Brands Corp. | 378,842 | 3,549,749 |
| ASGN, Inc. * | 210,951 | 23,666,593 |
| Barrett Business Services, Inc. | 29,990 | 2,324,225 |
| Brady Corp., Class A | 192,472 | 10,264,532 |
| BrightView Holdings, Inc. * | 119,911 | 1,838,236 |
| CACI International, Inc., Class A * | 93,409 | 24,056,554 |
| Casella Waste Systems, Inc., Class A * | 189,818 | 14,044,634 |
| CBIZ, Inc. * | 211,002 | 7,197,278 |
| Cimpress plc * | 77,440 | 7,355,251 |
| Clean Harbors, Inc. * | 199,071 | 20,428,666 |
| CoreCivic, Inc. * | 476,957 | 4,636,022 |
| Covanta Holding Corp. | 469,439 | 9,412,252 |
| Deluxe Corp. | 167,400 | 6,419,790 |
| Driven Brands Holdings, Inc. * | 172,682 | 5,159,738 |
| Ennis, Inc. | 102,955 | 1,998,357 |
| Exponent, Inc. | 206,669 | 24,159,606 |
| Forrester Research, Inc. * | 43,707 | 2,078,268 |
| Franklin Covey Co. * | 40,471 | 1,759,274 |
| FTI Consulting, Inc. * | 135,694 | 18,957,809 |
| GP Strategies Corp. * | 51,857 | 1,072,403 |
| Harsco Corp. * | 313,966 | 5,726,740 |
| Healthcare Services Group, Inc. | 296,332 | 7,752,045 |
| Heidrick & Struggles International, Inc. | 77,148 | 3,334,337 |
| Heritage-Crystal Clean, Inc. * | 61,103 | 1,804,983 |
| Herman Miller, Inc. | 292,662 | 12,300,584 |
| HNI Corp. | 172,705 | 6,543,792 |
| Huron Consulting Group, Inc. * | 89,539 | 4,420,540 |
| ICF International, Inc. | 67,209 | 6,294,795 |
| Insperity, Inc. | 142,640 | 15,738,898 |
| Interface, Inc. | 234,280 | 3,368,946 |
| KAR Auction Services, Inc. * | 494,903 | 8,368,810 |
| KBR, Inc. | 562,108 | 21,888,485 |
| Kelly Services, Inc., Class A | 132,951 | 2,584,567 |
| Kforce, Inc. | 76,509 | 4,469,656 |
| Kimball International, Inc., Class B | 146,949 | 1,832,454 |
| Korn Ferry | 214,150 | 15,138,263 |
| ManTech International Corp., Class A | 108,717 | 8,607,125 |
| Matthews International Corp., Class A | 125,635 | 4,652,264 |
| Mistras Group, Inc. * | 69,572 | 738,159 |
| MSA Safety, Inc. | 144,447 | 23,521,749 |
| NL Industries, Inc. | 32,321 | 221,076 |
| Pitney Bowes, Inc. | 696,076 | 5,199,688 |
| Quad/Graphics, Inc. * | 132,202 | 547,316 |
| Resources Connection, Inc. | 122,371 | 1,933,462 |
| Science Applications International Corp. | 229,871 | 19,362,034 |
| SP Plus Corp. * | 91,817 | 2,973,953 |
| Steelcase, Inc., Class A | 362,301 | 5,104,821 |
| Team, Inc. * | 119,749 | 536,475 |
| Tetra Tech, Inc. | 215,248 | 30,961,272 |
| The Brink's Co. | 197,330 | 15,423,313 |
| TriNet Group, Inc. * | 156,747 | 14,433,264 |
| TrueBlue, Inc. * | 140,689 | 3,845,030 |
| UniFirst Corp. | 60,421 | 13,840,638 |
| Upwork, Inc. * | 365,170 | 16,326,751 |
| US Ecology, Inc. * | 124,947 | 4,479,350 |
| Viad Corp. * | 81,203 | 3,507,158 |
| Vidler Water Resouces, Inc. * | 72,981 | 1,086,687 |
| VSE Corp. | 40,514 | 2,025,295 |
| | | 505,653,124 |
| |
| Security | Number
of Shares | Value ($) |
| Consumer Durables & Apparel 4.3% |
| Acushnet Holdings Corp. | 135,181 | 6,753,643 |
| American Outdoor Brands, Inc. * | 55,451 | 1,543,201 |
| AMMO, Inc. *(a) | 306,574 | 2,253,319 |
| Beazer Homes USA, Inc. * | 117,284 | 2,194,384 |
| Brunswick Corp. | 309,594 | 29,990,371 |
| Callaway Golf Co. * | 461,044 | 12,936,895 |
| Capri Holdings Ltd. * | 601,624 | 33,997,772 |
| Carter's, Inc. | 174,285 | 17,843,298 |
| Casper Sleep, Inc. * | 97,841 | 487,248 |
| Cavco Industries, Inc. * | 33,814 | 8,639,477 |
| Century Communities, Inc. | 116,359 | 8,156,766 |
| Columbia Sportswear Co. | 121,156 | 12,359,124 |
| Crocs, Inc. * | 258,618 | 36,935,823 |
| Deckers Outdoor Corp. * | 110,402 | 46,197,717 |
| Dream Finders Homes, Inc., Class A *(a) | 40,028 | 832,582 |
| Ethan Allen Interiors, Inc. | 86,987 | 2,089,428 |
| Fossil Group, Inc. * | 187,231 | 2,508,895 |
| G-III Apparel Group Ltd. * | 172,640 | 5,339,755 |
| GoPro, Inc., Class A * | 497,049 | 4,955,579 |
| Green Brick Partners, Inc. * | 191,141 | 4,776,614 |
| Hayward Holdings, Inc. * | 164,357 | 3,443,279 |
| Helen of Troy Ltd. * | 96,943 | 23,187,796 |
| Installed Building Products, Inc. | 89,472 | 11,110,633 |
| iRobot Corp. *(a) | 111,379 | 9,035,064 |
| Johnson Outdoors, Inc., Class A | 28,582 | 3,280,928 |
| KB Home | 352,296 | 15,159,297 |
| Kontoor Brands, Inc. | 187,463 | 10,115,503 |
| La-Z-Boy, Inc. | 183,640 | 6,429,236 |
| Latham Group, Inc. * | 80,870 | 1,776,714 |
| Legacy Housing Corp. * | 35,276 | 691,410 |
| Levi Strauss & Co., Class A | 330,101 | 8,651,947 |
| LGI Homes, Inc. * | 87,035 | 13,954,322 |
| M.D.C Holdings, Inc. | 220,170 | 11,503,882 |
| M/I Homes, Inc. * | 115,782 | 7,455,203 |
| Malibu Boats, Inc., Class A * | 82,664 | 5,918,742 |
| Marine Products Corp. | 117,728 | 1,669,383 |
| Mattel, Inc. * | 1,383,408 | 29,535,761 |
| Meritage Homes Corp. * | 150,086 | 16,740,592 |
| Movado Group, Inc. | 66,928 | 2,418,778 |
| Oxford Industries, Inc. | 66,966 | 6,047,030 |
| Purple Innovation, Inc. * | 241,880 | 5,901,872 |
| PVH Corp. * | 283,561 | 29,714,357 |
| Ralph Lauren Corp. | 191,877 | 22,282,676 |
| Skechers U.S.A., Inc., Class A * | 533,231 | 26,890,839 |
| Skyline Champion Corp. * | 206,672 | 12,962,468 |
| Smith & Wesson Brands, Inc. | 211,164 | 5,095,387 |
| Sonos, Inc. * | 390,307 | 15,506,897 |
| Steven Madden Ltd. | 305,384 | 12,358,890 |
| Sturm Ruger & Co., Inc. | 69,710 | 5,450,625 |
| Taylor Morrison Home Corp., Class A * | 511,586 | 14,370,451 |
| Tempur Sealy International, Inc. | 726,577 | 32,477,992 |
| TopBuild Corp. * | 131,595 | 28,791,670 |
| Tri Pointe Homes, Inc. * | 469,800 | 11,167,146 |
| Tupperware Brands Corp. * | 196,996 | 4,702,295 |
| Unifi, Inc. * | 59,225 | 1,376,389 |
| Universal Electronics, Inc. * | 54,613 | 2,759,049 |
| Vera Bradley, Inc. * | 89,219 | 1,022,450 |
| Vista Outdoor, Inc. * | 229,056 | 9,356,938 |
| Vizio Holding Corp., Class A *(a) | 47,020 | 959,678 |
| Wolverine World Wide, Inc. | 328,450 | 11,778,217 |
| YETI Holdings, Inc. * | 297,466 | 29,550,272 |
| | | 713,393,949 |
| |
Schwab U.S. Equity ETFs | Annual Report
Schwab U.S. Small-Cap ETF
Portfolio Holdings as of August 31, 2021 (continued)
| Security | Number
of Shares | Value ($) |
| Consumer Services 4.1% |
| 2U, Inc. * | 295,067 | 10,926,331 |
| Accel Entertainment, Inc. * | 214,914 | 2,475,809 |
| Adtalem Global Education, Inc. * | 196,040 | 7,253,480 |
| American Public Education, Inc. * | 74,431 | 1,957,535 |
| Bally's Corp. * | 117,817 | 5,919,126 |
| Biglari Holdings, Inc., Class A * | 236 | 206,171 |
| Biglari Holdings, Inc., Class B * | 3,755 | 656,562 |
| BJ's Restaurants, Inc. * | 92,132 | 3,939,564 |
| Bloomin' Brands, Inc. * | 320,940 | 8,597,983 |
| Bluegreen Vacations Holding Corp. * | 59,502 | 1,362,001 |
| Boyd Gaming Corp. * | 320,138 | 19,646,869 |
| Brinker International, Inc. * | 181,432 | 9,664,883 |
| Caesars Entertainment, Inc. * | 829,038 | 84,255,132 |
| Carriage Services, Inc. | 65,578 | 3,031,671 |
| Carrols Restaurant Group, Inc. | 138,722 | 575,696 |
| Choice Hotels International, Inc. | 114,563 | 13,674,240 |
| Churchill Downs, Inc. | 137,783 | 29,003,321 |
| Chuy's Holdings, Inc. * | 78,652 | 2,537,314 |
| Coursera, Inc. * | 64,334 | 2,474,929 |
| Cracker Barrel Old Country Store, Inc. | 94,071 | 13,506,714 |
| Dave & Buster's Entertainment, Inc. * | 189,509 | 7,091,427 |
| Denny's Corp. * | 254,456 | 4,208,702 |
| Diamond Resorts International, Inc. - Escrow *(a)(b) | 82,246 | 20,909 |
| Dine Brands Global, Inc. * | 68,051 | 5,629,179 |
| El Pollo Loco Holdings, Inc. * | 74,855 | 1,357,870 |
| Everi Holdings, Inc. * | 349,918 | 7,960,634 |
| Fiesta Restaurant Group, Inc. * | 68,825 | 826,588 |
| frontdoor, Inc. * | 339,915 | 14,827,092 |
| GAN Ltd. * | 53,004 | 906,368 |
| Golden Entertainment, Inc. * | 75,511 | 3,603,385 |
| Golden Nugget Online Gaming, Inc. * | 162,246 | 3,504,514 |
| Graham Holdings Co., Class B | 16,079 | 9,917,688 |
| Grand Canyon Education, Inc. * | 183,787 | 16,382,773 |
| H&R Block, Inc. | 719,666 | 18,459,433 |
| Hilton Grand Vacations, Inc. * | 339,337 | 14,825,634 |
| Houghton Mifflin Harcourt Co. * | 503,253 | 6,778,818 |
| Hyatt Hotels Corp., Class A * | 150,025 | 11,040,340 |
| Jack in the Box, Inc. | 88,142 | 9,339,526 |
| Laureate Education, Inc., Class A * | 431,139 | 6,868,044 |
| Lindblad Expeditions Holdings, Inc. * | 121,668 | 1,789,736 |
| Marriott Vacations Worldwide Corp. * | 169,673 | 25,374,597 |
| Monarch Casino & Resort, Inc. * | 51,453 | 3,260,577 |
| Noodles & Co. * | 117,438 | 1,478,544 |
| OneSpaWorld Holdings Ltd. * | 217,851 | 2,287,435 |
| Papa John's International, Inc. | 131,147 | 16,725,177 |
| Penn National Gaming, Inc. * | 590,376 | 47,879,494 |
| Perdoceo Education Corp. * | 279,436 | 3,068,207 |
| Planet Fitness, Inc., Class A * | 330,902 | 26,902,333 |
| Playa Hotels & Resorts N.V. * | 378,734 | 2,768,546 |
| PlayAGS, Inc. * | 150,230 | 1,230,384 |
| Red Rock Resorts, Inc., Class A * | 258,995 | 12,123,556 |
| Regis Corp. * | 95,631 | 518,320 |
| Rush Street Interactive, Inc. * | 234,326 | 3,486,771 |
| Ruth's Hospitality Group, Inc. * | 126,560 | 2,593,214 |
| Scientific Games Corp., Class A * | 224,911 | 16,272,311 |
| SeaWorld Entertainment, Inc. * | 203,810 | 10,025,414 |
| Shake Shack, Inc., Class A * | 144,160 | 12,505,880 |
| Six Flags Entertainment Corp. * | 301,417 | 12,731,854 |
| Strategic Education, Inc. | 97,710 | 7,648,739 |
| Stride, Inc. * | 164,727 | 5,640,252 |
| Target Hospitality Corp. * | 108,516 | 431,894 |
| Texas Roadhouse, Inc. | 260,904 | 24,785,880 |
| The Cheesecake Factory, Inc. * | 182,470 | 8,512,225 |
| The Wendy's Co. | 702,339 | 16,167,844 |
| Travel & Leisure Co. | 341,847 | 18,719,542 |
| Security | Number
of Shares | Value ($) |
| Vivint Smart Home, Inc. * | 181,298 | 2,211,836 |
| Wingstop, Inc. | 117,896 | 20,269,859 |
| WW International, Inc. * | 190,243 | 4,118,761 |
| | | 676,743,437 |
| |
| Diversified Financials 4.8% |
| Affiliated Managers Group, Inc. | 165,469 | 28,147,932 |
| Alerus Financial Corp. | 57,787 | 1,725,520 |
| Apollo Commercial Real Estate Finance, Inc. | 510,330 | 7,935,631 |
| Arbor Realty Trust, Inc. | 490,627 | 8,968,662 |
| Ares Management Corp., Class A | 438,510 | 33,844,202 |
| ARMOUR Residential REIT, Inc. | 281,910 | 3,061,543 |
| Artisan Partners Asset Management, Inc., Class A | 240,876 | 12,515,917 |
| Assetmark Financial Holdings, Inc. * | 68,865 | 1,850,403 |
| B. Riley Financial, Inc. | 70,078 | 4,592,912 |
| BGC Partners, Inc., Class A | 1,342,317 | 6,912,933 |
| Blackstone Mortgage Trust, Inc., Class A | 583,019 | 19,128,853 |
| Blucora, Inc. * | 191,986 | 3,150,490 |
| Brightsphere Investment Group, Inc. | 236,093 | 6,419,369 |
| BrightSpire Capital, Inc. | 319,191 | 3,198,294 |
| Broadmark Realty Capital, Inc. | 493,740 | 5,189,207 |
| Cannae Holdings, Inc. * | 341,632 | 10,904,893 |
| Capstead Mortgage Corp. | 381,976 | 2,631,815 |
| Chimera Investment Corp. | 914,396 | 14,008,547 |
| Cohen & Steers, Inc. | 93,746 | 8,222,462 |
| Cowen, Inc., Class A | 106,530 | 3,839,341 |
| Curo Group Holdings Corp. | 70,201 | 1,149,190 |
| Diamond Hill Investment Group, Inc. | 11,535 | 2,111,251 |
| Donnelley Financial Solutions, Inc. * | 118,140 | 3,939,969 |
| Dynex Capital, Inc. | 122,579 | 2,177,003 |
| Ellington Financial, Inc. | 173,582 | 3,214,739 |
| Encore Capital Group, Inc. * | 122,983 | 6,051,993 |
| Enova International, Inc. * | 146,190 | 4,821,346 |
| Evercore, Inc., Class A | 162,382 | 22,675,022 |
| EZCORP, Inc., Class A * | 209,740 | 1,445,109 |
| Federated Hermes, Inc. | 370,942 | 12,548,968 |
| FirstCash, Inc. | 162,689 | 13,940,820 |
| Focus Financial Partners, Inc., Class A * | 199,010 | 10,324,639 |
| Granite Point Mortgage Trust, Inc. | 218,763 | 3,010,179 |
| Green Dot Corp., Class A * | 215,817 | 11,274,280 |
| Greenhill & Co., Inc. | 59,108 | 871,252 |
| Hamilton Lane, Inc., Class A | 128,033 | 11,019,800 |
| Hannon Armstrong Sustainable Infrastructure Capital, Inc. | 312,057 | 18,838,881 |
| Houlihan Lokey, Inc. | 203,793 | 18,382,129 |
| Interactive Brokers Group, Inc., Class A | 320,480 | 20,715,827 |
| Invesco Mortgage Capital, Inc. | 1,121,949 | 3,500,481 |
| Janus Henderson Group plc | 678,182 | 29,405,971 |
| KKR Real Estate Finance Trust, Inc. | 107,949 | 2,302,552 |
| Ladder Capital Corp., Class A | 501,092 | 5,717,460 |
| Lazard Ltd., Class A | 447,159 | 21,195,337 |
| LendingClub Corp. * | 385,356 | 11,969,157 |
| LendingTree, Inc. * | 43,760 | 7,291,729 |
| LPL Financial Holdings, Inc. | 317,489 | 46,940,749 |
| MFA Financial, Inc. | 1,750,813 | 8,403,902 |
| Moelis & Co., Class A | 243,140 | 15,062,523 |
| Navient Corp. | 712,013 | 16,525,822 |
| Nelnet, Inc., Class A | 83,657 | 6,766,178 |
| New Residential Investment Corp. | 1,850,873 | 20,211,533 |
| New York Mortgage Trust, Inc. | 1,504,112 | 6,648,175 |
| OneMain Holdings, Inc. | 421,382 | 24,368,521 |
| Open Lending Corp., Class A * | 385,397 | 14,248,127 |
| Oportun Financial Corp. * | 69,955 | 1,766,364 |
| PennyMac Mortgage Investment Trust | 388,227 | 7,535,486 |
Schwab U.S. Equity ETFs | Annual Report
Schwab U.S. Small-Cap ETF
Portfolio Holdings as of August 31, 2021 (continued)
| Security | Number
of Shares | Value ($) |
| Piper Sandler Cos. | 57,168 | 8,170,451 |
| PJT Partners, Inc., Class A | 97,573 | 7,706,316 |
| PRA Group, Inc. * | 181,615 | 7,627,830 |
| PROG Holdings, Inc. | 267,111 | 12,639,692 |
| Ready Capital Corp. | 228,850 | 3,503,693 |
| Redwood Trust, Inc. | 448,425 | 5,591,860 |
| Safeguard Scientifics, Inc. * | 83,624 | 655,612 |
| SLM Corp. | 1,280,624 | 24,011,700 |
| StepStone Group, Inc., Class A | 107,759 | 5,158,423 |
| Stifel Financial Corp. | 417,691 | 28,862,448 |
| StoneX Group, Inc. * | 66,053 | 4,603,234 |
| TPG RE Finance Trust, Inc. | 238,059 | 2,999,543 |
| Tradeweb Markets, Inc., Class A | 416,100 | 36,204,861 |
| Two Harbors Investment Corp. | 1,242,484 | 8,200,394 |
| Upstart Holdings, Inc. * | 66,965 | 15,343,021 |
| Virtu Financial, Inc., Class A | 312,883 | 7,659,376 |
| Virtus Investment Partners, Inc. | 28,470 | 8,902,569 |
| Western Asset Mortgage Capital Corp. | 249,784 | 694,399 |
| WisdomTree Investments, Inc. | 444,888 | 2,807,243 |
| World Acceptance Corp. * | 15,540 | 2,950,580 |
| | | 798,914,635 |
| |
| Energy 2.7% |
| Antero Midstream Corp. | 1,136,040 | 10,917,344 |
| Antero Resources Corp. * | 1,101,460 | 15,112,031 |
| Arch Resources, Inc. * | 60,474 | 4,577,277 |
| Archrock, Inc. | 513,293 | 3,942,090 |
| Berry Corp. | 265,872 | 1,595,232 |
| Bonanza Creek Energy, Inc. | 75,562 | 2,937,851 |
| Brigham Minerals, Inc., Class A | 148,636 | 2,841,920 |
| Bristow Group, Inc. * | 91,844 | 2,898,597 |
| Cactus, Inc., Class A | 215,678 | 8,090,082 |
| Callon Petroleum Co. * | 183,473 | 6,269,272 |
| Centennial Resource Development, Inc., Class A * | 731,044 | 3,728,324 |
| ChampionX Corp. * | 742,892 | 17,331,670 |
| Cimarex Energy Co. | 408,881 | 26,258,338 |
| Clean Energy Fuels Corp. * | 459,875 | 3,646,809 |
| CNX Resources Corp. * | 873,702 | 9,925,255 |
| Comstock Resources, Inc. * | 221,439 | 1,308,704 |
| CONSOL Energy, Inc. * | 119,261 | 2,722,729 |
| Core Laboratories N.V. | 183,626 | 5,060,733 |
| CVR Energy, Inc. | 114,901 | 1,654,574 |
| Delek US Holdings, Inc. * | 287,143 | 4,913,017 |
| Denbury, Inc. * | 198,363 | 13,950,870 |
| DMC Global, Inc. * | 74,131 | 2,977,842 |
| Dorian LPG Ltd. | 107,701 | 1,423,807 |
| Dril-Quip, Inc. * | 140,447 | 3,412,862 |
| EQT Corp. * | 1,106,782 | 20,287,314 |
| Equitrans Midstream Corp. | 1,612,517 | 14,077,273 |
| Exterran Corp. * | 104,389 | 414,424 |
| Falcon Minerals Corp. | 153,373 | 680,976 |
| Frank's International N.V. *(a) | 489,417 | 1,409,521 |
| Green Plains, Inc. | 185,111 | 6,497,396 |
| Helix Energy Solutions Group, Inc. * | 561,945 | 2,112,913 |
| Helmerich & Payne, Inc. | 431,040 | 11,603,597 |
| International Seaways, Inc. | 166,146 | 2,857,711 |
| Kosmos Energy Ltd. * | 1,618,555 | 3,819,790 |
| Laredo Petroleum, Inc. * | 38,303 | 2,069,511 |
| Liberty Oilfield Services, Inc., Class A * | 346,457 | 3,540,791 |
| Magnolia Oil & Gas Corp., Class A | 577,782 | 9,059,622 |
| Matador Resources Co. | 435,405 | 12,517,894 |
| Murphy Oil Corp. | 574,980 | 12,224,075 |
| Nabors Industries Ltd. * | 25,866 | 2,181,538 |
| NACCO Industries, Inc., Class A | 16,044 | 399,656 |
| New Fortress Energy, Inc. | 196,234 | 5,763,393 |
| Newpark Resources, Inc. * | 358,872 | 940,245 |
| Security | Number
of Shares | Value ($) |
| NextDecade Corp. * | 453,844 | 1,506,762 |
| NexTier Oilfield Solutions, Inc. * | 640,999 | 2,307,596 |
| Northern Oil and Gas, Inc. | 184,433 | 3,061,588 |
| Oasis Petroleum, Inc. | 79,667 | 6,898,366 |
| Oceaneering International, Inc. * | 395,639 | 4,866,360 |
| Oil States International, Inc. * | 244,468 | 1,432,582 |
| Overseas Shipholding Group, Inc., Class A * | 293,927 | 770,089 |
| Ovintiv, Inc. | 1,035,046 | 28,215,354 |
| Par Pacific Holdings, Inc. * | 176,609 | 2,912,282 |
| Patterson-UTI Energy, Inc. | 744,756 | 5,779,307 |
| PBF Energy, Inc., Class A * | 381,300 | 3,965,520 |
| PDC Energy, Inc. | 394,013 | 16,450,043 |
| Peabody Energy Corp. * | 272,902 | 4,360,974 |
| Penn Virginia Corp. * | 61,614 | 1,275,410 |
| ProPetro Holding Corp. * | 324,561 | 2,512,102 |
| Range Resources Corp. * | 1,029,365 | 15,049,316 |
| Renewable Energy Group, Inc. * | 188,935 | 9,148,233 |
| REX American Resources Corp. * | 20,822 | 1,764,873 |
| RPC, Inc. * | 227,331 | 870,678 |
| Select Energy Services, Inc., Class A * | 254,701 | 1,362,650 |
| SM Energy Co. | 434,459 | 8,298,167 |
| Southwestern Energy Co. * | 2,576,961 | 11,725,173 |
| Talos Energy, Inc. * | 126,409 | 1,567,472 |
| TechnipFMC plc * | 1,680,096 | 11,139,036 |
| Tellurian, Inc. * | 843,276 | 2,690,050 |
| Tidewater, Inc. * | 161,605 | 1,858,458 |
| Transocean Ltd. * | 2,301,314 | 8,192,678 |
| US Silica Holdings, Inc. * | 294,811 | 2,588,441 |
| Vine Energy, Inc., Class A * | 92,415 | 1,374,211 |
| W&T Offshore, Inc. * | 369,644 | 1,205,039 |
| Whiting Petroleum Corp. * | 154,874 | 7,271,334 |
| World Fuel Services Corp. | 250,884 | 8,118,606 |
| | | 450,493,620 |
| |
| Food & Staples Retailing 0.9% |
| Albertsons Cos., Inc., Class A (a) | 185,070 | 5,618,725 |
| BJ's Wholesale Club Holdings, Inc. * | 543,790 | 30,811,141 |
| Casey's General Stores, Inc. | 146,812 | 30,031,863 |
| Grocery Outlet Holding Corp. * | 345,340 | 8,989,200 |
| Ingles Markets, Inc., Class A | 56,515 | 3,836,803 |
| Natural Grocers by Vitamin Cottage, Inc. | 48,327 | 584,273 |
| Performance Food Group Co. * | 530,559 | 26,644,673 |
| PriceSmart, Inc. | 92,639 | 7,838,186 |
| Rite Aid Corp. * | 218,535 | 3,876,811 |
| SpartanNash Co. | 143,535 | 3,086,003 |
| Sprouts Farmers Market, Inc. * | 468,961 | 11,677,129 |
| The Andersons, Inc. | 124,479 | 3,781,672 |
| The Chefs' Warehouse, Inc. * | 129,712 | 3,921,194 |
| United Natural Foods, Inc. * | 223,243 | 8,215,342 |
| Village Super Market, Inc., Class A | 33,914 | 759,335 |
| Weis Markets, Inc. | 65,061 | 3,705,224 |
| | | 153,377,574 |
| |
| Food, Beverage & Tobacco 1.6% |
| Alico, Inc. | 18,629 | 695,421 |
| AppHarvest, Inc. *(a) | 241,804 | 2,031,154 |
| B&G Foods, Inc. (a) | 256,835 | 7,797,511 |
| Cal-Maine Foods, Inc. | 148,621 | 5,374,135 |
| Calavo Growers, Inc. | 66,032 | 3,098,221 |
| Celsius Holdings, Inc. * | 131,250 | 10,731,000 |
| Coca-Cola Consolidated, Inc. | 18,518 | 7,521,271 |
| Darling Ingredients, Inc. * | 648,436 | 48,308,482 |
| Flowers Foods, Inc. | 781,226 | 18,850,983 |
| Fresh Del Monte Produce, Inc. | 120,781 | 3,971,279 |
Schwab U.S. Equity ETFs | Annual Report
Schwab U.S. Small-Cap ETF
Portfolio Holdings as of August 31, 2021 (continued)
| Security | Number
of Shares | Value ($) |
| Freshpet, Inc. * | 171,581 | 21,986,389 |
| Hostess Brands, Inc. * | 521,001 | 8,315,176 |
| J&J Snack Foods Corp. | 59,630 | 9,765,009 |
| John B Sanfilippo & Son, Inc. | 35,297 | 2,999,892 |
| Laird Superfood, Inc. *(a) | 11,260 | 224,412 |
| Lancaster Colony Corp. | 77,586 | 13,751,343 |
| Landec Corp. * | 101,774 | 1,102,212 |
| Limoneira Co. | 59,566 | 979,861 |
| MGP Ingredients, Inc. | 52,226 | 3,410,358 |
| Mission Produce, Inc. * | 32,846 | 681,226 |
| National Beverage Corp. | 92,463 | 4,304,153 |
| Pilgrim's Pride Corp. * | 193,679 | 5,392,023 |
| Sanderson Farms, Inc. | 78,786 | 15,481,449 |
| Seaboard Corp. | 1,005 | 4,275,873 |
| Seneca Foods Corp., Class A * | 30,355 | 1,486,484 |
| Simply Good Foods Co. * | 334,243 | 11,905,736 |
| Tattooed Chef, Inc. *(a) | 151,035 | 3,197,411 |
| The Duckhorn Portfolio, Inc. * | 77,249 | 1,660,081 |
| The Hain Celestial Group, Inc. * | 324,399 | 12,135,767 |
| Tootsie Roll Industries, Inc. | 69,828 | 2,210,056 |
| TreeHouse Foods, Inc. * | 223,017 | 8,356,447 |
| Turning Point Brands, Inc. | 46,876 | 2,332,550 |
| Universal Corp. | 97,247 | 4,920,698 |
| Utz Brands, Inc. | 215,498 | 4,184,971 |
| Vector Group Ltd. | 507,820 | 7,627,456 |
| Vital Farms, Inc. * | 62,311 | 1,120,352 |
| | | 262,186,842 |
| |
| Health Care Equipment & Services 6.6% |
| 1Life Healthcare, Inc. * | 310,097 | 7,600,477 |
| Acadia Healthcare Co., Inc. * | 355,902 | 23,532,240 |
| Accelerate Diagnostics, Inc. *(a) | 132,194 | 826,212 |
| Accolade, Inc. * | 65,092 | 3,084,059 |
| Accuray, Inc. * | 367,393 | 1,495,289 |
| Acutus Medical, Inc. * | 42,241 | 540,262 |
| AdaptHealth Corp. * | 378,953 | 9,110,030 |
| Addus HomeCare Corp. * | 59,862 | 5,382,791 |
| Agiliti, Inc. * | 107,982 | 2,303,256 |
| Alignment Healthcare, Inc. * | 110,893 | 1,959,479 |
| Allscripts Healthcare Solutions, Inc. * | 559,834 | 8,599,050 |
| Amedisys, Inc. * | 129,414 | 23,740,998 |
| American Well Corp., Class A * | 231,749 | 2,482,032 |
| AMN Healthcare Services, Inc. * | 187,440 | 21,278,189 |
| AngioDynamics, Inc. * | 151,205 | 4,279,101 |
| Apollo Medical Holdings, Inc. * | 52,321 | 3,971,687 |
| Apria, Inc. * | 29,588 | 1,055,404 |
| AtriCure, Inc. * | 180,916 | 13,319,036 |
| Atrion Corp. | 5,644 | 3,917,275 |
| Avanos Medical, Inc. * | 190,561 | 6,288,513 |
| Aveanna Healthcare Holdings, Inc. * | 152,611 | 1,440,648 |
| AxoGen, Inc. * | 141,463 | 2,413,359 |
| Axonics, Inc. * | 136,771 | 10,255,090 |
| Biodesix, Inc. * | 15,432 | 139,197 |
| BioLife Solutions, Inc. * | 124,781 | 7,282,219 |
| Bioventus, Inc., Class A * | 32,856 | 476,741 |
| Brookdale Senior Living, Inc. * | 734,359 | 5,360,821 |
| Butterfly Network, Inc. *(a) | 516,459 | 6,383,433 |
| Cardiovascular Systems, Inc. * | 159,193 | 5,697,517 |
| Castle Biosciences, Inc. * | 73,465 | 5,636,969 |
| Castlight Health, Inc., Class B * | 372,405 | 674,053 |
| Certara, Inc. * | 157,719 | 5,294,627 |
| Cerus Corp. * | 680,414 | 4,388,670 |
| Change Healthcare, Inc. * | 906,566 | 19,790,336 |
| Clover Health Investments Corp. *(a) | 440,888 | 3,782,819 |
| Community Health Systems, Inc. * | 492,022 | 6,056,791 |
| Computer Programs & Systems, Inc. * | 51,340 | 1,826,164 |
| CONMED Corp. | 115,318 | 15,145,866 |
| Security | Number
of Shares | Value ($) |
| CorVel Corp. * | 36,091 | 5,948,158 |
| Covetrus, Inc. * | 395,422 | 8,932,583 |
| CryoLife, Inc. * | 155,030 | 4,067,987 |
| CryoPort, Inc. * | 181,135 | 11,514,752 |
| Eargo, Inc. * | 41,697 | 834,357 |
| Envista Holdings Corp. * | 637,528 | 27,279,823 |
| Evolent Health, Inc., Class A * | 313,720 | 7,704,963 |
| Fulgent Genetics, Inc. *(a) | 70,119 | 6,397,658 |
| Glaukos Corp. * | 183,516 | 10,943,059 |
| Globus Medical, Inc., Class A * | 308,387 | 25,164,379 |
| GoodRx Holdings, Inc., Class A *(a) | 247,837 | 9,422,763 |
| Hanger, Inc. * | 154,545 | 3,690,535 |
| Health Catalyst, Inc. * | 148,970 | 8,135,252 |
| HealthEquity, Inc. * | 330,648 | 21,217,682 |
| HealthStream, Inc. * | 100,130 | 3,042,951 |
| Heska Corp. * | 39,257 | 10,414,882 |
| Hims & Hers Health, Inc. * | 260,919 | 2,056,042 |
| ICU Medical, Inc. * | 78,224 | 15,593,954 |
| Inari Medical, Inc. * | 33,344 | 2,729,540 |
| Innovage Holding Corp. * | 69,533 | 1,045,081 |
| Inogen, Inc. * | 73,652 | 4,359,462 |
| Inovalon Holdings, Inc., Class A * | 308,632 | 12,607,617 |
| Inspire Medical Systems, Inc. * | 107,947 | 24,132,631 |
| Integer Holdings Corp. * | 130,721 | 12,913,928 |
| Integra LifeSciences Holdings Corp. * | 281,618 | 21,186,122 |
| Intersect ENT, Inc. * | 132,185 | 3,596,754 |
| Invacare Corp. * | 140,137 | 1,185,559 |
| iRhythm Technologies, Inc. * | 116,179 | 5,553,356 |
| Lantheus Holdings, Inc. * | 267,584 | 7,056,190 |
| LeMaitre Vascular, Inc. | 67,703 | 3,833,344 |
| LHC Group, Inc. * | 125,868 | 23,507,108 |
| LivaNova plc * | 208,273 | 17,222,094 |
| Lucira Health, Inc. *(a) | 36,760 | 335,619 |
| Magellan Health, Inc. * | 92,903 | 8,790,482 |
| MEDNAX, Inc. * | 341,797 | 10,975,102 |
| Meridian Bioscience, Inc. * | 171,776 | 3,476,746 |
| Merit Medical Systems, Inc. * | 195,352 | 14,020,413 |
| Mesa Laboratories, Inc. | 19,365 | 5,168,906 |
| ModivCare, Inc. * | 48,367 | 9,540,874 |
| Multiplan Corp. * | 1,033,206 | 6,199,236 |
| National HealthCare Corp. | 48,811 | 3,604,692 |
| National Research Corp. | 53,456 | 2,886,624 |
| Natus Medical, Inc. * | 135,108 | 3,583,064 |
| Neogen Corp. * | 425,845 | 18,643,494 |
| Nevro Corp. * | 138,307 | 16,873,454 |
| NextGen Healthcare, Inc. * | 220,676 | 3,367,516 |
| Novocure Ltd. * | 340,857 | 45,746,418 |
| NuVasive, Inc. * | 204,767 | 12,724,221 |
| Omnicell, Inc. * | 171,677 | 26,656,288 |
| Ontrak, Inc. * | 31,615 | 383,174 |
| Option Care Health, Inc. * | 478,065 | 12,788,239 |
| OraSure Technologies, Inc. * | 285,271 | 3,123,717 |
| Ortho Clinical Diagnostics Holdings plc * | 316,720 | 6,473,757 |
| Orthofix Medical, Inc. * | 77,532 | 3,287,357 |
| OrthoPediatrics Corp. * | 53,732 | 3,766,613 |
| Outset Medical, Inc. * | 78,735 | 3,880,848 |
| Owens & Minor, Inc. | 298,434 | 11,125,620 |
| Patterson Cos., Inc. | 344,835 | 10,565,744 |
| PetIQ, Inc. * | 95,517 | 2,478,666 |
| Phreesia, Inc. * | 146,104 | 10,453,741 |
| Premier, Inc., Class A | 281,116 | 10,451,893 |
| Privia Health Group, Inc. * | 79,267 | 2,362,949 |
| Progyny, Inc. * | 147,386 | 8,234,456 |
| Pulmonx Corp. * | 41,835 | 1,681,349 |
| R1 RCM, Inc. * | 548,130 | 10,809,124 |
| RadNet, Inc. * | 173,321 | 5,444,013 |
| Schrodinger, Inc. * | 145,926 | 8,710,323 |
| SeaSpine Holdings Corp. * | 116,003 | 1,946,530 |
Schwab U.S. Equity ETFs | Annual Report
Schwab U.S. Small-Cap ETF
Portfolio Holdings as of August 31, 2021 (continued)
| Security | Number
of Shares | Value ($) |
| Select Medical Holdings Corp. | 427,899 | 14,792,468 |
| Shockwave Medical, Inc. * | 126,258 | 27,045,726 |
| SI-BONE, Inc. * | 107,264 | 2,618,314 |
| Signify Health, Inc., Class A * | 94,063 | 2,444,697 |
| Silk Road Medical, Inc. * | 136,670 | 8,101,798 |
| Simulations Plus, Inc. | 60,559 | 2,682,764 |
| SmileDirectClub, Inc. *(a) | 351,826 | 1,935,043 |
| SOC Telemed, Inc. *(a) | 233,865 | 633,774 |
| STAAR Surgical Co. * | 186,017 | 28,734,046 |
| Surgery Partners, Inc. * | 121,000 | 5,953,200 |
| Surmodics, Inc. * | 54,978 | 3,302,528 |
| Tabula Rasa HealthCare, Inc. * | 89,590 | 2,805,063 |
| Tactile Systems Technology, Inc. * | 77,735 | 3,457,653 |
| Talis Biomedical Corp. * | 59,876 | 482,601 |
| Tandem Diabetes Care, Inc. * | 248,387 | 27,861,570 |
| Tenet Healthcare Corp. * | 423,533 | 31,913,212 |
| The Ensign Group, Inc. | 204,968 | 16,739,737 |
| The Pennant Group, Inc. * | 101,001 | 3,087,601 |
| Tivity Health, Inc. * | 150,379 | 3,496,312 |
| TransMedics Group, Inc. * | 96,753 | 3,161,888 |
| Treace Medical Concepts, Inc. * | 45,801 | 1,156,475 |
| Triple-S Management Corp., Class B * | 95,460 | 3,388,830 |
| US Physical Therapy, Inc. | 51,081 | 5,996,909 |
| Vapotherm, Inc. * | 86,965 | 2,404,582 |
| Varex Imaging Corp. * | 155,806 | 4,544,861 |
| ViewRay, Inc. * | 480,293 | 2,900,970 |
| Vocera Communications, Inc. * | 136,248 | 6,606,666 |
| | | 1,098,911,816 |
| |
| Household & Personal Products 0.7% |
| BellRing Brands, Inc., Class A * | 156,769 | 5,294,089 |
| Central Garden & Pet Co. * | 39,047 | 1,798,114 |
| Central Garden & Pet Co., Class A * | 158,369 | 6,599,236 |
| Coty, Inc., Class A * | 1,124,284 | 10,984,255 |
| Edgewell Personal Care Co. | 215,596 | 9,119,711 |
| elf Beauty, Inc. * | 153,224 | 4,742,283 |
| Energizer Holdings, Inc. | 230,459 | 9,066,257 |
| Inter Parfums, Inc. | 70,290 | 5,098,836 |
| LifeMD, Inc. *(a) | 76,658 | 604,065 |
| Medifast, Inc. | 46,613 | 10,623,103 |
| Nu Skin Enterprises, Inc., Class A | 198,459 | 10,045,994 |
| Revlon, Inc., Class A *(a) | 26,614 | 303,666 |
| Spectrum Brands Holdings, Inc. | 152,151 | 11,876,907 |
| The Beauty Health Co. * | 321,980 | 8,278,106 |
| The Honest Co., Inc. * | 103,338 | 1,051,981 |
| USANA Health Sciences, Inc. * | 45,772 | 4,441,257 |
| WD-40 Co. | 54,309 | 13,014,066 |
| | | 112,941,926 |
| |
| Insurance 2.4% |
| Ambac Financial Group, Inc. * | 186,558 | 2,628,602 |
| American Equity Investment Life Holding Co. | 340,677 | 10,796,054 |
| American National Group, Inc. | 36,266 | 6,981,205 |
| AMERISAFE, Inc. | 76,634 | 4,410,287 |
| Argo Group International Holdings Ltd. | 138,068 | 7,303,797 |
| Assured Guaranty Ltd. | 299,088 | 14,912,528 |
| Axis Capital Holdings Ltd. | 319,288 | 16,337,967 |
| Brighthouse Financial, Inc. * | 340,232 | 16,657,759 |
| BRP Group, Inc., Class A * | 184,714 | 6,954,482 |
| Citizens, Inc. * | 197,504 | 1,179,099 |
| CNO Financial Group, Inc. | 521,984 | 12,767,729 |
| Crawford & Co., Class A | 74,487 | 742,635 |
| Crawford & Co., Class B | 36,977 | 349,433 |
| Donegal Group, Inc., Class A | 59,220 | 891,853 |
| eHealth, Inc. * | 103,616 | 4,004,758 |
| Security | Number
of Shares | Value ($) |
| Employers Holdings, Inc. | 113,120 | 4,657,150 |
| Enstar Group Ltd. * | 52,378 | 12,082,033 |
| First American Financial Corp. | 436,191 | 30,764,551 |
| Genworth Financial, Inc., Class A * | 2,010,196 | 7,538,235 |
| GoHealth, Inc., Class A * | 202,087 | 982,143 |
| Goosehead Insurance, Inc., Class A | 66,545 | 9,767,475 |
| Greenlight Capital Re Ltd., Class A * | 109,981 | 927,140 |
| Horace Mann Educators Corp. | 164,505 | 6,744,705 |
| Independence Holding Co. | 32,986 | 1,648,640 |
| James River Group Holdings Ltd. | 147,818 | 5,438,224 |
| Kemper Corp. | 240,727 | 16,513,872 |
| Kinsale Capital Group, Inc. | 85,351 | 15,521,079 |
| Lemonade, Inc. *(a) | 70,619 | 5,334,559 |
| MBIA, Inc. * | 188,594 | 2,110,367 |
| Mercury General Corp. | 105,384 | 6,292,479 |
| MetroMile, Inc. *(a) | 279,927 | 1,119,708 |
| National Western Life Group, Inc., Class A | 9,136 | 2,025,086 |
| NI Holdings, Inc. * | 29,700 | 579,744 |
| Oscar Health, Inc., Class A * | 149,640 | 2,332,888 |
| Palomar Holdings, Inc. * | 86,208 | 7,741,478 |
| Primerica, Inc. | 156,377 | 23,916,298 |
| ProAssurance Corp. | 214,002 | 5,457,051 |
| RLI Corp. | 157,759 | 17,232,016 |
| Root, Inc., Class A *(a) | 213,114 | 1,374,585 |
| Safety Insurance Group, Inc. | 56,409 | 4,586,616 |
| Selective Insurance Group, Inc. | 238,063 | 19,894,925 |
| Selectquote, Inc. * | 174,915 | 1,670,438 |
| SiriusPoint Ltd. * | 301,948 | 2,962,110 |
| State Auto Financial Corp. | 70,064 | 3,543,837 |
| Stewart Information Services Corp. | 106,360 | 6,695,362 |
| The Hanover Insurance Group, Inc. | 142,815 | 20,181,188 |
| Trean Insurance Group, Inc. * | 41,069 | 419,315 |
| Trupanion, Inc. * | 133,403 | 12,217,047 |
| United Fire Group, Inc. | 85,677 | 2,224,175 |
| United Insurance Holdings Corp. | 85,884 | 327,218 |
| Universal Insurance Holdings, Inc. | 112,594 | 1,603,339 |
| Unum Group | 809,994 | 21,562,040 |
| White Mountains Insurance Group Ltd. | 12,303 | 13,789,325 |
| | | 406,696,629 |
| |
| Materials 4.5% |
| AdvanSix, Inc. * | 111,289 | 4,062,048 |
| Alcoa Corp. * | 740,544 | 32,857,937 |
| Allegheny Technologies, Inc. * | 504,395 | 9,008,495 |
| American Vanguard Corp. | 107,163 | 1,642,809 |
| Amyris, Inc. * | 739,528 | 11,129,896 |
| Arconic Corp. * | 388,395 | 13,395,744 |
| Avient Corp. | 362,082 | 18,860,851 |
| Balchem Corp. | 128,640 | 18,063,629 |
| Cabot Corp. | 224,606 | 11,993,960 |
| Carpenter Technology Corp. | 190,466 | 6,352,041 |
| Century Aluminum Co. * | 199,932 | 2,563,128 |
| Chase Corp. | 29,232 | 3,347,064 |
| Clearwater Paper Corp. * | 65,451 | 2,126,503 |
| Cleveland-Cliffs, Inc. * | 1,825,755 | 42,850,470 |
| Coeur Mining, Inc. * | 1,019,508 | 7,187,531 |
| Commercial Metals Co. | 478,085 | 15,595,133 |
| Compass Minerals International, Inc. | 134,830 | 9,024,172 |
| Danimer Scientific, Inc. * | 247,615 | 4,838,397 |
| Diversey Holdings Ltd. * | 178,425 | 3,117,085 |
| Domtar Corp. * | 199,396 | 10,932,883 |
| Eagle Materials, Inc. | 168,395 | 26,411,072 |
| Ecovyst, Inc. | 210,106 | 2,733,479 |
| Element Solutions, Inc. | 863,575 | 19,629,060 |
| Ferro Corp. * | 327,649 | 6,815,099 |
| Forterra, Inc. * | 76,172 | 1,755,003 |
Schwab U.S. Equity ETFs | Annual Report
Schwab U.S. Small-Cap ETF
Portfolio Holdings as of August 31, 2021 (continued)
| Security | Number
of Shares | Value ($) |
| FutureFuel Corp. | 103,748 | 831,021 |
| Gatos Silver, Inc. *(a) | 88,102 | 1,263,383 |
| GCP Applied Technologies, Inc. * | 191,964 | 4,576,422 |
| Glatfelter Corp. | 176,585 | 2,790,043 |
| Graphic Packaging Holding Co. | 1,130,050 | 23,188,626 |
| Greif, Inc., Class A | 104,681 | 6,628,401 |
| Greif, Inc., Class B | 24,840 | 1,527,660 |
| H.B. Fuller Co. | 207,179 | 13,999,085 |
| Hawkins, Inc. | 75,064 | 2,843,424 |
| Haynes International, Inc. | 50,303 | 1,974,393 |
| Hecla Mining Co. | 2,124,555 | 13,066,013 |
| Ingevity Corp. * | 158,740 | 12,761,109 |
| Innospec, Inc. | 97,573 | 9,132,833 |
| Kaiser Aluminum Corp. | 62,806 | 7,929,886 |
| Koppers Holdings, Inc. * | 86,755 | 2,854,239 |
| Kraton Corp. * | 127,400 | 5,366,088 |
| Kronos Worldwide, Inc. | 86,580 | 1,146,319 |
| Livent Corp. * | 633,678 | 15,759,572 |
| Loop Industries, Inc. *(a) | 88,952 | 806,795 |
| Louisiana-Pacific Corp. | 406,248 | 25,772,373 |
| Materion Corp. | 80,865 | 5,905,571 |
| McEwen Mining, Inc. *(a) | 1,157,154 | 1,330,727 |
| Mercer International, Inc. | 155,458 | 1,769,112 |
| Minerals Technologies, Inc. | 133,767 | 10,519,437 |
| MP Materials Corp. *(a) | 263,978 | 8,861,741 |
| Myers Industries, Inc. | 142,728 | 3,254,198 |
| Neenah, Inc. | 66,780 | 3,365,044 |
| O-I Glass, Inc. * | 626,375 | 9,477,054 |
| Olin Corp. | 568,331 | 28,325,617 |
| Orion Engineered Carbons S.A. * | 240,371 | 4,247,356 |
| Pactiv Evergreen, Inc. | 161,126 | 2,215,483 |
| PureCycle Technologies, Inc. *(a) | 291,970 | 4,294,879 |
| Quaker Chemical Corp. | 52,428 | 13,585,143 |
| Ranpak Holdings Corp. * | 159,623 | 4,900,426 |
| Rayonier Advanced Materials, Inc. * | 255,119 | 1,801,140 |
| Resolute Forest Products, Inc. | 313,830 | 3,844,417 |
| Schnitzer Steel Industries, Inc., Class A | 108,119 | 5,115,110 |
| Schweitzer-Mauduit International, Inc. | 124,640 | 4,769,973 |
| Sensient Technologies Corp. | 167,687 | 14,563,616 |
| Silgan Holdings, Inc. | 310,869 | 13,190,172 |
| Stepan Co. | 84,824 | 9,971,909 |
| Summit Materials, Inc., Class A * | 465,793 | 15,683,250 |
| SunCoke Energy, Inc. | 341,589 | 2,374,044 |
| The Chemours Co. | 656,455 | 21,997,807 |
| TimkenSteel Corp. * | 151,509 | 2,072,643 |
| Tredegar Corp. | 103,847 | 1,379,088 |
| Trinseo S.A. | 153,624 | 7,977,694 |
| Tronox Holdings plc, Class A | 437,200 | 9,238,036 |
| United States Lime & Minerals, Inc. | 8,299 | 1,212,401 |
| United States Steel Corp. | 1,069,419 | 28,606,958 |
| Valhi, Inc. | 8,587 | 203,684 |
| Valvoline, Inc. | 718,264 | 21,662,842 |
| Venator Materials plc * | 214,692 | 702,043 |
| Verso Corp., Class A | 117,262 | 2,233,841 |
| W.R. Grace & Co. | 247,842 | 17,259,717 |
| Warrior Met Coal, Inc. | 203,804 | 4,563,172 |
| Worthington Industries, Inc. | 138,707 | 8,038,071 |
| Zymergen, Inc. *(a) | 63,352 | 831,178 |
| | | 741,855,768 |
| |
| Media & Entertainment 2.9% |
| Advantage Solutions, Inc. * | 417,169 | 3,633,542 |
| AMC Entertainment Holdings, Inc., Class A *(a) | 1,991,817 | 93,874,335 |
| AMC Networks, Inc., Class A * | 122,078 | 5,802,367 |
| Angi, Inc. * | 326,919 | 3,478,418 |
| Cardlytics, Inc. * | 130,334 | 11,831,721 |
| Security | Number
of Shares | Value ($) |
| Cargurus, Inc. * | 360,949 | 10,965,631 |
| Cars.com, Inc. * | 273,005 | 3,472,624 |
| Cinemark Holdings, Inc. * | 431,441 | 7,692,593 |
| Clear Channel Outdoor Holdings, Inc. * | 1,868,017 | 4,912,885 |
| Emerald Holding, Inc. * | 91,495 | 455,645 |
| Entercom Communications Corp. * | 473,290 | 1,680,180 |
| Eventbrite, Inc., Class A * | 296,931 | 5,249,740 |
| EverQuote, Inc., Class A * | 43,149 | 849,604 |
| fuboTV, Inc. *(a) | 378,008 | 11,018,933 |
| Gannett Co., Inc. * | 535,298 | 3,399,142 |
| Gray Television, Inc. | 355,282 | 8,079,113 |
| Hemisphere Media Group, Inc. * | 72,028 | 887,385 |
| iHeartMedia, Inc., Class A * | 443,678 | 11,038,709 |
| John Wiley & Sons, Inc., Class A | 176,560 | 10,258,136 |
| Liberty Media Corp. - Liberty Braves, Class A * | 41,829 | 1,087,554 |
| Liberty Media Corp. - Liberty Braves, Class C * | 142,323 | 3,679,050 |
| Liberty TripAdvisor Holdings, Inc., Class A * | 288,020 | 1,077,195 |
| Lions Gate Entertainment Corp., Class A * | 237,259 | 3,065,386 |
| Lions Gate Entertainment Corp., Class B * | 483,497 | 5,685,925 |
| Loral Space & Communications, Inc. | 50,550 | 2,123,605 |
| Madison Square Garden Entertainment Corp. * | 99,739 | 7,998,070 |
| Madison Square Garden Sports Corp. * | 69,167 | 12,504,010 |
| Magnite, Inc. * | 510,867 | 14,825,360 |
| MediaAlpha, Inc., Class A * | 87,227 | 1,934,695 |
| Meredith Corp. * | 161,055 | 6,926,976 |
| National CineMedia, Inc. | 268,373 | 687,035 |
| Nexstar Media Group, Inc., Class A | 169,416 | 25,370,046 |
| QuinStreet, Inc. * | 195,452 | 3,500,545 |
| Scholastic Corp. | 119,313 | 3,965,964 |
| Sciplay Corp., Class A * | 96,793 | 1,810,997 |
| Sinclair Broadcast Group, Inc., Class A | 194,289 | 5,830,613 |
| TechTarget, Inc. * | 93,834 | 7,936,480 |
| TEGNA, Inc. | 875,174 | 15,508,083 |
| The E.W. Scripps Co., Class A | 229,091 | 4,247,347 |
| The Marcus Corp. * | 95,217 | 1,485,385 |
| The New York Times Co., Class A | 575,876 | 29,242,983 |
| TripAdvisor, Inc. * | 388,693 | 13,604,255 |
| TrueCar, Inc. * | 360,801 | 1,515,364 |
| Vimeo, Inc. * | 614,072 | 23,408,425 |
| Warner Music Group Corp., Class A | 370,983 | 14,097,354 |
| WideOpenWest, Inc. * | 207,610 | 4,405,484 |
| World Wrestling Entertainment, Inc., Class A | 179,609 | 9,359,425 |
| Yelp, Inc. * | 277,765 | 10,696,730 |
| ZoomInfo Technologies, Inc., Class A * | 720,959 | 46,999,317 |
| | | 483,160,361 |
| |
| Pharmaceuticals, Biotechnology & Life Sciences 9.5% |
| 10X Genomics, Inc., Class A * | 294,186 | 51,753,201 |
| 4D Molecular Therapeutics, Inc. * | 34,837 | 1,064,270 |
| 89bio, Inc. * | 35,578 | 658,549 |
| ACADIA Pharmaceuticals, Inc. * | 463,685 | 8,119,124 |
| Acceleron Pharma, Inc. * | 209,444 | 28,040,363 |
| Adaptive Biotechnologies Corp. * | 333,832 | 12,124,778 |
| Adverum Biotechnologies, Inc. * | 358,502 | 871,160 |
| Aerie Pharmaceuticals, Inc. * | 185,843 | 2,770,919 |
| Agenus, Inc. * | 722,757 | 4,459,411 |
| Agios Pharmaceuticals, Inc. * | 202,764 | 9,059,496 |
| Akebia Therapeutics, Inc. * | 634,530 | 1,865,518 |
| Akero Therapeutics, Inc. * | 70,034 | 1,662,607 |
Schwab U.S. Equity ETFs | Annual Report
Schwab U.S. Small-Cap ETF
Portfolio Holdings as of August 31, 2021 (continued)
| Security | Number
of Shares | Value ($) |
| Akouos, Inc. * | 56,406 | 670,667 |
| Akoya Biosciences, Inc. * | 26,334 | 420,554 |
| Alector, Inc. * | 208,755 | 5,642,648 |
| Aligos Therapeutics, Inc. * | 40,889 | 697,157 |
| Alkermes plc * | 636,353 | 19,892,395 |
| Allakos, Inc. * | 127,427 | 11,361,391 |
| Allogene Therapeutics, Inc. * | 263,784 | 6,291,248 |
| Allovir, Inc. * | 66,106 | 1,272,541 |
| Altimmune, Inc. * | 120,868 | 1,811,811 |
| ALX Oncology Holdings, Inc. * | 47,173 | 3,302,110 |
| Amicus Therapeutics, Inc. * | 1,054,527 | 12,011,063 |
| Amneal Pharmaceuticals, Inc. * | 454,315 | 2,562,337 |
| Amphastar Pharmaceuticals, Inc. * | 145,455 | 2,859,645 |
| AnaptysBio, Inc. * | 84,205 | 2,156,490 |
| Angion Biomedica Corp. * | 21,033 | 231,573 |
| ANI Pharmaceuticals, Inc. * | 39,523 | 1,198,733 |
| Anika Therapeutics, Inc. * | 58,697 | 2,531,602 |
| Annexon, Inc. * | 62,196 | 1,016,905 |
| Antares Pharma, Inc. * | 634,395 | 2,499,516 |
| Apellis Pharmaceuticals, Inc. * | 233,015 | 15,344,038 |
| Applied Molecular Transport, Inc. * | 69,732 | 2,096,841 |
| Aprea Therapeutics, Inc. *(a) | 50,861 | 234,978 |
| Arcturus Therapeutics Holdings, Inc. * | 81,387 | 4,460,821 |
| Arcus Biosciences, Inc. * | 177,360 | 5,173,591 |
| Arcutis Biotherapeutics, Inc. * | 109,484 | 2,317,776 |
| Arena Pharmaceuticals, Inc. * | 240,528 | 12,728,742 |
| Arrowhead Pharmaceuticals, Inc. * | 412,800 | 27,707,136 |
| Arvinas, Inc. * | 130,126 | 11,218,162 |
| Assembly Biosciences, Inc. * | 153,285 | 582,483 |
| Atara Biotherapeutics, Inc. * | 333,254 | 4,992,145 |
| Atea Pharmaceuticals, Inc. * | 49,096 | 1,459,133 |
| Athenex, Inc. * | 286,757 | 1,046,663 |
| Athira Pharma, Inc. * | 67,018 | 709,721 |
| Avidity Biosciences, Inc. * | 64,961 | 1,483,709 |
| Avrobio, Inc. * | 150,654 | 1,003,356 |
| Axsome Therapeutics, Inc. * | 105,681 | 2,713,888 |
| Beam Therapeutics, Inc. * | 116,575 | 12,930,499 |
| Berkeley Lights, Inc. * | 34,251 | 1,217,966 |
| BioAtla, Inc. * | 43,671 | 1,794,441 |
| BioCryst Pharmaceuticals, Inc. * | 704,724 | 11,219,206 |
| Biohaven Pharmaceutical Holding Co., Ltd. * | 219,391 | 28,792,875 |
| Bioxcel Therapeutics, Inc. * | 62,812 | 1,849,813 |
| Black Diamond Therapeutics, Inc. * | 64,228 | 648,703 |
| Blueprint Medicines Corp. * | 231,392 | 21,581,932 |
| Bolt Biotherapeutics, Inc. *(a) | 48,616 | 863,420 |
| Bridgebio Pharma, Inc. * | 384,969 | 19,290,797 |
| Bruker Corp. | 403,307 | 35,616,041 |
| C4 Therapeutics, Inc. *(a) | 56,257 | 2,257,593 |
| Cara Therapeutics, Inc. * | 169,827 | 2,679,870 |
| CareDx, Inc. * | 206,447 | 15,128,436 |
| CASI Pharmaceuticals, Inc. * | 354,857 | 567,771 |
| Catalyst Pharmaceuticals, Inc. * | 381,424 | 2,101,646 |
| Cerevel Therapeutics Holdings, Inc. *(a) | 201,678 | 6,385,126 |
| ChemoCentryx, Inc. * | 197,924 | 3,129,178 |
| Chimerix, Inc. * | 281,087 | 1,995,718 |
| Clene, Inc. *(a) | 80,625 | 645,000 |
| Clovis Oncology, Inc. *(a) | 417,723 | 2,013,425 |
| Codexis, Inc. * | 225,026 | 6,080,203 |
| Coherus Biosciences, Inc. * | 264,307 | 4,223,626 |
| Collegium Pharmaceutical, Inc. * | 140,322 | 2,880,811 |
| Corbus Pharmaceuticals Holdings, Inc. *(a) | 435,103 | 561,283 |
| Corcept Therapeutics, Inc. * | 416,301 | 8,858,885 |
| Cortexyme, Inc. * | 53,129 | 5,116,323 |
| Crinetics Pharmaceuticals, Inc. * | 98,271 | 2,316,247 |
| Cue Biopharma, Inc. * | 111,591 | 1,337,976 |
| Cullinan Oncology, Inc. * | 51,753 | 1,460,470 |
| Security | Number
of Shares | Value ($) |
| Cyclerion Therapeutics, Inc. * | 129,714 | 443,622 |
| Cymabay Therapeutics, Inc. * | 249,834 | 989,343 |
| Cytokinetics, Inc. * | 324,046 | 10,683,797 |
| CytomX Therapeutics, Inc. * | 258,882 | 1,325,476 |
| Deciphera Pharmaceuticals, Inc. * | 160,851 | 5,066,807 |
| Denali Therapeutics, Inc. * | 322,037 | 17,132,368 |
| Design Therapeutics, Inc. *(a) | 48,326 | 759,685 |
| Dicerna Pharmaceuticals, Inc. * | 265,285 | 5,459,565 |
| Dynavax Technologies Corp. * | 405,690 | 7,894,727 |
| Dyne Therapeutics, Inc. * | 73,064 | 1,236,974 |
| Eagle Pharmaceuticals, Inc. * | 45,692 | 2,438,582 |
| Edgewise Therapeutics, Inc. *(a) | 44,668 | 707,541 |
| Editas Medicine, Inc. * | 268,934 | 17,101,513 |
| Eloxx Pharmaceuticals, Inc. *(a) | 279,101 | 452,144 |
| Emergent BioSolutions, Inc. * | 180,626 | 11,393,888 |
| Enanta Pharmaceuticals, Inc. * | 71,280 | 4,077,216 |
| Endo International plc * | 925,293 | 2,118,921 |
| Epizyme, Inc. * | 367,832 | 1,898,013 |
| Esperion Therapeutics, Inc. *(a) | 111,045 | 1,445,806 |
| Evelo Biosciences, Inc. *(a) | 105,166 | 1,195,737 |
| Fate Therapeutics, Inc. * | 316,953 | 23,216,807 |
| FibroGen, Inc. * | 336,053 | 3,908,296 |
| Finch Therapeutics Group, Inc. *(a) | 29,959 | 423,920 |
| Flexion Therapeutics, Inc. * | 175,730 | 1,050,865 |
| Foghorn Therapeutics, Inc. *(a) | 30,201 | 392,009 |
| Forma Therapeutics Holdings, Inc. * | 81,466 | 1,957,628 |
| Frequency Therapeutics, Inc. * | 124,081 | 957,905 |
| G1 Therapeutics, Inc. * | 128,445 | 1,942,088 |
| Gemini Therapeutics, Inc. *(a) | 114,239 | 562,056 |
| Generation Bio Co. * | 84,422 | 2,110,550 |
| Geron Corp. * | 1,262,691 | 1,830,902 |
| Global Blood Therapeutics, Inc. * | 246,912 | 7,083,905 |
| Gossamer Bio, Inc. * | 187,652 | 1,865,261 |
| Graybug Vision, Inc. *(a) | 23,663 | 103,644 |
| Gritstone bio, Inc. *(a) | 77,107 | 709,384 |
| Halozyme Therapeutics, Inc. * | 530,711 | 22,284,555 |
| Harpoon Therapeutics, Inc. * | 87,356 | 828,135 |
| Heron Therapeutics, Inc. * | 363,212 | 4,238,684 |
| Homology Medicines, Inc. * | 167,155 | 1,201,844 |
| Humanigen, Inc. *(a) | 187,328 | 3,105,898 |
| IGM Biosciences, Inc. * | 28,370 | 2,020,228 |
| IMARA, Inc. * | 18,449 | 88,371 |
| ImmunityBio, Inc. *(a) | 288,748 | 3,285,952 |
| ImmunoGen, Inc. * | 792,937 | 4,797,269 |
| Immunovant, Inc. * | 196,874 | 1,704,929 |
| Inhibrx, Inc. * | 29,073 | 829,162 |
| Innoviva, Inc. * | 249,386 | 3,805,630 |
| Inovio Pharmaceuticals, Inc. *(a) | 826,070 | 7,137,245 |
| Inozyme Pharma, Inc. * | 28,860 | 445,021 |
| Insmed, Inc. * | 450,057 | 12,619,598 |
| Instil Bio, Inc. *(a) | 66,072 | 1,245,457 |
| Intellia Therapeutics, Inc. * | 263,734 | 42,337,219 |
| Intercept Pharmaceuticals, Inc. * | 104,422 | 1,556,932 |
| Intra-Cellular Therapies, Inc. * | 283,339 | 9,406,855 |
| Invitae Corp. * | 721,139 | 21,367,349 |
| Iovance Biotherapeutics, Inc. * | 569,652 | 13,711,524 |
| Ironwood Pharmaceuticals, Inc. * | 642,751 | 8,420,038 |
| iTeos Therapeutics, Inc. * | 44,492 | 1,261,348 |
| Jounce Therapeutics, Inc. * | 113,595 | 706,561 |
| Kadmon Holdings, Inc. * | 633,996 | 3,474,298 |
| Kaleido Biosciences, Inc. *(a) | 84,035 | 515,975 |
| Karuna Therapeutics, Inc. * | 74,745 | 8,887,181 |
| Karyopharm Therapeutics, Inc. * | 258,863 | 1,501,405 |
| Keros Therapeutics, Inc. * | 36,867 | 1,240,206 |
| Kinnate Biopharma, Inc. *(a) | 50,304 | 1,112,725 |
| Kodiak Sciences, Inc. * | 126,040 | 11,870,447 |
| Kronos Bio, Inc. * | 52,711 | 1,102,187 |
| Krystal Biotech, Inc. * | 69,538 | 4,029,032 |
Schwab U.S. Equity ETFs | Annual Report
Schwab U.S. Small-Cap ETF
Portfolio Holdings as of August 31, 2021 (continued)
| Security | Number
of Shares | Value ($) |
| Kura Oncology, Inc. * | 262,787 | 4,851,048 |
| Kymera Therapeutics, Inc. * | 55,191 | 3,429,569 |
| Lannett Co., Inc. * | 132,352 | 465,879 |
| Lexicon Pharmaceuticals, Inc. * | 265,930 | 1,255,190 |
| Ligand Pharmaceuticals, Inc. * | 65,998 | 8,731,535 |
| MacroGenics, Inc. * | 237,999 | 5,619,156 |
| Madrigal Pharmaceuticals, Inc. * | 39,421 | 3,262,088 |
| MannKind Corp. * | 988,245 | 4,743,576 |
| Maravai LifeSciences Holdings, Inc., Class A * | 385,234 | 22,798,148 |
| Medpace Holdings, Inc. * | 109,826 | 20,026,771 |
| Mersana Therapeutics, Inc. * | 219,733 | 3,060,881 |
| MiMedx Group, Inc. *(a) | 389,407 | 5,747,647 |
| Mirati Therapeutics, Inc. * | 183,646 | 31,170,236 |
| Mirum Pharmaceuticals, Inc. * | 63,733 | 1,035,661 |
| Molecular Templates, Inc. * | 160,926 | 1,049,238 |
| Morphic Holding, Inc. * | 59,128 | 3,725,655 |
| Myovant Sciences Ltd. * | 159,206 | 3,875,074 |
| Myriad Genetics, Inc. * | 305,783 | 10,940,916 |
| NanoString Technologies, Inc. * | 179,222 | 10,430,720 |
| Natera, Inc. * | 333,535 | 39,500,550 |
| Nektar Therapeutics * | 722,921 | 11,190,817 |
| NeoGenomics, Inc. * | 467,680 | 22,738,602 |
| NexImmune, Inc. *(a) | 25,835 | 363,757 |
| NextCure, Inc. * | 56,841 | 433,128 |
| NGM Biopharmaceuticals, Inc. * | 94,578 | 2,064,638 |
| Nkarta, Inc. * | 64,710 | 2,092,721 |
| Nurix Therapeutics, Inc. * | 52,060 | 1,675,811 |
| Nuvation Bio, Inc. * | 250,321 | 2,310,463 |
| Odonate Therapeutics, Inc. * | 81,261 | 281,976 |
| Olema Pharmaceuticals, Inc. * | 46,243 | 1,383,591 |
| Omeros Corp. *(a) | 247,124 | 4,028,121 |
| Oncorus, Inc. * | 36,730 | 379,421 |
| OPKO Health, Inc. * | 1,727,747 | 6,669,103 |
| Optinose, Inc. *(a) | 147,041 | 427,889 |
| Organogenesis Holdings, Inc. * | 197,038 | 3,361,468 |
| ORIC Pharmaceuticals, Inc. * | 56,783 | 1,254,336 |
| Osmotica Pharmaceuticals plc * | 62,618 | 220,415 |
| Oyster Point Pharma, Inc. * | 49,848 | 656,997 |
| Pacific Biosciences of California, Inc. * | 786,729 | 24,632,485 |
| Pacira BioSciences, Inc. * | 174,569 | 10,350,196 |
| Paratek Pharmaceuticals, Inc. * | 163,154 | 907,136 |
| Passage Bio, Inc. * | 97,930 | 1,177,119 |
| PDL BioPharma, Inc. *(b) | 430,207 | 1,062,611 |
| Personalis, Inc. * | 113,539 | 2,404,756 |
| Phathom Pharmaceuticals, Inc. * | 52,400 | 1,864,916 |
| Phibro Animal Health Corp., Class A | 80,675 | 1,959,596 |
| Pliant Therapeutics, Inc. * | 36,427 | 664,429 |
| PMV Pharmaceuticals, Inc. * | 48,837 | 1,482,203 |
| Poseida Therapeutics, Inc. * | 58,987 | 509,648 |
| Praxis Precision Medicines, Inc. * | 62,215 | 1,236,212 |
| Precigen, Inc. * | 368,364 | 2,228,602 |
| Precision BioSciences, Inc. * | 182,202 | 2,290,279 |
| Prelude Therapeutics, Inc. * | 46,149 | 1,647,058 |
| Prestige Consumer Healthcare, Inc. * | 197,913 | 11,358,227 |
| Prometheus Biosciences, Inc. * | 41,394 | 903,217 |
| Protagonist Therapeutics, Inc. * | 160,598 | 7,789,003 |
| Prothena Corp. plc * | 112,025 | 7,519,118 |
| Provention Bio, Inc. * | 215,459 | 1,445,730 |
| PTC Therapeutics, Inc. * | 279,419 | 12,196,639 |
| Puma Biotechnology, Inc. * | 140,474 | 1,063,388 |
| Quanterix Corp. * | 108,035 | 5,515,187 |
| Radius Health, Inc. * | 186,390 | 2,583,365 |
| RAPT Therapeutics, Inc. * | 38,985 | 1,274,810 |
| Reata Pharmaceuticals, Inc., Class A * | 105,674 | 11,255,338 |
| Recursion Pharmaceuticals, Inc., Class A *(a) | 98,743 | 2,490,298 |
| REGENXBIO, Inc. * | 138,222 | 4,464,571 |
| Security | Number
of Shares | Value ($) |
| Relay Therapeutics, Inc. * | 82,051 | 2,628,094 |
| Relmada Therapeutics, Inc. * | 55,593 | 1,329,229 |
| Repligen Corp. * | 202,948 | 57,430,225 |
| Replimune Group, Inc. * | 103,157 | 3,276,266 |
| Revance Therapeutics, Inc. * | 263,734 | 7,062,797 |
| REVOLUTION Medicines, Inc. * | 189,314 | 5,507,144 |
| Rhythm Pharmaceuticals, Inc. * | 145,301 | 1,890,366 |
| Rocket Pharmaceuticals, Inc. * | 176,276 | 6,030,402 |
| Rubius Therapeutics, Inc. * | 173,871 | 3,776,478 |
| Sage Therapeutics, Inc. * | 206,418 | 9,538,576 |
| Sana Biotechnology, Inc. * | 97,387 | 2,336,314 |
| Sangamo Therapeutics, Inc. * | 473,573 | 4,693,108 |
| Satsuma Pharmaceuticals, Inc. * | 34,657 | 170,859 |
| Seer, Inc. * | 51,362 | 2,053,453 |
| Sensei Biotherapeutics, Inc. *(a) | 36,336 | 391,702 |
| Seres Therapeutics, Inc. * | 225,429 | 1,445,000 |
| Shattuck Labs, Inc. * | 48,977 | 1,034,884 |
| SIGA Technologies, Inc. * | 170,140 | 1,111,014 |
| Sigilon Therapeutics, Inc. * | 27,659 | 164,294 |
| Silverback Therapeutics, Inc. *(a) | 48,690 | 1,071,180 |
| Sorrento Therapeutics, Inc. *(a) | 959,788 | 8,638,092 |
| Sotera Health Co. * | 292,116 | 7,145,157 |
| Spectrum Pharmaceuticals, Inc. * | 640,004 | 1,504,009 |
| SpringWorks Therapeutics, Inc. * | 108,905 | 8,178,766 |
| Spruce Biosciences, Inc. *(a) | 25,043 | 192,080 |
| SQZ Biotechnologies Co. * | 32,228 | 428,632 |
| Stoke Therapeutics, Inc. * | 80,016 | 2,094,819 |
| Supernus Pharmaceuticals, Inc. * | 210,231 | 5,787,659 |
| Syndax Pharmaceuticals, Inc. * | 144,157 | 2,521,306 |
| Syros Pharmaceuticals, Inc. * | 221,729 | 1,175,164 |
| Tarsus Pharmaceuticals, Inc. * | 23,781 | 630,197 |
| Taysha Gene Therapies, Inc. *(a) | 33,305 | 662,103 |
| TCR2 Therapeutics, Inc. * | 106,413 | 1,784,546 |
| TG Therapeutics, Inc. * | 460,013 | 12,452,552 |
| TherapeuticsMD, Inc. *(a) | 1,397,414 | 1,110,944 |
| Theravance Biopharma, Inc. * | 202,761 | 1,682,916 |
| Translate Bio, Inc. * | 277,466 | 10,377,228 |
| Travere Therapeutics, Inc. * | 218,163 | 4,762,498 |
| Tricida, Inc. *(a) | 113,619 | 493,106 |
| Turning Point Therapeutics, Inc. * | 171,501 | 13,209,007 |
| Twist Bioscience Corp. * | 166,767 | 18,879,692 |
| Ultragenyx Pharmaceutical, Inc. * | 251,535 | 24,220,305 |
| uniQure N.V. * | 153,723 | 4,457,967 |
| United Therapeutics Corp. * | 178,118 | 38,273,996 |
| UNITY Biotechnology, Inc. * | 132,336 | 423,475 |
| Vanda Pharmaceuticals, Inc. * | 221,098 | 3,701,181 |
| Vaxart, Inc. *(a) | 484,817 | 4,339,112 |
| Vaxcyte, Inc. * | 72,163 | 1,892,836 |
| VBI Vaccines, Inc. *(a) | 947,517 | 3,420,536 |
| Veracyte, Inc. * | 266,696 | 12,830,745 |
| Vericel Corp. * | 183,853 | 9,959,317 |
| Vir Biotechnology, Inc. * | 263,009 | 13,555,484 |
| Vor BioPharma, Inc. * | 41,449 | 608,886 |
| Voyager Therapeutics, Inc. * | 107,536 | 350,567 |
| WaVe Life Sciences Ltd. * | 139,931 | 885,763 |
| Xencor, Inc. * | 230,950 | 7,822,277 |
| Y-mAbs Therapeutics, Inc. * | 107,084 | 3,296,046 |
| Zentalis Pharmaceuticals, Inc. * | 70,292 | 4,793,212 |
| ZIOPHARM Oncology, Inc. * | 854,581 | 1,392,967 |
| Zogenix, Inc. * | 221,085 | 3,274,269 |
| | | 1,573,454,178 |
| |
| Real Estate 7.0% |
| Acadia Realty Trust | 342,316 | 7,263,946 |
| Agree Realty Corp. | 270,258 | 20,147,734 |
| Alexander & Baldwin, Inc. | 287,173 | 5,996,172 |
| Alexander's, Inc. | 8,451 | 2,250,501 |
Schwab U.S. Equity ETFs | Annual Report
Schwab U.S. Small-Cap ETF
Portfolio Holdings as of August 31, 2021 (continued)
| Security | Number
of Shares | Value ($) |
| Altisource Portfolio Solutions S.A. *(a) | 35,778 | 388,191 |
| American Assets Trust, Inc. | 199,067 | 7,926,848 |
| American Finance Trust, Inc. | 431,432 | 3,718,944 |
| Apple Hospitality REIT, Inc. | 824,891 | 12,191,889 |
| Armada Hoffler Properties, Inc. | 237,649 | 3,191,626 |
| Brandywine Realty Trust | 677,386 | 9,402,118 |
| Brixmor Property Group, Inc. | 1,177,765 | 27,618,589 |
| Broadstone Net Lease, Inc. | 618,361 | 16,943,091 |
| CareTrust REIT, Inc. | 383,740 | 8,438,443 |
| Centerspace | 51,454 | 5,206,116 |
| Chatham Lodging Trust * | 198,714 | 2,384,568 |
| CIM Commercial Trust Corp. (a) | 88,191 | 617,337 |
| City Office REIT, Inc. | 173,550 | 2,771,594 |
| Columbia Property Trust, Inc. | 455,527 | 7,616,411 |
| Community Healthcare Trust, Inc. | 90,653 | 4,397,577 |
| CorEnergy Infrastructure Trust, Inc. (a) | 53,935 | 259,967 |
| CorePoint Lodging, Inc. * | 154,888 | 2,239,680 |
| CoreSite Realty Corp. | 170,459 | 25,291,002 |
| Corporate Office Properties Trust | 445,292 | 12,548,329 |
| Cousins Properties, Inc. | 589,395 | 22,727,071 |
| Cushman & Wakefield plc * | 486,417 | 8,823,604 |
| DiamondRock Hospitality Co. * | 833,786 | 7,537,425 |
| DigitalBridge Group, Inc. * | 1,929,332 | 13,312,391 |
| Diversified Healthcare Trust | 944,937 | 3,543,514 |
| Easterly Government Properties, Inc. | 332,930 | 7,114,714 |
| EastGroup Properties, Inc. | 159,040 | 28,668,550 |
| Empire State Realty Trust, Inc., Class A | 559,270 | 5,743,703 |
| EPR Properties | 296,529 | 15,048,847 |
| Equity Commonwealth | 483,334 | 12,731,018 |
| Essential Properties Realty Trust, Inc. | 465,869 | 15,098,814 |
| eXp World Holdings, Inc. | 229,624 | 10,528,260 |
| First Industrial Realty Trust, Inc. | 513,128 | 28,730,037 |
| Forestar Group, Inc. * | 67,150 | 1,396,049 |
| Four Corners Property Trust, Inc. | 302,015 | 8,640,649 |
| Franklin Street Properties Corp. | 382,285 | 1,834,968 |
| FRP Holdings, Inc. * | 24,427 | 1,409,438 |
| Getty Realty Corp. | 150,318 | 4,754,558 |
| Gladstone Commercial Corp. | 143,987 | 3,258,426 |
| Global Medical REIT, Inc. | 216,773 | 3,342,640 |
| Global Net Lease, Inc. | 378,034 | 6,426,578 |
| Healthcare Realty Trust, Inc. | 561,637 | 16,865,959 |
| Hersha Hospitality Trust * | 145,026 | 1,360,344 |
| Highwoods Properties, Inc. | 412,546 | 18,849,227 |
| Hudson Pacific Properties, Inc. | 598,671 | 15,792,941 |
| Independence Realty Trust, Inc. | 405,092 | 8,296,284 |
| Industrial Logistics Properties Trust | 258,904 | 7,101,737 |
| Innovative Industrial Properties, Inc. | 95,282 | 23,430,797 |
| iStar, Inc. (a) | 290,396 | 7,680,974 |
| JBG SMITH Properties | 438,175 | 13,202,213 |
| Kennedy-Wilson Holdings, Inc. | 485,501 | 10,676,167 |
| Kite Realty Group Trust | 335,094 | 6,789,004 |
| Lexington Realty Trust | 1,100,509 | 14,889,887 |
| Life Storage, Inc. | 305,309 | 37,992,652 |
| LTC Properties, Inc. | 155,932 | 5,381,213 |
| Mack-Cali Realty Corp. * | 341,836 | 6,112,028 |
| Marcus & Millichap, Inc. * | 95,506 | 3,745,745 |
| Monmouth Real Estate Investment Corp. | 390,016 | 7,402,504 |
| National Health Investors, Inc. | 181,718 | 10,870,371 |
| National Storage Affiliates Trust | 308,154 | 17,641,816 |
| New Senior Investment Group, Inc. | 310,601 | 2,711,547 |
| Newmark Group, Inc., Class A | 646,908 | 8,810,887 |
| NexPoint Residential Trust, Inc. | 89,658 | 5,808,942 |
| Office Properties Income Trust | 191,607 | 5,083,334 |
| One Liberty Properties, Inc. | 65,432 | 2,083,355 |
| Outfront Media, Inc. * | 577,247 | 14,292,636 |
| Paramount Group, Inc. | 659,889 | 5,846,617 |
| Park Hotels & Resorts, Inc. * | 938,104 | 17,955,311 |
| Security | Number
of Shares | Value ($) |
| Pebblebrook Hotel Trust | 521,008 | 11,477,806 |
| Physicians Realty Trust | 854,704 | 15,820,571 |
| Piedmont Office Realty Trust, Inc., Class A | 491,790 | 8,763,698 |
| PotlatchDeltic Corp. | 265,802 | 13,808,414 |
| Preferred Apartment Communities, Inc., Class A | 203,416 | 2,538,632 |
| PS Business Parks, Inc. | 79,627 | 12,519,753 |
| QTS Realty Trust, Inc., Class A | 273,183 | 21,302,810 |
| Rayonier, Inc. | 552,888 | 20,335,221 |
| RE/MAX Holdings, Inc., Class A | 75,133 | 2,516,204 |
| Realogy Holdings Corp. * | 461,748 | 8,103,677 |
| Redfin Corp. * | 412,587 | 20,039,351 |
| Retail Opportunity Investments Corp. | 471,063 | 8,516,819 |
| Retail Properties of America, Inc., Class A | 851,841 | 11,261,338 |
| Retail Value, Inc. | 68,519 | 1,712,975 |
| Rexford Industrial Realty, Inc. | 532,413 | 32,972,337 |
| RLJ Lodging Trust | 654,068 | 9,438,201 |
| RPT Realty | 322,095 | 4,167,909 |
| Ryman Hospitality Properties, Inc. * | 218,417 | 18,143,900 |
| Sabra Health Care REIT, Inc. | 856,084 | 13,697,344 |
| Safehold, Inc. | 57,004 | 5,108,128 |
| Saul Centers, Inc. | 51,349 | 2,366,162 |
| Seritage Growth Properties, Class A * | 157,656 | 2,549,298 |
| Service Properties Trust | 653,657 | 7,471,300 |
| SITE Centers Corp. | 669,525 | 10,786,048 |
| SL Green Realty Corp. | 274,990 | 19,271,299 |
| Spirit Realty Capital, Inc. | 455,811 | 23,597,335 |
| STAG Industrial, Inc. | 634,671 | 26,814,850 |
| Summit Hotel Properties, Inc. * | 420,888 | 3,922,676 |
| Sunstone Hotel Investors, Inc. * | 857,450 | 9,937,845 |
| Tanger Factory Outlet Centers, Inc. | 399,677 | 6,682,599 |
| Tejon Ranch Co. * | 81,367 | 1,563,874 |
| Terreno Realty Corp. | 276,748 | 18,489,534 |
| The GEO Group, Inc. | 482,176 | 3,736,864 |
| The Howard Hughes Corp. * | 179,158 | 16,219,174 |
| The Macerich Co. | 666,666 | 11,386,655 |
| The RMR Group, Inc., Class A | 60,698 | 2,812,745 |
| The St. Joe Co. | 123,730 | 5,724,987 |
| UMH Properties, Inc. | 166,632 | 3,949,178 |
| Uniti Group, Inc. | 925,710 | 12,099,030 |
| Universal Health Realty Income Trust | 50,758 | 3,006,396 |
| Urban Edge Properties | 436,365 | 8,264,753 |
| Urstadt Biddle Properties, Inc. | 10,152 | 160,300 |
| Urstadt Biddle Properties, Inc., Class A | 117,656 | 2,244,876 |
| Washington Real Estate Investment Trust | 335,429 | 8,432,685 |
| Whitestone REIT | 158,239 | 1,552,325 |
| Xenia Hotels & Resorts, Inc. * | 451,351 | 7,862,534 |
| | | 1,159,306,829 |
| |
| Retailing 5.3% |
| 1-800-Flowers.com, Inc., Class A * | 102,504 | 3,255,527 |
| Abercrombie & Fitch Co., Class A * | 245,628 | 8,783,657 |
| Academy Sports & Outdoors, Inc. * | 156,493 | 6,927,945 |
| America's Car-Mart, Inc. * | 24,396 | 3,155,135 |
| American Eagle Outfitters, Inc. | 598,568 | 18,268,295 |
| Arko Corp. * | 259,431 | 2,682,517 |
| Asbury Automotive Group, Inc. * | 76,630 | 14,271,571 |
| AutoNation, Inc. * | 214,316 | 23,379,732 |
| Bed Bath & Beyond, Inc. * | 423,061 | 11,651,100 |
| Big Lots, Inc. | 126,688 | 6,164,638 |
| Boot Barn Holdings, Inc. * | 116,012 | 10,357,551 |
| Caleres, Inc. | 151,135 | 3,716,410 |
| Camping World Holdings, Inc., Class A | 156,353 | 6,244,739 |
| CarLotz, Inc. *(a) | 268,522 | 1,103,625 |
Schwab U.S. Equity ETFs | Annual Report
Schwab U.S. Small-Cap ETF
Portfolio Holdings as of August 31, 2021 (continued)
| Security | Number
of Shares | Value ($) |
| CarParts.com, Inc. * | 142,242 | 2,456,519 |
| Chewy, Inc., Class A * | 330,656 | 29,137,407 |
| Chico's FAS, Inc. * | 485,608 | 2,510,593 |
| Conn's, Inc. * | 77,188 | 1,898,825 |
| Core-Mark Holding Co., Inc. | 179,138 | 8,240,348 |
| Designer Brands, Inc., Class A * | 234,348 | 3,398,046 |
| Dick's Sporting Goods, Inc. (a) | 260,609 | 36,696,353 |
| Dillard's, Inc., Class A | 28,331 | 5,395,922 |
| Duluth Holdings, Inc., Class B * | 49,674 | 772,927 |
| Five Below, Inc. * | 222,451 | 47,339,797 |
| Floor & Decor Holdings, Inc., Class A * | 416,751 | 51,385,398 |
| Foot Locker, Inc. | 409,564 | 23,218,183 |
| Franchise Group, Inc. | 106,746 | 3,707,289 |
| Funko, Inc., Class A * | 90,756 | 1,809,675 |
| GameStop Corp., Class A * | 220,462 | 48,113,627 |
| Genesco, Inc. * | 56,337 | 3,494,584 |
| Group 1 Automotive, Inc. | 67,713 | 11,202,439 |
| Groupon, Inc. * | 91,133 | 2,257,364 |
| GrowGeneration Corp. * | 202,925 | 6,491,571 |
| Guess?, Inc. | 152,120 | 3,679,783 |
| Haverty Furniture Cos., Inc. | 66,667 | 2,375,345 |
| Hibbett, Inc. | 64,288 | 6,151,719 |
| Kohl's Corp. | 621,239 | 35,659,119 |
| Lands' End, Inc. * | 65,394 | 2,213,587 |
| Leslie's, Inc. * | 373,435 | 9,007,252 |
| Liquidity Services, Inc. * | 107,288 | 2,617,827 |
| Lithia Motors, Inc., Class A | 118,176 | 39,151,709 |
| Lumber Liquidators Holdings, Inc. * | 114,724 | 2,393,143 |
| Macy's, Inc. * | 1,236,280 | 27,680,309 |
| MarineMax, Inc. * | 87,836 | 4,270,586 |
| Monro, Inc. | 132,795 | 7,557,364 |
| Murphy USA, Inc. | 99,664 | 15,475,826 |
| National Vision Holdings, Inc. * | 322,842 | 19,364,063 |
| Nordstrom, Inc. * | 431,742 | 12,352,139 |
| Ollie's Bargain Outlet Holdings, Inc. * | 225,303 | 16,307,431 |
| Overstock.com, Inc. * | 170,569 | 12,306,553 |
| Party City Holdco, Inc. * | 441,016 | 3,003,319 |
| Penske Automotive Group, Inc. | 128,264 | 11,534,782 |
| Petco Health & Wellness Co., Inc. * | 287,380 | 6,187,291 |
| PetMed Express, Inc. | 80,388 | 2,213,886 |
| Porch Group, Inc. * | 297,417 | 5,948,340 |
| Poshmark, Inc., Class A * | 54,884 | 1,601,515 |
| Quotient Technology, Inc. * | 322,334 | 2,340,145 |
| Qurate Retail, Inc., Class A | 1,505,787 | 16,608,831 |
| Rent-A-Center, Inc. | 236,477 | 14,916,969 |
| RH * | 66,805 | 46,808,259 |
| Sally Beauty Holdings, Inc. * | 448,022 | 8,328,729 |
| Shift Technologies, Inc. *(a) | 237,384 | 1,766,137 |
| Shoe Carnival, Inc. | 68,565 | 2,624,668 |
| Shutterstock, Inc. | 88,424 | 10,191,750 |
| Signet Jewelers Ltd. | 207,684 | 16,448,573 |
| Sleep Number Corp. * | 97,037 | 8,976,893 |
| Sonic Automotive, Inc., Class A | 92,607 | 4,680,358 |
| Sportsman's Warehouse Holdings, Inc. * | 173,408 | 3,076,258 |
| Stamps.com, Inc. * | 72,624 | 23,886,034 |
| Stitch Fix, Inc., Class A * | 254,018 | 10,645,894 |
| The Aaron's Co., Inc. | 135,507 | 3,593,646 |
| The Buckle, Inc. | 114,507 | 4,434,856 |
| The Cato Corp., Class A | 76,499 | 1,320,373 |
| The Children's Place, Inc. * | 58,158 | 5,050,441 |
| The Container Store Group, Inc. * | 77,514 | 899,162 |
| The ODP Corp. * | 212,273 | 10,012,917 |
| The RealReal, Inc. * | 241,239 | 3,001,013 |
| Urban Outfitters, Inc. * | 272,666 | 9,003,431 |
| Vroom, Inc. * | 140,628 | 3,777,268 |
| Weyco Group, Inc. | 27,051 | 621,362 |
| Security | Number
of Shares | Value ($) |
| Winmark Corp. | 11,727 | 2,458,331 |
| Zumiez, Inc. * | 83,614 | 3,360,447 |
| | | 877,374,942 |
| |
| Semiconductors & Semiconductor Equipment 2.8% |
| ACM Research, Inc., Class A * | 40,965 | 3,652,030 |
| Allegro MicroSystems, Inc. * | 165,397 | 4,970,180 |
| Ambarella, Inc. * | 143,743 | 14,887,463 |
| Amkor Technology, Inc. | 426,066 | 11,704,033 |
| Axcelis Technologies, Inc. * | 133,224 | 6,622,565 |
| Brooks Automation, Inc. | 294,590 | 25,028,366 |
| CEVA, Inc. * | 90,437 | 4,363,585 |
| Cirrus Logic, Inc. * | 228,858 | 19,148,549 |
| CMC Materials, Inc. | 115,995 | 15,383,257 |
| Cohu, Inc. * | 192,412 | 6,865,260 |
| Cree, Inc. * | 459,161 | 39,019,502 |
| Diodes, Inc. * | 168,067 | 16,273,928 |
| FormFactor, Inc. * | 307,840 | 11,968,819 |
| Ichor Holdings Ltd. * | 111,317 | 4,932,456 |
| Impinj, Inc. * | 89,977 | 5,244,759 |
| Kulicke & Soffa Industries, Inc. | 246,061 | 17,271,022 |
| Lattice Semiconductor Corp. * | 541,426 | 33,633,383 |
| MACOM Technology Solutions Holdings, Inc. * | 185,138 | 11,239,728 |
| MaxLinear, Inc., Class A * | 271,981 | 14,205,568 |
| MKS Instruments, Inc. | 219,494 | 32,305,127 |
| NeoPhotonics Corp. * | 201,723 | 1,884,093 |
| Onto Innovation, Inc. * | 194,457 | 14,415,097 |
| PDF Solutions, Inc. * | 117,829 | 2,653,509 |
| Photronics, Inc. * | 251,332 | 3,787,573 |
| Power Integrations, Inc. | 240,506 | 26,128,572 |
| Rambus, Inc. * | 446,109 | 10,617,394 |
| Semtech Corp. * | 257,482 | 18,003,142 |
| Silicon Laboratories, Inc. * | 177,416 | 27,964,310 |
| SiTime Corp. * | 50,015 | 10,645,193 |
| SkyWater Technology, Inc. *(a) | 27,720 | 925,294 |
| SMART Global Holdings, Inc. * | 66,081 | 3,202,285 |
| SunPower Corp. * | 321,586 | 6,930,178 |
| Synaptics, Inc. * | 140,142 | 26,596,149 |
| Ultra Clean Holdings, Inc. * | 173,706 | 8,032,165 |
| Veeco Instruments, Inc. * | 198,998 | 4,535,164 |
| | | 465,039,698 |
| |
| Software & Services 8.0% |
| 8x8, Inc. * | 435,506 | 10,517,470 |
| A10 Networks, Inc. * | 237,762 | 3,302,514 |
| ACI Worldwide, Inc. * | 468,651 | 15,104,622 |
| Agilysys, Inc. * | 81,330 | 4,621,984 |
| Alarm.com Holdings, Inc. * | 179,502 | 15,137,404 |
| Alliance Data Systems Corp. | 197,206 | 19,347,881 |
| Altair Engineering, Inc., Class A * | 181,146 | 13,402,993 |
| Appfolio, Inc., Class A * | 69,688 | 8,230,153 |
| Appian Corp. * | 156,029 | 16,726,309 |
| Asana, Inc., Class A * | 108,855 | 8,223,995 |
| Avaya Holdings Corp. * | 301,954 | 6,090,412 |
| Benefitfocus, Inc. * | 116,787 | 1,409,619 |
| BigCommerce Holdings, Inc. * | 49,289 | 2,934,667 |
| Blackbaud, Inc. * | 193,698 | 13,498,814 |
| Blackline, Inc. * | 204,851 | 22,349,244 |
| BM Technologies, Inc. *(b) | 16,801 | 154,026 |
| Bottomline Technologies (DE), Inc. * | 155,986 | 6,593,528 |
| Box, Inc., Class A * | 556,935 | 14,357,784 |
| BTRS Holdings, Inc. * | 255,198 | 2,784,210 |
| Cantaloupe, Inc. * | 231,223 | 2,367,724 |
| Cass Information Systems, Inc. | 47,360 | 2,134,989 |
| Cerence, Inc. * | 149,951 | 16,260,686 |
Schwab U.S. Equity ETFs | Annual Report
Schwab U.S. Small-Cap ETF
Portfolio Holdings as of August 31, 2021 (continued)
| Security | Number
of Shares | Value ($) |
| ChannelAdvisor Corp. * | 117,404 | 3,007,890 |
| Cloudera, Inc. * | 886,020 | 14,114,299 |
| Cloudflare, Inc., Class A * | 762,622 | 92,078,980 |
| CommVault Systems, Inc. * | 182,568 | 14,782,531 |
| Conduent, Inc. * | 682,493 | 4,982,199 |
| Cornerstone OnDemand, Inc. * | 246,625 | 14,131,612 |
| CSG Systems International, Inc. | 130,442 | 6,288,609 |
| Datto Holding Corp. * | 89,024 | 2,270,112 |
| Digimarc Corp. *(a) | 55,902 | 1,634,574 |
| Digital Turbine, Inc. * | 308,621 | 18,038,897 |
| DigitalOcean Holdings, Inc. * | 67,345 | 4,153,840 |
| Dolby Laboratories, Inc., Class A | 258,794 | 25,649,073 |
| Domo, Inc., Class B * | 112,633 | 10,080,653 |
| Dropbox, Inc., Class A * | 1,175,008 | 37,259,504 |
| Duck Creek Technologies, Inc. * | 130,456 | 6,083,163 |
| E2open Parent Holdings, Inc. * | 497,088 | 5,935,231 |
| Ebix, Inc. | 93,265 | 2,684,167 |
| Envestnet, Inc. * | 215,805 | 17,236,345 |
| Everbridge, Inc. * | 149,302 | 23,435,935 |
| EVERTEC, Inc. | 237,619 | 10,989,879 |
| Evo Payments, Inc., Class A * | 185,820 | 4,727,261 |
| ExlService Holdings, Inc. * | 132,688 | 16,339,200 |
| Fastly, Inc., Class A * | 344,116 | 15,003,458 |
| FireEye, Inc. * | 945,705 | 17,202,374 |
| GreenSky, Inc., Class A * | 207,690 | 1,651,135 |
| Grid Dynamics Holdings, Inc. * | 101,021 | 2,704,332 |
| GTY Technology Holdings, Inc. * | 186,388 | 1,375,543 |
| InterDigital, Inc. | 122,057 | 8,801,530 |
| International Money Express, Inc. * | 109,895 | 2,004,485 |
| j2 Global, Inc. * | 168,275 | 23,171,467 |
| Jamf Holding Corp. * | 144,324 | 5,072,989 |
| Limelight Networks, Inc. * | 492,445 | 1,329,601 |
| LivePerson, Inc. * | 254,233 | 16,296,335 |
| LiveRamp Holdings, Inc. * | 273,111 | 13,382,439 |
| Manhattan Associates, Inc. * | 252,735 | 41,193,278 |
| MAXIMUS, Inc. | 243,814 | 21,233,761 |
| McAfee Corp., Class A | 144,071 | 3,826,526 |
| Medallia, Inc. * | 342,615 | 11,570,109 |
| MicroStrategy, Inc., Class A *(a) | 30,868 | 21,431,652 |
| Mimecast Ltd. * | 235,209 | 16,419,940 |
| Model N, Inc. * | 122,940 | 4,168,895 |
| Momentive Global, Inc. * | 485,262 | 9,515,988 |
| MoneyGram International, Inc. * | 277,954 | 2,498,806 |
| N-Able, Inc. * | 143,744 | 1,944,856 |
| NCR Corp. * | 519,154 | 22,053,662 |
| New Relic, Inc. * | 217,541 | 17,396,754 |
| Nutanix, Inc., Class A * | 812,805 | 30,000,633 |
| ON24, Inc. * | 35,090 | 793,385 |
| OneSpan, Inc. * | 134,201 | 2,586,053 |
| Pagerduty, Inc. * | 232,094 | 9,933,623 |
| Paya Holdings, Inc., Class A * | 225,877 | 2,179,713 |
| Paylocity Holding Corp. * | 149,025 | 40,117,530 |
| Paysign, Inc. * | 126,787 | 315,700 |
| Perficient, Inc. * | 131,013 | 15,619,370 |
| Ping Identity Holding Corp. * | 145,727 | 3,781,616 |
| Progress Software Corp. | 174,571 | 8,128,026 |
| PROS Holdings, Inc. * | 157,975 | 6,830,839 |
| Q2 Holdings, Inc. * | 209,920 | 18,491,853 |
| QAD, Inc., Class A | 48,857 | 4,251,048 |
| Qualtrics International, Inc., Class A * | 228,127 | 10,329,591 |
| Qualys, Inc. * | 133,477 | 15,667,530 |
| Rackspace Technology, Inc. * | 140,834 | 1,967,451 |
| Rapid7, Inc. * | 218,597 | 26,563,907 |
| Repay Holdings Corp. * | 299,875 | 6,900,124 |
| Sabre Corp. * | 1,267,147 | 14,230,061 |
| Sailpoint Technologies Holdings, Inc. * | 366,257 | 17,162,803 |
| Shift4 Payments, Inc., Class A * | 154,011 | 13,200,283 |
| Smartsheet, Inc., Class A * | 465,976 | 37,077,710 |
| Security | Number
of Shares | Value ($) |
| SolarWinds Corp. | 144,059 | 2,459,087 |
| Sprout Social, Inc., Class A * | 112,975 | 13,737,760 |
| SPS Commerce, Inc. * | 142,267 | 19,281,447 |
| Sumo Logic, Inc. * | 67,029 | 1,397,555 |
| Switch, Inc., Class A | 358,291 | 8,889,200 |
| Telos Corp. * | 97,402 | 3,214,266 |
| Tenable Holdings, Inc. * | 272,176 | 12,076,449 |
| Teradata Corp. * | 434,647 | 23,770,844 |
| TTEC Holdings, Inc. | 72,431 | 7,638,573 |
| Tucows, Inc., Class A *(a) | 38,308 | 2,839,006 |
| Unisys Corp. * | 265,724 | 6,433,178 |
| Upland Software, Inc. * | 102,711 | 4,003,675 |
| Varonis Systems, Inc. * | 421,002 | 29,053,348 |
| Verint Systems, Inc. * | 258,118 | 11,522,388 |
| Verra Mobility Corp. * | 541,048 | 8,391,654 |
| Viant Technology, Inc., Class A * | 45,565 | 626,519 |
| VirnetX Holding Corp. * | 255,110 | 1,145,444 |
| Vonage Holdings Corp. * | 937,301 | 13,215,944 |
| Workiva, Inc. * | 167,393 | 23,480,216 |
| Xperi Holding Corp. | 416,171 | 8,893,574 |
| Yext, Inc. * | 395,115 | 5,341,955 |
| Zuora, Inc., Class A * | 419,409 | 7,121,565 |
| | | 1,323,367,393 |
| |
| Technology Hardware & Equipment 3.4% |
| 3D Systems Corp. * | 495,987 | 15,097,844 |
| 908 Devices, Inc. * | 27,320 | 983,520 |
| ADTRAN, Inc. | 192,050 | 3,967,753 |
| Advanced Energy Industries, Inc. | 152,307 | 13,735,045 |
| Aeva Technologies, Inc. *(a) | 358,875 | 3,520,564 |
| Applied Optoelectronics, Inc. *(a) | 98,245 | 720,136 |
| Arlo Technologies, Inc. * | 325,922 | 2,020,716 |
| Avid Technology, Inc. * | 168,047 | 4,337,293 |
| Avnet, Inc. | 394,610 | 15,965,921 |
| Badger Meter, Inc. | 115,698 | 12,390,099 |
| Belden, Inc. | 177,429 | 10,157,810 |
| Benchmark Electronics, Inc. | 142,030 | 3,839,071 |
| CalAmp Corp. * | 139,497 | 1,581,896 |
| Calix, Inc. * | 224,333 | 10,453,918 |
| Casa Systems, Inc. * | 135,531 | 954,138 |
| Coherent, Inc. * | 97,516 | 24,639,368 |
| CommScope Holding Co., Inc. * | 809,405 | 12,788,599 |
| Comtech Telecommunications Corp. | 103,392 | 2,638,564 |
| Corsair Gaming, Inc. *(a) | 84,020 | 2,432,379 |
| CTS Corp. | 128,320 | 4,501,466 |
| Daktronics, Inc. * | 145,038 | 883,281 |
| Diebold Nixdorf, Inc. * | 310,318 | 3,376,260 |
| EchoStar Corp., Class A * | 171,298 | 4,625,046 |
| ePlus, Inc. * | 53,524 | 5,792,367 |
| Extreme Networks, Inc. * | 498,796 | 5,401,961 |
| Fabrinet * | 146,252 | 15,066,881 |
| FARO Technologies, Inc. * | 71,962 | 4,961,060 |
| Harmonic, Inc. * | 401,311 | 3,708,114 |
| II-VI, Inc. * | 417,436 | 26,290,119 |
| Infinera Corp. * | 813,207 | 6,887,863 |
| Inseego Corp. *(a) | 263,127 | 2,210,267 |
| Insight Enterprises, Inc. * | 140,056 | 14,410,362 |
| Itron, Inc. * | 179,027 | 15,040,058 |
| Kimball Electronics, Inc. * | 98,988 | 2,392,540 |
| Knowles Corp. * | 367,930 | 7,358,600 |
| Littelfuse, Inc. | 97,363 | 27,787,400 |
| Lumentum Holdings, Inc. * | 300,904 | 26,070,323 |
| Methode Electronics, Inc. | 152,460 | 7,100,062 |
| Napco Security Technologies, Inc. * | 46,284 | 1,811,093 |
| NETGEAR, Inc. * | 120,855 | 4,318,149 |
| NetScout Systems, Inc. * | 292,874 | 8,030,605 |
| nLight, Inc. * | 149,100 | 4,116,651 |
Schwab U.S. Equity ETFs | Annual Report
Schwab U.S. Small-Cap ETF
Portfolio Holdings as of August 31, 2021 (continued)
| Security | Number
of Shares | Value ($) |
| Novanta, Inc. * | 140,282 | 21,494,008 |
| OSI Systems, Inc. * | 66,282 | 6,557,941 |
| Ouster, Inc. *(a) | 274,070 | 2,302,188 |
| PAR Technology Corp. * | 94,691 | 6,432,360 |
| PC Connection, Inc. | 43,628 | 2,112,031 |
| Plantronics, Inc. * | 150,516 | 4,482,367 |
| Plexus Corp. * | 113,400 | 10,413,522 |
| Pure Storage, Inc., Class A * | 1,011,117 | 26,117,152 |
| Ribbon Communications, Inc. * | 471,756 | 3,080,567 |
| Rogers Corp. * | 74,206 | 15,762,096 |
| Sanmina Corp. * | 258,192 | 10,193,420 |
| ScanSource, Inc. * | 101,004 | 3,593,722 |
| Super Micro Computer, Inc. * | 168,406 | 6,153,555 |
| SYNNEX Corp. | 164,528 | 20,906,573 |
| TTM Technologies, Inc. * | 395,459 | 5,536,426 |
| Velodyne Lidar, Inc. *(a) | 225,353 | 1,487,330 |
| ViaSat, Inc. * | 270,016 | 13,943,626 |
| Viavi Solutions, Inc. * | 908,495 | 14,799,384 |
| Vishay Intertechnology, Inc. | 526,278 | 11,562,328 |
| Vontier Corp. | 669,516 | 24,350,297 |
| Xerox Holdings Corp. | 639,539 | 14,396,023 |
| | | 570,042,078 |
| |
| Telecommunication Services 0.6% |
| Anterix, Inc. * | 46,678 | 2,754,936 |
| ATN International, Inc. | 43,457 | 1,981,205 |
| Bandwidth, Inc., Class A * | 90,711 | 9,334,162 |
| Cincinnati Bell, Inc. * | 201,996 | 3,128,918 |
| Cogent Communications Holdings, Inc. | 167,806 | 12,179,359 |
| Consolidated Communications Holdings, Inc. * | 292,089 | 2,707,665 |
| Globalstar, Inc. * | 2,629,364 | 5,232,434 |
| Gogo, Inc. *(a) | 199,026 | 2,676,900 |
| Iridium Communications, Inc. * | 465,792 | 20,732,402 |
| Liberty Latin America Ltd., Class A * | 198,854 | 2,835,658 |
| Liberty Latin America Ltd., Class C * | 606,247 | 8,723,894 |
| ORBCOMM, Inc. * | 315,511 | 3,625,221 |
| Radius Global Infrastructure, Inc., Class A * | 242,758 | 4,340,513 |
| Shenandoah Telecommunications Co. | 198,122 | 5,909,979 |
| Spok Holdings, Inc. | 72,015 | 713,669 |
| Telephone and Data Systems, Inc. | 395,123 | 8,028,899 |
| United States Cellular Corp. * | 58,466 | 1,867,989 |
| | | 96,773,803 |
| |
| Transportation 1.7% |
| Air Transport Services Group, Inc. * | 240,981 | 6,600,470 |
| Allegiant Travel Co. * | 57,794 | 11,121,877 |
| ArcBest Corp. | 100,683 | 6,718,577 |
| Atlas Air Worldwide Holdings, Inc. * | 109,345 | 8,000,774 |
| Avis Budget Group, Inc. * | 204,981 | 18,602,026 |
| Daseke, Inc. * | 244,302 | 2,308,654 |
| Echo Global Logistics, Inc. * | 105,659 | 3,474,068 |
| Forward Air Corp. | 108,345 | 9,552,779 |
| Frontier Group Holdings, Inc. * | 119,169 | 1,826,861 |
| Hawaiian Holdings, Inc. * | 202,610 | 4,096,774 |
| Heartland Express, Inc. | 193,277 | 3,243,188 |
| Hub Group, Inc., Class A * | 133,916 | 9,400,903 |
| JetBlue Airways Corp. * | 1,255,462 | 18,995,140 |
| Kirby Corp. * | 238,333 | 12,772,265 |
| Knight-Swift Transportation Holdings, Inc. | 486,855 | 25,282,380 |
| Landstar System, Inc. | 152,303 | 25,591,473 |
| Macquarie Infrastructure Corp. | 291,758 | 11,626,556 |
| Marten Transport Ltd. | 233,097 | 3,633,982 |
| Matson, Inc. | 172,214 | 13,634,182 |
| Security | Number
of Shares | Value ($) |
| Ryder System, Inc. | 213,606 | 16,979,541 |
| Saia, Inc. * | 104,410 | 25,071,973 |
| Schneider National, Inc., Class B | 145,937 | 3,289,420 |
| SkyWest, Inc. * | 199,746 | 9,318,151 |
| Spirit Airlines, Inc. * | 429,720 | 10,541,032 |
| Sun Country Airlines Holdings, Inc. * | 88,019 | 2,850,935 |
| TuSimple Holdings, Inc., Class A *(a) | 132,525 | 5,547,497 |
| Universal Logistics Holdings, Inc. | 28,069 | 613,869 |
| Werner Enterprises, Inc. | 226,211 | 10,668,111 |
| | | 281,363,458 |
| |
| Utilities 2.2% |
| ALLETE, Inc. | 206,955 | 13,952,906 |
| American States Water Co. | 147,007 | 13,555,515 |
| Avista Corp. | 274,863 | 11,503,017 |
| Black Hills Corp. | 249,338 | 17,535,941 |
| California Water Service Group | 201,512 | 12,806,088 |
| Chesapeake Utilities Corp. | 69,570 | 9,092,799 |
| Clearway Energy, Inc., Class A | 124,820 | 3,712,147 |
| Clearway Energy, Inc., Class C | 304,682 | 9,563,968 |
| Hawaiian Electric Industries, Inc. | 432,950 | 18,876,620 |
| IDACORP, Inc. | 200,292 | 21,100,762 |
| MDU Resources Group, Inc. | 797,955 | 25,670,212 |
| MGE Energy, Inc. | 143,458 | 11,554,107 |
| Middlesex Water Co. | 69,263 | 7,578,065 |
| National Fuel Gas Co. | 361,690 | 18,739,159 |
| New Jersey Resources Corp. | 382,214 | 14,271,871 |
| Northwest Natural Holding Co. | 121,558 | 6,254,159 |
| NorthWestern Corp. | 200,931 | 12,779,212 |
| ONE Gas, Inc. | 211,189 | 15,167,594 |
| Ormat Technologies, Inc. | 177,570 | 12,630,554 |
| Otter Tail Corp. | 164,834 | 9,044,442 |
| PNM Resources, Inc. | 341,674 | 16,912,863 |
| Portland General Electric Co. | 355,326 | 18,245,990 |
| SJW Group | 108,619 | 7,530,555 |
| South Jersey Industries, Inc. | 448,845 | 11,135,844 |
| Southwest Gas Holdings, Inc. | 230,006 | 16,171,722 |
| Spire, Inc. | 204,973 | 13,671,699 |
| Sunnova Energy International, Inc. * | 257,480 | 9,320,776 |
| Unitil Corp. | 59,615 | 2,956,904 |
| York Water Co. | 51,837 | 2,673,234 |
| | | 364,008,725 |
| Total Common Stock |
| (Cost $11,810,961,655) | | 16,585,596,121 |
|
| Rights 0.0% of net assets |
| |
| Media & Entertainment 0.0% |
| Contra Restorbio, Inc. CVR *(b) | 8,172 | — |
| Media General, Inc. CVR *(b) | 177,806 | 15,131 |
| Total Rights |
| (Cost $—) | | 15,131 |
|
Schwab U.S. Equity ETFs | Annual Report
Schwab U.S. Small-Cap ETF
Portfolio Holdings as of August 31, 2021 (continued)
| Security | Number
of Shares | Value ($) |
| Short-Term Investments 1.8% of net assets |
| |
| Money Market Funds 1.8% |
| State Street Institutional U.S. Government Money Market Fund, Premier Class 0.03% (c) | 24,337,919 | 24,337,919 |
| Wells Fargo Government Money Market Fund, Select Class 0.03% (c)(d) | 283,816,843 | 283,816,843 |
| Total Short-Term Investments |
| (Cost $308,154,762) | | 308,154,762 |
| | Number of
Contracts | Notional
Amount
($) | Current Value/
Unrealized
Appreciation
($) |
| Futures Contracts | |
| Long | |
| Russell 2000 Index, e-mini, expires 09/17/21 | 500 | 56,780,000 | 406,087 |
| * | Non-income producing security. |
| (a) | All or a portion of this security is on loan. Securities on loan were valued at $275,851,290. |
| (b) | Fair-valued by management using significant unobservable inputs in accordance with procedures approved by the fund’s Board of Trustees. |
| (c) | The rate shown is the 7-day yield. |
| (d) | Security purchased with cash collateral received for securities on loan. |
| | |
| CVR — | Contingent Value Rights |
| REIT — | Real Estate Investment Trust |
The following is a summary of the inputs used to value the fund’s investments as of August 31, 2021 (see financial note 2(a) for additional information):
| Description | Quoted Prices in
Active Markets for
Identical Assets
(Level 1) | Other Significant
Observable Inputs
(Level 2) | Significant
Unobservable Inputs
(Level 3) | Total | |
| Assets | | | | | |
| Common Stock1 | $13,012,031,113 | $— | $— | $13,012,031,113 | |
| Consumer Services | 676,722,528 | — | 20,909 | 676,743,437 | |
| Pharmaceuticals, Biotechnology & Life Sciences | 1,572,391,567 | — | 1,062,611 | 1,573,454,178 | |
| Software & Services | 1,323,213,367 | — | 154,026 | 1,323,367,393 | |
| Rights 1 | | | | | |
| Media & Entertainment | — | — | 15,131 * | 15,131 | |
| Short-Term Investments1 | 308,154,762 | — | — | 308,154,762 | |
| Futures Contracts2 | 406,087 | — | — | 406,087 | |
| Total | $16,892,919,424 | $— | $1,252,677 | $16,894,172,101 | |
| * | Level 3 amount shown includes securities determined to have no value at August 31, 2021. |
| 1 | As categorized in the Portfolio Holdings. |
| 2 | Futures contracts are reported at cumulative unrealized appreciation or depreciation. |
Fund investments in mutual funds are classified as Level 1, without consideration to the classification level of the underlying securities held by the mutual funds, which could be Level 1, Level 2 or Level 3.
Schwab U.S. Equity ETFs | Annual Report
Schwab U.S. Small-Cap ETF
Statement of Assets and Liabilities
As of August 31, 2021
| Assets |
| Investments in securities, at value - unaffiliated (cost $11,835,299,574) including securities on loan of $275,851,290 | | $16,609,949,171 |
| Collateral invested for securities on loan, at value (cost $283,816,843) | | 283,816,843 |
| Deposit with broker for futures contracts | | 3,152,500 |
| Receivables: | | |
| Dividends | | 9,026,523 |
| Fund shares sold | | 5,178,942 |
| Income from securities on loan | | 284,115 |
| Variation margin on futures contracts | + | 111,649 |
| Total assets | | 16,911,519,743 |
| Liabilities |
| Collateral held for securities on loan | | 283,816,843 |
| Payables: | | |
| Investments bought | | 5,113,307 |
| Management fees | + | 531,342 |
| Total liabilities | | 289,461,492 |
| Net Assets |
| Total assets | | 16,911,519,743 |
| Total liabilities | – | 289,461,492 |
| Net assets | | $16,622,058,251 |
| Net Assets by Source | | |
| Capital received from investors | | 12,496,847,841 |
| Total distributable earnings | | 4,125,210,410 |
| Net Asset Value (NAV) |
| Net Assets | ÷ | Shares
Outstanding | = | NAV |
| $16,622,058,251 | | 160,300,000 | | $103.69 |
| | | | | |
Schwab U.S. Equity ETFs | Annual Report
Schwab U.S. Small-Cap ETF
Statement of Operations
For the period September 1, 2020 through August 31, 2021
| Investment Income |
| Dividends received from securities - unaffiliated (net of foreign withholding tax of $102,887) | | $163,624,585 |
| Securities on loan, net | + | 6,778,907 |
| Total investment income | | 170,403,492 |
| Expenses |
| Management fees | | 5,601,300 |
| Total expenses | – | 5,601,300 |
| Net investment income | | 164,802,192 |
| Realized and Unrealized Gains (Losses) |
| Net realized losses on sales of securities - unaffiliated | | (203,524,933) |
| Net realized gains on in-kind redemptions - unaffiliated | | 835,469,800 |
| Net realized gains on futures contracts | + | 5,390,034 |
| Net realized gains | | 637,334,901 |
| Net change in unrealized appreciation (depreciation) on securities - unaffiliated | | 4,068,288,111 |
| Net change in unrealized appreciation (depreciation) on futures contracts | + | 451,459 |
| Net change in unrealized appreciation (depreciation) | + | 4,068,739,570 |
| Net realized and unrealized gains | | 4,706,074,471 |
| Increase in net assets resulting from operations | | $4,870,876,663 |
Schwab U.S. Equity ETFs | Annual Report
Schwab U.S. Small-Cap ETF
Statement of Changes in Net Assets
For the current and prior report periods
| Operations | |
| | 9/1/20-8/31/21 | 9/1/19-8/31/20 |
| Net investment income | | $164,802,192 | $126,677,272 |
| Net realized gains | | 637,334,901 | 136,600,549 |
| Net change in unrealized appreciation (depreciation) | + | 4,068,739,570 | 276,936,463 |
| Increase in net assets resulting from operations | | 4,870,876,663 | 540,214,284 |
| Distributions to Shareholders | |
| Total distributions | | ($151,607,245) | ($120,143,285) |
| Transactions in Fund Shares | | | |
| | | 9/1/20-8/31/21 | 9/1/19-8/31/20 |
| | | SHARES | VALUE | SHARES | VALUE |
| Shares sold | | 38,000,000 | $3,343,950,196 | 42,600,000 | $2,778,455,384 |
| Shares redeemed | + | (18,700,000) | (1,485,539,714) | (18,650,000) | (1,254,218,652) |
| Net transactions in fund shares | | 19,300,000 | $1,858,410,482 | 23,950,000 | $1,524,236,732 |
| Shares Outstanding and Net Assets | | | |
| | | 9/1/20-8/31/21 | 9/1/19-8/31/20 |
| | | SHARES | NET ASSETS | SHARES | NET ASSETS |
| Beginning of period | | 141,000,000 | $10,044,378,351 | 117,050,000 | $8,100,070,620 |
| Total increase | + | 19,300,000 | 6,577,679,900 | 23,950,000 | 1,944,307,731 |
| End of period | | 160,300,000 | $16,622,058,251 | 141,000,000 | $10,044,378,351 |
Schwab U.S. Equity ETFs | Annual Report
Schwab U.S. Dividend Equity ETF
Financial Statements
Financial Highlights
| | 9/1/20–
8/31/21 | 9/1/19–
8/31/20 | 9/1/18–
8/31/19 | 9/1/17–
8/31/18 | 9/1/16–
8/31/17 | |
| Per-Share Data |
| Net asset value at beginning of period | $57.31 | $53.30 | $52.71 | $45.83 | $42.47 | |
| Income (loss) from investment operations: | | | | | | |
| Net investment income (loss)1 | 2.27 | 1.87 | 1.66 | 1.49 | 1.40 | |
| Net realized and unrealized gains (losses) | 20.27 | 3.98 | 0.48 | 6.75 | 3.26 | |
| Total from investment operations | 22.54 | 5.85 | 2.14 | 8.24 | 4.66 | |
| Less distributions: | | | | | | |
| Distributions from net investment income | (2.19) | (1.84) | (1.55) | (1.36) | (1.30) | |
| Net asset value at end of period | $77.66 | $57.31 | $53.30 | $52.71 | $45.83 | |
| Total return | 40.15% | 11.46% | 4.18% | 18.21% | 11.12% | |
| Ratios/Supplemental Data |
| Ratios to average net assets: | | | | | | |
| Total expenses | 0.06% | 0.06% | 0.06% 2 | 0.07% | 0.07% | |
| Net investment income (loss) | 3.27% | 3.48% | 3.23% | 2.99% | 3.17% | |
| Portfolio turnover rate3 | 46% | 43% | 24% | 23% | 15% | |
| Net assets, end of period (x 1,000) | $27,954,732 | $12,693,835 | $9,820,959 | $8,092,908 | $6,040,705 | |
| |
1
Calculated based on the average shares outstanding during the period.
2
Effective March 11, 2019, the annual operating expense ratio was reduced. The ratio presented for the period ended 8/31/19 is a blended ratio.
3
Portfolio turnover rate excludes securities received or delivered from processing of in-kind creations or redemptions.
Schwab U.S. Equity ETFs | Annual Report
Schwab U.S. Dividend Equity ETF
Portfolio Holdings as of August 31, 2021
This section shows all the securities in the fund’s portfolio and their values as of the report date.
The fund files its complete schedule of portfolio holdings with the U.S. Securities and Exchange Commission (SEC) for the first and third quarters of each fiscal year on Form N-PORT Part F. The fund’s Form N-PORT Part F is available on the SEC’s website at www.sec.gov. You can also obtain this information at no cost on the fund’s website at www.schwabassetmanagement.com/schwabetfs_prospectus, by calling 1-866-414-6349, or by sending an email request to orders@mysummaryprospectus.com. The fund also makes available its complete schedule of portfolio holdings on a daily basis on the fund’s website.
| Security | Number
of Shares | Value ($) |
| Common Stock 99.7% of net assets |
| |
| Banks 8.2% |
| 1st Source Corp. | 155,288 | 7,298,536 |
| BancFirst Corp. | 166,592 | 9,422,444 |
| Bank of Hawaii Corp. | 359,546 | 30,133,550 |
| Bank OZK | 1,085,312 | 46,049,788 |
| Banner Corp. | 315,254 | 18,032,529 |
| Cathay General Bancorp | 670,731 | 26,681,679 |
| City Holding Co. | 140,622 | 10,954,454 |
| Comerica, Inc. | 1,248,188 | 92,253,575 |
| CVB Financial Corp. | 1,147,262 | 23,358,254 |
| Federal Agricultural Mortgage Corp., Class C | 73,277 | 7,173,818 |
| Fifth Third Bancorp | 6,375,975 | 247,770,389 |
| First Commonwealth Financial Corp. | 862,986 | 11,667,571 |
| First Horizon Corp. | 4,983,555 | 81,680,467 |
| Heritage Financial Corp. | 321,495 | 8,182,048 |
| Huntington Bancshares, Inc. | 13,232,570 | 205,501,812 |
| International Bancshares Corp. | 500,825 | 20,974,551 |
| KeyCorp | 8,689,726 | 176,575,232 |
| M&T Bank Corp. | 1,153,958 | 161,565,660 |
| Northwest Bancshares, Inc. | 1,141,703 | 14,864,973 |
| Premier Financial Corp. | 334,021 | 10,154,238 |
| Regions Financial Corp. | 8,616,723 | 176,039,651 |
| S&T Bancorp, Inc. | 352,859 | 10,515,198 |
| Stock Yards Bancorp, Inc. | 189,026 | 9,749,961 |
| Synovus Financial Corp. | 1,333,132 | 57,457,989 |
| U.S. Bancorp | 12,258,690 | 703,526,219 |
| Webster Financial Corp. | 808,248 | 40,832,689 |
| Zions Bancorp NA | 1,473,509 | 85,316,171 |
| | | 2,293,733,446 |
| |
| Capital Goods 13.7% |
| 3M Co. | 5,193,708 | 1,011,422,696 |
| Cummins, Inc. | 1,327,356 | 313,229,469 |
| Emerson Electric Co. | 5,381,368 | 567,734,324 |
| Fastenal Co. | 5,151,393 | 287,705,299 |
| Illinois Tool Works, Inc. | 2,584,527 | 601,832,957 |
| Lockheed Martin Corp. | 2,210,623 | 795,382,155 |
| McGrath RentCorp | 216,734 | 15,123,699 |
| MSC Industrial Direct Co., Inc., Class A | 418,466 | 35,239,022 |
| Snap-on, Inc. | 485,822 | 109,285,659 |
| Watsco, Inc. | 294,555 | 82,010,003 |
| | | 3,818,965,283 |
| |
| Commercial & Professional Services 0.1% |
| Ennis, Inc. | 232,921 | 4,520,996 |
| HNI Corp. | 386,693 | 14,651,798 |
| | | 19,172,794 |
| |
| Consumer Durables & Apparel 1.1% |
| Hasbro, Inc. | 1,145,190 | 112,583,629 |
| Leggett & Platt, Inc. | 1,192,041 | 57,682,864 |
| Security | Number
of Shares | Value ($) |
| Sturm Ruger & Co., Inc. | 157,017 | 12,277,159 |
| Whirlpool Corp. | 563,162 | 124,757,278 |
| | | 307,300,930 |
| |
| Diversified Financials 8.2% |
| Apollo Global Management, Inc. | 1,892,250 | 113,118,705 |
| BlackRock, Inc. | 1,266,545 | 1,194,719,233 |
| Cohen & Steers, Inc. | 212,442 | 18,633,288 |
| Evercore, Inc., Class A | 377,006 | 52,645,118 |
| Federated Hermes, Inc. | 843,816 | 28,546,295 |
| Franklin Resources, Inc. | 2,449,319 | 79,455,909 |
| Janus Henderson Group plc | 1,529,833 | 66,333,559 |
| Lazard Ltd., Class A | 1,012,293 | 47,982,688 |
| Northern Trust Corp. | 1,868,087 | 221,405,671 |
| T. Rowe Price Group, Inc. | 2,044,175 | 457,629,457 |
| | | 2,280,469,923 |
| |
| Energy 1.6% |
| ONEOK, Inc. | 3,990,951 | 209,604,746 |
| Valero Energy Corp. | 3,663,873 | 242,951,419 |
| | | 452,556,165 |
| |
| Food, Beverage & Tobacco 12.7% |
| Altria Group, Inc. | 16,669,525 | 837,310,241 |
| B&G Foods, Inc. (a) | 581,563 | 17,656,253 |
| Flowers Foods, Inc. | 1,768,463 | 42,673,012 |
| Kellogg Co. | 2,281,292 | 144,040,777 |
| PepsiCo, Inc. | 7,550,987 | 1,180,898,857 |
| The Coca-Cola Co. | 19,884,989 | 1,119,723,730 |
| Tyson Foods, Inc., Class A | 2,643,213 | 207,545,085 |
| | | 3,549,847,955 |
| |
| Household & Personal Products 1.6% |
| Kimberly-Clark Corp. | 3,031,465 | 417,766,192 |
| Nu Skin Enterprises, Inc., Class A | 456,081 | 23,086,820 |
| | | 440,853,012 |
| |
| Insurance 5.3% |
| Cincinnati Financial Corp. | 1,344,646 | 165,929,317 |
| Employers Holdings, Inc. | 255,161 | 10,504,978 |
| Fidelity National Financial, Inc. | 2,610,199 | 127,456,017 |
| Mercury General Corp. | 238,066 | 14,214,921 |
| Principal Financial Group, Inc. | 2,274,494 | 151,958,944 |
| Prudential Financial, Inc. | 3,559,932 | 376,925,600 |
| Safety Insurance Group, Inc. | 125,923 | 10,238,799 |
| The Allstate Corp. | 2,716,343 | 367,466,881 |
| The Hartford Financial Services Group, Inc. | 3,206,353 | 215,531,049 |
| Unum Group | 1,828,669 | 48,679,169 |
| | | 1,488,905,675 |
| |
Schwab U.S. Equity ETFs | Annual Report
Schwab U.S. Dividend Equity ETF
Portfolio Holdings as of August 31, 2021 (continued)
| Security | Number
of Shares | Value ($) |
| Materials 3.6% |
| Amcor plc | 14,012,121 | 180,055,755 |
| International Paper Co. | 3,525,523 | 211,848,677 |
| Neenah, Inc. | 149,834 | 7,550,135 |
| Newmont Corp. | 7,178,070 | 416,256,279 |
| Schweitzer-Mauduit International, Inc. | 281,450 | 10,771,092 |
| Sonoco Products Co. | 900,893 | 58,828,313 |
| Steel Dynamics, Inc. | 1,797,143 | 121,289,181 |
| | | 1,006,599,432 |
| |
| Media & Entertainment 1.0% |
| Omnicom Group, Inc. | 1,928,899 | 141,233,985 |
| The Interpublic Group of Cos., Inc. | 3,501,932 | 130,376,928 |
| | | 271,610,913 |
| |
| Pharmaceuticals, Biotechnology & Life Sciences 12.6% |
| Amgen, Inc. | 4,605,896 | 1,038,767,725 |
| Merck & Co., Inc. | 14,900,445 | 1,136,754,949 |
| Organon & Co. | 2,266,979 | 76,827,918 |
| Pfizer, Inc. | 27,712,302 | 1,276,705,753 |
| | | 3,529,056,345 |
| |
| Retailing 5.6% |
| Best Buy Co., Inc. | 2,066,857 | 240,809,509 |
| Genuine Parts Co. | 1,295,089 | 158,246,925 |
| PetMed Express, Inc. | 181,780 | 5,006,221 |
| The Home Depot, Inc. | 3,589,500 | 1,170,823,110 |
| | | 1,574,885,765 |
| |
| Semiconductors & Semiconductor Equipment 8.3% |
| Broadcom, Inc. | 2,377,930 | 1,182,330,575 |
| Texas Instruments, Inc. | 5,916,818 | 1,129,579,725 |
| | | 2,311,910,300 |
| |
| Software & Services 8.0% |
| Automatic Data Processing, Inc. | 3,838,025 | 802,300,746 |
| Cass Information Systems, Inc. | 106,019 | 4,779,337 |
| International Business Machines Corp. | 7,322,003 | 1,027,569,901 |
| Paychex, Inc. | 2,878,550 | 329,507,619 |
| The Western Union Co. | 3,686,732 | 79,780,880 |
| | | 2,243,938,483 |
| |
| Security | Number
of Shares | Value ($) |
| Technology Hardware & Equipment 4.3% |
| Cisco Systems, Inc. | 20,422,263 | 1,205,321,962 |
| |
| Telecommunication Services 3.8% |
| Verizon Communications, Inc. | 19,337,912 | 1,063,585,160 |
| Total Common Stock |
| (Cost $23,528,257,001) | | 27,858,713,543 |
|
| Short-Term Investments 0.1% of net assets |
| |
| Money Market Funds 0.1% |
| State Street Institutional U.S. Government Money Market Fund, Premier Class 0.03% (b) | 20,785,798 | 20,785,798 |
| Wells Fargo Government Money Market Fund, Select Class 0.03% (b)(c) | 14,870,900 | 14,870,900 |
| Total Short-Term Investments |
| (Cost $35,656,698) | | 35,656,698 |
| | Number of
Contracts | Notional
Amount
($) | Current Value/
Unrealized
Appreciation
($) |
| Futures Contracts | |
| Long | |
| S&P 500 Index, e-mini, expires 09/17/21 | 224 | 50,629,600 | 1,070,061 |
| S&P Mid-Cap 400 Index, e-mini, expires 09/17/21 | 117 | 32,198,400 | 592,049 |
| Net Unrealized Appreciation | 1,662,110 |
| (a) | All or a portion of this security is on loan. Securities on loan were valued at $14,502,200. |
| (b) | The rate shown is the 7-day yield. |
| (c) | Security purchased with cash collateral received for securities on loan. |
Schwab U.S. Equity ETFs | Annual Report
Schwab U.S. Dividend Equity ETF
Portfolio Holdings as of August 31, 2021 (continued)
The following is a summary of the inputs used to value the fund’s investments as of August 31, 2021 (see financial note 2(a) for additional information):
| Description | Quoted Prices in
Active Markets for
Identical Assets
(Level 1) | Other Significant
Observable Inputs
(Level 2) | Significant
Unobservable Inputs
(Level 3) | Total | |
| Assets | | | | | |
| Common Stock1 | $27,858,713,543 | $— | $— | $27,858,713,543 | |
| Short-Term Investments1 | 35,656,698 | — | — | 35,656,698 | |
| Futures Contracts2 | 1,662,110 | — | — | 1,662,110 | |
| Total | $27,896,032,351 | $— | $— | $27,896,032,351 | |
| 1 | As categorized in the Portfolio Holdings. |
| 2 | Futures contracts are reported at cumulative unrealized appreciation or depreciation. |
Fund investments in mutual funds are classified as Level 1, without consideration to the classification level of the underlying securities held by the mutual funds, which could be Level 1, Level 2 or Level 3.
Schwab U.S. Equity ETFs | Annual Report
Schwab U.S. Dividend Equity ETF
Statement of Assets and Liabilities
As of August 31, 2021
| Assets |
| Investments in securities, at value — unaffiliated (cost $23,549,042,799) including securities on loan of $14,502,200 | | $27,879,499,341 |
| Collateral invested for securities on loan, at value (cost $14,870,900) | | 14,870,900 |
| Deposit with broker for futures contracts | | 3,840,500 |
| Receivables: | | |
| Dividends | | 72,700,380 |
| Fund shares sold | | 31,058,630 |
| Income from securities on loan | + | 23,745 |
| Total assets | | 28,001,993,496 |
| Liabilities |
| Collateral held for securities on loan | | 14,870,900 |
| Payables: | | |
| Investments bought | | 30,917,362 |
| Management fees | | 1,348,539 |
| Variation margin on futures contracts | + | 124,723 |
| Total liabilities | | 47,261,524 |
| Net Assets |
| Total assets | | 28,001,993,496 |
| Total liabilities | – | 47,261,524 |
| Net assets | | $27,954,731,972 |
| Net Assets by Source | | |
| Capital received from investors | | 24,146,416,956 |
| Total distributable earnings | | 3,808,315,016 |
| Net Asset Value (NAV) |
| Net Assets | ÷ | Shares
Outstanding | = | NAV |
| $27,954,731,972 | | 359,950,000 | | $77.66 |
| | | | | |
Schwab U.S. Equity ETFs | Annual Report
Schwab U.S. Dividend Equity ETF
Statement of Operations
For the period September 1, 2020 through August 31, 2021
| Investment Income |
| Dividends received from securities - unaffiliated | | $660,193,445 |
| Securities on loan, net | + | 221,408 |
| Total investment income | | 660,414,853 |
| Expenses |
| Management fees | | 11,910,532 |
| Total expenses | – | 11,910,532 |
| Net investment income | | 648,504,321 |
| Realized and Unrealized Gains (Losses) |
| Net realized losses on sales of securities - unaffiliated | | (81,741,643) |
| Net realized gains on in-kind redemptions - unaffiliated | | 2,093,559,688 |
| Net realized gains on futures contracts | + | 8,782,218 |
| Net realized gains | | 2,020,600,263 |
| Net change in unrealized appreciation (depreciation) on securities - unaffiliated | | 3,441,628,653 |
| Net change in unrealized appreciation (depreciation) on futures contracts | + | (1,013,905) |
| Net change in unrealized appreciation (depreciation) | + | 3,440,614,748 |
| Net realized and unrealized gains | | 5,461,215,011 |
| Increase in net assets resulting from operations | | $6,109,719,332 |
Schwab U.S. Equity ETFs | Annual Report
Schwab U.S. Dividend Equity ETF
Statement of Changes in Net Assets
For the current and prior report periods
| Operations | |
| | 9/1/20-8/31/21 | 9/1/19-8/31/20 |
| Net investment income | | $648,504,321 | $386,647,011 |
| Net realized gains | | 2,020,600,263 | 596,800,824 |
| Net change in unrealized appreciation (depreciation) | + | 3,440,614,748 | 214,500,332 |
| Increase in net assets resulting from operations | | 6,109,719,332 | 1,197,948,167 |
| Distributions to Shareholders | |
| Total distributions | | ($601,978,825) | ($372,797,395) |
| Transactions in Fund Shares | | | |
| | | 9/1/20-8/31/21 | 9/1/19-8/31/20 |
| | | SHARES | VALUE | SHARES | VALUE |
| Shares sold | | 216,000,000 | $15,237,717,398 | 103,250,000 | $5,542,147,119 |
| Shares redeemed | + | (77,550,000) | (5,484,560,831) | (66,000,000) | (3,494,422,490) |
| Net transactions in fund shares | | 138,450,000 | $9,753,156,567 | 37,250,000 | $2,047,724,629 |
| Shares Outstanding and Net Assets | | | |
| | | 9/1/20-8/31/21 | 9/1/19-8/31/20 |
| | | SHARES | NET ASSETS | SHARES | NET ASSETS |
| Beginning of period | | 221,500,000 | $12,693,834,898 | 184,250,000 | $9,820,959,497 |
| Total increase | + | 138,450,000 | 15,260,897,074 | 37,250,000 | 2,872,875,401 |
| End of period | | 359,950,000 | $27,954,731,972 | 221,500,000 | $12,693,834,898 |
Schwab U.S. Equity ETFs | Annual Report
1. Business Structure of the Funds:
Each of the funds in this report is a series of Schwab Strategic Trust (the trust), a no-load, open-end management investment company. The trust is organized as a Delaware statutory trust and is registered under the Investment Company Act of 1940, as amended (the 1940 Act). The list below shows all the operational funds in the trust as of the end of the period, including the funds discussed in this report, which are highlighted:
| SCHWAB STRATEGIC TRUST (ORGANIZED JANUARY 27, 2009) |
| Schwab U.S. Broad Market ETF | Schwab U.S. TIPS ETF |
| Schwab 1000 Index ETF | Schwab Short-Term U.S. Treasury ETF |
| Schwab U.S. Large-Cap ETF | Schwab Intermediate-Term U.S. Treasury ETF |
| Schwab U.S. Large-Cap Growth ETF | Schwab Long-Term U.S. Treasury ETF |
| Schwab U.S. Large-Cap Value ETF | Schwab U.S. Aggregate Bond ETF |
| Schwab U.S. Mid-Cap ETF | Schwab 1-5 Year Corporate Bond ETF |
| Schwab U.S. Small-Cap ETF | Schwab 5-10 Year Corporate Bond ETF |
| Schwab U.S. Dividend Equity ETF | Schwab Fundamental U.S. Broad Market Index ETF |
| Schwab U.S. REIT ETF | Schwab Fundamental U.S. Large Company Index ETF |
| Schwab International Equity ETF | Schwab Fundamental U.S. Small Company Index ETF |
| Schwab International Small-Cap Equity ETF | Schwab Fundamental International Large Company Index ETF |
| Schwab International Dividend Equity ETF | Schwab Fundamental International Small Company Index ETF |
| Schwab Emerging Markets Equity ETF | Schwab Fundamental Emerging Markets Large Company Index ETF |
The funds issue and redeem shares at their net asset value per share (NAV) only in large blocks of shares (Creation Units). These transactions are usually in exchange for a basket of securities and/or an amount of cash. As a practical matter, only institutional investors who have entered into an authorized participant agreement purchase or redeem Creation Units. Except when aggregated in Creation Units, shares of the funds are not redeemable securities.
Individual shares of the funds trade on national securities exchanges and elsewhere during the trading day and can only be bought and sold at market prices throughout the trading day through a broker-dealer. Because fund shares trade at market prices rather than NAV, shares may trade at a price greater than NAV (premium) or less than NAV (discount). A chart showing the frequency at which each fund’s daily closing market price was at a discount or premium to each fund’s NAV can be found at www.schwabassetmanagement.com.
Each fund maintains its own account for purposes of holding assets and accounting, and is considered a separate entity for tax purposes. Within its account, each fund may also keep certain assets in segregated accounts, as required by securities law.
2. Significant Accounting Policies:
The following is a summary of the significant accounting policies the funds use in their preparation of financial statements. The funds follow the investment company accounting and reporting guidance of the Financial Accounting Standards Board (FASB) Accounting Standard Codification Topic 946 Financial Services — Investment Companies. The accounting policies are in conformity with accounting principles generally accepted in the United States of America (GAAP).
The funds may invest in certain mutual funds and exchange-traded funds (ETFs) referred to as “underlying funds”. For more information about the underlying funds’ operations and policies, please refer to those funds’ semiannual and annual reports, which are filed with the U.S. Securities and Exchange Commission (SEC) and available on the SEC’s website at www.sec.gov.
(a) Security Valuation:
Under procedures approved by the funds’ Board of Trustees (the Board), the investment adviser has formed a Pricing Committee to administer the pricing and valuation of portfolio securities and other assets and to ensure that prices used for internal purposes or provided by third parties reasonably reflect fair value. Among other things, these procedures allow the funds to utilize independent pricing services, quotations from securities and financial instrument dealers and other market sources to determine fair value.
The funds value the securities in their portfolios every business day. The funds use the following policies to value various types of securities:
Schwab U.S. Equity ETFs | Annual Report
Financial Notes (continued)
2. Significant Accounting Policies (continued):
• Securities traded on an exchange or over-the-counter: Traded securities are valued at the closing value for the day, or, on days when no closing value has been reported, at the mean of the most recent bid and ask quotes. Securities that are primarily traded on foreign exchanges are valued at the official closing price or the last sales price on the exchange where the securities are principally traded with these values then translated into U.S. dollars at the current exchange rate, unless these securities are fair valued as discussed below.
• Futures contracts: Futures contracts are valued at their settlement prices as of the close of their exchanges.
• Mutual funds: Mutual funds are valued at their respective NAVs.
• Securities for which no quoted value is available: The Board has adopted procedures to fair value each fund’s securities when market prices are not “readily available” or are unreliable. For example, a fund may fair value a security when it is de-listed or its trading is halted or suspended; when a security’s primary pricing source is unable or unwilling to provide a price; or when a security’s primary trading market is closed during regular market hours. Each fund makes fair value determinations in good faith in accordance with the fund’s valuation procedures. The Pricing Committee considers a number of factors, including unobservable market inputs, when arriving at fair value. The Pricing Committee may employ techniques such as the review of related or comparable assets or liabilities, related market activities, recent transactions, market multiples, book values, transactional back-testing, disposition analysis and other relevant information. The Pricing Committee regularly reviews these inputs and assumptions to calibrate the valuations. Due to the subjective and variable nature of fair value pricing, there can be no assurance that a fund could obtain the fair value assigned to the security upon the sale of such security. The Board convenes on a regular basis to review fair value determinations made by the funds pursuant to the valuation procedures.
In accordance with the authoritative guidance on fair value measurements and disclosures under GAAP, the funds disclose the fair value of their investments in a hierarchy that prioritizes the significant inputs to valuation techniques used to measure the fair value. The hierarchy gives the highest priority to valuations based upon unadjusted quoted prices in active markets for identical assets or liabilities (Level 1 measurements) and the lowest priority to valuations based upon unobservable inputs that are significant to the valuation (Level 3 measurements). If inputs used to measure the financial instruments fall within different levels of the hierarchy, the categorization is based on the lowest level input that is significant to the valuation. If the funds determine that either the volume and/or level of activity for an asset or liability has significantly decreased (from normal conditions for that asset or liability) or price quotations or observable inputs are not associated with orderly transactions, increased analysis and management judgment will be required to estimate fair value.
The three levels of the fair value hierarchy are as follows:
• Level 1—quoted prices in active markets for identical securities—Investments whose values are based on quoted market prices in active markets, and whose values are therefore classified as Level 1 prices, include active listed equities, mutual funds and futures contracts. Investments in mutual funds are valued daily at their NAVs, which are classified as Level 1 prices, without consideration to the classification level of the underlying securities held by an underlying fund.
• Level 2—other significant observable inputs (including quoted prices for similar securities, interest rates, prepayment speeds, credit risk, etc.)—Investments that trade in markets that are not considered to be active, but whose values are based on quoted market prices, dealer quotations or valuations provided by alternative pricing sources supported by observable inputs are classified as Level 2 prices. These generally include U.S. government and sovereign obligations, most government agency securities, investment-grade corporate bonds, certain mortgage products, less liquid listed equities, and state, municipal and provincial obligations.
• Level 3—significant unobservable inputs (including the funds’ own assumptions in determining the fair value of investments)—Investments whose values are classified as Level 3 prices have significant unobservable inputs, as they may trade infrequently or not at all. When observable prices are not available for these securities, the funds use one or more valuation techniques for which sufficient and reliable data is available. The inputs used by the funds in estimating the value of Level 3 prices may include the original transaction price, quoted prices for similar securities or assets in active markets, completed or pending third-party transactions in the underlying investment or comparable issuers, and changes in financial ratios or cash flows. Level 3 prices may also be adjusted to reflect illiquidity and/or non-transferability, with the amount of such discount estimated by the funds in the absence of market information. Assumptions used by the funds due to the lack of observable inputs may significantly impact the resulting fair value and therefore the funds’ results of operations.
The inputs or methodology used for valuing securities are not necessarily an indication of the risk associated with investing in those securities.
Schwab U.S. Equity ETFs | Annual Report
Financial Notes (continued)
2. Significant Accounting Policies (continued):
The levels associated with valuing the funds’ investments as of August 31, 2021 are disclosed in the Portfolio Holdings.
(b) Accounting Policies for certain Portfolio Investments (if held):
Futures Contracts: Futures contracts are instruments that represent an agreement between two parties that obligates one party to buy, and the other party to sell, specific instruments at an agreed upon price on a stipulated future date. A fund must give the broker a deposit of cash and/or securities (initial margin) whenever it enters into a futures contract. The amount of the deposit may vary from one contract to another. Subsequent payments (variation margin) are made or received by a fund depending on the daily fluctuations in the value of the futures contract and are accounted for as unrealized appreciation or depreciation until the contract is closed, at which time the gains or losses are realized. Futures contracts are traded publicly on exchanges, and their value may change daily.
Securities Lending: Under the trust’s Securities Lending Program, a fund (lender) may make short-term loans of its securities to another party (borrower) to generate additional revenue for the fund. The borrower pledges collateral in the form of cash, securities issued or fully guaranteed by the U.S. government or foreign governments, or letters of credit issued by a bank. Collateral at the individual loan level is required to be maintained on a daily marked-to-market basis in an amount at least equal to the current value of the securities loaned. The lending agent provides a fund with indemnification against borrower default (the borrower fails to return the security on loan) reducing the risk of loss as a result of default. The cash collateral of securities loaned is currently invested in money market portfolios operating pursuant to Rule 2a-7 under the 1940 Act. Each fund bears the risk of loss with respect to the investment of cash collateral. The terms of the securities lending agreement allow the funds or the lending agent to terminate any loan at any given time and the securities must be returned within the earlier of the standard trade settlement period or the specified time period under the relevant securities lending agreement. Securities lending income, as disclosed in each fund’s Statement of Operations, if applicable, represents the income earned from the investment of the cash collateral plus any fees paid by borrowers, less the fees paid to the lending agent and broker rebates which are subject to adjustments pursuant to the securities lending agreement. On loans not collateralized by cash, a fee is received from the borrower, and is allocated between a fund and the lending agent. The aggregate fair value of securities loaned will not at any time exceed one-third of the total assets of a fund, including collateral received from the loan. Securities lending fees paid to the unaffiliated lending agent start at 10% of gross lending revenue, with subsequent breakpoints to a low of 5%. In this context, the gross lending revenue equals the income received from the investment of cash collateral and fees paid by borrowers less any rebates paid to the borrowers. Any expenses charged by the cash collateral fund are in addition to these fees. All remaining revenue is retained by the fund, as applicable. No portion of lending revenue is paid to or retained by Charles Schwab Investment Management, Inc. (CSIM or the investment adviser) or any affiliate of CSIM.
As of August 31, 2021, Schwab U.S. Broad Market ETF, Schwab 1000 Index ETF, Schwab U.S. Large-Cap ETF, Schwab U.S. Large-Cap Growth ETF, Schwab U.S. Large-Cap Value ETF, Schwab U.S. Mid-Cap ETF, Schwab U.S. Small-Cap ETF and Schwab U.S. Dividend Equity ETF had securities on loan, all of which were classified as common stocks. The value of the securities on loan and the related collateral as of August 31, 2021, are disclosed in each fund’s Portfolio Holdings and Statement of Assets and Liabilities.
(c) Security Transactions:
Security transactions are recorded as of the date the order to buy or sell the security is executed. Realized gains and losses from security transactions are based on the identified costs of the securities involved.
When a fund closes out a futures contract position, it calculates the difference between the value of the position at the beginning and at the end of the contract, and records a realized gain or loss accordingly.
(d) Investment Income:
Interest income is recorded as it accrues. Dividends, in the form of cash or non-cash income such as in the form of additional securities, and distributions from portfolio securities and underlying funds are recorded on the date they are effective (the ex-dividend date), although the funds record certain foreign security dividends on the date the ex-dividend date is confirmed. Any distributions from underlying funds are recorded in accordance with the character of the distributions as designated by the underlying funds.
Schwab U.S. Equity ETFs | Annual Report
Financial Notes (continued)
2. Significant Accounting Policies (continued):
(e) Expenses:
Pursuant to the Amended and Restated Advisory Agreement (Advisory Agreement) between CSIM and the trust, the investment adviser will pay the operating expenses of each fund, excluding taxes, any brokerage expenses, and extraordinary or non-routine expenses. Taxes, any brokerage expenses and extraordinary or non-routine expenses that are specific to a fund are charged directly to the fund.
(f) Distributions to Shareholders:
The funds make distributions from net investment income, if any, quarterly and from net realized capital gains, if any, once a year.
(g) Accounting Estimates:
The accounting policies described in this report conform to GAAP. Notwithstanding this, shareholders should understand that in order to follow these principles, fund management has to make estimates and assumptions that affect the information reported in the financial statements. It’s possible that once the results are known, they may turn out to be different from these estimates and these differences may be material.
(h) Federal Income Taxes:
The funds intend to meet federal income and excise tax requirements for regulated investment companies under subchapter M of the Internal Revenue Code, as amended. Accordingly, the funds distribute substantially all of their net investment income and net realized capital gains, if any, to their respective shareholders each year. As long as a fund meets the tax requirements, it is not required to pay federal income tax.
(i) Indemnification:
Under the funds’ organizational documents, the officers and trustees are indemnified against certain liabilities arising out of the performance of their duties to the funds. In addition, in the normal course of business the funds enter into contracts with their vendors and others that provide general indemnifications. The funds’ maximum exposure under these arrangements is unknown as this would involve future claims that may be made against the funds. However, based on experience, the funds expect the risk of loss attributable to these arrangements to be remote.
3. Risk Factors:
Investing in the funds may involve certain risks, as discussed in the funds’ prospectus, including, but not limited to, those described below. Any of these risks could cause an investor to lose money.
Market Risk. Financial markets rise and fall in response to a variety of factors, sometimes rapidly and unpredictably. Markets may be impacted by economic, political, regulatory and other conditions, including economic sanctions and other government actions. In addition, the occurrence of global events, such as war, terrorism, environmental disasters, natural disasters or epidemics, may also negatively affect the financial markets. As with any investment whose performance is tied to these markets, the value of an investment in a fund will fluctuate, which means that an investor could lose money over short or long periods.
Investment Style Risk. The funds are index funds. Therefore, each fund follows the securities included in its respective index during upturns as well as downturns. Because of their indexing strategies, the funds do not take steps to reduce market exposure or to lessen the effects of a declining market. In addition, because of the funds’ expenses, the funds’ performance may be below that of their respective index. Errors relating to the index may occur from time to time and may not be identified by the index provider for a period of time. In addition, market disruptions could cause delays in the index’s rebalancing schedule. Such errors and/or market disruptions may result in losses for the fund.
Schwab U.S. Dividend Equity ETF primarily invests in dividend paying stocks. As a result, fund performance will correlate with the performance of the dividend paying stock segment of the stock market, and a fund may underperform funds that do not limit their investments to dividend paying stocks. If stocks held by a fund reduce or stop paying dividends, the fund’s ability to generate income may be affected.
Equity Risk. The prices of equity securities rise and fall daily. These price movements may result from factors affecting individual companies, industries or the securities market as a whole. In addition, equity markets tend to move in cycles, which may cause stock prices to fall over short or extended periods of time.
Schwab U.S. Equity ETFs | Annual Report
Financial Notes (continued)
3. Risk Factors (continued):
Market Capitalization Risk. Securities issued by companies of different market capitalizations tend to go in and out of favor based on market and economic conditions. During a period when securities of a particular market capitalization fall behind other types of investments, a fund’s performance could be impacted.
Large-Cap Company Risk. Certain funds invest in large-cap company stocks. Large-cap companies are generally more mature and the securities issued by these companies may not be able to reach the same levels of growth as the securities issued by small- or mid-cap companies.
Mid-Cap Company Risk. Certain funds invest in mid-cap company stocks. Mid-cap companies may be more vulnerable to adverse business or economic events than larger, more established companies and the value of securities issued by these companies may move sharply.
Small-Cap Company Risk. Certain funds invest in small-cap company stocks. Securities issued by small-cap companies may be riskier than those issued by larger companies, and their prices may move sharply, especially during market upturns and downturns.
Growth Investing Risk. Certain funds invest in growth stocks. Growth stocks can be volatile. Growth companies usually invest a high portion of earnings in their businesses and may lack the dividends of value stocks that can cushion stock prices in a falling market. The prices of growth stocks are based largely on projections of the issuer’s future earnings and revenues. If a company’s earnings or revenues fall short of expectations, its stock price may fall dramatically. Growth stocks may also be more expensive relative to their earnings or assets compared to value or other stocks.
Value Investing Risk. Certain funds emphasize a “value” style of investing, which targets undervalued companies with characteristics for improved valuations. This style of investing is subject to the risk that the valuations never improve or that the returns on “value” securities may not move in tandem with the returns on other styles of investing or the stock market in general.
Sampling Index Tracking Risk. Certain funds may not fully replicate the index and may hold securities not included in the index. As a result, a fund is subject to the risk that the investment adviser’s investment management strategy, the implementation of which is subject to a number of constraints, may not produce the intended results. Because certain funds utilize a sampling approach they may not track the return of their respective index as well as they would if the funds purchased all of the securities in their respective index.
Tracking Error Risk. As index funds, each fund seeks to track the performance of its respective index, although it may not be successful in doing so. The divergence between the performance of a fund and the index, positive or negative, is called “tracking error.” Tracking error can be caused by many factors and it may be significant.
Derivatives Risk. Each fund may invest in derivative instruments. The principal types of derivatives a fund may use are futures contracts. A futures contract is an agreement to buy or sell a financial instrument at a specific price on a specific day. A fund’s use of derivative instruments involves risks different from, or possibly greater than, the risks associated with investing directly in securities and other traditional investments. Certain of these risks, such as market risk, liquidity risk and leverage risk, are discussed elsewhere in this section. A fund’s use of derivatives is also subject to counterparty risk, lack of availability risk, valuation risk, correlation risk and tax risk. Counterparty risk is the risk that the counterparty to a derivative transaction may not fulfill its contractual obligations either because the financial condition of the counterparty declines, or because the counterparty is otherwise unable or unwilling to perform under the contract. Lack of availability risk is the risk that suitable derivative transactions may not be available in all circumstances for risk management or other purposes. Valuation risk is the risk that a particular derivative may be valued incorrectly. Correlation risk is the risk that changes in the value of the derivative may not correlate perfectly with the underlying asset, rate or index. Tax risk is the risk that the use of derivatives may cause a fund to realize higher amounts of short-term capital gains. A fund’s use of derivatives could reduce the fund’s performance, increase the fund’s volatility, and cause the fund to lose more than the initial amount invested. Furthermore, the use of derivatives subject to regulation by the Commodity Futures Trading Commission (CFTC) could cause the fund to become a commodity pool, which would require the fund to comply with certain CFTC rules.
Liquidity Risk. A fund may be unable to sell certain securities, such as illiquid securities, readily at a favorable time or price, or the fund may have to sell them at a loss.
Leverage Risk. Certain fund transactions, such as derivatives transactions, may give rise to a form of leverage and may expose a fund to greater risk. Leverage tends to magnify the effect of any decrease or increase in the value of a fund’s portfolio securities. The use of leverage may cause a fund to liquidate portfolio positions when it would not be advantageous to do so in order to satisfy its obligations.
Schwab U.S. Equity ETFs | Annual Report
Financial Notes (continued)
3. Risk Factors (continued):
Securities Lending Risk. Securities lending involves the risk of loss of rights in, or delay in recovery of, the loaned securities if the borrower fails to return the security loaned or becomes insolvent.
Concentration Risk. To the extent that a fund’s or an index’s portfolio is concentrated in the securities of issuers in a particular market, industry, group of industries, sector or asset class, the fund may be adversely affected by the performance of those securities, may be subject to increased price volatility and may be more vulnerable to adverse economic, market, political or regulatory occurrences affecting that market, industry, group of industries, sector or asset class.
Market Trading Risk. Although fund shares are listed on national securities exchanges, there can be no assurance that an active trading market for fund shares will develop or be maintained. If an active market is not maintained, investors may find it difficult to buy or sell fund shares.
Shares of the Fund May Trade at Prices Other Than NAV. Fund shares may be bought and sold in the secondary market at market prices. Although it is expected that the market price of the shares of a fund will approximate the fund’s NAV, there may be times when the market price and the NAV vary significantly. An investor may pay more than NAV when buying shares of a fund in the secondary market, and an investor may receive less than NAV when selling those shares in the secondary market. The market price of fund shares may deviate, sometimes significantly, from NAV during periods of market volatility or market disruption. (See the unaudited Frequency Distribution of Discounts and Premiums in Other Information for an overview showing the frequency at which the daily closing price was at a discount or a premium to a fund’s daily NAV.)
Please refer to the funds’ prospectus for a more complete description of the principal risks of investing in the funds.
4. Affiliates and Affiliated Transactions:
Investment Adviser
CSIM, a wholly owned subsidiary of The Charles Schwab Corporation, serves as each fund’s investment adviser pursuant to the Advisory Agreement between CSIM and the trust.
For its advisory services to the funds, CSIM is entitled to receive an annual management fee, payable monthly, based on a percentage of each fund’s average daily net assets as follows:
Schwab U.S.
Broad
Market
ETF | Schwab
1000
Index
ETF | Schwab U.S.
Large-Cap
ETF | Schwab U.S.
Large-Cap
Growth
ETF | Schwab U.S.
Large-Cap
Value
ETF | Schwab U.S.
Mid-Cap
ETF | Schwab U.S.
Small-Cap
ETF | Schwab U.S.
Dividend
Equity
ETF |
| 0.03% | 0.05% | 0.03% | 0.04% | 0.04% | 0.04% | 0.04% | 0.06% |
Schwab U.S. Equity ETFs | Annual Report
Financial Notes (continued)
4. Affiliates and Affiliated Transactions (continued):
Investment from Affiliates
Certain funds in the Fund Complex (for definition refer to Trustees and Officers section) may own shares of other funds in the Fund Complex. The table below reflects the percentages of shares of each fund in this report that are owned by other funds in the Fund Complex as of August 31, 2021, as applicable:
| | Underlying Funds | |
| | Schwab U.S.
Large-Cap
ETF | Schwab U.S.
Small-Cap
ETF |
| Schwab VIT Balanced Portfolio | 0.1% | 0.0%* |
| Schwab VIT Balanced with Growth Portfolio | 0.2% | 0.1% |
| Schwab VIT Growth Portfolio | 0.2% | 0.1% |
| Schwab Target 2010 Index Fund | 0.0%* | 0.0%* |
| Schwab Target 2015 Index Fund | 0.1% | 0.0%* |
| Schwab Target 2020 Index Fund | 0.2% | 0.0%* |
| Schwab Target 2025 Index Fund | 0.5% | 0.1% |
| Schwab Target 2030 Index Fund | 0.9% | 0.1% |
| Schwab Target 2035 Index Fund | 0.6% | 0.1% |
| Schwab Target 2040 Index Fund | 0.8% | 0.2% |
| Schwab Target 2045 Index Fund | 0.5% | 0.1% |
| Schwab Target 2050 Index Fund | 0.6% | 0.1% |
| Schwab Target 2055 Index Fund | 0.4% | 0.1% |
| Schwab Target 2060 Index Fund | 0.4% | 0.1% |
| Schwab Target 2065 Index Fund | 0.0%* | 0.0%* |
Interfund Transactions
The funds may engage in direct transactions with certain other funds in the Fund Complex in accordance with procedures adopted by the Board pursuant to Rule 17a-7 under the 1940 Act. When one fund is seeking to sell a security that another is seeking to buy, an interfund transaction can allow both funds to benefit by reducing transaction costs. This practice is limited to funds that share the same investment adviser, trustees and/or officers. For the period ended August 31, 2021, each fund’s total aggregate security transactions with other funds in the Fund Complex as well as any realized gains (losses) were as follows:
| | Total Aggregate Transactions | Realized Gains (Losses) |
| Schwab U.S. Broad Market ETF | $245,095,212 | ($56,384,053) |
| Schwab 1000 Index ETF | 27,163,364 | (2,752,738) |
| Schwab U.S. Large-Cap ETF | 541,578,726 | (127,244,500) |
| Schwab U.S. Large-Cap Growth ETF | 1,686,025,420 | (14,412,909) |
| Schwab U.S. Large-Cap Value ETF | 1,564,499,078 | (135,403,274) |
| Schwab U.S. Mid-Cap ETF | 515,390,889 | (95,384,449) |
| Schwab U.S. Small-Cap ETF | 819,197,633 | (72,108,247) |
| Schwab U.S. Dividend Equity ETF | 268,514,331 | (7,752,552) |
Interfund Borrowing and Lending
Pursuant to an exemptive order issued by the SEC, the funds may enter into interfund borrowing and lending transactions with other funds in the Fund Complex. All loans are for temporary or emergency purposes and the interest rate to be charged will be the average of the overnight repurchase agreement rate and the short-term bank loan rate. All loans are subject to numerous conditions designed to ensure fair and equitable treatment of all participating funds. The interfund lending facility is subject to the oversight and periodic review of the Board. The funds had no interfund borrowing or lending activity during the period.
Schwab U.S. Equity ETFs | Annual Report
Financial Notes (continued)
| | 5. Other Service Providers: |
SEI Investments Distribution Co. is the principal underwriter and distributor of shares of the funds.
State Street Bank and Trust Company (State Street) serves as the funds’ transfer agent. As part of these services, the transfer agent maintains records pertaining to the sale, redemption and transfer of the funds’ shares. The transfer agent is also responsible for the order-taking function for the funds’ shares.
State Street also serves as custodian and accountant for the funds. The custodian is responsible for the daily safekeeping of securities and cash held by the funds. The funds’ accountant maintains all books and records related to the funds’ transactions.
6. Board of Trustees:
The Board may include people who are officers and/or directors of CSIM or its affiliates. Federal securities law limits the percentage of such “interested persons” who may serve on a trust’s board, and the trust was in compliance with these limitations throughout the report period. The trust does not pay any interested or non-interested trustees (independent trustees). The independent trustees are paid by CSIM. For information regarding the trustees, please refer to the Trustees and Officers table at the end of this report.
7. Borrowing from Banks:
During the period, the funds were participants with other funds in the Fund Complex in a joint, syndicated, committed $750 million line of credit (the Syndicated Credit Facility), which matured on October 1, 2020. On October 1, 2020, the Syndicated Credit Facility was further amended to run for a new 364 day period with a line of credit of $850 million, maturing on September 30, 2021. Under the terms of the Syndicated Credit Facility, in addition to CSIM paying the interest charged on any borrowings by a fund, CSIM paid a commitment fee of 0.15% per annum on the funds’ proportionate share of the unused portion of the Syndicated Credit Facility.
During the period, the funds were participants with other funds in the Fund Complex in a joint, unsecured, uncommitted $500 million line of credit (the Uncommitted Credit Facility), with State Street, which was scheduled to mature on November 27, 2020. However, on October 1, 2020, the Uncommitted Credit Facility was amended to run for a new 364 day period with a line of credit of $400 million, maturing on September 30, 2021. Under the terms of the Uncommitted Credit Facility, CSIM pays interest on the amount a fund borrows. There were no borrowings from either line of credit during the period.
The funds also have access to custodian overdraft facilities. A fund may have utilized the overdraft facility and incurred an interest expense, which is paid by CSIM. The interest expense is determined based on a negotiated rate above the current Federal Funds Rate.
8. Derivatives:
Certain funds entered into equity index futures contracts during the report period. The funds invested in futures contracts to equitize available cash. The value and variation margin for futures contracts held at August 31, 2021 are presented in the Portfolio Holdings and Statement of Assets and Liabilities, respectively. The net realized gains (losses) and net change in unrealized appreciation (depreciation) on futures contracts are presented in the Statement of Operations. Refer to financial note 2(b) for the funds’ accounting policies with respect to futures contracts and financial note 3 for disclosures concerning the risks of investing in futures contracts. During the period ended August 31, 2021, the month-end average notional amounts of futures contracts held by the funds and the month-end average number of contracts held were as follows:
| | Notional Amounts | Number of Contracts |
| Schwab U.S. Broad Market ETF | $27,007,515 | 139 |
| Schwab 1000 Index ETF | 2,059,131 | 10 |
| Schwab U.S. Large-Cap ETF | 32,604,540 | 167 |
| Schwab U.S. Large-Cap Growth ETF | 9,282,918 | 75 |
| Schwab U.S. Large-Cap Value ETF | 15,470,386 | 221 |
| Schwab U.S. Mid-Cap ETF | 11,653,965 | 49 |
| Schwab U.S. Small-Cap ETF | 24,270,280 | 246 |
| Schwab U.S. Dividend Equity ETF | 46,329,161 | 221 |
Schwab U.S. Equity ETFs | Annual Report
Financial Notes (continued)
| | 9. Purchases and Sales of Investment Securities: |
For the period ended August 31, 2021, purchases and sales of securities (excluding in-kind transactions and short-term obligations) were as follows:
| | Purchases
of Securities | Sales
of Securities |
| Schwab U.S. Broad Market ETF | $898,213,616 | $819,034,364 |
| Schwab 1000 Index ETF | 104,162,051 | 82,526,370 |
| Schwab U.S. Large-Cap ETF | 1,230,313,855 | 1,154,567,113 |
| Schwab U.S. Large-Cap Growth ETF | 1,720,322,586 | 1,694,847,060 |
| Schwab U.S. Large-Cap Value ETF | 1,973,658,976 | 1,961,280,467 |
| Schwab U.S. Mid-Cap ETF | 2,186,981,177 | 1,967,648,120 |
| Schwab U.S. Small-Cap ETF | 2,572,389,994 | 2,139,589,545 |
| Schwab U.S. Dividend Equity ETF | 9,263,622,652 | 9,098,727,531 |
10. In-Kind Transactions:
The consideration for the purchase of Creation Units of a fund often consists of the in-kind deposit of a designated portfolio of equity securities, which constitutes an optimized representation of the securities involved in a relevant fund’s underlying index, and an amount of cash. Investors purchasing and redeeming Creation Units are subject to a standard creation transaction fee and a standard redemption transaction fee paid to the custodian to offset transfer and other transaction costs associated with the issuance and redemption of Creation Units. Purchasers and redeemers of Creation Units for cash are subject to an additional variable charge paid to the fund that will offset the transaction costs to the fund of buying or selling portfolio securities. In addition, purchasers and redeemers of shares in Creation Units are responsible for payment of the costs of transferring securities to or out of the fund. From time to time, CSIM may cover the cost of any transaction fees when believed to be in the best interests of a fund.
The in-kind transactions for the period ended August 31, 2021, were as follows:
| | In-Kind Purchases
of Securities | In-Kind Sales
of Securities |
| Schwab U.S. Broad Market ETF | $1,318,161,430 | $715,321,449 |
| Schwab 1000 Index ETF | 524,878,364 | 21,453,143 |
| Schwab U.S. Large-Cap ETF | 2,879,044,375 | 417,305,391 |
| Schwab U.S. Large-Cap Growth ETF | 2,680,276,572 | 2,680,100,172 |
| Schwab U.S. Large-Cap Value ETF | 1,380,779,877 | 591,741,638 |
| Schwab U.S. Mid-Cap ETF | 1,527,932,872 | 884,199,948 |
| Schwab U.S. Small-Cap ETF | 3,197,976,054 | 1,364,697,480 |
| Schwab U.S. Dividend Equity ETF | 14,954,787,740 | 5,317,639,531 |
For the period ended August 31, 2021, where applicable, the funds realized net capital gains or losses resulting from in-kind redemptions of Creation Units. Because such gains or losses are not taxable to the funds and are not distributed to existing fund shareholders, the gains or losses are reclassified from accumulated net realized gains or losses to capital received from investors at the end of the funds’ tax year. These reclassifications have no effect on net assets or net asset values per share. The net realized in-kind gains or losses for the period ended August 31, 2021 are disclosed in the funds’ Statements of Operations.
Schwab U.S. Equity ETFs | Annual Report
Financial Notes (continued)
As of August 31, 2021, the tax basis cost of the funds’ investments and gross unrealized appreciation and depreciation were as follows:
| | Schwab U.S.
Broad
Market
ETF | Schwab
1000
Index
ETF | | Schwab U.S.
Large-Cap
ETF | | Schwab U.S.
Large-Cap
Growth
ETF | | Schwab U.S.
Large-Cap
Value
ETF | |
| Tax cost | $12,533,580,174 | $1,444,784,987 | | $19,290,390,296 | | $8,659,346,703 | | $7,399,587,763 | |
| Gross unrealized appreciation | $10,455,506,472 | $676,646,270 | | $14,377,931,365 | | $7,999,955,677 | | $2,700,749,290 | |
| Gross unrealized depreciation | (595,761,509) | (32,800,325) | | (624,511,325) | | (87,455,218) | | (186,507,941) | |
| Net unrealized appreciation (depreciation) | $9,859,744,963 | $643,845,945 | | $13,753,420,040 | | $7,912,500,459 | | $2,514,241,349 | |
| | Schwab U.S.
Mid-Cap
ETF | | Schwab U.S.
Small-Cap
ETF | | Schwab U.S.
Dividend
Equity
ETF |
| Tax cost | $7,076,776,663 | | $12,246,870,006 | | $23,626,093,768 |
| Gross unrealized appreciation | $3,239,777,769 | | $5,473,842,161 | | $4,475,738,745 |
| Gross unrealized depreciation | (300,208,639) | | (826,540,066) | | (205,800,162) |
| Net unrealized appreciation (depreciation) | $2,939,569,130 | | $4,647,302,095 | | $4,269,938,583 |
As of August 31, 2021, the components of distributable earnings on a tax basis were as follows:
| | Schwab U.S.
Broad
Market
ETF | | Schwab
1000
Index
ETF | | Schwab U.S.
Large-Cap
ETF | | Schwab U.S.
Large-Cap
Growth
ETF | | Schwab U.S.
Large-Cap
Value
ETF | | Schwab U.S.
Mid-Cap
ETF | | Schwab U.S.
Small-Cap
ETF | | Schwab U.S.
Dividend
Equity
ETF |
| Undistributed ordinary income | $60,616,484 | | $5,654,381 | | $90,549,219 | | $23,364,535 | | $39,044,236 | | $31,691,986 | | $43,669,649 | | $125,605,858 |
| Net unrealized appreciation (depreciation) on investments | 9,859,744,963 | | 643,845,945 | | 13,753,420,040 | | 7,912,500,459 | | 2,514,241,349 | | 2,939,569,130 | | 4,647,302,095 | | 4,269,938,583 |
| Capital loss carryforwards and other losses | (188,735,777) | | (15,455,599) | | (368,801,288) | | (257,365,605) | | (442,350,029) | | (537,950,940) | | (565,761,334) | | (587,229,425) |
| Total | $9,731,625,670 | | $634,044,727 | | $13,475,167,971 | | $7,678,499,389 | | $2,110,935,556 | | $2,433,310,176 | | $4,125,210,410 | | $3,808,315,016 |
The primary difference between book basis and tax basis unrealized appreciation or unrealized depreciation of investments is the tax deferral of losses on wash sales, realization for tax purposes of unrealized appreciation or depreciation on futures contracts, partnership investments and non-taxable dividends. The tax cost of the funds’ investments, disclosed above, have been adjusted from their book amounts to reflect these unrealized appreciation or depreciation differences, as applicable.
Capital loss carryforwards may be used to offset future realized capital gains for federal income tax purposes. As of August 31, 2021, the funds had capital loss carryforwards with no expiration available to offset future net capital gains as follows:
| Expiration Date | Schwab U.S.
Broad
Market
ETF | Schwab
1000
Index
ETF | Schwab U.S.
Large-Cap
ETF | Schwab U.S.
Large-Cap
Growth
ETF | Schwab U.S.
Large-Cap
Value
ETF | Schwab U.S.
Mid-Cap
ETF | Schwab U.S.
Small-Cap
ETF | Schwab U.S.
Dividend
Equity
ETF |
| No expiration | $188,735,777 | $15,455,599 | $368,801,288 | $257,365,605 | $442,350,029 | $537,950,940 | $565,761,334 | $587,229,425 |
Schwab U.S. Equity ETFs | Annual Report
Financial Notes (continued)
11. Federal Income Taxes (continued):
The tax basis components of distributions paid during the current and prior fiscal years were:
| | Schwab U.S.
Broad
Market
ETF | Schwab
1000
Index
ETF | Schwab U.S.
Large-Cap
ETF | Schwab U.S.
Large-Cap
Growth
ETF | Schwab U.S.
Large-Cap
Value
ETF | Schwab U.S.
Mid-Cap
ETF | Schwab U.S.
Small-Cap
ETF | Schwab U.S.
Dividend
Equity
ETF |
| Current fiscal year end distributions | | | | | |
| Ordinary income | $289,355,570 | $21,896,405 | $415,722,485 | $64,681,390 | $222,245,635 | $95,570,430 | $151,607,245 | $601,978,825 |
| Prior fiscal year end distributions | | | | | |
| Ordinary income | $300,375,280 | $17,831,170 | $373,490,030 | $73,115,600 | $214,669,300 | $102,603,225 | $120,143,285 | $372,797,395 |
Distributions paid to shareholders are based on net investment income and net realized gains determined on a tax basis, which may differ from net investment income and net realized gains for financial reporting purposes. These differences reflect the differing character of certain income items and net realized gains and losses for financial statement and tax purposes, and may result in reclassification among certain capital accounts on the financial statements. The funds may also designate a portion of the amount paid to redeeming shareholders as a distribution for tax purposes.
Permanent book and tax basis differences may result in reclassifications between components of net assets as required. The adjustments have no impact on net assets or the results of operations.
As of August 31, 2021, management has reviewed the tax positions for open periods (for federal purposes, three years from the date of filing and for state purposes, four years from the date of filing) as applicable to the funds, and has determined that no provision for income tax is required in the funds’ financial statements. The funds recognize interest and penalties, if any, related to unrecognized tax benefits as income tax expense in the Statement of Operations. During the fiscal year ended August 31, 2021, the funds did not incur any interest or penalties.
12. Subsequent Events:
Management has determined there are no subsequent events or transactions through the date the financial statements were issued that would have materially impacted the financial statements as presented.
Schwab U.S. Equity ETFs | Annual Report
Report of Independent Registered Public Accounting Firm
To the Board of Trustees of Schwab Strategic Trust and Shareholders of Schwab U.S. Broad Market ETF, Schwab 1000 Index ETF, Schwab U.S. Large-Cap ETF, Schwab U.S. Large-Cap Growth ETF, Schwab U.S. Large-Cap Value ETF, Schwab U.S. Mid-Cap ETF, Schwab U.S. Small-Cap ETF, and Schwab U.S. Dividend Equity ETF:
Opinion on the Financial Statements and Financial Highlights
We have audited the accompanying statements of assets and liabilities, including the portfolio holdings, of Schwab U.S. Broad Market ETF, Schwab 1000 Index ETF, Schwab U.S. Large-Cap ETF, Schwab U.S. Large-Cap Growth ETF, Schwab U.S. Large-Cap Value ETF, Schwab U.S. Mid-Cap ETF, Schwab U.S. Small-Cap ETF, and Schwab U.S. Dividend Equity ETF (the “Funds”), eight of the funds constituting Schwab Strategic Trust, as of August 31, 2021, and the related statements of operations for the year then ended, the related statements of changes in net assets and the financial highlights for the two years in the period then ended, and the related notes. In our opinion, the financial statements and financial highlights present fairly, in all material respects, the financial position of each of the Funds as of August 31, 2021, the results of their operations for the year then ended, and the changes in their net assets and the financial highlights for the two years in the period then ended in conformity with accounting principles generally accepted in the United States of America. The financial highlights for each of the three years in the period ended August 31, 2019; except for Schwab 1000 Index ETF, the financial highlights for the year ended August 31, 2019 and for the period from October 11, 2017 through August 31, 2018, were audited by other auditors, whose report, dated October 17, 2019, expressed an unqualified opinion on such financial highlights.
Basis for Opinion
These financial statements and financial highlights are the responsibility of the Funds’ management. Our responsibility is to express an opinion on the Funds’ financial statements and financial highlights based on our audits. We are a public accounting firm registered with the Public Company Accounting Oversight Board (United States) (PCAOB) and are required to be independent with respect to the Funds in accordance with the U.S. federal securities laws and the applicable rules and regulations of the Securities and Exchange Commission and the PCAOB.
We conducted our audits in accordance with the standards of the PCAOB. Those standards require that we plan and perform the audit to obtain reasonable assurance about whether the financial statements and financial highlights are free of material misstatement, whether due to error or fraud. The Funds are not required to have, nor were we engaged to perform, an audit of their internal control over financial reporting. As part of our audits we are required to obtain an understanding of internal control over financial reporting but not for the purpose of expressing an opinion on the effectiveness of the Funds’ internal control over financial reporting. Accordingly, we express no such opinion.
Our audits included performing procedures to assess the risks of material misstatement of the financial statements and financial highlights, whether due to error or fraud, and performing procedures that respond to those risks. Such procedures included examining, on a test basis, evidence regarding the amounts and disclosures in the financial statements and financial highlights. Our audits also included evaluating the accounting principles used and significant estimates made by management, as well as evaluating the overall presentation of the financial statements and financial highlights. Our procedures included confirmation of securities owned as of August 31, 2021, by correspondence with the custodian and brokers; when replies were not received from brokers, we performed other auditing procedures. We believe that our audits provide a reasonable basis for our opinion.
Deloitte & Touche LLP
Denver, Colorado
October 19, 2021
We have served as the auditor of one or more investment companies in the Schwab Funds Complex since 2020.
Schwab U.S. Equity ETFs | Annual Report
Other Federal Tax Information (unaudited)
For corporate shareholders, the following percentage of the funds’ dividend distributions paid during the fiscal year ended August 31, 2021 qualify for the corporate dividends received deduction:
| Schwab U.S. Broad Market ETF | 91.05% |
| Schwab 1000 Index ETF | 92.81% |
| Schwab U.S. Large-Cap ETF | 91.85% |
| Schwab U.S. Large-Cap Growth ETF | 98.29% |
| Schwab U.S. Large-Cap Value ETF | 90.67% |
| Schwab U.S. Mid-Cap ETF | 80.12% |
| Schwab U.S. Small-Cap ETF | 80.60% |
| Schwab U.S. Dividend Equity ETF | 100.00% |
For the fiscal year ended August 31, 2021, the funds designated the following amounts of the dividend distributions as qualified dividends for the purpose of the maximum rate under section 1(h)(ii) of the Internal Revenue Code. Shareholders will be notified in January 2022 via IRS form 1099 of the amount for use in preparing their 2021 income tax return.
| Schwab U.S. Broad Market ETF | $282,064,101 |
| Schwab 1000 Index ETF | 21,471,488 |
| Schwab U.S. Large-Cap ETF | 406,612,717 |
| Schwab U.S. Large-Cap Growth ETF | 64,109,522 |
| Schwab U.S. Large-Cap Value ETF | 216,045,477 |
| Schwab U.S. Mid-Cap ETF | 78,227,887 |
| Schwab U.S. Small-Cap ETF | 127,038,220 |
| Schwab U.S. Dividend Equity ETF | 601,978,825 |
For the fiscal year ended August 31, 2021, Schwab U.S Broad Market ETF, Schwab 1000 Index ETF, Schwab U.S. Large-Cap ETF, Schwab U.S. Large-Cap Growth ETF, Schwab U.S. Large-Cap Value ETF, Schwab U.S. Mid-Cap ETF and Schwab U.S. Small-Cap ETF designate $7,291,469, $424,917, $9,109,768, $571,868, $6,200,158, $13,177,927 and $13,872,785 as dividends eligible for the 20% qualified business income deduction under section 199A of the Internal Revenue Code. Shareholders will be notified in January 2022 via IRS form 1099 of the amounts for use in preparing their 2021 income tax return.
Schwab U.S. Equity ETFs | Annual Report
Investment Advisory Agreement Approval
The Investment Company Act of 1940, as amended (the 1940 Act), requires that the continuation of a fund’s investment advisory agreement must be specifically approved (1) by the vote of the trustees or by a vote of the shareholders of the fund, and (2) by the vote of a majority of the trustees who are not parties to the investment advisory agreement or “interested persons” of any party (the Independent Trustees), cast in person at a meeting called for the purpose of voting on such approval. In connection with such approvals, the fund’s trustees must request and evaluate, and the investment adviser is required to furnish, such information as may be reasonably necessary to evaluate the terms of the investment advisory agreement.
The Board of Trustees (the Board or the Trustees, as appropriate) calls and holds one or more meetings each year that are dedicated, in whole or in part, to considering whether to renew the investment advisory agreement (the Agreement) between Schwab Strategic Trust (the Trust) and Charles Schwab Investment Management, Inc. (CSIM) with respect to the existing funds in the Trust, including Schwab U.S. Broad Market ETF, Schwab U.S. Large-Cap ETF, Schwab U.S. Large-Cap Growth ETF, Schwab U.S. Large-Cap Value ETF, Schwab U.S. Mid-Cap ETF, Schwab U.S. Small-Cap ETF, Schwab U.S. Dividend Equity ETF and Schwab 1000 Index ETF (the Funds), and to review certain other agreements pursuant to which CSIM provides investment advisory services to certain other registered investment companies. In preparation for the meeting(s), the Board requests and reviews a wide variety of materials provided by CSIM, including information about CSIM’s affiliates, personnel, business goals and priorities, profitability, third-party oversight, corporate structure and operations. As part of the renewal process, the Independent Trustees’ legal counsel, on behalf of the Independent Trustees, sends an information request letter to CSIM seeking certain relevant information. The responses by CSIM are provided to the Trustees in the Board materials for their review prior to their meeting, and the Trustees are provided with the opportunity to request any additional materials. The Board also receives data provided by an independent provider of investment company data. This information is in addition to the detailed information about the Funds that the Board reviews during the course of each year, including information that relates to the Funds’ operations and performance, legal and compliance matters, risk management, portfolio turnover, and sales and marketing activity. In considering the renewal, the Independent Trustees receive advice from Independent Trustees’ legal counsel, including a memorandum regarding the responsibilities of trustees for the approval of investment advisory agreements. In addition, the Independent Trustees participate in question and answer sessions with representatives of CSIM and meet in executive session outside the presence of Fund management.
The Board, including a majority of the Independent Trustees, considered information specifically relating to the continuance of the Agreement with respect to the Funds at meetings held on May 12, 2021 and June 8, 2021, and approved the renewal of the Agreement with respect to the Funds for an additional one-year term at the meeting on June 8, 2021 called for the purpose of voting on such approval.1
The Board’s approval of the continuance of the Agreement with respect to the Funds was based on consideration and evaluation of a variety of specific factors discussed at these meetings and at prior meetings, including:
| 1. | the nature, extent and quality of the services provided to each Fund under the Agreement, including the resources of CSIM and its affiliates dedicated to the Funds; |
| 2. | each Fund’s investment performance and how it compared to that of certain other comparable exchange-traded funds and benchmark data; |
| 3. | each Fund’s expenses and how those expenses compared to those of certain other similar exchange-traded funds; |
| 4. | the profitability of CSIM and its affiliates, including Charles Schwab & Co., Inc. (Schwab), with respect to each Fund, including both direct and indirect benefits accruing to CSIM and its affiliates; and |
| 5. | the extent to which economies of scale would be realized as each Fund grows and whether fee levels in the Agreement reflect those economies of scale for the benefit of Fund investors. |
Nature, Extent and Quality of Services. The Board considered the nature, extent and quality of the services provided by CSIM to the Funds and the resources of CSIM and its affiliates dedicated to the Funds. In this regard, the Trustees evaluated, among other things, CSIM’s experience, track record, compliance program, resources dedicated to hiring and retaining skilled personnel and specialized talent, and information security resources. The Trustees also considered information provided by CSIM relating to services and support provided with respect to the Funds’ portfolio management team, portfolio strategy, and internal investment guidelines, as well as trading infrastructure, liquidity management, product design and analysis, shareholder communications, securities valuation, fund accounting and custody, and vendor and risk oversight. The Trustees also considered investments CSIM has made in its infrastructure, including modernizing CSIM’s technology and use of data, increasing expertise in key areas (including portfolio management and trade operations), and improving business continuity, cybersecurity, due diligence, risk management processes, and information security programs, which are designed to provide enhanced services to the Funds and their shareholders. The Trustees considered CSIM’s
Schwab U.S. Equity ETFs | Annual Report
effective implementation of its business continuity plan in response to the COVID-19 pandemic and government-mandated restrictions during the prior year. The Trustees also considered Schwab’s reputation as a full service brokerage firm and its overall financial condition, including Schwab’s ability to maintain consistent operations and service levels during recent periods of remote work and market volatility. Following such evaluation, the Board concluded, within the context of its full deliberations, that the nature, extent and quality of services provided by CSIM to the Funds and the resources of CSIM and its affiliates dedicated to the Funds supported renewal of the Agreement with respect to the Funds.
Fund Performance. The Board considered each Fund’s performance in determining whether to renew the Agreement with respect to such Fund. Specifically, the Trustees considered each Fund’s performance relative to a peer category of other exchange-traded funds and applicable indices/benchmarks, in light of total return, yield and market trends, as well as in consideration of each Fund’s investment style and strategy attributes and disclosures. As part of this review, the Trustees considered the composition of the peer category, selection criteria and the reputation of the independent provider of investment company data who prepared the peer category analysis. In evaluating the performance of each Fund, the Trustees considered the risk profile for such Fund and such Fund’s demonstrated performance in tracking its benchmark index. The Trustees further considered the level of Fund performance in the context of their review of Fund expenses and adviser profitability discussed below and also noted that the Board and a designated committee of the Board review performance throughout the year. Following such evaluation, the Board concluded, within the context of its full deliberations, that the performance of each Fund, supported renewal of the Agreement with respect to such Fund.
Fund Expenses. With respect to each Fund’s expenses, the Trustees considered the rate of compensation called for by the Agreement and each Fund’s operating expense ratio, in each case in comparison to those of other similar exchange-traded funds, such peer groups and comparisons having been selected and calculated by an independent provider of investment company data. CSIM reported to the Board, and the Board took into account, the risk assumed by CSIM in the development of the Funds and provision of services as well as the competitive marketplace for financial products. The Trustees also considered fees charged by CSIM to mutual funds and other ETFs that it manages. Following such evaluation, the Board concluded, within the context of its full deliberations, that the expenses of each Fund are reasonable and supported renewal of the Agreement with respect to such Fund.
Profitability. The Trustees considered the compensation flowing to CSIM and its affiliates, directly or indirectly and reviewed profitability on a pre-tax basis, without regard to
distribution expenses. In this connection, the Trustees reviewed management’s profitability analyses. The Trustees also reviewed profitability of CSIM relating to the Schwab fund complex as a whole, noting the benefits to Fund shareholders of being part of the Schwab fund complex, including the allocations of certain fixed costs across the Funds and other funds in the complex. The Trustees also considered any other benefits derived by CSIM from its relationship with the Funds, such as whether, by virtue of its management of the Funds, CSIM obtains investment information or other research resources that aid it in providing advisory services to other clients. The Trustees considered whether the compensation and profitability with respect to the Funds under the Agreement and other service agreements were reasonable and justified in light of the quality of all services rendered to the Funds by CSIM and its affiliates. The Trustees noted that CSIM continues to invest substantial sums in its business in order to provide enhanced research capabilities, services and systems to benefit the Funds. Based on this evaluation, the Board concluded, within the context of its full deliberations, that the profitability of CSIM with respect to each Fund is reasonable and supported renewal of the Agreement with respect to such Fund.
Economies of Scale. Although the Trustees recognized the difficulty of determining economies of scale with precision, the Trustees considered the potential existence of any economies of scale by way of the relatively low advisory fee and unitary fee structure of the Funds and whether those are passed along to a Fund’s shareholders through (i) the enhancement of services provided to the Funds in return for fees paid, including through investments by CSIM in CSIM’s infrastructure, including modernizing CSIM’s technology and use of data, increasing expertise and capabilities in key areas (including portfolio and trade operations), and improving business continuity, cybersecurity, due diligence and information security programs, which are designed to provide enhanced services to the Funds and their shareholders; (ii) graduated investment advisory fee schedules or unitary fee structures, fee waivers, or expense caps by CSIM and its affiliates for those funds in the Schwab fund complex with such features; and (iii) pricing a fund to scale and keeping overall expenses down as the fund grows. The Trustees acknowledged that CSIM has shared any economies of scale with the Funds by investing in CSIM’s infrastructure, as discussed above, over time and that CSIM’s internal costs of providing investment management, technology, administrative, legal and compliance services to the Funds continue to increase as a result of regulatory or other developments. Based on this evaluation, the Board concluded, within the context of its full deliberations, that each Fund obtains reasonable benefits from economies of scale.
In the course of their deliberations, the Trustees may have accorded different weights to various factors and did not identify any particular information or factor that was all important or controlling. Based on the Trustees’ deliberation and their evaluation of the information described above, the
Schwab U.S. Equity ETFs | Annual Report
Board, including all of the Independent Trustees, approved the continuation of the Agreement with respect to the Funds and concluded that the compensation under the Agreement with respect to the Funds is fair and reasonable in light of the
services provided and the related expenses borne by CSIM and its affiliates and such other matters as the Trustees considered to be relevant in the exercise of their reasonable judgment.
| 1 | The meeting on June 8, 2021 was held by means of videoconference in reliance on exemptive relief from the in-person voting requirement under the 1940 Act as provided by the Securities and Exchange Commission. |
Schwab U.S. Equity ETFs | Annual Report
Trustees and Officers
The tables below give information about the trustees and officers of Schwab Strategic Trust, which includes the funds covered in this report. The “Fund Complex” includes The Charles Schwab Family of Funds, Schwab Capital Trust, Schwab Investments, Schwab Annuity Portfolios, Schwab Strategic Trust and Laudus Trust. The Fund Complex includes 102 funds.
The address for all trustees and officers is 211 Main Street, San Francisco, CA 94105. You can find more information about the trustees and officers in the Statement of Additional Information, which is available free by calling 1-877-824-5615.
| Independent Trustees |
Name, Year of Birth, and
Position(s) with the trust
(Terms of office, and
length of Time Served1) | Principal Occupations
During the Past Five Years | Number of
Portfolios in
Fund Complex
Overseen by
the Trustee | Other Directorships |
Robert W. Burns
1959
Trustee
(Trustee of Schwab Strategic Trust since 2009; The Charles Schwab Family of Funds, Schwab Investments, Schwab Capital Trust, Schwab Annuity Portfolios and Laudus Trust since 2016) | Retired/Private Investor (Jan. 2009 – present). Formerly, Managing Director, Pacific Investment Management Company, LLC (PIMCO) (investment management firm) and President, PIMCO Funds. | 102 | None |
John F. Cogan
1947
Trustee
(Trustee of The Charles Schwab Family of Funds, Schwab Investments, Schwab Capital Trust and Schwab Annuity Portfolios since 2008; Laudus Trust since 2010; Schwab Strategic Trust since 2016) | Senior Fellow (Oct. 1979 – present), The Hoover Institution at Stanford University (public policy think tank); Senior Fellow (2000 – present), Stanford Institute for Economic Policy Research; Professor of Public Policy (1994 – 2015), Stanford University. | 102 | Director (2005 – 2020), Gilead Sciences, Inc. |
Nancy F. Heller
1956
Trustee
(Trustee of The Charles Schwab Family of Funds, Schwab Investments, Schwab Capital Trust, Schwab Annuity Portfolios, Schwab Strategic Trust and Laudus Trust since 2018) | Retired. President and Chairman (2014 – 2016), TIAA Charitable (financial services); Senior Managing Director (2003 – 2016), TIAA (financial services). | 102 | None |
David L. Mahoney
1954
Trustee
(Trustee of The Charles Schwab Family of Funds, Schwab Investments, Schwab Capital Trust, Schwab Annuity Portfolios and Laudus Trust since 2011; Schwab Strategic Trust since 2016) | Private Investor. | 102 | Director (2004 – present), Corcept Therapeutics Incorporated
Director (2009 – present), Adamas Pharmaceuticals, Inc.
Director (2003 – 2019), Symantec Corporation |
Jane P. Moncreiff
1961
Trustee
(Trustee of The Charles Schwab Family of Funds, Schwab Investments, Schwab Capital Trust, Schwab Annuity Portfolios, Schwab Strategic Trust and Laudus Trust since 2019) | Consultant (2018 – present), Fulham Advisers LLC (management consulting); Chief Investment Officer (2009 – 2017), CareGroup Healthcare System, Inc. (healthcare). | 102 | None |
Schwab U.S. Equity ETFs | Annual Report
| Independent Trustees (continued) |
Name, Year of Birth, and
Position(s) with the trust
(Terms of office, and
length of Time Served1) | Principal Occupations
During the Past Five Years | Number of
Portfolios in
Fund Complex
Overseen by
the Trustee | Other Directorships |
Kiran M. Patel
1948
Trustee
(Trustee of The Charles Schwab Family of Funds, Schwab Investments, Schwab Capital Trust, Schwab Annuity Portfolios and Laudus Trust since 2011; Schwab Strategic Trust since 2016) | Retired. Executive Vice President and General Manager of Small Business Group (Dec. 2008 – Sept. 2013), Intuit, Inc. (financial software and services firm for consumers and small businesses). | 102 | Director (2008 – present), KLA-Tencor Corporation |
Kimberly S. Patmore
1956
Trustee
(Trustee of The Charles Schwab Family of Funds, Schwab Investments, Schwab Capital Trust, Schwab Annuity Portfolios, Schwab Strategic Trust and Laudus Trust since 2016) | Consultant (2008 – present), Patmore Management Consulting (management consulting). | 102 | None |
J. Derek Penn
1957
Trustee
(Trustee of The Charles Schwab Family of Funds, Schwab Investments, Schwab Capital Trust, Schwab Annuity Portfolios, Schwab Strategic Trust and Laudus Trust since 2021) | Head of Equity Sales and Trading (2006 – 2018), BNY Mellon (financial services). | 102 | None |
| Interested Trustees |
Name, Year of Birth, and
Position(s) with the trust
(Terms of office, and
length of Time Served1) | Principal Occupations
During the Past Five Years | Number of
Portfolios in
Fund Complex
Overseen by
the Trustee | Other Directorships |
Walter W. Bettinger II2
1960
Chairman and Trustee
(Trustee of The Charles Schwab Family of Funds, Schwab Investments, Schwab Capital Trust and Schwab Annuity Portfolios since 2008; Schwab Strategic Trust since 2009; Laudus Trust since 2010) | Director, President and Chief Executive Officer (Oct. 2008 – present), The Charles Schwab Corporation; President and Chief Executive Officer (Oct. 2008 – present) and Director (May 2008 – present), Charles Schwab & Co., Inc.; Director (Apr. 2006 – present), Charles Schwab Bank, SSB; Director (Nov. 2017 – present), Charles Schwab Premier Bank, SSB; Director (July 2019 – present), Charles Schwab Trust Bank; Director (May 2008 – present) and President and Chief Executive Officer (Aug. 2017 – present), Schwab Holdings, Inc.; Director (Oct. 2020 – present), TD Ameritrade Holding Corporation; Director (July 2016 – present), Charles Schwab Investment Management, Inc. | 102 | Director (2008 – present), The Charles Schwab Corporation |
Schwab U.S. Equity ETFs | Annual Report
| Interested Trustees (continued) |
Name, Year of Birth, and
Position(s) with the trust
(Terms of office, and
length of Time Served1) | Principal Occupations
During the Past Five Years | Number of
Portfolios in
Fund Complex
Overseen by
the Trustee | Other Directorships |
Joseph R. Martinetto2
1962
Trustee
(Trustee of The Charles Schwab Family of Funds, Schwab Investments, Schwab Capital Trust, Schwab Annuity Portfolios, Schwab Strategic Trust and Laudus Trust since 2016) | Chief Operating Officer (Feb. 2018 – present) and Senior Executive Vice President (July 2015 – Feb. 2018), The Charles Schwab Corporation; Senior Executive Vice President (July 2015 – present), Charles Schwab & Co., Inc.; Chief Financial Officer (July 2015 – Aug. 2017) and Executive Vice President and Chief Financial Officer (May 2007 – July 2015), The Charles Schwab Corporation and Charles Schwab & Co., Inc.; Director (May 2007 – present), Charles Schwab & Co., Inc.; Director (Apr. 2010 – present) and Chief Executive Officer (July 2013 – Apr. 2015), Charles Schwab Bank, SSB; Director (Nov. 2017 – present), Charles Schwab Premier Bank, SSB; Director (May 2007 – present), Chief Financial Officer (May 2007 – Aug. 2017), Senior Executive Vice President (Feb. 2016 – present), and Executive Vice President (May 2007 – Feb. 2016), Schwab Holdings, Inc.; Director (Oct. 2020 – present), TD Ameritrade Holding Corporation. | 102 | None |
| Officers of the Trust |
Name, Year of Birth, and Position(s) with the trust
(Terms of office, and length of Time Served3) | Principal Occupations During the Past Five Years |
Jonathan de St. Paer
1973
President and Chief Executive Officer
(Officer of The Charles Schwab Family of Funds, Schwab Investments, Schwab Capital Trust, Schwab Annuity Portfolios, Schwab Strategic Trust and Laudus Trust since 2018) | Director (Apr. 2019 – present), President (Oct. 2018 – present), Chief Operating Officer (Jan. 2020 – present), and Chief Executive Officer (Apr. 2019 – Nov. 2019), Charles Schwab Investment Management, Inc.; Senior Vice President (June 2020 – present) and Chief Operating Officer (Jan. 2020 – present), Charles Schwab Investment Advisory, Inc.; Chief Executive Officer (Apr. 2019 – present), President (Nov. 2018 – present) and Trustee (Apr. 2019 – Dec. 2020), Schwab Funds, Laudus Funds and Schwab ETFs; Director (Apr. 2019 – present), Charles Schwab Worldwide Funds plc and Charles Schwab Asset Management (Ireland) Limited; Senior Vice President (Apr. 2019 – present), Senior Vice President – Strategy and Product Development (CSIM) (Jan. 2014 – Mar. 2019), and Vice President (Jan. 2009 – Dec. 2013), Charles Schwab & Co., Inc. |
Mark Fischer
1970
Treasurer, Chief Financial Officer and Chief Operating Officer
(Officer of The Charles Schwab Family of Funds, Schwab Investments, Schwab Capital Trust, Schwab Annuity Portfolios, Schwab Strategic Trust and Laudus Trust since 2013) | Treasurer and Chief Financial Officer (Jan. 2016 – present) and Chief Operating Officer (Dec. 2020 – present), Schwab Funds, Laudus Funds and Schwab ETFs; Assistant Treasurer (Dec. 2013 – Dec. 2015), Schwab Funds and Laudus Funds; Assistant Treasurer (Nov. 2013 – Dec. 2015), Schwab ETFs; Chief Financial Officer (Mar. 2020 – present) and Vice President (Oct. 2013 – present), Charles Schwab Investment Management, Inc.; Executive Director (Apr. 2011 – Sept. 2013), J.P. Morgan Investor Services; Assistant Treasurer (May 2005 – Mar. 2011), Massachusetts Financial Service Investment Management. |
Omar Aguilar
1970
Senior Vice President and Chief Investment Officer
(Officer of The Charles Schwab Family of Funds, Schwab Investments, Schwab Capital Trust, Schwab Annuity Portfolios, Schwab Strategic Trust and Laudus Trust since 2011) | Senior Vice President and Chief Investment Officer (Apr. 2011 – present), Charles Schwab Investment Management, Inc.; Senior Vice President and Chief Investment Officer (June 2011 – present), Schwab Funds, Laudus Funds and Schwab ETFs; Head of the Portfolio Management Group and Vice President of Portfolio Management (May 2009 – Apr. 2011), Financial Engines, Inc. (investment management firm); Head of Quantitative Equity (July 2004 – Jan. 2009), ING Investment Management. |
Brett Wander
1961
Senior Vice President and Chief Investment Officer
(Officer of The Charles Schwab Family of Funds, Schwab Investments, Schwab Capital Trust, Schwab Annuity Portfolios, Schwab Strategic Trust and Laudus Trust since 2011) | Senior Vice President and Chief Investment Officer (Apr. 2011 – present), Charles Schwab Investment Management, Inc.; Senior Vice President and Chief Investment Officer (June 2011 – present), Schwab Funds, Laudus Funds and Schwab ETFs; Senior Managing Director and Global Head of Active Fixed-Income Strategies (Jan. 2008 – Oct. 2010), State Street Global Advisors; Director of Alpha Strategies (Apr. 2006 – Jan. 2008), Loomis, Sayles & Company (investment management firm). |
William P. McMahon, Jr.
1972
Senior Vice President and Chief Investment Officer
(Officer of The Charles Schwab Family of Funds, Schwab Investments, Schwab Capital Trust, Schwab Annuity Portfolios, Schwab Strategic Trust and Laudus Trust since 2021) | Senior Vice President and Chief Investment Officer (Jan. 2020 – present), Charles Schwab Investment Management, Inc.; Senior Vice President and Chief Investment Officer (June 2021 – present), Schwab Funds, Laudus Funds and Schwab ETFs; Senior Vice President and Chief Investment Officer – ThomasPartners Strategies (Apr. 2018 – Dec. 2019), Charles Schwab Investment Advisory, Inc.; Senior Vice President and Chief Investment Officer (May 2001 – Apr. 2018), ThomasPartners, Inc. |
Schwab U.S. Equity ETFs | Annual Report
| Officers of the Trust (continued) |
Name, Year of Birth, and Position(s) with the trust
(Terms of office, and length of Time Served3) | Principal Occupations During the Past Five Years |
David Lekich
1964
Vice President and Assistant Secretary, Schwab Funds and Schwab ETFs
Vice President and Assistant Clerk, Laudus Funds
(Officer of The Charles Schwab Family of Funds, Schwab Investments, Schwab Capital Trust, Schwab Annuity Portfolios, Schwab Strategic Trust and Laudus Trust since 2011) | Senior Vice President (Sept. 2011 – present) and Vice President (Mar. 2004 – Sept. 2011), Charles Schwab & Co., Inc.; Senior Vice President and Chief Counsel (Sept. 2011 – present) and Vice President (Jan. 2011 – Sept. 2011), Charles Schwab Investment Management, Inc.; Vice President and Assistant Secretary (Oct. 2021 – present), Secretary (Apr. 2011 – Oct. 2021) and Chief Legal Officer (Dec. 2011 – Oct. 2021), Schwab Funds; Vice President and Assistant Clerk (Apr. 2011 – present), Laudus Funds; Vice President and Assistant Secretary (Oct. 2021 – present), Secretary (May 2011 – Oct. 2021) and Chief Legal Officer (Nov. 2011 – Oct. 2021), Schwab ETFs. |
Catherine MacGregor
1964
Chief Legal Officer and Secretary, Schwab Funds and Schwab ETFs
Chief Legal Officer, Vice President and Clerk, Laudus Funds
(Officer of The Charles Schwab Family of Funds, Schwab Investments, Schwab Capital Trust, Schwab Annuity Portfolios and Laudus Trust since 2005; Schwab Strategic Trust since 2009) | Vice President (July 2005 – present), Charles Schwab & Co., Inc.; Vice President (Sept. 2005 – present), Charles Schwab Investment Management, Inc.; Vice President (Dec. 2005 – present) and Chief Legal Officer and Clerk (Mar. 2007 – present), Laudus Funds; Chief Legal Officer and Secretary (Oct. 2021 – present), Vice President (Nov. 2005 – Oct. 2021) and Assistant Secretary (June 2007 – Oct. 2021), Schwab Funds; Chief Legal Officer and Secretary (Oct. 2021 – present), Vice President and Assistant Secretary (Oct. 2009 – Oct. 2021), Schwab ETFs. |
| 1 | Each Trustee shall hold office until the election and qualification of his or her successor, or until he or she dies, resigns or is removed. The retirement policy requires that each independent trustee retire by December 31 of the year in which the Trustee turns 74 or the Trustee’s twentieth year of service as an independent trustee on any trust in the Fund Complex, whichever occurs first. |
| 2 | Mr. Bettinger and Mr. Martinetto are Interested Trustees. Mr. Bettinger is an Interested Trustee because he owns stock of The Charles Schwab Corporation (CSC), the parent company of Charles Schwab Investment Management, Inc. (CSIM), the investment adviser for the trusts in the Fund Complex, is an employee and director of Charles Schwab & Co., Inc. (Schwab), the principal underwriter for The Charles Schwab Family of Funds, Schwab Investments, Schwab Capital Trust, Schwab Annuity Portfolios and Laudus Trust, and is a director of CSIM. Mr. Martinetto is an Interested Trustee because he owns stock of CSC and is an employee and director of Schwab. |
| 3 | The President, Treasurer and Secretary/Clerk hold office until their respective successors are chosen and qualified or until he or she sooner dies, resigns, is removed or becomes disqualified. Each of the other officers serves at the pleasure of the Board. |
Schwab U.S. Equity ETFs | Annual Report
ask See “offer.”
asset allocation The practice of dividing a portfolio among different asset classes, with each asset class assigned a particular percentage to help offset risks and rewards, based on your goals, time horizon and risk tolerance.
asset class A group of securities with similar structure and basic characteristics. Stocks, bonds and cash are the three main examples of asset classes.
authorized participant (AP) A large institutional investor that places orders for creation units with the funds’ distributor.
beta A historical measure of an investment’s volatility relative to a market index (usually the S&P 500®). The index is defined as having a beta of 1.00. Investments with a beta higher than 1.00 have been more volatile than the index; those with a beta of less than 1.00 have been less volatile.
bid The highest price at which someone is willing to buy a security.
Bloomberg US Aggregate Bond Index An index that is a broad-based benchmark measuring the performance of the U.S. investment grade, taxable bond market, including U.S. Treasuries, government-related and corporate bonds, mortgage pass-through securities, commercial mortgage-backed securities, and asset-backed securities that are publicly available for sale in the United States. To be eligible for inclusion in the index, securities must be fixed rate, non-convertible, U.S. dollar-denominated with at least $300 million or more of outstanding face value and have one or more years remaining to maturity. The index excludes certain types of securities, including tax-exempt state and local government series bonds, structured notes embedded with swaps or other special features, private placements, floating rate securities, inflation-linked bonds and Eurobonds. The index is market capitalization weighted and the securities in the index are updated on the last business day of each month.
Bloomberg US Treasury Bills 1–3 Month Index An index that includes all publicly issued zero-coupon U.S. Treasury Bills that have a remaining maturity of less than 3 months but more than 1 month, are rated investment grade and have $300 million or more of outstanding face value. It excludes zero-coupon STRIPS.
cap, capitalization See “market cap.”
capital gain, capital loss The difference between the amount paid for an investment and its value at a later time. If the investment has been sold, the capital gain or loss is considered a realized gain or loss. If the investment is still held, the gain or loss is still “on paper” and is considered unrealized.
commencement of operations The date that the first NAV was calculated.
creation unit (C.U.) A basket of securities that is delivered by an authorized participant (AP) to the fund equal to the current holdings of the ETF, plus a designated cash component. In return, the APs receive a large block of ETF shares (typically 50,000 shares), which investors can then buy and sell in the secondary market.
dividend yield A stock’s indicated annual dividend divided by current price. At the portfolio level, it is the value-weighted average of the dividend yield of the securities in the portfolio.
Dow Jones U.S. Broad Stock Market Index An index that is a subset of the Dow Jones U.S. Total Stock Market Index, which includes the largest 2,500 publicly traded U.S. companies and is designed to measure the performance of large- and small-cap U.S. equity securities. The index is a float-adjusted market capitalization weighted index that reflects the shares of securities actually available to investors in the marketplace.
Dow Jones U.S. Dividend 100 Index An index that is designed to measure the performance of high dividend yielding stocks issued by U.S. companies that have a record of consistently paying dividends, selected for fundamental strength relative to their peers, based on financial ratios. The 100-component index is a subset of the Dow Jones U.S. Broad Market Index, which includes the 2,500 largest U.S. stocks based on full market capitalization and excludes real estate investment trusts (REITs). It is modified market capitalization weighted.
Dow Jones U.S. Large-Cap Growth Total Stock Market Index An index, which is a subset of the Dow Jones U.S. Total Stock Market Index, that is designed to measure the performance of large-cap U.S. equity securities that are classified as “growth” based on a multi-factor analysis. The index is a float-adjusted market capitalization weighted index.
Dow Jones U.S. Large-Cap Total Stock Market Index An index that is a subset of the Dow Jones U.S. Total Stock Market Index, and is designed to measure the performance of large-cap U.S. equity securities. The index is a float-adjusted market capitalization weighted index.
Dow Jones U.S. Large-Cap Value Total Stock Market Index An index that is a subset of the Dow Jones U.S. Total Stock Market Index, and is designed to measure the performance of large-cap U.S. equity securities that are classified as “value” based on a multi-factor analysis. The index is a float-adjusted market capitalization weighted index.
Dow Jones U.S. Mid-Cap Total Stock Market Index An index that is a subset of the Dow Jones U.S. Total Stock Market Index, and is designed to measure the performance of mid-cap U.S. equity securities. The index is a float-adjusted market capitalization weighted index.
Dow Jones U.S. Small-Cap Total Stock Market Index An index that is a subset of the Dow Jones U.S. Total Stock Market Index, and is designed to measure the performance of small-cap U.S. equity securities. The index is a float-adjusted market capitalization weighted index.
Dow Jones U.S. Total Stock Market Index An index which includes all U.S. equity issues with readily available prices. The index is a float-adjusted market capitalization weighted index that reflects the shares of securities actually available to investors in the marketplace.
exchange A marketplace, or any organization or group that provides or maintains a marketplace for trading securities, options, futures, or commodities.
expense ratio The amount that is taken from the fund’s assets each year to cover the operating expenses. An expense ratio of 0.50% means that a fund’s expenses amount to half of one percent of its average net assets a year.
gross domestic product (GDP) The output of goods and services produced by labor and property located in the United States.
inception date The date that the shares began trading in the secondary market.
Schwab U.S. Equity ETFs | Annual Report
indicative optimized portfolio value (IOPV) A calculation disseminated by the stock exchange that approximates the fund’s NAV every 15 seconds throughout the trading day.
liquidity The ability to convert a security or asset quickly into cash.
market cap, market capitalization The value of a company as determined by the total value of all shares of its stock outstanding. Free-float market capitalization is a variation of market capitalization that only includes shares generally available to the public, and excludes shares of a company held by entities such as the government. Modified market capitalization weighting represents a mix between conventional market capitalization weighting and equal weighting.
market price return The return based on the change in market price per share of the fund over a given time period. Market price returns assume that dividends and capital gain distributions have been reinvested in the fund at market price.
median market cap The midpoint of the range of market caps of the stocks held by a fund. There are different ways of calculating median market cap. With a simple median, half of the stocks in the fund’s portfolio would be larger than the median, and half would be smaller. With a weighted median (the type that is calculated for these funds), half of the fund’s assets are invested in stocks that are larger than the median market cap, and half in stocks that are smaller.
MSCI EAFE Index (Net) A free float-adjusted market capitalization index that is designed to measure the equity market performance of developed markets in Europe, Australasia, and the Far East. The Net version of the index reflects reinvested dividends net of withholding taxes, but reflects no deductions for expenses or other taxes; returns are calculated applying dividend withholding rates applicable to non-resident persons who do not benefit from double taxation treaties.
net asset value (NAV) The value of one share of a fund. NAV is calculated by taking the fund’s total assets, subtracting liabilities, and dividing by the number of shares outstanding.
NAV return The return based on the change in NAV of the fund over a given time period. NAV returns assume that dividends and capital gain distributions have been reinvested in the fund.
offer (ask) The lowest price at which an individual is willing to sell a security.
open The price at which a security opened for trading on a given day.
outstanding shares, shares outstanding When speaking of the fund, indicates all shares currently held by investors.
price-to-book ratio (P/B) The market price of a company’s stock compared with its “book value.” A mutual fund’s P/B is the weighted average of the P/B of all stocks in the fund’s portfolio.
price-to-earnings ratio (P/E) The market price of a company’s stock compared with earnings over the past year. A mutual fund’s P/E is the weighted average of the P/E of all stocks in the fund’s portfolio.
primary market The market that deals with the issuance of new securities.
rights and warrants Rights and warrants are types of securities that entitle the holder to purchase a proportionate amount of common stock at a specified price for a specific period of time. Rights allow a shareholder to buy more shares directly from the company, usually at a
price somewhat lower than the current market price of the outstanding shares. Warrants are usually issued with bonds and preferred stock. Rights and warrants can trade on the market separately from the company’s stock. The prices of rights and warrants do not necessarily move parallel to the prices of the underlying common stock. Rights usually expire within a few weeks of issuance, while warrants may not expire for several years. If a right or warrant is not exercised within the specified time period, it will become worthless and a fund will lose the purchase price it paid for the right or warrant and the right to purchase the underlying security.
Russell 1000 Index An index that measures the performance of the 1,000 largest companies in the Russell 3000 Index, and represents approximately 92% of the total market capitalization of the Russell 3000 Index. The Russell 3000 Index measures the performance of the largest 3,000 U.S. companies representing approximately 98% of the investable U.S. equity market.
Russell 2000 Index An index that measures the performance of the 2,000 smallest companies in the Russell 3000 Index. The Russell 3000 Index measures the performance of the largest 3,000 U.S. companies representing approximately 98% of the investable U.S. equity market.
S&P 500 Index An index that is designed to measure the performance of 500 leading publicly traded companies from a broad range of industries.
Schwab 1000 Index A float-adjusted market capitalization weighted index developed by Charles Schwab & Co., Inc. that represents the performance of the largest 1,000 publicly traded companies in the United States. As a result of corporate actions, the index may be comprised of more or less than 1,000 securities.
SEC yield A standard yield calculation developed by the Securities and Exchange Commission (SEC) that allows for fairer comparisons of bond funds. It is based on the most recent 30-day period covered by the fund’s filings with the SEC. The yield figure reflects the dividends and interest earned during the period, after the deduction of the fund’s expenses. This is also referred to as the “standardized yield.”
sampling If a fund uses a sampling method, the fund will not fully replicate the benchmark index and may hold securities not included in the index. A fund that utilizes a sampling approach may not track the return of the index.
secondary market The market in which investors purchase securities from other investors rather than directly from the issuing companies. Organized exchanges facilitate the trading of securities in the secondary market.
spread The gap between bid and ask prices of a security.
stock A share of ownership, or equity, in the issuing company.
total return The percentage that an investor would have earned or lost on an investment in the fund assuming dividends and distributions were reinvested.
tracking error The difference between the performance of the fund and its benchmark index, positive or negative.
Schwab U.S. Equity ETFs | Annual Report
Schwab ETFs
Schwab ETFs are designed to serve as simple low-cost core investment products for a diversified portfolio. These ETFs seek to provide consistent, repeatable performance through a variety of investment strategies that span the equity and fixed income spectrum. The list below shows all currently available Schwab ETFs.
Investors should carefully consider information contained in the prospectus, or if available, the summary prospectus, including investment objectives, risks, charges and expenses before investing. Please call 1-877-824-5615 for a prospectus for any Schwab ETF. Please read the prospectus carefully before you invest. This report must be preceded or accompanied by a current prospectus.
Proxy Voting Policies, Procedures and Results
A description of the proxy voting policies and procedures used to determine how to vote proxies on behalf of the funds is available without charge, upon request, by visiting the Schwab ETFs’ website at www.schwabassetmanagement.com/schwabetfs_prospectus, the SEC’s website at www.sec.gov, or by contacting Schwab ETFs at 1-877-824-5615.
Information regarding how a fund voted proxies relating to portfolio securities during the most recent twelve-month period ended June 30 is available, without charge, by visiting the fund’s website at www.schwabassetmanagement.com/schwabetfs_prospectus or the SEC’s website at www.sec.gov.
U.S. ETFs
Schwab U.S. Broad Market ETF
Schwab 1000 Index® ETF
Schwab U.S. Large-Cap ETF
Schwab U.S. Large-Cap Growth ETF
Schwab U.S. Large-Cap Value ETF
Schwab U.S. Mid-Cap ETF
Schwab U.S. Small-Cap ETF
Schwab U.S. Dividend Equity ETF
Schwab U.S. REIT ETF
International ETFs
Schwab International Equity ETF
Schwab International Small-Cap Equity ETF
Schwab International Dividend Equity ETF
Schwab Emerging Markets Equity ETF
Fixed-Income ETFs
Schwab U.S. TIPS ETF
Schwab Short-Term U.S. Treasury ETF
Schwab Intermediate-Term U.S. Treasury ETF
Schwab Long-Term U.S. Treasury ETF
Schwab U.S. Aggregate Bond ETF
Schwab 1-5 Year Corporate Bond ETF
Schwab 5-10 Year Corporate Bond ETF
Fundamental Index* ETFs
Schwab Fundamental U.S. Broad Market Index ETF
Schwab Fundamental U.S. Large Company Index ETF
Schwab Fundamental U.S. Small Company Index ETF
Schwab Fundamental International Large Company Index ETF
Schwab Fundamental International Small Company Index ETF
Schwab Fundamental Emerging Markets Large Company
Index ETF
Investment Adviser
Charles Schwab Investment Management, Inc.
211 Main Street, San Francisco, CA 94105
Schwab ETFs
1-877-824-5615
© 2021 Charles Schwab Investment Management, Inc. All rights reserved.
Printed on recycled paper.
| * | FUNDAMENTAL INDEX is a registered trademark of Research Affiliates LLC. |
This page is intentionally left blank.
Item 2: Code of Ethics.
| (a) | Registrant has adopted a code of ethics that applies to its principal executive officer, principal financial officer, and any other persons who perform a similar function, regardless of whether these individuals are employed by Registrant or a third party. |
| (c) | During the period covered by the report, no amendments were made to the provisions of this code of ethics. |
| (d) | During the period covered by the report, Registrant did not grant any waivers, including implicit waivers, from the provisions of this code of ethics. |
| (f)(1) | Registrant has filed this code of ethics as an exhibit pursuant to Item 13(a)(1) of Form N-CSR. |
Item 3: Audit Committee Financial Expert.
Registrant’s Board of Trustees has determined that Kiran M. Patel, Kimberly S. Patmore and J. Derek Penn, each currently serving on its audit, compliance and valuation committee, are each an “audit committee financial expert,” as such term is defined in Item 3 of Form N-CSR. Each member of Registrant’s audit, compliance and valuation committee is “independent” under the standards set forth in Item 3 of Form N-CSR.
The designation of each of Mr. Patel, Ms. Patmore and Mr. Penn as an “audit committee financial expert” pursuant to Item 3 of Form N-CSR does not (i) impose upon such individual any duties, obligations, or liability that are greater than the duties, obligations and liability imposed upon such individual as a member of Registrant’s audit, compliance and valuation committee or Board of Trustees in the absence of such designation; and (ii) affect the duties, obligations or liability of any other member of Registrant’s audit, compliance and valuation committee or Board of Trustees.
Item 4: Principal Accountant Fees and Services.
Registrant is composed of twenty-seven operational series. Twelve series have a fiscal year-end of August 31, whose annual financial statements are reported in Item 1, seven series have a fiscal year-end of the last day of February, one has a fiscal year end of March 31, and seven series have a fiscal year-end of December 31. Principal accountant fees disclosed in Items 4(a)-(d) and 4(g) include fees billed for services rendered to each of the twenty-seven operational series during 2021/2022 and the twenty-five operational series during 2020/2021, based on their respective 2021/2022 and 2020/2021 fiscal years, as applicable.
The following table presents fees billed by the principal accountant in each of the last two fiscal years for the services rendered to the Funds:
| | | | | | | | | | | | | | | | | | | | | | | | | | | | | | |
| (a) Audit Fees | | | (b) Audit-Related Fees | | | (c) Tax Fees1 | | | (d) All Other Fees | |
Fiscal
Year
2021/2022 | | | Fiscal
Year
2020/2021 | | | Fiscal
Year
2021/2022 | | | Fiscal
Year
2020/2021 | | | Fiscal
Year
2021/2022 | | | Fiscal
Year
2020/2021 | | | Fiscal
Year
2021/2022 | | | Fiscal
Year
2020/2021 | |
| $ | 468,400 | | | $ | 450,900 | | | $ | 0 | | | $ | 0 | | | $ | 83,700 | | | $ | 77,500 | | | $ | 0 | | | $ | 0 | |
| 1 | The nature of the services includes tax compliance, tax advice and tax planning. |
(e)(1) Registrant’s audit, compliance and valuation committee does not have pre-approval policies and procedures as described in paragraph (c)(7) of Rule 2-01 of Regulation S-X.
(2) There were no services described in each of paragraphs (b) through (d) above (including services required to be approved by Registrant’s audit, compliance and valuation committee pursuant to paragraph (c)(7)(ii) of Rule 2-01 of Regulation S-X) that were approved by Registrant’s audit, compliance and valuation committee pursuant to paragraph (c)(7)(i)(C) of Rule 2-01 of Regulation S-X.
(f) Not applicable.
(g) Below are the aggregate non-audit fees billed in each of the last two fiscal years by Registrant’s principal accountant for services rendered to Registrant, to Registrant’s investment adviser, and to any entity controlling, controlled by, or under common control with Registrant’s investment adviser that provides ongoing services to Registrant.
| | |
| 2021/2022: $3,622,031 | | 2020/2021: $4,263,876 |
(h) During the past fiscal year, all non-audit services provided by Registrant’s principal accountant to either Registrant’s investment adviser or to any entity controlling, controlled by, or under common control with Registrant’s investment adviser that provides ongoing services to Registrant were pre-approved. Included in the audit, compliance and valuation committee’s pre-approval was the review and consideration as to whether the provision of these non-audit services is compatible with maintaining the principal accountant’s independence.
Item 5: Audit Committee of Listed Registrants.
The Registrant is a listed issuer as defined in Rule 10A-3 under the Exchange Act and has separately-designated standing audit, compliance and valuation committee established in accordance with Section 3(a)58(A) of the Exchange Act. The Registrant’s audit, compliance and valuation committee members are Kiran M. Patel, John F. Cogan, Kimberly S. Patmore, and J. Derek Penn.
Item 6: Schedule of Investments.
The schedules of investments are included as part of the report to shareholders filed under Item 1 of this Form.
Item 7: Disclosure of Proxy Voting Policies and Procedures for Closed-End Management Investment Companies.
Not applicable.
Item 8: Portfolio Managers of Closed-End Management Investment Companies.
Not applicable.
Item 9: Purchases of Equity Securities by Closed-End Management Investment Company and Affiliated Purchasers.
Not applicable.
Item 10: Submission of Matters to a Vote of Security Holders.
Not applicable.
Item 11: Controls and Procedures.
| (a) | Based on their evaluation of Registrant’s disclosure controls and procedures, as of a date within 90 days of the filing date, Registrant’s Chief Executive Officer, Jonathan de St. Paer and Registrant’s Chief Financial Officer, Mark Fischer, have concluded that Registrant’s disclosure controls and procedures are: (i) reasonably designed to ensure that information required to be disclosed in this report is appropriately communicated to Registrant’s officers to |
| | allow timely decisions regarding disclosures required in this report; (ii) reasonably designed to ensure that information required to be disclosed in this report is recorded, processed, summarized and reported in a timely manner; and (iii) are effective in achieving the goals described in (i) and (ii) above. |
| | (b) | During the period covered by this report, there have been no changes in Registrant’s internal control over financial reporting that the above officers believe to have materially affected, or to be reasonably likely to materially affect, Registrant’s internal control over financial reporting. |
Item 12: Disclosure of Securities Lending Activities for Closed-End Management Investment Companies.
Not applicable.
Item 13: Exhibits.
Pursuant to the requirements of the Securities Exchange Act of 1934 and the Investment Company Act of 1940, the registrant has duly caused this report to be signed on its behalf by the undersigned, thereunto duly authorized.
(Registrant) Schwab Strategic Trust – Schwab U.S. Equity ETFs and Schwab International Equity ETFs
| | |
| By: | | /s/ Jonathan de St. Paer |
| | Jonathan de St. Paer |
| | Chief Executive Officer |
| |
| Date: | | October 19, 2021 |
Pursuant to the requirements of the Securities Exchange Act of 1934 and the Investment Company Act of 1940, this report has been signed below by the following persons on behalf of the registrant and in the capacities and on the dates indicated.
| | |
| By: | | /s/ Jonathan de St. Paer |
| | Jonathan de St. Paer |
| | Chief Executive Officer |
| |
| Date: | | October 19, 2021 |
| |
| By: | | /s/ Mark Fischer |
| | Mark Fischer |
| | Chief Financial Officer |
| |
| Date: | | October 19, 2021 |