UNITED STATES
SECURITIES AND EXCHANGE COMMISSION
Washington, D.C. 20549
FORM N-CSR
CERTIFIED SHAREHOLDER REPORT OF REGISTERED
MANAGEMENT INVESTMENT COMPANIES
Investment Company Act file number: 811-22311
Schwab Strategic Trust
(Exact name of registrant as specified in charter)
211 Main Street, San Francisco, California 94105
(Address of principal executive offices) (Zip code)
Jonathan de St. Paer
Schwab Strategic Trust
211 Main Street, San Francisco, California 94105
(Name and address of agent for service)
Registrant’s telephone number, including area code: (415) 636-7000
Date of fiscal year end: December 31
Date of reporting period: December 31, 2020
Item 1: Report(s) to Shareholders.
Annual Report | December 31, 2020
Schwab Fixed-Income ETFs
| Schwab U.S. TIPS ETF | SCHP |
| Schwab Short-Term U.S. Treasury ETF | SCHO |
| Schwab Intermediate-Term U.S. Treasury ETF | SCHR |
| Schwab Long-Term U.S. Treasury ETF | SCHQ |
| Schwab U.S. Aggregate Bond ETF | SCHZ |
| Schwab 1-5 Year Corporate Bond ETF | SCHJ |
| Schwab 5-10 Year Corporate Bond ETF | SCHI |
Fund investment adviser: Charles Schwab Investment Management, Inc. (CSIM)
Distributor: SEI Investments Distribution Co. (SIDCO)
Schwab Fixed-Income ETFs | Annual Report
The performance data quoted represents past performance. Past performance does not guarantee future results. Investment return and principal value of an investment will fluctuate so that an investor’s shares, when sold or redeemed, may be worth more or less than the original cost. Current performance may be lower or higher than the performance quoted. To obtain performance information current to the most recent month end, please visit www.schwabfunds.com/schwabetfs_prospectus.
| Total Returns for the 12 Months Ended December 31, 2020 |
Schwab U.S. TIPS ETF
(Ticker Symbol: SCHP) | |
| Market Price Return1 | 10.86% |
| NAV Return1 | 10.94% |
| Bloomberg Barclays US Treasury Inflation-Linked Bond Index (Series-L)SM | 10.99% |
| ETF Category: Morningstar Inflation-Protected Bond2 | 10.01% |
| Performance Details | pages 7-8 |
| |
Schwab Short-Term U.S. Treasury ETF
(Ticker Symbol: SCHO) | |
| Market Price Return1 | 3.11% |
| NAV Return1 | 3.11% |
| Bloomberg Barclays US Treasury 1-3 Year Index | 3.16% |
| ETF Category: Morningstar Short Government2 | 3.11% |
| Performance Details | pages 9-10 |
| |
Schwab Intermediate-Term U.S. Treasury ETF
(Ticker Symbol: SCHR) | |
| Market Price Return1 | 7.72% |
| NAV Return1 | 7.62% |
| Bloomberg Barclays US Treasury 3-10 Year Index | 7.67% |
| ETF Category: Morningstar Intermediate Government2 | 5.65% |
| Performance Details | pages 11-12 |
| |
Schwab Long-Term U.S. Treasury ETF
(Ticker Symbol: SCHQ) | |
| Market Price Return1 | 17.72% |
| NAV Return1 | 17.64% |
| Bloomberg Barclays US Long Treasury Index | 17.70% |
| ETF Category: Morningstar Long Government2 | 17.48% |
| Performance Details | pages 13-14 |
| Total Returns for the 12 Months Ended December 31, 2020 |
Schwab U.S. Aggregate Bond ETF
(Ticker Symbol: SCHZ) | |
| Market Price Return1 | 7.46% |
| NAV Return1 | 7.50% |
| Bloomberg Barclays US Aggregate Bond Index | 7.51% |
| ETF Category: Morningstar Intermediate Core Bond2 | 7.52% |
| Performance Details | pages 15-16 |
| |
Schwab 1-5 Year Corporate Bond ETF
(Ticker Symbol: SCHJ) | |
| Market Price Return1 | 5.29% |
| NAV Return1 | 5.31% |
| Bloomberg Barclays US 1-5 Year Corporate Bond Index | 5.41% |
| ETF Category: Morningstar Short-Term Bond2 | 3.81% |
| Performance Details | pages 17-18 |
| |
Schwab 5-10 Year Corporate Bond ETF
(Ticker Symbol: SCHI) | |
| Market Price Return1 | 9.75% |
| NAV Return1 | 9.83% |
| Bloomberg Barclays US 5-10 Year Corporate Bond Index | 9.75% |
| ETF Category: Morningstar Corporate Bond2 | 9.24% |
| Performance Details | pages 19-20 |
All total returns on this page assume dividends and distributions were reinvested. Index figures do not include trading and management costs, which would lower performance. Indices are unmanaged and cannot be invested in directly. Performance results less than one year are not annualized.
For index definitions, please see the Glossary.
Performance does not reflect the deduction of taxes that a shareholder would pay on fund distributions or on the redemption or sale of fund shares.
Shares are bought and sold at market price, which may be higher or lower than the net asset value (NAV). Brokerage commissions will reduce returns.
Fixed income securities are subject to increased loss of principal during periods of rising interest rates. An investment in the fund(s) is not insured or guaranteed by the Federal Deposit Insurance Corporation (FDIC) or any other government agency.
U.S. Treasury Inflation-Protected Securities (TIPS) generally have lower yields than conventional fixed rate bonds and will likely decline in price during periods of deflation, which could result in losses.
Index ownership — Bloomberg Index Services Limited and its affiliates (collectively, Bloomberg) and Bloomberg’s licensors, including Barclays Bank PLC (Barclays), own all proprietary rights in the Bloomberg Barclays Indices. The funds are not sponsored, endorsed, sold or promoted by Bloomberg or Barclays. Neither Bloomberg nor Barclays endorses or recommends the funds. Neither Bloomberg nor Barclays guarantees the timeliness, accurateness or completeness of any data or information relating to the Bloomberg Barclays Indices, and neither shall be liable in any way in respect of the use or accuracy of the Bloomberg Barclays Indices.
| 1 | ETF performance must be shown based on both a Market Price and a Net Asset Value (NAV) basis. The fund’s per share net asset value (NAV) is the value of one share of the fund. NAV is calculated by taking the fund’s total assets (including the market value of securities owned), subtracting liabilities, and dividing by the number of shares outstanding. The NAV Return is based on the NAV of the fund, and the Market Price Return is based on the market price per share of the fund. The price used to calculate market return (Market Price) is determined using the Official Closing Price of the primary stock exchange (generally, 4:00 p.m. Eastern time) and may not represent the returns you would receive if shares were traded at other times. Market Price and NAV returns assume that dividends and capital gain distributions have been reinvested in the fund at Market Price and NAV, respectively. |
| 2 | Source for category information: Morningstar, Inc. The Morningstar Category return represents all passively- and actively-managed ETFs within the category as of the report date. |
Schwab Fixed-Income ETFs | Annual Report
Jonathan de St. Paer
President of Charles Schwab
Investment Management, Inc.
and the funds covered
in this report.
Dear Shareholder,
The COVID-19 pandemic broadly reshaped life during 2020—in ways that are likely to reverberate well into the new year and remind us to expect the unexpected. Markets began the year on a high note, with equities riding the longest bull market cycle in history and bonds experiencing conditions typical of an extended economic expansion. However, beginning in late-February, as COVID-19 spread globally and broad swaths of the economy shut down, equity prices and bond yields fell sharply. The S&P 500® Index, a bellwether for the overall U.S. stock market, dropped 30% over just 22 trading days in late February and early March and yields on U.S. Treasuries all fell to under 1% for the first time, with the 10-year U.S. Treasury yield falling to an all-time low. By the end of March, the U.S. Federal Reserve (Fed) lowered its policy rate to near zero. These and other swift federal actions supported fixed-income market liquidity and helped restore investor confidence. Within months most broad U.S. equity markets had regained the ground they had lost. Corporate bonds gained modest ground as well, while government bond performance proved mixed. Despite recurrent waves of COVID-19 infection in the U.S. and much of the rest of the world, the S&P 500® Index reached new heights in early September. After a pre-election pullback, the S&P 500® Index continued to set records throughout November and December. Yields on U.S. Treasuries, particularly longer-term U.S. Treasuries, trended upward late in the period, while yields on Treasury Inflation-Protected Securities (TIPS) were negative. For the 12-month reporting period ended December 31, 2020, the broad U.S. bond market, as measured by the Bloomberg Barclays US Aggregate Bond Index, returned 7.5%. The S&P 500® Index returned 18.4% during the same period.
While market volatility and uncertainty can be unsettling, we believe that having a diversified portfolio and investing plan to rely on can help investors to achieve their long-term goals, even during difficult times. In addition to adding diversification to a portfolio, an allocation to fixed income can provide income and help to manage overall risk. The Schwab Fixed-Income ETFs provide convenient and low-cost options for gaining exposure to different segments of the fixed-income market. Offering access to government and corporate issuers with short-, intermediate- or long-term maturities as well as TIPS, the Schwab Fixed-Income ETFs can serve as part of the core of a diversified portfolio.
Thank you for investing with Charles Schwab Investment Management, and for trusting us to help you achieve your financial goals. For more information about the Schwab Fixed-Income ETFs, please continue reading this report. In addition, you can find further details about these funds by visiting our website at www.schwabfunds.com. We are also happy to hear from you at 1-877-824-5615.
Sincerely,
“ While market volatility and uncertainty can be unsettling, we believe that having a diversified portfolio and investing plan to rely on can help investors to achieve their long-term goals, even during difficult times.”
Past performance is no guarantee of future results.
Diversification and asset allocation strategies do not ensure a profit and cannot protect against losses in a declining market.
Management views may have changed since the report date.
Schwab Fixed-Income ETFs | Annual Report
The Investment Environment
For the 12-month reporting period ended December 31, 2020, U.S. fixed-income markets generated strong returns in a historically volatile year. Up until the final week of February, U.S. and international equity markets rose steadily with several key U.S. market indices hitting recording highs in mid-February. However, beginning in late February, the COVID-19 outbreak wreaked havoc on the global economy, prompting dramatic social distancing restrictions, shuttering businesses, and resulting in a new record for the fastest U.S. market decline with the S&P 500® Index, a bellwether for the overall U.S. stock market, dropping 30% in just 22 trading days in late February and early March. By the end of March, governments and central banks around the world had begun passing extensive emergency rescue and fiscal stimulus measures in an effort to support their economies. The extraordinary response prompted a rally in global equity markets from their market lows, particularly in the U.S. By early September, key U.S. market indices hit new record highs before falling back slightly as COVID-19 infection rates spiked, raising fears of a resurgence as well as the possibility of increased social distancing restrictions and shuttering of businesses. Equity markets generally rose again in November and December fueled by the early stages of a shift in the market towards cyclical sectors, in part as a result of the initial distribution of COVID-19 vaccines in December. Amid this market volatility, bond prices rose on strong demand for most of the reporting period, driving yields down. For the 12-month reporting period, the Bloomberg Barclays US Aggregate Bond Index, representing the broad U.S. bond market, returned 7.51%. The Bloomberg Barclays US 1-5 Year Corporate Bond Index and Bloomberg Barclays US 5-10 Year Corporate Bond Index returned 5.41% and 9.75%, respectively, while the Bloomberg Barclays US Treasury 1-3 Year Index and the Bloomberg Barclays US Treasury 3-10 Year index returned 3.16% and 7.67%, respectively. Over the same period, the Bloomberg Barclays US Treasury Inflation-Linked Bond Index (Series-L)TM returned 10.99%.
Prior to the onset of the COVID-19 pandemic, the U.S. economy, despite ongoing trade tensions with China, maintained steady growth, albeit at a slowing pace. However, amid the fallout of the COVID-19 pandemic, the U.S. entered recessionary territory with record speed. U.S. gross domestic product (GDP) fell steeply, declining at an annualized rate of 5.0% and 31.4% for the first and second quarters of 2020, respectively, with the second quarter representing the largest contraction in U.S. GDP since 1947 when modern GDP measurements began. GDP subsequently jumped by an annualized rate of 33.4% for the third quarter of 2020, reflecting increased consumer demand and business spending. Unemployment remained at record lows through February before a record number of unemployment claims in March resulted in the largest monthly increase in the U.S. unemployment rate since January
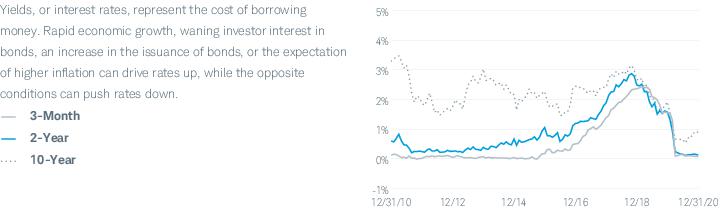
Yields of U.S. Treasury Securities: Effective Yields of Three-Month, Two-Year and 10-Year Treasuries
Index figures assume dividends and distributions were reinvested. Index figures do not include trading and management costs, which would lower performance. Indices are unmanaged and cannot be invested in directly. Performance results less than one year are not annualized. Past performance is not an indication of future results.
For index definitions, please see the Glossary.
Data source: Bloomberg L.P.
Nothing in this report represents a recommendation of a security by the investment adviser.
Management views may have changed since the report date.
Schwab Fixed-Income ETFs | Annual Report
The Investment Environment (continued)
1975. In April, this record was broken again when unemployment skyrocketed, rising to the highest level since the Great Depression. Unemployment declined from May through November, dropping below double digits beginning in August. Unemployment was unchanged from November to December. Consumer confidence remained solid through February, but was volatile over the remainder of the reporting period.
Many central banks around the world, including the U.S. Federal Reserve (Fed), reduced their policy rates over the reporting period, while others maintained low—and for some international central banks, negative—interest rates. In the U.S., after enacting three interest rate cuts in the second half of 2019 and as the economic implications of the COVID-19 pandemic grew, the Fed cut interest rates by 0.50% in early March and by 1.00% in mid-March, resulting in a federal funds rate of 0.00% to 0.25%. In addition, the Fed also announced extensive emergency measures to support the economy in light of the COVID-19 pandemic, including large purchases of U.S. Treasuries and other securities to support smooth market function, facilitating the flow of credit to municipalities, new financing for employers, consumers, and businesses, and the establishment of facilities to support credit to businesses and consumers alike. In August, the Fed announced that it was shifting its interest rate policy approach to potentially allow inflation to rise above its previous 2% target during economic expansions, which would keep interest rates lower for longer. Outside the U.S., central banks were similarly accommodative. The European Central Bank held its policy rate at 0.00%, unchanged since March 2016, and launched a new asset purchase program to help counter the impact of the COVID-19 pandemic. The Bank of Japan upheld its short-term interest rate target of -0.1%, also unchanged since 2016, and increased the annual pace of its purchases of exchange-traded funds (ETFs) and other assets. The Bank of England lowered its key official bank rate from 0.75% to 0.10% in two emergency cuts in March.
Throughout most of the reporting period, bond prices rose on strong demand, driving yields down. (Bond prices and bond yields typically move in opposite directions.) Corporate credit markets were particularly strong. At the end of March 2020, as equity markets plummeted, as investors sought the perceived safety of asset classes such as fixed-income securities, and as the Fed implemented additional rate cuts, demand for U.S. Treasuries soared, driving yields to historic lows. Yields remained near record lows through the remainder of the reporting period. The yield on the 10-year U.S. Treasury fell from 1.92% at the beginning of the reporting period to 0.93% at the end of the reporting period. The yield on the three-month U.S. Treasury fell from 1.55% to 0.09% over the period. Yields trended upward late in the reporting period in anticipation of a new fiscal aid package and hope for economic improvement in 2021. Outside the U.S., bond yields generally remained low.
Schwab Fixed-Income ETFs | Annual Report
 | Matthew Hastings, CFA, Vice President and Head of Taxable Bond Strategies, leads the portfolio management team for Schwab Fixed-Income ETFs and Schwab’s taxable bond funds. He also has overall responsibility for all aspects of the management of the funds. Prior to joining CSIM in 1999, Mr. Hastings was in fixed-income sales and trading at Lehman Brothers. He has worked in the fixed-income securities industry since 1996. |
 | Steven Hung, Senior Portfolio Manager, is responsible for the day-to-day co-management of the Schwab U.S. Aggregate Bond ETF, Schwab 1-5 Year Corporate Bond ETF and Schwab 5-10 Year Corporate Bond ETF. His primary focus is corporate bonds. Prior to joining CSIM in 1999, Mr. Hung was an associate in Schwab’s management training program for nine months. In that role, he worked as a clerk on the options trading floor of the Pacific Coast Stock Exchange. |
 | Mark McKissick, CFA, Senior Portfolio Manager, is responsible for the day-to-day co-management of the Schwab U.S. TIPS ETF, Schwab Short-Term U.S. Treasury ETF, Schwab Intermediate-Term U.S. Treasury ETF, Schwab Long-Term U.S. Treasury ETF and Schwab U.S. Aggregate Bond ETF. Prior to joining CSIM in 2016, Mr. McKissick worked at Denver Investments for 17 years, most recently as a director of fixed income and portfolio manager. In this role he co-managed multiple bond strategies, as well as oversaw the firm’s fixed-income business including the investment process, client service and other administrative functions. |
 | Alfonso Portillo, Jr., Senior Portfolio Manager, is responsible for the day-to-day co-management of the Schwab U.S. Aggregate Bond ETF. His primary focus is securitized products. Prior to joining CSIM in 2007, Mr. Portillo worked for ten years at Pacific Investment Management Company, most recently as a vice president and member of the mortgage- and asset-backed portfolio management team. He has worked in fixed-income asset management since 1996. |
Schwab Fixed-Income ETFs | Annual Report
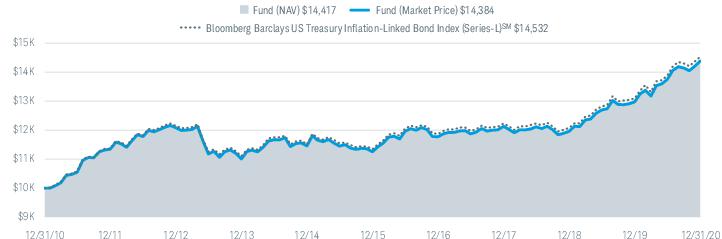
The Schwab U.S. TIPS ETF (the fund) seeks to track as closely as possible, before fees and expenses, the total return of an index composed of inflation-protected U.S. Treasury securities. To pursue this investment objective, the fund generally invests in securities that are included in the Bloomberg Barclays US Treasury Inflation-Linked Bond Index (Series-L)SM (the index). For more information about the fund’s investment objective, strategy, and risks, please see the fund’s prospectus.
Market Highlights. In a tumultuous year marked by the COVID-19 pandemic that sent financial markets reeling, most U.S. bonds posted strong gains. Beginning in late February, the COVID-19 outbreak wreaked havoc on the global economy and sent stock markets into bear-market territory and the U.S. into recession with record speed. By the end of March, U.S. Congress and the U.S. Federal Reserve (Fed) had begun passing extensive emergency rescue and fiscal stimulus measures in an effort to help bolster the economy. The Fed implemented two emergency rate cuts in March, bringing the target range for the federal funds rate to 0.00% to 0.25%, where it remained through the end of the reporting period. U.S. Treasury yields across the board, including yields on U.S. Treasury Inflation-Protected Securities (TIPS), fell to historic lows and prices rose. (Bond yields and bond prices typically move in opposite directions.) The unprecedented stimulus measures raised expectations of future inflation, which drove TIPS to outperform non-inflation-protected securities for the year.
Performance. Over the 12-month reporting period, the fund closely tracked the performance of the index. For the 12 months ended December 31, 2020, the fund’s market price return was 10.86% and its NAV return was 10.94% (for an explanation of market price and NAV returns, please refer to footnote 2 on the following page). The index returned 10.99% during the same period. Differences between the return of the fund and the return of the index may be attributable to, among other things, the operational and transactional costs incurred by the fund and not the index. The fund’s gains came primarily from price appreciation, although coupon income and inflation accrual generated by the fund’s holdings further boosted fund performance.
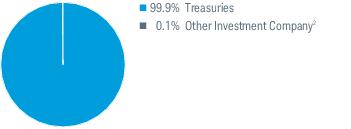
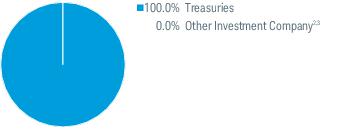
Portfolio Composition % of Investments1
By Security Type
| Weighted Average Maturity4 | 8.1 Yrs |
| Weighted Average Duration4 | 7.6 Yrs |
Management views and portfolio holdings may have changed since the report date.
An index is a statistical composite of a specified financial market or sector. Unlike the fund, an index does not actually hold a portfolio of securities and its return is not inclusive of operational and transaction costs incurred by the fund.
Fixed income securities are subject to increased loss of principal during periods of rising interest rates. An investment in the fund is not insured or guaranteed by the Federal Deposit Insurance Corporation (FDIC) or any other government agency.
TIPS generally have lower yields than conventional fixed rate bonds and will likely decline in price during periods of deflation, which could result in losses.
| 1 | The percentage may differ from the Portfolio Holdings because the above calculation is based on a percentage of total investments, whereas the calculation in the Portfolio Holdings is based on a percentage of net assets. |
| 2 | Includes the fund’s position in money market mutual funds registered under the Investment Company Act of 1940, as amended. |
| 3 | Less than 0.05%. |
| 4 | See Glossary for definitions of maturity and duration. |
Schwab Fixed-Income ETFs | Annual Report
Performance and Fund Facts as of December 31, 2020
The performance data quoted represents past performance. Past performance does not guarantee future results. Investment return and principal value of an investment will fluctuate so that an investor’s shares, when sold or redeemed, may be worth more or less than the original cost. Current performance may be lower or higher than the performance quoted. To obtain performance information current to the most recent month end, please visit www.schwabfunds.com/schwabetfs_prospectus.
Performance of Hypothetical $10,000 Investment (December 31, 2010 – December 31, 2020)1
Average Annual Total Returns1
| Fund and Inception Date | 1 Year | 5 Years | 10 Years |
| Fund: Schwab U.S. TIPS ETF (8/5/2010) | | | |
| Market Price Return2 | 10.86% | 5.03% | 3.70% |
| NAV Return2 | 10.94% | 5.02% | 3.73% |
| Bloomberg Barclays US Treasury Inflation-Linked Bond Index (Series-L)SM | 10.99% | 5.08% | 3.81% |
| ETF Category: Morningstar Inflation-Protected Bond3 | 10.01% | 4.59% | 3.20% |
| Fund Expense Ratio4: 0.05% |
All total returns on this page assume dividends and distributions were reinvested. Index figures do not include trading and management costs, which would lower performance. Indices are unmanaged and cannot be invested in directly. Performance results less than one year are not annualized.
For index definitions, please see the Glossary.
Shares are bought and sold at market price, which may be higher or lower than the net asset value (NAV). Brokerage commissions will reduce returns.
Index ownership — Bloomberg Index Services Limited and its affiliates (collectively, Bloomberg) and Bloomberg’s licensors, including Barclays Bank PLC (Barclays), own all proprietary rights in the Bloomberg Barclays Indices. The fund is not sponsored, endorsed, sold or promoted by Bloomberg or Barclays. Neither Bloomberg nor Barclays endorses or recommends the fund. Neither Bloomberg nor Barclays guarantees the timeliness, accurateness or completeness of any data or information relating to the Bloomberg Barclays Indices, and neither shall be liable in any way in respect of the use or accuracy of the Bloomberg Barclays Indices.
| 1 | Performance does not reflect the deduction of taxes that a shareholder would pay on fund distributions or on the redemption or sale of fund shares. |
| 2 | ETF performance must be shown based on both a Market Price and a Net Asset Value (NAV) basis. The fund’s per share net asset value (NAV) is the value of one share of the fund. NAV is calculated by taking the fund’s total assets (including the market value of securities owned), subtracting liabilities, and dividing by the number of shares outstanding. The NAV Return is based on the NAV of the fund, and the Market Price Return is based on the market price per share of the fund. The price used to calculate market return (Market Price) is determined using the Official Closing Price of the primary stock exchange (generally, 4:00 p.m. Eastern time) and may not represent the returns you would receive if shares were traded at other times. NAV is used as a proxy for purposes of calculating Market Price Return on inception date. Market Price and NAV returns assume that dividends and capital gain distributions have been reinvested in the fund at Market Price and NAV, respectively. |
| 3 | Source for category information: Morningstar, Inc. The Morningstar Category return represents all passively- and actively-managed ETFs within the category as of the report date. |
| 4 | As stated in the prospectus. |
Schwab Fixed-Income ETFs | Annual Report
Schwab Short-Term U.S. Treasury ETF
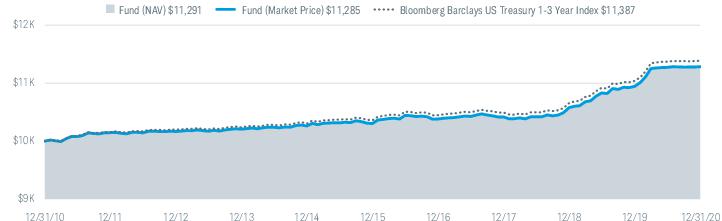
The Schwab Short-Term U.S. Treasury ETF (the fund) seeks to track as closely as possible, before fees and expenses, the total return of an index that measures the performance of the short-term U.S. Treasury bond market. To pursue this investment objective, the fund generally invests in a representative sample of securities in the Bloomberg Barclays US Treasury 1-3 Year Index (the index). For more information about the fund’s investment objective, strategy, and risks, please see the fund’s prospectus.
Market Highlights. In a tumultuous year marked by the COVID-19 pandemic that sent financial markets reeling, most U.S. bonds posted strong gains. The strongest performance came from longer-term corporate bond markets and longer-term U.S. Treasuries, although shorter-term U.S. Treasuries, Treasury Inflation-Protected Securities (TIPS), and government and asset-backed securities all posted solid gains. Beginning in late February, the COVID-19 outbreak wreaked havoc on the global economy and sent stock markets into bear-market territory and the U.S. into recession with record speed. By the end of March, U.S. Congress and the U.S. Federal Reserve (Fed) had begun passing extensive emergency rescue and fiscal stimulus measures in an effort to help bolster the economy. The Fed implemented two emergency rate cuts in March, bringing the target range for the federal funds rate to 0.00% to 0.25%, where it remained through the end of the reporting period.
Yields on short-term U.S. Treasuries fell steeply in March and prices rose. (Bond yields and bond prices typically move in opposite directions.) Yields generally remained low through the end of the reporting period. The yield on the one-year U.S. Treasury bill, which began the year at 1.59%, ended the reporting period at 0.10%, just off its low of 0.09% a week earlier. The yield on the two-year U.S. Treasury note fell from 1.58% to 0.13% over the reporting period. Similarly, the yield on the three-year U.S. Treasury note fell from 1.62% to 0.17%. The spread between the one-year and three-year yields widened slightly over the reporting period, from 0.03% at the beginning of the reporting period to 0.07% at the end of the reporting period.
Performance. Over the 12-month reporting period, the fund closely tracked the performance of the index. For the 12 months ended December 31, 2020, the fund’s market price return and NAV return were 3.11% (for an explanation of market price and NAV returns, please refer to footnote 2 on the following page). The index returned 3.16% during the same period. Differences between the return of the fund and the return of the index may be attributable to, among other things, the operational and transactional costs incurred by the fund and not the index. The fund’s gains came primarily from coupon income generated by the fund’s holdings, with price appreciation further boosting the fund’s return.
Portfolio Composition % of Investments1
By Security Type
| Weighted Average Maturity3 | 2.0 Yrs |
| Weighted Average Duration3 | 2.0 Yrs |
Management views and portfolio holdings may have changed since the report date.
An index is a statistical composite of a specified financial market or sector. Unlike the fund, an index does not actually hold a portfolio of securities and its return is not inclusive of operational and transaction costs incurred by the fund.
Fixed income securities are subject to increased loss of principal during periods of rising interest rates. An investment in the fund is not insured or guaranteed by the Federal Deposit Insurance Corporation (FDIC) or any other government agency.
| 1 | The percentage may differ from the Portfolio Holdings because the above calculation is based on a percentage of total investments, whereas the calculation in the Portfolio Holdings is based on a percentage of net assets. |
| 2 | Includes the fund’s position in money market mutual funds registered under the Investment Company Act of 1940, as amended. |
| 3 | See Glossary for definitions of maturity and duration. |
Schwab Fixed-Income ETFs | Annual Report
Schwab Short-Term U.S. Treasury ETF
Performance and Fund Facts as of December 31, 2020
The performance data quoted represents past performance. Past performance does not guarantee future results. Investment return and principal value of an investment will fluctuate so that an investor’s shares, when sold or redeemed, may be worth more or less than the original cost. Current performance may be lower or higher than the performance quoted. To obtain performance information current to the most recent month end, please visit www.schwabfunds.com/schwabetfs_prospectus.
Performance of Hypothetical $10,000 Investment (December 31, 2010 – December 31, 2020)1
Average Annual Total Returns1
| Fund and Inception Date | 1 Year | 5 Years | 10 Years |
| Fund: Schwab Short-Term U.S. Treasury ETF (8/5/2010) | | | |
| Market Price Return2 | 3.11% | 1.84% | 1.22% |
| NAV Return2 | 3.11% | 1.84% | 1.22% |
| Bloomberg Barclays US Treasury 1-3 Year Index | 3.16% | 1.91% | 1.31% |
| ETF Category: Morningstar Short Government3 | 3.11% | 1.74% | 1.27% |
| Fund Expense Ratio4: 0.05% |
All total returns on this page assume dividends and distributions were reinvested. Index figures do not include trading and management costs, which would lower performance. Indices are unmanaged and cannot be invested in directly. Performance results less than one year are not annualized.
For index definitions, please see the Glossary.
Shares are bought and sold at market price, which may be higher or lower than the net asset value (NAV). Brokerage commissions will reduce returns.
Index ownership — Bloomberg Index Services Limited and its affiliates (collectively, Bloomberg) and Bloomberg’s licensors, including Barclays Bank PLC (Barclays), own all proprietary rights in the Bloomberg Barclays Indices. The fund is not sponsored, endorsed, sold or promoted by Bloomberg or Barclays. Neither Bloomberg nor Barclays endorses or recommends the fund. Neither Bloomberg nor Barclays guarantees the timeliness, accurateness or completeness of any data or information relating to the Bloomberg Barclays Indices, and neither shall be liable in any way in respect of the use or accuracy of the Bloomberg Barclays Indices.
| 1 | Performance does not reflect the deduction of taxes that a shareholder would pay on fund distributions or on the redemption or sale of fund shares. |
| 2 | ETF performance must be shown based on both a Market Price and a Net Asset Value (NAV) basis. The fund’s per share net asset value (NAV) is the value of one share of the fund. NAV is calculated by taking the fund’s total assets (including the market value of securities owned), subtracting liabilities, and dividing by the number of shares outstanding. The NAV Return is based on the NAV of the fund, and the Market Price Return is based on the market price per share of the fund. The price used to calculate market return (Market Price) is determined using the Official Closing Price of the primary stock exchange (generally, 4:00 p.m. Eastern time) and may not represent the returns you would receive if shares were traded at other times. NAV is used as a proxy for purposes of calculating Market Price Return on inception date. Market Price and NAV returns assume that dividends and capital gain distributions have been reinvested in the fund at Market Price and NAV, respectively. |
| 3 | Source for category information: Morningstar, Inc. The Morningstar Category return represents all passively- and actively-managed ETFs within the category as of the report date. |
| 4 | As stated in the prospectus. |
Schwab Fixed-Income ETFs | Annual Report
Schwab Intermediate-Term U.S. Treasury ETF
The Schwab Intermediate-Term U.S. Treasury ETF (the fund) seeks to track as closely as possible, before fees and expenses, the total return of an index that measures the performance of the intermediate-term U.S. Treasury bond market. To pursue this investment objective, the fund generally invests in a representative sample of securities included in the Bloomberg Barclays US Treasury 3-10 Year Index (the index). For more information about the fund’s investment objective, strategy, and risks, please see the fund’s prospectus.
Market Highlights. In a tumultuous year marked by the COVID-19 pandemic that sent financial markets reeling, most U.S. bonds posted strong gains. The strongest performance came from longer-term corporate bond markets and longer-term U.S. Treasuries, although shorter-term U.S. Treasuries, Treasury Inflation-Protected Securities (TIPS), and government and asset-backed securities all posted solid gains. Beginning in late February, the COVID-19 outbreak wreaked havoc on the global economy and sent stock markets into bear-market territory and the U.S. into recession with record speed. By the end of March, U.S. Congress and the U.S. Federal Reserve (Fed) had begun passing extensive emergency rescue and fiscal stimulus measures in an effort to help bolster the economy. The Fed implemented two emergency rate cuts in March, bringing the target range for the federal funds rate to 0.00% to 0.25%, where it remained through the end of the reporting period.
Yields on intermediate-term U.S. Treasuries fell steeply in March and prices rose. (Bond yields and bond prices typically move in opposite directions.) Yields generally remained low throughout the reporting period, although yields on intermediate-term securities rose modestly by the end of the year in anticipation of a new fiscal aid package that passed in late December, coupled with the initial distribution of a COVID-19 vaccine in December and hope for economic improvement in 2021. The yield on the three-year U.S. Treasury note, which began the year at 1.62%, ended the reporting period at 0.17%, up slightly from its low of 0.10% in August. The yield on the five-year U.S. Treasury note fell from 1.69% to 0.36% over the reporting period, up from its low of 0.19% in August. The yield on the 10-year U.S. Treasury note fell from 1.92% to 0.93%, up from its low of 0.52% in August.
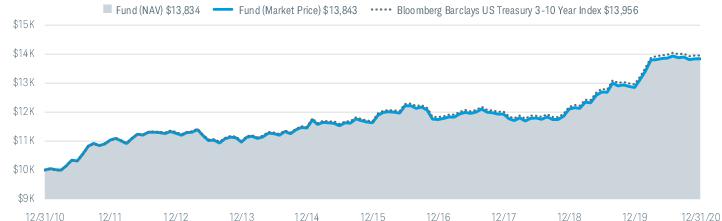
Performance. Over the 12-month reporting period, the fund closely tracked the performance of the index. For the 12 months ended December 31, 2020, the fund’s market price return was 7.72% and its NAV return was 7.62% (for an explanation of market price and NAV returns, please refer to footnote 2 on the following page). The index returned 7.67% during the same period. The fund’s gains came primarily from price appreciation, although coupon income generated by the fund’s holdings further boosted fund performance.
Portfolio Composition % of Investments1
By Security Type
| Weighted Average Maturity3 | 5.6 Yrs |
| Weighted Average Duration3 | 5.3 Yrs |
Management views and portfolio holdings may have changed since the report date.
An index is a statistical composite of a specified financial market or sector. Unlike the fund, an index does not actually hold a portfolio of securities and its return is not inclusive of operational and transaction costs incurred by the fund.
Fixed income securities are subject to increased loss of principal during periods of rising interest rates. An investment in the fund is not insured or guaranteed by the Federal Deposit Insurance Corporation (FDIC) or any other government agency.
| 1 | The percentage may differ from the Portfolio Holdings because the above calculation is based on a percentage of total investments, whereas the calculation in the Portfolio Holdings is based on a percentage of net assets. |
| 2 | Includes the fund’s position in money market mutual funds registered under the Investment Company Act of 1940, as amended. |
| 3 | See Glossary for definitions of maturity and duration. |
Schwab Fixed-Income ETFs | Annual Report
Schwab Intermediate-Term U.S. Treasury ETF
Performance and Fund Facts as of December 31, 2020
The performance data quoted represents past performance. Past performance does not guarantee future results. Investment return and principal value of an investment will fluctuate so that an investor’s shares, when sold or redeemed, may be worth more or less than the original cost. Current performance may be lower or higher than the performance quoted. To obtain performance information current to the most recent month end, please visit www.schwabfunds.com/schwabetfs_prospectus.
Performance of Hypothetical $10,000 Investment (December 31, 2010 – December 31, 2020)1
Average Annual Total Returns1
| Fund and Inception Date | 1 Year | 5 Years | 10 Years |
| Fund: Schwab Intermediate-Term U.S. Treasury ETF (8/5/2010) | | | |
| Market Price Return2 | 7.72% | 3.54% | 3.31% |
| NAV Return2 | 7.62% | 3.56% | 3.30% |
| Bloomberg Barclays US Treasury 3-10 Year Index | 7.67% | 3.63% | 3.39% |
| ETF Category: Morningstar Intermediate Government3 | 5.65% | 2.88% | 2.70% |
| Fund Expense Ratio4: 0.05% |
All total returns on this page assume dividends and distributions were reinvested. Index figures do not include trading and management costs, which would lower performance. Indices are unmanaged and cannot be invested in directly. Performance results less than one year are not annualized.
For index definitions, please see the Glossary.
Shares are bought and sold at market price, which may be higher or lower than the net asset value (NAV). Brokerage commissions will reduce returns.
Index ownership — Bloomberg Index Services Limited and its affiliates (collectively, Bloomberg) and Bloomberg’s licensors, including Barclays Bank PLC (Barclays), own all proprietary rights in the Bloomberg Barclays Indices. The fund is not sponsored, endorsed, sold or promoted by Bloomberg or Barclays. Neither Bloomberg nor Barclays endorses or recommends the fund. Neither Bloomberg nor Barclays guarantees the timeliness, accurateness or completeness of any data or information relating to the Bloomberg Barclays Indices, and neither shall be liable in any way in respect of the use or accuracy of the Bloomberg Barclays Indices.
| 1 | Performance does not reflect the deduction of taxes that a shareholder would pay on fund distributions or on the redemption or sale of fund shares. |
| 2 | ETF performance must be shown based on both a Market Price and a Net Asset Value (NAV) basis. The fund’s per share net asset value (NAV) is the value of one share of the fund. NAV is calculated by taking the fund’s total assets (including the market value of securities owned), subtracting liabilities, and dividing by the number of shares outstanding. The NAV Return is based on the NAV of the fund, and the Market Price Return is based on the market price per share of the fund. The price used to calculate market return (Market Price) is determined using the Official Closing Price of the primary stock exchange (generally, 4:00 p.m. Eastern time) and may not represent the returns you would receive if shares were traded at other times. NAV is used as a proxy for purposes of calculating Market Price Return on inception date. Market Price and NAV returns assume that dividends and capital gain distributions have been reinvested in the fund at Market Price and NAV, respectively. |
| 3 | Source for category information: Morningstar, Inc. The Morningstar Category return represents all passively- and actively-managed ETFs within the category as of the report date. |
| 4 | As stated in the prospectus. |
Schwab Fixed-Income ETFs | Annual Report
Schwab Long-Term U.S. Treasury ETF
The Schwab Long-Term U.S. Treasury ETF (the fund) seeks to track as closely as possible, before fees and expenses, the total return of an index that measures the performance of the long-term U.S. Treasury bond market. To pursue this investment objective, the fund generally invests in securities that are included in the Bloomberg Barclays US Long Treasury Index (the index). For more information about the fund’s investment objective, strategy, and risks, please see the fund’s prospectus.
Market Highlights. In a tumultuous year marked by the COVID-19 pandemic that sent financial markets reeling, most U.S. bonds posted strong gains. The strongest performance came from longer-term corporate bond markets and longer-term U.S. Treasuries, although shorter-term U.S. Treasuries, Treasury Inflation-Protected Securities (TIPS), and government and asset-backed securities all posted solid gains. Beginning in late February, the COVID-19 outbreak wreaked havoc on the global economy and sent stock markets into bear-market territory and the U.S. into recession with record speed. By the end of March, U.S. Congress and the U.S. Federal Reserve (Fed) had begun passing extensive emergency rescue and fiscal stimulus measures in an effort to help bolster the economy. The Fed implemented two emergency rate cuts in March, bringing the target range for the federal funds rate to 0.00% to 0.25%, where it remained through the end of the reporting period.
Yields on longer-term U.S. Treasuries fell steeply in March and prices rose. (Bond yields and bond prices typically move in opposite directions.) Yields generally remained low throughout the reporting period, although yields on longer-term securities gained momentum toward the end of the year in anticipation of a new fiscal aid package that passed in late December, coupled with the initial distribution of a COVID-19 vaccine in December and hope for economic improvement in 2021. The yield on the 10-year U.S. Treasury note, which began the year at 1.92%, ended the reporting period at 0.93%, up from its low of 0.52% in August. The yield on the 30-year U.S. Treasury bond began the year at 2.39% and ended the reporting period at 1.65%, up from its low of 0.99% in March.
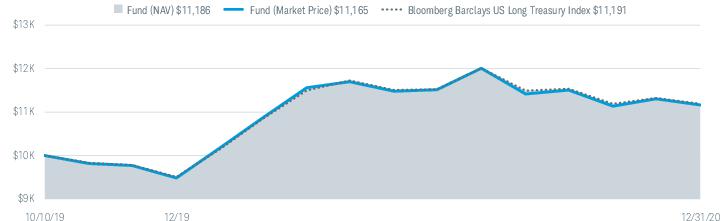
Performance. Over the 12-month reporting period, the fund closely tracked the performance of the index. For the 12 months ended December 31, 2020, the fund’s market price return was 17.72% and its NAV return was 17.64% (for an explanation of market price and NAV returns, please refer to footnote 2 on the following page). The index returned 17.70% during the same period. The fund’s gains came primarily from price appreciation, although coupon income generated by the fund’s holdings further boosted fund performance.
Portfolio Composition % of Investments1
By Security Type
| Weighted Average Maturity4 | 24.5 Yrs |
| Weighted Average Duration4 | 18.3 Yrs |
Management views and portfolio holdings may have changed since the report date.
An index is a statistical composite of a specified financial market or sector. Unlike the fund, an index does not actually hold a portfolio of securities and its return is not inclusive of operational and transaction costs incurred by the fund.
Fixed income securities are subject to increased loss of principal during periods of rising interest rates. An investment in the fund is not insured or guaranteed by the Federal Deposit Insurance Corporation (FDIC) or any other government agency.
| 1 | The percentage may differ from the Portfolio Holdings because the above calculation is based on a percentage of total investments, whereas the calculation in the Portfolio Holdings is based on a percentage of net assets. |
| 2 | Includes the fund’s position in money market mutual funds registered under the Investment Company Act of 1940, as amended. |
| 3 | Less than 0.05%. |
| 4 | See Glossary for definitions of maturity and duration. |
Schwab Fixed-Income ETFs | Annual Report
Schwab Long-Term U.S. Treasury ETF
Performance and Fund Facts as of December 31, 2020
The performance data quoted represents past performance. Past performance does not guarantee future results. Investment return and principal value of an investment will fluctuate so that an investor’s shares, when sold or redeemed, may be worth more or less than the original cost. Current performance may be lower or higher than the performance quoted. To obtain performance information current to the most recent month end, please visit www.schwabfunds.com/schwabetfs_prospectus.
Performance of Hypothetical $10,000 Investment (October 10, 2019 – December 31, 2020)1
Average Annual Total Returns1
| Fund and Inception Date | 1 Year | Since Inception* |
| Fund: Schwab Long-Term U.S. Treasury ETF (10/10/2019) | | |
| Market Price Return2 | 17.72% | 9.40% |
| NAV Return2 | 17.64% | 9.56% |
| Bloomberg Barclays US Long Treasury Index | 17.70% | 9.59% |
| ETF Category: Morningstar Long Government3 | 17.48% | N/A |
| Fund Expense Ratio4: 0.05% |
All total returns on this page assume dividends and distributions were reinvested. Index figures do not include trading and management costs, which would lower performance. Indices are unmanaged and cannot be invested in directly. Performance results less than one year are not annualized.
For index definitions, please see the Glossary.
Shares are bought and sold at market price, which may be higher or lower than the net asset value (NAV). Brokerage commissions will reduce returns.
Index ownership — Bloomberg Index Services Limited and its affiliates (collectively, Bloomberg) and Bloomberg’s licensors, including Barclays Bank PLC (Barclays), own all proprietary rights in the Bloomberg Barclays Indices. The fund is not sponsored, endorsed, sold or promoted by Bloomberg or Barclays. Neither Bloomberg nor Barclays endorses or recommends the fund. Neither Bloomberg nor Barclays guarantees the timeliness, accurateness or completeness of any data or information relating to the Bloomberg Barclays Indices, and neither shall be liable in any way in respect of the use or accuracy of the Bloomberg Barclays Indices.
| * | Inception (10/10/19) represents the date that the shares began trading in the secondary market. |
| 1 | Performance does not reflect the deduction of taxes that a shareholder would pay on fund distributions or on the redemption or sale of fund shares. |
| 2 | ETF performance must be shown based on both a Market Price and a Net Asset Value (NAV) basis. The fund’s per share net asset value (NAV) is the value of one share of the fund. NAV is calculated by taking the fund’s total assets (including the market value of securities owned), subtracting liabilities, and dividing by the number of shares outstanding. The NAV Return is based on the NAV of the fund, and the Market Price Return is based on the market price per share of the fund. The price used to calculate market return (Market Price) is determined using the Official Closing Price of the primary stock exchange (generally, 4:00 p.m. Eastern time) and may not represent the returns you would receive if shares were traded at other times. NAV is used as a proxy for purposes of calculating Market Price Return on inception date. Market Price and NAV returns assume that dividends and capital gain distributions have been reinvested in the fund at Market Price and NAV, respectively. |
| 3 | Source for category information: Morningstar, Inc. The Morningstar Category return represents all passively- and actively-managed ETFs within the category as of the report date. |
| 4 | As stated in the prospectus. |
Schwab Fixed-Income ETFs | Annual Report
Schwab U.S. Aggregate Bond ETF
The Schwab U.S. Aggregate Bond ETF (the fund) seeks to track as closely as possible, before fees and expenses, the total return of an index that measures the performance of the broad U.S. investment-grade bond market. To pursue this investment objective, the fund generally invests in a representative sample of securities included in the Bloomberg Barclays US Aggregate Bond Index (the index). In addition, for the 12-month reporting period ended December 31, 2020, the fund also held positions in TBAs, or “to be announced” securities. TBAs are mortgage-backed bonds that settle on a forward date and are used to gain exposure to the mortgage market. The average month-end position in these securities was 1.8% of the fund, with a minimum exposure of 0.8% and a maximum exposure of 3.7%. For more information about the fund’s investment objective, strategy, and risks, please see the fund’s prospectus.
Market Highlights. In a tumultuous year marked by the COVID-19 pandemic that sent financial markets reeling, most U.S. bonds posted strong gains. The strongest performance came from longer-term corporate bond markets and longer-term U.S. Treasuries, although shorter-term U.S. Treasuries, Treasury Inflation-Protected Securities (TIPS), and government and asset-backed securities all posted solid gains. Beginning in late February, the COVID-19 outbreak wreaked havoc on the global economy and sent stock markets into bear-market territory and the U.S. into recession with record speed. By the end of March, U.S. Congress and the U.S. Federal Reserve (Fed) had begun passing extensive emergency rescue and fiscal stimulus measures in an effort to help bolster the economy. The Fed implemented two emergency rate cuts in March, bringing the target range for the federal funds rate to 0.00% to 0.25%, where it remained through the end of the reporting period.
Throughout most of the reporting period, bond prices rose on strong demand, driving yields down. (Bond yields and bond prices typically move in opposite directions.) Demand for U.S. Treasuries spiked in March, driving yields to historic lows. Yields trended upward toward the end of the year in anticipation of a new fiscal aid package that passed in late December, coupled with the initial distribution of a COVID-19 vaccine in December and hope for economic improvement in 2021. The corporate bond market experienced an increase in supply as companies took advantage of the low interest rate environment to refinance existing debt or issue new debt, driving prices higher. Over the reporting period, the yield on the three-month U.S. Treasury bill fell from 1.55% to 0.09%, the yield on the 10-year U.S. Treasury note fell from 1.92% to 0.93%, and the yield on the 30-year U.S. Treasury bond fell from 2.39% to 1.65%.
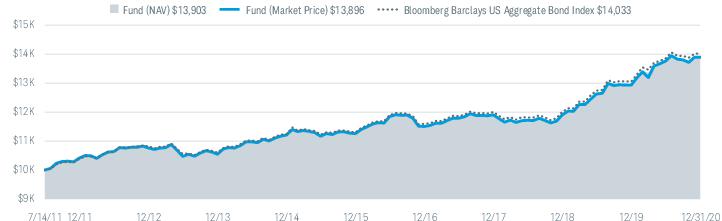
Performance. Over the 12-month reporting period, the fund closely tracked the performance of the index, which meant keeping the fund’s credit quality, duration, and sector allocations aligned to the index. For the 12 months ended December 31, 2020, the fund’s market price return was 7.46% and its NAV return were 7.50% (for an explanation of market price and NAV returns, please refer to footnote 2 on the following page). The index returned 7.51% during the same period. Differences between the return of the fund and the return of the index may be attributable to, among other things, the operational and transactional costs incurred by the fund and not the index. The fund’s gains came primarily from price appreciation, although coupon income generated by the fund’s holdings further boosted fund performance.
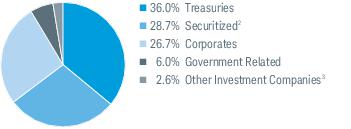
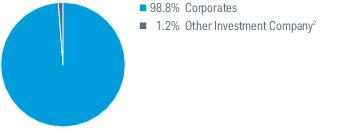
Portfolio Composition % of Investments1
By Security Type
| Weighted Average Maturity4 | 8.1 Yrs |
| Weighted Average Duration4 | 6.3 Yrs |
Management views and portfolio holdings may have changed since the report date.
An index is a statistical composite of a specified financial market or sector. Unlike the fund, an index does not actually hold a portfolio of securities and its return is not inclusive of operational and transaction costs incurred by the fund.
Fixed income securities are subject to increased loss of principal during periods of rising interest rates. An investment in the fund is not insured or guaranteed by the Federal Deposit Insurance Corporation (FDIC) or any other government agency.
| 1 | The percentage may differ from the Portfolio Holdings because the above calculation is based on a percentage of total investments, whereas the calculation in the Portfolio Holdings is based on a percentage of net assets. |
| 2 | The fund may seek to obtain exposure to U.S. agency mortgage pass-through securities, in part or in full, through the use of “to-be-announced” or “TBA” transactions, which are standardized contracts for future delivery of mortgage pass-through securities in which the exact mortgage pools to be delivered are not specified until a few days prior to settlement. These transactions represented approximately 1.3% of total investments on December 31, 2020. |
| 3 | Includes the fund’s position in money market mutual funds registered under the Investment Company Act of 1940, as amended. |
| 4 | See Glossary for definitions of maturity and duration. |
Schwab Fixed-Income ETFs | Annual Report
Schwab U.S. Aggregate Bond ETF
Performance and Fund Facts as of December 31, 2020
The performance data quoted represents past performance. Past performance does not guarantee future results. Investment return and principal value of an investment will fluctuate so that an investor’s shares, when sold or redeemed, may be worth more or less than the original cost. Current performance may be lower or higher than the performance quoted. To obtain performance information current to the most recent month end, please visit www.schwabfunds.com/schwabetfs_prospectus.
Performance of Hypothetical $10,000 Investment (July 14, 2011 – December 31, 2020)1
Average Annual Total Returns1
| Fund and Inception Date | 1 Year | 5 Years | Since Inception* |
| Fund: Schwab U.S. Aggregate Bond ETF (7/14/2011) | | | |
| Market Price Return2 | 7.46% | 4.31% | 3.54% |
| NAV Return2 | 7.50% | 4.35% | 3.54% |
| Bloomberg Barclays US Aggregate Bond Index | 7.51% | 4.44% | 3.64% |
| ETF Category: Morningstar Intermediate Core Bond3 | 7.52% | 4.26% | N/A |
| Fund Expense Ratio4: 0.04% |
All total returns on this page assume dividends and distributions were reinvested. Index figures do not include trading and management costs, which would lower performance. Indices are unmanaged and cannot be invested in directly. Performance results less than one year are not annualized.
For index definitions, please see the Glossary.
Shares are bought and sold at market price, which may be higher or lower than the net asset value (NAV). Brokerage commissions will reduce returns.
Index ownership — Bloomberg Index Services Limited and its affiliates (collectively, Bloomberg) and Bloomberg’s licensors, including Barclays Bank PLC (Barclays), own all proprietary rights in the Bloomberg Barclays Indices. The fund is not sponsored, endorsed, sold or promoted by Bloomberg or Barclays. Neither Bloomberg nor Barclays endorses or recommends the fund. Neither Bloomberg nor Barclays guarantees the timeliness, accurateness or completeness of any data or information relating to the Bloomberg Barclays Indices, and neither shall be liable in any way in respect of the use or accuracy of the Bloomberg Barclays Indices.
| * | Inception (7/14/11) represents the date that the shares began trading in the secondary market. |
| 1 | Performance does not reflect the deduction of taxes that a shareholder would pay on fund distributions or on the redemption or sale of fund shares. |
| 2 | ETF performance must be shown based on both a Market Price and a Net Asset Value (NAV) basis. The fund’s per share net asset value (NAV) is the value of one share of the fund. NAV is calculated by taking the fund’s total assets (including the market value of securities owned), subtracting liabilities, and dividing by the number of shares outstanding. The NAV Return is based on the NAV of the fund, and the Market Price Return is based on the market price per share of the fund. The price used to calculate market return (Market Price) is determined using the Official Closing Price of the primary stock exchange (generally, 4:00 p.m. Eastern time) and may not represent the returns you would receive if shares were traded at other times. NAV is used as a proxy for purposes of calculating Market Price Return on inception date. Market Price and NAV returns assume that dividends and capital gain distributions have been reinvested in the fund at Market Price and NAV, respectively. |
| 3 | Source for category information: Morningstar, Inc. The Morningstar Category return represents all passively- and actively-managed ETFs within the category as of the report date. |
| 4 | As stated in the prospectus. |
Schwab Fixed-Income ETFs | Annual Report
Schwab 1-5 Year Corporate Bond ETF
The Schwab 1-5 Year Corporate Bond ETF (the fund) seeks to track as closely as possible, before fees and expenses, the total return of an index that measures the performance of the short-term U.S. corporate bond market. To pursue this investment objective, the fund generally invests in a representative sample of securities included in the Bloomberg Barclays US 1-5 Year Corporate Bond Index (the index). For more information about the fund’s investment objective, strategy, and risks, please see the fund’s prospectus.
Market Highlights. In a tumultuous year marked by the COVID-19 pandemic that sent financial markets reeling, most U.S. bonds posted strong gains. The strongest performance came from longer-term corporate bond markets and longer-term U.S. Treasuries, although shorter-term U.S. Treasuries, Treasury Inflation-Protected Securities (TIPS), and government and asset-backed securities all posted solid gains. Beginning in late February, the COVID-19 outbreak wreaked havoc on the global economy and sent stock markets into bear-market territory and the U.S. into recession with record speed. By the end of March, U.S. Congress and the U.S. Federal Reserve (Fed) had begun passing extensive emergency rescue and fiscal stimulus measures in an effort to help bolster the economy. The Fed implemented two emergency rate cuts in March, bringing the target range for the federal funds rate to 0.00% to 0.25%, where it remained through the end of the reporting period.
Yields on U.S. Treasuries fell steeply in early March, while yields on U.S. corporate bonds fell steeply in late March, and prices rose. (Bond yields and bond prices typically move in opposite directions.) Yields generally remained low throughout the reporting period, although yields trended upward toward the end of the year in anticipation of a new fiscal aid package that passed in late December, coupled with the initial distribution of a COVID-19 vaccine in December and hope for economic improvement in 2021. The corporate bond market experienced an increase in supply as companies took advantage of the low interest rate environment to refinance existing debt or issue new debt, driving prices higher. Credit spreads between shorter-term corporate bonds and U.S. Treasuries tightened slightly over the year.
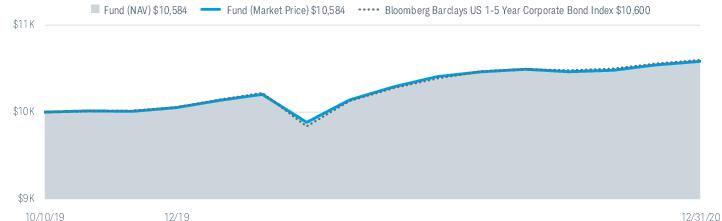
Performance. Over the 12-month reporting period, the fund closely tracked the performance of the index. For the 12 months ended December 31, 2020, the fund’s market price return was 5.29% and its NAV return was 5.31% (for an explanation of market price and NAV returns, please refer to footnote 2 on the following page). The index returned 5.41% during the same period. Differences between the return of the fund and the return of the index may be attributable to, among other things, the operational and transactional costs incurred by the fund and not the index. The fund’s gains came primarily from coupon income generated by the fund’s holdings, with price appreciation further boosting the fund’s return.
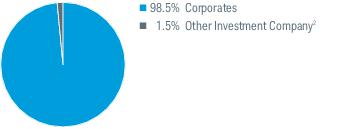
Portfolio Composition % of Investments1
By Security Type
| Weighted Average Maturity3 | 2.9 Yrs |
| Weighted Average Duration3 | 2.8 Yrs |
Management views and portfolio holdings may have changed since the report date.
An index is a statistical composite of a specified financial market or sector. Unlike the fund, an index does not actually hold a portfolio of securities and its return is not inclusive of operational and transaction costs incurred by the fund.
Fixed income securities are subject to increased loss of principal during periods of rising interest rates. An investment in the fund is not insured or guaranteed by the Federal Deposit Insurance Corporation (FDIC) or any other government agency.
| 1 | The percentage may differ from the Portfolio Holdings because the above calculation is based on a percentage of total investments, excluding derivatives, whereas the calculation in the Portfolio Holdings is based on a percentage of net assets. |
| 2 | Includes the fund’s position in money market mutual funds registered under the Investment Company Act of 1940, as amended. |
| 3 | See Glossary for definitions of maturity and duration. |
Schwab Fixed-Income ETFs | Annual Report
Schwab 1-5 Year Corporate Bond ETF
Performance and Fund Facts as of December 31, 2020
The performance data quoted represents past performance. Past performance does not guarantee future results. Investment return and principal value of an investment will fluctuate so that an investor’s shares, when sold or redeemed, may be worth more or less than the original cost. Current performance may be lower or higher than the performance quoted. To obtain performance information current to the most recent month end, please visit www.schwabfunds.com/schwabetfs_prospectus.
Performance of Hypothetical $10,000 Investment (October 10, 2019 – December 31, 2020)1
Average Annual Total Returns1
| Fund and Inception Date | 1 Year | Since Inception* |
| Fund: Schwab 1-5 Year Corporate Bond ETF (10/10/2019) | | |
| Market Price Return2 | 5.29% | 4.73% |
| NAV Return2 | 5.31% | 4.74% |
| Bloomberg Barclays US 1-5 Year Corporate Bond Index | 5.41% | 4.86% |
| ETF Category: Morningstar Short-Term Bond3 | 3.81% | N/A |
| Fund Expense Ratio4: 0.05% |
All total returns on this page assume dividends and distributions were reinvested. Index figures do not include trading and management costs, which would lower performance. Indices are unmanaged and cannot be invested in directly. Performance results less than one year are not annualized.
For index definitions, please see the Glossary.
Shares are bought and sold at market price, which may be higher or lower than the net asset value (NAV). Brokerage commissions will reduce returns.
Index ownership — Bloomberg Index Services Limited and its affiliates (collectively, Bloomberg) and Bloomberg’s licensors, including Barclays Bank PLC (Barclays), own all proprietary rights in the Bloomberg Barclays Indices. The fund is not sponsored, endorsed, sold or promoted by Bloomberg or Barclays. Neither Bloomberg nor Barclays endorses or recommends the fund. Neither Bloomberg nor Barclays guarantees the timeliness, accurateness or completeness of any data or information relating to the Bloomberg Barclays Indices, and neither shall be liable in any way in respect of the use or accuracy of the Bloomberg Barclays Indices.
| * | Inception (10/10/19) represents the date that the shares began trading in the secondary market. |
| 1 | Performance does not reflect the deduction of taxes that a shareholder would pay on fund distributions or on the redemption or sale of fund shares. |
| 2 | ETF performance must be shown based on both a Market Price and a Net Asset Value (NAV) basis. The fund’s per share net asset value (NAV) is the value of one share of the fund. NAV is calculated by taking the fund’s total assets (including the market value of securities owned), subtracting liabilities, and dividing by the number of shares outstanding. The NAV Return is based on the NAV of the fund, and the Market Price Return is based on the market price per share of the fund. The price used to calculate market return (Market Price) is determined using the Official Closing Price of the primary stock exchange (generally, 4:00 p.m. Eastern time) and may not represent the returns you would receive if shares were traded at other times. NAV is used as a proxy for purposes of calculating Market Price Return on inception date. Market Price and NAV returns assume that dividends and capital gain distributions have been reinvested in the fund at Market Price and NAV, respectively. |
| 3 | Source for category information: Morningstar, Inc. The Morningstar Category return represents all passively- and actively-managed ETFs within the category as of the report date. |
| 4 | As stated in the prospectus. |
Schwab Fixed-Income ETFs | Annual Report
Schwab 5-10 Year Corporate Bond ETF
The Schwab 5-10 Year Corporate Bond ETF (the fund) seeks to track as closely as possible, before fees and expenses, the total return of an index that measures the performance of the intermediate-term U.S. corporate bond market. To pursue this investment objective, the fund generally invests in a representative sample of securities included in the Bloomberg Barclays US 5-10 Year Corporate Bond Index (the index). For more information about the fund’s investment objective, strategy, and risks, please see the fund’s prospectus.
Market Highlights. In a tumultuous year marked by the COVID-19 pandemic that sent financial markets reeling, most U.S. bonds posted strong gains. The strongest performance came from longer-term corporate bond markets and longer-term U.S. Treasuries, although shorter-term U.S. Treasuries, Treasury Inflation-Protected Securities (TIPS), and government and asset-backed securities all posted solid gains. Beginning in late February, the COVID-19 outbreak wreaked havoc on the global economy and sent stock markets into bear-market territory and the U.S. into recession with record speed. By the end of March, U.S. Congress and the U.S. Federal Reserve (Fed) had begun passing extensive emergency rescue and fiscal stimulus measures in an effort to help bolster the economy. The Fed implemented two emergency rate cuts in March, bringing the target range for the federal funds rate to 0.00% to 0.25%, where it remained through the end of the reporting period.
Yields on U.S. Treasuries fell steeply in early March, while yields on U.S. corporate bonds fell steeply in late March, and prices rose. (Bond yields and bond prices typically move in opposite directions.) Yields generally remained low throughout the reporting period, although yields trended upward toward the end of the year in anticipation of a new fiscal aid package that passed in late December, coupled with the initial distribution of a COVID-19 vaccine in December and hope for economic improvement in 2021. The corporate bond market experienced an increase in supply as companies took advantage of the low interest rate environment to refinance existing debt or issue new debt, driving prices higher. Credit spreads between longer-term corporate bonds and U.S. Treasuries increased slightly over the year.
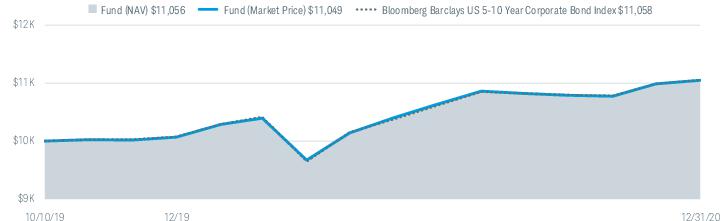
Performance. Over the 12-month reporting period, the fund closely tracked the performance of the index. For the 12 months ended December 31, 2020, the fund’s market price return was 9.75% and its NAV return were 9.83% (for an explanation of market price and NAV returns, please refer to footnote 2 on the following page). The index returned 9.75% during the same period. The fund’s gains came primarily from price appreciation, although coupon income generated by the fund’s holdings further boosted fund performance.
Portfolio Composition % of Investments1
By Security Type
| Weighted Average Maturity3 | 7.3 Yrs |
| Weighted Average Duration3 | 6.4 Yrs |
Management views and portfolio holdings may have changed since the report date.
An index is a statistical composite of a specified financial market or sector. Unlike the fund, an index does not actually hold a portfolio of securities and its return is not inclusive of operational and transaction costs incurred by the fund.
Fixed income securities are subject to increased loss of principal during periods of rising interest rates. An investment in the fund is not insured or guaranteed by the Federal Deposit Insurance Corporation (FDIC) or any other government agency.
| 1 | The percentage may differ from the Portfolio Holdings because the above calculation is based on a percentage of total investments, excluding derivatives, whereas the calculation in the Portfolio Holdings is based on a percentage of net assets. |
| 2 | Includes the fund’s position in money market mutual funds registered under the Investment Company Act of 1940, as amended. |
| 3 | See Glossary for definitions of maturity and duration. |
Schwab Fixed-Income ETFs | Annual Report
Schwab 5-10 Year Corporate Bond ETF
Performance and Fund Facts as of December 31, 2020
The performance data quoted represents past performance. Past performance does not guarantee future results. Investment return and principal value of an investment will fluctuate so that an investor’s shares, when sold or redeemed, may be worth more or less than the original cost. Current performance may be lower or higher than the performance quoted. To obtain performance information current to the most recent month end, please visit www.schwabfunds.com/schwabetfs_prospectus.
Performance of Hypothetical $10,000 Investment (October 10, 2019 – December 31, 2020)1
Average Annual Total Returns1
| Fund and Inception Date | 1 Year | Since Inception* |
| Fund: Schwab 5-10 Year Corporate Bond ETF (10/10/2019) | | |
| Market Price Return2 | 9.75% | 8.46% |
| NAV Return2 | 9.83% | 8.52% |
| Bloomberg Barclays US 5-10 Year Corporate Bond Index | 9.75% | 8.52% |
| ETF Category: Morningstar Corporate Bond3 | 9.24% | N/A |
| Fund Expense Ratio4: 0.05% |
All total returns on this page assume dividends and distributions were reinvested. Index figures do not include trading and management costs, which would lower performance. Indices are unmanaged and cannot be invested in directly. Performance results less than one year are not annualized.
For index definitions, please see the Glossary.
Shares are bought and sold at market price, which may be higher or lower than the net asset value (NAV). Brokerage commissions will reduce returns.
Index ownership — Bloomberg Index Services Limited and its affiliates (collectively, Bloomberg) and Bloomberg’s licensors, including Barclays Bank PLC (Barclays), own all proprietary rights in the Bloomberg Barclays Indices. The fund is not sponsored, endorsed, sold or promoted by Bloomberg or Barclays. Neither Bloomberg nor Barclays endorses or recommends the fund. Neither Bloomberg nor Barclays guarantees the timeliness, accurateness or completeness of any data or information relating to the Bloomberg Barclays Indices, and neither shall be liable in any way in respect of the use or accuracy of the Bloomberg Barclays Indices.
| * | Inception (10/10/19) represents the date that the shares began trading in the secondary market. |
| 1 | Performance does not reflect the deduction of taxes that a shareholder would pay on fund distributions or on the redemption or sale of fund shares. |
| 2 | ETF performance must be shown based on both a Market Price and a Net Asset Value (NAV) basis. The fund’s per share net asset value (NAV) is the value of one share of the fund. NAV is calculated by taking the fund’s total assets (including the market value of securities owned), subtracting liabilities, and dividing by the number of shares outstanding. The NAV Return is based on the NAV of the fund, and the Market Price Return is based on the market price per share of the fund. The price used to calculate market return (Market Price) is determined using the Official Closing Price of the primary stock exchange (generally, 4:00 p.m. Eastern time) and may not represent the returns you would receive if shares were traded at other times. NAV is used as a proxy for purposes of calculating Market Price Return on inception date. Market Price and NAV returns assume that dividends and capital gain distributions have been reinvested in the fund at Market Price and NAV, respectively. |
| 3 | Source for category information: Morningstar, Inc. The Morningstar Category return represents all passively- and actively-managed ETFs within the category as of the report date. |
| 4 | As stated in the prospectus. |
Schwab Fixed-Income ETFs | Annual Report
Fund Expenses (Unaudited)
Examples for a $1,000 Investment
As a fund shareholder, you may incur two types of costs: (1) transaction costs, including brokerage commissions on purchases and sales of fund shares; and, (2) ongoing costs, including management fees.
The expense examples below are intended to help you understand your ongoing cost (in dollars) of investing in a fund and to compare this cost with the ongoing cost of investing in other mutual funds. These examples are based on an investment of $1,000 invested for six months beginning July 1, 2020 and held through December 31, 2020.
Actual Return lines in the table below provide information about actual account values and actual expenses. You may use this information, together with the amount you invested, to estimate the expenses that you paid over the period. To do so, simply divide your account value by $1,000 (for example, an $8,600 account value ÷ $1,000 = 8.6), then multiply the result by the number given for your fund under the heading entitled “Expenses Paid During Period.”
Hypothetical Return lines in the table below provide information about hypothetical account values and hypothetical expenses based on a fund’s actual expense ratio and an assumed return of 5% per year before expenses. Because the return used is not an actual return, it may not be used to estimate the actual ending account value or expenses you paid for the period.
You may use this information to compare the ongoing costs of investing in a fund and other funds. To do so, compare this 5% hypothetical example with the 5% hypothetical examples that appear in the shareholder reports of the other funds.
Please note that the expenses shown in the table are meant to highlight your ongoing costs only, and do not reflect any transactional costs, including any brokerage commissions you may pay when purchasing or selling shares of a fund. Therefore, the hypothetical return lines of the table are useful in comparing ongoing costs only, and will not help you determine the relative total costs of owning different funds. In addition, if these transactional costs were included, your costs would have been higher.
| | Expense Ratio
(Annualized)1 | Beginning
Account Value
at 7/1/20 | Ending
Account Value
(Net of Expenses)
at 12/31/20 | Expenses Paid
During Period
7/1/20-12/31/202 |
| Schwab U.S. TIPS ETF | | | | |
| Actual Return | 0.05% | $1,000.00 | $1,046.50 | $0.26 |
| Hypothetical 5% Return | 0.05% | $1,000.00 | $1,024.85 | $0.25 |
| Schwab Short-Term U.S. Treasury ETF | | | | |
| Actual Return | 0.05% | $1,000.00 | $1,001.10 | $0.25 |
| Hypothetical 5% Return | 0.05% | $1,000.00 | $1,024.85 | $0.25 |
| Schwab Intermediate-Term U.S. Treasury ETF | | | | |
| Actual Return | 0.05% | $1,000.00 | $ 997.90 | $0.25 |
| Hypothetical 5% Return | 0.05% | $1,000.00 | $1,024.85 | $0.25 |
| Schwab Long-Term U.S. Treasury ETF | | | | |
| Actual Return | 0.05% | $1,000.00 | $ 970.80 | $0.25 |
| Hypothetical 5% Return | 0.05% | $1,000.00 | $1,024.85 | $0.25 |
| Schwab U.S. Aggregate Bond ETF | | | | |
| Actual Return | 0.04% | $1,000.00 | $1,012.40 | $0.20 |
| Hypothetical 5% Return | 0.04% | $1,000.00 | $1,024.90 | $0.20 |
| Schwab 1-5 Year Corporate Bond ETF | | | | |
| Actual Return | 0.05% | $1,000.00 | $1,019.50 | $0.25 |
| Hypothetical 5% Return | 0.05% | $1,000.00 | $1,024.85 | $0.25 |
| Schwab 5-10 Year Corporate Bond ETF | | | | |
| Actual Return | 0.05% | $1,000.00 | $1,041.50 | $0.26 |
| Hypothetical 5% Return | 0.05% | $1,000.00 | $1,024.85 | $0.25 |
| 1 | Based on the most recent six-month expense ratio. |
| 2 | Expenses for each fund are equal to its annualized expense ratio, multiplied by the average account value over the period, multiplied by 184 days of the period, and divided by 366 days of the fiscal year. |
Schwab Fixed-Income ETFs | Annual Report
Financial Statements
Financial Highlights
| | 1/1/20–
12/31/20 | 1/1/19–
12/31/19 | 1/1/18–
12/31/18 | 1/1/17–
12/31/17 | 1/1/16–
12/31/16 | |
| Per-Share Data |
| Net asset value at beginning of period | $56.57 | $53.27 | $55.39 | $54.84 | $53.15 | |
| Income (loss) from investment operations: | | | | | | |
| Net investment income (loss)1 | 0.81 | 1.21 | 1.51 | 1.17 | 0.99 | |
| Net realized and unrealized gains (losses) | 5.37 | 3.23 | (2.23) | 0.43 | 1.46 | |
| Total from investment operations | 6.18 | 4.44 | (0.72) | 1.60 | 2.45 | |
| Less distributions: | | | | | | |
| Distributions from net investment income | (0.69) | (1.14) | (1.40) | (1.05) | (0.76) | |
| Net asset value at end of period | $62.06 | $56.57 | $53.27 | $55.39 | $54.84 | |
| Total return | 10.94% | 8.36% | (1.31%) | 2.95% | 4.60% | |
| Ratios/Supplemental Data |
| Ratios to average net assets: | | | | | | |
| Total expenses | 0.05% | 0.05% | 0.05% | 0.05% 2 | 0.07% | |
| Net investment income (loss) | 1.36% | 2.18% | 2.80% | 2.13% | 1.78% | |
| Portfolio turnover rate3 | 23% | 20% | 17% | 19% | 16% | |
| Net assets, end of period (x 1,000) | $14,090,007 | $8,733,970 | $5,779,263 | $2,880,386 | $1,614,977 | |
| |
1
Calculated based on the average shares outstanding during the period.
2
Effective March 1, 2017, the annual operating expense ratio was reduced. The ratio presented for the period ended 12/31/17 is a blended ratio.
3
Portfolio turnover rate excludes securities received or delivered from processing of in-kind creations or redemptions.
Schwab Fixed-Income ETFs | Annual Report
Portfolio Holdings as of December 31, 2020
This section shows all the securities in the fund’s portfolio and their values as of the report date.
The fund files its complete schedule of portfolio holdings with the U.S. Securities and Exchange Commission (SEC) for the first and third quarters of each fiscal year on Form N-PORT Part F. The fund’s Form N-PORT Part F is available on the SEC’s website at www.sec.gov and on the fund’s website at www.schwabfunds.com/schwabetfs_prospectus. The fund also makes available its complete schedule of portfolio holdings on a daily basis on the fund’s website.
For fixed rate obligations, the rate shown is the interest rate (the rate established when the obligation was issued). For variable rate obligations, the rate shown is the rate as of the report date based on each security’s rate reset date. The reference rate and spread used is shown parenthetically in the security description if available; if not the reference rate is described in a footnote. The maturity date shown for all the securities is the final legal maturity. Inflation-protected securities are fixed-income securities whose principal value is periodically adjusted to the rate of inflation. The interest rate on these instruments is generally fixed at issuance at a rate lower than typical bonds or notes. Over the life of an inflation-indexed instrument interest will be paid based on a principal value, which is adjusted for any inflation or deflation.
Security
Rate, Maturity Date | Face
Amount ($) | Value ($) |
| Treasuries 99.8% of net assets |
| U.S. Treasury Inflation Protected Securities |
| 0.13%, 01/15/22 | 430,749,026 | 438,667,145 |
| 0.13%, 04/15/22 | 424,843,354 | 433,890,835 |
| 0.13%, 07/15/22 | 420,841,464 | 434,176,941 |
| 0.13%, 01/15/23 | 496,869,157 | 516,466,969 |
| 0.63%, 04/15/23 | 414,575,831 | 436,782,444 |
| 0.38%, 07/15/23 | 484,620,296 | 513,786,199 |
| 0.63%, 01/15/24 | 465,142,403 | 499,519,981 |
| 0.50%, 04/15/24 | 284,706,553 | 305,341,896 |
| 0.13%, 07/15/24 | 448,260,692 | 480,349,299 |
| 0.13%, 10/15/24 | 355,819,541 | 381,716,354 |
| 0.25%, 01/15/25 | 445,954,032 | 481,514,986 |
| 2.38%, 01/15/25 | 272,462,123 | 318,489,929 |
| 0.13%, 04/15/25 | 322,083,760 | 346,621,234 |
| 0.38%, 07/15/25 | 425,593,557 | 467,775,279 |
| 0.13%, 10/15/25 | 354,411,770 | 385,576,370 |
| 0.63%, 01/15/26 | 364,559,490 | 407,260,762 |
| 2.00%, 01/15/26 | 194,458,787 | 231,326,176 |
| 0.13%, 07/15/26 | 347,748,971 | 382,718,483 |
| 0.38%, 01/15/27 | 345,508,059 | 385,784,855 |
| 2.38%, 01/15/27 | 159,595,408 | 198,612,952 |
| 0.38%, 07/15/27 | 354,806,539 | 399,401,237 |
| 0.50%, 01/15/28 | 370,293,504 | 419,989,599 |
| 1.75%, 01/15/28 | 160,349,463 | 196,869,087 |
| 3.63%, 04/15/28 | 152,732,668 | 210,255,340 |
| 0.75%, 07/15/28 | 326,778,497 | 380,406,946 |
| 0.88%, 01/15/29 | 268,876,899 | 316,211,865 |
| 2.50%, 01/15/29 | 143,722,362 | 188,962,377 |
| 3.88%, 04/15/29 | 184,619,032 | 266,232,098 |
| 0.25%, 07/15/29 | 323,445,895 | 366,475,491 |
Security
Rate, Maturity Date | Face
Amount ($) | Value ($) |
| 0.13%, 01/15/30 | 380,978,552 | 425,288,129 |
| 0.13%, 07/15/30 | 419,037,839 | 470,499,310 |
| 3.38%, 04/15/32 | 63,936,425 | 97,509,600 |
| 2.13%, 02/15/40 | 83,163,497 | 128,971,465 |
| 2.13%, 02/15/41 | 118,485,786 | 186,060,412 |
| 0.75%, 02/15/42 | 203,339,527 | 259,176,429 |
| 0.63%, 02/15/43 | 151,263,670 | 188,755,449 |
| 1.38%, 02/15/44 | 211,282,525 | 304,590,327 |
| 0.75%, 02/15/45 | 230,919,737 | 298,307,254 |
| 1.00%, 02/15/46 | 122,594,575 | 167,410,540 |
| 0.88%, 02/15/47 | 147,110,071 | 197,989,374 |
| 1.00%, 02/15/48 | 126,059,356 | 175,698,011 |
| 1.00%, 02/15/49 | 123,182,785 | 173,662,936 |
| 0.25%, 02/15/50 | 162,403,081 | 193,780,742 |
| Total Treasuries |
| (Cost $13,110,977,207) | | 14,058,883,107 |
| Security | Number
of Shares | Value ($) |
| Other Investment Company 0.0% of net assets |
| |
| Money Market Fund 0.0% |
| State Street Institutional U.S. Government Money Market Fund, Premier Class 0.03% (a) | 1,860,948 | 1,860,948 |
| Total Other Investment Company |
| (Cost $1,860,948) | | 1,860,948 |
| (a) | The rate shown is the 7-day yield. |
The following is a summary of the inputs used to value the fund’s investments as of December 31, 2020 (see financial note 2(a) for additional information):
| Description | Quoted Prices in
Active Markets for
Identical Assets
(Level 1) | Other Significant
Observable Inputs
(Level 2) | Significant
Unobservable Inputs
(Level 3) | Total | |
| Assets | | | | | |
| Treasuries | $— | $14,058,883,107 | $— | $14,058,883,107 | |
| Other Investment Company1 | 1,860,948 | — | — | 1,860,948 | |
| Total | $1,860,948 | $14,058,883,107 | $— | $14,060,744,055 | |
| 1 | As categorized in Portfolio Holdings. |
Schwab Fixed-Income ETFs | Annual Report
Portfolio Holdings as of December 31, 2020 (continued)
Fund investments in underlying mutual funds are classified as Level 1, without consideration to the classification level of the investments held by the underlying mutual funds, which could be Level 1, Level 2 or Level 3.
Schwab Fixed-Income ETFs | Annual Report
Statement of Assets and Liabilities
As of December 31, 2020
| Assets |
| Investments in unaffiliated issuers, at value (cost $13,112,838,155) | | $14,060,744,055 |
| Receivables: | | |
| Investments sold | | 178,477,565 |
| Interest | | 31,119,443 |
| Fund shares sold | | 21,691,969 |
| Dividends | + | 231 |
| Total assets | | 14,292,033,263 |
| Liabilities |
| Payables: | | |
| Investments bought | | 201,445,235 |
| Management fees | + | 580,843 |
| Total liabilities | | 202,026,078 |
| Net Assets |
| Total assets | | 14,292,033,263 |
| Total liabilities | – | 202,026,078 |
| Net assets | | $14,090,007,185 |
| Net Assets by Source | | |
| Capital received from investors | | 13,183,901,564 |
| Total distributable earnings | | 906,105,621 |
| Net Asset Value (NAV) |
| Net Assets | ÷ | Shares
Outstanding | = | NAV |
| $14,090,007,185 | | 227,050,000 | | $62.06 |
| | | | | |
Schwab Fixed-Income ETFs | Annual Report
Statement of Operations
For the period January 1, 2020 through December 31, 2020
| Investment Income |
| Interest | | $150,535,770* |
| Dividends | | 23,110 |
| Securities on loan, net | + | 6,861 |
| Total investment income | | 150,565,741 |
| Expenses |
| Management fees | | 5,343,459 |
| Total expenses | – | 5,343,459 |
| Net investment income | | 145,222,282 |
| Realized and Unrealized Gains (Losses) |
| Net realized losses on investments | | (194,059) |
| Net realized gains on in-kind redemptions | + | 163,733,542 |
| Net realized gains | | 163,539,483 |
| Net change in unrealized appreciation (depreciation) on investments | + | 744,938,595 |
| Net realized and unrealized gains | | 908,478,078 |
| Increase in net assets resulting from operations | | $1,053,700,360 |
| * | See financial note 2(b) regarding inflation-protected securities. |
Schwab Fixed-Income ETFs | Annual Report
Statement of Changes in Net Assets
For the current and prior report periods
| Operations | |
| | 1/1/20-12/31/20 | 1/1/19-12/31/19 |
| Net investment income | | $145,222,282 | $153,051,236 |
| Net realized gains | | 163,539,483 | 1,958,522 |
| Net change in unrealized appreciation (depreciation) | + | 744,938,595 | 361,225,335 |
| Increase in net assets resulting from operations | | 1,053,700,360 | 516,235,093 |
| Distributions to Shareholders | |
| Total distributions | | ($145,346,920) | ($152,790,170) |
| Transactions in Fund Shares | | | |
| | | 1/1/20-12/31/20 | 1/1/19-12/31/19 |
| | | SHARES | VALUE | SHARES | VALUE |
| Shares sold | | 117,700,000 | $7,091,983,560 | 55,400,000 | $3,115,333,976 |
| Shares redeemed | + | (45,050,000) | (2,644,299,382) | (9,500,000) | (524,072,192) |
| Net transactions in fund shares | | 72,650,000 | $4,447,684,178 | 45,900,000 | $2,591,261,784 |
| Shares Outstanding and Net Assets | | | |
| | | 1/1/20-12/31/20 | 1/1/19-12/31/19 |
| | | SHARES | NET ASSETS | SHARES | NET ASSETS |
| Beginning of period | | 154,400,000 | $8,733,969,567 | 108,500,000 | $5,779,262,860 |
| Total increase | + | 72,650,000 | 5,356,037,618 | 45,900,000 | 2,954,706,707 |
| End of period | | 227,050,000 | $14,090,007,185 | 154,400,000 | $8,733,969,567 |
Schwab Fixed-Income ETFs | Annual Report
Schwab Short-Term U.S. Treasury ETF
Financial Statements
Financial Highlights
| | 1/1/20–
12/31/20 | 1/1/19–
12/31/19 | 1/1/18–
12/31/18 | 1/1/17–
12/31/17 | 1/1/16–
12/31/16 | |
| Per-Share Data |
| Net asset value at beginning of period | $50.48 | $49.88 | $50.03 | $50.41 | $50.43 | |
| Income (loss) from investment operations: | | | | | | |
| Net investment income (loss)1 | 0.65 | 1.14 | 0.94 | 0.57 | 0.42 | |
| Net realized and unrealized gains (losses) | 0.91 | 0.60 | (0.20) 2 | (0.39) | (0.03) | |
| Total from investment operations | 1.56 | 1.74 | 0.74 | 0.18 | 0.39 | |
| Less distributions: | | | | | | |
| Distributions from net investment income | (0.65) | (1.14) | (0.89) | (0.56) | (0.41) | |
| Net asset value at end of period | $51.39 | $50.48 | $49.88 | $50.03 | $50.41 | |
| Total return | 3.11% | 3.53% | 1.50% | 0.35% | 0.78% | |
| Ratios/Supplemental Data |
| Ratios to average net assets: | | | | | | |
| Total expenses | 0.05% | 0.06% 3 | 0.06% | 0.06% | 0.08% 4 | |
| Net investment income (loss) | 1.26% | 2.27% | 1.89% | 1.13% | 0.83% | |
| Portfolio turnover rate5 | 74% | 77% | 65% | 65% | 66% | |
| Net assets, end of period (x 1,000) | $7,507,924 | $5,262,952 | $4,254,630 | $2,181,398 | $1,414,092 | |
| |
1
Calculated based on the average shares outstanding during the period.
2
The per share amount does not accord with the change in aggregate gains and losses in securities during the period because of the timing of sales and repurchases of fund shares in relation to fluctuating market values.
3
Effective December 13, 2019, the annual operating expense ratio was reduced to 0.05%. The ratio presented for the period ended 12/31/19 is a blended ratio.
4
Effective December 29, 2016, the annual operating expense ratio was reduced. The ratio presented for the period ended 12/31/16 is a blended ratio.
5
Portfolio turnover rate excludes securities received or delivered from processing of in-kind creations or redemptions.
Schwab Fixed-Income ETFs | Annual Report
Schwab Short-Term U.S. Treasury ETF
Portfolio Holdings as of December 31, 2020
This section shows all the securities in the fund’s portfolio and their values as of the report date.
The fund files its complete schedule of portfolio holdings with the U.S. Securities and Exchange Commission (SEC) for the first and third quarters of each fiscal year on Form N-PORT Part F. The fund’s Form N-PORT Part F is available on the SEC’s website at www.sec.gov and on the fund’s website at www.schwabfunds.com/schwabetfs_prospectus. The fund also makes available its complete schedule of portfolio holdings on a daily basis on the fund’s website.
For fixed rate obligations, the rate shown is the interest rate (the rate established when the obligation was issued). For variable rate obligations, the rate shown is the rate as of the report date based on each security’s rate reset date. The reference rate and spread used is shown parenthetically in the security description if available; if not the reference rate is described in a footnote. The maturity date shown for all the securities is the final legal maturity.
Security
Rate, Maturity Date | Face
Amount ($) | Value ($) |
| Treasuries 99.6% of net assets |
| Bonds |
| 7.25%, 08/15/22 | 9,818,000 | 10,951,864 |
| 7.63%, 11/15/22 | 6,025,000 | 6,868,735 |
| 7.13%, 02/15/23 | 12,077,000 | 13,864,019 |
| 6.25%, 08/15/23 | 17,260,000 | 20,018,903 |
| Notes |
| 2.50%, 01/15/22 | 87,677,000 | 89,836,389 |
| 1.38%, 01/31/22 | 54,485,000 | 55,227,784 |
| 1.50%, 01/31/22 | 51,224,000 | 51,988,358 |
| 1.88%, 01/31/22 | 93,580,000 | 95,356,558 |
| 2.00%, 02/15/22 | 69,106,000 | 70,566,404 |
| 2.50%, 02/15/22 | 75,775,000 | 77,796,654 |
| 1.13%, 02/28/22 | 90,358,000 | 91,423,943 |
| 1.75%, 02/28/22 | 61,704,000 | 62,875,412 |
| 1.88%, 02/28/22 | 62,548,000 | 63,824,615 |
| 2.38%, 03/15/22 | 85,249,000 | 87,555,052 |
| 0.38%, 03/31/22 | 99,920,000 | 100,249,814 |
| 1.75%, 03/31/22 | 65,671,000 | 67,008,790 |
| 1.88%, 03/31/22 | 52,990,000 | 54,150,191 |
| 2.25%, 04/15/22 | 84,609,000 | 86,929,138 |
| 0.13%, 04/30/22 | 65,987,000 | 66,006,332 |
| 1.75%, 04/30/22 | 69,715,000 | 71,233,207 |
| 1.88%, 04/30/22 | 80,209,000 | 82,081,065 |
| 1.75%, 05/15/22 | 61,415,000 | 62,787,242 |
| 2.13%, 05/15/22 | 80,767,000 | 82,983,360 |
| 0.13%, 05/31/22 | 90,935,000 | 90,954,537 |
| 1.75%, 05/31/22 | 76,003,000 | 77,750,178 |
| 1.88%, 05/31/22 | 71,200,000 | 72,968,875 |
| 1.75%, 06/15/22 | 85,884,000 | 87,913,680 |
| 0.13%, 06/30/22 | 68,424,000 | 68,440,037 |
| 1.75%, 06/30/22 | 75,667,000 | 77,509,905 |
| 2.13%, 06/30/22 | 67,207,000 | 69,220,585 |
| 1.75%, 07/15/22 | 82,141,000 | 84,196,129 |
| 0.13%, 07/31/22 | 78,893,000 | 78,908,409 |
| 1.88%, 07/31/22 | 87,531,000 | 89,953,489 |
| 2.00%, 07/31/22 | 99,132,000 | 102,067,237 |
| 1.50%, 08/15/22 | 89,680,000 | 91,689,042 |
| 1.63%, 08/15/22 | 28,668,000 | 29,368,462 |
| 0.13%, 08/31/22 | 72,210,000 | 72,218,462 |
| 1.63%, 08/31/22 | 79,409,000 | 81,383,368 |
| 1.88%, 08/31/22 | 133,934,000 | 137,818,610 |
| 1.50%, 09/15/22 | 70,048,000 | 71,684,278 |
| 0.13%, 09/30/22 | 75,819,000 | 75,826,405 |
| 1.75%, 09/30/22 | 70,667,000 | 72,666,931 |
| 1.88%, 09/30/22 | 89,444,000 | 92,169,247 |
| 1.38%, 10/15/22 | 76,541,000 | 78,248,223 |
| 0.13%, 10/31/22 | 81,938,000 | 81,947,602 |
| 1.88%, 10/31/22 | 59,890,000 | 61,802,503 |
| 2.00%, 10/31/22 | 74,668,000 | 77,220,129 |
| 1.63%, 11/15/22 | 140,891,000 | 144,831,545 |
| 0.13%, 11/30/22 | 139,132,000 | 139,148,305 |
| 2.00%, 11/30/22 | 127,986,000 | 132,560,500 |
Security
Rate, Maturity Date | Face
Amount ($) | Value ($) |
| 1.63%, 12/15/22 | 78,470,000 | 80,771,991 |
| 0.13%, 12/31/22 | 112,000,000 | 112,006,562 |
| 2.13%, 12/31/22 | 124,867,000 | 129,832,415 |
| 1.50%, 01/15/23 | 71,428,000 | 73,422,962 |
| 1.75%, 01/31/23 | 66,269,000 | 68,502,990 |
| 2.38%, 01/31/23 | 72,274,000 | 75,636,435 |
| 1.38%, 02/15/23 | 77,544,000 | 79,588,617 |
| 2.00%, 02/15/23 | 116,704,000 | 121,331,132 |
| 1.50%, 02/28/23 | 64,874,000 | 66,784,742 |
| 2.63%, 02/28/23 | 76,105,000 | 80,186,725 |
| 0.50%, 03/15/23 | 92,290,000 | 93,043,461 |
| 1.50%, 03/31/23 | 61,287,000 | 63,156,732 |
| 2.50%, 03/31/23 | 76,161,000 | 80,192,178 |
| 0.25%, 04/15/23 | 94,740,000 | 94,987,953 |
| 1.63%, 04/30/23 | 68,917,000 | 71,296,790 |
| 2.75%, 04/30/23 | 80,071,000 | 84,922,177 |
| 0.13%, 05/15/23 | 102,734,000 | 102,709,922 |
| 1.75%, 05/15/23 | 114,088,000 | 118,442,061 |
| 1.63%, 05/31/23 | 54,855,000 | 56,813,495 |
| 2.75%, 05/31/23 | 63,275,000 | 67,242,046 |
| 0.25%, 06/15/23 | 104,829,000 | 105,107,452 |
| 1.38%, 06/30/23 | 64,176,000 | 66,143,897 |
| 2.63%, 06/30/23 | 62,995,000 | 66,880,512 |
| 0.13%, 07/15/23 | 66,796,000 | 66,764,689 |
| 1.25%, 07/31/23 | 67,593,000 | 69,520,457 |
| 2.75%, 07/31/23 | 67,242,000 | 71,749,315 |
| 0.13%, 08/15/23 | 111,900,000 | 111,838,805 |
| 2.50%, 08/15/23 | 106,845,000 | 113,439,340 |
| 1.38%, 08/31/23 | 61,528,000 | 63,539,677 |
| 2.75%, 08/31/23 | 50,846,000 | 54,353,580 |
| 0.13%, 09/15/23 | 107,819,000 | 107,743,190 |
| 1.38%, 09/30/23 | 65,802,000 | 68,015,106 |
| 2.88%, 09/30/23 | 55,055,000 | 59,149,716 |
| 0.13%, 10/15/23 | 134,605,000 | 134,510,357 |
| 1.63%, 10/31/23 | 59,943,000 | 62,446,088 |
| 2.88%, 10/31/23 | 58,650,000 | 63,149,555 |
| 0.25%, 11/15/23 | 144,097,000 | 144,496,644 |
| 2.75%, 11/15/23 | 141,440,000 | 151,976,175 |
| 2.13%, 11/30/23 | 48,907,000 | 51,713,421 |
| 2.88%, 11/30/23 | 42,832,000 | 46,210,040 |
| 0.13%, 12/15/23 | 142,000,000 | 141,839,141 |
| 2.25%, 12/31/23 | 50,500,000 | 53,654,278 |
| 2.63%, 12/31/23 | 70,000,000 | 75,137,891 |
| Total Treasuries |
| (Cost $7,414,295,456) | | 7,482,301,214 |
Schwab Fixed-Income ETFs | Annual Report
Schwab Short-Term U.S. Treasury ETF
Portfolio Holdings as of December 31, 2020 (continued)
| Security | Number
of Shares | Value ($) |
| Other Investment Company 0.1% of net assets |
| |
| Money Market Fund 0.1% |
| State Street Institutional U.S. Government Money Market Fund, Premier Class 0.03% (a) | 6,484,056 | 6,484,056 |
| Total Other Investment Company |
| (Cost $6,484,056) | | 6,484,056 |
| (a) | The rate shown is the 7-day yield. |
The following is a summary of the inputs used to value the fund’s investments as of December 31, 2020 (see financial note 2(a) for additional information):
| Description | Quoted Prices in
Active Markets for
Identical Assets
(Level 1) | Other Significant
Observable Inputs
(Level 2) | Significant
Unobservable Inputs
(Level 3) | Total | |
| Assets | | | | | |
| Treasuries | $— | $7,482,301,214 | $— | $7,482,301,214 | |
| Other Investment Company1 | 6,484,056 | — | — | 6,484,056 | |
| Total | $6,484,056 | $7,482,301,214 | $— | $7,488,785,270 | |
| 1 | As categorized in Portfolio Holdings. |
Fund investments in underlying mutual funds are classified as Level 1, without consideration to the classification level of the investments held by the underlying mutual funds, which could be Level 1, Level 2 or Level 3.
Schwab Fixed-Income ETFs | Annual Report
Schwab Short-Term U.S. Treasury ETF
Statement of Assets and Liabilities
As of December 31, 2020
| Assets |
| Investments in unaffiliated issuers, at value (cost $7,420,779,512) | | $7,488,785,270 |
| Receivables: | | |
| Investments sold | | 676,616,205 |
| Fund shares sold | | 280,072,115 |
| Interest | | 26,120,447 |
| Dividends | + | 48 |
| Total assets | | 8,471,594,085 |
| Liabilities |
| Payables: | | |
| Investments bought | | 662,724,317 |
| Management fees | | 320,509 |
| Fund shares redeemed | + | 300,625,502 |
| Total liabilities | | 963,670,328 |
| Net Assets |
| Total assets | | 8,471,594,085 |
| Total liabilities | – | 963,670,328 |
| Net assets | | $7,507,923,757 |
| Net Assets by Source | | |
| Capital received from investors | | 7,442,389,565 |
| Total distributable earnings | | 65,534,192 |
| Net Asset Value (NAV) |
| Net Assets | ÷ | Shares
Outstanding | = | NAV |
| $7,507,923,757 | | 146,100,000 | | $51.39 |
| | | | | |
Schwab Fixed-Income ETFs | Annual Report
Schwab Short-Term U.S. Treasury ETF
Statement of Operations
For the period January 1, 2020 through December 31, 2020
| Investment Income |
| Interest | | $91,564,896 |
| Dividends | + | 16,880 |
| Total investment income | | 91,581,776 |
| Expenses |
| Management fees | | 3,497,770 |
| Total expenses | – | 3,497,770 |
| Net investment income | | 88,084,006 |
| Realized and Unrealized Gains (Losses) |
| Net realized gains on investments | | 22,772,264 |
| Net realized gains on in-kind redemptions | + | 59,856,837 |
| Net realized gains | | 82,629,101 |
| Net change in unrealized appreciation (depreciation) on investments | + | 22,483,068 |
| Net realized and unrealized gains | | 105,112,169 |
| Increase in net assets resulting from operations | | $193,196,175 |
Schwab Fixed-Income ETFs | Annual Report
Schwab Short-Term U.S. Treasury ETF
Statement of Changes in Net Assets
For the current and prior report periods
| Operations | |
| | 1/1/20-12/31/20 | 1/1/19-12/31/19 |
| Net investment income | | $88,084,006 | $122,485,147 |
| Net realized gains | | 82,629,101 | 21,531,491 |
| Net change in unrealized appreciation (depreciation) | + | 22,483,068 | 44,234,324 |
| Increase in net assets resulting from operations | | 193,196,175 | 188,250,962 |
| Distributions to Shareholders | |
| Total distributions | | ($88,160,440) | ($122,565,815) |
| Transactions in Fund Shares | | | |
| | | 1/1/20-12/31/20 | 1/1/19-12/31/19 |
| | | SHARES | VALUE | SHARES | VALUE |
| Shares sold | | 133,700,000 | $6,866,598,962 | 92,750,000 | $4,666,572,488 |
| Shares redeemed | + | (91,850,000) | (4,726,663,144) | (73,800,000) | (3,723,935,297) |
| Net transactions in fund shares | | 41,850,000 | $2,139,935,818 | 18,950,000 | $942,637,191 |
| Shares Outstanding and Net Assets | | | |
| | | 1/1/20-12/31/20 | 1/1/19-12/31/19 |
| | | SHARES | NET ASSETS | SHARES | NET ASSETS |
| Beginning of period | | 104,250,000 | $5,262,952,204 | 85,300,000 | $4,254,629,866 |
| Total increase | + | 41,850,000 | 2,244,971,553 | 18,950,000 | 1,008,322,338 |
| End of period | | 146,100,000 | $7,507,923,757 | 104,250,000 | $5,262,952,204 |
Schwab Fixed-Income ETFs | Annual Report
Schwab Intermediate-Term U.S. Treasury ETF
Financial Statements
Financial Highlights
| | 1/1/20–
12/31/20 | 1/1/19–
12/31/19 | 1/1/18–
12/31/18 | 1/1/17–
12/31/17 | 1/1/16–
12/31/16 | |
| Per-Share Data |
| Net asset value at beginning of period | $54.97 | $52.89 | $53.35 | $53.41 | $53.55 | |
| Income (loss) from investment operations: | | | | | | |
| Net investment income (loss)1 | 0.94 | 1.28 | 1.21 | 0.89 | 0.79 | |
| Net realized and unrealized gains (losses) | 3.24 | 2.07 | (0.55) 2 | (0.07) | (0.15) | |
| Total from investment operations | 4.18 | 3.35 | 0.66 | 0.82 | 0.64 | |
| Less distributions: | | | | | | |
| Distributions from net investment income | (0.94) | (1.27) | (1.12) | (0.88) | (0.78) | |
| Net asset value at end of period | $58.21 | $54.97 | $52.89 | $53.35 | $53.41 | |
| Total return | 7.62% | 6.38% | 1.28% | 1.54% | 1.16% | |
| Ratios/Supplemental Data |
| Ratios to average net assets: | | | | | | |
| Total expenses | 0.05% | 0.06% 3 | 0.06% | 0.06% | 0.09% 4 | |
| Net investment income (loss) | 1.63% | 2.35% | 2.34% | 1.66% | 1.44% | |
| Portfolio turnover rate5 | 51% | 38% | 41% | 30% | 30% | |
| Net assets, end of period (x 1,000) | $3,952,710 | $4,735,743 | $3,480,449 | $1,165,708 | $790,506 | |
| |
1
Calculated based on the average shares outstanding during the period.
2
The per share amount does not accord with the change in aggregate gains and losses in securities during the period because of the timing of sales and repurchases of fund shares in relation to fluctuating market values.
3
Effective December 13, 2019, the annual operating expense ratio was reduced to 0.05%. The ratio presented for the period ended 12/31/19 is a blended ratio.
4
Effective December 29, 2016, the annual operating expense ratio was reduced. The ratio presented for the period ended 12/31/16 is a blended ratio.
5
Portfolio turnover rate excludes securities received or delivered from processing of in-kind creations or redemptions.
Schwab Fixed-Income ETFs | Annual Report
Schwab Intermediate-Term U.S. Treasury ETF
Portfolio Holdings as of December 31, 2020
This section shows all the securities in the fund’s portfolio and their values as of the report date.
The fund files its complete schedule of portfolio holdings with the U.S. Securities and Exchange Commission (SEC) for the first and third quarters of each fiscal year on Form N-PORT Part F. The fund’s Form N-PORT Part F is available on the SEC’s website at www.sec.gov and on the fund’s website at www.schwabfunds.com/schwabetfs_prospectus. The fund also makes available its complete schedule of portfolio holdings on a daily basis on the fund’s website.
For fixed rate obligations, the rate shown is the interest rate (the rate established when the obligation was issued). For variable rate obligations, the rate shown is the rate as of the report date based on each security’s rate reset date. The reference rate and spread used is shown parenthetically in the security description if available; if not the reference rate is described in a footnote. The maturity date shown for all the securities is the final legal maturity.
Security
Rate, Maturity Date | Face
Amount ($) | Value ($) |
| Treasuries 99.6% of net assets |
| Bonds |
| 7.50%, 11/15/24 | 7,321,000 | 9,374,598 |
| 7.63%, 02/15/25 | 2,789,000 | 3,630,820 |
| 6.88%, 08/15/25 | 3,275,000 | 4,258,268 |
| 6.00%, 02/15/26 | 6,133,000 | 7,883,301 |
| 6.75%, 08/15/26 | 3,310,000 | 4,469,664 |
| 6.50%, 11/15/26 | 4,110,000 | 5,544,486 |
| 6.63%, 02/15/27 | 2,767,000 | 3,791,330 |
| 6.38%, 08/15/27 | 3,467,000 | 4,780,397 |
| 6.13%, 11/15/27 | 9,751,000 | 13,393,913 |
| 5.50%, 08/15/28 | 5,629,000 | 7,641,807 |
| 5.25%, 11/15/28 | 7,050,000 | 9,507,035 |
| 5.25%, 02/15/29 | 5,021,000 | 6,810,124 |
| 6.13%, 08/15/29 | 3,750,000 | 5,435,156 |
| 6.25%, 05/15/30 | 6,600,000 | 9,837,609 |
| Notes |
| 2.75%, 02/15/24 | 37,924,000 | 40,975,697 |
| 2.13%, 02/29/24 | 28,838,000 | 30,606,581 |
| 2.38%, 02/29/24 | 38,619,000 | 41,283,108 |
| 2.13%, 03/31/24 | 54,401,000 | 57,807,438 |
| 2.00%, 04/30/24 | 26,645,000 | 28,243,700 |
| 2.25%, 04/30/24 | 41,625,000 | 44,463,955 |
| 2.50%, 05/15/24 | 58,293,000 | 62,817,539 |
| 2.00%, 05/31/24 | 50,657,000 | 53,759,741 |
| 1.75%, 06/30/24 | 33,131,000 | 34,911,791 |
| 2.00%, 06/30/24 | 30,132,000 | 32,016,427 |
| 1.75%, 07/31/24 | 31,845,000 | 33,592,743 |
| 2.13%, 07/31/24 | 30,559,000 | 32,645,607 |
| 2.38%, 08/15/24 | 61,109,000 | 65,871,205 |
| 1.25%, 08/31/24 | 39,401,000 | 40,873,920 |
| 1.88%, 08/31/24 | 26,034,000 | 27,604,176 |
| 1.50%, 09/30/24 | 32,901,000 | 34,457,372 |
| 2.13%, 09/30/24 | 25,213,000 | 26,991,698 |
| 1.50%, 10/31/24 | 26,200,000 | 27,462,922 |
| 2.25%, 10/31/24 | 23,400,000 | 25,195,219 |
| 2.25%, 11/15/24 | 51,337,000 | 55,317,623 |
| 1.50%, 11/30/24 | 34,478,000 | 36,157,456 |
| 2.13%, 11/30/24 | 21,872,000 | 23,470,536 |
| 1.75%, 12/31/24 | 26,376,000 | 27,942,075 |
| 2.25%, 12/31/24 | 19,038,000 | 20,548,398 |
| 1.38%, 01/31/25 | 31,052,000 | 32,454,192 |
| 2.50%, 01/31/25 | 21,366,000 | 23,308,136 |
| 2.00%, 02/15/25 | 53,642,000 | 57,449,325 |
| 1.13%, 02/28/25 | 32,471,000 | 33,617,632 |
| 2.75%, 02/28/25 | 22,488,000 | 24,792,142 |
| 0.50%, 03/31/25 | 35,245,000 | 35,571,292 |
| 2.63%, 03/31/25 | 21,440,000 | 23,557,200 |
| 0.38%, 04/30/25 | 42,092,000 | 42,249,845 |
| 2.88%, 04/30/25 | 23,363,000 | 25,959,396 |
| 2.13%, 05/15/25 | 51,038,000 | 55,097,116 |
| 0.25%, 05/31/25 | 14,699,000 | 14,671,439 |
| 2.88%, 05/31/25 | 23,706,000 | 26,381,259 |
Security
Rate, Maturity Date | Face
Amount ($) | Value ($) |
| 0.25%, 06/30/25 | 33,840,000 | 33,755,400 |
| 2.75%, 06/30/25 | 22,401,000 | 24,845,859 |
| 0.25%, 07/31/25 | 39,588,000 | 39,473,566 |
| 2.88%, 07/31/25 | 24,327,000 | 27,156,914 |
| 2.00%, 08/15/25 | 50,406,000 | 54,310,496 |
| 0.25%, 08/31/25 | 46,321,000 | 46,169,009 |
| 2.75%, 08/31/25 | 14,303,000 | 15,907,059 |
| 0.25%, 09/30/25 | 40,211,000 | 40,057,067 |
| 3.00%, 09/30/25 | 23,459,000 | 26,402,371 |
| 0.25%, 10/31/25 | 52,014,000 | 51,792,534 |
| 3.00%, 10/31/25 | 23,836,000 | 26,871,366 |
| 2.25%, 11/15/25 | 53,899,000 | 58,872,025 |
| 0.38%, 11/30/25 | 57,013,000 | 57,095,401 |
| 2.88%, 11/30/25 | 24,431,000 | 27,435,250 |
| 0.38%, 12/31/25 | 55,000,000 | 55,045,117 |
| 2.63%, 12/31/25 | 20,915,000 | 23,263,036 |
| 2.63%, 01/31/26 | 27,933,000 | 31,111,470 |
| 1.63%, 02/15/26 | 47,487,000 | 50,506,876 |
| 2.50%, 02/28/26 | 28,272,000 | 31,337,745 |
| 2.25%, 03/31/26 | 21,866,000 | 23,979,998 |
| 2.38%, 04/30/26 | 19,450,000 | 21,477,814 |
| 1.63%, 05/15/26 | 48,746,000 | 51,903,065 |
| 2.13%, 05/31/26 | 26,609,000 | 29,049,544 |
| 1.88%, 06/30/26 | 19,708,000 | 21,264,624 |
| 1.88%, 07/31/26 | 21,397,000 | 23,100,402 |
| 1.50%, 08/15/26 | 56,424,000 | 59,743,318 |
| 1.38%, 08/31/26 | 18,609,000 | 19,575,796 |
| 1.63%, 09/30/26 | 22,345,000 | 23,822,738 |
| 1.63%, 10/31/26 | 22,222,000 | 23,700,284 |
| 2.00%, 11/15/26 | 48,216,000 | 52,480,103 |
| 1.63%, 11/30/26 | 23,958,000 | 25,560,191 |
| 1.75%, 12/31/26 | 22,925,000 | 24,637,211 |
| 1.50%, 01/31/27 | 22,686,000 | 24,047,160 |
| 2.25%, 02/15/27 | 49,276,000 | 54,473,078 |
| 1.13%, 02/28/27 | 14,797,000 | 15,345,529 |
| 0.63%, 03/31/27 | 23,295,000 | 23,436,044 |
| 0.50%, 04/30/27 | 37,791,000 | 37,699,475 |
| 2.38%, 05/15/27 | 51,490,000 | 57,439,509 |
| 0.50%, 05/31/27 | 28,658,000 | 28,560,608 |
| 0.50%, 06/30/27 | 38,800,000 | 38,637,828 |
| 0.38%, 07/31/27 | 39,082,000 | 38,565,996 |
| 2.25%, 08/15/27 | 49,860,000 | 55,290,066 |
| 0.50%, 08/31/27 | 39,024,000 | 38,786,198 |
| 0.38%, 09/30/27 | 45,619,000 | 44,924,023 |
| 0.50%, 10/31/27 | 50,095,000 | 49,703,633 |
| 2.25%, 11/15/27 | 48,895,000 | 54,292,550 |
| 0.63%, 11/30/27 | 56,207,000 | 56,198,218 |
| 0.63%, 12/31/27 | 55,000,000 | 54,944,141 |
| 2.75%, 02/15/28 | 55,032,000 | 63,106,226 |
| 2.88%, 05/15/28 | 52,505,000 | 60,831,965 |
| 2.88%, 08/15/28 | 47,889,000 | 55,633,549 |
| 3.13%, 11/15/28 | 62,504,000 | 74,008,642 |
| 2.63%, 02/15/29 | 48,289,000 | 55,445,581 |
| 2.38%, 05/15/29 | 40,350,000 | 45,611,262 |
| 1.63%, 08/15/29 | 45,610,000 | 48,799,137 |
Schwab Fixed-Income ETFs | Annual Report
Schwab Intermediate-Term U.S. Treasury ETF
Portfolio Holdings as of December 31, 2020 (continued)
Security
Rate, Maturity Date | Face
Amount ($) | Value ($) |
| 1.75%, 11/15/29 | 39,496,000 | 42,692,708 |
| 1.50%, 02/15/30 | 47,842,000 | 50,626,554 |
| 0.63%, 05/15/30 | 73,860,000 | 72,227,002 |
| 0.63%, 08/15/30 | 105,303,000 | 102,695,106 |
| 0.88%, 11/15/30 | 75,509,000 | 75,255,337 |
| Total Treasuries |
| (Cost $3,810,570,195) | | 3,937,465,183 |
| Security | Number
of Shares | Value ($) |
| Other Investment Company 0.1% of net assets |
| |
| Money Market Fund 0.1% |
| State Street Institutional U.S. Government Money Market Fund, Premier Class 0.03% (a) | 3,865,148 | 3,865,148 |
| Total Other Investment Company |
| (Cost $3,865,148) | | 3,865,148 |
| (a) | The rate shown is the 7-day yield. |
The following is a summary of the inputs used to value the fund’s investments as of December 31, 2020 (see financial note 2(a) for additional information):
| Description | Quoted Prices in
Active Markets for
Identical Assets
(Level 1) | Other Significant
Observable Inputs
(Level 2) | Significant
Unobservable Inputs
(Level 3) | Total | |
| Assets | | | | | |
| Treasuries | $— | $3,937,465,183 | $— | $3,937,465,183 | |
| Other Investment Company1 | 3,865,148 | — | — | 3,865,148 | |
| Total | $3,865,148 | $3,937,465,183 | $— | $3,941,330,331 | |
| 1 | As categorized in Portfolio Holdings. |
Fund investments in underlying mutual funds are classified as Level 1, without consideration to the classification level of the investments held by the underlying mutual funds, which could be Level 1, Level 2 or Level 3.
Schwab Fixed-Income ETFs | Annual Report
Schwab Intermediate-Term U.S. Treasury ETF
Statement of Assets and Liabilities
As of December 31, 2020
| Assets |
| Investments in unaffiliated issuers, at value (cost $3,814,435,343) | | $3,941,330,331 |
| Receivables: | | |
| Investments sold | | 195,999,084 |
| Fund shares sold | | 61,081,283 |
| Interest | | 15,002,294 |
| Dividends | + | 51 |
| Total assets | | 4,213,413,043 |
| Liabilities |
| Payables: | | |
| Investments bought | | 205,236,074 |
| Management fees | | 164,098 |
| Fund shares redeemed | + | 55,303,010 |
| Total liabilities | | 260,703,182 |
| Net Assets |
| Total assets | | 4,213,413,043 |
| Total liabilities | – | 260,703,182 |
| Net assets | | $3,952,709,861 |
| Net Assets by Source | | |
| Capital received from investors | | 3,828,435,117 |
| Total distributable earnings | | 124,274,744 |
| Net Asset Value (NAV) |
| Net Assets | ÷ | Shares
Outstanding | = | NAV |
| $3,952,709,861 | | 67,900,000 | | $58.21 |
| | | | | |
Schwab Fixed-Income ETFs | Annual Report
Schwab Intermediate-Term U.S. Treasury ETF
Statement of Operations
For the period January 1, 2020 through December 31, 2020
| Investment Income |
| Interest | | $70,928,301 |
| Dividends | | 18,576 |
| Securities on loan, net | + | 20,249 |
| Total investment income | | 70,967,126 |
| Expenses |
| Management fees | | 2,112,084 |
| Total expenses | – | 2,112,084 |
| Net investment income | | 68,855,042 |
| Realized and Unrealized Gains (Losses) |
| Net realized gains on investments | | 20,029,809 |
| Net realized gains on in-kind redemptions | + | 294,547,724 |
| Net realized gains | | 314,577,533 |
| Net change in unrealized appreciation (depreciation) on investments | + | (12,306,381) |
| Net realized and unrealized gains | | 302,271,152 |
| Increase in net assets resulting from operations | | $371,126,194 |
Schwab Fixed-Income ETFs | Annual Report
Schwab Intermediate-Term U.S. Treasury ETF
Statement of Changes in Net Assets
For the current and prior report periods
| Operations | |
| | 1/1/20-12/31/20 | 1/1/19-12/31/19 |
| Net investment income | | $68,855,042 | $100,694,259 |
| Net realized gains | | 314,577,533 | 24,699,981 |
| Net change in unrealized appreciation (depreciation) | + | (12,306,381) | 127,844,208 |
| Increase in net assets resulting from operations | | 371,126,194 | 253,238,448 |
| Distributions to Shareholders | |
| Total distributions | | ($68,701,360) | ($100,812,255) |
| Transactions in Fund Shares | | | |
| | | 1/1/20-12/31/20 | 1/1/19-12/31/19 |
| | | SHARES | VALUE | SHARES | VALUE |
| Shares sold | | 53,250,000 | $3,088,045,843 | 46,950,000 | $2,562,077,403 |
| Shares redeemed | + | (71,500,000) | (4,173,504,097) | (26,600,000) | (1,459,209,492) |
| Net transactions in fund shares | | (18,250,000) | ($1,085,458,254) | 20,350,000 | $1,102,867,911 |
| Shares Outstanding and Net Assets | | | |
| | | 1/1/20-12/31/20 | 1/1/19-12/31/19 |
| | | SHARES | NET ASSETS | SHARES | NET ASSETS |
| Beginning of period | | 86,150,000 | $4,735,743,281 | 65,800,000 | $3,480,449,177 |
| Total increase or decrease | + | (18,250,000) | (783,033,420) | 20,350,000 | 1,255,294,104 |
| End of period | | 67,900,000 | $3,952,709,861 | 86,150,000 | $4,735,743,281 |
Schwab Fixed-Income ETFs | Annual Report
Schwab Long-Term U.S. Treasury ETF
Financial Statements
Financial Highlights
| | 1/1/20–
12/31/20 | 10/10/19 1–
12/31/19 | | | | |
| Per-Share Data |
| Net asset value at beginning of period | $47.34 | $50.00 | | | | |
| Income (loss) from investment operations: | | | | | | |
| Net investment income (loss)2 | 0.86 | 0.22 | | | | |
| Net realized and unrealized gains (losses) | 7.50 | (2.67) | | | | |
| Total from investment operations | 8.36 | (2.45) | | | | |
| Less distributions: | | | | | | |
| Distributions from net investment income | (0.83) | (0.21) | | | | |
| Net asset value at end of period | $54.87 | $47.34 | | | | |
| Total return | 17.64% | (4.91%) 3 | | | | |
| Ratios/Supplemental Data |
| Ratios to average net assets: | | | | | | |
| Total expenses | 0.05% | 0.06% 4,5 | | | | |
| Net investment income (loss) | 1.55% | 2.07% 4 | | | | |
| Portfolio turnover rate6 | 45% | 3% 3 | | | | |
| Net assets, end of period (x 1,000) | $90,535 | $18,935 | | | | |
| |
1
Commencement of operations.
2
Calculated based on the average shares outstanding during the period.
3
Not annualized.
4
Annualized.
5
Effective December 13, 2019, the annual operating expense ratio was reduced to 0.05%. The ratio presented for the period ended 12/31/19 is a blended ratio.
6
Portfolio turnover rate excludes securities received or delivered from processing of in-kind creations or redemptions.
Schwab Fixed-Income ETFs | Annual Report
Schwab Long-Term U.S. Treasury ETF
Portfolio Holdings as of December 31, 2020
This section shows all the securities in the fund’s portfolio and their values as of the report date.
The fund files its complete schedule of portfolio holdings with the U.S. Securities and Exchange Commission (SEC) for the first and third quarters of each fiscal year on Form N-PORT Part F. The fund’s Form N-PORT Part F is available on the SEC’s website at www.sec.gov and on the fund’s website at www.schwabfunds.com/schwabetfs_prospectus. The fund also makes available its complete schedule of portfolio holdings on a daily basis on the fund’s website.
For fixed rate obligations, the rate shown is the interest rate (the rate established when the obligation was issued). For variable rate obligations, the rate shown is the rate as of the report date based on each security’s rate reset date. The reference rate and spread used is shown parenthetically in the security description if available; if not the reference rate is described in a footnote. The maturity date shown for all the securities is the final legal maturity.
Security
Rate, Maturity Date | Face
Amount ($) | Value ($) |
| Treasuries 99.4% of net assets |
| Bonds |
| 5.38%, 02/15/31 | 376,200 | 540,641 |
| 4.50%, 02/15/36 | 386,000 | 566,576 |
| 4.75%, 02/15/37 | 228,400 | 348,221 |
| 5.00%, 05/15/37 | 294,800 | 462,076 |
| 4.38%, 02/15/38 | 310,200 | 461,229 |
| 4.50%, 05/15/38 | 351,300 | 530,573 |
| 3.50%, 02/15/39 | 397,100 | 539,342 |
| 4.25%, 05/15/39 | 534,000 | 792,615 |
| 4.50%, 08/15/39 | 570,500 | 873,043 |
| 4.38%, 11/15/39 | 613,700 | 928,221 |
| 4.63%, 02/15/40 | 618,300 | 963,920 |
| 1.13%, 05/15/40 | 2,241,000 | 2,128,250 |
| 4.38%, 05/15/40 | 598,800 | 909,147 |
| 1.13%, 08/15/40 | 2,935,900 | 2,781,077 |
| 3.88%, 08/15/40 | 595,200 | 853,368 |
| 1.38%, 11/15/40 | 2,341,200 | 2,315,776 |
| 4.25%, 11/15/40 | 590,800 | 887,862 |
| 4.75%, 02/15/41 | 627,500 | 1,002,921 |
| 4.38%, 05/15/41 | 578,400 | 887,076 |
| 3.75%, 08/15/41 | 585,200 | 831,898 |
| 3.13%, 11/15/41 | 614,600 | 804,070 |
| 3.13%, 02/15/42 | 707,200 | 927,647 |
| 3.00%, 05/15/42 | 604,800 | 778,396 |
| 2.75%, 08/15/42 | 791,500 | 981,584 |
| 2.75%, 11/15/42 | 1,071,800 | 1,328,362 |
| 3.13%, 02/15/43 | 994,500 | 1,305,126 |
| 2.88%, 05/15/43 | 1,451,700 | 1,836,514 |
| 3.63%, 08/15/43 | 1,165,600 | 1,647,230 |
| 3.75%, 11/15/43 | 1,129,800 | 1,627,177 |
| 3.63%, 02/15/44 | 1,409,300 | 1,996,472 |
| 3.38%, 05/15/44 | 1,353,800 | 1,852,485 |
| 3.13%, 08/15/44 | 1,467,500 | 1,936,641 |
| 3.00%, 11/15/44 | 1,322,900 | 1,713,466 |
| 2.50%, 02/15/45 | 1,595,700 | 1,904,244 |
| 3.00%, 05/15/45 | 1,174,400 | 1,524,701 |
| 2.88%, 08/15/45 | 1,306,400 | 1,663,313 |
| 3.00%, 11/15/45 | 676,100 | 880,409 |
| 2.50%, 02/15/46 | 1,476,400 | 1,765,221 |
| 2.50%, 05/15/46 | 1,447,900 | 1,731,259 |
| 2.25%, 08/15/46 | 1,569,100 | 1,792,819 |
| 2.88%, 11/15/46 | 1,310,300 | 1,675,341 |
| 3.00%, 02/15/47 | 1,403,100 | 1,836,197 |
| 3.00%, 05/15/47 | 1,044,200 | 1,368,636 |
| 2.75%, 08/15/47 | 1,512,300 | 1,897,818 |
| 2.75%, 11/15/47 | 1,568,600 | 1,970,309 |
| 3.00%, 02/15/48 | 1,793,700 | 2,356,333 |
| 3.13%, 05/15/48 | 1,888,800 | 2,537,337 |
| 3.00%, 08/15/48 | 2,078,800 | 2,736,870 |
| 3.38%, 11/15/48 | 2,096,600 | 2,946,706 |
| 3.00%, 02/15/49 | 2,222,200 | 2,933,130 |
| 2.88%, 05/15/49 | 2,221,400 | 2,870,639 |
Security
Rate, Maturity Date | Face
Amount ($) | Value ($) |
| 2.25%, 08/15/49 | 2,257,100 | 2,585,437 |
| 2.38%, 11/15/49 | 1,937,100 | 2,277,757 |
| 2.00%, 02/15/50 | 2,383,600 | 2,591,234 |
| 1.25%, 05/15/50 | 2,754,200 | 2,500,512 |
| 1.38%, 08/15/50 | 3,219,200 | 3,015,485 |
| 1.63%, 11/15/50 | 2,341,200 | 2,332,420 |
| Total Treasuries |
| (Cost $89,728,702) | | 90,033,129 |
| Security | Number
of Shares | Value ($) |
| Other Investment Company 0.0% of net assets |
| |
| Money Market Fund 0.0% |
| State Street Institutional U.S. Government Money Market Fund, Premier Class 0.03% (a) | 265 | 265 |
| Total Other Investment Company |
| (Cost $265) | | 265 |
| (a) | The rate shown is the 7-day yield. |
Schwab Fixed-Income ETFs | Annual Report
Schwab Long-Term U.S. Treasury ETF
Portfolio Holdings as of December 31, 2020 (continued)
The following is a summary of the inputs used to value the fund’s investments as of December 31, 2020 (see financial note 2(a) for additional information):
| Description | Quoted Prices in
Active Markets for
Identical Assets
(Level 1) | Other Significant
Observable Inputs
(Level 2) | Significant
Unobservable Inputs
(Level 3) | Total | |
| Assets | | | | | |
| Treasuries | $— | $90,033,129 | $— | $90,033,129 | |
| Other Investment Company1 | 265 | — | — | 265 | |
| Total | $265 | $90,033,129 | $— | $90,033,394 | |
| 1 | As categorized in Portfolio Holdings. |
Fund investments in underlying mutual funds are classified as Level 1, without consideration to the classification level of the investments held by the underlying mutual funds, which could be Level 1, Level 2 or Level 3.
Schwab Fixed-Income ETFs | Annual Report
Schwab Long-Term U.S. Treasury ETF
Statement of Assets and Liabilities
As of December 31, 2020
| Assets |
| Investments in unaffiliated issuers, at value (cost $89,728,967) | | $90,033,394 |
| Receivables: | | |
| Investments sold | | 2,171,300 |
| Interest | + | 507,279 |
| Total assets | | 92,711,973 |
| Liabilities |
| Payables: | | |
| Investments bought | | 2,172,759 |
| Management fees | + | 3,864 |
| Total liabilities | | 2,176,623 |
| Net Assets |
| Total assets | | 92,711,973 |
| Total liabilities | – | 2,176,623 |
| Net assets | | $90,535,350 |
| Net Assets by Source | | |
| Capital received from investors | | 90,824,997 |
| Total distributable loss | | (289,647) |
| Net Asset Value (NAV) |
| Net Assets | ÷ | Shares
Outstanding | = | NAV |
| $90,535,350 | | 1,650,000 | | $54.87 |
| | | | | |
Schwab Fixed-Income ETFs | Annual Report
Schwab Long-Term U.S. Treasury ETF
Statement of Operations
For the period January 1, 2020 through December 31, 2020
| Investment Income |
| Interest | | $941,095 |
| Dividends | + | 153 |
| Total investment income | | 941,248 |
| Expenses |
| Management fees | | 29,448 |
| Total expenses | – | 29,448 |
| Net investment income | | 911,800 |
| Realized and Unrealized Gains (Losses) |
| Net realized losses on investments | | (607,597) |
| Net realized gains on in-kind redemptions | + | 1,932,140 |
| Net realized gains | | 1,324,543 |
| Net change in unrealized appreciation (depreciation) on investments | + | 913,961 |
| Net realized and unrealized gains | | 2,238,504 |
| Increase in net assets resulting from operations | | $3,150,304 |
Schwab Fixed-Income ETFs | Annual Report
Schwab Long-Term U.S. Treasury ETF
Statement of Changes in Net Assets
For the current and prior report periods
| Operations | |
| | 1/1/20-12/31/20 | 10/10/19*-12/31/19 |
| Net investment income | | $911,800 | $69,454 |
| Net realized gains (losses) | | 1,324,543 | (18,893) |
| Net change in unrealized appreciation (depreciation) | + | 913,961 | (609,534) |
| Increase (decrease) in net assets resulting from operations | | 3,150,304 | (558,973) |
| Distributions to Shareholders | |
| Total distributions | | ($911,465) | ($66,835) |
| Transactions in Fund Shares | | | |
| | | 1/1/20-12/31/20 | 10/10/19*-12/31/19 |
| | | SHARES | VALUE | SHARES | VALUE |
| Shares sold | | 1,550,000 | $86,042,044 | 400,000 | $19,560,860 |
| Shares redeemed | + | (300,000) | (16,680,585) | — | — |
| Net transactions in fund shares | | 1,250,000 | $69,361,459 | 400,000 | $19,560,860 |
| Shares Outstanding and Net Assets | | | |
| | | 1/1/20-12/31/20 | 10/10/19*-12/31/19 |
| | | SHARES | NET ASSETS | SHARES | NET ASSETS |
| Beginning of period | | 400,000 | $18,935,052 | — | $— |
| Total increase | + | 1,250,000 | 71,600,298 | 400,000 | 18,935,052 |
| End of period | | 1,650,000 | $90,535,350 | 400,000 | $18,935,052 |
| * | Commencement of operations. |
Schwab Fixed-Income ETFs | Annual Report
Schwab U.S. Aggregate Bond ETF
Financial Statements
Financial Highlights
| | 1/1/20–
12/31/20 | 1/1/19–
12/31/19 | 1/1/18–
12/31/18 | 1/1/17–
12/31/17 | 1/1/16–
12/31/16 | |
| Per-Share Data |
| Net asset value at beginning of period | $53.43 | $50.59 | $52.07 | $51.55 | $51.41 | |
| Income (loss) from investment operations: | | | | | | |
| Net investment income (loss)1 | 1.19 | 1.43 | 1.35 | 1.18 | 1.06 | |
| Net realized and unrealized gains (losses) | 2.79 | 2.90 | (1.42) | 0.59 | 0.23 2 | |
| Total from investment operations | 3.98 | 4.33 | (0.07) | 1.77 | 1.29 | |
| Less distributions: | | | | | | |
| Distributions from net investment income | (1.36) | (1.49) | (1.41) | (1.25) | (1.15) | |
| Net asset value at end of period | $56.05 | $53.43 | $50.59 | $52.07 | $51.55 | |
| Total return | 7.50% | 8.64% | (0.09%) | 3.46% | 2.49% | |
| Ratios/Supplemental Data |
| Ratios to average net assets: | | | | | | |
| Total expenses | 0.04% | 0.04% | 0.04% | 0.04% | 0.05% 3 | |
| Net investment income (loss) | 2.14% | 2.71% | 2.67% | 2.26% | 2.01% | |
| Portfolio turnover rate4,5 | 68% | 63% | 71% | 101% | 119% | |
| Net assets, end of period (x 1,000) | $8,732,745 | $7,383,509 | $5,544,583 | $4,925,693 | $3,309,447 | |
| |
1
Calculated based on the average shares outstanding during the period.
2
The per share amount does not accord with the change in aggregate gains and losses in securities on the Statement of Operations during the period because of the timing of sales and repurchases of fund shares in relation to fluctuating market values.
3
Effective October 7, 2016, the annual operating expense ratio was reduced. The ratio presented for the period ended 12/31/16 is a blended ratio.
4
Portfolio turnover rate excludes securities received or delivered from processing of in-kind creations or redemptions.
5
Includes to-be-announced (TBA) transactions. (See financial note 2)
Schwab Fixed-Income ETFs | Annual Report
Schwab U.S. Aggregate Bond ETF
Portfolio Holdings as of December 31, 2020
This section shows all the securities in the fund’s portfolio and their values as of the report date.
The fund files its complete schedule of portfolio holdings with the U.S. Securities and Exchange Commission (SEC) for the first and third quarters of each fiscal year on Form N-PORT Part F. The fund’s Form N-PORT Part F is available on the SEC’s website at www.sec.gov and on the fund’s website at www.schwabfunds.com/schwabetfs_prospectus. The fund also makes available its complete schedule of portfolio holdings on a daily basis on the fund’s website.
For fixed rate obligations, the rate shown is the interest rate (the rate established when the obligation was issued). For variable rate obligations, the rate shown is the rate as of the report date based on each security’s rate reset date. The reference rate and spread used is shown parenthetically in the security description if available; if not the reference rate is described in a footnote. The maturity date shown for all the securities is the final legal maturity.
Security
Rate, Maturity Date | Face
Amount ($) | Value ($) |
| Corporates 27.2% of net assets |
| |
| Financial Institutions 8.2% |
| Banking 5.7% |
| Ally Financial, Inc. |
| 4.13%, 02/13/22 | 200,000 | 207,938 |
| 4.63%, 05/19/22 | 150,000 | 158,480 |
| 3.05%, 06/05/23 (a) | 300,000 | 316,605 |
| 1.45%, 10/02/23 (a) | 200,000 | 204,256 |
| 3.88%, 05/21/24 (a) | 250,000 | 274,428 |
| 5.13%, 09/30/24 | 250,000 | 288,353 |
| 4.63%, 03/30/25 | 150,000 | 171,134 |
| 5.80%, 05/01/25 (a) | 250,000 | 298,635 |
| 8.00%, 11/01/31 | 600,000 | 882,372 |
| 8.00%, 11/01/31 | 400,000 | 575,312 |
| American Express Co. |
| 2.75%, 05/20/22 (a) | 675,000 | 696,350 |
| 2.50%, 08/01/22 (a) | 700,000 | 722,736 |
| 2.65%, 12/02/22 | 450,000 | 470,003 |
| 3.40%, 02/27/23 (a) | 600,000 | 638,382 |
| 3.70%, 08/03/23 (a) | 800,000 | 866,840 |
| 3.40%, 02/22/24 (a) | 325,000 | 354,432 |
| 2.50%, 07/30/24 (a) | 450,000 | 481,239 |
| 3.00%, 10/30/24 (a) | 650,000 | 710,073 |
| 4.20%, 11/06/25 (a) | 650,000 | 757,009 |
| 3.13%, 05/20/26 (a) | 50,000 | 56,279 |
| 4.05%, 12/03/42 | 500,000 | 644,375 |
| American Express Credit Corp. |
| 2.70%, 03/03/22 (a) | 400,000 | 410,432 |
| 3.30%, 05/03/27 (a) | 550,000 | 625,988 |
| Australia & New Zealand Banking Group Ltd. |
| 2.63%, 05/19/22 | 650,000 | 671,086 |
| 2.63%, 11/09/22 | 500,000 | 521,995 |
| 2.05%, 11/21/22 | 250,000 | 258,723 |
| Banco Bilbao Vizcaya Argentaria S.A. |
| 0.88%, 09/18/23 | 600,000 | 604,944 |
| 1.13%, 09/18/25 | 400,000 | 403,764 |
| Banco Santander S.A. |
| 3.50%, 04/11/22 | 200,000 | 207,440 |
| 3.13%, 02/23/23 | 200,000 | 210,712 |
| 3.85%, 04/12/23 | 600,000 | 644,160 |
| 2.71%, 06/27/24 | 400,000 | 427,048 |
| 2.75%, 05/28/25 | 600,000 | 642,624 |
| 5.18%, 11/19/25 | 400,000 | 468,948 |
| 4.25%, 04/11/27 | 200,000 | 232,062 |
| 3.80%, 02/23/28 | 600,000 | 681,132 |
| 4.38%, 04/12/28 | 400,000 | 469,336 |
| 3.31%, 06/27/29 | 600,000 | 676,260 |
| 3.49%, 05/28/30 | 400,000 | 449,448 |
| Bancolombia S.A. |
| 3.00%, 01/29/25 (a) | 350,000 | 364,823 |
Security
Rate, Maturity Date | Face
Amount ($) | Value ($) |
| Bank of America Corp. |
| 2.50%, 10/21/22 (a) | 1,500,000 | 1,527,195 |
| 3.30%, 01/11/23 | 1,700,000 | 1,803,275 |
| 3.12%, 01/20/23 (a)(b) | 2,750,000 | 2,829,942 |
| 2.88%, 04/24/23 (a)(b) | 350,000 | 361,389 |
| 4.10%, 07/24/23 | 500,000 | 547,665 |
| 3.00%, 12/20/23 (a)(b) | 1,300,000 | 1,368,289 |
| 4.13%, 01/22/24 | 950,000 | 1,054,300 |
| 3.55%, 03/05/24 (a)(b) | 1,000,000 | 1,068,350 |
| 4.00%, 04/01/24 | 650,000 | 721,727 |
| 3.86%, 07/23/24 (a)(b) | 750,000 | 814,380 |
| 4.20%, 08/26/24 | 950,000 | 1,065,748 |
| 0.81%, 10/24/24 (a)(b) | 400,000 | 404,264 |
| 4.00%, 01/22/25 | 750,000 | 843,382 |
| 3.46%, 03/15/25 (a)(b) | 1,075,000 | 1,171,212 |
| 3.95%, 04/21/25 | 1,000,000 | 1,127,450 |
| 3.88%, 08/01/25 | 2,300,000 | 2,626,301 |
| 0.98%, 09/25/25 (a)(b) | 650,000 | 658,365 |
| 3.09%, 10/01/25 (a)(b) | 350,000 | 380,765 |
| 2.46%, 10/22/25 (a)(b) | 350,000 | 373,776 |
| 2.02%, 02/13/26 (a)(b) | 500,000 | 524,745 |
| 4.45%, 03/03/26 | 500,000 | 583,545 |
| 3.50%, 04/19/26 | 1,000,000 | 1,134,500 |
| 4.25%, 10/22/26 | 650,000 | 761,410 |
| 1.20%, 10/24/26 (a)(b) | 400,000 | 406,740 |
| 3.56%, 04/23/27 (a)(b) | 750,000 | 847,597 |
| 3.25%, 10/21/27 (a) | 1,000,000 | 1,121,500 |
| 4.18%, 11/25/27 (a) | 1,200,000 | 1,394,652 |
| 3.82%, 01/20/28 (a)(b) | 1,250,000 | 1,436,600 |
| 3.71%, 04/24/28 (a)(b) | 500,000 | 570,955 |
| 3.59%, 07/21/28 (a)(b) | 850,000 | 967,334 |
| 3.42%, 12/20/28 (a)(b) | 1,700,000 | 1,921,425 |
| 3.97%, 03/05/29 (a)(b) | 1,000,000 | 1,167,510 |
| 4.27%, 07/23/29 (a)(b) | 650,000 | 774,839 |
| 3.97%, 02/07/30 (a)(b) | 950,000 | 1,121,123 |
| 3.19%, 07/23/30 (a)(b) | 1,500,000 | 1,682,250 |
| 2.88%, 10/22/30 (a)(b) | 800,000 | 876,624 |
| 2.50%, 02/13/31 (a)(b) | 1,200,000 | 1,275,048 |
| 2.59%, 04/29/31 (a)(b) | 1,000,000 | 1,071,750 |
| 1.90%, 07/23/31 (a)(b) | 750,000 | 759,120 |
| 1.92%, 10/24/31 (a)(b) | 950,000 | 963,233 |
| 6.11%, 01/29/37 | 650,000 | 951,944 |
| 4.24%, 04/24/38 (a)(b) | 700,000 | 868,679 |
| 7.75%, 05/14/38 | 550,000 | 936,232 |
| 4.08%, 04/23/40 (a)(b) | 500,000 | 615,615 |
| 2.68%, 06/19/41 (a)(b) | 1,050,000 | 1,095,759 |
| 5.88%, 02/07/42 | 500,000 | 762,470 |
| 5.00%, 01/21/44 | 1,150,000 | 1,623,386 |
| 4.88%, 04/01/44 | 250,000 | 346,875 |
| 4.75%, 04/21/45 | 200,000 | 274,412 |
| 4.44%, 01/20/48 (a)(b) | 750,000 | 995,955 |
| 3.95%, 01/23/49 (a)(b) | 400,000 | 500,252 |
| 4.33%, 03/15/50 (a)(b) | 1,025,000 | 1,341,766 |
| 4.08%, 03/20/51 (a)(b) | 1,800,000 | 2,281,212 |
| 2.83%, 10/24/51 (a)(b) | 550,000 | 574,178 |
Schwab Fixed-Income ETFs | Annual Report
Schwab U.S. Aggregate Bond ETF
Portfolio Holdings as of December 31, 2020 (continued)
Security
Rate, Maturity Date | Face
Amount ($) | Value ($) |
| Bank of America NA |
| 3.34%, 01/25/23 (a)(b) | 250,000 | 258,275 |
| 6.00%, 10/15/36 | 600,000 | 899,952 |
| Bank of Montreal |
| 2.90%, 03/26/22 | 450,000 | 464,711 |
| 2.35%, 09/11/22 | 900,000 | 932,067 |
| 2.05%, 11/01/22 | 200,000 | 206,520 |
| 2.55%, 11/06/22 (a) | 500,000 | 520,135 |
| 0.45%, 12/08/23 | 200,000 | 200,714 |
| 3.30%, 02/05/24 | 500,000 | 542,920 |
| 2.50%, 06/28/24 | 300,000 | 320,472 |
| 1.85%, 05/01/25 | 475,000 | 499,054 |
| 4.34%, 10/05/28 (a)(b) | 300,000 | 330,222 |
| 3.80%, 12/15/32 (a)(b) | 429,000 | 486,070 |
| Bank of New York Mellon Corp. |
| 2.60%, 02/07/22 (a) | 750,000 | 767,662 |
| 1.95%, 08/23/22 | 750,000 | 771,705 |
| 1.85%, 01/27/23 (a) | 300,000 | 309,438 |
| 2.95%, 01/29/23 (a) | 500,000 | 526,095 |
| 3.50%, 04/28/23 | 250,000 | 268,283 |
| 2.20%, 08/16/23 (a) | 500,000 | 524,200 |
| 3.65%, 02/04/24 (a) | 100,000 | 109,874 |
| 3.25%, 09/11/24 (a) | 350,000 | 385,336 |
| 2.10%, 10/24/24 | 250,000 | 265,595 |
| 3.00%, 02/24/25 (a) | 250,000 | 275,313 |
| 1.60%, 04/24/25 (a) | 450,000 | 470,246 |
| 3.95%, 11/18/25 (a) | 950,000 | 1,101,135 |
| 2.45%, 08/17/26 (a) | 200,000 | 217,986 |
| 3.25%, 05/16/27 (a) | 300,000 | 339,864 |
| 3.40%, 01/29/28 (a) | 250,000 | 286,923 |
| 3.44%, 02/07/28 (a)(b) | 300,000 | 344,058 |
| 3.00%, 10/30/28 (a) | 350,000 | 397,870 |
| 3.30%, 08/23/29 (a) | 250,000 | 286,173 |
| Bank of Nova Scotia |
| 2.70%, 03/07/22 | 700,000 | 720,251 |
| 2.00%, 11/15/22 | 400,000 | 413,136 |
| 2.38%, 01/18/23 | 250,000 | 260,293 |
| 1.95%, 02/01/23 | 350,000 | 361,561 |
| 1.63%, 05/01/23 | 550,000 | 566,054 |
| 0.80%, 06/15/23 | 150,000 | 151,475 |
| 3.40%, 02/11/24 | 500,000 | 544,565 |
| 2.20%, 02/03/25 | 400,000 | 424,524 |
| 1.30%, 06/11/25 | 550,000 | 564,525 |
| 4.50%, 12/16/25 | 300,000 | 350,325 |
| 2.70%, 08/03/26 | 650,000 | 718,217 |
| BankUnited, Inc. |
| 4.88%, 11/17/25 (a) | 200,000 | 231,566 |
| Barclays Bank PLC |
| 1.70%, 05/12/22 (a) | 950,000 | 966,568 |
| Barclays PLC |
| 3.68%, 01/10/23 (a) | 550,000 | 567,143 |
| 4.61%, 02/15/23 (a)(b) | 950,000 | 991,705 |
| 4.34%, 05/16/24 (a)(b) | 750,000 | 812,317 |
| 4.38%, 09/11/24 | 200,000 | 221,532 |
| 1.01%, 12/10/24 (a) | 250,000 | 251,890 |
| 3.65%, 03/16/25 | 800,000 | 883,904 |
| 3.93%, 05/07/25 (a)(b) | 700,000 | 766,507 |
| 4.38%, 01/12/26 | 900,000 | 1,037,016 |
| 5.20%, 05/12/26 | 850,000 | 993,361 |
| 4.34%, 01/10/28 (a) | 400,000 | 460,284 |
| 4.84%, 05/09/28 (a) | 700,000 | 809,606 |
| 4.97%, 05/16/29 (a)(b) | 950,000 | 1,144,018 |
| 5.09%, 06/20/30 (a)(b) | 500,000 | 601,520 |
| 2.65%, 06/24/31 (a)(b) | 200,000 | 209,002 |
| 3.56%, 09/23/35 (a)(b) | 400,000 | 431,500 |
Security
Rate, Maturity Date | Face
Amount ($) | Value ($) |
| 5.25%, 08/17/45 | 500,000 | 692,055 |
| 4.95%, 01/10/47 | 500,000 | 683,155 |
| BBVA USA |
| 2.88%, 06/29/22 (a) | 250,000 | 258,758 |
| 2.50%, 08/27/24 (a) | 250,000 | 265,545 |
| 3.88%, 04/10/25 (a) | 250,000 | 281,130 |
| BNP Paribas S.A. |
| 3.25%, 03/03/23 | 375,000 | 398,681 |
| 4.25%, 10/15/24 | 300,000 | 338,109 |
| BPCE S.A. |
| 4.00%, 04/15/24 | 750,000 | 832,155 |
| 3.38%, 12/02/26 | 250,000 | 283,668 |
| Canadian Imperial Bank of Commerce |
| 2.55%, 06/16/22 | 250,000 | 258,568 |
| 0.95%, 06/23/23 | 500,000 | 506,845 |
| 2.61%, 07/22/23 (a)(b) | 100,000 | 103,381 |
| 3.50%, 09/13/23 | 700,000 | 759,983 |
| 3.10%, 04/02/24 | 250,000 | 270,720 |
| 2.25%, 01/28/25 | 250,000 | 265,428 |
| Capital One Bank USA NA |
| 3.38%, 02/15/23 | 250,000 | 264,810 |
| 2.28%, 01/28/26 (a)(b) | 500,000 | 523,240 |
| Capital One Financial Corp. |
| 3.05%, 03/09/22 (a) | 500,000 | 514,855 |
| 3.50%, 06/15/23 | 2,100,000 | 2,255,484 |
| 3.90%, 01/29/24 (a) | 250,000 | 273,998 |
| 3.30%, 10/30/24 (a) | 700,000 | 770,420 |
| 3.20%, 02/05/25 (a) | 500,000 | 546,335 |
| 4.20%, 10/29/25 (a) | 550,000 | 628,199 |
| 3.75%, 07/28/26 (a) | 400,000 | 453,236 |
| 3.75%, 03/09/27 (a) | 250,000 | 286,738 |
| 3.65%, 05/11/27 (a) | 700,000 | 803,670 |
| 3.80%, 01/31/28 (a) | 550,000 | 636,025 |
| CIT Bank NA |
| 2.97%, 09/27/25 (a)(b) | 250,000 | 260,913 |
| Citibank NA |
| 3.65%, 01/23/24 (a) | 850,000 | 930,138 |
| Citigroup, Inc. |
| 4.50%, 01/14/22 | 1,300,000 | 1,355,861 |
| 2.75%, 04/25/22 (a) | 950,000 | 978,481 |
| 4.05%, 07/30/22 | 100,000 | 105,655 |
| 2.70%, 10/27/22 (a) | 400,000 | 416,224 |
| 3.14%, 01/24/23 (a)(b) | 1,000,000 | 1,028,750 |
| 3.50%, 05/15/23 | 450,000 | 482,665 |
| 2.88%, 07/24/23 (a)(b) | 950,000 | 986,261 |
| 3.88%, 10/25/23 | 350,000 | 385,200 |
| 4.04%, 06/01/24 (a)(b) | 450,000 | 489,240 |
| 3.75%, 06/16/24 | 500,000 | 553,235 |
| 4.00%, 08/05/24 | 250,000 | 278,655 |
| 3.88%, 03/26/25 | 450,000 | 504,157 |
| 3.35%, 04/24/25 (a)(b) | 550,000 | 599,269 |
| 3.30%, 04/27/25 | 765,000 | 849,838 |
| 4.40%, 06/10/25 | 750,000 | 860,265 |
| 5.50%, 09/13/25 | 1,000,000 | 1,203,370 |
| 3.70%, 01/12/26 | 750,000 | 854,062 |
| 4.60%, 03/09/26 | 800,000 | 939,400 |
| 3.11%, 04/08/26 (a)(b) | 1,100,000 | 1,205,028 |
| 3.40%, 05/01/26 | 500,000 | 563,335 |
| 3.20%, 10/21/26 (a) | 1,000,000 | 1,118,250 |
| 4.30%, 11/20/26 | 500,000 | 584,180 |
| 4.45%, 09/29/27 | 1,150,000 | 1,359,852 |
| 3.89%, 01/10/28 (a)(b) | 750,000 | 862,845 |
| 6.63%, 01/15/28 | 350,000 | 459,725 |
| 3.67%, 07/24/28 (a)(b) | 1,250,000 | 1,424,312 |
| 4.13%, 07/25/28 | 900,000 | 1,053,603 |
| 3.52%, 10/27/28 (a)(b) | 600,000 | 678,636 |
Schwab Fixed-Income ETFs | Annual Report
Schwab U.S. Aggregate Bond ETF
Portfolio Holdings as of December 31, 2020 (continued)
Security
Rate, Maturity Date | Face
Amount ($) | Value ($) |
| 4.08%, 04/23/29 (a)(b) | 300,000 | 352,794 |
| 3.98%, 03/20/30 (a)(b) | 950,000 | 1,118,007 |
| 2.98%, 11/05/30 (a)(b) | 900,000 | 992,601 |
| 2.67%, 01/29/31 (a)(b) | 750,000 | 805,402 |
| 4.41%, 03/31/31 (a)(b) | 1,350,000 | 1,638,360 |
| 2.57%, 06/03/31 (a)(b) | 700,000 | 746,508 |
| 6.63%, 06/15/32 | 250,000 | 355,698 |
| 5.88%, 02/22/33 | 350,000 | 471,468 |
| 6.00%, 10/31/33 | 350,000 | 481,701 |
| 3.88%, 01/24/39 (a)(b) | 800,000 | 960,752 |
| 8.13%, 07/15/39 | 300,000 | 538,053 |
| 5.32%, 03/26/41 (a)(b) | 600,000 | 842,880 |
| 5.88%, 01/30/42 | 400,000 | 612,968 |
| 6.68%, 09/13/43 | 300,000 | 488,769 |
| 5.30%, 05/06/44 | 500,000 | 701,225 |
| 4.65%, 07/30/45 | 550,000 | 745,288 |
| 4.75%, 05/18/46 | 650,000 | 867,061 |
| 4.28%, 04/24/48 (a)(b) | 350,000 | 457,156 |
| 4.65%, 07/23/48 (a) | 800,000 | 1,106,080 |
| Citizens Bank NA |
| 3.25%, 02/14/22 (a) | 500,000 | 515,050 |
| 2.65%, 05/26/22 (a) | 250,000 | 257,555 |
| 3.70%, 03/29/23 (a) | 250,000 | 267,470 |
| Citizens Financial Group, Inc. |
| 2.85%, 07/27/26 (a) | 150,000 | 166,788 |
| 3.25%, 04/30/30 (a) | 450,000 | 508,999 |
| 2.64%, 09/30/32 (a)(c) | 250,000 | 266,065 |
| Comerica, Inc. |
| 3.70%, 07/31/23 (a) | 300,000 | 324,360 |
| 4.00%, 02/01/29 (a) | 400,000 | 479,216 |
| Cooperatieve Rabobank UA |
| 2.75%, 01/10/22 | 250,000 | 256,308 |
| 3.88%, 02/08/22 | 1,250,000 | 1,299,550 |
| 2.75%, 01/10/23 | 250,000 | 262,265 |
| 4.63%, 12/01/23 | 450,000 | 501,777 |
| 3.38%, 05/21/25 | 750,000 | 837,555 |
| 4.38%, 08/04/25 | 500,000 | 571,540 |
| 3.75%, 07/21/26 | 250,000 | 282,973 |
| 5.25%, 05/24/41 | 700,000 | 1,034,516 |
| 5.75%, 12/01/43 | 500,000 | 748,520 |
| 5.25%, 08/04/45 | 500,000 | 717,355 |
| Credit Suisse AG |
| 2.80%, 04/08/22 | 500,000 | 516,105 |
| 1.00%, 05/05/23 | 500,000 | 507,590 |
| 3.63%, 09/09/24 | 1,300,000 | 1,443,221 |
| 2.95%, 04/09/25 | 500,000 | 548,795 |
| Credit Suisse Group AG |
| 3.80%, 06/09/23 | 600,000 | 646,326 |
| 3.75%, 03/26/25 | 1,250,000 | 1,389,987 |
| 4.55%, 04/17/26 | 750,000 | 883,080 |
| 4.88%, 05/15/45 | 500,000 | 702,245 |
| Credit Suisse Group Funding Guernsey Ltd. |
| 3.80%, 09/15/22 | 500,000 | 528,660 |
| Credit Suisse USA, Inc. |
| 7.13%, 07/15/32 | 250,000 | 390,440 |
| Deutsche Bank AG |
| 3.30%, 11/16/22 | 500,000 | 522,395 |
| 3.95%, 02/27/23 | 1,000,000 | 1,062,020 |
| 3.70%, 05/30/24 | 99,000 | 106,854 |
| 3.70%, 05/30/24 | 250,000 | 269,498 |
| 3.96%, 11/26/25 (a)(b) | 450,000 | 492,480 |
| 4.10%, 01/13/26 | 200,000 | 222,280 |
| 4.10%, 01/13/26 | 200,000 | 223,438 |
| 2.13%, 11/24/26 (a)(b) | 550,000 | 563,128 |
| 3.55%, 09/18/31 (a)(b) | 750,000 | 815,025 |
Security
Rate, Maturity Date | Face
Amount ($) | Value ($) |
| Discover Bank |
| 4.20%, 08/08/23 | 500,000 | 547,590 |
| 2.45%, 09/12/24 (a) | 250,000 | 264,913 |
| 4.68%, 08/09/28 (a)(b) | 250,000 | 266,040 |
| 4.65%, 09/13/28 (a) | 1,000,000 | 1,199,240 |
| Discover Financial Services |
| 3.85%, 11/21/22 | 1,250,000 | 1,330,487 |
| 3.95%, 11/06/24 (a) | 200,000 | 223,580 |
| Fifth Third Bancorp |
| 3.50%, 03/15/22 (a) | 250,000 | 258,788 |
| 2.60%, 06/15/22 (a) | 250,000 | 257,688 |
| 1.63%, 05/05/23 (a) | 200,000 | 205,916 |
| 4.30%, 01/16/24 (a) | 250,000 | 277,420 |
| 3.65%, 01/25/24 (a) | 575,000 | 627,727 |
| 2.55%, 05/05/27 (a) | 250,000 | 272,340 |
| 3.95%, 03/14/28 (a) | 150,000 | 177,677 |
| 8.25%, 03/01/38 | 350,000 | 596,837 |
| Fifth Third Bank NA |
| 1.80%, 01/30/23 (a) | 500,000 | 514,550 |
| 3.95%, 07/28/25 (a) | 250,000 | 286,113 |
| 3.85%, 03/15/26 (a) | 500,000 | 567,960 |
| First Horizon Corp. |
| 3.55%, 05/26/23 (a) | 200,000 | 212,592 |
| 4.00%, 05/26/25 (a) | 200,000 | 223,716 |
| First Republic Bank |
| 2.50%, 06/06/22 (a) | 250,000 | 257,098 |
| 4.63%, 02/13/47 (a) | 250,000 | 329,648 |
| Goldman Sachs Capital I |
| 6.35%, 02/15/34 | 350,000 | 493,584 |
| Goldman Sachs Group, Inc. |
| 5.75%, 01/24/22 | 1,600,000 | 1,691,248 |
| 3.00%, 04/26/22 (a) | 1,300,000 | 1,310,608 |
| 3.63%, 01/22/23 | 800,000 | 853,768 |
| 3.20%, 02/23/23 (a) | 600,000 | 634,200 |
| 2.91%, 06/05/23 (a)(b) | 250,000 | 259,048 |
| 2.91%, 07/24/23 (a)(b) | 1,000,000 | 1,038,450 |
| 0.63%, 11/17/23 (a)(b) | 850,000 | 854,105 |
| 3.63%, 02/20/24 (a) | 600,000 | 654,324 |
| 4.00%, 03/03/24 | 1,050,000 | 1,160,491 |
| 3.85%, 07/08/24 (a) | 650,000 | 718,068 |
| 3.50%, 01/23/25 (a) | 1,000,000 | 1,104,450 |
| 3.50%, 04/01/25 (a) | 1,300,000 | 1,445,574 |
| 3.75%, 05/22/25 (a) | 950,000 | 1,066,859 |
| 3.27%, 09/29/25 (a)(b) | 800,000 | 876,464 |
| 4.25%, 10/21/25 | 750,000 | 859,867 |
| 3.50%, 11/16/26 (a) | 950,000 | 1,067,363 |
| 1.09%, 12/09/26 (a)(b) | 500,000 | 505,995 |
| 5.95%, 01/15/27 | 265,000 | 334,088 |
| 3.85%, 01/26/27 (a) | 1,100,000 | 1,257,696 |
| 3.69%, 06/05/28 (a)(b) | 1,100,000 | 1,267,541 |
| 3.81%, 04/23/29 (a)(b) | 675,000 | 783,027 |
| 4.22%, 05/01/29 (a)(b) | 950,000 | 1,125,902 |
| 2.60%, 02/07/30 (a) | 700,000 | 753,900 |
| 3.80%, 03/15/30 (a) | 850,000 | 1,001,359 |
| 6.13%, 02/15/33 | 150,000 | 217,593 |
| 6.45%, 05/01/36 | 400,000 | 587,476 |
| 6.75%, 10/01/37 | 1,950,000 | 2,988,102 |
| 4.02%, 10/31/38 (a)(b) | 900,000 | 1,100,205 |
| 4.41%, 04/23/39 (a)(b) | 800,000 | 1,022,008 |
| 6.25%, 02/01/41 | 950,000 | 1,502,187 |
| 4.80%, 07/08/44 (a) | 675,000 | 934,875 |
| 5.15%, 05/22/45 | 800,000 | 1,124,032 |
| 4.75%, 10/21/45 (a) | 500,000 | 698,690 |
Schwab Fixed-Income ETFs | Annual Report
Schwab U.S. Aggregate Bond ETF
Portfolio Holdings as of December 31, 2020 (continued)
Security
Rate, Maturity Date | Face
Amount ($) | Value ($) |
| HSBC Bank USA NA |
| 5.88%, 11/01/34 | 250,000 | 354,935 |
| 5.63%, 08/15/35 | 500,000 | 686,715 |
| 7.00%, 01/15/39 | 250,000 | 398,243 |
| HSBC Holdings PLC |
| 3.26%, 03/13/23 (a)(b) | 1,050,000 | 1,084,461 |
| 3.60%, 05/25/23 | 700,000 | 753,403 |
| 3.03%, 11/22/23 (a)(b) | 250,000 | 262,843 |
| 4.25%, 03/14/24 | 950,000 | 1,048,971 |
| 3.95%, 05/18/24 (a)(b) | 500,000 | 540,080 |
| 3.80%, 03/11/25 (a)(b) | 1,300,000 | 1,419,990 |
| 4.25%, 08/18/25 | 400,000 | 453,828 |
| 2.63%, 11/07/25 (a)(b) | 250,000 | 266,153 |
| 4.30%, 03/08/26 | 1,300,000 | 1,502,267 |
| 3.90%, 05/25/26 | 1,100,000 | 1,256,409 |
| 2.10%, 06/04/26 (a)(b) | 600,000 | 625,254 |
| 4.29%, 09/12/26 (a)(b) | 1,000,000 | 1,140,820 |
| 4.38%, 11/23/26 | 500,000 | 577,655 |
| 1.59%, 05/24/27 (a)(b) | 750,000 | 762,705 |
| 4.04%, 03/13/28 (a)(b) | 500,000 | 570,985 |
| 2.01%, 09/22/28 (a)(b) | 650,000 | 666,438 |
| 4.58%, 06/19/29 (a)(b) | 1,250,000 | 1,480,362 |
| 4.95%, 03/31/30 | 850,000 | 1,064,319 |
| 3.97%, 05/22/30 (a)(b) | 1,000,000 | 1,156,760 |
| 2.85%, 06/04/31 (a)(b) | 250,000 | 268,835 |
| 2.36%, 08/18/31 (a)(b) | 500,000 | 517,490 |
| 7.63%, 05/17/32 | 387,000 | 568,743 |
| 6.50%, 05/02/36 | 650,000 | 942,071 |
| 6.50%, 09/15/37 | 650,000 | 952,484 |
| 6.80%, 06/01/38 | 650,000 | 988,604 |
| 6.10%, 01/14/42 | 400,000 | 609,780 |
| 5.25%, 03/14/44 | 495,000 | 688,921 |
| HSBC USA, Inc. |
| 3.50%, 06/23/24 | 200,000 | 219,190 |
| Huntington Bancshares, Inc. |
| 2.30%, 01/14/22 (a) | 50,000 | 50,940 |
| 2.63%, 08/06/24 (a) | 250,000 | 267,325 |
| 4.00%, 05/15/25 (a) | 350,000 | 396,753 |
| 2.55%, 02/04/30 (a) | 250,000 | 269,133 |
| Huntington National Bank |
| 2.50%, 08/07/22 (a) | 500,000 | 516,425 |
| 3.55%, 10/06/23 (a) | 500,000 | 542,325 |
| ING Groep N.V. |
| 3.15%, 03/29/22 | 800,000 | 827,640 |
| 4.10%, 10/02/23 | 200,000 | 219,880 |
| 3.55%, 04/09/24 | 250,000 | 273,225 |
| 3.95%, 03/29/27 | 500,000 | 578,800 |
| 4.55%, 10/02/28 | 500,000 | 609,465 |
| 4.05%, 04/09/29 | 255,000 | 303,618 |
| Intesa Sanpaolo S.p.A. |
| 5.25%, 01/12/24 | 200,000 | 223,768 |
| JPMorgan Chase & Co. |
| 4.50%, 01/24/22 | 600,000 | 626,988 |
| 3.25%, 09/23/22 | 950,000 | 998,554 |
| 2.97%, 01/15/23 (a) | 500,000 | 513,815 |
| 3.20%, 01/25/23 | 1,291,000 | 1,369,015 |
| 3.21%, 04/01/23 (a)(b) | 250,000 | 259,230 |
| 2.78%, 04/25/23 (a)(b) | 500,000 | 515,995 |
| 3.38%, 05/01/23 | 1,575,000 | 1,683,864 |
| 2.70%, 05/18/23 (a) | 750,000 | 789,315 |
| 3.88%, 02/01/24 | 1,020,000 | 1,126,702 |
| 3.56%, 04/23/24 (a)(b) | 700,000 | 749,854 |
| 3.63%, 05/13/24 | 500,000 | 553,200 |
| 1.51%, 06/01/24 (a)(b) | 100,000 | 102,775 |
| 3.80%, 07/23/24 (a)(b) | 1,390,000 | 1,506,746 |
| 3.88%, 09/10/24 | 900,000 | 1,007,883 |
Security
Rate, Maturity Date | Face
Amount ($) | Value ($) |
| 0.65%, 09/16/24 (a)(b) | 200,000 | 201,216 |
| 4.02%, 12/05/24 (a)(b) | 700,000 | 771,995 |
| 3.13%, 01/23/25 (a) | 1,000,000 | 1,095,190 |
| 3.22%, 03/01/25 (a)(b) | 1,350,000 | 1,456,852 |
| 3.90%, 07/15/25 (a) | 750,000 | 852,322 |
| 2.30%, 10/15/25 (a)(b) | 650,000 | 690,462 |
| 2.01%, 03/13/26 (a)(b) | 700,000 | 736,869 |
| 3.30%, 04/01/26 (a) | 925,000 | 1,036,287 |
| 2.08%, 04/22/26 (a)(b) | 1,100,000 | 1,162,139 |
| 3.20%, 06/15/26 (a) | 799,000 | 894,688 |
| 2.95%, 10/01/26 (a) | 975,000 | 1,084,102 |
| 7.63%, 10/15/26 | 150,000 | 205,301 |
| 1.05%, 11/19/26 (a)(b) | 700,000 | 708,456 |
| 4.13%, 12/15/26 | 700,000 | 818,706 |
| 3.96%, 01/29/27 (a)(b) | 200,000 | 230,296 |
| 8.00%, 04/29/27 | 200,000 | 280,238 |
| 4.25%, 10/01/27 | 493,000 | 585,132 |
| 3.63%, 12/01/27 (a) | 500,000 | 568,800 |
| 3.78%, 02/01/28 (a)(b) | 950,000 | 1,091,987 |
| 3.54%, 05/01/28 (a)(b) | 1,050,000 | 1,199,971 |
| 2.18%, 06/01/28 (a)(b) | 500,000 | 531,345 |
| 3.51%, 01/23/29 (a)(b) | 750,000 | 855,330 |
| 4.01%, 04/23/29 (a)(b) | 750,000 | 881,767 |
| 4.20%, 07/23/29 (a)(b) | 1,150,000 | 1,372,467 |
| 4.45%, 12/05/29 (a)(b) | 750,000 | 919,522 |
| 3.70%, 05/06/30 (a)(b) | 900,000 | 1,045,215 |
| 8.75%, 09/01/30 | 50,000 | 74,131 |
| 2.74%, 10/15/30 (a)(b) | 1,200,000 | 1,307,220 |
| 4.49%, 03/24/31 (a)(b) | 1,400,000 | 1,728,342 |
| 2.52%, 04/22/31 (a)(b) | 900,000 | 967,320 |
| 2.96%, 05/13/31 (a)(b) | 1,000,000 | 1,095,800 |
| 1.76%, 11/19/31 (a)(b) | 600,000 | 605,748 |
| 6.40%, 05/15/38 | 900,000 | 1,400,391 |
| 3.88%, 07/24/38 (a)(b) | 850,000 | 1,036,328 |
| 5.50%, 10/15/40 | 500,000 | 739,515 |
| 3.11%, 04/22/41 (a)(b) | 600,000 | 678,636 |
| 5.60%, 07/15/41 | 350,000 | 529,494 |
| 2.53%, 11/19/41 (a)(b) | 500,000 | 514,650 |
| 5.40%, 01/06/42 | 500,000 | 747,800 |
| 5.63%, 08/16/43 | 450,000 | 678,843 |
| 4.85%, 02/01/44 | 400,000 | 577,564 |
| 4.95%, 06/01/45 | 600,000 | 853,470 |
| 4.26%, 02/22/48 (a)(b) | 600,000 | 791,022 |
| 4.03%, 07/24/48 (a)(b) | 500,000 | 638,760 |
| 3.96%, 11/15/48 (a)(b) | 1,200,000 | 1,515,948 |
| 3.90%, 01/23/49 (a)(b) | 500,000 | 632,900 |
| 3.11%, 04/22/51 (a)(b) | 800,000 | 892,536 |
| KeyBank NA |
| 3.30%, 02/01/22 | 350,000 | 361,368 |
| 2.40%, 06/09/22 | 250,000 | 257,468 |
| 2.30%, 09/14/22 | 250,000 | 258,450 |
| 3.38%, 03/07/23 | 250,000 | 266,455 |
| 1.25%, 03/10/23 | 500,000 | 510,095 |
| 3.30%, 06/01/25 | 250,000 | 278,343 |
| KeyCorp |
| 4.10%, 04/30/28 | 1,000,000 | 1,191,260 |
| 2.55%, 10/01/29 | 150,000 | 162,705 |
| Lloyds Bank PLC |
| 2.25%, 08/14/22 | 200,000 | 206,220 |
| Lloyds Banking Group PLC |
| 3.00%, 01/11/22 | 250,000 | 256,540 |
| 2.86%, 03/17/23 (a)(b) | 650,000 | 668,252 |
| 1.33%, 06/15/23 (a)(b) | 400,000 | 404,544 |
| 4.05%, 08/16/23 | 500,000 | 545,955 |
| 2.91%, 11/07/23 (a)(b) | 500,000 | 521,580 |
| 3.90%, 03/12/24 | 350,000 | 384,836 |
| 4.50%, 11/04/24 | 800,000 | 895,736 |
Schwab Fixed-Income ETFs | Annual Report
Schwab U.S. Aggregate Bond ETF
Portfolio Holdings as of December 31, 2020 (continued)
Security
Rate, Maturity Date | Face
Amount ($) | Value ($) |
| 4.45%, 05/08/25 | 200,000 | 229,912 |
| 3.87%, 07/09/25 (a)(b) | 400,000 | 441,444 |
| 4.58%, 12/10/25 | 200,000 | 229,012 |
| 2.44%, 02/05/26 (a)(b) | 200,000 | 211,512 |
| 4.65%, 03/24/26 | 1,250,000 | 1,443,450 |
| 3.75%, 01/11/27 | 400,000 | 454,496 |
| 4.38%, 03/22/28 | 1,300,000 | 1,545,271 |
| 3.57%, 11/07/28 (a)(b) | 450,000 | 508,207 |
| 5.30%, 12/01/45 | 350,000 | 483,899 |
| 4.34%, 01/09/48 | 600,000 | 746,550 |
| Manufacturers & Traders Trust Co. |
| 2.50%, 05/18/22 (a) | 250,000 | 257,185 |
| 2.90%, 02/06/25 (a) | 250,000 | 272,383 |
| 3.40%, 08/17/27 | 250,000 | 283,398 |
| Mitsubishi UFJ Financial Group, Inc. |
| 3.22%, 03/07/22 | 600,000 | 620,076 |
| 2.62%, 07/18/22 | 700,000 | 724,360 |
| 2.67%, 07/25/22 | 750,000 | 777,105 |
| 3.46%, 03/02/23 | 377,000 | 401,984 |
| 3.76%, 07/26/23 | 250,000 | 271,280 |
| 3.41%, 03/07/24 | 500,000 | 544,275 |
| 2.80%, 07/18/24 | 300,000 | 321,705 |
| 0.85%, 09/15/24 (a)(b) | 750,000 | 755,272 |
| 2.19%, 02/25/25 | 850,000 | 896,631 |
| 3.78%, 03/02/25 | 250,000 | 280,185 |
| 1.41%, 07/17/25 | 500,000 | 514,020 |
| 3.85%, 03/01/26 | 750,000 | 867,172 |
| 2.76%, 09/13/26 | 200,000 | 219,702 |
| 3.68%, 02/22/27 | 200,000 | 227,338 |
| 3.29%, 07/25/27 | 1,100,000 | 1,249,974 |
| 3.96%, 03/02/28 | 250,000 | 294,670 |
| 3.74%, 03/07/29 | 800,000 | 940,976 |
| 3.20%, 07/18/29 | 750,000 | 846,315 |
| 2.56%, 02/25/30 | 400,000 | 432,160 |
| 2.05%, 07/17/30 | 550,000 | 574,777 |
| 4.29%, 07/26/38 | 300,000 | 384,210 |
| 4.15%, 03/07/39 | 150,000 | 188,877 |
| 3.75%, 07/18/39 | 500,000 | 604,965 |
| Mizuho Financial Group, Inc. |
| 2.95%, 02/28/22 | 700,000 | 721,042 |
| 2.60%, 09/11/22 | 550,000 | 570,922 |
| 3.55%, 03/05/23 | 250,000 | 266,280 |
| 2.72%, 07/16/23 (a)(b) | 300,000 | 309,837 |
| 1.24%, 07/10/24 (a)(b) | 400,000 | 406,812 |
| 0.85%, 09/08/24 (a)(b) | 250,000 | 251,535 |
| 3.92%, 09/11/24 (a)(b) | 250,000 | 271,738 |
| 2.56%, 09/13/25 (a)(b) | 200,000 | 211,602 |
| 2.23%, 05/25/26 (a)(b) | 400,000 | 421,264 |
| 3.66%, 02/28/27 | 400,000 | 453,760 |
| 3.17%, 09/11/27 | 700,000 | 783,251 |
| 4.02%, 03/05/28 | 200,000 | 234,642 |
| 4.25%, 09/11/29 (a)(b) | 500,000 | 595,505 |
| 3.15%, 07/16/30 (a)(b) | 250,000 | 277,843 |
| 2.87%, 09/13/30 (a)(b) | 200,000 | 217,662 |
| 2.59%, 05/25/31 (a)(b) | 200,000 | 213,838 |
| 2.20%, 07/10/31 (a)(b) | 250,000 | 259,570 |
| 1.98%, 09/08/31 (a)(b) | 650,000 | 662,577 |
| Morgan Stanley |
| 2.75%, 05/19/22 | 602,000 | 621,902 |
| 4.88%, 11/01/22 | 1,150,000 | 1,240,367 |
| 3.13%, 01/23/23 | 1,300,000 | 1,372,982 |
| 3.75%, 02/25/23 | 650,000 | 697,092 |
| 4.10%, 05/22/23 | 750,000 | 813,870 |
| 0.56%, 11/10/23 (a)(b) | 550,000 | 551,166 |
| 3.74%, 04/24/24 (a)(b) | 1,000,000 | 1,076,560 |
| 3.88%, 04/29/24 | 1,000,000 | 1,108,560 |
| 3.70%, 10/23/24 | 850,000 | 946,628 |
Security
Rate, Maturity Date | Face
Amount ($) | Value ($) |
| 2.72%, 07/22/25 (a)(b) | 340,000 | 364,035 |
| 4.00%, 07/23/25 | 1,400,000 | 1,602,916 |
| 0.86%, 10/21/25 (a)(b) | 400,000 | 403,136 |
| 5.00%, 11/24/25 | 750,000 | 896,160 |
| 3.88%, 01/27/26 | 200,000 | 229,650 |
| 2.19%, 04/28/26 (a)(b) | 700,000 | 740,712 |
| 3.13%, 07/27/26 | 1,750,000 | 1,959,440 |
| 6.25%, 08/09/26 | 100,000 | 127,735 |
| 4.35%, 09/08/26 | 1,050,000 | 1,237,257 |
| 0.99%, 12/10/26 (a)(b) | 500,000 | 504,225 |
| 3.63%, 01/20/27 | 1,100,000 | 1,263,669 |
| 3.95%, 04/23/27 | 50,000 | 57,902 |
| 3.59%, 07/22/28 (a)(b) | 1,750,000 | 1,999,375 |
| 3.77%, 01/24/29 (a)(b) | 850,000 | 986,323 |
| 4.43%, 01/23/30 (a)(b) | 1,150,000 | 1,403,644 |
| 2.70%, 01/22/31 (a)(b) | 1,250,000 | 1,360,450 |
| 3.62%, 04/01/31 (a)(b) | 900,000 | 1,047,753 |
| 1.79%, 02/13/32 (a)(b) | 250,000 | 252,260 |
| 7.25%, 04/01/32 | 400,000 | 616,712 |
| 3.97%, 07/22/38 (a)(b) | 500,000 | 620,850 |
| 4.46%, 04/22/39 (a)(b) | 250,000 | 326,848 |
| 6.38%, 07/24/42 | 800,000 | 1,311,176 |
| 4.30%, 01/27/45 | 1,000,000 | 1,336,050 |
| 4.38%, 01/22/47 | 700,000 | 953,162 |
| 5.60%, 03/24/51 (a)(b) | 950,000 | 1,536,853 |
| MUFG Americas Holdings Corp. |
| 3.50%, 06/18/22 | 200,000 | 209,176 |
| 3.00%, 02/10/25 (a) | 250,000 | 273,095 |
| MUFG Union Bank NA |
| 3.15%, 04/01/22 (a) | 250,000 | 258,183 |
| 2.10%, 12/09/22 (a) | 250,000 | 258,065 |
| National Australia Bank Ltd. |
| 2.80%, 01/10/22 | 250,000 | 256,515 |
| 2.50%, 05/22/22 | 500,000 | 515,550 |
| 3.00%, 01/20/23 | 250,000 | 263,730 |
| 2.88%, 04/12/23 | 500,000 | 529,210 |
| 3.63%, 06/20/23 | 250,000 | 270,225 |
| 3.38%, 01/14/26 | 500,000 | 564,085 |
| 2.50%, 07/12/26 | 250,000 | 272,768 |
| National Bank of Canada |
| 2.10%, 02/01/23 | 350,000 | 362,012 |
| Natwest Group PLC |
| 6.13%, 12/15/22 | 1,250,000 | 1,374,075 |
| 3.50%, 05/15/23 (a)(b) | 500,000 | 520,165 |
| 6.10%, 06/10/23 | 300,000 | 336,318 |
| 3.88%, 09/12/23 | 450,000 | 488,227 |
| 6.00%, 12/19/23 | 400,000 | 456,680 |
| 2.36%, 05/22/24 (a)(b) | 200,000 | 208,190 |
| 5.13%, 05/28/24 | 1,250,000 | 1,404,475 |
| 4.52%, 06/25/24 (a)(b) | 350,000 | 382,302 |
| 4.27%, 03/22/25 (a)(b) | 700,000 | 774,795 |
| 4.80%, 04/05/26 | 600,000 | 709,752 |
| 4.89%, 05/18/29 (a)(b) | 1,000,000 | 1,203,920 |
| 3.75%, 11/01/29 (a)(b) | 200,000 | 213,524 |
| 5.08%, 01/27/30 (a)(b) | 850,000 | 1,047,242 |
| 4.45%, 05/08/30 (a)(b) | 250,000 | 298,215 |
| 3.03%, 11/28/35 (a)(b) | 250,000 | 258,528 |
| New York Community Bancorp, Inc. |
| 5.90%, 11/06/28 (a)(b) | 200,000 | 207,112 |
| Northern Trust Corp. |
| 3.95%, 10/30/25 | 500,000 | 579,535 |
| 3.65%, 08/03/28 (a) | 250,000 | 294,285 |
| 3.15%, 05/03/29 (a) | 250,000 | 284,383 |
| 1.95%, 05/01/30 (a) | 250,000 | 261,308 |
| 3.38%, 05/08/32 (a)(b) | 200,000 | 219,036 |
Schwab Fixed-Income ETFs | Annual Report
Schwab U.S. Aggregate Bond ETF
Portfolio Holdings as of December 31, 2020 (continued)
Security
Rate, Maturity Date | Face
Amount ($) | Value ($) |
| People's United Financial, Inc. |
| 3.65%, 12/06/22 (a) | 165,000 | 173,016 |
| PNC Bank NA |
| 2.63%, 02/17/22 (a) | 350,000 | 358,855 |
| 2.70%, 11/01/22 (a) | 250,000 | 260,490 |
| 2.95%, 01/30/23 (a) | 1,000,000 | 1,051,860 |
| 3.50%, 06/08/23 (a) | 250,000 | 268,633 |
| 3.80%, 07/25/23 (a) | 500,000 | 541,790 |
| 3.30%, 10/30/24 (a) | 250,000 | 275,503 |
| 3.25%, 06/01/25 (a) | 250,000 | 278,165 |
| 3.10%, 10/25/27 (a) | 300,000 | 337,977 |
| 3.25%, 01/22/28 (a) | 500,000 | 569,240 |
| 4.05%, 07/26/28 | 750,000 | 889,567 |
| 2.70%, 10/22/29 | 250,000 | 274,670 |
| PNC Financial Services Group, Inc. |
| 3.30%, 03/08/22 (a) | 250,000 | 258,403 |
| 2.85%, 11/09/22 | 200,000 | 209,428 |
| 3.50%, 01/23/24 (a) | 350,000 | 381,913 |
| 2.20%, 11/01/24 (a) | 500,000 | 532,200 |
| 2.60%, 07/23/26 (a) | 300,000 | 330,138 |
| 3.15%, 05/19/27 (a) | 100,000 | 113,028 |
| 3.45%, 04/23/29 (a) | 250,000 | 289,435 |
| 2.55%, 01/22/30 (a) | 650,000 | 713,401 |
| Regions Bank |
| 6.45%, 06/26/37 | 250,000 | 356,580 |
| Regions Financial Corp. |
| 2.25%, 05/18/25 (a) | 250,000 | 265,453 |
| 7.38%, 12/10/37 | 150,000 | 227,723 |
| Royal Bank of Canada |
| 2.75%, 02/01/22 | 1,050,000 | 1,078,465 |
| 2.80%, 04/29/22 | 70,000 | 72,368 |
| 1.60%, 04/17/23 | 400,000 | 411,456 |
| 3.70%, 10/05/23 | 500,000 | 545,985 |
| 0.50%, 10/26/23 | 425,000 | 427,559 |
| 2.55%, 07/16/24 | 450,000 | 481,635 |
| 2.25%, 11/01/24 | 550,000 | 585,579 |
| 1.15%, 06/10/25 | 200,000 | 204,522 |
| 4.65%, 01/27/26 | 250,000 | 295,410 |
| Santander Holdings USA, Inc. |
| 3.70%, 03/28/22 (a) | 1,000,000 | 1,033,070 |
| 3.40%, 01/18/23 (a) | 100,000 | 105,055 |
| 3.50%, 06/07/24 (a) | 250,000 | 270,853 |
| 3.45%, 06/02/25 (a) | 200,000 | 218,628 |
| 4.50%, 07/17/25 (a) | 700,000 | 795,305 |
| 4.40%, 07/13/27 (a) | 500,000 | 570,470 |
| Santander UK Group Holdings PLC |
| 3.57%, 01/10/23 (a) | 200,000 | 206,282 |
| 3.37%, 01/05/24 (a)(b) | 2,000,000 | 2,104,500 |
| 1.53%, 08/21/26 (a)(b) | 450,000 | 458,793 |
| Santander UK PLC |
| 2.10%, 01/13/23 | 200,000 | 206,600 |
| 4.00%, 03/13/24 | 350,000 | 387,471 |
| Signature Bank |
| FRN |
| 4.00%, 10/15/30 (a)(b) | 350,000 | 356,209 |
| State Street Corp. |
| 2.83%, 03/30/23 (a)(b) | 500,000 | 515,620 |
| 3.10%, 05/15/23 | 250,000 | 266,365 |
| 3.70%, 11/20/23 | 200,000 | 219,548 |
| 3.78%, 12/03/24 (a)(b) | 250,000 | 274,383 |
| 3.30%, 12/16/24 | 500,000 | 555,715 |
| 3.55%, 08/18/25 | 571,000 | 648,376 |
| 2.35%, 11/01/25 (a)(b) | 300,000 | 320,094 |
| 2.90%, 03/30/26 (a)(b) | 100,000 | 108,964 |
| 2.65%, 05/19/26 | 350,000 | 385,641 |
Security
Rate, Maturity Date | Face
Amount ($) | Value ($) |
| 4.14%, 12/03/29 (a)(b) | 500,000 | 607,275 |
| 2.40%, 01/24/30 | 250,000 | 274,303 |
| Sumitomo Mitsui Banking Corp. |
| 3.00%, 01/18/23 | 250,000 | 263,210 |
| 3.40%, 07/11/24 | 500,000 | 546,255 |
| 3.65%, 07/23/25 | 250,000 | 281,538 |
| Sumitomo Mitsui Financial Group, Inc. |
| 2.85%, 01/11/22 | 500,000 | 512,670 |
| 2.78%, 07/12/22 | 1,100,000 | 1,140,964 |
| 3.10%, 01/17/23 | 1,000,000 | 1,055,520 |
| 3.75%, 07/19/23 | 250,000 | 270,693 |
| 3.94%, 10/16/23 | 250,000 | 273,580 |
| 2.70%, 07/16/24 | 1,250,000 | 1,335,437 |
| 2.45%, 09/27/24 | 350,000 | 373,289 |
| 2.35%, 01/15/25 | 450,000 | 477,545 |
| 1.47%, 07/08/25 | 550,000 | 564,410 |
| 3.78%, 03/09/26 | 450,000 | 513,414 |
| 2.63%, 07/14/26 | 1,000,000 | 1,088,170 |
| 3.01%, 10/19/26 | 800,000 | 888,480 |
| 3.45%, 01/11/27 | 300,000 | 338,592 |
| 3.36%, 07/12/27 | 350,000 | 396,932 |
| 3.54%, 01/17/28 | 200,000 | 227,506 |
| 3.94%, 07/19/28 | 100,000 | 117,176 |
| 4.31%, 10/16/28 | 450,000 | 539,374 |
| 3.04%, 07/16/29 | 1,150,000 | 1,278,616 |
| 2.72%, 09/27/29 | 200,000 | 217,686 |
| 2.75%, 01/15/30 | 450,000 | 492,160 |
| 2.13%, 07/08/30 | 250,000 | 261,183 |
| 2.14%, 09/23/30 | 250,000 | 251,773 |
| SVB Financial Group |
| 3.50%, 01/29/25 | 100,000 | 109,463 |
| 3.13%, 06/05/30 (a) | 250,000 | 282,145 |
| Svenska Handelsbanken AB |
| 3.90%, 11/20/23 | 650,000 | 716,378 |
| Synchrony Bank |
| 3.00%, 06/15/22 (a) | 750,000 | 774,952 |
| Synchrony Financial |
| 4.38%, 03/19/24 (a) | 158,000 | 174,092 |
| 4.25%, 08/15/24 (a) | 250,000 | 274,805 |
| 3.70%, 08/04/26 (a) | 300,000 | 332,784 |
| 3.95%, 12/01/27 (a) | 750,000 | 844,965 |
| 5.15%, 03/19/29 (a) | 350,000 | 424,480 |
| Synovus Financial Corp. |
| 3.13%, 11/01/22 (a) | 250,000 | 259,478 |
| Toronto-Dominion Bank |
| 1.90%, 12/01/22 | 450,000 | 464,099 |
| 0.75%, 06/12/23 | 350,000 | 353,836 |
| 3.50%, 07/19/23 | 1,250,000 | 1,351,975 |
| 0.45%, 09/11/23 | 350,000 | 351,127 |
| 3.25%, 03/11/24 | 300,000 | 325,989 |
| 2.65%, 06/12/24 | 500,000 | 536,280 |
| 1.15%, 06/12/25 | 150,000 | 153,227 |
| 0.75%, 09/11/25 | 525,000 | 527,189 |
| Truist Bank |
| 2.63%, 01/15/22 (a) | 250,000 | 255,623 |
| 2.80%, 05/17/22 (a) | 655,000 | 676,556 |
| 2.45%, 08/01/22 (a) | 500,000 | 516,220 |
| 3.00%, 02/02/23 (a) | 250,000 | 263,168 |
| 2.75%, 05/01/23 (a) | 200,000 | 210,802 |
| 3.20%, 04/01/24 (a) | 350,000 | 379,614 |
| 3.69%, 08/02/24 (a)(b) | 500,000 | 541,875 |
| 1.50%, 03/10/25 (a) | 400,000 | 414,616 |
| 3.63%, 09/16/25 (a) | 750,000 | 845,445 |
| 4.05%, 11/03/25 (a) | 350,000 | 403,214 |
| 3.80%, 10/30/26 (a) | 500,000 | 576,185 |
| 2.25%, 03/11/30 (a) | 600,000 | 630,852 |
Schwab Fixed-Income ETFs | Annual Report
Schwab U.S. Aggregate Bond ETF
Portfolio Holdings as of December 31, 2020 (continued)
Security
Rate, Maturity Date | Face
Amount ($) | Value ($) |
| Truist Financial Corp. |
| 2.70%, 01/27/22 (a) | 400,000 | 409,576 |
| 3.95%, 03/22/22 (a) | 100,000 | 104,114 |
| 2.75%, 04/01/22 (a) | 100,000 | 102,868 |
| 3.05%, 06/20/22 (a) | 500,000 | 519,085 |
| 2.20%, 03/16/23 (a) | 600,000 | 623,952 |
| 3.75%, 12/06/23 (a) | 800,000 | 880,072 |
| 2.50%, 08/01/24 (a) | 160,000 | 170,693 |
| 4.00%, 05/01/25 (a) | 750,000 | 852,660 |
| 3.70%, 06/05/25 (a) | 230,000 | 260,477 |
| 1.20%, 08/05/25 (a) | 300,000 | 307,686 |
| 1.13%, 08/03/27 (a) | 500,000 | 503,765 |
| 3.88%, 03/19/29 (a) | 100,000 | 117,774 |
| US Bancorp |
| 3.00%, 03/15/22 (a) | 510,000 | 525,932 |
| 2.95%, 07/15/22 (a) | 1,500,000 | 1,558,890 |
| 3.70%, 01/30/24 (a) | 250,000 | 275,293 |
| 3.38%, 02/05/24 (a) | 450,000 | 490,846 |
| 2.40%, 07/30/24 (a) | 400,000 | 427,416 |
| 3.60%, 09/11/24 (a) | 700,000 | 774,557 |
| 1.45%, 05/12/25 (a) | 500,000 | 518,935 |
| 2.38%, 07/22/26 (a) | 200,000 | 217,564 |
| 3.15%, 04/27/27 (a) | 650,000 | 734,831 |
| 3.90%, 04/26/28 (a) | 1,200,000 | 1,431,552 |
| 1.38%, 07/22/30 (a) | 450,000 | 451,197 |
| US Bank NA |
| 1.80%, 01/21/22 (a) | 250,000 | 253,993 |
| 1.95%, 01/09/23 (a) | 250,000 | 258,143 |
| 2.85%, 01/23/23 (a) | 250,000 | 262,813 |
| 2.05%, 01/21/25 (a) | 550,000 | 582,246 |
| 2.80%, 01/27/25 (a) | 500,000 | 544,375 |
| Webster Financial Corp. |
| 4.10%, 03/25/29 (a) | 100,000 | 110,851 |
| Wells Fargo & Co. |
| 3.50%, 03/08/22 | 1,400,000 | 1,451,772 |
| 2.63%, 07/22/22 | 1,594,000 | 1,650,587 |
| 3.07%, 01/24/23 (a) | 1,350,000 | 1,388,313 |
| 3.45%, 02/13/23 | 600,000 | 636,774 |
| 4.48%, 01/16/24 | 250,000 | 278,113 |
| 3.75%, 01/24/24 (a) | 1,000,000 | 1,092,010 |
| 1.65%, 06/02/24 (a)(b) | 650,000 | 668,388 |
| 3.30%, 09/09/24 | 1,100,000 | 1,205,633 |
| 3.00%, 02/19/25 | 650,000 | 707,772 |
| 3.55%, 09/29/25 | 1,050,000 | 1,181,050 |
| 2.41%, 10/30/25 (a)(b) | 1,850,000 | 1,956,097 |
| 2.16%, 02/11/26 (a)(b) | 800,000 | 841,704 |
| 3.00%, 04/22/26 | 1,250,000 | 1,378,750 |
| 2.19%, 04/30/26 (a)(b) | 1,000,000 | 1,053,220 |
| 4.10%, 06/03/26 | 1,450,000 | 1,665,644 |
| 7.57%, 08/01/26 | 150,000 | 196,718 |
| 3.00%, 10/23/26 | 1,100,000 | 1,220,307 |
| 3.20%, 06/17/27 (a)(b) | 750,000 | 832,807 |
| 4.30%, 07/22/27 | 800,000 | 940,312 |
| 3.58%, 05/22/28 (a)(b) | 950,000 | 1,078,563 |
| 2.39%, 06/02/28 (a)(b) | 750,000 | 799,552 |
| 4.15%, 01/24/29 (a) | 750,000 | 890,437 |
| 2.88%, 10/30/30 (a)(b) | 1,200,000 | 1,310,460 |
| 2.57%, 02/11/31 (a)(b) | 1,000,000 | 1,065,230 |
| 4.48%, 04/04/31 (a)(b) | 850,000 | 1,040,629 |
| 5.38%, 02/07/35 | 500,000 | 686,035 |
| 5.50%, 08/01/35 | 400,000 | 539,348 |
| 5.95%, 12/15/36 | 200,000 | 267,182 |
| 3.07%, 04/30/41 (a)(b) | 1,000,000 | 1,089,000 |
| 5.38%, 11/02/43 | 650,000 | 906,119 |
| 5.61%, 01/15/44 | 1,200,000 | 1,701,252 |
| 4.65%, 11/04/44 | 750,000 | 960,547 |
| 3.90%, 05/01/45 | 700,000 | 875,119 |
Security
Rate, Maturity Date | Face
Amount ($) | Value ($) |
| 4.90%, 11/17/45 | 650,000 | 867,873 |
| 4.40%, 06/14/46 | 600,000 | 751,578 |
| 4.75%, 12/07/46 | 700,000 | 919,772 |
| 5.01%, 04/04/51 (a)(b) | 1,900,000 | 2,705,486 |
| Wells Fargo Bank NA |
| 3.55%, 08/14/23 (a) | 1,300,000 | 1,405,027 |
| 6.60%, 01/15/38 | 500,000 | 766,225 |
| Westpac Banking Corp. |
| 2.80%, 01/11/22 | 250,000 | 256,525 |
| 2.50%, 06/28/22 | 250,000 | 258,510 |
| 2.75%, 01/11/23 | 1,050,000 | 1,102,290 |
| 2.00%, 01/13/23 | 200,000 | 207,002 |
| 3.65%, 05/15/23 | 250,000 | 269,703 |
| 3.30%, 02/26/24 | 250,000 | 272,863 |
| 2.35%, 02/19/25 | 250,000 | 268,498 |
| 2.85%, 05/13/26 | 600,000 | 667,002 |
| 2.70%, 08/19/26 | 450,000 | 497,952 |
| 3.35%, 03/08/27 | 450,000 | 511,735 |
| 3.40%, 01/25/28 | 300,000 | 346,284 |
| 2.65%, 01/16/30 | 250,000 | 280,470 |
| 2.89%, 02/04/30 (a)(b) | 400,000 | 419,840 |
| 4.32%, 11/23/31 (a)(b) | 500,000 | 570,690 |
| 4.11%, 07/24/34 (a)(b) | 800,000 | 910,320 |
| 4.42%, 07/24/39 | 300,000 | 383,748 |
| | | 494,477,185 |
| Brokerage/Asset Managers/Exchanges 0.3% |
| Affiliated Managers Group, Inc. |
| 4.25%, 02/15/24 | 250,000 | 275,795 |
| 3.30%, 06/15/30 (a) | 300,000 | 327,279 |
| Ameriprise Financial, Inc. |
| 3.00%, 03/22/22 | 50,000 | 51,646 |
| 3.70%, 10/15/24 | 475,000 | 529,430 |
| 3.00%, 04/02/25 (a) | 150,000 | 163,760 |
| 2.88%, 09/15/26 (a) | 250,000 | 277,700 |
| BGC Partners, Inc. |
| 5.38%, 07/24/23 | 200,000 | 217,578 |
| 3.75%, 10/01/24 (a) | 300,000 | 314,040 |
| 4.38%, 12/15/25 (a) | 100,000 | 105,822 |
| BlackRock, Inc. |
| 3.38%, 06/01/22 | 250,000 | 260,953 |
| 3.50%, 03/18/24 | 1,250,000 | 1,375,575 |
| 3.20%, 03/15/27 | 50,000 | 56,620 |
| 3.25%, 04/30/29 (a) | 200,000 | 231,018 |
| 2.40%, 04/30/30 (a) | 250,000 | 273,712 |
| 1.90%, 01/28/31 (a) | 200,000 | 209,906 |
| Brookfield Asset Management, Inc. |
| 4.00%, 01/15/25 (a) | 200,000 | 224,186 |
| Brookfield Finance, Inc. |
| 4.00%, 04/01/24 (a) | 250,000 | 274,802 |
| 3.90%, 01/25/28 (a) | 500,000 | 578,935 |
| 4.85%, 03/29/29 (a) | 250,000 | 306,972 |
| 4.35%, 04/15/30 (a) | 250,000 | 300,462 |
| 4.70%, 09/20/47 (a) | 300,000 | 383,748 |
| 3.45%, 04/15/50 (a) | 200,000 | 212,536 |
| 3.50%, 03/30/51 (a) | 250,000 | 269,427 |
| Cboe Global Markets, Inc. |
| 3.65%, 01/12/27 (a) | 200,000 | 229,324 |
| Charles Schwab Corp. |
| 2.65%, 01/25/23 (a)(d) | 300,000 | 314,394 |
| 3.55%, 02/01/24 (a)(d) | 150,000 | 163,742 |
| 4.20%, 03/24/25 (a)(d) | 250,000 | 286,730 |
| 3.85%, 05/21/25 (a)(d) | 125,000 | 142,405 |
| 3.20%, 01/25/28 (a)(d) | 450,000 | 514,354 |
| 4.00%, 02/01/29 (a)(d) | 250,000 | 299,042 |
Schwab Fixed-Income ETFs | Annual Report
Schwab U.S. Aggregate Bond ETF
Portfolio Holdings as of December 31, 2020 (continued)
Security
Rate, Maturity Date | Face
Amount ($) | Value ($) |
| 3.25%, 05/22/29 (a)(d) | 200,000 | 229,660 |
| 4.63%, 03/22/30 (a)(d) | 250,000 | 316,102 |
| CME Group, Inc. |
| 3.00%, 03/15/25 (a) | 500,000 | 549,020 |
| 5.30%, 09/15/43 (a) | 300,000 | 448,629 |
| 4.15%, 06/15/48 (a) | 200,000 | 270,746 |
| E*TRADE Financial Corp. |
| 2.95%, 08/24/22 (a) | 200,000 | 207,924 |
| 3.80%, 08/24/27 (a) | 100,000 | 115,443 |
| 4.50%, 06/20/28 (a) | 250,000 | 302,565 |
| Eaton Vance Corp. |
| 3.50%, 04/06/27 (a) | 123,000 | 137,237 |
| Franklin Resources, Inc. |
| 2.80%, 09/15/22 | 100,000 | 104,174 |
| 2.85%, 03/30/25 | 150,000 | 163,769 |
| 1.60%, 10/30/30 (a) | 250,000 | 249,070 |
| Intercontinental Exchange, Inc. |
| 2.35%, 09/15/22 (a) | 250,000 | 257,953 |
| 0.70%, 06/15/23 | 200,000 | 201,624 |
| 3.45%, 09/21/23 (a) | 150,000 | 161,802 |
| 4.00%, 10/15/23 | 500,000 | 548,945 |
| 3.75%, 12/01/25 (a) | 250,000 | 284,175 |
| 3.10%, 09/15/27 (a) | 100,000 | 112,060 |
| 3.75%, 09/21/28 (a) | 500,000 | 585,315 |
| 2.10%, 06/15/30 (a) | 500,000 | 523,750 |
| 1.85%, 09/15/32 (a) | 500,000 | 504,740 |
| 2.65%, 09/15/40 (a) | 250,000 | 257,453 |
| 4.25%, 09/21/48 (a) | 400,000 | 510,192 |
| 3.00%, 06/15/50 (a) | 500,000 | 531,205 |
| 3.00%, 09/15/60 (a) | 500,000 | 524,050 |
| Invesco Finance PLC |
| 3.13%, 11/30/22 | 250,000 | 263,288 |
| 3.75%, 01/15/26 | 350,000 | 396,168 |
| 5.38%, 11/30/43 | 100,000 | 130,568 |
| Jefferies Group LLC |
| 5.13%, 01/20/23 | 500,000 | 547,220 |
| 6.25%, 01/15/36 | 100,000 | 133,758 |
| 6.50%, 01/20/43 | 150,000 | 206,361 |
| Jefferies Group LLC/Jefferies Group Capital Finance, Inc. |
| 4.85%, 01/15/27 | 700,000 | 827,302 |
| 4.15%, 01/23/30 | 250,000 | 293,050 |
| Lazard Group LLC |
| 3.63%, 03/01/27 (a) | 200,000 | 222,240 |
| 4.50%, 09/19/28 (a) | 150,000 | 178,466 |
| 4.38%, 03/11/29 (a) | 150,000 | 176,825 |
| Legg Mason, Inc. |
| 4.75%, 03/15/26 | 250,000 | 297,305 |
| 5.63%, 01/15/44 | 176,000 | 254,447 |
| Nasdaq, Inc. |
| 0.45%, 12/21/22 (a) | 200,000 | 200,252 |
| 3.85%, 06/30/26 (a) | 350,000 | 402,304 |
| 2.50%, 12/21/40 (a) | 250,000 | 247,723 |
| 3.25%, 04/28/50 (a) | 250,000 | 275,325 |
| Nomura Holdings, Inc. |
| 2.65%, 01/16/25 | 500,000 | 533,805 |
| 1.85%, 07/16/25 | 500,000 | 520,230 |
| 3.10%, 01/16/30 | 500,000 | 546,525 |
| 2.68%, 07/16/30 | 550,000 | 583,753 |
| Raymond James Financial, Inc. |
| 3.63%, 09/15/26 | 200,000 | 230,684 |
| 4.65%, 04/01/30 (a) | 200,000 | 246,608 |
| 4.95%, 07/15/46 | 300,000 | 412,242 |
| Stifel Financial Corp. |
| 4.25%, 07/18/24 | 100,000 | 112,344 |
| 4.00%, 05/15/30 (a) | 200,000 | 228,994 |
Security
Rate, Maturity Date | Face
Amount ($) | Value ($) |
| TD Ameritrade Holding Corp. |
| 2.95%, 04/01/22 (a) | 200,000 | 205,818 |
| 3.75%, 04/01/24 (a) | 200,000 | 219,684 |
| 3.30%, 04/01/27 (a) | 450,000 | 508,054 |
| 2.75%, 10/01/29 (a) | 150,000 | 165,630 |
| | | 26,836,469 |
| Finance Companies 0.3% |
| AerCap Ireland Capital DAC/AerCap Global Aviation Trust |
| 3.95%, 02/01/22 (a) | 750,000 | 774,150 |
| 4.63%, 07/01/22 | 150,000 | 157,872 |
| 3.30%, 01/23/23 (a) | 250,000 | 261,005 |
| 4.13%, 07/03/23 (a) | 300,000 | 321,267 |
| 4.88%, 01/16/24 (a) | 250,000 | 273,830 |
| 3.15%, 02/15/24 (a) | 400,000 | 420,672 |
| 6.50%, 07/15/25 (a) | 200,000 | 239,390 |
| 4.45%, 10/01/25 (a) | 150,000 | 167,858 |
| 4.45%, 04/03/26 (a) | 650,000 | 731,854 |
| 3.65%, 07/21/27 (a) | 1,050,000 | 1,139,365 |
| 4.63%, 10/15/27 (a) | 150,000 | 170,153 |
| Air Lease Corp. |
| 3.50%, 01/15/22 | 250,000 | 257,050 |
| 3.75%, 02/01/22 (a) | 140,000 | 144,015 |
| 2.63%, 07/01/22 (a) | 100,000 | 102,705 |
| 2.25%, 01/15/23 | 200,000 | 205,460 |
| 2.75%, 01/15/23 (a) | 250,000 | 258,380 |
| 3.88%, 07/03/23 (a) | 100,000 | 106,692 |
| 4.25%, 09/15/24 (a) | 650,000 | 712,380 |
| 2.30%, 02/01/25 (a) | 250,000 | 259,008 |
| 3.25%, 03/01/25 (a) | 200,000 | 213,608 |
| 3.38%, 07/01/25 (a) | 100,000 | 108,475 |
| 2.88%, 01/15/26 (a) | 200,000 | 212,074 |
| 3.75%, 06/01/26 (a) | 250,000 | 276,282 |
| 3.63%, 04/01/27 (a) | 650,000 | 704,554 |
| 3.63%, 12/01/27 (a) | 449,000 | 495,045 |
| 4.63%, 10/01/28 (a) | 150,000 | 172,143 |
| 3.25%, 10/01/29 (a) | 250,000 | 264,143 |
| 3.00%, 02/01/30 (a) | 200,000 | 205,834 |
| Aircastle Ltd. |
| 5.50%, 02/15/22 | 100,000 | 104,606 |
| 5.00%, 04/01/23 | 250,000 | 268,830 |
| 4.40%, 09/25/23 (a) | 250,000 | 267,038 |
| 4.13%, 05/01/24 (a) | 300,000 | 320,025 |
| 4.25%, 06/15/26 (a) | 200,000 | 212,168 |
| Ares Capital Corp. |
| 3.63%, 01/19/22 (a) | 100,000 | 102,810 |
| 3.50%, 02/10/23 (a) | 350,000 | 370,678 |
| 4.20%, 06/10/24 (a) | 400,000 | 436,284 |
| 4.25%, 03/01/25 (a) | 100,000 | 108,802 |
| 3.25%, 07/15/25 (a) | 300,000 | 317,838 |
| 3.88%, 01/15/26 (a) | 450,000 | 488,250 |
| FS KKR Capital Corp. |
| 4.63%, 07/15/24 (a) | 100,000 | 105,475 |
| 4.13%, 02/01/25 (a) | 350,000 | 364,857 |
| 3.40%, 01/15/26 (a) | 50,000 | 49,719 |
| GATX Corp. |
| 4.35%, 02/15/24 (a) | 100,000 | 110,521 |
| 3.85%, 03/30/27 (a) | 200,000 | 226,434 |
| 3.50%, 03/15/28 (a) | 100,000 | 112,472 |
| 4.55%, 11/07/28 (a) | 350,000 | 422,523 |
| 4.70%, 04/01/29 (a) | 255,000 | 311,210 |
| 5.20%, 03/15/44 (a) | 150,000 | 199,059 |
| GE Capital Funding LLC |
| 3.45%, 05/15/25 (a)(c) | 500,000 | 553,040 |
| 4.05%, 05/15/27 (a)(c) | 250,000 | 286,035 |
Schwab Fixed-Income ETFs | Annual Report
Schwab U.S. Aggregate Bond ETF
Portfolio Holdings as of December 31, 2020 (continued)
Security
Rate, Maturity Date | Face
Amount ($) | Value ($) |
| 4.40%, 05/15/30 (a)(c) | 750,000 | 884,467 |
| 4.55%, 05/15/32 (a)(c) | 250,000 | 300,142 |
| GE Capital International Funding Co. |
| 3.37%, 11/15/25 | 850,000 | 945,582 |
| 4.42%, 11/15/35 | 3,775,000 | 4,511,049 |
| Goldman Sachs BDC, Inc. |
| 3.75%, 02/10/25 (a) | 125,000 | 133,088 |
| 2.88%, 01/15/26 (a) | 250,000 | 255,263 |
| Golub Capital BDC, Inc. |
| 3.38%, 04/15/24 (a) | 200,000 | 203,970 |
| International Lease Finance Corp. |
| 5.88%, 08/15/22 | 250,000 | 270,448 |
| Main Street Capital Corp. |
| 5.20%, 05/01/24 | 350,000 | 380,646 |
| Oaktree Specialty Lending Corp. |
| 3.50%, 02/25/25 (a) | 100,000 | 103,723 |
| Owl Rock Capital Corp. |
| 5.25%, 04/15/24 (a) | 200,000 | 216,700 |
| 4.00%, 03/30/25 (a) | 250,000 | 261,235 |
| 4.25%, 01/15/26 (a) | 200,000 | 210,852 |
| Prospect Capital Corp. |
| 5.88%, 03/15/23 | 27,000 | 28,360 |
| | | 23,799,463 |
| Financial Other 0.0% |
| Andrew W Mellon Foundation |
| 0.95%, 08/01/27 (a) | 250,000 | 249,173 |
| Blackstone Secured Lending Fund |
| 3.63%, 01/15/26 (a)(c) | 250,000 | 257,680 |
| CME Group, Inc. |
| 3.00%, 09/15/22 | 200,000 | 209,484 |
| ORIX Corp. |
| 2.90%, 07/18/22 | 540,000 | 559,310 |
| 4.05%, 01/16/24 | 150,000 | 164,547 |
| 3.70%, 07/18/27 | 143,000 | 163,698 |
| | | 1,603,892 |
| Insurance 1.2% |
| ACE Capital Trust II |
| 9.70%, 04/01/30 | 100,000 | 153,524 |
| Aegon NV |
| 5.50%, 04/11/48 (a)(b) | 250,000 | 283,138 |
| Aetna, Inc. |
| 2.75%, 11/15/22 (a) | 150,000 | 155,687 |
| 2.80%, 06/15/23 (a) | 250,000 | 263,343 |
| 3.50%, 11/15/24 (a) | 700,000 | 769,160 |
| 6.63%, 06/15/36 | 150,000 | 223,403 |
| 6.75%, 12/15/37 | 250,000 | 382,290 |
| 4.50%, 05/15/42 (a) | 450,000 | 555,840 |
| 4.75%, 03/15/44 (a) | 250,000 | 320,685 |
| 3.88%, 08/15/47 (a) | 150,000 | 179,202 |
| Aflac, Inc. |
| 3.63%, 06/15/23 | 500,000 | 540,665 |
| 3.63%, 11/15/24 | 150,000 | 168,123 |
| 3.25%, 03/17/25 | 200,000 | 221,618 |
| 3.60%, 04/01/30 (a) | 350,000 | 412,391 |
| 4.75%, 01/15/49 (a) | 250,000 | 350,027 |
| Alleghany Corp. |
| 4.95%, 06/27/22 | 150,000 | 159,558 |
| 3.63%, 05/15/30 (a) | 300,000 | 340,914 |
| Allied World Assurance Co. Holdings Ltd. |
| 4.35%, 10/29/25 (a) | 300,000 | 328,557 |
Security
Rate, Maturity Date | Face
Amount ($) | Value ($) |
| Allstate Corp. |
| 3.15%, 06/15/23 | 450,000 | 480,429 |
| 0.75%, 12/15/25 (a) | 400,000 | 402,248 |
| 3.28%, 12/15/26 (a) | 250,000 | 286,218 |
| 5.35%, 06/01/33 | 79,000 | 109,114 |
| 4.50%, 06/15/43 | 450,000 | 609,903 |
| 4.20%, 12/15/46 (a) | 226,000 | 299,346 |
| 3.85%, 08/10/49 (a) | 250,000 | 318,152 |
| 6.50%, 05/15/57 (a)(b) | 100,000 | 133,007 |
| American Equity Investment Life Holding Co. |
| 5.00%, 06/15/27 (a) | 100,000 | 113,129 |
| American Financial Group, Inc. |
| 5.25%, 04/02/30 (a) | 100,000 | 123,977 |
| 4.50%, 06/15/47 (a) | 250,000 | 302,830 |
| American International Group, Inc. |
| 4.88%, 06/01/22 | 540,000 | 573,669 |
| 4.13%, 02/15/24 | 450,000 | 498,136 |
| 2.50%, 06/30/25 (a) | 450,000 | 484,492 |
| 3.75%, 07/10/25 (a) | 500,000 | 562,075 |
| 3.90%, 04/01/26 (a) | 450,000 | 513,553 |
| 4.20%, 04/01/28 (a) | 400,000 | 474,708 |
| 4.25%, 03/15/29 (a) | 200,000 | 240,414 |
| 3.40%, 06/30/30 (a) | 500,000 | 573,380 |
| 3.88%, 01/15/35 (a) | 250,000 | 300,860 |
| 4.70%, 07/10/35 (a) | 200,000 | 257,472 |
| 4.50%, 07/16/44 (a) | 700,000 | 898,044 |
| 4.80%, 07/10/45 (a) | 500,000 | 666,665 |
| 4.75%, 04/01/48 (a) | 400,000 | 539,920 |
| 5.75%, 04/01/48 (a)(b) | 210,000 | 242,487 |
| 4.38%, 06/30/50 (a) | 300,000 | 391,404 |
| 4.38%, 01/15/55 (a) | 550,000 | 714,263 |
| 8.18%, 05/15/58 (a)(b) | 50,000 | 73,390 |
| Anthem, Inc. |
| 3.13%, 05/15/22 | 250,000 | 259,473 |
| 2.95%, 12/01/22 (a) | 750,000 | 785,640 |
| 3.30%, 01/15/23 | 750,000 | 794,460 |
| 3.50%, 08/15/24 (a) | 350,000 | 384,363 |
| 3.35%, 12/01/24 (a) | 350,000 | 385,556 |
| 2.38%, 01/15/25 (a) | 300,000 | 320,904 |
| 3.65%, 12/01/27 (a) | 500,000 | 577,020 |
| 4.10%, 03/01/28 (a) | 250,000 | 296,250 |
| 2.88%, 09/15/29 (a) | 210,000 | 232,943 |
| 2.25%, 05/15/30 (a) | 450,000 | 475,870 |
| 5.95%, 12/15/34 | 100,000 | 145,491 |
| 5.85%, 01/15/36 | 100,000 | 138,921 |
| 6.38%, 06/15/37 | 50,000 | 72,585 |
| 4.63%, 05/15/42 | 600,000 | 786,816 |
| 4.65%, 01/15/43 | 475,000 | 625,798 |
| 5.10%, 01/15/44 | 200,000 | 278,078 |
| 4.65%, 08/15/44 (a) | 500,000 | 662,015 |
| 4.38%, 12/01/47 (a) | 250,000 | 325,855 |
| 4.55%, 03/01/48 (a) | 150,000 | 199,439 |
| 3.70%, 09/15/49 (a) | 250,000 | 299,227 |
| 3.13%, 05/15/50 (a) | 350,000 | 384,433 |
| Aon Corp. |
| 8.21%, 01/01/27 | 100,000 | 134,324 |
| 4.50%, 12/15/28 (a) | 100,000 | 121,031 |
| 3.75%, 05/02/29 (a) | 100,000 | 116,977 |
| 6.25%, 09/30/40 | 150,000 | 224,910 |
| Aon PLC |
| 4.00%, 11/27/23 (a) | 300,000 | 327,537 |
| 3.50%, 06/14/24 (a) | 500,000 | 546,035 |
| 3.88%, 12/15/25 (a) | 300,000 | 342,363 |
| 4.60%, 06/14/44 (a) | 300,000 | 397,845 |
| 4.75%, 05/15/45 (a) | 250,000 | 340,037 |
Schwab Fixed-Income ETFs | Annual Report
Schwab U.S. Aggregate Bond ETF
Portfolio Holdings as of December 31, 2020 (continued)
Security
Rate, Maturity Date | Face
Amount ($) | Value ($) |
| Arch Capital Finance LLC |
| 4.01%, 12/15/26 (a) | 200,000 | 232,474 |
| 5.03%, 12/15/46 (a) | 400,000 | 549,020 |
| Arch Capital Group Ltd. |
| 3.64%, 06/30/50 (a) | 250,000 | 291,157 |
| Arch Capital Group US, Inc. |
| 5.14%, 11/01/43 | 50,000 | 68,245 |
| Assurant, Inc. |
| 4.20%, 09/27/23 (a) | 200,000 | 218,844 |
| 4.90%, 03/27/28 (a) | 150,000 | 174,728 |
| 3.70%, 02/22/30 (a) | 100,000 | 110,690 |
| Assured Guaranty US Holdings, Inc. |
| 5.00%, 07/01/24 | 200,000 | 229,240 |
| Athene Holding Ltd. |
| 4.13%, 01/12/28 (a) | 450,000 | 501,597 |
| 6.15%, 04/03/30 (a) | 200,000 | 248,362 |
| 3.50%, 01/15/31 (a) | 250,000 | 266,420 |
| AXA S.A. |
| 8.60%, 12/15/30 | 500,000 | 779,330 |
| AXIS Specialty Finance LLC |
| 3.90%, 07/15/29 (a) | 400,000 | 447,776 |
| Berkshire Hathaway Finance Corp. |
| 3.00%, 05/15/22 | 350,000 | 363,555 |
| 1.85%, 03/12/30 (a) | 400,000 | 422,444 |
| 1.45%, 10/15/30 (a) | 200,000 | 202,978 |
| 5.75%, 01/15/40 | 100,000 | 153,923 |
| 4.40%, 05/15/42 | 350,000 | 466,266 |
| 4.30%, 05/15/43 | 300,000 | 397,989 |
| 4.20%, 08/15/48 (a) | 950,000 | 1,256,736 |
| 4.25%, 01/15/49 (a) | 700,000 | 930,244 |
| 2.85%, 10/15/50 (a) | 200,000 | 214,992 |
| Berkshire Hathaway, Inc. |
| 3.00%, 02/11/23 | 250,000 | 264,188 |
| 2.75%, 03/15/23 (a) | 1,050,000 | 1,103,214 |
| 3.13%, 03/15/26 (a) | 1,495,000 | 1,673,488 |
| 4.50%, 02/11/43 | 50,000 | 68,060 |
| Brighthouse Financial, Inc. |
| 3.70%, 06/22/27 (a) | 480,000 | 522,259 |
| 5.63%, 05/15/30 (a) | 400,000 | 494,412 |
| 4.70%, 06/22/47 (a) | 485,000 | 512,354 |
| Brown & Brown, Inc. |
| 4.20%, 09/15/24 (a) | 295,000 | 329,863 |
| 4.50%, 03/15/29 (a) | 50,000 | 59,309 |
| 2.38%, 03/15/31 (a) | 250,000 | 260,570 |
| Chubb Corp. |
| 6.00%, 05/11/37 | 250,000 | 378,602 |
| 6.50%, 05/15/38 | 260,000 | 415,571 |
| Chubb INA Holdings, Inc. |
| 2.88%, 11/03/22 (a) | 400,000 | 416,908 |
| 2.70%, 03/13/23 | 250,000 | 262,883 |
| 3.15%, 03/15/25 | 400,000 | 441,824 |
| 3.35%, 05/03/26 (a) | 500,000 | 564,540 |
| 1.38%, 09/15/30 (a) | 350,000 | 349,604 |
| 4.35%, 11/03/45 (a) | 600,000 | 816,156 |
| Cincinnati Financial Corp. |
| 6.92%, 05/15/28 | 350,000 | 462,738 |
| 6.13%, 11/01/34 | 50,000 | 70,294 |
| CNA Financial Corp. |
| 3.95%, 05/15/24 (a) | 100,000 | 110,754 |
| 4.50%, 03/01/26 (a) | 350,000 | 410,924 |
| 3.45%, 08/15/27 (a) | 150,000 | 170,249 |
| 3.90%, 05/01/29 (a) | 25,000 | 29,778 |
| 2.05%, 08/15/30 (a) | 250,000 | 258,225 |
Security
Rate, Maturity Date | Face
Amount ($) | Value ($) |
| CNO Financial Group, Inc. |
| 5.25%, 05/30/29 (a) | 320,000 | 387,302 |
| Enstar Group Ltd. |
| 4.95%, 06/01/29 (a) | 250,000 | 287,297 |
| Equitable Holdings, Inc. |
| 3.90%, 04/20/23 (a) | 250,000 | 269,153 |
| 4.35%, 04/20/28 (a) | 550,000 | 650,809 |
| 5.00%, 04/20/48 (a) | 500,000 | 657,600 |
| Everest Reinsurance Holdings, Inc. |
| 4.87%, 06/01/44 | 115,000 | 152,477 |
| 3.50%, 10/15/50 (a) | 250,000 | 284,808 |
| Fairfax Financial Holdings Ltd. |
| 4.85%, 04/17/28 (a) | 250,000 | 283,293 |
| 4.63%, 04/29/30 (a) | 250,000 | 281,630 |
| Fidelity National Financial, Inc. |
| 4.50%, 08/15/28 (a) | 300,000 | 350,271 |
| 3.40%, 06/15/30 (a) | 200,000 | 221,436 |
| 2.45%, 03/15/31 (a) | 250,000 | 255,218 |
| First American Financial Corp. |
| 4.60%, 11/15/24 | 150,000 | 166,886 |
| 4.00%, 05/15/30 (a) | 200,000 | 229,866 |
| Globe Life, Inc. |
| 4.55%, 09/15/28 (a) | 270,000 | 324,618 |
| 2.15%, 08/15/30 (a) | 250,000 | 255,010 |
| Hanover Insurance Group, Inc. |
| 4.50%, 04/15/26 (a) | 150,000 | 176,403 |
| 2.50%, 09/01/30 (a) | 250,000 | 261,048 |
| Hartford Financial Services Group, Inc. |
| 2.80%, 08/19/29 (a) | 20,000 | 21,866 |
| 5.95%, 10/15/36 | 300,000 | 421,644 |
| 6.10%, 10/01/41 | 150,000 | 225,687 |
| 4.40%, 03/15/48 (a) | 150,000 | 198,945 |
| 3.60%, 08/19/49 (a) | 250,000 | 294,932 |
| Humana, Inc. |
| 3.85%, 10/01/24 (a) | 600,000 | 664,818 |
| 4.50%, 04/01/25 (a) | 200,000 | 229,994 |
| 3.95%, 03/15/27 (a) | 100,000 | 115,269 |
| 3.13%, 08/15/29 (a) | 200,000 | 221,216 |
| 4.88%, 04/01/30 (a) | 200,000 | 250,606 |
| 4.63%, 12/01/42 (a) | 100,000 | 128,285 |
| 4.95%, 10/01/44 (a) | 250,000 | 338,870 |
| 4.80%, 03/15/47 (a) | 150,000 | 201,267 |
| 3.95%, 08/15/49 (a) | 150,000 | 184,089 |
| Kemper Corp. |
| 4.35%, 02/15/25 (a) | 100,000 | 110,977 |
| 2.40%, 09/30/30 (a) | 200,000 | 203,822 |
| Lincoln National Corp. |
| 3.35%, 03/09/25 | 168,000 | 185,126 |
| 3.63%, 12/12/26 (a) | 104,000 | 119,261 |
| 3.80%, 03/01/28 (a) | 600,000 | 695,400 |
| 3.05%, 01/15/30 (a) | 50,000 | 55,880 |
| 3.40%, 01/15/31 (a) | 250,000 | 286,520 |
| 6.30%, 10/09/37 | 150,000 | 208,826 |
| 7.00%, 06/15/40 | 150,000 | 228,876 |
| 4.35%, 03/01/48 (a) | 150,000 | 193,130 |
| Loews Corp. |
| 2.63%, 05/15/23 (a) | 150,000 | 157,118 |
| 3.75%, 04/01/26 (a) | 250,000 | 285,738 |
| 3.20%, 05/15/30 (a) | 250,000 | 284,313 |
| 6.00%, 02/01/35 | 100,000 | 139,156 |
| 4.13%, 05/15/43 (a) | 100,000 | 119,102 |
| Manulife Financial Corp. |
| 4.15%, 03/04/26 | 350,000 | 408,642 |
| 2.48%, 05/19/27 (a) | 250,000 | 270,885 |
Schwab Fixed-Income ETFs | Annual Report
Schwab U.S. Aggregate Bond ETF
Portfolio Holdings as of December 31, 2020 (continued)
Security
Rate, Maturity Date | Face
Amount ($) | Value ($) |
| 4.06%, 02/24/32 (a)(b) | 250,000 | 273,333 |
| 5.38%, 03/04/46 | 200,000 | 296,562 |
| Markel Corp. |
| 3.50%, 11/01/27 (a) | 500,000 | 560,475 |
| 3.35%, 09/17/29 (a) | 100,000 | 112,203 |
| 5.00%, 04/05/46 | 75,000 | 102,703 |
| 4.30%, 11/01/47 (a) | 50,000 | 63,562 |
| 5.00%, 05/20/49 (a) | 200,000 | 277,754 |
| Marsh & McLennan Cos., Inc. |
| 3.88%, 03/15/24 (a) | 350,000 | 386,757 |
| 3.50%, 06/03/24 (a) | 500,000 | 545,750 |
| 3.75%, 03/14/26 (a) | 250,000 | 284,758 |
| 4.38%, 03/15/29 (a) | 500,000 | 610,250 |
| 2.25%, 11/15/30 (a) | 275,000 | 291,717 |
| 4.75%, 03/15/39 (a) | 250,000 | 335,785 |
| 4.35%, 01/30/47 (a) | 300,000 | 400,305 |
| 4.20%, 03/01/48 (a) | 100,000 | 130,786 |
| 4.90%, 03/15/49 (a) | 500,000 | 726,010 |
| Mercury General Corp. |
| 4.40%, 03/15/27 (a) | 100,000 | 111,305 |
| MetLife, Inc. |
| 3.60%, 04/10/24 | 1,215,000 | 1,340,667 |
| 3.00%, 03/01/25 | 100,000 | 109,961 |
| 3.60%, 11/13/25 (a) | 250,000 | 283,533 |
| 4.55%, 03/23/30 (a) | 300,000 | 375,876 |
| 5.70%, 06/15/35 | 600,000 | 881,298 |
| 6.40%, 12/15/36 (a) | 700,000 | 907,074 |
| 10.75%, 08/01/39 (a)(b) | 100,000 | 170,464 |
| 5.88%, 02/06/41 | 250,000 | 384,032 |
| 4.13%, 08/13/42 | 250,000 | 319,992 |
| 4.88%, 11/13/43 | 100,000 | 142,221 |
| 4.72%, 12/15/44 | 150,000 | 206,202 |
| 4.05%, 03/01/45 | 150,000 | 192,518 |
| 4.60%, 05/13/46 (a) | 650,000 | 901,108 |
| Nationwide Financial Services, Inc. |
| 6.75%, 05/15/37 (b) | 65,000 | 77,978 |
| Old Republic International Corp. |
| 3.88%, 08/26/26 (a) | 250,000 | 287,635 |
| PartnerRe Finance B LLC |
| 3.70%, 07/02/29 (a) | 160,000 | 184,523 |
| Principal Financial Group, Inc. |
| 3.13%, 05/15/23 | 250,000 | 265,875 |
| 3.10%, 11/15/26 (a) | 150,000 | 167,739 |
| 3.70%, 05/15/29 (a) | 150,000 | 176,213 |
| 2.13%, 06/15/30 (a) | 250,000 | 262,035 |
| 4.63%, 09/15/42 | 200,000 | 258,144 |
| 4.35%, 05/15/43 | 250,000 | 314,155 |
| 4.30%, 11/15/46 (a) | 50,000 | 63,532 |
| Progressive Corp. |
| 3.20%, 03/26/30 (a) | 150,000 | 173,414 |
| Prudential Financial, Inc. |
| 3.88%, 03/27/28 (a) | 350,000 | 414,564 |
| 2.10%, 03/10/30 (a) | 250,000 | 265,403 |
| 5.75%, 07/15/33 | 100,000 | 136,142 |
| 5.70%, 12/14/36 | 90,000 | 130,353 |
| 6.63%, 12/01/37 | 300,000 | 453,171 |
| 3.00%, 03/10/40 (a) | 200,000 | 219,012 |
| 5.88%, 09/15/42 (a)(b) | 550,000 | 590,139 |
| 5.63%, 06/15/43 (a)(b) | 600,000 | 648,144 |
| 5.20%, 03/15/44 (a)(b) | 100,000 | 107,405 |
| 4.60%, 05/15/44 | 300,000 | 393,981 |
| 5.38%, 05/15/45 (a)(b) | 300,000 | 328,137 |
| 3.91%, 12/07/47 (a) | 350,000 | 424,830 |
| 4.42%, 03/27/48 (a) | 250,000 | 326,957 |
| 5.70%, 09/15/48 (a)(b) | 200,000 | 231,464 |
| 3.94%, 12/07/49 (a) | 350,000 | 428,995 |
Security
Rate, Maturity Date | Face
Amount ($) | Value ($) |
| 4.35%, 02/25/50 (a) | 250,000 | 328,780 |
| 3.70%, 10/01/50 (a)(b) | 250,000 | 264,480 |
| 3.70%, 03/13/51 (a) | 450,000 | 542,110 |
| Prudential PLC |
| 3.13%, 04/14/30 | 350,000 | 398,079 |
| Reinsurance Group of America, Inc. |
| 4.70%, 09/15/23 | 365,000 | 405,139 |
| 3.90%, 05/15/29 (a) | 200,000 | 229,630 |
| 3.15%, 06/15/30 (a) | 250,000 | 275,063 |
| RenaissanceRe Holdings Ltd. |
| 3.60%, 04/15/29 (a) | 300,000 | 339,510 |
| The Progressive Corp. |
| 4.00%, 03/01/29 (a) | 560,000 | 673,669 |
| 6.25%, 12/01/32 | 110,000 | 161,377 |
| 4.35%, 04/25/44 | 150,000 | 200,384 |
| 3.70%, 01/26/45 | 150,000 | 183,873 |
| 4.13%, 04/15/47 (a) | 250,000 | 330,877 |
| 4.20%, 03/15/48 (a) | 300,000 | 403,803 |
| 3.95%, 03/26/50 (a) | 200,000 | 263,144 |
| Transatlantic Holdings, Inc. |
| 8.00%, 11/30/39 | 171,000 | 273,297 |
| Travelers Cos., Inc. |
| 6.75%, 06/20/36 | 50,000 | 78,906 |
| 6.25%, 06/15/37 | 500,000 | 764,125 |
| 4.60%, 08/01/43 | 200,000 | 279,088 |
| 4.30%, 08/25/45 (a) | 200,000 | 266,780 |
| 3.75%, 05/15/46 (a) | 200,000 | 250,860 |
| 4.00%, 05/30/47 (a) | 150,000 | 196,472 |
| 4.10%, 03/04/49 (a) | 350,000 | 469,794 |
| 2.55%, 04/27/50 (a) | 350,000 | 368,651 |
| Travelers Property Casualty Corp. |
| 6.38%, 03/15/33 | 300,000 | 450,756 |
| Trinity Acquisition PLC |
| 4.40%, 03/15/26 (a) | 110,000 | 128,385 |
| UnitedHealth Group, Inc. |
| 2.88%, 03/15/22 (a) | 500,000 | 512,380 |
| 3.35%, 07/15/22 | 500,000 | 523,805 |
| 2.38%, 10/15/22 | 380,000 | 394,345 |
| 2.75%, 02/15/23 (a) | 250,000 | 261,510 |
| 2.88%, 03/15/23 | 400,000 | 422,756 |
| 3.50%, 06/15/23 | 382,000 | 411,273 |
| 3.50%, 02/15/24 | 500,000 | 546,640 |
| 2.38%, 08/15/24 | 450,000 | 480,235 |
| 3.75%, 07/15/25 | 750,000 | 855,217 |
| 3.70%, 12/15/25 | 100,000 | 114,682 |
| 1.25%, 01/15/26 (a) | 100,000 | 102,763 |
| 3.10%, 03/15/26 | 350,000 | 392,651 |
| 3.85%, 06/15/28 | 450,000 | 535,117 |
| 3.88%, 12/15/28 | 350,000 | 420,007 |
| 2.88%, 08/15/29 | 300,000 | 340,815 |
| 2.00%, 05/15/30 (a) | 500,000 | 531,345 |
| 4.63%, 07/15/35 | 500,000 | 673,230 |
| 5.80%, 03/15/36 | 200,000 | 300,250 |
| 6.63%, 11/15/37 | 350,000 | 562,187 |
| 6.88%, 02/15/38 | 750,000 | 1,235,242 |
| 3.50%, 08/15/39 (a) | 400,000 | 475,468 |
| 2.75%, 05/15/40 (a) | 500,000 | 543,755 |
| 5.70%, 10/15/40 (a) | 100,000 | 150,707 |
| 5.95%, 02/15/41 (a) | 150,000 | 231,374 |
| 4.63%, 11/15/41 (a) | 73,000 | 99,630 |
| 4.75%, 07/15/45 | 650,000 | 917,988 |
| 4.20%, 01/15/47 (a) | 400,000 | 531,808 |
| 4.25%, 04/15/47 (a) | 250,000 | 332,790 |
| 3.75%, 10/15/47 (a) | 200,000 | 249,304 |
| 4.25%, 06/15/48 (a) | 500,000 | 671,640 |
| 4.45%, 12/15/48 (a) | 350,000 | 485,233 |
Schwab Fixed-Income ETFs | Annual Report
Schwab U.S. Aggregate Bond ETF
Portfolio Holdings as of December 31, 2020 (continued)
Security
Rate, Maturity Date | Face
Amount ($) | Value ($) |
| 3.70%, 08/15/49 (a) | 400,000 | 502,304 |
| 2.90%, 05/15/50 (a) | 400,000 | 443,824 |
| 3.88%, 08/15/59 (a) | 450,000 | 587,115 |
| 3.13%, 05/15/60 (a) | 400,000 | 464,796 |
| Unum Group |
| 4.00%, 03/15/24 | 100,000 | 108,983 |
| 4.50%, 03/15/25 (a) | 100,000 | 113,457 |
| 4.00%, 06/15/29 (a) | 400,000 | 452,348 |
| 5.75%, 08/15/42 | 100,000 | 123,376 |
| 4.50%, 12/15/49 (a) | 400,000 | 428,496 |
| Voya Financial, Inc. |
| 3.65%, 06/15/26 | 750,000 | 858,892 |
| 4.80%, 06/15/46 | 275,000 | 349,624 |
| 4.70%, 01/23/48 (a)(b) | 100,000 | 104,528 |
| Willis North America, Inc. |
| 3.60%, 05/15/24 (a) | 400,000 | 437,592 |
| 4.50%, 09/15/28 (a) | 300,000 | 362,121 |
| 2.95%, 09/15/29 (a) | 200,000 | 219,450 |
| 5.05%, 09/15/48 (a) | 150,000 | 211,667 |
| 3.88%, 09/15/49 (a) | 100,000 | 122,914 |
| WR Berkley Corp. |
| 4.63%, 03/15/22 | 150,000 | 157,320 |
| 4.00%, 05/12/50 (a) | 100,000 | 123,205 |
| XLIT Ltd. |
| 5.25%, 12/15/43 | 250,000 | 360,415 |
| 5.50%, 03/31/45 | 100,000 | 140,227 |
| | | 108,453,502 |
| REITs 0.7% |
| Agree LP |
| 2.90%, 10/01/30 (a) | 250,000 | 265,375 |
| Alexandria Real Estate Equities, Inc. |
| 4.00%, 01/15/24 (a) | 200,000 | 220,258 |
| 4.30%, 01/15/26 (a) | 250,000 | 290,275 |
| 3.80%, 04/15/26 (a) | 150,000 | 172,883 |
| 3.95%, 01/15/28 (a) | 250,000 | 290,075 |
| 2.75%, 12/15/29 (a) | 50,000 | 54,681 |
| 4.70%, 07/01/30 (a) | 250,000 | 311,042 |
| 4.90%, 12/15/30 (a) | 250,000 | 318,432 |
| 3.38%, 08/15/31 (a) | 230,000 | 264,452 |
| 1.88%, 02/01/33 (a) | 250,000 | 249,865 |
| 4.85%, 04/15/49 (a) | 150,000 | 210,956 |
| 4.00%, 02/01/50 (a) | 150,000 | 189,359 |
| American Campus Communities Operating Partnership LP |
| 3.75%, 04/15/23 (a) | 250,000 | 264,167 |
| 3.30%, 07/15/26 (a) | 250,000 | 273,110 |
| 2.85%, 02/01/30 (a) | 200,000 | 209,258 |
| 3.88%, 01/30/31 (a) | 125,000 | 140,298 |
| American Homes 4 Rent LP |
| 4.25%, 02/15/28 (a) | 190,000 | 218,871 |
| 4.90%, 02/15/29 (a) | 100,000 | 121,096 |
| AvalonBay Communities, Inc. |
| 3.50%, 11/15/24 (a) | 700,000 | 772,191 |
| 3.45%, 06/01/25 (a) | 150,000 | 167,343 |
| 3.35%, 05/15/27 (a) | 250,000 | 280,202 |
| 3.20%, 01/15/28 (a) | 250,000 | 279,090 |
| 3.30%, 06/01/29 (a) | 150,000 | 170,303 |
| 2.30%, 03/01/30 (a) | 250,000 | 266,695 |
| 2.45%, 01/15/31 (a) | 350,000 | 377,030 |
| 4.35%, 04/15/48 (a) | 150,000 | 193,145 |
| Boston Properties LP |
| 3.85%, 02/01/23 (a) | 1,000,000 | 1,064,880 |
| 3.13%, 09/01/23 (a) | 500,000 | 530,640 |
| 3.80%, 02/01/24 (a) | 100,000 | 108,852 |
| 3.65%, 02/01/26 (a) | 200,000 | 228,550 |
Security
Rate, Maturity Date | Face
Amount ($) | Value ($) |
| 2.75%, 10/01/26 (a) | 150,000 | 163,749 |
| 4.50%, 12/01/28 (a) | 250,000 | 300,950 |
| 3.40%, 06/21/29 (a) | 350,000 | 391,230 |
| 2.90%, 03/15/30 (a) | 200,000 | 215,828 |
| 3.25%, 01/30/31 (a) | 283,000 | 313,123 |
| Brandywine Operating Partnership LP |
| 4.10%, 10/01/24 (a) | 200,000 | 212,408 |
| 3.95%, 11/15/27 (a) | 100,000 | 107,328 |
| 4.55%, 10/01/29 (a) | 150,000 | 168,450 |
| Brixmor Operating Partnership LP |
| 3.85%, 02/01/25 (a) | 250,000 | 274,447 |
| 3.90%, 03/15/27 (a) | 200,000 | 222,794 |
| 4.13%, 05/15/29 (a) | 500,000 | 576,100 |
| 4.05%, 07/01/30 (a) | 550,000 | 633,231 |
| Camden Property Trust |
| 4.10%, 10/15/28 (a) | 150,000 | 178,404 |
| 3.15%, 07/01/29 (a) | 366,000 | 413,177 |
| 2.80%, 05/15/30 (a) | 250,000 | 278,420 |
| 3.35%, 11/01/49 (a) | 100,000 | 115,215 |
| Columbia Property Trust Operating Partnership LP |
| 3.65%, 08/15/26 (a) | 200,000 | 209,322 |
| Corporate Office Properties LP |
| 3.60%, 05/15/23 (a) | 150,000 | 158,465 |
| 2.25%, 03/15/26 (a) | 250,000 | 261,077 |
| CubeSmart LP |
| 4.00%, 11/15/25 (a) | 250,000 | 282,655 |
| 4.38%, 02/15/29 (a) | 118,000 | 139,567 |
| 3.00%, 02/15/30 (a) | 150,000 | 163,931 |
| 2.00%, 02/15/31 (a) | 250,000 | 251,030 |
| CyrusOne LP/CyrusOne Finance Corp. |
| 2.90%, 11/15/24 (a) | 200,000 | 214,172 |
| 3.45%, 11/15/29 (a) | 200,000 | 215,894 |
| 2.15%, 11/01/30 (a) | 250,000 | 244,560 |
| Digital Realty Trust LP |
| 2.75%, 02/01/23 (a) | 200,000 | 208,836 |
| 3.70%, 08/15/27 (a) | 370,000 | 426,743 |
| 4.45%, 07/15/28 (a) | 300,000 | 358,095 |
| 3.60%, 07/01/29 (a) | 300,000 | 344,454 |
| Duke Realty LP |
| 3.75%, 12/01/24 (a) | 550,000 | 609,609 |
| 2.88%, 11/15/29 (a) | 150,000 | 165,429 |
| 1.75%, 07/01/30 (a) | 250,000 | 253,378 |
| 3.05%, 03/01/50 (a) | 100,000 | 109,183 |
| ERP Operating LP |
| 3.38%, 06/01/25 (a) | 250,000 | 276,737 |
| 2.85%, 11/01/26 (a) | 650,000 | 718,698 |
| 3.25%, 08/01/27 (a) | 250,000 | 280,090 |
| 3.50%, 03/01/28 (a) | 200,000 | 228,820 |
| 4.15%, 12/01/28 (a) | 50,000 | 59,639 |
| 3.00%, 07/01/29 (a) | 200,000 | 223,174 |
| 4.50%, 07/01/44 (a) | 150,000 | 198,827 |
| 4.50%, 06/01/45 (a) | 250,000 | 327,240 |
| Essex Portfolio LP |
| 3.25%, 05/01/23 (a) | 150,000 | 158,207 |
| 3.88%, 05/01/24 (a) | 450,000 | 495,805 |
| 3.50%, 04/01/25 (a) | 300,000 | 332,691 |
| 3.63%, 05/01/27 (a) | 150,000 | 169,124 |
| 4.00%, 03/01/29 (a) | 150,000 | 174,776 |
| 3.00%, 01/15/30 (a) | 150,000 | 166,140 |
| 1.65%, 01/15/31 (a) | 150,000 | 148,656 |
| 2.65%, 03/15/32 (a) | 200,000 | 214,448 |
| 4.50%, 03/15/48 (a) | 114,000 | 148,278 |
| 2.65%, 09/01/50 (a) | 250,000 | 241,663 |
Schwab Fixed-Income ETFs | Annual Report
Schwab U.S. Aggregate Bond ETF
Portfolio Holdings as of December 31, 2020 (continued)
Security
Rate, Maturity Date | Face
Amount ($) | Value ($) |
| Federal Realty Investment Trust |
| 3.95%, 01/15/24 (a) | 200,000 | 218,588 |
| 1.25%, 02/15/26 (a) | 150,000 | 152,751 |
| 3.25%, 07/15/27 (a) | 200,000 | 218,048 |
| 3.20%, 06/15/29 (a) | 100,000 | 108,893 |
| 4.50%, 12/01/44 (a) | 200,000 | 236,044 |
| Healthcare Realty Trust, Inc. |
| 2.40%, 03/15/30 (a) | 150,000 | 155,697 |
| 2.05%, 03/15/31 (a) | 250,000 | 251,260 |
| Healthcare Trust of America Holdings LP |
| 3.75%, 07/01/27 (a) | 650,000 | 739,082 |
| 2.00%, 03/15/31 (a) | 250,000 | 250,695 |
| Healthpeak Properties, Inc. |
| 4.25%, 11/15/23 (a) | 23,000 | 25,222 |
| 4.20%, 03/01/24 (a) | 200,000 | 220,286 |
| 3.40%, 02/01/25 (a) | 250,000 | 276,250 |
| 3.25%, 07/15/26 (a) | 300,000 | 339,324 |
| 3.50%, 07/15/29 (a) | 250,000 | 284,742 |
| 3.00%, 01/15/30 (a) | 250,000 | 274,982 |
| 6.75%, 02/01/41 (a) | 250,000 | 368,262 |
| Highwoods Realty LP |
| 4.20%, 04/15/29 (a) | 400,000 | 457,072 |
| 3.05%, 02/15/30 (a) | 150,000 | 158,315 |
| 2.60%, 02/01/31 (a) | 250,000 | 254,368 |
| Host Hotels & Resorts LP |
| 3.75%, 10/15/23 (a) | 250,000 | 265,105 |
| 3.88%, 04/01/24 (a) | 200,000 | 211,812 |
| 3.38%, 12/15/29 (a) | 300,000 | 309,876 |
| 3.50%, 09/15/30 (a) | 375,000 | 396,214 |
| Hudson Pacific Properties LP |
| 3.95%, 11/01/27 (a) | 150,000 | 165,675 |
| 4.65%, 04/01/29 (a) | 250,000 | 291,797 |
| 3.25%, 01/15/30 (a) | 150,000 | 159,191 |
| Kilroy Realty LP |
| 3.80%, 01/15/23 (a) | 250,000 | 261,832 |
| 4.38%, 10/01/25 (a) | 350,000 | 393,508 |
| 4.25%, 08/15/29 (a) | 200,000 | 230,882 |
| 3.05%, 02/15/30 (a) | 200,000 | 213,334 |
| 2.50%, 11/15/32 (a) | 250,000 | 254,645 |
| Kimco Realty Corp. |
| 3.40%, 11/01/22 (a) | 513,000 | 538,809 |
| 2.80%, 10/01/26 (a) | 550,000 | 600,820 |
| 1.90%, 03/01/28 (a) | 250,000 | 256,547 |
| 2.70%, 10/01/30 (a) | 300,000 | 325,467 |
| 4.25%, 04/01/45 (a) | 150,000 | 168,077 |
| 4.45%, 09/01/47 (a) | 200,000 | 234,322 |
| 3.70%, 10/01/49 (a) | 150,000 | 161,381 |
| Lexington Realty Trust |
| 2.70%, 09/15/30 (a) | 250,000 | 261,875 |
| Life Storage LP |
| 3.88%, 12/15/27 (a) | 350,000 | 400,351 |
| 4.00%, 06/15/29 (a) | 150,000 | 176,142 |
| 2.20%, 10/15/30 (a) | 250,000 | 255,740 |
| Mid-America Apartments LP |
| 3.75%, 06/15/24 (a) | 250,000 | 272,800 |
| 4.00%, 11/15/25 (a) | 150,000 | 170,669 |
| 3.60%, 06/01/27 (a) | 60,000 | 67,960 |
| 4.20%, 06/15/28 (a) | 350,000 | 412,678 |
| 2.75%, 03/15/30 (a) | 100,000 | 108,653 |
| 1.70%, 02/15/31 (a) | 250,000 | 250,243 |
| National Retail Properties, Inc. |
| 3.90%, 06/15/24 (a) | 100,000 | 108,740 |
| 3.60%, 12/15/26 (a) | 250,000 | 275,497 |
| 3.50%, 10/15/27 (a) | 125,000 | 137,668 |
| 4.30%, 10/15/28 (a) | 200,000 | 231,792 |
Security
Rate, Maturity Date | Face
Amount ($) | Value ($) |
| 2.50%, 04/15/30 (a) | 100,000 | 103,382 |
| 4.80%, 10/15/48 (a) | 150,000 | 184,716 |
| 3.10%, 04/15/50 (a) | 100,000 | 97,041 |
| Office Properties Income Trust |
| 4.00%, 07/15/22 (a) | 175,000 | 179,086 |
| 4.25%, 05/15/24 (a) | 250,000 | 261,350 |
| 4.50%, 02/01/25 (a) | 67,000 | 71,194 |
| Omega Healthcare Investors, Inc. |
| 4.95%, 04/01/24 (a) | 850,000 | 927,460 |
| 4.50%, 01/15/25 (a) | 50,000 | 54,768 |
| 5.25%, 01/15/26 (a) | 100,000 | 114,602 |
| 4.50%, 04/01/27 (a) | 100,000 | 112,693 |
| 4.75%, 01/15/28 (a) | 93,000 | 106,265 |
| 3.63%, 10/01/29 (a) | 150,000 | 159,747 |
| 3.38%, 02/01/31 (a) | 250,000 | 263,357 |
| Physicians Realty LP |
| 4.30%, 03/15/27 (a) | 250,000 | 275,047 |
| Piedmont Operating Partnership LP |
| 3.15%, 08/15/30 (a) | 250,000 | 254,652 |
| Prologis LP |
| 3.75%, 11/01/25 (a) | 466,000 | 532,741 |
| 3.25%, 10/01/26 (a) | 150,000 | 170,592 |
| 4.38%, 02/01/29 (a) | 25,000 | 30,679 |
| 2.25%, 04/15/30 (a) | 350,000 | 375,928 |
| 1.25%, 10/15/30 (a) | 350,000 | 346,997 |
| 3.00%, 04/15/50 (a) | 400,000 | 444,164 |
| 2.13%, 10/15/50 (a) | 300,000 | 280,245 |
| Public Storage |
| 3.09%, 09/15/27 (a) | 250,000 | 280,050 |
| 3.39%, 05/01/29 (a) | 150,000 | 172,308 |
| Realty Income Corp. |
| 3.88%, 07/15/24 (a) | 650,000 | 718,412 |
| 0.75%, 03/15/26 (a) | 250,000 | 249,765 |
| 3.00%, 01/15/27 (a) | 500,000 | 553,335 |
| 3.65%, 01/15/28 (a) | 500,000 | 569,320 |
| 3.25%, 01/15/31 (a) | 250,000 | 284,112 |
| 4.65%, 03/15/47 (a) | 200,000 | 273,216 |
| Regency Centers LP |
| 3.60%, 02/01/27 (a) | 250,000 | 275,215 |
| 4.13%, 03/15/28 (a) | 200,000 | 228,006 |
| 2.95%, 09/15/29 (a) | 150,000 | 160,403 |
| 4.40%, 02/01/47 (a) | 300,000 | 350,070 |
| 4.65%, 03/15/49 (a) | 50,000 | 59,660 |
| Retail Properties of America, Inc. |
| 4.75%, 09/15/30 (a) | 250,000 | 268,370 |
| Sabra Health Care LP |
| 4.80%, 06/01/24 (a) | 150,000 | 160,871 |
| 5.13%, 08/15/26 (a) | 100,000 | 111,856 |
| 3.90%, 10/15/29 (a) | 250,000 | 262,597 |
| Simon Property Group LP |
| 2.35%, 01/30/22 (a) | 300,000 | 304,947 |
| 2.75%, 02/01/23 (a) | 500,000 | 521,900 |
| 2.75%, 06/01/23 (a) | 500,000 | 525,165 |
| 3.75%, 02/01/24 (a) | 250,000 | 271,570 |
| 2.00%, 09/13/24 (a) | 125,000 | 130,769 |
| 3.38%, 10/01/24 (a) | 100,000 | 108,885 |
| 3.50%, 09/01/25 (a) | 150,000 | 165,798 |
| 3.30%, 01/15/26 (a) | 250,000 | 275,297 |
| 3.38%, 06/15/27 (a) | 750,000 | 832,762 |
| 3.38%, 12/01/27 (a) | 50,000 | 56,131 |
| 2.45%, 09/13/29 (a) | 450,000 | 473,998 |
| 6.75%, 02/01/40 (a) | 420,000 | 628,366 |
| 4.75%, 03/15/42 (a) | 250,000 | 307,517 |
| 4.25%, 10/01/44 (a) | 150,000 | 173,003 |
| 4.25%, 11/30/46 (a) | 100,000 | 117,011 |
Schwab Fixed-Income ETFs | Annual Report
Schwab U.S. Aggregate Bond ETF
Portfolio Holdings as of December 31, 2020 (continued)
Security
Rate, Maturity Date | Face
Amount ($) | Value ($) |
| 3.25%, 09/13/49 (a) | 400,000 | 411,272 |
| 3.80%, 07/15/50 (a) | 250,000 | 279,605 |
| SITE Centers Corp. |
| 3.63%, 02/01/25 (a) | 150,000 | 155,849 |
| 4.25%, 02/01/26 (a) | 200,000 | 216,124 |
| 4.70%, 06/01/27 (a) | 204,000 | 223,519 |
| SL Green Operating Partnership LP |
| 3.25%, 10/15/22 (a) | 250,000 | 258,007 |
| Spirit Realty LP |
| 4.45%, 09/15/26 (a) | 60,000 | 67,865 |
| 3.20%, 01/15/27 (a) | 200,000 | 212,898 |
| 3.40%, 01/15/30 (a) | 250,000 | 271,592 |
| 3.20%, 02/15/31 (a) | 250,000 | 265,672 |
| STORE Capital Corp. |
| 4.50%, 03/15/28 (a) | 85,000 | 96,915 |
| 4.63%, 03/15/29 (a) | 150,000 | 174,423 |
| Tanger Properties LP |
| 3.13%, 09/01/26 (a) | 100,000 | 103,298 |
| 3.88%, 07/15/27 (a)(e) | 150,000 | 157,494 |
| UDR, Inc. |
| 2.95%, 09/01/26 (a) | 150,000 | 165,128 |
| 3.50%, 01/15/28 (a) | 145,000 | 162,749 |
| 4.40%, 01/26/29 (a) | 150,000 | 178,935 |
| 3.00%, 08/15/31 (a) | 600,000 | 662,586 |
| 2.10%, 08/01/32 (a) | 100,000 | 102,149 |
| Ventas Realty LP |
| 3.13%, 06/15/23 (a) | 150,000 | 158,447 |
| 3.50%, 04/15/24 (a) | 150,000 | 163,376 |
| 3.75%, 05/01/24 (a) | 150,000 | 163,836 |
| 2.65%, 01/15/25 (a) | 300,000 | 321,822 |
| 3.25%, 10/15/26 (a) | 200,000 | 220,520 |
| 4.00%, 03/01/28 (a) | 650,000 | 743,112 |
| 4.40%, 01/15/29 (a) | 150,000 | 175,212 |
| 4.75%, 11/15/30 (a) | 200,000 | 244,914 |
| 5.70%, 09/30/43 (a) | 250,000 | 326,245 |
| 4.88%, 04/15/49 (a) | 250,000 | 311,802 |
| VEREIT Operating Partnership LP |
| 4.60%, 02/06/24 (a) | 200,000 | 220,758 |
| 4.63%, 11/01/25 (a) | 150,000 | 173,129 |
| 3.95%, 08/15/27 (a) | 550,000 | 625,311 |
| 3.40%, 01/15/28 (a) | 250,000 | 276,177 |
| 3.10%, 12/15/29 (a) | 100,000 | 108,291 |
| Vornado Realty LP |
| 3.50%, 01/15/25 (a) | 150,000 | 158,585 |
| Welltower, Inc. |
| 3.75%, 03/15/23 (a) | 350,000 | 371,185 |
| 4.50%, 01/15/24 (a) | 400,000 | 440,804 |
| 3.63%, 03/15/24 (a) | 300,000 | 327,441 |
| 4.00%, 06/01/25 (a) | 200,000 | 226,294 |
| 4.13%, 03/15/29 (a) | 400,000 | 467,180 |
| 3.10%, 01/15/30 (a) | 150,000 | 164,270 |
| 2.75%, 01/15/31 (a) | 250,000 | 266,882 |
| 6.50%, 03/15/41 (a) | 300,000 | 424,026 |
| 4.95%, 09/01/48 (a) | 150,000 | 195,147 |
| WP Carey, Inc. |
| 4.60%, 04/01/24 (a) | 85,000 | 94,948 |
| 4.00%, 02/01/25 (a) | 400,000 | 441,952 |
| 3.85%, 07/15/29 (a) | 100,000 | 114,589 |
| 2.40%, 02/01/31 (a) | 200,000 | 208,548 |
| | | 63,325,898 |
| | | 718,496,409 |
| |
Security
Rate, Maturity Date | Face
Amount ($) | Value ($) |
| Industrial 16.8% |
| Basic Industry 0.8% |
| Air Products and Chemicals, Inc. |
| 2.75%, 02/03/23 | 250,000 | 262,398 |
| 3.35%, 07/31/24 (a) | 20,000 | 21,867 |
| 1.50%, 10/15/25 (a) | 250,000 | 260,893 |
| 1.85%, 05/15/27 (a) | 250,000 | 264,660 |
| 2.05%, 05/15/30 (a) | 250,000 | 267,293 |
| 2.70%, 05/15/40 (a) | 300,000 | 323,457 |
| 2.80%, 05/15/50 (a) | 300,000 | 330,636 |
| Albemarle Corp. |
| 4.15%, 12/01/24 (a) | 150,000 | 167,138 |
| 5.45%, 12/01/44 (a) | 100,000 | 120,369 |
| Barrick Gold Corp. |
| 5.25%, 04/01/42 | 100,000 | 137,911 |
| Barrick North America Finance LLC |
| 5.70%, 05/30/41 | 550,000 | 798,913 |
| 5.75%, 05/01/43 | 50,000 | 73,078 |
| Barrick PD Australia Finance Pty Ltd. |
| 5.95%, 10/15/39 | 500,000 | 722,635 |
| BHP Billiton Finance USA Ltd. |
| 2.88%, 02/24/22 | 250,000 | 257,243 |
| 3.85%, 09/30/23 | 450,000 | 492,399 |
| 6.42%, 03/01/26 | 200,000 | 253,964 |
| 4.13%, 02/24/42 | 250,000 | 326,407 |
| 5.00%, 09/30/43 | 900,000 | 1,325,898 |
| Cabot Corp. |
| 3.70%, 07/15/22 | 100,000 | 103,586 |
| 4.00%, 07/01/29 (a) | 150,000 | 161,999 |
| Celanese US Holdings LLC |
| 4.63%, 11/15/22 | 250,000 | 268,680 |
| 3.50%, 05/08/24 (a) | 300,000 | 324,852 |
| Celulosa Arauco y Constitucion S.A. |
| 4.50%, 08/01/24 (a) | 200,000 | 220,470 |
| 3.88%, 11/02/27 (a) | 200,000 | 221,820 |
| Dow Chemical Co. |
| 3.50%, 10/01/24 (a) | 250,000 | 274,363 |
| 4.55%, 11/30/25 (a) | 283,000 | 331,266 |
| 4.80%, 11/30/28 (a) | 50,000 | 61,569 |
| 7.38%, 11/01/29 | 450,000 | 642,663 |
| 2.10%, 11/15/30 (a) | 250,000 | 256,260 |
| 4.25%, 10/01/34 (a) | 400,000 | 484,188 |
| 5.25%, 11/15/41 (a) | 200,000 | 266,062 |
| 4.38%, 11/15/42 (a) | 400,000 | 492,688 |
| 4.63%, 10/01/44 (a) | 350,000 | 439,327 |
| 5.55%, 11/30/48 (a) | 350,000 | 508,242 |
| 4.80%, 05/15/49 (a) | 250,000 | 345,017 |
| 3.60%, 11/15/50 (a) | 250,000 | 281,265 |
| DuPont de Nemours, Inc. |
| 2.17%, 05/01/23 | 750,000 | 760,447 |
| 4.21%, 11/15/23 (a) | 800,000 | 883,928 |
| 4.49%, 11/15/25 (a) | 625,000 | 730,681 |
| 4.73%, 11/15/28 (a) | 800,000 | 986,280 |
| 5.32%, 11/15/38 (a) | 700,000 | 951,447 |
| 5.42%, 11/15/48 (a) | 605,000 | 877,613 |
| Eastman Chemical Co. |
| 3.60%, 08/15/22 (a) | 649,000 | 676,673 |
| 4.80%, 09/01/42 (a) | 250,000 | 318,442 |
| 4.65%, 10/15/44 (a) | 300,000 | 381,102 |
| Ecolab, Inc. |
| 2.38%, 08/10/22 (a) | 300,000 | 309,477 |
| 2.70%, 11/01/26 (a) | 200,000 | 222,360 |
| 3.25%, 12/01/27 (a) | 800,000 | 908,472 |
| 4.80%, 03/24/30 (a) | 50,000 | 64,040 |
Schwab Fixed-Income ETFs | Annual Report
Schwab U.S. Aggregate Bond ETF
Portfolio Holdings as of December 31, 2020 (continued)
Security
Rate, Maturity Date | Face
Amount ($) | Value ($) |
| 1.30%, 01/30/31 (a) | 300,000 | 297,336 |
| 3.95%, 12/01/47 (a) | 264,000 | 340,510 |
| 2.13%, 08/15/50 (a) | 250,000 | 239,050 |
| EI du Pont de Nemours and Co. |
| 1.70%, 07/15/25 (a) | 200,000 | 208,396 |
| 2.30%, 07/15/30 (a) | 150,000 | 159,869 |
| Fibria Overseas Finance Ltd. |
| 4.00%, 01/14/25 (a) | 400,000 | 429,608 |
| 5.50%, 01/17/27 | 300,000 | 343,569 |
| FMC Corp. |
| 3.20%, 10/01/26 (a) | 150,000 | 167,354 |
| 3.45%, 10/01/29 (a) | 150,000 | 171,029 |
| 4.50%, 10/01/49 (a) | 150,000 | 195,458 |
| Georgia-Pacific LLC |
| 8.00%, 01/15/24 | 250,000 | 307,522 |
| 7.75%, 11/15/29 | 250,000 | 371,202 |
| Huntsman International LLC |
| 5.13%, 11/15/22 (a) | 150,000 | 160,205 |
| 4.50%, 05/01/29 (a) | 250,000 | 290,002 |
| International Flavors & Fragrances, Inc. |
| 4.45%, 09/26/28 (a) | 250,000 | 296,807 |
| 5.00%, 09/26/48 (a) | 400,000 | 539,748 |
| International Paper Co. |
| 5.00%, 09/15/35 (a) | 100,000 | 131,730 |
| 7.30%, 11/15/39 | 300,000 | 481,695 |
| 6.00%, 11/15/41 (a) | 200,000 | 291,606 |
| 4.80%, 06/15/44 (a) | 500,000 | 665,910 |
| 5.15%, 05/15/46 (a) | 150,000 | 208,149 |
| 4.40%, 08/15/47 (a) | 300,000 | 393,354 |
| 4.35%, 08/15/48 (a) | 800,000 | 1,053,000 |
| Kinross Gold Corp. |
| 5.95%, 03/15/24 (a) | 250,000 | 284,877 |
| 4.50%, 07/15/27 (a) | 250,000 | 291,085 |
| Linde, Inc. |
| 2.65%, 02/05/25 (a) | 400,000 | 433,816 |
| 3.20%, 01/30/26 (a) | 700,000 | 784,693 |
| 1.10%, 08/10/30 (a) | 200,000 | 198,192 |
| 3.55%, 11/07/42 (a) | 100,000 | 121,323 |
| 2.00%, 08/10/50 (a) | 250,000 | 234,828 |
| Lubrizol Corp. |
| 6.50%, 10/01/34 | 96,000 | 149,700 |
| LYB International Finance BV |
| 4.00%, 07/15/23 | 350,000 | 380,800 |
| 5.25%, 07/15/43 | 250,000 | 325,542 |
| 4.88%, 03/15/44 (a) | 200,000 | 253,438 |
| LYB International Finance II BV |
| 3.50%, 03/02/27 (a) | 300,000 | 336,729 |
| LYB International Finance III LLC |
| 3.38%, 05/01/30 (a) | 250,000 | 281,277 |
| 2.25%, 10/01/30 (a) | 200,000 | 206,120 |
| 3.38%, 10/01/40 (a) | 250,000 | 267,418 |
| 4.20%, 10/15/49 (a) | 300,000 | 352,059 |
| 4.20%, 05/01/50 (a) | 550,000 | 646,662 |
| 3.63%, 04/01/51 (a) | 250,000 | 274,285 |
| 3.80%, 10/01/60 (a) | 250,000 | 269,363 |
| LyondellBasell Industries NV |
| 5.75%, 04/15/24 (a) | 450,000 | 518,413 |
| 4.63%, 02/26/55 (a) | 400,000 | 486,188 |
| Mosaic Co. |
| 3.25%, 11/15/22 (a) | 300,000 | 313,836 |
| 4.25%, 11/15/23 (a) | 100,000 | 109,253 |
| 4.05%, 11/15/27 (a) | 650,000 | 740,447 |
| 4.88%, 11/15/41 (a) | 150,000 | 175,362 |
| 5.63%, 11/15/43 (a) | 200,000 | 259,812 |
Security
Rate, Maturity Date | Face
Amount ($) | Value ($) |
| Newmont Corp. |
| 3.70%, 03/15/23 (a) | 86,000 | 90,838 |
| 2.80%, 10/01/29 (a) | 350,000 | 382,977 |
| 2.25%, 10/01/30 (a) | 400,000 | 422,212 |
| 5.88%, 04/01/35 | 350,000 | 512,074 |
| 6.25%, 10/01/39 | 200,000 | 304,772 |
| 4.88%, 03/15/42 (a) | 400,000 | 542,796 |
| 5.45%, 06/09/44 (a) | 150,000 | 214,616 |
| Nucor Corp. |
| 4.13%, 09/15/22 (a) | 250,000 | 263,325 |
| 4.00%, 08/01/23 (a) | 300,000 | 324,744 |
| 3.95%, 05/01/28 (a) | 100,000 | 118,098 |
| 2.70%, 06/01/30 (a) | 250,000 | 275,270 |
| 2.98%, 12/15/55 (a)(c) | 550,000 | 579,661 |
| Nutrien Ltd. |
| 3.15%, 10/01/22 (a) | 150,000 | 156,135 |
| 3.63%, 03/15/24 (a) | 450,000 | 489,361 |
| 3.00%, 04/01/25 (a) | 100,000 | 108,492 |
| 4.20%, 04/01/29 (a) | 250,000 | 299,320 |
| 4.13%, 03/15/35 (a) | 800,000 | 957,720 |
| 5.88%, 12/01/36 | 100,000 | 135,390 |
| 5.63%, 12/01/40 | 50,000 | 69,177 |
| 6.13%, 01/15/41 (a) | 350,000 | 506,821 |
| 4.90%, 06/01/43 (a) | 100,000 | 129,469 |
| 5.25%, 01/15/45 (a) | 300,000 | 412,593 |
| 5.00%, 04/01/49 (a) | 50,000 | 69,451 |
| 3.95%, 05/13/50 (a) | 300,000 | 365,505 |
| Packaging Corp. of America |
| 3.65%, 09/15/24 (a) | 500,000 | 548,425 |
| 3.40%, 12/15/27 (a) | 200,000 | 225,320 |
| 4.05%, 12/15/49 (a) | 150,000 | 187,617 |
| PPG Industries, Inc. |
| 3.20%, 03/15/23 (a) | 200,000 | 211,698 |
| 2.40%, 08/15/24 (a) | 100,000 | 106,072 |
| 2.80%, 08/15/29 (a) | 200,000 | 220,010 |
| 2.55%, 06/15/30 (a) | 300,000 | 322,971 |
| Reliance Steel & Aluminum Co. |
| 4.50%, 04/15/23 (a) | 200,000 | 215,888 |
| 2.15%, 08/15/30 (a) | 250,000 | 257,900 |
| Rio Tinto Alcan, Inc. |
| 7.25%, 03/15/31 | 381,000 | 566,734 |
| 6.13%, 12/15/33 | 50,000 | 76,107 |
| Rio Tinto Finance USA Ltd. |
| 3.75%, 06/15/25 (a) | 500,000 | 565,125 |
| 7.13%, 07/15/28 | 250,000 | 355,975 |
| 5.20%, 11/02/40 | 350,000 | 513,600 |
| Rio Tinto Finance USA PLC |
| 4.75%, 03/22/42 (a) | 400,000 | 557,576 |
| 4.13%, 08/21/42 (a) | 100,000 | 131,037 |
| Rohm & Haas Co. |
| 7.85%, 07/15/29 | 450,000 | 627,907 |
| RPM International, Inc. |
| 3.45%, 11/15/22 (a) | 100,000 | 103,577 |
| 3.75%, 03/15/27 (a) | 250,000 | 277,273 |
| 4.25%, 01/15/48 (a) | 250,000 | 279,513 |
| Sherwin-Williams Co. |
| 4.20%, 01/15/22 (a) | 250,000 | 257,380 |
| 3.13%, 06/01/24 (a) | 250,000 | 270,468 |
| 3.45%, 08/01/25 (a) | 100,000 | 110,610 |
| 3.45%, 06/01/27 (a) | 450,000 | 510,430 |
| 2.95%, 08/15/29 (a) | 300,000 | 332,403 |
| 2.30%, 05/15/30 (a) | 200,000 | 210,434 |
| 4.55%, 08/01/45 (a) | 150,000 | 195,815 |
| 4.50%, 06/01/47 (a) | 400,000 | 534,660 |
Schwab Fixed-Income ETFs | Annual Report
Schwab U.S. Aggregate Bond ETF
Portfolio Holdings as of December 31, 2020 (continued)
Security
Rate, Maturity Date | Face
Amount ($) | Value ($) |
| 3.80%, 08/15/49 (a) | 200,000 | 243,422 |
| 3.30%, 05/15/50 (a) | 150,000 | 169,349 |
| Southern Copper Corp. |
| 3.88%, 04/23/25 | 150,000 | 166,956 |
| 7.50%, 07/27/35 | 350,000 | 534,145 |
| 6.75%, 04/16/40 | 400,000 | 600,732 |
| 5.25%, 11/08/42 | 700,000 | 940,856 |
| 5.88%, 04/23/45 | 295,000 | 427,921 |
| Steel Dynamics, Inc. |
| 2.80%, 12/15/24 (a) | 200,000 | 215,204 |
| 2.40%, 06/15/25 (a) | 200,000 | 213,188 |
| 1.65%, 10/15/27 (a) | 250,000 | 257,365 |
| 3.45%, 04/15/30 (a) | 250,000 | 283,995 |
| 3.25%, 10/15/50 (a) | 250,000 | 261,325 |
| Suzano Austria GmbH |
| 6.00%, 01/15/29 (a) | 700,000 | 845,544 |
| 5.00%, 01/15/30 (a) | 450,000 | 512,253 |
| 3.75%, 01/15/31 (a) | 250,000 | 266,178 |
| Teck Resources Ltd. |
| 3.90%, 07/15/30 (a) | 250,000 | 278,855 |
| 6.13%, 10/01/35 | 400,000 | 518,240 |
| 6.00%, 08/15/40 (a) | 150,000 | 188,489 |
| 6.25%, 07/15/41 (a) | 350,000 | 453,106 |
| 5.40%, 02/01/43 (a) | 100,000 | 118,915 |
| Vale Overseas Ltd. |
| 6.25%, 08/10/26 | 800,000 | 995,096 |
| 3.75%, 07/08/30 (a) | 500,000 | 558,290 |
| 8.25%, 01/17/34 | 200,000 | 307,898 |
| 6.88%, 11/21/36 | 498,000 | 732,224 |
| 6.88%, 11/10/39 | 450,000 | 672,214 |
| Vale S.A. |
| 5.63%, 09/11/42 | 250,000 | 336,455 |
| Westlake Chemical Corp. |
| 3.60%, 08/15/26 (a) | 200,000 | 224,958 |
| 3.38%, 06/15/30 (a) | 250,000 | 276,975 |
| 5.00%, 08/15/46 (a) | 200,000 | 260,446 |
| 4.38%, 11/15/47 (a) | 180,000 | 214,844 |
| WestRock MWV LLC |
| 8.20%, 01/15/30 | 215,000 | 308,460 |
| Weyerhaeuser Co. |
| 8.50%, 01/15/25 | 200,000 | 257,734 |
| 6.95%, 10/01/27 | 200,000 | 259,944 |
| 4.00%, 11/15/29 (a) | 175,000 | 206,588 |
| 7.38%, 03/15/32 | 450,000 | 675,666 |
| WRKCo, Inc. |
| 3.00%, 09/15/24 (a) | 250,000 | 269,078 |
| 3.75%, 03/15/25 (a) | 600,000 | 669,696 |
| 4.65%, 03/15/26 (a) | 250,000 | 294,335 |
| 3.90%, 06/01/28 (a) | 250,000 | 289,990 |
| 4.90%, 03/15/29 (a) | 250,000 | 309,410 |
| 4.20%, 06/01/32 (a) | 250,000 | 303,195 |
| 3.00%, 06/15/33 (a) | 250,000 | 276,795 |
| | | 69,300,736 |
| Capital Goods 1.6% |
| 3M Co. |
| 2.75%, 03/01/22 (a) | 450,000 | 462,163 |
| 2.00%, 06/26/22 | 100,000 | 102,626 |
| 1.75%, 02/14/23 (a) | 200,000 | 206,066 |
| 2.25%, 03/15/23 (a) | 500,000 | 521,045 |
| 3.25%, 02/14/24 (a) | 250,000 | 271,490 |
| 2.00%, 02/14/25 (a) | 450,000 | 477,508 |
| 2.65%, 04/15/25 (a) | 550,000 | 598,053 |
| 2.25%, 09/19/26 (a) | 100,000 | 108,043 |
| 2.88%, 10/15/27 (a) | 300,000 | 335,184 |
Security
Rate, Maturity Date | Face
Amount ($) | Value ($) |
| 3.38%, 03/01/29 (a) | 150,000 | 173,789 |
| 2.38%, 08/26/29 (a) | 350,000 | 379,603 |
| 3.05%, 04/15/30 (a) | 200,000 | 227,938 |
| 3.13%, 09/19/46 (a) | 200,000 | 224,672 |
| 3.63%, 10/15/47 (a) | 200,000 | 242,248 |
| 4.00%, 09/14/48 (a) | 550,000 | 706,189 |
| 3.25%, 08/26/49 (a) | 300,000 | 345,705 |
| 3.70%, 04/15/50 (a) | 250,000 | 310,670 |
| ABB Finance USA, Inc. |
| 2.88%, 05/08/22 | 500,000 | 517,220 |
| Acuity Brands Lighting, Inc. |
| 2.15%, 12/15/30 (a) | 125,000 | 126,931 |
| Allegion PLC |
| 3.50%, 10/01/29 (a) | 110,000 | 121,796 |
| Allegion US Holding Co., Inc. |
| 3.20%, 10/01/24 (a) | 500,000 | 535,160 |
| Amcor Finance USA, Inc. |
| 3.63%, 04/28/26 (a) | 80,000 | 89,778 |
| 4.50%, 05/15/28 (a) | 300,000 | 357,081 |
| Amphenol Corp. |
| 2.05%, 03/01/25 (a) | 200,000 | 211,552 |
| 4.35%, 06/01/29 (a) | 250,000 | 308,602 |
| 2.80%, 02/15/30 (a) | 250,000 | 276,980 |
| Avery Dennison Corp. |
| 2.65%, 04/30/30 (a) | 200,000 | 215,130 |
| Bemis Co., Inc. |
| 2.63%, 06/19/30 (a) | 250,000 | 271,218 |
| BOC Aviation Ltd. |
| 3.00%, 05/23/22 (a) | 200,000 | 204,246 |
| Boeing Co. |
| 2.13%, 03/01/22 (a) | 150,000 | 152,204 |
| 2.70%, 05/01/22 | 250,000 | 256,565 |
| 2.80%, 03/01/23 (a) | 150,000 | 156,122 |
| 4.51%, 05/01/23 (a) | 950,000 | 1,024,252 |
| 1.88%, 06/15/23 (a) | 100,000 | 101,964 |
| 2.80%, 03/01/24 (a) | 250,000 | 262,798 |
| 2.85%, 10/30/24 (a) | 100,000 | 105,949 |
| 4.88%, 05/01/25 (a) | 1,150,000 | 1,310,643 |
| 2.60%, 10/30/25 (a) | 300,000 | 314,403 |
| 2.75%, 02/01/26 (a) | 600,000 | 632,694 |
| 3.10%, 05/01/26 (a) | 200,000 | 213,306 |
| 2.70%, 02/01/27 (a) | 300,000 | 312,273 |
| 2.80%, 03/01/27 (a) | 200,000 | 207,292 |
| 5.04%, 05/01/27 (a) | 700,000 | 820,827 |
| 3.45%, 11/01/28 (a) | 350,000 | 376,656 |
| 3.20%, 03/01/29 (a) | 450,000 | 475,060 |
| 2.95%, 02/01/30 (a) | 200,000 | 207,294 |
| 5.15%, 05/01/30 (a) | 1,500,000 | 1,817,685 |
| 6.13%, 02/15/33 | 350,000 | 456,347 |
| 3.60%, 05/01/34 (a) | 350,000 | 370,958 |
| 3.25%, 02/01/35 (a) | 250,000 | 256,315 |
| 6.63%, 02/15/38 | 300,000 | 403,812 |
| 3.55%, 03/01/38 (a) | 50,000 | 51,544 |
| 3.50%, 03/01/39 (a) | 150,000 | 152,528 |
| 6.88%, 03/15/39 | 200,000 | 274,148 |
| 5.88%, 02/15/40 | 800,000 | 1,027,768 |
| 5.71%, 05/01/40 (a) | 1,100,000 | 1,431,012 |
| 3.65%, 03/01/47 (a) | 550,000 | 562,347 |
| 3.63%, 03/01/48 (a) | 100,000 | 102,251 |
| 3.85%, 11/01/48 (a) | 150,000 | 156,885 |
| 3.90%, 05/01/49 (a) | 300,000 | 316,887 |
| 3.75%, 02/01/50 (a) | 425,000 | 447,334 |
| 5.81%, 05/01/50 (a) | 1,400,000 | 1,931,846 |
| 3.83%, 03/01/59 (a) | 150,000 | 153,072 |
| 3.95%, 08/01/59 (a) | 390,000 | 419,078 |
| 5.93%, 05/01/60 (a) | 1,100,000 | 1,561,208 |
Schwab Fixed-Income ETFs | Annual Report
Schwab U.S. Aggregate Bond ETF
Portfolio Holdings as of December 31, 2020 (continued)
Security
Rate, Maturity Date | Face
Amount ($) | Value ($) |
| Carlisle Cos., Inc. |
| 3.50%, 12/01/24 (a) | 400,000 | 439,228 |
| 2.75%, 03/01/30 (a) | 250,000 | 268,675 |
| Carrier Global Corp. |
| 1.92%, 02/15/23 (a) | 250,000 | 257,628 |
| 2.24%, 02/15/25 (a) | 650,000 | 687,895 |
| 2.49%, 02/15/27 (a) | 400,000 | 431,788 |
| 2.72%, 02/15/30 (a) | 700,000 | 749,238 |
| 2.70%, 02/15/31 (a)(c) | 250,000 | 269,070 |
| 3.38%, 04/05/40 (a) | 500,000 | 549,495 |
| 3.58%, 04/05/50 (a)(c) | 550,000 | 618,156 |
| Caterpillar Financial Services Corp. |
| 2.95%, 02/26/22 | 150,000 | 154,620 |
| 2.85%, 06/01/22 | 113,000 | 117,227 |
| 2.40%, 06/06/22 | 200,000 | 206,128 |
| 1.90%, 09/06/22 | 150,000 | 154,172 |
| 2.55%, 11/29/22 | 1,250,000 | 1,304,512 |
| 3.45%, 05/15/23 | 65,000 | 69,766 |
| 0.65%, 07/07/23 | 500,000 | 504,365 |
| 0.45%, 09/14/23 | 250,000 | 250,985 |
| 3.65%, 12/07/23 | 100,000 | 109,769 |
| 2.85%, 05/17/24 | 150,000 | 161,702 |
| 3.30%, 06/09/24 | 250,000 | 273,540 |
| 2.15%, 11/08/24 | 450,000 | 477,999 |
| 3.25%, 12/01/24 | 100,000 | 110,476 |
| 1.45%, 05/15/25 | 300,000 | 310,629 |
| 0.80%, 11/13/25 | 400,000 | 403,052 |
| 1.10%, 09/14/27 | 250,000 | 253,048 |
| Caterpillar, Inc. |
| 3.40%, 05/15/24 (a) | 1,050,000 | 1,147,723 |
| 2.60%, 04/09/30 (a) | 250,000 | 275,745 |
| 6.05%, 08/15/36 | 300,000 | 450,375 |
| 5.20%, 05/27/41 | 275,000 | 405,531 |
| 3.80%, 08/15/42 | 250,000 | 316,727 |
| 4.30%, 05/15/44 (a) | 125,000 | 167,325 |
| 3.25%, 09/19/49 (a) | 400,000 | 470,868 |
| 3.25%, 04/09/50 (a) | 500,000 | 590,155 |
| 4.75%, 05/15/64 (a) | 200,000 | 300,006 |
| CNH Industrial Capital LLC |
| 4.20%, 01/15/24 | 540,000 | 596,689 |
| 1.88%, 01/15/26 (a) | 200,000 | 210,196 |
| CNH Industrial NV |
| 4.50%, 08/15/23 | 350,000 | 382,392 |
| 3.85%, 11/15/27 (a) | 150,000 | 169,880 |
| Crane Co. |
| 4.20%, 03/15/48 (a) | 150,000 | 159,968 |
| Deere & Co. |
| 2.60%, 06/08/22 (a) | 450,000 | 462,460 |
| 2.75%, 04/15/25 (a) | 500,000 | 543,815 |
| 5.38%, 10/16/29 | 150,000 | 199,983 |
| 3.10%, 04/15/30 (a) | 300,000 | 343,566 |
| 7.13%, 03/03/31 | 150,000 | 223,502 |
| 3.90%, 06/09/42 (a) | 250,000 | 316,480 |
| 2.88%, 09/07/49 (a) | 200,000 | 224,356 |
| 3.75%, 04/15/50 (a) | 300,000 | 390,150 |
| Dover Corp. |
| 2.95%, 11/04/29 (a) | 200,000 | 217,502 |
| 5.38%, 10/15/35 | 100,000 | 133,616 |
| 5.38%, 03/01/41 (a) | 200,000 | 256,322 |
| Eagle Materials, Inc. |
| 4.50%, 08/01/26 (a) | 300,000 | 311,199 |
| Eaton Corp. |
| 2.75%, 11/02/22 | 800,000 | 835,192 |
| 4.00%, 11/02/32 | 200,000 | 244,762 |
| 4.15%, 11/02/42 | 350,000 | 444,335 |
Security
Rate, Maturity Date | Face
Amount ($) | Value ($) |
| Emerson Electric Co. |
| 0.88%, 10/15/26 (a) | 200,000 | 201,638 |
| 1.80%, 10/15/27 (a) | 200,000 | 211,376 |
| 1.95%, 10/15/30 (a) | 150,000 | 158,310 |
| 5.25%, 11/15/39 | 140,000 | 193,768 |
| 2.75%, 10/15/50 (a) | 300,000 | 320,214 |
| Flowserve Corp. |
| 3.50%, 10/01/30 (a) | 250,000 | 268,390 |
| Fortive Corp. |
| 3.15%, 06/15/26 (a) | 400,000 | 444,368 |
| 4.30%, 06/15/46 (a) | 250,000 | 310,010 |
| Fortune Brands Home & Security, Inc. |
| 4.00%, 09/21/23 (a) | 200,000 | 218,442 |
| 4.00%, 06/15/25 (a) | 250,000 | 283,485 |
| 3.25%, 09/15/29 (a) | 200,000 | 222,256 |
| General Dynamics Corp. |
| 2.25%, 11/15/22 (a) | 200,000 | 206,406 |
| 3.38%, 05/15/23 (a) | 750,000 | 802,387 |
| 1.88%, 08/15/23 (a) | 100,000 | 103,809 |
| 3.25%, 04/01/25 (a) | 200,000 | 221,050 |
| 3.50%, 05/15/25 (a) | 250,000 | 280,105 |
| 2.13%, 08/15/26 (a) | 250,000 | 268,785 |
| 2.63%, 11/15/27 (a) | 150,000 | 165,065 |
| 3.75%, 05/15/28 (a) | 400,000 | 468,820 |
| 3.63%, 04/01/30 (a) | 500,000 | 594,540 |
| 4.25%, 04/01/40 (a) | 300,000 | 390,939 |
| 3.60%, 11/15/42 (a) | 150,000 | 184,478 |
| 4.25%, 04/01/50 (a) | 225,000 | 307,753 |
| General Electric Co. |
| 2.70%, 10/09/22 | 500,000 | 520,140 |
| 3.10%, 01/09/23 | 600,000 | 631,176 |
| 3.45%, 05/15/24 (a) | 250,000 | 272,948 |
| 3.45%, 05/01/27 (a) | 600,000 | 677,088 |
| 3.63%, 05/01/30 (a) | 500,000 | 570,840 |
| 6.75%, 03/15/32 | 1,000,000 | 1,403,880 |
| 6.15%, 08/07/37 | 300,000 | 412,785 |
| 5.88%, 01/14/38 | 1,150,000 | 1,562,367 |
| 6.88%, 01/10/39 | 700,000 | 1,032,801 |
| 4.25%, 05/01/40 (a) | 500,000 | 591,310 |
| 4.13%, 10/09/42 | 322,000 | 378,482 |
| 4.50%, 03/11/44 | 250,000 | 306,445 |
| 4.35%, 05/01/50 (a) | 1,250,000 | 1,518,562 |
| Hexcel Corp. |
| 3.95%, 02/15/27 (a) | 200,000 | 217,704 |
| Honeywell International, Inc. |
| 2.15%, 08/08/22 (a) | 450,000 | 462,964 |
| 0.48%, 08/19/22 (a) | 800,000 | 801,328 |
| 3.35%, 12/01/23 | 100,000 | 108,990 |
| 2.30%, 08/15/24 (a) | 250,000 | 266,690 |
| 1.35%, 06/01/25 (a) | 400,000 | 413,968 |
| 2.50%, 11/01/26 (a) | 450,000 | 497,596 |
| 2.70%, 08/15/29 (a) | 250,000 | 279,835 |
| 1.95%, 06/01/30 (a) | 350,000 | 370,646 |
| 5.70%, 03/15/37 | 200,000 | 287,732 |
| 5.38%, 03/01/41 | 200,000 | 290,976 |
| 3.81%, 11/21/47 (a) | 50,000 | 63,879 |
| 2.80%, 06/01/50 (a) | 250,000 | 274,500 |
| Hubbell, Inc. |
| 3.15%, 08/15/27 (a) | 100,000 | 106,923 |
| 3.50%, 02/15/28 (a) | 250,000 | 274,585 |
| Huntington Ingalls Industries, Inc. |
| 3.48%, 12/01/27 (a) | 190,000 | 213,203 |
| 4.20%, 05/01/30 (a) | 250,000 | 297,077 |
| IDEX Corp. |
| 3.00%, 05/01/30 (a) | 250,000 | 276,473 |
Schwab Fixed-Income ETFs | Annual Report
Schwab U.S. Aggregate Bond ETF
Portfolio Holdings as of December 31, 2020 (continued)
Security
Rate, Maturity Date | Face
Amount ($) | Value ($) |
| Illinois Tool Works, Inc. |
| 3.50%, 03/01/24 (a) | 265,000 | 289,041 |
| 2.65%, 11/15/26 (a) | 600,000 | 664,608 |
| 4.88%, 09/15/41 (a) | 150,000 | 208,835 |
| 3.90%, 09/01/42 (a) | 350,000 | 442,249 |
| Ingersoll-Rand Global Holding Co., Ltd. |
| 3.75%, 08/21/28 (a) | 500,000 | 583,920 |
| 4.30%, 02/21/48 (a) | 400,000 | 502,512 |
| John Deere Capital Corp. |
| 3.20%, 01/10/22 | 200,000 | 206,022 |
| 2.95%, 04/01/22 | 100,000 | 103,387 |
| 2.15%, 09/08/22 | 500,000 | 516,095 |
| 2.70%, 01/06/23 | 500,000 | 524,495 |
| 2.80%, 01/27/23 | 150,000 | 157,823 |
| 2.80%, 03/06/23 | 200,000 | 211,320 |
| 3.45%, 06/07/23 | 150,000 | 161,327 |
| 0.70%, 07/05/23 | 50,000 | 50,539 |
| 0.40%, 10/10/23 | 100,000 | 100,420 |
| 3.45%, 01/10/24 | 200,000 | 218,104 |
| 2.60%, 03/07/24 | 400,000 | 427,868 |
| 2.65%, 06/24/24 | 475,000 | 510,497 |
| 2.05%, 01/09/25 | 200,000 | 211,976 |
| 3.40%, 09/11/25 | 100,000 | 112,523 |
| 2.65%, 06/10/26 | 400,000 | 439,116 |
| 2.80%, 09/08/27 | 350,000 | 391,097 |
| 3.05%, 01/06/28 | 50,000 | 56,130 |
| 3.45%, 03/07/29 | 150,000 | 174,632 |
| 2.80%, 07/18/29 | 500,000 | 559,335 |
| 2.45%, 01/09/30 | 400,000 | 438,548 |
| Johnson Controls International plc |
| 3.63%, 07/02/24 (a) | 250,000 | 271,380 |
| 3.90%, 02/14/26 (a) | 183,000 | 208,873 |
| 1.75%, 09/15/30 (a) | 100,000 | 102,173 |
| 6.00%, 01/15/36 | 382,000 | 533,673 |
| 4.63%, 07/02/44 (a) | 200,000 | 260,774 |
| 5.13%, 09/14/45 (a) | 24,000 | 33,066 |
| 4.50%, 02/15/47 (a) | 50,000 | 66,076 |
| Kennametal, Inc. |
| 4.63%, 06/15/28 (a) | 100,000 | 112,094 |
| L3Harris Technologies, Inc. |
| 3.83%, 04/27/25 (a) | 200,000 | 224,530 |
| 3.85%, 12/15/26 (a) | 400,000 | 463,988 |
| 4.40%, 06/15/28 (a) | 295,000 | 355,457 |
| 4.40%, 06/15/28 (a) | 500,000 | 600,940 |
| 2.90%, 12/15/29 (a) | 300,000 | 332,844 |
| 6.15%, 12/15/40 | 150,000 | 227,070 |
| Leggett & Platt, Inc. |
| 3.50%, 11/15/27 (a) | 200,000 | 217,842 |
| 4.40%, 03/15/29 (a) | 326,000 | 375,164 |
| Legrand France S.A. |
| 8.50%, 02/15/25 | 250,000 | 325,757 |
| Lennox International, Inc. |
| 1.35%, 08/01/25 (a) | 100,000 | 102,513 |
| 1.70%, 08/01/27 (a) | 300,000 | 306,999 |
| Lockheed Martin Corp. |
| 3.10%, 01/15/23 (a) | 500,000 | 525,860 |
| 3.55%, 01/15/26 (a) | 850,000 | 966,356 |
| 1.85%, 06/15/30 (a) | 300,000 | 314,949 |
| 3.60%, 03/01/35 (a) | 100,000 | 121,025 |
| 5.72%, 06/01/40 | 315,000 | 466,956 |
| 4.07%, 12/15/42 | 500,000 | 650,660 |
| 3.80%, 03/01/45 (a) | 150,000 | 187,340 |
| 4.70%, 05/15/46 (a) | 250,000 | 351,035 |
| 2.80%, 06/15/50 (a) | 250,000 | 270,598 |
| 4.09%, 09/15/52 (a) | 925,000 | 1,236,790 |
Security
Rate, Maturity Date | Face
Amount ($) | Value ($) |
| Martin Marietta Materials, Inc. |
| 4.25%, 07/02/24 (a) | 200,000 | 222,888 |
| 3.45%, 06/01/27 (a) | 25,000 | 28,019 |
| 2.50%, 03/15/30 (a) | 300,000 | 320,001 |
| 4.25%, 12/15/47 (a) | 250,000 | 300,153 |
| Masco Corp. |
| 5.95%, 03/15/22 | 100,000 | 106,387 |
| 4.45%, 04/01/25 (a) | 500,000 | 574,820 |
| 2.00%, 10/01/30 (a) | 200,000 | 203,940 |
| 4.50%, 05/15/47 (a) | 350,000 | 440,996 |
| Mohawk Industries, Inc. |
| 3.85%, 02/01/23 (a) | 200,000 | 212,976 |
| 3.63%, 05/15/30 (a) | 200,000 | 224,916 |
| Northrop Grumman Corp. |
| 2.55%, 10/15/22 (a) | 500,000 | 519,380 |
| 3.25%, 08/01/23 | 250,000 | 268,395 |
| 2.93%, 01/15/25 (a) | 400,000 | 435,368 |
| 3.20%, 02/01/27 (a) | 500,000 | 562,650 |
| 3.25%, 01/15/28 (a) | 250,000 | 283,253 |
| 4.40%, 05/01/30 (a) | 300,000 | 371,577 |
| 5.05%, 11/15/40 | 150,000 | 206,174 |
| 4.75%, 06/01/43 | 750,000 | 1,008,217 |
| 3.85%, 04/15/45 (a) | 550,000 | 668,041 |
| 4.03%, 10/15/47 (a) | 550,000 | 689,969 |
| 5.25%, 05/01/50 (a) | 450,000 | 670,392 |
| nVent Finance Sarl |
| 4.55%, 04/15/28 (a) | 275,000 | 299,514 |
| Oshkosh Corp. |
| 3.10%, 03/01/30 (a) | 200,000 | 218,228 |
| Otis Worldwide Corp. |
| 2.06%, 04/05/25 (a) | 500,000 | 530,895 |
| 2.29%, 04/05/27 (a) | 200,000 | 214,040 |
| 2.57%, 02/15/30 (a) | 500,000 | 537,210 |
| 3.36%, 02/15/50 (a) | 450,000 | 524,515 |
| Owens Corning |
| 3.40%, 08/15/26 (a) | 150,000 | 165,590 |
| 3.95%, 08/15/29 (a) | 200,000 | 230,826 |
| 3.88%, 06/01/30 (a) | 100,000 | 115,420 |
| 7.00%, 12/01/36 | 145,000 | 207,328 |
| 4.30%, 07/15/47 (a) | 200,000 | 240,160 |
| 4.40%, 01/30/48 (a) | 100,000 | 120,977 |
| Parker-Hannifin Corp. |
| 3.50%, 09/15/22 | 250,000 | 262,903 |
| 2.70%, 06/14/24 (a) | 250,000 | 268,445 |
| 3.25%, 03/01/27 (a) | 100,000 | 111,713 |
| 3.25%, 06/14/29 (a) | 370,000 | 420,527 |
| 4.20%, 11/21/34 (a) | 250,000 | 309,712 |
| 6.25%, 05/15/38 | 300,000 | 440,082 |
| 4.45%, 11/21/44 (a) | 250,000 | 323,647 |
| 4.10%, 03/01/47 (a) | 150,000 | 189,080 |
| 4.00%, 06/14/49 (a) | 350,000 | 439,351 |
| Pentair Finance Sarl |
| 4.50%, 07/01/29 (a) | 250,000 | 297,620 |
| Precision Castparts Corp. |
| 2.50%, 01/15/23 (a) | 350,000 | 363,730 |
| 3.25%, 06/15/25 (a) | 200,000 | 221,176 |
| 3.90%, 01/15/43 (a) | 250,000 | 294,318 |
| 4.38%, 06/15/45 (a) | 139,000 | 175,682 |
| Raytheon Technologies Corp. |
| 2.80%, 03/15/22 (a) | 800,000 | 821,840 |
| 2.50%, 12/15/22 (a)(c) | 450,000 | 466,569 |
| 3.20%, 03/15/24 (a) | 250,000 | 269,968 |
| 3.95%, 08/16/25 (a) | 650,000 | 745,979 |
| 3.13%, 05/04/27 (a) | 350,000 | 391,202 |
| 4.13%, 11/16/28 (a) | 900,000 | 1,074,771 |
| 7.50%, 09/15/29 | 250,000 | 364,765 |
Schwab Fixed-Income ETFs | Annual Report
Schwab U.S. Aggregate Bond ETF
Portfolio Holdings as of December 31, 2020 (continued)
Security
Rate, Maturity Date | Face
Amount ($) | Value ($) |
| 2.25%, 07/01/30 (a) | 250,000 | 265,543 |
| 5.40%, 05/01/35 | 250,000 | 344,042 |
| 4.45%, 11/16/38 (a) | 250,000 | 319,125 |
| 4.88%, 10/15/40 (c) | 250,000 | 330,727 |
| 4.70%, 12/15/41 | 250,000 | 326,585 |
| 4.80%, 12/15/43 (a) | 290,000 | 382,391 |
| 4.35%, 04/15/47 (a) | 500,000 | 657,735 |
| 3.13%, 07/01/50 (a) | 300,000 | 330,936 |
| Republic Services, Inc. |
| 2.50%, 08/15/24 (a) | 450,000 | 480,456 |
| 0.88%, 11/15/25 (a) | 250,000 | 252,258 |
| 2.90%, 07/01/26 (a) | 550,000 | 609,416 |
| 3.38%, 11/15/27 (a) | 500,000 | 567,895 |
| 3.95%, 05/15/28 (a) | 75,000 | 88,248 |
| 2.30%, 03/01/30 (a) | 200,000 | 212,156 |
| 1.45%, 02/15/31 (a) | 250,000 | 245,165 |
| 3.05%, 03/01/50 (a) | 150,000 | 163,676 |
| Rockwell Automation, Inc. |
| 3.50%, 03/01/29 (a) | 100,000 | 116,606 |
| 4.20%, 03/01/49 (a) | 250,000 | 338,772 |
| Roper Technologies, Inc. |
| 3.13%, 11/15/22 (a) | 250,000 | 261,723 |
| 2.35%, 09/15/24 (a) | 150,000 | 159,827 |
| 1.00%, 09/15/25 (a) | 250,000 | 253,183 |
| 3.85%, 12/15/25 (a) | 500,000 | 565,630 |
| 1.40%, 09/15/27 (a) | 250,000 | 253,715 |
| 4.20%, 09/15/28 (a) | 50,000 | 59,723 |
| 2.95%, 09/15/29 (a) | 400,000 | 440,908 |
| 2.00%, 06/30/30 (a) | 350,000 | 359,341 |
| 1.75%, 02/15/31 (a) | 250,000 | 249,333 |
| Snap-on, Inc. |
| 4.10%, 03/01/48 (a) | 200,000 | 258,324 |
| 3.10%, 05/01/50 (a) | 200,000 | 227,864 |
| Sonoco Products Co. |
| 3.13%, 05/01/30 (a) | 400,000 | 445,096 |
| 5.75%, 11/01/40 (a) | 130,000 | 177,512 |
| Stanley Black & Decker, Inc. |
| 4.25%, 11/15/28 (a) | 250,000 | 304,425 |
| 2.30%, 03/15/30 (a) | 350,000 | 376,064 |
| 5.20%, 09/01/40 | 109,000 | 153,488 |
| 4.85%, 11/15/48 (a) | 300,000 | 421,119 |
| 4.00%, 03/15/60 (a)(b) | 250,000 | 267,080 |
| Textron, Inc. |
| 3.88%, 03/01/25 (a) | 250,000 | 274,358 |
| 4.00%, 03/15/26 (a) | 200,000 | 226,074 |
| 3.65%, 03/15/27 (a) | 150,000 | 165,921 |
| 3.90%, 09/17/29 (a) | 200,000 | 229,196 |
| 2.45%, 03/15/31 (a) | 250,000 | 257,223 |
| Timken Co. |
| 4.50%, 12/15/28 (a) | 150,000 | 167,801 |
| Trane Technologies Global Holding Co., Ltd. |
| 4.25%, 06/15/23 | 250,000 | 273,183 |
| Trane Technologies Luxembourg Finance S.A. |
| 3.80%, 03/21/29 (a) | 350,000 | 411,407 |
| United Technologies Corp. |
| 6.05%, 06/01/36 | 500,000 | 730,690 |
| 6.13%, 07/15/38 | 500,000 | 748,405 |
| 5.70%, 04/15/40 | 650,000 | 955,110 |
| 4.50%, 06/01/42 | 1,000,000 | 1,307,670 |
| 4.15%, 05/15/45 (a) | 250,000 | 316,862 |
| 3.75%, 11/01/46 (a) | 300,000 | 359,445 |
| 4.05%, 05/04/47 (a) | 450,000 | 561,960 |
| 4.63%, 11/16/48 (a) | 100,000 | 136,361 |
Security
Rate, Maturity Date | Face
Amount ($) | Value ($) |
| Valmont Industries, Inc. |
| 5.00%, 10/01/44 (a) | 130,000 | 153,669 |
| 5.25%, 10/01/54 (a) | 100,000 | 120,011 |
| Vulcan Materials Co. |
| 3.90%, 04/01/27 (a) | 200,000 | 233,696 |
| 3.50%, 06/01/30 (a) | 250,000 | 286,338 |
| 4.50%, 06/15/47 (a) | 250,000 | 310,437 |
| 4.70%, 03/01/48 (a) | 125,000 | 160,635 |
| Waste Connections, Inc. |
| 4.25%, 12/01/28 (a) | 200,000 | 239,204 |
| 3.50%, 05/01/29 (a) | 209,000 | 238,828 |
| 2.60%, 02/01/30 (a) | 500,000 | 538,315 |
| Waste Management, Inc. |
| 2.90%, 09/15/22 (a) | 450,000 | 466,933 |
| 2.40%, 05/15/23 (a) | 366,000 | 382,441 |
| 0.75%, 11/15/25 (a) | 300,000 | 301,305 |
| 3.15%, 11/15/27 (a) | 300,000 | 339,858 |
| 1.15%, 03/15/28 (a) | 250,000 | 250,095 |
| 4.10%, 03/01/45 (a) | 500,000 | 635,975 |
| 4.15%, 07/15/49 (a) | 250,000 | 333,127 |
| 2.50%, 11/15/50 (a) | 250,000 | 250,920 |
| Westinghouse Air Brake Technologies Corp. |
| 4.40%, 03/15/24 (a)(f)(g) | 350,000 | 383,383 |
| 3.20%, 06/15/25 (a) | 350,000 | 377,912 |
| 3.45%, 11/15/26 (a) | 300,000 | 329,259 |
| 4.95%, 09/15/28 (a)(f)(g) | 500,000 | 592,815 |
| WW Grainger, Inc. |
| 1.85%, 02/15/25 (a) | 200,000 | 210,686 |
| 4.60%, 06/15/45 (a) | 150,000 | 200,463 |
| 4.20%, 05/15/47 (a) | 500,000 | 642,500 |
| Xylem, Inc. |
| 3.25%, 11/01/26 (a) | 285,000 | 320,833 |
| 1.95%, 01/30/28 (a) | 300,000 | 317,382 |
| 2.25%, 01/30/31 (a) | 250,000 | 263,838 |
| 4.38%, 11/01/46 (a) | 95,000 | 117,812 |
| | | 135,724,202 |
| Communications 2.6% |
| Activision Blizzard, Inc. |
| 3.40%, 09/15/26 (a) | 300,000 | 341,649 |
| 3.40%, 06/15/27 (a) | 250,000 | 283,595 |
| 1.35%, 09/15/30 (a) | 200,000 | 196,904 |
| 4.50%, 06/15/47 (a) | 78,000 | 102,451 |
| 2.50%, 09/15/50 (a) | 250,000 | 244,040 |
| America Movil S.A.B. de C.V. |
| 3.13%, 07/16/22 | 700,000 | 728,147 |
| 3.63%, 04/22/29 (a) | 250,000 | 284,308 |
| 2.88%, 05/07/30 (a) | 200,000 | 217,704 |
| 6.13%, 11/15/37 | 150,000 | 216,057 |
| 6.13%, 03/30/40 | 1,200,000 | 1,779,960 |
| 4.38%, 07/16/42 | 500,000 | 626,590 |
| 4.38%, 04/22/49 (a) | 550,000 | 709,340 |
| American Tower Corp. |
| 2.25%, 01/15/22 | 250,000 | 254,793 |
| 4.70%, 03/15/22 | 153,000 | 160,824 |
| 3.50%, 01/31/23 | 800,000 | 849,224 |
| 3.00%, 06/15/23 | 200,000 | 212,196 |
| 5.00%, 02/15/24 | 350,000 | 396,571 |
| 3.38%, 05/15/24 (a) | 250,000 | 272,293 |
| 2.95%, 01/15/25 (a) | 280,000 | 303,688 |
| 2.40%, 03/15/25 (a) | 350,000 | 373,093 |
| 4.00%, 06/01/25 (a) | 100,000 | 112,968 |
| 3.38%, 10/15/26 (a) | 250,000 | 281,043 |
| 2.75%, 01/15/27 (a) | 65,000 | 70,839 |
| 3.13%, 01/15/27 (a) | 100,000 | 110,414 |
Schwab Fixed-Income ETFs | Annual Report
Schwab U.S. Aggregate Bond ETF
Portfolio Holdings as of December 31, 2020 (continued)
Security
Rate, Maturity Date | Face
Amount ($) | Value ($) |
| 3.55%, 07/15/27 (a) | 450,000 | 509,728 |
| 3.60%, 01/15/28 (a) | 300,000 | 341,322 |
| 1.50%, 01/31/28 (a) | 250,000 | 251,828 |
| 3.95%, 03/15/29 (a) | 250,000 | 291,250 |
| 3.80%, 08/15/29 (a) | 750,000 | 872,257 |
| 2.90%, 01/15/30 (a) | 150,000 | 163,752 |
| 1.88%, 10/15/30 (a) | 250,000 | 252,553 |
| 3.70%, 10/15/49 (a) | 300,000 | 341,043 |
| 3.10%, 06/15/50 (a) | 550,000 | 568,320 |
| 2.95%, 01/15/51 (a) | 250,000 | 250,888 |
| AT&T, Inc. |
| 3.00%, 06/30/22 (a) | 825,000 | 853,735 |
| 2.63%, 12/01/22 (a) | 250,000 | 259,353 |
| 4.05%, 12/15/23 | 150,000 | 166,083 |
| 3.90%, 03/11/24 (a) | 400,000 | 439,416 |
| 4.45%, 04/01/24 (a) | 350,000 | 390,954 |
| 3.95%, 01/15/25 (a) | 350,000 | 394,069 |
| 3.40%, 05/15/25 (a) | 750,000 | 833,602 |
| 3.60%, 07/15/25 (a) | 250,000 | 281,148 |
| 4.13%, 02/17/26 (a) | 250,000 | 289,503 |
| 2.95%, 07/15/26 (a) | 250,000 | 276,868 |
| 3.80%, 02/15/27 (a) | 350,000 | 403,253 |
| 4.25%, 03/01/27 (a) | 500,000 | 584,830 |
| 2.30%, 06/01/27 (a) | 700,000 | 746,599 |
| 1.65%, 02/01/28 (a) | 550,000 | 562,749 |
| 4.10%, 02/15/28 (a) | 700,000 | 823,466 |
| 4.35%, 03/01/29 (a) | 1,050,000 | 1,253,584 |
| 4.30%, 02/15/30 (a) | 1,050,000 | 1,254,970 |
| 2.75%, 06/01/31 (a) | 1,200,000 | 1,284,156 |
| 2.25%, 02/01/32 (a) | 950,000 | 964,601 |
| 2.55%, 12/01/33 (a)(c) | 1,481,000 | 1,519,358 |
| 6.15%, 09/15/34 | 200,000 | 270,394 |
| 4.50%, 05/15/35 (a) | 1,000,000 | 1,217,300 |
| 5.25%, 03/01/37 (a) | 950,000 | 1,232,340 |
| 4.90%, 08/15/37 (a) | 504,000 | 633,165 |
| 4.85%, 03/01/39 (a) | 740,000 | 919,909 |
| 6.00%, 08/15/40 (a) | 300,000 | 418,938 |
| 5.35%, 09/01/40 | 500,000 | 658,590 |
| 3.50%, 06/01/41 (a) | 700,000 | 753,921 |
| 5.15%, 03/15/42 | 450,000 | 572,188 |
| 4.90%, 06/15/42 | 150,000 | 187,337 |
| 4.30%, 12/15/42 (a) | 500,000 | 585,955 |
| 3.10%, 02/01/43 (a) | 400,000 | 407,668 |
| 4.65%, 06/01/44 (a) | 250,000 | 296,095 |
| 4.80%, 06/15/44 (a) | 350,000 | 437,290 |
| 4.35%, 06/15/45 (a) | 500,000 | 580,580 |
| 4.85%, 07/15/45 (a) | 100,000 | 125,416 |
| 4.75%, 05/15/46 (a) | 1,000,000 | 1,238,150 |
| 5.15%, 11/15/46 (a) | 650,000 | 843,966 |
| 5.65%, 02/15/47 (a) | 200,000 | 272,984 |
| 5.45%, 03/01/47 (a) | 628,000 | 849,357 |
| 4.50%, 03/09/48 (a) | 1,200,000 | 1,436,892 |
| 4.55%, 03/09/49 (a) | 859,000 | 1,029,271 |
| 5.15%, 02/15/50 (a) | 450,000 | 583,285 |
| 3.65%, 06/01/51 (a) | 900,000 | 943,263 |
| 3.30%, 02/01/52 (a) | 1,050,000 | 1,046,010 |
| 3.50%, 09/15/53 (a)(c) | 1,735,000 | 1,749,921 |
| 3.55%, 09/15/55 (a)(c) | 1,925,000 | 1,937,820 |
| 3.80%, 12/01/57 (a)(c) | 1,825,000 | 1,911,158 |
| 3.65%, 09/15/59 (a)(c) | 1,594,000 | 1,611,024 |
| 3.85%, 06/01/60 (a) | 400,000 | 422,432 |
| 3.50%, 02/01/61 (a) | 400,000 | 396,440 |
| Bell Canada |
| 4.46%, 04/01/48 (a) | 550,000 | 737,027 |
Security
Rate, Maturity Date | Face
Amount ($) | Value ($) |
| British Telecommunications PLC |
| 4.50%, 12/04/23 (a) | 250,000 | 277,025 |
| 5.13%, 12/04/28 (a) | 1,250,000 | 1,541,512 |
| 9.63%, 12/15/30 (f)(g) | 100,000 | 166,058 |
| CC Holdings GS V LLC/Crown Castle GS III Corp. |
| 3.85%, 04/15/23 | 500,000 | 537,980 |
| Charter Communications Operating LLC/Charter Communications Operating Capital |
| 4.46%, 07/23/22 (a) | 900,000 | 948,960 |
| 4.50%, 02/01/24 (a) | 450,000 | 499,788 |
| 4.91%, 07/23/25 (a) | 1,700,000 | 1,974,839 |
| 3.75%, 02/15/28 (a) | 425,000 | 477,466 |
| 4.20%, 03/15/28 (a) | 250,000 | 288,518 |
| 5.05%, 03/30/29 (a) | 500,000 | 607,615 |
| 2.80%, 04/01/31 (a) | 500,000 | 527,955 |
| 6.38%, 10/23/35 (a) | 800,000 | 1,098,216 |
| 5.38%, 04/01/38 (a) | 550,000 | 690,695 |
| 6.48%, 10/23/45 (a) | 1,200,000 | 1,697,628 |
| 5.38%, 05/01/47 (a) | 950,000 | 1,192,677 |
| 5.75%, 04/01/48 (a) | 600,000 | 786,564 |
| 5.13%, 07/01/49 (a) | 550,000 | 671,154 |
| 4.80%, 03/01/50 (a) | 1,050,000 | 1,249,909 |
| 3.70%, 04/01/51 (a) | 500,000 | 518,370 |
| 6.83%, 10/23/55 (a) | 400,000 | 604,280 |
| 3.85%, 04/01/61 (a) | 250,000 | 252,725 |
| Comcast Cable Communications Holdings, Inc. |
| 9.46%, 11/15/22 | 598,000 | 700,270 |
| Comcast Corp. |
| 3.00%, 02/01/24 (a) | 450,000 | 484,074 |
| 3.60%, 03/01/24 | 450,000 | 494,860 |
| 3.70%, 04/15/24 (a) | 950,000 | 1,048,372 |
| 3.38%, 02/15/25 (a) | 200,000 | 220,990 |
| 3.10%, 04/01/25 (a) | 750,000 | 825,495 |
| 3.38%, 08/15/25 (a) | 550,000 | 613,959 |
| 3.95%, 10/15/25 (a) | 950,000 | 1,091,664 |
| 3.15%, 03/01/26 (a) | 750,000 | 835,755 |
| 2.35%, 01/15/27 (a) | 550,000 | 592,383 |
| 3.30%, 02/01/27 (a) | 530,000 | 598,932 |
| 3.15%, 02/15/28 (a) | 750,000 | 844,132 |
| 3.55%, 05/01/28 (a) | 292,000 | 336,656 |
| 4.15%, 10/15/28 (a) | 1,500,000 | 1,802,610 |
| 2.65%, 02/01/30 (a) | 500,000 | 546,490 |
| 3.40%, 04/01/30 (a) | 500,000 | 577,740 |
| 4.25%, 10/15/30 (a) | 500,000 | 615,720 |
| 1.95%, 01/15/31 (a) | 950,000 | 975,260 |
| 1.50%, 02/15/31 (a) | 350,000 | 346,206 |
| 4.25%, 01/15/33 | 650,000 | 817,063 |
| 7.05%, 03/15/33 | 250,000 | 386,108 |
| 5.65%, 06/15/35 | 100,000 | 143,784 |
| 4.40%, 08/15/35 (a) | 230,000 | 295,003 |
| 6.50%, 11/15/35 | 250,000 | 388,103 |
| 3.20%, 07/15/36 (a) | 250,000 | 285,345 |
| 6.95%, 08/15/37 | 400,000 | 647,456 |
| 3.90%, 03/01/38 (a) | 500,000 | 611,685 |
| 4.60%, 10/15/38 (a) | 1,000,000 | 1,319,730 |
| 3.25%, 11/01/39 (a) | 100,000 | 113,469 |
| 3.75%, 04/01/40 (a) | 450,000 | 544,131 |
| 4.65%, 07/15/42 | 150,000 | 202,115 |
| 4.50%, 01/15/43 | 100,000 | 132,664 |
| 4.75%, 03/01/44 | 500,000 | 685,530 |
| 4.60%, 08/15/45 (a) | 822,000 | 1,107,127 |
| 3.40%, 07/15/46 (a) | 550,000 | 632,764 |
| 4.00%, 08/15/47 (a) | 266,000 | 334,085 |
| 3.97%, 11/01/47 (a) | 1,098,000 | 1,377,166 |
| 4.00%, 03/01/48 (a) | 600,000 | 756,672 |
| 4.70%, 10/15/48 (a) | 1,250,000 | 1,744,437 |
| 4.00%, 11/01/49 (a) | 1,000,000 | 1,269,000 |
Schwab Fixed-Income ETFs | Annual Report
Schwab U.S. Aggregate Bond ETF
Portfolio Holdings as of December 31, 2020 (continued)
Security
Rate, Maturity Date | Face
Amount ($) | Value ($) |
| 3.45%, 02/01/50 (a) | 500,000 | 589,225 |
| 2.80%, 01/15/51 (a) | 500,000 | 521,775 |
| 2.45%, 08/15/52 (a) | 350,000 | 340,918 |
| 4.05%, 11/01/52 (a) | 500,000 | 640,580 |
| 4.95%, 10/15/58 (a) | 900,000 | 1,368,396 |
| 2.65%, 08/15/62 (a) | 350,000 | 351,407 |
| Crown Castle International Corp. |
| 5.25%, 01/15/23 | 600,000 | 657,714 |
| 3.20%, 09/01/24 (a) | 350,000 | 380,790 |
| 1.35%, 07/15/25 (a) | 100,000 | 102,220 |
| 4.45%, 02/15/26 (a) | 500,000 | 579,425 |
| 3.70%, 06/15/26 (a) | 250,000 | 282,383 |
| 4.00%, 03/01/27 (a) | 200,000 | 229,524 |
| 3.65%, 09/01/27 (a) | 300,000 | 340,554 |
| 3.80%, 02/15/28 (a) | 350,000 | 402,108 |
| 3.10%, 11/15/29 (a) | 200,000 | 220,886 |
| 3.30%, 07/01/30 (a) | 350,000 | 393,621 |
| 2.25%, 01/15/31 (a) | 400,000 | 414,832 |
| 4.75%, 05/15/47 (a) | 450,000 | 579,546 |
| 4.00%, 11/15/49 (a) | 150,000 | 176,073 |
| 4.15%, 07/01/50 (a) | 100,000 | 121,597 |
| 3.25%, 01/15/51 (a) | 300,000 | 315,993 |
| Deutsche Telekom International Finance BV |
| 8.75%, 06/15/30 (f)(g) | 1,200,000 | 1,898,940 |
| 9.25%, 06/01/32 | 100,000 | 170,620 |
| Discovery Communications LLC |
| 2.95%, 03/20/23 (a) | 263,000 | 277,036 |
| 3.90%, 11/15/24 (a) | 400,000 | 444,228 |
| 3.45%, 03/15/25 (a) | 250,000 | 274,973 |
| 4.90%, 03/11/26 (a) | 100,000 | 118,031 |
| 3.95%, 03/20/28 (a) | 750,000 | 860,340 |
| 4.13%, 05/15/29 (a) | 250,000 | 292,625 |
| 3.63%, 05/15/30 (a) | 450,000 | 515,502 |
| 6.35%, 06/01/40 | 150,000 | 215,957 |
| 4.88%, 04/01/43 | 300,000 | 371,982 |
| 5.20%, 09/20/47 (a) | 450,000 | 587,281 |
| 5.30%, 05/15/49 (a) | 100,000 | 132,890 |
| 4.65%, 05/15/50 (a) | 350,000 | 439,124 |
| 4.00%, 09/15/55 (a)(c) | 1,064,000 | 1,192,914 |
| Electronic Arts, Inc. |
| 4.80%, 03/01/26 (a) | 25,000 | 29,743 |
| Fox Corp. |
| 3.67%, 01/25/22 | 500,000 | 517,565 |
| 4.03%, 01/25/24 (a) | 250,000 | 275,255 |
| 3.05%, 04/07/25 (a) | 150,000 | 164,220 |
| 4.71%, 01/25/29 (a) | 650,000 | 791,050 |
| 3.50%, 04/08/30 (a) | 300,000 | 341,973 |
| 5.48%, 01/25/39 (a) | 350,000 | 481,981 |
| 5.58%, 01/25/49 (a) | 500,000 | 734,245 |
| Grupo Televisa S.A.B. |
| 6.63%, 03/18/25 | 300,000 | 366,078 |
| 6.63%, 01/15/40 | 550,000 | 770,748 |
| 5.00%, 05/13/45 (a) | 400,000 | 484,656 |
| 6.13%, 01/31/46 (a) | 250,000 | 347,475 |
| 5.25%, 05/24/49 (a) | 200,000 | 253,822 |
| Interpublic Group of Cos., Inc. |
| 3.75%, 02/15/23 | 500,000 | 534,585 |
| 4.20%, 04/15/24 | 150,000 | 167,156 |
| 4.75%, 03/30/30 (a) | 300,000 | 374,370 |
| 5.40%, 10/01/48 (a) | 150,000 | 207,981 |
| Koninklijke KPN N.V. |
| 8.38%, 10/01/30 | 190,000 | 271,510 |
| Moody's Corp. |
| 4.50%, 09/01/22 (a) | 276,000 | 291,406 |
| 4.88%, 02/15/24 (a) | 100,000 | 112,268 |
| 3.75%, 03/24/25 (a) | 250,000 | 281,135 |
Security
Rate, Maturity Date | Face
Amount ($) | Value ($) |
| 3.25%, 01/15/28 (a) | 250,000 | 282,363 |
| 4.25%, 02/01/29 (a) | 200,000 | 240,636 |
| 5.25%, 07/15/44 | 100,000 | 138,885 |
| 4.88%, 12/17/48 (a) | 200,000 | 272,962 |
| 2.55%, 08/18/60 (a) | 250,000 | 236,188 |
| NBCUniversal Media LLC |
| 6.40%, 04/30/40 | 200,000 | 315,784 |
| 5.95%, 04/01/41 | 1,050,000 | 1,604,841 |
| 4.45%, 01/15/43 | 100,000 | 131,723 |
| Omnicom Group, Inc. |
| 2.45%, 04/30/30 (a) | 250,000 | 266,475 |
| 4.20%, 06/01/30 (a) | 200,000 | 240,800 |
| Omnicom Group, Inc./Omnicom Capital, Inc. |
| 3.63%, 05/01/22 | 350,000 | 365,064 |
| 3.65%, 11/01/24 (a) | 250,000 | 276,463 |
| 3.60%, 04/15/26 (a) | 500,000 | 571,000 |
| Orange S.A. |
| 9.00%, 03/01/31 | 800,000 | 1,322,912 |
| 5.38%, 01/13/42 | 300,000 | 427,668 |
| 5.50%, 02/06/44 (a) | 300,000 | 440,829 |
| RELX Capital, Inc. |
| 3.50%, 03/16/23 (a) | 250,000 | 266,330 |
| 4.00%, 03/18/29 (a) | 350,000 | 416,602 |
| 3.00%, 05/22/30 (a) | 250,000 | 278,613 |
| Rogers Communications, Inc. |
| 3.00%, 03/15/23 (a) | 250,000 | 262,813 |
| 4.10%, 10/01/23 (a) | 250,000 | 273,605 |
| 3.63%, 12/15/25 (a) | 220,000 | 249,960 |
| 2.90%, 11/15/26 (a) | 100,000 | 111,197 |
| 4.50%, 03/15/43 (a) | 100,000 | 128,164 |
| 5.45%, 10/01/43 (a) | 250,000 | 353,120 |
| 5.00%, 03/15/44 (a) | 500,000 | 687,930 |
| 4.30%, 02/15/48 (a) | 200,000 | 256,514 |
| 4.35%, 05/01/49 (a) | 450,000 | 584,374 |
| 3.70%, 11/15/49 (a) | 400,000 | 473,768 |
| S&P Global, Inc. |
| 4.00%, 06/15/25 (a) | 250,000 | 285,195 |
| 2.95%, 01/22/27 (a) | 400,000 | 443,328 |
| 2.50%, 12/01/29 (a) | 200,000 | 218,608 |
| 1.25%, 08/15/30 (a) | 250,000 | 246,505 |
| 3.25%, 12/01/49 (a) | 200,000 | 232,606 |
| 2.30%, 08/15/60 (a) | 250,000 | 236,980 |
| T-Mobile USA, Inc. |
| 3.50%, 04/15/25 (a)(c) | 1,100,000 | 1,217,942 |
| 1.50%, 02/15/26 (a) | 250,000 | 256,250 |
| 3.75%, 04/15/27 (a)(c) | 1,400,000 | 1,598,408 |
| 2.05%, 02/15/28 (a) | 750,000 | 781,312 |
| 3.88%, 04/15/30 (a)(c) | 2,300,000 | 2,662,549 |
| 2.55%, 02/15/31 (a)(c) | 750,000 | 789,330 |
| 2.25%, 11/15/31 (a)(c) | 250,000 | 256,845 |
| 4.38%, 04/15/40 (a)(c) | 900,000 | 1,100,754 |
| 3.00%, 02/15/41 (a) | 400,000 | 415,148 |
| 4.50%, 04/15/50 (a)(c) | 1,000,000 | 1,240,570 |
| 3.30%, 02/15/51 (a)(c) | 900,000 | 930,753 |
| 3.60%, 11/15/60 (a)(c) | 400,000 | 425,636 |
| TCI Communications, Inc. |
| 7.88%, 02/15/26 | 100,000 | 134,605 |
| 7.13%, 02/15/28 | 350,000 | 484,760 |
| Telefonica Emisiones S.A. |
| 4.57%, 04/27/23 | 150,000 | 163,980 |
| 4.10%, 03/08/27 | 350,000 | 405,398 |
| 7.05%, 06/20/36 | 650,000 | 972,218 |
| 4.67%, 03/06/38 | 250,000 | 301,895 |
| 5.21%, 03/08/47 | 1,000,000 | 1,282,050 |
| 4.90%, 03/06/48 | 500,000 | 624,560 |
| 5.52%, 03/01/49 (a) | 650,000 | 874,243 |
Schwab Fixed-Income ETFs | Annual Report
Schwab U.S. Aggregate Bond ETF
Portfolio Holdings as of December 31, 2020 (continued)
Security
Rate, Maturity Date | Face
Amount ($) | Value ($) |
| Telefonica Europe BV |
| 8.25%, 09/15/30 | 450,000 | 684,688 |
| TELUS Corp. |
| 2.80%, 02/16/27 (a) | 200,000 | 220,818 |
| 3.70%, 09/15/27 (a) | 250,000 | 288,075 |
| 4.60%, 11/16/48 (a) | 150,000 | 198,033 |
| 4.30%, 06/15/49 (a) | 200,000 | 253,818 |
| Thomson Reuters Corp. |
| 4.30%, 11/23/23 (a) | 400,000 | 438,868 |
| 5.85%, 04/15/40 | 200,000 | 279,916 |
| 5.65%, 11/23/43 (a) | 150,000 | 204,638 |
| Time Warner Cable LLC |
| 6.55%, 05/01/37 | 300,000 | 414,138 |
| 7.30%, 07/01/38 | 550,000 | 822,607 |
| 6.75%, 06/15/39 | 400,000 | 570,424 |
| 5.88%, 11/15/40 (a) | 900,000 | 1,195,812 |
| 5.50%, 09/01/41 (a) | 550,000 | 710,396 |
| 4.50%, 09/15/42 (a) | 250,000 | 291,868 |
| Time Warner Entertainment Co. LP |
| 8.38%, 03/15/23 | 77,000 | 90,072 |
| 8.38%, 07/15/33 | 500,000 | 774,825 |
| TWDC Enterprises 18 Corp. |
| 2.35%, 12/01/22 | 700,000 | 727,531 |
| 3.15%, 09/17/25 | 200,000 | 222,156 |
| 3.00%, 02/13/26 | 600,000 | 666,348 |
| 1.85%, 07/30/26 | 300,000 | 316,557 |
| 7.00%, 03/01/32 | 250,000 | 375,033 |
| 4.13%, 12/01/41 | 400,000 | 502,956 |
| 4.13%, 06/01/44 | 200,000 | 255,498 |
| 3.00%, 07/30/46 | 200,000 | 218,162 |
| Verizon Communications, Inc. |
| 2.95%, 03/15/22 | 200,000 | 206,320 |
| 2.45%, 11/01/22 (a) | 200,000 | 206,976 |
| 5.15%, 09/15/23 | 1,000,000 | 1,127,550 |
| 4.15%, 03/15/24 (a) | 200,000 | 221,382 |
| 3.50%, 11/01/24 (a) | 508,000 | 561,487 |
| 3.38%, 02/15/25 | 900,000 | 1,000,008 |
| 0.85%, 11/20/25 (a) | 300,000 | 302,634 |
| 2.63%, 08/15/26 | 650,000 | 712,777 |
| 4.13%, 03/16/27 | 1,550,000 | 1,828,302 |
| 3.00%, 03/22/27 (a) | 250,000 | 277,423 |
| 4.33%, 09/21/28 | 1,450,000 | 1,746,844 |
| 3.88%, 02/08/29 (a) | 350,000 | 412,293 |
| 4.02%, 12/03/29 (a) | 1,457,000 | 1,731,441 |
| 3.15%, 03/22/30 (a) | 500,000 | 561,230 |
| 1.50%, 09/18/30 (a) | 500,000 | 492,100 |
| 1.68%, 10/30/30 (a)(c) | 718,000 | 714,812 |
| 7.75%, 12/01/30 | 250,000 | 385,083 |
| 1.75%, 01/20/31 (a) | 500,000 | 499,030 |
| 4.50%, 08/10/33 | 950,000 | 1,199,973 |
| 4.40%, 11/01/34 (a) | 800,000 | 999,768 |
| 4.27%, 01/15/36 | 950,000 | 1,179,862 |
| 5.25%, 03/16/37 | 700,000 | 956,312 |
| 4.81%, 03/15/39 | 566,000 | 741,652 |
| 2.65%, 11/20/40 (a) | 500,000 | 505,605 |
| 4.75%, 11/01/41 | 450,000 | 595,026 |
| 3.85%, 11/01/42 (a) | 356,000 | 424,024 |
| 6.55%, 09/15/43 | 200,000 | 326,480 |
| 4.13%, 08/15/46 | 500,000 | 617,580 |
| 4.86%, 08/21/46 | 1,250,000 | 1,684,675 |
| 5.50%, 03/16/47 | 200,000 | 290,482 |
| 4.52%, 09/15/48 | 1,250,000 | 1,627,675 |
| 5.01%, 04/15/49 | 650,000 | 902,486 |
| 4.00%, 03/22/50 (a) | 350,000 | 425,656 |
| 2.88%, 11/20/50 (a) | 1,000,000 | 1,009,160 |
| 5.01%, 08/21/54 | 500,000 | 703,295 |
Security
Rate, Maturity Date | Face
Amount ($) | Value ($) |
| 4.67%, 03/15/55 | 700,000 | 941,500 |
| 2.99%, 10/30/56 (a) | 1,457,000 | 1,469,559 |
| 3.00%, 11/20/60 (a) | 750,000 | 759,870 |
| ViacomCBS, Inc. |
| 3.38%, 03/01/22 (a) | 500,000 | 512,950 |
| 4.25%, 09/01/23 (a) | 200,000 | 218,060 |
| 3.88%, 04/01/24 (a) | 248,000 | 271,369 |
| 3.50%, 01/15/25 (a) | 200,000 | 219,708 |
| 4.75%, 05/15/25 (a) | 500,000 | 580,880 |
| 2.90%, 01/15/27 (a) | 400,000 | 440,016 |
| 3.38%, 02/15/28 (a) | 800,000 | 901,544 |
| 3.70%, 06/01/28 (a) | 150,000 | 171,588 |
| 4.20%, 06/01/29 (a) | 289,000 | 346,421 |
| 4.95%, 01/15/31 (a) | 250,000 | 314,148 |
| 4.20%, 05/19/32 (a) | 300,000 | 361,359 |
| 5.50%, 05/15/33 | 300,000 | 387,084 |
| 6.88%, 04/30/36 | 400,000 | 579,456 |
| 4.85%, 07/01/42 (a) | 150,000 | 184,781 |
| 4.38%, 03/15/43 | 400,000 | 473,852 |
| 5.85%, 09/01/43 (a) | 650,000 | 906,314 |
| 4.90%, 08/15/44 (a) | 400,000 | 500,528 |
| 4.60%, 01/15/45 (a) | 250,000 | 302,205 |
| 4.95%, 05/19/50 (a) | 200,000 | 261,214 |
| Vodafone Group PLC |
| 2.95%, 02/19/23 | 350,000 | 368,918 |
| 3.75%, 01/16/24 | 800,000 | 875,208 |
| 4.13%, 05/30/25 | 500,000 | 571,985 |
| 4.38%, 05/30/28 | 1,000,000 | 1,200,420 |
| 7.88%, 02/15/30 | 250,000 | 371,825 |
| 6.25%, 11/30/32 | 100,000 | 140,149 |
| 6.15%, 02/27/37 | 530,000 | 767,700 |
| 5.00%, 05/30/38 | 350,000 | 458,787 |
| 4.38%, 02/19/43 | 400,000 | 498,736 |
| 5.25%, 05/30/48 | 1,050,000 | 1,465,285 |
| 4.88%, 06/19/49 | 700,000 | 936,600 |
| 4.25%, 09/17/50 | 500,000 | 620,885 |
| 5.13%, 06/19/59 | 300,000 | 417,216 |
| Walt Disney Co. |
| 1.65%, 09/01/22 | 250,000 | 255,570 |
| 3.00%, 09/15/22 | 100,000 | 104,523 |
| 1.75%, 08/30/24 (a) | 350,000 | 365,138 |
| 3.70%, 09/15/24 (a) | 250,000 | 277,510 |
| 3.35%, 03/24/25 | 500,000 | 554,720 |
| 3.70%, 10/15/25 (a) | 600,000 | 678,672 |
| 1.75%, 01/13/26 | 500,000 | 523,770 |
| 3.70%, 03/23/27 | 200,000 | 231,792 |
| 2.20%, 01/13/28 | 350,000 | 374,462 |
| 2.00%, 09/01/29 (a) | 375,000 | 391,601 |
| 3.80%, 03/22/30 | 200,000 | 238,524 |
| 2.65%, 01/13/31 | 800,000 | 878,120 |
| 6.20%, 12/15/34 | 1,175,000 | 1,776,459 |
| 6.40%, 12/15/35 | 450,000 | 700,065 |
| 6.15%, 03/01/37 | 200,000 | 293,332 |
| 6.65%, 11/15/37 | 500,000 | 790,900 |
| 4.63%, 03/23/40 (a) | 250,000 | 335,185 |
| 3.50%, 05/13/40 (a) | 550,000 | 648,307 |
| 6.15%, 02/15/41 | 150,000 | 232,704 |
| 4.75%, 09/15/44 (a) | 190,000 | 260,494 |
| 4.95%, 10/15/45 (a) | 385,000 | 536,417 |
| 4.75%, 11/15/46 (a) | 200,000 | 272,532 |
| 2.75%, 09/01/49 (a) | 600,000 | 635,964 |
| 4.70%, 03/23/50 (a) | 650,000 | 924,488 |
| 3.60%, 01/13/51 (a) | 850,000 | 1,031,126 |
| 3.80%, 05/13/60 (a) | 350,000 | 445,501 |
| Weibo Corp. |
| 3.50%, 07/05/24 (a) | 450,000 | 471,578 |
| 3.38%, 07/08/30 (a) | 300,000 | 307,713 |
Schwab Fixed-Income ETFs | Annual Report
Schwab U.S. Aggregate Bond ETF
Portfolio Holdings as of December 31, 2020 (continued)
Security
Rate, Maturity Date | Face
Amount ($) | Value ($) |
| WPP Finance 2010 |
| 3.63%, 09/07/22 | 100,000 | 105,250 |
| 3.75%, 09/19/24 | 300,000 | 333,891 |
| | | 224,151,265 |
| Consumer Cyclical 1.9% |
| Advance Auto Parts, Inc. |
| 1.75%, 10/01/27 (a) | 250,000 | 255,158 |
| 3.90%, 04/15/30 (a) | 200,000 | 230,776 |
| Alibaba Group Holding Ltd. |
| 3.13%, 11/28/21 (a) | 250,000 | 254,875 |
| 2.80%, 06/06/23 (a) | 200,000 | 210,392 |
| 3.60%, 11/28/24 (a) | 900,000 | 991,854 |
| 3.40%, 12/06/27 (a) | 750,000 | 840,825 |
| 4.50%, 11/28/34 (a) | 300,000 | 372,429 |
| 4.00%, 12/06/37 (a) | 550,000 | 651,260 |
| 4.20%, 12/06/47 (a) | 400,000 | 503,604 |
| 4.40%, 12/06/57 (a) | 500,000 | 673,055 |
| Amazon.com, Inc. |
| 2.50%, 11/29/22 (a) | 500,000 | 518,985 |
| 2.40%, 02/22/23 (a) | 1,250,000 | 1,305,087 |
| 2.80%, 08/22/24 (a) | 700,000 | 758,828 |
| 0.80%, 06/03/25 (a) | 250,000 | 253,963 |
| 5.20%, 12/03/25 (a) | 100,000 | 121,552 |
| 1.20%, 06/03/27 (a) | 50,000 | 50,946 |
| 3.15%, 08/22/27 (a) | 600,000 | 683,454 |
| 1.50%, 06/03/30 (a) | 750,000 | 764,977 |
| 4.80%, 12/05/34 (a) | 550,000 | 756,459 |
| 3.88%, 08/22/37 (a) | 1,050,000 | 1,311,618 |
| 4.95%, 12/05/44 (a) | 600,000 | 882,006 |
| 4.05%, 08/22/47 (a) | 1,100,000 | 1,459,590 |
| 2.50%, 06/03/50 (a) | 900,000 | 934,695 |
| 4.25%, 08/22/57 (a) | 900,000 | 1,280,286 |
| 2.70%, 06/03/60 (a) | 800,000 | 857,424 |
| American Honda Finance Corp. |
| 2.60%, 11/16/22 | 1,000,000 | 1,043,000 |
| 2.05%, 01/10/23 | 150,000 | 155,117 |
| 1.95%, 05/10/23 | 500,000 | 518,680 |
| 3.45%, 07/14/23 | 100,000 | 107,755 |
| 0.65%, 09/08/23 | 200,000 | 201,418 |
| 3.55%, 01/12/24 | 400,000 | 436,852 |
| 2.90%, 02/16/24 | 500,000 | 536,205 |
| 2.40%, 06/27/24 | 500,000 | 531,815 |
| 2.15%, 09/10/24 | 200,000 | 211,882 |
| 1.00%, 09/10/25 | 200,000 | 202,496 |
| 2.30%, 09/09/26 | 300,000 | 324,237 |
| 3.50%, 02/15/28 | 100,000 | 115,821 |
| Aptiv Corp. |
| 4.15%, 03/15/24 (a) | 390,000 | 430,069 |
| Aptiv PLC |
| 4.35%, 03/15/29 (a) | 150,000 | 173,760 |
| 4.40%, 10/01/46 (a) | 150,000 | 164,288 |
| 5.40%, 03/15/49 (a) | 100,000 | 125,647 |
| Automatic Data Processing, Inc. |
| 3.38%, 09/15/25 (a) | 250,000 | 281,267 |
| 1.25%, 09/01/30 (a) | 200,000 | 200,148 |
| AutoNation, Inc. |
| 3.50%, 11/15/24 (a) | 100,000 | 107,921 |
| 3.80%, 11/15/27 (a) | 300,000 | 332,706 |
| 4.75%, 06/01/30 (a) | 250,000 | 301,705 |
| AutoZone, Inc. |
| 3.70%, 04/15/22 (a) | 250,000 | 258,885 |
| 3.25%, 04/15/25 (a) | 650,000 | 713,076 |
| 3.13%, 04/21/26 (a) | 50,000 | 55,382 |
| 3.75%, 06/01/27 (a) | 200,000 | 230,358 |
Security
Rate, Maturity Date | Face
Amount ($) | Value ($) |
| 3.75%, 04/18/29 (a) | 200,000 | 230,656 |
| 4.00%, 04/15/30 (a) | 250,000 | 296,325 |
| 1.65%, 01/15/31 (a) | 250,000 | 248,478 |
| Best Buy Co., Inc. |
| 4.45%, 10/01/28 (a) | 200,000 | 241,204 |
| 1.95%, 10/01/30 (a) | 200,000 | 201,266 |
| Block Financial LLC |
| 5.50%, 11/01/22 (a) | 145,000 | 154,450 |
| 5.25%, 10/01/25 (a) | 250,000 | 286,535 |
| 3.88%, 08/15/30 (a) | 250,000 | 270,180 |
| Booking Holdings, Inc. |
| 2.75%, 03/15/23 (a) | 170,000 | 178,537 |
| 4.10%, 04/13/25 (a) | 500,000 | 568,385 |
| 3.60%, 06/01/26 (a) | 495,000 | 563,627 |
| 4.50%, 04/13/27 (a) | 250,000 | 298,935 |
| 3.55%, 03/15/28 (a) | 250,000 | 287,292 |
| 4.63%, 04/13/30 (a) | 500,000 | 622,105 |
| BorgWarner, Inc. |
| 2.65%, 07/01/27 (a) | 250,000 | 269,992 |
| 4.38%, 03/15/45 (a) | 320,000 | 378,349 |
| Choice Hotels International, Inc. |
| 3.70%, 12/01/29 (a) | 200,000 | 218,976 |
| 3.70%, 01/15/31 (a) | 250,000 | 277,100 |
| Costco Wholesale Corp. |
| 2.30%, 05/18/22 (a) | 750,000 | 771,187 |
| 2.75%, 05/18/24 (a) | 50,000 | 53,809 |
| 3.00%, 05/18/27 (a) | 650,000 | 730,080 |
| 1.60%, 04/20/30 (a) | 400,000 | 410,712 |
| 1.75%, 04/20/32 (a) | 600,000 | 623,934 |
| Cummins, Inc. |
| 3.65%, 10/01/23 (a) | 100,000 | 108,641 |
| 0.75%, 09/01/25 (a) | 200,000 | 201,556 |
| 1.50%, 09/01/30 (a) | 250,000 | 251,863 |
| 4.88%, 10/01/43 (a) | 150,000 | 211,695 |
| 2.60%, 09/01/50 (a) | 350,000 | 358,333 |
| Daimler Finance North America LLC |
| 8.50%, 01/18/31 | 550,000 | 871,211 |
| Darden Restaurants, Inc. |
| 3.85%, 05/01/27 (a) | 155,000 | 171,056 |
| 4.55%, 02/15/48 (a) | 100,000 | 111,265 |
| Dollar General Corp. |
| 3.25%, 04/15/23 (a) | 250,000 | 264,843 |
| 4.15%, 11/01/25 (a) | 89,000 | 102,943 |
| 3.88%, 04/15/27 (a) | 200,000 | 231,422 |
| 4.13%, 05/01/28 (a) | 250,000 | 296,267 |
| 3.50%, 04/03/30 (a) | 300,000 | 345,780 |
| 4.13%, 04/03/50 (a) | 200,000 | 255,324 |
| Dollar Tree, Inc. |
| 3.70%, 05/15/23 (a) | 600,000 | 643,284 |
| 4.20%, 05/15/28 (a) | 400,000 | 476,320 |
| DR Horton, Inc. |
| 4.38%, 09/15/22 (a) | 100,000 | 105,546 |
| 4.75%, 02/15/23 (a) | 90,000 | 96,960 |
| 5.75%, 08/15/23 (a) | 100,000 | 112,244 |
| 2.50%, 10/15/24 (a) | 200,000 | 213,756 |
| 2.60%, 10/15/25 (a) | 210,000 | 226,729 |
| 1.40%, 10/15/27 (a) | 250,000 | 252,025 |
| eBay, Inc. |
| 3.80%, 03/09/22 (a) | 500,000 | 518,600 |
| 2.60%, 07/15/22 (a) | 150,000 | 154,301 |
| 2.75%, 01/30/23 (a) | 400,000 | 418,708 |
| 3.60%, 06/05/27 (a) | 600,000 | 684,564 |
| 2.70%, 03/11/30 (a) | 200,000 | 216,212 |
| 4.00%, 07/15/42 (a) | 200,000 | 228,816 |
Schwab Fixed-Income ETFs | Annual Report
Schwab U.S. Aggregate Bond ETF
Portfolio Holdings as of December 31, 2020 (continued)
Security
Rate, Maturity Date | Face
Amount ($) | Value ($) |
| Expedia Group, Inc. |
| 4.50%, 08/15/24 (a) | 100,000 | 109,045 |
| 5.00%, 02/15/26 (a) | 100,000 | 112,093 |
| 4.63%, 08/01/27 (a) | 225,000 | 251,993 |
| 3.80%, 02/15/28 (a) | 200,000 | 214,370 |
| 3.25%, 02/15/30 (a) | 800,000 | 832,312 |
| Ford Foundation |
| 2.42%, 06/01/50 (a) | 300,000 | 307,572 |
| General Motors Co. |
| 4.88%, 10/02/23 | 1,100,000 | 1,221,495 |
| 5.40%, 10/02/23 | 300,000 | 337,035 |
| 4.00%, 04/01/25 | 400,000 | 444,292 |
| 6.13%, 10/01/25 (a) | 800,000 | 971,592 |
| 4.20%, 10/01/27 (a) | 250,000 | 283,765 |
| 5.00%, 10/01/28 (a) | 250,000 | 297,465 |
| 5.00%, 04/01/35 | 500,000 | 601,595 |
| 6.60%, 04/01/36 (a) | 450,000 | 613,003 |
| 5.15%, 04/01/38 (a) | 400,000 | 480,608 |
| 6.25%, 10/02/43 | 600,000 | 812,022 |
| 5.20%, 04/01/45 | 400,000 | 485,048 |
| 6.75%, 04/01/46 (a) | 300,000 | 430,221 |
| 5.40%, 04/01/48 (a) | 200,000 | 252,186 |
| 5.95%, 04/01/49 (a) | 400,000 | 541,432 |
| General Motors Financial Co., Inc. |
| 3.45%, 01/14/22 (a) | 750,000 | 769,350 |
| 3.45%, 04/10/22 (a) | 350,000 | 360,514 |
| 3.15%, 06/30/22 (a) | 500,000 | 517,340 |
| 3.55%, 07/08/22 | 400,000 | 417,916 |
| 3.25%, 01/05/23 (a) | 440,000 | 461,626 |
| 5.20%, 03/20/23 | 550,000 | 603,449 |
| 3.70%, 05/09/23 (a) | 100,000 | 106,165 |
| 4.15%, 06/19/23 (a) | 100,000 | 107,797 |
| 1.70%, 08/18/23 | 200,000 | 205,336 |
| 5.10%, 01/17/24 (a) | 400,000 | 447,888 |
| 3.95%, 04/13/24 (a) | 250,000 | 272,790 |
| 3.50%, 11/07/24 (a) | 250,000 | 271,372 |
| 4.00%, 01/15/25 (a) | 250,000 | 275,610 |
| 2.90%, 02/26/25 (a) | 350,000 | 374,265 |
| 4.35%, 04/09/25 (a) | 61,000 | 68,466 |
| 2.75%, 06/20/25 (a) | 250,000 | 266,930 |
| 5.25%, 03/01/26 (a) | 375,000 | 441,551 |
| 4.00%, 10/06/26 (a) | 600,000 | 676,956 |
| 4.35%, 01/17/27 (a) | 500,000 | 570,075 |
| 2.70%, 08/20/27 (a) | 400,000 | 423,392 |
| 3.85%, 01/05/28 (a) | 600,000 | 666,612 |
| 5.65%, 01/17/29 (a) | 150,000 | 185,921 |
| 3.60%, 06/21/30 (a) | 500,000 | 557,515 |
| Genuine Parts Co. |
| 1.88%, 11/01/30 (a) | 125,000 | 124,785 |
| GLP Capital LP/GLP Financing II, Inc. |
| 5.38%, 11/01/23 (a) | 300,000 | 328,026 |
| 3.35%, 09/01/24 (a) | 250,000 | 262,938 |
| 5.25%, 06/01/25 (a) | 300,000 | 339,129 |
| 5.38%, 04/15/26 (a) | 250,000 | 287,272 |
| 5.75%, 06/01/28 (a) | 350,000 | 414,827 |
| 5.30%, 01/15/29 (a) | 200,000 | 233,794 |
| 4.00%, 01/15/30 (a) | 250,000 | 273,532 |
| 4.00%, 01/15/31 (a) | 200,000 | 218,548 |
| Harley-Davidson, Inc. |
| 3.50%, 07/28/25 (a) | 100,000 | 109,046 |
| 4.63%, 07/28/45 (a) | 150,000 | 171,911 |
| Harman International Industries, Inc. |
| 4.15%, 05/15/25 (a) | 150,000 | 167,993 |
| Home Depot, Inc. |
| 2.63%, 06/01/22 (a) | 850,000 | 876,766 |
| 2.70%, 04/01/23 (a) | 600,000 | 629,730 |
Security
Rate, Maturity Date | Face
Amount ($) | Value ($) |
| 3.75%, 02/15/24 (a) | 500,000 | 548,590 |
| 3.00%, 04/01/26 (a) | 500,000 | 559,030 |
| 2.13%, 09/15/26 (a) | 250,000 | 269,738 |
| 2.50%, 04/15/27 (a) | 200,000 | 219,272 |
| 3.90%, 12/06/28 (a) | 500,000 | 602,315 |
| 2.95%, 06/15/29 (a) | 650,000 | 739,537 |
| 2.70%, 04/15/30 (a) | 250,000 | 279,202 |
| 5.88%, 12/16/36 | 1,700,000 | 2,585,343 |
| 3.30%, 04/15/40 (a) | 300,000 | 353,682 |
| 5.40%, 09/15/40 (a) | 191,000 | 280,629 |
| 5.95%, 04/01/41 (a) | 500,000 | 780,050 |
| 4.20%, 04/01/43 (a) | 250,000 | 326,412 |
| 4.88%, 02/15/44 (a) | 1,050,000 | 1,493,667 |
| 4.40%, 03/15/45 (a) | 150,000 | 200,597 |
| 3.90%, 06/15/47 (a) | 100,000 | 128,192 |
| 4.50%, 12/06/48 (a) | 350,000 | 493,391 |
| 3.13%, 12/15/49 (a) | 450,000 | 520,510 |
| 3.35%, 04/15/50 (a) | 500,000 | 599,050 |
| 3.50%, 09/15/56 (a) | 297,000 | 368,755 |
| Hyatt Hotels Corp. |
| 3.38%, 07/15/23 (a) | 150,000 | 157,731 |
| 5.38%, 04/23/25 (a) | 250,000 | 283,802 |
| 4.85%, 03/15/26 (a) | 150,000 | 168,810 |
| 4.38%, 09/15/28 (a) | 100,000 | 110,117 |
| IHS Markit Ltd. |
| 4.13%, 08/01/23 (a) | 150,000 | 163,584 |
| 3.63%, 05/01/24 (a) | 120,000 | 131,065 |
| 4.75%, 08/01/28 (a) | 350,000 | 432,197 |
| 4.25%, 05/01/29 (a) | 450,000 | 547,632 |
| JD.com, Inc. |
| 3.88%, 04/29/26 | 200,000 | 222,720 |
| 3.38%, 01/14/30 (a) | 200,000 | 217,784 |
| 4.13%, 01/14/50 | 400,000 | 444,004 |
| Kohl's Corp. |
| 3.25%, 02/01/23 (a) | 250,000 | 258,948 |
| 9.50%, 05/15/25 (a) | 200,000 | 259,418 |
| 4.25%, 07/17/25 (a) | 200,000 | 216,924 |
| 5.55%, 07/17/45 (a) | 100,000 | 107,903 |
| Las Vegas Sands Corp. |
| 3.20%, 08/08/24 (a) | 540,000 | 573,264 |
| 2.90%, 06/25/25 (a) | 200,000 | 209,864 |
| 3.50%, 08/18/26 (a) | 350,000 | 375,917 |
| 3.90%, 08/08/29 (a) | 300,000 | 323,190 |
| Lear Corp. |
| 3.80%, 09/15/27 (a) | 300,000 | 336,759 |
| 4.25%, 05/15/29 (a) | 150,000 | 171,395 |
| 5.25%, 05/15/49 (a) | 350,000 | 430,409 |
| Lennar Corp. |
| 4.75%, 11/15/22 (a) | 400,000 | 424,444 |
| 4.88%, 12/15/23 (a) | 150,000 | 166,283 |
| 4.50%, 04/30/24 (a) | 250,000 | 277,437 |
| 5.88%, 11/15/24 (a) | 250,000 | 289,697 |
| 4.75%, 05/30/25 (a) | 150,000 | 171,140 |
| 5.25%, 06/01/26 (a) | 200,000 | 237,642 |
| 5.00%, 06/15/27 (a) | 150,000 | 177,287 |
| 4.75%, 11/29/27 (a) | 300,000 | 354,933 |
| Lowe's Cos., Inc. |
| 3.12%, 04/15/22 (a) | 500,000 | 514,515 |
| 4.00%, 04/15/25 (a) | 200,000 | 227,338 |
| 3.38%, 09/15/25 (a) | 700,000 | 782,824 |
| 2.50%, 04/15/26 (a) | 150,000 | 163,079 |
| 3.10%, 05/03/27 (a) | 460,000 | 517,279 |
| 1.30%, 04/15/28 (a) | 250,000 | 251,850 |
| 6.50%, 03/15/29 | 401,000 | 548,608 |
| 3.65%, 04/05/29 (a) | 472,000 | 551,192 |
| 4.50%, 04/15/30 (a) | 400,000 | 497,476 |
Schwab Fixed-Income ETFs | Annual Report
Schwab U.S. Aggregate Bond ETF
Portfolio Holdings as of December 31, 2020 (continued)
Security
Rate, Maturity Date | Face
Amount ($) | Value ($) |
| 1.70%, 10/15/30 (a) | 250,000 | 252,968 |
| 5.00%, 04/15/40 (a) | 350,000 | 477,928 |
| 4.65%, 04/15/42 (a) | 150,000 | 199,061 |
| 4.38%, 09/15/45 (a) | 350,000 | 451,146 |
| 3.70%, 04/15/46 (a) | 250,000 | 299,062 |
| 4.05%, 05/03/47 (a) | 550,000 | 690,387 |
| 4.55%, 04/05/49 (a) | 400,000 | 543,608 |
| 5.13%, 04/15/50 (a) | 400,000 | 599,188 |
| 3.00%, 10/15/50 (a) | 250,000 | 268,523 |
| Magna International, Inc. |
| 3.63%, 06/15/24 (a) | 250,000 | 274,282 |
| 4.15%, 10/01/25 (a) | 250,000 | 287,480 |
| 2.45%, 06/15/30 (a) | 250,000 | 269,838 |
| Marriott International, Inc. |
| 2.30%, 01/15/22 (a) | 350,000 | 354,557 |
| 3.60%, 04/15/24 (a) | 200,000 | 214,062 |
| 3.75%, 03/15/25 (a) | 700,000 | 756,994 |
| 3.75%, 10/01/25 (a) | 200,000 | 217,440 |
| 3.13%, 06/15/26 (a) | 300,000 | 320,979 |
| 4.65%, 12/01/28 (a) | 150,000 | 173,339 |
| 4.63%, 06/15/30 (a) | 150,000 | 176,171 |
| 3.50%, 10/15/32 (a) | 400,000 | 438,624 |
| Mastercard, Inc. |
| 3.38%, 04/01/24 | 250,000 | 274,570 |
| 2.00%, 03/03/25 (a) | 300,000 | 318,795 |
| 2.95%, 11/21/26 (a) | 500,000 | 559,665 |
| 3.30%, 03/26/27 (a) | 500,000 | 570,775 |
| 2.95%, 06/01/29 (a) | 350,000 | 395,160 |
| 3.35%, 03/26/30 (a) | 500,000 | 583,680 |
| 3.80%, 11/21/46 (a) | 200,000 | 253,740 |
| 3.95%, 02/26/48 (a) | 100,000 | 130,190 |
| 3.65%, 06/01/49 (a) | 300,000 | 374,700 |
| 3.85%, 03/26/50 (a) | 500,000 | 647,680 |
| McDonald's Corp. |
| 2.63%, 01/15/22 | 400,000 | 409,540 |
| 3.35%, 04/01/23 (a) | 450,000 | 479,313 |
| 3.25%, 06/10/24 | 250,000 | 273,170 |
| 3.38%, 05/26/25 (a) | 800,000 | 888,384 |
| 3.70%, 01/30/26 (a) | 600,000 | 682,686 |
| 3.50%, 03/01/27 (a) | 100,000 | 114,160 |
| 3.50%, 07/01/27 (a) | 300,000 | 344,700 |
| 3.80%, 04/01/28 (a) | 450,000 | 526,932 |
| 2.63%, 09/01/29 (a) | 400,000 | 438,808 |
| 2.13%, 03/01/30 (a) | 250,000 | 263,665 |
| 3.60%, 07/01/30 (a) | 300,000 | 352,020 |
| 4.70%, 12/09/35 (a) | 350,000 | 456,368 |
| 6.30%, 10/15/37 | 180,000 | 273,015 |
| 6.30%, 03/01/38 | 150,000 | 227,328 |
| 5.70%, 02/01/39 | 33,000 | 47,575 |
| 4.88%, 07/15/40 | 200,000 | 267,500 |
| 3.70%, 02/15/42 | 150,000 | 178,358 |
| 3.63%, 05/01/43 | 150,000 | 175,311 |
| 4.88%, 12/09/45 (a) | 900,000 | 1,225,881 |
| 4.45%, 03/01/47 (a) | 350,000 | 454,744 |
| 4.45%, 09/01/48 (a) | 500,000 | 655,125 |
| 3.63%, 09/01/49 (a) | 450,000 | 529,816 |
| 4.20%, 04/01/50 (a) | 150,000 | 192,848 |
| NIKE, Inc. |
| 2.25%, 05/01/23 (a) | 350,000 | 364,570 |
| 2.40%, 03/27/25 (a) | 400,000 | 431,328 |
| 2.38%, 11/01/26 (a) | 250,000 | 274,262 |
| 2.85%, 03/27/30 (a) | 500,000 | 567,435 |
| 3.25%, 03/27/40 (a) | 500,000 | 586,820 |
| 3.63%, 05/01/43 (a) | 50,000 | 61,715 |
| 3.88%, 11/01/45 (a) | 400,000 | 519,908 |
| 3.38%, 11/01/46 (a) | 150,000 | 181,583 |
| 3.38%, 03/27/50 (a) | 500,000 | 618,995 |
Security
Rate, Maturity Date | Face
Amount ($) | Value ($) |
| NVR, Inc. |
| 3.95%, 09/15/22 (a) | 171,000 | 180,107 |
| 3.00%, 05/15/30 (a) | 250,000 | 273,015 |
| O'Reilly Automotive, Inc. |
| 3.55%, 03/15/26 (a) | 500,000 | 565,400 |
| 3.60%, 09/01/27 (a) | 250,000 | 286,740 |
| 4.35%, 06/01/28 (a) | 59,000 | 70,450 |
| 3.90%, 06/01/29 (a) | 150,000 | 176,706 |
| 1.75%, 03/15/31 (a) | 250,000 | 250,433 |
| PACCAR Financial Corp. |
| 2.65%, 05/10/22 | 250,000 | 258,213 |
| 2.30%, 08/10/22 | 200,000 | 206,644 |
| 2.65%, 04/06/23 | 250,000 | 263,283 |
| 2.15%, 08/15/24 | 50,000 | 53,025 |
| 1.80%, 02/06/25 | 200,000 | 209,820 |
| PulteGroup, Inc. |
| 5.50%, 03/01/26 (a) | 150,000 | 178,704 |
| 5.00%, 01/15/27 (a) | 200,000 | 236,314 |
| 7.88%, 06/15/32 | 375,000 | 561,206 |
| 6.38%, 05/15/33 | 150,000 | 206,483 |
| 6.00%, 02/15/35 | 125,000 | 171,038 |
| PVH Corp. |
| 4.63%, 07/10/25 (a)(c) | 200,000 | 225,378 |
| Ralph Lauren Corp. |
| 1.70%, 06/15/22 | 150,000 | 152,825 |
| 3.75%, 09/15/25 (a) | 200,000 | 226,014 |
| Rockefeller Foundation |
| 2.49%, 10/01/50 (a) | 250,000 | 259,258 |
| Ross Stores, Inc. |
| 4.60%, 04/15/25 (a) | 200,000 | 231,156 |
| Sands China Ltd. |
| 4.60%, 08/08/23 (a) | 550,000 | 589,803 |
| 5.13%, 08/08/25 (a) | 850,000 | 956,573 |
| 5.40%, 08/08/28 (a) | 900,000 | 1,055,439 |
| Starbucks Corp. |
| 1.30%, 05/07/22 | 170,000 | 172,370 |
| 2.70%, 06/15/22 (a) | 300,000 | 309,132 |
| 3.10%, 03/01/23 (a) | 350,000 | 370,016 |
| 3.85%, 10/01/23 (a) | 350,000 | 379,701 |
| 2.00%, 03/12/27 (a) | 300,000 | 318,840 |
| 3.50%, 03/01/28 (a) | 550,000 | 631,845 |
| 4.00%, 11/15/28 (a) | 250,000 | 297,925 |
| 3.55%, 08/15/29 (a) | 650,000 | 758,862 |
| 2.25%, 03/12/30 (a) | 200,000 | 212,680 |
| 2.55%, 11/15/30 (a) | 275,000 | 297,712 |
| 3.75%, 12/01/47 (a) | 500,000 | 590,080 |
| 4.50%, 11/15/48 (a) | 300,000 | 390,456 |
| 4.45%, 08/15/49 (a) | 350,000 | 461,307 |
| 3.35%, 03/12/50 (a) | 100,000 | 111,586 |
| 3.50%, 11/15/50 (a) | 300,000 | 345,519 |
| Tapestry, Inc. |
| 3.00%, 07/15/22 (a) | 150,000 | 153,815 |
| 4.25%, 04/01/25 (a) | 300,000 | 324,831 |
| 4.13%, 07/15/27 (a) | 200,000 | 216,844 |
| Target Corp. |
| 2.90%, 01/15/22 | 250,000 | 256,890 |
| 3.50%, 07/01/24 | 450,000 | 499,378 |
| 2.25%, 04/15/25 (a) | 500,000 | 536,085 |
| 2.50%, 04/15/26 | 100,000 | 110,728 |
| 3.38%, 04/15/29 (a) | 525,000 | 615,489 |
| 2.35%, 02/15/30 (a) | 250,000 | 273,717 |
| 2.65%, 09/15/30 (a) | 400,000 | 449,076 |
| 4.00%, 07/01/42 | 500,000 | 673,400 |
| 3.63%, 04/15/46 | 400,000 | 505,456 |
| 3.90%, 11/15/47 (a) | 250,000 | 330,652 |
Schwab Fixed-Income ETFs | Annual Report
Schwab U.S. Aggregate Bond ETF
Portfolio Holdings as of December 31, 2020 (continued)
Security
Rate, Maturity Date | Face
Amount ($) | Value ($) |
| TJX Cos., Inc. |
| 2.50%, 05/15/23 (a) | 350,000 | 365,960 |
| 3.50%, 04/15/25 (a) | 400,000 | 446,872 |
| 2.25%, 09/15/26 (a) | 500,000 | 540,155 |
| 1.15%, 05/15/28 (a) | 100,000 | 100,543 |
| 3.88%, 04/15/30 (a) | 500,000 | 600,770 |
| Toyota Motor Corp. |
| 2.16%, 07/02/22 | 300,000 | 308,430 |
| 3.42%, 07/20/23 | 250,000 | 269,750 |
| 2.36%, 07/02/24 | 150,000 | 159,453 |
| 2.76%, 07/02/29 | 150,000 | 168,282 |
| Toyota Motor Credit Corp. |
| 2.60%, 01/11/22 | 450,000 | 460,593 |
| 3.30%, 01/12/22 | 250,000 | 257,728 |
| 2.65%, 04/12/22 | 50,000 | 51,519 |
| 1.15%, 05/26/22 | 500,000 | 506,325 |
| 2.80%, 07/13/22 | 500,000 | 519,560 |
| 0.45%, 07/22/22 | 250,000 | 250,773 |
| 2.15%, 09/08/22 | 150,000 | 154,785 |
| 0.35%, 10/14/22 | 150,000 | 150,353 |
| 2.70%, 01/11/23 | 250,000 | 262,038 |
| 2.90%, 03/30/23 | 500,000 | 529,065 |
| 0.50%, 08/14/23 | 500,000 | 502,650 |
| 3.45%, 09/20/23 | 400,000 | 433,444 |
| 3.35%, 01/08/24 | 200,000 | 217,038 |
| 2.90%, 04/17/24 | 350,000 | 377,601 |
| 1.80%, 02/13/25 | 500,000 | 524,760 |
| 3.00%, 04/01/25 | 450,000 | 494,797 |
| 3.20%, 01/11/27 | 350,000 | 394,919 |
| 1.15%, 08/13/27 | 300,000 | 302,085 |
| 3.05%, 01/11/28 | 250,000 | 282,285 |
| 3.65%, 01/08/29 | 400,000 | 473,924 |
| 2.15%, 02/13/30 | 250,000 | 268,828 |
| 3.38%, 04/01/30 | 350,000 | 410,833 |
| Tractor Supply Co. |
| 1.75%, 11/01/30 (a) | 125,000 | 125,953 |
| TWDC Enterprises 18 Corp. |
| 4.38%, 08/16/41 | 300,000 | 385,419 |
| VF Corp. |
| 2.40%, 04/23/25 (a) | 475,000 | 508,416 |
| 2.80%, 04/23/27 (a) | 200,000 | 218,978 |
| 2.95%, 04/23/30 (a) | 250,000 | 276,897 |
| Visa, Inc. |
| 2.15%, 09/15/22 (a) | 310,000 | 319,895 |
| 2.80%, 12/14/22 (a) | 900,000 | 942,282 |
| 3.15%, 12/14/25 (a) | 1,250,000 | 1,403,175 |
| 1.90%, 04/15/27 (a) | 400,000 | 425,624 |
| 0.75%, 08/15/27 (a) | 150,000 | 149,631 |
| 2.75%, 09/15/27 (a) | 100,000 | 111,470 |
| 2.05%, 04/15/30 (a) | 500,000 | 535,590 |
| 1.10%, 02/15/31 (a) | 150,000 | 147,621 |
| 4.15%, 12/14/35 (a) | 1,200,000 | 1,564,608 |
| 2.70%, 04/15/40 (a) | 250,000 | 274,460 |
| 4.30%, 12/14/45 (a) | 1,200,000 | 1,644,936 |
| 2.00%, 08/15/50 (a) | 500,000 | 478,450 |
| Walgreen Co. |
| 3.10%, 09/15/22 | 100,000 | 104,544 |
| 4.40%, 09/15/42 | 250,000 | 271,977 |
| Walgreens Boots Alliance, Inc. |
| 3.80%, 11/18/24 (a) | 850,000 | 939,862 |
| 3.45%, 06/01/26 (a) | 550,000 | 610,632 |
| 3.20%, 04/15/30 (a) | 200,000 | 216,982 |
| 4.50%, 11/18/34 (a) | 50,000 | 57,762 |
| 4.80%, 11/18/44 (a) | 450,000 | 512,653 |
| 4.65%, 06/01/46 (a) | 250,000 | 279,620 |
| 4.10%, 04/15/50 (a) | 700,000 | 743,253 |
Security
Rate, Maturity Date | Face
Amount ($) | Value ($) |
| Walmart, Inc. |
| 2.35%, 12/15/22 (a) | 650,000 | 676,149 |
| 2.55%, 04/11/23 (a) | 1,350,000 | 1,412,883 |
| 3.40%, 06/26/23 (a) | 100,000 | 107,477 |
| 3.30%, 04/22/24 (a) | 300,000 | 326,724 |
| 2.85%, 07/08/24 (a) | 400,000 | 433,132 |
| 2.65%, 12/15/24 (a) | 1,800,000 | 1,950,354 |
| 3.55%, 06/26/25 (a) | 100,000 | 113,291 |
| 3.05%, 07/08/26 (a) | 100,000 | 112,681 |
| 3.70%, 06/26/28 (a) | 1,700,000 | 2,004,028 |
| 3.25%, 07/08/29 (a) | 500,000 | 582,510 |
| 2.38%, 09/24/29 (a) | 150,000 | 164,910 |
| 5.25%, 09/01/35 | 1,000,000 | 1,458,810 |
| 6.50%, 08/15/37 | 100,000 | 162,540 |
| 6.20%, 04/15/38 | 150,000 | 240,239 |
| 3.95%, 06/28/38 (a) | 850,000 | 1,085,790 |
| 5.00%, 10/25/40 | 150,000 | 218,924 |
| 5.63%, 04/15/41 | 150,000 | 231,408 |
| 4.00%, 04/11/43 (a) | 150,000 | 194,556 |
| 4.30%, 04/22/44 (a) | 300,000 | 410,121 |
| 3.63%, 12/15/47 (a) | 600,000 | 762,720 |
| 4.05%, 06/29/48 (a) | 900,000 | 1,223,037 |
| 2.95%, 09/24/49 (a) | 350,000 | 404,421 |
| Western Union Co. |
| 4.25%, 06/09/23 (a) | 500,000 | 541,600 |
| 2.85%, 01/10/25 (a) | 200,000 | 215,114 |
| | | 169,674,767 |
| Consumer Non-Cyclical 4.5% |
| Abbott Laboratories |
| 2.55%, 03/15/22 | 300,000 | 308,172 |
| 3.40%, 11/30/23 (a) | 850,000 | 921,587 |
| 3.88%, 09/15/25 (a) | 100,000 | 114,658 |
| 3.75%, 11/30/26 (a) | 558,000 | 654,155 |
| 1.15%, 01/30/28 (a) | 250,000 | 253,805 |
| 4.75%, 11/30/36 (a) | 750,000 | 1,029,765 |
| 6.00%, 04/01/39 | 60,000 | 93,656 |
| 5.30%, 05/27/40 | 250,000 | 371,222 |
| 4.75%, 04/15/43 (a) | 250,000 | 353,595 |
| 4.90%, 11/30/46 (a) | 1,150,000 | 1,706,623 |
| AbbVie, Inc. |
| 3.38%, 11/14/21 | 600,000 | 615,774 |
| 2.15%, 11/19/21 | 500,000 | 507,895 |
| 3.45%, 03/15/22 (a) | 1,000,000 | 1,030,980 |
| 3.25%, 10/01/22 (a) | 750,000 | 781,500 |
| 2.90%, 11/06/22 | 725,000 | 758,799 |
| 3.20%, 11/06/22 (a) | 500,000 | 523,435 |
| 2.30%, 11/21/22 | 1,000,000 | 1,036,770 |
| 2.85%, 05/14/23 (a) | 1,200,000 | 1,263,372 |
| 3.75%, 11/14/23 (a) | 250,000 | 272,843 |
| 3.85%, 06/15/24 (a) | 500,000 | 551,120 |
| 2.60%, 11/21/24 (a) | 1,300,000 | 1,394,198 |
| 3.80%, 03/15/25 (a) | 250,000 | 279,278 |
| 3.60%, 05/14/25 (a) | 1,100,000 | 1,227,226 |
| 3.20%, 05/14/26 (a) | 200,000 | 222,346 |
| 2.95%, 11/21/26 (a) | 1,275,000 | 1,413,669 |
| 4.25%, 11/14/28 (a) | 590,000 | 708,260 |
| 3.20%, 11/21/29 (a) | 1,900,000 | 2,143,105 |
| 4.55%, 03/15/35 (a) | 690,000 | 875,141 |
| 4.50%, 05/14/35 (a) | 1,275,000 | 1,606,398 |
| 4.30%, 05/14/36 (a) | 1,200,000 | 1,486,320 |
| 4.05%, 11/21/39 (a) | 1,300,000 | 1,576,783 |
| 4.63%, 10/01/42 (a) | 100,000 | 127,476 |
| 4.40%, 11/06/42 | 700,000 | 878,983 |
| 4.85%, 06/15/44 (a) | 500,000 | 663,785 |
| 4.75%, 03/15/45 (a) | 168,000 | 220,537 |
| 4.70%, 05/14/45 (a) | 1,200,000 | 1,568,232 |
Schwab Fixed-Income ETFs | Annual Report
Schwab U.S. Aggregate Bond ETF
Portfolio Holdings as of December 31, 2020 (continued)
Security
Rate, Maturity Date | Face
Amount ($) | Value ($) |
| 4.45%, 05/14/46 (a) | 250,000 | 319,040 |
| 4.88%, 11/14/48 (a) | 569,000 | 776,856 |
| 4.25%, 11/21/49 (a) | 1,650,000 | 2,078,851 |
| Adventist Health System |
| 2.95%, 03/01/29 (a) | 200,000 | 217,998 |
| 3.63%, 03/01/49 (a) | 100,000 | 114,460 |
| Advocate Health & Hospitals Corp. |
| 3.83%, 08/15/28 (a) | 200,000 | 230,308 |
| 2.21%, 06/15/30 (a) | 250,000 | 260,368 |
| 4.27%, 08/15/48 (a) | 89,000 | 116,930 |
| 3.39%, 10/15/49 (a) | 300,000 | 341,964 |
| Agilent Technologies, Inc. |
| 3.20%, 10/01/22 (a) | 150,000 | 156,189 |
| 2.75%, 09/15/29 (a) | 350,000 | 383,029 |
| Ahold Finance USA LLC |
| 6.88%, 05/01/29 | 250,000 | 348,202 |
| AHS Hospital Corp. |
| 5.02%, 07/01/45 | 100,000 | 137,118 |
| Allina Health System |
| 3.89%, 04/15/49 | 100,000 | 115,213 |
| Altria Group, Inc. |
| 3.49%, 02/14/22 | 200,000 | 206,864 |
| 2.85%, 08/09/22 | 600,000 | 623,574 |
| 2.95%, 05/02/23 | 400,000 | 422,088 |
| 4.00%, 01/31/24 | 550,000 | 604,818 |
| 3.80%, 02/14/24 (a) | 350,000 | 382,396 |
| 2.35%, 05/06/25 (a) | 200,000 | 212,454 |
| 4.40%, 02/14/26 (a) | 250,000 | 290,105 |
| 2.63%, 09/16/26 (a) | 150,000 | 162,053 |
| 4.80%, 02/14/29 (a) | 1,010,000 | 1,212,212 |
| 3.40%, 05/06/30 (a) | 200,000 | 223,740 |
| 5.80%, 02/14/39 (a) | 600,000 | 791,028 |
| 4.25%, 08/09/42 | 550,000 | 615,846 |
| 4.50%, 05/02/43 | 300,000 | 348,717 |
| 5.38%, 01/31/44 | 600,000 | 767,892 |
| 3.88%, 09/16/46 (a) | 400,000 | 426,228 |
| 5.95%, 02/14/49 (a) | 650,000 | 911,904 |
| 4.45%, 05/06/50 (a) | 300,000 | 356,268 |
| 6.20%, 02/14/59 (a) | 600,000 | 854,988 |
| AmerisourceBergen Corp. |
| 3.40%, 05/15/24 (a) | 250,000 | 271,920 |
| 3.45%, 12/15/27 (a) | 1,000,000 | 1,140,580 |
| 2.80%, 05/15/30 (a) | 200,000 | 218,052 |
| Amgen, Inc. |
| 2.70%, 05/01/22 (a) | 300,000 | 308,232 |
| 2.65%, 05/11/22 (a) | 400,000 | 411,940 |
| 3.63%, 05/15/22 (a) | 500,000 | 518,145 |
| 3.63%, 05/22/24 (a) | 650,000 | 714,181 |
| 1.90%, 02/21/25 (a) | 250,000 | 263,230 |
| 3.13%, 05/01/25 (a) | 250,000 | 274,475 |
| 2.60%, 08/19/26 (a) | 700,000 | 764,862 |
| 2.20%, 02/21/27 (a) | 250,000 | 267,618 |
| 3.20%, 11/02/27 (a) | 150,000 | 169,116 |
| 2.45%, 02/21/30 (a) | 500,000 | 537,960 |
| 2.30%, 02/25/31 (a) | 475,000 | 505,490 |
| 3.15%, 02/21/40 (a) | 700,000 | 765,947 |
| 4.95%, 10/01/41 | 600,000 | 807,456 |
| 5.15%, 11/15/41 (a) | 476,000 | 661,502 |
| 4.40%, 05/01/45 (a) | 650,000 | 825,532 |
| 4.56%, 06/15/48 (a) | 300,000 | 396,336 |
| 3.38%, 02/21/50 (a) | 800,000 | 895,640 |
| 4.66%, 06/15/51 (a) | 1,200,000 | 1,634,988 |
| 2.77%, 09/01/53 (a)(c) | 722,000 | 727,198 |
Security
Rate, Maturity Date | Face
Amount ($) | Value ($) |
| Anheuser-Busch Cos. LLC/Anheuser-Busch InBev Worldwide, Inc. |
| 3.65%, 02/01/26 (a) | 1,200,000 | 1,358,412 |
| 4.70%, 02/01/36 (a) | 1,600,000 | 2,031,408 |
| 4.90%, 02/01/46 (a) | 3,050,000 | 3,988,027 |
| Anheuser-Busch InBev Finance, Inc. |
| 3.65%, 02/01/26 (a) | 500,000 | 566,400 |
| 4.70%, 02/01/36 (a) | 387,000 | 485,731 |
| 4.00%, 01/17/43 | 150,000 | 173,466 |
| 4.63%, 02/01/44 | 400,000 | 503,428 |
| 4.90%, 02/01/46 (a) | 550,000 | 715,660 |
| Anheuser-Busch InBev Worldwide, Inc. |
| 4.15%, 01/23/25 (a) | 700,000 | 797,363 |
| 4.00%, 04/13/28 (a) | 1,050,000 | 1,238,622 |
| 4.75%, 01/23/29 (a) | 1,425,000 | 1,759,661 |
| 3.50%, 06/01/30 (a) | 650,000 | 754,409 |
| 4.90%, 01/23/31 (a) | 750,000 | 956,212 |
| 4.38%, 04/15/38 (a) | 125,000 | 154,590 |
| 8.20%, 01/15/39 | 400,000 | 688,012 |
| 5.45%, 01/23/39 (a) | 550,000 | 746,449 |
| 4.35%, 06/01/40 (a) | 400,000 | 492,924 |
| 4.95%, 01/15/42 | 540,000 | 711,185 |
| 3.75%, 07/15/42 | 250,000 | 284,925 |
| 4.60%, 04/15/48 (a) | 800,000 | 1,014,120 |
| 4.44%, 10/06/48 (a) | 550,000 | 685,223 |
| 5.55%, 01/23/49 (a) | 1,250,000 | 1,779,462 |
| 4.50%, 06/01/50 (a) | 1,000,000 | 1,264,860 |
| 4.75%, 04/15/58 (a) | 950,000 | 1,253,667 |
| 5.80%, 01/23/59 (a) | 650,000 | 1,000,980 |
| 4.60%, 06/01/60 (a) | 600,000 | 773,166 |
| Archer-Daniels-Midland Co. |
| 2.50%, 08/11/26 (a) | 900,000 | 983,502 |
| 3.25%, 03/27/30 (a) | 400,000 | 463,076 |
| 3.75%, 09/15/47 (a) | 150,000 | 191,762 |
| 4.50%, 03/15/49 (a) | 150,000 | 215,639 |
| Ascension Health |
| 2.53%, 11/15/29 (a) | 70,000 | 76,511 |
| 3.11%, 11/15/39 (a) | 100,000 | 111,757 |
| 3.95%, 11/15/46 | 650,000 | 839,585 |
| AstraZeneca PLC |
| 2.38%, 06/12/22 (a) | 750,000 | 771,682 |
| 3.50%, 08/17/23 (a) | 500,000 | 539,545 |
| 3.38%, 11/16/25 | 300,000 | 337,608 |
| 0.70%, 04/08/26 (a) | 200,000 | 199,058 |
| 1.38%, 08/06/30 (a) | 450,000 | 445,284 |
| 6.45%, 09/15/37 | 1,350,000 | 2,081,308 |
| 4.00%, 09/18/42 | 150,000 | 187,236 |
| 4.38%, 11/16/45 | 250,000 | 333,128 |
| 4.38%, 08/17/48 (a) | 250,000 | 337,715 |
| 2.13%, 08/06/50 (a) | 500,000 | 470,175 |
| Banner Health |
| 2.34%, 01/01/30 (a) | 350,000 | 369,001 |
| 2.91%, 01/01/51 (a) | 250,000 | 263,723 |
| BAT Capital Corp. |
| 2.76%, 08/15/22 (a) | 1,550,000 | 1,604,885 |
| 3.22%, 08/15/24 (a) | 650,000 | 704,743 |
| 2.79%, 09/06/24 (a) | 300,000 | 321,066 |
| 3.22%, 09/06/26 (a) | 300,000 | 330,849 |
| 4.70%, 04/02/27 (a) | 500,000 | 590,335 |
| 3.56%, 08/15/27 (a) | 1,350,000 | 1,507,518 |
| 2.26%, 03/25/28 (a) | 100,000 | 103,528 |
| 3.46%, 09/06/29 (a) | 150,000 | 165,926 |
| 4.91%, 04/02/30 (a) | 350,000 | 423,797 |
| 2.73%, 03/25/31 (a) | 250,000 | 259,148 |
| 4.39%, 08/15/37 (a) | 350,000 | 392,829 |
| 3.73%, 09/25/40 (a) | 400,000 | 418,644 |
| 4.54%, 08/15/47 (a) | 350,000 | 390,285 |
Schwab Fixed-Income ETFs | Annual Report
Schwab U.S. Aggregate Bond ETF
Portfolio Holdings as of December 31, 2020 (continued)
Security
Rate, Maturity Date | Face
Amount ($) | Value ($) |
| 4.76%, 09/06/49 (a) | 400,000 | 462,420 |
| 5.28%, 04/02/50 (a) | 200,000 | 248,010 |
| 3.98%, 09/25/50 (a) | 400,000 | 417,636 |
| BAT International Finance PLC |
| 1.67%, 03/25/26 (a) | 100,000 | 102,658 |
| Baxalta, Inc. |
| 4.00%, 06/23/25 (a) | 300,000 | 339,252 |
| 5.25%, 06/23/45 (a) | 198,000 | 274,844 |
| Baxter International, Inc. |
| 3.95%, 04/01/30 (a)(c) | 250,000 | 299,310 |
| 1.73%, 04/01/31 (a)(c) | 250,000 | 252,768 |
| 3.50%, 08/15/46 (a) | 250,000 | 285,888 |
| Baylor Scott & White Holdings |
| 4.19%, 11/15/45 (a) | 400,000 | 494,640 |
| Becton Dickinson & Co. |
| 2.89%, 06/06/22 (a) | 981,000 | 1,013,226 |
| 3.73%, 12/15/24 (a) | 1,000,000 | 1,107,940 |
| 3.70%, 06/06/27 (a) | 181,000 | 207,685 |
| 2.82%, 05/20/30 (a) | 250,000 | 275,278 |
| 4.69%, 12/15/44 (a) | 400,000 | 518,656 |
| 4.67%, 06/06/47 (a) | 500,000 | 657,140 |
| 3.79%, 05/20/50 (a) | 250,000 | 298,153 |
| Biogen, Inc. |
| 4.05%, 09/15/25 (a) | 1,000,000 | 1,146,750 |
| 2.25%, 05/01/30 (a) | 500,000 | 521,005 |
| 5.20%, 09/15/45 (a) | 700,000 | 941,521 |
| 3.15%, 05/01/50 (a) | 450,000 | 466,366 |
| Bon Secours Mercy Health, Inc. |
| 3.46%, 06/01/30 (a) | 100,000 | 113,503 |
| 2.10%, 06/01/31 (a) | 150,000 | 151,728 |
| Boston Scientific Corp. |
| 3.45%, 03/01/24 (a) | 350,000 | 379,512 |
| 3.85%, 05/15/25 | 200,000 | 225,710 |
| 3.75%, 03/01/26 (a) | 250,000 | 283,915 |
| 4.00%, 03/01/28 (a) | 200,000 | 236,226 |
| 4.00%, 03/01/29 (a) | 300,000 | 353,490 |
| 2.65%, 06/01/30 (a) | 500,000 | 536,965 |
| 7.00%, 11/15/35 (f)(g) | 150,000 | 220,565 |
| 4.55%, 03/01/39 (a) | 75,000 | 96,413 |
| 7.38%, 01/15/40 | 50,000 | 79,497 |
| 4.70%, 03/01/49 (a) | 350,000 | 480,182 |
| Bristol-Myers Squibb Co. |
| 2.60%, 05/16/22 | 820,000 | 846,265 |
| 3.25%, 08/15/22 | 350,000 | 366,758 |
| 3.55%, 08/15/22 | 600,000 | 631,392 |
| 2.75%, 02/15/23 (a) | 500,000 | 524,585 |
| 3.25%, 02/20/23 (a) | 200,000 | 211,972 |
| 4.00%, 08/15/23 | 300,000 | 328,731 |
| 0.54%, 11/13/23 (a) | 500,000 | 500,955 |
| 3.63%, 05/15/24 (a) | 1,000,000 | 1,097,320 |
| 2.90%, 07/26/24 (a) | 1,150,000 | 1,248,451 |
| 3.88%, 08/15/25 (a) | 700,000 | 798,924 |
| 0.75%, 11/13/25 (a) | 250,000 | 252,093 |
| 3.20%, 06/15/26 (a) | 1,000,000 | 1,126,560 |
| 3.25%, 02/27/27 | 250,000 | 283,445 |
| 3.45%, 11/15/27 (a) | 600,000 | 692,544 |
| 3.90%, 02/20/28 (a) | 350,000 | 415,905 |
| 3.40%, 07/26/29 (a) | 1,325,000 | 1,542,724 |
| 1.45%, 11/13/30 (a) | 100,000 | 100,535 |
| 4.13%, 06/15/39 (a) | 250,000 | 321,460 |
| 2.35%, 11/13/40 (a) | 300,000 | 307,842 |
| 3.25%, 08/01/42 | 350,000 | 403,875 |
| 5.25%, 08/15/43 | 250,000 | 360,470 |
| 4.50%, 03/01/44 (a) | 100,000 | 139,141 |
| 5.00%, 08/15/45 (a) | 600,000 | 868,014 |
| 4.35%, 11/15/47 (a) | 600,000 | 812,046 |
Security
Rate, Maturity Date | Face
Amount ($) | Value ($) |
| 4.55%, 02/20/48 (a) | 500,000 | 697,140 |
| 4.25%, 10/26/49 (a) | 1,300,000 | 1,761,279 |
| Brown-Forman Corp. |
| 4.00%, 04/15/38 (a) | 300,000 | 371,688 |
| 4.50%, 07/15/45 (a) | 150,000 | 203,727 |
| Bunge Ltd. Finance Corp. |
| 3.00%, 09/25/22 (a) | 250,000 | 259,655 |
| 3.75%, 09/25/27 (a) | 600,000 | 687,720 |
| Campbell Soup Co. |
| 2.50%, 08/02/22 | 350,000 | 361,550 |
| 3.95%, 03/15/25 (a) | 250,000 | 282,125 |
| 4.15%, 03/15/28 (a) | 650,000 | 765,147 |
| 2.38%, 04/24/30 (a) | 250,000 | 264,253 |
| 4.80%, 03/15/48 (a) | 100,000 | 133,742 |
| 3.13%, 04/24/50 (a) | 300,000 | 319,251 |
| Cardinal Health, Inc. |
| 3.08%, 06/15/24 (a) | 822,000 | 885,220 |
| 3.75%, 09/15/25 (a) | 250,000 | 282,665 |
| 3.41%, 06/15/27 (a) | 400,000 | 452,020 |
| 4.60%, 03/15/43 | 100,000 | 119,631 |
| 4.50%, 11/15/44 (a) | 150,000 | 175,272 |
| 4.90%, 09/15/45 (a) | 400,000 | 498,676 |
| 4.37%, 06/15/47 (a) | 100,000 | 117,885 |
| Catholic Health Services of Long Island Obligated Group |
| 3.37%, 07/01/50 (a) | 250,000 | 263,685 |
| Children's Health System of Texas |
| 2.51%, 08/15/50 (a) | 250,000 | 243,835 |
| Children's Hospital |
| 2.93%, 07/15/50 (a) | 150,000 | 147,432 |
| Children's Hospital Corp. |
| 4.12%, 01/01/47 (a) | 100,000 | 129,326 |
| 2.59%, 02/01/50 (a) | 120,000 | 121,709 |
| Children's Hospital Medical Center |
| 4.27%, 05/15/44 | 150,000 | 189,009 |
| Church & Dwight Co., Inc. |
| 3.15%, 08/01/27 (a) | 500,000 | 553,940 |
| Cigna Corp. |
| 3.90%, 02/15/22 | 194,000 | 201,622 |
| 3.05%, 11/30/22 (a) | 39,000 | 40,841 |
| 3.00%, 07/15/23 (a) | 485,000 | 513,988 |
| 3.75%, 07/15/23 (a) | 1,000,000 | 1,080,590 |
| 3.25%, 04/15/25 (a) | 300,000 | 330,048 |
| 4.13%, 11/15/25 (a) | 750,000 | 863,917 |
| 4.50%, 02/25/26 (a) | 485,000 | 567,911 |
| 3.40%, 03/01/27 (a) | 635,000 | 718,445 |
| 3.05%, 10/15/27 (a) | 291,000 | 325,204 |
| 4.38%, 10/15/28 (a) | 1,300,000 | 1,572,077 |
| 2.40%, 03/15/30 (a) | 500,000 | 532,915 |
| 4.80%, 08/15/38 (a) | 500,000 | 651,970 |
| 3.20%, 03/15/40 (a) | 250,000 | 276,005 |
| 6.13%, 11/15/41 | 145,000 | 215,982 |
| 4.80%, 07/15/46 (a) | 630,000 | 838,278 |
| 3.88%, 10/15/47 (a) | 339,000 | 403,461 |
| 4.90%, 12/15/48 (a) | 850,000 | 1,172,507 |
| 3.40%, 03/15/50 (a) | 400,000 | 450,716 |
| City of Hope |
| 5.62%, 11/15/43 | 195,000 | 279,807 |
| Cleveland Clinic Foundation |
| 4.86%, 01/01/14 | 350,000 | 501,039 |
| Clorox Co. |
| 3.05%, 09/15/22 (a) | 200,000 | 207,990 |
| 3.10%, 10/01/27 (a) | 100,000 | 112,901 |
| 3.90%, 05/15/28 (a) | 550,000 | 647,999 |
Schwab Fixed-Income ETFs | Annual Report
Schwab U.S. Aggregate Bond ETF
Portfolio Holdings as of December 31, 2020 (continued)
Security
Rate, Maturity Date | Face
Amount ($) | Value ($) |
| Coca-Cola Co. |
| 2.50%, 04/01/23 | 250,000 | 262,825 |
| 3.20%, 11/01/23 | 1,450,000 | 1,573,177 |
| 1.75%, 09/06/24 | 300,000 | 314,652 |
| 2.95%, 03/25/25 | 500,000 | 551,540 |
| 2.88%, 10/27/25 | 250,000 | 278,083 |
| 2.55%, 06/01/26 | 300,000 | 328,719 |
| 3.38%, 03/25/27 | 400,000 | 459,140 |
| 2.90%, 05/25/27 | 150,000 | 167,844 |
| 1.45%, 06/01/27 | 250,000 | 258,405 |
| 1.00%, 03/15/28 | 400,000 | 401,136 |
| 2.13%, 09/06/29 | 300,000 | 320,892 |
| 3.45%, 03/25/30 | 700,000 | 825,706 |
| 1.65%, 06/01/30 | 250,000 | 257,098 |
| 1.38%, 03/15/31 | 400,000 | 399,896 |
| 4.20%, 03/25/50 | 300,000 | 419,442 |
| 2.60%, 06/01/50 | 700,000 | 739,830 |
| 2.50%, 03/15/51 | 200,000 | 207,182 |
| 2.75%, 06/01/60 | 300,000 | 324,627 |
| Coca-Cola Consolidated, Inc. |
| 3.80%, 11/25/25 (a) | 150,000 | 166,973 |
| Coca-Cola Femsa S.A.B. de C.V. |
| 2.75%, 01/22/30 (a) | 800,000 | 867,816 |
| 1.85%, 09/01/32 (a) | 250,000 | 252,240 |
| 5.25%, 11/26/43 | 200,000 | 282,214 |
| Colgate-Palmolive Co. |
| 2.10%, 05/01/23 | 460,000 | 479,844 |
| 3.25%, 03/15/24 | 500,000 | 545,965 |
| 3.70%, 08/01/47 (a) | 277,000 | 363,122 |
| CommonSpirit Health |
| 2.76%, 10/01/24 (a) | 250,000 | 268,808 |
| 3.35%, 10/01/29 (a) | 300,000 | 331,323 |
| 4.35%, 11/01/42 | 300,000 | 354,561 |
| 3.82%, 10/01/49 (a) | 250,000 | 283,080 |
| 4.19%, 10/01/49 (a) | 300,000 | 353,928 |
| Community Health Network, Inc. |
| 3.10%, 05/01/50 (a) | 250,000 | 254,208 |
| Conagra Brands, Inc. |
| 3.20%, 01/25/23 (a) | 174,000 | 183,145 |
| 4.30%, 05/01/24 (a) | 360,000 | 403,301 |
| 4.60%, 11/01/25 (a) | 350,000 | 412,401 |
| 1.38%, 11/01/27 (a) | 400,000 | 404,172 |
| 4.85%, 11/01/28 (a) | 500,000 | 622,540 |
| 8.25%, 09/15/30 | 100,000 | 151,369 |
| 5.30%, 11/01/38 (a) | 350,000 | 471,058 |
| 5.40%, 11/01/48 (a) | 350,000 | 501,525 |
| Constellation Brands, Inc. |
| 3.20%, 02/15/23 (a) | 350,000 | 370,352 |
| 4.25%, 05/01/23 | 500,000 | 545,315 |
| 4.75%, 11/15/24 | 250,000 | 287,348 |
| 4.40%, 11/15/25 (a) | 350,000 | 407,449 |
| 4.75%, 12/01/25 | 200,000 | 237,232 |
| 3.70%, 12/06/26 (a) | 200,000 | 229,502 |
| 4.65%, 11/15/28 (a) | 250,000 | 304,140 |
| 3.15%, 08/01/29 (a) | 250,000 | 278,648 |
| 2.88%, 05/01/30 (a) | 550,000 | 604,208 |
| 4.50%, 05/09/47 (a) | 175,000 | 222,597 |
| 4.10%, 02/15/48 (a) | 150,000 | 183,359 |
| 5.25%, 11/15/48 (a) | 200,000 | 283,270 |
| CVS Health Corp. |
| 3.50%, 07/20/22 (a) | 550,000 | 574,370 |
| 2.75%, 12/01/22 (a) | 500,000 | 519,950 |
| 3.70%, 03/09/23 (a) | 1,766,000 | 1,889,461 |
| 3.38%, 08/12/24 (a) | 650,000 | 710,164 |
| 2.63%, 08/15/24 (a) | 300,000 | 321,537 |
| 4.10%, 03/25/25 (a) | 600,000 | 680,844 |
Security
Rate, Maturity Date | Face
Amount ($) | Value ($) |
| 3.88%, 07/20/25 (a) | 950,000 | 1,076,682 |
| 2.88%, 06/01/26 (a) | 900,000 | 989,892 |
| 3.00%, 08/15/26 (a) | 250,000 | 277,085 |
| 3.63%, 04/01/27 (a) | 300,000 | 341,994 |
| 1.30%, 08/21/27 (a) | 100,000 | 100,706 |
| 4.30%, 03/25/28 (a) | 2,870,000 | 3,404,738 |
| 3.25%, 08/15/29 (a) | 250,000 | 281,878 |
| 3.75%, 04/01/30 (a) | 400,000 | 466,924 |
| 1.75%, 08/21/30 (a) | 100,000 | 100,550 |
| 4.88%, 07/20/35 (a) | 250,000 | 325,345 |
| 4.78%, 03/25/38 (a) | 1,525,000 | 1,933,837 |
| 6.13%, 09/15/39 | 150,000 | 217,427 |
| 4.13%, 04/01/40 (a) | 450,000 | 540,135 |
| 2.70%, 08/21/40 (a) | 600,000 | 609,468 |
| 5.30%, 12/05/43 (a) | 600,000 | 815,802 |
| 5.13%, 07/20/45 (a) | 950,000 | 1,278,481 |
| 5.05%, 03/25/48 (a) | 2,600,000 | 3,518,710 |
| 4.25%, 04/01/50 (a) | 300,000 | 375,699 |
| Danaher Corp. |
| 3.35%, 09/15/25 (a) | 150,000 | 167,465 |
| 2.60%, 10/01/50 (a) | 250,000 | 259,545 |
| Dartmouth-Hitchcock Health |
| 4.18%, 08/01/48 (a) | 250,000 | 295,045 |
| DENTSPLY SIRONA, Inc. |
| 3.25%, 06/01/30 (a) | 200,000 | 223,124 |
| DH Europe Finance II Sarl |
| 2.05%, 11/15/22 | 250,000 | 257,788 |
| 2.20%, 11/15/24 (a) | 400,000 | 424,404 |
| 2.60%, 11/15/29 (a) | 250,000 | 273,678 |
| 3.25%, 11/15/39 (a) | 350,000 | 399,161 |
| 3.40%, 11/15/49 (a) | 350,000 | 416,083 |
| Diageo Capital PLC |
| 2.63%, 04/29/23 (a) | 250,000 | 261,888 |
| 2.13%, 10/24/24 (a) | 450,000 | 474,853 |
| 1.38%, 09/29/25 (a) | 300,000 | 308,499 |
| 3.88%, 05/18/28 (a) | 450,000 | 529,321 |
| 2.38%, 10/24/29 (a) | 200,000 | 215,154 |
| 2.00%, 04/29/30 (a) | 250,000 | 260,990 |
| 2.13%, 04/29/32 (a) | 250,000 | 263,913 |
| 5.88%, 09/30/36 | 600,000 | 876,216 |
| 3.88%, 04/29/43 (a) | 50,000 | 62,746 |
| Diageo Investment Corp. |
| 2.88%, 05/11/22 | 262,000 | 271,052 |
| 4.25%, 05/11/42 | 100,000 | 128,876 |
| Dignity Health |
| 3.13%, 11/01/22 | 250,000 | 260,225 |
| 5.27%, 11/01/64 | 150,000 | 204,711 |
| Duke University Health System, Inc. |
| 3.92%, 06/01/47 (a) | 200,000 | 251,102 |
| Edwards Lifesciences Corp. |
| 4.30%, 06/15/28 (a) | 250,000 | 296,450 |
| Eli Lilly and Co. |
| 2.35%, 05/15/22 | 350,000 | 359,835 |
| 2.75%, 06/01/25 (a) | 110,000 | 120,280 |
| 3.10%, 05/15/27 (a) | 250,000 | 281,370 |
| 3.38%, 03/15/29 (a) | 350,000 | 407,092 |
| 3.88%, 03/15/39 (a) | 250,000 | 314,843 |
| 3.95%, 05/15/47 (a) | 100,000 | 129,296 |
| 3.95%, 03/15/49 (a) | 500,000 | 655,685 |
| 2.25%, 05/15/50 (a) | 850,000 | 837,862 |
| 4.15%, 03/15/59 (a) | 400,000 | 551,800 |
| 2.50%, 09/15/60 (a) | 250,000 | 252,193 |
| Estee Lauder Cos., Inc. |
| 2.00%, 12/01/24 (a) | 50,000 | 52,836 |
| 2.38%, 12/01/29 (a) | 200,000 | 216,624 |
Schwab Fixed-Income ETFs | Annual Report
Schwab U.S. Aggregate Bond ETF
Portfolio Holdings as of December 31, 2020 (continued)
Security
Rate, Maturity Date | Face
Amount ($) | Value ($) |
| 2.60%, 04/15/30 (a) | 250,000 | 276,020 |
| 4.38%, 06/15/45 (a) | 150,000 | 200,849 |
| 4.15%, 03/15/47 (a) | 600,000 | 794,268 |
| 3.13%, 12/01/49 (a) | 200,000 | 231,998 |
| Flowers Foods, Inc. |
| 4.38%, 04/01/22 (a) | 250,000 | 259,630 |
| Fomento Economico Mexicano S.A.B. de C.V. |
| 4.38%, 05/10/43 | 150,000 | 187,947 |
| 3.50%, 01/16/50 (a) | 1,050,000 | 1,173,406 |
| General Mills, Inc. |
| 2.60%, 10/12/22 (a) | 150,000 | 155,873 |
| 3.70%, 10/17/23 (a) | 166,000 | 180,728 |
| 4.00%, 04/17/25 (a) | 950,000 | 1,075,371 |
| 3.20%, 02/10/27 (a) | 300,000 | 337,113 |
| 4.20%, 04/17/28 (a) | 325,000 | 389,961 |
| 2.88%, 04/15/30 (a) | 350,000 | 388,741 |
| 4.55%, 04/17/38 (a) | 400,000 | 518,328 |
| 5.40%, 06/15/40 | 100,000 | 142,959 |
| 4.70%, 04/17/48 (a) | 250,000 | 351,705 |
| Gilead Sciences, Inc. |
| 4.40%, 12/01/21 (a) | 350,000 | 359,369 |
| 1.95%, 03/01/22 (a) | 200,000 | 203,488 |
| 3.25%, 09/01/22 (a) | 450,000 | 469,746 |
| 2.50%, 09/01/23 (a) | 600,000 | 631,404 |
| 0.75%, 09/29/23 (a) | 750,000 | 752,175 |
| 3.70%, 04/01/24 (a) | 700,000 | 765,394 |
| 3.50%, 02/01/25 (a) | 600,000 | 664,140 |
| 3.65%, 03/01/26 (a) | 700,000 | 794,402 |
| 2.95%, 03/01/27 (a) | 100,000 | 110,505 |
| 1.20%, 10/01/27 (a) | 250,000 | 252,100 |
| 4.60%, 09/01/35 (a) | 500,000 | 645,785 |
| 4.00%, 09/01/36 (a) | 300,000 | 364,983 |
| 5.65%, 12/01/41 (a) | 200,000 | 290,348 |
| 4.80%, 04/01/44 (a) | 600,000 | 794,520 |
| 4.50%, 02/01/45 (a) | 350,000 | 448,549 |
| 4.75%, 03/01/46 (a) | 950,000 | 1,264,165 |
| 4.15%, 03/01/47 (a) | 825,000 | 1,010,971 |
| 2.80%, 10/01/50 (a) | 500,000 | 501,070 |
| GlaxoSmithKline Capital PLC |
| 2.85%, 05/08/22 | 590,000 | 610,408 |
| 2.88%, 06/01/22 (a) | 550,000 | 569,101 |
| 3.00%, 06/01/24 (a) | 300,000 | 324,447 |
| 3.38%, 06/01/29 (a) | 650,000 | 756,873 |
| GlaxoSmithKline Capital, Inc. |
| 2.80%, 03/18/23 | 100,000 | 105,488 |
| 3.38%, 05/15/23 | 250,000 | 267,895 |
| 3.63%, 05/15/25 | 1,000,000 | 1,127,420 |
| 3.88%, 05/15/28 | 500,000 | 595,875 |
| 5.38%, 04/15/34 | 180,000 | 257,638 |
| 6.38%, 05/15/38 | 950,000 | 1,507,973 |
| Hackensack Meridian Health, Inc. |
| 2.68%, 09/01/41 (a) | 250,000 | 251,470 |
| 4.21%, 07/01/48 (a) | 150,000 | 192,231 |
| 4.50%, 07/01/57 (a) | 150,000 | 201,018 |
| Hartford HealthCare Corp. |
| 3.45%, 07/01/54 | 150,000 | 158,357 |
| Hasbro, Inc. |
| 2.60%, 11/19/22 | 200,000 | 207,568 |
| 3.00%, 11/19/24 (a) | 200,000 | 217,024 |
| 3.55%, 11/19/26 (a) | 250,000 | 279,388 |
| 3.50%, 09/15/27 (a) | 100,000 | 110,494 |
| 3.90%, 11/19/29 (a) | 200,000 | 227,324 |
| 6.35%, 03/15/40 | 200,000 | 260,358 |
| 5.10%, 05/15/44 (a) | 100,000 | 114,452 |
Security
Rate, Maturity Date | Face
Amount ($) | Value ($) |
| HCA, Inc. |
| 4.75%, 05/01/23 | 450,000 | 491,341 |
| 5.00%, 03/15/24 | 1,000,000 | 1,125,870 |
| 5.25%, 04/15/25 | 500,000 | 584,815 |
| 5.25%, 06/15/26 (a) | 250,000 | 296,380 |
| 4.50%, 02/15/27 (a) | 500,000 | 582,325 |
| 4.13%, 06/15/29 (a) | 550,000 | 639,160 |
| 5.13%, 06/15/39 (a) | 300,000 | 384,693 |
| 5.50%, 06/15/47 (a) | 700,000 | 939,981 |
| 5.25%, 06/15/49 (a) | 850,000 | 1,123,496 |
| Hershey Co. |
| 0.90%, 06/01/25 (a) | 250,000 | 254,288 |
| 2.30%, 08/15/26 (a) | 710,000 | 772,011 |
| 2.45%, 11/15/29 (a) | 100,000 | 109,709 |
| 3.13%, 11/15/49 (a) | 150,000 | 172,092 |
| 2.65%, 06/01/50 (a) | 300,000 | 316,386 |
| Hormel Foods Corp. |
| 1.80%, 06/11/30 (a) | 250,000 | 258,940 |
| Hospital Special Surgery |
| Series 2020 |
| 2.67%, 10/01/50 (a) | 250,000 | 244,755 |
| IHC Health Services, Inc. |
| 4.13%, 05/15/48 (a) | 200,000 | 260,630 |
| Indiana University Health, Inc. Obligated Group |
| 3.97%, 11/01/48 (a) | 240,000 | 303,754 |
| Ingredion, Inc. |
| 3.20%, 10/01/26 (a) | 150,000 | 167,291 |
| 2.90%, 06/01/30 (a) | 250,000 | 276,160 |
| 3.90%, 06/01/50 (a) | 100,000 | 120,116 |
| Integris Baptist Medical Center, Inc. |
| Series A |
| 3.88%, 08/15/50 (a) | 300,000 | 352,254 |
| JM Smucker Co. |
| 3.50%, 03/15/25 | 500,000 | 557,750 |
| 2.38%, 03/15/30 (a) | 200,000 | 212,680 |
| 4.25%, 03/15/35 | 250,000 | 308,873 |
| 4.38%, 03/15/45 | 250,000 | 315,505 |
| 3.55%, 03/15/50 (a) | 100,000 | 114,115 |
| Johnson & Johnson |
| 2.45%, 12/05/21 | 100,000 | 102,056 |
| 2.25%, 03/03/22 (a) | 350,000 | 357,696 |
| 2.05%, 03/01/23 (a) | 100,000 | 103,584 |
| 3.38%, 12/05/23 | 500,000 | 546,640 |
| 2.63%, 01/15/25 (a) | 320,000 | 346,672 |
| 0.55%, 09/01/25 (a) | 350,000 | 351,767 |
| 2.45%, 03/01/26 (a) | 450,000 | 490,095 |
| 2.95%, 03/03/27 (a) | 1,600,000 | 1,796,896 |
| 0.95%, 09/01/27 (a) | 350,000 | 351,890 |
| 2.90%, 01/15/28 (a) | 100,000 | 113,060 |
| 1.30%, 09/01/30 (a) | 350,000 | 352,562 |
| 3.55%, 03/01/36 (a) | 117,000 | 143,711 |
| 3.63%, 03/03/37 (a) | 500,000 | 615,230 |
| 3.40%, 01/15/38 (a) | 1,250,000 | 1,507,925 |
| 5.85%, 07/15/38 | 382,000 | 594,388 |
| 2.10%, 09/01/40 (a) | 400,000 | 404,652 |
| 4.50%, 09/01/40 | 50,000 | 68,649 |
| 4.85%, 05/15/41 | 150,000 | 211,605 |
| 4.50%, 12/05/43 (a) | 200,000 | 281,564 |
| 3.70%, 03/01/46 (a) | 925,000 | 1,184,490 |
| 3.75%, 03/03/47 (a) | 200,000 | 259,752 |
| 2.25%, 09/01/50 (a) | 400,000 | 406,456 |
| 2.45%, 09/01/60 (a) | 400,000 | 417,016 |
| Kaiser Foundation Hospitals |
| 3.15%, 05/01/27 (a) | 750,000 | 847,965 |
| 4.88%, 04/01/42 | 50,000 | 68,591 |
Schwab Fixed-Income ETFs | Annual Report
Schwab U.S. Aggregate Bond ETF
Portfolio Holdings as of December 31, 2020 (continued)
Security
Rate, Maturity Date | Face
Amount ($) | Value ($) |
| 4.15%, 05/01/47 (a) | 125,000 | 162,475 |
| 3.27%, 11/01/49 (a) | 550,000 | 630,217 |
| Kellogg Co. |
| 2.65%, 12/01/23 | 350,000 | 373,464 |
| 4.30%, 05/15/28 (a) | 750,000 | 900,187 |
| 2.10%, 06/01/30 (a) | 250,000 | 263,130 |
| 4.50%, 04/01/46 | 231,000 | 302,044 |
| Keurig Dr Pepper, Inc. |
| 4.06%, 05/25/23 (a) | 450,000 | 489,352 |
| 3.13%, 12/15/23 (a) | 250,000 | 268,693 |
| 4.42%, 05/25/25 (a) | 800,000 | 922,872 |
| 3.40%, 11/15/25 (a) | 200,000 | 224,678 |
| 2.55%, 09/15/26 (a) | 150,000 | 164,117 |
| 3.43%, 06/15/27 (a) | 150,000 | 170,835 |
| 4.60%, 05/25/28 (a) | 500,000 | 610,515 |
| 3.20%, 05/01/30 (a) | 300,000 | 340,791 |
| 4.99%, 05/25/38 (a) | 200,000 | 267,944 |
| 4.50%, 11/15/45 (a) | 150,000 | 192,957 |
| 4.42%, 12/15/46 (a) | 250,000 | 319,618 |
| 5.09%, 05/25/48 (a) | 150,000 | 211,992 |
| 3.80%, 05/01/50 (a) | 250,000 | 300,300 |
| Kimberly-Clark Corp. |
| 2.40%, 06/01/23 | 250,000 | 262,698 |
| 1.05%, 09/15/27 (a) | 250,000 | 253,990 |
| 3.95%, 11/01/28 (a) | 200,000 | 240,710 |
| 3.20%, 04/25/29 (a) | 600,000 | 691,794 |
| 3.10%, 03/26/30 (a) | 200,000 | 230,524 |
| 6.63%, 08/01/37 | 100,000 | 164,490 |
| 5.30%, 03/01/41 | 450,000 | 657,832 |
| 3.20%, 07/30/46 (a) | 100,000 | 118,783 |
| Koninklijke Ahold Delhaize N.V. |
| 5.70%, 10/01/40 | 73,000 | 108,242 |
| Koninklijke Philips N.V. |
| 6.88%, 03/11/38 | 217,000 | 340,069 |
| 5.00%, 03/15/42 | 200,000 | 270,248 |
| Kroger Co. |
| 2.80%, 08/01/22 (a) | 500,000 | 518,280 |
| 4.00%, 02/01/24 (a) | 450,000 | 494,181 |
| 2.65%, 10/15/26 (a) | 100,000 | 109,848 |
| 4.50%, 01/15/29 (a) | 200,000 | 246,084 |
| 2.20%, 05/01/30 (a) | 550,000 | 579,452 |
| 7.50%, 04/01/31 | 100,000 | 147,902 |
| 6.90%, 04/15/38 | 90,000 | 137,488 |
| 5.40%, 07/15/40 (a) | 500,000 | 680,140 |
| 5.15%, 08/01/43 (a) | 67,000 | 92,610 |
| 3.88%, 10/15/46 (a) | 200,000 | 237,228 |
| 4.45%, 02/01/47 (a) | 350,000 | 446,407 |
| 4.65%, 01/15/48 (a) | 200,000 | 263,284 |
| 5.40%, 01/15/49 (a) | 200,000 | 290,820 |
| 3.95%, 01/15/50 (a) | 320,000 | 388,867 |
| Laboratory Corp. of America Holdings |
| 3.25%, 09/01/24 (a) | 1,250,000 | 1,360,512 |
| 2.30%, 12/01/24 (a) | 200,000 | 212,538 |
| 3.60%, 02/01/25 (a) | 150,000 | 165,971 |
| 2.95%, 12/01/29 (a) | 100,000 | 110,792 |
| 4.70%, 02/01/45 (a) | 300,000 | 393,891 |
| Mayo Clinic |
| 3.77%, 11/15/43 | 100,000 | 121,914 |
| 4.13%, 11/15/52 | 250,000 | 330,000 |
| McCormick & Co., Inc. |
| 2.70%, 08/15/22 (a) | 300,000 | 310,761 |
| 3.15%, 08/15/24 (a) | 200,000 | 217,476 |
| 3.40%, 08/15/27 (a) | 350,000 | 396,406 |
| 2.50%, 04/15/30 (a) | 200,000 | 214,464 |
| 4.20%, 08/15/47 (a) | 150,000 | 192,384 |
Security
Rate, Maturity Date | Face
Amount ($) | Value ($) |
| McKesson Corp. |
| 2.70%, 12/15/22 (a) | 250,000 | 259,745 |
| 3.80%, 03/15/24 (a) | 500,000 | 548,565 |
| 0.90%, 12/03/25 (a) | 250,000 | 251,413 |
| 3.95%, 02/16/28 (a) | 300,000 | 350,616 |
| 4.75%, 05/30/29 (a) | 200,000 | 246,448 |
| 6.00%, 03/01/41 (a) | 150,000 | 210,282 |
| 4.88%, 03/15/44 (a) | 69,000 | 86,780 |
| McLaren Health Care Corp. |
| Series A |
| 4.39%, 05/15/48 (a) | 100,000 | 129,950 |
| Mead Johnson Nutrition Co. |
| 4.13%, 11/15/25 (a) | 300,000 | 346,392 |
| 5.90%, 11/01/39 | 150,000 | 222,861 |
| 4.60%, 06/01/44 (a) | 250,000 | 333,613 |
| MedStar Health, Inc. |
| 3.63%, 08/15/49 | 100,000 | 114,720 |
| Medtronic, Inc. |
| 3.50%, 03/15/25 | 648,000 | 726,784 |
| 4.38%, 03/15/35 | 800,000 | 1,080,480 |
| 4.63%, 03/15/45 | 750,000 | 1,070,947 |
| Memorial Sloan-Kettering Cancer Center |
| 5.00%, 07/01/42 | 30,000 | 41,301 |
| 4.13%, 07/01/52 | 300,000 | 397,659 |
| 4.20%, 07/01/55 | 400,000 | 537,584 |
| Merck & Co., Inc. |
| 2.35%, 02/10/22 | 400,000 | 409,204 |
| 2.80%, 05/18/23 | 800,000 | 847,872 |
| 2.75%, 02/10/25 (a) | 1,700,000 | 1,851,351 |
| 0.75%, 02/24/26 (a) | 100,000 | 101,084 |
| 3.40%, 03/07/29 (a) | 500,000 | 582,195 |
| 1.45%, 06/24/30 (a) | 450,000 | 455,809 |
| 6.50%, 12/01/33 (g) | 250,000 | 389,895 |
| 3.90%, 03/07/39 (a) | 350,000 | 444,853 |
| 2.35%, 06/24/40 (a) | 450,000 | 467,752 |
| 3.60%, 09/15/42 (a) | 200,000 | 247,742 |
| 4.15%, 05/18/43 | 450,000 | 591,228 |
| 3.70%, 02/10/45 (a) | 700,000 | 874,496 |
| 4.00%, 03/07/49 (a) | 600,000 | 797,736 |
| 2.45%, 06/24/50 (a) | 250,000 | 259,318 |
| Methodist Hospital |
| Series 20A |
| 2.71%, 12/01/50 (a) | 250,000 | 257,158 |
| Molson Coors Beverage Co. |
| 3.50%, 05/01/22 | 200,000 | 208,190 |
| 3.00%, 07/15/26 (a) | 590,000 | 647,820 |
| 5.00%, 05/01/42 | 350,000 | 439,050 |
| 4.20%, 07/15/46 (a) | 600,000 | 690,540 |
| Mondelez International, Inc. |
| 0.63%, 07/01/22 | 175,000 | 175,865 |
| 2.13%, 04/13/23 (a) | 50,000 | 51,896 |
| 1.50%, 05/04/25 (a) | 300,000 | 310,536 |
| 3.63%, 02/13/26 (a) | 200,000 | 227,426 |
| 4.13%, 05/07/28 (a) | 300,000 | 356,982 |
| 2.75%, 04/13/30 (a) | 425,000 | 467,351 |
| 1.50%, 02/04/31 (a) | 250,000 | 247,428 |
| 1.88%, 10/15/32 (a) | 250,000 | 253,720 |
| 2.63%, 09/04/50 (a) | 400,000 | 404,160 |
| Montefiore Obligated Group |
| 4.29%, 09/01/50 | 300,000 | 329,157 |
| Mount Sinai Hospitals Group, Inc. |
| 3.74%, 07/01/49 (a) | 350,000 | 397,946 |
| 3.39%, 07/01/50 (a) | 250,000 | 269,883 |
| MultiCare Health System |
| 2.80%, 08/15/50 (a) | 150,000 | 156,326 |
Schwab Fixed-Income ETFs | Annual Report
Schwab U.S. Aggregate Bond ETF
Portfolio Holdings as of December 31, 2020 (continued)
Security
Rate, Maturity Date | Face
Amount ($) | Value ($) |
| Mylan, Inc. |
| 4.20%, 11/29/23 (a) | 200,000 | 218,750 |
| 4.55%, 04/15/28 (a) | 350,000 | 417,837 |
| 5.40%, 11/29/43 (a) | 250,000 | 332,040 |
| 5.20%, 04/15/48 (a) | 250,000 | 330,633 |
| New York and Presbyterian Hospital |
| 2.26%, 08/01/40 (a) | 250,000 | 244,590 |
| 4.02%, 08/01/45 | 100,000 | 125,644 |
| 4.06%, 08/01/56 | 50,000 | 65,244 |
| 2.61%, 08/01/60 (a) | 250,000 | 246,930 |
| 3.95%, 08/01/19 (a) | 450,000 | 521,136 |
| Northwell Healthcare, Inc. |
| 3.98%, 11/01/46 (a) | 200,000 | 231,328 |
| 4.26%, 11/01/47 (a) | 300,000 | 361,029 |
| 3.81%, 11/01/49 (a) | 150,000 | 172,304 |
| Novartis Capital Corp. |
| 2.40%, 09/21/22 | 650,000 | 674,849 |
| 3.40%, 05/06/24 | 350,000 | 384,632 |
| 1.75%, 02/14/25 (a) | 350,000 | 367,272 |
| 3.00%, 11/20/25 (a) | 750,000 | 831,405 |
| 2.00%, 02/14/27 (a) | 390,000 | 416,383 |
| 3.10%, 05/17/27 (a) | 750,000 | 844,245 |
| 2.20%, 08/14/30 (a) | 500,000 | 538,435 |
| 4.40%, 05/06/44 | 625,000 | 863,606 |
| 4.00%, 11/20/45 (a) | 500,000 | 657,610 |
| 2.75%, 08/14/50 (a) | 450,000 | 496,503 |
| NYU Langone Hospitals |
| 5.75%, 07/01/43 | 200,000 | 283,422 |
| 4.78%, 07/01/44 | 350,000 | 442,186 |
| 4.37%, 07/01/47 (a) | 130,000 | 158,322 |
| 3.38%, 07/01/55 (a) | 200,000 | 213,836 |
| Orlando Health Obligated Group |
| 4.09%, 10/01/48 (a) | 100,000 | 121,202 |
| 3.33%, 10/01/50 (a) | 250,000 | 276,033 |
| Partners Healthcare System, Inc. |
| 3.77%, 07/01/48 (a) | 250,000 | 297,875 |
| 3.19%, 07/01/49 (a) | 100,000 | 111,633 |
| 4.12%, 07/01/55 | 150,000 | 194,231 |
| 3.34%, 07/01/60 (a) | 250,000 | 287,310 |
| PeaceHealth Obligated Group |
| 4.79%, 11/15/48 (a) | 100,000 | 135,849 |
| 3.22%, 11/15/50 (a) | 250,000 | 271,740 |
| PepsiCo, Inc. |
| 2.75%, 03/05/22 | 800,000 | 823,360 |
| 2.25%, 05/02/22 (a) | 200,000 | 205,044 |
| 2.75%, 03/01/23 | 500,000 | 527,320 |
| 0.75%, 05/01/23 | 200,000 | 202,896 |
| 0.40%, 10/07/23 | 200,000 | 201,094 |
| 3.60%, 03/01/24 (a) | 850,000 | 929,560 |
| 2.75%, 04/30/25 (a) | 300,000 | 326,838 |
| 3.50%, 07/17/25 (a) | 100,000 | 112,436 |
| 2.38%, 10/06/26 (a) | 250,000 | 272,543 |
| 2.63%, 03/19/27 (a) | 200,000 | 220,262 |
| 3.00%, 10/15/27 (a) | 500,000 | 564,320 |
| 2.63%, 07/29/29 (a) | 550,000 | 608,822 |
| 2.75%, 03/19/30 (a) | 400,000 | 447,904 |
| 1.63%, 05/01/30 (a) | 225,000 | 231,174 |
| 1.40%, 02/25/31 (a) | 200,000 | 201,532 |
| 3.50%, 03/19/40 (a) | 500,000 | 604,560 |
| 4.00%, 03/05/42 | 250,000 | 324,858 |
| 3.60%, 08/13/42 | 145,000 | 177,457 |
| 4.60%, 07/17/45 (a) | 875,000 | 1,229,734 |
| 4.45%, 04/14/46 (a) | 500,000 | 699,110 |
| 3.45%, 10/06/46 (a) | 1,000,000 | 1,209,010 |
| 3.38%, 07/29/49 (a) | 350,000 | 425,232 |
| 2.88%, 10/15/49 (a) | 250,000 | 280,455 |
Security
Rate, Maturity Date | Face
Amount ($) | Value ($) |
| 3.63%, 03/19/50 (a) | 450,000 | 571,576 |
| 3.88%, 03/19/60 (a) | 300,000 | 403,245 |
| PerkinElmer, Inc. |
| 3.30%, 09/15/29 (a) | 250,000 | 282,178 |
| Perrigo Finance Unlimited Co. |
| 3.90%, 12/15/24 (a) | 300,000 | 330,045 |
| 4.38%, 03/15/26 (a) | 200,000 | 226,848 |
| 3.15%, 06/15/30 (a) | 250,000 | 268,250 |
| 4.90%, 12/15/44 (a) | 250,000 | 280,713 |
| Pfizer, Inc. |
| 2.20%, 12/15/21 | 350,000 | 356,604 |
| 2.80%, 03/11/22 | 96,000 | 98,904 |
| 3.00%, 06/15/23 | 500,000 | 533,205 |
| 3.20%, 09/15/23 (a) | 500,000 | 538,815 |
| 2.95%, 03/15/24 (a) | 268,000 | 289,311 |
| 3.40%, 05/15/24 | 250,000 | 275,150 |
| 0.80%, 05/28/25 (a) | 500,000 | 507,820 |
| 2.75%, 06/03/26 | 800,000 | 885,416 |
| 3.00%, 12/15/26 | 300,000 | 338,847 |
| 3.60%, 09/15/28 (a) | 250,000 | 295,093 |
| 3.45%, 03/15/29 (a) | 500,000 | 584,655 |
| 2.63%, 04/01/30 (a) | 500,000 | 555,415 |
| 1.70%, 05/28/30 (a) | 250,000 | 258,925 |
| 4.00%, 12/15/36 | 250,000 | 317,990 |
| 4.10%, 09/15/38 (a) | 200,000 | 256,596 |
| 3.90%, 03/15/39 (a) | 250,000 | 313,330 |
| 7.20%, 03/15/39 | 650,000 | 1,121,666 |
| 2.55%, 05/28/40 (a) | 250,000 | 266,710 |
| 5.60%, 09/15/40 | 200,000 | 296,476 |
| 4.30%, 06/15/43 | 150,000 | 198,570 |
| 4.40%, 05/15/44 | 850,000 | 1,150,730 |
| 4.13%, 12/15/46 | 1,000,000 | 1,324,550 |
| 4.20%, 09/15/48 (a) | 300,000 | 403,488 |
| 4.00%, 03/15/49 (a) | 150,000 | 197,553 |
| 2.70%, 05/28/50 (a) | 250,000 | 269,175 |
| Pharmacia LLC |
| 6.60%, 12/01/28 | 500,000 | 696,475 |
| Philip Morris International, Inc. |
| 2.63%, 02/18/22 (a) | 200,000 | 204,900 |
| 2.38%, 08/17/22 (a) | 500,000 | 515,820 |
| 2.50%, 08/22/22 | 250,000 | 259,580 |
| 2.50%, 11/02/22 (a) | 250,000 | 259,743 |
| 2.63%, 03/06/23 | 150,000 | 157,619 |
| 2.13%, 05/10/23 (a) | 500,000 | 519,940 |
| 2.88%, 05/01/24 (a) | 200,000 | 215,308 |
| 1.50%, 05/01/25 (a) | 200,000 | 207,338 |
| 2.75%, 02/25/26 (a) | 230,000 | 251,222 |
| 0.88%, 05/01/26 (a) | 250,000 | 250,768 |
| 3.13%, 03/02/28 (a) | 650,000 | 731,302 |
| 3.38%, 08/15/29 (a) | 250,000 | 287,000 |
| 2.10%, 05/01/30 (a) | 250,000 | 260,688 |
| 6.38%, 05/16/38 | 650,000 | 993,733 |
| 4.38%, 11/15/41 | 250,000 | 314,918 |
| 4.50%, 03/20/42 | 250,000 | 319,208 |
| 3.88%, 08/21/42 | 250,000 | 296,495 |
| 4.13%, 03/04/43 | 250,000 | 307,308 |
| 4.88%, 11/15/43 | 375,000 | 503,340 |
| 4.25%, 11/10/44 | 400,000 | 505,232 |
| Procter & Gamble Co. |
| 2.30%, 02/06/22 | 581,000 | 594,247 |
| 2.15%, 08/11/22 | 500,000 | 515,675 |
| 2.70%, 02/02/26 | 500,000 | 554,975 |
| 2.45%, 11/03/26 | 350,000 | 386,788 |
| 2.80%, 03/25/27 | 200,000 | 223,120 |
| 3.00%, 03/25/30 | 500,000 | 576,430 |
| 3.55%, 03/25/40 | 300,000 | 374,052 |
Schwab Fixed-Income ETFs | Annual Report
Schwab U.S. Aggregate Bond ETF
Portfolio Holdings as of December 31, 2020 (continued)
Security
Rate, Maturity Date | Face
Amount ($) | Value ($) |
| 3.50%, 10/25/47 | 650,000 | 844,168 |
| 3.60%, 03/25/50 | 450,000 | 605,866 |
| Providence St Joseph Health Obligated Group |
| 2.53%, 10/01/29 (a) | 350,000 | 375,812 |
| 3.74%, 10/01/47 | 112,000 | 132,151 |
| 3.93%, 10/01/48 (a) | 200,000 | 243,370 |
| Quest Diagnostics, Inc. |
| 3.50%, 03/30/25 (a) | 300,000 | 334,164 |
| 4.20%, 06/30/29 (a) | 100,000 | 119,080 |
| 2.95%, 06/30/30 (a) | 300,000 | 331,320 |
| 2.80%, 06/30/31 (a) | 300,000 | 329,661 |
| 4.70%, 03/30/45 (a) | 300,000 | 381,711 |
| Regeneron Pharmaceuticals, Inc. |
| 1.75%, 09/15/30 (a) | 450,000 | 444,136 |
| 2.80%, 09/15/50 (a) | 250,000 | 242,950 |
| Reynolds American, Inc. |
| 4.45%, 06/12/25 (a) | 750,000 | 856,102 |
| 5.70%, 08/15/35 (a) | 200,000 | 255,760 |
| 7.25%, 06/15/37 | 375,000 | 517,714 |
| 6.15%, 09/15/43 | 500,000 | 655,085 |
| 5.85%, 08/15/45 (a) | 1,250,000 | 1,598,175 |
| Royalty Pharma PLC |
| 0.75%, 09/02/23 (c) | 350,000 | 351,907 |
| 1.20%, 09/02/25 (a)(c) | 350,000 | 355,936 |
| 1.75%, 09/02/27 (a)(c) | 450,000 | 463,527 |
| 2.20%, 09/02/30 (a)(c) | 450,000 | 462,627 |
| 3.30%, 09/02/40 (a)(c) | 450,000 | 475,501 |
| 3.55%, 09/02/50 (a)(c) | 450,000 | 480,861 |
| Rush Obligated Group |
| 3.92%, 11/15/29 (a) | 150,000 | 176,886 |
| RWJ Barnabas Health, Inc. |
| 3.95%, 07/01/46 (a) | 200,000 | 242,792 |
| Sanofi |
| 3.38%, 06/19/23 (a) | 350,000 | 375,963 |
| 3.63%, 06/19/28 (a) | 250,000 | 292,318 |
| Sharp HealthCare |
| 2.68%, 08/01/50 (a) | 250,000 | 254,390 |
| Shire Acquisitions Investments Ireland DAC |
| 2.88%, 09/23/23 (a) | 1,400,000 | 1,484,476 |
| 3.20%, 09/23/26 (a) | 900,000 | 1,008,216 |
| Smith & Nephew PLC |
| 2.03%, 10/14/30 (a) | 250,000 | 254,793 |
| Spectrum Health System Obligated Group |
| 3.49%, 07/15/49 (a) | 100,000 | 114,782 |
| SSM Health Care Corp. |
| 3.69%, 06/01/23 (a) | 200,000 | 214,110 |
| Stanford Health Care |
| 3.80%, 11/15/48 (a) | 200,000 | 251,454 |
| Stryker Corp. |
| 3.38%, 05/15/24 (a) | 150,000 | 163,601 |
| 3.50%, 03/15/26 (a) | 790,000 | 897,156 |
| 3.65%, 03/07/28 (a) | 150,000 | 173,541 |
| 1.95%, 06/15/30 (a) | 500,000 | 515,515 |
| 4.38%, 05/15/44 (a) | 100,000 | 125,127 |
| 4.63%, 03/15/46 (a) | 400,000 | 537,724 |
| 2.90%, 06/15/50 (a) | 300,000 | 319,779 |
| Sutter Health |
| 1.32%, 08/15/25 (a) | 150,000 | 153,053 |
| 4.09%, 08/15/48 (a) | 100,000 | 122,629 |
| Sysco Corp. |
| 3.55%, 03/15/25 (a) | 600,000 | 668,442 |
| 3.75%, 10/01/25 (a) | 500,000 | 563,975 |
| 3.30%, 07/15/26 (a) | 250,000 | 278,490 |
| 3.25%, 07/15/27 (a) | 200,000 | 223,492 |
Security
Rate, Maturity Date | Face
Amount ($) | Value ($) |
| 2.40%, 02/15/30 (a) | 200,000 | 208,894 |
| 5.95%, 04/01/30 (a) | 400,000 | 526,428 |
| 6.60%, 04/01/40 (a) | 200,000 | 293,684 |
| 4.85%, 10/01/45 (a) | 225,000 | 286,225 |
| 4.50%, 04/01/46 (a) | 200,000 | 244,424 |
| 4.45%, 03/15/48 (a) | 100,000 | 122,383 |
| 3.30%, 02/15/50 (a) | 300,000 | 315,750 |
| 6.60%, 04/01/50 (a) | 550,000 | 848,243 |
| Takeda Pharmaceutical Co., Ltd. |
| 4.00%, 11/26/21 (a) | 650,000 | 668,707 |
| 4.40%, 11/26/23 (a) | 250,000 | 277,108 |
| 5.00%, 11/26/28 (a) | 400,000 | 497,456 |
| 2.05%, 03/31/30 (a) | 700,000 | 716,163 |
| 3.03%, 07/09/40 (a) | 550,000 | 582,241 |
| 3.18%, 07/09/50 (a) | 600,000 | 640,788 |
| 3.38%, 07/09/60 (a) | 300,000 | 332,850 |
| Texas Health Resources |
| 2.33%, 11/15/50 (a) | 250,000 | 237,848 |
| 4.33%, 11/15/55 | 100,000 | 135,241 |
| Thermo Fisher Scientific, Inc. |
| 3.00%, 04/15/23 (a) | 500,000 | 527,270 |
| 4.15%, 02/01/24 (a) | 800,000 | 884,520 |
| 4.13%, 03/25/25 (a) | 300,000 | 341,661 |
| 3.20%, 08/15/27 (a) | 332,000 | 373,895 |
| 2.60%, 10/01/29 (a) | 250,000 | 274,418 |
| 4.50%, 03/25/30 (a) | 300,000 | 374,943 |
| 5.30%, 02/01/44 (a) | 200,000 | 293,080 |
| 4.10%, 08/15/47 (a) | 250,000 | 334,567 |
| Toledo Hospital |
| 5.33%, 11/15/28 | 75,000 | 87,432 |
| 5.75%, 11/15/38 (a) | 275,000 | 328,702 |
| Trinity Health Corp. |
| 4.13%, 12/01/45 | 225,000 | 276,669 |
| Tyson Foods, Inc. |
| 4.50%, 06/15/22 (a) | 250,000 | 262,283 |
| 3.90%, 09/28/23 (a) | 150,000 | 163,874 |
| 3.95%, 08/15/24 (a) | 150,000 | 167,166 |
| 4.00%, 03/01/26 (a) | 250,000 | 288,130 |
| 3.55%, 06/02/27 (a) | 350,000 | 400,036 |
| 4.35%, 03/01/29 (a) | 260,000 | 316,254 |
| 4.88%, 08/15/34 (a) | 800,000 | 1,059,504 |
| 5.15%, 08/15/44 (a) | 125,000 | 173,344 |
| 4.55%, 06/02/47 (a) | 400,000 | 530,540 |
| 5.10%, 09/28/48 (a) | 210,000 | 301,606 |
| Unilever Capital Corp. |
| 3.00%, 03/07/22 | 250,000 | 258,060 |
| 2.20%, 05/05/22 (a) | 250,000 | 256,163 |
| 0.38%, 09/14/23 | 250,000 | 250,725 |
| 3.25%, 03/07/24 (a) | 200,000 | 217,172 |
| 2.60%, 05/05/24 (a) | 450,000 | 480,262 |
| 2.00%, 07/28/26 | 500,000 | 534,270 |
| 2.90%, 05/05/27 (a) | 200,000 | 222,974 |
| 3.50%, 03/22/28 (a) | 550,000 | 640,348 |
| 2.13%, 09/06/29 (a) | 400,000 | 428,772 |
| 1.38%, 09/14/30 (a) | 450,000 | 452,866 |
| 5.90%, 11/15/32 | 300,000 | 441,663 |
| Universal Health Services, Inc. |
| 2.65%, 10/15/30 (a)(c) | 225,000 | 234,101 |
| Utah Acquisition Sub, Inc. |
| 3.95%, 06/15/26 (a) | 800,000 | 916,320 |
| 5.25%, 06/15/46 (a) | 300,000 | 394,383 |
| Viatris, Inc. |
| 1.65%, 06/22/25 (a)(c) | 350,000 | 362,365 |
| 2.30%, 06/22/27 (a)(c) | 250,000 | 265,908 |
| 2.70%, 06/22/30 (a)(c) | 400,000 | 424,900 |
Schwab Fixed-Income ETFs | Annual Report
Schwab U.S. Aggregate Bond ETF
Portfolio Holdings as of December 31, 2020 (continued)
Security
Rate, Maturity Date | Face
Amount ($) | Value ($) |
| 3.85%, 06/22/40 (a)(c) | 650,000 | 733,122 |
| 4.00%, 06/22/50 (a)(c) | 700,000 | 802,382 |
| Whirlpool Corp. |
| 4.00%, 03/01/24 | 100,000 | 110,248 |
| 3.70%, 05/01/25 | 100,000 | 111,522 |
| 4.75%, 02/26/29 (a) | 250,000 | 306,080 |
| 4.50%, 06/01/46 (a) | 150,000 | 187,248 |
| 4.60%, 05/15/50 (a) | 300,000 | 391,476 |
| Willis-Knighton Medical Center |
| 4.81%, 09/01/48 (a) | 150,000 | 200,051 |
| Wyeth LLC |
| 6.50%, 02/01/34 | 200,000 | 311,698 |
| 6.00%, 02/15/36 | 150,000 | 224,799 |
| 5.95%, 04/01/37 | 500,000 | 754,975 |
| Yale-New Haven Health Services Corp. |
| Series 2020 |
| 2.50%, 07/01/50 (a) | 250,000 | 244,745 |
| Zimmer Biomet Holdings, Inc. |
| 3.15%, 04/01/22 (a) | 250,000 | 257,200 |
| 3.70%, 03/19/23 (a) | 100,000 | 106,627 |
| 3.55%, 04/01/25 (a) | 600,000 | 663,942 |
| 3.05%, 01/15/26 (a) | 350,000 | 386,827 |
| 3.55%, 03/20/30 (a) | 300,000 | 340,191 |
| 4.45%, 08/15/45 (a) | 299,000 | 351,364 |
| Zoetis, Inc. |
| 3.25%, 02/01/23 (a) | 350,000 | 368,574 |
| 3.00%, 09/12/27 (a) | 500,000 | 560,515 |
| 3.90%, 08/20/28 (a) | 620,000 | 732,697 |
| 2.00%, 05/15/30 (a) | 200,000 | 207,452 |
| 4.70%, 02/01/43 (a) | 300,000 | 411,924 |
| 4.45%, 08/20/48 (a) | 150,000 | 200,645 |
| 3.00%, 05/15/50 (a) | 300,000 | 332,622 |
| | | 391,728,215 |
| Energy 2.2% |
| Baker Hughes a GE Co. LLC/Baker Hughes Co-Obligor, Inc. |
| 2.77%, 12/15/22 (a) | 400,000 | 418,164 |
| 3.34%, 12/15/27 (a) | 650,000 | 732,062 |
| 3.14%, 11/07/29 (a) | 200,000 | 220,190 |
| 4.49%, 05/01/30 (a) | 150,000 | 180,776 |
| 4.08%, 12/15/47 (a) | 725,000 | 831,205 |
| Baker Hughes Holdings LLC |
| 5.13%, 09/15/40 | 150,000 | 199,799 |
| Boardwalk Pipelines LP |
| 4.95%, 12/15/24 (a) | 330,000 | 369,385 |
| 4.45%, 07/15/27 (a) | 450,000 | 509,773 |
| 3.40%, 02/15/31 (a) | 250,000 | 261,785 |
| BP Capital Markets America, Inc. |
| 3.25%, 05/06/22 | 250,000 | 259,858 |
| 2.52%, 09/19/22 (a) | 200,000 | 207,048 |
| 2.94%, 04/06/23 | 500,000 | 528,150 |
| 2.75%, 05/10/23 | 550,000 | 580,415 |
| 3.22%, 11/28/23 (a) | 400,000 | 429,840 |
| 3.79%, 02/06/24 (a) | 400,000 | 437,424 |
| 3.22%, 04/14/24 (a) | 350,000 | 378,430 |
| 3.19%, 04/06/25 (a) | 300,000 | 330,171 |
| 3.80%, 09/21/25 (a) | 300,000 | 340,461 |
| 3.41%, 02/11/26 (a) | 250,000 | 280,415 |
| 3.12%, 05/04/26 (a) | 350,000 | 387,936 |
| 3.02%, 01/16/27 (a) | 300,000 | 331,872 |
| 3.54%, 04/06/27 (a) | 300,000 | 341,511 |
| 3.59%, 04/14/27 (a) | 150,000 | 170,727 |
| 3.94%, 09/21/28 (a) | 550,000 | 647,663 |
| 4.23%, 11/06/28 (a) | 600,000 | 717,774 |
| 3.63%, 04/06/30 (a) | 700,000 | 815,430 |
Security
Rate, Maturity Date | Face
Amount ($) | Value ($) |
| 1.75%, 08/10/30 (a) | 400,000 | 402,980 |
| 3.00%, 02/24/50 (a) | 650,000 | 670,676 |
| 2.77%, 11/10/50 (a) | 500,000 | 498,855 |
| BP Capital Markets PLC |
| 3.56%, 11/01/21 | 400,000 | 410,120 |
| 3.06%, 03/17/22 | 300,000 | 309,552 |
| 2.50%, 11/06/22 | 300,000 | 312,084 |
| 3.99%, 09/26/23 | 250,000 | 273,885 |
| 3.81%, 02/10/24 | 500,000 | 549,200 |
| 3.54%, 11/04/24 | 300,000 | 332,997 |
| 3.51%, 03/17/25 | 300,000 | 335,010 |
| 3.28%, 09/19/27 (a) | 450,000 | 507,136 |
| 3.72%, 11/28/28 (a) | 250,000 | 289,748 |
| Burlington Resources LLC |
| 7.20%, 08/15/31 | 250,000 | 372,632 |
| 7.40%, 12/01/31 | 100,000 | 151,332 |
| 5.95%, 10/15/36 | 250,000 | 354,287 |
| Canadian Natural Resources Ltd. |
| 2.95%, 01/15/23 (a) | 550,000 | 575,850 |
| 3.80%, 04/15/24 (a) | 150,000 | 162,707 |
| 3.90%, 02/01/25 (a) | 100,000 | 110,640 |
| 3.85%, 06/01/27 (a) | 200,000 | 224,934 |
| 2.95%, 07/15/30 (a) | 200,000 | 214,592 |
| 7.20%, 01/15/32 | 225,000 | 302,810 |
| 6.45%, 06/30/33 | 150,000 | 197,030 |
| 6.50%, 02/15/37 | 200,000 | 265,374 |
| 6.25%, 03/15/38 | 500,000 | 671,310 |
| 6.75%, 02/01/39 | 250,000 | 345,130 |
| 4.95%, 06/01/47 (a) | 250,000 | 316,645 |
| Cheniere Corpus Christi Holdings LLC |
| 7.00%, 06/30/24 (a) | 625,000 | 731,125 |
| 5.88%, 03/31/25 (a) | 375,000 | 436,586 |
| 5.13%, 06/30/27 (a) | 550,000 | 652,041 |
| 3.70%, 11/15/29 (a) | 450,000 | 501,313 |
| Chevron Corp. |
| 2.41%, 03/03/22 (a) | 300,000 | 306,495 |
| 2.50%, 03/03/22 (a) | 300,000 | 307,269 |
| 2.36%, 12/05/22 (a) | 299,000 | 309,710 |
| 1.14%, 05/11/23 | 400,000 | 408,456 |
| 2.57%, 05/16/23 (a) | 250,000 | 262,453 |
| 3.19%, 06/24/23 (a) | 1,150,000 | 1,224,704 |
| 2.90%, 03/03/24 (a) | 1,250,000 | 1,340,487 |
| 1.55%, 05/11/25 (a) | 950,000 | 988,988 |
| 2.95%, 05/16/26 (a) | 250,000 | 277,715 |
| 2.00%, 05/11/27 (a) | 100,000 | 106,144 |
| 2.24%, 05/11/30 (a) | 500,000 | 536,550 |
| 2.98%, 05/11/40 (a) | 300,000 | 333,195 |
| 3.08%, 05/11/50 (a) | 300,000 | 336,066 |
| Chevron USA, Inc. |
| 0.43%, 08/11/23 | 200,000 | 200,642 |
| 0.69%, 08/12/25 (a) | 250,000 | 251,845 |
| 1.02%, 08/12/27 (a) | 250,000 | 250,525 |
| 2.34%, 08/12/50 (a) | 250,000 | 244,238 |
| Cimarex Energy Co. |
| 4.38%, 06/01/24 (a) | 250,000 | 272,875 |
| 3.90%, 05/15/27 (a) | 200,000 | 221,392 |
| 4.38%, 03/15/29 (a) | 200,000 | 227,662 |
| Columbia Pipeline Group, Inc. |
| 4.50%, 06/01/25 (a) | 483,000 | 556,967 |
| 5.80%, 06/01/45 (a) | 100,000 | 137,676 |
| Concho Resources, Inc. |
| 4.30%, 08/15/28 (a) | 650,000 | 771,647 |
| 2.40%, 02/15/31 (a) | 250,000 | 262,048 |
| 4.88%, 10/01/47 (a) | 150,000 | 204,725 |
| 4.85%, 08/15/48 (a) | 275,000 | 376,068 |
Schwab Fixed-Income ETFs | Annual Report
Schwab U.S. Aggregate Bond ETF
Portfolio Holdings as of December 31, 2020 (continued)
Security
Rate, Maturity Date | Face
Amount ($) | Value ($) |
| Conoco Funding Co. |
| 7.25%, 10/15/31 | 200,000 | 300,094 |
| ConocoPhillips Co. |
| 4.95%, 03/15/26 (a) | 700,000 | 841,029 |
| 6.95%, 04/15/29 | 450,000 | 631,786 |
| 5.90%, 10/15/32 | 100,000 | 136,896 |
| 5.90%, 05/15/38 | 250,000 | 361,215 |
| 6.50%, 02/01/39 | 1,100,000 | 1,703,625 |
| 4.30%, 11/15/44 (a) | 300,000 | 381,093 |
| 5.95%, 03/15/46 (a) | 125,000 | 191,663 |
| Devon Energy Corp. |
| 5.85%, 12/15/25 (a) | 250,000 | 294,618 |
| 7.88%, 09/30/31 | 150,000 | 210,360 |
| 7.95%, 04/15/32 | 100,000 | 141,786 |
| 5.60%, 07/15/41 (a) | 500,000 | 612,380 |
| 4.75%, 05/15/42 (a) | 150,000 | 170,891 |
| 5.00%, 06/15/45 (a) | 400,000 | 469,788 |
| Diamondback Energy, Inc. |
| 2.88%, 12/01/24 (a) | 300,000 | 315,846 |
| 4.75%, 05/31/25 (a) | 225,000 | 253,584 |
| 5.38%, 05/31/25 (a) | 300,000 | 311,805 |
| 3.25%, 12/01/26 (a) | 300,000 | 321,186 |
| 3.50%, 12/01/29 (a) | 300,000 | 320,988 |
| Eastern Energy Gas Holdings LLC |
| 2.50%, 11/15/24 (a) | 150,000 | 160,787 |
| 3.60%, 12/15/24 (a) | 300,000 | 331,632 |
| 3.00%, 11/15/29 (a) | 200,000 | 222,156 |
| 4.80%, 11/01/43 (a) | 400,000 | 519,564 |
| Enable Midstream Partners LP |
| 3.90%, 05/15/24 (a) | 100,000 | 102,313 |
| 4.40%, 03/15/27 (a) | 250,000 | 254,340 |
| 4.95%, 05/15/28 (a) | 250,000 | 259,213 |
| 4.15%, 09/15/29 (a) | 300,000 | 298,776 |
| 5.00%, 05/15/44 (a) | 250,000 | 240,890 |
| Enbridge Energy Partners LP |
| 5.88%, 10/15/25 (a) | 150,000 | 182,976 |
| 7.50%, 04/15/38 | 100,000 | 143,662 |
| 5.50%, 09/15/40 (a) | 200,000 | 248,500 |
| 7.38%, 10/15/45 (a) | 150,000 | 232,041 |
| Enbridge, Inc. |
| 4.00%, 10/01/23 (a) | 250,000 | 272,528 |
| 2.50%, 01/15/25 (a) | 150,000 | 161,021 |
| 4.25%, 12/01/26 (a) | 850,000 | 997,364 |
| 3.70%, 07/15/27 (a) | 475,000 | 542,464 |
| 3.13%, 11/15/29 (a) | 350,000 | 386,746 |
| 4.50%, 06/10/44 (a) | 250,000 | 295,588 |
| 5.50%, 12/01/46 (a) | 150,000 | 203,039 |
| 4.00%, 11/15/49 (a) | 150,000 | 171,834 |
| Energy Transfer Operating LP |
| 5.20%, 02/01/22 (a) | 1,450,000 | 1,505,854 |
| 4.25%, 03/15/23 (a) | 250,000 | 265,628 |
| 5.88%, 01/15/24 (a) | 900,000 | 1,011,663 |
| 4.90%, 02/01/24 (a) | 250,000 | 273,918 |
| 4.05%, 03/15/25 (a) | 200,000 | 219,686 |
| 2.90%, 05/15/25 (a) | 350,000 | 370,723 |
| 4.75%, 01/15/26 (a) | 350,000 | 396,648 |
| 4.20%, 04/15/27 (a) | 250,000 | 275,408 |
| 5.50%, 06/01/27 (a) | 350,000 | 411,134 |
| 4.95%, 06/15/28 (a) | 100,000 | 115,509 |
| 5.25%, 04/15/29 (a) | 300,000 | 350,730 |
| 3.75%, 05/15/30 (a) | 500,000 | 540,690 |
| 4.90%, 03/15/35 (a) | 550,000 | 607,420 |
| 6.63%, 10/15/36 | 325,000 | 393,065 |
| 7.50%, 07/01/38 | 500,000 | 659,420 |
| 6.05%, 06/01/41 (a) | 350,000 | 410,014 |
| 6.50%, 02/01/42 (a) | 600,000 | 738,468 |
Security
Rate, Maturity Date | Face
Amount ($) | Value ($) |
| 5.15%, 02/01/43 (a) | 100,000 | 106,066 |
| 5.95%, 10/01/43 (a) | 48,000 | 54,850 |
| 5.15%, 03/15/45 (a) | 350,000 | 379,792 |
| 6.13%, 12/15/45 (a) | 400,000 | 473,924 |
| 5.30%, 04/15/47 (a) | 300,000 | 330,894 |
| 6.00%, 06/15/48 (a) | 350,000 | 413,560 |
| 6.25%, 04/15/49 (a) | 500,000 | 609,150 |
| 5.00%, 05/15/50 (a) | 650,000 | 708,857 |
| Energy Transfer Partners LP/Regency Energy Finance Corp. |
| 4.50%, 11/01/23 (a) | 300,000 | 325,095 |
| Eni USA, Inc. |
| 7.30%, 11/15/27 | 150,000 | 201,504 |
| Enterprise Products Operating LLC |
| 3.50%, 02/01/22 | 150,000 | 155,127 |
| 3.35%, 03/15/23 (a) | 550,000 | 581,548 |
| 3.90%, 02/15/24 (a) | 400,000 | 438,276 |
| 3.75%, 02/15/25 (a) | 300,000 | 336,240 |
| 3.70%, 02/15/26 (a) | 150,000 | 170,112 |
| 3.95%, 02/15/27 (a) | 425,000 | 494,041 |
| 4.15%, 10/16/28 (a) | 400,000 | 474,448 |
| 3.13%, 07/31/29 (a) | 650,000 | 722,709 |
| 2.80%, 01/31/30 (a) | 575,000 | 625,054 |
| 6.65%, 10/15/34 | 250,000 | 352,467 |
| 7.55%, 04/15/38 | 150,000 | 230,256 |
| 6.13%, 10/15/39 | 250,000 | 350,520 |
| 6.45%, 09/01/40 | 70,000 | 100,513 |
| 5.95%, 02/01/41 | 100,000 | 137,358 |
| 5.70%, 02/15/42 | 150,000 | 207,054 |
| 4.85%, 08/15/42 (a) | 300,000 | 374,580 |
| 4.45%, 02/15/43 (a) | 300,000 | 362,919 |
| 4.85%, 03/15/44 (a) | 400,000 | 497,336 |
| 5.10%, 02/15/45 (a) | 350,000 | 455,791 |
| 4.90%, 05/15/46 (a) | 400,000 | 505,528 |
| 4.25%, 02/15/48 (a) | 500,000 | 588,070 |
| 4.80%, 02/01/49 (a) | 450,000 | 570,145 |
| 4.20%, 01/31/50 (a) | 500,000 | 587,765 |
| 3.70%, 01/31/51 (a) | 325,000 | 359,284 |
| 3.20%, 02/15/52 (a) | 250,000 | 254,798 |
| 4.95%, 10/15/54 (a) | 225,000 | 285,703 |
| 3.95%, 01/31/60 (a) | 325,000 | 363,191 |
| 4.88%, 08/16/77 (a)(b) | 200,000 | 192,712 |
| 5.25%, 08/16/77 (a)(b) | 335,000 | 340,176 |
| 5.38%, 02/15/78 (a)(b) | 235,000 | 234,868 |
| EOG Resources, Inc. |
| 2.63%, 03/15/23 (a) | 500,000 | 522,310 |
| 3.15%, 04/01/25 (a) | 250,000 | 275,125 |
| 4.15%, 01/15/26 (a) | 50,000 | 58,164 |
| 4.38%, 04/15/30 (a) | 300,000 | 365,961 |
| 3.90%, 04/01/35 (a) | 165,000 | 194,967 |
| 4.95%, 04/15/50 (a) | 300,000 | 408,654 |
| Equinor A.S.A. |
| 1.75%, 01/22/26 (a) | 450,000 | 472,779 |
| Exxon Mobil Corp. |
| 2.40%, 03/06/22 (a) | 500,000 | 510,980 |
| 1.90%, 08/16/22 | 350,000 | 359,436 |
| 2.73%, 03/01/23 (a) | 400,000 | 419,284 |
| 1.57%, 04/15/23 | 1,300,000 | 1,338,584 |
| 3.18%, 03/15/24 (a) | 250,000 | 269,995 |
| 2.02%, 08/16/24 (a) | 375,000 | 394,946 |
| 2.71%, 03/06/25 (a) | 600,000 | 648,558 |
| 2.99%, 03/19/25 (a) | 900,000 | 986,202 |
| 3.04%, 03/01/26 (a) | 400,000 | 443,592 |
| 2.28%, 08/16/26 (a) | 800,000 | 862,752 |
| 2.44%, 08/16/29 (a) | 400,000 | 434,892 |
| 3.48%, 03/19/30 (a) | 650,000 | 755,956 |
| 2.61%, 10/15/30 (a) | 1,000,000 | 1,093,760 |
Schwab Fixed-Income ETFs | Annual Report
Schwab U.S. Aggregate Bond ETF
Portfolio Holdings as of December 31, 2020 (continued)
Security
Rate, Maturity Date | Face
Amount ($) | Value ($) |
| 3.00%, 08/16/39 (a) | 250,000 | 272,805 |
| 4.23%, 03/19/40 (a) | 400,000 | 498,608 |
| 3.57%, 03/06/45 (a) | 400,000 | 462,732 |
| 4.11%, 03/01/46 (a) | 850,000 | 1,050,404 |
| 3.10%, 08/16/49 (a) | 700,000 | 759,423 |
| 4.33%, 03/19/50 (a) | 950,000 | 1,245,241 |
| 3.45%, 04/15/51 (a) | 900,000 | 1,031,265 |
| Halliburton Co. |
| 3.50%, 08/01/23 (a) | 350,000 | 373,964 |
| 3.80%, 11/15/25 (a) | 500,000 | 561,250 |
| 2.92%, 03/01/30 (a) | 300,000 | 318,414 |
| 4.85%, 11/15/35 (a) | 375,000 | 440,516 |
| 6.70%, 09/15/38 | 250,000 | 336,247 |
| 7.45%, 09/15/39 | 400,000 | 579,576 |
| 4.50%, 11/15/41 (a) | 150,000 | 166,031 |
| 4.75%, 08/01/43 (a) | 250,000 | 284,130 |
| 5.00%, 11/15/45 (a) | 600,000 | 710,514 |
| Helmerich & Payne, Inc. |
| 4.65%, 03/15/25 (a) | 200,000 | 223,072 |
| Hess Corp. |
| 4.30%, 04/01/27 (a) | 200,000 | 220,958 |
| 7.88%, 10/01/29 | 200,000 | 263,312 |
| 7.30%, 08/15/31 | 413,000 | 539,543 |
| 7.13%, 03/15/33 | 300,000 | 393,645 |
| 6.00%, 01/15/40 | 100,000 | 123,183 |
| 5.60%, 02/15/41 | 500,000 | 606,520 |
| 5.80%, 04/01/47 (a) | 50,000 | 63,394 |
| HollyFrontier Corp. |
| 2.63%, 10/01/23 | 150,000 | 153,411 |
| 5.88%, 04/01/26 (a) | 260,000 | 292,167 |
| 4.50%, 10/01/30 (a) | 250,000 | 264,278 |
| Husky Energy, Inc. |
| 3.95%, 04/15/22 (a) | 350,000 | 360,934 |
| 6.80%, 09/15/37 | 400,000 | 516,504 |
| Kinder Morgan Energy Partners LP |
| 3.95%, 09/01/22 (a) | 200,000 | 209,938 |
| 3.45%, 02/15/23 (a) | 1,100,000 | 1,159,169 |
| 3.50%, 09/01/23 (a) | 250,000 | 267,790 |
| 4.15%, 02/01/24 (a) | 200,000 | 219,192 |
| 4.30%, 05/01/24 (a) | 300,000 | 332,556 |
| 5.80%, 03/15/35 | 100,000 | 125,971 |
| 6.50%, 02/01/37 | 200,000 | 258,996 |
| 6.95%, 01/15/38 | 150,000 | 206,601 |
| 6.55%, 09/15/40 | 100,000 | 134,337 |
| 7.50%, 11/15/40 | 150,000 | 215,378 |
| 6.38%, 03/01/41 | 200,000 | 263,136 |
| 5.63%, 09/01/41 | 150,000 | 182,502 |
| 5.00%, 08/15/42 (a) | 1,100,000 | 1,298,000 |
| 4.70%, 11/01/42 (a) | 300,000 | 345,048 |
| 5.00%, 03/01/43 (a) | 350,000 | 414,809 |
| 5.50%, 03/01/44 (a) | 50,000 | 63,410 |
| 5.40%, 09/01/44 (a) | 400,000 | 501,424 |
| Kinder Morgan, Inc. |
| 4.30%, 06/01/25 (a) | 750,000 | 856,372 |
| 4.30%, 03/01/28 (a) | 740,000 | 869,108 |
| 2.00%, 02/15/31 (a) | 250,000 | 251,605 |
| 7.80%, 08/01/31 | 500,000 | 722,615 |
| 5.55%, 06/01/45 (a) | 700,000 | 904,414 |
| 5.20%, 03/01/48 (a) | 196,000 | 249,569 |
| 3.25%, 08/01/50 (a) | 250,000 | 250,413 |
| Magellan Midstream Partners LP |
| 3.25%, 06/01/30 (a) | 250,000 | 282,065 |
| 5.15%, 10/15/43 (a) | 400,000 | 513,760 |
| 4.25%, 09/15/46 (a) | 100,000 | 114,548 |
| 4.20%, 10/03/47 (a) | 200,000 | 230,732 |
Security
Rate, Maturity Date | Face
Amount ($) | Value ($) |
| 4.85%, 02/01/49 (a) | 99,000 | 126,052 |
| 3.95%, 03/01/50 (a) | 250,000 | 281,888 |
| Marathon Oil Corp. |
| 2.80%, 11/01/22 (a) | 550,000 | 567,567 |
| 3.85%, 06/01/25 (a) | 200,000 | 214,520 |
| 4.40%, 07/15/27 (a) | 350,000 | 389,200 |
| 6.80%, 03/15/32 | 138,000 | 171,112 |
| 6.60%, 10/01/37 | 300,000 | 370,461 |
| 5.20%, 06/01/45 (a) | 150,000 | 172,100 |
| Marathon Petroleum Corp. |
| 4.50%, 05/01/23 (a) | 400,000 | 434,624 |
| 4.75%, 12/15/23 (a) | 200,000 | 222,010 |
| 3.63%, 09/15/24 (a) | 350,000 | 380,873 |
| 4.70%, 05/01/25 (a) | 400,000 | 458,840 |
| 5.13%, 12/15/26 (a) | 100,000 | 119,319 |
| 3.80%, 04/01/28 (a) | 450,000 | 502,159 |
| 6.50%, 03/01/41 (a) | 400,000 | 538,368 |
| 4.75%, 09/15/44 (a) | 250,000 | 287,740 |
| 4.50%, 04/01/48 (a) | 250,000 | 283,690 |
| 5.00%, 09/15/54 (a) | 150,000 | 171,978 |
| MPLX LP |
| 3.50%, 12/01/22 (a) | 250,000 | 262,688 |
| 3.38%, 03/15/23 (a) | 100,000 | 105,895 |
| 4.50%, 07/15/23 (a) | 300,000 | 326,976 |
| 4.88%, 12/01/24 (a) | 450,000 | 516,577 |
| 5.25%, 01/15/25 (a) | 200,000 | 205,522 |
| 4.00%, 02/15/25 (a) | 250,000 | 279,223 |
| 4.88%, 06/01/25 (a) | 450,000 | 520,069 |
| 1.75%, 03/01/26 (a) | 250,000 | 258,948 |
| 4.13%, 03/01/27 (a) | 450,000 | 520,173 |
| 4.25%, 12/01/27 (a) | 396,000 | 465,011 |
| 4.00%, 03/15/28 (a) | 325,000 | 374,679 |
| 4.80%, 02/15/29 (a) | 500,000 | 601,535 |
| 2.65%, 08/15/30 (a) | 500,000 | 525,945 |
| 4.50%, 04/15/38 (a) | 500,000 | 574,585 |
| 5.20%, 03/01/47 (a) | 300,000 | 371,853 |
| 5.20%, 12/01/47 (a) | 200,000 | 246,520 |
| 4.70%, 04/15/48 (a) | 600,000 | 715,842 |
| 5.50%, 02/15/49 (a) | 425,000 | 561,710 |
| 4.90%, 04/15/58 (a) | 150,000 | 180,945 |
| National Fuel Gas Co. |
| 3.75%, 03/01/23 (a) | 200,000 | 210,502 |
| 5.20%, 07/15/25 (a) | 150,000 | 168,989 |
| 5.50%, 01/15/26 (a) | 150,000 | 173,438 |
| 3.95%, 09/15/27 (a) | 150,000 | 159,606 |
| 4.75%, 09/01/28 (a) | 200,000 | 217,618 |
| National Oilwell Varco, Inc. |
| 3.60%, 12/01/29 (a) | 200,000 | 209,388 |
| 3.95%, 12/01/42 (a) | 300,000 | 305,586 |
| Noble Energy, Inc. |
| 3.90%, 11/15/24 (a) | 170,000 | 189,297 |
| 3.85%, 01/15/28 (a) | 250,000 | 290,855 |
| 3.25%, 10/15/29 (a) | 200,000 | 227,476 |
| 6.00%, 03/01/41 (a) | 450,000 | 681,988 |
| 5.25%, 11/15/43 (a) | 300,000 | 428,337 |
| 5.05%, 11/15/44 (a) | 350,000 | 493,346 |
| 4.95%, 08/15/47 (a) | 100,000 | 142,054 |
| 4.20%, 10/15/49 (a) | 150,000 | 196,601 |
| Northwest Pipeline LLC |
| 4.00%, 04/01/27 (a) | 250,000 | 286,220 |
| ONEOK Partners LP |
| 3.38%, 10/01/22 (a) | 400,000 | 416,748 |
| 5.00%, 09/15/23 (a) | 150,000 | 164,511 |
| 4.90%, 03/15/25 (a) | 200,000 | 227,584 |
| 6.65%, 10/01/36 | 250,000 | 320,605 |
| 6.85%, 10/15/37 | 150,000 | 193,584 |
Schwab Fixed-Income ETFs | Annual Report
Schwab U.S. Aggregate Bond ETF
Portfolio Holdings as of December 31, 2020 (continued)
Security
Rate, Maturity Date | Face
Amount ($) | Value ($) |
| 6.13%, 02/01/41 (a) | 50,000 | 60,164 |
| 6.20%, 09/15/43 (a) | 150,000 | 185,391 |
| ONEOK, Inc. |
| 7.50%, 09/01/23 (a) | 200,000 | 231,568 |
| 2.75%, 09/01/24 (a) | 250,000 | 264,030 |
| 2.20%, 09/15/25 (a) | 200,000 | 207,084 |
| 5.85%, 01/15/26 (a) | 200,000 | 239,622 |
| 4.55%, 07/15/28 (a) | 625,000 | 715,219 |
| 4.35%, 03/15/29 (a) | 250,000 | 284,308 |
| 3.40%, 09/01/29 (a) | 250,000 | 268,720 |
| 3.10%, 03/15/30 (a) | 200,000 | 212,644 |
| 6.35%, 01/15/31 (a) | 250,000 | 321,600 |
| 4.95%, 07/13/47 (a) | 225,000 | 253,791 |
| 5.20%, 07/15/48 (a) | 750,000 | 879,450 |
| 4.45%, 09/01/49 (a) | 250,000 | 265,640 |
| 7.15%, 01/15/51 (a) | 150,000 | 212,543 |
| Phillips 66 |
| 4.30%, 04/01/22 | 550,000 | 576,559 |
| 3.85%, 04/09/25 (a) | 750,000 | 845,085 |
| 1.30%, 02/15/26 (a) | 200,000 | 203,500 |
| 3.90%, 03/15/28 (a) | 200,000 | 230,962 |
| 2.15%, 12/15/30 (a) | 250,000 | 254,008 |
| 4.65%, 11/15/34 (a) | 250,000 | 306,270 |
| 5.88%, 05/01/42 | 500,000 | 697,470 |
| 4.88%, 11/15/44 (a) | 650,000 | 822,627 |
| Phillips 66 Partners LP |
| 3.61%, 02/15/25 (a) | 500,000 | 542,995 |
| 3.75%, 03/01/28 (a) | 125,000 | 136,101 |
| 3.15%, 12/15/29 (a) | 300,000 | 313,668 |
| 4.68%, 02/15/45 (a) | 200,000 | 218,306 |
| 4.90%, 10/01/46 (a) | 275,000 | 310,404 |
| Pioneer Natural Resources Co. |
| 1.90%, 08/15/30 (a) | 250,000 | 248,293 |
| Plains All American Pipeline LP |
| 6.65%, 01/15/37 | 100,000 | 122,386 |
| 4.30%, 01/31/43 (a) | 700,000 | 692,489 |
| 4.90%, 02/15/45 (a) | 200,000 | 215,270 |
| Plains All American Pipeline LP/PAA Finance Corp. |
| 3.65%, 06/01/22 (a) | 200,000 | 206,124 |
| 2.85%, 01/31/23 (a) | 200,000 | 206,900 |
| 3.85%, 10/15/23 (a) | 150,000 | 161,076 |
| 4.65%, 10/15/25 (a) | 750,000 | 839,647 |
| 4.50%, 12/15/26 (a) | 410,000 | 460,200 |
| 3.55%, 12/15/29 (a) | 100,000 | 104,894 |
| 3.80%, 09/15/30 (a) | 250,000 | 269,225 |
| 5.15%, 06/01/42 (a) | 200,000 | 217,664 |
| 4.70%, 06/15/44 (a) | 200,000 | 209,446 |
| Sabine Pass Liquefaction LLC |
| 6.25%, 03/15/22 (a) | 150,000 | 157,899 |
| 5.63%, 04/15/23 (a) | 650,000 | 713,394 |
| 5.75%, 05/15/24 (a) | 775,000 | 887,406 |
| 5.63%, 03/01/25 (a) | 750,000 | 876,202 |
| 5.88%, 06/30/26 (a) | 450,000 | 544,779 |
| 5.00%, 03/15/27 (a) | 600,000 | 709,236 |
| 4.20%, 03/15/28 (a) | 450,000 | 516,627 |
| 4.50%, 05/15/30 (a) | 525,000 | 625,270 |
| Schlumberger Finance Canada Ltd. |
| 1.40%, 09/17/25 (a) | 250,000 | 257,330 |
| Schlumberger Investment S.A. |
| 3.65%, 12/01/23 (a) | 500,000 | 542,805 |
| 2.65%, 06/26/30 (a) | 500,000 | 535,455 |
| Shell International Finance BV |
| 2.38%, 08/21/22 | 100,000 | 103,516 |
| 2.25%, 01/06/23 | 600,000 | 623,382 |
| 3.40%, 08/12/23 | 750,000 | 810,787 |
| 2.00%, 11/07/24 (a) | 300,000 | 316,257 |
Security
Rate, Maturity Date | Face
Amount ($) | Value ($) |
| 2.38%, 04/06/25 (a) | 300,000 | 321,708 |
| 3.25%, 05/11/25 | 1,400,000 | 1,554,266 |
| 2.88%, 05/10/26 | 500,000 | 553,355 |
| 2.50%, 09/12/26 | 450,000 | 493,384 |
| 3.88%, 11/13/28 (a) | 500,000 | 593,215 |
| 2.38%, 11/07/29 (a) | 475,000 | 511,366 |
| 2.75%, 04/06/30 (a) | 750,000 | 830,010 |
| 4.13%, 05/11/35 | 850,000 | 1,064,871 |
| 6.38%, 12/15/38 | 1,500,000 | 2,347,725 |
| 3.63%, 08/21/42 | 150,000 | 175,398 |
| 4.55%, 08/12/43 | 1,025,000 | 1,362,994 |
| 4.38%, 05/11/45 | 250,000 | 329,742 |
| 4.00%, 05/10/46 | 675,000 | 848,758 |
| 3.75%, 09/12/46 | 400,000 | 485,224 |
| 3.13%, 11/07/49 (a) | 350,000 | 388,577 |
| 3.25%, 04/06/50 (a) | 650,000 | 738,783 |
| Spectra Energy Partners LP |
| 4.75%, 03/15/24 (a) | 300,000 | 335,688 |
| 5.95%, 09/25/43 (a) | 450,000 | 585,549 |
| 4.50%, 03/15/45 (a) | 100,000 | 118,247 |
| Suncor Energy, Inc. |
| 2.80%, 05/15/23 | 150,000 | 158,021 |
| 3.60%, 12/01/24 (a) | 250,000 | 276,178 |
| 3.10%, 05/15/25 (a) | 150,000 | 164,381 |
| 5.35%, 07/15/33 | 200,000 | 244,612 |
| 5.95%, 12/01/34 | 250,000 | 325,102 |
| 5.95%, 05/15/35 | 350,000 | 451,867 |
| 6.80%, 05/15/38 | 350,000 | 494,879 |
| 6.50%, 06/15/38 | 400,000 | 563,968 |
| 6.85%, 06/01/39 | 150,000 | 211,554 |
| 4.00%, 11/15/47 (a) | 250,000 | 284,218 |
| Sunoco Logistics Partners Operations LP |
| 3.45%, 01/15/23 (a) | 200,000 | 208,366 |
| 4.25%, 04/01/24 (a) | 250,000 | 270,610 |
| 4.00%, 10/01/27 (a) | 200,000 | 218,836 |
| 6.10%, 02/15/42 | 150,000 | 171,636 |
| 4.95%, 01/15/43 (a) | 250,000 | 260,335 |
| 5.30%, 04/01/44 (a) | 150,000 | 162,600 |
| 5.35%, 05/15/45 (a) | 250,000 | 276,725 |
| 5.40%, 10/01/47 (a) | 300,000 | 335,877 |
| TC PipeLines LP |
| 4.38%, 03/13/25 (a) | 200,000 | 225,698 |
| 3.90%, 05/25/27 (a) | 100,000 | 112,704 |
| Total Capital Canada Ltd. |
| 2.75%, 07/15/23 | 450,000 | 477,954 |
| Total Capital International S.A. |
| 2.88%, 02/17/22 | 300,000 | 308,763 |
| 2.70%, 01/25/23 | 250,000 | 262,393 |
| 3.70%, 01/15/24 | 500,000 | 549,115 |
| 3.75%, 04/10/24 | 500,000 | 554,220 |
| 2.43%, 01/10/25 (a) | 300,000 | 320,271 |
| 3.46%, 02/19/29 (a) | 656,000 | 760,160 |
| 2.83%, 01/10/30 (a) | 375,000 | 419,284 |
| 2.99%, 06/29/41 (a) | 300,000 | 327,150 |
| 3.46%, 07/12/49 (a) | 300,000 | 350,085 |
| 3.13%, 05/29/50 (a) | 800,000 | 874,384 |
| 3.39%, 06/29/60 (a) | 300,000 | 342,144 |
| Total Capital S.A. |
| 3.88%, 10/11/28 | 175,000 | 207,912 |
| TransCanada PipeLines Ltd. |
| 2.50%, 08/01/22 | 195,000 | 201,714 |
| 3.75%, 10/16/23 (a) | 300,000 | 325,914 |
| 4.88%, 01/15/26 (a) | 350,000 | 416,573 |
| 4.25%, 05/15/28 (a) | 600,000 | 711,450 |
| 4.10%, 04/15/30 (a) | 150,000 | 177,675 |
| 4.63%, 03/01/34 (a) | 650,000 | 795,288 |
Schwab Fixed-Income ETFs | Annual Report
Schwab U.S. Aggregate Bond ETF
Portfolio Holdings as of December 31, 2020 (continued)
Security
Rate, Maturity Date | Face
Amount ($) | Value ($) |
| 6.20%, 10/15/37 | 250,000 | 350,210 |
| 4.75%, 05/15/38 (a) | 200,000 | 249,324 |
| 7.25%, 08/15/38 | 100,000 | 151,791 |
| 7.63%, 01/15/39 | 550,000 | 863,885 |
| 6.10%, 06/01/40 | 450,000 | 624,856 |
| 5.00%, 10/16/43 (a) | 250,000 | 314,868 |
| 4.88%, 05/15/48 (a) | 350,000 | 454,863 |
| 5.10%, 03/15/49 (a) | 450,000 | 605,169 |
| Transcontinental Gas Pipe Line Co. LLC |
| 7.85%, 02/01/26 (a) | 250,000 | 328,327 |
| 3.25%, 05/15/30 (a) | 250,000 | 280,180 |
| 5.40%, 08/15/41 (a) | 150,000 | 191,898 |
| 4.45%, 08/01/42 (a) | 100,000 | 117,864 |
| 4.60%, 03/15/48 (a) | 200,000 | 245,190 |
| Valero Energy Corp. |
| 2.70%, 04/15/23 | 250,000 | 261,128 |
| 1.20%, 03/15/24 | 300,000 | 302,325 |
| 3.65%, 03/15/25 | 173,000 | 189,345 |
| 2.85%, 04/15/25 (a) | 400,000 | 426,944 |
| 3.40%, 09/15/26 (a) | 450,000 | 494,491 |
| 2.15%, 09/15/27 (a) | 200,000 | 204,854 |
| 4.35%, 06/01/28 (a) | 200,000 | 228,326 |
| 4.00%, 04/01/29 (a) | 300,000 | 338,169 |
| 7.50%, 04/15/32 | 150,000 | 209,553 |
| 6.63%, 06/15/37 | 550,000 | 732,347 |
| 4.90%, 03/15/45 | 400,000 | 467,960 |
| Valero Energy Partners LP |
| 4.38%, 12/15/26 (a) | 200,000 | 232,588 |
| 4.50%, 03/15/28 (a) | 150,000 | 174,620 |
| Williams Cos., Inc. |
| 3.60%, 03/15/22 (a) | 1,200,000 | 1,238,916 |
| 4.30%, 03/04/24 (a) | 150,000 | 165,435 |
| 4.55%, 06/24/24 (a) | 300,000 | 336,057 |
| 3.90%, 01/15/25 (a) | 487,000 | 541,490 |
| 4.00%, 09/15/25 (a) | 150,000 | 170,562 |
| 3.75%, 06/15/27 (a) | 750,000 | 858,975 |
| 3.50%, 11/15/30 (a) | 350,000 | 397,260 |
| 8.75%, 03/15/32 | 500,000 | 732,790 |
| 6.30%, 04/15/40 | 600,000 | 803,772 |
| 5.80%, 11/15/43 (a) | 300,000 | 384,477 |
| 4.90%, 01/15/45 (a) | 150,000 | 179,804 |
| 5.10%, 09/15/45 (a) | 500,000 | 624,315 |
| 4.85%, 03/01/48 (a) | 300,000 | 371,046 |
| | | 190,702,777 |
| Industrial Other 0.1% |
| Boston University |
| 4.06%, 10/01/48 (a) | 230,000 | 292,427 |
| California Institute of Technology |
| 4.70%, 11/01/11 | 300,000 | 417,309 |
| 3.65%, 09/01/19 (a) | 50,000 | 56,571 |
| CBRE Services, Inc. |
| 4.88%, 03/01/26 (a) | 350,000 | 414,575 |
| Cintas Corp. No. 2 |
| 3.70%, 04/01/27 (a) | 550,000 | 634,788 |
| Duke University |
| 2.68%, 10/01/44 | 150,000 | 157,754 |
| Emory University |
| 2.97%, 09/01/50 (a) | 350,000 | 380,551 |
| George Washington University |
| 4.30%, 09/15/44 | 50,000 | 62,780 |
| 4.87%, 09/15/45 | 150,000 | 206,068 |
| 4.13%, 09/15/48 (a) | 510,000 | 646,512 |
Security
Rate, Maturity Date | Face
Amount ($) | Value ($) |
| Georgetown University |
| 4.32%, 04/01/49 (a) | 26,000 | 33,315 |
| 2.94%, 04/01/50 | 225,000 | 230,881 |
| 5.22%, 10/01/18 (a) | 150,000 | 218,446 |
| Johns Hopkins University |
| 4.08%, 07/01/53 | 125,000 | 168,107 |
| Leland Stanford Junior University |
| 3.65%, 05/01/48 (a) | 300,000 | 381,651 |
| Massachusetts Institute of Technology |
| 2.99%, 07/01/50 (a) | 200,000 | 232,550 |
| 2.29%, 07/01/51 (a) | 150,000 | 152,240 |
| 5.60%, 07/01/11 | 315,000 | 557,018 |
| 4.68%, 07/01/14 | 300,000 | 454,512 |
| 3.89%, 07/01/16 | 200,000 | 255,732 |
| Northeastern University |
| 2.89%, 10/01/50 | 100,000 | 105,587 |
| Northwestern University |
| 4.64%, 12/01/44 | 200,000 | 267,350 |
| 2.64%, 12/01/50 (a) | 250,000 | 268,537 |
| President and Fellows of Harvard College |
| 4.88%, 10/15/40 | 50,000 | 71,810 |
| 3.15%, 07/15/46 (a) | 207,000 | 245,032 |
| 2.52%, 10/15/50 (a) | 150,000 | 159,888 |
| 3.30%, 07/15/56 (a) | 300,000 | 372,522 |
| Quanta Services, Inc. |
| 2.90%, 10/01/30 (a) | 200,000 | 215,330 |
| Steelcase, Inc. |
| 5.13%, 01/18/29 (a) | 200,000 | 235,336 |
| The American University |
| 3.67%, 04/01/49 | 100,000 | 112,611 |
| Trustees of Boston College |
| 3.13%, 07/01/52 | 200,000 | 220,056 |
| Trustees of Princeton University |
| 5.70%, 03/01/39 | 250,000 | 380,372 |
| Trustees of Princeton University |
| Series 2020 |
| 2.52%, 07/01/50 (a) | 50,000 | 52,573 |
| Trustees of the University of Pennsylvania |
| 2.40%, 10/01/50 (a) | 100,000 | 102,117 |
| 3.61%, 02/15/19 (a) | 150,000 | 172,377 |
| University of Chicago |
| 2.76%, 04/01/45 (a) | 150,000 | 155,268 |
| University of Notre Dame du Lac |
| 3.44%, 02/15/45 | 150,000 | 182,871 |
| 3.39%, 02/15/48 (a) | 399,000 | 495,997 |
| University of Southern California |
| 3.03%, 10/01/39 | 500,000 | 552,080 |
| 3.84%, 10/01/47 (a) | 400,000 | 506,540 |
| 5.25%, 10/01/11 | 50,000 | 79,670 |
| 3.23%, 10/01/20 (a) | 250,000 | 254,587 |
| William Marsh Rice University |
| 3.57%, 05/15/45 | 300,000 | 364,515 |
| 3.77%, 05/15/55 | 100,000 | 131,152 |
| Yale University |
| 1.48%, 04/15/30 (a) | 350,000 | 359,611 |
| | | 12,017,576 |
| Technology 2.4% |
| Adobe, Inc. |
| 1.90%, 02/01/25 (a) | 150,000 | 158,690 |
| 3.25%, 02/01/25 (a) | 430,000 | 474,905 |
| 2.15%, 02/01/27 (a) | 300,000 | 323,364 |
| 2.30%, 02/01/30 (a) | 450,000 | 487,183 |
Schwab Fixed-Income ETFs | Annual Report
Schwab U.S. Aggregate Bond ETF
Portfolio Holdings as of December 31, 2020 (continued)
Security
Rate, Maturity Date | Face
Amount ($) | Value ($) |
| Agilent Technologies, Inc. |
| 3.88%, 07/15/23 (a) | 400,000 | 430,860 |
| Alphabet, Inc. |
| 3.38%, 02/25/24 | 450,000 | 492,340 |
| 0.45%, 08/15/25 (a) | 500,000 | 500,255 |
| 2.00%, 08/15/26 (a) | 500,000 | 536,280 |
| 0.80%, 08/15/27 (a) | 250,000 | 248,595 |
| 1.10%, 08/15/30 (a) | 750,000 | 738,277 |
| 1.90%, 08/15/40 (a) | 500,000 | 489,245 |
| 2.05%, 08/15/50 (a) | 800,000 | 765,200 |
| 2.25%, 08/15/60 (a) | 600,000 | 579,486 |
| Altera Corp. |
| 4.10%, 11/15/23 | 200,000 | 220,586 |
| Amdocs Ltd. |
| 2.54%, 06/15/30 (a) | 250,000 | 263,925 |
| Analog Devices, Inc. |
| 3.13%, 12/05/23 (a) | 200,000 | 215,410 |
| 2.95%, 04/01/25 (a) | 250,000 | 273,230 |
| 3.90%, 12/15/25 (a) | 300,000 | 342,801 |
| 5.30%, 12/15/45 (a) | 290,000 | 400,899 |
| Apple Inc. |
| 2.15%, 02/09/22 | 600,000 | 612,618 |
| 2.50%, 02/09/22 (a) | 1,150,000 | 1,176,473 |
| 2.70%, 05/13/22 | 500,000 | 516,860 |
| 1.70%, 09/11/22 | 300,000 | 307,665 |
| 2.10%, 09/12/22 (a) | 200,000 | 206,148 |
| 2.40%, 01/13/23 (a) | 1,000,000 | 1,042,000 |
| 2.85%, 02/23/23 (a) | 500,000 | 525,735 |
| 2.40%, 05/03/23 | 1,850,000 | 1,941,094 |
| 0.75%, 05/11/23 | 625,000 | 633,106 |
| 3.00%, 02/09/24 (a) | 450,000 | 484,443 |
| 3.45%, 05/06/24 | 1,150,000 | 1,267,254 |
| 2.85%, 05/11/24 (a) | 650,000 | 700,869 |
| 1.80%, 09/11/24 (a) | 250,000 | 262,575 |
| 2.75%, 01/13/25 (a) | 500,000 | 543,370 |
| 2.50%, 02/09/25 | 500,000 | 540,690 |
| 1.13%, 05/11/25 (a) | 750,000 | 771,930 |
| 3.20%, 05/13/25 | 600,000 | 670,434 |
| 0.55%, 08/20/25 (a) | 500,000 | 502,310 |
| 3.25%, 02/23/26 (a) | 850,000 | 954,057 |
| 2.45%, 08/04/26 (a) | 1,000,000 | 1,090,940 |
| 2.05%, 09/11/26 (a) | 600,000 | 642,486 |
| 3.35%, 02/09/27 (a) | 475,000 | 541,357 |
| 3.20%, 05/11/27 (a) | 550,000 | 623,793 |
| 3.00%, 06/20/27 (a) | 500,000 | 563,925 |
| 2.90%, 09/12/27 (a) | 550,000 | 616,995 |
| 3.00%, 11/13/27 (a) | 700,000 | 790,748 |
| 2.20%, 09/11/29 (a) | 550,000 | 594,995 |
| 1.65%, 05/11/30 (a) | 550,000 | 566,857 |
| 1.25%, 08/20/30 (a) | 500,000 | 500,295 |
| 4.50%, 02/23/36 (a) | 250,000 | 337,450 |
| 3.85%, 05/04/43 | 1,000,000 | 1,274,270 |
| 4.45%, 05/06/44 | 230,000 | 318,490 |
| 3.45%, 02/09/45 | 650,000 | 792,343 |
| 4.38%, 05/13/45 | 1,000,000 | 1,379,760 |
| 4.65%, 02/23/46 (a) | 200,000 | 286,270 |
| 3.85%, 08/04/46 (a) | 238,000 | 307,208 |
| 4.25%, 02/09/47 (a) | 1,600,000 | 2,182,496 |
| 3.75%, 09/12/47 (a) | 500,000 | 632,780 |
| 3.75%, 11/13/47 (a) | 469,000 | 595,067 |
| 2.95%, 09/11/49 (a) | 450,000 | 505,768 |
| 2.65%, 05/11/50 (a) | 700,000 | 746,809 |
| 2.40%, 08/20/50 (a) | 600,000 | 613,854 |
| 2.55%, 08/20/60 (a) | 500,000 | 514,160 |
Security
Rate, Maturity Date | Face
Amount ($) | Value ($) |
| Applied Materials, Inc. |
| 3.90%, 10/01/25 (a) | 900,000 | 1,032,921 |
| 3.30%, 04/01/27 (a) | 500,000 | 567,245 |
| 1.75%, 06/01/30 (a) | 250,000 | 259,810 |
| 5.10%, 10/01/35 (a) | 100,000 | 139,094 |
| 5.85%, 06/15/41 | 250,000 | 393,883 |
| 4.35%, 04/01/47 (a) | 100,000 | 139,036 |
| 2.75%, 06/01/50 (a) | 300,000 | 326,544 |
| Arrow Electronics, Inc. |
| 4.50%, 03/01/23 (a) | 150,000 | 160,709 |
| 3.25%, 09/08/24 (a) | 400,000 | 432,276 |
| 3.88%, 01/12/28 (a) | 225,000 | 253,944 |
| Autodesk, Inc. |
| 4.38%, 06/15/25 (a) | 500,000 | 572,320 |
| Avnet, Inc. |
| 4.63%, 04/15/26 (a) | 350,000 | 397,194 |
| Baidu, Inc. |
| 2.88%, 07/06/22 | 500,000 | 513,945 |
| 3.50%, 11/28/22 | 200,000 | 209,892 |
| 3.88%, 09/29/23 (a) | 400,000 | 430,812 |
| 4.38%, 05/14/24 (a) | 350,000 | 384,675 |
| 3.08%, 04/07/25 (a) | 400,000 | 428,700 |
| 4.13%, 06/30/25 | 200,000 | 224,038 |
| 1.72%, 04/09/26 (a) | 200,000 | 203,874 |
| 3.63%, 07/06/27 | 400,000 | 442,308 |
| 4.38%, 03/29/28 (a) | 250,000 | 288,500 |
| 3.43%, 04/07/30 (a) | 200,000 | 222,344 |
| 2.38%, 10/09/30 (a) | 200,000 | 205,210 |
| Broadcom Corp./Broadcom Cayman Finance Ltd. |
| 2.65%, 01/15/23 (a) | 75,000 | 78,089 |
| 3.63%, 01/15/24 (a) | 1,050,000 | 1,136,992 |
| 3.13%, 01/15/25 (a) | 250,000 | 270,343 |
| 3.88%, 01/15/27 (a) | 1,700,000 | 1,910,086 |
| 3.50%, 01/15/28 (a) | 350,000 | 385,630 |
| Broadcom, Inc. |
| 2.25%, 11/15/23 | 600,000 | 626,988 |
| 3.63%, 10/15/24 (a) | 500,000 | 549,155 |
| 4.70%, 04/15/25 (a) | 800,000 | 918,272 |
| 3.15%, 11/15/25 (a) | 620,000 | 677,406 |
| 4.25%, 04/15/26 (a) | 500,000 | 573,300 |
| 3.46%, 09/15/26 (a) | 504,000 | 559,465 |
| 4.11%, 09/15/28 (a) | 1,417,000 | 1,623,429 |
| 4.75%, 04/15/29 (a) | 850,000 | 1,014,747 |
| 5.00%, 04/15/30 (a) | 850,000 | 1,034,662 |
| 4.15%, 11/15/30 (a) | 600,000 | 694,698 |
| 4.30%, 11/15/32 (a) | 800,000 | 949,512 |
| Broadridge Financial Solutions, Inc. |
| 2.90%, 12/01/29 (a) | 350,000 | 384,874 |
| CA, Inc. |
| 4.70%, 03/15/27 (a) | 249,000 | 285,165 |
| Cadence Design Systems, Inc. |
| 4.38%, 10/15/24 (a) | 150,000 | 168,936 |
| Cisco Systems, Inc. |
| 2.20%, 09/20/23 (a) | 520,000 | 545,553 |
| 3.63%, 03/04/24 | 225,000 | 247,869 |
| 3.50%, 06/15/25 | 250,000 | 282,870 |
| 2.95%, 02/28/26 | 350,000 | 390,079 |
| 2.50%, 09/20/26 (a) | 450,000 | 495,135 |
| 5.90%, 02/15/39 | 500,000 | 769,200 |
| 5.50%, 01/15/40 | 900,000 | 1,354,302 |
| Citrix Systems, Inc. |
| 4.50%, 12/01/27 (a) | 250,000 | 294,105 |
| 3.30%, 03/01/30 (a) | 250,000 | 276,633 |
Schwab Fixed-Income ETFs | Annual Report
Schwab U.S. Aggregate Bond ETF
Portfolio Holdings as of December 31, 2020 (continued)
Security
Rate, Maturity Date | Face
Amount ($) | Value ($) |
| Corning, Inc. |
| 2.90%, 05/15/22 (a) | 250,000 | 257,275 |
| 5.75%, 08/15/40 | 150,000 | 203,820 |
| 5.35%, 11/15/48 (a) | 250,000 | 353,618 |
| 3.90%, 11/15/49 (a) | 150,000 | 183,329 |
| 4.38%, 11/15/57 (a) | 450,000 | 558,157 |
| 5.85%, 11/15/68 (a) | 50,000 | 73,681 |
| 5.45%, 11/15/79 (a) | 400,000 | 545,356 |
| Dell International LLC/EMC Corp. |
| 5.45%, 06/15/23 (a)(c) | 1,250,000 | 1,383,212 |
| 4.00%, 07/15/24 (a)(c) | 250,000 | 275,888 |
| 5.85%, 07/15/25 (a)(c) | 200,000 | 239,202 |
| 6.02%, 06/15/26 (a)(c) | 1,600,000 | 1,954,784 |
| 4.90%, 10/01/26 (a)(c) | 500,000 | 590,930 |
| 6.10%, 07/15/27 (a)(c) | 250,000 | 310,623 |
| 5.30%, 10/01/29 (a)(c) | 650,000 | 796,828 |
| 6.20%, 07/15/30 (a)(c) | 350,000 | 453,873 |
| 8.10%, 07/15/36 (a)(c) | 606,000 | 892,686 |
| 8.35%, 07/15/46 (a)(c) | 700,000 | 1,060,458 |
| DXC Technology Co. |
| 4.00%, 04/15/23 | 250,000 | 267,318 |
| 4.25%, 04/15/24 (a) | 125,000 | 137,121 |
| 4.13%, 04/15/25 (a) | 150,000 | 166,127 |
| 4.75%, 04/15/27 (a) | 200,000 | 230,048 |
| Equifax, Inc. |
| 3.30%, 12/15/22 (a) | 325,000 | 340,746 |
| 3.95%, 06/15/23 (a) | 150,000 | 162,138 |
| 2.60%, 12/01/24 (a) | 300,000 | 321,501 |
| 2.60%, 12/15/25 (a) | 100,000 | 108,213 |
| 3.10%, 05/15/30 (a) | 300,000 | 335,061 |
| Equinix, Inc. |
| 2.63%, 11/18/24 (a) | 350,000 | 374,448 |
| 1.00%, 09/15/25 (a) | 650,000 | 652,632 |
| 2.90%, 11/18/26 (a) | 100,000 | 109,628 |
| 5.38%, 05/15/27 (a) | 450,000 | 490,626 |
| 1.55%, 03/15/28 (a) | 250,000 | 253,428 |
| 3.20%, 11/18/29 (a) | 650,000 | 715,468 |
| 3.00%, 07/15/50 (a) | 250,000 | 253,830 |
| 2.95%, 09/15/51 (a) | 250,000 | 254,185 |
| Fidelity National Information Services, Inc. |
| 3.50%, 04/15/23 (a) | 384,000 | 407,697 |
| 3.00%, 08/15/26 (a) | 450,000 | 501,061 |
| 4.25%, 05/15/28 (a) | 550,000 | 654,263 |
| 3.75%, 05/21/29 (a) | 50,000 | 59,040 |
| 4.50%, 08/15/46 (a) | 100,000 | 126,229 |
| Fiserv, Inc. |
| 3.50%, 10/01/22 (a) | 250,000 | 261,815 |
| 3.80%, 10/01/23 (a) | 400,000 | 436,260 |
| 2.75%, 07/01/24 (a) | 850,000 | 913,333 |
| 3.85%, 06/01/25 (a) | 250,000 | 282,425 |
| 3.20%, 07/01/26 (a) | 600,000 | 672,066 |
| 2.25%, 06/01/27 (a) | 200,000 | 213,686 |
| 4.20%, 10/01/28 (a) | 750,000 | 895,717 |
| 3.50%, 07/01/29 (a) | 950,000 | 1,091,930 |
| 2.65%, 06/01/30 (a) | 200,000 | 217,212 |
| 4.40%, 07/01/49 (a) | 650,000 | 870,005 |
| Flex Ltd. |
| 4.75%, 06/15/25 (a) | 500,000 | 571,975 |
| 3.75%, 02/01/26 (a) | 350,000 | 391,356 |
| 4.88%, 06/15/29 (a) | 200,000 | 238,268 |
| 4.88%, 05/12/30 (a) | 250,000 | 301,388 |
| FLIR Systems, Inc. |
| 2.50%, 08/01/30 (a) | 250,000 | 263,738 |
| Genpact Luxembourg Sarl |
| 3.38%, 12/01/24 (a) | 250,000 | 272,845 |
Security
Rate, Maturity Date | Face
Amount ($) | Value ($) |
| Global Payments, Inc. |
| 3.75%, 06/01/23 (a) | 600,000 | 641,352 |
| 2.65%, 02/15/25 (a) | 200,000 | 214,396 |
| 4.45%, 06/01/28 (a) | 250,000 | 296,818 |
| 3.20%, 08/15/29 (a) | 400,000 | 444,880 |
| 2.90%, 05/15/30 (a) | 375,000 | 408,506 |
| 4.15%, 08/15/49 (a) | 350,000 | 431,091 |
| Hewlett Packard Enterprise Co. |
| 4.40%, 10/15/22 (a) | 620,000 | 658,917 |
| 2.25%, 04/01/23 (a) | 400,000 | 415,684 |
| 4.65%, 10/01/24 (a) | 550,000 | 625,449 |
| 4.90%, 10/15/25 (a) | 1,100,000 | 1,288,716 |
| 1.75%, 04/01/26 (a) | 350,000 | 363,024 |
| 6.20%, 10/15/35 (a) | 50,000 | 64,771 |
| 6.35%, 10/15/45 (a) | 650,000 | 859,495 |
| HP, Inc. |
| 4.05%, 09/15/22 | 250,000 | 265,350 |
| 2.20%, 06/17/25 (a) | 400,000 | 423,712 |
| 3.00%, 06/17/27 (a) | 200,000 | 220,858 |
| 3.40%, 06/17/30 (a) | 500,000 | 557,365 |
| 6.00%, 09/15/41 | 400,000 | 522,728 |
| IBM Credit LLC |
| 2.20%, 09/08/22 | 250,000 | 258,040 |
| 3.00%, 02/06/23 | 300,000 | 316,788 |
| Intel Corp. |
| 2.35%, 05/11/22 (a) | 700,000 | 718,711 |
| 3.10%, 07/29/22 | 250,000 | 261,543 |
| 2.70%, 12/15/22 | 850,000 | 890,451 |
| 2.88%, 05/11/24 (a) | 200,000 | 215,828 |
| 3.40%, 03/25/25 (a) | 600,000 | 666,918 |
| 3.70%, 07/29/25 (a) | 650,000 | 734,942 |
| 3.75%, 03/25/27 (a) | 250,000 | 290,143 |
| 3.15%, 05/11/27 (a) | 1,000,000 | 1,125,980 |
| 2.45%, 11/15/29 (a) | 700,000 | 758,611 |
| 3.90%, 03/25/30 (a) | 400,000 | 480,600 |
| 4.60%, 03/25/40 (a) | 200,000 | 264,328 |
| 4.80%, 10/01/41 | 500,000 | 683,600 |
| 4.25%, 12/15/42 | 150,000 | 192,312 |
| 4.90%, 07/29/45 (a) | 100,000 | 140,034 |
| 4.10%, 05/19/46 (a) | 650,000 | 823,062 |
| 4.10%, 05/11/47 (a) | 425,000 | 541,157 |
| 3.73%, 12/08/47 (a) | 600,000 | 718,704 |
| 3.25%, 11/15/49 (a) | 600,000 | 676,062 |
| 4.75%, 03/25/50 (a) | 700,000 | 978,992 |
| 3.10%, 02/15/60 (a) | 450,000 | 488,943 |
| 4.95%, 03/25/60 (a) | 350,000 | 519,722 |
| International Business Machines Corp. |
| 2.85%, 05/13/22 | 850,000 | 880,192 |
| 1.88%, 08/01/22 | 200,000 | 205,174 |
| 2.88%, 11/09/22 | 450,000 | 471,901 |
| 3.38%, 08/01/23 | 300,000 | 323,646 |
| 3.63%, 02/12/24 | 1,150,000 | 1,261,435 |
| 3.00%, 05/15/24 | 750,000 | 812,760 |
| 7.00%, 10/30/25 | 150,000 | 194,925 |
| 3.45%, 02/19/26 | 750,000 | 850,920 |
| 3.30%, 05/15/26 | 800,000 | 905,192 |
| 3.30%, 01/27/27 | 1,000,000 | 1,129,710 |
| 1.70%, 05/15/27 (a) | 100,000 | 104,089 |
| 3.50%, 05/15/29 | 1,250,000 | 1,443,775 |
| 1.95%, 05/15/30 (a) | 300,000 | 309,756 |
| 5.88%, 11/29/32 | 300,000 | 433,449 |
| 4.15%, 05/15/39 | 850,000 | 1,078,386 |
| 2.85%, 05/15/40 (a) | 300,000 | 323,058 |
| 4.00%, 06/20/42 | 375,000 | 468,229 |
| 4.70%, 02/19/46 | 300,000 | 418,500 |
| 4.25%, 05/15/49 | 950,000 | 1,249,696 |
Schwab Fixed-Income ETFs | Annual Report
Schwab U.S. Aggregate Bond ETF
Portfolio Holdings as of December 31, 2020 (continued)
Security
Rate, Maturity Date | Face
Amount ($) | Value ($) |
| 2.95%, 05/15/50 (a) | 300,000 | 320,751 |
| 7.13%, 12/01/96 | 100,000 | 173,149 |
| Intuit, Inc. |
| 0.95%, 07/15/25 (a) | 150,000 | 152,013 |
| 1.35%, 07/15/27 (a) | 250,000 | 255,835 |
| Jabil, Inc. |
| 4.70%, 09/15/22 | 150,000 | 160,742 |
| 3.95%, 01/12/28 (a) | 250,000 | 285,603 |
| 3.60%, 01/15/30 (a) | 100,000 | 111,943 |
| 3.00%, 01/15/31 (a) | 300,000 | 319,758 |
| Juniper Networks, Inc. |
| 3.75%, 08/15/29 (a) | 250,000 | 287,723 |
| 2.00%, 12/10/30 (a) | 200,000 | 197,632 |
| Keysight Technologies, Inc. |
| 4.60%, 04/06/27 (a) | 550,000 | 656,804 |
| KLA Corp. |
| 4.65%, 11/01/24 (a) | 500,000 | 569,870 |
| 4.10%, 03/15/29 (a) | 174,000 | 208,816 |
| 5.00%, 03/15/49 (a) | 200,000 | 281,120 |
| 3.30%, 03/01/50 (a) | 200,000 | 226,258 |
| Lam Research Corp. |
| 3.80%, 03/15/25 (a) | 500,000 | 561,640 |
| 3.75%, 03/15/26 (a) | 50,000 | 57,297 |
| 4.00%, 03/15/29 (a) | 400,000 | 480,648 |
| 1.90%, 06/15/30 (a) | 250,000 | 259,868 |
| 4.88%, 03/15/49 (a) | 195,000 | 284,634 |
| 2.88%, 06/15/50 (a) | 300,000 | 323,871 |
| 3.13%, 06/15/60 (a) | 200,000 | 226,264 |
| Leidos, Inc. |
| 2.95%, 05/15/23 (a)(c) | 100,000 | 105,373 |
| 3.63%, 05/15/25 (a)(c) | 100,000 | 111,985 |
| 4.38%, 05/15/30 (a)(c) | 300,000 | 360,078 |
| 2.30%, 02/15/31 (a)(c) | 250,000 | 256,878 |
| Marvell Technology Group Ltd. |
| 4.88%, 06/22/28 (a) | 164,000 | 194,832 |
| Microchip Technology, Inc. |
| 4.33%, 06/01/23 (a) | 300,000 | 325,122 |
| Micron Technology, Inc. |
| 2.50%, 04/24/23 | 400,000 | 417,232 |
| 4.64%, 02/06/24 (a) | 200,000 | 222,726 |
| 4.98%, 02/06/26 (a) | 50,000 | 59,234 |
| 4.19%, 02/15/27 (a) | 500,000 | 585,420 |
| 5.33%, 02/06/29 (a) | 250,000 | 313,548 |
| 4.66%, 02/15/30 (a) | 250,000 | 307,195 |
| Microsoft Corp. |
| 2.40%, 02/06/22 (a) | 700,000 | 715,589 |
| 2.38%, 02/12/22 (a) | 500,000 | 511,185 |
| 2.65%, 11/03/22 (a) | 350,000 | 364,410 |
| 2.38%, 05/01/23 (a) | 250,000 | 261,275 |
| 2.00%, 08/08/23 (a) | 650,000 | 678,450 |
| 3.63%, 12/15/23 (a) | 750,000 | 819,682 |
| 2.88%, 02/06/24 (a) | 567,000 | 608,839 |
| 2.70%, 02/12/25 (a) | 900,000 | 976,797 |
| 3.13%, 11/03/25 (a) | 1,000,000 | 1,118,280 |
| 2.40%, 08/08/26 (a) | 1,600,000 | 1,746,480 |
| 3.30%, 02/06/27 (a) | 825,000 | 941,308 |
| 3.50%, 02/12/35 (a) | 950,000 | 1,171,815 |
| 4.20%, 11/03/35 (a) | 350,000 | 461,891 |
| 3.45%, 08/08/36 (a) | 750,000 | 925,245 |
| 4.10%, 02/06/37 (a) | 800,000 | 1,049,024 |
| 5.20%, 06/01/39 | 44,000 | 66,292 |
| 4.50%, 10/01/40 | 300,000 | 421,668 |
| 3.50%, 11/15/42 | 250,000 | 307,880 |
| 3.75%, 02/12/45 (a) | 150,000 | 192,462 |
| 4.45%, 11/03/45 (a) | 575,000 | 818,610 |
Security
Rate, Maturity Date | Face
Amount ($) | Value ($) |
| 3.70%, 08/08/46 (a) | 1,575,000 | 1,996,234 |
| 4.25%, 02/06/47 (a) | 650,000 | 909,265 |
| 2.53%, 06/01/50 (a) | 2,050,000 | 2,165,866 |
| 4.00%, 02/12/55 (a) | 450,000 | 622,768 |
| 4.75%, 11/03/55 (a) | 50,000 | 76,842 |
| 3.95%, 08/08/56 (a) | 750,000 | 1,029,165 |
| 4.50%, 02/06/57 (a) | 500,000 | 756,515 |
| 2.68%, 06/01/60 (a) | 1,210,000 | 1,318,476 |
| Motorola Solutions, Inc. |
| 3.50%, 03/01/23 | 400,000 | 423,096 |
| 4.60%, 02/23/28 (a) | 200,000 | 241,962 |
| 4.60%, 05/23/29 (a) | 250,000 | 300,978 |
| 2.30%, 11/15/30 (a) | 250,000 | 255,335 |
| 5.50%, 09/01/44 | 200,000 | 255,188 |
| NetApp, Inc. |
| 3.30%, 09/29/24 (a) | 200,000 | 217,840 |
| 2.38%, 06/22/27 (a) | 150,000 | 160,257 |
| 2.70%, 06/22/30 (a) | 250,000 | 269,753 |
| NVIDIA Corp. |
| 3.20%, 09/16/26 (a) | 400,000 | 453,540 |
| 2.85%, 04/01/30 (a) | 500,000 | 563,180 |
| 3.50%, 04/01/40 (a) | 350,000 | 420,136 |
| 3.50%, 04/01/50 (a) | 650,000 | 793,019 |
| 3.70%, 04/01/60 (a) | 150,000 | 192,909 |
| NXP BV/NXP Funding LLC |
| 5.35%, 03/01/26 (a)(c) | 500,000 | 599,890 |
| 5.55%, 12/01/28 (a)(c) | 250,000 | 316,953 |
| NXP BV/NXP Funding LLC/NXP USA, Inc. |
| 2.70%, 05/01/25 (a)(c) | 200,000 | 215,192 |
| 3.88%, 06/18/26 (a)(c) | 250,000 | 286,323 |
| 3.15%, 05/01/27 (a)(c) | 200,000 | 221,002 |
| 4.30%, 06/18/29 (a)(c) | 350,000 | 417,301 |
| 3.40%, 05/01/30 (a)(c) | 350,000 | 398,377 |
| Oracle Corp. |
| 2.50%, 05/15/22 (a) | 1,150,000 | 1,180,785 |
| 2.50%, 10/15/22 | 1,400,000 | 1,455,748 |
| 2.63%, 02/15/23 (a) | 550,000 | 576,515 |
| 3.63%, 07/15/23 | 200,000 | 216,816 |
| 2.40%, 09/15/23 (a) | 1,000,000 | 1,052,380 |
| 3.40%, 07/08/24 (a) | 650,000 | 711,776 |
| 2.95%, 11/15/24 (a) | 500,000 | 544,105 |
| 2.50%, 04/01/25 (a) | 1,100,000 | 1,182,335 |
| 2.95%, 05/15/25 (a) | 500,000 | 548,295 |
| 2.65%, 07/15/26 (a) | 756,000 | 829,619 |
| 2.80%, 04/01/27 (a) | 700,000 | 773,591 |
| 3.25%, 11/15/27 (a) | 1,000,000 | 1,140,800 |
| 2.95%, 04/01/30 (a) | 1,200,000 | 1,343,316 |
| 3.25%, 05/15/30 (a) | 150,000 | 172,775 |
| 4.30%, 07/08/34 (a) | 600,000 | 761,184 |
| 3.90%, 05/15/35 (a) | 350,000 | 428,697 |
| 3.85%, 07/15/36 (a) | 500,000 | 606,480 |
| 3.80%, 11/15/37 (a) | 900,000 | 1,085,166 |
| 6.50%, 04/15/38 | 500,000 | 796,815 |
| 6.13%, 07/08/39 | 200,000 | 309,352 |
| 3.60%, 04/01/40 (a) | 1,100,000 | 1,293,490 |
| 5.38%, 07/15/40 | 750,000 | 1,075,597 |
| 4.50%, 07/08/44 (a) | 250,000 | 326,100 |
| 4.13%, 05/15/45 (a) | 595,000 | 742,411 |
| 4.00%, 07/15/46 (a) | 1,100,000 | 1,351,372 |
| 4.00%, 11/15/47 (a) | 700,000 | 861,924 |
| 3.60%, 04/01/50 (a) | 1,500,000 | 1,753,725 |
| 4.38%, 05/15/55 (a) | 525,000 | 692,879 |
| 3.85%, 04/01/60 (a) | 1,150,000 | 1,412,924 |
| PayPal Holdings, Inc. |
| 2.20%, 09/26/22 | 350,000 | 361,680 |
| 1.35%, 06/01/23 | 350,000 | 358,862 |
Schwab Fixed-Income ETFs | Annual Report
Schwab U.S. Aggregate Bond ETF
Portfolio Holdings as of December 31, 2020 (continued)
Security
Rate, Maturity Date | Face
Amount ($) | Value ($) |
| 2.40%, 10/01/24 (a) | 400,000 | 427,676 |
| 1.65%, 06/01/25 (a) | 350,000 | 366,468 |
| 2.65%, 10/01/26 (a) | 400,000 | 440,240 |
| 2.85%, 10/01/29 (a) | 650,000 | 724,100 |
| 2.30%, 06/01/30 (a) | 300,000 | 321,801 |
| 3.25%, 06/01/50 (a) | 350,000 | 404,148 |
| QUALCOMM, Inc. |
| 3.00%, 05/20/22 | 400,000 | 415,376 |
| 2.60%, 01/30/23 (a) | 200,000 | 209,774 |
| 2.90%, 05/20/24 (a) | 125,000 | 134,816 |
| 3.45%, 05/20/25 (a) | 650,000 | 725,881 |
| 3.25%, 05/20/27 (a) | 350,000 | 398,153 |
| 1.30%, 05/20/28 (a) | 734,000 | 742,133 |
| 2.15%, 05/20/30 (a) | 400,000 | 424,804 |
| 1.65%, 05/20/32 (a)(c) | 850,000 | 854,394 |
| 4.65%, 05/20/35 (a) | 300,000 | 403,395 |
| 4.80%, 05/20/45 (a) | 700,000 | 993,440 |
| 4.30%, 05/20/47 (a) | 250,000 | 338,718 |
| 3.25%, 05/20/50 (a) | 275,000 | 320,293 |
| salesforce.com, Inc. |
| 3.25%, 04/11/23 (a) | 400,000 | 426,496 |
| 3.70%, 04/11/28 (a) | 375,000 | 443,156 |
| Seagate HDD Cayman |
| 4.75%, 06/01/23 | 400,000 | 432,600 |
| 4.75%, 01/01/25 | 180,000 | 196,301 |
| 4.88%, 06/01/27 (a) | 301,000 | 338,902 |
| 4.09%, 06/01/29 (a)(c) | 272,000 | 291,649 |
| 4.13%, 01/15/31 (a)(c) | 300,000 | 320,838 |
| 5.75%, 12/01/34 (a) | 150,000 | 176,873 |
| ServiceNow, Inc. |
| 1.40%, 09/01/30 (a) | 500,000 | 489,045 |
| Telefonaktiebolaget LM Ericsson |
| 4.13%, 05/15/22 | 650,000 | 677,131 |
| Tencent Music Entertainment Group |
| 1.38%, 09/03/25 (a) | 200,000 | 200,974 |
| 2.00%, 09/03/30 (a) | 200,000 | 198,790 |
| Texas Instruments, Inc. |
| 1.85%, 05/15/22 (a) | 350,000 | 357,410 |
| 2.25%, 05/01/23 (a) | 250,000 | 261,308 |
| 1.38%, 03/12/25 (a) | 250,000 | 259,670 |
| 2.90%, 11/03/27 (a) | 200,000 | 224,270 |
| 2.25%, 09/04/29 (a) | 350,000 | 377,874 |
| 1.75%, 05/04/30 (a) | 200,000 | 207,306 |
| 3.88%, 03/15/39 (a) | 50,000 | 62,873 |
| 4.15%, 05/15/48 (a) | 550,000 | 740,355 |
| Trimble, Inc. |
| 4.15%, 06/15/23 (a) | 250,000 | 270,933 |
| 4.90%, 06/15/28 (a) | 175,000 | 209,834 |
| Tyco Electronics Group S.A. |
| 3.50%, 02/03/22 (a) | 250,000 | 256,535 |
| 3.45%, 08/01/24 (a) | 165,000 | 179,360 |
| 3.70%, 02/15/26 (a) | 150,000 | 168,696 |
| 3.13%, 08/15/27 (a) | 150,000 | 167,147 |
| Verisk Analytics, Inc. |
| 4.00%, 06/15/25 (a) | 500,000 | 567,320 |
| 4.13%, 03/15/29 (a) | 475,000 | 573,154 |
| 3.63%, 05/15/50 (a) | 100,000 | 116,790 |
| VMware, Inc. |
| 2.95%, 08/21/22 (a) | 450,000 | 467,068 |
| 4.50%, 05/15/25 (a) | 350,000 | 401,044 |
| 3.90%, 08/21/27 (a) | 500,000 | 564,815 |
| 4.70%, 05/15/30 (a) | 500,000 | 602,595 |
Security
Rate, Maturity Date | Face
Amount ($) | Value ($) |
| Xilinx, Inc. |
| 2.95%, 06/01/24 (a) | 350,000 | 377,503 |
| 2.38%, 06/01/30 (a) | 200,000 | 210,048 |
| | | 210,715,163 |
| Transportation 0.7% |
| American Airlines 2015-2 Class AA Pass-Through Trust |
| 3.60%, 09/22/27 | 118,029 | 116,550 |
| American Airlines 2016-2 Class AA Pass-Through Trust |
| 3.20%, 06/15/28 | 688,075 | 669,387 |
| American Airlines 2017-2 Class AA Pass Through Trust |
| 3.35%, 10/15/29 | 43,235 | 41,959 |
| American Airlines 2019-1 Class AA Pass Through Trust |
| 3.15%, 02/15/32 | 337,831 | 328,770 |
| BNSF Funding Trust I |
| 6.61%, 12/15/55 (a)(b) | 100,000 | 115,123 |
| Burlington Northern Santa Fe LLC |
| 3.05%, 03/15/22 (a) | 250,000 | 256,653 |
| 3.85%, 09/01/23 (a) | 425,000 | 460,836 |
| 3.75%, 04/01/24 (a) | 250,000 | 274,108 |
| 3.40%, 09/01/24 (a) | 1,300,000 | 1,427,270 |
| 3.00%, 04/01/25 (a) | 240,000 | 263,021 |
| 7.00%, 12/15/25 | 150,000 | 194,403 |
| 6.20%, 08/15/36 | 100,000 | 152,751 |
| 5.05%, 03/01/41 (a) | 500,000 | 695,350 |
| 5.40%, 06/01/41 (a) | 150,000 | 218,898 |
| 4.40%, 03/15/42 (a) | 200,000 | 263,186 |
| 4.38%, 09/01/42 (a) | 550,000 | 727,683 |
| 4.45%, 03/15/43 (a) | 200,000 | 267,928 |
| 5.15%, 09/01/43 (a) | 550,000 | 793,149 |
| 4.55%, 09/01/44 (a) | 800,000 | 1,089,448 |
| 3.90%, 08/01/46 (a) | 100,000 | 127,497 |
| 4.05%, 06/15/48 (a) | 1,200,000 | 1,580,712 |
| 4.15%, 12/15/48 (a) | 300,000 | 401,379 |
| Canadian National Railway Co. |
| 2.95%, 11/21/24 (a) | 150,000 | 162,194 |
| 6.90%, 07/15/28 | 150,000 | 208,691 |
| 6.38%, 11/15/37 | 150,000 | 235,539 |
| 3.20%, 08/02/46 (a) | 300,000 | 354,948 |
| 3.65%, 02/03/48 (a) | 300,000 | 372,456 |
| 4.45%, 01/20/49 (a) | 350,000 | 489,905 |
| 2.45%, 05/01/50 (a) | 300,000 | 309,216 |
| Canadian Pacific Railway Co. |
| 4.45%, 03/15/23 (a) | 150,000 | 161,649 |
| 2.90%, 02/01/25 (a) | 271,000 | 294,070 |
| 4.00%, 06/01/28 (a) | 250,000 | 294,175 |
| 2.05%, 03/05/30 (a) | 200,000 | 210,300 |
| 7.13%, 10/15/31 | 350,000 | 520,362 |
| 4.80%, 09/15/35 (a) | 45,000 | 59,233 |
| 5.95%, 05/15/37 | 200,000 | 295,764 |
| 4.80%, 08/01/45 (a) | 150,000 | 208,451 |
| 6.13%, 09/15/15 (a) | 289,000 | 484,185 |
| CH Robinson Worldwide, Inc. |
| 4.20%, 04/15/28 (a) | 200,000 | 236,850 |
| Continental Airlines 2007-1 Class A Pass Through Trust |
| 5.98%, 04/19/22 | 259,388 | 262,174 |
| Continental Airlines 2012-1 Class A Pass Through Trust |
| 4.15%, 04/11/24 | 84,535 | 85,032 |
| CSX Corp. |
| 3.40%, 08/01/24 (a) | 300,000 | 328,083 |
| 3.35%, 11/01/25 (a) | 150,000 | 168,099 |
| 2.60%, 11/01/26 (a) | 250,000 | 273,453 |
| 3.25%, 06/01/27 (a) | 628,000 | 710,613 |
| 3.80%, 03/01/28 (a) | 250,000 | 291,435 |
| 2.40%, 02/15/30 (a) | 175,000 | 189,271 |
Schwab Fixed-Income ETFs | Annual Report
Schwab U.S. Aggregate Bond ETF
Portfolio Holdings as of December 31, 2020 (continued)
Security
Rate, Maturity Date | Face
Amount ($) | Value ($) |
| 6.15%, 05/01/37 | 500,000 | 743,330 |
| 5.50%, 04/15/41 (a) | 550,000 | 775,648 |
| 4.75%, 05/30/42 (a) | 50,000 | 65,755 |
| 4.10%, 03/15/44 (a) | 850,000 | 1,063,443 |
| 3.80%, 11/01/46 (a) | 500,000 | 605,740 |
| 4.50%, 03/15/49 (a) | 300,000 | 404,154 |
| 3.80%, 04/15/50 (a) | 150,000 | 185,559 |
| 3.95%, 05/01/50 (a) | 300,000 | 378,393 |
| 4.50%, 08/01/54 (a) | 200,000 | 265,316 |
| 4.25%, 11/01/66 (a) | 100,000 | 133,947 |
| 4.65%, 03/01/68 (a) | 125,000 | 176,724 |
| Delta Air Lines 2007-1 Class A Pass Through Trust |
| 6.82%, 08/10/22 | 274,887 | 281,028 |
| Delta Air Lines 2019-1 Class AA Pass Through Trust |
| 3.20%, 04/25/24 | 188,000 | 192,260 |
| Delta Air Lines 2020-1 Class AA Pass-Through Trust |
| 2.00%, 06/10/28 | 145,515 | 145,910 |
| FedEx Corp 2020-1 Class AA Pass Through Trust |
| 1.88%, 02/20/34 | 250,000 | 255,550 |
| FedEx Corp. |
| 2.63%, 08/01/22 | 200,000 | 207,104 |
| 4.00%, 01/15/24 | 300,000 | 332,487 |
| 3.80%, 05/15/25 (a) | 300,000 | 339,024 |
| 3.25%, 04/01/26 (a) | 350,000 | 390,803 |
| 3.30%, 03/15/27 (a) | 400,000 | 448,844 |
| 3.40%, 02/15/28 (a) | 450,000 | 514,579 |
| 4.20%, 10/17/28 (a) | 100,000 | 119,684 |
| 3.10%, 08/05/29 (a) | 300,000 | 335,670 |
| 4.25%, 05/15/30 (a) | 300,000 | 364,725 |
| 4.90%, 01/15/34 | 62,000 | 80,199 |
| 3.90%, 02/01/35 | 300,000 | 359,679 |
| 3.88%, 08/01/42 | 200,000 | 234,132 |
| 5.10%, 01/15/44 | 250,000 | 338,365 |
| 4.10%, 02/01/45 | 77,000 | 91,832 |
| 4.75%, 11/15/45 (a) | 265,000 | 346,472 |
| 4.55%, 04/01/46 (a) | 500,000 | 639,645 |
| 4.40%, 01/15/47 (a) | 675,000 | 847,604 |
| 4.95%, 10/17/48 (a) | 300,000 | 409,005 |
| 5.25%, 05/15/50 (a) | 550,000 | 780,604 |
| JB Hunt Transport Services, Inc. |
| 3.88%, 03/01/26 (a) | 375,000 | 432,735 |
| JetBlue 2019-1 Class AA Pass Through Trust |
| 2.75%, 05/15/32 | 192,684 | 193,058 |
| JetBlue 2020-1 Class A Pass Through Trust |
| Series 1A |
| 4.00%, 11/15/32 | 250,000 | 269,418 |
| Kansas City Southern |
| 3.00%, 05/15/23 (a) | 150,000 | 155,957 |
| 2.88%, 11/15/29 (a) | 150,000 | 162,423 |
| 4.30%, 05/15/43 (a) | 150,000 | 175,016 |
| 4.95%, 08/15/45 (a) | 200,000 | 254,286 |
| 4.70%, 05/01/48 (a) | 200,000 | 254,816 |
| 4.20%, 11/15/69 (a) | 350,000 | 415,170 |
| Kirby Corp. |
| 4.20%, 03/01/28 (a) | 200,000 | 222,278 |
| Norfolk Southern Corp. |
| 3.00%, 04/01/22 (a) | 700,000 | 719,292 |
| 2.90%, 06/15/26 (a) | 550,000 | 608,421 |
| 2.55%, 11/01/29 (a) | 100,000 | 108,463 |
| 4.84%, 10/01/41 | 350,000 | 479,468 |
| 4.45%, 06/15/45 (a) | 250,000 | 326,537 |
| 4.65%, 01/15/46 (a) | 450,000 | 605,605 |
| 3.94%, 11/01/47 (a) | 250,000 | 307,673 |
| 4.15%, 02/28/48 (a) | 275,000 | 349,643 |
| 4.10%, 05/15/49 (a) | 100,000 | 126,836 |
Security
Rate, Maturity Date | Face
Amount ($) | Value ($) |
| 3.40%, 11/01/49 (a) | 100,000 | 115,025 |
| 3.05%, 05/15/50 (a) | 300,000 | 329,007 |
| 4.05%, 08/15/52 (a) | 250,000 | 319,422 |
| 3.16%, 05/15/55 (a) | 275,000 | 300,440 |
| Ryder System, Inc. |
| 2.88%, 06/01/22 (a) | 150,000 | 155,015 |
| 3.40%, 03/01/23 (a) | 275,000 | 291,541 |
| 3.75%, 06/09/23 (a) | 200,000 | 215,298 |
| 3.88%, 12/01/23 (a) | 250,000 | 272,978 |
| 3.65%, 03/18/24 (a) | 500,000 | 546,845 |
| 3.35%, 09/01/25 (a) | 235,000 | 262,027 |
| 2.90%, 12/01/26 (a) | 200,000 | 220,110 |
| Southwest Airlines Co. |
| 4.75%, 05/04/23 | 250,000 | 271,960 |
| 5.25%, 05/04/25 (a) | 350,000 | 406,283 |
| 3.00%, 11/15/26 (a) | 350,000 | 375,431 |
| 5.13%, 06/15/27 (a) | 475,000 | 564,827 |
| 3.45%, 11/16/27 (a) | 300,000 | 328,224 |
| 2.63%, 02/10/30 (a) | 650,000 | 663,630 |
| Union Pacific Corp. |
| 4.16%, 07/15/22 (a) | 250,000 | 262,310 |
| 2.95%, 01/15/23 (a) | 150,000 | 156,831 |
| 2.75%, 04/15/23 (a) | 100,000 | 104,787 |
| 3.50%, 06/08/23 (a) | 100,000 | 107,245 |
| 3.65%, 02/15/24 (a) | 350,000 | 381,003 |
| 3.15%, 03/01/24 (a) | 250,000 | 270,640 |
| 3.25%, 08/15/25 (a) | 500,000 | 554,885 |
| 2.75%, 03/01/26 (a) | 500,000 | 546,955 |
| 2.15%, 02/05/27 (a) | 175,000 | 186,403 |
| 3.70%, 03/01/29 (a) | 300,000 | 349,932 |
| 2.40%, 02/05/30 (a) | 250,000 | 269,900 |
| 3.38%, 02/01/35 (a) | 600,000 | 690,354 |
| 4.38%, 09/10/38 (a) | 300,000 | 377,466 |
| 3.55%, 08/15/39 (a) | 250,000 | 289,825 |
| 4.15%, 01/15/45 (a) | 400,000 | 493,820 |
| 4.05%, 11/15/45 (a) | 120,000 | 148,110 |
| 4.00%, 04/15/47 (a) | 500,000 | 619,400 |
| 4.30%, 03/01/49 (a) | 200,000 | 263,102 |
| 3.25%, 02/05/50 (a) | 650,000 | 741,292 |
| 3.80%, 10/01/51 (a) | 250,000 | 307,438 |
| 3.95%, 08/15/59 (a) | 150,000 | 185,810 |
| 3.84%, 03/20/60 (a) | 700,000 | 867,881 |
| 2.97%, 09/16/62 (a)(c) | 450,000 | 473,548 |
| 4.38%, 11/15/65 (a) | 300,000 | 401,958 |
| 4.10%, 09/15/67 (a) | 50,000 | 62,932 |
| 3.75%, 02/05/70 (a) | 250,000 | 299,955 |
| United Airlines 2013-1 Class A Pass Through Trust |
| 4.30%, 08/15/25 | 843,366 | 850,282 |
| United Airlines 2014-1 Class A Pass-Through Trust |
| 4.00%, 04/11/26 | 101,013 | 101,653 |
| United Airlines 2014-2 Class A Pass-Through Trust |
| 3.75%, 09/03/26 | 203,223 | 205,619 |
| United Airlines 2016-1 Class AA Pass-Through Trust |
| 3.10%, 07/07/28 | 505,021 | 512,631 |
| United Airlines 2016-2 Class AA Pass-Through Trust |
| 2.88%, 10/07/28 | 16,828 | 16,860 |
| United Airlines 2018-1 Class AA Pass-Through Trust |
| 3.50%, 03/01/30 | 317,885 | 314,710 |
| United Airlines 2019-1 Class AA Pass Through Trust |
| 4.15%, 08/25/31 | 302,997 | 314,726 |
| United Airlines 2019-2 Class AA Pass Through Trust |
| 2.70%, 05/01/32 | 197,046 | 188,544 |
| United Parcel Service, Inc. |
| 2.35%, 05/16/22 (a) | 250,000 | 256,723 |
| 2.45%, 10/01/22 | 350,000 | 363,251 |
Schwab Fixed-Income ETFs | Annual Report
Schwab U.S. Aggregate Bond ETF
Portfolio Holdings as of December 31, 2020 (continued)
Security
Rate, Maturity Date | Face
Amount ($) | Value ($) |
| 2.50%, 04/01/23 (a) | 250,000 | 261,855 |
| 2.20%, 09/01/24 (a) | 150,000 | 159,365 |
| 2.80%, 11/15/24 (a) | 150,000 | 162,420 |
| 3.90%, 04/01/25 (a) | 450,000 | 509,103 |
| 3.05%, 11/15/27 (a) | 350,000 | 397,218 |
| 3.40%, 03/15/29 (a) | 100,000 | 115,565 |
| 2.50%, 09/01/29 (a) | 150,000 | 163,545 |
| 4.45%, 04/01/30 (a) | 325,000 | 407,452 |
| 6.20%, 01/15/38 | 400,000 | 626,724 |
| 5.20%, 04/01/40 (a) | 150,000 | 213,465 |
| 4.88%, 11/15/40 (a) | 550,000 | 761,722 |
| 3.63%, 10/01/42 | 100,000 | 121,355 |
| 3.40%, 11/15/46 (a) | 200,000 | 240,248 |
| 3.75%, 11/15/47 (a) | 250,000 | 317,518 |
| 4.25%, 03/15/49 (a) | 310,000 | 415,316 |
| 3.40%, 09/01/49 (a) | 200,000 | 241,090 |
| 5.30%, 04/01/50 (a) | 400,000 | 604,636 |
| | | 60,587,959 |
| | | 1,464,602,660 |
| |
| Utility 2.2% |
| Electric 2.0% |
| AEP Texas, Inc. |
| 3.95%, 06/01/28 (a) | 95,000 | 111,238 |
| 2.10%, 07/01/30 (a) | 250,000 | 261,478 |
| 3.45%, 01/15/50 (a) | 150,000 | 171,285 |
| AEP Transmission Co. LLC |
| 3.75%, 12/01/47 (a) | 250,000 | 303,775 |
| 4.25%, 09/15/48 (a) | 110,000 | 144,620 |
| 3.80%, 06/15/49 (a) | 250,000 | 308,665 |
| AES Corp. |
| 1.38%, 01/15/26 (a)(c) | 250,000 | 252,245 |
| 2.45%, 01/15/31 (a)(c) | 350,000 | 354,630 |
| Alabama Power Co. |
| 3.55%, 12/01/23 | 350,000 | 381,398 |
| 1.45%, 09/15/30 (a) | 250,000 | 252,495 |
| 6.00%, 03/01/39 | 225,000 | 334,955 |
| 3.85%, 12/01/42 | 150,000 | 184,262 |
| 4.30%, 01/02/46 (a) | 500,000 | 665,375 |
| 3.70%, 12/01/47 (a) | 850,000 | 1,034,144 |
| 4.30%, 07/15/48 (a) | 100,000 | 133,940 |
| Ameren Corp. |
| 3.65%, 02/15/26 (a) | 750,000 | 848,482 |
| 3.50%, 01/15/31 (a) | 300,000 | 346,230 |
| Ameren Illinois Co. |
| 4.15%, 03/15/46 (a) | 300,000 | 385,179 |
| 3.70%, 12/01/47 (a) | 150,000 | 184,734 |
| 3.25%, 03/15/50 (a) | 100,000 | 116,929 |
| American Electric Power Co., Inc. |
| 4.30%, 12/01/28 (a) | 400,000 | 480,028 |
| 3.25%, 03/01/50 (a) | 200,000 | 215,114 |
| Appalachian Power Co. |
| 3.40%, 06/01/25 (a) | 500,000 | 554,020 |
| 3.30%, 06/01/27 (a) | 300,000 | 333,654 |
| 7.00%, 04/01/38 | 410,000 | 634,463 |
| 4.45%, 06/01/45 (a) | 500,000 | 637,010 |
| 4.50%, 03/01/49 (a) | 150,000 | 199,211 |
| 3.70%, 05/01/50 (a) | 300,000 | 361,248 |
| Arizona Public Service Co. |
| 3.15%, 05/15/25 (a) | 250,000 | 274,957 |
| 4.35%, 11/15/45 (a) | 775,000 | 1,005,214 |
| 3.35%, 05/15/50 (a) | 250,000 | 291,877 |
| 2.65%, 09/15/50 (a) | 250,000 | 259,705 |
Security
Rate, Maturity Date | Face
Amount ($) | Value ($) |
| Avangrid, Inc. |
| 3.15%, 12/01/24 (a) | 500,000 | 545,460 |
| 3.20%, 04/15/25 (a) | 100,000 | 109,635 |
| 3.80%, 06/01/29 (a) | 145,000 | 167,155 |
| Avista Corp. |
| 4.35%, 06/01/48 (a) | 150,000 | 194,142 |
| Baltimore Gas and Electric Co. |
| 3.50%, 11/15/21 (a) | 100,000 | 101,911 |
| 3.50%, 08/15/46 (a) | 250,000 | 294,335 |
| 3.75%, 08/15/47 (a) | 100,000 | 122,564 |
| 4.25%, 09/15/48 (a) | 100,000 | 132,343 |
| Berkshire Hathaway Energy Co. |
| 2.80%, 01/15/23 (a) | 350,000 | 367,139 |
| 3.50%, 02/01/25 (a) | 150,000 | 165,536 |
| 4.05%, 04/15/25 (a)(c) | 600,000 | 681,606 |
| 3.25%, 04/15/28 (a) | 625,000 | 715,087 |
| 3.70%, 07/15/30 (a)(c) | 200,000 | 237,204 |
| 6.13%, 04/01/36 | 637,000 | 942,989 |
| 5.95%, 05/15/37 | 250,000 | 363,880 |
| 5.15%, 11/15/43 (a) | 260,000 | 357,916 |
| 4.50%, 02/01/45 (a) | 350,000 | 450,219 |
| 3.80%, 07/15/48 (a) | 250,000 | 300,867 |
| 4.25%, 10/15/50 (a)(c) | 300,000 | 387,489 |
| 2.85%, 05/15/51 (a)(c) | 350,000 | 360,185 |
| Black Hills Corp. |
| 3.05%, 10/15/29 (a) | 200,000 | 220,010 |
| 2.50%, 06/15/30 (a) | 250,000 | 263,943 |
| 4.35%, 05/01/33 (a) | 400,000 | 485,748 |
| 4.20%, 09/15/46 (a) | 100,000 | 121,524 |
| 3.88%, 10/15/49 (a) | 100,000 | 117,418 |
| CenterPoint Energy Houston Electric LLC |
| 3.55%, 08/01/42 (a) | 128,000 | 150,518 |
| 3.95%, 03/01/48 (a) | 200,000 | 257,018 |
| 4.25%, 02/01/49 (a) | 300,000 | 398,028 |
| 2.90%, 07/01/50 (a) | 150,000 | 164,721 |
| CenterPoint Energy, Inc. |
| 2.50%, 09/01/22 (a) | 500,000 | 517,090 |
| 3.85%, 02/01/24 (a) | 250,000 | 273,872 |
| 4.25%, 11/01/28 (a) | 400,000 | 474,668 |
| 2.95%, 03/01/30 (a) | 400,000 | 437,732 |
| 3.70%, 09/01/49 (a) | 150,000 | 172,868 |
| Cleco Corporate Holdings LLC |
| 3.74%, 05/01/26 (a) | 270,000 | 299,279 |
| 3.38%, 09/15/29 (a) | 170,000 | 177,528 |
| 4.97%, 05/01/46 (a) | 100,000 | 116,959 |
| CMS Energy Corp. |
| 3.00%, 05/15/26 (a) | 350,000 | 386,687 |
| 3.45%, 08/15/27 (a) | 200,000 | 226,046 |
| 4.88%, 03/01/44 (a) | 400,000 | 532,240 |
| Commonwealth Edison Co. |
| 2.55%, 06/15/26 (a) | 123,000 | 135,116 |
| 3.70%, 08/15/28 (a) | 950,000 | 1,126,396 |
| 6.45%, 01/15/38 | 300,000 | 464,085 |
| 3.80%, 10/01/42 (a) | 200,000 | 239,556 |
| 4.60%, 08/15/43 (a) | 150,000 | 197,799 |
| 4.70%, 01/15/44 (a) | 150,000 | 201,764 |
| 3.70%, 03/01/45 (a) | 250,000 | 297,967 |
| 4.35%, 11/15/45 (a) | 150,000 | 195,404 |
| 3.65%, 06/15/46 (a) | 250,000 | 299,072 |
| 3.75%, 08/15/47 (a) | 100,000 | 122,233 |
| 4.00%, 03/01/48 (a) | 100,000 | 127,126 |
| 4.00%, 03/01/49 (a) | 300,000 | 383,619 |
| 3.20%, 11/15/49 (a) | 100,000 | 113,065 |
| 3.00%, 03/01/50 (a) | 250,000 | 274,857 |
Schwab Fixed-Income ETFs | Annual Report
Schwab U.S. Aggregate Bond ETF
Portfolio Holdings as of December 31, 2020 (continued)
Security
Rate, Maturity Date | Face
Amount ($) | Value ($) |
| Connecticut Light and Power Co. |
| 4.30%, 04/15/44 (a) | 200,000 | 262,172 |
| 4.00%, 04/01/48 (a) | 250,000 | 325,885 |
| Consolidated Edison Co. of New York, Inc. |
| 3.35%, 04/01/30 (a) | 200,000 | 229,276 |
| 5.30%, 03/01/35 | 250,000 | 331,317 |
| 6.75%, 04/01/38 | 500,000 | 765,065 |
| 5.50%, 12/01/39 | 250,000 | 346,815 |
| 5.70%, 06/15/40 | 150,000 | 211,442 |
| 3.95%, 03/01/43 (a) | 1,000,000 | 1,180,140 |
| 4.45%, 03/15/44 (a) | 950,000 | 1,200,135 |
| 4.13%, 05/15/49 (a) | 150,000 | 185,973 |
| 3.95%, 04/01/50 (a) | 350,000 | 427,021 |
| 4.63%, 12/01/54 (a) | 525,000 | 705,679 |
| 4.30%, 12/01/56 (a) | 50,000 | 64,257 |
| 4.00%, 11/15/57 (a) | 250,000 | 308,500 |
| 4.50%, 05/15/58 (a) | 240,000 | 319,658 |
| 3.70%, 11/15/59 (a) | 300,000 | 351,438 |
| Consumers Energy Co. |
| 3.38%, 08/15/23 (a) | 250,000 | 267,858 |
| 3.95%, 05/15/43 (a) | 250,000 | 312,907 |
| 4.05%, 05/15/48 (a) | 100,000 | 130,832 |
| 4.35%, 04/15/49 (a) | 350,000 | 479,794 |
| 3.10%, 08/15/50 (a) | 250,000 | 288,105 |
| 3.50%, 08/01/51 (a) | 100,000 | 123,103 |
| 2.50%, 05/01/60 (a) | 300,000 | 301,080 |
| Dayton Power & Light Co. |
| 3.95%, 06/15/49 (a) | 250,000 | 293,655 |
| Delmarva Power & Light Co. |
| 3.50%, 11/15/23 (a) | 500,000 | 541,385 |
| Dominion Energy South Carolina, Inc. |
| 5.30%, 05/15/33 | 250,000 | 336,455 |
| 5.45%, 02/01/41 (a) | 100,000 | 144,187 |
| 5.10%, 06/01/65 (a) | 175,000 | 278,616 |
| Dominion Energy, Inc. |
| 2.75%, 09/15/22 (a) | 250,000 | 258,305 |
| 3.07%, 08/15/24 | 200,000 | 216,250 |
| 2.85%, 08/15/26 (a) | 500,000 | 551,400 |
| 4.25%, 06/01/28 (a) | 150,000 | 180,245 |
| 3.38%, 04/01/30 (a) | 550,000 | 626,802 |
| 6.30%, 03/15/33 | 45,000 | 63,932 |
| 5.25%, 08/01/33 | 500,000 | 658,725 |
| 5.95%, 06/15/35 | 100,000 | 140,149 |
| 7.00%, 06/15/38 | 200,000 | 307,370 |
| 4.90%, 08/01/41 (a) | 200,000 | 263,344 |
| 4.05%, 09/15/42 (a) | 400,000 | 480,688 |
| 4.70%, 12/01/44 (a) | 100,000 | 131,189 |
| 4.60%, 03/15/49 (a) | 150,000 | 201,672 |
| 5.75%, 10/01/54 (a)(b) | 100,000 | 111,434 |
| DTE Electric Co. |
| 3.38%, 03/01/25 (a) | 150,000 | 166,116 |
| 2.63%, 03/01/31 (a) | 300,000 | 332,595 |
| 4.30%, 07/01/44 (a) | 100,000 | 130,105 |
| 3.70%, 03/15/45 (a) | 150,000 | 182,018 |
| 3.70%, 06/01/46 (a) | 400,000 | 491,872 |
| 4.05%, 05/15/48 (a) | 150,000 | 197,033 |
| 3.95%, 03/01/49 (a) | 389,000 | 504,529 |
| DTE Energy Co. |
| 2.60%, 06/15/22 | 100,000 | 103,152 |
| 3.30%, 06/15/22 (a) | 500,000 | 518,370 |
| 2.25%, 11/01/22 | 200,000 | 207,094 |
| 3.70%, 08/01/23 (a) | 250,000 | 270,285 |
| 3.50%, 06/01/24 (a) | 140,000 | 152,188 |
| 2.53%, 10/01/24 | 120,000 | 128,242 |
| 2.85%, 10/01/26 (a) | 645,000 | 708,965 |
| 3.40%, 06/15/29 (a) | 200,000 | 227,344 |
Security
Rate, Maturity Date | Face
Amount ($) | Value ($) |
| 2.95%, 03/01/30 (a) | 200,000 | 220,060 |
| 6.38%, 04/15/33 | 250,000 | 359,550 |
| Duke Energy Carolinas LLC |
| 3.05%, 03/15/23 (a) | 200,000 | 211,680 |
| 3.95%, 11/15/28 (a) | 236,000 | 281,281 |
| 2.45%, 02/01/30 (a) | 250,000 | 269,680 |
| 6.10%, 06/01/37 | 250,000 | 371,380 |
| 6.05%, 04/15/38 | 1,255,000 | 1,890,256 |
| 5.30%, 02/15/40 | 600,000 | 857,148 |
| 4.25%, 12/15/41 (a) | 250,000 | 317,617 |
| 3.75%, 06/01/45 (a) | 750,000 | 903,810 |
| 3.88%, 03/15/46 (a) | 250,000 | 307,907 |
| 3.70%, 12/01/47 (a) | 200,000 | 241,950 |
| Duke Energy Corp. |
| 2.40%, 08/15/22 (a) | 100,000 | 103,173 |
| 3.05%, 08/15/22 (a) | 950,000 | 984,333 |
| 3.75%, 04/15/24 (a) | 690,000 | 760,270 |
| 0.90%, 09/15/25 (a) | 200,000 | 200,740 |
| 2.65%, 09/01/26 (a) | 500,000 | 545,270 |
| 3.15%, 08/15/27 (a) | 200,000 | 223,940 |
| 3.40%, 06/15/29 (a) | 350,000 | 397,561 |
| 2.45%, 06/01/30 (a) | 500,000 | 533,410 |
| 4.80%, 12/15/45 (a) | 100,000 | 132,559 |
| 3.75%, 09/01/46 (a) | 200,000 | 232,640 |
| 3.95%, 08/15/47 (a) | 250,000 | 302,870 |
| 4.20%, 06/15/49 (a) | 200,000 | 253,838 |
| Duke Energy Florida LLC |
| 3.20%, 01/15/27 (a) | 1,000,000 | 1,120,180 |
| 3.80%, 07/15/28 (a) | 100,000 | 117,573 |
| 2.50%, 12/01/29 (a) | 150,000 | 163,659 |
| 1.75%, 06/15/30 (a) | 250,000 | 255,230 |
| 6.40%, 06/15/38 | 250,000 | 390,142 |
| 5.65%, 04/01/40 | 250,000 | 368,065 |
| 3.85%, 11/15/42 (a) | 250,000 | 300,325 |
| 4.20%, 07/15/48 (a) | 100,000 | 129,465 |
| Duke Energy Florida Project Finance LLC |
| Series 2026 |
| 2.54%, 09/01/29 | 150,000 | 161,858 |
| Duke Energy Indiana LLC |
| 6.35%, 08/15/38 | 150,000 | 231,018 |
| 4.90%, 07/15/43 (a) | 75,000 | 102,284 |
| 3.75%, 05/15/46 (a) | 50,000 | 60,006 |
| 3.25%, 10/01/49 (a) | 200,000 | 227,348 |
| 2.75%, 04/01/50 (a) | 200,000 | 209,844 |
| Duke Energy Ohio, Inc. |
| 3.65%, 02/01/29 (a) | 150,000 | 174,011 |
| 2.13%, 06/01/30 (a) | 200,000 | 209,210 |
| 4.30%, 02/01/49 (a) | 150,000 | 194,120 |
| Duke Energy Progress LLC |
| 3.25%, 08/15/25 (a) | 150,000 | 167,400 |
| 4.10%, 05/15/42 (a) | 200,000 | 250,038 |
| 4.38%, 03/30/44 (a) | 200,000 | 260,486 |
| 4.15%, 12/01/44 (a) | 550,000 | 703,054 |
| 4.20%, 08/15/45 (a) | 50,000 | 64,413 |
| 3.70%, 10/15/46 (a) | 500,000 | 608,850 |
| 3.60%, 09/15/47 (a) | 200,000 | 241,818 |
| 2.50%, 08/15/50 (a) | 250,000 | 251,923 |
| Edison International |
| 2.40%, 09/15/22 (a) | 200,000 | 204,900 |
| 3.13%, 11/15/22 (a) | 150,000 | 155,928 |
| 2.95%, 03/15/23 (a) | 500,000 | 520,910 |
| 3.55%, 11/15/24 (a) | 200,000 | 217,114 |
| El Paso Electric Co. |
| 6.00%, 05/15/35 | 69,000 | 96,169 |
Schwab Fixed-Income ETFs | Annual Report
Schwab U.S. Aggregate Bond ETF
Portfolio Holdings as of December 31, 2020 (continued)
Security
Rate, Maturity Date | Face
Amount ($) | Value ($) |
| Emera US Finance LP |
| 3.55%, 06/15/26 (a) | 187,000 | 210,197 |
| 4.75%, 06/15/46 (a) | 525,000 | 674,693 |
| Enel Americas S.A. |
| 4.00%, 10/25/26 (a) | 200,000 | 225,508 |
| Enel Chile S.A. |
| 4.88%, 06/12/28 (a) | 475,000 | 562,875 |
| Entergy Arkansas LLC |
| 3.50%, 04/01/26 (a) | 500,000 | 565,705 |
| 4.20%, 04/01/49 (a) | 300,000 | 394,368 |
| 2.65%, 06/15/51 (a) | 250,000 | 256,945 |
| Entergy Corp. |
| 4.00%, 07/15/22 (a) | 250,000 | 262,230 |
| 0.90%, 09/15/25 (a) | 250,000 | 250,535 |
| 2.95%, 09/01/26 (a) | 250,000 | 275,925 |
| 2.80%, 06/15/30 (a) | 250,000 | 271,317 |
| 3.75%, 06/15/50 (a) | 200,000 | 234,098 |
| Entergy Louisiana LLC |
| 5.40%, 11/01/24 | 150,000 | 176,801 |
| 2.40%, 10/01/26 (a) | 500,000 | 541,550 |
| 3.12%, 09/01/27 (a) | 150,000 | 166,757 |
| 3.25%, 04/01/28 (a) | 150,000 | 169,014 |
| 1.60%, 12/15/30 (a) | 300,000 | 303,573 |
| 4.00%, 03/15/33 (a) | 211,000 | 263,761 |
| 4.95%, 01/15/45 (a) | 500,000 | 550,675 |
| 4.20%, 09/01/48 (a) | 200,000 | 261,120 |
| 4.20%, 04/01/50 (a) | 50,000 | 65,191 |
| Entergy Mississippi LLC |
| 3.85%, 06/01/49 (a) | 250,000 | 306,845 |
| Entergy Texas, Inc. |
| 4.00%, 03/30/29 (a) | 247,000 | 289,867 |
| 1.75%, 03/15/31 (a) | 250,000 | 250,923 |
| 3.55%, 09/30/49 (a) | 200,000 | 232,940 |
| Evergy Kansas Central, Inc. |
| 4.13%, 03/01/42 (a) | 250,000 | 310,107 |
| 4.10%, 04/01/43 (a) | 650,000 | 809,945 |
| 4.25%, 12/01/45 (a) | 250,000 | 322,367 |
| Evergy Metro, Inc. |
| 3.15%, 03/15/23 (a) | 100,000 | 105,337 |
| 4.20%, 06/15/47 (a) | 95,000 | 122,625 |
| 4.13%, 04/01/49 (a) | 200,000 | 258,862 |
| Evergy, Inc. |
| 2.45%, 09/15/24 (a) | 350,000 | 371,329 |
| 2.90%, 09/15/29 (a) | 250,000 | 274,715 |
| Eversource Energy |
| 2.75%, 03/15/22 (a) | 500,000 | 513,720 |
| 2.80%, 05/01/23 (a) | 100,000 | 105,079 |
| 3.80%, 12/01/23 (a) | 500,000 | 547,000 |
| 3.30%, 01/15/28 (a) | 250,000 | 280,757 |
| 1.65%, 08/15/30 (a) | 250,000 | 249,438 |
| 3.45%, 01/15/50 (a) | 250,000 | 287,330 |
| Exelon Corp. |
| 3.50%, 06/01/22 (a) | 300,000 | 312,153 |
| 3.95%, 06/15/25 (a) | 500,000 | 566,870 |
| 3.40%, 04/15/26 (a) | 100,000 | 112,729 |
| 4.05%, 04/15/30 (a) | 450,000 | 533,700 |
| 4.95%, 06/15/35 (a)(c) | 250,000 | 313,905 |
| 5.63%, 06/15/35 | 250,000 | 338,422 |
| 5.10%, 06/15/45 (a) | 100,000 | 135,639 |
| 4.45%, 04/15/46 (a) | 150,000 | 191,847 |
| 4.70%, 04/15/50 (a) | 250,000 | 332,082 |
| Exelon Generation Co. LLC |
| 4.25%, 06/15/22 (a) | 500,000 | 521,960 |
| 6.25%, 10/01/39 | 750,000 | 906,787 |
| 5.60%, 06/15/42 (a) | 250,000 | 288,267 |
Security
Rate, Maturity Date | Face
Amount ($) | Value ($) |
| Florida Power & Light Co. |
| 2.75%, 06/01/23 (a) | 250,000 | 261,900 |
| 3.25%, 06/01/24 (a) | 250,000 | 269,675 |
| 2.85%, 04/01/25 (a) | 250,000 | 272,972 |
| 3.13%, 12/01/25 (a) | 500,000 | 555,365 |
| 4.95%, 06/01/35 | 150,000 | 208,676 |
| 5.95%, 02/01/38 | 150,000 | 225,401 |
| 5.96%, 04/01/39 | 500,000 | 764,600 |
| 5.69%, 03/01/40 | 100,000 | 149,248 |
| 4.13%, 02/01/42 (a) | 150,000 | 191,237 |
| 4.05%, 06/01/42 (a) | 350,000 | 446,159 |
| 3.80%, 12/15/42 (a) | 275,000 | 341,313 |
| 3.70%, 12/01/47 (a) | 55,000 | 68,660 |
| 3.95%, 03/01/48 (a) | 250,000 | 325,405 |
| 4.13%, 06/01/48 (a) | 150,000 | 200,924 |
| 3.99%, 03/01/49 (a) | 150,000 | 196,577 |
| 3.15%, 10/01/49 (a) | 350,000 | 405,170 |
| Fortis, Inc. |
| 3.06%, 10/04/26 (a) | 310,000 | 341,949 |
| Georgia Power Co. |
| 2.85%, 05/15/22 | 500,000 | 517,295 |
| 2.10%, 07/30/23 | 250,000 | 261,250 |
| 2.20%, 09/15/24 (a) | 150,000 | 158,528 |
| 3.25%, 03/30/27 (a) | 100,000 | 110,923 |
| 2.65%, 09/15/29 (a) | 100,000 | 110,039 |
| 4.75%, 09/01/40 | 100,000 | 131,106 |
| 4.30%, 03/15/42 | 150,000 | 190,881 |
| 4.30%, 03/15/43 | 100,000 | 126,975 |
| 3.70%, 01/30/50 (a) | 100,000 | 121,759 |
| Iberdrola International BV |
| 6.75%, 07/15/36 | 200,000 | 306,734 |
| Idaho Power Co. |
| 4.20%, 03/01/48 (a) | 200,000 | 261,000 |
| Indiana Michigan Power Co. |
| 3.85%, 05/15/28 (a) | 50,000 | 58,240 |
| 4.55%, 03/15/46 (a) | 100,000 | 131,678 |
| 3.75%, 07/01/47 (a) | 250,000 | 300,585 |
| 4.25%, 08/15/48 (a) | 200,000 | 257,640 |
| Interstate Power and Light Co. |
| 3.25%, 12/01/24 (a) | 200,000 | 219,712 |
| 4.10%, 09/26/28 (a) | 100,000 | 119,518 |
| 2.30%, 06/01/30 (a) | 300,000 | 318,552 |
| 6.25%, 07/15/39 | 350,000 | 512,109 |
| 3.70%, 09/15/46 (a) | 50,000 | 58,628 |
| IPALCO Enterprises, Inc. |
| 4.25%, 05/01/30 (a)(c) | 200,000 | 232,370 |
| ITC Holdings Corp. |
| 3.25%, 06/30/26 (a) | 470,000 | 523,679 |
| 3.35%, 11/15/27 (a) | 100,000 | 112,752 |
| 5.30%, 07/01/43 (a) | 100,000 | 133,674 |
| Kentucky Utilities Co. |
| 5.13%, 11/01/40 (a) | 200,000 | 275,454 |
| 3.30%, 06/01/50 (a) | 250,000 | 284,282 |
| Louisville Gas and Electric Co. |
| 4.25%, 04/01/49 (a) | 250,000 | 322,545 |
| MidAmerican Energy Co. |
| 3.10%, 05/01/27 (a) | 50,000 | 56,251 |
| 3.65%, 04/15/29 (a) | 200,000 | 238,064 |
| 6.75%, 12/30/31 | 200,000 | 299,568 |
| 5.80%, 10/15/36 | 200,000 | 292,266 |
| 4.80%, 09/15/43 (a) | 150,000 | 204,909 |
| 4.40%, 10/15/44 (a) | 325,000 | 424,915 |
| 4.25%, 05/01/46 (a) | 200,000 | 262,882 |
| 3.95%, 08/01/47 (a) | 150,000 | 190,475 |
| 3.65%, 08/01/48 (a) | 250,000 | 307,092 |
Schwab Fixed-Income ETFs | Annual Report
Schwab U.S. Aggregate Bond ETF
Portfolio Holdings as of December 31, 2020 (continued)
Security
Rate, Maturity Date | Face
Amount ($) | Value ($) |
| 4.25%, 07/15/49 (a) | 350,000 | 470,575 |
| 3.15%, 04/15/50 (a) | 200,000 | 230,258 |
| Mississippi Power Co. |
| 3.95%, 03/30/28 (a) | 250,000 | 291,642 |
| 4.25%, 03/15/42 | 100,000 | 122,574 |
| National Rural Utilities Cooperative Finance Corp. |
| 2.40%, 04/25/22 (a) | 250,000 | 256,505 |
| 2.30%, 09/15/22 (a) | 250,000 | 258,110 |
| 3.40%, 11/15/23 (a) | 250,000 | 269,972 |
| 2.95%, 02/07/24 (a) | 410,000 | 439,385 |
| 3.25%, 11/01/25 (a) | 400,000 | 445,852 |
| 3.40%, 02/07/28 (a) | 250,000 | 287,737 |
| 3.90%, 11/01/28 (a) | 250,000 | 294,190 |
| 3.70%, 03/15/29 (a) | 200,000 | 234,250 |
| 1.35%, 03/15/31 (a) | 250,000 | 247,508 |
| 4.75%, 04/30/43 (a)(b) | 100,000 | 105,334 |
| 5.25%, 04/20/46 (a)(b) | 450,000 | 497,884 |
| 4.40%, 11/01/48 (a) | 150,000 | 201,726 |
| 4.30%, 03/15/49 (a) | 100,000 | 131,940 |
| Nevada Power Co. |
| 3.70%, 05/01/29 (a) | 750,000 | 880,845 |
| 6.65%, 04/01/36 | 500,000 | 762,705 |
| 3.13%, 08/01/50 (a) | 200,000 | 221,918 |
| NextEra Energy Capital Holdings, Inc. |
| 2.90%, 04/01/22 | 100,000 | 103,214 |
| 2.80%, 01/15/23 (a) | 250,000 | 262,040 |
| 3.15%, 04/01/24 (a) | 350,000 | 378,696 |
| 2.75%, 05/01/25 (a) | 450,000 | 487,449 |
| 3.25%, 04/01/26 (a) | 500,000 | 560,105 |
| 3.55%, 05/01/27 (a) | 200,000 | 228,288 |
| 3.50%, 04/01/29 (a) | 600,000 | 686,136 |
| 2.75%, 11/01/29 (a) | 350,000 | 381,769 |
| 2.25%, 06/01/30 (a) | 800,000 | 839,408 |
| 4.80%, 12/01/77 (a)(b) | 150,000 | 164,765 |
| Northern States Power Co. |
| 6.25%, 06/01/36 | 620,000 | 934,470 |
| 6.20%, 07/01/37 | 150,000 | 233,157 |
| 3.40%, 08/15/42 (a) | 145,000 | 170,382 |
| 4.00%, 08/15/45 (a) | 250,000 | 325,975 |
| 3.60%, 05/15/46 (a) | 300,000 | 367,854 |
| 3.60%, 09/15/47 (a) | 250,000 | 308,135 |
| 2.90%, 03/01/50 (a) | 200,000 | 224,888 |
| 2.60%, 06/01/51 (a) | 50,000 | 53,115 |
| NorthWestern Corp. |
| 4.18%, 11/15/44 (a) | 260,000 | 316,495 |
| NSTAR Electric Co. |
| 3.20%, 05/15/27 (a) | 150,000 | 170,055 |
| 3.25%, 05/15/29 (a) | 250,000 | 286,742 |
| 5.50%, 03/15/40 | 150,000 | 218,258 |
| 4.40%, 03/01/44 (a) | 150,000 | 198,641 |
| Oglethorpe Power Corp. |
| 5.95%, 11/01/39 | 150,000 | 200,841 |
| 5.38%, 11/01/40 | 150,000 | 190,280 |
| 5.05%, 10/01/48 (a) | 100,000 | 127,411 |
| 3.75%, 08/01/50 (a) | 250,000 | 269,472 |
| 5.25%, 09/01/50 | 150,000 | 187,623 |
| Ohio Power Co. |
| 2.60%, 04/01/30 (a) | 200,000 | 218,898 |
| 4.00%, 06/01/49 (a) | 250,000 | 314,835 |
| Oklahoma Gas and Electric Co. |
| 3.30%, 03/15/30 (a) | 125,000 | 143,243 |
| 3.25%, 04/01/30 (a) | 150,000 | 171,110 |
| 4.15%, 04/01/47 (a) | 240,000 | 295,709 |
Security
Rate, Maturity Date | Face
Amount ($) | Value ($) |
| Oncor Electric Delivery Co. LLC |
| 2.75%, 06/01/24 (a) | 400,000 | 430,356 |
| 3.70%, 11/15/28 (a) | 265,000 | 310,596 |
| 5.75%, 03/15/29 (a) | 73,000 | 95,329 |
| 7.50%, 09/01/38 | 200,000 | 331,880 |
| 4.55%, 12/01/41 (a) | 800,000 | 1,060,248 |
| 3.75%, 04/01/45 (a) | 200,000 | 245,776 |
| 4.10%, 11/15/48 (a) | 150,000 | 195,738 |
| 3.80%, 06/01/49 (a) | 150,000 | 187,940 |
| 3.10%, 09/15/49 (a) | 200,000 | 228,894 |
| 3.70%, 05/15/50 (a) | 150,000 | 188,171 |
| 5.35%, 10/01/52 (a)(c) | 250,000 | 387,922 |
| Pacific Gas and Electric Co. |
| 1.75%, 06/16/22 (a) | 500,000 | 501,500 |
| 3.85%, 11/15/23 (a) | 500,000 | 532,850 |
| 3.50%, 06/15/25 (a) | 500,000 | 541,165 |
| 3.15%, 01/01/26 | 500,000 | 533,705 |
| 2.95%, 03/01/26 (a) | 500,000 | 529,440 |
| 2.10%, 08/01/27 (a) | 450,000 | 458,140 |
| 3.30%, 12/01/27 (a) | 500,000 | 535,160 |
| 3.75%, 07/01/28 | 500,000 | 547,630 |
| 4.55%, 07/01/30 (a) | 1,250,000 | 1,427,537 |
| 2.50%, 02/01/31 (a) | 550,000 | 551,166 |
| 4.50%, 07/01/40 | 1,000,000 | 1,126,790 |
| 3.30%, 08/01/40 (a) | 250,000 | 251,110 |
| 4.45%, 04/15/42 (a) | 500,000 | 546,285 |
| 4.00%, 12/01/46 (a) | 250,000 | 260,388 |
| 3.95%, 12/01/47 (a) | 250,000 | 259,695 |
| 4.95%, 07/01/50 (a) | 1,300,000 | 1,546,701 |
| 3.50%, 08/01/50 (a) | 500,000 | 497,485 |
| PacifiCorp |
| 2.95%, 02/01/22 (a) | 83,000 | 84,830 |
| 3.50%, 06/15/29 (a) | 100,000 | 115,810 |
| 2.70%, 09/15/30 (a) | 150,000 | 165,513 |
| 7.70%, 11/15/31 | 100,000 | 154,330 |
| 5.75%, 04/01/37 | 100,000 | 142,962 |
| 6.35%, 07/15/38 | 350,000 | 530,442 |
| 6.00%, 01/15/39 | 100,000 | 149,403 |
| 4.13%, 01/15/49 (a) | 250,000 | 322,607 |
| 4.15%, 02/15/50 (a) | 300,000 | 394,026 |
| 3.30%, 03/15/51 (a) | 250,000 | 289,555 |
| PECO Energy Co. |
| 3.70%, 09/15/47 (a) | 500,000 | 612,950 |
| 3.90%, 03/01/48 (a) | 1,000,000 | 1,267,490 |
| 3.00%, 09/15/49 (a) | 100,000 | 110,907 |
| Pinnacle West Capital Corp. |
| 1.30%, 06/15/25 (a) | 150,000 | 152,720 |
| Potomac Electric Power Co. |
| 3.60%, 03/15/24 (a) | 250,000 | 271,677 |
| 4.15%, 03/15/43 (a) | 100,000 | 126,619 |
| PPL Capital Funding, Inc. |
| 4.20%, 06/15/22 (a) | 100,000 | 104,494 |
| 3.40%, 06/01/23 (a) | 750,000 | 797,850 |
| 4.13%, 04/15/30 (a) | 350,000 | 417,431 |
| 4.70%, 06/01/43 (a) | 100,000 | 125,444 |
| 5.00%, 03/15/44 (a) | 250,000 | 323,770 |
| PPL Electric Utilities Corp. |
| 6.25%, 05/15/39 | 500,000 | 762,290 |
| 4.75%, 07/15/43 (a) | 300,000 | 403,722 |
| 4.15%, 06/15/48 (a) | 550,000 | 715,374 |
| Progress Energy, Inc. |
| 7.75%, 03/01/31 | 250,000 | 372,857 |
| 7.00%, 10/30/31 | 60,000 | 86,272 |
| 6.00%, 12/01/39 | 85,000 | 119,688 |
Schwab Fixed-Income ETFs | Annual Report
Schwab U.S. Aggregate Bond ETF
Portfolio Holdings as of December 31, 2020 (continued)
Security
Rate, Maturity Date | Face
Amount ($) | Value ($) |
| Public Service Co. of Colorado |
| 2.25%, 09/15/22 (a) | 350,000 | 358,368 |
| 3.70%, 06/15/28 (a) | 150,000 | 175,301 |
| 1.90%, 01/15/31 (a) | 155,000 | 161,831 |
| 6.25%, 09/01/37 | 200,000 | 303,474 |
| 4.05%, 09/15/49 (a) | 300,000 | 394,299 |
| 3.20%, 03/01/50 (a) | 250,000 | 290,662 |
| 2.70%, 01/15/51 (a) | 100,000 | 107,690 |
| Public Service Co. of New Hampshire |
| 3.50%, 11/01/23 (a) | 300,000 | 324,207 |
| 3.60%, 07/01/49 (a) | 250,000 | 304,830 |
| Public Service Electric and Gas Co. |
| 3.00%, 05/15/27 (a) | 150,000 | 167,046 |
| 2.45%, 01/15/30 (a) | 100,000 | 108,876 |
| 3.95%, 05/01/42 (a) | 100,000 | 123,705 |
| 3.80%, 01/01/43 (a) | 125,000 | 153,255 |
| 3.80%, 03/01/46 (a) | 200,000 | 249,532 |
| 3.60%, 12/01/47 (a) | 500,000 | 608,950 |
| 3.85%, 05/01/49 (a) | 250,000 | 319,675 |
| 3.20%, 08/01/49 (a) | 150,000 | 172,817 |
| 3.15%, 01/01/50 (a) | 200,000 | 230,190 |
| 2.70%, 05/01/50 (a) | 250,000 | 266,448 |
| 2.05%, 08/01/50 (a) | 300,000 | 282,045 |
| Public Service Enterprise Group, Inc. |
| 2.65%, 11/15/22 (a) | 150,000 | 156,462 |
| 2.88%, 06/15/24 (a) | 250,000 | 269,620 |
| 0.80%, 08/15/25 (a) | 500,000 | 500,955 |
| 1.60%, 08/15/30 (a) | 250,000 | 247,175 |
| Puget Energy, Inc. |
| 4.10%, 06/15/30 (a) | 200,000 | 229,718 |
| Puget Sound Energy, Inc. |
| 5.80%, 03/15/40 | 200,000 | 285,042 |
| 5.64%, 04/15/41 (a) | 250,000 | 357,425 |
| 4.30%, 05/20/45 (a) | 150,000 | 190,223 |
| 4.22%, 06/15/48 (a) | 250,000 | 320,540 |
| 3.25%, 09/15/49 (a) | 150,000 | 168,879 |
| San Diego Gas & Electric Co. |
| 3.60%, 09/01/23 (a) | 100,000 | 107,589 |
| 2.50%, 05/15/26 (a) | 200,000 | 216,996 |
| 1.70%, 10/01/30 (a) | 200,000 | 202,636 |
| 3.75%, 06/01/47 (a) | 150,000 | 176,675 |
| 4.15%, 05/15/48 (a) | 169,000 | 212,419 |
| 4.10%, 06/15/49 (a) | 140,000 | 177,163 |
| 3.32%, 04/15/50 (a) | 150,000 | 171,972 |
| Sempra Energy |
| 3.55%, 06/15/24 (a) | 400,000 | 435,924 |
| Sierra Pacific Power Co. |
| 2.60%, 05/01/26 (a) | 200,000 | 217,276 |
| Southern California Edison Co. |
| 2.40%, 02/01/22 (a) | 200,000 | 203,674 |
| 3.50%, 10/01/23 (a) | 250,000 | 268,653 |
| 1.20%, 02/01/26 (a) | 200,000 | 201,914 |
| 4.20%, 03/01/29 (a) | 150,000 | 176,171 |
| 6.65%, 04/01/29 | 500,000 | 637,465 |
| 2.85%, 08/01/29 (a) | 150,000 | 163,745 |
| 2.25%, 06/01/30 (a) | 150,000 | 156,470 |
| 6.00%, 01/15/34 | 100,000 | 140,330 |
| 5.35%, 07/15/35 | 250,000 | 337,650 |
| 5.55%, 01/15/37 | 500,000 | 640,505 |
| 5.95%, 02/01/38 | 500,000 | 681,680 |
| 5.50%, 03/15/40 | 200,000 | 267,304 |
| 4.05%, 03/15/42 (a) | 105,000 | 120,753 |
| 3.90%, 03/15/43 (a) | 200,000 | 226,604 |
| 4.65%, 10/01/43 (a) | 400,000 | 499,048 |
| 3.60%, 02/01/45 (a) | 100,000 | 110,679 |
| 4.00%, 04/01/47 (a) | 500,000 | 588,930 |
Security
Rate, Maturity Date | Face
Amount ($) | Value ($) |
| 4.13%, 03/01/48 (a) | 550,000 | 660,445 |
| 4.88%, 03/01/49 (a) | 450,000 | 596,272 |
| 3.65%, 02/01/50 (a) | 400,000 | 457,528 |
| Southern Co. |
| 2.95%, 07/01/23 (a) | 500,000 | 530,265 |
| 3.25%, 07/01/26 (a) | 550,000 | 617,342 |
| 3.70%, 04/30/30 (a) | 500,000 | 580,380 |
| 4.25%, 07/01/36 (a) | 250,000 | 309,877 |
| 4.40%, 07/01/46 (a) | 450,000 | 567,720 |
| 4.00%, 01/15/51 (a)(b) | 250,000 | 264,465 |
| 5.50%, 03/15/57 (a)(b) | 150,000 | 155,846 |
| Southern Power Co. |
| 2.50%, 12/15/21 (a) | 100,000 | 101,881 |
| 5.15%, 09/15/41 | 650,000 | 802,249 |
| Southwestern Electric Power Co. |
| 2.75%, 10/01/26 (a) | 500,000 | 544,840 |
| 4.10%, 09/15/28 (a) | 200,000 | 236,102 |
| 3.90%, 04/01/45 (a) | 100,000 | 116,591 |
| 3.85%, 02/01/48 (a) | 150,000 | 176,927 |
| Southwestern Public Service Co. |
| 4.50%, 08/15/41 (a) | 150,000 | 196,233 |
| 3.40%, 08/15/46 (a) | 100,000 | 113,350 |
| 3.70%, 08/15/47 (a) | 150,000 | 178,035 |
| 3.75%, 06/15/49 (a) | 100,000 | 121,663 |
| 3.15%, 05/01/50 (a) | 250,000 | 279,487 |
| Tampa Electric Co. |
| 4.10%, 06/15/42 (a) | 50,000 | 60,622 |
| 4.30%, 06/15/48 (a) | 550,000 | 706,711 |
| Toledo Edison Co. |
| 6.15%, 05/15/37 | 100,000 | 136,903 |
| Tucson Electric Power Co. |
| 3.05%, 03/15/25 (a) | 250,000 | 272,027 |
| 1.50%, 08/01/30 (a) | 250,000 | 247,968 |
| 4.85%, 12/01/48 (a) | 100,000 | 135,301 |
| 4.00%, 06/15/50 (a) | 100,000 | 123,011 |
| Union Electric Co. |
| 2.95%, 06/15/27 (a) | 44,000 | 48,712 |
| 3.50%, 03/15/29 (a) | 750,000 | 866,587 |
| 2.95%, 03/15/30 (a) | 150,000 | 168,177 |
| 3.90%, 09/15/42 (a) | 115,000 | 140,774 |
| 3.65%, 04/15/45 (a) | 100,000 | 119,587 |
| 4.00%, 04/01/48 (a) | 250,000 | 315,420 |
| 3.25%, 10/01/49 (a) | 100,000 | 115,295 |
| 2.63%, 03/15/51 (a) | 250,000 | 261,525 |
| Virginia Electric and Power Co. |
| 2.95%, 01/15/22 (a) | 250,000 | 255,180 |
| 2.75%, 03/15/23 (a) | 481,000 | 504,319 |
| 3.45%, 02/15/24 (a) | 250,000 | 269,877 |
| 3.15%, 01/15/26 (a) | 250,000 | 277,407 |
| 2.95%, 11/15/26 (a) | 200,000 | 223,382 |
| 3.50%, 03/15/27 (a) | 700,000 | 799,701 |
| 2.88%, 07/15/29 (a) | 150,000 | 168,605 |
| 6.00%, 05/15/37 | 550,000 | 805,145 |
| 8.88%, 11/15/38 | 150,000 | 279,025 |
| 4.00%, 01/15/43 (a) | 100,000 | 125,619 |
| 4.45%, 02/15/44 (a) | 500,000 | 660,660 |
| 4.20%, 05/15/45 (a) | 50,000 | 64,421 |
| 3.80%, 09/15/47 (a) | 300,000 | 374,946 |
| 4.60%, 12/01/48 (a) | 450,000 | 632,898 |
| 3.30%, 12/01/49 (a) | 200,000 | 233,948 |
| WEC Energy Group, Inc. |
| 3.55%, 06/15/25 (a) | 101,000 | 112,718 |
| 1.38%, 10/15/27 (a) | 250,000 | 254,635 |
| 1.80%, 10/15/30 (a) | 250,000 | 251,173 |
Schwab Fixed-Income ETFs | Annual Report
Schwab U.S. Aggregate Bond ETF
Portfolio Holdings as of December 31, 2020 (continued)
Security
Rate, Maturity Date | Face
Amount ($) | Value ($) |
| Wisconsin Electric Power Co. |
| 2.05%, 12/15/24 (a) | 100,000 | 105,741 |
| 4.30%, 10/15/48 (a) | 125,000 | 169,708 |
| Wisconsin Power and Light Co. |
| 3.00%, 07/01/29 (a) | 250,000 | 282,457 |
| 3.65%, 04/01/50 (a) | 150,000 | 179,808 |
| Wisconsin Public Service Corp. |
| 3.67%, 12/01/42 | 250,000 | 294,407 |
| 4.75%, 11/01/44 (a) | 100,000 | 136,642 |
| 3.30%, 09/01/49 (a) | 300,000 | 345,390 |
| Xcel Energy, Inc. |
| 3.30%, 06/01/25 (a) | 200,000 | 220,392 |
| 4.00%, 06/15/28 (a) | 250,000 | 295,140 |
| 2.60%, 12/01/29 (a) | 200,000 | 217,328 |
| 3.40%, 06/01/30 (a) | 250,000 | 287,727 |
| 6.50%, 07/01/36 | 140,000 | 210,364 |
| 3.50%, 12/01/49 (a) | 200,000 | 233,400 |
| | | 173,681,296 |
| Natural Gas 0.1% |
| Atmos Energy Corp. |
| 3.00%, 06/15/27 (a) | 650,000 | 721,298 |
| 1.50%, 01/15/31 (a) | 250,000 | 249,845 |
| 5.50%, 06/15/41 (a) | 150,000 | 216,402 |
| 4.15%, 01/15/43 (a) | 100,000 | 125,300 |
| 4.13%, 10/15/44 (a) | 100,000 | 126,841 |
| 4.30%, 10/01/48 (a) | 100,000 | 133,264 |
| 4.13%, 03/15/49 (a) | 150,000 | 195,546 |
| 3.38%, 09/15/49 (a) | 200,000 | 235,630 |
| CenterPoint Energy Resources Corp. |
| 4.00%, 04/01/28 (a) | 50,000 | 58,476 |
| 1.75%, 10/01/30 (a) | 200,000 | 202,448 |
| 5.85%, 01/15/41 (a) | 250,000 | 352,232 |
| 4.10%, 09/01/47 (a) | 300,000 | 368,016 |
| National Grid USA |
| 5.80%, 04/01/35 | 100,000 | 130,646 |
| NiSource, Inc. |
| 0.95%, 08/15/25 (a) | 500,000 | 503,840 |
| 3.49%, 05/15/27 (a) | 225,000 | 255,620 |
| 2.95%, 09/01/29 (a) | 100,000 | 110,073 |
| 3.60%, 05/01/30 (a) | 350,000 | 405,793 |
| 1.70%, 02/15/31 (a) | 400,000 | 398,608 |
| 4.80%, 02/15/44 (a) | 775,000 | 1,023,721 |
| 5.65%, 02/01/45 (a) | 300,000 | 434,289 |
| 4.38%, 05/15/47 (a) | 150,000 | 191,487 |
| 3.95%, 03/30/48 (a) | 100,000 | 123,233 |
| ONE Gas, Inc. |
| 3.61%, 02/01/24 (a) | 100,000 | 108,897 |
| 2.00%, 05/15/30 (a) | 250,000 | 260,985 |
| 4.66%, 02/01/44 (a) | 200,000 | 263,312 |
| 4.50%, 11/01/48 (a) | 100,000 | 133,691 |
| Piedmont Natural Gas Co., Inc. |
| 3.50%, 06/01/29 (a) | 270,000 | 309,290 |
| 3.64%, 11/01/46 (a) | 160,000 | 184,446 |
| 3.35%, 06/01/50 (a) | 150,000 | 169,124 |
| Sempra Energy |
| 2.88%, 10/01/22 (a) | 250,000 | 259,898 |
| 2.90%, 02/01/23 (a) | 250,000 | 262,618 |
| 4.05%, 12/01/23 (a) | 200,000 | 219,080 |
| 3.75%, 11/15/25 (a) | 135,000 | 152,582 |
| 3.25%, 06/15/27 (a) | 150,000 | 167,880 |
| 3.40%, 02/01/28 (a) | 250,000 | 285,123 |
| 3.80%, 02/01/38 (a) | 250,000 | 289,807 |
| 6.00%, 10/15/39 | 350,000 | 502,967 |
| 4.00%, 02/01/48 (a) | 250,000 | 298,177 |
Security
Rate, Maturity Date | Face
Amount ($) | Value ($) |
| Southern California Gas Co. |
| 3.20%, 06/15/25 (a) | 50,000 | 55,521 |
| 2.60%, 06/15/26 (a) | 400,000 | 435,336 |
| 2.55%, 02/01/30 (a) | 250,000 | 271,340 |
| 5.13%, 11/15/40 | 100,000 | 137,877 |
| 3.75%, 09/15/42 (a) | 100,000 | 118,450 |
| 4.13%, 06/01/48 (a) | 150,000 | 193,421 |
| 4.30%, 01/15/49 (a) | 400,000 | 533,400 |
| 3.95%, 02/15/50 (a) | 150,000 | 190,430 |
| Southern Co. Gas Capital Corp. |
| 3.25%, 06/15/26 (a) | 100,000 | 112,468 |
| 1.75%, 01/15/31 (a) | 250,000 | 252,605 |
| 4.40%, 06/01/43 (a) | 100,000 | 123,737 |
| 3.95%, 10/01/46 (a) | 650,000 | 769,106 |
| 4.40%, 05/30/47 (a) | 250,000 | 316,920 |
| Southwest Gas Corp. |
| 2.20%, 06/15/30 (a) | 250,000 | 263,320 |
| 4.15%, 06/01/49 (a) | 250,000 | 310,490 |
| Washington Gas Light Co. |
| 3.80%, 09/15/46 (a) | 55,000 | 66,070 |
| 3.65%, 09/15/49 (a) | 250,000 | 298,615 |
| | | 14,879,591 |
| Utility Other 0.1% |
| American Water Capital Corp. |
| 3.40%, 03/01/25 (a) | 250,000 | 276,923 |
| 2.95%, 09/01/27 (a) | 100,000 | 110,462 |
| 3.75%, 09/01/28 (a) | 250,000 | 292,327 |
| 3.45%, 06/01/29 (a) | 250,000 | 287,540 |
| 2.80%, 05/01/30 (a) | 200,000 | 220,858 |
| 6.59%, 10/15/37 | 450,000 | 698,062 |
| 4.30%, 12/01/42 (a) | 150,000 | 198,347 |
| 4.00%, 12/01/46 (a) | 90,000 | 113,695 |
| 3.75%, 09/01/47 (a) | 400,000 | 491,084 |
| 4.20%, 09/01/48 (a) | 250,000 | 329,015 |
| 4.15%, 06/01/49 (a) | 150,000 | 198,648 |
| 3.45%, 05/01/50 (a) | 200,000 | 238,014 |
| Essential Utilities, Inc. |
| 3.57%, 05/01/29 (a) | 250,000 | 288,390 |
| 2.70%, 04/15/30 (a) | 200,000 | 217,538 |
| 4.28%, 05/01/49 (a) | 150,000 | 193,872 |
| 3.35%, 04/15/50 (a) | 200,000 | 223,692 |
| Veolia Environnement S.A. |
| 6.75%, 06/01/38 | 100,000 | 142,884 |
| | | 4,521,351 |
| | | 193,082,238 |
| Total Corporates |
| (Cost $2,139,325,830) | | 2,376,181,307 |
|
| Treasuries 36.7% of net assets |
| Bonds |
| 7.25%, 08/15/22 | 1,498,000 | 1,671,001 |
| 7.63%, 11/15/22 | 2,198,000 | 2,505,806 |
| 7.13%, 02/15/23 | 1,498,000 | 1,719,657 |
| 6.25%, 08/15/23 | 2,248,000 | 2,607,329 |
| 7.50%, 11/15/24 | 1,748,000 | 2,238,328 |
| 7.63%, 02/15/25 | 1,000,000 | 1,301,836 |
| 6.88%, 08/15/25 | 1,200,000 | 1,560,281 |
| 6.00%, 02/15/26 | 1,889,000 | 2,428,103 |
| 6.75%, 08/15/26 | 1,209,000 | 1,632,575 |
| 6.50%, 11/15/26 | 1,748,000 | 2,358,093 |
| 6.63%, 02/15/27 | 1,000,000 | 1,370,195 |
| 6.38%, 08/15/27 | 1,200,000 | 1,654,594 |
Schwab Fixed-Income ETFs | Annual Report
Schwab U.S. Aggregate Bond ETF
Portfolio Holdings as of December 31, 2020 (continued)
Security
Rate, Maturity Date | Face
Amount ($) | Value ($) |
| 6.13%, 11/15/27 | 2,934,000 | 4,030,124 |
| 5.50%, 08/15/28 | 1,748,000 | 2,373,047 |
| 5.25%, 11/15/28 | 2,248,000 | 3,031,463 |
| 5.25%, 02/15/29 | 2,774,000 | 3,762,454 |
| 6.13%, 08/15/29 | 3,144,000 | 4,556,835 |
| 6.25%, 05/15/30 | 3,131,000 | 4,666,902 |
| 5.38%, 02/15/31 | 4,194,000 | 6,027,237 |
| 4.50%, 02/15/36 | 3,144,000 | 4,614,803 |
| 4.75%, 02/15/37 | 2,082,000 | 3,174,237 |
| 5.00%, 05/15/37 | 3,348,000 | 5,247,728 |
| 4.38%, 02/15/38 | 2,796,000 | 4,157,303 |
| 4.50%, 05/15/38 | 2,996,000 | 4,524,896 |
| 3.50%, 02/15/39 | 2,472,000 | 3,357,478 |
| 4.25%, 05/15/39 | 4,046,000 | 6,005,465 |
| 4.50%, 08/15/39 | 3,746,000 | 5,732,551 |
| 4.38%, 11/15/39 | 4,625,000 | 6,995,313 |
| 4.63%, 02/15/40 | 4,305,000 | 6,711,428 |
| 1.13%, 05/15/40 | 15,900,000 | 15,100,031 |
| 4.38%, 05/15/40 | 4,194,000 | 6,367,672 |
| 1.13%, 08/15/40 | 21,800,000 | 20,650,391 |
| 3.88%, 08/15/40 | 5,394,000 | 7,733,648 |
| 1.38%, 11/15/40 | 17,600,000 | 17,408,875 |
| 4.25%, 11/15/40 | 4,853,000 | 7,293,149 |
| 4.75%, 02/15/41 | 4,692,000 | 7,499,136 |
| 4.38%, 05/15/41 | 4,144,000 | 6,355,536 |
| 3.75%, 08/15/41 | 4,317,000 | 6,136,885 |
| 3.13%, 11/15/41 | 4,944,000 | 6,468,143 |
| 3.13%, 02/15/42 | 5,682,000 | 7,453,186 |
| 3.00%, 05/15/42 | 2,998,000 | 3,858,520 |
| 2.75%, 08/15/42 | 6,391,000 | 7,925,839 |
| 2.75%, 11/15/42 | 9,008,000 | 11,164,290 |
| 3.13%, 02/15/43 | 8,086,000 | 10,611,612 |
| 2.88%, 05/15/43 | 10,831,000 | 13,702,061 |
| 3.63%, 08/15/43 | 9,417,000 | 13,308,134 |
| 3.75%, 11/15/43 | 9,250,000 | 13,322,168 |
| 3.63%, 02/15/44 | 11,177,000 | 15,833,792 |
| 3.38%, 05/15/44 | 10,794,000 | 14,770,071 |
| 3.13%, 08/15/44 | 10,682,000 | 14,096,902 |
| 3.00%, 11/15/44 | 10,936,000 | 14,164,683 |
| 2.50%, 02/15/45 | 11,682,000 | 13,940,824 |
| 3.00%, 05/15/45 | 10,134,000 | 13,156,782 |
| 2.88%, 08/15/45 | 10,532,000 | 13,409,375 |
| 3.00%, 11/15/45 | 3,982,000 | 5,185,311 |
| 2.50%, 02/15/46 | 10,986,000 | 13,135,136 |
| 2.50%, 05/15/46 | 10,882,000 | 13,011,641 |
| 2.25%, 08/15/46 | 11,678,000 | 13,343,027 |
| 2.88%, 11/15/46 | 9,369,000 | 11,979,145 |
| 3.00%, 02/15/47 | 11,134,000 | 14,570,753 |
| 3.00%, 05/15/47 | 4,088,000 | 5,358,154 |
| 2.75%, 08/15/47 | 11,430,000 | 14,343,757 |
| 2.75%, 11/15/47 | 11,528,000 | 14,480,249 |
| 3.00%, 02/15/48 | 12,534,000 | 16,465,563 |
| 3.13%, 05/15/48 | 15,120,000 | 20,311,594 |
| 3.00%, 08/15/48 | 15,728,000 | 20,706,895 |
| 3.38%, 11/15/48 | 14,684,000 | 20,637,903 |
| 3.00%, 02/15/49 | 16,426,000 | 21,681,037 |
| 2.88%, 05/15/49 | 16,676,000 | 21,549,822 |
| 2.25%, 08/15/49 | 16,976,000 | 19,445,477 |
| 2.38%, 11/15/49 | 15,478,000 | 18,199,951 |
| 2.00%, 02/15/50 | 17,698,000 | 19,239,662 |
| 1.25%, 05/15/50 | 21,900,000 | 19,882,805 |
| 1.38%, 08/15/50 | 25,650,000 | 24,026,836 |
| 1.63%, 11/15/50 | 18,100,000 | 18,032,125 |
| Notes |
| 2.00%, 02/15/22 | 8,582,000 | 8,763,362 |
| 1.13%, 02/28/22 | 14,498,000 | 14,669,031 |
| 1.75%, 02/28/22 | 10,586,000 | 10,786,969 |
| 1.88%, 02/28/22 | 9,788,000 | 9,987,775 |
Security
Rate, Maturity Date | Face
Amount ($) | Value ($) |
| 2.38%, 03/15/22 | 13,980,000 | 14,358,170 |
| 0.38%, 03/31/22 | 15,000,000 | 15,049,512 |
| 1.75%, 03/31/22 | 9,942,000 | 10,144,529 |
| 1.88%, 03/31/22 | 11,184,000 | 11,428,868 |
| 2.25%, 04/15/22 | 11,982,000 | 12,310,569 |
| 0.13%, 04/30/22 | 15,600,000 | 15,604,570 |
| 1.75%, 04/30/22 | 9,988,000 | 10,205,512 |
| 1.88%, 04/30/22 | 11,910,000 | 12,187,977 |
| 1.75%, 05/15/22 | 12,190,000 | 12,462,370 |
| 2.13%, 05/15/22 | 14,182,000 | 14,571,174 |
| 0.13%, 05/31/22 | 14,400,000 | 14,403,094 |
| 1.75%, 05/31/22 | 15,986,000 | 16,353,491 |
| 1.88%, 05/31/22 | 11,990,000 | 12,287,877 |
| 1.75%, 06/15/22 | 11,492,000 | 11,763,588 |
| 0.13%, 06/30/22 | 13,800,000 | 13,803,234 |
| 1.75%, 06/30/22 | 10,486,000 | 10,741,391 |
| 2.13%, 06/30/22 | 9,792,000 | 10,085,378 |
| 1.75%, 07/15/22 | 14,980,000 | 15,354,793 |
| 0.13%, 07/31/22 | 16,500,000 | 16,503,223 |
| 1.88%, 07/31/22 | 12,292,000 | 12,632,191 |
| 2.00%, 07/31/22 | 9,488,000 | 9,768,934 |
| 1.50%, 08/15/22 | 12,710,000 | 12,994,734 |
| 1.63%, 08/15/22 | 6,891,000 | 7,059,372 |
| 0.13%, 08/31/22 | 18,200,000 | 18,202,133 |
| 1.63%, 08/31/22 | 10,488,000 | 10,748,766 |
| 1.88%, 08/31/22 | 8,988,000 | 9,248,687 |
| 1.50%, 09/15/22 | 10,388,000 | 10,630,657 |
| 0.13%, 09/30/22 | 20,200,000 | 20,201,973 |
| 1.75%, 09/30/22 | 8,442,000 | 8,680,915 |
| 1.88%, 09/30/22 | 8,488,000 | 8,746,619 |
| 1.38%, 10/15/22 | 11,482,000 | 11,738,102 |
| 0.13%, 10/31/22 | 17,800,000 | 17,802,086 |
| 1.88%, 10/31/22 | 9,986,000 | 10,304,889 |
| 2.00%, 10/31/22 | 10,586,000 | 10,947,826 |
| 1.63%, 11/15/22 | 22,645,000 | 23,278,352 |
| 0.13%, 11/30/22 | 22,000,000 | 22,002,578 |
| 2.00%, 11/30/22 | 16,672,000 | 17,267,894 |
| 1.63%, 12/15/22 | 12,288,000 | 12,648,480 |
| 0.13%, 12/31/22 | 21,000,000 | 21,001,230 |
| 2.13%, 12/31/22 | 19,472,000 | 20,246,316 |
| 1.50%, 01/15/23 | 8,286,000 | 8,517,425 |
| 1.75%, 01/31/23 | 8,448,000 | 8,732,790 |
| 2.38%, 01/31/23 | 10,486,000 | 10,973,845 |
| 1.38%, 02/15/23 | 8,492,000 | 8,715,910 |
| 2.00%, 02/15/23 | 9,672,000 | 10,055,480 |
| 1.50%, 02/28/23 | 4,498,000 | 4,630,480 |
| 2.63%, 02/28/23 | 5,188,000 | 5,466,247 |
| 0.50%, 03/15/23 | 5,300,000 | 5,343,270 |
| 1.50%, 03/31/23 | 6,990,000 | 7,203,250 |
| 2.50%, 03/31/23 | 8,090,000 | 8,518,201 |
| 0.25%, 04/15/23 | 6,000,000 | 6,015,703 |
| 1.63%, 04/30/23 | 7,990,000 | 8,265,905 |
| 2.75%, 04/30/23 | 7,186,000 | 7,621,371 |
| 0.13%, 05/15/23 | 8,900,000 | 8,897,914 |
| 1.75%, 05/15/23 | 15,680,000 | 16,278,412 |
| 1.63%, 05/31/23 | 7,838,000 | 8,117,841 |
| 2.75%, 05/31/23 | 9,984,000 | 10,609,950 |
| 0.25%, 06/15/23 | 10,000,000 | 10,026,563 |
| 1.38%, 06/30/23 | 5,494,000 | 5,662,468 |
| 2.63%, 06/30/23 | 10,968,000 | 11,644,503 |
| 0.13%, 07/15/23 | 9,400,000 | 9,395,594 |
| 1.25%, 07/31/23 | 6,242,000 | 6,419,995 |
| 2.75%, 07/31/23 | 5,896,000 | 6,291,216 |
| 0.13%, 08/15/23 | 14,700,000 | 14,691,961 |
| 2.50%, 08/15/23 | 12,152,000 | 12,902,006 |
| 1.38%, 08/31/23 | 4,992,000 | 5,155,215 |
| 2.75%, 08/31/23 | 7,994,000 | 8,545,461 |
| 0.13%, 09/15/23 | 15,800,000 | 15,788,891 |
Schwab Fixed-Income ETFs | Annual Report
Schwab U.S. Aggregate Bond ETF
Portfolio Holdings as of December 31, 2020 (continued)
Security
Rate, Maturity Date | Face
Amount ($) | Value ($) |
| 1.38%, 09/30/23 | 6,742,000 | 6,968,752 |
| 2.88%, 09/30/23 | 11,672,000 | 12,540,105 |
| 0.13%, 10/15/23 | 12,600,000 | 12,591,141 |
| 1.63%, 10/31/23 | 7,740,000 | 8,063,205 |
| 2.88%, 10/31/23 | 7,486,000 | 8,060,317 |
| 0.25%, 11/15/23 | 16,900,000 | 16,946,871 |
| 2.75%, 11/15/23 | 13,278,000 | 14,267,107 |
| 2.13%, 11/30/23 | 11,234,000 | 11,878,638 |
| 2.88%, 11/30/23 | 5,576,000 | 6,015,763 |
| 0.13%, 12/15/23 | 20,000,000 | 19,977,344 |
| 2.25%, 12/31/23 | 7,342,000 | 7,800,588 |
| 2.63%, 12/31/23 | 17,776,000 | 19,080,731 |
| 2.25%, 01/31/24 | 6,694,000 | 7,121,788 |
| 2.50%, 01/31/24 | 10,970,000 | 11,754,184 |
| 2.75%, 02/15/24 | 16,595,000 | 17,930,379 |
| 2.13%, 02/29/24 | 9,238,000 | 9,804,549 |
| 2.38%, 02/29/24 | 12,982,000 | 13,877,555 |
| 2.13%, 03/31/24 | 22,218,000 | 23,609,229 |
| 2.00%, 04/30/24 | 9,494,000 | 10,063,640 |
| 2.25%, 04/30/24 | 18,574,000 | 19,840,805 |
| 2.50%, 05/15/24 | 22,698,000 | 24,459,755 |
| 2.00%, 05/31/24 | 19,468,000 | 20,660,415 |
| 1.75%, 06/30/24 | 13,032,000 | 13,732,470 |
| 2.00%, 06/30/24 | 8,240,000 | 8,755,322 |
| 1.75%, 07/31/24 | 15,078,000 | 15,905,523 |
| 2.13%, 07/31/24 | 8,488,000 | 9,067,571 |
| 2.38%, 08/15/24 | 22,568,000 | 24,326,717 |
| 1.25%, 08/31/24 | 12,186,000 | 12,641,547 |
| 1.88%, 08/31/24 | 9,490,000 | 10,062,366 |
| 1.50%, 09/30/24 | 12,982,000 | 13,596,109 |
| 2.13%, 09/30/24 | 9,784,000 | 10,474,231 |
| 1.50%, 10/31/24 | 14,480,000 | 15,177,981 |
| 2.25%, 10/31/24 | 9,238,000 | 9,946,728 |
| 2.25%, 11/15/24 | 21,870,000 | 23,565,779 |
| 1.50%, 11/30/24 | 14,480,000 | 15,185,334 |
| 2.13%, 11/30/24 | 8,988,000 | 9,644,896 |
| 1.75%, 12/31/24 | 11,982,000 | 12,693,431 |
| 2.25%, 12/31/24 | 8,988,000 | 9,701,071 |
| 1.38%, 01/31/25 | 9,996,000 | 10,447,382 |
| 2.50%, 01/31/25 | 8,488,000 | 9,259,546 |
| 2.00%, 02/15/25 | 14,686,000 | 15,728,362 |
| 1.13%, 02/28/25 | 5,998,000 | 6,209,804 |
| 2.75%, 02/28/25 | 7,390,000 | 8,147,186 |
| 0.50%, 03/31/25 | 14,200,000 | 14,331,461 |
| 2.63%, 03/31/25 | 4,724,000 | 5,190,495 |
| 0.38%, 04/30/25 | 8,900,000 | 8,933,375 |
| 2.88%, 04/30/25 | 10,986,000 | 12,206,905 |
| 2.13%, 05/15/25 | 19,380,400 | 20,921,747 |
| 0.25%, 05/31/25 | 8,700,000 | 8,683,688 |
| 2.88%, 05/31/25 | 9,288,000 | 10,336,165 |
| 0.25%, 06/30/25 | 16,500,000 | 16,458,750 |
| 2.75%, 06/30/25 | 8,988,000 | 9,968,956 |
| 0.25%, 07/31/25 | 16,100,000 | 16,053,461 |
| 2.88%, 07/31/25 | 10,386,000 | 11,594,184 |
| 2.00%, 08/15/25 | 22,668,000 | 24,423,885 |
| 0.25%, 08/31/25 | 17,900,000 | 17,841,266 |
| 2.75%, 08/31/25 | 9,736,000 | 10,827,877 |
| 0.25%, 09/30/25 | 16,300,000 | 16,237,602 |
| 3.00%, 09/30/25 | 8,682,000 | 9,771,320 |
| 0.25%, 10/31/25 | 20,800,000 | 20,711,438 |
| 3.00%, 10/31/25 | 10,688,000 | 12,049,050 |
| 2.25%, 11/15/25 | 20,872,000 | 22,797,768 |
| 0.38%, 11/30/25 | 22,600,000 | 22,632,664 |
| 2.88%, 11/30/25 | 10,682,000 | 11,995,552 |
| 0.38%, 12/31/25 | 21,000,000 | 21,017,227 |
| 2.63%, 12/31/25 | 9,686,000 | 10,773,405 |
| 2.63%, 01/31/26 | 8,738,000 | 9,732,289 |
| 1.63%, 02/15/26 | 20,672,000 | 21,986,610 |
Security
Rate, Maturity Date | Face
Amount ($) | Value ($) |
| 2.50%, 02/28/26 | 13,476,000 | 14,937,304 |
| 2.25%, 03/31/26 | 10,086,000 | 11,061,111 |
| 2.38%, 04/30/26 | 8,084,000 | 8,926,820 |
| 1.63%, 05/15/26 | 20,285,000 | 21,598,771 |
| 2.13%, 05/31/26 | 9,388,000 | 10,249,056 |
| 1.88%, 06/30/26 | 10,484,000 | 11,312,072 |
| 1.88%, 07/31/26 | 9,284,000 | 10,023,093 |
| 1.50%, 08/15/26 | 18,724,000 | 19,825,498 |
| 1.38%, 08/31/26 | 6,986,000 | 7,348,945 |
| 1.63%, 09/30/26 | 7,490,000 | 7,985,335 |
| 1.63%, 10/31/26 | 10,084,000 | 10,754,822 |
| 2.00%, 11/15/26 | 17,082,000 | 18,592,689 |
| 1.63%, 11/30/26 | 7,986,000 | 8,520,064 |
| 1.75%, 12/31/26 | 6,990,000 | 7,512,066 |
| 1.50%, 01/31/27 | 7,190,000 | 7,621,400 |
| 2.25%, 02/15/27 | 15,126,000 | 16,721,320 |
| 1.13%, 02/28/27 | 4,800,000 | 4,977,937 |
| 0.63%, 03/31/27 | 7,500,000 | 7,545,410 |
| 0.50%, 04/30/27 | 6,850,000 | 6,833,410 |
| 2.38%, 05/15/27 | 18,920,000 | 21,106,147 |
| 0.50%, 05/31/27 | 8,200,000 | 8,172,133 |
| 0.50%, 06/30/27 | 11,400,000 | 11,352,352 |
| 0.38%, 07/31/27 | 14,600,000 | 14,407,234 |
| 2.25%, 08/15/27 | 17,272,000 | 19,153,029 |
| 0.50%, 08/31/27 | 14,000,000 | 13,914,687 |
| 0.38%, 09/30/27 | 17,000,000 | 16,741,016 |
| 0.50%, 10/31/27 | 14,900,000 | 14,783,594 |
| 2.25%, 11/15/27 | 14,074,000 | 15,627,638 |
| 0.63%, 11/30/27 | 21,600,000 | 21,596,625 |
| 0.63%, 12/31/27 | 21,000,000 | 20,978,672 |
| 2.75%, 02/15/28 | 20,822,000 | 23,876,978 |
| 2.88%, 05/15/28 | 21,770,000 | 25,222,586 |
| 2.88%, 08/15/28 | 21,268,000 | 24,707,434 |
| 3.13%, 11/15/28 | 25,214,000 | 29,854,952 |
| 2.63%, 02/15/29 | 23,666,000 | 27,173,375 |
| 2.38%, 05/15/29 | 22,558,000 | 25,499,352 |
| 1.63%, 08/15/29 | 17,666,000 | 18,901,240 |
| 1.75%, 11/15/29 | 12,466,000 | 13,474,967 |
| 1.50%, 02/15/30 | 22,298,000 | 23,595,813 |
| 0.63%, 05/15/30 | 30,700,000 | 30,021,242 |
| 0.63%, 08/15/30 | 38,300,000 | 37,351,477 |
| 0.88%, 11/15/30 | 28,400,000 | 28,304,594 |
| Total Treasuries |
| (Cost $2,997,740,403) | | 3,203,026,285 |
|
| Government Related 6.2% of net assets |
| |
| Agency 2.6% |
| Foreign 0.9% |
| Austria 0.0% |
| Oesterreichische Kontrollbank AG |
| 2.63%, 01/31/22 | 350,000 | 359,027 |
| 1.63%, 09/17/22 | 500,000 | 512,135 |
| 2.88%, 03/13/23 | 850,000 | 898,815 |
| 1.50%, 02/12/25 | 700,000 | 730,786 |
| 0.38%, 09/17/25 | 500,000 | 497,455 |
| | | 2,998,218 |
| British Virgin 0.0% |
| CNOOC Finance 2013 Ltd. |
| 3.00%, 05/09/23 | 750,000 | 780,773 |
| 2.88%, 09/30/29 (a) | 300,000 | 313,518 |
| 3.30%, 09/30/49 (a) | 200,000 | 199,490 |
| | | 1,293,781 |
Schwab Fixed-Income ETFs | Annual Report
Schwab U.S. Aggregate Bond ETF
Portfolio Holdings as of December 31, 2020 (continued)
Security
Rate, Maturity Date | Face
Amount ($) | Value ($) |
| Canada 0.1% |
| CNOOC Finance 2014 ULC |
| 4.25%, 04/30/24 | 700,000 | 760,522 |
| 4.88%, 04/30/44 | 250,000 | 312,472 |
| CNOOC Petroleum North America ULC |
| 5.88%, 03/10/35 | 500,000 | 655,635 |
| 6.40%, 05/15/37 | 750,000 | 1,034,557 |
| Export Development Canada |
| 2.00%, 05/17/22 | 250,000 | 256,303 |
| 1.75%, 07/18/22 | 750,000 | 768,180 |
| 2.50%, 01/24/23 | 600,000 | 628,614 |
| 1.38%, 02/24/23 | 900,000 | 922,986 |
| 2.75%, 03/15/23 | 450,000 | 475,281 |
| 2.63%, 02/21/24 | 740,000 | 794,383 |
| | | 6,608,933 |
| China 0.0% |
| Industrial & Commercial Bank of China Ltd. |
| 2.96%, 11/08/22 | 250,000 | 259,260 |
| 3.54%, 11/08/27 | 250,000 | 278,158 |
| | | 537,418 |
| Colombia 0.0% |
| Ecopetrol S.A. |
| 5.88%, 09/18/23 | 500,000 | 559,390 |
| 4.13%, 01/16/25 | 427,000 | 465,891 |
| 5.38%, 06/26/26 (a) | 378,000 | 435,766 |
| 6.88%, 04/29/30 (a) | 950,000 | 1,226,222 |
| 7.38%, 09/18/43 | 350,000 | 478,398 |
| 5.88%, 05/28/45 | 650,000 | 788,469 |
| | | 3,954,136 |
| Germany 0.3% |
| FMS Wertmanagement |
| 2.00%, 08/01/22 (i) | 700,000 | 719,880 |
| 2.75%, 03/06/23 (i) | 275,000 | 290,092 |
| 2.75%, 01/30/24 (i) | 700,000 | 753,256 |
| Kreditanstalt fuer Wiederaufbau |
| 2.38%, 08/25/21 (i) | 1,000,000 | 1,014,190 |
| 2.00%, 11/30/21 (i) | 300,000 | 305,010 |
| 3.13%, 12/15/21 (i) | 1,500,000 | 1,541,910 |
| 2.63%, 01/25/22 (i) | 1,250,000 | 1,282,625 |
| 2.50%, 02/15/22 (i) | 1,600,000 | 1,641,632 |
| 2.13%, 03/07/22 (i) | 1,450,000 | 1,483,437 |
| 2.13%, 06/15/22 (i) | 1,250,000 | 1,285,300 |
| 1.75%, 08/22/22 (i) | 250,000 | 256,430 |
| 2.00%, 09/29/22 (i) | 2,500,000 | 2,579,100 |
| 2.00%, 10/04/22 (i) | 750,000 | 773,857 |
| 2.38%, 12/29/22 (i) | 1,700,000 | 1,773,916 |
| 2.13%, 01/17/23 (i) | 1,050,000 | 1,091,422 |
| 1.63%, 02/15/23 (i) | 1,700,000 | 1,751,510 |
| 2.63%, 02/28/24 (i) | 1,500,000 | 1,611,735 |
| 1.38%, 08/05/24 (i) | 1,400,000 | 1,454,334 |
| 2.50%, 11/20/24 (i) | 2,200,000 | 2,385,878 |
| 0.38%, 07/18/25 (i) | 1,000,000 | 998,930 |
| 2.88%, 04/03/28 (i) | 1,100,000 | 1,266,056 |
| 1.75%, 09/14/29 (i) | 700,000 | 747,894 |
| 0.75%, 09/30/30 (i) | 500,000 | 488,570 |
| 0.00%, 06/29/37 (h)(i) | 750,000 | 593,678 |
| Landwirtschaftliche Rentenbank |
| 3.13%, 11/14/23 (i) | 450,000 | 487,148 |
| 2.00%, 01/13/25 (i) | 1,150,000 | 1,223,289 |
| 2.38%, 06/10/25 (i) | 600,000 | 650,922 |
| 1.75%, 07/27/26 (i) | 500,000 | 533,130 |
Security
Rate, Maturity Date | Face
Amount ($) | Value ($) |
| 2.50%, 11/15/27 (i) | 500,000 | 558,960 |
| 0.88%, 09/03/30 (i) | 750,000 | 738,293 |
| | | 32,282,384 |
| Japan 0.2% |
| Japan Bank for International Cooperation |
| 2.50%, 06/01/22 | 250,000 | 257,778 |
| 2.38%, 07/21/22 | 1,500,000 | 1,547,880 |
| 2.38%, 11/16/22 | 2,300,000 | 2,388,941 |
| 1.75%, 01/23/23 | 500,000 | 514,585 |
| 0.63%, 05/22/23 | 500,000 | 503,460 |
| 3.25%, 07/20/23 | 800,000 | 858,776 |
| 3.38%, 10/31/23 | 350,000 | 379,561 |
| 2.50%, 05/23/24 | 1,150,000 | 1,229,913 |
| 1.75%, 10/17/24 | 300,000 | 314,199 |
| 2.50%, 05/28/25 | 200,000 | 216,512 |
| 0.63%, 07/15/25 | 200,000 | 200,208 |
| 1.88%, 07/21/26 | 350,000 | 372,127 |
| 2.25%, 11/04/26 | 1,200,000 | 1,301,412 |
| 2.88%, 06/01/27 | 1,050,000 | 1,182,436 |
| 2.88%, 07/21/27 | 650,000 | 732,492 |
| 2.75%, 11/16/27 | 700,000 | 785,323 |
| 3.25%, 07/20/28 | 400,000 | 466,120 |
| 3.50%, 10/31/28 | 350,000 | 416,304 |
| 2.00%, 10/17/29 | 700,000 | 752,451 |
| Japan International Cooperation Agency |
| 2.13%, 10/20/26 | 200,000 | 215,514 |
| 2.75%, 04/27/27 | 200,000 | 222,940 |
| 1.00%, 07/22/30 | 370,000 | 363,902 |
| | | 15,222,834 |
| Norway 0.1% |
| Equinor A.S.A. |
| 3.15%, 01/23/22 | 500,000 | 515,420 |
| 2.45%, 01/17/23 | 450,000 | 469,939 |
| 2.65%, 01/15/24 | 100,000 | 106,348 |
| 3.70%, 03/01/24 | 550,000 | 605,066 |
| 3.25%, 11/10/24 | 150,000 | 165,327 |
| 2.88%, 04/06/25 (a) | 450,000 | 491,377 |
| 3.00%, 04/06/27 (a) | 150,000 | 167,385 |
| 3.63%, 09/10/28 (a) | 250,000 | 291,643 |
| 3.13%, 04/06/30 (a) | 500,000 | 569,395 |
| 2.38%, 05/22/30 (a) | 100,000 | 107,211 |
| 3.63%, 04/06/40 (a) | 150,000 | 181,514 |
| 4.25%, 11/23/41 | 900,000 | 1,135,170 |
| 3.95%, 05/15/43 | 100,000 | 122,609 |
| 4.80%, 11/08/43 | 210,000 | 285,159 |
| 3.25%, 11/18/49 (a) | 250,000 | 279,405 |
| 3.70%, 04/06/50 (a) | 450,000 | 543,694 |
| | | 6,036,662 |
| Republic of Korea 0.1% |
| Export-Import Bank of Korea |
| 2.75%, 01/25/22 | 200,000 | 205,006 |
| 5.00%, 04/11/22 | 250,000 | 264,648 |
| 2.38%, 06/25/24 | 200,000 | 211,842 |
| 2.88%, 01/21/25 | 1,200,000 | 1,303,896 |
| 1.88%, 02/12/25 | 200,000 | 209,498 |
| 3.25%, 11/10/25 | 1,450,000 | 1,625,638 |
| 2.63%, 05/26/26 | 250,000 | 274,840 |
| 2.38%, 04/21/27 | 250,000 | 266,555 |
| 1.25%, 09/21/30 | 500,000 | 491,870 |
| Korea Development Bank |
| 3.38%, 03/12/23 | 200,000 | 212,910 |
| 3.75%, 01/22/24 | 300,000 | 328,155 |
Schwab Fixed-Income ETFs | Annual Report
Schwab U.S. Aggregate Bond ETF
Portfolio Holdings as of December 31, 2020 (continued)
Security
Rate, Maturity Date | Face
Amount ($) | Value ($) |
| 2.13%, 10/01/24 | 550,000 | 579,584 |
| 3.38%, 09/16/25 | 500,000 | 561,355 |
| 2.00%, 09/12/26 | 350,000 | 374,472 |
| | | 6,910,269 |
| Sweden 0.1% |
| Svensk Exportkredit AB |
| 2.38%, 03/09/22 | 1,350,000 | 1,383,871 |
| 2.00%, 08/30/22 | 550,000 | 565,868 |
| 1.63%, 11/14/22 | 400,000 | 410,384 |
| 2.88%, 03/14/23 | 200,000 | 211,344 |
| 0.75%, 04/06/23 | 200,000 | 202,240 |
| 1.75%, 12/12/23 | 500,000 | 521,385 |
| 0.38%, 07/30/24 | 350,000 | 350,172 |
| 0.63%, 05/14/25 | 500,000 | 501,990 |
| 0.50%, 08/26/25 | 300,000 | 299,178 |
| | | 4,446,432 |
| | | 80,291,067 |
| U.S. 1.7% |
| CNOOC Finance 2015 USA LLC |
| 3.75%, 05/02/23 | 250,000 | 264,495 |
| 3.50%, 05/05/25 | 650,000 | 701,402 |
| 4.38%, 05/02/28 | 450,000 | 515,079 |
| Fannie Mae |
| 2.00%, 01/05/22 | 250,000 | 254,795 |
| 1.88%, 04/05/22 | 3,000,000 | 3,066,150 |
| 1.38%, 09/06/22 | 7,000,000 | 7,148,260 |
| 2.38%, 01/19/23 | 3,000,000 | 3,138,180 |
| 0.25%, 05/22/23 | 4,000,000 | 4,010,440 |
| 0.25%, 07/10/23 | 7,000,000 | 7,013,720 |
| 2.88%, 09/12/23 | 3,000,000 | 3,217,710 |
| 0.25%, 11/27/23 | 2,000,000 | 2,002,780 |
| 2.50%, 02/05/24 | 6,000,000 | 6,425,880 |
| 0.38%, 08/25/25 | 3,500,000 | 3,498,040 |
| 0.50%, 11/07/25 | 4,000,000 | 4,018,840 |
| 2.13%, 04/24/26 | 6,000,000 | 6,537,660 |
| 0.75%, 10/08/27 | 1,000,000 | 1,003,550 |
| 7.13%, 01/15/30 | 527,000 | 805,952 |
| 7.25%, 05/15/30 | 1,000,000 | 1,553,510 |
| 0.88%, 08/05/30 | 1,000,000 | 982,460 |
| 6.63%, 11/15/30 | 2,700,000 | 4,091,580 |
| 5.63%, 07/15/37 | 1,500,000 | 2,385,135 |
| Federal Farm Credit Banks Funding Corp. |
| 0.20%, 10/02/23 | 1,000,000 | 998,700 |
| Federal Home Loan Bank |
| 0.25%, 06/03/22 | 4,000,000 | 4,007,400 |
| 2.38%, 06/10/22 | 400,000 | 412,512 |
| 0.13%, 08/12/22 | 1,000,000 | 1,000,110 |
| 1.88%, 12/09/22 | 2,000,000 | 2,067,120 |
| 1.38%, 02/17/23 | 1,000,000 | 1,026,140 |
| 2.13%, 03/10/23 | 250,000 | 260,738 |
| 2.50%, 02/13/24 | 1,600,000 | 1,714,848 |
| 2.88%, 06/14/24 | 1,075,000 | 1,173,169 |
| 1.50%, 08/15/24 | 2,000,000 | 2,093,340 |
| 5.38%, 08/15/24 | 1,750,000 | 2,070,617 |
| 0.50%, 06/13/25 | 2,000,000 | 2,008,960 |
| 0.38%, 09/04/25 | 1,000,000 | 1,000,050 |
| 3.25%, 11/16/28 | 5,000,000 | 5,970,150 |
| 5.50%, 07/15/36 | 400,000 | 618,104 |
| Freddie Mac |
| 2.38%, 01/13/22 | 5,351,000 | 5,475,464 |
| 0.25%, 06/08/22 | 2,500,000 | 2,507,600 |
| 0.38%, 04/20/23 | 2,000,000 | 2,010,700 |
| 2.75%, 06/19/23 | 2,500,000 | 2,660,775 |
Security
Rate, Maturity Date | Face
Amount ($) | Value ($) |
| 0.25%, 06/26/23 | 4,000,000 | 4,010,360 |
| 0.25%, 08/24/23 | 6,000,000 | 6,011,640 |
| 0.25%, 09/08/23 | 3,000,000 | 3,006,570 |
| 0.13%, 10/16/23 | 3,000,000 | 2,996,910 |
| 0.25%, 11/06/23 | 2,500,000 | 2,503,975 |
| 0.25%, 12/04/23 | 3,000,000 | 3,004,140 |
| 1.50%, 02/12/25 | 5,000,000 | 5,244,000 |
| 0.38%, 07/21/25 | 3,000,000 | 3,002,130 |
| 0.38%, 09/23/25 | 2,000,000 | 1,998,260 |
| 6.75%, 09/15/29 | 500,000 | 748,235 |
| 6.75%, 03/15/31 | 1,564,000 | 2,411,594 |
| 6.25%, 07/15/32 | 700,000 | 1,085,189 |
| Tennessee Valley Authority |
| 2.88%, 09/15/24 | 2,000,000 | 2,192,360 |
| 6.75%, 11/01/25 | 488,000 | 632,780 |
| 2.88%, 02/01/27 | 500,000 | 564,450 |
| 5.25%, 09/15/39 | 750,000 | 1,131,502 |
| 4.63%, 09/15/60 | 100,000 | 156,631 |
| | | 142,412,841 |
| | | 222,703,908 |
| |
| Local Authority 1.0% |
| Foreign 0.3% |
| Canada 0.3% |
| Hydro-Quebec |
| 8.05%, 07/07/24 | 1,160,000 | 1,458,364 |
| Province of Alberta |
| 2.20%, 07/26/22 | 250,000 | 257,498 |
| 3.35%, 11/01/23 | 646,000 | 700,451 |
| 2.95%, 01/23/24 | 500,000 | 538,940 |
| 1.88%, 11/13/24 | 700,000 | 736,967 |
| 1.00%, 05/20/25 | 200,000 | 203,514 |
| 3.30%, 03/15/28 | 1,450,000 | 1,673,198 |
| 1.30%, 07/22/30 | 600,000 | 597,438 |
| Province of British Columbia |
| 2.00%, 10/23/22 | 650,000 | 671,014 |
| 1.75%, 09/27/24 | 500,000 | 526,470 |
| 2.25%, 06/02/26 | 450,000 | 490,028 |
| Province of Manitoba |
| 2.13%, 05/04/22 | 390,000 | 399,809 |
| 2.60%, 04/16/24 | 250,000 | 268,028 |
| 3.05%, 05/14/24 | 250,000 | 271,495 |
| 2.13%, 06/22/26 | 750,000 | 807,735 |
| Province of New Brunswick |
| 2.50%, 12/12/22 | 250,000 | 259,630 |
| 3.63%, 02/24/28 | 200,000 | 233,626 |
| Province of Ontario |
| 2.40%, 02/08/22 | 750,000 | 767,805 |
| 2.55%, 04/25/22 | 500,000 | 515,020 |
| 2.25%, 05/18/22 | 500,000 | 513,760 |
| 2.45%, 06/29/22 | 850,000 | 877,786 |
| 1.75%, 01/24/23 | 1,000,000 | 1,030,360 |
| 3.40%, 10/17/23 | 900,000 | 976,500 |
| 3.05%, 01/29/24 | 1,100,000 | 1,190,365 |
| 3.20%, 05/16/24 | 850,000 | 929,883 |
| 2.50%, 04/27/26 | 500,000 | 548,660 |
| 2.30%, 06/15/26 | 550,000 | 597,866 |
| 1.05%, 05/21/27 | 350,000 | 353,647 |
| 2.00%, 10/02/29 | 400,000 | 427,588 |
| 1.13%, 10/07/30 | 500,000 | 493,740 |
| Province of Quebec |
| 2.38%, 01/31/22 | 800,000 | 818,512 |
| 2.63%, 02/13/23 | 350,000 | 367,462 |
| 7.50%, 07/15/23 | 150,000 | 176,001 |
Schwab Fixed-Income ETFs | Annual Report
Schwab U.S. Aggregate Bond ETF
Portfolio Holdings as of December 31, 2020 (continued)
Security
Rate, Maturity Date | Face
Amount ($) | Value ($) |
| 7.13%, 02/09/24 | 1,000,000 | 1,201,070 |
| 2.50%, 04/09/24 | 200,000 | 213,902 |
| 2.88%, 10/16/24 | 700,000 | 765,387 |
| 1.50%, 02/11/25 | 850,000 | 885,368 |
| 0.60%, 07/23/25 | 800,000 | 802,656 |
| 2.50%, 04/20/26 | 50,000 | 54,852 |
| 2.75%, 04/12/27 | 500,000 | 559,435 |
| 7.50%, 09/15/29 | 818,000 | 1,236,432 |
| 1.35%, 05/28/30 | 400,000 | 406,684 |
| | | 26,804,946 |
| U.S. 0.7% |
| Alameda County Joint Powers Authority |
| RB (Build America Bonds) Series 2010 |
| 7.05%, 12/01/44 | 105,000 | 175,461 |
| American Municipal Power, Inc. |
| RB (Build America Bonds) Series 2010 |
| 5.94%, 02/15/47 | 200,000 | 300,218 |
| RB (Build America Bonds) Series 2010 |
| 6.27%, 02/15/50 | 500,000 | 725,390 |
| RB (Build America Bonds) Series 2010 |
| 8.08%, 02/15/50 | 250,000 | 464,607 |
| Bay Area Toll Authority |
| RB (Build America Bonds) Series 2009F2 |
| 6.26%, 04/01/49 | 750,000 | 1,295,707 |
| RB (Build America Bonds) Series 2010S1 |
| 7.04%, 04/01/50 | 500,000 | 919,502 |
| RB (Build America Bonds) Series 2010S3 |
| 6.91%, 10/01/50 | 600,000 | 1,107,432 |
| California |
| GO (Build America Bonds) Series 2009 |
| 7.50%, 04/01/34 | 1,250,000 | 2,084,437 |
| GO (Build America Bonds) Series 2009 |
| 7.55%, 04/01/39 | 1,400,000 | 2,467,346 |
| GO (Build America Bonds) Series 2009 |
| 7.30%, 10/01/39 | 950,000 | 1,571,571 |
| GO (Build America Bonds) Series 2009 |
| 7.35%, 11/01/39 | 865,000 | 1,440,813 |
| GO Bonds |
| 7.60%, 11/01/40 | 200,000 | 364,038 |
| California State University |
| RB Series 2017B |
| 3.90%, 11/01/47 (a) | 100,000 | 120,464 |
| Chicago O'Hare International Airport |
| RB (Build America Bonds) Series 2010B |
| 6.40%, 01/01/40 | 150,000 | 223,001 |
| Series C |
| 4.47%, 01/01/49 | 150,000 | 184,100 |
| Chicago Transit Authority Sales & Transfer Tax Receipts Revenue |
| RB (Pension Funding) Series 2008A |
| 6.90%, 12/01/40 | 445,000 | 631,970 |
| RB (Pension Funding) Series 2008B |
| 6.90%, 12/01/40 | 200,000 | 284,032 |
| City of Atlanta GA Water & Wastewater Revenue |
| 2.26%, 11/01/35 (a) | 125,000 | 131,111 |
| City of Houston TX |
| GO Bonds (Pension Funding) Series 2017 |
| 3.96%, 03/01/47 | 255,000 | 315,761 |
| City of San Antonio TX Electric & Gas Systems Revenue |
| RB (Build America Bonds) Series 2009 |
| 5.99%, 02/01/39 | 150,000 | 225,402 |
| RB Series 2012 |
| 4.43%, 02/01/42 | 200,000 | 259,322 |
| 2.91%, 02/01/48 (a) | 125,000 | 130,559 |
Security
Rate, Maturity Date | Face
Amount ($) | Value ($) |
| City of San Francisco CA Public Utilities Commission Water Revenue |
| Series A |
| 3.30%, 11/01/39 (a) | 250,000 | 271,850 |
| RB (Build America Bonds) Series 2010 |
| 6.95%, 11/01/50 | 100,000 | 172,808 |
| Commonwealth Financing Authority |
| Series A |
| 4.14%, 06/01/38 | 215,000 | 256,319 |
| Commonwealth of Massachusetts |
| GO (Build America Bonds) Series 2010D |
| 4.50%, 08/01/31 | 400,000 | 511,481 |
| Series D |
| 2.66%, 09/01/39 | 145,000 | 162,233 |
| GO (Build America Bonds) Series 2009 |
| 5.46%, 12/01/39 | 100,000 | 143,511 |
| Series D |
| 2.81%, 09/01/43 | 150,000 | 161,648 |
| Series H |
| 2.90%, 09/01/49 | 200,000 | 213,844 |
| Commonwealth of Massachusetts Transportation Fund Revenue |
| RB (Build America Bonds) Series 2010 |
| 5.73%, 06/01/40 | 200,000 | 286,848 |
| Connecticut |
| GO Bonds Series 2008A |
| 5.85%, 03/15/32 | 700,000 | 963,978 |
| County of Clark Department of Aviation |
| RB (Build America Bonds) Series 2010C |
| 6.82%, 07/01/45 | 350,000 | 566,335 |
| County of Miami-Dade FL Water & Sewer System Revenue |
| Series C |
| 3.49%, 10/01/42 (a) | 150,000 | 161,801 |
| Dallas Area Rapid Transit |
| Series B |
| 6.00%, 12/01/44 | 50,000 | 76,550 |
| RB (Build America Bonds) Series 2010 |
| 5.02%, 12/01/48 | 250,000 | 354,370 |
| Dallas County Hospital District |
| GO (Build America Bonds) Series C |
| 5.62%, 08/15/44 | 150,000 | 218,864 |
| Dallas Fort Worth International Airport |
| Series A |
| 2.99%, 11/01/38 | 150,000 | 162,982 |
| Series C |
| 3.09%, 11/01/40 (a) | 160,000 | 167,141 |
| Series A |
| 3.14%, 11/01/45 | 20,000 | 21,544 |
| Dallas Independent School District |
| GO (Build America Bonds) Series 2010C |
| 6.45%, 02/15/35 (a) | 350,000 | 358,026 |
| District of Columbia |
| Series E |
| 5.59%, 12/01/34 | 350,000 | 477,204 |
| District of Columbia Water & Sewer Authority |
| RB Series 2014A |
| 4.81%, 10/01/14 | 185,000 | 271,154 |
| Florida State Board of Administration Finance Corp. |
| Series A |
| 2.64%, 07/01/21 | 100,000 | 101,111 |
| Series A |
| 1.26%, 07/01/25 | 350,000 | 358,212 |
| Series A |
| 1.71%, 07/01/27 | 350,000 | 363,118 |
| Series A |
| 2.15%, 07/01/30 | 350,000 | 367,976 |
Schwab Fixed-Income ETFs | Annual Report
Schwab U.S. Aggregate Bond ETF
Portfolio Holdings as of December 31, 2020 (continued)
Security
Rate, Maturity Date | Face
Amount ($) | Value ($) |
| Foothill-Eastern Transportation Corridor Agency |
| Series A |
| 4.09%, 01/15/49 (a) | 100,000 | 107,489 |
| Series A |
| 3.92%, 01/15/53 (a) | 100,000 | 105,914 |
| Georgia Municipal Electric Authority |
| RB (Build America Bonds) Series 2010 |
| 6.64%, 04/01/57 | 246,000 | 368,063 |
| Grand Parkway Transportation Corp. |
| RB Series 2013E |
| 5.18%, 10/01/42 | 200,000 | 280,292 |
| Series B |
| 3.24%, 10/01/52 (a) | 250,000 | 260,240 |
| Illinois |
| GO Bonds (Pension Funding) Series 2003 |
| 4.95%, 06/01/23 | 390,000 | 399,066 |
| GO Bonds (Pension Funding) Series 2003 |
| 5.10%, 06/01/33 | 2,395,000 | 2,561,057 |
| GO (Build America Bonds) Series 2010 |
| 6.63%, 02/01/35 | 150,000 | 171,944 |
| GO (Build America Bonds) Series 2010 |
| 6.73%, 04/01/35 | 125,000 | 144,696 |
| GO (Build America Bonds) Series 2010 |
| 7.35%, 07/01/35 | 150,000 | 175,656 |
| JobsOhio Beverage System |
| RB (Build America Bonds) Series B |
| 3.99%, 01/01/29 | 100,000 | 115,743 |
| Series B |
| 4.53%, 01/01/35 | 200,000 | 255,695 |
| Los Angeles Community College District |
| GO Bonds Series 2020 |
| 1.61%, 08/01/28 | 125,000 | 130,258 |
| GO Bonds Series 2020 |
| 1.81%, 08/01/30 | 200,000 | 208,120 |
| GO Bonds Series 2020 |
| 2.11%, 08/01/32 (a) | 250,000 | 260,292 |
| GO (Build America Bonds) Series 2010 |
| 6.75%, 08/01/49 | 85,000 | 153,183 |
| Los Angeles Department of Water & Power Power System Revenue |
| RB (Build America Bonds) Series 2010 |
| 6.57%, 07/01/45 | 250,000 | 437,742 |
| Los Angeles Unified School District |
| GO (Build America Bonds) Series 2009 |
| 5.76%, 07/01/29 | 300,000 | 389,200 |
| GO (Build America Bonds) Series 2009 |
| 5.75%, 07/01/34 | 225,000 | 317,056 |
| GO (Build America Bonds) Series 2010 |
| 6.76%, 07/01/34 | 450,000 | 677,773 |
| Maryland Health & Higher Educational Facilities Authority |
| RB Series D |
| 3.05%, 07/01/40 (a) | 100,000 | 103,789 |
| RB Series D |
| 3.20%, 07/01/50 | 100,000 | 103,246 |
| Massachusetts School Building Authority |
| RB Series B |
| 1.75%, 08/15/30 | 500,000 | 511,744 |
| RB Series B |
| 3.40%, 10/15/40 (a) | 100,000 | 107,359 |
| Metropolitan Government Nashville & Davidson County Health & Educational Facs Bd |
| RB (Vanderbilt Univ Medical Center) Series 2016 B |
| 4.05%, 07/01/26 (a) | 800,000 | 911,086 |
| Metropolitan Transportation Authority |
| RB (Build America Bonds) Series C |
| 7.34%, 11/15/39 | 350,000 | 555,460 |
Security
Rate, Maturity Date | Face
Amount ($) | Value ($) |
| RB (Build America Bonds) Series E |
| 6.81%, 11/15/40 | 650,000 | 848,386 |
| Michigan Finance Authority |
| RB Series 2019 |
| 3.38%, 12/01/40 | 350,000 | 393,222 |
| Michigan State Building Authority |
| RB Series 2020 |
| 2.71%, 10/15/40 (a) | 250,000 | 255,378 |
| Missouri Health & Educational Facilities Authority |
| RB Series 2017A |
| 3.65%, 08/15/57 (a) | 75,000 | 94,996 |
| Municipal Electric Authority of Georgia |
| RB (Build America Bonds) Series 2010 |
| 6.66%, 04/01/57 | 149,000 | 225,851 |
| New Jersey Economic Development Authority |
| Series A |
| 7.43%, 02/15/29 | 416,000 | 536,224 |
| New Jersey Transportation Trust Fund Authority |
| RB (Build America Bonds) Series 2010C |
| 5.75%, 12/15/28 | 900,000 | 1,087,380 |
| RB Series 2019B |
| 4.13%, 06/15/42 | 250,000 | 265,060 |
| New Jersey Turnpike Authority |
| RB (Build America Bonds) Series 2009F |
| 7.41%, 01/01/40 | 500,000 | 839,260 |
| RB (Build America Bonds) Series 2010A |
| 7.10%, 01/01/41 | 850,000 | 1,390,039 |
| New York City Transitional Finance Authority |
| RB (Build America Bonds) Series 2011A1 |
| 5.51%, 08/01/37 | 450,000 | 619,500 |
| New York City Water & Sewer System |
| Water System RB (Build America Bonds) Series 2009 |
| 5.75%, 06/15/41 | 300,000 | 462,411 |
| Water System RB (Build America Bonds) |
| 6.01%, 06/15/42 | 250,000 | 398,000 |
| Water System RB (Build America Bonds) Series 2011CC |
| 5.88%, 06/15/44 | 250,000 | 402,253 |
| New York State Dormitory Authority |
| Series F |
| 3.11%, 02/15/39 | 200,000 | 220,024 |
| RB Series 2009F |
| 5.63%, 03/15/39 | 200,000 | 275,314 |
| RB (Build America Bonds) Series 2010 |
| 5.60%, 03/15/40 | 200,000 | 283,566 |
| Series B |
| 3.14%, 07/01/43 | 200,000 | 210,696 |
| New York State Urban Development Corp. |
| RB (Build America Bonds) Series 2009 |
| 5.77%, 03/15/39 | 185,000 | 242,623 |
| North Texas Tollway Authority |
| RB (Build America Bonds) Series 2009B |
| 6.72%, 01/01/49 | 350,000 | 609,143 |
| Ohio State University |
| RB (Build America Bonds) Series 2010C |
| 4.91%, 06/01/40 | 450,000 | 623,902 |
| Series A |
| 3.80%, 12/01/46 | 75,000 | 92,994 |
| Ohio Turnpike & Infrastructure Commission |
| RB Series A |
| 3.22%, 02/15/48 (a) | 100,000 | 102,052 |
| Oregon |
| GO Bonds (Pension Funding) Series 2003 |
| 5.89%, 06/01/27 | 500,000 | 630,641 |
Schwab Fixed-Income ETFs | Annual Report
Schwab U.S. Aggregate Bond ETF
Portfolio Holdings as of December 31, 2020 (continued)
Security
Rate, Maturity Date | Face
Amount ($) | Value ($) |
| Oregon School Boards Association |
| Series B |
| 5.55%, 06/30/28 | 500,000 | 615,227 |
| Port Authority of New York & New Jersey |
| RB Series AAA |
| 1.09%, 07/01/23 | 300,000 | 304,641 |
| Consolidated Bonds 164th Series |
| 5.65%, 11/01/40 | 240,000 | 343,738 |
| Consolidated Bonds 165th Series |
| 5.65%, 11/01/40 | 200,000 | 287,178 |
| Consolidated Bonds 181st Series |
| 4.96%, 08/01/46 | 200,000 | 271,632 |
| Consolidated Bonds 168th Series |
| 4.93%, 10/01/51 | 450,000 | 625,603 |
| Consolidated Bonds 174th Series |
| 4.46%, 10/01/62 | 1,150,000 | 1,527,706 |
| Regents of the University of California Medical Center Pooled Revenue |
| Series F |
| 6.58%, 05/15/49 | 200,000 | 324,120 |
| Regional Transportation District Sales Tax Revenue |
| Series B |
| 5.84%, 11/01/50 | 100,000 | 166,465 |
| Rutgers The State University of New Jersey |
| Series R |
| 3.27%, 05/01/43 | 100,000 | 106,771 |
| Series P |
| 3.92%, 05/01/19 (a) | 150,000 | 170,501 |
| Sales Tax Securitization Corp. |
| RB Series 2017B |
| 3.59%, 01/01/43 | 150,000 | 158,424 |
| RB Series B |
| 3.82%, 01/01/48 | 200,000 | 217,684 |
| Salt River Project Agricultural Improvement & Power District |
| RB (Build America Bonds) Series 2010 |
| 4.84%, 01/01/41 | 75,000 | 103,396 |
| San Diego County Regional Transportation Commission |
| RB (Build America Bonds) Series 2010A |
| 5.91%, 04/01/48 | 300,000 | 482,259 |
| San Diego County Water Authority Financing Corp. |
| RB (Build America Bonds) Series 2010B |
| 6.14%, 05/01/49 | 350,000 | 553,217 |
| San Jose Redevelopment Agency Successor Agency |
| Series A |
| 3.38%, 08/01/34 (a) | 1,200,000 | 1,296,889 |
| Santa Clara Valley Transportation Authority |
| RB (Build America Bonds) Series 2010 |
| 5.88%, 04/01/32 | 150,000 | 193,237 |
| State of Oregon Department of Transportation |
| RB (Build America Bonds) Series 2010A |
| 5.83%, 11/15/34 | 125,000 | 181,659 |
| Texas |
| GO Mobility Fund Bonds (Build America Bonds) Series 2009A |
| 5.52%, 04/01/39 | 750,000 | 1,129,267 |
| GO (Build America Bonds) Series 2010A |
| 4.68%, 04/01/40 | 500,000 | 692,759 |
| Texas Private Activity Bond Surface Transportation Corp. |
| RB Series B |
| 3.92%, 12/31/49 | 250,000 | 285,265 |
| Texas Transportation Commission |
| RB (Build America Bonds) Series B |
| 5.18%, 04/01/30 | 130,000 | 167,852 |
| 2.47%, 10/01/44 (a) | 350,000 | 351,362 |
Security
Rate, Maturity Date | Face
Amount ($) | Value ($) |
| University of California |
| RB Series 2019BD |
| 3.35%, 07/01/29 | 200,000 | 229,568 |
| RB Series BG |
| 1.61%, 05/15/30 (a) | 250,000 | 252,546 |
| RB Series 2013AJ |
| 4.60%, 05/15/31 | 250,000 | 300,125 |
| RB (Build America Bonds) Series 2009 |
| 5.77%, 05/15/43 | 300,000 | 433,086 |
| RB Series AS |
| 5.95%, 05/15/45 | 250,000 | 370,228 |
| RB Series AD |
| 4.86%, 05/15/12 | 500,000 | 716,390 |
| RB Series 2015AQ |
| 4.77%, 05/15/15 | 200,000 | 282,878 |
| University of Pittsburgh-of the Commonwealth System of Higher Education |
| RB Series 2019A |
| 3.56%, 09/15/19 (a) | 200,000 | 221,847 |
| University of Texas System |
| RB (Build America Bonds) Series C |
| 4.79%, 08/15/46 | 50,000 | 68,858 |
| University of Virginia |
| General Revenue Pledge and Refunding Bonds, Series 2020 |
| 2.26%, 09/01/50 (a) | 350,000 | 344,703 |
| Series C |
| 4.18%, 09/01/17 (a) | 150,000 | 201,181 |
| Utah |
| GO (Build America Bonds) Series D |
| 4.55%, 07/01/24 | 275,000 | 297,125 |
| GO (Build America Bonds) Series B |
| 3.54%, 07/01/25 | 525,000 | 570,649 |
| Westchester County Local Development Corp. |
| RB, Series 2020 |
| 3.85%, 11/01/50 (a) | 250,000 | 255,880 |
| Wisconsin |
| RB Series A |
| 5.70%, 05/01/26 | 615,000 | 703,689 |
| | | 59,319,835 |
| | | 86,124,781 |
| |
| Sovereign 1.2% |
| Canada 0.0% |
| Canada Government International Bond |
| 2.63%, 01/25/22 | 1,100,000 | 1,128,721 |
| 2.00%, 11/15/22 | 750,000 | 775,650 |
| 1.63%, 01/22/25 | 1,050,000 | 1,103,025 |
| | | 3,007,396 |
| Chile 0.1% |
| Chile Government International Bond |
| 3.25%, 09/14/21 | 150,000 | 153,381 |
| 2.25%, 10/30/22 | 150,000 | 155,510 |
| 3.13%, 03/27/25 | 400,000 | 441,252 |
| 3.13%, 01/21/26 | 400,000 | 444,888 |
| 3.24%, 02/06/28 (a) | 750,000 | 852,007 |
| 2.55%, 01/27/32 (a) | 600,000 | 647,340 |
| 3.63%, 10/30/42 | 100,000 | 117,592 |
| 3.86%, 06/21/47 | 450,000 | 550,859 |
| 3.50%, 01/25/50 (a) | 650,000 | 749,742 |
| | | 4,112,571 |
Schwab Fixed-Income ETFs | Annual Report
Schwab U.S. Aggregate Bond ETF
Portfolio Holdings as of December 31, 2020 (continued)
Security
Rate, Maturity Date | Face
Amount ($) | Value ($) |
| Colombia 0.1% |
| Colombia Government International Bond |
| 2.63%, 03/15/23 (a) | 300,000 | 310,509 |
| 4.00%, 02/26/24 (a) | 700,000 | 758,646 |
| 8.13%, 05/21/24 | 300,000 | 368,661 |
| 4.50%, 01/28/26 (a) | 400,000 | 454,248 |
| 3.88%, 04/25/27 (a) | 850,000 | 948,328 |
| 4.50%, 03/15/29 (a) | 600,000 | 696,324 |
| 3.00%, 01/30/30 (a) | 500,000 | 527,330 |
| 3.13%, 04/15/31 (a) | 300,000 | 319,602 |
| 10.38%, 01/28/33 | 100,000 | 161,676 |
| 7.38%, 09/18/37 | 550,000 | 805,085 |
| 6.13%, 01/18/41 | 950,000 | 1,278,082 |
| 5.63%, 02/26/44 (a) | 1,450,000 | 1,886,116 |
| 5.00%, 06/15/45 (a) | 1,300,000 | 1,594,775 |
| 5.20%, 05/15/49 (a) | 900,000 | 1,142,055 |
| | | 11,251,437 |
| Hungary 0.0% |
| Hungary Government International Bond |
| 5.38%, 02/21/23 | 650,000 | 714,656 |
| 5.75%, 11/22/23 | 600,000 | 685,236 |
| 5.38%, 03/25/24 | 500,000 | 571,710 |
| 7.63%, 03/29/41 | 550,000 | 979,616 |
| | | 2,951,218 |
| Indonesia 0.1% |
| Indonesia Government International Bond |
| 2.95%, 01/11/23 | 550,000 | 574,217 |
| 4.45%, 02/11/24 | 250,000 | 277,630 |
| 3.50%, 01/11/28 | 250,000 | 280,803 |
| 4.10%, 04/24/28 | 500,000 | 582,585 |
| 4.75%, 02/11/29 | 400,000 | 485,828 |
| 3.40%, 09/18/29 | 200,000 | 224,212 |
| 2.85%, 02/14/30 | 400,000 | 433,208 |
| 3.85%, 10/15/30 | 550,000 | 640,904 |
| 4.35%, 01/11/48 | 700,000 | 838,985 |
| 5.35%, 02/11/49 | 500,000 | 689,050 |
| 3.70%, 10/30/49 | 200,000 | 220,012 |
| 3.50%, 02/14/50 | 250,000 | 272,815 |
| 4.20%, 10/15/50 | 550,000 | 659,488 |
| 4.45%, 04/15/70 | 300,000 | 370,266 |
| | | 6,550,003 |
| Israel 0.1% |
| Israel Government International Bond |
| 4.00%, 06/30/22 | 200,000 | 211,234 |
| 3.15%, 06/30/23 | 700,000 | 746,606 |
| 2.88%, 03/16/26 | 300,000 | 331,128 |
| 3.25%, 01/17/28 | 300,000 | 343,119 |
| 2.50%, 01/15/30 | 550,000 | 597,047 |
| 2.75%, 07/03/30 | 900,000 | 995,508 |
| 4.50%, 01/30/43 | 700,000 | 926,828 |
| 4.13%, 01/17/48 | 250,000 | 323,765 |
| 3.38%, 01/15/50 | 850,000 | 946,280 |
| 3.88%, 07/03/50 | 650,000 | 784,901 |
| 4.50%, 04/03/20 | 300,000 | 399,438 |
| | | 6,605,854 |
| Italy 0.1% |
| Italy Government International Bond |
| 6.88%, 09/27/23 | 1,000,000 | 1,161,880 |
| 2.38%, 10/17/24 | 1,750,000 | 1,843,030 |
| 2.88%, 10/17/29 | 700,000 | 738,794 |
Security
Rate, Maturity Date | Face
Amount ($) | Value ($) |
| 5.38%, 06/15/33 | 754,000 | 971,861 |
| 4.00%, 10/17/49 | 750,000 | 831,832 |
| Republic of Italy Government International Bond |
| 1.25%, 02/17/26 | 500,000 | 498,960 |
| | | 6,046,357 |
| Mexico 0.3% |
| Mexico Government International Bond |
| 8.00%, 09/24/22 | 100,000 | 112,259 |
| 4.00%, 10/02/23 | 1,200,000 | 1,316,364 |
| 3.60%, 01/30/25 | 450,000 | 501,728 |
| 3.90%, 04/27/25 (a) | 600,000 | 675,720 |
| 4.13%, 01/21/26 | 500,000 | 575,785 |
| 4.15%, 03/28/27 | 800,000 | 926,176 |
| 3.75%, 01/11/28 | 850,000 | 958,749 |
| 4.50%, 04/22/29 | 1,150,000 | 1,351,054 |
| 3.25%, 04/16/30 (a) | 1,200,000 | 1,301,532 |
| 2.66%, 05/24/31 (a) | 750,000 | 770,513 |
| 8.30%, 08/15/31 | 150,000 | 229,515 |
| 4.75%, 04/27/32 (a) | 850,000 | 1,025,899 |
| 7.50%, 04/08/33 | 250,000 | 363,480 |
| 6.75%, 09/27/34 | 750,000 | 1,059,195 |
| 6.05%, 01/11/40 | 1,050,000 | 1,414,402 |
| 4.75%, 03/08/44 | 1,350,000 | 1,609,551 |
| 5.55%, 01/21/45 | 950,000 | 1,252,432 |
| 4.60%, 01/23/46 | 1,200,000 | 1,408,356 |
| 4.35%, 01/15/47 | 600,000 | 686,880 |
| 4.60%, 02/10/48 | 950,000 | 1,118,463 |
| 4.50%, 01/31/50 (a) | 1,025,000 | 1,206,087 |
| 5.00%, 04/27/51 (a) | 850,000 | 1,061,846 |
| 3.77%, 05/24/61 (a) | 1,050,000 | 1,099,350 |
| 5.75%, 10/12/10 | 850,000 | 1,133,679 |
| | | 23,159,015 |
| Panama 0.1% |
| Panama Government International Bond |
| 4.00%, 09/22/24 (a) | 700,000 | 776,398 |
| 3.75%, 03/16/25 (a) | 750,000 | 831,870 |
| 7.13%, 01/29/26 | 300,000 | 383,730 |
| 8.88%, 09/30/27 | 150,000 | 216,816 |
| 3.88%, 03/17/28 (a) | 400,000 | 459,900 |
| 9.38%, 04/01/29 | 500,000 | 780,975 |
| 3.16%, 01/23/30 (a) | 400,000 | 444,920 |
| 2.25%, 09/29/32 (a) | 750,000 | 774,645 |
| 6.70%, 01/26/36 | 900,000 | 1,340,388 |
| 4.50%, 05/15/47 | 200,000 | 258,086 |
| 4.50%, 04/16/50 (a) | 750,000 | 966,315 |
| 4.30%, 04/29/53 | 400,000 | 508,704 |
| 4.50%, 04/01/56 (a) | 750,000 | 970,275 |
| 3.87%, 07/23/60 (a) | 575,000 | 679,449 |
| | | 9,392,471 |
| Peru 0.1% |
| Peruvian Government International Bond |
| 7.35%, 07/21/25 | 700,000 | 898,191 |
| 2.39%, 01/23/26 (a) | 350,000 | 373,894 |
| 4.13%, 08/25/27 | 500,000 | 588,405 |
| 2.84%, 06/20/30 | 350,000 | 388,521 |
| 2.78%, 01/23/31 (a) | 850,000 | 935,731 |
| 1.86%, 12/01/32 (a) | 450,000 | 455,800 |
| 8.75%, 11/21/33 | 450,000 | 770,409 |
| 6.55%, 03/14/37 | 550,000 | 837,430 |
| 5.63%, 11/18/50 | 900,000 | 1,417,068 |
Schwab Fixed-Income ETFs | Annual Report
Schwab U.S. Aggregate Bond ETF
Portfolio Holdings as of December 31, 2020 (continued)
Security
Rate, Maturity Date | Face
Amount ($) | Value ($) |
| 2.78%, 12/01/60 (a) | 450,000 | 455,832 |
| 3.23%, 07/28/21 (a) | 250,000 | 251,203 |
| | | 7,372,484 |
| Philippines 0.1% |
| Philippine Government International Bond |
| 4.20%, 01/21/24 | 550,000 | 613,663 |
| 9.50%, 10/21/24 | 500,000 | 671,275 |
| 10.63%, 03/16/25 | 250,000 | 355,345 |
| 5.50%, 03/30/26 | 400,000 | 498,752 |
| 3.00%, 02/01/28 | 650,000 | 720,551 |
| 3.75%, 01/14/29 | 600,000 | 701,538 |
| 9.50%, 02/02/30 | 650,000 | 1,074,157 |
| 2.46%, 05/05/30 | 700,000 | 756,658 |
| 7.75%, 01/14/31 | 550,000 | 851,086 |
| 1.65%, 06/10/31 | 200,000 | 202,776 |
| 6.38%, 01/15/32 | 350,000 | 501,953 |
| 6.38%, 10/23/34 | 700,000 | 1,030,750 |
| 5.00%, 01/13/37 | 200,000 | 265,154 |
| 3.95%, 01/20/40 | 1,300,000 | 1,552,733 |
| 3.70%, 03/01/41 | 250,000 | 290,360 |
| 3.70%, 02/02/42 | 1,100,000 | 1,281,093 |
| 2.95%, 05/05/45 | 200,000 | 212,076 |
| 2.65%, 12/10/45 | 500,000 | 508,010 |
| | | 12,087,930 |
| Poland 0.0% |
| Poland Government International Bond |
| 5.00%, 03/23/22 | 1,150,000 | 1,218,046 |
| 3.00%, 03/17/23 | 1,000,000 | 1,058,210 |
| 4.00%, 01/22/24 | 600,000 | 665,574 |
| 3.25%, 04/06/26 | 644,000 | 727,475 |
| | | 3,669,305 |
| Republic of Korea 0.0% |
| Korea International Bond |
| 3.88%, 09/11/23 | 550,000 | 601,298 |
| 2.75%, 01/19/27 | 650,000 | 711,113 |
| 3.50%, 09/20/28 | 200,000 | 234,026 |
| 2.50%, 06/19/29 | 350,000 | 386,733 |
| 1.00%, 09/16/30 | 200,000 | 196,492 |
| 4.13%, 06/10/44 | 400,000 | 541,580 |
| 3.88%, 09/20/48 | 200,000 | 270,612 |
| | | 2,941,854 |
| Uruguay 0.1% |
| Uruguay Government International Bond |
| 8.00%, 11/18/22 | 66,667 | 73,001 |
| 4.50%, 08/14/24 | 150,000 | 165,668 |
| 4.38%, 10/27/27 | 500,000 | 592,550 |
| 4.38%, 01/23/31 (a) | 650,000 | 799,428 |
| 7.63%, 03/21/36 | 700,000 | 1,136,450 |
| 4.13%, 11/20/45 | 250,000 | 312,412 |
| 5.10%, 06/18/50 | 1,150,000 | 1,613,956 |
| 4.98%, 04/20/55 | 900,000 | 1,255,482 |
| | | 5,948,947 |
| | | 105,096,842 |
| |
| Supranational* 1.4% |
| African Development Bank |
| 2.38%, 09/23/21 | 800,000 | 812,744 |
| 0.50%, 04/22/22 | 200,000 | 200,848 |
| 1.63%, 09/16/22 | 350,000 | 358,568 |
| 2.13%, 11/16/22 | 1,500,000 | 1,553,775 |
Security
Rate, Maturity Date | Face
Amount ($) | Value ($) |
| 0.75%, 04/03/23 | 950,000 | 961,561 |
| 3.00%, 09/20/23 | 50,000 | 53,730 |
| Asian Development Bank |
| 1.75%, 06/08/21 | 450,000 | 453,047 |
| 2.00%, 02/16/22 | 2,000,000 | 2,041,080 |
| 1.88%, 02/18/22 | 500,000 | 509,555 |
| 0.63%, 04/07/22 | 1,500,000 | 1,508,730 |
| 1.88%, 07/19/22 | 650,000 | 667,017 |
| 1.75%, 09/13/22 | 2,175,000 | 2,232,268 |
| 1.63%, 01/24/23 | 750,000 | 772,050 |
| 2.75%, 03/17/23 | 900,000 | 950,274 |
| 0.25%, 07/14/23 | 750,000 | 750,592 |
| 0.25%, 10/06/23 | 750,000 | 750,337 |
| 2.63%, 01/30/24 | 645,000 | 691,653 |
| 1.50%, 10/18/24 | 1,350,000 | 1,409,508 |
| 2.00%, 01/22/25 | 1,650,000 | 1,757,943 |
| 0.63%, 04/29/25 | 1,000,000 | 1,009,400 |
| 0.38%, 09/03/25 | 750,000 | 748,043 |
| 2.00%, 04/24/26 | 500,000 | 539,015 |
| 2.63%, 01/12/27 | 1,000,000 | 1,114,770 |
| 2.50%, 11/02/27 | 1,188,000 | 1,325,642 |
| 2.75%, 01/19/28 | 250,000 | 283,838 |
| 5.82%, 06/16/28 | 300,000 | 405,222 |
| 1.75%, 09/19/29 | 750,000 | 799,447 |
| 1.88%, 01/24/30 | 1,000,000 | 1,076,650 |
| 0.75%, 10/08/30 | 1,150,000 | 1,121,227 |
| Asian Infrastructure Investment Bank |
| 2.25%, 05/16/24 | 950,000 | 1,012,196 |
| 0.50%, 05/28/25 | 950,000 | 952,099 |
| Corp. Andina de Fomento |
| 2.13%, 09/27/21 | 613,000 | 620,209 |
| 3.25%, 02/11/22 | 600,000 | 616,860 |
| 4.38%, 06/15/22 | 550,000 | 578,237 |
| 2.38%, 05/12/23 | 350,000 | 361,939 |
| 3.75%, 11/23/23 | 250,000 | 270,198 |
| 1.63%, 09/23/25 | 300,000 | 304,329 |
| Council of Europe Development Bank |
| 1.75%, 09/26/22 | 650,000 | 667,563 |
| 0.25%, 06/10/23 | 200,000 | 200,178 |
| 0.25%, 10/20/23 | 200,000 | 200,126 |
| 2.50%, 02/27/24 | 315,000 | 336,984 |
| 1.38%, 02/27/25 | 350,000 | 364,084 |
| European Bank for Reconstruction & Development |
| 1.88%, 07/15/21 | 500,000 | 504,545 |
| 1.50%, 11/02/21 | 1,100,000 | 1,112,188 |
| 2.75%, 03/07/23 | 475,000 | 500,911 |
| 0.25%, 07/10/23 | 500,000 | 500,390 |
| 1.63%, 09/27/24 | 300,000 | 314,592 |
| 0.50%, 05/19/25 | 400,000 | 401,468 |
| 0.50%, 11/25/25 | 950,000 | 951,871 |
| European Investment Bank |
| 1.63%, 06/15/21 | 600,000 | 603,960 |
| 1.38%, 09/15/21 | 1,150,000 | 1,159,798 |
| 2.13%, 10/15/21 | 1,000,000 | 1,015,360 |
| 2.88%, 12/15/21 | 1,250,000 | 1,282,075 |
| 2.25%, 03/15/22 | 1,500,000 | 1,537,515 |
| 2.63%, 05/20/22 | 1,175,000 | 1,214,644 |
| 2.38%, 06/15/22 | 1,650,000 | 1,702,701 |
| 2.25%, 08/15/22 | 470,000 | 485,707 |
| 1.38%, 09/06/22 | 900,000 | 918,045 |
| 2.50%, 03/15/23 | 1,750,000 | 1,838,760 |
| 1.38%, 05/15/23 | 1,000,000 | 1,027,690 |
| 2.88%, 08/15/23 | 1,400,000 | 1,497,356 |
| 0.25%, 09/15/23 | 1,250,000 | 1,251,687 |
| 3.13%, 12/14/23 | 1,300,000 | 1,410,552 |
| 3.25%, 01/29/24 | 1,650,000 | 1,801,684 |
Schwab Fixed-Income ETFs | Annual Report
Schwab U.S. Aggregate Bond ETF
Portfolio Holdings as of December 31, 2020 (continued)
Security
Rate, Maturity Date | Face
Amount ($) | Value ($) |
| 2.63%, 03/15/24 | 1,600,000 | 1,720,944 |
| 2.25%, 06/24/24 | 450,000 | 480,708 |
| 2.50%, 10/15/24 | 500,000 | 541,610 |
| 1.88%, 02/10/25 | 1,100,000 | 1,167,969 |
| 1.63%, 03/14/25 | 1,300,000 | 1,367,951 |
| 0.63%, 07/25/25 | 900,000 | 908,991 |
| 2.13%, 04/13/26 | 600,000 | 651,516 |
| 2.38%, 05/24/27 | 367,000 | 406,441 |
| 1.63%, 10/09/29 | 500,000 | 528,855 |
| 0.88%, 05/17/30 | 255,000 | 252,593 |
| 0.75%, 09/23/30 | 500,000 | 488,495 |
| 4.88%, 02/15/36 | 400,000 | 589,304 |
| Inter-American Development Bank |
| 1.25%, 09/14/21 | 800,000 | 806,080 |
| 2.13%, 01/18/22 | 1,250,000 | 1,275,525 |
| 1.75%, 04/14/22 | 1,100,000 | 1,122,275 |
| 1.75%, 09/14/22 | 1,000,000 | 1,026,590 |
| 2.50%, 01/18/23 | 1,250,000 | 1,308,300 |
| 0.50%, 05/24/23 | 1,300,000 | 1,309,074 |
| 3.00%, 10/04/23 | 750,000 | 807,000 |
| 0.25%, 11/15/23 | 750,000 | 750,308 |
| 2.63%, 01/16/24 | 1,150,000 | 1,231,960 |
| 3.00%, 02/21/24 | 500,000 | 542,395 |
| 2.13%, 01/15/25 | 1,100,000 | 1,176,648 |
| 1.75%, 03/14/25 | 1,350,000 | 1,425,951 |
| 0.88%, 04/03/25 | 650,000 | 662,812 |
| 0.63%, 07/15/25 | 500,000 | 504,365 |
| 2.00%, 06/02/26 | 550,000 | 592,411 |
| 2.00%, 07/23/26 | 500,000 | 539,055 |
| 2.38%, 07/07/27 | 1,200,000 | 1,324,776 |
| 0.63%, 09/16/27 | 750,000 | 744,098 |
| 3.13%, 09/18/28 | 1,700,000 | 1,992,774 |
| 2.25%, 06/18/29 | 1,150,000 | 1,270,405 |
| 3.88%, 10/28/41 | 150,000 | 207,213 |
| 3.20%, 08/07/42 | 200,000 | 252,756 |
| 4.38%, 01/24/44 | 600,000 | 898,272 |
| International Bank for Reconstruction & Development |
| 2.25%, 06/24/21 | 2,550,000 | 2,575,219 |
| 2.75%, 07/23/21 | 550,000 | 557,871 |
| 1.38%, 09/20/21 | 250,000 | 252,183 |
| 2.00%, 01/26/22 | 2,150,000 | 2,192,118 |
| 1.63%, 02/10/22 | 975,000 | 990,766 |
| 2.13%, 07/01/22 | 1,750,000 | 1,801,065 |
| 1.88%, 10/07/22 | 2,250,000 | 2,317,027 |
| 7.63%, 01/19/23 | 500,000 | 575,505 |
| 1.88%, 06/19/23 | 350,000 | 364,322 |
| 3.00%, 09/27/23 | 1,560,000 | 1,678,092 |
| 2.50%, 03/19/24 | 1,450,000 | 1,553,298 |
| 1.50%, 08/28/24 | 950,000 | 991,116 |
| 2.50%, 11/25/24 | 1,300,000 | 1,408,875 |
| 1.63%, 01/15/25 | 1,200,000 | 1,260,120 |
| 0.75%, 03/11/25 | 1,250,000 | 1,268,650 |
| 0.63%, 04/22/25 | 2,500,000 | 2,524,075 |
| 2.50%, 07/29/25 | 1,750,000 | 1,913,677 |
| 0.50%, 10/28/25 | 500,000 | 501,355 |
| 3.13%, 11/20/25 | 450,000 | 508,136 |
| 1.88%, 10/27/26 | 250,000 | 268,513 |
| 2.50%, 11/22/27 | 200,000 | 223,508 |
| 0.75%, 11/24/27 | 500,000 | 500,475 |
| 1.75%, 10/23/29 | 950,000 | 1,012,899 |
| 0.88%, 05/14/30 | 1,750,000 | 1,732,465 |
| 0.75%, 08/26/30 | 1,000,000 | 975,600 |
| 4.75%, 02/15/35 | 450,000 | 643,892 |
| International Finance Corp. |
| 1.13%, 07/20/21 | 650,000 | 653,445 |
| 2.00%, 10/24/22 | 850,000 | 878,058 |
| 0.50%, 03/20/23 | 200,000 | 201,444 |
Security
Rate, Maturity Date | Face
Amount ($) | Value ($) |
| 2.88%, 07/31/23 | 500,000 | 533,960 |
| 1.38%, 10/16/24 | 750,000 | 779,715 |
| 0.75%, 08/27/30 | 750,000 | 731,475 |
| Nordic Investment Bank |
| 2.25%, 09/30/21 | 750,000 | 761,565 |
| 2.13%, 02/01/22 | 250,000 | 255,238 |
| 1.38%, 10/17/22 | 200,000 | 204,282 |
| 0.38%, 05/19/23 | 400,000 | 401,588 |
| 2.88%, 07/19/23 | 450,000 | 480,285 |
| 2.25%, 05/21/24 | 200,000 | 213,190 |
| 0.38%, 09/11/25 | 400,000 | 398,828 |
| | | 124,337,350 |
| Total Government Related |
| (Cost $505,846,542) | | 538,262,881 |
|
| Securitized 29.3% of net assets |
| |
| Asset-Backed Securities 0.3% |
| Automobile 0.1% |
| Ally Auto Receivables Trust 2019-4 |
| Series 2019-4, Class A4, ABS |
| 1.92%, 01/15/25 (a) | 2,000,000 | 2,061,190 |
| Ford Credit Auto Owner Trust |
| Series 2018-A, Class A4 |
| 3.16%, 10/15/23 (a) | 2,000,000 | 2,053,758 |
| Honda Auto Receivables Owner Trust |
| Series 2018-3, Class A4 |
| 3.07%, 11/21/24 (a) | 540,000 | 555,611 |
| Nissan Auto Receivables Owner Trust |
| Series 2017-C, Class A4 |
| 2.28%, 02/15/24 (a) | 900,000 | 911,857 |
| Toyota Auto Receivables Owner Trust |
| Series 2018-C, Class A4 |
| 3.13%, 02/15/24 (a) | 2,100,000 | 2,181,645 |
| | | 7,764,061 |
| Credit Card 0.2% |
| American Express Credit Account Master Trust |
| Series 2018-8, Class A |
| 3.18%, 04/15/24 (a) | 1,200,000 | 1,224,839 |
| Series 2019-1, Class A |
| 2.87%, 10/15/24 (a) | 1,300,000 | 1,341,371 |
| Series 2019-3, Class A, ABS |
| 2.00%, 04/15/25 (a) | 630,000 | 649,062 |
| Series 2018-2, Class A |
| 3.01%, 10/15/25 (a) | 5,200,000 | 5,518,240 |
| Capital One Multi-Asset Execution Trust |
| Series 2017-A6, Class A6 |
| 2.29%, 07/15/25 (a) | 1,300,000 | 1,345,641 |
| Series 2019-A3, Class A3, ABS |
| 2.06%, 08/15/28 (a) | 2,000,000 | 2,136,568 |
| Citibank Credit Card Issuance Trust |
| Series 2018-A6, Class A6 |
| 3.21%, 12/07/24 (a) | 4,800,000 | 5,075,569 |
| Discover Card Execution Note Trust |
| Series 2018-A5, Class A5 |
| 3.32%, 03/15/24 (a) | 585,000 | 597,627 |
| Series 2017-A2, Class A2 |
| 2.39%, 07/15/24 (a) | 1,363,000 | 1,393,716 |
Schwab Fixed-Income ETFs | Annual Report
Schwab U.S. Aggregate Bond ETF
Portfolio Holdings as of December 31, 2020 (continued)
Security
Rate, Maturity Date | Face
Amount ($) | Value ($) |
| Series 2018-A1, Class A1 |
| 3.03%, 08/15/25 (a) | 2,100,000 | 2,222,216 |
| | | 21,504,849 |
| | | 29,268,910 |
| |
| Commercial Mortgage-Backed Securities 2.2% |
| BANK |
| Series 2017-BNK8, Class A4 |
| 3.49%, 11/15/50 (a) | 600,000 | 688,098 |
| Series 2017-BNK9, Class A4 |
| 3.54%, 11/15/54 (a) | 1,000,000 | 1,145,602 |
| Series 2017-BNK7, Class A5 |
| 3.44%, 09/15/60 (a) | 1,000,000 | 1,138,688 |
| Series 2019-BN19, Class A3 |
| 3.18%, 08/15/61 (a) | 800,000 | 905,212 |
| Series 2020-BN26, Class A4 |
| 2.40%, 03/15/63 (a) | 700,000 | 750,431 |
| BBCMS Mortgage Trust 2018-C2 |
| Series 2018-C2, Class A4 |
| 4.05%, 12/15/51 (a) | 1,150,000 | 1,354,870 |
| Benchmark 2019-B12 Mortgage Trust |
| Series 2019-B12, Class A5 |
| 3.12%, 08/15/52 (a) | 600,000 | 677,611 |
| Benchmark 2019-B13 Mortgage Trust |
| Series 2019-B13, Class A4 |
| 2.95%, 08/15/57 (a) | 2,000,000 | 2,233,585 |
| Benchmark 2019-B9 Mortgage Trust |
| Series 2019-B9, Class A5 |
| 4.02%, 03/15/52 (a) | 600,000 | 713,338 |
| Benchmark 2020-B16 Mortgage Trust |
| Series 2020-B16, Class A5 |
| 2.73%, 02/15/53 (a) | 1,073,000 | 1,181,082 |
| Benchmark 2020-B18 Mortgage Trust |
| Series 2020-B18, Class A5 |
| 1.93%, 07/15/53 (a) | 1,845,000 | 1,904,851 |
| CCUBS Commercial Mortgage Trust |
| Series 2017-C1, Class A4 |
| 3.54%, 11/15/50 (a) | 1,747,000 | 2,001,392 |
| CD Mortgage Trust |
| Series 2017-CD3, Class A4 |
| 3.63%, 02/10/50 (a) | 1,715,000 | 1,941,209 |
| CFCRE Commercial Mortgage Trust |
| Series 2016-C3, Class A3 |
| 3.87%, 01/10/48 (a) | 5,325,000 | 6,038,982 |
| Series 2016-C7, Class A3 |
| 3.84%, 12/10/54 (a) | 3,625,000 | 4,117,526 |
| Series 2016-C4, Class A4 |
| 3.28%, 05/10/58 (a) | 1,000,000 | 1,103,096 |
| Citigroup Commercial Mortgage Trust |
| Series 2013-GC17, Class A4 |
| 4.13%, 11/10/46 (a) | 615,000 | 671,851 |
| Series 2014-GC23, Class A4 |
| 3.62%, 07/10/47 (a) | 1,000,000 | 1,097,656 |
| Series 2014-GC25, Class A4 |
| 3.64%, 10/10/47 (a) | 210,000 | 230,829 |
| Series 2016-GC36, Class A5 |
| 3.62%, 02/10/49 (a) | 3,350,000 | 3,766,966 |
| Series 2016-GC37, Class A4 |
| 3.31%, 04/10/49 (a) | 600,000 | 666,090 |
| Series 2017-P7, Class A4 |
| 3.71%, 04/14/50 (a) | 500,000 | 570,616 |
| Series 2017-C4, Class A4 |
| 3.47%, 10/12/50 (a) | 5,600,000 | 6,366,784 |
Security
Rate, Maturity Date | Face
Amount ($) | Value ($) |
| COMM Mortgage Trust |
| Series 2012-LC4, Class A4 |
| 3.29%, 12/10/44 (a) | 276,997 | 281,727 |
| Series 2012-CR3, Class A3 |
| 2.82%, 10/15/45 (a) | 254,249 | 259,059 |
| Series 2013-CR6, Class A4 |
| 3.10%, 03/10/46 (a) | 4,950,000 | 5,186,900 |
| Series 2014-CR14, Class A3 |
| 3.96%, 02/10/47 (a) | 240,000 | 261,326 |
| Series 2014-CR16, Class ASB |
| 3.65%, 04/10/47 (a) | 435,297 | 453,478 |
| Series 2014-LC15, Class A4 |
| 4.01%, 04/10/47 (a) | 400,000 | 439,810 |
| Series 2014-CR18, Class A4 |
| 3.55%, 07/15/47 (a) | 475,648 | 514,175 |
| Series 2014-CR19, Class ASB |
| 3.50%, 08/10/47 (a) | 298,245 | 314,642 |
| Series 2014-UBS4, Class A5 |
| 3.69%, 08/10/47 (a) | 1,850,000 | 2,002,907 |
| Series 2014-CR20, Class A3 |
| 3.33%, 11/10/47 (a) | 2,050,000 | 2,193,378 |
| Series 2014-CR21, Class A3 |
| 3.53%, 12/10/47 (a) | 173,691 | 187,952 |
| Series 2015-CR22, Class A5 |
| 3.31%, 03/10/48 (a) | 750,000 | 823,305 |
| Series 2015-CR24, Class A5 |
| 3.70%, 08/10/48 (a) | 400,000 | 448,378 |
| Series 2015-LC23, Class A4 |
| 3.77%, 10/10/48 (a) | 440,000 | 492,117 |
| Series 2016-CR28, Class A4 |
| 3.76%, 02/10/49 (a) | 2,700,000 | 3,057,615 |
| Series 2016-DC2, Class A5 |
| 3.77%, 02/10/49 (a) | 100,000 | 112,965 |
| Series 2015-PC1, Class ASB |
| 3.61%, 07/10/50 (a) | 1,932,802 | 2,053,594 |
| Series 2015-PC1, Class A5 |
| 3.90%, 07/10/50 (a) | 497,400 | 557,020 |
| Series 2013-CR11, Class A3 |
| 3.98%, 08/10/50 (a) | 449,875 | 486,976 |
| Series 2013-CR11, Class A4 |
| 4.26%, 08/10/50 (a) | 340,000 | 371,720 |
| CSAIL Commercial Mortgage Trust |
| Series 2015-C3, Class A4 |
| 3.72%, 08/15/48 (a) | 300,000 | 333,641 |
| Series 2015-C1, Class A4 |
| 3.51%, 04/15/50 (a) | 1,308,000 | 1,441,812 |
| CSMC Trust |
| Series 2016-NXSR, Class A4 |
| 3.79%, 12/15/49 (a) | 100,000 | 113,636 |
| Fannie Mae |
| Series 2015-M4, Class AV2 |
| 2.51%, 07/25/22 (a) | 57,609 | 58,058 |
| Series 2016-M3, Class ASQ2 |
| 2.26%, 02/25/23 (a)(f)(j) | 25,912 | 26,141 |
| Series 2014-M9, Class A2 |
| 3.10%, 07/25/24 (a)(f)(j) | 465,575 | 503,356 |
| Series 2015-M3, Class A2 |
| 2.72%, 10/25/24 (a) | 504,462 | 540,726 |
| Series 2015-M13, Class A2 |
| 2.71%, 06/25/25 (a)(f)(j) | 150,000 | 162,580 |
| Series 2016-M6, Class A2 |
| 2.49%, 05/25/26 (a) | 2,600,000 | 2,825,895 |
| Freddie Mac |
| Series K018, Class A2 |
| 2.79%, 01/25/22 (a) | 134,389 | 136,167 |
| Series K024, Class A2 |
| 2.57%, 09/25/22 (a) | 800,000 | 820,135 |
Schwab Fixed-Income ETFs | Annual Report
Schwab U.S. Aggregate Bond ETF
Portfolio Holdings as of December 31, 2020 (continued)
Security
Rate, Maturity Date | Face
Amount ($) | Value ($) |
| Series K026, Class A2 |
| 2.51%, 11/25/22 (a) | 550,000 | 565,346 |
| Series K027, Class A2 |
| 2.64%, 01/25/23 (a) | 1,000,000 | 1,033,156 |
| Series K028, Class A2 |
| 3.11%, 02/25/23 (a) | 250,000 | 261,334 |
| Series K030, Class A2 |
| 3.25%, 04/25/23 (a)(f)(k) | 850,000 | 899,998 |
| Series K031, Class A2 |
| 3.30%, 04/25/23 (a) | 3,225,000 | 3,430,648 |
| Series K033, Class A2 |
| 3.06%, 07/25/23 (a) | 1,540,000 | 1,635,771 |
| Series K034, Class A2 |
| 3.53%, 07/25/23 (a) | 150,000 | 161,292 |
| Series K035, Class A2 |
| 3.46%, 08/25/23 (a)(f)(k) | 450,000 | 483,265 |
| Series K725, Class A2 |
| 3.00%, 01/25/24 (a) | 1,300,000 | 1,392,633 |
| Series K037, Class A2 |
| 3.49%, 01/25/24 (a) | 600,000 | 650,825 |
| Series K727, Class A2 |
| 2.95%, 07/25/24 (a) | 1,765,000 | 1,899,231 |
| Series K728, Class A2 |
| 3.06%, 08/25/24 (a)(f)(k) | 3,700,000 | 4,003,107 |
| Series K040, Class A2 |
| 3.24%, 09/25/24 (a) | 750,000 | 820,880 |
| Series K045, Class A1 |
| 2.49%, 11/25/24 (a) | 317,581 | 323,554 |
| Series K042, Class A2 |
| 2.67%, 12/25/24 (a) | 100,000 | 107,703 |
| Series K043, Class A2 |
| 3.06%, 12/25/24 (a) | 750,000 | 821,282 |
| Series K044, Class A2 |
| 2.81%, 01/25/25 (a) | 1,015,000 | 1,100,725 |
| Series K045, Class A2 |
| 3.02%, 01/25/25 (a) | 400,000 | 437,788 |
| Series K053, Class A1 |
| 2.55%, 02/25/25 (a) | 447,893 | 467,529 |
| Series K731, Class A2 |
| 3.60%, 02/25/25 (a)(f)(k) | 300,000 | 331,552 |
| Series K046, Class A2 |
| 3.21%, 03/25/25 (a) | 920,000 | 1,015,239 |
| Series KS03, Class A4 |
| 3.16%, 05/25/25 (a)(f)(k) | 250,000 | 273,944 |
| Series K048, Class A2 |
| 3.28%, 06/25/25 (a)(f)(k) | 838,000 | 933,813 |
| Series K733, Class A2 |
| 3.75%, 08/25/25 (a)(f)(k) | 1,500,000 | 1,688,673 |
| Series K053, Class A2 |
| 3.00%, 12/25/25 (a) | 950,000 | 1,050,911 |
| Series K054, Class A2 |
| 2.75%, 01/25/26 (a) | 300,000 | 328,822 |
| Series K055, Class A2 |
| 2.67%, 03/25/26 (a) | 750,000 | 821,419 |
| Series K735, Class A2 |
| 2.86%, 05/25/26 (a) | 100,000 | 110,250 |
| Series K058, Class A2 |
| 2.65%, 08/25/26 (a) | 750,000 | 829,199 |
| Series K061, Class A2 |
| 3.35%, 11/25/26 (a)(f)(k) | 520,000 | 592,748 |
| Series K062, Class A2 |
| 3.41%, 12/25/26 (a) | 257,767 | 295,150 |
| Series K067, Class A1 |
| 2.90%, 03/25/27 (a) | 1,459,470 | 1,575,498 |
| Series K064, Class A2 |
| 3.22%, 03/25/27 (a) | 107,000 | 121,776 |
| Series K071, Class A2 |
| 3.29%, 11/25/27 (a) | 4,768,000 | 5,509,036 |
Security
Rate, Maturity Date | Face
Amount ($) | Value ($) |
| Series K070, Class A2, VRN |
| 3.30%, 11/25/27 (a)(f)(k) | 308,000 | 355,863 |
| Series K072, Class A2 |
| 3.44%, 12/25/27 (a) | 1,500,000 | 1,748,386 |
| Series K074, Class A2 |
| 3.60%, 01/25/28 (a) | 8,175,000 | 9,604,376 |
| Series K078, Class A2 |
| 3.85%, 06/25/28 (a) | 1,183,000 | 1,414,666 |
| Series K083, Class A2 |
| 4.05%, 09/25/28 (a)(f)(k) | 2,100,000 | 2,544,227 |
| Series K085, Class A2 |
| 4.06%, 10/25/28 (a)(f)(k) | 900,000 | 1,089,366 |
| Series K087, Class A2 |
| 3.77%, 12/25/28 (a) | 2,560,000 | 3,066,822 |
| Series K088, Class A2 |
| 3.69%, 01/25/29 (a) | 600,000 | 716,686 |
| Series K100, Class A2 |
| 2.67%, 09/25/29 (a) | 800,000 | 901,697 |
| Series K103, Class A2 |
| 2.65%, 11/25/29 (a) | 2,200,000 | 2,477,364 |
| Series K-1511, Class A2 |
| 3.47%, 03/25/31 (a) | 500,000 | 593,215 |
| Series K-1512, Class A2 |
| 2.99%, 05/25/31 (a) | 1,425,000 | 1,635,965 |
| Series K154, Class A2 |
| 3.42%, 04/25/32 (a) | 1,760,000 | 2,096,106 |
| Series K155, Class A3 |
| 3.75%, 04/25/33 (a) | 835,000 | 1,021,252 |
| Series K157, Class A2 |
| 3.99%, 05/25/33 (a) | 1,700,000 | 2,093,370 |
| GS Mortgage Securities Trust |
| Series 2013-GC13, Class A5 |
| 4.05%, 07/10/46 (a)(f)(l) | 649,000 | 702,310 |
| Series 2013-GC14, Class A5 |
| 4.24%, 08/10/46 (a) | 700,000 | 760,266 |
| Series 2016-GS4, Class A4 |
| 3.44%, 11/10/49 (a) | 365,000 | 411,238 |
| JP Morgan Chase Commercial Mortgage Securities Trust |
| Series 2012-C6, Class A3 |
| 3.51%, 05/15/45 (a) | 264,201 | 273,312 |
| Series 2012-CBX, Class A4 |
| 3.48%, 06/15/45 (a) | 390,430 | 397,328 |
| Series 2014-C20, Class A4A1 |
| 3.54%, 07/15/47 (a) | 800,000 | 830,678 |
| Series 2015-JP1, Class A4 |
| 3.65%, 01/15/49 (a) | 600,000 | 673,734 |
| JPMBB Commercial Mortgage Securities Trust |
| Series 2015-C29, Class A4 |
| 3.61%, 05/15/48 (a) | 1,000,000 | 1,115,271 |
| Series 2015-C28, Class A4 |
| 3.23%, 10/15/48 (a) | 2,000,000 | 2,189,189 |
| Series 2015-C33, Class A4 |
| 3.77%, 12/15/48 (a) | 1,150,000 | 1,303,163 |
| Morgan Stanley Bank of America Merrill Lynch Trust |
| Series 2012-C5, Class A4 |
| 3.18%, 08/15/45 (a) | 430,000 | 444,516 |
| Series 2013-C10, Class A4 |
| 4.08%, 07/15/46 (a)(f)(l) | 180,000 | 192,679 |
| Series 2013-C11, Class A4 |
| 4.15%, 08/15/46 (a)(f)(k) | 1,000,000 | 1,060,494 |
| Series 2014-C16, Class A5 |
| 3.89%, 06/15/47 (a) | 270,000 | 295,041 |
| Series 2015-C24, Class ASB |
| 3.48%, 05/15/48 (a) | 919,746 | 978,779 |
| Series 2015-C24, Class A4 |
| 3.73%, 05/15/48 (a) | 93,000 | 104,221 |
Schwab Fixed-Income ETFs | Annual Report
Schwab U.S. Aggregate Bond ETF
Portfolio Holdings as of December 31, 2020 (continued)
Security
Rate, Maturity Date | Face
Amount ($) | Value ($) |
| Series 2013-C8, Class AS |
| 3.38%, 12/15/48 (a) | 80,000 | 83,222 |
| Morgan Stanley Capital I Trust |
| Series 2012-C4, Class A4 |
| 3.24%, 03/15/45 (a) | 300,000 | 305,667 |
| Series 2015-UBS8, Class A4 |
| 3.81%, 12/15/48 (a) | 400,000 | 449,184 |
| Series 2017-H1, Class A4 |
| 3.26%, 06/15/50 (a) | 250,000 | 278,477 |
| Series 2017-HR2, Class A4 |
| 3.59%, 12/15/50 (a) | 1,300,000 | 1,493,896 |
| Series 2020-HR8, Class A4 |
| 2.04%, 07/15/53 (a) | 3,000,000 | 3,116,687 |
| UBS Commercial Mortgage Trust |
| Series 2017-C3, Class A4 |
| 3.43%, 08/15/50 (a) | 1,550,000 | 1,752,253 |
| Series 2017-C6, Class A5 |
| 3.58%, 12/15/50 (a) | 1,000,000 | 1,142,255 |
| Series 2019-C18, Class A4 |
| 3.04%, 12/15/52 (a) | 500,000 | 559,364 |
| UBS-Barclays Commercial Mortgage Trust |
| Series 2012-C4, Class A5 |
| 2.85%, 12/10/45 (a) | 500,000 | 519,924 |
| Series 2013-C5, Class A4 |
| 3.18%, 03/10/46 (a) | 1,850,000 | 1,934,074 |
| Wells Fargo Commercial Mortgage Trust |
| Series 2013-LC12, Class A4 |
| 4.22%, 07/15/46 (a)(f)(l) | 640,000 | 687,944 |
| Series 2015-C28, Class A3 |
| 3.29%, 05/15/48 (a) | 1,069,390 | 1,157,311 |
| Series 2015-C31, Class A3 |
| 3.43%, 11/15/48 (a) | 1,383,668 | 1,526,682 |
| Series 2015-P2, Class A4 |
| 3.81%, 12/15/48 (a) | 1,500,000 | 1,703,270 |
| Series 2016-NXS6, Class A4 |
| 2.92%, 11/15/49 (a) | 150,000 | 163,803 |
| Series 2014-LC16 Class A4 |
| 3.55%, 08/15/50 (a) | 840,498 | 882,398 |
| Series 2017-C40, Class A4 |
| 3.58%, 10/15/50 (a) | 1,551,000 | 1,769,462 |
| Series 2017-C41, Class A4 |
| 3.47%, 11/15/50 (a) | 2,000,000 | 2,266,786 |
| Series 2017-C42, Class A4 |
| 3.59%, 12/15/50 (a) | 2,400,000 | 2,753,402 |
| Series 2018-C44, Class A5 |
| 4.21%, 05/15/51 (a) | 1,500,000 | 1,781,673 |
| Series 2019-C50, Class A5 |
| 3.73%, 05/15/52 (a) | 1,000,000 | 1,162,669 |
| Series 2015-C30, Class A4 |
| 3.66%, 09/15/58 (a) | 723,000 | 810,801 |
| Series 2016-NXS5, Class A4 |
| 3.37%, 01/15/59 (a) | 1,375,000 | 1,497,000 |
| Series 2016-NXS5, Class A6 |
| 3.64%, 01/15/59 (a) | 2,000,000 | 2,259,124 |
| Wells Fargo Commercial Mortgage Trust 2015-NXS4 |
| Series 2015-NXS4, Class A4 |
| 3.72%, 12/15/48 (a) | 2,000,000 | 2,255,089 |
| Wells Fargo Commercial Mortgage Trust 2016-C32 |
| Series 2016-C32, Class A4 |
| 3.56%, 01/15/59 (a) | 500,000 | 559,625 |
| Wells Fargo Commercial Mortgage Trust 2019-C53 |
| Series 2019-C53, Class A4 |
| 3.04%, 10/15/52 (a) | 4,000,000 | 4,483,144 |
| Wells Fargo Commercial Mortgage Trust 2019-C54 |
| Series 2019-C54, Class A4 |
| 3.15%, 12/15/52 (a) | 800,000 | 902,815 |
Security
Rate, Maturity Date | Face
Amount ($) | Value ($) |
| Wells Fargo Commercial Mortgage Trust 2020-C55 |
| Series 2020-C55, Class A5 |
| 2.73%, 02/15/53 (a) | 750,000 | 823,762 |
| WFRBS Commercial Mortgage Trust |
| Series 2013-C14, Class A5 |
| 3.34%, 06/15/46 (a) | 547,687 | 580,453 |
| Series 2013-C15, Class A4 |
| 4.15%, 08/15/46 (a)(f)(l) | 520,000 | 563,638 |
| Series 2014-C19, Class A4 |
| 3.83%, 03/15/47 (a) | 100,000 | 107,613 |
| Series 2013-C12, Class A4 |
| 3.20%, 03/15/48 (a) | 881,000 | 925,793 |
| | | 191,052,493 |
| |
| Mortgage-Backed Securities Pass-Through 26.8% |
| Fannie Mae |
| 4.00%, 02/01/24 to 08/01/50 (a) | 133,517,674 | 145,031,335 |
| 5.50%, 06/01/24 to 11/01/48 (a) | 7,596,648 | 8,833,219 |
| 4.50%, 12/01/24 to 07/01/50 (a) | 57,212,352 | 63,334,876 |
| 3.50%, 08/01/25 to 08/01/50 (a) | 188,646,504 | 202,412,711 |
| 3.00%, 12/01/25 to 09/01/50 (a) | 221,033,992 | 233,875,207 |
| 2.50%, 07/01/27 to 01/01/51 (a) | 168,935,211 | 177,827,542 |
| 2.00%, 04/01/28 to 02/01/51 (a) | 117,502,812 | 122,355,672 |
| 6.00%, 12/01/32 to 07/01/41 (a) | 3,618,567 | 4,248,217 |
| 5.00%, 09/01/33 to 11/01/49 (a) | 16,096,650 | 18,164,062 |
| 6.50%, 08/01/34 to 05/01/40 (a) | 786,411 | 928,387 |
| 1.50%, 09/01/35 to 12/01/50 (a) | 16,479,400 | 16,820,783 |
| Freddie Mac |
| 2.00%, 08/01/23 to 01/01/51 (a) | 112,592,200 | 117,173,399 |
| 4.00%, 03/01/24 to 07/01/50 (a) | 66,836,694 | 72,444,768 |
| 5.50%, 05/01/24 to 08/01/41 (a) | 3,704,075 | 4,320,372 |
| 3.50%, 12/01/25 to 12/01/50 (a) | 111,096,539 | 118,959,662 |
| 3.00%, 08/01/26 to 09/01/50 (a) | 150,561,923 | 159,101,300 |
| 2.50%, 04/01/27 to 12/01/50 (a) | 121,134,104 | 127,470,370 |
| 6.00%, 09/01/32 to 07/01/40 (a) | 2,530,025 | 2,978,110 |
| 5.00%, 11/01/33 to 12/01/49 (a) | 9,512,089 | 10,788,038 |
| 6.50%, 12/01/33 to 09/01/39 (a) | 283,171 | 340,129 |
| 4.50%, 05/01/34 to 08/01/49 (a) | 25,338,293 | 28,071,555 |
| 1.50%, 08/01/35 to 01/01/51 (a) | 28,248,408 | 28,759,758 |
| Ginnie Mae |
| 3.00%, 01/20/27 to 08/20/50 (a) | 150,235,195 | 158,732,986 |
| 2.50%, 03/20/27 to 09/20/50 (a) | 62,098,320 | 65,771,342 |
| 3.50%, 09/20/32 to 07/20/50 (a) | 139,445,012 | 150,176,609 |
| 6.00%, 10/20/32 to 01/20/45 (a) | 1,161,455 | 1,338,761 |
| 5.50%, 02/20/33 to 03/20/49 (a) | 2,343,433 | 2,631,844 |
| 5.00%, 03/20/33 to 07/20/49 (a) | 11,816,564 | 13,192,112 |
| 4.50%, 01/20/39 to 02/20/50 (a) | 31,002,670 | 34,192,592 |
| 4.00%, 06/15/39 to 02/20/50 (a) | 68,699,150 | 74,460,408 |
| 2.00%, 07/20/50 to 09/20/50 (a) | 4,145,392 | 4,338,323 |
| Ginnie Mae TBA |
| 2.00%, 01/01/51 (a)(m) | 1,000,000 | 1,045,414 |
| 2.50%, 01/01/51 (a)(m) | 2,000,000 | 2,116,952 |
| 3.00%, 01/01/51 (a)(m) | 8,000,000 | 8,365,724 |
| Government National Mortgage Association |
| 2.50%, 09/20/35 to 12/20/50 (a) | 26,630,725 | 28,207,127 |
| 3.00%, 03/15/50 to 11/20/50 (a) | 1,803,259 | 1,889,698 |
| 3.50%, 05/20/50 to 11/20/50 (a) | 1,703,703 | 1,802,872 |
| 2.00%, 10/20/50 to 12/20/50 (a) | 22,048,443 | 23,074,596 |
| UMBS TBA |
| 2.00%, 01/01/36 to 01/01/51 (a)(m) | 42,500,000 | 44,192,270 |
| 2.50%, 01/01/36 to 01/01/51 (a)(m) | 30,000,000 | 31,525,126 |
| 3.00%, 01/01/36 to 01/01/51 (a)(m) | 22,500,000 | 23,597,771 |
Schwab Fixed-Income ETFs | Annual Report
Schwab U.S. Aggregate Bond ETF
Portfolio Holdings as of December 31, 2020 (continued)
Security
Rate, Maturity Date | Face
Amount ($) | Value ($) |
| 3.50%, 01/01/36 (a)(m) | 500,000 | 530,061 |
| 1.50%, 01/01/51 (a)(m) | 2,000,000 | 2,020,984 |
| | | 2,337,443,044 |
| Total Securitized |
| (Cost $2,490,122,112) | | 2,557,764,447 |
| Security | Number
of Shares | Value ($) |
| Other Investment Companies 2.6% of net assets |
| |
| Money Market Fund 2.6% |
| State Street Institutional U.S. Government Money Market Fund, Premier Class 0.03% (n) | 229,760,498 | 229,760,498 |
| |
| Security | Number
of Shares | Value ($) |
| Securities Lending Collateral 0.0% |
| Wells Fargo Government Money Market Fund, Select Class 0.03% (n) | 137,795 | 137,795 |
| Total Other Investment Companies |
| (Cost $229,898,293) | | 229,898,293 |
| * | Supranational bonds represent the debt of international organizations or institutions such as the World Bank, the International Monetary Fund, regional multilateral development banks and others. |
| (a) | The effective maturity may be shorter than the final maturity shown because of the possibility of interim principal payments and prepayments or as the result of embedded demand features (puts or calls). |
| (b) | Security converts to floating rate after the fixed-rate coupon period. |
| (c) | Securities exempt from registration under Rule 144A of the Securities Act of 1933, as amended. These securities may be resold in transactions exempt from registrations, normally to qualified institutional buyers. At the period end, the value of these amounted to $48,985,018 or 0.6% of net assets. |
| (d) | Issuer is affiliated with the fund’s investment adviser. |
| (e) | All or a portion of this security is on loan. Securities on loan were valued at $133,345. |
| (f) | Variable-rate security. |
| (g) | Interest rate is subject to adjustments from time to time if a nationally recognized statistical rating organization downgrades (or subsequently upgrades) the debt rating assigned to the bond. |
| (h) | Zero Coupon Bond. |
| (i) | Guaranteed by the Republic of Germany. |
| (j) | Variable rate is determined by formula set forth in the security’s offering documents and is affected by the MBS (Mortgage-Backed Securities) pass-through rate, which is the rate earned from a securitized asset pool once management fees and guarantee fees have been paid to the securitizing corporation. |
| (k) | Variable rate is determined by formula set forth in the security’s offering documents and is affected by the current WAC (Weighted Average Coupon), which is the weighted average gross interest rate of the securitized asset pool and is determined by the different speeds at which the underlying mortgages are paid down. |
| (l) | Security is a type of structured mortgage-backed security (MBS) that involves tranching (i.e. dividing) the underlying MBS pools’ cash flows into securities that have varying coupon and principal payback profiles. Tranches pay an investor an interest rate, which is determined by a formula set forth in the security’s offering documents. The floating interest rate may reset once a year and is generally tied to the London Interbank Offered Rate (LIBOR), the Constant Maturity Treasury (CMT), or the Cost of Funds Index (COFI). LIBOR is the interest rate banks charge each other for short-term loans. The CMT is an index published by the Federal Reserve Board to compute an index based on the monthly average yield of a range of Treasury securities maturing at different periods, adjusted to the equivalent of a one-year maturity. The COFI is a regional index of the average interest expenses paid by financial institutions on money market accounts, passbooks, CDs, and other liabilities. A variable interest rate can also be affected by the current WAC (Weighted Average Coupon), which is the weighted average gross interest rate of the securitized asset pool and is determined by the different speeds at which the underlying mortgages are paid down. |
| (m) | Security or a portion of the security purchased on a delayed delivery or when-issued basis. |
| (n) | The rate shown is the 7-day yield. |
| | |
| GO — | General obligation |
| RB — | Revenue bond |
| REIT — | Real Estate Investment Trust |
| TBA — | To-be-announced |
| UMBS — | Uniform Mortgage-Backed Securities are single-class securities backed by mortgage loans purchased by either Freddie Mac or Fannie Mae |
Schwab Fixed-Income ETFs | Annual Report
Schwab U.S. Aggregate Bond ETF
Portfolio Holdings as of December 31, 2020 (continued)
The fund owns corporate bonds of an affiliate, The Charles Schwab Corp., since those corporate bonds are included in its index. Below is a summary of investment activities involving The Charles Schwab Corp. notes owned by the fund during the period ended December 31, 2020:
| |
Value at
12/31/19 | Gross
Purchases* | Gross
Sales | Realized
Gains(Losses) | Net change
in unrealized
appreciation
(depreciation) |
Value at
12/31/20 | Face
amount at
12/31/20 | Interest
Income
Earned |
| Charles Schwab Corp., 3.25%, 05/21/21 | $203,859 | $49,603 | ($256,219) | $3,021 | ($264) | $— | — | $3,097 |
| Charles Schwab Corp., 2.65%, 01/25/23 | — | 308,067 | — | — | 6,327 | 314,394 | 300,000 | 5,167 |
| Charles Schwab Corp., 3.55%, 02/01/24 | — | 158,122 | — | — | 5,620 | 163,742 | 150,000 | 4,837 |
| Charles Schwab Corp., 4.20%, 03/24/25 | — | 278,299 | — | — | 8,431 | 286,730 | 250,000 | 6,912 |
| Charles Schwab Corp., 3.85%, 05/21/25 | — | 133,810 | — | — | 8,595 | 142,405 | 125,000 | 4,719 |
| Charles Schwab Corp., 3.20%, 01/25/28 | 476,293 | (2,913) | — | — | 40,974 | 514,354 | 450,000 | 14,400 |
| Charles Schwab Corp., 4.00%, 02/01/29 | — | 280,521 | — | — | 18,521 | 299,042 | 250,000 | 9,167 |
| Charles Schwab Corp., 3.25%, 05/22/29 | — | 210,864 | — | — | 18,796 | 229,660 | 200,000 | 6,247 |
| Charles Schwab Corp., 4.63%, 03/22/30 | — | 284,911 | — | — | 31,191 | 316,102 | 250,000 | 8,229 |
| Total | $680,152 | $1,701,284 | ($256,219) | $3,021 | $138,191 | $2,266,429 | | $62,775 |
* Amount includes amortization of premiums and/or accretion of discounts.
The following is a summary of the inputs used to value the fund’s investments as of December 31, 2020 (see financial note 2(a) for additional information):
| Description | Quoted Prices in
Active Markets for
Identical Assets
(Level 1) | Other Significant
Observable Inputs
(Level 2) | Significant
Unobservable Inputs
(Level 3) | Total | |
| Assets | | | | | |
| Corporates 1 | $— | $2,376,181,307 | $— | $2,376,181,307 | |
| Treasuries | — | 3,203,026,285 | — | 3,203,026,285 | |
| Government Related1 | — | 538,262,881 | — | 538,262,881 | |
| Securitized 1 | — | 2,557,764,447 | — | 2,557,764,447 | |
| Other Investment Companies1 | 229,898,293 | — | — | 229,898,293 | |
| Total | $229,898,293 | $8,675,234,920 | $— | $8,905,133,213 | |
| 1 | As categorized in Portfolio Holdings. |
Fund investments in underlying mutual funds are classified as Level 1, without consideration to the classification level of the investments held by the underlying mutual funds, which could be Level 1, Level 2 or Level 3.
Schwab Fixed-Income ETFs | Annual Report
Schwab U.S. Aggregate Bond ETF
Statement of Assets and Liabilities
As of December 31, 2020
| Assets |
| Investments in affiliated issuer, at value (cost $2,126,377) | | $2,266,429 |
| Investments in unaffiliated issuers, at value (cost $8,360,669,008) including securities on loan of $133,345 | | 8,902,728,989 |
| Collateral invested for securities on loan, at value (cost $137,795) | | 137,795 |
| Receivables: | | |
| Investments sold | | 119,815,553 |
| Interest | | 42,469,044 |
| Fund shares sold | | 11,218,565 |
| Dividends | | 3,709 |
| Foreign tax reclaims | | 1,448 |
| Income from securities on loan | + | 310 |
| Total assets | | 9,078,641,842 |
| Liabilities |
| Collateral held for securities on loan | | 137,795 |
| Payables: | | |
| Investments bought | | 224,642,588 |
| Investments bought — Delayed delivery | | 120,817,774 |
| Management fees | | 290,316 |
| Fund shares redeemed | + | 8,297 |
| Total liabilities | | 345,896,770 |
| Net Assets |
| Total assets | | 9,078,641,842 |
| Total liabilities | – | 345,896,770 |
| Net assets | | $8,732,745,072 |
| Net Assets by Source | | |
| Capital received from investors | | 8,199,502,241 |
| Total distributable earnings | | 533,242,831 |
| Net Asset Value (NAV) |
| Net Assets | ÷ | Shares
Outstanding | = | NAV |
| $8,732,745,072 | | 155,800,000 | | $56.05 |
| | | | | |
Schwab Fixed-Income ETFs | Annual Report
Schwab U.S. Aggregate Bond ETF
Statement of Operations
For the period January 1, 2020 through December 31, 2020
| Investment Income |
| Interest received from affiliated issuer | | $62,775 |
| Interest received from unaffiliated issuers | | 173,606,598 |
| Dividends received from unaffiliated issuers | | 692,747 |
| Securities on loan, net | + | 8,091 |
| Total investment income | | 174,370,211 |
| Expenses |
| Management fees | | 3,198,188 |
| Total expenses | – | 3,198,188 |
| Net investment income | | 171,172,023 |
| Realized and Unrealized Gains (Losses) |
| Net realized gains on affiliated issuer | | 3,021 |
| Net realized gains on unaffiliated investments | | 67,729,602 |
| Net realized gains on in-kind redemptions on unaffiliated investments | + | 481,038 |
| Net realized gains | | 68,213,661 |
| Net change in unrealized appreciation (depreciation) on affiliated issuer | | 138,191 |
| Net change in unrealized appreciation (depreciation) on unaffiliated investments | + | 308,210,684 |
| Net change in unrealized appreciation (depreciation) | + | 308,348,875 |
| Net realized and unrealized gains | | 376,562,536 |
| Increase in net assets resulting from operations | | $547,734,559 |
Schwab Fixed-Income ETFs | Annual Report
Schwab U.S. Aggregate Bond ETF
Statement of Changes in Net Assets
For the current and prior report periods
| Operations | |
| | 1/1/20-12/31/20 | 1/1/19-12/31/19 |
| Net investment income | | $171,172,023 | $174,839,792 |
| Net realized gains | | 68,213,661 | 9,439,160 |
| Net change in unrealized appreciation (depreciation) | + | 308,348,875 | 330,898,161 |
| Increase in net assets resulting from operations | | 547,734,559 | 515,177,113 |
| Distributions to Shareholders | |
| Total distributions | | ($196,101,450) | ($184,048,740) |
| Transactions in Fund Shares | | | |
| | | 1/1/20-12/31/20 | 1/1/19-12/31/19 |
| | | SHARES | VALUE | SHARES | VALUE |
| Shares sold | | 31,800,000 | $1,772,159,926 | 28,700,000 | $1,512,898,662 |
| Shares redeemed | + | (14,200,000) | (774,556,964) | (100,000) | (5,100,791) |
| Net transactions in fund shares | | 17,600,000 | $997,602,962 | 28,600,000 | $1,507,797,871 |
| Shares Outstanding and Net Assets | | | |
| | | 1/1/20-12/31/20 | 1/1/19-12/31/19 |
| | | SHARES | NET ASSETS | SHARES | NET ASSETS |
| Beginning of period | | 138,200,000 | $7,383,509,001 | 109,600,000 | $5,544,582,757 |
| Total increase | + | 17,600,000 | 1,349,236,071 | 28,600,000 | 1,838,926,244 |
| End of period | | 155,800,000 | $8,732,745,072 | 138,200,000 | $7,383,509,001 |
Schwab Fixed-Income ETFs | Annual Report
Schwab 1-5 Year Corporate Bond ETF
Financial Statements
Financial Highlights
| | 1/1/20–
12/31/20 | 10/10/19 1–
12/31/19 | | | | |
| Per-Share Data |
| Net asset value at beginning of period | $50.04 | $50.00 | | | | |
| Income (loss) from investment operations: | | | | | | |
| Net investment income (loss)2 | 0.89 | 0.23 | | | | |
| Net realized and unrealized gains (losses) | 1.74 | 0.02 | | | | |
| Total from investment operations | 2.63 | 0.25 | | | | |
| Less distributions: | | | | | | |
| Distributions from net investment income | (0.89) | (0.21) | | | | |
| Distributions from net realized gains | (0.41) | — | | | | |
| Total distributions | (1.30) | (0.21) | | | | |
| Net asset value at end of period | $51.37 | $50.04 | | | | |
| Total return | 5.31% | 0.50% 3 | | | | |
| Ratios/Supplemental Data |
| Ratios to average net assets: | | | | | | |
| Total expenses | 0.05% | 0.06% 4,5 | | | | |
| Net investment income (loss) | 1.74% | 2.01% 4 | | | | |
| Portfolio turnover rate6 | 80% | 12% 3 | | | | |
| Net assets, end of period (x 1,000) | $118,146 | $35,029 | | | | |
| |
1
Commencement of operations.
2
Calculated based on the average shares outstanding during the period.
3
Not annualized.
4
Annualized.
5
Effective December 13, 2019, the annual operating expense ratio was reduced to 0.05%. The ratio presented for the period ended 12/31/19 is a blended ratio.
6
Portfolio turnover rate excludes securities received or delivered from processing of in-kind creations or redemptions.
Schwab Fixed-Income ETFs | Annual Report
Schwab 1-5 Year Corporate Bond ETF
Portfolio Holdings as of December 31, 2020
This section shows all the securities in the fund’s portfolio and their values as of the report date.
The fund files its complete schedule of portfolio holdings with the U.S. Securities and Exchange Commission (SEC) for the first and third quarters of each fiscal year on Form N-PORT Part F. The fund’s Form N-PORT Part F is available on the SEC’s website at www.sec.gov and on the fund’s website at www.schwabfunds.com/schwabetfs_prospectus. The fund also makes available its complete schedule of portfolio holdings on a daily basis on the fund’s website.
For fixed rate obligations, the rate shown is the interest rate (the rate established when the obligation was issued). For variable rate obligations, the rate shown is the rate as of the report date based on each security’s rate reset date. The reference rate and spread used is shown parenthetically in the security description if available; if not the reference rate is described in a footnote. The maturity date shown for all the securities is the final legal maturity.
Security
Rate, Maturity Date | Face
Amount ($) | Value ($) |
| Corporates 98.6% of net assets |
| |
| Financial Institutions 41.6% |
| Banking 32.8% |
| Ally Financial, Inc. |
| 4.13%, 02/13/22 | 100,000 | 103,969 |
| 3.05%, 06/05/23 (a) | 50,000 | 52,768 |
| 1.45%, 10/02/23 (a) | 50,000 | 51,064 |
| 3.88%, 05/21/24 (a) | 50,000 | 54,886 |
| 5.13%, 09/30/24 | 20,000 | 23,068 |
| 4.63%, 03/30/25 | 50,000 | 57,045 |
| American Express Co. |
| 2.75%, 05/20/22 (a) | 100,000 | 103,163 |
| 2.50%, 08/01/22 (a) | 85,000 | 87,761 |
| 2.65%, 12/02/22 | 140,000 | 146,223 |
| 3.40%, 02/27/23 (a) | 100,000 | 106,397 |
| 3.70%, 08/03/23 (a) | 325,000 | 352,154 |
| 3.40%, 02/22/24 (a) | 25,000 | 27,264 |
| 2.50%, 07/30/24 (a) | 35,000 | 37,430 |
| 3.00%, 10/30/24 (a) | 40,000 | 43,697 |
| Banco Bilbao Vizcaya Argentaria S.A. |
| 1.13%, 09/18/25 | 200,000 | 201,882 |
| Banco Santander S.A. |
| 3.50%, 04/11/22 | 200,000 | 207,440 |
| 2.75%, 05/28/25 | 200,000 | 214,208 |
| BancorpSouth Bank |
| 4.13%, 11/20/29 (a)(b) | 25,000 | 25,203 |
| Bank of America Corp. |
| 2.50%, 10/21/22 (a) | 100,000 | 101,813 |
| 3.30%, 01/11/23 | 425,000 | 450,819 |
| 3.12%, 01/20/23 (a)(b) | 150,000 | 154,360 |
| 2.88%, 04/24/23 (a)(b) | 25,000 | 25,814 |
| 4.10%, 07/24/23 | 110,000 | 120,486 |
| 3.00%, 12/20/23 (a)(b) | 130,000 | 136,829 |
| 4.13%, 01/22/24 | 150,000 | 166,468 |
| 3.55%, 03/05/24 (a)(b) | 175,000 | 186,961 |
| 4.00%, 04/01/24 | 50,000 | 55,518 |
| 1.49%, 05/19/24 (a)(b) | 100,000 | 102,408 |
| 3.86%, 07/23/24 (a)(b) | 200,000 | 217,168 |
| 4.20%, 08/26/24 | 50,000 | 56,092 |
| 0.81%, 10/24/24 (a)(b) | 150,000 | 151,599 |
| 4.00%, 01/22/25 | 175,000 | 196,789 |
| 3.46%, 03/15/25 (a)(b) | 135,000 | 147,082 |
| 3.95%, 04/21/25 | 200,000 | 225,490 |
| 3.88%, 08/01/25 | 100,000 | 114,187 |
| 0.98%, 09/25/25 (a)(b) | 100,000 | 101,287 |
| 3.09%, 10/01/25 (a)(b) | 75,000 | 81,592 |
| 2.46%, 10/22/25 (a)(b) | 50,000 | 53,397 |
| 3.37%, 01/23/26 (a)(b) | 45,000 | 49,491 |
| 2.02%, 02/13/26 (a)(b) | 55,000 | 57,722 |
| 1.32%, 06/19/26 (a)(b) | 200,000 | 204,264 |
| 1.20%, 10/24/26 (a)(b) | 150,000 | 152,527 |
Security
Rate, Maturity Date | Face
Amount ($) | Value ($) |
| Bank of America NA |
| 3.34%, 01/25/23 (a)(b) | 250,000 | 258,275 |
| Bank of Montreal |
| 2.90%, 03/26/22 | 100,000 | 103,269 |
| 0.45%, 12/08/23 | 50,000 | 50,179 |
| 3.30%, 02/05/24 | 250,000 | 271,460 |
| 2.50%, 06/28/24 | 80,000 | 85,459 |
| 1.85%, 05/01/25 | 25,000 | 26,266 |
| 4.34%, 10/05/28 (a)(b) | 25,000 | 27,519 |
| Bank of New York Mellon Corp. |
| 1.95%, 08/23/22 | 150,000 | 154,341 |
| 2.95%, 01/29/23 (a) | 100,000 | 105,219 |
| 3.50%, 04/28/23 | 50,000 | 53,657 |
| 2.66%, 05/16/23 (a)(b) | 100,000 | 103,190 |
| 0.35%, 12/07/23 (a) | 50,000 | 50,114 |
| 3.40%, 05/15/24 (a) | 100,000 | 109,617 |
| 2.10%, 10/24/24 | 25,000 | 26,560 |
| 3.00%, 02/24/25 (a) | 45,000 | 49,556 |
| 1.60%, 04/24/25 (a) | 100,000 | 104,499 |
| 3.95%, 11/18/25 (a) | 75,000 | 86,932 |
| Bank of Nova Scotia |
| 2.38%, 01/18/23 | 100,000 | 104,117 |
| 1.63%, 05/01/23 | 200,000 | 205,838 |
| 0.80%, 06/15/23 | 150,000 | 151,474 |
| 3.40%, 02/11/24 | 125,000 | 136,141 |
| 2.20%, 02/03/25 | 30,000 | 31,839 |
| 1.30%, 06/11/25 | 100,000 | 102,641 |
| Barclays Bank PLC |
| 1.70%, 05/12/22 (a) | 200,000 | 203,488 |
| Barclays PLC |
| 4.61%, 02/15/23 (a)(b) | 100,000 | 104,390 |
| 3.65%, 03/16/25 | 225,000 | 248,598 |
| 2.85%, 05/07/26 (a)(b) | 200,000 | 214,864 |
| BNP Paribas S.A. |
| 3.25%, 03/03/23 | 100,000 | 106,315 |
| Canadian Imperial Bank of Commerce |
| 2.55%, 06/16/22 | 200,000 | 206,854 |
| 0.50%, 12/14/23 | 50,000 | 50,179 |
| 3.10%, 04/02/24 | 85,000 | 92,045 |
| 2.25%, 01/28/25 | 25,000 | 26,543 |
| 0.95%, 10/23/25 | 50,000 | 50,795 |
| Capital One Financial Corp. |
| 3.20%, 01/30/23 (a) | 165,000 | 174,308 |
| 2.60%, 05/11/23 (a) | 100,000 | 104,838 |
| 3.90%, 01/29/24 (a) | 300,000 | 328,797 |
| 3.30%, 10/30/24 (a) | 100,000 | 110,060 |
| 3.20%, 02/05/25 (a) | 20,000 | 21,853 |
| 4.25%, 04/30/25 (a) | 50,000 | 57,253 |
| Citigroup, Inc. |
| 2.90%, 12/08/21 (a) | 50,000 | 51,097 |
| 4.50%, 01/14/22 | 100,000 | 104,297 |
| 4.05%, 07/30/22 | 100,000 | 105,655 |
| 2.70%, 10/27/22 (a) | 150,000 | 156,084 |
Schwab Fixed-Income ETFs | Annual Report
Schwab 1-5 Year Corporate Bond ETF
Portfolio Holdings as of December 31, 2020 (continued)
Security
Rate, Maturity Date | Face
Amount ($) | Value ($) |
| 3.14%, 01/24/23 (a)(b) | 100,000 | 102,875 |
| 3.50%, 05/15/23 | 125,000 | 134,074 |
| 2.88%, 07/24/23 (a)(b) | 200,000 | 207,634 |
| 3.88%, 10/25/23 | 100,000 | 110,057 |
| 4.04%, 06/01/24 (a)(b) | 75,000 | 81,540 |
| 3.75%, 06/16/24 | 40,000 | 44,259 |
| 4.00%, 08/05/24 | 120,000 | 133,754 |
| 3.88%, 03/26/25 | 25,000 | 28,009 |
| 3.35%, 04/24/25 (a)(b) | 75,000 | 81,718 |
| 3.30%, 04/27/25 | 100,000 | 111,090 |
| 5.50%, 09/13/25 | 200,000 | 240,674 |
| 3.11%, 04/08/26 (a)(b) | 350,000 | 383,418 |
| Citizens Bank NA |
| 2.65%, 05/26/22 (a) | 250,000 | 257,555 |
| Comerica, Inc. |
| 3.70%, 07/31/23 (a) | 25,000 | 27,030 |
| Cooperatieve Rabobank UA |
| 3.88%, 02/08/22 | 300,000 | 311,892 |
| 3.95%, 11/09/22 | 250,000 | 265,475 |
| Credit Suisse AG |
| 2.80%, 04/08/22 | 250,000 | 258,052 |
| 1.00%, 05/05/23 | 250,000 | 253,795 |
| 2.95%, 04/09/25 | 250,000 | 274,397 |
| Deutsche Bank AG |
| 3.95%, 02/27/23 | 250,000 | 265,505 |
| 3.70%, 05/30/24 | 50,000 | 53,967 |
| 3.70%, 05/30/24 | 100,000 | 107,799 |
| 2.13%, 11/24/26 (a)(b) | 150,000 | 153,580 |
| Discover Bank |
| 2.45%, 09/12/24 (a) | 250,000 | 264,912 |
| Discover Financial Services |
| 5.20%, 04/27/22 | 65,000 | 68,965 |
| Fifth Third Bancorp |
| 2.60%, 06/15/22 (a) | 50,000 | 51,538 |
| 1.63%, 05/05/23 (a) | 75,000 | 77,218 |
| 4.30%, 01/16/24 (a) | 50,000 | 55,484 |
| 3.65%, 01/25/24 (a) | 150,000 | 163,755 |
| 2.38%, 01/28/25 (a) | 70,000 | 74,538 |
| First Citizens BancShares, Inc. |
| 3.38%, 03/15/30 (a)(b) | 25,000 | 25,312 |
| First Horizon Corp. |
| 3.55%, 05/26/23 (a) | 50,000 | 53,148 |
| 4.00%, 05/26/25 (a) | 50,000 | 55,929 |
| Goldman Sachs Group, Inc. |
| 5.75%, 01/24/22 | 100,000 | 105,703 |
| 3.00%, 04/26/22 (a) | 100,000 | 100,816 |
| 3.63%, 01/22/23 | 100,000 | 106,721 |
| 3.20%, 02/23/23 (a) | 100,000 | 105,700 |
| 2.91%, 06/05/23 (a)(b) | 375,000 | 388,571 |
| 0.63%, 11/17/23 (a)(b) | 100,000 | 100,483 |
| 3.63%, 02/20/24 (a) | 90,000 | 98,149 |
| 4.00%, 03/03/24 | 125,000 | 138,154 |
| 3.85%, 07/08/24 (a) | 125,000 | 138,090 |
| 3.50%, 01/23/25 (a) | 125,000 | 138,056 |
| 3.50%, 04/01/25 (a) | 500,000 | 555,990 |
| 3.75%, 05/22/25 (a) | 300,000 | 336,903 |
| 1.09%, 12/09/26 (a)(b) | 50,000 | 50,600 |
| HSBC Holdings PLC |
| 3.26%, 03/13/23 (a)(b) | 250,000 | 258,205 |
| 4.25%, 03/14/24 | 200,000 | 220,836 |
| 3.95%, 05/18/24 (a)(b) | 470,000 | 507,675 |
| 2.10%, 06/04/26 (a)(b) | 200,000 | 208,418 |
| 4.29%, 09/12/26 (a)(b) | 200,000 | 228,164 |
| HSBC USA, Inc. |
| 3.50%, 06/23/24 | 100,000 | 109,595 |
Security
Rate, Maturity Date | Face
Amount ($) | Value ($) |
| Huntington Bancshares, Inc. |
| 2.30%, 01/14/22 (a) | 100,000 | 101,880 |
| 4.00%, 05/15/25 (a) | 100,000 | 113,358 |
| ING Groep N.V. |
| 3.15%, 03/29/22 | 200,000 | 206,910 |
| JPMorgan Chase & Co. |
| 4.50%, 01/24/22 | 75,000 | 78,373 |
| 3.25%, 09/23/22 | 50,000 | 52,556 |
| 2.97%, 01/15/23 (a) | 250,000 | 256,907 |
| 3.20%, 01/25/23 | 125,000 | 132,554 |
| 2.78%, 04/25/23 (a)(b) | 150,000 | 154,798 |
| 3.38%, 05/01/23 | 50,000 | 53,456 |
| 2.70%, 05/18/23 (a) | 100,000 | 105,242 |
| 3.63%, 05/13/24 | 150,000 | 165,960 |
| 1.51%, 06/01/24 (a)(b) | 150,000 | 154,162 |
| 3.80%, 07/23/24 (a)(b) | 165,000 | 178,858 |
| 3.88%, 09/10/24 | 400,000 | 447,948 |
| 4.02%, 12/05/24 (a)(b) | 200,000 | 220,570 |
| 3.13%, 01/23/25 (a) | 200,000 | 219,038 |
| 3.22%, 03/01/25 (a)(b) | 150,000 | 161,872 |
| 3.90%, 07/15/25 (a) | 100,000 | 113,643 |
| 2.30%, 10/15/25 (a)(b) | 55,000 | 58,424 |
| 2.08%, 04/22/26 (a)(b) | 300,000 | 316,947 |
| 1.05%, 11/19/26 (a)(b) | 100,000 | 101,208 |
| KeyBank NA |
| 2.30%, 09/14/22 | 250,000 | 258,450 |
| 1.25%, 03/10/23 | 250,000 | 255,047 |
| Lloyds Banking Group PLC |
| 3.00%, 01/11/22 | 200,000 | 205,232 |
| 2.91%, 11/07/23 (a)(b) | 250,000 | 260,790 |
| 2.44%, 02/05/26 (a)(b) | 250,000 | 264,390 |
| Manufacturers & Traders Trust Co. |
| 2.50%, 05/18/22 (a) | 250,000 | 257,185 |
| Mitsubishi UFJ Financial Group, Inc. |
| 3.00%, 02/22/22 | 100,000 | 102,997 |
| 2.62%, 07/18/22 | 225,000 | 232,830 |
| 3.76%, 07/26/23 | 200,000 | 217,024 |
| 2.53%, 09/13/23 | 200,000 | 210,846 |
| 3.41%, 03/07/24 | 250,000 | 272,137 |
| 2.19%, 02/25/25 | 200,000 | 210,972 |
| Mizuho Financial Group, Inc. |
| 2.95%, 02/28/22 | 200,000 | 206,012 |
| 2.84%, 07/16/25 (a)(b) | 200,000 | 213,234 |
| Morgan Stanley |
| 2.75%, 05/19/22 | 100,000 | 103,306 |
| 4.88%, 11/01/22 | 150,000 | 161,787 |
| 3.13%, 01/23/23 | 50,000 | 52,807 |
| 3.75%, 02/25/23 | 90,000 | 96,520 |
| 4.10%, 05/22/23 | 100,000 | 108,516 |
| 0.56%, 11/10/23 (a)(b) | 150,000 | 150,318 |
| 3.74%, 04/24/24 (a)(b) | 75,000 | 80,742 |
| 3.88%, 04/29/24 | 200,000 | 221,712 |
| 3.70%, 10/23/24 | 175,000 | 194,894 |
| 2.72%, 07/22/25 (a)(b) | 85,000 | 91,009 |
| 4.00%, 07/23/25 | 250,000 | 286,235 |
| 0.86%, 10/21/25 (a)(b) | 100,000 | 100,784 |
| 2.19%, 04/28/26 (a)(b) | 300,000 | 317,448 |
| National Australia Bank Ltd. |
| 2.88%, 04/12/23 | 250,000 | 264,605 |
| Natwest Group PLC |
| 6.13%, 12/15/22 | 100,000 | 109,926 |
| 3.50%, 05/15/23 (a)(b) | 200,000 | 208,066 |
| 3.88%, 09/12/23 | 200,000 | 216,990 |
| 5.13%, 05/28/24 | 200,000 | 224,716 |
| 3.75%, 11/01/29 (a)(b) | 200,000 | 213,524 |
Schwab Fixed-Income ETFs | Annual Report
Schwab 1-5 Year Corporate Bond ETF
Portfolio Holdings as of December 31, 2020 (continued)
Security
Rate, Maturity Date | Face
Amount ($) | Value ($) |
| People's United Financial, Inc. |
| 3.65%, 12/06/22 (a) | 100,000 | 104,858 |
| PNC Bank NA |
| 2.70%, 11/01/22 (a) | 250,000 | 260,490 |
| PNC Financial Services Group, Inc. |
| 2.85%, 11/09/22 | 250,000 | 261,785 |
| 3.50%, 01/23/24 (a) | 75,000 | 81,838 |
| 3.90%, 04/29/24 (a) | 40,000 | 44,292 |
| 2.20%, 11/01/24 (a) | 100,000 | 106,440 |
| Regions Financial Corp. |
| 3.80%, 08/14/23 (a) | 50,000 | 54,328 |
| 2.25%, 05/18/25 (a) | 100,000 | 106,181 |
| Royal Bank of Canada |
| 2.75%, 02/01/22 | 50,000 | 51,356 |
| 2.80%, 04/29/22 | 50,000 | 51,692 |
| 1.60%, 04/17/23 | 200,000 | 205,728 |
| 3.70%, 10/05/23 | 170,000 | 185,635 |
| 0.50%, 10/26/23 | 75,000 | 75,451 |
| 2.55%, 07/16/24 | 70,000 | 74,921 |
| 1.15%, 06/10/25 | 100,000 | 102,261 |
| Santander Holdings USA, Inc. |
| 3.70%, 03/28/22 (a) | 75,000 | 77,480 |
| Santander UK Group Holdings PLC |
| 3.37%, 01/05/24 (a)(b) | 200,000 | 210,450 |
| 4.80%, 11/15/24 (a)(b) | 200,000 | 222,376 |
| Santander UK PLC |
| 4.00%, 03/13/24 | 200,000 | 221,412 |
| State Street Corp. |
| 2.83%, 03/30/23 (a)(b) | 50,000 | 51,562 |
| 2.65%, 05/15/23 (a)(b) | 13,000 | 13,413 |
| 3.10%, 05/15/23 | 20,000 | 21,309 |
| 3.78%, 12/03/24 (a)(b) | 200,000 | 219,506 |
| 2.35%, 11/01/25 (a)(b) | 100,000 | 106,698 |
| 2.90%, 03/30/26 (a)(b) | 25,000 | 27,241 |
| Sumitomo Mitsui Financial Group, Inc. |
| 2.78%, 07/12/22 | 325,000 | 337,103 |
| 3.10%, 01/17/23 | 200,000 | 211,104 |
| 2.70%, 07/16/24 | 200,000 | 213,670 |
| 2.35%, 01/15/25 | 200,000 | 212,242 |
| 1.47%, 07/08/25 | 200,000 | 205,240 |
| SVB Financial Group |
| 3.50%, 01/29/25 | 50,000 | 54,732 |
| Synchrony Financial |
| 2.85%, 07/25/22 (a) | 225,000 | 232,686 |
| 4.38%, 03/19/24 (a) | 50,000 | 55,093 |
| Toronto-Dominion Bank |
| 1.90%, 12/01/22 | 100,000 | 103,133 |
| 3.50%, 07/19/23 | 150,000 | 162,237 |
| 3.25%, 03/11/24 | 50,000 | 54,332 |
| 2.65%, 06/12/24 | 250,000 | 268,140 |
| 0.75%, 09/11/25 | 75,000 | 75,313 |
| Truist Bank |
| 2.45%, 08/01/22 (a) | 50,000 | 51,622 |
| 1.25%, 03/09/23 (a) | 250,000 | 255,080 |
| 3.69%, 08/02/24 (a)(b) | 50,000 | 54,188 |
| 1.50%, 03/10/25 (a) | 250,000 | 259,135 |
| 4.05%, 11/03/25 (a) | 50,000 | 57,602 |
| Truist Financial Corp. |
| 2.70%, 01/27/22 (a) | 150,000 | 153,591 |
| 3.95%, 03/22/22 (a) | 50,000 | 52,057 |
| 2.50%, 08/01/24 (a) | 125,000 | 133,354 |
| 2.85%, 10/26/24 (a) | 125,000 | 135,709 |
| 4.00%, 05/01/25 (a) | 75,000 | 85,266 |
| 3.70%, 06/05/25 (a) | 50,000 | 56,626 |
Security
Rate, Maturity Date | Face
Amount ($) | Value ($) |
| US Bancorp |
| 3.70%, 01/30/24 (a) | 30,000 | 33,035 |
| 3.38%, 02/05/24 (a) | 255,000 | 278,146 |
| 2.40%, 07/30/24 (a) | 200,000 | 213,708 |
| 1.45%, 05/12/25 (a) | 200,000 | 207,574 |
| US Bank NA |
| 1.80%, 01/21/22 (a) | 250,000 | 253,992 |
| Wells Fargo & Co. |
| 3.50%, 03/08/22 | 175,000 | 181,471 |
| 2.63%, 07/22/22 | 300,000 | 310,650 |
| 3.07%, 01/24/23 (a) | 110,000 | 113,122 |
| 3.45%, 02/13/23 | 180,000 | 191,032 |
| 4.13%, 08/15/23 | 25,000 | 27,299 |
| 3.75%, 01/24/24 (a) | 275,000 | 300,303 |
| 1.65%, 06/02/24 (a)(b) | 100,000 | 102,829 |
| 3.30%, 09/09/24 | 100,000 | 109,603 |
| 3.00%, 02/19/25 | 350,000 | 381,108 |
| 2.41%, 10/30/25 (a)(b) | 170,000 | 179,749 |
| 2.16%, 02/11/26 (a)(b) | 115,000 | 120,995 |
| 2.19%, 04/30/26 (a)(b) | 200,000 | 210,644 |
| Westpac Banking Corp. |
| 2.80%, 01/11/22 | 75,000 | 76,957 |
| 2.00%, 01/13/23 | 30,000 | 31,050 |
| 3.65%, 05/15/23 | 118,000 | 127,300 |
| 3.30%, 02/26/24 | 100,000 | 109,145 |
| 2.35%, 02/19/25 | 125,000 | 134,249 |
| 2.89%, 02/04/30 (a)(b) | 100,000 | 104,960 |
| | | 38,780,631 |
| Brokerage/Asset Managers/Exchanges 1.3% |
| Affiliated Managers Group, Inc. |
| 4.25%, 02/15/24 | 50,000 | 55,159 |
| Ameriprise Financial, Inc. |
| 3.00%, 03/22/22 | 150,000 | 154,936 |
| 4.00%, 10/15/23 | 50,000 | 55,042 |
| BGC Partners, Inc. |
| 5.38%, 07/24/23 | 50,000 | 54,395 |
| BlackRock, Inc. |
| 3.50%, 03/18/24 | 60,000 | 66,028 |
| Brookfield Asset Management, Inc. |
| 4.00%, 01/15/25 (a) | 65,000 | 72,860 |
| Brookfield Finance, Inc. |
| 4.00%, 04/01/24 (a) | 25,000 | 27,480 |
| Charles Schwab Corp. |
| 2.65%, 01/25/23 (a)(d) | 25,000 | 26,200 |
| 3.55%, 02/01/24 (a)(d) | 10,000 | 10,916 |
| CME Group, Inc. |
| 3.00%, 03/15/25 (a) | 50,000 | 54,902 |
| E*TRADE Financial Corp. |
| 2.95%, 08/24/22 (a) | 20,000 | 20,792 |
| Franklin Resources, Inc. |
| 2.85%, 03/30/25 | 50,000 | 54,590 |
| Intercontinental Exchange, Inc. |
| 0.70%, 06/15/23 | 50,000 | 50,406 |
| 3.45%, 09/21/23 (a) | 50,000 | 53,934 |
| 4.00%, 10/15/23 | 50,000 | 54,895 |
| 3.75%, 12/01/25 (a) | 100,000 | 113,670 |
| Invesco Finance PLC |
| 3.13%, 11/30/22 | 50,000 | 52,658 |
| 4.00%, 01/30/24 | 25,000 | 27,497 |
| Jefferies Financial Group, Inc. |
| 5.50%, 10/18/23 (a) | 45,000 | 49,678 |
| Jefferies Group LLC |
| 5.13%, 01/20/23 | 50,000 | 54,722 |
Schwab Fixed-Income ETFs | Annual Report
Schwab 1-5 Year Corporate Bond ETF
Portfolio Holdings as of December 31, 2020 (continued)
Security
Rate, Maturity Date | Face
Amount ($) | Value ($) |
| Lazard Group LLC |
| 3.75%, 02/13/25 | 50,000 | 55,553 |
| Nasdaq, Inc. |
| 0.45%, 12/21/22 (a) | 50,000 | 50,063 |
| 4.25%, 06/01/24 (a) | 25,000 | 27,772 |
| Nomura Holdings, Inc. |
| 1.85%, 07/16/25 | 200,000 | 208,092 |
| Stifel Financial Corp. |
| 4.25%, 07/18/24 | 15,000 | 16,852 |
| TD Ameritrade Holding Corp. |
| 3.75%, 04/01/24 (a) | 30,000 | 32,953 |
| 3.63%, 04/01/25 (a) | 50,000 | 55,746 |
| | | 1,557,791 |
| Finance Companies 1.6% |
| AerCap Ireland Capital DAC/AerCap Global Aviation Trust |
| 3.30%, 01/23/23 (a) | 250,000 | 261,005 |
| 4.88%, 01/16/24 (a) | 150,000 | 164,298 |
| 3.50%, 01/15/25 (a) | 150,000 | 159,498 |
| Air Lease Corp. |
| 3.50%, 01/15/22 | 50,000 | 51,410 |
| 2.75%, 01/15/23 (a) | 150,000 | 155,028 |
| 3.00%, 09/15/23 (a) | 55,000 | 57,887 |
| 2.30%, 02/01/25 (a) | 25,000 | 25,901 |
| 3.38%, 07/01/25 (a) | 100,000 | 108,475 |
| Aircastle Ltd. |
| 4.40%, 09/25/23 (a) | 75,000 | 80,111 |
| 4.13%, 05/01/24 (a) | 50,000 | 53,338 |
| Ares Capital Corp. |
| 3.63%, 01/19/22 (a) | 10,000 | 10,281 |
| 3.50%, 02/10/23 (a) | 135,000 | 142,976 |
| 4.20%, 06/10/24 (a) | 10,000 | 10,907 |
| 4.25%, 03/01/25 (a) | 20,000 | 21,760 |
| 3.25%, 07/15/25 (a) | 50,000 | 52,973 |
| FS KKR Capital Corp. |
| 4.63%, 07/15/24 (a) | 25,000 | 26,369 |
| 4.13%, 02/01/25 (a) | 60,000 | 62,547 |
| GATX Corp. |
| 4.35%, 02/15/24 (a) | 25,000 | 27,630 |
| 3.25%, 03/30/25 (a) | 50,000 | 54,625 |
| GE Capital Funding LLC |
| 3.45%, 05/15/25 (a)(c) | 50,000 | 55,304 |
| Goldman Sachs BDC, Inc. |
| 3.75%, 02/10/25 (a) | 35,000 | 37,265 |
| Golub Capital BDC, Inc. |
| 3.38%, 04/15/24 (a) | 25,000 | 25,496 |
| International Lease Finance Corp. |
| 5.88%, 08/15/22 | 45,000 | 48,681 |
| Main Street Capital Corp. |
| 5.20%, 05/01/24 | 50,000 | 54,378 |
| Oaktree Specialty Lending Corp. |
| 3.50%, 02/25/25 (a) | 60,000 | 62,234 |
| Owl Rock Capital Corp. |
| 5.25%, 04/15/24 (a) | 25,000 | 27,088 |
| 4.00%, 03/30/25 (a) | 30,000 | 31,348 |
| 3.75%, 07/22/25 (a) | 25,000 | 26,022 |
| Sixth Street Specialty Lending, Inc. |
| 3.88%, 11/01/24 (a) | 20,000 | 20,786 |
| | | 1,915,621 |
Security
Rate, Maturity Date | Face
Amount ($) | Value ($) |
| Financial Other 0.2% |
| ORIX Corp. |
| 2.90%, 07/18/22 | 75,000 | 77,682 |
| 4.05%, 01/16/24 | 25,000 | 27,425 |
| 3.25%, 12/04/24 | 50,000 | 54,568 |
| | | 159,675 |
| Insurance 3.1% |
| Aetna, Inc. |
| 2.75%, 11/15/22 (a) | 25,000 | 25,948 |
| 3.50%, 11/15/24 (a) | 50,000 | 54,940 |
| Aflac, Inc. |
| 3.63%, 06/15/23 | 25,000 | 27,033 |
| 3.63%, 11/15/24 | 25,000 | 28,021 |
| 3.25%, 03/17/25 | 50,000 | 55,404 |
| Allstate Corp. |
| 3.15%, 06/15/23 | 85,000 | 90,748 |
| 0.75%, 12/15/25 (a) | 50,000 | 50,281 |
| American International Group, Inc. |
| 4.88%, 06/01/22 | 146,000 | 155,103 |
| 4.13%, 02/15/24 | 50,000 | 55,348 |
| 2.50%, 06/30/25 (a) | 50,000 | 53,832 |
| 3.75%, 07/10/25 (a) | 50,000 | 56,207 |
| Anthem, Inc. |
| 3.30%, 01/15/23 | 150,000 | 158,892 |
| 3.50%, 08/15/24 (a) | 50,000 | 54,909 |
| 2.38%, 01/15/25 (a) | 125,000 | 133,710 |
| Aon Corp. |
| 2.20%, 11/15/22 | 100,000 | 103,407 |
| Assured Guaranty US Holdings, Inc. |
| 5.00%, 07/01/24 | 50,000 | 57,310 |
| Berkshire Hathaway Finance Corp. |
| 3.00%, 05/15/22 | 25,000 | 25,968 |
| Berkshire Hathaway, Inc. |
| 3.00%, 02/11/23 | 50,000 | 52,837 |
| 2.75%, 03/15/23 (a) | 175,000 | 183,869 |
| Brown & Brown, Inc. |
| 4.20%, 09/15/24 (a) | 20,000 | 22,364 |
| Chubb INA Holdings, Inc. |
| 2.88%, 11/03/22 (a) | 50,000 | 52,114 |
| 2.70%, 03/13/23 | 50,000 | 52,577 |
| 3.35%, 05/15/24 | 25,000 | 27,374 |
| 3.15%, 03/15/25 | 50,000 | 55,228 |
| CNA Financial Corp. |
| 3.95%, 05/15/24 (a) | 25,000 | 27,689 |
| CNO Financial Group, Inc. |
| 5.25%, 05/30/25 (a) | 50,000 | 58,251 |
| Equitable Holdings, Inc. |
| 3.90%, 04/20/23 (a) | 25,000 | 26,915 |
| First American Financial Corp. |
| 4.60%, 11/15/24 | 25,000 | 27,814 |
| Humana, Inc. |
| 3.15%, 12/01/22 (a) | 25,000 | 26,121 |
| 3.85%, 10/01/24 (a) | 25,000 | 27,701 |
| 4.50%, 04/01/25 (a) | 100,000 | 114,997 |
| Kemper Corp. |
| 4.35%, 02/15/25 (a) | 20,000 | 22,195 |
| Lincoln National Corp. |
| 4.20%, 03/15/22 | 85,000 | 88,845 |
| Markel Corp. |
| 4.90%, 07/01/22 | 10,000 | 10,641 |
Schwab Fixed-Income ETFs | Annual Report
Schwab 1-5 Year Corporate Bond ETF
Portfolio Holdings as of December 31, 2020 (continued)
Security
Rate, Maturity Date | Face
Amount ($) | Value ($) |
| Marsh & McLennan Cos., Inc. |
| 3.30%, 03/14/23 (a) | 15,000 | 15,881 |
| 3.88%, 03/15/24 (a) | 35,000 | 38,676 |
| 3.50%, 06/03/24 (a) | 30,000 | 32,745 |
| 3.50%, 03/10/25 (a) | 100,000 | 111,209 |
| MetLife, Inc. |
| 3.05%, 12/15/22 | 20,000 | 21,043 |
| 4.37%, 09/15/23 | 25,000 | 27,726 |
| 3.60%, 04/10/24 | 25,000 | 27,586 |
| 3.00%, 03/01/25 | 100,000 | 109,961 |
| Old Republic International Corp. |
| 4.88%, 10/01/24 (a) | 25,000 | 28,679 |
| Primerica, Inc. |
| 4.75%, 07/15/22 | 25,000 | 26,633 |
| Principal Financial Group, Inc. |
| 3.13%, 05/15/23 | 50,000 | 53,175 |
| 3.40%, 05/15/25 (a) | 50,000 | 55,455 |
| Prudential Financial, Inc. |
| 5.88%, 09/15/42 (a)(b) | 75,000 | 80,473 |
| 5.63%, 06/15/43 (a)(b) | 80,000 | 86,419 |
| 5.20%, 03/15/44 (a)(b) | 100,000 | 107,405 |
| RenaissanceRe Finance, Inc. |
| 3.70%, 04/01/25 (a) | 20,000 | 21,936 |
| UnitedHealth Group, Inc. |
| 3.35%, 07/15/22 | 300,000 | 314,283 |
| 2.38%, 10/15/22 | 50,000 | 51,888 |
| 2.75%, 02/15/23 (a) | 100,000 | 104,604 |
| 3.50%, 02/15/24 | 50,000 | 54,664 |
| Unum Group |
| 4.50%, 03/15/25 (a) | 75,000 | 85,093 |
| Voya Financial, Inc. |
| 5.65%, 05/15/53 (a)(b) | 70,000 | 74,305 |
| Willis North America, Inc. |
| 3.60%, 05/15/24 (a) | 75,000 | 82,048 |
| XLIT Ltd. |
| 4.45%, 03/31/25 | 15,000 | 17,149 |
| | | 3,693,629 |
| REITs 2.6% |
| Alexandria Real Estate Equities, Inc. |
| 3.45%, 04/30/25 (a) | 100,000 | 110,997 |
| American Campus Communities Operating Partnership LP |
| 3.75%, 04/15/23 (a) | 25,000 | 26,417 |
| AvalonBay Communities, Inc. |
| 3.45%, 06/01/25 (a) | 50,000 | 55,781 |
| 3.50%, 11/15/25 (a) | 100,000 | 112,735 |
| Boston Properties LP |
| 3.13%, 09/01/23 (a) | 150,000 | 159,192 |
| 3.80%, 02/01/24 (a) | 25,000 | 27,213 |
| 3.20%, 01/15/25 (a) | 70,000 | 76,425 |
| Brandywine Operating Partnership LP |
| 3.95%, 02/15/23 (a) | 25,000 | 25,949 |
| Brixmor Operating Partnership LP |
| 3.85%, 02/01/25 (a) | 20,000 | 21,956 |
| Columbia Property Trust Operating Partnership LP |
| 4.15%, 04/01/25 (a) | 20,000 | 21,099 |
| CubeSmart LP |
| 4.38%, 12/15/23 (a) | 10,000 | 10,954 |
| CyrusOne LP/CyrusOne Finance Corp. |
| 2.90%, 11/15/24 (a) | 70,000 | 74,960 |
| Digital Realty Trust LP |
| 2.75%, 02/01/23 (a) | 20,000 | 20,884 |
| 4.75%, 10/01/25 (a) | 50,000 | 58,601 |
Security
Rate, Maturity Date | Face
Amount ($) | Value ($) |
| Duke Realty LP |
| 3.75%, 12/01/24 (a) | 100,000 | 110,838 |
| ERP Operating LP |
| 4.63%, 12/15/21 (a) | 100,000 | 102,913 |
| Essex Portfolio LP |
| 3.25%, 05/01/23 (a) | 25,000 | 26,368 |
| 3.88%, 05/01/24 (a) | 50,000 | 55,089 |
| 3.50%, 04/01/25 (a) | 15,000 | 16,635 |
| Federal Realty Investment Trust |
| 3.95%, 01/15/24 (a) | 50,000 | 54,647 |
| Healthpeak Properties, Inc. |
| 3.88%, 08/15/24 (a) | 25,000 | 27,776 |
| 3.40%, 02/01/25 (a) | 25,000 | 27,625 |
| Host Hotels & Resorts LP |
| 3.75%, 10/15/23 (a) | 20,000 | 21,208 |
| 3.88%, 04/01/24 (a) | 15,000 | 15,886 |
| Kilroy Realty LP |
| 3.80%, 01/15/23 (a) | 25,000 | 26,183 |
| Kimco Realty Corp. |
| 3.40%, 11/01/22 (a) | 50,000 | 52,515 |
| 2.70%, 03/01/24 (a) | 150,000 | 158,533 |
| 3.30%, 02/01/25 (a) | 25,000 | 27,431 |
| Mid-America Apartments LP |
| 4.30%, 10/15/23 (a) | 40,000 | 43,678 |
| National Retail Properties, Inc. |
| 3.30%, 04/15/23 (a) | 25,000 | 26,435 |
| 3.90%, 06/15/24 (a) | 30,000 | 32,622 |
| Office Properties Income Trust |
| 4.00%, 07/15/22 (a) | 50,000 | 51,168 |
| 4.25%, 05/15/24 (a) | 50,000 | 52,270 |
| 4.50%, 02/01/25 (a) | 50,000 | 53,130 |
| Omega Healthcare Investors, Inc. |
| 4.38%, 08/01/23 (a) | 70,000 | 75,898 |
| 4.50%, 01/15/25 (a) | 25,000 | 27,384 |
| Piedmont Operating Partnership LP |
| 4.45%, 03/15/24 (a) | 25,000 | 26,850 |
| Prologis LP |
| 3.75%, 11/01/25 (a) | 50,000 | 57,161 |
| Public Storage |
| 2.37%, 09/15/22 (a) | 50,000 | 51,684 |
| Realty Income Corp. |
| 4.65%, 08/01/23 (a) | 50,000 | 54,867 |
| 3.88%, 07/15/24 (a) | 100,000 | 110,525 |
| Sabra Health Care LP |
| 4.80%, 06/01/24 (a) | 10,000 | 10,725 |
| Simon Property Group LP |
| 2.63%, 06/15/22 (a) | 25,000 | 25,692 |
| 2.75%, 02/01/23 (a) | 100,000 | 104,380 |
| 2.75%, 06/01/23 (a) | 50,000 | 52,516 |
| 2.00%, 09/13/24 (a) | 75,000 | 78,461 |
| 3.50%, 09/01/25 (a) | 100,000 | 110,532 |
| SL Green Operating Partnership LP |
| 3.25%, 10/15/22 (a) | 20,000 | 20,641 |
| UDR, Inc. |
| 4.00%, 10/01/25 (a) | 50,000 | 56,794 |
| Ventas Realty LP |
| 3.50%, 04/15/24 (a) | 100,000 | 108,917 |
| 3.75%, 05/01/24 (a) | 35,000 | 38,228 |
| 2.65%, 01/15/25 (a) | 10,000 | 10,727 |
| VEREIT Operating Partnership LP |
| 4.60%, 02/06/24 (a) | 25,000 | 27,595 |
Schwab Fixed-Income ETFs | Annual Report
Schwab 1-5 Year Corporate Bond ETF
Portfolio Holdings as of December 31, 2020 (continued)
Security
Rate, Maturity Date | Face
Amount ($) | Value ($) |
| Welltower, Inc. |
| 3.75%, 03/15/23 (a) | 20,000 | 21,211 |
| 4.50%, 01/15/24 (a) | 25,000 | 27,550 |
| 3.63%, 03/15/24 (a) | 130,000 | 141,891 |
| WP Carey, Inc. |
| 4.60%, 04/01/24 (a) | 25,000 | 27,926 |
| | | 3,054,268 |
| | | 49,161,615 |
| |
| Industrial 52.4% |
| Basic Industry 2.1% |
| Air Products and Chemicals, Inc. |
| 1.50%, 10/15/25 (a) | 100,000 | 104,357 |
| Albemarle Corp. |
| 4.15%, 12/01/24 (a) | 20,000 | 22,285 |
| BHP Billiton Finance USA Ltd. |
| 2.88%, 02/24/22 | 50,000 | 51,449 |
| Celanese US Holdings LLC |
| 3.50%, 05/08/24 (a) | 50,000 | 54,142 |
| Domtar Corp. |
| 4.40%, 04/01/22 (a) | 50,000 | 51,762 |
| DuPont de Nemours, Inc. |
| 2.17%, 05/01/23 | 250,000 | 253,482 |
| 4.21%, 11/15/23 (a) | 50,000 | 55,245 |
| Eastman Chemical Co. |
| 3.80%, 03/15/25 (a) | 50,000 | 55,690 |
| Ecolab, Inc. |
| 2.38%, 08/10/22 (a) | 50,000 | 51,580 |
| Fibria Overseas Finance Ltd. |
| 4.00%, 01/14/25 (a) | 50,000 | 53,701 |
| Georgia-Pacific LLC |
| 8.00%, 01/15/24 | 15,000 | 18,451 |
| Huntsman International LLC |
| 5.13%, 11/15/22 (a) | 50,000 | 53,401 |
| International Flavors & Fragrances, Inc. |
| 3.20%, 05/01/23 (a) | 20,000 | 20,935 |
| Kinross Gold Corp. |
| 5.95%, 03/15/24 (a) | 25,000 | 28,488 |
| Linde, Inc. |
| 2.45%, 02/15/22 (a) | 50,000 | 50,949 |
| 2.20%, 08/15/22 (a) | 50,000 | 51,335 |
| 2.70%, 02/21/23 (a) | 20,000 | 20,871 |
| 2.65%, 02/05/25 (a) | 15,000 | 16,268 |
| LYB International Finance BV |
| 4.00%, 07/15/23 | 100,000 | 108,800 |
| LYB International Finance III LLC |
| 2.88%, 05/01/25 (a) | 75,000 | 81,376 |
| 1.25%, 10/01/25 (a) | 50,000 | 50,918 |
| Mosaic Co. |
| 3.25%, 11/15/22 (a) | 10,000 | 10,461 |
| 4.25%, 11/15/23 (a) | 125,000 | 136,566 |
| NewMarket Corp. |
| 4.10%, 12/15/22 | 20,000 | 21,220 |
| Nucor Corp. |
| 4.00%, 08/01/23 (a) | 100,000 | 108,248 |
| 2.00%, 06/01/25 (a) | 50,000 | 52,930 |
| Nutrien Ltd. |
| 3.15%, 10/01/22 (a) | 50,000 | 52,045 |
| 1.90%, 05/13/23 | 100,000 | 103,410 |
| 3.00%, 04/01/25 (a) | 100,000 | 108,492 |
Security
Rate, Maturity Date | Face
Amount ($) | Value ($) |
| Packaging Corp. of America |
| 3.65%, 09/15/24 (a) | 50,000 | 54,842 |
| PPG Industries, Inc. |
| 2.40%, 08/15/24 (a) | 25,000 | 26,518 |
| Reliance Steel & Aluminum Co. |
| 4.50%, 04/15/23 (a) | 15,000 | 16,192 |
| 1.30%, 08/15/25 (a) | 50,000 | 50,899 |
| Rio Tinto Finance USA Ltd. |
| 3.75%, 06/15/25 (a) | 50,000 | 56,512 |
| Southern Copper Corp. |
| 3.50%, 11/08/22 | 25,000 | 26,363 |
| 3.88%, 04/23/25 | 50,000 | 55,652 |
| Steel Dynamics, Inc. |
| 2.40%, 06/15/25 (a) | 50,000 | 53,297 |
| WestRock RKT LLC |
| 4.90%, 03/01/22 | 177,000 | 186,268 |
| 4.00%, 03/01/23 (a) | 35,000 | 37,244 |
| | | 2,412,644 |
| Capital Goods 5.3% |
| 3M Co. |
| 2.75%, 03/01/22 (a) | 35,000 | 35,946 |
| 1.75%, 02/14/23 (a) | 50,000 | 51,517 |
| 2.25%, 03/15/23 (a) | 100,000 | 104,209 |
| 3.25%, 02/14/24 (a) | 50,000 | 54,298 |
| 2.00%, 02/14/25 (a) | 20,000 | 21,223 |
| 2.65%, 04/15/25 (a) | 50,000 | 54,368 |
| 3.00%, 08/07/25 | 50,000 | 55,545 |
| ABB Finance USA, Inc. |
| 2.88%, 05/08/22 | 75,000 | 77,583 |
| Amphenol Corp. |
| 3.20%, 04/01/24 (a) | 25,000 | 26,937 |
| 2.05%, 03/01/25 (a) | 50,000 | 52,888 |
| Boeing Co. |
| 2.13%, 03/01/22 (a) | 10,000 | 10,147 |
| 2.80%, 03/01/23 (a) | 15,000 | 15,612 |
| 4.51%, 05/01/23 (a) | 125,000 | 134,770 |
| 1.88%, 06/15/23 (a) | 50,000 | 50,982 |
| 1.95%, 02/01/24 | 75,000 | 77,089 |
| 2.80%, 03/01/24 (a) | 50,000 | 52,560 |
| 2.85%, 10/30/24 (a) | 50,000 | 52,975 |
| 4.88%, 05/01/25 (a) | 200,000 | 227,938 |
| Carlisle Cos., Inc. |
| 3.75%, 11/15/22 (a) | 50,000 | 52,530 |
| 3.50%, 12/01/24 (a) | 29,000 | 31,844 |
| Carrier Global Corp. |
| 1.92%, 02/15/23 (a) | 10,000 | 10,305 |
| 2.24%, 02/15/25 (a) | 55,000 | 58,206 |
| Caterpillar Financial Services Corp. |
| 1.95%, 11/18/22 | 30,000 | 30,964 |
| 2.55%, 11/29/22 | 30,000 | 31,308 |
| 3.45%, 05/15/23 | 100,000 | 107,333 |
| 0.65%, 07/07/23 | 150,000 | 151,309 |
| 0.45%, 09/14/23 | 100,000 | 100,394 |
| 3.75%, 11/24/23 | 20,000 | 21,939 |
| 2.85%, 05/17/24 | 25,000 | 26,950 |
| 3.30%, 06/09/24 | 190,000 | 207,890 |
| 2.15%, 11/08/24 | 75,000 | 79,666 |
| Caterpillar, Inc. |
| 2.60%, 06/26/22 (a) | 20,000 | 20,571 |
| CNH Industrial Capital LLC |
| 4.38%, 04/05/22 | 70,000 | 73,234 |
| CNH Industrial NV |
| 4.50%, 08/15/23 | 75,000 | 81,941 |
Schwab Fixed-Income ETFs | Annual Report
Schwab 1-5 Year Corporate Bond ETF
Portfolio Holdings as of December 31, 2020 (continued)
Security
Rate, Maturity Date | Face
Amount ($) | Value ($) |
| Deere & Co. |
| 2.75%, 04/15/25 (a) | 50,000 | 54,381 |
| Eaton Corp. |
| 2.75%, 11/02/22 | 100,000 | 104,399 |
| Fortune Brands Home & Security, Inc. |
| 4.00%, 09/21/23 (a) | 25,000 | 27,305 |
| General Dynamics Corp. |
| 3.38%, 05/15/23 (a) | 50,000 | 53,492 |
| 3.25%, 04/01/25 (a) | 100,000 | 110,525 |
| General Electric Co. |
| 3.10%, 01/09/23 | 65,000 | 68,377 |
| 3.38%, 03/11/24 | 100,000 | 108,474 |
| 3.45%, 05/15/24 (a) | 100,000 | 109,179 |
| Honeywell International, Inc. |
| 2.15%, 08/08/22 (a) | 60,000 | 61,729 |
| 0.48%, 08/19/22 (a) | 200,000 | 200,332 |
| 1.35%, 06/01/25 (a) | 75,000 | 77,619 |
| Illinois Tool Works, Inc. |
| 3.50%, 03/01/24 (a) | 20,000 | 21,814 |
| John Deere Capital Corp. |
| 2.65%, 01/06/22 | 50,000 | 51,221 |
| 2.75%, 03/15/22 | 100,000 | 102,994 |
| 2.95%, 04/01/22 | 15,000 | 15,508 |
| 2.15%, 09/08/22 | 40,000 | 41,288 |
| 2.80%, 01/27/23 | 40,000 | 42,086 |
| 2.80%, 03/06/23 | 200,000 | 211,320 |
| 0.40%, 10/10/23 | 150,000 | 150,630 |
| 3.65%, 10/12/23 | 20,000 | 21,853 |
| 3.45%, 01/10/24 | 50,000 | 54,526 |
| 2.60%, 03/07/24 | 30,000 | 32,090 |
| 2.65%, 06/24/24 | 20,000 | 21,495 |
| 2.05%, 01/09/25 | 20,000 | 21,198 |
| L3Harris Technologies, Inc. |
| 3.95%, 05/28/24 (a) | 60,000 | 66,044 |
| Legrand France S.A. |
| 8.50%, 02/15/25 | 20,000 | 26,061 |
| Lennox International, Inc. |
| 1.35%, 08/01/25 (a) | 50,000 | 51,257 |
| Lockheed Martin Corp. |
| 3.10%, 01/15/23 (a) | 70,000 | 73,620 |
| 2.90%, 03/01/25 (a) | 100,000 | 109,051 |
| Masco Corp. |
| 5.95%, 03/15/22 | 10,000 | 10,639 |
| 4.45%, 04/01/25 (a) | 50,000 | 57,482 |
| Northrop Grumman Corp. |
| 2.55%, 10/15/22 (a) | 50,000 | 51,938 |
| 3.25%, 08/01/23 | 50,000 | 53,679 |
| 2.93%, 01/15/25 (a) | 100,000 | 108,842 |
| Otis Worldwide Corp. |
| 2.06%, 04/05/25 (a) | 150,000 | 159,268 |
| Parker-Hannifin Corp. |
| 2.70%, 06/14/24 (a) | 25,000 | 26,845 |
| Precision Castparts Corp. |
| 2.50%, 01/15/23 (a) | 85,000 | 88,335 |
| Raytheon Technologies Corp. |
| 2.80%, 03/15/22 (a) | 50,000 | 51,365 |
| 2.50%, 12/15/22 (a)(c) | 125,000 | 129,602 |
| 3.20%, 03/15/24 (a) | 75,000 | 80,990 |
| 3.95%, 08/16/25 (a) | 100,000 | 114,766 |
| Republic Services, Inc. |
| 2.50%, 08/15/24 (a) | 20,000 | 21,354 |
| 3.20%, 03/15/25 (a) | 30,000 | 32,945 |
| 0.88%, 11/15/25 (a) | 50,000 | 50,452 |
Security
Rate, Maturity Date | Face
Amount ($) | Value ($) |
| Roper Technologies, Inc. |
| 2.80%, 12/15/21 (a) | 25,000 | 25,533 |
| 3.13%, 11/15/22 (a) | 75,000 | 78,517 |
| 2.35%, 09/15/24 (a) | 50,000 | 53,276 |
| Stanley Black & Decker, Inc. |
| 4.00%, 03/15/60 (a)(b) | 25,000 | 26,708 |
| Textron, Inc. |
| 4.30%, 03/01/24 (a) | 10,000 | 10,958 |
| 3.88%, 03/01/25 (a) | 50,000 | 54,871 |
| Trane Technologies Global Holding Co., Ltd. |
| 4.25%, 06/15/23 | 35,000 | 38,246 |
| Vulcan Materials Co. |
| 4.50%, 04/01/25 (a) | 100,000 | 114,841 |
| Waste Management, Inc. |
| 2.90%, 09/15/22 (a) | 10,000 | 10,376 |
| 2.40%, 05/15/23 (a) | 30,000 | 31,348 |
| 3.13%, 03/01/25 (a) | 100,000 | 109,875 |
| 0.75%, 11/15/25 (a) | 50,000 | 50,218 |
| Westinghouse Air Brake Technologies Corp. |
| 4.40%, 03/15/24 (a)(e)(f) | 200,000 | 219,076 |
| 3.20%, 06/15/25 (a) | 50,000 | 53,987 |
| WW Grainger, Inc. |
| 1.85%, 02/15/25 (a) | 15,000 | 15,801 |
| | | 6,264,972 |
| Communications 4.7% |
| American Tower Corp. |
| 4.70%, 03/15/22 | 50,000 | 52,557 |
| 3.50%, 01/31/23 | 50,000 | 53,077 |
| 3.00%, 06/15/23 | 75,000 | 79,573 |
| 5.00%, 02/15/24 | 150,000 | 169,959 |
| 3.38%, 05/15/24 (a) | 100,000 | 108,917 |
| 2.95%, 01/15/25 (a) | 50,000 | 54,230 |
| AT&T, Inc. |
| 3.00%, 06/30/22 (a) | 215,000 | 222,488 |
| 4.05%, 12/15/23 | 50,000 | 55,361 |
| 3.90%, 03/11/24 (a) | 50,000 | 54,927 |
| 4.45%, 04/01/24 (a) | 50,000 | 55,851 |
| 3.95%, 01/15/25 (a) | 100,000 | 112,591 |
| CC Holdings GS V LLC/Crown Castle GS III Corp. |
| 3.85%, 04/15/23 | 130,000 | 139,875 |
| Charter Communications Operating LLC/Charter Communications Operating Capital |
| 4.46%, 07/23/22 (a) | 175,000 | 184,520 |
| 4.50%, 02/01/24 (a) | 235,000 | 261,000 |
| 4.91%, 07/23/25 (a) | 100,000 | 116,167 |
| Comcast Cable Communications Holdings, Inc. |
| 9.46%, 11/15/22 | 20,000 | 23,420 |
| Comcast Corp. |
| 3.00%, 02/01/24 (a) | 50,000 | 53,786 |
| 3.60%, 03/01/24 | 105,000 | 115,467 |
| 3.70%, 04/15/24 (a) | 200,000 | 220,710 |
| 3.38%, 02/15/25 (a) | 25,000 | 27,624 |
| 3.10%, 04/01/25 (a) | 250,000 | 275,165 |
| Crown Castle International Corp. |
| 5.25%, 01/15/23 | 100,000 | 109,619 |
| 3.20%, 09/01/24 (a) | 50,000 | 54,399 |
| Discovery Communications LLC |
| 2.95%, 03/20/23 (a) | 19,000 | 20,014 |
| 3.80%, 03/13/24 (a) | 100,000 | 109,212 |
| 3.95%, 06/15/25 (a) | 50,000 | 56,283 |
| Fox Corp. |
| 3.67%, 01/25/22 | 150,000 | 155,269 |
| 3.05%, 04/07/25 (a) | 120,000 | 131,376 |
Schwab Fixed-Income ETFs | Annual Report
Schwab 1-5 Year Corporate Bond ETF
Portfolio Holdings as of December 31, 2020 (continued)
Security
Rate, Maturity Date | Face
Amount ($) | Value ($) |
| Moody's Corp. |
| 4.50%, 09/01/22 (a) | 50,000 | 52,791 |
| 4.88%, 02/15/24 (a) | 50,000 | 56,134 |
| 3.75%, 03/24/25 (a) | 100,000 | 112,454 |
| Omnicom Group, Inc./Omnicom Capital, Inc. |
| 3.63%, 05/01/22 | 100,000 | 104,304 |
| 3.65%, 11/01/24 (a) | 50,000 | 55,293 |
| RELX Capital, Inc. |
| 3.50%, 03/16/23 (a) | 50,000 | 53,266 |
| Rogers Communications, Inc. |
| 3.00%, 03/15/23 (a) | 20,000 | 21,025 |
| 4.10%, 10/01/23 (a) | 50,000 | 54,721 |
| S&P Global, Inc. |
| 4.00%, 06/15/25 (a) | 50,000 | 57,039 |
| T-Mobile USA, Inc. |
| 3.50%, 04/15/25 (a)(c) | 150,000 | 166,083 |
| Thomson Reuters Corp. |
| 4.30%, 11/23/23 (a) | 85,000 | 93,259 |
| Time Warner Entertainment Co. LP |
| 8.38%, 03/15/23 | 25,000 | 29,244 |
| TWDC Enterprises 18 Corp. |
| 3.15%, 09/17/25 | 100,000 | 111,078 |
| Verizon Communications, Inc. |
| 2.45%, 11/01/22 (a) | 55,000 | 56,918 |
| 5.15%, 09/15/23 | 120,000 | 135,306 |
| 3.50%, 11/01/24 (a) | 100,000 | 110,529 |
| 3.38%, 02/15/25 | 200,000 | 222,224 |
| 0.85%, 11/20/25 (a) | 100,000 | 100,878 |
| ViacomCBS, Inc. |
| 4.25%, 09/01/23 (a) | 40,000 | 43,612 |
| 3.88%, 04/01/24 (a) | 20,000 | 21,885 |
| 3.70%, 08/15/24 (a) | 50,000 | 54,871 |
| 4.75%, 05/15/25 (a) | 100,000 | 116,176 |
| Vodafone Group PLC |
| 2.50%, 09/26/22 | 50,000 | 51,815 |
| 3.75%, 01/16/24 | 105,000 | 114,871 |
| 4.13%, 05/30/25 | 100,000 | 114,397 |
| Walt Disney Co. |
| 1.65%, 09/01/22 | 40,000 | 40,891 |
| 1.75%, 08/30/24 (a) | 50,000 | 52,163 |
| 3.70%, 09/15/24 (a) | 50,000 | 55,502 |
| 3.35%, 03/24/25 | 150,000 | 166,416 |
| WPP Finance 2010 |
| 3.75%, 09/19/24 | 70,000 | 77,908 |
| | | 5,576,490 |
| Consumer Cyclical 8.4% |
| Alibaba Group Holding Ltd. |
| 3.60%, 11/28/24 (a) | 200,000 | 220,412 |
| Amazon.com, Inc. |
| 3.30%, 12/05/21 (a) | 25,000 | 25,579 |
| 2.50%, 11/29/22 (a) | 200,000 | 207,594 |
| 2.40%, 02/22/23 (a) | 75,000 | 78,305 |
| 2.80%, 08/22/24 (a) | 25,000 | 27,101 |
| 3.80%, 12/05/24 (a) | 100,000 | 112,453 |
| American Honda Finance Corp. |
| 3.38%, 12/10/21 | 50,000 | 51,453 |
| 2.60%, 11/16/22 | 50,000 | 52,150 |
| 2.05%, 01/10/23 | 50,000 | 51,706 |
| 1.95%, 05/10/23 | 200,000 | 207,472 |
| 0.65%, 09/08/23 | 50,000 | 50,355 |
| 3.63%, 10/10/23 | 75,000 | 81,656 |
| 2.40%, 06/27/24 | 50,000 | 53,182 |
Security
Rate, Maturity Date | Face
Amount ($) | Value ($) |
| 2.15%, 09/10/24 | 30,000 | 31,782 |
| 1.00%, 09/10/25 | 50,000 | 50,624 |
| Aptiv Corp. |
| 4.15%, 03/15/24 (a) | 70,000 | 77,192 |
| AutoNation, Inc. |
| 3.50%, 11/15/24 (a) | 15,000 | 16,188 |
| AutoZone, Inc. |
| 3.70%, 04/15/22 (a) | 50,000 | 51,777 |
| 3.25%, 04/15/25 (a) | 15,000 | 16,456 |
| 3.63%, 04/15/25 (a) | 90,000 | 100,884 |
| Booking Holdings, Inc. |
| 4.10%, 04/13/25 (a) | 135,000 | 153,464 |
| BorgWarner, Inc. |
| 3.38%, 03/15/25 (a) | 60,000 | 66,236 |
| Costco Wholesale Corp. |
| 2.30%, 05/18/22 (a) | 50,000 | 51,413 |
| 2.75%, 05/18/24 (a) | 30,000 | 32,285 |
| Cummins, Inc. |
| 3.65%, 10/01/23 (a) | 15,000 | 16,296 |
| 0.75%, 09/01/25 (a) | 50,000 | 50,389 |
| Dollar General Corp. |
| 3.25%, 04/15/23 (a) | 25,000 | 26,484 |
| 4.15%, 11/01/25 (a) | 100,000 | 115,666 |
| Dollar Tree, Inc. |
| 3.70%, 05/15/23 (a) | 120,000 | 128,657 |
| DR Horton, Inc. |
| 4.38%, 09/15/22 (a) | 35,000 | 36,941 |
| 5.75%, 08/15/23 (a) | 15,000 | 16,837 |
| 2.60%, 10/15/25 (a) | 15,000 | 16,195 |
| eBay, Inc. |
| 2.75%, 01/30/23 (a) | 50,000 | 52,339 |
| 3.45%, 08/01/24 (a) | 20,000 | 21,846 |
| 1.90%, 03/11/25 (a) | 100,000 | 105,261 |
| Expedia Group, Inc. |
| 3.60%, 12/15/23 (a)(c) | 50,000 | 53,423 |
| 4.50%, 08/15/24 (a) | 20,000 | 21,809 |
| General Motors Co. |
| 4.88%, 10/02/23 | 25,000 | 27,761 |
| 5.40%, 10/02/23 | 125,000 | 140,431 |
| 4.00%, 04/01/25 | 30,000 | 33,322 |
| 6.13%, 10/01/25 (a) | 100,000 | 121,449 |
| General Motors Financial Co., Inc. |
| 3.45%, 04/10/22 (a) | 50,000 | 51,502 |
| 3.55%, 07/08/22 | 100,000 | 104,479 |
| 5.20%, 03/20/23 | 50,000 | 54,859 |
| 3.70%, 05/09/23 (a) | 100,000 | 106,165 |
| 4.25%, 05/15/23 | 100,000 | 107,909 |
| 1.70%, 08/18/23 | 100,000 | 102,668 |
| 5.10%, 01/17/24 (a) | 50,000 | 55,986 |
| 3.95%, 04/13/24 (a) | 70,000 | 76,381 |
| 4.00%, 01/15/25 (a) | 200,000 | 220,488 |
| 4.35%, 04/09/25 (a) | 150,000 | 168,358 |
| 4.30%, 07/13/25 (a) | 100,000 | 112,259 |
| GLP Capital LP/GLP Financing II, Inc. |
| 5.38%, 11/01/23 (a) | 20,000 | 21,868 |
| 3.35%, 09/01/24 (a) | 15,000 | 15,776 |
| 5.25%, 06/01/25 (a) | 75,000 | 84,782 |
| Home Depot, Inc. |
| 2.63%, 06/01/22 (a) | 30,000 | 30,945 |
| 2.70%, 04/01/23 (a) | 65,000 | 68,221 |
| 3.75%, 02/15/24 (a) | 40,000 | 43,887 |
| Hyatt Hotels Corp. |
| 3.38%, 07/15/23 (a) | 50,000 | 52,577 |
| 5.38%, 04/23/25 (a) | 15,000 | 17,028 |
Schwab Fixed-Income ETFs | Annual Report
Schwab 1-5 Year Corporate Bond ETF
Portfolio Holdings as of December 31, 2020 (continued)
Security
Rate, Maturity Date | Face
Amount ($) | Value ($) |
| IHS Markit Ltd. |
| 4.13%, 08/01/23 (a) | 50,000 | 54,528 |
| 3.63%, 05/01/24 (a) | 25,000 | 27,305 |
| Kohl's Corp. |
| 3.25%, 02/01/23 (a) | 50,000 | 51,790 |
| 4.25%, 07/17/25 (a) | 100,000 | 108,462 |
| Las Vegas Sands Corp. |
| 3.20%, 08/08/24 (a) | 100,000 | 106,160 |
| Lennar Corp. |
| 4.88%, 12/15/23 (a) | 100,000 | 110,855 |
| Lowe's Cos., Inc. |
| 3.13%, 09/15/24 (a) | 125,000 | 135,890 |
| 4.00%, 04/15/25 (a) | 25,000 | 28,417 |
| Magna International, Inc. |
| 3.63%, 06/15/24 (a) | 25,000 | 27,428 |
| Marriott International, Inc. |
| 2.30%, 01/15/22 (a) | 50,000 | 50,651 |
| 4.15%, 12/01/23 (a) | 50,000 | 54,045 |
| 3.60%, 04/15/24 (a) | 15,000 | 16,055 |
| 5.75%, 05/01/25 (a) | 100,000 | 117,180 |
| Mastercard, Inc. |
| 3.38%, 04/01/24 | 25,000 | 27,457 |
| 2.00%, 03/03/25 (a) | 250,000 | 265,662 |
| McDonald's Corp. |
| 2.63%, 01/15/22 | 75,000 | 76,789 |
| 3.35%, 04/01/23 (a) | 50,000 | 53,257 |
| 3.38%, 05/26/25 (a) | 50,000 | 55,524 |
| 3.30%, 07/01/25 (a) | 50,000 | 55,654 |
| 1.45%, 09/01/25 (a) | 50,000 | 51,836 |
| NIKE, Inc. |
| 2.40%, 03/27/25 (a) | 80,000 | 86,266 |
| NVR, Inc. |
| 3.95%, 09/15/22 (a) | 100,000 | 105,326 |
| O'Reilly Automotive, Inc. |
| 3.80%, 09/01/22 (a) | 15,000 | 15,720 |
| PACCAR Financial Corp. |
| 3.40%, 08/09/23 | 75,000 | 80,980 |
| 0.35%, 08/11/23 | 150,000 | 150,063 |
| 1.80%, 02/06/25 | 10,000 | 10,491 |
| Ralph Lauren Corp. |
| 1.70%, 06/15/22 | 75,000 | 76,412 |
| Ross Stores, Inc. |
| 4.60%, 04/15/25 (a) | 20,000 | 23,116 |
| Sands China Ltd. |
| 4.60%, 08/08/23 (a) | 200,000 | 214,474 |
| Starbucks Corp. |
| 1.30%, 05/07/22 | 30,000 | 30,418 |
| 2.70%, 06/15/22 (a) | 50,000 | 51,522 |
| 3.10%, 03/01/23 (a) | 55,000 | 58,145 |
| 3.80%, 08/15/25 (a) | 100,000 | 113,842 |
| Tapestry, Inc. |
| 3.00%, 07/15/22 (a) | 15,000 | 15,381 |
| 4.25%, 04/01/25 (a) | 50,000 | 54,139 |
| Target Corp. |
| 3.50%, 07/01/24 | 65,000 | 72,132 |
| 2.25%, 04/15/25 (a) | 100,000 | 107,217 |
| TJX Cos., Inc. |
| 2.50%, 05/15/23 (a) | 125,000 | 130,700 |
| Toyota Motor Corp. |
| 2.16%, 07/02/22 | 50,000 | 51,405 |
| Toyota Motor Credit Corp. |
| 2.60%, 01/11/22 | 150,000 | 153,531 |
| 3.30%, 01/12/22 | 25,000 | 25,773 |
Security
Rate, Maturity Date | Face
Amount ($) | Value ($) |
| 2.15%, 09/08/22 | 100,000 | 103,190 |
| 0.35%, 10/14/22 | 250,000 | 250,587 |
| 2.63%, 01/10/23 | 50,000 | 52,366 |
| 2.90%, 03/30/23 | 50,000 | 52,907 |
| 1.35%, 08/25/23 | 100,000 | 102,722 |
| 3.45%, 09/20/23 | 250,000 | 270,902 |
| 2.90%, 04/17/24 | 50,000 | 53,943 |
| 1.80%, 02/13/25 | 25,000 | 26,238 |
| 3.00%, 04/01/25 | 100,000 | 109,955 |
| 0.80%, 10/16/25 | 50,000 | 50,297 |
| VF Corp. |
| 2.05%, 04/23/22 | 115,000 | 117,431 |
| 2.40%, 04/23/25 (a) | 25,000 | 26,759 |
| Visa, Inc. |
| 2.15%, 09/15/22 (a) | 100,000 | 103,192 |
| 2.80%, 12/14/22 (a) | 50,000 | 52,349 |
| 3.15%, 12/14/25 (a) | 100,000 | 112,254 |
| Walgreen Co. |
| 3.10%, 09/15/22 | 50,000 | 52,272 |
| Walgreens Boots Alliance, Inc. |
| 3.80%, 11/18/24 (a) | 190,000 | 210,087 |
| Walmart, Inc. |
| 2.35%, 12/15/22 (a) | 25,000 | 26,006 |
| 2.55%, 04/11/23 (a) | 50,000 | 52,329 |
| 3.40%, 06/26/23 (a) | 150,000 | 161,215 |
| 3.30%, 04/22/24 (a) | 100,000 | 108,908 |
| 2.85%, 07/08/24 (a) | 100,000 | 108,283 |
| 2.65%, 12/15/24 (a) | 165,000 | 178,782 |
| Western Union Co. |
| 4.25%, 06/09/23 (a) | 30,000 | 32,496 |
| 2.85%, 01/10/25 (a) | 75,000 | 80,668 |
| | | 9,947,099 |
| Consumer Non-Cyclical 13.2% |
| Abbott Laboratories |
| 3.40%, 11/30/23 (a) | 100,000 | 108,422 |
| 2.95%, 03/15/25 (a) | 100,000 | 109,821 |
| AbbVie, Inc. |
| 3.45%, 03/15/22 (a) | 50,000 | 51,549 |
| 3.25%, 10/01/22 (a) | 75,000 | 78,150 |
| 2.90%, 11/06/22 | 250,000 | 261,655 |
| 3.20%, 11/06/22 (a) | 50,000 | 52,344 |
| 2.30%, 11/21/22 | 100,000 | 103,677 |
| 2.85%, 05/14/23 (a) | 100,000 | 105,281 |
| 3.75%, 11/14/23 (a) | 100,000 | 109,137 |
| 2.60%, 11/21/24 (a) | 200,000 | 214,492 |
| 3.80%, 03/15/25 (a) | 150,000 | 167,566 |
| 3.60%, 05/14/25 (a) | 200,000 | 223,132 |
| Altria Group, Inc. |
| 2.85%, 08/09/22 | 145,000 | 150,697 |
| 2.95%, 05/02/23 | 50,000 | 52,761 |
| 4.00%, 01/31/24 | 65,000 | 71,479 |
| 3.80%, 02/14/24 (a) | 75,000 | 81,942 |
| 2.35%, 05/06/25 (a) | 80,000 | 84,982 |
| AmerisourceBergen Corp. |
| 3.40%, 05/15/24 (a) | 25,000 | 27,192 |
| 3.25%, 03/01/25 (a) | 20,000 | 21,943 |
| Amgen, Inc. |
| 2.70%, 05/01/22 (a) | 75,000 | 77,058 |
| 2.65%, 05/11/22 (a) | 50,000 | 51,493 |
| 3.63%, 05/15/22 (a) | 20,000 | 20,726 |
| 2.25%, 08/19/23 (a) | 50,000 | 52,434 |
| 3.63%, 05/22/24 (a) | 100,000 | 109,874 |
| 1.90%, 02/21/25 (a) | 20,000 | 21,058 |
| 3.13%, 05/01/25 (a) | 100,000 | 109,790 |
Schwab Fixed-Income ETFs | Annual Report
Schwab 1-5 Year Corporate Bond ETF
Portfolio Holdings as of December 31, 2020 (continued)
Security
Rate, Maturity Date | Face
Amount ($) | Value ($) |
| Anheuser-Busch InBev Worldwide, Inc. |
| 4.15%, 01/23/25 (a) | 155,000 | 176,559 |
| Archer-Daniels-Midland Co. |
| 2.75%, 03/27/25 (a) | 50,000 | 54,461 |
| AstraZeneca PLC |
| 3.50%, 08/17/23 (a) | 75,000 | 80,932 |
| 3.38%, 11/16/25 | 100,000 | 112,536 |
| BAT Capital Corp. |
| 2.76%, 08/15/22 (a) | 100,000 | 103,541 |
| 3.22%, 08/15/24 (a) | 150,000 | 162,633 |
| Baxalta, Inc. |
| 4.00%, 06/23/25 (a) | 100,000 | 113,084 |
| Becton Dickinson & Co. |
| 2.89%, 06/06/22 (a) | 102,000 | 105,351 |
| 3.36%, 06/06/24 (a) | 125,000 | 135,759 |
| 3.73%, 12/15/24 (a) | 20,000 | 22,159 |
| Biogen, Inc. |
| 3.63%, 09/15/22 | 175,000 | 184,667 |
| 4.05%, 09/15/25 (a) | 100,000 | 114,675 |
| Boston Scientific Corp. |
| 3.38%, 05/15/22 | 25,000 | 26,043 |
| 3.45%, 03/01/24 (a) | 100,000 | 108,432 |
| Bristol-Myers Squibb Co. |
| 2.60%, 05/16/22 | 100,000 | 103,203 |
| 3.55%, 08/15/22 | 150,000 | 157,848 |
| 2.75%, 02/15/23 (a) | 100,000 | 104,917 |
| 3.25%, 02/20/23 (a) | 50,000 | 52,993 |
| 7.15%, 06/15/23 | 100,000 | 116,386 |
| 3.63%, 05/15/24 (a) | 75,000 | 82,299 |
| 2.90%, 07/26/24 (a) | 175,000 | 189,982 |
| 3.88%, 08/15/25 (a) | 50,000 | 57,066 |
| 0.75%, 11/13/25 (a) | 50,000 | 50,419 |
| Brown-Forman Corp. |
| 3.50%, 04/15/25 (a) | 50,000 | 55,576 |
| Bunge Ltd. Finance Corp. |
| 3.00%, 09/25/22 (a) | 32,000 | 33,236 |
| 1.63%, 08/17/25 (a) | 50,000 | 51,580 |
| Campbell Soup Co. |
| 2.50%, 08/02/22 | 50,000 | 51,650 |
| 3.65%, 03/15/23 (a) | 40,000 | 42,750 |
| 3.30%, 03/19/25 (a) | 50,000 | 54,826 |
| Cardinal Health, Inc. |
| 2.62%, 06/15/22 (a) | 70,000 | 72,089 |
| 3.08%, 06/15/24 (a) | 100,000 | 107,691 |
| 3.50%, 11/15/24 (a) | 20,000 | 21,916 |
| Church & Dwight Co., Inc. |
| 2.45%, 08/01/22 (a) | 50,000 | 51,561 |
| Cigna Corp. |
| 3.90%, 02/15/22 | 50,000 | 51,965 |
| 3.00%, 07/15/23 (a) | 25,000 | 26,494 |
| 3.75%, 07/15/23 (a) | 115,000 | 124,268 |
| 3.25%, 04/15/25 (a) | 100,000 | 110,016 |
| 4.13%, 11/15/25 (a) | 100,000 | 115,189 |
| Clorox Co. |
| 3.05%, 09/15/22 (a) | 50,000 | 51,998 |
| 3.50%, 12/15/24 (a) | 25,000 | 27,744 |
| Coca-Cola Co. |
| 3.20%, 11/01/23 | 105,000 | 113,920 |
| 1.75%, 09/06/24 | 100,000 | 104,884 |
| 2.95%, 03/25/25 | 50,000 | 55,154 |
| 2.88%, 10/27/25 | 50,000 | 55,616 |
Security
Rate, Maturity Date | Face
Amount ($) | Value ($) |
| Colgate-Palmolive Co. |
| 2.25%, 11/15/22 | 15,000 | 15,575 |
| 2.10%, 05/01/23 | 25,000 | 26,079 |
| 3.25%, 03/15/24 | 50,000 | 54,596 |
| CommonSpirit Health |
| 1.55%, 10/01/25 (a) | 75,000 | 77,248 |
| Conagra Brands, Inc. |
| 3.20%, 01/25/23 (a) | 10,000 | 10,526 |
| 4.30%, 05/01/24 (a) | 75,000 | 84,021 |
| Constellation Brands, Inc. |
| 3.20%, 02/15/23 (a) | 50,000 | 52,907 |
| 4.25%, 05/01/23 | 100,000 | 109,063 |
| 4.40%, 11/15/25 (a) | 100,000 | 116,414 |
| CVS Health Corp. |
| 3.50%, 07/20/22 (a) | 100,000 | 104,431 |
| 4.75%, 12/01/22 (a) | 65,000 | 69,638 |
| 3.70%, 03/09/23 (a) | 245,000 | 262,128 |
| 3.38%, 08/12/24 (a) | 100,000 | 109,256 |
| 2.63%, 08/15/24 (a) | 90,000 | 96,461 |
| 4.10%, 03/25/25 (a) | 175,000 | 198,579 |
| DH Europe Finance II Sarl |
| 2.05%, 11/15/22 | 50,000 | 51,558 |
| 2.20%, 11/15/24 (a) | 30,000 | 31,830 |
| Diageo Capital PLC |
| 2.63%, 04/29/23 (a) | 50,000 | 52,377 |
| Diageo Investment Corp. |
| 2.88%, 05/11/22 | 150,000 | 155,182 |
| General Mills, Inc. |
| 3.15%, 12/15/21 (a) | 50,000 | 50,969 |
| 2.60%, 10/12/22 (a) | 50,000 | 51,958 |
| 3.70%, 10/17/23 (a) | 25,000 | 27,218 |
| 4.00%, 04/17/25 (a) | 100,000 | 113,197 |
| Gilead Sciences, Inc. |
| 1.95%, 03/01/22 (a) | 60,000 | 61,046 |
| 3.25%, 09/01/22 (a) | 105,000 | 109,607 |
| 0.75%, 09/29/23 (a) | 100,000 | 100,290 |
| 3.70%, 04/01/24 (a) | 45,000 | 49,204 |
| 3.50%, 02/01/25 (a) | 100,000 | 110,690 |
| GlaxoSmithKline Capital PLC |
| 2.85%, 05/08/22 | 100,000 | 103,459 |
| 2.88%, 06/01/22 (a) | 35,000 | 36,216 |
| 0.53%, 10/01/23 (a) | 150,000 | 150,793 |
| 3.00%, 06/01/24 (a) | 50,000 | 54,074 |
| GlaxoSmithKline Capital, Inc. |
| 2.80%, 03/18/23 | 100,000 | 105,488 |
| 3.38%, 05/15/23 | 125,000 | 133,947 |
| Hasbro, Inc. |
| 2.60%, 11/19/22 | 50,000 | 51,892 |
| 3.00%, 11/19/24 (a) | 25,000 | 27,128 |
| HCA, Inc. |
| 4.75%, 05/01/23 | 135,000 | 147,402 |
| 5.00%, 03/15/24 | 50,000 | 56,293 |
| 5.25%, 04/15/25 | 75,000 | 87,722 |
| Hershey Co. |
| 3.38%, 05/15/23 (a) | 15,000 | 16,097 |
| JM Smucker Co. |
| 3.00%, 03/15/22 | 50,000 | 51,559 |
| 3.50%, 03/15/25 | 50,000 | 55,775 |
| Johnson & Johnson |
| 2.25%, 03/03/22 (a) | 40,000 | 40,880 |
| 3.38%, 12/05/23 | 50,000 | 54,664 |
| 2.63%, 01/15/25 (a) | 70,000 | 75,834 |
| 0.55%, 09/01/25 (a) | 75,000 | 75,379 |
Schwab Fixed-Income ETFs | Annual Report
Schwab 1-5 Year Corporate Bond ETF
Portfolio Holdings as of December 31, 2020 (continued)
Security
Rate, Maturity Date | Face
Amount ($) | Value ($) |
| Kellogg Co. |
| 2.65%, 12/01/23 | 25,000 | 26,676 |
| Keurig Dr Pepper, Inc. |
| 4.06%, 05/25/23 (a) | 100,000 | 108,745 |
| 4.42%, 05/25/25 (a) | 100,000 | 115,359 |
| Kimberly-Clark Corp. |
| 2.40%, 03/01/22 | 50,000 | 51,283 |
| Kroger Co. |
| 3.40%, 04/15/22 (a) | 25,000 | 25,800 |
| 2.80%, 08/01/22 (a) | 70,000 | 72,559 |
| 4.00%, 02/01/24 (a) | 35,000 | 38,436 |
| Laboratory Corp. of America Holdings |
| 3.75%, 08/23/22 (a) | 50,000 | 52,377 |
| 3.25%, 09/01/24 (a) | 50,000 | 54,420 |
| 2.30%, 12/01/24 (a) | 100,000 | 106,269 |
| McCormick & Co., Inc. |
| 2.70%, 08/15/22 (a) | 20,000 | 20,717 |
| 3.15%, 08/15/24 (a) | 25,000 | 27,185 |
| McKesson Corp. |
| 2.70%, 12/15/22 (a) | 50,000 | 51,949 |
| 2.85%, 03/15/23 (a) | 39,000 | 40,765 |
| 3.80%, 03/15/24 (a) | 50,000 | 54,856 |
| 0.90%, 12/03/25 (a) | 50,000 | 50,283 |
| Medtronic, Inc. |
| 3.50%, 03/15/25 | 105,000 | 117,766 |
| Merck & Co., Inc. |
| 2.35%, 02/10/22 | 50,000 | 51,151 |
| 2.40%, 09/15/22 (a) | 25,000 | 25,811 |
| 2.80%, 05/18/23 | 100,000 | 105,984 |
| 2.90%, 03/07/24 (a) | 20,000 | 21,573 |
| 2.75%, 02/10/25 (a) | 170,000 | 185,135 |
| Molson Coors Beverage Co. |
| 3.50%, 05/01/22 | 50,000 | 52,048 |
| Mondelez International, Inc. |
| 0.63%, 07/01/22 | 50,000 | 50,247 |
| 2.13%, 04/13/23 (a) | 50,000 | 51,896 |
| 1.50%, 05/04/25 (a) | 75,000 | 77,634 |
| Novartis Capital Corp. |
| 2.40%, 05/17/22 (a) | 100,000 | 102,798 |
| 2.40%, 09/21/22 | 100,000 | 103,823 |
| 3.40%, 05/06/24 | 50,000 | 54,947 |
| 1.75%, 02/14/25 (a) | 35,000 | 36,727 |
| 3.00%, 11/20/25 (a) | 100,000 | 110,854 |
| PeaceHealth Obligated Group |
| 1.38%, 11/15/25 (a) | 50,000 | 50,964 |
| PepsiCo, Inc. |
| 3.10%, 07/17/22 (a) | 25,000 | 25,992 |
| 2.75%, 03/01/23 | 50,000 | 52,732 |
| 0.75%, 05/01/23 | 50,000 | 50,724 |
| 0.40%, 10/07/23 | 100,000 | 100,547 |
| 3.60%, 03/01/24 (a) | 100,000 | 109,360 |
| 2.25%, 03/19/25 (a) | 175,000 | 187,325 |
| 2.75%, 04/30/25 (a) | 25,000 | 27,237 |
| Pfizer, Inc. |
| 2.80%, 03/11/22 | 65,000 | 66,966 |
| 3.20%, 09/15/23 (a) | 50,000 | 53,881 |
| 2.95%, 03/15/24 (a) | 100,000 | 107,952 |
| 3.40%, 05/15/24 | 50,000 | 55,030 |
| Philip Morris International, Inc. |
| 2.50%, 11/02/22 (a) | 50,000 | 51,949 |
| 1.13%, 05/01/23 | 50,000 | 51,014 |
| 2.13%, 05/10/23 (a) | 40,000 | 41,595 |
| 2.88%, 05/01/24 (a) | 190,000 | 204,543 |
Security
Rate, Maturity Date | Face
Amount ($) | Value ($) |
| 3.25%, 11/10/24 | 30,000 | 33,033 |
| 1.50%, 05/01/25 (a) | 25,000 | 25,917 |
| Procter & Gamble Co. |
| 2.30%, 02/06/22 | 50,000 | 51,140 |
| 2.15%, 08/11/22 | 10,000 | 10,314 |
| 3.10%, 08/15/23 | 100,000 | 107,500 |
| 0.55%, 10/29/25 | 75,000 | 75,691 |
| Quest Diagnostics, Inc. |
| 3.50%, 03/30/25 (a) | 25,000 | 27,847 |
| Reynolds American, Inc. |
| 4.85%, 09/15/23 | 80,000 | 89,286 |
| 4.45%, 06/12/25 (a) | 100,000 | 114,147 |
| Royalty Pharma PLC |
| 0.75%, 09/02/23 (c) | 50,000 | 50,273 |
| 1.20%, 09/02/25 (a)(c) | 50,000 | 50,848 |
| Sanofi |
| 3.38%, 06/19/23 (a) | 75,000 | 80,563 |
| Shire Acquisitions Investments Ireland DAC |
| 2.88%, 09/23/23 (a) | 150,000 | 159,051 |
| SSM Health Care Corp. |
| 3.69%, 06/01/23 (a) | 15,000 | 16,058 |
| Sutter Health |
| 1.32%, 08/15/25 (a) | 50,000 | 51,018 |
| Sysco Corp. |
| 2.60%, 06/12/22 | 25,000 | 25,801 |
| 5.65%, 04/01/25 (a) | 100,000 | 119,378 |
| Thermo Fisher Scientific, Inc. |
| 3.00%, 04/15/23 (a) | 65,000 | 68,545 |
| 4.15%, 02/01/24 (a) | 50,000 | 55,282 |
| 4.13%, 03/25/25 (a) | 50,000 | 56,943 |
| Tyson Foods, Inc. |
| 4.50%, 06/15/22 (a) | 125,000 | 131,141 |
| 3.90%, 09/28/23 (a) | 100,000 | 109,249 |
| 3.95%, 08/15/24 (a) | 25,000 | 27,861 |
| Unilever Capital Corp. |
| 2.20%, 05/05/22 (a) | 100,000 | 102,465 |
| 0.38%, 09/14/23 | 100,000 | 100,290 |
| 3.25%, 03/07/24 (a) | 100,000 | 108,586 |
| Viatris, Inc. |
| 1.13%, 06/22/22 (c) | 100,000 | 100,949 |
| 1.65%, 06/22/25 (a)(c) | 50,000 | 51,767 |
| Whirlpool Corp. |
| 4.00%, 03/01/24 | 10,000 | 11,025 |
| 3.70%, 05/01/25 | 100,000 | 111,522 |
| Zimmer Biomet Holdings, Inc. |
| 3.55%, 04/01/25 (a) | 150,000 | 165,985 |
| Zoetis, Inc. |
| 3.25%, 02/01/23 (a) | 75,000 | 78,980 |
| | | 15,643,712 |
| Energy 7.7% |
| Baker Hughes a GE Co. LLC/Baker Hughes Co-Obligor, Inc. |
| 2.77%, 12/15/22 (a) | 135,000 | 141,130 |
| Boardwalk Pipelines LP |
| 3.38%, 02/01/23 (a) | 35,000 | 36,533 |
| 4.95%, 12/15/24 (a) | 50,000 | 55,967 |
| BP Capital Markets America, Inc. |
| 2.52%, 09/19/22 (a) | 50,000 | 51,762 |
| 2.94%, 04/06/23 | 100,000 | 105,630 |
| 2.75%, 05/10/23 | 65,000 | 68,594 |
| 3.22%, 11/28/23 (a) | 25,000 | 26,865 |
| 3.79%, 02/06/24 (a) | 40,000 | 43,742 |
| 3.22%, 04/14/24 (a) | 75,000 | 81,092 |
Schwab Fixed-Income ETFs | Annual Report
Schwab 1-5 Year Corporate Bond ETF
Portfolio Holdings as of December 31, 2020 (continued)
Security
Rate, Maturity Date | Face
Amount ($) | Value ($) |
| 3.19%, 04/06/25 (a) | 30,000 | 33,017 |
| 3.80%, 09/21/25 (a) | 100,000 | 113,487 |
| BP Capital Markets PLC |
| 3.06%, 03/17/22 | 100,000 | 103,184 |
| 3.81%, 02/10/24 | 150,000 | 164,760 |
| 3.54%, 11/04/24 | 25,000 | 27,750 |
| Canadian Natural Resources Ltd. |
| 3.80%, 04/15/24 (a) | 100,000 | 108,471 |
| 3.90%, 02/01/25 (a) | 50,000 | 55,320 |
| Cheniere Corpus Christi Holdings LLC |
| 5.88%, 03/31/25 (a) | 150,000 | 174,634 |
| Chevron Corp. |
| 2.50%, 03/03/22 (a) | 75,000 | 76,817 |
| 1.14%, 05/11/23 | 150,000 | 153,171 |
| 3.19%, 06/24/23 (a) | 100,000 | 106,496 |
| 2.90%, 03/03/24 (a) | 25,000 | 26,810 |
| 1.55%, 05/11/25 (a) | 100,000 | 104,104 |
| Chevron USA, Inc. |
| 0.69%, 08/12/25 (a) | 200,000 | 201,476 |
| Cimarex Energy Co. |
| 4.38%, 06/01/24 (a) | 25,000 | 27,288 |
| Devon Energy Corp. |
| 5.85%, 12/15/25 (a) | 25,000 | 29,462 |
| Diamondback Energy, Inc. |
| 2.88%, 12/01/24 (a) | 10,000 | 10,528 |
| 4.75%, 05/31/25 (a) | 75,000 | 84,528 |
| Eastern Energy Gas Holdings LLC |
| 2.50%, 11/15/24 (a) | 20,000 | 21,438 |
| 3.60%, 12/15/24 (a) | 65,000 | 71,854 |
| Enable Midstream Partners LP |
| 3.90%, 05/15/24 (a) | 50,000 | 51,157 |
| Enbridge, Inc. |
| 2.90%, 07/15/22 (a) | 200,000 | 207,770 |
| 2.50%, 01/15/25 (a) | 25,000 | 26,837 |
| Energy Transfer Operating LP |
| 5.20%, 02/01/22 (a) | 75,000 | 77,889 |
| 3.60%, 02/01/23 (a) | 50,000 | 52,322 |
| 4.25%, 03/15/23 (a) | 50,000 | 53,126 |
| 5.88%, 01/15/24 (a) | 50,000 | 56,203 |
| 4.90%, 02/01/24 (a) | 20,000 | 21,913 |
| 4.50%, 04/15/24 (a) | 70,000 | 76,712 |
| 4.05%, 03/15/25 (a) | 50,000 | 54,921 |
| 2.90%, 05/15/25 (a) | 50,000 | 52,961 |
| Energy Transfer Partners LP/Regency Energy Finance Corp. |
| 5.00%, 10/01/22 (a) | 100,000 | 106,155 |
| Enterprise Products Operating LLC |
| 3.50%, 02/01/22 | 50,000 | 51,709 |
| 3.35%, 03/15/23 (a) | 50,000 | 52,868 |
| 3.90%, 02/15/24 (a) | 50,000 | 54,785 |
| 3.75%, 02/15/25 (a) | 35,000 | 39,228 |
| 4.88%, 08/16/77 (a)(b) | 45,000 | 43,360 |
| EOG Resources, Inc. |
| 2.63%, 03/15/23 (a) | 100,000 | 104,462 |
| Exxon Mobil Corp. |
| 2.40%, 03/06/22 (a) | 150,000 | 153,294 |
| 1.90%, 08/16/22 | 30,000 | 30,809 |
| 2.73%, 03/01/23 (a) | 40,000 | 41,928 |
| 1.57%, 04/15/23 | 100,000 | 102,968 |
| 3.18%, 03/15/24 (a) | 65,000 | 70,199 |
| 2.02%, 08/16/24 (a) | 30,000 | 31,596 |
| 2.71%, 03/06/25 (a) | 100,000 | 108,093 |
| 2.99%, 03/19/25 (a) | 180,000 | 197,240 |
| Halliburton Co. |
| 3.50%, 08/01/23 (a) | 60,000 | 64,108 |
Security
Rate, Maturity Date | Face
Amount ($) | Value ($) |
| Helmerich & Payne, Inc. |
| 4.65%, 03/15/25 (a) | 50,000 | 55,768 |
| HollyFrontier Corp. |
| 2.63%, 10/01/23 | 50,000 | 51,137 |
| Husky Energy, Inc. |
| 3.95%, 04/15/22 (a) | 25,000 | 25,781 |
| Kinder Morgan Energy Partners LP |
| 4.15%, 03/01/22 | 200,000 | 208,638 |
| 3.45%, 02/15/23 (a) | 100,000 | 105,379 |
| 3.50%, 09/01/23 (a) | 50,000 | 53,558 |
| 4.15%, 02/01/24 (a) | 25,000 | 27,399 |
| 4.30%, 05/01/24 (a) | 25,000 | 27,713 |
| 4.25%, 09/01/24 (a) | 50,000 | 55,904 |
| Marathon Oil Corp. |
| 2.80%, 11/01/22 (a) | 50,000 | 51,597 |
| 3.85%, 06/01/25 (a) | 50,000 | 53,630 |
| Marathon Petroleum Corp. |
| 4.75%, 12/15/23 (a) | 45,000 | 49,952 |
| 3.63%, 09/15/24 (a) | 50,000 | 54,411 |
| 4.70%, 05/01/25 (a) | 100,000 | 114,710 |
| MPLX LP |
| 3.50%, 12/01/22 (a) | 50,000 | 52,538 |
| 3.38%, 03/15/23 (a) | 45,000 | 47,653 |
| 4.50%, 07/15/23 (a) | 35,000 | 38,147 |
| 4.88%, 12/01/24 (a) | 150,000 | 172,192 |
| 4.00%, 02/15/25 (a) | 20,000 | 22,338 |
| 4.88%, 06/01/25 (a) | 50,000 | 57,785 |
| National Fuel Gas Co. |
| 5.20%, 07/15/25 (a) | 50,000 | 56,329 |
| Noble Energy, Inc. |
| 3.90%, 11/15/24 (a) | 45,000 | 50,108 |
| ONEOK Partners LP |
| 3.38%, 10/01/22 (a) | 50,000 | 52,094 |
| ONEOK, Inc. |
| 4.25%, 02/01/22 (a) | 125,000 | 128,761 |
| 7.50%, 09/01/23 (a) | 15,000 | 17,368 |
| 2.75%, 09/01/24 (a) | 45,000 | 47,525 |
| 2.20%, 09/15/25 (a) | 50,000 | 51,771 |
| 5.85%, 01/15/26 (a) | 20,000 | 23,962 |
| Phillips 66 |
| 4.30%, 04/01/22 | 50,000 | 52,415 |
| 3.85%, 04/09/25 (a) | 50,000 | 56,339 |
| Phillips 66 Partners LP |
| 2.45%, 12/15/24 (a) | 20,000 | 21,054 |
| 3.61%, 02/15/25 (a) | 20,000 | 21,720 |
| Plains All American Pipeline LP/PAA Finance Corp. |
| 3.65%, 06/01/22 (a) | 50,000 | 51,531 |
| 2.85%, 01/31/23 (a) | 90,000 | 93,105 |
| 3.85%, 10/15/23 (a) | 30,000 | 32,215 |
| 3.60%, 11/01/24 (a) | 30,000 | 32,092 |
| Sabine Pass Liquefaction LLC |
| 6.25%, 03/15/22 (a) | 100,000 | 105,266 |
| 5.75%, 05/15/24 (a) | 150,000 | 171,756 |
| 5.63%, 03/01/25 (a) | 250,000 | 292,067 |
| Schlumberger Finance Canada Ltd. |
| 1.40%, 09/17/25 (a) | 50,000 | 51,466 |
| Schlumberger Investment S.A. |
| 3.65%, 12/01/23 (a) | 90,000 | 97,705 |
| Shell International Finance BV |
| 2.38%, 08/21/22 | 200,000 | 207,032 |
| 3.40%, 08/12/23 | 35,000 | 37,837 |
| 0.38%, 09/15/23 | 100,000 | 100,259 |
| 3.50%, 11/13/23 (a) | 50,000 | 54,420 |
| 2.00%, 11/07/24 (a) | 125,000 | 131,774 |
Schwab Fixed-Income ETFs | Annual Report
Schwab 1-5 Year Corporate Bond ETF
Portfolio Holdings as of December 31, 2020 (continued)
Security
Rate, Maturity Date | Face
Amount ($) | Value ($) |
| 2.38%, 04/06/25 (a) | 85,000 | 91,151 |
| 3.25%, 05/11/25 | 100,000 | 111,019 |
| Spectra Energy Partners LP |
| 4.75%, 03/15/24 (a) | 25,000 | 27,974 |
| Suncor Energy, Inc. |
| 3.10%, 05/15/25 (a) | 100,000 | 109,587 |
| Sunoco Logistics Partners Operations LP |
| 3.45%, 01/15/23 (a) | 50,000 | 52,092 |
| 4.25%, 04/01/24 (a) | 15,000 | 16,237 |
| Total Capital Canada Ltd. |
| 2.75%, 07/15/23 | 50,000 | 53,106 |
| Total Capital International S.A. |
| 2.88%, 02/17/22 | 20,000 | 20,584 |
| 3.70%, 01/15/24 | 70,000 | 76,876 |
| 3.75%, 04/10/24 | 150,000 | 166,266 |
| TransCanada PipeLines Ltd. |
| 2.50%, 08/01/22 | 150,000 | 155,164 |
| Valero Energy Corp. |
| 2.70%, 04/15/23 | 75,000 | 78,338 |
| 1.20%, 03/15/24 | 50,000 | 50,388 |
| 2.85%, 04/15/25 (a) | 85,000 | 90,726 |
| Williams Cos., Inc. |
| 3.60%, 03/15/22 (a) | 50,000 | 51,622 |
| 4.50%, 11/15/23 (a) | 75,000 | 82,735 |
| 4.55%, 06/24/24 (a) | 44,000 | 49,288 |
| 4.00%, 09/15/25 (a) | 100,000 | 113,708 |
| | | 9,051,585 |
| Industrial Other 0.1% |
| Cintas Corp. No. 2 |
| 2.90%, 04/01/22 (a) | 25,000 | 25,746 |
| Yale University |
| 0.87%, 04/15/25 (a) | 100,000 | 101,757 |
| | | 127,503 |
| Technology 9.2% |
| Adobe, Inc. |
| 1.70%, 02/01/23 | 15,000 | 15,437 |
| 1.90%, 02/01/25 (a) | 45,000 | 47,607 |
| 3.25%, 02/01/25 (a) | 50,000 | 55,221 |
| Agilent Technologies, Inc. |
| 3.88%, 07/15/23 (a) | 55,000 | 59,243 |
| Alphabet, Inc. |
| 3.38%, 02/25/24 | 10,000 | 10,941 |
| 0.45%, 08/15/25 (a) | 100,000 | 100,051 |
| Analog Devices, Inc. |
| 2.50%, 12/05/21 (a) | 70,000 | 71,265 |
| 2.88%, 06/01/23 (a) | 50,000 | 52,669 |
| Apple Inc. |
| 2.50%, 02/09/22 (a) | 200,000 | 204,604 |
| 2.30%, 05/11/22 (a) | 50,000 | 51,347 |
| 2.70%, 05/13/22 | 50,000 | 51,686 |
| 2.10%, 09/12/22 (a) | 25,000 | 25,769 |
| 2.85%, 02/23/23 (a) | 100,000 | 105,147 |
| 2.40%, 05/03/23 | 150,000 | 157,386 |
| 0.75%, 05/11/23 | 25,000 | 25,324 |
| 3.00%, 02/09/24 (a) | 150,000 | 161,481 |
| 3.45%, 05/06/24 | 100,000 | 110,196 |
| 2.85%, 05/11/24 (a) | 125,000 | 134,782 |
| 1.80%, 09/11/24 (a) | 20,000 | 21,006 |
| 2.75%, 01/13/25 (a) | 160,000 | 173,878 |
| 2.50%, 02/09/25 | 100,000 | 108,138 |
| 1.13%, 05/11/25 (a) | 150,000 | 154,386 |
Security
Rate, Maturity Date | Face
Amount ($) | Value ($) |
| 3.20%, 05/13/25 | 100,000 | 111,739 |
| 0.55%, 08/20/25 (a) | 50,000 | 50,231 |
| Arrow Electronics, Inc. |
| 4.50%, 03/01/23 (a) | 50,000 | 53,570 |
| 3.25%, 09/08/24 (a) | 25,000 | 27,017 |
| 4.00%, 04/01/25 (a) | 25,000 | 27,353 |
| Avnet, Inc. |
| 4.88%, 12/01/22 | 50,000 | 53,510 |
| Baidu, Inc. |
| 3.88%, 09/29/23 (a) | 100,000 | 107,703 |
| 4.38%, 05/14/24 (a) | 250,000 | 274,767 |
| Broadcom Corp./Broadcom Cayman Finance Ltd. |
| 2.65%, 01/15/23 (a) | 25,000 | 26,030 |
| 3.63%, 01/15/24 (a) | 165,000 | 178,670 |
| 3.13%, 01/15/25 (a) | 65,000 | 70,289 |
| Broadcom, Inc. |
| 3.13%, 10/15/22 | 50,000 | 52,367 |
| 2.25%, 11/15/23 | 100,000 | 104,498 |
| 4.70%, 04/15/25 (a) | 150,000 | 172,176 |
| 3.15%, 11/15/25 (a) | 30,000 | 32,778 |
| Cisco Systems, Inc. |
| 3.00%, 06/15/22 | 50,000 | 52,022 |
| 2.20%, 09/20/23 (a) | 50,000 | 52,457 |
| 3.63%, 03/04/24 | 80,000 | 88,131 |
| Corning, Inc. |
| 2.90%, 05/15/22 (a) | 15,000 | 15,437 |
| Dell International LLC/EMC Corp. |
| 5.45%, 06/15/23 (a)(c) | 290,000 | 320,905 |
| 4.00%, 07/15/24 (a)(c) | 25,000 | 27,589 |
| 5.85%, 07/15/25 (a)(c) | 50,000 | 59,800 |
| DXC Technology Co. |
| 4.00%, 04/15/23 | 50,000 | 53,464 |
| 4.25%, 04/15/24 (a) | 25,000 | 27,424 |
| 4.13%, 04/15/25 (a) | 20,000 | 22,150 |
| Equifax, Inc. |
| 3.30%, 12/15/22 (a) | 70,000 | 73,391 |
| 2.60%, 12/01/24 (a) | 25,000 | 26,792 |
| Equinix, Inc. |
| 2.63%, 11/18/24 (a) | 20,000 | 21,397 |
| 1.25%, 07/15/25 (a) | 50,000 | 51,019 |
| 1.00%, 09/15/25 (a) | 50,000 | 50,203 |
| Fidelity National Information Services, Inc. |
| 3.88%, 06/05/24 (a) | 50,000 | 55,082 |
| Fiserv, Inc. |
| 3.50%, 10/01/22 (a) | 100,000 | 104,726 |
| 3.80%, 10/01/23 (a) | 120,000 | 130,878 |
| 2.75%, 07/01/24 (a) | 100,000 | 107,451 |
| Flex Ltd. |
| 5.00%, 02/15/23 | 15,000 | 16,272 |
| 4.75%, 06/15/25 (a) | 50,000 | 57,197 |
| Global Payments, Inc. |
| 3.75%, 06/01/23 (a) | 100,000 | 106,892 |
| 4.00%, 06/01/23 (a) | 75,000 | 81,173 |
| Hewlett Packard Enterprise Co. |
| 4.40%, 10/15/22 (a) | 65,000 | 69,080 |
| 4.45%, 10/02/23 (a) | 150,000 | 165,309 |
| 4.65%, 10/01/24 (a) | 35,000 | 39,801 |
| 4.90%, 10/15/25 (a) | 200,000 | 234,312 |
| HP, Inc. |
| 2.20%, 06/17/25 (a) | 150,000 | 158,892 |
| IBM Credit LLC |
| 2.20%, 09/08/22 | 100,000 | 103,216 |
Schwab Fixed-Income ETFs | Annual Report
Schwab 1-5 Year Corporate Bond ETF
Portfolio Holdings as of December 31, 2020 (continued)
Security
Rate, Maturity Date | Face
Amount ($) | Value ($) |
| Intel Corp. |
| 2.35%, 05/11/22 (a) | 50,000 | 51,337 |
| 2.70%, 12/15/22 | 50,000 | 52,380 |
| 2.88%, 05/11/24 (a) | 125,000 | 134,892 |
| 3.40%, 03/25/25 (a) | 50,000 | 55,576 |
| International Business Machines Corp. |
| 2.85%, 05/13/22 | 150,000 | 155,328 |
| 3.38%, 08/01/23 | 150,000 | 161,823 |
| 3.63%, 02/12/24 | 100,000 | 109,690 |
| 3.00%, 05/15/24 | 250,000 | 270,920 |
| Jabil, Inc. |
| 4.70%, 09/15/22 | 50,000 | 53,580 |
| Juniper Networks, Inc. |
| 1.20%, 12/10/25 (a) | 50,000 | 50,619 |
| Keysight Technologies, Inc. |
| 4.55%, 10/30/24 (a) | 100,000 | 113,626 |
| KLA Corp. |
| 4.65%, 11/01/24 (a) | 75,000 | 85,480 |
| Lam Research Corp. |
| 3.80%, 03/15/25 (a) | 15,000 | 16,849 |
| Leidos, Inc. |
| 2.95%, 05/15/23 (a)(c) | 50,000 | 52,687 |
| 3.63%, 05/15/25 (a)(c) | 60,000 | 67,191 |
| Marvell Technology Group Ltd. |
| 4.20%, 06/22/23 (a) | 50,000 | 54,150 |
| Microchip Technology, Inc. |
| 4.33%, 06/01/23 (a) | 95,000 | 102,955 |
| Micron Technology, Inc. |
| 2.50%, 04/24/23 | 150,000 | 156,462 |
| 4.64%, 02/06/24 (a) | 25,000 | 27,841 |
| Microsoft Corp. |
| 2.40%, 02/06/22 (a) | 50,000 | 51,114 |
| 2.38%, 02/12/22 (a) | 150,000 | 153,355 |
| 2.65%, 11/03/22 (a) | 145,000 | 150,970 |
| 2.00%, 08/08/23 (a) | 70,000 | 73,064 |
| 3.63%, 12/15/23 (a) | 125,000 | 136,614 |
| 2.88%, 02/06/24 (a) | 120,000 | 128,855 |
| 2.70%, 02/12/25 (a) | 140,000 | 151,946 |
| 3.13%, 11/03/25 (a) | 150,000 | 167,742 |
| Motorola Solutions, Inc. |
| 4.00%, 09/01/24 | 100,000 | 111,815 |
| NetApp, Inc. |
| 3.30%, 09/29/24 (a) | 40,000 | 43,568 |
| 1.88%, 06/22/25 (a) | 100,000 | 104,759 |
| NXP BV/NXP Funding LLC |
| 4.88%, 03/01/24 (a)(c) | 25,000 | 28,233 |
| NXP BV/NXP Funding LLC/NXP USA, Inc. |
| 2.70%, 05/01/25 (a)(c) | 75,000 | 80,697 |
| Oracle Corp. |
| 2.50%, 05/15/22 (a) | 40,000 | 41,071 |
| 2.50%, 10/15/22 | 425,000 | 441,923 |
| 2.63%, 02/15/23 (a) | 75,000 | 78,616 |
| 2.40%, 09/15/23 (a) | 100,000 | 105,238 |
| 3.40%, 07/08/24 (a) | 225,000 | 246,384 |
| 2.95%, 11/15/24 (a) | 50,000 | 54,410 |
| 2.50%, 04/01/25 (a) | 210,000 | 225,718 |
| PayPal Holdings, Inc. |
| 2.20%, 09/26/22 | 100,000 | 103,337 |
| 1.35%, 06/01/23 | 50,000 | 51,266 |
| 2.40%, 10/01/24 (a) | 50,000 | 53,460 |
| 1.65%, 06/01/25 (a) | 50,000 | 52,353 |
| QUALCOMM, Inc. |
| 3.00%, 05/20/22 | 50,000 | 51,922 |
| 2.60%, 01/30/23 (a) | 75,000 | 78,665 |
Security
Rate, Maturity Date | Face
Amount ($) | Value ($) |
| 2.90%, 05/20/24 (a) | 25,000 | 26,963 |
| 3.45%, 05/20/25 (a) | 100,000 | 111,674 |
| salesforce.com, Inc. |
| 3.25%, 04/11/23 (a) | 25,000 | 26,656 |
| Seagate HDD Cayman |
| 4.88%, 03/01/24 (a) | 50,000 | 54,396 |
| 4.75%, 01/01/25 | 25,000 | 27,264 |
| Telefonaktiebolaget LM Ericsson |
| 4.13%, 05/15/22 | 50,000 | 52,087 |
| Texas Instruments, Inc. |
| 2.25%, 05/01/23 (a) | 25,000 | 26,131 |
| 2.63%, 05/15/24 (a) | 25,000 | 26,710 |
| 1.38%, 03/12/25 (a) | 50,000 | 51,934 |
| Trimble, Inc. |
| 4.15%, 06/15/23 (a) | 25,000 | 27,093 |
| 4.75%, 12/01/24 (a) | 20,000 | 22,878 |
| Tyco Electronics Group S.A. |
| 3.50%, 02/03/22 (a) | 15,000 | 15,392 |
| VMware, Inc. |
| 2.95%, 08/21/22 (a) | 45,000 | 46,707 |
| Xilinx, Inc. |
| 2.95%, 06/01/24 (a) | 25,000 | 26,965 |
| | | 10,896,055 |
| Transportation 1.7% |
| Burlington Northern Santa Fe LLC |
| 3.05%, 09/01/22 (a) | 75,000 | 77,901 |
| 3.00%, 03/15/23 (a) | 15,000 | 15,768 |
| 3.85%, 09/01/23 (a) | 25,000 | 27,108 |
| 3.75%, 04/01/24 (a) | 152,000 | 166,657 |
| 7.00%, 12/15/25 | 50,000 | 64,801 |
| Canadian Pacific Railway Co. |
| 2.90%, 02/01/25 (a) | 90,000 | 97,662 |
| Continental Airlines 2012-1 Class A Pass Through Trust |
| 4.15%, 04/11/24 | 44,160 | 44,420 |
| CSX Corp. |
| 3.40%, 08/01/24 (a) | 75,000 | 82,021 |
| Delta Air Lines 2019-1 Class AA Pass Through Trust |
| 3.20%, 04/25/24 | 100,000 | 102,266 |
| FedEx Corp. |
| 3.40%, 01/14/22 | 20,000 | 20,633 |
| 4.00%, 01/15/24 | 50,000 | 55,414 |
| 3.20%, 02/01/25 | 175,000 | 192,640 |
| Norfolk Southern Corp. |
| 3.00%, 04/01/22 (a) | 130,000 | 133,583 |
| 3.85%, 01/15/24 (a) | 25,000 | 27,282 |
| Ryder System, Inc. |
| 2.88%, 06/01/22 (a) | 50,000 | 51,672 |
| 3.75%, 06/09/23 (a) | 15,000 | 16,147 |
| 2.50%, 09/01/24 (a) | 20,000 | 21,270 |
| 3.35%, 09/01/25 (a) | 15,000 | 16,725 |
| Southwest Airlines Co. |
| 4.75%, 05/04/23 | 50,000 | 54,392 |
| 5.25%, 05/04/25 (a) | 130,000 | 150,905 |
| Union Pacific Corp. |
| 2.95%, 03/01/22 | 145,000 | 149,488 |
| 2.95%, 01/15/23 (a) | 25,000 | 26,139 |
| 3.50%, 06/08/23 (a) | 50,000 | 53,623 |
| 3.65%, 02/15/24 (a) | 15,000 | 16,329 |
| 3.15%, 03/01/24 (a) | 20,000 | 21,651 |
| 3.25%, 01/15/25 (a) | 15,000 | 16,452 |
| 3.75%, 07/15/25 (a) | 75,000 | 85,058 |
Schwab Fixed-Income ETFs | Annual Report
Schwab 1-5 Year Corporate Bond ETF
Portfolio Holdings as of December 31, 2020 (continued)
Security
Rate, Maturity Date | Face
Amount ($) | Value ($) |
| United Parcel Service, Inc. |
| 2.45%, 10/01/22 | 20,000 | 20,757 |
| 2.50%, 04/01/23 (a) | 25,000 | 26,186 |
| 3.90%, 04/01/25 (a) | 150,000 | 169,701 |
| | | 2,004,651 |
| | | 61,924,711 |
| |
| Utility 4.6% |
| Electric 4.3% |
| Alabama Power Co. |
| 3.55%, 12/01/23 | 20,000 | 21,794 |
| Ameren Corp. |
| 2.50%, 09/15/24 (a) | 25,000 | 26,665 |
| Ameren Illinois Co. |
| 3.25%, 03/01/25 (a) | 25,000 | 27,501 |
| American Electric Power Co., Inc. |
| 3.65%, 12/01/21 | 50,000 | 51,526 |
| 2.95%, 12/15/22 (a) | 50,000 | 52,219 |
| Appalachian Power Co. |
| 3.40%, 06/01/25 (a) | 50,000 | 55,402 |
| Arizona Public Service Co. |
| 3.15%, 05/15/25 (a) | 50,000 | 54,991 |
| Avangrid, Inc. |
| 3.15%, 12/01/24 (a) | 35,000 | 38,182 |
| 3.20%, 04/15/25 (a) | 50,000 | 54,817 |
| Baltimore Gas and Electric Co. |
| 3.35%, 07/01/23 (a) | 25,000 | 26,686 |
| Berkshire Hathaway Energy Co. |
| 3.75%, 11/15/23 (a) | 50,000 | 54,535 |
| 3.50%, 02/01/25 (a) | 30,000 | 33,107 |
| 4.05%, 04/15/25 (a)(c) | 100,000 | 113,601 |
| Black Hills Corp. |
| 4.25%, 11/30/23 (a) | 15,000 | 16,463 |
| CenterPoint Energy, Inc. |
| 2.50%, 09/01/22 (a) | 50,000 | 51,709 |
| 3.85%, 02/01/24 (a) | 75,000 | 82,162 |
| Consumers Energy Co. |
| 3.38%, 08/15/23 (a) | 13,000 | 13,929 |
| Delmarva Power & Light Co. |
| 3.50%, 11/15/23 (a) | 25,000 | 27,069 |
| Dominion Energy, Inc. |
| 2.75%, 09/15/22 (a) | 100,000 | 103,322 |
| 3.07%, 08/15/24 | 50,000 | 54,063 |
| 3.30%, 03/15/25 (a) | 100,000 | 110,320 |
| DTE Electric Co. |
| 3.38%, 03/01/25 (a) | 50,000 | 55,372 |
| DTE Energy Co. |
| 0.55%, 11/01/22 | 50,000 | 50,186 |
| 2.25%, 11/01/22 | 50,000 | 51,774 |
| 3.70%, 08/01/23 (a) | 35,000 | 37,840 |
| 3.85%, 12/01/23 (a) | 30,000 | 32,664 |
| 3.50%, 06/01/24 (a) | 30,000 | 32,612 |
| 1.05%, 06/01/25 (a) | 100,000 | 101,289 |
| Duke Energy Carolinas LLC |
| 3.05%, 03/15/23 (a) | 23,000 | 24,343 |
| Duke Energy Corp. |
| 2.40%, 08/15/22 (a) | 75,000 | 77,380 |
| 3.05%, 08/15/22 (a) | 50,000 | 51,807 |
| 3.75%, 04/15/24 (a) | 75,000 | 82,638 |
| 0.90%, 09/15/25 (a) | 50,000 | 50,185 |
Security
Rate, Maturity Date | Face
Amount ($) | Value ($) |
| Duke Energy Progress LLC |
| 2.80%, 05/15/22 (a) | 30,000 | 30,829 |
| 3.25%, 08/15/25 (a) | 50,000 | 55,800 |
| Edison International |
| 2.95%, 03/15/23 (a) | 25,000 | 26,046 |
| 3.55%, 11/15/24 (a) | 50,000 | 54,279 |
| 4.95%, 04/15/25 (a) | 40,000 | 45,631 |
| Entergy Arkansas LLC |
| 3.70%, 06/01/24 (a) | 17,000 | 18,675 |
| Entergy Corp. |
| 4.00%, 07/15/22 (a) | 113,000 | 118,528 |
| Entergy Louisiana LLC |
| 5.40%, 11/01/24 | 100,000 | 117,867 |
| Evergy, Inc. |
| 2.45%, 09/15/24 (a) | 100,000 | 106,094 |
| Eversource Energy |
| 2.75%, 03/15/22 (a) | 25,000 | 25,686 |
| 3.80%, 12/01/23 (a) | 50,000 | 54,700 |
| 2.90%, 10/01/24 (a) | 25,000 | 27,040 |
| 3.15%, 01/15/25 (a) | 25,000 | 27,266 |
| 0.80%, 08/15/25 (a) | 50,000 | 50,000 |
| Exelon Corp. |
| 3.50%, 06/01/22 (a) | 20,000 | 20,810 |
| Exelon Generation Co. LLC |
| 3.40%, 03/15/22 (a) | 15,000 | 15,495 |
| 4.25%, 06/15/22 (a) | 20,000 | 20,878 |
| 3.25%, 06/01/25 (a) | 50,000 | 54,613 |
| Florida Power & Light Co. |
| 2.75%, 06/01/23 (a) | 25,000 | 26,190 |
| 3.25%, 06/01/24 (a) | 30,000 | 32,361 |
| 2.85%, 04/01/25 (a) | 50,000 | 54,594 |
| Georgia Power Co. |
| 2.10%, 07/30/23 | 40,000 | 41,800 |
| IPALCO Enterprises, Inc. |
| 3.70%, 09/01/24 (a) | 10,000 | 10,929 |
| ITC Holdings Corp. |
| 3.65%, 06/15/24 (a) | 75,000 | 81,798 |
| National Rural Utilities Cooperative Finance Corp. |
| 1.75%, 01/21/22 | 50,000 | 50,823 |
| 3.40%, 11/15/23 (a) | 25,000 | 26,997 |
| 2.95%, 02/07/24 (a) | 100,000 | 107,167 |
| NextEra Energy Capital Holdings, Inc. |
| 2.90%, 04/01/22 | 100,000 | 103,214 |
| 2.80%, 01/15/23 (a) | 40,000 | 41,926 |
| 3.15%, 04/01/24 (a) | 65,000 | 70,329 |
| 2.75%, 05/01/25 (a) | 75,000 | 81,241 |
| Northern States Power Co. |
| 2.60%, 05/15/23 (a) | 100,000 | 104,175 |
| NSTAR Electric Co. |
| 2.38%, 10/15/22 (a) | 50,000 | 51,549 |
| Oncor Electric Delivery Co. LLC |
| 2.75%, 06/01/24 (a) | 100,000 | 107,589 |
| Pacific Gas & Electric Co. |
| 1.75%, 06/16/22 (a) | 150,000 | 150,450 |
| Pacific Gas and Electric Co. |
| 3.85%, 11/15/23 (a) | 50,000 | 53,285 |
| 3.45%, 07/01/25 | 75,000 | 81,406 |
| PacifiCorp |
| 3.60%, 04/01/24 (a) | 50,000 | 54,433 |
| PECO Energy Co. |
| 2.38%, 09/15/22 (a) | 200,000 | 205,980 |
Schwab Fixed-Income ETFs | Annual Report
Schwab 1-5 Year Corporate Bond ETF
Portfolio Holdings as of December 31, 2020 (continued)
Security
Rate, Maturity Date | Face
Amount ($) | Value ($) |
| PPL Capital Funding, Inc. |
| 4.20%, 06/15/22 (a) | 50,000 | 52,247 |
| 3.50%, 12/01/22 (a) | 50,000 | 52,521 |
| 3.40%, 06/01/23 (a) | 13,000 | 13,829 |
| PSEG Power LLC |
| 3.85%, 06/01/23 (a) | 50,000 | 53,798 |
| Public Service Electric & Gas Co. |
| 3.25%, 09/01/23 (a) | 50,000 | 53,749 |
| Public Service Enterprise Group, Inc. |
| 2.65%, 11/15/22 (a) | 50,000 | 52,154 |
| 0.80%, 08/15/25 (a) | 100,000 | 100,191 |
| Puget Energy, Inc. |
| 5.63%, 07/15/22 (a) | 50,000 | 53,193 |
| Sempra Energy |
| 3.55%, 06/15/24 (a) | 50,000 | 54,490 |
| Southern California Edison Co. |
| 3.40%, 06/01/23 (a) | 50,000 | 53,388 |
| 3.50%, 10/01/23 (a) | 25,000 | 26,865 |
| Southern Co. |
| 2.95%, 07/01/23 (a) | 100,000 | 106,053 |
| 4.00%, 01/15/51 (a)(b) | 25,000 | 26,447 |
| 5.50%, 03/15/57 (a)(b) | 25,000 | 25,974 |
| Virginia Electric & Power Co. |
| 2.75%, 03/15/23 (a) | 50,000 | 52,424 |
| WEC Energy Group, Inc. |
| 0.55%, 09/15/23 | 50,000 | 50,257 |
| Wisconsin Electric Power Co. |
| 2.05%, 12/15/24 (a) | 25,000 | 26,435 |
| Xcel Energy, Inc. |
| 0.50%, 10/15/23 (a) | 50,000 | 50,193 |
| | | 5,030,834 |
| Natural Gas 0.2% |
| CenterPoint Energy Resources Corp. |
| 3.55%, 04/01/23 (a) | 20,000 | 21,351 |
| NiSource, Inc. |
| 0.95%, 08/15/25 (a) | 50,000 | 50,384 |
| Sempra Energy |
| 2.88%, 10/01/22 (a) | 50,000 | 51,979 |
| 4.05%, 12/01/23 (a) | 75,000 | 82,155 |
| Southern Co. Gas Capital Corp. |
| 2.45%, 10/01/23 (a) | 85,000 | 89,326 |
| | | 295,195 |
| Utility Other 0.1% |
| American Water Capital Corp. |
| 3.85%, 03/01/24 (a) | 35,000 | 38,327 |
| 3.40%, 03/01/25 (a) | 35,000 | 38,769 |
| | | 77,096 |
| | | 5,403,125 |
| Total Corporates |
| (Cost $113,318,732) | | 116,489,451 |
| Security | Number
of Shares | Value ($) |
| Other Investment Company 1.2% of net assets |
| |
| Money Market Fund 1.2% |
| State Street Institutional U.S. Government Money Market Fund, Premier Class 0.03% (g) | 1,415,925 | 1,415,925 |
| Total Other Investment Company |
| (Cost $1,415,925) | | 1,415,925 |
| | Number of
Contracts | Notional
Amount
($) | Current Value/
Unrealized
Depreciation
($) |
| Futures Contracts | |
| Long | |
| 5 Year US Treasury Note (CBOT), expires 03/31/21 | 5 | 630,820 | (7) |
| (a) | The effective maturity may be shorter than the final maturity shown because of the possibility of interim principal payments and prepayments or as the result of embedded demand features (puts or calls). |
| (b) | Security converts to floating rate after the fixed-rate coupon period. |
| (c) | Securities exempt from registration under Rule 144A of the Securities Act of 1933, as amended. These securities may be resold in transactions exempt from registrations, normally to qualified institutional buyers. At the period end, the value of these amounted to $1,408,952 or 1.2% of net assets. |
| (d) | Issuer is affiliated with the fund’s investment adviser. |
| (e) | Variable-rate security. |
| (f) | Interest rate is subject to adjustments from time to time if a nationally recognized statistical rating organization downgrades (or subsequently upgrades) the debt rating assigned to the bond. |
| (g) | The rate shown is the 7-day yield. |
| | |
| CBOT — | Chicago Board of Trade |
| REIT — | Real Estate Investment Trust |
Schwab Fixed-Income ETFs | Annual Report
Schwab 1-5 Year Corporate Bond ETF
Portfolio Holdings as of December 31, 2020 (continued)
The fund owns corporate bonds of an affiliate, The Charles Schwab Corp., since those corporate bonds are included in its index. Below is a summary of investment activities involving The Charles Schwab Corp. notes owned by the fund during the period ended December 31, 2020:
| |
Value at
12/31/19 | Gross
Purchases* | Gross
Sales | Realized
Gains(Losses) | Net change
in unrealized
appreciation
(depreciation) |
Value at
12/31/20 | Face
amount at
12/31/20 | Interest
Income
Earned |
| Charles Schwab Corp., 2.65%, 01/25/23 | $— | $25,530 | $— | $— | $670 | $26,200 | 25,000 | $602 |
| Charles Schwab Corp., 3.55%, 02/01/24 | — | 10,596 | — | — | 320 | 10,916 | 10,000 | 294 |
| Total | $— | $36,126 | $— | $— | $990 | $37,116 | | $896 |
* Amount includes amortization of premiums and/or accretion of discounts.
The following is a summary of the inputs used to value the fund’s investments as of December 31, 2020 (see financial note 2(a) for additional information):
| Description | Quoted Prices in
Active Markets for
Identical Assets
(Level 1) | Other Significant
Observable Inputs
(Level 2) | Significant
Unobservable Inputs
(Level 3) | Total | |
| Assets | | | | | |
| Corporates 1 | $— | $116,489,451 | $— | $116,489,451 | |
| Other Investment Company1 | 1,415,925 | — | — | 1,415,925 | |
| Liabilities | | | | | |
| Futures Contracts2 | (7) | — | — | (7) | |
| Total | $1,415,918 | $116,489,451 | $— | $117,905,369 | |
| 1 | As categorized in Portfolio Holdings. |
| 2 | Futures contracts are valued at unrealized appreciation or depreciation. |
Fund investments in underlying mutual funds are classified as Level 1, without consideration to the classification level of the investments held by the underlying mutual funds, which could be Level 1, Level 2 or Level 3.
Schwab Fixed-Income ETFs | Annual Report
Schwab 1-5 Year Corporate Bond ETF
Statement of Assets and Liabilities
As of December 31, 2020
| Assets |
| Investments in affiliated issuer, at value (cost $36,126) | | $37,116 |
| Investments in unaffiliated issuers, at value (cost $114,698,531) | | 117,868,260 |
| Deposit with broker for futures contracts | | 20,423 |
| Receivables: | | |
| Interest | | 903,819 |
| Foreign tax reclaims | | 724 |
| Dividends | + | 35 |
| Total assets | | 118,830,377 |
| Liabilities |
| Payables: | | |
| Investments bought | | 679,596 |
| Management fees | | 4,916 |
| Variation margin on futures contracts | + | 104 |
| Total liabilities | | 684,616 |
| Net Assets |
| Total assets | | 118,830,377 |
| Total liabilities | – | 684,616 |
| Net assets | | $118,145,761 |
| Net Assets by Source | | |
| Capital received from investors | | 114,971,630 |
| Total distributable earnings | | 3,174,131 |
| Net Asset Value (NAV) |
| Net Assets | ÷ | Shares
Outstanding | = | NAV |
| $118,145,761 | | 2,300,000 | | $51.37 |
| | | | | |
Schwab Fixed-Income ETFs | Annual Report
Schwab 1-5 Year Corporate Bond ETF
Statement of Operations
For the period January 1, 2020 through December 31, 2020
| Investment Income |
| Interest received from affiliated issuer | | $896 |
| Interest received from unaffiliated issuers | | 1,717,952 |
| Dividends received from unaffiliated issuers | + | 1,766 |
| Total investment income | | 1,720,614 |
| Expenses |
| Management fees | | 48,142 |
| Total expenses | – | 48,142 |
| Net investment income | | 1,672,472 |
| Realized and Unrealized Gains (Losses) |
| Net realized gains on unaffiliated investments | | 1,192,324 |
| Net realized gains on in-kind redemptions on unaffiliated investments | | 57,215 |
| Net realized losses on futures contracts | + | (11,444) |
| Net realized gains | | 1,238,095 |
| Net change in unrealized appreciation (depreciation) on affiliated issuer | | 990 |
| Net change in unrealized appreciation (depreciation) on unaffiliated investments | | 3,134,668 |
| Net change in unrealized appreciation (depreciation) on futures contracts | + | (7) |
| Net change in unrealized appreciation (depreciation) | + | 3,135,651 |
| Net realized and unrealized gains | | 4,373,746 |
| Increase in net assets resulting from operations | | $6,046,218 |
Schwab Fixed-Income ETFs | Annual Report
Schwab 1-5 Year Corporate Bond ETF
Statement of Changes in Net Assets
For the current and prior report periods
| Operations | |
| | 1/1/20-12/31/20 | 10/10/19*-12/31/19 |
| Net investment income | | $1,672,472 | $137,147 |
| Net realized gains (losses) | | 1,238,095 | (3,498) |
| Net change in unrealized appreciation (depreciation) | + | 3,135,651 | 35,061 |
| Increase in net assets resulting from operations | | 6,046,218 | 168,710 |
| Distributions to Shareholders | |
| Total distributions | | ($2,580,855) | ($135,820) |
| Transactions in Fund Shares | | | |
| | | 1/1/20-12/31/20 | 10/10/19*-12/31/19 |
| | | SHARES | VALUE | SHARES | VALUE |
| Shares sold | | 2,950,000 | $149,197,325 | 700,000 | $34,996,345 |
| Shares redeemed | + | (1,350,000) | (69,546,162) | — | — |
| Net transactions in fund shares | | 1,600,000 | $79,651,163 | 700,000 | $34,996,345 |
| Shares Outstanding and Net Assets | | | |
| | | 1/1/20-12/31/20 | 10/10/19*-12/31/19 |
| | | SHARES | NET ASSETS | SHARES | NET ASSETS |
| Beginning of period | | 700,000 | $35,029,235 | — | $— |
| Total increase | + | 1,600,000 | 83,116,526 | 700,000 | 35,029,235 |
| End of period | | 2,300,000 | $118,145,761 | 700,000 | $35,029,235 |
| * | Commencement of operations. |
Schwab Fixed-Income ETFs | Annual Report
Schwab 5-10 Year Corporate Bond ETF
Financial Statements
Financial Highlights
| | 1/1/20–
12/31/20 | 10/10/19 1–
12/31/19 | | | | |
| Per-Share Data |
| Net asset value at beginning of period | $50.07 | $50.00 | | | | |
| Income (loss) from investment operations: | | | | | | |
| Net investment income (loss)2 | 1.26 | 0.29 | | | | |
| Net realized and unrealized gains (losses) | 3.60 | 0.04 | | | | |
| Total from investment operations | 4.86 | 0.33 | | | | |
| Less distributions: | | | | | | |
| Distributions from net investment income | (1.24) | (0.26) | | | | |
| Net asset value at end of period | $53.69 | $50.07 | | | | |
| Total return | 9.83% | 0.67% 3 | | | | |
| Ratios/Supplemental Data |
| Ratios to average net assets: | | | | | | |
| Total expenses | 0.05% | 0.06% 4,5 | | | | |
| Net investment income (loss) | 2.43% | 2.61% 4 | | | | |
| Portfolio turnover rate6 | 36% | 8% 3 | | | | |
| Net assets, end of period (x 1,000) | $190,584 | $110,151 | | | | |
| |
1
Commencement of operations.
2
Calculated based on the average shares outstanding during the period.
3
Not annualized.
4
Annualized.
5
Effective December 13, 2019, the annual operating expense ratio was reduced to 0.05%. The ratio presented for the period ended 12/31/19 is a blended ratio.
6
Portfolio turnover rate excludes securities received or delivered from processing of in-kind creations or redemptions.
Schwab Fixed-Income ETFs | Annual Report
Schwab 5-10 Year Corporate Bond ETF
Portfolio Holdings as of December 31, 2020
This section shows all the securities in the fund’s portfolio and their values as of the report date.
The fund files its complete schedule of portfolio holdings with the U.S. Securities and Exchange Commission (SEC) for the first and third quarters of each fiscal year on Form N-PORT Part F. The fund’s Form N-PORT Part F is available on the SEC’s website at www.sec.gov and on the fund’s website at www.schwabfunds.com/schwabetfs_prospectus. The fund also makes available its complete schedule of portfolio holdings on a daily basis on the fund’s website.
For fixed rate obligations, the rate shown is the interest rate (the rate established when the obligation was issued). For variable rate obligations, the rate shown is the rate as of the report date based on each security’s rate reset date. The reference rate and spread used is shown parenthetically in the security description if available; if not the reference rate is described in a footnote. The maturity date shown for all the securities is the final legal maturity.
Security
Rate, Maturity Date | Face
Amount ($) | Value ($) |
| Corporates 98.1% of net assets |
| |
| Financial Institutions 33.8% |
| Banking 22.8% |
| American Express Co. |
| 3.13%, 05/20/26 (a) | 100,000 | 112,558 |
| American Express Credit Corp. |
| 3.30%, 05/03/27 (a) | 200,000 | 227,632 |
| Banco Santander S.A. |
| 4.25%, 04/11/27 | 200,000 | 232,062 |
| 3.80%, 02/23/28 | 200,000 | 227,044 |
| 3.49%, 05/28/30 | 200,000 | 224,724 |
| Bank of America Corp. |
| 4.45%, 03/03/26 | 250,000 | 291,772 |
| 3.50%, 04/19/26 | 275,000 | 311,987 |
| 4.25%, 10/22/26 | 25,000 | 29,285 |
| 3.56%, 04/23/27 (a)(b) | 200,000 | 226,026 |
| 3.25%, 10/21/27 (a) | 250,000 | 280,375 |
| 4.18%, 11/25/27 (a) | 250,000 | 290,552 |
| 3.82%, 01/20/28 (a)(b) | 150,000 | 172,392 |
| 3.71%, 04/24/28 (a)(b) | 175,000 | 199,834 |
| 3.59%, 07/21/28 (a)(b) | 200,000 | 227,608 |
| 3.42%, 12/20/28 (a)(b) | 625,000 | 706,406 |
| 3.97%, 03/05/29 (a)(b) | 275,000 | 321,065 |
| 4.27%, 07/23/29 (a)(b) | 200,000 | 238,412 |
| 3.97%, 02/07/30 (a)(b) | 355,000 | 418,946 |
| 3.19%, 07/23/30 (a)(b) | 220,000 | 246,730 |
| 2.88%, 10/22/30 (a)(b) | 175,000 | 191,762 |
| 2.50%, 02/13/31 (a)(b) | 250,000 | 265,635 |
| 2.59%, 04/29/31 (a)(b) | 225,000 | 241,144 |
| 1.90%, 07/23/31 (a)(b) | 300,000 | 303,648 |
| 1.92%, 10/24/31 (a)(b) | 250,000 | 253,483 |
| Bank of Montreal |
| 3.80%, 12/15/32 (a)(b) | 100,000 | 113,303 |
| Bank of New York Mellon Corp. |
| 2.80%, 05/04/26 (a) | 125,000 | 138,329 |
| 2.45%, 08/17/26 (a) | 75,000 | 81,745 |
| 3.40%, 01/29/28 (a) | 100,000 | 114,769 |
| 3.44%, 02/07/28 (a)(b) | 150,000 | 172,029 |
| 3.00%, 10/30/28 (a) | 100,000 | 113,677 |
| 3.30%, 08/23/29 (a) | 100,000 | 114,469 |
| Bank of Nova Scotia |
| 4.50%, 12/16/25 | 75,000 | 87,581 |
| 2.70%, 08/03/26 | 150,000 | 165,743 |
| Barclays PLC |
| 5.20%, 05/12/26 | 400,000 | 467,464 |
| 4.34%, 01/10/28 (a) | 200,000 | 230,142 |
| 4.84%, 05/09/28 (a) | 200,000 | 231,316 |
| 4.97%, 05/16/29 (a)(b) | 225,000 | 270,952 |
| 5.09%, 06/20/30 (a)(b) | 200,000 | 240,608 |
Security
Rate, Maturity Date | Face
Amount ($) | Value ($) |
| Capital One Financial Corp. |
| 3.75%, 07/28/26 (a) | 132,000 | 149,568 |
| 3.75%, 03/09/27 (a) | 100,000 | 114,695 |
| 3.65%, 05/11/27 (a) | 150,000 | 172,215 |
| 3.80%, 01/31/28 (a) | 100,000 | 115,641 |
| Citigroup, Inc. |
| 3.70%, 01/12/26 | 250,000 | 284,687 |
| 4.60%, 03/09/26 | 200,000 | 234,850 |
| 3.40%, 05/01/26 | 410,000 | 461,935 |
| 3.20%, 10/21/26 (a) | 250,000 | 279,562 |
| 4.30%, 11/20/26 | 150,000 | 175,254 |
| 4.45%, 09/29/27 | 275,000 | 325,182 |
| 3.89%, 01/10/28 (a)(b) | 350,000 | 402,661 |
| 3.67%, 07/24/28 (a)(b) | 295,000 | 336,138 |
| 4.13%, 07/25/28 | 170,000 | 199,014 |
| 3.52%, 10/27/28 (a)(b) | 155,000 | 175,314 |
| 4.08%, 04/23/29 (a)(b) | 150,000 | 176,397 |
| 3.98%, 03/20/30 (a)(b) | 175,000 | 205,949 |
| 2.98%, 11/05/30 (a)(b) | 150,000 | 165,434 |
| 2.67%, 01/29/31 (a)(b) | 300,000 | 322,161 |
| 4.41%, 03/31/31 (a)(b) | 350,000 | 424,760 |
| 2.57%, 06/03/31 (a)(b) | 100,000 | 106,644 |
| Citizens Financial Group, Inc. |
| 2.85%, 07/27/26 (a) | 100,000 | 111,192 |
| 2.50%, 02/06/30 (a) | 50,000 | 53,677 |
| 3.25%, 04/30/30 (a) | 50,000 | 56,556 |
| Comerica, Inc. |
| 4.00%, 02/01/29 (a) | 100,000 | 119,804 |
| Cooperatieve Rabobank UA |
| 3.75%, 07/21/26 | 250,000 | 282,972 |
| Credit Suisse Group AG |
| 4.55%, 04/17/26 | 250,000 | 294,360 |
| Deutsche Bank AG |
| 4.10%, 01/13/26 | 50,000 | 55,570 |
| 4.10%, 01/13/26 | 200,000 | 223,438 |
| Discover Bank |
| 2.70%, 02/06/30 (a) | 250,000 | 266,810 |
| Discover Financial Services |
| 4.10%, 02/09/27 (a) | 125,000 | 144,706 |
| Fifth Third Bancorp |
| 2.55%, 05/05/27 (a) | 50,000 | 54,468 |
| 3.95%, 03/14/28 (a) | 150,000 | 177,677 |
| First Horizon Bank |
| 5.75%, 05/01/30 (a) | 250,000 | 294,017 |
| Goldman Sachs Group, Inc. |
| 3.75%, 02/25/26 (a) | 200,000 | 227,578 |
| 3.50%, 11/16/26 (a) | 270,000 | 303,356 |
| 3.85%, 01/26/27 (a) | 315,000 | 360,158 |
| 3.69%, 06/05/28 (a)(b) | 225,000 | 259,270 |
| 3.81%, 04/23/29 (a)(b) | 190,000 | 220,408 |
| 4.22%, 05/01/29 (a)(b) | 325,000 | 385,177 |
| 2.60%, 02/07/30 (a) | 150,000 | 161,550 |
| 3.80%, 03/15/30 (a) | 250,000 | 294,517 |
Schwab Fixed-Income ETFs | Annual Report
Schwab 5-10 Year Corporate Bond ETF
Portfolio Holdings as of December 31, 2020 (continued)
Security
Rate, Maturity Date | Face
Amount ($) | Value ($) |
| HSBC Holdings PLC |
| 4.30%, 03/08/26 | 200,000 | 231,118 |
| 3.90%, 05/25/26 | 200,000 | 228,438 |
| 4.38%, 11/23/26 | 250,000 | 288,827 |
| 1.59%, 05/24/27 (a)(b) | 200,000 | 203,388 |
| 4.04%, 03/13/28 (a)(b) | 225,000 | 256,943 |
| 4.58%, 06/19/29 (a)(b) | 200,000 | 236,858 |
| 4.95%, 03/31/30 | 200,000 | 250,428 |
| 3.97%, 05/22/30 (a)(b) | 225,000 | 260,271 |
| 2.85%, 06/04/31 (a)(b) | 200,000 | 215,068 |
| 2.36%, 08/18/31 (a)(b) | 200,000 | 206,996 |
| Huntington Bancshares, Inc. |
| 2.55%, 02/04/30 (a) | 175,000 | 188,393 |
| ING Groep N.V. |
| 4.55%, 10/02/28 | 250,000 | 304,732 |
| JPMorgan Chase & Co. |
| 3.30%, 04/01/26 (a) | 325,000 | 364,101 |
| 3.20%, 06/15/26 (a) | 162,000 | 181,401 |
| 2.95%, 10/01/26 (a) | 359,000 | 399,172 |
| 4.13%, 12/15/26 | 340,000 | 397,657 |
| 3.96%, 01/29/27 (a)(b) | 150,000 | 172,722 |
| 4.25%, 10/01/27 | 150,000 | 178,032 |
| 3.63%, 12/01/27 (a) | 100,000 | 113,760 |
| 3.78%, 02/01/28 (a)(b) | 185,000 | 212,650 |
| 3.54%, 05/01/28 (a)(b) | 100,000 | 114,283 |
| 2.18%, 06/01/28 (a)(b) | 100,000 | 106,269 |
| 3.51%, 01/23/29 (a)(b) | 285,000 | 325,025 |
| 4.01%, 04/23/29 (a)(b) | 275,000 | 323,315 |
| 4.20%, 07/23/29 (a)(b) | 195,000 | 232,723 |
| 4.45%, 12/05/29 (a)(b) | 150,000 | 183,905 |
| 3.70%, 05/06/30 (a)(b) | 200,000 | 232,270 |
| 2.74%, 10/15/30 (a)(b) | 255,000 | 277,784 |
| 4.49%, 03/24/31 (a)(b) | 300,000 | 370,359 |
| 2.52%, 04/22/31 (a)(b) | 225,000 | 241,830 |
| 2.96%, 05/13/31 (a)(b) | 340,000 | 372,572 |
| 1.76%, 11/19/31 (a)(b) | 150,000 | 151,437 |
| KeyBank NA |
| 3.90%, 04/13/29 | 250,000 | 290,057 |
| KeyCorp |
| 2.25%, 04/06/27 | 100,000 | 107,286 |
| Lloyds Banking Group PLC |
| 3.75%, 01/11/27 | 200,000 | 227,248 |
| 4.38%, 03/22/28 | 250,000 | 297,167 |
| 4.55%, 08/16/28 | 200,000 | 241,718 |
| Mitsubishi UFJ Financial Group, Inc. |
| 3.85%, 03/01/26 | 200,000 | 231,246 |
| 3.68%, 02/22/27 | 200,000 | 227,338 |
| 3.29%, 07/25/27 | 100,000 | 113,634 |
| 3.96%, 03/02/28 | 200,000 | 235,736 |
| 3.74%, 03/07/29 | 100,000 | 117,622 |
| 3.20%, 07/18/29 | 200,000 | 225,684 |
| 2.05%, 07/17/30 | 200,000 | 209,010 |
| Mizuho Financial Group, Inc. |
| 4.02%, 03/05/28 | 200,000 | 234,642 |
| 4.25%, 09/11/29 (a)(b) | 200,000 | 238,202 |
| 2.59%, 05/25/31 (a)(b) | 200,000 | 213,838 |
| 2.20%, 07/10/31 (a)(b) | 200,000 | 207,656 |
| Morgan Stanley |
| 3.88%, 01/27/26 | 150,000 | 172,238 |
| 3.13%, 07/27/26 | 550,000 | 615,824 |
| 6.25%, 08/09/26 | 100,000 | 127,735 |
| 4.35%, 09/08/26 | 100,000 | 117,834 |
| 3.63%, 01/20/27 | 385,000 | 442,284 |
| 3.95%, 04/23/27 | 308,000 | 356,676 |
| 3.59%, 07/22/28 (a)(b) | 100,000 | 114,250 |
| 3.77%, 01/24/29 (a)(b) | 308,000 | 357,397 |
Security
Rate, Maturity Date | Face
Amount ($) | Value ($) |
| 4.43%, 01/23/30 (a)(b) | 130,000 | 158,673 |
| 2.70%, 01/22/31 (a)(b) | 340,000 | 370,042 |
| 3.62%, 04/01/31 (a)(b) | 250,000 | 291,042 |
| 1.79%, 02/13/32 (a)(b) | 50,000 | 50,452 |
| National Australia Bank Ltd. |
| 2.50%, 07/12/26 | 250,000 | 272,767 |
| Natwest Group PLC |
| 3.07%, 05/22/28 (a)(b) | 200,000 | 217,652 |
| 4.89%, 05/18/29 (a)(b) | 225,000 | 270,882 |
| 5.08%, 01/27/30 (a)(b) | 400,000 | 492,820 |
| Northern Trust Corp. |
| 3.65%, 08/03/28 (a) | 75,000 | 88,286 |
| 3.15%, 05/03/29 (a) | 50,000 | 56,877 |
| 1.95%, 05/01/30 (a) | 50,000 | 52,262 |
| PNC Bank NA |
| 3.25%, 01/22/28 (a) | 250,000 | 284,620 |
| 2.70%, 10/22/29 | 250,000 | 274,670 |
| PNC Financial Services Group, Inc. |
| 2.60%, 07/23/26 (a) | 50,000 | 55,023 |
| 3.45%, 04/23/29 (a) | 100,000 | 115,774 |
| 2.55%, 01/22/30 (a) | 190,000 | 208,533 |
| Royal Bank of Canada |
| 4.65%, 01/27/26 | 100,000 | 118,164 |
| Santander Holdings USA, Inc. |
| 3.24%, 10/05/26 (a)(c) | 200,000 | 217,800 |
| 4.40%, 07/13/27 (a) | 135,000 | 154,027 |
| State Street Corp. |
| 2.65%, 05/19/26 | 100,000 | 110,183 |
| 2.40%, 01/24/30 | 125,000 | 137,151 |
| 3.03%, 11/01/34 (a)(b) | 100,000 | 109,719 |
| Sumitomo Mitsui Financial Group, Inc. |
| 3.78%, 03/09/26 | 100,000 | 114,092 |
| 2.63%, 07/14/26 | 200,000 | 217,634 |
| 3.01%, 10/19/26 | 100,000 | 111,060 |
| 3.36%, 07/12/27 | 100,000 | 113,409 |
| 3.35%, 10/18/27 | 75,000 | 84,467 |
| 3.54%, 01/17/28 | 75,000 | 85,315 |
| 4.31%, 10/16/28 | 100,000 | 119,861 |
| 3.04%, 07/16/29 | 450,000 | 500,328 |
| 3.20%, 09/17/29 | 100,000 | 109,528 |
| 2.75%, 01/15/30 | 200,000 | 218,738 |
| 2.13%, 07/08/30 | 200,000 | 208,946 |
| 2.14%, 09/23/30 | 100,000 | 100,709 |
| SVB Financial Group |
| 3.13%, 06/05/30 (a) | 50,000 | 56,429 |
| Synchrony Financial |
| 3.95%, 12/01/27 (a) | 100,000 | 112,662 |
| 5.15%, 03/19/29 (a) | 110,000 | 133,408 |
| Toronto-Dominion Bank |
| 3.63%, 09/15/31 (a)(b) | 50,000 | 56,673 |
| Truist Bank |
| 2.25%, 03/11/30 (a) | 250,000 | 262,855 |
| Truist Financial Corp. |
| 1.13%, 08/03/27 (a) | 250,000 | 251,883 |
| 3.88%, 03/19/29 (a) | 50,000 | 58,887 |
| US Bancorp |
| 2.38%, 07/22/26 (a) | 150,000 | 163,173 |
| 3.15%, 04/27/27 (a) | 170,000 | 192,187 |
| 3.00%, 07/30/29 (a) | 100,000 | 111,977 |
| 1.38%, 07/22/30 (a) | 150,000 | 150,399 |
| Wells Fargo & Co. |
| 3.00%, 04/22/26 | 375,000 | 413,625 |
| 4.10%, 06/03/26 | 200,000 | 229,744 |
| 7.57%, 08/01/26 | 25,000 | 32,786 |
Schwab Fixed-Income ETFs | Annual Report
Schwab 5-10 Year Corporate Bond ETF
Portfolio Holdings as of December 31, 2020 (continued)
Security
Rate, Maturity Date | Face
Amount ($) | Value ($) |
| 3.00%, 10/23/26 | 500,000 | 554,685 |
| 3.20%, 06/17/27 (a)(b) | 200,000 | 222,082 |
| 4.30%, 07/22/27 | 250,000 | 293,847 |
| 3.58%, 05/22/28 (a)(b) | 200,000 | 227,066 |
| 2.39%, 06/02/28 (a)(b) | 250,000 | 266,517 |
| 4.15%, 01/24/29 (a) | 152,000 | 180,462 |
| 2.88%, 10/30/30 (a)(b) | 300,000 | 327,615 |
| 2.57%, 02/11/31 (a)(b) | 300,000 | 319,569 |
| 4.48%, 04/04/31 (a)(b) | 200,000 | 244,854 |
| Westpac Banking Corp. |
| 2.85%, 05/13/26 | 150,000 | 166,751 |
| 2.70%, 08/19/26 | 100,000 | 110,656 |
| 3.35%, 03/08/27 | 100,000 | 113,719 |
| 3.40%, 01/25/28 | 50,000 | 57,714 |
| 2.65%, 01/16/30 | 70,000 | 78,532 |
| 4.32%, 11/23/31 (a)(b) | 100,000 | 114,138 |
| 4.11%, 07/24/34 (a)(b) | 225,000 | 256,028 |
| | | 43,356,009 |
| Brokerage/Asset Managers/Exchanges 1.5% |
| Affiliated Managers Group, Inc. |
| 3.30%, 06/15/30 (a) | 50,000 | 54,547 |
| Ameriprise Financial, Inc. |
| 2.88%, 09/15/26 (a) | 50,000 | 55,540 |
| BGC Partners, Inc. |
| 4.38%, 12/15/25 (a) | 150,000 | 158,733 |
| BlackRock, Inc. |
| 3.20%, 03/15/27 | 50,000 | 56,619 |
| 3.25%, 04/30/29 (a) | 100,000 | 115,509 |
| 2.40%, 04/30/30 (a) | 50,000 | 54,743 |
| Brookfield Finance, Inc. |
| 4.25%, 06/02/26 (a) | 25,000 | 29,182 |
| 3.90%, 01/25/28 (a) | 40,000 | 46,315 |
| 4.85%, 03/29/29 (a) | 75,000 | 92,092 |
| 4.35%, 04/15/30 (a) | 110,000 | 132,203 |
| Cboe Global Markets, Inc. |
| 3.65%, 01/12/27 (a) | 50,000 | 57,331 |
| Charles Schwab Corp. |
| 3.20%, 03/02/27 (a)(d) | 50,000 | 56,330 |
| 3.25%, 05/22/29 (a)(d) | 30,000 | 34,449 |
| 4.63%, 03/22/30 (a)(d) | 150,000 | 189,661 |
| CME Group, Inc. |
| 3.75%, 06/15/28 (a) | 50,000 | 59,441 |
| E*TRADE Financial Corp. |
| 3.80%, 08/24/27 (a) | 75,000 | 86,582 |
| Eaton Vance Corp. |
| 3.50%, 04/06/27 (a) | 25,000 | 27,894 |
| Franklin Resources, Inc. |
| 1.60%, 10/30/30 (a) | 100,000 | 99,628 |
| Intercontinental Exchange, Inc. |
| 3.10%, 09/15/27 (a) | 50,000 | 56,030 |
| 3.75%, 09/21/28 (a) | 66,000 | 77,262 |
| 2.10%, 06/15/30 (a) | 100,000 | 104,750 |
| Invesco Finance PLC |
| 3.75%, 01/15/26 | 50,000 | 56,596 |
| Jefferies Group LLC/Jefferies Group Capital Finance, Inc. |
| 4.85%, 01/15/27 | 100,000 | 118,186 |
| 4.15%, 01/23/30 | 80,000 | 93,776 |
| Lazard Group LLC |
| 3.63%, 03/01/27 (a) | 25,000 | 27,780 |
| 4.50%, 09/19/28 (a) | 100,000 | 118,977 |
| 4.38%, 03/11/29 (a) | 10,000 | 11,788 |
| Legg Mason, Inc. |
| 4.75%, 03/15/26 | 75,000 | 89,191 |
Security
Rate, Maturity Date | Face
Amount ($) | Value ($) |
| Nasdaq, Inc. |
| 3.85%, 06/30/26 (a) | 50,000 | 57,472 |
| Nomura Holdings, Inc. |
| 2.68%, 07/16/30 | 400,000 | 424,548 |
| Raymond James Financial, Inc. |
| 4.65%, 04/01/30 (a) | 100,000 | 123,304 |
| TD Ameritrade Holding Corp. |
| 3.30%, 04/01/27 (a) | 50,000 | 56,451 |
| 2.75%, 10/01/29 (a) | 25,000 | 27,605 |
| | | 2,850,515 |
| Finance Companies 0.9% |
| AerCap Ireland Capital DAC/AerCap Global Aviation Trust |
| 4.45%, 04/03/26 (a) | 300,000 | 337,779 |
| 3.88%, 01/23/28 (a) | 150,000 | 161,541 |
| Air Lease Corp. |
| 3.75%, 06/01/26 (a) | 50,000 | 55,257 |
| 3.63%, 04/01/27 (a) | 100,000 | 108,393 |
| 3.63%, 12/01/27 (a) | 50,000 | 55,128 |
| 3.25%, 10/01/29 (a) | 35,000 | 36,980 |
| 3.00%, 02/01/30 (a) | 150,000 | 154,375 |
| Ares Capital Corp. |
| 3.88%, 01/15/26 (a) | 100,000 | 108,500 |
| GATX Corp. |
| 3.25%, 09/15/26 (a) | 50,000 | 55,531 |
| 3.85%, 03/30/27 (a) | 50,000 | 56,608 |
| 3.50%, 03/15/28 (a) | 25,000 | 28,118 |
| 4.70%, 04/01/29 (a) | 75,000 | 91,532 |
| GE Capital Funding LLC |
| 4.40%, 05/15/30 (a)(c) | 250,000 | 294,822 |
| Owl Rock Capital Corp. |
| 4.25%, 01/15/26 (a) | 50,000 | 52,713 |
| 3.40%, 07/15/26 (a) | 100,000 | 101,370 |
| | | 1,698,647 |
| Financial Other 0.0% |
| ORIX Corp. |
| 3.70%, 07/18/27 | 35,000 | 40,066 |
| Insurance 4.1% |
| Aflac, Inc. |
| 2.88%, 10/15/26 (a) | 50,000 | 55,401 |
| 3.60%, 04/01/30 (a) | 100,000 | 117,826 |
| Alleghany Corp. |
| 3.63%, 05/15/30 (a) | 100,000 | 113,638 |
| American Equity Investment Life Holding Co. |
| 5.00%, 06/15/27 (a) | 50,000 | 56,565 |
| American Financial Group, Inc. |
| 3.50%, 08/15/26 (a) | 100,000 | 110,272 |
| American International Group, Inc. |
| 4.20%, 04/01/28 (a) | 50,000 | 59,338 |
| 4.25%, 03/15/29 (a) | 200,000 | 240,414 |
| 3.40%, 06/30/30 (a) | 50,000 | 57,338 |
| 5.75%, 04/01/48 (a)(b) | 50,000 | 57,735 |
| Anthem, Inc. |
| 3.65%, 12/01/27 (a) | 181,000 | 208,881 |
| 4.10%, 03/01/28 (a) | 50,000 | 59,250 |
| 2.88%, 09/15/29 (a) | 60,000 | 66,555 |
| 2.25%, 05/15/30 (a) | 150,000 | 158,623 |
| Aon Corp. |
| 3.75%, 05/02/29 (a) | 100,000 | 116,977 |
| 2.80%, 05/15/30 (a) | 150,000 | 164,361 |
Schwab Fixed-Income ETFs | Annual Report
Schwab 5-10 Year Corporate Bond ETF
Portfolio Holdings as of December 31, 2020 (continued)
Security
Rate, Maturity Date | Face
Amount ($) | Value ($) |
| Arch Capital Finance LLC |
| 4.01%, 12/15/26 (a) | 50,000 | 58,118 |
| Assurant, Inc. |
| 4.90%, 03/27/28 (a) | 60,000 | 69,891 |
| Athene Holding Ltd. |
| 6.15%, 04/03/30 (a) | 100,000 | 124,181 |
| AXIS Specialty Finance LLC |
| 3.90%, 07/15/29 (a) | 50,000 | 55,972 |
| AXIS Specialty Finance PLC |
| 4.00%, 12/06/27 (a) | 100,000 | 111,803 |
| Berkshire Hathaway Finance Corp. |
| 1.85%, 03/12/30 (a) | 250,000 | 264,027 |
| 1.45%, 10/15/30 (a) | 50,000 | 50,745 |
| Berkshire Hathaway, Inc. |
| 3.13%, 03/15/26 (a) | 100,000 | 111,939 |
| Brighthouse Financial, Inc. |
| 3.70%, 06/22/27 (a) | 125,000 | 136,005 |
| 5.63%, 05/15/30 (a) | 50,000 | 61,801 |
| Brown & Brown, Inc. |
| 4.50%, 03/15/29 (a) | 35,000 | 41,516 |
| Chubb INA Holdings, Inc. |
| 3.35%, 05/03/26 (a) | 150,000 | 169,362 |
| 1.38%, 09/15/30 (a) | 100,000 | 99,887 |
| CNA Financial Corp. |
| 4.50%, 03/01/26 (a) | 25,000 | 29,352 |
| 3.90%, 05/01/29 (a) | 50,000 | 59,556 |
| 2.05%, 08/15/30 (a) | 50,000 | 51,645 |
| CNO Financial Group, Inc. |
| 5.25%, 05/30/29 (a) | 75,000 | 90,774 |
| Enstar Group Ltd. |
| 4.95%, 06/01/29 (a) | 50,000 | 57,459 |
| Equitable Holdings, Inc. |
| 4.35%, 04/20/28 (a) | 150,000 | 177,493 |
| Fairfax Financial Holdings Ltd. |
| 4.85%, 04/17/28 (a) | 50,000 | 56,659 |
| 4.63%, 04/29/30 (a) | 50,000 | 56,326 |
| Fidelity National Financial, Inc. |
| 3.40%, 06/15/30 (a) | 100,000 | 110,718 |
| First American Financial Corp. |
| 4.00%, 05/15/30 (a) | 75,000 | 86,200 |
| Globe Life, Inc. |
| 4.55%, 09/15/28 (a) | 50,000 | 60,114 |
| Hanover Insurance Group, Inc. |
| 2.50%, 09/01/30 (a) | 50,000 | 52,210 |
| Hartford Financial Services Group, Inc. |
| 2.80%, 08/19/29 (a) | 100,000 | 109,332 |
| Humana, Inc. |
| 3.95%, 03/15/27 (a) | 50,000 | 57,634 |
| 3.13%, 08/15/29 (a) | 150,000 | 165,912 |
| 4.88%, 04/01/30 (a) | 50,000 | 62,651 |
| Kemper Corp. |
| 2.40%, 09/30/30 (a) | 50,000 | 50,956 |
| Lincoln National Corp. |
| 3.80%, 03/01/28 (a) | 75,000 | 86,925 |
| 3.05%, 01/15/30 (a) | 100,000 | 111,760 |
| Loews Corp. |
| 3.20%, 05/15/30 (a) | 50,000 | 56,863 |
| Manulife Financial Corp. |
| 4.15%, 03/04/26 | 95,000 | 110,917 |
| 2.48%, 05/19/27 (a) | 50,000 | 54,177 |
| 4.06%, 02/24/32 (a)(b) | 100,000 | 109,333 |
Security
Rate, Maturity Date | Face
Amount ($) | Value ($) |
| Markel Corp. |
| 3.50%, 11/01/27 (a) | 75,000 | 84,071 |
| Marsh & McLennan Cos., Inc. |
| 3.75%, 03/14/26 (a) | 50,000 | 56,952 |
| 4.38%, 03/15/29 (a) | 100,000 | 122,050 |
| 2.25%, 11/15/30 (a) | 35,000 | 37,128 |
| Mercury General Corp. |
| 4.40%, 03/15/27 (a) | 25,000 | 27,826 |
| MetLife, Inc. |
| 4.55%, 03/23/30 (a) | 100,000 | 125,292 |
| Old Republic International Corp. |
| 3.88%, 08/26/26 (a) | 50,000 | 57,527 |
| PartnerRe Finance B LLC |
| 3.70%, 07/02/29 (a) | 45,000 | 51,897 |
| Principal Financial Group, Inc. |
| 3.70%, 05/15/29 (a) | 65,000 | 76,359 |
| 2.13%, 06/15/30 (a) | 50,000 | 52,407 |
| Progressive Corp. |
| 2.45%, 01/15/27 | 100,000 | 108,182 |
| 3.20%, 03/26/30 (a) | 100,000 | 115,609 |
| Prudential Financial, Inc. |
| 1.50%, 03/10/26 (a) | 200,000 | 207,980 |
| 3.88%, 03/27/28 (a) | 125,000 | 148,059 |
| 2.10%, 03/10/30 (a) | 50,000 | 53,081 |
| 4.50%, 09/15/47 (a)(b) | 100,000 | 110,123 |
| 3.70%, 10/01/50 (a)(b) | 50,000 | 52,896 |
| Prudential PLC |
| 3.13%, 04/14/30 | 100,000 | 113,737 |
| Reinsurance Group of America, Inc. |
| 3.95%, 09/15/26 (a) | 30,000 | 34,389 |
| 3.90%, 05/15/29 (a) | 50,000 | 57,407 |
| 3.15%, 06/15/30 (a) | 50,000 | 55,013 |
| RenaissanceRe Holdings Ltd. |
| 3.60%, 04/15/29 (a) | 50,000 | 56,585 |
| UnitedHealth Group, Inc. |
| 3.10%, 03/15/26 | 100,000 | 112,186 |
| 3.45%, 01/15/27 | 100,000 | 114,612 |
| 3.38%, 04/15/27 | 50,000 | 57,108 |
| 2.95%, 10/15/27 | 100,000 | 112,339 |
| 3.85%, 06/15/28 | 25,000 | 29,729 |
| 3.88%, 12/15/28 | 50,000 | 60,001 |
| 2.88%, 08/15/29 | 175,000 | 198,809 |
| 2.00%, 05/15/30 (a) | 100,000 | 106,269 |
| Unum Group |
| 4.00%, 06/15/29 (a) | 100,000 | 113,087 |
| Voya Financial, Inc. |
| 3.65%, 06/15/26 | 50,000 | 57,260 |
| 4.70%, 01/23/48 (a)(b) | 25,000 | 26,132 |
| Willis North America, Inc. |
| 4.50%, 09/15/28 (a) | 50,000 | 60,353 |
| 2.95%, 09/15/29 (a) | 100,000 | 109,725 |
| | | 7,825,567 |
| REITs 4.5% |
| Alexandria Real Estate Equities, Inc. |
| 4.30%, 01/15/26 (a) | 50,000 | 58,055 |
| 3.80%, 04/15/26 (a) | 50,000 | 57,627 |
| 3.95%, 01/15/28 (a) | 50,000 | 58,015 |
| 2.75%, 12/15/29 (a) | 200,000 | 218,724 |
| American Campus Communities Operating Partnership LP |
| 3.30%, 07/15/26 (a) | 75,000 | 81,933 |
| 2.85%, 02/01/30 (a) | 50,000 | 52,315 |
Schwab Fixed-Income ETFs | Annual Report
Schwab 5-10 Year Corporate Bond ETF
Portfolio Holdings as of December 31, 2020 (continued)
Security
Rate, Maturity Date | Face
Amount ($) | Value ($) |
| American Homes 4 Rent LP |
| 4.25%, 02/15/28 (a) | 50,000 | 57,597 |
| 4.90%, 02/15/29 (a) | 30,000 | 36,329 |
| AvalonBay Communities, Inc. |
| 2.95%, 05/11/26 (a) | 35,000 | 38,833 |
| 2.90%, 10/15/26 (a) | 100,000 | 111,081 |
| 3.35%, 05/15/27 (a) | 30,000 | 33,624 |
| 2.30%, 03/01/30 (a) | 50,000 | 53,339 |
| Boston Properties LP |
| 3.65%, 02/01/26 (a) | 125,000 | 142,844 |
| 2.75%, 10/01/26 (a) | 50,000 | 54,583 |
| 4.50%, 12/01/28 (a) | 100,000 | 120,380 |
| 3.40%, 06/21/29 (a) | 100,000 | 111,780 |
| 2.90%, 03/15/30 (a) | 85,000 | 91,727 |
| Brandywine Operating Partnership LP |
| 3.95%, 11/15/27 (a) | 50,000 | 53,664 |
| Brixmor Operating Partnership LP |
| 3.90%, 03/15/27 (a) | 50,000 | 55,698 |
| 4.13%, 05/15/29 (a) | 75,000 | 86,415 |
| 4.05%, 07/01/30 (a) | 100,000 | 115,133 |
| Camden Property Trust |
| 3.15%, 07/01/29 (a) | 75,000 | 84,667 |
| 2.80%, 05/15/30 (a) | 100,000 | 111,368 |
| Columbia Property Trust Operating Partnership LP |
| 3.65%, 08/15/26 (a) | 35,000 | 36,631 |
| CubeSmart LP |
| 3.13%, 09/01/26 (a) | 100,000 | 109,715 |
| CyrusOne LP/CyrusOne Finance Corp. |
| 3.45%, 11/15/29 (a) | 50,000 | 53,974 |
| 2.15%, 11/01/30 (a) | 100,000 | 97,824 |
| Digital Realty Trust LP |
| 4.45%, 07/15/28 (a) | 100,000 | 119,365 |
| 3.60%, 07/01/29 (a) | 100,000 | 114,818 |
| Duke Realty LP |
| 4.00%, 09/15/28 (a) | 50,000 | 59,050 |
| 2.88%, 11/15/29 (a) | 50,000 | 55,143 |
| 1.75%, 07/01/30 (a) | 150,000 | 152,026 |
| ERP Operating LP |
| 2.85%, 11/01/26 (a) | 75,000 | 82,927 |
| 4.15%, 12/01/28 (a) | 100,000 | 119,277 |
| 3.00%, 07/01/29 (a) | 70,000 | 78,111 |
| Essex Portfolio LP |
| 3.38%, 04/15/26 (a) | 70,000 | 78,653 |
| 4.00%, 03/01/29 (a) | 100,000 | 116,517 |
| Federal Realty Investment Trust |
| 3.25%, 07/15/27 (a) | 100,000 | 109,024 |
| Healthcare Realty Trust, Inc. |
| 2.40%, 03/15/30 (a) | 50,000 | 51,899 |
| Healthcare Trust of America Holdings LP |
| 3.50%, 08/01/26 (a) | 85,000 | 96,402 |
| 3.10%, 02/15/30 (a) | 50,000 | 54,677 |
| Healthpeak Properties, Inc. |
| 3.25%, 07/15/26 (a) | 93,000 | 105,190 |
| 3.50%, 07/15/29 (a) | 50,000 | 56,948 |
| 3.00%, 01/15/30 (a) | 50,000 | 54,997 |
| Highwoods Realty LP |
| 4.20%, 04/15/29 (a) | 100,000 | 114,268 |
| Host Hotels & Resorts LP |
| 3.38%, 12/15/29 (a) | 50,000 | 51,646 |
| 3.50%, 09/15/30 (a) | 100,000 | 105,657 |
| Hudson Pacific Properties LP |
| 3.95%, 11/01/27 (a) | 20,000 | 22,090 |
| 4.65%, 04/01/29 (a) | 100,000 | 116,719 |
Security
Rate, Maturity Date | Face
Amount ($) | Value ($) |
| Kilroy Realty LP |
| 4.25%, 08/15/29 (a) | 70,000 | 80,809 |
| 3.05%, 02/15/30 (a) | 125,000 | 133,334 |
| Kimco Realty Corp. |
| 2.80%, 10/01/26 (a) | 75,000 | 81,930 |
| 1.90%, 03/01/28 (a) | 50,000 | 51,310 |
| 2.70%, 10/01/30 (a) | 100,000 | 108,489 |
| Lexington Realty Trust |
| 2.70%, 09/15/30 (a) | 50,000 | 52,375 |
| Life Storage LP |
| 3.88%, 12/15/27 (a) | 70,000 | 80,070 |
| 4.00%, 06/15/29 (a) | 80,000 | 93,942 |
| Mid-America Apartments LP |
| 4.20%, 06/15/28 (a) | 100,000 | 117,908 |
| 3.95%, 03/15/29 (a) | 40,000 | 47,014 |
| National Retail Properties, Inc. |
| 3.60%, 12/15/26 (a) | 100,000 | 110,199 |
| 4.30%, 10/15/28 (a) | 50,000 | 57,948 |
| Omega Healthcare Investors, Inc. |
| 5.25%, 01/15/26 (a) | 100,000 | 114,602 |
| 3.63%, 10/01/29 (a) | 100,000 | 106,498 |
| Physicians Realty LP |
| 4.30%, 03/15/27 (a) | 50,000 | 55,010 |
| Piedmont Operating Partnership LP |
| 3.15%, 08/15/30 (a) | 50,000 | 50,931 |
| Prologis LP |
| 3.25%, 10/01/26 (a) | 79,000 | 89,845 |
| 2.13%, 04/15/27 (a) | 100,000 | 107,589 |
| 2.25%, 04/15/30 (a) | 100,000 | 107,408 |
| Public Storage |
| 3.09%, 09/15/27 (a) | 100,000 | 112,020 |
| Realty Income Corp. |
| 4.13%, 10/15/26 (a) | 50,000 | 58,913 |
| 3.65%, 01/15/28 (a) | 75,000 | 85,398 |
| 3.25%, 01/15/31 (a) | 50,000 | 56,822 |
| Regency Centers LP |
| 3.60%, 02/01/27 (a) | 75,000 | 82,564 |
| 2.95%, 09/15/29 (a) | 50,000 | 53,468 |
| 3.70%, 06/15/30 (a) | 50,000 | 56,669 |
| Retail Properties of America, Inc. |
| 4.75%, 09/15/30 (a) | 50,000 | 53,674 |
| Sabra Health Care LP |
| 3.90%, 10/15/29 (a) | 90,000 | 94,535 |
| Simon Property Group LP |
| 3.30%, 01/15/26 (a) | 50,000 | 55,059 |
| 3.25%, 11/30/26 (a) | 100,000 | 111,000 |
| 3.38%, 06/15/27 (a) | 100,000 | 111,035 |
| 3.38%, 12/01/27 (a) | 100,000 | 112,261 |
| 2.45%, 09/13/29 (a) | 150,000 | 157,999 |
| SITE Centers Corp. |
| 4.70%, 06/01/27 (a) | 26,000 | 28,488 |
| Spirit Realty LP |
| 4.45%, 09/15/26 (a) | 34,000 | 38,457 |
| 3.20%, 01/15/27 (a) | 75,000 | 79,837 |
| 4.00%, 07/15/29 (a) | 50,000 | 56,385 |
| STORE Capital Corp. |
| 4.50%, 03/15/28 (a) | 70,000 | 79,813 |
| Tanger Properties LP |
| 3.13%, 09/01/26 (a) | 50,000 | 51,649 |
| UDR, Inc. |
| 2.95%, 09/01/26 (a) | 50,000 | 55,043 |
| 3.50%, 01/15/28 (a) | 50,000 | 56,120 |
Schwab Fixed-Income ETFs | Annual Report
Schwab 5-10 Year Corporate Bond ETF
Portfolio Holdings as of December 31, 2020 (continued)
Security
Rate, Maturity Date | Face
Amount ($) | Value ($) |
| 4.40%, 01/26/29 (a) | 100,000 | 119,290 |
| 3.20%, 01/15/30 (a) | 50,000 | 55,662 |
| Ventas Realty LP |
| 3.25%, 10/15/26 (a) | 125,000 | 137,825 |
| 3.85%, 04/01/27 (a) | 45,000 | 50,341 |
| 4.00%, 03/01/28 (a) | 21,000 | 24,008 |
| 4.40%, 01/15/29 (a) | 100,000 | 116,808 |
| 3.00%, 01/15/30 (a) | 45,000 | 48,442 |
| VEREIT Operating Partnership LP |
| 4.88%, 06/01/26 (a) | 50,000 | 58,790 |
| 3.95%, 08/15/27 (a) | 75,000 | 85,270 |
| 3.40%, 01/15/28 (a) | 50,000 | 55,235 |
| 3.10%, 12/15/29 (a) | 70,000 | 75,804 |
| Welltower, Inc. |
| 4.25%, 04/01/26 (a) | 135,000 | 157,630 |
| 4.13%, 03/15/29 (a) | 100,000 | 116,795 |
| 3.10%, 01/15/30 (a) | 50,000 | 54,757 |
| WP Carey, Inc. |
| 3.85%, 07/15/29 (a) | 30,000 | 34,377 |
| | | 8,584,733 |
| | | 64,355,537 |
| |
| Industrial 57.9% |
| Basic Industry 2.6% |
| Air Products and Chemicals, Inc. |
| 2.05%, 05/15/30 (a) | 50,000 | 53,459 |
| Cabot Corp. |
| 4.00%, 07/01/29 (a) | 50,000 | 54,000 |
| Celulosa Arauco y Constitucion S.A. |
| 3.88%, 11/02/27 (a) | 200,000 | 221,820 |
| Dow Chemical Co. |
| 3.63%, 05/15/26 (a) | 25,000 | 28,215 |
| 4.80%, 11/30/28 (a) | 90,000 | 110,824 |
| 7.38%, 11/01/29 | 50,000 | 71,407 |
| DuPont de Nemours, Inc. |
| 4.73%, 11/15/28 (a) | 170,000 | 209,584 |
| Eastman Chemical Co. |
| 4.50%, 12/01/28 (a) | 25,000 | 30,298 |
| Ecolab, Inc. |
| 2.70%, 11/01/26 (a) | 75,000 | 83,385 |
| 3.25%, 12/01/27 (a) | 25,000 | 28,390 |
| 4.80%, 03/24/30 (a) | 125,000 | 160,100 |
| Fibria Overseas Finance Ltd. |
| 5.50%, 01/17/27 | 125,000 | 143,154 |
| FMC Corp. |
| 3.20%, 10/01/26 (a) | 50,000 | 55,785 |
| Huntsman International LLC |
| 4.50%, 05/01/29 (a) | 75,000 | 87,001 |
| International Flavors & Fragrances, Inc. |
| 4.45%, 09/26/28 (a) | 50,000 | 59,361 |
| International Paper Co. |
| 3.80%, 01/15/26 (a) | 50,000 | 56,717 |
| Kinross Gold Corp. |
| 4.50%, 07/15/27 (a) | 50,000 | 58,217 |
| Linde, Inc. |
| 3.20%, 01/30/26 (a) | 50,000 | 56,050 |
| 1.10%, 08/10/30 (a) | 100,000 | 99,096 |
| LYB International Finance II BV |
| 3.50%, 03/02/27 (a) | 75,000 | 84,182 |
| LYB International Finance III LLC |
| 3.38%, 05/01/30 (a) | 50,000 | 56,256 |
| 2.25%, 10/01/30 (a) | 100,000 | 103,060 |
Security
Rate, Maturity Date | Face
Amount ($) | Value ($) |
| Mosaic Co. |
| 4.05%, 11/15/27 (a) | 50,000 | 56,958 |
| Newmont Corp. |
| 2.80%, 10/01/29 (a) | 75,000 | 82,066 |
| Nucor Corp. |
| 3.95%, 05/01/28 (a) | 100,000 | 118,098 |
| Nutrien Ltd. |
| 4.00%, 12/15/26 (a) | 75,000 | 87,214 |
| 4.20%, 04/01/29 (a) | 50,000 | 59,864 |
| 2.95%, 05/13/30 (a) | 100,000 | 110,371 |
| Packaging Corp. of America |
| 3.00%, 12/15/29 (a) | 85,000 | 94,848 |
| PPG Industries, Inc. |
| 3.75%, 03/15/28 (a) | 75,000 | 90,055 |
| 2.80%, 08/15/29 (a) | 75,000 | 82,504 |
| Reliance Steel & Aluminum Co. |
| 2.15%, 08/15/30 (a) | 50,000 | 51,580 |
| Rio Tinto Finance USA Ltd. |
| 7.13%, 07/15/28 | 50,000 | 71,195 |
| Rohm & Haas Co. |
| 7.85%, 07/15/29 | 100,000 | 139,535 |
| RPM International, Inc. |
| 3.75%, 03/15/27 (a) | 50,000 | 55,455 |
| 4.55%, 03/01/29 (a) | 50,000 | 58,334 |
| Sherwin-Williams Co. |
| 3.45%, 06/01/27 (a) | 25,000 | 28,357 |
| 2.95%, 08/15/29 (a) | 135,000 | 149,581 |
| Steel Dynamics, Inc. |
| 5.00%, 12/15/26 (a) | 70,000 | 74,667 |
| 1.65%, 10/15/27 (a) | 50,000 | 51,473 |
| 3.45%, 04/15/30 (a) | 75,000 | 85,198 |
| Suzano Austria GmbH |
| 6.00%, 01/15/29 (a) | 200,000 | 241,584 |
| Teck Resources Ltd. |
| 3.90%, 07/15/30 (a) | 100,000 | 111,542 |
| Vale Overseas Ltd. |
| 6.25%, 08/10/26 | 190,000 | 236,335 |
| 3.75%, 07/08/30 (a) | 150,000 | 167,487 |
| Westlake Chemical Corp. |
| 3.60%, 08/15/26 (a) | 75,000 | 84,359 |
| WestRock MWV LLC |
| 8.20%, 01/15/30 | 50,000 | 71,735 |
| Weyerhaeuser Co. |
| 6.95%, 10/01/27 | 25,000 | 32,493 |
| 4.00%, 11/15/29 (a) | 175,000 | 206,587 |
| WRKCo, Inc. |
| 4.65%, 03/15/26 (a) | 75,000 | 88,300 |
| 3.38%, 09/15/27 (a) | 75,000 | 83,884 |
| 4.00%, 03/15/28 (a) | 75,000 | 86,856 |
| 3.90%, 06/01/28 (a) | 25,000 | 28,999 |
| 4.90%, 03/15/29 (a) | 50,000 | 61,882 |
| | | 4,959,757 |
| Capital Goods 5.6% |
| 3M Co. |
| 2.25%, 09/19/26 (a) | 100,000 | 108,043 |
| 3.63%, 09/14/28 (a) | 50,000 | 58,474 |
| 3.38%, 03/01/29 (a) | 100,000 | 115,859 |
| 2.38%, 08/26/29 (a) | 100,000 | 108,458 |
| Acuity Brands Lighting, Inc. |
| 2.15%, 12/15/30 (a) | 25,000 | 25,386 |
| Allegion PLC |
| 3.50%, 10/01/29 (a) | 50,000 | 55,362 |
Schwab Fixed-Income ETFs | Annual Report
Schwab 5-10 Year Corporate Bond ETF
Portfolio Holdings as of December 31, 2020 (continued)
Security
Rate, Maturity Date | Face
Amount ($) | Value ($) |
| Amcor Finance USA, Inc. |
| 4.50%, 05/15/28 (a) | 65,000 | 77,368 |
| Amphenol Corp. |
| 4.35%, 06/01/29 (a) | 50,000 | 61,720 |
| 2.80%, 02/15/30 (a) | 75,000 | 83,094 |
| Avery Dennison Corp. |
| 4.88%, 12/06/28 (a) | 95,000 | 117,932 |
| 2.65%, 04/30/30 (a) | 100,000 | 107,565 |
| Boeing Co. |
| 3.10%, 05/01/26 (a) | 50,000 | 53,327 |
| 2.25%, 06/15/26 (a) | 50,000 | 51,201 |
| 2.70%, 02/01/27 (a) | 20,000 | 20,818 |
| 2.80%, 03/01/27 (a) | 75,000 | 77,734 |
| 5.04%, 05/01/27 (a) | 150,000 | 175,891 |
| 3.25%, 02/01/28 (a) | 150,000 | 160,936 |
| 3.25%, 03/01/28 (a) | 140,000 | 148,421 |
| 3.45%, 11/01/28 (a) | 50,000 | 53,808 |
| 3.20%, 03/01/29 (a) | 120,000 | 126,683 |
| 2.95%, 02/01/30 (a) | 50,000 | 51,824 |
| 5.15%, 05/01/30 (a) | 425,000 | 515,011 |
| Carlisle Cos., Inc. |
| 2.75%, 03/01/30 (a) | 250,000 | 268,675 |
| Carrier Global Corp. |
| 2.49%, 02/15/27 (a) | 75,000 | 80,960 |
| 2.72%, 02/15/30 (a) | 150,000 | 160,551 |
| Caterpillar, Inc. |
| 2.60%, 09/19/29 (a) | 180,000 | 198,826 |
| CNH Industrial Capital LLC |
| 1.88%, 01/15/26 (a) | 50,000 | 52,549 |
| CNH Industrial NV |
| 3.85%, 11/15/27 (a) | 40,000 | 45,301 |
| Deere & Co. |
| 5.38%, 10/16/29 | 50,000 | 66,661 |
| Eagle Materials, Inc. |
| 4.50%, 08/01/26 (a) | 25,000 | 25,933 |
| Emerson Electric Co. |
| 0.88%, 10/15/26 (a) | 50,000 | 50,410 |
| 1.80%, 10/15/27 (a) | 100,000 | 105,688 |
| Fortive Corp. |
| 3.15%, 06/15/26 (a) | 95,000 | 105,537 |
| Fortune Brands Home & Security, Inc. |
| 3.25%, 09/15/29 (a) | 25,000 | 27,782 |
| General Dynamics Corp. |
| 3.50%, 04/01/27 (a) | 200,000 | 230,252 |
| 3.63%, 04/01/30 (a) | 175,000 | 208,089 |
| General Electric Co. |
| 5.55%, 01/05/26 | 50,000 | 60,939 |
| 3.45%, 05/01/27 (a) | 100,000 | 112,848 |
| 3.63%, 05/01/30 (a) | 200,000 | 228,336 |
| Hexcel Corp. |
| 3.95%, 02/15/27 (a) | 50,000 | 54,426 |
| Honeywell International, Inc. |
| 2.50%, 11/01/26 (a) | 110,000 | 121,635 |
| 2.70%, 08/15/29 (a) | 75,000 | 83,950 |
| 1.95%, 06/01/30 (a) | 100,000 | 105,899 |
| Hubbell, Inc. |
| 3.50%, 02/15/28 (a) | 50,000 | 54,917 |
| Huntington Ingalls Industries, Inc. |
| 3.48%, 12/01/27 (a) | 50,000 | 56,106 |
| 4.20%, 05/01/30 (a) | 100,000 | 118,831 |
| IDEX Corp. |
| 3.00%, 05/01/30 (a) | 50,000 | 55,295 |
Security
Rate, Maturity Date | Face
Amount ($) | Value ($) |
| Illinois Tool Works, Inc. |
| 2.65%, 11/15/26 (a) | 125,000 | 138,460 |
| John Deere Capital Corp. |
| 2.65%, 06/10/26 | 150,000 | 164,668 |
| 2.25%, 09/14/26 | 50,000 | 54,114 |
| 1.75%, 03/09/27 | 50,000 | 52,611 |
| 2.80%, 09/08/27 | 35,000 | 39,110 |
| 3.05%, 01/06/28 | 50,000 | 56,129 |
| 3.45%, 03/07/29 | 20,000 | 23,284 |
| 2.80%, 07/18/29 | 65,000 | 72,714 |
| 2.45%, 01/09/30 | 40,000 | 43,855 |
| Johnson Controls International plc |
| 3.90%, 02/14/26 (a) | 50,000 | 57,069 |
| L3Harris Technologies, Inc. |
| 3.85%, 12/15/26 (a) | 100,000 | 115,997 |
| 4.40%, 06/15/28 (a) | 150,000 | 180,282 |
| 4.40%, 06/15/28 (a) | 25,000 | 30,124 |
| Leggett & Platt, Inc. |
| 3.50%, 11/15/27 (a) | 50,000 | 54,461 |
| 4.40%, 03/15/29 (a) | 50,000 | 57,540 |
| Lennox International, Inc. |
| 1.70%, 08/01/27 (a) | 50,000 | 51,167 |
| Lockheed Martin Corp. |
| 3.55%, 01/15/26 (a) | 135,000 | 153,480 |
| Martin Marietta Materials, Inc. |
| 3.50%, 12/15/27 (a) | 72,000 | 82,145 |
| Masco Corp. |
| 4.38%, 04/01/26 (a) | 25,000 | 29,301 |
| 2.00%, 10/01/30 (a) | 50,000 | 50,985 |
| Mohawk Industries, Inc. |
| 3.63%, 05/15/30 (a) | 40,000 | 44,983 |
| Northrop Grumman Corp. |
| 3.20%, 02/01/27 (a) | 50,000 | 56,265 |
| 3.25%, 01/15/28 (a) | 165,000 | 186,947 |
| 4.40%, 05/01/30 (a) | 100,000 | 123,859 |
| nVent Finance Sarl |
| 4.55%, 04/15/28 (a) | 40,000 | 43,566 |
| Oshkosh Corp. |
| 3.10%, 03/01/30 (a) | 50,000 | 54,557 |
| Otis Worldwide Corp. |
| 2.29%, 04/05/27 (a) | 50,000 | 53,510 |
| 2.57%, 02/15/30 (a) | 120,000 | 128,930 |
| Owens Corning |
| 3.40%, 08/15/26 (a) | 100,000 | 110,393 |
| 3.88%, 06/01/30 (a) | 50,000 | 57,710 |
| Parker-Hannifin Corp. |
| 3.25%, 03/01/27 (a) | 60,000 | 67,028 |
| 3.25%, 06/14/29 (a) | 75,000 | 85,242 |
| Pentair Finance Sarl |
| 4.50%, 07/01/29 (a) | 50,000 | 59,524 |
| Raytheon Technologies Corp. |
| 3.50%, 03/15/27 (a) | 100,000 | 114,191 |
| 3.13%, 05/04/27 (a) | 125,000 | 139,715 |
| 6.70%, 08/01/28 | 20,000 | 27,217 |
| 4.13%, 11/16/28 (a) | 325,000 | 388,112 |
| 2.25%, 07/01/30 (a) | 100,000 | 106,217 |
| Republic Services, Inc. |
| 2.90%, 07/01/26 (a) | 50,000 | 55,402 |
| 3.38%, 11/15/27 (a) | 15,000 | 17,037 |
| 3.95%, 05/15/28 (a) | 75,000 | 88,248 |
| 2.30%, 03/01/30 (a) | 75,000 | 79,558 |
| Rockwell Automation, Inc. |
| 3.50%, 03/01/29 (a) | 50,000 | 58,303 |
Schwab Fixed-Income ETFs | Annual Report
Schwab 5-10 Year Corporate Bond ETF
Portfolio Holdings as of December 31, 2020 (continued)
Security
Rate, Maturity Date | Face
Amount ($) | Value ($) |
| Roper Technologies, Inc. |
| 3.80%, 12/15/26 (a) | 100,000 | 115,678 |
| 1.40%, 09/15/27 (a) | 100,000 | 101,486 |
| 4.20%, 09/15/28 (a) | 50,000 | 59,723 |
| 2.95%, 09/15/29 (a) | 75,000 | 82,670 |
| 2.00%, 06/30/30 (a) | 50,000 | 51,335 |
| Snap-on, Inc. |
| 3.25%, 03/01/27 (a) | 25,000 | 28,009 |
| Stanley Black & Decker, Inc. |
| 3.40%, 03/01/26 (a) | 25,000 | 28,423 |
| 4.25%, 11/15/28 (a) | 50,000 | 60,885 |
| 2.30%, 03/15/30 (a) | 100,000 | 107,447 |
| Textron, Inc. |
| 4.00%, 03/15/26 (a) | 50,000 | 56,518 |
| 3.65%, 03/15/27 (a) | 50,000 | 55,307 |
| 3.90%, 09/17/29 (a) | 75,000 | 85,948 |
| Timken Co. |
| 4.50%, 12/15/28 (a) | 75,000 | 83,900 |
| Trane Technologies Luxembourg Finance S.A. |
| 3.50%, 03/21/26 (a) | 50,000 | 56,606 |
| 3.80%, 03/21/29 (a) | 90,000 | 105,790 |
| Vulcan Materials Co. |
| 3.90%, 04/01/27 (a) | 50,000 | 58,424 |
| 3.50%, 06/01/30 (a) | 100,000 | 114,535 |
| Waste Connections, Inc. |
| 4.25%, 12/01/28 (a) | 75,000 | 89,701 |
| 3.50%, 05/01/29 (a) | 50,000 | 57,136 |
| 2.60%, 02/01/30 (a) | 50,000 | 53,832 |
| Waste Management, Inc. |
| 3.15%, 11/15/27 (a) | 155,000 | 175,593 |
| 1.15%, 03/15/28 (a) | 50,000 | 50,019 |
| Westinghouse Air Brake Technologies Corp. |
| 3.45%, 11/15/26 (a) | 135,000 | 148,167 |
| 4.95%, 09/15/28 (a)(e)(f) | 125,000 | 148,204 |
| Xylem, Inc. |
| 3.25%, 11/01/26 (a) | 50,000 | 56,286 |
| | | 10,720,943 |
| Communications 7.9% |
| Activision Blizzard, Inc. |
| 3.40%, 09/15/26 (a) | 175,000 | 199,295 |
| 1.35%, 09/15/30 (a) | 50,000 | 49,226 |
| America Movil S.A.B. de C.V. |
| 3.63%, 04/22/29 (a) | 200,000 | 227,446 |
| 2.88%, 05/07/30 (a) | 200,000 | 217,704 |
| American Tower Corp. |
| 4.40%, 02/15/26 (a) | 20,000 | 23,158 |
| 3.38%, 10/15/26 (a) | 125,000 | 140,521 |
| 3.13%, 01/15/27 (a) | 175,000 | 193,224 |
| 3.55%, 07/15/27 (a) | 50,000 | 56,637 |
| 3.60%, 01/15/28 (a) | 100,000 | 113,774 |
| 3.95%, 03/15/29 (a) | 50,000 | 58,250 |
| 3.80%, 08/15/29 (a) | 275,000 | 319,828 |
| 2.90%, 01/15/30 (a) | 35,000 | 38,209 |
| 1.88%, 10/15/30 (a) | 150,000 | 151,531 |
| AT&T, Inc. |
| 4.13%, 02/17/26 (a) | 260,000 | 301,083 |
| 2.95%, 07/15/26 (a) | 190,000 | 210,419 |
| 3.80%, 02/15/27 (a) | 95,000 | 109,454 |
| 4.25%, 03/01/27 (a) | 200,000 | 233,932 |
| 2.30%, 06/01/27 (a) | 200,000 | 213,314 |
| 1.65%, 02/01/28 (a) | 150,000 | 153,477 |
| 4.10%, 02/15/28 (a) | 150,000 | 176,457 |
| 4.35%, 03/01/29 (a) | 325,000 | 388,014 |
Security
Rate, Maturity Date | Face
Amount ($) | Value ($) |
| 4.30%, 02/15/30 (a) | 275,000 | 328,683 |
| 2.55%, 12/01/33 (a)(c) | 57,000 | 58,476 |
| British Telecommunications PLC |
| 5.13%, 12/04/28 (a) | 200,000 | 246,642 |
| Charter Communications Operating LLC/Charter Communications Operating Capital |
| 3.75%, 02/15/28 (a) | 95,000 | 106,728 |
| 4.20%, 03/15/28 (a) | 125,000 | 144,259 |
| 5.05%, 03/30/29 (a) | 125,000 | 151,904 |
| Comcast Corp. |
| 3.15%, 03/01/26 (a) | 175,000 | 195,009 |
| 2.35%, 01/15/27 (a) | 50,000 | 53,853 |
| 3.30%, 02/01/27 (a) | 125,000 | 141,258 |
| 3.30%, 04/01/27 (a) | 100,000 | 113,834 |
| 3.15%, 02/15/28 (a) | 125,000 | 140,689 |
| 3.55%, 05/01/28 (a) | 100,000 | 115,293 |
| 4.15%, 10/15/28 (a) | 342,000 | 410,995 |
| 2.65%, 02/01/30 (a) | 175,000 | 191,271 |
| 3.40%, 04/01/30 (a) | 50,000 | 57,774 |
| 4.25%, 10/15/30 (a) | 100,000 | 123,144 |
| Crown Castle International Corp. |
| 4.45%, 02/15/26 (a) | 100,000 | 115,885 |
| 3.65%, 09/01/27 (a) | 100,000 | 113,518 |
| 3.80%, 02/15/28 (a) | 25,000 | 28,722 |
| 4.30%, 02/15/29 (a) | 225,000 | 266,890 |
| 3.10%, 11/15/29 (a) | 50,000 | 55,222 |
| 3.30%, 07/01/30 (a) | 100,000 | 112,463 |
| Deutsche Telekom International Finance BV |
| 8.75%, 06/15/30 (e)(f) | 200,000 | 316,490 |
| Discovery Communications LLC |
| 4.90%, 03/11/26 (a) | 100,000 | 118,031 |
| 3.95%, 03/20/28 (a) | 50,000 | 57,356 |
| 4.13%, 05/15/29 (a) | 150,000 | 175,575 |
| 3.63%, 05/15/30 (a) | 50,000 | 57,278 |
| Electronic Arts, Inc. |
| 4.80%, 03/01/26 (a) | 50,000 | 59,487 |
| Fox Corp. |
| 4.71%, 01/25/29 (a) | 225,000 | 273,825 |
| 3.50%, 04/08/30 (a) | 100,000 | 113,991 |
| Interpublic Group of Cos., Inc. |
| 4.75%, 03/30/30 (a) | 150,000 | 187,185 |
| Koninklijke KPN N.V. |
| 8.38%, 10/01/30 | 50,000 | 71,450 |
| Moody's Corp. |
| 3.25%, 01/15/28 (a) | 75,000 | 84,709 |
| Omnicom Group, Inc. |
| 2.45%, 04/30/30 (a) | 50,000 | 53,295 |
| 4.20%, 06/01/30 (a) | 50,000 | 60,200 |
| Omnicom Group, Inc./Omnicom Capital, Inc. |
| 3.60%, 04/15/26 (a) | 125,000 | 142,750 |
| RELX Capital, Inc. |
| 4.00%, 03/18/29 (a) | 185,000 | 220,204 |
| Rogers Communications, Inc. |
| 3.63%, 12/15/25 (a) | 50,000 | 56,809 |
| S&P Global, Inc. |
| 2.95%, 01/22/27 (a) | 50,000 | 55,416 |
| 1.25%, 08/15/30 (a) | 50,000 | 49,301 |
| T-Mobile USA, Inc. |
| 3.75%, 04/15/27 (a)(c) | 300,000 | 342,516 |
| 2.05%, 02/15/28 (a) | 200,000 | 208,350 |
| 3.88%, 04/15/30 (a)(c) | 650,000 | 752,459 |
| TCI Communications, Inc. |
| 7.88%, 02/15/26 | 50,000 | 67,303 |
| 7.13%, 02/15/28 | 65,000 | 90,027 |
Schwab Fixed-Income ETFs | Annual Report
Schwab 5-10 Year Corporate Bond ETF
Portfolio Holdings as of December 31, 2020 (continued)
Security
Rate, Maturity Date | Face
Amount ($) | Value ($) |
| Telefonica Emisiones S.A. |
| 4.10%, 03/08/27 | 150,000 | 173,742 |
| Telefonica Europe BV |
| 8.25%, 09/15/30 | 200,000 | 304,306 |
| TELUS Corp. |
| 3.70%, 09/15/27 (a) | 75,000 | 86,423 |
| Thomson Reuters Corp. |
| 3.35%, 05/15/26 (a) | 50,000 | 56,083 |
| TWDC Enterprises 18 Corp. |
| 3.00%, 02/13/26 | 150,000 | 166,587 |
| 1.85%, 07/30/26 | 100,000 | 105,519 |
| Verizon Communications, Inc. |
| 2.63%, 08/15/26 | 200,000 | 219,316 |
| 4.13%, 03/16/27 | 325,000 | 383,354 |
| 3.00%, 03/22/27 (a) | 150,000 | 166,453 |
| 4.33%, 09/21/28 | 235,000 | 283,109 |
| 3.88%, 02/08/29 (a) | 175,000 | 206,146 |
| 4.02%, 12/03/29 (a) | 300,000 | 356,508 |
| 3.15%, 03/22/30 (a) | 225,000 | 252,553 |
| 1.50%, 09/18/30 (a) | 50,000 | 49,210 |
| 1.68%, 10/30/30 (a)(c) | 100,000 | 99,556 |
| ViacomCBS, Inc. |
| 4.00%, 01/15/26 (a) | 100,000 | 114,650 |
| 2.90%, 01/15/27 (a) | 150,000 | 165,006 |
| 3.38%, 02/15/28 (a) | 50,000 | 56,347 |
| 3.70%, 06/01/28 (a) | 50,000 | 57,196 |
| Vodafone Group PLC |
| 4.38%, 05/30/28 | 215,000 | 258,090 |
| 7.88%, 02/15/30 | 100,000 | 148,730 |
| Walt Disney Co. |
| 1.75%, 01/13/26 | 200,000 | 209,508 |
| 3.38%, 11/15/26 (a) | 150,000 | 169,581 |
| 3.70%, 03/23/27 | 100,000 | 115,896 |
| 2.20%, 01/13/28 | 100,000 | 106,989 |
| 2.00%, 09/01/29 (a) | 250,000 | 261,067 |
| | | 15,033,397 |
| Consumer Cyclical 7.6% |
| Advance Auto Parts, Inc. |
| 1.75%, 10/01/27 (a) | 50,000 | 51,032 |
| 3.90%, 04/15/30 (a) | 75,000 | 86,541 |
| Alibaba Group Holding Ltd. |
| 3.40%, 12/06/27 (a) | 200,000 | 224,220 |
| Amazon.com, Inc. |
| 5.20%, 12/03/25 (a) | 175,000 | 212,716 |
| 1.20%, 06/03/27 (a) | 100,000 | 101,891 |
| 1.50%, 06/03/30 (a) | 200,000 | 203,994 |
| American Honda Finance Corp. |
| 2.35%, 01/08/27 | 29,000 | 31,289 |
| 3.50%, 02/15/28 | 41,000 | 47,487 |
| Aptiv PLC |
| 4.35%, 03/15/29 (a) | 75,000 | 86,880 |
| Automatic Data Processing, Inc. |
| 1.25%, 09/01/30 (a) | 100,000 | 100,074 |
| AutoNation, Inc. |
| 3.80%, 11/15/27 (a) | 50,000 | 55,451 |
| 4.75%, 06/01/30 (a) | 100,000 | 120,682 |
| AutoZone, Inc. |
| 3.13%, 04/21/26 (a) | 50,000 | 55,382 |
| 3.75%, 06/01/27 (a) | 25,000 | 28,795 |
| 3.75%, 04/18/29 (a) | 75,000 | 86,496 |
| 4.00%, 04/15/30 (a) | 50,000 | 59,265 |
Security
Rate, Maturity Date | Face
Amount ($) | Value ($) |
| Best Buy Co., Inc. |
| 4.45%, 10/01/28 (a) | 50,000 | 60,301 |
| 1.95%, 10/01/30 (a) | 50,000 | 50,317 |
| Block Financial LLC |
| 3.88%, 08/15/30 (a) | 100,000 | 108,072 |
| Booking Holdings, Inc. |
| 3.60%, 06/01/26 (a) | 125,000 | 142,330 |
| 4.50%, 04/13/27 (a) | 50,000 | 59,787 |
| 3.55%, 03/15/28 (a) | 25,000 | 28,729 |
| 4.63%, 04/13/30 (a) | 150,000 | 186,631 |
| BorgWarner, Inc. |
| 2.65%, 07/01/27 (a) | 100,000 | 107,997 |
| Choice Hotels International, Inc. |
| 3.70%, 12/01/29 (a) | 30,000 | 32,846 |
| Costco Wholesale Corp. |
| 3.00%, 05/18/27 (a) | 75,000 | 84,240 |
| 1.38%, 06/20/27 (a) | 50,000 | 51,590 |
| 1.60%, 04/20/30 (a) | 250,000 | 256,695 |
| Cummins, Inc. |
| 1.50%, 09/01/30 (a) | 100,000 | 100,745 |
| Darden Restaurants, Inc. |
| 3.85%, 05/01/27 (a) | 50,000 | 55,180 |
| Dollar General Corp. |
| 3.88%, 04/15/27 (a) | 50,000 | 57,856 |
| 4.13%, 05/01/28 (a) | 50,000 | 59,253 |
| Dollar Tree, Inc. |
| 4.20%, 05/15/28 (a) | 75,000 | 89,310 |
| DR Horton, Inc. |
| 1.40%, 10/15/27 (a) | 100,000 | 100,810 |
| eBay, Inc. |
| 2.70%, 03/11/30 (a) | 175,000 | 189,185 |
| Expedia Group, Inc. |
| 5.00%, 02/15/26 (a) | 75,000 | 84,070 |
| 4.63%, 08/01/27 (a) | 75,000 | 83,998 |
| 3.80%, 02/15/28 (a) | 75,000 | 80,389 |
| 3.25%, 02/15/30 (a) | 125,000 | 130,049 |
| General Motors Co. |
| 4.20%, 10/01/27 (a) | 125,000 | 141,882 |
| 6.80%, 10/01/27 (a) | 100,000 | 128,868 |
| 5.00%, 10/01/28 (a) | 30,000 | 35,696 |
| General Motors Financial Co., Inc. |
| 5.25%, 03/01/26 (a) | 200,000 | 235,494 |
| 4.00%, 10/06/26 (a) | 200,000 | 225,652 |
| 4.35%, 01/17/27 (a) | 50,000 | 57,008 |
| 5.65%, 01/17/29 (a) | 50,000 | 61,973 |
| 3.60%, 06/21/30 (a) | 100,000 | 111,503 |
| Genuine Parts Co. |
| 1.88%, 11/01/30 (a) | 50,000 | 49,914 |
| GLP Capital LP/GLP Financing II, Inc. |
| 5.38%, 04/15/26 (a) | 100,000 | 114,909 |
| 5.75%, 06/01/28 (a) | 80,000 | 94,818 |
| 5.30%, 01/15/29 (a) | 100,000 | 116,897 |
| Home Depot, Inc. |
| 3.00%, 04/01/26 (a) | 175,000 | 195,660 |
| 2.13%, 09/15/26 (a) | 150,000 | 161,842 |
| 2.50%, 04/15/27 (a) | 50,000 | 54,818 |
| 2.80%, 09/14/27 (a) | 155,000 | 173,175 |
| 3.90%, 12/06/28 (a) | 100,000 | 120,463 |
| 2.95%, 06/15/29 (a) | 94,000 | 106,948 |
| 2.70%, 04/15/30 (a) | 50,000 | 55,841 |
| Hyatt Hotels Corp. |
| 4.85%, 03/15/26 (a) | 50,000 | 56,270 |
| 4.38%, 09/15/28 (a) | 60,000 | 66,070 |
| 5.75%, 04/23/30 (a) | 50,000 | 61,583 |
Schwab Fixed-Income ETFs | Annual Report
Schwab 5-10 Year Corporate Bond ETF
Portfolio Holdings as of December 31, 2020 (continued)
Security
Rate, Maturity Date | Face
Amount ($) | Value ($) |
| IHS Markit Ltd. |
| 4.75%, 08/01/28 (a) | 125,000 | 154,356 |
| 4.25%, 05/01/29 (a) | 25,000 | 30,424 |
| JD.com, Inc. |
| 3.88%, 04/29/26 | 200,000 | 222,720 |
| 3.38%, 01/14/30 (a) | 200,000 | 217,784 |
| Las Vegas Sands Corp. |
| 3.50%, 08/18/26 (a) | 150,000 | 161,107 |
| 3.90%, 08/08/29 (a) | 75,000 | 80,797 |
| Lear Corp. |
| 3.80%, 09/15/27 (a) | 60,000 | 67,352 |
| 4.25%, 05/15/29 (a) | 25,000 | 28,566 |
| 3.50%, 05/30/30 (a) | 50,000 | 54,972 |
| Lennar Corp. |
| 5.25%, 06/01/26 (a) | 100,000 | 118,821 |
| Lowe's Cos., Inc. |
| 2.50%, 04/15/26 (a) | 175,000 | 190,258 |
| 3.10%, 05/03/27 (a) | 75,000 | 84,339 |
| 1.30%, 04/15/28 (a) | 100,000 | 100,740 |
| 6.50%, 03/15/29 | 72,000 | 98,503 |
| 3.65%, 04/05/29 (a) | 100,000 | 116,778 |
| 4.50%, 04/15/30 (a) | 100,000 | 124,369 |
| 1.70%, 10/15/30 (a) | 125,000 | 126,484 |
| Magna International, Inc. |
| 2.45%, 06/15/30 (a) | 50,000 | 53,968 |
| Marriott International, Inc. |
| 4.00%, 04/15/28 (a) | 50,000 | 55,472 |
| 4.65%, 12/01/28 (a) | 50,000 | 57,780 |
| 4.63%, 06/15/30 (a) | 150,000 | 176,170 |
| Mastercard, Inc. |
| 2.95%, 11/21/26 (a) | 25,000 | 27,983 |
| 3.30%, 03/26/27 (a) | 150,000 | 171,232 |
| 3.50%, 02/26/28 (a) | 50,000 | 57,965 |
| 2.95%, 06/01/29 (a) | 275,000 | 310,483 |
| 3.35%, 03/26/30 (a) | 50,000 | 58,368 |
| McDonald's Corp. |
| 3.70%, 01/30/26 (a) | 200,000 | 227,562 |
| 3.50%, 03/01/27 (a) | 125,000 | 142,700 |
| 3.80%, 04/01/28 (a) | 100,000 | 117,096 |
| 2.13%, 03/01/30 (a) | 100,000 | 105,466 |
| 3.60%, 07/01/30 (a) | 100,000 | 117,340 |
| NIKE, Inc. |
| 2.38%, 11/01/26 (a) | 75,000 | 82,279 |
| 2.75%, 03/27/27 (a) | 100,000 | 110,925 |
| 2.85%, 03/27/30 (a) | 150,000 | 170,230 |
| NVR, Inc. |
| 3.00%, 05/15/30 (a) | 50,000 | 54,603 |
| O'Reilly Automotive, Inc. |
| 4.35%, 06/01/28 (a) | 100,000 | 119,406 |
| 3.90%, 06/01/29 (a) | 50,000 | 58,902 |
| 4.20%, 04/01/30 (a) | 175,000 | 211,220 |
| PulteGroup, Inc. |
| 5.00%, 01/15/27 (a) | 200,000 | 236,314 |
| Ralph Lauren Corp. |
| 2.95%, 06/15/30 (a) | 50,000 | 54,311 |
| Ross Stores, Inc. |
| 0.88%, 04/15/26 (a) | 50,000 | 50,021 |
| 4.70%, 04/15/27 (a) | 14,000 | 16,569 |
| Sands China Ltd. |
| 5.40%, 08/08/28 (a) | 200,000 | 234,542 |
| Starbucks Corp. |
| 2.45%, 06/15/26 (a) | 75,000 | 81,316 |
| 3.50%, 03/01/28 (a) | 75,000 | 86,161 |
| 4.00%, 11/15/28 (a) | 11,000 | 13,109 |
Security
Rate, Maturity Date | Face
Amount ($) | Value ($) |
| 3.55%, 08/15/29 (a) | 150,000 | 175,122 |
| 2.25%, 03/12/30 (a) | 75,000 | 79,755 |
| 2.55%, 11/15/30 (a) | 30,000 | 32,478 |
| Tapestry, Inc. |
| 4.13%, 07/15/27 (a) | 20,000 | 21,684 |
| Target Corp. |
| 2.50%, 04/15/26 | 115,000 | 127,337 |
| 3.38%, 04/15/29 (a) | 100,000 | 117,236 |
| TJX Cos., Inc. |
| 2.25%, 09/15/26 (a) | 60,000 | 64,819 |
| 3.75%, 04/15/27 (a) | 50,000 | 58,052 |
| 3.88%, 04/15/30 (a) | 150,000 | 180,231 |
| Toyota Motor Corp. |
| 2.76%, 07/02/29 | 100,000 | 112,188 |
| Toyota Motor Credit Corp. |
| 3.20%, 01/11/27 | 50,000 | 56,417 |
| 3.05%, 01/11/28 | 150,000 | 169,371 |
| 3.65%, 01/08/29 | 25,000 | 29,620 |
| 2.15%, 02/13/30 | 175,000 | 188,179 |
| Tractor Supply Co. |
| 1.75%, 11/01/30 (a) | 100,000 | 100,762 |
| VF Corp. |
| 2.80%, 04/23/27 (a) | 50,000 | 54,745 |
| 2.95%, 04/23/30 (a) | 50,000 | 55,380 |
| Visa, Inc. |
| 1.90%, 04/15/27 (a) | 100,000 | 106,406 |
| 2.75%, 09/15/27 (a) | 200,000 | 222,940 |
| 2.05%, 04/15/30 (a) | 150,000 | 160,677 |
| Walgreens Boots Alliance, Inc. |
| 3.45%, 06/01/26 (a) | 200,000 | 222,048 |
| 3.20%, 04/15/30 (a) | 75,000 | 81,368 |
| Walmart, Inc. |
| 3.05%, 07/08/26 (a) | 100,000 | 112,681 |
| 5.88%, 04/05/27 | 50,000 | 64,109 |
| 3.70%, 06/26/28 (a) | 200,000 | 235,768 |
| 3.25%, 07/08/29 (a) | 100,000 | 116,502 |
| 2.38%, 09/24/29 (a) | 50,000 | 54,970 |
| 7.55%, 02/15/30 | 75,000 | 114,949 |
| | | 14,533,516 |
| Consumer Non-Cyclical 15.0% |
| Abbott Laboratories |
| 3.75%, 11/30/26 (a) | 150,000 | 175,848 |
| AbbVie, Inc. |
| 3.20%, 05/14/26 (a) | 175,000 | 194,553 |
| 2.95%, 11/21/26 (a) | 275,000 | 304,909 |
| 4.25%, 11/14/28 (a) | 150,000 | 180,066 |
| 3.20%, 11/21/29 (a) | 475,000 | 535,776 |
| Advocate Health & Hospitals Corp. |
| 3.83%, 08/15/28 (a) | 130,000 | 149,700 |
| Agilent Technologies, Inc. |
| 3.05%, 09/22/26 (a) | 25,000 | 27,730 |
| 2.75%, 09/15/29 (a) | 150,000 | 164,155 |
| Ahold Finance USA LLC |
| 6.88%, 05/01/29 | 25,000 | 34,820 |
| Altria Group, Inc. |
| 4.40%, 02/14/26 (a) | 100,000 | 116,042 |
| 2.63%, 09/16/26 (a) | 125,000 | 135,044 |
| 4.80%, 02/14/29 (a) | 225,000 | 270,047 |
| 3.40%, 05/06/30 (a) | 150,000 | 167,805 |
| AmerisourceBergen Corp. |
| 3.45%, 12/15/27 (a) | 50,000 | 57,029 |
| 2.80%, 05/15/30 (a) | 50,000 | 54,513 |
Schwab Fixed-Income ETFs | Annual Report
Schwab 5-10 Year Corporate Bond ETF
Portfolio Holdings as of December 31, 2020 (continued)
Security
Rate, Maturity Date | Face
Amount ($) | Value ($) |
| Amgen, Inc. |
| 2.60%, 08/19/26 (a) | 50,000 | 54,633 |
| 2.20%, 02/21/27 (a) | 100,000 | 107,047 |
| 3.20%, 11/02/27 (a) | 125,000 | 140,930 |
| 2.45%, 02/21/30 (a) | 125,000 | 134,490 |
| 2.30%, 02/25/31 (a) | 50,000 | 53,210 |
| Anheuser-Busch Cos. LLC/Anheuser-Busch InBev Worldwide, Inc. |
| 3.65%, 02/01/26 (a) | 400,000 | 452,804 |
| Anheuser-Busch InBev Finance, Inc. |
| 3.65%, 02/01/26 (a) | 235,000 | 266,208 |
| Anheuser-Busch InBev Worldwide, Inc. |
| 4.00%, 04/13/28 (a) | 250,000 | 294,910 |
| 4.75%, 01/23/29 (a) | 95,000 | 117,311 |
| 3.50%, 06/01/30 (a) | 200,000 | 232,126 |
| Archer-Daniels-Midland Co. |
| 2.50%, 08/11/26 (a) | 175,000 | 191,236 |
| 3.25%, 03/27/30 (a) | 100,000 | 115,769 |
| Ascension Health |
| 2.53%, 11/15/29 (a) | 100,000 | 109,302 |
| AstraZeneca PLC |
| 3.13%, 06/12/27 (a) | 30,000 | 33,824 |
| 4.00%, 01/17/29 (a) | 250,000 | 299,020 |
| Banner Health |
| 2.34%, 01/01/30 (a) | 50,000 | 52,715 |
| BAT Capital Corp. |
| 3.22%, 09/06/26 (a) | 250,000 | 275,707 |
| 3.56%, 08/15/27 (a) | 300,000 | 335,004 |
| 2.26%, 03/25/28 (a) | 125,000 | 129,410 |
| 3.46%, 09/06/29 (a) | 50,000 | 55,309 |
| 4.91%, 04/02/30 (a) | 50,000 | 60,543 |
| BAT International Finance PLC |
| 1.67%, 03/25/26 (a) | 50,000 | 51,329 |
| Baxter International, Inc. |
| 2.60%, 08/15/26 (a) | 75,000 | 82,031 |
| 3.95%, 04/01/30 (a)(c) | 50,000 | 59,862 |
| Becton Dickinson & Co. |
| 3.70%, 06/06/27 (a) | 250,000 | 286,857 |
| 2.82%, 05/20/30 (a) | 50,000 | 55,056 |
| Biogen, Inc. |
| 2.25%, 05/01/30 (a) | 200,000 | 208,402 |
| Boston Scientific Corp. |
| 3.75%, 03/01/26 (a) | 25,000 | 28,392 |
| 4.00%, 03/01/29 (a) | 150,000 | 176,745 |
| 2.65%, 06/01/30 (a) | 75,000 | 80,545 |
| Bristol-Myers Squibb Co. |
| 3.20%, 06/15/26 (a) | 225,000 | 253,476 |
| 3.25%, 02/27/27 | 100,000 | 113,378 |
| 1.13%, 11/13/27 (a) | 100,000 | 101,093 |
| 3.45%, 11/15/27 (a) | 100,000 | 115,424 |
| 3.90%, 02/20/28 (a) | 175,000 | 207,952 |
| 3.40%, 07/26/29 (a) | 275,000 | 320,188 |
| 1.45%, 11/13/30 (a) | 150,000 | 150,802 |
| Bunge Ltd. Finance Corp. |
| 3.25%, 08/15/26 (a) | 100,000 | 111,376 |
| Campbell Soup Co. |
| 4.15%, 03/15/28 (a) | 75,000 | 88,286 |
| 2.38%, 04/24/30 (a) | 50,000 | 52,851 |
| Cardinal Health, Inc. |
| 3.41%, 06/15/27 (a) | 100,000 | 113,005 |
| Church & Dwight Co., Inc. |
| 3.15%, 08/01/27 (a) | 25,000 | 27,697 |
| Cigna Corp. |
| 3.40%, 03/01/27 (a) | 100,000 | 113,141 |
| 3.05%, 10/15/27 (a) | 200,000 | 223,508 |
Security
Rate, Maturity Date | Face
Amount ($) | Value ($) |
| 4.38%, 10/15/28 (a) | 325,000 | 393,019 |
| 2.40%, 03/15/30 (a) | 150,000 | 159,874 |
| Clorox Co. |
| 3.90%, 05/15/28 (a) | 50,000 | 58,909 |
| 1.80%, 05/15/30 (a) | 100,000 | 103,088 |
| Coca-Cola Co. |
| 2.55%, 06/01/26 | 175,000 | 191,753 |
| 2.25%, 09/01/26 | 125,000 | 135,890 |
| 3.38%, 03/25/27 | 250,000 | 286,962 |
| 2.90%, 05/25/27 | 30,000 | 33,569 |
| 1.45%, 06/01/27 | 50,000 | 51,681 |
| 2.13%, 09/06/29 | 100,000 | 106,964 |
| 3.45%, 03/25/30 | 100,000 | 117,958 |
| 1.65%, 06/01/30 | 50,000 | 51,420 |
| Coca-Cola Femsa S.A.B. de C.V. |
| 2.75%, 01/22/30 (a) | 150,000 | 162,715 |
| CommonSpirit Health |
| 3.35%, 10/01/29 (a) | 170,000 | 187,750 |
| Conagra Brands, Inc. |
| 4.85%, 11/01/28 (a) | 125,000 | 155,635 |
| 8.25%, 09/15/30 | 100,000 | 151,369 |
| Constellation Brands, Inc. |
| 3.70%, 12/06/26 (a) | 75,000 | 86,063 |
| 3.50%, 05/09/27 (a) | 75,000 | 85,219 |
| 4.65%, 11/15/28 (a) | 75,000 | 91,242 |
| 3.15%, 08/01/29 (a) | 25,000 | 27,865 |
| 2.88%, 05/01/30 (a) | 50,000 | 54,928 |
| CVS Health Corp. |
| 2.88%, 06/01/26 (a) | 200,000 | 219,976 |
| 3.00%, 08/15/26 (a) | 100,000 | 110,834 |
| 3.63%, 04/01/27 (a) | 100,000 | 113,998 |
| 1.30%, 08/21/27 (a) | 50,000 | 50,353 |
| 4.30%, 03/25/28 (a) | 810,000 | 960,919 |
| 3.25%, 08/15/29 (a) | 150,000 | 169,126 |
| 3.75%, 04/01/30 (a) | 50,000 | 58,366 |
| 1.75%, 08/21/30 (a) | 200,000 | 201,100 |
| DENTSPLY SIRONA, Inc. |
| 3.25%, 06/01/30 (a) | 50,000 | 55,781 |
| DH Europe Finance II Sarl |
| 2.60%, 11/15/29 (a) | 75,000 | 82,103 |
| Diageo Capital PLC |
| 2.38%, 10/24/29 (a) | 200,000 | 215,154 |
| Edwards Lifesciences Corp. |
| 4.30%, 06/15/28 (a) | 100,000 | 118,580 |
| Eli Lilly and Co. |
| 3.10%, 05/15/27 (a) | 25,000 | 28,137 |
| 3.38%, 03/15/29 (a) | 75,000 | 87,234 |
| Estee Lauder Cos., Inc. |
| 3.15%, 03/15/27 (a) | 50,000 | 56,226 |
| 2.38%, 12/01/29 (a) | 50,000 | 54,156 |
| 2.60%, 04/15/30 (a) | 100,000 | 110,408 |
| General Mills, Inc. |
| 4.20%, 04/17/28 (a) | 175,000 | 209,979 |
| 2.88%, 04/15/30 (a) | 100,000 | 111,069 |
| Gilead Sciences, Inc. |
| 3.65%, 03/01/26 (a) | 250,000 | 283,715 |
| 2.95%, 03/01/27 (a) | 150,000 | 165,757 |
| 1.65%, 10/01/30 (a) | 150,000 | 150,559 |
| GlaxoSmithKline Capital PLC |
| 3.38%, 06/01/29 (a) | 75,000 | 87,331 |
| GlaxoSmithKline Capital, Inc. |
| 3.88%, 05/15/28 | 150,000 | 178,762 |
Schwab Fixed-Income ETFs | Annual Report
Schwab 5-10 Year Corporate Bond ETF
Portfolio Holdings as of December 31, 2020 (continued)
Security
Rate, Maturity Date | Face
Amount ($) | Value ($) |
| Hasbro, Inc. |
| 3.55%, 11/19/26 (a) | 50,000 | 55,878 |
| 3.50%, 09/15/27 (a) | 130,000 | 143,642 |
| 3.90%, 11/19/29 (a) | 80,000 | 90,930 |
| HCA, Inc. |
| 5.25%, 06/15/26 (a) | 200,000 | 237,104 |
| 4.50%, 02/15/27 (a) | 100,000 | 116,465 |
| 4.13%, 06/15/29 (a) | 175,000 | 203,369 |
| Hershey Co. |
| 2.30%, 08/15/26 (a) | 14,000 | 15,223 |
| 2.45%, 11/15/29 (a) | 75,000 | 82,282 |
| Hormel Foods Corp. |
| 1.80%, 06/11/30 (a) | 100,000 | 103,576 |
| Ingredion, Inc. |
| 2.90%, 06/01/30 (a) | 150,000 | 165,696 |
| JM Smucker Co. |
| 3.38%, 12/15/27 (a) | 25,000 | 28,253 |
| Johnson & Johnson |
| 2.45%, 03/01/26 (a) | 75,000 | 81,682 |
| 2.95%, 03/03/27 (a) | 200,000 | 224,612 |
| 0.95%, 09/01/27 (a) | 200,000 | 201,080 |
| 2.90%, 01/15/28 (a) | 125,000 | 141,325 |
| 6.95%, 09/01/29 | 12,000 | 17,563 |
| 1.30%, 09/01/30 (a) | 200,000 | 201,464 |
| Kaiser Foundation Hospitals |
| 3.15%, 05/01/27 (a) | 50,000 | 56,531 |
| Kellogg Co. |
| 3.25%, 04/01/26 | 25,000 | 28,081 |
| 3.40%, 11/15/27 (a) | 200,000 | 228,792 |
| 4.30%, 05/15/28 (a) | 25,000 | 30,006 |
| Keurig Dr Pepper, Inc. |
| 2.55%, 09/15/26 (a) | 37,000 | 40,482 |
| 3.43%, 06/15/27 (a) | 25,000 | 28,473 |
| 4.60%, 05/25/28 (a) | 275,000 | 335,783 |
| Kimberly-Clark Corp. |
| 2.75%, 02/15/26 | 100,000 | 110,977 |
| 3.95%, 11/01/28 (a) | 50,000 | 60,178 |
| 3.20%, 04/25/29 (a) | 35,000 | 40,355 |
| Kroger Co. |
| 3.50%, 02/01/26 (a) | 25,000 | 28,126 |
| 2.65%, 10/15/26 (a) | 100,000 | 109,848 |
| 4.50%, 01/15/29 (a) | 75,000 | 92,281 |
| 2.20%, 05/01/30 (a) | 50,000 | 52,678 |
| Laboratory Corp. of America Holdings |
| 2.95%, 12/01/29 (a) | 150,000 | 166,188 |
| McCormick & Co., Inc. |
| 3.40%, 08/15/27 (a) | 50,000 | 56,630 |
| 2.50%, 04/15/30 (a) | 50,000 | 53,616 |
| McKesson Corp. |
| 3.95%, 02/16/28 (a) | 25,000 | 29,218 |
| 4.75%, 05/30/29 (a) | 50,000 | 61,612 |
| Medtronic Global Holdings SCA |
| 3.35%, 04/01/27 (a) | 35,000 | 39,432 |
| Merck & Co., Inc. |
| 3.40%, 03/07/29 (a) | 150,000 | 174,658 |
| 1.45%, 06/24/30 (a) | 200,000 | 202,582 |
| Molson Coors Beverage Co. |
| 3.00%, 07/15/26 (a) | 300,000 | 329,400 |
| Mondelez International, Inc. |
| 3.63%, 02/13/26 (a) | 100,000 | 113,713 |
| 2.75%, 04/13/30 (a) | 125,000 | 137,456 |
| Mylan, Inc. |
| 4.55%, 04/15/28 (a) | 100,000 | 119,382 |
Security
Rate, Maturity Date | Face
Amount ($) | Value ($) |
| Novartis Capital Corp. |
| 2.00%, 02/14/27 (a) | 100,000 | 106,765 |
| 3.10%, 05/17/27 (a) | 150,000 | 168,849 |
| PepsiCo, Inc. |
| 2.38%, 10/06/26 (a) | 135,000 | 147,173 |
| 3.00%, 10/15/27 (a) | 200,000 | 225,728 |
| 2.63%, 07/29/29 (a) | 50,000 | 55,348 |
| 2.75%, 03/19/30 (a) | 150,000 | 167,964 |
| 1.63%, 05/01/30 (a) | 75,000 | 77,058 |
| PerkinElmer, Inc. |
| 3.30%, 09/15/29 (a) | 50,000 | 56,436 |
| Perrigo Finance Unlimited Co. |
| 3.15%, 06/15/30 (a) | 200,000 | 214,600 |
| Pfizer, Inc. |
| 2.75%, 06/03/26 | 100,000 | 110,677 |
| 3.00%, 12/15/26 | 300,000 | 338,847 |
| 3.60%, 09/15/28 (a) | 150,000 | 177,055 |
| 3.45%, 03/15/29 (a) | 150,000 | 175,396 |
| 2.63%, 04/01/30 (a) | 150,000 | 166,624 |
| 1.70%, 05/28/30 (a) | 100,000 | 103,570 |
| Pharmacia LLC |
| 6.60%, 12/01/28 | 100,000 | 139,295 |
| Philip Morris International, Inc. |
| 2.75%, 02/25/26 (a) | 25,000 | 27,307 |
| 3.13%, 08/17/27 (a) | 57,000 | 63,959 |
| 3.13%, 03/02/28 (a) | 100,000 | 112,508 |
| 2.10%, 05/01/30 (a) | 100,000 | 104,275 |
| 1.75%, 11/01/30 (a) | 200,000 | 202,286 |
| Procter & Gamble Co. |
| 2.70%, 02/02/26 | 175,000 | 194,241 |
| 2.45%, 11/03/26 | 25,000 | 27,628 |
| 2.80%, 03/25/27 | 150,000 | 167,340 |
| 3.00%, 03/25/30 | 75,000 | 86,464 |
| 1.20%, 10/29/30 | 100,000 | 100,141 |
| Providence St Joseph Health Obligated Group |
| 2.53%, 10/01/29 (a) | 125,000 | 134,219 |
| Quest Diagnostics, Inc. |
| 3.45%, 06/01/26 (a) | 50,000 | 56,420 |
| 4.20%, 06/30/29 (a) | 25,000 | 29,770 |
| 2.95%, 06/30/30 (a) | 100,000 | 110,440 |
| Royalty Pharma PLC |
| 1.75%, 09/02/27 (a)(c) | 250,000 | 257,515 |
| Rush Obligated Group |
| 3.92%, 11/15/29 (a) | 50,000 | 58,962 |
| Sanofi |
| 3.63%, 06/19/28 (a) | 75,000 | 87,695 |
| Shire Acquisitions Investments Ireland DAC |
| 3.20%, 09/23/26 (a) | 100,000 | 112,024 |
| Smith & Nephew PLC |
| 2.03%, 10/14/30 (a) | 150,000 | 152,875 |
| Stanford Health Care |
| 3.31%, 08/15/30 (a) | 50,000 | 57,011 |
| Stryker Corp. |
| 3.65%, 03/07/28 (a) | 175,000 | 202,464 |
| 1.95%, 06/15/30 (a) | 100,000 | 103,103 |
| Sutter Health |
| 2.29%, 08/15/30 (a) | 150,000 | 157,005 |
| Sysco Corp. |
| 3.30%, 07/15/26 (a) | 25,000 | 27,849 |
| 3.25%, 07/15/27 (a) | 150,000 | 167,619 |
| 2.40%, 02/15/30 (a) | 40,000 | 41,779 |
| 5.95%, 04/01/30 (a) | 125,000 | 164,509 |
| Takeda Pharmaceutical Co., Ltd. |
| 5.00%, 11/26/28 (a) | 400,000 | 497,456 |
Schwab Fixed-Income ETFs | Annual Report
Schwab 5-10 Year Corporate Bond ETF
Portfolio Holdings as of December 31, 2020 (continued)
Security
Rate, Maturity Date | Face
Amount ($) | Value ($) |
| Thermo Fisher Scientific, Inc. |
| 2.95%, 09/19/26 (a) | 100,000 | 111,557 |
| 3.20%, 08/15/27 (a) | 50,000 | 56,310 |
| 2.60%, 10/01/29 (a) | 150,000 | 164,650 |
| 4.50%, 03/25/30 (a) | 75,000 | 93,736 |
| Toledo Hospital |
| 5.33%, 11/15/28 | 25,000 | 29,144 |
| Tyson Foods, Inc. |
| 4.00%, 03/01/26 (a) | 100,000 | 115,252 |
| 3.55%, 06/02/27 (a) | 150,000 | 171,444 |
| 4.35%, 03/01/29 (a) | 25,000 | 30,409 |
| Unilever Capital Corp. |
| 2.00%, 07/28/26 | 150,000 | 160,281 |
| 2.90%, 05/05/27 (a) | 200,000 | 222,974 |
| 1.38%, 09/14/30 (a) | 200,000 | 201,274 |
| Universal Health Services, Inc. |
| 2.65%, 10/15/30 (a)(c) | 50,000 | 52,023 |
| Utah Acquisition Sub, Inc. |
| 3.95%, 06/15/26 (a) | 100,000 | 114,540 |
| Viatris, Inc. |
| 2.70%, 06/22/30 (a)(c) | 200,000 | 212,450 |
| Whirlpool Corp. |
| 4.75%, 02/26/29 (a) | 90,000 | 110,189 |
| Zimmer Biomet Holdings, Inc. |
| 3.55%, 03/20/30 (a) | 75,000 | 85,048 |
| Zoetis, Inc. |
| 3.90%, 08/20/28 (a) | 175,000 | 206,810 |
| 2.00%, 05/15/30 (a) | 50,000 | 51,863 |
| | | 28,637,262 |
| Energy 7.1% |
| Baker Hughes a GE Co. LLC/Baker Hughes Co-Obligor, Inc. |
| 3.34%, 12/15/27 (a) | 100,000 | 112,625 |
| 3.14%, 11/07/29 (a) | 50,000 | 55,048 |
| 4.49%, 05/01/30 (a) | 100,000 | 120,517 |
| Boardwalk Pipelines LP |
| 4.45%, 07/15/27 (a) | 75,000 | 84,962 |
| 4.80%, 05/03/29 (a) | 50,000 | 57,360 |
| BP Capital Markets America, Inc. |
| 3.41%, 02/11/26 (a) | 95,000 | 106,558 |
| 3.12%, 05/04/26 (a) | 125,000 | 138,549 |
| 3.02%, 01/16/27 (a) | 100,000 | 110,624 |
| 3.54%, 04/06/27 (a) | 200,000 | 227,674 |
| 3.59%, 04/14/27 (a) | 42,000 | 47,804 |
| 3.94%, 09/21/28 (a) | 100,000 | 117,757 |
| 4.23%, 11/06/28 (a) | 200,000 | 239,258 |
| 3.63%, 04/06/30 (a) | 150,000 | 174,735 |
| 1.75%, 08/10/30 (a) | 50,000 | 50,373 |
| BP Capital Markets PLC |
| 3.28%, 09/19/27 (a) | 43,000 | 48,460 |
| Canadian Natural Resources Ltd. |
| 3.85%, 06/01/27 (a) | 100,000 | 112,467 |
| 2.95%, 07/15/30 (a) | 75,000 | 80,472 |
| Cheniere Corpus Christi Holdings LLC |
| 5.13%, 06/30/27 (a) | 200,000 | 237,106 |
| 3.70%, 11/15/29 (a) | 125,000 | 139,254 |
| Chevron Corp. |
| 2.95%, 05/16/26 (a) | 275,000 | 305,486 |
| 2.24%, 05/11/30 (a) | 100,000 | 107,310 |
| Chevron USA, Inc. |
| 1.02%, 08/12/27 (a) | 200,000 | 200,420 |
Security
Rate, Maturity Date | Face
Amount ($) | Value ($) |
| Cimarex Energy Co. |
| 3.90%, 05/15/27 (a) | 115,000 | 127,300 |
| 4.38%, 03/15/29 (a) | 45,000 | 51,224 |
| Concho Resources, Inc. |
| 4.30%, 08/15/28 (a) | 175,000 | 207,751 |
| ConocoPhillips Co. |
| 4.95%, 03/15/26 (a) | 150,000 | 180,220 |
| 6.95%, 04/15/29 | 125,000 | 175,496 |
| Devon Energy Corp. |
| 5.85%, 12/15/25 (a) | 100,000 | 117,847 |
| Diamondback Energy, Inc. |
| 3.25%, 12/01/26 (a) | 50,000 | 53,531 |
| 3.50%, 12/01/29 (a) | 100,000 | 106,996 |
| Eastern Energy Gas Holdings LLC |
| 3.00%, 11/15/29 (a) | 50,000 | 55,539 |
| Enable Midstream Partners LP |
| 4.40%, 03/15/27 (a) | 75,000 | 76,302 |
| 4.95%, 05/15/28 (a) | 100,000 | 103,685 |
| 4.15%, 09/15/29 (a) | 35,000 | 34,857 |
| Enbridge, Inc. |
| 4.25%, 12/01/26 (a) | 70,000 | 82,136 |
| 3.13%, 11/15/29 (a) | 100,000 | 110,499 |
| Energy Transfer Operating LP |
| 4.75%, 01/15/26 (a) | 75,000 | 84,996 |
| 4.20%, 04/15/27 (a) | 115,000 | 126,687 |
| 5.50%, 06/01/27 (a) | 50,000 | 58,733 |
| 4.95%, 06/15/28 (a) | 125,000 | 144,386 |
| 5.25%, 04/15/29 (a) | 175,000 | 204,592 |
| 3.75%, 05/15/30 (a) | 100,000 | 108,138 |
| Eni USA, Inc. |
| 7.30%, 11/15/27 | 50,000 | 67,168 |
| Enterprise Products Operating LLC |
| 3.70%, 02/15/26 (a) | 75,000 | 85,056 |
| 3.95%, 02/15/27 (a) | 100,000 | 116,245 |
| 4.15%, 10/16/28 (a) | 75,000 | 88,959 |
| 3.13%, 07/31/29 (a) | 85,000 | 94,508 |
| 2.80%, 01/31/30 (a) | 175,000 | 190,234 |
| 5.25%, 08/16/77 (a)(b) | 75,000 | 76,159 |
| 5.38%, 02/15/78 (a)(b) | 50,000 | 49,972 |
| EOG Resources, Inc. |
| 4.15%, 01/15/26 (a) | 50,000 | 58,164 |
| 4.38%, 04/15/30 (a) | 50,000 | 60,993 |
| Exxon Mobil Corp. |
| 3.04%, 03/01/26 (a) | 150,000 | 166,347 |
| 2.28%, 08/16/26 (a) | 100,000 | 107,844 |
| 2.44%, 08/16/29 (a) | 275,000 | 298,988 |
| 3.48%, 03/19/30 (a) | 250,000 | 290,752 |
| 2.61%, 10/15/30 (a) | 100,000 | 109,376 |
| Halliburton Co. |
| 2.92%, 03/01/30 (a) | 50,000 | 53,069 |
| Hess Corp. |
| 4.30%, 04/01/27 (a) | 100,000 | 110,479 |
| 7.88%, 10/01/29 | 55,000 | 72,411 |
| HollyFrontier Corp. |
| 5.88%, 04/01/26 (a) | 130,000 | 146,084 |
| 4.50%, 10/01/30 (a) | 100,000 | 105,711 |
| Husky Energy, Inc. |
| 4.40%, 04/15/29 (a) | 100,000 | 111,492 |
| Kinder Morgan, Inc. |
| 4.30%, 03/01/28 (a) | 50,000 | 58,723 |
| Magellan Midstream Partners LP |
| 5.00%, 03/01/26 (a) | 75,000 | 89,557 |
| 3.25%, 06/01/30 (a) | 50,000 | 56,413 |
Schwab Fixed-Income ETFs | Annual Report
Schwab 5-10 Year Corporate Bond ETF
Portfolio Holdings as of December 31, 2020 (continued)
Security
Rate, Maturity Date | Face
Amount ($) | Value ($) |
| Marathon Oil Corp. |
| 4.40%, 07/15/27 (a) | 100,000 | 111,200 |
| Marathon Petroleum Corp. |
| 5.13%, 12/15/26 (a) | 50,000 | 59,659 |
| 3.80%, 04/01/28 (a) | 50,000 | 55,796 |
| MPLX LP |
| 4.13%, 03/01/27 (a) | 100,000 | 115,594 |
| 4.25%, 12/01/27 (a) | 125,000 | 146,784 |
| 4.00%, 03/15/28 (a) | 125,000 | 144,107 |
| 4.80%, 02/15/29 (a) | 75,000 | 90,230 |
| 2.65%, 08/15/30 (a) | 150,000 | 157,783 |
| National Fuel Gas Co. |
| 5.50%, 01/15/26 (a) | 50,000 | 57,813 |
| 3.95%, 09/15/27 (a) | 50,000 | 53,202 |
| 4.75%, 09/01/28 (a) | 75,000 | 81,607 |
| National Oilwell Varco, Inc. |
| 3.60%, 12/01/29 (a) | 60,000 | 62,816 |
| Noble Energy, Inc. |
| 3.85%, 01/15/28 (a) | 50,000 | 58,171 |
| 3.25%, 10/15/29 (a) | 25,000 | 28,435 |
| Northwest Pipeline LLC |
| 4.00%, 04/01/27 (a) | 40,000 | 45,795 |
| ONEOK, Inc. |
| 5.85%, 01/15/26 (a) | 50,000 | 59,905 |
| 4.00%, 07/13/27 (a) | 100,000 | 111,742 |
| 4.55%, 07/15/28 (a) | 125,000 | 143,044 |
| 4.35%, 03/15/29 (a) | 50,000 | 56,862 |
| 3.40%, 09/01/29 (a) | 50,000 | 53,744 |
| 6.35%, 01/15/31 (a) | 30,000 | 38,592 |
| Phillips 66 |
| 1.30%, 02/15/26 (a) | 50,000 | 50,875 |
| 3.90%, 03/15/28 (a) | 75,000 | 86,611 |
| Phillips 66 Partners LP |
| 3.55%, 10/01/26 (a) | 50,000 | 54,864 |
| 3.75%, 03/01/28 (a) | 125,000 | 136,101 |
| 3.15%, 12/15/29 (a) | 100,000 | 104,556 |
| Pioneer Natural Resources Co. |
| 4.45%, 01/15/26 (a) | 50,000 | 57,942 |
| 1.90%, 08/15/30 (a) | 50,000 | 49,659 |
| Plains All American Pipeline LP/PAA Finance Corp. |
| 4.50%, 12/15/26 (a) | 25,000 | 28,061 |
| 3.55%, 12/15/29 (a) | 100,000 | 104,894 |
| Sabine Pass Liquefaction LLC |
| 5.88%, 06/30/26 (a) | 125,000 | 151,327 |
| 5.00%, 03/15/27 (a) | 95,000 | 112,296 |
| 4.20%, 03/15/28 (a) | 95,000 | 109,066 |
| 4.50%, 05/15/30 (a) | 200,000 | 238,198 |
| Schlumberger Investment S.A. |
| 2.65%, 06/26/30 (a) | 50,000 | 53,546 |
| Shell International Finance BV |
| 2.88%, 05/10/26 | 100,000 | 110,671 |
| 2.50%, 09/12/26 | 247,000 | 270,813 |
| 3.88%, 11/13/28 (a) | 150,000 | 177,964 |
| 2.38%, 11/07/29 (a) | 115,000 | 123,804 |
| 2.75%, 04/06/30 (a) | 100,000 | 110,668 |
| Spectra Energy Partners LP |
| 3.38%, 10/15/26 (a) | 50,000 | 55,890 |
| Sunoco Logistics Partners Operations LP |
| 3.90%, 07/15/26 (a) | 50,000 | 54,840 |
| 4.00%, 10/01/27 (a) | 125,000 | 136,772 |
| TC PipeLines LP |
| 3.90%, 05/25/27 (a) | 50,000 | 56,352 |
Security
Rate, Maturity Date | Face
Amount ($) | Value ($) |
| Tennessee Gas Pipeline Co. LLC |
| 7.00%, 03/15/27 | 50,000 | 63,012 |
| 7.00%, 10/15/28 | 50,000 | 65,363 |
| Total Capital International S.A. |
| 3.46%, 02/19/29 (a) | 125,000 | 144,847 |
| 2.83%, 01/10/30 (a) | 110,000 | 122,990 |
| Total Capital S.A. |
| 3.88%, 10/11/28 | 50,000 | 59,403 |
| TransCanada PipeLines Ltd. |
| 4.88%, 01/15/26 (a) | 80,000 | 95,217 |
| 4.10%, 04/15/30 (a) | 150,000 | 177,675 |
| Transcontinental Gas Pipe Line Co. LLC |
| 7.85%, 02/01/26 (a) | 75,000 | 98,498 |
| 4.00%, 03/15/28 (a) | 50,000 | 57,464 |
| 3.25%, 05/15/30 (a) | 50,000 | 56,036 |
| Valero Energy Corp. |
| 3.40%, 09/15/26 (a) | 110,000 | 120,876 |
| 2.15%, 09/15/27 (a) | 50,000 | 51,214 |
| 4.35%, 06/01/28 (a) | 50,000 | 57,082 |
| 4.00%, 04/01/29 (a) | 100,000 | 112,723 |
| Valero Energy Partners LP |
| 4.50%, 03/15/28 (a) | 50,000 | 58,207 |
| Williams Cos., Inc. |
| 3.75%, 06/15/27 (a) | 150,000 | 171,795 |
| 3.50%, 11/15/30 (a) | 100,000 | 113,503 |
| | | 13,544,994 |
| Industrial Other 0.2% |
| CBRE Services, Inc. |
| 4.88%, 03/01/26 (a) | 50,000 | 59,225 |
| Cintas Corp. No. 2 |
| 3.70%, 04/01/27 (a) | 100,000 | 115,416 |
| Emory University |
| 2.14%, 09/01/30 (a) | 100,000 | 105,269 |
| Quanta Services, Inc. |
| 2.90%, 10/01/30 (a) | 50,000 | 53,832 |
| Steelcase, Inc. |
| 5.13%, 01/18/29 (a) | 50,000 | 58,834 |
| | | 392,576 |
| Technology 9.8% |
| Adobe, Inc. |
| 2.15%, 02/01/27 (a) | 50,000 | 53,894 |
| 2.30%, 02/01/30 (a) | 75,000 | 81,197 |
| Alphabet, Inc. |
| 2.00%, 08/15/26 (a) | 125,000 | 134,070 |
| 0.80%, 08/15/27 (a) | 100,000 | 99,438 |
| 1.10%, 08/15/30 (a) | 100,000 | 98,437 |
| Amdocs Ltd. |
| 2.54%, 06/15/30 (a) | 50,000 | 52,785 |
| Analog Devices, Inc. |
| 3.50%, 12/05/26 (a) | 100,000 | 113,872 |
| Apple Inc. |
| 3.25%, 02/23/26 (a) | 200,000 | 224,484 |
| 2.45%, 08/04/26 (a) | 200,000 | 218,188 |
| 2.05%, 09/11/26 (a) | 200,000 | 214,162 |
| 3.35%, 02/09/27 (a) | 150,000 | 170,955 |
| 3.20%, 05/11/27 (a) | 100,000 | 113,417 |
| 3.00%, 06/20/27 (a) | 200,000 | 225,570 |
| 2.90%, 09/12/27 (a) | 150,000 | 168,271 |
| 3.00%, 11/13/27 (a) | 175,000 | 197,687 |
| 2.20%, 09/11/29 (a) | 175,000 | 189,317 |
Schwab Fixed-Income ETFs | Annual Report
Schwab 5-10 Year Corporate Bond ETF
Portfolio Holdings as of December 31, 2020 (continued)
Security
Rate, Maturity Date | Face
Amount ($) | Value ($) |
| 1.65%, 05/11/30 (a) | 100,000 | 103,065 |
| 1.25%, 08/20/30 (a) | 150,000 | 150,088 |
| Applied Materials, Inc. |
| 3.30%, 04/01/27 (a) | 125,000 | 141,811 |
| 1.75%, 06/01/30 (a) | 100,000 | 103,924 |
| Arrow Electronics, Inc. |
| 3.88%, 01/12/28 (a) | 75,000 | 84,648 |
| Autodesk, Inc. |
| 3.50%, 06/15/27 (a) | 100,000 | 112,919 |
| 2.85%, 01/15/30 (a) | 60,000 | 66,727 |
| Avnet, Inc. |
| 4.63%, 04/15/26 (a) | 50,000 | 56,742 |
| Baidu, Inc. |
| 2.38%, 10/09/30 (a) | 200,000 | 205,210 |
| Broadcom Corp./Broadcom Cayman Finance Ltd. |
| 3.88%, 01/15/27 (a) | 400,000 | 449,432 |
| 3.50%, 01/15/28 (a) | 100,000 | 110,180 |
| Broadcom, Inc. |
| 4.25%, 04/15/26 (a) | 175,000 | 200,655 |
| 3.46%, 09/15/26 (a) | 250,000 | 277,512 |
| 4.11%, 09/15/28 (a) | 50,000 | 57,284 |
| 4.75%, 04/15/29 (a) | 310,000 | 370,084 |
| 5.00%, 04/15/30 (a) | 300,000 | 365,175 |
| 4.15%, 11/15/30 (a) | 300,000 | 347,349 |
| Broadridge Financial Solutions, Inc. |
| 3.40%, 06/27/26 (a) | 50,000 | 56,431 |
| 2.90%, 12/01/29 (a) | 50,000 | 54,982 |
| CA, Inc. |
| 4.70%, 03/15/27 (a) | 125,000 | 143,155 |
| Cisco Systems, Inc. |
| 2.50%, 09/20/26 (a) | 175,000 | 192,552 |
| Citrix Systems, Inc. |
| 4.50%, 12/01/27 (a) | 200,000 | 235,284 |
| 3.30%, 03/01/30 (a) | 75,000 | 82,990 |
| Dell International LLC/EMC Corp. |
| 6.02%, 06/15/26 (a)(c) | 400,000 | 488,696 |
| 4.90%, 10/01/26 (a)(c) | 125,000 | 147,732 |
| 6.10%, 07/15/27 (a)(c) | 50,000 | 62,125 |
| 5.30%, 10/01/29 (a)(c) | 255,000 | 312,602 |
| DXC Technology Co. |
| 4.75%, 04/15/27 (a) | 50,000 | 57,512 |
| Equifax, Inc. |
| 2.60%, 12/15/25 (a) | 100,000 | 108,213 |
| 3.10%, 05/15/30 (a) | 50,000 | 55,844 |
| Equinix, Inc. |
| 2.90%, 11/18/26 (a) | 125,000 | 137,035 |
| 5.38%, 05/15/27 (a) | 150,000 | 163,542 |
| 1.55%, 03/15/28 (a) | 200,000 | 202,742 |
| 3.20%, 11/18/29 (a) | 50,000 | 55,036 |
| 2.15%, 07/15/30 (a) | 100,000 | 101,986 |
| Fidelity National Information Services, Inc. |
| 3.00%, 08/15/26 (a) | 50,000 | 55,674 |
| 4.25%, 05/15/28 (a) | 125,000 | 148,696 |
| 3.75%, 05/21/29 (a) | 75,000 | 88,559 |
| Fiserv, Inc. |
| 3.20%, 07/01/26 (a) | 300,000 | 336,033 |
| 4.20%, 10/01/28 (a) | 50,000 | 59,715 |
| 3.50%, 07/01/29 (a) | 275,000 | 316,085 |
| 2.65%, 06/01/30 (a) | 75,000 | 81,455 |
| Flex Ltd. |
| 3.75%, 02/01/26 (a) | 75,000 | 83,862 |
| 4.88%, 06/15/29 (a) | 75,000 | 89,350 |
| 4.88%, 05/12/30 (a) | 50,000 | 60,278 |
Security
Rate, Maturity Date | Face
Amount ($) | Value ($) |
| Global Payments, Inc. |
| 4.45%, 06/01/28 (a) | 50,000 | 59,364 |
| 3.20%, 08/15/29 (a) | 130,000 | 144,586 |
| 2.90%, 05/15/30 (a) | 100,000 | 108,935 |
| Hewlett Packard Enterprise Co. |
| 1.75%, 04/01/26 (a) | 50,000 | 51,861 |
| HP, Inc. |
| 3.40%, 06/17/30 (a) | 150,000 | 167,209 |
| Intel Corp. |
| 2.60%, 05/19/26 (a) | 100,000 | 109,181 |
| 3.75%, 03/25/27 (a) | 175,000 | 203,100 |
| 3.15%, 05/11/27 (a) | 50,000 | 56,299 |
| 2.45%, 11/15/29 (a) | 100,000 | 108,373 |
| 3.90%, 03/25/30 (a) | 225,000 | 270,337 |
| International Business Machines Corp. |
| 3.45%, 02/19/26 | 250,000 | 283,640 |
| 3.30%, 05/15/26 | 200,000 | 226,298 |
| 3.30%, 01/27/27 | 100,000 | 112,971 |
| 1.70%, 05/15/27 (a) | 150,000 | 156,133 |
| 3.50%, 05/15/29 | 200,000 | 231,004 |
| 1.95%, 05/15/30 (a) | 200,000 | 206,504 |
| Jabil, Inc. |
| 3.95%, 01/12/28 (a) | 50,000 | 57,121 |
| 3.60%, 01/15/30 (a) | 35,000 | 39,180 |
| Juniper Networks, Inc. |
| 3.75%, 08/15/29 (a) | 50,000 | 57,545 |
| 2.00%, 12/10/30 (a) | 50,000 | 49,408 |
| Keysight Technologies, Inc. |
| 4.60%, 04/06/27 (a) | 125,000 | 149,274 |
| 3.00%, 10/30/29 (a) | 25,000 | 27,678 |
| KLA Corp. |
| 4.10%, 03/15/29 (a) | 100,000 | 120,009 |
| Lam Research Corp. |
| 4.00%, 03/15/29 (a) | 150,000 | 180,243 |
| 1.90%, 06/15/30 (a) | 125,000 | 129,934 |
| Leidos, Inc. |
| 4.38%, 05/15/30 (a)(c) | 100,000 | 120,026 |
| Marvell Technology Group Ltd. |
| 4.88%, 06/22/28 (a) | 50,000 | 59,400 |
| Maxim Integrated Products, Inc. |
| 3.45%, 06/15/27 (a) | 40,000 | 44,981 |
| Micron Technology, Inc. |
| 4.98%, 02/06/26 (a) | 45,000 | 53,310 |
| 4.19%, 02/15/27 (a) | 26,000 | 30,442 |
| 5.33%, 02/06/29 (a) | 150,000 | 188,128 |
| 4.66%, 02/15/30 (a) | 50,000 | 61,439 |
| Microsoft Corp. |
| 2.40%, 08/08/26 (a) | 320,000 | 349,296 |
| 3.30%, 02/06/27 (a) | 375,000 | 427,867 |
| Motorola Solutions, Inc. |
| 4.60%, 02/23/28 (a) | 200,000 | 241,962 |
| 4.60%, 05/23/29 (a) | 25,000 | 30,098 |
| NetApp, Inc. |
| 2.70%, 06/22/30 (a) | 75,000 | 80,926 |
| NVIDIA Corp. |
| 3.20%, 09/16/26 (a) | 75,000 | 85,039 |
| 2.85%, 04/01/30 (a) | 150,000 | 168,954 |
| NXP BV/NXP Funding LLC |
| 5.35%, 03/01/26 (a)(c) | 50,000 | 59,989 |
| 5.55%, 12/01/28 (a)(c) | 50,000 | 63,391 |
| NXP BV/NXP Funding LLC/NXP USA, Inc. |
| 3.88%, 06/18/26 (a)(c) | 75,000 | 85,897 |
| 3.15%, 05/01/27 (a)(c) | 100,000 | 110,501 |
Schwab Fixed-Income ETFs | Annual Report
Schwab 5-10 Year Corporate Bond ETF
Portfolio Holdings as of December 31, 2020 (continued)
Security
Rate, Maturity Date | Face
Amount ($) | Value ($) |
| 4.30%, 06/18/29 (a)(c) | 125,000 | 149,036 |
| 3.40%, 05/01/30 (a)(c) | 50,000 | 56,911 |
| Oracle Corp. |
| 2.65%, 07/15/26 (a) | 400,000 | 438,952 |
| 2.80%, 04/01/27 (a) | 250,000 | 276,282 |
| 3.25%, 11/15/27 (a) | 100,000 | 114,080 |
| 2.95%, 04/01/30 (a) | 275,000 | 307,843 |
| PayPal Holdings, Inc. |
| 2.65%, 10/01/26 (a) | 100,000 | 110,060 |
| 2.85%, 10/01/29 (a) | 225,000 | 250,650 |
| QUALCOMM, Inc. |
| 3.25%, 05/20/27 (a) | 185,000 | 210,452 |
| 1.30%, 05/20/28 (a) | 50,000 | 50,554 |
| 2.15%, 05/20/30 (a) | 150,000 | 159,301 |
| salesforce.com, Inc. |
| 3.70%, 04/11/28 (a) | 100,000 | 118,175 |
| Seagate HDD Cayman |
| 4.88%, 06/01/27 (a) | 50,000 | 56,296 |
| 4.09%, 06/01/29 (a)(c) | 150,000 | 160,836 |
| ServiceNow, Inc. |
| 1.40%, 09/01/30 (a) | 100,000 | 97,809 |
| Texas Instruments, Inc. |
| 2.25%, 09/04/29 (a) | 100,000 | 107,964 |
| 1.75%, 05/04/30 (a) | 100,000 | 103,653 |
| Trimble, Inc. |
| 4.90%, 06/15/28 (a) | 50,000 | 59,953 |
| Tyco Electronics Group S.A. |
| 3.13%, 08/15/27 (a) | 50,000 | 55,716 |
| Verisk Analytics, Inc. |
| 4.13%, 03/15/29 (a) | 100,000 | 120,664 |
| VMware, Inc. |
| 4.65%, 05/15/27 (a) | 150,000 | 175,750 |
| 3.90%, 08/21/27 (a) | 75,000 | 84,722 |
| 4.70%, 05/15/30 (a) | 100,000 | 120,519 |
| Xilinx, Inc. |
| 2.38%, 06/01/30 (a) | 100,000 | 105,024 |
| | | 18,595,750 |
| Transportation 2.1% |
| American Airlines 2015-2 Class AA Pass-Through Trust |
| 3.60%, 09/22/27 | 59,014 | 58,275 |
| American Airlines 2016-1 Class AA Pass-Through Trust |
| 3.58%, 07/15/29 | 40,469 | 40,213 |
| American Airlines 2016-2 Class AA Pass-Through Trust |
| 3.20%, 06/15/28 | 40,475 | 39,376 |
| American Airlines 2016-3 Class AA Pass-Through Trust |
| 3.00%, 10/15/28 | 41,093 | 40,251 |
| American Airlines 2017-1 Class AA Pass-Through Trust |
| 3.65%, 02/15/29 | 82,875 | 82,786 |
| BNSF Funding Trust I |
| 6.61%, 12/15/55 (a)(b) | 50,000 | 57,561 |
| Burlington Northern Santa Fe LLC |
| 3.25%, 06/15/27 (a) | 66,000 | 74,981 |
| Canadian National Railway Co. |
| 2.75%, 03/01/26 (a) | 100,000 | 109,868 |
| 6.90%, 07/15/28 | 35,000 | 48,694 |
| Canadian Pacific Railway Co. |
| 4.00%, 06/01/28 (a) | 50,000 | 58,835 |
| 2.05%, 03/05/30 (a) | 75,000 | 78,862 |
| CH Robinson Worldwide, Inc. |
| 4.20%, 04/15/28 (a) | 55,000 | 65,134 |
Security
Rate, Maturity Date | Face
Amount ($) | Value ($) |
| CSX Corp. |
| 2.60%, 11/01/26 (a) | 50,000 | 54,691 |
| 3.25%, 06/01/27 (a) | 50,000 | 56,578 |
| 3.80%, 03/01/28 (a) | 100,000 | 116,574 |
| 4.25%, 03/15/29 (a) | 50,000 | 60,708 |
| 2.40%, 02/15/30 (a) | 50,000 | 54,078 |
| Delta Air Lines 2020-1 Class AA Pass-Through Trust |
| 2.00%, 06/10/28 | 97,010 | 97,273 |
| FedEx Corp. |
| 3.25%, 04/01/26 (a) | 125,000 | 139,572 |
| 3.30%, 03/15/27 (a) | 50,000 | 56,106 |
| 3.40%, 02/15/28 (a) | 75,000 | 85,763 |
| 4.20%, 10/17/28 (a) | 75,000 | 89,763 |
| 3.10%, 08/05/29 (a) | 120,000 | 134,268 |
| JB Hunt Transport Services, Inc. |
| 3.88%, 03/01/26 (a) | 100,000 | 115,396 |
| Kansas City Southern |
| 2.88%, 11/15/29 (a) | 50,000 | 54,141 |
| Kirby Corp. |
| 4.20%, 03/01/28 (a) | 30,000 | 33,342 |
| Norfolk Southern Corp. |
| 3.15%, 06/01/27 (a) | 100,000 | 111,910 |
| 2.55%, 11/01/29 (a) | 75,000 | 81,347 |
| Ryder System, Inc. |
| 2.90%, 12/01/26 (a) | 50,000 | 55,028 |
| Southwest Airlines Co. |
| 3.00%, 11/15/26 (a) | 25,000 | 26,817 |
| 5.13%, 06/15/27 (a) | 200,000 | 237,822 |
| 3.45%, 11/16/27 (a) | 25,000 | 27,352 |
| 2.63%, 02/10/30 (a) | 60,000 | 61,258 |
| Union Pacific Corp. |
| 2.75%, 03/01/26 (a) | 100,000 | 109,391 |
| 2.15%, 02/05/27 (a) | 125,000 | 133,145 |
| 3.95%, 09/10/28 (a) | 150,000 | 178,825 |
| 3.70%, 03/01/29 (a) | 50,000 | 58,322 |
| 2.40%, 02/05/30 (a) | 125,000 | 134,950 |
| United Airlines 2014-1 Class A Pass-Through Trust |
| 4.00%, 04/11/26 | 121,912 | 122,685 |
| United Airlines 2014-2 Class A Pass-Through Trust |
| 3.75%, 09/03/26 | 43,086 | 43,594 |
| United Airlines 2016-1 Class AA Pass-Through Trust |
| 3.10%, 07/07/28 | 147,298 | 149,517 |
| United Airlines 2016-2 Class AA Pass-Through Trust |
| 2.88%, 10/07/28 | 84,141 | 84,300 |
| United Airlines 2018-1 Class AA Pass-Through Trust |
| 3.50%, 03/01/30 | 45,412 | 44,959 |
| United Airlines 2020-1 Class A Pass-Through Trust |
| 5.88%, 10/15/27 | 100,000 | 108,006 |
| United Parcel Service, Inc. |
| 2.40%, 11/15/26 (a) | 75,000 | 81,853 |
| 3.05%, 11/15/27 (a) | 25,000 | 28,373 |
| 3.40%, 03/15/29 (a) | 125,000 | 144,456 |
| 2.50%, 09/01/29 (a) | 75,000 | 81,772 |
| | | 4,008,771 |
| | | 110,426,966 |
| |
| Utility 6.4% |
| Electric 5.5% |
| AEP Texas, Inc. |
| 3.95%, 06/01/28 (a) | 100,000 | 117,093 |
| 2.10%, 07/01/30 (a) | 75,000 | 78,443 |
Schwab Fixed-Income ETFs | Annual Report
Schwab 5-10 Year Corporate Bond ETF
Portfolio Holdings as of December 31, 2020 (continued)
Security
Rate, Maturity Date | Face
Amount ($) | Value ($) |
| AEP Transmission Co. LLC |
| 3.10%, 12/01/26 (a) | 35,000 | 39,459 |
| Alabama Power Co. |
| 1.45%, 09/15/30 (a) | 50,000 | 50,499 |
| Ameren Illinois Co. |
| 3.80%, 05/15/28 (a) | 35,000 | 40,902 |
| 1.55%, 11/15/30 (a) | 50,000 | 50,503 |
| American Electric Power Co., Inc. |
| 4.30%, 12/01/28 (a) | 25,000 | 30,002 |
| 2.30%, 03/01/30 (a) | 50,000 | 52,285 |
| Appalachian Power Co. |
| 3.30%, 06/01/27 (a) | 75,000 | 83,413 |
| Arizona Public Service Co. |
| 2.60%, 08/15/29 (a) | 100,000 | 109,460 |
| Avangrid, Inc. |
| 3.80%, 06/01/29 (a) | 50,000 | 57,639 |
| Berkshire Hathaway Energy Co. |
| 3.25%, 04/15/28 (a) | 50,000 | 57,207 |
| 3.70%, 07/15/30 (a)(c) | 100,000 | 118,602 |
| Black Hills Corp. |
| 3.95%, 01/15/26 (a) | 50,000 | 57,100 |
| 3.05%, 10/15/29 (a) | 25,000 | 27,501 |
| 2.50%, 06/15/30 (a) | 100,000 | 105,577 |
| CenterPoint Energy Houston Electric LLC |
| 2.40%, 09/01/26 (a) | 75,000 | 81,264 |
| CenterPoint Energy, Inc. |
| 2.95%, 03/01/30 (a) | 30,000 | 32,830 |
| Cleco Corporate Holdings LLC |
| 3.74%, 05/01/26 (a) | 75,000 | 83,133 |
| CMS Energy Corp. |
| 3.00%, 05/15/26 (a) | 50,000 | 55,241 |
| 3.45%, 08/15/27 (a) | 25,000 | 28,256 |
| 4.75%, 06/01/50 (a)(b) | 50,000 | 56,437 |
| Commonwealth Edison Co. |
| 2.55%, 06/15/26 (a) | 60,000 | 65,910 |
| 3.70%, 08/15/28 (a) | 25,000 | 29,642 |
| 2.20%, 03/01/30 (a) | 160,000 | 171,594 |
| Connecticut Light & Power Co. |
| 3.20%, 03/15/27 (a) | 50,000 | 56,564 |
| Consolidated Edison Co. of New York, Inc. |
| 3.13%, 11/15/27 (a) | 19,000 | 21,275 |
| 3.80%, 05/15/28 (a) | 25,000 | 29,011 |
| 4.00%, 12/01/28 (a) | 33,000 | 38,970 |
| 3.35%, 04/01/30 (a) | 50,000 | 57,319 |
| Dominion Energy, Inc. |
| 2.85%, 08/15/26 (a) | 150,000 | 165,420 |
| 3.60%, 03/15/27 (a) | 50,000 | 56,862 |
| 4.25%, 06/01/28 (a) | 35,000 | 42,057 |
| 3.38%, 04/01/30 (a) | 100,000 | 113,964 |
| DTE Energy Co. |
| 2.85%, 10/01/26 (a) | 50,000 | 54,958 |
| 3.80%, 03/15/27 (a) | 50,000 | 57,723 |
| 3.40%, 06/15/29 (a) | 50,000 | 56,836 |
| 2.95%, 03/01/30 (a) | 50,000 | 55,015 |
| Duke Energy Carolinas LLC |
| 2.95%, 12/01/26 (a) | 100,000 | 112,208 |
| 3.95%, 11/15/28 (a) | 50,000 | 59,593 |
| 6.00%, 12/01/28 | 50,000 | 66,572 |
| 2.45%, 08/15/29 (a) | 100,000 | 107,985 |
| 2.45%, 02/01/30 (a) | 50,000 | 53,936 |
| Duke Energy Corp. |
| 2.65%, 09/01/26 (a) | 125,000 | 136,317 |
| 3.40%, 06/15/29 (a) | 110,000 | 124,948 |
Security
Rate, Maturity Date | Face
Amount ($) | Value ($) |
| Duke Energy Florida LLC |
| 3.20%, 01/15/27 (a) | 50,000 | 56,009 |
| 3.80%, 07/15/28 (a) | 75,000 | 88,180 |
| 2.50%, 12/01/29 (a) | 100,000 | 109,106 |
| 1.75%, 06/15/30 (a) | 100,000 | 102,092 |
| Duke Energy Progress LLC |
| 3.70%, 09/01/28 (a) | 75,000 | 87,583 |
| 3.45%, 03/15/29 (a) | 50,000 | 57,871 |
| Edison International |
| 5.75%, 06/15/27 (a) | 50,000 | 59,906 |
| Emera US Finance LP |
| 3.55%, 06/15/26 (a) | 75,000 | 84,304 |
| Enel Americas S.A. |
| 4.00%, 10/25/26 (a) | 50,000 | 56,377 |
| Enel Chile S.A. |
| 4.88%, 06/12/28 (a) | 70,000 | 82,950 |
| Entergy Arkansas LLC |
| 3.50%, 04/01/26 (a) | 75,000 | 84,856 |
| Entergy Corp. |
| 2.95%, 09/01/26 (a) | 25,000 | 27,593 |
| 2.80%, 06/15/30 (a) | 100,000 | 108,527 |
| Entergy Louisiana LLC |
| 2.40%, 10/01/26 (a) | 100,000 | 108,310 |
| 3.12%, 09/01/27 (a) | 115,000 | 127,847 |
| Entergy Texas, Inc. |
| 4.00%, 03/30/29 (a) | 75,000 | 88,016 |
| Evergy Metro, Inc. |
| 2.25%, 06/01/30 (a) | 50,000 | 53,079 |
| Evergy, Inc. |
| 2.90%, 09/15/29 (a) | 75,000 | 82,414 |
| Eversource Energy |
| 1.65%, 08/15/30 (a) | 200,000 | 199,550 |
| Exelon Corp. |
| 3.40%, 04/15/26 (a) | 75,000 | 84,547 |
| 4.05%, 04/15/30 (a) | 100,000 | 118,600 |
| Fortis, Inc. |
| 3.06%, 10/04/26 (a) | 50,000 | 55,153 |
| Georgia Power Co. |
| 3.25%, 03/30/27 (a) | 75,000 | 83,192 |
| 2.65%, 09/15/29 (a) | 45,000 | 49,518 |
| Gulf Power Co. |
| 3.30%, 05/30/27 (a) | 25,000 | 28,188 |
| Interstate Power and Light Co. |
| 4.10%, 09/26/28 (a) | 50,000 | 59,759 |
| 3.60%, 04/01/29 (a) | 100,000 | 115,970 |
| ITC Holdings Corp. |
| 3.25%, 06/30/26 (a) | 75,000 | 83,566 |
| 3.35%, 11/15/27 (a) | 30,000 | 33,826 |
| MidAmerican Energy Co. |
| 3.65%, 04/15/29 (a) | 75,000 | 89,274 |
| Mississippi Power Co. |
| 3.95%, 03/30/28 (a) | 50,000 | 58,328 |
| National Rural Utilities Cooperative Finance Corp. |
| 3.40%, 02/07/28 (a) | 50,000 | 57,547 |
| 3.90%, 11/01/28 (a) | 30,000 | 35,303 |
| 3.70%, 03/15/29 (a) | 50,000 | 58,562 |
| 2.40%, 03/15/30 (a) | 25,000 | 27,105 |
| Nevada Power Co. |
| 3.70%, 05/01/29 (a) | 100,000 | 117,446 |
| 2.40%, 05/01/30 (a) | 100,000 | 107,650 |
| NextEra Energy Capital Holdings, Inc. |
| 3.55%, 05/01/27 (a) | 150,000 | 171,216 |
| 3.50%, 04/01/29 (a) | 25,000 | 28,589 |
Schwab Fixed-Income ETFs | Annual Report
Schwab 5-10 Year Corporate Bond ETF
Portfolio Holdings as of December 31, 2020 (continued)
Security
Rate, Maturity Date | Face
Amount ($) | Value ($) |
| 2.75%, 11/01/29 (a) | 100,000 | 109,077 |
| 2.25%, 06/01/30 (a) | 250,000 | 262,315 |
| 4.80%, 12/01/77 (a)(b) | 50,000 | 54,922 |
| 5.65%, 05/01/79 (a)(b) | 50,000 | 58,887 |
| NSTAR Electric Co. |
| 3.20%, 05/15/27 (a) | 100,000 | 113,370 |
| 3.25%, 05/15/29 (a) | 100,000 | 114,697 |
| 3.95%, 04/01/30 (a) | 25,000 | 30,366 |
| Ohio Power Co. |
| 2.60%, 04/01/30 (a) | 100,000 | 109,449 |
| Oklahoma Gas and Electric Co. |
| 3.80%, 08/15/28 (a) | 25,000 | 29,021 |
| 3.30%, 03/15/30 (a) | 30,000 | 34,378 |
| Oncor Electric Delivery Co. LLC |
| 3.70%, 11/15/28 (a) | 125,000 | 146,507 |
| Pacific Gas and Electric Co. |
| 3.15%, 01/01/26 | 50,000 | 53,371 |
| 2.95%, 03/01/26 (a) | 200,000 | 211,776 |
| 2.10%, 08/01/27 (a) | 50,000 | 50,905 |
| 3.30%, 12/01/27 (a) | 100,000 | 107,032 |
| 4.55%, 07/01/30 (a) | 300,000 | 342,609 |
| PPL Capital Funding, Inc. |
| 3.10%, 05/15/26 (a) | 75,000 | 83,067 |
| 4.13%, 04/15/30 (a) | 100,000 | 119,266 |
| Public Service Co. of Colorado |
| 3.70%, 06/15/28 (a) | 25,000 | 29,217 |
| Public Service Electric and Gas Co. |
| 2.25%, 09/15/26 (a) | 100,000 | 108,172 |
| 3.00%, 05/15/27 (a) | 50,000 | 55,682 |
| 3.65%, 09/01/28 (a) | 50,000 | 58,142 |
| 2.45%, 01/15/30 (a) | 20,000 | 21,775 |
| Public Service Enterprise Group, Inc. |
| 1.60%, 08/15/30 (a) | 50,000 | 49,435 |
| Puget Energy, Inc. |
| 4.10%, 06/15/30 (a) | 50,000 | 57,429 |
| San Diego Gas & Electric Co. |
| 1.70%, 10/01/30 (a) | 100,000 | 101,318 |
| Sierra Pacific Power Co. |
| 2.60%, 05/01/26 (a) | 100,000 | 108,638 |
| Southern California Edison Co. |
| 1.20%, 02/01/26 (a) | 50,000 | 50,479 |
| 3.65%, 03/01/28 (a) | 50,000 | 56,270 |
| 4.20%, 03/01/29 (a) | 100,000 | 117,447 |
| 6.65%, 04/01/29 | 50,000 | 63,746 |
| 2.85%, 08/01/29 (a) | 50,000 | 54,582 |
| Southern Co. |
| 3.25%, 07/01/26 (a) | 100,000 | 112,244 |
| 3.70%, 04/30/30 (a) | 100,000 | 116,076 |
| 4.00%, 01/15/51 (a)(b) | 50,000 | 52,893 |
| Southwestern Electric Power Co. |
| 2.75%, 10/01/26 (a) | 100,000 | 108,968 |
| Tucson Electric Power Co. |
| 1.50%, 08/01/30 (a) | 50,000 | 49,594 |
| Union Electric Co. |
| 3.50%, 03/15/29 (a) | 75,000 | 86,659 |
| 2.95%, 03/15/30 (a) | 50,000 | 56,059 |
| Virginia Electric and Power Co. |
| 3.15%, 01/15/26 (a) | 25,000 | 27,741 |
| 3.50%, 03/15/27 (a) | 50,000 | 57,121 |
| 3.80%, 04/01/28 (a) | 150,000 | 175,926 |
| 2.88%, 07/15/29 (a) | 100,000 | 112,403 |
| WEC Energy Group, Inc. |
| 1.38%, 10/15/27 (a) | 100,000 | 101,854 |
Security
Rate, Maturity Date | Face
Amount ($) | Value ($) |
| Xcel Energy, Inc. |
| 3.35%, 12/01/26 (a) | 50,000 | 56,522 |
| 4.00%, 06/15/28 (a) | 100,000 | 118,056 |
| 3.40%, 06/01/30 (a) | 100,000 | 115,091 |
| | | 10,585,988 |
| Natural Gas 0.7% |
| Atmos Energy Corp. |
| 2.63%, 09/15/29 (a) | 50,000 | 55,208 |
| CenterPoint Energy Resources Corp. |
| 4.00%, 04/01/28 (a) | 150,000 | 175,426 |
| 1.75%, 10/01/30 (a) | 50,000 | 50,612 |
| NiSource, Inc. |
| 3.49%, 05/15/27 (a) | 75,000 | 85,207 |
| 2.95%, 09/01/29 (a) | 100,000 | 110,073 |
| 3.60%, 05/01/30 (a) | 100,000 | 115,941 |
| ONE Gas, Inc. |
| 2.00%, 05/15/30 (a) | 50,000 | 52,197 |
| Piedmont Natural Gas Co., Inc. |
| 3.50%, 06/01/29 (a) | 60,000 | 68,731 |
| Sempra Energy |
| 3.25%, 06/15/27 (a) | 100,000 | 111,920 |
| 3.40%, 02/01/28 (a) | 75,000 | 85,537 |
| Southern California Gas Co. |
| 2.60%, 06/15/26 (a) | 75,000 | 81,625 |
| 2.55%, 02/01/30 (a) | 50,000 | 54,268 |
| Southern Co. Gas Capital Corp. |
| 3.25%, 06/15/26 (a) | 35,000 | 39,364 |
| Southwest Gas Corp. |
| 2.20%, 06/15/30 (a) | 200,000 | 210,656 |
| | | 1,296,765 |
| Utility Other 0.2% |
| American Water Capital Corp. |
| 2.95%, 09/01/27 (a) | 60,000 | 66,277 |
| 3.45%, 06/01/29 (a) | 100,000 | 115,016 |
| 2.80%, 05/01/30 (a) | 100,000 | 110,429 |
| Essential Utilities, Inc. |
| 3.57%, 05/01/29 (a) | 50,000 | 57,678 |
| 2.70%, 04/15/30 (a) | 50,000 | 54,385 |
| | | 403,785 |
| | | 12,286,538 |
| Total Corporates |
| (Cost $176,791,919) | | 187,069,041 |
| Security | Number
of Shares | Value ($) |
| Other Investment Company 1.5% of net assets |
| |
| Money Market Fund 1.5% |
| State Street Institutional U.S. Government Money Market Fund, Premier Class 0.03% (g) | 2,779,733 | 2,779,733 |
| Total Other Investment Company |
| (Cost $2,779,733) | | 2,779,733 |
Schwab Fixed-Income ETFs | Annual Report
Schwab 5-10 Year Corporate Bond ETF
Portfolio Holdings as of December 31, 2020 (continued)
| | Number of
Contracts | Notional
Amount
($) | Current Value/
Unrealized
Appreciation
($) |
| Futures Contracts | |
| Long | |
| 10 Year US Treasury Note (CBOT), expires 03/22/21 | 11 | 1,518,859 | 327 |
| (a) | The effective maturity may be shorter than the final maturity shown because of the possibility of interim principal payments and prepayments or as the result of embedded demand features (puts or calls). |
| (b) | Security converts to floating rate after the fixed-rate coupon period. |
| (c) | Securities exempt from registration under Rule 144A of the Securities Act of 1933, as amended. These securities may be resold in transactions exempt from registrations, normally to qualified institutional buyers. At the period end, the value of these amounted to $4,283,823 or 2.2% of net assets. |
| (d) | Issuer is affiliated with the fund’s investment adviser. |
| (e) | Variable-rate security. |
| (f) | Interest rate is subject to adjustments from time to time if a nationally recognized statistical rating organization downgrades (or subsequently upgrades) the debt rating assigned to the bond. |
| (g) | The rate shown is the 7-day yield. |
| | |
| CBOT — | Chicago Board of Trade |
| REIT — | Real Estate Investment Trust |
The fund owns corporate bonds of an affiliate, The Charles Schwab Corp., since those corporate bonds are included in its index. Below is a summary of investment activities involving The Charles Schwab Corp. notes owned by the fund during the period ended December 31, 2020:
| |
Value at
12/31/19 | Gross
Purchases* | Gross
Sales | Realized
Gains(Losses) | Net change
in unrealized
appreciation
(depreciation) |
Value at
12/31/20 | Face
amount at
12/31/20 | Interest
Income
Earned |
| Charles Schwab Corp., 3.20%, 03/02/27 | $262,441 | ($820) | ($212,791) | $3,093 | $4,407 | $56,330 | 50,000 | $3,876 |
| Charles Schwab Corp., 3.25%, 05/22/29 | — | 32,219 | — | — | 2,230 | 34,449 | 30,000 | 871 |
| Charles Schwab Corp., 4.63%, 03/22/30 | — | 173,186 | — | — | 16,475 | 189,661 | 150,000 | 4,625 |
| Total | $262,441 | $204,585 | ($212,791) | $3,093 | $23,112 | $280,440 | | $9,372 |
* Amount includes amortization of premiums and/or accretion of discounts.
The following is a summary of the inputs used to value the fund’s investments as of December 31, 2020 (see financial note 2(a) for additional information):
| Description | Quoted Prices in
Active Markets for
Identical Assets
(Level 1) | Other Significant
Observable Inputs
(Level 2) | Significant
Unobservable Inputs
(Level 3) | Total | |
| Assets | | | | | |
| Corporates 1 | $— | $187,069,041 | $— | $187,069,041 | |
| Other Investment Company1 | 2,779,733 | — | — | 2,779,733 | |
| Futures Contracts2 | 327 | — | — | 327 | |
| Total | $2,780,060 | $187,069,041 | $— | $189,849,101 | |
| 1 | As categorized in Portfolio Holdings. |
| 2 | Futures contracts are valued at unrealized appreciation or depreciation. |
Fund investments in underlying mutual funds are classified as Level 1, without consideration to the classification level of the investments held by the underlying mutual funds, which could be Level 1, Level 2 or Level 3.
Schwab Fixed-Income ETFs | Annual Report
Schwab 5-10 Year Corporate Bond ETF
Statement of Assets and Liabilities
As of December 31, 2020
| Assets |
| Investments in affiliated issuer, at value (cost $257,590) | | $280,440 |
| Investments in unaffiliated issuers, at value (cost $179,314,062) | | 189,568,334 |
| Cash | | 60,726 |
| Deposit with broker for futures contracts | | 22,100 |
| Receivables: | | |
| Interest | | 1,486,227 |
| Variation margin on futures contracts | | 327 |
| Dividends | + | 38 |
| Total assets | | 191,418,192 |
| Liabilities |
| Payables: | | |
| Investments bought | | 826,515 |
| Management fees | + | 7,680 |
| Total liabilities | | 834,195 |
| Net Assets |
| Total assets | | 191,418,192 |
| Total liabilities | – | 834,195 |
| Net assets | | $190,583,997 |
| Net Assets by Source | | |
| Capital received from investors | | 180,336,268 |
| Total distributable earnings | | 10,247,729 |
| Net Asset Value (NAV) |
| Net Assets | ÷ | Shares
Outstanding | = | NAV |
| $190,583,997 | | 3,550,000 | | $53.69 |
| | | | | |
Schwab Fixed-Income ETFs | Annual Report
Schwab 5-10 Year Corporate Bond ETF
Statement of Operations
For the period January 1, 2020 through December 31, 2020
| Investment Income |
| Interest received from affiliated issuer | | $9,372 |
| Interest received from unaffiliated issuers | | 3,753,831 |
| Dividends received from unaffiliated issuers | | 2,328 |
| Securities on loan, net | + | 11 |
| Total investment income | | 3,765,542 |
| Expenses |
| Management fees | | 75,832 |
| Total expenses | – | 75,832 |
| Net investment income | | 3,689,710 |
| Realized and Unrealized Gains (Losses) |
| Net realized gains on affiliated issuer | | 3,093 |
| Net realized losses on unaffiliated investments | | (29,842) |
| Net realized gains on in-kind redemptions on unaffiliated investments | | 618,662 |
| Net realized losses on futures contracts | + | (7,326) |
| Net realized gains | | 584,587 |
| Net change in unrealized appreciation (depreciation) on affiliated issuer | | 23,112 |
| Net change in unrealized appreciation (depreciation) on unaffiliated investments | | 9,580,281 |
| Net change in unrealized appreciation (depreciation) on futures contracts | + | 327 |
| Net change in unrealized appreciation (depreciation) | + | 9,603,720 |
| Net realized and unrealized gains | | 10,188,307 |
| Increase in net assets resulting from operations | | $13,878,017 |
Schwab Fixed-Income ETFs | Annual Report
Schwab 5-10 Year Corporate Bond ETF
Statement of Changes in Net Assets
For the current and prior report periods
| Operations | |
| | 1/1/20-12/31/20 | 10/10/19*-12/31/19 |
| Net investment income | | $3,689,710 | $427,615 |
| Net realized gains (losses) | | 584,587 | (17,360) |
| Net change in unrealized appreciation (depreciation) | + | 9,603,720 | 673,729 |
| Increase in net assets resulting from operations | | 13,878,017 | 1,083,984 |
| Distributions to Shareholders | |
| Total distributions | | ($3,679,790) | ($424,080) |
| Transactions in Fund Shares | | | |
| | | 1/1/20-12/31/20 | 10/10/19*-12/31/19 |
| | | SHARES | VALUE | SHARES | VALUE |
| Shares sold | | 2,250,000 | $117,151,963 | 2,200,000 | $109,490,865 |
| Shares redeemed | + | (900,000) | (46,916,962) | — | — |
| Net transactions in fund shares | | 1,350,000 | $70,235,001 | 2,200,000 | $109,490,865 |
| Shares Outstanding and Net Assets | | | |
| | | 1/1/20-12/31/20 | 10/10/19*-12/31/19 |
| | | SHARES | NET ASSETS | SHARES | NET ASSETS |
| Beginning of period | | 2,200,000 | $110,150,769 | — | $— |
| Total increase | + | 1,350,000 | 80,433,228 | 2,200,000 | 110,150,769 |
| End of period | | 3,550,000 | $190,583,997 | 2,200,000 | $110,150,769 |
| * | Commencement of operations. |
Schwab Fixed-Income ETFs | Annual Report
1. Business Structure of the Funds:
Each of the funds in this report is a series of Schwab Strategic Trust (the trust), a no-load, open-end management investment company. The trust is organized as a Delaware statutory trust and is registered under the Investment Company Act of 1940, as amended (the 1940 Act). The list below shows all the operational funds in the trust as of the end of the period, including the funds discussed in this report, which are highlighted:
| SCHWAB STRATEGIC TRUST (ORGANIZED JANUARY 27, 2009) |
| Schwab U.S. TIPS ETF | Schwab U.S. Small-Cap ETF |
| Schwab Short-Term U.S. Treasury ETF | Schwab U.S. Dividend Equity ETF |
| Schwab Intermediate-Term U.S. Treasury ETF | Schwab International Equity ETF |
| Schwab Long-Term U.S. Treasury ETF | Schwab International Small-Cap Equity ETF |
| Schwab U.S. Aggregate Bond ETF | Schwab Emerging Markets Equity ETF |
| Schwab 1-5 Year Corporate Bond ETF | Schwab U.S. REIT ETF |
| Schwab 5-10 Year Corporate Bond ETF | Schwab Fundamental U.S. Broad Market Index ETF |
| Schwab U.S. Broad Market ETF | Schwab Fundamental U.S. Large Company Index ETF |
| Schwab 1000 Index® ETF | Schwab Fundamental U.S. Small Company Index ETF |
| Schwab U.S. Large-Cap ETF | Schwab Fundamental International Large Company Index ETF |
| Schwab U.S. Large-Cap Growth ETF | Schwab Fundamental International Small Company Index ETF |
| Schwab U.S. Large-Cap Value ETF | Schwab Fundamental Emerging Markets Large Company Index ETF |
| Schwab U.S. Mid-Cap ETF | |
The funds issue and redeem shares at their net asset value per share (NAV) only in large blocks of shares, typically 50,000 shares or more (Creation Units). These transactions are usually in exchange for a basket of securities and/or an amount of cash. As a practical matter, only institutions or large investors purchase or redeem Creation Units. Except when aggregated in Creation Units, shares of the funds are not redeemable securities.
Individual shares of the funds trade on national securities exchanges and elsewhere during the trading day and can only be bought and sold at market prices throughout the trading day through a broker-dealer. Because fund shares trade at market prices rather than NAV, shares may trade at a price greater than NAV (premium) or less than NAV (discount). A chart showing the frequency at which each fund’s daily closing market price was at a discount or premium to each fund’s NAV can be found at www.schwabfunds.com.
Each fund maintains its own account for purposes of holding assets and accounting, and is considered a separate entity for tax purposes. Within its account, each fund may also keep certain assets in segregated accounts, as required by securities law.
2. Significant Accounting Policies:
The following is a summary of the significant accounting policies the funds use in their preparation of financial statements. The funds follow the investment company accounting and reporting guidance of the Financial Accounting Standards Board (FASB) Accounting Standard Codification Topic 946 Financial Services — Investment Companies. The accounting policies are in conformity with accounting principles generally accepted in the United States of America (GAAP).
The funds may invest in certain other investment companies (underlying funds). For more information about the underlying funds’ operations and policies, please refer to those funds’ semiannual and annual reports, which are filed with the U.S. Securities and Exchange Commission (SEC) and available on the SEC’s website at www.sec.gov.
(a) Security Valuation:
Under procedures approved by the funds’ Board of Trustees (the Board), the investment adviser has formed a Pricing Committee to administer the pricing and valuation of portfolio securities and other assets and to ensure that prices used for internal purposes or provided by third parties reasonably reflect fair value. Among other things, these procedures allow the funds to utilize independent pricing services, quotations from securities and financial instrument dealers and other market sources to determine fair value.
The funds value the securities in their portfolios every business day. The funds use the following policies to value various types of securities:
• Bonds and notes: Fixed income investments are generally valued using an evaluated price at the mid-point of the bid/ask spread provided by an approved, independent pricing service (mid-price). To determine the evaluated mid-price, a pricing service may use a variety of techniques and inputs. Techniques may include, but are not limited to, spread models that
Schwab Fixed-Income ETFs | Annual Report
Financial Notes (continued)
2. Significant Accounting Policies (continued):
calculate an investment-specific price relative to a benchmark or yield curve models that establish a price based on yields of comparable bonds along a range of maturities. Inputs differ by valuation approach and technique, as appropriate, and examples of inputs may include, but are not limited to, interest rates, market conditions, comparable bonds, market trades, projected cash flows, credit reviews and issuer news.
• Securities for which no quoted value is available: The Board has adopted procedures to fair value each fund’s securities when market prices are not “readily available” or are unreliable. For example, a fund may fair value a security when it is de-listed or its trading is halted or suspended; when a security’s primary pricing source is unable or unwilling to provide a price; or when a security’s primary trading market is closed during regular market hours. Each fund makes fair value determinations in good faith in accordance with the fund’s valuation procedures. The Pricing Committee considers a number of factors, including unobservable market inputs when arriving at fair value. The Pricing Committee may employ techniques such as the review of related or comparable assets or liabilities, related market activities, recent transactions, market multiples, book values, transactional back-testing, disposition analysis and other relevant information. The Pricing Committee regularly reviews these inputs and assumptions to calibrate the valuations. Due to the subjective and variable nature of fair value pricing, there can be no assurance that a fund could obtain the fair value assigned to the security upon the sale of such security. The Board convenes on a regular basis to review fair value determinations made by the funds pursuant to the valuation procedures.
• Futures contracts: Futures contracts are valued at their settlement prices as of the close of their exchanges.
• Short-term securities (60 days or less to maturity): Securities with remaining maturities of 60 days or less are generally valued at an evaluated price; however, such securities may be valued at their amortized cost if it approximates the security’s market value.
• Underlying funds: Mutual funds are valued at their respective NAVs.
In accordance with the authoritative guidance on fair value measurements and disclosures under generally accepted accounting principles in the United States of America, the funds disclose the fair value of their investments in a hierarchy that prioritizes the significant inputs to valuation techniques used to measure the fair value. The hierarchy gives the highest priority to valuations based upon unadjusted quoted prices in active markets for identical assets or liabilities (Level 1 measurements) and the lowest priority to valuations based upon unobservable inputs that are significant to the valuation (Level 3 measurements). If inputs used to measure the financial instruments fall within different levels of the hierarchy, the categorization is based on the lowest level input that is significant to the valuation. If the funds determine that either the volume and/or level of activity for an asset or liability has significantly decreased (from normal conditions for that asset or liability) or price quotations or observable inputs are not associated with orderly transactions, increased analysis and management judgment will be required to estimate fair value.
The three levels of the fair value hierarchy are as follows:
• Level 1—quoted prices in active markets for identical securities—Investments whose values are based on quoted market prices in active markets, and whose values are therefore classified as Level 1 prices, include active listed equities and futures contracts. Investments in mutual funds are valued daily at their NAVs, which are classified as Level 1 prices, without consideration to the classification level of the specific investments held by an underlying fund.
• Level 2—other significant observable inputs (including quoted prices for similar securities, interest rates, prepayment speeds, credit risk, etc.)—Investments that trade in markets that are not considered to be active, but whose values are based on quoted market prices, dealer quotations or valuations provided by alternative pricing sources supported by observable inputs are classified as Level 2 prices. These generally include U.S. government and sovereign obligations, most government agency securities, investment-grade corporate bonds, certain mortgage products, less liquid listed equities, and state, municipal and provincial obligations.
• Level 3—significant unobservable inputs (including the funds’ own assumptions in determining the fair value of investments)—Investments whose values are classified as Level 3 prices have significant unobservable inputs, as they may trade infrequently or not at all. When observable prices are not available for these securities, the funds use one or more valuation techniques for which sufficient and reliable data is available. The inputs used by the funds in estimating the value of Level 3 prices may include the original transaction price, quoted prices for similar securities or assets in active markets, completed or pending third-party transactions in the underlying investment or comparable issuers, and changes in financial ratios or cash flows. Level 3 prices may also be adjusted to reflect illiquidity and/or non-transferability, with the amount of such discount estimated by the funds in the absence of market information. Assumptions used by the funds due to the lack of observable inputs may significantly impact the resulting fair value and therefore the funds’ results of operations.
The inputs or methodology used for valuing securities are not necessarily an indication of the risk associated with investing in those securities.
Schwab Fixed-Income ETFs | Annual Report
Financial Notes (continued)
2. Significant Accounting Policies (continued):
The levels associated with valuing the funds’ investments as of December 31, 2020 are disclosed in the Portfolio Holdings.
(b) Accounting Policies for certain Portfolio Investments (if held):
Futures Contracts: Futures contracts are instruments that represent an agreement between two parties that obligates one party to buy, and the other party to sell, specific instruments at an agreed upon price on a stipulated future date. A fund must give the broker a deposit of cash and/or securities (initial margin) whenever it enters into a futures contract. The amount of the deposit may vary from one contract to another. Subsequent payments (variation margin) are made or received by a fund depending on the daily fluctuations in the value of the futures contract and are accounted for as unrealized appreciation or depreciation until the contract is closed, at which time the gains or losses are realized. Futures contracts are traded publicly on exchanges, and their fair value may change daily.
Securities Lending: Under the trust’s Securities Lending Program, a fund (lender) may make short-term loans of its securities to another party (borrower) to generate additional revenue for the fund. The borrower pledges collateral in the form of cash, securities issued or fully guaranteed by the U.S. government or foreign governments, or letters of credit issued by a bank. Collateral at the individual loan level is required to be maintained on a daily marked-to-market basis in an amount at least equal to the current value of the securities loaned. The lending agent provides a fund with indemnification against borrower default (the borrower fails to return the security on loan) reducing the risk of loss as a result of default. The cash collateral of securities loaned is currently invested in money market portfolios operating under Rule 2a-7 of the 1940 Act. Each fund bears the risk of loss with respect to the investment of cash collateral. The terms of the securities lending agreements allow the funds or the lending agent to terminate any loan at any given time and the securities must be returned within the earlier of the standard trade settlement period or the specified time period under the relevant securities lending agreement. Securities lending income, as disclosed in each fund’s Statement of Operations, if applicable, represents the income earned from the investment of the cash collateral plus any fees paid by borrowers, less the fees paid to the lending agent and broker rebates which are subject to adjustments pursuant to the securities lending agreement. On loans not collateralized by cash, a fee is received from the borrower, and is allocated between a fund and the lending agent. The aggregate market value of securities loaned will not at any time exceed one-third of the total assets of a fund, including collateral received from the loan. Securities lending fees paid to the unaffiliated lending agents start at 10% of gross lending revenue, with subsequent breakpoints to a low of 7.5%. In this context, the gross lending revenue equals the income received from the investment of cash collateral and fees paid by borrowers less any rebates paid to the borrowers. Any expenses charged by the cash collateral fund are in addition to these fees. All remaining revenue is retained by the fund, as applicable. No portion of lending revenue is paid to or retained by CSIM or any affiliate of CSIM.
As of December 31, 2020, only Schwab U.S. Aggregate Bond ETF had securities on loan, all of which were classified as government related bonds. The value of the securities on loan and the related collateral at December 31, 2020 are disclosed in the fund’s Portfolio Holdings and Statement of Assets and Liabilities.
Inflation-Protected Securities: The Schwab U.S. TIPS ETF invests in inflation-protected securities. Inflation-protected securities are fixed-income securities whose principal value is periodically adjusted to the rate of inflation. The interest rate on these instruments is generally fixed at issuance at a rate lower than typical bonds or notes. Over the life of an inflation-indexed instrument, interest will be paid based on a principal value, which is adjusted for any inflation or deflation. Any increase or decrease in the principal amount of an inflation-protected security will be included as an addition or reduction to interest income on the Statement of Operations, even though investors do not receive their principal until maturity.
TBA Commitments: The Schwab U.S. Aggregate Bond ETF may enter into “TBA” (to-be-announced) commitments to purchase or sell securities for a fixed price at a future date. Payments or proceeds of TBA commitments are not delivered until the contractual settlement date. Unsettled TBA commitments are valued at the current market value generally according to the procedures described above in the Security Valuation section. The fund’s use of TBA commitments may cause the fund to experience higher portfolio turnover and higher transaction costs.
Agency MBS and TBA Transactions: The Treasury Market Practices Group (TMPG) of the Federal Reserve Bank of New York recommended the margining of certain forward-settling Agency MBS (Mortgage-Backed Securities) transactions, including TBAs, to reduce counterparty credit risk. The TMPG recommended market participants exchange two-way variation margin on a regular basis. The Schwab U.S. Aggregate Bond ETF posts and receives variation margin with certain counterparties in instances where the unrealized gain/loss on such transactions exceeds certain pre-determined thresholds. The variation margin, if any, is disclosed on the Statement of Assets and Liabilities.
Delayed Delivery Transactions and When-Issued Securities: During the period, certain funds transacted in securities on a delayed delivery or when-issued basis. Payment and delivery may take place after the customary settlement period for that security. The price of the underlying securities and the date when the securities will be delivered and paid for are fixed at the time the transaction is negotiated. The securities purchased on a delayed delivery or when-issued basis are identified as such in the funds’ Portfolio Holdings. The funds may receive compensation for interest forgone in the purchase of a delayed delivery or when-issued security.
Schwab Fixed-Income ETFs | Annual Report
Financial Notes (continued)
2. Significant Accounting Policies (continued):
With respect to purchase commitments, the funds identify securities as segregated in their records with a value at least equal to the amount of the commitment. Losses may arise due to changes in the value of the underlying securities or if the counterparty does not perform under the contract’s terms, or if the issuer does not issue the securities due to political, economic, or other factors.
(c) Security Transactions:
Security transactions are recorded as of the date the order to buy or sell the security is executed. Realized gains or losses from security transactions are based on the identified costs of the securities involved. Gains and losses from paydowns on mortgage and asset backed securities are recorded as adjustments to interest income.
(d) Investment Income:
Interest income is recorded as it accrues. If a fund buys a debt security at a discount (less than face value) or a premium (more than face value), it amortizes premiums and accretes discounts from the purchase settlement date up to maturity. The fund then increases (in the case of discounts) or reduces (in the case of premiums) the income it records from the security. Certain securities may be callable (meaning that the issuer has the option to pay it off before its maturity date). The fund amortizes the premium and accretes the discount on each callable security to the security’s maturity date, except when the purchase price is higher than the call price at the security’s call date (in which case the premium is amortized to the call date). Any increase or decrease in the principal amount of an inflation-protected security is included as an addition or reduction to interest income on the Statement of Operations; such adjustments may have a significant impact on a fund’s distributions. Dividends from underlying funds are recorded on the date they are effective (the ex-dividend date). Any distributions from underlying funds are recorded in accordance with the character of the distributions as designated by the underlying funds.
(e) Expenses:
Pursuant to the Amended and Restated Advisory Agreement (Advisory Agreement) between Charles Schwab Investment Management, Inc. (CSIM or the investment adviser) and the trust, the investment adviser will pay the operating expenses of each fund, excluding taxes, any brokerage expenses, and extraordinary or non-routine expenses. Taxes, any brokerage expenses and extraordinary or non-routine expenses that are specific to a fund are charged directly to the fund.
(f) U.S. Treasury, Agency Debt & Agency MBS Charges:
Due to market conditions or other reasons, delivery of U.S. Treasury securities, agency debt and agency MBS may not occur on a timely basis. In these instances, a fund may fail to receive a security purchased causing the fund to be unable to deliver a security sold. The TMPG recommends voluntary fail charges when securities are not delivered as agreed by the parties. These fail charges are included in net realized gains (losses) on each fund’s Statement of Operations, if any.
(g) Distributions to Shareholders:
The funds make distributions from net investment income, if any, monthly and from net realized capital gains, if any, once a year.
(h) Accounting Estimates:
The accounting policies described in this report conform to GAAP. Notwithstanding this, shareholders should understand that in order to follow these principles, fund management has to make estimates and assumptions that affect the information reported in the financial statements. It’s possible that once the results are known, they may turn out to be different from these estimates and these differences may be material.
(i) Federal Income Taxes:
The funds intend to meet federal income and excise tax requirements for regulated investment companies under subchapter M of the Internal Revenue Code, as amended. Accordingly, the funds distribute substantially all of their net investment income and net realized capital gains, if any, to their respective shareholders each year. As long as a fund meets the tax requirements, it is not required to pay federal income tax.
(j) Indemnification:
Under the funds’ organizational documents, the officers and trustees are indemnified against certain liabilities arising out of the performance of their duties to the funds. In addition, in the normal course of business the funds enter into contracts with their vendors and others that provide general indemnifications. The funds’ maximum exposure under these arrangements is unknown as this would involve future claims that may be made against the funds. However, based on experience, the funds expect the risk of loss attributable to these arrangements to be remote.
Schwab Fixed-Income ETFs | Annual Report
Financial Notes (continued)
2. Significant Accounting Policies (continued):
(k) Recent Accounting Standards:
In March 2020, the FASB issued Accounting Standards Update “Facilitation of the Effects of Reference Rate Reform on Financial Reporting (Topic 848)” (ASU 2020-04), which provides optional temporary financial reporting relief from the effect of certain types of contract modifications due to the planned discontinuation of the London Interbank Offered Rate (LIBOR) and other interbank-offered based reference rates at the end of 2021. The temporary relief provided is effective for certain reference rate-related contract modifications that occur during the period March 12, 2020 through December 31, 2022. At this time, management believes the adoption of ASU 2020-04 will not have a material impact to the financial statements.
3. Risk Factors:
Investing in the funds may involve certain risks, as discussed in the funds’ prospectus, including, but not limited to, those described below. Any of these risks could cause an investor to lose money.
Market Risk. Financial markets rise and fall in response to a variety of factors, sometimes rapidly and unpredictably. Markets may be impacted by economic, political, regulatory and other conditions, including economic sanctions and other government actions. In addition, the occurrence of global events, such as war, terrorism, environmental disasters, natural disasters, and epidemics may also negatively affect the financial markets. As with any investment whose performance is tied to these markets, the value of an investment in a fund will fluctuate, which means that an investor could lose money over short or long periods.
Investment Style Risk. The funds are index funds. Therefore, the funds follow the securities included in an index during upturns as well as downturns. Because of their indexing strategy, the funds do not take steps to reduce market exposure or to lessen the effects of a declining market. In addition, because of each fund’s expenses, each fund’s performance may be below that of its respective index. Market disruptions could cause delays in an index’s rebalancing schedule which may result in an index and, in turn, a fund experiencing returns different than those that would have been achieved under a normal rebalancing schedule.
Interest Rate Risk. Interest rates rise and fall over time. As with any investment whose yield reflects current interest rates, a fund’s yield will change over time. During periods when interest rates are low, a fund’s yield (and total return) also may be low. Changes in interest rates also may affect a fund’s share price: a rise in interest rates generally causes a fund’s share price to fall. The longer a fund’s portfolio duration, the more sensitive to interest rate movements its share price is likely to be. Also, a change in a central bank’s monetary policy or economic conditions, among other things, may result in a change in interest rates, which could have sudden and unpredictable effects on the markets and significantly impact the value of fixed-income securities in which a fund invests.
Credit Risk. The funds are subject to the risk that a decline in the credit quality of an issuer, guarantor or liquidity provider of a portfolio investment or a counterparty could cause the funds to lose money or underperform. The funds could lose money if, due to a decline in credit quality, the issuer, guarantor or liquidity provider of a portfolio investment or a counterparty fails to make, or is perceived as being unable or unwilling to make, timely principal or interest payments or otherwise honor its obligations.
Inflation-Protected Security Risk. The value of inflation-protected securities, including TIPS, generally will fluctuate in response to changes in “real” interest rates, generally decreasing when real interest rates rise and increasing when real interest rates fall. Real interest rates represent nominal (or stated) interest rates reduced by the expected impact of inflation. In addition, interest payments on inflation-indexed securities will generally vary up or down along with the rate of inflation.
Sampling Index Tracking Risk. To the extent a fund uses sampling techniques, the fund may not fully replicate the index and may hold securities not included in the index. As a result, a fund is subject to the risk that the investment adviser’s investment management strategy, the implementation of which is subject to a number of constraints, may not produce the intended results. If a fund uses a sampling approach, it may not track the return of the index as well as it would if a fund purchased all of the securities in its index.
Tracking Error Risk. As index funds, the funds seek to track the performance of an index, although they may not be successful in doing so. The divergence between the performance of a fund and the index, positive or negative, is called “tracking error.” Tracking error can be caused by many factors and it may be significant.
Liquidity Risk. A fund may be unable to sell certain securities, such as illiquid securities, readily at a favorable time or price, or the fund may have to sell them at a loss.
Securities Lending Risk. Securities lending involves the risk of loss of rights in, or delay in recovery of, the loaned securities if the borrower fails to return the security loaned or becomes insolvent.
Market Trading Risk. Although fund shares are listed on national securities exchanges, there can be no assurance that an active trading market for fund shares will develop or be maintained. If an active market is not maintained, investors may find it difficult to buy or sell fund shares.
Schwab Fixed-Income ETFs | Annual Report
Financial Notes (continued)
3. Risk Factors (continued):
Mortgage-Backed and Mortgage Pass-Through Securities Risk. With respect to the Schwab U.S. Aggregate Bond ETF, certain of the mortgage-backed securities in which the fund may invest are not backed by the full faith and credit of the U.S. government and there can be no assurance that the U.S. government would provide financial support to its agencies or instrumentalities where it was not obligated to do so which can cause the fund to lose money or underperform. The risks of investing in mortgage-backed securities include, among others, interest rate risk, credit risk, prepayment risk and extension risk. Mortgage-backed securities tend to increase in value less than other debt securities when interest rates decline, but are subject to similar or greater risk of decline in market value during periods of rising interest rates. Transactions in mortgage pass-through securities often occur through TBA transactions, as described in the fund’s prospectus. The fund could lose money or underperform if a TBA counterparty defaults or goes bankrupt.
Portfolio Turnover Risk. With respect to the Schwab U.S. Aggregate Bond ETF, the fund may engage in frequent trading of its portfolio securities in connection with its tracking of the index, primarily due to the fund rolling over its positions in TBAs as it tracks the portion of the index represented by mortgage-backed securities. A higher portfolio turnover rate may result in increased transaction costs, which may lower the fund’s performance. A higher portfolio turnover rate can also result in an increase in taxable capital gains distributions to the fund’s shareholders.
Prepayment and Extension Risk. With respect to the Schwab U.S. Aggregate Bond ETF, certain of the fund’s fixed-income securities are subject to the risk that the securities may be paid off earlier or later than expected, especially during periods of falling or rising interest rates, respectively. Prepayments of obligations could cause the fund to forgo future interest income on the portion of the security’s principal repaid early and force the fund to reinvest that money at the lower prevailing interest rates. Extensions of obligations could cause the fund to exhibit additional volatility and hold securities paying lower-than-market rates of interest. Either case could hurt the fund’s performance.
Non-U.S. Issuer Risk. Certain funds may invest in U.S.-registered, dollar-denominated bonds of non-U.S. corporations, governments, agencies and supra-national entities to the extent such bonds are included in the fund’s index. A fund’s investments in bonds of non-U.S. issuers may involve certain risks that are greater than those associated with investments in securities of U.S. issuers. These include risks of adverse changes in foreign economic, political, regulatory and other conditions; the imposition of economic sanctions or other government restrictions; differing accounting, auditing, financial reporting and legal standards and practices; differing securities market structures; and higher transaction costs. These risks may be heightened in connection with bonds issued by non-U.S. corporations and entities in emerging markets.
Derivatives Risk. Certain funds may invest in derivatives instruments. The principal types of derivatives used by such funds are futures contracts. A futures contract is an agreement to buy or sell a financial instrument at a specific price on a specific day. A fund’s use of derivative instruments involves risks different from, or possibly greater than, the risks associated with investing directly in securities and other traditional investments. Certain of these risks, such as market risk, credit risk, liquidity risk and leverage risk, are discussed elsewhere in this section. A fund’s use of derivatives is also subject to lack of availability risk, valuation risk, correlation risk and tax risk. Lack of availability risk is the risk that suitable derivative transactions may not be available in all circumstances for risk management or other purposes. Valuation risk is the risk that a particular derivative may be valued incorrectly. Correlation risk is the risk that changes in the value of the derivative may not correlate perfectly with the underlying asset, rate or index. Tax risk is the risk that the use of derivatives may cause a fund to realize higher amounts of short-term capital gains. A fund’s use of derivatives could reduce the fund’s performance, increase the fund’s volatility, and cause the fund to lose more than the initial amount invested. Furthermore, the use of derivatives subject to regulation by the Commodity Futures Trading Commission (CFTC) could cause a fund to become a commodity pool, which would require the fund to comply with certain CFTC rules.
Concentration Risk. To the extent that a fund’s or an index’s portfolio is concentrated in the securities of issuers in a particular market, industry, group of industries, sector or asset class, the fund may be adversely affected by the performance of those securities, may be subject to increased price volatility and may be more vulnerable to adverse economic, market, political or regulatory occurrences affecting that market, industry, group of industries, sector or asset class.
Shares of the Fund May Trade at Prices Other Than NAV. Fund shares may be bought and sold in the secondary market at market prices. Although it is expected that the market price of the shares of a fund will approximate the fund’s NAV, there may be times when the market price and the NAV vary significantly. An investor may pay more than NAV when buying shares of a fund in the secondary market, and an investor may receive less than NAV when selling those shares in the secondary market. The market price of fund shares may deviate, sometimes significantly, from NAV during periods of market volatility or market disruption. (See the unaudited Frequency Distribution of Discounts and Premiums in Other Information for an overview showing the frequency at which the daily closing price was at a discount or a premium to a fund’s daily NAV.)
Please refer to the funds’ prospectus for a more complete description of the principal risks of investing in the funds.
Schwab Fixed-Income ETFs | Annual Report
Financial Notes (continued)
4. Affiliates and Affiliated Transactions:
Investment Adviser
CSIM, a wholly owned subsidiary of The Charles Schwab Corporation, serves as each fund’s investment adviser pursuant to the Advisory Agreement between CSIM and the trust.
For its advisory services to the funds, CSIM is entitled to receive an annual management fee, payable monthly, based on a percentage of each fund’s average daily net assets as follows:
Schwab
U.S. TIPS ETF | Schwab
Short-Term
U.S. Treasury ETF | Schwab
Intermediate-Term
U.S. Treasury ETF | Schwab
Long-Term
U.S. Treasury ETF | Schwab
U.S. Aggregate
Bond ETF | Schwab
1-5 Year
Corporate Bond ETF | Schwab
5-10 Year
Corporate Bond ETF |
| 0.05% | 0.05% | 0.05% | 0.05% | 0.04% | 0.05% | 0.05% |
Investment from Affiliates
Certain funds in the Fund Complex (for definition refer to Trustees and Officers section) may own shares of other funds in the Fund Complex. The table below reflects the percentages of shares of each fund in this report that are owned by other funds in the Fund Complex as of December 31, 2020, as applicable:
| | Underlying Funds | | |
| | Schwab
U.S. TIPS ETF | Schwab
Short-Term
U.S. Treasury ETF | Schwab
U.S. Aggregate
Bond ETF |
| Schwab Target 2010 Index Fund | 0.0%* | 0.1% | 0.3% |
| Schwab Target 2015 Index Fund | 0.0%* | 0.1% | 0.4% |
| Schwab Target 2020 Index Fund | 0.1% | 0.3% | 1.3% |
| Schwab Target 2025 Index Fund | 0.1% | 0.2% | 1.7% |
| Schwab Target 2030 Index Fund | 0.0%* | 0.2% | 1.9% |
| Schwab Target 2035 Index Fund | -% | 0.1% | 0.9% |
| Schwab Target 2040 Index Fund | -% | 0.1% | 0.8% |
| Schwab Target 2045 Index Fund | -% | 0.0%* | 0.3% |
| Schwab Target 2050 Index Fund | -% | 0.0%* | 0.3% |
| Schwab Target 2055 Index Fund | -% | 0.0%* | 0.1% |
| Schwab Target 2060 Index Fund | -% | 0.0%* | 0.1% |
| Schwab VIT Balanced Portfolio | 0.0%* | 0.1% | 0.3% |
| Schwab VIT Balanced with Growth Portfolio | 0.0%* | 0.1% | 0.5% |
| Schwab VIT Growth Portfolio | -% | -% | 0.3% |
* Less than 0.05%
Interfund Borrowing and Lending
Pursuant to an exemptive order issued by the SEC, the funds may enter into interfund borrowing and lending transactions with other funds in the Fund Complex. All loans are for temporary or emergency purposes and the interest rate to be charged will be the average of the overnight repurchase agreement rate and the short-term bank loan rate. All loans are subject to numerous conditions designed to ensure fair and equitable treatment of all participating funds. The interfund lending facility is subject to the oversight and periodic review of the Board. The funds had no interfund borrowing or lending activity during the period.
5. Other Service Providers:
SEI Investments Distribution Co. is the principal underwriter and distributor of shares of the funds.
State Street Bank and Trust Company (State Street) serves as the funds’ transfer agent. As part of these services, the transfer agent maintains records pertaining to the sale, redemption and transfer of the funds’ shares. The transfer agent is also responsible for the order-taking function for the funds’ shares.
State Street also serves as custodian and accountant for the funds. The custodian is responsible for the daily safekeeping of securities and cash held by the funds. The funds’ accountant maintains all books and records related to the funds’ transactions.
Schwab Fixed-Income ETFs | Annual Report
Financial Notes (continued)
6. Board of Trustees:
The Board may include people who are officers and/or directors of CSIM or its affiliates. Federal securities law limits the percentage of such “interested persons” who may serve on a trust’s board, and the trust was in compliance with these limitations throughout the report period. The trust does not pay any interested or non-interested trustees (independent trustees). The independent trustees are paid by CSIM. For information regarding the trustees, please refer to the Trustees and Officers table at the end of this report.
7. Borrowing from Banks:
During the period, the funds were participants with other funds in the Fund Complex in a joint, syndicated, committed $750 million line of credit (the Syndicated Credit Facility), which matured on October 1, 2020. On October 1, 2020, the Syndicated Credit Facility was amended to run for a new 364 day period with a line of credit of $850 million, maturing on September 30, 2021. Under the terms of the Syndicated Credit Facility, in addition to CSIM paying the interest charged on any borrowings by a fund, CSIM paid a commitment fee of 0.15% per annum on the funds’ proportionate share of the unused portion of the Syndicated Credit Facility.
During the period, the funds were participants with other funds in the Fund Complex in a joint, unsecured, uncommitted $500 million line of credit (the Uncommitted Credit Facility), with State Street, which was scheduled to mature on November 27, 2020. However, on October 1, 2020, the Uncommitted Credit Facility was amended to run for a new 364 day period with a line of credit of $400 million, maturing on September 30, 2021. Under the terms of the Uncommitted Credit Facility, CSIM pays interest on the amount a fund borrows. There were no borrowings from either line of credit during the period.
The funds also have access to custodian overdraft facilities. A fund may have utilized the overdraft facility and incurred an interest expense, which is paid by CSIM. The interest expense is determined based on a negotiated rate above the current Federal Funds Rate.
8. Derivatives:
Certain funds entered into U.S. Treasury futures contracts during the report period. The funds invested in futures contracts to help manage the effects of interest rate changes. The current value and variation margin for futures contracts held at December 31, 2020 are presented on the Portfolio Holdings and Statement of Assets and Liabilities, respectively. The net realized and change in unrealized gains (losses) on futures contracts are presented on the Statement of Operations. Refer to financial note 2(b) for the funds’ accounting policies with respect to futures contracts and financial note 3 for disclosures concerning the risks of investing in futures contracts. During the period ended December 31, 2020, the month-end average notional amounts of futures contracts held by the funds and the month-end average number of contracts held were as follows:
| | Notional Amounts | Number of Contracts |
| Schwab 1-5 Year Corporate Bond ETF | $435,465 | 3 |
| Schwab 5-10 Year Corporate Bond ETF | 598,675 | 4 |
Schwab Fixed-Income ETFs | Annual Report
Financial Notes (continued)
9. Purchases and Sales/Maturities of Investment Securities:
For the period ended December 31, 2020, purchases and sales/maturities of securities (excluding in-kind transactions and short-term obligations) were as follows:
| | Purchases of Long-Term
U.S. Government Securities* | Purchases of Other
Long-Term Securities | Total Purchases of
Long-Term Securities |
| Schwab U.S. TIPS ETF | $2,897,131,179 | $— | $2,897,131,179 |
| Schwab Short-Term U.S. Treasury ETF | 8,195,027,150 | — | 8,195,027,150 |
| Schwab Intermediate-Term U.S. Treasury ETF | 3,448,802,520 | — | 3,448,802,520 |
| Schwab Long-Term U.S. Treasury ETF | 71,106,084 | — | 71,106,084 |
| Schwab U.S. Aggregate Bond ETF | 5,336,960,781 | 1,021,299,343 | 6,358,260,124 |
| Schwab 1-5 Year Corporate Bond ETF | 65,500 | 160,560,633 | 160,626,133 |
| Schwab 5-10 Year Corporate Bond ETF | — | 139,507,570 | 139,507,570 |
| | Sales/Maturities of
Long-Term
U.S. Government
Securities | Sales/Maturities of
Other Long-Term Securities | Total Sales/Maturities of
Long-Term Securities |
| Schwab U.S. TIPS ETF | $2,488,656,921 | $— | $2,488,656,921 |
| Schwab Short-Term U.S. Treasury ETF | 5,110,337,348 | — | 5,110,337,348 |
| Schwab Intermediate-Term U.S. Treasury ETF | 2,114,999,908 | — | 2,114,999,908 |
| Schwab Long-Term U.S. Treasury ETF | 26,586,087 | — | 26,586,087 |
| Schwab U.S. Aggregate Bond ETF | 4,825,137,635 | 564,294,522 | 5,389,432,157 |
| Schwab 1-5 Year Corporate Bond ETF | 469,054 | 73,688,188 | 74,157,242 |
| Schwab 5-10 Year Corporate Bond ETF | — | 53,640,149 | 53,640,149 |
*Includes securities guaranteed by U.S. Government Agencies.
10. In-Kind Transactions:
The consideration for the purchase of Creation Units of a fund often consists of the in-kind deposit of a designated portfolio of fixed-income securities, which constitutes an optimized representation of the securities involved in a relevant fund’s underlying index, and an amount of cash. Investors purchasing and redeeming Creation Units are subject to a standard creation transaction fee and a standard redemption transaction fee paid to the custodian to offset transfer and other transaction costs associated with the issuance and redemption of Creation Units. Purchasers and redeemers of Creation Units for cash are subject to an additional variable charge paid to the fund that will offset the transaction costs to the fund of buying or selling portfolio securities. In addition, purchasers and redeemers of shares in Creation Units are responsible for payment of the costs of transferring securities to or out of the fund. From time to time, CSIM may cover the cost of any transaction fees when believed to be in the best interests of the fund.
The in-kind transactions for the period ended December 31, 2020, were as follows:
| | In-Kind Purchases
of Securities | In-Kind Sales
of Securities |
| Schwab U.S. TIPS ETF | $6,318,341,050 | $2,370,428,059 |
| Schwab Short-Term U.S. Treasury ETF | 2,919,718,821 | 3,832,304,535 |
| Schwab Intermediate-Term U.S. Treasury ETF | 1,428,778,051 | 3,822,233,841 |
| Schwab Long-Term U.S. Treasury ETF | 41,139,755 | 16,291,780 |
| Schwab U.S. Aggregate Bond ETF | 44,167,063 | 4,218,707 |
| Schwab 1-5 Year Corporate Bond ETF | 4,512,233 | 12,598,510 |
| Schwab 5-10 Year Corporate Bond ETF | 4,138,565 | 20,772,759 |
For the period ended December 31, 2020, the funds realized net capital gains or losses resulting from in-kind redemptions of Creation Units. Because such gains or losses are not taxable to the funds and are not distributed to existing fund shareholders, the gains or losses are reclassified from accumulated net realized gains or losses to capital received from investors at the end of the funds’ tax year. These reclassifications have no effect on net assets or net asset values per share. The net realized in-kind gains or losses for the period ended December 31, 2020 are disclosed in the funds’ Statements of Operations, if any.
Schwab Fixed-Income ETFs | Annual Report
Financial Notes (continued)
11. Federal Income Taxes
As of December 31, 2020, the tax basis cost of the funds’ investments and gross unrealized appreciation and depreciation were as follows:
| | Schwab
U.S. TIPS ETF | | Schwab
Short-Term
U.S. Treasury ETF | | Schwab
Intermediate-Term
U.S. Treasury ETF | | Schwab
Long-Term
U.S. Treasury ETF |
| Tax cost | $13,125,758,001 | | $7,420,986,730 | | $3,815,776,228 | | $90,098,386 |
| Gross unrealized appreciation | $947,905,900 | | $68,122,741 | | $128,414,409 | | $665,387 |
| Gross unrealized depreciation | (12,919,846) | | (324,201) | | (2,860,306) | | (730,379) |
| Net unrealized appreciation (depreciation) | $934,986,054 | | $67,798,540 | | $125,554,103 | | ($64,992) |
| | Schwab
U.S. Aggregate
Bond ETF | | Schwab
1-5 Year
Corporate Bond ETF | | Schwab
5-10 Year
Corporate Bond ETF |
| Tax cost | $8,368,105,512 | | $114,736,302 | | $179,600,995 |
| Gross unrealized appreciation | $550,636,165 | | $3,173,772 | | $10,328,767 |
| Gross unrealized depreciation | (13,608,464) | | (4,705) | | (80,661) |
| Net unrealized appreciation (depreciation) | $537,027,701 | | $3,169,067 | | $10,248,106 |
As of December 31, 2020, the components of distributable earnings on a tax basis were as follows:
| | Schwab
U.S. TIPS ETF | | Schwab
Short-Term
U.S. Treasury ETF | | Schwab
Intermediate-Term
U.S. Treasury ETF | | Schwab
Long-Term
U.S. Treasury ETF |
| Undistributed ordinary income | $842,372 | | $73,176 | | $160,823 | | $2,954 |
| Net unrealized appreciation (depreciation) on investments | 934,986,054 | | 67,798,540 | | 125,554,103 | | (64,992) |
| Capital loss carryforwards | (29,722,805) | | (2,337,524) | | (1,440,182) | | (227,609) |
| Total | $906,105,621 | | $65,534,192 | | $124,274,744 | | ($289,647) |
| | Schwab
U.S. Aggregate
Bond ETF | | Schwab
1-5 Year
Corporate Bond ETF | | Schwab
5-10 Year
Corporate Bond ETF |
| Undistributed ordinary income | $186,758 | | $5,064 | | $13,455 |
| Net unrealized appreciation (depreciation) on investments | 537,027,701 | | 3,169,067 | | 10,248,106 |
| Capital loss carryforwards | (3,971,628) | | — | | (13,832) |
| Total | $533,242,831 | | $3,174,131 | | $10,247,729 |
The primary difference between book basis and tax basis unrealized appreciation or unrealized depreciation of investments is the tax deferral of losses on wash sales. The tax cost of the funds’ investments, disclosed above, have been adjusted from their book amounts to reflect these unrealized appreciation or depreciation differences, as applicable.
Net investment income and realized capital gains and losses may differ for financial statement and tax purposes primarily due to differing treatments of paydown gains and losses and amortization of bond discounts and premiums.
Capital loss carryforwards may be used to offset future realized capital gains for federal income tax purposes. As of December 31, 2020, the funds had capital loss carryforwards available to offset future net capital gains before the expiration dates as follows:
| Expiration Date | Schwab
U.S. TIPS ETF | | Schwab
Short-Term
U.S. Treasury ETF | | Schwab
Intermediate-Term
U.S. Treasury ETF | | Schwab
Long-Term
U.S. Treasury ETF |
| No expiration | $29,722,805 | | $2,337,524 | | $1,440,182 | | $227,609 |
| Total | $29,722,805 | | $2,337,524 | | $1,440,182 | | $227,609 |
Schwab Fixed-Income ETFs | Annual Report
Financial Notes (continued)
11. Federal Income Taxes (continued):
| Expiration Date | Schwab
U.S. Aggregate
Bond ETF | | Schwab
1-5 Year
Corporate Bond ETF | | Schwab
5-10 Year
Corporate Bond ETF |
| No expiration | $3,971,628 | | $— | | $13,832 |
| Total | $3,971,628 | | $— | | $13,832 |
For the fiscal year ended December 31, 2020, the funds had capital loss carryforwards utilized as follows:
| | Schwab
U.S. TIPS ETF | Schwab
Short-Term
U.S. Treasury ETF | Schwab
Intermediate-Term
U.S. Treasury ETF | Schwab
Long-Term
U.S. Treasury ETF |
| Capital loss carryforwards utilized | $3,059,212 | $22,986,733 | $20,669,535 | $— |
| | Schwab
U.S. Aggregate
Bond ETF | Schwab
1-5 Year
Corporate Bond ETF | Schwab
5-10 Year
Corporate Bond ETF |
| Capital loss carryforwards utilized | $43,133,301 | $2,869 | $— |
The tax basis components of distributions paid during the current and prior fiscal years were:
| | Schwab
U.S. TIPS ETF | Schwab
Short-Term
U.S. Treasury ETF | Schwab
Intermediate-Term
U.S. Treasury ETF | Schwab
Long-Term
U.S. Treasury ETF |
| Current fiscal year end distributions | | | | |
| Ordinary income | $145,346,920 | $88,160,440 | $68,701,360 | $911,465 |
| Prior fiscal year end distributions | | | | |
| Ordinary income | $152,790,170 | $122,565,815 | $100,812,255 | $66,835 |
| | Schwab
U.S. Aggregate
Bond ETF | Schwab
1-5 Year
Corporate Bond ETF | Schwab
5-10 Year
Corporate Bond ETF |
| Current fiscal year end distributions | | | |
| Ordinary income | $196,101,450 | $2,580,855 | $3,679,790 |
| Prior fiscal year end distributions | | | |
| Ordinary income | $184,048,740 | $135,820 | $424,080 |
Distributions paid to shareholders are based on net investment income and net realized gains determined on a tax basis, which may differ from net investment income and net realized gains for financial reporting purposes. These differences reflect the differing character of certain income items and net realized gains and losses for financial statement and tax purposes, and may result in reclassification among certain capital accounts on the financial statements. The funds may also designate a portion of the amount paid to redeeming shareholders as a distribution for tax purposes.
Permanent book and tax basis differences may result in reclassifications between components of net assets as required. The adjustments have no impact on net assets or the results of operations.
As of December 31, 2020, management has reviewed the tax positions for open periods (for federal purposes, three years from the date of filing and for state purposes, four years from the date of filing) as applicable to the funds, and has determined that no provision for income tax is required in the funds’ financial statements. The funds recognize interest and penalties, if any, related to unrecognized tax benefits as income tax expense in the Statement of Operations. During the fiscal year ended December 31, 2020, the funds did not incur any interest or penalties.
12. Independent Registered Public Accounting Firm:
On June 8, 2020, the Audit, Compliance and Valuation Committee of the Board approved, and on June 9, 2020, the Board approved, Deloitte & Touche LLP as the independent registered accounting firm of the Schwab Funds Complex for fiscal periods ending after June 8, 2020.
Schwab Fixed-Income ETFs | Annual Report
Financial Notes (continued)
12. Independent Registered Public Accounting Firm (continued):
On June 8, 2020, PricewaterhouseCoopers LLP (the “Prior Auditor”) resigned as the independent registered public accounting firm of the Schwab Funds Complex. The Prior Auditor’s reports on the financial statements of the Schwab U.S. TIPS ETF, Schwab Short-Term U.S. Treasury ETF, Schwab Intermediate-Term U.S. Treasury ETF and Schwab U.S. Aggregate Bond ETF for the past two fiscal years, December 31, 2018 and December 31, 2019, and the Schwab Long-Term U.S. Treasury ETF, Schwab 1-5 Year Corporate Bond ETF and Schwab 5-10 Year Corporate Bond ETF for the period October 10, 2019 (commencement of operations) through December 31, 2019, did not contain an adverse opinion or disclaimer of opinion, and were not qualified or modified as to uncertainty, audit scope or accounting principles. During the last two period year-ends detailed above and through June 8, 2020, there were no (1) disagreements with the Prior Auditor on any matter of accounting principles or practices, financial statement disclosure, or auditing scope or procedure, which disagreements, if not resolved to the Prior Auditor’s satisfaction, would have caused it to make reference to that matter in connection with its reports on the funds’ financial statements for such periods; or (2) “reportable events,” as that term is defined in Item 304 (a)(1)(v) of Regulation S-K under the Securities Exchange Act of 1934.
13. Subsequent Events:
Management has determined there are no subsequent events or transactions through the date the financial statements were issued that would have materially impacted the financial statements as presented.
Schwab Fixed-Income ETFs | Annual Report
Report of Independent Registered Public Accounting Firm
To the Board of Trustees of Schwab Strategic Trust and Shareholders of Schwab U.S. TIPS ETF, Schwab Short-Term U.S. Treasury ETF, Schwab Intermediate-Term U.S. Treasury ETF, Schwab Long-Term U.S. Treasury ETF, Schwab U.S. Aggregate Bond ETF, Schwab 1-5 Year Corporate Bond ETF, and Schwab 5-10 Year Corporate Bond ETF:
Opinion on the Financial Statements and Financial Highlights
We have audited the accompanying statements of assets and liabilities, including the portfolio holdings, of Schwab U.S. TIPS ETF, Schwab Short-Term U.S. Treasury ETF, Schwab Intermediate-Term U.S. Treasury ETF, Schwab Long-Term U.S. Treasury ETF, Schwab U.S. Aggregate Bond ETF, Schwab 1-5 Year Corporate Bond ETF, and Schwab 5-10 Year Corporate Bond ETF (the “Funds”), seven of the funds constituting Schwab Strategic Trust, as of December 31, 2020, and the related statements of operations, statements of changes in net assets, and the financial highlights for the year then ended, and the related notes. In our opinion, the financial statements and financial highlights present fairly, in all material respects, the financial position of each of the Funds as of December 31, 2020, and the results of their operations, the changes in their net assets, and the financial highlights for the year then ended in conformity with accounting principles generally accepted in the United States of America. The statements of changes in net assets for the year ended December 31, 2019 and the financial highlights for each of the four years in the period ended December 31, 2019; except for Schwab Long-Term U.S. Treasury ETF, Schwab 1-5 Year Corporate Bond ETF, and Schwab 5-10 Year Corporate Bond ETF, the statements of changes in net assets and the financial highlights for the period from October 10, 2019 to December 31, 2019, were audited by other auditors, whose report, dated February 18, 2020, expressed an unqualified opinion on such statements of changes in net assets and financial highlights.
Basis for Opinion
These financial statements and financial highlights are the responsibility of the Funds’ management. Our responsibility is to express an opinion on the Funds’ financial statements and financial highlights based on our audits. We are a public accounting firm registered with the Public Company Accounting Oversight Board (United States) (PCAOB) and are required to be independent with respect to the Funds in accordance with the U.S. federal securities laws and the applicable rules and regulations of the Securities and Exchange Commission and the PCAOB.
We conducted our audits in accordance with the standards of the PCAOB. Those standards require that we plan and perform the audit to obtain reasonable assurance about whether the financial statements and financial highlights are free of material misstatement, whether due to error or fraud. The Funds are not required to have, nor were we engaged to perform, an audit of their internal control over financial reporting. As part of our audits we are required to obtain an understanding of internal control over financial reporting but not for the purpose of expressing an opinion on the effectiveness of the Funds’ internal control over financial reporting. Accordingly, we express no such opinion.
Our audits included performing procedures to assess the risks of material misstatement of the financial statements and financial highlights, whether due to error or fraud, and performing procedures that respond to those risks. Such procedures included examining, on a test basis, evidence regarding the amounts and disclosures in the financial statements and financial highlights. Our audits also included evaluating the accounting principles used and significant estimates made by management, as well as evaluating the overall presentation of the financial statements and financial highlights. Our procedures included confirmation of securities owned as of December 31, 2020, by correspondence with the custodian and brokers; when replies were not received from brokers, we performed other auditing procedures. We believe that our audits provide a reasonable basis for our opinion.
Deloitte & Touche LLP
Denver, Colorado
February 17, 2021
We have served as the auditor of one or more investment companies in the Schwab Funds Complex since 2020.
Schwab Fixed-Income ETFs | Annual Report
Other Federal Tax Information (unaudited)
For the fiscal year ended December 31, 2020, the funds designate the following percentage of income dividends, to the maximum amount allowed, as interest-related dividends eligible for exemption from U.S. withholding tax for nonresident aliens and foreign corporations.
| Schwab U.S. TIPS ETF | 100.00% |
| Schwab Short-Term U.S. Treasury ETF | 100.00% |
| Schwab Intermediate-Term U.S. Treasury ETF | 100.00% |
| Schwab Long-Term U.S. Treasury ETF | 100.00% |
| Schwab U.S. Aggregate Bond ETF | 90.87% |
| Schwab 1-5 Year Corporate Bond ETF | 78.43% |
| Schwab 5-10 Year Corporate Bond ETF | 84.90% |
For the fiscal year ended December 31, 2020, the Schwab 1-5 Year Corporate Bond ETF designates the maximum amount allowed, or 100% of the short-term capital gain dividends of $912,120 as exempt from U.S. withholding tax for nonresident aliens and foreign corporations.
For the fiscal year ended December 31, 2020, the funds designate the following percentage of dividend income as business interest income under section 163(j) of the Internal Revenue Code.
| Schwab U.S. TIPS ETF | 100.00% |
| Schwab Short-Term U.S. Treasury ETF | 100.00% |
| Schwab Intermediate-Term U.S. Treasury ETF | 100.00% |
| Schwab Long-Term U.S. Treasury ETF | 100.00% |
| Schwab U.S. Aggregate Bond ETF | 100.00% |
| Schwab 1-5 Year Corporate Bond ETF | 59.63% |
| Schwab 5-10 Year Corporate Bond ETF | 100.00% |
Schwab Fixed-Income ETFs | Annual Report
Liquidity Risk Management Program (Unaudited)
The Funds have adopted and implemented a liquidity risk management program (the “program”) as required by Rule 22e-4 under the Investment Company Act of 1940, as amended. The Funds’ Board of Trustees (the “Board”) has designated the Funds’ investment adviser, Charles Schwab Investment Management, Inc. (“CSIM”) as the administrator of the program. Personnel of CSIM or its affiliates conduct the day-to-day operation of the program.
Under the program, CSIM manages a Fund’s liquidity risk, which is the risk that the Fund could not meet shareholder redemption requests without significant dilution of remaining shareholders’ interests in the Fund. The program is reasonably designed to assess and manage a Fund’s liquidity risk, taking into consideration the Fund’s investment strategy and the liquidity of its portfolio investments during normal and reasonably foreseeable stressed conditions; its historical redemption history and shareholder concentrations; and its cash holdings and access to other funding sources, including the custodian overdraft facility and lines of credit. CSIM’s process of determining the degree of liquidity of each Fund’s investments is supported by third-party liquidity assessment vendors.
The Funds’ Board reviewed a report at its meeting held on September 22, 2020 prepared by CSIM regarding the operation and effectiveness of the program for the period June 1, 2019, through May 31, 2020. No significant liquidity events impacting any of the Funds were noted in the report. In addition, CSIM provided its assessment that the program had been operating effectively in managing each Fund’s liquidity risk.
Schwab Fixed-Income ETFs | Annual Report
Trustees and Officers
The tables below give information about the trustees and officers of Schwab Strategic Trust, which includes the funds covered in this report. The “Fund Complex” includes The Charles Schwab Family of Funds, Schwab Capital Trust, Schwab Investments, Schwab Annuity Portfolios, Schwab Strategic Trust and Laudus Trust. The Fund Complex includes 102 funds.
The address for all trustees and officers is 211 Main Street, San Francisco, CA 94105. You can find more information about the trustees and officers in the Statement of Additional Information, which is available free by calling 1-877-824-5615.
| Independent Trustees |
Name, Year of Birth, and
Position(s) with the trust
(Terms of office, and
length of Time Served1) | Principal Occupations
During the Past Five Years | Number of
Portfolios in
Fund Complex
Overseen by
the Trustee | Other Directorships |
Robert W. Burns
1959
Trustee
(Trustee of Schwab Strategic Trust since 2009; The Charles Schwab Family of Funds, Schwab Investments, Schwab Capital Trust, Schwab Annuity Portfolios and Laudus Trust since 2016) | Retired/Private Investor (Jan. 2009 – present). Formerly, Managing Director, Pacific Investment Management Company, LLC (PIMCO) (investment management firm) and President, PIMCO Funds. | 102 | None |
John F. Cogan
1947
Trustee
(Trustee of The Charles Schwab Family of Funds, Schwab Investments, Schwab Capital Trust and Schwab Annuity Portfolios since 2008; Laudus Trust since 2010; Schwab Strategic Trust since 2016) | Senior Fellow (Oct. 1979 – present), The Hoover Institution at Stanford University (public policy think tank); Senior Fellow (2000 – present), Stanford Institute for Economic Policy Research; Professor of Public Policy (1994 – 2015), Stanford University. | 102 | Director (2005 – 2020), Gilead Sciences, Inc. |
Nancy F. Heller
1956
Trustee
(Trustee of The Charles Schwab Family of Funds, Schwab Investments, Schwab Capital Trust, Schwab Annuity Portfolios, Schwab Strategic Trust and Laudus Trust since 2018) | Retired. President and Chairman (2014 – 2016), TIAA Charitable (financial services); Senior Managing Director (2003 – 2016), TIAA (financial services). | 102 | None |
David L. Mahoney
1954
Trustee
(Trustee of The Charles Schwab Family of Funds, Schwab Investments, Schwab Capital Trust, Schwab Annuity Portfolios and Laudus Trust since 2011; Schwab Strategic Trust since 2016) | Private Investor. | 102 | Director (2004 – present), Corcept Therapeutics Incorporated
Director (2009 – present), Adamas Pharmaceuticals, Inc.
Director (2003 – 2019), Symantec Corporation |
Jane P. Moncreiff
1961
Trustee
(Trustee of The Charles Schwab Family of Funds, Schwab Investments, Schwab Capital Trust, Schwab Annuity Portfolios, Schwab Strategic Trust and Laudus Trust since 2019) | Consultant (2018 – present), Fulham Advisers LLC (management consulting); Chief Investment Officer (2009 – 2017), CareGroup Healthcare System, Inc. (healthcare). | 102 | None |
Schwab Fixed-Income ETFs | Annual Report
| Independent Trustees (continued) |
Name, Year of Birth, and
Position(s) with the trust
(Terms of office, and
length of Time Served1) | Principal Occupations
During the Past Five Years | Number of
Portfolios in
Fund Complex
Overseen by
the Trustee | Other Directorships |
Kiran M. Patel
1948
Trustee
(Trustee of The Charles Schwab Family of Funds, Schwab Investments, Schwab Capital Trust, Schwab Annuity Portfolios and Laudus Trust since 2011; Schwab Strategic Trust since 2016) | Retired. Executive Vice President and General Manager of Small Business Group (Dec. 2008 – Sept. 2013), Intuit, Inc. (financial software and services firm for consumers and small businesses). | 102 | Director (2008 – present), KLA-Tencor Corporation |
Kimberly S. Patmore
1956
Trustee
(Trustee of The Charles Schwab Family of Funds, Schwab Investments, Schwab Capital Trust, Schwab Annuity Portfolios, Schwab Strategic Trust and Laudus Trust since 2016) | Consultant (2008 – present), Patmore Management Consulting (management consulting). | 102 | None |
| Interested Trustees |
Name, Year of Birth, and
Position(s) with the trust
(Terms of office, and
length of Time Served1) | Principal Occupations
During the Past Five Years | Number of
Portfolios in
Fund Complex
Overseen by
the Trustee | Other Directorships |
Walter W. Bettinger II2
1960
Chairman and Trustee
(Trustee of The Charles Schwab Family of Funds, Schwab Investments, Schwab Capital Trust and Schwab Annuity Portfolios since 2008; Schwab Strategic Trust since 2009; Laudus Trust since 2010) | Director, President and Chief Executive Officer (Oct. 2008 – present), The Charles Schwab Corporation; President and Chief Executive Officer (Oct. 2008 – present) and Director (May 2008 – present), Charles Schwab & Co., Inc.; Director (Apr. 2006 – present), Charles Schwab Bank, SSB; Director (Nov. 2017 – present), Charles Schwab Premier Bank, SSB; Director (July 2019 – present), Charles Schwab Trust Bank; Director (May 2008 – present) and President and Chief Executive Officer (Aug. 2017 – present), Schwab Holdings, Inc.; Director (Oct. 2020 – present), TD Ameritrade Holding Corporation; Director (July 2016 – present), Charles Schwab Investment Management, Inc. | 102 | Director (2008 – present), The Charles Schwab Corporation |
Joseph R. Martinetto2
1962
Trustee
(Trustee of The Charles Schwab Family of Funds, Schwab Investments, Schwab Capital Trust, Schwab Annuity Portfolios, Schwab Strategic Trust and Laudus Trust since 2016) | Chief Operating Officer (Feb. 2018 – present) and Senior Executive Vice President (July 2015 – Feb. 2018), The Charles Schwab Corporation; Senior Executive Vice President (July 2015 – present), Charles Schwab & Co., Inc.; Chief Financial Officer (July 2015 – Aug. 2017) and Executive Vice President and Chief Financial Officer (May 2007 – July 2015), The Charles Schwab Corporation and Charles Schwab & Co., Inc.; Director (May 2007 – present), Charles Schwab & Co., Inc.; Director (Apr. 2010 – present) and Chief Executive Officer (July 2013 – Apr. 2015), Charles Schwab Bank, SSB; Director (Nov. 2017 – present), Charles Schwab Premier Bank, SSB; Director (May 2007 – present), Chief Financial Officer (May 2007 – Aug. 2017), Senior Executive Vice President (Feb. 2016 – present), and Executive Vice President (May 2007 – Feb. 2016), Schwab Holdings, Inc.; Director (Oct. 2020 – present), TD Ameritrade Holding Corporation. | 102 | None |
Schwab Fixed-Income ETFs | Annual Report
| Officers of the Trust |
Name, Year of Birth, and Position(s) with the trust
(Terms of office, and length of Time Served3) | Principal Occupations During the Past Five Years |
Jonathan de St. Paer
1973
President and Chief Executive Officer
(Officer of The Charles Schwab Family of Funds, Schwab Investments, Schwab Capital Trust, Schwab Annuity Portfolios, Schwab Strategic Trust and Laudus Trust since 2018) | Director (Apr. 2019 – present), President (Oct. 2018 – present), Chief Operating Officer (Jan. 2020 – present), and Chief Executive Officer (Apr. 2019 – Nov. 2019), Charles Schwab Investment Management, Inc.; Senior Vice President (June 2020 – present) and Chief Operating Officer (Jan. 2020 – present), Charles Schwab Investment Advisory, Inc.; Chief Executive Officer (Apr. 2019 – present), President (Nov. 2018 – present) and Trustee (Apr. 2019 – Dec. 2020), Schwab Funds, Laudus Funds and Schwab ETFs; Director (Apr. 2019 – present), Charles Schwab Worldwide Funds plc and Charles Schwab Asset Management (Ireland) Limited; Senior Vice President (Apr. 2019 – present), Senior Vice President – Strategy and Product Development (CSIM) (Jan. 2014 – Mar. 2019), and Vice President (Jan. 2009 – Dec. 2013), Charles Schwab & Co., Inc. |
Mark Fischer
1970
Treasurer, Chief Financial Officer and Chief Operating Officer
(Officer of The Charles Schwab Family of Funds, Schwab Investments, Schwab Capital Trust, Schwab Annuity Portfolios, Schwab Strategic Trust and Laudus Trust since 2013) | Treasurer and Chief Financial Officer (Jan. 2016 – present) and Chief Operating Officer (Dec. 2020 – present), Schwab Funds, Laudus Funds and Schwab ETFs; Assistant Treasurer (Dec. 2013 – Dec. 2015), Schwab Funds and Laudus Funds; Assistant Treasurer (Nov. 2013 – Dec. 2015), Schwab ETFs; Chief Financial Officer (Mar. 2020 – present) and Vice President (Oct. 2013 – present), Charles Schwab Investment Management, Inc.; Executive Director (Apr. 2011 – Sept. 2013), J.P. Morgan Investor Services; Assistant Treasurer (May 2005 – Mar. 2011), Massachusetts Financial Service Investment Management. |
Omar Aguilar
1970
Senior Vice President and Chief Investment Officer – Equities and Multi-Asset Strategies
(Officer of The Charles Schwab Family of Funds, Schwab Investments, Schwab Capital Trust, Schwab Annuity Portfolios, Schwab Strategic Trust and Laudus Trust since 2011) | Senior Vice President and Chief Investment Officer (Apr. 2011 – present), Charles Schwab Investment Management, Inc.; Senior Vice President and Chief Investment Officer – Equities and Multi-Asset Strategies (June 2011 – present), Schwab Funds, Laudus Funds and Schwab ETFs; Head of the Portfolio Management Group and Vice President of Portfolio Management (May 2009 – Apr. 2011), Financial Engines, Inc. (investment management firm); Head of Quantitative Equity (July 2004 – Jan. 2009), ING Investment Management. |
Brett Wander
1961
Senior Vice President and Chief Investment Officer – Fixed Income
(Officer of The Charles Schwab Family of Funds, Schwab Investments, Schwab Capital Trust, Schwab Annuity Portfolios, Schwab Strategic Trust and Laudus Trust since 2011) | Senior Vice President and Chief Investment Officer (Apr. 2011 – present), Charles Schwab Investment Management, Inc.; Senior Vice President and Chief Investment Officer – Fixed Income (June 2011 – present), Schwab Funds, Laudus Funds and Schwab ETFs; Senior Managing Director and Global Head of Active Fixed-Income Strategies (Jan. 2008 – Oct. 2010), State Street Global Advisors; Director of Alpha Strategies (Apr. 2006 – Jan. 2008), Loomis, Sayles & Company (investment management firm). |
David Lekich
1964
Chief Legal Officer and Secretary, Schwab Funds and Schwab ETFs
Vice President and Assistant Clerk, Laudus Funds
(Officer of The Charles Schwab Family of Funds, Schwab Investments, Schwab Capital Trust, Schwab Annuity Portfolios, Schwab Strategic Trust and Laudus Trust since 2011) | Senior Vice President (Sept. 2011 – present) and Vice President (Mar. 2004 – Sept. 2011), Charles Schwab & Co., Inc.; Senior Vice President and Chief Counsel (Sept. 2011 – present) and Vice President (Jan. 2011 – Sept. 2011), Charles Schwab Investment Management, Inc.; Secretary (Apr. 2011 – present) and Chief Legal Officer (Dec. 2011 – present), Schwab Funds; Vice President and Assistant Clerk (Apr. 2011 – present), Laudus Funds; Secretary (May 2011 – present) and Chief Legal Officer (Nov. 2011 – present), Schwab ETFs. |
Catherine MacGregor
1964
Vice President and Assistant Secretary, Schwab Funds and Schwab ETFs
Chief Legal Officer, Vice President and Clerk, Laudus Funds
(Officer of The Charles Schwab Family of Funds, Schwab Investments, Schwab Capital Trust, Schwab Annuity Portfolios and Laudus Trust since 2005; Schwab Strategic Trust since 2009) | Vice President (July 2005 – present), Charles Schwab & Co., Inc.; Vice President (Sept. 2005 – present), Charles Schwab Investment Management, Inc.; Vice President (Dec. 2005 – present) and Chief Legal Officer and Clerk (Mar. 2007 – present), Laudus Funds; Vice President (Nov. 2005 – present) and Assistant Secretary (June 2007 – present), Schwab Funds; Vice President and Assistant Secretary (Oct. 2009 – present), Schwab ETFs. |
| 1 | Each Trustee shall hold office until the election and qualification of his or her successor, or until he or she dies, resigns or is removed. The retirement policy requires that each independent trustee retire by December 31 of the year in which the Trustee turns 74 or the Trustee’s twentieth year of service as an independent trustee on any trust in the Fund Complex, whichever occurs first. |
| 2 | Mr. Bettinger and Mr. Martinetto are Interested Trustees. Mr. Bettinger is an Interested Trustee because he owns stock of The Charles Schwab Corporation (CSC), the parent company of Charles Schwab Investment Management, Inc. (CSIM), the investment adviser for the trusts in the Fund Complex, is an employee and director of Charles Schwab & Co., Inc. (CS&Co), the principal underwriter for The Charles Schwab Family of Funds, Schwab Investments, Schwab Capital Trust, Schwab Annuity Portfolios and Laudus Trust, and is a director of CSIM. Mr. Martinetto is an Interested Trustee because he owns stock of CSC and is an employee and director of CS&Co. |
| 3 | The President, Treasurer and Secretary/Clerk hold office until their respective successors are chosen and qualified or until he or she sooner dies, resigns, is removed or becomes disqualified. Each of the other officers serves at the pleasure of the Board. |
Schwab Fixed-Income ETFs | Annual Report
ask See “offer.”
asset allocation The practice of dividing a portfolio among different asset classes, with each asset class assigned a particular percentage to help offset risks and rewards, based on your goals, time horizon and risk tolerance.
asset-backed securities Bond or other debt securities that represent ownership in a pool of assets such as credit card debt.
asset class A group of securities with similar structure and basic characteristics. Stocks, bonds and cash are the three main examples of asset classes.
authorized participant (AP) A large institutional investor that places orders for creation units with the funds’ distributor.
bid The highest price at which someone is willing to buy a security.
Bloomberg Barclays US 1–5 Year Corporate Bond Index An index that measures the performance of U.S. investment grade, taxable corporate bonds with maturities greater than or equal to one year and less than five years that have $300 million or more of outstanding face value. The securities in the index must be denominated in U.S. dollars and must be fixed-rate. The index includes securities publicly issued by U.S. and non-U.S. industrial, utility and financial issuers. The index excludes certain types of securities, including contingent capital securities, inflation-linked bonds, floating-rate issues, taxable and tax-exempt municipal securities, structured notes and pass-through certificates. The index is market capitalization weighted and the securities in the index are updated on the last business day of each month.
Bloomberg Barclays US 5–10 Year Corporate Bond Index An index that measures the performance of U.S. investment grade, taxable corporate bonds with maturities greater than or equal to five years and less than ten years that have $300 million or more of outstanding face value. The securities in the index must be denominated in U.S. dollars and must be fixed-rate. The index includes securities publicly issued by U.S. and non-U.S. industrial, utility and financial issuers. The index excludes certain types of securities, including contingent capital securities, inflation-linked bonds, floating-rate bonds, taxable and tax-exempt municipal securities, structured notes and pass-through certificates. The index is market capitalization weighted and the securities in the index are updated on the last business day of each month.
Bloomberg Barclays US Aggregate Bond Index An index that is a broad-based benchmark measuring the performance of the U.S. investment grade, taxable bond market, including U.S. Treasuries, government-related and corporate bonds, mortgage pass-through securities, commercial mortgage-backed securities, and asset-backed securities that are publicly available for sale in the United States. To be eligible for inclusion in the index, securities must be fixed rate, non-convertible, U.S. dollar-denominated with at least $300 million or more of outstanding face value and have one or more years remaining to maturity. The index excludes certain types of securities, including tax-exempt state and local government series bonds, structured notes embedded with swaps or other special features, private placements, floating rate securities, inflation-linked bonds and Eurobonds. The index is market capitalization weighted and the securities in the index are updated on the last business day of each month.
Bloomberg Barclays US Long Treasury Index An index that includes all publicly issued, U.S. Treasury securities that have a remaining maturity of ten or more years, are rated investment grade, and have $300 million or more of outstanding face value. The securities in the index must be denominated in U.S. dollars and must be fixed-rate and non-convertible. The index excludes U.S. Treasury stripped securities. The index is market capitalization weighted and the securities in the index are updated on the last business day of each month.
Bloomberg Barclays US Treasury 1–3 Year Index An index which includes all publicly-issued U.S. Treasury securities that have a remaining maturity of greater than or equal to one year and less than three years, are rated investment grade, and have $300 million or more of outstanding face value. The securities in the index must be denominated in U.S. dollars and must be fixed-rate and non-convertible. The index excludes state and local government series bonds and coupon issues that have been stripped from bonds. The index is market capitalization weighted and the securities in the index are updated on the last business day of each month.
Bloomberg Barclays US Treasury 3–10 Year Index An index which includes all publicly-issued U.S. Treasury securities that have a remaining maturity of greater than or equal to three years and less than ten years, are rated investment grade, and have $300 million or more of outstanding face value. The securities in the index must be denominated in U.S. dollars and must be fixed-rate and non-convertible. The index excludes state and local government series bonds and coupon issues that have been stripped from bonds. The index is market capitalization weighted and the securities in the index are updated on the last business day of each month.
Bloomberg Barclays US Treasury Inflation-Linked Bond Index (Series-L) An index which includes all publicly-issued U.S. Treasury Inflation-Protected Securities (TIPS) that have at least one year remaining to maturity, are rated investment grade and have $500 million or more of outstanding face value. The TIPS in the index must be denominated in U.S. dollars and must be fixed-rate and non-convertible. The index is market capitalization weighted and the TIPS in the index are updated on the last business day of each month. TIPS are publicly issued, dollar denominated U.S. Government securities issued by the U.S. Treasury that have principal and interest payments linked to an official inflation measure (as measured by the Consumer Price Index, or CPI) and their payments are supported by the full faith and credit of the United States.
bond A security representing a loan from the investor to the issuer. A bond typically pays interest at a fixed rate (the “coupon rate”) until a specified date (the “maturity date”), at which time the issuer returns the money borrowed (“principal” or “face value”) to the bondholder. Because of their structure, bonds are sometimes called “fixed income securities” or “debt securities.”
call An early repayment of a bond’s principal by the issuer, usually done because the issuer is able to refinance its bond debt at a lower rate.
call protection A term used in reference to a bond that cannot be called by the issuer before maturity, or at least for many years from the present date. A bond that offers call protection can more reliably be expected to provide a given yield over a given number of years than a bond that could be called (assuming both bonds are of the same credit quality).
capital gain, capital loss The difference between the amount paid for an investment and its value at a later time. If the investment has been sold, the capital gain or loss is considered a realized gain or loss. If the investment is still held, the gain or loss is still “on paper” and is considered unrealized.
commencement of operations The date that the first NAV was calculated.
coupon, coupon rate The annual rate of interest paid until maturity by the issuer of a debt security.
Schwab Fixed-Income ETFs | Annual Report
creation unit (C.U.) A basket of securities that is delivered by an authorized participant (AP) to the fund equal to the current holdings of the ETF, plus a designated cash component. In return, the APs receive a large block of ETF shares (typically 50,000 shares), which investors can then buy and sell in the secondary market.
credit quality The capacity of an issuer to make its interest and principal payments; an assessment typically rendered by an independent third-party organization.
credit risk The risk that a bond issuer may be unable to pay interest or principal to its bondholders.
duration A measure of an individual bond’s sensitivity to interest rates, expressed in years. Calculations of duration generally take into account the bond’s yield, interest payments, maturity date and call features.
weighted average duration A measure of the duration of all bonds in a fund’s portfolio, also expressed in years, based on the market value weighted average duration of each bond in the portfolio.
exchange A marketplace, or any organization or group that provides or maintains a marketplace for trading securities, options, futures, or commodities.
expense ratio The amount that is taken from the fund’s assets each year to cover the operating expenses. An expense ratio of 0.50% means that a fund’s expenses amount to half of one percent of its average net assets a year.
face value The value of a bond, note, mortgage or other security as given on the certificate or instrument. Face value is also referred to as par value or nominal value.
inception date The date that the shares began trading in the secondary market.
indicative optimized portfolio value (IOPV) A calculation disseminated by the stock exchange that approximates the fund’s NAV every 15 seconds throughout the trading day.
interest Payments to bondholders (usually made twice a year) as compensation for loaning the bond principal to the issuer.
interest rate risk The risk that a bond’s value will fluctuate if market interest rates change or are expected to change. Bond prices tend to move in the opposite direction of interest rates: when interest rates rise, bond prices tend to fall.
liquidity The ability to convert a security or asset quickly into cash.
market price return The return based on the change in market price per share of the fund over a given time period. Market price returns assume that dividends and capital gain distributions have been reinvested in the fund at market price.
maturity The maturity of a bond will generally be determined using a portfolio security’s final maturity date (date on which the final principal payment of a bond is scheduled to be paid); however, for securitized products, such as mortgage-backed securities and certain other asset-backed securities, maturity will be determined on an average life basis (weighted average time to receipt of all principal payments) by the investment adviser. Because pre-payment rates of individual mortgage pools vary widely, the average life of a particular pool cannot be predicted precisely. For securities with embedded demand features, such as puts or calls, either the demand date or the final maturity date will be used depending on interest rates, yields and other market conditions. The weighted average maturity (WAM) of a fund is dollar-weighted based upon the market value of a fund’s securities at the time of the calculation.
mortgage-backed securities Bond or other debt securities that represent ownership in a pool of mortgage loans.
net asset value (NAV) The value of one share of a fund. NAV is calculated by taking the fund’s total assets, subtracting liabilities, and dividing by the number of shares outstanding.
NAV return The return based on the change in NAV of the fund over a given time period. NAV returns assume that dividends and capital gain distributions have been reinvested in the fund.
offer (ask) The lowest price at which an individual is willing to sell a security.
open The price at which a security opened for trading on a given day.
outstanding shares, shares outstanding When speaking of the fund, indicates all shares currently held by investors.
prepayment risk The risk that a mortgage-backed security may be paid off early, typically because interest rates have fallen and the homeowners who hold the underlying mortgages have refinanced those mortgages at lower rates. In this type of situation, the investor who held the mortgage-backed security will usually have to settle for a lower rate when reinvesting the principal.
primary market The market that deals with the issuance of new securities.
replication If a fund uses a full replication method, the fund will invest substantially all of its assets proportionately in the securities included in the underlying index.
S&P 500 Index An index that is designed to measure the performance of 500 leading publicly traded companies from a broad range of industries.
sampling If a fund uses a sampling method, the fund will not fully replicate the underlying index and may hold securities not included in the index. A fund that utilizes a sampling approach may not track the return of the index as closely as a fund that uses a full replication method.
secondary market The market in which investors purchase securities from other investors rather than directly from the issuing companies. Organized exchanges facilitate the trading of securities in the secondary market.
spread The gap between bid and ask prices of a security.
total return The percentage that an investor would have earned or lost on an investment in the fund assuming dividends and distributions were reinvested.
tracking error The difference between the performance of the fund and its benchmark index, positive or negative.
Treasury inflation protected security (TIPS) A United States Treasury bond whose principal increases at the same rate as the Consumer Price Index (CPI).The interest payment is then calculated off that inflated (adjusted) principal and repaid at maturity.
weighted average For mutual funds or ETFs, an average that gives the same weight to each security as the security represents in the fund’s portfolio.
yield The income paid out by an investment, expressed as a percentage of the investment’s market value.
yield to maturity The annualized rate of return a bondholder could expect if the bond were held to maturity. In addition to interest payments, yield to maturity also factors in any difference between a bond’s current price and its principal amount, or face value.
Schwab Fixed-Income ETFs | Annual Report
Schwab ETFs
Schwab ETFs are designed to serve as simple low-cost core investment products for a diversified portfolio. These ETFs seek to provide consistent, repeatable performance through a variety of investment strategies that span the equity and fixed income spectrum. The list below shows all currently available Schwab ETFs.
Investors should carefully consider information contained in the prospectus, or if available, the summary prospectus, including investment objectives, risks, charges and expenses before investing. Please call 1-877-824-5615 for a prospectus for any Schwab ETF. Please read the prospectus carefully before you invest. This report must be preceded or accompanied by a current prospectus.
Proxy Voting Policies, Procedures and Results
A description of the proxy voting policies and procedures used to determine how to vote proxies on behalf of the funds is available without charge, upon request, by visiting the Schwab ETFs’ website at www.schwabfunds.com/schwabetfs_prospectus, the SEC’s website at www.sec.gov, or by contacting Schwab ETFs at 1-877-824-5615.
Information regarding how a fund voted proxies relating to portfolio securities during the most recent twelve-month period ended June 30 is available, without charge, by visiting the fund’s website at www.schwabfunds.com/schwabetfs_prospectus or the SEC’s website at www.sec.gov.
U.S. ETFs
Schwab U.S. Broad Market ETF
Schwab 1000 Index® ETF
Schwab U.S. Large-Cap ETF
Schwab U.S. Large-Cap Growth ETF
Schwab U.S. Large-Cap Value ETF
Schwab U.S. Mid-Cap ETF
Schwab U.S. Small-Cap ETF
Schwab U.S. Dividend Equity ETF
Schwab U.S. REIT ETF
International ETFs
Schwab International Equity ETF
Schwab International Small-Cap Equity ETF
Schwab Emerging Markets Equity ETF
Fixed Income ETFs
Schwab U.S. TIPS ETF
Schwab Short-Term U.S. Treasury ETF
Schwab Intermediate-Term U.S. Treasury ETF
Schwab Long-Term U.S. Treasury ETF
Schwab U.S. Aggregate Bond ETF
Schwab 1-5 Year Corporate Bond ETF
Schwab 5-10 Year Corporate Bond ETF
Fundamental Index* ETFs
Schwab Fundamental U.S. Broad Market Index ETF
Schwab Fundamental U.S. Large Company Index ETF
Schwab Fundamental U.S. Small Company Index ETF
Schwab Fundamental International Large Company Index ETF
Schwab Fundamental International Small Company Index ETF
Schwab Fundamental Emerging Markets Large Company
Index ETF
Investment Adviser
Charles Schwab Investment Management, Inc.
211 Main Street, San Francisco, CA 94105
Schwab ETFs
1-877-824-5615
© 2021 Charles Schwab Investment Management, Inc. All rights reserved.
Printed on recycled paper.
| * | FUNDAMENTAL INDEX is a registered trademark of Research Affiliates LLC. |
This page is intentionally left blank.
Item 2: Code of Ethics.
| (a) | Registrant has adopted a code of ethics that applies to its principal executive officer, principal financial officer, and any other persons who perform a similar function, regardless of whether these individuals are employed by Registrant or a third party. |
| (c) | During the period covered by the report, no amendments were made to the provisions of this code of ethics. |
| (d) | During the period covered by the report, Registrant did not grant any waivers, including implicit waivers, from the provisions of this code of ethics. |
| (f)(1) | Registrant has filed this code of ethics as an exhibit pursuant to Item 13(a)(1) of Form N-CSR. |
Item 3: Audit Committee Financial Expert.
Registrant’s Board of Trustees has determined that Kiran M. Patel and Kimberly S. Patmore, each currently serving on its audit, compliance and valuation committee, are each an “audit committee financial expert,” as such term is defined in Item 3 of Form N-CSR. Each member of Registrant’s audit, compliance and valuation committee is “independent” under the standards set forth in Item 3 of Form N-CSR.
The designation of each of Mr. Patel and Ms. Patmore as an “audit committee financial expert” pursuant to Item 3 of Form N-CSR does not (i) impose upon such individual any duties, obligations, or liability that are greater than the duties, obligations and liability imposed upon such individual as a member of Registrant’s audit, compliance and valuation committee or Board of Trustees in the absence of such designation; and (ii) affect the duties, obligations or liability of any other member of Registrant’s audit, compliance and valuation committee or Board of Trustees.
Item 4: Principal Accountant Fees and Services.
Registrant is composed of twenty-five operational series. Seven series have a fiscal year-end of December 31, whose annual financial statements are reported in Item 1, seven series have a fiscal year-end of the last day of February and eleven series have a fiscal year-end of August 31. Principal accountant fees disclosed in Items 4(a)-(d) and 4(g) include fees billed for services rendered to each of the twenty-five operational series during 2020/2021 and 2019/2020, based on their respective 2020/2021 and 2019/2020 fiscal years, as applicable.
The following table presents fees billed by the principal accountant in each of the last two fiscal years for the services rendered to the funds:
| | | | | | | | | | | | | | |
| (a) Audit Fees | | (b) Audit-Related Fees | | (c) Tax Fees1 | | (d) All Other Fees |
Fiscal Year
2020/2021 | | Fiscal Year
2019/2020 | | Fiscal Year
2020/2021 | | Fiscal Year
2019/2020 | | Fiscal Year
2020/2021 | | Fiscal Year
2019/2020 | | Fiscal
Year
2020/2021 | | Fiscal
Year
2019/2020 |
| $450,900 | | $563,669 | | $0 | | $0 | | $77,500 | | $104,429 | | $0 | | $0 |
| 1 | The nature of the services includes tax compliance, tax advice and tax planning. |
| | |
| (e) (1) | | Registrant’s audit, compliance and valuation committee does not have pre-approval policies and procedures as described in paragraph (c)(7) of Rule 2-01 of Regulation S-X. |
| |
| (2) | | There were no services described in each of paragraphs (b) through (d) above (including services required to be approved by Registrant’s audit, compliance and valuation committee pursuant to paragraph (c)(7)(ii) of Rule 2-01 of Regulation S-X) that were approved by Registrant’s audit, compliance and valuation committee pursuant to paragraph (c)(7)(i)(C) of Rule 2-01 of Regulation S-X. |
(f) Not applicable.
(g) Below are the aggregate non-audit fees billed in each of the last two fiscal years by Registrant’s principal accountant for services rendered to Registrant, to Registrant’s investment adviser, and to any entity controlling, controlled by, or under common control with Registrant’s investment adviser that provides ongoing services to Registrant.
2020/2021: $3,577,864 2019/2020: $104,429
(h) During the past fiscal year, all non-audit services provided by Registrant’s principal accountant to either Registrant’s investment adviser or to any entity controlling, controlled by, or under common control with Registrant’s investment adviser that provides ongoing services to Registrant were pre-approved. Included in the audit, compliance and valuation committee’s pre-approval was the review and consideration as to whether the provision of these non-audit services is compatible with maintaining the principal accountant’s independence.
Item 5: Audit Committee of Listed Registrants.
The Registrant is a listed issuer as defined in Rule 10A-3 under the Exchange Act and has separately-designated standing audit, compliance and valuation committee established in accordance with Section 3(a)58)(A) of the Exchange Act. The Registrant’s audit, compliance and valuation committee members are Kiran M. Patel, John F. Cogan, Nancy F. Heller and Kimberly S. Patmore.
Item 6: Schedule of Investments.
The schedules of investments are included as part of the report to shareholders filed under Item 1 of this Form.
Item 7: Disclosure of Proxy Voting Policies and Procedures for Closed-End Management Investment Companies.
Not applicable.
Item 8: Portfolio Managers of Closed-End Management Investment Companies.
Not applicable.
Item 9: Purchases of Equity Securities by Closed-End Management Investment Company and Affiliated Purchasers.
Not applicable.
Item 10: Submission of Matters to a Vote of Security Holders.
Not applicable.
Item 11: Controls and Procedures.
| (a) | Based on their evaluation of Registrant’s disclosure controls and procedures, as of a date within 90 days of the filing date, Registrant’s Chief Executive Officer, Jonathan de St. Paer and Registrant’s Chief Financial Officer, Mark Fischer, have concluded that Registrant’s disclosure controls and procedures are: (i) reasonably designed to ensure that information required to be disclosed in this report is appropriately communicated to Registrant’s officers to allow timely decisions regarding disclosures |
| | required in this report; (ii) reasonably designed to ensure that information required to be disclosed in this report is recorded, processed, summarized and reported in a timely manner; and (iii) are effective in achieving the goals described in (i) and (ii) above. |
| (b) | During the period covered by this report, there have been no changes in Registrant’s internal control over financial reporting that the above officers believe to have materially affected, or to be reasonably likely to materially affect, Registrant’s internal control over financial reporting. |
Item 12: Disclosure of Securities Lending Activities for Closed-End Management Investment Companies.
Not applicable.
Item 13: Exhibits.
Pursuant to the requirements of the Securities Exchange Act of 1934 and the Investment Company Act of 1940, the registrant has duly caused this report to be signed on its behalf by the undersigned, thereunto duly authorized.
(Registrant) Schwab Strategic Trust
| | |
| By: | | /s/ Jonathan de St. Paer |
| | Jonathan de St. Paer Chief Executive Officer |
| |
| Date: | | February 17, 2021 |
Pursuant to the requirements of the Securities Exchange Act of 1934 and the Investment Company Act of 1940, this report has been signed below by the following persons on behalf of the registrant and in the capacities and on the dates indicated.
| | |
| By: | | /s/ Jonathan de St. Paer |
| | Jonathan de St. Paer Chief Executive Officer |
| |
| Date: | | February 17, 2021 |
| |
| By: | | /s/ Mark Fischer |
| | Mark Fischer Chief Financial Officer |
| |
| Date: | | February 17, 2021 |