Washington, D.C. 20549
Gifford R. Zimmerman
Form N-CSR is to be used by management investment companies to file reports with the Commission not later than 10 days after the transmission to stockholders of any report that is required to be transmitted to stockholders under Rule 30e-1 under the Investment Company Act of 1940 (17 CFR 270.30e-1). The Commission may use the information provided on Form N-CSR in its regulatory, disclosure review, inspection, and policymaking roles.
A registrant is required to disclose the information specified by Form N-CSR, and the Commission will make this information public. A registrant is not required to respond to the collection of information contained in Form N-CSR unless the Form displays a currently valid Office of Management and Budget ("OMB") control number. Please direct comments concerning the accuracy of the information collection burden estimate and any suggestions for reducing the burden to Secretary, Securities and Exchange Commission, 450 Fifth Street, NW, Washington, DC 20549-0609. The OMB has reviewed this collection of information under the clearance requirements of 44 U.S.C. ss. 3507.
ITEM 1. REPORTS TO STOCKHOLDERS.
Life is Complex
Nuveen makes things e-simple.
It only takes a minute to sign up for e-Reports. Once enrolled, you'll receive an e-mail as soon as your Nuveen Fund information is ready—no more waiting for delivery by regular mail. Just click on the link within the e-mail to see the report and save it on your computer if you wish.
Free e-Reports right to your e-mail!
www.investordelivery.com
If you receive your Nuveen Fund dividends and statements from your financial advisor or brokerage account.
or
www.nuveen.com/accountaccess
If you receive your Nuveen Fund dividends and statements directly from Nuveen.
Table of Contents
| Chairman's Letter to Shareholders | 4 |
| | |
| Portfolio Manager's Comments | 5 |
| | |
| Fund Leverage | 8 |
| | |
| Common Share Information | 10 |
| | |
| Risk Considerations | 12 |
| | |
| Performance Overview and Holding Summaries | 13 |
| | |
| Portfolios of Investments | 17 |
| | |
| Statement of Assets and Liabilities | 53 |
| | |
| Statement of Operations | 54 |
| | |
| Statement of Changes in Net Assets | 55 |
| | |
| Statement of Cash Flows | 57 |
| | |
| Financial Highlights | 58 |
| | |
| Notes to Financial Statements | 63 |
| | |
| Additional Fund Information | 77 |
| | |
| Glossary of Terms Used in this Report | 78 |
| | |
| Reinvest Automatically, Easily and Conveniently | 80 |
| | |
| Annual Investment Management Agreement Approval Process | 81 |
Chairman's Letter to Shareholders
Dear Shareholders,
After a sluggish first half of 2016, the U.S. economy gained some momentum in the third quarter. In fact, it was the economy's strongest quarterly acceleration in two years, propelled by healthy consumer spending, a temporary surge in exports and a turnaround in inventories. As the year winds down, 2016 looks on track to deliver the same steady-but-slow growth that has characterized the seven-year recovery.
A year ago, the U.S. Federal Reserve (Fed) took the first step toward policy "normalization" by raising its benchmark interest rate at its December 2015 meeting. Speculation about the Fed's intentions since then has been a strong influence on the markets throughout 2016. After remaining on hold for a year, the Fed judged that the economy's modest growth, the return to "full" employment and an uptick in inflation were sufficient to raise the target rate at the December 2016 meeting.
Global conditions continue to look subdued by comparison. Investors continue to adjust to the idea of a slower Chinese economy, which has helped commodity prices stabilize and lift global inflation expectations. The U.K.'s June 23rd "Brexit" vote to leave the European Union introduced a new set of economic and political uncertainties to the already fragile conditions across Europe. Moreover, there are growing concerns that global central banks' unprecedented efforts to revive growth may be showing signs of fatigue. Interest rates are currently negative in Europe and Japan and near or at zero in the U.S., U.K. and elsewhere; nonetheless, growth has remained subdued.
Since the election, U.S. stocks have rallied strongly on expectations that the Republican controlled Congress and Trump administration will pursue more business friendly policies. But the details have yet to be seen. Given muted global growth, the risk of policy errors by central banks around the world, the unfolding Brexit process and an uncertain political outlook (not just in the U.S. but also in Europe), we anticipate that turbulence remains on the horizon for the time being. In this environment, Nuveen remains committed to both managing downside risks and seeking upside potential. If you're concerned about how resilient your investment portfolio might be, we encourage you to talk to your financial advisor. On behalf of the other members of the Nuveen Fund Board, we look forward to continuing to earn your trust in the months and years ahead.
Sincerely,
William J. Schneider
Chairman of the Board
December 22, 2016
Portfolio Manager's Comments
Nuveen New Jersey Quality Municipal Income Fund (NXJ)
(formerly known as Nuveen New Jersey Dividend Advantage Municipal Fund)
Nuveen New Jersey Municipal Value Fund (NJV)
Nuveen Pennsylvania Quality Municipal Income Fund (NQP)
(formerly known as Nuveen Pennsylvania Investment Quality Municipal Fund)
Nuveen Pennsylvania Municipal Value Fund (NPN)
These Funds feature portfolio management by Nuveen Asset Management, LLC, an affiliate of Nuveen Investments, Inc. Portfolio manager Paul L. Brennan, CFA, reviews key investment strategies and the six-month performance of the Nuveen New Jersey and Pennsylvania Funds. Paul assumed portfolio management responsibility for these four Funds in 2011.
Effective December 28, 2016 (subsequent to the close of the reporting period), NXJ and NQP changed their name in an effort to create a clearly differentiated product line, with distinct credit profile target and consistent naming for all Nuveen Closed-end Funds within each credit profile group.
What key strategies were used to manage these Funds during the six-month reporting period ended October 31, 2016?
Interest rates, except at the very longest end of the yield curve, ended the six-month reporting period slightly above where they began, pushing municipal bond yields modestly higher while prices fell. Thirty-year bond yields were nearly flat, while zero- to four-year maturities exhibited the largest increase in yields, resulting in an overall flattening of the yield curve that was supportive to municipal bond performance over this reporting period. Pennsylvania's municipal bond market slightly lagged the national market, while New Jersey's municipal market generally outperformed the national market.
Our trading activity continued to focus on pursuing the Fund's investment objectives. We continued to seek bonds in areas of the market that we expected to perform well as the economy continued to improve. The Fund's positioning emphasized intermediate and longer maturities, lower rated credits and sectors offering higher yields. Additionally, with both Pennsylvania and New Jersey facing ongoing fiscal challenges, we continued to limit exposure to state-supported obligations in all four Funds.
The New Jersey municipal bond market presented fewer opportunities over this reporting period compared to our more active trading in the Pennsylvania Funds. New Jersey's market is dominated by state-issued and higher quality bonds, which are among the features we've tended to deemphasize within the Funds' positioning. However, NXJ and NJV did add to health care holdings, buying credits issued for St. Joseph's Healthcare System, St. Barnabas Health and Atlantic Health System. We also purchased a
| |
| Certain statements in this report are forward-looking statements. Discussions of specific investments are for illustration only and are not intended as recommendations of individual investments. The forward-looking statements and other views expressed herein are those of the portfolio manager as of the date of this report. Actual future results or occurrences may differ significantly from those anticipated in any forward-looking statements, and the views expressed herein are subject to change at any time, due to numerous market and other factors. The Funds disclaim any obligation to update publicly or revise any forward-looking statements or views expressed herein. |
For financial reporting purposes, the ratings disclosed are the highest rating given by one of the following national rating agencies: Standard & Poor's (S&P), Moody's Investors Service, Inc. (Moody's) or Fitch, Inc. (Fitch). This treatment of split-rated securities may differ from that used for other purposes, such as for Fund investment policies. Credit ratings are subject to change. AAA, AA, A and BBB are investment grade ratings, while BB, B, CCC, CC, C and D are below investment grade ratings. Certain bonds backed by U.S. Government or agency securities are regarded as having an implied rating equal to the rating of such securities. Holdings designated N/R are not rated by these national rating agencies. Ratings are not covered by the report of independent registered public accounting firm.
Bond insurance guarantees only the payment of principal and interest on the bond when due, and not the value of the bonds themselves, which will fluctuate with the bond market and the financial success of the issuer and the insurer. Insurance relates specifically to the bonds in the portfolio and not to the share prices of a Fund. No representation is made as to the insurers' ability to meet their commitments.
Refer to the Glossary of Terms Used in this Report for further definition of the terms used within this section.
Portfolio Manager's Comments (continued)
transportation bond issued for the New Jersey Turnpike Authority and for higher education student loan credits. The Pennsylvania Funds added to housing, health care, life care and general obligation (GOs) bonds including local school district GOs.
To fund these purchases, we generally reinvested the proceeds from called and maturing bonds. We also sold short-dated and/or higher quality issues that we tend to hold over short timeframes as a source of liquidity that can be sold to fund longer-term holdings when attractive opportunities arise. Additionally, we sought to diversify some of the call risk in NPN and NJV, which hold meaningful exposure to bonds with 2019 call dates. These two Funds were launched in 2009 when interest rates were higher, and during the reporting period advance refundings of bonds callable in 2019 was elevated. We sold some of these refunded bonds and reinvested the proceeds into lower rated bonds with longer call structures. For NQP, we also invested the proceeds from incremental preferred share offerings that were conducted as part of the overall management of the Fund's leverage.
As of October 31, 2016, all of these Funds continued to use inverse floating rate securities. We employ inverse floaters for a variety of reasons, including duration management, income enhancement and total return enhancement. As part of our duration management strategies, NXJ and NQP also invested in forward interest rates swaps to help reduce price volatility risk to movements in U.S. interest rates relative to the Fund's benchmark. These swaps had a negligible impact on performance during the reporting period.
How did the Funds perform during the six-month reporting period ended October 31, 2016?
The tables in each Fund's Performance Overview and Holding Summaries section of this report provide the Funds' total returns for the six-month, one-year, five-year, ten-year and since inception periods ended October 31, 2016. Each Fund's total returns at common share net asset value (NAV) are compared with the performance of corresponding market indexes and Lipper classification averages.
For the six months ended October 31, 2016, the total returns at common share NAV for NXJ and NJV underperformed the returns for the S&P Municipal Bond New Jersey Index, but beat the national S&P Municipal Bond Index, while NQP and NPN trailed both the S&P Municipal Bond Pennsylvania Index and the national S&P Municipal Bond Index. For the same period, NXJ matched the average return for the Lipper New Jersey Municipal Debt Funds Classification Average, while NJV lagged the average. NQP and NPN both underperformed the Lipper Pennsylvania Municipal Debt Funds Classification Average for the six-month reporting period.
Although municipal bond yields rose slightly over the six-month reporting period and prices fell, the flattening of the yield curve was beneficial to the Funds' performance. Consistent with our long term strategy, these Funds tended to have longer durations than their respective states' municipal markets, with overweightings in the longer parts of the yield curve that outperformed and underweightings in the underperforming shorter end of the curve.
Credit ratings allocations boosted performance for the four Funds during this reporting period. The returns of lower quality bonds generally outpaced those of higher quality credits amid robust investor demand for higher yielding assets. The Funds' overweight allocations to the medium and lower quality categories (A rated and lower) and underweight allocations to AAA and AA rated credits were advantageous to performance.
On a sector basis, the Funds benefited from their exposures to some of the municipal market's better-performing sectors during this reporting period, including tobacco, health care and higher education. These areas of the market continued to be supported by demand for higher yielding assets and generally stable credit fundamentals. Sectors that fared less well during the reporting period were dominated by higher quality and/or shorter maturity paper, such as pre-refunded bonds and state GOs. As New Jersey has faced ongoing credit downgrades for several years and Pennsylvania's credit outlook was dampened by a nine-month budget stalemate that ended in March 2016, GOs issued by these states continued to underperform. Relative to their respective state benchmark indexes, the New Jersey Funds maintained underweight exposures to the State of New Jersey and the Pennsylvania Funds ended the reporting period with no exposure to the Commonwealth of Pennsylvania, which was advantageous to relative performance. However, on absolute terms, the Funds' positions in state GOs lagged the performance of the broader market.
In addition, the use of regulatory leverage was an important positive factor affecting the performance of NXJ and NQP. NJV and NPN do not use regulatory leverage. Leverage is discussed in more detail later in the Fund Leverage section of this report.
An Update Involving Puerto Rico
As noted in the Funds' previous shareholder reports, we continue to monitor situations in the broader municipal market for any impact on the Funds' holdings and performance: the ongoing economic problems of Puerto Rico is one such case. Puerto Rico's continued economic weakening, escalating debt service obligations, and long-standing inability to deliver a balanced budget led to multiple downgrades on its debt over the past two years. Puerto Rico has warned investors since 2014 that the island's debt burden may be unsustainable and the Commonwealth has been exploring various strategies to deal with this burden, including Chapter 9 bankruptcy, which is currently not available by law. On June 30, 2016, President Obama signed the Puerto Rico Oversight, Management and Economic Stability Act (PROMESA) into law. The legislation creates a path for Puerto Rico to establish an independent oversight board responsible for managing the government's financial operations and restructure debt. Implementation is expected to take time, as the law focuses on developing a comprehensive five-year fiscal plan.
In terms of Puerto Rico holdings, shareholders should note that, as of the end of this reporting period, NXJ and NQP had limited exposure, which was either insured or investment grade, to Puerto Rico debt, 0.35% and 0.64%, respectively, while NJV and NPN did not hold any Puerto Rico bonds. The Puerto Rico credits offered higher yields, added diversification and triple exemption (i.e., exemption from most federal, state and local taxes). Puerto Rico general obligation debt is currently rated Caa2/CC/CC (below investment grade) by Moody's, S&P and Fitch, respectively, with negative outlooks.
A Note About Investment Valuations
The municipal securities held by the Funds are valued by the Funds' pricing service using a range of market-based inputs and assumptions. A different municipal pricing service might incorporate different assumptions and inputs into its valuation methodology, potentially resulting in different values for the same securities. These differences could be significant, both as to such individual securities, and as to the value of a given Fund's portfolio in its entirety. Thus, the current net asset value of a Fund's shares may be impacted, higher or lower, if the Fund were to change pricing service, or if its pricing service were to materially change its valuation methodology. On October 4, 2016, the Funds' current municipal bond pricing service was acquired by the parent company of another pricing service. The two services have not yet combined their valuation organizations and processes, but may do so in the future. Thus there is an increased risk that the organization acting as each Fund's pricing service may change, or that the Funds' pricing service may change its valuation methodology, either of which could have an impact on the net asset value of each Fund's shares.
Fund Leverage
IMPACT OF THE FUNDS' LEVERAGE STRATEGY ON PERFORMANCE
One important factor impacting the returns of the Funds relative to their comparative benchmarks was the Funds' use of leverage through their issuance of preferred shares and/or investments in inverse floating rate securities, which represent leveraged investments in underlying bonds. NJV and NPN do not use regulatory leverage. The Funds use leverage because our research has shown that, over time, leveraging provides opportunities for additional income, particularly in the recent market environment where short-term market rates are at or near historical lows, meaning that the short-term rates the Fund has been paying on its leveraging instruments have been much lower than the interest the Fund has been earning on its portfolio of long-term bonds that it has bought with the proceeds of that leverage. However, use of leverage also can expose the Fund to additional price volatility. When a Fund uses leverage, the Fund will experience a greater increase in its net asset value if the municipal bonds acquired through the use of leverage increase in value, but it will also experience a correspondingly larger decline in its net asset value if the bonds acquired through leverage decline in value, which will make the Fund's net asset value more volatile, and its total return performance more variable over time. In addition, income in levered funds will typically decrease in comparison to unlevered funds when short-term interest rates increase and increase when short-term interest rates decrease. Regulatory leverage made a positive contribution to the performance of NXJ and NQP over this reporting period. The use of leverage through inverse floating rate securities in NXJ and NJV also made a positive contribution while having a negligible impact on the performance of NQP and NPN over this reporting period.
As of October 31, 2016, the Funds' percentages of leverage are as shown in the accompanying table.
| | NXJ | NJV | NQP | NPN | |
| Effective Leverage* | 37.81% | 9.12% | 38.99% | 4.05% | |
| Regulatory Leverage* | 31.49% | 0.00% | 33.78% | 0.00% | |
| * | Effective Leverage is a Fund's effective economic leverage, and includes both regulatory leverage and the leverage effects of certain derivative and other investments in a Fund's portfolio that increase the Fund's investment exposure. Currently, the leverage effects of Tender Option Bond (TOB) inverse floater holdings are included in effective leverage values, in addition to any regulatory leverage. Regulatory leverage consists of preferred shares issued or borrowings of a Fund. Both of these are part of a Fund's capital structure. Regulatory leverage is subject to asset coverage limits set forth in the Investment Company Act of 1940. |
THE FUNDS' REGULATORY LEVERAGE
As of October 31, 2016, NXJ and NQP have issued and outstanding, Variable Rate MuniFund Term Preferred (VMTP) Shares and/or Variable Rate Demand Preferred (VRDP) Shares as shown in the accompanying table. As mentioned previously, NJV and NPN do not use regulatory leverage.
| | | VMTP Shares | | | VRDP Shares | | | | |
| | | | | | Shares | | | | | | Shares | | | | |
| | | | | | Issued at | | | | | | Issued at | | | | |
| | | | | | Liquidation | | | | | | Liquidation | | | | |
| Fund | | Series | | | Preference | | | Series | | | Preference | | | Total | |
| NXJ | | | — | | | | — | | | | 1 | | | $ | 81,000,000 | | | | |
| | | | — | | | | — | | | | 2 | | | $ | 144,300,000 | | | | |
| | | | — | | | | — | | | | 3 | | | $ | 88,600,000 | | | | |
| | | | | | | | | | | | | | | $ | 313,900,000 | | | $ | 313,900,000 | |
| NQP | | | 2019 | | | $ | 87,000,000 | | | | 2 | | | $ | 112,500,000 | | | | | |
| | | | — | | | | — | | | | 3 | | | $ | 105,000,000 | | | | | |
| | | | | | | $ | 87,000,000 | | | | | | | $ | 217,500,000 | | | $ | 304,500,000 | |
During the current reporting period, NQP refinanced all of its outstanding Series 2017 VMTP Shares with the issuance of new Series 2019 VMTP Shares. In conjunction with this refinancing NQP issued an additional $39,000,000 Series 2019 VMTP Shares at liquidation preference, to be invested in accordance with the Fund's investment policies.
Refer to Notes to Financial Statements, Note – 4 Fund Shares, Preferred Shares for further details on VMTP and VRDP Shares and each Fund's respective transactions.
Subsequent to the close of the current reporting period, NXJ and NQP each designated a special rate period until November 15, 2017, for each Fund's Series 2 and Series 3 VRDP Shares. In connection with the transition to the special rate period, the VRDP shares of each series have been remarketed and sold to an institutional investor. During the special rate period, the VRDP shares will not be remarketed by a remarketing agent, be subject to optional or mandatory tender events, or supported by a liquidity provider. During this period, VRDP dividends will be set monthly at a floating rate based on a predetermined formula.
Common Share Information
COMMON SHARE DISTRIBUTION INFORMATION
The following information regarding the Funds' distributions is current as of October 31, 2016. Each Fund's distribution levels may vary over time based on each Fund's investment activity and portfolio investments value changes.
During the current reporting period, each Fund's distributions to common shareholders were as shown in the accompanying table.
| | | Per Common Share Amounts |
| Monthly Distributions (Ex-Dividend Date) | | NXJ | | | NJV | | | NQP | | | NPN | |
| May 2016 | | $ | 0.0680 | | | $ | 0.0490 | | | $ | 0.0675 | | | $ | 0.0520 | |
| June | | | 0.0650 | | | | 0.0490 | | | | 0.0640 | | | | 0.0520 | |
| July | | | 0.0650 | | | | 0.0490 | | | | 0.0640 | | | | 0.0520 | |
| August | | | 0.0650 | | | | 0.0490 | | | | 0.0640 | | | | 0.0520 | |
| September | | | 0.0605 | | | | 0.0490 | | | | 0.0600 | | | | 0.0520 | |
| October 2016 | | | 0.0605 | | | | 0.0490 | | | | 0.0600 | | | | 0.0520 | |
| Total Distributions from Net Investment Income | | $ | 0.3840 | | | $ | 0.2940 | | | $ | 0.3795 | | | $ | 0.3120 | |
| | | | | | | | | | | | | | | | | |
| Yields | | | | | | | | | | | | | | | | |
| Market Yield* | | | 5.14 | % | | | 3.62 | % | | | 5.18 | % | | | 3.75 | % |
| Taxable-Equivalent Yield* | | | 7.63 | % | | | 5.37 | % | | | 7.42 | % | | | 5.37 | % |
| * | Market Yield is based on the Fund's current annualized monthly dividend divided by the Fund's current market price as of the end of the reporting period. Taxable-Equivalent Yield represents the yield that must be earned on a fully taxable investment in order to equal the yield of the Fund on an after-tax basis. It is based on a combined federal and state income tax rate of 32.6% and 30.2% for New Jersey and Pennsylvania, respectively. When comparing a Fund to investments that generate qualified dividend income, the Taxable-Equivalent Yield is lower. |
Each Fund in this report seeks to pay regular monthly dividends out of its net investment income at a rate that reflects its past and projected net income performance. To permit each Fund to maintain a more stable monthly dividend, the Fund may pay dividends at a rate that may be more or less than the amount of net income actually earned by the Fund during the period. If a Fund has cumulatively earned more than it has paid in dividends, it will hold the excess in reserve as undistributed net investment income (UNII) as part of the Fund's net asset value. Conversely, if a Fund has cumulatively paid in dividends more than it has earned, the excess will constitute a negative UNII that will likewise be reflected in the Fund's net asset value. Each Fund will, over time, pay all its net investment income as dividends to shareholders.
As of October 31, 2016, the Funds had positive UNII balances, based upon our best estimate, for tax purposes. NXJ, NJV and NPN had positive UNII balances while NQP had a negative UNII balance for financial reporting purposes.
All monthly dividends paid by each Fund during the current reporting period were paid from net investment income. If a portion of the Fund's monthly distributions was sourced from or comprised of elements other than net investment income, including capital gains and/or a return of capital, shareholders would have received a notice to that effect. For financial reporting purposes, the composition and per share amounts of each Fund's dividends for the reporting period are presented in this report's Statement of Changes in Net Assets and Financial Highlights, respectively. For income tax purposes, distribution information for each Fund as of its most recent tax year end is presented in Note 6 — Income Tax Information within the Notes to Financial Statements of this report.
COMMON SHARE REPURCHASES
During August 2016, the Funds' Board of Trustees reauthorized an open-market share repurchase program, allowing each Fund to repurchase an aggregate of up to approximately 10% of its outstanding shares.
As of October 31, 2016, and since the inception of the Funds' repurchase programs, the Funds have cumulatively repurchased and retired their outstanding common shares as shown in the accompanying table.
| | | NXJ | | | NJV | | | NQP | | | NPN | |
| Common shares cumulatively repurchased and retired | | | 608,600 | | | | 15,000 | | | | 363,400 | | | | 0 | |
| Common shares authorized for repurchase | | | 4,260,000 | | | | 155,000 | | | | 3,775,000 | | | | 120,000 | |
During the current reporting period, the Funds did not repurchase any of their outstanding common shares.
OTHER COMMON SHARE INFORMATION
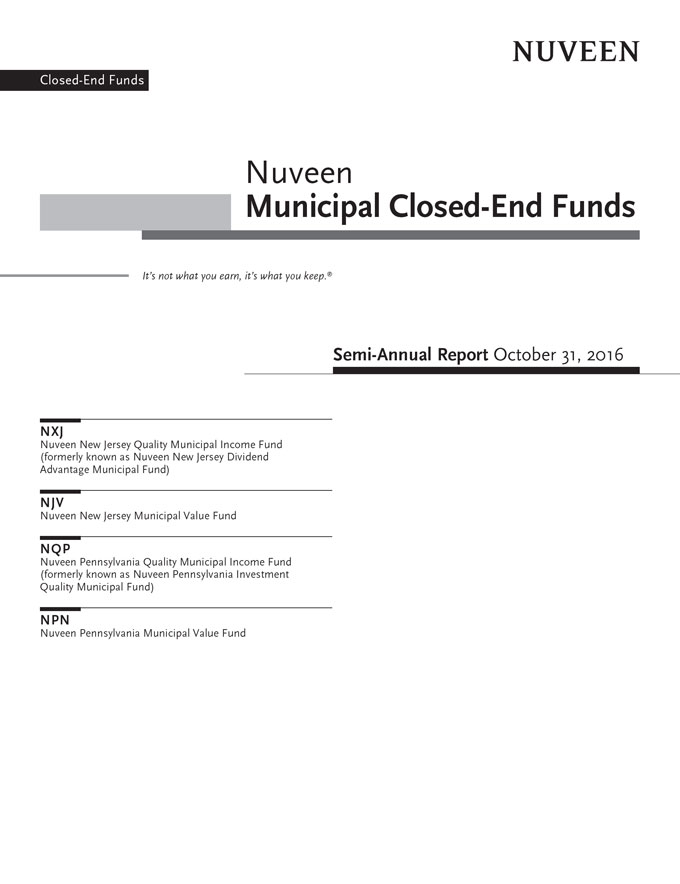
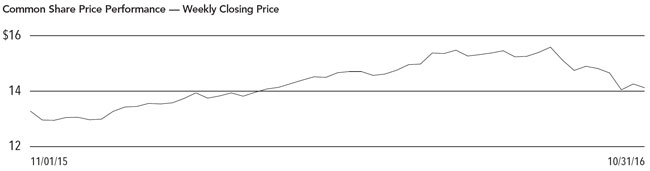
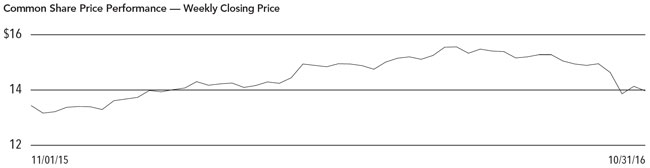
As of October 31, 2016, and during the current reporting period, the Funds' common share prices were trading at a premium/ (discount) to their common share NAVs as shown in the accompanying table.
| | | NXJ | | | NJV | | | NQP | | | NPN | |
| Common share NAV | | $ | 16.04 | | | $ | 16.23 | | | $ | 15.81 | | | $ | 16.31 | |
| Common share price | | $ | 14.12 | | | $ | 16.25 | | | $ | 13.96 | | | $ | 16.65 | |
| Premium/(Discount) to NAV | | | (11.97 | )% | | | 0.12 | % | | | (11.70 | )% | | | 2.08 | % |
| 6-month average premium/(discount) to NAV | | | (8.94 | )% | | | (2.61 | )% | | | (7.73 | )% | | | (1.57 | )% |
Risk Considerations
Fund shares are not guaranteed or endorsed by any bank or other insured depository institution, and are not federally insured by the Federal Deposit Insurance Corporation.
Nuveen New Jersey Quality Municipal Income Fund (NXJ)
(formerly known as Nuveen New Jersey Dividend Advantage Municipal Fund)
Investing in closed-end funds involves risk; principal loss is possible. There is no guarantee the Fund's investment objectives will be achieved. Closed-end fund shares may frequently trade at a discount or premium to their net asset value. Debt or fixed income securities such as those held by the Fund, are subject to market risk, credit risk, interest rate risk, derivatives risk, liquidity risk, and income risk. As interest rates rise, bond prices fall. Leverage increases return volatility and magnifies the Fund's potential return and its risks; there is no guarantee a fund's leverage strategy will be successful. State concentration makes the Fund more susceptible to local adverse economic, political, or regulatory changes affecting municipal bond issuers. These and other risk considerations such as inverse floater risk and tax risk are described in more detail on the Fund's web page at www.nuveen.com/NXJ.
Nuveen New Jersey Municipal Value Fund (NJV)
Investing in closed-end funds involves risk; principal loss is possible. There is no guarantee the Fund's investment objectives will be achieved. Closed-end fund shares may frequently trade at a discount or premium to their net asset value. Debt or fixed income securities such as those held by the Fund, are subject to market risk, credit risk, interest rate risk, derivatives risk, liquidity risk, and income risk. As interest rates rise, bond prices fall. State concentration makes the Fund more susceptible to local adverse economic, political, or regulatory changes affecting municipal bond issuers. These and other risk considerations such as tax risk are described in more detail on the Fund's web page at www.nuveen.com/NJV.
Nuveen Pennsylvania Quality Municipal Income Fund (NQP)
(formerly known as Nuveen Pennsylvania Investment Quality Municipal Fund)
Investing in closed-end funds involves risk; principal loss is possible. There is no guarantee the Fund's investment objectives will be achieved. Closed-end fund shares may frequently trade at a discount or premium to their net asset value. Debt or fixed income securities such as those held by the Fund, are subject to market risk, credit risk, interest rate risk, derivatives risk, liquidity risk, and income risk. As interest rates rise, bond prices fall. Leverage increases return volatility and magnifies the Fund's potential return and its risks; there is no guarantee a fund's leverage strategy will be successful. State concentration makes the Fund more susceptible to local adverse economic, political, or regulatory changes affecting municipal bond issuers. These and other risk considerations such as inverse floater risk and tax risk are described in more detail on the Fund's web page at www.nuveen.com/NQP.
Nuveen Pennsylvania Municipal Value Fund (NPN)
Investing in closed-end funds involves risk; principal loss is possible. There is no guarantee the Fund's investment objectives will be achieved. Closed-end fund shares may frequently trade at a discount or premium to their net asset value. Debt or fixed income securities such as those held by the Fund, are subject to market risk, credit risk, interest rate risk, derivatives risk, liquidity risk, and income risk. As interest rates rise, bond prices fall. State concentration makes the Fund more susceptible to local adverse economic, political, or regulatory changes affecting municipal bond issuers. These and other risk considerations such as tax risk are described in more detail on the Fund's web page at www.nuveen.com/NPN.
| NXJ | |
| | Nuveen New Jersey Quality Municipal Income Fund |
| | (formerly known as Nuveen New Jersey Dividend Advantage Municipal Fund) |
| | Performance Overview and Holding Summaries as of October 31, 2016 |
Refer to the Glossary of Terms Used in this Report for further definition of the terms used within this section.
Average Annual Total Returns as of October 31, 2016
| | Cumulative | | Average Annual |
| | 6-Month | | 1-Year | 5-Year | 10-Year | |
| NXJ at Common Share NAV | 1.47% | | 9.66% | 7.28% | 5.88% | |
| NXJ at Common Share Price | (1.19)% | | 13.09% | 7.02% | 4.62% | |
| S&P Municipal Bond New Jersey Index | 1.94% | | 7.30% | 5.06% | 4.73% | |
| S&P Municipal Bond Index | 0.98% | | 4.53% | 4.57% | 4.53% | |
| Lipper New Jersey Municipal Debt Funds Classification Average | 1.47% | | 8.42% | 7.33% | 5.74% | |
Past performance is not predictive of future results. Current performance may be higher or lower than the data shown. Returns do not reflect the deduction of taxes that shareholders may have to pay on Fund distributions or upon the sale of Fund shares. Returns at NAV are net of Fund expenses, and assume reinvestment of distributions. Comparative index and Lipper return information is provided for the Fund's shares at NAV only. Indexes and Lipper averages are not available for direct investment.
This data relates to the securities held in the Fund's portfolio of investments as of the end of the reporting period. It should not be construed as a measure of performance for the Fund itself. Holdings are subject to change.
For financial reporting purposes, the ratings disclosed are the highest rating given by one of the following national rating agencies: Standard & Poor's Group, Moody's Investors Service, Inc. or Fitch, Inc. This treatment of split-rated securities may differ from that used for other purposes, such as for Fund investment policies. Credit ratings are subject to change. AAA, AA, A and BBB are investment grade ratings; BB, B, CCC, CC, C and D are below-investment grade ratings. Certain bonds backed by U.S. Government or agency securities are regarded as having an implied rating equal to the rating of such securities. Holdings designated N/R are not rated by these national rating agencies.
| Fund Allocation | |
| (% of net assets) | |
| Long-Term Municipal Bonds | 144.3% |
| Common Stocks | 0.1% |
| Other Assets Less Liabilities | 1.6% |
| Net Assets Plus VRDP Shares, at Liquidation Preference | 146.0% |
| VRDP Shares, at Liquidation Preference | (46.0)% |
| Net Assets | 100% |
| | |
| Portfolio Composition | |
(% of total investments)1 | |
| Tax Obligation/Limited | 23.2% |
| Transportation | 17.5% |
| Health Care | 15.2% |
| Education and Civic Organizations | 12.0% |
| U.S. Guaranteed | 9.6% |
| Tax Obligation/General | 4.7% |
| Consumer Staples | 4.0% |
| Other | 13.8% |
| Total | 100% |
| | |
| Portfolio Credit Quality | |
(% of total investment exposure)1 | |
| AAA/U.S. Guaranteed | 13.8% |
| AA | 39.6% |
| A | 30.2% |
| BBB | 9.3% |
| BB or Lower | 6.3% |
| N/R (not rated) | 0.8% |
| N/A (not applicable) | 0.0% |
| Total | 100% |
1 Excluding investments in derivatives.
| NJV | |
| | Nuveen New Jersey Municipal Value Fund |
| | Performance Overview and Holding Summaries as of October 31, 2016 |
Refer to the Glossary of Terms Used in this Report for further definition of the terms used within this section.
Average Annual Total Returns as of October 31, 2016
| | Cumulative | | Average Annual |
| | 6-Month | | 1-Year | 5-Year | Since Inception | |
| NJV at Common Share NAV | 1.24% | | 5.29% | 6.01% | 6.79% | |
| NJV at Common Share Price | 9.16% | | 18.57% | 7.22% | 6.50% | |
| S&P Municipal Bond New Jersey Index | 1.94% | | 7.30% | 5.06% | 5.62% | |
| S&P Municipal Bond Index | 0.98% | | 4.53% | 4.57% | 5.38% | |
| Lipper New Jersey Municipal Debt Funds Classification Average | 1.47% | | 8.42% | 7.33% | 6.55% | |
Since inception returns are from 4/28/09. Past performance is not predictive of future results. Current performance may be higher or lower than the data shown. Returns do not reflect the deduction of taxes that shareholders may have to pay on Fund distributions or upon the sale of Fund shares. Returns at NAV are net of Fund expenses, and assume reinvestment of distributions. Comparative index and Lipper return information is provided for the Fund's shares at NAV only. Indexes and Lipper averages are not available for direct investment.
This data relates to the securities held in the Fund's portfolio of investments as of the end of the reporting period. It should not be construed as a measure of performance for the Fund itself. Holdings are subject to change.
For financial reporting purposes, the ratings disclosed are the highest rating given by one of the following national rating agencies: Standard & Poor's Group, Moody's Investors Service, Inc. or Fitch, Inc. This treatment of split-rated securities may differ from that used for other purposes, such as for Fund investment policies. Credit ratings are subject to change. AAA, AA, A and BBB are investment grade ratings; BB, B, CCC, CC, C and D are below-investment grade ratings. Certain bonds backed by U.S. Government or agency securities are regarded as having an implied rating equal to the rating of such securities. Holdings designated N/R are not rated by these national rating agencies.
| Fund Allocation | |
| (% of net assets) | |
| Long-Term Municipal Bonds | 99.8% |
| Common Stocks | 2.4% |
| Short-Term Municipal Bonds | 1.6% |
| Other Assets Less Liabilities | 2.2% |
| Net Assets Plus Floating Rate Obligations | 106.0% |
| Floating Rate Obligations | (6.0)% |
| Net Assets | 100% |
| | |
| Portfolio Composition | |
| (% of total investments) | |
| Tax Obligation/Limited | 20.7% |
| Education and Civic Organizations | 16.8% |
| Health Care | 16.3% |
| Transportation | 10.8% |
| U.S. Guaranteed | 8.1% |
| Housing/Multifamily | 7.5% |
| Tax Obligation/General | 7.3% |
| Other | 12.5% |
| Total | 100% |
| | |
| Portfolio Credit Quality | |
| (% of total investment exposure) | |
| AAA/U.S. Guaranteed | 8.2% |
| AA | 42.6% |
| A | 31.4% |
| BBB | 8.8% |
| BB or Lower | 5.2% |
| N/R (not rated) | 1.6% |
| N/A (not applicable) | 2.2% |
| Total | 100% |
| NQP | |
| | Nuveen Pennsylvania Quality Municipal Income Fund |
| | (formerly known as Nuveen Pennsylvania Investment Quality Municipal Fund) |
| | Performance Overview and Holding Summaries as of October 31, 2016 |
Refer to the Glossary of Terms Used in this Report for further definition of the terms used within this section.
Average Annual Total Returns as of October 31, 2016
| | Cumulative | | Average Annual |
| | 6-Month | | 1-Year | 5-Year | 10-Year | |
| NQP at Common Share NAV | 0.57% | | 6.83% | 6.94% | 5.84% | |
| NQP at Common Share Price | (3.99)% | | 10.18% | 5.71% | 6.36% | |
| S&P Municipal Bond Pennsylvania Index | 0.84% | | 4.35% | 4.73% | 4.69% | |
| S&P Municipal Bond Index | 0.98% | | 4.53% | 4.57% | 4.53% | |
| Lipper Pennsylvania Municipal Debt Funds Classification Average | 1.00% | | 7.10% | 6.88% | 5.44% | |
Past performance is not predictive of future results. Current performance may be higher or lower than the data shown. Returns do not reflect the deduction of taxes that shareholders may have to pay on Fund distributions or upon the sale of Fund shares. Returns at NAV are net of Fund expenses, and assume reinvestment of distributions. Comparative index and Lipper return information is provided for the Fund's shares at NAV only. Indexes and Lipper averages are not available for direct investment.
This data relates to the securities held in the Fund's portfolio of investments as of the end of the reporting period. It should not be construed as a measure of performance for the Fund itself. Holdings are subject to change.
For financial reporting purposes, the ratings disclosed are the highest rating given by one of the following national rating agencies: Standard & Poor's Group, Moody's Investors Service, Inc. or Fitch, Inc. This treatment of split-rated securities may differ from that used for other purposes, such as for Fund investment policies. Credit ratings are subject to change. AAA, AA, A and BBB are investment grade ratings; BB, B, CCC, CC, C and D are below-investment grade ratings. Certain bonds backed by U.S. Government or agency securities are regarded as having an implied rating equal to the rating of such securities. Holdings designated N/R are not rated by these national rating agencies.
| Fund Allocation | |
| (% of net assets) | |
| Long-Term Municipal Bonds | 157.2% |
| Other Assets Less Liabilities | 2.2% |
| Net Assets Plus Floating Rate Obligations, VMTP Shares, at Liquidation Preference & VRDP Shares, at Liquidation Preference | 159.4% |
| Floating Rate Obligations | (8.4)% |
| VMTP Shares, at Liquidation Preference | (14.6)% |
| VRDP Shares, at Liquidation Preference | (36.4)% |
| Net Assets | 100% |
| | |
| Portfolio Composition | |
(% of total investments)1 | |
| Health Care | 19.2% |
| Tax Obligation/General | 18.2% |
| U.S. Guaranteed | 15.2% |
| Education and Civic Organizations | 11.5% |
| Housing/Single Family | 7.2% |
| Water and Sewer | 6.7% |
| Tax Obligation/Limited | 5.8% |
| Transportation | 5.7% |
| Other | 10.5% |
| Total | 100% |
| | |
| Portfolio Credit Quality | |
(% of total investment exposure)1 | |
| AAA/U.S. Guaranteed | 15.5% |
| AA | 40.3% |
| A | 29.0% |
| BBB | 6.3% |
| BB or Lower | 5.3% |
| N/R (not rated) | 3.6% |
| Total | 100% |
1 Excluding investments in derivatives.
| NPN | |
| | Nuveen Pennsylvania Municipal Value Fund |
| | Performance Overview and Holding Summaries as of October 31, 2016 |
Refer to the Glossary of Terms Used in this Report for further definition of the terms used within this section.
Average Annual Total Returns as of October 31, 2016
| | Cumulative | | Average Annual |
| | 6-Month | | 1-Year | 5-Year | Since Inception | |
| NPN at Common Share NAV | 0.72% | | 4.15% | 5.35% | 6.45% | |
| NPN at Common Share Price | 3.16% | | 16.36% | 7.28% | 6.32% | |
| S&P Municipal Bond Pennsylvania Index | 0.84% | | 4.35% | 4.73% | 5.40% | |
| S&P Municipal Bond Index | 0.98% | | 4.53% | 4.57% | 5.38% | |
| Lipper Pennsylvania Municipal Debt Funds Classification Average | 1.00% | | 7.10% | 6.88% | 6.27% | |
Since inception returns are from 4/28/09. Past performance is not predictive of future results. Current performance may be higher or lower than the data shown. Returns do not reflect the deduction of taxes that shareholders may have to pay on Fund distributions or upon the sale of Fund shares. Returns at NAV are net of Fund expenses, and assume reinvestment of distributions. Comparative index and Lipper return information is provided for the Fund's shares at NAV only. Indexes and Lipper averages are not available for direct investment.
This data relates to the securities held in the Fund's portfolio of investments as of the end of the reporting period. It should not be construed as a measure of performance for the Fund itself. Holdings are subject to change.
For financial reporting purposes, the ratings disclosed are the highest rating given by one of the following national rating agencies: Standard & Poor's Group, Moody's Investors Service, Inc. or Fitch, Inc. This treatment of split-rated securities may differ from that used for other purposes, such as for Fund investment policies. Credit ratings are subject to change. AAA, AA, A and BBB are investment grade ratings; BB, B, CCC, CC, C and D are below-investment grade ratings. Certain bonds backed by U.S. Government or agency securities are regarded as having an implied rating equal to the rating of such securities. Holdings designated N/R are not rated by these national rating agencies.
| Fund Allocation | |
| (% of net assets) | |
| Long-Term Municipal Bonds | 98.5% |
| Other Assets Less Liabilities | 3.0% |
| Net Assets Plus Floating Rate Obligations | 101.5% |
| Floating Rate Obligations | (1.5)% |
| Net Assets | 100% |
| | |
| Portfolio Composition | |
| (% of total investments) | |
| Health Care | 20.2% |
| U.S. Guaranteed | 16.8% |
| Tax Obligation/Limited | 10.0% |
| Housing/Single Family | 8.2% |
| Tax Obligation/General | 7.2% |
| Utilities | 7.0% |
| Housing/Multifamily | 6.8% |
| Education and Civic Organizations | 6.3% |
| Transportation | 6.2% |
| Other | 11.3% |
| Total | 100% |
| | |
| Portfolio Credit Quality | |
| (% of total investment exposure) | |
| AAA/U.S. Guaranteed | 16.4% |
| AA | 41.2% |
| A | 23.4% |
| BBB | 13.6% |
| BB or Lower | 2.6% |
| N/R (not rated) | 2.8% |
| Total | 100% |
| NXJ | |
| | Nuveen New Jersey Quality Municipal Income Fund |
| | (formerly known as Nuveen New Jersey Dividend Advantage Municipal Fund) |
| | Portfolio of Investments | October 31, 2016 (Unaudited) |
| | Principal | | | Optional Call | | | | | | |
| | Amount (000) | | Description (1) | Provisions (2) | | Ratings (3) | | | Value | |
| | | | LONG-TERM INVESTMENTS – 144.4% (100.0% of Total Investments) | | | | | | | |
| | | | MUNICIPAL BONDS – 144.3% (99.9% of Total Investments) | | | | | | | |
| | | | Consumer Discretionary – 0.4% (0.2% of Total Investments) | | | | | | | |
| | | | Middlesex County Improvement Authority, New Jersey, Senior Revenue Bonds, Heldrich Center Hotel/Conference Center Project, Series 2005A: | | | | | | | |
| $ | 1,720 | | 5.000%, 1/01/32 | 1/17 at 100.00 | | Caa1 | | $ | 1,335,735 | |
| | 1,485 | | 5.125%, 1/01/37 | 1/17 at 100.00 | | Caa1 | | | 1,123,893 | |
| | 3,205 | | Total Consumer Discretionary | | | | | | 2,459,628 | |
| | | | Consumer Staples – 5.7% (4.0% of Total Investments) | | | | | | | |
| | | | Tobacco Settlement Financing Corporation, New Jersey, Tobacco Settlement Asset-Backed Bonds, Series 2007-1A: | | | | | | | |
| | 3,350 | | 4.500%, 6/01/23 | 6/17 at 100.00 | | Baa3 | | | 3,397,604 | |
| | 32,225 | | 4.750%, 6/01/34 | 6/17 at 100.00 | | B– | | | 31,047,498 | |
| | 4,890 | | 5.000%, 6/01/41 | 6/17 at 100.00 | | B– | | | 4,606,282 | |
| | 40,465 | | Total Consumer Staples | | | | | | 39,051,384 | |
| | | | Education and Civic Organizations – 17.3% (12.0% of Total Investments) | | | | | | | |
| | 1,760 | | Camden County Improvement Authority, New Jersey, Lease Revenue Bonds Rowan University School of Osteopathic Medicine Project, Series 2013A, 5.000%, 12/01/32 | 12/23 at 100.00 | | A | | | 2,032,853 | |
| | 2,025 | | New Jersey Economic Development Authority, Revenue Bonds, The Seeing Eye Inc., Refunding Series 2015, 5.000%, 3/01/25 | No Opt. Call | | A | | | 2,522,644 | |
| | 2,455 | | New Jersey Economic Development Authority, Rutgers University General Obligation Lease Revenue Bonds, Tender Option Bond 2016-XF2357, 16.343%, 6/15/46 (IF) (4) | 6/23 at 100.00 | | Aa3 | | | 3,976,904 | |
| | | | New Jersey Education Facilities Authority Revenue Bonds, The College of New Jersey Issue, Series 2013A: | | | | | | | |
| | 2,475 | | 5.000%, 7/01/38 | 7/23 at 100.00 | | AA– | | | 2,811,996 | |
| | 3,250 | | 5.000%, 7/01/43 | 7/23 at 100.00 | | AA– | | | 3,673,508 | |
| | 250 | | New Jersey Educational Facilities Authority, Revenue Bonds, Georgian Court University, Series 2007D, 5.000%, 7/01/27 | 7/17 at 100.00 | | BBB– | | | 254,945 | |
| | 1,100 | | New Jersey Educational Facilities Authority, Revenue Bonds, Kean University, Refunding Series 2015H, 4.000%, 7/01/39 – AGM Insured | 7/25 at 100.00 | | AA | | | 1,153,361 | |
| | 5,000 | | New Jersey Educational Facilities Authority, Revenue Bonds, Montclair State University, Series 2014A, 5.000%, 7/01/44 | No Opt. Call | | AA– | | | 5,716,950 | |
| | | | New Jersey Educational Facilities Authority, Revenue Bonds, Montclair State University, Series 2015D: | | | | | | | |
| | 2,395 | | 5.000%, 7/01/31 | 7/25 at 100.00 | | AA– | | | 2,846,553 | |
| | 1,600 | | 5.000%, 7/01/33 | 7/25 at 100.00 | | AA– | | | 1,885,328 | |
| | 1,000 | | 5.000%, 7/01/34 | 7/25 at 100.00 | | AA– | | | 1,172,420 | |
| | 5,955 | | New Jersey Educational Facilities Authority, Revenue Bonds, New Jersey City University, Series 2015A, 5.000%, 7/01/45 | 7/25 at 100.00 | | AA | | | 6,750,825 | |
| | | | New Jersey Educational Facilities Authority, Revenue Bonds, Passaic County Community College, Series 2010C: | | | | | | | |
| | 1,500 | | 5.250%, 7/01/32 | 7/20 at 100.00 | | A2 | | | 1,622,265 | |
| | 1,000 | | 5.375%, 7/01/41 | 7/20 at 100.00 | | A2 | | | 1,079,670 | |
| | 1,000 | | New Jersey Educational Facilities Authority, Revenue Bonds, Princeton University, Series 2007E, 5.000%, 7/01/33 | No Opt. Call | | AAA | | | 1,028,510 | |
| | 4,335 | | New Jersey Educational Facilities Authority, Revenue Bonds, Princeton University, Tender Option Bond Trust 2015-XF0099, 12.259%, 7/01/39 (IF) | 7/21 at 100.00 | | AAA | | | 6,352,726 | |
| | 4,000 | | New Jersey Educational Facilities Authority, Revenue Bonds, Princeton University, Tender Option Bond Trust 2015-XF0149, 12.482%, 7/01/44 (IF) (4) | 7/24 at 100.00 | | AAA | | | 6,348,880 | |
| NXJ | Nuveen New Jersey Quality Municipal Income Fund | |
| | Portfolio of Investments (continued) | October 31, 2016 (Unaudited) |
| | Principal | | | Optional Call | | | | | | |
| | Amount (000) | | Description (1) | Provisions (2) | | Ratings (3) | | | Value | |
| | | | Education and Civic Organizations (continued) | | | | | | | |
| | | | New Jersey Educational Facilities Authority, Revenue Bonds, Ramapo College, Series 2012B: | | | | | | | |
| $ | 550 | | 5.000%, 7/01/37 | 7/22 at 100.00 | | A | | $ | 616,341 | |
| | 1,050 | | 5.000%, 7/01/42 | 7/22 at 100.00 | | A | | | 1,171,685 | |
| | | | New Jersey Educational Facilities Authority, Revenue Bonds, Rider University, Series 2012A: | | | | | | | |
| | 1,140 | | 5.000%, 7/01/32 | 7/21 at 100.00 | | Baa2 | | | 1,245,302 | |
| | 740 | | 5.000%, 7/01/37 | 7/21 at 100.00 | | Baa2 | | | 799,622 | |
| | 1,200 | | New Jersey Educational Facilities Authority, Revenue Bonds, Seton Hall University, Refunding Series 2015C, 5.000%, 7/01/35 | 7/25 at 100.00 | | A– | | | 1,380,924 | |
| | | | New Jersey Educational Facilities Authority, Revenue Bonds, Seton Hall University, Series 2013D: | | | | | | | |
| | 675 | | 5.000%, 7/01/38 | 7/23 at 100.00 | | A– | | | 766,908 | |
| | 1,935 | | 5.000%, 7/01/43 | 7/23 at 100.00 | | A– | | | 2,187,150 | |
| | 1,970 | | New Jersey Educational Facilities Authority, Revenue Bonds, Seton Hall University, Series 2016C, 3.000%, 7/01/46 | 7/26 at 100.00 | | A– | | | 1,809,425 | |
| | 2,000 | | New Jersey Educational Facilities Authority, Revenue Bonds, Stockton University Issue, Refunding Series 2016A, 5.000%, 7/01/41 | 7/26 at 100.00 | | A | | | 2,247,640 | |
| | 975 | | New Jersey Educational Facilities Authority, Revenue Bonds, The College of Saint Elizabeth, Series 2016D, 5.000%, 7/01/46 | 7/26 at 100.00 | | BB | | | 1,021,576 | |
| | 4,560 | | New Jersey Educational Facilities Authority, Revenue Bonds, William Paterson University, Series 2015C, 5.000%, 7/01/40 | 7/25 at 100.00 | | A+ | | | 5,173,092 | |
| | | | New Jersey Educational Facilities Authority, Revenue Refunding Bonds, College of New Jersey, Series 2012A: | | | | | | | |
| | 200 | | 5.000%, 7/01/18 | No Opt. Call | | AA– | | | 212,912 | |
| | 1,000 | | 5.000%, 7/01/19 | No Opt. Call | | AA– | | | 1,101,090 | |
| | | | New Jersey Higher Education Assistance Authority, Student Loan Revenue Bonds, Senior Lien Series 2016-1A: | | | | | | | |
| | 6,180 | | 3.500%, 12/01/32 (Alternative Minimum Tax) | 12/25 at 100.00 | | Aa2 | | | 5,954,245 | |
| | 1,430 | | 4.000%, 12/01/39 (Alternative Minimum Tax) | 12/25 at 100.00 | | Aa2 | | | 1,437,550 | |
| | 2,590 | | New Jersey Higher Education Assistance Authority, Student Loan Revenue Bonds, Series 2008A, 6.125%, 6/01/30 – AGC Insured (Alternative Minimum Tax) | 6/18 at 100.00 | | AA | | | 2,739,184 | |
| | 1,045 | | New Jersey Higher Education Assistance Authority, Student Loan Revenue Bonds, Series 2010-1A, 5.000%, 12/01/25 | 12/19 at 100.00 | | AA | | | 1,097,992 | |
| | 960 | | New Jersey Higher Education Assistance Authority, Student Loan Revenue Bonds, Series 2010-2, 5.000%, 12/01/30 | 12/20 at 100.00 | | Aa3 | | | 1,040,582 | |
| | 1,410 | | New Jersey Higher Education Assistance Authority, Student Loan Revenue Bonds, Series 2011-1, 5.750%, 12/01/27 (Alternative Minimum Tax) | 12/21 at 100.00 | | Aa3 | | | 1,586,969 | |
| | | | New Jersey Higher Education Assistance Authority, Student Loan Revenue Bonds, Series 2012-1A: | | | | | | | |
| | 4,655 | | 4.250%, 12/01/25 (Alternative Minimum Tax) | 12/22 at 100.00 | | AA | | | 5,059,194 | |
| | 1,535 | | 4.375%, 12/01/26 (Alternative Minimum Tax) | 12/22 at 100.00 | | AA | | | 1,675,023 | |
| | 500 | | New Jersey Higher Education Assistance Authority, Student Loan Revenue Bonds, Series 2012-1B, 5.750%, 12/01/39 (Alternative Minimum Tax) | 12/22 at 100.00 | | A | | | 551,210 | |
| | 1,495 | | New Jersey Higher Education Assistance Authority, Student Loan Revenue Bonds, Series 2013-1A, 3.750%, 12/01/26 (Alternative Minimum Tax) | 12/22 at 100.00 | | AA | | | 1,527,143 | |
| | | | New Jersey Higher Education Assistance Authority, Student Loan Revenue Bonds, Series 2015-1A: | | | | | | | |
| | 5,000 | | 4.000%, 12/01/28 (Alternative Minimum Tax) | 12/24 at 100.00 | | AA | | | 5,282,150 | |
| | 2,575 | | 4.000%, 12/01/30 (Alternative Minimum Tax) | 12/24 at 100.00 | | AA | | | 2,700,197 | |
| | | | New Jersey Higher Education Assistance Authority, Student Loan Revenue Bonds, Tender Option Bond Trust 2015-XF0151: | | | | | | | |
| | 1,400 | | 9.909%, 12/01/23 (Alternative Minimum Tax) (IF) (4) | 12/22 at 100.00 | | AA | | | 1,553,720 | |
| | 1,250 | | 9.842%, 12/01/24 (Alternative Minimum Tax) (IF) (4) | 12/22 at 100.00 | | AA | | | 1,348,400 | |
| | 850 | | 10.407%, 12/01/25 (Alternative Minimum Tax) (IF) (4) | 12/22 at 100.00 | | AA | | | 913,954 | |
| | 250 | | 11.051%, 12/01/26 (Alternative Minimum Tax) (IF) (4) | 12/22 at 100.00 | | AA | | | 271,500 | |
| | 2,500 | | 12.058%, 12/01/27 (Alternative Minimum Tax) (IF) (4) | 12/23 at 100.00 | | AA | | | 3,111,200 | |
| | Principal | | | Optional Call | | | | | | |
| | Amount (000) | | Description (1) | Provisions (2) | | Ratings (3) | | | Value | |
| | | | Education and Civic Organizations (continued) | | | | | | | |
| $ | 2,000 | | New Jersey Higher Education Assistance Authority, Student Loan Revenue Bonds, Tender Option Bond Trust 2016-XG0001, 17.970%, 6/01/30 (IF) (4) | 6/19 at 100.00 | | AA | | $ | 2,799,840 | |
| | 575 | | New Jersey Institute of Technology, New Jersey, General Obligation Bonds, Series 2012A, 5.000%, 7/01/42 | 7/22 at 100.00 | | A1 | | | 660,646 | |
| | 2,300 | | New Jersey Institute of Technology, New Jersey, General Obligation Bonds, Series 2015A, 5.000%, 7/01/45 | 7/25 at 100.00 | | A1 | | | 2,609,235 | |
| | 2,170 | | Rutgers State University, New Jersey, Revenue Bonds, Tender Option Bond 2016-XF2356, 16.260%, 5/01/43 (IF) (4) | 5/23 at 100.00 | | Aa3 | | | 3,561,903 | |
| | 101,765 | | Total Education and Civic Organizations | | | | | | 118,445,842 | |
| | | | Financials – 1.5% (1.0% of Total Investments) | | | | | | | |
| | | | New Jersey Economic Development Authority, Revenue Refunding Bonds, Kapkowski Road Landfill Project, Series 2002: | | | | | | | |
| | 7,875 | | 5.750%, 10/01/21 | No Opt. Call | | Ba2 | | | 8,494,132 | |
| | 1,500 | | 6.500%, 4/01/28 | No Opt. Call | | Ba2 | | | 1,835,535 | |
| | 9,375 | | Total Financials | | | | | | 10,329,667 | |
| | | | Health Care – 22.0% (15.2% of Total Investments) | | | | | | | |
| | | | Camden County Improvement Authority, New Jersey, Health Care Redevelopment Revenue Bonds, Cooper Health System Obligated Group Issue, Refunding Series 2014A: | | | | | | | |
| | 175 | | 5.000%, 2/15/25 | No Opt. Call | | BBB+ | | | 207,198 | |
| | 220 | | 5.000%, 2/15/26 | No Opt. Call | | BBB+ | | | 258,436 | |
| | 1,320 | | 5.000%, 2/15/27 | No Opt. Call | | BBB+ | | | 1,534,434 | |
| | 1,385 | | 5.000%, 2/15/28 | No Opt. Call | | BBB+ | | | 1,600,645 | |
| | 1,385 | | 5.000%, 2/15/29 | No Opt. Call | | BBB+ | | | 1,585,451 | |
| | 2,500 | | 5.000%, 2/15/32 | 2/24 at 100.00 | | BBB+ | | | 2,813,725 | |
| | 3,040 | | 5.000%, 2/15/33 | No Opt. Call | | BBB+ | | | 3,413,069 | |
| | 145 | | 5.000%, 2/15/34 | No Opt. Call | | BBB+ | | | 162,493 | |
| | 1,950 | | 5.000%, 2/15/35 | No Opt. Call | | BBB+ | | | 2,183,903 | |
| | 6,100 | | Camden County Improvement Authority, New Jersey, Health Care Redevelopment Revenue Bonds, Cooper Health System Obligated Group Issue, Series 2013A, 5.750%, 2/15/42 | 2/23 at 100.00 | | BBB+ | | | 7,052,697 | |
| | 225 | | New Jersey Health Care Facilities Finance Authority, Revenue Bonds, AHS Hospital Corporation, Series 2008A, 5.000%, 7/01/27 | 7/18 at 100.00 | | AA– | | | 239,218 | |
| | 2,500 | | New Jersey Health Care Facilities Financing Authority, Hospital Revenue Bonds, Virtua Health, Tender Option Bond Trust 2016-XG0047, 17.021%, 7/01/38 – AGC Insured (IF) (4) | 7/19 at 100.00 | | AA | | | 3,538,800 | |
| | | | New Jersey Health Care Facilities Financing Authority, New Jersey, Revenue Bonds, Saint Peters University Hospital, Refunding Series 2011: | | | | | | | |
| | 2,000 | | 6.000%, 7/01/26 | 7/21 at 100.00 | | BB+ | | | 2,196,280 | |
| | 2,500 | | 6.250%, 7/01/35 | 7/21 at 100.00 | | BB+ | | | 2,769,650 | |
| | 2,050 | | New Jersey Health Care Facilities Financing Authority, New Jersey, Revenue Bonds, Saint Peters University Hospital, Series 2007, 5.750%, 7/01/37 | 7/18 at 100.00 | | BB+ | | | 2,143,439 | |
| | 1,140 | | New Jersey Health Care Facilities Financing Authority, Revenue and Refunding Bonds, Barnabas Health, Series 2012A, 5.000%, 7/01/24 | No Opt. Call | | A+ | | | 1,335,670 | |
| | | | New Jersey Health Care Facilities Financing Authority, Revenue and Refunding Bonds, Palisades Medical Center Obligated Group Issue, Series 2013: | | | | | | | |
| | 3,125 | | 5.250%, 7/01/31 | 7/23 at 100.00 | | A– | | | 3,566,125 | |
| | 1,560 | | 5.500%, 7/01/43 | 7/23 at 100.00 | | A– | | | 1,781,348 | |
| | 2,525 | | New Jersey Health Care Facilities Financing Authority, Revenue Bonds, AHS Hospital Corporation, Refunding Series 2016, 4.000%, 7/01/41 | 1/27 at 100.00 | | AA– | | | 2,647,564 | |
| | 10,000 | | New Jersey Health Care Facilities Financing Authority, Revenue Bonds, Barnabas Health, Refunding Series 2014A, 5.000%, 7/01/44 | 7/24 at 100.00 | | A+ | | | 11,371,300 | |
| | 3,765 | | New Jersey Health Care Facilities Financing Authority, Revenue Bonds, CentraState Medical Center, Series 2006A, 5.000%, 7/01/30 – AGC Insured | 7/17 at 100.00 | | A3 | | | 3,838,079 | |
| NXJ | Nuveen New Jersey Quality Municipal Income Fund | |
| | Portfolio of Investments (continued) | October 31, 2016 (Unaudited) |
| | Principal | | | Optional Call | | | | | | |
| | Amount (000) | | Description (1) | Provisions (2) | | Ratings (3) | | | Value | |
| | | | Health Care (continued) | | | | | | | |
| | | | New Jersey Health Care Facilities Financing Authority, Revenue Bonds, Hunterdon Medical Center, Refunding Series 2014A: | | | | | | | |
| $ | 2,055 | | 5.000%, 7/01/45 | 7/24 at 100.00 | | A+ | | $ | 2,323,280 | |
| | 3,295 | | 4.000%, 7/01/45 | 7/24 at 100.00 | | A+ | | | 3,392,499 | |
| | | | New Jersey Health Care Facilities Financing Authority, Revenue Bonds, Kennedy Health System Obligated Group Issue, Refunding Series 2012: | | | | | | | |
| | 4,155 | | 3.750%, 7/01/27 | No Opt. Call | | A3 | | | 4,344,343 | |
| | 3,375 | | 5.000%, 7/01/31 | 7/22 at 100.00 | | A3 | | | 3,775,511 | |
| | 1,500 | | 5.000%, 7/01/37 | 7/22 at 100.00 | | A3 | | | 1,652,325 | |
| | | | New Jersey Health Care Facilities Financing Authority, Revenue Bonds, Meridian Health System Obligated Group, Refunding Series 2011: | | | | | | | |
| | 3,000 | | 5.000%, 7/01/25 | 7/18 at 100.00 | | A+ | | | 3,507,900 | |
| | 3,000 | | 5.000%, 7/01/26 | 7/22 at 100.00 | | A+ | | | 3,479,850 | |
| | 2,500 | | 5.000%, 7/01/27 | 7/22 at 100.00 | | A+ | | | 2,888,975 | |
| | 1,450 | | New Jersey Health Care Facilities Financing Authority, Revenue Bonds, Meridian Health System Obligated Group, Refunding Series 2013A, 5.000%, 7/01/32 | 7/23 at 100.00 | | A+ | | | 1,663,136 | |
| | | | New Jersey Health Care Facilities Financing Authority, Revenue Bonds, Meridian Health, Series 2007: | | | | | | | |
| | 7,520 | | 5.000%, 7/01/38 – AGC Insured | 7/18 at 100.00 | | AA | | | 7,919,538 | |
| | 2,250 | | 5.000%, 7/01/38 | 7/18 at 100.00 | | AA | | | 2,376,810 | |
| | | | New Jersey Health Care Facilities Financing Authority, Revenue Bonds, Princeton HealthCare System, Series 2016A: | | | | | | | |
| | 830 | | 5.000%, 7/01/32 | 7/26 at 100.00 | | Baa2 | | | 984,837 | |
| | 1,055 | | 5.000%, 7/01/33 | 7/26 at 100.00 | | Baa2 | | | 1,246,905 | |
| | 340 | | 5.000%, 7/01/34 | 7/26 at 100.00 | | Baa2 | | | 400,585 | |
| | | | New Jersey Health Care Facilities Financing Authority, Revenue Bonds, Robert Wood Johnson University Hospital Issue, Series 2014A: | | | | | | | |
| | 4,235 | | 5.000%, 7/01/39 | 7/24 at 100.00 | | A+ | | | 4,815,746 | |
| | 5,955 | | 5.000%, 7/01/43 | 7/24 at 100.00 | | A+ | | | 6,758,508 | |
| | 3,945 | | New Jersey Health Care Facilities Financing Authority, Revenue Bonds, Robert Wood Johnson University Hospital, Series 2013A, 5.500%, 7/01/43 | 7/23 at 100.00 | | A+ | | | 4,613,322 | |
| | 2,195 | | New Jersey Health Care Facilities Financing Authority, Revenue Bonds, RWJ Barnabas Health Obligated Group, Refunding Series 2016A, 5.000%, 7/01/43 (WI/DD, Settling 11/02/16) | 7/26 at 100.00 | | A+ | | | 2,524,052 | |
| | 3,475 | | New Jersey Health Care Facilities Financing Authority, Revenue Bonds, Saint Barnabas Health Care System, Series 2006A, 5.000%, 7/01/29 | 1/17 at 100.00 | | A+ | | | 3,527,473 | |
| | | | New Jersey Health Care Facilities Financing Authority, Revenue Bonds, Saint Joseph's Healthcare System Obligated Group Issue, Refunding Series 2016: | | | | | | | |
| | 1,250 | | 4.000%, 7/01/34 | 7/26 at 100.00 | | BBB– | | | 1,297,200 | |
| | 2,600 | | 5.000%, 7/01/35 | 7/26 at 100.00 | | BBB– | | | 2,939,040 | |
| | 1,700 | | 5.000%, 7/01/36 | 7/26 at 100.00 | | BBB– | | | 1,911,242 | |
| | 6,455 | | 5.000%, 7/01/41 | 7/26 at 100.00 | | BBB– | | | 7,223,338 | |
| | 5,805 | | 4.000%, 7/01/48 | 7/26 at 100.00 | | BBB– | | | 5,848,828 | |
| | 2,345 | | New Jersey Health Care Facilities Financing Authority, Revenue Bonds, Saint Luke's Warren Hospital Obligated Group, Series 2013, 4.000%, 8/15/37 | 8/23 at 100.00 | | A– | | | 2,418,797 | |
| | | | New Jersey Health Care Facilities Financing Authority, Revenue Bonds, University Hospital Issue, Refunding Series 2015A: | | | | | | | |
| | 5,055 | | 4.125%, 7/01/38 – AGM Insured | 7/25 at 100.00 | | AA | | | 5,370,836 | |
| | 3,910 | | 5.000%, 7/01/46 – AGM Insured | 7/25 at 100.00 | | AA | | | 4,434,096 | |
| | 134,860 | | Total Health Care | | | | | | 149,878,496 | |
| | | | Housing/Multifamily – 4.0% (2.8% of Total Investments) | | | | | | | |
| | 1,900 | | New Jersey Economic Development Authority, Revenue Bonds, Provident Group – Rowan Properties LLC – Rowan University Student Housing Project, Series 2015A, 5.000%, 1/01/48 | 1/25 at 100.00 | | BBB– | | | 2,105,884 | |
| | 6,075 | | New Jersey Economic Development Authority, Revenue Bonds, West Campus Housing LLC – New Jersey City University Student Housing Project, Series 2015, 5.000%, 7/01/47 | 7/25 at 100.00 | | BBB– | | | 6,467,384 | |
| | Principal | | | Optional Call | | | | | | |
| | Amount (000) | | Description (1) | Provisions (2) | | Ratings (3) | | | Value | |
| | | | Housing/Multifamily (continued) | | | | | | | |
| | | | New Jersey Economic Development Authority, Student Housing Revenue Bonds, Provident Group-Montclair Properties LLC, Montclair State University Student Housing Project, Series 2010A: | | | | | | | |
| $ | 3,870 | | 5.750%, 6/01/31 | 6/20 at 100.00 | | Baa3 | | $ | 4,299,841 | |
| | 2,100 | | 5.875%, 6/01/42 | 6/20 at 100.00 | | Baa3 | | | 2,325,078 | |
| | | | New Jersey Housing and Mortgage Finance Agency, Multifamily Housing Revenue Bonds, Series 2013-2: | | | | | | | |
| | 2,165 | | 4.350%, 11/01/33 (Alternative Minimum Tax) | 11/22 at 100.00 | �� | AA | | | 2,263,226 | |
| | 1,235 | | 4.600%, 11/01/38 (Alternative Minimum Tax) | 11/22 at 100.00 | | AA | | | 1,302,135 | |
| | 1,235 | | 4.750%, 11/01/46 (Alternative Minimum Tax) | 11/22 at 100.00 | | AA | | | 1,299,109 | |
| | 2,280 | | New Jersey Housing and Mortgage Finance Agency, Multifamily Revenue Bonds, Series 2015A, 4.000%, 11/01/45 | 11/24 at 100.00 | | AA– | | | 2,347,716 | |
| | 4,870 | | New Jersey Housing and Mortgage Finance Agency, Multifamily Revenue Bonds, Series 2015B, 1.000%, 11/01/17 | No Opt. Call | | AA– | | | 4,868,685 | |
| | 25,730 | | Total Housing/Multifamily | | | | | | 27,279,058 | |
| | | | Housing/Single Family – 3.2% (2.2% of Total Investments) | | | | | | | |
| | | | New Jersey Housing & Mortgage Finance Agency, Single Family Home Mortgage Revenue Bonds, Series 2011A: | | | | | | | |
| | 10,000 | | 4.450%, 10/01/25 | 10/21 at 100.00 | | Aa2 | | | 10,883,600 | |
| | 10,000 | | 4.650%, 10/01/29 | 4/21 at 100.00 | | Aa2 | | | 10,742,900 | |
| | 545 | | New Jersey Housing and Mortgage Finance Agency, Single Family Housing Revenue Bonds, Series 2007T, 4.700%, 10/01/37 (Alternative Minimum Tax) | 4/17 at 100.00 | | AA | | | 547,485 | |
| | 20,545 | | Total Housing/Single Family | | | | | | 22,173,985 | |
| | | | Industrials – 0.2% (0.1% of Total Investments) | | | | | | | |
| | 1,340 | | Gloucester County Improvement Authority, New Jersey, Solid Waste Resource Recovery Revenue Refunding Bonds, Waste Management Inc. Project, Series 1999B, 2.125%, 12/01/29 (Mandatory put 12/01/17) | No Opt. Call | | A– | | | 1,355,879 | |
| | | | Long-Term Care – 2.3% (1.6% of Total Investments) | | | | | | | |
| | 7,835 | | Burlington County Bridge Commission, New Jersey, Economic Development Revenue Bonds, The Evergreens Project, Series 2007, 5.625%, 1/01/38 | 1/18 at 100.00 | | N/R | | | 8,134,766 | |
| | 510 | | New Jersey Economic Development Authority, Fixed Rate Revenue Bonds, Lions Gate Project, Series 2014, 5.250%, 1/01/44 | 1/24 at 100.00 | | N/R | | | 547,709 | |
| | 5,000 | | New Jersey Economic Development Authority, Revenue Bonds, United Methodist Homes of New Jersey Obligated Group Issue, Refunding Series 2013, 5.000%, 7/01/34 | 7/23 at 100.00 | | BBB– | | | 5,422,150 | |
| | 1,410 | | New Jersey Economic Development Authority, Revenue Bonds, United Methodist Homes of New Jersey Obligated Group Issue, Refunding Series 2014A, 5.000%, 7/01/29 | 7/24 at 100.00 | | BBB– | | | 1,570,134 | |
| | 14,755 | | Total Long-Term Care | | | | | | 15,674,759 | |
| | | | Tax Obligation/General – 6.7% (4.7% of Total Investments) | | | | | | | |
| | 2,225 | | Cumberland County Improvement Authority, New Jersey, County General Obligation Revenue Bonds, Technical High School Project, Series 2014, 5.000%, 9/01/39 – AGM Insured | 9/24 at 100.00 | | AA | | | 2,580,644 | |
| | 825 | | Elizabeth, Union County, New Jersey, General Obligation Bonds, General Improvement Series 2014, 3.125%, 4/01/27 – AGM Insured | 4/24 at 100.00 | | AA | | | 868,139 | |
| | 2,250 | | Freehold Regional High School District, Monmouth County, New Jersey, General Obligation Bonds, Refunding Series 2001, 5.000%, 3/01/17 – FGIC Insured | No Opt. Call | | AA+ | | | 2,281,298 | |
| | 690 | | Haddon Heights School District, Camden County, New Jersey, General Obligation Bonds, Refunding Series 2012, 3.250%, 1/01/30 | 1/23 at 100.00 | | AA– | | | 707,457 | |
| | 1,100 | | Linden, New Jersey, General Obligation Bonds, Refunding Series 2011, 4.000%, 5/01/23 | 5/21 at 100.00 | | AA– | | | 1,210,176 | |
| | | | Medford Township Board of Education, Burlington County, New Jersey, General Obligation Bonds, Refunding Series 2015: | | | | | | | |
| | 710 | | 5.000%, 3/01/22 | No Opt. Call | | Aa2 | | | 832,866 | |
| | 755 | | 5.000%, 3/01/24 | No Opt. Call | | Aa2 | | | 914,026 | |
| NXJ | Nuveen New Jersey Quality Municipal Income Fund | |
| | Portfolio of Investments (continued) | October 31, 2016 (Unaudited) |
| | Principal | | | Optional Call | | | | | | |
| | Amount (000) | | Description (1) | Provisions (2) | | Ratings (3) | | | Value | |
| | | | Tax Obligation/General (continued) | | | | | | | |
| $ | 1,975 | | Middletown Township Board of Education, Monmouth County, New Jersey, Refunding Series 2010, 5.000%, 8/01/27 | 8/20 at 100.00 | | AA | | $ | 2,254,107 | |
| | 2,805 | | Monmouth County Improvement Authority, New Jersey, Governmental Pooled Loan Revenue Bonds, Refunding Series 2016B, 4.000%, 8/01/24 | No Opt. Call | | AAA | | | 3,304,038 | |
| | 2,280 | | Monroe Township Board of Education, Middlesex County, New Jersey, General Obligation Bonds, Refunding Series 2015, 5.000%, 3/01/38 | 3/25 at 100.00 | | AA– | | | 2,659,643 | |
| | 760 | | Montclair Township, Essex County, New Jersey, General Obligation Bonds, Parking Utility, Refunding Series 2014A, 5.000%, 1/01/37 | 1/24 at 100.00 | | AAA | | | 882,854 | |
| | | | New Brunswick Parking Authority, Middlesex County, New Jersey, Guaranteed Parking Revenue Bonds, Refunding Series 2012: | | | | | | | |
| | 465 | | 5.000%, 9/01/28 | 9/22 at 100.00 | | A+ | | | 535,159 | |
| | 610 | | 5.000%, 9/01/29 | 9/22 at 100.00 | | A+ | | | 699,646 | |
| | 300 | | 5.000%, 9/01/31 | 9/22 at 100.00 | | A+ | | | 342,156 | |
| | 250 | | 3.625%, 9/01/34 | 9/22 at 100.00 | | A+ | | | 258,298 | |
| | | | New Brunswick Parking Authority, Middlesex County, New Jersey, Guaranteed Parking Revenue Bonds, Refunding Series 2016: | | | | | | | |
| | 1,000 | | 3.000%, 9/01/32 | 9/25 at 100.00 | | AA | | | 1,009,990 | |
| | 1,000 | | 3.000%, 9/01/33 | 9/25 at 100.00 | | AA | | | 1,007,100 | |
| | | | South Brunswick Township, Middlesex County, New Jersey, General Obligation Bonds, Refunding Series 2014: | | | | | | | |
| | 740 | | 3.000%, 9/01/17 | No Opt. Call | | AA | | | 753,135 | |
| | 400 | | 5.000%, 9/01/22 | No Opt. Call | | AA | | | 478,484 | |
| | | | Sparta Township Board of Education, Sussex County, New Jersey, General Obligation Bonds, Refunding Series 2015: | | | | | | | |
| | 1,595 | | 5.000%, 2/15/32 | 2/25 at 100.00 | | AA– | | | 1,885,242 | |
| | 1,000 | | 5.000%, 2/15/34 | 2/25 at 100.00 | | AA– | | | 1,174,620 | |
| | 1,395 | | 5.000%, 2/15/35 | 2/25 at 100.00 | | AA– | | | 1,634,075 | |
| | 4,260 | | Sussex County, New Jersey, General Obligation Bonds, Refunding Series 2014, 4.000%, 2/15/22 | No Opt. Call | | AA+ | | | 4,829,945 | |
| | 5,165 | | Union County Utilities Authority, New Jersey, Resource Recovery Facility Lease Revenue Refunding Bonds, Covantan Union Inc. Lessee, Series 2011B, 5.250%, 12/01/31 (Alternative Minimum Tax) | 12/21 at 100.00 | | AA+ | | | 5,701,334 | |
| | 2,515 | | Union County Utilities Authority, New Jersey, Solid Waste System County Deficiency Revenue Bonds, Series 2011A, 5.000%, 6/15/41 | 6/21 at 100.00 | | AA+ | | | 2,799,396 | |
| | 1,515 | | Washington Township Board of Education, Mercer County, New Jersey, General Obligation Bonds, Series 2005, 5.250%, 1/01/27 – AGM Insured | No Opt. Call | | A2 | | | 1,932,261 | |
| | 1,435 | | West Deptford Township, Gloucester County, New Jersey, General Obligation Bonds, Refunding Series 2014, 4.000%, 9/01/28 – BAM Insured | 9/24 at 100.00 | | AA | | | 1,594,041 | |
| | 635 | | West Deptford Township, Gloucester County, New Jersey, General Obligation Bonds, Series 2005, 5.000%, 7/01/27 – AGM Insured | 7/17 at 100.00 | | AA | | | 651,847 | |
| | 100 | | Woodbridge Township, Middlesex County, New Jersey, General Obligation Bonds, Series 2010, 5.000%, 7/15/19 | No Opt. Call | | AA+ | | | 110,386 | |
| | 40,755 | | Total Tax Obligation/General | | | | | | 45,892,363 | |
| | | | Tax Obligation/Limited – 33.5% (23.2% of Total Investments) | | | | | | | |
| | 3,775 | | Bergen County Improvement Authority, New Jersey, Guaranteed Lease Revenue Bonds, County Administration Complex Project, Series 2005, 5.000%, 11/15/26 | No Opt. Call | | Aaa | | | 4,887,946 | |
| | 4,175 | | Essex County Improvement Authority, New Jersey, Project Consolidation Revenue Bonds, Refunding Series 2007, 5.250%, 12/15/22 – AMBAC Insured | No Opt. Call | | AA+ | | | 5,072,082 | |
| | 3,000 | | Garden State Preservation Trust, New Jersey, Open Space and Farmland Preservation Bonds, Series 2003B, 0.000%, 11/01/25 – AGM Insured | No Opt. Call | | AA | | | 2,406,330 | |
| | 3,015 | | Garden State Preservation Trust, New Jersey, Open Space and Farmland Preservation Bonds, Series 2005A, 5.750%, 11/01/28 – AGM Insured | No Opt. Call | | AA | | | 3,850,728 | |
| | Principal | | | Optional Call | | | | | | |
| | Amount (000) | | Description (1) | Provisions (2) | | Ratings (3) | | | Value | |
| | | | Tax Obligation/Limited (continued) | | | | | | | |
| $ | 5,120 | | Garden State Preservation Trust, New Jersey, Open Space and Farmland Preservation Bonds, Series 2005C, 5.125%, 11/01/18 – AGM Insured | No Opt. Call | | AA | | $ | 5,515,213 | |
| | | | Government of Guam, Business Privilege Tax Bonds, Series 2011A: | | | | | | | |
| | 5,005 | | 5.250%, 1/01/36 | 1/22 at 100.00 | | A | | | 5,482,327 | |
| | 3,020 | | 5.125%, 1/01/42 | 1/22 at 100.00 | | A | | | 3,273,740 | |
| | 500 | | Government of Guam, Business Privilege Tax Bonds, Series 2012B-1, 5.000%, 1/01/29 | 1/22 at 100.00 | | A | | | 551,290 | |
| | 1,110 | | Hudson County Improvement Authority, New Jersey, County Secured Lease Revenue Bonds, Hudson County Plaza Refunding Project, Series 2013, 3.250%, 4/01/35 | 4/22 at 100.00 | | Aa3 | | | 1,124,541 | |
| | | | Hudson County Improvement Authority, New Jersey, County Secured Lease Revenue Bonds, Hudson County Vocational Technical Schools Project, Series 2016: | | | | | | | |
| | 10,560 | | 5.000%, 5/01/46 | 5/26 at 100.00 | | AA | | | 12,351,714 | |
| | 3,745 | | 5.250%, 5/01/51 | 5/26 at 100.00 | | AA | | | 4,471,193 | |
| | | | New Jersey Economic Development Authority, Cigarette Tax Revenue Refunding Bonds, Series 2012: | | | | | | | |
| | 310 | | 5.000%, 6/15/21 | No Opt. Call | | BBB+ | | | 344,128 | |
| | 6,400 | | 5.000%, 6/15/25 | 6/22 at 100.00 | | BBB+ | | | 7,090,560 | |
| | 3,480 | | 5.000%, 6/15/26 | 6/22 at 100.00 | | BBB+ | | | 3,836,839 | |
| | 7,945 | | 5.000%, 6/15/28 | No Opt. Call | | BBB+ | | | 8,639,155 | |
| | 415 | | 5.000%, 6/15/29 | No Opt. Call | | BBB+ | | | 449,088 | |
| | | | New Jersey Economic Development Authority, Revenue Bonds, Newark Downtown District Management Corporation Project, Series 2007: | | | | | | | |
| | 440 | | 5.125%, 6/15/27 | 6/17 at 100.00 | | Baa3 | | | 446,626 | |
| | 740 | | 5.125%, 6/15/37 | 6/17 at 100.00 | | Baa3 | | | 748,584 | |
| | 5,000 | | New Jersey Economic Development Authority, School Facilities Construction Financing Program Bonds, Refunding Series 2014PP, 5.000%, 6/15/26 | 6/24 at 100.00 | | A3 | | | 5,630,500 | |
| | 6,385 | | New Jersey Economic Development Authority, School Facilities Construction Financing Program Bonds, Refunding Series 2014UU, 5.000%, 6/15/27 | 6/24 at 100.00 | | A3 | | | 7,206,558 | |
| | 12,000 | | New Jersey Economic Development Authority, School Facilities Construction Financing Program Bonds, Refunding Series 2015WW, 5.250%, 6/15/40 | 6/25 at 100.00 | | A3 | | | 13,361,879 | |
| | 1,400 | | New Jersey Health Care Facilities Financing Authority, State Contract Bonds, Hospital Asset Transformation Program, Series 2008A, 5.250%, 10/01/38 | 10/18 at 100.00 | | A3 | | | 1,481,312 | |
| | | | New Jersey Transportation Trust Fund Authority, Federal Highway Aid Grant Anticipation Bonds, Series 2006: | | | | | | | |
| | 2,120 | | 5.000%, 6/15/17 – FGIC Insured | 1/17 at 100.00 | | AA– | | | 2,127,696 | |
| | 3,750 | | 5.000%, 6/15/18 – FGIC Insured | 1/17 at 100.00 | | AA– | | | 3,763,575 | |
| | | | New Jersey Transportation Trust Fund Authority, Federal Highway Reimbursement Revenue Notes, Series 2016A-1&2: | | | | | | | |
| | 1,130 | | 5.000%, 6/15/29 (WI/DD, Settling 11/02/16) | 6/26 at 100.00 | | A+ | | | 1,263,114 | |
| | 655 | | 5.000%, 6/15/30 (WI/DD, Settling 11/02/16) | 6/26 at 100.00 | | A+ | | | 727,849 | |
| | 32,965 | | New Jersey Transportation Trust Fund Authority, Transportation System Bonds, Capital Appreciation Series 2010A, 0.000%, 12/15/30 | No Opt. Call | | A3 | | | 18,393,150 | |
| | 8,100 | | New Jersey Transportation Trust Fund Authority, Transportation System Bonds, Refunding Series 2006A, 5.500%, 12/15/22 | No Opt. Call | | A3 | | | 9,324,315 | |
| | | | New Jersey Transportation Trust Fund Authority, Transportation System Bonds, Refunding Series 2006C: | | | | | | | |
| | 21,000 | | 0.000%, 12/15/32 – AGM Insured | No Opt. Call | | AA | | | 11,115,720 | |
| | 34,855 | | 0.000%, 12/15/33 – AGM Insured | No Opt. Call | | AA | | | 17,440,744 | |
| | 30,310 | | 0.000%, 12/15/34 – AGM Insured | No Opt. Call | | AA | | | 14,410,890 | |
| | 9,000 | | New Jersey Transportation Trust Fund Authority, Transportation System Bonds, Series 2004B, 5.500%, 12/15/16 – NPFG Insured | No Opt. Call | | AA– | | | 9,051,750 | |
| | 7,500 | | New Jersey Transportation Trust Fund Authority, Transportation System Bonds, Series 2007A, 5.000%, 12/15/26 – AMBAC Insured | 12/17 at 100.00 | | A3 | | | 7,784,325 | |
| | 7,000 | | New Jersey Transportation Trust Fund Authority, Transportation System Bonds, Series 2010D, 5.000%, 12/15/24 | No Opt. Call | | A3 | | | 7,982,310 | |
| NXJ | Nuveen New Jersey Quality Municipal Income Fund | |
| | Portfolio of Investments (continued) | October 31, 2016 (Unaudited) |
| | Principal | | | Optional Call | | | | | | |
| | Amount (000) | | Description (1) | Provisions (2) | | Ratings (3) | | | Value | |
| | | | Tax Obligation/Limited (continued) | | | | | | | |
| $ | 3,860 | | Passaic County Improvement Authority, New Jersey, Lease Revenue Bonds, Preakness Healthcare Center Expansion Project, Refunding Series 2015, 3.750%, 5/01/36 | 5/25 at 100.00 | | AA | | $ | 4,012,547 | |
| | | | Passaic County Improvement Authority, New Jersey, Lease Revenue Bonds, Preakness Healthcare Center Expansion Project, Series 2012: | | | | | | | |
| | 865 | | 5.000%, 5/01/21 | No Opt. Call | | Aa3 | | | 1,003,642 | |
| | 4,560 | | 3.500%, 5/01/35 | 5/22 at 100.00 | | Aa3 | | | 4,670,170 | |
| | 2,500 | | Union County Improvement Authority, New Jersey, General Obligation Lease Bonds, County College Facility Project, Series 2014B, 5.000%, 2/01/20 | No Opt. Call | | AA+ | | | 2,802,150 | |
| | | | Union County Improvement Authority, New Jersey, General Obligation Lease Bonds, Juvenile Detention Center Facility Project, Tender Option Bond Trust 2015-XF1019: | | | | | | | |
| | 285 | | 21.892%, 5/01/28 (IF) (4) | No Opt. Call | | Aa1 | | | 716,239 | |
| | 285 | | 21.964%, 5/01/29 (IF) (4) | No Opt. Call | | Aa1 | | | 726,023 | |
| | 200 | | 21.964%, 5/01/30 (IF) (4) | No Opt. Call | | Aa1 | | | 515,010 | |
| | 370 | | 21.741%, 5/01/31 (IF) (4) | No Opt. Call | | Aa1 | | | 957,246 | |
| | 385 | | 21.857%, 5/01/32 (IF) (4) | No Opt. Call | | Aa1 | | | 1,012,504 | |
| | 400 | | 21.861%, 5/01/33 (IF) (4) | No Opt. Call | | Aa1 | | | 1,056,060 | |
| | 415 | | 21.964%, 5/01/34 (IF) (4) | No Opt. Call | | Aa1 | | | 1,098,194 | |
| | 3,975 | | Union County Improvement Authority, New Jersey, Lease Revenue Refunding Bonds, City of Plainfield – Park Madison Redevelopment Project, Tender Option Trust 2016-XG0057, 16.117%, 3/01/34 (IF) (4) | No Opt. Call | | AA+ | | | 8,598,044 | |
| | 264,025 | | Total Tax Obligation/Limited | | | | | | 228,775,600 | |
| | | | Transportation – 25.2% (17.5% of Total Investments) | | | | | | | |
| | 5,550 | | Casino Reinvestment Development Authority, New Jersey, Parking Revenue Bonds, Series 2005A, 5.250%, 6/01/20 – NPFG Insured | 1/17 at 100.00 | | AA– | | | 5,568,038 | |
| | 2,400 | | Delaware River and Bay Authority, Delaware and New Jersey, Revenue Bonds, Series 2012A, 5.000%, 1/01/42 | 1/23 at 100.00 | | A1 | | | 2,698,488 | |
| | | | Delaware River and Bay Authority, Delaware and New Jersey, Revenue Bonds, Series 2014A: | | | | | | | |
| | 1,285 | | 5.000%, 1/01/34 | 1/24 at 100.00 | | A1 | | | 1,489,058 | |
| | 5,890 | | 4.125%, 1/01/39 | 1/24 at 100.00 | | A1 | | | 6,377,456 | |
| | 7,800 | | 5.000%, 1/01/44 | 1/24 at 100.00 | | A1 | | | 8,939,658 | |
| | | | Delaware River Joint Toll Bridge Commission, New Jersey and Pennsylvania, Bridge System Revenue Bonds, Refunding Series 2015: | | | | | | | |
| | 440 | | 3.000%, 7/01/27 – BAM Insured | 7/25 at 100.00 | | AA | | | 461,846 | |
| | 1,000 | | 4.000%, 7/01/34 – BAM Insured | 7/25 at 100.00 | | AA | | | 1,089,330 | |
| | 2,820 | | 4.000%, 7/01/35 – BAM Insured | 7/25 at 100.00 | | AA | | | 3,060,631 | |
| | | | Delaware River Joint Toll Bridge Commission, Pennsylvania, Bridge System Revenue Bonds, Refunding Series 2012A: | | | | | | | |
| | 2,115 | | 5.000%, 7/01/24 | 7/22 at 100.00 | | A1 | | | 2,520,107 | |
| | 1,105 | | 5.000%, 7/01/25 | 7/22 at 100.00 | | A1 | | | 1,307,093 | |
| | 650 | | 4.000%, 7/01/26 | 7/22 at 100.00 | | A1 | | | 719,128 | |
| | 625 | | 4.000%, 7/01/27 | 7/22 at 100.00 | | A1 | | | 686,894 | |
| | | | Delaware River Port Authority, New Jersey and Pennsylvania, Revenue Bonds, Series 2010E: | | | | | | | |
| | 1,000 | | 5.000%, 1/01/40 – AGM Insured | 1/20 at 100.00 | | AA | | | 1,109,470 | |
| | 5,000 | | 5.000%, 1/01/40 | 1/20 at 100.00 | | A | | | 5,539,150 | |
| | 7,035 | | Delaware River Port Authority, New Jersey and Pennsylvania, Revenue Bonds, Series 2013, 5.000%, 1/01/40 | 1/24 at 100.00 | | A | | | 8,097,496 | |
| | | | Delaware River Port Authority, Pennsylvania and New Jersey, Revenue Refunding Bonds, Port District Project, Series 2012: | | | | | | | |
| | 1,800 | | 5.000%, 1/01/24 | No Opt. Call | | A– | | | 2,042,316 | |
| | 1,635 | | 5.000%, 1/01/25 | No Opt. Call | | A– | | | 1,874,544 | |
| | 1,350 | | 5.000%, 1/01/26 | No Opt. Call | | A– | | | 1,538,406 | |
| | 3,595 | | 5.000%, 1/01/27 | No Opt. Call | | A– | | | 4,035,603 | |
| | 5,555 | | New Jersey Economic Development Authority, Private Activity Bonds, The Goethals Bridge Replacement Project, Series 2013, 5.625%, 1/01/52 (Alternative Minimum Tax) | 1/24 at 100.00 | | BBB | | | 6,380,695 | |
| | Principal | | | Optional Call | | | | | | |
| | Amount (000) | | Description (1) | Provisions (2) | | Ratings (3) | | | Value | |
| | | | Transportation (continued) | | | | | | | |
| | | | New Jersey Economic Development Authority, Special Facilities Revenue Bonds, Continental Airlines Inc., Series 1999: | | | | | | | |
| $ | 1,000 | | 5.125%, 9/15/23 (Alternative Minimum Tax) | 3/17 at 100.00 | | BB– | | $ | 1,115,390 | |
| | 1,800 | | 5.250%, 9/15/29 (Alternative Minimum Tax) | 9/22 at 101.00 | | BB– | | | 2,006,352 | |
| | 2,250 | | New Jersey Economic Development Authority, Special Facilities Revenue Bonds, Continental Airlines Inc., Series 2000A & 2000B, 5.625%, 11/15/30 (Alternative Minimum Tax) | 3/24 at 101.00 | | BB– | | | 2,585,025 | |
| | | | New Jersey Transit Corporation, Grant Anticipation Notes, Federal Transit Administration Section 5307 Urbanized Area Formula Funds, Series 2014A: | | | | | | | |
| | 6,000 | | 5.000%, 9/15/20 | No Opt. Call | | A | | | 6,581,160 | |
| | 5,750 | | 5.000%, 9/15/21 | No Opt. Call | | A | | | 6,402,395 | |
| | 7,780 | | New Jersey Turnpike Authority, Revenue Bonds, Refunding Series 2015E, 5.000%, 1/01/45 | 1/25 at 100.00 | | A+ | | | 8,990,724 | |
| | 3,065 | | New Jersey Turnpike Authority, Revenue Bonds, Series 2005A, 5.250%, 1/01/29 – AGM Insured | No Opt. Call | | AA | | | 4,004,514 | |
| | 7,500 | | New Jersey Turnpike Authority, Revenue Bonds, Series 2009I, 5.000%, 1/01/35 | 1/20 at 100.00 | | A+ | | | 8,276,850 | |
| | 7,620 | | New Jersey Turnpike Authority, Revenue Bonds, Series 2012B, 5.000%, 1/01/28 | 1/23 at 100.00 | | A+ | | | 9,007,754 | |
| | 3,625 | | New Jersey Turnpike Authority, Revenue Bonds, Tender Option Bond Trust 2016-XF1057, 14.996%, 1/01/43 (IF) (4) | 7/22 at 100.00 | | A+ | | | 5,655,834 | |
| | 2,100 | | Passaic County Improvement Authority, New Jersey, County Guaranteed Parking Revenue Bonds, 200 Hospital Plaza Project, Series 2010, 5.000%, 5/01/42 | 5/20 at 100.00 | | Aa3 | | | 2,332,512 | |
| | 2,750 | | Passaic County Improvement Authority, New Jersey, Revenue Bonds, Paterson Parking Deck Facility, Series 2005, 5.000%, 4/15/35 – AGM Insured | 1/17 at 100.00 | | A2 | | | 2,758,910 | |
| | 7,225 | | Port Authority of New York and New Jersey, Consolidated Revenue Bonds, One Hundred Seventy Ninth Series 2013, 5.000%, 12/01/43 | 12/23 at 100.00 | | AA– | | | 8,493,277 | |
| | 5,700 | | Port Authority of New York and New Jersey, Consolidated Revenue Bonds, One Hundred Seventy Seventh Series 2013, 4.000%, 1/15/43 (Alternative Minimum Tax) | 1/23 at 100.00 | | AA– | | | 5,941,566 | |
| | | | Port Authority of New York and New Jersey, Special Project Bonds, JFK International Air Terminal LLC, Sixth Series 1997: | | | | | | | |
| | 19,655 | | 5.750%, 12/01/22 – NPFG Insured (Alternative Minimum Tax) | 12/16 at 100.00 | | AA– | | | 20,081,316 | |
| | 12,130 | | 5.750%, 12/01/25 – NPFG Insured (Alternative Minimum Tax) | 12/16 at 100.00 | | AA– | | | 12,368,354 | |
| | 154,600 | | Total Transportation | | | | | | 172,137,340 | |
| | | | U.S. Guaranteed – 13.9% (9.6% of Total Investments) (5) | | | | | | | |
| | 930 | | New Jersey Economic Development Authority, Revenue Bonds, Yeshiva Ktana of Passaic, Series 1993, 8.000%, 9/15/18 (ETM) | No Opt. Call | | N/R (5) | | | 1,012,379 | |
| | | | New Jersey Economic Development Authority, School Facilities Construction Financing Program Bonds, Series 2007U: | | | | | | | |
| | 5,435 | | 5.000%, 9/01/37 (Pre-refunded 9/01/17) | 9/17 at 100.00 | | AAA | | | 5,625,171 | |
| | 2,910 | | 5.000%, 9/01/37 (Pre-refunded 9/01/17) | 9/17 at 100.00 | | A3 (5) | | | 3,011,821 | |
| | 2,625 | | 5.000%, 9/01/37 (Pre-refunded 9/01/17) – AMBAC Insured | 9/17 at 100.00 | | AAA | | | 2,716,849 | |
| | 1,545 | | 5.000%, 9/01/37 (Pre-refunded 9/01/17) – AMBAC Insured | 9/17 at 100.00 | | A– (5) | | | 1,599,060 | |
| | | | New Jersey Educational Facilities Authority, Revenue Bonds, Kean University, Series 2007D: | | | | | | | |
| | 7,310 | | 5.000%, 7/01/32 (Pre-refunded 7/01/17) – FGIC Insured | 7/17 at 100.00 | | AA– (5) | | | 7,519,358 | |
| | 6,875 | | 5.000%, 7/01/39 (Pre-refunded 7/01/17) – FGIC Insured | 7/17 at 100.00 | | AA– (5) | | | 7,071,900 | |
| | 25 | | New Jersey Educational Facilities Authority, Revenue Bonds, University of Medicine and Dentistry of New Jersey, Refunding Series 2009B, 6.000%, 12/01/17 (ETM) | No Opt. Call | | N/R (5) | | | 25,811 | |
| | | | New Jersey Educational Facilities Authority, Revenue Bonds, University of Medicine and Dentistry of New Jersey, Refunding Series 2009B: | | | | | | | |
| | 25 | | 6.500%, 12/01/19 (Pre-refunded 6/01/19) | 6/19 at 100.00 | | N/R (5) | | | 28,456 | |
| | 100 | | 6.500%, 12/01/20 (Pre-refunded 6/01/19) | 6/19 at 100.00 | | N/R (5) | | | 113,825 | |
| | 5 | | 7.125%, 12/01/23 (Pre-refunded 6/01/19) | 6/19 at 100.00 | | N/R (5) | | | 5,771 | |
| | 30 | | New Jersey Environmental Infrastructure Trust, Environmental Infrastructure Bonds, Series 2012A, 3.250%, 9/01/31 (Pre-refunded 9/01/21) | 9/21 at 100.00 | | N/R (5) | | | 32,916 | |
| NXJ | Nuveen New Jersey Quality Municipal Income Fund | |
| | Portfolio of Investments (continued) | October 31, 2016 (Unaudited) |
| | Principal | | | Optional Call | | | | | | |
| | Amount (000) | | Description (1) | Provisions (2) | | Ratings (3) | | | Value | |
| | | | U.S. Guaranteed (5) (continued) | | | | | | | |
| $ | 4,885 | | New Jersey Health Care Facilities Finance Authority, Revenue Bonds, AHS Hospital Corporation, Series 2008A, 5.000%, 7/01/27 (Pre-refunded 7/01/18) | 7/18 at 100.00 | | N/R (5) | | $ | 5,215,959 | |
| | 6,840 | | New Jersey Health Care Facilities Financing Authority, Revenue Bonds, Atlanticare Regional Medical Center, Series 2007, 5.000%, 7/01/37 (Pre-refunded 7/01/17) | 7/17 at 100.00 | | N/R (5) | | | 7,028,921 | |
| | | | New Jersey Health Care Facilities Financing Authority, Revenue Bonds, RWJ Health Care Corporation, Series 2005B: | | | | | | | |
| | 1,620 | | 5.000%, 7/01/25 (Pre-refunded 12/05/16) – RAAI Insured | 12/16 at 100.00 | | AA (5) | | | 1,623,580 | |
| | 2,885 | | 5.000%, 7/01/35 (Pre-refunded 12/05/16) – RAAI Insured | 12/16 at 100.00 | | AA (5) | | | 2,889,674 | |
| | 7,670 | | New Jersey Health Care Facilities Financing Authority, Revenue Bonds, Saint Barnabas Health Care System, Refunding Series 2011A, 5.625%, 7/01/37 (Pre-refunded 7/01/21) | 7/21 at 100.00 | | A+ (5) | | | 9,227,010 | |
| | 5,000 | | New Jersey Health Care Facilities Financing Authority, Revenue Bonds, Saint Joseph's Healthcare System Obligated Group Issue, Series 2008, 6.625%, 7/01/38 (Pre-refunded 7/01/18) | 7/18 at 100.00 | | BBB– (5) | | | 5,480,750 | |
| | 3,805 | | New Jersey Health Care Facilities Financing Authority, Revenue Bonds, St. Clare's Hospital, Series 2004A, 5.250%, 7/01/20 – RAAI Insured (ETM) | No Opt. Call | | AA (5) | | | 4,359,807 | |
| | 410 | | New Jersey Health Care Facilities Financing Authority, State Contract Bonds, Hospital Asset Transformation Program, Series 2008A, 5.250%, 10/01/38 (Pre-refunded 10/01/18) | 10/18 at 100.00 | | N/R (5) | | | 444,264 | |
| | 1,555 | | New Jersey Sports and Exposition Authority, Convention Center Luxury Tax Bonds, Series 2004, 5.500%, 3/01/22 – NPFG Insured (ETM) | No Opt. Call | | AA– (5) | | | 1,902,154 | |
| | 1,650 | | Newark Housing Authority, New Jersey, City-Secured Police Facility Revenue Bonds, South Ward Police Facility, Series 2009A, 6.750%, 12/01/38 (Pre-refunded 12/01/19) – AGC Insured | 12/19 at 100.00 | | A3 (5) | | | 1,936,688 | |
| | 305 | | North Hudson Sewerage Authority, New Jersey, Gross Revenue Senior Lien Lease Certificates, Series 2012A, 5.000%, 6/01/27 (Pre-refunded 6/01/22) | 6/22 at 100.00 | | N/R (5) | | | 366,268 | |
| | 15,840 | | North Hudson Sewerage Authority, New Jersey, Sewerage Revenue Refunding Bonds, Series 2001A, 0.000%, 8/01/23 – NPFG Insured (ETM) | No Opt. Call | | A3 (5) | | | 14,141,477 | |
| | 7,580 | | Port Authority of New York and New Jersey, Consolidated Revenue Bonds, One Hundred Forty Eighth Series 2007, 5.000%, 8/15/32 (Pre-refunded 8/15/17) – AGM Insured | 8/17 at 100.00 | | AA (5) | | | 7,838,326 | |
| | 3,750 | | Puerto Rico Industrial, Tourist, Educational, Medical and Environmental Control Facilities Financing Authority, Adjustable Rate Industrial Revenue Bonds, American Home Products Corporation, Series 1983A, 5.100%, 12/01/18 (Pre-refunded 12/14/16) | 12/16 at 100.00 | | A1 (5) | | | 3,855,900 | |
| | 91,610 | | Total U.S. Guaranteed | | | | | | 95,074,095 | |
| | | | Utilities – 2.7% (1.9% of Total Investments) | | | | | | | |
| | 6,300 | | Essex County Improvement Authority, New Jersey, Solid Waste Disposal Revenue Bonds, Covanta Project, Series 2015, 5.250%, 7/01/45 (Alternative Minimum Tax) | 7/20 at 100.00 | | Ba2 | | | 6,517,917 | |
| | 1,510 | | Industrial Pollution Control Financing Authority of Cape May County (New Jersey), Pollution Control Revenue Refunding Bonds, 1991 Series A (Atlantic City Electric Company Project), 6.800%, 3/01/21 – NPFG Insured | No Opt. Call | | AA– | | | 1,789,380 | |
| | | | New Jersey Economic Development Authority, Energy Facilities Revenue Bonds, UMM Energy Partners, LLC Project, Series 2012A: | | | | | | | |
| | 1,000 | | 4.750%, 6/15/32 (Alternative Minimum Tax) | No Opt. Call | | Baa3 | | | 1,051,780 | |
| | 1,225 | | 5.125%, 6/15/43 (Alternative Minimum Tax) | 6/22 at 100.00 | | Baa3 | | | 1,295,609 | |
| | 5,100 | | New Jersey Economic Development Authority, Water Facilities Revenue Bonds, New Jersey-American Water Company Inc. Project, Refunding Series 2010B, 5.600%, 11/01/34 (Alternative Minimum Tax) | 5/20 at 100.00 | | A+ | | | 5,682,776 | |
| | 2,040 | | New Jersey Economic Development Authority, Water Facilities Revenue Bonds, New Jersey-American Water Company Inc. Project, Refunding Series 2010D, 4.875%, 11/01/29 (Alternative Minimum Tax) | 11/20 at 100.00 | | A+ | | | 2,205,424 | |
| | 17,175 | | Total Utilities | | | | | | 18,542,886 | |
| | Principal | | | Optional Call | | | | | | |
| | Amount (000) | | Description (1) | Provisions (2) | | Ratings (3) | | | Value | |
| | | | Water and Sewer – 5.7% (3.9% of Total Investments) | | | | | | | |
| | | | Bergen County Utilities Authority, New Jersey, Water Pollution Control System Revenue Bonds, Refunding Series 2014: | | | | | | | |
| $ | 1,000 | | 3.125%, 12/15/30 | 12/24 at 100.00 | | AA– | | $ | 1,022,710 | |
| | 1,000 | | 3.125%, 12/15/31 | 12/24 at 100.00 | | AA– | | | 1,017,610 | |
| | | | New Jersey Economic Development Authority, Water Facilities Revenue Bonds, Middlesex Water Company, Series 2012C: | | | | | | | |
| | 1,460 | | 5.000%, 10/01/23 | No Opt. Call | | A+ | | | 1,757,533 | |
| | 15,670 | | 4.250%, 10/01/47 (Alternative Minimum Tax) | 10/22 at 100.00 | | A+ | | | 16,365,277 | |
| | 1,650 | | New Jersey Environmental Infrastructure Trust, Environmental Infrastructure Bonds, Series 2012A, 3.250%, 9/01/31 | 9/21 at 100.00 | | AAA | | | 1,714,367 | |
| | 6,270 | | New Jersey Environmental Infrastructure Trust, Environmental Infrastructure Bonds, Tender Option Bond Trust 2016-XF0395, 6.685%, 9/01/21 (IF) (4) | No Opt. Call | | AAA | | | 7,916,377 | |
| | | | North Hudson Sewerage Authority, New Jersey, Gross Revenue Senior Lien Lease Certificates, Series 2012A: | | | | | | | |
| | 3,515 | | 5.000%, 6/01/27 | 6/22 at 100.00 | | A | | | 4,035,888 | |
| | 4,000 | | 5.000%, 6/01/42 – NPFG Insured | 6/22 at 100.00 | | A | | | 4,487,000 | |
| | 395 | | Wanaque Valley Regional Sewer Authority, Passaic County, New Jersey, Sewer Revenue Refunding Bonds, Series 1993B, 5.750%, 9/01/18 – AMBAC Insured | No Opt. Call | | A2 | | | 408,786 | |
| | 34,960 | | Total Water and Sewer | | | | | | 38,725,548 | |
| $ | 955,165 | | Total Municipal Bonds (cost $905,769,238) | | | | | | 985,796,530 | |
| | | | | | | | | | | |
| | Shares | | Description (1) | | | | | | Value | |
| | | | COMMON STOCKS – 0.1% (0.1% of Total Investments) | | | | | | | |
| | | | Airlines – 0.1% (0.1% of Total Investments) | | | | | | | |
| | 13,262 | | American Airlines Group Inc. (6) | | | | | $ | 538,437 | |
| | | | Total Common Stocks (cost $0) | | | | | | 538,437 | |
| | | | Total Long-Term Investments (cost $905,769,238) | | | | | | 986,334,967 | |
| | | | Variable Rate Demand Preferred Shares, at Liquidation Preference – (46.0)% (7) | | | | | | (313,900,000 | ) |
| | | | Other Assets Less Liabilities – 1.6% (8) | | | | | | 10,427,240 | |
| | | | Net Assets Applicable to Common Shares – 100% | | | | | $ | 682,862,207 | |
| NXJ | Nuveen New Jersey Quality Municipal Income Fund | |
| | Portfolio of Investments (continued) | October 31, 2016 (Unaudited) |
Investments in Derivatives as of October 31, 2016
Interest Rate Swaps
| Counterparty | Notional
Amount | | Fund
Pay/Receive
Floating
Rate | | Floating
Rate
Index | | Fixed Rate (Annualized | ) | Fixed Rate Payment Frequency | | Effective Date (9) | | Termination Date | | Unrealized Appreciation (Depreciation | ) |
| JPMorgan Chase Bank, N.A. | $ | 50,750,000 | | Receive | | USD-BMA | | 1.130 | % | Quarterly | | 10/30/17 | | 10/30/26 | | $ | 997,038 | |
| (1) | All percentages shown in the Portfolio of Investments are based on net assets applicable to common shares unless otherwise noted. |
| (2) | Optional Call Provisions: Dates (month and year) and prices of the earliest optional call or redemption. There may be other call provisions at varying prices at later dates. Certain mortgage-backed securities may be subject to periodic principal paydowns. |
| (3) | For financial reporting purposes, the ratings disclosed are the highest of Standard & Poor's Group ("Standard & Poor's"), Moody's Investors Service, Inc. ("Moody's") or Fitch, Inc. ("Fitch") rating. This treatment of split-rated securities may differ from that used for other purposes, such as for Fund investment policies. Ratings below BBB by Standard & Poor's, Baa by Moody's or BBB by Fitch are considered to be below investment grade. Holdings designated N/R are not rated by any of these national rating agencies. |
| (4) | Investment, or portion of investment, has been pledged to collateralize the net payment obligations for investments in inverse floating rate transactions. |
| (5) | Backed by an escrow or trust containing sufficient U.S. Government or U.S. Government agency securities, which ensure the timely payment of principal and interest. Certain bonds backed by U.S. Government or agency securities are regarded as having an implied rating equal to the rating of such securities. |
| (6) | On November 28, 2011, AMR Corp. ("AMR"), the parent company of American Airlines Group, Inc. ("AAL") filed for federal bankruptcy protection. On December 9, 2013, AMR emerged from federal bankruptcy with the acceptance of its reorganization plan by the bankruptcy court. Under the settlement agreement established to meet AMR's unsecured bond obligations, the bondholders, including the Fund, received a distribution of AAL preferred stock which was converted to AAL common stock over a 120-day period. Every 30 days, a quarter of the preferred stock was converted to AAL common stock based on the 5-day volume-weighted average price and the amount of preferred shares tendered during the optional preferred conversion period. |
| (7) | Variable Rate Demand Preferred Shares, at Liquidation Preference as a percentage of Total Investments is 31.8%. |
| (8) | Other assets less liabilities includes the unrealized appreciation (depreciation) of certain over-the-counter ("OTC") derivatives as presented on the Statement of Assets and Liabilities, when applicable. The unrealized appreciation (depreciation) of OTC-cleared and exchange-traded derivatives is recognized as part of the cash collateral at brokers and/or the receivable or payable for variation margin as presented on the Statement of Assets and Liabilities, when applicable. |
| (9) | Effective date represents the date on which both the Fund and counterparty commence interest payment accruals on each contract. |
| (ETM) | Escrowed to maturity. |
| (IF) | Inverse floating rate investment. |
| (WI/DD) | Investment, or portion of investment, purchased on a when-issued or delayed delivery basis. |
| USD-BMA | United States Dollar-Bond Market Association |
See accompanying notes to financial statements.
| NJV | | |
| | Nuveen New Jersey Municipal Value Fund | |
| | Portfolio of Investments | October 31, 2016 (Unaudited) |
| | Principal | | | Optional Call | | | | | | |
| | Amount (000) | | Description (1) | Provisions (2) | | Ratings (3) | | | Value | |
| | | | LONG-TERM INVESTMENTS – 102.2% (98.5% of Total Investments) | | | | | | | |
| | | | MUNICIPAL BONDS – 99.8% (96.2% of Total Investments) | | | | | | | |
| | | | Consumer Staples – 4.0% (3.9% of Total Investments) | | | | | | | |
| | | | Tobacco Settlement Financing Corporation, New Jersey, Tobacco Settlement Asset-Backed Bonds, Series 2007-1A: | | | | | | | |
| $ | 205 | | 4.750%, 6/01/34 | 6/17 at 100.00 | | B– | | $ | 197,509 | |
| | 870 | | 5.000%, 6/01/41 | 6/17 at 100.00 | | B– | | | 819,523 | |
| | 1,075 | | Total Consumer Staples | | | | | | 1,017,032 | |
| | | | Education and Civic Organizations – 17.5% (16.8% of Total Investments) | | | | | | | |
| | 110 | | Camden County Improvement Authority, New Jersey, Lease Revenue Bonds Rowan University School of Osteopathic Medicine Project, Series 2013A, 5.000%, 12/01/32 | 12/23 at 100.00 | | A | | | 127,053 | |
| | 115 | | New Jersey Economic Development Authority, Revenue Bonds, The Seeing Eye Inc., Refunding Series 2015, 5.000%, 3/01/25 | No Opt. Call | | A | | | 143,261 | |
| | 45 | | New Jersey Economic Development Authority, Rutgers University General Obligation Lease Revenue Bonds, Tender Option Bond 2016-XF2357, 16.343%, 6/15/46 (IF) (4) | 6/23 at 100.00 | | Aa3 | | | 72,896 | |
| | 185 | | New Jersey Educational Facilities Authority, Revenue Bonds, College of New Jersey, Refunding Series 2016F, 3.000%, 7/01/40 | 7/26 at 100.00 | | AA– | | | 175,811 | |
| | 910 | | New Jersey Educational Facilities Authority, Revenue Bonds, Kean University, Refunding Series 2009A, 5.500%, 9/01/36 | 9/19 at 100.00 | | A2 | | | 1,007,015 | |
| | 100 | | New Jersey Educational Facilities Authority, Revenue Bonds, Kean University, Refunding Series 2015H, 4.000%, 7/01/39 – AGM Insured | 7/25 at 100.00 | | AA | | | 104,851 | |
| | 155 | | New Jersey Educational Facilities Authority, Revenue Bonds, New Jersey City University, Series 2015A, 5.000%, 7/01/45 | 7/25 at 100.00 | | AA | | | 175,714 | |
| | | | New Jersey Educational Facilities Authority, Revenue Bonds, Rider University, Series 2012A: | | | | | | | |
| | 90 | | 5.000%, 7/01/32 | 7/21 at 100.00 | | Baa2 | | | 98,313 | |
| | 30 | | 5.000%, 7/01/37 | 7/21 at 100.00 | | Baa2 | | | 32,417 | |
| | 75 | | New Jersey Educational Facilities Authority, Revenue Bonds, Seton Hall University, Series 2013D, 5.000%, 7/01/38 | 7/23 at 100.00 | | A– | | | 85,212 | |
| | | | New Jersey Educational Facilities Authority, Revenue Bonds, Seton Hall University, Series 2016C: | | | | | | | |
| | 320 | | 3.000%, 7/01/41 | 7/26 at 100.00 | | A– | | | 298,531 | |
| | 50 | | 3.000%, 7/01/46 | 7/26 at 100.00 | | A– | | | 45,925 | |
| | 100 | | New Jersey Educational Facilities Authority, Revenue Bonds, Stockton University Issue, Refunding Series 2016A, 5.000%, 7/01/41 | 7/26 at 100.00 | | A | | | 112,382 | |
| | 25 | | New Jersey Educational Facilities Authority, Revenue Bonds, The College of Saint Elizabeth, Series 2016D, 5.000%, 7/01/46 | 7/26 at 100.00 | | BB | | | 26,194 | |
| | 1,000 | | New Jersey Higher Education Assistance Authority, Student Loan Revenue Bonds, Series 2009A, 5.625%, 6/01/30 | 6/19 at 100.00 | | AA | | | 1,099,980 | |
| | 30 | | New Jersey Higher Education Assistance Authority, Student Loan Revenue Bonds, Series 2010-2, 5.000%, 12/01/30 | 12/20 at 100.00 | | Aa3 | | | 32,518 | |
| | 100 | | New Jersey Higher Education Assistance Authority, Student Loan Revenue Bonds, Series 2012-1B, 5.750%, 12/01/39 (Alternative Minimum Tax) | 12/22 at 100.00 | | A | | | 110,242 | |
| | 195 | | New Jersey Higher Education Assistance Authority, Student Loan Revenue Bonds, Series 2015-1A, 4.000%, 12/01/30 (Alternative Minimum Tax) | 12/24 at 100.00 | | AA | | | 204,481 | |
| | 100 | | New Jersey Higher Education Assistance Authority, Student Loan Revenue Bonds, Tender Option Bond Trust 2015-XF0151, 9.909%, 12/01/23 (Alternative Minimum Tax) (IF) (4) | 12/22 at 100.00 | | AA | | | 110,980 | |
| NJV | Nuveen New Jersey Municipal Value Fund | |
| | Portfolio of Investments (continued) | October 31, 2016 (Unaudited) |
| | Principal | | | Optional Call | | | | | | |
| | Amount (000) | | Description (1) | Provisions (2) | | Ratings (3) | | | Value | |
| | | | Education and Civic Organizations (continued) | | | | | | | |
| $ | 200 | | New Jersey Institute of Technology, New Jersey, General Obligation Bonds, Series 2015A, 5.000%, 7/01/45 | 7/25 at 100.00 | | A1 | | $ | 226,890 | |
| | 60 | | Rutgers State University, New Jersey, Revenue Bonds, Tender Option Bond 2016-XF2356, 16.260%, 5/01/43 (IF) (4) | 5/23 at 100.00 | | Aa3 | | | 98,486 | |
| | 3,995 | | Total Education and Civic Organizations | | | | | | 4,389,152 | |
| | | | Health Care – 16.9% (16.3% of Total Investments) | | | | | | | |
| | 105 | | Camden County Improvement Authority, New Jersey, Health Care Redevelopment Revenue Bonds, Cooper Health System Obligated Group Issue, Refunding Series 2014A, 5.000%, 2/15/25 | No Opt. Call | | BBB+ | | | 124,319 | |
| | 115 | | Camden County Improvement Authority, New Jersey, Health Care Redevelopment Revenue Bonds, Cooper Health System Obligated Group Issue, Series 2013A, 5.750%, 2/15/42 | 2/23 at 100.00 | | BBB+ | | | 132,961 | |
| | 2,000 | | New Jersey Health Care Facilities Financing Authority, Hospital Revenue Bonds, Virtua Health, Series 2009A, 5.500%, 7/01/38 – AGC Insured (UB) (4) | 7/19 at 100.00 | | AA | | | 2,207,760 | |
| | 105 | | New Jersey Health Care Facilities Financing Authority, Revenue and Refunding Bonds, Palisades Medical Center Obligated Group Issue, Series 2013, 5.250%, 7/01/31 | 7/23 at 100.00 | | A– | | | 119,822 | |
| | 70 | | New Jersey Health Care Facilities Financing Authority, Revenue Bonds, AHS Hospital Corporation, Refunding Series 2016, 4.000%, 7/01/41 | 1/27 at 100.00 | | AA– | | | 73,398 | |
| | 215 | | New Jersey Health Care Facilities Financing Authority, Revenue Bonds, Barnabas Health, Refunding Series 2014A, 5.000%, 7/01/44 | 7/24 at 100.00 | | A+ | | | 244,483 | |
| | 100 | | New Jersey Health Care Facilities Financing Authority, Revenue Bonds, Hunterdon Medical Center, Refunding Series 2014A, 4.000%, 7/01/45 | 7/24 at 100.00 | | A+ | | | 102,959 | |
| | 20 | | New Jersey Health Care Facilities Financing Authority, Revenue Bonds, Meridian Health System Obligated Group, Refunding Series 2011, 5.000%, 7/01/21 | No Opt. Call | | A+ | | | 23,148 | |
| | | | New Jersey Health Care Facilities Financing Authority, Revenue Bonds, Meridian Health, Series 2007: | | | | | | | |
| | 100 | | 5.000%, 7/01/38 – AGC Insured | 7/18 at 100.00 | | AA | | | 105,313 | |
| | 65 | | 5.000%, 7/01/38 | 7/18 at 100.00 | | AA | | | 68,663 | |
| | | | New Jersey Health Care Facilities Financing Authority, Revenue Bonds, Princeton HealthCare System, Series 2016A: | | | | | | | |
| | 25 | | 5.000%, 7/01/32 | 7/26 at 100.00 | | Baa2 | | | 29,664 | |
| | 40 | | 5.000%, 7/01/33 | 7/26 at 100.00 | | Baa2 | | | 47,276 | |
| | 130 | | New Jersey Health Care Facilities Financing Authority, Revenue Bonds, Robert Wood Johnson University Hospital Issue, Series 2014A, 5.000%, 7/01/39 | 7/24 at 100.00 | | A+ | | | 147,827 | |
| | 110 | | New Jersey Health Care Facilities Financing Authority, Revenue Bonds, Robert Wood Johnson University Hospital, Series 2013A, 5.500%, 7/01/43 | 7/23 at 100.00 | | A+ | | | 128,635 | |
| | 340 | | New Jersey Health Care Facilities Financing Authority, Revenue Bonds, Saint Joseph's Healthcare System Obligated Group Issue, Refunding Series 2016, 4.000%, 7/01/48 | 7/26 at 100.00 | | BBB– | | | 342,567 | |
| | 100 | | New Jersey Health Care Facilities Financing Authority, Revenue Bonds, Saint Luke's Warren Hospital Obligated Group, Series 2013, 4.000%, 8/15/37 | 8/23 at 100.00 | | A– | | | 103,147 | |
| | | | New Jersey Health Care Facilities Financing Authority, Revenue Bonds, University Hospital Issue, Refunding Series 2015A: | | | | | | | |
| | 125 | | 4.125%, 7/01/38 – AGM Insured | 7/25 at 100.00 | | AA | | | 132,810 | |
| | 110 | | 5.000%, 7/01/46 – AGM Insured | 7/25 at 100.00 | | AA | | | 124,744 | |
| | 3,875 | | Total Health Care | | | | | | 4,259,496 | |
| | | | Housing/Multifamily – 7.8% (7.5% of Total Investments) | | | | | | | |
| | 100 | | New Jersey Economic Development Authority, Revenue Bonds, Provident Group – Rowan Properties LLC – Rowan University Student Housing Project, Series 2015A, 5.000%, 1/01/48 | 1/25 at 100.00 | | BBB– | | | 110,836 | |
| | 155 | | New Jersey Economic Development Authority, Revenue Bonds, West Campus Housing LLC – New Jersey City University Student Housing Project, Series 2015, 5.000%, 7/01/47 | 7/25 at 100.00 | | BBB– | | | 165,011 | |
| | Principal | | | Optional Call | | | | | | |
| | Amount (000) | | Description (1) | Provisions (2) | | Ratings (3) | | | Value | |
| | | | Housing/Multifamily (continued) | | | | | | | |
| | | | New Jersey Economic Development Authority, Student Housing Revenue Bonds, Provident Group-Montclair Properties LLC, Montclair State University Student Housing Project, Series 2010A: | | | | | | | |
| $ | 100 | | 5.750%, 6/01/31 | 6/20 at 100.00 | | Baa3 | | $ | 111,107 | |
| | 50 | | 5.875%, 6/01/42 | 6/20 at 100.00 | | Baa3 | | | 55,359 | |
| | 1,000 | | New Jersey Housing and Mortgage Finance Agency, Multifamily Revenue Bonds, Series 2009A, 4.950%, 5/01/41 | 11/19 at 100.00 | | AA– | | | 1,049,390 | |
| | 60 | | New Jersey Housing and Mortgage Finance Agency, Multifamily Revenue Bonds, Series 2015A, 4.000%, 11/01/45 | 11/24 at 100.00 | | AA– | | | 61,782 | |
| | 130 | | New Jersey Housing and Mortgage Finance Agency, Multifamily Revenue Bonds, Series 2015B, 1.000%, 11/01/17 | No Opt. Call | | AA– | | | 129,965 | |
| | 270 | | New Jersey Housing and Mortgage Finance Agency, Multifamily Revenue Bonds, Series 2016B, 3.600%, 11/01/40 | 11/25 at 100.00 | | AA– | | | 273,110 | |
| | 1,865 | | Total Housing/Multifamily | | | | | | 1,956,560 | |
| | | | Housing/Single Family – 0.5% (0.4% of Total Investments) | | | | | | | |
| | 115 | | New Jersey Housing & Mortgage Finance Agency, Single Family Home Mortgage Revenue Bonds, Series 2011A, 4.500%, 10/01/29 | 10/21 at 100.00 | | Aa2 | | | 117,416 | |
| | | | Long-Term Care – 1.9% (1.9% of Total Investments) | | | | | | | |
| | 260 | | Burlington County Bridge Commission, New Jersey, Economic Development Revenue Bonds, The Evergreens Project, Series 2007, 5.625%, 1/01/38 | 1/18 at 100.00 | | N/R | | | 269,948 | |
| | 15 | | New Jersey Economic Development Authority, Fixed Rate Revenue Bonds, Lions Gate Project, Series 2014, 5.250%, 1/01/44 | 1/24 at 100.00 | | N/R | | | 16,109 | |
| | 140 | | New Jersey Economic Development Authority, Revenue Bonds, United Methodist Homes of New Jersey Obligated Group Issue, Refunding Series 2013, 5.000%, 7/01/34 | 7/23 at 100.00 | | BBB– | | | 151,820 | |
| | 40 | | New Jersey Economic Development Authority, Revenue Bonds, United Methodist Homes of New Jersey Obligated Group Issue, Refunding Series 2014A, 5.000%, 7/01/29 | 7/24 at 100.00 | | BBB– | | | 44,543 | |
| | 455 | | Total Long-Term Care | | | | | | 482,420 | |
| | | | Tax Obligation/General – 7.6% (7.3% of Total Investments) | | | | | | | |
| | | | Medford Township Board of Education, Burlington County, New Jersey, General Obligation Bonds, Refunding Series 2015: | | | | | | | |
| | 20 | | 5.000%, 3/01/22 | No Opt. Call | | Aa2 | | | 23,461 | |
| | 20 | | 5.000%, 3/01/24 | No Opt. Call | | Aa2 | | | 24,213 | |
| | 150 | | Monmouth County Improvement Authority, New Jersey, Governmental Loan Revenue Bonds, Series 2007, 5.000%, 12/01/16 – AMBAC Insured | No Opt. Call | | N/R | | | 150,485 | |
| | 70 | | Monmouth County Improvement Authority, New Jersey, Governmental Pooled Loan Revenue Bonds, Refunding Series 2016B, 4.000%, 8/01/24 | No Opt. Call | | AAA | | | 82,454 | |
| | 200 | | Monroe Township Board of Education of Gloucester County, New Jersey, General Obligation Bond, Refunding Series 2014, 3.000%, 3/01/17 | No Opt. Call | | AA– | | | 201,514 | |
| | 110 | | Monroe Township Board of Education, Middlesex County, New Jersey, General Obligation Bonds, Refunding Series 2015, 5.000%, 3/01/38 | 3/25 at 100.00 | | AA– | | | 128,316 | |
| | 20 | | Montclair Township, Essex County, New Jersey, General Obligation Bonds, Parking Utility, Refunding Series 2014A, 5.000%, 1/01/37 | 1/24 at 100.00 | | AAA | | | 23,233 | |
| | | | New Brunswick Parking Authority, Middlesex County, New Jersey, Guaranteed Parking Revenue Bonds, Refunding Series 2016A: | | | | | | | |
| | 310 | | 5.000%, 9/01/29 – BAM Insured | 9/26 at 100.00 | | AA | | | 377,080 | |
| | 130 | | 5.000%, 9/01/39 – BAM Insured | No Opt. Call | | AA | | | 153,084 | |
| | 195 | | New Brunswick Parking Authority, Middlesex County, New Jersey, Guaranteed Parking Revenue Bonds, Refunding Series 2016B, 3.000%, 9/01/39 – AGM Insured | 9/26 at 100.00 | | AA | | | 182,736 | |
| NJV | Nuveen New Jersey Municipal Value Fund | |
| | Portfolio of Investments (continued) | October 31, 2016 (Unaudited) |
| | Principal | | | Optional Call | | | | | | |
| | Amount (000) | | Description (1) | Provisions (2) | | Ratings (3) | | | Value | |
| | | | Tax Obligation/General (continued) | | | | | | | |
| $ | 30 | | North Bergen Township, New Jersey, General Obligation Bonds, General Improvement Series 2009, 4.000%, 2/01/17 | No Opt. Call | | AA– | | $ | 30,241 | |
| | 25 | | South Brunswick Township, Middlesex County, New Jersey, General Obligation Bonds, Refunding Series 2014, 3.000%, 9/01/17 | No Opt. Call | | AA | | | 25,444 | |
| | 110 | | Sussex County, New Jersey, General Obligation Bonds, Refunding Series 2014, 4.000%, 2/15/22 | No Opt. Call | | AA+ | | | 124,717 | |
| | 150 | | Union County Utilities Authority, New Jersey, Resource Recovery Facility Lease Revenue Refunding Bonds, Covantan Union Inc. Lessee, Series 2011B, 5.250%, 12/01/31 (Alternative Minimum Tax) | 12/21 at 100.00 | | AA+ | | | 165,576 | |
| | 170 | | Union County Utilities Authority, New Jersey, Solid Waste System County Deficiency Revenue Bonds, Series 2011A, 5.000%, 6/15/41 | 6/21 at 100.00 | | AA+ | | | 189,224 | |
| | 25 | | Washington Borough, Warren County, New Jersey, General Obligation Bonds, Series 2008, 4.500%, 3/01/17 – AGM Insured | No Opt. Call | | A2 | | | 25,302 | |
| | 1,735 | | Total Tax Obligation/General | | | | | | 1,907,080 | |
| | | | Tax Obligation/Limited – 21.5% (20.7% of Total Investments) | | | | | | | |
| | 270 | | Garden State Preservation Trust, New Jersey, Open Space and Farmland Preservation Bonds, Series 2005A, 5.750%, 11/01/28 – AGM Insured | No Opt. Call | | AA | | | 344,841 | |
| | | | Hudson County Improvement Authority, New Jersey, County Secured Lease Revenue Bonds, Hudson County Vocational Technical Schools Project, Series 2016: | | | | | | | |
| | 250 | | 5.000%, 5/01/46 | 5/26 at 100.00 | | AA | | | 292,418 | |
| | 175 | | 5.250%, 5/01/51 | 5/26 at 100.00 | | AA | | | 208,934 | |
| | | | New Jersey Economic Development Authority, Cigarette Tax Revenue Refunding Bonds, Series 2012: | | | | | | | |
| | 250 | | 5.000%, 6/15/25 | 6/22 at 100.00 | | BBB+ | | | 276,975 | |
| | 400 | | 5.000%, 6/15/28 | No Opt. Call | | BBB+ | | | 434,948 | |
| | 545 | | New Jersey Health Care Facilities Financing Authority, State Contract Bonds, Hospital Asset Transformation Program, Series 2008A, 5.250%, 10/01/38 | 10/18 at 100.00 | | A3 | | | 576,654 | |
| | 2,000 | | New Jersey Health Care Facilities Financing Authority, State Contract Bonds, Hospital Asset Transformation Program, Series 2009A, 5.750%, 10/01/31 | 10/19 at 100.00 | | A3 | | | 2,207,240 | |
| | 2,270 | | New Jersey Transportation Trust Fund Authority, Transportation System Bonds, Series 2009A, 0.000%, 12/15/39 | No Opt. Call | | A3 | | | 778,020 | |
| | 110 | | Union County Improvement Authority, New Jersey, General Obligation Lease Bonds, Juvenile Detention Center Facility Project, Tender Option Bond Trust 2015-XF1019, 21.400%, 5/01/30 (IF) (4) | No Opt. Call | | Aa1 | | | 278,530 | |
| | 6,270 | | Total Tax Obligation/Limited | | | | | | 5,398,560 | |
| | | | Transportation – 11.2% (10.8% of Total Investments) | | | | | | | |
| | 250 | | Casino Reinvestment Development Authority, New Jersey, Parking Revenue Bonds, Series 2005A, 5.250%, 6/01/20 – NPFG Insured | 1/17 at 100.00 | | AA– | | | 250,813 | |
| | | | Delaware River and Bay Authority, Delaware and New Jersey, Revenue Bonds, Series 2014A: | | | | | | | |
| | 150 | | 4.125%, 1/01/39 | 1/24 at 100.00 | | A1 | | | 162,414 | |
| | 200 | | 5.000%, 1/01/44 | 1/24 at 100.00 | | A1 | | | 229,222 | |
| | 300 | | Delaware River Port Authority, Pennsylvania and New Jersey, Revenue Refunding Bonds, Port District Project, Series 2012, 5.000%, 1/01/27 | No Opt. Call | | A– | | | 336,768 | |
| | 190 | | New Jersey Economic Development Authority, Private Activity Bonds, The Goethals Bridge Replacement Project, Series 2013, 5.625%, 1/01/52 (Alternative Minimum Tax) | 1/24 at 100.00 | | BBB | | | 218,242 | |
| | 80 | | New Jersey Economic Development Authority, Special Facilities Revenue Bonds, Continental Airlines Inc., Series 2000A & 2000B, 5.625%, 11/15/30 (Alternative Minimum Tax) | 3/24 at 101.00 | | BB– | | | 91,912 | |
| | 295 | | New Jersey Turnpike Authority, Revenue Bonds, Refunding Series 2015E, 5.000%, 1/01/45 | 1/25 at 100.00 | | A+ | | | 340,908 | |
| | 765 | | New Jersey Turnpike Authority, Revenue Bonds, Series 2009E, 5.250%, 1/01/40 | 1/19 at 100.00 | | A+ | | | 824,043 | |
| | Principal | | | Optional Call | | | | | | |
| | Amount (000) | | Description (1) | Provisions (2) | | Ratings (3) | | | Value | |
| | | | Transportation (continued) | | | | | | | |
| $ | 315 | | Port Authority of New York and New Jersey, Consolidated Revenue Bonds, One Hundred Seventy Ninth Series 2013, 5.000%, 12/01/43 | 12/23 at 100.00 | | AA– | | $ | 370,295 | |
| | 2,545 | | Total Transportation | | | | | | 2,824,617 | |
| | | | U.S. Guaranteed – 8.4% (8.1% of Total Investments) (5) | | | | | | | |
| | 630 | | Guam Government, Limited Obligation Section 30 Revenue Bonds, Series 2009A, 5.750%, 12/01/34 (Pre-refunded 12/01/19) | 12/19 at 100.00 | | BBB+ (5) | | | 720,386 | |
| | 5 | | New Jersey Health Care Facilities Finance Authority, Revenue Bonds, AHS Hospital Corporation, Series 2008A, 5.125%, 7/01/22 (Pre-refunded 7/01/18) | 7/18 at 100.00 | | N/R (5) | | | 5,349 | |
| | 70 | | New Jersey Health Care Facilities Financing Authority, Revenue Bonds, Saint Barnabas Health Care System, Refunding Series 2011A, 5.625%, 7/01/37 (Pre-refunded 7/01/21) | 7/21 at 100.00 | | A+ (5) | | | 84,210 | |
| | 515 | | New Jersey Health Care Facilities Financing Authority, Revenue Bonds, Saint Joseph's Healthcare System Obligated Group Issue, Series 2008, 6.000%, 7/01/18 (ETM) | No Opt. Call | | BBB– (5) | | | 544,046 | |
| | 155 | | New Jersey Health Care Facilities Financing Authority, State Contract Bonds, Hospital Asset Transformation Program, Series 2008A, 5.250%, 10/01/38 (Pre-refunded 10/01/18) | 10/18 at 100.00 | | N/R (5) | | | 167,953 | |
| | 500 | | Newark Housing Authority, New Jersey, City-Secured Police Facility Revenue Bonds, South Ward Police Facility, Series 2009A, 6.750%, 12/01/38 (Pre-refunded 12/01/19) – AGC Insured | 12/19 at 100.00 | | A3 (5) | | | 586,875 | |
| | 1,875 | | Total U.S. Guaranteed | | | | | | 2,108,819 | |
| | | | Utilities – 2.5% (2.5% of Total Investments) | | | | | | | |
| | 270 | | Essex County Improvement Authority, New Jersey, Solid Waste Disposal Revenue Bonds, Covanta Project, Series 2015, 5.250%, 7/01/45 (Alternative Minimum Tax) | 7/20 at 100.00 | | Ba2 | | | 279,339 | |
| | 300 | | Industrial Pollution Control Financing Authority of Cape May County (New Jersey), Pollution Control Revenue Refunding Bonds, 1991 Series A (Atlantic City Electric Company Project), 6.800%, 3/01/21 – NPFG Insured | No Opt. Call | | AA– | | | 355,506 | |
| | 570 | | Total Utilities | | | | | | 634,845 | |
| $ | 24,375 | | Total Municipal Bonds (cost $22,864,942) | | | | | | 25,095,997 | |
| | | | | | | | | | | |
| | Shares | | Description (1) | | | | | | Value | |
| | | | COMMON STOCKS – 2.4% (2.3% of Total Investments) | | | | | | | |
| | | | Airlines – 2.4% (2.3% of Total Investments) | | | | | | | |
| | 15,008 | | American Airlines Group Inc. (6) | | | | | $ | 609,325 | |
| | | | Total Common Stocks (cost $207,228) | | | | | | 609,325 | |
| | | | Total Long-Term Investments (cost $23,072,170) | | | | | | 25,705,322 | |
| NJV | Nuveen New Jersey Municipal Value Fund | |
| | Portfolio of Investments (continued) | October 31, 2016 (Unaudited) |
| | Principal | | | Optional Call | | | | | | |
| | Amount (000) | | Description (1) | Provisions (2) | | Ratings (3) | | | Value | |
| | | | SHORT-TERM INVESTMENTS – 1.6% (1.5% of Total Investments) | | | | | | | |
| | | | MUNICIPAL BONDS – 1.6% (1.5% of Total Investments) | | | | | | | |
| | | | Housing/Single Family – 1.6% (1.5% of Total Investments) | | | | | | | |
| $ | 400 | | New Jersey Housing and Mortgage Finance Agency, Single Family Housing Revenue Bonds, Variable Rate Demand Obligation, Series 2005O, 0.640%, 10/01/26 (7) | 1/17 at 100.00 | | A-2 | | $ | 400,000 | |
| $ | 400 | | Total Short-Term Investments (cost $400,000) | | | | | | 400,000 | |
| | | | Total Investments (cost $23,472,170) – 103.8% | | | | | | 26,105,322 | |
| | | | Floating Rate Obligations – (6.0)% | | | | | | (1,500,000 | ) |
| | | | Other Assets Less Liabilities – 2.2% | | | | | | 550,209 | |
| | | | Net Assets Applicable to Common Shares – 100% | | | | | $ | 25,155,531 | |
| (1) | All percentages shown in the Portfolio of Investments are based on net assets applicable to common shares unless otherwise noted. |
| (2) | Optional Call Provisions: Dates (month and year) and prices of the earliest optional call or redemption. There may be other call provisions at varying prices at later dates. Certain mortgage-backed securities may be subject to periodic principal paydowns. |
| (3) | For financial reporting purposes, the ratings disclosed are the highest of Standard & Poor's Group ("Standard & Poor's"), Moody's Investors Service, Inc. ("Moody's") or Fitch, Inc. ("Fitch") rating. This treatment of split-rated securities may differ from that used for other purposes, such as for Fund investment policies. Ratings below BBB by Standard & Poor's, Baa by Moody's or BBB by Fitch are considered to be below investment grade. Holdings designated N/R are not rated by any of these national rating agencies. |
| (4) | Investment, or portion of investment, has been pledged to collateralize the net payment obligations for investments in inverse floating rate transactions. |
| (5) | Backed by an escrow or trust containing sufficient U.S. Government or U.S. Government agency securities, which ensure the timely payment of principal and interest. Certain bonds backed by U.S. Government or agency securities are regarded as having an implied rating equal to the rating of such securities. |
| (6) | On November 28, 2011, AMR Corp. ("AMR"), the parent company of American Airlines Group, Inc. ("AAL") filed for federal bankruptcy protection. On December 9, 2013, AMR emerged from federal bankruptcy with the acceptance of its reorganization plan by the bankruptcy court. Under the settlement agreement established to meet AMR's unsecured bond obligations, the bondholders, including the Fund, received a distribution of AAL preferred stock which was converted to AAL common stock over a 120-day period. Every 30 days, a quarter of the preferred stock was converted to AAL common stock based on the 5-day volume-weighted average price and the amount of preferred shares tendered during the optional preferred conversion period. |
| (7) | Investment has maturity of greater than one year, but has variable rate and demand features which qualify it as a short-term investment. The rate disclosed is that in effect as of the end of the reporting period. This rate changes periodically based on market conditions or a specified market index. |
| (ETM) | Escrowed to maturity. |
| (IF) | Inverse floating rate investment. |
| (UB) | Underlying bond of an inverse floating rate trust reflected as a financing transaction. See Notes to Financial Statements, Note 3 – Portfolio Securities and Investments in Derivatives, Inverse Floating Rate Securities for more information. |
See accompanying notes to financial statements.
| NQP |
| | Nuveen Pennsylvania Quality Municipal Income Fund |
| | (formerly known as Nuveen Pennsylvania Investment Quality Municipal Fund) |
| | Portfolio of Investments | October 31, 2016 (Unaudited) |
| | Principal | | | Optional Call | | | | | | |
| | Amount (000) | | Description (1) | Provisions (2) | | Ratings (3) | | | Value | |
| | | | LONG-TERM INVESTMENTS – 157.2% (100.0% of Total Investments) | | | | | | | |
| | | | MUNICIPAL BONDS – 157.2% (100.0% of Total Investments) | | | | | | | |
| | | | Consumer Staples – 0.4% (0.3% of Total Investments) | | | | | | | |
| $ | 2,000 | | Pennsylvania Economic Development Financing Authority, Solid Waste Disposal Revenue Bonds, Procter & Gamble Paper Project, Series 2001, 5.375%, 3/01/31 (Alternative Minimum Tax) | No Opt. Call | | AA– | | $ | 2,566,180 | |
| | | | Education and Civic Organizations – 18.1% (11.5% of Total Investments) | | | | | | | |
| | 1,420 | | Allegheny County Higher Education Building Authority, Pennsylvania, College Revenue Refunding Bonds, Robert Morris College, Series 1998A, 6.000%, 5/01/28 | No Opt. Call | | Baa3 | | | 1,665,419 | |
| | 5,020 | | Allegheny County Higher Education Building Authority, Pennsylvania, Revenue Bonds, Carnegie Mellon University, Series 2013, 5.000%, 3/01/28 | 3/23 at 100.00 | | AA– | | | 5,985,095 | |
| | 2,865 | | Allegheny County Higher Education Building Authority, Pennsylvania, Revenue Bonds, Duquesne University, Series 2013A, 3.500%, 3/01/34 | 3/23 at 100.00 | | A | | | 2,901,930 | |
| | | | Allegheny County Higher Education Building Authority, Pennsylvania, Revenue Bonds, Robert Morris University, Series 2016: | | | | | | | |
| | 735 | | 3.000%, 10/15/30 (WI/DD, Settling 11/01/16) | 10/26 at 100.00 | | Baa3 | | | 705,710 | |
| | 1,000 | | 5.000%, 10/15/38 (WI/DD, Settling 11/01/16) | 10/26 at 100.00 | | Baa3 | | | 1,126,970 | |
| | 1,440 | | Chester County Industrial Development Authority, Pennsylvania, Avon Grove Charter School Revenue Bonds, Series 2007A, 6.375%, 12/15/37 | 12/17 at 100.00 | | BBB– | | | 1,493,035 | |
| | 2,200 | | Crawford County Industrial Development Authority, Pennsylvania, College Revenue Bonds, Allegheny College, Series 2016, 3.000%, 5/01/34 | 5/26 at 100.00 | | A– | | | 2,050,598 | |
| | 1,020 | | Dallas Area Municipal Authority, Pennsylvania, Revenue Bonds, Misericordia University, Series 2014, 5.000%, 5/01/37 | 5/24 at 100.00 | | Baa3 | | | 1,119,980 | |
| | 750 | | Delaware County Authority, Pennsylvania, General Revenue Bonds, Eastern University, Series 2006, 4.500%, 10/01/27 – RAAI Insured | 1/17 at 100.00 | | AA | | | 751,065 | |
| | | | Huntingdon County General Authority, Pennsylvania, Revenue Bonds, Juniata College, Series 2016OO2: | | | | | | | |
| | 590 | | 3.250%, 5/01/36 | 5/26 at 100.00 | | BBB+ | | | 563,609 | |
| | 1,815 | | 3.500%, 5/01/41 | 5/26 at 100.00 | | BBB+ | | | 1,733,271 | |
| | | | Indiana County Industrial Development Authority, Pennsylvania, Revenue Bonds, Student Cooperative Association Inc./Indiana University of Pennsylvania – Student Union Project, Series 1999B: | | | | | | | |
| | 815 | | 0.000%, 11/01/16 – AMBAC Insured | No Opt. Call | | N/R | | | 815,000 | |
| | 760 | | 0.000%, 11/01/17 – AMBAC Insured | No Opt. Call | | N/R | | | 754,292 | |
| | 815 | | 0.000%, 11/01/19 – AMBAC Insured | No Opt. Call | | N/R | | | 786,222 | |
| | 5,235 | | Lycoming County Authority, Pennsylvania, Revenue Bonds, Pennsylvania College of Technology, Series 2012, 5.000%, 5/01/32 | 5/22 at 100.00 | | A | | | 5,869,325 | |
| | 2,155 | | Montgomery County Higher Education and Health Authority, Pennsylvania, Revenue Bonds, Arcadia University, Series 2010, 5.625%, 4/01/40 | 4/20 at 100.00 | | BBB | | | 2,304,773 | |
| | 835 | | New Wilmington, Pennsylvania, Revenue, Westminster College, Series 2007G, 5.125%, 5/01/33 – RAAI Insured | 5/17 at 100.00 | | AA | | | 848,076 | |
| | 1,465 | | Pennsylvania Higher Educational Facilities Authority, Revenue Bonds, Holy Family University, Series 2013A, 6.500%, 9/01/38 | 9/23 at 100.00 | | BBB– | | | 1,653,926 | |
| | 10,750 | | Pennsylvania Higher Educational Facilities Authority, General Revenue Bonds, State System of Higher Education, Series 2008AH, 5.000%, 6/15/33 | 6/18 at 100.00 | | Aa3 | | | 11,388,872 | |
| | 2,405 | | Pennsylvania Higher Educational Facilities Authority, Revenue Bonds, AICUP Financing Program-Mount Aloysius College Project, Series 2011R-1, 5.000%, 11/01/35 | 11/21 at 100.00 | | A | | | 2,716,904 | |
| NQP | Nuveen Pennsylvania Quality Municipal Income Fund | |
| | Portfolio of Investments (continued) | October 31, 2016 (Unaudited) |
| | Principal | | | Optional Call | | | | | | |
| | Amount (000) | | Description (1) | Provisions (2) | | Ratings (3) | | | Value | |
| | | | Education and Civic Organizations (continued) | | | | | | | |
| | | | Pennsylvania Higher Educational Facilities Authority, Revenue Bonds, Bryn Mawr College, Refunding Series 2014: | | | | | | | |
| $ | 2,545 | | 5.000%, 12/01/38 | 12/24 at 100.00 | | AA | | $ | 2,983,605 | |
| | 2,080 | | 5.000%, 12/01/44 | 12/24 at 100.00 | | AA | | | 2,426,923 | |
| | 1,500 | | Pennsylvania Higher Educational Facilities Authority, Revenue Bonds, Drexel University, Series 2011A, 5.250%, 5/01/41 | 5/21 at 100.00 | | A | | | 1,720,410 | |
| | 1,000 | | Pennsylvania Higher Educational Facilities Authority, Revenue Bonds, Gwynedd Mercy College, Series 2012-KK1, 5.375%, 5/01/42 | 5/22 at 100.00 | | BBB | | | 1,096,920 | |
| | 320 | | Pennsylvania Higher Educational Facilities Authority, Revenue Bonds, LaSalle University, Series 2012, 4.000%, 5/01/32 | 11/22 at 100.00 | | BBB | | | 330,694 | |
| | 1,195 | | Pennsylvania Higher Educational Facilities Authority, Revenue Bonds, Philadelphia University, Refunding Series 2013, 5.000%, 6/01/32 | 6/23 at 100.00 | | BBB | | | 1,330,752 | |
| | 2,000 | | Pennsylvania Higher Educational Facilities Authority, Revenue Bonds, Temple University, First Series of 2012, 5.000%, 4/01/42 | 4/22 at 100.00 | | Aa3 | | | 2,259,360 | |
| | 7,125 | | Pennsylvania Higher Educational Facilities Authority, Revenue Bonds, Thomas Jefferson University, Refunding Series 2015A, 5.250%, 9/01/50 | 3/25 at 100.00 | | A+ | | | 8,242,129 | |
| | 2,000 | | Pennsylvania Higher Educational Facilities Authority, Revenue Bonds, Thomas Jefferson University, Series 2010, 5.000%, 3/01/40 | 3/20 at 100.00 | | A+ | | | 2,184,620 | |
| | 760 | | Pennsylvania Higher Educational Facilities Authority, Revenue Bonds, Thomas Jefferson University, Series 2012, 5.000%, 3/01/42 | 9/22 at 100.00 | | A+ | | | 858,982 | |
| | | | Pennsylvania Higher Educational Facilities Authority, Revenue Bonds, University of the Sciences in Philadelphia, Series 2012: | | | | | | | |
| | 1,030 | | 4.000%, 11/01/39 | 11/22 at 100.00 | | A3 | | | 1,078,101 | |
| | 4,300 | | 5.000%, 11/01/42 | 11/22 at 100.00 | | A3 | | | 4,874,996 | |
| | 1,310 | | Pennsylvania Higher Educational Facilities Authority, Revenue Bonds, University of the Sciences in Philadelphia, Series 2015A, 5.000%, 11/01/36 | 11/25 at 100.00 | | A3 | | | 1,499,740 | |
| | 1,540 | | Pennsylvania Higher Educational Facilities Authority, Revenue Bonds, Widener University, Series 2013A, 5.500%, 7/15/38 | No Opt. Call | | A– | | | 1,752,150 | |
| | 3,005 | | Pennsylvania State University, Revenue Bonds, Series 2010, 5.000%, 3/01/35 | 3/20 at 100.00 | | Aa1 | | | 3,357,306 | |
| | 554 | | Philadelphia Authority for Industrial Development, Pennsylvania, Revenue Bonds, Leadership Learning Partners, Series 2005A, 5.375%, 7/01/36 (4) | 1/17 at 100.00 | | N/R | | | 6 | |
| | 4,500 | | Philadelphia Authority for Industrial Development, Pennsylvania, Revenue Bonds, Philadelphia Performing Arts Charter School, Series 2013, 6.750%, 6/15/43 | 6/20 at 100.00 | | BB– | | | 4,774,860 | |
| | 500 | | Philadelphia Authority for Industrial Development, Pennsylvania, Revenue Bonds, Richard Allen Preparatory Charter School, Series 2006, 6.250%, 5/01/33 | 1/17 at 100.00 | | N/R | | | 500,345 | |
| | 2,320 | | Scranton-Lackawanna Health and Welfare Authority, Pennsylvania, Revenue Bonds, University of Scranton, Series 2016, 5.000%, 11/01/37 | 5/26 at 100.00 | | A– | | | 2,649,556 | |
| | 5,250 | | Scranton-Lackawanna Health and Welfare Authority, Pennsylvania, University Revenue Bonds, Marywood University, Series 2016, 5.000%, 6/01/46 | 6/26 at 100.00 | | N/R | | | 5,553,765 | |
| | 5,000 | | State Public School Building Authority, Pennsylvania, College Revenue Bonds, Northampton County Area Community College, Series 2011, 5.500%, 3/01/31 | 3/21 at 100.00 | | A1 | | | 5,766,300 | |
| | 215 | | State Public School Building Authority, Pennsylvania, College Revenue Bonds, Westmoreland County Community College, Series 2016A, 3.000%, 10/15/35 – AGM Insured | 10/25 at 100.00 | | AA | | | 207,565 | |
| | 1,100 | | Wilkes-Barre Finance Authority, Pennsylvania, Revenue Bonds, University of Scranton, Series 2010, 5.000%, 11/01/40 | 11/20 at 100.00 | | A– | | | 1,229,316 | |
| | | | Wilkes-Barre Finance Authority, Pennsylvania, Revenue Bonds, University of Scranton, Series 2015A: | | | | | | | |
| | 1,890 | | 5.000%, 11/01/32 | 11/25 at 100.00 | | A– | | | 2,192,684 | |
| | 740 | | 5.000%, 11/01/33 | 11/25 at 100.00 | | A– | | | 854,715 | |
| | 740 | | 4.000%, 11/01/35 | 11/25 at 100.00 | | A– | | | 785,384 | |
| | 98,609 | | Total Education and Civic Organizations | | | | | | 107,745,256 | |
| | Principal | | | Optional Call | | | | | | |
| | Amount (000) | | Description (1) | Provisions (2) | | Ratings (3) | | | Value | |
| | | | Health Care – 30.1% (19.2% of Total Investments) | | | | | | | |
| | | | Allegheny County Hospital Development Authority, Pennsylvania, Revenue Bonds, Ohio Valley General Hospital, Series 2005A: | | | | | | | |
| $ | 2,170 | | 5.000%, 4/01/25 | 1/17 at 100.00 | | B2 | | $ | 2,115,099 | |
| | 4,160 | | 5.125%, 4/01/35 | 1/17 at 100.00 | | B2 | | | 4,037,738 | |
| | | | Beaver County Hospital Authority, Pennsylvania, Revenue Bonds, Heritage Valley Health System, Inc., Series 2012: | | | | | | | |
| | 4,010 | | 5.000%, 5/15/26 | 5/21 at 100.00 | | A+ | | | 4,550,067 | |
| | 1,910 | | 5.000%, 5/15/27 | 5/21 at 100.00 | | A+ | | | 2,154,442 | |
| | 2,000 | | 5.000%, 5/15/28 | 5/21 at 100.00 | | A+ | | | 2,247,340 | |
| | 3,300 | | Berks County Municipal Authority, Pennsylvania, Revenue Bonds, Reading Hospital and Medical Center Project, Series 2012A, 4.500%, 11/01/41 | 5/22 at 100.00 | | AA– | | | 3,497,703 | |
| | 4,000 | | Central Bradford Progress Authority, Pennsylvania, Revenue Bonds, Guthrie Health, Refunding Series 2011, 5.375%, 12/01/41 | 12/21 at 100.00 | | AA– | | | 4,539,560 | |
| | | | Centre County Hospital Authority, Pennsylvania, Hospital Revenue Bonds, Mount Nittany Medical Center Project, Series 2016A: | | | | | | | |
| | 705 | | 5.000%, 11/15/41 | 11/25 at 100.00 | | A | | | 815,593 | |
| | 1,485 | | 5.000%, 11/15/46 | 11/25 at 100.00 | | A | | | 1,707,809 | |
| | 1,595 | | Chester County Health and Educational Facilities Authority, Pennsylvania, Health System Revenue Bonds, Jefferson Health System, Series 2010A, 5.000%, 5/15/40 | 5/20 at 100.00 | | AA | | | 1,751,374 | |
| | | | Dauphin County General Authority, Pennsylvania, Health System Revenue Bonds, Pinnacle Health System Project, Refunding Series 2016A: | | | | | | | |
| | 1,275 | | 5.000%, 6/01/34 | 6/26 at 100.00 | | A+ | | | 1,506,374 | |
| | 360 | | 5.000%, 6/01/35 | 6/26 at 100.00 | | A+ | | | 422,687 | |
| | 3,400 | | Dauphin County General Authority, Pennsylvania, Health System Revenue Bonds, Pinnacle Health System Project, Series 2012A, 5.000%, 6/01/42 | 6/22 at 100.00 | | A+ | | | 3,792,428 | |
| | 1,500 | | Doylestown Hospital Authority, Pennsylvania, Hospital Revenue Bonds, Series 2013A, 5.000%, 7/01/28 | 7/23 at 100.00 | | BBB | | | 1,669,935 | |
| | 2,275 | | Doylestown Hospital Authority, Pennsylvania, Hospital Revenue Bonds, Series 2016A, 5.000%, 7/01/41 | 7/26 at 100.00 | | BBB | | | 2,526,092 | |
| | 3,000 | | Erie County Hospital Authority, Pennsylvania, Hospital Revenue Bonds, Saint Vincent Health Center Project, Series 2010A, 7.000%, 7/01/27 | 7/20 at 100.00 | | Ba2 | | | 3,155,700 | |
| | 850 | | Erie County Hospital Authority, Pennsylvania, Revenue Bonds, Hamot Health Foundation, Series 2007, 5.000%, 11/01/37 – CIFG Insured | 11/17 at 100.00 | | AA | | | 875,211 | |
| | 6,840 | | Franklin County Industrial Development Authority, Pennsylvania, Revenue Bonds, Chambersburg Hospital Project, Series 2010, 5.375%, 7/01/42 | 7/20 at 100.00 | | A+ | | | 7,650,745 | |
| | 4,555 | | Geisinger Authority, Montour County, Pennsylvania, Health System Revenue Bonds, Geisinger Health System, Series 2014A, 5.000%, 6/01/41 | 6/24 at 100.00 | | AA | | | 5,191,880 | |
| | 1,370 | | Indiana County Hospital Authority, Pennsylvania, Hospital Revenue Bonds, Indiana Regional Medical Center, Series 2014A, 6.000%, 6/01/39 | 6/23 at 100.00 | | Ba1 | | | 1,550,689 | |
| | 4,200 | | Lancaster County Hospital Authority, Revenue Bonds, University of Pennsylvania Health System, Refunding Series 2016B, 5.000%, 8/15/46 | 8/26 at 100.00 | | AA– | | | 4,892,286 | |
| | 3,000 | | Lancaster County Hospital Authority, Revenue Bonds, University of Pennsylvania Health System, Series 2016A, 5.000%, 8/15/42 | 8/26 at 100.00 | | AA– | | | 3,502,800 | |
| | 3,450 | | Lehigh County General Purpose Authority, Pennsylvania, Hospital Revenue Bonds, Lehigh Valley Health Network, Refunding Series 2016A, 4.000%, 7/01/35 | 7/26 at 100.00 | | A+ | | | 3,670,421 | |
| | 2,565 | | Lehigh County General Purpose Authority, Pennsylvania, Hospital Revenue Bonds, Lehigh Valley Health Network, Series 2012B, 4.000%, 7/01/43 | No Opt. Call | | A+ | | | 2,649,645 | |
| | | | Lehigh County General Purpose Authority, Pennsylvania, Revenue Bonds, Good Shepherd Group, Refunding Series 2016: | | | | | | | |
| | 1,265 | | 3.000%, 11/01/36 | 5/26 at 100.00 | | A | | | 1,148,165 | |
| | 2,900 | | 4.000%, 11/01/41 | 5/26 at 100.00 | | A | | | 2,965,656 | |
| | 5,240 | | 4.000%, 11/01/46 | 5/26 at 100.00 | | A | | | 5,350,197 | |
| NQP | Nuveen Pennsylvania Quality Municipal Income Fund | |
| | Portfolio of Investments (continued) | October 31, 2016 (Unaudited) |
| | Principal | | | Optional Call | | | | | | |
| | Amount (000) | | Description (1) | Provisions (2) | | Ratings (3) | | | Value | |
| | | | Health Care (continued) | | | | | | | |
| $ | 4,600 | | Lehigh County General Purpose Authority, Pennsylvania, Revenue Bonds, Good Shepherd Group, Series 2012, 4.000%, 11/01/32 | No Opt. Call | | A | | $ | 4,846,974 | |
| | | | Lycoming County Authority, Pennsylvania, Health System Revenue Bonds, Susquehanna Health System Project, Series 2009A: | | | | | | | |
| | 6,000 | | 5.500%, 7/01/28 | 7/19 at 100.00 | | AA– | | | 6,645,780 | |
| | 2,840 | | 5.750%, 7/01/39 | 7/19 at 100.00 | | AA– | | | 3,155,467 | |
| | | | Monroe County Hospital Authority, Pennsylvania, Hospital Revenue Bonds, Pocono Medical Center, Series 2012A: | | | | | | | |
| | 365 | | 4.000%, 1/01/25 | 1/22 at 100.00 | | A– | | | 393,302 | |
| | 3,000 | | 5.000%, 1/01/41 | 1/22 at 100.00 | | A– | | | 3,255,900 | |
| | | | Monroe County Hospital Authority, Pennsylvania, Hospital Revenue Bonds, Pocono Medical Center, Series 2016: | | | | | | | |
| | 1,135 | | 3.375%, 7/01/32 (WI/DD, Settling 12/01/16) | 7/26 at 100.00 | | A– | | | 1,116,034 | |
| | 2,650 | | 5.000%, 7/01/41 (WI/DD, Settling 12/01/16) | 7/26 at 100.00 | | A– | | | 2,981,542 | |
| | 3,730 | | Montgomery County Higher Education and Health Authority, Pennsylvania, Hospital Revenue Bonds, Abington Memorial Hospital Obligated Group, Series 2012A, 5.000%, 6/01/31 | 6/22 at 100.00 | | A+ | | | 4,207,888 | |
| | 925 | | Montgomery County Industrial Development Authority, Pennsylvania, Health Facilities Revenue Bonds, Jefferson Health System, Series 2012A, 5.000%, 10/01/41 | 4/22 at 100.00 | | AA | | | 1,025,122 | |
| | 7,500 | | Montgomery County Industrial Development Authority, Pennsylvania, Health System Revenue Bonds, Albert Einstein Healthcare Network Issue, Series 2015A, 5.250%, 1/15/45 | 1/25 at 100.00 | | Baa2 | | | 8,307,450 | |
| | 4,000 | | Pennsylvania Economic Development Financing Authority, Revenue Bonds, University of Pittsburgh Medical Center, Series 2013A, 5.000%, 7/01/43 | 7/23 at 100.00 | | Aa3 | | | 4,492,840 | |
| | 16,385 | | Pennsylvania Higher Educational Facilities Authority, Revenue Bonds, University of Pennsylvania Health System, Refunding Series 2016C, 4.000%, 8/15/41 (UB) (5) | 8/26 at 100.00 | | AA– | | | 17,365,316 | |
| | 3,100 | | Pennsylvania Higher Educational Facilities Authority, Revenue Bonds, University of Pennsylvania Health System, Series 2012A, 5.000%, 8/15/42 | 8/22 at 100.00 | | AA– | | | 3,462,018 | |
| | 2,440 | | Philadelphia Hospitals and Higher Education Facilities Authority, Pennsylvania, Hospital Revenue Bonds, Children's Hospital of Philadelphia, Tender Option Bond Trust 2015-XF0114, 12.250%, 7/01/41 (IF) | 7/21 at 100.00 | | AA | | | 3,332,576 | |
| | 4,650 | | Philadelphia Hospitals and Higher Education Facilities Authority, Pennsylvania, Hospital Revenue Bonds, Temple University Health System Obligated Group, Series 2012A, 5.625%, 7/01/42 | 7/22 at 100.00 | | BBB– | | | 5,148,899 | |
| | | | Pocono Mountains Industrial Park Authority, Pennsylvania, Hospital Revenue Bonds, Saint Luke's Hospital -Monroe Project, Series 2015A: | | | | | | | |
| | 3,000 | | 5.000%, 8/15/40 | 2/25 at 100.00 | | A– | | | 3,370,530 | |
| | 1,590 | | 4.000%, 8/15/45 | 2/25 at 100.00 | | A– | | | 1,647,288 | |
| | 600 | | Saint Mary Hospital Authority, Pennsylvania, Health System Revenue Bonds, Catholic Health East, Series 2010A, 5.000%, 11/15/40 | 11/20 at 100.00 | | AA | | | 661,650 | |
| | 3,000 | | Southcentral Pennsylvania General Authority, Revenue Bonds, Wellspan Health Obligated Group, Refunding Series 2014A, 5.000%, 6/01/44 | 6/24 at 100.00 | | Aa3 | | | 3,402,000 | |
| | | | Union County Hospital Authority, Pennsylvania, Hospital Revenue Bonds, Evangelical Community Hospital Project, Refunding and Improvement Series 2011: | | | | | | | |
| | 3,130 | | 6.875%, 8/01/31 | 8/21 at 100.00 | | A– | | | 3,701,820 | |
| | 2,500 | | 7.000%, 8/01/41 | 8/21 at 100.00 | | A– | | | 2,941,300 | |
| | 3,470 | | Washington County Hospital Authority, Pennsylvania, Hospital Revenue Bonds, The Washington Hospital Project, Series 2013A, 5.000%, 7/01/28 | 7/23 at 100.00 | | A– | | | 3,925,576 | |
| | | | West Shore Area Authority, Cumberland County, Pennsylvania, Hospital Revenue Bonds, Holy Spirit Hospital of the Sisters of Christian Charity Project, Series 2011: | | | | | | | |
| | 325 | | 6.250%, 1/01/31 | 1/21 at 100.00 | | AA | | | 380,656 | |
| | 4,555 | | 6.500%, 1/01/36 | 1/21 at 100.00 | | AA | | | 5,352,397 | |
| | Principal | | | Optional Call | | | | | | |
| | Amount (000) | | Description (1) | Provisions (2) | | Ratings (3) | | | Value | |
| | | | Health Care (continued) | | | | | | | |
| | | | West Shore Area Authority, Cumberland County, Pennsylvania, Hospital Revenue Bonds, Holy Spirit Hospital of the Sisters of Christian Charity, Series 2011B: | | | | | | | |
| $ | 1,635 | | 5.625%, 1/01/32 | 1/22 at 100.00 | | AA | | $ | 1,912,247 | |
| | 1,970 | | 5.750%, 1/01/41 | 1/22 at 100.00 | | AA | | | 2,295,070 | |
| | 575 | | Westmoreland County Industrial Development Authority, Pennsylvania, Health System Revenue Bonds, Excela Health Project, Series 2010A, 5.125%, 7/01/30 | 7/20 at 100.00 | | A3 | | | 627,653 | |
| | 163,050 | | Total Health Care | | | | | | 179,892,931 | |
| | | | Housing/Multifamily – 1.4% (0.9% of Total Investments) | | | | | | | |
| | 160 | | Chester County Industrial Development Authority, Pennsylvania, Student Housing Revenue Bonds, University Student Housing, LLC Project at West Chester University Series 2013A, 5.000%, 8/01/45 | 8/23 at 100.00 | | Baa3 | | | 172,312 | |
| | 1,235 | | East Hempfield Township Industrial Development Authority, Pennsylvania, Student Services Inc.– Student Housing Project at Millersville University, Series 2014, 5.000%, 7/01/46 | No Opt. Call | | BBB– | | | 1,337,579 | |
| | 1,900 | | East Hempfield Township Industrial Development Authority, Pennsylvania, Student Services Inc.– Student Housing Project at Millersville University, Series 2015, 5.000%, 7/01/47 | 7/25 at 100.00 | | BBB– | | | 2,067,504 | |
| | | | Pennsylvania Higher Educational Facilities Authority, Revenue Bonds, Foundation for Student Housing at Indiana University, Project Series 2012A: | | | | | | | |
| | 1,000 | | 5.000%, 7/01/27 | 7/22 at 100.00 | | BBB+ | | | 1,139,810 | |
| | 750 | | 5.000%, 7/01/32 | 7/22 at 100.00 | | BBB+ | | | 839,633 | |
| | 420 | | Pennsylvania Higher Educational Facilities Authority, Revenue Bonds, Shippensburg University Student Services, Inc. Student Housing Project at Shippensburg University of Pennsylvania, Series 2012, 5.000%, 10/01/44 | No Opt. Call | | BBB– | | | 451,122 | |
| | 270 | | Pennsylvania Higher Educational Facilities Authority, Revenue Bonds, University Properties Inc. Student Housing Project at East Stroudsburg University of Pennsylvania, Series 2016A, 5.000%, 7/01/31 | 7/26 at 100.00 | | Baa3 | | | 304,876 | |
| | 1,760 | | Philadelphia Authority for Industrial Development, Pennsylvania, Multifamily Housing Revenue Bonds, Presbyterian Homes Germantown – Morrisville Project, Series 2005A, 5.625%, 7/01/35 | 5/17 at 100.00 | | Baa3 | | | 1,780,029 | |
| | 7,495 | | Total Housing/Multifamily | | | | | | 8,092,865 | |
| | | | Housing/Single Family – 11.3% (7.2% of Total Investments) | | | | | | | |
| | | | Pennsylvania Housing Finance Agency, Single Family Mortgage Revenue Bonds, Series 2007-97A: | | | | | | | |
| | 1,355 | | 4.600%, 10/01/27 (Alternative Minimum Tax) | 1/17 at 100.00 | | AA+ | | | 1,357,263 | |
| | 2,455 | | 4.600%, 10/01/27 (Alternative Minimum Tax) (UB) | 1/17 at 100.00 | | AA+ | | | 2,459,100 | |
| | | | Pennsylvania Housing Finance Agency, Single Family Mortgage Revenue Bonds, Series 2012-114: | | | | | | | |
| | 4,595 | | 3.300%, 10/01/32 | No Opt. Call | | AA+ | | | 4,687,038 | |
| | 2,265 | | 3.650%, 10/01/37 | No Opt. Call | | AA+ | | | 2,314,083 | |
| | 2,190 | | 3.700%, 10/01/42 | No Opt. Call | | AA+ | | | 2,277,885 | |
| | | | Pennsylvania Housing Finance Agency, Single Family Mortgage Revenue Bonds, Series 2015-116B: | | | | | | | |
| | 2,330 | | 3.950%, 10/01/40 | 10/24 at 100.00 | | AA+ | | | 2,387,295 | |
| | 3,315 | | 4.000%, 4/01/45 | 10/24 at 100.00 | | AA+ | | | 3,398,671 | |
| | | | Pennsylvania Housing Finance Agency, Single Family Mortgage Revenue Bonds, Series 2015-117B: | | | | | | | |
| | 3,290 | | 3.900%, 10/01/35 | 10/24 at 100.00 | | AA+ | | | 3,412,520 | |
| | 2,465 | | 4.050%, 10/01/40 | 10/24 at 100.00 | | AA+ | | | 2,552,803 | |
| | 4,320 | | 4.150%, 10/01/45 | 10/24 at 100.00 | | AA+ | | | 4,473,274 | |
| | 7,185 | | Pennsylvania Housing Finance Agency, Single Family Mortgage Revenue Bonds, Series 2015-118B, 4.100%, 10/01/45 | 4/25 at 100.00 | | AA+ | | | 7,480,806 | |
| | 2,045 | | Pennsylvania Housing Finance Agency, Single Family Mortgage Revenue Bonds, Series 2016-119, 3.500%, 10/01/36 | 4/25 at 100.00 | | AA+ | | | 2,071,790 | |
| | 7,000 | | Pennsylvania Housing Finance Agency, Single Family Mortgage Revenue Bonds, Series 2016-120, 3.200%, 4/01/40 | 10/25 at 100.00 | | AA+ | | | 6,920,130 | |
| | 20,000 | | Pennsylvania Housing Finance Agency, Single Family Mortgage Revenue Bonds, Series 2016-121, 3.200%, 10/01/41 (UB) | 10/25 at 100.00 | | AA+ | | | 19,628,400 | |
| NQP | Nuveen Pennsylvania Quality Municipal Income Fund | |
| | Portfolio of Investments (continued) | October 31, 2016 (Unaudited) |
| | Principal | | | Optional Call | | | | | | |
| | Amount (000) | | Description (1) | Provisions (2) | | Ratings (3) | | | Value | |
| | | | Housing/Single Family (continued) | | | | | | | |
| $ | 1,050 | | Pennsylvania Housing Finance Agency, Single Family Mortgage Revenue Bonds, Tender Option Bond Trust 2015-XF0066, 12.613%, 10/01/33 (Alternative Minimum Tax) (IF) | 10/22 at 100.00 | | AA+ | | $ | 1,316,396 | |
| | 600 | | Pennsylvania Housing Finance Agency, Single Family Mortgage Revenue Bonds, Tender Option Bonds Trust 2015-XF0109, 9.413%, 10/01/38 (IF) (5) | 10/22 at 100.00 | | AA+ | | | 670,128 | |
| | 66,460 | | Total Housing/Single Family | | | | | | 67,407,582 | |
| | | | Industrials – 1.1% (0.7% of Total Investments) | | | | | | | |
| | 750 | | Allegheny County Industrial Development Authority, Pennsylvania, Revenue Bonds, United States Steel Corporation, Series 2005, 5.500%, 11/01/16 | No Opt. Call | | B | | | 750,000 | |
| | | | Pennsylvania Economic Development Financing Authority, Exempt Facilities Revenue Refunding Bonds, Amtrak Project, Series 2012A: | | | | | | | |
| | 2,495 | | 5.000%, 11/01/23 (Alternative Minimum Tax) | 11/22 at 100.00 | | A1 | | | 2,868,252 | |
| | 545 | | 5.000%, 11/01/27 (Alternative Minimum Tax) | 11/22 at 100.00 | | A1 | | | 612,128 | |
| | 2,000 | | 5.000%, 11/01/41 (Alternative Minimum Tax) | 11/22 at 100.00 | | A1 | | | 2,178,020 | |
| | 5,790 | | Total Industrials | | | | | | 6,408,400 | |
| | | | Long-Term Care – 5.1% (3.3% of Total Investments) | | | | | | | |
| | | | Bucks County Industrial Development Authority, Pennsylvania, Revenue Bonds, Lutheran Community at Telford Center, Series 2007: | | | | | | | |
| | 470 | | 5.750%, 1/01/27 | 1/17 at 100.00 | | N/R | | | 471,311 | |
| | 760 | | 5.750%, 1/01/37 | 1/17 at 100.00 | | N/R | | | 761,626 | |
| | 230 | | Chester County Health and Education Facilities Authority, Pennsylvania, Revenue Bonds, Simpson Senior Services Project, Series 2015A, 5.000%, 12/01/35 | 12/25 at 100.00 | | N/R | | | 237,519 | |
| | 500 | | Cumberland County Municipal Authority Revenue Bonds, Pennsylvania, Diakon Lutheran Social Ministries Project, Series 2009, 6.375%, 1/01/39 | 1/19 at 100.00 | | BBB+ | | | 553,460 | |
| | | | Cumberland County Municipal Authority Revenue Bonds, Pennsylvania, Diakon Lutheran Social Ministries Project, Series 2016: | | | | | | | |
| | 985 | | 5.000%, 1/01/28 | 1/26 at 100.00 | | N/R | | | 1,165,649 | |
| | 1,070 | | 5.000%, 1/01/29 | 1/26 at 100.00 | | N/R | | | 1,254,864 | |
| | 735 | | 5.000%, 1/01/30 | 1/26 at 100.00 | | N/R | | | 855,540 | |
| | 300 | | 3.250%, 1/01/36 | 1/26 at 100.00 | | N/R | | | 291,012 | |
| | 2,015 | | 3.250%, 1/01/39 | 1/26 at 100.00 | | N/R | | | 1,880,035 | |
| | | | Cumberland County Municipal Authority, Pennsylvania, Revenue Bonds, Diakon Lutheran Social Ministries Project, Series 2015: | | | | | | | |
| | 4,380 | | 4.000%, 1/01/33 | 1/25 at 100.00 | | BBB+ | | | 4,641,223 | |
| | 5,740 | | 5.000%, 1/01/38 | 1/25 at 100.00 | | BBB+ | | | 6,514,670 | |
| | 2,030 | | Delaware County Authority, Pennsylvania, Revenue Bonds, Elwyn, Inc. Project, Series 2010, 5.000%, 6/01/21 | 6/17 at 100.00 | | BBB | | | 2,067,027 | |
| | 640 | | Lancaster County Hospital Authority, Pennsylvania, Health Center Revenue Bonds, Masonic Villages Project, Series 2015, 5.000%, 11/01/35 | 5/25 at 100.00 | | A | | | 738,266 | |
| | 530 | | Lancaster County Hospital Authority, Pennsylvania, Health Center Revenue Bonds, Saint Anne's Retirement Community, Inc., Series 2012, 5.000%, 4/01/33 | 4/22 at 100.00 | | BB+ | | | 557,412 | |
| | 370 | | Lancaster County Hospital Authority, Pennsylvania, Revenue Bonds, Brethren Village Project, Series 2008A, 6.375%, 7/01/30 | 7/17 at 100.00 | | N/R | | | 376,723 | |
| | 1,250 | | Lancaster County Hospital Authority, Pennsylvania, Revenue Bonds, Landis Homes Retirement Community Project, Refunding Series 2015A, 5.000%, 7/01/45 | 7/25 at 100.00 | | N/R | | | 1,380,700 | |
| | | | Lancaster Industrial Development Authority, Pennsylvania, Revenue Bonds, Garden Spot Village Project, Series 2013: | | | | | | | |
| | 1,000 | | 5.375%, 5/01/28 | 5/23 at 100.00 | | BBB | | | 1,123,730 | |
| | 1,665 | | 5.750%, 5/01/35 | 5/23 at 100.00 | | BBB | | | 1,874,424 | |
| | Principal | | | Optional Call | | | | | | |
| | Amount (000) | | Description (1) | Provisions (2) | | Ratings (3) | | | Value | |
| | | | Long-Term Care (continued) | | | | | | | |
| $ | 1,500 | | Langhorne Manor Boro Higher Education and Health Authority, Pennsylvania, Revenue Bonds, Woods Services Project, Series 2013, 4.000%, 11/15/38 | 11/18 at 100.00 | | A– | | $ | 1,518,600 | |
| | 2,115 | | Montgomery County Industrial Development Authority, Pennsylvania, Revenue Bonds, ACTS Retirement-Life Communities, Inc. Obligated Group, Refunding Series 2012, 5.000%, 11/15/26 | 5/22 at 100.00 | | A– | | | 2,412,158 | |
| | 28,285 | | Total Long-Term Care | | | | | | 30,675,949 | |
| | | | Materials – 1.2% (0.7% of Total Investments) | | | | | | | |
| | 6,455 | | Pennsylvania Economic Development Financing Authority, Exempt Facilities Revenue Bonds, National Gypsum Company, Refunding Series 2014, 5.500%, 11/01/44 (Alternative Minimum Tax) | 11/24 at 100.00 | | N/R | | | 7,116,960 | |
| | | | Tax Obligation/General – 28.6% (18.2% of Total Investments) | | | | | | | |
| | 1,700 | | Allegheny County, Pennsylvania, General Obligation Bonds, Series 2011C-65, 5.375%, 5/01/31 | 5/21 at 100.00 | | AA– | | | 1,970,096 | |
| | | | Allegheny County, Pennsylvania, General Obligation Bonds, Series 2013C-72: | | | | | | | |
| | 2,780 | | 5.250%, 12/01/32 | 12/23 at 100.00 | | AA– | | | 3,313,176 | |
| | 2,000 | | 5.250%, 12/01/33 | 12/23 at 100.00 | | AA– | | | 2,374,960 | |
| | | | Allegheny County, Pennsylvania, General Obligation Bonds, Series 2014C-74: | | | | | | | |
| | 1,750 | | 5.000%, 12/01/32 | 12/24 at 100.00 | | AA– | | | 2,044,665 | |
| | 1,285 | | 5.000%, 12/01/34 | 12/24 at 100.00 | | AA– | | | 1,495,277 | |
| | 5,100 | | Allegheny County, Pennsylvania, General Obligation Bonds, Series C69-C70 of 2012, 5.000%, 12/01/37 | 12/22 at 100.00 | | AA– | | | 5,977,455 | |
| | | | Bethel Park School District, Allegheny County, Pennsylvania, General Obligation Bonds, Refunding Series 2016: | | | | | | | |
| | 1,500 | | 4.000%, 8/01/31 | 8/26 at 100.00 | | Aa2 | | | 1,657,995 | |
| | 1,500 | | 4.000%, 8/01/32 | 8/26 at 100.00 | | Aa2 | | | 1,652,610 | |
| | 1,255 | | 4.000%, 8/01/33 | 8/26 at 100.00 | | Aa2 | | | 1,380,425 | |
| | 1,950 | | Boyertown Area School District, Berks and Montgomery Counties, Pennsylvania, General Obligation Bonds, Series 2015, 5.000%, 10/01/38 | 4/24 at 100.00 | | AA | | | 2,238,288 | |
| | 3,000 | | Bristol Township School District, Bucks County, Pennsylvania, General Obligation Bonds, Series 2013, 5.250%, 6/01/43 | 6/23 at 100.00 | | A2 | | | 3,427,410 | |
| | | | Canon-McMillan School District, Washington County, Pennsylvania, General Obligation Bonds, Series 2014D: | | | | | | | |
| | 3,000 | | 5.000%, 12/15/37 | 12/24 at 100.00 | | AA | | | 3,485,880 | |
| | 1,075 | | 5.000%, 12/15/38 – BAM Insured | 12/24 at 100.00 | | AA | | | 1,247,409 | |
| | 1,100 | | 5.000%, 12/15/39 | 12/24 at 100.00 | | AA | | | 1,275,549 | |
| | | | Centre County, Pennsylvania, General Obligation Bonds, Series 2012B: | | | | | | | |
| | 310 | | 4.000%, 7/01/24 | 7/20 at 100.00 | | AA | | | 335,984 | |
| | 1,430 | | 4.000%, 7/01/25 | 7/20 at 100.00 | | AA | | | 1,541,654 | |
| | 915 | | 4.000%, 7/01/26 | 7/20 at 100.00 | | AA | | | 982,902 | |
| | 650 | | Cranberry Township, Pennsylvania, General Obligation Bonds, Refunding Series 2015, 3.250%, 10/01/32 | 10/25 at 100.00 | | Aa1 | | | 675,012 | |
| | 10,000 | | Delaware Valley Regional Finance Authority, Pennsylvania, Local Government Revenue Bonds, Series 2002, 5.750%, 7/01/17 (UB) (5) | No Opt. Call | | A+ | | | 10,319,500 | |
| | 7,450 | | Erie City School District, Erie County, Pennsylvania, General Obligation Bonds, Series 2000, 0.000%, 9/01/30 – AMBAC Insured | No Opt. Call | | N/R | | | 4,377,099 | |
| | 6,680 | | Gateway School District, Allegheny County, Pennsylvania, General Obligation Bonds, Refunding Series 2012, 4.000%, 10/15/32 | 10/22 at 100.00 | | Aa3 | | | 7,124,420 | |
| | 6,225 | | Lehighton Area School District, Carbon County, Pennsylvania, General Obligation Bonds, Limited Tax Series 2015A, 5.000%, 11/15/43 – BAM Insured | 11/23 at 100.00 | | AA | | | 7,081,560 | |
| | 1,260 | | Luzerne County, Pennsylvania, General Obligation Bonds, Series 2003C, 5.250%, 12/15/16 – FGIC Insured | No Opt. Call | | AA– | | | 1,265,557 | |
| | 2,000 | | Luzerne County, Pennsylvania, General Obligation Bonds, Series 2008B, 5.000%, 12/15/27 – AGM Insured | 6/18 at 100.00 | | AA | | | 2,103,860 | |
| NQP | Nuveen Pennsylvania Quality Municipal Income Fund | |
| | Portfolio of Investments (continued) | October 31, 2016 (Unaudited) |
| | Principal | | | Optional Call | | | | | | |
| | Amount (000) | | Description (1) | Provisions (2) | | Ratings (3) | | | Value | |
| | | | Tax Obligation/General (continued) | | | | | | | |
| | | | North Allegheny School District, Allegheny County, Pennsylvania, General Obligation Bonds, Series 2015: | | | | | | | |
| $ | 5,000 | | 5.000%, 5/01/31 | 5/25 at 100.00 | | AA | | $ | 5,922,450 | |
| | 4,000 | | 5.000%, 5/01/32 | 5/25 at 100.00 | | AA | | | 4,717,880 | |
| | 2,875 | | 5.000%, 5/01/33 | 5/25 at 100.00 | | AA | | | 3,379,016 | |
| | | | Pennsbury School District, Bucks County, Pennsylvania, General Obligation Bonds, Series 2016A: | | | | | | | |
| | 2,375 | | 5.000%, 10/01/31 | 4/25 at 100.00 | | Aa2 | | | 2,815,183 | |
| | 3,115 | | 5.000%, 10/01/32 | 4/25 at 100.00 | | Aa2 | | | 3,674,236 | |
| | 1,000 | | 5.000%, 10/01/33 | 4/25 at 100.00 | | Aa2 | | | 1,174,570 | |
| | 2,660 | | 5.000%, 10/01/34 | 4/25 at 100.00 | | Aa2 | | | 3,113,450 | |
| | 2,045 | | 5.000%, 10/01/35 | 4/25 at 100.00 | | Aa2 | | | 2,386,904 | |
| | 1,410 | | 5.000%, 10/01/36 | 4/25 at 100.00 | | Aa2 | | | 1,642,283 | |
| | 2,620 | | Pennsylvania Economic Development Financing Authority, Parking System Revenue Bonds, Capitol Region Parking System, Junior Insured Series 2013C, 5.500%, 1/01/30 – AGM Insured | 1/24 at 100.00 | | AA | | | 3,151,755 | |
| | 3,925 | | Philadelphia School District, Pennsylvania, General Obligation Bonds, Series 2007A, 5.000%,6/01/34 – FGIC Insured | No Opt. Call | | AA– | | | 4,578,786 | |
| | 3,345 | | Philadelphia, Pennsylvania, General Obligation Bonds, Refunding Series 2011, 6.500%, 8/01/41 | 8/20 at 100.00 | | A+ | | | 3,938,604 | |
| | 745 | | Pittsburgh School District, Allegheny County, Pennsylvania, General Obligation Bonds, Series 2014A, 5.000%, 9/01/25 – BAM Insured | 9/22 at 100.00 | | AA | | | 878,541 | |
| | | | Pittsburgh, Pennsylvania, General Obligation Bonds, Series 2012B: | | | | | | | |
| | 2,590 | | 5.000%, 9/01/25 | 9/22 at 100.00 | | A+ | | | 3,054,258 | |
| | 6,790 | | 5.000%, 9/01/26 | 9/22 at 100.00 | | A+ | | | 7,964,602 | |
| | | | Pocono Mountain School District, Monroe County, Pennsylvania, General Obligation Bonds, Refunding Series 2016: | | | | | | | |
| | 1,010 | | 3.125%, 9/01/32 – AGM Insured | 9/25 at 100.00 | | AA | | | 1,034,311 | |
| | 2,035 | | 3.300%, 9/01/34 – AGM Insured | 9/25 at 100.00 | | AA | | | 2,079,465 | |
| | 2,485 | | Radnor Township School District, Delaware County, Pennsylvania, General Obligation Bonds, Series 2012, 3.000%, 2/15/34 | 2/18 at 100.00 | | Aa1 | | | 2,505,029 | |
| | 1,000 | | Radnor Township, Pennsylvania, General Obligation Bonds, Series 2012, 4.000%, 11/01/37 | 11/22 at 100.00 | | Aa1 | | | 1,064,720 | |
| | 11,440 | | Reading School District, Berks County, Pennsylvania, General Obligation Bonds, Series 2003B, 0.000%, 1/15/32 – FGIC Insured | No Opt. Call | | AA– | | | 6,908,158 | |
| | 1,005 | | Scranton, Lackawanna County, Pennsylvania, General Obligation Bonds, Series 2012A, 8.500%, 9/01/22 | No Opt. Call | | N/R | | | 1,112,284 | |
| | 1,000 | | Scranton, Lackawanna County, Pennsylvania, General Obligation Bonds, Series 2012C, 7.250%, 9/01/22 | No Opt. Call | | N/R | | | 1,046,000 | |
| | | | Scranton, Lackawanna County, Pennsylvania, General Obligation Notes, Series 2016: | | | | | | | |
| | 280 | | 5.000%, 11/15/26 | 5/24 at 100.00 | | BB | | | 301,879 | |
| | 2,925 | | 5.000%, 11/15/32 | 5/24 at 100.00 | | BB | | | 3,129,019 | |
| | 1,150 | | South Park School District, Allegheny County, Pennsylvania, General Obligation Bonds, Series 2014, 3.375%, 8/01/32 – BAM Insured | 2/20 at 100.00 | | AA | | | 1,172,345 | |
| | 1,890 | | State College Area School District, Centre County, Pennsylvania, General Obligation Bonds, Refunding Series 2015B, 5.000%, 5/15/23 | No Opt. Call | | Aa1 | | | 2,284,424 | |
| | 21,000 | | State Public School Building Authority, Pennsylvania, Lease Revenue Bonds, Philadelphia School District, Series 2003, 5.500%, 6/01/28 – AGM Insured (UB) (5) | No Opt. Call | | AA | | | 26,131,770 | |
| | | | The Redevelopment Authority of the City of Scranton, Lackawanna county, Pennsylvania, Guaranteed Lease Revenue Bonds, Series 2016A: | | | | | | | |
| | 285 | | 5.000%, 11/15/21 | No Opt. Call | | BB | | | 300,344 | |
| | 170 | | 5.000%, 11/15/28 | 5/24 at 100.00 | | BB | | | 178,988 | |
| | 158,085 | | Total Tax Obligation/General | | | | | | 170,989,997 | |
| | Principal | | | Optional Call | | | | | | |
| | Amount (000) | | Description (1) | Provisions (2) | | Ratings (3) | | | Value | |
| | | | Tax Obligation/Limited – 9.1% (5.8% of Total Investments) | | | | | | | |
| $ | 1,675 | | Allegheny County Redevelopment Authority, Pennsylvania, TIF Revenue Bonds, Pittsburg Mills Project, Series 2004, 5.600%, 7/01/23 | 1/17 at 100.00 | | N/R | | $ | 1,670,628 | |
| | 1,475 | | Allentown Neighborhood Improvement Zone Development Authority, Pennsylvania, Tax Revenue Bonds, Series 2012A, 5.000%, 5/01/35 | 5/22 at 100.00 | | Baa2 | | | 1,585,964 | |
| | | | Government of Guam, Business Privilege Tax Bonds, Series 2011A: | | | | | | | |
| | 1,670 | | 5.250%, 1/01/36 | 1/22 at 100.00 | | A | | | 1,829,268 | |
| | 655 | | 5.125%, 1/01/42 | 1/22 at 100.00 | | A | | | 710,033 | |
| | 1,746 | | Monroe County Industrial Development Authority, Pennsylvania, Special Obligation Revenue Bonds, Tobyhanna Township Project, Series 2014, 6.875%, 7/01/33 | 7/24 at 100.00 | | N/R | | | 1,845,627 | |
| | | | Pennsylvania Turnpike Commission, Motor License Fund-Enhanced Subordinate Special Revenue Bonds, Series 2010A: | | | | | | | |
| | 1,755 | | 5.500%, 12/01/34 | 12/20 at 100.00 | | A2 | | | 2,007,211 | |
| | 3,915 | | 5.000%, 12/01/38 | 12/19 at 100.00 | | AA– | | | 4,305,991 | |
| | 3,180 | | Pennsylvania Turnpike Commission, Motor License Fund-Enhanced Turnpike Subordinate Special Revenue Bonds, Series 2012A, 5.000%, 12/01/31 | 12/21 at 100.00 | | AA– | | | 3,620,716 | |
| | 7,000 | | Pennsylvania Turnpike Commission, Motor License Fund-Enhanced Turnpike Subordinate Special Revenue Bonds, Series 2013B-1, 5.250%, 12/01/43 | 12/23 at 100.00 | | AA– | | | 8,099,700 | |
| | | | Pennsylvania Turnpike Commission, Motor License Fund-Enhanced Turnpike Subordinate Special Revenue Bonds, Series 2014A: | | | | | | | |
| | 2,650 | | 0.000%, 12/01/37 (6) | No Opt. Call | | AA– | | | 2,354,048 | |
| | 4,000 | | 0.000%, 12/01/44 (6) | No Opt. Call | | AA– | | | 3,542,680 | |
| | 4,000 | | Pennsylvania Turnpike Commission, Motor License Fund-Enhanced Turnpike Subordinate Special Revenue, Series 2011B, 5.000%, 12/01/41 | 12/21 at 100.00 | | AA– | | | 4,460,320 | |
| | 2,200 | | Pennsylvania Turnpike Commission, Registration Fee Revenue Bonds, Series 2005A, 5.250%, 7/15/18 – AGM Insured | No Opt. Call | | AA | | | 2,355,628 | |
| | 5,530 | | Philadelphia Authority For Industrial Development, Pennsylvania, Revenue Bonds, Cultural and Commercial Corridors Program, Refunding Series 2016A, 5.000%, 12/01/30 | 12/25 at 100.00 | | A+ | | | 6,456,220 | |
| | 3,820 | | Pittsburgh and Allegheny County Sports and Exhibition Authority, Pennsylvania, Hotel Room Excise Tax Revenue Bonds, Refunding Series 2012, 5.000%, 2/01/26 – AGC Insured | 8/22 at 100.00 | | AA | | | 4,408,929 | |
| | 4,225 | | Puerto Rico Highway and Transportation Authority, Highway Revenue Bonds, Series 2007N, 5.500%, 7/01/29 – AMBAC Insured | No Opt. Call | | CC | | | 4,565,155 | |
| | 440 | | Washington County Redevelopment Authority, Pennsylvania, Tanger Outlet Victory Center Tax Increment Bonds, Series 2006A, 5.450%, 7/01/35 | 7/17 at 100.00 | | N/R | | | 441,936 | |
| | 49,936 | | Total Tax Obligation/Limited | | | | | | 54,260,054 | |
| | | | Transportation – 8.9% (5.7% of Total Investments) | | | | | | | |
| | 3,280 | | Delaware River Port Authority, New Jersey and Pennsylvania, Revenue Bonds, Series 2010E, 5.000%, 1/01/40 | 1/20 at 100.00 | | A | | | 3,633,682 | |
| | | | Delaware River Port Authority, Pennsylvania and New Jersey, Revenue Refunding Bonds, Port District Project, Series 2012: | | | | | | | |
| | 1,270 | | 5.000%, 1/01/22 | No Opt. Call | | A– | | | 1,431,481 | |
| | 2,425 | | 5.000%, 1/01/23 | No Opt. Call | | A– | | | 2,770,878 | |
| | 2,310 | | 5.000%, 1/01/24 | No Opt. Call | | A– | | | 2,620,972 | |
| | 205 | | 5.000%, 1/01/25 | No Opt. Call | | A– | | | 235,035 | |
| | 3,980 | | Pennsylvania Economic Development Financing Authority, Parking System Revenue Bonds, Capitol Region Parking System, Series 2013A, 5.250%, 1/01/44 – AGM Insured | 1/24 at 100.00 | | AA | | | 4,542,414 | |
| | 12,100 | | Pennsylvania Turnpike Commission, Turnpike Revenue Bonds, Capital Appreciation Series 2009E, 0.000%, 12/01/38 (6) | 12/27 at 100.00 | | A– | | | 14,969,272 | |
| | 820 | | Pennsylvania Turnpike Commission, Turnpike Revenue Bonds, Refunding Subordinate Second Series 2016B-2, 5.000%, 6/01/39 | 6/26 at 100.00 | | A3 | | | 930,101 | |
| | 3,000 | | Pennsylvania Turnpike Commission, Turnpike Revenue Bonds, Series 2014C, 5.000%, 12/01/44 | No Opt. Call | | A1 | | | 3,450,990 | |
| | 9,895 | | Pennsylvania Turnpike Commission, Turnpike Revenue Bonds, Series 2015B, 5.000%, 12/01/45 | 12/25 at 100.00 | | A1 | | | 11,314,240 | |
| NQP | Nuveen Pennsylvania Quality Municipal Income Fund | |
| | Portfolio of Investments (continued) | October 31, 2016 (Unaudited) |
| | Principal | | | Optional Call | | | | | | |
| | Amount (000) | | Description (1) | Provisions (2) | | Ratings (3) | | | Value | |
| | | | Transportation (continued) | | | | | | | |
| $ | 2,475 | | Pennsylvania Turnpike Commission, Turnpike Revenue Bonds, Subordinate Lien, Refunding Series 2010B-1, 5.000%, 12/01/37 | 12/19 at 100.00 | | A– | | $ | 2,720,594 | |
| | 2,000 | | Pennsylvania Turnpike Commission, Turnpike Revenue Bonds, Subordinate Series 2009C, 6.250%, 6/01/33 – AGM Insured | 6/26 at 100.00 | | AA | | | 2,593,980 | |
| | 1,865 | | Philadelphia, Pennsylvania, Airport Revenue Bonds, Series 2010A, 5.250%, 6/15/28 | 6/20 at 100.00 | | A | | | 2,072,090 | |
| | 45,625 | | Total Transportation | | | | | | 53,285,729 | |
| | | | U.S. Guaranteed – 24.0% (15.2% of Total Investments) (7) | | | | | | | |
| | 2,240 | | Allegheny County, Pennsylvania, General Obligation Bonds, Series 2011C-65, 5.375%, 5/01/31 (Pre-refunded 5/01/21) | 5/21 at 100.00 | | N/R (7) | | | 2,655,520 | |
| | 25 | | Allentown Area Hospital Authority, Pennsylvania, Revenue Bonds, Sacred Heart Hospital, Series 2005, 6.000%, 11/15/16 (ETM) | No Opt. Call | | N/R (7) | | | 25,052 | |
| | 6,025 | | Bethel Park School District, Allegheny County, Pennsylvania, General Obligation Bonds, Series 2009, 5.000%, 8/01/29 (Pre-refunded 8/01/19) | 8/19 at 100.00 | | Aa2 (7) | | | 6,682,508 | |
| | 4,100 | | Centre County Hospital Authority, Pennsylvania, Hospital Revenue Bonds, Mount Nittany Medical Center Project, Series 2011, 7.000%, 11/15/46 (Pre-refunded 11/15/21) | 11/21 at 100.00 | | A (7) | | | 5,253,002 | |
| | 4,500 | | Cumberland County Municipal Authority Revenue Bonds, Pennsylvania, Diakon Lutheran Social Ministries Project, Series 2009, 6.375%, 1/01/39 (Pre-refunded 1/01/19) | 1/19 at 100.00 | | N/R (7) | | | 5,017,590 | |
| | 6,505 | | Cumberland County Municipal Authority, Pennsylvania, Revenue Bonds, Diakon Lutheran Social Ministries, Series 2007, 5.000%, 1/01/36 (Pre-refunded 1/01/17) | 1/17 at 100.00 | | N/R (7) | | | 6,550,600 | |
| | | | Erie Higher Education Building Authority, Pennsylvania, Revenue Bonds, Gannon University, Series 2007-GG3: | | | | | | | |
| | 1,855 | | 5.000%, 5/01/32 (Pre-refunded 5/01/17) – RAAI Insured | 5/17 at 100.00 | | AA (7) | | | 1,872,808 | |
| | 500 | | 5.000%, 5/01/35 (Pre-refunded 5/01/17) – RAAI Insured | 5/17 at 100.00 | | AA (7) | | | 504,455 | |
| | | | Harrisburg Redevelopment Authority, Dauphin County, Pennsylvania, Guaranteed Revenue Bonds, Series 1998B: | | | | | | | |
| | 1,750 | | 0.000%, 5/01/22 (Pre-refunded 11/15/16) – AGM Insured | 11/16 at 77.54 | | AA (7) | | | 1,327,323 | |
| | 2,750 | | 0.000%, 11/01/22 (Pre-refunded 11/15/16) – AGM Insured | 11/16 at 75.56 | | AA (7) | | | 2,032,635 | |
| | 2,750 | | 0.000%, 5/01/23 (Pre-refunded 11/15/16) – AGM Insured | 11/16 at 73.59 | | AA (7) | | | 1,975,325 | |
| | 1,875 | | Heidelberg, Lebanon County, Pennsylvania, Guaranteed Sewer Revenue Bonds, Series 2011, 5.125%,12/01/46 (Pre-refunded 12/01/16) | 12/16 at 100.00 | | AA– (7) | | | 1,881,956 | |
| | 3,385 | | Lancaster County Hospital Authority, Pennsylvania, Health System Revenue Bonds, Lancaster General Hospital Project, Tender Option Bond Trust 2015-XF0064, 12.258%, 7/01/42 (Pre-refunded 1/01/22) (IF) | 1/22 at 100.00 | | N/R (7) | | | 5,314,281 | |
| | 3,775 | | Lancaster County Hospital Authority, Pennsylvania, Hospital Revenue Bonds, The Lancaster General Hospital Project, Series 2007A, 5.000%, 3/15/26 (Pre-refunded 3/15/17) | 3/17 at 100.00 | | N/R (7) | | | 3,834,985 | |
| | 7,660 | | Lehigh County General Purpose Authority, Pennsylvania, Hospital Revenue Bonds, Lehigh Valley Health Network, Series 2008A, 5.000%, 7/01/33 (Pre-refunded 7/01/18) – AGM Insured | 7/18 at 100.00 | | AA (7) | | | 8,184,250 | |
| | | | Lehigh County General Purpose Authority, Pennsylvania, Revenue Bonds, Good Shepherd Group, Series 2007: | | | | | | | |
| | 9,850 | | 5.000%, 11/01/30 (Pre-refunded 11/01/17) – AGC Insured | 11/17 at 100.00 | | AA (7) | | | 10,272,466 | |
| | 2,180 | | 5.000%, 11/01/37 (Pre-refunded 11/01/17) – AGC Insured | 11/17 at 100.00 | | AA (7) | | | 2,273,500 | |
| | | | Lower Merion School District, Montgomery County, Pennsylvania, General Obligation Bonds, Series 2007: | | | | | | | |
| | 200 | | 5.000%, 9/01/23 (Pre-refunded 9/01/17) | 9/17 at 100.00 | | N/R (7) | | | 207,180 | |
| | 60 | | 5.000%, 9/01/23 (Pre-refunded 9/01/17) | 9/17 at 100.00 | | Aaa | | | 62,154 | |
| | 1,660 | | Monroe County Hospital Authority, Pennsylvania, Hospital Revenue Bonds, Pocono Medical Center, Series 2007, 5.125%, 1/01/37 (Pre-refunded 1/01/17) | 1/17 at 100.00 | | A– (7) | | | 1,672,218 | |
| | 1,115 | | Montgomery County Industrial Development Authority, Pennsylvania, FHA Insured Mortgage Revenue Bonds, New Regional Medical Center Project, Series 2010, 5.375%, 8/01/38 (Pre-refunded 8/01/20) | 8/20 at 100.00 | | N/R (7) | | | 1,290,958 | |
| | | | Northampton County General Purpose Authority, Pennsylvania, Hospital Revenue Bonds, Saint Lukes Hospital Project, Series 2008A: | | | | | | | |
| | 1,235 | | 5.250%, 8/15/23 (Pre-refunded 8/15/18) | 8/18 at 100.00 | | A– (7) | | | 1,329,650 | |
| | 2,000 | | 5.500%, 8/15/35 (Pre-refunded 8/15/18) | 8/18 at 100.00 | | A– (7) | | | 2,162,120 | |
| | Principal | | | Optional Call | | | | | | |
| | Amount (000) | | Description (1) | Provisions (2) | | Ratings (3) | | | Value | |
| | | | U.S. Guaranteed (7) (continued) | | | | | | | |
| $ | 4,010 | | Pennsylvania Economic Development Financing Authority, Health System Revenue Bonds, Albert Einstein Healthcare, Series 2009A, 6.250%, 10/15/23 (Pre-refunded 10/15/19) | 10/19 at 100.00 | | N/R (7) | | $ | 4,512,333 | |
| | 6,220 | | Pennsylvania Higher Educational Facilities Authority, Revenue Bonds, Drexel University, Series 2007A, 5.000%, 5/01/37 (Pre-refunded 11/01/17) – NPFG Insured | 11/17 at 100.00 | | AA– (7) | | | 6,482,982 | |
| | 1,300 | | Pennsylvania Higher Educational Facilities Authority, Revenue Bonds, Edinboro University Foundation Student Housing Project, Series 2010, 6.000%, 7/01/43 (Pre-refunded 7/01/20) | 7/20 at 100.00 | | N/R (7) | | | 1,522,391 | |
| | 5,000 | | Pennsylvania Higher Educational Facilities Authority, Revenue Bonds, Slippery Rock University Foundation Inc., Series 2007A, 5.000%, 7/01/39 (Pre-refunded 7/01/17) – SYNCORA GTY Insured | 7/17 at 100.00 | | N/R (7) | | | 5,142,200 | |
| | 5,000 | | Pennsylvania Public School Building Authority, Lease Revenue Bonds, School District of Philadelphia, Series 2006B, 5.000%, 6/01/33 (Pre-refunded 12/01/16) – AGM Insured | 12/16 at 100.00 | | AA (7) | | | 5,013,550 | |
| | 5,125 | | Pennsylvania Turnpike Commission, Oil Franchise Tax Revenue Bonds, Senior Lien Series 2003A, 5.000%, 12/01/32 (Pre-refunded 12/01/18) – NPFG Insured | 12/18 at 100.00 | | AA (7) | | | 5,561,958 | |
| | 8,990 | | Pennsylvania, General Obligation Bonds, Refunding First Series 2006, 4.750%, 3/01/27 (Pre-refunded 3/01/17) | 3/17 at 100.00 | | AA– (7) | | | 9,111,994 | |
| | | | Philadelphia Authority for Industrial Development, Pennsylvania, Revenue Bonds, Franklin Towne Charter High School, Series 2006A: | | | | | | | |
| | 1,550 | | 5.250%, 1/01/27 (Pre-refunded 1/01/17) | 1/17 at 100.00 | | Baa1 (7) | | | 1,561,517 | |
| | 1,650 | | 5.375%, 1/01/32 (Pre-refunded 1/01/17) | 1/17 at 100.00 | | Baa1 (7) | | | 1,662,590 | |
| | 12,885 | | Philadelphia Gas Works, Pennsylvania, Revenue Bonds, Seventh Series, 2007, 5.000%, 10/01/37 (Pre-refunded 10/01/17) – AMBAC Insured | 10/17 at 100.00 | | A (7) | | | 13,392,153 | |
| | 385 | | Philadelphia Gas Works, Pennsylvania, Revenue Bonds, Twelfth Series 1990B, 7.000%, 5/15/20 – NPFG Insured (ETM) | No Opt. Call | | AA– (7) | | | 430,696 | |
| | 7,165 | | Philadelphia Hospitals and Higher Education Facilities Authority, Pennsylvania, Health System Revenue Bonds, Jefferson Health System, Series 2010B, 5.000%, 5/15/40 (Pre-refunded 5/15/20) | 5/20 at 100.00 | | N/R (7) | | | 8,129,624 | |
| | 2,125 | | Philadelphia Hospitals and Higher Education Facilities Authority, Pennsylvania, Hospital Revenue Bonds, Presbyterian Medical Center of Philadelphia, Series 1993, 6.650%, 12/01/19 (ETM) | No Opt. Call | | AA+ (7) | | | 2,309,386 | |
| | 1,470 | | Puerto Rico, Highway Revenue Bonds, Highway and Transportation Authority, Series 2003AA, 5.500%, 7/01/19 – NPFG Insured (ETM) | No Opt. Call | | A3 (7) | | | 1,645,474 | |
| | 45 | | Saint Mary Hospital Authority, Pennsylvania, Health System Revenue Bonds, Catholic Health East, Series 2010A, 5.000%, 11/15/40 (Pre-refunded 11/15/20) | 11/20 at 100.00 | | N/R (7) | | | 51,900 | |
| | 2,250 | | Scranton Parking Authority, Pennsylvania, Guaranteed Parking Revenue Bonds, Series 2007, 5.250%, 6/01/39 (Pre-refunded 6/01/17) – RAAI Insured | 6/17 at 100.00 | | AA (7) | | | 2,309,940 | |
| | 1,613 | | South Fork Municipal Authority, Pennsylvania, Hospital Revenue Bonds, Conemaugh Valley Memorial Hospital, Series 2010, 5.500%, 7/01/29 (Pre-refunded 7/01/20) | 7/20 at 100.00 | | N/R (7) | | | 1,866,402 | |
| | 134,778 | | Total U.S. Guaranteed | | | | | | 143,089,626 | |
| | | | Utilities – 7.3% (4.6% of Total Investments) | | | | | | | |
| | 1,200 | | Beaver County Industrial Development Authority, Pennsylvania, Pollution Control Revenue Bonds, FirstEnergy Nuclear Generation Project, Refunding Series 2005A, 4.000%, 1/01/35 (Mandatory put 7/01/21) | No Opt. Call | | CCC+ | | | 1,012,764 | |
| | | | Beaver County Industrial Development Authority, Pennsylvania, Pollution Control Revenue Refunding Bonds, FirstEnergy Nuclear Generation Project, Series 2006A: | | | | | | | |
| | 3,000 | | 4.375%, 1/01/35 (Mandatory put 7/01/22) | No Opt. Call | | B1 | | | 2,943,180 | |
| | 4,160 | | 0.000%, 4/01/41 | No Opt. Call | | B | | | 3,588,166 | |
| | 1,300 | | Beaver County Industrial Development Authority, Pennsylvania, Pollution Control Revenue Refunding Bonds, FirstEnergy Nuclear Generation Project, Series 2006B, 3.500%, 12/01/35 (Mandatory put 6/01/20) | No Opt. Call | | CCC+ | | | 1,118,169 | |
| | 7,500 | | Beaver County Industrial Development Authority, Pennsylvania, Pollution Control Revenue Refunding Bonds, FirstEnergy Nuclear Generation Project, Series 2008A, 2.700%, 4/01/35 (Mandatory put 4/02/18) | No Opt. Call | | BB+ | | | 7,095,975 | |
| | 7,250 | | Delaware County Industrial Development Authority, Pennsylvania, Revenue Bonds, Covanta Project, Refunding Series 2015A, 5.000%, 7/01/43 | 7/20 at 100.00 | | Ba2 | | | 7,439,804 | |
| NQP | Nuveen Pennsylvania Quality Municipal Income Fund | |
| | Portfolio of Investments (continued) | October 31, 2016 (Unaudited) |
| | Principal | | | Optional Call | | | | | | |
| | Amount (000) | | Description (1) | Provisions (2) | | Ratings (3) | | | Value | |
| | | | Utilities (continued) | | | | | | | |
| $ | 4,015 | | Luzerne County Industrial Development Authority, Pennsylvania, Water Facility Revenue Refunding Bonds, Pennsylvania-American Water Company, Series 2009, 5.500%, 12/01/39 | 12/19 at 100.00 | | A+ | | $ | 4,465,684 | |
| | 2,220 | | Pennsylvania Economic Development Financing Authority, Exempt Facilities Revenue Refunding Bonds, PPL Energy Supply, LLC Project, Series 2009A, 6.400%, 12/01/38 | 9/25 at 100.00 | | B+ | | | 2,339,525 | |
| | 4,575 | | Pennsylvania Economic Development Financing Authority, Water Facilities Revenue Bonds, Aqua Pennsylvania, Inc. Project, Series 2009A, 5.000%, 10/01/39 | 10/19 at 100.00 | | AA– | | | 5,015,115 | |
| | 5,000 | | Pennsylvania Economic Development Financing Authority, Water Facilities Revenue Bonds, Aqua Pennsylvania, Inc. Project, Series 2009B, 5.000%, 11/15/40 | 11/19 at 100.00 | | AA– | | | 5,496,000 | |
| | 2,735 | | Philadelphia Gas Works, Pennsylvania, Revenue Bonds, Refunding Thirteenth Series 2015, 5.000%, 8/01/29 | 8/25 at 100.00 | | A | | | 3,231,758 | |
| | 42,955 | | Total Utilities | | | | | | 43,746,140 | |
| | | | Water and Sewer – 10.6% (6.7% of Total Investments) | | | | | | | |
| | | | Allegheny County Sanitary Authority, Pennsylvania, Sewer Revenue Bonds, Refunding Series 2015: | | | | | | | |
| | 3,325 | | 5.000%, 12/01/40 | 12/25 at 100.00 | | A1 | | | 3,838,779 | |
| | 3,320 | | 5.000%, 12/01/45 | 12/25 at 100.00 | | A1 | | | 3,813,120 | |
| | 750 | | Allegheny County Sanitary Authority, Pennsylvania, Sewer Revenue Bonds, Refunding Series 2016, 4.000%, 12/01/32 – AGM Insured | 12/26 at 100.00 | | AA | | | 821,670 | |
| | | | Bucks County Water and Sewer Authority, Pennsylvania, Revenue Bonds, Tender Option Bond Trust 2015-XF0123: | | | | | | | |
| | 1,665 | | 11.808%, 12/01/29 (IF) (5) | 12/21 at 100.00 | | AA | | | 2,407,140 | |
| | 825 | | 11.798%, 12/01/33 (IF) (5) | 12/21 at 100.00 | | AA | | | 1,162,046 | |
| | | | Delaware County Regional Water Quality Control Authority, Pennsylvania, Sewerage Revenue Bonds, Series 2015: | | | | | | | |
| | 1,110 | | 5.000%, 5/01/40 | 5/25 at 100.00 | | Aa3 | | | 1,284,492 | |
| | 2,220 | | 4.000%, 5/01/45 | 5/25 at 100.00 | | Aa3 | | | 2,380,306 | |
| | | | Easton, Pennsylvania, Area Joint Sewer Authority, Water and Sewer Revenue Bonds, Series 2015: | | | | | | | |
| | 1,090 | | 3.125%, 12/01/32 – BAM Insured | 12/23 at 100.00 | | AA | | | 1,111,549 | |
| | 705 | | 3.125%, 12/01/33 – BAM Insured | 12/23 at 100.00 | | AA | | | 715,173 | |
| | 1,155 | | 3.200%, 12/01/34 – BAM Insured | 12/23 at 100.00 | | AA | | | 1,174,358 | |
| | | | Findlay Township Municipal Authority, Allegheny County, Pennsylvania, Revenue Bonds, Series 2015: | | | | | | | |
| | 390 | | 3.125%, 12/15/32 – BAM Insured | 12/20 at 100.00 | | AA | | | 390,858 | |
| | 665 | | 3.375%, 12/15/35 – BAM Insured | 12/20 at 100.00 | | AA | | | 666,569 | |
| | | | Lehigh County Authority, Pennsylvania, Water and Sewer Revenue Bonds, Allentown Concession, Capital Appreciation Series 2013B: | | | | | | | |
| | 7,295 | | 0.000%, 12/01/34 | No Opt. Call | | A | | | 3,871,019 | |
| | 4,420 | | 0.000%, 12/01/35 | No Opt. Call | | A | | | 2,264,675 | |
| | 12,500 | | Lehigh County Authority, Pennsylvania, Water and Sewer Revenue Bonds, Allentown Concession, Series 2013A, 5.125%, 12/01/47 | 12/23 at 100.00 | | A | | | 14,257,874 | |
| | 1,100 | | Pennsylvania Economic Development Financing Authority, Sewage Sludge Disposal Revenue Bonds, Philadelphia Biosolids Facility Project, Series 2009, 6.250%, 1/01/32 | 1/20 at 100.00 | | BBB+ | | | 1,199,352 | |
| | 6,560 | | Philadelphia, Pennsylvania, Water and Wastewater Revenue Bonds, Series 2011A, 5.000%, 1/01/41 | 1/21 at 100.00 | | A+ | | | 7,412,997 | |
| | 2,500 | | Philadelphia, Pennsylvania, Water and Wastewater Revenue Bonds, Series 2013A, 5.125%, 1/01/43 | 1/22 at 100.00 | | A+ | | | 2,818,725 | |
| | 5,000 | | Pittsburgh Water and Sewer Authority, Pennsylvania, Water and Sewer System Revenue Bonds, First Lien Series 2013B, 5.250%, 9/01/40 | 9/23 at 100.00 | | A | | | 5,817,650 | |
| | Principal | | | Optional Call | | | | | | |
| | Amount (000) | | Description (1) | Provisions (2) | | Ratings (3) | | | Value | |
| | | | Water and Sewer (continued) | | | | | | | |
| $ | 2,840 | | Robinson Township Municipal Authority, Allegheny County, Pennsylvania, Water and Sewer Revenue Bonds, Series 2014, 4.000%, 5/15/40 – BAM Insured | 11/19 at 100.00 | | AA | | $ | 2,869,934 | |
| | 1,930 | | Westmoreland County Municipal Authority, Pennsylvania, Municipal Service Revenue Bonds, Tender Option Bond Trust 2016-XF1058, 15.011%, 8/15/37 (IF) (5) | 8/23 at 100.00 | | A+ | | | 3,001,054 | |
| | 61,365 | | Total Water and Sewer | | | | | | 63,279,340 | |
| $ | 870,888 | | Total Long-Term Investments (cost $875,177,948) | | | | | | 938,557,009 | |
| | | | Floating Rate Obligations – (8.4)% | | | | | | (50,255,000 | ) |
| | | | Variable Rate MuniFund Term Preferred Shares, at Liquidation Preference – (14.6)% (8) | | | | | | (87,000,000 | ) |
| | | | Variable Rate Demand Preferred Shares, at Liquidation Preference – (36.4)% (9) | | | | | | (217,500,000 | ) |
| | | | Other Assets Less Liabilities – 2.2% (10) | | | | | | 13,119,049 | |
| | | | Net Assets Applicable to Common Shares – 100% | | | | | $ | 596,921,058 | |
Investments in Derivatives as of October 31, 2016
Interest Rate Swaps
| Counterparty | Notional Amount | | Fund Pay/Receive Floating Rate | | Floating Rate Index | | Fixed Rate (Annualized | ) | Fixed Rate Payment Frequency | | Effective Date (11) | Termination Date | Unrealized Appreciation (Depreciation | ) |
| JPMorgan Chase Bank, N.A. | $ | 19,500,000 | | Receive | | USD-BMA | | 1.346 | % | Quarterly | | 11/15/17 | | 11/15/28 | $ | 223,826 | |
| (1) | All percentages shown in the Portfolio of Investments are based on net assets applicable to common shares unless otherwise noted. |
| (2) | Optional Call Provisions: Dates (month and year) and prices of the earliest optional call or redemption. There may be other call provisions at varying prices at later dates. Certain mortgage-backed securities may be subject to periodic principal paydowns. |
| (3) | For financial reporting purposes, the ratings disclosed are the highest of Standard & Poor's Group ("Standard & Poor's"), Moody's Investors Service, Inc. ("Moody's") or Fitch, Inc. ("Fitch") rating. This treatment of split-rated securities may differ from that used for other purposes, such as for Fund investment policies. Ratings below BBB by Standard & Poor's, Baa by Moody's or BBB by Fitch are considered to be below investment grade. Holdings designated N/R are not rated by any of these national rating agencies. |
| (4) | As of, or subsequent to, the end of the reporting period, this security is non-income producing. Non-income producing, in the case of a fixed-income security, generally denotes that the issuer has (1) defaulted on the payment of principal or interest, (2) is under the protection of the Federal Bankruptcy Court or (3) the Fund's Adviser has concluded that the issue is not likely to meet its future interest payment obligations and has ceased accruing additional income on the Fund's records. |
| (5) | Investment, or portion of investment, has been pledged to collateralize the net payment obligations for investments in inverse floating rate transactions. |
| (6) | Step-up coupon. The rate shown is the coupon as of the end of the reporting period. |
| (7) | Backed by an escrow or trust containing sufficient U.S. Government or U.S. Government agency securities, which ensure the timely payment of principal and interest. Certain bonds backed by U.S. Government or agency securities are regarded as having an implied rating equal to the rating of such securities. |
| (8) | Variable Rate MuniFund Term Preferred Shares, at Liquidation Preference as a percentage of Total Investments is 9.3%. |
| (9) | Variable Rate Demand Preferred Shares, at Liquidation Preference as a percentage of Total Investments is 23.2%. |
| (10) | Other assets less liabilities includes the unrealized appreciation (depreciation) of certain over-the-counter ("OTC") derivatives as presented on the Statement of Assets and Liabilities, when applicable. The unrealized appreciation (depreciation) of OTC-cleared and exchange-traded derivatives is recognized as part of the cash collateral at brokers and/or the receivable or payable for variation margin as presented on the Statement of Assets and Liabilities, when applicable. |
| (11) | Effective date represents the date on which both the Fund and counterparty commence interest payment accruals on each contract. |
| (ETM) | Escrowed to maturity. |
| (IF) | Inverse floating rate investment. |
| (UB) | Underlying bond of an inverse floating rate trust reflected as a financing transaction. See Notes to Financial Statements, Note 3 – Portfolio Securities and Investments in Derivatives, Inverse Floating Rate Securities for more information. |
| (WI/DD) | Investment, or portion of investment, purchased on a when-issued or delayed delivery basis. |
| USD-BMA | United States Dollar-Bond Market Association |
See accompanying notes to financial statements.
| NPN | | |
| | Nuveen Pennsylvania Municipal Value Fund | |
| | Portfolio of Investments | October 31, 2016 (Unaudited) |
| | Principal | | | Optional Call | | | | | | |
| | Amount (000) | | Description (1) | Provisions (2) | | Ratings (3) | | | Value | |
| | | | LONG-TERM INVESTMENTS – 98.5% (100.0% of Total Investments) | | | | | | | |
| | | | MUNICIPAL BONDS – 98.5% (100.0% of Total Investments) | | | | | | | |
| | | | Consumer Staples – 4.0% (4.1% of Total Investments) | | | | | | | |
| $ | 635 | | District of Columbia Tobacco Settlement Corporation, Tobacco Settlement Asset-Backed Bonds, Series 2001, 6.500%, 5/15/33 | No Opt. Call | | Baa1 | | $ | 766,120 | |
| | 25 | | Pennsylvania Economic Development Financing Authority, Solid Waste Disposal Revenue Bonds, Procter & Gamble Paper Project, Series 2001, 5.375%, 3/01/31 (Alternative Minimum Tax) | No Opt. Call | | AA– | | | 32,077 | |
| | 660 | | Total Consumer Staples | | | | | | 798,197 | |
| | | | Education and Civic Organizations – 6.2% (6.3% of Total Investments) | | | | | | | |
| | 30 | | Dallas Area Municipal Authority, Pennsylvania, Revenue Bonds, Misericordia University, Series 2014, 5.000%, 5/01/37 | 5/24 at 100.00 | | Baa3 | | | 32,941 | |
| | | | Huntingdon County General Authority, Pennsylvania, Revenue Bonds, Juniata College, Series 2016OO2: | | | | | | | |
| | 15 | | 3.250%, 5/01/36 | 5/26 at 100.00 | | BBB+ | | | 14,329 | |
| | 40 | | 3.500%, 5/01/41 | 5/26 at 100.00 | | BBB+ | | | 38,199 | |
| | 500 | | Lehigh County General Purpose Authority, Pennsylvania, College Revenue Bonds, Muhlenberg College Project, Series 2009, 5.250%, 2/01/39 | 2/19 at 100.00 | | A+ | | | 529,320 | |
| | 35 | | Pennsylvania Higher Educational Facilities Authority, Revenue Bonds, Holy Family University, Series 2013A, 6.500%, 9/01/38 | 9/23 at 100.00 | | BBB– | | | 39,514 | |
| | 120 | | Pennsylvania Higher Educational Facilities Authority, Revenue Bonds, Philadelphia University, Refunding Series 2013, 5.000%, 6/01/32 | 6/23 at 100.00 | | BBB | | | 133,631 | |
| | 40 | | Pennsylvania Higher Educational Facilities Authority, Revenue Bonds, Thomas Jefferson University, Series 2012, 5.000%, 3/01/42 | 9/22 at 100.00 | | A+ | | | 45,210 | |
| | | | Pennsylvania Higher Educational Facilities Authority, Revenue Bonds, University of the Sciences in Philadelphia, Series 2012: | | | | | | | |
| | 35 | | 4.000%, 11/01/39 | 11/22 at 100.00 | | A3 | | | 36,635 | |
| | 60 | | 5.000%, 11/01/42 | 11/22 at 100.00 | | A3 | | | 68,023 | |
| | 75 | | Pennsylvania Higher Educational Facilities Authority, Revenue Bonds, Widener University, Series 2013A, 5.500%, 7/15/38 | No Opt. Call | | A– | | | 85,332 | |
| | 100 | | Philadelphia Authority for Industrial Development, Pennsylvania, Revenue Bonds, Philadelphia Performing Arts Charter School, Series 2013, 6.750%, 6/15/43 | 6/20 at 100.00 | | BB– | | | 106,108 | |
| | 100 | | Wilkes-Barre Finance Authority, Pennsylvania, Revenue Bonds, University of Scranton, Series 2010, 5.000%, 11/01/40 | 11/20 at 100.00 | | A– | | | 111,756 | |
| | 1,150 | | Total Education and Civic Organizations | | | | | | 1,240,998 | |
| | | | Health Care – 19.9% (20.2% of Total Investments) | | | | | | | |
| | 695 | | Allegheny County Hospital Development Authority, Pennsylvania, Revenue Bonds, University of Pittsburgh Medical Center, Series 2009A, 5.500%, 8/15/34 | 8/19 at 100.00 | | Aa3 | | | 769,427 | |
| | 100 | | Centre County Hospital Authority, Pennsylvania, Hospital Revenue Bonds, Mount Nittany Medical Center Project, Series 2016A, 5.000%, 11/15/46 | 11/25 at 100.00 | | A | | | 115,004 | |
| | 55 | | Dauphin County General Authority, Pennsylvania, Health System Revenue Bonds, Pinnacle Health System Project, Refunding Series 2016A, 5.000%, 6/01/35 | 6/26 at 100.00 | | A+ | | | 64,577 | |
| | 35 | | Dauphin County General Authority, Pennsylvania, Health System Revenue Bonds, Pinnacle Health System Project, Series 2012A, 5.000%, 6/01/42 | 6/22 at 100.00 | | A+ | | | 39,040 | |
| | 225 | | Doylestown Hospital Authority, Pennsylvania, Hospital Revenue Bonds, Series 2016A, 5.000%, 7/01/41 | 7/26 at 100.00 | | BBB | | | 249,833 | |
| | 600 | | Geisinger Authority, Montour County, Pennsylvania, Health System Revenue Bonds, Geisinger Health System, Series 2009A, 5.250%, 6/01/39 | 6/19 at 100.00 | | AA | | | 650,741 | |
| | 210 | | Lancaster County Hospital Authority, Revenue Bonds, University of Pennsylvania Health System, Refunding Series 2016B, 5.000%, 8/15/46 | 8/26 at 100.00 | | AA– | | | 244,614 | |
| | Principal | | | Optional Call | | | | | | |
| | Amount (000) | | Description (1) | Provisions (2) | | Ratings (3) | | | Value | |
| | | | Health Care (continued) | | | | | | | |
| $ | 150 | | Lancaster County Hospital Authority, Revenue Bonds, University of Pennsylvania Health System, Series 2016A, 5.000%, 8/15/42 | 8/26 at 100.00 | | AA– | | $ | 175,140 | |
| | | | Lehigh County General Purpose Authority, Pennsylvania, Revenue Bonds, Good Shepherd Group, Refunding Series 2016: | | | | | | | |
| | 30 | | 3.000%, 11/01/36 | 5/26 at 100.00 | | A | | | 27,229 | |
| | 150 | | 4.000%, 11/01/41 | 5/26 at 100.00 | | A | | | 153,396 | |
| | 100 | | Lycoming County Authority, Pennsylvania, Health System Revenue Bonds, Susquehanna Health System Project, Series 2009A, 5.750%, 7/01/39 | 7/19 at 100.00 | | AA– | | | 111,108 | |
| | 5 | | Montgomery County Higher Education and Health Authority, Pennsylvania, Hospital Revenue Bonds, Abington Memorial Hospital Obligated Group, Series 2009A, 5.125%, 6/01/33 | 6/19 at 100.00 | | A+ | | | 5,375 | |
| | 200 | | Montgomery County Industrial Development Authority, Pennsylvania, Health System Revenue Bonds, Albert Einstein Healthcare Network Issue, Series 2015A, 5.250%, 1/15/45 | 1/25 at 100.00 | | Baa2 | | | 221,532 | |
| | 100 | | Philadelphia Hospitals and Higher Education Facilities Authority, Pennsylvania, Hospital Revenue Bonds, Temple University Health System Obligated Group, Series 2012A, 5.625%, 7/01/42 | 7/22 at 100.00 | | BBB– | | | 110,729 | |
| | 705 | | St. Mary Hospital Authority, Pennsylvania, Health System Revenue Bonds, Catholic Health East, Series 2009D, 6.250%, 11/15/34 | 5/19 at 100.00 | | AA | | | 783,629 | |
| | 100 | | West Shore Area Authority, Cumberland County, Pennsylvania, Hospital Revenue Bonds, Holy Spirit Hospital of the Sisters of Christian Charity Project, Series 2011, 6.250%, 1/01/31 | 1/21 at 100.00 | | AA | | | 117,125 | |
| | 100 | | West Shore Area Authority, Cumberland County, Pennsylvania, Hospital Revenue Bonds, Holy Spirit Hospital of the Sisters of Christian Charity, Series 2011B, 5.750%, 1/01/41 | 1/22 at 100.00 | | AA | | | 116,501 | |
| | 3,560 | | Total Health Care | | | | | | 3,955,000 | |
| | | | Housing/Multifamily – 6.7% (6.8% of Total Investments) | | | | | | | |
| | 15 | | Chester County Industrial Development Authority, Pennsylvania, Student Housing Revenue Bonds, University Student Housing, LLC Project at West Chester University Series 2013A, 5.000%, 8/01/45 | 8/23 at 100.00 | | Baa3 | | | 16,154 | |
| | 30 | | East Hempfield Township Industrial Development Authority, Pennsylvania, Student Services Inc.– Student Housing Project at Millersville University, Series 2014, 5.000%, 7/01/46 | No Opt. Call | | BBB– | | | 32,492 | |
| | 100 | | East Hempfield Township Industrial Development Authority, Pennsylvania, Student Services Inc. – Student Housing Project at Millersville University, Series 2015, 5.000%, 7/01/47 | 7/25 at 100.00 | | BBB– | | | 108,816 | |
| | 300 | | Pennsylvania Higher Educational Facilities Authority, Revenue Bonds, University Properties Inc. Student Housing Project at East Stroudsburg University of Pennsylvania, Series 2016A, 5.000%, 7/01/35 | 7/26 at 100.00 | | Baa3 | | | 334,563 | |
| | 800 | | Pittsburgh Urban Redevelopment Authority, Pennsylvania, Multifamily Housing Revenue Bonds, Eva P. Mithcell Residence Project, Series 2009, 5.100%, 10/20/44 | 10/19 at 100.00 | | Aa1 | | | 835,336 | |
| | 1,245 | | Total Housing/Multifamily | | | | | | 1,327,361 | |
| | | | Housing/Single Family – 8.1% (8.2% of Total Investments) | | | | | | | |
| | | | Pennsylvania Housing Finance Agency, Single Family Mortgage Revenue Bonds, Series 2012-114: | | | | | | | |
| | 55 | | 3.300%, 10/01/32 | No Opt. Call | | AA+ | | | 56,102 | |
| | 25 | | 3.650%, 10/01/37 | No Opt. Call | | AA+ | | | 25,542 | |
| | 30 | | 3.700%, 10/01/42 | No Opt. Call | | AA+ | | | 31,204 | |
| | 130 | | Pennsylvania Housing Finance Agency, Single Family Mortgage Revenue Bonds, Series 2015-116B, 4.000%, 4/01/45 | 10/24 at 100.00 | | AA+ | | | 133,280 | |
| | 315 | | Pennsylvania Housing Finance Agency, Single Family Mortgage Revenue Bonds, Series 2015-118B, 4.100%, 10/01/45 | 4/25 at 100.00 | | AA+ | | | 327,969 | |
| | 55 | | Pennsylvania Housing Finance Agency, Single Family Mortgage Revenue Bonds, Series 2016-119, 3.500%, 10/01/36 | 4/25 at 100.00 | | AA+ | | | 55,721 | |
| | 500 | | Pennsylvania Housing Finance Agency, Single Family Mortgage Revenue Bonds, Series 2016-120, 3.200%, 4/01/40 | 10/25 at 100.00 | | AA+ | | | 494,294 | |
| | 400 | | Pennsylvania Housing Finance Agency, Single Family Mortgage Revenue Bonds, Series 2016-121, 3.200%, 10/01/41 (UB) | 10/25 at 100.00 | | AA+ | | | 392,568 | |
| | 50 | | Pennsylvania Housing Finance Agency, Single Family Mortgage Revenue Bonds, Tender Option Bond Trust 2015-XF0066, 12.613%, 10/01/33 (Alternative Minimum Tax) (IF) | 10/22 at 100.00 | | AA+ | | | 62,686 | |
| NPN | Nuveen Pennsylvania Municipal Value Fund | |
| | Portfolio of Investments (continued) | October 31, 2016 (Unaudited) |
| | Principal | | | Optional Call | | | | | | |
| | Amount (000) | | Description (1) | Provisions (2) | | Ratings (3) | | | Value | |
| | | | Housing/Single Family (continued) | | | | | | | |
| $ | 25 | | Pennsylvania Housing Finance Agency, Single Family Mortgage Revenue Bonds, Tender Option Bonds Trust 2015-XF0109, 9.413%, 10/01/38 (IF) (4) | 10/22 at 100.00 | | AA+ | | $ | 27,922 | |
| | 1,585 | | Total Housing/Single Family | | | | | | 1,607,288 | |
| | | | Long-Term Care – 3.0% (3.0% of Total Investments) | | | | | | | |
| | | | Cumberland County Municipal Authority, Pennsylvania, Revenue Bonds, Diakon Lutheran Social Ministries Project, Series 2015: | | | | | | | |
| | 120 | | 4.000%, 1/01/33 | 1/25 at 100.00 | | BBB+ | | | 127,157 | |
| | 135 | | 5.000%, 1/01/38 | 1/25 at 100.00 | | BBB+ | | | 153,220 | |
| | 20 | | Lancaster County Hospital Authority, Pennsylvania, Health Center Revenue Bonds, Masonic Villages Project, Series 2015, 5.000%, 11/01/35 | 5/25 at 100.00 | | A | | | 23,071 | |
| | 55 | | Lancaster Industrial Development Authority, Pennsylvania, Revenue Bonds, Garden Spot Village Project, Series 2013, 5.750%, 5/01/35 | 5/23 at 100.00 | | BBB | | | 61,918 | |
| | 200 | | Montgomery County Industrial Development Authority, Pennsylvania, Revenue Bonds, ACTS Retirement-Life Communities, Inc. Obligated Group, Series 2016, 5.000%, 11/15/36 | 11/26 at 100.00 | | N/R | | | 227,842 | |
| | 530 | | Total Long-Term Care | | | | | | 593,208 | |
| | | | Materials – 0.9% (0.9% of Total Investments) | | | | | | | |
| | 165 | | Pennsylvania Economic Development Financing Authority, Exempt Facilities Revenue Bonds, National Gypsum Company, Refunding Series 2014, 5.500%, 11/01/44 (Alternative Minimum Tax) | 11/24 at 100.00 | | N/R | | | 181,921 | |
| | | | Tax Obligation/General – 7.1% (7.2% of Total Investments) | | | | | | | |
| | 220 | | Allegheny County, Pennsylvania, General Obligation Bonds, Series 2013C-72, 5.250%, 12/01/32 | 12/23 at 100.00 | | AA– | | | 262,194 | |
| | 45 | | Boyertown Area School District, Berks and Montgomery Counties, Pennsylvania, General Obligation Bonds, Series 2015, 5.000%, 10/01/38 | 4/24 at 100.00 | | AA | | | 51,653 | |
| | 115 | | Canon-McMillan School District, Washington County, Pennsylvania, General Obligation Bonds, Series 2014D, 5.000%, 12/15/39 | 12/24 at 100.00 | | AA | | | 133,353 | |
| | 195 | | Lehighton Area School District, Carbon County, Pennsylvania, General Obligation Bonds, Limited Tax Series 2015A, 5.000%, 11/15/43 – BAM Insured | 11/23 at 100.00 | | AA | | | 221,832 | |
| | 15 | | Pittsburgh School District, Allegheny County, Pennsylvania, General Obligation Bonds, Series 2014A, 5.000%, 9/01/25 – BAM Insured | 9/22 at 100.00 | | AA | | | 17,689 | |
| | 390 | | Pittsburgh, Pennsylvania, General Obligation Bonds, Series 2012B, 5.000%, 9/01/26 | 9/22 at 100.00 | | A+ | | | 457,465 | |
| | | | Pocono Mountain School District, Monroe County, Pennsylvania, General Obligation Bonds, Refunding Series 2016: | | | | | | | |
| | 25 | | 3.125%, 9/01/32 – AGM Insured | 9/25 at 100.00 | | AA | | | 25,602 | |
| | 35 | | 3.300%, 9/01/34 – AGM Insured | 9/25 at 100.00 | | AA | | | 35,765 | |
| | 35 | | Radnor Township School District, Delaware County, Pennsylvania, General Obligation Bonds, Series 2012, 3.000%, 2/15/34 | 2/18 at 100.00 | | Aa1 | | | 35,282 | |
| | 25 | | Scranton, Lackawanna County, Pennsylvania, General Obligation Bonds, Series 2012A, 8.500%, 9/01/22 | No Opt. Call | | N/R | | | 27,669 | |
| | 25 | | Scranton, Lackawanna County, Pennsylvania, General Obligation Bonds, Series 2012C, 7.250%, 9/01/22 | No Opt. Call | | N/R | | | 26,150 | |
| | 80 | | Scranton, Lackawanna County, Pennsylvania, General Obligation Notes, Series 2016, 5.000%, 11/15/32 | 5/24 at 100.00 | | BB | | | 85,580 | |
| | | | The Redevelopment Authority of the City of Scranton, Lackawanna county, Pennsylvania, Guaranteed Lease Revenue Bonds, Series 2016A: | | | | | | | |
| | 15 | | 5.000%, 11/15/21 | No Opt. Call | | BB | | | 15,808 | |
| | 10 | | 5.000%, 11/15/28 | 5/24 at 100.00 | | BB | | | 10,529 | |
| | 1,230 | | Total Tax Obligation/General | | | | | | 1,406,571 | |
| | | | Tax Obligation/Limited – 9.9% (10.0% of Total Investments) | | | | | | | |
| | 25 | | Allentown Neighborhood Improvement Zone Development Authority, Pennsylvania, Tax Revenue Bonds, Series 2012A, 5.000%, 5/01/35 | 5/22 at 100.00 | | Baa2 | | | 26,881 | |
| | 120 | | Government of Guam, Business Privilege Tax Bonds, Series 2011A, 5.250%, 1/01/36 | 1/22 at 100.00 | | A | | | 131,444 | |
| | 104 | | Monroe County Industrial Development Authority, Pennsylvania, Special Obligation Revenue Bonds, Tobyhanna Township Project, Series 2014, 6.875%, 7/01/33 | 7/24 at 100.00 | | N/R | | | 109,934 | |
| | Principal | | | Optional Call | | | | | | |
| | Amount (000) | | Description (1) | Provisions (2) | | Ratings (3) | | | Value | |
| | | | Tax Obligation/Limited (continued) | | | | | | | |
| | | | Pennsylvania Turnpike Commission, Motor License Fund-Enhanced Subordinate Special Revenue Bonds, Series 2010A: | | | | | | | |
| $ | 585 | | 5.500%, 12/01/34 | 12/20 at 100.00 | | A2 | | $ | 669,070 | |
| | 100 | | 5.000%, 12/01/38 | 12/19 at 100.00 | | AA– | | | 109,987 | |
| | 100 | | Pennsylvania Turnpike Commission, Motor License Fund-Enhanced Turnpike Subordinate Special Revenue Bonds, Series 2014A, 0.000%, 12/01/37 (5) | No Opt. Call | | AA– | | | 88,832 | |
| | 750 | | Philadelphia Municipal Authority, Pennsylvania, Lease Revenue Bonds, Series 2009, 6.500%, 4/01/34 | 4/19 at 100.00 | | A+ | | | 830,160 | |
| | 1,784 | | Total Tax Obligation/Limited | | | | | | 1,966,308 | |
| | | | Transportation – 6.1% (6.2% of Total Investments) | | | | | | | |
| | 240 | | Delaware River Port Authority, New Jersey and Pennsylvania, Revenue Bonds, Series 2010E, 5.000%, 1/01/40 | 1/20 at 100.00 | | A | | | 265,879 | |
| | 140 | | Pennsylvania Economic Development Financing Authority, Parking System Revenue Bonds, Capitol Region Parking System, Series 2013A, 5.250%, 1/01/44 – AGM Insured | 1/24 at 100.00 | | AA | | | 159,783 | |
| | 175 | | Pennsylvania Economic Development Financing Authority, Private Activity Revenue Bonds, Pennsylvania Rapid Bridge Replacement Project, Series 2015, 5.000%, 6/30/42 (Alternative Minimum Tax) | 6/26 at 100.00 | | BBB | | | 193,939 | |
| | 460 | | Pennsylvania Turnpike Commission, Turnpike Revenue Bonds, Series 2015B, 5.000%, 12/01/45 | 12/25 at 100.00 | | A1 | | | 525,977 | |
| | 55 | | Pennsylvania Turnpike Commission, Turnpike Revenue Bonds, Subordinate Lien, Refunding Series 2010B-1, 5.000%, 12/01/37 | 12/19 at 100.00 | | A– | | | 60,458 | |
| | 1,070 | | Total Transportation | | | | | | 1,206,036 | |
| | | | U.S. Guaranteed – 16.5% (16.8% of Total Investments) (6) | | | | | | | |
| | 550 | | Guam Government, Limited Obligation Section 30 Revenue Bonds, Series 2009A, 5.750%, 12/01/34 (Pre-refunded 12/01/19) | 12/19 at 100.00 | | BBB+ (6) | | | 628,909 | |
| | 750 | | Montgomery County Industrial Development Authority, Pennsylvania, Revenue Bonds, ACTS Retirement-Life Communities, Inc. Obligated Group, Series 2009A-1, 6.250%, 11/15/29 (Pre-refunded 11/15/19) | 11/19 at 100.00 | | A– (6) | | | 866,588 | |
| | 350 | | Pennsylvania Economic Development Financing Authority, Health System Revenue Bonds, Albert Einstein Healthcare, Series 2009A, 6.250%, 10/15/23 (Pre-refunded 10/15/19) | 10/19 at 100.00 | | N/R (6) | | | 393,845 | |
| | 50 | | Pennsylvania Higher Educational Facilities Authority, Revenue Bonds, Edinboro University Foundation Student Housing Project, Series 2010, 6.000%, 7/01/43 (Pre-refunded 7/01/20) | 7/20 at 100.00 | | N/R (6) | | | 58,554 | |
| | | | Philadelphia, Pennsylvania, Water and Wastewater Revenue Bonds, Series 2009A: | | | | | | | |
| | 750 | | 5.250%, 1/01/32 (Pre-refunded 1/01/19) | 1/19 at 100.00 | | A+ (6) | | | 808,215 | |
| | 500 | | 5.250%, 1/01/36 (Pre-refunded 1/01/19) | 1/19 at 100.00 | | A+ (6) | | | 538,590 | |
| | 2,950 | | Total U.S. Guaranteed | | | | | | 3,294,701 | |
| | | | Utilities – 6.9% (7.0% of Total Investments) | | | | | | | |
| | 100 | | Beaver County Industrial Development Authority, Pennsylvania, Pollution Control Revenue Bonds, FirstEnergy Nuclear Generation Project, Refunding Series 2005A, 4.000%, 1/01/35 (Mandatory put 7/01/21) | No Opt. Call | | BBB– | | | 84,397 | |
| | 25 | | Beaver County Industrial Development Authority, Pennsylvania, Pollution Control Revenue Refunding Bonds, FirstEnergy Nuclear Generation Project, Series 2006A, 0.000%, 4/01/41 | No Opt. Call | | B | | | 21,564 | |
| | 105 | | Beaver County Industrial Development Authority, Pennsylvania, Pollution Control Revenue Refunding Bonds, FirstEnergy Nuclear Generation Project, Series 2006B, 3.500%, 12/01/35 (Mandatory put 6/01/20) | No Opt. Call | | A | | | 90,314 | |
| | 750 | | Chester County Industrial Development Authority, Pennsylvania, Water Facilities Revenue Bonds, Aqua Pennsylvania Inc. Project, Series 2007A, 5.000%, 2/01/40 – FGIC Insured (Alternative Minimum Tax) | 2/17 at 100.00 | | AA– | | | 753,630 | |
| | 170 | | Delaware County Industrial Development Authority, Pennsylvania, Revenue Bonds, Covanta Project, Refunding Series 2015A, 5.000%, 7/01/43 | 7/20 at 100.00 | | Ba2 | | | 174,450 | |
| | 100 | | Pennsylvania Economic Development Financing Authority, Exempt Facilities Revenue Refunding Bonds, PPL Energy Supply, LLC Project, Series 2009A, 6.400%, 12/01/38 | 9/25 at 100.00 | | B+ | | | 105,384 | |
| | 125 | | Philadelphia Gas Works, Pennsylvania, Revenue Bonds, Refunding Thirteenth Series 2015, 5.000%, 8/01/30 | 8/25 at 100.00 | | A | | | 146,523 | |
| | 1,375 | | Total Utilities | | | | | | 1,376,262 | |
| NPN | Nuveen Pennsylvania Municipal Value Fund | |
| | Portfolio of Investments (continued) | October 31, 2016 (Unaudited) |
| | Principal | | | Optional Call | | | | | | |
| | Amount (000) | | Description (1) | Provisions (2) | | Ratings (3) | | | Value | |
| | | | Water and Sewer – 3.2% (3.3% of Total Investments) | | | | | | | |
| $ | 175 | | Bucks County Water and Sewer Authority, Pennsylvania, Revenue Bonds, Tender Option Bond Trust 2015-XF0123, 11.798%, 12/01/33 (IF) (4) | 12/21 at 100.00 | | AA | | $ | 246,495 | |
| | 75 | | Easton, Pennsylvania, Area Joint Sewer Authority, Water and Sewer Revenue Bonds, Series 2015, 3.125%, 12/01/33 – BAM Insured | 12/23 at 100.00 | | AA | | | 76,082 | |
| | 30 | | Findlay Township Municipal Authority, Allegheny County, Pennsylvania, Revenue Bonds, Series 2015, 3.125%, 12/15/32 – BAM Insured | 12/20 at 100.00 | | AA | | | 30,066 | |
| | 200 | | Lehigh County Authority, Pennsylvania, Water and Sewer Revenue Bonds, Allentown Concession, Series 2013A, 5.125%, 12/01/47 | 12/23 at 100.00 | | A | | | 228,125 | |
| | 60 | | Robinson Township Municipal Authority, Allegheny County, Pennsylvania, Water and Sewer Revenue Bonds, Series 2014, 4.000%, 5/15/40 – BAM Insured | 11/19 at 100.00 | | AA | | | 60,632 | |
| | 540 | | Total Water and Sewer | | | | | | 641,400 | |
| $ | 17,844 | | Total Long-Term Investments (cost $17,954,653) | | | | | | 19,595,251 | |
| | | | Floating Rate Obligations – (1.5)% | | | | | | (300,000 | ) |
| | | | Other Assets Less Liabilities – 3.0% | | | | | | 596,111 | |
| | | | Net Assets Applicable to Common Shares – 100% | | | | | $ | 19,891,362 | |
| (1) | All percentages shown in the Portfolio of Investments are based on net assets applicable to common shares unless otherwise noted. |
| (2) | Optional Call Provisions: Dates (month and year) and prices of the earliest optional call or redemption. There may be other call provisions at varying prices at later dates. Certain mortgage-backed securities may be subject to periodic principal paydowns. |
| (3) | For financial reporting purposes, the ratings disclosed are the highest of Standard & Poor's Group ("Standard & Poor's"), Moody's Investors Service, Inc. ("Moody's") or Fitch, Inc. ("Fitch") rating. This treatment of split-rated securities may differ from that used for other purposes, such as for Fund investment policies. Ratings below BBB by Standard & Poor's, Baa by Moody's or BBB by Fitch are considered to be below investment grade. Holdings designated N/R are not rated by any of these national rating agencies. |
| (4) | Investment, or portion of investment, has been pledged to collateralize the net payment obligations for investments in inverse floating rate transactions. |
| (5) | Step-up coupon. The rate shown is the coupon as of the end of the reporting period. |
| (6) | Backed by an escrow or trust containing sufficient U.S. Government or U.S. Government agency securities, which ensure the timely payment of principal and interest. Certain bonds backed by U.S. Government or agency securities are regarded as having an implied rating equal to the rating of such securities. |
| (IF) | Inverse floating rate investment. |
| (UB) | Underlying bond of an inverse floating rate trust reflected as a financing transaction. See Notes to Financial Statements, Note 3 – Portfolio Securities and Investments in Derivatives, Inverse Floating Rate Securities for more information. |
See accompanying notes to financial statements.
| Statement of | | |
| | Assets and Liabilities | October 31, 2016 (Unaudited) |
| | | | New Jersey | * | | New Jersey | | | Pennsylvania | ** | | Pennsylvania | |
| | | | Quality | | | Municipal | | | Quality | | | Municipal | |
| | | | Income | | | Value | | | Income | | | Value | |
| | | | (NXJ | ) | | (NJV | ) | | (NQP | ) | | (NPN | ) |
| Assets | | | | | | | | | | | | | |
| Long-term investments, at value (cost $905,769,238, $23,072,170, $875,177,948 and $17,954,653, respectively) | | $ | 986,334,967 | | $ | 25,705,322 | | $ | 938,557,009 | | $ | 19,595,251 | |
| Short-term investments, at value (cost approximates value) | | | — | | | 400,000 | | | — | | | — | |
| Cash | | | 545,257 | | | 298,246 | | | 3,997,519 | | | 400,671 | |
| Unrealized appreciation on interest rate swaps | | | 997,038 | | | — | | | 223,826 | | | — | |
| Receivable for: | | | | | | | | | | | | | |
| Interest | | | 14,292,579 | | | 360,297 | | | 12,684,101 | | | 281,691 | |
| Investments sold | | | 201,981 | | | — | | | 4,896,507 | | | 5,000 | |
| Deferred offering costs | | | 1,600,323 | | | — | | | 918,817 | | | — | |
| Other assets | | | 385,563 | | | 187 | | | 300,761 | | | 1,035 | |
| Total assets | | | 1,004,357,708 | | | 26,764,052 | | | 961,578,540 | | | 20,283,648 | |
| Liabilities | | | | | | | | | | | | | |
| Floating rate obligations | | | — | | | 1,500,000 | | | 50,255,000 | | | 300,000 | |
| Payable for: | | | | | | | | | | | | | |
| Dividends | | | 2,344,344 | | | 73,381 | | | 2,052,918 | | | 61,102 | |
| Interest | | | — | | | — | | | 126,603 | | | — | |
| Investments purchased | | | 4,441,900 | | | — | | | 6,551,018 | | | — | |
| Offering costs | | | — | | | — | | | 111,445 | | | — | |
| Variable Rate MuniFund Term Preferred ("VMTP") Shares, at liquidation preference | | | — | | | — | | | 87,000,000 | | | — | |
| Variable Rate Demand Preferred ("VRDP") Shares, at liquidation preference | | | 313,900,000 | | | — | | | 217,500,000 | | | — | |
| Accrued expenses: | | | | | | | | | | | | | |
| Management fees | | | 512,347 | | | 13,220 | | | 463,835 | | | 9,906 | |
| Trustees fees | | | 122,724 | | | 225 | | | 117,527 | | | 178 | |
| Other | | | 174,186 | | | 21,695 | | | 479,136 | | | 21,100 | |
| Total liabilities | | | 321,495,501 | | | 1,608,521 | | | 364,657,482 | | | 392,286 | |
| Net assets applicable to common shares | | $ | 682,862,207 | | $ | 25,155,531 | | $ | 596,921,058 | | $ | 19,891,362 | |
| Common shares outstanding | | | 42,584,679 | | | 1,550,297 | | | 37,754,841 | | | 1,219,807 | |
| Net asset value ("NAV") per common share outstanding | | $ | 16.04 | | $ | 16.23 | | $ | 15.81 | | $ | 16.31 | |
| Net assets applicable to common shares consist of: | | | | | | | | | | | | | |
| Common shares, $0.01 par value per share | | $ | 425,847 | | $ | 15,503 | | $ | 377,548 | | $ | 12,198 | |
| Paid-in surplus | | | 606,729,028 | | | 22,148,704 | | | 533,830,942 | | | 17,445,766 | |
| Undistributed (Over-distribution of) net investment income | | | 713,075 | | | 108,069 | | | (1,395,542 | ) | | 211,172 | |
| Accumulated net realized gain (loss) | | | (6,568,510 | ) | | 250,103 | | | 505,223 | | | 581,628 | |
| Net unrealized appreciation (depreciation) | | | 81,562,767 | | | 2,633,152 | | | 63,602,887 | | | 1,640,598 | |
| Net assets applicable to common shares | | $ | 682,862,207 | | $ | 25,155,531 | | $ | 596,921,058 | | $ | 19,891,362 | |
| Authorized shares: | | | | | | | | | | | | | |
| Common | | | Unlimited | | | Unlimited | | | Unlimited | | | Unlimited | |
| Preferred | | | Unlimited | | | N/A | | | Unlimited | | | N/A | |
N/A — Fund is not authorized to issue Preferred Shares.
| * | Formerly known as New Jersey Dividend Advantage. |
| ** | Formerly known as Pennsylvania Investment Quality. |
See accompanying notes to financial statements.
| Statement of | | |
| | Operations | Six Months Ended October 31, 2016 (Unaudited) |
| | | | New Jersey | | | New Jersey | | | Pennsylvania | | | Pennsylvania | |
| | | | Quality | | | Municipal | | | Quality | | | Municipal | |
| | | | Income | | | Value | | | Income | | | Value | |
| | | | (NXJ | ) | | (NJV | ) | | (NQP | ) | | (NPN | ) |
| Investment Income | | $ | 21,490,031 | | $ | 574,783 | | $ | 19,019,128 | | $ | 471,796 | |
| Expenses | | | | | | | | | | | | | |
| Management fees | | | 3,075,996 | | | 79,398 | | | 2,717,203 | | | 58,965 | |
| Interest expense and amortization of offering costs | | | 1,050,306 | | | 8,309 | | | 1,530,088 | | | 288 | |
| Liquidity fees | | | 1,531,273 | | | — | | | 1,075,621 | | | — | |
| Remarketing fees | | | 160,439 | | | — | | | 111,166 | | | — | |
| Custodian fees | | | 53,616 | | | 7,039 | | | 48,248 | | | 6,617 | |
| Trustees fees | | | 14,458 | | | 367 | | | 12,725 | | | 287 | |
| Professional fees | | | 11,925 | | | 11,191 | | | 11,870 | | | 11,126 | |
| Shareholder reporting expenses | | | 35,648 | | | 5,487 | | | 37,435 | | | 5,243 | |
| Shareholder servicing agent fees | | | 16,904 | | | 124 | | | 30,642 | | | 83 | |
| Stock exchange listing fees | | | 6,876 | | | 177 | | | 6,096 | | | 138 | |
| Investor relations expenses | | | 52,427 | | | 1,871 | | | 46,783 | | | 1,677 | |
| Other | | | 70,252 | | | 6,523 | | | 45,965 | | | 6,422 | |
| Total expenses | | | 6,080,120 | | | 120,486 | | | 5,673,842 | | | 90,846 | |
| Net investment income (loss) | | | 15,409,911 | | | 454,297 | | | 13,345,286 | | | 380,950 | |
| Realized and Unrealized Gain (Loss) | | | | | | | | | | | | | |
| Net realized gain (loss) from: | | | | | | | | | | | | | |
| Investments | | | 1,316,653 | | | 203,157 | | | 2,342,735 | | | 307,020 | |
| Swaps | | | (4,000,000 | ) | | — | | | — | | | — | |
| Change in net unrealized appreciation (depreciation) of: | | | | | | | | | | | | | |
| Investments | | | (6,297,108 | ) | | (347,489 | ) | | (11,903,072 | ) | | (541,759 | ) |
| Swaps | | | 3,814,005 | | | — | | | 223,826 | | | — | |
| Net realized and unrealized gain (loss) | | | (5,166,450 | ) | | (144,332 | ) | | (9,336,511 | ) | | (234,739 | ) |
| Net increase (decrease) in net assets applicable to common shares from operations | | $ | 10,243,461 | | $ | 309,965 | | $ | 4,008,775 | | $ | 146,211 | |
See accompanying notes to financial statements.
| Statement of | | |
| | Changes in Net Assets | (Unaudited) |
| | | New Jersey | | New Jersey |
| | | Quality Income (NXJ) | | Municipal Value (NJV) |
| | | | Six Months | | | Year | | | Six Months | | | Year | |
| | | | Ended | | | Ended | | | Ended | | | Ended | |
| | | | 10/31/16 | | | 4/30/16 | | | 10/31/16 | | | 4/30/16 | |
| Operations | | | | | | | | | | | | | |
| Net investment income (loss) | | $ | 15,409,911 | | $ | 33,872,344 | | $ | 454,297 | | $ | 969,943 | |
| Net realized gain (loss) from: | | | | | | | | | | | | | |
| Investments | | | 1,316,653 | | | 1,086,377 | | | 203,157 | | | 63,034 | |
| Swaps | | | (4,000,000 | ) | | — | | | — | | | — | |
| Change in net unrealized appreciation (depreciation) of: | | | | | | | | | | | | | |
| Investments | | | (6,297,108 | ) | | 29,494,099 | | | (347,489 | ) | | 96,605 | |
| Swaps | | | 3,814,005 | | | (2,816,967 | ) | | — | | | — | |
| Net increase (decrease) in net assets applicable to common shares from operations | | | 10,243,461 | | | 61,635,853 | | | 309,965 | | | 1,129,582 | |
| Distributions to Common Shareholders | | | | | | | | | | | | | |
| From net investment income | | | (16,352,517 | ) | | (34,887,468 | ) | | (455,729 | ) | | (938,856 | ) |
| From accumulated net realized gains | | | — | | | (344,985 | ) | | — | | | (323,803 | ) |
| Decrease in net assets applicable to common shares from distributions to common shareholders | | | (16,352,517 | ) | | (35,232,453 | ) | | (455,729 | ) | | (1,262,659 | ) |
| Capital Share Transactions | | | | | | | | | | | | | |
| Common shares: | | | | | | | | | | | | | |
| Net proceeds from shares issued to shareholders due to reinvestment of distributions | | | — | | | — | | | 4,323 | | | — | |
| Cost of shares repurchased and retired | | | — | | | (6,101,727 | ) | | — | | | — | |
| Net increase (decrease) in net assets applicable to common shares from capital share transactions | | | — | | | (6,101,727 | ) | | 4,323 | | | — | |
| Net increase (decrease) in net assets applicable to common shares | | | (6,109,056 | ) | | 20,301,673 | | | (141,441 | ) | | (133,077 | ) |
| Net assets applicable to common shares at the beginning of period | | | 688,971,263 | | | 668,669,590 | | | 25,296,972 | | | 25,430,049 | |
| Net assets applicable to common shares at the end of period | | $ | 682,862,207 | | $ | 688,971,263 | | $ | 25,155,531 | | $ | 25,296,972 | |
| Undistributed (Over-distribution of) net investment income at the end of period | | $ | 713,075 | | $ | 1,655,681 | | $ | 108,069 | | $ | 109,501 | |
See accompanying notes to financial statements.
Statement of Changes in Net Assets (Unaudited) (continued)
| | | Pennsylvania Quality | | Pennsylvania Municipal |
| | | Income (NQP) | | Value (NPN) |
| | | | Six Months | | | Year | | | Six Months | | | Year | |
| | | | Ended | | | Ended | | | Ended | | | Ended | |
| | | | 10/31/16 | | | 4/30/16 | | | 10/31/16 | | | 4/30/16 | |
| Operations | | | | | | | | | | | | | |
| Net investment income (loss) | | $ | 13,345,286 | | $ | 30,318,912 | | $ | 380,950 | | $ | 827,936 | |
| Net realized gain (loss) from: | | | | | | | | | | | | | |
| Investments | | | 2,342,735 | | | 1,035,292 | | | 307,020 | | | 334,215 | |
| Swaps | | | — | | | — | | | — | | | — | |
| Change in net unrealized appreciation (depreciation) of: | | | | | | | | | | | | | |
| Investments | | | (11,903,072 | ) | | 16,309,552 | | | (541,759 | ) | | (226,671 | ) |
| Swaps | | | 223,826 | | | — | | | — | | | — | |
| Net increase (decrease) in net assets applicable to common shares from operations | | | 4,008,775 | | | 47,663,756 | | | 146,211 | | | 935,480 | |
| Distributions to Common Shareholders | | | | | | | | | | | | | |
| From net investment income | | | (14,327,963 | ) | | (31,373,686 | ) | | (380,507 | ) | | (769,533 | ) |
| From accumulated net realized gains | | | — | | | — | | | — | | | — | |
| Decrease in net assets applicable to common shares from distributions to common shareholders | | | (14,327,963 | ) | | (31,373,686 | ) | | (380,507 | ) | | (769,533 | ) |
| Capital Share Transactions | | | | | | | | | | | | | |
| Common shares: | | | | | | | | | | | | | |
| Net proceeds from shares issued to shareholders due to reinvestment of distributions | | | — | | | — | | | 7,582 | | | — | |
| Cost of shares repurchased and retired | | | — | | | (1,589,406 | ) | | — | | | — | |
| Net increase (decrease) in net assets applicable to common shares from capital share transactions | | | — | | | (1,589,406 | ) | | 7,582 | | | — | |
| Net increase (decrease) in net assets applicable to common shares | | | (10,319,188 | ) | | 14,700,664 | | | (226,714 | ) | | 165,947 | |
| Net assets applicable to common shares at the beginning of period | | | 607,240,246 | | | 592,539,582 | | | 20,118,076 | | | 19,952,129 | |
| Net assets applicable to common shares at the end of period | | $ | 596,921,058 | | $ | 607,240,246 | | $ | 19,891,362 | | $ | 20,118,076 | |
| Undistributed (Over-distribution of) net investment income at the end of period | | $ | (1,395,542 | ) | $ | (412,865 | ) | $ | 211,172 | | $ | 210,729 | |
See accompanying notes to financial statements.
| Statement of | | |
| | Cash Flows | Six Months Ended October 31, 2016 (Unaudited) |
| | | | New Jersey | | | Pennsylvania | |
| | | | Quality | | | Quality | |
| | | | Income | | | Income | |
| | | | (NXJ | ) | | (NQP | ) |
| Cash Flows from Operating Activities: | | | | | | | |
| Net Increase (Decrease) in Net Assets Applicable to Common Shares from Operations | | $ | 10,243,461 | | $ | 4,008,775 | |
| Adjustments to reconcile the net increase (decrease) in net assets applicable to common shares from operations to net cash provided by (used in) operating activities: | | | | | | | |
| Purchases of investments | | | (69,290,681 | ) | | (164,662,792 | ) |
| Proceeds from sales and maturities of investments | | | 77,559,928 | | | 99,657,484 | |
| Proceeds from (Payments for) swap contracts, net | | | (4,000,000 | ) | | — | |
| Taxes paid | | | (50 | ) | | (79 | ) |
| Amortization (Accretion) of premiums and discounts, net | | | 463,447 | | | 778,792 | |
| Amortization of deferred offering costs | | | 30,390 | | | 173,287 | |
| (Increase) Decrease in: | | | | | | | |
| Receivable for interest | | | 352,702 | | | (49,845 | ) |
| Receivable for investments sold | | | (201,981 | ) | | 5,310,798 | |
| Other assets | | | 1,963 | | | 2,648 | |
| Increase (Decrease) in: | | | | | | | |
| Payable for interest | | | — | | | 126,603 | |
| Payable for investments purchased | | | (3,572,885 | ) | | 6,551,018 | |
| Accrued management fees | | | 16,452 | | | 30,225 | |
| Accrued professional fees | | | (43,921 | ) | | (329,887 | ) |
| Accrued Trustees fees | | | 8,639 | | | 7,544 | |
| Accrued other expenses | | | 96,253 | | | 356,977 | |
| Net realized gain (loss) from: | | | | | | | |
| Investments | | | (1,316,653 | ) | | (2,342,735 | ) |
| Swaps | | | 4,000,000 | | | — | |
| Change in net unrealized appreciation (depreciation) of: | | | | | | | |
| Investments | | | 6,297,108 | | | 11,903,072 | |
| Swaps | | | (3,814,005 | ) | | (223,826 | ) |
| Net cash provided by (used in) operating activities | | | 16,830,167 | | | (38,701,941 | ) |
| Cash Flows from Financing Activities: | | | | | | | |
| (Payments for) deferred offering costs | | | — | | | (145,000 | ) |
| Proceeds from VMTP Shares issued, at liquidation preference | | | — | | | 39,000,000 | |
| Increase (Decrease) in: | | | | | | | |
| Cash overdraft | | | — | | | (2,871,672 | ) |
| Floating rate obligations | | | — | | | 21,185,000 | |
| Payable for offering costs | | | — | | | 111,445 | |
| Cash distributions paid to common shareholders | | | (16,641,066 | ) | | (14,580,313 | ) |
| Net cash provided by (used in) financing activities | | | (16,641,066 | ) | | 42,699,460 | |
| Net Increase (Decrease) in Cash | | | 189,101 | | | 3,997,519 | |
| Cash at the beginning of period | | | 356,156 | | | — | |
| Cash at the end of period | | $ | 545,257 | | $ | 3,997,519 | |
| | | | New Jersey | | | Pennsylvania | |
| | | | Quality | | | Quality | |
| | | | Income | | | Income | |
| Supplemental Disclosure of Cash Flow Information | | | (NXJ | ) | | (NQP | ) |
| Cash paid for interest (excluding amortization of offering costs) | | $ | 1,019,916 | | $ | 1,230,031 | |
See accompanying notes to financial statements.
| Financial | |
| | Highlights (Unaudited) |
Selected data for a common share outstanding throughout each period:
| | | | | | Investment Operations | | Less Distributions to
Common Shareholders | | Common Share |
| | | | Beginning
Common
Share
NAV | | | Net
Investment
Income
(Loss | ) | | Net
Realized/
Unrealized
Gain (Loss | ) | | Total | | | From
Net
Investment
Income | | | From
Accum-
ulated
Net
Realized
Gains | | | Total | | | Discount
Per
Share
Repurchased
and Retired | | | Ending
NAV | | | Ending
Share
Price | |
| New Jersey Quality Income (NXJ) | | | | | | | | | | | | | | | | | | | | | | |
| Year Ended 4/30: | | | | | | | | | | | | | | | | | | | | | | |
| 2017(e) | | $ | 16.18 | | $ | 0.36 | | $ | (0.12 | ) | $ | 0.24 | | $ | (0.38 | ) | $ | — | | $ | (0.38 | ) | $ | — | | $ | 16.04 | | $ | 14.12 | |
| 2016 | | | 15.53 | | | 0.79 | | | 0.66 | | | 1.45 | | | (0.82 | ) | | (0.01 | ) | | (0.83 | ) | | 0.03 | | | 16.18 | | | 14.66 | |
| 2015 | | | 15.28 | | | 0.67 | | | 0.34 | | | 1.01 | | | (0.77 | ) | | — | | | (0.77 | ) | | 0.01 | | | 15.53 | | | 13.58 | |
| 2014 | | | 16.12 | | | 0.71 | | | (0.87 | ) | | (0.16 | ) | | (0.68 | ) | | — | | | (0.68 | ) | | —* | | | 15.28 | | | 13.64 | |
| 2013 | | | 15.31 | | | 0.63 | | | 0.93 | | | 1.56 | | | (0.75 | ) | | — | | | (0.75 | ) | | — | | | 16.12 | | | 14.94 | |
| 2012 | | | 13.61 | | | 0.71 | | | 1.83 | | | 2.54 | | | (0.83 | ) | | (0.01 | ) | | (0.84 | ) | | — | | | 15.31 | | | 14.92 | |
| | | | | | | | | | | | | | | | | | | | | | | | | | | | | | | | |
| New Jersey Municipal Value (NJV) | | | | | | | | | | | | | | | | | | | | | | |
| Year Ended 4/30: | | | | | | | | | | | | | | | | | | | | | | |
| 2017(e) | | | 16.32 | | | 0.29 | | | (0.09 | ) | | 0.20 | | | (0.29 | ) | | — | | | (0.29 | ) | | — | | | 16.23 | | | 16.25 | |
| 2016 | | | 16.41 | | | 0.62 | | | 0.11 | | | 0.73 | | | (0.61 | ) | | (0.21 | ) | | (0.82 | ) | | — | | | 16.32 | | | 15.16 | |
| 2015 | | | 16.15 | | | 0.62 | | | 0.43 | | | 1.05 | | | (0.63 | ) | | (0.18 | ) | | (0.81 | ) | | 0.02 | | | 16.41 | | | 14.75 | |
| 2014 | | | 16.98 | | | 0.65 | | | (0.66 | ) | | (0.01 | ) | | (0.63 | ) | | (0.19 | ) | | (0.82 | ) | | — | | | 16.15 | | | 14.48 | |
| 2013 | | | 16.62 | | | 0.67 | | | 0.61 | | | 1.28 | | | (0.67 | ) | | (0.25 | ) | | (0.92 | ) | | — | | | 16.98 | | | 16.02 | |
| 2012 | | | 14.72 | | | 0.75 | | | 1.91 | | | 2.66 | | | (0.76 | ) | | — | | | (0.76 | ) | | — | | | 16.62 | | | 16.34 | |
| (a) | Total Return Based on Common Share NAV is the combination of changes in common share NAV, reinvested dividend income at NAV and reinvested capital gains distributions at NAV, if any. The last dividend declared in the period, which is typically paid on the first business day of the following month, is assumed to be reinvested at the ending NAV. The actual reinvest price for the last dividend declared in the period may often be based on the Fund's market price (and not its NAV), and therefore may be different from the price used in the calculation. Total returns are not annualized. |
| | |
| | Total Return Based on Common Share Price is the combination of changes in the market price per share and the effect of reinvested dividend income and reinvested capital gains distributions, if any, at the average price paid per share at the time of reinvestment. The last dividend declared in the period, which is typically paid on the first business day of the following month, is assumed to be reinvested at the ending market price. The actual reinvestment for the last dividend declared in the period may take place over several days, and in some instances may not be based on the market price, so the actual reinvestment price may be different from the price used in the calculation. Total returns are not annualized. |
| | | | | | | | | | Common Share Supplemental Data/
Ratios Applicable to Common Shares |
| | | Common Share
Total Returns | | | | Ratios to Average Net Assets(b) | | | |
| | | | Based
on
NAV | (a) | | Based
on
Share
Price | (a) | | Ending
Net
Assets
(000 | ) | | Expenses | (c) | | Net
Investment
Income (Loss | ) | | Portfolio
Turnover
Rate | (d) |
| | | | | | | | | | | | | | | | | | | | |
| | | | | | | | | | | | | | | | | | | | |
| | | | 1.47 | % | | (1.19 | )% | $ | 682,862 | | | 1.72 | %** | | 4.37 | %** | | 7 | % |
| | | | 9.85 | | | 14.79 | | | 688,971 | | | 1.56 | | | 5.12 | | | 14 | |
| | | | 6.77 | | | 5.35 | | | 668,670 | | | 1.71 | | | 4.64 | | | 14 | |
| | | | (0.71 | ) | | (3.78 | ) | | 100,181 | | | 2.07 | | | 4.83 | | | 6 | |
| | | | 10.29 | | | 5.04 | | | 105,892 | | | 2.37 | | | 3.91 | | | 17 | |
| | | | 19.09 | | | 25.08 | | | 100,578 | | | 2.52 | | | 4.82 | | | 15 | |
| | | | | | | | | | | | | | | | | | | | |
| | | | | | | | | | | | | | | | | | | | |
| | | | 1.24 | | | 9.16 | | | 25,156 | | | 0.94 | ** | | 3.53 | ** | | 8 | |
| | | | 4.57 | | | 8.70 | | | 25,297 | | | 0.89 | | | 3.87 | | | 8 | |
| | | | 6.68 | | | 7.62 | | | 25,430 | | | 0.87 | | | 3.75 | | | 13 | |
| | | | 0.25 | | | (4.18 | ) | | 25,272 | | | 0.88 | | | 4.12 | | | 12 | |
| | | | 7.86 | | | 3.58 | | | 26,574 | | | 0.83 | | | 3.95 | | | 7 | |
| | | | 18.43 | | | 24.34 | | | 25,957 | | | 0.85 | | | 4.76 | | | 20 | |
| (b) | Net Investment Income (Loss) ratios reflect income earned and expenses incurred on assets attributable to preferred shares issued by the Fund, where applicable. |
| (c) | The expense ratios reflect, among other things, all interest expense and other costs related to preferred shares (as described in Note 4 – Fund Shares, Preferred Shares) and/or the interest expense deemed to have been paid by the Fund on the floating rate certificates issued by the special purpose trusts for the self-deposited inverse floaters held by the Fund (as described in Note 3 – Portfolio Securities and Investments in Derivatives, Inverse Floating Rate Securities), where applicable, as follows: |
| New Jersey Quality Income (NXJ) | | | | |
| Year Ended 4/30: | | | | |
| 2017(e) | | | 0.78 | %** |
| 2016 | | | 0.57 | |
| 2015 | | | 0.60 | |
| 2014 | | | 0.98 | |
| 2013 | | | 1.27 | |
| 2012 | | | 1.41 | |
| New Jersey Municipal Value (NJV) | | | | |
| Year Ended 4/30: | | | | |
| 2017(e) | | | 0.06 | %** |
| 2016 | | | 0.04 | |
| 2015 | | | 0.04 | |
| 2014 | | | 0.04 | |
| 2013 | | | 0.04 | |
| 2012 | | | 0.04 | |
| (d) | Portfolio Turnover Rate is calculated based on the lesser of long-term purchases or sales (as disclosed in Note 5 – Investment Transactions) divided by the average long-term market value during the period. |
| (e) | For the six months ended October 31, 2016. |
| * | Rounds to less than $0.01 per share. |
| ** | Annualized. |
See accompanying notes to financial statements.
Financial Highlights (Unaudited) (continued)
Selected data for a common share outstanding throughout each period:
| | | | | | Investment Operations | | Less Distributions to
Common Shareholders | | Common Share |
| | | | Beginning
Common
Share
NAV | | | Net
Investment
Income
(Loss | ) | | Net
Realized/
Unrealized
Gain (Loss | ) | | Total | | | From
Net
Investment
Income | | | From
Accum-
ulated
Net
Realized
Gains | | | Total | | | Discount
Per
Share
Repurchased
and Retired | | | Ending
NAV | | | Ending
Share
Price | |
| Pennsylvania Quality Income (NQP) | | | | | | | | | | | | | | | | | | | |
| Year Ended 4/30: | | | | | | | | | | | | | | | | | | | | | | | | | | | | | | | |
| 2017(e) | | $ | 16.08 | | $ | 0.35 | | $ | (0.24 | ) | $ | 0.11 | | $ | (0.38 | ) | $ | — | | $ | (0.38 | ) | $ | — | | $ | 15.81 | | $ | 13.96 | |
| 2016 | | | 15.64 | | | 0.80 | | | 0.46 | | | 1.26 | | | (0.83 | ) | | — | | | (0.83 | ) | | 0.01 | | | 16.08 | | | 14.91 | |
| 2015 | | | 15.17 | | | 0.81 | | | 0.50 | | | 1.31 | | | (0.84 | ) | | — | | | (0.84 | ) | | — | * | | 15.64 | | | 13.87 | |
| 2014 | | | 16.21 | | | 0.74 | | | (0.93 | ) | | (0.19 | ) | | (0.85 | ) | | — | | | (0.85 | ) | | — | * | | 15.17 | | | 13.76 | |
| 2013 | | | 15.78 | | | 0.80 | | | 0.54 | | | 1.34 | | | (0.91 | ) | | — | | | (0.91 | ) | | — | | | 16.21 | | | 15.24 | |
| 2012 | | | 14.11 | | | 0.90 | | | 1.70 | | | 2.60 | | | (0.93 | ) | | — | | | (0.93 | ) | | — | | | 15.78 | | | 15.67 | |
| | | | | | | | | | | | | | | | | | | | | | | | | | | | | | | | |
| Pennsylvania Municipal Value (NPN) | | | | | | | | | | | | | | | | | | | |
| Year Ended 4/30: | | | | | | | | | | | | | | | | | | | | | | | | | | | | | | | |
| 2017(e) | | | 16.50 | | | 0.31 | | | (0.19 | ) | | 0.12 | | | (0.31 | ) | | — | | | (0.31 | ) | | — | | | 16.31 | | | 16.65 | |
| 2016 | | | 16.36 | | | 0.68 | | | 0.09 | | | 0.77 | | | (0.63 | ) | | — | | | (0.63 | ) | | — | | | 16.50 | | | 16.45 | |
| 2015 | | | 15.91 | | | 0.67 | | | 0.41 | | | 1.08 | | | (0.63 | ) | | — | | | (0.63 | ) | | — | | | 16.36 | | | 15.57 | |
| 2014 | | | 16.48 | | | 0.67 | | | (0.56 | ) | | 0.11 | | | (0.64 | ) | | (0.04 | ) | | (0.68 | ) | | — | | | 15.91 | | | 14.45 | |
| 2013 | | | 16.36 | | | 0.68 | | | 0.38 | | | 1.06 | | | (0.64 | ) | | (0.30 | ) | | (0.94 | ) | | — | | | 16.48 | | | 15.86 | |
| 2012 | | | 14.79 | | | 0.72 | | | 1.58 | | | 2.30 | | | (0.71 | ) | | (0.02 | ) | | (0.73 | ) | | — | | | 16.36 | | | 15.38 | |
| (a) | Total Return Based on Common Share NAV is the combination of changes in common share NAV, reinvested dividend income at NAV and reinvested capital gains distributions at NAV, if any. The last dividend declared in the period, which is typically paid on the first business day of the following month, is assumed to be reinvested at the ending NAV. The actual reinvest price for the last dividend declared in the period may often be based on the Fund's market price (and not its NAV), and therefore may be different from the price used in the calculation. Total returns are not annualized. |
| | Total Return Based on Common Share Price is the combination of changes in the market price per share and the effect of reinvested dividend income and reinvested capital gains distributions, if any, at the average price paid per share at the time of reinvestment. The last dividend declared in the period, which is typically paid on the first business day of the following month, is assumed to be reinvested at the ending market price. The actual reinvestment for the last dividend declared in the period may take place over several days, and in some instances may not be based on the market price, so the actual reinvestment price may be different from the price used in the calculation. Total returns are not annualized. |
| | | | | | | | | Common Share Supplemental Data/
Ratios Applicable to Common Shares |
| | | Common Share
Total Returns | | | | Ratios to Average Net Assets(b) | | | |
| | | | | | | | | | | | | | | | | | | | |
| | | | Based
on
NAV | (a) | | Based
on
Share
Price | (a) | | Ending
Net
Assets
(000) | | | Expenses | (c) | | Net
Investment
Income (Loss) | | | Portfolio
Turnover
Rate | (d) |
| | | | | | | | | | | | | | | | | | | | |
| | | | | | | | | | | | | | | | | | | | |
| | | | 0.57 | % | | (3.99 | )% | $ | 596,921 | | | 1.81 | %** | | 4.31 | %** | | 11 | % |
| | | | 8.46 | | | 14.21 | | | 607,240 | | | 1.51 | | | 5.13 | | | 16 | |
| | | | 8.79 | | | 7.09 | | | 592,540 | | | 1.60 | | | 5.21 | | | 9 | |
| | | | (0.69 | ) | | (3.65 | ) | | 574,558 | | | 1.87 | | | 5.33 | | | 8 | |
| | | | 8.50 | | | 2.97 | | | 261,195 | | | 1.80 | | | 4.98 | | | 17 | |
| | | | 18.88 | | | 27.48 | | | 253,937 | | | 1.63 | | | 6.00 | | | 18 | |
| | | | | | | | | | | | | | | | | | | | |
| | | | | | | | | | | | | | | | | | | | |
| | | | 0.72 | | | 3.16 | | | 19,891 | | | 0.89 | ** | | 3.74 | ** | | 13 | |
| | | | 4.82 | | | 10.09 | | | 20,118 | | | 0.85 | | | 4.17 | | | 14 | |
| | | | 6.87 | | | 12.30 | | | 19,952 | | | 0.85 | | | 4.11 | | | 5 | |
| | | | 0.80 | | | (4.45 | ) | | 19,401 | | | 0.85 | | | 4.28 | | | 6 | |
| | | | 6.58 | | | 9.39 | | | 20,089 | | | 0.81 | | | 4.11 | | | 7 | |
| | | | 15.89 | | | 15.68 | | | 19,948 | | | 0.86 | | | 4.60 | | | 11 | |
| (b) | Net Investment Income (Loss) ratios reflect income earned and expenses incurred on assets attributable to preferred shares issued by the Fund, where applicable. |
| (c) | The expense ratios reflect, among other things, all interest expense and other costs related to preferred shares (as described in Note 4 – Fund Shares, Preferred Shares) and/or the interest expense deemed to have been paid by the Fund on the floating rate certificates issued by the special purpose trusts for the self-deposited inverse floaters held by the Fund (as described in Note 3 – Portfolio Securities and Investments in Derivatives, Inverse Floating Rate Securities), where applicable, as follows: |
| Pennsylvania Quality Income (NQP) | | | | |
| Year Ended 4/30: | | | | |
| 2017(e) | | | 0.85 | %** |
| 2016 | | | 0.56 | |
| 2015 | | | 0.60 | |
| 2014 | | | 0.68 | |
| 2013 | | | 0.72 | |
| 2012 | | | 0.61 | |
| Pennsylvania Municipal Value (NPN) | | | | |
| Year Ended 4/30: | | | | |
| 2017(e) | | | 0.00 | %*** |
| 2016 | | | — | |
| 2015 | | | — | |
| 2014 | | | — | |
| 2013 | | | — | |
| 2012 | | | — | |
| (d) | Portfolio Turnover Rate is calculated based on the lesser of long-term purchases or sales (as disclosed in Note 5 – Investment Transactions) divided by the average long-term market value during the period. |
| (e) | For the six months ended October 31, 2016. |
| * | Rounds to less than $0.01 per share. |
| ** | Annualized. |
| *** | Annualized ratio rounds to less than 0.01%. |
See accompanying notes to financial statements.
Financial Highlights (Unaudited) (continued)
| | | MTP Shares
at the End of Period(a) | | VMTP Shares
at the End of Period | | VRDP Shares
at the End of Period | | MTP, VMTP and/or
VRDP Shares at
the End of Period |
| | | | Aggregate
Amount
Outstanding
(000) | | | Asset
Coverage
Per $10
Share | | | Aggregate
Amount
Outstanding
(000) | | | Asset
Coverage
Per $100,000
Share | | | Aggregate
Amount
Outstanding
(000) | | | Asset
Coverage
Per $100,000
Share | | | Asset
Coverage
Per $1
Liquidation
Preference | |
| New Jersey Quality Income (NXJ) | | | | | | | | | | | | | | | | |
| Year Ended 4/30: | | | | | | | | | | | | | | | | |
| 2017(b) | | $ | — | | $ | — | | $ | — | | $ | — | | $ | 313,900 | | $ | 317,541 | | $ | — | |
| 2016 | | | — | | | — | | | — | | | — | | | 313,900 | | | 319,488 | | | — | |
| 2015 | | | — | | | — | | | — | | | — | | | 313,900 | | | 313,020 | | | — | |
| 2014 | | | — | | | — | | | — | | | — | | | 45,000 | | | 322,624 | | | — | |
| 2013 | | | 44,861 | | | 33.60 | | | — | | | — | | | — | | | — | | | — | |
| 2012 | | | 44,861 | | | 32.42 | | | — | | | — | | | — | | | — | | | — | |
| | | | | | | | | | | | | | | | | | | | | | | |
| Pennsylvania Quality Income (NQP) | | | | | | | | | | | | | | | | |
| Year Ended 4/30: | | | | | | | | | | | | | | | | |
| 2017(b) | | | — | | | — | | | 87,000 | | | 296,033 | | | 217,500 | | | 296,033 | | | 2.96 | |
| 2016 | | | — | | | — | | | 48,000 | | | 328,716 | | | 217,500 | | | 328,716 | | | 3.29 | |
| 2015 | | | — | | | — | | | 48,000 | | | 323,179 | | | 217,500 | | | 323,179 | | | 3.23 | |
| 2014 | | | 47,740 | | | 31.66 | | | — | | | — | | | 217,500 | | | 316,618 | | | 3.17 | |
| 2013 | | | — | | | — | | | — | | | — | | | 112,500 | | | 332,174 | | | — | |
| 2012 | | | — | | | — | | | — | | | — | | | 112,500 | | | 325,722 | | | — | |
| (a) | The Ending and Average Market Value Per Share for each Series of the Fund's MTP Shares were as follows: |
| | | | 2015 | | | 2014 | | | 2013 | | | 2012 | |
| New Jersey Quality Income (NXJ) | | | | | | | | | | | | | |
| Series 2014 (NXJ PRCCL) | | | | | | | | | | | | | |
| Ending Market Value per Share | | $ | — | | $ | — | | $ | 10.02 | | $ | 10.08 | |
| Average Market Value per Share | | | — | | | 10.03 | ^ | | 10.09 | | | 10.07 | |
| Series 2015 (NXJ PRCCL) | | | | | | | | | | | | | |
| Ending Market Value per Share | | | — | | | | | | | | | | |
| Average Market Value per Share | | | 10.01 | ^^ | | | | | | | | | |
| | | | | | | | | | | | | | |
| Pennsylvania Quality Income (NQP) | | | | | | | | | | | | | |
| Series 2015 (NQP PRCCL) | | | | | | | | | | | | | |
| Ending Market Value per Share | | | — | | | 10.05 | | | | | | | |
| Average Market Value per Share | | | 10.01 | ΩΩ | | 10.03 | Ω | | | | | | |
| Series 2015 (NQP PRDCL) | | | | | | | | | | | | | |
| Ending Market Value per Share | | | — | | | 10.04 | | | | | | | |
| Average Market Value per Share | | | 10.02 | ΩΩ | | 10.03 | Ω | | | | | | |
| (b) | For the six months ended October 31, 2016. |
| ^ | For the period May 1, 2013 through September 9, 2013. |
| ^^ | For the period November 10, 2014 (effective date of the reorganizations) through February 9, 2015. |
| Ω | For the period February 11, 2014 (effective date of the reorganizations) through April 30, 2014. |
| ΩΩ | For the period May 1, 2014 through May 30, 2014. |
See accompanying notes to financial statements.
Notes to Financial Statements (Unaudited)
1. General Information and Significant Accounting Policies
General Information
Fund Information
The funds covered in this report and their corresponding New York Stock Exchange ("NYSE") or NYSE MKT symbols are as follows (each a "Fund" and collectively, the "Funds"):
| | • | Nuveen New Jersey Quality Municipal Income Fund (NXJ) ("New Jersey Quality Income (NXJ)") |
| | • | Nuveen New Jersey Municipal Value Fund (NJV) ("New Jersey Municipal Value (NJV)") |
| | • | Nuveen Pennsylvania Quality Municipal Income Fund (NQP) ("Pennsylvania Quality Income (NQP)") |
| | • | Nuveen Pennsylvania Municipal Value Fund (NPN) ("Pennsylvania Municipal Value (NPN)") |
The Funds are registered under the Investment Company Act of 1940, as amended, as diversified closed-end management investment companies. Common shares of New Jersey Quality Income (NXJ) and Pennsylvania Quality Income (NQP) are traded on the NYSE while common shares of New Jersey Municipal Value (NJV) and Pennsylvania Municipal Value (NPN) are traded on the NYSE MKT. New Jersey Quality Income (NXJ), New Jersey Municipal Value (NJV), Pennsylvania Quality Income (NQP) and Pennsylvania Municipal Value (NPN) were organized as Massachusetts business trusts on June 1, 1999, January 26, 2009, December 20, 1990 and January 26, 2009, respectively.
The end of the reporting period for the Funds is October 31, 2016, and the period covered by these Notes to Financial Statements is the six months ended October 31, 2016 (the "current fiscal period").
Effective December 28, 2016, subsequent to the end of the reporting period, New Jersey Quality Income (NXJ) changed its name from Nuveen New Jersey Dividend Advantage Municipal Fund ("New Jersey Dividend Advantage") and Pennsylvania Quality Income (NQP) changed its name from Nuveen Pennsylvania Investment Quality Municipal Fund ("Pennsylvania Investment Quality").
Investment Adviser
The Funds' investment adviser is Nuveen Fund Advisors, LLC (the "Adviser"), a wholly-owned subsidiary of Nuveen Investments, Inc. ("Nuveen"). Nuveen is an operating division of TIAA Global Asset Management. The Adviser has overall responsibility for management of the Funds, oversees the management of the Funds' portfolios, manages the Funds' business affairs and provides certain clerical, bookkeeping and other administrative services, and, if necessary, asset allocation decisions. The Adviser has entered into sub-advisory agreements with Nuveen Asset Management, LLC (the "Sub-Adviser"), a subsidiary of the Adviser, under which the Sub-Adviser manages the investment portfolios of the Funds.
Investment Objectives and Principal Investment Strategies
Each Fund seeks to provide current income exempt from both regular federal and designated state income taxes by investing primarily in a portfolio of municipal obligations issued by state and local government authorities within a single state or certain U.S. territories.
Effective August 5, 2016, New Jersey Quality Income (NXJ) and Pennsylvania Quality Income (NQP) have added an investment policy to limit the amount of securities subject to the alternative minimum tax ("AMT") to no more than 20% of each Fund's managed assets (as defined in Note 7 – Management Fees and Other Transactions with Affiliates).
Significant Accounting Policies
Each Fund is an investment company and follows accounting and reporting guidance under Financial Accounting Standards Board (FASB) Accounting Standards Codification (ASC) Topic 946, "Financial Services – Investment Companies." The following is a summary of significant accounting policies followed by the Funds in the preparation of their financial statements in accordance with U.S. generally accepted accounting principles ("U.S. GAAP").
Investment Transactions
Investment transactions are recorded on a trade date basis. Realized gains and losses from investment transactions are determined on the specific identification method, which is the same basis used for federal income tax purposes. Investments purchased on a when-issued/delayed delivery basis may have extended settlement periods. Any investments so purchased are subject to market fluctuation during this period. The Funds have earmarked securities in their portfolios with a current value at least equal to the amount of the when-issued/delayed delivery purchase commitments.
Notes to Financial Statements (Unaudited) (continued)
As of the end of the reporting period, the following Funds' outstanding when-issued/delayed delivery purchase commitments were as follows:
| | | | New Jersey | | | Pennsylvania | |
| | | | Quality | | | Quality | |
| | | | Income | | | Income | |
| | | | (NXJ | ) | | (NQP | ) |
| Outstanding when-issued/delayed delivery purchase commitments | | $ | 4,441,900 | | $ | 6,551,018 | |
Investment Income
Dividend income is recorded on the ex-dividend date. Investment income, which reflects the amortization of premiums and accretion of discounts for financial reporting purposes, is recorded on an accrual basis. Investment income also reflects paydown gains and losses, if any.
Professional Fees
Professional fees presented on the Statement of Operations consist of legal fees incurred in the normal course of operations, audit fees, tax consulting fees and, in some cases, workout expenditures. Workout expenditures are incurred in an attempt to protect or enhance an investment or to pursue other claims or legal actions on behalf of Fund shareholders. If a refund is received for workout expenditures paid in a prior reporting period, such amounts will be recognized as "Legal fee refund" on the Statement of Operations.
Dividends and Distributions to Common Shareholders
Dividends from net investment income, if any, are declared monthly. Net realized capital gains and/or market discount from investment transactions, if any, are distributed to shareholders at least annually. Furthermore, capital gains are distributed only to the extent they exceed available capital loss carryforwards.
Distributions to common shareholders of net investment income, net realized capital gains and/or market discount, if any, are recorded on the ex-dividend date. The amount and timing of distributions are determined in accordance with federal income tax regulations, which may differ from U.S. GAAP.
Indemnifications
Under the Funds' organizational documents, their officers and trustees are indemnified against certain liabilities arising out of the performance of their duties to the Funds. In addition, in the normal course of business, the Funds enter into contracts that provide general indemnifications to other parties. The Funds' maximum exposure under these arrangements is unknown as this would involve future claims that may be made against the Funds that have not yet occurred. However, the Funds have not had prior claims or losses pursuant to these contracts and expect the risk of loss to be remote.
Netting Agreements
In the ordinary course of business, the Funds may enter into transactions subject to enforceable International Swaps and Derivative Association, Inc. ("ISDA") master agreements or other similar arrangements ("netting agreements"). Generally, the right to offset in netting agreements allows each Fund to offset certain securities and derivatives with a specific counterparty, when applicable, as well as any collateral received or delivered to that counterparty based on the terms of the agreements. Generally, each Fund manages its cash collateral and securities collateral on a counterparty basis.
The Funds' investments subject to netting agreements as of the end of the reporting period, if any, are further described in Note 3 – Portfolio Securities and Investments in Derivatives.
Use of Estimates
The preparation of financial statements in conformity with U.S. GAAP requires management to make estimates and assumptions that affect the reported amounts of assets and liabilities at the date of the financial statements and the reported amounts of increases and decreases in net assets applicable to common shares from operations during the reporting period. Actual results may differ from those estimates.
2. Investment Valuation and Fair Value Measurements
The fair valuation input levels as described below are for fair value measurement purposes.
Fair value is defined as the price that would be received upon selling an investment or transferring a liability in an orderly transaction to an independent buyer in the principal or most advantageous market for the investment. A three-tier hierarchy is used to maximize the use of observable market data and minimize the use of unobservable inputs and to establish classification of fair value measurements for disclosure purposes. Observable inputs reflect the assumptions market participants would use in pricing the asset or liability. Observable inputs are based on market data obtained from sources independent of the reporting entity. Unobservable inputs reflect the reporting entity's own assumptions about the assumptions market participants would use in pricing the asset or liability. Unobservable inputs are based on the best information available in the circumstances. The following is a summary of the three-tiered hierarchy of valuation input levels.
| | Level 1 – | Inputs are unadjusted and prices are determined using quoted prices in active markets for identical securities. |
| | Level 2 – | Prices are determined using other significant observable inputs (including quoted prices for similar securities, interest rates, prepayment speeds, credit risk, etc.). |
| | Level 3 – | Prices are determined using significant unobservable inputs (including management's assumptions in determining the fair value of investments). |
Prices of fixed income securities are provided by an independent pricing service ("pricing service") approved by the Funds' Board of Trustees (the "Board"). The pricing service establishes a security's fair value using methods that may include consideration of the following: yields or prices of investments of comparable quality, type of issue, coupon, maturity and rating, market quotes or indications of value from security dealers, evaluations of anticipated cash flows or collateral, general market conditions and other information and analysis, including the obligor's credit characteristics considered relevant. These securities are generally classified as Level 2. In pricing certain securities, particularly less liquid and lower quality securities, the pricing service may consider information about a security, its issuer or market activity, provided by the Adviser. These securities are generally classified as Level 2 or Level 3 depending on the observability of the significant inputs.
Prices of swap contracts are also provided by a pricing service approved by the Board using the same methods as described above and are generally classified as Level 2.
Common stocks and other equity-type securities are valued at the last sales price on the securities exchange on which such securities are primarily traded and are generally classified as Level 1. Securities primarily traded on the NASDAQ National Market ("NASDAQ") are valued at the NASDAQ Official Closing Price and are generally classified as Level 1. However, securities traded on a securities exchange or NASDAQ for which there were no transactions on a given day or securities not listed on a securities exchange or NASDAQ are valued at the quoted bid price and are generally classified as Level 2.
Certain securities may not be able to be priced by the pre-established pricing methods as described above. Such securities may be valued by the Board and/or its appointee at fair value. These securities generally include, but are not limited to, restricted securities (securities which may not be publicly sold without registration under the Securities Act of 1933, as amended) for which a pricing service is unable to provide a market price; securities whose trading has been formally suspended; debt securities that have gone into default and for which there is no current market quotation; a security whose market price is not available from a pre-established pricing source; a security with respect to which an event has occurred that is likely to materially affect the value of the security after the market has closed but before the calculation of a Fund's net asset value ("NAV") (as may be the case in non-U.S. markets on which the security is primarily traded) or make it difficult or impossible to obtain a reliable market quotation; and a security whose price, as provided by the pricing service, is not deemed to reflect the security's fair value. As a general principle, the fair value of a security would appear to be the amount that the owner might reasonably expect to receive for it in a current sale. A variety of factors may be considered in determining the fair value of such securities, which may include consideration of the following: yields or prices of investments of comparable quality, type of issue, coupon, maturity and rating, market quotes or indications of value from security dealers, evaluations of anticipated cash flows or collateral, general market conditions and other information and analysis, including the obligor's credit characteristics considered relevant. These securities are generally classified as Level 2 or Level 3 depending on the observability of the significant inputs. Regardless of the method employed to value a particular security, all valuations are subject to review by the Board and/or its appointee.
The inputs or methodologies used for valuing securities are not an indication of the risks associated with investing in those securities. The following is a summary of each Fund's fair value measurements as of the end of the reporting period:
| New Jersey Quality Income (NXJ) | | | Level 1 | | | Level 2 | | | Level 3 | | | Total | |
| Long-Term Investments*: | | | | | | | | | | | | | |
| Municipal Bonds | | $ | — | | $ | 985,796,530 | | $ | — | | $ | 985,796,530 | |
| Common Stocks | | | 538,437 | | | — | | | — | | | 538,437 | |
| Investments in Derivatives: | | | | | | | | | | | | | |
| Interest Rate Swaps** | | | — | | | 997,038 | | | — | | | 997,038 | |
| Total | | $ | 538,437 | | $ | 986,793,568 | | $ | — | | $ | 987,332,005 | |
| New Jersey Municipal Value (NJV) | | | | | | | | | | | | | |
| Long-Term Investments*: | | | | | | | | | | | | | |
| Municipal Bonds | | $ | — | | $ | 25,095,997 | | $ | — | | $ | 25,095,997 | |
| Common Stocks | | | 609,325 | | | — | | | — | | | 609,325 | |
| Short-Term Investments*: | | | | | | | | | | | | | |
| Municipal Bonds | | | — | | | 400,000 | | | — | | | 400,000 | |
| Total | | $ | 609,325 | | $ | 25,495,997 | | $ | — | | $ | 26,105,322 | |
| Pennsylvania Quality Income (NQP) | | | | | | | | | | | | | |
| Long-Term Investments*: | | | | | | | | | | | | | |
| Municipal Bonds | | $ | — | | $ | 938,557,009 | | $ | — | | $ | 938,557,009 | |
| Investments in Derivatives: | | | | | | | | | | | | | |
| Interest Rate Swaps** | | | — | | | 223,826 | | | — | | | 223,826 | |
| Total | | $ | — | | $ | 938,780,835 | | $ | — | | $ | 938,780,835 | |
| Pennsylvania Municipal Value (NPN) | | | | | | | | | | | | | |
| Long-Term Investments*: | | | | | | | | | | | | | |
| Municipal Bonds | | $ | — | | $ | 19,595,251 | | $ | — | | $ | 19,595,251 | |
| * | Refer to the Fund's Portfolio of Investments for industry classifications. |
| ** | Represents net unrealized appreciation (depreciation) as reported in the Fund's Portfolio of Investments. |
Notes to Financial Statements (Unaudited) (continued)
The Board is responsible for the valuation process and has appointed the oversight of the daily valuation process to the Adviser's Valuation Committee. The Valuation Committee, pursuant to the valuation policies and procedures adopted by the Board, is responsible for making fair value determinations, evaluating the effectiveness of the Funds' pricing policies and reporting to the Board. The Valuation Committee is aided in its efforts by the Adviser's dedicated Securities Valuation Team, which is responsible for administering the daily valuation process and applying fair value methodologies as approved by the Valuation Committee. When determining the reliability of independent pricing services for investments owned by the Funds, the Valuation Committee, among other things, conducts due diligence reviews of the pricing services and monitors the quality of security prices received through various testing reports conducted by the Securities Valuation Team.
The Valuation Committee will consider pricing methodologies it deems relevant and appropriate when making a fair value determination, based on the facts and circumstances specific to the portfolio instrument. Fair value determinations generally will be derived as follows, using public or private market information:
| | (i) | If available, fair value determinations shall be derived by extrapolating from recent transactions or quoted prices for identical or comparable securities. |
| | | |
| | (ii) | If such information is not available, an analytical valuation methodology may be used based on other available information including, but not limited to: analyst appraisals, research reports, corporate action information, issuer financial statements and shelf registration statements. Such analytical valuation methodologies may include, but are not limited to: multiple of earnings, discount from market value of a similar freely-traded security, discounted cash flow analysis, book value or a multiple thereof, risk premium/yield analysis, yield to maturity and/or fundamental investment analysis. |
The purchase price of a portfolio instrument will be used to fair value the instrument only if no other valuation methodology is available or deemed appropriate, and it is determined that the purchase price fairly reflects the instrument's current value.
For each portfolio security that has been fair valued pursuant to the policies adopted by the Board, the fair value price is compared against the last available and next available market quotations. The Valuation Committee reviews the results of such testing and fair valuation occurrences are reported to the Board.
3. Portfolio Securities and Investments in Derivatives
Portfolio Securities
Inverse Floating Rate Securities
Each Fund is authorized to invest in inverse floating rate securities. An inverse floating rate security is created by depositing a municipal bond (referred to as an "Underlying Bond"), typically with a fixed interest rate, into a special purpose tender option bond ("TOB") trust (referred to as the "TOB Trust") created by or at the direction of one or more Funds. In turn, the TOB Trust issues (a) floating rate certificates (referred to as "Floaters") in face amounts equal to some fraction of the Underlying Bond's par amount or market value, and (b) an inverse floating rate certificate (referred to as an "Inverse Floater") that represents all remaining or residual interest in the TOB Trust. Floaters typically pay short-term tax-exempt interest rates to third parties who are also provided a right to tender their certificate and receive its par value, which may be paid from the proceeds of a remarketing of the Floaters, by a loan to the TOB Trust from a third party liquidity provider ("Liquidity Provider"), or by the sale of assets from the TOB Trust. The Inverse Floater is issued to a long term investor, such as one or more of the Funds. The income received by the Inverse Floater holder varies inversely with the short-term rate paid to holders of the Floaters, and in most circumstances the Inverse Floater holder bears substantially all of the Underlying Bond's downside investment risk and also benefits disproportionately from any potential appreciation of the Underlying Bond's value. The value of an Inverse Floater will be more volatile than that of the Underlying Bond because the interest rate is dependent on not only the fixed coupon rate of the Underlying Bond but also on the short-term interest paid on the Floaters, and because the Inverse Floater essentially bears the risk of loss (and possible gain) of the greater face value of the Underlying Bond.
The Inverse Floater held by a Fund gives the Fund the right to (a) cause the holders of the Floaters to tender their certificates at par (or slightly more than par in certain circumstances), and (b) have the trustee of the TOB Trust (the "Trustee") transfer the Underlying Bond held by the TOB Trust to the Fund, thereby collapsing the TOB Trust.
The Fund may acquire an Inverse Floater in a transaction where it (a) transfers an Underlying Bond that it owns to a TOB Trust created by a third party or (b) transfers an Underlying Bond that it owns, or that it has purchased in a secondary market transaction for the purpose of creating an Inverse Floater, to a TOB Trust created at its direction, and in return receives the Inverse Floater of the TOB Trust (referred to as a "self-deposited Inverse Floater"). A Fund may also purchase an Inverse Floater in a secondary market transaction from a third party creator of the TOB Trust without first owning the Underlying Bond (referred to as an "externally-deposited Inverse Floater").
An investment in a self-deposited Inverse Floater is accounted for as a "financing" transaction (i.e., a secured borrowing). For a self-deposited Inverse Floater, the Underlying Bond deposited into the TOB Trust is identified in the Fund's Portfolio of Investments as "(UB) – Underlying bond of an inverse floating rate trust reflected as a financing transaction," with the Fund recognizing as liabilities, labeled "Floating rate obligations" on the Statement of Assets and Liabilities, (a) the liquidation value of Floaters issued by the TOB Trust, and (b) the amount of any borrowings by the TOB Trust from a Liquidity Provider to enable the TOB Trust to purchase outstanding Floaters in lieu of a remarketing. In addition, the Fund recognizes in "Investment
Income" the entire earnings of the Underlying Bond, and recognizes (a) the interest paid to the holders of the Floaters or on the TOB Trust's borrowings, and (b) other expenses related to remarketing, administration, trustee, liquidity and other services to a TOB Trust, as a component of "Interest expense and amortization of offering costs" on the Statement of Operations.
In contrast, an investment in an externally-deposited Inverse Floater is accounted for as a purchase of the Inverse Floater and is identified in the Fund's Portfolio of Investments as "(IF) – Inverse floating rate investment." For an externally-deposited Inverse Floater, a Fund's Statement of Assets and Liabilities recognizes the Inverse Floater and not the Underlying Bond as an asset, and the Fund does not recognize the Floaters, or any related borrowings from a Liquidity Provider, as a liability. Additionally, the Fund reflects in "Investment Income" only the net amount of earnings on the Inverse Floater (net of the interest paid to the holders of the Floaters or the Liquidity Provider as lender, and the expenses of the Trust), and does not show the amount of that interest paid or the expenses of the TOB Trust as described above as interest expense on the Statement of Operations.
Fees paid upon the creation of a TOB Trust for self-deposited Inverse Floaters and externally-deposited Inverse Floaters are recognized as part of the cost basis of the Inverse Floater and are capitalized over the term of the TOB Trust.
As of the end of the reporting period, the aggregate value of Floaters issued by each Fund's TOB Trust for self-deposited Inverse Floaters and externally-deposited Inverse Floaters was as follows:
| | | | New Jersey | | | New Jersey | | | Pennsylvania | | | Pennsylvania | |
| | | | Quality | | | Municipal | | | Quality | | | Municipal | |
| | | | Income | | | Value | | | Income | | | Value | |
| Floating Rate Obligations Outstanding | | | (NXJ | ) | | (NJV | ) | | (NQP | ) | | (NPN | ) |
| Floating rate obligations: self-deposited Inverse Floaters | | $ | — | | $ | 1,500,000 | | $ | 50,255,000 | | $ | 300,000 | |
| Floating rate obligations: externally-deposited Inverse Floaters | | | 101,200,000 | | | 1,025,000 | | | 26,705,000 | | | 540,000 | |
| Total | | $ | 101,200,000 | | $ | 2,525,000 | | $ | 76,960,000 | | $ | 840,000 | |
During the current fiscal period, the average amount of Floaters (including any borrowings from a Liquidity Provider) outstanding, and the average annual interest rate and fees related to self-deposited Inverse Floaters, were as follows:
| | | | New Jersey | | | New Jersey | | | Pennsylvania | | | Pennsylvania | |
| | | | Quality | | | Municipal | | | Quality | | | Municipal | |
| | | | Income | | | Value | | | Income | | | Value | |
| Self-Deposited Inverse Floaters | | | (NXJ | ) | | (NJV | ) | | (NQP | ) | | (NPN | ) |
| Average floating rate obligations outstanding | | $ | — | | $ | 1,500,000 | | $ | 33,070,054 | | $ | 42,391 | |
| Average annual interest rate and fees | | | — | % | | 1.10 | % | | 1.07 | % | | 1.35 | % |
TOB Trusts are supported by a liquidity facility provided by a Liquidity Provider pursuant to which the Liquidity Provider agrees, in the event that Floaters are (a) tendered to the Trustee for remarketing and the remarketing does not occur, or (b) subject to mandatory tender pursuant to the terms of the TOB Trust agreement, to either purchase Floaters or to provide the Trustee with an advance from a loan facility to fund the purchase of Floaters by the TOB Trust. In certain circumstances, the Liquidity Provider may otherwise elect to have the Trustee sell the Underlying Bond to retire the Floaters that were tendered and not remarketed prior to providing such a loan. In these circumstances, the Liquidity Provider remains obligated to provide a loan to the extent that the proceeds of the sale of the Underlying Bond is not sufficient to pay the purchase price of the Floaters.
The size of the commitment under the loan facility for a given TOB Trust is at least equal to the balance of that TOB Trust's outstanding Floaters plus any accrued interest. In consideration of the loan facility, fee schedules are in place and are charged by the Liquidity Provider(s). Any loans made by the Liquidity Provider will be secured by the purchased Floaters held by the TOB Trust. Interest paid on any outstanding loan balances will be effectively borne by the Fund that owns the Inverse Floaters of the TOB Trust that has incurred the borrowing and may be at a rate that is greater than the rate that would have been paid had the Floaters been successfully remarketed.
As described above, any amounts outstanding under a liquidity facility are recognized as a component of "Floating rate obligations" on the Statement of Assets and Liabilities by the Fund holding the corresponding Inverse Floaters issued by the borrowing TOB Trust. As of the end of the reporting period, New Jersey Quality Income (NXJ) and New Jersey Municipal Value (NJV) had outstanding borrowings under such liquidity facilities in the amount of $20,232,349 and $425,893, respectively, which are recognized as a component of "Floating rate obligations" on the Statement of Assets and Liabilities. There were no loans outstanding under such facilities for any of the other Funds as of the end of the reporting period.
Each Fund may also enter into shortfall and forbearance agreements (sometimes referred to as a "recourse arrangement" or "credit recovery swap") (TOB Trusts involving such agreements are referred to herein as "Recourse Trusts"), under which a Fund agrees to reimburse the Liquidity Provider for the Trust's Floaters, in certain circumstances, for the amount (if any) by which the liquidation value of the Underlying Bond held by the TOB Trust may fall short of the sum of the liquidation value of the Floaters issued by the TOB Trust plus any amounts borrowed by the TOB Trust from the Liquidity Provider, plus any shortfalls in interest cash flows. Under these agreements, a Fund's potential exposure to losses related to or on an Inverse Floater may increase beyond the value of the Inverse Floater as a Fund may potentially be liable to fulfill all amounts owed to holders of the Floaters or the Liquidity Provider. Any such shortfall amount in the aggregate is recognized as "Unrealized depreciation on Recourse Trusts" on the Statement of Assets and Liabilities.
Notes to Financial Statements (Unaudited) (continued)
As of the end of the reporting period, each Fund's maximum exposure to the Floaters issued by Recourse Trusts for self-deposited Inverse Floaters and externally-deposited Inverse Floaters was as follows:
| | | | New Jersey | | | New Jersey | | | Pennsylvania | | | Pennsylvania | |
| | | | Quality | | | Municipal | | | Quality | | | Municipal | |
| | | | Income | | | Value | | | Income | | | Value | |
| Floating Rate Obligations — Recourse Trusts | | | (NXJ | ) | | (NJV | ) | | (NQP | ) | | (NPN | ) |
| Maximum exposure to Recourse Trusts: self-deposited Inverse Floaters | | $ | — | | $ | 1,500,000 | | $ | 33,785,000 | | $ | — | |
| Maximum exposure to Recourse Trusts: externally-deposited Inverse Floaters | | | 92,535,000 | | | 1,025,000 | | | 11,955,000 | | | 400,000 | |
| Total | | $ | 92,535,000 | | $ | 2,525,000 | | $ | 45,740,000 | | $ | 400,000 | |
Zero Coupon Securities
A zero coupon security does not pay a regular interest coupon to its holders during the life of the security. Income to the holder of the security comes from accretion of the difference between the original purchase price of the security at issuance and the par value of the security at maturity and is effectively paid at maturity. The market prices of zero coupon securities generally are more volatile than the market prices of securities that pay interest periodically.
Investments in Derivatives
In addition to the inverse floating rate securities in which each Fund may invest, which are considered portfolio securities for financial reporting purposes, each Fund is authorized to invest in certain derivative instruments such as futures, options and swap contracts. Each Fund limits its investments in futures, options on futures and swap contracts to the extent necessary for the Adviser to claim exclusion from registration by the Commodity Futures Trading Commission as a commodity pool operator with respect to the Fund. The Funds record derivative instruments at fair value, with changes in fair value recognized on the Statement of Operations, when applicable. Even though the Funds' investments in derivatives may represent economic hedges, they are not considered to be hedge transactions for financial reporting purposes.
Interest Rate Swap Contracts
Interest rate swap contracts involve a Fund's agreement with the counterparty to pay or receive a fixed rate payment in exchange for the counterparty receiving or paying a variable rate payment. Forward interest rate swap contracts involve a Fund's agreement with a counterparty to pay, in the future, a fixed or variable rate payment in exchange for the counterparty paying the Fund a variable or fixed rate payment, the accruals for which begin at a specified date in the future (the "effective date").
The amount of the payment obligation is based on the notional amount and the termination date of the contract. Interest rate swap contracts do not involve the delivery of securities or other underlying assets or principal. Accordingly, the risk of loss with respect to the swap counterparty on such transactions is limited to the net amount of interest payments that the Fund is to receive.
Interest rate swap contracts are valued daily. Upon entering into an interest rate swap contract (and beginning on the effective date for a forward interest rate swap contract), the Fund accrues the fixed rate payment expected to be paid or received and the variable rate payment expected to be received or paid on the interest rate swap contracts on a daily basis, and recognizes the daily change in the fair value of the Fund's contractual rights and obligations under the contracts. For an over-the-counter ("OTC") swap that is not cleared through a clearing house ("OTC Uncleared"), the net amount recorded on these transactions, for each counterparty, is recognized on the Statement of Assets and Liabilities as a component of "Unrealized appreciation or depreciation on interest rate swaps (, net)."
Upon the execution of an OTC swap cleared through a clearing house ("OTC Cleared"), the Fund is obligated to deposit cash or eligible securities, also known as "initial margin," into an account at its clearing broker equal to a specified percentage of the contract amount. Cash deposited by the Fund to cover initial margin requirements on open swap contracts, if any, is recognized as a component of "Cash collateral at brokers" on the Statement of Assets and Liabilities. Investments in OTC Cleared swaps obligate the Fund and the clearing broker to settle monies on a daily basis representing changes in the prior day's "mark-to-market" of the swap contract. If the Fund has unrealized appreciation, the clearing broker will credit the Fund's account with an amount equal to the appreciation. Conversely, if the Fund has unrealized depreciation, the clearing broker will debit the Fund's account with an amount equal to the depreciation. These daily cash settlements are also known as "variation margin." Variation margin for OTC Cleared swaps is recognized as a receivable and/or payable for "Variation margin on swap contracts" on the Statement of Assets and Liabilities. Upon the execution of an OTC Uncleared swap, neither the Fund nor the counterparty is required to deposit initial margin as the trades are recorded bilaterally between both parties to the swap contract, and the terms of the variation margin are subject to a predetermined threshold negotiated by the Fund and the counterparty. Variation margin for OTC Uncleared swaps is recognized as a component of "Unrealized appreciation or depreciation on interest rate swaps (, net)" as described in the preceding paragraph.
The net amount of periodic payments settled in cash are recognized as a component of "Net realized gain (loss) from swaps" on the Statement of Operations, in addition to the net realized gain or loss recorded upon the termination of the swap contract. For tax purposes, payments expected to be received or paid on the swap contracts are treated as ordinary income or expense, respectively. Changes in the value of the swap contracts during the
fiscal period are recognized as a component of "Change in net unrealized appreciation (depreciation) of swaps" on the Statement of Operations. In certain instances, payments are made or received upon entering into the swap contract to compensate for differences between the stated terms of the swap agreements and prevailing market conditions (credit spreads, currency exchange rates, interest rates, and other relevant factors). Payments received or made at the beginning of the measurement period, if any, are recognized as "Interest rate swaps premiums paid and/or received" on the Statement of Assets and Liabilities.
During the current fiscal period, New Jersey Quality Income (NXJ) and Pennsylvania Quality Income (NQP) invested in forward interest rate swap contracts to help reduce price volatility risk to movements in U.S. interest rates relative to each Fund's benchmark.
The average notional amount of interest rate swap contracts outstanding during the current fiscal period was as follows:
| | | | New Jersey | | | Pennsylvania | |
| | | | Quality | | | Quality | |
| | | | Income | | | Income | |
| | | | (NXJ | ) | | (NQP | ) |
| Average notional amount of interest rate swap contracts outstanding* | | $ | 55,916,667 | | $ | 6,500,000 | |
| * | The average notional amount is calculated based on the outstanding notional at the beginning of the fiscal period and at the end of each fiscal quarter within the current fiscal period. |
The following table presents the fair value of all swap contracts held by the Funds as of the end of the reporting period, the location of these instruments on the Statement of Assets and Liabilities and the primary underlying risk exposure.
| | | Location on the Statement of Assets and Liabilities |
| Underlying | Derivative | Asset Derivatives | | (Liability) Derivatives |
| Risk Exposure | Instrument | Location | | | Value | | Location | | Value |
| New Jersey Quality Income (NXJ) | | | | | | | | | |
| Interest rate | Swaps (OTC Uncleared) | Unrealized appreciation | | $ | 997,038 | | — | $ | — |
| | | on interest rate swaps | | | | | | | |
| Pennsylvania Quality Income (NQP) | | | | | | | | | |
| Interest rate | Swaps (OTC Uncleared) | Unrealized appreciation | | $ | 223,826 | | — | $ | — |
| | | on interest rate swaps | | | | | | | |
The following table presents the swap contracts subject to netting agreements and the collateral delivered related to those swap contracts as of the end of the reporting period.
| | | | | | | Gross | | | Gross | | | Amounts | | Net Unrealized | | | | | | | |
| | | | | | | Unrealized | | | Unrealized | | | Netted on | | | Appreciation | | | Collateral | | | | |
| | | | | | Appreciation on | | (Depreciation) on | | | Statement | | (Depreciation) on | | | Pledged | | | | |
| | | | | | | Interest | | | Interest | | of Assets and | | | Interest Rate | | | to (from | ) | | Net | |
| Fund | | | Counterparty | | | Rate Swaps | * | | Rate Swaps | * | | Liabilities | | | Swaps | | Counterparty | | | Exposure | |
| New Jersey Quality | | | JPMorgan Chase | | $ | 997,038 | | $ | — | | $ | — | | $ | 997,038 | | $ | (997,038 | ) | $ | — | |
| Income (NXJ) | | | Bank, N.A. | | | | | | | | | | | | | | | | | | | |
| Pennsylvania Quality | | | JPMorgan Chase | | $ | 223,826 | | $ | — | | $ | — | | $ | 223,826 | | $ | (223,826 | ) | $ | — | |
| Income (NQP) | | | Bank, N.A. | | | | | | | | | | | | | | | | | | | |
| * | Represents gross unrealized appreciation (depreciation) for the counterparty as reported in the Fund's Portfolio of Investments. |
The following table presents the amount of net realized gain (loss) and change in net unrealized appreciation (depreciation) recognized on swap contracts on the Statement of Operations during the current fiscal period, and the primary underlying risk exposure.
| | | | | | | | | | Net Realized | | | Change in Net Unrealized | |
| | | | Underlying | | | Derivative | | Gain (Loss) from | | Appreciation (Depreciation) of | |
| Fund | | | Risk Exposure | | | Instrument | | | Swaps | | | Swaps | |
| New Jersey Quality Income (NXJ) | | | Interest rate | | | Swaps | | $ | (4,000,000 | ) | $ | 3,814,005 | |
| Pennsylvania Quality Income (NQP) | | | Interest rate | | | Swaps | | $ | — | | $ | 223,826 | |
Market and Counterparty Credit Risk
In the normal course of business each Fund may invest in financial instruments and enter into financial transactions where risk of potential loss exists due to changes in the market (market risk) or failure of the other party to the transaction to perform (counterparty credit risk). The potential loss could exceed the value of the financial assets recorded on the financial statements. Financial assets, which potentially expose each Fund to counterparty credit risk, consist principally of cash due from counterparties on forward, option and swap transactions, when applicable. The extent of each Fund's exposure to counterparty credit risk in respect to these financial assets approximates their carrying value as recorded on the Statement of Assets and Liabilities.
Notes to Financial Statements (Unaudited) (continued)
Each Fund helps manage counterparty credit risk by entering into agreements only with counterparties the Adviser believes have the financial resources to honor their obligations and by having the Adviser monitor the financial stability of the counterparties. Additionally, counterparties may be required to pledge collateral daily (based on the daily valuation of the financial asset) on behalf of each Fund with a value approximately equal to the amount of any unrealized gain above a pre-determined threshold. Reciprocally, when each Fund has an unrealized loss, the Funds have instructed the custodian to pledge assets of the Funds as collateral with a value approximately equal to the amount of the unrealized loss above a pre-determined threshold. Collateral pledges are monitored and subsequently adjusted if and when the valuations fluctuate, either up or down, by at least the pre-determined threshold amount.
4. Fund Shares
Common Share Transactions
Transactions in common shares for the Funds during the Funds' current and prior fiscal period, where applicable, were as follows:
| | | New Jersey | | New Jersey |
| | | Quality Income (NXJ) | | Municipal Value (NJV) |
| | | | Six Months | | | Year | | | Six Months | | | Year | |
| | | | Ended | | | Ended | | | Ended | | | Ended | |
| | | | 10/31/16 | | | 4/30/16 | | | 10/31/16 | | | 4/30/16 | |
| Common shares: | | | | | | | | | | | | | |
| Issued to shareholders due to reinvestments of distributions | | | — | | | — | | | 261 | | | — | |
| Repurchased and retired | | | — | | | (473,600 | ) | | — | | | — | |
| Weighted average common share: | | | | | | | | | | | | | |
| Price per share repurchased and retired | | $ | — | | $ | 12.86 | | $ | — | | $ | — | |
| Discount per share repurchased and retired | | | — | % | | 15.38 | % | | — | % | | — | % |
| | | Pennsylvania | | Pennsylvania |
| | | Quality Income (NQP) | | Municipal Value (NPN) |
| | | | Six Months | | | Year | | | Six Months | | | Year | |
| | | | Ended | | | Ended | | | Ended | | | Ended | |
| | | | 10/31/16 | | | 4/30/16 | | | 10/31/16 | | | 4/30/16 | |
| Common shares: | | | | | | | | | | | | | |
| Issued to shareholders due to reinvestments of distributions | | | — | | | — | | | 455 | | | — | |
| Repurchased and retired | | | — | | | (121,000 | ) | | — | | | — | |
| Weighted average common share: | | | | | | | | | | | | | |
| Price per share repurchased and retired | | $ | — | | $ | 13.12 | | $ | — | | $ | — | |
| Discount per share repurchased and retired | | | — | % | | 15.08 | % | | — | % | | — | % |
Preferred Shares
Variable Rate MuniFund Term Preferred Shares
The following Fund has issued and outstanding Variable Rate MuniFund Term Preferred ("VMTP") Shares, with a $100,000 liquidation preference per share. VMTP Shares are issued via private placement and are not publicly available.
As of the end of the reporting period, VMTP Shares outstanding, at liquidation preference, for the Fund was as follows:
| | | | | | | Shares | | | Liquidation | |
| Fund | | | Series | | | Outstanding | | | Preference | |
| Pennsylvania Quality Income (NQP) | | | 2019 | | | 870 | | $ | 87,000,000 | |
During the current fiscal period, Pennsylvania Quality Income (NQP) refinanced all of its outstanding Series 2017 VMTP Shares with the issuance of new Series 2019 VMTP Shares. In conjunction with this refinancing Pennsylvania Quality Income (NQP) issued an additional $39,000,000 Series 2019 VMTP Shares at liquidation preference, to be invested in accordance with the Fund's investment policies.
The Fund is obligated to redeem its VMTP Shares by the date as specified in its offering document ("Term Redemption Date"), unless earlier redeemed by the Fund. VMTP Shares are subject to optional and mandatory redemption in certain circumstances. The VMTP Shares may be redeemed at the option of the Fund, subject to payment of premium for approximately one year following the date of issuance ("Premium Expiration Date"), and at the redemption price per share thereafter. The redemption price per share is equal to the sum of the liquidation preference per share plus any accumulated but unpaid dividends. The Fund may be obligated to redeem a certain amount of the VMTP Shares if the Fund fails to maintain certain asset coverage and leverage ratio requirements and such failures are not cured by the applicable cure date. The Term Redemption Date and Premium Expiration Date for the Fund's VMTP Shares are as follows:
| | | | | | | Term | | | Premium | |
| Fund | | | Series | | | Redemption Date | | | Expiration Date | |
| Pennsylvania Quality Income (NQP) | | | 2019 | | | September 1, 2019 | | | August 31, 2017 | |
The average liquidation preference of VMTP Shares outstanding and annualized dividend rate for the Fund during the current fiscal period were as follows:
| | | | Pennsylvania | |
| | | | Quality | |
| | | | Income | |
| | | | (NQP | ) |
| Average liquidation preference of VMTP Shares outstanding | | $ | 60,929,348 | |
| Annualized dividend rate | | | 1.50 | % |
VMTP Shares are subject to restrictions on transfer, generally do not trade, and market quotations are generally not available. VMTP Shares are short-term or short/intermediate-term instruments that pay a variable dividend rate tied to a short-term index, plus an additional fixed "spread" amount established at the time of issuance. The fair value of VMTP Shares is expected to be approximately their liquidation preference so long as the fixed "spread" on the VMTP Shares remains roughly in line with the "spread" being demanded by investors on instruments having similar terms in the current market environment. In present market conditions, the Fund's Adviser has determined that fair value of VMTP Shares is approximately their liquidation preference, but their fair value could vary if market conditions change materially. For financial reporting purposes, the liquidation preference of VMTP Shares is a liability and is recognized as "Variable Rate MuniFund Term Preferred ("VMTP") Shares, at liquidation preference" on the Statement of Assets and Liabilities.
Dividends on the VMTP shares (which are treated as interest payments for financial reporting purposes) are set weekly. Unpaid dividends on VMTP Shares are recognized as a component of "Interest payable" on the Statement of Assets and Liabilities. Dividends accrued on VMTP Shares are recognized as a component of "Interest expense and amortization of offering costs" on the Statement of Operations.
The Fund incurred offering costs of $145,000 in connection with its issuance of Series 2019 VMTP Shares, which was expensed as incurred and is recognized as a component of "Interest expense and amortization of offering costs" on the Statement of Operations.
Variable Rate Demand Preferred Shares
The following Funds have issued and have outstanding Variable Rate Demand Preferred ("VRDP") Shares, with a $100,000 liquidation preference per share. VRDP Shares are issued via private placement and are not publicly available.
As of the end of the reporting period, details of the Funds' VRDP Shares outstanding were as follows:
| | | | | | | Shares | | | Liquidation | | | | |
| Fund | | | Series | | | Outstanding | | | Preference | | | Maturity | |
| New Jersey Quality Income (NXJ) | | | 1 | | | 810 | | $ | 81,000,000 | | | August 3, 2043 | |
| | | | 2 | | | 1,443 | | | 144,300,000 | | | April 1, 2043 | |
| | | | 3 | | | 886 | | | 88,600,000 | | | April 1, 2043 | |
| Pennsylvania Quality Income (NQP) | | | 2 | | | 1,125 | | $ | 112,500,000 | | | December 1, 2042 | |
| | | | 3 | | | 1,050 | | | 105,000,000 | | | December 1, 2042 | |
VRDP Shares include a liquidity feature that allows VRDP shareholders to have their shares purchased by a liquidity provider with whom each Fund has contracted in the event that the VRDP Shares are not able to be successfully remarketed. Each Fund is required to redeem any VRDP Shares that are still owned by the liquidity provider after six months of continuous, unsuccessful remarketing. Each Fund pays an annual remarketing fee of 0.10% on the aggregate principal amount of all VRDP Shares outstanding. Each Fund's VRDP Shares have successfully remarketed since issuance.
VRDP shares in the Funds are considered to be Special Rate Period VRDP. Special Rate Period VRDP are sold to banks with an initial special short/intermediate rate period (typically three years) with a dividend rate set at a fixed spread to a specified short-term municipal index rate calculated weekly. Weekly remarketings do not take place during the initial special rate period. After the initial special rate period, Special Rate Period VRDP Shares will revert back to traditional VRDP Shares with dividends set at weekly remarketings, with an option to sell the shares to a designated liquidity provider, unless the Board approves another special rate period.
Dividends on the VRDP Shares (which are treated as interest payments for financial reporting purposes) are set at a rate established by a remarketing agent; therefore, the market value of the VRDP Shares is expected to approximate its liquidation preference. In the event that VRDP Shares are unable to be successfully remarketed, the dividend rate will be the maximum rate which is designed to escalate according to a specified schedule in order to enhance the remarketing agent's ability to successfully remarket the VRDP Shares.
Subject to certain conditions, VRDP Shares may be redeemed, in whole or in part, at any time at the option of each Fund. Each Fund may also redeem certain of the VRDP Shares if the Fund fails to maintain certain asset coverage requirements and such failures are not cured by the applicable cure date. The redemption price per share is equal to the sum of the liquidation preference per share plus any accumulated but unpaid dividends.
Notes to Financial Statements (Unaudited) (continued)
The average liquidation preference of VRDP Shares outstanding and annualized dividend rate for each Fund during the current fiscal period were as follows:
| | | | New Jersey | | | Pennsylvania | |
| | | | Quality | | | Quality | |
| | | | Income | | | Income | |
| | | | (NXJ | ) | | (NQP | ) |
| Average liquidation preference of VRDP Shares outstanding | | $ | 313,900,000 | | $ | 217,500,000 | |
| Annualized dividend rate | | | 0.64 | % | | 0.65 | % |
For financial reporting purposes, the liquidation preference of VRDP Shares is a liability and is recognized as "Variable Rate Demand Preferred ("VRDP") Shares, at liquidation preference" on the Statement of Assets and Liabilities. Unpaid dividends on VRDP Shares are recognized as a component of "Interest payable" on the Statement of Assets and Liabilities, when applicable. Dividends accrued on VRDP Shares are recognized as a component of "Interest expense and amortization of offering costs" on the Statement of Operations. Costs incurred by the Funds in connection with their offerings of VRDP Shares were recorded as a deferred charge, which are amortized over the life of the shares and are recognized as a component of "Deferred offering costs" on the Statement of Assets and Liabilities and "Interest expense and amortization of offering costs" on the Statement of Operations. In addition to interest expense, each Fund also pays a per annum liquidity fee to the liquidity provider, as well as a remarketing fee, which are recognized as "Liquidity fees" and "Remarketing fees," respectively, on the Statement of Operations.
Preferred Share Transactions
Transactions in preferred shares for the Funds during the Funds' current and prior fiscal period, where applicable, are noted in the following tables.
Transactions in VMTP Shares for the Funds, where applicable, were as follows:
| | | | Six Months Ended | |
| | | | October 31, 2016 | |
| | | | Series | | | Shares | | | Amount | |
| Pennsylvania Quality Income (NQP) | | | | | | | | | | |
| VMTP Shares issued | | | 2019 | | | 870 | | $ | 87,000,000 | |
| VMTP Shares exchanged | | | 2017 | | | (480 | ) | | (48,000,000 | ) |
| Net increase (decrease) | | | | | | 390 | | $ | 39,000,000 | |
5. Investment Transactions
Long-term purchases and sales (including maturities but excluding derivative transactions, where applicable) during the current fiscal period were as follows:
| | | | New Jersey | | | New Jersey | | | Pennsylvania | | | Pennsylvania | |
| | | | Quality | | | Municipal | | | Quality | | | Municipal | |
| | | | Income | | | Value | | | Income | | | Value | |
| | | | (NXJ | ) | | (NJV | ) | | (NQP | ) | | (NPN | ) |
| Purchases | | $ | 69,290,681 | | $ | 2,098,911 | | $ | 164,662,792 | | $ | 2,683,289 | |
| Sales and maturities | | | 77,559,928 | | | 3,677,750 | | | 99,657,484 | | | 2,602,198 | |
6. Income Tax Information
Each Fund is a separate taxpayer for federal income tax purposes. Each Fund intends to distribute substantially all of its net investment income and net capital gains to shareholders and to otherwise comply with the requirements of Subchapter M of the Internal Revenue Code applicable to regulated investment companies. Therefore, no federal income tax provision is required. Furthermore, each Fund intends to satisfy conditions that will enable interest from municipal securities, which is exempt from regular federal and designated state income taxes, to retain such tax-exempt status when distributed to shareholders of the Funds. Net realized capital gains and ordinary income distributions paid by the Funds are subject to federal taxation.
For all open tax years and all major taxing jurisdictions, management of the Funds has concluded that there are no significant uncertain tax positions that would require recognition in the financial statements. Open tax years are those that are open for examination by taxing authorities (i.e., generally the last four tax year ends and the interim tax period since then). Furthermore, management of the Funds is also not aware of any tax positions for which it is reasonably possible that the total amounts of unrecognized tax benefits will significantly change in the next twelve months.
The following information is presented on an income tax basis. Differences between amounts for financial statement and federal income tax purposes are primarily due to timing differences in recognizing taxable market discount, timing differences in recognizing certain gains and losses on investment transactions and the treatment of investments in inverse floating rate securities reflected as financing transactions, if any. To the extent that differences arise that are permanent in nature, such amounts are reclassified within the capital accounts as detailed below. Temporary differences do not require reclassification. Temporary and permanent differences do not impact the NAVs of the Funds.
As of October 31, 2016, the cost and unrealized appreciation (depreciation) of investments (excluding investments in derivatives, where applicable), as determined on a federal income tax basis, were as follows:
| | | | New Jersey | | | New Jersey | | | Pennsylvania | | | Pennsylvania | |
| | | | Quality | | | Municipal | | | Quality | | | Municipal | |
| | | | Income | | | Value | | | Income | | | Value | |
| | | | (NXJ | ) | | (NJV | ) | | (NQP | ) | | (NPN | ) |
| Cost of investments | | $ | 904,671,693 | | $ | 21,905,352 | | $ | 824,984,794 | | $ | 17,626,994 | |
| Gross unrealized: | | | | | | | | | | | | | |
| Appreciation | | | 83,707,781 | | | 2,751,122 | | | 68,187,947 | | | 1,734,057 | |
| Depreciation | | | (2,044,507 | ) | | (51,152 | ) | | (4,870,756 | ) | | (65,800 | ) |
| Net unrealized appreciation (depreciation) of investments | | $ | 81,663,274 | | $ | 2,699,970 | | $ | 63,317,191 | | $ | 1,668,257 | |
Permanent differences, primarily due to federal taxes paid, taxable market discount, expiration of capital loss carryforwards, nondeductible offering costs and nondeductible reorganization expenses resulted in reclassifications among the Funds' components of common share net assets as of April 30, 2016, the Funds' last tax year end, as follows:
| | | | New Jersey | | | New Jersey | | | Pennsylvania | | | Pennsylvania | |
| | | | Quality | | | Municipal | | | Quality | | | Municipal | |
| | | | Income | | | Value | | | Income | | | Value | |
| | | | (NXJ | ) | | (NJV | ) | | (NQP | ) | | (NPN | ) |
| Paid-in-surplus | | $ | (235,910 | ) | $ | — | | $ | (2,195,737 | ) | $ | — | |
| Undistributed (Over-distribution of) net investment income | | | 226,115 | | | (2,220 | ) | | (48,496 | ) | | (1,477 | ) |
| Accumulated net realized gain (loss) | | | 9,795 | | | 2,220 | | | 2,244,233 | | | 1,477 | |
The tax components of undistributed net tax-exempt income, net ordinary income and net long-term capital gains as of April 30, 2016, the Funds' last tax year end, were as follows:
| | | | New Jersey | | | New Jersey | | | Pennsylvania | | | Pennsylvania | |
| | | | Quality | | | Municipal | | | Quality | | | Municipal | |
| | | | Income | | | Value | | | Income | | | Value | |
| | | | (NXJ | ) | | (NJV | ) | | (NQP | ) | | (NPN | ) |
Undistributed net tax-exempt income1 | | $ | 3,551,068 | | $ | 93,327 | | $ | 1,569,870 | | $ | 87,262 | |
Undistributed net ordinary income2 | | | 24,423 | | | 6,180 | | | 18,612 | | | 74,461 | |
| Undistributed net long-term capital gains | | | — | | | 31,153 | | | — | | | 273,014 | |
1 | Undistributed net tax-exempt income (on a tax basis) has not been reduced for the dividend declared on April 1, 2016, paid on May 2, 2016. |
2 | Net ordinary income consists of taxable market discount income and net short-term capital gains, if any. |
The tax character of distributions paid during the Funds' last tax year ended April 30, 2016, was designated for purposes of the dividends paid deduction as follows:
| | | | New Jersey | | | New Jersey | | | Pennsylvania | | | Pennsylvania | |
| | | | Quality | | | Municipal | | | Quality | | | Municipal | |
| | | | Income | | | Value | | | Income | | | Value | |
| | | | (NXJ | ) | | (NJV | ) | | (NQP | ) | | (NPN | ) |
| Distributions from net tax-exempt income | | $ | 35,379,191 | | $ | 914,520 | | $ | 31,959,341 | | $ | 760,876 | |
Distributions from net ordinary income2 | | | 21,295 | | | 25,886 | | | 369,997 | | | 8,657 | |
| Distributions from net long-term capital gains | | | 345,375 | | | 323,803 | | | — | | | — | |
2 | Net ordinary income consists of taxable market discount income and net short-term capital gains, if any. |
As of April 30, 2016, the Funds' last tax year end, the following Funds had unused capital loss carryforwards available for federal income tax purposes to be applied against future capital gains, if any. If not applied, the carryforwards will expire as shown in the following table. The losses not subject to expiration will be utilized first by a Fund.
| | | | New Jersey | | | Pennsylvania | |
| | | | Quality | | | Quality | |
| | | | Income | | | Income | |
| | | | (NXJ | )3 | | (NQP | ) |
| Expiration: | | | | | | | |
| April 30, 2017 | | $ | — | | $ | 13,518 | |
| Not subject to expiration | | | 3,885,212 | | | 1,187,800 | |
| Total | | $ | 3,885,212 | | $ | 1,201,318 | |
3 | A portion of New Jersey Dividend Advantage's (NXJ) capital loss carryforward is subject to an annual limitation under the Internal Revenue Code and related regulations. |
Notes to Financial Statements (Unaudited) (continued)
During the Funds' last tax year ended April 30, 2016, the following Funds utilized capital loss carryforwards as follows:
| | | | New Jersey | | | Pennsylvania | | | Pennsylvania | |
| | | | Quality | | | Quality | | | Municipal | |
| | | | Income | | | Income | | | Value | |
| | | | (NXJ | ) | | (NQP | ) | | (NPN | ) |
| Utilized capital loss carryforwards | | $ | 1,105,345 | | $ | 985,996 | | $ | 61,084 | |
As of April 30, 2016, the Funds' last tax year end, $2,167,149, of Pennsylvania Quality Income's (NQP) capital loss carryforward expired.
7. Management Fees and Other Transactions with Affiliates
Management Fees
Each Fund's management fee compensates the Adviser for overall investment advisory and administrative services and general office facilities. The Sub-Adviser is compensated for its services to the Funds from the management fees paid to the Adviser.
Each Fund's management fee consists of two components – a fund-level fee, based only on the amount of assets within each individual Fund, and a complex-level fee, based on the aggregate amount of all eligible fund assets managed by the Adviser. This pricing structure enables Fund shareholders to benefit from growth in the assets within their respective Fund as well as from growth in the amount of complex-wide assets managed by the Adviser.
For the period May 1, 2016 through July 31, 2016, the annual Fund-level fee, payable monthly, for each Fund is calculated according to the following schedules:
| | | | New Jersey Quality Income (NXJ) |
| Average Daily Managed Assets* | | | Fund-Level Fee |
| For the first $125 million | | | 0.4500 | % |
| For the next $125 million | | | 0.4375 | % |
| For the next $250 million | | | 0.4250 | % |
| For the next $500 million | | | 0.4125 | % |
| For the next $1 billion | | | 0.4000 | % |
| For managed assets over $2 billion | | | 0.3750 | % |
| | | | New Jersey Municipal Value (NJV) |
| | | | Pennsylvania Municipal Value (NPN) |
| Average Daily Net Assets* | | | Fund-Level Fee |
| For the first $125 million | | | 0.4000 | % |
| For the next $125 million | | | 0.3875 | % |
| For the next $250 million | | | 0.3750 | % |
| For the next $500 million | | | 0.3625 | % |
| For the next $1 billion | | | 0.3500 | % |
| For managed assets over $2 billion | | | 0.3375 | % |
| | | | Pennsylvania Quality Income (NQP) |
| Average Daily Managed Assets* | | | Fund-Level Fee |
| For the first $125 million | | | 0.4500 | % |
| For the next $125 million | | | 0.4375 | % |
| For the next $250 million | | | 0.4250 | % |
| For the next $500 million | | | 0.4125 | % |
| For the next $1 billion | | | 0.4000 | % |
| For the next $3 billion | | | 0.3875 | % |
| For managed assets over $5 billion | | | 0.3750 | % |
Effective August 1, 2016, annual Fund-level fee, payable monthly, for each Fund is calculated according to the following schedules:
| | | | New Jersey Quality Income (NXJ) |
| | | | Pennsylvania Quality Income (NQP) |
| Average Daily Managed Assets* | | | Fund-Level Fee |
| For the first $125 million | | | 0.4500 | % |
| For the next $125 million | | | 0.4375 | |
| For the next $250 million | | | 0.4250 | |
| For the next $500 million | | | 0.4125 | |
| For the next $1 billion | | | 0.4000 | |
| For the next $3 billion | | | 0.3750 | |
| For managed assets over $5 billion | | | 0.3625 | |
| | | | New Jersey Municipal Value (NJV) |
| | | | Pennsylvania Municipal Value (NPN) |
| Average Daily Net Assets* | | | Fund-Level Fee |
| For the first $125 million | | | 0.4000 | % |
| For the next $125 million | | | 0.3875 | % |
| For the next $250 million | | | 0.3750 | % |
| For the next $500 million | | | 0.3625 | % |
| For the next $1 billion | | | 0.3500 | % |
| For the next $3 billion | | | 0.3250 | % |
| For managed assets over $5 billion | | | 0.3125 | % |
The annual complex-level fee, payable monthly, for each Fund is calculated by multiplying the current complex-wide fee rate, determined according to the following schedule by the Fund's daily managed assets (net assets for New Jersey Municipal Value (NJV) and Pennsylvania Municipal Value (NPN):
| Complex-Level Managed Asset Breakpoint Level* | | | Effective Rate at Breakpoint Level |
| $55 billion | | | 0.2000 | % |
| $56 billion | | | 0.1996 | |
| $57 billion | | | 0.1989 | |
| $60 billion | | | 0.1961 | |
| $63 billion | | | 0.1931 | |
| $66 billion | | | 0.1900 | |
| $71 billion | | | 0.1851 | |
| $76 billion | | | 0.1806 | |
| $80 billion | | | 0.1773 | |
| $91 billion | | | 0.1691 | |
| $125 billion | | | 0.1599 | |
| $200 billion | | | 0.1505 | |
| $250 billion | | | 0.1469 | |
| $300 billion | | | 0.1445 | |
| * | For the complex-level fees, managed assets include closed-end fund assets managed by the Adviser that are attributable to certain types of leverage. For these purposes, leverage includes the funds' use of preferred stock and borrowings and certain investments in the residual interest certificates (also called inverse floating rate securities) in tender option bond (TOB) trusts, including the portion of assets held by a TOB trust that has been effectively financed by the trust's issuance of floating rate securities, subject to an agreement by the Adviser as to certain funds to limit the amount of such assets for determining managed assets in certain circumstances. The complex-level fee is calculated based upon the aggregate daily managed assets of all Nuveen funds that constitute "eligible assets." Eligible assets do not include assets attributable to investments in other Nuveen funds or assets in excess of a determined amount (originally $2 billion) added to the Nuveen fund complex in connection with the Adviser's assumption of the management of the former First American Funds effective January 1, 2011. As of October 31, 2016, the complex-level fee for each Fund was 0.1610%. |
Other Transactions with Affiliates
The Funds pay no compensation directly to those of its trustees who are affiliated with the Adviser or to its officers, all of whom receive remuneration for their services to the Funds from the Adviser or its affiliates. The Board has adopted a deferred compensation plan for independent trustees that enables trustees to elect to defer receipt of all or a portion of the annual compensation they are entitled to receive from certain Nuveen-advised funds. Under the plan, deferred amounts are treated as though equal dollar amounts had been invested in shares of select Nuveen-advised funds.
Notes to Financial Statements (Unaudited) (continued)
Each Fund is permitted to purchase or sell securities from or to certain other funds managed by the Adviser ("inter-fund trade") under specified conditions outlined in procedures adopted by the Board. These procedures have been designed to ensure that any inter-fund trade of securities by the Fund from or to another fund that is, or could be, considered an affiliate of the Fund under certain limited circumstances by virtue of having a common investment adviser (or affiliated investment adviser), common officer and/or common trustee complies with Rule 17a-7 of the 1940 Act. Further, as defined under these procedures, each inter-fund trade is effected at the current market price as provided by an independent pricing service. Unsettled inter-fund trades as of the end of the reporting period are recognized as a component of "Receivable for investments sold" and/or "Payable for investments purchased" on the Statement of Assets and Liabilities, when applicable.
During the current fiscal period, the following Fund engaged in inter-fund trades pursuant to these procedures as follows:
| | | | Pennsylvania | |
| | | | Municipal | |
| | | | Value | |
| Inter-Fund Trades | | | (NPN | ) |
| Purchases | | $ | 16,925 | |
| Sales | | | — | |
8. Borrowing Arrangements
Uncommitted Line of Credit
During the current fiscal period, the Funds participated in an unsecured bank line of credit ("Unsecured Credit Line") under which outstanding balances would bear interest at a variable rate. Although the Funds participated in the Unsecured Credit Line, they did not have any outstanding balances during the current fiscal period.
Committed Line of Credit
The Funds, along with certain other funds managed by the Adviser ("Participating Funds"), have established a 364-day, $2.5 billion standby credit facility with a group of lenders, under which the Participating Funds may borrow for various purposes other than leveraging for investment purposes. A large portion of this facility's capacity (and its associated costs as described below) is currently dedicated for use by a small number of Participating Funds, which does not include any of the Funds covered by this shareholder report. The remaining capacity under the facility (and the corresponding portion of the facility's annual costs) is separately dedicated to most of the other open-end funds in the Nuveen fund family, along with a number of Nuveen closed-end funds, including all of the Funds covered by this shareholder report. The credit facility expires in July 2017 unless extended or renewed.
The credit facility has the following terms: a fee of 0.15% per annum on unused commitment amounts, and interest at a rate equal to the higher of (a) one-month LIBOR (London Inter-Bank Offered Rate) plus 1.25% per annum or (b) the Fed Funds rate plus 1.25% per annum on amounts borrowed. Participating Funds paid administration, legal and arrangement fees, which are recognized as a component of "Other expenses" on the Statement of Operations, and along with commitment fees, have been allocated among such Participating Funds based upon the relative proportions of the facility's aggregate capacity reserved for them and other factors deemed relevant by the Adviser and the Board of each Participating Fund.
During the current fiscal period, none of the Funds utilized this facility.
9. Subsequent Events
Fund information
As mentioned in Note 1- General Information and Significant Accounting Policies, New Jersey Quality Income (NXJ) changed its name from New Jersey Dividend Advantage and Pennsylvania Quality Income (NQP) changed its name from Pennsylvania Investment Quality, effective December 28, 2016.
Variable Rate Demand Preferred Shares
Subsequent to the end of the reporting period, New Jersey Quality Income (NXJ) and Pennsylvania Quality Income (NQP) each designated a special rate period until November 15, 2017, for each Fund's Series 2 and Series 3 VRDP Shares. In connection with the transition to the special rate period, the VRDP Shares of each series have been remarketed and sold to an institutional investor. During the special rate period, the VRDP Shares will not be remarketed by a remarketing agent, be subject to optional or mandatory tender events, or supported by a liquidity provider. During the period, VRDP dividends will be set monthly as a floating rate based on the predetermined formula.
Additional Fund Information
| Board of Trustees | | | | | |
William Adams IV* John K. Nelson | Mongo Cook * William J. Schneider | Jack B. Evans Judith M. Stockdale | William C. Hunter Carole E. Stone | David J. Kundert Terence J. Toth | Albin F. Moschner Margaret L. Wolff |
| | | | | | |
| * Interested Board Member. |
| |
Fund Manager Nuveen Fund Advisors, LLC 333 West Wacker Drive Chicago, IL 60606 | Custodian State Street Bank and Trust Company, One Lincoln Street, Boston, MA 02111 | Legal Counsel Chapman and Cutler LLP Chicago, IL 60603 | Independent Registered Public Accounting Firm KPMG LLP 200 East Randolph Drive Chicago, IL 60601 | Transfer Agent and Shareholder Services State Street Bank & Trust Company Nuveen Funds P.O. Box 43071 Providence, RI 02940-3071 (800) 257-8787 |
Quarterly Form N-Q Portfolio of Investments Information
Each Fund is required to file its complete schedule of portfolio holdings with the Securities and Exchange Commission (SEC) for the first and third quarters of each fiscal year on Form N-Q. You may obtain this information directly from the SEC. Visit the SEC on-line at http://www.sec.gov or in person at the SEC's Public Reference Room in Washington, D.C. Call the SEC toll-free at (800) SEC-0330 for room hours and operation.
Nuveen Funds' Proxy Voting Information
You may obtain (i) information regarding how each fund voted proxies relating to portfolio securities held during the most recent twelve-month period ended June 30, without charge, upon request, by calling Nuveen toll-free at (800) 257-8787 or on Nuveen's website at www.nuveen.com and (ii) a description of the policies and procedures that each fund used to determine how to vote proxies relating to portfolio securities without charge, upon request, by calling Nuveen toll free at (800) 257-8787. You may also obtain this information directly from the SEC. Visit the SEC on-line at http://www.sec.gov.
CEO Certification Disclosure
Each Fund's Chief Executive Officer (CEO) has submitted to the New York Stock Exchange (NYSE) the annual CEO certification as required by Section 303A.12(a) of the NYSE Listed Company Manual. Each Fund has filed with the SEC the certification of its CEO and Chief Financial Officer required by Section 302 of the Sarbanes-Oxley Act.
Common Share Repurchases
Each Fund intends to repurchase, through its open-market share repurchase program, shares of its own common stock at such times and in such amounts as is deemed advisable. During the period covered by this report, each Fund repurchased shares of its common stock, as shown in the accompanying table. Any future repurchases will be reported to shareholders in the next annual or semi-annual report.
| | | | NXJ | | | NJV | | | NQP | | | NPN | |
| Common shares repurchased | | | — | | | — | | | — | | | — | |
FINRA BrokerCheck
The Financial Industry Regulatory Authority (FINRA) provides information regarding the disciplinary history of FINRA member firms and associated investment professionals. This information as well as an investor brochure describing FINRA BrokerCheck is available to the public by calling the FINRA BrokerCheck Hotline number at (800) 289-9999 or by visiting www.FINRA.org.
Glossary of Terms Used in this Report
| ■ | Auction Rate Bond: An auction rate bond is a security whose interest payments are adjusted periodically through an auction process, which process typically also serves as a means for buying and selling the bond. Auctions that fail to attract enough buyers for all the shares offered for sale are deemed to have "failed," with current holders receiving a formula-based interest rate until the next scheduled auction. |
| | |
| ■ | Average Annual Total Return: This is a commonly used method to express an investment's performance over a particular, usually multi-year time period. It expresses the return that would have been necessary each year to equal the investment's actual cumulative performance (including change in NAV or market price and reinvested dividends and capital gains distributions, if any) over the time period being considered. |
| | |
| ■ | Duration: Duration is a measure of the expected period over which a bond's principal and interest will be paid, and consequently is a measure of the sensitivity of a bond's or bond fund's value to changes when market interest rates change. Generally, the longer a bond's or fund's duration, the more the price of the bond or fund will change as interest rates change. |
| | |
| ■ | Effective Leverage: Effective leverage is a fund's effective economic leverage, and includes both regulatory leverage (see leverage) and the leverage effects of certain derivative investments in the fund's portfolio. Currently, the leverage effects of Tender Option Bond (TOB) inverse floater holdings are included in effective leverage values, in addition to any regulatory leverage. |
| | |
| ■ | Forward Interest Rate Swap: A contractual agreement between two counterparties under which one party agrees to make periodic payments to the other for an agreed period of time based on a fixed rate, while the other party agrees to make periodic payments based on a floating rate of interest based on an underlying index. Alternatively, both series of cashflows to be exchanged could be calculated using floating rates of interest but floating rates that are based upon different underlying indexes. |
| | |
| ■ | Inverse Floating Rate Securities: Inverse floating rate securities, also known as inverse floaters or tender option bonds (TOBs), are created by depositing a municipal bond, typically with a fixed interest rate, into a special purpose trust. This trust, in turn, (a) issues floating rate certificates typically paying short-term tax-exempt interest rates to third parties in amounts equal to some fraction of the deposited bond's par amount or market value, and (b) issues an inverse floating rate certificate (sometimes referred to as an "inverse floater") to an investor (such as a Fund) interested in gaining investment exposure to a long-term municipal bond. The income received by the holder of the inverse floater varies inversely with the short-term rate paid to the floating rate certificates' holders, and in most circumstances the holder of the inverse floater bears substantially all of the underlying bond's downside investment risk. The holder of the inverse floater typically also benefits disproportionately from any potential appreciation of the underlying bond's value. Hence, an inverse floater essentially represents an investment in the underlying bond on a leveraged basis. |
| | |
| ■ | Leverage: Leverage is created whenever a fund has investment exposure (both reward and/or risk) equivalent to more than 100% of the investment capital. |
| | |
| ■ | Lipper New Jersey Municipal Debt Funds Classification Average: Calculated using the returns of all closed-end funds in this category. Lipper returns account for the effects of management fees and assume reinvestment of distributions, but do not reflect any applicable sales charges. |
| | |
| ■ | Lipper Pennsylvania Municipal Debt Funds Classification Average: Calculated using the returns of all closed-end funds in this category. Lipper returns account for the effects of management fees and assume reinvestment of distributions, but do not reflect any applicable sales charges. |
| ■ | Net Asset Value (NAV) Per Share: A fund's Net Assets is equal to its total assets (securities, cash, accrued earnings and receivables) less its total liabilities. NAV per share is equal to the fund's Net Assets divided by its number of shares outstanding. |
| | |
| ■ | Pre-Refunding: Pre-Refunding, also known as advanced refundings or refinancings, is a procedure used by state and local governments to refinance municipal bonds to lower interest expenses. The issuer sells new bonds with a lower yield and uses the proceeds to buy U.S. Treasury securities, the interest from which is used to make payments on the higher-yielding bonds. Because of this collateral, pre-refunding generally raises a bond's credit rating and thus its value. |
| | |
| ■ | Regulatory Leverage: Regulatory leverage consists of preferred shares issued by or borrowings of a fund. Both of these are part of a fund's capital structure. Regulatory leverage is subject to asset coverage limits set in the Investment Company Act of 1940. |
| | |
| ■ | S&P Municipal Bond Index: An unleveraged, market value-weighted index designed to measure the performance of the tax-exempt, investment-grade U.S. municipal bond market. Index returns assume reinvestment of distributions, but do not reflect any applicable sales charges or management fees. |
| | |
| ■ | S&P Municipal Bond New Jersey Index: An unleveraged, market value-weighted index designed to measure the performance of the tax-exempt, investment-grade New Jersey municipal bond market. Index returns assume reinvestment of distributions, but do not reflect any applicable sales charges or management fees. |
| | |
| ■ | S&P Municipal Bond Pennsylvania Index: An unleveraged, market value-weighted index designed to measure the performance of the tax-exempt, investment-grade Pennsylvania municipal bond market. Index returns assume reinvestment of distributions, but do not reflect any applicable sales charges or management fees. |
| | |
| ■ | Total Investment Exposure: Total investment exposure is a fund's assets managed by the Adviser that are attributable to financial leverage. For these purposes, financial leverage includes a fund's use of preferred stock and borrowings and investments in the residual interest certificates (also called inverse floating rate securities) in tender option bond (TOB) trusts, including the portion of assets held by a TOB trust that has been effectively financed by the trust's issuance of floating rate securities. |
| | |
| ■ | Zero Coupon Bond: A zero coupon bond does not pay a regular interest coupon to its holders during the life of the bond. Income to the holder of the bond comes from accretion of the difference between the original purchase price of the bond at issuance and the par value of the bond at maturity and is effectively paid at maturity. The market prices of zero coupon bonds generally are more volatile than the market prices of bonds that pay interest periodically. |
Reinvest Automatically, Easily and Conveniently
Nuveen makes reinvesting easy. A phone call is all it takes to set up your reinvestment account.
Nuveen Closed-End Funds Automatic Reinvestment Plan
Nuveen Closed-End Fund allows you to conveniently reinvest distributions in additional Fund shares. By choosing to reinvest, you'll be able to invest money regularly and automatically, and watch your investment grow through the power of compounding. Just like distributions in cash, there may be times when income or capital gains taxes may be payable on distributions that are reinvested. It is important to note that an automatic reinvestment plan does not ensure a profit, nor does it protect you against loss in a declining market.
Easy and convenient
To make recordkeeping easy and convenient, each month you'll receive a statement showing your total distributions, the date of investment, the shares acquired and the price per share, and the total number of shares you own.
How shares are purchased
The shares you acquire by reinvesting will either be purchased on the open market or newly issued by the Fund. If the shares are trading at or above net asset value at the time of valuation, the Fund will issue new shares at the greater of the net asset value or 95% of the then-current market price. If the shares are trading at less than net asset value, shares for your account will be purchased on the open market. If the Plan Agent begins purchasing Fund shares on the open market while shares are trading below net asset value, but the Fund's shares subsequently trade at or above their net asset value before the Plan Agent is able to complete its purchases, the Plan Agent may cease open-market purchases and may invest the uninvested portion of the distribution in newly-issued Fund shares at a price equal to the greater of the shares' net asset value or 95% of the shares' market value on the last business day immediately prior to the purchase date. Distributions received to purchase shares in the open market will normally be invested shortly after the distribution payment date. No interest will be paid on distributions awaiting reinvestment. Because the market price of the shares may increase before purchases are completed, the average purchase price per share may exceed the market price at the time of valuation, resulting in the acquisition of fewer shares than if the distribution had been paid in shares issued by the Fund. A pro rata portion of any applicable brokerage commissions on open market purchases will be paid by Plan participants. These commissions usually will be lower than those charged on individual transactions.
Flexible
You may change your distribution option or withdraw from the Plan at any time, should your needs or situation change. You can reinvest whether your shares are registered in your name, or in the name of a brokerage firm, bank, or other nominee. Ask your investment advisor if his or her firm will participate on your behalf. Participants whose shares are registered in the name of one firm may not be able to transfer the shares to another firm and continue to participate in the Plan. The Fund reserves the right to amend or terminate the Plan at any time. Although the Fund reserves the right to amend the Plan to include a service charge payable by the participants, there is no direct service charge to participants in the Plan at this time.
Call today to start reinvesting distributions
For more information on the Nuveen Automatic Reinvestment Plan or to enroll in or withdraw from the Plan, speak with your financial advisor or call us at (800) 257-8787.
Annual Investment Management Agreement Approval Process (Unaudited)
The Board of Trustees of each Fund (the "Board," and each Trustee a "Board Member"), including the Board Members who are not parties to the Funds' advisory or sub-advisory agreements or "interested persons" of any such parties (the "Independent Board Members"), is responsible for overseeing the performance of the investment adviser and sub-adviser to the respective Fund and determining whether to continue such Fund's advisory agreement (the "Investment Management Agreement") between the Fund and Nuveen Fund Advisors, LLC (the "Adviser") and the sub-advisory agreement (the "Sub-Advisory Agreement" and, together with the Investment Management Agreement, the "Advisory Agreements") between the Adviser and Nuveen Asset Management, LLC (the "Sub-Adviser"). Following an initial term with respect to each Fund upon its commencement of operations, the Board reviews each Investment Management Agreement and Sub-Advisory Agreement on behalf of each Fund and votes to determine whether the respective Advisory Agreement should be renewed. Accordingly, at an in-person meeting held on May 24-26, 2016 (the "May Meeting"), the Board, including a majority of the Independent Board Members, considered and approved the existing Advisory Agreements for the Funds.
During the year, the Board and its Committees met regularly to receive materials and discuss a variety of topics impacting the Funds including, among other things, overall market conditions and market performance, Fund investment performance, brokerage execution, valuation of securities, compliance matters, securities lending, leverage matters, risk management and ongoing initiatives. The Board had established several standing Committees, including the Open-end Fund Committee and Closed-end Fund Committee which permit the Board Members to delve further into the topics particularly relevant to the respective product line and enhance the Board's effectiveness and oversight of the Funds. The Board also seeks to meet with the Sub-Adviser and its investment team at least once over a multiple year rotation through site visits. The information and knowledge the Board gained throughout the year from the Board and Committee meetings, site visits and the related materials were relevant to the Board's evaluation of the Advisory Agreements, and the Board took such information into account in its review of the Advisory Agreements.
In addition to the materials received throughout the year, the Board received additional materials prepared specifically for its annual review of the Advisory Agreements in response to a request by independent legal counsel on behalf of the Independent Board Members. The materials addressed a variety of topics, including a description of the services provided by the Adviser and the Sub-Adviser (each, a "Fund Adviser"); a review of fund performance with a detailed focus on any performance outliers; an analysis of the investment teams; an analysis of the fees and expense ratios of the Funds, including information comparing such fees and expenses to that of peer groups; an assessment of shareholder services for the Funds and of the performance of certain service providers; a review of initiatives instituted or continued during the past year; and a review of premium/discount trends and leverage management as well as information regarding the profitability of the Fund Advisers, the compensation of portfolio managers, and compliance and risk matters.
As part of its annual review, the Board held a separate meeting on April 12-13, 2016 to review the Funds' investment performance and consider an analysis by the Adviser of the Sub-Adviser examining, among other things, the team's assets under management, investment performance, investment approach, and the stability and structure of the Sub-Adviser's organization and investment team. During the review, the Independent Board Members requested and received additional information from management. Throughout the year and throughout their review of the Advisory Agreements, the Independent Board Members were assisted by independent legal counsel. The Independent Board Members met separately with independent legal counsel without management present and received a memorandum from such counsel outlining their fiduciary duties and legal standards in reviewing the Advisory Agreements. The Independent Board Members' review of the Advisory Agreements reflected an ongoing process that incorporated the information and considerations that occurred over the years, including the most recent year, as well as the information specifically furnished for the renewal process. In deciding to renew the Advisory Agreements, the Independent Board Members
Annual Investment Management Agreement Approval Process (Unaudited) (continued)
did not identify a particular factor as controlling, but rather the decision reflected the comprehensive consideration of all the information presented. The following summarizes the principal factors, but not all the factors, the Board considered in its review of the Advisory Agreements and its conclusions.
| A. | Nature, Extent and Quality of Services |
| | In evaluating the renewal of the Advisory Agreements, the Independent Board Members received and considered information regarding the nature, extent and quality of the applicable Fund Adviser's services provided to the respective Fund and the initiatives undertaken during the past year by the Adviser. The Board recognized the comprehensive set of services the Adviser provided to manage and operate the Nuveen funds, including (a) product management (such as setting dividends, positioning the product in the marketplace, maintaining and enhancing shareholder communications and reporting to the Board); (b) investment services (such as overseeing the Sub-Adviser and other service providers; analyzing investment performance and risks; overseeing risk management and disclosure; developing and interpreting investment policies; assisting in the development of products; helping to prepare financial statements and marketing disclosures; and overseeing trade execution); (c) fund administration (such as helping to prepare fund tax returns and complete other tax compliance matters; and helping to prepare regulatory filings and shareholder reports); (d) fund Board administration (such as preparing Board materials and organizing and providing assistance for Board meetings); (e) compliance (such as helping to devise and maintain the funds' compliance program and related testing); (f) legal support (such as helping to prepare registration statements and proxy statements, interpreting regulations and policies and overseeing fund activities); and (g) providing leverage management. |
| | |
| | The Board reviewed the continued investment the Adviser had made in its business to continue to strengthen the breadth and quality of its services to the benefit of the Nuveen funds. The Board noted the Adviser's additional staffing in key areas that support the funds and the Board, including in investment services, operations, closed-end fund/structured products, fund governance, compliance, fund administration, product management, and information technology. Among the enhancements to its services, the Board recognized the Adviser's (a) expanded activities and support required as a result of regulatory developments, including in areas of compliance and reporting; (b) expanded efforts to support leverage management with a goal of seeking the most effective structure for fund shareholders given appropriate risk levels and regulatory constraints; (c) increased support for dividend management; (d) continued investment in its technical capabilities as the Adviser continued to build out a centralized fund data platform, enhance mobility and remote access capabilities, rationalize and upgrade software platforms, and automate certain regulatory liquidity determinations; (e) continued efforts to rationalize the product line through mergers, liquidations and re-positioning of Nuveen funds with the goal of increasing efficiencies, reducing costs, improving performance and addressing shareholder needs; (f) continued efforts to develop new lines of business designed to enhance the Nuveen product line and meet investor demands; and (g) continued commitment to enhance risk oversight, including the formation of the operational risk group to provide operational risk assessment, the access to platforms which provide better risk reporting to support investment teams, and the development of a new team to initially review new products and major product initiatives. The Board also recognized the Adviser's efforts to renegotiate certain fees of other service providers which culminated in reduced expenses for all funds for custody and accounting services without diminishing the breadth and quality of the services provided. The Board considered the Chief Compliance Officer's report regarding the Adviser's compliance program, the Adviser's continued development, execution and management of its compliance program, and the additions to the compliance team to support the continued growth of the Nuveen fund family and address regulatory developments. |
| | |
| | The Board also considered information highlighting the various initiatives that the Adviser had implemented or continued during the year to enhance or support the closed-end fund product line. The Board noted the Adviser's continued efforts during 2015 (a) to rationalize the product line through mergers designed to help reduce product overlap, offer shareholders the potential for lower fees and enhanced investor acceptance, and address persistent discounts in the secondary market; (b) to oversee and manage leverage as the Adviser facilitated the rollover of existing facilities and conducted negotiations for improved terms and pricing to reduce leverage costs; (c) to conduct capital management services including share repurchases |
| | and/or share issuances throughout the year and monitoring market conditions to capitalize on such opportunities for the closed-end funds; and (d) to implement data-driven market analytics which, among other things, provided a better analysis of the shareholder base, enhanced the ability to monitor the closed-end funds versus peers and helped to understand trading discounts. The Board also considered the quality and breadth of Nuveen's investment relations program through which Nuveen seeks to build awareness of, and educate investors and financial advisers with respect to, Nuveen closed-end funds which may help to build an active secondary market for the closed-end fund product line. |
| | |
| | As noted, the Adviser also oversees the Sub-Adviser who primarily provides the portfolio advisory services to the Funds. The Board recognized the skill and competency of the Adviser in monitoring and analyzing the performance of the Sub-Adviser and managing the sub-advisory relationship. The Board noted that the Adviser recommended the renewal of each Sub-Advisory Agreement. |
| | |
| | Based on their review, the Independent Board Members found that, overall, the nature, extent and quality of services provided to the respective Funds under each applicable Advisory Agreement were satisfactory. |
| | |
| B. | The Investment Performance of the Funds and Fund Advisers |
| | The Board considered the long-term and short-term performance history of each Fund. As noted above, the Board reviewed fund performance at its quarterly meetings throughout the year and took into account the information derived from the discussions with representatives of the Adviser about fund performance at these meetings. The Board also considered the Adviser's analysis of fund performance with particular focus on any performance outliers and the factors contributing to such performance and any steps the investment team had taken to address performance concerns. The Board reviewed, among other things, each Fund's investment performance both on an absolute basis and in comparison to peer funds (the "Performance Peer Group") and to recognized and/or customized benchmarks (i.e., generally benchmarks derived from multiple recognized benchmarks) for the quarter, one-, three- and five-year periods ending December 31, 2015, as well as performance information reflecting the first quarter of 2016. |
| | |
| | In evaluating performance information, the Board recognized the following factors may impact the performance data as well as the consideration to be given to particular performance data: |
| | |
| | • The performance data reflected a snapshot in time, in this case as of the end of the most recent calendar year or quarter. A different performance period, however, could generate significantly different results. |
| | |
| | • Long-term performance can be adversely affected by even one period of significant underperformance so that a single investment decision or theme had the ability to disproportionately affect long-term performance. |
| | |
| | • Shareholders evaluate performance based on their own holding period which may differ from the performance period reviewed by the Board, leading to different performance results. |
| | |
| | • The Board recognized the difficulty in establishing appropriate peer groups and benchmarks for certain funds, including Nuveen New Jersey Municipal Value Fund (the "New Jersey Fund") and Nuveen Pennsylvania Municipal Value Fund (the "Pennsylvania Fund"). The Board noted that management classified the Performance Peer Groups as low, medium and high in relevancy and took the relevancy of the Performance Peer Group into account when considering the comparative performance data. If the Performance Peer Group differed somewhat from a fund, the Board recognized that the comparative performance data may be of limited value. The Board also recognized that each fund operated pursuant to its own investment objective(s), parameters and restrictions which may differ from that of the Performance Peer Group or benchmark and that these variations lead to differences in performance results. Further, for funds that utilized leverage, the Board understood that leverage during different periods could provide both benefits and risks to a portfolio as compared to an unlevered benchmark. |
| | |
| | In addition to the foregoing, the Independent Board Members continued to recognize the importance of secondary market trading for the shares of closed-end funds. At the quarterly meetings as well as the May Meeting, the Independent Board |
Annual Investment Management Agreement Approval Process (Unaudited) (continued)
| | Members (either at the Board level or through the Closed-end Fund Committee) reviewed, among other things, the premium or discount to net asset value of the Nuveen closed-end funds as of a specified date and over various periods as well as in comparison to the premium/discount average in their respective Lipper peer category. At the May Meeting and/or prior meetings, the Independent Board Members (either at the Board level or through the Closed-end Fund Committee) reviewed, among other things, an analysis by the Adviser of the key economic, market and competitive trends that affected the closed-end fund market and Nuveen closed-end funds and considered any actions proposed periodically by the Adviser to address trading discounts of certain closed-end funds, including, among other things, share repurchases, fund reorganizations, adjusting fund investment mandates and strategies, and increasing fund awareness to investors. The Independent Board Members considered the evaluation of the premium and discount levels of the closed-end funds to be a continuing priority in their oversight of the closed-end funds. |
| | |
| | With respect to any Nuveen funds for which the Board has identified performance concerns, the Board monitors such funds closely until performance improves, discusses with the Adviser the reasons for such results, considers those steps necessary or appropriate to address such issues, and reviews the results of any efforts undertaken. The Board was aware, however, that shareholders chose to invest or remain invested in a fund knowing that the Adviser and the applicable sub-adviser manage the fund, knowing the fund's investment strategy and seeking exposure to that strategy (even if the strategy was "out of favor" in the marketplace) and knowing the fund's fee structure. |
| | |
| | For Nuveen New Jersey Quality Municipal Income Fund (the "New Jersey Quality Fund"), the Board noted that, although the Fund ranked in the fourth quartile of its Performance Peer Group for the longer three- and five-year periods, the Fund was in the first quartile for the one-year period. The Fund also outperformed its benchmark in the one-, three- and five-year periods. The Fund further ranked in the first quartile in its Performance Peer Group and outperformed its benchmark in the quarter ending March 31, 2016. The Board was satisfied with the progress of this Fund. |
| | |
| | For the New Jersey Fund, the Board noted that the Fund ranked in its Performance Peer Group in the fourth quartile in the one-, three- and five-year periods. In addition, although the Fund underperformed its benchmark in the one-year period, the Fund outperformed its benchmark in the three- and five-year periods. In reviewing the comparative peer information, the Board recognized that the peer group was classified as low relevancy because the Fund is an unlevered fund and the funds in the peer group consist primarily of levered funds. The Board recognized that, as a result, the Fund can generally be expected to under-perform levered funds in up markets and outperform such funds in down markets. The Board also recognized the Fund's positive absolute performance for the one-, three- and five-year periods. Given the Fund's investment mandate, the Board was satisfied with the explanation for the variance from peer performance and with the Fund's performance. |
| | |
| | For Nuveen Pennsylvania Quality Municipal Income Fund (the "Pennsylvania Quality Fund"), the Board noted that the Fund ranked in its Performance Peer Group in the third quartile in the one-, three- and five-year periods and outperformed its benchmark in each of such periods. The Board determined that the Fund's performance had been satisfactory. |
| | |
| | For the Pennsylvania Fund, the Board noted that, although the Fund ranked in its Performance Peer Group in the fourth quartile in the one- and five-year periods, the Fund ranked in the third quartile in the three-year period. The Fund also outperformed its benchmark in the one-, three- and five-year periods. The Board determined that the Fund's performance had been satisfactory. |
| | |
| C. | Fees, Expenses and Profitability |
| | 1. Fees and Expenses |
| | The Board evaluated the management fees and other fees and expenses of each Fund. The Board reviewed, among other things, the gross and net management fees and net total expenses of each Fund (expressed as a percentage of average net assets) in absolute terms and also in comparison to the fee and expense levels of a comparable universe of funds (the "Peer Universe") selected by an independent third-party fund data provider. The Independent Board Members also reviewed the methodology regarding the construction of the applicable Peer Universe. |
| | In their evaluation of the management fee schedule, the Independent Board Members considered the fund-level and complex-wide breakpoint schedules, as described in further detail below. In this regard, the Board considered that management recently reviewed the breakpoint schedules for the closed-end funds which resulted in reduced breakpoints and/or new breakpoints at certain asset thresholds for numerous closed-end funds, including the Funds. |
| | |
| | In reviewing the comparative fee and expense information, the Independent Board Members recognized that various factors such as the limited size and particular composition of the Peer Universe (including the inclusion of other Nuveen funds in the peer set); expense anomalies; changes in the funds comprising the Peer Universe from year to year; levels of reimbursement or fee waivers; the timing of information used; the differences in the type and use of leverage; differences in services provided; and differences in the states reflected in the Peer Universe can impact the usefulness of the comparative data in helping to assess the appropriateness of a fund's fees and expenses. In addition, in reviewing a fund's fees and expenses compared to the fees and expenses of its peers (excluding leverage costs and leveraged assets), the Board generally considered a fund's expenses and fees to be higher if they were over 10 basis points higher, slightly higher if they were 6 to 10 basis points higher, in line if they were within approximately 5 basis points higher than the peer average and below if they were below the peer average of the Peer Universe. The Board reviewed the net expense ratio in recognition that the net expense ratio generally best represented the net experience of the shareholders of a fund as it directly reflected the costs of investing in the respective fund. The Board noted that the majority of the Nuveen funds had a net expense ratio near or below the average of the respective peers. For funds with a net expense ratio of 6 basis points or higher than their respective peer average, the Independent Board Members reviewed the reasons for the outlier status and were satisfied with the explanation for the difference or with any steps taken to address the difference. |
| | |
| | The Independent Board Members noted that the New Jersey Quality Fund, the New Jersey Fund and the Pennsylvania Fund each had a net management fee and a net expense ratio below its respective peer average, and the Pennsylvania Quality Fund had a net management fee in line with its peer average and a net expense ratio below its peer average. |
| | |
| | Based on their review of the fee and expense information provided, the Independent Board Members determined that each Fund's management fees (as applicable) to a Fund Adviser were reasonable in light of the nature, extent and quality of services provided to the Fund. |
| | |
| | 2. Comparisons with the Fees of Other Clients |
| | The Board also reviewed information regarding the fee rates for other types of clients advised or sub-advised by the respective Fund Adviser. For the Adviser and/or the Sub-Adviser, such other clients may include municipal separately managed accounts and passively managed exchange traded funds (ETFs). |
| | |
| | The Board recognized that each Fund had an affiliated sub-adviser. With respect to affiliated sub-advisers, the Board reviewed, among other things, the range of advisory fee rates and average fee rate assessed for the different types of clients. The Board reviewed information regarding the different types of services provided to the Funds compared to that provided to these other clients which typically did not require the same breadth of day-to-day services required for registered funds. The Board further considered information regarding the differences in, among other things, investment policies, investor profiles, and account sizes between the Nuveen funds and the other types of clients. In addition, the Independent Board Members also recognized that the management fee rates of the foreign funds advised by the Adviser may also vary due to, among other things, differences in the client base, governing bodies, operational complexities and services covered by the management fee. The Independent Board Members recognized that the foregoing variations resulted in different economics among the product structures and culminated in varying management fees among the types of clients and funds. |
| | |
| | The Board also was aware that, since the Funds had a sub-adviser, each Fund's management fee reflected two components, the fee retained by the Adviser for its services and the fee the Adviser paid to the Sub-Adviser. The Board noted that many of the administrative services provided to support the Funds by the Adviser may not be required to the same extent or at all for |
Annual Investment Management Agreement Approval Process (Unaudited) (continued)
| | the institutional clients or other clients. In general, the Board noted that higher fee levels reflected higher levels of service provided by the Fund Adviser, increased investment management complexity, greater product management requirements and higher levels of business risk or some combination of the foregoing. Given the inherent differences in the various products, particularly the extensive services provided to the Funds, the Independent Board Members concluded such facts justify the different levels of fees. |
| | |
| | 3. Profitability of Fund Advisers |
| | In conjunction with their review of fees, the Independent Board Members also considered the profitability of Nuveen for its advisory activities on an absolute basis and in comparison to other investment advisers. The Independent Board Members reviewed, among other things, Nuveen's adjusted operating margins, the gross and net revenue margins (pre-tax and after-tax) for advisory activities for the Nuveen funds, and the revenues, expenses, and net income (pre-tax and after-tax) of Nuveen for each of the last two calendar years. The Independent Board Members reviewed an analysis of the key drivers behind the changes in revenues and expenses that impacted profitability in 2015. The Independent Board Members also noted that the sub-advisory fees for the Funds are paid by the Adviser, however, the Board recognized that the Sub-Adviser is affiliated with Nuveen. In their review, the Independent Board Members recognized that profitability data is rather subjective as various allocation methodologies may be reasonable to employ but yet yield different results. The Board also reviewed the results of certain alternative methodologies. The Board considered the allocation methodology employed to prepare the profitability data as well as a summary of the refinements to the methodology that had been adopted over the years which may limit some of the comparability of Nuveen's revenue margins over time. Two Independent Board Members also served as point persons for the Board throughout the year to review and discuss the methodology employed to develop the profitability analysis and any proposed changes thereto and to keep the Board apprised of such changes during the year. In reviewing the profitability data, the Independent Board Members noted that Nuveen's operating margin as well as its margins for its advisory activities to the Nuveen funds for 2015 were consistent with such margins for 2014. |
| | |
| | The Board also considered Nuveen's adjusted operating margins compared to that of other comparable investment advisers (based on asset size and composition) with publicly available data. The Independent Board Members recognized, however, the limitations of the comparative data as the other advisers may have a different business mix, employ different allocation methodologies, have different capital structure and costs, may not be representative of the industry or other factors that limit the comparability of the profitability information. Nevertheless, the Independent Board Members noted that Nuveen's adjusted operating margins appeared comparable to the adjusted margins of the peers. |
| | |
| | Further, as the Adviser is a wholly-owned subsidiary of Nuveen which in turn is an operating division of TIAA Global Asset Management, the investment management arm of Teachers Insurance and Annuity Association of America ("TIAA-CREF"), the Board reviewed a balance sheet for TIAA-CREF reflecting its assets, liabilities and capital and contingency reserves for the last two calendar years to have a better understanding of the financial stability and strength of the TIAA-CREF complex, together with Nuveen. |
| | |
| | Based on the information provided, the Independent Board Members noted that the Adviser appeared to be sufficiently profitable to operate as a viable investment management firm and to honor its obligations as a sponsor of the Nuveen funds. |
| | |
| | With respect to the Sub-Adviser, the Independent Board Members also considered the profitability of the Sub-Adviser from its relationship with the Nuveen funds. The Independent Board Members reviewed the Sub-Adviser's revenues, expenses and revenue margins (pre- and post-tax) for its advisory activities for the calendar year ended December 31, 2015. The Independent Board Members also reviewed profitability analysis reflecting the revenues, expenses and revenue margin (pre- and post-tax) by asset type for the Sub Adviser for the calendar year ending December 31, 2015. |
| | In evaluating the reasonableness of the compensation, the Independent Board Members also considered other amounts paid to a Fund Adviser by the Funds as well as indirect benefits (such as soft dollar arrangements), if any, the Fund Adviser and its affiliates received or were expected to receive that were directly attributable to the management of a Fund. See Section E below for additional information on indirect benefits a Fund Adviser may receive as a result of its relationship with the Funds. |
| | |
| | Based on their review, the Independent Board Members determined that the Adviser's and the Sub-Adviser's levels of profitability were reasonable in light of the respective services provided. |
| | |
| D. | Economies of Scale and Whether Fee Levels Reflect These Economies of Scale |
| | The Independent Board Members recognized that as the assets of a particular fund or the Nuveen complex in the aggregate increase over time, economies of scale may be realized with respect to the management of the funds, and the Independent Board Members considered the extent to which these economies are shared with the funds and their shareholders. Although the Independent Board Members recognized that economies of scale are difficult to measure with precision, the Board noted that there were several acceptable means to share economies of scale, including through breakpoints in the management fee schedule reducing the fee rates as asset levels grow, fee waiver and expense limitation agreements and the Adviser's investment in its business which can enhance the services provided to the funds. With respect to breakpoints, the Independent Board Members noted that, subject to certain exceptions, the funds in the Nuveen complex pay a management fee to the Adviser which is generally comprised of a fund-level component and complex-level component. The fund-level fee component declines as the assets of the particular fund grow and the complex-level fee component declines when eligible assets of all the funds in the Nuveen complex combined grow. With respect to closed-end funds, the Independent Board Members noted that, although such funds may from time-to-time make additional share offerings, the growth of their assets would occur primarily through the appreciation of such funds' investment portfolios. The complex-wide fee arrangement was designed to capture economies of scale achieved when total fund complex assets increase, even if the assets of a particular fund are unchanged or decrease. The approach reflected the notion that some of Nuveen's costs were attributable to services provided to all its funds in the complex, and therefore all funds should benefit if these costs were spread over a larger asset base. |
| | |
| | The Independent Board Members reviewed the breakpoint and complex-wide schedules and the material savings achieved from fund-level breakpoints and complex-wide fee reductions for the 2015 calendar year. |
| | |
| | In addition, the Independent Board Members recognized the Adviser's ongoing investment in its business to expand or enhance the services provided to the Nuveen funds. The Independent Board Members noted, among other things, the additions to groups who play a key role in supporting the funds including in closed-end funds/structured products, fund administration, operations, fund governance, investment services, compliance, product management, and technology. The Independent Board Members also recognized the investments in systems necessary to manage the funds including in areas of risk oversight, information technology and compliance. |
| | |
| | Based on their review, the Independent Board Members concluded that the current fee structure was acceptable and reflected economies of scale to be shared with shareholders when assets under management increase. |
| | |
| E. | Indirect Benefits |
| | The Independent Board Members received and considered information regarding other additional benefits the respective Fund Adviser or its affiliates may receive as a result of their relationship with the Funds, including compensation paid to affiliates and research received in connection with brokerage transactions (i.e., soft dollar arrangements). In this regard, the Independent Board Members noted any revenues received by affiliates of the Adviser for serving as co-manager in initial public offerings of new closed-end funds and as underwriter on shelf offerings for certain existing funds. |
Annual Investment Management Agreement Approval Process (Unaudited) (continued)
| | In addition to the above, the Independent Board Members considered that the Funds' portfolio transactions are allocated by the Sub-Adviser and the Sub-Adviser may benefit from research received through soft-dollar arrangements. The Board noted, however, that with respect to transactions in fixed income securities, such securities generally trade on a principal basis and do not generate soft dollar credits. Although the Board recognized the Sub-Adviser may benefit from a soft dollar arrangement if it does not have to pay for this research out of its own assets, the Board also recognized that any such research may benefit the Funds to the extent it enhances the ability of the Sub-Adviser to manage the Funds. |
| | |
| | Based on their review, the Independent Board Members concluded that any indirect benefits received by a Fund Adviser as a result of its relationship with the Funds were reasonable and within acceptable parameters. |
| | |
| F. | Other Considerations |
| | The Independent Board Members did not identify any single factor discussed previously as all-important or controlling. The Board Members, including the Independent Board Members, concluded that the terms of each Advisory Agreement were fair and reasonable, that the respective Fund Adviser's fees were reasonable in light of the services provided to each Fund and that the Advisory Agreements be renewed. |
Notes
Notes
Notes
Nuveen:
Serving Investors for Generations
Since 1898, financial advisors and their clients have relied on Nuveen to provide dependable investment solutions through continued adherence to proven, long-term investing principles. Today, we offer a range of high quality equity and fixed-income solutions designed to be integral components of a well-diversified core portfolio.
Focused on meeting investor needs.
Nuveen helps secure the long-term goals of individual investors and the advisors who serve them. As an operating division of TIAA Global Asset Management, Nuveen provides access to investment expertise from leading asset managers and solutions across traditional and alternative asset classes. Built on more than a century of industry leadership, Nuveen's teams of experts align with clients' specific financial needs and goals, demonstrating commitment to advisors and investors through market perspectives and wealth management and portfolio advisory services. Nuveen manages more than $244 billion in assets as of September 30, 2016.
Find out how we can help you.
To learn more about how the products and services of Nuveen may be able to help you meet your financial goals, talk to your financial advisor, or call us at (800) 257-8787. Please read the information provided carefully before you invest. Investors should consider the investment objective and policies, risk considerations, charges and expenses of any investment carefully. Where applicable, be sure to obtain a prospectus, which contains this and other relevant information. To obtain a prospectus, please contact your securities representative or Nuveen, 333 W. Wacker Dr., Chicago, IL 60606. Please read the prospectus carefully before you invest or send money.
Learn more about Nuveen Funds at: www.nuveen.com/cef
Distributed by Nuveen Investments, LLC | 333 West Wacker Drive | Chicago, IL 60606 | www.nuveen.com | |
ESA-A-1016D 21470-INV-B-12/17
ITEM 2. CODE OF ETHICS.
Not applicable to this filing.
ITEM 3. AUDIT COMMITTEE FINANCIAL EXPERT.
Not applicable to this filing.
ITEM 4. PRINCIPAL ACCOUNTANT FEES AND SERVICES.
Not applicable to this filing.
ITEM 5. AUDIT COMMITTEE OF LISTED REGISTRANTS.
Not applicable to this filing.
ITEM 6. SCHEDULE OF INVESTMENTS.
(a) See Portfolio of Investments in Item 1.
(b) Not applicable.
ITEM 7. DISCLOSURE OF PROXY VOTING POLICIES AND PROCEDURES FOR CLOSED-END MANAGEMENT INVESTMENT COMPANIES.
Not applicable to this filing.
ITEM 8. PORTFOLIO MANAGERS OF CLOSED-END MANAGEMENT INVESTMENT COMPANIES.
Not applicable to this filing.
ITEM 9. PURCHASES OF EQUITY SECURITIES BY CLOSED-END MANAGEMENT INVESTMENT COMPANY AND AFFILIATED PURCHASERS.
Not applicable.
ITEM 10. SUBMISSION OF MATTERS TO A VOTE OF SECURITY HOLDERS.
There have been no material changes to the procedures by which shareholders may recommend nominees to the registrant's Board implemented after the registrant last provided disclosure in response to this Item.
ITEM 11. CONTROLS AND PROCEDURES.
ITEM 12. EXHIBITS.
File the exhibits listed below as part of this Form.
Pursuant to the requirements of the Securities Exchange Act of 1934 and the Investment Company Act of 1940, the registrant has duly caused this report to be signed on its behalf by the undersigned, thereunto duly authorized.
Gifford R. Zimmerman
Pursuant to the requirements of the Securities Exchange Act of 1934 and the Investment Company Act of 1940, this report has been signed below by the following persons on behalf of the registrant and in the capacities and on the dates indicated.
Cedric H. Antosiewicz
Stephen D. Foy