Washington, D.C. 20549
Gifford R. Zimmerman
Form N-CSR is to be used by management investment companies to file reports with the Commission not later than 10 days after the transmission to stockholders of any report that is required to be transmitted to stockholders under Rule 30e-1 under the Investment Company Act of 1940 (17 CFR 270.30e-1). The Commission may use the information provided on Form N-CSR in its regulatory, disclosure review, inspection, and policymaking roles.
A registrant is required to disclose the information specified by Form N-CSR, and the Commission will make this information public. A registrant is not required to respond to the collection of information contained in Form N-CSR unless the Form displays a currently valid Office of Management and Budget ("OMB") control number. Please direct comments concerning the accuracy of the information collection burden estimate and any suggestions for reducing the burden to Secretary, Securities and Exchange Commission, 450 Fifth Street, NW, Washington, DC 20549-0609. The OMB has reviewed this collection of information under the clearance requirements of 44 U.S.C. ss. 3507.
ITEM 1. REPORTS TO STOCKHOLDERS.
Life is
Complex.
Nuveen makes things e-simple.
It only takes a minute to sign up for e-Reports. Once enrolled, you’ll receive an e-mail as soon as your Nuveen Fund information is ready—no more waiting for delivery by regular mail. Just click on the link within the e-mail to see the report and save it on your computer if you wish.
Free e-Reports
right to your e-mail!
www.investordelivery.com
If you receive your Nuveen Fund
dividends and statements from your
financial advisor or brokerage account.
or
www.nuveen.com/client-access
If you receive your Nuveen Fund
dividends and statements directly from
Nuveen.
NOT FDIC INSURED MAY LOSE
VALUE NO BANK GUARANTEE
Table of Contents
| | |
| Chairman’s Letter to Shareholders | 4 |
| | |
| Portfolio Manager’s Comments | 5 |
| | |
| Fund Leverage | 8 |
| | |
| Common Share Information | 10 |
| | |
| Risk Considerations | 12 |
| | |
| Performance Overview and Holding Summaries | 13 |
| | |
| Portfolios of Investments | 17 |
| | |
| Statement of Assets and Liabilities | 54 |
| | |
| Statement of Operations | 55 |
| | |
| Statement of Changes in Net Assets | 56 |
| | |
| Statement of Cash Flows | 58 |
| | |
| Financial Highlights | 60 |
| | |
| Notes to Financial Statements | 65 |
| | |
| Additional Fund Information | 79 |
| | |
| Glossary of Terms Used in this Report | 80 |
| | |
| Reinvest Automatically, Easily and Conveniently | 82 |
| | |
| Annual Investment Management Agreement Approval Process | 83 |
3
Chairman’s Letter
to Shareholders
Dear Shareholders,
I am honored to serve as the new independent chairman of the Nuveen Fund Board, effective July 1, 2018. I’d like to gratefully acknowledge the stewardship of my predecessor William J. Schneider and, on behalf of my fellow Board members, reinforce our commitment to the legacy of strong, independent oversight of your Funds.
After growing in sync with the rest of the world in 2017, the U.S. economy has emerged as the leader in 2018. U.S. stock markets have largely shrugged off trade war risks and escalating tariffs, while China’s manufacturing activity has weakened, European export sales have slowed and business outlooks around the world have dimmed. Within emerging markets, a stronger U.S. dollar and rising interest rates have negatively impacted financial markets for those countries most vulnerable to tightening global conditions. Additionally, global markets have remained watchful of geopolitical concerns, including the ongoing Brexit negotiations, North Korea relations and rising populism around the world, which pose a range of outcomes that are difficult to predict.
Despite these risks, global growth remains intact, although at a slower pace, providing support to corporate earnings. Fiscal stimulus, an easing regulatory environment and robust consumer spending has helped boost the U.S. economy’s momentum. Economic growth in Europe, the U.K. and Japan stabilized after a sluggish start to 2018 and China’s policy makers remain committed to supporting their domestic economy. Subdued inflation pressures have kept central bank policy in line with expectations, even as Europe moves closer to winding down its monetary stimulus and the Federal Reserve remains on a moderate tightening course.
Headlines and political turbulence will continue to obscure underlying fundamentals at times and cause temporary bouts of volatility. We encourage you to work with your financial advisor to evaluate your goals, timeline and risk tolerance. On behalf of the other members of the Nuveen Fund Board, we look forward to continuing to earn your trust in the months and years ahead.
Sincerely,
Terence J. Toth
Chairman of the Board
October 22, 2018
4
Portfolio Manager’s Comments
Nuveen New Jersey Quality Municipal Income Fund (NXJ)
Nuveen New Jersey Municipal Value Fund (NJV)
Nuveen Pennsylvania Quality Municipal Income Fund (NQP)
Nuveen Pennsylvania Municipal Value Fund (NPN)
These Funds feature portfolio management by Nuveen Asset Management, LLC (NAM), an affiliate of Nuveen, LLC. Portfolio manager Paul L. Brennan, CFA, reviews key investment strategies and the six-month performance of the Nuveen New Jersey and Pennsylvania Funds. Paul assumed portfolio management responsibility for these four Funds in 2011.
What key strategies were used to manage these Funds during the six-month reporting period ended August 31, 2018?
Municipal bond performance, as measured by the S&P Municipal Bond Index, was positive during the six-month reporting period, bolstered by a benign credit backdrop and favorable supply-demand dynamics. Issuance has been shrinking after the Jobs and Tax Cut Act of 2017 revoked tax-exempt advance refunding, while demand has remained persistently strong. The mismatch has boosted the value of municipal bonds. Longer-term municipal yields fell (because yields move in the opposite direction of prices) amid strong demand, but shorter-term yields rose along with the Federal Reserve’s (Fed) policy rate hikes. Credit spreads continued to narrow, as economic data pointed to an upswing in growth while inflation remained relatively low. New Jersey’s municipal bond market outperformed the national market while Pennsylvania’s market performed in line with the national market in this reporting period.
We also note that New Jersey is among the states with the highest personal income and property taxes, which will be more meaningfully affected by the new limits on state and local tax (known as SALT) deductions. While individual taxpayers in New Jersey could see an increased tax burden, we also expect municipal bond demand to remain robust. In-state issues, which offer both state and federal tax advantages, are likely to be especially attractive to taxpayers in high income states. For state and local governments, the ability to raise taxes in the future may be more politically challenging. Bonds backed by tax revenues could face headwinds going forward, and state and local credit profiles could suffer if delays in tax increases hurt pension funding, capital investment or other government spending priorities.
This material is not intended to be a recommendation or investment advice, does not constitute a solicitation to buy or sell securities, and is not provided in a fiduciary capacity. The information provided does not take into account the specific objectives or circumstances of any particular investor, or suggest any specific course of action. Investment decisions should be made based on an investor’s objectives and circumstances and in consultation with his or her advisors.Certain statements in this report are forward-looking statements. Discussions of specific investments are for illustration only and are not intended as recommendations of individual investments. The forward-looking statements and other views expressed herein are those of the portfolio manager as of the date of this report. Actual future results or occurrences may differ significantly from those anticipated in any forward-looking statements, and the views expressed herein are subject to change at any time, due to numerous market and other factors. The Funds disclaim any obligation to update publicly or revise any forward-looking statements or views expressed herein.
For financial reporting purposes, the ratings disclosed are the highest rating given by one of the following national rating agencies: Standard & Poor’s Group (S&P), Moody’s Investors Service, Inc. (Moody’s) or Fitch, Inc. (Fitch). This treatment of split-rated securities may differ from that used for other purposes, such as for Fund investment policies. Credit ratings are subject to change. AAA, AA, A and BBB are investment grade ratings, while BB, B, CCC, CC, C and D are below investment grade ratings. Holdings designated N/R are not rated by these national rating agencies.
Bond insurance guarantees only the payment of principal and interest on the bond when due, and not the value of the bonds themselves, which will fluctuate with the bond market and the financial success of the issuer and the insurer. Insurance relates specifically to the bonds in the portfolio and not to the share prices of a Fund. No representation is made as to the insurers’ ability to meet their commitments.
Refer to the Glossary of Terms Used in this Report for further definition of the terms used within this section.
5
Portfolio Manager’s Comments (continued)
Our trading activity continued to focus on pursuing the Funds’ investment objectives. We continued to seek bonds in areas of the market that we expected to perform well as the economy continued to improve. In this reporting period, we opportunistically sought to buy bonds offering better relative value and long-term total return potential. The Funds’ positioning emphasized intermediate and longer maturities, lower rated credits and sectors offering higher yields. Additionally, with both Pennsylvania and New Jersey facing ongoing fiscal challenges, we continued to limit exposure to state-supported obligations in all four Funds. The New Jersey Funds added bonds issued for the health care, student loan, single-family housing, and county/local general obligation (GO) sectors. Elevated call activity in the tobacco sector affected NXJ and NJV, as the state of New Jersey refunded its tobacco settlement revenue bonds in this reporting period. We reinvested some of the proceeds from the called tobacco bonds, which were rated below investment grade, back into the new issues, which were issued with investment grade ratings. In Pennsylvania, we bought housing, life care, hospitals, higher education and county GO bonds.
To fund these purchases, we reinvested the proceeds primarily from called and maturing bonds. We also selectively sold positions with short maturities such as pre-refunded bonds, bonds nearing their call dates and some higher quality positions that had appreciated due to strong demand, which could be swapped for more attractive relative long-term opportunities. Additionally, we sought to diversify some of the call risk in NPN and NJV, which hold meaningful exposure to bonds with 2019 call dates. In fact, NJV had an elevated level of advance refundings in its portfolio in this reporting period. NPN and NJV were launched in 2009 when interest rates were higher, and advance refundings or simple current refundings, of bonds callable in 2019 is likely to remain elevated in the current environment of still low interest rates. However, we should note these trades have had a negative impact on the two Funds’ earnings in the short term. To keep the Funds fully invested, the older bonds, which were issued when prevailing interest rates were higher, are being replaced with the lower yielding bonds available in the current market.
As of August 31, 2018, all of these Funds continued to use inverse floating rate securities. We employ inverse floaters for a variety of reasons, including duration management, income enhancement and total return enhancement. As part of our duration management strategies, NXJ and NQP also invested in forward interest rates swaps and NQP invested in U.S. Treasury futures to help reduce price volatility risk to movements in U.S. interest rates relative to the Funds’ benchmark. The impact on performance from the Funds’ use of futures and swaps was negligible.
How did the Funds perform during the six-month reporting period ended August 31, 2018?
The tables in each Fund's Performance Overview and Holding Summaries section of this report provide the Funds’ total returns for the six-month, one-year, five-year, ten-year and since inception periods ended August 31, 2018. Each Fund’s total returns at common share net asset value (NAV) are compared with the performance of corresponding market indexes.
For the six-month reporting period ended August 31, 2018, the total returns at common share NAV for these four Funds outperformed the national S&P Municipal Bond Index, NXJ, NQP and NPN beat their respective state’s S&P Municipal Bond Index, while NJV trailed the S&P Municipal Bond New Jersey Index.
The main positive contributor to the Funds’ relative performance was their longer yield curve and duration positioning. In this reporting period, longer duration bonds outperformed those with shorter durations and all four Funds held overweight exposures to longer duration credits and underweight exposures to shorter duration credits.
The Funds’ credit ratings allocations were also advantageous to relative performance. The Funds have continued to emphasize lower rated bonds over high grade bonds, which was favorable to performance as lower credit quality bonds (A rated and lower) performed better than higher quality (AAA and AA rated) bonds in this reporting period.
6
Performance was also driven by our selection in individual credits. The four Funds’ holdings in local GOs and pre-refunded bonds underperformed due to these sectors’ higher credit ratings and lower yields. However, for the New Jersey Funds, some of the newly refunded bonds appreciated strongly, including tobacco bonds. The two Pennsylvania Funds’ exposure to FirstEnergy Solutions benefited performance in this reporting period. The energy supplier had performed poorly earlier in 2017 amid credit concerns relating to its parent company’s plan to exit the power generation business (as detailed in “An Update on FirstEnergy Solutions Corp.” at the end of this commentary). Recent progress on negotiations with bondholders helped the bonds appreciate during this reporting period, which was positive for NQP and NPN’s performance.
In addition, the use of regulatory leverage was a factor affecting the performance of NXJ and NQP. NJV and NPN do not use regulatory leverage. Leverage is discussed in more detail later in the Fund Leverage section of this report.
An Update on FirstEnergy Solutions Corp.
FirstEnergy Solutions Corp. and all of its subsidiaries filed for protection under Chapter 11 of the U.S. Bankruptcy Code on March 18, 2018. FirstEnergy Solutions and its subsidiaries specialize in coal and nuclear energy production. It is one of the main energy producers in the state of Ohio and a major energy provider in Pennsylvania. Because of the challenging market environment for nuclear and coal power in the face of inexpensive natural gas, FirstEnergy announced in late 2016 that it would begin a strategic review of its generation assets. FirstEnergy Solutions is a unique corporate issuer in that the majority of its debt was issued in the municipal market to finance pollution control and waste disposal for its coal and nuclear plants. A substantial amount of bondholders, of which Nuveen Funds are included, entered into an “Agreement in Principal” with FirstEnergy Solutions’ parent, FirstEnergy Corp., to resolve potential claims that bondholders may have against FirstEnergy Corp. The agreement is subject to the approval of the FirstEnergy Corp. board of directors, FirstEnergy Solutions and the bankruptcy court.
In terms of FirstEnergy holdings, shareholders should note that NQP had 1.57% and NPN had 1.49% exposure, which was a mix of unsecured and secured holdings. NXJ and NJV had no exposure to FirstEnergy.
7
Fund Leverage
IMPACT OF THE FUNDS’ LEVERAGE STRATEGIES ON PERFORMANCE
One important factor impacting the returns of the Funds’ common shares relative to their comparative benchmarks was the Funds’ use of leverage through their issuance of preferred shares and/or investments in inverse floating rate securities, which represent leveraged investments in underlying bonds. NJV and NPN do not use regulatory leverage. The Funds use leverage because our research has shown that, over time, leveraging provides opportunities for additional income, particularly in the recent market environment where short-term market rates are at or near historical lows, meaning that the short-term rates the Fund has been paying on its leveraging instruments in recent years have been much lower than the interest the Fund has been earning on its portfolio of long-term bonds that it has bought with the proceeds of that leverage.
However, use of leverage can expose Fund common shares to additional price volatility. When a Fund uses leverage, the Fund common shares will experience a greater increase in their net asset value if the municipal bonds acquired through the use of leverage increase in value, but will also experience a correspondingly larger decline in their net asset value if the bonds acquired through leverage decline in value, which will make the shares’ net asset value more volatile, and total return performance more variable, over time.
In addition, common share income in levered funds will typically decrease in comparison to unlevered funds when short-term interest rates increase and increase when short-term interest rates decrease. Over the last few quarters, short-term interest rates have indeed increased from their extended lows after the 2007-09 financial crisis. This increase has reduced common share net income, and also reduced potential for long-term total returns. Nevertheless, the ability to effectively borrow at current short-term rates is still resulting in enhanced common share income, and management believes that the advantages of continuation of leverage outweigh the associated increase in risk and volatility described above.
Leverage from issuance of preferred shares had a positive impact on the performance of NXJ and NQP over the reporting period. The use of leverage through inverse floating rate securities had a negligible impact on the performance of the Funds over the reporting period.
| As of August 31, 2018, the Funds’ percentages of leverage are as shown in the accompanying table. |
| | NXJ | NJV | NQP | NPN |
| Effective Leverage* | 39.26% | 9.45% | 40.39% | 4.18% |
| Regulatory Leverage* | 32.59% | 0.00% | 35.32% | 0.00% |
| * | Effective Leverage is a Fund’s effective economic leverage, and includes both regulatory leverage and the leverage effects of certain derivative and other investments in a Fund’s portfolio that increase the Fund’s investment exposure. Currently, the leverage effects of Tender Option Bond (TOB) inverse floater holdings are included in effective leverage values, in addition to any regu- latory leverage. Regulatory leverage consists of preferred shares issued or borrowings of a Fund. Both of these are part of a Fund’s capital structure. A Fund, however, may from time to time borrow on a typically transient basis in connection with its day-to-day operations, primarily in connection with the need to settle portfolio trades. Such incidental borrowings are excluded from the calculation of a Fund’s effective leverage ratio. Regulatory leverage is subject to asset coverage limits set forth in the Investment Company Act of 1940. |
8
THE FUNDS’ REGULATORY LEVERAGE
As of August 31, 2018, the following Funds have issued and outstanding preferred shares as shown in the accompanying table. As mentioned previously, NJV and NPN do not use regulatory leverage.
| | | Variable Rate | | | Variable Rate | | | | |
| | | Preferred* | | | Remarketed Preferred** | | | | |
| | | Shares Issued at | | | Shares Issued at | | | | |
| | | Liquidation Preference | | | Liquidation Preference | | | Total | |
| NXJ | | $ | 313,900,000 | | | $ | — | | | $ | 313,900,000 | |
| NQP | | $ | 304,500,000 | | | $ | — | | | $ | 304,500,000 | |
| * | Preferred shares of the Fund featuring a floating rate dividend based on a predetermined formula or spread to an index rate. Includes the following preferred shares AMTP, iMTP, VMTP, MFP- VRM and VRDP in Special Rate Mode, where applicable. See Notes to Financial Statements, Note 4 – Fund Shares, Preferred Shares for further details. |
| ** | Preferred shares of the Fund featuring floating rate dividends set by a remarketing agent via a regular remarketing. Includes the following preferred shares VRDP not in Special Rate Mode, MFP- VRRM and MFP-VRDM, where applicable. See Notes to Financial Statements, Note 4 – Fund Shares, Preferred Shares for further details. |
Refer to Notes to Financial Statements, Note – 4 Fund Shares, Preferred Shares for further details on preferred shares and each Fund’s respective transactions.
9
Common Share Information
COMMON SHARE DISTRIBUTION INFORMATION
The following information regarding the Funds’ distributions is current as of August 31, 2018. Each Fund’s distribution levels may vary over time based on each Fund’s investment activity and portfolio investment value changes.
During the current reporting period, each Fund’s distributions to common shareholders were as shown in the accompanying table.
| | | Per Common Share Amounts | |
| Monthly Distributions (Ex-Dividend Date) | | NXJ | | | NJV | | | NQP | | | NPN | |
| March 2018 | | $ | 0.0580 | | | $ | 0.0475 | | | $ | 0.0535 | | | $ | 0.0430 | |
| April | | | 0.0580 | | | | 0.0475 | | | | 0.0535 | | | | 0.0430 | |
| May | | | 0.0580 | | | | 0.0475 | | | | 0.0535 | | | | 0.0430 | |
| June | | | 0.0545 | | | | 0.0450 | | | | 0.0505 | | | | 0.0430 | |
| July | | | 0.0545 | | | | 0.0450 | | | | 0.0505 | | | | 0.0430 | |
| August 2018 | | | 0.0545 | | | | 0.0450 | | | | 0.0505 | | | | 0.0430 | |
| Total Distributions from Net Investment Income | | $ | 0.3375 | | | $ | 0.2775 | | | $ | 0.3120 | | | $ | 0.2580 | |
| | |
| Yields | | | | | | | | | | | | | | | | |
| Market Yield* | | | 4.97 | % | | | 4.18 | % | | | 4.75 | % | | | 3.80 | % |
| Taxable-Equivalent Yield* | | | 7.14 | % | | | 6.01 | % | | | 6.52 | % | | | 5.21 | % |
| * | Market Yield is based on the Fund’s current annualized monthly dividend divided by the Fund’s current market price as of the end of the reporting period. Taxable-Equivalent Yield represents the yield that must be earned on a fully taxable investment in order to equal the yield of the Fund on an after-tax basis. It is based on a combined federal and state income tax rate of 30.4% and 27.1% for New Jersey and Pennsylvania, respectively. When comparing a Fund to investments that generate qualified dividend income, the Taxable-Equivalent Yield is lower. |
Each Fund in this report seeks to pay regular monthly dividends out of its net investment income at a rate that reflects its past and projected net income performance. To permit each Fund to maintain a more stable monthly dividend, the Fund may pay dividends at a rate that may be more or less than the amount of net income actually earned by the Fund during the period. If a Fund has cumulatively earned more than it has paid in dividends, it will hold the excess in reserve as undistributed net investment income (UNII) as part of the Fund’s net asset value. Conversely, if a Fund has cumulatively paid in dividends more than it has earned, the excess will constitute a negative UNII that will likewise be reflected in the Fund’s net asset value. Each Fund will, over time, pay all its net investment income as dividends to shareholders.
As of August 31, 2018, the Funds had positive UNII balances, based upon our best estimate, for tax purposes. NXJ and NJV had positive UNII balances while NQP and NPN had negative UNII balances for financial reporting purposes.
All monthly dividends paid by each Fund during the current reporting period were paid from net investment income. If a portion of the Fund’s monthly distributions is sourced from or comprised of elements other than net investment income, including capital gains and/or a return of capital, shareholders will be notified of those sources. For financial reporting purposes, the composition and per share amounts of each Fund’s dividends for the reporting period are presented in this report’s Statement of Changes in Net Assets and Financial Highlights, respectively. For income tax purposes, distribution information for each Fund as of its most recent tax year end is presented in Note 6 — Income Tax Information within the Notes to Financial Statements of this report.
10
COMMON SHARE REPURCHASES
During August 2018, the Funds’ Board of Trustees reauthorized an open-market share repurchase program, allowing each Fund to repurchase an aggregate of up to approximately 10% of its outstanding shares.
As of August 31, 2018, and since the inception of the Funds’ repurchase programs, the Funds have cumulatively repurchased and retired their outstanding common shares as shown in the accompanying table.
| | NXJ | NJV | NQP | NPN |
| Common shares cumulatively repurchased and retired | 1,198,100 | 18,900 | 536,200 | 0 |
| Common shares authorized for repurchase | 4,215,000 | 155,000 | 3,760,000 | 120,000 |
During the current reporting period, the following Funds repurchased and retired their common shares at a weighted average price per common share and a weighted average discount per common share as shown in the accompanying table.
| | | NXJ | | | NJV | | | NQP | |
| Common shares repurchased and retired | | | 539,900 | | | | 3,900 | | | | 157,300 | |
| Weighted average price per common share repurchased and retired | | $ | 13.03 | | | $ | 12.98 | | | $ | 12.44 | |
| Weighted average discount per common share repurchased and retired | | | 15.65 | % | | | 14.38 | % | | | 15.50 | % |
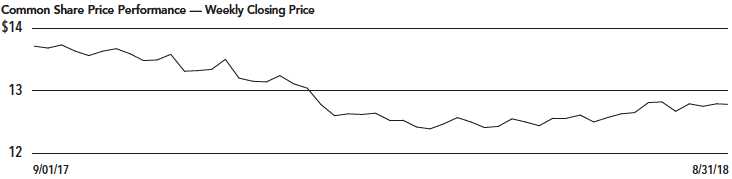
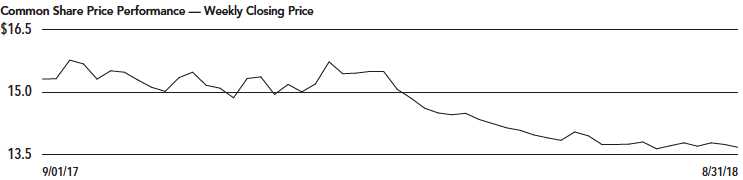
OTHER COMMON SHARE INFORMATION
As of August 31, 2018, and during the current reporting period, the Funds’ common share prices were trading at a premium/ (discount) to their common share NAVs as shown in the accompanying table.
| | | NXJ | | | NJV | | | NQP | | | NPN | |
| Common share NAV | | $ | 15.46 | | | $ | 15.15 | | | $ | 14.84 | | | $ | 14.81 | |
| Common share Price | | $ | 13.15 | | | $ | 12.92 | | | $ | 12.77 | | | $ | 13.58 | |
| Premium/(Discount) to NAV | | | (14.94 | )% | | | (14.72 | )% | | | (13.95 | )% | | | (8.31 | )% |
| 6-month average premium/(discount) to NAV | | | (15.42 | )% | | | (13.48 | )% | | | (14.93 | )% | | | (4.93 | )% |
11
Risk Considerations
Fund shares are not guaranteed or endorsed by any bank or other insured depository institution, and are not federally insured by the Federal Deposit Insurance Corporation.
Nuveen New Jersey Quality Municipal Income Fund (NXJ)
Investing in closed-end funds involves risk; principal loss is possible. There is no guarantee the Fund’s investment objectives will be achieved. Closed-end fund shares may frequently trade at a discount or premium to their net asset value. Debt or fixed income securities such as those held by the Fund, are subject to market risk, credit risk, interest rate risk, derivatives risk, liquidity risk, and income risk. As interest rates rise, bond prices fall. Leverage increases return volatility and magnifies the Fund’s potential return and its risks; there is no guarantee a fund’s leverage strategy will be successful. State concentration makes the Fund more susceptible to local adverse economic, political, or regulatory changes affecting municipal bond issuers. These and other risk considerations such as inverse floater risk and tax risk are described in more detail on the Fund’s web page at www.nuveen.com/NXJ.
Nuveen New Jersey Municipal Value Fund (NJV)
Investing in closed-end funds involves risk; principal loss is possible. There is no guarantee the Fund’s investment objectives will be achieved. Closed-end fund shares may frequently trade at a discount or premium to their net asset value. Debt or fixed income securities such as those held by the Fund, are subject to market risk, credit risk, interest rate risk, derivatives risk, liquidity risk, and income risk. As interest rates rise, bond prices fall. State concentration makes the Fund more susceptible to local adverse economic, political, or regulatory changes affecting municipal bond issuers. These and other risk considerations such as tax risk are described in more detail on the Fund’s web page at www.nuveen.com/NJV.
Nuveen Pennsylvania Quality Municipal Income Fund (NQP)
Investing in closed-end funds involves risk; principal loss is possible. There is no guarantee the Fund’s investment objectives will be achieved. Closed-end fund shares may frequently trade at a discount or premium to their net asset value. Debt or fixed income securities such as those held by the Fund, are subject to market risk, credit risk, interest rate risk, derivatives risk, liquidity risk, and income risk. As interest rates rise, bond prices fall. Leverage increases return volatility and magnifies the Fund’s potential return and its risks; there is no guarantee a fund’s leverage strategy will be successful. State concentration makes the Fund more susceptible to local adverse economic, political, or regulatory changes affecting municipal bond issuers. These and other risk considerations such as inverse floater risk and tax risk are described in more detail on the Fund’s web page at www.nuveen.com/NQP.
Nuveen Pennsylvania Municipal Value Fund (NPN)
Investing in closed-end funds involves risk; principal loss is possible. There is no guarantee the Fund’s investment objectives will be achieved. Closed-end fund shares may frequently trade at a discount or premium to their net asset value. Debt or fixed income securities such as those held by the Fund, are subject to market risk, credit risk, interest rate risk, derivatives risk, liquidity risk, and income risk. As interest rates rise, bond prices fall. State concentration makes the Fund more susceptible to local adverse economic, political, or regulatory changes affecting municipal bond issuers. These and other risk considerations such as tax risk are described in more detail on the Fund’s web page at www.nuveen.com/NPN.
12
| | |
| NXJ | Nuveen New Jersey Quality Municipal Income Fund Performance Overview and Holding Summaries as of August 31, 2018 |
| |
| Refer to Glossary of Terms Used in this Report for further definition of the terms used within this section. |
| |
Average Annual Total Returns as of August 31, 2018 |
| | Cumulative | | Average Annual |
| | 6-Month | | 1-Year | 5-Year | 10-Year |
| NXJ at Common Share NAV | 2.81% | | 1.62% | 7.21% | 6.32% |
| NXJ at Common Share Price | 3.00% | | (0.52)% | 7.03% | 6.27% |
| S&P Municipal Bond New Jersey Index | 2.30% | | 2.00% | 4.80% | 4.76% |
| S&P Municipal Bond Index | 1.78% | | 0.61% | 4.23% | 4.36% |
Past performance is not predictive of future results. Current performance may be higher or lower than the data shown. Returns do not reflect the deduction of taxes that shareholders may have to pay on Fund distributions or upon the sale of Fund shares. Returns at NAV are net of Fund expenses, and assume reinvestment of distributions. Comparative index return information is provided for the Fund’s shares at NAV only. Indexes are not available for direct investment.
This data relates to the securities held in the Fund’s portfolio of investments as of the end of the reporting period. It should not be construed as a measure of performance for the Fund itself. Holdings are subject to change.
For financial reporting purposes, the ratings disclosed are the highest rating given by one of the following national rating agencies: Standard & Poor’s Group, Moody’s Investors Service, Inc. or Fitch, Inc. This treatment of split-rated securities may differ from that used for other purposes, such as for Fund investment policies. Credit ratings are subject to change. AAA, AA, A and BBB are investment grade ratings; BB, B, CCC, CC, C and D are below-investment grade ratings. Holdings designated N/R are not rated by these national rating agencies.
Fund Allocation | |
(% of net assets) | |
| Long-Term Municipal Bonds | 148.3% |
| Other Assets Less Liabilities | 1.2% |
Net Assets Plus Floating Rate Obligations & VRDP Shares, net of deferred offering costs | 149.5% |
| Floating Rate Obligations | (1.4)% |
| VRDP Shares, net of deferred offering costs | (48.1)% |
Net Assets | 100% |
Portfolio Composition | |
(% of total investments) | |
| Tax Obligation/Limited | 22.7% |
| Transportation | 19.2% |
| Education and Civic Organizations | 14.8% |
| Health Care | 13.4% |
| U.S. Guaranteed | 7.2% |
| Tax Obligation/General | 4.5% |
| Water and Sewer | 3.4% |
| Other | 14.8% |
Total | 100% |
Portfolio Credit Quality | |
(% of total investment exposure) | |
| U.S. Guaranteed | 6.6% |
| AAA | 13.4% |
| AA | 29.4% |
| A | 29.3% |
| BBB | 15.4% |
| BB or Lower | 5.1% |
| N/R (not rated) | 0.8% |
Total | 100% |
13
| | |
NJV | Nuveen New Jersey Municipal Value Fund |
| | Performance Overview and Holding Summaries as of August 31, 2018 |
| |
| Refer to Glossary of Terms Used in this Report for further definition of the terms used within this section. |
| |
Average Annual Total Returns as of August 31, 2018 |
| | Cumulative | | Average Annual |
| | 6-Month | | 1-Year | 5-Year | Since Inception |
| NJV at Common Share NAV | 1.84% | | 0.99% | 5.14% | 5.79% |
| NJV at Common Share Price | (2.61)% | | (7.71)% | 4.22% | 3.85% |
| S&P Municipal Bond New Jersey Index | 2.30% | | 2.00% | 4.80% | 4.99% |
| S&P Municipal Bond Index | 1.78% | | 0.61% | 4.23% | 4.61% |
Since inception returns are from 4/28/09. Past performance is not predictive of future results. Current performance may be higher or lower than the data shown. Returns do not reflect the deduction of taxes that shareholders may have to pay on Fund distributions or upon the sale of Fund shares. Returns at NAV are net of Fund expenses, and assume reinvestment of distributions. Comparative index return information is provided for the Fund’s shares at NAV only. Indexes are not available for direct investment.
This data relates to the securities held in the Fund’s portfolio of investments as of the end of the reporting period. It should not be construed as a measure of performance for the Fund itself. Holdings are subject to change.
For financial reporting purposes, the ratings disclosed are the highest rating given by one of the following national rating agencies: Standard & Poor’s Group, Moody’s Investors Service, Inc. or Fitch, Inc. This treatment of split-rated securities may differ from that used for other purposes, such as for Fund investment policies. Credit ratings are subject to change. AAA, AA, A and BBB are investment grade ratings; BB, B, CCC, CC, C and D are below-investment grade ratings. Holdings designated N/R are not rated by these national rating agencies.
Fund Allocation | |
(% of net assets) | |
| Long-Term Municipal Bonds | 105.7% |
| Other Assets Less Liabilities | 0.7% |
Net Assets Plus Floating Rate Obligations | 106.4% |
| Floating Rate Obligations | (6.4)% |
Net Assets | 100% |
Portfolio Composition | |
(% of total investments) | |
| Health Care | 20.2% |
| Education and Civic Organizations | 17.8% |
| U.S. Guaranteed | 15.2% |
| Transportation | 11.5% |
| Tax Obligation/Limited | 10.0% |
| Tax Obligation/General | 8.5% |
| Housing/Multifamily | 7.0% |
| Other | 9.8% |
Total | 100% |
Portfolio Credit Quality | |
(% of total investment exposure) | |
| U.S. Guaranteed | 14.0% |
| AAA | 10.7% |
| AA | 33.2% |
| A | 21.7% |
| BBB | 14.3% |
| BB or Lower | 5.0% |
| N/R (not rated) | 1.1% |
Total | 100% |
14
| | |
| NQP | Nuveen Pennsylvania Quality Municipal Income Fund Performance Overview and Holding Summaries as of August 31, 2018 |
| |
| Refer to Glossary of Terms Used in this Report for further definition of the terms used within this section. |
| |
Average Annual Total Returns as of August 31, 2018 |
| | Cumulative | | Average Annual |
| | 6-Month | | 1-Year | 5-Year | 10-Year |
| NQP at Common Share NAV | 3.03% | | 1.12% | 6.72% | 6.13% |
| NQP at Common Share Price | 4.55% | | (1.96)% | 6.59% | 6.62% |
| S&P Municipal Bond Pennsylvania Index | 1.78% | | 0.80% | 4.46% | 4.52% |
| S&P Municipal Bond Index | 1.78% | | 0.61% | 4.23% | 4.36% |
Past performance is not predictive of future results. Current performance may be higher or lower than the data shown. Returns do not reflect the deduction of taxes that shareholders may have to pay on Fund distributions or upon the sale of Fund shares. Returns at NAV are net of Fund expenses, and assume reinvestment of distributions. Comparative index return information is provided for the Fund’s shares at NAV only. Indexes are not available for direct investment.
This data relates to the securities held in the Fund’s portfolio of investments as of the end of the reporting period. It should not be construed as a measure of performance for the Fund itself. Holdings are subject to change.
For financial reporting purposes, the ratings disclosed are the highest rating given by one of the following national rating agencies: Standard & Poor’s Group, Moody’s Investors Service, Inc. or Fitch, Inc. This treatment of split-rated securities may differ from that used for other purposes, such as for Fund investment policies. Credit ratings are subject to change. AAA, AA, A and BBB are investment grade ratings; BB, B, CCC, CC, C and D are below-investment grade ratings. Holdings designated N/R are not rated by these national rating agencies.
Fund Allocation | |
(% of net assets) | |
| Long-Term Municipal Bonds | 161.0% |
| Other Assets Less Liabilities | 2.1% |
Net Assets Plus Floating Rate Obligations, VMTP Shares, net of deferred offering costs & VRDP Shares, net of deferred offering costs | 163.1% |
| Floating Rate Obligations | (8.6)% |
| VMTP Shares, net of deferred offering costs | (15.6)% |
| VRDP Shares, net of deferred offering costs | (38.9)% |
Net Assets | 100% |
Portfolio Composition | |
(% of total investments) | |
| Health Care | 21.0% |
| Tax Obligation/General | 15.2% |
| Education and Civic Organizations | 12.2% |
| U.S. Guaranteed | 11.8% |
| Housing/Single Family | 10.4% |
| Transportation | 6.5% |
| Tax Obligation/Limited | 6.4% |
| Water and Sewer | 5.6% |
| Utilities | 5.2% |
| Other | 5.7% |
Total | 100% |
Portfolio Credit Quality | |
(% of total investment exposure) | |
| U.S. Guaranteed | 13.4% |
| AAA | 0.1% |
| AA | 40.4% |
| A | 29.1% |
| BBB | 8.2% |
| BB or Lower | 4.1% |
| N/R (not rated) | 4.7% |
Total | 100% |
15
| | |
NPN | Nuveen Pennsylvania Municipal Value Fund |
| | Performance Overview and Holding Summaries as of August 31, 2018 |
| |
| Refer to Glossary of Terms Used in this Report for further definition of the terms used within this section. |
| |
Average Annual Total Returns as of August 31, 2018 |
| | Cumulative | | Average Annual |
| | 6-Month | | 1-Year | 5-Year | Since Inception |
| NPN at Common Share NAV | 1.96% | | 0.86% | 4.78% | 5.42% |
| NPN at Common Share Price | (8.69)% | | (6.98)% | 5.28% | 4.10% |
| S&P Municipal Bond Pennsylvania Index | 1.78% | | 0.80% | 4.46% | 4.68% |
| S&P Municipal Bond Index | 1.78% | | 0.61% | 4.23% | 4.61% |
Since inception returns are from 4/28/09. Past performance is not predictive of future results. Current performance may be higher or lower than the data shown. Returns do not reflect the deduction of taxes that shareholders may have to pay on Fund distributions or upon the sale of Fund shares. Returns at NAV are net of Fund expenses, and assume reinvestment of distributions. Comparative index return information is provided for the Fund’s shares at NAV only. Indexes are not available for direct investment.
This data relates to the securities held in the Fund’s portfolio of investments as of the end of the reporting period. It should not be construed as a measure of performance for the Fund itself. Holdings are subject to change.
For financial reporting purposes, the ratings disclosed are the highest rating given by one of the following national rating agencies: Standard & Poor’s Group, Moody’s Investors Service, Inc. or Fitch, Inc. This treatment of split-rated securities may differ from that used for other purposes, such as for Fund investment policies. Credit ratings are subject to change. AAA, AA, A and BBB are investment grade ratings; BB, B, CCC, CC, C and D are below-investment grade ratings. Holdings designated N/R are not rated by these national rating agencies.
Fund Allocation | |
(% of net assets) | |
| Long-Term Municipal Bonds | 101.2% |
| Other Assets Less Liabilities | 0.5% |
Net Assets Plus Floating Rate Obligations | 101.7% |
| Floating Rate Obligations | (1.7)% |
Net Assets | 100% |
Portfolio Composition | |
(% of total investments) | |
| Health Care | 19.4% |
| U.S. Guaranteed | 18.6% |
| Housing/Single Family | 11.3% |
| Transportation | 8.7% |
| Tax Obligation/General | 8.0% |
| Housing/Multifamily | 7.0% |
| Education and Civic Organizations | 6.2% |
| Tax Obligation/Limited | 5.2% |
| Utilities | 4.7% |
| Other | 10.9% |
Total | 100% |
Portfolio Credit Quality | |
(% of total investment exposure) | |
| U.S. Guaranteed | 20.0% |
| AA | 35.3% |
| A | 23.6% |
| BBB | 11.3% |
| BB or Lower | 4.0% |
| N/R (not rated) | 5.8% |
Total | 100% |
16
| | |
| NXJ | Nuveen New Jersey Quality Municipal Income Fund Portfolio of Investments August 31, 2018 (Unaudited) |
| | | | | | | | |
| | Principal | | | Optional Call | | | |
| | Amount (000) | | Description (1) | Provisions (2) | Ratings (3) | | Value |
| | | | LONG-TERM INVESTMENTS – 148.3% (100.0% of Total Investments) | | | | |
| | | | MUNICIPAL BONDS – 148.3% (100.0% of Total Investments) | | | | |
| | | | Consumer Discretionary – 0.5% (0.3% of Total Investments) | | | | |
| | | | Middlesex County Improvement Authority, New Jersey, Senior Revenue Bonds, Heldrich Center Hotel/Conference Center Project, Series 2005A: | | | | |
| $ | 2,460 | | 5.000%, 1/01/32 | 11/18 at 100.00 | Caa2 | $ | 1,906,549 |
| | 1,485 | | 5.125%, 1/01/37 | 11/18 at 100.00 | Caa2 | | 1,084,763 |
| | 3,945 | | Total Consumer Discretionary | | | | 2,991,312 |
| | | | Consumer Staples – 4.5% (3.1% of Total Investments) | | | | |
| | | | Tobacco Settlement Financing Corporation, New Jersey, Tobacco Settlement Asset-Backed Bonds, Series 2018A: | | | | |
| | 8,005 | | 4.000%, 6/01/37 | 6/28 at 100.00 | A– | | 8,140,445 |
| | 12,645 | | 5.000%, 6/01/46 | 6/28 at 100.00 | BBB+ | | 13,815,927 |
| | 6,930 | | Tobacco Settlement Financing Corporation, New Jersey, Tobacco Settlement Asset-Backed Bonds, Series 2018B, 5.000%, 6/01/46 | 6/28 at 100.00 | BBB | | 7,484,053 |
| | 27,580 | | Total Consumer Staples | | | | 29,440,425 |
| | | | Education and Civic Organizations – 21.9% (14.8% of Total Investments) | | | | |
| | 1,760 | | Camden County Improvement Authority, New Jersey, Lease Revenue Bonds, Rowan University School of Osteopathic Medicine Project, Refunding Series 2013A, 5.000%, 12/01/32 | 12/23 at 100.00 | A | | 1,951,910 |
| | 1,000 | | New Jersey Economic Development Authority, Charter School Revenue Bonds, Foundation Academy Charter School, Series 2018A, 5.000%, 7/01/50 | 1/28 at 100.00 | BBB– | | 1,065,100 |
| | 175 | | New Jersey Economic Development Authority, Charter School Revenue Bonds, Teaneck Community Charter School, Series 2017A, 5.125%, 9/01/52, 144A | 9/27 at 100.00 | BB | | 168,597 |
| | 2,025 | | New Jersey Economic Development Authority, Revenue Bonds, The Seeing Eye Inc., Refunding Series 2015, 5.000%, 3/01/25 | No Opt. Call | A | | 2,325,186 |
| | | | New Jersey Economic Development Authority, Revenue Bonds, The Seeing Eye Inc., Refunding Series 2017: | | | | |
| | 500 | | 5.000%, 6/01/32 | 12/27 at 100.00 | A | | 577,530 |
| | 820 | | 3.000%, 6/01/32 | 12/27 at 100.00 | A | | 780,738 |
| | 2,455 | | New Jersey Economic Development Authority, Rutgers University General Obligation Lease Revenue Bonds, Tender Option Bond Trust 2016-XF2357, 13.553%, 6/15/46, 144A (IF) (4) | 6/23 at 100.00 | Aa3 | | 3,516,419 |
| | | | New Jersey Education Facilities Authority Revenue Bonds, The College of New Jersey Issue, Series 2013A: | | | | |
| | 2,475 | | 5.000%, 7/01/38 | 7/23 at 100.00 | AA– | | 2,713,070 |
| | 3,250 | | 5.000%, 7/01/43 | 7/23 at 100.00 | AA– | | 3,551,892 |
| | 1,100 | | New Jersey Educational Facilities Authority, Revenue Bonds, Kean University, Refunding Series 2015H, 4.000%, 7/01/39 – AGM Insured | 7/25 at 100.00 | AA | | 1,145,969 |
| | 5,000 | | New Jersey Educational Facilities Authority, Revenue Bonds, Montclair State University, Series 2014A, 5.000%, 7/01/44 | 7/24 at 100.00 | AA– | | 5,541,650 |
| | | | New Jersey Educational Facilities Authority, Revenue Bonds, Montclair State University, Series 2015D: | | | | |
| | 2,395 | | 5.000%, 7/01/31 | 7/25 at 100.00 | AA– | | 2,731,234 |
| | 1,600 | | 5.000%, 7/01/33 | 7/25 at 100.00 | AA– | | 1,813,968 |
| | 1,000 | | 5.000%, 7/01/34 | 7/25 at 100.00 | AA– | | 1,130,420 |
| | 5,955 | | New Jersey Educational Facilities Authority, Revenue Bonds, New Jersey City University, Series 2015A, 5.000%, 7/01/45 | 7/25 at 100.00 | AA | | 6,526,739 |
| | | | New Jersey Educational Facilities Authority, Revenue Bonds, Passaic County Community College, Series 2010C: | | | | |
| | 1,500 | | 5.250%, 7/01/32 | 7/20 at 100.00 | A3 | | 1,583,160 |
| | 1,000 | | 5.375%, 7/01/41 | 7/20 at 100.00 | A3 | | 1,056,190 |
17
| | |
NXJ | Nuveen New Jersey Quality Municipal Income Fund |
| | Portfolio of Investments (continued) |
| | August 31, 2018 (Unaudited) |
| |
| | Principal | | | Optional Call | | | |
| | Amount (000) | | Description (1) | Provisions (2) | Ratings (3) | | Value |
| | | | Education and Civic Organizations (continued) | | | | |
| $ | 4,335 | | New Jersey Educational Facilities Authority, Revenue Bonds, Princeton University, Tender Option Bond Trust 2015-XF0099, 10.400%, 7/01/39, 144A (IF) | 7/21 at 100.00 | AAA | $ | 5,351,297 |
| | 4,000 | | New Jersey Educational Facilities Authority, Revenue Bonds, Princeton University, Tender Option Bond Trust 2015-XF0149, 10.687%, 7/01/44, 144A (IF) (4) | 7/24 at 100.00 | AAA | | 5,518,680 |
| | | | New Jersey Educational Facilities Authority, Revenue Bonds, Ramapo College, Refunding Series 2012B: | | | | |
| | 550 | | 5.000%, 7/01/37 | 7/22 at 100.00 | A | | 596,046 |
| | 1,050 | | 5.000%, 7/01/42 | 7/22 at 100.00 | A | | 1,135,522 |
| | | | New Jersey Educational Facilities Authority, Revenue Bonds, Rider University, Series 2012A: | | | | |
| | 1,150 | | 5.000%, 7/01/32 | 7/21 at 100.00 | Baa2 | | 1,201,267 |
| | 740 | | 5.000%, 7/01/37 | 7/21 at 100.00 | Baa2 | | 763,917 |
| | | | New Jersey Educational Facilities Authority, Revenue Bonds, Rider University, Series 2017F: | | | | |
| | 330 | | 3.750%, 7/01/37 | 7/27 at 100.00 | Baa2 | | 312,031 |
| | 3,830 | | 4.000%, 7/01/42 | 7/27 at 100.00 | Baa2 | | 3,687,256 |
| | 4,205 | | 5.000%, 7/01/47 | 7/27 at 100.00 | Baa2 | | 4,514,782 |
| | 1,200 | | New Jersey Educational Facilities Authority, Revenue Bonds, Seton Hall University, Refunding Series 2015C, 5.000%, 7/01/35 | 7/25 at 100.00 | A– | | 1,329,840 |
| | 795 | | New Jersey Educational Facilities Authority, Revenue Bonds, Seton Hall University, Refunding Series 2017D, 3.500%, 7/01/44 | 7/27 at 100.00 | A– | | 768,670 |
| | | | New Jersey Educational Facilities Authority, Revenue Bonds, Seton Hall University, Series 2013D: | | | | |
| | 730 | | 5.000%, 7/01/38 | 7/23 at 100.00 | A– | | 804,022 |
| | 1,935 | | 5.000%, 7/01/43 | 7/23 at 100.00 | A– | | 2,120,218 |
| | 1,970 | | New Jersey Educational Facilities Authority, Revenue Bonds, Seton Hall University, Series 2016C, 3.000%, 7/01/46 | 7/26 at 100.00 | A– | | 1,694,495 |
| | | | New Jersey Educational Facilities Authority, Revenue Bonds, Stevens Institute of Technology, Series 2017A: | | | | |
| | 1,060 | | 5.000%, 7/01/37 | 7/27 at 100.00 | A– | | 1,194,313 |
| | 2,500 | | 5.000%, 7/01/42 | 7/27 at 100.00 | A– | | 2,800,525 |
| | 1,690 | | 5.000%, 7/01/47 | 7/27 at 100.00 | A– | | 1,883,623 |
| | 1,050 | | 4.000%, 7/01/47 | 7/27 at 100.00 | A– | | 1,066,359 |
| | 2,000 | | New Jersey Educational Facilities Authority, Revenue Bonds, Stockton University Issue, Refunding Series 2016A, 5.000%, 7/01/41 | 7/26 at 100.00 | A– | | 2,159,580 |
| | 975 | | New Jersey Educational Facilities Authority, Revenue Bonds, The College of Saint Elizabeth, Series 2016D, 5.000%, 7/01/46 | 7/26 at 100.00 | BB | | 983,092 |
| | 4,560 | | New Jersey Educational Facilities Authority, Revenue Bonds, William Paterson University, Series 2015C, 5.000%, 7/01/40 | 7/25 at 100.00 | A2 | | 5,018,189 |
| | | | New Jersey Educational Facilities Authority, Revenue Bonds, William Paterson University, Series 2017B: | | | | |
| | 2,000 | | 5.000%, 7/01/42 – AGM Insured | 7/27 at 100.00 | AA | | 2,242,040 |
| | 2,420 | | 5.000%, 7/01/47 – AGM Insured | 7/27 at 100.00 | AA | | 2,703,092 |
| | 1,000 | | New Jersey Educational Facilities Authority, Revenue Refunding Bonds, College of New Jersey, Series 2012A, 5.000%, 7/01/19 | No Opt. Call | AA– | | 1,026,890 |
| | | | New Jersey Higher Education Assistance Authority, Senior Student Loan Revenue Bonds, Refunding Series 2018A: | | | | |
| | 2,500 | | 3.750%, 12/01/30 (Alternative Minimum Tax) | 6/28 at 100.00 | Aaa | | 2,490,175 |
| | 2,560 | | 4.000%, 12/01/32 (Alternative Minimum Tax) | 6/28 at 100.00 | Aaa | | 2,609,587 |
| | 2,000 | | 4.000%, 12/01/33 (Alternative Minimum Tax) | 6/28 at 100.00 | Aaa | | 2,037,120 |
| | 1,685 | | 4.000%, 12/01/35 (Alternative Minimum Tax) | 6/28 at 100.00 | Aaa | | 1,712,145 |
| | | | New Jersey Higher Education Assistance Authority, Student Loan Revenue Bonds, Senior Lien Series 2016-1A: | | | | |
| | 6,180 | | 3.500%, 12/01/32 (Alternative Minimum Tax) | 12/25 at 100.00 | Aaa | | 6,003,870 |
| | 1,430 | | 4.000%, 12/01/39 (Alternative Minimum Tax) | 12/25 at 100.00 | Aaa | | 1,427,898 |
18
| | | | | | | | |
| | Principal | | | Optional Call | | | |
| | Amount (000) | | Description (1) | Provisions (2) | Ratings (3) | | Value |
| | | | Education and Civic Organizations (continued) | | | | |
| $ | 785 | | New Jersey Higher Education Assistance Authority, Student Loan Revenue Bonds, Series 2010-1A, 5.000%, 12/01/25 | 12/19 at 100.00 | Aaa | $ | 809,052 |
| | 960 | | New Jersey Higher Education Assistance Authority, Student Loan Revenue Bonds, Series 2010-2, 5.000%, 12/01/30 | 12/20 at 100.00 | Aaa | | 1,009,546 |
| | 875 | | New Jersey Higher Education Assistance Authority, Student Loan Revenue Bonds, Series 2011-1, 5.750%, 12/01/27 (Alternative Minimum Tax) | 12/21 at 100.00 | Aaa | | 928,944 |
| | | | New Jersey Higher Education Assistance Authority, Student Loan Revenue Bonds, Series 2012-1A: | | | | |
| | 2,855 | | 4.250%, 12/01/25 (Alternative Minimum Tax) | 12/22 at 100.00 | Aaa | | 2,955,639 |
| | 940 | | 4.375%, 12/01/26 (Alternative Minimum Tax) | 12/22 at 100.00 | Aaa | | 975,852 |
| | 500 | | New Jersey Higher Education Assistance Authority, Student Loan Revenue Bonds, Series 2012-1B, 5.750%, 12/01/39 (Alternative Minimum Tax) | 12/22 at 100.00 | Aaa | | 542,290 |
| | 1,030 | | New Jersey Higher Education Assistance Authority, Student Loan Revenue Bonds, Series 2013-1A, 3.750%, 12/01/26 (Alternative Minimum Tax) | 12/22 at 100.00 | Aaa | | 1,046,521 |
| | | | New Jersey Higher Education Assistance Authority, Student Loan Revenue Bonds, Series 2015-1A: | | | | |
| | 5,000 | | 4.000%, 12/01/28 (Alternative Minimum Tax) | 12/24 at 100.00 | Aaa | | 5,184,250 |
| | 2,575 | | 4.000%, 12/01/30 (Alternative Minimum Tax) | 12/24 at 100.00 | Aaa | | 2,633,427 |
| | 6,855 | | New Jersey Higher Education Assistance Authority, Student Loan Revenue Bonds, Subordinate Series 2017-C, 4.250%, 12/01/47 (Alternative Minimum Tax) | 12/26 at 100.00 | Aaa | | 6,969,136 |
| | | | New Jersey Higher Education Assistance Authority, Student Loan Revenue Bonds, Tender Option Bond Trust 2015-XF0151: | | | | |
| | 966 | | 7.298%, 12/01/23, 144A (Alternative Minimum Tax) (IF) (4) | 12/22 at 100.00 | Aaa | | 1,044,951 |
| | 865 | | 7.265%, 12/01/24, 144A (Alternative Minimum Tax) (IF) (4) | 12/22 at 100.00 | Aaa | | 938,707 |
| | 590 | | 7.801%, 12/01/25, 144A (Alternative Minimum Tax) (IF) (4) | 12/22 at 100.00 | Aaa | | 622,615 |
| | 175 | | 8.219%, 12/01/26, 144A (Alternative Minimum Tax) (IF) (4) | 12/22 at 100.00 | Aaa | | 186,149 |
| | 2,185 | | 9.252%, 12/01/27, 144A (Alternative Minimum Tax) (IF) | 12/23 at 100.00 | Aaa | | 2,485,284 |
| | 2,000 | | New Jersey Higher Education Assistance Authority, Student Loan Revenue Bonds, Tender Option Bond Trust 2016-XG0001, 15.608%, 6/01/30, 144A (IF) (4) | 6/19 at 100.00 | AA | | 2,211,980 |
| | 400 | | New Jersey Institute of Technology, New Jersey, General Obligation Bonds, Series 2012A, 5.000%, 7/01/42 | 7/22 at 100.00 | A1 | | 431,976 |
| | 2,300 | | New Jersey Institute of Technology, New Jersey, General Obligation Bonds, Series 2015A, 5.000%, 7/01/45 | 7/25 at 100.00 | A1 | | 2,560,774 |
| | 2,170 | | Rutgers State University, New Jersey, Revenue Bonds, Tender Option Bond Trust 2016-XF2356, 13.466%, 5/01/43, 144A (IF) (4) | 5/23 at 100.00 | Aa3 | | 3,090,688 |
| | 130,466 | | Total Education and Civic Organizations | | | | 141,964,094 |
| | | | Financials – 1.3% (0.9% of Total Investments) | | | | |
| | | | New Jersey Economic Development Authority, Revenue Refunding Bonds, Kapkowski Road Landfill Project, Series 2002: | | | | |
| | 6,155 | | 5.750%, 10/01/21 | No Opt. Call | Ba2 | | 6,482,938 |
| | 1,500 | | 6.500%, 4/01/28 | No Opt. Call | Ba2 | | 1,747,050 |
| | 7,655 | | Total Financials | | | | 8,229,988 |
| | | | Health Care – 19.9% (13.4% of Total Investments) | | | | |
| | | | Camden County Improvement Authority, New Jersey, Health Care Redevelopment Revenue Bonds, Cooper Health System Obligated Group Issue, Refunding Series 2014A: | | | | |
| | 175 | | 5.000%, 2/15/25 | 2/24 at 100.00 | BBB+ | | 193,940 |
| | 220 | | 5.000%, 2/15/26 | 2/24 at 100.00 | BBB+ | | 242,062 |
| | 1,320 | | 5.000%, 2/15/27 | 2/24 at 100.00 | BBB+ | | 1,444,740 |
| | 1,385 | | 5.000%, 2/15/28 | 2/24 at 100.00 | BBB+ | | 1,510,079 |
| | 1,385 | | 5.000%, 2/15/29 | 2/24 at 100.00 | BBB+ | | 1,504,304 |
| | 2,500 | | 5.000%, 2/15/32 | 2/24 at 100.00 | BBB+ | | 2,686,950 |
| | 3,040 | | 5.000%, 2/15/33 | 2/24 at 100.00 | BBB+ | | 3,259,518 |
| | 1,000 | | 5.000%, 2/15/34 | 2/24 at 100.00 | BBB+ | | 1,070,170 |
| | 1,950 | | 5.000%, 2/15/35 | 2/24 at 100.00 | BBB+ | | 2,082,853 |
| | 6,100 | | Camden County Improvement Authority, New Jersey, Health Care Redevelopment Revenue Bonds, Cooper Health System Obligated Group Issue, Series 2013A, 5.750%, 2/15/42 | 2/23 at 100.00 | BBB+ | | 6,628,870 |
19
| | |
NXJ | Nuveen New Jersey Quality Municipal Income Fund |
| | Portfolio of Investments (continued) |
| | August 31, 2018 (Unaudited) |
| |
| | Principal | | | Optional Call | | | |
| | Amount (000) | | Description (1) | Provisions (2) | Ratings (3) | | Value |
| | | | Health Care (continued) | | | | |
| $ | 225 | | New Jersey Health Care Facilities Finance Authority, Revenue Bonds, AHS Hospital Corporation, Series 2008A, 5.000%, 7/01/27 | 11/18 at 100.00 | AA– | $ | 225,592 |
| | 2,500 | | New Jersey Health Care Facilities Financing Authority, Hospital Revenue Bonds, Virtua Health, Tender Option Bond Trust 2016-XG0047, 15.440%, 7/01/38, 144A – AGC Insured (IF) (4) | 7/19 at 100.00 | AA | | 2,806,200 |
| | | | New Jersey Health Care Facilities Financing Authority, New Jersey, Revenue Bonds, Saint Peters University Hospital, Refunding Series 2011: | | | | |
| | 2,000 | | 6.000%, 7/01/26 | 7/21 at 100.00 | BB+ | | 2,124,280 |
| | 2,750 | | 6.250%, 7/01/35 | 7/21 at 100.00 | BB+ | | 2,933,067 |
| | 3,550 | | New Jersey Health Care Facilities Financing Authority, New Jersey, Revenue Bonds, Saint Peters University Hospital, Series 2007, 5.750%, 7/01/37 | 11/18 at 100.00 | BB+ | | 3,557,916 |
| | 1,145 | | New Jersey Health Care Facilities Financing Authority, Revenue and Refunding Bonds, Barnabas Health, Series 2012A, 5.000%, 7/01/24 | 7/22 at 100.00 | A+ | | 1,260,107 |
| | 2,525 | | New Jersey Health Care Facilities Financing Authority, Revenue Bonds, AHS Hospital Corporation, Refunding Series 2016, 4.000%, 7/01/41 | 1/27 at 100.00 | AA– | | 2,584,186 |
| | 10,000 | | New Jersey Health Care Facilities Financing Authority, Revenue Bonds, Barnabas Health, Refunding Series 2014A, 5.000%, 7/01/44 | 7/24 at 100.00 | A+ | | 10,893,400 |
| | | | New Jersey Health Care Facilities Financing Authority, Revenue Bonds, Hackensack Meridian Health Obligated Group, Refunding Series 2017A: | | | | |
| | 1,200 | | 5.000%, 7/01/28 | 7/27 at 100.00 | AA– | | 1,416,372 |
| | 4,140 | | 5.000%, 7/01/57 | 7/27 at 100.00 | AA– | | 4,584,470 |
| | | | New Jersey Health Care Facilities Financing Authority, Revenue Bonds, Hunterdon Medical Center, Refunding Series 2014A: | | | | |
| | 2,055 | | 5.000%, 7/01/45 | 7/24 at 100.00 | A+ | | 2,213,749 |
| | 1,310 | | 4.000%, 7/01/45 | 7/24 at 100.00 | A+ | | 1,317,388 |
| | 12,010 | | New Jersey Health Care Facilities Financing Authority, Revenue Bonds, Inspira Health Obligated Group Issue, Series 2017A, 5.000%, 7/01/42 (UB) (4) | 7/27 at 100.00 | A2 | | 13,444,114 |
| | | | New Jersey Health Care Facilities Financing Authority, Revenue Bonds, Meridian Health System Obligated Group, Refunding Series 2011: | | | | |
| | 3,000 | | 5.000%, 7/01/25 | 7/22 at 100.00 | AA– | | 3,313,200 |
| | 3,000 | | 5.000%, 7/01/26 | 7/22 at 100.00 | AA– | | 3,307,380 |
| | 2,500 | | 5.000%, 7/01/27 | 7/22 at 100.00 | AA– | | 2,751,325 |
| | 1,450 | | New Jersey Health Care Facilities Financing Authority, Revenue Bonds, Meridian Health System Obligated Group, Refunding Series 2013A, 5.000%, 7/01/32 | 7/23 at 100.00 | AA– | | 1,606,716 |
| | | | New Jersey Health Care Facilities Financing Authority, Revenue Bonds, Princeton HealthCare System, Series 2016A: | | | | |
| | 830 | | 5.000%, 7/01/32 | 7/26 at 100.00 | AA | | 957,446 |
| | 1,055 | | 5.000%, 7/01/33 | 7/26 at 100.00 | AA | | 1,212,997 |
| | 1,370 | | 5.000%, 7/01/34 | 7/26 at 100.00 | AA | | 1,571,034 |
| | | | New Jersey Health Care Facilities Financing Authority, Revenue Bonds, Robert Wood Johnson University Hospital Issue, Series 2014A: | | | | |
| | 4,235 | | 5.000%, 7/01/39 | 7/24 at 100.00 | A+ | | 4,677,092 |
| | 5,955 | | 5.000%, 7/01/43 | 7/24 at 100.00 | A+ | | 6,523,345 |
| | 3,945 | | New Jersey Health Care Facilities Financing Authority, Revenue Bonds, Robert Wood Johnson University Hospital, Series 2013A, 5.500%, 7/01/43 | 7/23 at 100.00 | A+ | | 4,416,506 |
| | 780 | | New Jersey Health Care Facilities Financing Authority, Revenue Bonds, RWJ Barnabas Health Obligated Group, Refunding Series 2016A, 5.000%, 7/01/43 | 7/26 at 100.00 | A+ | | 871,299 |
| �� | | | New Jersey Health Care Facilities Financing Authority, Revenue Bonds, Saint Joseph’s Healthcare System Obligated Group Issue, Refunding Series 2016: | | | | |
| | 1,600 | | 3.000%, 7/01/32 | 7/26 at 100.00 | BBB– | | 1,414,080 |
| | 1,135 | | 4.000%, 7/01/34 | 7/26 at 100.00 | BBB– | | 1,141,015 |
| | 1,600 | | 5.000%, 7/01/35 | 7/26 at 100.00 | BBB– | | 1,729,920 |
| | 2,700 | | 5.000%, 7/01/36 | 7/26 at 100.00 | BBB– | | 2,902,203 |
| | 3,095 | | 5.000%, 7/01/41 | 7/26 at 100.00 | BBB– | | 3,305,243 |
| | 5,740 | | 4.000%, 7/01/48 | 7/26 at 100.00 | BBB– | | 5,574,057 |
20
| | | | | | | | |
| | Principal | | | Optional Call | | | |
| | Amount (000) | | Description (1) | Provisions (2) | Ratings (3) | | Value |
| | | | Health Care (continued) | | | | |
| $ | 2,345 | | New Jersey Health Care Facilities Financing Authority, Revenue Bonds, Saint Luke’s Warren Hospital Obligated Group, Series 2013, 4.000%, 8/15/37 | 8/23 at 100.00 | A– | $ | 2,372,249 |
| | | | New Jersey Health Care Facilities Financing Authority, Revenue Bonds, University Hospital Issue, Refunding Series 2015A: | | | | |
| | 5,055 | | 4.125%, 7/01/38 – AGM Insured | 7/25 at 100.00 | AA | | 5,201,696 |
| | 3,910 | | 5.000%, 7/01/46 – AGM Insured | 7/25 at 100.00 | AA | | 4,285,399 |
| | 119,785 | | Total Health Care | | | | 129,118,529 |
| | | | Housing/Multifamily – 3.4% (2.3% of Total Investments) | | | | |
| | 1,845 | | New Jersey Economic Development Authority, Revenue Bonds, Provident Group – Kean Properties LLC – Kean University Student Housing Project, Series 2017A, 5.000%, 7/01/47 | 1/27 at 100.00 | BBB– | | 1,985,238 |
| | 1,900 | | New Jersey Economic Development Authority, Revenue Bonds, Provident Group – Rowan Properties LLC – Rowan University Student Housing Project, Series 2015A, 5.000%, 1/01/48 | 1/25 at 100.00 | BBB– | | 2,007,274 |
| | 6,075 | | New Jersey Economic Development Authority, Revenue Bonds, West Campus Housing LLC – New Jersey City University Student Housing Project, Series 2015, 5.000%, 7/01/47 | 7/25 at 100.00 | BBB– | | 6,272,984 |
| | | | New Jersey Housing and Mortgage Finance Agency, Multifamily Housing Revenue Bonds, Series 2013-2: | | | | |
| | 2,165 | | 4.350%, 11/01/33 (Alternative Minimum Tax) | 11/22 at 100.00 | AA | | 2,230,448 |
| | 1,235 | | 4.600%, 11/01/38 (Alternative Minimum Tax) | 11/22 at 100.00 | AA | | 1,273,075 |
| | 1,235 | | 4.750%, 11/01/46 (Alternative Minimum Tax) | 11/22 at 100.00 | AA | | 1,273,421 |
| | 4,320 | | New Jersey Housing and Mortgage Finance Agency, Multifamily Revenue Bonds, Series 2015A, 4.000%, 11/01/45 | 11/24 at 100.00 | AA– | | 4,378,709 |
| | | | New Jersey Housing and Mortgage Finance Agency, Multifamily Revenue Bonds, Series 2017D: | | | | |
| | 1,125 | | 3.900%, 11/01/32 (Alternative Minimum Tax) | 5/26 at 100.00 | AA– | | 1,121,321 |
| | 1,750 | | 4.250%, 11/01/37 (Alternative Minimum Tax) | 5/26 at 100.00 | AA– | | 1,760,150 |
| | 21,650 | | Total Housing/Multifamily | | | | 22,302,620 |
| | | | Housing/Single Family – 5.0% (3.4% of Total Investments) | | | | |
| | | | New Jersey Housing & Mortgage Finance Agency, Single Family Home Mortgage Revenue Bonds, Series 2011A: | | | | |
| | 8,795 | | 4.450%, 10/01/25 | 4/21 at 100.00 | Aa2 | | 9,174,856 |
| | 8,805 | | 4.650%, 10/01/29 | 4/21 at 100.00 | Aa2 | | 9,124,269 |
| | | | New Jersey Housing and Mortgage Finance Agency, Single Family Housing Revenue Bonds, Series 2018A: | | | | |
| | 6,915 | | 3.600%, 4/01/33 | 10/27 at 100.00 | AA | | 6,907,048 |
| | 3,700 | | 3.750%, 10/01/35 | 10/27 at 100.00 | AA | | 3,711,248 |
| | 3,695 | | New Jersey Housing and Mortgage Finance Agency, Single Family Housing Revenue Bonds, Series 2018B, 3.800%, 10/01/32 (Alternative Minimum Tax) | 10/27 at 100.00 | AA | | 3,686,945 |
| | 31,910 | | Total Housing/Single Family | | | | 32,604,366 |
| | | | Long-Term Care – 2.3% (1.6% of Total Investments) | | | | |
| | 7,835 | | Burlington County Bridge Commission, New Jersey, Economic Development Revenue Bonds, The Evergreens Project, Series 2007, 5.625%, 1/01/38 | 11/18 at 100.00 | N/R | | 7,667,331 |
| | 510 | | New Jersey Economic Development Authority, Fixed Rate Revenue Bonds, Lions Gate Project, Series 2014, 5.250%, 1/01/44 | 1/24 at 100.00 | N/R | | 529,360 |
| | 5,000 | | New Jersey Economic Development Authority, Revenue Bonds, United Methodist Homes of New Jersey Obligated Group Issue, Refunding Series 2013, 5.000%, 7/01/34 | 7/23 at 100.00 | BBB– | | 5,234,900 |
| | 1,410 | | New Jersey Economic Development Authority, Revenue Bonds, United Methodist Homes of New Jersey Obligated Group Issue, Refunding Series 2014A, 5.000%, 7/01/29 | 7/24 at 100.00 | BBB– | | 1,509,729 |
| | 14,755 | | Total Long-Term Care | | | | 14,941,320 |
| | | | Tax Obligation/General – 6.7% (4.5% of Total Investments) | | | | |
| | 2,225 | | Cumberland County Improvement Authority, New Jersey, County General Obligation Revenue Bonds, Technical High School Project, Series 2014, 5.000%, 9/01/39 – AGM Insured | 9/24 at 100.00 | AA | | 2,465,990 |
21
| | |
NXJ | Nuveen New Jersey Quality Municipal Income Fund |
| | Portfolio of Investments (continued) |
| | August 31, 2018 (Unaudited) |
| |
| | Principal | | | Optional Call | | | |
| | Amount (000) | | Description (1) | Provisions (2) | Ratings (3) | | Value |
| | | | Tax Obligation/General (continued) | | | | |
| | | | Gloucester County, New Jersey, General Obligation Bonds, Series 2017B: | | | | |
| $ | 550 | | 4.000%, 10/15/24 | No Opt. Call | AA | $ | 600,385 |
| | 575 | | 4.000%, 10/15/27 | No Opt. Call | AA | | 635,496 |
| | 795 | | Hamilton Township, Mercer County Board of Education, New Jersey, General Obligation Bonds, Series 2017, 3.250%, 12/15/38 | 12/27 at 100.00 | AA | | 773,050 |
| | | | Hudson County Improvement Authority, New Jersey, County Guaranteed Governmental Loan Revenue Bonds, Guttenberg General Obligation Bond Project, Series 2018: | | | | |
| | 375 | | 3.250%, 8/01/34 | 8/25 at 100.00 | AA | | 365,869 |
| | 1,040 | | 5.000%, 8/01/42 | 8/25 at 100.00 | AA | | 1,156,490 |
| | | | Hudson County, New Jersey, General Obligation Bonds, County College, Refunding Series 2017: | | | | |
| | 500 | | 4.000%, 2/15/22 | No Opt. Call | AA | | 534,845 |
| | 300 | | 4.000%, 2/15/23 | No Opt. Call | AA | | 325,524 |
| | 500 | | 4.000%, 2/15/25 | No Opt. Call | AA | | 552,845 |
| | 325 | | 4.000%, 2/15/27 | No Opt. Call | AA | | 360,334 |
| | | | Jersey City, New Jersey, General Obligation Bonds, Refunding General Improvement Series 2017A: | | | | |
| | 1,000 | | 5.000%, 11/01/29 | 11/27 at 100.00 | AA– | | 1,170,390 |
| | 550 | | 5.000%, 11/01/30 | 11/27 at 100.00 | AA– | | 640,827 |
| | 515 | | 5.000%, 11/01/31 | 11/27 at 100.00 | AA– | | 597,802 |
| | 440 | | 5.000%, 11/01/33 | 11/27 at 100.00 | AA– | | 509,595 |
| | 1,100 | | Linden, New Jersey, General Obligation Bonds, Refunding Series 2011, 4.000%, 5/01/23 | 5/21 at 100.00 | AA– | | 1,155,429 |
| | 1,235 | | Middlesex County, New Jersey, General Obligation Bonds, Refunding General Improvement Series 2017, 4.000%, 1/15/24 | No Opt. Call | AAA | | 1,356,648 |
| | 975 | | Middlesex County, New Jersey, General Obligation Bonds, Refunding Redevelopment Series 2017, 4.000%, 1/15/23 | No Opt. Call | AAA | | 1,058,587 |
| | 1,975 | | Middletown Township Board of Education, Monmouth County, New Jersey, Refunding Series 2010, 5.000%, 8/01/27 | 8/20 at 100.00 | AA– | | 2,092,453 |
| | 2,280 | | Monroe Township Board of Education, Middlesex County, New Jersey, General Obligation Bonds, Refunding Series 2015, 5.000%, 3/01/38 | 3/25 at 100.00 | AA– | | 2,535,679 |
| | 760 | | Montclair Township, Essex County, New Jersey, General Obligation Bonds, Refunding Parking Utility Series 2014A, 5.000%, 1/01/37 | 1/24 at 100.00 | AAA | | 852,097 |
| | | | Mount Laurel Township, Burlington County, New Jersey, General Obligation Bonds, Refunding Series 2017: | | | | |
| | 250 | | 3.000%, 4/15/22 | No Opt. Call | AA | | 258,048 |
| | 750 | | 4.000%, 4/15/29 | 4/27 at 100.00 | AA | | 808,890 |
| | | | New Brunswick Parking Authority, Middlesex County, New Jersey, Guaranteed Parking Revenue Bonds, Refunding Series 2012: | | | | |
| | 465 | | 5.000%, 9/01/28 | 9/22 at 100.00 | A+ | | 508,687 |
| | 610 | | 5.000%, 9/01/29 | 9/22 at 100.00 | A+ | | 667,066 |
| | 300 | | 5.000%, 9/01/31 | 9/22 at 100.00 | A+ | | 327,471 |
| | 250 | | 3.625%, 9/01/34 | 9/22 at 100.00 | A+ | | 251,710 |
| | 2,190 | | New Brunswick, New Jersey, General Obligation Bonds, Cultural Center Project, Series 2017, 4.000%, 9/15/44 – AGM Insured | 9/27 at 100.00 | AA | | 2,279,286 |
| | | | Sparta Township Board of Education, Sussex County, New Jersey, General Obligation Bonds, Refunding Series 2015: | | | | |
| | 1,000 | | 5.000%, 2/15/34 | 2/25 at 100.00 | AA– | | 1,118,250 |
| | 1,395 | | 5.000%, 2/15/35 | 2/25 at 100.00 | AA– | | 1,557,364 |
| | 5,165 | | Union County Utilities Authority, New Jersey, Resource Recovery Facility Lease Revenue Bonds, Covantan Union Inc. Lessee, Refunding Series 2011B, 5.250%, 12/01/31 (Alternative Minimum Tax) | 12/21 at 100.00 | AA+ | | 5,639,457 |
| | 2,515 | | Union County Utilities Authority, New Jersey, Solid Waste System County Deficiency Revenue Bonds, Series 2011A, 5.000%, 6/15/41 | 6/21 at 100.00 | Aaa | | 2,705,084 |
| | | | Union County, New Jersey, General Obligation Bonds, Refunding Series 2017: | | | | |
| | 2,000 | | 4.000%, 3/01/24 | No Opt. Call | Aaa | | 2,186,260 |
| | 2,170 | | 3.000%, 3/01/27 | 9/25 at 100.00 | Aaa | | 2,212,597 |
| | 1,515 | | Washington Township Board of Education, Mercer County, New Jersey, General Obligation Bonds, Series 2005, 5.250%, 1/01/27 – AGM Insured | No Opt. Call | Aa3 | | 1,827,499 |
22
| | | | | | | | |
| | Principal | | | Optional Call | | | |
| | Amount (000) | | Description (1) | Provisions (2) | Ratings (3) | | Value |
| | | | Tax Obligation/General (continued) | | | | |
| $ | 1,435 | | West Deptford Township, Gloucester County, New Jersey, General Obligation Bonds, Refunding Series 2014, 4.000%, 9/01/28 – BAM Insured | 9/24 at 100.00 | AA | $ | 1,515,547 |
| | 100 | | Woodbridge Township, Middlesex County, New Jersey, General Obligation Bonds, Refunding Series 2010, 5.000%, 7/15/19 | No Opt. Call | AA+ | | 102,868 |
| | 40,125 | | Total Tax Obligation/General | | | | 43,706,419 |
| | | | Tax Obligation/Limited – 33.7% (22.7% of Total Investments) | | | | |
| | 3,775 | | Bergen County Improvement Authority, New Jersey, Guaranteed Lease Revenue Bonds, County Administration Complex Project, Series 2005, 5.000%, 11/15/26 | No Opt. Call | Aaa | | 4,482,548 |
| | 1,000 | | Burlington County Bridge Commission, New Jersey, County Guaranteed Bridge System Revenue Bonds, Series 2017, 5.000%, 10/01/19 | No Opt. Call | Aa1 | | 1,035,770 |
| | 4,150 | | Essex County Improvement Authority, New Jersey, Project Consolidation Revenue Bonds, Refunding Series 2007, 5.250%, 12/15/22 – AMBAC Insured | No Opt. Call | Aaa | | 4,702,033 |
| | 3,000 | | Garden State Preservation Trust, New Jersey, Open Space and Farmland Preservation Bonds, Series 2003B, 0.000%, 11/01/25 – AGM Insured | No Opt. Call | AA | | 2,444,880 |
| | 3,015 | | Garden State Preservation Trust, New Jersey, Open Space and Farmland Preservation Bonds, Series 2005A, 5.750%, 11/01/28 – AGM Insured | No Opt. Call | AA | | 3,557,730 |
| | 5,120 | | Garden State Preservation Trust, New Jersey, Open Space and Farmland Preservation Bonds, Series 2005C, 5.125%, 11/01/18 – AGM Insured | No Opt. Call | AA | | 5,148,416 |
| | | | Government of Guam, Business Privilege Tax Bonds, Series 2011A: | | | | |
| | 5,005 | | 5.250%, 1/01/36 | 1/22 at 100.00 | A | | 5,298,143 |
| | 3,020 | | 5.125%, 1/01/42 | 1/22 at 100.00 | A | | 3,170,577 |
| | 500 | | Government of Guam, Business Privilege Tax Bonds, Series 2012B-1, 5.000%, 1/01/29 | 1/22 at 100.00 | A | | 528,775 |
| | 1,110 | | Hudson County Improvement Authority, New Jersey, County Secured Lease Revenue Bonds, Hudson County Plaza Project, Refunding Series 2013, 3.250%, 4/01/35 | 4/22 at 100.00 | Aa3 | | 1,091,785 |
| | | | Hudson County Improvement Authority, New Jersey, County Secured Lease Revenue Bonds, Hudson County Vocational Technical Schools Project, Series 2016: | | | | |
| | 10,310 | | 5.000%, 5/01/46 | 5/26 at 100.00 | AA | | 11,545,963 |
| | 3,745 | | 5.250%, 5/01/51 | 5/26 at 100.00 | AA | | 4,229,903 |
| | | | New Jersey Economic Development Authority, Cigarette Tax Revenue Refunding Bonds, Series 2012: | | | | |
| | 310 | | 5.000%, 6/15/21 | No Opt. Call | BBB+ | | 330,832 |
| | 6,400 | | 5.000%, 6/15/25 | 6/22 at 100.00 | BBB+ | | 6,865,472 |
| | 3,480 | | 5.000%, 6/15/26 | 6/22 at 100.00 | BBB+ | | 3,716,396 |
| | 7,945 | | 5.000%, 6/15/28 | 6/22 at 100.00 | BBB+ | | 8,441,006 |
| | 415 | | 5.000%, 6/15/29 | 6/22 at 100.00 | BBB+ | | 439,693 |
| | 5,750 | | New Jersey Economic Development Authority, Revenue Bonds, Motor Vehicle Surcharge, Refunding Series 2017A, 3.375%, 7/01/30 | 7/27 at 100.00 | BBB+ | | 5,686,175 |
| | | | New Jersey Economic Development Authority, Revenue Bonds, Newark Downtown District Management Corporation Project, Series 2007: | | | | |
| | 405 | | 5.125%, 6/15/27 | 11/18 at 100.00 | Baa3 | | 405,227 |
| | 740 | | 5.125%, 6/15/37 | 11/18 at 100.00 | Baa3 | | 740,340 |
| | 6,385 | | New Jersey Economic Development Authority, School Facilities Construction Bonds, Series 2014UU, 5.000%, 6/15/27 | 6/24 at 100.00 | A– | | 6,951,413 |
| | 12,000 | | New Jersey Economic Development Authority, School Facilities Construction Bonds, Series 2015WW, 5.250%, 6/15/40 | 6/25 at 100.00 | A– | | 12,978,240 |
| | 5,000 | | New Jersey Economic Development Authority, School Facilities Construction Financing Program Bonds, Refunding Series 2014PP, 5.000%, 6/15/26 | 6/24 at 100.00 | A– | | 5,465,550 |
| | 6,000 | | New Jersey Economic Development Authority, Sublease Revenue Bonds, New Jersey Transit Corporation Projects, Refunding Series 2017B, 5.000%, 11/01/25 | No Opt. Call | A– | | 6,701,820 |
| | | | New Jersey Transportation Trust Fund Authority, Federal Highway Reimbursement Revenue Notes, Series 2016A-1: | | | | |
| | 1,130 | | 5.000%, 6/15/29 | 6/26 at 100.00 | A+ | | 1,261,600 |
| | 655 | | 5.000%, 6/15/30 | 6/26 at 100.00 | A+ | | 728,432 |
23
| | |
NXJ | Nuveen New Jersey Quality Municipal Income Fund |
| | Portfolio of Investments (continued) |
| | August 31, 2018 (Unaudited) |
| |
| | Principal | | | Optional Call | | | |
| | Amount (000) | | Description (1) | Provisions (2) | Ratings (3) | | Value |
| | | | Tax Obligation/Limited (continued) | | | | |
| $ | 32,965 | | New Jersey Transportation Trust Fund Authority, Transportation System Bonds, Capital Appreciation Series 2010A, 0.000%, 12/15/30 | No Opt. Call | A– | $ | 19,717,685 |
| | 8,100 | | New Jersey Transportation Trust Fund Authority, Transportation System Bonds, Refunding Series 2006A, 5.500%, 12/15/22 | No Opt. Call | A– | | 8,999,748 |
| | | | New Jersey Transportation Trust Fund Authority, Transportation System Bonds, Refunding Series 2006C: | | | | |
| | 37,565 | | 0.000%, 12/15/32 – AGM Insured | No Opt. Call | AA | | 21,310,625 |
| | 39,090 | | 0.000%, 12/15/33 – AGM Insured | No Opt. Call | AA | | 21,090,228 |
| | 5,160 | | 0.000%, 12/15/34 – AGM Insured | No Opt. Call | AA | | 2,652,498 |
| | 7,500 | | New Jersey Transportation Trust Fund Authority, Transportation System Bonds, Series 2007A, 5.000%, 12/15/26 – AMBAC Insured | 10/18 at 100.00 | A– | | 7,514,325 |
| | 7,000 | | New Jersey Transportation Trust Fund Authority, Transportation System Bonds, Series 2010D, 5.000%, 12/15/24 | No Opt. Call | A– | | 7,778,400 |
| | 3,860 | | Passaic County Improvement Authority, New Jersey, Lease Revenue Bonds, Preakness Healthcare Center Expansion Project, Refunding Series 2015, 3.750%, 5/01/36 | 5/25 at 100.00 | AA | | 3,930,522 |
| | | | Passaic County Improvement Authority, New Jersey, Lease Revenue Bonds, Preakness Healthcare Center Expansion Project, Series 2012: | | | | |
| | 865 | | 5.000%, 5/01/21 | No Opt. Call | Aa2 | | 933,396 |
| | 4,105 | | 3.500%, 5/01/35 | 5/22 at 100.00 | Aa2 | | 4,109,064 |
| | | | Union County Improvement Authority, New Jersey, General Obligation Lease Bonds, Juvenile Detention Center Facility Project, Tender Option Bond Trust 2015-XF1019: | | | | |
| | 285 | | 18.592%, 5/01/28, 144A (IF) (4) | No Opt. Call | Aaa | | 612,759 |
| | 285 | | 18.650%, 5/01/29, 144A (IF) (4) | No Opt. Call | Aaa | | 625,427 |
| | 200 | | 18.650%, 5/01/30, 144A (IF) (4) | No Opt. Call | Aaa | | 449,920 |
| | 370 | | 18.472%, 5/01/31, 144A (IF) (4) | No Opt. Call | Aaa | | 846,534 |
| | 385 | | 18.565%, 5/01/32, 144A (IF) (4) | No Opt. Call | Aaa | | 910,667 |
| | 400 | | 18.568%, 5/01/33, 144A (IF) (4) | No Opt. Call | Aaa | | 964,460 |
| | 415 | | 18.650%, 5/01/34, 144A (IF) (4) | No Opt. Call | Aaa | | 1,022,892 |
| | 3,975 | | Union County Improvement Authority, New Jersey, Lease Revenue Bonds, Plainfield – Park Madison Redevelopment Project, Tender Option Bond Trust 2016-XG0057, 13.362%, 3/01/34, 144A (IF) (4) | No Opt. Call | AA+ | | 7,193,558 |
| | 252,890 | | Total Tax Obligation/Limited | | | | 218,611,427 |
| | | | Transportation – 28.5% (19.2% of Total Investments) | | | | |
| | 5,550 | | Casino Reinvestment Development Authority, New Jersey, Parking Revenue Bonds, Series 2005A, 5.250%, 6/01/20 – NPFG Insured | 11/18 at 100.00 | Baa2 | | 5,565,596 |
| | 2,400 | | Delaware River and Bay Authority, Delaware and New Jersey, Revenue Bonds, Series 2012A, 5.000%, 1/01/42 | 1/23 at 100.00 | A1 | | 2,603,256 |
| | | | Delaware River and Bay Authority, Delaware and New Jersey, Revenue Bonds, Series 2014A: | | | | |
| | 1,285 | | 5.000%, 1/01/34 | 1/24 at 100.00 | A1 | | 1,429,216 |
| | 5,890 | | 4.125%, 1/01/39 | 1/24 at 100.00 | A1 | | 6,046,910 |
| | 7,800 | | 5.000%, 1/01/44 | 1/24 at 100.00 | A1 | | 8,598,096 |
| | | | Delaware River Joint Toll Bridge Commission, New Jersey and Pennsylvania, Bridge System Revenue Bonds, Refunding Series 2015: | | | | |
| | 1,000 | | 4.000%, 7/01/34 – BAM Insured | 7/25 at 100.00 | AA | | 1,049,270 |
| | 2,820 | | 4.000%, 7/01/35 – BAM Insured | 7/25 at 100.00 | AA | | 2,951,891 |
| | | | Delaware River Joint Toll Bridge Commission, New Jersey and Pennsylvania, Bridge System Revenue Bonds, Series 2017: | | | | |
| | 2,820 | | 5.000%, 7/01/42 | 7/27 at 100.00 | A1 | | 3,219,002 |
| | 10,210 | | 5.000%, 7/01/47 | 7/27 at 100.00 | A1 | | 11,612,446 |
| | | | Delaware River Joint Toll Bridge Commission, Pennsylvania, Bridge System Revenue Bonds, Refunding Series 2012A: | | | | |
| | 2,150 | | 5.000%, 7/01/24 | 7/22 at 100.00 | A1 | | 2,366,140 |
| | 1,105 | | 5.000%, 7/01/25 | 7/22 at 100.00 | A1 | | 1,214,815 |
| | 650 | | 4.000%, 7/01/26 | 7/22 at 100.00 | A1 | | 682,890 |
| | 625 | | 4.000%, 7/01/27 | 7/22 at 100.00 | A1 | | 654,531 |
24
| | | | | | | | |
| | Principal | | | Optional Call | | | |
| | Amount (000) | | Description (1) | Provisions (2) | Ratings (3) | | Value |
| | | | Transportation (continued) | | | | |
| | | | Delaware River Port Authority, New Jersey and Pennsylvania, Revenue Bonds, Series 2010E: | | | | |
| $ | 1,000 | | 5.000%, 1/01/40 – AGM Insured | 1/20 at 100.00 | AA | $ | 1,039,330 |
| | 5,005 | | 5.000%, 1/01/40 | 1/20 at 100.00 | A | | 5,191,837 |
| | 7,035 | | Delaware River Port Authority, New Jersey and Pennsylvania, Revenue Bonds, Series 2013, 5.000%, 1/01/40 | 1/24 at 100.00 | A | | 7,769,454 |
| | | | Delaware River Port Authority, Pennsylvania and New Jersey, Revenue Refunding Bonds, Port District Project, Series 2012: | | | | |
| | 1,800 | | 5.000%, 1/01/24 | 1/23 at 100.00 | A– | | 1,983,222 |
| | 1,635 | | 5.000%, 1/01/25 | 1/23 at 100.00 | A– | | 1,792,287 |
| | 1,875 | | 5.000%, 1/01/26 | 1/23 at 100.00 | A– | | 2,044,950 |
| | 3,595 | | 5.000%, 1/01/27 | 1/23 at 100.00 | A– | | 3,905,572 |
| | 5,555 | | New Jersey Economic Development Authority, Private Activity Bonds, The Goethals Bridge Replacement Project, Series 2013, 5.625%, 1/01/52 (Alternative Minimum Tax) | 1/24 at 100.00 | BBB | | 6,123,388 |
| | | | New Jersey Economic Development Authority, Special Facilities Revenue Bonds, Continental Airlines Inc., Series 1999: | | | | |
| | 1,000 | | 5.125%, 9/15/23 (Alternative Minimum Tax) | 9/18 at 100.00 | BB | | 1,080,610 |
| | 1,800 | | 5.250%, 9/15/29 (Alternative Minimum Tax) | 8/22 at 101.00 | BB | | 1,956,222 |
| | 2,250 | | New Jersey Economic Development Authority, Special Facilities Revenue Bonds, Continental Airlines Inc., Series 2000A & 2000B, 5.625%, 11/15/30 (Alternative Minimum Tax) | 3/24 at 101.00 | BB | | 2,544,503 |
| | | | New Jersey Economic Development Authority, Special Facility Revenue Bonds, Port Newark Container Terminal LLC Project, Refunding Series 2017: | | | | |
| | 5,660 | | 5.000%, 10/01/37 (Alternative Minimum Tax) | 10/27 at 100.00 | Ba1 | | 6,113,762 |
| | 7,440 | | 5.000%, 10/01/47 (Alternative Minimum Tax) | 10/27 at 100.00 | Ba1 | | 7,983,641 |
| | | | New Jersey Transit Corporation, Grant Anticipation Notes, Federal Transit Administration Section 5307 Urbanized Area Formula Funds, Series 2014A: | | | | |
| | 6,000 | | 5.000%, 9/15/20 | No Opt. Call | A | | 6,339,960 |
| | 5,750 | | 5.000%, 9/15/21 | No Opt. Call | A | | 6,184,068 |
| | 6,570 | | New Jersey Turnpike Authority, Revenue Bonds, Refunding Series 2015E, 5.000%, 1/01/45 | 1/25 at 100.00 | A+ | | 7,269,508 |
| | 3,065 | | New Jersey Turnpike Authority, Revenue Bonds, Series 2005A, 5.250%, 1/01/29 – AGM Insured | No Opt. Call | AA | | 3,755,575 |
| | 7,620 | | New Jersey Turnpike Authority, Revenue Bonds, Series 2012B, 5.000%, 1/01/28 | 1/23 at 100.00 | A+ | | 8,441,741 |
| | 1,365 | | New Jersey Turnpike Authority, Revenue Bonds, Tender Option Bond Trust 2016-XF1057, 12.498%, 1/01/43, 144A (IF) (4) | 7/22 at 100.00 | A+ | | 1,922,057 |
| | 2,750 | | Passaic County Improvement Authority, New Jersey, Revenue Bonds, Paterson Parking Deck Facility, Series 2005, 5.000%, 4/15/35 – AGM Insured | 11/18 at 100.00 | A2 | | 2,756,490 |
| | 7,235 | | Port Authority of New York and New Jersey, Consolidated Revenue Bonds, One Hundred Seventy Ninth Series 2013, 5.000%, 12/01/43 | 12/23 at 100.00 | AA– | | 8,042,571 |
| | 5,700 | | Port Authority of New York and New Jersey, Consolidated Revenue Bonds, One Hundred Seventy Seventh Series 2013, 4.000%, 1/15/43 (Alternative Minimum Tax) | 1/23 at 100.00 | AA– | | 5,795,646 |
| | 3,500 | | Port Authority of New York and New Jersey, Consolidated Revenue Bonds, Two Hundred Ninth Series 2018, 5.000%, 7/15/32 | 7/28 at 100.00 | AA– | | 4,152,750 |
| | | | Port Authority of New York and New Jersey, Special Project Bonds, JFK International Air Terminal LLC, Sixth Series 1997: | | | | |
| | 19,655 | | 5.750%, 12/01/22 – NPFG Insured (Alternative Minimum Tax) | 12/18 at 100.00 | Baa1 | | 20,423,117 |
| | 12,130 | | 5.750%, 12/01/25 – NPFG Insured (Alternative Minimum Tax) | 12/18 at 100.00 | Baa1 | | 12,604,526 |
| | 171,295 | | Total Transportation | | | | 185,210,846 |
| | | | U.S. Guaranteed – 10.7% (7.2% of Total Investments) (5) | | | | |
| | 25 | | Essex County Improvement Authority, New Jersey, Project Consolidation Revenue Bonds, Refunding Series 2007, 5.250%, 12/15/22 – AMBAC Insured (ETM) | No Opt. Call | Aaa | | 28,359 |
| | 335 | | New Jersey Economic Development Authority, Revenue Bonds, Yeshiva Ktana of Passaic, Series 1993, 8.000%, 9/15/18 (ETM) | No Opt. Call | N/R | | 335,603 |
| | | | New Jersey Economic Development Authority, Student Housing Revenue Bonds, Provident Group- Montclair Properties LLC, Montclair State University Student Housing Project, Series 2010A: | | | | |
| | 3,870 | | 5.750%, 6/01/31 (Pre-refunded 6/01/20) | 6/20 at 100.00 | Aaa | | 4,138,694 |
| | 2,100 | | 5.875%, 6/01/42 (Pre-refunded 6/01/20) | 6/20 at 100.00 | Aaa | | 2,250,276 |
25
| | |
NXJ | Nuveen New Jersey Quality Municipal Income Fund |
| | Portfolio of Investments (continued) |
| | August 31, 2018 (Unaudited) |
| | Principal | | | Optional Call | | | |
| | Amount (000) | | Description (1) | Provisions (2) | Ratings (3) | | Value |
| | | | U.S. Guaranteed (5) (continued) | | | | |
| | | | New Jersey Educational Facilities Authority, Revenue Bonds, University of Medicine and Dentistry of New Jersey, Refunding Series 2009B: | | | | |
| $ | 25 | | 6.500%, 12/01/19 (Pre-refunded 6/01/19) | 6/19 at 100.00 | N/R | $ | 25,901 |
| | 100 | | 6.500%, 12/01/20 (Pre-refunded 6/01/19) | 6/19 at 100.00 | N/R | | 103,604 |
| | 5 | | 7.125%, 12/01/23 (Pre-refunded 6/01/19) | 6/19 at 100.00 | N/R | | 5,203 |
| | 30 | | New Jersey Environmental Infrastructure Trust, Environmental Infrastructure Bonds, Series 2012A, 3.250%, 9/01/31 (Pre-refunded 9/01/21) | 9/21 at 100.00 | N/R | | 31,100 |
| | | | New Jersey Health Care Facilities Financing Authority, Revenue and Refunding Bonds, Palisades Medical Center Obligated Group Issue, Series 2013: | | | | |
| | 555 | | 5.250%, 7/01/31 (Pre-refunded 7/01/23) | 7/23 at 100.00 | N/R | | 632,300 |
| | 2,570 | | 5.250%, 7/01/31 (Pre-refunded 7/01/23) | 7/23 at 100.00 | N/R | | 2,934,272 |
| | 275 | | 5.500%, 7/01/43 (Pre-refunded 7/01/23) | 7/23 at 100.00 | N/R | | 316,431 |
| | 1,285 | | 5.500%, 7/01/43 (Pre-refunded 7/01/23) | 7/23 at 100.00 | N/R | | 1,481,785 |
| | | | New Jersey Health Care Facilities Financing Authority, Revenue Bonds, Kennedy Health System Obligated Group Issue, Refunding Series 2012: | | | | |
| | 4,165 | | 3.750%, 7/01/27 (ETM) | 7/22 at 100.00 | N/R | | 4,567,589 |
| | 3,375 | | 5.000%, 7/01/31 (Pre-refunded 7/01/22) | 7/22 at 100.00 | N/R | | 3,741,761 |
| | 1,500 | | 5.000%, 7/01/37 (Pre-refunded 7/01/22) | 7/22 at 100.00 | N/R | | 1,663,005 |
| | 7,670 | | New Jersey Health Care Facilities Financing Authority, Revenue Bonds, Saint Barnabas Health Care System, Refunding Series 2011A, 5.625%, 7/01/37 (Pre-refunded 7/01/21) | 7/21 at 100.00 | N/R | | 8,460,163 |
| | 3,805 | | New Jersey Health Care Facilities Financing Authority, Revenue Bonds, St. Clare’s Hospital, Series 2004A, 5.250%, 7/01/20 – RAAI Insured (ETM) | No Opt. Call | AA | | 4,042,736 |
| | | | New Jersey Health Care Facilities Financing Authority, State Contract Bonds, Hospital Asset Transformation Program, Series 2008A: | | | | |
| | 410 | | 5.250%, 10/01/38 (Pre-refunded 10/01/18) | 10/18 at 100.00 | N/R | | 411,111 |
| | 1,400 | | 5.250%, 10/01/38 (Pre-refunded 10/01/18) | 10/18 at 100.00 | BBB+ | | 1,403,794 |
| | 175 | | New Jersey Institute of Technology, New Jersey, General Obligation Bonds, Series 2012A, 5.000%, 7/01/42 (Pre-refunded 7/01/22) | 7/22 at 100.00 | N/R | | 194,700 |
| | 1,555 | | New Jersey Sports and Exposition Authority, Convention Center Luxury Tax Bonds, Series 2004, 5.500%, 3/01/22 – NPFG Insured (ETM) | No Opt. Call | Baa2 | | 1,737,526 |
| | 2,260 | | New Jersey Turnpike Authority, Revenue Bonds, Tender Option Bond Trust 2016-XF1057, 12.498%, 1/01/43, 144A (Pre-refunded 7/01/22) (IF) (4) | 7/22 at 100.00 | N/R | | 3,182,306 |
| | 7,500 | | New Jersey Turnpike Authority, Revenue Bonds, Series 2009I, 5.000%, 1/01/35 (Pre- refunded 1/01/20) | 1/20 at 100.00 | A+ | | 7,827,075 |
| | 1,650 | | Newark Housing Authority, New Jersey, City-Secured Police Facility Revenue Bonds, South Ward Police Facility, Series 2009A, 6.750%, 12/01/38 (Pre-refunded 12/01/19) – AGC Insured | 12/19 at 100.00 | A3 | | 1,752,713 |
| | | | North Hudson Sewerage Authority, New Jersey, Gross Revenue Lease Certificates, Senior Lien Series 2012A: | | | | |
| | 1,455 | | 5.000%, 6/01/27 (Pre-refunded 6/01/22) | 6/22 at 100.00 | N/R | | 1,610,903 |
| | 225 | | 5.000%, 6/01/42 (Pre-refunded 6/01/22) | 6/22 at 100.00 | N/R | | 249,109 |
| | 15,840 | | North Hudson Sewerage Authority, New Jersey, Sewerage Revenue Refunding Bonds, Series 2001A, 0.000%, 8/01/23 – NPFG Insured (ETM) | No Opt. Call | Baa2 | | 14,117,875 |
| | 2,100 | | Passaic County Improvement Authority, New Jersey, County Guaranteed Parking Revenue Bonds, 200 Hospital Plaza Project, Series 2010, 5.000%, 5/01/42 (Pre-refunded 5/01/20) | 5/20 at 100.00 | Aa2 | | 2,213,673 |
| | 66,260 | | Total U.S. Guaranteed | | | | 69,459,567 |
| | | | Utilities – 4.8% (3.2% of Total Investments) | | | | |
| | 13,500 | | Essex County Improvement Authority, New Jersey, Solid Waste Disposal Revenue Bonds, Covanta Project, Series 2015, 5.250%, 7/01/45, 144A (Alternative Minimum Tax) | 7/20 at 100.00 | BB– | | 13,634,325 |
| | 1,510 | | Industrial Pollution Control Financing Authority of Cape May County (New Jersey), Pollution Control Revenue Refunding Bonds, 1991 Series A (Atlantic City Electric Company Project), 6.800%, 3/01/21 – NPFG Insured | No Opt. Call | A | | 1,657,285 |
26
| | | | | | | | |
| | Principal | | | Optional Call | | | |
| | Amount (000) | | Description (1) | Provisions (2) | Ratings (3) | | Value |
| | | | Utilities (continued) | | | | |
| | | | New Jersey Economic Development Authority, Energy Facilities Revenue Bonds, UMM Energy Partners, LLC Project, Series 2012A: | | | | |
| $ | 1,000 | | 4.750%, 6/15/32 (Alternative Minimum Tax) | 6/22 at 100.00 | Baa3 | $ | 1,032,370 |
| | 1,225 | | 5.125%, 6/15/43 (Alternative Minimum Tax) | 6/22 at 100.00 | Baa3 | | 1,268,451 |
| | 5,100 | | New Jersey Economic Development Authority, Water Facilities Revenue Bonds, New Jersey-American Water Company Inc. Project, Refunding Series 2010B, 5.600%, 11/01/34 (Alternative Minimum Tax) | 5/20 at 100.00 | A+ | | 5,352,093 |
| | 2,040 | | New Jersey Economic Development Authority, Water Facilities Revenue Bonds, New Jersey-American Water Company Inc. Project, Refunding Series 2010D, 4.875%, 11/01/29 (Alternative Minimum Tax) | 11/20 at 100.00 | A+ | | 2,126,578 |
| | 2,700 | | Passaic County Utilities Authority, New Jersey, Solid Waste Disposal Revenue Bonds, Refunding Series 2018, 5.000%, 3/01/37 | No Opt. Call | AA | | 3,281,013 |
| | 2,530 | | Salem County Pollution Control Financing Authority, New Jersey, Pollution Control Revenue Bonds, Chambers Project, Refunding Series 2014A, 5.000%, 12/01/23 (Alternative Minimum Tax) | No Opt. Call | BBB– | | 2,713,830 |
| | 29,605 | | Total Utilities | | | | 31,065,945 |
| | | | Water and Sewer – 5.1% (3.4% of Total Investments) | | | | |
| | | | New Jersey Economic Development Authority, Water Facilities Revenue Bonds, Middlesex Water Company, Series 2012C: | | | | |
| | 1,460 | | 5.000%, 10/01/23 | No Opt. Call | A+ | | 1,646,194 |
| | 15,670 | | 4.250%, 10/01/47 (Alternative Minimum Tax) | 10/22 at 100.00 | A+ | | 15,886,089 |
| | 1,650 | | New Jersey Environmental Infrastructure Trust, Environmental Infrastructure Bonds, Series 2012A, 3.250%, 9/01/31 | 9/21 at 100.00 | AAA | | 1,665,939 |
| | 6,270 | | New Jersey Environmental Infrastructure Trust, Environmental Infrastructure Bonds, Tender Option Bond Trust 2016-XF0395, 5.775%, 9/01/21, 144A (IF) (4) | No Opt. Call | AAA | | 7,065,726 |
| | | | North Hudson Sewerage Authority, New Jersey, Gross Revenue Lease Certificates, Senior Lien Series 2012A: | | | | |
| | 2,365 | | 5.000%, 6/01/27 | 6/22 at 100.00 | A | | 2,579,127 |
| | 3,775 | | 5.000%, 6/01/42 | 6/22 at 100.00 | A | | 4,052,425 |
| | 105 | | Wanaque Valley Regional Sewer Authority, Passaic County, New Jersey, Sewer Revenue Refunding Bonds, Series 1993B, 5.750%, 9/01/18 – AMBAC Insured | No Opt. Call | N/R | | 105,000 |
| | 31,295 | | Total Water and Sewer | | | | 33,000,500 |
| $ | 949,216 | | Total Long-Term Investments (cost $918,060,110) | | | | 962,647,358 |
| | | | Floating Rate Obligations – (1.4)% | | | | (9,005,000) |
| | | | Variable Rate Demand Preferred Shares, net of deferred offering costs – (48.1)% (6) | | | | (312,410,169) |
| | | | Other Assets Less Liabilities – 1.2% (7) | | | | 8,036,352 |
| | | | Net Assets Applicable to Common Shares – 100% | | | $ | 649,268,541 |
Investments in Derivatives |
Interest Rate Swaps - OTC Cleared |
| | | | | | | | | | | Variation |
| | Fund | | | Fixed Rate | | | | Premiums | Unrealized | Margin |
Notional | Pay/Receive | Floating Rate | Fixed Rate | Payment | Effective | Maturity | | Paid | Appreciation | Receivable/ |
Amount | Floating Rate | Index | (Annualized) | Frequency | Date (8) | Date | Value | (Received) | (Depreciation) | (Payable) |
| $9,500,000 | Receive | 3-Month LIBOR | 3.050% | Semi-Annually | 6/04/19 | 6/04/29 | $(61,262) | $502 | $(61,764) | $(9,242) |
27
| | |
| NXJ | Nuveen New Jersey Quality Municipal Income Fund Portfolio of Investments (continued) August 31, 2018 (Unaudited) |
| (1) | All percentages shown in the Portfolio of Investments are based on net assets applicable to common shares unless otherwise noted. |
| (2) | Optional Call Provisions: Dates (month and year) and prices of the earliest optional call or redemption. There may be other call provisions at varying prices at later dates. Certain mortgage-backed securities may be subject to periodic principal paydowns. |
| (3) | For financial reporting purposes, the ratings disclosed are the highest of Standard & Poor’s Group (“Standard & Poor’s”), Moody’s Investors Service, Inc. (“Moody’s”) or Fitch, Inc. (“Fitch”) rating. This treatment of split-rated securities may differ from that used for other purposes, such as for Fund investment policies. Ratings below BBB by Standard & Poor’s, Baa by Moody’s or BBB by Fitch are considered to be below investment grade. Holdings designated N/R are not rated by any of these national rating agencies. |
| (4) | Investment, or portion of investment, has been pledged to collateralize the net payment obligations for investments in inverse floating rate transactions. |
| (5) | Backed by an escrow or trust containing sufficient U.S. Government or U.S. Government agency securities, which ensure the timely payment of principal and interest. |
(6) | Variable Rate Demand Preferred Shares, net of deferred offering costs as a percentage of Total Investments is 32.5%. |
(7) | Other assets less liabilities includes the unrealized appreciation (depreciation) of certain over-the-counter (“OTC”) derivatives as presented on the Statement of Assets and Liabilities, when applicable. The unrealized appreciation (depreciation) of OTC cleared and exchange-traded derivatives is recognized as part of cash collateral at brokers and/or the receivable or payable for variation margin as presented on the Statement of Assets and Liabilities, when applicable. |
(8) | Effective date represents the date on which both the Fund and counterparty commence interest payment accruals on each contract. |
144A | Investment is exempt from registration under Rule 144A of the Securities Act of 1933, as amended. These investments may only be resold in transactions exempt from registration, which are normally those transactions with qualified institutional buyers. |
ETM | Escrowed to maturity. |
IF | Inverse floating rate security issued by a tender option bond (“TOB”) trust, the interest rate on which varies inversely with the Securities Industry Financial Markets Association (SIFMA) short-term rate, which resets weekly, or a similar short-term rate, and is reduced by the expenses related to the TOB trust. |
LIBOR | London Inter-Bank Offered Rate |
UB | Underlying bond of an inverse floating rate trust reflected as a financing transaction. See Notes to Financial Statements, Note 3 – Portfolio Securities and Investments in Derivatives, Inverse Floating Rate Securities for more information. |
See accompanying notes to financial statements.
28
| | |
| NJV | Nuveen New Jersey Municipal Value Fund Portfolio of Investments August 31, 2018 (Unaudited) |
| | | | | | | | |
| | Principal | | | Optional Call | | | |
| | Amount (000) | | Description (1) | Provisions (2) | Ratings (3) | | Value |
| | | | LONG-TERM INVESTMENTS – 105.7% (100.0% of Total Investments) | | | | |
| | | | MUNICIPAL BONDS – 105.7% (100.0% of Total Investments) | | | | |
| | | | Consumer Discretionary – 0.3% (0.3% of Total Investments) | | | | |
| $ | 100 | | Middlesex County Improvement Authority, New Jersey, Senior Revenue Bonds, Heldrich Center Hotel/Conference Center Project, Series 2005A, 5.000%, 1/01/32 | 11/18 at 100.00 | Caa2 | $ | 77,502 |
| | | | Consumer Staples – 2.8% (2.6% of Total Investments) | | | | |
| | | | Tobacco Settlement Financing Corporation, New Jersey, Tobacco Settlement Asset-Backed Bonds, Series 2018A: | | | | |
| | 190 | | 4.000%, 6/01/37 | 6/28 at 100.00 | A– | | 193,215 |
| | 305 | | 5.000%, 6/01/46 | 6/28 at 100.00 | BBB+ | | 333,243 |
| | 120 | | Tobacco Settlement Financing Corporation, New Jersey, Tobacco Settlement Asset-Backed Bonds, Series 2018B, 5.000%, 6/01/46 | 6/28 at 100.00 | BBB | | 129,594 |
| | 615 | | Total Consumer Staples | | | | 656,052 |
| | | | Education and Civic Organizations – 18.9% (17.8% of Total Investments) | | | | |
| | 110 | | Camden County Improvement Authority, New Jersey, Lease Revenue Bonds, Rowan University School of Osteopathic Medicine Project, Refunding Series 2013A, 5.000%, 12/01/32 | 12/23 at 100.00 | A | | 121,994 |
| | 25 | | New Jersey Economic Development Authority, Charter School Revenue Bonds, Foundation Academy Charter School, Series 2018A, 5.000%, 7/01/38 | 1/28 at 100.00 | BBB– | | 26,868 |
| | | | New Jersey Economic Development Authority, Charter School Revenue Bonds, North Star Academy Charter School of Newark, Series 2017: | | | | |
| | 220 | | 4.000%, 7/15/37 | 7/27 at 100.00 | BBB– | | 214,579 |
| | 25 | | 5.000%, 7/15/47 | 7/27 at 100.00 | BBB– | | 26,829 |
| | 100 | | New Jersey Economic Development Authority, Charter School Revenue Bonds, Teaneck Community Charter School, Series 2017A, 5.125%, 9/01/52, 144A | 9/27 at 100.00 | BB | | 96,341 |
| | 115 | | New Jersey Economic Development Authority, Revenue Bonds, The Seeing Eye Inc., Refunding Series 2015, 5.000%, 3/01/25 | No Opt. Call | A | | 132,048 |
| | | | New Jersey Economic Development Authority, Revenue Bonds, The Seeing Eye Inc., Refunding Series 2017: | | | | |
| | 15 | | 5.000%, 6/01/32 | 12/27 at 100.00 | A | | 17,326 |
| | 20 | | 3.000%, 6/01/32 | 12/27 at 100.00 | A | | 19,042 |
| | 45 | | New Jersey Economic Development Authority, Rutgers University General Obligation Lease Revenue Bonds, Tender Option Bond Trust 2016-XF2357, 13.553%, 6/15/46, 144A (IF) (4) | 6/23 at 100.00 | Aa3 | | 64,456 |
| | 185 | | New Jersey Educational Facilities Authority, Revenue Bonds, College of New Jersey, Refunding Series 2016F, 3.000%, 7/01/40 | 7/26 at 100.00 | AA– | | 162,397 |
| | 100 | | New Jersey Educational Facilities Authority, Revenue Bonds, Kean University, Refunding Series 2015H, 4.000%, 7/01/39 – AGM Insured | 7/25 at 100.00 | AA | | 104,179 |
| | 155 | | New Jersey Educational Facilities Authority, Revenue Bonds, New Jersey City University, Series 2015A, 5.000%, 7/01/45 | 7/25 at 100.00 | AA | | 169,882 |
| | | | New Jersey Educational Facilities Authority, Revenue Bonds, Rider University, Series 2012A: | | | | |
| | 100 | | 5.000%, 7/01/32 | 7/21 at 100.00 | Baa2 | | 104,458 |
| | 30 | | 5.000%, 7/01/37 | 7/21 at 100.00 | Baa2 | | 30,970 |
| | | | New Jersey Educational Facilities Authority, Revenue Bonds, Rider University, Series 2017F: | | | | |
| | 5 | | 3.750%, 7/01/37 | 7/27 at 100.00 | Baa2 | | 4,728 |
| | 100 | | 4.000%, 7/01/42 | 7/27 at 100.00 | Baa2 | | 96,273 |
| | 100 | | 5.000%, 7/01/47 | 7/27 at 100.00 | Baa2 | | 107,367 |
| | 80 | | New Jersey Educational Facilities Authority, Revenue Bonds, Seton Hall University, Series 2013D, 5.000%, 7/01/38 | 7/23 at 100.00 | A– | | 88,112 |
29
| | |
NJV | Nuveen New Jersey Municipal Value Fund |
| | Portfolio of Investments (continued) |
| | August 31, 2018 (Unaudited) |
| | Principal | | | Optional Call | | | |
| | Amount (000) | | Description (1) | Provisions (2) | Ratings (3) | | Value |
| | | | Education and Civic Organizations (continued) | | | | |
| | | | New Jersey Educational Facilities Authority, Revenue Bonds, Seton Hall University, Series 2016C: | | | | |
| $ | 435 | | 3.000%, 7/01/41 | 7/26 at 100.00 | A– | $ | 382,774 |
| | 50 | | 3.000%, 7/01/46 | 7/26 at 100.00 | A– | | 43,008 |
| | 200 | | New Jersey Educational Facilities Authority, Revenue Bonds, Stevens Institute of Technology, Series 2017A, 4.000%, 7/01/47 | 7/27 at 100.00 | A– | | 203,116 |
| | 100 | | New Jersey Educational Facilities Authority, Revenue Bonds, Stockton University Issue, Refunding Series 2016A, 5.000%, 7/01/41 | 7/26 at 100.00 | A– | | 107,979 |
| | 25 | | New Jersey Educational Facilities Authority, Revenue Bonds, The College of Saint Elizabeth, Series 2016D, 5.000%, 7/01/46 | 7/26 at 100.00 | BB | | 25,208 |
| | 215 | | New Jersey Higher Education Assistance Authority, Senior Student Loan Revenue Bonds, Refunding Series 2018A, 4.000%, 12/01/35 (Alternative Minimum Tax) | 6/28 at 100.00 | Aaa | | 218,464 |
| | 200 | | New Jersey Higher Education Assistance Authority, Student Loan Revenue Bonds, Senior Lien Series 2017-1A, 4.000%, 12/01/40 (Alternative Minimum Tax) | 12/26 at 100.00 | Aaa | | 199,114 |
| | 905 | | New Jersey Higher Education Assistance Authority, Student Loan Revenue Bonds, Series 2009A, 5.625%, 6/01/30 | 6/19 at 100.00 | AA | | 928,982 |
| | 30 | | New Jersey Higher Education Assistance Authority, Student Loan Revenue Bonds, Series 2010-2, 5.000%, 12/01/30 | 12/20 at 100.00 | Aaa | | 31,548 |
| | 100 | | New Jersey Higher Education Assistance Authority, Student Loan Revenue Bonds, Series 2012-1B, 5.750%, 12/01/39 (Alternative Minimum Tax) | 12/22 at 100.00 | Aaa | | 108,458 |
| | 195 | | New Jersey Higher Education Assistance Authority, Student Loan Revenue Bonds, Series 2015-1A, 4.000%, 12/01/30 (Alternative Minimum Tax) | 12/24 at 100.00 | Aaa | | 199,425 |
| | 74 | | New Jersey Higher Education Assistance Authority, Student Loan Revenue Bonds, Tender Option Bond Trust 2015-XF0151, 7.298%, 12/01/23, 144A (Alternative Minimum Tax) (IF) (4) | 12/22 at 100.00 | Aaa | | 80,048 |
| | 200 | | New Jersey Institute of Technology, New Jersey, General Obligation Bonds, Series 2015A, 5.000%, 7/01/45 | 7/25 at 100.00 | A1 | | 222,676 |
| | 60 | | Rutgers State University, New Jersey, Revenue Bonds, Tender Option Bond Trust 2016-XF2356, 13.466%, 5/01/43, 144A (IF) (4) | 5/23 at 100.00 | Aa3 | | 85,457 |
| | 4,319 | | Total Education and Civic Organizations | | | | 4,424,106 |
| | | | Health Care – 21.3% (20.2% of Total Investments) | | | | |
| | | | Camden County Improvement Authority, New Jersey, Health Care Redevelopment Revenue Bonds, Cooper Health System Obligated Group Issue, Refunding Series 2014A: | | | | |
| | 105 | | 5.000%, 2/15/25 | 2/24 at 100.00 | BBB+ | | 116,364 |
| | 100 | | 5.000%, 2/15/34 | 2/24 at 100.00 | BBB+ | | 107,017 |
| | 115 | | Camden County Improvement Authority, New Jersey, Health Care Redevelopment Revenue Bonds, Cooper Health System Obligated Group Issue, Series 2013A, 5.750%, 2/15/42 | 2/23 at 100.00 | BBB+ | | 124,971 |
| | 360 | | New Jersey Health Care Facilities Financing Authority, Hospital Revenue Bonds, Virtua Health, Series 2009A, 5.500%, 7/01/38 – AGC Insured | 7/19 at 100.00 | AA | | 371,023 |
| | 1,640 | | New Jersey Health Care Facilities Financing Authority, Hospital Revenue Bonds, Virtua Health, Series 2009, 5.500%, 7/01/38 – AGC Insured (UB) (4) | 7/19 at 100.00 | AA | | 1,690,217 |
| | 175 | | New Jersey Health Care Facilities Financing Authority, New Jersey, Revenue Bonds, Saint Peters University Hospital, Refunding Series 2011, 6.250%, 7/01/35 | 7/21 at 100.00 | BB+ | | 186,650 |
| | 70 | | New Jersey Health Care Facilities Financing Authority, Revenue Bonds, AHS Hospital Corporation, Refunding Series 2016, 4.000%, 7/01/41 | 1/27 at 100.00 | AA– | | 71,641 |
| | 215 | | New Jersey Health Care Facilities Financing Authority, Revenue Bonds, Barnabas Health, Refunding Series 2014A, 5.000%, 7/01/44 | 7/24 at 100.00 | A+ | | 234,208 |
| | | | New Jersey Health Care Facilities Financing Authority, Revenue Bonds, Hackensack Meridian Health Obligated Group, Refunding Series 2017A: | | | | |
| | 125 | | 5.000%, 7/01/28 | 7/27 at 100.00 | AA– | | 147,539 |
| | 150 | | 5.000%, 7/01/57 | 7/27 at 100.00 | AA– | | 166,104 |
| | 110 | | New Jersey Health Care Facilities Financing Authority, Revenue Bonds, Hunterdon Medical Center, Refunding Series 2014A, 4.000%, 7/01/45 | 7/24 at 100.00 | A+ | | 110,620 |
30
| | | | | | | | |
| | Principal | | | Optional Call | | | |
| | Amount (000) | | Description (1) | Provisions (2) | Ratings (3) | | Value |
| | | | Health Care (continued) | | | | |
| $ | 360 | | New Jersey Health Care Facilities Financing Authority, Revenue Bonds, Inspira Health Obligated Group Issue, Series 2017A, 5.000%, 7/01/42 (UB) (4) | 7/27 at 100.00 | A2 | $ | 402,988 |
| | 20 | | New Jersey Health Care Facilities Financing Authority, Revenue Bonds, Meridian Health System Obligated Group, Refunding Series 2011, 5.000%, 7/01/21 | No Opt. Call | AA– | | 21,661 |
| | | | New Jersey Health Care Facilities Financing Authority, Revenue Bonds, Princeton HealthCare System, Series 2016A: | | | | |
| | 25 | | 5.000%, 7/01/32 | 7/26 at 100.00 | AA | | 28,839 |
| | 40 | | 5.000%, 7/01/33 | 7/26 at 100.00 | AA | | 45,990 |
| | 30 | | 5.000%, 7/01/34 | 7/26 at 100.00 | AA | | 34,402 |
| | 130 | | New Jersey Health Care Facilities Financing Authority, Revenue Bonds, Robert Wood Johnson University Hospital Issue, Series 2014A, 5.000%, 7/01/39 | 7/24 at 100.00 | A+ | | 143,571 |
| | 110 | | New Jersey Health Care Facilities Financing Authority, Revenue Bonds, Robert Wood Johnson University Hospital, Series 2013A, 5.500%, 7/01/43 | 7/23 at 100.00 | A+ | | 123,147 |
| | 100 | | New Jersey Health Care Facilities Financing Authority, Revenue Bonds, RWJ Barnabas Health Obligated Group, Refunding Series 2016A, 5.000%, 7/01/43 | 7/26 at 100.00 | A+ | | 111,705 |
| | | | New Jersey Health Care Facilities Financing Authority, Revenue Bonds, Saint Joseph’s Healthcare System Obligated Group Issue, Refunding Series 2016: | | | | |
| | 10 | | 3.000%, 7/01/32 | 7/26 at 100.00 | BBB– | | 8,838 |
| | 405 | | 4.000%, 7/01/48 | 7/26 at 100.00 | BBB– | | 393,291 |
| | 100 | | New Jersey Health Care Facilities Financing Authority, Revenue Bonds, Saint Luke’s Warren Hospital Obligated Group, Series 2013, 4.000%, 8/15/37 | 8/23 at 100.00 | A– | | 101,162 |
| | | | New Jersey Health Care Facilities Financing Authority, Revenue Bonds, University Hospital Issue, Refunding Series 2015A: | | | | |
| | 130 | | 4.125%, 7/01/38 – AGM Insured | 7/25 at 100.00 | AA | | 133,773 |
| | 110 | | 5.000%, 7/01/46 – AGM Insured | 7/25 at 100.00 | AA | | 120,561 |
| | 4,735 | | Total Health Care | | | | 4,996,282 |
| | | | Housing/Multifamily – 7.4% (7.0% of Total Investments) | | | | |
| | 55 | | New Jersey Economic Development Authority, Revenue Bonds, Provident Group – Kean Properties LLC – Kean University Student Housing Project, Series 2017A, 5.000%, 7/01/47 | 1/27 at 100.00 | BBB– | | 59,181 |
| | 100 | | New Jersey Economic Development Authority, Revenue Bonds, Provident Group – Rowan Properties LLC – Rowan University Student Housing Project, Series 2015A, 5.000%, 1/01/48 | 1/25 at 100.00 | BBB– | | 105,646 |
| | 155 | | New Jersey Economic Development Authority, Revenue Bonds, West Campus Housing LLC – New Jersey City University Student Housing Project, Series 2015, 5.000%, 7/01/47 | 7/25 at 100.00 | BBB– | | 160,051 |
| | 1,000 | | New Jersey Housing and Mortgage Finance Agency, Multifamily Revenue Bonds, Series 2009A, 4.950%, 5/01/41 | 11/19 at 100.00 | AA– | | 1,017,489 |
| | 120 | | New Jersey Housing and Mortgage Finance Agency, Multifamily Revenue Bonds, Series 2015A, 4.000%, 11/01/45 | 11/24 at 100.00 | AA– | | 121,631 |
| | 270 | | New Jersey Housing and Mortgage Finance Agency, Multifamily Revenue Bonds, Series 2016B, 3.600%, 11/01/40 | 11/25 at 100.00 | AA– | | 268,766 |
| | 1,700 | | Total Housing/Multifamily | | | | 1,732,764 |
| | | | Housing/Single Family – 1.5% (1.4% of Total Investments) | | | | |
| | | | New Jersey Housing and Mortgage Finance Agency, Single Family Housing Revenue Bonds, Series 2018A: | | | | |
| | 165 | | 3.600%, 4/01/33 | 10/27 at 100.00 | AA | | 164,810 |
| | 90 | | 3.750%, 10/01/35 | 10/27 at 100.00 | AA | | 90,274 |
| | 90 | | New Jersey Housing and Mortgage Finance Agency, Single Family Housing Revenue Bonds, Series 2018B, 3.800%, 10/01/32 (Alternative Minimum Tax) | 10/27 at 100.00 | AA | | 89,804 |
| | 345 | | Total Housing/Single Family | | | | 344,888 |
| | | | Long-Term Care – 2.1% (2.0% of Total Investments) | | | | |
| | 285 | | Burlington County Bridge Commission, New Jersey, Economic Development Revenue Bonds, The Evergreens Project, Series 2007, 5.625%, 1/01/38 | 11/18 at 100.00 | N/R | | 278,901 |
31
| | |
NJV | Nuveen New Jersey Municipal Value Fund |
| | Portfolio of Investments (continued) |
| | August 31, 2018 (Unaudited) |
| |
| | Principal | | | Optional Call | | | |
| | Amount (000) | | Description (1) | Provisions (2) | Ratings (3) | | Value |
| | | | Long-Term Care (continued) | | | | |
| $ | 15 | | New Jersey Economic Development Authority, Fixed Rate Revenue Bonds, Lions Gate Project, Series 2014, 5.250%, 1/01/44 | 1/24 at 100.00 | N/R | $ | 15,569 |
| | 140 | | New Jersey Economic Development Authority, Revenue Bonds, United Methodist Homes of New Jersey Obligated Group Issue, Refunding Series 2013, 5.000%, 7/01/34 | 7/23 at 100.00 | BBB– | | 146,577 |
| | 40 | | New Jersey Economic Development Authority, Revenue Bonds, United Methodist Homes of New Jersey Obligated Group Issue, Refunding Series 2014A, 5.000%, 7/01/29 | 7/24 at 100.00 | BBB– | | 42,829 |
| | 480 | | Total Long-Term Care | | | | 483,876 |
| | | | Tax Obligation/General – 9.0% (8.5% of Total Investments) | | | | |
| | 100 | | Gloucester County, New Jersey, General Obligation Bonds, Series 2017B, 4.000%, 10/15/27 | No Opt. Call | AA | | 110,521 |
| | 100 | | Jersey City, New Jersey, General Obligation Bonds, Refunding General Improvement Series 2017A, 5.000%, 11/01/29 | 11/27 at 100.00 | AA– | | 117,039 |
| | 260 | | Middlesex County, New Jersey, General Obligation Bonds, Refunding General Improvement Series 2017, 4.000%, 1/15/24 | No Opt. Call | AAA | | 285,610 |
| | 225 | | Middlesex County, New Jersey, General Obligation Bonds, Refunding Redevelopment Series 2017, 5.000%, 1/15/27 | No Opt. Call | AAA | | 268,508 |
| | 110 | | Monroe Township Board of Education, Middlesex County, New Jersey, General Obligation Bonds, Refunding Series 2015, 5.000%, 3/01/38 | 3/25 at 100.00 | AA– | | 122,335 |
| | 20 | | Montclair Township, Essex County, New Jersey, General Obligation Bonds, Refunding Parking Utility Series 2014A, 5.000%, 1/01/37 | 1/24 at 100.00 | AAA | | 22,424 |
| | 100 | | Montclair Township, Essex County, New Jersey, General Obligation Bonds, Refunding School Series 2017B, 4.000%, 3/01/25 | No Opt. Call | AAA | | 110,765 |
| | 50 | | Mount Laurel Township, Burlington County, New Jersey, General Obligation Bonds, Refunding Series 2017, 4.000%, 4/15/25 | No Opt. Call | AA | | 54,671 |
| | | | New Brunswick Parking Authority, Middlesex County, New Jersey, Guaranteed Parking Revenue Bonds, Refunding Series 2016A: | | | | |
| | 310 | | 5.000%, 9/01/29 – BAM Insured | 9/26 at 100.00 | AA | | 356,364 |
| | 130 | | 5.000%, 9/01/39 – BAM Insured | 9/26 at 100.00 | AA | | 145,505 |
| | 195 | | New Brunswick Parking Authority, Middlesex County, New Jersey, Guaranteed Parking Revenue Bonds, Refunding Series 2016B, 3.000%, 9/01/39 – AGM Insured | 9/26 at 100.00 | AA | | 174,455 |
| | 150 | | Union County Utilities Authority, New Jersey, Resource Recovery Facility Lease Revenue Bonds, Covantan Union Inc. Lessee, Refunding Series 2011B, 5.250%, 12/01/31 (Alternative Minimum Tax) | 12/21 at 100.00 | AA+ | | 163,779 |
| | 170 | | Union County Utilities Authority, New Jersey, Solid Waste System County Deficiency Revenue Bonds, Series 2011A, 5.000%, 6/15/41 | 6/21 at 100.00 | Aaa | | 182,849 |
| | 1,920 | | Total Tax Obligation/General | | | | 2,114,825 |
| | | | Tax Obligation/Limited – 10.5% (10.0% of Total Investments) | | | | |
| | 270 | | Garden State Preservation Trust, New Jersey, Open Space and Farmland Preservation Bonds, Series 2005A, 5.750%, 11/01/28 – AGM Insured | No Opt. Call | AA | | 318,603 |
| | 175 | | Hudson County Improvement Authority, New Jersey, County Secured Lease Revenue Bonds, Hudson County Vocational Technical Schools Project, Series 2016, 5.250%, 5/01/51 | 5/26 at 100.00 | AA | | 197,659 |
| | | | New Jersey Economic Development Authority, Cigarette Tax Revenue Refunding Bonds, Series 2012: | | | | |
| | 250 | | 5.000%, 6/15/25 | 6/22 at 100.00 | BBB+ | | 268,183 |
| | 400 | | 5.000%, 6/15/28 | 6/22 at 100.00 | BBB+ | | 424,972 |
| | 115 | | New Jersey Economic Development Authority, Revenue Bonds, Motor Vehicle Surcharge, Refunding Series 2017A, 3.375%, 7/01/30 | 7/27 at 100.00 | BBB+ | | 113,724 |
| �� | 2,170 | | New Jersey Transportation Trust Fund Authority, Transportation System Bonds, Series 2009A, 0.000%, 12/15/39 | No Opt. Call | A– | | 804,201 |
32
| | | | | | | | |
| | Principal | | | Optional Call | | | |
| | Amount (000) | | Description (1) | Provisions (2) | Ratings (3) | | Value |
| | | | Tax Obligation/Limited (continued) | | | | |
| $ | 100 | | New Jersey Transportation Trust Fund Authority, Transportation System Bonds, Series 2011B, 5.000%, 6/15/42 | 6/21 at 100.00 | A– | $ | 103,103 |
| | 110 | | Union County Improvement Authority, New Jersey, General Obligation Lease Bonds, Juvenile Detention Center Facility Project, Tender Option Bond Trust 2015-XF1019, 18.200%, 5/01/30, 144A (IF) (4) | No Opt. Call | Aaa | | 243,708 |
| | 3,590 | | Total Tax Obligation/Limited | | | | 2,474,153 |
| | | | Transportation – 12.1% (11.5% of Total Investments) | | | | |
| | 250 | | Casino Reinvestment Development Authority, New Jersey, Parking Revenue Bonds, Series 2005A, 5.250%, 6/01/20 – NPFG Insured | 11/18 at 100.00 | Baa2 | | 250,703 |
| | | | Delaware River and Bay Authority, Delaware and New Jersey, Revenue Bonds, Series 2014A: | | | | |
| | 150 | | 4.125%, 1/01/39 | 1/24 at 100.00 | A1 | | 153,996 |
| | 200 | | 5.000%, 1/01/44 | 1/24 at 100.00 | A1 | | 220,464 |
| | 540 | | Delaware River Joint Toll Bridge Commission, New Jersey and Pennsylvania, Bridge System Revenue Bonds, Series 2017, 5.000%, 7/01/47 | 7/27 at 100.00 | A1 | | 614,174 |
| | 300 | | Delaware River Port Authority, Pennsylvania and New Jersey, Revenue Refunding Bonds, Port District Project, Series 2012, 5.000%, 1/01/27 | 1/23 at 100.00 | A– | | 325,917 |
| | 190 | | New Jersey Economic Development Authority, Private Activity Bonds, The Goethals Bridge Replacement Project, Series 2013, 5.625%, 1/01/52 (Alternative Minimum Tax) | 1/24 at 100.00 | BBB | | 209,441 |
| | 80 | | New Jersey Economic Development Authority, Special Facilities Revenue Bonds, Continental Airlines Inc., Series 2000A & 2000B, 5.625%, 11/15/30 (Alternative Minimum Tax) | 3/24 at 101.00 | BB | | 90,471 |
| | 320 | | New Jersey Economic Development Authority, Special Facility Revenue Bonds, Port Newark Container Terminal LLC Project, Refunding Series 2017, 5.000%, 10/01/47 (Alternative Minimum Tax) | 10/27 at 100.00 | Ba1 | | 343,382 |
| | 255 | | New Jersey Turnpike Authority, Revenue Bonds, Refunding Series 2015E, 5.000%, 1/01/45 | 1/25 at 100.00 | A+ | | 282,150 |
| | 315 | | Port Authority of New York and New Jersey, Consolidated Revenue Bonds, One Hundred Seventy Ninth Series 2013, 5.000%, 12/01/43 | 12/23 at 100.00 | AA– | | 350,160 |
| | 2,600 | | Total Transportation | | | | 2,840,858 |
| | | | U.S. Guaranteed – 16.1% (15.2% of Total Investments) (5) | | | | |
| | 630 | | Guam Government, Limited Obligation Section 30 Revenue Bonds, Series 2009A, 5.750%, 12/01/34 (Pre-refunded 12/01/19) | 12/19 at 100.00 | BBB+ | | 660,971 |
| | | | New Jersey Economic Development Authority, Student Housing Revenue Bonds, Provident Group-Montclair Properties LLC, Montclair State University Student Housing Project, Series 2010A: | | | | |
| | 100 | | 5.750%, 6/01/31 (Pre-refunded 6/01/20) | 6/20 at 100.00 | Aaa | | 106,943 |
| | 50 | | 5.875%, 6/01/42 (Pre-refunded 6/01/20) | 6/20 at 100.00 | Aaa | | 53,578 |
| | 810 | | New Jersey Educational Facilities Authority, Revenue Bonds, Kean University, Refunding Series 2009A, 5.500%, 9/01/36 (Pre-refunded 9/01/19) | 9/19 at 100.00 | A2 | | 840,706 |
| | | | New Jersey Health Care Facilities Financing Authority, Revenue and Refunding Bonds, Palisades Medical Center Obligated Group Issue, Series 2013: | | | | |
| | 20 | | 5.250%, 7/01/31 (Pre-refunded 7/01/23) | 7/23 at 100.00 | N/R | | 22,786 |
| | 85 | | 5.250%, 7/01/31 (Pre-refunded 7/01/23) | 7/23 at 100.00 | N/R | | 97,048 |
| | 70 | | New Jersey Health Care Facilities Financing Authority, Revenue Bonds, Saint Barnabas Health Care System, Refunding Series 2011A, 5.625%, 7/01/37 (Pre-refunded 7/01/21) | 7/21 at 100.00 | N/R | | 77,211 |
| | 270 | | New Jersey Health Care Facilities Financing Authority, State Contract Bonds, Hospital Asset Transformation Program, Series 2008A, 5.250%, 10/01/38 (Pre-refunded 10/01/18) | 10/18 at 100.00 | BBB+ | | 270,732 |
| | 1,575 | | New Jersey Health Care Facilities Financing Authority, State Contract Bonds, Hospital Asset Transformation Program, Series 2009A, 5.750%, 10/01/31 (Pre-refunded 10/01/19) | 10/19 at 100.00 | A– | | 1,641,084 |
| | 3,610 | | Total U.S. Guaranteed | | | | 3,771,059 |
33
| | |
NJV | Nuveen New Jersey Municipal Value Fund |
| | Portfolio of Investments (continued) |
| | August 31, 2018 (Unaudited) |
| |
| | Principal | | | Optional Call | | | |
| | Amount (000) | | Description (1) | Provisions (2) | Ratings (3) | | Value |
| | | | Utilities – 3.7% (3.5% of Total Investments) | | | | |
| $ | 470 | | Essex County Improvement Authority, New Jersey, Solid Waste Disposal Revenue Bonds, Covanta Project, Series 2015, 5.250%, 7/01/45, 144A (Alternative Minimum Tax) | 7/20 at 100.00 | BB– | $ | 474,677 |
| | 300 | | Industrial Pollution Control Financing Authority of Cape May County (New Jersey), Pollution Control Revenue Refunding Bonds, 1991 Series A (Atlantic City Electric Company Project), 6.800%, 3/01/21 – NPFG Insured | No Opt. Call | A | | 329,262 |
| | 65 | | Salem County Pollution Control Financing Authority, New Jersey, Pollution Control Revenue Bonds, Chambers Project, Refunding Series 2014A, 5.000%, 12/01/23 (Alternative Minimum Tax) | No Opt. Call | BBB– | | 69,723 |
| | 835 | | Total Utilities | | | | 873,662 |
| $ | 24,849 | | Total Long-Term Investments (cost $24,010,758) | | | | 24,790,027 |
| | | | Floating Rate Obligations – (6.4)% | | | | (1,500,000) |
| | | | Other Assets Less Liabilities – 0.7% | | | | 158,266 |
| | | | Net Assets Applicable to Common Shares – 100% | | | $ | 23,448,293 |
| (1) | All percentages shown in the Portfolio of Investments are based on net assets applicable to common shares unless otherwise noted. |
(2) | Optional Call Provisions: Dates (month and year) and prices of the earliest optional call or redemption. There may be other call provisions at varying prices at later dates. Certain mortgage-backed securities may be subject to periodic principal paydowns. |
| (3) | For financial reporting purposes, the ratings disclosed are the highest of Standard & Poor’s Group (“Standard & Poor’s”), Moody’s Investors Service, Inc. (“Moody’s”) or Fitch, Inc. (“Fitch”) rating. This treatment of split-rated securities may differ from that used for other purposes, such as for Fund investment policies. Ratings below BBB by Standard & Poor’s, Baa by Moody’s or BBB by Fitch are considered to be below investment grade. Holdings designated N/R are not rated by any of these national rating agencies. |
| (4) | Investment, or portion of investment, has been pledged to collateralize the net payment obligations for investments in inverse floating rate transactions. |
| (5) | Backed by an escrow or trust containing sufficient U.S. Government or U.S. Government agency securities, which ensure the timely payment of principal and interest. |
144A | Investment is exempt from registration under Rule 144A of the Securities Act of 1933, as amended. These investments may only be resold in transactions exempt from registration, which are normally those transactions with qualified institutional buyers. |
IF | Inverse floating rate security issued by a tender option bond (“TOB”) trust, the interest rate on which varies inversely with the Securities Industry Financial Markets Association (SIFMA) short-term rate, which resets weekly, or a similar short-term rate, and is reduced by the expenses related to the TOB trust. |
UB | Underlying bond of an inverse floating rate trust reflected as a financing transaction. See Notes to Financial Statements, Note 3 – Portfolio Securities and Investments in Derivatives, Inverse Floating Rate Securities for more information. |
See accompanying notes to financial statements.
34
| | |
| NQP | Nuveen Pennsylvania Quality Municipal Income Fund Portfolio of Investments August 31, 2018 (Unaudited) |
| | Principal | | | Optional Call | | | |
| | Amount (000) | | Description (1) | Provisions (2) | Ratings (3) | | Value |
| | | | LONG-TERM INVESTMENTS – 161.0% (100.0% of Total Investments) | | | | |
| | | | MUNICIPAL BONDS – 161.0% (100.0% of Total Investments) | | | | |
| | | | Consumer Staples – 0.4% (0.3% of Total Investments) | | | | |
| $ | 2,000 | | Pennsylvania Economic Development Financing Authority, Solid Waste Disposal Revenue Bonds, Procter & Gamble Paper Project, Series 2001, 5.375%, 3/01/31 (Alternative Minimum Tax) | No Opt. Call | AA– | $ | 2,396,960 |
| | | | Education and Civic Organizations – 19.6% (12.2% of Total Investments) | | | | |
| | 1,255 | | Allegheny County Higher Education Building Authority, Pennsylvania, College Revenue Refunding Bonds, Robert Morris College, Series 1998A, 6.000%, 5/01/28 | No Opt. Call | Baa3 | | 1,420,484 |
| | 5,035 | | Allegheny County Higher Education Building Authority, Pennsylvania, Revenue Bonds, Carnegie Mellon University, Series 2013, 5.000%, 3/01/28 | 3/23 at 100.00 | AA | | 5,627,620 |
| | 940 | | Allegheny County Higher Education Building Authority, Pennsylvania, Revenue Bonds, Duquesne University, Series 2013A, 3.500%, 3/01/34 | 3/23 at 100.00 | A | | 916,895 |
| | | | Allegheny County Higher Education Building Authority, Pennsylvania, Revenue Bonds, Robert Morris University, Series 2016: | | | | |
| | 735 | | 3.000%, 10/15/30 | 10/26 at 100.00 | Baa3 | | 659,714 |
| | 1,000 | | 5.000%, 10/15/38 | 10/26 at 100.00 | Baa3 | | 1,080,150 |
| | 1,625 | | Allegheny County Higher Education Building Authority, Pennsylvania, Revenue Bonds, Robert Morris University, Series 2017, 5.000%, 10/15/47 | 10/27 at 100.00 | Baa3 | | 1,755,715 |
| | 3,215 | | Bucks County Industrial Development Authority, Pennsylvania, Revenue Bonds, School Lane Charter School Project, Series 2016, 5.125%, 3/15/36 | 3/27 at 100.00 | BBB– | | 3,454,903 |
| | 835 | | Chester County Industrial Development Authority, Pennsylvania, Avon Grove Charter School Revenue Bonds, Series 2017A, 5.000%, 12/15/47 | 12/27 at 100.00 | BBB– | | 870,187 |
| | 2,200 | | Crawford County Industrial Development Authority, Pennsylvania, College Revenue Bonds, Allegheny College, Series 2016, 3.000%, 5/01/34 | 5/26 at 100.00 | A– | | 1,957,626 |
| | 1,000 | | Cumberland County Municipal Authority, Pennsylvania, Revenue Bonds, Dickinson College , Project Second Series 2017A, 5.000%, 11/01/39 | 11/27 at 100.00 | A+ | | 1,124,100 |
| | 1,020 | | Dallas Area Municipal Authority, Pennsylvania, Revenue Bonds, Misericordia University, Series 2014, 5.000%, 5/01/37 | 5/24 at 100.00 | Baa3 | | 1,079,058 |
| | 750 | | Delaware County Authority, Pennsylvania, General Revenue Bonds, Eastern University, Series 2006, 4.500%, 10/01/27 – RAAI Insured | 11/18 at 100.00 | AA | | 750,608 |
| | 4,595 | | Erie Higher Education Building Authority, Pennsylvania, Revenue Bonds, Gannon University, Series 2016, 4.000%, 5/01/46 | 11/26 at 100.00 | BBB+ | | 4,365,939 |
| | 2,395 | | General Authority of Southcentral Pennsylvania, Revenue Bonds, AICUP Financing Program-York College of Pennsylvania, Series 2017 PP4, 3.375%, 11/01/37 | 10/27 at 100.00 | A– | | 2,266,676 |
| | | | Huntingdon County General Authority, Pennsylvania, Revenue Bonds, Juniata College, Series 2016OO2: | | | | |
| | 590 | | 3.250%, 5/01/36 | 5/26 at 100.00 | BBB+ | | 540,658 |
| | 1,555 | | 3.500%, 5/01/41 | 5/26 at 100.00 | BBB+ | | 1,439,806 |
| | 815 | | Indiana County Industrial Development Authority, Pennsylvania, Revenue Bonds, Student Cooperative Association Inc./Indiana University of Pennsylvania – Student Union Project, Series 1999B, 0.000%, 11/01/19 – AMBAC Insured | No Opt. Call | N/R | | 798,203 |
| | | | Lackawanna County Industrial Development Authority, Pennsylvania, Revenue Bonds, University of Scranton, Series 2017: | | | | |
| | 475 | | 3.375%, 11/01/33 | 11/27 at 100.00 | A– | | 454,000 |
| | 2,910 | | 4.000%, 11/01/40 | 11/27 at 100.00 | A– | | 2,925,423 |
| | 5,235 | | Lycoming County Authority, Pennsylvania, Revenue Bonds, Pennsylvania College of Technology, Series 2012, 5.000%, 5/01/32 | 5/22 at 100.00 | A | | 5,535,175 |
| | 1,855 | | Montgomery County Higher Education and Health Authority, Pennsylvania, Revenue Bonds, Thomas Jefferson University, Series 2018A, 5.000%, 9/01/48 | 9/28 at 100.00 | A+ | | 2,059,755 |
35
| | |
NQP | Nuveen Pennsylvania Quality Municipal Income Fund |
| | Portfolio of Investments (continued) |
| | August 31, 2018 (Unaudited) |
| | Principal | | | Optional Call | | | |
| | Amount (000) | | Description (1) | Provisions (2) | Ratings (3) | | Value |
| | | | Education and Civic Organizations (continued) | | | | |
| $ | 2,155 | | Montgomery County Higher Education and Health Authority, Pennsylvania, Revenue Bonds, Arcadia University, Series 2010, 5.625%, 4/01/40 | 4/20 at 100.00 | BBB | $ | 2,228,744 |
| | 1,400 | | Northampton County General Purpose Authority, Pennsylvania, Revenue Bonds, Lafayette College, Refunding Series 2017, 5.000%, 11/01/34 | 11/27 at 100.00 | Aa3 | | 1,619,016 |
| | 1,465 | | Pennsylvania Higher Educational Facilities Authority, Revenue Bonds, Holy Family University, Series 2013A, 6.500%, 9/01/38 | 9/23 at 100.00 | BBB– | | 1,627,058 |
| | 1,625 | | Pennsylvania Higher Educational Facilities Authority, General Revenue Bonds, State System of Higher Education, Series 2008AH, 5.000%, 6/15/33 | 11/18 at 100.00 | Aa3 | | 1,628,884 |
| | 2,415 | | Pennsylvania Higher Educational Facilities Authority, Revenue Bonds, AICUP Financing Program-Mount Aloysius College Project, Series 2011R-1, 5.000%, 11/01/35 | 11/21 at 100.00 | A– | | 2,579,582 |
| | | | Pennsylvania Higher Educational Facilities Authority, Revenue Bonds, Bryn Mawr College, Refunding Series 2014: | | | | |
| | 2,545 | | 5.000%, 12/01/38 | 12/24 at 100.00 | AA | | 2,893,003 |
| | 2,080 | | 5.000%, 12/01/44 | 12/24 at 100.00 | AA | | 2,356,744 |
| | 85 | | Pennsylvania Higher Educational Facilities Authority, Revenue Bonds, Drexel University, Series 2011A, 5.250%, 5/01/41 | 5/21 at 100.00 | A | | 90,809 |
| | 1,000 | | Pennsylvania Higher Educational Facilities Authority, Revenue Bonds, Gwynedd Mercy College, Series 2012-KK1, 5.375%, 5/01/42 | 5/22 at 100.00 | BBB | | 1,041,440 |
| | 320 | | Pennsylvania Higher Educational Facilities Authority, Revenue Bonds, LaSalle University, Series 2012, 4.000%, 5/01/32 | 11/22 at 100.00 | BBB | | 321,571 |
| | 2,000 | | Pennsylvania Higher Educational Facilities Authority, Revenue Bonds, Temple University, First Series of 2012, 5.000%, 4/01/42 | 4/22 at 100.00 | Aa3 | | 2,148,540 |
| | 7,125 | | Pennsylvania Higher Educational Facilities Authority, Revenue Bonds, Thomas Jefferson University, Refunding Series 2015A, 5.250%, 9/01/50 | 3/25 at 100.00 | A+ | | 7,895,498 |
| | 760 | | Pennsylvania Higher Educational Facilities Authority, Revenue Bonds, Thomas Jefferson University, Series 2012, 5.000%, 3/01/42 | 9/22 at 100.00 | A+ | | 819,706 |
| | | | Pennsylvania Higher Educational Facilities Authority, Revenue Bonds, University of the Sciences in Philadelphia, Series 2012: | | | | |
| | 1,030 | | 4.000%, 11/01/39 | 11/22 at 100.00 | A3 | | 1,037,025 |
| | 4,300 | | 5.000%, 11/01/42 | 11/22 at 100.00 | A3 | | 4,642,194 |
| | 1,310 | | Pennsylvania Higher Educational Facilities Authority, Revenue Bonds, University of the Sciences in Philadelphia, Series 2015A, 5.000%, 11/01/36 | 11/25 at 100.00 | A3 | | 1,450,851 |
| | 1,590 | | Pennsylvania Higher Educational Facilities Authority, Revenue Bonds, Widener University, Series 2013A, 5.500%, 7/15/38 | 7/23 at 100.00 | A– | | 1,708,137 |
| | 3,005 | | Pennsylvania State University, Revenue Bonds, Series 2010, 5.000%, 3/01/35 | 3/20 at 100.00 | Aa1 | | 3,135,237 |
| | 1,255 | | Philadelphia Authority for Industrial Development, Pennsylvania, Revenue Bonds, La Salle University, Series 2017, 3.625%, 5/01/35 | 11/27 at 100.00 | BBB– | | 1,198,123 |
| | 554 | | Philadelphia Authority for Industrial Development, Pennsylvania, Revenue Bonds, Leadership Learning Partners, Series 2005A, 5.375%, 7/01/36 (4) | 11/18 at 100.00 | N/R | | 5,540 |
| | 4,500 | | Philadelphia Authority for Industrial Development, Pennsylvania, Revenue Bonds, Philadelphia Performing Arts Charter School, Series 2013, 6.750%, 6/15/43, 144A | 6/20 at 100.00 | BB | | 4,699,710 |
| | 500 | | Philadelphia Authority for Industrial Development, Pennsylvania, Revenue Bonds, Richard Allen Preparatory Charter School, Series 2006, 6.250%, 5/01/33 | 11/18 at 100.00 | N/R | | 434,915 |
| | 2,420 | | Philadelphia Authority for Industrial Development, Pennsylvania, Revenue Bonds, University of the Arts, Series 2017, 5.000%, 3/15/45, 144A | 3/28 at 100.00 | N/R | | 2,460,317 |
| | 2,320 | | Scranton-Lackawanna Health and Welfare Authority, Pennsylvania, Revenue Bonds, University of Scranton, Series 2016, 5.000%, 11/01/37 | 5/26 at 100.00 | A– | | 2,519,358 |
| | 5,250 | | Scranton-Lackawanna Health and Welfare Authority, Pennsylvania, University Revenue Bonds, Marywood University, Series 2016, 5.000%, 6/01/46 | 6/26 at 100.00 | BB+ | | 5,306,648 |
| | 5,000 | | State Public School Building Authority, Pennsylvania, College Revenue Bonds, Northampton County Area Community College, Series 2011, 5.500%, 3/01/31 | 3/21 at 100.00 | A1 | | 5,391,200 |
36
| | | | | | | | |
| | Principal | | | Optional Call | | | |
| | Amount (000) | | Description (1) | Provisions (2) | Ratings (3) | | Value |
| | | | Education and Civic Organizations (continued) | | | | |
| $ | 3,555 | | Washington County Industrial Development Authority, Pennsylvania, College Revenue Bonds, AICUP Financing Program-Washington and Jefferson College Project, Series 2017-PP5, 3.375%, 11/01/36 | 11/27 at 100.00 | A– | $ | 3,349,094 |
| | | | Wilkes-Barre Finance Authority, Pennsylvania, Revenue Bonds, University of Scranton, Series 2015A: | | | | |
| | 1,890 | | 5.000%, 11/01/32 | 11/25 at 100.00 | A– | | 2,118,803 |
| | 740 | | 5.000%, 11/01/33 | 11/25 at 100.00 | A– | | 827,564 |
| | 740 | | 4.000%, 11/01/35 | 11/25 at 100.00 | A– | | 746,852 |
| | 104,969 | | Total Education and Civic Organizations | | | | 109,364,858 |
| | | | Health Care – 33.8% (21.0% of Total Investments) | | | | |
| | 11,220 | | Allegheny County Hospital Development Authority, Pennsylvania, Revenue Bonds, Allegheny Health Network Obligated Group Issue, Series 2018A, 4.000%, 4/01/44 | 4/28 at 100.00 | A | | 11,095,570 |
| | | | Allegheny County Hospital Development Authority, Pennsylvania, Revenue Bonds, Ohio Valley General Hospital, Series 2005A: | | | | |
| | 1,860 | | 5.000%, 4/01/25 | 11/18 at 100.00 | Caa1 | | 1,837,401 |
| | 4,160 | | 5.125%, 4/01/35 | 11/18 at 100.00 | Caa1 | | 3,830,112 |
| | | | Beaver County Hospital Authority, Pennsylvania, Revenue Bonds, Heritage Valley Health System, Inc., Series 2012: | | | | |
| | 4,010 | | 5.000%, 5/15/26 | 5/21 at 100.00 | AA– | | 4,292,264 |
| | 1,910 | | 5.000%, 5/15/27 | 5/21 at 100.00 | AA– | | 2,040,300 |
| | 2,000 | | 5.000%, 5/15/28 | 5/21 at 100.00 | AA– | | 2,133,740 |
| | 10,385 | | Berks County Industrial Development Authority, Pennsylvania, Health System Revenue Bonds, Tower Health Project, Series 2017, 5.000%, 11/01/50 | 11/27 at 100.00 | A | | 11,348,936 |
| | 3,300 | | Berks County Municipal Authority, Pennsylvania, Revenue Bonds, Reading Hospital & Medical Center Project, Series 2012A, 4.500%, 11/01/41 | 5/22 at 100.00 | A | | 3,408,735 |
| | 4,000 | | Central Bradford Progress Authority, Pennsylvania, Revenue Bonds, Guthrie Health, Refunding Series 2011, 5.375%, 12/01/41 | 12/21 at 100.00 | AA– | | 4,365,920 |
| | | | Centre County Hospital Authority, Pennsylvania, Hospital Revenue Bonds, Mount Nittany Medical Center Project, Series 2016A: | | | | |
| | 805 | | 5.000%, 11/15/41 | 11/25 at 100.00 | A | | 883,318 |
| | 2,985 | | 5.000%, 11/15/46 | 11/25 at 100.00 | A | | 3,263,471 |
| | 420 | | Chester County Health and Education Facilities Authority, Pennsylvania, Health System Revenue Bonds, Jefferson Health System, Series 2010A, 5.000%, 5/15/40 | 5/20 at 100.00 | AA | | 439,370 |
| | | | Chester County Health and Education Facilities Authority, Pennsylvania, Health System Revenue Bonds, Main Line Health System, Series 2017A: | | | | |
| | 3,200 | | 4.000%, 10/01/36 | 10/27 at 100.00 | AA | | 3,308,288 |
| | 1,655 | | 4.000%, 10/01/37 | 10/27 at 100.00 | AA | | 1,707,116 |
| | | | Dauphin County General Authority, Pennsylvania, Health System Revenue Bonds, Pinnacle Health System Project, Refunding Series 2016A: | | | | |
| | 1,375 | | 5.000%, 6/01/34 | 6/26 at 100.00 | A+ | | 1,544,414 |
| | 375 | | 5.000%, 6/01/35 | 6/26 at 100.00 | A+ | | 420,113 |
| | 3,460 | | Dauphin County General Authority, Pennsylvania, Health System Revenue Bonds, Pinnacle Health System Project, Series 2012A, 5.000%, 6/01/42 | 6/22 at 100.00 | A+ | | 3,712,995 |
| | 1,500 | | Doylestown Hospital Authority, Pennsylvania, Hospital Revenue Bonds, Series 2013A, 5.000%, 7/01/28 | 7/23 at 100.00 | BBB– | | 1,603,095 |
| | 2,275 | | Doylestown Hospital Authority, Pennsylvania, Hospital Revenue Bonds, Series 2016A, 5.000%, 7/01/41 | 7/26 at 100.00 | BBB– | | 2,427,971 |
| | 5,000 | | Dubois Hospital Authority, Pennsylvania, Hospital Revenue Bonds, Penn Highlands Healthcare, Series 2018, 5.000%, 7/15/48 | 1/28 at 100.00 | A– | | 5,518,450 |
| | 6,845 | | Franklin County Industrial Development Authority, Pennsylvania, Revenue Bonds, Chambersburg Hospital Project, Series 2010, 5.375%, 7/01/42 | 7/20 at 100.00 | AA– | | 7,218,258 |
| | 4,555 | | Geisinger Authority, Montour County, Pennsylvania, Health System Revenue Bonds, Geisinger Health System, Series 2014A, 5.000%, 6/01/41 | 6/24 at 100.00 | AA | | 4,994,056 |
37
| | |
NQP | Nuveen Pennsylvania Quality Municipal Income Fund |
| | Portfolio of Investments (continued) |
| | August 31, 2018 (Unaudited) |
| | Principal | | | Optional Call | | | |
| | Amount (000) | | Description (1) | Provisions (2) | Ratings (3) | | Value |
| | | | Health Care (continued) | | | | |
| $ | 1,370 | | Indiana County Hospital Authority, Pennsylvania, Hospital Revenue Bonds, Indiana Regional Medical Center, Series 2014A, 6.000%, 6/01/39 | 6/23 at 100.00 | Ba1 | $ | 1,477,312 |
| | 2,200 | | Lancaster County Hospital Authority, Revenue Bonds, University of Pennsylvania Health System, Refunding Series 2016B, 5.000%, 8/15/46 | 8/26 at 100.00 | AA | | 2,479,114 |
| | 3,000 | | Lancaster County Hospital Authority, Revenue Bonds, University of Pennsylvania Health System, Series 2016A, 5.000%, 8/15/42 | 8/26 at 100.00 | AA | | 3,394,080 |
| | 3,450 | | Lehigh County General Purpose Authority, Pennsylvania, Hospital Revenue Bonds, Lehigh Valley Health Network, Refunding Series 2016A, 4.000%, 7/01/35 | 7/26 at 100.00 | A+ | | 3,486,846 |
| | 2,565 | | Lehigh County General Purpose Authority, Pennsylvania, Hospital Revenue Bonds, Lehigh Valley Health Network, Series 2012B, 4.000%, 7/01/43 | 7/22 at 100.00 | A+ | | 2,573,003 |
| | | | Lehigh County General Purpose Authority, Pennsylvania, Revenue Bonds, Good Shepherd Group, Refunding Series 2016: | | | | |
| | 1,265 | | 3.000%, 11/01/36 | 5/26 at 100.00 | A | | 1,122,384 |
| | 2,850 | | 4.000%, 11/01/41 | 5/26 at 100.00 | A | | 2,859,206 |
| | 4,955 | | 4.000%, 11/01/46 | 5/26 at 100.00 | A | | 4,954,752 |
| | 4,600 | | Lehigh County General Purpose Authority, Pennsylvania, Revenue Bonds, Good Shepherd Group, Series 2012, 4.000%, 11/01/32 | 11/22 at 100.00 | A | | 4,751,018 |
| | | | Lycoming County Authority, Pennsylvania, Health System Revenue Bonds, Susquehanna Health System Project, Series 2009A: | | | | |
| | 6,000 | | 5.500%, 7/01/28 | 7/19 at 100.00 | AA– | | 6,185,700 |
| | 2,840 | | 5.750%, 7/01/39 | 7/19 at 100.00 | AA– | | 2,935,339 |
| | | | Monroe County Hospital Authority, Pennsylvania, Hospital Revenue Bonds, Pocono Medical Center, Series 2016: | | | | |
| | 1,020 | | 3.375%, 7/01/32 | 7/26 at 100.00 | A+ | | 978,996 |
| | 2,650 | | 5.000%, 7/01/41 | 7/26 at 100.00 | A+ | | 2,914,099 |
| | 925 | | Montgomery County Industrial Development Authority, Pennsylvania, Health Facilities Revenue Bonds, Jefferson Health System, Series 2012A, 5.000%, 10/01/41 | 4/22 at 100.00 | AA | | 991,424 |
| | 7,500 | | Montgomery County Industrial Development Authority, Pennsylvania, Health System Revenue Bonds, Albert Einstein Healthcare Network Issue, Series 2015A, 5.250%, 1/15/45 | 1/25 at 100.00 | Baa3 | | 7,991,250 |
| | 4,000 | | Pennsylvania Economic Development Financing Authority, Revenue Bonds, University of Pittsburgh Medical Center, Series 2013A, 5.000%, 7/01/43 | 7/23 at 100.00 | AA– | | 4,309,920 |
| | 3,100 | | Pennsylvania Higher Educational Facilities Authority, Revenue Bonds, University of Pennsylvania Health System, Series 2012A, 5.000%, 8/15/42 | 8/22 at 100.00 | AA | | 3,345,737 |
| | 16,385 | | Pennsylvania Higher Educational Facilities Authority, Revenue Bonds, University of Pennsylvania Health System, Series 2016C, 4.000%, 8/15/41 (UB) (5) | | | | |
| | 2,935 | | Philadelphia Authority for Industrial Development, Pennsylvania, Hospital Revenue Bonds, The Children’s Hospital of Philadelphia, Series 2017, 5.000%, 7/01/33 | 7/27 at 100.00 | AA | | 3,394,298 |
| | 4,885 | | Philadelphia Hospitals and Higher Education Facilities Authority, Pennsylvania, Hospital Revenue Bonds, Temple University Health System Obligated Group, Series 2012A, 5.625%, 7/01/42 | 7/22 at 100.00 | BBB– | | 5,269,450 |
| | 2,440 | | Philadelphia Hospitals and Higher Education Facilities Authority, Pennsylvania, Hospital Revenue Bonds, Children’s Hospital of Philadelphia, Tender Option Bond Trust 2015-XF0114, 10.393%, 7/01/41, 144A (IF) | 7/21 at 100.00 | AA | | 2,932,734 |
| | | | Pocono Mountains Industrial Park Authority, Pennsylvania, Hospital Revenue Bonds, Saint Luke’s Hospital -Monroe Project, Series 2015A: | 8/26 at 100.00 | AA | | 16,879,827 |
| | 3,000 | | 5.000%, 8/15/40 | 2/25 at 100.00 | A– | | 3,250,350 |
| | 1,590 | | 4.000%, 8/15/45 | 2/25 at 100.00 | A– | | 1,590,859 |
| | 3,000 | | Pottsville Hospital Authority, Pennsylvania, Hospital Revenue Bonds, Lehigh Valley Health Network, Series 2016B, 5.000%, 7/01/45 | 1/27 at 100.00 | A+ | | 3,299,580 |
| | 3,000 | | Southcentral Pennsylvania General Authority, Revenue Bonds, Wellspan Health Obligated Group, Refunding Series 2014A, 5.000%, 6/01/44 | 6/24 at 100.00 | Aa3 | | 3,259,590 |
| | 1,800 | | The Hospitals and Higher Education Facilities Authority of Philadelphia, Hospital Revenue Bonds, Pennsylvania, Temple University Health System Obligated Group, Series of 2017, 5.000%, 7/01/30 | 7/27 at 100.00 | BBB– | | 1,987,506 |
38
| | | | | | | | |
| | Principal | | | Optional Call | | | |
| | Amount (000) | | Description (1) | Provisions (2) | Ratings (3) | | Value |
| | | | Health Care (continued) | | | | |
| $ | 3,470 | | Washington County Hospital Authority, Pennsylvania, Hospital Revenue Bonds, The Washington Hospital Project, Series 2013A, 5.000%, 7/01/28 | 7/23 at 100.00 | A– | $ | 3,651,724 |
| | | | West Shore Area Authority, Cumberland County, Pennsylvania, Hospital Revenue Bonds, Holy Spirit Hospital of the Sisters of Christian Charity, Series 2011B: | | | | |
| | 1,835 | | 5.625%, 1/01/32 | 1/22 at 100.00 | AA | | 2,027,767 |
| | 1,970 | | 5.750%, 1/01/41 | 1/22 at 100.00 | AA | | 2,183,450 |
| | 575 | | Westmoreland County Industrial Development Authority, Pennsylvania, Health System Revenue Bonds, Excela Health Project, Series 2010A, 5.125%, 7/01/30 | 7/20 at 100.00 | A3 | | 599,294 |
| �� | 178,470 | | Total Health Care | | | | 188,470,502 |
| | | | Housing/Multifamily – 1.1% (0.6% of Total Investments) | | | | |
| | 160 | | Chester County Industrial Development Authority, Pennsylvania, Student Housing Revenue Bonds, University Student Housing, LLC Project at West Chester University Series 2013A, 5.000%, 8/01/45 | 8/23 at 100.00 | Baa3 | | 167,856 |
| | 1,235 | | East Hempfield Township Industrial Development Authority, Pennsylvania, Student Services Inc. – Student Housing Project at Millersville University, Series 2014, 5.000%, 7/01/46 | 7/24 at 100.00 | BBB– | | 1,307,062 |
| | 1,900 | | East Hempfield Township Industrial Development Authority, Pennsylvania, Student Services Inc. – Student Housing Project at Millersville University, Series 2015, 5.000%, 7/01/47 | 7/25 at 100.00 | BBB– | | 2,018,180 |
| | 420 | | Pennsylvania Higher Educational Facilities Authority, Revenue Bonds, Shippensburg University Student Services, Inc. Student Housing Project at Shippensburg University of Pennsylvania, Series 2012, 5.000%, 10/01/44 | 10/22 at 100.00 | BBB– | | 435,788 |
| | 270 | | Pennsylvania Higher Educational Facilities Authority, Revenue Bonds, University Properties Inc. Student Housing Project at East Stroudsburg University of Pennsylvania, Series 2016A, 5.000%, 7/01/31 | 7/26 at 100.00 | Baa3 | | 292,302 |
| | 1,658 | | Philadelphia Authority for Industrial Development, Pennsylvania, Multifamily Housing Revenue Bonds, Presbyterian Homes Germantown – Morrisville Project, Series 2005A, 5.625%, 7/01/35 | 11/18 at 100.00 | Baa3 | | 1,659,525 |
| | 5,643 | | Total Housing/Multifamily | | | | 5,880,713 |
| | | | Housing/Single Family – 16.8% (10.4% of Total Investments) | | | | |
| | | | Pennsylvania Housing Finance Agency, Single Family Mortgage Revenue Bonds, Series 2012-114: | | | | |
| | 4,750 | | 3.300%, 10/01/32 | 10/21 at 100.00 | AA+ | | 4,718,175 |
| | 2,275 | | 3.650%, 10/01/37 | 10/21 at 100.00 | AA+ | | 2,278,890 |
| | 2,005 | | 3.700%, 10/01/42 | 10/21 at 100.00 | AA+ | | 2,006,684 |
| | | | Pennsylvania Housing Finance Agency, Single Family Mortgage Revenue Bonds, Series 2015-116B: | | | | |
| | 2,330 | | 3.950%, 10/01/40 | 10/24 at 100.00 | AA+ | | 2,358,845 |
| | 3,145 | | 4.000%, 4/01/45 | 10/24 at 100.00 | AA+ | | 3,173,651 |
| | | | Pennsylvania Housing Finance Agency, Single Family Mortgage Revenue Bonds, Series 2015-117B: | | | | |
| | 3,290 | | 3.900%, 10/01/35 | 10/24 at 100.00 | AA+ | | 3,354,122 |
| | 2,465 | | 4.050%, 10/01/40 | 10/24 at 100.00 | AA+ | | 2,515,508 |
| | 4,225 | | 4.150%, 10/01/45 | 10/24 at 100.00 | AA+ | | 4,322,851 |
| | 7,175 | | Pennsylvania Housing Finance Agency, Single Family Mortgage Revenue Bonds, Series 2015-118B, 4.100%, 10/01/45 | 4/25 at 100.00 | AA+ | | 7,290,589 |
| | 20,000 | | Pennsylvania Housing Finance Agency, Single Family Mortgage Revenue Bonds, Series 2016, 3.200%, 10/01/41 (UB) | 10/25 at 100.00 | AA+ | | 18,545,000 |
| | 2,045 | | Pennsylvania Housing Finance Agency, Single Family Mortgage Revenue Bonds, Series 2016-119, 3.500%, 10/01/36 | 4/25 at 100.00 | AA+ | | 2,026,022 |
| | 7,000 | | Pennsylvania Housing Finance Agency, Single Family Mortgage Revenue Bonds, Series 2016-120, 3.200%, 4/01/40 | 10/25 at 100.00 | AA+ | | 6,385,260 |
| | 2,450 | | Pennsylvania Housing Finance Agency, Single Family Mortgage Revenue Bonds, Series 2016-121, 3.200%, 10/01/41 | 10/25 at 100.00 | AA+ | | 2,271,763 |
| | | | Pennsylvania Housing Finance Agency, Single Family Mortgage Revenue Bonds, Series 2017: | | | | |
| | 2,000 | | 3.650%, 10/01/32 (UB) (5) | 4/26 at 100.00 | AA+ | | 2,043,840 |
| | 6,725 | | 3.900%, 10/01/36 (UB) (5) | 4/26 at 100.00 | AA+ | | 6,866,494 |
39
| | |
NQP | Nuveen Pennsylvania Quality Municipal Income Fund |
| | Portfolio of Investments (continued) |
| | August 31, 2018 (Unaudited) |
| | Principal | | | Optional Call | | | |
| | Amount (000) | | Description (1) | Provisions (2) | Ratings (3) | | Value |
| | | | Housing/Single Family (continued) | | | | |
| | | | Pennsylvania Housing Finance Agency, Single Family Mortgage Revenue Bonds, Series 2017-123B: | | | | |
| $ | 4,160 | | 3.450%, 10/01/32 | 10/26 at 100.00 | AA+ | $ | 4,177,430 |
| | 4,165 | | 3.900%, 10/01/37 | 10/26 at 100.00 | AA+ | | 4,242,969 |
| | 3,960 | | 4.000%, 10/01/42 | 10/26 at 100.00 | AA+ | | 4,020,034 |
| | 5,000 | | Pennsylvania Housing Finance Agency, Single Family Mortgage Revenue Bonds, Series 2017-124B, 3.500%, 10/01/37 | 10/26 at 100.00 | AA+ | | 4,924,550 |
| | | | Pennsylvania Housing Finance Agency, Single Family Mortgage Revenue Bonds, Series 2018-126A: | | | | |
| | 2,400 | | 3.700%, 10/01/33 | 4/27 at 100.00 | AA+ | | 2,408,712 |
| | 2,260 | | 3.950%, 10/01/38 | 4/27 at 100.00 | AA+ | | 2,266,486 |
| | 615 | | Pennsylvania Housing Finance Agency, Single Family Mortgage Revenue Bonds, Tender Option Bond Trust 2015-XF0066, 11.164%, 10/01/33, 144A (Alternative Minimum Tax) (IF) | No Opt. Call | AA+ | | 619,526 |
| | 600 | | Pennsylvania Housing Finance Agency, Single Family Mortgage Revenue Bonds, Tender Option Bond Trust 2015-XF0109, 7.494%, 10/01/31, 144A (IF) (5) | 10/22 at 100.00 | AA+ | | 625,644 |
| | 95,040 | | Total Housing/Single Family | | | | 93,443,045 |
| | | | Industrials – 1.0% (0.6% of Total Investments) | | | | |
| | | | Pennsylvania Economic Development Financing Authority, Exempt Facilities Revenue Refunding Bonds, Amtrak Project, Series 2012A: | | | | |
| | 2,495 | | 5.000%, 11/01/23 (Alternative Minimum Tax) | 11/22 at 100.00 | A1 | | 2,715,982 |
| | 545 | | 5.000%, 11/01/27 (Alternative Minimum Tax) | 11/22 at 100.00 | A1 | | 588,595 |
| | 2,000 | | 5.000%, 11/01/41 (Alternative Minimum Tax) | 11/22 at 100.00 | A1 | | 2,125,340 |
| | 5,040 | | Total Industrials | | | | 5,429,917 |
| | | | Long-Term Care – 5.4% (3.4% of Total Investments) | | | | |
| | | | Berks County Industrial Development Authority, Pennsylvania, Healthcare Facilities Revenue Bonds, The Highlands at Wyomissing, Series 2018: | | | | |
| | 1,000 | | 5.000%, 5/15/43 | 5/25 at 102.00 | N/R | | 1,084,590 |
| | 400 | | 5.000%, 5/15/48 | 5/25 at 102.00 | N/R | | 432,600 |
| | | | Berks County Industrial Development Authority, Pennsylvania, Healthcare Facilities Revenue Bonds, Highlands at Wyomissing, Series 2017A: | | | | |
| | 565 | | 5.000%, 5/15/37 | 5/27 at 100.00 | N/R | | 614,771 |
| | 1,160 | | 5.000%, 5/15/47 | 5/27 at 100.00 | N/R | | 1,252,371 |
| | 230 | | Chester County Health and Education Facilities Authority, Pennsylvania, Revenue Bonds, Simpson Senior Services Project, Series 2015A, 5.000%, 12/01/35 | 12/25 at 100.00 | N/R | | 235,594 |
| | | | Cumberland County Municipal Authority, Pennsylvania, Revenue Bonds, Diakon Lutheran Social Ministries Project, Series 2016: | | | | |
| | 985 | | 5.000%, 1/01/28 | 1/26 at 100.00 | N/R | | 1,104,658 |
| | 1,815 | | 5.000%, 1/01/29 | 1/26 at 100.00 | N/R | | 2,026,683 |
| | 735 | | 5.000%, 1/01/30 | 1/26 at 100.00 | N/R | | 817,680 |
| | 300 | | 3.250%, 1/01/36 | 1/26 at 100.00 | N/R | | 275,955 |
| | 2,015 | | 3.250%, 1/01/39 | 1/26 at 100.00 | N/R | | 1,821,741 |
| | 500 | | Cumberland County Municipal Authority Revenue Bonds, Pennsylvania, Diakon Lutheran Social Ministries Project, Series 2009, 6.375%, 1/01/39 | 1/19 at 100.00 | BBB+ | | 505,725 |
| | | | Cumberland County Municipal Authority, Pennsylvania, Revenue Bonds, Diakon Lutheran Social Ministries Project, Series 2015: | | | | |
| | 4,380 | | 4.000%, 1/01/33 | 1/25 at 100.00 | BBB+ | | 4,418,807 |
| | 5,740 | | 5.000%, 1/01/38 | 1/25 at 100.00 | BBB+ | | 6,214,124 |
| | 650 | | Lancaster County Hospital Authority, Pennsylvania, Health Center Revenue Bonds, Masonic Villages Project, Series 2015, 5.000%, 11/01/35 | 5/25 at 100.00 | A | | 709,430 |
| | 530 | | Lancaster County Hospital Authority, Pennsylvania, Health Center Revenue Bonds, Saint Anne’s Retirement Community, Inc., Series 2012, 5.000%, 4/01/33 | 4/22 at 100.00 | BB+ | | 542,497 |
| | 1,250 | | Lancaster County Hospital Authority, Pennsylvania, Revenue Bonds, Landis Homes Retirement Community Project, Refunding Series 2015A, 5.000%, 7/01/45 | 7/25 at 100.00 | N/R | | 1,324,688 |
40
| | | | | | | | |
| | Principal | | | Optional Call | | | |
| | Amount (000) | | Description (1) | Provisions (2) | Ratings (3) | | Value |
| | | | Long-Term Care (continued) | | | | |
| | | | Lancaster Industrial Development Authority, Pennsylvania, Revenue Bonds, Garden Spot Village Project, Series 2013: | | | | |
| $ | 1,000 | | 5.375%, 5/01/28 | 5/23 at 100.00 | BBB | $ | 1,093,790 |
| | 1,665 | | 5.750%, 5/01/35 | 5/23 at 100.00 | BBB | | 1,832,832 |
| | 1,500 | | Langhorne Manor Boro Higher Education and Health Authority, Pennsylvania, Revenue Bonds, Woods Services Project, Series 2013, 4.000%, 11/15/38 | 11/18 at 100.00 | A– | | 1,500,735 |
| | 2,150 | | Montgomery County Industrial Development Authority, Pennsylvania, Revenue Bonds, ACTS Retirement-Life Communities, Inc. Obligated Group, Refunding Series 2012, 5.000%, 11/15/26 | 5/22 at 100.00 | A– | | 2,315,615 |
| | 28,570 | | Total Long-Term Care | | | | 30,124,886 |
| | | | Materials – 1.2% (0.8% of Total Investments) | | | | |
| | 6,455 | | Pennsylvania Economic Development Financing Authority, Exempt Facilities Revenue Bonds, National Gypsum Company, Refunding Series 2014, 5.500%, 11/01/44 (Alternative Minimum Tax) | 11/24 at 100.00 | N/R | | 6,808,928 |
| | | | Tax Obligation/General – 24.5% (15.2% of Total Investments) | | | | |
| | 1,305 | | Adams County, Pennsylvania, General Obligation Bonds, Series 2017B, 2.500%, 11/15/29 | 11/25 at 100.00 | Aa2 | | 1,231,737 |
| | 1,700 | | Allegheny County, Pennsylvania, General Obligation Bonds, Series 2011C-65, 5.375%, 5/01/31 | 5/21 at 100.00 | AA– | | 1,842,562 |
| | | | Allegheny County, Pennsylvania, General Obligation Bonds, Series 2013C-72: | | | | |
| | 2,780 | | 5.250%, 12/01/32 | 12/23 at 100.00 | AA– | | 3,132,726 |
| | 2,000 | | 5.250%, 12/01/33 | 12/23 at 100.00 | AA– | | 2,252,720 |
| | | | Allegheny County, Pennsylvania, General Obligation Bonds, Series 2014C-74: | | | | |
| | 1,750 | | 5.000%, 12/01/32 | 12/24 at 100.00 | AA– | | 1,958,285 |
| | 1,285 | | 5.000%, 12/01/34 | 12/24 at 100.00 | AA– | | 1,433,276 |
| | 5,100 | | Allegheny County, Pennsylvania, General Obligation Bonds, Series C69-C70 of 2012, 5.000%, 12/01/37 | 12/22 at 100.00 | AA– | | 5,564,508 |
| | | | Bethel Park School District, Allegheny County, Pennsylvania, General Obligation Bonds, Refunding Series 2016: | | | | |
| | 1,500 | | 4.000%, 8/01/31 | 8/26 at 100.00 | Aa2 | | 1,583,205 |
| | 1,500 | | 4.000%, 8/01/32 | 8/26 at 100.00 | Aa2 | | 1,578,915 |
| | 1,255 | | 4.000%, 8/01/33 | 8/26 at 100.00 | Aa2 | | 1,316,558 |
| | 1,950 | | Boyertown Area School District, Berks and Montgomery Counties, Pennsylvania, General Obligation Bonds, Series 2015, 5.000%, 10/01/38 | 4/24 at 100.00 | AA– | | 2,140,320 |
| | 3,000 | | Bristol Township School District, Bucks County, Pennsylvania, General Obligation Bonds, Series 2013, 5.250%, 6/01/43 | 6/23 at 100.00 | A2 | | 3,297,360 |
| | | | Canon-McMillan School District, Washington County, Pennsylvania, General Obligation Bonds, Series 2014D: | | | | |
| | 3,000 | | 5.000%, 12/15/37 | 12/24 at 100.00 | AA | | 3,333,600 |
| | 1,075 | | 5.000%, 12/15/38 – BAM Insured | 12/24 at 100.00 | AA | | 1,193,250 |
| | 1,100 | | 5.000%, 12/15/39 | 12/24 at 100.00 | AA | | 1,219,669 |
| | 2,400 | | County of Allegheny, Pennsylvania, General Obligation Bonds, Series 2018C-77, 5.000%, 11/01/43 | 11/28 at 100.00 | AA– | | 2,731,752 |
| | 650 | | Cranberry Township, Pennsylvania, General Obligation Bonds, Refunding Series 2015, 3.250%, 10/01/32 | 10/25 at 100.00 | Aaa | | 656,143 |
| | 7,465 | | Erie City School District, Erie County, Pennsylvania, General Obligation Bonds, Series 2000, 0.000%, 9/01/30 – AMBAC Insured | No Opt. Call | N/R | | 4,562,085 |
| | 6,680 | | Gateway School District, Allegheny County, Pennsylvania, General Obligation Bonds, Refunding Series 2012, 4.000%, 10/15/32 | 10/22 at 100.00 | Aa3 | | 6,899,772 |
| | 6,225 | | Lehighton Area School District, Carbon County, Pennsylvania, General Obligation Bonds, Limited Tax Series 2015A, 5.000%, 11/15/43 – BAM Insured | 11/23 at 100.00 | AA | | 6,816,313 |
| | | | North Allegheny School District, Allegheny County, Pennsylvania, General Obligation Bonds, Series 2015: | | | | |
| | 5,000 | | 5.000%, 5/01/31 | 5/25 at 100.00 | AA | | 5,689,550 |
| | 4,000 | | 5.000%, 5/01/32 | 5/25 at 100.00 | AA | | 4,546,440 |
| | 2,875 | | 5.000%, 5/01/33 | 5/25 at 100.00 | AA | | 3,260,279 |
41
| | |
NQP | Nuveen Pennsylvania Quality Municipal Income Fund |
| | Portfolio of Investments (continued) |
| | August 31, 2018 (Unaudited) |
| |
| | Principal | | | Optional Call | | | |
| | Amount (000) | | Description (1) | Provisions (2) | Ratings (3) | | Value |
| | | | Tax Obligation/General (continued) | | | | |
| | | | Pennsbury School District, Bucks County, Pennsylvania, General Obligation Bonds, Series 2016A: | | | | |
| $ | 3,115 | | 5.000%, 10/01/32 | 4/25 at 100.00 | Aa2 | $ | 3,525,713 |
| | 1,000 | | 5.000%, 10/01/33 | 4/25 at 100.00 | Aa2 | | 1,128,650 |
| | 2,660 | | 5.000%, 10/01/34 | 4/25 at 100.00 | Aa2 | | 2,995,399 |
| | 2,045 | | 5.000%, 10/01/35 | 4/25 at 100.00 | Aa2 | | 2,297,660 |
| | 2,620 | | Pennsylvania Economic Development Financing Authority, Parking System Revenue Bonds, Capitol Region Parking System, Junior Insured Series 2013C, 5.500%, 1/01/30 – AGM Insured | 1/24 at 100.00 | AA | | 2,938,487 |
| | 3,925 | | Philadelphia School District, Pennsylvania, General Obligation Bonds, Series 2007A, 5.000%, 6/01/34 – FGIC Insured | No Opt. Call | A+ | | 4,427,871 |
| | 745 | | Pittsburgh School District, Allegheny County, Pennsylvania, General Obligation Bonds, Series 2014A, 5.000%, 9/01/25 – BAM Insured | 9/22 at 100.00 | AA | | 823,642 |
| | | | Pittsburgh, Pennsylvania, General Obligation Bonds, Series 2012B: | | | | |
| | 2,590 | | 5.000%, 9/01/25 | 9/22 at 100.00 | AA– | | 2,864,436 |
| | 6,800 | | 5.000%, 9/01/26 | 9/22 at 100.00 | AA– | | 7,515,088 |
| | 2,485 | | Radnor Township School District, Delaware County, Pennsylvania, General Obligation Bonds, Series 2012, 3.000%, 2/15/34 | 11/18 at 100.00 | Aa1 | | 2,410,003 |
| | 1,000 | | Radnor Township, Pennsylvania, General Obligation Bonds, Series 2012, 4.000%, 11/01/37 | 11/22 at 100.00 | Aa1 | | 1,038,370 |
| | 11,440 | | Reading School District, Berks County, Pennsylvania, General Obligation Bonds, Series 2003B, 0.000%, 1/15/32 – FGIC Insured | No Opt. Call | Baa2 | | 6,945,453 |
| | | | Scranton, Lackawanna County, Pennsylvania, General Obligation Notes, Series 2016: | | | | |
| | 280 | | 5.000%, 11/15/26 | 5/24 at 100.00 | BB+ | | 300,602 |
| | 2,925 | | 5.000%, 11/15/32 | 5/24 at 100.00 | BB+ | | 3,096,902 |
| | 1,000 | | South Park School District, Allegheny County, Pennsylvania, General Obligation Bonds, Series 2014, 3.375%, 8/01/32 – BAM Insured | 2/20 at 100.00 | AA | | 1,002,500 |
| | 21,000 | | State Public School Building Authority, Pennsylvania, School Revenue Bonds, Philadelphia School District Project, Series 2003, 5.500%, 6/01/28 – AGM Insured (UB) (5) | No Opt. Call | AA | | 24,858,540 |
| | | | The Redevelopment Authority of the City of Scranton, Lackawanna county, Pennsylvania, Guaranteed Lease Revenue Bonds, Series 2016A: | | | | |
| | 285 | | 5.000%, 11/15/21 | No Opt. Call | BB+ | | 293,450 |
| | 170 | | 5.000%, 11/15/28 | 5/24 at 100.00 | BB+ | | 172,256 |
| | 131,680 | | Total Tax Obligation/General | | | | 136,876,047 |
| | | | Tax Obligation/Limited – 10.3% (6.4% of Total Investments) | | | | |
| | 1,290 | | Allegheny County Redevelopment Authority, Pennsylvania, TIF Revenue Bonds, Pittsburg Mills Project, Series 2004, 5.600%, 7/01/23 | 10/18 at 100.00 | N/R | | 1,273,462 |
| | 1,475 | | Allentown Neighborhood Improvement Zone Development Authority, Pennsylvania, Tax Revenue Bonds, Series 2012A, 5.000%, 5/01/35 | 5/22 at 100.00 | Baa3 | | 1,533,779 |
| | 155 | | Allentown Neighborhood Improvement Zone Development Authority, Pennsylvania, Tax Revenue Bonds, City Center Project, Series 2018, 5.000%, 5/01/33, 144A | 5/28 at 100.00 | Ba1 | | 170,963 |
| | 1,115 | | Allentown Neighborhood Improvement Zone Development Authority, Pennsylvania, Tax Revenue Bonds, City Center Refunding Project, Series 2017, 5.000%, 5/01/42, 144A | 5/27 at 100.00 | Ba1 | | 1,201,758 |
| | | | Commonwealth Financing Authority, Pennsylvania, State Appropriation Lease Bonds, Master Settlement, Series 2018: | | | | |
| | 1,135 | | 5.000%, 6/01/33 | 6/28 at 100.00 | A1 | | 1,284,434 |
| | 5,000 | | 4.000%, 6/01/39 – AGM Insured | 6/28 at 100.00 | AA | | 5,117,400 |
| | | | Government of Guam, Business Privilege Tax Bonds, Series 2011A: | | | | |
| | 1,670 | | 5.250%, 1/01/36 | 1/22 at 100.00 | A | | 1,767,812 |
| | 655 | | 5.125%, 1/01/42 | 1/22 at 100.00 | A | | 687,658 |
| | 1,662 | | Monroe County Industrial Development Authority, Pennsylvania, Special Obligation Revenue Bonds, Tobyhanna Township Project, Series 2014, 6.875%, 7/01/33, 144A | 7/24 at 100.00 | N/R | | 1,687,595 |
| | 3,500 | | Norristown Area School District, Pennsylvania, Installment Purchase Certificates of Participation, Series 2012, 5.000%, 4/01/32 | 4/22 at 100.00 | Baa1 | | 3,655,610 |
42
| | | | | | | | |
| | Principal | | | Optional Call | | | |
| | Amount (000) | | Description (1) | Provisions (2) | Ratings (3) | | Value |
| | | | Tax Obligation/Limited (continued) | | | | |
| $ | 1,935 | | Pennsylvania Turnpike Commission, Motor License Fund-Enhanced Turnpike Special Revenue Bonds, Subordinate Series 2011B, 5.000%, 12/01/41 | 12/21 at 100.00 | A2 | $ | 2,074,552 |
| | 7,000 | | Pennsylvania Turnpike Commission, Motor License Fund-Enhanced Turnpike Subordinate Special Revenue Bonds, Series 2013B-1, 5.250%, 12/01/43 | 12/23 at 100.00 | AA– | | 7,801,080 |
| | | | Pennsylvania Turnpike Commission, Motor License Fund-Enhanced Turnpike Subordinate Special Revenue Bonds, Series 2014A: | | | | |
| | 2,650 | | 0.000%, 12/01/37 (6) | No Opt. Call | AA– | | 2,465,136 |
| | 4,000 | | 0.000%, 12/01/44 (6) | No Opt. Call | AA– | | 3,716,720 |
| | 2,500 | | Pennsylvania Turnpike Commission, Oil Franchise Tax Revenue Bonds, Subordinate Series 2018B, 5.000%, 12/01/48 | 12/28 at 100.00 | A+ | | 2,786,050 |
| | 5,530 | | Philadelphia Authority For Industrial Development, Pennsylvania, Revenue Bonds, Cultural and Commercial Corridors Program, Refunding Series 2016A, 5.000%, 12/01/30 | 12/25 at 100.00 | A | | 6,187,351 |
| | 3,820 | | Pittsburgh and Allegheny County Sports and Exhibition Authority, Pennsylvania, Hotel Room Excise Tax Revenue Bonds, Refunding Series 2012, 5.000%, 2/01/26 – AGC Insured | 8/22 at 100.00 | AA | | 4,182,098 |
| | 4,225 | | Puerto Rico Highway and Transportation Authority, Highway Revenue Bonds, Series 2007N, 5.500%, 7/01/29 – AMBAC Insured | No Opt. Call | C | | 4,763,814 |
| | 2,500 | | Southeastern Pennsylvania Transportation Authority, Capital Grant Receipts Bonds, Federal Transit Administration Section 5309 Fixed Guideway Modernization Formula Funds, Series 2011, 5.000%, 6/01/23 | No Opt. Call | AA– | | 2,812,100 |
| | 1,180 | | Southeastern Pennsylvania Transportation Authority, Capital Grant Receipts Bonds, Federal Transit Administration Section 5337 State of Good Repair Formula Program Funds, Refunding Series 2017, 5.000%, 6/01/24 | No Opt. Call | AA– | | 1,348,964 |
| | 825 | | Washington County Redevelopment Authority, Pennsylvania, Tanger Outlet Victory Center Tax Increment Bonds, Series 2018, 5.000%, 7/01/35 | 1/28 at 100.00 | BB | | 845,336 |
| | 53,822 | | Total Tax Obligation/Limited | | | | 57,363,672 |
| | | | Transportation – 10.5% (6.5% of Total Investments) | | | | |
| | 3,280 | | Delaware River Port Authority, New Jersey and Pennsylvania, Revenue Bonds, Series 2010E, 5.000%, 1/01/40 | 1/20 at 100.00 | A | | 3,402,442 |
| | | | Delaware River Port Authority, Pennsylvania and New Jersey, Revenue Refunding Bonds, Port District Project, Series 2012: | | | | |
| | 1,270 | | 5.000%, 1/01/22 | No Opt. Call | A– | | 1,384,135 |
| | 2,425 | | 5.000%, 1/01/23 | No Opt. Call | A– | | 2,684,427 |
| | 2,310 | | 5.000%, 1/01/24 | 1/23 at 100.00 | A– | | 2,545,135 |
| | 610 | | 5.000%, 1/01/25 | 1/23 at 100.00 | A– | | 668,682 |
| | 3,990 | | Pennsylvania Economic Development Financing Authority, Parking System Revenue Bonds, Capitol Region Parking System, Series 2013A, 5.250%, 1/01/44 – AGM Insured | 1/24 at 100.00 | AA | | 4,304,053 |
| | 12,100 | | Pennsylvania Turnpike Commission, Turnpike Revenue Bonds, Capital Appreciation Series 2009E, 6.375%, 12/01/38 | 12/27 at 100.00 | A | | 14,868,117 |
| | 820 | | Pennsylvania Turnpike Commission, Turnpike Revenue Bonds, Refunding Subordinate Second Series 2016B-2, 5.000%, 6/01/39 | 6/26 at 100.00 | A3 | | 896,900 |
| | 3,000 | | Pennsylvania Turnpike Commission, Turnpike Revenue Bonds, Series 2014C, 5.000%, 12/01/44 | 12/24 at 100.00 | A+ | | 3,297,720 |
| | 10,000 | | Pennsylvania Turnpike Commission, Turnpike Revenue Bonds, Series 2015B, 5.000%, 12/01/45 | 12/25 at 100.00 | A1 | | 11,059,100 |
| | 2,000 | | Pennsylvania Turnpike Commission, Turnpike Revenue Bonds, Subordinate Series 2009C, 6.250%, 6/01/33 – AGM Insured | 6/26 at 100.00 | AA | | 2,444,280 |
| | | | Pennsylvania Turnpike Commission, Turnpike Revenue Bonds, Subordinate Series 2017B-1: | | | | |
| | 1,430 | | 5.000%, 6/01/31 | 6/27 at 100.00 | A3 | | 1,602,801 |
| | 1,430 | | 5.000%, 6/01/33 | 6/27 at 100.00 | A3 | | 1,592,505 |
| | 605 | | Philadelphia, Pennsylvania, Airport Revenue Bonds, Refunding Series 2017A, 3.000%, 7/01/34 – AGM Insured | 7/27 at 100.00 | AA | | 572,711 |
| | 1,500 | | Philadelphia, Pennsylvania, Airport Revenue Bonds, Refunding Series 2017B, 5.000%, 7/01/42 (Alternative Minimum Tax) | 7/27 at 100.00 | A | | 1,669,440 |
| | 1,865 | | Philadelphia, Pennsylvania, Airport Revenue Bonds, Series 2010A, 5.250%, 6/15/28 | 6/20 at 100.00 | A | | 1,979,399 |
43
| | |
NQP | Nuveen Pennsylvania Quality Municipal Income Fund |
| | Portfolio of Investments (continued) |
| | August 31, 2018 (Unaudited) |
| | Principal | | | Optional Call | | | |
| | Amount (000) | | Description (1) | Provisions (2) | Ratings (3) | | Value |
| | | | Transportation (continued) | | | | |
| | | | Pittsburgh and Allegheny County Sports and Exhibition Authority, Pennsylvania, Parking Revenue Bonds, Series 2017: | | | | |
| $ | 1,000 | | 5.000%, 12/15/30 | 12/27 at 100.00 | A– | $ | 1,133,160 |
| | 500 | | 5.000%, 12/15/33 | 12/27 at 100.00 | A– | | 561,060 |
| | 550 | | 5.000%, 12/15/34 | 12/27 at 100.00 | A– | | 615,313 |
| | 1,000 | | 5.000%, 12/15/36 | 12/27 at 100.00 | A– | | 1,112,040 |
| | 250 | | 5.000%, 12/15/37 | 12/27 at 100.00 | A– | | 277,385 |
| | 51,935 | | Total Transportation | | | | 58,670,805 |
| | | | U.S. Guaranteed – 19.0% (11.8% of Total Investments) (7) | | | | |
| | 2,325 | | Allegheny County, Pennsylvania, General Obligation Bonds, Series 2011C-65, 5.375%, 5/01/31 (Pre-refunded 5/01/21) | 5/21 at 100.00 | N/R | | 2,534,459 |
| | 6,025 | | Bethel Park School District, Allegheny County, Pennsylvania, General Obligation Bonds, Series 2009, 5.000%, 8/01/29 (Pre-refunded 8/01/19) | 8/19 at 100.00 | Aa2 | | 6,207,256 |
| | | | Bucks County Water and Sewer Authority, Pennsylvania, Revenue Bonds, Tender Option Bond Trust 2015-XF0123: | | | | |
| | 825 | | 10.338%, 12/01/29 (Pre-refunded 12/01/21) – AGM Insured, 144A (IF) (5) | 12/21 at 100.00 | AA | | 1,069,753 |
| | 1,665 | | 10.346%, 12/01/33 (Pre-refunded 12/01/21) – AGM Insured, 144A (IF) (5) | 12/21 at 100.00 | AA | | 2,159,438 |
| | 4,100 | | Centre County Hospital Authority, Pennsylvania, Hospital Revenue Bonds, Mount Nittany Medical Center Project, Series 2011, 7.000%, 11/15/46 (Pre-refunded 11/15/21) | 11/21 at 100.00 | AA– | | 4,746,365 |
| | | | Centre County, Pennsylvania, General Obligation Bonds, Series 2012B: | | | | |
| | 310 | | 4.000%, 7/01/24 (Pre-refunded 7/01/20) | 7/20 at 100.00 | AA | | 322,450 |
| | 1,430 | | 4.000%, 7/01/25 (Pre-refunded 7/01/20) | 7/20 at 100.00 | AA | | 1,487,429 |
| | 915 | | 4.000%, 7/01/26 (Pre-refunded 7/01/20) | 7/20 at 100.00 | AA | | 951,746 |
| | 1,175 | | Chester County Health and Education Facilities Authority, Pennsylvania, Health System Revenue Bonds, Jefferson Health System, Series 2010A, 5.000%, 5/15/40 (Pre-refunded 5/15/20) | 5/20 at 100.00 | N/R | | 1,240,072 |
| | 4,500 | | Cumberland County Municipal Authority Revenue Bonds, Pennsylvania, Diakon Lutheran Social Ministries Project, Series 2009, 6.375%, 1/01/39 (Pre-refunded 1/01/19) | 1/19 at 100.00 | N/R | | 4,568,490 |
| | 3,000 | | Erie County Hospital Authority, Pennsylvania, Hospital Revenue Bonds, Saint Vincent Health Center Project, Series 2010A, 7.000%, 7/01/27 (Pre-refunded 7/01/20) | 7/20 at 100.00 | N/R | | 3,278,310 |
| | 3,385 | | Lancaster County Hospital Authority, Pennsylvania, Health System Revenue Bonds, Lancaster General Hospital Project, Tender Option Bond Trust 2015-XF0064, 10.400%, 7/01/42, 144A (Pre-refunded 1/01/22) (IF) | 1/22 at 100.00 | N/R | | 4,365,601 |
| | | | Monroe County Hospital Authority, Pennsylvania, Hospital Revenue Bonds, Pocono Medical Center, Series 2012A: | | | | |
| | 365 | | 4.000%, 1/01/25 (Pre-refunded 1/01/22) | 1/22 at 100.00 | N/R | | 388,586 |
| | 3,000 | | 5.000%, 1/01/41 (Pre-refunded 1/01/22) | 1/22 at 100.00 | N/R | | 3,289,830 |
| | 3,730 | | Montgomery County Higher Education and Health Authority, Pennsylvania, Hospital Revenue Bonds, Abington Memorial Hospital Obligated Group, Series 2012A, 5.000%, 6/01/31 (Pre- refunded 6/01/22) | 6/22 at 100.00 | N/R | | 4,129,670 |
| | 1,130 | | Montgomery County Industrial Development Authority, Pennsylvania, FHA Insured Mortgage Revenue Bonds, New Regional Medical Center Project, Series 2010, 5.375%, 8/01/38 (Pre-refunded 8/01/20) | 8/20 at 100.00 | N/R | | 1,207,077 |
| | 3,525 | | Pennsylvania Economic Development Financing Authority, Health System Revenue Bonds , Albert Einstein Healthcare, Series 2009A, 6.250%, 10/15/23 (Pre-refunded 10/15/19) | 10/19 at 100.00 | N/R | | 3,659,726 |
| | 1,415 | | Pennsylvania Higher Educational Facilities Authority, Revenue Bonds, Drexel University, Series 2011A, 5.250%, 5/01/41 (Pre-refunded 5/01/21) | 5/21 at 100.00 | N/R | | 1,539,845 |
| | 1,300 | | Pennsylvania Higher Educational Facilities Authority, Revenue Bonds, Edinboro University Foundation Student Housing Project, Series 2010, 6.000%, 7/01/43 (Pre-refunded 7/01/20) | 7/20 at 100.00 | N/R | | 1,396,187 |
| | | | Pennsylvania Higher Educational Facilities Authority, Revenue Bonds, Foundation for Student Housing at Indiana University, Project Series 2012A: | | | | |
| | 1,000 | | 5.000%, 7/01/27 (Pre-refunded 7/01/22) | 7/22 at 100.00 | N/R | | 1,108,670 |
| | 750 | | 5.000%, 7/01/32 (Pre-refunded 7/01/22) | 7/22 at 100.00 | N/R | | 831,503 |
| | 1,195 | | Pennsylvania Higher Educational Facilities Authority, Revenue Bonds, Philadelphia University, Refunding Series 2013, 5.000%, 6/01/32 (Pre-refunded 6/01/23) | 6/23 at 100.00 | N/R | | 1,352,238 |
44
| | | | | | | | |
| | Principal | | | Optional Call | | | |
| | Amount (000) | | Description (1) | Provisions (2) | Ratings (3) | | Value |
| | | | U.S. Guaranteed (7) (continued) | | | | |
| $ | 2,015 | | Pennsylvania Higher Educational Facilities Authority, Revenue Bonds, Thomas Jefferson University, Series 2010, 5.000%, 3/01/40 (Pre-refunded 3/01/20) | 3/20 at 100.00 | A+ | $ | 2,109,302 |
| | | | Pennsylvania Turnpike Commission, Motor License Fund-Enhanced Turnpike Special Revenue Bonds, Subordinate Series 2010A1&2: | | | | |
| | 315 | | 5.500%, 12/01/34 (Pre-refunded 12/01/20) | 12/20 at 100.00 | N/R | | 340,524 |
| | 1,440 | | 5.500%, 12/01/34 (Pre-refunded 12/01/20) | 12/20 at 100.00 | AA– | | 1,556,683 |
| | 3,915 | | 5.000%, 12/01/38 (Pre-refunded 12/01/19) | 12/19 at 100.00 | AA– | | 4,075,084 |
| | 2,065 | | Pennsylvania Turnpike Commission, Motor License Fund-Enhanced Turnpike Special Revenue Bonds, Subordinate Series 2011B, 5.000%, 12/01/41 (Pre-refunded 12/01/21) | 12/21 at 100.00 | N/R | | 2,265,780 |
| | 3,180 | | Pennsylvania Turnpike Commission, Motor License Fund-Enhanced Turnpike Special Revenue Bonds, Subordinate Series 2012A, 5.000%, 12/01/31 (Pre-refunded 12/01/21) | 12/21 at 100.00 | AA– | | 3,494,470 |
| | 5,125 | | Pennsylvania Turnpike Commission, Oil Franchise Tax Revenue Bonds, Senior Lien Series 2003A, 5.000%, 12/01/32 (Pre-refunded 12/01/18) – NPFG Insured | 12/18 at 100.00 | AA | | 5,167,589 |
| | 2,485 | | Pennsylvania Turnpike Commission, Turnpike Revenue Bonds, Subordinate Lien, Refunding Series 2010B-1, 5.000%, 12/01/37 (Pre-refunded 12/01/19) | 12/19 at 100.00 | A | | 2,586,612 |
| | 205 | | Philadelphia Gas Works, Pennsylvania, Revenue Bonds, Twelfth Series 1990B, 7.000%, 5/15/20 – NPFG Insured (ETM) | No Opt. Call | N/R | | 216,890 |
| | 7,165 | | Philadelphia Hospitals and Higher Education Facilities Authority, Pennsylvania, Health System Revenue Bonds, Jefferson Health System, Series 2010B, 5.000%, 5/15/40 (Pre-refunded 5/15/20) | 5/20 at 100.00 | N/R | | 7,549,474 |
| | 1,135 | | Philadelphia Hospitals and Higher Education Facilities Authority, Pennsylvania, Hospital Revenue Bonds, Presbyterian Medical Center of Philadelphia, Series 1993, 6.650%, 12/01/19 (ETM) | No Opt. Call | AA+ | | 1,177,755 |
| | 3,345 | | Philadelphia, Pennsylvania, General Obligation Bonds, Refunding Series 2011, 6.500%, 8/01/41 (Pre-refunded 8/01/20) | 8/20 at 100.00 | A | | 3,643,407 |
| | 1,470 | | Puerto Rico, Highway Revenue Bonds, Highway and Transportation Authority, Series 2003AA, 5.500%, 7/01/19 – NPFG Insured (ETM) | No Opt. Call | Baa2 | | 1,515,746 |
| | | | Saint Mary Hospital Authority, Pennsylvania, Health System Revenue Bonds, Catholic Health East, Series 2010A: | | | | |
| | 55 | | 5.000%, 11/15/40 (Pre-refunded 11/15/20) | 11/20 at 100.00 | N/R | | 58,744 |
| | 605 | | 5.000%, 11/15/40 (Pre-refunded 11/15/20) | 11/20 at 100.00 | AA– | | 646,188 |
| | 1,613 | | South Fork Municipal Authority, Pennsylvania, Hospital Revenue Bonds, Conemaugh Valley Memorial Hospital, Series 2010, 5.500%, 7/01/29 (Pre-refunded 7/01/20) | 7/20 at 100.00 | N/R | | 1,717,974 |
| | | | Union County Hospital Authority, Pennsylvania, Hospital Revenue Bonds, Evangelical Community Hospital Project, Refunding & Improvement Series 2011: | | | | |
| | 3,130 | | 6.875%, 8/01/31 (Pre-refunded 8/01/21) | 8/21 at 100.00 | A– | | 3,569,984 |
| | 2,500 | | 7.000%, 8/01/41 (Pre-refunded 8/01/21) | 8/21 at 100.00 | A– | | 2,860,225 |
| | | | West Shore Area Authority, Cumberland County, Pennsylvania, Hospital Revenue Bonds, Holy Spirit Hospital of the Sisters of Christian Charity Project, Series 2011: | | | | |
| | 325 | | 6.250%, 1/01/31 (Pre-refunded 1/01/21) | 1/21 at 100.00 | AA | | 357,815 |
| | 4,555 | | 6.500%, 1/01/36 (Pre-refunded 1/01/21) | 1/21 at 100.00 | AA | | 5,040,700 |
| | 1,930 | | Westmoreland County Municipal Authority, Pennsylvania, Municipal Service Revenue Bonds, Tender Option Bond Trust 2016-XF1058, 12.574%, 8/15/37, 144A (Pre-refunded 8/15/23) (IF) (5) | 8/23 at 100.00 | A+ | | 2,973,416 |
| | 1,110 | | Wilkes-Barre Finance Authority, Pennsylvania, Revenue Bonds, University of Scranton, Series 2010, 5.000%, 11/01/40 (Pre-refunded 11/01/20) | 11/20 at 100.00 | A– | | 1,186,690 |
| | 96,748 | | Total U.S. Guaranteed | | | | 105,945,753 |
| | | | Utilities – 8.3% (5.2% of Total Investments) | | | | |
| | 2,540 | | Beaver County Industrial Development Authority, Pennsylvania, Pollution Control Revenue Bonds, FirstEnergy Nuclear Generation Project, Refunding Series 2005A, 4.000%, 1/01/35 (Mandatory put 7/01/21) (4) | No Opt. Call | N/R | | 1,524,000 |
| | 3,000 | | Beaver County Industrial Development Authority, Pennsylvania, Pollution Control Revenue Refunding Bonds, FirstEnergy Nuclear Generation Project, Series 2006A, 4.375%, 1/01/35 (Mandatory put 7/01/22) (4) | No Opt. Call | N/R | | 2,895,000 |
| | 6,210 | | Beaver County Industrial Development Authority, Pennsylvania, Pollution Control Revenue Refunding Bonds, FirstEnergy Nuclear Generation Project, Series 2006B, 3.500%, 12/01/35 (Mandatory put 6/01/20) (4) | No Opt. Call | N/R | | 3,726,000 |
45
| | |
NQP | Nuveen Pennsylvania Quality Municipal Income Fund |
| | Portfolio of Investments (continued) |
| | August 31, 2018 (Unaudited) |
| | Principal | | | Optional Call | | | |
| | Amount (000) | | Description (1) | Provisions (2) | Ratings (3) | | Value |
| | | | Utilities (continued) | | | | |
| $ | 9,855 | | Beaver County Industrial Development Authority, Pennsylvania, Pollution Control Revenue Refunding Bonds, FirstEnergy Nuclear Generation Project, Series 2008A, 2.700%, 4/01/35 (4) | No Opt. Call | N/R | $ | 5,913,000 |
| | 7,250 | | Delaware County Industrial Development Authority, Pennsylvania, Revenue Bonds, Covanta Project, Refunding Series 2015A, 5.000%, 7/01/43 | 7/20 at 100.00 | BB– | | 7,329,968 |
| | 4,015 | | Luzerne County Industrial Development Authority, Pennsylvania, Water Facility Revenue Refunding Bonds, Pennsylvania-American Water Company, Series 2009, 5.500%, 12/01/39 | 12/19 at 100.00 | A+ | | 4,190,536 |
| | 2,220 | | Pennsylvania Economic Development Financing Authority, Exempt Facilities Revenue Refunding Bonds, PPL Energy Supply, LLC Project, Series 2009A, 6.400%, 12/01/38 | 9/25 at 100.00 | B+ | | 2,264,999 |
| | 4,575 | | Pennsylvania Economic Development Financing Authority, Water Facilities Revenue Bonds, Aqua Pennsylvania, Inc. Project, Series 2009A, 5.000%, 10/01/39 | 10/19 at 100.00 | AA– | | 4,716,825 |
| | 5,000 | | Pennsylvania Economic Development Financing Authority, Water Facilities Revenue Bonds, Aqua Pennsylvania, Inc. Project, Series 2009B, 5.000%, 11/15/40 | 11/19 at 100.00 | AA– | | 5,171,800 |
| | | | Philadelphia Gas Works, Pennsylvania, Revenue Bonds, General Ordinance, Fifteenth Series 2017: | | | | |
| | 3,500 | | 5.000%, 8/01/42 | 8/27 at 100.00 | A | | 3,918,495 |
| | 1,500 | | 5.000%, 8/01/47 | 8/27 at 100.00 | A | | 1,673,265 |
| | 2,735 | | Philadelphia Gas Works, Pennsylvania, Revenue Bonds, Refunding Thirteenth Series 2015, 5.000%, 8/01/29 | 8/25 at 100.00 | A | | 3,099,329 |
| | 52,400 | | Total Utilities | | | | 46,423,217 |
| | | | Water and Sewer – 9.1% (5.6% of Total Investments) | | | | |
| | | | Allegheny County Sanitary Authority, Pennsylvania, Sewer Revenue Bonds, Refunding Series 2015: | | | | |
| | 3,325 | | 5.000%, 12/01/40 | 12/25 at 100.00 | A+ | | 3,679,412 |
| | 3,320 | | 5.000%, 12/01/45 | 12/25 at 100.00 | A+ | | 3,660,400 |
| | | | Delaware County Regional Water Quality Control Authority, Pennsylvania, Sewer Revenue Bonds, Series 2015: | | | | |
| | 1,110 | | 5.000%, 5/01/40 | 5/25 at 100.00 | Aa3 | | 1,236,618 |
| | 2,220 | | 4.000%, 5/01/45 | 5/25 at 100.00 | Aa3 | | 2,266,775 |
| | 665 | | Findlay Township Municipal Authority, Allegheny County, Pennsylvania, Revenue Bonds, Series 2015, 3.375%, 12/15/35 – BAM Insured | 12/20 at 100.00 | AA | | 658,523 |
| | | | Lehigh County Authority, Pennsylvania, Water and Sewer Revenue Bonds, Allentown Concession, Capital Appreciation Series 2013B: | | | | |
| | 7,295 | | 0.000%, 12/01/34 | No Opt. Call | A | | 3,828,416 |
| | 4,420 | | 0.000%, 12/01/35 | No Opt. Call | A | | 2,210,575 |
| | 12,500 | | Lehigh County Authority, Pennsylvania, Water and Sewer Revenue Bonds, Allentown Concession, Series 2013A, 5.125%, 12/01/47 | 12/23 at 100.00 | A | | 13,740,125 |
| | 1,100 | | Pennsylvania Economic Development Financing Authority, Sewage Sludge Disposal Revenue Bonds, Philadelphia Biosolids Facility Project, Series 2009, 6.250%, 1/01/32 | 1/20 at 100.00 | BBB+ | | 1,146,530 |
| | 6,560 | | Philadelphia, Pennsylvania, Water and Wastewater Revenue Bonds, Series 2011A, 5.000%, 1/01/41 | 1/21 at 100.00 | A+ | | 6,935,166 |
| | 2,500 | | Philadelphia, Pennsylvania, Water and Wastewater Revenue Bonds, Series 2013A, 5.125%, 1/01/43 | 1/22 at 100.00 | A+ | | 2,684,725 |
| | 5,000 | | Pittsburgh Water and Sewer Authority, Pennsylvania, Water and Sewer System Revenue Bonds, First Lien Series 2013B, 5.250%, 9/01/40 | 9/23 at 100.00 | A | | 5,561,750 |
| | 2,840 | | Robinson Township Municipal Authority, Allegheny County, Pennsylvania, Water and Sewer Revenue Bonds, Series 2014, 4.000%, 5/15/40 – BAM Insured | 11/19 at 100.00 | AA | | 2,791,294 |
| | 170 | | Robinson Township Municipal Authority, Allegheny County, Pennsylvania, Water and Sewer Revenue Bonds, Series 2017, 3.375%, 5/15/32 – AGM Insured | 5/26 at 100.00 | AA | | 172,242 |
| | 53,025 | | Total Water and Sewer | | | | 50,572,551 |
| $ | 865,797 | | Total Long-Term Investments (cost $872,405,952) | | | | 897,771,854 |
| | | | Floating Rate Obligations – (8.6)% | | | | (47,825,000) |
| | | | Variable Rate MuniFund Term Preferred Shares, net of deferred offering costs – (15.6)% (8) | | | | (86,992,645) |
| | | | Variable Rate Demand Preferred Shares, net of deferred offering costs – (38.9)% (9) | | | | (216,665,196) |
| | | | Other Assets Less Liabilities – 2.1% (10) | | | | 11,327,125 |
| | | | Net Assets Applicable to Common Shares – 100% | | | $ | 557,616,138 |
46
Investments in Derivatives |
Futures Contracts |
| | | | | | | | Variation |
| | | | | | | Unrealized | Margin |
| | Contract | Number of | Expiration | Notional | | Appreciation | Receivable/ |
Description | Position | Contracts | Date | Amount | Value | (Depreciation) | (Payable) |
| U.S. Treasury Long Bond | Short | (122) | 12/18 | $(17,526,225) | $17,594,688 | $(68,462) | $(68,148) |
Interest Rate Swaps – OTC Uncleared |
Counterparty | Notional Amount | Fund Pay/Receive Floating Rate | Floating Rate Index | Fixed Rate (Annualized) | Fixed Rate Payment Frequency | Effective Date (11) | Optional Termination Date | Maturity Date | Value | Unrealized Appreciation (Depreciation) |
| JPMorgan Chase Bank, N.A. | $20,300,000 | Receive | 3-Month SIFMA | 2.038% | Quarterly | 12/14/18 | 1/11/19 | 12/14/28 | $311,928 | $311,928 |
(1) | All percentages shown in the Portfolio of Investments are based on net assets applicable to common shares unless otherwise noted. |
| (2) | Optional Call Provisions: Dates (month and year) and prices of the earliest optional call or redemption. There may be other call provisions at varying prices at later dates. Certain mortgage-backed securities may be subject to periodic principal paydowns. |
| (3) | For financial reporting purposes, the ratings disclosed are the highest of Standard & Poor’s Group (“Standard & Poor’s”), Moody’s Investors Service, Inc. (“Moody’s”) or Fitch, Inc. (“Fitch”) rating. This treatment of split-rated securities may differ from that used for other purposes, such as for Fund investment policies. Ratings below BBB by Standard & Poor’s, Baa by Moody’s or BBB by Fitch are considered to be below investment grade. Holdings designated N/R are not rated by any of these national rating agencies. |
| (4) | As of, or subsequent to, the end of the reporting period, this security is non-income producing. Non-income producing, in the case of a fixed-income security, generally denotes that the issuer has (1) defaulted on the payment of principal or interest, (2) is under the protection of the Federal Bankruptcy Court or (3) the Fund’s Adviser has concluded that the issue is not likely to meet its future interest payment obligations and has ceased accruing additional income on the Fund’s records. |
| (5) | Investment, or portion of investment, has been pledged to collateralize the net payment obligations for investments in inverse floating rate transactions. |
| (6) | Step-up coupon bond, a bond with a coupon that increases (“steps up”), usually at regular intervals, while the bond is outstanding. The rate shown is the coupon as of the end of the reporting period. |
| (7) | Backed by an escrow or trust containing sufficient U.S. Government or U.S. Government agency securities, which ensure the timely payment of principal and interest. |
| (8) | Variable Rate MuniFund Term Preferred Shares, net of deferred offering costs as a percentage of Total Investments is 9.7%. |
| (9) | Variable Rate Demand Preferred Shares, net of deferred offering costs as a percentage of Total Investments is 24.1%. |
(10) | Other assets less liabilities includes the unrealized appreciation (depreciation) of certain over-the-counter (“OTC”) derivatives as presented on the Statement of Assets and Liabilities, when applicable. The unrealized appreciation (depreciation) of OTC cleared and exchange-traded derivatives is recognized as part of cash collateral at brokers and/or the receivable or payable for variation margin as presented on the Statement of Assets and Liabilities, when applicable. |
(11) | Effective date represents the date on which both the Fund and counterparty commence interest payment accruals on each contract. |
144A | Investment is exempt from registration under Rule 144A of the Securities Act of 1933, as amended. These investments may only be resold in transactions exempt from registration, which are normally those transactions with qualified institutional buyers. |
ETM | Escrowed to maturity. |
| IF | Inverse floating rate security issued by a tender option bond (“TOB”) trust, the interest rate on which varies inversely with the Securities Industry Financial Markets Association (SIFMA) short-term rate, which resets weekly, or a similar short-term rate, and is reduced by the expenses related to the TOB trust. |
| SIFMA | Securities Industry and Financial Market Association |
| UB | Underlying bond of an inverse floating rate trust reflected as a financing transaction. See Notes to Financial Statements, Note 3 – Portfolio Securities and Investments in Derivatives, Inverse Floating Rate Securities for more information. |
See accompanying notes to financial statements.
47
| | |
| NPN | Nuveen Pennsylvania Municipal Value Fund Portfolio of Investments August 31, 2018 (Unaudited) |
| | | | | | | | |
| | Principal | | | Optional Call | | | |
| | Amount (000) | | Description (1) | Provisions (2) | Ratings (3) | | Value |
| | | | LONG-TERM INVESTMENTS – 101.2% (100.0% of Total Investments) | | | | |
| | | | MUNICIPAL BONDS – 101.2% (100.0% of Total Investments) | | | | |
| | | | Consumer Staples – 3.8% (3.7% of Total Investments) | | | | |
| $ | 485 | | District of Columbia Tobacco Settlement Corporation, Tobacco Settlement Asset-Backed Bonds, Series 2001, 6.500%, 5/15/33 | No Opt. Call | A– | $ | 548,102 |
| | 110 | | Pennsylvania Economic Development Financing Authority, Solid Waste Disposal Revenue Bonds, Procter & Gamble Paper Project, Series 2001, 5.375%, 3/01/31 (Alternative Minimum Tax) | No Opt. Call | AA– | | 131,833 |
| | 595 | | Total Consumer Staples | | | | 679,935 |
| | | | Education and Civic Organizations – 6.3% (6.2% of Total Investments) | | | | |
| | 50 | | Allegheny County Higher Education Building Authority, Pennsylvania, Revenue Bonds, Robert Morris University, Series 2017, 5.000%, 10/15/37 | 10/27 at 100.00 | Baa3 | | 54,502 |
| | 70 | | Bucks County Industrial Development Authority, Pennsylvania, Revenue Bonds, School Lane Charter School Project, Series 2016, 5.125%, 3/15/36 | 3/27 at 100.00 | BBB– | | 75,223 |
| | 20 | | Chester County Industrial Development Authority, Pennsylvania, Avon Grove Charter School Revenue Bonds, Series 2017A, 5.000%, 12/15/47 | 12/27 at 100.00 | BBB– | | 20,843 |
| | 100 | | Cumberland County Municipal Authority, Pennsylvania, Revenue Bonds, Dickinson College Project, Second Series 2017A, 5.000%, 11/01/39 | 11/27 at 100.00 | A+ | | 112,410 |
| | 30 | | Dallas Area Municipal Authority, Pennsylvania, Revenue Bonds, Misericordia University, Series 2014, 5.000%, 5/01/37 | 5/24 at 100.00 | Baa3 | | 31,737 |
| | 60 | | Erie Higher Education Building Authority, Pennsylvania, Revenue Bonds, Gannon University, Series 2016, 4.000%, 5/01/46 | 11/26 at 100.00 | BBB+ | | 57,009 |
| | 60 | | General Authority of Southcentral Pennsylvania, Revenue Bonds, AICUP Financing Program-York College of Pennsylvania, Series 2017 PP4, 3.375%, 11/01/37 | 10/27 at 100.00 | A– | | 56,785 |
| | | | Huntingdon County General Authority, Pennsylvania, Revenue Bonds, Juniata College, Series 2016OO2: | | | | |
| | 15 | | 3.250%, 5/01/36 | 5/26 at 100.00 | BBB+ | | 13,746 |
| | 35 | | 3.500%, 5/01/41 | 5/26 at 100.00 | BBB+ | | 32,407 |
| | 50 | | Montgomery County Higher Education and Health Authority, Pennsylvania, Revenue Bonds, Thomas Jefferson University, Series 2018A, 5.000%, 9/01/48 | 9/28 at 100.00 | A+ | | 55,519 |
| | 35 | | Pennsylvania Higher Educational Facilities Authority, Revenue Bonds, Holy Family University, Series 2013A, 6.500%, 9/01/38 | 9/23 at 100.00 | BBB– | | 38,872 |
| | 40 | | Pennsylvania Higher Educational Facilities Authority, Revenue Bonds, Thomas Jefferson University, Series 2012, 5.000%, 3/01/42 | 9/22 at 100.00 | A+ | | 43,142 |
| | | | Pennsylvania Higher Educational Facilities Authority, Revenue Bonds, University of the Sciences in Philadelphia, Series 2012: | | | | |
| | 35 | | 4.000%, 11/01/39 | 11/22 at 100.00 | A3 | | 35,239 |
| | 60 | | 5.000%, 11/01/42 | 11/22 at 100.00 | A3 | | 64,775 |
| | 95 | | Pennsylvania Higher Educational Facilities Authority, Revenue Bonds, Widener University, Series 2013A, 5.500%, 7/15/38 | 7/23 at 100.00 | A– | | 102,059 |
| | 70 | | Philadelphia Authority for Industrial Development, Pennsylvania, Revenue Bonds, La Salle University, Series 2017, 3.625%, 5/01/35 | 11/27 at 100.00 | BBB– | | 66,828 |
| | 100 | | Philadelphia Authority for Industrial Development, Pennsylvania, Revenue Bonds, Philadelphia Performing Arts Charter School, Series 2013, 6.750%, 6/15/43, 144A | 6/20 at 100.00 | BB | | 104,438 |
| | 50 | | Philadelphia Authority for Industrial Development, Pennsylvania, Revenue Bonds, University of the Arts, Series 2017, 5.000%, 3/15/45, 144A | 3/28 at 100.00 | N/R | | 50,833 |
| | 135 | | Washington County Industrial Development Authority, Pennsylvania, College Revenue Bonds, AICUP Financing Program-Washington and Jefferson College Project, Series 2017-PP5, 3.375%, 11/01/36 | 11/27 at 100.00 | A– | | 127,181 |
| | 1,110 | | Total Education and Civic Organizations | | | | 1,143,548 |
48
| | | | | | | | |
| | Principal | | | Optional Call | | | |
| | Amount (000) | | Description (1) | Provisions (2) | Ratings (3) | | Value |
| | | | Health Care – 19.6% (19.4% of Total Investments) | | | | |
| $ | 260 | | Allegheny County Hospital Development Authority, Pennsylvania, Revenue Bonds, Allegheny Health Network Obligated Group Issue, Series 2018A, 4.000%, 4/01/44 | 4/28 at 100.00 | A | $ | 257,117 |
| | 500 | | Allegheny County Hospital Development Authority, Pennsylvania, Revenue Bonds, University of Pittsburgh Medical Center, Series 2009A, 5.500%, 8/15/34 | 8/19 at 100.00 | AA– | | 515,330 |
| | 235 | | Berks County Industrial Development Authority, Pennsylvania, Health System Revenue Bonds, Tower Health Project, Series 2017, 5.000%, 11/01/50 | 11/27 at 100.00 | A | | 256,813 |
| | 100 | | Centre County Hospital Authority, Pennsylvania, Hospital Revenue Bonds, Mount Nittany Medical Center Project, Series 2016A, 5.000%, 11/15/46 | 11/25 at 100.00 | A | | 109,329 |
| | 75 | | Chester County Health and Education Facilities Authority, Pennsylvania, Health System Revenue Bonds, Main Line Health System, Series 2017A, 4.000%, 10/01/37 | 10/27 at 100.00 | AA | | 77,362 |
| | 55 | | Dauphin County General Authority, Pennsylvania, Health System Revenue Bonds, Pinnacle Health System Project, Refunding Series 2016A, 5.000%, 6/01/35 | 6/26 at 100.00 | A+ | | 61,617 |
| | 35 | | Dauphin County General Authority, Pennsylvania, Health System Revenue Bonds, Pinnacle Health System Project, Series 2012A, 5.000%, 6/01/42 | 6/22 at 100.00 | A+ | | 37,559 |
| | 225 | | Doylestown Hospital Authority, Pennsylvania, Hospital Revenue Bonds, Series 2016A, 5.000%, 7/01/41 | 7/26 at 100.00 | BBB– | | 240,129 |
| | 150 | | Dubois Hospital Authority, Pennsylvania, Hospital Revenue Bonds, Penn Highlands Healthcare, Series 2018, 5.000%, 7/15/48 | 1/28 at 100.00 | A– | | 165,554 |
| | 100 | | Lancaster County Hospital Authority, Revenue Bonds, University of Pennsylvania Health System, Refunding Series 2016B, 5.000%, 8/15/46 | 8/26 at 100.00 | AA | | 112,687 |
| | 150 | | Lancaster County Hospital Authority, Revenue Bonds, University of Pennsylvania Health System, Series 2016A, 5.000%, 8/15/42 | 8/26 at 100.00 | AA | | 169,704 |
| | 100 | | Lehigh County General Purpose Authority, Pennsylvania, Revenue Bonds, Good Shepherd Group, Refunding Series 2016, 4.000%, 11/01/41 | 5/26 at 100.00 | A | | 100,323 |
| | 100 | | Lycoming County Authority, Pennsylvania, Health System Revenue Bonds, Susquehanna Health System Project, Series 2009A, 5.750%, 7/01/39 | 7/19 at 100.00 | AA– | | 103,357 |
| | 200 | | Montgomery County Industrial Development Authority, Pennsylvania, Health System Revenue Bonds, Albert Einstein Healthcare Network Issue, Series 2015A, 5.250%, 1/15/45 | 1/25 at 100.00 | Baa3 | | 213,100 |
| | 65 | | Philadelphia Authority for Industrial Development, Pennsylvania, Hospital Revenue Bonds, The Children’s Hospital of Philadelphia, Series 2017, 5.000%, 7/01/33 | 7/27 at 100.00 | AA | | 75,172 |
| | 145 | | Philadelphia Hospitals and Higher Education Facilities Authority, Pennsylvania, Hospital Revenue Bonds, Temple University Health System Obligated Group, Series 2012A, 5.625%, 7/01/42 | 7/22 at 100.00 | BBB– | | 156,412 |
| | 200 | | Pottsville Hospital Authority, Pennsylvania, Hospital Revenue Bonds, Lehigh Valley Health Network, Series 2016B, 5.000%, 7/01/45 | 1/27 at 100.00 | A+ | | 219,972 |
| | 445 | | Saint Mary Hospital Authority, Pennsylvania, Health System Revenue Bonds, Catholic Health East, Series 2009D, 6.250%, 11/15/34 | 5/19 at 100.00 | AA– | | 458,403 |
| | 100 | | The Hospitals and Higher Education Facilities Authority of Philadelphia, Pennsylvania, Hospital Revenue Bonds, Temple University Health System Obligated Group, Series of 2017, 5.000%, 7/01/30 | 7/27 at 100.00 | BBB– | | 110,417 |
| | 100 | | West Shore Area Authority, Cumberland County, Pennsylvania, Hospital Revenue Bonds, Holy Spirit Hospital of the Sisters of Christian Charity, Series 2011B, 5.750%, 1/01/41 | 1/22 at 100.00 | AA | | 110,835 |
| | 3,340 | | Total Health Care | | | | 3,551,192 |
| | | | Housing/Multifamily – 7.1% (7.0% of Total Investments) | | | | |
| | 15 | | Chester County Industrial Development Authority, Pennsylvania, Student Housing Revenue Bonds, University Student Housing, LLC Project at West Chester University Series 2013A, 5.000%, 8/01/45 | 8/23 at 100.00 | Baa3 | | 15,737 |
| | 30 | | East Hempfield Township Industrial Development Authority, Pennsylvania, Student Services Inc. – Student Housing Project at Millersville University, Series 2014, 5.000%, 7/01/46 | 7/24 at 100.00 | BBB– | | 31,751 |
| | 100 | | East Hempfield Township Industrial Development Authority, Pennsylvania, Student Services Inc. – Student Housing Project at Millersville University, Series 2015, 5.000%, 7/01/47 | 7/25 at 100.00 | BBB– | | 106,220 |
| | 300 | | Pennsylvania Higher Educational Facilities Authority, Revenue Bonds, University Properties Inc. Student Housing Project at East Stroudsburg University of Pennsylvania, Series 2016A, 5.000%, 7/01/35 | 7/26 at 100.00 | Baa3 | | 321,003 |
49
| | |
NPN | Nuveen Pennsylvania Municipal Value Fund |
| | Portfolio of Investments (continued) |
| | August 31, 2018 (Unaudited) |
| | Principal | | | Optional Call | | | |
| | Amount (000) | | Description (1) | Provisions (2) | Ratings (3) | | Value |
| | | | Housing/Multifamily (continued) | | | | |
| $ | 800 | | Pittsburgh Urban Redevelopment Authority, Pennsylvania, Multifamily Housing Revenue Bonds, Eva P. Mitchell Residence Project, Series 2009, 5.100%, 10/20/44 | 10/19 at 100.00 | Aa1 | $ | 812,100 |
| | 1,245 | | Total Housing/Multifamily | | | | 1,286,811 |
| | | | Housing/Single Family – 11.4% (11.3% of Total Investments) | | | | |
| | | | Pennsylvania Housing Finance Agency, Single Family Mortgage Revenue Bonds, Series 2012-114: | | | | |
| | 65 | | 3.300%, 10/01/32 | 10/21 at 100.00 | AA+ | | 64,565 |
| | 25 | | 3.650%, 10/01/37 | 10/21 at 100.00 | AA+ | | 25,043 |
| | 40 | | 3.700%, 10/01/42 | 10/21 at 100.00 | AA+ | | 40,034 |
| | 120 | | Pennsylvania Housing Finance Agency, Single Family Mortgage Revenue Bonds, Series 2015-116B, 4.000%, 4/01/45 | 10/24 at 100.00 | AA+ | | 121,093 |
| | 315 | | Pennsylvania Housing Finance Agency, Single Family Mortgage Revenue Bonds, Series 2015-118B, 4.100%, 10/01/45 | 4/25 at 100.00 | AA+ | | 320,075 |
| | 400 | | Pennsylvania Housing Finance Agency, Single Family Mortgage Revenue Bonds, Series 2016, 3.200%, 10/01/41 (UB) | 10/25 at 100.00 | AA+ | | 370,900 |
| | 55 | | Pennsylvania Housing Finance Agency, Single Family Mortgage Revenue Bonds, Series 2016-119, 3.500%, 10/01/36 | 4/25 at 100.00 | AA+ | | 54,490 |
| | 500 | | Pennsylvania Housing Finance Agency, Single Family Mortgage Revenue Bonds, Series 2016-120, 3.200%, 4/01/40 | 10/25 at 100.00 | AA+ | | 456,090 |
| | 100 | | Pennsylvania Housing Finance Agency, Single Family Mortgage Revenue Bonds, Series 2016-121, 3.200%, 10/01/41 | 10/25 at 100.00 | AA+ | | 92,725 |
| | | | Pennsylvania Housing Finance Agency, Single Family Mortgage Revenue Bonds, Series 2017-123B: | | | | |
| | 70 | | 3.450%, 10/01/32 | 10/26 at 100.00 | AA+ | | 70,293 |
| | 75 | | 3.900%, 10/01/37 | 10/26 at 100.00 | AA+ | | 76,404 |
| | 70 | | 4.000%, 10/01/42 | 10/26 at 100.00 | AA+ | | 71,061 |
| | 250 | | Pennsylvania Housing Finance Agency, Single Family Mortgage Revenue Bonds, Series 2017-125B, 3.700%, 10/01/47 | 4/27 at 100.00 | AA+ | | 249,110 |
| | 35 | | Pennsylvania Housing Finance Agency, Single Family Mortgage Revenue Bonds, Tender Option Bond Trust 2015-XF0066, 11.164%, 10/01/33, 144A (Alternative Minimum Tax) (IF) | No Opt. Call | AA+ | | 35,258 |
| | 25 | | Pennsylvania Housing Finance Agency, Single Family Mortgage Revenue Bonds, Tender Option Bond Trust 2015-XF0109, 7.494%, 10/01/31, 144A (IF) (4) | 10/22 at 100.00 | AA+ | | 26,069 |
| | 2,145 | | Total Housing/Single Family | | | | 2,073,210 |
| | | | Long-Term Care – 4.7% (4.6% of Total Investments) | | | | |
| | 155 | | Berks County Industrial Development Authority, Pennsylvania, Healthcare Facilities Revenue Bonds, Highlands at Wyomissing, Series 2017A, 5.000%, 5/15/42 | 5/27 at 100.00 | N/R | | 167,938 |
| | 100 | | Cumberland County Municipal Authority Revenue Bonds, Pennsylvania, Diakon Lutheran Social Ministries Project, Series 2016, 5.000%, 1/01/29 | 1/26 at 100.00 | N/R | | 111,663 |
| | | | Cumberland County Municipal Authority, Pennsylvania, Revenue Bonds, Diakon Lutheran Social Ministries Project, Series 2015: | | | | |
| | 120 | | 4.000%, 1/01/33 | 1/25 at 100.00 | BBB+ | | 121,063 |
| | 135 | | 5.000%, 1/01/38 | 1/25 at 100.00 | BBB+ | | 146,151 |
| | 20 | | Lancaster County Hospital Authority, Pennsylvania, Health Center Revenue Bonds, Masonic Villages Project, Series 2015, 5.000%, 11/01/35 | 5/25 at 100.00 | A | | 21,829 |
| | 55 | | Lancaster Industrial Development Authority, Pennsylvania, Revenue Bonds, Garden Spot Village Project, Series 2013, 5.750%, 5/01/35 | 5/23 at 100.00 | BBB | | 60,544 |
| | 200 | | Montgomery County Industrial Development Authority, Pennsylvania, Revenue Bonds, ACTS Retirement-Life Communities, Inc. Obligated Group, Series 2016, 5.000%, 11/15/36 | 11/26 at 100.00 | N/R | | 220,752 |
| | 785 | | Total Long-Term Care | | | | 849,940 |
| | | | Materials – 1.0% (1.0% of Total Investments) | | | | |
| | 165 | | Pennsylvania Economic Development Financing Authority, Exempt Facilities Revenue Bonds, National Gypsum Company, Refunding Series 2014, 5.500%, 11/01/44 (Alternative Minimum Tax) | 11/24 at 100.00 | N/R | | 174,047 |
50
| | | | | | | | |
| | Principal | | | Optional Call | | | |
| | Amount (000) | | Description (1) | Provisions (2) | Ratings (3) | | Value |
| | | | Tax Obligation/General – 8.1% (8.0% of Total Investments) | | | | |
| $ | 215 | | Adams County, Pennsylvania, General Obligation Bonds, Series 2017B, 2.500%, 11/15/29 | 11/25 at 100.00 | Aa2 | $ | 202,930 |
| | 220 | | Allegheny County, Pennsylvania, General Obligation Bonds, Series 2013C-72, 5.250%, 12/01/32 | 12/23 at 100.00 | AA– | | 247,914 |
| | 45 | | Boyertown Area School District, Berks and Montgomery Counties, Pennsylvania, General Obligation Bonds, Series 2015, 5.000%, 10/01/38 | 4/24 at 100.00 | AA– | | 49,392 |
| | 115 | | Canon-McMillan School District, Washington County, Pennsylvania, General Obligation Bonds, Series 2014D, 5.000%, 12/15/39 | 12/24 at 100.00 | AA | | 127,511 |
| | 195 | | Lehighton Area School District, Carbon County, Pennsylvania, General Obligation Bonds, Limited Tax Series 2015A, 5.000%, 11/15/43 – BAM Insured | 11/23 at 100.00 | AA | | 213,523 |
| | 15 | | Pittsburgh School District, Allegheny County, Pennsylvania, General Obligation Bonds, Series 2014A, 5.000%, 9/01/25 – BAM Insured | 9/22 at 100.00 | AA | | 16,583 |
| | 400 | | Pittsburgh, Pennsylvania, General Obligation Bonds, Series 2012B, 5.000%, 9/01/26 | 9/22 at 100.00 | AA– | | 442,064 |
| | 55 | | Radnor Township School District, Delaware County, Pennsylvania, General Obligation Bonds, Series 2012, 3.000%, 2/15/34 | 10/18 at 100.00 | Aa1 | | 53,340 |
| | 80 | | Scranton, Lackawanna County, Pennsylvania, General Obligation Notes, Series 2016, 5.000%, 11/15/32 | 5/24 at 100.00 | BB+ | | 84,702 |
| | | | The Redevelopment Authority of the City of Scranton, Lackawanna county, Pennsylvania, Guaranteed Lease Revenue Bonds, Series 2016A: | | | | |
| | 15 | | 5.000%, 11/15/21 | No Opt. Call | BB+ | | 15,445 |
| | 10 | | 5.000%, 11/15/28 | 5/24 at 100.00 | BB+ | | 10,133 |
| | 1,365 | | Total Tax Obligation/General | | | | 1,463,537 |
| | | | Tax Obligation/Limited – 5.3% (5.2% of Total Investments) | | | | |
| | 25 | | Allentown Neighborhood Improvement Zone Development Authority, Pennsylvania, Tax Revenue Bonds, Series 2012A, 5.000%, 5/01/35 | 5/22 at 100.00 | Baa3 | | 25,996 |
| | 230 | | Allentown Neighborhood Improvement Zone Development Authority, Pennsylvania, Tax Revenue Bonds, City Center Refunding Project, Series 2017, 5.000%, 5/01/42, 144A | 5/27 at 100.00 | Ba1 | | 247,896 |
| | | | Commonwealth Financing Authority, Pennsylvania, State Appropriation Lease Bonds, Master Settlement, Series 2018: | | | | |
| | 35 | | 5.000%, 6/01/33 | 6/28 at 100.00 | A1 | | 39,608 |
| | 95 | | 4.000%, 6/01/39 – AGM Insured | 6/28 at 100.00 | AA | | 97,231 |
| | 120 | | Government of Guam, Business Privilege Tax Bonds, Series 2011A, 5.250%, 1/01/36 | 1/22 at 100.00 | A | | 127,028 |
| | 100 | | Monroe County Industrial Development Authority, Pennsylvania, Special Obligation Revenue Bonds, Tobyhanna Township Project, Series 2014, 6.875%, 7/01/33, 144A | 7/24 at 100.00 | N/R | | 101,540 |
| | 100 | | Pennsylvania Turnpike Commission, Motor License Fund-Enhanced Turnpike Subordinate Special Revenue Bonds, Series 2014A, 0.000%, 12/01/37(5) | No Opt. Call | AA– | | 93,024 |
| | 100 | | Pennsylvania Turnpike Commission, Oil Franchise Tax Revenue Bonds, Subordinate Series 2018B, 5.000%, 12/01/48 | 12/28 at 100.00 | A+ | | 111,442 |
| | 15 | | Washington County Redevelopment Authority, Pennsylvania, Tanger Outlet Victory Center Tax Increment Bonds, Series 2018, 5.000%, 7/01/35 | 1/28 at 100.00 | BB | | 15,370 |
| | 100 | | York County School of Technology Authority, Pennsylvania, Lease Revenue Bonds, York County School of Technology, Series 2017B, 3.125%, 2/15/32 – BAM Insured | 8/24 at 100.00 | AA | | 96,108 |
| | 920 | | Total Tax Obligation/Limited | | | | 955,243 |
| | | | Transportation – 8.8% (8.7% of Total Investments) | | | | |
| | 230 | | Delaware River Joint Toll Bridge Commission, New Jersey and Pennsylvania, Bridge System Revenue Bonds, Series 2017, 5.000%, 7/01/42 | 7/27 at 100.00 | A1 | | 262,543 |
| | 240 | | Delaware River Port Authority, New Jersey and Pennsylvania, Revenue Bonds, Series 2010E, 5.000%, 1/01/40 | 1/20 at 100.00 | A | | 248,959 |
| | 140 | | Pennsylvania Economic Development Financing Authority, Parking System Revenue Bonds, Capitol Region Parking System, Series 2013A, 5.250%, 1/01/44 – AGM Insured | 1/24 at 100.00 | AA | | 151,019 |
| | 175 | | Pennsylvania Economic Development Financing Authority, Private Activity Revenue Bonds, Pennsylvania Rapid Bridge Replacement Project, Series 2015, 5.000%, 6/30/42 (Alternative Minimum Tax) | 6/26 at 100.00 | BBB | | 188,591 |
51
| | |
NPN | Nuveen Pennsylvania Municipal Value Fund |
| | Portfolio of Investments (continued) |
| | August 31, 2018 (Unaudited) |
| | Principal | | | Optional Call | | | |
| | Amount (000) | | Description (1) | Provisions (2) | Ratings (3) | | Value |
| | | | Transportation (continued) | | | | |
| $ | 565 | | Pennsylvania Turnpike Commission, Turnpike Revenue Bonds, Series 2015B, 5.000%, 12/01/45 | 12/25 at 100.00 | A1 | $ | 624,838 |
| | 100 | | Pittsburgh and Allegheny County Sports and Exhibition Authority, Pennsylvania, Parking Revenue Bonds, Series 2017, 5.000%, 12/15/34 | 12/27 at 100.00 | A– | | 111,875 |
| | 1,450 | | Total Transportation | | | | 1,587,825 |
| | | | U.S. Guaranteed – 18.8% (18.6% of Total Investments) (6) | | | | |
| | 175 | | Bucks County Water and Sewer Authority, Pennsylvania, Revenue Bonds, Tender Option Bond Trust 2015-XF0123, 10.338%, 12/01/29 (Pre-refunded 12/01/21) – AGM Insured, 144A (IF) (4) | 12/21 at 100.00 | AA | | 226,917 |
| | 550 | | Guam Government, Limited Obligation Section 30 Revenue Bonds, Series 2009A, 5.750%, 12/01/34 (Pre-refunded 12/01/19) | 12/19 at 100.00 | BBB+ | | 577,037 |
| | 5 | | Montgomery County Higher Education and Health Authority, Pennsylvania, Hospital Revenue Bonds, Abington Memorial Hospital Obligated Group, Series 2009A, 5.125%, 6/01/33 (Pre- refunded 6/01/19) | 6/19 at 100.00 | A+ | | 5,124 |
| | 750 | | Montgomery County Industrial Development Authority, Pennsylvania, Revenue Bonds, ACTS Retirement-Life Communities, Inc. Obligated Group, Series 2009A-1, 6.250%, 11/15/29 (Pre-refunded 11/15/19) | 11/19 at 100.00 | A– | | 790,709 |
| | 310 | | Pennsylvania Economic Development Financing Authority, Health System Revenue Bonds , Albert Einstein Healthcare, Series 2009A, 6.250%, 10/15/23 (Pre-refunded 10/15/19) | 10/19 at 100.00 | N/R | | 321,848 |
| | 50 | | Pennsylvania Higher Educational Facilities Authority, Revenue Bonds, Edinboro University Foundation Student Housing Project, Series 2010, 6.000%, 7/01/43 (Pre-refunded 7/01/20) | 7/20 at 100.00 | N/R | | 53,700 |
| | 120 | | Pennsylvania Higher Educational Facilities Authority, Revenue Bonds, Philadelphia University, Refunding Series 2013, 5.000%, 6/01/32 (Pre-refunded 6/01/23) | 6/23 at 100.00 | N/R | | 135,790 |
| | | | Pennsylvania Turnpike Commission, Motor License Fund-Enhanced Turnpike Special Revenue Bonds, Subordinate Series 2010A1&2: | | | | |
| | 110 | | 5.500%, 12/01/34 (Pre-refunded 12/01/20) | 12/20 at 100.00 | N/R | | 118,913 |
| | 480 | | 5.500%, 12/01/34 (Pre-refunded 12/01/20) | 12/20 at 100.00 | AA– | | 518,894 |
| | 100 | | 5.000%, 12/01/38 (Pre-refunded 12/01/19) | 12/19 at 100.00 | AA– | | 104,089 |
| | 55 | | Pennsylvania Turnpike Commission, Turnpike Revenue Bonds, Subordinate Lien, Refunding Series 2010B-1, 5.000%, 12/01/37 (Pre-refunded 12/01/19) | 12/19 at 100.00 | A | | 57,249 |
| | 275 | | Philadelphia Municipal Authority, Pennsylvania, Lease Revenue Bonds, Series 2009, 6.500%, 4/01/34 (Pre-refunded 4/01/19) | 4/19 at 100.00 | A | | 282,736 |
| | 100 | | West Shore Area Authority, Cumberland County, Pennsylvania, Hospital Revenue Bonds, Holy Spirit Hospital of the Sisters of Christian Charity Project, Series 2011, 6.250%, 1/01/31 (Pre-refunded 1/01/21) | 1/21 at 100.00 | AA | | 110,097 |
| | 100 | | Wilkes-Barre Finance Authority, Pennsylvania, Revenue Bonds, University of Scranton, Series 2010, 5.000%, 11/01/40 (Pre-refunded 11/01/20) | 11/20 at 100.00 | A– | | 106,909 |
| | 3,180 | | Total U.S. Guaranteed | | | | 3,410,012 |
| | | | Utilities – 4.7% (4.7% of Total Investments) | | | | |
| | 140 | | Beaver County Industrial Development Authority, Pennsylvania, Pollution Control Revenue Bonds, FirstEnergy Nuclear Generation Project, Refunding Series 2005A, 4.000%, 1/01/35 (Mandatory put 7/01/21) (7) | No Opt. Call | N/R | | 84,000 |
| | 250 | | Beaver County Industrial Development Authority, Pennsylvania, Pollution Control Revenue Refunding Bonds, FirstEnergy Nuclear Generation Project, Series 2006B, 3.500%, 12/01/35 (Mandatory put 6/01/20) (7) | No Opt. Call | N/R | | 150,000 |
| | 10 | | Beaver County Industrial Development Authority, Pennsylvania, Pollution Control Revenue Refunding Bonds, FirstEnergy Nuclear Generation Project, Series 2008A, 2.700%, 4/01/35 (7) | No Opt. Call | N/R | | 6,000 |
| | 170 | | Delaware County Industrial Development Authority, Pennsylvania, Revenue Bonds, Covanta Project, Refunding Series 2015A, 5.000%, 7/01/43 | 7/20 at 100.00 | BB– | | 171,875 |
| | 55 | | Pennsylvania Economic Development Financing Authority, Exempt Facilities Revenue Bonds, Shippingport Project, First Energy Guarantor, Series 2006A, 2.550%, 11/01/41 (Mandatory put 12/03/18) (7) | No Opt. Call | N/R | | 33,000 |
52
| | | | | | | | |
| | Principal | | | Optional Call | | | |
| | Amount (000) | | Description (1) | Provisions (2) | Ratings (3) | | Value |
| | | | Utilities (continued) | | | | |
| $ | 100 | | Pennsylvania Economic Development Financing Authority, Exempt Facilities Revenue Refunding Bonds, PPL Energy Supply, LLC Project, Series 2009A, 6.400%, 12/01/38 | 9/25 at 100.00 | B+ | $ | 102,027 |
| | 150 | | Philadelphia Gas Works, Pennsylvania, Revenue Bonds, General Ordinance, Fifteenth Series 2017, 5.000%, 8/01/47 | 8/27 at 100.00 | A | | 167,327 |
| | 125 | | Philadelphia Gas Works, Pennsylvania, Revenue Bonds, Refunding Thirteenth Series 2015, 5.000%, 8/01/30 | 8/25 at 100.00 | A | | 141,234 |
| | 1,000 | | Total Utilities | | | | 855,463 |
| | | | Water and Sewer – 1.6% (1.6% of Total Investments) | | | | |
| | 200 | | Lehigh County Authority, Pennsylvania, Water and Sewer Revenue Bonds, Allentown Concession, Series 2013A, 5.125%, 12/01/47 | 12/23 at 100.00 | A | | 219,842 |
| | 60 | | Robinson Township Municipal Authority, Allegheny County, Pennsylvania, Water and Sewer Revenue Bonds, Series 2014, 4.000%, 5/15/40 – BAM Insured | 11/19 at 100.00 | AA | | 58,971 |
| | 5 | | Robinson Township Municipal Authority, Allegheny County, Pennsylvania, Water and Sewer Revenue Bonds, Series 2017, 3.375%, 5/15/32 – AGM Insured | 5/26 at 100.00 | AA | | 5,066 |
| | 265 | | Total Water and Sewer | | | | 283,879 |
| $ | 17,565 | | Total Long-Term Investments (cost $17,822,381) | | | | 18,314,642 |
| | | | Floating Rate Obligations – (1.7)% | | | | (300,000) |
| | | | Other Assets Less Liabilities – 0.5% | | | | 89,755 |
| | | | Net Assets Applicable to Common Shares – 100% | | | $ | 18,104,397 |
| (1) | All percentages shown in the Portfolio of Investments are based on net assets applicable to common shares unless otherwise noted. |
| (2) | Optional Call Provisions: Dates (month and year) and prices of the earliest optional call or redemption. There may be other call provisions at varying prices at later dates. Certain mortgage-backed securities may be subject to periodic principal paydowns. |
(3) | For financial reporting purposes, the ratings disclosed are the highest of Standard & Poor’s Group (“Standard & Poor’s”), Moody’s Investors Service, Inc. (“Moody’s”) or Fitch, Inc. (“Fitch”) rating. This treatment of split-rated securities may differ from that used for other purposes, such as for Fund investment policies. Ratings below BBB by Standard & Poor’s, Baa by Moody’s or BBB by Fitch are considered to be below investment grade. Holdings designated N/R are not rated by any of these national rating agencies. |
(4) | Investment, or portion of investment, has been pledged to collateralize the net payment obligations for investments in inverse floating rate transactions. |
| (5) | Step-up coupon bond, a bond with a coupon that increases (“steps up”), usually at regular intervals, while the bond is outstanding. The rate shown is the coupon as of the end of the reporting period. |
| (6) | Backed by an escrow or trust containing sufficient U.S. Government or U.S. Government agency securities, which ensure the timely payment of principal and interest. |
(7) | As of, or subsequent to, the end of the reporting period, this security is non-income producing. Non-income producing, in the case of a fixed-income security, generally denotes that the issuer has (1) defaulted on the payment of principal or interest, (2) is under the protection of the Federal Bankruptcy Court or (3) the Fund’s Adviser has concluded that the issue is not likely to meet its future interest payment obligations and has ceased accruing additional income on the Fund’s records. |
144A | Investment is exempt from registration under Rule 144A of the Securities Act of 1933, as amended. These investments may only be resold in transactions exempt from registration, which are normally those transactions with qualified institutional buyers. |
IF | Inverse floating rate security issued by a tender option bond (“TOB”) trust, the interest rate on which varies inversely with the Securities Industry Financial Markets Association (SIFMA) short-term rate, which resets weekly, or a similar short-term rate, and is reduced by the expenses related to the TOB trust. |
UB | Underlying bond of an inverse floating rate trust reflected as a financing transaction. See Notes to Financial Statements, Note 3 – Portfolio Securities and Investments in Derivatives, Inverse Floating Rate Securities for more information. |
See accompanying notes to financial statements.
53
| |
| Statement of Assets and Liabilities |
| |
| August 31, 2018 (Unaudited) |
| |
| |
| | | NXJ | | | NJV | | | NQP | | | NPN | |
Assets | | | | | | | | | | | | |
Long-term investments, at value (cost $918,060,110, $24,010,758, $872,405,952 and $17,822,381, respectively) | | $ | 962,647,358 | | | $ | 24,790,027 | | | $ | 897,771,854 | | | $ | 18,314,642 | |
| Cash | | | 167,689 | | | | — | | | | 2,972,438 | | | | — | |
Cash collateral at brokers for investments in futures contracts(1) | | | — | | | | — | | | | 361,639 | | | | — | |
Cash collateral at brokers for investments in swaps(1) | | | 403,881 | | | | — | | | | — | | | | — | |
| Interest rate swaps premiums paid | | | 502 | | | | — | | | | — | | | | — | |
| Unrealized appreciation on interest rate swaps | | | — | | | | — | | | | 311,928 | | | | — | |
| Receivable for: | | | | | | | | | | | | | | | | |
| Interest | | | 10,060,926 | | | | 295,239 | | | | 10,387,743 | | | | 231,630 | |
| Investments sold | | | 157,611 | | | | — | | | | — | | | | — | |
| Other assets | | | 152,514 | | | | 2,464 | | | | 145,093 | | | | 2,466 | |
| Total assets | | | 973,590,481 | | | | 25,087,730 | | | | 911,950,695 | | | | 18,548,738 | |
Liabilities | | | | | | | | | | | | | | | | |
| Cash overdraft | | | — | | | | 26,815 | | | | — | | | | 52,986 | |
| Floating rate obligations | | | 9,005,000 | | | | 1,500,000 | | | | 47,825,000 | | | | 300,000 | |
| Payable for: | | | | | | | | | | | | | | | | |
| Dividends | | | 2,017,313 | | | | 68,511 | | | | 1,697,174 | | | | 51,140 | |
| Interest | | | — | | | | — | | | | 176,670 | | | | — | |
| Variation margin on futures contracts | | | — | | | | — | | | | 68,148 | | | | — | |
| Variation margin on swaps | | | 9,242 | | | | — | | | | — | | | | — | |
Variable Rate MuniFund Term Preferred (“VMTP”) Shares, net of deferred offering costs (liquidation preference $—, $—, $87,000,000 and $—, respectively) | | | — | | | | — | | | | 86,992,645 | | | | — | |
Variable Rate Demand Preferred (“VRDP”) Shares, net of deferred offering costs (liquidation preference $313,900,000, $—, $217,500,000 and $—, respectively) | | | 312,410,169 | | | | — | | | | 216,665,196 | | | | — | |
| Accrued expenses: | | | | | | | | | | | | | | | | |
| Management fees | | | 497,403 | | | | 12,309 | | | | 441,399 | | | | 8,969 | |
| Trustees fees | | | 152,329 | | | | 95 | | | | 144,919 | | | | 73 | |
| Other | | | 230,484 | | | | 31,707 | | | | 323,406 | | | | 31,173 | |
| Total liabilities | | | 324,321,940 | | | | 1,639,437 | | | | 354,334,557 | | | | 444,341 | |
| Net assets applicable to common shares | | $ | 649,268,541 | | | $ | 23,448,293 | | | $ | 557,616,138 | | | $ | 18,104,397 | |
| Common shares outstanding | | | 41,995,179 | | | | 1,547,457 | | | | 37,582,041 | | | | 1,222,574 | |
| Net asset value (“NAV”) per common share outstanding | | $ | 15.46 | | | $ | 15.15 | | | $ | 14.84 | | | $ | 14.81 | |
Net assets applicable to common shares consist of: | | | | | | | | | | | | | | | | |
| Common shares, $0.01 par value per share | | $ | 419,952 | | | $ | 15,475 | | | $ | 375,820 | | | $ | 12,226 | |
| Paid-in surplus | | | 598,545,092 | | | | 22,114,765 | | | | 531,184,836 | | | | 17,489,436 | |
| Undistributed (Over-distribution of) net investment income | | | 1,367,943 | | | | 40,043 | | | | (1,075,373 | ) | | | (1,511 | ) |
| Accumulated net realized gain (loss) | | | 4,410,070 | | | | 498,741 | | | | 1,521,173 | | | | 111,985 | |
| Net unrealized appreciation (depreciation) | | | 44,525,484 | | | | 779,269 | | | | 25,609,682 | | | | 492,261 | |
| Net assets applicable to common shares | | $ | 649,268,541 | | | $ | 23,448,293 | | | $ | 557,616,138 | | | $ | 18,104,397 | |
| Authorized shares: | | | | | | | | | | | | | | | | |
| Common | | Unlimited | | | Unlimited | | | Unlimited | | | Unlimited | |
| Preferred | | Unlimited | | | | N/A | | | Unlimited | | | | N/A | |
(1) Cash pledged to collateralize the net payment obligations for investments in derivatives. |
| N/A — Fund is not authorized to issue Preferred Shares. |
See accompanying notes to financial statements.
54
| |
| Statement of Operations |
| |
| Six Months Ended August 31, 2018 (Unaudited) |
| |
| |
| | | NXJ | | | NJV | | | NQP | | | NPN | |
Investment Income | | $ | 20,906,721 | | | $ | 548,567 | | | $ | 18,213,715 | | | $ | 402,477 | |
Expenses | | | | | | | | | | | | | | | | |
| Management fees | | | 2,961,005 | | | | 73,257 | | | | 2,618,718 | | | | 53,335 | |
| Interest expense and amortization of offering costs | | | 3,444,093 | | | | 14,642 | | | | 3,761,734 | | | | 2,946 | |
| Custodian fees | | | 56,248 | | | | 8,474 | | | | 53,069 | | | | 8,150 | |
| Trustees fees | | | 13,902 | | | | 337 | | | | 12,371 | | | | 259 | |
| Professional fees | | | 99,498 | | | | 11,574 | | | | 13,494 | | | | 11,513 | |
| Shareholder reporting expenses | | | 33,127 | | | | 6,387 | | | | 35,763 | | | | 6,314 | |
| Shareholder servicing agent fees | | | 11,298 | | | | 78 | | | | 20,487 | | | | 57 | |
| Stock exchange listing fees | | | 5,901 | | | | 3,150 | | | | 5,237 | | | | 3,441 | |
| Investor relations expenses | | | 26,371 | | | | 1,098 | | | | 23,555 | | | | 964 | |
| Other | | | 45,641 | | | | 7,192 | | | | 55,545 | | | | 7,211 | |
| Total expenses | | | 6,697,084 | | | | 126,189 | | | | 6,599,973 | | | | 94,190 | |
| Net investment income (loss) | | | 14,209,637 | | | | 422,378 | | | | 11,613,742 | | | | 308,287 | |
Realized and Unrealized Gain (Loss) | | | | | | | | | | | | | | | | |
| Net realized gain (loss) from: | | | | | | | | | | | | | | | | |
| Investments | | | 8,018,375 | | | | 411,467 | | | | 390,084 | | | | 32,676 | |
| Futures contracts | | | — | | | | — | | | | (273,202 | ) | | | — | |
| Swaps | | | 1,888 | | | | — | | | | 510,566 | | | | — | |
| Change in net unrealized appreciation (depreciation) of: | | | | | | | | | | | | | | | | |
| Investments | | | (5,229,561 | ) | | | (414,656 | ) | | | 4,707,075 | | | | 11,042 | |
| Futures contracts | | | — | | | | — | | | | (68,462 | ) | | | — | |
| Swaps | | | (61,764 | ) | | | — | | | | (657,057 | ) | | | — | |
| Net realized and unrealized gain (loss) | | | 2,728,938 | | | | (3,189 | ) | | | 4,609,004 | | | | 43,718 | |
Net increase (decrease) in net assets applicable to common shares from operations | | $ | 16,938,575 | | | $ | 419,189 | | | $ | 16,222,746 | | | $ | 352,005 | |
See accompanying notes to financial statements.
55
Statement of Changes in Net Assets
(Unaudited)
| | | | | | | | | | | | | |
| | | NXJ | | | NJV | |
| | | Six Months | | | Year | | | Six Months | | | Year | |
| | | Ended | | | Ended | | | Ended | | | Ended | |
| | | 8/31/18 | | | 2/28/18 | | | 8/31/18 | | | 2/28/18 | |
Operations | | | | | | | | | | | | |
| Net investment income (loss) | | $ | 14,209,637 | | | $ | 30,307,036 | | | $ | 422,378 | | | $ | 881,233 | |
| Net realized gain (loss) from: | | | | | | | | | | | | | | | | |
| Investments | | | 8,018,375 | | | | (348,769 | ) | | | 411,467 | | | | 145,010 | |
| Futures contracts | | | — | | | | — | | | | — | | | | — | |
| Swaps | | | 1,888 | | | | 1,369,000 | | | | — | | | | — | |
Change in net unrealized appreciation (depreciation) of: | | | | | | | | | | | | | | | | |
| Investments | | | (5,229,561 | ) | | | 6,872,993 | | | | (414,656 | ) | | | (214,984 | ) |
| Futures contracts | | | — | | | | — | | | | — | | | | — | |
| Swaps | | | (61,764 | ) | | | (1,720,413 | ) | | | — | | | | — | |
Net increase (decrease) in net assets applicable to common shares from operations | | | 16,938,575 | | | | 36,479,847 | | | | 419,189 | | | | 811,259 | |
Distributions to Common Shareholders | | | | | | | | | | | | | | | | |
| From net investment income | | | (14,307,304 | ) | | | (29,752,332 | ) | | | (430,434 | ) | | | (895,598 | ) |
| From accumulated net realized gains | | | — | | | | — | | | | — | | | | (546,388 | ) |
Decrease in net assets applicable to common shares from distributions to common shareholders | | | (14,307,304 | ) | | | (29,752,332 | ) | | | (430,434 | ) | | | (1,441,986 | ) |
Capital Share Transactions | | | | | | | | | | | | | | | | |
| Common shares: | | | | | | | | | | | | | | | | |
Cost of shares repurchased and retired | | | (7,046,745 | ) | | | (669,274 | ) | | | (50,668 | ) | | | — | |
Net proceeds from shares issued to shareholders due to reinvestment of distributions | | | — | | | | — | | | | — | | | | 2,200 | |
Net increase (decrease) in net assets applicable to common shares from capital share transactions | | | (7,046,745 | ) | | | (669,274 | ) | | | (50,668 | ) | | | 2,200 | |
Net increase (decrease) in net assets applicable to common shares | | | (4,415,474 | ) | | | 6,058,241 | | | | (61,913 | ) | | | (628,527 | ) |
Net assets applicable to common shares at the beginning of period | | | 653,684,015 | | | | 647,625,774 | | | | 23,510,206 | | | | 24,138,733 | |
Net assets applicable to common shares at the end of period | | $ | 649,268,541 | | | $ | 653,684,015 | | | $ | 23,448,293 | | | $ | 23,510,206 | |
Undistributed (Over-distribution of) net investment income at the end of period | | $ | 1,367,943 | | | $ | 1,465,610 | | | $ | 40,043 | | | $ | 48,099 | |
See accompanying notes to financial statements.
56
| | | | | | | | | | | | | |
| | | NQP | | | NPN | |
| | | Six Months | | | Year | | | Six Months | | | Year | |
| | | Ended | | | Ended | | | Ended | | | Ended | |
| | | 8/31/18 | | | 2/28/18 | | | 8/31/18 | | | 2/28/18 | |
Operations | | | | | | | | | | | | |
| Net investment income (loss) | | $ | 11,613,742 | | | $ | 25,968,448 | | | $ | 308,287 | | | $ | 671,345 | |
| Net realized gain (loss) from: | | | | | | | | | | | | | | | | |
| Investments | | | 390,084 | | | | 953,724 | | | | 32,676 | | | | 159,795 | |
| Futures contracts | | | (273,202 | ) | | | — | | | | — | | | | — | |
| Swaps | | | 510,566 | | | | 1,066,000 | | | | — | | | | — | |
| Change in net unrealized appreciation (depreciation) of: | | | | | | | | | | | | | | | | |
| Investments | | | 4,707,075 | | | | (4,563,430 | ) | | | 11,042 | | | | (351,563 | ) |
| Futures contracts | | | (68,462 | ) | | | — | | | | — | | | | — | |
| Swaps | | | (657,057 | ) | | | (362,007 | ) | | | — | | | | — | |
| Net increase (decrease) in net assets applicable to common shares from operations | | | 16,222,746 | | | | 23,062,735 | | | | 352,005 | | | | 479,577 | |
Distributions to Common Shareholders | | | | | | | | | | | | | | | | |
| From net investment income | | | (11,741,524 | ) | | | (26,080,218 | ) | | | (315,424 | ) | | | (711,822 | ) |
| From accumulated net realized gains | | | — | | | | (64,183 | ) | | | — | | | | (235,044 | ) |
| Decrease in net assets applicable to common shares from distributions to common shareholders | | | (11,741,524 | ) | | | (26,144,401 | ) | | | (315,424 | ) | | | (946,866 | ) |
Capital Share Transactions | | | | | | | | | | | | | | | | |
| Common shares: | | | | | | | | | | | | | | | | |
| Cost of shares repurchased and retired | | | (1,959,407 | ) | | | (196,781 | ) | | | — | | | | — | |
| Net proceeds from shares issued to shareholders due to reinvestment of distributions | | | — | | | | — | | | | 1,486 | | | | 16,262 | |
| Net increase (decrease) in net assets applicable to common shares from capital share transactions | | | (1,959,407 | ) | | | (196,781 | ) | | | 1,486 | | | | 16,262 | |
| Net increase (decrease) in net assets applicable to common shares | | | 2,521,815 | | | | (3,278,447 | ) | | | 38,067 | | | | (451,027 | ) |
| Net assets applicable to common shares at the beginning of period | | | 555,094,323 | | | | 558,372,770 | | | | 18,066,330 | | | | 18,517,357 | |
| Net assets applicable to common shares at the end of period | | $ | 557,616,138 | | | $ | 555,094,323 | | | $ | 18,104,397 | | | $ | 18,066,330 | |
| Undistributed (Over-distribution of) net investment income at the end of period | | $ | (1,075,373 | ) | | $ | (947,591 | ) | | $ | (1,511 | ) | | $ | 5,626 | |
See accompanying notes to financial statements.
57
| |
| Statement of Cash Flows |
| |
| Six Months Ended August 31, 2018 (Unaudited) |
| |
| |
| | | NXJ | | | NQP | |
Cash Flows from Operating Activities: | | | | | | |
Net Increase (Decrease) in Net Assets Applicable to Common Shares from Operations | | $ | 16,938,575 | | | $ | 16,222,746 | |
| Adjustments to reconcile the net increase (decrease) in net assets applicable to common shares from operations to net cash provided by (used in) operating activities: | | | | | | | | |
| Purchases of investments | | | (70,646,193 | ) | | | (36,261,433 | ) |
| Proceeds from sales and maturities of investments | | | 75,409,656 | | | | 38,220,811 | |
| Premiums received (paid) for interest rate swaps | | | (502 | ) | | | — | |
| Taxes paid | | | (41 | ) | | | (49,271 | ) |
| Amortization (Accretion) of premiums and discounts, net | | | 618,252 | | | | 1,729,582 | |
| Amortization of deferred offering costs | | | 30,390 | | | | 21,038 | |
| (Increase) Decrease in: | | | | | | | | |
| Receivable for interest | | | (10,974 | ) | | | 206,083 | |
| Receivable for investments sold | | | 1,794,016 | | | | 12,896,248 | |
| Other assets | | | (12,723 | ) | | | (14,664 | ) |
| Increase (Decrease) in: | | | | | | | | |
| Payable for interest | | | — | | | | 45,360 | |
| Payable for investments purchased | | | — | | | | (11,804,356 | ) |
| Payable for variation margin on futures contracts | | | — | | | | 68,148 | |
| Payable for variation margin on swaps | | | 9,242 | | | | — | |
| Accrued management fees | | | 46,898 | | | | 42,093 | |
| Accrued Trustees fees | | | 10,184 | | | | 9,908 | |
| Accrued other expenses | | | (1,225 | ) | | | (63,051 | ) |
| Net realized (gain) loss from investments | | | (8,018,375 | ) | | | (390,084 | ) |
| Change in net unrealized (appreciation) depreciation of: | | | | | | | | |
| Investments | | | 5,229,561 | | | | (4,707,075 | ) |
Swaps(1) | | | — | | | | 657,057 | |
| Net cash provided by (used in) operating activities | | | 21,396,741 | | | | 16,829,140 | |
Cash Flows from Financing Activities | | | | | | | | |
| Cash distributions paid to common shareholders | | | (14,463,556 | ) | | | (11,854,264 | ) |
| Cost of common shares repurchased and retired | | | (7,046,745 | ) | | | (1,959,407 | ) |
| Net cash provided by (used in) financing activities | | | (21,510,301 | ) | | | (13,813,671 | ) |
Net Increase (Decrease) in Cash and Cash Collateral at Brokers | | | (113,560 | ) | | | 3,015,469 | |
| Cash and cash collateral at the beginning of period | | | 685,130 | | | | 318,608 | |
| Cash and cash collateral at the end of period | | $ | 571,570 | | | $ | 3,334,077 | |
(1) Excluding over-the-counter cleared swaps. | | | | | | | | |
| | |
Supplemental Disclosure of Cash Flow Information | | NXJ | | | NQP | |
| Cash paid for interest (excluding amortization of offering costs) | | $ | 3,438,953 | | | $ | 3,702,675 | |
See accompanying notes to financial statements.
58
THIS PAGE INTENTIONALLY LEFT BLANK
59
Financial Highlights (Unaudited)
| |
| Selected data for a common share outstanding throughout each period: |
| |
| |
| | | | | | | | | | | | | | | Less Distributions to | | | | | | | | | | |
| | | | | | Investment Operations | | | Common Shareholders | | | Common Share | |
| | | Beginning Common Share NAV | | | Net Investment Income (Loss) | | | Net Realized/ Unrealized Gain (Loss) | | | Total | | | From Net Investment Income | | | From Accum- ulated Net Realized Gains | | | Total | | | Discount Per Share Repurchased and Retired | | | Ending NAV | | | Ending Share Price | |
NXJ | | | | | | | | | | | | | | | | | | | | | | | | | | | | | | |
Year Ended 2/28-2/29: | | | | | | | | | | | | | | | | | | | | | | | | | |
| 2019(f) | | $ | 15.37 | | | $ | 0.34 | | | $ | 0.06 | | | $ | 0.40 | | | $ | (0.34 | ) | | $ | — | | | $ | (0.34 | ) | | $ | 0.03 | | | $ | 15.46 | | | $ | 13.15 | |
| 2018 | | | 15.21 | | | | 0.71 | | | | 0.15 | | | | 0.86 | | | | (0.70 | ) | | | — | | | | (0.70 | ) | | | — | * | | | 15.37 | | | | 13.10 | |
| 2017(e) | | | 16.18 | | | | 0.60 | | | | (0.94 | ) | | | (0.34 | ) | | | (0.63 | ) | | | — | | | | (0.63 | ) | | | — | | | | 15.21 | | | | 13.42 | |
Year Ended 4/30: | | | | | | | | | | | | | | | | | | | | | | | | | | | | | | | | | |
| 2016 | | | 15.53 | | | | 0.79 | | | | 0.66 | | | | 1.45 | | | | (0.82 | ) | | | (0.01 | ) | | | (0.83 | ) | | | 0.03 | | | | 16.18 | | | | 14.66 | |
| 2015 | | | 15.28 | | | | 0.67 | | | | 0.34 | | | | 1.01 | | | | (0.77 | ) | | | — | | | | (0.77 | ) | | | 0.01 | | | | 15.53 | | | | 13.58 | |
| 2014 | | | 16.12 | | | | 0.71 | | | | (0.87 | ) | | | (0.16 | ) | | | (0.68 | ) | | | — | | | | (0.68 | ) | | | — | * | | | 15.28 | | | | 13.64 | |
| 2013 | | | 15.31 | | | | 0.63 | | | | 0.93 | | | | 1.56 | | | | (0.75 | ) | | | — | | | | (0.75 | ) | | | — | | | | 16.12 | | | | 14.94 | |
| | |
NJV | | | | | | | | | | | | | | | | | | | | | | | | | | | | | | | | | | | | | | | | |
Year Ended 2/28-2/29: | | | | | | | | | | | | | | | | | | | | | | | | | | | | | | | | | |
| 2019(f) | | | 15.15 | | | | 0.27 | | | | — | * | | | 0.27 | | | | (0.28 | ) | | | — | | | | (0.28 | ) | | | 0.01 | | | | 15.15 | | | | 12.92 | |
| 2018 | | | 15.56 | | | | 0.57 | | | | (0.05 | ) | | | 0.52 | | | | (0.58 | ) | | | (0.35 | ) | | | (0.93 | ) | | | — | | | | 15.15 | | | | 13.55 | |
| 2017(e) | | | 16.32 | | | | 0.49 | | | | (0.58 | ) | | | (0.09 | ) | | | (0.52 | ) | | | (0.15 | ) | | | (0.67 | ) | | | — | | | | 15.56 | | | | 15.61 | |
Year Ended 4/30: | | | | | | | | | | | | | | | | | | | | | | | | | | | | | | | | | |
| 2016 | | | 16.41 | | | | 0.62 | | | | 0.11 | | | | 0.73 | | | | (0.61 | ) | | | (0.21 | ) | | | (0.82 | ) | | | — | | | | 16.32 | | | | 15.16 | |
| 2015 | | | 16.15 | | | | 0.62 | | | | 0.43 | | | | 1.05 | | | | (0.63 | ) | | | (0.18 | ) | | | (0.81 | ) | | | 0.02 | | | | 16.41 | | | | 14.75 | |
| 2014 | | | 16.98 | | | | 0.65 | | | | (0.66 | ) | | | (0.01 | ) | | | (0.63 | ) | | | (0.19 | ) | | | (0.82 | ) | | | — | | | | 16.15 | | | | 14.48 | |
| 2013 | | | 16.62 | | | | 0.67 | | | | 0.61 | | | | 1.28 | | | | (0.67 | ) | | | (0.25 | ) | | | (0.92 | ) | | | — | | | | 16.98 | | | | 16.02 | |
| (a) | Total Return Based on Common Share NAV is the combination of changes in common share NAV, reinvested dividend income at NAV and reinvested capital gains distributions at NAV, if any. The last dividend declared in the period, which is typically paid on the first business day of the following month, is assumed to be reinvested at the ending NAV. The actual reinvest price for the last dividend declared in the period may often be based on the Fund’s market price (and not its NAV), and therefore may be different from the price used in the calculation. Total returns are not annualized. |
| | Total Return Based on Common Share Price is the combination of changes in the market price per share and the effect of reinvested dividend income and reinvested capital gains distributions, if any, at the average price paid per share at the time of reinvestment. The last dividend declared in the period, which is typically paid on the first business day of the following month, is assumed to be reinvested at the ending market price. The actual reinvestment for the last dividend declared in the period may take place over several days, and in some instances may not be based on the market price, so the actual reinvestment price may be different from the price used in the calculation. Total returns are not annualized. |
60
| | | | | | | | | | | | | | | | | |
| | | | | | | Common Share Supplemental Data/ | |
| | | | | | | Ratios Applicable to Common Shares | |
Common Share | | | | | | | | | | | | | |
Total Returns | | | | | | Ratios to Average Net Assets(b) | | | | |
| | |
| | |
| | | | Based | | | Ending | | | | | | | | | | |
Based | | | on | | | Net | | | | | | Net | | | Portfolio | |
on | | | Share | | | Assets | | | | | | Investment | | | Turnover | |
NAV(a) | | | Price(a) | | | | (000 | ) | | Expenses(c) | | | Income (Loss) | | | Rate(d) | |
| | |
| | |
| | 2.81 | % | | | 3.00 | % | | $ | 649,269 | | | | 2.03 | %** | | | 4.32 | %** | | | 7 | % |
| | 5.66 | | | | 2.74 | | | | 653,684 | | | | 1.78 | | | | 4.55 | | | | 11 | |
| | (2.20 | ) | | | (4.35 | ) | | | 647,626 | | | | 1.76 | ** | | | 4.54 | ** | | | 12 | |
| | |
| | 9.85 | | | | 14.79 | | | | 688,971 | | | | 1.56 | | | | 5.12 | | | | 14 | |
| | 6.77 | | | | 5.35 | | | | 668,670 | | | | 1.71 | | | | 4.64 | | | | 14 | |
| | (0.71 | ) | | | (3.78 | ) | | | 100,181 | | | | 2.07 | | | | 4.83 | | | | 6 | |
| | 10.29 | | | | 5.04 | | | | 105,892 | | | | 2.37 | | | | 3.91 | | | | 17 | |
| | |
| | |
| | |
| | 1.84 | | | | (2.61 | ) | | | 23,448 | | | | 1.06 | ** | | | 3.56 | ** | | | 8 | |
| | 3.31 | | | | (7.48 | ) | | | 23,510 | | | | 1.03 | | | | 3.63 | | | | 16 | |
| | (0.57 | ) | | | 7.39 | | | | 24,139 | | | | 0.96 | ** | | | 3.62 | ** | | | 14 | |
| | |
| | 4.57 | | | | 8.70 | | | | 25,297 | | | | 0.89 | | | | 3.87 | | | | 8 | |
| | 6.68 | | | | 7.62 | | | | 25,430 | | | | 0.87 | | | | 3.75 | | | | 13 | |
| | 0.25 | | | | (4.18 | ) | | | 25,272 | | | | 0.88 | | | | 4.12 | | | | 12 | |
| | 7.86 | | | | 3.58 | | | | 26,574 | | | | 0.83 | | | | 3.95 | | | | 7 | |
| (b) | Net Investment Income (Loss) ratios reflect income earned and expenses incurred on assets attributable to preferred shares issued by the Fund, where applicable. |
| (c) | The expense ratios reflect, among other things, all interest expense and other costs related to preferred shares (as described in Note 4 – Fund Shares, Preferred Shares) and/or the interest expense deemed to have been paid by the Fund on the floating rate certificates issued by the special purpose trusts for the self-deposited inverse floaters held by the Fund (as described in Note 3 – Portfolio Securities and Investments in Derivatives, Inverse Floating Rate Securities), where applicable, as follows: |
NXJ | | | NJV | |
| Year Ended 2/28-2/29: | | | Year Ended 2/28-2/29: | |
| 2019(f) | 1.05%** | | 2019(f) | 0.12%** |
| 2018 | 0.80 | | 2018 | 0.09 |
| 2017(e) | 0.79** | | 2017(e) | 0.07** |
| Year Ended 4/30: | | | Year Ended 4/30: | |
| 2016 | 0.57 | | 2016 | 0.04 |
| 2015 | 0.60 | | 2015 | 0.04 |
| 2014 | 0.98 | | 2014 | 0.04 |
| 2013 | 1.27 | | 2013 | 0.04 |
| (d) | Portfolio Turnover Rate is calculated based on the lesser of long-term purchases or sales (as disclosed in Note 5 – Investment Transactions) divided by the average long-term market value during the period. |
| (e) | For the ten months ended February 28, 2017. |
| (f) | For the six months ended August 31, 2018. |
| * | Rounds to less than $0.01 per share. |
| ** | Annualized. |
See accompanying notes to financial statements.
61
Financial Highlights (Unaudited) (continued)
Selected data for a common share outstanding throughout each period:
| | | | | | | | | | | | | | | | | | | | | | | | | | | | | | | |
| | | | | | | | | | | | | | | Less Distributions to | | | | | | | | | | |
| | | | | | Investment Operations | | | Common Shareholders | | | Common Share | |
| | | Beginning Common Share NAV | | | Net Investment Income (Loss) | | | Net Realized/ Unrealized Gain (Loss) | | | Total | | | From Net Investment Income | | | From Accum- ulated Net Realized Gains | | | Total | | | Discount Per Share Repurchased and Retired | | | Ending NAV | | | Ending Share Price | |
NQP | | | | | | | | | | | | | | | | | | | | | | | | | | | | | | |
Year Ended 2/28-2/29: | | | | | | | | | | | | | | | | | | | | | | | | | |
| 2019(f) | | $ | 14.71 | | | $ | 0.31 | | | $ | 0.12 | | | $ | 0.43 | | | $ | (0.31 | ) | | $ | — | | | $ | (0.31 | ) | | $ | 0.01 | | | $ | 14.84 | | | $ | 12.77 | |
| 2018 | | | 14.79 | | | | 0.69 | | | | (0.08 | ) | | | 0.61 | | | | (0.69 | ) | | | — | *** | | | (0.69 | ) | | | — | * | | | 14.71 | | | | 12.52 | |
| 2017(e) | | | 16.08 | | | | 0.60 | | | | (1.24 | ) | | | (0.64 | ) | | | (0.62 | ) | | | (0.03 | ) | | | (0.65 | ) | | | — | | | | 14.79 | | | | 13.30 | |
Year Ended 4/30: | | | | | | | | | | | | | | | | | | | | | | | | | | | | | | | | | |
| 2016 | | | 15.64 | | | | 0.80 | | | | 0.46 | | | | 1.26 | | | | (0.83 | ) | | | — | | | | (0.83 | ) | | | 0.01 | | | | 16.08 | | | | 14.91 | |
| 2015 | | | 15.17 | | | | 0.81 | | | | 0.50 | | | | 1.31 | | | | (0.84 | ) | | | — | | | | (0.84 | ) | | | — | * | | | 15.64 | | | | 13.87 | |
| 2014 | | | 16.21 | | | | 0.74 | | | | (0.93 | ) | | | (0.19 | ) | | | (0.85 | ) | | | — | | | | (0.85 | ) | | | — | * | | | 15.17 | | | | 13.76 | |
| 2013 | | | 15.78 | | | | 0.80 | | | | 0.54 | | | | 1.34 | | | | (0.91 | ) | | | — | | | | (0.91 | ) | | | — | | | | 16.21 | | | | 15.24 | |
| | |
NPN | | | | | | | | | | | | | | | | | | | | | | | | | | | | | | | | | | | | | | | | |
Year Ended 2/28-2/29: | | | | | | | | | | | | | | | | | | | | | | | | | | | | | | | | | |
| 2019(f) | | | 14.78 | | | | 0.25 | | | | 0.04 | | | | 0.29 | | | | (0.26 | ) | | | — | | | | (0.26 | ) | | | — | | | | 14.81 | | | | 13.58 | |
| 2018 | | | 15.16 | | | | 0.55 | | | | (0.16 | ) | | | 0.39 | | | | (0.58 | ) | | | (0.19 | ) | | | (0.77 | ) | | | — | | | | 14.78 | | | | 15.15 | |
| 2017(e) | | | 16.50 | | | | 0.51 | | | | (0.73 | ) | | | (0.22 | ) | | | (0.64 | ) | | | (0.48 | ) | | | (1.12 | ) | | | — | | | | 15.16 | | | | 15.83 | |
Year Ended 4/30: | | | | | | | | | | | | | | | | | | | | | | | | | | | | | | | | | |
| 2016 | | | 16.36 | | | | 0.68 | | | | 0.09 | | | | 0.77 | | | | (0.63 | ) | | | — | | | | (0.63 | ) | | | — | | | | 16.50 | | | | 16.45 | |
| 2015 | | | 15.91 | | | | 0.67 | | | | 0.41 | | | | 1.08 | | | | (0.63 | ) | | | — | | | | (0.63 | ) | | | — | | | | 16.36 | | | | 15.57 | |
| 2014 | | | 16.48 | | | | 0.67 | | | | (0.56 | ) | | | 0.11 | | | | (0.64 | ) | | | (0.04 | ) | | | (0.68 | ) | | | — | | | | 15.91 | | | | 14.45 | |
| 2013 | | | 16.36 | | | | 0.68 | | | | 0.38 | | | | 1.06 | | | | (0.64 | ) | | | (0.30 | ) | | | (0.94 | ) | | | — | | | | 16.48 | | | | 15.86 | |
| (a) | Total Return Based on Common Share NAV is the combination of changes in common share NAV, reinvested dividend income at NAV and reinvested capital gains distributions at NAV, if any. The last dividend declared in the period, which is typically paid on the first business day of the following month, is assumed to be reinvested at the ending NAV. The actual reinvest price for the last dividend declared in the period may often be based on the Fund’s market price (and not its NAV), and therefore may be different from the price used in the calculation. Total returns are not annualized. |
| | Total Return Based on Common Share Price is the combination of changes in the market price per share and the effect of reinvested dividend income and reinvested capital gains distributions, if any, at the average price paid per share at the time of reinvestment. The last dividend declared in the period, which is typically paid on the first business day of the following month, is assumed to be reinvested at the ending market price. The actual reinvestment for the last dividend declared in the period may take place over several days, and in some instances may not be based on the market price, so the actual reinvestment price may be different from the price used in the calculation. Total returns are not annualized. |
62
| | | | | | | | | | | | | | | | | |
| | | | | | | Common Share Supplemental Data/ | |
| | | | | | | Ratios Applicable to Common Shares | |
Common Share | | | | | | | | | | | | | |
Total Returns | | | | | | Ratios to Average Net Assets(b) | |
| | |
| | |
| | | | Based | | | Ending | | | | | | | | | | |
Based | | | on | | | Net | | | | | | Net | | | Portfolio | |
on | | | Share | | | Assets | | | | | | Investment | | | Turnover | |
NAV(a) | | | Price(a) | | | | (000 | ) | | Expenses(c) | | | Income (Loss) | | | Rate(d) | |
| | |
| | |
| | 3.03 | % | | | 4.55 | % | | $ | 557,616 | | | | 2.35 | %** | | | 4.14 | %** | | | 4 | % |
| | 4.12 | | | | (0.85 | ) | | | 555,094 | | | | 2.05 | | | | 4.56 | | | | 12 | |
| | (4.19 | ) | | | (6.66 | ) | | | 558,373 | | | | 1.87 | ** | | | 4.57 | ** | | | 16 | |
| | |
| | 8.46 | | | | 14.21 | | | | 607,240 | | | | 1.51 | | | | 5.13 | | | | 16 | |
| | 8.79 | | | | 7.09 | | | | 592,540 | | | | 1.60 | | | | 5.21 | | | | 9 | |
| | (0.69 | ) | | | (3.65 | ) | | | 574,558 | | | | 1.87 | | | | 5.33 | | | | 8 | |
| | 8.50 | | | | 2.97 | | | | 261,195 | | | | 1.80 | | | | 4.98 | | | | 17 | |
| | |
| | |
| | |
| | 1.96 | | | | (8.69 | ) | | | 18,104 | | | | 1.03 | ** | | | 3.38 | ** | | | 3 | |
| | 2.58 | | | | 0.68 | | | | 18,066 | | | | 1.02 | | | | 3.61 | | | | 28 | |
| | (1.33 | ) | | | 3.08 | | | | 18,517 | | | | 0.93 | ** | | | 3.80 | ** | | | 23 | |
| | |
| | 4.82 | | | | 10.09 | | | | 20,118 | | | | 0.85 | | | | 4.17 | | | | 14 | |
| | 6.87 | | | | 12.30 | | | | 19,952 | | | | 0.85 | | | | 4.11 | | | | 5 | |
| | 0.80 | | | | (4.45 | ) | | | 19,401 | | | | 0.85 | | | | 4.28 | | | | 6 | |
| | 6.58 | | | | 9.39 | | | | 20,089 | | | | 0.81 | | | | 4.11 | | | | 7 | |
| (b) | Net Investment Income (Loss) ratios reflect income earned and expenses incurred on assets attributable to preferred shares issued by the Fund, where applicable. |
| (c) | The expense ratios reflect, among other things, all interest expense and other costs related to preferred shares (as described in Note 4 – Fund Shares, Preferred Shares) and/or the interest expense deemed to have been paid by the Fund on the floating rate certificates issued by the special purpose trusts for the self-deposited inverse floaters held by the Fund (as described in Note 3 – Portfolio Securities and Investments in Derivatives, Inverse Floating Rate Securities), where applicable, as follows: |
NQP | | | NPN | |
| Year Ended 2/28-2/29: | | | Year Ended 2/28-2/29: | |
| 2019(f) | 1.34%** | | 2019(f) | 0.03%** |
| 2018 | 1.06 | | 2018 | 0.02 |
| 2017(e) | 0.89** | | 2017(e) | 0.01** |
| Year Ended 4/30: | | | Year Ended 4/30: | |
| 2016 | 0.56 | | 2016 | — |
| 2015 | 0.60 | | 2015 | — |
| 2014 | 0.68 | | 2014 | — |
| 2013 | 0.72 | | 2013 | — |
| (d) | Portfolio Turnover Rate is calculated based on the lesser of long-term purchases or sales (as disclosed in Note 5 – Investment Transactions) divided by the average long-term market value during the period. |
| (e) | For the ten months ended February 28, 2017. |
| (f) | For the six months ended August 31, 2018. |
| * | Rounds to less than $0.01 per share. |
| ** | Annualized. |
| *** | Rounds to less than $(0.01) per share. |
See accompanying notes to financial statements.
63
Financial Highlights (Unaudited) (continued)
| | | | | | | | | | | | | | | | | | | | | | |
| | | MTP Shares at the End of Period (a) | | | VMTP Shares at the End of Period | | | VRDP Shares at the End of Period | | | MTP, VMTP and/or VRDP Shares at the End of Period | |
| | | | | | | | | | | | | | | | | | | | | Asset | |
| | | Aggregate | | | Asset | | | Aggregate | | | Asset | | | Aggregate | | | Asset | | | Coverage | |
| | | Amount | | | Coverage | | | Amount | | | Coverage | | | Amount | | | Coverage | | | Per $1 | |
| | | Outstanding | | | Per $10 | | | Outstanding | | | Per $100,000 | | | Outstanding | | | Per $100,000 | | | Liquidation | |
| | | | (000 | ) | | Share | | | | (000 | ) | | Share | | | | (000 | ) | | Share | | | Preference | |
NXJ | | | | | | | | | | | | | | | | | | | | | | | | |
| Year Ended 2/28-2/29: | | | | | | | | | | | | | | | | | | |
| 2019(c) | | $ | — | | | $ | — | | | $ | — | | | $ | — | | | $ | 313,900 | | | $ | 306,839 | | | $ | — | |
| 2018 | | | — | | | | — | | | | — | | | | — | | | | 313,900 | | | | 308,246 | | | | — | |
| 2017(b) | | | — | | | | — | | | | — | | | | — | | | | 313,900 | | | | 306,316 | | | | — | |
| Year Ended 4/30: | | | | | | | | | | | | | | | | | | | | | |
| 2016 | | | — | | | | — | | | | — | | | | — | | | | 313,900 | | | | 319,488 | | | | — | |
| 2015 | | | — | | | | — | | | | — | | | | — | | | | 313,900 | | | | 313,020 | | | | — | |
| 2014 | | | — | | | | — | | | | — | | | | — | | | | 45,000 | | | | 322,624 | | | | — | |
| 2013 | | | 44,861 | | | | 33.60 | | | | — | | | | — | | | | — | | | | — | | | | — | |
| | |
NQP | | | | | | | | | | | | | | | | | | | | | | | | | | | | |
| Year Ended 2/28-2/29: | | | | | | | | | | | | | | | | | | | | | |
| 2019(c) | | | — | | | | — | | | | 87,000 | | | | 283,125 | | | | 217,500 | | | | 283,125 | | | | 2.83 | |
| 2018 | | | — | | | | — | | | | 87,000 | | | | 282,297 | | | | 217,500 | | | | 282,297 | | | | 2.82 | |
| 2017(b) | | | — | | | | — | | | | 87,000 | | | | 283,374 | | | | 217,500 | | | | 283,374 | | | | 2.83 | |
| Year Ended 4/30: | | | | | | | | | | | | | | | | | | | | | |
| 2016 | | | — | | | | — | | | | 48,000 | | | | 328,716 | | | | 217,500 | | | | 328,716 | | | | 3.29 | |
| 2015 | | | — | | | | — | | | | 48,000 | | | | 323,179 | | | | 217,500 | | | | 323,179 | | | | 3.23 | |
| 2014 | | | 47,740 | | | | 31.66 | | | | — | | | | — | | | | 217,500 | | | | 316,618 | | | | 3.17 | |
| 2013 | | | — | | | | — | | | | — | | | | — | | | | 112,500 | | | | 332,174 | | | | — | |
| (a) | The Ending and Average Market Value Per Share for each Series of the Fund’s MTP Shares were as follows: |
| | | | | | | | | | |
| | | 2015 | | | 2014 | | | 2013 | |
NXJ | | | | | | | | | |
Series 2014 (NXJ PRCCL) | | | | | | | | | |
| Ending Market Value per Share | | $ | — | | | $ | — | | | $ | 10.02 | |
| Average Market Value per Share | | | — | | | 10.03 | ^ | | | 10.09 | |
Series 2015 (NXJ PRCCL) | | | | | | | | | | | | |
| Ending Market Value per Share | | | — | | | | | | | | | |
| Average Market Value per Share | | 10.01 | ^^ | | | | | | | | |
| | |
NQP | | | | | | | | | | | | |
Series 2015 (NQP PRCCL) | | | | | | | | | | | | |
| Ending Market Value per Share | | | — | | | | 10.05 | | | | | |
| Average Market Value per Share | | 10.01 | ΩΩ | | 10.03 | Ω | | | | |
Series 2015 (NQP PRDCL) | | | | | | | | | | | | |
| Ending Market Value per Share | | | — | | | | 10.04 | | | | | |
| Average Market Value per Share | | 10.02 | ΩΩ | | 10.03 | Ω | | | | |
| (b) | For the ten months ended February 28, 2017. |
| (c) | For the six months ended August 31, 2018. |
| ^ | For the period May 1, 2013 through September 9, 2013. |
| ^^ | For the period November 10, 2014 (effective date of the reorganizations) through February 9, 2015. |
| Ω | For the period February 11, 2014 (effective date of the reorganizations) through April 30, 2014. |
| ΩΩ | For the period May 1, 2014 through May 30, 2014. |
See accompanying notes to financial statements.
64
Notes to
Financial Statements (Unaudited)
1. General Information and Significant Accounting Policies
General Information
Fund Information
The funds covered in this report and their corresponding New York Stock Exchange (“NYSE”) symbols are as follows (each a “Fund” and collectively, the “Funds”):
| · | Nuveen New Jersey Quality Municipal Income Fund (NXJ) |
| · | Nuveen New Jersey Municipal Value Fund (NJV) |
| · | Nuveen Pennsylvania Quality Municipal Income Fund (NQP) |
| · | Nuveen Pennsylvania Municipal Value Fund (NPN) |
The Funds are registered under the Investment Company Act of 1940, as amended, as diversified (non-diversified for NJV) closed-end management investment companies. NXJ, NJV, NQP and NPN were organized as Massachusetts business trusts on June 1, 1999, January 26, 2009, December 20, 1990 and January 26, 2009, respectively.
The end of the reporting period for the Funds is August 31, 2018, and the period covered by these Notes to Financial is the six months ended August 31, 2018 (the “current fiscal period”).
Investment Adviser
The Funds’ investment adviser is Nuveen Fund Advisors, LLC (the “Adviser”), a subsidiary of Nuveen, LLC (“Nuveen”). Nuveen is the investment management arm of Teachers Insurance and Annuity Association of America (TIAA). The Adviser has overall responsibility for management of the Funds, oversees the management of the Funds’ portfolios, manages the Funds’ business affairs and provides certain clerical, bookkeeping and other administrative services, and if necessary asset allocation decisions. The Adviser has entered into sub-advisory agreements with Nuveen Asset Management, LLC (the “Sub-Adviser”), a subsidiary of the Adviser, under which the Sub-Adviser manages the investment portfolios of the Funds.
Investment Objectives and Principal Investment Strategies
Each Fund seeks to provide current income exempt from both regular federal and designated state income taxes by investing primarily in a portfolio of municipal obligations issued by state and local government authorities within a single state or certain U.S. territories.
Significant Accounting Policies
Each Fund is an investment company and follows accounting and reporting guidance under Financial Accounting Standards Board (“FASB”) Accounting Standards Codification (ASC) Topic 946, “Financial Services – Investment Companies.” The following is a summary of significant accounting policies followed by the Funds in the preparation of their financial statements in accordance with U.S. generally accepted accounting principles (“U.S. GAAP”).
Investment Transactions
Investment transactions are recorded on a trade date basis. Realized gains and losses from investment transactions are determined on the specific identification method, which is the same basis used for federal income tax purposes. Investments purchased on a when-issued/delayed delivery basis may have extended settlement periods. Any investments so purchased are subject to market fluctuation during this period. The Funds have earmarked securities in their portfolios with a current value at least equal to the amount of the when-issued/delayed delivery purchase commitments.
As of the end of the reporting period, the Funds did not have any outstanding when-issued/delayed delivery purchase commitments.
Investment Income
Investment income is comprised of interest income, which reflects the amortization of premiums and accretion of discounts for financial reporting purposes, and is recorded on an accrual basis. Investment income also reflects payment-in-kind (“PIK”) interest and paydown gains and losses, if any. PIK interest represents income received in the form of securities in lieu of cash.
65
Notes to Financial Statements (Unaudited) (continued)
Professional Fees
Professional fees presented on the Statement of Operations consist of legal fees incurred in the normal course of operations, audit fees, tax consulting fees and, in some cases, workout expenditures. Workout expenditures are incurred in an attempt to protect or enhance an investment or to pursue other claims or legal actions on behalf of Fund shareholders. If a refund is received for workout expenditures paid in a prior reporting period, such amounts will be recognized as “Legal fee refund” on the Statement of Operations.
Dividends and Distributions to Common Shareholders
Dividends from net investment income, if any, are declared monthly. Net realized capital gains and/or market discount from investment transactions, if any, are distributed to shareholders at least annually. Furthermore, capital gains are distributed only to the extent they exceed available capital loss carryforwards.
Distributions to common shareholders of net investment income, net realized capital gains and/or market discount, if any, are recorded on the ex-dividend date. The amount and timing of distributions are determined in accordance with federal income tax regulations, which may differ from U.S. GAAP.
Compensation
The Funds pay no compensation directly to those of its trustees who are affiliated with the Adviser or to its officers, all of whom receive remuneration for their services to the Funds from the Adviser or its affiliates. The Funds’ Board of Trustees (the “Board”) has adopted a deferred compensation plan for independent trustees that enables trustees to elect to defer receipt of all or a portion of the annual compensation they are entitled to receive from certain Nuveen-advised funds. Under the plan, deferred amounts are treated as though equal dollar amounts had been invested in shares of select Nuveen-advised funds.
Indemnifications
Under the Funds’ organizational documents, their officers and trustees are indemnified against certain liabilities arising out of the performance of their duties to the Funds. In addition, in the normal course of business, the Funds enter into contracts that provide general indemnifications to other parties. The Funds’ maximum exposure under these arrangements is unknown as this would involve future claims that may be made against the Funds that have not yet occurred. However, the Funds have not had prior claims or losses pursuant to these contracts and expect the risk of loss to be remote.
Netting Agreements
In the ordinary course of business, the Funds may enter into transactions subject to enforceable International Swaps and Derivative Association, Inc. (ISDA) master agreements or other similar arrangements (“netting agreements”). Generally, the right to offset in netting agreements allows each Fund to offset certain securities and derivatives with a specific counterparty, when applicable, as well as any collateral received or delivered to that counterparty based on the terms of the agreements. Generally, each Fund manages its cash collateral and securities collateral on a counterparty basis.
The Funds’ investments subject to netting agreements as of the end of the reporting period, if any, are further described in Note 3 – Portfolio Securities and Investments in Derivatives.
Use of Estimates
The preparation of financial statements in conformity with U.S. GAAP requires management to make estimates and assumptions that affect the reported amounts of assets and liabilities at the date of the financial statements and the reported amounts of increases and decreases in net assets applicable to common shares from operations during the current fiscal period. Actual results may differ from those estimates.
2. Investment Valuation and Fair Value Measurements
The fair valuation input levels as described below are for fair value measurement purposes.
Fair value is defined as the price that would be received upon selling an investment or transferring a liability in an orderly transaction to an independent buyer in the principal or most advantageous market for the investment. A three-tier hierarchy is used to maximize the use of observable market data and minimize the use of unobservable inputs and to establish classification of fair value measurements for disclosure purposes. Observable inputs reflect the assumptions market participants would use in pricing the asset or liability. Observable inputs are based on market data obtained from sources independent of the reporting entity. Unobservable inputs reflect the reporting entity’s own assumptions about the assumptions market participants would use in pricing the asset or liability. Unobservable inputs are based on the best information available in the circumstances. The following is a summary of the three-tiered hierarchy of valuation input levels.
Level 1 – Inputs are unadjusted and prices are determined using quoted prices in active markets for identical securities.
Level 2 – Prices are determined using other significant observable inputs (including quoted prices for similar securities, interest rates, prepayment speeds, credit risk, etc.).
Level 3 – Prices are determined using significant unobservable inputs (including management’s assumptions in determining the fair value of investments).
66
Prices of fixed income securities are provided by an independent pricing service (“pricing service”) approved by the Board. The pricing service establishes a security’s fair value using methods that may include consideration of the following: yields or prices of investments of comparable quality, type of issue, coupon, maturity and rating, market quotes or indications of value from security dealers, evaluations of anticipated cash flows or collateral, general market conditions and other information and analysis, including the obligor’s credit characteristics considered relevant. These securities are generally classified as Level 2. In pricing certain securities, particularly less liquid and lower quality securities, the pricing service may consider information about a security, its issuer or market activity, provided by the Adviser. These securities are generally classified as Level 2 or Level 3 depending on the observability of the significant inputs.
Prices of swap contracts are also provided by a pricing service approved by the Board using the same methods as described above and are generally classified as Level 2.
Futures contracts are valued using the closing settlement price or, in the absence of such a price, the last traded price and are generally classified as Level 1.
Certain securities may not be able to be priced by the pre-established pricing methods as described above. Such securities may be valued by the Board and/or its appointee at fair value. These securities generally include, but are not limited to, restricted securities (securities which may not be publicly sold without registration under the Securities Act of 1933, as amended) for which a pricing service is unable to provide a market price; securities whose trading has been formally suspended; debt securities that have gone into default and for which there is no current market quotation; a security whose market price is not available from a pre-established pricing source; a security with respect to which an event has occurred that is likely to materially affect the value of the security after the market has closed but before the calculation of a Fund’s net asset value (“NAV”) (as may be the case in non-U.S. markets on which the security is primarily traded) or make it difficult or impossible to obtain a reliable market quotation; and a security whose price, as provided by the pricing service, is not deemed to reflect the security’s fair value. As a general principle, the fair value of a security would appear to be the amount that the owner might reasonably expect to receive for it in a current sale. A variety of factors may be considered in determining the fair value of such securities, which may include consideration of the following: yields or prices of investments of comparable quality, type of issue, coupon, maturity and rating, market quotes or indications of value from security dealers, evaluations of anticipated cash flows or collateral, general market conditions and other information and analysis, including the obligor’s credit characteristics considered relevant. These securities are generally classified as Level 2 or Level 3 depending on the observability of the significant inputs. Regardless of the method employed to value a particular security, all valuations are subject to review by the Board and/or its appointee.
The inputs or methodologies used for valuing securities are not an indication of the risks associated with investing in those securities. The following is a summary of each Fund’s fair value measurements as of the end of the reporting period:
| | | | | | | | | | | | | |
NXJ | | Level 1 | | | Level 2 | | | Level 3 | | | Total | |
| Long-Term Investments*: | | | | | | | | | | | | |
| Municipal Bonds | | $ | — | | | $ | 962,647,358 | | | $ | — | | | $ | 962,647,358 | |
| Investments in Derivatives: | | | | | | | | | | | | | | | | |
| Interest Rate Swaps** | | | — | | | | (61,764 | ) | | | — | | | | (61,764 | ) |
| Total | | $ | — | | | $ | 962,585,594 | | | $ | — | | | $ | 962,585,594 | |
NJV | | | | | | | | | | | | | | | | |
| Long-Term Investments*: | | | | | | | | | | | | | | | | |
| Municipal Bonds | | $ | — | | | $ | 24,790,027 | | | $ | — | | | $ | 24,790,027 | |
NQP | | | | | | | | | | | | | | | | |
| Long-Term Investments*: | | | | | | | | | | | | | | | | |
| Municipal Bonds | | $ | — | | | $ | 897,771,854 | | | $ | — | | | $ | 897,771,854 | |
| Investments in Derivatives: | | | | | | | | | | | | | | | | |
| Futures Contracts** | | | (68,462 | ) | | | — | | | | — | | | | (68,462 | ) |
| Interest Rate Swaps** | | | — | | | | 311,928 | | | | — | | | | 311,928 | |
| Total | | $ | (68,462 | ) | | $ | 898,083,782 | | | $ | — | | | $ | 898,015,320 | |
NPN | | | | | | | | | | | | | | | | |
| Long-Term Investments*: | | | | | | | | | | | | | | | | |
| Municipal Bonds | | $ | — | | | $ | 18,314,642 | | | $ | — | | | $ | 18,314,642 | |
| * | Refer to the Fund’s Portfolio of Investments for industry classifications. |
| ** | Represents net unrealized appreciation (depreciation) as reported in the Fund’s Portfolio of Investments. |
The Board is responsible for the valuation process and has appointed the oversight of the daily valuation process to the Adviser’s Valuation Committee. The Valuation Committee, pursuant to the valuation policies and procedures adopted by the Board, is responsible for making fair value determinations, evaluating the effectiveness of the Funds’ pricing policies and reporting to the Board. The Valuation Committee is aided in its efforts by the Adviser’s dedicated Securities Valuation Team, which is responsible for administering the daily valuation process and applying fair value methodologies as approved by the Valuation Committee. When determining the reliability of independent pricing services for investments owned by the Funds, the Valuation Committee, among other things, conducts due diligence reviews of the pricing services and monitors the quality of security prices received through various testing reports conducted by the Securities Valuation Team.
67
Notes to Financial Statements (Unaudited) (continued)
The Valuation Committee will consider pricing methodologies it deems relevant and appropriate when making a fair value determination, based on the facts and circumstances specific to the portfolio instrument. Fair value determinations generally will be derived as follows, using public or private market information:
| (i) | If available, fair value determinations shall be derived by extrapolating from recent transactions or quoted prices for identical or comparable securities. |
| (ii) | If such information is not available, an analytical valuation methodology may be used based on other available information including, but not limited to: analyst appraisals, research reports, corporate action information, issuer financial statements and shelf registration statements. Such analytical valuation methodologies may include, but are not limited to: multiple of earnings, discount from market value of a similar freely-traded security, discounted cash flow analysis, book value or a multiple thereof, risk premium/yield analysis, yield to maturity and/or fundamental investment analysis. |
The purchase price of a portfolio instrument will be used to fair value the instrument only if no other valuation methodology is available or deemed appropriate, and it is determined that the purchase price fairly reflects the instrument’s current value.
For each portfolio security that has been fair valued pursuant to the policies adopted by the Board, the fair value price is compared against the last available and next available market quotations. The Valuation Committee reviews the results of such testing and fair valuation occurrences are reported to the Board.
3. Portfolio Securities and Investments in Derivatives
Portfolio Securities
Inverse Floating Rate Securities
Each Fund is authorized to invest in inverse floating rate securities. An inverse floating rate security is created by depositing a municipal bond (referred to as an “Underlying Bond”), typically with a fixed interest rate, into a special purpose tender option bond (“TOB”) trust (referred to as the “TOB Trust”) created by or at the direction of one or more Funds. In turn, the TOB Trust issues (a) floating rate certificates (referred to as “Floaters”) in face amounts equal to some fraction of the Underlying Bond’s par amount or market value, and (b) an inverse floating rate certificate (referred to as an “Inverse Floater”) that represents all remaining or residual interest in the TOB Trust. Floaters typically pay short-term tax-exempt interest rates to third parties who are also provided a right to tender their certificate and receive its par value, which may be paid from the proceeds of a remarketing of the Floaters, by a loan to the TOB Trust from a third party liquidity provider (“Liquidity Provider”), or by the sale of assets from the TOB Trust. The Inverse Floater is issued to a long term investor, such as one or more of the Funds. The income received by the Inverse Floater holder varies inversely with the short-term rate paid to holders of the Floaters, and in most circumstances the Inverse Floater holder bears substantially all of the Underlying Bond’s downside investment risk and also benefits disproportionately from any potential appreciation of the Underlying Bond’s value. The value of an Inverse Floater will be more volatile than that of the Underlying Bond because the interest rate is dependent on not only the fixed coupon rate of the Underlying Bond but also on the short-term interest paid on the Floaters, and because the Inverse Floater essentially bears the risk of loss (and possible gain) of the greater face value of the Underlying Bond.
The Inverse Floater held by a Fund gives the Fund the right to (a) cause the holders of the Floaters to tender their certificates at par (or slightly more than par in certain circumstances), and (b) have the trustee of the TOB Trust (the “Trustee”) transfer the Underlying Bond held by the TOB Trust to the Fund, thereby collapsing the TOB Trust.
The Fund may acquire an Inverse Floater in a transaction where it (a) transfers an Underlying Bond that it owns to a TOB Trust created by a third party or (b) transfers an Underlying Bond that it owns, or that it has purchased in a secondary market transaction for the purpose of creating an Inverse Floater, to a TOB Trust created at its direction, and in return receives the Inverse Floater of the TOB Trust (referred to as a “self-deposited Inverse Floater”). A Fund may also purchase an Inverse Floater in a secondary market transaction from a third party creator of the TOB Trust without first owning the Underlying Bond (referred to as an “externally-deposited Inverse Floater”).
An investment in a self-deposited Inverse Floater is accounted for as a “financing” transaction (i.e., a secured borrowing). For a self-deposited Inverse Floater, the Underlying Bond deposited into the TOB Trust is identified in the Fund’s Portfolio of Investments as “(UB) – Underlying bond of an inverse floating rate trust reflected as a financing transaction,” with the Fund recognizing as liabilities, labeled “Floating rate obligations” on the Statement of Assets and Liabilities, (a) the liquidation value of Floaters issued by the TOB Trust, and (b) the amount of any borrowings by the TOB Trust from a Liquidity Provider to enable the TOB Trust to purchase outstanding Floaters in lieu of a remarketing. In addition, the Fund recognizes in “Investment Income” the entire earnings of the Underlying Bond, and recognizes (a) the interest paid to the holders of the Floaters or on the TOB Trust’s borrowings, and (b) other expenses related to remarketing, administration, trustee, liquidity and other services to a TOB Trust, as a component of “Interest expense and amortization of offering costs” on the Statement of Operations.
In contrast, an investment in an externally-deposited Inverse Floater is accounted for as a purchase of the Inverse Floater and is identified in the Fund’s Portfolio of Investments as “(IF) – Inverse floating rate investment.” For an externally-deposited Inverse Floater, a Fund’s Statement of Assets and Liabilities recognizes the Inverse Floater and not the Underlying Bond as an asset, and the Fund does not recognize the Floaters, or any related
68
borrowings from a Liquidity Provider, as a liability. Additionally, the Fund reflects in “Investment Income” only the net amount of earnings on the Inverse Floater (net of the interest paid to the holders of the Floaters or the Liquidity Provider as lender, and the expenses of the Trust), and does not show the amount of that interest paid or the expenses of the TOB Trust as described above as interest expense on the Statement of Operations.
Fees paid upon the creation of a TOB Trust for self-deposited Inverse Floaters and externally-deposited Inverse Floaters are recognized as part of the cost basis of the Inverse Floater and are capitalized over the term of the TOB Trust.
As of the end of the reporting period, the aggregate value of Floaters issued by each Fund’s TOB Trust for self-deposited Inverse Floaters and externally-deposited Inverse Floaters was as follows:
| | | | | | | | | | | | | |
Floating Rate Obligations Outstanding | | NXJ | | | NJV | | | NQP | | | NPN | |
| Floating rate obligations: self-deposited Inverse Floaters | | $ | 9,005,000 | | | $ | 1,500,000 | | | $ | 47,825,000 | | | $ | 300,000 | |
| Floating rate obligations: externally-deposited Inverse Floaters | | | 96,748,000 | | | | 947,000 | | | | 25,435,000 | | | | 490,000 | |
| Total | | $ | 105,753,000 | | | $ | 2,447,000 | | | $ | 73,260,000 | | | $ | 790,000 | |
During the current fiscal period, the average amount of Floaters (including any borrowings from a Liquidity Provider) outstanding, and the average annual interest rate and fees related to self-deposited Inverse Floaters, were as follows:
| | | | | | | | | | | | | |
Self-Deposited Inverse Floaters | | NXJ | | | NJV | | | NQP | | | NPN | |
| Average floating rate obligations outstanding | | $ | 9,005,000 | | | $ | 1,500,000 | | | $ | 47,825,000 | | | $ | 300,000 | |
| Average annual interest rate and fees | | | 1.93 | % | | | 1.94 | % | | | 1.92 | % | | | 1.95 | % |
TOB Trusts are supported by a liquidity facility provided by a Liquidity Provider pursuant to which the Liquidity Provider agrees, in the event that Floaters are (a) tendered to the Trustee for remarketing and the remarketing does not occur, or (b) subject to mandatory tender pursuant to the terms of the TOB Trust agreement, to either purchase Floaters or to provide the Trustee with an advance from a loan facility to fund the purchase of Floaters by the TOB Trust. In certain circumstances, the Liquidity Provider may otherwise elect to have the Trustee sell the Underlying Bond to retire the Floaters that were tendered and not remarketed prior to providing such a loan. In these circumstances, the Liquidity Provider remains obligated to provide a loan to the extent that the proceeds of the sale of the Underlying Bond is not sufficient to pay the purchase price of the Floaters.
The size of the commitment under the loan facility for a given TOB Trust is at least equal to the balance of that TOB Trust’s outstanding Floaters plus any accrued interest. In consideration of the loan facility, fee schedules are in place and are charged by the Liquidity Provider(s). Any loans made by the Liquidity Provider will be secured by the purchased Floaters held by the TOB Trust. Interest paid on any outstanding loan balances will be effectively borne by the Fund that owns the Inverse Floaters of the TOB Trust that has incurred the borrowing and may be at a rate that is greater than the rate that would have been paid had the Floaters been successfully remarketed.
As described above, any amounts outstanding under a liquidity facility are recognized as a component of “Floating rate obligations” on the Statement of Assets and Liabilities by the Fund holding the corresponding Inverse Floaters issued by the borrowing TOB Trust. As of the end of the reporting period, there were no loans outstanding under any such facility.
Each Fund may also enter into shortfall and forbearance agreements (sometimes referred to as a “recourse arrangement”) (TOB Trusts involving such agreements are referred to herein as “Recourse Trusts”), under which a Fund agrees to reimburse the Liquidity Provider for the Trust’s Floaters, in certain circumstances, for the amount (if any) by which the liquidation value of the Underlying Bond held by the TOB Trust may fall short of the sum of the liquidation value of the Floaters issued by the TOB Trust plus any amounts borrowed by the TOB Trust from the Liquidity Provider, plus any shortfalls in interest cash flows. Under these agreements, a Fund’s potential exposure to losses related to or on an Inverse Floater may increase beyond the value of the Inverse Floater as a Fund may potentially be liable to fulfill all amounts owed to holders of the Floaters or the Liquidity Provider. Any such shortfall amount in the aggregate is recognized as “Unrealized depreciation on Recourse Trusts” on the Statement of Assets and Liabilities.
As of the end of the reporting period, each Fund’s maximum exposure to the Floaters issued by Recourse Trusts for self-deposited Inverse Floaters and externally-deposited Inverse Floaters was as follows:
| | | | | | | | | | | | | |
Floating Rate Obligations — Recourse Trusts | | NXJ | | | NJV | | | NQP | | | NPN | |
| Maximum exposure to Recourse Trusts: self-deposited Inverse Floaters | | $ | 9,005,000 | | | $ | 1,500,000 | | | $ | 32,825,000 | | | $ | — | |
| Maximum exposure to Recourse Trusts: externally-deposited Inverse Floaters | | | 88,083,000 | | | | 947,000 | | | | 11,955,000 | | | | — | |
| Total | | $ | 97,088,000 | | | $ | 2,447,000 | | | $ | 44,780,000 | | | $ | — | |
Zero Coupon Securities
A zero coupon security does not pay a regular interest coupon to its holders during the life of the security. Income to the holder of the security comes from accretion of the difference between the original purchase price of the security at issuance and the par value of the security at maturity and is effectively paid at maturity. The market prices of zero coupon securities generally are more volatile than the market prices of securities that pay interest periodically.
69
Notes to Financial Statements (Unaudited) (continued)
Investments in Derivatives
In addition to the inverse floating rate securities in which each Fund may invest, which are considered portfolio securities for financial reporting purposes, each Fund is authorized to invest in certain derivative investments such as futures, options and swap contracts. Each Fund limits its investments in futures, options on futures and swap contracts to the extent necessary for the Adviser to claim exclusion from registration by the Commodity Futures Trading Commission as a commodity pool operator with respect to the Fund. The Funds record derivative instruments at fair value, with changes in fair value recognized on the Statement of Operations, when applicable. Even though the Funds’ investments in derivatives may represent economic hedges, they are not considered to be hedge transactions for financial reporting purposes.
Futures Contracts
Upon execution of a futures contract, a Fund is obligated to deposit cash or eligible securities, also known as “initial margin,” into an account at its clearing broker equal to a specified percentage of the contract amount. Cash held by the broker to cover initial margin requirements on open futures contracts, if any, is recognized as “Cash collateral at brokers for investments in futures contracts” on the Statement of Assets and Liabilities. Investments in futures contracts obligate a Fund and the clearing broker to settle monies on a daily basis representing changes in the prior days “mark-to-market” of the open contracts. If a Fund has unrealized appreciation the clearing broker would credit the Fund’s account with an amount equal to appreciation and conversely if a Fund has unrealized depreciation the clearing broker would debit the Fund’s account with an amount equal to depreciation. These daily cash settlements are also known as “variation margin.” Variation margin is recognized as a receivable and/or payable for “Variation margin on futures contracts” on the Statement of Assets and Liabilities.
During the period the futures contract is open, changes in the value of the contract are recognized as an unrealized gain or loss by “marking-to-market” on a daily basis to reflect the changes in market value of the contract, which is recognized as a component of “Change in net unrealized appreciation (depreciation) of futures contracts” on the Statement of Operations. When the contract is closed or expired, a Fund records a realized gain or loss equal to the difference between the value of the contract on the closing date and value of the contract when originally entered into, which is recognized as a component of “Net realized gain (loss) from futures contracts” on the Statement of Operations.
Risks of investments in futures contracts include the possible adverse movement in the price of the securities or indices underlying the contracts, the possibility that there may not be a liquid secondary market for the contracts and/or that a change in the value of the contract may not correlate with a change in the value of the underlying securities or indices.
During the current fiscal period, NQP used U.S. Treasury futures as part of an overall portfolio construction strategy to manage portfolio duration and yield curve exposure.
The average notional amount of futures contracts outstanding during the current fiscal period was as follows:
| | | | |
| | | NQP | |
| Average notional amount of futures contracts outstanding* | | $ | 11,623,502 | |
| * | The average notional amount is calculated based on the absolute aggregate notional amount of contracts outstanding at the beginning of the current fiscal period and at the end of each fiscal quarter within the current fiscal period. |
The following table presents the fair value of all futures contracts held by NQP as of the end of the reporting period, the location of these instruments on the Statement of Assets and Liabilities and the primary underlying risk exposure.
| | | | | | | | | | | | |
| | | | Location on the Statement of Assets and Liabilities | |
Underlying | Derivative | | Asset Derivatives | | (Liability) Derivatives | |
Risk Exposure | Instrument | | Location | | | Value | | Location | | Value | |
NQP | | | | | | | | | | | |
| Interest rate | Futures contracts | | | — | | | $ | — | | Payable for | | $ | (68,462 | ) |
| | | | | | | | | | | variation margin | | | | |
| | | | | | | | | | | on futures | | | | |
| | | | | | | | | | | contracts* | | | | |
| * | Value represents unrealized appreciation (depreciation) of futures contracts as reported in the Fund’s Portfolio of Investments and not the asset and/or liability derivatives location as described in the table above. |
The following table presents the amount of net realized gain (loss) and change in net unrealized appreciation (depreciation) recognized on futures contracts on the Statement of Operations during the current fiscal period, and the primary underlying risk exposure.
| | | | | |
| | | | | Change in Net |
| | | | | Unrealized |
| | | | Net Realized | Appreciation |
| | Underlying | Derivative | Gain (Loss) from | (Depreciation) of |
Fund | Risk Exposure | Instrument | Futures Contracts | Futures Contracts |
NQP | Interest rate | Futures contracts | $ (273,202) | $ (68,462) |
70
Interest Rate Swap Contracts
Interest rate swap contracts involve a Fund’s agreement with the counterparty to pay or receive a fixed rate payment in exchange for the counterparty receiving or paying a variable rate payment. Forward interest rate swap contracts involve a Fund’s agreement with a counterparty to pay, in the future, a fixed or variable rate payment in exchange for the counterparty paying the Fund a variable or fixed rate payment, the accruals for which begin at a specified date in the future (the “effective date”).
The amount of the payment obligation for an interest rate swap is based is based on the notional amount and the termination date of the contract. Interest rate swap contracts do not involve the delivery of securities or other underlying assets or principal. Accordingly, the risk of loss with respect to the swap counterparty on such transactions is limited to the net amount of interest payments that the Fund is to receive.
Interest rate swap contracts are valued daily. Upon entering into an interest rate swap contract (and beginning on the effective date for a forward interest rate swap contract), the Fund accrues the fixed rate payment expected to be paid or received and the variable rate payment expected to be received or paid on the interest rate swap contracts on a daily basis, and recognizes the daily change in the fair value of the Fund’s contractual rights and obligations under the contracts. For an over-the-counter (“OTC”) swap that is not cleared through a clearing house (“OTC Uncleared”), the amount recorded on these transactions is recognized on the Statement of Assets and Liabilities as a component of “Unrealized appreciation or depreciation on interest rate swaps.”
Upon the execution of an OTC swap cleared through a clearing house (“OTC Cleared”), the Fund is obligated to deposit cash or eligible securities, also known as “initial margin,” into an account at its clearing broker equal to a specified percentage of the contract amount. Cash deposited by the Fund to cover initial margin requirements on open swap contracts, if any, is recognized as a component of “Cash collateral at brokers for investments in swaps” on the Statement of Assets and Liabilities. Investments in OTC Cleared swaps obligate the Fund and the clearing broker to settle monies on a daily basis representing changes in the prior day’s “mark-to-market” of the swap contract. If the Fund has unrealized appreciation, the clearing broker will credit the Fund’s account with an amount equal to the appreciation. Conversely, if the Fund has unrealized depreciation, the clearing broker will debit the Fund’s account with an amount equal to the depreciation. These daily cash settlements are also known as “variation margin.” Variation margin for OTC Cleared swaps is recognized as a receivable and/or payable for “Variation margin on swap contracts” on the Statement of Assets and Liabilities. Upon the execution of an OTC Uncleared swap, neither the Fund nor the counterparty is required to deposit initial margin as the trades are recorded bilaterally between both parties to the swap contract, and the terms of the variation margin are subject to a predetermined threshold negotiated by the Fund and the counterparty. Variation margin for OTC Uncleared swaps is recognized as a component of “Unrealized appreciation or depreciation on interest rate swaps” as described in the preceding paragraph.
The net amount of periodic payments settled in cash are recognized as a component of “Net realized gain (loss) from swaps” on the Statement of Operations, in addition to the net realized gain or loss recorded upon the termination of the swap contract. For tax purposes, payments expected to be received or paid on the swap contracts are treated as ordinary income or expense, respectively. Changes in the value of the swap contracts during the fiscal period are recognized as a component of “Change in net unrealized appreciation (depreciation) of swaps” on the Statement of Operations. In certain instances, payments are made or received upon entering into the swap contract to compensate for differences between the stated terms of the swap agreements and prevailing market conditions (credit spreads, currency exchange rates, interest rates, and other relevant factors). Payments received or made at the beginning of the measurement period, if any, are recognized as “Interest rate swaps premiums received and/or paid” on the Statement of Assets and Liabilities.
During the current fiscal period, NXJ and NQP invested in forward interest rate swap contracts, reducing the Fund’s duration and limiting their vulnerability to rising rates.
The average notional amount of interest rate swap contracts outstanding during the current fiscal period was as follows:
| | | | | | | |
| | | NXJ | | | NQP | |
| Average notional amount of interest rate swap contracts outstanding* | | $ | 6,333,333 | | | $ | 27,633,333 | |
* The average notional amount is calculated based on the outstanding notional at the beginning of the current fiscal period and at the end of each fiscal quarter within the current fiscal period.
The following table presents the fair value of all swap contracts held by the Funds as of the end of the reporting period, the location of these instruments on the Statement of Assets and Liabilities and the primary underlying risk exposure.
| | | | | | | | | | | | |
| | | | Location on the Statement of Assets and Liabilities | |
Underlying | Derivative | | Asset Derivatives | | (Liability) Derivatives | |
Risk Exposure | Instrument | | Location | | | Value | | Location | | Value | |
NXJ | | | | | | | | | | | |
| Interest rate | Swaps (OTC Cleared) | | — | | | $ | — | | Payable for variation margin | | $ | (61,764 | ) |
| | | | | | | | | | on swap contracts**^ | | | | |
NQP | | | | | | | | | | | | | |
| Interest rate | Swaps (OTC Uncleared) | | Unrealized appreciation | | | $ | 311,928 | | — | | $ | — | |
| | | on interest rate swaps | | | | | | | | | | |
| ** | Value represents unrealized appreciation (depreciation) of swaps as reported in the Fund’s Portfolio of Investments and not the asset and/or liability amount as described in the table above. |
| ^ | Some swap contracts require a counterparty to pay or receive a premium, which is disclosed on the Statement of Assets and Liabilities and is not reflected in the cumulative unrealized appreciation (depreciation) presented above. |
71
Notes to Financial Statements (Unaudited) (continued)
The following table presents the swap contracts subject to netting agreements and the collateral delivered related to those swap contracts as of the end of the reporting period.
| | | | | | | |
| | | Gross | Gross | Net Unrealized | | |
| | | Unrealized | Unrealized | Appreciation | Collateral | |
| | | Appreciation on | (Depreciation) | (Depreciation) on | Pledged | |
| | | Interest | on Interest | Interest Rate | to (from) | Net |
Fund | Counterparty | Rate Swaps*** | Rate Swaps*** | Swaps | Counterparty | Exposure |
NQP | JPMorgan Chase Bank, N.A. | $ 311,928 | $ — | $ 311,928 | $ (311,928) | $ — |
*** Represents gross unrealized appreciation (depreciation) for the counterparty as reported in the Fund’s Portfolio of Investments.
The following table presents the amount of net realized gain (loss) and change in net unrealized appreciation (depreciation) recognized on swap contracts on the Statement of Operations during the current fiscal period, and the primary underlying risk exposure.
| | | | | | | | | |
| | | | | | | | Change in Net | |
| | | | | | | | Unrealized | |
| | | | | Net Realized | | | Appreciation | |
| Underlying | Derivative | | Gain (Loss) from | | | (Depreciation) of | |
Fund | Risk Exposure | Instrument | | Swaps | | | Swaps | |
NXJ | Interest rate | Swaps | | $ | 1,888 | | | $ | (61,764 | ) |
NQP | Interest rate | Swaps | | $ | 510,566 | | | $ | (657,057 | ) |
Market and Counterparty Credit Risk
In the normal course of business each Fund may invest in financial instruments and enter into financial transactions where risk of potential loss exists due to changes in the market (market risk) or failure of the other party to the transaction to perform (counterparty credit risk). The potential loss could exceed the value of the financial assets recorded on the financial statements. Financial assets, which potentially expose each Fund to counterparty credit risk, consist principally of cash due from counterparties on forward, option and swap transactions, when applicable. The extent of each Fund’s exposure to counterparty credit risk in respect to these financial assets approximates their carrying value as recorded on the Statement of Assets and Liabilities.
Each Fund helps manage counterparty credit risk by entering into agreements only with counterparties the Adviser believes have the financial resources to honor their obligations and by having the Adviser monitor the financial stability of the counterparties. Additionally, counterparties may be required to pledge collateral daily (based on the daily valuation of the financial asset) on behalf of each Fund with a value approximately equal to the amount of any unrealized gain above a pre-determined threshold. Reciprocally, when each Fund has an unrealized loss, the Funds have instructed the custodian to pledge assets of the Funds as collateral with a value approximately equal to the amount of the unrealized loss above a pre-determined threshold. Collateral pledges are monitored and subsequently adjusted if and when the valuations fluctuate, either up or down, by at least the pre-determined threshold amount.
4. Fund Shares
Common Share Transactions
Transactions in common shares during the Funds’ current and prior fiscal period, where applicable, were as follows:
| | | | | | | | | | | | | |
| | | NXJ | | | NJV | |
| | | Six Months | | | Year | | | Six Months | | | Year | |
| | | Ended | | | Ended | | | Ended | | | Ended | |
| | | 8/31/18 | | | 2/28/18 | | | 8/31/18 | | | 2/28/18 | |
| Common shares: | | | | | | | | | | | | |
| Issued to shareholders due to reinvestments of distributions | | | — | | | | — | | | | — | | | | 141 | |
| Repurchased and retired | | | (539,900 | ) | | | (49,600 | ) | | | (3,900 | ) | | | — | |
| Weighted average common share: | | | | | | | | | | | | | | | | |
| Price per share repurchased and retired | | $ | 13.03 | | | $ | 13.47 | | | $ | 12.98 | | | $ | — | |
| Discount per share repurchased and retired | | | 15.65 | % | | | 14.07 | % | | | 14.38 | % | | | — | % |
| | |
| | | NQP | | | NPN | |
| | | Six Months | | | Year | | | Six Months | | | Year | |
| | | Ended | | | Ended | | | Ended | | | Ended | |
| | | 8/31/18 | | | 2/28/18 | | | 8/31/18 | | | 2/28/18 | |
| Common shares: | | | | | | | | | | | | | | | | |
| Issued to shareholders due to reinvestments of distributions | | | — | | | | — | | | | 100 | | | | 1,060 | |
| Repurchased and retired | | | (157,300 | ) | | | (15,500 | ) | | | — | | | | — | |
| Weighted average common share: | | | | | | | | | | | | | | | | |
| Price per share repurchased and retired | | $ | 12.44 | | | $ | 12.68 | | | $ | — | | | $ | — | |
| Discount per share repurchased and retired | | | 15.50 | % | | | 14.72 | % | | | — | % | | | — | % |
72
Preferred Shares
Variable Rate MuniFund Term Preferred Shares
The following Fund has issued and has outstanding Variable Rate MuniFund Term Preferred (“VMTP”) Shares, with a $100,000 liquidation preference per share. VMTP Shares are issued via private placement and are not publicly available.
As of the end of the reporting period, details of the following Fund’s VMTP Shares outstanding were as follows:
| | | | | | | Liquidation | | | | |
| | | | | | | Preference | | | | |
| | | | Shares | | | net of deferred | | | Liquidation | |
Fund | Series | | Outstanding | | | offering costs | | | Preference | |
NQP | 2019 | | | 870 | | | $ | 86,992,645 | | | $ | 87,000,000 | |
The Fund is obligated to redeem its VMTP Shares by the date as specified in its offering document (“Term Redemption Date”), unless earlier redeemed by the Fund. VMTP Shares are subject to optional and mandatory redemption in certain circumstances. The VMTP Shares may be redeemed at the option of the Fund, subject to payment of premium for approximately one year following the date of issuance (“Premium Expiration Date”), and at the redemption price per share thereafter. The redemption price per share is equal to the sum of the liquidation preference per share plus any accumulated but unpaid dividends. The Fund may be obligated to redeem a certain amount of the VMTP Shares if the Fund fails to maintain certain asset coverage and leverage ratio requirements and such failures are not cured by the applicable cure date. The Term Redemption Date and Premium Expiration Date for the Fund’s VMTP Shares are as follows:
| | | | |
| | | Term | Premium |
Fund | Series | Redemption Date | Expiration Date |
NQP | 2019 | September 1, 2019 | August 31, 2017 |
The average liquidation preference of VMTP Shares outstanding and annualized dividend rate for the Fund during the current fiscal period were as follows:
| | | NQP | |
| Average liquidation preference of VMTP Shares outstanding | | $ | 87,000,000 | |
| Annualized dividend rate | | | 2.29 | % |
VMTP Shares are subject to restrictions on transfer, generally do not trade, and market quotations are generally not available. VMTP Shares are short-term or short/intermediate-term instruments that pay a variable dividend rate tied to a short-term index, plus an additional fixed “spread” amount established at the time of issuance. The fair value of VMTP Shares is expected to be approximately their liquidation preference so long as the fixed “spread” on the VMTP Shares remains roughly in line with the “spread” being demanded by investors on instruments having similar terms in the current market environment. In present market conditions, the Fund’s Adviser has determined that fair value of VMTP Shares is approximately their liquidation preference, but their fair value could vary if market conditions change materially. For financial reporting purposes, the liquidation preference of VMTP Shares is a liability and is recognized as a component of “Variable Rate MuniFund Term Preferred (“VMTP”) Shares, net of deferred offering costs” on the Statement of Assets and Liabilities.
Dividends on the VMTP shares (which are treated as interest payments for financial reporting purposes) are set weekly. Unpaid dividends on VMTP Shares are recognized as a component of “Interest payable” on the Statement of Assets and Liabilities. Dividends accrued on VMTP Shares are recognized as a component of “Interest expense and amortization of offering costs” on the Statement of Operations.
Costs incurred in connection with the Fund’s initial offering of VMTP Shares were recorded as a deferred charges, which are amortized over the life of the shares and are recognized as components of “Variable Rate MuniFund Term Preferred (“VMTP“) Shares, net of deferred offering costs” on the Statement of Assets and Liabilities and “Interest expense and amortization of offering costs” on the Statement of Operations.
Variable Rate Demand Preferred Shares
The following Funds have issued and have outstanding Variable Rate Demand Preferred (“VRDP”) Shares, with a $100,000 liquidation preference per share. VRDP Shares are issued via private placement and are not publicly available.
As of the end of the reporting period, NXJ and NQP had $312,410,169 and $216,665,196 VRDP Shares at liquidation preference, net of deferred offering costs, respectively. Further details of the Funds’ VRDP Shares outstanding as of the end of the reporting period, were as follows:
| | | | | | | | | | | | |
| | | | | | Shares | | | Liquidation | | Special Rate | |
Fund | | Series | | | Outstanding | | | Preference | | Period Expiration | Maturity |
NXJ | | | 1 | | | | 810 | | | $ | 81,000,000 | | July 24, 2019 | August 3, 2043 |
| | | | 2 | | | | 1,443 | | | | 144,300,000 | | April 1, 2043 | April 1, 2043 |
| | | | 3 | | | | 886 | | | | 88,600,000 | | November 14, 2018 | April 1, 2043 |
NQP | | | 2 | | | | 1,125 | | | $ | 112,500,000 | | December 1, 2042 | December 1, 2042 |
| | | | 3 | | | | 1,050 | | | | 105,000,000 | | November 14, 2018 | December 1, 2042 |
73
Notes to Financial Statements (Unaudited) (continued)
VRDP Shares include a liquidity feature that allows VRDP shareholders to have their shares purchased by a liquidity provider with whom each Fund has contracted in the event that the VRDP Shares are not able to be successfully remarketed. Each Fund is required to redeem any VRDP Shares that are still owned by the liquidity provider after six months of continuous, unsuccessful remarketing. Each Fund pays an annual remarketing fee of 0.10% on the aggregate principal amount of all VRDP Shares outstanding. Each Fund’s VRDP Shares have successfully remarketed since issuance.
All series of NXJ’s and NQP’s VRDP Shares are considered to be Special Rate Period VRDP, which are sold to institutional investors. During the special rate period, the VRDP Shares will not be remarketed by a remarketing agent, be subject to optional or mandatory tender events, or be supported by a liquidity provider. During the special rate period, VRDP dividends will be set monthly as a floating rate based on the predetermined formula. Following the initial special rate period, Special Rate Period VRDP Shares will transition to traditional VRDP Shares with dividends set at weekly remarketings, and be supported by a designated liquidity provider, unless the Board approves a subsequent special rate period.
Dividends on the VRDP Shares (which are treated as interest payments for financial reporting purposes) are set at a rate established by a remarketing agent; therefore, the market value of the VRDP Shares is expected to approximate its liquidation preference. In the event that VRDP Shares are unable to be successfully remarketed, the dividend rate will be the maximum rate which is designed to escalate according to a specified schedule in order to enhance the remarketing agent’s ability to successfully remarket the VRDP Shares.
Subject to certain conditions, VRDP Shares may be redeemed, in whole or in part, at any time at the option of each Fund. Each Fund may also redeem certain of the VRDP Shares if the Fund fails to maintain certain asset coverage requirements and such failures are not cured by the applicable cure date. The redemption price per share is equal to the sum of the liquidation preference per share plus any accumulated but unpaid dividends.
The average liquidation preference of VRDP Shares outstanding and annualized dividend rate for each Fund during the current fiscal period were as follows:
| | | | | | | |
| | | NXJ | | | NQP | |
| Average liquidation preference of VRDP Shares outstanding | | $ | 313,900,000 | | | $ | 217,500,000 | |
| Annualized dividend rate | | | 2.10 | % | | | 2.07 | % |
For financial reporting purposes, the liquidation preference of VRDP Shares is a liability and is recognized as a component of “Variable Rate Demand Preferred (“VRDP”) Shares, net of deferred offering costs” on the Statement of Assets and Liabilities. Unpaid dividends on VRDP Shares are recognized as a component of “Interest payable” on the Statement of Assets and Liabilities, when applicable. Dividends accrued on VRDP Shares are recognized as a component of “Interest expense and amortization of offering costs” on the Statement of Operations. Costs incurred by the Funds in connection with their offerings of VRDP Shares were recorded as a deferred charge, which are amortized over the life of the shares and are recognized as a component of “Variable Rate Demand Preferred (“VRDP”) Shares, net of deferred offering costs” on the Statement of Assets and Liabilities and “Interest expense and amortization of offering costs” on the Statement of Operations. In addition to interest expense, each Fund may also pay a per annum liquidity fee to the liquidity provider, as well as a remarketing fee, which are recognized as “Liquidity fees” and “Remarketing fees,” respectively, on the Statement of Operations, when applicable.
Preferred Share Transactions
The Funds did not have any transactions in preferred shares during the current and prior fiscal period.
5. Investment Transactions
Long-term purchases and sales (including maturities but excluding derivative transactions, where applicable) during the current fiscal period were as follows:
| | | | | | | | | | | | | |
| | | NXJ | | | NJV | | | NQP | | | NPN | |
| Purchases | | $ | 70,646,193 | | | $ | 2,108,526 | | | $ | 36,261,433 | | | $ | 762,788 | |
| Sales and maturities | | | 75,409,656 | | | | 2,105,098 | | | | 38,220,811 | | | | 627,523 | |
6. Income Tax Information
Each Fund is a separate taxpayer for federal income tax purposes. Each Fund intends to distribute substantially all of its net investment income and net capital gains to shareholders and to otherwise comply with the requirements of Subchapter M of the Internal Revenue Code applicable to regulated investment companies. Therefore, no federal income tax provision is required. Furthermore, each Fund intends to satisfy conditions that will enable interest from municipal securities, which is exempt from regular federal and designated state income taxes, to retain such tax-exempt status when distributed to shareholders of the Funds. Net realized capital gains and ordinary income distributions paid by the Funds are subject to federal taxation.
For all open tax years and all major taxing jurisdictions, management of the Funds has concluded that there are no significant uncertain tax positions that would require recognition in the financial statements. Open tax years are those that are open for examination by taxing authorities (i.e., generally the last four tax year ends and the interim tax period since then). Furthermore, management of the Funds is also not aware of any tax positions for which it is reasonably possible that the total amounts of unrecognized tax benefits will significantly change in the next twelve months.
74
The following information is presented on an income tax basis. Differences between amounts for financial statement and federal income tax purposes are primarily due to timing differences in recognizing taxable market discount, timing differences in recognizing certain gains and losses on investment transactions and the treatment of investments in inverse floating rate securities reflected as financing transactions, if any. To the extent that differences arise that are permanent in nature, such amounts are reclassified within the capital accounts as detailed below. Temporary differences do not require reclassification. Temporary and permanent differences do not impact the NAVs of the Funds.
The tables below present the cost and unrealized appreciation (depreciation) of each Fund’s investment portfolio, as determined on a federal income tax basis, as of August 31, 2018.
For purposes of this disclosure, derivative tax cost is generally the sum of any upfront fees or premiums exchanged and any amounts unrealized for income statement reporting but realized in income and/or capital gains for tax reporting. If a particular derivative category does not disclose any tax unrealized appreciation or depreciation, the change in value of those derivatives have generally been fully realized for tax purposes.
| | | | | | | | | | | | | |
| | | NXJ | | | NJV | | | NQP | | | NPN | |
| Tax cost of investments: | | $ | 908,251,607 | | | $ | 22,506,590 | | | $ | 824,051,585 | | | $ | 17,500,367 | |
| Gross unrealized: | | | | | | | | | | | | | | | | |
| Appreciation | | | 49,257,969 | | | | 959,620 | | | | 37,422,609 | | | | 719,597 | |
| Depreciation | | | (3,867,256 | ) | | | (176,185 | ) | | | (11,527,296 | ) | | | (205,320 | ) |
| Net unrealized appreciation (depreciation) of investments | | $ | 45,390,713 | | | $ | 783,435 | | | $ | 25,895,313 | | | $ | 514,277 | |
| | | | | | | | | | | | | | | NQP | |
| Tax cost of futures contracts | | | | | | | | | | | | | | $ | (68,462 | ) |
| Net unrealized appreciation (depreciation) of futures contracts | | | | | | | | | | | | | | | — | |
| | | | | | | | | | | NXJ | | | NQP | |
| Tax cost of swaps | | | | | | | | | | $ | 502 | | | $ | — | |
| Net unrealized appreciation (depreciation) of swaps | | | | | | | | | | | (61,764 | ) | | | 311,928 | |
Permanent differences, primarily due to federal taxes paid, taxable market discount, and nondeductible offering costs, resulted in reclassifications among the Funds’ components of common share net assets as of February 28, 2018, the Funds’ last tax year end, as follows:
| | | | | | | | | | | | | |
| | | NXJ | | | NJV | | | NQP | | | NPN | |
| Paid-in-surplus | | $ | (143,897 | ) | | $ | — | | | $ | (153,045 | ) | | $ | — | |
| Undistributed (Over-distribution of) net investment income | | | 133,084 | | | | (4 | ) | | | 128,956 | | | | — | |
| Accumulated net realized gain (loss) | | | 10,813 | | | | 4 | | | | 24,089 | | | | — | |
The tax components of undistributed net tax-exempt income, net ordinary income and net long-term capital gains as of February 28, 2018, the Funds’ last tax year end, were as follows:
| | | | | | | | | | | | | |
| | | NXJ | | | NJV | | | NQP | | | NPN | |
Undistributed net tax-exempt income1 | | $ | 2,449,229 | | | $ | 69,711 | | | $ | 596,004 | | | $ | 39,687 | |
Undistributed net ordinary income2 | | | 1,781 | | | | 2,994 | | | | 17,945 | | | | — | |
| Undistributed net long-term capital gains | | | — | | | | 86,498 | | | | 844,454 | | | | 79,309 | |
1 | Undistributed net tax-exempt income (on a tax basis) has not been reduced for the dividend declared on February 1, 2018, paid on March 1, 2018. |
2 | Net ordinary income consists of taxable market discount income and net short-term capital gains, if any. |
The tax character of distributions paid during the Funds’ last tax year ended February 28, 2018 was designated for purposes of the dividends paid deduction as follows:
| | | | | | | | | | | | | |
| | | NXJ | | | NJV | | | NQP | | | NPN | |
| Distributions from net tax-exempt income | | $ | 34,901,901 | | | $ | 886,594 | | | $ | 31,232,070 | | | $ | 709,942 | |
Distributions from net ordinary income2 | | | 119,237 | | | | 15,669 | | | | 143,468 | | | | 30,136 | |
| Distributions from net long-term capital gains | | | — | | | | 542,044 | | | | 64,183 | | | | 214,679 | |
2 | Net ordinary income consists of taxable market discount income and net short-term capital gains, if any. |
75
Notes to Financial Statements (Unaudited) (continued)
As of February 28, 2018, the Funds’ last tax year end, the following Fund has unused capital losses carrying forward available for federal income tax purposes to be applied against future capital gains, if any. The capital losses are not subject to expiration.
| | | | |
| | | NXJ3 | |
| Capital losses to be carried forward – not subject to expiration | | $ | 3,586,406 | |
3 | A portion of NXJ’s capital loss carryforward is subject to an annual limitation under the Internal Revenue Code and related regulations. |
During the Funds’ last tax year ended February 28, 2018, NXJ utilized $1,031,847 of its capital loss carryforward.
7. Management Fees and Other Transactions with Affiliates
Management Fees
Each Fund’s management fee compensates the Adviser for overall investment advisory and administrative services and general office facilities. The Sub-Adviser is compensated for its services to the Funds from the management fees paid to the Adviser.
Each Fund’s management fee consists of two components – a fund-level fee, based only on the amount of assets within each individual Fund, and a complex-level fee, based on the aggregate amount of all eligible fund assets managed by the Adviser. This pricing structure enables Fund shareholders to benefit from growth in the assets within their respective Fund as well as from growth in the amount of complex-wide assets managed by the Adviser.
The annual fund-level fee, payable monthly, for each Fund is calculated according to the following schedules:
| | | | |
| | | NXJ | |
| | | NQP | |
Average Daily Managed Assets* | | Fund-Level Fee | |
| For the first $125 million | | | 0.4500 | % |
| For the next $125 million | | | 0.4375 | |
| For the next $250 million | | | 0.4250 | |
| For the next $500 million | | | 0.4125 | |
| For the next $1 billion | | | 0.4000 | |
| For the next $3 billion | | | 0.3750 | |
| For managed assets over $5 billion | | | 0.3625 | |
| | | NJV | |
| | | NPN | |
Average Daily Net Assets* | | Fund-Level Fee | |
| For the first $125 million | | | 0.4000 | % |
| For the next $125 million | | | 0.3875 | |
| For the next $250 million | | | 0.3750 | |
| For the next $500 million | | | 0.3625 | |
| For the next $1 billion | | | 0.3500 | |
| For the next $3 billion | | | 0.3250 | |
| For managed assets over $5 billion | | | 0.3125 | |
76
The annual complex-level fee, payable monthly, for each Fund is calculated by multiplying the current complex-wide fee rate, determined according to the following schedule by the Fund’s daily managed assets (net assets for NJV and NPN):
| | | | |
Complex-Level Eligible Asset Breakpoint Level* | | Effective Complex-Level Fee Rate at Breakpoint Level | |
| $55 billion | | | 0.2000 | % |
| $56 billion | | | 0.1996 | |
| $57 billion | | | 0.1989 | |
| $60 billion | | | 0.1961 | |
| $63 billion | | | 0.1931 | |
| $66 billion | | | 0.1900 | |
| $71 billion | | | 0.1851 | |
| $76 billion | | | 0.1806 | |
| $80 billion | | | 0.1773 | |
| $91 billion | | | 0.1691 | |
| $125 billion | | | 0.1599 | |
| $200 billion | | | 0.1505 | |
| $250 billion | | | 0.1469 | |
| $300 billion | | | 0.1445 | |
| * | For the complex-level fees, managed assets include closed-end fund assets managed by the Adviser that are attributable to certain types of leverage. For these purposes, leverage includes the funds’ use of preferred stock and borrowings and certain investments in the residual interest certificates (also called inverse floating rate securities) in tender option bond (TOB) trusts, including the portion of assets held by a TOB trust that has been effectively financed by the trust’s issuance of floating rate securities, subject to an agreement by the Adviser as to certain funds to limit the amount of such assets for determining managed assets in certain circumstances. The complex-level fee is calculated based upon the aggregate daily managed assets of all Nuveen funds that constitute “eligible assets.” Eligible assets do not include assets attributable to investments in other Nuveen funds or assets in excess of a determined amount (originally $2 billion) added to the Nuveen fund complex in connection with the Adviser’s assumption of the management of the former First American Funds effective January 1, 2011. As of August 31, 2018, the complex-level fee for each Fund was 0.1588%. |
Other Transactions with Affiliates
Each Fund is permitted to purchase or sell securities from or to certain other funds managed by the Adviser (“inter-fund trade”) under specified conditions outlined in procedures adopted by the Board. These procedures have been designed to ensure that any inter-fund trade of securities by the Fund from or to another fund that is, or could be, considered an affiliate of the Fund under certain limited circumstances by virtue of having a common investment adviser (or affiliated investment adviser), common officer and/or common trustee complies with Rule 17a-7 of the 1940 Act. Further, as defined under these procedures, each inter-fund trade is effected at the current market price as provided by an independent pricing service. Unsettled inter-fund trades as of the end of the reporting period are recognized as a component of “Receivable for investments sold” and/or “Payable for investments purchased” on the Statement of Assets and Liabilities, when applicable.
During the current fiscal period, the Funds did not engage in inter-fund trades pursuant to these procedures.
8. Borrowing Arrangements
Committed Line of Credit
The Funds, along with certain other funds managed by the Adviser (“Participating Funds”), have established a 364-day, approximately $2.65 billion standby credit facility with a group of lenders, under which the Participating Funds may borrow for various purposes other than leveraging for investment purposes. A large portion of this facility’s capacity (and its associated costs as described below) is currently dedicated for use by a small number of Participating Funds, which does not include any of the Funds covered by this shareholder report. The credit facility expires in July 2019 unless extended or renewed.
The credit facility has the following terms: a fee of 0.15% per annum on unused commitment amounts, and interest at a rate equal to the higher of (a) one-month LIBOR (London Inter-Bank Offered Rate) plus 1.00% per annum or (b) the Fed Funds rate plus 1.00% per annum on amounts borrowed. Participating Funds paid administration, legal and arrangement fees, which are recognized as a component of “Other expenses” on the Statement of Operations, and along with commitment fees, have been allocated among such Participating Funds based upon the relative proportions of the facility’s aggregate capacity reserved for them and other factors deemed relevant by the Adviser and the Board of each Participating Fund.
77
Notes to Financial Statements (Unaudited) (continued)
During the current fiscal period, the following Funds utilized this facility. The Funds’ maximum outstanding balance during the utilization period was as follows:
| | | | | | | |
| | | NXJ | | | NQP | |
| Maximum outstanding balance | | $ | 22,300,000 | | | $ | 4,000,000 | |
During each Fund's utilization period(s) during the current fiscal period, the average daily balance outstanding and average annual interest rate on the Borrowings were as follows:
| | | | | | | |
| | | NXJ | | | NQP | |
| Average daily balance outstanding | | $ | 19,500,000 | | | $ | 4,000,000 | |
| Average annual interest rate | | | 2.90 | % | | | 3.09 | % |
Borrowings outstanding as of the end of the reporting period are recognized as “Borrowings” on the Statement of Assets and Liabilities, where applicable.
Inter-Fund Borrowing and Lending
The Securities and Exchange Commission (“SEC”) has granted an exemptive order permitting registered open-end and closed-end Nuveen funds to participate in an inter-fund lending facility whereby the Nuveen funds may directly lend to and borrow money from each other for temporary purposes (e.g., to satisfy redemption requests or when a sale of securities “fails,” resulting in an unanticipated cash shortfall) (the “Inter-Fund Program”). The closed-end Nuveen funds, including the Funds covered by this shareholder report, will participate only as lenders, and not as borrowers, in the Inter-Fund Program because such closed-end funds rarely, if ever, need to borrow cash to meet redemptions. The Inter-Fund Program is subject to a number of conditions, including, among other things, the requirements that (1) no fund may borrow or lend money through the Inter-Fund Program unless it receives a more favorable interest rate than is typically available from a bank or other financial institution for a comparable transaction; (2) no fund may borrow on an unsecured basis through the Inter-Fund Program unless the fund’s outstanding borrowings from all sources immediately after the inter-fund borrowing total 10% or less of its total assets; provided that if the borrowing fund has a secured borrowing outstanding from any other lender, including but not limited to another fund, the inter-fund loan must be secured on at least an equal priority basis with at least an equivalent percentage of collateral to loan value; (3) if a fund’s total outstanding borrowings immediately after an inter-fund borrowing would be greater than 10% of its total assets, the fund may borrow through the inter-fund loan on a secured basis only; (4) no fund may lend money if the loan would cause its aggregate outstanding loans through the Inter-Fund Program to exceed 15% of its net assets at the time of the loan; (5) a fund’s inter-fund loans to any one fund shall not exceed 5% of the lending fund’s net assets; (6) the duration of inter-fund loans will be limited to the time required to receive payment for securities sold, but in no event more than seven days; and (7) each interfund loan may be called on one business day’s notice by a lending fund and may be repaid on any day by a borrowing fund. In addition, a Nuveen fund may participate in the Inter-Fund Program only if and to the extent that such participation is consistent with the fund’s investment objective and investment policies. The Board is responsible for overseeing the Inter-Fund Program.
The limitations detailed above and the other conditions of the SEC exemptive order permitting the Inter-Fund Program are designed to minimize the risks associated with Inter-Fund Program for both the lending fund and the borrowing fund. However, no borrowing or lending activity is without risk. When a fund borrows money from another fund, there is a risk that the loan could be called on one day’s notice or not renewed, in which case the fund may have to borrow from a bank at a higher rate or take other actions to payoff such loan if an inter-fund loan is not available from another fund. Any delay in repayment to a lending fund could result in a lost investment opportunity or additional borrowing costs.
During the current reporting period, none of the Funds covered by this shareholder report have entered into any inter-fund loan activity.
9. New Accounting Pronouncements
FASB Accounting Standards Update (“ASU”) 2017-08 (“ASU 2017-08”) Premium Amortization on Purchased Callable Debt Securities
The FASB has issued ASU 2017-08, which shortens the premium amortization period for purchased non-contingently callable debt securities. ASU 2017-08 specifies that the premium amortization period ends at the earliest call date, for purchased non-contingently callable debt securities. ASU 2017-08 is effective for fiscal years, and interim periods within those fiscal years, beginning after December 15, 2018. Management is currently evaluating the implications of ASU 2017-08, if any.
78
Additional Fund
Information
| | | | | | |
Board of Trustees | | | | | |
| Margo Cook * | Jack B. Evans | William C. Hunter | Albin F. Moschner | John K. Nelson | William J. Schneider |
| Judith M. Stockdale | Carole E. Stone | Terence J. Toth | Margaret L. Wolff | Robert L. Young | |
| |
| * Interested Board Member. |
| | | | | |
Fund Manager | Custodian | Legal Counsel | Independent Registered | Transfer Agent and |
| Nuveen Fund Advisors, LLC | State Street Bank | Chapman and Cutler LLP | Public Accounting Firm | Shareholder Services |
| 333 West Wacker Drive | and Trust Company | Chicago, IL 60603 | KPMG LLP | Computershare Trust |
| Chicago, IL 60606 | One Lincoln Street | | 200 East Randolph Street | Company, N.A. |
| | Boston, MA 02111 | | Chicago, IL 60601 | 250 Royall Street |
| | | | | Canton, MA 02021 |
| | | | | (800) 257-8787 |
Quarterly Form N-Q Portfolio of Investments Information
Each Fund is required to file its complete schedule of portfolio holdings with the Securities and Exchange Commission (SEC) for the first and third quarters of each fiscal year on Form N-Q. You may obtain this information directly from the SEC. Visit the SEC on-line at http://www.sec.gov or in person at the SEC’s Public Reference Room in Washington, D.C. Call the SEC toll-free at (800) SEC-0330 for room hours and operation.
Nuveen Funds’ Proxy Voting Information
You may obtain (i) information regarding how each fund voted proxies relating to portfolio securities held during the most recent twelve-month period ended June 30, without charge, upon request, by calling Nuveen toll-free at (800) 257-8787 or on Nuveen’s website at www.nuveen.com and (ii) a description of the policies and procedures that each fund used to determine how to vote proxies relating to portfolio securities without charge, upon request, by calling Nuveen toll free at (800) 257-8787. You may also obtain this information directly from the SEC. Visit the SEC on-line at http://www.sec.gov.
CEO Certification Disclosure
Each Fund’s Chief Executive Officer (CEO) has submitted to the New York Stock Exchange (NYSE) the annual CEO certification as required by Section 303A.12(a) of the NYSE Listed Company Manual. Each Fund has filed with the SEC the certification of its CEO and Chief Financial Officer required by Section 302 of the Sarbanes-Oxley Act.
Common Share Repurchases
Each Fund intends to repurchase, through its open-market share repurchase program, shares of its own common stock at such times and in such amounts as is deemed advisable. During the period covered by this report, each Fund repurchased shares of its common stock, as shown in the accompanying table. Any future repurchases will be reported to shareholders in the next annual or semi-annual report.
| | | | | |
| | NXJ | NJV | NQP | NPN |
| Common shares repurchased | 539,900 | 3,900 | 157,300 | — |
FINRA BrokerCheck
The Financial Industry Regulatory Authority (FINRA) provides information regarding the disciplinary history of FINRA member firms and associated investment professionals. This information as well as an investor brochure describing FINRA BrokerCheck is available to the public by calling the FINRA BrokerCheck Hotline number at (800) 289-9999 or by visiting www.FINRA.org.
79Glossary of Terms Used in this Report
| ■ | Auction Rate Bond: An auction rate bond is a security whose interest payments are adjusted periodically through an auction process, which process typically also serves as a means for buying and selling the bond. Auctions that fail to attract enough buyers for all the shares offered for sale are deemed to have “failed,” with current holders receiving a formula-based interest rate until the next scheduled auction. |
| ■ | Average Annual Total Return: This is a commonly used method to express an investment’s performance over a particular, usually multi-year time period. It expresses the return that would have been necessary each year to equal the investment’s actual cumulative performance (including change in NAV or market price and reinvested dividends and capital gains distributions, if any) over the time period being considered. |
| ■ | Duration: Duration is a measure of the expected period over which a bond’s principal and interest will be paid, and consequently is a measure of the sensitivity of a bond’s or bond fund’s value to changes when market interest rates change. Generally, the longer a bond’s or fund’s duration, the more the price of the bond or fund will change as interest rates change. |
| ■ | Effective Leverage: Effective leverage is a fund’s effective economic leverage, and includes both regulatory leverage (see leverage) and the leverage effects of certain derivative investments in the fund’s portfolio. Currently, the leverage effects of Tender Option Bond (TOB) inverse floater holdings are included in effective leverage values, in addition to any regulatory leverage. |
| ■ | Forward Interest Rate Swap: A contractual agreement between two counterparties under which one party agrees to make periodic payments to the other for an agreed period of time based on a fixed rate, while the other party agrees to make periodic payments based on a floating rate of interest based on an underlying index. Alternatively, both series of cashflows to be exchanged could be calculated using floating rates of interest but floating rates that are based upon different underlying indexes. |
| ■ | Inverse Floating Rate Securities: Inverse floating rate securities, also known as inverse floaters or tender option bonds (TOBs), are created by depositing a municipal bond, typically with a fixed interest rate, into a special purpose trust. This trust, in turn, (a) issues floating rate certificates typically paying short-term tax-exempt interest rates to third parties in amounts equal to some fraction of the deposited bond’s par amount or market value, and (b) issues an inverse floating rate certificate (sometimes referred to as an “inverse floater”) to an investor (such as a Fund) interested in gaining investment exposure to a long-term municipal bond. The income received by the holder of the inverse floater varies inversely with the short-term rate paid to the floating rate certificates’ holders, and in most circumstances the holder of the inverse floater bears substantially all of the underlying bond’s downside investment risk. The holder of the inverse floater typically also benefits disproportionately from any potential appreciation of the underlying bond’s value. Hence, an inverse floater essentially represents an investment in the underlying bond on a leveraged basis. |
| ■ | Leverage: Leverage is created whenever a fund has investment exposure (both reward and/or risk) equivalent to more than 100% of the investment capital. |
| ■ | Net Asset Value (NAV) Per Share: A fund’s Net Assets is equal to its total assets (securities, cash, accrued earnings and receivables) less its total liabilities. NAV per share is equal to the fund’s Net Assets divided by its number of shares outstanding. |
| ■ | Pre-Refunding: Pre-Refunding, also known as advanced refundings or refinancings, is a procedure used by state and local governments to refinance municipal bonds to lower interest expenses. The issuer sells new bonds with a lower yield and uses the proceeds to buy U.S. Treasury securities, the interest from which is used to make payments on the higher-yielding bonds. Because of this collateral, pre-refunding generally raises a bond’s credit rating and thus its value. |
80
| ■ | Regulatory Leverage: Regulatory leverage consists of preferred shares issued by or borrowings of a fund. Both of these are part of a fund’s capital structure. Regulatory leverage is subject to asset coverage limits set in the Investment Company Act of 1940. |
| ■ | S&P Municipal Bond Index: An unleveraged, market value-weighted index designed to measure the performance of the tax-exempt, investment-grade U.S. municipal bond market. Index returns assume reinvestment of distributions, but do not reflect any applicable sales charges or management fees. |
| ■ | S&P Municipal Bond New Jersey Index: An unleveraged, market value-weighted index designed to measure the performance of the tax-exempt, investment-grade New Jersey municipal bond market. Index returns assume reinvestment of distributions, but do not reflect any applicable sales charges or management fees. |
| ■ | S&P Municipal Bond Pennsylvania Index: An unleveraged, market value-weighted index designed to measure the performance of the tax-exempt, investment-grade Pennsylvania municipal bond market. Index returns assume reinvestment of distributions, but do not reflect any applicable sales charges or management fees. |
| ■ | Total Investment Exposure: Total investment exposure is a fund’s assets managed by the Adviser that are attributable to financial leverage. For these purposes, financial leverage includes a fund’s use of preferred stock and borrowings and investments in the residual interest certificates (also called inverse floating rate securities) in tender option bond (TOB) trusts, including the portion of assets held by a TOB trust that has been effectively financed by the trust’s issuance of floating rate securities. |
| ■ | Zero Coupon Bond: A zero coupon bond does not pay a regular interest coupon to its holders during the life of the bond. Income to the holder of the bond comes from accretion of the difference between the original purchase price of the bond at issuance and the par value of the bond at maturity and is effectively paid at maturity. The market prices of zero coupon bonds generally are more volatile than the market prices of bonds that pay interest periodically. |
81
Reinvest Automatically, Easily and Conveniently
Nuveen makes reinvesting easy. A phone call is all it takes to set up your reinvestment account.
Nuveen Closed-End Funds Automatic Reinvestment PlanNuveen Closed-End Fund allows you to conveniently reinvest distributions in additional Fund shares. By choosing to reinvest, you’ll be able to invest money regularly and automatically, and watch your investment grow through the power of compounding. Just like distributions in cash, there may be times when income or capital gains taxes may be payable on distributions that are reinvested. It is important to note that an automatic reinvestment plan does not ensure a profit, nor does it protect you against loss in a declining market.
Easy and convenient
To make recordkeeping easy and convenient, each month you’ll receive a statement showing your total distributions, the date of investment, the shares acquired and the price per share, and the total number of shares you own.
How shares are purchased
The shares you acquire by reinvesting will either be purchased on the open market or newly issued by the Fund. If the shares are trading at or above net asset value at the time of valuation, the Fund will issue new shares at the greater of the net asset value or 95% of the then-current market price. If the shares are trading at less than net asset value, shares for your account will be purchased on the open market. If the Plan Agent begins purchasing Fund shares on the open market while shares are trading below net asset value, but the Fund’s shares subsequently trade at or above their net asset value before the Plan Agent is able to complete its purchases, the Plan Agent may cease open-market purchases and may invest the uninvested portion of the distribution in newly-issued Fund shares at a price equal to the greater of the shares’ net asset value or 95% of the shares’ market value on the last business day immediately prior to the purchase date. Distributions received to purchase shares in the open market will normally be invested shortly after the distribution payment date. No interest will be paid on distributions awaiting reinvestment. Because the market price of the shares may increase before purchases are completed, the average purchase price per share may exceed the market price at the time of valuation, resulting in the acquisition of fewer shares than if the distribution had been paid in shares issued by the Fund. A pro rata portion of any applicable brokerage commissions on open market purchases will be paid by Plan participants. These commissions usually will be lower than those charged on individual transactions.
Flexible
You may change your distribution option or withdraw from the Plan at any time, should your needs or situation change. You can reinvest whether your shares are registered in your name, or in the name of a brokerage firm, bank, or other nominee. Ask your investment advisor if his or her firm will participate on your behalf. Participants whose shares are registered in the name of one firm may not be able to transfer the shares to another firm and continue to participate in the Plan. The Fund reserves the right to amend or terminate the Plan at any time. Although the Fund reserves the right to amend the Plan to include a service charge payable by the participants, there is no direct service charge to participants in the Plan at this time.
Call today to start reinvesting distributions
For more information on the Nuveen Automatic Reinvestment Plan or to enroll in or withdraw from the Plan, speak with your financial advisor or call us at (800) 257-8787.
82
Annual Investment Management Agreement Approval Process (Unaudited)
At a meeting held on May 22-24, 2018 (the “May Meeting”), the Board of Trustees (each, a “Board,” and each Trustee, a “Board Member”) of each Fund, including the Board Members who are not “interested persons” (as defined under the Investment Company Act of 1940 (the “1940 Act”)) (the “Independent Board Members”), approved, for its respective Fund, the renewal of the management agreement (the “Investment Management Agreement”) with Nuveen Fund Advisors, LLC (the “Adviser”) pursuant to which the Adviser serves as investment adviser to such Fund and the sub-advisory agreement (the “Sub-Advisory Agreement”) with Nuveen Asset Management, LLC (the “Sub-Adviser”) pursuant to which the Sub-Adviser serves as investment sub-adviser to such Fund. Following an initial two-year period, the Board, including the Independent Board Members, is required under the 1940 Act to review and approve each Investment Management Agreement and Sub-Advisory Agreement on behalf of the applicable Fund on an annual basis. The Investment Management Agreements and Sub-Advisory Agreements are collectively referred to as the “Advisory Agreements” and the Adviser and the Sub-Adviser are collectively, the “Fund Advisers” and each, a “Fund Adviser.”
In response to a request on behalf of the Independent Board Members by independent legal counsel, the Board received and reviewed prior to the May Meeting extensive materials specifically prepared for the annual review of Advisory Agreements by the Adviser as well as by Broadridge Financial Solutions, Inc. (“Broadridge” or “Lipper”), an independent provider of investment company data. The materials provided in connection with the annual review covered a breadth of subject matter including, but not limited to, a description of the nature, extent and quality of services provided by each Fund Adviser; a review of the Sub-Adviser and the applicable investment team(s); an analysis of fund performance in absolute terms and as compared to the performance of certain peer funds and benchmarks with a focus on any performance outliers; an analysis of the fees and expense ratios of the Nuveen funds in absolute terms and as compared to those of certain peer funds with a focus on any expense outliers; a description of portfolio manager compensation; a review of the secondary market for Nuveen closed-end funds (including, among other things an analysis of performance, distribution and valuation and capital raising trends in the broader closed-end fund market and in particular to Nuveen closed-end funds; a review of the leverage management actions taken on behalf of the Nuveen closed-end funds and the resulting impact on performance; and a description of the distribution management process and any capital management activities); a review of the performance of various service providers; a description of various initiatives Nuveen had undertaken or continued during the year for the benefit of particular Nuveen fund(s) and/or the complex; a description of the profitability or financial data of Nuveen and the various sub-advisers to the Nuveen funds; and a description of indirect benefits received by the Fund Advisers as a result of their relationships with the Nuveen funds. The Independent Board Members also received a memorandum from independent legal counsel outlining their fiduciary duties and legal standards in reviewing the Advisory Agreements. The Board Members held an in-person meeting on April 10-11, 2018 (the “April Meeting”), in part, to review and discuss the performance of the Nuveen funds and the Adviser’s evaluation of the various sub-advisers to the Nuveen funds. Prior to the May Meeting, the Board Members also received and reviewed supplemental information provided in response to questions posed by the Board Members.
The information prepared specifically for the annual review of the Advisory Agreements supplemented the information provided to the Board and its committees throughout the year. The Board and its committees met regularly during the year and the information provided and topics discussed were relevant to the review of the Advisory Agreements. Some of these reports and other data included, among other things, materials that outlined the investment performance of the Nuveen funds; strategic plans of the Adviser which may impact the services it provides to the Nuveen funds; the review of the Nuveen funds and applicable investment teams; the management of leveraging financing for the Nuveen closed-end funds; the secondary market trading of the Nuveen closed-end funds and any actions to address discounts; compliance, regulatory and risk management matters; the trading practices of the various sub-advisers; valuation of securities; fund expenses; and overall market and regulatory developments. The Board further
83
Annual Investment Management Agreement Approval Process (Unaudited) (continued)
continued its practice of seeking to meet periodically with the various sub-advisers to the Nuveen funds and their investment teams, when feasible. As a result, the Independent Board Members considered the review of the Advisory Agreements to be an ongoing process and employed the accumulated information, knowledge, and experience the Board Members had gained during their tenure on the boards governing the Nuveen funds and working with the Fund Advisers in their review of the Advisory Agreements. Throughout the year and during the annual review of Advisory Agreements, the Independent Board Members met in executive sessions with independent legal counsel and had the benefit of counsel’s advice.
In deciding to renew the Advisory Agreements, the Independent Board Members did not identify a particular factor as determinative, but rather the decision reflected the comprehensive consideration of all the information provided, and each Board Member may have attributed different levels of importance to the various factors and information considered in connection with the approval process. The following summarizes the principal factors, but not all the factors, the Board considered in deciding to renew the Advisory Agreements and its conclusions.
A. Nature, Extent and Quality of Services
In evaluating the renewal of the Advisory Agreements, the Independent Board Members received and considered information regarding the nature, extent and quality of the applicable Fund Adviser’s services provided to the respective Fund and the resulting performance of each Fund. With respect to the Adviser, the Board recognized the comprehensive set of management, oversight and administrative services the Adviser and its affiliates provided to manage and operate the Nuveen funds in a highly regulated industry. As illustrative, these services included, but were not limited to, product management; investment oversight, risk management and securities valuation services; fund accounting and administration services; board support and administration services; compliance and regulatory oversight services; legal support; and with respect to closed-end funds, leverage, capital and distribution management services.
In addition to the services necessary to operate and maintain the Nuveen funds, the Board recognized the Adviser’s continued program of improvements and innovations to make the Nuveen fund complex more relevant and attractive to existing and new investors and to accommodate the new and changing regulatory requirements in an increasingly complex regulatory environment. The Board noted that some of the initiatives the Adviser had taken over recent years to benefit the complex and particular Nuveen funds included, among other things:
• Fund Rationalizations – continuing efforts to rationalize the product line through mergers, liquidations and repositionings in seeking to enhance shareholder value over the years through increased efficiency, reduced costs, improved performance and revised investment approaches more relevant to current shareholder needs;
• Product Innovations – developing product innovations and launching new products that will help the Nuveen fund complex offer a variety of products that will attract new investors and retain existing investors, such as launching the target term funds, exchange-traded funds (“ETFs”) and multi-asset class funds;
• Risk Management Enhancements – continuing efforts to enhance risk management, including enhancing reporting to increase the efficiency of risk monitoring, implementing programs to strengthen the ability to detect and mitigate operational risks, dedicating resources and staffing necessary to create standards to help ensure compliance with new liquidity requirements, and implementing a price verification system;
• Additional Compliance Services – the continuing investment of significant resources, time and additional staffing to meet the various new regulatory requirements affecting the Nuveen funds over the past several years, the further implementation of unified compliance policies and processes, the development of additional compliance training modules, and the reorganization of the compliance team adding further depth to its senior leadership;
• Expanded Dividend Management Services – as the Nuveen fund complex has grown, the additional services necessary to manage the distributions of the varied funds offered and investing in automated systems to assist in this process; and
84
• with respect specifically to closed-end funds, such initiatives also included:
•• Leverage Management Services – continuing activities to expand financing relationships and develop new product structures to lower fund leverage expenses and to manage associated risks, particularly in an interest rate increasing environment;
•• Capital Management Services – continuing capital management activities through the share repurchase program and additional equity offerings in seeking to increase net asset value and/or improve fund performance for the respective Nuveen funds;
•• Data and Market Analytics – continuing development of databases that help with obtaining and analyzing ownership data of closed-end funds;
•• Enhanced Secondary Market Reporting – providing enhanced reporting and commentary on the secondary market trading of closed-end funds which permit more efficient analysis of the performance of the Nuveen funds compared to peers and of trends in the marketplace; and
•• Tender Option Bond Services – providing the additional support services necessary for Nuveen funds that seek to use tender option bonds to meet new regulatory requirements.
The Board also recognized the Adviser’s investor relations program which seeks to advance the Nuveen closed-end funds through, among other things, raising awareness and delivering education regarding closed-end funds to investors and financial advisors and promoting the Nuveen closed-end funds with such investors.
In addition to the services provided by the Adviser, the Board also noted the business related risks the Adviser incurred in managing the Nuveen funds, including entrepreneurial, legal and litigation risks.
The Board further considered the division of responsibilities between the Adviser and the Sub-Adviser and the investment and compliance oversight over the Sub-Adviser provided by the Adviser. The Board recognized that the Sub-Adviser generally provided the portfolio advisory services for the Funds. The Board reviewed the Adviser’s analysis of the Sub-Adviser which evaluated, among other things, the investment team, the members’ experience and any changes to the team during the year, the team’s assets under management, the stability and history of the organization, the team’s investment approach and the performance of the Funds over various periods. The Board noted that the Adviser recommended the renewal of the Sub-Advisory Agreements.
Based on its review, the Board determined, in the exercise of its reasonable business judgment, that it was satisfied with the nature, extent and quality of services provided to the respective Funds under each applicable Advisory Agreement.
B. The Investment Performance of the Funds and Fund Advisers
As part of its evaluation of the services provided by the Fund Advisers, the Board considered the investment performance of each Fund. In this regard, the Board reviewed fund performance over the quarter, one-, three- and five-year periods ending December 31, 2017 as well as performance data for the first quarter of 2018 ending March 31, 2018. The Independent Board Members noted that they reviewed and discussed fund performance over various time periods with management at their quarterly meetings throughout the year and their review and analysis of performance during the annual review of Advisory Agreements incorporated such discussions.
The Board reviewed performance on an absolute basis and in comparison to the performance of peer funds (the “Performance Peer Group”) and recognized and/or customized benchmarks (i.e., generally benchmarks derived from multiple recognized benchmarks). The Board considered the Adviser’s analysis of each Nuveen fund’s performance, including, in particular, an analysis of the Nuveen funds determined to be performance outliers and the factors contributing to their underperformance. In addition to the foregoing, in recognizing the importance of secondary market trading to shareholders of closed-end funds, the
85
Annual Investment Management Agreement Approval Process (Unaudited) (continued)
Board reviewed, among other things, the premium or discount to net asset value of the Nuveen closed-end funds as of a specified date as well as relative to the premiums or discounts of certain peers and the funds’ total return based on net asset value and market price over various periods. The Board considers the review of premiums and discounts of the closed-end funds to be a continuing priority and as such, the Board and/or its Closed-end Fund Committee also receives an update on the secondary closed-end fund market and evaluates the premiums and discounts of the Nuveen closed-end funds at each quarterly meeting, reviewing, among other things, the premium and discount trends in the broader closed-end fund market, by asset category and by closed-end fund; the historical total return performance data for the Nuveen closed-end funds based on net asset value and price over various periods; the volatility trends in the market; the distribution data of the Nuveen closed-end funds and as compared to peer averages; and a summary of the common share shelf offerings and share repurchase activity during the applicable quarter. As the Board’s Closed-end Fund Committee oversees matters particularly impacting the closed-end fund product line, the committee further engages in more in-depth discussions of the premiums and discounts of the Nuveen closed-end funds at each of its quarterly meetings.
In reviewing performance data, the Independent Board Members appreciated some of the inherent limitations of such data. In this regard, the Independent Board Members recognized that there may be limitations with the comparative data of certain peer groups or benchmarks as they may pursue objective(s), strategies or have other characteristics that are different from the respective Nuveen fund and therefore the performance results necessarily are different and limit the value of the comparisons. As an example, some funds may utilize leverage which may add to or detract from performance compared to an unlevered benchmark. The Independent Board Members also noted that management had ranked the relevancy of the peer group as low, medium or high to help the Board evaluate the value of the comparative peer performance data. The Board was aware that the performance data was measured as of a specific date and a different time period may reflect significantly different results and a period of underperformance can significantly impact long term performance figures. The Board further recognized that a shareholder’s experience in a Fund depends on his or her own holding period which may differ from that reviewed by the Independent Board Members.
In their review of performance, the Independent Board Members focused, in particular, on the Adviser’s analysis of Nuveen funds determined to be underperforming performance outliers. The Independent Board Members noted that only a limited number of the Nuveen funds appeared to be underperforming performance outliers at the end of 2017 and considered the factors contributing to the respective fund’s performance and whether there were any performance concerns that needed to be addressed. The Board recognized that some periods of underperformance may only be temporary while other periods of underperformance may indicate a broader issue that may require a corrective action. Accordingly, with respect to any Nuveen funds for which the Board had identified performance issues, the Board monitors such funds closely until performance improves, discusses with the Adviser the reasons for such results, considers whether any steps are necessary or appropriate to address such issues, and reviews the results of any efforts undertaken.
For Nuveen New Jersey Quality Municipal Income Fund (the “New Jersey Quality Fund”), the Board noted that the Fund ranked in the first quartile of its Performance Peer Group in the one- and three-year periods and second quartile in the five-year period. The Fund also outperformed its benchmark in the one-, three- and five-year periods. The Board was satisfied with the Fund’s overall performance.
For Nuveen New Jersey Municipal Value Fund (the “New Jersey Municipal Value Fund”), the Board noted that although the Fund ranked in the fourth quartile of its Performance Peer Group in the three- and five-year periods, the Fund ranked in the third quartile in the one-year period. In its review, the Board, however, noted that the Performance Peer Group was classified as low for relevancy. Although the Fund underperformed its benchmark in the one- and three-year periods, the Fund outperformed its benchmark in the five-year period. The Board was satisfied with the Fund’s overall performance.
86
For Nuveen Pennsylvania Quality Municipal Income Fund (the “Pennsylvania Quality Fund”), the Board noted that the Fund ranked in the first quartile of its Performance Peer Group in the one-year period and the second quartile in the three- and five-year periods. The Fund also outperformed its benchmark in the one-, three- and five-year periods. The Board was satisfied with the Fund’s overall performance.
For Nuveen Pennsylvania Municipal Value Fund (the “Pennsylvania Municipal Value Fund”), the Board noted that although the Fund ranked in the fourth quartile of its Performance Peer Group in the three- and five-year periods, the Fund ranked in the third quartile in the one-year period. In its review, the Board, however, noted that the Performance Peer Group was classified as low for relevancy. Although the Fund underperformed its benchmark in the three- and five-year periods, the Fund outperformed its benchmark in the one-year period. The Board was satisfied with the Fund’s overall performance.
C. Fees, Expenses and Profitability
1. Fees and Expenses
In its annual review, the Board considered the fees paid to the Fund Advisers and the total operating expense ratio of each Fund. More specifically, the Independent Board Members reviewed, among other things, each Fund’s gross and net management fee rates and net total expense ratio in relation to those of a comparable universe of funds (the “Peer Universe”) established by Broadridge. The Independent Board Members reviewed the methodology Broadridge employed to establish its Peer Universe and recognized that differences between the applicable fund and its respective Peer Universe may limit some of the value of the comparative data. The Independent Board Members also considered a fund’s operating expense ratio as it more directly reflected the shareholder’s costs in investing in the respective fund. In their review, the Independent Board Members considered, in particular, each fund with a net expense ratio (excluding investment-related costs of leverage for closed-end funds) of six basis points or higher compared to that of its peer average (each an “Expense Outlier Fund”). The Board noted that the number of Nuveen funds classified as an Expense Outlier Fund pursuant to the foregoing criteria had decreased over the past few years with only a limited number of the Nuveen funds identified as Expense Outlier Funds in 2017. The Independent Board Members reviewed an analysis as to the factors contributing to each such fund’s higher relative net expense ratio. In addition, although the Board reviewed a fund’s total net expenses both including and excluding investment-related expenses (i.e., leverage costs) and taxes for certain of the Nuveen closed-end funds, the Board recognized that leverage expenses will vary across funds and in comparison to peers because of differences in the forms and terms of leverage employed by the respective fund. Accordingly, in reviewing the comparative data between a fund and its peers, the Board generally considered the fund’s net expense ratio and fees (excluding leverage costs and leveraged assets for the closed-end funds) to be higher if they were over 10 basis points higher, slightly higher if they were 6 to 10 basis points higher, in line if they were within approximately 5 basis points higher than the peer average and below if they were below the peer average of the Peer Universe.
In their review of the fee arrangements for the Nuveen funds, the Independent Board Members considered the management fee schedules, including the complex-wide and fund-level breakpoint schedules, as applicable. The Board considered that across the Nuveen fund complex, the complex-wide fee breakpoints reduced fees by $47.4 million and fund-level breakpoints reduced fees by $54.6 million in 2017.
The Board considered the sub-advisory fees paid to the Sub-Adviser, including any breakpoint schedule, and as described below, comparative data of the fees the Sub-Adviser charges to other clients.
The Independent Board Members noted that: (a) the Pennsylvania Quality Fund had a net management fee in line with its peer average and a net expense ratio below its peer average; and (b) each of the New Jersey Quality Fund, the New Jersey Municipal Value Fund and the Pennsylvania Municipal Value Fund had a net management fee and a net expense ratio below its respective peer averages.
Based on their review of the information provided, the Board determined that each Fund’s management fees (as applicable) to a Fund Adviser were reasonable in light of the nature, extent and quality of services provided to the Fund.
87
Annual Investment Management Agreement Approval Process (Unaudited) (continued)
2. Comparisons with the Fees of Other Clients
In determining the appropriateness of fees, the Board also reviewed information regarding the fee rates the respective Fund Advisers charged for certain other types of clients and the type of services provided to these other clients. With respect to the Adviser and/or affiliated sub-advisers to the municipal funds, such other clients may include retail and institutional managed accounts, passively managed ETFs sub-advised by the Sub-Adviser but that are offered by another fund complex and municipal managed accounts offered by an unaffiliated adviser.
The Board recognized that each Fund had an affiliated sub-adviser and reviewed, among other things, the range of fees and average fee rates assessed for managed accounts. In addition to the comparative fee data, the Board also reviewed, among other things, a description of the different levels of services provided to other clients compared to the services provided to the Nuveen funds as well as the differences in portfolio investment policies, investor profiles, account sizes and regulatory requirements, all of which contribute to the variations in the fee schedules. In general, the Board noted that the higher fee levels reflect higher levels of services provided by Nuveen, increased investment management complexity, greater product management requirements and higher levels of business risk or some combination of these factors. The Board further considered that the Sub-Adviser’s fee is essentially for portfolio management services and therefore more comparable to the fees it receives for retail wrap accounts and other external sub-advisory mandates. The Board concluded the varying levels of fees were justified given, among other things, the inherent differences in the products and the level of services provided to the Nuveen funds versus other clients, the differing regulatory requirements and legal liabilities and the entrepreneurial risks incurred in sponsoring and advising a registered investment company.
3. Profitability of Fund Advisers
In conjunction with their review of fees, the Independent Board Members considered Nuveen’s level of profitability for its advisory services to the Nuveen funds for the calendar years 2017 and 2016. In considering profitability, the Independent Board Members reviewed the level of profitability realized by Nuveen including and excluding any distribution expenses incurred by Nuveen from its own resources. The Independent Board Members also reviewed a description of the expense allocation methodology employed to develop the financial information and a summary of the history of changes to the methodology over the years. For comparability purposes, the Board recognized that a prior year’s profitability would be restated to reflect any refinements to the methodology. The Independent Board Members were aware of the inherent limitations in calculating profitability as the use of different reasonable allocation methodologies may lead to significantly different results and in reviewing profitability margins over extended periods given the refinements to the methodology over time. The Board noted that two Independent Board Members, along with independent counsel, serve as the Board’s liaisons to review and discuss any proposed changes to the methodology prior to the full Board’s review.
In their review, the Independent Board Members evaluated, among other things, Nuveen’s adjusted operating margins, gross and net revenue margins (pre-tax and after-tax) for advisory activities for the Nuveen funds, and the revenues, expenses, and net income (pre-tax and after-tax and before distribution) of Nuveen for fund advisory services for each of the last two calendar years. The Independent Board Members also reviewed an analysis of the key drivers behind the changes in revenues and expenses that impacted profitability in 2017 versus 2016. The Board noted that Nuveen recently launched its ETF product line in 2016 and reviewed the revenues, expenses and operating margin from this product line.
In addition to reviewing Nuveen’s profitability in absolute terms, the Independent Board Members also examined comparative profitability data reviewing, among other things, the revenues, expenses and adjusted total company margins of other advisory firms that had publicly available information and comparable assets under management (based on asset size and asset composition) for 2017 and as compared to their adjusted operating margins for 2016. The Independent Board Members, however, recognized the difficulty in comparing the profitability of various fund managers given the limited public information
88
available and the subjective nature of calculating profitability which may be affected by numerous factors including the fund manager’s organizational structure, types of funds, other lines of business, methodology used to allocate expenses and cost of capital. Nevertheless, considering such limitations and based on the information provided, the Board noted that Nuveen’s adjusted operating margins appeared reasonable when compared to the adjusted margins of the peers.
Aside from Nuveen’s profitability, the Board recognized that the Adviser is a subsidiary of Nuveen, LLC, the investment management arm of Teachers Insurance and Annuity Association of America (“TIAA”). As such, the Board also reviewed a balance sheet for TIAA reflecting its assets, liabilities and capital and contingency reserves for the 2017 and 2016 calendar years to consider the financial strength of TIAA.
In reviewing profitability, the Independent Board Members also considered the profitability of the various sub-advisers from their relationships with the respective Nuveen fund(s). The Independent Board Members reviewed the Sub-Adviser’s revenues, expenses and revenue margins (pre- and post-tax) for its advisory activities for the calendar year ended December 31, 2017. The Independent Board Members also reviewed a profitability analysis reflecting the revenues, expenses and revenue margin (pre- and post-tax) by asset type for the Sub-Adviser for the calendar year ending December 31, 2017 and the pre- and post-tax revenue margin from 2017 and 2016.
In evaluating the reasonableness of the compensation, the Independent Board Members also considered any other ancillary benefits derived by the respective Fund Adviser from its relationship with the Nuveen funds as discussed in further detail below.
Based on a consideration of all the information provided, the Board noted that Nuveen’s and the Sub-Adviser’s level of profitability was acceptable and not unreasonable in light of the services provided.
D. Economies of Scale and Whether Fee Levels Reflect These Economies of Scale
The Independent Board Members considered the extent to which economies of scale may be achieved as a Fund grows and whether these economies of scale have been shared with shareholders. Although the Board recognized that economies of scale are difficult to measure, the Independent Board Members noted that there are several methods that may be used in seeking to share economies of scale, including through breakpoints in the management fee schedule reducing the fee rates as asset levels grow, fee waivers and/or expense limitation agreements and the Adviser’s investment in its business which can enhance the services provided to the Nuveen funds. With respect to breakpoint schedules, because the Board had previously recognized that economies of scale may occur not only when the assets of a particular fund grow but also when the assets in the complex grow, the Nuveen funds generally pay the Adviser a management fee comprised of a fund-level component and a complex-level component each with its own breakpoint schedule, subject to certain exceptions. In general terms, the breakpoint schedule at the fund level reduces fees as assets in the particular fund pass certain thresholds and the breakpoint schedule at the complex level reduces fees on certain funds as the eligible assets in the complex pass certain thresholds. Subject to exceptions for certain Nuveen funds, the Independent Board Members reviewed the fund-level and complex-level fee schedules and any resulting savings in fees. In addition, with respect to closed-end funds, the Independent Board Members noted that, although such funds may from time-to-time make additional share offerings, the growth of their assets would occur primarily through the appreciation of such funds’ investment portfolios. Further, the Independent Board Members recognized the Adviser’s continued reinvestment in its business through, among other things, improvements in technology, additional staffing, product innovations and other organizational changes designed to expand or enhance the services provided to the benefit of all of the Nuveen funds.
Based on its review, the Board concluded that the current fee arrangements together with the Adviser’s reinvestment in its business appropriately shared any economies of scale with shareholders.
89
Annual Investment Management Agreement Approval Process (Unaudited) (continued)
E. Indirect Benefits
The Independent Board Members received and considered information regarding other benefits the respective Fund Adviser or its affiliates may receive as a result of their relationship with the Nuveen funds. The Independent Board Members reviewed the revenues that an affiliate of the Adviser received in 2017 as a result of serving as co-manager in the initial public offerings of new closed-end funds and as the underwriter on shelf offerings of existing closed-end funds.
In addition to the above, the Independent Board Members considered whether the Sub-Adviser uses commissions paid by the Funds on portfolio transactions to obtain research products and other services (“soft dollar transactions”). The Board recognized that the Sub-Adviser may benefit from research received from broker-dealers that execute Fund portfolio transactions. The Board, however, noted that the benefits for sub-advisers transacting in fixed-income securities may be more limited as such securities generally trade on a principal basis and therefore do not generate brokerage commissions. Further, the Board noted that although the Sub-Adviser may benefit from the receipt of research and other services that it may otherwise have to pay for out of its own resources, the research may also benefit the Funds to the extent it enhances the ability of the Sub-Adviser to manage the Funds or is acquired through the commissions paid on portfolio transactions of other funds or clients.
Based on their review, the Board concluded that any indirect benefits received by a Fund Adviser as a result of its relationship with the Funds were reasonable and within acceptable parameters.
F. Other Considerations
The Board Members did not identify any single factor discussed previously as all-important or controlling. The Board Members, including the Independent Board Members, concluded that the terms of each Advisory Agreement were fair and reasonable, that the respective Fund Adviser’s fees were reasonable in light of the services provided to each Fund and that the Advisory Agreements be renewed.
90
Notes
91
Nuveen:
Serving Investors for Generations
Since 1898, financial advisors and their clients have relied on Nuveen to provide dependable investment solutions through continued adherence to proven, long-term investing principles. Today, we offer a range of high quality solutions designed to be integral components of a well-diversified core portfolio.
Focused on meeting investor needs.
Nuveen is the investment manager of TIAA. We have grown into one of the world’s premier global asset managers, with specialist knowledge across all major asset classes and particular strength in solutions that provide income for investors and that draw on our expertise in alternatives and responsible investing. Nuveen is driven not only by the independent investment processes across the firm, but also the insights, risk management, analytics and other tools and resources that a truly world-class platform provides. As a global asset manager, our mission is to work in partnership with our clients to create solutions which help them secure their financial future.
Find out how we can help you.
To learn more about how the products and services of Nuveen may be able to help you meet your financial goals, talk to your financial advisor, or call us at (800) 257-8787. Please read the information provided carefully before you invest. Investors should consider the investment objective and policies, risk considerations, charges and expenses of any investment carefully. Where applicable, be sure to obtain a prospectus, which contains this and other relevant information. To obtain a prospectus, please contact your securities representative or Nuveen, 333 W. Wacker Dr., Chicago, IL 60606. Please read the prospectus carefully before you invest or send money.
Learn more about Nuveen Funds at: www.nuveen.com/closed-end funds
| Nuveen Securities, LLC, member FINRA and SIPC | 333 West Wacker Drive Chicago, IL 60606 | www.nuveen.com | | ESA-D-0818D 621984-INV-B-10/19 |
ITEM 2. CODE OF ETHICS.
Not applicable to this filing.
ITEM 3. AUDIT COMMITTEE FINANCIAL EXPERT.
Not applicable to this filing.
ITEM 4. PRINCIPAL ACCOUNTANT FEES AND SERVICES.
Not applicable to this filing.
ITEM 5. AUDIT COMMITTEE OF LISTED REGISTRANTS.
Not applicable to this filing.
ITEM 6. SCHEDULE OF INVESTMENTS.
(a) See Portfolio of Investments in Item 1.
(b) Not applicable.
ITEM 7. DISCLOSURE OF PROXY VOTING POLICIES AND PROCEDURES FOR CLOSED-END MANAGEMENT INVESTMENT COMPANIES.
Not applicable to this filing.
ITEM 8. PORTFOLIO MANAGERS OF CLOSED-END MANAGEMENT INVESTMENT COMPANIES.
Not applicable to this filing.
ITEM 9. PURCHASES OF EQUITY SECURITIES BY CLOSED-END MANAGEMENT INVESTMENT COMPANY AND AFFILIATED PURCHASERS.
* The program was reauthorized for a maximum repurchase amount of 155,000 shares on August 7, 2018. Any repurchases made by the registrant pursuant to the program were made through open-market transactions.