Life is Complex.
Nuveen makes things e-simple.
It only takes a minute to sign up for e-Reports. Once enrolled, you’ll receive an e-mail as soon as your Nuveen Fund information is ready—no more waiting for delivery by regular mail. Just click on the link within the e-mail to see the report and save it on your computer if you wish.
Free e-Reports
right to your e-mail!
www.investordelivery.com
If you receive your Nuveen Fund
dividends and statements from your
financial professional or brokerage account.
or
www.nuveen.com/client-access
If you receive your Nuveen Fund
dividends and statements directly from
Nuveen.
NOT FDIC INSURED MAY LOSE
VALUE NO BANK GUARANTEE
| | |
| 4 |
| | |
| 5 |
| | |
| 10 |
| | |
| 11 |
| | |
| 13 |
| | |
| 14 |
| | |
| 22 |
| | |
| 62 |
| | |
| 63 |
| | |
| 64 |
| | |
| 66 |
| | |
| 68 |
| | |
| 73 |
| | |
| 86 |
| | |
| 87 |
| | |
| 88 |
| | |
| 90 |
| | |
| 91 |
3
Chair’s Letterto Shareholders Dear Shareholders,
The COVID-19 crisis is taking an unprecedented toll on our health, societies, economies and financial markets. Our thoughts are with you during this time of significant disruption caused by the disease and its economic fallout.
A renewed increase in COVID-19 cases in some areas, including an outbreak affecting President Trump and White House staffers and contacts, showed that controlling the spread of the novel coronavirus remains an ongoing public health concern as economies reopen and social activities resume. In the meantime, medical knowledge is improving and some areas have been able to implement much narrower restrictions when infection clusters have recurred. This has helped an economic recovery gain traction, with a significant recovery in jobs, consumer spending, manufacturing and other indicators from their weakest levels. Additionally, progress toward a vaccine and treatments has been promising, while the timeline is unknown. Markets have recently taken an optimistic view, but the path of the economy from here and the upcoming U.S. presidential election are increasingly in the forefront.
While we do not want to understate the dampening effect on the global economy, it is important to differentiate short-term interruptions from the longer-lasting implications to the economy. Prior to the COVID-19 crisis, some areas of the global economy were showing signs of improvement after trade tensions had weighed on economic activity for much of 2019. More recently, countries that have reopened have seen marked improvement in some near-term economic indicators. Central banks and governments around the world have announced economic stimulus measures and pledged to continue doing what it takes to support their economies. In the U.S., the Federal Reserve has cut its benchmark interest rate to near zero and introduced similar programs that helped revive the U.S. economy after the 2008 financial crisis. The U.S. Government has approved three relief packages, including a $2 trillion-dollar package directly supporting businesses and individuals. The Coronavirus Aid, Relief and Economic Security Act, called the CARES Act, has provided direct payments and expanded unemployment benefits to individuals, loans and grants to small businesses, loans and other money to large corporations and funding for hospitals, public health, education and state and local governments. In the European Union, the European Central Bank recently increased the size of its Pandemic Emergency Purchase Program, known as PEPP, to $1.6 trillion from $882 billion and extended its duration to June 2021.
In the meantime, patience and a long-term perspective are key for investors. When market fluctuations are the leading headlines day after day, it’s tempting to “do something.” However, your long-term goals can’t be met with short-term thinking. We encourage you to talk to your financial professional, who can review your time horizon, risk tolerance and investment goals. On behalf of the other members of the Nuveen Fund Board, we look forward to continuing to earn your trust in the months and years ahead.
Sincerely,
Terence J. Toth
Chair of the Board
October 23, 2020
4
Portfolio Manager’s CommentsNuveen New Jersey Quality Municipal Income Fund (NXJ)Nuveen New Jersey Municipal Value Fund (NJV)Nuveen Pennsylvania Quality Municipal Income Fund (NQP)Nuveen Pennsylvania Municipal Value Fund (NPN) These Funds feature portfolio management by Nuveen Asset Management, LLC (NAM), an affiliate of Nuveen Fund Advisors, LLC, the Funds’ investment adviser. Portfolio manager Paul L. Brennan, CFA, reviews key investment strategies and the six-month performance of the Nuveen New Jersey and Pennsylvania Funds. Paul assumed portfolio management responsibility for these four Funds in 2011.
During August 2020, the Nuveen New Jersey Municipal Value Fund (NJV) was approved for merger into Nuveen AMT-Free Municipal Value Fund (NUW) (10/31 FYE) by the Funds’ Board of Trustees. The merger is pending shareholder approval.
During August 2020, the Nuveen Pennsylvania Municipal Value Fund ( NPN) was approved for merger into Nuveen AMT-Free Municipal Value Fund (NUW) (10/31 FYE) by the Funds’ Board of Trustees. The merger is pending shareholder approval.
An Update on COVID-19 Coronavirus and its Impact on the Securities Markets
Slowing COVID-19 coronavirus infection rates around the world encouraged authorities to loosen restrictions on business and social activity in recent months. While economic indicators have improved considerably from the depths of the shutdown, some regions, including the U.S. and Europe, have seen an uptick in infection rates after reopening, which prompted tightening coronavirus restrictions in some areas. Additionally, certain government programs supporting businesses and workers are expiring with little clarity on extensions or replacement options. Amid these challenges, the pace of recovery appeared to be moderating, and short-term market volatility has picked up again.
The initial market response was severe, but the responses from central banks and governments to ease the strain on financial systems, businesses and individuals, as well as positive vaccine news, have helped markets bounce back from the depths of the crisis. Although the detection of the virus in China was made public in December 2019, markets did not start to fully acknowledge the risks and potential economic impact until the latter portion of February 2020, when outbreaks outside of China were first reported. Global stock markets sold off severely, with the S&P 500® index reaching a bear market (a 20% drop from the previous high) within three weeks, the fastest bear market decline in history. Even certain parts of the bond market suffered; below investment grade municipal
This material is not intended to be a recommendation or investment advice, does not constitute a solicitation to buy, sell or hold a security or an investment strategy and is not provided in a fiduciary capacity. The information provided does not take into account the specific objectives or circumstances of any particular investor, or suggest any specific course of action. Investment decisions should be made based on an investor’s objectives and circumstances and in consultation with his or her advisors.
Certain statements in this report are forward-looking statements. Discussions of specific investments are for illustration only and are not intended as recommendations of individual investments. The forward-looking statements and other views expressed herein are those of the portfolio manager as of the date of this report. Actual future results or occurrences may differ significantly from those anticipated in any forward-looking statements, and the views expressed herein are subject to change at any time, due to numerous market and other factors. The Funds disclaim any obligation to update publicly or revise any forward-looking statements or views expressed herein.
For financial reporting purposes, the ratings disclosed are the highest rating given by one of the following national rating agencies: Standard & Poor’s Group (S&P), Moody’s Investors Service, Inc. (Moody’s) or Fitch, Inc. (Fitch). This treatment of split-rated securities may differ from that used for other purposes, such as for Fund investment policies. Credit ratings are subject to change. AAA, AA, A and BBB are investment grade ratings, while BB, B, CCC, CC, C and D are below investment grade ratings. Holdings designated N/R are not rated by these national rating agencies.
Bond insurance guarantees only the payment of principal and interest on the bond when due, and not the value of the bonds themselves, which will fluctuate with the bond market and the financial success of the issuer and the insurer. Insurance relates specifically to the bonds in the portfolio and not to the share prices of a Fund. No representation is made as to the insurers’ ability to meet their commitments.
Refer to the Glossary of Terms Used in this Report for further definition of the terms used within this section.
5
Portfolio Manager’s Comments (continued)
and corporate bonds generally dropped the furthest, mostly out of concerns for the continued financial stability of lower quality issuers. Demand for safe-haven assets, along with mounting recession fears, drove the yield on the 10-year U.S. Treasury note to 0.5% in March 2020, an all-time low. Additionally, oil prices collapsed to an 18-year low on supply glut concerns, as shutdowns across the global economy sharply reduced oil demand, although oil prices have recovered to well above those lows.
While most markets have recovered most of their losses, volatility will likely remain elevated until the health crisis itself is under control (via fewer new cases, lower infection rates and/or verified treatments or vaccines). There are still many unknowns and new information is incoming daily, compounding the difficulty of modeling outcomes for epidemiologists and economists alike.
Nuveen, LLC and our portfolio management teams are monitoring the situation carefully and continuously refining our views and approaches to managing the Funds to best pursue investment objectives while mitigating risks through all market environments.
What key strategies were used to manage these Funds during the six-month reporting period ended August 31, 2020?
The Nuveen New Jersey Quality Municipal Income Fund’s investment objective is to provide current income exempt from regular federal and New Jersey income tax and to enhance portfolio value. The Fund invests in municipal securities that are exempt from federal and New Jersey state income taxes. The Fund invests at least 80% of its managed assets in securities rated, at the time of investment, investment grade or, if they are unrated, are judged by the portfolio manager to be of comparable quality. The Fund may invest up to 20% of its managed assets in municipal securities rated below investment quality or judged by the portfolio manager to be of comparable quality, of which up to 10% of its managed assets may be rated below B-/B3 or of comparable quality. The Fund uses leverage.
The Nuveen New Jersey Municipal Value Fund’s primary investment objective is to provide current income exempt from regular federal and New Jersey income taxes; secondary investment objective is to enhance portfolio value and total return. The Fund invests in municipal securities that are exempt from federal and New Jersey state income taxes. The Fund invests at least 80% of its managed assets in municipal securities rated investment grade at the time of investment, or, if they are unrated, are judged by the portfolio manager to be of comparable quality. The Fund may invest up to 20% of managed assets in municipal securities that are not exempt from New Jersey state income taxes if the portfolio manager believes doing so would enhance the Fund’s after-tax total returns. The Fund may invest up to 20% of its managed assets in municipal securities rated below investment quality or judged by the portfolio manager to be of comparable quality, of which up to 10% of its managed assets may be rated below B-/B3 or of comparable quality. The Fund may invest in inverse floating rate municipal securities, also known as tender option bonds. The Fund’s use of tender option bonds to more efficiently implement its investment strategy may create up to 10% effective leverage.
The Nuveen Pennsylvania Quality Municipal Income Fund’s primary investment objective Fund is current income exempt from regular federal income taxes and Pennsylvania income taxes. The secondary objective is the enhancement of portfolio value. The Fund invests in municipal securities that are exempt from federal, Pennsylvania state, and local income taxes. The Fund invests at least 80% of its managed assets in securities rated, at the time of investment, investment grade or, if they are unrated, are judged by the portfolio manager to be of comparable quality. The Fund may invest up to 20% of its managed assets in municipal securities rated below investment quality or judged by the portfolio manager to be of comparable quality, of which up to 10% of its managed assets may be rated below B-/B3 or of comparable quality. The Fund uses leverage.
The Nuveen Pennsylvania Municipal Value Fund’s primary investment objective is to provide current income exempt from regular federal and Pennsylvania income taxes; secondary investment objective is to enhance portfolio value and total return. The Fund invests in state municipal securities that are exempt from federal, Pennsylvania state, and local income taxes. The Fund invests at least
6
80% of its managed assets in municipal securities rated investment grade at the time of investment, or, if they are unrated, are judged by the portfolio manager to be of comparable quality. The Fund may invest up to 20% of managed assets in municipal securities that are not exempt from Pennsylvania state income taxes if the portfolio manager believes doing so would enhance the Fund’s after-tax total returns. The Fund may invest up to 20% of its managed assets in municipal securities rated below investment quality or judged by the portfolio manager to be of comparable quality, of which up to 10% of its managed assets may be rated below B-/B3 or of comparable quality. The Fund may invest in inverse floating rate municipal securities, also known as tender option bonds. The Fund’s use of tender option bonds to more efficiently implement its investment strategy may create up to 10% effective leverage.
During the six-month reporting period, the municipal bond market endured a liquidity-driven sell-off followed by an uneven recovery across the credit quality spectrum. With the Federal Reserve (Fed) providing financial assistance, the highest credit quality segments of the market snapped back relatively quickly. However, the turnaround in lower rated municipal credits and sectors was slower to materialize amid macroeconomic uncertainty and a broader reevaluation of municipal credit risk.
As the economic shock caused by coronavirus containment measures was becoming apparent in March 2020, financial markets including U.S. municipal bonds responded dramatically. Interest rate volatility spiked, municipal bond prices severely dislocated from Treasury bond prices and municipal credit spreads widened to levels significantly above the long-term average. Quick intervention from the Fed to inject liquidity into the financial system and bolster confidence in the credit markets brought stability, supporting a rebound in the high grade segments of the municipal bond market. Lower rated, higher yielding municipal bonds, however, were slower to rebound, as these credits are more typically found in sectors more affected by the coronavirus, including transportation, lodging, convention centers, hospitals, senior living facilities and higher education.
Despite the elevated volatility in March and April 2020, interest rates ended the six-month reporting period down slightly from the beginning of the reporting period. A sharper fall in short-term rates, driven by the Fed moving its benchmark target rate to zero, steepened the yield curve. Demand for municipal bonds began to recover, with investor inflows resuming a positive trend after the March-April 2020 sell-off, including in high yield municipal bonds. Issuance also approached more normal levels by the end of the reporting period. Notably, taxable municipal bonds’ share of issuance has risen meaningfully over the past year, which has increased the scarcity value of tax-exempt municipal bonds. Supply-demand conditions have therefore remained favorable for municipal bonds, helping credit spreads to narrow from the widest levels seen during the pandemic-induced volatility. At the state level, the New Jersey municipal market underperformed the national market, while the Pennsylvania municipal market performed in line with the national market during the reporting period, as measured by their respective state S&P Municipal Bond Indexes.
Our trading activity continued to focus on pursuing the Funds’ investment objectives. We continued to seek bonds in areas of the market that we expected to demonstrate resilience and perform well over the long term. Trading activity was somewhat lighter during this reporting period as the Funds were well positioned for the environment and the prevailing environment offered fewer opportunities to replace positions with more attractive names. Additionally, as closed ends funds do not need to manage cash to meet investor redemptions, the Funds weren’t forced to sell positions during the market turbulence.
Portfolio turnover was mainly driven by the proceeds from called and maturing bonds, bond coupon income and a small amount of high grade bond sales. For NXJ and NQP, we took some small precautionary steps to prepare for the possibility of deleveraging, including delaying the reinvestment of cash proceeds from called bonds and coupon income. However, market liquidity, although stressed, remains sufficient and deleveraging was not needed. The two New Jersey Funds added issues for Atlantic City Electric, New Jersey Housing and Mortgage Finance Agency, New Jersey-American Water Company and a number of county and local municipalities (including Mercer, Monmouth and Union counties, and NXJ also bought Somerset County and Berkeley Heights Township). NQP added Pennsylvania Housing Finance Agency, Geisinger Health System, Westmoreland County Water, Puerto Rico
7
Portfolio Manager’s Comments (continued)
sales tax revenue bonds (known as COFINAs) and Saint Joseph’s University credits. NPN bought two school districts (Philadelphia and Allentown). We continued to limit the Funds’ exposure to each state’s government debt due to concerns about their fiscal health that pre-dated the COVID-19 crisis.
We should also note that the elevated call activity in NJV and NPN, which was driven by their higher exposure to bonds with 2019 call dates, has since moderated. Due to their inceptions in 2009, NJV and NPN held more exposure to bonds callable in 2019 than NXJ and NQP. As such, we sold more of those callable bonds and refunding activity was higher during calendar years 2018 and 2019 for NJV and NPN. These trades had a short-term negative impact on the two Funds’ earnings, as the older bonds, which were issued when prevailing interest rates were higher, were replaced with the lower yielding bonds available in the current market.
As of August 31, 2020, the four Funds continued to use inverse floating rate securities. We employ inverse floaters for a variety of reasons, including duration management, income enhancement and total return enhancement. As part of our duration management strategies, the four Funds used U.S. Treasury futures as part of an overall portfolio construction strategy to manage portfolio duration and yield curve exposure. The hedging strategies performed as expected given the direction of interest rates during the reporting period. Although the Treasury futures detracted modestly from performance due to the meaningful outperformance of Treasury bonds over municipal bonds during this reporting period, they enabled the Funds to invest in longer duration bonds that were contributors to performance and that helped support the Funds’ dividends. The Treasury futures positions were eliminated from NXJ and NQP prior to the end of the reporting period.
How did the Funds perform during the six-month reporting period ended August 31, 2020?
The tables in each Fund’s Performance Overview and Holding Summaries section of this report provide the Funds’ total returns for the six-month, one-year, five-year and ten-year periods ended August 31, 2020. Each Fund’s total returns at common share net asset value (NAV) are compared with the performance of corresponding market indexes.
For the six-month reporting period ended August 31, 2020, the total returns on common share NAV for all four Funds underperformed the national S&P Municipal Bond Index and their respective state’s S&P Municipal Bond Index.
The Funds’ exposure to lower rated, higher yielding bonds, which underperformed the market during this reporting period, was the main driver of negative absolute performance and relative underperformance. Most of the underperformance in the lower rated segments occurred in the March-April 2020 sell-off, and while credit spread recovery continued over the subsequent months, spreads were still wide of pre-pandemic levels at the close of this reporting period. From a credit quality perspective, the Funds’ overweight allocations in BBB and lower rated bonds were the most detrimental to relative performance, with overweight allocations to single A rated credits a smaller detractor.
On a sector basis, the New Jersey Funds were hurt by overweight exposures to New Jersey government debt, higher education/student loan debt, health care, transportation, industrial development revenue/pollution control revenue (IDR/PCR) and tobacco settlement bonds. (NXJ and NJV’s portfolio weightings in New Jersey state government debt are overweight relative to the national S&P Municipal Bond Index and underweight relative to the S&P Municipal Bond New Jersey Index.) The Funds’ underweight to local GOs, which performed well in New Jersey, was another relative detractor. Positive sector performance in NXJ and NJV came from overweight allocations to pre-refunded bonds and housing debt. In the Pennsylvania Funds, the weakest performing sector positions included overweight exposures to high education/student loan debt, health care, transportation and IDR/PCR. Local GOs performed well in Pennsylvania, but the Funds’ underweight exposure detracted. Conversely, NQP and NPN benefited from overweight allocations to pre-refunded bonds, water and sewer bonds and housing debt.
8
Security selection was a significantly negative influence on performance for NXJ and NJV during this reporting period. The most underperforming credits were New Jersey state paper (as Fitch downgraded the state’s credit rating in April 2020), several higher education names (including small, lower-rated private colleges, student residence halls projects and New Jersey student loan debt) and health care credits (such as hospitals, which faced both increased costs due to tri-state area COVID-19 infection rates and lower revenues as elective procedures were cancelled or postponed, and senior living facilities, due to uncertainty about their high risk populations). However, positions that fared better tended to benefit from higher credit quality and more favorable yield curve positioning. Notable outperformers for NXJ and NJV included local tax-supported debt (county and school district GOs), New Jersey Turnpike and selected IDR credits (New Jersey-American Water, Atlantic City Electric and Covanta).
For the Pennsylvania Funds, security selection had a mixed impact. The better performing positions were higher credit quality and those better positioned for the yield curve environment during this reporting period, including local tax-supported debt (such as local municipal and school district debt), pre-refunded bonds and water and sewer credits. Underperforming positions in NQP and NPN included higher education bonds (small, lower rated private schools and student residence halls projects), health care credits (hospitals and senior living facilities), transportation bonds (Pennsylvania Turnpike in NQP and Delaware River Port Authority in NPN) and IDR names (Energy Harbor common stock (see further explanation below) and PPL Energy Supply). Washington D.C. tobacco settlement bonds also detracted from NPN.
During this reporting period, NQP and NPN received Energy Harbor common stock, after FirstEnergy Solutions emerged from bankruptcy and the restructured company was renamed Energy Harbor. The Funds received Energy Harbor stock when their holdings of bonds issued by FirstEnergy Solutions were converted into Energy Harbor equity as part of its debt reorganization and emergence from bankruptcy protection, which was completed in February 2020. The shares performed well in the first few months after they were issued, due in part to post-emergence price increases. In July 2020, the value of Energy Harbor equity fell sharply after federal authorities charged certain Ohio politicians and lobbyists with having accepted large payments from an unnamed company (which was easily identifiable as Energy Harbor’s pre-bankruptcy parent, FirstEnergy Corp.) in what was alleged to be a corrupt scheme to adopt legislation that would benefit that parent company. At the end of the reporting period Energy Harbor equity represented 1.3% of the total investments of NQP, and 1.5% of the total investments of NPN.
Duration and yield curve positioning had a small impact on the Funds’ relative performance during this reporting period. The move in interest rates was relatively muted during this reporting period, and the negative impact of the duration hedge using Treasury futures (as detailed in the strategy section of the commentary) offset positive contributions elsewhere.
In addition, the use of regulatory leverage was a factor affecting the performance of NXJ and NQP. NJV and NPN do not use regulatory leverage. Leverage is discussed in more detail later in the Fund Leverage section of this report.
9
IMPACT OF THE FUNDS’ LEVERAGE STRATEGIES ON PERFORMANCE
One important factor impacting the returns of the Funds’ common shares relative to their comparative benchmarks was the Funds’ use of leverage through their issuance of preferred shares and/or investments in inverse floating rate securities, which represent leveraged investments in underlying bonds. The Funds use leverage because our research has shown that, over time, leveraging provides opportunities for additional income. The opportunity arises when short-term rates that a Fund pays on its leveraging instruments are lower than the interest the Fund earns on its portfolio of long-term bonds that it has bought with the proceeds of that leverage. This has been particularly true in the recent market environment where short-term rates have been low by historical standards.
However, use of leverage can expose Fund common shares to additional price volatility. When a Fund uses leverage, the Fund’s common shares will experience a greater increase in their net asset value if the municipal bonds acquired through the use of leverage increase in value, but will also experience a correspondingly larger decline in their net asset value if the bonds acquired through leverage decline in value. All this will make the shares’ total return performance more variable over time.
In addition, common share income in levered funds will typically decrease in comparison to unlevered funds when short-term interest rates increase and increase when short-term interest rates decrease. In recent quarters, fund leverage expenses have generally tracked the overall movement of short-term tax-exempt interest rates. While fund leverage expenses are somewhat higher than their recent lows, leverage nevertheless continues to provide the opportunity for incremental common share income, particularly over longer-term periods.
Leverage from issuance of preferred shares had a negative impact on the performance of NXJ and NQP over the reporting period. The use of leverage through inverse floating rate securities had a negligible impact on the performance of NXJ, NQP and NPN and a negative impact on the performance of NJV over the reporting period.
As of August 31, 2020, the Funds’ percentages of leverage are as shown in the accompanying table.
| | | | | |
| NXJ | NJV | NQP | NPN |
Effective Leverage* | 38.35% | 6.64% | 39.11% | 4.42% |
Regulatory Leverage* | 31.75% | 0.00% | 27.12% | 0.00% |
| |
| * Effective Leverage is a Fund’s effective economic leverage, and includes both regulatory leverage and the leverage effects of certain derivative and other investments in a Fund’s portfolio that increase the Fund’s investment exposure. Currently, the leverage effects of Tender Option Bond (TOB) inverse floater holdings are included in effective leverage values, in addition to any regulatory leverage. Regulatory leverage consists of preferred shares issued or borrowings of a Fund. Both of these are part of a Fund’s capital structure. A Fund, however, may from time to time borrow on a typically transient basis in connection with its day-to-day operations, primarily in connection with the need to settle portfolio trades. Such incidental borrowings are excluded from the calculation of a Fund’s effective leverage ratio. Regulatory leverage is subject to asset coverage limits set forth in the Investment Company Act of 1940. |
THE FUNDS’ REGULATORY LEVERAGE
As of August 31, 2020, the following Funds have issued and outstanding preferred shares as shown in the accompanying table. As mentioned previously, NJV and NPN do not use regulatory leverage.
| | | | | | | | | | |
| | Variable Rate | | | Variable Rate | | | | |
| | Preferred* | | | Remarketed Preferred** | | | | |
| | Shares Issued at | | | Shares Issued at | | | | |
| | Liquidation Preference | | | Liquidation Preference | | | Total | |
NXJ | | $ | 313,900,000 | | | $ | — | | | $ | 313,900,000 | |
NQP | | $ | 217,500,000 | | | $ | — | | | $ | 217,500,000 | |
| | |
| * | Preferred shares of the Fund featuring a floating rate dividend based on a predetermined formula or spread to an index rate. Includes the following preferred shares AMTP, iMTP, MFP-VRM and VRDP in Special Rate Mode, where applicable. See Notes to Financial Statements, Note 5 – Fund Shares for further details. |
**
| Preferred shares of the Fund featuring floating rate dividends set by a remarketing agent via a regular remarketing. Includes the following preferred shares VRDP not in Special Rate Mode, MFP-VRRM and MFP-VRDM, where applicable. See Notes to Financial Statements, Note 5 – Fund Shares for further details. |
Refer to Notes to Financial Statements, Note – 5 Fund Shares for further details on preferred shares and each Fund’s respective transactions.
10
COMMON SHARE DISTRIBUTION INFORMATION
The following information regarding the Funds’ distributions is current as of August 31, 2020. Each Fund’s distribution levels may vary over time based on each Fund’s investment activity and portfolio investment value changes.
During the current reporting period, each Fund’s distributions to common shareholders were as shown in the accompanying table.
| | | | | | | | | | | | | |
| | | Per Common Share Amounts | |
| Monthly Distributions (Ex-Dividend Date) | | NXJ | | | NJV | | | NQP | | | NPN | |
March 2020 | | $ | 0.0515 | | | $ | 0.0310 | | | $ | 0.0505 | | | $ | 0.0305 | |
April | | | 0.0515 | | | | 0.0310 | | | | 0.0505 | | | | 0.0305 | |
May | | | 0.0515 | | | | 0.0310 | | | | 0.0505 | | | | 0.0305 | |
June | | | 0.0555 | | | | 0.0310 | | | | 0.0535 | | | | 0.0305 | |
July | | | 0.0555 | | | | 0.0310 | | | | 0.0535 | | | | 0.0305 | |
August 2020 | | | 0.0555 | | | | 0.0310 | | | | 0.0535 | | | | 0.0305 | |
| Total Distributions from Net Investment Income | | $ | 0.3210 | | | $ | 0.1860 | | | $ | 0.3120 | | | $ | 0.1830 | |
| | |
| Yields | | | | | | | | | | | | | | | | |
Market Yield* | | | 4.85 | % | | | 2.66 | % | | | 4.69 | % | | | 2.42 | % |
Taxable-Equivalent Yield* | | | 10.01 | % | | | 5.49 | % | | | 8.36 | % | | | 4.29 | % |
| |
| * Market Yield is based on the Fund’s current annualized monthly dividend divided by the Fund’s current market price as of the end of the reporting period. Taxable-Equivalent Yield represents the yield that must be earned on a fully taxable investment in order to equal the yield of the Fund on an after-tax basis. It is based on a combined federal and state income tax rate of 51.6% and 43.9% for the New Jersey and Pennsylvania Funds, respectively. Your actual combined federal and state income tax rate may differ from the assumed rate. The Taxable-Equivalent Yield also takes into account the percentage of the Fund’s income generated and paid by the Fund (based on payments made during the previous calendar year) that was either exempt from federal income tax but not from state income tax (e.g., income from an out-of-state municipal bond), or was exempt from neither federal nor state income tax. Separately, if the comparison were instead to investments that generate qualified dividend income, which is taxable at a rate lower than an individual’s ordinary graduated tax rate, the fund’s Taxable-Equivalent Yield would be lower. |
Each Fund seeks to pay regular monthly dividends out of its net investment income at a rate that reflects its past and projected net income performance. To permit each Fund to maintain a more stable monthly dividend, the Fund may pay dividends at a rate that may be more or less than the amount of net income actually earned by the Fund during the period. Distributions to common shareholders are determined on a tax basis, which may differ from amounts recorded in the accounting records. In instances where the monthly dividend exceeds the earned net investment income, the Fund would report a negative undistributed net ordinary income. Refer to Note 6 – Income Tax Information for additional information regarding the amounts of undistributed net ordinary income and undistributed net long-term capital gains and the character of the actual distributions paid by the Fund during the period.
All monthly dividends paid by each Fund during the current reporting period were paid from net investment income. If a portion of the Fund’s monthly distributions is sourced or comprised of elements other than net investment income, including capital gains and/or a return of capital, shareholders will be notified of those sources. For financial reporting purposes, the per share amounts of each Fund’s distributions for the reporting period are presented in this report’s Financial Highlights. For income tax purposes, distribution information for each Fund as of its most recent tax year end is presented in Note 6 – Income Tax Information within the Notes to Financial Statements of this report.
11
Common Share Information (continued)
NUVEEN CLOSED-END FUND DISTRIBUTION AMOUNTS
The Nuveen Closed-End Funds’ monthly and quarterly periodic distributions to shareholders are posted on www.nuveen.com and can be found on Nuveen’s enhanced closed-end fund resource page, which is at https://www.nuveen.com/resource-center-closed-endfunds, along with other Nuveen closed-end fund product updates. To ensure timely access to the latest information, shareholders may use a subscribe function, which can be activated at this web page (https://www.nuveen.com/subscriptions).
COMMON SHARE REPURCHASES
During August 2020, the Funds’ Board of Trustees reauthorized an open-market share repurchase program, allowing each Fund to repurchase an aggregate of up to approximately 10% of its outstanding shares.
As of August 31, 2020, and since the inception of the Funds’ repurchase programs, the Funds have cumulatively repurchased and retired their outstanding common shares as shown in the accompanying table.
| | | | | |
| NXJ | NJV | NQP | NPN |
Common shares cumulatively repurchased and retired | 1,710,343 | 42,000 | 734,900 | 3,500 |
Common shares authorized for repurchase | 4,145,000 | 150,000 | 3,735,000 | 120,000 |
During the current reporting period, the following Funds repurchased and retired their common shares at a weighted average price per share and a weighted average discount per share as shown in the following table.
| | | | | | | |
| | NXJ | | | NJV | |
Common shares repurchased and retired | | | 25,343 | | | | 6,499 | |
Weighted average price per common share repurchased and retired | | $ | 13.36 | | | $ | 12.82 | |
Weighted average discount per common share repurchased and retired | | | 16.96 | % | | | 15.23 | % |
OTHER COMMON SHARE INFORMATION
As of August 31, 2020, and during the current reporting period, the Funds’ common share prices were trading at a premium/ (discount) to their common share NAVs as shown in the accompanying table.
| | | | | | | | | | | | | |
| | NXJ | | | NJV | | | NQP | | | NPN | |
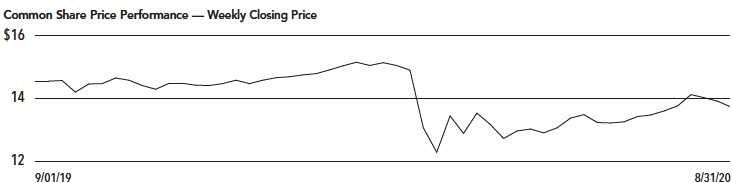
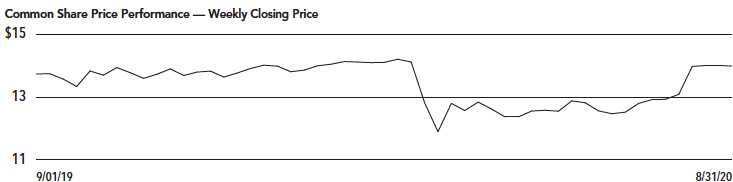
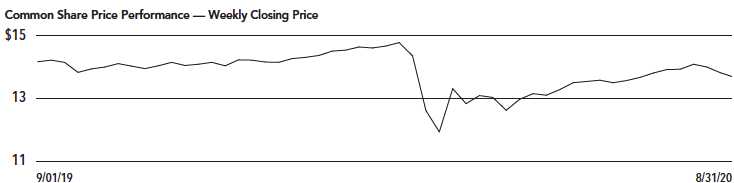
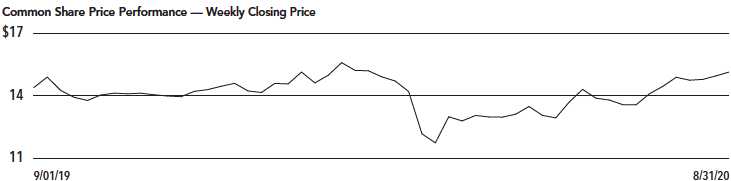
Common share NAV | | $ | 16.26 | | | $ | 15.30 | | | $ | 15.64 | | | $ | 15.07 | |
Common share Price | | $ | 13.72 | | | $ | 13.99 | | | $ | 13.68 | | | $ | 15.15 | |
Premium/(Discount) to NAV | | | (15.62 | )% | | | (8.56 | )% | | | (12.53 | )% | | | 0.53 | % |
6-month average premium/(discount) to NAV | | | (15.72 | )% | | | (13.95 | )% | | | (13.12 | )% | | | (8.62 | )% |
12
Fund shares are not guaranteed or endorsed by any bank or other insured depository institution, and are not federally insured by the Federal Deposit Insurance Corporation.
Nuveen New Jersey Quality Municipal Income Fund (NXJ)
Investing in closed-end funds involves risk; principal loss is possible. There is no guarantee the Fund’s investment objectives will be achieved. Closed-end fund shares may frequently trade at a discount or premium to their net asset value. Debt or fixed income securities such as those held by the Fund, are subject to market risk, credit risk, interest rate risk, derivatives risk, liquidity risk, and income risk. As interest rates rise, bond prices fall. Leverage increases return volatility and magnifies the Fund’s potential return and its risks; there is no guarantee a fund’s leverage strategy will be successful. State concentration makes the Fund more susceptible to local adverse economic, political, or regulatory changes affecting municipal bond issuers. These and other risk considerations such as inverse floater risk and tax risk are described in more detail on the Fund’s web page at www.nuveen.com/NXJ.
Nuveen New Jersey Municipal Value Fund (NJV)
Investing in closed-end funds involves risk; principal loss is possible. There is no guarantee the Fund’s investment objectives will be achieved. Closed-end fund shares may frequently trade at a discount or premium to their net asset value. Debt or fixed income securities such as those held by the Fund, are subject to market risk, credit risk, interest rate risk, derivatives risk, liquidity risk, and income risk. As interest rates rise, bond prices fall. State concentration makes the Fund more susceptible to local adverse economic, political, or regulatory changes affecting municipal bond issuers. These and other risk considerations such as tax risk are described in more detail on the Fund’s web page at www.nuveen.com/NJV.
Nuveen Pennsylvania Quality Municipal Income Fund (NQP)
Investing in closed-end funds involves risk; principal loss is possible. There is no guarantee the Fund’s investment objectives will be achieved. Closed-end fund shares may frequently trade at a discount or premium to their net asset value. Debt or fixed income securities such as those held by the Fund, are subject to market risk, credit risk, interest rate risk, derivatives risk, liquidity risk, and income risk. As interest rates rise, bond prices fall. Leverage increases return volatility and magnifies the Fund’s potential return and its risks; there is no guarantee a fund’s leverage strategy will be successful. State concentration makes the Fund more susceptible to local adverse economic, political, or regulatory changes affecting municipal bond issuers. These and other risk considerations such as inverse floater risk and tax risk are described in more detail on the Fund’s web page at www.nuveen.com/NQP.
Nuveen Pennsylvania Municipal Value Fund (NPN)
Investing in closed-end funds involves risk; principal loss is possible. There is no guarantee the Fund’s investment objectives will be achieved. Closed-end fund shares may frequently trade at a discount or premium to their net asset value. Debt or fixed income securities such as those held by the Fund, are subject to market risk, credit risk, interest rate risk, derivatives risk, liquidity risk, and income risk. As interest rates rise, bond prices fall. State concentration makes the Fund more susceptible to local adverse economic, political, or regulatory changes affecting municipal bond issuers. These and other risk considerations such as tax risk are described in more detail on the Fund’s web page at www.nuveen.com/NPN.
13
| | |
| Nuveen New Jersey Quality Municipal Income Fund Performance Overview and Holding Summaries as of August 31, 2020 |
| | | | | |
Refer to Glossary of Terms Used in this Report for further definition of the terms used within this section. |
| Average Annual Total Returns as of August 31, 2020 |
|
| Cumulative | Average Annual |
| 6-Month | 1-Year | 5-Year | 10-Year |
NXJ at Common Share NAV | (3.08)% | 1.10% | 6.11% | 5.76% |
NXJ at Common Share Price | (4.60)% | (1.25)% | 6.85% | 4.89% |
S&P Municipal Bond New Jersey Index | (0.92)% | 2.30% | 5.02% | 4.41% |
S&P Municipal Bond Index | 0.29% | 3.15% | 3.95% | 4.03% |
Past performance is not predictive of future results. Current performance may be higher or lower than the data shown. Returns do not reflect the deduction of taxes that shareholders may have to pay on Fund distributions or upon the sale of Fund shares. Returns at NAV are net of Fund expenses, and assume reinvestment of distributions. Comparative index return information is provided for the Fund’s shares at NAV only. Indexes are not available for direct investment.
14
This data relates to the securities held in the Fund’s portfolio of investments as of the end of the reporting period. It should not be construed as a measure of performance for the Fund itself. Holdings are subject to change.
For financial reporting purposes, the ratings disclosed are the highest rating given by one of the following national rating agencies: Standard & Poor’s Group, Moody’s Investors Service, Inc. or Fitch, Inc. This treatment of split-rated securities may differ from that used for other purposes, such as for Fund investment policies. Credit ratings are subject to change. AAA, AA, A and BBB are investment grade ratings; BB, B, CCC, CC, C and D are below-investment grade ratings. Holdings designated N/R are not rated by these national rating agencies.
| | |
| Fund Allocation | |
| (% of net assets) | |
Long-Term Municipal Bonds | 149.6% |
Short-Term Municipal Bonds | 0.1% |
Other Assets Less Liabilities | 1.8% |
| Net Assets Plus Floating Rate | |
| Obligations & VRDP Shares, | |
| net of deferred offering costs | 151.5% |
Floating Rate Obligations | (5.2)% |
VRDP Shares, net of deferred offering costs | (46.3)% |
| Net Assets | 100% |
| | |
| States and Territories | |
| (% of total investments) | |
New Jersey | 87.1% |
Pennsylvania | 5.2% |
New York | 4.7% |
Delaware | 2.1% |
Guam | 0.9% |
| Total | 100% |
| | |
| Portfolio Composition | |
| (% of total investments) | |
Tax Obligation/Limited | 23.3% |
Transportation | 19.1% |
Health Care | 14.0% |
Education and Civic Organizations | 11.9% |
U.S. Guaranteed | 7.3% |
Tax Obligation/General | 6.1% |
Housing/Single Family | 6.1% |
Other | 12.2% |
| Total | 100% |
| | |
| Portfolio Credit Quality | |
| (% of total investment exposure) | |
U.S. Guaranteed | 8.7% |
AAA | 10.0% |
AA | 31.5% |
A | 19.4% |
BBB | 22.0% |
BB or Lower | 6.7% |
N/R | 1.7% |
| Total | 100% |
15
| | |
| NJV | Nuveen New Jersey Municipal Value Fund Performance Overview and Holding Summaries as of August 31, 2020 |
| | | | | |
Refer to Glossary of Terms Used in this Report for further definition of the terms used within this section. |
| Average Annual Total Returns as of August 31, 2020 |
|
| Cumulative | Average Annual |
| 6-Month | 1-Year | 5-Year | 10-Year |
NJV at Common Share NAV | (2.69)% | 0.30% | 3.96% | 4.36% |
NJV at Common Share Price | 1.66% | 5.04% | 5.49% | 4.43% |
S&P Municipal Bond New Jersey Index | (0.92)% | 2.30% | 5.02% | 4.41% |
S&P Municipal Bond Index | 0.29% | 3.15% | 3.95% | 4.03% |
Past performance is not predictive of future results. Current performance may be higher or lower than the data shown. Returns do not reflect the deduction of taxes that shareholders may have to pay on Fund distributions or upon the sale of Fund shares. Returns at NAV are net of Fund expenses, and assume reinvestment of distributions. Comparative index return information is provided for the Fund’s shares at NAV only. Indexes are not available for direct investment.
16
This data relates to the securities held in the Fund’s portfolio of investments as of the end of the reporting period. It should not be construed as a measure of performance for the Fund itself. Holdings are subject to change.
For financial reporting purposes, the ratings disclosed are the highest rating given by one of the following national rating agencies: Standard & Poor’s Group, Moody’s Investors Service, Inc. or Fitch, Inc. This treatment of split-rated securities may differ from that used for other purposes, such as for Fund investment policies. Credit ratings are subject to change. AAA, AA, A and BBB are investment grade ratings; BB, B, CCC, CC, C and D are below-investment grade ratings. Holdings designated N/R are not rated by these national rating agencies.
| | |
| Fund Allocation | |
| (% of net assets) | |
Long-Term Municipal Bonds | 102.0% |
Other Assets Less Liabilities | 1.5% |
| Net Assets Plus Floating | |
| Rate Obligations | 103.5% |
Floating Rate Obligations | (3.5)% |
| Net Assets | 100% |
| | |
| States and Territories | |
| (% of total investments) | |
New Jersey | 89.7% |
Pennsylvania | 6.6% |
Delaware | 2.2% |
New York | 1.5% |
| Total | 100% |
| | |
| Portfolio Composition | |
| (% of total investments) | |
Education and Civic Organizations | 15.8% |
Tax Obligation/Limited | 15.7% |
Transportation | 15.6% |
Health Care | 14.4% |
Tax Obligation/General | 9.3% |
Housing/Multifamily | 8.2% |
Housing/Single Family | 6.0% |
U.S. Guaranteed | 5.3% |
Other | 9.7% |
| Total | 100% |
| | |
| Portfolio Credit Quality | |
| (% of total investment exposure) | |
U.S. Guaranteed | 6.3% |
AAA | 9.8% |
AA | 31.9% |
A | 21.2% |
BBB | 22.7% |
BB or Lower | 6.4% |
N/R | 1.7% |
| Total | 100% |
17
| | |
| NQP | Nuveen Pennsylvania Quality Municipal Income Fund Performance Overview and Holding Summaries as of August 31, 2020 |
| | | | | |
Refer to Glossary of Terms Used in this Report for further definition of the terms used within this section. |
| Average Annual Total Returns as of August 31, 2020 |
|
| Cumulative | Average Annual |
| 6-Month | 1-Year | 5-Year | 10-Year |
NQP at Common Share NAV | (2.62)% | 1.60% | 4.76% | 5.41% |
NQP at Common Share Price | (3.19)% | 0.91% | 6.18% | 4.96% |
S&P Municipal Bond Pennsylvania Index | 0.28% | 3.16% | 4.07% | 4.22% |
S&P Municipal Bond Index | 0.29% | 3.15% | 3.95% | 4.03% |
Past performance is not predictive of future results. Current performance may be higher or lower than the data shown. Returns do not reflect the deduction of taxes that shareholders may have to pay on Fund distributions or upon the sale of Fund shares. Returns at NAV are net of Fund expenses, and assume reinvestment of distributions. Comparative index return information is provided for the Fund’s shares at NAV only. Indexes are not available for direct investment.
18
This data relates to the securities held in the Fund’s portfolio of investments as of the end of the reporting period. It should not be construed as a measure of performance for the Fund itself. Holdings are subject to change.
For financial reporting purposes, the ratings disclosed are the highest rating given by one of the following national rating agencies: Standard & Poor’s Group, Moody’s Investors Service, Inc. or Fitch, Inc. This treatment of split-rated securities may differ from that used for other purposes, such as for Fund investment policies. Credit ratings are subject to change. AAA, AA, A and BBB are investment grade ratings; BB, B, CCC, CC, C and D are below-investment grade ratings. Holdings designated N/R are not rated by these national rating agencies.
| | |
| Fund Allocation | |
| (% of net assets) | |
Long-Term Municipal Bonds | 155.4% |
Common Stocks | 2.0% |
Short-Term Municipal Bonds | 0.3% |
Other Assets Less Liabilities | 3.2% |
| Net Assets Plus Floating Rate Obligations | |
| & VRDP Shares, net of deferred offering | |
| costs | 160.9% |
Floating Rate Obligations | (23.8)% |
VRDP Shares, net of deferred offering costs | (37.1)% |
| Net Assets | 100% |
| | |
| States and Territories | |
| (% of total municipal bonds) | |
Pennsylvania | 98.2% |
Puerto Rico | 1.5% |
Guam | 0.3% |
| Total | 100% |
| | |
| Portfolio Composition | |
| (% of total investments) | |
Health Care | 22.5% |
U.S. Guaranteed | 13.3% |
Tax Obligation/General | 11.8% |
Education and Civic Organizations | 11.1% |
Housing/Single Family | 11.0% |
Water and Sewer | 7.0% |
Transportation | 6.3% |
Tax Obligation/Limited | 6.1% |
Other | 10.9% |
| Total | 100% |
| | |
| Portfolio Credit Quality | |
| (% of total investment exposure) | |
U.S. Guaranteed | 14.9% |
AAA | 0.4% |
AA | 35.0% |
A | 29.5% |
BBB | 10.9% |
BB or Lower | 4.5% |
N/R | 3.6% |
N/A | 1.2% |
| Total | 100% |
19
| | |
| NPN | Nuveen Pennsylvania Municipal Value Fund Performance Overview and Holding Summaries as of August 31, 2020 |
| | | | | |
Refer to Glossary of Terms Used in this Report for further definition of the terms used within this section. |
| Average Annual Total Returns as of August 31, 2020 |
|
| Cumulative | Average Annual |
| 6-Month | 1-Year | 5-Year | 10-Year |
NPN at Common Share NAV | (2.52)% | 0.45% | 3.21% | 4.19% |
NPN at Common Share Price | 4.64% | 8.40% | 5.33% | 4.26% |
S&P Municipal Bond Pennsylvania Index | 0.28% | 3.16% | 4.07% | 4.22% |
S&P Municipal Bond Index | 0.29% | 3.15% | 3.95% | 4.03% |
Past performance is not predictive of future results. Current performance may be higher or lower than the data shown. Returns do not reflect the deduction of taxes that shareholders may have to pay on Fund distributions or upon the sale of Fund shares. Returns at NAV are net of Fund expenses, and assume reinvestment of distributions. Comparative index return information is provided for the Fund’s shares at NAV only. Indexes are not available for direct investment.
20
This data relates to the securities held in the Fund’s portfolio of investments as of the end of the reporting period. It should not be construed as a measure of performance for the Fund itself. Holdings are subject to change.
For financial reporting purposes, the ratings disclosed are the highest rating given by one of the following national rating agencies: Standard & Poor’s Group, Moody’s Investors Service, Inc. or Fitch, Inc. This treatment of split-rated securities may differ from that used for other purposes, such as for Fund investment policies. Credit ratings are subject to change. AAA, AA, A and BBB are investment grade ratings; BB, B, CCC, CC, C and D are below-investment grade ratings. Holdings designated N/R are not rated by these national rating agencies.
| | |
| Fund Allocation | |
| (% of net assets) | |
Long-Term Municipal Bonds | 98.1% |
Common Stocks | 1.5% |
Other Assets Less Liabilities | 2.8% |
| Net Assets Plus Floating | |
| Rate Obligations | 102.4% |
Floating Rate Obligations | (2.4)% |
| Net Assets | 100% |
| | |
| States and Territories | |
| (% of total municipal bonds) | |
Pennsylvania | 96.4% |
District of Columbia | 2.0% |
Puerto Rico | 0.9% |
Guam | 0.7% |
| Total | 100% |
| | |
| Portfolio Composition | |
| (% of total investments) | |
Health Care | 20.0% |
Housing/Single Family | 11.4% |
U.S. Guaranteed | 11.0% |
Transportation | 8.7% |
Education and Civic Organizations | 8.3% |
Tax Obligation/Limited | 7.4% |
Housing/Multifamily | 7.1% |
Tax Obligation/General | 6.1% |
Long-Term Care | 5.8% |
Utilities | 5.8% |
Other | 8.4% |
| Total | 100% |
| | |
| Portfolio Credit Quality | |
| (% of total investment exposure) | |
U.S. Guaranteed | 12.6% |
AAA | 0.7% |
AA | 31.5% |
A | 29.0% |
BBB | 14.7% |
BB or Lower | 6.1% |
N/R | 3.9% |
N/A | 1.5% |
| Total | 100% |
21
| | |
| Nuveen New Jersey Quality Municipal Income Fund Portfolio of Investments August 31, 2020 (Unaudited) |
| | | | | | |
| Principal | | | Optional Call | | |
| Amount (000) | | Description (1) | Provisions (2) | Ratings (3) | Value |
| | LONG-TERM INVESTMENTS – 149.6% (99.9% of Total Investments) | | | |
| | MUNICIPAL BONDS – 149.6% (99.9% of Total Investments) | | | |
| | Consumer Discretionary – 0.4% (0.2% of Total Investments) | | | |
| | Middlesex County Improvement Authority, New Jersey, Senior Revenue Bonds, Heldrich | | | |
| | Center Hotel/Conference Center Project, Series 2005A: | | | |
| $ 2,460 | | 5.000%, 1/01/32 | 10/20 at 100.00 | Caa3 | $ 1,562,002 |
| 1,485 | | 5.125%, 1/01/37 | 10/20 at 100.00 | Caa3 | 855,167 |
| 3,945 | | Total Consumer Discretionary | | | 2,417,169 |
| | Consumer Staples – 4.8% (3.2% of Total Investments) | | | |
| | Tobacco Settlement Financing Corporation, New Jersey, Tobacco Settlement Asset-Backed | | | |
| | Bonds, Series 2018A: | | | |
| 8,505 | | 4.000%, 6/01/37 | 6/28 at 100.00 | A– | 9,641,353 |
| 965 | | 5.000%, 6/01/46 | 6/28 at 100.00 | BBB+ | 1,126,522 |
| 11,680 | | 5.250%, 6/01/46 | 6/28 at 100.00 | BBB+ | 13,838,697 |
| 6,930 | | Tobacco Settlement Financing Corporation, New Jersey, Tobacco Settlement Asset-Backed | 6/28 at 100.00 | BB+ | 7,855,848 |
| | Bonds, Series 2018B, 5.000%, 6/01/46 | | | |
| 28,080 | | Total Consumer Staples | | | 32,462,420 |
| | Education and Civic Organizations – 17.8% (11.9% of Total Investments) | | | |
| 1,760 | | Camden County Improvement Authority, New Jersey, Lease Revenue Bonds, Rowan University | 12/23 at 100.00 | A | 1,943,902 |
| | School of Osteopathic Medicine Project, Refunding Series 2013A, 5.000%, 12/01/32 | | | |
| 1,000 | | New Jersey Economic Development Authority, Charter School Revenue Bonds, Foundation | 1/28 at 100.00 | BBB– | 1,105,140 |
| | Academy Charter School, Series 2018A, 5.000%, 7/01/50 | | | |
| 175 | | New Jersey Economic Development Authority, Charter School Revenue Bonds, Teaneck | 9/27 at 100.00 | BB | 179,916 |
| | Community Charter School, Series 2017A, 5.125%, 9/01/52, 144A | | | |
| 2,025 | | New Jersey Economic Development Authority, Revenue Bonds, The Seeing Eye Inc, Refunding | No Opt. Call | A | 2,394,664 |
| | Series 2015, 5.000%, 3/01/25 | | | |
| | New Jersey Economic Development Authority, Revenue Bonds, The Seeing Eye Inc, Refunding | | | |
| | Series 2017: | | | |
| 500 | | 5.000%, 6/01/32 | 12/27 at 100.00 | A | 603,060 |
| 820 | | 3.000%, 6/01/32 | 12/27 at 100.00 | A | 850,455 |
| 1,100 | | New Jersey Educational Facilities Authority, Revenue Bonds, Kean University, Refunding | 7/25 at 100.00 | AA | 1,182,357 |
| | Series 2015H, 4.000%, 7/01/39 – AGM Insured | | | |
| 5,950 | | New Jersey Educational Facilities Authority, Revenue Bonds, Montclair State University, | 7/24 at 100.00 | A+ | 6,541,311 |
| | Series 2014A, 5.000%, 7/01/44 | | | |
| | New Jersey Educational Facilities Authority, Revenue Bonds, Montclair State University, | | | |
| | Series 2015D: | | | |
| 2,395 | | 5.000%, 7/01/31 | 7/25 at 100.00 | A+ | 2,758,585 |
| 1,600 | | 5.000%, 7/01/33 | 7/25 at 100.00 | A+ | 1,829,408 |
| 1,000 | | 5.000%, 7/01/34 | 7/25 at 100.00 | A+ | 1,141,290 |
| 4,335 | | New Jersey Educational Facilities Authority, Revenue Bonds, Princeton University, Tender | 7/21 at 100.00 | AAA | 4,808,079 |
| | Option Bond Trust 2015-XF0099, 13.319%, 7/01/39, 144A (IF) | | | |
| 4,000 | | New Jersey Educational Facilities Authority, Revenue Bonds, Princeton University, Tender | 7/24 at 100.00 | AAA | 5,689,720 |
| | Option Bond Trust 2015-XF0149, 13.687%, 7/01/44, 144A (IF) (4) | | | |
| | New Jersey Educational Facilities Authority, Revenue Bonds, Ramapo College, Refunding | | | |
| | Series 2012B: | | | |
| 550 | | 5.000%, 7/01/37 | 7/22 at 100.00 | A | 578,677 |
| 1,050 | | 5.000%, 7/01/42 | 7/22 at 100.00 | A | 1,101,009 |
22
| | | | | | |
| Principal | | | Optional Call | | |
| Amount (000) | | Description (1) | Provisions (2) | Ratings (3) | Value |
| | Education and Civic Organizations (continued) | | | |
| | New Jersey Educational Facilities Authority, Revenue Bonds, Rider University, | | | |
| | Series 2012A: | | | |
| $ 1,150 | | 5.000%, 7/01/32 | 7/21 at 100.00 | BB+ | $ 1,155,221 |
| 740 | | 5.000%, 7/01/37 | 7/21 at 100.00 | BB+ | 741,739 |
| | New Jersey Educational Facilities Authority, Revenue Bonds, Rider University, | | | |
| | Series 2017F: | | | |
| 330 | | 3.750%, 7/01/37 | 7/27 at 100.00 | BB+ | 286,483 |
| 3,830 | | 4.000%, 7/01/42 | 7/27 at 100.00 | BB+ | 3,310,652 |
| 4,205 | | 5.000%, 7/01/47 | 7/27 at 100.00 | BB+ | 4,204,706 |
| 1,200 | | New Jersey Educational Facilities Authority, Revenue Bonds, Seton Hall University, | 7/25 at 100.00 | BBB+ | 1,307,280 |
| | Refunding Series 2015C, 5.000%, 7/01/35 | | | |
| 775 | | New Jersey Educational Facilities Authority, Revenue Bonds, Seton Hall University, | 7/27 at 100.00 | BBB+ | 777,534 |
| | Refunding Series 2017D, 3.500%, 7/01/44 | | | |
| | New Jersey Educational Facilities Authority, Revenue Bonds, Seton Hall University, | | | |
| | Series 2013D: | | | |
| 685 | | 5.000%, 7/01/38 | 7/23 at 100.00 | BBB+ | 719,373 |
| 1,935 | | 5.000%, 7/01/43 | 7/23 at 100.00 | BBB+ | 2,022,307 |
| 1,970 | | New Jersey Educational Facilities Authority, Revenue Bonds, Seton Hall University, | 7/26 at 100.00 | BBB+ | 1,807,849 |
| | Series 2016C, 3.000%, 7/01/46 | | | |
| | New Jersey Educational Facilities Authority, Revenue Bonds, Stevens Institute of | | | |
| | Technology Issue, Green Series 2020A: | | | |
| 860 | | 4.000%, 7/01/50 | 7/30 at 100.00 | BBB+ | 933,582 |
| 680 | | 3.000%, 7/01/50 | 7/30 at 100.00 | BBB+ | 661,803 |
| | New Jersey Educational Facilities Authority, Revenue Bonds, Stevens Institute of | | | |
| | Technology, Series 2017A: | | | |
| 1,060 | | 5.000%, 7/01/37 | 7/27 at 100.00 | BBB+ | 1,240,613 |
| 2,500 | | 5.000%, 7/01/42 | 7/27 at 100.00 | BBB+ | 2,889,500 |
| 3,160 | | 5.000%, 7/01/47 | 7/27 at 100.00 | BBB+ | 3,632,199 |
| 1,050 | | 4.000%, 7/01/47 | 7/27 at 100.00 | BBB+ | 1,117,200 |
| 975 | | New Jersey Educational Facilities Authority, Revenue Bonds, The College of Saint | 7/26 at 100.00 | BB | 975,419 |
| | Elizabeth, Series 2016D, 5.000%, 7/01/46 | | | |
| 4,560 | | New Jersey Educational Facilities Authority, Revenue Bonds, William Paterson University, | 7/25 at 100.00 | A3 | 5,060,870 |
| | Series 2015C, 5.000%, 7/01/40 | | | |
| | New Jersey Educational Facilities Authority, Revenue Bonds, William Paterson University, | | | |
| | Series 2017B: | | | |
| 2,000 | | 5.000%, 7/01/42 – AGM Insured | 7/27 at 100.00 | AA | 2,344,480 |
| 2,420 | | 5.000%, 7/01/47 – AGM Insured | 7/27 at 100.00 | AA | 2,817,824 |
| | New Jersey Higher Education Assistance Authority, Senior Student Loan Revenue Bonds, | | | |
| | Refunding Series 2018A: | | | |
| 2,500 | | 3.750%, 12/01/30 (AMT) | 6/28 at 100.00 | Aaa | 2,666,925 |
| 2,560 | | 4.000%, 12/01/32 (AMT) | 6/28 at 100.00 | Aaa | 2,750,515 |
| 2,000 | | 4.000%, 12/01/33 (AMT) | 6/28 at 100.00 | Aaa | 2,139,940 |
| 2,135 | | 4.000%, 12/01/35 (AMT) | 6/28 at 100.00 | Aaa | 2,269,206 |
| | New Jersey Higher Education Assistance Authority, Student Loan Revenue Bonds, Senior | | | |
| | Lien Series 2016-1A: | | | |
| 5,695 | | 3.500%, 12/01/32 (AMT) | 12/25 at 100.00 | Aaa | 5,829,573 |
| 1,320 | | 4.000%, 12/01/39 (AMT) | 12/25 at 100.00 | Aaa | 1,365,672 |
| 1,880 | | New Jersey Higher Education Assistance Authority, Student Loan Revenue Bonds, Senior | 6/28 at 100.00 | Aa1 | 1,861,106 |
| | Series 2019B, 3.250%, 12/01/39 (AMT) | | | |
| 740 | | New Jersey Higher Education Assistance Authority, Student Loan Revenue Bonds, Senior | 12/28 at 100.00 | Aa1 | 747,222 |
| | Series 2020B, 3.500%, 12/01/39 (AMT) | | | |
| 960 | | New Jersey Higher Education Assistance Authority, Student Loan Revenue Bonds, Series | 12/20 at 100.00 | Aaa | 968,726 |
| | 2010-2, 5.000%, 12/01/30 | | | |
| 660 | | New Jersey Higher Education Assistance Authority, Student Loan Revenue Bonds, Series | 12/21 at 100.00 | Aaa | 693,865 |
| | 2011-1, 5.750%, 12/01/27 (AMT) | | | |
23
| | |
| NXJ | Nuveen New Jersey Quality Municipal Income Fund Portfolio of Investments (continued) August 31, 2020 (Unaudited) |
| | | | | | |
| Principal | | | Optional Call | | |
| Amount (000) | | Description (1) | Provisions (2) | Ratings (3) | Value |
| | Education and Civic Organizations (continued) | | | |
| | New Jersey Higher Education Assistance Authority, Student Loan Revenue Bonds, | | | |
| | Series 2012-1A: | | | |
| $ 1,725 | | 4.250%, 12/01/25 (AMT) | 12/22 at 100.00 | Aaa | $ 1,814,666 |
| 565 | | 4.375%, 12/01/26 (AMT) | 12/22 at 100.00 | Aaa | 593,742 |
| 500 | | New Jersey Higher Education Assistance Authority, Student Loan Revenue Bonds, Series | 12/22 at 100.00 | Aaa | 535,885 |
| | 2012-1B, 5.750%, 12/01/39 (AMT) | | | |
| 570 | | New Jersey Higher Education Assistance Authority, Student Loan Revenue Bonds, Series | 12/22 at 100.00 | Aaa | 588,673 |
| | 2013-1A, 3.750%, 12/01/26 (AMT) | | | |
| | New Jersey Higher Education Assistance Authority, Student Loan Revenue Bonds, | | | |
| | Series 2015-1A: | | | |
| 4,285 | | 4.000%, 12/01/28 (AMT) | 12/24 at 100.00 | Aaa | 4,562,754 |
| 2,210 | | 4.000%, 12/01/30 (AMT) | 12/24 at 100.00 | Aaa | 2,337,672 |
| 6,855 | | New Jersey Higher Education Assistance Authority, Student Loan Revenue Bonds, | 12/26 at 100.00 | Aaa | 7,250,533 |
| | Subordinate Series 2017-C, 4.250%, 12/01/47 (AMT) | | | |
| 4,795 | | New Jersey Higher Education Assistance Authority, Student Loan Revenue Bonds, | 6/28 at 100.00 | A2 | 4,762,154 |
| | Subordinate Series 2019C, 3.625%, 12/01/49 (AMT) | | | |
| | New Jersey Higher Education Assistance Authority, Student Loan Revenue Bonds, Tender | | | |
| | Option Bond Trust 2015-XF0151: | | | |
| 536 | | 11.801%, 12/01/23 (AMT), 144A (IF) | 12/22 at 100.00 | Aaa | 609,872 |
| 480 | | 11.946%, 12/01/24 (AMT), 144A (IF) | 12/22 at 100.00 | Aaa | 543,974 |
| 325 | | 12.306%, 12/01/25 (AMT), 144A (IF) | 12/22 at 100.00 | Aaa | 368,628 |
| 100 | | 12.214%, 12/01/26 (AMT), 144A (IF) | 12/22 at 100.00 | Aaa | 112,447 |
| 1,385 | | 13.776%, 12/01/27 (AMT), 144A (IF) | 12/22 at 100.00 | Aaa | 1,690,074 |
| 2,300 | | New Jersey Institute of Technology, New Jersey, General Obligation Bonds, Series 2015A, | 7/25 at 100.00 | A1 | 2,583,820 |
| | 5.000%, 7/01/45 | | | |
| 111,426 | | Total Education and Civic Organizations | | | 120,361,851 |
| | Financials – 0.7% (0.5% of Total Investments) | | | |
| | New Jersey Economic Development Authority, Revenue Refunding Bonds, Kapkowski Road | | | |
| | Landfill Project, Series 2002: | | | |
| 3,290 | | 5.750%, 10/01/21 | No Opt. Call | Ba2 | 3,327,013 |
| 1,500 | | 6.500%, 4/01/28 | No Opt. Call | Ba2 | 1,643,790 |
| 4,790 | | Total Financials | | | 4,970,803 |
| | Health Care – 20.8% (13.9% of Total Investments) | | | |
| | Camden County Improvement Authority, New Jersey, Health Care Redevelopment Revenue | | | |
| | Bonds, Cooper Health System Obligated Group Issue, Refunding Series 2014A: | | | |
| 175 | | 5.000%, 2/15/25 | 2/24 at 100.00 | BBB+ | 197,421 |
| 220 | | 5.000%, 2/15/26 | 2/24 at 100.00 | BBB+ | 247,368 |
| 1,320 | | 5.000%, 2/15/27 | 2/24 at 100.00 | BBB+ | 1,478,941 |
| 1,385 | | 5.000%, 2/15/28 | 2/24 at 100.00 | BBB+ | 1,547,073 |
| 1,385 | | 5.000%, 2/15/29 | 2/24 at 100.00 | BBB+ | 1,542,419 |
| 2,500 | | 5.000%, 2/15/32 | 2/24 at 100.00 | BBB+ | 2,761,375 |
| 3,040 | | 5.000%, 2/15/33 | 2/24 at 100.00 | BBB+ | 3,348,742 |
| 1,000 | | 5.000%, 2/15/34 | 2/24 at 100.00 | BBB+ | 1,099,630 |
| 1,950 | | 5.000%, 2/15/35 | 2/24 at 100.00 | BBB+ | 2,141,100 |
| 6,100 | | Camden County Improvement Authority, New Jersey, Health Care Redevelopment Revenue | 2/23 at 100.00 | BBB+ | 6,591,172 |
| | Bonds, Cooper Health System Obligated Group Issue, Series 2013A, 5.750%, 2/15/42 | | | |
| 225 | | New Jersey Health Care Facilities Finance Authority, Revenue Bonds, AHS Hospital | 10/20 at 100.00 | AA– | 225,713 |
| | Corporation, Series 2008A, 5.000%, 7/01/27 | | | |
| | New Jersey Health Care Facilities Financing Authority, New Jersey, Revenue Bonds, Saint | | | |
| | Peters University Hospital, Refunding Series 2011: | | | |
| 2,000 | | 6.000%, 7/01/26 | 7/21 at 100.00 | BB+ | 2,064,620 |
| 3,425 | | 6.250%, 7/01/35 | 7/21 at 100.00 | BB+ | 3,536,758 |
| 3,550 | | New Jersey Health Care Facilities Financing Authority, New Jersey, Revenue Bonds, Saint | 10/20 at 100.00 | BB+ | 3,561,218 |
| | Peters University Hospital, Series 2007, 5.750%, 7/01/37 | | | |
24
| | | | | | |
| Principal | | | Optional Call | | |
| Amount (000) | | Description (1) | Provisions (2) | Ratings (3) | Value |
| | Health Care (continued) | | | |
| $ 1,145 | | New Jersey Health Care Facilities Financing Authority, Revenue and Refunding Bonds, | 7/22 at 100.00 | AA– | $ 1,234,184 |
| | Barnabas Health, Series 2012A, 5.000%, 7/01/24 | | | |
| 2,525 | | New Jersey Health Care Facilities Financing Authority, Revenue Bonds, AHS Hospital | 1/27 at 100.00 | AA– | 2,795,377 |
| | Corporation, Refunding Series 2016, 4.000%, 7/01/41 | | | |
| 11,000 | | New Jersey Health Care Facilities Financing Authority, Revenue Bonds, Barnabas Health, | 7/24 at 100.00 | AA– | 12,169,850 |
| | Refunding Series 2014A, 5.000%, 7/01/44 | | | |
| | New Jersey Health Care Facilities Financing Authority, Revenue Bonds, Hackensack | | | |
| | Meridian Health Obligated Group, Refunding Series 2017A: | | | |
| 700 | | 5.000%, 7/01/28 | 7/27 at 100.00 | AA– | 876,666 |
| 4,140 | | 5.000%, 7/01/57 | 7/27 at 100.00 | AA– | 4,851,211 |
| | New Jersey Health Care Facilities Financing Authority, Revenue Bonds, Hunterdon Medical | | | |
| | Center, Refunding Series 2014A: | | | |
| 2,055 | | 5.000%, 7/01/45 | 7/24 at 100.00 | A+ | 2,236,251 |
| 1,310 | | 4.000%, 7/01/45 | 7/24 at 100.00 | A+ | 1,374,635 |
| 12,010 | | New Jersey Health Care Facilities Financing Authority, Revenue Bonds, Inspira Health | 7/27 at 100.00 | AA– | 14,120,157 |
| | Obligated Group Issue, Series 2017A, 5.000%, 7/01/42 (UB) (4) | | | |
| | New Jersey Health Care Facilities Financing Authority, Revenue Bonds, Meridian Health | | | |
| | System Obligated Group, Refunding Series 2011: | | | |
| 3,000 | | 5.000%, 7/01/25 | 7/22 at 100.00 | AA– | 3,248,550 |
| 3,000 | | 5.000%, 7/01/26 | 7/22 at 100.00 | AA– | 3,239,790 |
| 2,500 | | 5.000%, 7/01/27 | 7/22 at 100.00 | AA– | 2,693,900 |
| 1,450 | | New Jersey Health Care Facilities Financing Authority, Revenue Bonds, Meridian Health | 7/23 at 100.00 | AA– | 1,596,667 |
| | System Obligated Group, Refunding Series 2013A, 5.000%, 7/01/32 | | | |
| | New Jersey Health Care Facilities Financing Authority, Revenue Bonds, Princeton | | | |
| | HealthCare System, Series 2016A: | | | |
| 830 | | 5.000%, 7/01/32 | 7/26 at 100.00 | AA | 999,536 |
| 1,055 | | 5.000%, 7/01/33 | 7/26 at 100.00 | AA | 1,265,567 |
| 1,370 | | 5.000%, 7/01/34 | 7/26 at 100.00 | AA | 1,639,890 |
| | New Jersey Health Care Facilities Financing Authority, Revenue Bonds, Robert Wood | | | |
| | Johnson University Hospital Issue, Series 2014A: | | | |
| 4,235 | | 5.000%, 7/01/39 | 7/24 at 100.00 | AA– | 4,714,275 |
| 5,955 | | 5.000%, 7/01/43 | 7/24 at 100.00 | AA– | 6,595,341 |
| 3,945 | | New Jersey Health Care Facilities Financing Authority, Revenue Bonds, Robert Wood | 7/23 at 100.00 | AA– | 4,315,593 |
| | Johnson University Hospital, Series 2013A, 5.500%, 7/01/43 | | | |
| 780 | | New Jersey Health Care Facilities Financing Authority, Revenue Bonds, RWJ Barnabas | 7/26 at 100.00 | AA– | 901,415 |
| | Health Obligated Group, Refunding Series 2016A, 5.000%, 7/01/43 | | | |
| | New Jersey Health Care Facilities Financing Authority, Revenue Bonds, Saint Joseph’s | | | |
| | Healthcare System Obligated Group Issue, Refunding Series 2016: | | | |
| 1,600 | | 3.000%, 7/01/32 | 7/26 at 100.00 | BBB– | 1,637,392 |
| 1,135 | | 4.000%, 7/01/34 | 7/26 at 100.00 | BBB– | 1,215,188 |
| 1,600 | | 5.000%, 7/01/35 | 7/26 at 100.00 | BBB– | 1,803,008 |
| 2,700 | | 5.000%, 7/01/36 | 7/26 at 100.00 | BBB– | 3,033,720 |
| 3,095 | | 5.000%, 7/01/41 | 7/26 at 100.00 | BBB– | 3,441,300 |
| 5,600 | | 4.000%, 7/01/48 | 7/26 at 100.00 | BBB– | 5,812,688 |
| 2,345 | | New Jersey Health Care Facilities Financing Authority, Revenue Bonds, Saint Luke’s | 8/23 at 100.00 | A– | 2,458,428 |
| | Warren Hospital Obligated Group, Series 2013, 4.000%, 8/15/37 | | | |
| | New Jersey Health Care Facilities Financing Authority, Revenue Bonds, University | | | |
| | Hospital Issue, Refunding Series 2015A: | | | |
| 5,055 | | 4.125%, 7/01/38 – AGM Insured | 7/25 at 100.00 | AA | 5,419,213 |
| 3,910 | | 5.000%, 7/01/46 – AGM Insured | 7/25 at 100.00 | AA | 4,371,184 |
| | New Jersey Health Care Facilities Financing Authority, Revenue Bonds, Valley Health | | | |
| | System Obligated Group, Series 2019: | | | |
| 2,055 | | 4.000%, 7/01/44 | 7/29 at 100.00 | A+ | 2,310,786 |
| 7,775 | | 3.000%, 7/01/49 | 7/29 at 100.00 | A+ | 7,921,792 |
| 128,150 | | Total Health Care | | | 140,637,104 |
25
| | |
| NXJ | Nuveen New Jersey Quality Municipal Income Fund Portfolio of Investments (continued) August 31, 2020 (Unaudited) |
| | | | | | |
| Principal | | | Optional Call | | |
| Amount (000) | | Description (1) | Provisions (2) | Ratings (3) | Value |
| | Housing/Multifamily – 3.2% (2.1% of Total Investments) | | | |
| $ 1,845 | | New Jersey Economic Development Authority, Revenue Bonds, Provident Group – Kean | 1/27 at 100.00 | B | $ 1,647,548 |
| | Properties LLC – Kean University Student Housing Project, Series 2017A, 5.000%, 7/01/47 | | | |
| 1,900 | | New Jersey Economic Development Authority, Revenue Bonds, Provident Group – Rowan | 1/25 at 100.00 | BB+ | 1,728,943 |
| | Properties LLC – Rowan University Student Housing Project, Series 2015A, 5.000%, 1/01/48 | | | |
| 6,075 | | New Jersey Economic Development Authority, Revenue Bonds, West Campus Housing LLC – New | 7/25 at 100.00 | BB+ | 5,773,498 |
| | Jersey City University Student Housing Project, Series 2015, 5.000%, 7/01/47 | | | |
| | New Jersey Housing and Mortgage Finance Agency, Multifamily Housing Revenue Bonds, | | | |
| | Series 2013-2: | | | |
| 2,165 | | 4.350%, 11/01/33 (AMT) | 11/22 at 100.00 | AA | 2,269,418 |
| 1,235 | | 4.600%, 11/01/38 (AMT) | 11/22 at 100.00 | AA | 1,292,847 |
| 1,235 | | 4.750%, 11/01/46 (AMT) | 11/22 at 100.00 | AA | 1,290,192 |
| 4,320 | | New Jersey Housing and Mortgage Finance Agency, Multifamily Revenue Bonds, Series 2015A, | 11/24 at 100.00 | AA– | 4,574,102 |
| | 4.000%, 11/01/45 | | | |
| | New Jersey Housing and Mortgage Finance Agency, Multifamily Revenue Bonds, Series 2017D: | | | |
| 1,125 | | 3.900%, 11/01/32 (AMT) | 5/26 at 100.00 | AA– | 1,240,594 |
| 1,750 | | 4.250%, 11/01/37 (AMT) | 5/26 at 100.00 | AA– | 1,926,803 |
| 21,650 | | Total Housing/Multifamily | | | 21,743,945 |
| | Housing/Single Family – 9.1% (6.1% of Total Investments) | | | |
| | New Jersey Housing & Mortgage Finance Agency, Single Family Home Mortgage Revenue Bonds, | | | |
| | Series 2011A: | | | |
| 7,130 | | 4.450%, 10/01/25 | 4/21 at 100.00 | Aa2 | 7,276,022 |
| 5,445 | | 4.650%, 10/01/29 | 4/21 at 100.00 | Aa2 | 5,515,295 |
| | New Jersey Housing and Mortgage Finance Agency, Single Family Housing Revenue Bonds, | | | |
| | Series 2018A: | | | |
| 6,455 | | 3.600%, 4/01/33 | 10/27 at 100.00 | AA | 7,114,443 |
| 3,970 | | 3.750%, 10/01/35 | 10/27 at 100.00 | AA | 4,445,527 |
| 3,450 | | New Jersey Housing and Mortgage Finance Agency, Single Family Housing Revenue Bonds, | 10/27 at 100.00 | AA | 3,817,839 |
| | Series 2018B, 3.800%, 10/01/32 (AMT) | | | |
| | New Jersey Housing and Mortgage Finance Agency, Single Family Housing Revenue Bonds, | | | |
| | Series 2019C: | | | |
| 5,260 | | 3.500%, 10/01/34 (UB) (4) | 4/28 at 100.00 | AA | 5,745,182 |
| 5,255 | | 3.850%, 10/01/39 (UB) (4) | 4/28 at 100.00 | AA | 5,681,601 |
| 3,590 | | 3.950%, 10/01/44 (UB) (4) | 4/28 at 100.00 | AA | 3,862,015 |
| | New Jersey Housing and Mortgage Finance Agency, Single Family Housing Revenue Bonds, | | | |
| | Series 2020E: | | | |
| 6,000 | | 2.050%, 10/01/35 | 4/29 at 100.00 | AA | 5,975,400 |
| 7,790 | | 2.250%, 10/01/40 | 4/29 at 100.00 | AA | 7,731,731 |
| 4,000 | | 2.400%, 10/01/45 | 4/29 at 100.00 | AA | 3,961,600 |
| 58,345 | | Total Housing/Single Family | | | 61,126,655 |
| | Long-Term Care – 1.6% (1.1% of Total Investments) | | | |
| 510 | | New Jersey Economic Development Authority, Fixed Rate Revenue Bonds, Lions Gate Project, | 1/24 at 100.00 | N/R | 494,618 |
| | Series 2014, 5.250%, 1/01/44 | | | |
| 5,000 | | New Jersey Economic Development Authority, Revenue Bonds, United Methodist Homes of New | 7/23 at 100.00 | BBB– | 5,092,050 |
| | Jersey Obligated Group Issue, Refunding Series 2013, 5.000%, 7/01/34 | | | |
| 1,410 | | New Jersey Economic Development Authority, Revenue Bonds, United Methodist Homes of New | 7/24 at 100.00 | BBB– | 1,462,071 |
| | Jersey Obligated Group Issue, Refunding Series 2014A, 5.000%, 7/01/29 | | | |
| 2,755 | | New Jersey Economic Development Authority, Revenue Bonds, White Horse HMT Urban Renewal | 1/28 at 102.00 | N/R | 2,631,879 |
| | LLC Project, Series 2020, 5.000%, 1/01/40, 144A | | | |
| 1,450 | | New Jersey Health Care Facilities Financing Authority, Revenue Bonds, Village Drive | 10/26 at 102.00 | N/R | 1,319,471 |
| | Healthcare Urban Renewal LLC, Series 2018, 5.750%, 10/01/38, 144A | | | |
| 11,125 | | Total Long-Term Care | | | 11,000,089 |
26
| | | | | | |
| Principal | | | Optional Call | | |
| Amount (000) | | Description (1) | Provisions (2) | Ratings (3) | Value |
| | Tax Obligation/General – 9.2% (6.1% of Total Investments) | | | |
| $ 2,000 | | Berkeley Heights Township, Union County, New Jersey, General Obligation Bonds, Bond | 1/21 at 100.00 | N/R | $ 2,001,220 |
| | Anticipation Note Series 2020, 0.500%, 3/09/21 | | | |
| 440 | | Cumberland County Improvement Authority, New Jersey, County General Obligation Revenue | 1/28 at 100.00 | AA | 488,048 |
| | Bonds, Technical High School Project, Series 2018, 3.125%, 1/15/32 – BAM Insured | | | |
| 2,920 | | Cumberland County Improvement Authority, New Jersey, Guaranteed Lease Revenue Bonds, | 10/28 at 100.00 | AA | 3,379,024 |
| | County Correctional Facility Project, Series 2018, 4.000%, 10/01/43 – BAM Insured | | | |
| 4,150 | | Essex County Improvement Authority, New Jersey, Project Consolidation Revenue Bonds, | No Opt. Call | Aaa | 4,628,661 |
| | Refunding Series 2007, 5.250%, 12/15/22 – AMBAC Insured | | | |
| 680 | | Hamilton Township, Mercer County Board of Education, New Jersey, General Obligation | 12/27 at 100.00 | AA | 735,910 |
| | Bonds, Series 2017, 3.250%, 12/15/38 | | | |
| | Harrison, New Jersey, General Obligation Bonds, Parking Utility Series 2018: | | | |
| 1,340 | | 3.125%, 3/01/31 – BAM Insured | 3/28 at 100.00 | AA | 1,485,310 |
| 1,110 | | 3.250%, 3/01/32 – BAM Insured | 3/28 at 100.00 | AA | 1,231,179 |
| 1,255 | | 3.500%, 3/01/36 – BAM Insured | 3/28 at 100.00 | AA | 1,388,645 |
| | Hudson County Improvement Authority, New Jersey, County Guaranteed Governmental Loan | | | |
| | Revenue Bonds, Guttenberg General Obligation Bond Project, Series 2018: | | | |
| 375 | | 3.250%, 8/01/34 | 8/25 at 100.00 | AA | 402,004 |
| 1,040 | | 5.000%, 8/01/42 | 8/25 at 100.00 | AA | 1,229,862 |
| | Jersey City, New Jersey, General Obligation Bonds, Refunding General Improvement | | | |
| | Series 2017A: | | | |
| 1,000 | | 5.000%, 11/01/29 | 11/27 at 100.00 | AA– | 1,267,790 |
| 515 | | 5.000%, 11/01/31 | 11/27 at 100.00 | AA– | 646,093 |
| 440 | | 5.000%, 11/01/33 | 11/27 at 100.00 | AA– | 546,647 |
| 1,100 | | Linden, New Jersey, General Obligation Bonds, Refunding Series 2011, 4.000%, 5/01/23 | 5/21 at 100.00 | AA– | 1,125,311 |
| 2,000 | | Mercer County, New Jersey, General Obligation Bonds, General Capital Improvement Open | No Opt. Call | N/R | 2,027,080 |
| | Space Farmland Notes, Series 2020A, 2.000%, 6/10/21 | | | |
| 3,825 | | Monmouth County Improvement Authority, New Jersey, Governmental Pooled Loan Revenue | No Opt. Call | N/R | 3,881,381 |
| | Bonds, Series 2020A, 2.000%, 7/12/21 | | | |
| 760 | | Montclair Township, Essex County, New Jersey, General Obligation Bonds, Refunding | 1/24 at 100.00 | AAA | 872,161 |
| | Parking Utility Series 2014A, 5.000%, 1/01/37 | | | |
| | New Brunswick Parking Authority, Middlesex County, New Jersey, Guaranteed Parking | | | |
| | Revenue Bonds, Refunding Series 2012: | | | |
| 465 | | 5.000%, 9/01/28 | 9/22 at 100.00 | A+ | 498,122 |
| 610 | | 5.000%, 9/01/29 | 9/22 at 100.00 | A+ | 652,578 |
| 300 | | 5.000%, 9/01/31 | 9/22 at 100.00 | A+ | 319,836 |
| 250 | | 3.625%, 9/01/34 | 9/22 at 100.00 | A+ | 257,575 |
| 2,190 | | New Brunswick, New Jersey, General Obligation Bonds, Cultural Center Project, Series | 9/27 at 100.00 | AA | 2,477,503 |
| | 2017, 4.000%, 9/15/44 – AGM Insured | | | |
| 3,250 | | New Jersey State, General Obligation Bonds, Various Purpose Series 2020, 2.250%, 6/01/35 | 12/27 at 100.00 | A– | 3,149,315 |
| 2,000 | | Somerset County, New Jersey, General Obligation Bonds, Bond Anticipation Notes Series | No Opt. Call | N/R | 2,075,880 |
| | 2020, 4.000%, 9/09/21, (WI/DD, Settling 9/10/20) | | | |
| | South Orange Village Township, New Jersey, General Obligation Bonds, Refunding | | | |
| | Series 2020: | | | |
| 500 | | 4.000%, 1/15/23 | No Opt. Call | AA– | 543,100 |
| 400 | | 4.000%, 1/15/25 | No Opt. Call | AA– | 461,488 |
| 500 | | 4.000%, 1/15/26 | No Opt. Call | AA– | 589,920 |
| 3,975 | | Union County Improvement Authority, New Jersey, Lease Revenue Bonds, Plainfield – Park | No Opt. Call | AA+ | 9,183,323 |
| | Madison Redevelopment Project, Tender Option Trust 2016-XG0057, 17.770%, 3/01/34, 144A (IF) (4) | | | |
| 5,165 | | Union County Utilities Authority, New Jersey, Resource Recovery Facility Lease Revenue | 12/21 at 100.00 | AA+ | 5,395,875 |
| | Bonds, Covanta Union Inc Lessee, Refunding Series 2011B, 5.250%, 12/01/31 (AMT) | | | |
| 2,515 | | Union County Utilities Authority, New Jersey, Solid Waste System County Deficiency | 6/21 at 100.00 | Aaa | 2,600,409 |
| | Revenue Bonds, Series 2011A, 5.000%, 6/15/41 | | | |
27
| | |
| NXJ | Nuveen New Jersey Quality Municipal Income Fund Portfolio of Investments (continued) August 31, 2020 (Unaudited) |
| | | | | | |
| Principal | | | Optional Call | | |
| Amount (000) | | Description (1) | Provisions (2) | Ratings (3) | Value |
| | Tax Obligation/General (continued) | | | |
| $ 2,000 | | Union County, New Jersey, General Obligation Bonds, Bond Anticipation Notes Series 2020, | No Opt. Call | N/R | $ 2,058,540 |
| | 4.000%, 6/18/21 | | | |
| 2,170 | | Union County, New Jersey, General Obligation Bonds, Refunding Series 2017, | 9/25 at 100.00 | Aaa | 2,412,693 |
| | 3.000%, 3/01/27 | | | |
| 1,515 | | Washington Township Board of Education, Mercer County, New Jersey, General Obligation | No Opt. Call | Aa3 | 1,930,004 |
| | Bonds, Series 2005, 5.250%, 1/01/27 – AGM Insured | | | |
| 52,755 | | Total Tax Obligation/General | | | 61,942,487 |
| | Tax Obligation/Limited – 34.8% (23.3% of Total Investments) | | | |
| 3,775 | | Bergen County Improvement Authority, New Jersey, Guaranteed Lease Revenue Bonds, County | No Opt. Call | Aaa | 4,789,493 |
| | Administration Complex Project, Series 2005, 5.000%, 11/15/26 | | | |
| 3,000 | | Garden State Preservation Trust, New Jersey, Open Space and Farmland Preservation Bonds, | No Opt. Call | AA | 2,813,790 |
| | Series 2003B, 0.000%, 11/01/25 – AGM Insured | | | |
| 2,230 | | Garden State Preservation Trust, New Jersey, Open Space and Farmland Preservation Bonds, | No Opt. Call | AA | 2,814,505 |
| | Series 2005A, 5.750%, 11/01/28 – AGM Insured | | | |
| | Government of Guam, Business Privilege Tax Bonds, Series 2011A: | | | |
| 5,005 | | 5.250%, 1/01/36 | 1/22 at 100.00 | BB | 5,161,456 |
| 3,020 | | 5.125%, 1/01/42 | 1/22 at 100.00 | BB | 3,099,064 |
| 500 | | Government of Guam, Business Privilege Tax Bonds, Series 2012B-1, 5.000%, 1/01/29 | 1/22 at 100.00 | BB | 516,160 |
| | Hudson County Improvement Authority, New Jersey, County Secured Lease Revenue Bonds, | | | |
| | Hudson County Vocational Technical Schools Project, Series 2016: | | | |
| 10,310 | | 5.000%, 5/01/46 | 5/26 at 100.00 | AA | 12,280,344 |
| 3,700 | | 5.250%, 5/01/51 | 5/26 at 100.00 | AA | 4,441,591 |
| | New Jersey Economic Development Authority, Cigarette Tax Revenue Refunding Bonds, | | | |
| | Series 2012: | | | |
| 310 | | 5.000%, 6/15/21 | No Opt. Call | BBB+ | 315,425 |
| 6,400 | | 5.000%, 6/15/25 | 6/22 at 100.00 | BBB+ | 6,613,184 |
| 3,480 | | 5.000%, 6/15/26 | 6/22 at 100.00 | BBB+ | 3,586,697 |
| 7,945 | | 5.000%, 6/15/28 | 6/22 at 100.00 | BBB+ | 8,151,491 |
| 415 | | 5.000%, 6/15/29 | 6/22 at 100.00 | BBB+ | 424,798 |
| 5,340 | | New Jersey Economic Development Authority, Lease Revenue Bonds, State House Project, | 12/28 at 100.00 | BBB+ | 5,900,914 |
| | Series 2017B, 4.500%, 6/15/40 | | | |
| 5,495 | | New Jersey Economic Development Authority, Revenue Bonds, Motor Vehicle Surcharge, | 7/27 at 100.00 | BBB+ | 5,588,690 |
| | Refunding Series 2017A, 3.375%, 7/01/30 | | | |
| 6,385 | | New Jersey Economic Development Authority, School Facilities Construction Bonds, Series | 6/24 at 100.00 | BBB+ | 7,111,485 |
| | 2014UU, 5.000%, 6/15/27 | | | |
| 11,345 | | New Jersey Economic Development Authority, School Facilities Construction Bonds, Series | 6/25 at 100.00 | BBB+ | 12,579,563 |
| | 2015WW, 5.250%, 6/15/40 | | | |
| 5,000 | | New Jersey Economic Development Authority, School Facilities Construction Financing | 6/24 at 100.00 | BBB+ | 5,587,250 |
| | Program Bonds, Refunding Series 2014PP, 5.000%, 6/15/26 | | | |
| 6,000 | | New Jersey Economic Development Authority, Sublease Revenue Bonds, New Jersey Transit | No Opt. Call | BBB+ | 6,989,640 |
| | Corporation Projects, Refunding Series 2017B, 5.000%, 11/01/25 | | | |
| | New Jersey Transportation Trust Fund Authority, Federal Highway Reimbursement Revenue | | | |
| | Notes, Series 2016A-1: | | | |
| 1,130 | | 5.000%, 6/15/29 | 6/26 at 100.00 | A+ | 1,314,314 |
| 655 | | 5.000%, 6/15/30 | 6/26 at 100.00 | A+ | 756,532 |
| 32,965 | | New Jersey Transportation Trust Fund Authority, Transportation System Bonds, Capital | No Opt. Call | BBB+ | 24,469,260 |
| | Appreciation Series 2010A, 0.000%, 12/15/30 | | | |
| 8,100 | | New Jersey Transportation Trust Fund Authority, Transportation System Bonds, Refunding | No Opt. Call | BBB+ | 8,904,087 |
| | Series 2006A, 5.500%, 12/15/22 | | | |
28
| | | | | | |
| Principal | | | Optional Call | | |
| Amount (000) | | Description (1) | Provisions (2) | Ratings (3) | Value |
| | Tax Obligation/Limited (continued) | | | |
| | New Jersey Transportation Trust Fund Authority, Transportation System Bonds, Refunding | | | |
| | Series 2006C: | | | |
| $ 37,565 | | 0.000%, 12/15/32 – AGM Insured | No Opt. Call | AA | $ 26,687,679 |
| 39,090 | | 0.000%, 12/15/33 – AGM Insured | No Opt. Call | AA | 26,724,660 |
| 5,160 | | 0.000%, 12/15/34 – AGM Insured | No Opt. Call | AA | 3,407,612 |
| 7,000 | | New Jersey Transportation Trust Fund Authority, Transportation System Bonds, Series | No Opt. Call | BBB+ | 8,043,700 |
| | 2010D, 5.000%, 12/15/24 | | | |
| | New Jersey Transportation Trust Fund Authority, Transportation System Bonds, | | | |
| | Series 2011B: | | | |
| 460 | | 5.500%, 6/15/31 | 6/21 at 100.00 | BBB+ | 472,126 |
| 4,470 | | 5.250%, 6/15/36 | 6/21 at 100.00 | BBB+ | 4,572,274 |
| 735 | | New Jersey Transportation Trust Fund Authority, Transportation System Bonds, Series | 6/22 at 100.00 | BBB+ | 765,995 |
| | 2012A, 5.000%, 6/15/42 | | | |
| | New Jersey Transportation Trust Fund Authority, Transportation System Bonds, | | | |
| | Series 2018A: | | | |
| 1,150 | | 5.000%, 12/15/35 | 12/28 at 100.00 | BBB+ | 1,344,396 |
| 440 | | 5.000%, 12/15/36 | 12/28 at 100.00 | BBB+ | 513,053 |
| 4,950 | | New Jersey Transportation Trust Fund Authority, Transportation System Bonds, Series | 12/29 at 100.00 | BBB+ | 5,332,684 |
| | 2019A, 4.000%, 12/15/39 | | | |
| | New Jersey Transportation Trust Fund Authority, Transportation System Bonds, | | | |
| | Series 2019BB: | | | |
| 3,825 | | 3.500%, 6/15/46 | 12/28 at 100.00 | BBB+ | 3,821,251 |
| 2,900 | | 4.000%, 6/15/50 | 12/28 at 100.00 | BBB+ | 3,048,538 |
| 3,860 | | Passaic County Improvement Authority, New Jersey, Lease Revenue Bonds, Preakness | 5/25 at 100.00 | AA | 4,165,558 |
| | Healthcare Center Expansion Project, Refunding Series 2015, 3.750%, 5/01/36 | | | |
| 4,005 | | Passaic County Improvement Authority, New Jersey, Lease Revenue Bonds, Preakness | 5/22 at 100.00 | Aa1 | 4,112,214 |
| | Healthcare Center Expansion Project, Series 2012, 3.500%, 5/01/35 | | | |
| | Union County Improvement Authority, New Jersey, General Obligation Lease Bonds, Juvenile | | | |
| | Detention Center Facility Project, Tender Option Bond Trust 2015-XF1019: | | | |
| 285 | | 24.810%, 5/01/28, 144A (IF) (4) | No Opt. Call | Aaa | 786,392 |
| 285 | | 24.895%, 5/01/29, 144A (IF) (4) | No Opt. Call | Aaa | 838,786 |
| 200 | | 24.895%, 5/01/30, 144A (IF) (4) | No Opt. Call | Aaa | 620,736 |
| 370 | | 24.632%, 5/01/31, 144A (IF) (4) | No Opt. Call | Aaa | 1,196,739 |
| 385 | | 24.769%, 5/01/32, 144A (IF) (4) | No Opt. Call | Aaa | 1,302,494 |
| 400 | | 24.774%, 5/01/33, 144A (IF) (4) | No Opt. Call | Aaa | 1,405,860 |
| 415 | | 24.895%, 5/01/34, 144A (IF) (4) | No Opt. Call | Aaa | 1,524,050 |
| 250,455 | | Total Tax Obligation/Limited | | | 234,896,530 |
| | Transportation – 28.5% (19.1% of Total Investments) | | | |
| 2,400 | | Delaware River and Bay Authority, Delaware and New Jersey, Revenue Bonds, Series 2012A, | 1/23 at 100.00 | A1 | 2,567,472 |
| | 5.000%, 1/01/42 | | | |
| | Delaware River and Bay Authority, Delaware and New Jersey, Revenue Bonds, Series 2014A: | | | |
| 1,285 | | 5.000%, 1/01/34 | 1/24 at 100.00 | A1 | 1,429,935 |
| 5,890 | | 4.125%, 1/01/39 | 1/24 at 100.00 | A1 | 6,265,429 |
| 7,800 | | 5.000%, 1/01/44 | 1/24 at 100.00 | A1 | 8,564,946 |
| 2,580 | | Delaware River and Bay Authority, Delaware and New Jersey, Revenue Bonds, Series 2019, | 1/29 at 100.00 | A1 | 2,908,589 |
| | 4.000%, 1/01/44 | | | |
| | Delaware River Joint Toll Bridge Commission, New Jersey and Pennsylvania, Bridge System | | | |
| | Revenue Bonds, Refunding Series 2015: | | | |
| 1,000 | | 4.000%, 7/01/34 – BAM Insured | 7/25 at 100.00 | AA | 1,107,560 |
| 2,820 | | 4.000%, 7/01/35 – BAM Insured | 7/25 at 100.00 | AA | 3,117,143 |
| | Delaware River Joint Toll Bridge Commission, New Jersey and Pennsylvania, Bridge System | | | |
| | Revenue Bonds, Refunding Series 2019B: | | | |
| 2,005 | | 5.000%, 7/01/28 | No Opt. Call | A1 | 2,634,470 |
| 1,520 | | 5.000%, 7/01/29 | No Opt. Call | A1 | 2,041,223 |
29
| | |
| NXJ | Nuveen New Jersey Quality Municipal Income Fund Portfolio of Investments (continued) August 31, 2020 (Unaudited) |
| | | | | | |
| Principal | | | Optional Call | | |
| Amount (000) | | Description (1) | Provisions (2) | Ratings (3) | Value |
| | Transportation (continued) | | | |
| | Delaware River Joint Toll Bridge Commission, New Jersey and Pennsylvania, Bridge System | | | |
| | Revenue Bonds, Series 2017: | | | |
| $ 2,820 | | 5.000%, 7/01/42 | 7/27 at 100.00 | A1 | $ 3,435,183 |
| 10,210 | | 5.000%, 7/01/47 | 7/27 at 100.00 | A1 | 12,353,487 |
| | Delaware River Joint Toll Bridge Commission, New Jersey and Pennsylvania, Bridge System | | | |
| | Revenue Bonds, Series 2019A: | | | |
| 1,050 | | 5.000%, 7/01/28 | No Opt. Call | A1 | 1,379,648 |
| 1,350 | | 5.000%, 7/01/29 | No Opt. Call | A1 | 1,812,929 |
| 950 | | 5.000%, 7/01/30 | 7/29 at 100.00 | A1 | 1,267,481 |
| 7,035 | | Delaware River Port Authority, New Jersey and Pennsylvania, Revenue Bonds, Series 2013, | 1/24 at 100.00 | A+ | 7,828,478 |
| | 5.000%, 1/01/40 | | | |
| 2,325 | | Delaware River Port Authority, New Jersey and Pennsylvania, Revenue Bonds, Series 2018A, | 1/29 at 100.00 | A+ | 2,850,008 |
| | 5.000%, 1/01/37 | | | |
| | Delaware River Port Authority, Pennsylvania and New Jersey, Revenue Refunding Bonds, | | | |
| | Port District Project, Series 2012: | | | |
| 1,800 | | 5.000%, 1/01/24 | 1/23 at 100.00 | A | 1,937,952 |
| 1,635 | | 5.000%, 1/01/25 | 1/23 at 100.00 | A | 1,756,154 |
| 1,875 | | 5.000%, 1/01/26 | 1/23 at 100.00 | A | 2,007,000 |
| 3,525 | | 5.000%, 1/01/27 | 1/23 at 100.00 | A | 3,759,271 |
| 5,555 | | New Jersey Economic Development Authority, Private Activity Bonds, The Goethals Bridge | 1/24 at 100.00 | BBB+ | 6,141,886 |
| | Replacement Project, Series 2013, 5.625%, 1/01/52 (AMT) | | | |
| | New Jersey Economic Development Authority, Special Facilities Revenue Bonds, Continental | | | |
| | Airlines Inc, Series 1999: | | | |
| 1,000 | | 5.125%, 9/15/23 (AMT) | 8/22 at 101.00 | Ba3 | 1,025,520 |
| 1,800 | | 5.250%, 9/15/29 (AMT) | 8/22 at 101.00 | Ba3 | 1,842,228 |
| 2,250 | | New Jersey Economic Development Authority, Special Facilities Revenue Bonds, Continental | 3/24 at 101.00 | Ba3 | 2,336,445 |
| | Airlines Inc, Series 2000A & 2000B, 5.625%, 11/15/30 (AMT) | | | |
| | New Jersey Economic Development Authority, Special Facility Revenue Bonds, Port Newark | | | |
| | Container Terminal LLC Project, Refunding Series 2017: | | | |
| 5,660 | | 5.000%, 10/01/37 (AMT) | 10/27 at 100.00 | Ba1 | 6,255,489 |
| 7,440 | | 5.000%, 10/01/47 (AMT) | 10/27 at 100.00 | Ba1 | 8,071,210 |
| | New Jersey Transit Corporation, Grant Anticipation Notes, Federal Transit Administration | | | |
| | Section 5307 Urbanized Area Formula Funds, Series 2014A: | | | |
| 6,000 | | 5.000%, 9/15/20 | No Opt. Call | A | 6,009,420 |
| 5,750 | | 5.000%, 9/15/21 | No Opt. Call | A | 6,008,462 |
| 6,570 | | New Jersey Turnpike Authority, Revenue Bonds, Refunding Series 2015E, 5.000%, 1/01/45 | 1/25 at 100.00 | A+ | 7,380,475 |
| 3,065 | | New Jersey Turnpike Authority, Revenue Bonds, Series 2005A, 5.250%, 1/01/29 – | No Opt. Call | AA | 4,077,032 |
| | AGM Insured | | | |
| 7,620 | | New Jersey Turnpike Authority, Revenue Bonds, Series 2012B, 5.000%, 1/01/28 | 1/23 at 100.00 | A+ | 8,327,212 |
| 1,365 | | New Jersey Turnpike Authority, Revenue Bonds, Tender Option Bond Trust 2016-XF1057, | 7/22 at 100.00 | A+ | 1,787,700 |
| | 17.317%, 1/01/43, 144A (IF) (4) | | | |
| 2,750 | | Passaic County Improvement Authority, New Jersey, Revenue Bonds, Paterson Parking Deck | 10/20 at 100.00 | A2 | 2,760,257 |
| | Facility, Series 2005, 5.000%, 4/15/35 – AGM Insured | | | |
| 7,235 | | Port Authority of New York and New Jersey, Consolidated Revenue Bonds, One Hundred | 12/23 at 100.00 | Aa3 | 8,051,180 |
| | Seventy Ninth Series 2013, 5.000%, 12/01/43 | | | |
| 5,000 | | Port Authority of New York and New Jersey, Consolidated Revenue Bonds, One Hundred | 1/23 at 100.00 | Aa3 | 5,256,250 |
| | Seventy Seventh Series 2013, 4.000%, 1/15/43 (AMT) | | | |
| | Port Authority of New York and New Jersey, Consolidated Revenue Bonds, Two Hundred | | | |
| | Eighteen Series 2019: | | | |
| 8,000 | | 4.000%, 11/01/41 (AMT) (UB) (4) | 11/29 at 100.00 | Aa3 | 8,982,560 |
| 4,000 | | 4.000%, 11/01/47 (AMT) (UB) (4) | 11/29 at 100.00 | Aa3 | 4,446,520 |
30
| | | | | | |
| Principal | | | Optional Call | | |
| Amount (000) | | Description (1) | Provisions (2) | Ratings (3) | Value |
| | Transportation (continued) | | | |
| | Port Authority of New York and New Jersey, Consolidated Revenue Bonds, Two Hundred | | | |
| | Fourteen Series 2019: | | | |
| $ 4,500 | | 4.000%, 9/01/38 (AMT) (UB) (4) | 9/29 at 100.00 | Aa3 | $ 5,091,615 |
| 2,500 | | 4.000%, 9/01/39 (AMT) (UB) (4) | 9/29 at 100.00 | Aa3 | 2,820,425 |
| | Port Authority of New York and New Jersey, Special Project Bonds, JFK International Air | | | |
| | Terminal LLC, Sixth Series 1997: | | | |
| 12,445 | | 5.750%, 12/01/22 – NPFG Insured (AMT) | 10/20 at 100.00 | Baa1 | 12,612,136 |
| 12,130 | | 5.750%, 12/01/25 – NPFG Insured (AMT) | 10/20 at 100.00 | Baa1 | 12,293,027 |
| 174,510 | | Total Transportation | | | 192,601,407 |
| | U.S. Guaranteed – 11.0% (7.3% of Total Investments) (5) | | | |
| 2,225 | | Cumberland County Improvement Authority, New Jersey, County General Obligation Revenue | 9/24 at 100.00 | AA | 2,639,228 |
| | Bonds, Technical High School Project, Series 2014, 5.000%, 9/01/39 (Pre-refunded 9/01/24) – | | | |
| | AGM Insured | | | |
| | Delaware River Joint Toll Bridge Commission, Pennsylvania, Bridge System Revenue Bonds, | | | |
| | Refunding Series 2012A: | | | |
| 2,150 | | 5.000%, 7/01/24 (Pre-refunded 7/01/22) | 7/22 at 100.00 | A1 | 2,337,222 |
| 650 | | 4.000%, 7/01/26 (Pre-refunded 7/01/22) | 7/22 at 100.00 | A1 | 694,733 |
| 625 | | 4.000%, 7/01/27 (Pre-refunded 7/01/22) | 7/22 at 100.00 | A1 | 668,013 |
| 25 | | Essex County Improvement Authority, New Jersey, Project Consolidation Revenue Bonds, | No Opt. Call | Aaa | 27,878 |
| | Refunding Series 2007, 5.250%, 12/15/22 – AMBAC Insured (ETM) | | | |
| 2,455 | | New Jersey Economic Development Authority, Rutgers University General Obligation Lease | 6/23 at 100.00 | Aa3 | 3,746,281 |
| | Revenue Bonds, Tender Option Bond 2016-XF2357, 17.963%, 6/15/46 (Pre-refunded 6/15/23), | | | |
| | 144A (IF) (4) | | | |
| 655 | | New Jersey Economic Development Authority, School Facilities Construction Bonds, Series | 6/25 at 100.00 | N/R | 810,359 |
| | 2015WW, 5.250%, 6/15/40 (Pre-refunded 6/15/25) | | | |
| | New Jersey Education Facilities Authority Revenue Bonds, The College of New Jersey | | | |
| | Issue, Series 2013A: | | | |
| 2,475 | | 5.000%, 7/01/38 (Pre-refunded 7/01/23) | 7/23 at 100.00 | A | 2,801,873 |
| 3,250 | | 5.000%, 7/01/43 (Pre-refunded 7/01/23) | 7/23 at 100.00 | A | 3,679,227 |
| 70 | | New Jersey Environmental Infrastructure Trust, Environmental Infrastructure Bonds, | No Opt. Call | N/R | 72,634 |
| | Refunding Series 2012A-R, 4.000%, 9/01/21 (ETM) | | | |
| 30 | | New Jersey Environmental Infrastructure Trust, Environmental Infrastructure Bonds, | 9/21 at 100.00 | N/R | 30,884 |
| | Series 2012A, 3.250%, 9/01/31 (Pre-refunded 9/01/21) | | | |
| | New Jersey Health Care Facilities Financing Authority, Revenue Bonds, Kennedy Health | | | |
| | System Obligated Group Issue, Refunding Series 2012: | | | |
| 4,165 | | 3.750%, 7/01/27 (ETM) | No Opt. Call | N/R | 4,714,072 |
| 3,375 | | 5.000%, 7/01/31 (Pre-refunded 7/01/22) | 7/22 at 100.00 | N/R | 3,665,655 |
| 1,500 | | 5.000%, 7/01/37 (Pre-refunded 7/01/22) | 7/22 at 100.00 | N/R | 1,629,180 |
| | New Jersey Health Care Facilities Financing Authority, Revenue Bonds, Palisades Medical | | | |
| | Center Obligated Group Issue, Refunding Series 2013: | | | |
| 555 | | 5.250%, 7/01/31 (Pre-refunded 7/01/23) | 7/23 at 100.00 | N/R | 627,156 |
| 2,570 | | 5.250%, 7/01/31 (Pre-refunded 7/01/23) | 7/23 at 100.00 | N/R | 2,931,419 |
| 275 | | 5.500%, 7/01/43 (Pre-refunded 7/01/23) | 7/23 at 100.00 | N/R | 312,678 |
| 1,285 | | 5.500%, 7/01/43 (Pre-refunded 7/01/23) | 7/23 at 100.00 | N/R | 1,474,769 |
| 7,670 | | New Jersey Health Care Facilities Financing Authority, Revenue Bonds, Saint Barnabas | 7/21 at 100.00 | N/R | 8,011,162 |
| | Health Care System, Refunding Series 2011A, 5.625%, 7/01/37 (Pre-refunded 7/01/21) | | | |
| | New Jersey Institute of Technology, New Jersey, General Obligation Bonds, Series 2012A: | | | |
| 175 | | 5.000%, 7/01/42 (Pre-refunded 7/01/22) | 7/22 at 100.00 | N/R | 190,071 |
| 400 | | 5.000%, 7/01/42 (Pre-refunded 7/01/22) | 7/22 at 100.00 | A1 | 434,832 |
| 1,555 | | New Jersey Sports and Exposition Authority, Convention Center Luxury Tax Bonds, Series | No Opt. Call | Baa2 | 1,676,197 |
| | 2004, 5.500%, 3/01/22 – NPFG Insured (ETM) | | | |
31
| | |
| NXJ | Nuveen New Jersey Quality Municipal Income Fund Portfolio of Investments (continued) August 31, 2020 (Unaudited) |
| | | | | | |
| Principal | | | Optional Call | | |
| Amount (000) | | Description (1) | Provisions (2) | Ratings (3) | Value |
| | U.S. Guaranteed (5) (continued) | | | |
| | New Jersey Transportation Trust Fund Authority, Transportation System Bonds, | | | |
| | Series 2011A: | | | |
| $ 80 | | 6.000%, 6/15/35 (Pre-refunded 6/15/21) | 6/21 at 100.00 | BBB+ | $ 83,662 |
| 1,015 | | 5.500%, 6/15/41 (Pre-refunded 6/15/21) | 6/21 at 100.00 | BBB+ | 1,057,640 |
| | New Jersey Transportation Trust Fund Authority, Transportation System Bonds, | | | |
| | Series 2011B: | | | |
| 270 | | 5.000%, 6/15/37 (Pre-refunded 6/15/21) | 6/21 at 100.00 | BBB+ | 280,284 |
| 25 | | 5.000%, 6/15/42 (Pre-refunded 6/15/21) | 6/21 at 100.00 | BBB+ | 25,952 |
| 2,260 | | New Jersey Turnpike Authority, Revenue Bonds, Tender Option Bond Trust 2016-XF1057, | 7/22 at 100.00 | N/R | 2,959,854 |
| | 17.317%, 1/01/43 (Pre-refunded 7/01/22), 144A (IF) (4) | | | |
| | North Hudson Sewerage Authority, New Jersey, Gross Revenue Lease Certificates, Senior | | | |
| | Lien Series 2012A: | | | |
| 1,455 | | 5.000%, 6/01/27 (Pre-refunded 6/01/22) | 6/22 at 100.00 | N/R | 1,577,278 |
| 2,365 | | 5.000%, 6/01/27 (Pre-refunded 6/01/22) | 6/22 at 100.00 | A+ | 2,563,755 |
| 225 | | 5.000%, 6/01/42 (Pre-refunded 6/01/22) | 6/22 at 100.00 | N/R | 243,909 |
| 15,840 | | North Hudson Sewerage Authority, New Jersey, Sewerage Revenue Refunding Bonds, Series | No Opt. Call | Baa2 | 15,615,706 |
| | 2001A, 0.000%, 8/01/23 – NPFG Insured (ETM) | | | |
| 2,170 | | Rutgers State University, New Jersey, Revenue Bonds, Tender Option Bond 2016-XF2356, | 5/23 at 100.00 | Aa3 | 3,277,590 |
| | 18.123%, 5/01/43 (Pre-refunded 5/01/23), 144A (IF) (4) | | | |
| | Sparta Township Board of Education, Sussex County, New Jersey, General Obligation Bonds, | | | |
| | Refunding Series 2015: | | | |
| 1,000 | | 5.000%, 2/15/34 (Pre-refunded 2/15/25) | 2/25 at 100.00 | AA | 1,209,710 |
| 1,395 | | 5.000%, 2/15/35 (Pre-refunded 2/15/25) | 2/25 at 100.00 | AA | 1,687,545 |
| 66,235 | | Total U.S. Guaranteed | | | 73,758,408 |
| | Utilities – 7.4% (4.9% of Total Investments) | | | |
| 1,510 | | Industrial Pollution Control Financing Authority of Cape May County (New Jersey), | No Opt. Call | A | 1,554,953 |
| | Pollution Control Revenue Refunding Bonds, 1991 Series A (Atlantic City Electric Company | | | |
| | Project), 6.800%, 3/01/21 – NPFG Insured | | | |
| | New Jersey Economic Development Authority, Energy Facilities Revenue Bonds, UMM Energy | | | |
| | Partners, LLC Project, Series 2012A: | | | |
| 1,000 | | 4.750%, 6/15/32 (AMT) | 6/22 at 100.00 | Baa2 | 1,053,930 |
| 1,225 | | 5.125%, 6/15/43 (AMT) | 6/22 at 100.00 | Baa2 | 1,291,493 |
| 1,950 | | New Jersey Economic Development Authority, Natural Gas Facilities Revenue Bonds, New | 8/24 at 100.00 | A1 | 1,980,888 |
| | Jersey Natural Gas Company Project, Refunding Series 2011A, 2.750%, 8/01/39 | | | |
| 15,670 | | New Jersey Economic Development Authority, Water Facilities Revenue Bonds, Middlesex | 10/22 at 100.00 | A+ | 16,238,351 |
| | Water Company, Series 2012C, 4.250%, 10/01/47 (AMT) | | | |
| 2,355 | | New Jersey Economic Development Authority, Water Facilities Revenue Bonds, Middlesex | 8/29 at 100.00 | A+ | 2,635,622 |
| | Water Company, Series 2019, 4.000%, 8/01/59 (AMT) | | | |
| 2,040 | | New Jersey Economic Development Authority, Water Facilities Revenue Bonds, New | 11/20 at 100.00 | A+ | 2,052,668 |
| | Jersey-American Water Company Inc Project, Refunding Series 2010D, 4.875%, 11/01/29 (AMT) | | | |
| 3,505 | | New Jersey Economic Development Authority, Water Facilities Revenue Bonds, New | No Opt. Call | A+ | 3,556,839 |
| | Jersey-American Water Company Inc Project, Refunding Series 2020B, 1.200%, 11/01/34 (AMT) | | | |
| | (Mandatory Put 6/01/23) | | | |
| 2,700 | | Passaic County Utilities Authority, New Jersey, Solid Waste Disposal Revenue Bonds, | No Opt. Call | AA | 3,802,194 |
| | Refunding Series 2018, 5.000%, 3/01/37 | | | |
| 2,065 | | Salem County Pollution Control Financing Authority, New Jersey, Pollution Control | No Opt. Call | BBB | 2,171,760 |
| | Revenue Bonds, Chambers Project, Refunding Series 2014A, 5.000%, 12/01/23 (AMT) | | | |
| 13,000 | | Salem County Pollution Control Financing Authority, New Jersey, Revenue Bonds, Atlantic | No Opt. Call | A | 13,252,460 |
| | City Electric Company Project, Refunding Series 2020, 2.250%, 6/01/29 | | | |
| 47,020 | | Total Utilities | | | 49,591,158 |
32
| | | | | | |
| Principal | | | Optional Call | | |
| Amount (000) | | Description (1) | Provisions (2) | Ratings (3) | Value |
| | Water and Sewer – 0.3% (0.2% of Total Investments) | | | |
| | New Jersey Environmental Infrastructure Trust, Environmental Infrastructure Bonds, | | | |
| | Series 2012A: | | | |
| $ 65 | | 3.250%, 9/01/31 | No Opt. Call | N/R | $ 66,914 |
| 1,585 | | 3.250%, 9/01/31 | No Opt. Call | N/R | 1,633,295 |
| 1,650 | | Total Water and Sewer | | | 1,700,209 |
| $ 960,136 | | Total Long-Term Investments (cost $927,731,076) | | | 1,009,210,235 |
|
| Principal | | | Optional Call | | |
| Amount (000) | | Description (1) | Provisions (2) | Ratings (3) | Value |
| | SHORT-TERM INVESTMENTS – 0.1% (0.1% of Total Investments) | | | |
| | MUNICIPAL BONDS – 0.1% (0.1% of Total Investments) | | | |
| | Health Care – 0.1% (0.1% of Total Investments) | | | |
| $ 600 | | New Jersey Health Care Facilities Financing Authority, Revenue Bonds, Inspira Health Obligated | No Opt. Call | N/R | $ 600,000 |
| | Group Issue, Variable Rate Demand Obligations, Tender Option Bond Trust Series 2017-ZM0546, | | | |
| | 0.240%, 7/01/25 (Mandatory Put 10/01/2020), 144A, (7) | | | |
| $ 600 | | Total Short-Term Investments (cost $600,000) | | | 600,000 |
| | Total Investments (cost $928,331,076) – 149.7% | | | 1,009,810,235 |
| | Floating Rate Obligations – (5.2)% | | | (34,780,000) |
| | Variable Rate Demand Preferred Shares, net of deferred offering costs – (46.3)% (6) | | | (312,530,901) |
| | Other Assets Less Liabilities –1.8% | | | 12,191,117 |
| | Net Asset Applicable to Common Shares – 100% | | | $ 674,690,451 |
| | |
(1) | All percentages shown in the Portfolio of Investments are based on net assets applicable to common shares unless otherwise noted. |
(2) | Optional Call Provisions: Dates (month and year) and prices of the earliest optional call or redemption. There may be other call provisions at varying prices at later dates. Certain mortgage-backed securities may be subject to periodic principal paydowns. |
(3) | For financial reporting purposes, the ratings disclosed are the highest of Standard & Poor’s Group (“Standard & Poor’s”), Moody’s Investors Service, Inc. (“Moody’s”) or Fitch, Inc. (“Fitch”) rating. This treatment of split-rated securities may differ from that used for other purposes, such as for Fund investment policies. Ratings below BBB by Standard & Poor’s, Baa by Moody’s or BBB by Fitch are considered to be below investment grade. Holdings designated N/R are not rated by any of these national rating agencies. |
(4) | Investment, or portion of investment, has been pledged to collateralize the net payment obligations for investments in inverse floating rate transactions. |
(5) | Backed by an escrow or trust containing sufficient U.S. Government or U.S. Government agency securities, which ensure the timely payment of principal and interest. |
(6) | Variable Rate Demand Preferred Shares, net of deferred offering costs as a percentage of Total Investments is 30.9%. |
(7) | Investment has a maturity of greater than one year, but has variable rate and/or demand features which qualify it as a short-term investment. The rate disclosed, as well as the reference rate and spread, where applicable, is that in effect as of the end of the reporting period. This rate changes periodically based on market conditions or a specified market index. |
144A | Investment is exempt from registration under Rule 144A of the Securities Act of 1933, as amended. These investments may only be resold in transactions exempt from registration, which are normally those transactions with qualified institutional buyers. |
AMT | Alternative Minimum Tax |
ETM | Escrowed to maturity |
IF | Inverse floating rate security issued by a tender option bond (“TOB”) trust, the interest rate on which varies inversely with the Securities Industry Financial Markets Association (SIFMA) short-term rate, which resets weekly, or a similar short-term rate, and is reduced by the expenses related to the TOB trust. |
UB | Underlying bond of an inverse floating rate trust reflected as a financing transaction. See Notes to Financial Statements, Note 4 – Portfolio Securities and Investments in Derivatives, for more information. |
WI/DD | Purchased on a when-issued or delayed delivery basis. |
| See accompanying notes to financial statements. |
33
| | |
| NJV | Nuveen New Jersey Municipal Value Fund Portfolio of Investments August 31, 2020 (Unaudited) |
| | | | | | |
| Principal | | | Optional Call | | |
| Amount (000) | | Description (1) | Provisions (2) | Ratings (3) | Value |
| | LONG-TERM INVESTMENTS – 102.0% (100.0% of Total Investments) | | | |
| | MUNICIPAL BONDS – 102.0% (100.0% of Total Investments) | | | |
| | Consumer Discretionary – 0.3% (0.3% of Total Investments) | | | |
| $ 100 | | Middlesex County Improvement Authority, New Jersey, Senior Revenue Bonds, Heldrich | 10/20 at 100.00 | Caa3 | $ 63,496 |
| | Center Hotel/Conference Center Project, Series 2005A, 5.000%, 1/01/32 | | | |
| | Consumer Staples – 3.2% (3.1% of Total Investments) | | | |
| | Tobacco Settlement Financing Corporation, New Jersey, Tobacco Settlement Asset-Backed | | | |
| | Bonds, Series 2018A: | | | |
| 215 | | 4.000%, 6/01/37 | 6/28 at 100.00 | A– | 243,726 |
| 305 | | 5.250%, 6/01/46 | 6/28 at 100.00 | BBB+ | 361,370 |
| 125 | | Tobacco Settlement Financing Corporation, New Jersey, Tobacco Settlement Asset-Backed | 6/28 at 100.00 | BB+ | 141,700 |
| | Bonds, Series 2018B, 5.000%, 6/01/46 | | | |
| 645 | | Total Consumer Staples | | | 746,796 |
| | Education and Civic Organizations – 16.1% (15.8% of Total Investments) | | | |
| 110 | | Camden County Improvement Authority, New Jersey, Lease Revenue Bonds, Rowan University | 12/23 at 100.00 | A | 121,494 |
| | School of Osteopathic Medicine Project, Refunding Series 2013A, 5.000%, 12/01/32 | | | |
| 25 | | New Jersey Economic Development Authority, Charter School Revenue Bonds, Foundation | 1/28 at 100.00 | BBB– | 28,159 |
| | Academy Charter School, Series 2018A, 5.000%, 7/01/38 | | | |
| | New Jersey Economic Development Authority, Charter School Revenue Bonds, North Star | | | |
| | Academy Charter School of Newark, Series 2017: | | | |
| 220 | | 4.000%, 7/15/37 | 7/27 at 100.00 | BBB– | 230,048 |
| 25 | | 5.000%, 7/15/47 | 7/27 at 100.00 | BBB– | 27,579 |
| 100 | | New Jersey Economic Development Authority, Charter School Revenue Bonds, Teaneck | 9/27 at 100.00 | BB | 102,809 |
| | Community Charter School, Series 2017A, 5.125%, 9/01/52, 144A | | | |
| 115 | | New Jersey Economic Development Authority, Revenue Bonds, The Seeing Eye Inc, Refunding | No Opt. Call | A | 135,993 |
| | Series 2015, 5.000%, 3/01/25 | | | |
| | New Jersey Economic Development Authority, Revenue Bonds, The Seeing Eye Inc, Refunding | | | |
| | Series 2017: | | | |
| 15 | | 5.000%, 6/01/32 | 12/27 at 100.00 | A | 18,092 |
| 20 | | 3.000%, 6/01/32 | 12/27 at 100.00 | A | 20,743 |
| 160 | | New Jersey Educational Facilities Authority, Revenue Bonds, College of New Jersey, | 7/26 at 100.00 | A | 160,960 |
| | Refunding Series 2016F, 3.000%, 7/01/40 | | | |
| 100 | | New Jersey Educational Facilities Authority, Revenue Bonds, Kean University, Refunding | 7/25 at 100.00 | AA | 107,487 |
| | Series 2015H, 4.000%, 7/01/39 – AGM Insured | | | |
| 50 | | New Jersey Educational Facilities Authority, Revenue Bonds, Montclair State University, | 7/24 at 100.00 | A+ | 54,969 |
| | Series 2014A, 5.000%, 7/01/44 | | | |
| | New Jersey Educational Facilities Authority, Revenue Bonds, Rider University, | | | |
| | Series 2012A: | | | |
| 100 | | 5.000%, 7/01/32 | 7/21 at 100.00 | BB+ | 100,454 |
| 30 | | 5.000%, 7/01/37 | 7/21 at 100.00 | BB+ | 30,070 |
| | New Jersey Educational Facilities Authority, Revenue Bonds, Rider University, | | | |
| | Series 2017F: | | | |
| 5 | | 3.750%, 7/01/37 | 7/27 at 100.00 | BB+ | 4,341 |
| 100 | | 4.000%, 7/01/42 | 7/27 at 100.00 | BB+ | 86,440 |
| 100 | | 5.000%, 7/01/47 | 7/27 at 100.00 | BB+ | 99,993 |
| 75 | | New Jersey Educational Facilities Authority, Revenue Bonds, Seton Hall University, | 7/23 at 100.00 | BBB+ | 78,763 |
| | Series 2013D, 5.000%, 7/01/38 | | | |
34
| | | | | | |
| Principal | | | Optional Call | | |
| Amount (000) | | Description (1) | Provisions (2) | Ratings (3) | Value |
| | Education and Civic Organizations (continued) | | | |
| | New Jersey Educational Facilities Authority, Revenue Bonds, Seton Hall University, | | | |
| | Series 2016C: | | | |
| $ 435 | | 3.000%, 7/01/41 | 7/26 at 100.00 | BBB+ | $ 412,315 |
| 50 | | 3.000%, 7/01/46 | 7/26 at 100.00 | BBB+ | 45,884 |
| 25 | | 4.000%, 7/01/46 | 7/26 at 100.00 | BBB+ | 25,806 |
| | New Jersey Educational Facilities Authority, Revenue Bonds, Stevens Institute of | | | |
| | Technology, Series 2017A: | | | |
| 30 | | 5.000%, 7/01/47 | 7/27 at 100.00 | BBB+ | 34,483 |
| 200 | | 4.000%, 7/01/47 | 7/27 at 100.00 | BBB+ | 212,800 |
| 25 | | New Jersey Educational Facilities Authority, Revenue Bonds, The College of Saint | 7/26 at 100.00 | BB | 25,011 |
| | Elizabeth, Series 2016D, 5.000%, 7/01/46 | | | |
| 265 | | New Jersey Higher Education Assistance Authority, Senior Student Loan Revenue Bonds, | 6/28 at 100.00 | Aaa | 281,658 |
| | Refunding Series 2018A, 4.000%, 12/01/35 (AMT) | | | |
| 100 | | New Jersey Higher Education Assistance Authority, Student Loan Revenue Bonds, Refunding | 6/28 at 100.00 | Aa1 | 99,031 |
| | Senior Series 2019A, 2.375%, 12/01/29 | | | |
| 200 | | New Jersey Higher Education Assistance Authority, Student Loan Revenue Bonds, Senior | 12/26 at 100.00 | Aaa | 209,056 |
| | Lien Series 2017-1A, 4.000%, 12/01/40 (AMT) | | | |
| 150 | | New Jersey Higher Education Assistance Authority, Student Loan Revenue Bonds, Senior | 6/28 at 100.00 | Aa1 | 148,492 |
| | Series 2019B, 3.250%, 12/01/39 (AMT) | | | |
| 25 | | New Jersey Higher Education Assistance Authority, Student Loan Revenue Bonds, Senior | 12/28 at 100.00 | Aa1 | 25,244 |
| | Series 2020B, 3.500%, 12/01/39 (AMT) | | | |
| 30 | | New Jersey Higher Education Assistance Authority, Student Loan Revenue Bonds, Series | 12/20 at 100.00 | Aaa | 30,273 |
| | 2010-2, 5.000%, 12/01/30 | | | |
| 100 | | New Jersey Higher Education Assistance Authority, Student Loan Revenue Bonds, Series | 12/22 at 100.00 | Aaa | 107,177 |
| | 2012-1B, 5.750%, 12/01/39 (AMT) | | | |
| 80 | | New Jersey Higher Education Assistance Authority, Student Loan Revenue Bonds, Series | 12/22 at 100.00 | Aaa | 82,807 |
| | 2013-1A, 4.000%, 12/01/28 (AMT) | | | |
| 165 | | New Jersey Higher Education Assistance Authority, Student Loan Revenue Bonds, Series | 12/24 at 100.00 | Aaa | 174,532 |
| | 2015-1A, 4.000%, 12/01/30 (AMT) | | | |
| 160 | | New Jersey Higher Education Assistance Authority, Student Loan Revenue Bonds, | 6/28 at 100.00 | A2 | 158,904 |
| | Subordinate Series 2019C, 3.625%, 12/01/49 (AMT) | | | |
| 39 | | New Jersey Higher Education Assistance Authority, Student Loan Revenue Bonds, Tender | 12/22 at 100.00 | Aaa | 44,375 |
| | Option Bond Trust 2015-XF0151, 11.801%, 12/01/23 (AMT), 144A (IF) | | | |
| 200 | | New Jersey Institute of Technology, New Jersey, General Obligation Bonds, Series 2015A, | 7/25 at 100.00 | A1 | 224,680 |
| | 5.000%, 7/01/45 | | | |
| 3,629 | | Total Education and Civic Organizations | | | 3,750,922 |
| | Health Care – 14.7% (14.4% of Total Investments) | | | |
| | Camden County Improvement Authority, New Jersey, Health Care Redevelopment Revenue | | | |
| | Bonds, Cooper Health System Obligated Group Issue, Refunding Series 2014A: | | | |
| 105 | | 5.000%, 2/15/25 | 2/24 at 100.00 | BBB+ | 118,453 |
| 100 | | 5.000%, 2/15/34 | 2/24 at 100.00 | BBB+ | 109,963 |
| 105 | | Camden County Improvement Authority, New Jersey, Health Care Redevelopment Revenue | 2/23 at 100.00 | BBB+ | 113,455 |
| | Bonds, Cooper Health System Obligated Group Issue, Series 2013A, 5.750%, 2/15/42 | | | |
| 200 | | New Jersey Health Care Facilities Financing Authority, New Jersey, Revenue Bonds, Saint | 7/21 at 100.00 | BB+ | 206,526 |
| | Peters University Hospital, Refunding Series 2011, 6.250%, 7/01/35 | | | |
| 80 | | New Jersey Health Care Facilities Financing Authority, Revenue Bonds, AHS Hospital | 1/27 at 100.00 | AA– | 88,566 |
| | Corporation, Refunding Series 2016, 4.000%, 7/01/41 | | | |
| 230 | | New Jersey Health Care Facilities Financing Authority, Revenue Bonds, Barnabas Health, | 7/24 at 100.00 | AA– | 254,460 |
| | Refunding Series 2014A, 5.000%, 7/01/44 | | | |
| | New Jersey Health Care Facilities Financing Authority, Revenue Bonds, Hackensack | | | |
| | Meridian Health Obligated Group, Refunding Series 2017A: | | | |
| 150 | | 5.000%, 7/01/28 | 7/27 at 100.00 | AA– | 187,857 |
| 150 | | 5.000%, 7/01/57 | 7/27 at 100.00 | AA– | 175,768 |
35
| | |
| NJV | Nuveen New Jersey Municipal Value Fund Portfolio of Investments (continued) August 31, 2020 (Unaudited) |
| | | | | | |
| Principal | | | Optional Call | | |
| Amount (000) | | Description (1) | Provisions (2) | Ratings (3) | Value |
| | Health Care (continued) | | | |
| $ 110 | | New Jersey Health Care Facilities Financing Authority, Revenue Bonds, Hunterdon Medical | 7/24 at 100.00 | A+ | $ 115,427 |
| | Center, Refunding Series 2014A, 4.000%, 7/01/45 | | | |
| 50 | | New Jersey Health Care Facilities Financing Authority, Revenue Bonds, Inspira Health | 7/26 at 100.00 | AA– | 54,528 |
| | Obligated Group Issue, Refunding Series 2016A, 4.000%, 7/01/41 | | | |
| 360 | | New Jersey Health Care Facilities Financing Authority, Revenue Bonds, Inspira Health | 7/27 at 100.00 | AA– | 423,252 |
| | Obligated Group Issue, Series 2017A, 5.000%, 7/01/42 (UB) (4) | | | |
| 20 | | New Jersey Health Care Facilities Financing Authority, Revenue Bonds, Meridian Health | No Opt. Call | AA– | 20,796 |
| | System Obligated Group, Refunding Series 2011, 5.000%, 7/01/21 | | | |
| | New Jersey Health Care Facilities Financing Authority, Revenue Bonds, Princeton | | | |
| | HealthCare System, Series 2016A: | | | |
| 25 | | 5.000%, 7/01/32 | 7/26 at 100.00 | AA | 30,107 |
| 40 | | 5.000%, 7/01/33 | 7/26 at 100.00 | AA | 47,984 |
| 30 | | 5.000%, 7/01/34 | 7/26 at 100.00 | AA | 35,910 |
| 130 | | New Jersey Health Care Facilities Financing Authority, Revenue Bonds, Robert Wood | 7/24 at 100.00 | AA– | 144,712 |
| | Johnson University Hospital Issue, Series 2014A, 5.000%, 7/01/39 | | | |
| 110 | | New Jersey Health Care Facilities Financing Authority, Revenue Bonds, Robert Wood | 7/23 at 100.00 | AA– | 120,333 |
| | Johnson University Hospital, Series 2013A, 5.500%, 7/01/43 | | | |
| 100 | | New Jersey Health Care Facilities Financing Authority, Revenue Bonds, RWJ Barnabas | 7/26 at 100.00 | AA– | 115,566 |
| | Health Obligated Group, Refunding Series 2016A, 5.000%, 7/01/43 | | | |
| | New Jersey Health Care Facilities Financing Authority, Revenue Bonds, Saint Joseph’s | | | |
| | Healthcare System Obligated Group Issue, Refunding Series 2016: | | | |
| 10 | | 3.000%, 7/01/32 | 7/26 at 100.00 | BBB– | 10,234 |
| 405 | | 4.000%, 7/01/48 | 7/26 at 100.00 | BBB– | 420,382 |
| 100 | | New Jersey Health Care Facilities Financing Authority, Revenue Bonds, Saint Luke’s | 8/23 at 100.00 | A– | 104,837 |
| | Warren Hospital Obligated Group, Series 2013, 4.000%, 8/15/37 | | | |
| | New Jersey Health Care Facilities Financing Authority, Revenue Bonds, University | | | |
| | Hospital Issue, Refunding Series 2015A: | | | |
| 130 | | 4.125%, 7/01/38 – AGM Insured | 7/25 at 100.00 | AA | 139,366 |
| 110 | | 5.000%, 7/01/46 – AGM Insured | 7/25 at 100.00 | AA | 122,975 |
| | New Jersey Health Care Facilities Financing Authority, Revenue Bonds, Valley Health | | | |
| | System Obligated Group, Series 2019: | | | |
| 50 | | 4.000%, 7/01/44 | 7/29 at 100.00 | A+ | 56,224 |
| 205 | | 3.000%, 7/01/49 | 7/29 at 100.00 | A+ | 208,870 |
| 3,105 | | Total Health Care | | | 3,426,551 |
| | Housing/Multifamily – 8.4% (8.2% of Total Investments) | | | |
| 55 | | New Jersey Economic Development Authority, Revenue Bonds, Provident Group – Kean | 1/27 at 100.00 | B | 49,114 |
| | Properties LLC – Kean University Student Housing Project, Series 2017A, 5.000%, 7/01/47 | | | |
| 100 | | New Jersey Economic Development Authority, Revenue Bonds, Provident Group – Rowan | 1/25 at 100.00 | BB+ | 90,997 |
| | Properties LLC – Rowan University Student Housing Project, Series 2015A, 5.000%, 1/01/48 | | | |
| 155 | | New Jersey Economic Development Authority, Revenue Bonds, West Campus Housing LLC – New | 7/25 at 100.00 | BB+ | 147,307 |
| | Jersey City University Student Housing Project, Series 2015, 5.000%, 7/01/47 | | | |
| 130 | | New Jersey Housing & Mortgage Finance Agency, Multifamily Conduit Revenue Bonds, | No Opt. Call | Aaa | 133,380 |
| | Riverside Village Family Apartments Phase 1 Project, Series 2019F, 1.350%, 12/01/22 | | | |
| 120 | | New Jersey Housing and Mortgage Finance Agency, Multifamily Revenue Bonds, Series 2015A, | 11/24 at 100.00 | AA– | 127,058 |
| | 4.000%, 11/01/45 | | | |
| 270 | | New Jersey Housing and Mortgage Finance Agency, Multifamily Revenue Bonds, Series 2016B, | 11/25 at 100.00 | AA– | 285,771 |
| | 3.600%, 11/01/40 | | | |
| 435 | | New Jersey Housing and Mortgage Finance Agency, Multifamily Revenue Bonds, Series 2018A, | 11/27 at 100.00 | AA– | 477,730 |
| | 3.875%, 11/01/38 | | | |
| 100 | | New Jersey Housing and Mortgage Finance Agency, Multifamily Revenue Bonds, Series 2019A, | 11/28 at 100.00 | AA– | 106,257 |
| | 2.900%, 11/01/39 | | | |
36
| | | | | | |
| Principal | | | Optional Call | | |
| Amount (000) | | Description (1) | Provisions (2) | Ratings (3) | Value |
| | Housing/Multifamily (continued) | | | |
| | New Jersey Housing and Mortgage Finance Agency, Multifamily Revenue Bonds, Series 2019B: | | | |
| $ 150 | | 1.300%, 11/01/20 | No Opt. Call | AA– | $ 150,194 |
| 175 | | 1.375%, 11/01/21 | No Opt. Call | AA– | 176,606 |
| 200 | | 1.500%, 5/01/23 | No Opt. Call | AA– | 204,144 |
| 1,890 | | Total Housing/Multifamily | | | 1,948,558 |
| | Housing/Single Family – 6.1% (6.0% of Total Investments) | | | |
| | New Jersey Housing and Mortgage Finance Agency, Single Family Housing Revenue Bonds, | | | |
| | Series 2018A: | | | |
| 150 | | 3.600%, 4/01/33 | 10/27 at 100.00 | AA | 165,324 |
| 95 | | 3.750%, 10/01/35 | 10/27 at 100.00 | AA | 106,379 |
| 85 | | New Jersey Housing and Mortgage Finance Agency, Single Family Housing Revenue Bonds, | 10/27 at 100.00 | AA | 94,063 |
| | Series 2018B, 3.800%, 10/01/32 (AMT) | | | |
| 720 | | New Jersey Housing and Mortgage Finance Agency, Single Family Housing Revenue Bonds, | 4/28 at 100.00 | AA | 774,555 |
| | Series 2019C, 3.950%, 10/01/44 (UB) (4) | | | |
| 290 | | New Jersey Housing and Mortgage Finance Agency, Single Family Housing Revenue Bonds, | 4/29 at 100.00 | AA | 287,831 |
| | Series 2020E, 2.250%, 10/01/40 | | | |
| 1,340 | | Total Housing/Single Family | | | 1,428,152 |
| | Long-Term Care – 1.5% (1.4% of Total Investments) | | | |
| 15 | | New Jersey Economic Development Authority, Fixed Rate Revenue Bonds, Lions Gate Project, | 1/24 at 100.00 | N/R | 14,548 |
| | Series 2014, 5.250%, 1/01/44 | | | |
| 140 | | New Jersey Economic Development Authority, Revenue Bonds, United Methodist Homes of New | 7/23 at 100.00 | BBB– | 142,577 |
| | Jersey Obligated Group Issue, Refunding Series 2013, 5.000%, 7/01/34 | | | |
| 40 | | New Jersey Economic Development Authority, Revenue Bonds, United Methodist Homes of New | 7/24 at 100.00 | BBB– | 41,477 |
| | Jersey Obligated Group Issue, Refunding Series 2014A, 5.000%, 7/01/29 | | | |
| 100 | | New Jersey Economic Development Authority, Revenue Bonds, White Horse HMT Urban Renewal | 1/28 at 102.00 | N/R | 95,531 |
| | LLC Project, Series 2020, 5.000%, 1/01/40, 144A | | | |
| 50 | | New Jersey Health Care Facilities Financing Authority, Revenue Bonds, Village Drive | 10/26 at 102.00 | N/R | 45,499 |
| | Healthcare Urban Renewal LLC, Series 2018, 5.750%, 10/01/38, 144A | | | |
| 345 | | Total Long-Term Care | | | 339,632 |
| | Tax Obligation/General – 9.5% (9.3% of Total Investments) | | | |
| 80 | | Cumberland County Improvement Authority, New Jersey, Guaranteed Lease Revenue Bonds, | 10/28 at 100.00 | AA | 92,576 |
| | County Correctional Facility Project, Series 2018, 4.000%, 10/01/43 – BAM Insured | | | |
| | Harrison, New Jersey, General Obligation Bonds, Parking Utility Series 2018: | | | |
| 35 | | 3.125%, 3/01/31 – BAM Insured | 3/28 at 100.00 | AA | 38,795 |
| 30 | | 3.250%, 3/01/32 – BAM Insured | 3/28 at 100.00 | AA | 33,275 |
| 50 | | 3.500%, 3/01/36 – BAM Insured | 3/28 at 100.00 | AA | 55,325 |
| 100 | | Jersey City, New Jersey, General Obligation Bonds, Refunding General Improvement Series | 11/27 at 100.00 | AA– | 126,779 |
| | 2017A, 5.000%, 11/01/29 | | | |
| 50 | | Mercer County, New Jersey, General Obligation Bonds, General Capital Improvement Open | No Opt. Call | N/R | 50,677 |
| | Space Farmland Notes, Series 2020A, 2.000%, 6/10/21 | | | |
| 125 | | Middlesex County, New Jersey, General Obligation Bonds, Refunding Redevelopment Series | No Opt. Call | AAA | 160,070 |
| | 2017, 5.000%, 1/15/27 | | | |
| 115 | | Monmouth County Improvement Authority, New Jersey, Governmental Pooled Loan Revenue | No Opt. Call | N/R | 116,695 |
| | Bonds, Series 2020A, 2.000%, 7/12/21 | | | |
| 20 | | Montclair Township, Essex County, New Jersey, General Obligation Bonds, Refunding | 1/24 at 100.00 | AAA | 22,952 |
| | Parking Utility Series 2014A, 5.000%, 1/01/37 | | | |
| 100 | | Montclair Township, Essex County, New Jersey, General Obligation Bonds, Refunding School | No Opt. Call | AAA | 116,595 |
| | Series 2017B, 4.000%, 3/01/25 | | | |
37
| | |
| NJV | Nuveen New Jersey Municipal Value Fund Portfolio of Investments (continued)
August 31, 2020 (Unaudited) |
| | | | | | |
| Principal | | | Optional Call | | |
| Amount (000) | | Description (1) | Provisions (2) | Ratings (3) | Value |
| | Tax Obligation/General (continued) | | | |
| | New Brunswick Parking Authority, Middlesex County, New Jersey, Guaranteed Parking | | | |
| | Revenue Bonds, Refunding Series 2016A: | | | |
| $ 300 | | 5.000%, 9/01/32 – BAM Insured | 9/26 at 100.00 | AA | $ 356,895 |
| 140 | | 5.000%, 9/01/39 – BAM Insured | 9/26 at 100.00 | AA | 163,416 |
| 100 | | New Jersey State, General Obligation Bonds, Various Purpose Series 2020, 2.250%, 6/01/35 | 12/27 at 100.00 | A– | 96,902 |
| 200 | | Ocean City, New Jersey, General Obligation Bonds, General Improvement Series 2019, | 9/26 at 100.00 | AA | 208,816 |
| | 2.250%, 9/15/33 | | | |
| 125 | | Sussex County, New Jersey, General Obligation Bonds, Series 2019, 3.000%, 6/01/27 | 6/26 at 100.00 | AA+ | 139,675 |
| 150 | | Union County Utilities Authority, New Jersey, Resource Recovery Facility Lease Revenue | 12/21 at 100.00 | AA+ | 156,705 |
| | Bonds, Covanta Union Inc Lessee, Refunding Series 2011B, 5.250%, 12/01/31 (AMT) | | | |
| 170 | | Union County Utilities Authority, New Jersey, Solid Waste System County Deficiency | 6/21 at 100.00 | Aaa | 175,773 |
| | Revenue Bonds, Series 2011A, 5.000%, 6/15/41 | | | |
| 100 | | Union County, New Jersey, General Obligation Bonds, Bond Anticipation Notes Series 2020, | No Opt. Call | N/R | 102,927 |
| | 4.000%, 6/18/21 | | | |
| 1,990 | | Total Tax Obligation/General | | | 2,214,848 |
| | Tax Obligation/Limited – 16.0% (15.7% of Total Investments) | | | |
| 245 | | Garden State Preservation Trust, New Jersey, Open Space and Farmland Preservation Bonds, | No Opt. Call | AA | 309,217 |
| | Series 2005A, 5.750%, 11/01/28 – AGM Insured | | | |
| 150 | | Hudson County Improvement Authority, New Jersey, County Secured Lease Revenue Bonds, | 5/26 at 100.00 | AA | 180,065 |
| | Hudson County Vocational Technical Schools Project, Series 2016, 5.250%, 5/01/51 | | | |
| | New Jersey Economic Development Authority, Cigarette Tax Revenue Refunding Bonds, | | | |
| | Series 2012: | | | |
| 250 | | 5.000%, 6/15/25 | 6/22 at 100.00 | BBB+ | 258,327 |
| 400 | | 5.000%, 6/15/28 | 6/22 at 100.00 | BBB+ | 410,396 |
| 100 | | New Jersey Economic Development Authority, Lease Revenue Bonds, State House Project, | 12/28 at 100.00 | BBB+ | 110,504 |
| | Series 2017B, 4.500%, 6/15/40 | | | |
| 125 | | New Jersey Economic Development Authority, Revenue Bonds, Motor Vehicle Surcharge, | 7/27 at 100.00 | BBB+ | 127,131 |
| | Refunding Series 2017A, 3.375%, 7/01/30 | | | |
| 2,170 | | New Jersey Transportation Trust Fund Authority, Transportation System Bonds, Series | No Opt. Call | BBB+ | 1,097,195 |
| | 2009A, 0.000%, 12/15/39 | | | |
| | New Jersey Transportation Trust Fund Authority, Transportation System Bonds, | | | |
| | Series 2011B: | | | |
| 180 | | 5.500%, 6/15/31 | 6/21 at 100.00 | BBB+ | 184,745 |
| 275 | | 5.250%, 6/15/36 | 6/21 at 100.00 | BBB+ | 281,292 |
| 50 | | New Jersey Transportation Trust Fund Authority, Transportation System Bonds, Series | 6/22 at 100.00 | BBB+ | 52,109 |
| | 2012A, 5.000%, 6/15/42 | | | |
| 50 | | New Jersey Transportation Trust Fund Authority, Transportation System Bonds, Series | 12/29 at 100.00 | BBB+ | 53,866 |
| | 2019A, 4.000%, 12/15/39 | | | |
| | New Jersey Transportation Trust Fund Authority, Transportation System Bonds, | | | |
| | Series 2019BB: | | | |
| 225 | | 3.500%, 6/15/46 | 12/28 at 100.00 | BBB+ | 224,779 |
| 100 | | 4.000%, 6/15/50 | 12/28 at 100.00 | BBB+ | 105,122 |
| 110 | | Union County Improvement Authority, New Jersey, General Obligation Lease Bonds, Juvenile | No Opt. Call | Aaa | 335,094 |
| | Detention Center Facility Project, Tender Option Bond Trust 2015-XF1019, 24.232%, 5/01/30, | | | |
| | 144A (IF) (4) | | | |
| 4,430 | | Total Tax Obligation/Limited | | | 3,729,842 |
| | Transportation – 15.8% (15.6% of Total Investments) | | | |
| | Delaware River and Bay Authority, Delaware and New Jersey, Revenue Bonds, Series 2014A: | | | |
| 150 | | 4.125%, 1/01/39 | 1/24 at 100.00 | A1 | 159,561 |
| 200 | | 5.000%, 1/01/44 | 1/24 at 100.00 | A1 | 219,614 |
| 130 | | Delaware River and Bay Authority, Delaware and New Jersey, Revenue Bonds, Series 2019, | 1/29 at 100.00 | A1 | 146,557 |
| | 4.000%, 1/01/44 | | | |
38
| | | | | | |
| Principal | | | Optional Call | | |
| Amount (000) | | Description (1) | Provisions (2) | Ratings (3) | Value |
| | Transportation (continued) | | | |
| $ 540 | | Delaware River Joint Toll Bridge Commission, New Jersey and Pennsylvania, Bridge System | 7/27 at 100.00 | A1 | $ 653,368 |
| | Revenue Bonds, Series 2017, 5.000%, 7/01/47 | | | |
| 295 | | Delaware River Joint Toll Bridge Commission, New Jersey and Pennsylvania, Bridge System | No Opt. Call | A1 | 387,615 |
| | Revenue Bonds, Series 2019A, 5.000%, 7/01/28 | | | |
| 175 | | Delaware River Port Authority, New Jersey and Pennsylvania, Revenue Bonds, Series 2018A, | 1/29 at 100.00 | A+ | 214,517 |
| | 5.000%, 1/01/37 | | | |
| 295 | | Delaware River Port Authority, Pennsylvania and New Jersey, Revenue Refunding Bonds, | 1/23 at 100.00 | A | 314,606 |
| | Port District Project, Series 2012, 5.000%, 1/01/27 | | | |
| 190 | | New Jersey Economic Development Authority, Private Activity Bonds, The Goethals Bridge | 1/24 at 100.00 | BBB+ | 210,073 |
| | Replacement Project, Series 2013, 5.625%, 1/01/52 (AMT) | | | |
| 80 | | New Jersey Economic Development Authority, Special Facilities Revenue Bonds, Continental | 3/24 at 101.00 | Ba3 | 83,074 |
| | Airlines Inc, Series 2000A & 2000B, 5.625%, 11/15/30 (AMT) | | | |
| 320 | | New Jersey Economic Development Authority, Special Facility Revenue Bonds, Port Newark | 10/27 at 100.00 | Ba1 | 347,149 |
| | Container Terminal LLC Project, Refunding Series 2017, 5.000%, 10/01/47 (AMT) | | | |
| 255 | | New Jersey Turnpike Authority, Revenue Bonds, Refunding Series 2015E, 5.000%, 1/01/45 | 1/25 at 100.00 | A+ | 286,457 |
| 315 | | Port Authority of New York and New Jersey, Consolidated Revenue Bonds, One Hundred | 12/23 at 100.00 | Aa3 | 350,535 |
| | Seventy Ninth Series 2013, 5.000%, 12/01/43 | | | |
| 250 | | South Jersey Transportation Authority, New Jersey, Transportation System Revenue Bonds, | 11/29 at 100.00 | AA | 322,152 |
| | Refunding Series 2019A, 5.000%, 11/01/31 – AGM Insured | | | |
| 3,195 | | Total Transportation | | | 3,695,278 |
| | U.S. Guaranteed – 5.4% (5.3% of Total Investments) (5) | | | |
| 45 | | New Jersey Economic Development Authority, Rutgers University General Obligation Lease | 6/23 at 100.00 | Aa3 | 68,669 |
| | Revenue Bonds, Tender Option Bond 2016-XF2357, 17.963%, 6/15/46 (Pre-refunded 6/15/23), | | | |
| | 144A (IF) (4) | | | |
| | New Jersey Health Care Facilities Financing Authority, Revenue Bonds, Palisades Medical | | | |
| | Center Obligated Group Issue, Refunding Series 2013: | | | |
| 20 | | 5.250%, 7/01/31 (Pre-refunded 7/01/23) | 7/23 at 100.00 | N/R | 22,600 |
| 85 | | 5.250%, 7/01/31 (Pre-refunded 7/01/23) | 7/23 at 100.00 | N/R | 96,954 |
| 75 | | New Jersey Health Care Facilities Financing Authority, Revenue Bonds, Saint Barnabas | 7/21 at 100.00 | N/R | 78,336 |
| | Health Care System, Refunding Series 2011A, 5.625%, 7/01/37 (Pre-refunded 7/01/21) | | | |
| | New Jersey Transportation Trust Fund Authority, Transportation System Bonds, | | | |
| | Series 2011A: | | | |
| 75 | | 6.000%, 6/15/35 (Pre-refunded 6/15/21) | 6/21 at 100.00 | BBB+ | 78,433 |
| 275 | | 5.500%, 6/15/41 (Pre-refunded 6/15/21) | 6/21 at 100.00 | BBB+ | 286,553 |
| | New Jersey Transportation Trust Fund Authority, Transportation System Bonds, | | | |
| | Series 2011B: | | | |
| 65 | | 5.000%, 6/15/37 (Pre-refunded 6/15/21) | 6/21 at 100.00 | BBB+ | 67,476 |
| 450 | | 5.000%, 6/15/42 (Pre-refunded 6/15/21) | 6/21 at 100.00 | BBB+ | 467,140 |
| 60 | | Rutgers State University, New Jersey, Revenue Bonds, Tender Option Bond 2016-XF2356, | 5/23 at 100.00 | Aa3 | 90,625 |
| | 18.123%, 5/01/43 (Pre-refunded 5/01/23), 144A (IF) (4) | | | |
| 1,150 | | Total U.S. Guaranteed | | | 1,256,786 |
| | Utilities – 5.0% (4.9% of Total Investments) | | | |
| 300 | | Industrial Pollution Control Financing Authority of Cape May County (New Jersey), | No Opt. Call | A | 308,931 |
| | Pollution Control Revenue Refunding Bonds, 1991 Series A (Atlantic City Electric Company | | | |
| | Project), 6.800%, 3/01/21 – NPFG Insured | | | |
| 215 | | New Jersey Economic Development Authority, Natural Gas Facilities Revenue Bonds, New | 8/24 at 100.00 | A1 | 218,406 |
| | Jersey Natural Gas Company Project, Refunding Series 2011A, 2.750%, 8/01/39 | | | |
| 100 | | New Jersey Economic Development Authority, Water Facilities Revenue Bonds, Middlesex | 8/29 at 100.00 | A+ | 111,916 |
| | Water Company, Series 2019, 4.000%, 8/01/59 (AMT) | | | |
| 160 | | New Jersey Economic Development Authority, Water Facilities Revenue Bonds, New | 12/29 at 100.00 | A+ | 170,067 |
| | Jersey-American Water Company Inc Project, Refunding Series 2019A, 2.200%, 10/01/39 (AMT) | | | |
| | (Mandatory Put 12/03/29) | | | |
39
| | |
| NJV | Nuveen New Jersey Municipal Value Fund Portfolio of Investments (continued) August 31, 2020 (Unaudited) |
| | | | | | |
| Principal | | | Optional Call | | |
| Amount (000) | | Description (1) | Provisions (2) | Ratings (3) | Value |
| | Utilities (continued) | | | |
| $ 55 | | Salem County Pollution Control Financing Authority, New Jersey, Pollution Control | No Opt. Call | BBB | $ 57,843 |
| | Revenue Bonds, Chambers Project, Refunding Series 2014A, 5.000%, 12/01/23 (AMT) | | | |
| 300 | | Salem County Pollution Control Financing Authority, New Jersey, Revenue Bonds, Atlantic | No Opt. Call | A | 305,826 |
| | City Electric Company Project, Refunding Series 2020, 2.250%, 6/01/29 | | | |
| 1,130 | | Total Utilities | | | 1,172,989 |
| $ 22,949 | | Total Long-Term Investments (cost $22,147,278) | | | 23,773,850 |
| | Floating Rate Obligations – (3.5)% | | | (810,000) |
| | Other Assets Less Liabilities – 1.5% (6) | | | 352,062 |
| | Net Asset Applicable to Common Shares – 100% | | | $ 23,315,912 |
Investments in Derivatives
Futures Contracts
| | | | | | | | |
| | | | | | | Variation |
| | | | | | Unrealized | Margin |
| Contract | Number of | Expiration | Notional | | Appreciation | Receivable/ |
| Description | Position | Contracts | Date | Amount | Value | (Depreciation) | (Payable) |
U.S. Treasury 5-Year Note | Short | (29) | 12/20 | $(3,650,139) | $(3,654,906) | $(4,767) | $(1,060) |
| | |
(1) | All percentages shown in the Portfolio of Investments are based on net assets applicable to common shares unless otherwise noted. |
(2) | Optional Call Provisions: Dates (month and year) and prices of the earliest optional call or redemption. There may be other call provisions at varying prices at later dates. Certain mortgage-backed securities may be subject to periodic principal paydowns. |
(3) | For financial reporting purposes, the ratings disclosed are the highest of Standard & Poor’s Group (“Standard & Poor’s”), Moody’s Investors Service, Inc. (“Moody’s”) or Fitch, Inc. (“Fitch”) rating. This treatment of split-rated securities may differ from that used for other purposes, such as for Fund investment policies. Ratings below BBB by Standard & Poor’s, Baa by Moody’s or BBB by Fitch are considered to be below investment grade. Holdings designated N/R are not rated by any of these national rating agencies. |
(4) | Investment, or portion of investment, has been pledged to collateralize the net payment obligations for investments in inverse floating rate transactions. |
(5) | Backed by an escrow or trust containing sufficient U.S. Government or U.S. Government agency securities, which ensure the timely payment of principal and interest. |
(6) | Other assets less liabilities includes the unrealized appreciation (depreciation) of certain over-the-counter (“OTC”) derivatives as presented on the Statement of Assets and Liabilities, when applicable. The unrealized appreciation (depreciation) of OTC cleared and exchange-traded derivatives is recognized as part of the cash collateral at brokers and/or the receivable or payable for variation margin as presented on the Statement of Assets and Liabilities, when applicable. |
144A | Investment is exempt from registration under Rule 144A of the Securities Act of 1933, as amended. These investments may only be resold in transactions exempt from registration, which are normally those transactions with qualified institutional buyers. |
AMT | Alternative Minimum Tax |
IF | Inverse floating rate security issued by a tender option bond (“TOB”) trust, the interest rate on which varies inversely with the Securities Industry Financial Markets Association (SIFMA) short-term rate, which resets weekly, or a similar short-term rate, and is reduced by the expenses related to the TOB trust. |
UB | Underlying bond of an inverse floating rate trust reflected as a financing transaction. See Notes to Financial Statements, Note 4 – Portfolio Securities and Investments in Derivatives, for more information.
|
| See accompanying notes to financial statements. |
40
| | |
| NQP | Nuveen Pennsylvania Quality Municipal Income Fund Portfolio of Investments August 31, 2020 (Unaudited) |
| | | | | | |
| Principal | | | Optional Call | | |
| Amount (000) | | Description (1) | Provisions (2) | Ratings (3) | Value |
| | LONG-TERM INVESTMENTS – 157.4% (99.8% of Total Investments) | | | |
| | MUNICIPAL BONDS – 155.4% (98.5% of Total Investments) | | | |
| | Consumer Staples – 0.5% (0.3% of Total Investments) | | | |
| $ 2,000 | | Pennsylvania Economic Development Financing Authority, Solid Waste Disposal Revenue | No Opt. Call | AA– | $ 2,718,780 |
| | Bonds, Procter & Gamble Paper Project, Series 2001, 5.375%, 3/01/31 (AMT) | | | |
| | Education and Civic Organizations – 17.6% (11.1% of Total Investments) | | | |
| 1,060 | | Allegheny County Higher Education Building Authority, Pennsylvania, College Revenue | No Opt. Call | Baa3 | 1,178,084 |
| | Refunding Bonds, Robert Morris College, Series 1998A, 6.000%, 5/01/28 | | | |
| 940 | | Allegheny County Higher Education Building Authority, Pennsylvania, Revenue Bonds, | 3/23 at 100.00 | A | 975,805 |
| | Duquesne University, Series 2013A, 3.500%, 3/01/34 | | | |
| | Allegheny County Higher Education Building Authority, Pennsylvania, Revenue Bonds, | | | |
| | Robert Morris University, Series 2016: | | | |
| 735 | | 3.000%, 10/15/30 | 10/26 at 100.00 | Baa3 | 671,628 |
| 1,000 | | 5.000%, 10/15/38 | 10/26 at 100.00 | Baa3 | 1,048,210 |
| 1,625 | | Allegheny County Higher Education Building Authority, Pennsylvania, Revenue Bonds, | 10/27 at 100.00 | Baa3 | 1,690,000 |
| | Robert Morris University, Series 2017, 5.000%, 10/15/47 | | | |
| | Berks County Municipal Authority, Pennsylvania, Revenue Bonds, Alvernia University | | | |
| | Project, Series 2020: | | | |
| 590 | | 5.000%, 10/01/39 | 10/29 at 100.00 | BB+ | 590,307 |
| 20 | | 5.000%, 10/01/49 | 10/29 at 100.00 | BB+ | 19,609 |
| 3,215 | | Bucks County Industrial Development Authority, Pennsylvania, Revenue Bonds, School Lane | 3/27 at 100.00 | BBB– | 3,603,983 |
| | Charter School Project, Series 2016, 5.125%, 3/15/36 | | | |
| 835 | | Chester County Industrial Development Authority, Pennsylvania, Avon Grove Charter School | 12/27 at 100.00 | BBB– | 918,124 |
| | Revenue Bonds, Series 2017A, 5.000%, 12/15/47 | | | |
| 2,200 | | Crawford County Industrial Development Authority, Pennsylvania, College Revenue Bonds, | 5/26 at 100.00 | A– | 2,214,058 |
| | Allegheny College, Series 2016, 3.000%, 5/01/34 | | | |
| 1,000 | | Cumberland County Municipal Authority, Pennsylvania, Revenue Bonds, Dickinson College | 11/27 at 100.00 | A+ | 1,181,480 |
| | Project, Second Series 2017A, 5.000%, 11/01/39 | | | |
| 1,470 | | Dallas Area Municipal Authority, Pennsylvania, Revenue Bonds, Misericordia University | 5/29 at 100.00 | Baa3 | 1,604,020 |
| | Project, Series 2019, 5.000%, 5/01/48 | | | |
| 1,020 | | Dallas Area Municipal Authority, Pennsylvania, Revenue Bonds, Misericordia University, | 5/24 at 100.00 | Baa3 | 1,080,425 |
| | Series 2014, 5.000%, 5/01/37 | | | |
| 750 | | Delaware County Authority, Pennsylvania, General Revenue Bonds, Eastern University, | 10/20 at 100.00 | AA | 750,420 |
| | Series 2006, 4.500%, 10/01/27 – RAAI Insured | | | |
| 4,595 | | Erie Higher Education Building Authority, Pennsylvania, Revenue Bonds, Gannon | 11/26 at 100.00 | BBB+ | 4,361,206 |
| | University, Series 2016, 4.000%, 5/01/46 | | | |
| 2,395 | | General Authority of Southcentral Pennsylvania, Revenue Bonds, AICUP Financing | 10/27 at 100.00 | A– | 2,472,790 |
| | Program-York College of Pennsylvania, Series 2017 PP4, 3.375%, 11/01/37 | | | |
| | Huntingdon County General Authority, Pennsylvania, Revenue Bonds, Juniata College, | | | |
| | Series 2016OO2: | | | |
| 590 | | 3.250%, 5/01/36 | 5/26 at 100.00 | BBB+ | 536,393 |
| 1,555 | | 3.500%, 5/01/41 | 5/26 at 100.00 | BBB+ | 1,397,681 |
| | Lackawanna County Industrial Development Authority, Pennsylvania, Revenue Bonds, | | | |
| | University of Scranton, Series 2017: | | | |
| 475 | | 3.375%, 11/01/33 | 11/27 at 100.00 | A– | 510,544 |
| 2,910 | | 4.000%, 11/01/40 | 11/27 at 100.00 | A– | 3,230,827 |
| 5,235 | | Lycoming County Authority, Pennsylvania, Revenue Bonds, Pennsylvania College of | 5/22 at 100.00 | A | 5,597,838 |
| | Technology, Series 2012, 5.000%, 5/01/32 | | | |
41
| | |
| NQP | Nuveen Pennsylvania Quality Municipal Income Fund Portfolio of Investments (continued) August 31, 2020 (Unaudited) |
| | | | | | |
| Principal | | | Optional Call | | |
| Amount (000) | | Description (1) | Provisions (2) | Ratings (3) | Value |
| | Education and Civic Organizations (continued) | | | |
| $ 1,855 | | Montgomery County Higher Education and Health Authority, Pennsylvania, Revenue Bonds, | 9/28 at 100.00 | A | $ 2,196,635 |
| | Thomas Jefferson University, Series 2018A, 5.000%, 9/01/48 | | | |
| | Montgomery County Higher Education and Health Authority, Pennsylvania, Revenue Bonds, | | | |
| | Thomas Jefferson University, Series 2019: | | | |
| 3,410 | | 4.000%, 9/01/44 | 9/29 at 100.00 | A | 3,753,319 |
| 395 | | 4.000%, 9/01/49 | 9/29 at 100.00 | A | 432,114 |
| 1,465 | | Pennsylvania Higher Educational Facilities Authority, Revenue Bonds, Holy Family | 9/23 at 100.00 | BBB– | 1,553,559 |
| | University, Series 2013A, 6.500%, 9/01/38 | | | |
| 2,415 | | Pennsylvania Higher Educational Facilities Authority, Revenue Bonds, AICUP Financing | 11/21 at 100.00 | BBB+ | 2,478,418 |
| | Program-Mount Aloysius College Project, Series 2011R-1, 5.000%, 11/01/35 | | | |
| | Pennsylvania Higher Educational Facilities Authority, Revenue Bonds, Bryn Mawr College, | | | |
| | Refunding Series 2014: | | | |
| 2,545 | | 5.000%, 12/01/38 | 12/24 at 100.00 | AA+ | 2,903,539 |
| 2,080 | | 5.000%, 12/01/44 | 12/24 at 100.00 | AA+ | 2,354,102 |
| 85 | | Pennsylvania Higher Educational Facilities Authority, Revenue Bonds, Drexel University, | 5/21 at 100.00 | A– | 87,852 |
| | Series 2011A, 5.250%, 5/01/41 | | | |
| 1,000 | | Pennsylvania Higher Educational Facilities Authority, Revenue Bonds, Gwynedd Mercy | 5/22 at 100.00 | BBB | 1,032,630 |
| | College, Series 2012-KK1, 5.375%, 5/01/42 | | | |
| 320 | | Pennsylvania Higher Educational Facilities Authority, Revenue Bonds, LaSalle University, | 11/22 at 100.00 | BBB– | 320,973 |
| | Series 2012, 4.000%, 5/01/32 | | | |
| 7,125 | | Pennsylvania Higher Educational Facilities Authority, Revenue Bonds, Thomas Jefferson | 3/25 at 100.00 | A | 8,122,714 |
| | University, Refunding Series 2015A, 5.250%, 9/01/50 (UB) (4) | | | |
| 760 | | Pennsylvania Higher Educational Facilities Authority, Revenue Bonds, Thomas Jefferson | 9/22 at 100.00 | A | 808,222 |
| | University, Series 2012, 5.000%, 3/01/42 | | | |
| | Pennsylvania Higher Educational Facilities Authority, Revenue Bonds, University of the | | | |
| | Sciences in Philadelphia, Series 2012: | | | |
| 1,030 | | 4.000%, 11/01/39 | 11/22 at 100.00 | Baa1 | 1,008,339 |
| 4,300 | | 5.000%, 11/01/42 | 11/22 at 100.00 | Baa1 | 4,395,245 |
| 1,310 | | Pennsylvania Higher Educational Facilities Authority, Revenue Bonds, University of the | 11/25 at 100.00 | Baa1 | 1,386,871 |
| | Sciences in Philadelphia, Series 2015A, 5.000%, 11/01/36 | | | |
| 1,590 | | Pennsylvania Higher Educational Facilities Authority, Revenue Bonds, Widener University, | 7/23 at 100.00 | A– | 1,664,380 |
| | Series 2013A, 5.500%, 7/15/38 | | | |
| 1,255 | | Philadelphia Authority for Industrial Development, Pennsylvania, Revenue Bonds, La Salle | 11/27 at 100.00 | BBB– | 1,150,772 |
| | University, Series 2017, 3.625%, 5/01/35 | | | |
| 4,500 | | Philadelphia Authority for Industrial Development, Pennsylvania, Revenue Bonds, | 10/20 at 100.00 | BB | 4,510,305 |
| | Philadelphia Performing Arts Charter School, Series 2013, 6.750%, 6/15/43, 144A | | | |
| 500 | | Philadelphia Authority for Industrial Development, Pennsylvania, Revenue Bonds, Richard | 10/20 at 100.00 | N/R | 455,490 |
| | Allen Preparatory Charter School, Series 2006, 6.250%, 5/01/33 | | | |
| | Philadelphia Authority for Industrial Development, Pennsylvania, Revenue Bonds, Saint | | | |
| | Joseph’s University Project, Refunding Series 2020C Forward Delivery: | | | |
| 1,500 | | 4.000%, 11/01/36 | 11/29 at 100.00 | A– | 1,714,755 |
| 1,400 | | 4.000%, 11/01/37 | 11/29 at 100.00 | A– | 1,595,020 |
| 2,420 | | Philadelphia Authority for Industrial Development, Pennsylvania, Revenue Bonds, | 3/28 at 100.00 | BB+ | 2,467,117 |
| | University of the Arts, Series 2017, 5.000%, 3/15/45, 144A | | | |
| 2,320 | | Scranton-Lackawanna Health and Welfare Authority, Pennsylvania, Revenue Bonds, | 5/26 at 100.00 | A– | 2,692,940 |
| | University of Scranton, Series 2016, 5.000%, 11/01/37 | | | |
| 5,250 | | Scranton-Lackawanna Health and Welfare Authority, Pennsylvania, University Revenue | 6/26 at 100.00 | BB+ | 5,259,975 |
| | Bonds, Marywood University, Series 2016, 5.000%, 6/01/46 | | | |
| 5,000 | | State Public School Building Authority, Pennsylvania, College Revenue Bonds, Northampton | 3/21 at 100.00 | A1 | 5,109,800 |
| | County Area Community College, Series 2011, 5.500%, 3/01/31 | | | |
| 3,555 | | Washington County Industrial Development Authority, Pennsylvania, College Revenue Bonds, | 11/27 at 100.00 | A– | 3,714,726 |
| | AICUP Financing Program-Washington and Jefferson College Project, Series 2017-PP5, | | | |
| | 3.375%, 11/01/36 | | | |
42
| | | | | | |
| Principal | | | Optional Call | | |
| Amount (000) | | Description (1) | Provisions (2) | Ratings (3) | Value |
| | Education and Civic Organizations (continued) | | | |
| | Wilkes-Barre Finance Authority, Pennsylvania, Revenue Bonds, University of Scranton, | | | |
| | Series 2015A: | | | |
| $ 1,890 | | 5.000%, 11/01/32 | 11/25 at 100.00 | A– | $ 2,200,773 |
| 740 | | 5.000%, 11/01/33 | 11/25 at 100.00 | A– | 857,512 |
| 740 | | 4.000%, 11/01/35 | 11/25 at 100.00 | A– | 808,961 |
| 96,970 | | Total Education and Civic Organizations | | | 102,670,490 |
| | Health Care – 35.5% (22.5% of Total Investments) | | | |
| 17,075 | | Allegheny County Hospital Development Authority, Pennsylvania, Revenue Bonds, Allegheny | 4/28 at 100.00 | A | 18,935,663 |
| | Health Network Obligated Group Issue, Series 2018A, 4.000%, 4/01/44 | | | |
| | Allegheny County Hospital Development Authority, Pennsylvania, Revenue Bonds, University | | | |
| | of Pittsburgh Medical Center, Series 2019A: | | | |
| 210 | | 4.000%, 7/15/35 | 7/29 at 100.00 | A | 243,058 |
| 1,000 | | 4.000%, 7/15/37 | 7/29 at 100.00 | A | 1,148,440 |
| 460 | | 4.000%, 7/15/38 | 7/29 at 100.00 | A | 526,231 |
| | Berks County Industrial Development Authority, Pennsylvania, Health System Revenue | | | |
| | Bonds, Tower Health Project, Series 2017: | | | |
| 10,000 | | 5.000%, 11/01/50 | 11/27 at 100.00 | BBB+ | 10,692,900 |
| 4,100 | | 5.000%, 11/01/50 (UB) (4) | 11/27 at 100.00 | BBB+ | 4,384,089 |
| 3,300 | | Berks County Municipal Authority, Pennsylvania, Revenue Bonds, Reading Hospital & | 5/22 at 100.00 | BBB+ | 3,341,415 |
| | Medical Center Project, Series 2012A, 4.500%, 11/01/41 | | | |
| | Centre County Hospital Authority, Pennsylvania, Hospital Revenue Bonds, Mount Nittany | | | |
| | Medical Center Project, Series 2016A: | | | |
| 805 | | 5.000%, 11/15/41 | 11/25 at 100.00 | AA– | 919,737 |
| 2,985 | | 5.000%, 11/15/46 | 11/25 at 100.00 | AA– | 3,390,333 |
| | Chester County Health and Education Facilities Authority, Pennsylvania, Health System | | | |
| | Revenue Bonds, Main Line Health System, Series 2017A: | | | |
| 3,200 | | 4.000%, 10/01/36 | 10/27 at 100.00 | AA | 3,662,016 |
| 1,935 | | 4.000%, 10/01/37 | 10/27 at 100.00 | AA | 2,208,319 |
| 6,395 | | Chester County Health and Education Facilities Authority, Pennsylvania, Health System | 9/30 at 100.00 | AA | 7,317,862 |
| | Revenue Bonds, Main Line Health System, Series 2020A, 4.000%, 9/01/50 | | | |
| | Dauphin County General Authority, Pennsylvania, Health System Revenue Bonds, Pinnacle | | | |
| | Health System Project, Refunding Series 2016A: | | | |
| 1,375 | | 5.000%, 6/01/34 | 6/26 at 100.00 | A | 1,612,586 |
| 375 | | 5.000%, 6/01/35 | 6/26 at 100.00 | A | 438,615 |
| 3,460 | | Dauphin County General Authority, Pennsylvania, Health System Revenue Bonds, Pinnacle | 6/22 at 100.00 | A | 3,661,753 |
| | Health System Project, Series 2012A, 5.000%, 6/01/42 | | | |
| 1,500 | | Doylestown Hospital Authority, Pennsylvania, Hospital Revenue Bonds, Series 2013A, | 7/23 at 100.00 | BBB– | 1,601,910 |
| | 5.000%, 7/01/28 | | | |
| 2,275 | | Doylestown Hospital Authority, Pennsylvania, Hospital Revenue Bonds, Series 2016A, | 7/26 at 100.00 | BBB– | 2,510,281 |
| | 5.000%, 7/01/41 | | | |
| 1,225 | | Doylestown Hospital Authority, Pennsylvania, Hospital Revenue Bonds, Series 2019A, | 7/29 at 100.00 | BBB– | 1,292,436 |
| | 4.000%, 7/01/45 | | | |
| 5,000 | | Dubois Hospital Authority, Pennsylvania, Hospital Revenue Bonds, Penn Highlands | 1/28 at 100.00 | A– | 5,840,550 |
| | Healthcare, Series 2018, 5.000%, 7/15/48 | | | |
| 4,555 | | Geisinger Authority, Montour County, Pennsylvania, Health System Revenue Bonds, | 6/24 at 100.00 | AA– | 5,093,765 |
| | Geisinger Health System, Series 2014A, 5.000%, 6/01/41 | | | |
| 10,000 | | Geisinger Authority, Montour County, Pennsylvania, Health System Revenue Bonds, | 4/30 at 100.00 | AA– | 11,429,800 |
| | Geisinger Health System, Series 2020A, 4.000%, 4/01/50 | | | |
| 1,370 | | Indiana County Hospital Authority, Pennsylvania, Hospital Revenue Bonds, Indiana | 6/23 at 100.00 | Ba3 | 1,458,228 |
| | Regional Medical Center, Series 2014A, 6.000%, 6/01/39 | | | |
| 2,200 | | Lancaster County Hospital Authority, Revenue Bonds, University of Pennsylvania Health | 8/26 at 100.00 | AA | 2,586,452 |
| | System, Refunding Series 2016B, 5.000%, 8/15/46 (UB) (4) | | | |
43
| | |
| NQP | Nuveen Pennsylvania Quality Municipal Income Fund Portfolio of Investments (continued) August 31, 2020 (Unaudited) |
| | | | | | |
| Principal | | | Optional Call | | |
| Amount (000) | | Description (1) | Provisions (2) | Ratings (3) | Value |
| | Health Care (continued) | | | |
| $ 3,000 | | Lancaster County Hospital Authority, Revenue Bonds, University of Pennsylvania Health | 8/26 at 100.00 | AA | $ 3,545,580 |
| | System, Series 2016A, 5.000%, 8/15/42 (UB) (4) | | | |
| 3,450 | | Lehigh County General Purpose Authority, Pennsylvania, Hospital Revenue Bonds, Lehigh | 7/26 at 100.00 | A+ | 3,844,542 |
| | Valley Health Network, Refunding Series 2016A, 4.000%, 7/01/35 | | | |
| 2,565 | | Lehigh County General Purpose Authority, Pennsylvania, Hospital Revenue Bonds, Lehigh | 7/22 at 100.00 | A+ | 2,645,233 |
| | Valley Health Network, Series 2012B, 4.000%, 7/01/43 | | | |
| | Lehigh County General Purpose Authority, Pennsylvania, Revenue Bonds, Good Shepherd | | | |
| | Group, Refunding Series 2016: | | | |
| 1,265 | | 3.000%, 11/01/36 | 5/26 at 100.00 | A | 1,314,398 |
| 2,850 | | 4.000%, 11/01/41 (UB) (4) | 5/26 at 100.00 | A | 3,081,876 |
| 4,955 | | 4.000%, 11/01/46 (UB) (4) | 5/26 at 100.00 | A | 5,301,652 |
| 4,600 | | Lehigh County General Purpose Authority, Pennsylvania, Revenue Bonds, Good Shepherd | 11/22 at 100.00 | A | 4,790,486 |
| | Group, Series 2012, 4.000%, 11/01/32 | | | |
| | Monroe County Hospital Authority, Pennsylvania, Hospital Revenue Bonds, Pocono Medical | | | |
| | Center, Series 2016: | | | |
| 1,020 | | 3.375%, 7/01/32 | 7/26 at 100.00 | A+ | 1,108,791 |
| 2,650 | | 5.000%, 7/01/41 | 7/26 at 100.00 | A+ | 3,072,808 |
| 7,500 | | Montgomery County Industrial Development Authority, Pennsylvania, Health System Revenue | 1/25 at 100.00 | Ba1 | 7,903,500 |
| | Bonds, Albert Einstein Healthcare Network Issue, Series 2015A, 5.250%, 1/15/45 | | | |
| 4,000 | | Pennsylvania Economic Development Financing Authority, Revenue Bonds, University of | 7/23 at 100.00 | A | 4,405,800 |
| | Pittsburgh Medical Center, Series 2013A, 5.000%, 7/01/43 | | | |
| 16,385 | | Pennsylvania Higher Educational Facilities Authority, Revenue Bonds, University of | 8/26 at 100.00 | AA | 18,229,951 |
| | Pennsylvania Health System, Refunding Series 2016C, 4.000%, 8/15/41 (UB) (4) | | | |
| 3,100 | | Pennsylvania Higher Educational Facilities Authority, Revenue Bonds, University of | 8/22 at 100.00 | AA | 3,323,696 |
| | Pennsylvania Health System, Series 2012A, 5.000%, 8/15/42 | | | |
| 13,525 | | Pennsylvania Higher Educational Facilities Authority, Revenue Bonds, University of | 8/29 at 100.00 | AA | 15,422,828 |
| | Pennsylvania Health System, Series 2019, 4.000%, 8/15/49 (UB) (4) | | | |
| 7,305 | | Philadelphia Hospitals and Higher Education Facilities Authority, Pennsylvania, Hospital | 7/21 at 100.00 | AA | 7,514,507 |
| | Revenue Bonds, Children’s Hospital of Philadelphia, Series 2011C, 5.000%, 7/01/41 | | | |
| 4,885 | | Philadelphia Hospitals and Higher Education Facilities Authority, Pennsylvania, Hospital Revenue | 7/22 at 100.00 | BBB– | 5,155,043 |
| | Bonds, Temple University Health System Obligated Group, Series 2012A, 5.625%, 7/01/42 | | | |
| | Pocono Mountains Industrial Park Authority, Pennsylvania, Hospital Revenue Bonds, Saint | | | |
| | Luke’s Hospital -Monroe Project, Series 2015A: | | | |
| 3,000 | | 5.000%, 8/15/40 | 2/25 at 100.00 | A– | 3,342,060 |
| 1,170 | | 4.000%, 8/15/45 | 2/25 at 100.00 | A– | 1,234,455 |
| 3,000 | | Pottsville Hospital Authority, Pennsylvania, Hospital Revenue Bonds, Lehigh Valley | 1/27 at 100.00 | A+ | 3,494,430 |
| | Health Network, Series 2016B, 5.000%, 7/01/45 | | | |
| 2,000 | | Saint Mary Hospital Authority, Pennsylvania, Hospital Revenue Bonds, Trinity Health | 12/28 at 100.00 | AA– | 2,437,840 |
| | Credit Group, Refunding Series 2019PA, 5.000%, 12/01/48 | | | |
| 3,000 | | Southcentral Pennsylvania General Authority, Revenue Bonds, Wellspan Health Obligated | 6/24 at 100.00 | Aa3 | 3,311,520 |
| | Group, Refunding Series 2014A, 5.000%, 6/01/44 | | | |
| 2,000 | | Southcentral Pennsylvania General Authority, Revenue Bonds, Wellspan Health Obligated | 6/29 at 100.00 | Aa3 | 2,445,880 |
| | Group, Series 2019A, 5.000%, 6/01/49 | | | |
| 1,800 | | The Hospitals and Higher Education Facilities Authority of Philadelphia, Pennsylvania, | 7/27 at 100.00 | BBB– | 2,099,232 |
| | Hospital Revenue Bonds, Temple University Health System Obligated Group, Series of 2017, | | | |
| | 5.000%, 7/01/30 | | | |
| 3,470 | | Washington County Hospital Authority, Pennsylvania, Hospital Revenue Bonds, The | 7/23 at 100.00 | A | 3,801,454 |
| | Washington Hospital Project, Series 2013A, 5.000%, 7/01/28 | | | |
| 575 | | Westmoreland County Industrial Development Authority, Pennsylvania, Health System | 10/20 at 100.00 | Baa1 | 576,524 |
| | Revenue Bonds, Excela Health Project, Series 2010A, 5.125%, 7/01/30 | | | |
| 187,870 | | Total Health Care | | | 207,700,525 |
44
| | | | | | |
| Principal | | | Optional Call | | |
| Amount (000) | | Description (1) | Provisions (2) | Ratings (3) | Value |
| | Housing/Multifamily – 1.2% (0.8% of Total Investments) | | | |
| $ 160 | | Chester County Industrial Development Authority, Pennsylvania, Student Housing Revenue | 8/23 at 100.00 | Baa3 | $ 162,302 |
| | Bonds, University Student Housing, LLC Project at West Chester University Series 2013A, | | | |
| | 5.000%, 8/01/45 | | | |
| 1,650 | | Clarion County Industrial Development Authority, Pennsylvania, Revenue Bonds, Clarion | 7/24 at 100.00 | A1 | 1,800,579 |
| | University Foundation Inc Student Housing Project at Clarion University, Series 2014A, | | | |
| | 5.000%, 7/01/45 | | | |
| 1,235 | | East Hempfield Township Industrial Development Authority, Pennsylvania, Student Services | 7/24 at 100.00 | BBB– | 1,250,363 |
| | Inc – Student Housing Project at Millersville University, Series 2014, 5.000%, 7/01/46 | | | |
| 1,900 | | East Hempfield Township Industrial Development Authority, Pennsylvania, Student Services | 7/25 at 100.00 | BBB– | 1,928,348 |
| | Inc – Student Housing Project at Millersville University, Series 2015, 5.000%, 7/01/47 | | | |
| 270 | | Pennsylvania Higher Educational Facilities Authority, Revenue Bonds, University | 7/26 at 100.00 | Baa3 | 279,923 |
| | Properties Inc Student Housing Project at East Stroudsburg University of Pennsylvania, Series | | | |
| | 2016A, 5.000%, 7/01/31 | | | |
| 1,548 | | Philadelphia Authority for Industrial Development, Pennsylvania, Multifamily Housing | 10/20 at 100.00 | Baa3 | 1,548,434 |
| | Revenue Bonds, Presbyterian Homes Germantown – Morrisville Project, Series 2005A, | | | |
| | 5.625%, 7/01/35 | | | |
| 6,763 | | Total Housing/Multifamily | | | 6,969,949 |
| | Housing/Single Family – 17.4% (11.0% of Total Investments) | | | |
| | Pennsylvania Housing Finance Agency, Single Family Mortgage Revenue Bonds, Series | | | |
| | 2012-114: | | | |
| 4,750 | | 3.300%, 10/01/32 (UB) (4) | 10/21 at 100.00 | AA+ | 4,830,085 |
| 4,425 | | 3.650%, 10/01/37 | 10/21 at 100.00 | AA+ | 4,490,667 |
| 2,275 | | 3.650%, 10/01/37 (UB) (4) | 10/21 at 100.00 | AA+ | 2,308,761 |
| 1,830 | | 3.700%, 10/01/42 (UB) (4) | 10/21 at 100.00 | AA+ | 1,854,376 |
| | Pennsylvania Housing Finance Agency, Single Family Mortgage Revenue Bonds, Series | | | |
| | 2015-116B: | | | |
| 2,330 | | 3.950%, 10/01/40 (UB) (4) | 10/24 at 100.00 | AA+ | 2,447,618 |
| 3,000 | | 4.000%, 4/01/45 (UB) (4) | 10/24 at 100.00 | AA+ | 3,140,010 |
| 3,290 | | Pennsylvania Housing Finance Agency, Single Family Mortgage Revenue Bonds, Series | 10/24 at 100.00 | AA+ | 3,522,833 |
| | 2015-117B, 3.900%, 10/01/35 (UB) (4) | | | |
| 2,045 | | Pennsylvania Housing Finance Agency, Single Family Mortgage Revenue Bonds, Series | 4/25 at 100.00 | AA+ | 2,149,500 |
| | 2016-119, 3.500%, 10/01/36 | | | |
| 7,000 | | Pennsylvania Housing Finance Agency, Single Family Mortgage Revenue Bonds, Series | 10/25 at 100.00 | AA+ | 7,359,450 |
| | 2016-120, 3.200%, 4/01/40 (UB) (4) | | | |
| 22,450 | | Pennsylvania Housing Finance Agency, Single Family Mortgage Revenue Bonds, Series | 10/25 at 100.00 | AA+ | 23,534,784 |
| | 2016-121, 3.200%, 10/01/41 (UB) (4) | | | |
| | Pennsylvania Housing Finance Agency, Single Family Mortgage Revenue Bonds, Series | | | |
| | 2017-122: | | | |
| 2,000 | | 3.650%, 10/01/32 (UB) (4) | 4/26 at 100.00 | AA+ | 2,182,540 |
| 6,725 | | 3.900%, 10/01/36 (UB) (4) | 4/26 at 100.00 | AA+ | 7,345,314 |
| | Pennsylvania Housing Finance Agency, Single Family Mortgage Revenue Bonds, Series | | | |
| | 2017-123B: | | | |
| 4,160 | | 3.450%, 10/01/32 (UB) (4) | 10/26 at 100.00 | AA+ | 4,549,251 |
| 4,165 | | 3.900%, 10/01/37 (UB) (4) | 10/26 at 100.00 | AA+ | 4,558,093 |
| 5,000 | | Pennsylvania Housing Finance Agency, Single Family Mortgage Revenue Bonds, Series | 10/26 at 100.00 | AA+ | 5,352,900 |
| | 2017-124B, 3.500%, 10/01/37 (UB) (4) | | | |
| | Pennsylvania Housing Finance Agency, Single Family Mortgage Revenue Bonds, Series | | | |
| | 2018-126A: | | | |
| 2,400 | | 3.700%, 10/01/33 (UB) (4) | 4/27 at 100.00 | AA+ | 2,644,872 |
| 2,260 | | 3.950%, 10/01/38 (UB) (4) | 4/27 at 100.00 | AA+ | 2,483,288 |
| 3,880 | | Pennsylvania Housing Finance Agency, Single Family Mortgage Revenue Bonds, Series | 4/29 at 100.00 | AA+ | 4,165,413 |
| | 2019-131A, 3.000%, 10/01/39 | | | |
45
| | |
| NQP | Nuveen Pennsylvania Quality Municipal Income Fund Portfolio of Investments (continued)
August 31, 2020 (Unaudited) |
| | | | | | |
| Principal | | | Optional Call | | |
| Amount (000) | | Description (1) | Provisions (2) | Ratings (3) | Value |
| | Housing/Single Family (continued) | | | |
| | Pennsylvania Housing Finance Agency, Single Family Mortgage Revenue Bonds, Series | | | |
| | 2020-132A: | | | |
| $ 2,000 | | 2.550%, 10/01/41 | 10/29 at 100.00 | AA+ | $ 2,016,240 |
| 10,000 | | 2.550%, 10/01/41 (UB) (4) | 10/29 at 100.00 | AA+ | 10,081,200 |
| 520 | | Pennsylvania Housing Finance Agency, Single Family Mortgage Revenue Bonds, Tender Option | 10/20 at 100.00 | AA+ | 574,116 |
| | Bonds Trust 2015-XF0109, 10.355%, 10/01/31, 144A (IF) (4) | | | |
| 96,505 | | Total Housing/Single Family | | | 101,591,311 |
| | Industrials – 2.2% (1.4% of Total Investments) | | | |
| 500 | | Pennsylvania Economic Development Financing Authority, Exempt Facilities Revenue Bonds, | 6/30 at 100.00 | N/R | 525,245 |
| | KDC Agribusiness Fairless Hills LLC Project, Series 2020A-1, 10.000%, 12/01/40, 144A | | | |
| 500 | | Pennsylvania Economic Development Financing Authority, Exempt Facilities Revenue Bonds, | 6/30 at 100.00 | N/R | 525,160 |
| | KDC Agribusiness Fairless Hills LLC Project, Series 2020A-2, 10.000%, 12/01/40 (AMT), 144A, | | | |
| | (WI/DD, Settling 9/22/20) | | | |
| 6,455 | | Pennsylvania Economic Development Financing Authority, Exempt Facilities Revenue Bonds, | 11/24 at 100.00 | N/R | 6,633,029 |
| | National Gypsum Company, Refunding Series 2014, 5.500%, 11/01/44 (AMT) | | | |
| | Pennsylvania Economic Development Financing Authority, Exempt Facilities Revenue | | | |
| | Refunding Bonds, Amtrak Project, Series 2012A: | | | |
| 2,495 | | 5.000%, 11/01/23 (AMT) | 11/22 at 100.00 | A1 | 2,729,106 |
| 545 | | 5.000%, 11/01/27 (AMT) | 11/22 at 100.00 | A1 | 594,404 |
| 2,000 | | 5.000%, 11/01/41 (AMT) | 11/22 at 100.00 | A1 | 2,153,020 |
| 12,495 | | Total Industrials | | | 13,159,964 |
| | Long-Term Care – 6.2% (3.9% of Total Investments) | | | |
| | Berks County Industrial Development Authority, Pennsylvania, Healthcare Facilities | | | |
| | Revenue Bonds, Highlands at Wyomissing, Series 2017A: | | | |
| 940 | | 5.000%, 5/15/37 | 5/27 at 100.00 | BBB | 1,009,598 |
| 1,160 | | 5.000%, 5/15/47 | 5/27 at 100.00 | BBB | 1,225,447 |
| | Berks County Industrial Development Authority, Pennsylvania, Healthcare Facilities | | | |
| | Revenue Bonds, The Highlands at Wyomissing, Series 2018: | | | |
| 1,000 | | 5.000%, 5/15/43 | 5/25 at 102.00 | BBB | 1,060,640 |
| 400 | | 5.000%, 5/15/48 | 5/25 at 102.00 | BBB | 422,328 |
| 230 | | Chester County Health and Education Facilities Authority, Pennsylvania, Revenue Bonds, | 12/25 at 100.00 | N/R | 232,413 |
| | Simpson Senior Services Project, Series 2015A, 5.000%, 12/01/35 | | | |
| 1,760 | | Chester County Health and Education Facilities Authority, Pennsylvania, Revenue Bonds, | 12/25 at 103.00 | N/R | 1,708,414 |
| | Simpson Senior Services Project, Series 2019, 5.000%, 12/01/51 | | | |
| 3,005 | | Cumberland County Municipal Authority, Pennsylvania, Revenue Bonds, Asbury Pennsylvania | 1/25 at 104.00 | N/R | 2,902,229 |
| | Obligated Group, Refunding Series 2019, 5.000%, 1/01/45 | | | |
| | Cumberland County Municipal Authority, Pennsylvania, Revenue Bonds, Diakon Lutheran | | | |
| | Social Ministries Project, Series 2015: | | | |
| 4,380 | | 4.000%, 1/01/33 | 1/25 at 100.00 | BBB+ | 4,463,614 |
| 5,740 | | 5.000%, 1/01/38 | 1/25 at 100.00 | BBB+ | 6,045,196 |
| | Cumberland County Municipal Authority, Pennsylvania, Revenue Bonds, Diakon Lutheran | | | |
| | Social Ministries Project, Series 2016: | | | |
| 985 | | 5.000%, 1/01/28 | 1/26 at 100.00 | BBB+ | 1,081,845 |
| 1,815 | | 5.000%, 1/01/29 | 1/26 at 100.00 | BBB+ | 1,985,973 |
| 735 | | 5.000%, 1/01/30 | 1/26 at 100.00 | BBB+ | 801,591 |
| 300 | | 3.250%, 1/01/36 | 1/26 at 100.00 | BBB+ | 288,045 |
| 2,015 | | 3.250%, 1/01/39 | 1/26 at 100.00 | BBB+ | 1,892,448 |
| | Cumberland County Municipal Authority, Pennsylvania, Revenue Bonds, Diakon Lutheran | | | |
| | Social Ministries Project, Series 2019A: | | | |
| 690 | | 4.125%, 1/01/38 | 1/29 at 100.00 | BBB+ | 712,832 |
| 1,410 | | 5.000%, 1/01/39 | 1/29 at 100.00 | BBB+ | 1,539,255 |
| 650 | | Lancaster County Hospital Authority, Pennsylvania, Health Center Revenue Bonds, Masonic | 5/25 at 100.00 | A | 718,679 |
| | Villages Project, Series 2015, 5.000%, 11/01/35 | | | |
| 530 | | Lancaster County Hospital Authority, Pennsylvania, Health Center Revenue Bonds, Saint | 4/22 at 100.00 | BB+ | 537,293 |
| | Anne’s Retirement Community, Inc, Series 2012, 5.000%, 4/01/33 | | | |
46
| | | | | | |
| Principal | | | Optional Call | | |
| Amount (000) | | Description (1) | Provisions (2) | Ratings (3) | Value |
| | Long-Term Care (continued) | | | |
| | Lancaster County Hospital Authority, Pennsylvania, Health Center Revenue Bonds, Saint | | | |
| | Anne’s Retirement Community, Inc, Series 2020: | | | |
| $ 975 | | 5.000%, 3/01/40 | 3/27 at 102.00 | BB+ | $ 1,008,413 |
| 715 | | 5.000%, 3/01/50 | 3/27 at 102.00 | BB+ | 729,886 |
| 1,250 | | Lancaster County Hospital Authority, Pennsylvania, Revenue Bonds, Landis Homes | 7/25 at 100.00 | BBB– | 1,282,788 |
| | Retirement Community Project, Refunding Series 2015A, 5.000%, 7/01/45 | | | |
| 1,500 | | Langhorne Manor Boro Higher Education and Health Authority, Pennsylvania, Revenue Bonds, | 10/20 at 100.00 | A– | 1,502,385 |
| | Woods Services Project, Series 2013, 4.000%, 11/15/38 | | | |
| | Northampton County Industrial Development Authority, Pennsylvania, Revenue Bonds, | | | |
| | Morningstar Senior Living, Inc, Series 2019: | | | |
| 1,845 | | 5.000%, 11/01/44 | 11/26 at 103.00 | BB+ | 1,896,789 |
| 1,000 | | 5.000%, 11/01/49 | 11/26 at 103.00 | BB+ | 1,022,810 |
| 35,030 | | Total Long-Term Care | | | 36,070,911 |
| | Tax Obligation/General – 18.5% (11.8% of Total Investments) | | | |
| 840 | | Adams County, Pennsylvania, General Obligation Bonds, Series 2017B, 2.500%, 11/15/29 | 11/25 at 100.00 | Aa2 | 908,796 |
| | Allegheny County, Pennsylvania, General Obligation Bonds, Series 2014C-74: | | | |
| 1,750 | | 5.000%, 12/01/32 | 12/24 at 100.00 | AA– | 2,056,775 |
| 1,285 | | 5.000%, 12/01/34 | 12/24 at 100.00 | AA– | 1,504,388 |
| 2,400 | | Allegheny County, Pennsylvania, General Obligation Bonds, Series 2018C-77, | 11/28 at 100.00 | AA– | 2,989,848 |
| | 5.000%, 11/01/43 | | | |
| | Bethel Park School District, Allegheny County, Pennsylvania, General Obligation Bonds, | | | |
| | Refunding Series 2016: | | | |
| 1,500 | | 4.000%, 8/01/31 | 8/26 at 100.00 | Aa2 | 1,729,965 |
| 1,255 | | 4.000%, 8/01/33 | 8/26 at 100.00 | Aa2 | 1,434,478 |
| 1,950 | | Boyertown Area School District, Berks and Montgomery Counties, Pennsylvania, General | 4/24 at 100.00 | AA– | 2,231,677 |
| | Obligation Bonds, Series 2015, 5.000%, 10/01/38 | | | |
| | Canon-McMillan School District, Washington County, Pennsylvania, General Obligation | | | |
| | Bonds, Series 2014D: | | | |
| 3,000 | | 5.000%, 12/15/37 | 12/24 at 100.00 | AA | 3,506,700 |
| 1,075 | | 5.000%, 12/15/38 – BAM Insured | 12/24 at 100.00 | AA | 1,255,084 |
| 1,100 | | 5.000%, 12/15/39 | 12/24 at 100.00 | AA | 1,284,272 |
| 2,900 | | Colonial School District, Montgomery County, Pennsylvania, General Obligation Bonds, | 2/27 at 100.00 | Aaa | 3,537,159 |
| | Series 2020, 5.000%, 2/15/44 | | | |
| 7,465 | | Erie City School District, Erie County, Pennsylvania, General Obligation Bonds, Series | No Opt. Call | N/R | 6,060,684 |
| | 2000, 0.000%, 9/01/30 – AMBAC Insured | | | |
| 6,225 | | Lehighton Area School District, Carbon County, Pennsylvania, General Obligation Bonds, | 11/23 at 100.00 | AA | 7,005,677 |
| | Limited Tax Series 2015A, 5.000%, 11/15/43 – BAM Insured | | | |
| | North Allegheny School District, Allegheny County, Pennsylvania, General Obligation | | | |
| | Bonds, Series 2015: | | | |
| 5,000 | | 5.000%, 5/01/31 | 5/25 at 100.00 | AA | 5,995,800 |
| 4,000 | | 5.000%, 5/01/32 | 5/25 at 100.00 | AA | 4,786,480 |
| 2,875 | | 5.000%, 5/01/33 | 5/25 at 100.00 | AA | 3,431,514 |
| | Penn Manor School District, Lancaster County, Pennsylvania, General Obligation Bonds, | | | |
| | Series 2019A: | | | |
| 1,000 | | 4.000%, 3/01/35 | 9/27 at 100.00 | AA | 1,151,290 |
| 1,000 | | 4.000%, 3/01/36 | 9/27 at 100.00 | AA | 1,147,190 |
| | Pennsbury School District, Bucks County, Pennsylvania, General Obligation Bonds, | | | |
| | Series 2016A: | | | |
| 1,000 | | 5.000%, 10/01/33 | 4/25 at 100.00 | Aa2 | 1,191,000 |
| 1,860 | | 5.000%, 10/01/34 | 4/25 at 100.00 | Aa2 | 2,212,489 |
| 2,045 | | 5.000%, 10/01/35 | 4/25 at 100.00 | Aa2 | 2,429,501 |
| 2,620 | | Pennsylvania Economic Development Financing Authority, Parking System Revenue Bonds, | 1/24 at 100.00 | AA | 3,013,917 |
| | Capitol Region Parking System, Junior Insured Series 2013C, 5.500%, 1/01/30 – AGM Insured | | | |
| 3,925 | | Philadelphia School District, Pennsylvania, General Obligation Bonds, Series 2007A, | No Opt. Call | A+ | 5,568,633 |
| | 5.000%, 6/01/34 – NPFG Insured | | | |
47
| | |
| NQP | Nuveen Pennsylvania Quality Municipal Income Fund Portfolio of Investments (continued) August 31, 2020 (Unaudited) |
| | | | | | |
| Principal | | | Optional Call | | |
| Amount (000) | | Description (1) | Provisions (2) | Ratings (3) | Value |
| | Tax Obligation/General (continued) | | | |
| $ 745 | | Pittsburgh School District, Allegheny County, Pennsylvania, General Obligation Bonds, | 9/22 at 100.00 | AA | $ 813,540 |
| | Series 2014A, 5.000%, 9/01/25 – BAM Insured | | | |
| 1,000 | | Radnor Township, Pennsylvania, General Obligation Bonds, Series 2012, 4.000%, 11/01/37 | 11/22 at 100.00 | Aa1 | 1,060,180 |
| 11,440 | | Reading School District, Berks County, Pennsylvania, General Obligation Bonds, Series | No Opt. Call | Baa2 | 8,750,570 |
| | 2003B, 0.000%, 1/15/32 – NPFG Insured | | | |
| | Scranton, Lackawanna County, Pennsylvania, General Obligation Notes, Series 2016: | | | |
| 260 | | 5.000%, 11/15/26 | 5/24 at 100.00 | BB+ | 285,332 |
| 2,925 | | 5.000%, 11/15/32 | 5/24 at 100.00 | BB+ | 3,157,625 |
| 21,000 | | State Public School Building Authority, Pennsylvania, Lease Revenue Bonds, Philadelphia | No Opt. Call | AA | 27,590,220 |
| | School District, Series 2003, 5.500%, 6/01/28 – AGM Insured (UB) (4) | | | |
| | The Redevelopment Authority of the City of Scranton, Lackawanna county, Pennsylvania, | | | |
| | Guaranteed Lease Revenue Bonds, Series 2016A: | | | |
| 170 | | 5.000%, 11/15/21 | No Opt. Call | BB+ | 170,321 |
| 170 | | 5.000%, 11/15/28 | 5/24 at 100.00 | BB+ | 165,747 |
| 95,780 | | Total Tax Obligation/General | | | 108,426,852 |
| | Tax Obligation/Limited – 9.3% (5.9% of Total Investments) | | | |
| 1,070 | | Allegheny County Redevelopment Authority, Pennsylvania, TIF Revenue Bonds, Pittsburg | 10/20 at 100.00 | N/R | 963,000 |
| | Mills Project, Series 2004, 5.600%, 7/01/23 | | | |
| 1,475 | | Allentown Neighborhood Improvement Zone Development Authority, Pennsylvania, Tax | 5/22 at 100.00 | Baa3 | 1,538,189 |
| | Revenue Bonds, Series 2012A, 5.000%, 5/01/35 | | | |
| 155 | | Allentown Neighborhood Improvement Zone Development Authority, Pennsylvania, Tax Revenue | 5/28 at 100.00 | Ba3 | 165,171 |
| | Bonds, City Center Project, Series 2018, 5.000%, 5/01/33, 144A | | | |
| 1,115 | | Allentown Neighborhood Improvement Zone Development Authority, Pennsylvania, Tax Revenue | 5/27 at 100.00 | Ba3 | 1,164,997 |
| | Bonds, City Center Refunding Project, Series 2017, 5.000%, 5/01/42, 144A | | | |
| | Commonwealth Financing Authority, Pennsylvania, State Appropriation Lease Bonds, Master | | | |
| | Settlement, Series 2018: | | | |
| 1,135 | | 5.000%, 6/01/33 | 6/28 at 100.00 | A1 | 1,413,733 |
| 1,180 | | 4.000%, 6/01/39 – AGM Insured | 6/28 at 100.00 | AA | 1,339,713 |
| 7,215 | | 4.000%, 6/01/39 – AGM Insured (UB) (4) | 6/28 at 100.00 | AA | 8,191,550 |
| | Government of Guam, Business Privilege Tax Bonds, Series 2011A: | | | |
| 1,670 | | 5.250%, 1/01/36 | 1/22 at 100.00 | BB | 1,722,204 |
| 655 | | 5.125%, 1/01/42 | 1/22 at 100.00 | BB | 672,148 |
| 1,578 | | Monroe County Industrial Development Authority, Pennsylvania, Special Obligation Revenue | 7/24 at 100.00 | N/R | 1,596,526 |
| | Bonds, Tobyhanna Township Project, Series 2014, 6.875%, 7/01/33, 144A | | | |
| | Pennsylvania Turnpike Commission, Motor License Fund-Enhanced Turnpike Subordinate | | | |
| | Special Revenue Bonds, Series 2014A: | | | |
| 2,650 | | 0.000%, 12/01/37 (11) | 12/26 at 100.00 | AA– | 2,915,292 |
| 4,000 | | 0.000%, 12/01/44 (11) | 12/26 at 100.00 | AA– | 4,366,040 |
| 2,500 | | Pennsylvania Turnpike Commission, Oil Franchise Tax Revenue Bonds, Subordinate Series | 12/28 at 100.00 | A+ | 2,994,950 |
| | 2018B, 5.000%, 12/01/48 | | | |
| 5,530 | | Philadelphia Authority For Industrial Development, Pennsylvania, City Agreement Revenue | 12/25 at 100.00 | A | 6,674,986 |
| | Bonds, Cultural and Commercial Corridors Program, Refunding Series 2016A, 5.000%, 12/01/30 | | | |
| 3,820 | | Pittsburgh and Allegheny County Sports and Exhibition Authority, Pennsylvania, Hotel | 8/22 at 100.00 | AA | 4,067,689 |
| | Room Excise Tax Revenue Bonds, Refunding Series 2012, 5.000%, 2/01/26 – AGM Insured | | | |
| 4,225 | | Puerto Rico Highway and Transportation Authority, Highway Revenue Bonds, Series 2007N, | No Opt. Call | C | 4,609,644 |
| | 5.500%, 7/01/29 – AMBAC Insured | | | |
| | Puerto Rico Sales Tax Financing Corporation, Sales Tax Revenue Bonds, Restructured | | | |
| | 2018A-1: | | | |
| 1,398 | | 4.750%, 7/01/53 | 7/28 at 100.00 | N/R | 1,469,354 |
| 2,899 | | 5.000%, 7/01/58 | 7/28 at 100.00 | N/R | 3,095,262 |
| | Puerto Rico Sales Tax Financing Corporation, Sales Tax Revenue Bonds, Taxable | | | |
| | Restructured Cofina Project Series 2019A-2: | | | |
| 705 | | 4.329%, 7/01/40 | 7/28 at 100.00 | N/R | 740,257 |
| 532 | | 4.329%, 7/01/40 | 7/28 at 100.00 | N/R | 558,605 |
| 3,332 | | 4.784%, 7/01/58 | 7/28 at 100.00 | N/R | 3,509,629 |
48
| | | | | | |
| Principal | | | Optional Call | | |
| Amount (000) | | Description (1) | Provisions (2) | Ratings (3) | Value |
| | Tax Obligation/Limited (continued) | | | |
| $ 825 | | Washington County Redevelopment Authority, Pennsylvania, Tanger Outlet Victory Center | 1/28 at 100.00 | BB | $ 842,713 |
| | Tax Increment Bonds, Series 2018, 5.000%, 7/01/35 | | | |
| 49,664 | | Total Tax Obligation/Limited | | | 54,611,652 |
| | Transportation – 9.9% (6.3% of Total Investments) | | | |
| | Delaware River Port Authority, Pennsylvania and New Jersey, Revenue Refunding Bonds, | | | |
| | Port District Project, Series 2012: | | | |
| 2,425 | | 5.000%, 1/01/23 | No Opt. Call | A | 2,618,467 |
| 2,310 | | 5.000%, 1/01/24 | 1/23 at 100.00 | A | 2,487,038 |
| 610 | | 5.000%, 1/01/25 | 1/23 at 100.00 | A | 655,201 |
| 4,000 | | Pennsylvania Economic Development Financing Authority, Parking System Revenue Bonds, | 1/24 at 100.00 | AA | 4,435,800 |
| | Capitol Region Parking System, Series 2013A, 5.250%, 1/01/44 – AGM Insured | | | |
| 12,100 | | Pennsylvania Turnpike Commission, Turnpike Revenue Bonds, Capital Appreciation Series | 12/27 at 100.00 | A | 15,599,199 |
| | 2009E, 6.375%, 12/01/38 | | | |
| 820 | | Pennsylvania Turnpike Commission, Turnpike Revenue Bonds, Refunding Subordinate Second | 6/26 at 100.00 | A3 | 950,610 |
| | Series 2016B-2, 5.000%, 6/01/39 | | | |
| 3,000 | | Pennsylvania Turnpike Commission, Turnpike Revenue Bonds, Series 2014C, 5.000%, 12/01/44 | 12/24 at 100.00 | A+ | 3,365,250 |
| 10,470 | | Pennsylvania Turnpike Commission, Turnpike Revenue Bonds, Series 2015B, 5.000%, 12/01/45 | 12/25 at 100.00 | A1 | 11,968,152 |
| | (UB) (4) | | | |
| 2,000 | | Pennsylvania Turnpike Commission, Turnpike Revenue Bonds, Subordinate Series 2009C, | 6/26 at 100.00 | AA | 2,565,060 |
| | 6.250%, 6/01/33 – AGM Insured | | | |
| | Pennsylvania Turnpike Commission, Turnpike Revenue Bonds, Subordinate Series 2017B-1: | | | |
| 1,430 | | 5.000%, 6/01/31 | 6/27 at 100.00 | A3 | 1,729,070 |
| 1,430 | | 5.000%, 6/01/33 | 6/27 at 100.00 | A3 | 1,711,982 |
| 1,500 | | Pennsylvania Turnpike Commission, Turnpike Revenue Bonds, Subordinate Series 2019A, | 12/29 at 100.00 | A3 | 1,650,435 |
| | 4.000%, 12/01/49 | | | |
| 585 | | Philadelphia, Pennsylvania, Airport Revenue Bonds, Refunding Series 2017A, 3.000%, | 7/27 at 100.00 | AA | 608,388 |
| | 7/01/34 – AGM Insured | | | |
| 1,500 | | Philadelphia, Pennsylvania, Airport Revenue Bonds, Refunding Series 2017B, 5.000%, | 7/27 at 100.00 | A | 1,725,150 |
| | 7/01/47 (AMT) | | | |
| 1,865 | | Philadelphia, Pennsylvania, Airport Revenue Bonds, Series 2010A, 5.250%, 6/15/28 | 10/20 at 100.00 | A | 1,879,174 |
| | Pittsburgh and Allegheny County Sports and Exhibition Authority, Pennsylvania, Parking | | | |
| | Revenue Bonds, Series 2017: | | | |
| 1,000 | | 5.000%, 12/15/30 | 12/27 at 100.00 | A | 1,192,080 |
| 500 | | 5.000%, 12/15/33 | 12/27 at 100.00 | A | 587,400 |
| 550 | | 5.000%, 12/15/34 | 12/27 at 100.00 | A | 644,424 |
| 1,000 | | 5.000%, 12/15/36 | 12/27 at 100.00 | A | 1,149,270 |
| 250 | | 5.000%, 12/15/37 | 12/27 at 100.00 | A | 284,780 |
| 49,345 | | Total Transportation | | | 57,806,930 |
| | U.S. Guaranteed – 21.0% (13.3% of Total Investments) (5) | | | |
| 1,700 | | Allegheny County, Pennsylvania, General Obligation Bonds, Series 2011C-65, 5.375%, | 5/21 at 100.00 | AA– | 1,759,024 |
| | 5/01/31 (Pre-refunded 5/01/21) | | | |
| | Allegheny County, Pennsylvania, General Obligation Bonds, Series 2013C-72: | | | |
| 2,780 | | 5.250%, 12/01/32 (Pre-refunded 12/01/23) | 12/23 at 100.00 | AA– | 3,232,195 |
| 2,000 | | 5.250%, 12/01/33 (Pre-refunded 12/01/23) | 12/23 at 100.00 | AA– | 2,325,320 |
| 5,100 | | Allegheny County, Pennsylvania, General Obligation Bonds, Series C69-C70 of 2012, | 12/22 at 100.00 | AA– | 5,648,607 |
| | 5.000%, 12/01/37 (Pre-refunded 12/01/22) | | | |
| | Beaver County Hospital Authority, Pennsylvania, Revenue Bonds, Heritage Valley Health | | | |
| | System, Inc, Series 2012: | | | |
| 4,010 | | 5.000%, 5/15/26 (Pre-refunded 5/15/21) | 5/21 at 100.00 | A3 | 4,143,934 |
| 1,910 | | 5.000%, 5/15/27 (Pre-refunded 5/15/21) | 5/21 at 100.00 | A3 | 1,973,794 |
| 2,000 | | 5.000%, 5/15/28 (Pre-refunded 5/15/21) | 5/21 at 100.00 | A3 | 2,066,800 |
| 3,000 | | Bristol Township School District, Bucks County, Pennsylvania, General Obligation Bonds, | 6/23 at 100.00 | A2 | 3,413,970 |
| | Series 2013, 5.250%, 6/01/43 (Pre-refunded 6/01/23) | | | |
49
| | |
| NQP | Nuveen Pennsylvania Quality Municipal Income Fund Portfolio of Investments (continued) August 31, 2020 (Unaudited) |
| | | | | | |
| Principal | | | Optional Call | | |
| Amount (000) | | Description (1) | Provisions (2) | Ratings (3) | Value |
| | U.S. Guaranteed (5) (continued) | | | |
| | Bucks County Water and Sewer Authority, Pennsylvania, Revenue Bonds, Tender Option Bond | | | |
| | Trust 2015-XF0123: | | | |
| $ 825 | | 13.278%, 12/01/29 – AGM Insured (Pre-refunded 12/01/21), 144A (IF) (4) | 12/21 at 100.00 | AA | $ 973,549 |
| 1,665 | | 13.290%, 12/01/33 – AGM Insured (Pre-refunded 12/01/21), 144A (IF) (4) | 12/21 at 100.00 | AA | 1,965,100 |
| 4,000 | | Central Bradford Progress Authority, Pennsylvania, Revenue Bonds, Guthrie Health, | 12/21 at 100.00 | AA– | 4,250,960 |
| | Refunding Series 2011, 5.375%, 12/01/41 (Pre-refunded 12/01/21) | | | |
| 4,100 | | Centre County Hospital Authority, Pennsylvania, Hospital Revenue Bonds, Mount Nittany | 11/21 at 100.00 | AA– | 4,432,141 |
| | Medical Center Project, Series 2011, 7.000%, 11/15/46 (Pre-refunded 11/15/21) | | | |
| 6,680 | | Gateway School District, Allegheny County, Pennsylvania, General Obligation Bonds, | 10/22 at 100.00 | A1 | 7,209,190 |
| | Refunding Series 2012, 4.000%, 10/15/32 (Pre-refunded 10/15/22) | | | |
| 3,385 | | Lancaster County Hospital Authority, Pennsylvania, Health System Revenue Bonds, | 1/22 at 100.00 | N/R | 4,020,771 |
| | Lancaster General Hospital Project, Tender Option Bond Trust 2015-XF0064, 13.317%, 7/01/42 | | | |
| | (Pre-refunded 1/01/22), 144A (IF) | | | |
| | Lancaster Industrial Development Authority, Pennsylvania, Revenue Bonds, Garden Spot | | | |
| | Village Project, Series 2013: | | | |
| 1,000 | | 5.375%, 5/01/28 (Pre-refunded 5/01/23) | 5/23 at 100.00 | N/R | 1,135,980 |
| 1,665 | | 5.750%, 5/01/35 (Pre-refunded 5/01/23) | 5/23 at 100.00 | N/R | 1,907,973 |
| | Monroe County Hospital Authority, Pennsylvania, Hospital Revenue Bonds, Pocono Medical | | | |
| | Center, Series 2012A: | | | |
| 365 | | 4.000%, 1/01/25 (Pre-refunded 1/01/22) | 1/22 at 100.00 | N/R | 382,516 |
| 3,000 | | 5.000%, 1/01/41 (Pre-refunded 1/01/22) | 1/22 at 100.00 | N/R | 3,183,750 |
| 3,730 | | Montgomery County Higher Education and Health Authority, Pennsylvania, Hospital Revenue | 6/22 at 100.00 | N/R | 4,036,643 |
| | Bonds, Abington Memorial Hospital Obligated Group, Series 2012A, 5.000%, 6/01/31 | | | |
| | (Pre-refunded 6/01/22) | | | |
| 925 | | Montgomery County Industrial Development Authority, Pennsylvania, Health Facilities | 4/22 at 100.00 | AA | 995,337 |
| | Revenue Bonds, Jefferson Health System, Series 2012A, 5.000%, 10/01/41 (Pre-refunded 4/01/22) | | | |
| 2,150 | | Montgomery County Industrial Development Authority, Pennsylvania, Revenue Bonds, ACTS | 5/22 at 100.00 | A– | 2,322,258 |
| | Retirement-Life Communities, Inc Obligated Group, Refunding Series 2012, 5.000%, 11/15/26 | | | |
| | (Pre-refunded 5/15/22) | | | |
| 3,500 | | Norristown Area School District, Pennsylvania, Installment Purchase Certificates of | 4/22 at 100.00 | N/R | 3,748,780 |
| | Participation, Series 2012, 5.000%, 4/01/32 (Pre-refunded 4/01/22) | | | |
| 1,415 | | Pennsylvania Higher Educational Facilities Authority, Revenue Bonds, Drexel University, | 5/21 at 100.00 | N/R | 1,462,968 |
| | Series 2011A, 5.250%, 5/01/41 (Pre-refunded 5/01/21) | | | |
| | Pennsylvania Higher Educational Facilities Authority, Revenue Bonds, Foundation for | | | |
| | Student Housing at Indiana University, Project Series 2012A: | | | |
| 1,000 | | 5.000%, 7/01/27 (Pre-refunded 7/01/22) | 7/22 at 100.00 | N/R | 1,083,230 |
| 750 | | 5.000%, 7/01/32 (Pre-refunded 7/01/22) | 7/22 at 100.00 | N/R | 812,423 |
| 1,195 | | Pennsylvania Higher Educational Facilities Authority, Revenue Bonds, Philadelphia | 6/23 at 100.00 | N/R | 1,349,956 |
| | University, Refunding Series 2013, 5.000%, 6/01/32 (Pre-refunded 6/01/23) | | | |
| 420 | | Pennsylvania Higher Educational Facilities Authority, Revenue Bonds, Shippensburg | 10/22 at 100.00 | N/R | 461,374 |
| | University Student Services, Inc Student Housing Project at Shippensburg University of | | | |
| | Pennsylvania, Series 2012, 5.000%, 10/01/44 (Pre-refunded 10/01/22) | | | |
| 2,000 | | Pennsylvania Higher Educational Facilities Authority, Revenue Bonds, Temple University, | 4/22 at 100.00 | Aa3 | 2,150,420 |
| | First Series of 2012, 5.000%, 4/01/42 (Pre-refunded 4/01/22) | | | |
| | Pennsylvania Turnpike Commission, Motor License Fund-Enhanced Turnpike Special Revenue | | | |
| | Bonds, Subordinate Series 2010A1&2: | | | |
| 345 | | 5.500%, 12/01/34 (Pre-refunded 12/01/20) | 12/20 at 100.00 | N/R | 349,533 |
| 1,440 | | 5.500%, 12/01/34 (Pre-refunded 12/01/20) | 12/20 at 100.00 | AA– | 1,459,109 |
| | Pennsylvania Turnpike Commission, Motor License Fund-Enhanced Turnpike Special Revenue | | | |
| | Bonds, Subordinate Series 2011B: | | | |
| 2,065 | | 5.000%, 12/01/41 (Pre-refunded 12/01/21) | 12/21 at 100.00 | A2 | 2,188,941 |
| 1,935 | | 5.000%, 12/01/41 (Pre-refunded 12/01/21) | 12/21 at 100.00 | A2 | 2,046,127 |
| 3,180 | | Pennsylvania Turnpike Commission, Motor License Fund-Enhanced Turnpike Special Revenue | 12/21 at 100.00 | AA– | 3,370,864 |
| | Bonds, Subordinate Series 2012A, 5.000%, 12/01/31 (Pre-refunded 12/01/21) | | | |
| 7,000 | | Pennsylvania Turnpike Commission, Motor License Fund-Enhanced Turnpike Subordinate | 12/23 at 100.00 | AA– | 8,089,270 |
| | Special Revenue Bonds, Series 2013B-1, 5.250%, 12/01/43 (Pre-refunded 12/01/23) | | | |
50
| | | | | | |
| Principal | | | Optional Call | | |
| Amount (000) | | Description (1) | Provisions (2) | Ratings (3) | Value |
| | U.S. Guaranteed (5) (continued) | | | |
| $ 2,500 | | Philadelphia, Pennsylvania, Water and Wastewater Revenue Bonds, Series 2013A, 5.125%, | 1/22 at 100.00 | A+ | $ 2,662,475 |
| | 1/01/43 (Pre-refunded 1/01/22) | | | |
| | Pittsburgh, Pennsylvania, General Obligation Bonds, Series 2012B: | | | |
| 2,590 | | 5.000%, 9/01/25 (Pre-refunded 9/01/22) | 9/22 at 100.00 | AA– | 2,835,480 |
| 6,800 | | 5.000%, 9/01/26 (Pre-refunded 9/01/22) | 9/22 at 100.00 | AA– | 7,444,504 |
| | Saint Mary Hospital Authority, Pennsylvania, Health System Revenue Bonds, Catholic | | | |
| | Health East, Series 2010A: | | | |
| 55 | | 5.000%, 11/15/40 (Pre-refunded 11/15/20) | 11/20 at 100.00 | N/R | 55,521 |
| 605 | | 5.000%, 11/15/40 (Pre-refunded 11/15/20) | 11/20 at 100.00 | AA– | 610,729 |
| | Union County Hospital Authority, Pennsylvania, Hospital Revenue Bonds, Evangelical | | | |
| | Community Hospital Project, Refunding & Improvement Series 2011: | | | |
| 3,130 | | 6.875%, 8/01/31 (Pre-refunded 8/01/21) | 8/21 at 100.00 | A– | 3,317,080 |
| 2,500 | | 7.000%, 8/01/41 (Pre-refunded 8/01/21) | 8/21 at 100.00 | A– | 2,651,550 |
| | West Shore Area Authority, Cumberland County, Pennsylvania, Hospital Revenue Bonds, Holy | | | |
| | Spirit Hospital of the Sisters of Christian Charity Project, Series 2011: | | | |
| 325 | | 6.250%, 1/01/31 (Pre-refunded 1/01/21) | 1/21 at 100.00 | AA– | 331,481 |
| 4,555 | | 6.500%, 1/01/36 (Pre-refunded 1/01/21) | 1/21 at 100.00 | AA– | 4,649,471 |
| | West Shore Area Authority, Cumberland County, Pennsylvania, Hospital Revenue Bonds, Holy | | | |
| | Spirit Hospital of the Sisters of Christian Charity, Series 2011B: | | | |
| 1,835 | | 5.625%, 1/01/32 (Pre-refunded 1/01/22) | 1/22 at 100.00 | AA– | 1,966,441 |
| 1,970 | | 5.750%, 1/01/41 (Pre-refunded 1/01/22) | 1/22 at 100.00 | AA– | 2,114,381 |
| 1,930 | | Westmoreland County Municipal Authority, Pennsylvania, Municipal Service Revenue Bonds, | 8/23 at 100.00 | A+ | 3,002,868 |
| | Tender Option Bond Trust 2016-XF1058, 17.534%, 8/15/37 (Pre-refunded 8/15/23), 144A (IF) (4) | | | |
| 1,110 | | Wilkes-Barre Finance Authority, Pennsylvania, Revenue Bonds, University of Scranton, | 11/20 at 100.00 | A– | 1,117,481 |
| | Series 2010, 5.000%, 11/01/40 (Pre-refunded 11/01/20) | | | |
| 112,140 | | Total U.S. Guaranteed | | | 122,712,269 |
| | Utilities – 5.0% (3.2% of Total Investments) | | | |
| 3,000 | | Beaver County Industrial Development Authority, Pennsylvania, Pollution Control Revenue | No Opt. Call | N/R | 3,022,500 |
| | Bonds, FirstEnergy Generation Project, Refunding Series 2006A, 4.375%, 1/01/35 (Mandatory | | | |
| | Put 7/01/22) | | | |
| 2,540 | | Beaver County Industrial Development Authority, Pennsylvania, Pollution Control Revenue | No Opt. Call | N/R | 3,175 |
| | Bonds, FirstEnergy Nuclear Generation Project, Refunding Series 2005A, 4.000%, 1/01/35 (6) | | | |
| 9,855 | | Beaver County Industrial Development Authority, Pennsylvania, Pollution Control Revenue | No Opt. Call | N/R | 12,319 |
| | Bonds, FirstEnergy Nuclear Generation Project, Refunding Series 2008A, 2.700%, 4/01/35 (6) | | | |
| 6,210 | | Beaver County Industrial Development Authority, Pennsylvania, Pollution Control Revenue | No Opt. Call | N/R | 7,762 |
| | Bonds, FirstEnergy Nuclear Generation Project, Series 2006B, 3.500%, 12/01/35 (6) | | | |
| 295 | | Luzerne County Industrial Development Authority, Pennsylvania, Revenue Bonds, | 12/29 at 100.00 | A+ | 321,627 |
| | Pennsylvania-American Water Company Project, Refunding Series 2019, 2.450%, 12/01/39 (AMT) | | | |
| | (Mandatory Put 12/03/29) | | | |
| 3,475 | | Pennsylvania Economic Development Financing Authority, Exempt Facilities Revenue Bonds, | 10/29 at 100.00 | A– | 3,665,256 |
| | York Water Company Project, Refunding Series 2019A, 3.000%, 10/01/36 (AMT) | | | |
| 3,400 | | Pennsylvania Economic Development Financing Authority, Exempt Facilities Revenue Bonds, | 11/29 at 100.00 | A– | 3,590,298 |
| | York Water Company Project, Refunding Series 2019B, 3.100%, 11/01/38 (AMT) | | | |
| 2,025 | | Pennsylvania Economic Development Financing Authority, Exempt Facilities Revenue | 9/25 at 100.00 | B | 1,666,474 |
| | Refunding Bonds, PPL Energy Supply, LLC Project, Series 2009A, 6.400%, 12/01/38 | | | |
| 7,500 | | Pennsylvania Economic Development Financing Authority, Revenue Bonds, | 10/29 at 100.00 | A+ | 8,158,125 |
| | Pennsylvania-American Water Company, Refunding Series 2019, 3.000%, 4/01/39 | | | |
| 5,000 | | Philadelphia Gas Works, Pennsylvania, Revenue Bonds, General Ordinance, Fifteenth Series | 8/27 at 100.00 | A | 5,724,600 |
| | 2017, 5.000%, 8/01/47 | | | |
| 2,735 | | Philadelphia Gas Works, Pennsylvania, Revenue Bonds, Refunding Thirteenth Series 2015, | 8/25 at 100.00 | A | 3,240,045 |
| | 5.000%, 8/01/29 | | | |
| 46,035 | | Total Utilities | | | 29,412,181 |
51
| | |
| NQP | Nuveen Pennsylvania Quality Municipal Income Fund Portfolio of Investments (continued) August 31, 2020 (Unaudited) |
| | | | | | |
| Principal | | | Optional Call | | |
| Amount (000) | | Description (1) | Provisions (2) | Ratings (3) | Value |
| | Water and Sewer – 11.1% (7.0% of Total Investments) | | | |
| | Allegheny County Sanitary Authority, Pennsylvania, Sewer Revenue Bonds, Refunding | | | |
| | Series 2015: | | | |
| $ 3,325 | | 5.000%, 12/01/40 | 12/25 at 100.00 | Aa3 | $ 3,927,390 |
| 3,320 | | 5.000%, 12/01/45 | 12/25 at 100.00 | Aa3 | 3,895,788 |
| | Delaware County Regional Water Quality Control Authority, Pennsylvania, Sewer Revenue | | | |
| | Bonds, Series 2015: | | | |
| 1,110 | | 5.000%, 5/01/40 | 5/25 at 100.00 | Aa3 | 1,302,574 |
| 2,220 | | 4.000%, 5/01/45 | 5/25 at 100.00 | Aa3 | 2,386,633 |
| | Lehigh County Authority, Pennsylvania, Water and Sewer Revenue Bonds, Allentown | | | |
| | Concession, Capital Appreciation Series 2013B: | | | |
| 7,295 | | 0.000%, 12/01/34 | No Opt. Call | A | 5,346,360 |
| 4,420 | | 0.000%, 12/01/35 | No Opt. Call | A | 3,137,095 |
| 12,500 | | Lehigh County Authority, Pennsylvania, Water and Sewer Revenue Bonds, Allentown | 12/23 at 100.00 | A | 14,121,125 |
| | Concession, Series 2013A, 5.125%, 12/01/47 | | | |
| 6,560 | | Philadelphia, Pennsylvania, Water and Wastewater Revenue Bonds, Series 2011A, | 1/21 at 100.00 | A+ | 6,633,078 |
| | 5.000%, 1/01/41 | | | |
| | Philadelphia, Pennsylvania, Water and Wastewater Revenue Bonds, Series 2018A: | | | |
| 5,000 | | 5.000%, 10/01/48 (UB) (4) | 10/28 at 100.00 | A+ | 6,150,950 |
| 7,000 | | 5.000%, 10/01/53 (UB) (4) | 10/28 at 100.00 | A+ | 8,576,540 |
| 1,000 | | Philadelphia, Pennsylvania, Water and Wastewater Revenue Bonds, Series 2019B, | 11/29 at 100.00 | A+ | 1,242,280 |
| | 5.000%, 11/01/54 | | | |
| 5,000 | | Pittsburgh Water and Sewer Authority, Pennsylvania, Water and Sewer System Revenue | 9/23 at 100.00 | A | 5,682,550 |
| | Bonds, First Lien Series 2013B, 5.250%, 9/01/40 | | | |
| | Westmoreland County Municipal Authority, Pennsylvania, Municipal Service Revenue Bonds, | | | |
| | Refunding Series 2020: | | | |
| 1,000 | | 4.000%, 8/15/24 – AGM Insured | No Opt. Call | AA | 1,115,440 |
| 1,190 | | 2.450%, 8/15/37 – AGM Insured | 8/28 at 100.00 | AA | 1,197,199 |
| 60,940 | | Total Water and Sewer | | | 64,715,002 |
| $ 851,537 | | Total Municipal Bonds (cost $844,013,486) | | | 908,566,816 |
| | | | | | |
| Shares | | Description (1) | | | Value |
| | COMMON STOCKS – 2.0% (1.3% of Total Investments) | | | |
| | Electric Utilities – 2.0% (1.3% of Total Investments) | | | |
| 601,606 | | Energy Harbor Corp, (7) (8) | | | $ 11,580,915 |
| | Total Common Stocks (cost $16,839,773) | | | 11,580,915 |
| | Total Long-Term Investments (cost $860,853,259) | | | 920,147,731 |
52
| | | | | | |
| Principal | | | Optional Call | | |
| Amount (000) | | Description (1) | Provisions (2) | Ratings (3) | Value |
| | SHORT-TERM INVESTMENTS – 0.3% (0.2% of Total Investments) | | | |
| | MUNICIPAL BONDS – 0.3% (0.2% of Total Investments) | | | |
| | Tax Obligation/Limited – 0.3% (0.2% of Total Investments) | | | |
| $ 1,875 | | Commonwealth Financing Authority, Pennsylvania, Tobacco Master Settlement Payment Revenue | 6/28 at 100.00 | AA | $ 1,875,000 |
| | Bonds, Variable Rate Demand Obligations, Tender Option Bond Trust Series 2018-XX1080, 0.170%, | | | |
| | 6/01/35 (Mandatory Put 10/01/20), 144A, (10) | | | |
| $ 1,875 | | Total Short-Term Investments (cost $1,875,000) | | | 1,875,000 |
| | Total Investments (cost $862,728,259) – 157.7% | | | 922,022,731 |
| | Floating Rate Obligations – (23.8)% | | | (139,425,000) |
| | Variable Rate Demand Preferred Shares, net of deferred offering costs – (37.1)% (9) | | | (216,734,085) |
| | Other Assets Less Liabilities – 3.2% | | | 18,760,323 |
| | Net Asset Applicable to Common Shares – 100% | | | $ 584,623,969 |
| | |
(1) | All percentages shown in the Portfolio of Investments are based on net assets applicable to common shares unless otherwise noted. |
(2) | Optional Call Provisions: Dates (month and year) and prices of the earliest optional call or redemption. There may be other call provisions at varying prices at later dates. Certain mortgage-backed securities may be subject to periodic principal paydowns. |
(3) | For financial reporting purposes, the ratings disclosed are the highest of Standard & Poor’s Group (“Standard & Poor’s”), Moody’s Investors Service, Inc. (“Moody’s”) or Fitch, Inc. (“Fitch”) rating. This treatment of split-rated securities may differ from that used for other purposes, such as for Fund investment policies. Ratings below BBB by Standard & Poor’s, Baa by Moody’s or BBB by Fitch are considered to be below investment grade. Holdings designated N/R are not rated by any of these national rating agencies. |
(4) | Investment, or portion of investment, has been pledged to collateralize the net payment obligations for investments in inverse floating rate transactions. |
(5) | Backed by an escrow or trust containing sufficient U.S. Government or U.S. Government agency securities, which ensure the timely payment of principal and interest. |
(6) | Defaulted security. A security whose issuer has failed to fully pay principal and/or interest when due, or is under the protection of bankruptcy. |
(7) | Common Stock received as part of the bankruptcy settlements for Beaver County Industrial Development Authority, Pennsylvania, Pollution Control Revenue Bonds, FirstEnergy Nuclear Generation Project, Refunding Series 2005A, 4.000%, 1/01/35; Beaver County Industrial Development Authority, Pennsylvania, Pollution Control Revenue Refunding Bonds, FirstEnergy Nuclear Generation Project, Series 2006A, 4.375%, 1/01/35; and Beaver County Industrial Development Authority, Pennsylvania, Pollution Control Revenue Refunding Bonds, FirstEnergy Nuclear Generation Project, Series 2006B, 3.500%, 12/01/35. |
(8) | For fair value measurement disclosure purposes, investment classified as Level 2. See Notes to Financial Statements, Note 3 - Investment Valuation and Fair Value Measurements for more information. |
(9) | Variable Rate Demand Preferred Shares, net of deferred offering costs as a percentage of Total Investments is 23.5%. |
(10) | Investment has a maturity of greater than one year, but has variable rate and/or demand features which qualify it as a short-term investment. The rate disclosed, as well as the reference rate and spread, where applicable, is that in effect as of the end of the reporting period. This rate changes periodically based on market conditions or a specified market index. |
(11) | Step-up coupon bond, a bond with a coupon that increases (“steps up”), usually at regular intervals, while the bond is outstanding. The rate shown is the coupon as of the end of the reporting period. |
144A | Investment is exempt from registration under Rule 144A of the Securities Act of 1933, as amended. These investments may only be resold in transactions exempt from registration, which are normally those transactions with qualified institutional buyers. |
AMT | Alternative Minimum Tax |
IF | Inverse floating rate security issued by a tender option bond (“TOB”) trust, the interest rate on which varies inversely with the Securities Industry Financial Markets Association (SIFMA) short-term rate, which resets weekly, or a similar short-term rate, and is reduced by the expenses related to the TOB trust. |
UB | Underlying bond of an inverse floating rate trust reflected as a financing transaction. See Notes to Financial Statements, Note 4 – Portfolio Securities and Investments in Derivatives, for more information. |
WI/DD | Purchased on a when-issued or delayed delivery basis. |
| See accompanying notes to financial statements. |
53
| | |
| NPN | Nuveen Pennsylvania Municipal Value Fund Portfolio of Investments August 31, 2020 (Unaudited) |
| | | | | | |
| Principal | | | Optional Call | | |
| Amount (000) | | Description (1) | Provisions (2) | Ratings (3) | Value |
| | LONG-TERM INVESTMENTS – 99.6% (100.0% of Total Investments) | | | |
| | MUNICIPAL BONDS – 98.1% (98.5% of Total Investments) | | | |
| | Consumer Staples – 2.7% (2.7% of Total Investments) | | | |
| $ 315 | | District of Columbia Tobacco Settlement Corporation, Tobacco Settlement Asset-Backed | No Opt. Call | A– | $ 352,693 |
| | Bonds, Series 2001, 6.500%, 5/15/33 | | | |
| 100 | | Pennsylvania Economic Development Financing Authority, Solid Waste Disposal Revenue | No Opt. Call | AA– | 135,939 |
| | Bonds, Procter & Gamble Paper Project, Series 2001, 5.375%, 3/01/31 (AMT) | | | |
| 415 | | Total Consumer Staples | | | 488,632 |
| | Education and Civic Organizations – 8.3% (8.3% of Total Investments) | | | |
| 50 | | Allegheny County Higher Education Building Authority, Pennsylvania, Revenue Bonds, | 10/27 at 100.00 | Baa3 | 52,879 |
| | Robert Morris University, Series 2017, 5.000%, 10/15/37 | | | |
| 15 | | Berks County Municipal Authority, Pennsylvania, Revenue Bonds, Alvernia University | 10/29 at 100.00 | BB+ | 15,008 |
| | Project, Series 2020, 5.000%, 10/01/39 | | | |
| 70 | | Bucks County Industrial Development Authority, Pennsylvania, Revenue Bonds, School Lane | 3/27 at 100.00 | BBB– | 78,469 |
| | Charter School Project, Series 2016, 5.125%, 3/15/36 | | | |
| 20 | | Chester County Industrial Development Authority, Pennsylvania, Avon Grove Charter School | 12/27 at 100.00 | BBB– | 21,991 |
| | Revenue Bonds, Series 2017A, 5.000%, 12/15/47 | | | |
| 100 | | Cumberland County Municipal Authority, Pennsylvania, Revenue Bonds, Dickinson College | 11/27 at 100.00 | A+ | 118,148 |
| | Project, Second Series 2017A, 5.000%, 11/01/39 | | | |
| 30 | | Dallas Area Municipal Authority, Pennsylvania, Revenue Bonds, Misericordia University | 5/29 at 100.00 | Baa3 | 32,735 |
| | Project, Series 2019, 5.000%, 5/01/48 | | | |
| 30 | | Dallas Area Municipal Authority, Pennsylvania, Revenue Bonds, Misericordia University, | 5/24 at 100.00 | Baa3 | 31,777 |
| | Series 2014, 5.000%, 5/01/37 | | | |
| 60 | | Erie Higher Education Building Authority, Pennsylvania, Revenue Bonds, Gannon | 11/26 at 100.00 | BBB+ | 56,947 |
| | University, Series 2016, 4.000%, 5/01/46 | | | |
| 75 | | General Authority of Southcentral Pennsylvania, Revenue Bonds, AICUP Financing | 10/27 at 100.00 | A– | 77,436 |
| | Program-York College of Pennsylvania, Series 2017 PP4, 3.375%, 11/01/37 | | | |
| | Huntingdon County General Authority, Pennsylvania, Revenue Bonds, Juniata College, | | | |
| | Series 2016OO2: | | | |
| 15 | | 3.250%, 5/01/36 | 5/26 at 100.00 | BBB+ | 13,637 |
| 35 | | 3.500%, 5/01/41 | 5/26 at 100.00 | BBB+ | 31,459 |
| 50 | | Montgomery County Higher Education and Health Authority, Pennsylvania, Revenue Bonds, | 9/28 at 100.00 | A | 59,209 |
| | Thomas Jefferson University, Series 2018A, 5.000%, 9/01/48 | | | |
| | Montgomery County Higher Education and Health Authority, Pennsylvania, Revenue Bonds, | | | |
| | Thomas Jefferson University, Series 2019: | | | |
| 50 | | 4.000%, 9/01/44 | 9/29 at 100.00 | A | 55,034 |
| 25 | | 4.000%, 9/01/49 | 9/29 at 100.00 | A | 27,349 |
| 90 | | Northampton County General Purpose Authority, Pennsylvania, Revenue Bonds, Lafayette | 11/28 at 100.00 | Aa3 | 103,455 |
| | College, Refunding Series 2018, 4.000%, 11/01/38 | | | |
| 35 | | Pennsylvania Higher Educational Facilities Authority, Revenue Bonds, Holy Family | 9/23 at 100.00 | BBB– | 37,116 |
| | University, Series 2013A, 6.500%, 9/01/38 | | | |
| 45 | | Pennsylvania Higher Educational Facilities Authority, Revenue Bonds, Thomas Jefferson | 9/22 at 100.00 | A | 47,855 |
| | University, Series 2012, 5.000%, 3/01/42 | | | |
| | Pennsylvania Higher Educational Facilities Authority, Revenue Bonds, University of the | | | |
| | Sciences in Philadelphia, Series 2012: | | | |
| 35 | | 4.000%, 11/01/39 | 11/22 at 100.00 | Baa1 | 34,264 |
| 60 | | 5.000%, 11/01/42 | 11/22 at 100.00 | Baa1 | 61,329 |
| 95 | | Pennsylvania Higher Educational Facilities Authority, Revenue Bonds, Widener University, | 7/23 at 100.00 | A– | 99,444 |
| | Series 2013A, 5.500%, 7/15/38 | | | |
54
| | | | | | |
| Principal | | | Optional Call | | |
| Amount (000) | | Description (1) | Provisions (2) | Ratings (3) | Value |
| | Education and Civic Organizations (continued) | | | |
| $ 70 | | Philadelphia Authority for Industrial Development, Pennsylvania, Revenue Bonds, La Salle | 11/27 at 100.00 | BBB– | $ 64,186 |
| | University, Series 2017, 3.625%, 5/01/35 | | | |
| 100 | | Philadelphia Authority for Industrial Development, Pennsylvania, Revenue Bonds, | 10/20 at 100.00 | BB | 100,229 |
| | Philadelphia Performing Arts Charter School, Series 2013, 6.750%, 6/15/43, 144A | | | |
| 50 | | Philadelphia Authority for Industrial Development, Pennsylvania, Revenue Bonds, | 3/28 at 100.00 | BB+ | 50,974 |
| | University of the Arts, Series 2017, 5.000%, 3/15/45, 144A | | | |
| 100 | | Scranton-Lackawanna Health and Welfare Authority, Pennsylvania, University Revenue | 6/26 at 100.00 | BB+ | 100,190 |
| | Bonds, Marywood University, Series 2016, 5.000%, 6/01/46 | | | |
| 145 | | Washington County Industrial Development Authority, Pennsylvania, College Revenue Bonds, | 11/27 at 100.00 | A– | 151,515 |
| | AICUP Financing Program-Washington and Jefferson College Project, Series 2017-PP5, | | | |
| | 3.375%, 11/01/36 | | | |
| 1,450 | | Total Education and Civic Organizations | | | 1,522,635 |
| | Health Care – 20.0% (20.0% of Total Investments) | | | |
| 460 | | Allegheny County Hospital Development Authority, Pennsylvania, Revenue Bonds, Allegheny | 4/28 at 100.00 | A | 510,126 |
| | Health Network Obligated Group Issue, Series 2018A, 4.000%, 4/01/44 | | | |
| 115 | | Allegheny County Hospital Development Authority, Pennsylvania, Revenue Bonds, University | 7/29 at 100.00 | A | 133,103 |
| | of Pittsburgh Medical Center, Series 2019A, 4.000%, 7/15/35 | | | |
| 380 | | Berks County Industrial Development Authority, Pennsylvania, Health System Revenue | 11/27 at 100.00 | BBB+ | 406,330 |
| | Bonds, Tower Health Project, Series 2017, 5.000%, 11/01/50 | | | |
| 100 | | Centre County Hospital Authority, Pennsylvania, Hospital Revenue Bonds, Mount Nittany | 11/25 at 100.00 | AA– | 113,579 |
| | Medical Center Project, Series 2016A, 5.000%, 11/15/46 | | | |
| 75 | | Chester County Health and Education Facilities Authority, Pennsylvania, Health System | 10/27 at 100.00 | AA | 85,594 |
| | Revenue Bonds, Main Line Health System, Series 2017A, 4.000%, 10/01/37 | | | |
| 190 | | Chester County Health and Education Facilities Authority, Pennsylvania, Health System | 9/30 at 100.00 | AA | 217,419 |
| | Revenue Bonds, Main Line Health System, Series 2020A, 4.000%, 9/01/50 | | | |
| 200 | | Cumberland County Municipal Authority, Pennsylvania, Revenue Bonds, Penn State Health, | 11/29 at 100.00 | A+ | 227,348 |
| | Series 2019, 4.000%, 11/01/44 | | | |
| 55 | | Dauphin County General Authority, Pennsylvania, Health System Revenue Bonds, Pinnacle | 6/26 at 100.00 | A | 64,330 |
| | Health System Project, Refunding Series 2016A, 5.000%, 6/01/35 | | | |
| 35 | | Dauphin County General Authority, Pennsylvania, Health System Revenue Bonds, Pinnacle | 6/22 at 100.00 | A | 37,041 |
| | Health System Project, Series 2012A, 5.000%, 6/01/42 | | | |
| 225 | | Doylestown Hospital Authority, Pennsylvania, Hospital Revenue Bonds, Series 2016A, | 7/26 at 100.00 | BBB– | 248,270 |
| | 5.000%, 7/01/41 | | | |
| 25 | | Doylestown Hospital Authority, Pennsylvania, Hospital Revenue Bonds, Series 2019A, | 7/29 at 100.00 | BBB– | 26,376 |
| | 4.000%, 7/01/45 | | | |
| 150 | | Dubois Hospital Authority, Pennsylvania, Hospital Revenue Bonds, Penn Highlands | 1/28 at 100.00 | A– | 175,217 |
| | Healthcare, Series 2018, 5.000%, 7/15/48 | | | |
| 100 | | Lancaster County Hospital Authority, Revenue Bonds, University of Pennsylvania Health | 8/26 at 100.00 | AA | 117,566 |
| | System, Refunding Series 2016B, 5.000%, 8/15/46 | | | |
| 155 | | Lancaster County Hospital Authority, Revenue Bonds, University of Pennsylvania Health | 8/26 at 100.00 | AA | 183,188 |
| | System, Series 2016A, 5.000%, 8/15/42 | | | |
| 100 | | Lehigh County General Purpose Authority, Pennsylvania, Revenue Bonds, Good Shepherd | 5/26 at 100.00 | A | 108,136 |
| | Group, Refunding Series 2016, 4.000%, 11/01/41 | | | |
| 40 | | Lehigh County General Purpose Authority, Pennsylvania, Revenue Bonds, Good Shepherd | 11/22 at 100.00 | A | 41,656 |
| | Group, Series 2012, 4.000%, 11/01/32 | | | |
| 200 | | Montgomery County Industrial Development Authority, Pennsylvania, Health System Revenue | 1/25 at 100.00 | Ba1 | 210,760 |
| | Bonds, Albert Einstein Healthcare Network Issue, Series 2015A, 5.250%, 1/15/45 | | | |
| 145 | | Philadelphia Hospitals and Higher Education Facilities Authority, Pennsylvania, Hospital | 7/22 at 100.00 | BBB– | 153,016 |
| | Revenue Bonds, Temple University Health System Obligated Group, Series 2012A, | | | |
| | 5.625%, 7/01/42 | | | |
| 200 | | Pottsville Hospital Authority, Pennsylvania, Hospital Revenue Bonds, Lehigh Valley | 1/27 at 100.00 | A+ | 232,962 |
| | Health Network, Series 2016B, 5.000%, 7/01/45 | | | |
55
| | |
| NPN | Nuveen Pennsylvania Municipal Value Fund Portfolio of Investments (continued) August 31, 2020 (Unaudited) |
| | | | | | |
| Principal | | | Optional Call | | |
| Amount (000) | | Description (1) | Provisions (2) | Ratings (3) | Value |
| | Health Care (continued) | | | |
| $ 210 | | Southcentral Pennsylvania General Authority, Revenue Bonds, Wellspan Health Obligated | 6/29 at 100.00 | Aa3 | $ 256,817 |
| | Group, Series 2019A, 5.000%, 6/01/49 | | | |
| 100 | | The Hospitals and Higher Education Facilities Authority of Philadelphia, Pennsylvania, | 7/27 at 100.00 | BBB– | 116,624 |
| | Hospital Revenue Bonds, Temple University Health System Obligated Group, Series of 2017, | | | |
| | 5.000%, 7/01/30 | | | |
| 3,260 | | Total Health Care | | | 3,665,458 |
| | Housing/Multifamily – 7.0% (7.1% of Total Investments) | | | |
| 15 | | Chester County Industrial Development Authority, Pennsylvania, Student Housing Revenue | 8/23 at 100.00 | Baa3 | 15,216 |
| | Bonds, University Student Housing, LLC Project at West Chester University Series 2013A, | | | |
| | 5.000%, 8/01/45 | | | |
| 35 | | Clarion County Industrial Development Authority, Pennsylvania, Revenue Bonds, Clarion | 7/24 at 100.00 | A1 | 38,194 |
| | University Foundation Inc Student Housing Project at Clarion University, Series 2014A, | | | |
| | 5.000%, 7/01/45 | | | |
| 30 | | East Hempfield Township Industrial Development Authority, Pennsylvania, Student Services | 7/24 at 100.00 | BBB– | 30,373 |
| | Inc – Student Housing Project at Millersville University, Series 2014, 5.000%, 7/01/46 | | | |
| 100 | | East Hempfield Township Industrial Development Authority, Pennsylvania, Student Services | 7/25 at 100.00 | BBB– | 101,492 |
| | Inc – Student Housing Project at Millersville University, Series 2015, 5.000%, 7/01/47 | | | |
| 300 | | Pennsylvania Higher Educational Facilities Authority, Revenue Bonds, University | 7/26 at 100.00 | Baa3 | 306,519 |
| | Properties Inc Student Housing Project at East Stroudsburg University of Pennsylvania, Series | | | |
| | 2016A, 5.000%, 7/01/35 | | | |
| 800 | | Pittsburgh Urban Redevelopment Authority, Pennsylvania, Multifamily Housing Revenue | 10/20 at 100.00 | Aa1 | 801,712 |
| | Bonds, Eva P Mithcell Residence Project, Series 2009, 5.100%, 10/20/44 | | | |
| 1,280 | | Total Housing/Multifamily | | | 1,293,506 |
| | Housing/Single Family – 11.3% (11.4% of Total Investments) | | | |
| | Pennsylvania Housing Finance Agency, Single Family Mortgage Revenue Bonds, | | | |
| | Series 2012-114: | | | |
| 65 | | 3.300%, 10/01/32 | 10/21 at 100.00 | AA+ | 66,096 |
| 25 | | 3.650%, 10/01/37 | 10/21 at 100.00 | AA+ | 25,371 |
| 35 | | 3.700%, 10/01/42 | 10/21 at 100.00 | AA+ | 35,466 |
| 115 | | Pennsylvania Housing Finance Agency, Single Family Mortgage Revenue Bonds, Series | 10/24 at 100.00 | AA+ | 120,367 |
| | 2015-116B, 4.000%, 4/01/45 | | | |
| 55 | | Pennsylvania Housing Finance Agency, Single Family Mortgage Revenue Bonds, Series | 4/25 at 100.00 | AA+ | 57,811 |
| | 2016-119, 3.500%, 10/01/36 | | | |
| 500 | | Pennsylvania Housing Finance Agency, Single Family Mortgage Revenue Bonds, Series | 10/25 at 100.00 | AA+ | 525,675 |
| | 2016-120, 3.200%, 4/01/40 | | | |
| | Pennsylvania Housing Finance Agency, Single Family Mortgage Revenue Bonds, | | | |
| | Series 2016-121: | | | |
| 400 | | 3.200%, 10/01/41 (UB) (4) | 10/25 at 100.00 | AA+ | 419,328 |
| 100 | | 3.200%, 10/01/41 | 10/25 at 100.00 | AA+ | 104,832 |
| | Pennsylvania Housing Finance Agency, Single Family Mortgage Revenue Bonds, | | | |
| | Series 2017-123B: | | | |
| 70 | | 3.450%, 10/01/32 | 10/26 at 100.00 | AA+ | 76,550 |
| 75 | | 3.900%, 10/01/37 | 10/26 at 100.00 | AA+ | 82,078 |
| 250 | | Pennsylvania Housing Finance Agency, Single Family Mortgage Revenue Bonds, Series | 4/27 at 100.00 | AA+ | 268,402 |
| | 2017-125B, 3.700%, 10/01/47 | | | |
| 250 | | Pennsylvania Housing Finance Agency, Single Family Mortgage Revenue Bonds, Series | 10/28 at 100.00 | AA+ | 268,270 |
| | 2019-129, 3.350%, 10/01/45 | | | |
| 25 | | Pennsylvania Housing Finance Agency, Single Family Mortgage Revenue Bonds, Tender Option | 10/20 at 100.00 | AA+ | 27,602 |
| | Bonds Trust 2015-XF0109, 10.355%, 10/01/31, 144A (IF) (4) | | | |
| 1,965 | | Total Housing/Single Family | | | 2,077,848 |
56
| | | | | | |
| Principal | | | Optional Call | | |
| Amount (000) | | Description (1) | Provisions (2) | Ratings (3) | Value |
| | Industrials – 1.5% (1.5% of Total Investments) | | | |
| $ 165 | | Pennsylvania Economic Development Financing Authority, Exempt Facilities Revenue Bonds, | 11/24 at 100.00 | N/R | $ 169,551 |
| | National Gypsum Company, Refunding Series 2014, 5.500%, 11/01/44 (AMT) | | | |
| 100 | | Pennsylvania Economic Development Financing Authority, Solid Waste Disposal Revenue | No Opt. Call | N/R | 104,080 |
| | Bonds, Waste Management Inc, Project, Series 2011, 2.150%, 7/01/41 (AMT) (Mandatory | | | |
| | Put 7/01/24) | | | |
| 265 | | Total Industrials | | | 273,631 |
| | Long-Term Care – 5.7% (5.8% of Total Investments) | | | |
| 155 | | Berks County Industrial Development Authority, Pennsylvania, Healthcare Facilities | 5/27 at 100.00 | BBB | 164,682 |
| | Revenue Bonds, Highlands at Wyomissing, Series 2017A, 5.000%, 5/15/42 | | | |
| 35 | | Chester County Health and Education Facilities Authority, Pennsylvania, Revenue Bonds, | 12/25 at 103.00 | N/R | 33,974 |
| | Simpson Senior Services Project, Series 2019, 5.000%, 12/01/51 | | | |
| 70 | | Cumberland County Municipal Authority, Pennsylvania, Revenue Bonds, Asbury Pennsylvania | 1/25 at 104.00 | N/R | 67,606 |
| | Obligated Group, Refunding Series 2019, 5.000%, 1/01/45 | | | |
| | Cumberland County Municipal Authority, Pennsylvania, Revenue Bonds, Diakon Lutheran | | | |
| | Social Ministries Project, Series 2015: | | | |
| 125 | | 4.000%, 1/01/33 | 1/25 at 100.00 | BBB+ | 127,386 |
| 135 | | 5.000%, 1/01/38 | 1/25 at 100.00 | BBB+ | 142,178 |
| 100 | | Cumberland County Municipal Authority, Pennsylvania, Revenue Bonds, Diakon Lutheran | 1/26 at 100.00 | BBB+ | 109,420 |
| | Social Ministries Project, Series 2016, 5.000%, 1/01/29 | | | |
| | Cumberland County Municipal Authority, Pennsylvania, Revenue Bonds, Diakon Lutheran | | | |
| | Social Ministries Project, Series 2019A: | | | |
| 25 | | 4.125%, 1/01/38 | 1/29 at 100.00 | BBB+ | 25,827 |
| 30 | | 5.000%, 1/01/39 | 1/29 at 100.00 | BBB+ | 32,750 |
| 20 | | Lancaster County Hospital Authority, Pennsylvania, Health Center Revenue Bonds, Masonic | 5/25 at 100.00 | A | 22,113 |
| | Villages Project, Series 2015, 5.000%, 11/01/35 | | | |
| 40 | | Lancaster County Hospital Authority, Pennsylvania, Health Center Revenue Bonds, Saint | 3/27 at 102.00 | BB+ | 40,833 |
| | Anne’s Retirement Community, Inc, Series 2020, 5.000%, 3/01/50 | | | |
| 200 | | Montgomery County Industrial Development Authority, Pennsylvania, Revenue Bonds, ACTS | 11/26 at 100.00 | A– | 231,544 |
| | Retirement-Life Communities, Inc Obligated Group, Series 2016, 5.000%, 11/15/36 | | | |
| 55 | | Northampton County Industrial Development Authority, Pennsylvania, Revenue Bonds, | 11/26 at 103.00 | BB+ | 56,544 |
| | Morningstar Senior Living, Inc, Series 2019, 5.000%, 11/01/44 | | | |
| 990 | | Total Long-Term Care | | | 1,054,857 |
| | Tax Obligation/General – 6.1% (6.1% of Total Investments) | | | |
| 160 | | Adams County, Pennsylvania, General Obligation Bonds, Series 2017B, 2.500%, 11/15/29 | 11/25 at 100.00 | Aa2 | 173,104 |
| 35 | | Allentown City School District, Lehigh County, Pennsylvania, General Obligation Bonds, | 12/20 at 100.00 | N/R | 35,004 |
| | Limited Tax Revenue Anticipation Note Series 2020, 2.375%, 3/31/21 | | | |
| 125 | | Bethel Park School District, Allegheny County, Pennsylvania, General Obligation Bonds, | 8/26 at 100.00 | Aa2 | 142,876 |
| | Refunding Series 2016, 4.000%, 8/01/33 | | | |
| 45 | | Boyertown Area School District, Berks and Montgomery Counties, Pennsylvania, General | 4/24 at 100.00 | AA– | 51,500 |
| | Obligation Bonds, Series 2015, 5.000%, 10/01/38 | | | |
| 115 | | Canon-McMillan School District, Washington County, Pennsylvania, General Obligation | 12/24 at 100.00 | AA | 134,265 |
| | Bonds, Series 2014D, 5.000%, 12/15/39 | | | |
| 100 | | Colonial School District, Montgomery County, Pennsylvania, General Obligation Bonds, | 2/27 at 100.00 | Aaa | 121,971 |
| | Series 2020, 5.000%, 2/15/44 | | | |
| 25 | | Easton Area School District, Northampton County, Pennsylvania, General Obligation Bonds, | 2/28 at 100.00 | Aa2 | 32,090 |
| | Series 2020B, 5.000%, 2/01/31 | | | |
| 195 | | Lehighton Area School District, Carbon County, Pennsylvania, General Obligation Bonds, | 11/23 at 100.00 | AA | 219,455 |
| | Limited Tax Series 2015A, 5.000%, 11/15/43 – BAM Insured | | | |
| 50 | | Philadelphia School District, Pennsylvania, General Obligation Bonds, Tax & Revenue | No Opt. Call | N/R | 51,524 |
| | Anticipation Note Series 2020-21A, 4.000%, 6/30/21 | | | |
57
| | |
| NPN | Nuveen Pennsylvania Municipal Value Fund Portfolio of Investments (continued)
August 31, 2020 (Unaudited) |
| | | | | | |
| Principal | | | Optional Call | | |
| Amount (000) | | Description (1) | Provisions (2) | Ratings (3) | Value |
| | Tax Obligation/General (continued) | | | |
| $ 15 | | Pittsburgh School District, Allegheny County, Pennsylvania, General Obligation Bonds, | 9/22 at 100.00 | AA | $ 16,380 |
| | Series 2014A, 5.000%, 9/01/25 – BAM Insured | | | |
| 35 | | Rostraver Township, Westmoreland County, Pennsylvania, General Obligation Bonds, Series | 9/25 at 100.00 | AA | 38,096 |
| | 2018, 3.500%, 9/01/34 – AGM Insured | | | |
| 80 | | Scranton, Lackawanna County, Pennsylvania, General Obligation Notes, Series 2016, | 5/24 at 100.00 | BB+ | 86,362 |
| | 5.000%, 11/15/32 | | | |
| | The Redevelopment Authority of the City of Scranton, Lackawanna county, Pennsylvania, | | | |
| | Guaranteed Lease Revenue Bonds, Series 2016A: | | | |
| 10 | | 5.000%, 11/15/21 | No Opt. Call | BB+ | 10,019 |
| 10 | | 5.000%, 11/15/28 | 5/24 at 100.00 | BB+ | 9,750 |
| 1,000 | | Total Tax Obligation/General | | | 1,122,396 |
| | Tax Obligation/Limited – 7.4% (7.4% of Total Investments) | | | |
| 25 | | Allentown Neighborhood Improvement Zone Development Authority, Pennsylvania, Tax | 5/22 at 100.00 | Baa3 | 26,071 |
| | Revenue Bonds, Series 2012A, 5.000%, 5/01/35 | | | |
| 230 | | Allentown Neighborhood Improvement Zone Development Authority, Pennsylvania, Tax Revenue | 5/27 at 100.00 | Ba3 | 240,313 |
| | Bonds, City Center Refunding Project, Series 2017, 5.000%, 5/01/42, 144A | | | |
| | Commonwealth Financing Authority, Pennsylvania, State Appropriation Lease Bonds, Master | | | |
| | Settlement, Series 2018: | | | |
| 35 | | 5.000%, 6/01/33 | 6/28 at 100.00 | A1 | 43,596 |
| 155 | | 4.000%, 6/01/39 – AGM Insured | 6/28 at 100.00 | AA | 175,979 |
| 200 | | 4.000%, 6/01/39 – AGM Insured (UB) (4) | 6/28 at 100.00 | AA | 227,070 |
| 120 | | Government of Guam, Business Privilege Tax Bonds, Series 2011A, 5.250%, 1/01/36 | 1/22 at 100.00 | BB | 123,751 |
| 100 | | Monroe County Industrial Development Authority, Pennsylvania, Special Obligation Revenue | 7/24 at 100.00 | N/R | 101,174 |
| | Bonds, Tobyhanna Township Project, Series 2014, 6.875%, 7/01/33, 144A | | | |
| 100 | | Pennsylvania Turnpike Commission, Motor License Fund-Enhanced Turnpike Subordinate | 12/26 at 100.00 | AA– | 110,011 |
| | Special Revenue Bonds, Series 2014A, 0.000%, 12/01/37 (5) | | | |
| 100 | | Pennsylvania Turnpike Commission, Oil Franchise Tax Revenue Bonds, Subordinate Series | 12/28 at 100.00 | A+ | 119,798 |
| | 2018B, 5.000%, 12/01/48 | | | |
| | Puerto Rico Sales Tax Financing Corporation, Sales Tax Revenue Bonds, Restructured 2018A-1: | | | |
| 32 | | 4.500%, 7/01/34 | 7/25 at 100.00 | N/R | 33,868 |
| 72 | | 5.000%, 7/01/58 | 7/28 at 100.00 | N/R | 76,875 |
| | Puerto Rico Sales Tax Financing Corporation, Sales Tax Revenue Bonds, Taxable | | | |
| | Restructured Cofina Project Series 2019A-2: | | | |
| 10 | | 4.329%, 7/01/40 | 7/28 at 100.00 | N/R | 10,500 |
| 10 | | 4.329%, 7/01/40 | 7/28 at 100.00 | N/R | 10,500 |
| 38 | | 4.784%, 7/01/58 | 7/28 at 100.00 | N/R | 40,026 |
| 15 | | Washington County Redevelopment Authority, Pennsylvania, Tanger Outlet Victory Center | 1/28 at 100.00 | BB | 15,322 |
| | Tax Increment Bonds, Series 2018, 5.000%, 7/01/35 | | | |
| 1,242 | | Total Tax Obligation/Limited | | | 1,354,854 |
| | Transportation – 8.7% (8.7% of Total Investments) | | | |
| 245 | | Delaware River Joint Toll Bridge Commission, New Jersey and Pennsylvania, Bridge System | 7/27 at 100.00 | A1 | 298,447 |
| | Revenue Bonds, Series 2017, 5.000%, 7/01/42 | | | |
| 125 | | Delaware River Port Authority, New Jersey and Pennsylvania, Revenue Bonds, Series 2018A, | 1/29 at 100.00 | A+ | 152,231 |
| | 5.000%, 1/01/38 | | | |
| 140 | | Pennsylvania Economic Development Financing Authority, Parking System Revenue Bonds, | 1/24 at 100.00 | AA | 155,253 |
| | Capitol Region Parking System, Series 2013A, 5.250%, 1/01/44 – AGM Insured | | | |
| 175 | | Pennsylvania Economic Development Financing Authority, Private Activity Revenue Bonds, | 6/26 at 100.00 | BBB | 196,425 |
| | Pennsylvania Rapid Bridge Replacement Project, Series 2015, 5.000%, 6/30/42 (AMT) | | | |
| 585 | | Pennsylvania Turnpike Commission, Turnpike Revenue Bonds, Series 2015B, 5.000%, 12/01/45 | 12/25 at 100.00 | A1 | 668,707 |
| 100 | | Pittsburgh and Allegheny County Sports and Exhibition Authority, Pennsylvania, Parking | 12/27 at 100.00 | A | 117,168 |
| | Revenue Bonds, Series 2017, 5.000%, 12/15/34 | | | |
| 1,370 | | Total Transportation | | | 1,588,231 |
58
| | | | | | |
| Principal | | | Optional Call | | |
| Amount (000) | | Description (1) | Provisions (2) | Ratings (3) | Value |
| | U.S. Guaranteed – 11.0% (11.0% of Total Investments) (6) | | | |
| $ 220 | | Allegheny County, Pennsylvania, General Obligation Bonds, Series 2013C-72, 5.250%, | 12/23 at 100.00 | AA– | $ 255,785 |
| | 12/01/32 (Pre-refunded 12/01/23) | | | |
| 10 | | Allegheny County, Pennsylvania, General Obligation Bonds, Series C69-C70 of 2012, | 12/22 at 100.00 | AA– | 11,076 |
| | 5.000%, 12/01/37 (Pre-refunded 12/01/22) | | | |
| 175 | | Bucks County Water and Sewer Authority, Pennsylvania, Revenue Bonds, Tender Option Bond | 12/21 at 100.00 | AA | 206,511 |
| | Trust 2015-XF0123, 13.278%, 12/01/29 – AGM Insured (Pre-refunded 12/01/21), 144A (IF) (4) | | | |
| 55 | | Lancaster Industrial Development Authority, Pennsylvania, Revenue Bonds, Garden Spot | 5/23 at 100.00 | N/R | 63,026 |
| | Village Project, Series 2013, 5.750%, 5/01/35 (Pre-refunded 5/01/23) | | | |
| 120 | | Pennsylvania Higher Educational Facilities Authority, Revenue Bonds, Philadelphia | 6/23 at 100.00 | N/R | 135,560 |
| | University, Refunding Series 2013, 5.000%, 6/01/32 (Pre-refunded 6/01/23) | | | |
| | Pennsylvania Turnpike Commission, Motor License Fund-Enhanced Turnpike Special Revenue | | | |
| | Bonds, Subordinate Series 2010A1&2: | | | |
| 110 | | 5.500%, 12/01/34 (Pre-refunded 12/01/20) | 12/20 at 100.00 | N/R | 111,445 |
| 480 | | 5.500%, 12/01/34 (Pre-refunded 12/01/20) | 12/20 at 100.00 | AA– | 486,370 |
| 400 | | Pittsburgh, Pennsylvania, General Obligation Bonds, Series 2012B, 5.000%, 9/01/26 | 9/22 at 100.00 | AA– | 437,912 |
| | (Pre-refunded 9/01/22) | | | |
| 100 | | West Shore Area Authority, Cumberland County, Pennsylvania, Hospital Revenue Bonds, Holy | 1/21 at 100.00 | AA– | 101,994 |
| | Spirit Hospital of the Sisters of Christian Charity Project, Series 2011, 6.250%, 1/01/31 | | | |
| | (Pre-refunded 1/01/21) | | | |
| 100 | | West Shore Area Authority, Cumberland County, Pennsylvania, Hospital Revenue Bonds, Holy | 1/22 at 100.00 | AA– | 107,329 |
| | Spirit Hospital of the Sisters of Christian Charity, Series 2011B, 5.750%, 1/01/41 | | | |
| | (Pre-refunded 1/01/22) | | | |
| 100 | | Wilkes-Barre Finance Authority, Pennsylvania, Revenue Bonds, University of Scranton, | 11/20 at 100.00 | A– | 100,674 |
| | Series 2010, 5.000%, 11/01/40 (Pre-refunded 11/01/20) | | | |
| 1,870 | | Total U.S. Guaranteed | | | 2,017,682 |
| | Utilities – 5.7% (5.8% of Total Investments) | | | |
| 140 | | Beaver County Industrial Development Authority, Pennsylvania, Pollution Control Revenue | No Opt. Call | N/R | 175 |
| | Bonds, FirstEnergy Nuclear Generation Project, Refunding Series 2005A, 4.000%, 1/01/35 (7) | | | |
| 10 | | Beaver County Industrial Development Authority, Pennsylvania, Pollution Control Revenue | No Opt. Call | N/R | 13 |
| | Bonds, FirstEnergy Nuclear Generation Project, Refunding Series 2008A, 2.700%, 4/01/35 (7) | | | |
| 250 | | Beaver County Industrial Development Authority, Pennsylvania, Pollution Control Revenue | No Opt. Call | N/R | 313 |
| | Bonds, FirstEnergy Nuclear Generation Project, Series 2006B, 3.500%, 12/01/35 (7) | | | |
| 125 | | Luzerne County Industrial Development Authority, Pennsylvania, Revenue Bonds, | 12/29 at 100.00 | A+ | 136,282 |
| | Pennsylvania-American Water Company Project, Refunding Series 2019, 2.450%, 12/01/39 (AMT) | | | |
| | (Mandatory Put 12/03/29) | | | |
| 55 | | Pennsylvania Economic Development Financing Authority, Exempt Facilities Revenue Bonds, | No Opt. Call | N/R | 69 |
| | Shippingport Project, First Energy Guarantor, Series 2006A, 2.550%, 11/01/41 (7) | | | |
| 235 | | Pennsylvania Economic Development Financing Authority, Exempt Facilities Revenue Bonds, | 10/29 at 100.00 | A– | 247,866 |
| | York Water Company Project, Refunding Series 2019A, 3.000%, 10/01/36 (AMT) | | | |
| 90 | | Pennsylvania Economic Development Financing Authority, Exempt Facilities Revenue | 9/25 at 100.00 | B | 74,065 |
| | Refunding Bonds, PPL Energy Supply, LLC Project, Series 2009A, 6.400%, 12/01/38 | | | |
| 250 | | Pennsylvania Economic Development Financing Authority, Revenue Bonds, | 10/29 at 100.00 | A+ | 271,937 |
| | Pennsylvania-American Water Company, Refunding Series 2019, 3.000%, 4/01/39 | | | |
| 150 | | Philadelphia Gas Works, Pennsylvania, Revenue Bonds, General Ordinance, Fifteenth Series | 8/27 at 100.00 | A | 171,738 |
| | 2017, 5.000%, 8/01/47 | | | |
| 125 | | Philadelphia Gas Works, Pennsylvania, Revenue Bonds, Refunding Thirteenth Series 2015, | 8/25 at 100.00 | A | 147,624 |
| | 5.000%, 8/01/30 | | | |
| 1,430 | | Total Utilities | | | 1,050,082 |
59
| | |
| NPN | Nuveen Pennsylvania Municipal Value Fund Portfolio of Investments (continued)
August 31, 2020 (Unaudited) |
| | | | | | |
| Principal | | | Optional Call | | |
| Amount (000) | | Description (1) | Provisions (2) | Ratings (3) | Value |
| | Water and Sewer – 2.7% (2.7% of Total Investments) | | | |
| $ 200 | | Allegheny County Sanitary Authority, Pennsylvania, Sewer Revenue Bonds, Refunding Series | 12/20 at 100.00 | AA | $ 202,198 |
| | 2010, 5.000%, 6/01/40 – AGM Insured | | | |
| 200 | | Lehigh County Authority, Pennsylvania, Water and Sewer Revenue Bonds, Allentown | 12/23 at 100.00 | A | 225,938 |
| | Concession, Series 2013A, 5.125%, 12/01/47 | | | |
| 25 | | Pittsburgh Water and Sewer Authority, Pennsylvania, Water and Sewer System Revenue | 9/29 at 100.00 | AA | 29,759 |
| | Bonds, Refunding Subordinate Series 2019B, 4.000%, 9/01/34 – AGM Insured | | | |
| 40 | | Upper Allegheny Joint Sanitary Authority, Allegheny County, Pennsylvania, Sewer Revenue | 9/29 at 100.00 | AA | 43,175 |
| | Bonds, Refunding Series 2019A, 3.000%, 9/01/44 – AGM Insured | | | |
| 465 | | Total Water and Sewer | | | 501,070 |
| $ 17,002 | | Total Municipal Bonds (cost $17,072,551) | | | 18,010,882 |
|
| Shares | | Description (1) | | | Value |
| | COMMON STOCKS – 1.5% (1.5% of Total Investments) | | | |
| | Electric Utilities – 1.5% (1.5% of Total Investments) | | | |
| 14,686 | | Energy Harbor Corp (8),(9) | | | $ 282,705 |
| | Total Common Stocks (cost $407,801) | | | 282,705 |
| | Total Long-Term Investments (cost $17,480,352) | | | 18,293,587 |
| | Floating Rate Obligations – (2.4)% | | | (450,000) |
| | Other Assets Less Liabilities – 2.8% (10) | | | 527,282 |
| | Net Asset Applicable to Common Shares – 100% | | | $ 18,370,869 |
Investments in Derivatives
Futures Contracts
| | | | | | | | |
| | | | | | | Variation |
| | | | | | Unrealized | Margin |
| Contract | Number of | Expiration | Notional | | Appreciation | Receivable/ |
| Description | Position | Contracts | Date | Amount | Value | (Depreciation) | (Payable) |
U.S. Treasury 10-Year Note | Short | (7) | 12/20 | $(972,751) | $(974,750) | $(1,999) | $(956) |
60
| | |
(1) | All percentages shown in the Portfolio of Investments are based on net assets applicable to common shares unless otherwise noted. |
(2) | Optional Call Provisions: Dates (month and year) and prices of the earliest optional call or redemption. There may be other call provisions at varying prices at later dates. Certain mortgage-backed securities may be subject to periodic principal paydowns. |
(3) | For financial reporting purposes, the ratings disclosed are the highest of Standard & Poor’s Group (“Standard & Poor’s”), Moody’s Investors Service, Inc. (“Moody’s”) or Fitch, Inc. (“Fitch”) rating. This treatment of split-rated securities may differ from that used for other purposes, such as for Fund investment policies. Ratings below BBB by Standard & Poor’s, Baa by Moody’s or BBB by Fitch are considered to be below investment grade. Holdings designated N/R are not rated by any of these national rating agencies. |
(4) | Investment, or portion of investment, has been pledged to collateralize the net payment obligations for investments in inverse floating rate transactions. |
(5) | Step-up coupon bond, a bond with a coupon that increases (“steps up”), usually at regular intervals, while the bond is outstanding. The rate shown is the coupon as of the end of the reporting period. |
(6) | Backed by an escrow or trust containing sufficient U.S. Government or U.S. Government agency securities, which ensure the timely payment of principal and interest. |
(7) | Defaulted security. A security whose issuer has failed to fully pay principal and/or interest when due, or is under the protection of bankruptcy. |
(8) | Common Stock received as part of the bankruptcy settlements for Beaver County Industrial Development Authority, Pennsylvania, Pollution Control Revenue Bonds, FirstEnergy Nuclear Generation Project, Refunding Series 2005A, 4.000%, 1/01/35; Beaver County Industrial Development Authority, Pennsylvania, Pollution Control Revenue Refunding Bonds, FirstEnergy Nuclear Generation Project, Series 2006A, 4.375%, 1/01/35; Beaver County Industrial Development Authority, Pennsylvania, Pollution Control Revenue Refunding Bonds, FirstEnergy Nuclear Generation Project, Series 2006B, 3.500%, 12/01/35; and Pennsylvania Economic Development Financing Authority, Exempt Facilities Revenue Bonds, Shippingport Project, First Energy Guarantor, Series 2006A, 2.550%, 11/01/41. |
(9) | For fair value measurement disclosure purposes, investment classified as Level 2. See Notes to Financial Statements, Note 3 - Investment Valuation and Fair Value Measurements for more information. |
(10) | Other assets less liabilities includes the unrealized appreciation (depreciation) of certain over-the-counter (“OTC”) derivatives as presented on the Statement of Assets and Liabilities, when applicable. The unrealized appreciation (depreciation) of OTC cleared and exchange-traded derivatives is recognized as part of the cash collateral at brokers and/or the receivable or payable for variation margin as presented on the Statement of Assets and Liabilities, when applicable. |
144A | Investment is exempt from registration under Rule 144A of the Securities Act of 1933, as amended. These investments may only be resold in transactions exempt from registration, which are normally those transactions with qualified institutional buyers. |
AMT | Alternative Minimum Tax |
IF | Inverse floating rate security issued by a tender option bond (“TOB”) trust, the interest rate on which varies inversely with the Securities Industry Financial Markets Association (SIFMA) short-term rate, which resets weekly, or a similar short-term rate, and is reduced by the expenses related to the TOB trust. |
UB | Underlying bond of an inverse floating rate trust reflected as a financing transaction. See Notes to Financial Statements, Note 4 – Portfolio Securities and Investments in Derivatives, for more information. |
| See accompanying notes to financial statements. |
61
Statement of Assets and Liabilities
August 31, 2020 (Unaudited)
| | | | | | | | | | | | | |
| | NXJ | | | NJV | | | NQP | | | NPN | |
| Assets | | | | | | | | | | | | |
Long-term investments, at value (cost $927,731,076, $22,147,278, | | | | | | | | | | | | |
| $860,853,259 and $17,480,352, respectively) | | $ | 1,009,210,235 | | | $ | 23,773,850 | | | $ | 920,147,731 | | | $ | 18,293,587 | |
Short-term investments, at value (cost approximates value) | | | 600,000 | | | | — | | | | 1,875,000 | | | | — | |
Cash | | | 8,354,183 | | | | 201,593 | | | | 10,160,773 | | | | 317,807 | |
Cash collateral at brokers for investments in futures contracts(1) | | | — | | | | 17,550 | | | | — | | | | 9,300 | |
Receivable for: | | | | | | | | | | | | | | | | |
| Interest | | | 9,804,508 | | | | 230,211 | | | | 10,677,960 | | | | 220,556 | |
| Investments sold | | | — | | | | — | | | | 1,572,825 | | | | 51,404 | |
Other assets | | | 156,441 | | | | 3,020 | | | | 147,657 | | | | 3,018 | |
| Total assets | | | 1,028,125,367 | | | | 24,226,224 | | | | 944,581,946 | | | | 18,895,672 | |
| Liabilities | | | | | | | | | | | | | | | | |
Floating rate obligations | | | 34,780,000 | | | | 810,000 | | | | 139,425,000 | | | | 450,000 | |
Payable for: | | | | | | | | | | | | | | | | |
| Dividends | | | 2,046,832 | | | | 46,124 | | | | 1,804,185 | | | | 36,155 | |
| Interest | | | 205,477 | | | | 4,744 | | | | 762,856 | | | | 2,712 | |
| Investments purchased - regular settlement | | | 996,139 | | | | 10,572 | | | | — | | | | — | |
| Investments purchased - when-issued/delayed-delivery settlement | | | 2,075,620 | | | | — | | | | 500,000 | | | | — | |
| Variation margin on futures contracts | | | — | | | | 1,060 | | | | — | | | | 956 | |
Variable Rate Demand Preferred (“VRDP”) Shares, net of deferred offering | | | | | | | | | | | | | | | | |
| costs (liquidation preference $313,900,000, $—, $217,500,000 and | | | | | | | | | | | | | | | | |
| $—, respectively) | | | 312,530,901 | | | | — | | | | 216,734,085 | | | | — | |
Accrued expenses: | | | | | | | | | | | | | | | | |
| Management fees | | | 510,019 | | | | 11,894 | | | | 455,957 | | | | 9,153 | |
| Trustees fees | | | 162,476 | | | | 288 | | | | 152,175 | | | | 231 | |
| Other | | | 127,452 | | | | 25,630 | | | | 123,719 | | | | 25,596 | |
| Total liabilities | | | 353,434,916 | | | | 910,312 | | | | 359,957,977 | | | | 524,803 | |
Net assets applicable to common shares | | $ | 674,690,451 | | | $ | 23,315,912 | | | $ | 584,623,969 | | | $ | 18,370,869 | |
Common shares outstanding | | | 41,482,936 | | | | 1,524,357 | | | | 37,383,341 | | | | 1,219,154 | |
Net asset value (“NAV”) per common share outstanding | | $ | 16.26 | | | $ | 15.30 | | | $ | 15.64 | | | $ | 15.07 | |
| Net assets applicable to common shares consist of: | | | | | | | | | | | | | | | | |
Common shares, $0.01 par value per share | | $ | 414,829 | | | $ | 15,244 | | | $ | 373,833 | | | $ | 12,192 | |
Paid-in-surplus | | | 591,976,254 | | | | 21,822,481 | | | | 528,820,243 | | | | 17,447,731 | |
Total distributable earnings | | | 82,299,368 | | | | 1,478,187 | | | | 55,429,893 | | | | 910,946 | |
Net assets applicable to common shares | | $ | 674,690,451 | | | $ | 23,315,912 | | | $ | 584,623,969 | | | $ | 18,370,869 | |
Authorized shares: | | | | | | | | | | | | | | | | |
| Common | | Unlimited | | | Unlimited | | | Unlimited | | | Unlimited | |
| Preferred | | Unlimited | | | | N/A | | | Unlimited | | | | N/A | |
| |
(1) Cash pledged to collateralize the net payment obligations for investments in derivatives. |
N/A — Fund is not authorized to issue preferred shares. |
See accompanying notes to financial statements.
62
Six Months Ended August 31, 2020 (Unaudited)
| | | | | | | | | | | | | |
| | NXJ | | | NJV | | | NQP | | | NPN | |
| Investment Income | | $ | 20,128,611 | | | $ | 426,903 | | | $ | 17,499,207 | | | $ | 345,728 | |
| Expenses | | | | | | | | | | | | | | | | |
Management fees | | | 2,973,137 | | | | 69,290 | | | | 2,674,679 | | | | 53,728 | |
Interest expense and amortization of offering costs | | | 2,422,400 | | | | 4,942 | | | | 2,338,770 | | | | 2,670 | |
Custodian fees | | | 43,153 | | | | 8,747 | | | | 38,755 | | | | 8,429 | |
Trustees fees | | | 14,718 | | | | 346 | | | | 12,107 | | | | 278 | |
Professional fees | | | 41,884 | | | | 8,929 | | | | 27,248 | | | | 8,846 | |
Shareholder reporting expenses | | | 32,297 | | | | 4,452 | | | | 33,216 | | | | 4,242 | |
Shareholder servicing agent fees | | | 9,650 | | | | 80 | | | | 9,426 | | | | 68 | |
Stock exchange listing fees | | | 5,610 | | | | 3,296 | | | | 5,048 | | | | 3,296 | |
Investor relations expenses | | | 27,473 | | | | 960 | | | | 22,445 | | | | 813 | |
Other | | | 48,022 | | | | 4,589 | | | | 39,984 | | | | 4,362 | |
Total expenses | | | 5,618,344 | | | | 105,631 | | | | 5,201,678 | | | | 86,732 | |
Net investment income (loss) | | | 14,510,267 | | | | 321,272 | | | | 12,297,529 | | | | 258,996 | |
| Realized and Unrealized Gain (Loss) | | | | | | | | | | | | | | | | |
Net realized gain (loss) from: | | | | | | | | | | | | | | | | |
| Investments | | | (558,445 | ) | | | 15,476 | | | | (68,129 | ) | | | 12,982 | |
| Futures contracts | | | (652,316 | ) | | | (105,533 | ) | | | (2,566,034 | ) | | | (33,356 | ) |
Change in net unrealized appreciation (depreciation) of: | | | | | | | | | | | | | | | | |
| Investments | | | (35,585,532 | ) | | | (947,969 | ) | | | (26,226,363 | ) | | | (722,429 | ) |
| Futures contracts | | | 203,441 | | | | 28,187 | | | | 830,629 | | | | 8,381 | |
Net realized and unrealized gain (loss) | | | (36,592,852 | ) | | | (1,009,839 | ) | | | (28,029,897 | ) | | | (734,422 | ) |
Net increase (decrease) in net assets applicable to common shares | | | | | | | | | | | | | | | | |
| from operations | | $ | (22,082,585 | ) | | $ | (688,567 | ) | | $ | (15,732,368 | ) | | $ | (475,426 | ) |
See accompanying notes to financial statements.
63
Statement of Changes in Net Assets
(Unaudited)
| | NXJ
| | | | |
| | Six Months | | | Year | | | Six Months | | | Year | |
| | Ended | | | Ended | | | Ended | | | Ended | |
| | 8/31/20 | | | 2/29/20 | | | 8/31/20 | | | 2/29/20 | |
| Operations | | | | | | | | | | | | |
Net investment income (loss) | | $ | 14,510,267 | | | $ | 26,706,428 | | | $ | 321,272 | | | $ | 699,471 | |
Net realized gain (loss) from: | | | | | | | | | | | | | | | | |
| Investments | | | (558,445 | ) | | | 1,066,098 | | | | 15,476 | | | | 61,707 | |
| Futures contracts | | | (652,316 | ) | | | (567,288 | ) | | | (105,533 | ) | | | (104,424 | ) |
| Swaps | | | — | | | | (820,253 | ) | | | — | | | | — | |
Change in net unrealized appreciation | | | | | | | | | | | | | | | | |
| (depreciation) of: | | | | | | | | | | | | | | | | |
| Investments | | | (35,585,532 | ) | | | 68,238,463 | | | | (947,969 | ) | | | 1,850,918 | |
| Futures contracts | | | 203,441 | | | | (203,441 | ) | | | 28,187 | | | | (37,309 | ) |
| Swaps | | | — | | | | 259,758 | | | | — | | | | — | |
Net increase (decrease) in net assets | | | | | | | | | | | | | | | | |
| applicable to common shares | | | | | | | | | | | | | | | | |
| from operations | | | (22,082,585 | ) | | | 94,679,765 | | | | (688,567 | ) | | | 2,470,363 | |
| Distributions to Common Shareholders | | | | | | | | | | | | | | | | |
Dividends | | | (13,321,502 | ) | | | (27,204,525 | ) | | | (284,371 | ) | | | (773,848 | ) |
Decrease in net assets applicable to | | | | | | | | | | | | | | | | |
| common shares from distributions | | | | | | | | | | | | | | | | |
| to common shareholders | | | (13,321,502 | ) | | | (27,204,525 | ) | | | (284,371 | ) | | | (773,848 | ) |
| Capital Share Transactions | | | | | | | | | | | | | | | | |
Common shares: | | | | | | | | | | | | | | | | |
| Net proceeds from shares issued to | | | | | | | | | | | | | | | | |
| shareholders due to reinvestment | | | | | | | | | | | | | | | | |
| of distributions | | | — | | | | — | | | | — | | | | — | |
| Cost of shares repurchased | | | | | | | | | | | | | | | | |
| and retired | | | (342,032 | ) | | | — | | | | (83,468 | ) | | | — | |
Net increase (decrease) in net assets | | | | | | | | | | | | | | | | |
| applicable to common shares from | | | | | | | | | | | | | | | | |
| capital share transactions | | | (342,032 | ) | | | — | | | | (83,468 | ) | | | — | |
Net increase (decrease) in net assets | | | | | | | | | | | | | | | | |
| applicable to common shares | | | (35,746,119 | ) | | | 67,475,240 | | | | (1,056,406 | ) | | | 1,696,515 | |
Net assets applicable to common | | | | | | | | | | | | | | | | |
| shares at the beginning of period | | | 710,436,570 | | | | 642,961,330 | | | | 24,372,318 | | | | 22,675,803 | |
Net assets applicable to common | | | | | | | | | | | | | | | | |
| shares at the end of period | | $ | 674,690,451 | | | $ | 710,436,570 | | | $ | 23,315,912 | | | $ | 24,372,318 | |
See accompanying notes to financial statements.
64
| | NQP
| | | NPN
| |
| | Six Months | | | Year | | | Six Months | | | Year | |
| | Ended | | | Ended | | | Ended | | | Ended | |
| | 8/31/20 | | | 2/29/20 | | | 8/31/20 | | | 2/29/20 | |
| Operations | | | | | | | | | | | | |
Net investment income (loss) | | $ | 12,297,529 | | | $ | 23,186,876 | | | $ | 258,996 | | | $ | 551,303 | |
Net realized gain (loss) from: | | | | | | | | | | | | | | | | |
| Investments | | | (68,129 | ) | | | 2,791,478 | | | | 12,982 | | | | 150,369 | |
| Futures contracts | | | (2,566,034 | ) | | | (4,309,126 | ) | | | (33,356 | ) | | | (28,350 | ) |
| Swaps | | | — | | | | — | | | | — | | | | — | |
Change in net unrealized appreciation | | | | | | | | | | | | | | | | |
| (depreciation) of: | | | | | | | | | | | | | | | | |
| Investments | | | (26,226,363 | ) | | | 53,710,447 | | | | (722,429 | ) | | | 1,014,478 | |
| Futures contracts | | | 830,629 | | | | (1,100,046 | ) | | | 8,381 | | | | (11,514 | ) |
| Swaps | | | — | | | | — | | | | — | | | | — | |
Net increase (decrease) in net assets | | | | | | | | | | | | | | | | |
| applicable to common shares | | | | | | | | | | | | | | | | |
| from operations | | | (15,732,368 | ) | | | 74,279,629 | | | | (475,426 | ) | | | 1,676,286 | |
| Distributions to Common Shareholders | | | | | | | | | | | | | | | | |
Dividends | | | (11,663,603 | ) | | | (22,654,307 | ) | | | (223,105 | ) | | | (593,448 | ) |
Decrease in net assets applicable to | | | | | | | | | | | | | | | | |
| common shares from distributions | | | | | | | | | | | | | | | | |
| to common shareholders | | | (11,663,603 | ) | | | (22,654,307 | ) | | | (223,105 | ) | | | (593,448 | ) |
| Capital Share Transactions | | | | | | | | | | | | | | | | |
Common shares: | | | | | | | | | | | | | | | | |
| Net proceeds from shares issued to | | | | | | | | | | | | | | | | |
| shareholders due to reinvestment | | | | | | | | | | | | | | | | |
| of distributions | | | — | | | | — | | | | — | | | | 1,250 | |
Cost of shares repurchased | | | | | | | | | | | | | | | | |
| and retired | | | — | | | | — | | | | — | | | | — | |
Net increase (decrease) in net assets | | | | | | | | | | | | | | | | |
| applicable to common shares from | | | | | | | | | | | | | | | | |
| capital share transactions | | | — | | | | — | | | | — | | | | 1,250 | |
Net increase (decrease) in net assets | | | | | | | | | | | | | | | | |
| applicable to common shares | | | (27,395,971 | ) | | | 51,625,322 | | | | (698,531 | ) | | | 1,084,088 | |
Net assets applicable to common | | | | | | | | | | | | | | | | |
| shares at the beginning of period | | | 612,019,940 | | | | 560,394,618 | | | | 19,069,400 | | | | 17,985,312 | |
Net assets applicable to common | | | | | | | | | | | | | | | | |
| shares at the end of period | | $ | 584,623,969 | | | $ | 612,019,940 | | | $ | 18,370,869 | | | $ | 19,069,400 | |
See accompanying notes to financial statements.
65
Six Months Ended August 31, 2020 (Unaudited)
| | | | | | | |
| | NXJ | | | NQP | |
| Cash Flows from Operating Activities: | | | | | | |
| Net Increase (Decrease) in Net Assets Applicable to Common | | | | | | |
| Shares from Operations | | $ | (22,082,585 | ) | | $ | (15,732,368 | ) |
Adjustments to reconcile the net increase (decrease) in net assets | | | | | | | | |
| applicable to common shares from operations to net cash provided by | | | | | | | | |
| (used in) operating activities: | | | | | | | | |
Purchases of investments | | | (70,816,047 | ) | | | (40,585,790 | ) |
Proceeds from sales and maturities of investments | | | 76,279,361 | | | | 49,601,650 | |
Proceeds from (Purchase of) short-term investments, net | | | (600,000 | ) | | | (1,875,000 | ) |
Taxes paid | | | (1,735 | ) | | | — | |
Amortization (Accretion) of premiums and discounts, net | | | 546,589 | | | | 1,734,229 | |
Amortization of deferred offering costs | | | 30,390 | | | | 17,340 | |
(Increase) Decrease in: | | | | | | | | |
| Receivable for interest | | | 182,373 | | | | (189,387 | ) |
| Receivable for investments sold | | | — | | | | 3,447,593 | |
| Other assets | | | 9,945 | | | | 6,460 | |
Increase (Decrease) in: | | | | | | | | |
| Payable for interest | | | 13,884 | | | | 55,613 | |
| Payable for investments purchased - regular settlement | | | 996,139 | | | | — | |
| Payable for investments purchased - when-issued/delayed-delivery settlement | | | (579,380 | ) | | | (1,437,351 | ) |
| Payable for variation margin on futures contracts | | | (139,344 | ) | | | (542,828 | ) |
| Accrued management fees | | | 28,058 | | | | 26,115 | |
| Accrued Trustees fees | | | 4,012 | | | | 2,615 | |
| Accrued other expenses | | | 19,943 | | | | 19,597 | |
Net realized (gain) loss from investments | | | 558,445 | | | | 68,129 | |
Change in net unrealized (appreciation) depreciation of investments | | | 35,585,532 | | | | 26,226,363 | |
Net cash provided by (used in) operating activities | | | 20,035,580 | | | | 20,842,980 | |
| Cash Flow from Financing Activities: | | | | | | | | |
Increase (Decrease) in cash overdraft | | | — | | | | (3,778,443 | ) |
Proceeds from floating rate obligations | | | 1,600,000 | | | | 4,865,000 | |
(Repayments of) floating rate obligations | | | (1,600,000 | ) | | | (695,000 | ) |
Cash distributions paid to common shareholders | | | (13,217,348 | ) | | | (11,588,810 | ) |
Cost of shares repurchased and retired | | | (342,032 | ) | | | — | |
Net cash provided by (used in) financing activities | | | (13,559,380 | ) | | | (11,197,253 | ) |
| Net Increase (Decrease) in Cash and Cash Collateral at Brokers | | | 6,476,200 | | | | 9,645,727 | |
Cash and cash collateral at brokers at the beginning of period | | | 1,877,983 | | | | 515,046 | |
Cash and cash collateral at brokers at the end of period | | $ | 8,354,183 | | | $ | 10,160,773 | |
| | |
| Supplemental Disclosure of Cash Flow Information | | NXJ | | | NQP | |
Cash paid for interest (excluding amortization of offering costs) | | $ | 2,378,126 | | | $ | 2,265,817 | |
See accompanying notes to financial statements.
66
THIS PAGE INTENTIONALLY LEFT BLANK
Financial Highlights (Unaudited)
Selected data for a common share outstanding throughout each period:
| | | | | | | | | | | | | | Less Distributions to | | | | | | | | | | |
| | | | | Investment Operations | | | Common Shareholders | | | Common Share | |
| | | | | | | | | | | | | | | | | From | | | | | | | | | | | | | |
| | | | | | | | | | | | | | | | | Accum- | | | | | | Discount | | | | | | | |
| | Beginning | | | Net | | | Net | | | | | | From | | | ulated | | | | | | Per | | | | | | | |
| | Common | | | Investment | | | Realized/ | | | | | | Net | | | Net | | | | | | Share | | | | | | Ending | |
| | Share | | | Income | | | Unrealized | | | | | | Investment | | | Realized | | | | | | Repurchased | | | Ending | | | Share | |
| | NAV | | | (Loss) | | | Gain (Loss) | | | Total | | | Income | | | Gains | | | Total | | | and Retired | | | NAV | | | Price | |
| NXJ | | | | | | | | | | | | | | | | | | | | | | | | | | | | | | |
Year Ended 2/28-2/29: | | | | | | | | | | | | | | | | | | | | | | | | | | | | |
2021(e) | | $ | 17.12 | | | $ | 0.35 | | | $ | (0.89 | ) | | $ | (0.54 | ) | | $ | (0.32 | ) | | $ | — | | | $ | (0.32 | ) | | $ | — | * | | $ | 16.26 | | | $ | 13.72 | |
2020 | | | 15.49 | | | | 0.64 | | | | 1.65 | | | | 2.29 | | | | (0.65 | ) | | | (0.01 | ) | | | (0.66 | ) | | | — | | | | 17.12 | | | | 14.73 | |
2019 | | | 15.37 | | | | 0.66 | | | | 0.14 | | | | 0.80 | | | | (0.66 | ) | | | (0.08 | ) | | | (0.74 | ) | | | 0.06 | | | | 15.49 | | | | 13.47 | |
2018 | | | 15.21 | | | | 0.71 | | | | 0.15 | | | | 0.86 | | | | (0.70 | ) | | | — | | | | (0.70 | ) | | | — | * | | | 15.37 | | | | 13.10 | |
2017(d) | | | 16.18 | | | | 0.60 | | | | (0.94 | ) | | | (0.34 | ) | | | (0.63 | ) | | | — | | | | (0.63 | ) | | | — | | | | 15.21 | | | | 13.42 | |
Year Ended 4/30: | | | | | | | | | | | | | | | | | | | | | | | | | | | | | | | | | | | | | | | | |
2016 | | | 15.53 | | | | 0.79 | | | | 0.66 | | | | 1.45 | | | | (0.82 | ) | | | (0.01 | ) | | | (0.83 | ) | | | 0.03 | | | | 16.18 | | | | 14.66 | |
2015 | | | 15.28 | | | | 0.67 | | | | 0.34 | | | | 1.01 | | | | (0.77 | ) | | | — | | | | (0.77 | ) | | | 0.01 | | | | 15.53 | | | | 13.58 | |
| | | | | | | | | | | | | | | | | | | | | | | | | | | | | | | | | | | | | | | | | |
| NJV | | | | | | | | | | | | | | | | | | | | | | | | | | | | | | | | | | | | | | | | |
Year Ended 2/28-2/29: | | | | | | | | | | | | | | | | | | | | | | | | | | | | | | | | | | | | | |
2021(e) | | | 15.92 | | | | 0.21 | | | | (0.65 | ) | | | (0.44 | ) | | | (0.19 | ) | | | — | | | | (0.19 | ) | | | 0.01 | | | | 15.30 | | | | 13.99 | |
2020 | | | 14.81 | | | | 0.46 | | | | 1.16 | | | | 1.62 | | | | (0.51 | ) | | | — | | | | (0.51 | ) | | | — | | | | 15.92 | | | | 13.96 | |
2019 | | | 15.15 | | | | 0.54 | | | | (0.02 | ) | | | 0.52 | | | | (0.55 | ) | | | (0.34 | ) | | | (0.89 | ) | | | 0.03 | | | | 14.81 | | | | 13.08 | |
2018 | | | 15.56 | | | | 0.57 | | | | (0.05 | ) | | | 0.52 | | | | (0.58 | ) | | | (0.35 | ) | | | (0.93 | ) | | | — | | | | 15.15 | | | | 13.55 | |
2017(d) | | | 16.32 | | | | 0.49 | | | | (0.58 | ) | | | (0.09 | ) | | | (0.52 | ) | | | (0.15 | ) | | | (0.67 | ) | | | — | | | | 15.56 | | | | 15.61 | |
Year Ended 4/30: | | | | | | | | | | | | | | | | | | | | | | | | | | | | | | | | | | | | | | | | |
2016 | | | 16.41 | | | | 0.62 | | | | 0.11 | | | | 0.73 | | | | (0.61 | ) | | | (0.21 | ) | | | (0.82 | ) | | | — | | | | 16.32 | | | | 15.16 | |
2015 | | | 16.15 | | | | 0.62 | | | | 0.43 | | | | 1.05 | | | | (0.63 | ) | | | (0.18 | ) | | | (0.81 | ) | | | 0.02 | | | | 16.41 | | | | 14.75 | |
| | |
(a) | Total Return Based on Common Share NAV is the combination of changes in common share NAV, reinvested dividend income at NAV and reinvested capital gains distributions at |
| NAV, if any. The last dividend declared in the period, which is typically paid on the first business day of the following month, is assumed to be reinvested at the ending NAV. The |
| actual reinvest price for the last dividend declared in the period may often be based on the Fund’s market price (and not its NAV), and therefore may be different from the price |
| used in the calculation. Total returns are not annualized. |
| | |
| Total Return Based on Common Share Price is the combination of changes in the market price per share and the effect of reinvested dividend income and reinvested capital gains |
| distributions, if any, at the average price paid per share at the time of reinvestment. The last dividend declared in the period, which is typically paid on the first business day of the |
| following month, is assumed to be reinvested at the ending market price. The actual reinvestment for the last dividend declared in the period may take place over several days, and |
| in some instances may not be based on the market price, so the actual reinvestment price may be different from the price used in the calculation. Total returns are not annualized. |
68
| | | | | | | Common Share Supplemental Data/ | |
| | | | | | | Ratios Applicable to Common Shares | |
| Common Share | | | | | | | | | | | | | |
| Total Returns | | | | | | Ratios to Average Net Assets(b) | | | | |
| | | | Based | | | Ending | | | | | | | | | | |
| Based | | | on | | | Net | | | | | | Net | | | Portfolio | |
| on | | | Share | | | Assets | | | | | | Investment | | | Turnover | |
| NAV(a) | | | Price(a) | | | | (000 | ) | | Expenses | | | Income (Loss) | | | Rate(c) | |
| | | | | | | | | | | | | | | | | | | | | | | |
| | (3.08 | )% | | | (4.60 | )% | | $ | 674,690 | | | | 1.69 | %** | | | 4.36 | %** | | | 7 | % |
| | 15.02 | | | | 14.43 | | | | 710,437 | | | | 2.07 | | | | 3.94 | | | | 8 | |
| | 5.77 | | | | 8.86 | | | | 642,961 | | | | 2.13 | | | | 4.30 | | | | 16 | |
| | 5.66 | | | | 2.74 | | | | 653,684 | | | | 1.78 | | | | 4.55 | | | | 11 | |
| | (2.20 | ) | | | (4.35 | ) | | | 647,626 | | | | 1.76 | ** | | | 4.54 | ** | | | 12 | |
| | |
| | 9.85 | | | | 14.79 | | | | 688,971 | | | | 1.56 | | | | 5.12 | | | | 14 | |
| | 6.77 | | | | 5.35 | | | | 668,670 | | | | 1.71 | | | | 4.64 | | | | 14 | |
| | | | | | | | | | | | | | | | | | | | | | | |
| | (2.69 | ) | | | 1.66 | | | | 23,316 | | | | 0.91 | ** | | | 2.78 | ** | | | 5 | |
| | 11.07 | | | | 10.71 | | | | 24,372 | | | | 0.99 | | | | 2.97 | | | | 21 | |
| | 3.73 | | | | 3.39 | | | | 22,676 | | | | 1.07 | | | | 3.58 | | | | 24 | |
| | 3.31 | | | | (7.48 | ) | | | 23,510 | | | | 1.03 | | | | 3.63 | | | | 16 | |
| | (0.57 | ) | | | 7.39 | | | | 24,139 | | | | 0.96 | ** | | | 3.62 | ** | | | 14 | |
| | |
| | 4.57 | | | | 8.70 | | | | 25,297 | | | | 0.89 | | | | 3.87 | | | | 8 | |
| | 6.68 | | | | 7.62 | | | | 25,430 | | | | 0.87 | | | | 3.75 | | | | 13 | |
(b) | • Net Investment Income (Loss) ratios reflect income earned and expenses incurred on assets attributable to preferred shares issued by the Fund. |
| • The expense ratios reflect, among other things, all interest expense and other costs related to preferred shares (as described in Note 5 – Fund Shares) and/or the interest |
| expense deemed to have been paid by the Fund in the floating rate certificates issued by the special purpose trusts for the self-deposited inverse floaters held by the Fund |
| (as described in Note 4 – Portfolio Securities and Investments in Derivatives), where applicable, as follows: |
| NXJ | | | NJV | |
Year Ended 2/28-2/29: | | | Year Ended 2/28-2/29: | |
2021(e) | 0.73%** | | 2021(e) | 0.04%** |
2020 | 1.11 | | 2020 | 0.06 |
2019 | 1.13 | | 2019 | 0.13 |
2018 | 0.80 | | 2018 | 0.09 |
2017(d) | 0.79** | | 2017(d) | 0.07** |
Year Ended 4/30: | | | Year Ended 4/30: | |
2016 | 0.57 | | 2016 | 0.04 |
2015 | 0.60 | | 2015 | 0.04 |
(c) | Portfolio Turnover Rate is calculated based on the lesser of long-term purchases or sales (as disclosed in Note 4 – Portfolio Securities and Investments in Derivatives) |
| divided by the average long-term market value during the period. |
(d) | For the ten months ended February 28, 2017. |
(e) | For the six months ended August 31, 2020. |
* | Rounds to less than $0.01 per share. |
** | Annualized. |
See accompanying notes to financial statements.
69
Financial Highlights (Unaudited) (continued)
Selected data for a common share outstanding throughout each period:
| | | | | | | | | | | | | | Less Distributions to | | | | | | | | | | |
| | | | | Investment Operations | | | Common Shareholders | | | Common Share | |
| | | | | | | | | | | | | | | | | From | | | | | | | | | | | | | |
| | | | | | | | | | | | | | | | | Accum- | | | | | | Discount | | | | | | | |
| | Beginning | | | Net | | | Net | | | | | | From | | | ulated | | | | | | Per | | | | | | | |
| | Common | | | Investment | | | Realized/ | | | | | | Net | | | Net | | | | | | Share | | | | | | Ending | |
| | Share | | | Income | | | Unrealized | | | | | | Investment | | | Realized | | | | | | Repurchased | | | Ending | | | Share | |
| | NAV | | | (Loss) | | | Gain (Loss) | | | Total | | | Income | | | Gains | | | Total | | | and Retired | | | NAV | | | Price | |
| NQP | | | | | | | | | | | | | | | | | | | | | | | | | | | | | | |
Year Ended 2/28-2/29: | | | | | | | | | | | | | | | | | | | | | | | | | | | | |
2021(e) | | $ | 16.37 | | | $ | 0.33 | | | $ | (0.75 | ) | | $ | (0.42 | ) | | $ | (0.31 | ) | | $ | — | | | $ | (0.31 | ) | | $ | — | | | $ | 15.64 | | | $ | 13.68 | |
2020 | | | 14.99 | | | | 0.62 | | | | 1.37 | | | | 1.99 | | | | (0.61 | ) | | | — | | | | (0.61 | ) | | | — | | | | 16.37 | | | | 14.46 | |
2019 | | | 14.71 | | | | 0.62 | | | | 0.27 | | | | 0.89 | | | | (0.59 | ) | | | (0.04 | ) | | | (0.63 | ) | | | 0.02 | | | | 14.99 | | | | 13.02 | |
2018 | | | 14.79 | | | | 0.69 | | | | (0.08 | ) | | | 0.61 | | | | (0.69 | ) | | | — | *** | | | (0.69 | ) | | | — | * | | | 14.71 | | | | 12.52 | |
2017(d) | | | 16.08 | | | | 0.60 | | | | (1.24 | ) | | | (0.64 | ) | | | (0.62 | ) | | | (0.03 | ) | | | (0.65 | ) | | | — | | | | 14.79 | | | | 13.30 | |
Year Ended 4/30: | | | | | | | | | | | | | | | | | | | | | | | | | | | | | | | | | | | | | | | | |
2016 | | | 15.64 | | | | 0.80 | | | | 0.46 | | | | 1.26 | | | | (0.83 | ) | | | — | | | | (0.83 | ) | | | 0.01 | | | | 16.08 | | | | 14.91 | |
2015 | | | 15.17 | | | | 0.81 | | | | 0.50 | | | | 1.31 | | | | (0.84 | ) | | | — | | | | (0.84 | ) | | | — | * | | | 15.64 | | | | 13.87 | |
| | | | | | | | | | | | | | | | | | | | | | | | | | | | | | | | | | | | | | | | | |
| NPN | | | | | | | | | | | | | | | | | | | | | | | | | | | | | | | | | | | | | | | | |
Year Ended 2/28-2/29: | | | | | | | | | | | | | | | | | | | | | | | | | | | | | | | | | | | | | |
2021(e) | | | 15.64 | | | | 0.21 | | | | (0.60 | ) | | | (0.39 | ) | | | (0.18 | ) | | | — | | | | (0.18 | ) | | | — | | | | 15.07 | | | | 15.15 | |
2020 | | | 14.75 | | | | 0.45 | | | | 0.93 | | | | 1.38 | | | | (0.47 | ) | | | (0.02 | ) | | | (0.49 | ) | | | — | | | | 15.64 | | | | 14.67 | |
2019 | | | 14.78 | | | | 0.50 | | | | 0.06 | | | | 0.56 | | | | (0.50 | ) | | | (0.10 | ) | | | (0.60 | ) | | | 0.01 | | | | 14.75 | | | | 13.19 | |
2018 | | | 15.16 | | | | 0.55 | | | | (0.16 | ) | | | 0.39 | | | | (0.58 | ) | | | (0.19 | ) | | | (0.77 | ) | | | — | | | | 14.78 | | | | 15.15 | |
2017(d) | | | 16.50 | | | | 0.51 | | | | (0.73 | ) | | | (0.22 | ) | | | (0.64 | ) | | | (0.48 | ) | | | (1.12 | ) | | | — | | | | 15.16 | | | | 15.83 | |
Year Ended 4/30: | | | | | | | | | | | | | | | | | | | | | | | | | | | | | | | | | | | | | | | | |
2016 | | | 16.36 | | | | 0.68 | | | | 0.09 | | | | 0.77 | | | | (0.63 | ) | | | — | | | | (0.63 | ) | | | — | | | | 16.50 | | | | 16.45 | |
2015 | | | 15.91 | | | | 0.67 | | | | 0.41 | | | | 1.08 | | | | (0.63 | ) | | | — | | | | (0.63 | ) | | | — | | | | 16.36 | | | | 15.57 | |
(a) | Total Return Based on Common Share NAV is the combination of changes in common share NAV, reinvested dividend income at NAV and reinvested capital gains distributions at |
| NAV, if any. The last dividend declared in the period, which is typically paid on the first business day of the following month, is assumed to be reinvested at the ending NAV. The |
| actual reinvest price for the last dividend declared in the period may often be based on the Fund’s market price (and not its NAV), and therefore may be different from the price |
| used in the calculation. Total returns are not annualized. |
| | |
| Total Return Based on Common Share Price is the combination of changes in the market price per share and the effect of reinvested dividend income and reinvested capital gains |
| distributions, if any, at the average price paid per share at the time of reinvestment. The last dividend declared in the period, which is typically paid on the first business day of the |
| following month, is assumed to be reinvested at the ending market price. The actual reinvestment for the last dividend declared in the period may take place over several days, and |
| in some instances may not be based on the market price, so the actual reinvestment price may be different from the price used in the calculation. Total returns are not annualized. |
70
| | | | | | | Common Share Supplemental Data/
| |
| | | | | | | Ratios Applicable to Common Shares
| |
Common Share
| | | | | | | | | | | | | |
| Total Returns | | | | | | Ratios to Average Net Assets(b) | | | | |
| | | | Based | | | Ending | | | | | | | | | | |
| Based | | | on | | | Net | | | | | | Net | | | Portfolio | |
| on | | | Share | | | Assets | | | | | | Investment | | | Turnover | |
| NAV(a) | | | Price(a) | | | | (000 | ) | | Expenses | | | Income (Loss) | | | Rate(c) | |
| | (2.62 | )% | | | (3.19 | )% | | $ | 584,624 | | | | 1.78 | %** | | | 4.22 | %** | | | 4 | % |
| | 13.62 | | | | 15.97 | | | | 612,020 | | | | 2.24 | | | | 3.95 | | | | 11 | |
| | 6.40 | | | | 9.41 | | | | 560,395 | | | | 2.44 | | | | 4.19 | | | | 8 | |
| | 4.12 | | | | (0.85 | ) | | | 555,094 | | | | 2.05 | | | | 4.56 | | | | 12 | |
| | (4.19 | ) | | | (6.66 | ) | | | 558,373 | | | | 1.87 | ** | | | 4.57 | ** | | | 16 | |
| | |
| | 8.46 | | | | 14.21 | | | | 607,240 | | | | 1.51 | | | | 5.13 | | | | 16 | |
| | 8.79 | | | | 7.09 | | | | 592,540 | | | | 1.60 | | | | 5.21 | | | | 9 | |
| | | | | | | | | | | | | | | | | | | | | | | |
| | (2.52 | ) | | | 4.64 | | | | 18,371 | | | | 0.94 | ** | | | 2.81 | ** | | | 1 | |
| | 9.54 | | | | 15.04 | | | | 19,069 | | | | 1.03 | | | | 2.97 | | | | 20 | |
| | 3.99 | | | | (8.87 | ) | | | 17,985 | | | | 1.02 | | | | 3.41 | | | | 10 | |
| | 2.58 | | | | 0.68 | | | | 18,066 | | | | 1.02 | | | | 3.61 | | | | 28 | |
| | (1.33 | ) | | | 3.08 | | | | 18,517 | | | | 0.93 | ** | | | 3.80 | ** | | | 23 | |
| | | | | | | | | | | | | | | | | | | | | | | |
| | 4.82 | | | | 10.09 | | | | 20,118 | | | | 0.85 | | | | 4.17 | | | | 14 | |
| | 6.87 | | | | 12.30 | | | | 19,952 | | | | 0.85 | | | | 4.11 | | | | 5 | |
(b) | • Net Investment Income (Loss) ratios reflect income earned and expenses incurred on assets attributable to preferred shares issued by the Fund. |
| • The expense ratios reflect, among other things, all interest expense and other costs related to preferred shares (as described in Note 5 – Fund Shares) and/or the interest |
| expense deemed to have been paid by the Fund in the floating rate certificates issued by the special purpose trusts for the self-deposited inverse floaters held by the Fund |
| (as described in Note 4 – Portfolio Securities and Investments in Derivatives), where applicable, as follows: |
| NQP | | | NPN | |
Year Ended 2/28-2/29: | | | Year Ended 2/28-2/29: | |
2021(e) | 0.80%** | | 2021(e) | 0.03%** |
2020 | 1.26 | | 2020 | 0.04 |
2019 | 1.43 | | 2019 | 0.04 |
2018 | 1.06 | | 2018 | 0.02 |
2017(d) | 0.89** | | 2017(d) | 0.01** |
Year Ended 4/30: | | | Year Ended 4/30: | |
2016 | 0.56 | | 2016 | — |
2015 | 0.60 | | 2015 | — |
(c) | Portfolio Turnover Rate is calculated based on the lesser of long-term purchases or sales (as disclosed in Note 4 – Portfolio Securities and Investments in Derivatives) |
| divided by the average long-term market value during the period. |
(d) | For the ten months ended February 28, 2017. |
(e) | For the six months ended August 31, 2020. |
* | Rounds to less than $0.01 per share. |
** | Annualized. |
*** | Rounds to more than $(0.01) per share. |
See accompanying notes to financial statements.
71
Financial Highlights (Unaudited) (continued)
| | | | | | | | VMTP and | |
| | VMTP Shares | | | VRDP Shares | | | VRDP Shares at | |
| | at the End of Period | | | at the End of Period | | | the End of Period | |
| | | | | | | | | | | | | | Asset | |
| | Aggregate | | | Asset | | | Aggregate | | | Asset | | | Coverage | |
| | Amount | | | Coverage | | | Amount | | | Coverage | | | Per $1 | |
| | Outstanding | | | Per $100,000 | | | Outstanding | | | Per $100,000 | | | Liquidation | |
| | | (000 | ) | | Share | | | | (000 | ) | | Share | | | Preference | |
| NXJ | | | | | | | | | | | | | | | | | |
Year Ended 2/28-2/29: | | | | | | | | | | | | | | | | | |
2021(c) | | $ | — | | | $ | — | | | $ | 313,900 | | | $ | 314,938 | | | $ | — | |
2020 | | | — | | | | — | | | | 313,900 | | | | 326,326 | | | | — | |
2019 | | | — | | | | — | | | | 313,900 | | | | 304,830 | | | | — | |
2018 | | | — | | | | — | | | | 313,900 | | | | 308,246 | | | | — | |
2017(b) | | | — | | | | — | | | | 313,900 | | | | 306,316 | | | | — | |
Year Ended 4/30: | | | | | | | | | | | | | | | | | | | | |
2016 | | | — | | | | — | | | | 313,900 | | | | 319,488 | | | | — | |
2015(a) | | | — | | | | — | | | | 313,900 | | | | 313,020 | | | | — | |
| | | | | | | | | | | | | | | | | | | | | |
| NQP | | | | | | | | | | | | | | | | | | | | |
Year Ended 2/28-2/29: | | | | | | | | | | | | | | | | | | | | |
2021(c) | | | — | | | | — | | | | 217,500 | | | | 368,793 | | | | — | |
2020 | | | — | | | | — | | | | 217,500 | | | | 381,388 | | | | — | |
2019 | | | — | | | | — | | | | 217,500 | | | | 357,653 | | | | — | |
2018 | | | 87,000 | | | | 282,297 | | | | 217,500 | | | | 282,297 | | | | 2.82 | |
2017(b) | | | 87,000 | | | | 283,374 | | | | 217,500 | | | | 283,374 | | | | 2.83 | |
Year Ended 4/30: | | | | | | | | | | | | | | | | | | | | |
2016 | | | 48,000 | | | | 328,716 | | | | 217,500 | | | | 328,716 | | | | 3.29 | |
2015(a) | | | 48,000 | | | | 323,179 | | | | 217,500 | | | | 323,179 | | | | 3.23 | |
(a) | The Ending and Average Market Value Per Share for each Series of the Fund’s MTP Shares were as follows: |
| | 2015 | |
| NXJ | | | |
| Series 2015 (NXJ PRCCL) | | | |
Ending Market Value per Share | | $ | — | |
Average Market Value per Share | | 10.01 | ^ |
| | | | |
|
| NQP | | | | |
| Series 2015 (NQP PRCCL) | | | | |
Ending Market Value per Share | | | — | |
Average Market Value per Share | | 10.01 | |
| Series 2015 (NQP PRDCL) | | | | |
Ending Market Value per Share | | | — | |
Average Market Value per Share | | 10.02 | |
(b) | For the ten months ended February 28, 2017. |
(c) | For the six months ended August 31, 2020. |
^ | For the period November 10, 2014 (effective date of the reorganizations) through February 9, 2015. |
| For the period May 1, 2014 through May 30, 2014. |
See accompanying notes to financial statements.
72
Notes to
Financial Statements
(Unaudited)
1. General Information
Fund Information
The funds covered in this report and their corresponding New York Stock Exchange (“NYSE”) symbols are as follows (each a “Fund” and collectively, the “Funds”):
| • | Nuveen New Jersey Quality Municipal Income Fund (NXJ) |
| • | Nuveen New Jersey Municipal Value Fund (NJV) |
| • | Nuveen Pennsylvania Quality Municipal Income Fund (NQP) |
| • | Nuveen Pennsylvania Municipal Value Fund (NPN) |
The Funds are registered under the Investment Company Act of 1940 (the “1940 Act”), as amended, as diversified (non-diversified for NJV) closed-end management investment companies. NXJ, NJV, NQP and NPN were organized as Massachusetts business trusts on June 1, 1999, January 26, 2009, December 20, 1990 and January 26, 2009, respectively.
The end of the reporting period for the Funds is August 31, 2020, and the period covered by these Notes to Financial Statements is the six months ended August 31, 2020 (the “current fiscal period”).
Investment Adviser and Sub-Adviser
The Funds’ investment adviser is Nuveen Fund Advisors, LLC (the “Adviser”), a subsidiary of Nuveen, LLC (“Nuveen”). Nuveen is the investment management arm of Teachers Insurance and Annuity Association of America (TIAA). The Adviser has overall responsibility for management of the Funds, oversees the management of the Funds’ portfolios, manages the Funds’ business affairs and provides certain clerical, bookkeeping and other administrative services, and, if necessary, asset allocation decisions. The Adviser has entered into sub-advisory agreements with Nuveen Asset Management, LLC (the “Sub-Adviser”), a subsidiary of the Adviser, under which the Sub-Adviser manages the investment portfolios of the Funds.
Fund Merger
During August 2020, the Funds’ Board of Trustees (the “Board”) approved the merger of NJV and NPN (the “Target Funds”) into the Nuveen AMT-Free Municipal Value Fund (NUW) (the “Acquiring Fund”) (each a “Merger” and collectively the “Mergers”). Each Merger is intended to create one larger fund with lower operating expenses and increased trading volume on the exchange for common shares. Each Merger is subject to customary conditions, including shareholder approval at annual shareholder meetings.
Upon the closing of the Mergers, the Target Funds will transfer their assets to the Acquiring Fund in exchange for common shares of the Acquiring Fund and the assumption by the Acquiring Fund of the liabilities of the Target Funds. The Target Funds will then be liquidated, dissolved and terminated in accordance with their Declaration of Trust. Shareholders of the Target Funds will become shareholders of the Acquiring Fund. Holders of common shares of the Target Funds will receive newly issued common shares of the Acquiring Fund, the aggregate net asset value (“NAV”) of which is equal to the aggregate NAV of the common shares of the Target Funds held immediately prior to the Mergers (including for this purpose fractional Acquiring Fund shares to which shareholders would be entitled).
Other Matters
The outbreak of the novel coronavirus (“COVID-19”) and subsequent global pandemic began significantly impacting the U.S. and global financial markets and economies during the calendar quarter ended March 31, 2020. The worldwide spread of COVID-19 has created significant uncertainty in the global economy. The duration and extent of COVID-19 over the long-term cannot be reasonably estimated at this time. The ultimate impact of COVID-19 and the extent to which COVID-19 impacts the Funds’ normal course of business, results of operations, investments, and cash flows will depend on future developments, which are highly uncertain and difficult to predict. Management continues to monitor and evaluate this situation.
73
Notes to Financial Statements (Unaudited) (continued)
2. Significant Accounting Policies
The accompanying financial statements were prepared in accordance with accounting principles generally accepted in the United States of America (“U.S. GAAP”), which may require the use of estimates made by management and the evaluation of subsequent events. Actual results may differ from those estimates. Each Fund is an investment company and follows the accounting guidance in the Financial Accounting Standards Board (“FASB”) Accounting Standards Codification 946, Financial Services—Investment Companies. The NAV for financial reporting purposes may differ from the NAV for processing security and common share transactions. The NAV for financial reporting purposes includes security and common share transactions through the date of the report. Total return is computed based on the NAV used for processing security and common share transactions. The following is a summary of the significant accounting policies consistently followed by the Funds.
Compensation
The Funds pay no compensation directly to those of its trustees who are affiliated with the Adviser or to its officers, all of whom receive remuneration for their services to the Funds from the Adviser or its affiliates. The Board has adopted a deferred compensation plan for independent trustees that enables trustees to elect to defer receipt of all or a portion of the annual compensation they are entitled to receive from certain Nuveen-advised funds. Under the plan, deferred amounts are treated as though equal dollar amounts had been invested in shares of select Nuveen-advised funds.
Distributions to Common Shareholders
Distributions to common shareholders are recorded on the ex-dividend date. The amount, character and timing of distributions are determined in accordance with federal income tax regulations, which may differ from U.S. GAAP.
Indemnifications
Under the Funds’ organizational documents, their officers and trustees are indemnified against certain liabilities arising out of the performance of their duties to the Funds. In addition, in the normal course of business, the Funds enter into contracts that provide general indemnifications to other parties. The Funds’ maximum exposure under these arrangements is unknown as this would involve future claims that may be made against the Funds that have not yet occurred. However, the Funds have not had prior claims or losses pursuant to these contracts and expect the risk of loss to be remote.
Investments and Investment Income
Securities transactions are accounted for as of the trade date for financial reporting purposes. Realized gains and losses on securities transactions are based upon the specific identification method. Investment income is comprised of interest income, which is recorded on an accrual basis and includes accretion of discounts and amortization of premiums for financial reporting purposes. Investment income also reflects payment-in-kind (“PIK”) interest and paydown gains and losses, if any. PIK interest represents income received in the form of securities in lieu of cash. Investment income also reflects dividend income, which is recorded on the ex-dividend date.
Netting Agreements
In the ordinary course of business, the Funds may enter into transactions subject to enforceable International Swaps and Derivative Association, Inc. (ISDA) master agreements or other similar arrangements (“netting agreements”). Generally, the right to offset in netting agreements allows each Fund to offset certain securities and derivatives with a specific counterparty, when applicable, as well as any collateral received or delivered to that counterparty based on the terms of the agreements. Generally, each Fund manages its cash collateral and securities collateral on a counterparty basis.
The Funds’ investments subject to netting agreements as of the end of the reporting period, if any, are further described in Note 4 – Portfolio Securities and Investments in Derivatives.
New Accounting Pronouncements and Rule Issuances
Fair Value Measurement: Disclosure Framework
During August 2018, the FASB issued Accounting Standards Update (“ASU”) 2018-13 (“ASU 2018-13”), Fair Value Measurement: Disclosure Framework – Changes to the Disclosure Requirements for Fair Value Measurements. ASU 2018-13 modifies the disclosures required by Topic 820, Fair Value Measurements. The amendments in ASU 2018-13 are effective for all entities for fiscal years, and interim periods within those fiscal years, beginning after December 15, 2019. Management has early implemented this guidance and it did not have a material impact on the Funds’ financial statements.
Reference Rate Reform
In March 2020, FASB issued ASU 2020-04, Reference Rate Reform: Facilitation of the Effects of Reference Rate Reform on Financial Reporting. The main objective of the new guidance is to provide relief to companies that will be impacted by the expected change in benchmark interest rates at the end of 2021, when participating banks will no longer be required to submit London Interbank Offered Rate (LIBOR) quotes by the UK Financial Conduct Authority (FCA). The new guidance allows companies to, provided the only change to existing contracts are a change to an approved benchmark
74
interest rate, account for modifications as a continuance of the existing contract without additional analysis. For new and existing contracts, the Funds may elect to apply the optional expedients as of March 12, 2020 through December 31, 2022. Management has not yet elected to apply the optional expedients, but is currently assessing the impact of the ASU’s adoption to the Funds’ financial statements and various filings.
3. Investment Valuation and Fair Value Measurements
The fair valuation input levels as described below are for fair value measurement purposes.
The Funds’ investments in securities are recorded at their estimated fair value. Fair value is defined as the price that would be received upon selling an investment or transferring a liability in an orderly transaction to an independent buyer in the principal or most advantageous market for the investment. A three-tier hierarchy is used to maximize the use of observable market data and minimize the use of unobservable inputs and to establish classification of fair value measurements for disclosure purposes. Observable inputs reflect the assumptions market participants would use in pricing the asset or liability. Observable inputs are based on market data obtained from sources independent of the reporting entity. Unobservable inputs reflect the reporting entity’s own assumptions about the assumptions market participants would use in pricing the asset or liability. Unobservable inputs are based on the best information available in the circumstances. The following is a summary of the three-tiered hierarchy of valuation input levels.
Level 1 – Inputs are unadjusted and prices are determined using quoted prices in active markets for identical securities.
Level 2 – Prices are determined using other significant observable inputs (including quoted prices for similar securities, interest rates, credit spreads, etc.).
Level 3 – Prices are determined using significant unobservable inputs (including management’s assumptions in determining the fair value of investments).
Common stocks and other equity-type securities are valued at the last sales price on the securities exchange on which such securities are primarily traded and are generally classified as Level 1. Securities primarily traded on the Nasdaq National Market (“Nasdaq”) are valued at the Nasdaq Official Closing Price and are generally classified as Level 1. However, securities traded on a securities exchange or Nasdaq for which there were no transactions on a given day or securities not listed on a securities exchange or Nasdaq are valued at the quoted bid price and are generally classified as Level 2.
Prices of fixed income securities are provided by an independent pricing service (“pricing service”) approved by the Board. The pricing service establishes a security’s fair value using methods that may include consideration of the following: yields or prices of investments of comparable quality, type of issue, coupon, maturity and rating, market quotes or indications of value from security dealers, evaluations of anticipated cash flows or collateral, general market conditions and other information and analysis, including the obligor’s credit characteristics considered relevant. These securities are generally classified as Level 2. In pricing certain securities, particularly less liquid and lower quality securities, the pricing service may consider information about a security, its issuer or market activity, provided by the Adviser. These securities are generally classified as Level 2 or Level 3 depending on the observability of the significant inputs.
Futures contracts are valued using the closing settlement price or, in the absence of such a price, the last traded price and are generally classified as Level 1.
Certain securities may not be able to be priced by the pre-established pricing methods as described above. Such securities may be valued by the Board and/or its appointee at fair value. These securities generally include, but are not limited to, restricted securities (securities which may not be publicly sold without registration under the Securities Act of 1933, as amended) for which a pricing service is unable to provide a market price; securities whose trading has been formally suspended; debt securities that have gone into default and for which there is no current market quotation; a security whose market price is not available from a pre-established pricing source; a security with respect to which an event has occurred that is likely to materially affect the value of the security after the market has closed but before the calculation of a Fund’s NAV (as may be the case in non-U.S. markets on which the security is primarily traded) or make it difficult or impossible to obtain a reliable market quotation; and a security whose price, as provided by the pricing service, is not deemed to reflect the security’s fair value. As a general principle, the fair value of a security would appear to be the amount that the owner might reasonably expect to receive for it in a current sale. A variety of factors may be considered in determining the fair value of such securities, which may include consideration of the following: yields or prices of investments of comparable quality, type of issue, coupon, maturity and rating, market quotes or indications of value from security dealers, evaluations of anticipated cash flows or collateral, general market conditions and other information and analysis, including the obligor’s credit characteristics considered relevant. These securities are generally classified as Level 2 or Level 3 depending on the observability of the significant inputs. Regardless of the method employed to value a particular security, all valuations are subject to review by the Board and/or its appointee.
75
Notes to Financial Statements (Unaudited) (continued)
The inputs or methodologies used for valuing securities are not an indication of the risks associated with investing in those securities. The following is a summary of each Fund’s fair value measurements as of the end of the reporting period:
| NXJ | | Level 1 | | | Level 2 | | | Level 3 | | | Total | |
Long-Term Investments*: | | | | | | | | | | | | |
| Municipal Bonds | | $ | — | | | $ | 1,009,210,235 | | | $ | — | | | $ | 1,009,210,235 | |
Short-Term Investments*: | | | | | | | | | | | | | | | | |
| Municipal Bonds | | | — | | | | 600,000 | | | | — | | | | 600,000 | |
Total | | $ | — | | | $ | 1,009,810,235 | | | $ | — | | | $ | 1,009,810,235 | |
| NJV | | | | | | | | | | | | | | | | |
Long-Term Investments*: | | | | | | | | | | | | | | | | |
| Municipal Bonds | | $ | — | | | $ | 23,773,850 | | | $ | — | | | $ | 23,773,850 | |
Investments in Derivatives: | | | | | | | | | | | | | | | | |
| Futures Contracts** | | | (4,767 | ) | | | — | | | | — | | | | (4,767 | ) |
Total | | $ | (4,767 | ) | | $ | 23,773,850 | | | $ | — | | | $ | 23,769,083 | |
| NQP | | | | | | | | | | | | | | | | |
Long-Term Investments*: | | | | | | | | | | | | | | | | |
| Municipal Bonds | | $ | — | | | $ | 908,566,816 | | | $ | — | | | $ | 908,566,816 | |
| Common Stocks | | | — | | | | 11,580,915 | *** | | | — | | | | 11,580,915 | |
Short-Term Investments*: | | | | | | | | | | | | | | | | |
| Municipal Bonds | | | — | | | | 1,875,000 | | | | — | | | | 1,875,000 | |
Total | | $ | — | | | $ | 922,022,731 | | | $ | — | | | $ | 922,022,731 | |
| NPN | | | | | | | | | | | | | | | | |
Long-Term Investments*: | | | | | | | | | | | | | | | | |
| Municipal Bonds | | $ | — | | | $ | 18,010,882 | | | $ | — | | | $ | 18,010,882 | |
| Common Stocks | | | — | | | | 282,705 | | | | — | | | | 282,705 | |
Investments in Derivatives: | | | | | | | | | | | | | | | | |
| Futures Contracts** | | | (1,999 | ) | | | — | | | | — | | | | (1,999 | ) |
Total | | $ | (1,999 | ) | | $ | 18,293,587 | | | $ | — | | | $ | 18,291,588 | |
* Refer to the Fund’s Portfolio of Investments for industry classifications.
** Represents net unrealized appreciation (depreciation) as reported in the Fund’s Portfolio of Investments.
*** Refer to the Fund’s Portfolio of Investments for securities classified as Level 2.
4. Portfolio Securities and Investments in Derivatives
Portfolio Securities
Inverse Floating Rate Securities
Each Fund is authorized to invest in inverse floating rate securities. An inverse floating rate security is created by depositing a municipal bond (referred to as an “Underlying Bond”), typically with a fixed interest rate, into a special purpose tender option bond (“TOB”) trust (referred to as the “TOB Trust”) created by or at the direction of one or more Funds. In turn, the TOB Trust issues (a) floating rate certificates (referred to as “Floaters”) in face amounts equal to some fraction of the Underlying Bond’s par amount or market value, and (b) an inverse floating rate certificate (referred to as an “Inverse Floater”) that represents all remaining or residual interest in the TOB Trust. Floaters typically pay short-term tax-exempt interest rates to third parties who are also provided a right to tender their certificate and receive its par value, which may be paid from the proceeds of a remarketing of the Floaters, by a loan to the TOB Trust from a third party liquidity provider (“Liquidity Provider”), or by the sale of assets from the TOB Trust. The Inverse Floater is issued to a long term investor, such as one or more of the Funds. The income received by the Inverse Floater holder varies inversely with the short-term rate paid to holders of the Floaters, and in most circumstances the Inverse Floater holder bears substantially all of the Underlying Bond’s downside investment risk and also benefits disproportionately from any potential appreciation of the Underlying Bond’s value. The value of an Inverse Floater will be more volatile than that of the Underlying Bond because the interest rate is dependent on not only the fixed coupon rate of the Underlying Bond but also on the short-term interest paid on the Floaters, and because the Inverse Floater essentially bears the risk of loss (and possible gain) of the greater face value of the Underlying Bond.
The Inverse Floater held by a Fund gives the Fund the right to (a) cause the holders of the Floaters to tender their certificates at par (or slightly more than par in certain circumstances), and (b) have the trustee of the TOB Trust (the “Trustee”) transfer the Underlying Bond held by the TOB Trust to the Fund, thereby collapsing the TOB Trust.
The Fund may acquire an Inverse Floater in a transaction where it (a) transfers an Underlying Bond that it owns to a TOB Trust created by a third party or (b) transfers an Underlying Bond that it owns, or that it has purchased in a secondary market transaction for the purpose of creating an Inverse
76
Floater, to a TOB Trust created at its direction, and in return receives the Inverse Floater of the TOB Trust (referred to as a “self-deposited Inverse Floater”). A Fund may also purchase an Inverse Floater in a secondary market transaction from a third party creator of the TOB Trust without first owning the Underlying Bond (referred to as an “externally-deposited Inverse Floater”).
An investment in a self-deposited Inverse Floater is accounted for as a “financing” transaction (i.e., a secured borrowing). For a self-deposited Inverse Floater, the Underlying Bond deposited into the TOB Trust is identified in the Fund’s Portfolio of Investments as “(UB) – Underlying bond of an inverse floating rate trust reflected as a financing transaction,” with the Fund recognizing as liabilities, labeled “Floating rate obligations” on the Statement of Assets and Liabilities, (a) the liquidation value of Floaters issued by the TOB Trust, and (b) the amount of any borrowings by the TOB Trust from a Liquidity Provider to enable the TOB Trust to purchase outstanding Floaters in lieu of a remarketing. In addition, the Fund recognizes in “Investment Income” the entire earnings of the Underlying Bond, and recognizes (a) the interest paid to the holders of the Floaters or on the TOB Trust’s borrowings, and (b) other expenses related to remarketing, administration, trustee, liquidity and other services to a TOB Trust, as a component of “Interest expense and amortization of offering costs” on the Statement of Operations. Earnings due from the Underlying Bond and interest due to the holders of the Floaters as of the end of the reporting period are recognized as components of “Receivable for interest” and “Payable for interest” on the Statement of Assets and Liabilities, respectively.
In contrast, an investment in an externally-deposited Inverse Floater is accounted for as a purchase of the Inverse Floater and is identified in the Fund’s Portfolio of Investments as “(IF) – Inverse floating rate investment.” For an externally-deposited Inverse Floater, a Fund’s Statement of Assets and Liabilities recognizes the Inverse Floater and not the Underlying Bond as an asset, and the Fund does not recognize the Floaters, or any related borrowings from a Liquidity Provider, as a liability. Additionally, the Fund reflects in “Investment Income” only the net amount of earnings on the Inverse Floater (net of the interest paid to the holders of the Floaters or the Liquidity Provider as lender, and the expenses of the Trust), and does not show the amount of that interest paid or the expenses of the TOB Trust as described above as interest expense on the Statement of Operations.
Fees paid upon the creation of a TOB Trust for self-deposited Inverse Floaters and externally-deposited Inverse Floaters are recognized as part of the cost basis of the Inverse Floater and are capitalized over the term of the TOB Trust.
As of the end of the reporting period, the aggregate value of Floaters issued by each Fund’s TOB Trust for self-deposited Inverse Floaters and externally-deposited Inverse Floaters was as follows:
| Floating Rate Obligations Outstanding | | NXJ | | | NJV | | | NQP | | | NPN | |
Floating rate obligations: self-deposited Inverse Floaters | | $ | 34,780,000 | | | $ | 810,000 | | | $ | 139,425,000 | | | $ | 450,000 | |
Floating rate obligations: externally-deposited Inverse Floaters | | | 71,068,000 | | | | 847,000 | | | | 18,550,000 | | | | 400,000 | |
Total | | $ | 105,848,000 | | | $ | 1,657,000 | | | $ | 157,975,000 | | | $ | 850,000 | |
During the current fiscal period, the average amount of Floaters (including any borrowings from a Liquidity Provider) outstanding, and the average annual interest rate and fees related to self-deposited Inverse Floaters, were as follows:
| Self-Deposited Inverse Floaters | | NXJ | | | NJV | | | NQP | | | NPN | |
Average floating rate obligations outstanding | | $ | 34,745,217 | | | $ | 810,000 | | | $ | 136,558,125 | | | $ | 450,000 | |
Average annual interest rate and fees | | | 1.20 | % | | | 1.21 | % | | | 1.23 | % | | | 1.18 | % |
TOB Trusts are supported by a liquidity facility provided by a Liquidity Provider pursuant to which the Liquidity Provider agrees, in the event that Floaters are (a) tendered to the Trustee for remarketing and the remarketing does not occur, or (b) subject to mandatory tender pursuant to the terms of the TOB Trust agreement, to either purchase Floaters or to provide the Trustee with an advance from a loan facility to fund the purchase of Floaters by the TOB Trust. In certain circumstances, the Liquidity Provider may otherwise elect to have the Trustee sell the Underlying Bond to retire the Floaters that were tendered and not remarketed prior to providing such a loan. In these circumstances, the Liquidity Provider remains obligated to provide a loan to the extent that the proceeds of the sale of the Underlying Bond is not sufficient to pay the purchase price of the Floaters.
The size of the commitment under the loan facility for a given TOB Trust is at least equal to the balance of that TOB Trust’s outstanding Floaters plus any accrued interest. In consideration of the loan facility, fee schedules are in place and are charged by the Liquidity Provider(s). Any loans made by the Liquidity Provider will be secured by the purchased Floaters held by the TOB Trust. Interest paid on any outstanding loan balances will be effectively borne by the Fund that owns the Inverse Floaters of the TOB Trust that has incurred the borrowing and may be at a rate that is greater than the rate that would have been paid had the Floaters been successfully remarketed.
As described above, any amounts outstanding under a liquidity facility are recognized as a component of “Floating rate obligations” on the Statement of Assets and Liabilities by the Fund holding the corresponding Inverse Floaters issued by the borrowing TOB Trust. As of the end of the reporting period, there were no loans outstanding under any such facility.
77
Notes to Financial Statements (Unaudited) (continued)
Each Fund may also enter into shortfall and forbearance agreements (sometimes referred to as a “recourse arrangement”) (TOB Trusts involving such agreements are referred to herein as “Recourse Trusts”), under which a Fund agrees to reimburse the Liquidity Provider for the Trust’s Floaters, in certain circumstances, for the amount (if any) by which the liquidation value of the Underlying Bond held by the TOB Trust may fall short of the sum of the liquidation value of the Floaters issued by the TOB Trust plus any amounts borrowed by the TOB Trust from the Liquidity Provider, plus any shortfalls in interest cash flows. Under these agreements, a Fund’s potential exposure to losses related to or on an Inverse Floater may increase beyond the value of the Inverse Floater as a Fund may potentially be liable to fulfill all amounts owed to holders of the Floaters or the Liquidity Provider. Any such shortfall amount in the aggregate is recognized as “Unrealized depreciation on Recourse Trusts” on the Statement of Assets and Liabilities.
As of the end of the reporting period, each Fund’s maximum exposure to the Floaters issued by Recourse Trusts for self-deposited Inverse Floaters and externally-deposited Inverse Floaters was as follows:
| Floating Rate Obligations — Recourse Trusts | | NXJ | | | NJV | | | NQP | | | NPN | |
Maximum exposure to Recourse Trusts: self-deposited Inverse Floaters | | $ | 34,780,000 | | | $ | 810,000 | | | $ | 124,425,000 | | | $ | 150,000 | |
Maximum exposure to Recourse Trusts: externally-deposited Inverse Floaters | | | 62,403,000 | | | | 847,000 | | | | 11,785,000 | | | | 400,000 | |
Total | | $ | 97,183,000 | | | $ | 1,657,000 | | | $ | 136,210,000 | | | $ | 550,000 | |
Zero Coupon Securities
A zero coupon security does not pay a regular interest coupon to its holders during the life of the security. Income to the holder of the security comes from accretion of the difference between the original purchase price of the security at issuance and the par value of the security at maturity and is effectively paid at maturity. The market prices of zero coupon securities generally are more volatile than the market prices of securities that pay interest periodically.
Investment Transactions
Long-term purchases and sales (including maturities but excluding derivative transactions, where applicable) during the current fiscal period were as follows:
| | NXJ | | | NJV | | | NQP | | | NPN | |
Purchases | | $ | 70,816,047 | | | $ | 1,175,626 | | | $ | 40,585,790 | | | $ | 129,783 | |
Sales and maturities | | | 76,279,361 | | | | 1,544,235 | | | | 49,601,650 | | | | 405,101 | |
The Funds may purchase securities on a when-issued or delayed-delivery basis. Securities purchased on a when-issued or delayed-delivery basis may have extended settlement periods; interest income is not accrued until settlement date. Any securities so purchased are subject to market fluctuation during this period. The Funds have earmarked securities in their portfolios with a current value at least equal to the amount of the when issued/delayed-delivery purchase commitments. If a Fund has outstanding when-issued/delayed-delivery purchases commitments as of the end of the reporting period, such amounts are recognized on the Statement of Assets and Liabilities.
Investments in Derivatives
In addition to the inverse floating rate securities in which each Fund may invest, which are considered portfolio securities for financial reporting purposes, each Fund is authorized to invest in certain derivative investments such as futures, options and swap contracts. Each Fund limits its investments in futures, options on futures and swap contracts to the extent necessary for the Adviser to claim exclusion from registration by the Commodity Futures Trading Commission as a commodity pool operator with respect to the Fund. The Funds record derivative instruments at fair value, with changes in fair value recognized on the Statement of Operations, when applicable. Even though the Funds’ investments in derivatives may represent economic hedges, they are not considered to be hedge transactions for financial reporting purposes.
Futures Contracts
Upon execution of a futures contract, a Fund is obligated to deposit cash or eligible securities, also known as “initial margin,” into an account at its clearing broker equal to a specified percentage of the contract amount. Cash held by the broker to cover initial margin requirements on open futures contracts, if any, is recognized as “Cash collateral at brokers for investments in futures contracts” on the Statement of Assets and Liabilities. Investments in futures contracts obligate a Fund and the clearing broker to settle monies on a daily basis representing changes in the prior days “mark-to-market” of the open contracts. If a Fund has unrealized appreciation the clearing broker would credit the Fund’s account with an amount equal to appreciation and conversely if a Fund has unrealized depreciation the clearing broker would debit the Fund’s account with an amount equal to depreciation. These daily cash settlements are also known as “variation margin.” Variation margin is recognized as a receivable and/or payable for “Variation margin on futures contracts” on the Statement of Assets and Liabilities.
During the period the futures contract is open, changes in the value of the contract are recognized as an unrealized gain or loss by “marking-to-market” on a daily basis to reflect the changes in market value of the contract, which is recognized as a component of “Change in net unrealized appreciation
78
(depreciation) of futures contracts” on the Statement of Operations. When the contract is closed or expired, a Fund records a realized gain or loss equal to the difference between the value of the contract on the closing date and value of the contract when originally entered into, which is recognized as a component of “Net realized gain (loss) from futures contracts” on the Statement of Operations.
Risks of investments in futures contracts include the possible adverse movement in the price of the securities or indices underlying the contracts, the possibility that there may not be a liquid secondary market for the contracts and/or that a change in the value of the contract may not correlate with a change in the value of the underlying securities or indices.
During the current fiscal period, the Funds used U.S. Treasury futures as part of an overall portfolio construction strategy to manage portfolio duration and yield curve exposure.
The average notional amount of futures contracts outstanding during the current fiscal period was as follows:
| | NXJ | | | NJV | | | NQP | | | NPN | |
Average notional amount of futures contracts outstanding* | | $ | 8,723,668 | | | $ | 3,066,326 | | | $ | 26,856,699 | | | $ | 776,408 | |
| * The average notional amount is calculated based on the absolute aggregate notional of contracts outstanding at the beginning of the current fiscal period and at the end of each fiscal quarter within the current fiscal period. |
The following table presents the fair value of all futures contracts held by the Funds as of the end of the reporting period, the location of these instruments on the Statement of Assets and Liabilities and the primary underlying risk exposure.
| | Location on the Statement of Assets and Liabilities
|
| Underlying | Derivative | Asset Derivatives | | (Liability) Derivatives
|
| Risk Exposure | Instrument | Location | |
| Location | Value |
| NJV | | | | | | |
Interest rate | Future contracts | — | |
| Payable for | $(4,767) |
| | | | | variation margin | |
| | | | | on futures | |
| | | | | contracts* | |
| NPN | | | | | | |
Interest rate | Futures contracts | — | |
| Payable for | $(1,999) |
| | | | | variation margin | |
| | | | | on futures | |
| | | | | contracts* | |
* Value represents the cumulative unrealized appreciation (depreciation) of futures contracts as reported in the Fund’s Portfolio of Investments and not the daily asset and/or liability derivatives location as described in the table above.
|
The following table presents the amount of net realized gain (loss) and change in net unrealized appreciation (depreciation) recognized on futures contracts on the Statement of Operations during the current fiscal period, and the primary underlying risk exposure.
| | | | Change in Net |
| | | | Unrealized |
| | | Net Realized | Appreciation |
| Underlying | Derivative | Gain (Loss) from | (Depreciation) of |
| Fund | Risk Exposure | Instrument | Futures Contracts | Futures Contracts |
| NXJ | Interest rate | Futures contracts | $ (652,316) | $203,441 |
| NJV | Interest rate | Futures contracts | $ (105,533) | $ 28,187 |
| NQP | Interest rate | Futures contracts | $(2,566,034) | $830,629 |
| NPN | Interest rate | Futures contracts | $ (33,356) | $ 8,381 |
Market and Counterparty Credit Risk
In the normal course of business each Fund may invest in financial instruments and enter into financial transactions where risk of potential loss exists due to changes in the market (market risk) or failure of the other party to the transaction to perform (counterparty credit risk). The potential loss could exceed the value of the financial assets recorded on the financial statements. Financial assets, which potentially expose each Fund to counterparty credit risk, consist principally of cash due from counterparties on forward, option and swap transactions, when applicable. The extent of each Fund’s exposure to counterparty credit risk in respect to these financial assets approximates their carrying value as recorded on the Statement of Assets and Liabilities.
79
Notes to Financial Statements (Unaudited) (continued)
Each Fund helps manage counterparty credit risk by entering into agreements only with counterparties the Adviser believes have the financial resources to honor their obligations and by having the Adviser monitor the financial stability of the counterparties. Additionally, counterparties may be required to pledge collateral daily (based on the daily valuation of the financial asset) on behalf of each Fund with a value approximately equal to the amount of any unrealized gain above a pre-determined threshold. Reciprocally, when each Fund has an unrealized loss, the Funds have instructed the custodian to pledge assets of the Funds as collateral with a value approximately equal to the amount of the unrealized loss above a pre-determined threshold. Collateral pledges are monitored and subsequently adjusted if and when the valuations fluctuate, either up or down, by at least the pre-determined threshold amount.
5. Fund Shares
Common Share Transactions
Transactions in common shares for the Funds during the Funds’ current and prior fiscal period, where applicable, were as follows:
| | NXJ | | | NJV | |
| | Six Months | | | Year | | | Six Months | | | Year | |
| | Ended | | | Ended | | | Ended | | | Ended | |
| | 8/31/20 | | | 2/29/20 | | | 8/31/20 | | | 2/29/20 | |
Common shares: | | | | | | | | | | | | |
| Issued to shareholders due to reinvestments of distributions | | | — | | | | — | | | | — | | | | — | |
| Repurchased and retired | | | (25,343 | ) | | | — | | | | (6,499 | ) | | | — | |
Weighted average common share: | | | | | | | | | | | | | | | | |
| Price per share repurchased and retired | | $ | 13.36 | | | $ | — | | | $ | 12.82 | | | $ | — | |
| Discount per share repurchased and retired | | | (16.96 | )% | | | — | % | | | (15.23 | )% | | | — | % |
| | NQP | | | NPN | |
| | Six Months | | | Year | | | Six Months | | | Year | |
| | Ended | | | Ended | | | Ended | | | Ended | |
| | 8/31/20 | | | 2/29/20 | | | 8/31/20 | | | 2/29/20 | |
Common shares: | | | | | | | | | | | | | | | | |
| Issued to shareholders due to reinvestments of distributions | | | — | | | | — | | | | — | | | | 80 | |
| Repurchased and retired | | | — | | | | — | | | | — | | | | — | |
Weighted average common share: | | | | | | | | | | | | | | | | |
| Price per share repurchased and retired | | $ | — | | | $ | — | | | $ | — | | | $ | — | |
| Discount per share repurchased and retired | | | — | % | | | — | % | | | — | % | | | — | % |
Preferred Shares
Variable Rate Demand Preferred Shares
The following Funds have issued and have outstanding Variable Rate Demand Preferred (“VRDP”) Shares, with a $100,000 liquidation preference per share. VRDP Shares are issued via private placement and are not publicly available.
As of the end of the reporting period, NXJ and NQP had $312,530,901 and $216,734,085 VRDP Shares at liquidation preference, net of deferred offering costs, respectively. Further details of the Funds’ VRDP Shares outstanding as of the end of the reporting period, were as follows:
| | Shares | Remarketing | Liquidation | Special Rate | |
| Fund | Series | Outstanding | Fees* | Preference | Period Expiration | Maturity |
| NXJ | 1 | 810 | N/A | $ 81,000,000 | July 21, 2021 | August 3, 2043 |
| 2 | 1,443 | N/A | 144,300,000 | April 1, 2043** | April 1, 2043 |
| 3 | 886 | N/A | 88,600,000 | April 1, 2043** | April 1, 2043 |
| NQP | 2 | 1,125 | N/A | $112,500,000 | December 1, 2042** | December 1, 2042 |
| 3 | 1,050 | N/A | 105,000,000 | December 1, 2042** | December 1, 2042 |
* Remarketing fees as a percentage of the aggregate principal amount of all VRDP Shares outstanding for each series.
** Subject to earlier termination by either the Fund or the holder.
N/A - Not applicable. Series is considered to be Special Rate VRDP and therefore does not pay a remarketing fee.
VRDP Shares include a liquidity feature that allows VRDP shareholders to have their shares purchased by a liquidity provider with whom each Fund has contracted in the event that the VRDP Shares are not able to be successfully remarketed. Each Fund is required to redeem any VRDP Shares that are still owned by the liquidity provider after six months of continuous, unsuccessful remarketing. Each Fund pays an annual remarketing fee on the aggregate principal amount of all VRDP Shares outstanding. Each Fund’s VRDP Shares have successfully remarketed since issuance.
80
All series of NXJ’s and NQP’s VRDP Shares are considered to be Special Rate Period VRDP, which are sold to institutional investors. During the special rate period, the VRDP Shares will not be remarketed by a remarketing agent, be subject to optional or mandatory tender events, or be supported by a liquidity provider and are not subject to remarking fees or liquidity fees. During the special rate period, VRDP dividends will be set monthly as a floating rate based on the predetermined formula. Following the initial special rate period, Special Rate Period VRDP Shares may transition to traditional VRDP Shares with dividends set at weekly remarketings, and be supported by a designated liquidity provider, or the Board may approve a subsequent special rate period.
Dividends on the VRDP Shares (which are treated as interest payments for financial reporting purposes) are set at a rate established by a remarketing agent; therefore, the market value of the VRDP Shares is expected to approximate its liquidation preference. In the event that VRDP Shares are unable to be successfully remarketed, the dividend rate will be the maximum rate which is designed to escalate according to a specified schedule in order to enhance the remarketing agent’s ability to successfully remarket the VRDP Shares.
Subject to certain conditions, VRDP Shares may be redeemed, in whole or in part, at any time at the option of each Fund. Each Fund may also redeem certain of the VRDP Shares if the Fund fails to maintain certain asset coverage requirements and such failures are not cured by the applicable cure date. The redemption price per share is equal to the sum of the liquidation preference per share plus any accumulated but unpaid dividends.
The average liquidation preference of VRDP Shares outstanding and annualized dividend rate for each Fund during the current fiscal period were as follows:
| NXJ | NQP |
Average liquidation preference of VRDP Shares outstanding | $313,900,000 | $217,500,000 |
Annualized dividend rate | 1.38% | 1.34% |
For financial reporting purposes, the liquidation preference of VRDP Shares is a liability and is recognized as a component of “Variable Rate Demand Preferred (“VRDP”) Shares, net of deferred offering costs” on the Statement of Assets and Liabilities. Unpaid dividends on VRDP Shares are recognized as a component of “Interest payable” on the Statement of Assets and Liabilities, when applicable. Dividends accrued on VRDP Shares are recognized as a component of “Interest expense and amortization of offering costs” on the Statement of Operations. Costs incurred by the Funds in connection with their offerings of VRDP Shares were recorded as a deferred charge, which are amortized over the life of the shares and are recognized as a component of “Variable Rate Demand Preferred (“VRDP”) Shares, net of deferred offering costs” on the Statement of Assets and Liabilities and “Interest expense and amortization of offering costs” on the Statement of Operations. In addition to interest expense, each Fund may also pay a per annum liquidity fee to the liquidity provider, as well as a remarketing fee, which are recognized as “Liquidity fees” and “Remarketing fees,” respectively, on the Statement of Operations.
Preferred Share Transactions
Transactions in preferred shares for the Funds during the Funds’ current and prior fiscal period, were applicable, are noted in the following table.
Transactions in VMTP Shares for the Funds, where applicable, were as follows:
| Year Ended
|
| February 28, 2019 |
| NQP | Series | Shares | Amount |
VMTP Shares redeemed | 2019 | (870) | $(87,000,000) |
6. Income Tax Information
Each Fund is a separate taxpayer for federal income tax purposes. Each Fund intends to distribute substantially all of its net investment income and net capital gains to shareholders and to otherwise comply with the requirements of Subchapter M of the Internal Revenue Code applicable to regulated investment companies. Therefore, no federal income tax provision is required. Furthermore, each Fund intends to satisfy conditions that will enable interest from municipal securities, which is exempt from regular federal and designated state income taxes, to retain such tax-exempt status when distributed to shareholders of the Funds. Net realized capital gains and ordinary income distributions paid by the Funds are subject to federal taxation.
For all open tax years and all major taxing jurisdictions, management of the Funds has concluded that there are no significant uncertain tax positions that would require recognition in the financial statements. Open tax years are those that are open for examination by taxing authorities (i.e., generally the last four tax year ends and the interim tax period since then). Furthermore, management of the Funds is also not aware of any tax positions for which it is reasonably possible that the total amounts of unrecognized tax benefits will significantly change in the next twelve months.
The following information is presented on an income tax basis. Differences between amounts for financial statement and federal income tax purposes are primarily due to timing differences in recognizing taxable market discount, timing differences in recognizing certain gains and losses on investment transactions and the treatment of investments in inverse floating rate securities reflected as financing transactions, if any. To the extent that differences arise that are permanent in nature, such amounts are reclassified within the capital accounts as detailed below. Temporary differences do not require reclassification. Temporary and permanent differences do not impact the NAVs of the Funds.
81
Notes to Financial Statements (Unaudited) (continued)
The table below presents the cost and unrealized appreciation (depreciation) of each Fund’s investment portfolio, as determined on a federal income tax basis, as of August 31, 2020.
For purposes of this disclosure, derivative tax cost is generally the sum of any upfront fees or premiums exchanged and any amounts unrealized for income statement reporting but realized in income and/or capital gains for tax reporting. If a particular derivative category does not disclose any tax unrealized appreciation or depreciation, the change in value of those derivatives have generally been fully realized for tax purposes.
| | NXJ | | | NJV | | | NQP | | | NPN | |
Tax cost of investments | | $ | 892,399,119 | | | $ | 21,329,356 | | | $ | 723,133,176 | | | $ | 17,014,761 | |
Gross unrealized: | | | | | | | | | | | | | | | | |
| Appreciation | | | 86,440,279 | | | | 1,732,545 | | | | 67,538,882 | | | | 1,036,824 | |
| Depreciation | | | (3,809,172 | ) | | | (102,817 | ) | | | (8,074,266 | ) | | | (209,995 | ) |
Net unrealized appreciation (depreciation) of investments | | $ | 82,631,107 | | | $ | 1,629,728 | | | $ | 59,464,616 | | | $ | 826,829 | |
Permanent differences, primarily due to treatment of notional principal contracts, distribution reallocations, federal taxes paid, taxable market discount and nondeductible offering costs, resulted in reclassifications among the Funds’ components of common share net assets as of February 29, 2020, the Funds’ last tax year end.
The tax components of undistributed net tax-exempt income, net ordinary income and net long-term capital gains as of February 29, 2020, the Funds’ last tax year end, were as follows:
| | NXJ | | | NJV | | | NQP | | | NPN | |
Undistributed net tax-exempt income1 | | $ | 2,202,331 | | | $ | 11,079 | | | $ | 1,642,510 | | | $ | 1,503 | |
Undistributed net ordinary income2 | | | 4,742 | | | | — | | | | 204,934 | | | | — | |
Undistributed net long-term capital gains | | | — | | | | — | | | | — | | | | 102,582 | |
1 Undistributed net tax-exempt income (on a tax basis) has not been reduced for the dividend declared on February 3, 2020, paid on March 2, 2020.
2 Net ordinary income consists of taxable market discount income and net short-term capital gains, if any.
The tax character of distributions paid during the Funds’ last tax year ended February 29, 2020 was designated for purposes of the dividends paid deduction as follows:
| | NXJ | | | NJV | | | NQP | | | NPN | |
Distributions from net tax-exempt income | | $ | 33,822,993 | | | $ | 783,330 | | | $ | 27,340,285 | | | $ | 574,798 | |
Distributions from net ordinary income2 | | | 96,471 | | | | 2,000 | | | | 38,513 | | | | 2,434 | |
Distributions from net long-term capital gains | | | 433,490 | | | | — | | | | — | | | | 19,261 | |
2 Net ordinary income consists of taxable market discount income and net short-term capital gains, if any.
As of February 29, 2020, the Funds’ last tax year end, the following Funds had unused capital losses carrying forward available for federal income tax purposes to be applied against future capital gains, if any. The capital losses are not subject to expiration.
| | NXJ | | | NJV | | | NQP | |
Not subject to expiration:
| | | | | | | | | |
| Short-term | | $ | — | | | $ | 52,303 | | | $ | 2,269,003 | |
| Long-term | | | 469,676 | | | | 27,713 | | | | 537,870 | |
Total | | $ | 469,676 | | | $ | 80,016 | | | $ | 2,806,873 | |
7. Management Fees and Other Transactions with Affiliates
Management Fees
Each Fund’s management fee compensates the Adviser for overall investment advisory and administrative services and general office facilities. The Sub-Adviser is compensated for its services to the Funds from the management fees paid to the Adviser.
82
Each Fund’s management fee consists of two components – a fund-level fee, based only on the amount of assets within each individual Fund, and a complex-level fee, based on the aggregate amount of all eligible fund assets managed by the Adviser. This pricing structure enables Fund shareholders to benefit from growth in the assets within their respective Fund as well as from growth in the amount of complex-wide assets managed by the Adviser.
The annual fund-level fee, payable monthly, for each Fund is calculated according to the following schedules:
| NXJ |
| NQP |
| Average Daily Managed Assets* | Fund-Level Fee |
For the first $125 million | 0.4500% |
For the next $125 million | 0.4375
|
For the next $250 million | 0.4250
|
For the next $500 million | 0.4125
|
For the next $1 billion | 0.4000
|
For the next $3 billion | 0.3750
|
For managed assets over $5 billion | 0.3625
|
| NJV |
| NPN |
| Average Daily Net Assets* | Fund-Level Fee |
For the first $125 million | 0.4000% |
For the next $125 million | 0.3875
|
For the next $250 million | 0.3750
|
For the next $500 million | 0.3625
|
For the next $1 billion | 0.3500
|
For the next $3 billion | 0.3250
|
For managed assets over $5 billion | 0.3125
|
The annual complex-level fee, payable monthly, for each Fund is calculated by multiplying the current complex-wide fee rate, determined according to the following schedule by the Fund’s daily managed assets (net assets for NJV and NPN):
| Complex-Level Eligible Asset Breakpoint Level* | Effective Complex-Level Fee Rate at Breakpoint Level |
$55 billion | 0.2000% |
$56 billion | 0.1996
|
$57 billion | 0.1989
|
$60 billion | 0.1961
|
$63 billion | 0.1931
|
$66 billion | 0.1900
|
$71 billion | 0.1851
|
$76 billion | 0.1806
|
$80 billion | 0.1773
|
$91 billion | 0.1691
|
$125 billion | 0.1599
|
$200 billion | 0.1505
|
$250 billion | 0.1469
|
$300 billion | 0.1445
|
| * For the complex-level fees, managed assets include closed-end fund assets managed by the Adviser that are attributable to certain types of leverage. For these purposes, leverage includes the funds’ use of preferred stock and borrowings and certain investments in the residual interest certificates (also called inverse floating rate securities) in tender option bond (TOB) trusts, including the portion of assets held by a TOB trust that has been effectively financed by the trust’s issuance of floating rate securities, subject to an agreement by the Adviser as to certain funds to limit the amount of such assets for determining managed assets in certain circumstances. The complex-level fee is calculated based upon the aggregate daily managed assets of all Nuveen open-end and closed-end funds that constitute “eligible assets.” Eligible assets do not include assets attributable to investments in other Nuveen funds or assets in excess of a determined amount (originally $2 billion) added to the Nuveen fund complex in connection with the Adviser’s assumption of the management of the former First American Funds effective January 1, 2011, but do not include certain assets of certain Nuveen funds that were reorganized into funds advised by an affiliate of the Adviser during the 2019 calendar year. As of August 31, 2020, the complex-level fee for each Fund was 0.1574%. |
83
Notes to Financial Statements (Unaudited) (continued)
Other Transactions with Affiliates
Each Fund is permitted to purchase or sell securities from or to certain other funds or accounts managed by the Sub-Adviser (“Affiliated Entity”) under specified conditions outlined in procedures adopted by the Board (“cross-trade”). These procedures have been designed to ensure that any cross-trade of securities by the Fund from or to an Affiliated Entity by virtue of having a common investment adviser (or affiliated investment adviser), common officer and/or common trustee complies with Rule 17a-7 under the 1940 Act. These transactions are effected at the current market price (as provided by an independent pricing service) without incurring broker commissions.
During the current fiscal period, the following Funds engaged in cross-trades pursuant to these procedures as follows:
| Cross-Trades | NXJ | NJV |
Purchase | $4,420,000 | $100,000 |
Sales | 2,920,000 | 50,000 |
8. Borrowing Arrangements
Committed Line of Credit
The Funds, along with certain other funds managed by the Adviser (“Participating Funds”), have established a 364-day, $2.405 billion standby credit facility with a group of lenders, under which the Participating Funds may borrow for various purposes other than leveraging for investment purposes. Each Participating Fund is allocated a designated proportion of the facility’s capacity (and its associated costs, as described below) based upon a multi-factor assessment of the likelihood and frequency of its need to draw on the facility, the size of the Fund and its anticipated draws, and the potential importance of such draws to the operations and well-being of the Fund, relative to those of the other Funds. A Fund may effect draws on the facility in excess of its designated capacity if and to the extent that other Participating Funds have undrawn capacity. The credit facility expires in June 2021 unless extended or renewed.
The credit facility has the following terms: a 0.10% upfront fee, 0.15% per annum on unused commitment amounts and a drawn interest rate equal to the higher of (a) one-month LIBOR (London Inter-Bank Offered Rate) plus 1.25% (1.00% prior to June 24, 2020) per annum or (b) the Fed Funds rate plus 1.25% (1.00% prior to June 24, 2020) per annum on amounts borrowed. Participating Funds paid administration, legal and arrangement fees, which are recognized as a component of “other expenses” on the Statement of Operations, and along with commitment fees, have been allocated among such Participating Funds based upon the relative proportions of the facility’s aggregate capacity reserved for them and other factors deemed relevant by the Adviser and the Board of each Participating Fund.
During the current fiscal period, the Funds did not utilize this facility.
Inter-Fund Borrowing and Lending
The Securities and Exchange Commission (“SEC”) has granted an exemptive order permitting registered open-end and closed-end Nuveen funds to participate in an inter-fund lending facility whereby the Nuveen funds may directly lend to and borrow money from each other for temporary purposes (e.g., to satisfy redemption requests or when a sale of securities “fails,” resulting in an unanticipated cash shortfall) (the “Inter-Fund Program”). The closed-end Nuveen funds, including the Funds covered by this shareholder report, will participate only as lenders, and not as borrowers, in the Inter-Fund Program because such closed-end funds rarely, if ever, need to borrow cash to meet redemptions. The Inter-Fund Program is subject to a number of conditions, including, among other things, the requirements that (1) no fund may borrow or lend money through the Inter-Fund Program unless it receives a more favorable interest rate than is typically available from a bank or other financial institution for a comparable transaction; (2) no fund may borrow on an unsecured basis through the Inter-Fund Program unless the fund’s outstanding borrowings from all sources immediately after the inter-fund borrowing total 10% or less of its total assets; provided that if the borrowing fund has a secured borrowing outstanding from any other lender, including but not limited to another fund, the inter-fund loan must be secured on at least an equal priority basis with at least an equivalent percentage of collateral to loan value; (3) if a fund’s total outstanding borrowings immediately after an inter-fund borrowing would be greater than 10% of its total assets, the fund may borrow through the inter-fund loan on a secured basis only; (4) no fund may lend money if the loan would cause its aggregate outstanding loans through the Inter-Fund Program to exceed 15% of its net assets at the time of the loan; (5) a fund’s inter-fund loans to any one fund shall not exceed 5% of the lending fund’s net assets; (6) the duration of inter-fund loans will be limited to the time required to receive payment for securities sold, but in no event more than seven days; and (7) each inter-fund loan may be called on one business day’s notice by a lending fund and may be repaid on any day by a borrowing fund. In addition, a Nuveen fund may participate in the Inter-Fund Program only if and to the extent that such participation is consistent with the fund’s investment objective and investment policies. The Board is responsible for overseeing the Inter-Fund Program.
84
The limitations detailed above and the other conditions of the SEC exemptive order permitting the Inter-Fund Program are designed to minimize the risks associated with Inter-Fund Program for both the lending fund and the borrowing fund. However, no borrowing or lending activity is without risk. When a fund borrows money from another fund, there is a risk that the loan could be called on one day’s notice or not renewed, in which case the fund may have to borrow from a bank at a higher rate or take other actions to payoff such loan if an inter-fund loan is not available from another fund. Any delay in repayment to a lending fund could result in a lost investment opportunity or additional borrowing costs.
During the current reporting period, none of the Funds covered by this shareholder report have entered into any inter-fund loan activity.
85
Shareholder Update
(Unaudited)
Changes Occurring During the Reporting Period
The following information in this semi-annual report is a summary of certain changes during the reporting period. This information may not reflect all of the changes that have occurred since you purchased shares of a Fund
Amended and Restated By-Laws
On October 5, 2020, after a rigorous and deliberative review, and consistent with the interests of each Fund’s long-term shareholders, the Board of Trustees of each Fund adopted Amended and Restated By-Laws.
Among other changes, the Amended and Restated By-Laws require compliance with certain amended deadlines and procedural and informational requirements in connection with advance notice of shareholder proposals or nominations, including certain information about the proponent and the proposal, or in the case of a nomination, the nominee. Any shareholder considering making a nomination or other proposal should carefully review and comply with those provisions of the Amended and Restated By-Laws.
The Amended and Restated By-Laws also include provisions (the “Control Share By-Law”) pursuant to which, in summary, a shareholder who obtains beneficial ownership of common shares of a Fund in a “Control Share Acquisition” may exercise voting rights with respect to such shares only to the extent the authorization of such voting rights is approved by other shareholders of the Fund. The Control Share By-Law is primarily intended to protect the interests of the Fund and its long-term shareholders by limiting the risk that the Fund will become subject to undue influence by opportunistic traders pursuing short-term agendas adverse to the best interests of the Fund and its long-term shareholders. The Control Share By-Law does not eliminate voting rights for common shares acquired in Control Share Acquisitions, but rather entrusts the Fund’s other “non-interested” shareholders with determining whether to approve the authorization of the voting rights of the person acquiring such shares.
Subject to various conditions and exceptions, the Control Share By-Law defines a “Control Share Acquisition” to include an acquisition of common shares that, but for the Control Share By-Law, would give the beneficial owner, upon the acquisition of such shares, the ability to exercise voting power in the election of Trustees of a Fund in any of the following ranges:
| | (i) | one-tenth or more, but less than one-fifth of all voting power; |
| | (ii) | one-fifth or more, but less than one-third of all voting power; |
| | (iii) | one-third or more, but less than a majority of all voting power; or |
| | (iv) | a majority or more of all voting power. |
The Control Share By-Law generally excludes certain acquisitions of common shares from the definition of a Control Share Acquisition, including acquisitions of common shares that occurred prior to October 5, 2020, though such shares are included in assessing whether any subsequent share acquisition exceeds one of the enumerated thresholds.
Subject to certain conditions and procedural requirements set forth in the Control Share By-Law, including the delivery of a “Control Share Acquisition Statement” to the Funds’ Secretary setting forth certain required information, a shareholder who obtains or proposes to obtain beneficial ownership of common shares in a Control Share Acquisition generally may demand a special meeting of shareholders for the purpose of considering whether the voting rights of such acquiring person with respect to such shares shall be authorized.
This discussion is only a high-level summary of certain aspects of the Amended and Restated By-Laws, and is qualified in its entirety by reference to the Amended and Restated By-Laws. Shareholders should refer to the Amended and Restated By-Laws for more information. A copy of the Amended and Restated By-Laws can be found in the Current Report on Form 8-K filed by the Funds with the Securities and Exchange Commission on October 6, 2020, which is available at www.sec.gov, and may also be obtained by writing to the Secretary of the Funds at 333 West Wacker Drive, Chicago, Illinois 60606.
86
Additional FundInformation | | | | | | |
| Board of Trustees* | | | | | |
Jack B. Evans | William C. Hunter | Albin F. Moschner | John K. Nelson | Judith M. Stockdale | Carole E. Stone |
Terence J. Toth | Margaret L. Wolff | Robert L. Young | | | |
* Matthew Thornton III has been appointed to the Board of Trustee effective November 16, 2020. | | |
|
|
| Investment Adviser | Custodian | Legal Counsel | Independent Registered | Transfer Agent and |
Nuveen Fund Advisors, LLC | State Street Bank | Chapman and Cutler LLP | Public Accounting Firm | Shareholder Services |
333 West Wacker Drive | and Trust Company | Chicago, IL 60603 | KPMG LLP | Computershare Trust |
Chicago, IL 60606 | One Lincoln Street | | 200 East Randolph Street | Company, N.A. |
| Boston, MA 02111 | | Chicago, IL 60601 | 150 Royall Street |
| | | | Canton, MA 02021 |
| | | | (800) 257-8787 |
Portfolio of Investments Information
Each Fund is required to file its complete schedule of portfolio holdings with the Securities and Exchange Commission (SEC) for the first and third quarters of each fiscal year as an exhibit to its report of Form N-PORT. You may obtain this information on the SEC’s website at http://www.sec.gov.
Nuveen Funds’ Proxy Voting Information
You may obtain (i) information regarding how each fund voted proxies relating to portfolio securities held during the most recent twelve-month period ended June 30, without charge, upon request, by calling Nuveen toll-free at (800) 257-8787 or on Nuveen’s website at www.nuveen.com and (ii) a description of the policies and procedures that each fund used to determine how to vote proxies relating to portfolio securities without charge, upon request, by calling Nuveen toll free at (800) 257-8787. You may also obtain this information directly from the SEC. Visit the SEC on-line at http://www.sec.gov.
CEO Certification Disclosure
Each Fund’s Chief Executive Officer (CEO) has submitted to the New York Stock Exchange (NYSE) the annual CEO certification as required by Section 303A.12(a) of the NYSE Listed Company Manual. Each Fund has filed with the SEC the certification of its CEO and Chief Financial Officer required by Section 302 of the Sarbanes-Oxley Act.
Common Share Repurchases
Each Fund intends to repurchase, through its open-market share repurchase program, shares of its own common stock at such times and in such amounts as is deemed advisable. During the period covered by this report, each Fund repurchased shares of its common stock, as shown in the accompanying table. Any future repurchases will be reported to shareholders in the next annual or semi-annual report.
| NXJ | NJV | NQP | NPN |
Common shares repurchased | 25,343 | 6,499 | — | — |
FINRA BrokerCheck
The Financial Industry Regulatory Authority (FINRA) provides information regarding the disciplinary history of FINRA member firms and associated investment professionals. This information as well as an investor brochure describing FINRA BrokerCheck is available to the public by calling the FINRA BrokerCheck Hotline number at (800) 289-9999 or by visiting www.FINRA.org.
87
Glossary of Terms Used in this Report
| ■ | Average Annual Total Return: This is a commonly used method to express an investment’s performance over a particular, usually multi-year time period. It expresses the return that would have been necessary each year to equal the investment’s actual cumula- tive performance (including change in NAV or market price and reinvested dividends and capital gains distributions, if any) over the time period being considered. |
| ■ | Duration: Duration is a measure of the expected period over which a bond’s principal and interest will be paid, and consequently is a measure of the sensitivity of a bond’s or bond fund’s value to changes when market interest rates change. Generally, the longer a bond’s or fund’s duration, the more the price of the bond or fund will change as interest rates change. |
| ■ | Effective Leverage: Effective leverage is a fund’s effective economic leverage, and includes both regulatory leverage (see leverage) and the leverage effects of certain derivative investments in the fund’s portfolio. Currently, the leverage effects of Tender Option Bond (TOB) inverse floater holdings are included in effective leverage values, in addition to any regulatory leverage. |
| ■ | Inverse Floating Rate Securities: Inverse floating rate securities, also known as inverse floaters or tender option bonds (TOBs), are created by depositing a municipal bond, typically with a fixed interest rate, into a special purpose trust. This trust, in turn, (a) issues floating rate certificates typically paying short-term tax-exempt interest rates to third parties in amounts equal to some fraction of the deposited bond’s par amount or market value, and (b) issues an inverse floating rate certificate (sometimes referred to as an “inverse floater”) to an investor (such as a Fund) interested in gaining investment exposure to a long-term municipal bond. The income received by the holder of the inverse floater varies inversely with the short-term rate paid to the floating rate certificates’ holders, and in most circumstances the holder of the inverse floater bears substantially all of the underlying bond’s downside invest- ment risk. The holder of the inverse floater typically also benefits disproportionately from any potential appreciation of the underlying bond’s value. Hence, an inverse floater essentially represents an investment in the underlying bond on a leveraged basis. |
| ■ | Leverage: Leverage is created whenever a fund has investment exposure (both reward and/or risk) equivalent to more than 100% of the investment capital. |
| ■ | Net Asset Value (NAV) Per Share: A fund’s Net Assets is equal to its total assets (securities, cash, accrued earnings and receivables) less its total liabilities. NAV per share is equal to the fund’s Net Assets divided by its number of shares outstanding. |
| ■ | Pre-Refunding: Pre-Refunding, also known as advanced refundings or refinancings, is a procedure used by state and local govern- ments to refinance municipal bonds to lower interest expenses. The issuer sells new bonds with a lower yield and uses the proceeds to buy U.S. Treasury securities, the interest from which is used to make payments on the higher-yielding bonds. Because of this collateral, pre-refunding generally raises a bond’s credit rating and thus its value. |
| ■ | Regulatory Leverage: Regulatory leverage consists of preferred shares issued by or borrowings of a fund. Both of these are part of a fund’s capital structure. Regulatory leverage is subject to asset coverage limits set in the Investment Company Act of 1940. |
88
| ■ | S&P Municipal Bond Index: An unleveraged, market value-weighted index designed to measure the performance of the tax- exempt, investment-grade U.S. municipal bond market. Index returns assume reinvestment of distributions, but do not reflect any applicable sales charges or management fees. |
| ■ | S&P Municipal Bond New Jersey Index: An unleveraged, market value-weighted index designed to measure the performance of the tax-exempt, investment-grade New Jersey municipal bond market. Index returns assume reinvestment of distributions, but do not reflect any applicable sales charges or management fees. |
| ■ | S&P Municipal Bond Pennsylvania Index: An unleveraged, market value-weighted index designed to measure the performance of the tax-exempt, investment-grade Pennsylvania municipal bond market. Index returns assume reinvestment of distributions, but do not reflect any applicable sales charges or management fees. |
| ■ | Total Investment Exposure: Total investment exposure is a fund’s assets managed by the Adviser that are attributable to financial leverage. For these purposes, financial leverage includes a fund’s use of preferred stock and borrowings and investments in the residual interest certificates (also called inverse floating rate securities) in tender option bond (TOB) trusts, including the portion of assets held by a TOB trust that has been effectively financed by the trust’s issuance of floating rate securities. |
| ■ | Zero Coupon Bond: A zero coupon bond does not pay a regular interest coupon to its holders during the life of the bond. Income to the holder of the bond comes from accretion of the difference between the original purchase price of the bond at issuance and the par value of the bond at maturity and is effectively paid at maturity. The market prices of zero coupon bonds generally are more volatile than the market prices of bonds that pay interest periodically. |
89
Reinvest Automatically, Easily and Conveniently
Nuveen makes reinvesting easy. A phone call is all it takes to set up your reinvestment account.
Nuveen Closed-End Funds Automatic Reinvestment Plan
Nuveen Closed-End Fund allows you to conveniently reinvest distributions in additional Fund shares. By choosing to reinvest, you’ll be able to invest money regularly and automatically, and watch your investment grow through the power of compounding. Just like distributions in cash, there may be times when income or capital gains taxes may be payable on distributions that are reinvested. It is important to note that an automatic reinvestment plan does not ensure a profit, nor does it protect you against loss in a declining market.
Easy and convenient
To make recordkeeping easy and convenient, each month you’ll receive a statement showing your total distributions, the date of investment, the shares acquired and the price per share, and the total number of shares you own.
How shares are purchased
The shares you acquire by reinvesting will either be purchased on the open market or newly issued by the Fund. If the shares are trading at or above net asset value at the time of valuation, the Fund will issue new shares at the greater of the net asset value or 95% of the then-current market price. If the shares are trading at less than net asset value, shares for your account will be purchased on the open market. If the Plan Agent begins purchasing Fund shares on the open market while shares are trading below net asset value, but the Fund’s shares subsequently trade at or above their net asset value before the Plan Agent is able to complete its purchases, the Plan Agent may cease open-market purchases and may invest the uninvested portion of the distribution in newly-issued Fund shares at a price equal to the greater of the shares’ net asset value or 95% of the shares’ market value on the last business day immediately prior to the purchase date. Distributions received to purchase shares in the open market will normally be invested shortly after the distribution payment date. No interest will be paid on distributions awaiting reinvestment. Because the market price of the shares may increase before purchases are completed, the average purchase price per share may exceed the market price at the time of valuation, resulting in the acquisition of fewer shares than if the distribution had been paid in shares issued by the Fund. A pro rata portion of any applicable brokerage commissions on open market purchases will be paid by Plan participants. These commissions usually will be lower than those charged on individual transactions.
Flexible
You may change your distribution option or withdraw from the Plan at any time, should your needs or situation change. You can reinvest whether your shares are registered in your name, or in the name of a brokerage firm, bank, or other nominee. Ask your investment advisor if his or her firm will participate on your behalf. Participants whose shares are registered in the name of one firm may not be able to transfer the shares to another firm and continue to participate in the Plan. The Fund reserves the right to amend or terminate the Plan at any time. Although the Fund reserves the right to amend the Plan to include a service charge payable by the participants, there is no direct service charge to participants in the Plan at this time.
Call today to start reinvesting distributions
For more information on the Nuveen Automatic Reinvestment Plan or to enroll in or withdraw from the Plan, speak with your financial professional or call us at (800) 257-8787.
90
Annual Investment Management Agreement Approval Process
At a meeting held on May 19-21, 2020 (the “May Meeting”), the Boards of Trustees (collectively, the “Board” and each Trustee, a “Board Member”) of the Funds, which are comprised entirely of Board Members who are not “interested persons” (as defined under the Investment Company Act of 1940 (the “1940 Act”)) (the “Independent Board Members”), approved, for their respective Fund, the renewal of the management agreement (each, an “Investment Management Agreement”) with Nuveen Fund Advisors, LLC (the “Adviser”) pursuant to which the Adviser serves as investment adviser to such Fund and the sub-advisory agreement (each, a “Sub-Advisory Agreement”) with Nuveen Asset Management, LLC (the “Sub-Adviser”) pursuant to which the Sub-Adviser serves as the investment sub-adviser to such Fund. Although the 1940 Act requires that continuances of the Advisory Agreements (as defined below) be approved by the in-person vote of a majority of the Independent Board Members, the May Meeting was held virtually through the internet in view of the health risks associated with holding an in-person meeting during the COVID-19 pandemic and governmental restrictions on gatherings. The May Meeting was held in reliance on an order issued by the Securities and Exchange Commission on March 13, 2020, as extended on March 25, 2020, which provided registered investment companies temporary relief from the in-person voting requirements of the 1940 Act with respect to the approval of a fund’s advisory agreement in response to the challenges arising in connection with the COVID-19 pandemic.
Following up to an initial two-year period, the Board considers the renewal of each Investment Management Agreement and Sub-Advisory Agreement on behalf of the applicable Fund on an annual basis. The Investment Management Agreements and Sub-Advisory Agreements are collectively referred to as the “Advisory Agreements” and the Adviser and the Sub-Adviser are collectively, the “Fund Advisers” and each, a “Fund Adviser.” Throughout the year, the Board and its committees meet regularly and, at these meetings, review an extensive array of topics and information that are relevant to its annual consideration of the renewal of the advisory agreements for the Nuveen funds. Such information may address, among other things, fund performance; the Adviser’s strategic plans; the review of the funds and investment teams; compliance, regulatory and risk management matters; the trading practices of the various sub-advisers to the funds; valuation of securities; fund expenses; overall market and regulatory developments; the management of leverage financing; and the secondary market trading of the closed-end funds and any actions to address discounts.
In addition to the information and materials received during the year, the Board, in response to a request made on its behalf by independent legal counsel, received extensive materials and information prepared specifically for its annual consideration of the renewal of the advisory agreements for the Nuveen funds by the Adviser and by Broadridge Financial Solutions, Inc. (“Broadridge”), an independent provider of investment company data. The materials cover a wide range of topics including, but not limited to, a description of the nature, extent and quality of services provided by the Fund Advisers; a review of each sub-adviser to the Nuveen funds and the applicable investment teams; an analysis of fund performance in absolute terms and as compared to the performance of certain peer funds and benchmarks with a focus on any performance outliers; an analysis of the fees and expense ratios of the Nuveen funds in absolute terms and as compared to those of certain peer funds with a focus on any expense outliers; a description of portfolio manager compensation; a review of the secondary market trading of shares of the Nuveen closed-end funds (including, among other things, an analysis of performance, distribution and valuation and capital raising trends in the broader closed-end fund market and in particular with respect to Nuveen closed-end funds; a review of the leverage management actions taken on behalf of the Nuveen closed-end funds and their resulting impact on performance; and a description of the distribution management process and any capital management activities); a review of the performance of various service providers; a description of various initiatives Nuveen had undertaken or continued during the year for the benefit of particular fund(s) and/or the complex; a description of the profitability or financial data of Nuveen and the sub-advisers to the Nuveen funds; and a description of indirect benefits received by the Adviser and the sub-advisers as a result of their relationships with the Nuveen funds.
91
Annual Investment Management Agreement Approval Process (continued)
In continuing its practice, the Board met prior to the May Meeting to begin its considerations of the renewal of the Advisory Agreements. Accordingly, on April 27-28, 2020 (the “April Meeting”), the Board met to review and discuss, in part, the performance of the Nuveen funds and the Adviser’s evaluation of each sub-adviser to the Nuveen funds. In its review, the Board recognized the volatile market conditions occurring during the first half of 2020 arising, in part, from the public health crisis caused by the novel coronavirus known as COVID-19 and the resulting impact on fund performance. Accordingly, the Board reviewed, among other things, fund performance reflecting the more volatile periods, including for various time periods ended the first quarter of 2020 and for various time periods ended April 17, 2020. At the April Meeting, the Board Members asked questions and requested additional information that was provided for the May Meeting. In continuing its review of the Nuveen funds in light of the extraordinary market conditions experienced in early 2020, the Board received updated fund performance data reflecting various time periods ended May 8, 2020 for its May Meeting. The Board also continued its practice of seeking to meet periodically with the various sub-advisers to the Nuveen funds and their investment teams, when feasible.
The Independent Board Members considered the review of the advisory agreements for the Nuveen funds to be an ongoing process and employed the accumulated information, knowledge, and experience the Board Members had gained during their tenure on the boards governing the Nuveen funds and working with the Adviser and sub-advisers in their review of the advisory agreements. The contractual arrangements are a result of multiple years of review, negotiation and information provided in connection with the boards’ annual review of the Nuveen funds’ advisory arrangements and oversight of the Nuveen funds.
The Independent Board Members were advised by independent legal counsel during the annual review process as well as throughout the year, including meeting in executive sessions with such counsel at which no representatives from the Adviser or the Sub-Adviser were present. In connection with their annual review, the Independent Board Members also received a memorandum from independent legal counsel outlining their fiduciary duties and legal standards in reviewing the Advisory Agreements.
The Board’s decision to renew the Advisory Agreements was not based on a single identified factor, but rather the decision reflected the comprehensive consideration of all the information provided throughout the year and at the April and May Meetings, and each Board Member may have attributed different levels of importance to the various factors and information considered in connection with the approval process. The following summarizes the principal factors and information, but not all the factors, the Board considered in deciding to renew the Advisory Agreements and its conclusions.
A. Nature, Extent and Quality of Services
In evaluating the renewal of the Advisory Agreements, the Independent Board Members received and considered information regarding the nature, extent and quality of the applicable Fund Adviser’s services provided to the respective Fund with particular focus on the services and enhancements to such services provided during the last year. The Independent Board Members considered the Investment Management Agreements and the Sub-Advisory Agreements separately in the course of their review. With this approach, they considered the respective roles of the Adviser and the Sub-Adviser in providing services to the Funds.
With respect to the Adviser, the Board recognized that the Adviser has provided a vast array of services the scope of which has expanded over the years in light of regulatory, market and other developments, such as the development of expanded compliance programs for the Nuveen funds. The Board also noted the extensive resources, tools and capabilities the Adviser and its affiliates devoted to the various operations of the Nuveen funds. These services include, but are not limited to: investment oversight, risk management and securities valuation services (such as analyzing investment performance and risk data; overseeing and reviewing the various sub-advisers to the Nuveen funds and their investment teams; overseeing trade execution, soft dollar practices and securities lending activities; providing daily valuation services and developing related valuation policies, procedures and methodologies; overseeing risk disclosure; periodic testing of investment and liquidity risks; participating in financial statement and marketing disclosures; participating in product development; and participating in leverage management and liquidity monitoring); product management (such as analyzing a fund’s position in the marketplace, setting dividends, preparing
92
shareholder and intermediary communications and other due diligence support); fund administration (such as preparing fund tax returns and other tax compliance services, overseeing the funds’ independent public accountants and other service providers; managing fund budgets and expenses; and helping to fulfill the funds’ regulatory filing requirements); oversight of shareholder services and transfer agency functions (such as overseeing transfer agent service providers which include registered shareholder customer service and transaction processing; and overseeing proxy solicitation and tabulation services); Board relations services (such as organizing and administering Board and committee meetings, preparing various reports to the Board and committees and providing other support services); compliance and regulatory oversight services (such as devising compliance programs; managing compliance policies; monitoring compliance with applicable fund policies and laws and regulations; and evaluating the compliance programs of the various sub-advisers to the Nuveen funds and certain other service providers); legal support and oversight of outside law firms (such as helping to prepare and file registration statements and proxy statements; overseeing fund activities and providing legal interpretations regarding such activities; and negotiating agreements with other fund service providers); and providing leverage, capital and distribution management services.
The Board also recognized that the Adviser and its affiliates have undertaken a number of initiatives over the previous year that benefited the complex and/or particular Nuveen funds including, but not limited to:
• Fund Improvements and Product Management Initiatives – continuing to proactively manage the Nuveen fund complex as a whole and at the individual fund level with an aim to enhance the shareholder outcomes through, among other things, rationalizing the product line and gaining efficiencies through mergers, repositionings and liquidations; reviewing and updating investment policies and benchmarks; and integrating certain investment teams and changing the portfolio managers serving various funds;
• Capital Initiatives – continuing to invest capital to support new Nuveen funds with initial capital as well as to facilitate modifications to the strategies or structure of existing funds;
• Compliance Program Initiatives – continuing efforts to mitigate compliance risk, increase operating efficiencies, strengthen key compliance program elements and support international business growth and other objectives through, among other things, integrating various investment teams across affiliates, consolidating marketing review functions, enhancing compliance related technologies and establishing and maintaining shared broad-based compliance policies throughout the organization and its affiliates;
• Risk Management and Valuation Services - continuing efforts to provide Nuveen with a more disciplined and consistent approach to identifying and mitigating the firm’s operational risks through, among other things, enhancing the interaction and reporting between the investment risk management team and various affiliates and adopting a risk operational framework across the complex;
• Regulatory Matters – continuing efforts to monitor regulatory trends and advocate on behalf of the Nuveen funds, to implement and comply with new or revised rules and mandates and to respond to regulatory inquiries and exams;
• Government Relations – continuing efforts of various Nuveen teams and affiliates to develop policy positions on a broad range of issues that may impact the Nuveen funds, advocate and communicate these positions to lawmakers and other regulatory authorities and work with trade associations to ensure these positions are represented;
• Business Continuity, Disaster Recovery and Information Services – continuing to periodically test business continuity and disaster recovery plans, maintain an information security program designed to identify and manage information security risks, and provide reports to the Board, at least annually, addressing, among other things, management’s security risk assessment, cyber risk profile, potential impact of new or revised laws and regulations, incident tracking and other relevant information technology risk-related reports;
93
Annual Investment Management Agreement Approval Process (continued)
• Expanded Dividend Management Services – continuing to manage the dividends among the varying types of Nuveen funds within the Nuveen complex to be consistent with the respective fund’s product design and investing resources to develop systems to assist in the process for newer products such as target term funds; and
• with respect specifically to closed-end funds, such initiatives also included:
•• Leverage Management Services – continuing to actively manage leverage including developing new leverage instruments, managing leverage exposure and costs through various providers, and managing and adapting tender option bond structures to comply with regulations and developing further relationships with leverage providers;
•• Capital Management, Market Intelligence and Secondary Market Services – ongoing capital management efforts through shelf offerings, share repurchases as appropriate to address discounts, tender offers and capital return programs as well as providing market data analysis to help understand closed-end fund ownership cycles and their impact on secondary market trading as well as to improve proxy solicitation efforts; and
•• Closed-end Fund Investor Relations Program – maintaining the closed-end fund investor relations program which, among other things, raises awareness, provides educational materials and cultivates advocacy for closed-end funds and the Nuveen closed-end fund product line.
The Board also noted the benefits to shareholders of investing in a Nuveen fund, as each Nuveen fund is a part of a large fund complex with a variety of investment disciplines, capabilities, expertise and resources available to navigate and support the funds including during stressed times as occurred in the market in the first half of 2020. In addition to the services provided by the Adviser, the Board also considered the risks borne by the Adviser and its affiliates in managing the Nuveen funds, including entrepreneurial, operational, reputational, regulatory and litigation risks.
The Board further considered the division of responsibilities between the Adviser and the Sub-Adviser and recognized that the Sub-Adviser and its investment personnel generally are responsible for the management of each Fund’s portfolio under the oversight of the Adviser and the Board. The Board considered an analysis of the Sub-Adviser provided by the Adviser which included, among other things, the Sub-Adviser’s assets under management and changes thereto, a summary of the applicable investment team and changes thereto, the investment approach of the team and the performance of the funds sub-advised by the Sub-Adviser over various periods. The Board further considered at the May Meeting or prior meetings evaluations of the Sub-Adviser’s compliance program and trade execution. The Board also considered the structure of investment personnel compensation programs and whether this structure provides appropriate incentives to act in the best interests of the respective Nuveen funds. The Board noted that the Adviser recommended the renewal of the Sub-Advisory Agreements.
Based on its review, the Board determined, in the exercise of its reasonable business judgment, that it was satisfied with the nature, extent and quality of services provided to the respective Funds under each applicable Advisory Agreement.
B. The Investment Performance of the Funds and Fund Advisers
In evaluating the quality of the services provided by the Fund Advisers, the Board also received and considered a variety of investment performance data of the Nuveen funds they advise. In this regard, the Board reviewed, among other things, Fund performance over the quarter, one-, three- and five-year periods ending December 31, 2019. Unless otherwise indicated, the performance data referenced below reflects the periods ended December 31, 2019. In general, the year 2019 was a period of strong market performance. However, as noted above, the Board recognized the unprecedented market volatility and decline that occurred in early 2020 and the significant impact it would have on fund performance. As a result, the Board reviewed performance data capturing more recent time periods, including performance data reflecting the first quarter of 2020 as well as performance data for various periods ended April 17, 2020 for its April Meeting and May 8, 2020 for its May Meeting.
94
The Board reviewed both absolute and relative fund performance during the annual review over the various time periods. With respect to the latter, the Board considered fund performance in comparison to the performance of peer funds (the “Performance Peer Group”) and recognized and/or customized benchmarks (i.e., generally benchmarks derived from multiple recognized benchmarks). For funds that had changes in portfolio managers, the Board considered performance data of such funds before and after such changes. In considering performance data, the Board is aware of certain inherent limitations with such data, including that differences between the objective(s), strategies and other characteristics of the Nuveen funds compared to the respective Performance Peer Group and/or benchmark(s) (such as differences in the use of leverage) as well as differences in the composition of the Performance Peer Group over time will necessarily contribute to differences in performance results and limit the value of the comparative information. To assist the Board in its review of the comparability of the relative performance, the Adviser has ranked the relevancy of the peer group to the funds as low, medium or high.
As noted above, the Board reviewed fund performance over various periods ended December 31, 2019 as well as the first quarter of 2020 and various time periods ended April 17, 2020 and May 8, 2020. In light of the significant market decline in the early part of 2020, the Board noted that a shorter period of underperformance may significantly impact longer term performance. Further, the Board recognized that performance data may differ significantly depending on the ending date selected and accordingly, performance results for periods ended at the year-end of 2019 may vary significantly from performance results for periods ended in the first quarter of 2020, particularly given the extraordinary market conditions at that time as the impact of COVID-19 and other market developments unfolded. The Board considered a fund’s performance in light of the overall financial market conditions. In addition, the Board recognized that shareholders may evaluate performance based on their own holding periods which may differ from the periods reviewed by the Board and lead to differing results.
The secondary market trading of shares of the Nuveen closed-end funds continues to be a priority for the Board given its importance to shareholders, and therefore data reflecting the premiums and discounts at which the shares of the closed-end funds trade is reviewed by the Board during its annual review and by the Board and/or its Closed-end Fund committee during its respective quarterly meetings throughout the year.
In addition to the performance data prepared in connection with the annual review of the advisory agreements of the Nuveen funds, the Board reviewed fund performance throughout the year at its quarterly meetings representing differing time periods and took into account the discussions that occurred at these Board meetings in evaluating a fund’s overall performance. The Board also considered, among other things, the Adviser’s analysis of each Nuveen fund’s performance, with particular focus on funds that were considered performance outliers (both overperformance and underperformance), the factors contributing to the performance and any steps taken to address any performance concerns. Given the volatile market conditions of early 2020, the Board considered the Adviser’s analysis of the impact of such conditions on the Nuveen funds’ performance.
The Board evaluated performance in light of various factors, including general market conditions, issuer-specific information, asset class information, fund cash flows and other factors. Accordingly, depending on the facts and circumstances, the Board may be satisfied with a fund’s performance notwithstanding that its performance may be below its benchmark or peer group for certain periods. However, with respect to any Nuveen funds for which the Board had identified performance issues, the Board monitors such funds closely until performance improves, discusses with the Adviser the reasons for such results, considers whether any steps are necessary or appropriate to address such issues, and reviews the results of any efforts undertaken.
The Board’s determinations with respect to each Fund are summarized below.
For Nuveen New Jersey Quality Municipal Income Fund (the “New Jersey Quality Fund”), the Board noted that the Fund outperformed its benchmark and ranked in the first quartile of its Performance Peer Group for the one-, three- and five-year periods ended December 31, 2019. With the market decline in the first quarter of 2020, the Fund continued to outperform its benchmark and rank in the first quartile of its Performance Peer Group for the one-, three- and five-year periods ended March 31,
95
Annual Investment Management Agreement Approval Process (continued)
2020. In its review, however, the Board noted that the Performance Peer Group was classified as low for relevancy. The Board was satisfied with the Fund’s overall performance.
For Nuveen New Jersey Municipal Value Fund (the “New Jersey Value Fund”), the Board noted that the Fund ranked in the fourth quartile of its Performance Peer Group for the one-, three- and five-year periods ended December 31, 2019. The Board, however, noted that the Performance Peer Group was classified as low for relevancy given, among other things, the small size of the peer group and the use of leverage by certain of the peers. While the Fund’s performance was below the performance of its benchmark for the three- and five-year periods ended December 31, 2019, the Fund outperformed its benchmark for the one-year period ended December 31, 2019. With the market decline in the first quarter of 2020, although the Fund’s performance was below the performance of its benchmark and the Fund ranked in the fourth quartile of its Performance Peer Group for the three- and five-year periods ended March 31, 2020, the Fund outperformed its benchmark and ranked in the second quartile of its Performance Peer Group for the one-year period ended March 31, 2020. The Board was satisfied with the Fund’s overall performance.
For Nuveen Pennsylvania Quality Municipal Income Fund (the “Pennsylvania Quality Fund”), the Board noted that the Fund outperformed its benchmark and ranked in the first quartile of its Performance Peer Group for the one-, three- and five-year periods ended December 31, 2019. With the market decline in the first quarter of 2020, although the Fund’s performance was below the performance of its benchmark for the one-year period ended March 31, 2020, the Fund outperformed its benchmark for the three- and five-year periods ended March 31, 2020. The Fund further ranked in the first quartile of its Performance Peer Group for the one-, three- and five-year periods ended March 31, 2020. The Board was satisfied with the Fund’s overall performance.
For Nuveen Pennsylvania Municipal Value Fund (the “Pennsylvania Value Fund”), the Board noted that although the Fund’s performance was below the performance of its benchmark for the three- and five-year periods ended December 31, 2019, the Fund outperformed its benchmark for the one-year period ended December 31, 2019. The Fund further ranked in the fourth quartile of its Performance Peer Group for the one-, three- and five-year periods ended December 31, 2019. In its review, the Board noted that the Performance Peer Group was classified as low for relevancy due to, in part, the small size of the peer group and the use of leverage among certain peers in the Performance Peer Group. With the market decline in the first quarter of 2020, the Fund’s performance was below the performance of its benchmark for the one-, three- and five-year periods ended March 31, 2020. Although the Fund ranked in the fourth quartile of its Performance Peer Group for the three- and five-year periods ended March 31, 2020, the Fund ranked in the third quartile of its Performance Peer Group for the one-year period ended March 31, 2020. The Board was satisfied with the Fund’s overall performance.
C. Fees, Expenses and Profitability
1. Fees and Expenses
As part of its annual review, the Board considered the contractual management fee and net management fee (the management fee after taking into consideration fee waivers and/or expense reimbursements, if any) paid by a Nuveen fund to the Adviser in light of the nature, extent and quality of the services provided. The Board also considered the total operating expense ratio of each Nuveen fund before and after any fee waivers and/or expense reimbursements. More specifically, the Independent Board Members reviewed, among other things, each fund’s gross and net management fee rates (i.e., before and after expense reimbursements and/or fee waivers, if any) and net total expense ratio in relation to those of a comparable universe of funds (the “Peer Universe”) established by Broadridge. The Independent Board Members reviewed the methodology Broadridge employed to establish its Peer Universe and recognized that differences between the applicable fund and its respective Peer Universe as well as changes to the composition of the Peer Universe from year to year may limit some of the value of the comparative data. The Independent Board Members also considered a fund’s operating expense ratio as it more directly reflected the shareholder’s costs in investing in the respective fund.
96
In their review, the Independent Board Members considered, in particular, each Nuveen fund with a net expense ratio (excluding investment-related costs of leverage) of six basis points or higher compared to that of its peer average (each, an “Expense Outlier Fund”), including the New Jersey Quality Fund, and an analysis as to the factors contributing to each such fund’s higher relative net expense ratio. In addition, although the Board reviewed a fund’s total net expenses both including and excluding investment-related expenses (i.e., leverage costs) and taxes for certain of the closed-end funds, the Board recognized that leverage expenses will vary across funds and in comparison to peers because of differences in the forms and terms of leverage employed by the respective fund. Accordingly, in reviewing the comparative data between a fund and its peers, the Board generally considered the fund’s net expense ratio and fees (excluding leverage costs and leveraged assets) to be higher if they were over 10 basis points higher, slightly higher if they were 6 to 10 basis points higher, in line if they were within approximately 5 basis points higher than the peer average and below if they were below the peer average of the Peer Universe. The Independent Board Members also considered, in relevant part, a fund’s net management fee and net total expense ratio in light of its performance history.
In their review of the fee arrangements for the Nuveen funds, the Independent Board Members considered the management fee schedules, including the complex-wide and fund-level breakpoint schedules. The Board noted that across the Nuveen fund complex, the complex-wide fee breakpoints reduced fees by $56.6 million and fund-level breakpoints reduced fees by $66.8 million in 2019.
With respect to the Sub-Adviser, the Board also considered the sub-advisory fee schedule paid to the Sub-Adviser in light of the sub-advisory services provided to the respective Fund, the breakpoint schedule and comparative data of the fees the Sub-Adviser charges to other clients, if any. In its review, the Board recognized that the compensation paid to the Sub-Adviser is the responsibility of the Adviser, not the Funds.
The Independent Board Members noted that (a) the Pennsylvania Value Fund had a net management fee and a net expense ratio that were below the respective peer averages; (b) the New Jersey Value Fund had a net management fee that was below the peer average and a net expense ratio that was the same as the peer average; (c) the Pennsylvania Quality Fund had a net management fee that was higher than the peer average, but a net expense ratio that was in line with the peer average; and (d) the New Jersey Quality Fund had a net management fee that was higher than the peer average and a net expense ratio that was slightly higher than the peer average. The Board noted the New Jersey Quality Fund’s net expense ratio was slightly higher than the peer set average due, in part, to the small size of the peer set which was comprised of three peers, one of which was a Nuveen fund.
Based on its review of the information provided, the Board determined that each Fund’s management fees (as applicable) to a Fund Adviser were reasonable in light of the nature, extent and quality of services provided to the Fund.
2. Comparisons with the Fees of Other Clients
In determining the appropriateness of fees, the Board also considered information regarding the fee rates the respective Fund Advisers charged to certain other types of clients and the type of services provided to these other clients. With respect to the Adviser and/or the Sub-Adviser, such other clients may include retail and institutional managed accounts, passively managed exchange-traded funds (“ETFs”) sub-advised by the Sub-Adviser but that are offered by another fund complex and municipal managed accounts offered by an unaffiliated adviser. With respect to the Sub-Adviser, the Board reviewed, among other things, the fee range and average fee of municipal retail wrap accounts and municipal institutional accounts.
In considering the fee data of other clients, the Board considered, among other things, the differences in the amount, type and level of services provided to the Nuveen funds relative to other clients as well as the differences in portfolio investment policies, investor profiles, account sizes and regulatory requirements, all of which contribute to the variations in the fee schedules. The Board recognized the complexity and myriad of services the Adviser had provided to the Nuveen funds compared to the other types of clients as the Adviser is principally responsible for all aspects of operating the funds, including complying with the
97
Annual Investment Management Agreement Approval Process (continued)
increased regulatory requirements required when managing the funds as well as the increased entrepreneurial, legal and regulatory risks that the Adviser incurs in sponsoring and managing the funds. Further, with respect to ETFs, the Board considered that Nuveen ETFs are passively managed compared to the active management of the other Nuveen funds which contributed to the differences in fee levels between the Nuveen ETFs and other Nuveen funds. In general, higher fee levels reflect higher levels of service provided by the Adviser, increased investment management complexity, greater product management requirements, and higher levels of business risk or some combination of these factors. The Board further considered that the Sub-Adviser’s fee is essentially for portfolio management services and therefore more comparable to the fees it receives for retail wrap accounts and other external sub-advisory mandates. The Board concluded the varying levels of fees were justified given, among other things, the inherent differences in the products and the level of services provided to the Nuveen funds versus other clients, the differing regulatory requirements and legal liabilities and the entrepreneurial, legal and regulatory risks incurred in sponsoring and advising a registered investment company.
3. Profitability of Fund Advisers
In their review, the Independent Board Members considered information regarding Nuveen’s level of profitability for its advisory services to the Nuveen funds for the calendar years 2019 and 2018. The Board reviewed, among other things, Nuveen’s net margins (pre-tax) (both including and excluding distribution expenses); gross and net revenue margins (pre- and post-tax); revenues, expenses, and net income (pre-tax and after-tax and before distribution) of Nuveen for fund advisory services; and comparative profitability data comparing the margins of Nuveen compared to the adjusted margins of certain peers with publicly available data and with the most comparable assets under management (based on asset size and asset composition) for each of the last two calendar years. The Board also reviewed the revenues and expenses the Adviser derived from its ETF product line for the 2018 and 2019 calendar years.
In reviewing the profitability data, the Independent Board Members recognized the subjective nature of calculating profitability as the information is not audited and is dependent on cost allocation methodologies to allocate expenses of Nuveen and its affiliates between the fund and non-fund businesses. The expenses to be allocated include direct expenses in servicing the Nuveen funds as well as indirect and/or shared costs (such as overhead, legal and compliance) some of which are attributed to the Nuveen funds pursuant to the cost allocation methodologies. The Independent Board Members reviewed a description of the cost allocation methodologies employed to develop the financial information and a summary of the history of changes to the methodology over the eleven-year period from 2008 to 2019. The Board had also appointed three Independent Board Members, along with the assistance of independent counsel, to serve as the Board’s liaisons to review the development of the profitability data and any proposed changes to the cost allocation methodology prior to incorporating any such changes and to report to the full Board. The Board recognized that other reasonable and valid allocation methodologies could be employed and could lead to significantly different results. Based on the data, the Independent Board Members noted that Nuveen’s net margins were higher in 2019 than the previous year and considered the key drivers behind the revenue and expense changes that impacted Nuveen’s net margins between the years. The Board also noted the reinvestments of some of the profits into the business through, among other things, the investment of seed capital in certain funds and continued investments in enhancements to information technology, internal infrastructure and data management improvements and global investment and innovation projects.
As noted above, the Independent Board Members also considered Nuveen’s margins from its relationship to the Nuveen funds compared to the adjusted margins of certain peers with publicly available data and with the most comparable assets under management (based on asset size and asset composition) to Nuveen for the calendar years 2019 and 2018. The Independent Board Members noted that Nuveen’s margins from its relationships with the Nuveen funds were on the low range compared to the adjusted margins of the peers. The Independent Board Members, however, recognized that it is difficult to make comparisons of profitability with other investment adviser peers given that comparative data is not generally public and the calculation of profitability is subjective and affected by numerous factors (such as types of funds a peer manages, its business mix, its cost of
98
capital, the numerous assumptions underlying the methodology used to allocate expenses and other factors) which can have a significant impact on the results.
Aside from Nuveen’s profitability, the Board recognized that the Adviser is a subsidiary of Nuveen, LLC, the investment management arm of Teachers Insurance and Annuity Association of America (“TIAA”). As such, the Board also reviewed a balance sheet for TIAA reflecting its assets, liabilities and capital and contingency reserves for the 2019 and 2018 calendar years to consider the financial strength of TIAA. The Board recognized the benefit of having an investment adviser and its parent with significant resources, particularly during periods of market stress.
In addition to Nuveen, the Independent Board Members also considered the profitability of the Sub-Adviser from its relationships with the Nuveen funds. In this regard, the Independent Board Members reviewed, among other things, the Sub-Adviser’s revenues, expenses and net revenue margins (pre- and post-tax) for its advisory activities for the calendar year ended December 31, 2019 as well as its pre-tax and after-tax net revenue margins for 2019 compared to such margins for 2018. The Independent Board Members also reviewed a profitability analysis reflecting the revenues, expenses and revenue margin (pre-and post-tax) by asset type for the Sub-Adviser for the calendar year ended December 31, 2019 and the pre- and post-tax revenue margins from 2019 and 2018.
In evaluating the reasonableness of the compensation, the Independent Board Members also considered any other ancillary benefits derived by the respective Fund Adviser from its relationship with the Nuveen funds as discussed in further detail below.
Based on a consideration of all the information provided, the Board noted that Nuveen’s and the Sub-Adviser’s level of profitability was acceptable and not unreasonable in light of the services provided.
D. Economies of Scale and Whether Fee Levels Reflect These Economies of Scale
The Board considered whether there have been economies of scale with respect to the management of the Nuveen funds and whether these economies of scale have been appropriately shared with the funds. The Board recognized that although economies of scale are difficult to measure, there are several methods to help share the benefits of economies of scale, including breakpoints in the management fee schedule, fee waivers and/or expense limitations, the pricing of Nuveen funds at scale at inception and investments in Nuveen’s business which can enhance the services provided to the funds for the fees paid. The Board noted that Nuveen generally has employed these various methods. In this regard, the Board noted that the management fee of the Adviser is generally comprised of a fund-level component and a complex-level component each with its own breakpoint schedule, subject to certain exceptions. The Board reviewed the fund-level and complex-level fee schedules. The Board considered that the fund-level breakpoint schedules are designed to share economies of scale with shareholders if the particular fund grows, and the complex-level breakpoint schedule is designed to deliver the benefits of economies of scale to shareholders when the eligible assets in the complex pass certain thresholds even if the assets of a particular fund are unchanged or have declined. With respect to the Nuveen closed-end funds, the Board noted that, although such funds may from time to time make additional share offerings, the growth of their assets would occur primarily through the appreciation of such funds’ investment portfolios. Further, in the calculation of the complex-level component, the Board noted that it had approved the acquisition of several Nuveen funds by similar TIAA-CREF funds in 2019. However, to mitigate the loss of the assets of these Nuveen funds deemed eligible to be included in the calculation of the complex-wide fee when these Nuveen funds left the complex upon acquisition, Nuveen agreed to credit approximately $460 million to assets under management to the Nuveen complex in calculating the complex-wide component.
The Independent Board Members also recognized the Adviser’s continued reinvestment in its business through, among other things, investments in its business infrastructure and information technology, portfolio accounting system and other systems and platforms that will, among other things, support growth, simplify and enhance information sharing, and enhance the investment process to the benefit of all of the Nuveen funds.
99
Annual Investment Management Agreement Approval Process (continued)
Based on its review, the Board concluded that the current fee arrangements together with the Adviser’s reinvestment in its business appropriately shared any economies of scale with shareholders.
E. Indirect Benefits
The Independent Board Members received and considered information regarding other benefits the respective Fund Adviser or its affiliates may receive as a result of their relationship with the Nuveen funds. The Board considered the compensation that an affiliate of the Adviser received for serving as co-manager in the initial public offerings of new closed-end funds and for serving as an underwriter on shelf offerings of existing closed-end funds. In addition, the Independent Board Members also noted that various sub-advisers (including the Sub-Adviser) may engage in soft dollar transactions pursuant to which they may receive the benefit of research products and other services provided by broker-dealers executing portfolio transactions on behalf of the applicable Nuveen funds, although the Board recognized that certain sub-advisers may be phasing out the use of soft dollars over time.
The Board, however, noted that the benefits for the Sub-Adviser when transacting in fixed-income securities may be more limited as such securities generally trade on a principal basis and therefore do not generate brokerage commissions. Further, the Board considered that although the Sub-Adviser may benefit from the receipt of research and other services that it may otherwise have to pay for out of its own resources, the research may also benefit the Nuveen funds to the extent it enhances the ability of the Sub-Adviser to manage such funds or is acquired through the commissions paid on portfolio transactions of other clients.
Based on its review, the Board concluded that any indirect benefits received by a Fund Adviser as a result of its relationship with the Funds were reasonable and within acceptable parameters.
F. Other Considerations
The Board Members did not identify any single factor discussed previously as all-important or controlling. The Board Members, including the Independent Board Members, concluded that the terms of each Advisory Agreement were fair and reasonable, that the respective Fund Adviser’s fees were reasonable in light of the services provided to each Fund and that the Advisory Agreements be renewed.
100
Notes
101
Notes
102
Notes
103
Nuveen:
Serving Investors for Generations
Since 1898, financial professionals and their clients have relied on Nuveen to provide dependable investment solutions through continued adherence to proven, long-term investing principles. Today, we offer a range of high quality solutions designed to be integral components of a well-diversified core portfolio.
Focused on meeting investor needs.
Nuveen is the investment manager of TIAA. We have grown into one of the world’s premier global asset managers, with specialist knowledge across all major asset classes and particular strength in solutions that provide income for investors and that draw on our expertise in alternatives and responsible investing. Nuveen is driven not only by the independent investment processes across the firm, but also the insights, risk management, analytics and other tools and resources that a truly world-class platform provides. As a global asset manager, our mission is to work in partnership with our clients to create solutions which help them secure their financial future.
Find out how we can help you.
To learn more about how the products and services of Nuveen may be able to help you meet your financial goals, talk to your financial professional, or call us at (800) 257-8787. Please read the information provided carefully before you invest. Investors should consider the investment objective and policies, risk considerations, charges and expenses of any investment carefully. Where applicable, be sure to obtain a prospectus, which contains this and other relevant information. To obtain a prospectus, please contact your securities representative or Nuveen, 333 W. Wacker Dr., Chicago, IL 60606. Please read the prospectus carefully before you invest or send money.
Learn more about Nuveen Funds at: www.nuveen.com/closed-end funds
Nuveen Securities, LLC, member FINRA and SIPC | 333 West Wacker Drive Chicago, IL 60606 | www.nuveen.com
ESA-D-0820D 1347355-INV-B-10/21