Exhibit 99.2

Q4 2018 Earnings Call
Q4 2018 Earnings Call Legal Disclaimer This presentation contains forward - looking statements within the meaning of the federal securities laws. All statements other th an statements of historical facts contained in this presentation, including statements regarding our future results of operations and financial position, business strategy and p lan s and objectives of management for future operations, are forward - looking statements. In many cases, you can identify forward - looking statements by terms such as “may,” “should,” “ex pects,” “plans,” “anticipates,” “could,” “intends,” “target,” “projects,” “contemplates,” “believes,” “estimates,” “predicts,” “potential” or “continue” or the negative of these te rms or other similar words. Forward - looking statements contained in this presentation include, but are not limited to, statements about (i) growth of the wind energy market and our ad dressable market; (ii) the potential impact of the increasing prevalence of auction - based tenders in the wind energy market and increased competition from solar energy on our gros s margins and overall financial performance; (iii) our future financial performance, including our net sales, cost of goods sold, gross profit or gross margin, operating expens es, ability to generate positive cash flow, and ability to achieve or maintain profitability; (iv) changes in domestic or international government or regulatory policy, including witho ut limitation, changes in trade policy. (v) the sufficiency of our cash and cash equivalents to meet our liquidity needs; (vi) our ability to attract and retain customers for our products, and to optimize product pricing; (vii) our ability to effectively manage our growth strategy and future expenses, including our startup and transition costs; (viii) competition from other win d b lade and wind blade turbine manufacturers; (ix) the discovery of defects in our products; (x) our ability to successfully expand in our existing wind energy markets and into new in ternational wind energy markets; (xi) our ability to successfully expand our transportation business and execute upon our strategy of entering new markets outside of wind energy; (x ii) worldwide economic conditions and their impact on customer demand; (xiii) our ability to maintain, protect and enhance our intellectual property; (xiv) our ability to compl y w ith existing, modified or new laws and regulations applying to our business, including the imposition of new taxes, duties or similar assessments on our products; (xv) the attraction an d r etention of qualified employees and key personnel; (xvi) our ability to maintain good working relationships with our employees, and avoid labor disruptions, strikes and other dispute s w ith labor unions that represent certain of our employees; and (xvii) our ability to procure adequate supplies of raw materials and components to fulfill our wind blade volu me commitments to our customers. These forward - looking statements are only predictions. These statements relate to future events or our future financial performa nce and involve known and unknown risks, uncertainties and other important factors that may cause our actual results, levels of activity, performance or achievements to materially differ from any future results, levels of activity, performance or achievements expressed or implied by these forward - looking statements. Because forward - looking statements are inh erently subject to risks and uncertainties, some of which cannot be predicted or quantified, you should not rely on these forward - looking statements as guarantees of future even ts. Further information on the factors, risks and uncertainties that could affect our financial results and the forward - looking statements in this presentation are included in ou r filings with the Securities and Exchange Commission and will be included in subsequent periodic and current reports we make with the Securities and Exchange Commission from time to time, including in our Annual Report on Form 10 - K for the year ended December 31, 2018. The forward - looking statements in this presentation represent our views as of the date of this presentation. We anticipate that subsequent events and developments will cause our views to change. However, while we may elect to update these forward - looking statements at some point in the future, we undertak e no obligation to update any forward - looking statement to reflect events or developments after the date on which the statement is made or to reflect the occurrence of una nti cipated events except to the extent required by applicable law. You should, therefore, not rely on these forward - looking statements as representing our views as of any date aft er the date of this presentation. Our forward - looking statements do not reflect the potential impact of any future acquisitions, mergers, dispositions, joint ventures, or investme nts we may make. This presentation includes unaudited non - GAAP financial measures including total billings, EBITDA, adjusted EBITDA, net cash (de bt) and free cash flow. We define total billings as the total amounts we have invoiced our customers for products and services for which we are entitled to payment under the ter ms of our long - term supply agreements or other contractual agreements. We define EBITDA as net income (loss) attributable to the Company plus interest expense (including lo sse s on the extinguishment of debt and net of interest income), income taxes and depreciation and amortization. We define Adjusted EBITDA as EBITDA plus any share - based compensation e xpense, plus or minus any gains or losses from foreign currency remeasurement and any gains or losses on the sale of assets. We define net cash (debt) as the total pri nci pal amount of debt outstanding less unrestricted cash and cash equivalents. We define free cash flow as net cash flow generated from operating activities less capital expendi tur es. We present non - GAAP measures when we believe that the additional information is useful and meaningful to investors. Non - GAAP financial measures do not have any stand ardized meaning and are therefore unlikely to be comparable to similar measures presented by other companies. The presentation of non - GAAP financial measures is not intended to be a substitute for, and should not be considered in isolation from, the financial measures reported in accordance with GAAP. See the appendix for the reconciliatio ns of certain non - GAAP financial measures to the comparable GAAP measures. This presentation also contains estimates and other information concerning our industry that are based on industry publicatio ns, surveys and forecasts. This information involves a number of assumptions and limitations, and we have not independently verified the accuracy or completeness of the information . 2 February 28, 2019
Q4 2018 Earnings Call Agenda • Q4 and Full Year 2018 Highlights • Q4 and Full Year 2018 Financial Highlights • Guidance for 2019 and 2020 Key Targets • Q&A • Appendix – Non - GAAP Information – Impact of ASC 606 on Full Year 2017 3 February 28, 2019
Q4 and Full Year 2018 Highlights
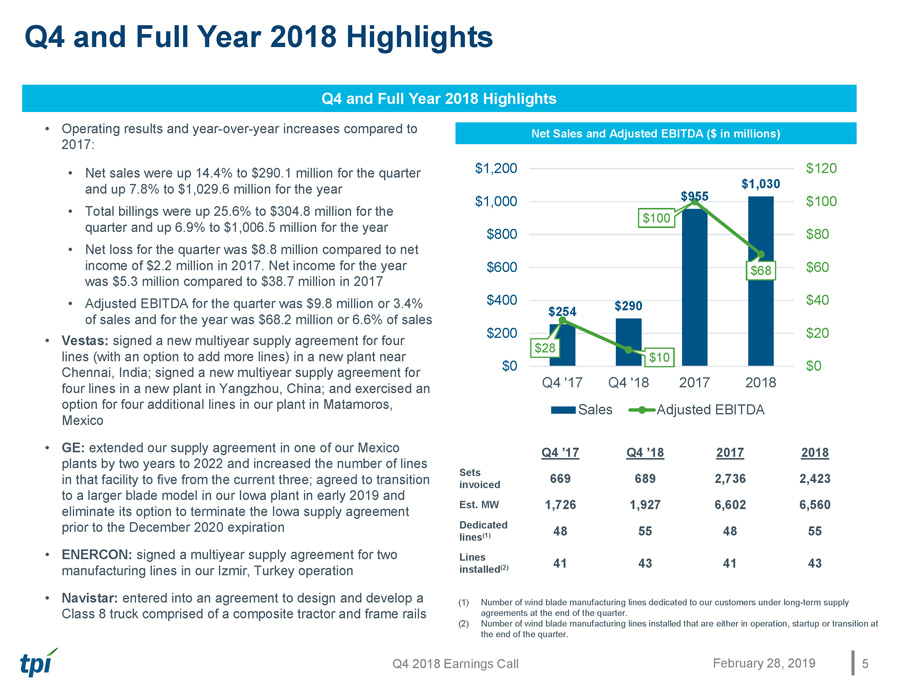
Q4 2018 Earnings Call Q4 and Full Year 2018 Highlights 5 February 28, 2019 Q4 and Full Year 2018 Highlights • Operating results and year - over - year increases compared to 201 7: • Net sales were up 14.4% to $290.1 million for the quarter and up 7.8% to $1,029.6 million for the year • Total billings were up 25.6% to $304.8 million for the quarter and up 6.9% to $1,006.5 million for the year • N et loss for the quarter was $ 8.8 million compared to net income of $2.2 million in 2017. Net income for the year was $5.3 million compared to $38.7 million in 2017 • Adjusted EBITDA for the quarter was $ 9.8 million or 3.4% of sales and for the year was $68.2 million or 6.6% of sales • Vestas: signed a new multiyear supply agreement for four lines (with an option to add more lines) in a new plant near Chennai, India; signed a new multiyear supply agreement for four lines in a new plant in Yangzhou, China; and exercised an option for four additional lines in our plant in Matamoros, Mexico • GE: extended our supply agreement in one of our Mexico plants by two years to 2022 and increased the number of lines in that facility to five from the current three; agreed to transition to a larger blade model in our Iowa plant in early 2019 and eliminate its option to terminate the Iowa supply agreement prior to the December 2020 expiration • ENERCON: signed a multiyear supply agreement for two manufacturing lines in our Izmir, Turkey operation • Navistar: entered into an agreement to design and develop a Class 8 truck comprised of a composite tractor and frame rails Net Sales and Adjusted EBITDA ($ in millions) Q4 ’17 Q4 ’18 2017 2018 Sets invoiced 669 689 2,736 2,423 Est. MW 1,726 1,927 6,602 6,560 Dedicated lines (1) 48 55 48 55 Lines installed (2) 41 43 41 43 (1) Number of wind blade manufacturing lines dedicated to our customers under long - term supply agreement s at the end of the quarter. (2) Number of wind blade manufacturing lines installed that are either in operation, startup or transition at the end of the quarter. $254 $290 $955 $1,030 $28 $10 $100 $68 $0 $20 $40 $60 $80 $100 $120 $0 $200 $400 $600 $800 $1,000 $1,200 Q4 '17 Q4 '18 2017 2018 Sales Adjusted EBITDA
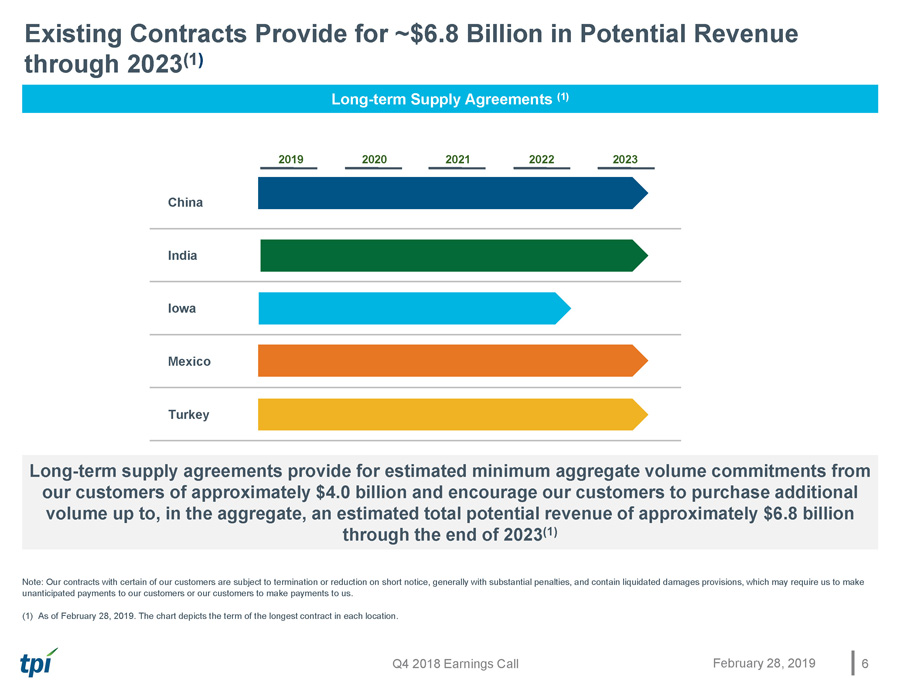
Q4 2018 Earnings Call Existing Contracts Provide for ~$6.8 Billion in Potential Revenue through 2023 (1 ) 6 February 28, 2019 Long - term Supply Agreements (1) Long - term supply agreements provide for estimated minimum aggregate volume commitments from our customers of approximately $ 4.0 billion and encourage our customers to purchase additional volume up to, in the aggregate, an estimated total potential revenue of approximately $6.8 billion through the end of 2023 (1) Note: Our contracts with certain of our customers are subject to termination or reduction on short notice, generally with substantial penalties, and contain l iqu idated damages provisions, which may require us to make unanticipated payments to our customers or our customers to make payments to us. (1) As of February 28, 2019 . The chart depicts the term of the longest contract in each location . 2019 2020 2021 2022 2023 China India Iowa Mexico Turkey
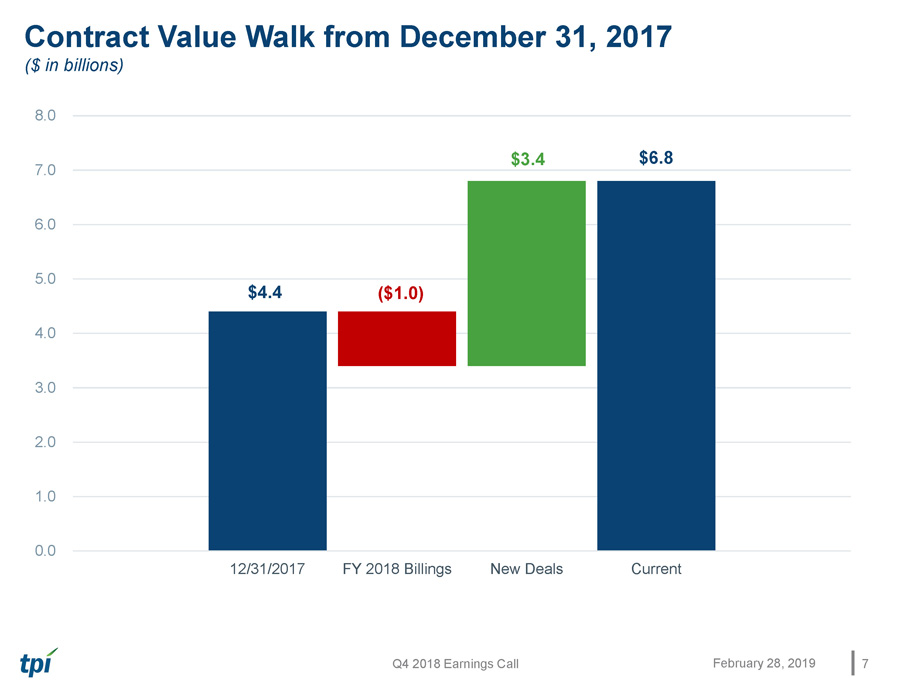
Q4 2018 Earnings Call Contract Value Walk from December 31, 2017 ($ in billions) $6.8 ($1.0) $3.4 $4.4 0.0 1.0 2.0 3.0 4.0 5.0 6.0 7.0 8.0 12/31/2017 FY 2018 Billings New Deals Current 7 February 28, 2019

Q4 and Full Year 2018 Financial Highlights
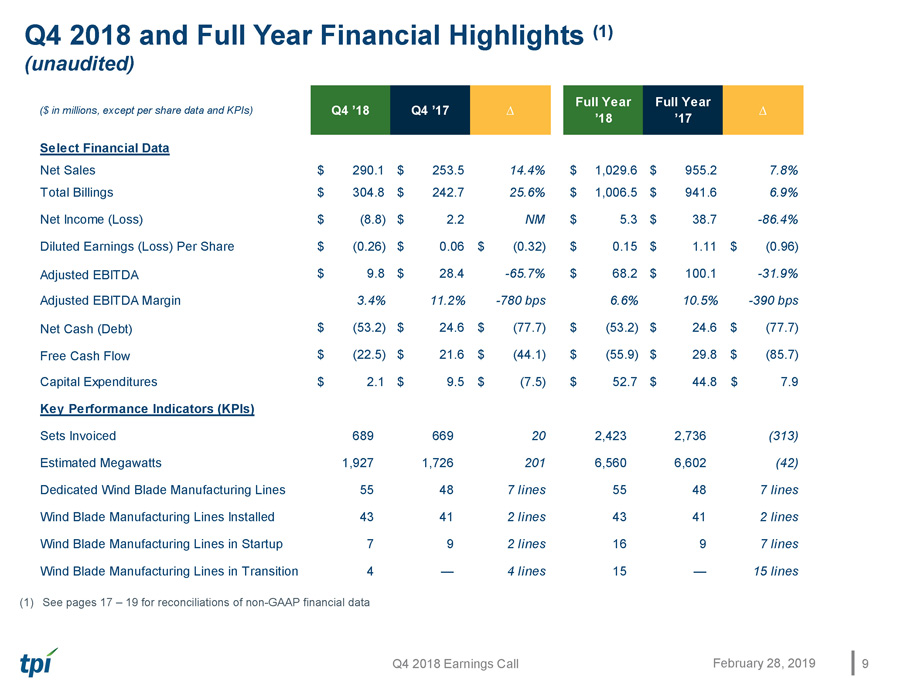
Q4 2018 Earnings Call Q4 2018 and Full Year Financial Highlights (1) (unaudited) 9 February 28, 2019 (1) See pages 17 – 19 for reconciliations of non - GAAP financial data ($ in millions, except per share data and KPIs) Q4 ’18 Q4 ’17 ∆ Full Year ’18 Full Year ’17 ∆ Select Financial Data Net Sales $ 290.1 $ 253.5 14.4% $ 1,029.6 $ 955.2 7.8% Total Billings $ 304.8 $ 242.7 25.6% $ 1,006.5 $ 941.6 6.9% Net Income (Loss) $ (8.8) $ 2.2 NM $ 5.3 $ 38.7 -86.4% Diluted Earnings (Loss) Per Share $ (0.26) $ 0.06 $ (0.32) $ 0.15 $ 1.11 $ (0.96) Adjusted EBITDA (1) $ 9.8 $ 28.4 -65.7% $ 68.2 $ 100.1 -31.9% Adjusted EBITDA Margin 3.4% 11.2% -780 bps 6.6% 10.5% -390 bps Net Cash (Debt) (1) $ (53.2) $ 24.6 $ (77.7) $ (53.2) $ 24.6 $ (77.7) Free Cash Flow (1) $ (22.5) $ 21.6 $ (44.1) $ (55.9) $ 29.8 $ (85.7) Capital Expenditures $ 2.1 $ 9.5 $ (7.5) $ 52.7 $ 44.8 $ 7.9 Key Performance Indicators (KPIs) Sets Invoiced 689 669 20 2,423 2,736 (313) Estimated Megawatts 1,927 1,726 201 6,560 6,602 (42) Dedicated Wind Blade Manufacturing Lines 55 48 7 lines 55 48 7 lines Wind Blade Manufacturing Lines Installed 43 41 2 lines 43 41 2 lines Wind Blade Manufacturing Lines in Startup 7 9 2 lines 16 9 7 lines Wind Blade Manufacturing Lines in Transition 4 — 4 lines 15 — 15 lines
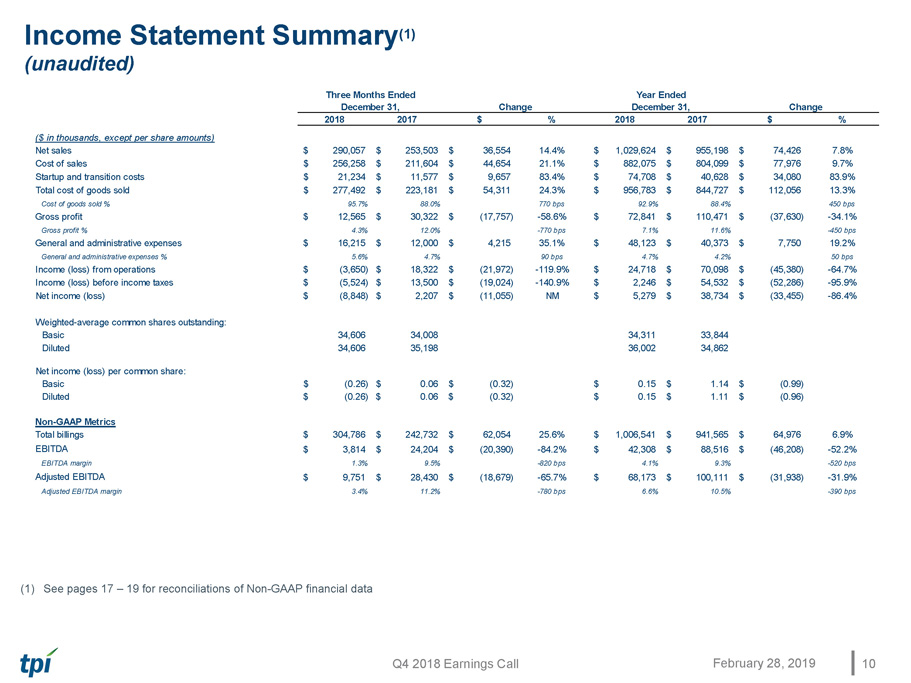
Q4 2018 Earnings Call Income Statement Summary (1) (unaudited) 10 February 28, 2019 (1) See pages 17 – 19 for reconciliations of Non - GAAP financial data 2018 2017 $ % 2018 2017 $ % ($ in thousands, except per share amounts) Net sales 290,057$ 253,503$ 36,554$ 14.4% 1,029,624$ 955,198$ 74,426$ 7.8% Cost of sales 256,258$ 211,604$ 44,654$ 21.1% 882,075$ 804,099$ 77,976$ 9.7% Startup and transition costs 21,234$ 11,577$ 9,657$ 83.4% 74,708$ 40,628$ 34,080$ 83.9% Total cost of goods sold 277,492$ 223,181$ 54,311$ 24.3% 956,783$ 844,727$ 112,056$ 13.3% Cost of goods sold % 95.7% 88.0% 770 bps 92.9% 88.4% 450 bps Gross profit 12,565$ 30,322$ (17,757)$ -58.6% 72,841$ 110,471$ (37,630)$ -34.1% Gross profit % 4.3% 12.0% -770 bps 7.1% 11.6% -450 bps General and administrative expenses 16,215$ 12,000$ 4,215$ 35.1% 48,123$ 40,373$ 7,750$ 19.2% General and administrative expenses % 5.6% 4.7% 90 bps 4.7% 4.2% 50 bps Income (loss) from operations (3,650)$ 18,322$ (21,972)$ -119.9% 24,718$ 70,098$ (45,380)$ -64.7% Income (loss) before income taxes (5,524)$ 13,500$ (19,024)$ -140.9% 2,246$ 54,532$ (52,286)$ -95.9% Net income (loss) (8,848)$ 2,207$ (11,055)$ NM 5,279$ 38,734$ (33,455)$ -86.4% Weighted-average common shares outstanding: Basic 34,606 34,008 34,311 33,844 Diluted 34,606 35,198 36,002 34,862 Net income (loss) per common share: Basic (0.26)$ 0.06$ (0.32)$ 0.15$ 1.14$ (0.99)$ Diluted (0.26)$ 0.06$ (0.32)$ 0.15$ 1.11$ (0.96)$ Non-GAAP Metrics Total billings 304,786$ 242,732$ 62,054$ 25.6% 1,006,541$ 941,565$ 64,976$ 6.9% EBITDA (1) 3,814$ 24,204$ (20,390)$ -84.2% 42,308$ 88,516$ (46,208)$ -52.2% EBITDA margin 1.3% 9.5% -820 bps 4.1% 9.3% -520 bps Adjusted EBITDA (1) 9,751$ 28,430$ (18,679)$ -65.7% 68,173$ 100,111$ (31,938)$ -31.9% Adjusted EBITDA margin 3.4% 11.2% -780 bps 6.6% 10.5% -390 bps Three Months Ended December 31, Change Year Ended December 31, Change
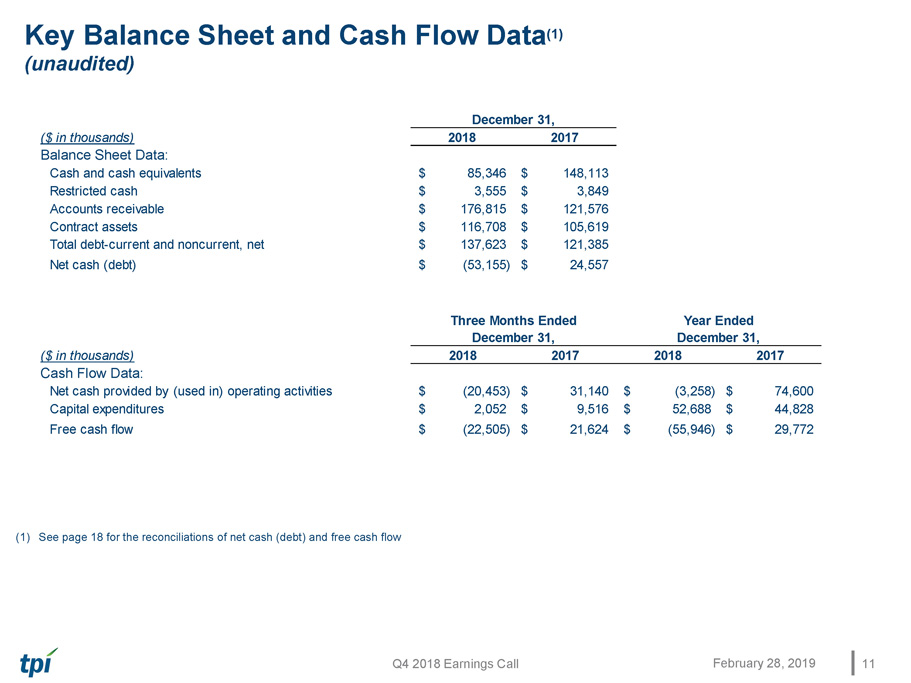
Q4 2018 Earnings Call Key Balance Sheet and Cash Flow Data (1) (unaudited) 11 February 28, 2019 (1) See page 18 for the reconciliation s of net cash (debt) and free cash flow ($ in thousands) 2018 2017 Balance Sheet Data: Cash and cash equivalents 85,346$ 148,113$ Restricted cash 3,555$ 3,849$ Accounts receivable 176,815$ 121,576$ Contract assets 116,708$ 105,619$ Total debt-current and noncurrent, net 137,623$ 121,385$ Net cash (debt) (1) (53,155)$ 24,557$ ($ in thousands) 2018 2017 2018 2017 Cash Flow Data: Net cash provided by (used in) operating activities (20,453)$ 31,140$ (3,258)$ 74,600$ Capital expenditures 2,052$ 9,516$ 52,688$ 44,828$ Free cash flow (1) (22,505)$ 21,624$ (55,946)$ 29,772$ Three Months Ended December 31, Year Ended December 31, December 31,
Guidance for 2019 and 2020 Key Targets

Q4 2018 Earnings Call 13 Note: All reference to lines is to wind blade manufacturing lines 2019 Key Guidance Metrics and 2020 Targets 2019 Guidance Updated 2019 Guidance Previous 2020 Target Total Billings $1.5B – $1.6B $1.5B – $1.6B $1.7B – $1.9B Net Sales $1.5B – $1.6B $1.5B – $1.6B $1.7B – $1.9B Adjusted EBITDA $120M – $130M $120M – $130M $170M – $190M Earnings per Share - FD $1.34 – $1.45 $1.24 – $1.35 Sets 3,300 – 3,500 3,300 – 3,500 Average Selling Price per Blade $135K – $140K $135K – $140K Non - Blade Billings $115M – $120M $115M – $120M G&A Costs as a % of Billings (incl. SBC and loss on sale of receivables) 4.0% – 4.25% 4.0% – 4.25% Estimated MW 9,800 – 10,400 9,800 – 10,400 Dedicated Lines - EOY 62 – 65 62 – 65 Share - Based Compensation $9M – $9.5M $9.5M – $10M Depreciation & Amortization $40M – $45M $40M – $45M Net Interest Expense $8M – $9M $12M – $13M Capital Expenditures $95M – $100M $95M – $100M Effective Tax Rate 20% – 25% 20% – 25% February 28, 2019
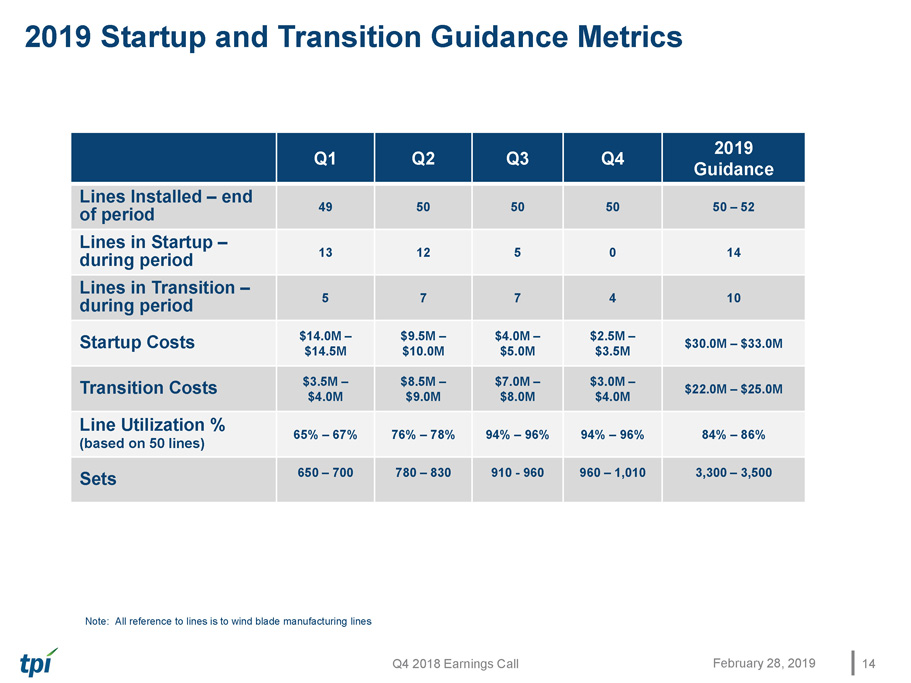
Q4 2018 Earnings Call 2019 Startup and Transition Guidance Metrics 14 February 28, 2019 Q1 Q2 Q3 Q4 2019 Guidance Lines Installed – end of period 49 50 50 50 50 – 52 Lines in Startup – during period 13 12 5 0 14 Lines in Transition – during period 5 7 7 4 10 Startup Costs $14.0M – $14.5M $9.5M – $10.0M $4.0M – $5.0M $2.5M – $3.5M $30.0M – $33.0M Transition Costs $3.5M – $4.0M $8.5M – $9.0M $7.0M – $8.0M $3.0M – $4.0M $22.0M – $25.0M Line Utilization % (based on 50 lines) 65% – 67% 76% – 78% 94% – 96% 94% – 96% 84% – 86% Sets 650 – 700 780 – 830 910 - 960 960 – 1,010 3,300 – 3,500 Note: All reference to lines is to wind blade manufacturing lines

Q&A
Appendix – Non - GAAP Information This presentation includes unaudited non - GAAP financial measures including total billings, EBITDA, adjusted EBITDA, net cash/deb t and free cash flow. We define total billings as the total amounts we have invoiced our customers for products and services fo r w hich we are entitled to payment under the terms of our long - term supply agreements or other contractual agreements. We define EBITDA as net income plus interest expense (including losses on the extinguishment of debt and net of interest income), income taxes and depreciation and amortization. We define adjusted EBITDA as EBITDA plus share - based compensation expense plus or minus any gains or losses from foreign currency transactions, plus or minus any gains or losses from the sale of assets. We define net cas h/debt as the total principal amount of debt outstanding less unrestricted cash and cash equivalents. We define free cash flow as ne t c ash flow generated from operating activities less capital expenditures. We present non - GAAP measures when we believe that the additional information is useful and meaningful to investors. Non - GAAP financial measures do not have any standardized meaning and are therefore unlikely to be comparable to similar measures presented by other companies. The presentation of non - GAAP financial measures is not intended to be a substitute for, and should not be considered in isolation from, the financial measures repor ted in accordance with GAAP. See below for a reconciliation of certain non - GAAP financial measures to the comparable GAAP measures.
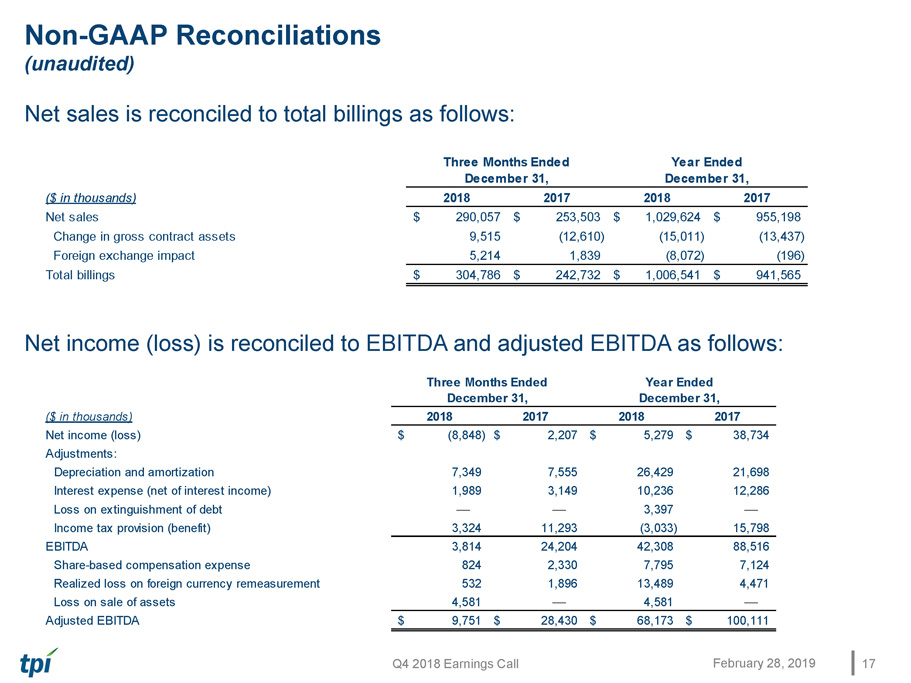
Q4 2018 Earnings Call Non - GAAP Reconciliations (unaudited) Net sales is reconciled to total billings as follows: Net income (loss) is reconciled to EBITDA and adjusted EBITDA as follows: 17 February 28, 2019 ($ in thousands) 2018 2017 2018 2017 Net sales 290,057$ 253,503$ 1,029,624$ 955,198$ Change in gross contract assets 9,515 (12,610) (15,011) (13,437) Foreign exchange impact 5,214 1,839 (8,072) (196) Total billings 304,786$ 242,732$ 1,006,541$ 941,565$ Three Months Ended December 31, Year Ended December 31, ($ in thousands) 2018 2017 2018 2017 Net income (loss) (8,848)$ 2,207$ 5,279$ 38,734$ Adjustments: Depreciation and amortization 7,349 7,555 26,429 21,698 Interest expense (net of interest income) 1,989 3,149 10,236 12,286 Loss on extinguishment of debt — — 3,397 — Income tax provision (benefit) 3,324 11,293 (3,033) 15,798 EBITDA 3,814 24,204 42,308 88,516 Share-based compensation expense 824 2,330 7,795 7,124 Realized loss on foreign currency remeasurement 532 1,896 13,489 4,471 Loss on sale of assets 4,581 — 4,581 — Adjusted EBITDA 9,751$ 28,430$ 68,173$ 100,111$ Three Months Ended December 31, Year Ended December 31,
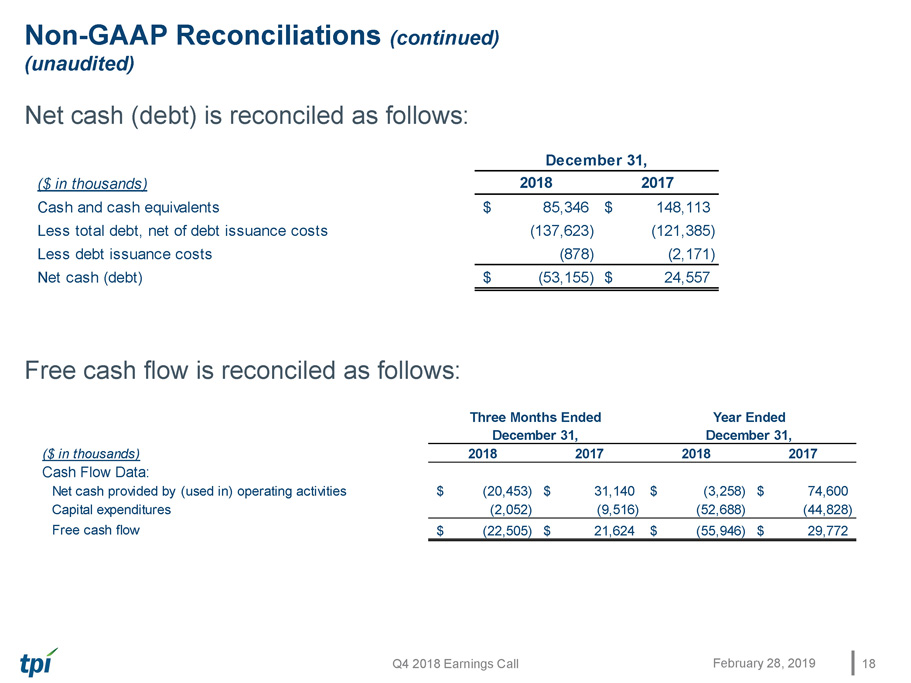
Q4 2018 Earnings Call Non - GAAP Reconciliations (continued) (unaudited) Net cash (debt) is reconciled as follows: Free cash flow is reconciled as follows: 18 February 28, 2019 ($ in thousands) 2018 2017 Cash and cash equivalents 85,346$ 148,113$ Less total debt, net of debt issuance costs (137,623) (121,385) Less debt issuance costs (878) (2,171) Net cash (debt) (53,155)$ 24,557$ December 31, ($ in thousands) 2018 2017 2018 2017 Cash Flow Data: Net cash provided by (used in) operating activities (20,453)$ 31,140$ (3,258)$ 74,600$ Capital expenditures (2,052) (9,516) (52,688) (44,828) Free cash flow (1) (22,505)$ 21,624$ (55,946)$ 29,772$ Three Months Ended December 31, Year Ended December 31,
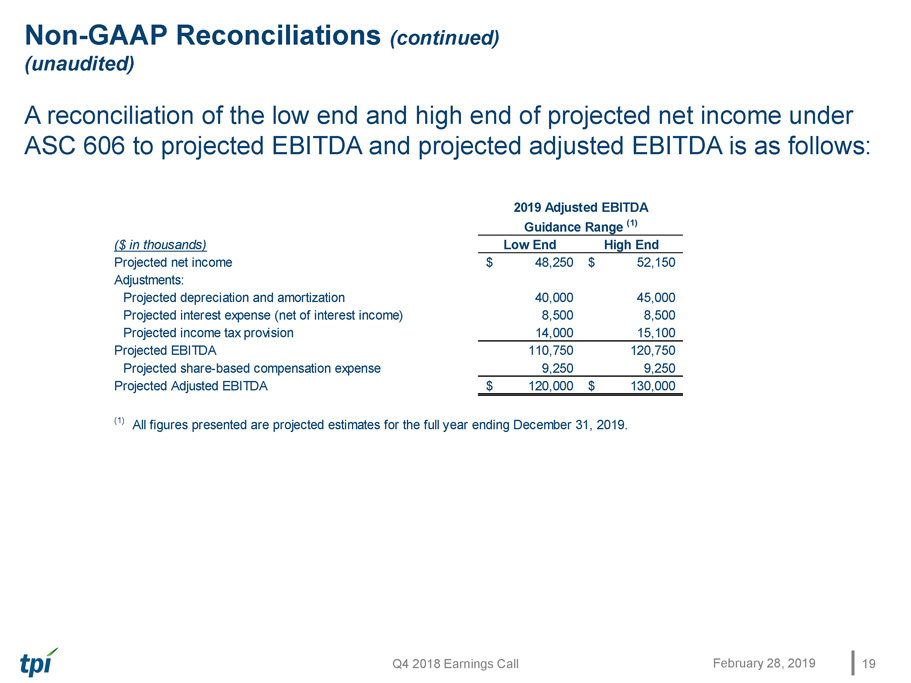
Q4 2018 Earnings Call Non - GAAP Reconciliations (continued) (unaudited) A reconciliation of the low end and high end of projected net income under ASC 606 to projected EBITDA and projected adjusted EBITDA is as follows: 19 February 28, 2019 ($ in thousands) Low End High End Projected net income 48,250$ 52,150$ Adjustments: Projected depreciation and amortization 40,000 45,000 Projected interest expense (net of interest income) 8,500 8,500 Projected income tax provision 14,000 15,100 Projected EBITDA 110,750 120,750 Projected share-based compensation expense 9,250 9,250 Projected Adjusted EBITDA 120,000$ 130,000$ (1) All figures presented are projected estimates for the full year ending December 31, 2019. 2019 Adjusted EBITDA Guidance Range (1)
Impact of ASC 606
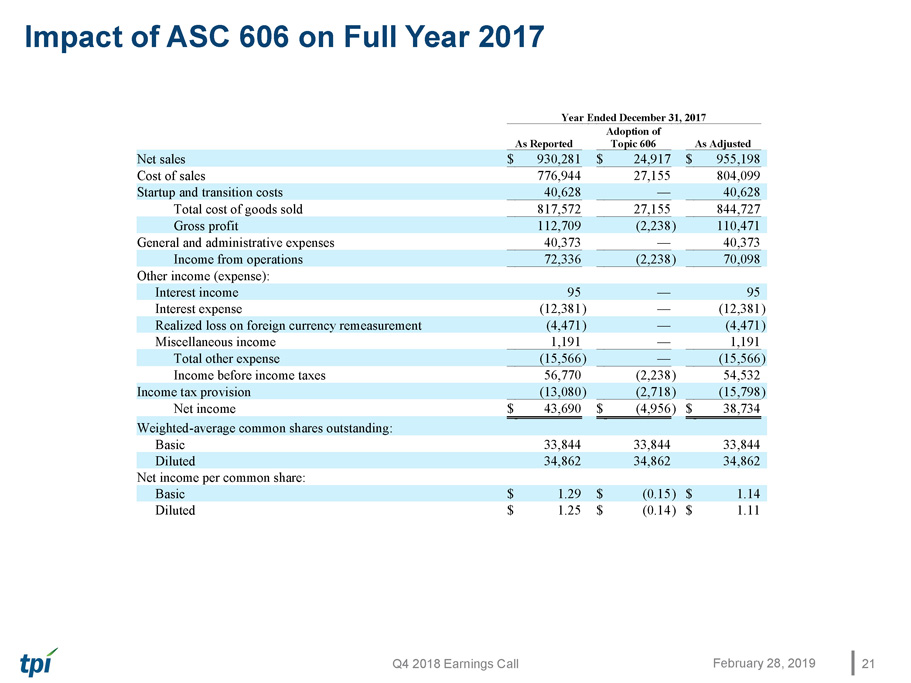
Q4 2018 Earnings Call Impact of ASC 606 on Full Year 2017 21 February 28, 2019 Year Ended December 31, 2017 As Reported Adoption of Topic 606 As Adjusted Net sales $ 930,281 $ 24,917 $ 955,198 Cost of sales 776,944 27,155 804,099 Startup and transition costs 40,628 — 40,628 Total cost of goods sold 817,572 27,155 844,727 Gross profit 112,709 (2,238 ) 110,471 General and administrative expenses 40,373 — 40,373 Income from operations 72,336 (2,238 ) 70,098 Other income (expense): Interest income 95 — 95 Interest expense (12,381 ) — (12,381 ) Realized loss on foreign currency remeasurement (4,471 ) — (4,471 ) Miscellaneous income 1,191 — 1,191 Total other expense (15,566 ) — (15,566 ) Income before income taxes 56,770 (2,238 ) 54,532 Income tax provision (13,080 ) (2,718 ) (15,798 ) Net income $ 43,690 $ (4,956 ) $ 38,734 Weighted-average common shares outstanding: Basic 33,844 33,844 33,844 Diluted 34,862 34,862 34,862 Net income per common share: Basic $ 1.29 $ (0.15 ) $ 1.14 Diluted $ 1.25 $ (0.14 ) $ 1.11