Table of Contents
FORM 6-K
U.S. SECURITIES AND EXCHANGE COMMISSION
Washington, D.C. 20549
Report of Foreign Private Issuer
Pursuant to Rule 13a-16 or 15d-16 of
the Securities Exchange Act of 1934
Commission File Number:333-163336
For the month ofAugust 2010.
NKSJ Holdings, Inc.
(Translation of registrant’s name into English)
26-1, Nishi-Shinjuku 1-chome
Shinjuku-ku, Tokyo 160-8338
Japan
(Address of principal executive offices)
Indicate by check mark whether the registrant files or will file annual reports under cover Form 20-F or Form 40-F.
Form 20-F X Form 40-F
Indicate by check mark if the registrant is submitting the Form 6-K in paper as permitted by Regulation S-T Rule 101(b)(1):
Indicate by check mark if the registrant is submitting the Form 6-K in paper as permitted by Regulation S-T Rule 101(b)(7):
Indicate by check mark whether by furnishing the information contained in this Form, the registrant is also thereby furnishing the information to the Commission pursuant to Rule 12g3-2(b) under the Securities Exchange Act of 1934.
Yes No X
If “Yes” is marked, indicate below the file number assigned to the registrant in connection with Rule 12g3-2(b): 82-
Table of Contents
Information furnished on this form:
| 1. | [English Translation] |
Summary of Consolidated Financial Results for the three months ended June 30, 2010
| 2. | [English Translation] |
Summary of Consolidated Financial Results for the three months ended June 30, 2010
(Supplementary Information)
| 3. | [English Summary] |
Quarterly Securities Report for the Three Months Ended June 30, 2010
Table of Contents
SIGNATURES
Pursuant to the requirements of the Securities Exchange Act of 1934, the registrant has duly caused this report to be signed on its behalf by the undersigned, thereunto duly authorized.
| NKSJ Holdings, Inc. | ||||||||
Date: August 27, 2010 | ||||||||
| By: | /S/ HIROHISA KURUMIDA | |||||||
| Hirohisa Kurumida | ||||||||
| Manager of Corporate Legal Department | ||||||||
Table of Contents
Summary of Consolidated Financial Results for the three months ended June 30, 2010
Table of Contents
UNOFFICIAL TRANSLATION
This document is an unofficial English translation of the Japanese original.
August 13, 2010
NKSJ Holdings, Inc.
Summary of Consolidated Financial Results for the three months ended June 30, 2010
Company Name: | NKSJ Holdings, Inc. | |
Listed on: | Tokyo and Osaka Stock Exchange | |
Stock Code Number: | 8630 | |
URL: | http://www.nksj-hd.com/ | |
Representative Director: | Masatoshi Sato, President & CEO | |
Contact: | Kazuhisa Tamura, Manager, Accounting Department |
Scheduled date to file Quarterly Financial Report: | August 13, 2010 | |||||||||||
Scheduled date to start payment of dividends: | ——— | |||||||||||
Supplementary information for quarterly financial statements: | Yes | |||||||||||
Schedule for quarterly investor meeting: | None |
Note) Any amounts less than one million yen are rounded down, unless otherwise noted.
| 1. | Consolidated Financial Results for the three months ended June 30, 2010 (April 1 to June 30, 2010) |
| (1) | Consolidated Results of Operations |
| Ordinary income | Ordinary profit | Net income | ||||||||||
| millions of yen | % | millions of yen | % | millions of yen | % | |||||||
Three months ended June 30, 2010 | 663,446 | — | 23,365 | — | 13,422 | — | ||||||
Three months ended June 30, 2009 | — | — | — | — | — | — | ||||||
| Note) | The percentages are changes from corresponding period of previous fiscal year. |
| Net income per share | Diluted net income per share | |||
| yen | yen | |||
Three months ended June 30, 2010 | 8.08 | 8.07 | ||
Three months ended June 30, 2009 | — | — |
| (2) | Consolidated Financial Conditions |
| Total assets | Total net assets | Equity ratio | Total net assets per share | |||||
| millions of yen | millions of yen | % | yen | |||||
As of June 30, 2010 | 9,061,946 | 1,097,536 | 12.1 | 658.04 | ||||
As of March 31, 2010 | — | — | — | — |
Reference) Equity capital: | As of June 30, 2010 | 1,092,658 million yen | ||
| As of March 31, 2010 | — million yen |
| 2. | Dividends |
| Dividends per share | ||||||||||
| First quarter-end | Second quarter-end | Third quarter-end | Fiscal year-end | Annual | ||||||
| yen | yen | yen | yen | yen | ||||||
Year ended March 31, 2010 | — | — | — | — | — | |||||
Year ending March 31, 2011 | — | |||||||||
Year ending March 31, 2011 (Forecast) | — | — | 20.00 | 20.00 | ||||||
| Note) | Revision to the forecasts for dividends during the first quarter: None |
Table of Contents
| 3. | Consolidated Forecasts for the fiscal year ending March 31, 2011 (April 1, 2010 to March 31, 2011) |
Note) The percentages are changes from corresponding period of previous fiscal year.
| Ordinary income | Ordinary profit | Net income | Net income per share | |||||||||||
| millions of yen | % | millions of yen | % | millions of yen | % | yen | ||||||||
Interim forecast (April 1 to September 30, 2010) | 1,323,000 | — | 17,000 | — | 9,000 | — | 5.41 | |||||||
Fiscal year ending March 31, 2011 (April 1, 2010 to March 31, 2011) | 2,642,000 | — | 48,000 | — | 25,000 | — | 15.04 | |||||||
| Note) | Revision to the forecasts for the fiscal year during the first quarter: None |
| 4. | Others |
| Note) | Please refer to “Other information” on page 2 for details. |
| (1) | Changes in significant subsidiaries during the first quarter: None |
Note) The above shows changes in specified subsidiaries resulting in the change in the scope of consolidation during the first quarter.
| (2) | Adoption of simplified accounting methods or special accounting methods: Yes |
Note) The above shows adoption of simplified accounting methods or accounting methods used specifically for the preparation of the quarterly consolidated financial statements.
| (3) | Changes in accounting policies, procedures and methods of presentation |
Changes due to revisions to accounting standards: | None | |
‚ Changes due to other reasons: | None | |
Note) The above shows changes which are shown in “Changes in significant accounting policies for the preparation of the quarterly consolidated financial statements.”
| (4) | Number of shares outstanding (Common stock): |
Total shares outstanding including treasury stock: | ||
As of June 30, 2010 | 1,661,409,178 shares | |
As of March 31, 2010 | — shares | |
‚ Treasury stock: | ||
As of June 30, 2010 | 958,551shares | |
As of March 31, 2010 | — shares | |
ƒ Average number of shares outstanding: | ||
For the three months ended June 30, 2010 | 1,661,096,165shares | |
For the three months ended June 30, 2009 | — shares | |
(Disclosure regarding the execution of the quarterly review process)
This summary is outside the scope of the quarterly review procedure which is required by “Financial Instruments and Exchange Act”, but the review procedure of the quarterly financial statements was completed.
(Note for using forecasted information etc.)
The forecasts included in this document are based on the currently available information and certain assumptions that we believe reasonable. Accordingly, the actual results may differ materially from those projected herein depending on various factors.
NKSJ Holdings, Inc. was established on April 1, 2010 as a holding company of Sompo Japan Insurance Inc. and NIPPONKOA Insurance Co., Ltd. This consolidated fiscal year is the first period, so there are no results for the fiscal year ended March 31, 2010 and the three months ended June 30, 2009.
Table of Contents
Table of Contents
| 1. | Qualitative Information related to the Consolidated Financial Results for the three months ended June 30, 2010 |
| (1) | Qualitative information related to the consolidated results of operations |
The consolidated results of operations for the three months ended June 30, 2010 are as follows.
Underwriting income of 619.4 billion yen, investment income of 41.4 billion yen and other ordinary income of 2.5 billion yen resulted in ordinary income of 663.4 billion yen.
In contrast, underwriting expenses of 518.6 billion yen, investment expenses of 12.4 billion yen, operating, general and administrative expenses of 105.5 billion yen and other ordinary expenses of 3.3 billion yen resulted in ordinary expenses of 640.0 billion yen.
As a result, ordinary profit amounted to 23.3 billion yen and net income amounted to 13.4 billion yen.
| (2) | Qualitative information related to the consolidated financial conditions |
As of June 30, 2010, the total assets amounted to 9,061.9 billion yen and the total net assets amounted to 1,097.5 billion yen.
| (3) | Qualitative information related to the consolidated forecasts |
There is no change on the consolidated forecasts for the fiscal year ending March 31, 2011 (first half fiscal year and full fiscal year) as disclosed on May 20, 2010.
| 2. | Other Information |
| (1) | Summary of changes in significant subsidiaries |
None.
| (2) | Summary of adoption of simplified accounting methods or special accounting methods |
Income taxes are calculated by applying a reasonably estimated effective tax rate to income before income taxes. The estimated effective tax rate is determined by estimating the effective tax rate after applying deferred tax accounting for the fiscal year, including the first quarter of this fiscal year. When it is remarkably unreasonable to adopt this accounting method, income taxes are calculated by the statutory effective tax rate.
| (3) | Summary of changes in accounting policies, procedures and methods of presentation |
NKSJ Holdings, Inc. is a sole parent company of Sompo Japan Insurance Inc. and NIPPONKOA Insurance Co., Ltd. established through share exchange on April 1, 2010. This consolidated fiscal year is the first period, so there is no change in accounting policies, procedures and methods of presentation.
Please refer to significant accounting policies for the preparation of the quarterly consolidated financial statements on page 5 for details.
| (4) | Summary of significant events related to going-concern assumption |
None.
2
Table of Contents
| 3. | Quarterly Consolidated Financial Statements |
| (1) | Quarterly Consolidated Balance Sheets |
| (Millions of yen) | |||
| As of June 30, 2010 | |||
Assets: | |||
Cash and deposits | 231,443 | ||
Call loans | 98,271 | ||
Receivables under resale agreements | 88,980 | ||
Receivables under securities borrowing transactions | 29,720 | ||
Monetary receivables bought | 67,334 | ||
Money trusts | 84,687 | ||
Securities | 6,493,858 | ||
Loans | 722,910 | ||
Tangible fixed assets | 364,691 | ||
Intangible fixed assets | 31,431 | ||
Other assets | 590,676 | ||
Deferred tax assets | 264,283 | ||
Allowance for possible loan losses | (6,343 | ) | |
Total assets | 9,061,946 | ||
Liabilities: | |||
Underwriting funds: | 7,414,499 | ||
Reserve for outstanding losses and claims | 1,022,013 | ||
Underwriting reserves | 6,392,486 | ||
Bonds | 128,000 | ||
Other liabilities | 288,878 | ||
Reserve for retirement benefits | 104,674 | ||
Reserve for retirement benefits to directors | 103 | ||
Reserve for bonus payments | 6,587 | ||
Reserves under the special laws: | 20,856 | ||
Reserve for price fluctuation | 20,856 | ||
Deferred tax liabilities | 808 | ||
Total liabilities | 7,964,409 | ||
Net assets: | |||
Shareholders’ equity: | |||
Common stock | 100,045 | ||
Capital surplus | 438,552 | ||
Retained earnings | 324,515 | ||
Treasury stock | (559 | ) | |
Total shareholders’ equity | 862,553 | ||
Valuation and translation adjustments: | |||
Unrealized gains on securities available for sale, net of tax | 247,933 | ||
Deferred gains on hedges | 4,117 | ||
Foreign currency translation adjustments | (21,946 | ) | |
Total valuation and translation adjustments | 230,104 | ||
Stock acquisition rights | 1,776 | ||
Non-controlling interests | 3,101 | ||
Total net assets | 1,097,536 | ||
Total liabilities and net assets | 9,061,946 | ||
3
Table of Contents
| (2) | Quarterly Consolidated Statements of Income |
| (Millions of yen) | |||
| Three months ended June 30, 2010 (April 1 to June 30, 2010) | |||
Ordinary income: | 663,446 | ||
Underwriting income: | 619,473 | ||
Net premiums written | 504,951 | ||
Deposits of premiums by policyholders | 39,147 | ||
Interest and dividend income on deposits of premiums, etc. | 15,175 | ||
Life insurance premiums written | 48,085 | ||
Reversal of reserve for outstanding losses and claims | 11,001 | ||
Investment income: | 41,471 | ||
Interest and dividend income | 43,965 | ||
Investment gains on money trusts | 368 | ||
Investment gains on trading securities | 31 | ||
Gains on sales of securities | 2,684 | ||
Transfer of interest and dividend income on deposits of premiums, etc. | (15,175 | ) | |
Other ordinary income | 2,501 | ||
Ordinary expenses: | 640,080 | ||
Underwriting expenses: | 518,649 | ||
Net claims paid | 291,713 | ||
Loss adjustment expenses | 33,027 | ||
Net commissions and brokerage fees | 90,321 | ||
Maturity refunds to policyholders | 69,500 | ||
Life insurance claims paid | 14,166 | ||
Provision for underwriting reserves | 16,475 | ||
Investment expenses: | 12,495 | ||
Investment losses on money trusts | 498 | ||
Losses on sales of securities | 1,348 | ||
Impairment losses on securities | 4,923 | ||
Operating, general and administrative expenses | 105,544 | ||
Other ordinary expenses: | 3,390 | ||
Interest paid | 1,793 | ||
Ordinary profit | 23,365 | ||
Extraordinary gains: | 1,989 | ||
Gains on disposal of fixed assets | 53 | ||
Gains on negative goodwill | 149 | ||
Other extraordinary gains | 1,785 | ||
Extraordinary losses: | 3,471 | ||
Losses on disposal of fixed assets | 131 | ||
Impairment losses | 36 | ||
Provision for reserves under the special laws: | 2,363 | ||
Provision for price fluctuation reserve | 2,363 | ||
Other extraordinary losses | 939 | ||
Income before income taxes and non-controlling interests | 21,883 | ||
Income taxes and deferred income taxes | 8,528 | ||
Income before non-controlling interests | 13,355 | ||
Non-controlling interests | (67 | ) | |
Net income | 13,422 | ||
4
Table of Contents
| (3) | Notes on Going-Concern Assumption |
None.
| (4) | Significant Accounting Policies for the Preparation of the Quarterly Consolidated Financial Statements |
| 1. | Scope of consolidation |
| (1) | Number of consolidated subsidiaries: 23 companies |
Sompo Japan Insurance Inc.
NIPPONKOA Insurance Co., Ltd.
Sonpo 24 Insurance Company Limited
Saison Automobile and Fire Insurance Company, Limited
Sompo Japan Himawari Life Insurance Co., Ltd.
NIPPONKOA Life Insurance Company, Limited
Sompo Japan DIY Life Insurance Co., Ltd.
Sompo Japan DC Securities Co., Ltd.
Healthcare Frontier Japan Inc.
Sompo Japan Asset Management Co., Ltd.
Sompo Japan Insurance Company of America
Sompo Japan Insurance Company of Europe Limited
NIPPONKOA Insurance Company (Europe) Limited
NIPPONKOA Management Services (Europe) Limited
Nippon Insurance Company of Europe Limited
Sompo Japan Asia Holdings Pte. Ltd.
Sompo Japan Insurance (Singapore) Pte. Ltd.
Tenet Insurance Company Limited
Sompo Japan Insurance (China) Co., Ltd.
NIPPONKOA Insurance Company (China) Limited
Sompo Japan Insurance (Hong Kong) Company Limited
NIPPONKOA Insurance Company (Asia) Limited
Yasuda Seguros S.A.
Tenet Insurance Company Limited is the company which was acquired 100% of its shares by Sompo Japan Insurance Inc. as of May 31, 2010.
| (2) | Names of principal non-consolidated subsidiaries |
Names of principal non-consolidated subsidiaries
Ark Re Limited
Sompo Japan Reinsurance Company Limited
As the non-consolidated subsidiaries do not have a material impact on reasonable judgment about the Group’s financial conditions and results of operations in terms of total assets, ordinary income, net income or loss and retained earnings, they are excluded from the scope of consolidation.
| 2. | Application of the equity method |
| (1) | Number of affiliates accounted for under the equity method: 6 companies |
Hitachi Capital Insurance Corporation
Yasuda Enterprise Development Co., Ltd.
Berjaya Sompo Insurance Berhad
Universal Sompo General Insurance Company Limited
Maritima Seguros S.A.
Maritima Saude Seguros S.A.
5
Table of Contents
| (2) | The non-consolidated subsidiaries and affiliates (Ark Re Limited and Sompo Japan Reinsurance Company Limited, etc.) are not accounted for under the equity method as each company has a minor impact on net income or loss and retained earnings and they do not have a material impact as a whole. |
| (3) | NKSJ Holdings, Inc. holds 20% or more of voting rights of Japan Earthquake Reinsurance Co., Ltd. (“Japan Earthquake”) through domestic insurance subsidiaries. As Japan Earthquake is engaged in public business and NKSJ Holdings, Inc. can not have a material impact on Japan Earthquake’s decision of finance, promotion and business strategy, Japan Earthquake is excluded from affiliate. |
| 3. | The balance sheet dates of consolidated subsidiaries |
The balance sheet dates of the first quarter of the foreign consolidated subsidiaries are March 31. As the differences in the quarterly balance sheet dates do not exceed three months, the financial statements as of March 31 are used for the preparation of the quarterly consolidated financial statements.
Necessary adjustments are made for the significant transactions during the periods from the quarterly balance sheet dates of the subsidiaries to the quarterly consolidated balance sheet date.
| 4. | Accounting policies |
| (1) | Valuation policies and methods for securities |
| (a) | Trading securities are carried at fair value. |
Cost of sale is calculated under the moving-average method.
| (b) | Bonds held to maturity are carried at amortized cost based on the moving-average method. |
| (c) | Policy reserve matching bonds are carried at amortized cost based on the moving-average method in accordance with “Temporary Treatment of Accounting and Auditing Concerning Policy Reserve Matching Bonds in the Insurance Industry” (Japanese Institute of Certified Public Accountants Industry Audit Practice Committee Report No.21). |
The outline of risk management policy in relation to policy reserve matching bonds is as follows.
Certain domestic consolidated life insurance subsidiary sets up “policy reserve for single-premium whole-life” as a sub-category, and follows the management policy to match the duration of the policy reserve in the sub-category with the duration of policy reserve matching bonds corresponding to this sub-category within a certain range, to better manage the changes in the interest rate risk associated with the assets and liabilities.
| (d) | Stocks of non-consolidated subsidiaries and affiliates that are not accounted for under the equity method are carried at cost based on the moving-average method. |
| (e) | Securities available for sale which have readily determinable fair value are carried at fair value based on the market price as of the quarterly balance sheet date. |
Changes in unrealized gains or losses, net of applicable income taxes, are directly included in net assets, and cost of sale is calculated based on the moving-average method.
| (f) | Securities available for sale which are considered extremely difficult to figure out fair value are carried at cost based on the moving-average method. |
| (g) | Securities managed as trust assets in money trust for trading purposes are carried at fair value. |
| (h) | Securities managed as trust assets in money trusts classified as other than trading purposes or held to maturity are carried on the same basis as that of securities available for sale. |
| (2) | Valuation policies and methods for derivative financial instruments |
Derivative financial instruments are carried at fair value.
6
Table of Contents
| (3) | Depreciation methods of significant assets |
| (a) | Tangible fixed assets (excluding lease assets) |
Depreciation of tangible fixed assets (excluding lease assets) held by NKSJ Holdings, Inc. and its domestic consolidated subsidiaries is computed using the declining-balance method, except for buildings (excluding fixtures) acquired on or after April 1, 1998 on which depreciation is computed using the straight-line method.
Depreciation of tangible fixed assets (excluding lease assets) held by the foreign consolidated subsidiaries is mainly computed using the straight-line method.
| (b) | Intangible fixed assets |
Capitalized software for internal use held by the consolidated subsidiaries is amortized using the straight-line method based on the estimated useful life.
| (4) | Accounting policies for significant reserves |
| (a) | Allowance for possible loan losses |
In order to provide for losses from defaults, the domestic consolidated insurance subsidiaries establish allowance for possible loan losses in accordance with the internal standards for self-assessment of assets and the policy of write-off and provision.
For claims on debtors that have legally, formally or substantially entered into bankruptcy, special liquidation or whose notes have been under suspension at clearing houses, allowances are provided based on the amount remaining after deduction of the estimated recoverable amounts from the disposal of collateral and from guarantees.
For claims on debtors that are highly probable that they would bankrupt in the future, allowances are provided based on the amount remaining after deduction of the estimated recoverable amounts from the disposal of collateral and from guarantees, considering the debtor’s overall solvency assessment.
For claims other than those described above, allowances are provided based on the amount of claims multiplied by the default rate, which is computed based on historical loan loss experience.
The departments responsible for respective assets assess relevant claim in accordance with the in-house self-assessment criteria. The asset auditing department independently reviews the results and allowances are provided based on the said results.
The other consolidated subsidiaries determine the collectability of the receivables respectively to provide allowances based on the said results to cover the estimated future losses.
| (b) | Reserve for retirement benefits |
In order to provide for employees’ retirement benefits, the domestic consolidated subsidiaries record the amount, which was considered to occur at the end of the first quarter, based on the projected retirement benefit obligation and the estimated plan assets at the end of the fiscal year.
Prior service costs are amortized using the straight-line method over certain years within the average remaining service years of employees at the time of occurrence.
Actuarial gains and losses are amortized using the straight-line method over certain years within the average remaining service years of employees at the time of occurrence from the following fiscal year.
| (c) | Reserve for retirement benefits to directors |
In order to provide for retirement benefits to directors, the domestic consolidated subsidiaries record the amount deemed accrued at the end of the first quarter based on internal regulations.
| (d) | Reserve for bonus payments |
In order to provide for employees’ bonus payments, the estimated amounts to be paid at the end of the first quarter are recorded.
| (e) | Reserve for price fluctuation |
In order to provide for possible losses arising from price fluctuation of stock etc, the domestic consolidated insurance subsidiaries set aside reserves under Article 115 of the Insurance Business Act.
7
Table of Contents
| (5) | Significant hedge accounting |
Generally the domestic consolidated subsidiaries apply the deferral hedge accounting method to interest rate swaps to hedge cash flow fluctuation risk of floating-rate loans and bonds and interest rate fluctuation risk related to long-term insurance contracts based on “The accounting and auditing treatment on the application of the financial products accounting standard to the insurance industry” (Japanese Institute of Certified Public Accountants Industry Audit Practice Committee Report No.26, hereafter “Industry Audit Practice Committee Report No.26”). The exceptional treatment is applied to certain interest rate swaps to the extent that such transactions meet certain conditions required for the application of the exceptional treatment.
The domestic consolidated subsidiaries apply fair value hedge accounting to equity swap transactions for hedging the future stock price fluctuation risks.
The fair value hedge accounting method is applied to foreign exchange forward contracts, currency option transactions and currency swap transactions in order to reduce foreign exchange rate fluctuation risk on foreign currency denominated assets. The exceptional treatment is applied to the transactions to the extent that such transactions meet certain conditions required for application of the exceptional treatment.
Hedge effectiveness is judged by periodically comparing the accumulated fluctuations of the market value or cash flows of the hedged item to those of the related hedging instrument for the period from the commencement of the hedge to the date of judgment. However, when the material conditions are shared among the hedging instrument and the hedged item and its effectiveness is considered high, when interest rate swaps meet requirements for applying the exceptional method or when certain transactions fulfill the required conditions to apply the exceptional treatment, the judgment of the hedge effectiveness is omitted.
The hedge effectiveness based on Industry Audit Practice Committee Report No.26 is judged by monitoring the interest rates which impact the calculation of theoretical prices of both insurance liabilities as hedged item and interest rate swaps as hedging instrument which are grouped by different remaining periods.
| (6) | Amortization of goodwill |
Goodwill is amortized over 20 years using the straight-line method. Insignificant amounts of goodwill are amortized at one time.
| (7) | Accounting for consumption taxes |
NKSJ Holdings, Inc. and its domestic consolidated subsidiaries account for national and local consumption taxes using the tax-excluded method, except for the domestic consolidated insurance subsidiaries’ expenses such as loss adjustment expenses and operating, general and administrative expenses for which the domestic consolidated insurance subsidiaries account using the tax-included method.
Non-deductible consumption taxes relating to assets are included in other assets and amortized in equal installments over five years.
| (5) | Notes for Material Changes in Shareholders’ Equity |
None.
8
Table of Contents
| (6) | Securities |
As of June 30, 2010
| 1. | Bonds held to maturity (which have readily determinable fair value) |
| (Millions of yen) | ||||||
| Carrying amount on balance sheet | Fair value | Unrealized gains (losses) | ||||
Domestic bonds | 1,064,939 | 1,127,109 | 62,169 | |||
Foreign securities | 85,561 | 85,736 | 175 | |||
Total | 1,150,501 | 1,212,846 | 62,344 | |||
2. Policy reserve matching bonds (which have readily determinable fair value) | ||||||
| (Millions of yen) | ||||||
| Carrying amount on balance sheet | Fair value | Unrealized gains (losses) | ||||
Domestic bonds | 10,442 | 10,972 | 530 | |||
Total | 10,442 | 10,972 | 530 | |||
| 3. | Securities available for sale (which have readily determinable fair value) |
| (Millions of yen) | |||||||
| Cost | Carrying amount on balance sheet | Unrealized gains (losses) | |||||
Domestic bonds | 2,456,168 | 2,535,300 | 79,132 | ||||
Domestic stocks | 1,133,722 | 1,486,446 | 352,723 | ||||
Foreign securities | 1,112,585 | 1,056,449 | (56,136 | ) | |||
Others | 127,660 | 129,891 | 2,231 | ||||
Total | 4,830,137 | 5,208,087 | 377,950 | ||||
Notes)
| 1. | Certificate of deposit, which are classified as cash and deposits and beneficial interests in the loan trusts, which are classified as monetary receivables bought in the quarterly consolidated balance sheet, are included in “Others” above. |
| 2. | Impairment losses on securities available for sale amount to 4,824 million yen. |
NKSJ Holdings, Inc. and its domestic consolidated subsidiaries recognize impairment losses on securities available for sale if fair value declines by 30% or more of their cost at the end of the first quarter, as a rule.
9
Table of Contents
| (7) | Derivatives transactions |
As of June 30, 2010
(Millions of yen) | |||||||||||
Type | Transaction | Notional amount | Fair value | Unrealized gains (losses) | |||||||
Currency derivatives | Forward foreign exchange: | ||||||||||
Short | 61,427 | 2,841 | 2,841 | ||||||||
Long | 43,805 | (1,443 | ) | (1,443 | ) | ||||||
| Currency option: | |||||||||||
Short | 18,199 | ||||||||||
| 182 | * | (0 | ) | 182 | |||||||
Long | 16,810 | ||||||||||
| 182 | * | 1,605 | 1,422 | ||||||||
Interest rate derivatives | Interest rate swap | 15,000 | 63 | 63 | |||||||
Equity derivatives | Equity index option: | ||||||||||
Short | 5,417 | ||||||||||
| 205 | * | (16 | ) | 188 | |||||||
Long | 4,400 | ||||||||||
| 205 | * | 508 | 303 | ||||||||
Bond derivatives | Bond future: | ||||||||||
Short | 478 | (9 | ) | (9 | ) | ||||||
Others | Credit derivatives: | ||||||||||
Short | 7,000 | (9 | ) | (9 | ) | ||||||
Long | 4,000 | 10 | 10 | ||||||||
| Weather derivatives: | |||||||||||
Short | 463 | ||||||||||
| 17 | * | (23 | ) | (5 | ) | ||||||
Long | 24 | ||||||||||
| — | * | — | — | ||||||||
| Earthquake derivatives: | |||||||||||
Short | 4,130 | ||||||||||
| 138 | * | (21 | ) | 116 | |||||||
Long | 3,447 | ||||||||||
| 358 | * | 172 | (186 | ) | |||||||
| Other forward: | |||||||||||
Long | 67 | 2 | 2 | ||||||||
Total | — | 3,682 | 3,479 | ||||||||
Notes)
| 1. | Derivatives transactions to which hedge accounting is applied are excluded. |
| 2. | Amounts with an asterisk (*) represent the amount of the option premiums. |
10
Table of Contents
| (8) | Business Combinations |
Three months ended June 30, 2010 (April 1 to June 30, 2010)
| 1. | Business integration |
| (1) | The name of acquiree and its type of business, reason for the business integration, date of integration, legal form of the integration, name of the controlling entity after the integration, percentage of voting rights acquired and the primary reason for defining the acquirer |
| (a) | The name of acquiree and its type of business |
NIPPONKOA Insurance Co., Ltd. : Property and casualty insurance
| (b) | Reason for the business integration |
In the face of the declining birthrate and aging society—the significant challenges Japan faces in the medium to long-term period—as well as of increased risks associated with depopulating society, deteriorating global climate change, and in response to the diversified consumer demands amidst the individuals’ lifestyle changes, companies are urged to take proper actions and contribute to social safety and to customers’ sense of security.
Based on this shared perspective, SOMPO JAPAN and NIPPONKOA decided to establish a—new solution service group which provides customers with security and service of the highest quality and contribute to social welfare, while sharing as a unitary group the strengths nurtured through 120 years of their respective history.
| (c) | Date of integration |
April, 1, 2010
| (d) | Legal form of the integration |
Share exchange
| (e) | Name of the controlling entity after the integration |
NKSJ Holdings, Inc.
| (f) | Percentage of voting rights acquired |
100%
| (g) | The primary reason for defining the acquiror |
Sompo Japan Insurance Inc. was defined as the acquiror based on relative ownership percentage of voting rights in general.
| (2) | The business term of the acquiree included in the quarterly consolidated statements of income for first quarter |
From April 1, 2010 to June 30, 2010
| (3) | Acquisition cost with details of the acquiree |
Purchase price | 444,248 million yen | |||||
Amount of stock acquisition rights | 713 million yen | |||||
Total | 444,962 million yen |
11
Table of Contents
| (4) | Share exchange ratio, basis of calculation for the share exchange and the number of shares to be allotted |
| (a) | Share exchange ratio |
One share of common stock of NKSJ Holdings, Inc. was allotted and delivered for each share of common stock of SOMPO JAPAN, and 0.9 shares of common stock of NKSJ Holdings, Inc. were allotted and delivered for each share of common stock of NIPPONKOA.
| (b) | Basis of calculation for the allotment in relation to the share exchange |
In order to ensure the fairness of the share exchange ratio to be used in the share exchange, SOMPO JAPAN appointed Nomura Securities Co., Ltd., Mizuho Securities Co., Ltd. and Goldman Sachs Japan Co., Ltd., and NIPPONKOA appointed Merrill Lynch Japan Securities Co., Ltd. and Mitsubishi UFJ Securities Co., Ltd. to calculate the share exchange ratio. Based on the calculation results and a comprehensive consideration of the financial conditions, asset conditions and future outlook of the Parties, SOMPO JAPAN and NIPPONKOA engaged in careful deliberation concerning the share exchange ratio. The Parties concluded and agreed that the share exchange ratio mentioned above is appropriate.
| (c) | Number of shares to be allotted |
SOMPO JAPAN | 984,055,299 shares | |||
NIPPONKOA | 677,207,979 shares |
| (5) | Negative goodwill |
| (a) | Amount of negative goodwill |
149 million yen
| (b) | Reason for recognizing negative goodwill |
The net amounts of assets acquired and liabilities assumed on the day of business integration exceeded the amount of investment based on evaluation of entity.
| (6) | Amounts of assets acquired and liabilities assumed on the day of business integration |
Total assets: | 3,064,910 million yen | |||
Securities | 2,180,871 million yen | |||
Total liabilities: | 2,619,450 million yen | |||
Underwriting funds | 2,482,288 million yen |
| (7) | Estimated amounts of influence on the quarterly consolidated statements of income for the fiscal year ending March 31, 2011 assuming that the business integration had been completed on the commencement date of the fiscal year |
There is no influence because the business integration was held on the same date of the commence date of the quarterly consolidated period for the fiscal year ending March 31, 2011.
12
Table of Contents
2. Business integration
| (1) | The name of acquiree and its type of business, reason for the business integration, date of integration, legal form of the integration, name of the controlling entity after the integration, percentage of voting rights acquired and the primary reason for defining the acquiror |
| (a) | The name of acquiree and its type of business |
Tenet Insurance Company Limited (“Tenet”) :Property and casualty insurance
| (b) | Reason for the business integration |
Through the acquisition of Tenet, Sompo Japan Group plans to further strengthen its solid platform and expand its operations in Singapore and Southeast Asia.
| (c) | Date of integration |
May, 31, 2010
| (d) | Legal form of the integration |
Acquisition of shares by cash
| (e) | Name of the controlling entity after the integration |
Tenet Insurance Company Limited
| (f) | Percentage of voting rights acquired |
100%
| (g) | The primary reason for defining the acquiror |
Sompo Japan was defined as the acquiror because Sompo Japan acquired shares of Tenet by cash.
| (2) | The business term of the acquiree included in the quarterly consolidated statements of income for first quarter |
None. The acquisition date is regarded as June 30, 2010.
| (3) | Acquisition cost with details of the acquiree |
| Purchase price | 97 million Singapore dollar | |||
| Direct cost for the acquisition | 1 million Singapore dollar | |||
| Total | 98 million Singapore dollar |
| (4) | Goodwill |
| (a) | Amount of goodwill |
38 million Singapore dollar
| (b) | Reason for recognizing goodwill |
The acquisition cost exceeded the net amounts of assets acquired and liabilities assumed on the day of business integration.
| (c) | Method and term of amortization |
Straight-line amortization in 20 years
13
Table of Contents
| (5) | Amounts of assets acquired and liabilities assumed on the day of business integration |
Total assets: | 122 million Singapore dollar | |||
Deposits | 72 million Singapore dollar | |||
Total liabilities: | 62 million Singapore dollar | |||
Underwriting funds | 55 million Singapore dollar |
14
Table of Contents
| 4. | Supplementary Information |
| (1) | Summary of Results of Operations |
| (Millions of yen) | |||
| Three months ended June 30, 2010 (April 1 to June 30, 2010) | |||
Ordinary income and expenses: | |||
Underwriting income: | 619,473 | ||
Net premiums written | 504,951 | ||
Deposits of premiums by policyholders | 39,147 | ||
Life insurance premiums written | 48,085 | ||
Underwriting expenses: | 518,649 | ||
Net claims paid | 291,713 | ||
Loss adjustment expenses | 33,027 | ||
Net commissions and brokerage fees | 90,321 | ||
Maturity refunds to policyholders | 69,500 | ||
Life insurance claims paid | 14,166 | ||
Investment income: | 41,471 | ||
Interest and dividend income | 43,965 | ||
Gains on sales of securities | 2,684 | ||
Investment expenses: | 12,495 | ||
Losses on sales of securities | 1,348 | ||
Impairment losses on securities | 4,923 | ||
Operating, general and administrative expenses | 105,544 | ||
Other ordinary income and expenses | (889 | ) | |
Ordinary profit | 23,365 | ||
Extraordinary gains and losses: | |||
Extraordinary gains | 1,989 | ||
Extraordinary losses | 3,471 | ||
Net extraordinary losses | (1,482 | ) | |
Income before income taxes and non-controlling interests | 21,883 | ||
Income taxes and deferred income taxes | 8,528 | ||
Income before non-controlling interests | 13,355 | ||
Non-controlling interests | (67 | ) | |
Net income | 13,422 | ||
15
Table of Contents
| (2) | Premiums Written and Claims Paid by Lines of Business (Consolidated) |
Direct premiums written (including deposits of premiums by policyholders)
| (Millions of yen) | ||||||
| Three months ended June 30, 2010 (April 1 to June 30, 2010) | ||||||
Business line | Amount | % of total amount | Rate of change | |||
| % | % | |||||
Fire and allied insurance | 89,069 | 15.2 | — | |||
Marine insurance | 14,890 | 2.5 | — | |||
Personal accident insurance | 77,847 | 13.3 | — | |||
Voluntary automobile insurance | 252,769 | 43.1 | — | |||
Compulsory automobile liability insurance | 66,838 | 11.4 | — | |||
Others | 85,564 | 14.6 | — | |||
Total | 586,981 | 100.0 | — | |||
Deposits of premiums by policyholders | 39,147 | 6.7 | — | |||
Net premiums written
| (Millions of yen) | ||||||
| Three months ended June 30, 2010 (April 1 to June 30, 2010) | ||||||
Business line | Amount | % of total amount | Rate of change | |||
| % | % | |||||
Fire and allied insurance | 56,708 | 11.2 | — | |||
Marine insurance | 11,471 | 2.3 | — | |||
Personal accident insurance | 50,897 | 10.1 | — | |||
Voluntary automobile insurance | 251,954 | 49.9 | — | |||
Compulsory automobile liability insurance | 56,675 | 11.2 | — | |||
Others | 77,244 | 15.3 | — | |||
Total | 504,951 | 100.0 | — | |||
Net claims paid
| (Millions of yen) | ||||||
| Three months ended June 30, 2010 (April 1 to June 30, 2010) | ||||||
Business line | Amount | % of total amount | Rate of change | |||
| % | % | |||||
Fire and allied insurance | 24,212 | 8.3 | — | |||
Marine insurance | 6,305 | 2.2 | — | |||
Personal accident insurance | 24,721 | 8.5 | — | |||
Voluntary automobile insurance | 147,739 | 50.6 | — | |||
Compulsory automobile liability insurance | 56,715 | 19.4 | — | |||
Others | 32,020 | 11.0 | — | |||
Total | 291,713 | 100.0 | — | |||
Note to the above three tables:
The above figures represent amounts before offsetting internal transactions among consolidated segments.
16
Table of Contents
| (3) | Life Insurance Business (Consolidated) |
Life insurance premiums
| (Millions of yen) | ||||
| Three months ended June 30, 2010 (April 1 to June 30, 2010) | ||||
| Amount | Rate of change | |||
| % | ||||
Life insurance premiums | 48,085 | — | ||
Note) The above figures represent amounts before offsetting internal transactions among consolidated segments.
Total amount of policies in force
| (Millions of yen) | ||||
| As of June 30, 2010 | ||||
| Amount | Rate of change | |||
| % | ||||
Individual insurance | 15,492,154 | — | ||
Individual annuities | 277,140 | — | ||
Group insurance | 3,019,192 | — | ||
Group annuities | — | — | ||
Notes)
| 1. | The above figures represent amounts before offsetting internal transactions among consolidated segments. |
| 2. | Amount of “Individual annuities” represents the sum of annuity fund at the beginning of annuity payment of contracts before the beginning of annuity payment and policy reserves for the contracts after the beginning of annuity payment. |
Total amount of new policies
| (Millions of yen) | ||||||
| Three months ended June 30, 2010 (April 1 to June 30, 2010) | ||||||
| Net increase by new policies and conversion | New policies | Net increase by conversion | ||||
Individual insurance | 693,607 | 693,607 | — | |||
Individual annuities | 3,138 | 3,138 | — | |||
Group insurance | 11,344 | 11,344 | — | |||
Group annuities | — | — | — | |||
Notes)
| 1. | The above figures represent amounts before offsetting internal transactions among consolidated segments. |
| 2. | Amount of “Net increase by new policies and conversion” for “Individual annuities” represents the amount of annuity fund at the beginning of annuity payment. |
Annualized premiums of new policies (individual insurance and individual annuities)
| (Millions of yen) | ||||
| Three months ended June 30, 2010 (April 1 to June 30, 2010) | ||||
| Amount | Rate of change | |||
| % | ||||
Annualized premiums of new policies | 7,815 | — | ||
Note) The above figures represent amounts before offsetting internal transactions among consolidated segments.
17
Table of Contents
Note Regarding Forward-looking Statements
This document includes “forward-looking statements” that reflect the information in relation to the NKSJ Holdings, Inc. (“NKSJ”). To the extent that statements in this document do not relate to historical or current facts, they constitute forward-looking statements. These forward-looking statements are based on the current assumptions and beliefs of NKSJ in light of the information currently available to NKSJ, and involve known and unknown risks, uncertainties and other factors. Such risks, uncertainties and other factors may cause the actual results, performance, achievements or financial position of NKSJ, as the case may be, to be materially different from any future results, performance, achievements or financial position expressed or implied by these forward-looking statements. NKSJ does not undertake or will not undertake any obligation to publicly update any forward-looking statements after the date of this document. Investors are advised to consult any further disclosures by NKSJ in their subsequent domestic filings in Japan and filings with, or submissions to, the U.S. Securities Exchange Commission pursuant to the U.S. Securities Exchange Act of 1934.
The risks, uncertainties and other factors referred to above include, but are not limited to, those below.
| (1) | Effects of deterioration of economic and business conditions in Japan |
| (2) | Risks associated with non-life insurance business, life insurance business, and other businesses in which NKSJ group participates |
| (3) | Changes to laws, regulations, and systems |
| (4) | Risk of natural disasters |
| (5) | Occurrence of unpredictable damages |
| (6) | Reinsurance risk |
| (7) | Overseas business risk |
| (8) | Effects of declining stock price |
| (9) | Effects of fluctuation in exchange rate |
| (10) | Effects of fluctuation in interest rate |
| (11) | Liquidity risk |
| (12) | Effects of decline in creditworthiness of investment and/or loan counterparties |
| (13) | Credit rating downgrade |
| (14) | Litigation risk |
| (15) | Risk concerning retirement benefit liabilities |
| (16) | Occurrence of personal information leak |
| (17) | Damage on business operations by major disasters |
| (18) | Effects resulting from business integration |
| (19) | Other risks |
18
Table of Contents
Summary of Consolidated Financial Results for the three months ended June 30, 2010
(Supplementary Information)
Table of Contents
UNOFFICIAL TRANSLATION
This document is an unofficial English translaion of Japanese original.
Summary of Consolidated Financial Results
for the three months ended June 30, 2010
Supplementary Information
August 13, 2010
NKSJ Holdings, Inc.
(Stock code number : 8630)
Table of Contents
Summary of Consolidated Financial Results for the three months ended June 30, 2010
Supplementary Information Contents
Overview of Business Results of Principal Consolidated Subsidiaries
1
Table of Contents
Overview of Business Results of Principal Consolidated Subsidiaries
(Reference) Sompo Japan Insurance Inc. (Non-consolidated)
| (Millions of yen) | |||||||||
| As of June 30, 2010 | As of March 31, 2010 | Increase (Decrease) | |||||||
| Amount | Amount | ||||||||
Assets: | |||||||||
Cash and deposits | 70,768 | 118,455 | (47,686 | ) | |||||
Call loans | 72,600 | 46,800 | 25,800 | ||||||
Receivables under resale agreements | 88,980 | 61,489 | 27,490 | ||||||
Monetary receivables bought | 33,842 | 34,585 | (742 | ) | |||||
Money trusts | 6,288 | 6,773 | (485 | ) | |||||
Securities | 3,405,319 | 3,525,735 | (120,415 | ) | |||||
Loans | 470,213 | 476,173 | (5,960 | ) | |||||
Tangible fixed assets | 212,095 | 212,244 | (148 | ) | |||||
Intangible fixed assets | 96 | 758 | (662 | ) | |||||
Other assets | 370,223 | 437,671 | (67,448 | ) | |||||
Deferred tax assets | 180,072 | 121,347 | 58,724 | ||||||
Allowance for possible loan losses | (4,088 | ) | (5,068 | ) | 980 | ||||
Allowance for possible investment losses | (7,734 | ) | (7,734 | ) | — | ||||
Total assets | 4,898,677 | 5,029,232 | (130,554 | ) | |||||
Liabilities: | |||||||||
Underwriting funds: | 3,796,435 | 3,797,586 | (1,150 | ) | |||||
Reserve for outstanding losses and claims | 677,750 | 687,801 | (10,050 | ) | |||||
Underwriting reserves | 3,118,684 | 3,109,784 | 8,900 | ||||||
Bonds | 128,000 | 128,000 | — | ||||||
Other liabilities | 177,390 | 181,855 | (4,464 | ) | |||||
Reserve for retirement benefits | 77,596 | 76,741 | 854 | ||||||
Reserve for bonus payments | 4,466 | 13,405 | (8,938 | ) | |||||
Reserves under the special laws: | 12,935 | 11,462 | 1,472 | ||||||
Reserve for price fluctuation | 12,935 | 11,462 | 1,472 | ||||||
Total liabilities | 4,196,824 | 4,209,051 | (12,226 | ) | |||||
Net assets: | |||||||||
Shareholders’ equity: | |||||||||
Common stock | 70,000 | 70,000 | — | ||||||
Capital surplus | 24,229 | 24,229 | — | ||||||
Retained earnings | 328,869 | 338,304 | (9,434 | ) | |||||
Total shareholders’ equity | 423,099 | 432,534 | (9,434 | ) | |||||
Valuation and translation adjustments: | |||||||||
Unrealized gains on securities available for sale, net of tax | 278,753 | 386,343 | (107,589 | ) | |||||
Total valuation and translation adjustments | 278,753 | 386,343 | (107,589 | ) | |||||
Stock acquisition rights | — | 1,302 | (1,302 | ) | |||||
Total net assets | 701,853 | 820,181 | (118,327 | ) | |||||
Total liabilities and net assets | 4,898,677 | 5,029,232 | (130,554 | ) | |||||
2
Table of Contents
(Reference) Sompo Japan Insurance Inc. (Non-consolidated)
Quarterly Statements of Income
| (Millions of yen) | |||||||||||||||
| Three months ended June 30, 2009 (April 1 to June 30, 2009) | Three months ended June 30, 2010 (April 1 to June 30, 2010) | Increase (Decrease) | Rate of change | ||||||||||||
| Amount | Amount | ||||||||||||||
Ordinary income: | 395,567 | 407,570 | 12,002 | 3.0 | % | ||||||||||
Underwriting income: | 374,436 | 381,432 | 6,996 | 1.9 | |||||||||||
Net premiums written | 330,758 | 331,126 | 368 | 0.1 | |||||||||||
Deposits of premiums by policyholders | 24,989 | 29,466 | 4,476 | 17.9 | |||||||||||
Interest and dividend income on deposits of premiums, etc. | 10,747 | 9,955 | (792 | ) | (7.4 | ) | |||||||||
Reversal of reserve for outstanding losses and claims | 7,717 | 10,050 | 2,333 | 30.2 | |||||||||||
Investment income: | 19,999 | 24,632 | 4,632 | 23.2 | |||||||||||
Interest and dividend income | 27,496 | 23,991 | (3,505 | ) | (12.7 | ) | |||||||||
Investment gains on money trusts | 109 | 0 | (109 | ) | (99.9 | ) | |||||||||
Investment gains on trading securities | — | 28 | 28 | — | |||||||||||
Gains on sales of securities | 2,968 | 1,657 | (1,310 | ) | (44.2 | ) | |||||||||
Transfer of interest and dividend income on deposits of premiums, etc. | (10,747 | ) | (9,955 | ) | 792 | — | |||||||||
Other ordinary income | 1,131 | 1,504 | 372 | 33.0 | |||||||||||
Ordinary expenses: | 398,706 | 392,212 | (6,494 | ) | (1.6 | ) | |||||||||
Underwriting expenses: | 329,542 | 324,499 | (5,043 | ) | (1.5 | ) | |||||||||
Net claims paid | 204,602 | 189,198 | (15,403 | ) | (7.5 | ) | |||||||||
Loss adjustment expenses | 19,036 | 23,595 | 4,558 | 23.9 | |||||||||||
Net commissions and brokerage fees | 55,986 | 55,575 | (410 | ) | (0.7 | ) | |||||||||
Maturity refunds to policyholders | 33,231 | 44,770 | 11,538 | 34.7 | |||||||||||
Provision for underwriting reserves | 13,329 | 8,900 | (4,428 | ) | (33.2 | ) | |||||||||
Investment expenses: | 6,981 | 9,020 | 2,038 | 29.2 | |||||||||||
Investment losses on money trusts | — | 226 | 226 | — | |||||||||||
Investment losses on trading securities | 136 | — | (136 | ) | (100.0 | ) | |||||||||
Losses on sales of securities | 1,969 | 900 | (1,069 | ) | (54.3 | ) | |||||||||
Impairment losses on securities | 856 | 4,146 | 3,290 | 384.2 | |||||||||||
Operating, general and administrative expenses | 59,828 | 56,784 | (3,043 | ) | (5.1 | ) | |||||||||
Other ordinary expenses: | 2,353 | 1,908 | (445 | ) | (18.9 | ) | |||||||||
Interest paid | 684 | 1,757 | 1,072 | 156.7 | |||||||||||
Ordinary profit (loss) | (3,139 | ) | 15,358 | 18,497 | — | ||||||||||
Extraordinary gains: | 97 | 3,105 | 3,007 | 3,069.2 | |||||||||||
Gains on disposal of fixed assets | 97 | 16 | (81 | ) | (83.3 | ) | |||||||||
Other extraordinary gains | — | 3,088 | 3,088 | — | |||||||||||
Extraordinary losses: | 771 | 2,317 | 1,546 | 200.5 | |||||||||||
Losses on disposal of fixed assets | 87 | 78 | (8 | ) | (10.3 | ) | |||||||||
Provision for reserves under the special laws: | 683 | 1,472 | 788 | 115.3 | |||||||||||
Provision for price fluctuation reserve | 683 | 1,472 | 788 | 115.3 | |||||||||||
Other extraordinary losses | — | 766 | 766 | — | |||||||||||
Income (loss) before income taxes | (3,812 | ) | 16,145 | 19,958 | — | ||||||||||
Income taxes and deferred income taxes | (2,403 | ) | 5,899 | 8,303 | — | ||||||||||
Net income (loss) | (1,408 | ) | 10,246 | 11,654 | — | ||||||||||
Underwriting result: | |||||||||||||||
Net premiums written | (+ | ) | 330,758 | 331,126 | 368 | 0.1 | |||||||||
Net claims paid | (– | ) | 204,602 | 189,198 | (15,403 | ) | (7.5 | ) | |||||||
Loss adjustment expenses | (– | ) | 19,036 | 23,595 | 4,558 | 23.9 | |||||||||
Operating expenses: | (– | ) | 111,792 | 108,983 | (2,809 | ) | (2.5 | ) | |||||||
Net commissions and brokerage fees | 55,986 | 55,575 | (410 | ) | (0.7 | ) | |||||||||
Operating, general and administrative expenses related to underwriting | 55,805 | 53,407 | (2,398 | ) | (4.3 | ) | |||||||||
Underwriting result | (4,673 | ) | 9,350 | 14,023 | — | ||||||||||
Underwriting profit (loss) | (12,378 | ) | 1,426 | 13,804 | — | ||||||||||
Ratios: | |||||||||||||||
Net loss ratio | (% | ) | 67.6 | 64.3 | (3.4 | ) | |||||||||
Net expense ratio | (% | ) | 33.8 | 32.9 | (0.9 | ) | |||||||||
Underwriting result ratio | (% | ) | (1.4 | ) | 2.8 | 4.2 | |||||||||
3
Table of Contents
(Reference) Sompo Japan Insurance Inc. (Non-consolidated)
Premiums Written and Claims Paid by Lines of Business
Direct premiums written (excluding deposits of premiums by policyholders)
| (Millions of yen) | ||||||||||||||||
| Three months ended June 30, 2009 (April 1 to June 30, 2009) | Three months ended June 30, 2010 (April 1 to June 30, 2010) | |||||||||||||||
Business line | Amount | % of total amount | Rate of change | Amount | % of total amount | Rate of change | ||||||||||
Fire and allied insurance | 43,084 | 12.3 | % | (1.1 | )% | 42,158 | 11.9 | % | (2.1 | )% | ||||||
Marine insurance | 7,119 | 2.0 | (23.3 | ) | 7,919 | 2.2 | 11.2 | |||||||||
Personal accident insurance | 35,396 | 10.1 | (1.1 | ) | 35,722 | 10.1 | 0.9 | |||||||||
Voluntary automobile insurance | 166,185 | 47.3 | (2.9 | ) | 164,428 | 46.5 | (1.1 | ) | ||||||||
Compulsory automobile liability insurance | 45,231 | 12.9 | (28.0 | ) | 46,412 | 13.1 | 2.6 | |||||||||
Others | 54,377 | 15.5 | 0.3 | 56,876 | 16.1 | 4.6 | ||||||||||
Total | 351,394 | 100.0 | (6.7 | ) | 353,517 | 100.0 | 0.6 | |||||||||
Deposits of premiums by policyholders | 24,989 | — | (10.0 | ) | 29,466 | — | 17.9 | |||||||||
Net premiums written | ||||||||||||||||
| (Millions of yen) | ||||||||||||||||
| Three months ended June 30, 2009 (April 1 to June 30, 2009) | Three months ended June 30, 2010 (April 1 to June 30, 2010) | |||||||||||||||
Business line | Amount | % of total amount | Rate of change | Amount | % of total amount | Rate of change | ||||||||||
Fire and allied insurance | 33,438 | 10.1 | % | (2.3 | )% | 34,500 | 10.4 | % | 3.2 | % | ||||||
Marine insurance | 5,893 | 1.8 | (22.7 | ) | 6,203 | 1.9 | 5.3 | |||||||||
Personal accident insurance | 35,111 | 10.6 | (1.2 | ) | 35,572 | 10.7 | 1.3 | |||||||||
Voluntary automobile insurance | 167,204 | 50.6 | (1.9 | ) | 164,173 | 49.6 | (1.8 | ) | ||||||||
Compulsory automobile liability insurance | 37,420 | 11.3 | (25.1 | ) | 38,980 | 11.8 | 4.2 | |||||||||
Others | 51,689 | 15.6 | 2.5 | 51,694 | 15.6 | 0.0 | ||||||||||
Total | 330,758 | 100.0 | (5.0 | ) | 331,126 | 100.0 | 0.1 | |||||||||
Net claims paid | ||||||||||||||||
| (Millions of yen) | ||||||||||||||||
| Three months ended June 30, 2009 (April 1 to June 30, 2009) | Three months ended June 30, 2010 (April 1 to June 30, 2010) | |||||||||||||||
Business line | Amount | Rate of change | Net loss ratio | Amount | Rate of change | Net loss ratio | ||||||||||
Fire and allied insurance | 13,771 | 4.0 | % | 42.8 | % | 14,504 | 5.3 | % | 43.7 | % | ||||||
Marine insurance | 3,241 | (3.2 | ) | 60.0 | 4,020 | 24.0 | 69.1 | |||||||||
Personal accident insurance | 16,524 | 3.5 | 51.3 | 16,834 | 1.9 | 52.0 | ||||||||||
Voluntary automobile insurance | 95,834 | (4.3 | ) | 64.5 | 93,834 | (2.1 | ) | 67.1 | ||||||||
Compulsory automobile liability insurance | 38,798 | (2.6 | ) | 112.0 | 38,750 | (0.1 | ) | 107.4 | ||||||||
Others | 36,431 | 72.7 | 73.4 | 21,254 | (41.7 | ) | 44.4 | |||||||||
Total | 204,602 | 5.6 | 67.6 | 189,198 | (7.5 | ) | 64.3 | |||||||||
4
Table of Contents
(Reference) Sompo Japan Insurance Inc. (Non-consolidated)
| (Millions of yen) | ||||||
| As of June 30, 2010 | As of March 31, 2010 | |||||
(A) Total Solvency Margin | 1,496,886 | 1,671,429 | ||||
Capital and funds, etc. | 423,099 | 414,156 | ||||
Reserve for price fluctuation | 12,935 | 11,462 | ||||
Contingency reserve | 611 | 611 | ||||
Catastrophic loss reserve | 474,909 | 466,702 | ||||
General allowance for possible loan losses | 897 | 992 | ||||
Unrealized gains on securities (before tax effect deductions) | 393,561 | 536,605 | ||||
Net unrealized gains and losses on real estate | 52,252 | 52,252 | ||||
Excess amount of reserve for maturity refunds | — | — | ||||
Subordinated debt, etc. | 128,000 | 128,000 | ||||
Deductions | 157,616 | 101,616 | ||||
Others | 168,235 | 162,261 | ||||
(B) Total Risks | ||||||
| 398,766 | 417,827 | ||||
Underwriting risk (R1) | 83,963 | 83,975 | ||||
Underwriting risk for third-sector insurance products including accident, sickness and nursing-care insurance (R2) | — | — | ||||
Guaranteed interest rate risk (R3) | 5,368 | 5,368 | ||||
Investment risk (R4) | 168,492 | 185,633 | ||||
Business management risk (R5) | 9,088 | 9,493 | ||||
Major catastrophe risk | 196,604 | 199,686 | ||||
(C) Solvency Margin Ratio (R6) [(A) / {(B) × 1/2}] × 100 | 750.7 | % | 800.0 | % | ||
| Note) | The above figures are calculated based on Articles 86 and 87 of the Ordinance for Enforcement of the Insurance Business Law and the provisions of Notification No. 50 of the Ministry of Finance (1996). The figures as of June 30, 2010 are partly calculated on the simplified method, for example, some bases for the major catastrophe risk calculation are deemed same as the figures as of March 31, 2010. |
5
Table of Contents
|
Exposure to Structured Finance
As of June 30, 2010
August 13, 2010
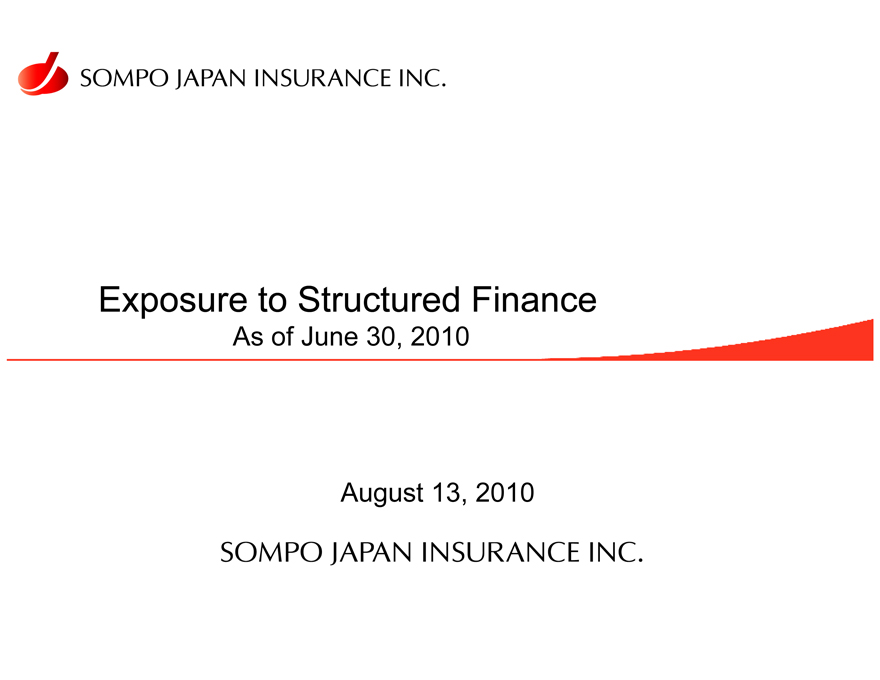
Summary of Financial Guarantee Insurance
Gains/Losses for
FY2010 1Q
(Overall financial guarantee)
6.4 billion yen gain (Gains from ABS-CDO guarantee)
Primarily due to some expected recovery from the past fiscal year’s loss payment.
Overall financial guarantee (Gains/Losses)
Loss payment (*1)
Provision/Reversal of Loss Reserves (*2)
Gains/Losses
FY2007
0.1
(30.0)
(29.9)
FY2008
(37.9)
(109.9)
(147.9)
FY2009
(63.8)
55.7
(8.0)
(Unit: billions of yen)
FY2009 1Q
(15.8)
14.1
(1.7)
FY2010 1Q
(0.2)
6.6
6.4
*1 Including commutation. *2 Including gains/losses of exchange hedge transaction.
Net exposure to ABS-CDOs
Net exposure to ABS-CDOs (after deduction of loss reserves) reduced to 40.8 billion yen. (Decreased by 2.7 billion yen since March 31, 2010)
(unit: billions of yen)
300.0 200.0 100.0 0.0
259.4
78.9
43.5
40.8
(Unit: billions of yen)
ABS-CDOs (Insured Amount)
Total of Insured Amount
Outstanding Loss Reserves
Insured Amount Net of Loss Reserves
3/31/2008
289.4
(30.0)
259.4
3/31/2009
218.0
(139.0)
78.9
3/31/2010
123.1
(79.5)
43.5
6/30/2010
117.4
(76.6)
40.8
6
Table of Contents
|
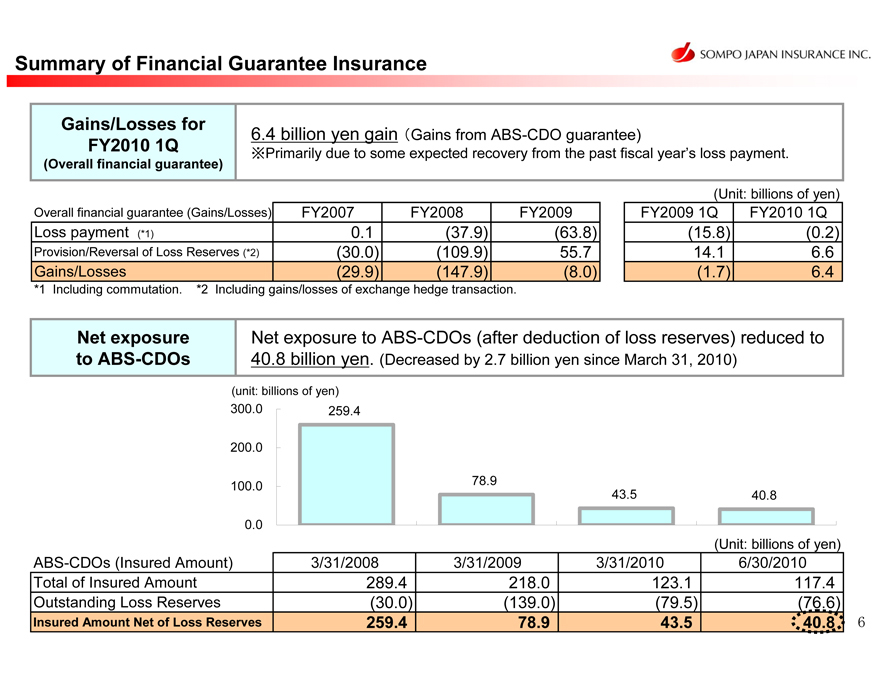
<Appendix 1> Financial Guarantee Insurance
(As of June 30, 2010, Unit: billions of yen, USD/JPY=88.51)
Categories
CDOs
ABS
ABS CDOs (backed by pools of asset backed securities) (*1)
Corporate CDOs (backed by pools of single corporate credits) (*2)
CDOs Total
RMBS (*3)
Global RMBS Domestic RMBS RMBS Total CMBS (*4) Other ABS
Global ABS (*5) Domestic ABS Other ABS Total
ABS Total
Public Finance Total
Insured Amount
Direct Insurance
(*6)
116.9 146.0 262.9
- 3
6.6 36.6-
3.3 8.6 12.0 48.6 -
311.5
Treaty Reinsurance
(*7)
0.5 1.6 2.2
10.8-10.8-
2 6.0 - 26.0 36.8 179.5
218.6
Total
117.4 147.7 265.2
10.8 36.6 47.4-
29.3 8.6 38.0 85.5 179.5
530.2
Outstanding Loss Reserve
(*8)
7 6.6 - 7 6.6
0.3 - 0.3 -
0.5 - 0.5 0.9 0.0
77.5
Insured Amount Net of Loss Reserves
40.8 147.7 188.5
10.4 36.6 47.0 -
28.8 8.6
37.5 84.5 179.4
452.6
Gains/Losses for FY2010 1Q
(*9)
6.4 -
6.4
-
-
6.4
*1 ABS CDOs (backed by pools of asset backed securities): The securities backed by securitized assets such as the RMBS, CDOs and CLOs.
*2 Corporate CDOs (backed by pools of single corporate credits): The securities backed by assets such as corporate bonds, loans and CDS.
*3 RMBS: Asset Backed Securities where underlying assets are residential mortgages. 93% of RMBS are rated investment grade (BBB or above) including AAA ratings for 79%.
*4 CMBS: Asset-backed securities where underlying assets are commercial mortgage loans.
*5 8% of global ABS are U.S. consumer loan-related ABS, while others are mainly related to corporate credit (e.g., leasing receivables).
*6 “Direct Insurance” includes facultative reinsurance policies and 9.0 billion yen of Direct Insurance to cover U.S. monoline guaranteed notes.
*7 “Treaty Reinsurance” is a portfolio-based reinsurance where certain parts of policies underwritten by an original insurer are ceded automatically to the reinsurer, Sompo Japan, in
accordance with the conditions agreed by the original insurer and the reinsurer.
*8 Recoverable reserve for the transaction which was terminated by claim payment is not included in “Outstanding Loss Reserve”.
*9 Total amount of 6.4 billion yen gain is comprised of 0.2 billion yen of loss payment offset by 8.1 billion yen of reversal of loss reserve and 1.5 billion yen losses of foreign
exchange hedge transaction for loss reserve. Financial Guarantee Insurance is not supposed to book mark-to-market unrealized gains/losses through income statement as it is
an insurance policy.
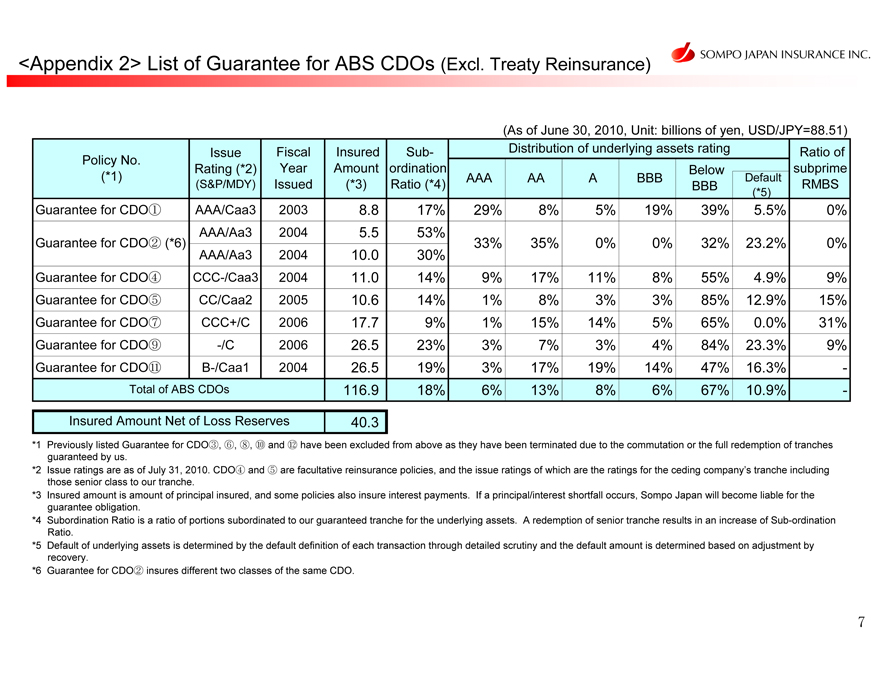
<Appendix 2> List of Guarantee for ABS CDOs (Excl. Treaty Reinsurance)
(As of June 30, 2010, Unit: billions of yen, USD/JPY=88.51)
Policy No. (*1)
Guarantee for CDO
Guarantee for CDO (*6)
Guarantee for CDO Guarantee for CDO Guarantee for CDO Guarantee for CDO Guarantee for CDO
Total of ABS CDOs
Issue Rating (*2) (S&P/MDY)
AAA/Caa3 AAA/Aa3 AAA/Aa3 CCC-/Caa3 CC/Caa2 CCC+/C
-/C B-/Caa1
Fiscal Year
Issued 2003 2004 2004 2004 2005 2006 2006 2004
Insured Amount (*3)
8.8
5.5
10.0
11.0
10.6
17.7
26.5
26.5 116.9
Subordination Ratio (*4) 17% 53% 30% 14% 14% 9% 23% 19% 18%
Distribution of underlying assets rating
AAA 29% 33%
9% 1% 1% 3%
3% 6%
AA 8% 35%
17% 8% 15% 7% 17% 13%
A 5% 0%
11% 3% 14% 3% 19% 8%
BBB 19% 0%
8% 3% 5
% 4% 14% 6%
Below BBB
39%
32%
55% 85% 65% 84% 47% 67%
Default (*5)
5.5%
23.2%
4.9% 12.9% 0.0% 23.3% 16.3
% 10.9%
Ratio of subprime RMBS
0%
0%
9% 15% 31% 9% -
Insured Amount Net of Loss Reserves 40.3
*1 Previously listed Guarantee for CDO, and have been excluded from above as they have been terminated due to the commutation or the full redemption of tranches
guaranteed by us.
*2 Issue ratings are as of July 31, 2010. CDO and are facultative reinsurance policies, and the issue ratings of which are the ratings for the ceding company’s tranche including
those senior class to our tranche.
*3 Insured amount is amount of principal insured, and some policies also insure interest payments. If a principal/interest shortfall occurs, Sompo Japan will become liable for the
guarantee obligation.
*4 Subordination Ratio is a ratio of portions subordinated to our guaranteed tranche for the underlying assets. A redemption of senior tranche results in an increase of Sub-ordination
Ratio.
*5 Default of underlying assets is determined by the default definition of each transaction through detailed scrutiny and the default amount is determined based on adjustment by
recovery.
*6 Guarantee for CDO insures different two classes of the same CDO.
7
Table of Contents
|
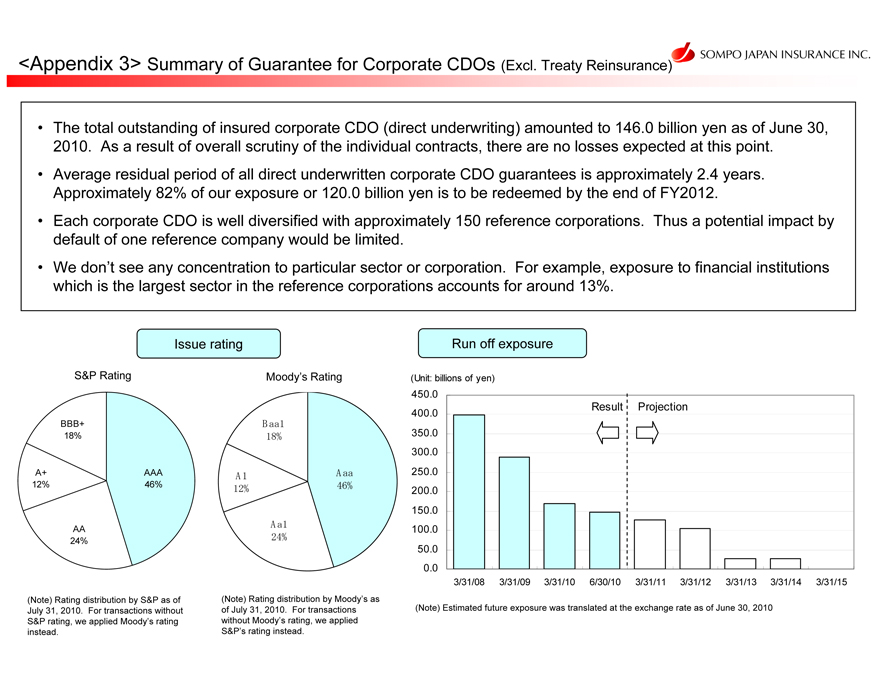
<Appendix 3> Summary of Guarantee for Corporate CDOs (Excl. Treaty Reinsurance)
The total outstanding of insured corporate CDO (direct underwriting) amounted to 146.0 billion yen as of June 30, 2010. As a result of overall scrutiny of the individual contracts, there are no losses expected at this point.
Average residual period of all direct underwritten corporate CDO guarantees is approximately 2.4 years. Approximately 82% of our exposure or 120.0 billion yen is to be redeemed by the end of FY2012.
Each corporate CDO is well diversified with approximately 150 reference corporations. Thus a potential impact by default of one reference company would be limited.
We don’t see any concentration to particular sector or corporation. For example, exposure to financial institutions which is the largest sector in the reference corporations accounts for around 13%.
Issue rating
S&P Rating
BBB+ 18%
A+ AAA 12% 46%
AA
24%
Moody’s Rating
Baa1 18%
A1 Aaa 12% 46%
Aa1 24%
(Note) Rating distribution by S&P as of July 31, 2010. For transactions without S&P rating, we applied Moody’s rating instead.
(Note) Rating distribution by Moody’s as of July 31, 2010. For transactions without Moody’s rating, we applied S&P’s rating instead.
Run off exposure
(Unit: billions of yen)
450.0 400.0 350.0 300.0 250.0 200.0 150.0 100.0 50.0 0.0
Result Projection
3/31/08 3/31/09 3/31/10 6/30/10 3/31/11 3/31/12 3/31/13 3/31/14 3/31/15
(Note) Estimated future exposure was translated at the exchange rate as of June 30, 2010
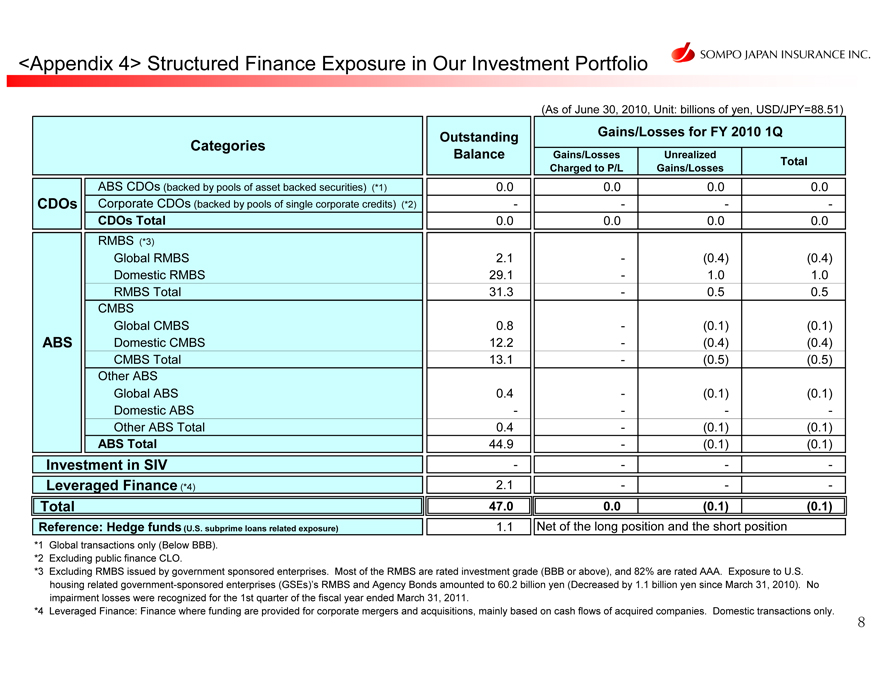
<Appendix 4> Structured Finance Exposure in Our Investment Portfolio
(As of June 30, 2010, Unit: billions of yen, USD/JPY=88.51)
Categories
ABS CDOs (backed by pools of asset backed securities) (*1)
CDOs
Corporate CDOs (backed by pools of single corporate credits) (*2)
CDOs Total
RMBS (*3)
Global RMBS Domestic RMBS RMBS Total CMBS
Global CMBS ABS Domestic CMBS
CMBS Total Other ABS
Global ABS Domestic ABS Other ABS Total
ABS Total Investment in SIV Leveraged Finance (*4) Total
Reference: Hedge funds (U.S. subprime loans related exposure)
Gains/Losses for FY 2010 1Q
Gains/Losses Charged to P/L
0.0 -
0.0
-
-
-
-
0.0
Unrealized Gains/Losses
0.0
-
0.0
(0.4)
1.0
0.5
(0.1)
(0.4)
(0.5)
(0.1)
-
(0.1)
(0.1)
-
(0.1)
Total
0.0
-
0.0
(0.4)
1.0
0.5
(0.1)
(0.4)
(0.5)
(0.1)
–
(0.1)
(0.1)
-
(0.1)
Outstanding Balance
0.0 - 0.0 2.1 29.1 31.3 0.8 12.2 13.1 0.4 - 0.4 44.9 - 2.1 47.0 1.1
Net of the long position and the short position
*1 Global transactions only (Below BBB).
*2 Excluding public finance CLO.
*3 Excluding RMBS issued by government sponsored enterprises. Most of the RMBS are rated investment grade (BBB or above), and 82% are rated AAA. Exposure to U.S. housing related government-sponsored enterprises (GSEs)’s RMBS and Agency Bonds amounted to 60.2 billion yen (Decreased by 1.1 billion yen since March 31, 2010). No impairment losses were recognized for the 1st quarter of the fiscal year ended March 31, 2011.
*4 Leveraged Finance: Finance where funding are provided for corporate mergers and acquisitions, mainly based on cash flows of acquired companies. Domestic transactions only.
8
Table of Contents
(Reference) NIPPONKOA Insurance Co., Ltd. (Non-consolidated)
| (Millions of yen) | |||||||||
| As of June 30, 2010 | As of March 31, 2010 | Increase (Decrease) | |||||||
| Amount | Amount | ||||||||
Assets: | |||||||||
Cash and deposits | 70,242 | 80,793 | (10,551 | ) | |||||
Call loans | 25,000 | 50,000 | (25,000 | ) | |||||
Monetary receivables bought | 33,491 | 6,129 | 27,361 | ||||||
Money trusts | 56,789 | 56,752 | 37 | ||||||
Securities | 1,756,202 | 1,822,848 | (66,645 | ) | |||||
Loans | 221,087 | 227,417 | (6,329 | ) | |||||
Tangible fixed assets | 129,322 | 130,437 | (1,115 | ) | |||||
Intangible fixed assets | 531 | 534 | (3 | ) | |||||
Other assets | 162,744 | 159,263 | 3,480 | ||||||
Deferred tax assets | 78,684 | 60,392 | 18,291 | ||||||
Allowance for possible loan losses | (2,073 | ) | (2,106 | ) | 33 | ||||
Total assets | 2,532,023 | 2,592,464 | (60,441 | ) | |||||
Liabilities: | |||||||||
Underwriting funds: | 2,044,167 | 2,059,290 | (15,123 | ) | |||||
Reserve for outstanding losses and claims | 266,522 | 267,872 | (1,349 | ) | |||||
Underwriting reserves | 1,777,644 | 1,791,418 | (13,773 | ) | |||||
Other liabilities | 57,910 | 65,184 | (7,274 | ) | |||||
Reserve for retirement benefits | 23,090 | 22,583 | 506 | ||||||
Reserve for bonus payments | 1,455 | 6,078 | (4,622 | ) | |||||
Reserve for bonus payments to directors | — | 41 | (41 | ) | |||||
Reserves under the special laws: | 6,421 | 5,643 | 778 | ||||||
Reserve for price fluctuation | 6,421 | 5,643 | 778 | ||||||
Total liabilities | 2,133,044 | 2,158,821 | (25,777 | ) | |||||
Net assets: | |||||||||
Shareholders’ equity: | |||||||||
Common stock | 91,249 | 91,249 | — | ||||||
Capital surplus | 46,702 | 46,702 | — | ||||||
Retained earnings | 118,686 | 117,202 | 1,484 | ||||||
Total shareholders’ equity | 256,637 | 255,153 | 1,484 | ||||||
Valuation and translation adjustments: | |||||||||
Unrealized gains on securities available for sale, net of tax | 138,223 | 175,808 | (37,584 | ) | |||||
Deferred gains or losses on hedges | 4,117 | 2,115 | 2,001 | ||||||
Total valuation and translation adjustments | 142,340 | 177,924 | (35,583 | ) | |||||
Stock acquisition rights | — | 565 | (565 | ) | |||||
Total net assets | 398,978 | 433,642 | (34,663 | ) | |||||
Total liabilities and net assets | 2,532,023 | 2,592,464 | (60,441 | ) | |||||
9
Table of Contents
(Reference) NIPPONKOA Insurance Co., Ltd. (Non-consolidated)
Quarterly Statements of Income
| (Millions of yen) | ||||||||||||||||
| Three months ended June 30, 2009 (April 1 to June 30, 2009) | Three months ended June 30, 2010 (April 1 to June 30, 2010) | Increase (Decrease) | Rate of change | |||||||||||||
| Amount | Amount | |||||||||||||||
Ordinary income: | 205,627 | 202,981 | (2,645 | ) | (1.3 | )% | ||||||||||
Underwriting income: | 192,970 | 190,147 | (2,823 | ) | (1.5 | ) | ||||||||||
Net premiums written | 162,099 | 160,285 | (1,814 | ) | (1.1 | ) | ||||||||||
Deposits of premiums by policyholders | 7,477 | 9,517 | 2,040 | 27.3 | ||||||||||||
Interest and dividend income on deposits of premiums, etc. | 5,874 | 5,205 | (668 | ) | (11.4 | ) | ||||||||||
Reversal of reserve for outstanding losses and claims | — | 1,349 | 1,349 | — | ||||||||||||
Reversal of underwriting reserves | 17,262 | 13,773 | (3,488 | ) | (20.2 | ) | ||||||||||
Investment income: | 12,310 | 12,435 | 124 | 1.0 | ||||||||||||
Interest and dividend income | 14,347 | 13,403 | (944 | ) | (6.6 | ) | ||||||||||
Investment gains on money trusts | 581 | 303 | (277 | ) | (47.7 | ) | ||||||||||
Gains on sales of securities | 1,941 | 3,171 | 1,229 | 63.3 | ||||||||||||
Transfer of interest and dividend income on deposits of premiums, etc. | (5,874 | ) | (5,205 | ) | 668 | — | ||||||||||
Other ordinary income | 345 | 398 | 53 | 15.4 | ||||||||||||
Ordinary expenses: | 194,338 | 191,810 | (2,528 | ) | (1.3 | ) | ||||||||||
Underwriting expenses: | 161,135 | 157,594 | (3,541 | ) | (2.2 | ) | ||||||||||
Net claims paid | 97,367 | 96,139 | (1,228 | ) | (1.3 | ) | ||||||||||
Loss adjustment expenses | 8,785 | 8,895 | 110 | 1.3 | ||||||||||||
Net commissions and brokerage fees | 27,960 | 27,195 | (764 | ) | (2.7 | ) | ||||||||||
Maturity refunds to policyholders | 25,540 | 24,497 | (1,042 | ) | (4.1 | ) | ||||||||||
Provision for reserve for outstanding losses and claims | 1,407 | — | (1,407 | ) | (100.0 | ) | ||||||||||
Investment expenses: | 2,418 | 3,439 | 1,021 | 42.2 | ||||||||||||
Investment losses on money trusts | 273 | 246 | (26 | ) | (9.7 | ) | ||||||||||
Losses on sales of securities | 478 | 1,623 | 1,144 | 239.3 | ||||||||||||
Impairment losses on securities | 179 | 445 | 266 | 148.3 | ||||||||||||
Operating, general and administrative expenses | 30,627 | 30,654 | 26 | 0.1 | ||||||||||||
Other ordinary expenses: | 157 | 122 | (34 | ) | (22.1 | ) | ||||||||||
Interest paid | 20 | 10 | (9 | ) | (49.2 | ) | ||||||||||
Ordinary profit | 11,288 | 11,171 | (117 | ) | (1.0 | ) | ||||||||||
Extraordinary gains: | 0 | 598 | 597 | 93,416.9 | ||||||||||||
Gains on disposal of fixed assets | 0 | 33 | 32 | 5,136.0 | ||||||||||||
Other extraordinary gains | — | 565 | 565 | — | ||||||||||||
Extraordinary losses: | 1,231 | 1,020 | (211 | ) | (17.1 | ) | ||||||||||
Losses on disposal of fixed assets | 67 | 43 | (24 | ) | (35.7 | ) | ||||||||||
Impairment losses | — | 36 | 36 | — | ||||||||||||
Provision for reserves under the special laws: | 649 | 778 | 128 | 19.7 | ||||||||||||
Provision for price fluctuation reserve | 649 | 778 | 128 | 19.7 | ||||||||||||
Other extraordinary losses | 513 | 162 | (351 | ) | (68.5 | ) | ||||||||||
Income before income taxes | 10,057 | 10,748 | 691 | 6.9 | ||||||||||||
Income taxes and deferred income taxes | 2,641 | 3,244 | 603 | 22.8 | ||||||||||||
Net income | 7,415 | 7,504 | 88 | 1.2 | ||||||||||||
Underwriting result: | ||||||||||||||||
Net premiums written | (+) | 162,099 | 160,285 | (1,814 | ) | (1.1 | ) | |||||||||
Net claims paid | (–) | 97,367 | 96,139 | (1,228 | ) | (1.3 | ) | |||||||||
Loss adjustment expenses | (–) | 8,785 | 8,895 | 110 | 1.3 | |||||||||||
Operating expenses: | (–) | 57,100 | 56,335 | (764 | ) | (1.3 | ) | |||||||||
Net commissions and brokerage fees | 27,960 | 27,195 | (764 | ) | (2.7 | ) | ||||||||||
Operating, general and administrative expenses related to underwriting | 29,140 | 29,139 | (0 | ) | (0.0 | ) | ||||||||||
Underwriting result | (1,153 | ) | (1,084 | ) | 68 | — | ||||||||||
Underwriting profit | 1,421 | 2,731 | 1,309 | 92.1 | ||||||||||||
Ratios: | ||||||||||||||||
Net loss ratio | (%) | 65.5 | 65.5 | — | ||||||||||||
Net expense ratio | (%) | 35.2 | 35.1 | (0.1 | ) | |||||||||||
Underwriting result ratio | (%) | (0.7 | ) | (0.7 | ) | — | ||||||||||
10
Table of Contents
(Reference) NIPPONKOA Insurance Co., Ltd. (Non-consolidated)
Premiums Written and Claims Paid by Lines of Business
Direct premiums written (excluding deposits of premiums by policyholders)
| (Millions of yen) | ||||||||||||||||
| Three months ended June 30, 2009 (April 1 to June 30, 2009) | Three months ended June 30, 2010 (April 1 to June 30, 2010) | |||||||||||||||
Business line | Amount | % of total amount | Rate of change | Amount | % of total amount | Rate of change | ||||||||||
Fire and allied insurance | 29,348 | 16.7 | % | (8.4 | )% | 28,940 | 16.6 | % | (1.4 | )% | ||||||
Marine insurance | 3,398 | 1.9 | (29.1 | ) | 3,731 | 2.1 | 9.8 | |||||||||
Personal accident insurance | 14,544 | 8.3 | (5.2 | ) | 14,333 | 8.2 | (1.5 | ) | ||||||||
Voluntary automobile insurance | 82,717 | 47.2 | (2.0 | ) | 81,206 | 46.8 | (1.8 | ) | ||||||||
Compulsory automobile liability insurance | 19,982 | 11.4 | (25.4 | ) | 20,334 | 11.7 | 1.8 | |||||||||
Others | 25,438 | 14.5 | (2.4 | ) | 25,483 | 14.6 | 0.2 | |||||||||
Total | 175,431 | 100.0 | (7.4 | ) | 174,029 | 100.0 | (0.8 | ) | ||||||||
Deposits of premiums by policyholders | 7,477 | — | (53.4 | ) | 9,517 | — | 27.3 | |||||||||
| Net premiums written | ||||||||||||||||
| (Millions of yen) | ||||||||||||||||
| Three months ended June 30, 2009 (April 1 to June 30, 2009) | Three months ended June 30, 2010 (April 1 to June 30, 2010) | |||||||||||||||
Business line | Amount | % of total amount | Rate of change | Amount | % of total amount | Rate of change | ||||||||||
Fire and allied insurance | 21,266 | 13.1 | % | (10.4 | )% | 20,099 | 12.5 | % | (5.5 | )% | ||||||
Marine insurance | 3,190 | 2.0 | (25.4 | ) | 3,330 | 2.1 | 4.4 | |||||||||
Personal accident insurance | 14,613 | 9.0 | (4.6 | ) | 14,520 | 9.1 | (0.6 | ) | ||||||||
Voluntary automobile insurance | 82,486 | 50.9 | (2.1 | ) | 81,083 | 50.5 | (1.7 | ) | ||||||||
Compulsory automobile liability insurance | 16,837 | 10.4 | (24.4 | ) | 17,553 | 11.0 | 4.3 | |||||||||
Others | 23,705 | 14.6 | (3.4 | ) | 23,698 | 14.8 | (0.0 | ) | ||||||||
Total | 162,099 | 100.0 | (7.1 | ) | 160,285 | 100.0 | (1.1 | ) | ||||||||
| Net claims paid | ||||||||||||||||
| (Millions of yen) | ||||||||||||||||
| Three months ended June 30, 2009 (April 1 to June 30, 2009) | Three months ended June 30, 2010 (April 1 to June 30, 2010) | |||||||||||||||
Business line | Amount | Rate of change | Net loss ratio | Amount | Rate of change | Net loss ratio | ||||||||||
Fire and allied insurance | 10,785 | 13.3 | % | 54.9 | % | 9,135 | (15.3 | )% | 49.8 | % | ||||||
Marine insurance | 1,904 | 48.5 | 61.1 | 1,587 | (16.6 | ) | 49.4 | |||||||||
Personal accident insurance | 7,584 | (5.1 | ) | 57.6 | 7,462 | (1.6 | ) | 56.7 | ||||||||
Voluntary automobile insurance | 48,002 | (1.6 | ) | 64.0 | 50,185 | 4.5 | 67.9 | |||||||||
Compulsory automobile liability insurance | 17,765 | (3.0 | ) | 111.9 | 17,814 | 0.3 | 108.0 | |||||||||
Others | 11,324 | (4.7 | ) | 52.6 | 9,952 | (12.1 | ) | 47.1 | ||||||||
Total | 97,367 | (0.4 | ) | 65.5 | 96,139 | (1.3 | ) | 65.5 | ||||||||
11
Table of Contents
(Reference) NIPPONKOA Insurance Co., Ltd. (Non-consolidated)
| (Millions of yen) | ||||||
| As of June 30, 2010 | As of March 31, 2010 | |||||
(A) Total Solvency Margin | 800,103 | 840,210 | ||||
Capital and funds, etc. | 256,637 | 249,698 | ||||
Reserve for price fluctuation | 6,421 | 5,643 | ||||
Contingency reserve | 12 | 12 | ||||
Catastrophic loss reserve | 284,864 | 285,675 | ||||
General allowance for possible loan losses | 43 | 40 | ||||
Unrealized gains on securities (before tax effect deductions) | 190,825 | 242,132 | ||||
Net unrealized gains and losses on real estate | 24,257 | 24,275 | ||||
Excess amount of reserve for maturity refunds | — | — | ||||
Subordinated debt, etc. | — | — | ||||
Deductions | 13,269 | 13,269 | ||||
Others | 50,310 | 46,002 | ||||
(B) Total Risks | 232,775 | 226,293 | ||||
| ||||||
Underwriting risk (R1) | 39,277 | 39,271 | ||||
Underwriting risk for third-sector insurance products including accident, sickness and nursing-care insurance (R2) | 1 | 1 | ||||
Guaranteed interest rate risk (R3) | 3,051 | 3,088 | ||||
Investment risk (R4) | 81,401 | 85,444 | ||||
Business management risk (R5) | 5,164 | 7,492 | ||||
Major catastrophe risk (R6) | 134,471 | 121,948 | ||||
(C) Solvency Margin Ratio [(A) / {(B) × 1/2}] × 100 | 687.4 | % | 742.5 | % | ||
| Note) | The above figures are calculated based on Articles 86 and 87 of the Ordinance for Enforcement of the Insurance Business Law and the provisions of Notification No. 50 of the Ministry of Finance (1996). The figures as of June 30, 2010 are partly calculated on the simplified method, for example, some bases for the major catastrophe risk calculation are deemed same as the figures as of March 31, 2010. |
12
Table of Contents
(Reference) NIPPONKOA Insurance Co., Ltd. (Non-consolidated)
Investments in the securitized paper and subprime loans (As of June 30, 2010)
Investments by NIPPONKOA in the securitized paper, as of June 30, 2010, are as follows.
| 1. | SPEs (Special Purpose Entities) |
None.
| 2. | CDOs (Collateralized Debt Obligations) |
| (Billions of Yen) | ||||||||||||
| As of June 30, 2010 | (Reference) As of March 31, 2010 | |||||||||||
| Fair value | Unrealized gains or losses | Impairment losses | Fair value | Unrealized gains or losses | Impairment losses | |||||||
CDO | 8.0 | 0.1 | — | 7.8 | 0.1 | — | ||||||
Rated | 7.5 | — | — | 7.2 | — | — | ||||||
Non-rated | 0.5 | 0.1 | — | 0.6 | 0.1 | — | ||||||
(Notes)
| (1) | NIPPONKOA recognized impairment on securities whose fair value is determinable as of the balance sheet date if the fair value declined by 30% or more from carrying value. Also applied to the table below. |
| (2) | Out of the rated CDOs, 13% is rated AAA, 13% is rated AA, 63% is rated A, and 11% is rated BB. |
| (3) | All of the underlying collateral pool for CDOs are assets supported by the corporate loans. |
| (4) | 93% of the CDOs is domestic and 7% is overseas. |
| (5) | The ratios for categorizations of the rated CDOs by region are calculated using the fair value. |
| (6) | Other than the figures in the table above, related to CDO, the Company recorded 0.2 billion yen of gains on derivative financial instruments. |
| 3. | Other subprime/Alt-A exposure |
None.
| 4. | CMBS (Commercial Mortgage-Backed Security) |
| (Billions of Yen) | |||||||||||||||
| As of June 30, 2010 | (Reference) As of March 31, 2010 | ||||||||||||||
| Fair value | Unrealized gains or losses | Impairment losses | Fair value | Unrealized gains or losses | Impairment losses | ||||||||||
CMBS | 7.2 | (0.3 | ) | — | 8.8 | (0.3 | ) | (0.1 | ) | ||||||
Domestic | 7.2 | (0.3 | ) | — | 8.8 | (0.3 | ) | (0.1 | ) | ||||||
Foreign | — | — | — | — | — | — | |||||||||
(Note) Amount in impairment losses includes the loss on evaluation of securities and other investment expenses.
| 5. | Leveraged finance |
None.
| 6. | CDS (Credit Default Swap) |
The Company does not hold CDS that reference the securitized paper including CDOs. The Company holds CDS that reference a single credit of a firm (7.0 billion yen of short commitment notional value, (0.0) billion yen of fair value, (0.0) billion yen of valuation loss).
[Definitions of securitized assets]
| • | SPEs: Special Purpose Entities. A general term of special purpose entities including SIV (Structured Investment Vehicle) that are specialized in investment of securitized papers. |
| • | CDO: Collateralized Debt Obligation. A securitized notes, which was supported, by asset pool of number of underlying debt securities and loans. |
| • | CMBS: Commercial Mortgage-Backed Security. An instrument that securitized the mortgage loans for commercial real estate. |
| • | Alt–A: A type of U.S. mortgage. Alt-A (Mezzanine) is placed in the middle of Prime loan, a loan for borrowers with higher creditscore, and Subprime loan, a loan for borrowers with lower creditscore. |
| • | CDS: Credit Default Swap. A swap contract involving trading of credits, which reference the creditworthiness of a corporate or securitized paper, called a reference credit (entity). |
13
Table of Contents
(Reference) SONPO 24 Insurance Co., Ltd. (Non-Consolidated)
| (Millions of yen) | |||||||||
| As of June 30, 2010 | As of March 31, 2010 | Increase (Decrease) | |||||||
| Amount | Amount | ||||||||
Assets: | |||||||||
Cash and deposits | 1,777 | 1,851 | (74 | ) | |||||
Securities | 15,772 | 15,618 | 153 | ||||||
Tangible fixed assets | 169 | 182 | (12 | ) | |||||
Other assets | 635 | 810 | (174 | ) | |||||
Total assets | 18,355 | 18,463 | (107 | ) | |||||
Liabilities: | |||||||||
Underwriting funds: | 8,606 | 8,538 | 68 | ||||||
Reserve for outstanding losses and claims | 2,426 | 2,333 | 92 | ||||||
Underwriting reserves | 6,180 | 6,204 | (24 | ) | |||||
Other liabilities | 1,198 | 1,443 | (245 | ) | |||||
Reserve for retirement benefits | 83 | 79 | 4 | ||||||
Reserve for bonus payments | 20 | 92 | (72 | ) | |||||
Reserves under the special laws: | 21 | 20 | 0 | ||||||
Reserve for price fluctuation | 21 | 20 | 0 | ||||||
Deferred tax liabilities | 34 | 18 | 15 | ||||||
Total liabilities | 9,965 | 10,193 | (228 | ) | |||||
Net assets: | |||||||||
Shareholders’ equity: | |||||||||
Common stock | 19,000 | 19,000 | — | ||||||
Capital surplus | 19,000 | 19,000 | — | ||||||
Retained earnings | (29,670 | ) | (29,763 | ) | 92 | ||||
Total shareholders’ equity | 8,329 | 8,236 | 92 | ||||||
Valuation and translation adjustments: | |||||||||
Unrealized gains on securities available for sale, net of tax | 60 | 32 | 27 | ||||||
Total valuation and translation adjustments | 60 | 32 | 27 | ||||||
Total net assets | 8,390 | 8,269 | 120 | ||||||
Total liabilities and net assets | 18,355 | 18,463 | (107 | ) | |||||
14
Table of Contents
(Reference) SONPO 24 Insurance Co., Ltd. (Non-Consolidated)
Quarterly Statements of Income
| (Millions of yen) | ||||||||||||||
| Three months ended June 30, 2009 (April 1 to June 30, 2009) | Three months ended June 30, 2010 (April 1 to June 30, 2010) | Increase (Decrease) | Rate of change | |||||||||||
| Amount | Amount | |||||||||||||
Ordinary income: | 2,332 | 2,619 | 286 | 12.3 | % | |||||||||
Underwriting income: | 2,307 | 2,569 | 262 | 11.4 | ||||||||||
Net premiums written | 2,304 | 2,542 | 238 | 10.3 | ||||||||||
Interest and dividend income on deposits of premiums, etc. | 2 | 2 | (0 | ) | (15.9 | ) | ||||||||
Reversal of underwriting reserves | — | 24 | 24 | — | ||||||||||
Investment income: | 24 | 49 | 24 | 100.7 | ||||||||||
Interest and dividend income | 27 | 21 | (5 | ) | (21.8 | ) | ||||||||
Gains on sales of securities | — | 30 | 30 | — | ||||||||||
Transfer of interest and dividend income on deposits of premiums, etc. | (2 | ) | (2 | ) | 0 | — | ||||||||
Other ordinary income | 0 | 0 | (0 | ) | (2.0 | ) | ||||||||
Ordinary expenses: | 2,539 | 2,524 | (14 | ) | (0.6 | ) | ||||||||
Underwriting expenses: | 1,804 | 1,869 | 64 | 3.6 | ||||||||||
Net claims paid | 1,217 | 1,449 | 231 | 19.0 | ||||||||||
Loss adjustment expenses | 149 | 163 | 14 | 9.4 | ||||||||||
Net commissions and brokerage fees | 153 | 163 | 10 | 6.6 | ||||||||||
Provision for reserve for outstanding losses and claims | 153 | 92 | (61 | ) | (39.9 | ) | ||||||||
Provision for underwriting reserves | 129 | — | (129 | ) | (100.0 | ) | ||||||||
Operating, general and administrative expenses | 734 | 654 | (79 | ) | (10.8 | ) | ||||||||
Other ordinary expenses | 0 | 0 | (0 | ) | (94.5 | ) | ||||||||
Ordinary profit (loss) | (207 | ) | 94 | 301 | — | |||||||||
Extraordinary losses: | 3 | 0 | (2 | ) | (75.8 | ) | ||||||||
Losses on disposal of fixed assets | 0 | 0 | 0 | 19.0 | ||||||||||
Provision for reserves under the special laws: | 0 | 0 | 0 | 0.9 | ||||||||||
Provision for price fluctuation reserve | 0 | 0 | 0 | 0.9 | ||||||||||
Other extraordinary losses | 2 | — | (2 | ) | (100.0 | ) | ||||||||
Income (loss) before income taxes | (210 | ) | 93 | 304 | — | |||||||||
Income taxes and deferred income taxes | 0 | 0 | — | — | ||||||||||
Net income (loss) | (211 | ) | 92 | 304 | — | |||||||||
Underwriting result: | ||||||||||||||
Net premiums written | (+) | 2,304 | 2,542 | 238 | 10.3 | |||||||||
Net claims paid | (–) | 1,217 | 1,449 | 231 | 19.0 | |||||||||
Loss adjustment expenses | (–) | 149 | 163 | 14 | 9.4 | |||||||||
Operating expenses: | (–) | 887 | 817 | (70 | ) | (7.9 | ) | |||||||
Net commissions and brokerage fees | 153 | 163 | 10 | 6.6 | ||||||||||
Operating, general and administrative expenses related to underwriting | 734 | 654 | (80 | ) | (10.9 | ) | ||||||||
Underwriting result | 49 | 111 | 62 | 126.5 | ||||||||||
Underwriting profit | (231 | ) | 45 | 277 | — | |||||||||
Ratios: | ||||||||||||||
Net loss ratio | (%) | 59.3 | 63.5 | 4.2 | ||||||||||
Net expense ratio | (%) | 38.5 | 32.1 | (6.4 | ) | |||||||||
Underwriting result ratio | (%) | 2.2 | 4.4 | 2.2 | ||||||||||
15
Table of Contents
(Reference) SONPO 24 Insurance Co., Ltd. (Non-Consolidated)
Premiums Written and Claims Paid by Lines of Business
Direct premiums written (excluding deposits of premiums by policyholders)
| (Millions of yen) | ||||||||||||||||
| Three months ended June 30, 2009 (April 1 to June 30, 2009) | Three months ended June 30, 2010 (April 1 to June 30, 2010) | |||||||||||||||
Business line | Amount | % of total amount | Rate of change | Amount | % of total amount | Rate of change | ||||||||||
Fire and allied insurance | — | — | % | — | % | — | — | % | — | % | ||||||
Marine insurance | — | — | — | — | — | — | ||||||||||
Personal accident insurance | — | — | — | — | — | — | ||||||||||
Voluntary automobile insurance | 2,313 | 100.0 | 23.1 | 2,547 | 100.0 | 10.1 | ||||||||||
Compulsory automobile liability insurance | — | — | — | — | — | — | ||||||||||
Others | — | — | — | — | — | — | ||||||||||
Total | 2,313 | 100.0 | 23.1 | 2,547 | 100.0 | 10.1 | ||||||||||
Deposits of premiums by policyholders | — | — | — | — | — | — | ||||||||||
Net premiums written
| (Millions of yen) | ||||||||||||||||
| Three months ended June 30, 2009 (April 1 to June 30, 2009) | Three months ended June 30, 2010 (April 1 to June 30, 2010) | |||||||||||||||
Business line | Amount | % of total amount | Rate of change | Amount | % of total amount | Rate of change | ||||||||||
Fire and allied insurance | — | — | % | — | % | — | — | % | — | % | ||||||
Marine insurance | — | — | — | — | — | — | ||||||||||
Personal accident insurance | — | — | — | — | — | — | ||||||||||
Voluntary automobile insurance | 2,273 | 98.7 | 23.5 | 2,503 | 98.5 | 10.1 | ||||||||||
Compulsory automobile liability insurance | 30 | 1.3 | (24.0 | ) | 39 | 1.5 | 27.7 | |||||||||
Others | — | — | — | — | — | — | ||||||||||
Total | 2,304 | 100.0 | 22.5 | 2,542 | 100.0 | 10.3 | ||||||||||
Net claims paid
| (Millions of yen) | ||||||||||||||||
| Three months ended June 30, 2009 (April 1 to June 30, 2009) | Three months ended June 30, 2010 (April 1 to June 30, 2010) | |||||||||||||||
Business line | Amount | Rate of change | Net loss ratio | Amount | Rate of change | Net loss ratio | ||||||||||
Fire and allied insurance | — | — | % | — | % | — | — | % | — | % | ||||||
Marine insurance | — | — | — | — | — | — | ||||||||||
Personal accident insurance | — | — | — | — | — | — | ||||||||||
Voluntary automobile insurance | 1,173 | 6.0 | 58.2 | 1,400 | 19.3 | 62.5 | ||||||||||
Compulsory automobile liability insurance | 43 | 7.2 | 142.7 | 49 | 12.5 | 125.7 | ||||||||||
Others | — | — | — | — | — | — | ||||||||||
Total | 1,217 | 6.1 | 59.3 | 1,449 | 19.0 | 63.5 | ||||||||||
16
Table of Contents
Reference SONPO 24 Insurance Co., Ltd. (Non-Consolidated)
| (Millions of yen) | ||||||
| As of June 30, 2010 | As of March 31, 2010 | |||||
(A) Total Solvency Margin | 8,688 | 8,616 | ||||
Capital and funds, etc. | 8,329 | 8,236 | ||||
Reserve for price fluctuation | 21 | 20 | ||||
Contingency reserve | — | — | ||||
Catastrophic loss reserve | 252 | 312 | ||||
General allowance for possible loan losses | — | — | ||||
Unrealized gains on securities (before tax effect deductions) | 85 | 46 | ||||
Net unrealized gains and losses on real estate | — | — | ||||
Excess amount of reserve for maturity refunds | — | — | ||||
Subordinated debt, etc. | — | — | ||||
Deductions | — | — | ||||
Others | — | — | ||||
(B) Total Risks
| 908 | 895 | ||||
Underwriting risk (R1) | 757 | 734 | ||||
Underwriting risk for third-sector insurance products including accident, sickness and nursing-care insurance (R2) | — | — | ||||
Guaranteed interest rate risk (R3) | — | — | ||||
Investment risk (R4) | 154 | 193 | ||||
Business management risk (R5) | 30 | 30 | ||||
Major catastrophe risk (R6) | 104 | 104 | ||||
(C) Solvency Margin Ratio [(A) / {(B) × 1/2}] × 100 | 1,913.2 | % | 1,924.8 | % | ||
| Note) | The above figures are calculated based on Articles 86 and 87 of the Ordinance for Enforcement of the Insurance Business Law and the provisions of Notification No. 50 of the Ministry of Finance (1996). The figures as of June 30, 2010 are partly calculated on the simplified method, for example, some bases for the major catastrophe risk calculation are deemed same as the figures as of March 31, 2010. |
17
Table of Contents
(Reference) Saison Automobile and Fire Insurance Company, Limited (Non-consolidated)
| (Millions of yen) | |||||||||
| As of June 30, 2010 | As of March 31, 2010 | Increase (Decrease) | |||||||
| Amount | Amount | ||||||||
Assets: | |||||||||
Cash and deposits | 7,511 | 10,796 | (3,284 | ) | |||||
Money trusts | 1,291 | 1,316 | (25 | ) | |||||
Securities | 21,603 | 19,223 | 2,379 | ||||||
Loans | 16 | 20 | (3 | ) | |||||
Tangible fixed assets | 288 | 171 | 117 | ||||||
Intangible fixed assets | 1,126 | 897 | 228 | ||||||
Other assets | 2,177 | 1,917 | 260 | ||||||
Allowance for possible loan losses | (0 | ) | (0 | ) | — | ||||
Total assets | 34,014 | 34,342 | (327 | ) | |||||
Liabilities: | |||||||||
Underwriting funds: | 19,791 | 19,359 | 431 | ||||||
Reserve for outstanding losses and claims | 4,930 | 4,946 | (16 | ) | |||||
Underwriting reserves | 14,861 | 14,413 | 448 | ||||||
Other liabilities | 1,395 | 1,431 | (35 | ) | |||||
Reserve for retirement benefits | 285 | 364 | (78 | ) | |||||
Reserve for retirement benefits to directors | 36 | 34 | 1 | ||||||
Reserve for bonus payments | 109 | 206 | (96 | ) | |||||
Reserves under the special laws: | 1 | 14 | (12 | ) | |||||
Reserve for price fluctuation | 1 | 14 | (12 | ) | |||||
Deferred tax liabilities | 60 | 100 | (39 | ) | |||||
Total liabilities | 21,680 | 21,510 | 169 | ||||||
Net assets: | |||||||||
Shareholders’ equity: | |||||||||
Common stock | 8,610 | 8,610 | — | ||||||
Capital surplus | 6,848 | 6,848 | — | ||||||
Retained earnings | (3,299 | ) | (2,925 | ) | (374 | ) | |||
Total shareholders’ equity | 12,158 | 12,532 | (374 | ) | |||||
Valuation and translation adjustments: | |||||||||
Unrealized gains on securities available for sale, net of tax | 175 | 299 | (123 | ) | |||||
Total valuation and translation adjustments | 175 | 299 | (123 | ) | |||||
Total net assets | 12,334 | 12,831 | (497 | ) | |||||
Total liabilities and net assets | 34,014 | 34,342 | (327 | ) | |||||
18
Table of Contents
(Reference) Saison Automobile and Fire Insurance Company, Limited (Non-consolidated)
Quarterly Statements of Income
| (Millions of yen) | ||||||||||||||
| Three months ended June 30, 2009 (April 1 to June 30, 2009) | Three months ended June 30, 2010 (April 1 to June 30, 2010) | Increase (Decrease) | Rate of change | |||||||||||
| Amount | Amount | |||||||||||||
Ordinary income: | 4,244 | 4,133 | (110 | ) | (2.6 | )% | ||||||||
Underwriting income: | 4,066 | 4,008 | (57 | ) | (1.4 | ) | ||||||||
Net premiums written | 3,613 | 3,816 | 202 | 5.6 | ||||||||||
Deposits of premiums by policyholders | 200 | 163 | (37 | ) | (18.6 | ) | ||||||||
Interest and dividend income on deposits of premiums, etc. | 9 | 12 | 2 | 32.5 | ||||||||||
Reversal of reserve for outstanding losses and claims | 242 | 16 | (226 | ) | (93.3 | ) | ||||||||
Investment income: | 122 | 71 | (50 | ) | (41.4 | ) | ||||||||
Interest and dividend income | 81 | 82 | 1 | 2.2 | ||||||||||
Investment gains on money trusts | 49 | — | (49 | ) | (100.0 | ) | ||||||||
Investment gains on trading securities | — | 0 | 0 | — | ||||||||||
Gains on sales of securities | 1 | 0 | (1 | ) | (88.7 | ) | ||||||||
Transfer of interest and dividend income on deposits of premiums, etc. | (9 | ) | (12 | ) | (2 | ) | — | |||||||
Other ordinary income | 55 | 53 | (2 | ) | (3.6 | ) | ||||||||
Ordinary expenses: | 4,163 | 4,513 | 349 | 8.4 | ||||||||||
Underwriting expenses: | 3,047 | 3,275 | 227 | 7.5 | ||||||||||
Net claims paid | 1,912 | 1,880 | (31 | ) | (1.7 | ) | ||||||||
Loss adjustment expenses | 199 | 253 | 54 | 27.1 | ||||||||||
Net commissions and brokerage fees | 466 | 457 | (9 | ) | (1.9 | ) | ||||||||
Maturity refunds to policyholders | 232 | 233 | 0 | 0.2 | ||||||||||
Provision for underwriting reserves | 234 | 448 | 213 | 90.8 | ||||||||||
Investment expenses: | 53 | 37 | (16 | ) | (30.1 | ) | ||||||||
Investment losses on money trusts | — | 25 | 25 | — | ||||||||||
Losses on sales of securities | 35 | — | (35 | ) | (100.0 | ) | ||||||||
Impairment losses on securities | — | 10 | 10 | — | ||||||||||
Operating, general and administrative expenses | 1,005 | 1,198 | 193 | 19.2 | ||||||||||
Other ordinary expenses: | 56 | 2 | (54 | ) | (96.3 | ) | ||||||||
Interest paid | 1 | 1 | 0 | 21.5 | ||||||||||
Ordinary profit (loss) | 81 | (379 | ) | (460 | ) | (567.9 | ) | |||||||
Extraordinary gains: | 0 | 12 | 11 | 1,713.4 | ||||||||||
Reversal of reserves under the special laws: | 0 | 12 | 11 | 1,713.4 | ||||||||||
Reversal of price fluctuation reserve | 0 | 12 | 11 | 1,713.4 | ||||||||||
Extraordinary losses: | 0 | 2 | 2 | 6,075.5 | ||||||||||
Losses on disposal of fixed assets | 0 | 2 | 2 | 6,075.5 | ||||||||||
Income (loss) before income taxes | 81 | (369 | ) | (450 | ) | (551.3 | ) | |||||||
Income taxes and deferred income taxes | 5 | 5 | — | — | ||||||||||
Net income (loss) | 76 | (374 | ) | (450 | ) | (590.1 | ) | |||||||
Underwriting result: | ||||||||||||||
Net premiums written | (+) | 3,613 | 3,816 | 202 | 5.6 | |||||||||
Net claims paid | (–) | 1,912 | 1,880 | (31 | ) | (1.7 | ) | |||||||
Loss adjustment expenses | (–) | 199 | 253 | 54 | 27.1 | |||||||||
Operating expenses: | (–) | 1,396 | 1,584 | 187 | 13.5 | |||||||||
Net commissions and brokerage fees | 466 | 457 | (9 | ) | (1.9 | ) | ||||||||
Operating, general and administrative expenses related to underwriting | 929 | 1,127 | 197 | 21.2 | ||||||||||
Underwriting result | 105 | 98 | (7 | ) | (7.1 | ) | ||||||||
Underwriting profit | 134 | (353 | ) | (487 | ) | (363.6 | ) | |||||||
Ratios: | ||||||||||||||
Net loss ratio | (%) | 58.4 | 55.9 | (2.5 | ) | |||||||||
Net expense ratio | (%) | 38.6 | 41.5 | 2.9 | ||||||||||
Underwriting result ratio | (%) | 2.9 | 2.6 | (0.3 | ) | |||||||||
19
Table of Contents
(Reference) Saison Automobile and Fire Insurance Company, Limited (Non-consolidated)
Premiums Written and Claims Paid by Lines of Business
Direct premiums written (excluding deposits of premiums by policyholders)
| (Millions of yen) | ||||||||||||||||
| Three months ended June 30, 2009 (April 1 to June 30, 2009) | Three months ended June 30, 2010 (April 1 to June 30, 2010) | |||||||||||||||
Business line | Amount | % of total amount | Rate of change | Amount | % of total amount | Rate of change | ||||||||||
Fire and allied insurance | 509 | 12.4 | % | 62.1 | % | 871 | 19.6 | % | 70.9 | % | ||||||
Marine insurance | 0 | 0.0 | 55.4 | 0 | 0.0 | (62.9 | ) | |||||||||
Personal accident insurance | 931 | 22.7 | 30.0 | 1,034 | 23.2 | 11.1 | ||||||||||
Voluntary automobile insurance | 2,329 | 56.7 | (4.5 | ) | 2,234 | 50.2 | (4.1 | ) | ||||||||
Compulsory automobile liability insurance | 96 | 2.4 | (23.1 | ) | 91 | 2.1 | (5.3 | ) | ||||||||
Others | 239 | 5.8 | 5.7 | 222 | 5.0 | (6.9 | ) | |||||||||
Total | 4,107 | 100.0 | 7.5 | 4,455 | 100.0 | 8.5 | ||||||||||
Deposits of premiums by policyholders | 200 | — | 6.2 | 163 | — | (18.6 | ) | |||||||||
Net premiums written
| (Millions of yen) | ||||||||||||||||
| Three months ended June 30, 2009 (April 1 to June 30, 2009) | Three months ended June 30, 2010 (April 1 to June 30, 2010) | |||||||||||||||
Business line | Amount | % of total amount | Rate of change | Amount | % of total amount | Rate of change | ||||||||||
Fire and allied insurance | 357 | 9.9 | % | 65.6 | % | 637 | 16.7 | % | 78.1 | % | ||||||
Marine insurance | 9 | 0.3 | (19.3 | ) | 6 | 0.2 | (32.1 | ) | ||||||||
Personal accident insurance | 620 | 17.2 | 16.7 | 652 | 17.1 | 5.2 | ||||||||||
Voluntary automobile insurance | 2,307 | 63.9 | (4.5 | ) | 2,213 | 58.0 | (4.1 | )�� | ||||||||
Compulsory automobile liability insurance | 94 | 2.6 | (19.4 | ) | 102 | 2.7 | 8.4 | |||||||||
Others | 223 | 6.2 | 5.8 | 204 | 5.4 | (8.8 | ) | |||||||||
Total | 3,613 | 100.0 | 3.1 | 3,816 | 100.0 | 5.6 | ||||||||||
Net claims paid
| (Millions of yen) | ||||||||||||||||
| Three months ended June 30, 2009 (April 1 to June 30, 2009) | Three months ended June 30, 2010 (April 1 to June 30, 2010) | |||||||||||||||
Business line | Amount | Rate of change | Net loss ratio | Amount | Rate of change | Net loss ratio | ||||||||||
Fire and allied insurance | 51 | (54.1 | )% | 15.3 | % | 59 | 15.6 | % | 10.5 | % | ||||||
Marine insurance | 5 | (20.2 | ) | 54.4 | 6 | 16.8 | 92.5 | |||||||||
Personal accident insurance | 369 | 28.1 | 65.1 | 386 | 4.5 | 67.4 | ||||||||||
Voluntary automobile insurance | 1,348 | 9.6 | 64.8 | 1,299 | (3.6 | ) | 66.6 | |||||||||
Compulsory automobile liability insurance | 97 | (4.3 | ) | 113.1 | 101 | 3.9 | 107.6 | |||||||||
Others | 39 | (15.2 | ) | 20.0 | 27 | (29.9 | ) | 17.7 | ||||||||
Total | 1,912 | 7.1 | 58.4 | 1,880 | (1.7 | ) | 55.9 | |||||||||
20
Table of Contents
(Reference) Saison Automobile and Fire Insurance Company, Limited (Non-consolidated)
| (Millions of yen) | ||||||
| As of June 30, 2010 | As of March 31, 2010 | |||||
(A) Total Solvency Margin | 14,493 | 15,333 | ||||
Capital and funds, etc. | 11,055 | 11,658 | ||||
Reserve for price fluctuation | 1 | 14 | ||||
Contingency reserve | 8 | 8 | ||||
Catastrophic loss reserve | 3,213 | 3,291 | ||||
General allowance for possible loan losses | 0 | 0 | ||||
Unrealized gains on securities (before tax effect deductions) | 212 | 359 | ||||
Net unrealized gains and losses on real estate | — | — | ||||
Excess amount of reserve for maturity refunds | — | — | ||||
Subordinated debt, etc. | — | — | ||||
Deductions | — | — | ||||
Others | 2 | 2 | ||||
(B) Total Risks
| 1,663 | 1,653 | ||||
Underwriting risk (R1) | 838 | 838 | ||||
Underwriting risk for third-sector insurance products including accident, sickness and nursing-care insurance (R2) | — | — | ||||
Guaranteed interest rate risk (R3) | 6 | 6 | ||||
Investment risk (R4) | 488 | 530 | ||||
Business management risk (R5) | 58 | 59 | ||||
Major catastrophe risk (R6) | 631 | 598 | ||||
(C) Solvency Margin Ratio [(A) / {(B) × 1/2}] × 100 | 1,742.2 | % | 1,854.7 | % | ||
| Note) | The above figures are calculated based on Articles 86 and 87 of the Ordinance for Enforcement of the Insurance Business Law and the provisions of Notification No. 50 of the Ministry of Finance (1996). The figures as of June 30, 2010 are partly calculated on the simplified method, for example, some bases for the major catastrophe risk calculation are deemed same as the figures as of March 31, 2010. |
21
Table of Contents
(Reference) Sompo Japan Himawari Life Insurance Co., Ltd. (Non-consolidated)
| (Millions of yen) | |||||||||
| As of June 30, 2010 | As of March 31, 2010 | Increase (Decrease) | |||||||
| Amount | Amount | ||||||||
Assets: | |||||||||
Cash and deposits | 32,027 | 32,988 | (960 | ) | |||||
Securities: | 1,042,223 | 1,030,306 | 11,917 | ||||||
Government bonds | 582,228 | 560,887 | 21,340 | ||||||
Municipal bonds | 69,907 | 70,489 | (581 | ) | |||||
Corporate bonds | 309,377 | 310,212 | (834 | ) | |||||
Domestic stocks | 4,579 | 5,140 | (560 | ) | |||||
Foreign securities | 76,129 | 83,576 | (7,446 | ) | |||||
Loans: | 17,437 | 17,162 | 275 | ||||||
Policy loans | 17,437 | 17,162 | 275 | ||||||
Tangible fixed assets | 1,219 | 1,197 | 22 | ||||||
Intangible fixed assets | 4,457 | 4,625 | (168 | ) | |||||
Agency accounts receivable | 148 | 174 | (25 | ) | |||||
Reinsurance accounts receivable | 742 | 1,206 | (464 | ) | |||||
Other assets | 20,040 | 21,401 | (1,360 | ) | |||||
Deferred tax assets | 12,154 | 13,164 | (1,009 | ) | |||||
Allowance for possible loan losses | (93 | ) | (94 | ) | 0 | ||||
Total assets | 1,130,357 | 1,122,133 | 8,223 | ||||||
Liabilities: | |||||||||
Policy reserves: | 1,063,843 | 1,054,852 | 8,991 | ||||||
Reserve for outstanding claims | 20,276 | 20,155 | 120 | ||||||
Policy reserves | 1,041,471 | 1,032,371 | 9,100 | ||||||
Reserve for dividends to policyholders | 2,095 | 2,325 | (230 | ) | |||||
Agency accounts payable | 1,246 | 1,591 | (345 | ) | |||||
Reinsurance accounts payable | 1,098 | 1,205 | (107 | ) | |||||
Other liabilities | 5,518 | 7,564 | (2,045 | ) | |||||
Reserve for retirement benefits | 734 | 663 | 70 | ||||||
Reserve for retirement benefits to directors | 54 | 45 | 9 | ||||||
Reserves under the special laws: | 897 | 794 | 103 | ||||||
Reserve for price fluctuation | 897 | 794 | 103 | ||||||
Total liabilities | 1,073,393 | 1,066,716 | 6,676 | ||||||
Net assets: | |||||||||
Shareholders’ equity: | |||||||||
Common stock | 17,250 | 17,250 | — | ||||||
Capital surplus | 10,000 | 10,000 | — | ||||||
Retained earnings | 26,979 | 27,283 | (304 | ) | |||||
Total shareholders’ equity | 54,229 | 54,533 | (304 | ) | |||||
Valuation and translation adjustments: | |||||||||
Unrealized gains on securities available for sale, net of tax | 2,735 | 882 | 1,852 | ||||||
Total valuation and translation adjustments | 2,735 | 882 | 1,852 | ||||||
Total net assets | 56,964 | 55,416 | 1,547 | ||||||
Total liabilities and net assets | 1,130,357 | 1,122,133 | 8,223 | ||||||
22
Table of Contents
(Reference) Sompo Japan Himawari Life Insurance Co., Ltd. (Non-consolidated)
Quarterly Statements of Income
| (Millions of yen) | ||||||||||||
| Three months ended June 30, 2009 (April 1 to June 30, 2009) | Three months ended June 30, 2010 (April 1 to June 30, 2010) | Increase (Decrease) | Rate of change | |||||||||
| Amount | Amount | |||||||||||
Ordinary income: | 61,239 | 60,798 | (440 | ) | (0.7 | )% | ||||||
Insurance premiums and other: | 55,225 | 55,905 | 679 | 1.2 | ||||||||
Insurance premiums | 54,484 | 55,203 | 718 | 1.3 | ||||||||
Investment income: | 6,003 | 4,836 | (1,166 | ) | (19.4 | ) | ||||||
Interest and dividend income | 4,448 | 4,697 | 248 | 5.6 | ||||||||
Gains on sales of securities | 360 | 139 | (220 | ) | (61.3 | ) | ||||||
Investment gains on special account | 1,195 | — | (1,195 | ) | (100.0 | ) | ||||||
Other ordinary income | 10 | 56 | 46 | 444.0 | ||||||||
Ordinary expenses: | 62,362 | 60,496 | (1,866 | ) | (3.0 | ) | ||||||
Insurance claims and other: | 39,784 | 35,327 | (4,457 | ) | (11.2 | ) | ||||||
Insurance claims | 5,265 | 5,340 | 75 | 1.4 | ||||||||
Annuity payments | 184 | 238 | 53 | 29.1 | ||||||||
Insurance benefits | 5,466 | 5,622 | 155 | 2.9 | ||||||||
Surrender benefits | 27,133 | 22,686 | (4,446 | ) | (16.4 | ) | ||||||
Other refunds | 444 | 273 | (170 | ) | (38.4 | ) | ||||||
Provision for policy reserves and other: | 8,024 | 9,221 | 1,196 | 14.9 | ||||||||
Provision for reserve for outstanding claims | 1,188 | 120 | (1,068 | ) | (89.9 | ) | ||||||
Provision for policy reserves | 6,835 | 9,100 | 2,264 | 33.1 | ||||||||
Provision for interest portion of reserve for dividends to policyholders | 0 | 0 | 0 | 84.0 | ||||||||
Investment expenses: | 221 | 1,170 | 949 | 429.0 | ||||||||
Interest paid | 7 | 13 | 5 | 80.8 | ||||||||
Losses on derivatives | 195 | 8 | (186 | ) | (95.6 | ) | ||||||
Investment losses on special account | — | 1,140 | 1,140 | — | ||||||||
Operating, general and administrative expenses | 13,952 | 14,179 | 227 | 1.6 | ||||||||
Other ordinary expenses | 379 | 597 | 218 | 57.6 | ||||||||
Ordinary profit (loss) | (1,123 | ) | 301 | 1,425 | — | |||||||
Extraordinary gains: | 4 | 0 | (3 | ) | (79.8 | ) | ||||||
Other extraordinary gains | 4 | 0 | (3 | ) | (79.8 | ) | ||||||
Extraordinary losses: | 75 | 265 | 190 | 250.9 | ||||||||
Losses on disposal of fixed assets | 1 | 5 | 4 | 373.0 | ||||||||
Provision for reserves under the special laws: | 74 | 103 | 28 | 38.5 | ||||||||
Provision for price fluctuation reserve | 74 | 103 | 28 | 38.5 | ||||||||
Other extraordinary losses | — | 156 | 156 | — | ||||||||
Provision for reserve for dividends to policyholders | 447 | 402 | (45 | ) | (10.1 | ) | ||||||
Loss before income taxes | (1,642 | ) | (365 | ) | 1,276 | — | ||||||
Income taxes and deferred income taxes | 65 | (60 | ) | (125 | ) | (192.4 | ) | |||||
Net loss | (1,707 | ) | (304 | ) | 1,402 | — | ||||||
23
Table of Contents
(Reference) Sompo Japan Himawari Life Insurance Co., Ltd. (Non-consolidated)
Total amount of policies in force and total amount of new policies
Total amount of policies in force
| (Number in thousands, Yen in hundred millions, %) | ||||||||||||||||
| As of June 30, 2010 | As of March 31, 2010 | |||||||||||||||
| Number | Amount | Number | Amount | |||||||||||||
| Rate of change | Rate of change | Rate of change | Rate of change | |||||||||||||
Individual insurance | 1,769 | 102.2 | 106,535 | 102.4 | 1,732 | 109.9 | 104,049 | 110.1 | ||||||||
Individual annuities | 15 | 99.6 | 799 | 99.7 | 15 | 98.2 | 801 | 98.5 | ||||||||
Group insurance | — | — | 18,587 | 101.1 | — | — | 18,379 | 92.0 | ||||||||
Group annuities | — | — | — | — | — | — | — | — | ||||||||
| Note) | Amount of “Individual annuities” represents the sum of annuity fund at the beginning of annuity payment of contracts before the beginning of annuity payment and policy reserves for the contracts after the beginning of annuity payment. |
Total amount of new policies
| (Number in thousands, Yen in hundred millions, %) | ||||||||||||||||
| Three months ended June 30, 2009 (April 1 to June 30, 2009) | Three months ended June 30, 2010 (April 1 to June 30, 2010) | |||||||||||||||
| Number | Amount | Number | Amount | |||||||||||||
| Rate of change | Rate of change | Rate of change | Rate of change | |||||||||||||
Individual insurance | 77 | 261.9 | 4,574 | 127.3 | 74 | 95.2 | 5,268 | 115.2 | ||||||||
Individual annuities | 0 | 107.8 | 5 | 97.7 | 0 | 90.1 | 4 | 88.5 | ||||||||
Group insurance | — | — | 100 | 808.1 | — | — | 82 | 81.9 | ||||||||
Group annuities | — | — | — | — | — | — | — | — | ||||||||
| Note) | Amount of “Individual annuities” represents the amount of annuity fund at the beginning of annuity payment. |
Annualized premiums
Policies in force
| (Yen in hundred millions, %) | ||||||||
| As of June 30, 2010 | As of March 31, 2010 | |||||||
| Rate of change | Rate of change | |||||||
Individual insurance | 192,205 | 99.7 | 192,742 | 98.1 | ||||
Individual annuities | 3,498 | 101.7 | 3,439 | 98.9 | ||||
Total | 195,703 | 99.8 | 196,181 | 98.2 | ||||
Medical and survival benefits | 73,852 | 101.4 | 72,864 | 106.1 | ||||
New policies
| (Yen in hundred millions, %) | ||||||||
| Three months ended June 30, 2009 (April 1 to June 30, 2009) | Three months ended June 30, 2010 (April 1 to June 30, 2010) | |||||||
| Rate of change | Rate of change | |||||||
Individual insurance | 5,739 | 144.1 | 5,445 | 94.9 | ||||
Individual annuities | 21 | 89.1 | 19 | 89.1 | ||||
Total | 5,761 | 143.7 | 5,465 | 94.9 | ||||
Medical and survival benefits | 3,031 | 275.7 | 2,644 | 87.2 | ||||
Notes)
| 1. | Annualized premiums are calculated by using multipliers for various premium payment terms to the premium per payment. In single premium contracts, the amount is calculated by dividing the premium by the duration of the policy. |
| 2. | Annualized premiums for medical and survival benefits include (a) premium related to medical benefits such as hospitalization and surgery benefits, (b) premium related to survival benefits such as specific illness and nursing benefits, and (c) premium related to premium waiver benefits, in which disability cause is excluded but causes such as specific illness and nursing care are included. |
24
Table of Contents
(Reference) Sompo Japan Himawari Life Insurance Co., Ltd. (Non-consolidated)
| (Millions of yen) | ||||||
| As of June 30, 2010 | As of March 31, 2010 | |||||
(A) Total Solvency Margin | 160,853 | 157,431 | ||||
Capital, etc. | 54,234 | 54,533 | ||||
Reserve for price fluctuation | 897 | 794 | ||||
Contingency reserve | 15,621 | 15,355 | ||||
General allowance for possible loan losses | 16 | 18 | ||||
Unrealized gains and losses on securities (90% of gain or 100% of loss) | 3,858 | 1,245 | ||||
Net unrealized gains and losses on real estate (85% of gain or 100% of loss) | — | — | ||||
Policy reserves in excess of surrender values | 70,084 | 69,171 | ||||
Brought in capital, etc. | — | — | ||||
Subordinated debt, etc. | — | — | ||||
Deductions | — | — | ||||
Others | 16,139 | 16,312 | ||||
(B) Total Risks
| 13,122 | 12,915 | ||||
Underwriting risk (R1) | 6,556 | 6,382 | ||||
Underwriting risk for third-sector insurance products including accident, sickness and nursing-care insurance (R8) | 3,602 | 3,516 | ||||
Guaranteed interest rate risk (R2) | 3,193 | 3,188 | ||||
Investment risk (R3) | 4,208 | 4,223 | ||||
Business management risk (R4) | 357 | 352 | ||||
Guaranteed minimum benefit risk (R7) | 326 | 322 | ||||
Solvency Margin Ratio [(A) / {(B) × 1/2}] × 100 | 2,451.6 | % | 2,437.9 | % | ||
Notes)
| 1. | The above figures are calculated based on Articles 86, 87, 161, 162 and 190 of the Ordinance for Enforcement of the Insurance Business Law and the provisions of Notification No. 50 of the Ministry of Finance (1996). “Policy reserves in excess of surrender values” is calculated based on the provisions of Article 1 Paragraph 3-1 of Notification No. 50 of the Ministry of Finance. |
| 2. | Guaranteed minimum benefit risk is calculated by the standard method. |
25
Table of Contents
(Reference) NIPPONKOA Life Insurance Co., Ltd. (Non-consolidated)
| (Millions of yen) | |||||||||
| As of June 30, 2010 | As of March 31, 2010 | Increase (Decrease) | |||||||
| Amount | Amount | ||||||||
Assets: | |||||||||
Cash and deposits | 9,362 | 14,371 | (5,009 | ) | |||||
Call loans | 671 | 478 | 193 | ||||||
Receivables under securities borrowing transactions | 29,720 | 25,382 | 4,338 | ||||||
Money trusts | 20,287 | 19,916 | 371 | ||||||
Securities: | 391,045 | 378,612 | 12,433 | ||||||
Government bonds | 256,174 | 243,074 | 13,099 | ||||||
Municipal bonds | 52,253 | 52,132 | 120 | ||||||
Corporate bonds | 76,139 | 75,571 | 567 | ||||||
Domestic stocks | 5,526 | 6,892 | (1,366 | ) | |||||
Foreign securities | 952 | 941 | 11 | ||||||
Loans: | 13,808 | 13,763 | 44 | ||||||
Policy loans | 13,808 | 13,763 | 44 | ||||||
Tangible fixed assets | 166 | 178 | (11 | ) | |||||
Intangible fixed assets | 615 | 240 | 374 | ||||||
Agency accounts receivable | 16 | 24 | (7 | ) | |||||
Reinsurance accounts receivable | 64 | 183 | (118 | ) | |||||
Other assets | 9,165 | 8,911 | 253 | ||||||
Deferred tax assets | 6,414 | 6,931 | (517 | ) | |||||
Allowance for possible loan losses | (8 | ) | (7 | ) | (0 | ) | |||
Total assets | 481,331 | 468,988 | 12,342 | ||||||
Liabilities: | |||||||||
Policy reserves: | 421,560 | 411,682 | 9,877 | ||||||
Reserve for outstanding claims | 3,014 | 2,998 | 16 | ||||||
Policy reserves | 417,139 | 407,193 | 9,946 | ||||||
Reserve for dividends to policyholders | 1,405 | 1,491 | (85 | ) | |||||
Agency accounts payable | 534 | 804 | (270 | ) | |||||
Reinsurance accounts payable | 79 | 113 | (33 | ) | |||||
Other liabilities | 31,733 | 30,000 | 1,733 | ||||||
Reserve for retirement benefits | 326 | 300 | 25 | ||||||
Reserve for bonus payments to directors | — | 15 | (15 | ) | |||||
Reserves under the special laws: | 563 | 542 | 20 | ||||||
Reserve for price fluctuation | 563 | 542 | 20 | ||||||
Total liabilities | 454,796 | 443,459 | 11,337 | ||||||
Net assets: | |||||||||
Shareholders’ equity: | |||||||||
Common stock | 20,000 | 20,000 | — | ||||||
Retained earnings | 1,583 | 1,564 | 19 | ||||||
Total shareholders’ equity | 21,583 | 21,564 | 19 | ||||||
Valuation and translation adjustments: | |||||||||
Unrealized gains on securities available for sale, net of tax | 4,950 | 3,964 | 986 | ||||||
Total valuation and translation adjustments | 4,950 | 3,964 | 986 | ||||||
Total net assets | 26,534 | 25,528 | 1,005 | ||||||
Total liabilities and net assets | 481,331 | 468,988 | 12,342 | ||||||
26
Table of Contents
(Reference) NIPPONKOA Life Insurance Co., Ltd. (Non-consolidated)
Quarterly Statements of Income
| (Millions of yen) | ||||||||||
| Three months ended June 30, 2009 (April 1 to June 30, 2009) | Three months ended June 30, 2010 (April 1 to June 30, 2010) | Increase (Decrease) | Rate of change | |||||||
| Amount | Amount | |||||||||
Ordinary income: | 24,290 | 25,269 | 979 | 4.0 | % | |||||
Insurance premiums and other: | 21,879 | 22,800 | 921 | 4.2 | ||||||
Insurance premiums | 21,847 | 22,732 | 885 | 4.1 | ||||||
Investment income: | 2,152 | 2,261 | 109 | 5.1 | ||||||
Interest and dividend income | 1,923 | 2,199 | 276 | 14.4 | ||||||
Investment gains on money trusts | 155 | 61 | (93 | ) | (60.2 | ) | ||||
Gains on sales of securities | 73 | — | (73 | ) | (100.0 | ) | ||||
Other ordinary income | 258 | 206 | (51 | ) | (20.0 | ) | ||||
Ordinary expenses: | 23,545 | 24,856 | 1,311 | 5.6 | ||||||
Insurance claims and other: | 9,604 | 10,240 | 635 | 6.6 | ||||||
Insurance claims | 2,196 | 2,558 | 361 | 16.5 | ||||||
Annuity payments | 87 | 116 | 28 | 32.2 | ||||||
Insurance benefits | 731 | 929 | 197 | 27.0 | ||||||
Surrender benefits | 6,417 | 6,462 | 45 | 0.7 | ||||||
Other refunds | 57 | 52 | (4 | ) | (8.6 | ) | ||||
Provision for policy reserves and other: | 9,430 | 9,963 | 532 | 5.7 | ||||||
Provision for reserve for outstanding claims | 130 | 16 | (114 | ) | (87.6 | ) | ||||
Provision for policy reserves | 9,299 | 9,946 | 647 | 7.0 | ||||||
Provision for interest portion of reserve for dividends to policyholders | 0 | 0 | 0 | 28.9 | ||||||
Investment expenses: | 20 | 12 | (7 | ) | (39.7 | ) | ||||
Interest paid | 18 | 9 | (8 | ) | (46.9 | ) | ||||
Operating, general and administrative expenses | 4,188 | 4,403 | 214 | 5.1 | ||||||
Other ordinary expenses | 301 | 237 | (64 | ) | (21.3 | ) | ||||
Ordinary profit | 744 | 412 | (331 | ) | (44.6 | ) | ||||
Extraordinary gains | — | — | — | — | ||||||
Extraordinary losses: | 27 | 37 | 10 | 38.5 | ||||||
Losses on disposal of fixed assets | 8 | 0 | (7 | ) | (93.8 | ) | ||||
Provision for reserves under the special laws: | 19 | 20 | 1 | 8.5 | ||||||
Provision for price fluctuation reserve | 19 | 20 | 1 | 8.5 | ||||||
Other extraordinary losses | — | 16 | 16 | — | ||||||
Provision for reserve for dividends to policyholders | 337 | 313 | (23 | ) | (7.0 | ) | ||||
Income before income taxes | 380 | 61 | (318 | ) | (83.9 | ) | ||||
Income taxes and deferred income taxes | 154 | 41 | (112 | ) | (72.9 | ) | ||||
Net income | 225 | 19 | (206 | ) | (91.4 | ) | ||||
27
Table of Contents
(Reference) NIPPONKOA Life Insurance Co., Ltd. (Non-consolidated)
Total amount of policies in force and total amount of new policies
Total amount of policies in force
| (Number in thousands, Yen in hundred millions, %) | ||||||||||||||||
| As of June 30, 2010 | As of March 31, 2010 | |||||||||||||||
| Number | Amount | Number | Amount | |||||||||||||
| Rate of change | Rate of change | Rate of change | Rate of change | |||||||||||||
Individual insurance | 568 | 102.2 | 40,416 | 100.9 | 555 | 111.1 | 40,044 | 105.1 | ||||||||
Individual annuities | 53 | 99.9 | 1,971 | 100.0 | 53 | 96.3 | 1,971 | 96.3 | ||||||||
Group insurance | — | — | 11,205 | 101.4 | — | — | 11,052 | 109.9 | ||||||||
Group annuities | — | — | — | — | — | — | — | — | ||||||||
| Note) | Amount of “Individual annuities” represents the sum of annuity fund at the beginning of annuity payment of contracts before the beginning of annuity payment and policy reserves for the contracts after the beginning of annuity payment. |
Total amount of new policies
| (Number in thousands, Yen in hundred millions, %) | ||||||||||||||||
| Three months ended June 30, 2009 (April 1 to June 30, 2009) | Three months ended June 30, 2010 (April 1 to June 30, 2010) | |||||||||||||||
| Number | Amount | Number | Amount | |||||||||||||
| Rate of change | Rate of change | Rate of change | Rate of change | |||||||||||||
Individual insurance | 22 | 126.1 | 1,493 | 103.8 | 22 | 100.8 | 1,517 | 101.7 | ||||||||
Individual annuities | — | 87.8 | 12 | 74.2 | — | 217.6 | 26 | 219.8 | ||||||||
Group insurance | — | — | 25 | 30.2 | — | — | 30 | 122.7 | ||||||||
Group annuities | — | — | — | — | — | — | — | — | ||||||||
| Note) | Amount of “Individual annuities” represents the amount of annuity fund at the beginning of annuity payment. |
Annualized premiums
Policies in force
| (Millions of yen, %) | ||||||||
| As of June 30, 2010 | As of March 31, 2010 | |||||||
| Rate of change | Rate of change | |||||||
Individual insurance | 58,402 | 101.1 | 57,758 | 105.3 | ||||
Individual annuities | 11,956 | 99.9 | 11,966 | 96.5 | ||||
Total | 70,358 | 100.9 | 69,725 | 103.6 | ||||
Medical and survival benefits | 13,860 | 101.8 | 13,610 | 111.6 | ||||
New policies
| (Millions of yen, %) | ||||||||
| Three months ended June 30, 2009 (April 1 to June 30, 2009) | Three months ended June 30, 2010 (April 1 to June 30, 2010) | |||||||
| Rate of change | Rate of change | |||||||
Individual insurance | 2,050 | 104.4 | 2,146 | 104.7 | ||||
Individual annuities | 70 | 81.2 | 138 | 197.1 | ||||
Total | 2,120 | 103.4 | 2,284 | 107.7 | ||||
Medical and survival benefits | 596 | 126.4 | 526 | 88.3 | ||||
Notes)
| 1. | Annualized premiums are calculated by using multipliers for various premium payment terms to the premium per payment. In single premium contracts, the amount is calculated by dividing the premium by the duration of the policy. |
| 2. | Annualized premiums for medical and survival benefits include (a) premium related to medical benefits such as hospitalization and surgery benefits and (b) premium related to survival benefits such as specific illness. |
28
Table of Contents
(Reference) NIPPONKOA Life Insurance Co., Ltd. (Non-consolidated)
| (Millions of yen) | ||||||
| As of June 30, 2010 | As of March 31, 2010 | |||||
| (A) Total Solvency Margin | 61,637 | 60,078 | ||||
Capital, etc. | 21,302 | 21,564 | ||||
Reserve for price fluctuation | 563 | 542 | ||||
Contingency reserve | 4,950 | 4,859 | ||||
General allowance for possible loan losses | — | — | ||||
Unrealized gains and losses on securities (90% of gain or 100% of loss) | 6,982 | 5,592 | ||||
Net unrealized gains and losses on real estate (85% of gain or 100% of loss) | — | — | ||||
Policy reserves in excess of surrender values | 26,305 | 25,993 | ||||
Brought in capital, etc. | — | — | ||||
Subordinated debt, etc. | — | — | ||||
Deductions | — | — | ||||
Others | 1,532 | 1,527 | ||||
(B) Total Risks
| 4,400 | 4,368 | ||||
Underwriting risk (R1) | 2,960 | 2,930 | ||||
Underwriting risk for third-sector insurance products including accident, sickness and nursing-care insurance (R8) | 1,001 | 970 | ||||
Guaranteed interest rate risk (R2) | 166 | 164 | ||||
Investment risk (R3) | 1,477 | 1,538 | ||||
Business management risk (R4) | 112 | 112 | ||||
Guaranteed minimum benefit risk (R7) | — | — | ||||
Solvency Margin Ratio [(A) / {(B) × 1/2}] × 100 | 2,801.1 | % | 2,750.4 | % | ||
| Note) | The above figures are calculated based on Articles 86, 87, 161, 162 and 190 of the Ordinance for Enforcement of the Insurance Business Law and the provisions of Notification No. 50 of the Ministry of Finance (1996). “Policy reserves in excess of surrender values” is calculated based on the provisions of Article 1 Paragraph 3-1 of Notification No. 50 of the Ministry of Finance. |
29
Table of Contents
(Reference) Sompo Japan DIY Life Insurance Co., Ltd. (Non-consolidated)
| (Millions of yen) | |||||||||
| As of June 30, 2010 | As of March 31, 2010 | Increase (Decrease) | |||||||
| Amount | Amount | ||||||||
Assets: | |||||||||
Cash and deposits | 186 | 182 | 3 | ||||||
Securities: | 5,233 | 5,407 | (174 | ) | |||||
Government bonds | 2,685 | 2,690 | (4 | ) | |||||
Domestic stocks | 930 | 950 | (20 | ) | |||||
Tangible fixed assets | 76 | 80 | (4 | ) | |||||
Intangible fixed assets | 0 | 0 | — | ||||||
Agency accounts receivable | 0 | 0 | 0 | ||||||
Reinsurance accounts receivable | 18 | 21 | (3 | ) | |||||
Other assets | 629 | 456 | 173 | ||||||
Allowance for possible loan losses | (0 | ) | (0 | ) | — | ||||
Total assets | 6,144 | 6,149 | (4 | ) | |||||
Liabilities: | |||||||||
Policy reserves: | 1,034 | 1,041 | (6 | ) | |||||
Reserve for outstanding claims | 129 | 141 | (11 | ) | |||||
Policy reserves | 904 | 899 | 4 | ||||||
Agency accounts payable | 3 | 3 | (0 | ) | |||||
Reinsurance accounts payable | 33 | 32 | 1 | ||||||
Other liabilities | 185 | 342 | (156 | ) | |||||
Reserve for retirement benefits | 21 | 20 | 1 | ||||||
Reserves under the special laws: | 15 | 15 | 0 | ||||||
Reserve for price fluctuation | 15 | 15 | 0 | ||||||
Deferred tax liabilities | 218 | 225 | (7 | ) | |||||
Total liabilities | 1,512 | 1,680 | (167 | ) | |||||
Net assets: | |||||||||
Shareholders’ equity: | |||||||||
Common stock | 10,100 | 10,100 | — | ||||||
Capital surplus | 2,100 | 2,100 | — | ||||||
Retained earnings | (7,952 | ) | (8,128 | ) | 175 | ||||
Total shareholders’ equity | 4,247 | 4,071 | 175 | ||||||
Valuation and translation adjustments: | |||||||||
Unrealized gains on securities available for sale, net of tax | 384 | 397 | (13 | ) | |||||
Total valuation and translation adjustments | 384 | 397 | (13 | ) | |||||
Total net assets | 4,631 | 4,468 | 162 | ||||||
Total liabilities and net assets | 6,144 | 6,149 | (4 | ) | |||||
30
Table of Contents
(Reference) Sompo Japan DIY Life Insurance Co., Ltd. (Non-consolidated)
Quarterly Statements of Income
| (Millions of yen) | |||||||||||
| Three months ended June 30, 2009 (April 1 to June 30, 2009) | Three months ended June 30, 2010 (April 1 to June 30, 2010) | Increase (Decrease) | Rate of change | ||||||||
| Amount | Amount | ||||||||||
Ordinary income: | 937 | 1,003 | 65 | 7.0 | % | ||||||
Insurance premiums and other: | 918 | 976 | 58 | 6.3 | |||||||
Insurance premiums | 889 | 916 | 26 | 3.0 | |||||||
Investment income: | 19 | 15 | (3 | ) | (20.2 | ) | |||||
Interest and dividend income | 19 | 15 | (3 | ) | (20.2 | ) | |||||
Other ordinary income: | 0 | 11 | 11 | 13,485.7 | |||||||
Reversal of reserve for outstanding losses and claims | — | 11 | 11 | — | |||||||
Ordinary expenses: | 1,137 | 826 | (310 | ) | (27.3 | ) | |||||
Insurance claims and other: | 333 | 213 | (119 | ) | (36.0 | ) | |||||
Insurance claims | 241 | 128 | (113 | ) | (46.9 | ) | |||||
Insurance benefits | 42 | 41 | (0 | ) | (1.7 | ) | |||||
Other refunds | 0 | 1 | 0 | 379.8 | |||||||
Provision for policy reserves and other: | 12 | 4 | (7 | ) | (61.5 | ) | |||||
Provision for reserve for outstanding claims | 1 | — | (1 | ) | (100.0 | ) | |||||
Provision for policy reserves | 10 | 4 | (6 | ) | (55.0 | ) | |||||
Investment expenses: | 0 | 0 | (0 | ) | (22.0 | ) | |||||
Interest paid | 0 | 0 | (0 | ) | (22.0 | ) | |||||
Operating, general and administrative expenses | 773 | 593 | (179 | ) | (23.3 | ) | |||||
Other ordinary expenses | 17 | 14 | (3 | ) | (18.1 | ) | |||||
Ordinary profit (loss) | (199 | ) | 177 | 376 | — | ||||||
Extraordinary losses: | 8 | 0 | (8 | ) | (96.0 | ) | |||||
Provision for reserves under the special laws: | 0 | 0 | (0 | ) | (8.9 | ) | |||||
Provision for price fluctuation reserve | 0 | 0 | (0 | ) | (8.9 | ) | |||||
Other extraordinary losses | 8 | — | (8 | ) | (100.0 | ) | |||||
Income (loss) before income taxes | (207 | ) | 176 | 384 | — | ||||||
Income taxes and deferred income taxes | 0 | 0 | — | — | |||||||
Net income (loss) | (208 | ) | 175 | 384 | — | ||||||
31
Table of Contents
(Reference) Sompo Japan DIY Life Insurance Co., Ltd. (Non-consolidated)
Total amount of policies in force and total amount of new policies
Total amount of policies in force
| (Number in thousands, Yen in hundred millions, %) | ||||||||||||||||
| As of June 30, 2010 | As of March 31, 2010 | |||||||||||||||
| Number | Amount | Number | Amount | |||||||||||||
| Rate of change | Rate of change | Rate of change | Rate of change | |||||||||||||
Individual insurance | 46 | 99.5 | 7,970 | 99.1 | 46 | 101.1 | 8,039 | 99.7 | ||||||||
Individual annuities | — | — | — | — | — | — | — | — | ||||||||
Group insurance | — | — | — | — | — | — | — | — | ||||||||
Group annuities | — | — | — | — | — | — | — | — | ||||||||
Total amount of new policies
| (Number in thousands, Yen in hundred millions, %) | ||||||||||||||||
| Three months ended June 30, 2009 (April 1 to June 30, 2009) | Three months ended June 30, 2010 (April 1 to June 30, 2010) | |||||||||||||||
| Number | Amount | Number | Amount | |||||||||||||
| Rate of change | Rate of change | Rate of change | Rate of change | |||||||||||||
Individual insurance | 1 | 116.4 | 229 | 111.2 | 0 | 68.1 | 149 | 65.1 | ||||||||
Individual annuities | — | — | — | — | — | — | — | — | ||||||||
Group insurance | — | — | — | — | — | — | — | — | ||||||||
Group annuities | — | — | — | — | — | — | — | — | ||||||||
Annualized premiums
Policies in force
| (Yen in hundred millions, %) | ||||||||
| As of June 30, 2010 | As of March 31, 2010 | |||||||
| Rate of change | Rate of change | |||||||
Individual insurance | 3,662 | 100.3 | 3,650 | 103.2 | ||||
Individual annuities | — | — | — | — | ||||
Total | 3,662 | 100.3 | 3,650 | 103.2 | ||||
Medical and survival benefits | 868 | 100.5 | 863 | 104.6 | ||||
New policies
| (Yen in hundred millions, %) | ||||||||
| Three months ended June 30, 2009 (April 1 to June 30, 2009) | Three months ended June 30, 2010 (April 1 to June 30, 2010) | |||||||
| Rate of change | Rate of change | |||||||
Individual insurance | 94 | 118.1 | 66 | 70.2 | ||||
Individual annuities | — | — | — | — | ||||
Total | 94 | 118.1 | 66 | 70.2 | ||||
Medical and survival benefits | 29 | 127.3 | 19 | 66.9 | ||||
Notes)
| 1. | Annualized premiums are calculated by using multipliers for various premium payment terms to the premium per payment. In single premium contracts, the amount is calculated by dividing the premium by the duration of the policy. |
| 2. | Annualized premiums for medical and survival benefits include (a) premium related to medical benefits such as hospitalization and surgery benefits, (b) premium related to survival benefits such as specific illness and nursing benefits, and (c) premium related to premium waiver benefits, in which disability cause is excluded but causes such as specific illness and nursing care are included. |
32
Table of Contents
(Reference) Sompo Japan DIY Life Insurance Co., Ltd. (Non-consolidated)
| (Millions of yen) | ||||||
| As of June 30, 2010 | As of March 31, 2010 | |||||
(A) Total Solvency Margin | 5,353 | 5,199 | ||||
Capital, etc. | 4,247 | 4,071 | ||||
Reserve for price fluctuation | 15 | 15 | ||||
Contingency reserve | 548 | 551 | ||||
General allowance for possible loan losses | — | — | ||||
Unrealized gains and losses on securities (90% of gain or 100% of loss) | 542 | 560 | ||||
Net unrealized gains and losses on real estate (85% of gain or 100% of loss) | — | — | ||||
Policy reserves in excess of surrender values | — | — | ||||
Brought in capital, etc. | — | — | ||||
Subordinated debt, etc. | — | — | ||||
Deductions | — | — | ||||
Others | — | — | ||||
(B) Total Risks
| 577 | 582 | ||||
Underwriting risk (R1) | 450 | 454 | ||||
Underwriting risk for third-sector insurance products including accident, sickness and nursing-care insurance (R8) | 95 | 95 | ||||
Guaranteed interest rate risk (R2) | 0 | 0 | ||||
Investment risk (R3) | 114 | 118 | ||||
Business management risk (R4) | 19 | 20 | ||||
Guaranteed minimum benefit risk (R7) | — | — | ||||
Solvency Margin Ratio [(A) / {(B) × 1/2}] × 100 | 1,853.3 | % | 1,785.9 | % | ||
| Note) | The above figures are calculated based on Articles 86, 87, 161, 162 and 190 of the Ordinance for Enforcement of the Insurance Business Law and the provisions of Notification No. 50 of the Ministry of Finance (1996). “Policy reserves in excess of surrender values” is calculated based on the provisions of Article 1 Paragraph 3-1 of Notification No. 50 of the Ministry of Finance. |
33
Table of Contents
Underwriting profit | = | Underwriting income – Underwriting expenses – Operating, general and administrative expenses related to underwriting + Other income and expenses* | ||
* | Other income and expenses include, but not limited to, income tax expenses for compulsory automobile liability insurance. | |||
Net loss ratio | = | (Net claims paid + Loss adjustment expenses) / Net premiums written × 100 | ||
Net expense ratio | = | (Net commissions and brokerage fees + Operating, general and administrative expenses related to underwriting) / Net premiums written × 100 | ||
Underwriting result ratio | = | (Net premiums written – Net claims paid – Loss adjustment expenses – Operating expenses) / Net premiums written × 100 | ||
| • | In addition to reserves to cover payments for claims, benefits and maturity refunds, etc., it is necessary for insurance companies to maintain sufficient solvency in order to cover against risks which may exceed their normal estimates, i.e. the occurrence of major catastrophes, the fluctuation in mortality rate due to significant changes in key environmental factors and a big decline in value of assets held by insurance companies, etc. |
| • | Solvency margin ratio, which is calculated in accordance with the Insurance Business Law, is the ratio of “solvency margin of insurance companies by means of their capital, reserves, etc.” (total solvency margin: (A)) to “risks which will exceed their normal estimates” (total risks: (B)). |
| • | “Risks which will exceed their normal estimates” are composed of risks described below. |
| <1> | Underwriting risk, underwriting risk for third-sector insurance products including accident, sickness and nursing-care insurance: |
| Risks of occurrence of insurance claims in excess of normal estimates (excluding risks relating to major catastrophes) |
| <2> | Guaranteed interest rate risk: |
| Risks of invested assets failing to yield assumed interest rates due to the aggravation of investment conditions than expected |
| <3> | Investment risk: |
| Risks of retained securities and other assets fluctuating in prices in excess of normal estimates |
| <4> | Business management risk: |
| Risks beyond normal estimates arising from business management (That does not fall under other categories.) |
| <5> | Major catastrophe risk: |
| Risks of the occurrence of major catastrophic losses in excess of normal estimates (risks such as the Great Kanto Earthquake or Isewan typhoon) |
| <6> | Guaranteed minimum benefit risk: |
| Risks of special account assets fluctuating in prices in excess of normal estimates |
| • | “Solvency margin of insurance companies by means of their capital, reserves, etc.” (total solvency margin) is the sum of total net assets (excluding planned outflows), certain reserves (reserve for price fluctuation, contingency reserve and catastrophic loss reserve, etc.) and parts of net unrealized gains and losses on real estate, etc. |
| • | Solvency margin ratio is one of the indicators for the regulatory authorities to monitor financial soundness of insurance companies. Solvency margin ratio exceeding 200% would indicate adequate capability to meet payments of possible insurance claims. |
34
Table of Contents
Note Regarding Forward-looking Statements
This document includes “forward-looking statements” that reflect the information in relation to the NKSJ Holdings, Inc. (“NKSJ”). To the extent that statements in this document do not relate to historical or current facts, they constitute forward-looking statements. These forward-looking statements are based on the current assumptions and beliefs of NKSJ in light of the information currently available to NKSJ, and involve known and unknown risks, uncertainties and other factors. Such risks, uncertainties and other factors may cause the actual results, performance, achievements or financial position of NKSJ, as the case may be, to be materially different from any future results, performance, achievements or financial position expressed or implied by these forward-looking statements. NKSJ does not undertake or will not undertake any obligation to publicly update any forward-looking statements after the date of this document. Investors are advised to consult any further disclosures by NKSJ in their subsequent domestic filings in Japan and filings with, or submissions to, the U.S. Securities Exchange Commission pursuant to the U.S. Securities Exchange Act of 1934.
The risks, uncertainties and other factors referred to above include, but are not limited to, those below.
| (1) | Effects of deterioration of economic and business conditions in Japan |
| (2) | Risks associated with non-life insurance business, life insurance business, and other businesses in which NKSJ group participates |
| (3) | Changes to laws, regulations, and systems |
| (4) | Risk of natural disasters |
| (5) | Occurrence of unpredictable damages |
| (6) | Reinsurance risk |
| (7) | Overseas business risk |
| (8) | Effects of declining stock price |
| (9) | Effects of fluctuation in exchange rate |
| (10) | Effects of fluctuation in interest rate |
| (11) | Liquidity risk |
| (12) | Effects of decline in creditworthiness of investment and/or loan counterparties |
| (13) | Credit rating downgrade |
| (14) | Litigation risk |
| (15) | Risk concerning retirement benefit liabilities |
| (16) | Occurrence of personal information leak |
| (17) | Damage on business operations by major disasters |
| (18) | Effects resulting from business integration |
| (19) | Other risks |
35
Table of Contents
Quarterly Securities Report for the Three Months Ended June 30, 2010
Section 1: Information on the company
1. Trends in major business indexes
3. Subsidiaries and affiliates
Section 2: Business Conditions
3. Significant contracts on management
4. Financial positions, results of operations, and cash flows
Section 3: Information on the facilities
Section 4: Information of the reporting company
(3) Status of warrant bonds’ outstanding warrants with adjusted exercise prices
(5) Changes in the Total Number of Shares Issued and the Amount of Common Stock
(6) Status of Major Shareholders
Section 5: Financial Conditions
1. Quarterly Consolidated Financial Statements
Part 2: Information on party(ies) providing guaranty to the Reporting Company
1
Table of Contents
Section 1: Information on the company
| 1. | Trends in major business indexes |
(Omitted.)
| 2. | Business overview |
(Omitted.)
| 3. | Subsidiaries and affiliates |
(Omitted.)
| 4. | Employees |
(Omitted.)
2
Table of Contents
Section 2: Business Conditions
| 1. | Insurance operation |
(Omitted.)
| 2. | Business risks |
The Company was established as a holding company on April 1, 2010, through a joint share transfer by Sompo Japan Insurance Inc. and Nipponkoa Insurance Co., Ltd., in accord with their business integration plan. The main business and other risks that may materially influence investors’ decisions with respect to the Company and NKSJ Group’s businesses are enumerated below. The Group has no significant events to report. The following discussion of risks includes forward-looking statements, which are based on the Company’s judgment as of this quarterly report’s filing date.
| (1) | Risks associated with deterioration in Japan’s economic environment |
The Japanese economy is expected to gradually recover by virtue of growth in exports and production against a backdrop of continued improvement in the global economy.
However, if economic recovery does not proceed as anticipated, its failure to do so could have a material impact on the NKSJ Group’s insurance or other operations.
The NKSJ Group’s operations are based in Japan and its main asset holdings include securities and loans. Its asset portfolios, which include domestic equities, domestic bonds, domestic loans, and domestic real estate, are relatively heavily exposed to the risk of changes in Japanese economic conditions.
The Group’s earnings and/or financial condition consequently could be adversely affected if the Japanese economic environment deteriorates markedly.
| (2) | Risk of intensification of competition in the non-life insurance business |
As a result of deregulation, Japan’s non-life insurance industry is seeing intensification of competition, including price competition, chiefly in the auto insurance market, a major nonlife insurance line, due to an influx of new entrants in addition to competition among incumbent insurers.
If competition continues to intensify (e.g., as a result of further deregulation), the Group’s earnings and/or financial condition could be adversely affected (e.g., in the form of reduced profitability).
| (3) | Regulatory risk |
The Group operates its businesses in compliance with various laws and regulations, most notably Japan’s Insurance Business Act. In the event that any of these laws or regulations are amended or new laws or regulations enacted, the NKSJ Group’s earnings and/or financial condition could be adversely affected. Possible impacts include reduction in revenues from sales of insurance products or services or mandatory appropriation of additional reserves.
| (4) | Natural catastrophe risks related to insurance products |
Japan is at risk of various natural catastrophes, including earthquakes, typhoons, floods, and torrential snowfall. Such natural catastrophes’ frequency and magnitude cannot be accurately predicted in advance. In addition to appropriately setting premium rates and claims payments, the NKSJ Group utilizes reinsurance and appropriates catastrophe reserves as a precaution against such natural catastrophe risks.
However, if natural catastrophes occur more frequently or in greater magnitude than projected, the NKSJ Group’s earnings and/or financial condition could be adversely affected.
3
Table of Contents
| (5) | Risk of larger than anticipated losses |
The NKSJ Group’s core insurance business’s cost of revenues is determined on an ex-post basis by payment of insurance claims. The Group appropriates policy reserves to cover future insurance policy liabilities, but if the Group incurs larger than normally anticipated losses as a result of currently unforeseeable events, the Group’s earnings and/or financial condition could be adversely affected.
| (6) | Reinsurance risk |
The Group endeavors to disperse the risk of natural catastrophes and large losses by utilizing reinsurance, but it may face sharp increases in reinsurance premiums or be unable to obtain adequate reinsurance coverage as a result of changes in the reinsurance market environment. Reinsurance also entails credit risk (i.e., the risk of insolvency rendering a reinsurer wholly or partially unable to honor its reinsurance claims obligations).
The Group also underwrites reinsurance policies covering selected risks, regions, and insurance lines. Such underwriting entails a risk of losses from natural catastrophes and other unanticipatedly large losses. If such reinsurance-related risks manifest, the Group’s earnings and/or financial condition could be adversely affected.
| (7) | Risk of equity price declines |
The Group has large holdings of marketable equity securities, mainly to maintain medium- to long-term relationships with companies with which it does business. In the event of a large equity market decline, the Group’s earnings and/or financial condition could be adversely affected by losses on the sale of equity holdings, unrealized losses on equity holdings, and/or reduction in unrealized gains on equity holdings.
| (8) | Interest rate risk |
The Group holds bonds, loans, and other assets that earn interest at a fixed rate. Such asset holdings are at risk of losing value due to a rise in interest rates. The Group also sells insurance products with an assumed rate of return (the rate of return promised to the policyholder at the time of policy inception), including cash-value insurance and long-term casualty and life insurance. The Group is therefore at risk of earning an actual rate of return on invested assets that is below the assumed rate of return as a result of a decline in interest rates. Additionally, the Group has issued subordinated bonds that convert to floating-rate instruments five years after their issuance.
The Group is consequently at risk of an increase in interest expense as a result of a rise in interest rates. If such interest rate risks manifest, the Group’s earnings and/or financial condition could be adversely affected.
| (9) | Credit risk |
The Group holds equities, bonds, loans, credit insurance contracts, and financial guaranty insurance contracts. The Group’s earnings and/or financial condition could be adversely affected if the Group’s assets decrease in value or the Group incurs bad debt losses or insurance claims obligations as a result of insolvency or diminished creditworthiness of an equity or bond issuer, borrower, or credit or financial guaranty insurance contract counterparty.
4
Table of Contents
| (10) | Currency risk |
The Group has assets and liabilities denominated in foreign currencies, including the US dollar and euro. The Group’s earnings and/or financial condition could be adversely affected by a decrease in asset values or increase in liability values resulting from exchange rate movements.
| (11) | Liquidity risk |
In the event of disorderly market conditions or deterioration in its liquidity position due to large insurance claims or increased insurance policy redemptions, the Group could be forced to sell assets at grossly depressed prices or raise funds at egregiously disadvantageous terms. In such an event, the Group’s earnings and/or financial condition could be adversely affected.
| (12) | Life insurance business risks |
The Group is actively engaged in the life insurance business. Although the life insurance business has favorable growth prospects, it also poses various risks, including the risk of requiring substantial additional capital to fund growth, the risk of failing to build a stable foundation in the life insurance market due to competition with other life insurers, and the risk of deterioration in profitability due to risks specific to life insurance products.
If any such risks manifest, the Group’s earnings and/or financial condition could be adversely affected.
| (13) | Overseas business risks |
The Group is actively expanding its insurance operations overseas. Overseas insurance markets pose country-specific risks not found in Japanese insurance markets. Such risks most notably include the risk of drastic changes in local political, social, or economic conditions; the risk of precipitous exchange rate movements; the risk of sudden legal or regulatory changes; and in certain countries and regions, the risk of political or social unrest due to terrorism or other violence.
Such risks could adversely affect the Group’s earnings and/or financial condition.
| (14) | Non-insurance business risk |
The Group provides non-insurance products and services also. Its non-insurance operations include asset management, risk consulting, healthcare, and defined-contribution pension businesses. The markets in which these businesses operate are all intensely competitive.
If such businesses’ earnings performance falls short of expectations, the Group’s earnings and/or financial condition could be adversely affected.
| (15) | Credit downgrade risk |
Some of the Group’s companies have been issued credit ratings by rating agencies. Credit agencies revise their ratings in response to various factors, including economic conditions and rated companies’ earnings performance.
If a group company’s credit rating is downgraded, the Group’s sales activities or funding costs could be adversely affected. In such an event, the Group’s earnings and/or financial condition could be adversely affected.
5
Table of Contents
| (16) | Business interruption risk |
The Group endeavors to ensure operational continuity through such means as formulating business continuity plans for contingencies such as a major Tokyo earthquake and H1N1 influenza pandemic.
Nonetheless, depending on the severity of such a crisis, the Group’s earnings and/or financial condition could be adversely affected by disruption of normal business operations.
| (17) | Information security risk |
In addition to handling large amounts of customer information, the Group also possesses a wide range of internal information (e.g., management information). Group companies rigorously safeguard such information by implementing customer information controls. In the event of a material information leak, the Group could suffer a loss of public trust and/or be forced to pay damages. In such an event, the Group’s earnings and/or financial condition could be adversely affected.
| (18) | Reputational risk |
If negative rumors about the Group or insurance industry are propagated by the mass media, Internet message boards, or other such means, the Group could suffer a loss of public trust as a result of such rumors, whether accurate or not, influencing the perceptions of customers and/or investors. In such an event, the Group would endeavor to minimize the impact by responding appropriately to the rumors in a timely manner, but if a negative rumor gains widespread notoriety, the Group’s earnings and/or financial condition could be adversely affected.
| (19) | System integration risk |
The Group’s major nonlife insurance subsidiaries are rebuilding their IT systems.
In addition to unifying their systems, they are completely upgrading the systems’ basic infrastructure and construction. Such IT system reforms entail a risk of major system failures due to system development or integration in addition to the risk of ordinary failures due to system crashes, malfunctions, or misuse.
In light of the risk of such system failures having a material impact on the Group’s operations, the Group has formulated basic policies regarding IT system strategy and risk controls and is endeavoring to implement effective IT system risk controls.
However, the Group’s earnings and/or financial condition could be adversely affected in the event of a major system failure.
| (20) | Risk of failure to adequately realize business integration synergies |
The Group formulates quantitative management targets that factor in synergies to be derived from business integration. To achieve these targets, the Group intends to consolidate group companies and implement business-specific strategies and various other initiatives.
If the Group fails to adequately realize anticipated synergies, its earnings and/or financial condition could be adversely affected.
6
Table of Contents
| (21) | Risks related to merger of life insurance subsidiaries |
The Group plans to merge its life insurance subsidiaries, Sompo Japan Himawari Life Insurance Co., Ltd., and Nipponkoa Life Insurance Company, Limited, subject to regulatory approval. Both companies are preparing to effectuate the merger by a scheduled effective date of October 1, 2011. Conceivable merger-related risks include those listed below. If any such risks manifest, the Group’s earnings and/or financial condition could be adversely affected.
| • | Risk of failure to adequately realize anticipated merger synergies |
| • | Risk of disruptions resulting from merger preparation delays or business process changes |
| • | Risk of failure to obtain regulatory approval |
| • | Risk of merger cost increases due to delayed regulatory approval or other unforeseen circumstances |
| (22) | Other risks |
In addition to the above risks, the Group is also at risk of operational setbacks or loss of customer trust due to system failures, clerical errors, improper conduct by Group personnel, legal violations, criminal acts perpetrated by outsiders, payment of damages in conjunction with litigation, or other such events. The Group’s earnings and/or financial condition could be adversely affected by penalties imposed by the authorities in response to such an event.
| 3. | Significant contracts on management |
(Omitted.)
| 4. | Financial positions, results of operations, and cash flows |
(Omitted.)
Section 3: Information on the facilities
(Omitted.)
7
Table of Contents
Section 4: Information of the reporting company
| 1. | Information on shares |
| (1) | Total Number of Shares |
(Omitted.)
| (2) | Stock Acquisition Rights |
(Omitted.)
| (3) | Status of warrant bonds’ outstanding warrants with adjusted exercise prices |
(Omitted.)
| (4) | Status of Rights Plan |
(Omitted.)
| (5) | Changes in the Total Number of Shares Issued and the Amount of Common Stock |
(Omitted.)
| (6) | Status of Major Shareholders |
The Company was established on April 1, 2010, and therefore had the following major shareholders as of the end of the fiscal first quarter (June 30, 2010).
(As of June 30, 2010) | ||||||
Shareholders’ name | Location | Number of shares held (thousands) | Percentage of ownership based on issued shares (%) | |||
State Street Bank and Trust Company (standing proxy: The Hongkong and Shanghai Banking Corporation Limited Tokyo Branch) | P.O. Box 351, Boston, Massachusetts 02101 U.S.A. (11-1 Nihonbashi 3-chome, Chuo-ku, Tokyo) | 90,109 | 5.42 | |||
| Japan Trustee Services Bank, Ltd. (Trust Account) | 8-11 Harumi 1-chome, Chuo-ku, Tokyo | 65,751 | 3.96 | |||
Longleaf Partners Fund (standing proxy: The Hongkong and Shanghai Banking Corporation Limited Tokyo Branch) | 6410 Poplar Avenue Suite 900, Memphis, TN 38119 U.S.A. (11-1 Nihonbashi 3-chome, Chuo-ku, Tokyo) | 57,330 | 3.45 | |||
| The Master Trust Bank of Japan, Ltd. (Trust Account) | 11-3 Hamamatsucho 2-chome, Minato-ku, Tokyo | 52,053 | 3.13 | |||
| The Dai-ichi Life Insurance Company, Limited | 13-1 Yurakucho 1-chome, Chiyoda-ku, Tokyo | 40,908 | 2.46 | |||
| NKSJ Holdings Employee Shareholding Plan | Human Capital and General Affairs Division, NKSJ Holdings, Inc, 26-1 Nishi-Shinjuku 1-chome, Shinjuku-ku, Tokyo | 36,670 | 2.21 | |||
| Mizuho Corporate Bank, Ltd. | 3-3 Marunouchi 1-chome, Chiyoda-ku, Tokyo | 34,052 | 2.05 | |||
| Nippon Express Co., Ltd. | 9-3 Higashi-Shinbashi 1-chome, Minato-ku, Tokyo | 32,004 | 1.93 | |||
Mellon Bank, N.A. Treaty Client Omnibus (standing proxy: The Bank of Tokyo-Mitsubishi UFJ, Ltd.) | One Mellon Bank Center, Pittsburgh, Pennsylvania (Clearing Division, 7-1 Marunouchi 2-chome, Chiyoda-ku, Tokyo) | 22,630 | 1.36 | |||
| Meiji Yasuda Life Insurance Company | 1-1 Marunouchi 2-chome, Chiyoda-ku, Tokyo | 22,503 | 1.35 | |||
| Total | — | 454,013 | 27.33 | |||
8
Table of Contents
Notes:
| 1. | Dai-Ichi Life Insurance Company’s shareholdings include 17,971,000 shares contributed by Dai-Ichi Life Insurance to a post-retirement benefit trust as a trust asset (in the shareholder registry, said shares are registered in the name of Mizuho Trust & Banking Co., Ltd., as beneficial owner on behalf of Dai-Ichi Life Insurance post-retirement benefit trust). |
| 2. | During the quarter ended June 30, 2010, the Company received notification that Southeastern Asset Management Inc. owned shares as specified below as of April 1, 2010, per a large shareholding report filed on April 8, 2010, but the Company was unable to confirm the number of shares effectively owned by Southeastern Asset Management as of June 30, 2010. The Company consequently listed its top 10 shareholders above based on the information recorded in its shareholder registry. |
Shareholders’ name | Location | Number of shares held (thousands) | Percentage of ownership based on issued shares (%) | |||
| Southeastern Asset Management Inc. | 6410 Poplar Avenue Suite 900, Memphis, TN 38119 U.S.A. | 208,200 | 12.53 |
| (7) | Status of Voting Rights |
(Omitted.)
| 2. | Changes in stock prices |
(Omitted.)
| 3. | Directors |
| (Omitted.) |
9
Table of Contents
Section 5: Financial Conditions
| 1 | Basis of Preparation of the Quarterly Consolidated Financial Statements |
| (1) | NKSJ Holdings, Inc. prepares its quarterly consolidated financial statements in accordance with the “Regulations concerning the Terminology, Forms and Preparation Methods of the Quarterly Consolidated Financial Statements” (Cabinet Ordinance No. 64, 2007) and the “Ordinance for Enforcement of the Insurance Business Law” (Ministry of Finance Ordinance No. 5, 1996) pursuant to the provision of Articles 61 and 82 of the “Regulations concerning the Terminology, Forms and Preparation Methods of the Quarterly Consolidated Financial Statements.” |
| (2) | NKSJ Holdings, Inc. was established as of April 1, 2010, so the three months ended June 30, 2009 (April 1 to June 30, 2009) and the fiscal year ended March 31, 2010 (April 1, 2009 to March 31, 2010) are not disclosed. Among the items which shall be disclosed when significant changes are recognized, compared with March 31, 2010 under Regulations concerning the Terminology, Forms and Preparation Methods of the Quarterly Consolidated Financial Statements, those items except for minor items are disclosed, as there is no amount of the corresponding period. |
| 2 | Audit Certification |
In accordance with the provision of Article 193-2 Paragraph 1 of the Financial Instruments and Exchange Act, the quarterly consolidated financial statements for the three months ended June 30, 2010 (April 1 to June 30, 2010) have been reviewed by Ernst & Young ShinNihon LLC.
10
Table of Contents
| 1. | Quarterly Consolidated Financial Statements |
| (1) | Quarterly Consolidated Balance Sheets |
| (Millions of yen) | |||||
| As of June 30, 2010 | |||||
Assets: | |||||
Cash and deposits | *2 | 231,443 | |||
Call loans | 98,271 | ||||
Receivables under resale agreements | 88,980 | ||||
Receivables under securities borrowing transactions | 29,720 | ||||
Monetary receivables bought | 67,334 | ||||
Money trusts | 84,687 | ||||
Securities | *2 | 6,493,858 | |||
Loans | 722,910 | ||||
Tangible fixed assets | *1,*2 | 364,691 | |||
Intangible fixed assets | 31,431 | ||||
Other assets | 590,676 | ||||
Deferred tax assets | 264,283 | ||||
Allowance for possible loan losses | (6,343 | ) | |||
Total assets | 9,061,946 | ||||
Liabilities: | |||||
Underwriting funds: | 7,414,499 | ||||
Reserve for outstanding losses and claims | 1,022,013 | ||||
Underwriting reserves | 6,392,486 | ||||
Bonds | 128,000 | ||||
Other liabilities | 288,878 | ||||
Reserve for retirement benefits | 104,674 | ||||
Reserve for retirement benefits to directors | 103 | ||||
Reserve for bonus payments | 6,587 | ||||
Reserves under the special laws: | 20,856 | ||||
Reserve for price fluctuation | 20,856 | ||||
Deferred tax liabilities | 808 | ||||
Total liabilities | 7,964,409 | ||||
Net assets: | |||||
Shareholders’ equity: | |||||
Common stock | 100,045 | ||||
Capital surplus | 438,552 | ||||
Retained earnings | 324,515 | ||||
Treasury stock | (559 | ) | |||
Total shareholders’ equity | 862,553 | ||||
Valuation and translation adjustments: | |||||
Unrealized gains on securities available for sale, net of tax | 247,933 | ||||
Deferred gains on hedges | 4,117 | ||||
Foreign currency translation adjustments | (21,946 | ) | |||
Total valuation and translation adjustments | 230,104 | ||||
Stock acquisition rights | 1,776 | ||||
Non-controlling interests | 3,101 | ||||
Total net assets | 1,097,536 | ||||
Total liabilities and net assets | 9,061,946 | ||||
11
Table of Contents
| (2) | Quarterly Consolidated Statements of Income |
| (Millions of yen) | |||||
| Three months ended June 30, 2010 (April 1 to June 30, 2010) | |||||
Ordinary income: | 663,446 | ||||
Underwriting income: | 619,473 | ||||
Net premiums written | 504,951 | ||||
Deposits of premiums by policyholders | 39,147 | ||||
Interest and dividend income on deposits of premiums, etc. | 15,175 | ||||
Life insurance premiums written | 48,085 | ||||
Reversal of reserve for outstanding losses and claims | 11,001 | ||||
Investment income: | 41,471 | ||||
Interest and dividend income | 43,965 | ||||
Investment gains on money trusts | 368 | ||||
Investment gains on trading securities | 31 | ||||
Gains on sales of securities | 2,684 | ||||
Transfer of interest and dividend income on deposits of premiums, etc. | (15,175 | ) | |||
Other ordinary income | 2,501 | ||||
Ordinary expenses: | 640,080 | ||||
Underwriting expenses: | 518,649 | ||||
Net claims paid | 291,713 | ||||
Loss adjustment expenses | *1 | 33,027 | |||
Net commissions and brokerage fees | *1 | 90,321 | |||
Maturity refunds to policyholders | 69,500 | ||||
Life insurance claims paid | 14,166 | ||||
Provision for underwriting reserves | 16,475 | ||||
Investment expenses: | 12,495 | ||||
Investment losses on money trusts | 498 | ||||
Losses on sales of securities | 1,348 | ||||
Impairment losses on securities | 4,923 | ||||
Operating, general and administrative expenses | *1 | 105,544 | |||
Other ordinary expenses: | 3,390 | ||||
Interest paid | 1,793 | ||||
Ordinary profit | 23,365 | ||||
Extraordinary gains: | 1,989 | ||||
Gains on disposal of fixed assets | 53 | ||||
Gains on negative goodwill | 149 | ||||
Other extraordinary gains | *2 | 1,785 | |||
Extraordinary losses: | 3,471 | ||||
Losses on disposal of fixed assets | 131 | ||||
Impairment losses | 36 | ||||
Provision for reserves under the special laws: | 2,363 | ||||
Provision for price fluctuation reserve | 2,363 | ||||
Other extraordinary losses | *3 | 939 | |||
Income before income taxes and non-controlling interests | 21,883 | ||||
Income taxes and deferred income taxes | 8,528 | ||||
Income before non-controlling interests | 13,355 | ||||
Non-controlling interests | (67 | ) | |||
Net income | 13,422 | ||||
12
Table of Contents
| (3) | Quarterly Consolidated Statements of Cash Flows |
| (Millions of yen) | |||
| Three months ended June 30, 2010 (April 1 to June 30, 2010) | |||
Cash flows from operating activities: | |||
Income before income taxes and non-controlling interests | 21,883 | ||
Depreciation | 4,715 | ||
Impairment losses | 36 | ||
Amortization of goodwill | 468 | ||
Gains on negative goodwill | (149 | ) | |
Increase (decrease) in reserve for outstanding losses and claims | (11,017 | ) | |
Increase (decrease) in underwriting reserves | 15,692 | ||
Increase (decrease) in allowance for possible loan losses | (995 | ) | |
Increase (decrease) in reserve for retirement benefits | 1,096 | ||
Increase (decrease) in reserve for retirement benefits to directors | 11 | ||
Increase (decrease) in reserve for bonus payments | (15,891 | ) | |
Increase (decrease) in reserve for bonus payments to directors | (57 | ) | |
Increase (decrease) in reserve for price fluctuation | 2,363 | ||
Interest and dividend income | (43,965 | ) | |
Losses (gains) on investment in securities | 4,305 | ||
Interest expenses | 1,793 | ||
Foreign exchange losses (gains) | 1,866 | ||
Losses (gains) related to tangible fixed assets | 77 | ||
Losses (gains) related to loans | 1 | ||
Investment losses (gains) on the equity method | 127 | ||
Decrease (increase) in other assets | 80,123 | ||
Increase (decrease) in other liabilities | (18,554 | ) | |
Others | (2,782 | ) | |
Subtotal | 41,149 | ||
Interest and dividend received | 45,102 | ||
Interest paid | (3,543 | ) | |
Income taxes paid | (8,475 | ) | |
Cash flows from operating activities | 74,234 | ||
13
Table of Contents
| (Millions of yen) | |||||
| Three months ended June 30, 2010 (April 1 to June 30, 2010) | |||||
Cash flows from investing activities: | |||||
Net decrease (increase) in deposits | 15,965 | ||||
Purchase of monetary receivables bought | (235 | ) | |||
Proceeds from sales and redemption of monetary receivables bought | 3,398 | ||||
Purchase of securities | (271,609 | ) | |||
Proceeds from sales and redemption of securities | 195,436 | ||||
Loans made | (42,010 | ) | |||
Collection of loans | 53,417 | ||||
Net increase in receivables and payables under securities borrowing transactions | 189 | ||||
Others | 5,030 | ||||
Subtotal | (40,418 | ) | |||
Total of operating activities and investment transactions as above | 33,815 | ||||
Acquisition of tangible fixed assets | (1,511 | ) | |||
Proceeds from sales of tangible fixed assets | 200 | ||||
Acquisition of stocks of subsidiaries resulting in changes in the scope of consolidation | (6,472 | ) | |||
Others | (691 | ) | |||
Cash flows from investing activities | (48,893 | ) | |||
Cash flows from financing activities: | |||||
Proceeds from issuance of stocks | 0 | ||||
Proceeds from sales of treasury stock | 12 | ||||
Acquisition of treasury stock | (692 | ) | |||
Dividends paid | (25,004 | ) | |||
Dividends paid to non-controlling shareholders | (5 | ) | |||
Others | (1,044 | ) | |||
Cash flows from financing activities | (26,734 | ) | |||
Effect of exchange rate changes on cash and cash equivalents | (1,036 | ) | |||
Net Increase (decrease) in cash and cash equivalents | (2,430 | ) | |||
Cash and cash equivalents at the beginning of the period | 262,844 | ||||
Net increase in cash and cash equivalents due to share exchange | 141,141 | ||||
Net increase in cash and cash equivalents due to merger | 2,480 | ||||
Cash and cash equivalents at the end of the period | *1 | 404,036 | |||
14
Table of Contents
[Changes in significant accounting policies for the preparation of the quarterly consolidated financial statements]
Three months ended June 30, 2010 (April 1 to June 30, 2010)
None.
Significant accounting policies for the preparation of the quarterly consolidated financial statements are as follows.
Three months ended June 30, 2010 (April 1 to June 30, 2010) | ||
1 Scope of consolidation | (1) Number of consolidated subsidiaries: 23 companies
Sompo Japan Insurance Inc.
NIPPONKOA Insurance Co., Ltd.
Sonpo 24 Insurance Company Limited
Saison Automobile and Fire Insurance Company, Limited
Sompo Japan Himawari Life Insurance Co., Ltd.
NIPPONKOA Life Insurance Company, Limited
Sompo Japan DIY Life Insurance Co., Ltd.
Sompo Japan DC Securities Co., Ltd.
Healthcare Frontier Japan Inc.
Sompo Japan Asset Management Co., Ltd.
Sompo Japan Insurance Company of America
Sompo Japan Insurance Company of Europe Limited
NIPPONKOA Insurance Company (Europe) Limited
NIPPONKOA Management Services (Europe) Limited
Nippon Insurance Company of Europe Limited
Sompo Japan Asia Holdings Pte. Ltd.
Sompo Japan Insurance (Singapore) Pte. Ltd.
Tenet Insurance Company Limited
Sompo Japan Insurance (China) Co., Ltd.
NIPPONKOA Insurance Company (China) Limited
Sompo Japan Insurance (Hong Kong) Company Limited
NIPPONKOA Insurance Company (Asia) Limited
Yasuda Seguros S.A. | |
Tenet Insurance Company Limited is the company which was acquired 100% of its shares by Sompo Japan Insurance Inc. as of May 31, 2010. | ||
(2) Names of principal non-consolidated subsidiaries
Names of principal non-consolidated subsidiaries
Ark Re Limited
Sompo Japan Reinsurance Company Limited | ||
As the non-consolidated subsidiaries do not have a material impact on reasonable judgment about the Group’s financial conditions and results of operations in terms of total assets, ordinary income, net income or loss and retained earnings, they are excluded from the scope of consolidation. | ||
2 Application of the equity method | (1) Number of affiliates accounted for under the equity method: 6 companies
Hitachi Capital Insurance Corporation
Yasuda Enterprise Development Co., Ltd.
Berjaya Sompo Insurance Berhad
Universal Sompo General Insurance Company Limited
Maritima Seguros S.A.
Maritima Saude Seguros S.A. | |
(2) The non-consolidated subsidiaries and affiliates (Ark Re Limited and Sompo Japan Reinsurance Company Limited, etc.) are not accounted for under the equity method as each company has a minor impact on net income or loss and retained earnings and they do not have a material impact as a whole. | ||
(3) NKSJ Holdings, Inc. holds 20% or more of voting rights of Japan Earthquake Reinsurance Co., Ltd. (“Japan Earthquake”) through domestic insurance subsidiaries. As Japan Earthquake is engaged in public business and NKSJ Holdings, Inc. can not have a material impact on Japan Earthquake’s decision of finance, promotion and business strategy, Japan Earthquake is excluded from affiliate. | ||
15
Table of Contents
Three months ended June 30, 2010 (April 1 to June 30, 2010) | ||
3 The balance sheet dates of consolidated subsidiaries | The balance sheet dates of the first quarter of the foreign consolidated subsidiaries are March 31. As the differences in the quarterly balance sheet dates do not exceed three months, the financial statements as of March 31 are used for the preparation of the quarterly consolidated financial statements. Necessary adjustments are made for the significant transactions during the periods from the quarterly balance sheet dates of the subsidiaries to the quarterly consolidated balance sheet date. | |
4 Accounting policies | (1) Valuation policies and methods for securities | |
(a) Trading securities are carried at fair value.
Cost of sale is calculated under the moving-average method. | ||
(b) Bonds held to maturity are carried at amortized cost based on the moving-average method. | ||
(c) Policy reserve matching bonds are carried at amortized cost based on the moving-average method in accordance with “Temporary Treatment of Accounting and Auditing Concerning Policy Reserve Matching Bonds in the Insurance Industry” (Japanese Institute of Certified Public Accountants Industry Audit Practice Committee Report No.21).
The outline of risk management policy in relation to policy reserve matching bonds is as follows.
Certain domestic consolidated life insurance subsidiary sets up “policy reserve for single-premium whole-life” as a sub-category, and follows the management policy to match the duration of the policy reserve in the sub-category with the duration of policy reserve matching bonds corresponding to this sub-category within a certain range, to better manage the changes in the interest rate risk associated with the assets and liabilities. | ||
(d) Stocks of non-consolidated subsidiaries and affiliates that are not accounted for under the equity method are carried at cost based on the moving-average method. | ||
(e) Securities available for sale which have readily determinable fair value are carried at fair value based on the market price as of the quarterly balance sheet date.
Changes in unrealized gains or losses, net of applicable income taxes, are directly included in net assets, and cost of sale is calculated based on the moving-average method. | ||
(f) Securities available for sale which are considered extremely difficult to figure out fair value are carried at cost based on the moving-average method. | ||
(g) Securities managed as trust assets in money trust for trading purposes are carried at fair value. | ||
(h) Securities managed as trust assets in money trusts classified as other than trading purposes or held to maturity are carried on the same basis as that of securities available for sale. | ||
(2) Valuation policies and methods for derivative financial instruments
Derivative financial instruments are carried at fair value. | ||
(3) Depreciation methods of significant assets | ||
(a) Tangible fixed assets (excluding lease assets)
Depreciation of tangible fixed assets (excluding lease assets) held by NKSJ Holdings, Inc. and its domestic consolidated subsidiaries is computed using the declining-balance method, except for buildings (excluding fixtures) acquired on or after April 1, 1998 on which depreciation is computed using the straight-line method.
Depreciation of tangible fixed assets (excluding lease assets) held by the foreign consolidated subsidiaries is mainly computed using the straight-line method. | ||
(b) Intangible fixed assets
Capitalized software for internal use held by the consolidated subsidiaries is amortized using the straight-line method based on the estimated useful life. | ||
16
Table of Contents
Three months ended June 30, 2010 (April 1 to June 30, 2010) | ||
(4) Accounting policies for significant reserves | ||
(a) Allowance for possible loan losses
In order to provide for losses from defaults, the domestic consolidated insurance subsidiaries establish allowance for possible loan losses in accordance with the internal standards for self-assessment of assets and the policy of write-off and provision.
For claims on debtors that have legally, formally or substantially entered into bankruptcy, special liquidation or whose notes have been under suspension at clearing houses, allowances are provided based on the amount remaining after deduction of the estimated recoverable amounts from the disposal of collateral and from guarantees.
For claims on debtors that are highly probable that they would bankrupt in the future, allowances are provided based on the amount remaining after deduction of the estimated recoverable amounts from the disposal of collateral and from guarantees, considering the debtor’s overall solvency assessment.
For claims other than those described above, allowances are provided based on the amount of claims multiplied by the default rate, which is computed based on historical loan loss experience.
The departments responsible for respective assets assess relevant claim in accordance with the in-house self-assessment criteria. The asset auditing department independently reviews the results and allowances are provided based on the said results.
The other consolidated subsidiaries determine the collectability of the receivables respectively to provide allowances based on the said results to cover the estimated future losses. | ||
(b) Reserve for retirement benefits
In order to provide for employees’ retirement benefits, the domestic consolidated subsidiaries record the amount, which was considered to occur at the end of the first quarter, based on the projected retirement benefit obligation and the estimated plan assets at the end of the fiscal year.
Prior service costs are amortized using the straight-line method over certain years within the average remaining service years of employees at the time of occurrence. Actuarial gains and losses are amortized using the straight-line method over certain years within the average remaining service years of employees at the time of occurrence from the following fiscal year. | ||
(c) Reserve for retirement benefits to directors
In order to provide for retirement benefits to directors, the domestic consolidated subsidiaries record the amount deemed accrued at the end of the first quarter based on internal regulations. | ||
(d) Reserve for bonus payments
In order to provide for employees’ bonus payments, the estimated amounts to be paid at the end of the first quarter are recorded. | ||
(e) Reserve for price fluctuation
In order to provide for possible losses arising from price fluctuation of stock etc, the domestic consolidated insurance subsidiaries set aside reserves under Article 115 of the Insurance Business Act. | ||
17
Table of Contents
Three months ended June 30, 2010 (April 1 to June 30, 2010) | ||
(5) Significant hedge accounting
Generally the domestic consolidated subsidiaries apply the deferral hedge accounting method to interest rate swaps to hedge cash flow fluctuation risk of floating-rate loans and bonds and interest rate fluctuation risk related to long-term insurance contracts based on “The accounting and auditing treatment on the application of the financial products accounting standard to the insurance industry” (Japanese Institute of Certified Public Accountants Industry Audit Practice Committee Report No.26, hereafter “Industry Audit Practice Committee Report No.26”). The exceptional treatment is applied to certain interest rate swaps to the extent that such transactions meet certain conditions required for the application of the exceptional treatment.
The domestic consolidated subsidiaries apply fair value hedge accounting to equity swap transactions for hedging the future stock price fluctuation risks.
The fair value hedge accounting method is applied to foreign exchange forward contracts, currency option transactions and currency swap transactions in order to reduce foreign exchange rate fluctuation risk on foreign currency denominated assets. The exceptional treatment is applied to the transactions to the extent that such transactions meet certain conditions required for application of the exceptional treatment.
Hedge effectiveness is judged by periodically comparing the accumulated fluctuations of the market value or cash flows of the hedged item to those of the related hedging instrument for the period from the commencement of the hedge to the date of judgment. However, when the material conditions are shared among the hedging instrument and the hedged item and its effectiveness is considered high, when interest rate swaps meet requirements for applying the exceptional method or when certain transactions fulfill the required conditions to apply the exceptional treatment, the judgment of the hedge effectiveness is omitted.
The hedge effectiveness based on Industry Audit Practice Committee Report No.26 is judged by monitoring the interest rates which impact the calculation of theoretical prices of both insurance liabilities as hedged item and interest rate swaps as hedging instrument which are grouped by different remaining periods. | ||
(6) Amortization of goodwill
Goodwill is amortized over 20 years using the straight-line method. Insignificant amounts of goodwill are amortized at one time. | ||
(7) Cash and cash equivalents in the quarterly consolidated statement of cash flows
Cash and cash equivalents in the quarterly consolidated statement of cash flows consist of cash on hand, demand deposits and short-term investments with original maturities or redemption of three months or less, which can be cashed easily and have few risks of fluctuation in value. | ||
(8) Accounting for consumption taxes
NKSJ Holdings, Inc. and its domestic consolidated subsidiaries account for national and local consumption taxes using the tax-excluded method, except for the domestic consolidated insurance subsidiaries’ expenses such as loss adjustment expenses and operating, general and administrative expenses for which the domestic consolidated insurance subsidiaries account using the tax-included method. Non-deductible consumption taxes relating to assets are included in other assets and amortized in equal installments over five years. | ||
18
Table of Contents
[Adoption of accounting methods used specifically for the quarterly consolidated financial statements]
Three months ended June 30, 2010 (April 1 to June 30, 2010) | ||
Calculation of income taxes | Income taxes are calculated by applying a reasonably estimated effective tax rate to income before income taxes. The estimated effective tax rate is determined by estimating the effective tax rate after applying deferred tax accounting for the fiscal year, including the first quarter of this fiscal year. When it is remarkably unreasonable to adopt this accounting method, income taxes are calculated by the statutory effective tax rate. |
19
Table of Contents
[Notes to the quarterly consolidated financial statements]
(Notes to the quarterly consolidated balance sheets)
As of June 30, 2010 |
*1 Accumulated depreciation of tangible fixed assets amounts to 389,362 million yen.
*2 Securities of 78,265 million yen, deposits of 7,696 million yen and tangible fixed assets of 5,270 million yen are pledged as collateral.
NKSJ Holdings, Inc. pledges securities of 3,437 million yen as collateral substantially through special purpose company established for guarantee on its obligation under reinsurance contracts. |
(Notes to the quarterly consolidated statements of income)
Three months ended June 30, 2010 (April 1 to June 30, 2010) |
*1 Major components of operating expenses |
Agency commissions, etc. | 90,843 million yen | |
Salaries | 52,716 million yen | |
Operating expenses represent the sum of loss adjustment expenses, operating, general and administrative expenses and net commissions and brokerage fees included in the quarterly consolidated statement of income.
|
*2 Other extraordinary gains are 1,785 million yen of gains on extinguishment of tie-in shares.
*3 The major component of other extraordinary losses is 902 million yen of the impact related to the adoption of accounting standards for asset retirement obligations. |
20
Table of Contents
(Notes to the quarterly consolidated statements of cash flows)
Three months ended June 30, 2010 (April 1 to June 30, 2010) | ||
*1 Reconciliation of cash and cash equivalents to the line items disclosed in the quarterly consolidated balance sheet as of June 30, 2010 | ||
Cash and deposits | 231,443 million yen | |
Call loans | 98,271 million yen | |
Receivables under resale agreements | 88,980 million yen | |
Monetary receivables bought | 67,334 million yen | |
Securities | 6,493,858 million yen | |
Time deposit with an original maturity of more than 3 months | (49,899) million yen | |
Monetary receivables bought other than cash equivalents | (38,334) million yen | |
Securities other than cash equivalents | (6,487,617) million yen | |
Cash and cash equivalents | 404,036 million yen | |
2 Cash flows from investing activities include cash flows from investment activities conducted as a part of insurance business. | ||
21
Table of Contents
(Shareholders’ Equity)
As of June 30, 2010 and the three months ended June 30, 2010 (April 1 to June 30, 2010)
| 1 | Type and number of shares outstanding: |
Common stock: 1,661,409 thousand shares
| 2 | Type and number of treasury stock: |
Common stock: 958 thousand shares
| 3 | Stock acquisition rights as of June 30, 2010: |
Stock acquisition rights for stock option: 1,776 million yen (NKSJ Holdings, Inc. 1,776 million yen)
| 4 | Dividends |
| (1) | Dividends paid |
NKSJ Holdings, Inc. is a joint holding company established through share exchange on April 1, 2010, so the amounts of dividends paid are the amounts approved at each general meeting of stockholders of wholly-owned subsidiaries mentioned below.
Sompo Japan Insurance Inc.
Resolution | Type of share | Total amount of dividend | Dividend per share | Date of record | Effective date | Source of dividend | ||||||
General meeting of stockholders held on June 28, 2010 | Common stock | 19,681 million yen | 20 yen | March 31, 2010 | June 29, 2010 | Retained earnings | ||||||
NIPPONKOA Insurance Co., Ltd.
Resolution | Type of share | Total amount of dividend | Dividend per share | Date of record | Effective date | Source of dividend | ||||||
General meeting of stockholders held on June 28, 2010 | Common stock | 6,019 million yen | 8 yen | March 31, 2010 | June 29, 2010 | Retained earnings | ||||||
| (2) | Of dividends with record date within the three months ended June 30, 2010, dividends with the effective date after June 30, 2010 |
None.
22
Table of Contents
(Segment Information)
[Segment Information]
| 1 | Summary of reportable segments |
| The reportable segment of NKSJ Holdings, Inc. is the component of our company, for which discrete financial information is available, and whose operating results are regularly reviewed by the board of directors to make decisions about resources to be allocated to the segment and assess its performance. |
| The respective group companies of NKSJ Holdings, Inc. determine their comprehensive strategies for their operations as independent management unit and roll out their operations under the group-wide management policy of NKSJ Holdings, Inc. |
| Therefore, NKSJ Holdings, Inc. is composed of the business segments which include the respective group companies as a minimum component, and “Property and casualty insurance business” and “Life insurance business” are determined as the reportable segments. NKSJ Holdings, Inc. and other operations which are not covered by the reportable segments, are included in “Others.” The major companies which constitute each reportable segment and “Others” are listed below. |
| “Property and casualty insurance business” conducts underwriting of property and casualty insurance and related investment activities. |
| “Life insurance business” conducts underwriting of life insurance and related investment activities. |
Major companies | ||
Reportable segments | ||
Property and casualty insurance business | Sompo Japan Insurance Inc.
NIPPONKOA Insurance Co., Ltd.
Sonpo 24 Insurance Company Limited
Saison Automobile and Fire Insurance Company, Limited
Sompo Japan Insurance Company of America
Sompo Japan Insurance Company of Europe Limited
Yasuda Seguros S.A. | |
Life insurance business | Sompo Japan Himawari Life Insurance Co., Ltd.
NIPPONKOA Life Insurance Company, Limited
Sompo Japan DIY Life Insurance Co., Ltd. | |
Others | NKSJ Holdings, Inc.
Sompo Japan DC Securities Co., Ltd.
Healthcare Frontier Japan Inc.
Sompo Japan Asset Management Co., Ltd.
Yasuda Enterprise Development Co., Ltd. | |
23
Table of Contents
| 2 | Information related to the amount of sales and net income or loss by each reportable segment |
Three months ended June 30, 2010 (April 1 to June 30, 2010)
| (Millions of yen) | ||||||||||||
| Reportable segments | Others | Total | ||||||||||
| Property and casualty | Life | Total | ||||||||||
Sales | ||||||||||||
Sales from transactions with external customers | 504,951 | 48,085 | 553,037 | 1,161 | 554,198 | |||||||
Sales arising from internal segment | — | — | — | 769 | 769 | |||||||
Total | 504,951 | 48,085 | 553,037 | 1,930 | 554,968 | |||||||
Net income (loss) attributable to segment | 15,042 | (687 | ) | 14,355 | (932 | ) | 13,422 | |||||
| Notes) | 1 | The definitions of sales are as follows. | ||||
Property and casualty: | Net premiums written | |||||
Life: | Life insurance premiums written | |||||
Others: | Ordinary income | |||||
2 | “Others” is business segments which are not included in reportable segments. It includes other operations. | |||||
| 3 | Difference between the total amount of net income or loss on reportable segments and the quarterly consolidated statements of income and major components of the difference |
(Information related to reconciliation)
| (Millions of yen) | |||
Net income | Amount | ||
Total amount of reportable segments | 14,355 | ||
Net income attributable to “Others” | (932 | ) | |
Net income in the quarterly consolidated statements of income | 13,422 |
| 4 | Information related to goodwill by reportable segments |
(Significant changes in the amount of goodwill)
In “Property and casualty insurance business”, as mentioned in “Business Combinations”, Sompo Japan Insurance Inc. of the consolidated subsidiary of NKSJ Holdings, Inc. acquired shares of Tenet Insurance Company Limited as of May 31, 2010. The increase in the amount of goodwill related to the acquisition is 2,609 million yen for the three months ended June 30, 2010.
(Significant gains on negative goodwill)
In “Property and casualty insurance business”, as mentioned in “Business Combinations”, Sompo Japan Insurance Inc., which was defined as the acquirer, acquired NIPPONKOA Insurance Co., Ltd. through share exchange as of April 1, 2010. The amount of gains on negative goodwill related to the acquisition is 149 million yen for the three months ended June 30, 2010.
24
Table of Contents
(Financial Instruments)
As of June 30, 2010
The financial instruments which NKSJ Holdings, Inc. considers extremely difficult to figure out the fair value are not included in the following table.
| (Millions of yen) | ||||||||
| Carrying amount on the consolidated balance sheet | Fair value | Unrealized gains (losses) | ||||||
Cash and deposits | 231,443 | 231,443 | — | |||||
Call loans | 98,271 | 98,271 | — | |||||
Receivables under resale agreements | 88,980 | 88,980 | — | |||||
Receivables under securities borrowing transactions | 29,720 | 29,720 | — | |||||
Monetary receivables bought | 67,334 | 67,334 | — | |||||
Money trusts | 83,915 | 83,915 | — | |||||
Securities | 6,301,819 | 6,364,693 | 62,874 | |||||
Loans | 722,910 | |||||||
Allowance for possible loan losses (*1) | (1,570 | ) | ||||||
| 721,340 | 729,318 | 7,978 | ||||||
Total assets | 7,622,825 | 7,693,678 | 70,852 | |||||
Bonds | 128,000 | 128,844 | 844 | |||||
Total liabilities | 128,000 | 128,844 | 844 | |||||
Derivative transactions (*2) | ||||||||
Not qualifying for hedge accounting | 3,682 | 3,682 | — | |||||
Qualifying for hedge accounting | 18,033 | 18,032 | (1 | ) | ||||
Total derivative transactions | 21,715 | 21,714 | (1 | ) | ||||
| (*1) | General allowance for possible loan losses and individual allowance for possible loan losses responding to loans are excluded. |
| (*2) | This table shows derivative transactions which are allocated on other assets and other liabilities collectively. Assets and liabilities arising out from derivative transactions are shown on the net basis. The items which are net debt in total are shown by an asterisk (*). |
Notes)
| 1 | Calculation methods for the fair value of cash and deposits |
Since all deposits are short term, the fair value approximates the book value, so the book value is presented as the fair value.
| 2 | Calculation methods for the fair value of call loans |
Since all call loans are short term, the fair value approximates the book value, so the book value is presented as the fair value.
| 3 | Calculation methods for the fair value of receivables under resale agreements |
Since all are short term, the fair value approximates the book value, so the book value is presented as the fair value.
| 4 | Calculation methods for the fair value of receivables under securities borrowing transactions |
Since all are short term, the fair value approximates the book value, so the book value is presented as the fair value.
| 5 | Calculation methods for the fair value of monetary receivables bought |
The fair value is based on the price quoted by counterparties.
25
Table of Contents
| 6 | Calculation methods for the fair value of money trusts |
The fair value of the domestic bonds which are managed as trust asset is based on exchange price, the price released by Japan Securities Dealers Association, the price quoted by counterparties and the over-the-counter average price released by the supplier. The fair value of the domestic stocks which are managed as trust asset is based on exchange price. And the fair value of foreign securities is based on exchange price, the price released by the industry association and the price quoted by counterparties. As for derivative transactions, the fair value of quoted derivatives is based on exchange price and the fair value of forward foreign exchange is based on forward exchange rate.
| 7 | Calculation methods for the fair value of securities |
The fair value of the domestic bonds is based on exchange price, the price released by Japan Securities Dealers Association and the price quoted by counterparties. The fair value of the domestic stocks is based on exchange price. And the fair value of foreign securities is based on exchange price and the price quoted by counterparties.
| 8 | Calculation methods for the fair value of loans |
The fair value is the amount of future collection cash flow of each loan which is discounted by the risk free rate for the corresponding the period, adding credit risk premium and liquidity premium thereto, or the total amount of principal and interest which is discounted by the expected interest rate of new loans by the types and categories of internal ratings. For the loans categorized as non-performing, probably irrecoverable, irrecoverable or some intensive control debtors, the fair value is the amount of present value of estimated future cash flow, or since the potential loan losses are estimated based on the amount expected to be covered by collateral and guarantee, the fair value approximates the amount which the current estimated loan losses are deducted from the carrying amount on the consolidated balance sheet, so such amount is presented as the fair value.
| 9 | Calculation methods for the fair value of bonds |
The fair value is calculated as the amount of future cash flow discounted at the risk free rate for the corresponding period, adding credit risk premium and liquidity premium thereto.
| 10 | Calculation methods for the fair value of derivative transactions |
The fair value of forward foreign exchange transactions is calculated using forward exchange rate. As for forward foreign exchange transactions between foreign currency and the other foreign currency, the fair value is calculated using forward exchange rate of the other foreign currency and yen on the day of forward foreign exchange transactions.
The fair value of currency option transactions is based on the price quoted by counterparties.
The currency swap transactions that applied exceptional accounting are accounted for together in loans of hedge objectives. Therefore, the fair value of currency swap transactions is included in the fair value of the loans.
The fair value of interest rate swap transactions is based on the price quoted by counterparties or the fair value calculated by discounting future cash flow to the present value.
The fair value of equity index option transactions is based on the closing price at major exchanges.
The fair value of bond future transactions is based on the closing price at major exchanges.
The fair value of credit derivative transactions is based on the price quoted by counterparties.
The fair value of weather derivative transactions is calculated based on the contract term and the element of the contract.
The fair value of earthquake derivative transactions is calculated based on the contract term and the element of the contract.
The fair value of other forward transactions is based on the price quoted by counterparties.
26
Table of Contents
(Securities)
As of June 30, 2010
1. Bonds held to maturity (which have readily determinable fair value)
| (Millions of yen) | |||||||
| Carrying amount on balance sheet | Fair value | Unrealized gains (losses) | |||||
Domestic bonds | 1,064,939 | 1,127,109 | 62,169 | ||||
Foreign securities | 85,561 | 85,736 | 175 | ||||
Total | 1,150,501 | 1,212,846 | 62,344 | ||||
2. Policy reserve matching bonds (which have readily determinable fair value)
| |||||||
| (Millions of yen) | |||||||
| Carrying amount on balance sheet | Fair value | Unrealized gains (losses) | |||||
Domestic bonds | 10,442 | 10,972 | 530 | ||||
Total | 10,442 | 10,972 | 530 | ||||
3. Securities available for sale (which have readily determinable fair value)
| |||||||
| (Millions of yen) | |||||||
| Cost | Carrying amount on balance sheet | Unrealized gains (losses) | |||||
Domestic bonds | 2,456,168 | 2,535,300 | 79,132 | ||||
Domestic stocks | 1,133,722 | 1,486,446 | 352,723 | ||||
Foreign securities | 1,112,585 | 1,056,449 | (56,136 | ) | |||
Others | 127,660 | 129,891 | 2,231 | ||||
Total | 4,830,137 | 5,208,087 | 377,950 | ||||
| Notes) | 1 | Certificate of deposit, which are classified as cash and deposits and beneficial interests in the loan trusts, which are classified as monetary receivables bought in the quarterly consolidated balance sheet, are included in “Others” above. | ||
| 2 | Impairment losses on securities available for sale amount to 4,824 million yen. | |||
| NKSJ Holdings, Inc. and its domestic consolidated subsidiaries recognize impairment losses on securities available for sale if fair value declines by 30% or more of their cost at the end of the first quarter, as a rule. | ||||
27
Table of Contents
(Derivatives transactions)
As of June 30, 2010
| (Millions of yen) | |||||||||||
Type | Transaction | Notional amount | Fair value | Unrealized gains (losses) | |||||||
Currency derivatives | Forward foreign exchange: | ||||||||||
Short | 61,427 | 2,841 | 2,841 | ||||||||
Long | 43,805 | (1,443 | ) | (1,443 | ) | ||||||
| Currency option: | |||||||||||
Short | 18,199 | ||||||||||
| 182 | * | (0 | ) | 182 | |||||||
Long | 16,810 | ||||||||||
| 182 | * | 1,605 | 1,422 | ||||||||
| Interest rate derivatives | Interest rate swap | 15,000 | 63 | 63 | |||||||
| Equity derivatives | Equity index option: | ||||||||||
Short | 5,417 | ||||||||||
| 205 | * | (16 | ) | 188 | |||||||
Long | 4,400 | ||||||||||
| 205 | * | 508 | 303 | ||||||||
| Bond derivatives | Bond future: | ||||||||||
Short | 478 | (9 | ) | (9 | ) | ||||||
Others | Credit derivatives: | ||||||||||
Short | 7,000 | (9 | ) | (9 | ) | ||||||
Long | 4,000 | 10 | 10 | ||||||||
| Weather derivatives: | |||||||||||
Short | 463 | ||||||||||
| 17 | * | (23 | ) | (5 | ) | ||||||
Long | 24 | ||||||||||
| — | * | — | — | ||||||||
| Earthquake derivatives: | |||||||||||
Short | 4,130 | ||||||||||
| 138 | * | (21 | ) | 116 | |||||||
Long | 3,447 | ||||||||||
| 358 | * | 172 | (186 | ) | |||||||
Other forward: | |||||||||||
Long | 67 | 2 | 2 | ||||||||
Total | — | 3,682 | 3,479 | ||||||||
| Notes) | 1 Derivatives transactions to which hedge accounting is applied are excluded. |
| 2 Amounts with an asterisk (*) represent the amount of the option premiums. |
28
Table of Contents
(Business Combinations)
Three months ended June 30, 2010 (April 1 to June 30, 2010)
| 1 | Business integration |
| (1) | The name of acquiree and its type of business, reason for the business integration, date of integration, legal form of the integration, name of the controlling entity after the integration, percentage of voting rights acquired and the primary reason for defining the acquirer |
| (a) | The name of acquiree and its type of business |
| NIPPONKOA Insurance Co., Ltd. : Property and casualty insurance |
| (b) | Reason for the business integration |
In the face of the declining birthrate and aging society—the significant challenges Japan faces in the medium to long-term period—as well as of increased risks associated with depopulating society, deteriorating global climate change, and in response to the diversified consumer demands amidst the individuals’ lifestyle changes, companies are urged to take proper actions and contribute to social safety and to customers’ sense of security.
Based on this shared perspective, SOMPO JAPAN and NIPPONKOA decided to establish a—new solution service group which provides customers with security and service of the highest quality and contribute to social welfare, while sharing as a unitary group the strengths nurtured through 120 years of their respective history.
| (c) | Date of integration |
April, 1, 2010
| (d) | Legal form of the integration |
Share exchange
| (e) | Name of the controlling entity after the integration |
NKSJ Holdings, Inc.
| (f) | Percentage of voting rights acquired |
100%
| (g) | The primary reason for defining the acquiror |
Sompo Japan Insurance Inc. was defined as the acquiror based on relative ownership percentage of voting rights in general.
| (2) | The business term of the acquiree included in the quarterly consolidated statements of income for first quarter |
From April 1, 2010 to June 30, 2010
| (3) | Acquisition cost with details of the acquiree |
Purchase price | 444,248 million yen | |||||
Amount of stock acquisition rights | 713 million yen | |||||
Total | 444,962 million yen |
29
Table of Contents
| (4) | Share exchange ratio, basis of calculation for the share exchange and the number of shares to be allotted |
| (a) | Share exchange ratio |
One share of common stock of NKSJ Holdings, Inc. was allotted and delivered for each share of common stock of SOMPO JAPAN, and 0.9 shares of common stock of NKSJ Holdings, Inc. were allotted and delivered for each share of common stock of NIPPONKOA.
| (b) | Basis of calculation for the allotment in relation to the share exchange |
In order to ensure the fairness of the share exchange ratio to be used in the share exchange, SOMPO JAPAN appointed Nomura Securities Co., Ltd., Mizuho Securities Co., Ltd. and Goldman Sachs Japan Co., Ltd., and NIPPONKOA appointed Merrill Lynch Japan Securities Co., Ltd. and Mitsubishi UFJ Securities Co., Ltd. to calculate the share exchange ratio. Based on the calculation results and a comprehensive consideration of the financial conditions, asset conditions and future outlook of the Parties, SOMPO JAPAN and NIPPONKOA engaged in careful deliberation concerning the share exchange ratio. The Parties concluded and agreed that the share exchange ratio mentioned above is appropriate.
| (c) | Number of shares to be allotted |
SOMPO JAPAN | 984,055,299 shares | |
NIPPONKOA | 677,207,979 shares |
| (5) | Negative goodwill |
| (a) | Amount of negative goodwill |
149 million yen
| (b) | Reason for recognizing negative goodwill |
The net amounts of assets acquired and liabilities assumed on the day of business integration exceeded the amount of investment based on evaluation of entity.
| (6) | Amounts of assets acquired and liabilities assumed on the day of business integration |
Total assets: | 3,064,910 million yen | |
Securities | 2,180,871 million yen | |
Total liabilities: | 2,619,450 million yen | |
Underwriting funds | 2,482,288 million yen |
| (7) | Estimated amounts of influence on the quarterly consolidated statements of income for the fiscal year ending March 31, 2011 assuming that the business integration had been completed on the commencement date of the fiscal year |
There is no influence because the business integration was held on the same date of the commence date of the quarterly consolidated period for the fiscal year ending March 31, 2011.
30
Table of Contents
| 2 | Business integration |
| (1) | The name of acquiree and its type of business, reason for the business integration, date of integration, legal form of the integration, name of the controlling entity after the integration, percentage of voting rights acquired and the primary reason for defining the acquiror |
| (a) | The name of acquiree and its type of business |
Tenet Insurance Company Limited (“Tenet”): Property and casualty insurance
| (b) | Reason for the business integration |
Through the acquisition of Tenet, Sompo Japan Group plans to further strengthen its solid platform and expand its operations in Singapore and Southeast Asia.
| (c) | Date of integration |
May, 31, 2010
| (d) | Legal form of the integration |
Acquisition of shares by cash
| (e) | Name of the controlling entity after the integration |
Tenet Insurance Company Limited
| (f) | Percentage of voting rights acquired |
100%
| (g) | The primary reason for defining the acquiror |
Sompo Japan was defined as the acquiror because Sompo Japan acquired shares of Tenet by cash.
| (2) | The business term of the acquiree included in the quarterly consolidated statements of income for first quarter |
None. The acquisition date is regarded as June 30, 2010.
| (3) | Acquisition cost with details of the acquiree |
Purchase price | 97 million Singapore dollar | |||
Direct cost for the acquisition | 1 million Singapore dollar | |||
Total | 98 million Singapore dollar |
| (4) | Goodwill |
| (a) | Amount of goodwill |
38 million Singapore dollar
| (b) | Reason for recognizing goodwill |
The acquisition cost exceeded the net amounts of assets acquired and liabilities assumed on the day of business integration.
| (c) | Method and term of amortization |
Straight-line amortization in 20 years
31
Table of Contents
| (5) | Amounts of assets acquired and liabilities assumed on the day of business integration |
Total assets: | 122 million Singapore dollar | |||
Deposits | 72 million Singapore dollar | |||
Total liabilities: | 62 million Singapore dollar | |||
Underwriting funds | 55 million Singapore dollar |
32
Table of Contents
(Per Share Information)
| 1 | Total net assets per share |
| As of June 30, 2010 | ||
Total net assets per share | 658.04 yen |
Note) Calculation of total net assets per share is based on the following figures.
| (Millions of yen) | |||
| As of June 30, 2010 | |||
Total net assets | 1,097,536 | ||
Amount to be deducted from total net assets: | (4,878 | ) | |
Stock acquisition rights | (1,776 | ) | |
Non-controlling interests | (3,101 | ) | |
Total net assets attributable to common stocks | 1,092,658 | ||
Number of common stocks used for calculation of total net assets per share | thousand shares 1,660,450 | |
| 2 | Net income per share |
| Three months ended June 30, 2010 (April 1 to June 30, 2010) | ||
Net income per share—Basic | 8.08 yen | |
Net income per share—Diluted | 8.07 yen |
Note) Calculation of basic net income per share and diluted net income per share is based on the following figures.
| (Millions of yen) | ||
| Three months ended June 30, 2010 (April 1 to June 30, 2010) | ||
(1) Net income per share—Basic | ||
Net income | 13,422 | |
Net income not attributable to common stockholders | — | |
Net income attributable to common stocks | 13,422 | |
Average number of common stocks outstanding | thousand shares 1,661,096 | |
(2) Net income per share—Diluted | ||
Adjustment of net income | — | |
Increase of common stocks: | thousand shares 2,074 | |
Stock acquisition rights | thousand shares 2,074 |
33
Table of Contents
[Significant subsequent events]
Three months ended June 30, 2010
(April 1 to June 30, 2010)
(Subsidiaries merge and become a direct subsidiary of NKSJ Holdings)
Sompo Japan Asset Management Co., Ltd. (SJAM) and ZEST Asset Management Ltd. (Zest AM), the asset management subsidiaries of, respectively, SOMPO JAPAN INSURANCE INC. (Sompo Japan) and the NIPPONKOA Insurance Co., Ltd. (Nipponkoa), NKSJ Holdings’ main subsidiaries, will merge, and the merged entity will become a direct subsidiary of NKSJ Holdings. Each of Sompo Japan’s and Nipponkoa’s board of directors formally approved the details on July 30, 2010. The overview of merged entity as subsidiary and purpose of this organizational restructuring are described as follows;
| 1 | Purpose of merger and of making merged entity a direct subsidiary |
The asset management subsidiaries will be merged to enhance the functions of the NKSJ Group’s asset management operations. As a strategic subsidiary in which the NKSJ Group’s asset management functions are concentrated, the merged entity will be moved from indirect subsidiary status to become a direct subsidiary of NKSJ Holdings.
| 2 | Outline of new entity after organizational restructuring |
Corporate name of merged entity: SOMPO JAPAN NIPPONKOA Asset Management Co., Ltd.
Location of head office: Chuo-ku, Tokyo
Lines of Business: Investment advisory business and investment trust business
Capital: 1,550 million yen
| 3 | Date of merger and of making merged entity into a direct subsidiary |
October 1, 2010 (subject to change)
| 4 | Merger method and change of company name |
Absorption merger with SJAM as the surviving entity
| 5 | Merger ratio |
1.204167 shares of SJAM common stock are to be delivered for each share of Zest AM common stock (ratio subject to change).
New SJAM shares to be issued in conjunction with the organizational restructuring will be 7,225 shares of common stock (subject to change).
| 6 | Method by which merged entity will become NKSJ Holdings’ direct subsidiary |
Shares of the new asset management company held by Sompo Japan and Nipponkoa will be delivered in-kind to NKSJ Holdings.
34
Table of Contents
| 2. | Others |
None.
Part 2: Information on party(ies) providing guaranty to the Reporting Company
(Omitted.)
35
Table of Contents
Note Regarding Forward-looking Statements
This document includes “forward-looking statements” that reflect the information in relation to the NKSJ Holdings, Inc. (“NKSJ”). To the extent that statements in this document do not relate to historical or current facts, they constitute forward-looking statements. These forward-looking statements are based on the current assumptions and beliefs of NKSJ in light of the information currently available to NKSJ, and involve known and unknown risks, uncertainties and other factors. Such risks, uncertainties and other factors may cause the actual results, performance, achievements or financial position of NKSJ, as the case may be, to be materially different from any future results, performance, achievements or financial position expressed or implied by these forward-looking statements. NKSJ does not undertake or will not undertake any obligation to publicly update any forward-looking statements after the date of this document. Investors are advised to consult any further disclosures by NKSJ in their subsequent domestic filings in Japan and filings with, or submissions to, the U.S. Securities Exchange Commission pursuant to the U.S. Securities Exchange Act of 1934.
The risks, uncertainties and other factors referred to above include, but are not limited to, those below. The risks, uncertainties and other factors are also referred to in our domestic Quarterly Securities Reports.
| (1) | Effects of deterioration of economic and business conditions in Japan |
| (2) | Risk of intensification of competition in the property and casualty insurance business |
| (3) | Changes to laws, regulations, and systems |
| (4) | Natural catastrophe risks related to insurance products |
| (5) | Occurrence of losses exceeding projection |
| (6) | Reinsurance risk |
| (7) | Effects of declining stock price |
| (8) | Effects of fluctuation in interest rate |
| (9) | Credit risk |
| (10) | Effects of fluctuation in foreign exchange rate |
| (11) | Liquidity risk |
| (12) | Life insurance business risks |
| (13) | Overseas business risk |
| (14) | Non-insurance business risk |
| (15) | Credit rating downgrade |
| (16) | Business interruption risk in case of natural disasters, etc. |
| (17) | Information security risk |
| (18) | Reputational risk |
| (19) | System integration risk |
| (20) | Risk of failure to adequately realize business integration synergies |
| (21) | Risks related to merger of life insurance subsidiaries |
| (22) | Other risks |
36