Exhibit 99.2
CROSSFIRST BANKSHARES, INC. NASDAQ: CFB 2nd Quarter 2022 Earnings Presentation July 19, 2022
LEGAL DISCLAIMER CROSSFIRST BANKSAHRES, INC. FORWARD -LOOKING STATEMENTS. The financial results in this presentation reflect preliminary, unaudited results, which are not final until the Company’s Quarterly Report on Form 10-Q is filed. This presentation and oral statements made during this meeting contain forward-looking statements. These forward- looking statements reflect our current views with respect to, among other things, future events and our financial performance . These forward-looking statements include, but are not limited to, statements regarding our business plans, the acquisition of F&S Bank, expansion targets and opportunities, and future financial performance . These statements are often, but not always, made through the use of words or phrases such as "may," "might," "should," "could," "predict," "potential," "believe," "expect," "continue," "will," "anticipate," "seek," "estimate," "intend," "plan," "strive," "projection," "goal," "target," "outlook," "aim," "would," "annualized" and "outlook," or the negative version of those words or other comparable words or phrases of a future or forward-looking nature. These forward -looking statements are not historical facts, and are based on current expectations, estimates and projections about our industry, management’s beliefs and certain assumptions made by management, many of which, by their nature, are inherently uncertain and beyond our control. Accordingly, we caution you that any such forward -looking statements are not guarantees of future performance and are subject to risks, assumptions, estimates and uncertainties that are difficult to predict. Although we believe that the expectations reflected in these forward-looking statements are reasonable as of the date made, actual results may prove to be materially different from the results expressed or implied by the forward-looking statements. There are or will be
important factors that could cause our actual results to differ materially from those indicated in these forward-looking statements, including, but not limited to, the following: risks relating to the COVID-19 pandemic; risks related to general business and economic conditions and any regulatory responses to such conditions; our ability to effectively execute our growth strategy and manage our growth, including identifying and consummating suitable mergers and acquisitions; the geographic concentration of our markets; fluctuation of the fair value of our investment securities due to factors outside our control; our ability to successfully manage our credit risk and the sufficiency of our allowance; regulatory restrictions on our ability to grow due to our concentration in commercial real estate lending; our ability to attract, hire and retain key personnel; interest rate fluctuations; our ability to raise or maintain sufficient capital; competition from banks, credit unions and other financial services providers; the effectiveness of our risk management framework in mitigating risks and losses; our ability to maintain effective internal control over financial reporting; our ability to keep pace with technological changes; system failures and interruptions, cyber-attacks and security breaches; employee error, fraudulent activity by employees or clients and inaccurate or incomplete information about our clients and counterparties; our ability to maintain our reputation; costs and effects of litigation, investigations or similar matters; risk exposure from transactions with financial counterparties; severe weather, acts of god, acts of war or terrorism; compliance with governmental and regulatory requirements; changes in the laws, rules, regulations, interpretations or policies relating to financial institutions, accounting, tax, trade, monetary and fiscal matters; compliance with requirements associated with being a public company; level of
coverage of our business by securities analysts; and future equity issuances.. These and other factors that could cause results to differ materially from those described in the forward-looking statements, as well as a discussion of the risks and uncertainties that may affect our business, can be found in our Annual Report on Form 10-K, our Quarterly Reports on Form 10-Q and in other filings we make with the Securities and Exchange Commission. These forward-looking statements are made as of the date of this communication, and we disclaim any obligation to update any forward-looking statement or to publicly announce the results of any revisions to any of the forward -looking statements included herein, except as required by law. Any forward-looking statement speaks only as of the date on which it is made, and we do not undertake any obligation to update or review any forward- looking statement, whether as a result of new information, future developments or otherwise, except as required by law. MARKET AND INDUSTRY DATA. This presentation references certain market, industry and demographic data, forecasts and other statistical information. We have obtained this data, forecasts and information from various independent, third party industry sources and publications . Nothing in the data, forecasts or information used or derived from third party sources should be construed as advice. Some data and other information are also based on our good faith estimates, which are derived from our review of industry publications and surveys and independent sources. We believe that these sources and estimates are reliable but have not independently verified them. Statements as to our market position are based on market data currently available to us. Although we are not aware of any misstatements regarding the economic, employment, industry and other market data presented herein, these estimates
involve inherent risks and uncertainties and are based on assumptions that are subject to change. 2
ABOUT NON-GAAP FINANCIAL MEASURES CROSSFIRST BANKSAHRES, INC. Certain of the financial measures and ratios we present, including “tangible common equity”, “tangible assets”, “tangible book value”, and “tangible book value per share” metrics, are supplemental measures that are not required by, or are not presented in accordance with, U.S. generally accepted accounting principles (GAAP). We refer to these financial measures and ratios as “non-GAAP financial measures.” We consider the use of select non-GAAP financial measures and ratios to be useful for financial and operational decision making and useful in evaluating period-to-period comparisons. We believe that these non-GAAP financial measures provide meaningful supplemental information regarding our performance by excluding certain expenditures or assets that we believe are not indicative of our primary business operating results or by presenting certain metrics on a fully taxable equivalent basis. We believe that management and investors benefit from referring to these non-GAAP financial measures in assessing our performance and when planning, forecasting, analyzing and comparing past, present and future periods. These non-GAAP financial measures should not be considered a substitute for financial information presented in accordance with GAAP and you should not rely on non-GAAP financial measures alone as measures of our performance. The non-GAAP financial measures we present may differ from non-GAAP financial measures used by our peers or other companies. We compensate for these limitations by providing the equivalent GAAP measures whenever we present the non-GAAP financial measures and by including a reconciliation of the impact of the components adjusted for in the non-GAAP financial measure so that both measures and the individual components may be considered when
analyzing our performance. CrossFirst does not provide a reconciliation of forward-looking non-GAAP financial measures to its comparable GAAP financial measures because it could not do so without unreasonable effort due to the unavailability of the information needed to calculate reconciling items and the variability, complexity and limited visibility of the adjusting items that would be excluded from the non -GAAP financial measures in future periods. When planning, forecasting and analyzing future periods, CrossFirst does so primarily on a non-GAAP basis without preparing a GAAP analysis as that would require estimates for various cash and non-cash reconciling items (including items such as expected credit losses, acquisition- and disposition-related expenses, and restructuring costs) that would be difficult to predict with reasonable accuracy. For example, future expectations for credit losses depend on a variety of factors including general economic conditions that make estimation on a GAAP basis impractical. It is also difficult to anticipate the need for or magnitude of presently unforeseen one-time restructuring expenses. As a result, CrossFirst does not believe that a GAAP reconciliation to forward-looking non-GAAP financial measure s would provide meaningful supplemental information about CrossFirst’s forward-looking measures. 3
OUR ROAD TO SUCCESS CROSSFIRST BANKSAHRES, INC. ONE TEAM Elevating our Strong Corporate Culture by Living our CrossFirst Values Attracting and Retaining High Performing Talent Well-being of our Employees ONE BANK Targeting Businesses and Professionals Branch-Light – Technology Focused Delivering Extraordinary Service and Customer Experience SHARED VISION Performance & Profitability Seizing Growth Opportun ities Strong Credit Quality Enhancing Products and Services Managing Enterprise Risk Contributing to our Communities Total Assets $5.7 billion Gross Loans $4.5 billion Total Deposits $4.7 billion Book Value/Share $12.27 4
OUR GROWTH CROSSFIRST BANKSAHRES, INC. Total Assets Compound Annual Growth Rates Since 2012 Total Assets 27.6% $565 $847 $1,220 $1,574 $2,133 $2,961 $4,107 $4,931 $5,659 $5,621 $5,708 2012 2013 2014 2015 2016 2017 2018 2019 2020 2021 Q2 2022 2012 Expanded into Wichita and Oklahoma City markets 2013 Expanded into Tulsa market through acquisition of Tulsa National Bancshares, Inc. (~$160mm in Total Assets) 2016 Expanded into Dallas market 2019 CrossFirst Bankshares, Inc. Initial Public Offering at $14.50; Nasdaq listed: CFB 2021 Expanded into Phoenix market Q2 2022* Entered into definitive agreement to acquire “Central” Note: Dollars in chart are in millions. * Subject to regulatory approval; Farmers & Stockmens Bank operates as Central Bank & Trust in Denver and Colorad o Springs and as Farmers & Stockmens Bank in New Mexico (“Central”). 5
VALUE DRIVEN BY OUR PEOPLE CROSSFIRST BANKSAHRES, INC. Our CrossFirst Brand Committed to pursuing excellence in banking and building trusted relationships with our employees, clients, communities, and stakeholders Strong core values of Character, Competence, Commitment, and Connection Our Commitment to Employees Diverse representation of top-tier talent Our IDEA (Inclusion, Diversity, Equality, and Accountability) Champions are a team of employee volunteers who promote diversity, equality and inclusion while supporting our core values and strengths-based culture. Our Investments in the Communities We Serve We proudly support over 100 organizations with donations and sponsorships in the communities we serve. We support our employees through our Generous Giving programs which support individuals in our communities. Investments for Our Future Develop our strong talent to create future leaders Promoted and onboarded new executive team members Hired 13 new revenue producers in 2022 Our Entrepreneurial culture attracts seasoned bankers with diverse banking experience 6
STRATEGIC ACQUISITION OF CENTRAL CROSSFIRST BANKSAHRES, INC. Market Expansion Advances our expansion strategy with access to Colorado & New Mexico Branch-light: Central has two branches in Colorado (Colorado Springs and Denver) and Farmers & Stockmens (F&S) has three in New Mexico (Clayton, Des Moines and Roy) U.S. News ranked Colorado the #2 economy in the United States in 2021 Experienced Leaders & Enhanced Client Resources Management team with extensive market experience and industry expertise Strong cultural alignment with a client centric business model Access to additional products and services provides a robust client experience CrossFirst’s advanced technology platform provides an opportunity for enhanced capabilities for clients Accelerates Growth Strategy Larger balance sheet and new market verticals leverages growth opportunities Adds significant core deposits and liquidity and diversifies balance sheet SBA lending – F&S Bank was the 15th ranked SBA lender in Colorado for SBA’s 2021 fiscal year Mortgage operation creates potential for enhancing fee income Creates Shareholder Value Expected 11.7% EPS accretion in 2023 estimate with fully realized synergies Internal rate of return expected to be in excess of 25% Deploys a portion of CFB’s capital for growth Source: SBA Lenders. 7
EXPANDING OUR FOOTPRINT CROSSFIRST BANKSAHRES, INC. AREAS OF FOCUS Continue to execute our organic growth strategy in new and existing markets, with our primary focus being an organic growth company Focus on new expansion in target markets where we current ly have client business Evaluate expansion strategies in key target markets: De Novo Expansion: Hire experienced talent to expand in key growth markets Strategic Acquisition: Provides operational scale and synergies Adds new lines of business Adds fee income opportunities CURRENT AND POTENTIAL TARGET MARKETS Austin, Texas Houston, Texas San Antonio, Texas Nashville, Tennessee Omaha, Nebraska Current CFB Location Planned CFB Location* * Subject to regulatory approval. 8
SECOND QUARTER 2022 HIGHLIGHTS CROSSFIRST BANKSAHRES, INC. Financial Performance Net Income $15.5M Diluted ES $0.31 REO 10.2% ROA 1.12% Net Income Net interest income increased 8% on strong loan growth and increased yield Non-interest expenses rose 6% during Q1 2022 driven by employee separation and merger-related costs Fully tax equivalent NIM increased 23bps to 3.52% during Q2 2022 and has expanded 38bps from Q2 2021 Balance Sheet Loan portfolio increased 4% from Q1 2022; the portfolio increased 7% from Q2 2021 Total deposits increased 3% from the prior quarter and 9% from Q2 2021; DDA as a percentage of total deposits increased 6% from Q2 2021 and grew 42% year over year Credit Quality Classified loans / total capital + combined ACL ratio of 12.0% has declined from 24.0% at Q2 2021 NCOs / average loans of 0.10%, consistent with Q1 2022, and 13bps lower than Q2 2021 NPAs / assets decreased 10bps during the quarter to 0.54% and have declined 55bps from Q2 2021 (1) For all quarters presented, investment yield accrual calculation changed to 30/360 from actual/actual and excludes unrealized gains and losses in the investment portfolio and earning assets. (2) Includes the accrual for off-balance sheet credit risk from unfunded commitments (“RUC”) that resulted from CECL adoption on January 1, 2022. 9
NET INTEREST MARGIN CROSSFIRST BANKSAHRES, INC. Yield on Loans & Cost of Deposits 3.99% 0.41% 4.00% 0.38% 4.17% 0.33% 4.00% 0.31% 4.28% 0.42% Q2 Q3 Q4 Q1 Q2 2021 2021 2021 2022 2022 Yield on Loans Cost of Total Deposits Net Interest Margin - Fully Tax Equivalent (FTE)* 3.14% 3.23% 3.30% 3.29% 3.52% Q2 Q3 Q4 Q1 Q2 2021 2021 2021 2022 2022 Fully tax-equivalent net interest margin increased 23bps from Q1 2022, primarily due to higher loan yields, loan growth, and accrual improvements, despite a continued decline in PPP fees Cost of funds increased 11bps from Q1 2022 due to market rate increases Loan to deposit ratio increased to 95% from 94% in Q1 2022 Current funding structure allows for significant additional capacity for borrowing or wholesale funding if necessary * For all quarters presented, investment yield accrual calculation changed to 30/360 from actual/actual and excludes unrealized gains and losses in the investment portfolio and earning assets 10
NET INTEREST INCOME SENSITIVITY CROSSFIRST BANKSAHRES, INC. Net Interest Income Impact From Rate Changes (2.73%) (1.09%) 1.99% 0.96% 4.14% 1.99% 6.38% 3.09% 8.58% 4.19% -100 bps +100 bps +200 bps +300 bps +400 bps Rate Shock* Rate Ramp* Anticipated asset sensitivity with rate increases driving potential expansion of net interest income Loans: Rate Reset and Cash Flow Profile 9% 10% 17% 3% 1-3… 4-12… 1-2… 2-5… >5 Years Roughly 70% of Company’s earning assets reprice or mature over the next 12 months, with 51% in month 1 Note: Data as of June 30, 2022 * Rate Shock analysis: measures instantaneous parallel shifts in market rates Rate Ramp analysis: rate changes occur gradually over 12 months time Balance sheet size and mix held constant from month end position and includes average YTD loan fees (excluding PPP fees) 11
ASSET QUALITY PERFORMANCE CROSSFIRST BANKSAHRES, INC. Classified Loans / (Total Capital +ACL + RUC*) $170.7 $124.1 $78.7 $73.3 $80.5 24.0% 17.3% 10.8% 10.7% 12.0% Q2 Q3 Q4 Q1 Q2 2021 2021 2021 2022 2022 Classified Loans Classified / Total Capital + LLR + RUC* Classified loans increased due to some C&I credits negatively affected by supply chain issues 15% of classifieds in Q2 2022 relate to Energy, down from 22% in Q1 2022 Non-performing Assets / Assets 1.09% 0.92% 0.58% 0.64% 0.54% Q2 Q3 Q4 Q1 Q2 2021 2021 2021 2022 2022 NPAs decreased due to continued improvements in pandemic related industries and energy 19% of the non-performing asset balance in Q2 2022 relates to energy credits Note: Dollar amounts are in millions. * Includes the accrual for off-balance sheet credit risk from unfunded commitments (“RUC”) that resulted from CECL adoption on January 1, 2022. 12
ASSET QUALITY PERFORMANCE CROSSFIRST BANKSAHRES, INC. Net Charge-Offs / Average Loans(1) 0.23% 0.13% 0.07% 0.10% 0.10% Q2 Q3 Q4 Q1 Q2 2021 2021 2021 2022 2022 Q2 2022 included $1.1 million of net charge-offs which consisted of loans in both energy and commercial and industrial credits Combined Allowance for Credit Losses / Total Loans 1.78% 1.51% 1.37% 1.38% 1.35% $75.5 $64.2 $58.4 $55.2 $55.8 Q2 Q3 Q4 Q1 Q2 2021 2021 2021 2022 2022 ACL RUC % Total Loans ACL/ Total Loans decreased slightly to 1.35% at end of Q2 2022 primarily due to credit improvements in C&I and energy loans Combined allowance for credit losses to non-accruing loans at the end of Q2 2022 was 221% Note: Dollar amounts are in millions Ratio is annualized for interim periods. 13
2022 GUIDANCE CROSSFIRST BANKSAHRES, INC. Business Driver Annual Outlook Loans Expect 8-10% core loan growth Deposits Expect continued deposit growth to fund lending growth with a continued focus on improving the DDA mix Net Interest Margin (NIM) Expect NIM to stay in the upper end of the range that we have experienced in 2022, assuming a Fed Funds Rate of 3.75% at year-end Combined ACL / Loans Anticipated to remain in the 1.30% to 1.45% range, based on current economic conditions Effective Tax Rate Expect to remain in the 20-23% range 14
SUPPLEMENTAL INFORMATION CROSSFIRST BANKSAHRES, INC. 15
STOCK REPURCHASE ACTIVITY CROSSFIRST BANKSAHRES, INC. 50,959 51,003 50,450 49,728 49,538 576 0 566 1,058 238 Q2 Q3 Q4 Q1 Q2 2021 2021 2021 2022 2022 # of Shares Repurchased # Shares Outstanding Repurchased only 0.5% of outstanding shares in Q2 2022 due to blackout period surrounding the acquisition announcement Drives improvement in ROE and EPS Little tangible book value dilution and a short earnback period Note: shares in thousands. 16
CAPITAL RATIOS CROSSFIRST BANKSAHRES, INC. 12.4% 12.4% 13.7% 12.6% 12.6% 13.9% 12.5% 12.5% 13.6% 11.9% 11.9% 12.9% 11.5% 11.5% 12.6% Q2 Q3 Q4 Q1 Q2 2021 2021 2021 2022 2022 Common Equity Tier 1 Tier 1 Risk Based Total Risk-Based Capital Maintaining strong capital levels to support future growth Remain well capitalized as we return capital to shareholders through share repurchases Execution of our profitable growth strategy supports capital ratios Capital ratios have decreased due to share repurchase activity and loan growth 17
DIVERSE LOAN PORTFOLIO CROSSFIRST BANKSAHRES, INC. Loan Mix by Type ($4.5bn) C&I 35% Owner Occupied Real Estate 8% Energy 5% CRE 42% Residential Real Estate 9% Other 1% Note: Gross loans, (net of unearned income) data as of June 30, 2022. 18
DIVERSE LOAN PORTFOLIO CROSSFIRST BANKSAHRES, INC. CRE Loan Portfolio by Segment ($1.9bn) Multi-Family 15% Retail 14% Office 16% Industrial 13% 1-4 Family Res Construction 7% Hotel 9% Other 26% C&I Loan Breakdown by Type ($1.6bn) Engineering & Contracting 11% Restaurants 5% Financial Management 5% Merchant Wholesalers 4% 18 Other Industries 44% Manufacturing 11% Business Loans to Individuals 6% Health Care 5% Note: Data as of June 30, 2022. 19
BALANCE SHEET GROWTH CROSSFIRST BANKSAHRES, INC. Year-over-year gross loan growth of 7% Annualized Q2 loan growth of over 16% $16 million in PPP loans were forgiven in Q2 2022 $182 million in PPP loans have been forgiven since Q2 2021 Balance Sheet Q2 2022 Q°Q 2018- Q2 2022 CAGR Gross Loans A 4% A 12% Total Deposits A 3% A 12% Total Assets A 3% A 10% $3,061 $3,208 $3,852 $3,924 $4,442 $4,695 $4,256 $4,684 $4,350 $4,622 $4,528 $4,744 2018 2019 2020 2021 Q1 Q2 2022 2022 Gross Loans Net of Unearned Income Total Deposits Note: Dollars are in millions. * Represents a non-GAAP financial measure. See Non-GAAP Reconciliation slides at the end of this presentation for additional detail. 20
COMBINED ALLOWANCE FOR CREDIT LOSSES CROSSFIRST BANKSAHRES, INC. ACL and Reserve for Unfunded Commitments $60.1 ($1.1) ($2.2) $4.3 $61.1 Q1 QTD Inidvidual Growth and Q2 2022 Net Charge-Offs Analysis Qualitative 2022 End Factors End ACL +* Reserve Note: As of end of period; dollars in millions. * Includes the accrual for off-balance sheet credit risk from unfunded commitments (“RUC”) that resulted from CECL adoption on January 1, 2022. 21
EXPENSE MANAGEMENT CROSSFIRST BANKSAHRES, INC. $25.8 $24.0 $26.7 $27.7 $29.2 $5.9 $4.5 $5.9 $5.2 $5.8 $1.8 $1.7 $1.9 $2.1 $2.4 $2.4 $2.4 $2.4 $2.5 $2.6 $15.7 $15.4 $16.5 $17.9 $17.1 Q2 Q3 Q4 Q1 Q2 2021 2021 2021 2022 2022 Salaries & Benefits Non-core Expense* Other Occupancy Data Processing, Software & Comm. Investments in talent and technology continue to account for the increase in expenses Non-core expense includes $1.1 million of employee separation costs and $0.2 million of acquisition-related costs Salaries and benefits were down due to the first quarter incentives and related taxes which normalized this quarter Note: Dollars are in millions and amounts shown are as of the end of the period unless otherwise specified. * Represents a non-GAAP financial measure. See Non-GAAP Reconciliation slides at the end of this presentation for additional detail. 22
IMPROVING CORE FUNDING BASE CROSSFIRST BANKSAHRES, INC. Average Total Deposits and % Non-Interest-Bearing $4,721 $4,449 $4,535 $4,633 $4,551 $3,919 $3,539 $3,477 $3,476 $3,401 $802 $910 $1,058 $1,157 $1,150 Q2 Q3 Q4 Q1 Q2 2021 2021 2021 2022 2022 Non-Interest-Bearing Other Deposits Cost of Deposits 0.41% 0.38% 0.33% 0.31% 0.42% Average demand deposits have increased 43% since Q2 2021 Cost of funds increased 11bps this quarter, due to market rate increases Non-interest-bearing deposits improved slightly to 25% of total deposits this quarter. Note: Dollars are in millions and amounts shown are as of the end of the period. 23
LOAN PORTFOLIO CROSSFIRST BANKSAHRES, INC. Average Gross Loans by Type $4,409 $4,231 $4,221 $4,333 $4,438 $455 $464 $463 $467 $468 $2,096 $2,076 $2,056 $2,116 $2,177 $341 $311 $290 $274 $241 $1,517 $1,380 $1,412 $1,476 $1,552 Q2 Q3 Q4 Q1 Q2 2021 2021 2021 2022 2022 C&I Energy CRE Consumer Loan Yield 3.99% 4.00% 4.17% 4.00% 4.28% The average loan portfolio at Q2 2022 grew 2% from previous quarter Loan growth primarily driven by commercial real estate and C&I portfolios Net balance of participations and syndications was $183 million as of Q2 2022 Note: Dollars are in millions and amounts shown are as of the end of the period. 24
PPP LOAN SUMMARY CROSSFIRST BANKSAHRES, INC. Fee Recognition $5.9 $2.1 $4.7 $1.7 $3.7 $4.2 $3.0 $1.3 $1.7 $0.9 $0.1 $0.0 $0.4 $2.2 $0.5 Q1 Q2 Q2 Q3 Q3 Q4 Q4 Q1 Q1 Q2 Q2 2021 2021 2021 2021 2021 2021 2021 2022 2022 2022 2022 Round 1 Unrecognized Fees Fee Recognized Round 2 Unrecognized Fees PPP Timeline $336 ($161) $197 ($88) $109 $111 $129 $96 ($44) $65 ($34) $31 ($16) $15 $225 $68 $13 Q1 Q2 Q3 Q4 Q1 Q2 2021 2021 2021 2021 2022 2022 End End End End End End 2020 PPP Loans Laon forgiveness 2021 PPP Loans Note: As of end of period; dollars in millions. 25
SECURITIES PORTFOLIO CROSSFIRST BANKSAHRES, INC. Investment Portfolio Breakouts as of June 30, 2022 Municipal - Taxable, 1.0% Municipal - Tax-Exempt, 73.2% CMO (Fixed), 1.9% Other, 0.8% MBS (Fixed), 23.1% Total: ~$696 million Securities Yield - Fully Tax Equivalent 3.07% 3.04% 3.02% 3.00% 3.07% 2.58% 2.58% 2.54% 2.61% 2.57% Q2 Q3 Q4 Q1 Q2 2021 2021 2021 2022 2022 Securities Yield- Cost of Fund Spread Securities Yield At the end of Q2 2022, the portfolio’s duration was approximately 5.3 years The fully taxable equivalent yield for Q2 2022 rose 7bps to 3.07% The securities portfolio has unrealized losses of approximately $69 million as of June 30, 2022 During Q2 2022, $23 million of securities were purchased at an average tax-equivalent yield of 4.32% and there were $8 million in MBS paydowns Based on approximate fair value. A tax rate of 21% is used to calculate the fully tax equivalent yield 26
QUARTERLY SELECTED FINANCIALS CROSSFIRST BANKSAHRES, INC. Unaudited CrossFirst Bankshares, Inc. 
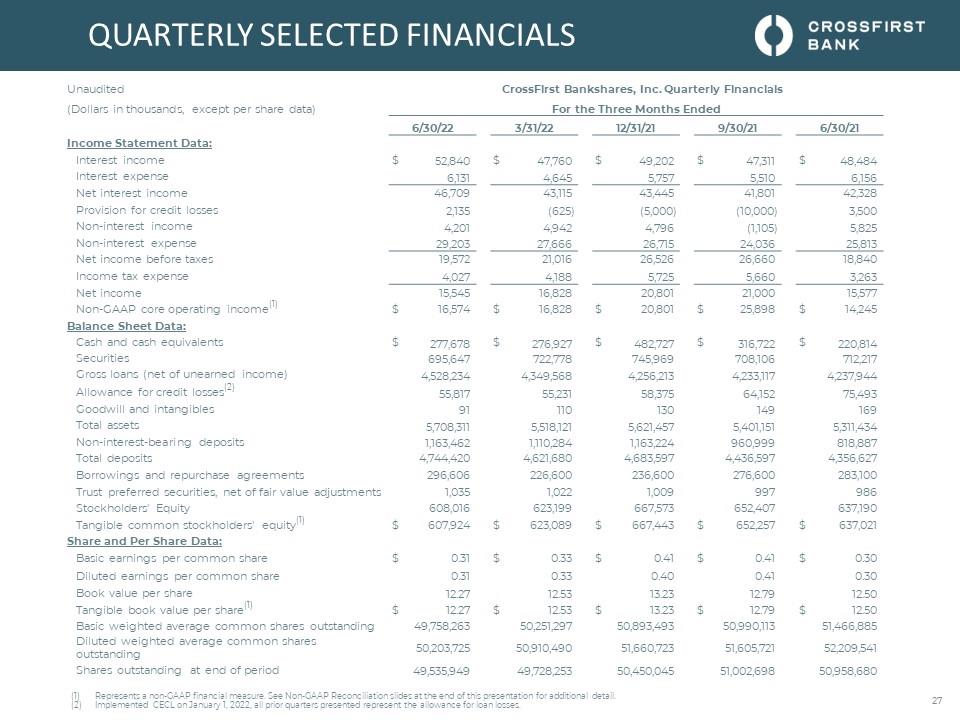
Quarterly Financials (Dollars in thousands, except per share data) For the Three Months Ended 6/30/22 3/31/22 12/31/21 9/30/21 6/30/21 Income Statement Data: Interest income $ 52,840 $ 47,760 $ 49,202 $ 47,311 $ 48,484 Interest expense 6,131 4,645 5,757 5,510 6,156 Net interest income 46,709 43,115 43,445 41,801 42,328 Provision for credit losses 2,135 (625) (5,000) (10,000) 3,500 Non-interest income 4,201 4,942 4,796 (1,105) 5,825 Non-interest expense 
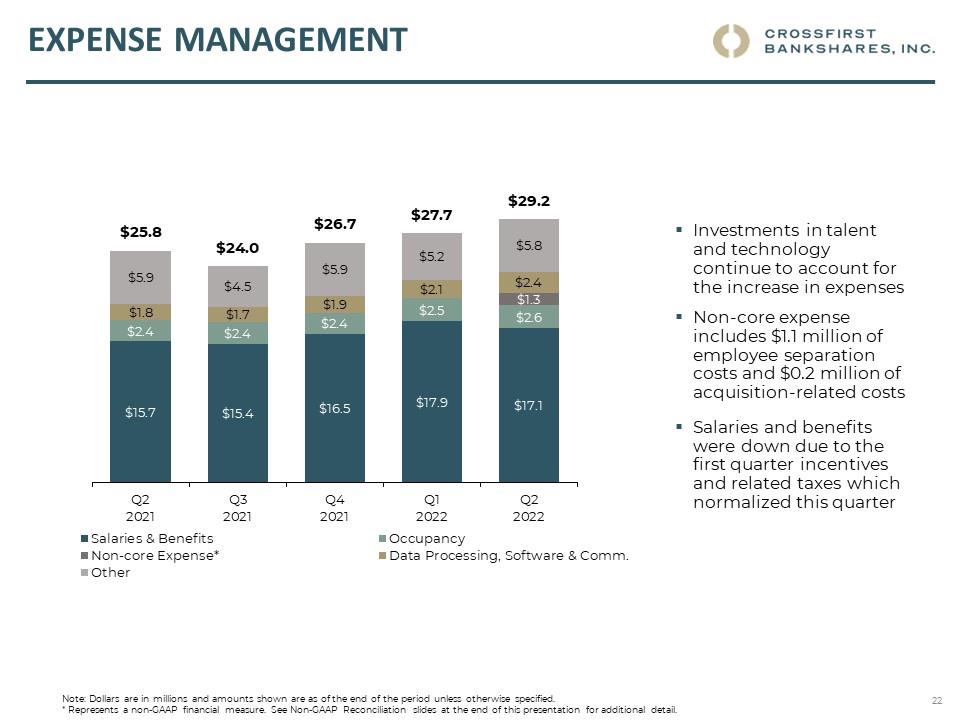
29,203 27,666 26,715 24,036 25,813 Net income before taxes 19,572 21,016 26,526 26,660 18,840 Income tax expense 4,027 4,188 
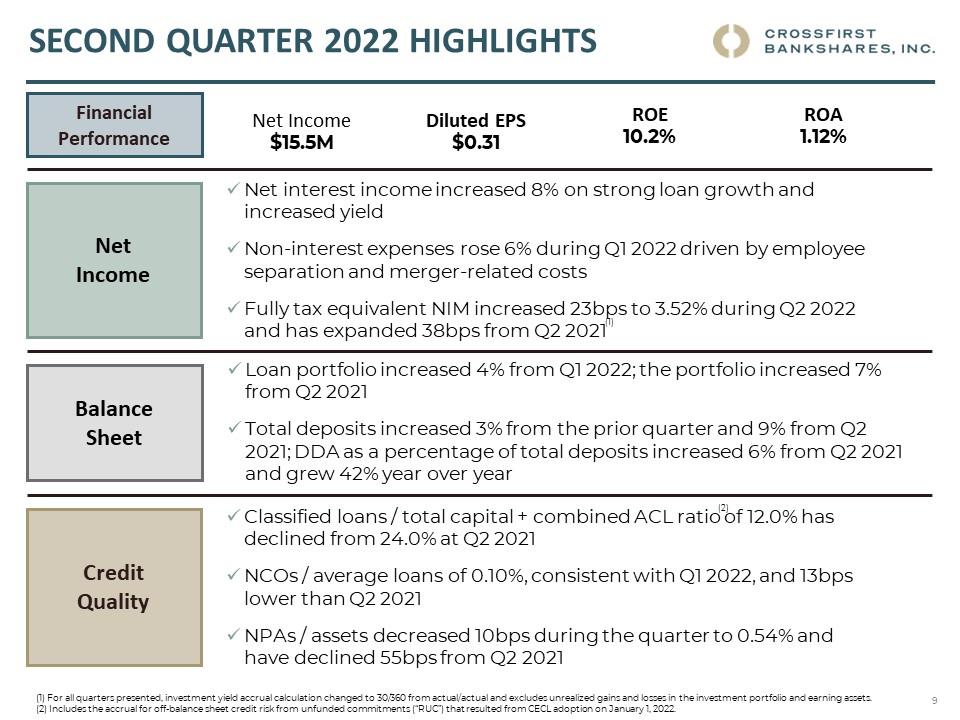
5,725 5,660 3,263 Net income 15,545 16,828 20,801 21,000 15,577 
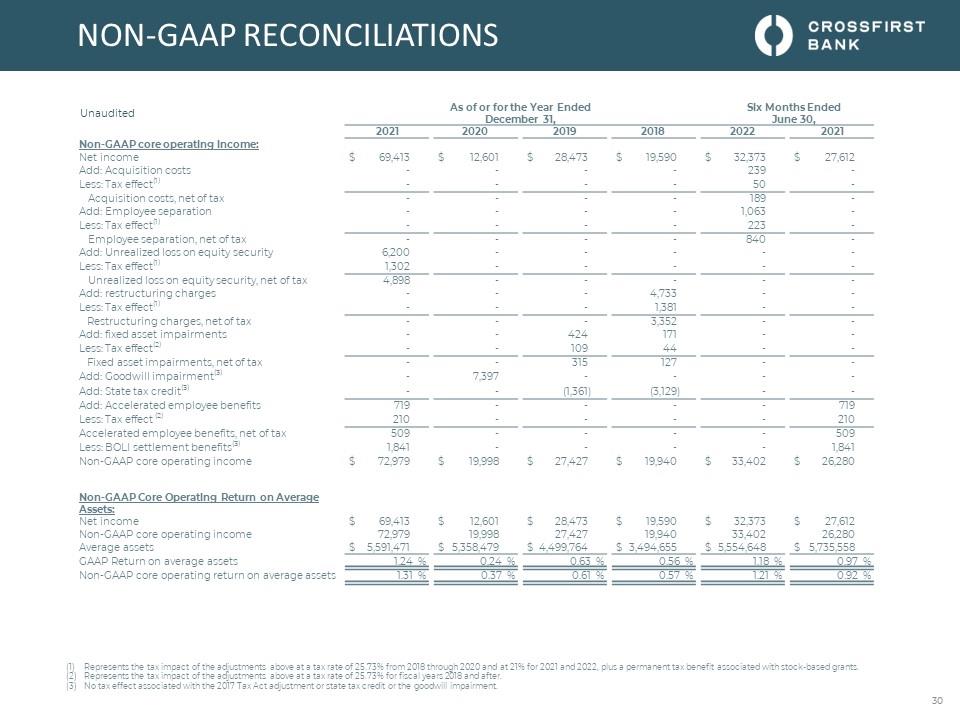
Non-GAAP core operating income(1) $ 16,574 $ 16,828 $ 20,801 $ 25,898 $ 14,245 Balance Sheet Data: Cash and cash equivalents $ 277,678 $ 276,927 $ 482,727 $ 316,722 $ 220,814 Securities 
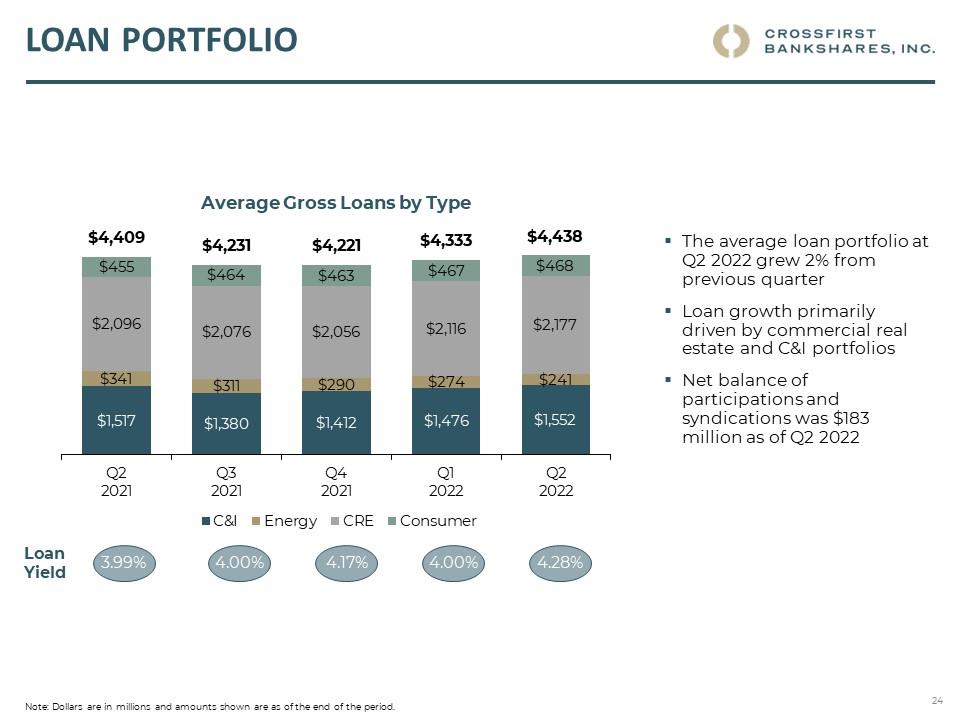
695,647 722,778 745,969 708,106 712,217 Gross loans (net of unearned income) 4,528,234 4,349,568 4,256,213 4,233,117 4,237,944 Allowance for credit losses(2) 55,817 55,231 58,375 64,152 75,493 Goodwill and intangibles 91 110 130 149 169 Total assets 5,708,311 5,518,121 5,621,457 5,401,151 5,311,434 
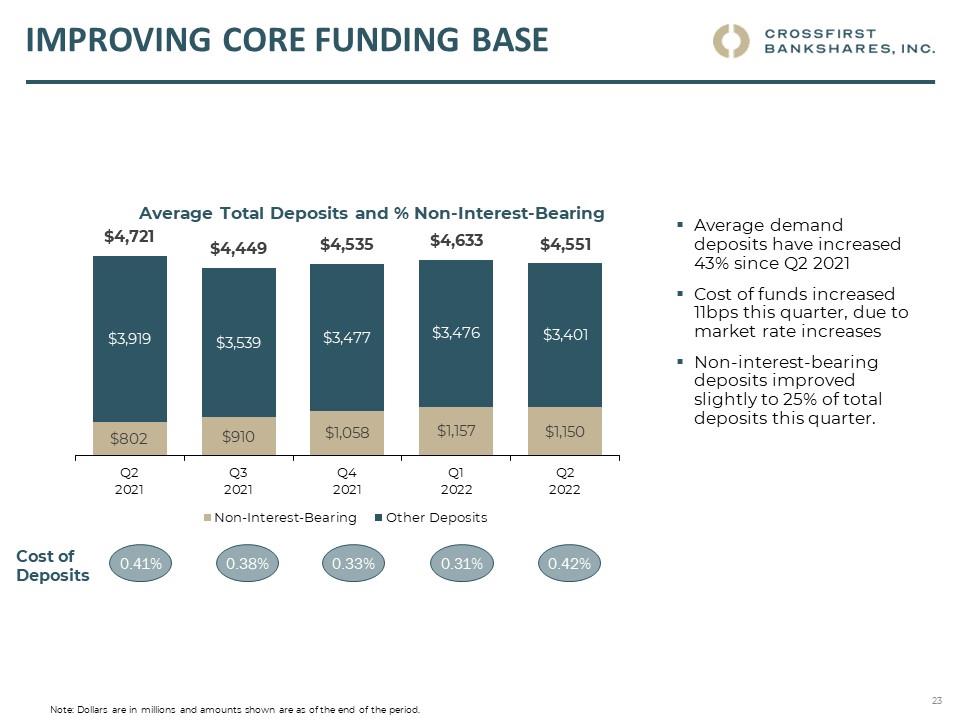
Non-interest-bearing deposits 1,163,462 1,110,284 1,163,224 960,999 818,887 Total deposits 4,744,420 4,621,680 4,683,597 4,436,597 4,356,627 Borrowings and repurchase agreements 296,606 226,600 236,600 276,600 283,100 Trust preferred securities, net of fair value adjustments 1,035 1,022 1,009 997 986 Stockholders' Equity 608,016 623,199 667,573 652,407 637,190 Tangible 
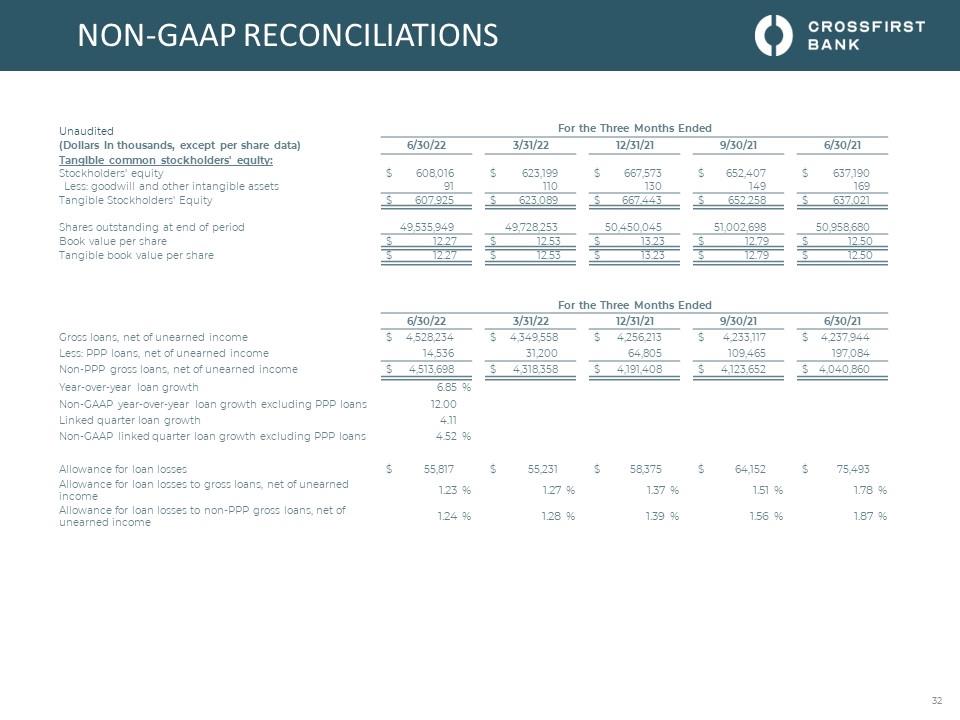
common stockholders' equity(1) $ 607,924 $ 623,089 $ 667,443 $ 652,257 $ 637,021 Share and Per Share Data: Basic earnings per common share $ 0.31 $ 0.33 $ 0.41 $ 0.41 $ 0.30 Diluted earnings per common share 0.31 0.33 0.40 0.41
0.30 Book value per share 12.27 12.53 13.23 12.79 12.50 Tangible book value per share(1) $ 12.27 $ 12.53 $ 13.23 $ 12.79 $ 12.50 Basic weighted average common shares outstanding 49,758,263 50,251,297 50,893,493 50,990,113 51,466,885 Diluted weighted average common shares outstanding 50,203,725 50,910,490 51,660,723 51,605,721 
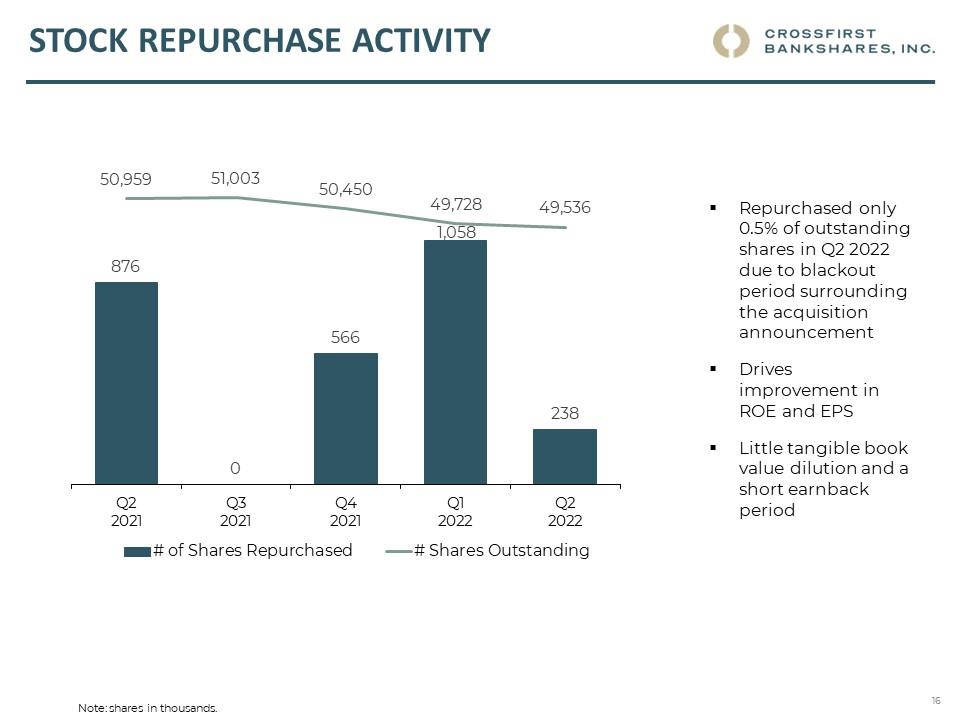
52,209,541 Shares outstanding at end of period 49,535,949 49,728,253 
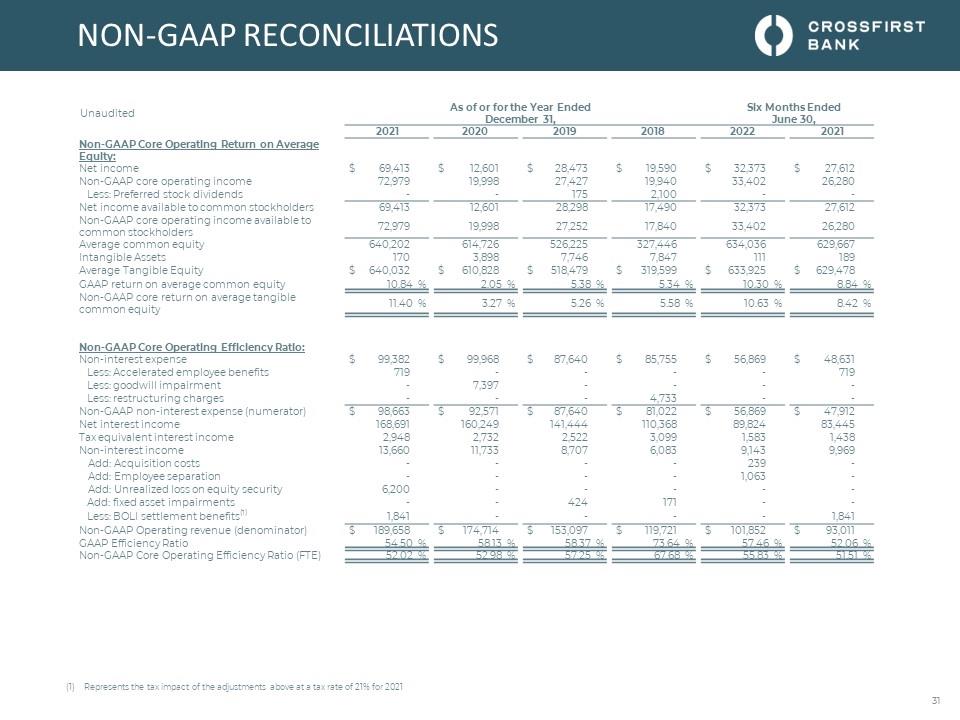
50,450,045 51,002,698 50,958,680 Represents a non-GAAP financial measure. See Non-GAAP Reconciliation slides at the end of this presentation for additional detail. Implemented CECL on January 1, 2022, all prior quarters presented represent the allowance for loan losses. 27
QUARTERLY SELECTED FINANCIALS CROSSFIRST BANKSAHRES, INC. CrossFirst Bankshares, Inc. Quarterly Financials Unaudited For the Three Months Ended 6/30/22 3/31/22 12/31/21 9/30/21 6/30/21 Selected Ratios: Return on average assets(1) 1.12 % 1.23 % 1.50 % 1.54 % 1.10 % Non-GAAP core operating return on average assets(1)(2) 1.20 1.23 1.50 1.90 1.01 Return on average common equity 10.15 10.44 12.57 12.92 9.86 Yield on earning assets 3.92 3.59 3.65 3.56 3.51 Yield on earning assets - tax equivalent(3) 3.98 3.64 3.72 3.64 3.59 Yield on securities 2.66 2.59 2.49 2.46 2.52 Yield on securities - tax equivalent(3) 3.07 3.00 3.02 3.04 3.07 Yield on loans 4.28 4.00 4.17 4.00 3.99 Cost of funds 0.50 0.39 0.48 0.46 0.49 Cost of interest-bearing liabilities 0.66 0.51 0.61 0.57 0.59 Cost of interest -bearing deposits 0.56 0.41 0.43 0.47 0.50 Cost of deposits 0.4 2 0.31 0.33 0.38 0.41 Cost of other borrowings 1.66 1.95 3.03 1.82 1.79 Net interest margin - tax equivalent(3) 3.52 3.29 3.30 3.23 3.14 Non-interest expense to average assets 2.11 2.02 1.93 1.76 1.82 Efficiency ratio(4) 57.36 57.57 55.38 59.06 53.61 Non-GAAP core operating efficiency ratio (FTE)(2)(4) 55.08 56.66 54.52 50.45 53.34 Non-interest-bearing deposits to total deposits 24.52 24.02 24.84 21.66 18.80 Loans to deposits 95.44 % 94.11 % 90.87 % 95.41 % 97.28 % Credit Quality Ratios: Allowance for credit losses to total loans 1.23 % 1.27 % 1.37 % 1.51 % 1.78 % Allowance for credit losses + RUC to total loans(5) 1.35 1.38 - - - Non-performing assets to total assets 0.54 0.64 0.58 0.92 1.09 Non-performing loans to total loans 0.66 0.79 0.74 1.15 1.33 Allowance for credit losses to non-performing loans 186.92 159.60 185.19 131.76 133.79 Net charge-offs (recoveries) to average loans(1) 0.10 % 0.10 % 0.07 % 0.13 % 0.23 % Capital Ratios: Total stockholders' equity to total assets 10.65 % 11.29 % 11.88 % 12.08 % 12.00
% Common equity tier 1 capital ratio 11.51 11.88 12.46 12.61 12.40 Tier 1 risk-based capital ratio 11.53 11.90 12.48 12.63 12.42 Total risk-based capital ratio 12.60 12.92 13.61 13.88 13.67 Tier 1 leverage ratio 11.77 % 11.61 % 11.84 % 11.77 % 10.81 % (1) Interim periods are annualized. (2) Represents a non-GAAP financial measure. See Non-GAAP Reconciliation slides at the end of this presentation for additional detail. (3) Tax-exempt income is calculated on a tax-equivalent basis. Tax-exempt income includes municipal securities, which is exempt from federal taxation. A tax rate of 21% is used. (4) Efficiency ratio is non-interest expense divided by the sum of net interest income and non-interest income; non-GAAP core operating efficiency ratio (FTE) is adjusted for non-core items (5) Includes the accrual for off-balance sheet credit risk from unfunded commitments (“RUC”) that resulted from CECL adoption on January 1, 2022. 28
NON-GAAP RECONCILIATIONS CROSSFIRST BANKSAHRES, INC. Unaudited For the Three Months Ended (Dollars in thousands) 6/30/22 3/31/22 12/31/21 9/30/21 6/30/21 Non-GAAP Core Operating Income: Net income $ 15,545 $ 16,828 $ 20,801 $ 21,000 $ 15,577 Add: Acquisition costs 239 - - - - Less: Tax effect(1) 50 - - - - Acquisition costs, net of tax 189 - - - - Add: Employee separation 1,063 - - - - Less: Tax effect(1) 223 - - - - Employee separation, net of tax 840 - - - - Add: Unrealized loss on equity security - - - 6,200 - Less: Tax effect(1) - - - 1,302 - Unrealized loss on equity securit y, net of tax - - - 4,898 - Add: Accelerated employee benefits - - - - 719 Less: Tax effect (2) - - - - 210 Accelerated employee benefits, net of tax - - - - 509 Less: BOLI settlement benefits(3) - - - - 1,841 Non-GAAP core operating income $ 16,574 $ 16,828 $ 20,801 $ 25,898 $ 14,245 Non-GAAP Core Operating Return on Average Assets: Net income $ 15,545 $ 16,828 $ 20,801 $ 21,000 $ 15,577 Non-GAAP core operating income 16,574 16,828 20,801 25,898 14,245 Average assets $ 5,545,657 $ 5,563,739 $ 5,490,482 $ 5,408,984 $ 5,673,638 GAAP return on average assets 1.12 % 1.23 % 1.50 % 1.54 % 1.10 % Non-GAAP core operating return on average assets 1.20 % 1.23 % 1.50 % 1.90 % 1.01 % Non-GAAP Core Operating Return on Average Equity: Net income available to common stockholders $ 15,545 $ 16,828 $ 20,801 $ 21,000 $ 15,577 Non-GAAP core operating income available to common stockholders 16,574 16,828 20,801 25,898 14,245 Average common equity 614,541 653,747 656,415 644,715 633,417 Less: average goodwill and intangibles 101 121 140 160 179 Average Tangible Equity $ 614,440 $ 653,626 $ 656,275 $ 644,555 $ 633,238 GAAP return on average common equit y 10.15 % 10.44 % 12.57 % 12.92 % 9.86 % Non-GAAP core return on average tangible common equity
10.82 % 10.44 % 12.57 % 15.94 % 9.02 % Non-GAAP Core Operating Efficiency Ratio: Non-interest expense $ 29,203 $ 27,666 $ 26,715 $ 24,036 $ 25,813 Less: Accelerated employee benefits - - - - 719 Non-GAAP non-interest expense (numerator) $ 29,203 $ 27,666 $ 26,715 $ 24,036 $ 25,094 Net interest income 46,709 43,115 43,445 41,801 42,328 Tax equivalent interest income(4) 808 775 762 748 734 Non-interest income 4,201 4,942 4,796 (1,105) 5,825 Add: Acquisition costs 239 - - - - Add: Employee separation 1,063 - - - - Add: Unrealized loss on equity security - - - 6,200 - Less: BOLI settlement benefits - - - - 1,841 Non-GAAP operating revenue (denominator) $ 53,020 $ 48,832 $ 49,003 $ 47,644 $ 47,046 GAAP Efficiency Ratio 57.36 % 57.57 % 55.38 % 59.06 % 53.61 % Non-GAAP core operating efficiency ratio (FTE) 55.08 % 56.66 % 54.52 % 50.45 % 53.34 % Represents the tax impact of the adjustments at a tax rate of 21.0%. Represents the tax impact of the adjustments above at a tax rate of 21.0%, plus a permanent tax benefit associated with stock-based grants. No tax effect. Tax exempt income (tax-free municipal securities) is calculated on a tax equivalent basis. The incremental tax rate used is 21.0%. 29
NON-GAAP RECONCILIATIONS CROSSFIRST BANKSAHRES, INC. Unaudited As of or for the Year Ended December 31, Six Months Ended June 30, 2021 2020 2019 2018 2022 2021 Non-GAAP core operating income: Net income $ 69,413 $ 12,601 $ 28,473 $ 19,590 $ 32,373 $ 27,612 Add: Acquisition costs - - - - 239 - Less: Tax effect(1) - - - - 50 - Acquisition costs, net of tax - - - - 189 - Add: Employee separation - - - - 1,063 - Less: Tax effect(1) - - - - 223 - Employee separation, net of tax - - - - 840 - Add: Unrealized loss on equity security 6,200 - - - - - Less: Tax effect(1) 1,302 - - - - - Unrealized loss on equity security, net of tax 4,898 - - - - - Add: restructuring charges - - - 4,733 - - Less: Tax effect(1) - - - 1,381 - - Restructuring charges, net of tax - - - 3,352 - - Add: fixed asset impairments - - 424 171 - - Less: Tax effect(2) - - 109 44 - - Fixed asset impairments, net of tax - - 315 127 - - Add: Goodwill impairment(3) - 7,397 - - - - Add: State tax credit(3) - - (1,361) (3,129) - - Add: Accelerated employee benefits 719 - - - - 719 Less: Tax effect (2) 210 - - - - 210 Accelerated employee benefits, net of tax 509 - - - - 509 Less: BOLI settlement benefits(3) 1,841 - - - - 1,841 Non-GAAP core operating income $ 72,979 $ 19,998 $ 27,427 $ 19,940 $ 33,402 $ 26,280 Non-GAAP Core Operating Return on Average Assets: Net income $ 69,413 $ 12,601 $ 28,473 $ 19,590 $ 32,373 $ 27,612 Non-GAAP core operating income 72,979 19,998 27,427 19,940 33,402 26,280 Average assets $ 5,591,471 $ 5,358,479 $ 4,499,764 $ 3,494,655 $ 5,554,648 $ 5,735,558 GAAP Return on average assets 1.24 % 0.24 % 0.63 % 0.56 % 1.18 % 0.97 % Non-GAAP core operating return on average assets 1.31 % 0.37 % 0.61 % 0.57 % 1.21 % 0.92 % Represents the tax impact of the adjustments above at a tax rate of 25.73% from 2018 through 2020 and at 21% for 2021 and 2022, plus a permanent tax benefit associated
with stock-based grants. Represents the tax impact of the adjustments above at a tax rate of 25.73% for fiscal years 2018 and after. No tax effect associated with the 2017 Tax Act adjustment or state tax credit or the goodwill impairment. 30
NON-GAAP RECONCILIATIONS CROSSFIRST BANKSAHRES, INC. Unaudited As of or for the Year Ended December 31, Six Months Ended June 30, 2021 2020 2019 2018 2022 2021 Non-GAAP Core Operating Return on Average Equity: Net income $ 69,413 $ 12,601 $ 28,473 $ 19,590 $ 32,373 $ 27,612 Non-GAAP core operating income 72,979 19,998 27,427 19,940 33,402 26,280 Less: Preferred stock dividends - - 175 2,100 - - Net income available to common stockholders 69,413 12,601 28,298 17,490 32,373 27,612 Non-GAAP core operating income available to common stockholders 72,979 19,998 27,252 17,840 33,402 26,280 Average common equity 640,202 614,726 526,225 327,446 634,036 629,667 Intangible Assets 170 3,898 7,746 7,847 111 189 Average Tangible Equity $ 640,032 $ 610,828 $ 518,479 $ 319,599 $ 633,925 $ 629,478 GAAP return on average common equity 10.84 % 2.05 % 5.38 % 5.34 % 10.30 % 8.84 % Non-GAAP core return on average tangible common equity 11.40 % 3.27 % 5.26 % 5.58 % 10.63 % 8.42 % Non-GAAP Core Operating Efficiency Ratio: Non-interest expense $ 99,382 $ 99,968 $ 87,640 $ 85,755 $ 56,869 $ 48,631 Less: Accelerated employee benefits 719 - - - - 719 Less: goodwill impairment - 7,397 - - - - Less: restructuring charges - - - 4,733 - - Non-GAAP non-interest expense (numerator) $ 98,663 $ 92,571 $ 87,640 $ 81,022 $ 56,869 $ 47,912 Net interest income 168,691 160,249 141,444 110,368 89,824 83,445 Tax equivalent interest income 2,948 2,732 2,522 3,099 1,583 1,438 Non-interest income 13,660 11,733 8,707 6,083 9,143 9,969 Add: Acquisition costs - - - - 239 - Add: Employee separation - - - - 1,063 - Add: Unrealized loss on equity security 6,200 - - - - - Add: fixed asset impairments - - 424 171 - - Less: BOLI settlement benefits(1) 1,841 - - - - 1,841 Non-GAAP Operating revenue (denominator) $ 189,658 $ 174,714 $
153,097 $ 119,721 $ 101,852 $ 93,011 GAAP Efficiency Ratio 54.50 % 58.13 % 58.37 % 73.64 % 57.46 % 52.06 % Non-GAAP Core Operating Efficiency Ratio (FTE) 52.02 % 52.98 % 57.25 % 67.68 % 55.83 % 51.51 % Represents the tax impact of the adjustments above at a tax rate of 21% for 2021 31
NON-GAAP RECONCILIATIONS CROSSFIRST BANKSAHRES, INC. Unaudited For the Three Months Ended (Dollars in thousands, except per share data) 6/30/22 3/31/22 12/31/21 9/30/21 6/30/21 Tangible common stockholders' equity: Stockholders' equity $ 608,016 $ 623,199 $ 667,573 $ 652,407 $ 637,190 Less: goodwill and other intangible assets 91 110 130 149 169 Tangible Stockholders' Equity $ 607,925 $ 623,089 $ 667,443 $ 652,258 $ 637,021 Shares outstanding at end of period 49,535,949 49,728,253 50,450,045 51,002,698 50,958,680 Book value per share $ 12.27 $ 12.53 $ 13.23 $ 12.79 $ 12.50 Tangible book value per share $ 12.27 $ 12.53 $ 13.23 $ 12.79 $ 12.50 For the Three Months Ended 6/30/22 3/31/22 12/31/21 9/30/21 6/30/21 Gross loans, net of unearned income $ 4,528,234 $ 4,349,558 $ 4,256,213 $ 4,233,117 $ 4,237,944 Less: PPP loans, net of unearned income 14,536 31,200 64,805 109,465 197,084 Non-PPP gross loans, net of unearned income $ 4,513,698 $ 4,318,358 $ 4,191,408 $ 4,123,652 $ 4,040,860 Year-over-year loan growth 6.85 % Non-GAAP year -over-year loan growth excluding PPP loans 12.00 Linked quarter loan growth 4.11 Non-GAAP linked quarter loan growth excluding PPP loans 4.52 % Allowance for loan losses $ 55,817 $ 55,231 $ 58,375 $ 64,152 $ 75,493 Allowance for loan losses to gross loans, net of unearned income 1.23 % 1.27 % 1.37 % 1.51 % 1.78 % Allowance for loan losses to non-PPP gross loans, net of unearned income 1.24 % 1.28 % 1.39 % 1.56 % 1.87 % 32