Table of Contents
Filed pursuant to
Rule 424(b)(3)
Registration No. 333-158478
MACQUARIE CNL GLOBAL INCOME TRUST, INC.
Supplement No. One dated March 22, 2011
to Prospectus dated April 23, 2010
TABLE OF CONTENTS
| 1 | ||||
| 1 | ||||
| 5 | ||||
| 6 | ||||
| 6 | ||||
| 13 | ||||
| 15 | ||||
| 19 | ||||
| 22 | ||||
| 30 | ||||
| 31 | ||||
| 34 | ||||
| 39 | ||||
| 40 | ||||
| 44 | ||||
| 44 | ||||
| 47 | ||||
| 49 | ||||
| 51 | ||||
| 52 | ||||
| 53 | ||||
| 55 | ||||
| 57 | ||||
| 57 | ||||
| 58 |
APPENDIX B – Prior Performance Tables – MIRA
APPENDIX C – Prior Performance Tables – CNL LLC and MIRA Inc.
APPENDIX D – Form of Subscription Agreement (post-escrow)
(i)
Table of Contents
ABOUT THIS PROSPECTUS SUPPLEMENT
This prospectus supplement is part of, and should be read in conjunction with, our prospectus dated April 23, 2010 and the additional information incorporated by reference herein and described under the heading “Incorporation of Certain Information By Reference” in this supplement. This supplement replaces all prior supplements to the prospectus. Capitalized terms used in this supplement have the same meaning as in the prospectus unless otherwise stated herein. The terms “we,” “our,” “us” and “Macquarie CNL Global Income Trust, Inc.” means Macquarie CNL Global Income Trust, Inc. and its subsidiaries.
This supplement updates our prospectus pursuant to Section 10(a)(3) of the Securities Act of 1933. This supplement also includes updated information from prior supplements, updated information about certain prior public investment programs and background information of our sponsors or their affiliates, updated information about our distribution policy and our redemption plan, and updated information about fees payable to our advisor.
Status of Our Offering
We commenced our initial public offering of shares of our common stock on April 23, 2010. Until our receipt and acceptance of subscriptions aggregating at least $2 million, all subscription proceeds were placed in escrow pursuant to the terms of an escrow agreement with UMB Bank, N.A. As of October 6, 2010, we satisfied the conditions of this escrow. As of October 8, 2010, we had accepted investors’ subscriptions to this offering received through October 6, 2010, at which time their funds were released from escrow and we commenced operations. Accordingly, all references in the prospectus to the prior escrow should be disregarded.
From April 23, 2010 through December 31, 2010, we had received total subscription proceeds in this offering for approximately $8.1 million and issued 818,145 shares of common stock to 187 investors. Further, during the period January 1, 2011 through March 2, 2011, we received an additional $2.5 million and issued an additional 248,260 shares of common stock. The total subscription proceeds received through March 2, 2011 include approximately $34,000 for 3,572 shares issued pursuant to our distribution reinvestment plan. The shares sold and the gross offering proceeds received from such sales do not include 22,222 shares purchased by our advisor for $200,000 preceding the commencement of our offering. As of March 2, 2011, there remained approximately 148.9 million shares of common stock available to be offered and sold in this offering.
Unless extended, this offering will terminate on April 23, 2012 (which is two years after the effective date of our registration statement on Form S-11 relating to this offering). In certain states, we will be required to renew our registration statement or file a new registration statement to extend the offering beyond this date. If we extend our offering beyond two years from the effective date of our registration statement, we will provide information in a prospectus supplement.
Attached to this supplement as Appendix D is an updated form of subscription agreement which replaces the form of subscription agreement contained in the prospectus dated April 23, 2010 and supplements thereto.
Termination of our Automatic Purchase Plan
Although we adopted an automatic purchase plan that allowed stockholders to make cash investments of $25 per month or $75 per quarter, our board of directors approved the termination of the automatic purchase plan. The termination date for the plan is March 31, 2011, after which shares in this offering may no longer be purchased under the automatic purchase plan. Accordingly, effective after March 31, 2011, all references in the prospectus to the automatic purchase plan should be disregarded.
1
Table of Contents
Redemption Plan
As of December 31, 2010, we had not received any redemption requests under our share redemption plan. As of that date, shares had not become eligible for redemption because they had not yet been held for one year.
Fees Paid in Connection with Our Offering
The Managing Dealer receives selling commissions of up to 7% of gross offering proceeds, marketing support fees of 3% of gross offering proceeds and reimbursement of actual expenses incurred in connection with due diligence of the offering. All or any portion of these fees may be reallowed to participating brokers.
For the year ended December 31, 2010, we incurred the following fees (in thousands):
| Year Ended December 31, 2010 | ||||
Selling commissions | $ | 523 | ||
Marketing support fee and due diligence expense reimbursements | 240 | |||
Total | $ | 763 | ||
Fees Paid in Connection with Our Operations
For the year ended December 31, 2010, our advisor earned no fees but incurred reimbursable expenses as follows (in thousands):
| Year Ended December 31, 2010 | ||||
Investment Services Fees(1) | $ | — | ||
Asset Management Fees(2) | — | |||
Financing Coordination Fee(3) | — | |||
Reimbursable expenses:(4) | ||||
Offering costs | 405 | |||
Acquisition costs | — | |||
Operating expenses | 962 | |||
Total | 1,367 | |||
Total fees earned and reimbursable expenses | $ | 1,367 | ||
FOOTNOTES:
| (1) | Investment Services Fees are paid for services in connection with the selection, evaluation, structure and purchase of Assets, generally equal to 1.85% of the purchase price of properties, the funds advanced for loans or the amount invested in the case of other Assets (except securities). No Investment Services Fee will be paid to our advisor in connection with investments that are securities. |
| (2) | Asset Management Fees are equal to 0.08334% per month of our Real Estate Asset Value, including our proportionate shares of those properties owned in joint ventures, and the outstanding principal amount of any loans made, and 0.1042% of the book value of securities, as of the end of the preceding month. |
| (3) | We will pay our advisor a Financing Coordination Fee equal to 1% of the gross amount of refinancings of any debt obligations of the Company or any of its subsidiaries. |
| (4) | Our advisor and its affiliates are entitled to reimbursement of certain expenses incurred on our behalf in connection with our organization, offering, acquisitions, and operating activities. Pursuant to the Advisory Agreement, we will not reimburse our advisor any amount by which Total Operating Expenses paid or incurred by us exceed the greater of 2% of Average Invested Assets or 25% of Net Income in any expense year, commencing April 1, 2011, except if a majority of our independent directors determines that such excess expenses are justified based on unusual and nonrecurring factors. |
2
Table of Contents
Amounts Due our Advisor and its Affiliates
Amounts due to our advisor and its affiliates as of December 31, 2010 for fees and expenses described above are as follows (in thousands):
| Year Ended December 31, 2010 | ||||
Due to the advisor and its affiliates: | ||||
Offering expenses | $ | 33 | ||
Operating expenses | 900 | |||
Total | $ | 933 | ||
Due to Managing Dealer: | ||||
Selling commissions | $ | 47 | ||
Marketing support fees and due diligence expense reimbursements | 20 | |||
Total | $ | 67 | ||
Total due to affiliates | $ | 1,000 | ||
For a more detailed discussion of the fees and compensation payable to our advisor, its affiliates and related parties, see “Management Compensation,” and “The Advisor and the Advisory Agreement.”
Changes in Certain Fees to be Paid to Our Advisor
On August 12, 2010, we amended the Advisory Agreement with our advisor and entered into a second amended and restated advisory agreement for the purpose of restructuring fees to be paid to our advisor for certain services. The Advisory Agreement, as now amended, reduced the Investment Services Fee to be paid to our advisor from (i) 3% to 1.85% of the purchase price or the amount invested in the case of real properties and (ii) 2% to 1.85% of the funds advanced for loans or the amount invested in the case of other Assets, except real properties or securities, for services in connection with the selection, evaluation, structure and purchase of Assets. As previously provided in the Advisory Agreement, no Investment Services Fee shall be paid to our advisor in connection with our purchase of investments that are securities.
The Advisory Agreement, as now amended, also changed the Disposition Fee from 3% to 1% in the case of the sale of real properties and certain other Assets. If our advisor, its affiliates or related parties provide a substantial amount of services in connection with the sale of one or more Assets (including the sale of all of our Assets or the sale of our Company or a portion thereof), we will pay our advisor, its affiliates or related parties a Disposition Fee in an amount equal to (i) in the case of the sale of real property, the lesser of (A) one-half of a competitive real estate commission or (B) 1% of the sales price of such property or properties, (ii) in the case of the sale of any Asset other than real property, loans or securities investments, 1% of the sales price of such Asset. The Disposition Fee in the case of the sale of any loan remains at 1% of the contract price of such loan. As previously provided in the Advisory Agreement, no Disposition Fee shall be paid to our advisor in connection with our disposition of investments that are securities; however, we may pay usual and customary brokerage fees to an affiliate or related party of our advisor, if, at the time of such payment, such affiliate or related party is a properly registered and licensed broker-dealer (or equivalent) in the jurisdiction in which the securities are being sold.
Further, the Advisory Agreement, as now amended, reduced from 8% to 6% the Priority Return that must be paid to investors before we may pay our advisor as Incentive Fees the Subordinated Share of Net Sales Proceeds from a sale of all or a portion of our Assets, the Subordinated Incentive Fee payable upon a Liquidity Event and the Performance Fee payable upon the occurrence of a Liquidity Event or one or more sales of assets subsequent to the termination or non-renewal of the Advisory Agreement.
In addition, the Advisory Agreement, as now amended, provides that we will pay our advisor for services rendered in connection with the refinancing of any debt obligations of the Company or any of its subsidiaries a Financing Coordination Fee equal to 1% of the gross amount of any such refinancing. Such Financing Coordination
3
Table of Contents
Fees are included in Total Operating Expenses for purposes of calculating conformance with the 2%/25% Guidelines.
In connection with our entering into the second amended and restated Advisory Agreement, our board of directors approved a second amendment and restatement of our articles of incorporation pursuant to Section 2-603 of the MGCL which was filed with the Maryland Department of Assessments and Taxation on August 13, 2010. The amendment also clarified that that we may distribute our own securities as stock distributions to our stockholders.
Distribution Policy
On May 25, 2010, our board of directors authorized a daily cash distribution of $0.0017808 per share of common stock which commenced on October 7, 2010, the day following the date on which we received and accepted subscriptions for the minimum offering of $2.0 million in shares of common stock. Distributions are calculated based on the number of days each stockholder has been a stockholder of record in that month. Distributions that accrued in October, the month the minimum offering was met, and November, the subsequent month, were aggregated and paid in December. Thereafter, at the end of each month, that month’s distributions will be aggregated and paid in the following month. The daily distribution rate is equal to an annualized distribution rate of 6.5%, using our offering price of $10.00 per share. Our board of directors intends to evaluate our distribution policy on a quarterly basis.
We may pay some or all of these distributions from sources other than cash flow from operations, such as cash flows from financing activities, which may include borrowings, cash resulting from a waiver or deferral of fees, and proceeds of our initial public offering. Distributions for stockholders participating in our distribution reinvestment plan will be reinvested into shares of our common stock promptly following the date such distributions are paid to the extent shares are available.
For the period October 7, 2010 through November 30, 2010, we distributed $42,647 to our stockholders. For the period December 1, 2010 through December 31, 2010, we had accrued $40,732 in distributions payable to our stockholders which we distributed on January 14, 2011. We did not have distributable earnings in 2010 and, therefore, distributions were made from financing activities including proceeds from this offering.
Macquarie — Charter Hall Group Transaction
On February 12, 2010, Macquarie Group Limited entered into an agreement to sell the majority of its Australian core real estate funds management platform to Charter Hall Group, a Sydney-based property funds management and development company (the “Charter Hall Group Transaction”). The Charter Hall Group Transaction, which was substantially completed in March 2010, included the sale of the management business of Macquarie Office Trust, Macquarie CountryWide Trust and Macquarie Direct Property Funds (which includes Macquarie Direct Property Fund, Macquarie Martin Place Trust and Macquarie Property Income Fund). Further, as part of the transaction, Charter Hall Group also acquired the asset service and property management businesses that support these funds. The Charter Hall Group Transaction did not affect Macquarie’s ownership of Macquarie CNL Global Income Advisors, LLC, our advisor. As a result of the Charter Hall Group Transaction, this supplement updates certain information about Macquarie and/or its affiliates in the sections of the prospectus titled “QUESTIONS AND ANSWERS ABOUT THIS OFFERING,” “BUSINESS,” and “PRIOR PERFORMANCE SUMMARY.”
Macquarie — EPN GP, LLC Transaction
On June 18, 2010, Macquarie sold its 50% interest in the Macquarie DDR Trust (“MDT”) responsible entity to EPN GP, LLC. As a part of this transaction, Macquarie will provide transitional services related to the management and administration of the trust until December 2010. Following the transaction, MDT has been renamed EDT Retail Trust. As a result of this transaction, this supplement updates certain information about Macquarie and/or its affiliates in the sections of the prospectus titled “QUESTIONS AND ANSWERS ABOUT THIS OFFERING,” “BUSINESS,” and “PRIOR PERFORMANCE SUMMARY.”
4
Table of Contents
INCORPORATION OF CERTAIN INFORMATION BY REFERENCE
The Commission allows us to “incorporate by reference” certain information that we file with it, which means that we can disclose important information to you by referring you to various documents that we have filed separately with the Commission. The information incorporated by reference is deemed to be a part of our prospectus and the information that we later file with the Commission may update and supersede the information in our prospectus, including information incorporated by reference. For information on how to access this information, see the following section of this supplement entitled “WHERE YOU CAN FIND MORE INFORMATION.”
We incorporate by reference the following documents that we have previously filed with the Commission:
| • | Annual Report on Form 10-K for the fiscal year ended December 31, 2010 filed on March 7, 2011. |
Upon request we will provide to each person, including a beneficial owner, to whom this supplement is delivered, a copy of any or all of the information that we have incorporated by reference into this supplement but have not delivered to investors. To receive a free copy of those documents, other than exhibits, unless they are specifically incorporated by reference in those documents, call or write to:
CNL Client Services
PO Box 4920
Orlando, FL 32802
866-650-0650, option 3
www.cnl.com
5
Table of Contents
WHERE YOU CAN FIND MORE INFORMATION
We are subject to the information requirements of the Securities Exchange Act of 1934, as amended, and, in accordance therewith, file annual, quarterly and current reports with the Commission. Such reports can be inspected and copied at the Public Reference Room of the Commission located at 100 F Street, NE, Washington, D.C. 20549. Please call the Commission at 1-800-SEC-0330 for more information on the operation of the Public Reference Room. Copies of such materials, including the documents that are incorporated by reference into our filings, can be obtained from the Public Reference Section of the Commission at prescribed rates. Such materials may also be accessed via the “View SEC Filings” link on the web site maintained by us athttp://www.MacquarieCNLGlobalIncomeTrust.com. Unless specifically listed above in “INCORPORATION OF CERTAIN INFORMATION BY REFERENCE,” the contents of that web site are not intended to be incorporated by reference into our prospectus.
We have filed a registration statement on Form S-11, of which this supplement forms a part, and related exhibits with the Commission under the Securities Act. The registration statement contains additional information about us and this offering. You can inspect or access electronically the registration statement and exhibits by the means described in the paragraph above.
The following supersedes and replaces in full the first paragraph under the heading “PROSPECTUS SUMMARY – Our Sponsors, Our Advisor and Other Related Entities” which appears on page 1 of the prospectus. In addition, all references to Macquarie Capital Funds throughout the prospectus are to be deemed replaced with Macquarie Infrastructure and Real Assets or MIRA.
Our Sponsors, Our Advisor and Other Related Entities
CNL Financial Group, LLC (“CNL LLC”) and Macquarie Infrastructure and Real Assets Inc. (“MIRA Inc.”) are our sponsors and who we consider to be our promoters. CNL LLC is an affiliate of CNL Financial Group, Inc. (“CNL”), which is one of the nation’s largest, privately held real estate investment and development companies, and is controlled by James M. Seneff, Jr. MIRA Inc. is a subsidiary under the Macquarie Infrastructure and Real Assets division (“MIRA”) (formerly known as “Macquarie Capital Funds”) of Macquarie Funds Group. Macquarie Funds Group is a business platform focused on the creation and management of specific asset class investor funds within Macquarie Group Limited, or “Macquarie.” Among other services, MIRA offers a range of real estate service capabilities including portfolio and asset management, development related services, property management services, due diligence, investment advisory services, financing and capital management and investor relations. Macquarie, a public company and global provider of banking, financial, advisory, investment and funds management services, is listed on the Australian Securities Exchange under the symbol MQG.
The following supersedes and replaces in full the discussion and table under the heading “PROSPECTUS SUMMARY – Compensation of our Advisor and Affiliates” beginning on page 10 of the prospectus.
Compensation of Our Advisor and Affiliates
Our advisor, its affiliates and related parties will perform services relating to the investment, management and sale of our assets. In addition, CNL Securities Corp., the managing dealer for this offering, will perform services in connection with the offer and sale of shares. The following table describes in summary form the compensation and reimbursement of expenses that we contemplate paying to our advisor, its affiliates and the managing dealer. The estimated maximum dollar amounts presented in the table are based on the assumption that we sell all of the shares of the offering at the following prices:
| • | 97.5% of the 150,000,000 shares are sold through our primary offering at $10.00 per share; and |
| • | 2.5% of such shares are sold pursuant to the distribution reinvestment plan at $9.50 per share. |
6
Table of Contents
Offering-stage compensation relates only to this primary offering, as opposed to any subsequent offerings. All or a portion of the selling commissions or marketing support fees will not be charged with regard to shares sold to certain categories of purchasers and for sales eligible for volume discounts and, in limited circumstances, the managing dealer fee may be reduced with respect to certain purchases.
Type of Compensation and | Method of Computation | Estimated Maximum Dollar Amount | ||
| Fees Paid in Connection with Our Offering | ||||
| Selling commissions to managing dealer and participating brokers | Up to 7% of gross proceeds of shares sold in our primary offering. No selling commissions will be paid in connection with shares sold pursuant to our distribution reinvestment plan. | $102.375 million | ||
| Marketing support fees to managing dealer and participating brokers | Up to 3% of gross proceeds of shares sold in our primary offering. No marketing support fees will be paid in connection with shares sold pursuant to our distribution reinvestment plan. | $43.875 million | ||
| Reimbursement of other organizational and offering expenses to our advisor, its affiliates and related parties | Actual expenses incurred in connection with our formation and this offering, including bona fide, itemized and detailed due diligence expenses incurred by our managing dealer and participating brokers. Under FINRA rules, the total amount of organizational and offering expenses (including selling commissions and marketing support fees) we incur for this offering may not exceed 15% of gross proceeds of our primary offering. | Amount is not determinable at this time but is estimated to be 1.5% of gross offering proceeds ($22.472 million) | ||
Fees Paid in Connection with the Acquisition of Properties, and Making Loans or Other Real Estate-Related Investments | ||||
| Investment services fee to our advisor on the purchase price of assets | 1.85% of the purchase price of properties, the funds advanced for loans or the amount invested in the case of other assets (except securities) for services in connection with the selection, evaluation, structure and purchase of assets. No investment services fee will be paid to our advisor in connection with our purchase of securities. | Amount is not determinable at this time but is estimated to be $20.480 million (assuming no debt financing to purchase assets) and approximately $77.218 million (assuming debt financing equals 75% of our total assets) | ||
| Other acquisition fees to our advisor, its affiliates and related parties | Fees that are usual and customary for comparable services in connection with the financing of a property or the acquisition of securities. Such fees are in addition to the investment services fees (described above). We may pay a brokerage fee that is usual and customary to an affiliate or related party of our advisor in connection with our purchase of securities if, at the time of such payment, such affiliate or related party is a properly registered and licensed broker-dealer (or equivalent) in the jurisdiction in which the securities are being acquired. Payment of such fees will be subject to approval of our board of directors, including a majority of our independent directors. | Amount is not determinable at this time | ||
7
Table of Contents
Type of Compensation and | Method of Computation | Estimated Maximum Dollar Amount | ||
| Reimbursement of acquisition expenses to our advisor, its affiliates and related parties | Actual expenses incurred in connection with the selection and purchase of properties and making loans or other real estate-related investments. | Amount is not determinable at this time but is estimated to be 0.50% of the purchase price of the assets, or $6.512 million (assuming no debt financing) and approximately $24.553 million (assuming debt financing equal to 75% of our total assets) | ||
| Fees Paid in Connection with Our Operations | ||||
| Asset management fee to our advisor | We will pay our advisor a monthly asset management fee in an amount equal to 0.08334% of the real estate asset value (the greater of the amount actually paid for the purchase of real property, or the most recently obtained appraised value of the real property that may have been obtained by us to provide valuations to certain ERISA plan stockholders, exclusive of acquisition fees and acquisition expenses) of our properties, including our proportionate share of those properties owned in joint ventures, and of the outstanding principal amount of any loans made, and an amount equal to 0.1042% of the book value of securities, as of the end of the preceding month. | Amount is not determinable at this time | ||
| Fees to our property manager | We, or our subsidiary property owners, will pay our property manager property management fees in an amount up to 4.5% of the gross revenues for management of our properties. This fee may be increased, subject to the approval of a majority of our independent directors, for certain properties, such as in connection with higher market fees payable with respect to properties located outside of the United States. In the event our property manager (through one of our sub-property managers) contracts with a third-party property manager in respect of a property, the management fees for such third-party property manager will be paid by our property manager. In addition, if our property manager provides leasing services with respect to a property, we, or our subsidiary property owners, will pay the property manager leasing fees equal to the leasing fees charged by unaffiliated persons rendering comparable services in the same geographic location of the applicable property. Our property manager also will be paid a project management fee equal to 5% of the total hard and soft costs for managing tenant and capital improvements. We, or our subsidiary property owners, will reimburse our property manager for the costs and expenses incurred on our behalf to the extent included in the annual business plan for a property, or as we may otherwise agree. Such costs and expenses may include the wages and salaries and other employee-related expenses of all on-site employees of our property manager or | Amount is not determinable at this time | ||
8
Table of Contents
Type of Compensation and | Method of Computation | Estimated Maximum Dollar Amount | ||
| its subcontractors who are engaged in the operation, management or maintenance of our properties, including taxes, insurance and benefits relating to such employees, and legal, travel and other out-of-pocket expenses that are directly related to the management of specific properties. | ||||
| Financing coordination fee to our advisor | If our advisor provides services in connection with the refinancing of any debt obligations of the company or any of our subsidiaries, we will pay our advisor a financing coordination fee equal to 1% of the gross amount of such refinancing, subject to certain limitations. | Amount is not determinable at this time because this fee is based on a fixed percentage of any debt refinancing. | ||
| Service Fee to CNL Capital Markets Corp. | We will pay CNL Capital Markets Corp., an affiliate of CNL, an initial setup fee and an annual maintenance fee of $4.57 and $19.20, respectively, per investor for providing certain administrative services to us. | Amount is not determinable at this time as actual amounts are dependent on the number of investors | ||
| Reimbursement to our advisor, its affiliates and related parties for total operating expenses | We will reimburse our advisor, its affiliates and related parties for actual total operating expenses incurred (which, in general, are those expenses relating to our administration on an on-going basis). To the extent that total operating expenses payable or reimbursable by us in any four consecutive fiscal quarters (an “expense year”), commencing with the fourth full quarter following the effective date of this offering exceeds the greater of 2% of average invested assets or 25% of net income (as defined in our articles of incorporation), our advisor is required to reimburse us within 60 days after the end of the expense year the amount by which the total operating expenses paid or incurred by us exceed the 2%/25% guidelines, unless a majority of our independent directors determine that such excess expenses are justified based on unusual and non-recurring factors. | Amount is not determinable at this time | ||
Fees Paid in Connection with Sales, Liquidation or Other Significant Events | ||||
| Disposition fee to our advisor, its affiliates and related parties | We will pay a disposition fee in an amount equal to (i) in the case of the sale of real property, the lesser of (A) one-half of a competitive real estate commission, or (B) 1% of the sales price of such property, (ii) in the case of the sale of any asset other than real property, loans or securities investments, 1% of the sales price of such asset, and (iii) in the case of the sale of loans, 1% of the contract price of any loan, if our advisor, its affiliates or related parties provide a substantial amount of services, as determined by our independent directors, in connection with the sale of one or more assets (including a sale of all of our assets or the sale of our company or a portion thereof). We will not pay a disposition fee upon the maturity, prepayment, workout, modification or extension of a loan unless there is a corresponding fee paid by the borrower to us, in which case the disposition fee will be the lesser of (i) 1% of | Amount is not determinable at this time as they are dependent upon the price at which assets are sold | ||
9
Table of Contents
Type of Compensation and | Method of Computation | Estimated Maximum Dollar Amount | ||
| the principal amount of the loan or (ii) the amount of the fee paid by the borrower in connection with such transaction. If we take ownership of a property as a result of a workout or foreclosure of a loan, we will pay a disposition fee of 1% of the contract price of such real property when sold. Even if our advisor receives a disposition fee, we may still be obligated to pay fees or commissions to another third party. However, the amount of real estate commissions or brokerage fees paid to our advisor or its affiliates, when added to the sums paid to unaffiliated parties in such a capacity, may not exceed the lesser of (i) a competitive real estate or brokerage commission or (ii) an amount equal to 6% of the sales price. We will not pay our advisor a disposition fee in connection with the sales of investments that are securities, however, we may pay a disposition fee in the form of a usual and customary brokerage fee to an affiliate or related party of our advisor, if, at the time of such payment, such affiliate or related party is a properly registered and licensed broker-dealer (or equivalent) in the jurisdiction in which the securities are being sold. | ||||
| Subordinated share of net sales proceeds payable to our advisor from the sales of assets | Upon the sale of our assets, we will pay our advisor a subordinated share of net sales proceeds equal to (i) 15% of the amount by which (A) the sum of net sales proceeds from the sale of our assets, and distributions paid to our stockholders from our inception through the measurement date, and total incentive fees, if any, previously paid to our advisor exceeds (B) the sum of the amount paid for our common stock in this offering which is outstanding (without deduction for organizational and offering expenses and less amounts paid to redeem shares under our share redemption plan) (“invested capital”) and amounts required to pay our stockholders a 6% cumulative, noncompounded annual return (the “priority return”) on invested capital, less (ii) total incentive fees, if any, previously paid to our advisor. “Incentive fees” means the subordinated share of net sales proceeds, the subordinated incentive fee and the performance fee. No subordinated share of net sales proceeds will be paid to our advisor following a listing of our shares. | Amount is not determinable at this time | ||
| Subordinated incentive fee payable to our advisor at such time, if any, as a liquidity event with respect to our shares occurs | Upon a listing, if any, of our common stock on a national securities exchange, or the receipt by our stockholders of cash or combination of cash and securities that are listed on a national securities exchange as a result of a merger, share acquisition or similar transaction, we will pay our advisor a subordinated incentive fee equal to (i) 15% of the amount by which (A) the sum of our market value or the market value of the listed securities received in exchange for our common stock, including any cash consideration received by our stockholders, and the total distributions paid or declared and payable to our stockholders since inception until the date of listing, and the total incentive fees, if any, previously paid to our advisor from inception to date of listing of our common stock or the effective date of our stockholders’ receipt of | Amount is not determinable at this time | ||
10
Table of Contents
Type of Compensation and | Method of Computation | Estimated Maximum Dollar Amount | ||
| listed securities or cash exceeds (B) the sum of our invested capital and the total distributions required to be made to the stockholders in order to pay them the priority return from our inception through the date of listing, less (ii) total incentive fees, if any, previously paid to our advisor. We may pay such fee in cash or listed equity securities or a combination of both. | ||||
| Performance fee payable to our advisor | Upon termination or non-renewal of the advisory agreement by our advisor for good reason (as defined in the advisory agreement) or by us or our operating partnership other than for cause (as defined in the advisory agreement), if a listing of our shares of common stock, or other liquidity event with respect to our shares of common stock, has not occurred, our advisor will be entitled to be paid a performance fee. The performance fee will be calculated upon a listing of our common stock on a national securities exchange or in connection with the receipt by our stockholders of cash or securities that are listed on a national securities exchange in exchange for our common stock, as a result of a merger, share acquisition or similar transaction, or a sale of any of our assets following such termination event and (i) in the event of a listing, or applicable merger, share acquisition or similar transaction, shall be calculated and paid in the same manner as the subordinated incentive fee and (ii) in the case of a sale of an asset, shall be calculated and paid in the same manner as the subordinated share of net sales proceeds, except that the amount of the performance fee payable to our advisor will be equal to the amount as calculated above multiplied by the quotient of (A) the number of days elapsed from the initial effective date of the advisory agreement through the effective date of the termination event, divided by (B) the number of days elapsed from the initial effective date of the advisory agreement through the date of listing or relevant merger, share acquisition or similar transaction, or the sales, as applicable. The performance fee will be payable in cash or listed equity securities within 30 days following the final determination of the performance fee. | Amount is not determinable at this time | ||
There are many conditions and restrictions on the amount of compensation our advisor, its affiliates and related parties may receive. The foregoing summarizes the anticipated terms of compensation arrangements during this offering; however, the terms of these arrangements may be changed in the future, subject to the approval of our independent directors. For a more detailed explanation of the fees and expenses payable to our advisor, its affiliates and related parties, see “Estimated Use of Proceeds” and “Management Compensation.”
The following supersedes and replaces in full the discussion under the heading “PROSPECTUS SUMMARY – Our Offering” beginning on page 16 of the prospectus.
Our Offering
On October 6, 2010, we received aggregate subscription proceeds in excess of the minimum offering amount of $2.0 million in shares of common stock, and on October 8, 2010, the funds were released from escrow and we commenced operations. As of March 2, 2011, we had received aggregate offering proceeds of approximately $10.6 million from the sale of 1,066,405 of our common shares in our public offering, including approximately
11
Table of Contents
$34,000 for 3,572 shares issued pursuant to our distribution reinvestment plan. The shares sold and the gross offering proceeds received from such sales do not include 22,222 shares purchased by our advisor for $200,000 preceding the commencement of our offering. As of March 2, 2011, approximately 148.9 million shares remained available for offer and sale pursuant to our public offering.
We are offering a maximum of $1,500,000,000 (150,000,000 shares) of our common stock to the public through our managing dealer, CNL Securities Corp., a registered broker-dealer affiliated with CNL. The shares will be offered at $10.00 per share, unless our board of directors changes this price, in its sole discretion. We have initially designated 2.5% of the shares in this offering as issuable pursuant to our distribution reinvestment plan, whereby the shares will be sold at up to a 5% discount to the prices for the primary offering as described above. We reserve the right to reallocate the shares of common stock registered in this offering between the primary offering and our distribution reinvestment plan. The offering of our shares will terminate on or before April 23, 2012, which is two years from the April 23, 2010 initial effective date of the registration statement for this offering. In addition, if we extend the offering for another year and file another registration statement during the one-year extension in order to sell additional shares, we could continue to sell shares in this offering until the earlier of 180 days after the third anniversary of the commencement of this offering or the effective date of the subsequent registration statement. If we decide to extend the primary offering beyond April 23, 2012, we will provide that information in a prospectus supplement. If we file a subsequent registration statement, we could continue offering shares with the same or different terms and conditions. Nothing in our organizational documents prohibits us from engaging in additional subsequent public offerings of our stock. Our board of directors may terminate this offering at any time. This offering must be registered in every state in which we offer or sell shares. Generally, such registrations are for a period of one year. Thus, we may have to stop offering and selling shares in any state in which the registration is not renewed annually.
This is a “best efforts” offering, which means our managing dealer and the participating brokers selling shares in our offering are required only to use their best efforts to sell our shares and have no firm commitment or obligation to purchase any of our shares.
The following supersedes and replaces in full the discussion under the heading “PROSPECTUS SUMMARY – Our Distribution Policy” beginning on page 17 of the prospectus.
Our Distribution Policy
In order to qualify as a REIT, we are required to distribute 90% of our annual REIT taxable income to our stockholders. We expect to generate little, if any, cash flow or funds from operations available for distribution until we make substantial investments. Therefore, until such time as we have sufficient cash flow or funds from operations, we may decide to not pay distributions or to fund all or a portion of the payment of distributions from sources other than cash flow from operations or funds from operations, such as from cash flows generated by financing activities, a component of which includes our secured and unsecured borrowings and the proceeds of this offering. Our advisor, its affiliates or related parties may also advance cash to us or waive asset management fees or other fees in order for us to have cash to pay distributions in excess of available cash flow or funds from operations. We have not established any limit on the extent to which we may use borrowings or proceeds of this offering to pay distributions, and there will be no assurance that we will be able to sustain distributions at any level.
We declare distributions daily and pay them on a monthly basis to our stockholders. Our board of directors determines the amount of each distribution and whether the distribution will be in cash or other property, which may include our own securities. The amount of each distribution generally will be based upon such factors as the amount of cash available for distribution, current and projected cash requirements, tax considerations and other factors. Because of the effect of other items, including depreciation and amortization associated with real estate investments, distributions, in whole or in part, in any period may constitute a return of capital for federal tax purposes.
Some or all of these distributions may be paid by the Company from sources other than cash flow from operations, such as cash flows from financing activities, which may include borrowings, cash resulting from a waiver or deferral of fees, and proceeds of our initial public offering. Distributions for stockholders participating in our distribution reinvestment plan will be reinvested into shares of the Company promptly following the date such distributions are paid to the extent shares are available.
12
Table of Contents
On May 25, 2010, our board of directors authorized a daily distribution of $0.0017808 per share of common stock which commenced on October 7, 2010, the day following the date on which we received and accepted subscriptions for the minimum offering of $2.0 million in shares of common stock. Distributions are calculated based on the number of days each stockholder has been a stockholder of record in that month. Distributions that accrued in October, the month the minimum offering was met, and November, the subsequent month, were aggregated and paid in December. Thereafter, at the end of each month, that month’s distributions will be aggregated and paid in the following month. The daily distribution rate is equal to an annualized distribution rate of 6.5%, using the Company’s offering price of $10.00 per share. Our board of directors intends to evaluate our distribution policy on a quarterly basis.
For the period October 7, 2010 through November 30, 2010, we distributed $42,647 to our stockholders. For the period December 1, 2010 through December 31, 2010, we had accrued $40,732 in distributions payable to our stockholders which we distributed on January 14, 2011. We did not have distributable earnings in 2010 and, therefore, distributions were made from financing activities including proceeds from this offering.
The following supersedes and replaces in full the discussion under the heading “PROSPECTUS SUMMARY – Our Distribution Reinvestment Plan and Automatic Purchase Plan” which appears on page 18 of the prospectus.
Our Distribution Reinvestment Plan
We have adopted a distribution reinvestment plan that will allow our stockholders to have the full amount of their distributions reinvested in additional shares that may be available. We have designated 2.5% of the shares in this offering as shares issuable pursuant to our distribution reinvestment plan for this purpose.
The following information supersedes and replaces the first bullet under the heading “PROSPECTUS SUMMARY – Our Redemption Plan” which appears on page 18 of the prospectus.
Our Redemption Plan
| • | if we elect to redeem shares, some or all of the proceeds from the sale of shares under our distribution reinvestment plan attributable to any month may be used to redeem shares presented for redemption during such month. In addition, we may use up to $100,000 per calendar quarter of the proceeds from any public offering for redemptions (with the unused amount of any offering proceeds available for use in future quarters to the extent not used to invest in assets or for other purposes); |
The following supersedes and replaces in full the discussion under the heading “PROSPECTUS SUMMARY – Estimated Use of Proceeds” which appears on page 18 of the prospectus.
Estimated Use of Proceeds
We estimate that approximately 86.45% to 86.94% of the net offering proceeds after paying the investment services fees and other acquisition expenses, assuming the sale of one-half of the shares being offered or the sale of the maximum offering, respectively, will be used for investment in real estate, loans and other real estate-related assets and other corporate purposes. A portion of the gross offering proceeds will be used to pay selling commissions, the marketing support fee and other organizational and offering expenses.
QUESTIONS AND ANSWERS ABOUT THIS OFFERING
The following supersedes and replaces in full the noted questions and answers under the heading “QUESTIONS AND ANSWERS ABOUT THIS OFFERING,” which appear on pages 20 and 21 of the prospectus.
| Q: | Who is Macquarie Group Limited? |
| A: | Macquarie Group Limited, or “Macquarie,” is a global provider of banking, financial, advisory, investment and funds management services. Macquarie’s main business focus is making returns by providing a |
13
Table of Contents
diversified range of services to clients. Macquarie acts on behalf of institutional, corporate and retail clients and counterparties around the world. |
Macquarie is listed in Australia on the Australian Securities Exchange (ASX: MQG) and is regulated by the Australian Prudential Regulation Authority, the Australian banking regulator, as the owner of Macquarie Bank Limited, an authorized deposit taker. Macquarie also owns a bank in the United Kingdom, Macquarie Bank International, which is regulated by the Financial Services Authority. Macquarie’s activities are also subject to scrutiny by other regulatory agencies around the world.
Founded in 1969, Macquarie operates in more than 70 office locations in 28 countries. Macquarie employed over 15,500 people and had assets under management of approximately US$307 billion as of September 30, 2010.
The figures noted in this “Questions and Answers about This Offering” section for each of Macquarie Group Limited, Macquarie Funds Group and the global real estate platform of Macquarie Funds Group and its affiliates are as of September 30, 2010 and include Macquarie DDR Trust (“MDT”) unless stated otherwise. On June 18, 2010, Macquarie sold its 50% interest in MDT’s responsible entity to EPN GP, LLC. As a part of this transaction, Macquarie provided transitional services related to the management and administration of the trust until December 18, 2010. Following the transaction, MDT was renamed EDT Retail Trust.
| Q: | Who is Macquarie Infrastructure and Real Assets? |
| A: | Macquarie Infrastructure and Real Assets (“MIRA”) is a business platform within Macquarie Funds Group, one of Macquarie’s six main operating groups. MIRA is a leading global alternative asset manager specializing in infrastructure, real estate and private equity funds and customized accounts. Through specialist management companies, as of September 30, 2010, it manages 6 listed and 37 unlisted funds or vehicles that invest in infrastructure (including airports, toll roads, communications infrastructure, utilities and related sectors), real estate (including investments in retail, office, industrial, and commercial sectors as well as real estate development), and other sectors. MIRA manages listed funds in Australia, Canada, the United States, Korea and Singapore. It manages unlisted funds in Australia, Korea, Hong Kong, India, Canada, the United States, Europe, Russia, South Africa, Mexico1 and the United Arab Emirates. As of September 30, 2010, assets under management in these funds totaled approximately $93 billion. |
Included within MIRA is a global real estate business platform made up of Macquarie subsidiaries (some of which are regulated in jurisdictions where they provide services) and professionals primarily focused on the creation and management of listed and unlisted real estate funds and real estate joint ventures in Australia, Asia, North America and Europe. The real estate service capabilities of MIRA and its affiliates include portfolio and asset management, development related services, due diligence, investment advisory services, financing and capital management, and investor relations. As of September 30, 2010, MIRA and its affiliates managed a global real estate portfolio with assets valued over $11 billion.
On July 2, 2010, Macquarie Group announced changes to some of its operating groups. As part of these changes, MIRA (formerly known as Macquarie Capital Funds) separated from Macquarie Capital and became a division of Macquarie Funds Group on October 1, 2010. MIRA Inc. is a corporation within the MIRA business platform and was formerly known as Macquarie Capital Funds Inc.
| Q: | Why are MIRA Inc. and CNL LLC jointly sponsoring this offering? |
| A: | MIRA Inc. and CNL LLC believe they bring strong complementary skills to the sponsorship of our company. CNL has a 35-year track record of forming and acquiring real estate businesses in the United States. Macquarie Real Estate Advisory Services LLC is an affiliate of MIRA. As of September 30, 2010, MIRA and its affiliates managed a global real estate portfolio with assets under management valued over $11 billion. |
| 1 | Macquarie Mexican Infrastructure Fund is comprised of parallel listed and unlisted vehicles. |
14
Table of Contents
The following supersedes and replaces in full the noted question and answer under the heading “QUESTIONS AND ANSWERS ABOUT THIS OFFERING,” which appears on page 24 of the prospectus.
| Q: | What will we do with the money raised in this offering? |
| A: | Depending primarily on the number of shares sold in this offering, we estimate that approximately 86.45% to 86.94% of the net offering proceeds after paying investment services fees and other acquisition fees, assuming the sale of one-half of the shares being offered or the sale of the maximum offering, respectively, will be used to invest in real estate, loans and other real estate-related assets, and other corporate purposes, including the repurchase of shares of our common stock under our redemption plan. The remainder of the offering proceeds will be used to pay selling commissions, the marketing support fee and other organizational and offering expenses. Pending the acquisition of properties or other real estate-related assets, we intend to invest the funds in short-term certificates of deposit issued by a bank, short-term securities directly or indirectly issued or guaranteed by the U.S. government or other short-term, highly liquid investments with appropriate safety of principal. These investments are expected to provide a lower internal rate of return than we seek to achieve from our intended investments. |
The following risk factor supersedes and replaces the corresponding risk factor under the heading “RISK FACTORS — Offering Related Risks” beginning on page 27 of the prospectus.
Offering Related Risks
This is a “best efforts” offering and the number and type of investments we make will depend on the total proceeds raised in the offering. In the event we raise substantially less than the maximum offering amount, we will make fewer investments, resulting in a less diversified portfolio of investments in terms of number, amount and location.
This offering is being made on a “best efforts” basis, which means our managing dealer and participating brokers are only required to use their best efforts to sell shares of our common stock and have no firm commitment or obligation to purchase any of our shares. We are not required to sell the full amount offered in our prospectus. If the total proceeds from the offering are substantially less than the maximum offering amount, we will make fewer investments, resulting in less diversification in terms of the number of investments owned, the geographic regions in which our real property investments are located and the types of investments that we make. A lack of diversification would increase the likelihood that any single investment’s performance would materially affect our overall investment performance. Your investment in our shares will be subject to greater risk to the extent that we have limited diversification in our portfolio of investments. Additionally, our inability to raise substantial funds would increase our fixed operating expenses as a percentage of gross income.
The following risk factors supersede and replace the corresponding risk factors under the heading “RISK FACTORS — Company Related Risks” beginning on page 29 of the prospectus.
Company Related Risks
We and our advisor have limited operating histories and the prior performance of real estate investment programs sponsored by CNL, MIRA, or their affiliates, may not be indicative of our future results.
We and our advisor have limited operating histories. Prior to October 8, 2010, the date our operations commenced, we had no previous performance history. You should not rely upon the past performance of other real estate investment programs sponsored by CNL or MIRA to predict our future results. You should consider our prospects in light of the risks, uncertainties and difficulties frequently encountered by companies that are, like us, in their early stage of development. To be successful, our advisor must, among other things:
| • | identify and acquire investments that meet our investment objectives; |
15
Table of Contents
| • | attract, integrate, motivate and retain qualified personnel to manage our day-to-day operations; |
| • | respond to competition for our targeted real estate properties and other investments; and |
| • | continue to build and expand its operational structure to support our business. |
There can be no assurance that our advisor will succeed in achieving these goals.
Because we rely on affiliates of CNL or MIRA for advisory, property management and managing dealer services, if these affiliates or their executive officers and other key personnel are unable to meet their obligations to us, we may be required to find alternative providers of these services, which could disrupt our business.
CNL and MIRA, through one or more of their respective affiliates or subsidiaries, jointly own and control our advisor and our property manager. CNL and MIRA each also separately own and control, directly or through affiliates or subsidiaries, our advisor’s sub-advisors and entities that are expected to provide property management services to us. In addition, CNL, through a subsidiary, owns and controls CNL Securities Corp., the managing dealer of this offering. In the event that any of these affiliates or related parties are unable to meet their obligations to us, we might be required to find alternative service providers, which could disrupt our business by causing delays and/or increasing our costs.
Further, our success depends to a significant degree upon the continued contributions of certain executive officers and other key personnel of our advisor, its affiliates and related parties, each of whom would be difficult to replace. We do not have employment agreements with our executive officers, and we cannot guarantee that they will remain affiliated with us or our advisor. Although several of our executive officers and other key employees of affiliates of our advisor, including Andrew A. Hyltin and Steven D. Shackelford, have entered into employment agreements with affiliates of our advisor, these agreements are terminable at will, and we cannot guarantee that such persons will remain employed by our advisor or its affiliates. We do not maintain key person life insurance on any of our executive officers.
In addition, the joint venture operating agreement for our advisor and property manager provides for the purchase by one member of the membership interests of the other member under the terms, and subject to the conditions, set forth in the agreement. We may lose the services of either of CNL or MIRA and their respective affiliates and related parties if one party exercises its purchase right.
The following risk factors supersede and replace the corresponding risk factors under the heading “RISK FACTORS — Risks Related to Conflicts of Interest and Our Relationships with Our Advisor, Its Affiliates and Related Parties” beginning on page 33 of the prospectus.
Risks Related to Conflicts of Interest and Our Relationships with Our Advisor, Its Affiliates and Related Parties
Our advisor, property manager and other entities affiliated with CNL or MIRA that conduct our day-to-day operations will face competing demands on their time.
We rely upon our advisor, including its investment committee, our property manager and the executive officers and employees of entities affiliated with CNL or MIRA, to conduct our day-to-day operations. Certain of these persons also conduct the day-to-day operations of other real estate investment programs sponsored, jointly or individually, by CNL, MIRA, or their respective affiliates, including CNL Macquarie Global Growth Trust, Inc., and may have other business interests as well. Our directors, James M. Seneff, Jr. and Matthew S. Banks, also are managers of our advisor and officers and/or directors of other entities affiliated with our advisor, including the advisors to other real estate investment programs sponsored, jointly or individually, by CNL, MIRA, or their respective affiliates, including CNL Macquarie Global Growth Trust, Inc. We have in common with CNL Macquarie Global Growth Trust, Inc. the same initial executive officers. Additionally, our advisor and the advisor to CNL Macquarie Global Growth Trust, Inc. have in common the same initial managers, executive officers and investment committee members. We currently anticipate that our executive officers and the executive officers of our advisor that are common to both our advisor, and the advisor of CNL Macquarie Global Growth Trust, Inc., will, on average, devote approximately one-third of their time to our business and operations, approximately one-third of their time to the business and operations of CNL Macquarie Global Growth Trust, Inc., and the balance of their time
16
Table of Contents
will be devoted to other individual or joint real estate programs of CNL, MIRA, or their affiliates, as applicable. It is also intended that the managers of our advisor (who are not also executive officers of our advisor) and the investment committee members of our advisor will devote the time necessary to fulfill their respective duties to us and our advisor. However, because these persons have competing interests on their time and resources, they may find it difficult to allocate their time between our business and these other activities. During times of intense activity in other programs and ventures, they may devote less time and resources to our business than is necessary or appropriate.
Other real estate investment programs sponsored by CNL, MIRA, or their respective affiliates, use investment strategies that are similar to ours, our advisor and its affiliates, and their and our executive officers will face conflicts of interest relating to the purchase and leasing of properties and other investments, and such conflicts may not be resolved in our favor.
One or more real estate investment programs sponsored by CNL, MIRA, or their respective affiliates, including CNL Macquarie Global Growth Trust, Inc., may be seeking to invest in properties and other real estate-related investments similar to the assets we are seeking to acquire. CNL has one public and MIRA and its affiliates have nine unlisted, active real estate investment programs with investment strategies similar to ours. In addition, affiliates of CNL and MIRA are jointly sponsoring CNL Macquarie Global Growth Trust, Inc., an active real estate investment program. All of these programs invest in commercial properties. As a result, we may be buying properties and other real estate-related investments at the same time as other programs sponsored by CNL, MIRA, or their affiliates, and managed by the executive officers and employees of our advisor or its affiliates, that are also buying properties and other real estate-related investments. We cannot assure you that properties we want to acquire will be allocated to us in this situation. Neither CNL, MIRA, nor their respective affiliates, are required to allocate any prospective investment to our advisor for review. Our advisor may choose a property that provides lower returns to us than a property allocated to another program sponsored by CNL, MIRA, or their affiliates. We also may be precluded from certain investment opportunities. In addition, we may acquire properties in geographic areas where other programs sponsored by CNL, MIRA, or their respective affiliates, own properties. If one of such other programs sponsored by CNL, MIRA, or their respective affiliates, attracts a tenant that we are competing for, we could suffer a loss of revenue due to delays in locating another suitable tenant. You will not have the opportunity to evaluate the manner in which these conflicts of interest are resolved before or after making your investment.
The following risk factors supersede and replace the corresponding risk factors under the heading “RISK FACTORS — Federal Income Tax Risks” beginning on page 50 of the prospectus.
Federal Income Tax Risks
Our investment strategy may cause us to incur penalty taxes, lose our REIT status, or own and sell properties through taxable REIT subsidiaries (“TRSs”), each of which would diminish the return to our stockholders.
The sale of one or more of our properties may be considered prohibited transactions under the Code. Any “inventory-like” sales, such as the sale of condominiums, would almost certainly be considered such a prohibited transaction. See “Federal Income Tax Considerations — Requirements for Qualification as a REIT — Operational Requirements — Prohibited Transactions.” If we are deemed to have engaged in a “prohibited transaction” (i.e., we sell a property held by us primarily for sale in the ordinary course of our trade or business), all taxable gain we derive from such sale would be subject to a 100% penalty tax. The Code sets forth a safe harbor for REITs that wish to sell property without risking the imposition of the 100% penalty tax. The principal requirements of the safe harbor are that: (i) the REIT must hold the applicable property for not less than two years for the production of rental income prior to its sale; (ii) the aggregate expenditures made by the REIT, or any partner of the REIT, during the two-year period preceding the date of sale which are includible in the basis of the property do not exceed 30% of the net selling price of the property; and (iii) the REIT does not make more than seven sales of property during the taxable year, the aggregate adjusted bases of property sold during the taxable year does not exceed 10% of the aggregate bases of all of the REIT’s assets as of the beginning of the taxable year or the fair market value of property sold during the taxable year does not exceed 10% of the fair market value of all of the REIT’s assets as of the beginning of the taxable year. Given our investment strategy, the sale of one or more of our properties may not fall within the prohibited transaction safe harbor.
17
Table of Contents
If we desire to sell a property pursuant to a transaction that does not fall within the safe harbor, we may be able to avoid the 100% penalty tax if we acquired the property through a TRS or acquired the property and transferred it to a TRS for a non-tax business purpose prior to the sale (i.e., for a reason other than the avoidance of taxes). However, there may be circumstances that prevent us from using a TRS in a transaction that does not qualify for the safe harbor. Additionally, even if it is possible to effect a property disposition through a TRS, we may decide to forego the use of a TRS in a transaction that does not meet the safe harbor based on our own internal analysis, the opinion of counsel or the opinion of other tax advisors that the disposition will not be subject to the 100% penalty tax. In cases where a property disposition is not effected through a TRS, the Internal Revenue Service could successfully assert that the disposition constitutes a prohibited transaction, in which event all of the net taxable gain from the sale of such property will be payable as a tax and thereby reducing the amount of cash available for investment by us or distribution to stockholders.
If we acquire a property that we anticipate will not fall within the safe harbor from the 100% penalty tax upon disposition, then we may acquire such property through a TRS in order to avoid the possibility that the sale of such property will be a prohibited transaction and subject to the 100% penalty tax. If we already own such a property directly or indirectly through an entity other than a TRS, we may contribute the property to a TRS if there is another, non-tax related business purpose for the contribution of such property to the TRS. Following the transfer of the property to a TRS, the TRS will operate the property and may sell such property and distribute the net proceeds from such sale to us, and we may distribute the net proceeds distributed to us by the TRS to our stockholders. Though a sale of the property by a TRS likely would eliminate the danger of the application of the 100% penalty tax, the TRS itself would be subject to a tax at the federal level, and potentially at the state and local levels, on the gain realized by it from the sale of the property as well as on the income earned while the property is operated by the TRS. This tax obligation would diminish the amount of the proceeds from the sale of such property that would be distributable to our stockholders. As a result, the amount available for distribution to our stockholders would be substantially less than if the REIT had not operated and sold such property through the TRS and such transaction was not successfully characterized as a prohibited transaction. The maximum federal corporate income tax rate currently is 35%. Federal, state and local corporate income tax rates may be increased in the future, and any such increase would reduce the amount of the net proceeds available for distribution by us to our stockholders from the sale of property through a TRS after the effective date of any increase in such tax rates.
As a REIT, the value of our investment in all of our TRSs may not exceed 25% of the value of all of our assets at the end of any calendar quarter. If the Internal Revenue Service were to determine that the value of our interests in all of our TRSs exceeded 25% of the value of our total assets at the end of any calendar quarter, then we would fail to qualify as a REIT. If we determine it to be in our best interest to own a substantial number of our properties through one or more TRSs, then it is possible that the Internal Revenue Service may conclude that the value of our interests in our TRSs exceeds 25% of the value of our total assets at the end of any calendar quarter and therefore cause us to fail to qualify as a REIT. Additionally, as a REIT, no more than 25% of our gross income with respect to any year may be from sources other than real estate. Distributions paid to us from a TRS are considered to be non-real estate income. Therefore, we may fail to qualify as a REIT if distributions from all of our TRSs, when aggregated with all other non-real estate income with respect to any one year, are more than 25% of our gross income with respect to such year.
Legislative or regulatory action could adversely affect us.
In recent years, numerous legislative, judicial and administrative changes have been made in the provisions of the federal income tax laws applicable to investments similar to an investment in shares of our common stock. Additional changes to the tax laws are likely to continue to occur, and we cannot assure you that any such changes will not adversely affect the taxation of our stockholders. We are under no obligation to update the prospectus for any such changes. Any such changes could have an adverse effect on an investment in our shares or on the market value or the resale potential of our assets. You are urged to consult with your own tax advisor with respect to the impact of recent legislation on your investment in our shares and the status of legislative, regulatory or administrative developments and proposals and their potential effect on an investment in our shares. You also should note that our counsel’s tax opinion is based upon our representations and existing law and Treasury Regulations, applicable as of the date of its opinion, all of which are subject to change, either prospectively or retroactively.
18
Table of Contents
Congress passed major federal tax legislation in 2003, with modifications to that legislation in 2005. One of the changes effected by that legislation generally reduced the tax rate on dividends paid by corporations prior to 2011 to individuals, trusts and estates to a maximum of 15%. In late 2010, legislation was enacted to extend this reduced rate for two years. REIT distributions generally do not qualify for this reduced rate. The tax changes did not, however, reduce the corporate tax rates. Therefore, the maximum corporate tax rate of 35% has not been affected. However, as a REIT, we generally would not be subject to federal or state corporate income taxes on that portion of our ordinary income or capital gain that we distribute currently to our stockholders, and we thus expect to avoid the “double taxation” typically imposed on other corporations.
Although REITs continue to receive substantially better tax treatment than entities taxed as corporations, it is possible that future legislation would result in a REIT having fewer tax advantages, and it could become more advantageous for a company that invests in real estate to elect to be taxed for U.S. federal income tax purposes as a corporation. As a result, our articles of incorporation provide our board of directors with the power, under certain circumstances, to revoke or otherwise terminate our REIT election and cause us to be taxed as a corporation, without the vote of our stockholders. Our board of directors has fiduciary duties to us and our stockholders in accordance with the Maryland General Corporation Law and could only cause such changes in our tax treatment if it determines in good faith that such changes are in the best interest of our stockholders.
The following supersedes and replaces in full the section of the prospectus entitled “ESTIMATED USE OF PROCEEDS” on pages 58 through 61 of the prospectus.
The following table sets forth information about how we intend to use the proceeds raised in this offering, assuming that we sell:
| • | approximately one-half of the maximum offering, of which 2.5% are sold through our Distribution Reinvestment Plan which is the plan pursuant to which our stockholders may elect to have the full amount of their cash distributions reinvested in additional shares of our common stock; |
| • | the maximum offering, of which 2.5% are sold through our Distribution Reinvestment Plan; |
| • | the maximum offering, of which no shares are sold through our Distribution Reinvestment Plan; and |
| • | the actual sales as of December 31, 2010, including shares sold through our Distribution Reinvestment Plan. |
The estimates and the amounts set forth below represent our best estimate of our intended sales proceeds; however, this is a best efforts offering so there is no guarantee as to the amount of shares that we will sell. In addition, we reserve the right to reallocate shares we are offering between the primary offering and our Distribution Reinvestment Plan. Depending primarily on the number of shares sold in this offering, we estimate that approximately 88.24% to 88.74% of the Gross Proceeds will be used for investment, the payment of Investment Services Fees and Acquisition Expenses or other corporate purposes. “Gross Proceeds” means the purchase price of all Equity Shares sold for our account through all offerings, without deduction for Organizational and Offering Expenses or volume or other discounts. For the purpose of computing Gross Proceeds, the purchase price of any Equity Share for which reduced or no selling commissions or marketing support fees are paid to our Managing Dealer or a participating broker shall be deemed to be the full amount of the offering price per Equity Share pursuant to the prospectus for such offering, with the exception of Equity Shares purchased pursuant to our Distribution Reinvestment Plan, which will be factored into the calculation using their actual purchase price. The remainder of offering proceeds is expected to be used to pay selling commissions, the marketing support fee and other Organizational and Offering Expenses. The amount available for investment will be less to the extent that we use offering proceeds, including proceeds from our Distribution Reinvestment Plan, to fund redemptions under our Redemption Plan (which is our redemption plan designed to provide our eligible stockholders with limited, interim liquidity by enabling them to sell shares back to us prior to the Listing of our shares, if any) pay distributions, repay debt, pay operating expenses or establish reserves. While we believe the estimated use of proceeds set forth below is reasonable, you should view this table only as an estimate of the use of proceeds that may be achieved.
19
Table of Contents
Assuming Sale of 75 Million Shares | Assuming Sale of Maximum Offering | Assuming Sale of Maximum Offering | Actual Sales as of December 31, 2010 | |||||||||||||||||||||||||||||
Percentage of shares sold pursuant to our Distribution Reinvestment Plan(1) | 2.5% | 2.5% | 0% | 0.3% | ||||||||||||||||||||||||||||
| Amount | Percent | Amount | Percent | Amount | Percent | Amount | Percent | |||||||||||||||||||||||||
GROSS PROCEEDS(2) | $ | 749,062,500 | 100.00 | % | $ | 1,498,125,000 | 100.00 | % | $ | 1,500,000,000 | 100.00 | % | $ | 8,127,853 | 100.00 | % | ||||||||||||||||
Less: | ||||||||||||||||||||||||||||||||
Selling Commissions and Marketing Support Fee(2)(3) | 73,125,000 | 9.76 | % | 146,250,000 | 9.76 | % | 150,000,000 | 10.00 | % | 763,121 | 9.39 | % | ||||||||||||||||||||
Other Organizational and Offering Expenses(3) | 14,981,250 | 2.00 | % | 22,471,875 | 1.50 | % | 22,500,000 | 1.50 | % | 405,282 | 4.99 | % | ||||||||||||||||||||
NET OFFERING PROCEEDS | 660,956,250 | 88.24 | % | 1,329,403,125 | 88.74 | % | 1,327,500,000 | 88.50 | % | 6,959,450 | 85.62 | % | ||||||||||||||||||||
Less: | ||||||||||||||||||||||||||||||||
Investment Services Fees(4)(6) | 10,183,000 | 1.36 | % | 20,480,000 | 1.37 | % | 20,451,000 | 1.37 | % | — | — | |||||||||||||||||||||
Acquisition Expenses(5)(6) | 3,238,000 | 0.43 | % | 6,512,000 | 0.43 | % | 6,503,000 | 0.43 | % | — | — | |||||||||||||||||||||
Initial Working Capital Reserve(7) | — | — | — | — | — | — | — | — | ||||||||||||||||||||||||
AMOUNT AVAILABLE FOR INVESTMENT(8)(9) | $ | 647,535,250 | 86.45 | % | $ | 1,302,411,125 | 86.94 | % | $ | 1,300,546,000 | 86.70 | % | $ | 6,959,450 | 85.62 | % | ||||||||||||||||
| (1) | Although we expect to sell 2.5% of the shares in this offering pursuant to our Distribution Reinvestment Plan, this table also illustrates the proceeds that would result should no shares be sold through our Distribution Reinvestment Plan in the case of a maximum offering. |
| (2) | We pay selling commissions and the marketing support fee to our Managing Dealer as shares are sold in accordance with the terms of the Managing Dealer Agreement. Our Managing Dealer intends to engage unrelated, third-party participating brokers in connection with the sale of the shares of this offering. In connection therewith, our Managing Dealer will pay such participating brokers up to 7% and up to 3% of the Gross Proceeds from the sale of shares by such participating brokers as selling commissions and a marketing support fee, respectively. See the section of the prospectus entitled “Plan of Distribution” for a description of the circumstances under which selling commissions and the marketing support fee may be reduced in connection with certain purchases including, but not limited to, purchases by investors that are clients of a registered investment advisor, registered representatives or principals of our Managing Dealer or participating brokers, and our advisor, its affiliates, managers, officers and employees. A portion of the selling commissions will be reduced in connection with volume purchases, and will be reflected by a corresponding reduction in the per share purchase price. Selling commissions and the marketing support fee will not be paid in connection with the purchase of shares pursuant to our Distribution Reinvestment Plan. |
| (3) | Estimated other Organizational and Offering Expenses presented in this table means any and all costs and expenses, excluding selling commissions and the marketing support fee which are presented separately in this table, incurred by us or any of our affiliates in connection with our formation, qualification and registration, and the marketing and distribution of our shares in this offering, including, without limitation, the following: legal, accounting and escrow fees; due diligence expenses, printing, amending, supplementing, mailing and distributing costs; personnel costs associated with processing investor subscriptions and the preparation and dissemination of organizational and offering documents and sales materials; telecopy and telephone costs; charges of transfer agents, registrars, trustees, depositories and experts; and fees, expenses and taxes related to the filing, registration and qualification of our shares under federal and state laws. Pursuant to FINRA, Organizational and Offering Expenses (which includes selling commissions and the marketing support fee) paid by us may not exceed 15% of Gross Proceeds of the primary offering. As of December 31, 2010, we paid or accrued $1.2 million of Organizational and Offering Expenses which represents our maximum liability for these expenses as of December 31, 2010. Organizational and Offering Expenses incurred by the advisor become our liability only to the extent such Organizational and Offering Expenses do not exceed the 15% limitation. Our advisor incurred on our behalf an additional $5.2 million of Organizational and Offering Expenses as of December 31, 2010. We record the Organizational and Offering Expenses, subject to the 15% limitation, as Gross Proceeds are received. Therefore, these additional costs will be deducted from future offering proceeds and reimbursed to our advisor and affiliates to the extent that such costs are within the 15% limitation. |
| (4) | For purposes of estimating the Investment Services Fee, we are assuming the proceeds of this offering are used to acquire assets the composition of which is 70% real properties, 15% loans and 15% real estate-related securities and other assets. The Investment Services Fees reflected in this table are calculated by multiplying the purchase price of real properties and loans by 1.85% and the purchase price of securities by 0%. For purposes of this table, we have assumed that no debt financing is used to acquire our investments; however, it is our intent to leverage our investments with debt. Our board of directors has adopted a policy generally to limit our aggregate borrowing to approximately 75% of the value of our assets once we have ceased raising capital under this offering or any subsequent offering and invested substantially all of our capital. Our intent is to target our aggregate borrowings to between 30% to 60% of the aggregate value of our assets once we own a seasoned and stable asset portfolio. The Investment Services Fee means the fee that our advisor will receive as compensation for services rendered in connection with the selection, |
20
Table of Contents
evaluation, structure and purchase of real properties, or Permitted Investments that are not securities, or the making or acquisition of loans that are not securities, a fee in the amount of (i) with respect to each (A) real property acquired directly by us or our Operating Partnership, 1.85% of the contract purchase price of such asset, or (B) loan or Permitted Investment that is not real property or a security acquired or made directly by us or our Operating Partnership, 1.85% of the amount invested, and (ii) with respect to each (A) real property acquired indirectly by us or our Operating Partnership through one or more of its affiliates or joint ventures, 1.85% of the contract purchase price of such asset multiplied by our, or our Operating Partnership’s, percentage equity interest in such affiliates or joint ventures, or (B) loan or Permitted Investment that is not real property or a security acquired or made indirectly by us or our Operating Partnership through one or more of its affiliates or joint ventures, 1.85% of the amount of the investment multiplied by our, or our Operating Partnership’s, percentage equity interest in such affiliates or joint ventures. Such fees shall be paid to our advisor as we or our Operating Partnership closes on the acquisition of such asset. Notwithstanding the foregoing, no Investment Services Fee shall be paid to the advisor in connection with the purchase by us or our Operating Partnership of real estate-related securities that are securities, Permitted Investments that are securities or loans that are securities. In the case of a development or construction project, upon completion of the project, our advisor shall determine the actual amounts paid. To the extent the amounts actually paid vary from the budgeted amounts on which the Investment Services Fee was initially based, our advisor will pay or invoice us for 1.85% of the budget variance such that the Investment Services Fee is ultimately 1.85% of amounts expended on such development or construction project. |
| (5) | Represents Acquisition Expenses that are neither reimbursed to us nor included in the purchase price of the properties. Acquisition Expenses means any and all expenses, exclusive of Acquisition Fees, incurred by us, our Operating Partnership, our advisor, or any of their affiliates in connection with the selection, acquisition, development or construction of any investment, including any real property, real estate-related securities, loans or Permitted Investments (which means all investments that are permitted to be made by a REIT under the Code), whether or not acquired, including, without limitation, legal fees and expenses, travel and communications expenses, costs of appraisals, nonrefundable option payments on property not acquired, accounting fees and expenses, title insurance premiums and the costs of performing due diligence. For purposes of this table, we have estimated that the third-party costs will average 0.5% of the contract purchase price of properties or other investments and assumed that we will not use debt financing to acquire our investments. |
| (6) | Pursuant to the NASAA REIT Guidelines, the total of all Acquisition Fees and Acquisition Expenses must be reasonable and may not exceed an amount equal to 6% of the Real Estate Asset Value of a property, or in the case of a loan, 6% of the funds advanced, unless a majority of our board of directors, including a majority of our Independent Directors, approves fees in excess of this limit subject to a determination that the transaction is commercially competitive, fair and reasonable to us. Acquisition Fees means any and all fees and commissions, exclusive of Acquisition Expenses, paid by any Person to any other Person (including any fees or commissions paid by or to any of our affiliates, our Operating Partnership or our advisor) in connection with the selection, evaluation, structure, purchase, development or construction of real property or with making or investing in loans, real estate-related securities or Permitted Investments, including, real estate commissions, selection fees, Investment Services Fees, development fees, construction fees, nonrecurring management fees, loan fees, points or any other fees of a similar nature. Excluded are development fees and construction fees paid to any Person not affiliated with our advisor in connection with the actual development and construction of a project. “Real Estate Asset Value” means the value of real properties wholly owned by us, our Operating Partnership and/or any of our respective subsidiaries, determined on the basis of cost (before non-cash reserves and depreciation), plus, in the case of real properties owned by any joint venture or partnership in which we, our Operating Partnership and/or any of our subsidiaries is the co-venturer or partner, our, the Operating Partnership’s or such subsidiary’s, as applicable, proportionate share of the value of such real properties determined on the basis of cost (before non-cash reserves and depreciation); provided, however, that during periods in which the board of directors is determining on a regular basis the current value of our net assets for purposes of enabling fiduciaries of employee benefit plan stockholders to comply with applicable Department of Labor reporting requirements, the “Real Estate Asset Value” will be equal to the greater of (i) the amount determined pursuant to the foregoing or (ii) the most recent aggregate valuation of the real properties established by the most recent independent valuation reports (before non-cash reserves and depreciation). For the purpose of the foregoing, the cost basis of a real property shall include the original contract price thereof plus any capital improvements made thereto, exclusive of Acquisition Fees and Acquisition Expenses. |
| (7) | Estimates for initial working capital reserves and reserves for initial and/or ongoing capital improvements will be established on a property-by-property basis at the time a property is acquired and as required by a lender. Such reserves may be funded from proceeds from this offering, debt proceeds, cash from operations and/or other sources of cash available to us. In addition to reserves for capital improvements, we may establish reserves for other purposes from offering proceeds, operating funds, and the available proceeds of any sales of our assets. |
| (8) | Although a substantial majority of the amount available for investment presented in this table is expected to be invested in properties or used to make or invest in loans or other real estate-related investments, we may use a portion of such amount (i) to repay debt incurred in connection with property acquisitions or other investment activities; (ii) to establish reserves; or (iii) for other corporate purposes, including, but not limited to, payment of distributions to stockholders or payments of offering expenses in connection with future offerings pending the receipt of offering proceeds from such offerings, provided that these |
21
Table of Contents
Organizational and Offering Expenses may not exceed the limitation of Organizational and Offering Expenses pursuant to our articles of incorporation and FINRA rules. In addition, we may use up to 100% of the proceeds from our Distribution Reinvestment Plan and $100,000 per calendar quarter of offering proceeds from our primary offering for redemptions of shares. See the section of the prospectus entitled “Summary of Redemption Plan.” |
| (9) | Until the proceeds from this offering are invested and generating operating cash flow or funds from operations sufficient to make distributions to our stockholders, we may determine not to pay distributions or to pay some or all of our distributions from other sources, including from the proceeds of this offering. We have not established any limit on the extent to which we may use proceeds of this offering to pay distributions, and there will be no assurance that we will be able to sustain distributions at any level. |
Until proceeds are required to be invested or used for other purposes, we expect to invest such amounts in short-term, highly liquid investments, subject to appropriate safety of principal, including, but not limited to, government obligations, bank certificates of deposit, short-term debt obligations and interest bearing accounts.
The following supersedes and replaces in full the discussion and table which appear on pages 62 through 69 of the section of the prospectus entitled “MANAGEMENT COMPENSATION,” and related footnotes thereto.
We are an externally advised company and as such, although we have a board of directors and executive officers responsible for our management, we have no paid employees. Two of our directors and all of our executive officers are employed by, and receive compensation from, affiliates of our advisor. Our advisor is responsible for managing our day-to-day affairs. Our property manager is responsible for managing our properties. Our Managing Dealer is responsible for performing services in connection with the offer and sale of our shares in this offering. Our Managing Dealer will engage participating brokers in connection with the sale of our shares and, in connection therewith, is expected to reallow the majority of the compensation received from us to such participating brokers as described below. In addition, our advisor and property manager are expected to engage other parties, including affiliates, to perform certain services and, in connection therewith, are expected to reallow a portion of their fees received from us to such entities.
The following table summarizes the compensation, reimbursements and distributions (exclusive of any distributions to which our affiliates may be entitled by reason of their purchase and ownership of shares in connection with this offering) we contemplate paying to our advisor, property manager, Managing Dealer and other affiliates and related parties, including amounts to reimburse their costs in providing services and for amounts advanced on our behalf. For additional information concerning compensation paid to our advisor and other affiliates and related parties, see the section of the prospectus and this supplement entitled “Certain Relationships and Related Transactions.” In addition, for information concerning compensation to our Independent Directors, see “Management.”
The compensation payable to our advisor is subject to the terms and conditions of our Advisory Agreement, which must be renewed on an annual basis. As a result, such amounts may be increased or decreased in future renewals of the Advisory Agreement. In addition, compensation payable to our property manager is subject to the terms of our property management agreement with it and may be changed upon future renewals. The terms of our Managing Dealer Agreement are not expected to change during this offering; however, in the event we determine to have additional equity offerings in the future, the terms of any future agreement, if any, could vary from the terms described below. Therefore, although this represents compensation and reimbursements we expect to pay to our advisor, property manager, Managing Dealer and other affiliates and related parties in connection with the sale of assets and investment of the proceeds from this offering, there is no assurance our costs for these and/or other future services will remain unchanged throughout our duration. In addition, because these figures cannot be precisely calculated at this time, the actual fees payable may exceed these estimates.
22
Table of Contents
Type of Compensation and Recipient | Method of Computation | Estimated Maximum Dollar Amount(1) | ||
| Fees Paid in Connection with Our Offering | ||||
| Selling commissions to our Managing Dealer and participating brokers(2) | We will pay our Managing Dealer selling commissions of up to 7% of Gross Proceeds of shares sold in connection with the primary offering. No selling commissions will be paid in connection with shares sold pursuant to our Distribution Reinvestment Plan. Pursuant to separately negotiated participating broker agreements, our Managing Dealer may reallow all or any portion of the 7% selling commissions to participating brokers with respect to shares they sell. | $102.375 million | ||
| Marketing support fee to our Managing Dealer and participating brokers(2) | We will pay our Managing Dealer a marketing support fee of up to 3% of Gross Proceeds of shares sold in connection with the primary offering. No marketing support fee will be paid in connection with shares sold pursuant to our Distribution Reinvestment Plan. Pursuant to separately negotiated agreements with participating brokers, our Managing Dealer may reallow all or any portion of the marketing support fees earned to participating brokers with respect to shares they sell. | $43.875 million | ||
| Reimbursement of other Organizational and Offering Expenses to our advisor, its affiliates and related parties | We will reimburse our advisor, its affiliates and related parties for actual expenses incurred in connection with our formation and this offering, including bona fide, itemized and detailed due diligence expenses incurred by our Managing Dealer and participating brokers(3). Under FINRA rules, the total amount of Organizational and Offering Expenses (including selling commissions and marketing support fees) we incur for this primary offering may not exceed 15% of Gross Proceeds of our primary offering. | Amount is not determinable at this time but is estimated to be 1.5% of Gross Proceeds ($22.472 million) | ||
Fees Paid in Connection with the Acquisition of Properties, and Making Loans or Other Real Estate- Related Investments | ||||
| Investment Services Fee to our advisor on the purchase price of Assets(4) | We will pay our advisor 1.85% of the purchase price of real properties, the funds advanced for loans or the amount invested in the case of other Assets (except securities) for services in connection with the selection, evaluation, structure and purchase of Assets. No Investment Services Fee will be paid to our advisor in connection with our purchase of securities. | Amount is not determinable at this time but is estimated to be $20.480 million (assuming no debt financing to purchase Assets) and approximately $77.218 million (assuming debt financing equal to 75% of our total Assets) | ||
23
Table of Contents
Type of Compensation and Recipient | Method of Computation | Estimated Maximum Dollar Amount(1) | ||
| Other Acquisition Fees to our advisor, its affiliates and related parties(4) | We may pay our advisor, its affiliates and related parties fees that are usual and customary for comparable services in connection with the financing of a property or the acquisition or disposition of securities. Such fees are in addition to the Investment Services Fee (described above). We may pay a brokerage fee that is usual and customary to an affiliate or related party of our advisor in connection with our purchase of securities if, at the time of such payment, such affiliate or related party is a properly registered and licensed broker-dealer (or equivalent) in the jurisdiction in which the securities are being acquired. | Amount is not determinable at this time | ||
| Reimbursement of Acquisition Expenses to our advisor, its affiliates and related parties(4) | We will reimburse our advisor, its affiliates and related parties for actual expenses incurred in connection with the selection and purchase of properties and making loans or other real estate-related investments, whether or not acquired. Acquisition Expenses may include, without limitation, legal fees and expenses, travel and communications expenses, costs of appraisals, nonrefundable option payments on property not acquired, accounting fees and expenses, title insurance premiums and the costs of performing due diligence.
Pursuant to our articles of incorporation, the total of all Acquisition Fees (which includes the Investment Services Fee) and any Acquisition Expenses must be reasonable and may not exceed an amount equal to 6% of the Real Estate Asset Value of a property, or in the case of a loan or other asset, 6% of the funds advanced or invested respectively, unless a majority of our board of directors, including a majority of our Independent Directors not otherwise interested in the transaction, approves fees in excess of this limit subject to a determination that the transaction is commercially competitive, fair and reasonable to us. Acquisition Fees will be reduced to the extent that, and if necessary to limit, the total compensation paid to all Persons involved in the acquisition of any property or the making or acquisition of any loan or other real estate-related investment to the amount customarily charged in an arm’s-length transaction by other Persons or entities rendering similar services in the same geographical location and for comparable types of Assets, and to the extent that other Acquisition Fees, finders’ fees, real estate commission, or other similar fees or commissions are paid by any Person in connection with the transaction. | Amount is not determinable at this time but is estimated to be 0.50% of the purchase price of Assets, or $6.512 million (assuming no debt financing) and approximately $24.553 million (assuming debt financing equal to 75% of our total Assets) | ||
| Fees Paid in Connection with Our Operations | ||||
Asset Management Fee to our advisor(4) | We will pay our advisor a monthly Asset Management Fee in an amount equal to 0.08334% of the Real Estate Asset Value of our properties, including our proportionate share | Amount is not determinable at this time as the amount | ||
24
Table of Contents
Type of Compensation and Recipient | Method of Computation | Estimated Maximum Dollar Amount(1) | ||
| of those properties owned in joint ventures, and on the outstanding principal amount of any loans made, plus an amount equal to 0.1042% on the book value of real estate-related securities and other securities, in each case as of the end of the preceding month. See footnote (6) in the “Estimated Use of Proceeds” section or the Glossary for definition of “Real Estate Asset Value.” All or any portion of the Asset Management Fee not paid as to any fiscal year may be deferred without interest and may be paid in such other fiscal year as our advisor determines, subject to any applicable limits in the year in question. | will depend upon, among other things, the cost of the properties and the amount invested in loans and securities | |||
| Fees to our property manager(5) | We, or our subsidiary property owners, will pay our property manager property management fees in an amount up to 4.5% of the gross revenues for management of our properties. This fee may be increased, subject to the approval of a majority of our Independent Directors, for certain properties, such as in connection with higher market fees payable with respect to properties located outside of the United States. In the event our property manager (through one of our sub-property managers) contracts with a third-party property manager in respect of a property, the management fees for such third-party property manager will be paid by our property manager. In addition to the property management fee, if our property manager provides leasing services with respect to a property, we, or our subsidiary property owners, will pay the property manager leasing fees in an amount equal to the leasing fees charged by unaffiliated Persons rendering comparable services in the same geographic location of the applicable property. We, or our subsidiary property owners, will also pay our property manager a project management fee equal to 5% of hard and soft costs for managing tenant and capital improvements. Our property manager will be reimbursed for the costs and expenses incurred by our property manager on our behalf to the extent included in the annual business plan for a property or otherwise as we may agree. Such costs and expenses may include the wages and salaries and other employee-related expenses of all on-site employees of our property manager or its subcontractors who are engaged in the operation, management, maintenance or access control of our properties, including taxes, insurance and benefits relating to such employees, and legal, travel and other out-of-pocket expenses that are directly related to the management of specific properties. | Amount is not determinable at this time | ||
| Financing Coordination Fee to our advisor | If our advisor provides services in connection with the refinancing of any debt obligations of the Company or any of our subsidiaries, we will pay our advisor a financing coordination fee equal to 1% of the gross amount of such refinancing, subject to certain limitations. | Amount is not determinable at this time because this fee is based on a fixed percentage of any debt refinancing. | ||
25
Table of Contents
Type of Compensation and Recipient | Method of Computation | Estimated Maximum Dollar Amount (1) | ||
| Service fee to CNL Capital Markets Corp. | We will pay CNL Capital Markets Corp., an affiliate of CNL, an initial setup fee and an annual maintenance fee of $4.57 and $19.20, respectively, per investor for providing certain administrative services to us. | Amount is not determinable at this time as actual amounts are dependent on the number of investors | ||
| Reimbursement to our advisor, its affiliates and related parties for Total Operating Expenses(4) | We will reimburse our advisor, its affiliates and related parties for actual Total Operating Expenses incurred on our behalf (which, in general, are those expenses relating to our administration on an ongoing basis). To the extent that Total Operating Expenses payable or reimbursable by us in any four consecutive fiscal quarters (an “Expense Year”), commencing the fourth full fiscal quarter following the effectiveness of the registration statement of which this supplement is a part, exceed the greater of 2% of Average Invested Assets or 25% of Net Income (the “2%/25% Guidelines”), our advisor will be required to reimburse us within 60 days after the end of the Expense Year the amount by which the Total Operating Expenses paid or incurred by us exceed the 2%/25% Guidelines, unless a majority of our Independent Directors determines that such excess expenses are justified based on unusual and non-recurring factors. | Amount is not determinable at this time | ||
Fees Paid in Connection with Sales, Liquidation or Other Significant Events | ||||
| Disposition Fee to our advisor, its affiliates and related parties | If our advisor, its affiliates or related parties provide a substantial amount of services, as determined in good faith by a majority of our Independent Directors, in connection with the sale of one or more Assets (including the sale of all of our Assets or the sale of our company or a portion thereof), we will pay our advisor, its affiliates or related parties a Disposition Fee in an amount equal to (i) in the case of the sale of real property, the lesser of (A) one-half of a competitive real estate commission (generally, a fee which is reasonable, customary and competitive in light of the size, type and location of the property, as determined by our board of directors), or (B) 1% of the sales price of such property or properties, (ii) in the case of the sale of any Asset other than real property, loans or securities investments, 1% of the sales price of such Asset, and (iii) in the case of the sale of loans, 1% of the contract price of any loan. We will not pay a Disposition Fee upon the maturity, prepayment, workout, modification or extension of a loan unless there is a corresponding fee paid by the borrower to us, in which case the Disposition Fee will be the lesser of (i) 1% of the principal amount of the loan or (ii) the amount of the fee paid by the borrower in connection with such transaction. If we take ownership of a property as a result of a workout or foreclosure of a loan, we will pay a Disposition | Amount is not determinable at this time as they are dependent upon price at which Assets are sold | ||
26
Table of Contents
Type of Compensation and Recipient | Method of Computation | Estimated Maximum Dollar Amount (1) | ||
| Fee of 1% of the contract price of such real property when sold. Even if our advisor receives a brokerage fee, we may still be obligated to pay fees and commissions to another third party. However, the amount of real estate commissions or brokerage fees paid to our advisor or its affiliates, when added to the sums paid to unaffiliated parties in such a capacity, may not exceed the lesser of (i) a competitive real estate or brokerage commission or (ii) an amount equal to 6% of the sales price. We will not pay our advisor a Disposition Fee in connection with the sales of investments that are securities; provided, however, we may pay a Disposition Fee in the form of a usual and customary brokerage fee to an affiliate or related party of our advisor if, at the time of such payment, such affiliate or related party is a properly registered and licensed broker-dealer (or equivalent) in the jurisdiction in which the securities are being sold, in which case such Disposition Fee shall be treated as part of our Total Operating Expenses. | ||||
| Subordinated Share of Net Sales Proceeds from sales of Assets payable to our advisor in our liquidation or otherwise | We will pay our advisor a Subordinated Share of Net Sales Proceeds equal to (i) 15% of the amount by which (A) the sum of Net Sales Proceeds from the sale of our Assets, and total distributions paid to our stockholders from the inception through the measurement date, and the total of Incentive Fees, if any, previously paid to our advisor from our inception through the measurement date exceeds (B) the sum of the total amount paid for our shares of common stock outstanding, without deduction for Organizational and Offering Expenses and reduced by amounts paid to redeem shares under our Redemption Plan (“Invested Capital”), and the total distributions that would be required to pay our stockholders from our inception until the measurement date a 6% cumulative, noncompounded annual return on Invested Capital (the “Priority Return”) including those paid prior to the date of payment, (ii) less total Incentive Fees, if any, previously paid to our advisor. “Incentive Fees” means the Subordinated Share of Net Sales Proceeds, the Subordinated Incentive Fee, and the Performance Fee. Following a Listing, no Subordinated Share of Net Sales Proceeds will be paid to our advisor. | Amount is not determinable at this time | ||
| Subordinated Incentive Fee payable to our advisor at such time, if any, as a Liquidity Event occurs | Upon any Liquidity Event, we will pay our advisor a Subordinated Incentive Fee equal to (i) 15% of the amount by which (A) the sum of our Market Value, and the total distributions paid or declared (and payable to our stockholders with respect to a record date prior to the effective date of the applicable Liquidity Event and a payment date after the date of such Liquidity Event) since inception until the date of the applicable Liquidity Event and total Incentive Fees, if any, previously paid to our advisor from inception to the date of the applicable Liquidity Event exceeds (B) the sum of our Invested Capital and the total | Amount is not determinable at this time | ||
27
Table of Contents
Type of Compensation and Recipient | Method of Computation | Estimated Maximum Dollar Amount (1) | ||
| distributions required to be made to our stockholders in order to pay them the Priority Return from our inception through the date of Listing, including those paid prior to such date of determination, (ii) less total Incentive Fees, if any, previously paid to our advisor. We may pay such fee in cash or listed equity securities or a combination of both. | ||||
| Performance Fee payable to our advisor | Upon termination or non-renewal of the Advisory Agreement by our advisor for good reason (as defined in the Advisory Agreement) or by us or our Operating Partnership other than for cause (as defined in the Advisory Agreement), if a Listing has not occurred, our advisor will be entitled to be paid a Performance Fee. The Performance Fee will be calculated upon a Liquidity Event or a sale of any of our Assets or a portion thereof following such termination event and (i) in the event of a Liquidity Event, shall be calculated and paid in the same manner as the Subordinated Incentive Fee, and (ii) in the case of a sale of an Asset, shall be calculated and paid in the same manner as the Subordinated Share of Net Sales Proceeds, except that the amount of the Performance Fee payable to our advisor will be equal to the amount as calculated above multiplied by the quotient of (A) the number of days elapsed from the initial effective date of the Advisory Agreement through the effective date of the termination event, divided by (B) the number of days elapsed from the initial effective date of the Advisory Agreement through the date of the applicable Liquidity Event or the sale, as applicable. The Performance Fee will be payable in cash or Listed equity securities within 30 days following the final determination of the Performance Fee. If the Subordinated Incentive Fee or the Subordinated Share of Net Sales Proceeds is payable to our advisor in connection with a Liquidity Event or sale, then our advisor shall not receive a Performance Fee. | Amount is not determinable at this time | ||
| (1) | The estimated maximum dollar amounts are based on the assumed sale of the maximum offering as follows: For the 150,000,000 shares sold, 97.5% are sold at a price of $10.00 per share through the primary offering, and 2.5% are sold at $9.50 per share through our Distribution Reinvestment Plan. |
| (2) | All or a portion of the selling commissions and marketing support fee will not be paid with regard to shares sold to certain categories of purchasers. In addition, selling commissions may be reduced for sales that are eligible for a volume discount. See the section of the prospectus entitled “Plan of Distribution” for additional information. |
| (3) | We will reimburse our Managing Dealer for actual, bona fide, itemized and detailed due diligence expenses incurred by it or other participating brokers in connection with this offering. Reimbursement is contingent upon receipt by our Managing Dealer of a detailed invoice or similar itemized statement from the participating broker that demonstrates the actual due diligence expenses incurred. Our Managing Dealer will reallow such reimbursements to the applicable participating broker. Such due diligence expense reimbursement will not exceed 0.50% of Gross Proceeds from our primary offering. |
| (4) | Our advisor has subcontracted substantially all of the services it performs to affiliates of our sponsors and expects to engage certain other affiliates and related parties to perform various services pursuant to our |
28
Table of Contents
Advisory Agreement. In connection therewith, our advisor will reallow up to all of its fees and reimbursements received from us to such entities. These fees and reimbursements may include amounts paid for services that would otherwise be performed by the advisor. The estimated maximum dollar amounts of Investment Services Fees and reimbursement of Acquisition Expenses was computed assuming: (i) we use 100% of the net proceeds of this offering to acquire assets the composition of which is 70% real properties, 15% loans and 15% real estate-related securities and other assets; (ii) no Investment Services Fees are paid with respect to investments in securities; and (iii) the computation of any compensation that assumes we borrow money, assumes debt financing equals 75% of the value of our total assets. Although an aggregate debt level of up to a maximum of 75% of the aggregate value of our assets is permitted by the NASAA REIT Guidelines and our articles of incorporation, once we own a seasoned and stable portfolio we currently do not intend to incur debt that would reach that maximum. If we limited our debt to between 30% to 60% of the aggregate value of our assets, as we currently intend to do, then our Investment Services Fees and Acquisition Expenses are estimated to be no greater than $49.688 million and $15.799 million, respectively. |
| (5) | Our property manager has subcontracted to the CNL Property Manager the performance of primarily all of its property management and leasing duties for properties located within the United States and Canada and subcontracted to the Macquarie Property Manager the performance of primarily all of its property management and leasing duties for other properties. Our property manager will pay all or a portion of its property management, leasing and project management fees to the CNL Property Manager or Macquarie Property Manager with whom it has subcontracted for these services. These sub-property managers may subcontract the performance of their property management and leasing duties to affiliated entities or unaffiliated third parties and, in such event, the CNL affiliated and MIRA affiliated sub-property managers will be responsible to pay such third-party property managers from the property management, leasing and project management fees they receive from our property manager. These amounts paid by the property manager to the sub-property managers, including amounts the sub-property managers may pay to third parties, may include amounts paid for services that would otherwise be performed by the property manager. |
Because our advisor, its affiliates and related parties are entitled to differing levels of compensation for undertaking different transactions on our behalf, such as the property management fees for operating our properties and the real estate commissions, our advisor has the ability to affect the nature of the compensation it receives by undertaking different transactions. However, our advisor is obligated to exercise good faith and integrity in all of its dealings with respect to our affairs pursuant to the Advisory Agreement. See “The Advisor and the Advisory Agreement.” Because these fees and expenses are payable only with respect to certain transactions or services, they may not be recovered by our advisor or its affiliates by reclassifying them under a different category.
In addition, from time to time, our advisor, or its affiliates, may agree, but are not obligated to, waive or defer all or a portion of the Investment Services Fee, Asset Management Fee or other fees, compensation or incentives due them, enter into lease agreements for unleased space as authorized by our board of directors, pay general administrative expenses or otherwise increase the amount of cash we have available to make distributions to stockholders.
29
Table of Contents
The following chart supersedes and replaces the chart under the heading “OUR STRUCTURE” on page 70 of the prospectus.
The following chart indicates the relationship between our advisor, our sponsors and certain other affiliates that will provide services to us.
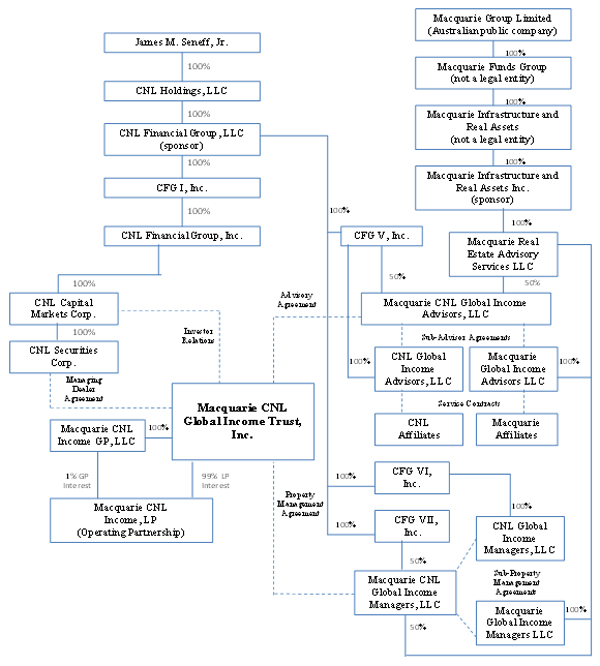
30
Table of Contents
The following supplements the information under the heading “BUSINESS – General,” on page 76 of the prospectus.
We commenced our initial public offering of shares of our common stock on April 23, 2010. Until our receipt and acceptance of subscriptions aggregating at least $2 million, all subscription proceeds were placed in escrow pursuant to the terms of an escrow agreement with UMB Bank, N.A. As of October 6, 2010, we had satisfied the conditions of the escrow and accepted aggregate subscriptions in excess of the Minimum Offering amount of $2 million in shares of common stock and on October 8, 2010, the funds were released from escrow and we commenced operations. As of March 2, 2011, we had received total subscription proceeds of approximately $10.6 million. As of the date of this supplement, we have not acquired any assets.
The following information supersedes and replaces in full the Macquarie Background information under the heading “BUSINESS,” on pages 77 through 81 of the prospectus.
Macquarie Background
Macquarie Group Limited
Macquarie Group Limited, or “Macquarie,” is a global provider of banking, financial, advisory, investment and funds management services. Macquarie’s main business focus is making returns by providing a diversified range of services to clients. Macquarie acts on behalf of institutional, corporate and retail clients and counterparties around the world.
Macquarie is listed in Australia on the Australian Securities Exchange (“ASX”) and is regulated by the Australian Prudential Regulation Authority, the Australian banking regulator, as the owner of Macquarie Bank Limited (“MBL”), an authorized deposit taker. Macquarie also owns a bank in the United Kingdom, Macquarie Bank International, which is regulated by the Financial Services Authority. Macquarie’s activities are also subject to scrutiny by other regulatory agencies around the world.
Founded in 1969, Macquarie operates in more than 70 office locations in 28 countries. Macquarie employed over 15,500 people and had assets under management of approximately US$307 billion as of September 30, 2010.
The figures noted in this “Business” section for each of Macquarie Group Limited, MIRA and the global real estate platform of MIRA and its affiliates are as of September 30, 2010 and include Macquarie DDR Trust (“MDT”) unless stated otherwise. On June 18, 2010, Macquarie sold its 50% interest in MDT’s responsible entity to EPN GP, LLC. As a part of this transaction, Macquarie provided transitional services related to the management and administration of the trust until December 18, 2010. Following the transaction, MDT was renamed EDT Retail Trust.
Macquarie History
Macquarie takes its origins from the merchant bank Hill Samuel Australia (“HSA”), a wholly owned subsidiary of Hill Samuel & Co. Limited, London. Established in Australia in 1969, it began operations in Sydney in January 1970 with only three staff. In 1981, in response to changes evolving from the deregulation of financial markets, HSA commenced work on a proposal to become a trading bank. Authority for HSA to become Macquarie Bank Limited (“MBL”) was given in 1985, making it only the second private trading bank to be established in Australia this past century. MBL adopted its name from Governor Lachlan Macquarie, a leading pioneer responsible for transforming the early settlement in Australia from a penal colony into a dynamic economy.
MBL took over all of HSA’s business operations and opened a retail branch in March 1985 in Sydney. MBL opened a trading bank branch in Melbourne a few months later and in Brisbane in November 1986. On July 29, 1996, MBL listed its fully paid ordinary shares on the ASX, and on October 30, 1996 entered the ASX’s All
31
Table of Contents
Ordinaries Index with a market capitalization of approximately A$1.3 billion2. In October 2007, MBL security holders and option holders and the Federal Court of Australia approved the creation of Macquarie Group Limited and the restructure of MBL into a non-operating holding company structure.
Macquarie Operational Organization
Macquarie has six main operating groups, described below, within which individual businesses operate. The businesses specialize in defined product or market sectors and work in close cooperation. On July 2, 2010, Macquarie Group announced changes to some of its operating groups. As part of these changes, Macquarie Infrastructure and Real Assets (referenced herein as “MIRA” and formerly known as Macquarie Capital Funds) separated from Macquarie Capital and became a division of Macquarie Funds Group on October 1, 2010.
Macquarie Funds Group
Macquarie Funds Group is a full-service fund manager offering a diverse range of products, including: (i) managed funds across a wide range of asset classes, including cash, fixed income, currencies, resources, listed property securities, equities, listed infrastructure securities and private equity; (ii) funds-based structured products; (iii) hedge funds and fund of funds; and (iv) responsible entity and back-office services. Macquarie Funds Group also holds investments in real estate funds and real estate funds management companies.
Macquarie Funds Group is comprised of several business platforms, including MIRA. MIRA’s global real estate fund and asset management activities are described in more detail below.
Macquarie Capital
Macquarie Capital provides advisory and capital raising services to corporate and government clients. Macquarie Capital’s depth of service includes specialist capabilities in: (i) mergers and acquisitions; (ii) takeovers and corporate restructuring advice; (iii) equity capital markets and equity and debt capital raising and management; (iv) debt structuring and distribution; (v) private equity placements; and (vi) principal products.
Macquarie Securities Group
Macquarie Securities Group is a full-service securities business in Asia and Australia, specializing in: (i) institutional cash equities broking; (ii) equity finance, arbitrage trading and synthetic product business; and (iii) equity-linked investments, trading products and risk management services to wholesale and retail clients in Australia, Asia, Europe, North America and Latin America.
Fixed Income, Currencies and Commodities
Fixed Income, Currencies and Commodities provides a variety of services across the globe with an underlying specialization in interest rate, commodity or foreign exchange related institutional trading, marketing, lending, clearing or platform provision. Fixed Income, Currencies and Commodities offers trading, sales, research and finance covering: (i) interest rate, debt and credit securities; (ii) foreign exchange spot, forward and tailored services; and (iii) metals, energy, environmental products, agriculture, freight, bulk commodities and complementary futures services.
Banking and Financial Services Group
The Banking and Financial Services Group provides retail banking and financial services, including: (i) cash management trust and wrap platform; (ii) full service stock-broking; (iii) relationship banking services for businesses and professionals; (iv) private banking and executive wealth management; (v) private portfolio management; (vi) mortgage management; and (vii) credit cards (issuer and wholesale service provider), life insurance, funds management and administration and online broking.
| 2 | A$ = Australian dollars. |
32
Table of Contents
Corporate and Asset Finance Group
Corporate and Asset Finance Group provides innovative and traditional capital, finance and related services to clients operating in selected international markets as well as being responsible for the procurement, underwriting and management of real estate loans for clients in real estate projects across all major real estate sectors.
Real Estate Banking Division
In addition to Macquarie Group’s six main operating groups, Macquarie Bank Limited includes the Real Estate Banking Division. Macquarie’s Real Estate Banking Division manages real estate projects and investments located in Australia, Asia, South Africa, North America and Europe.
Macquarie Infrastructure and Real Assets (“MIRA”)
MIRA is a business platform within Macquarie Funds Group, one of Macquarie’s six main operating groups. MIRA is a leading global alternative asset manager specializing in infrastructure, real estate and private equity funds and customized accounts. Through specialist management companies, as of September 30, 2010, it managed 6 listed and 37 unlisted funds or vehicles that invest in infrastructure (including airports, toll roads, communications infrastructure, utilities and related sectors), real estate (including investments in retail, office, industrial, and commercial sectors as well as real estate development), and other sectors. MIRA manages listed funds in Australia, Canada, the United States, Korea and Singapore. It manages unlisted funds in Australia, Korea, Hong Kong, India, Canada, the United States, Europe, Russia, South Africa, Mexico3 and the United Arab Emirates. As of September 30, 2010, assets under management in these funds totaled approximately $93 billion.
Included within MIRA is a global real estate business platform made up of Macquarie subsidiaries (some of which are regulated in the jurisdictions where they provide services) and professionals focused on the creation and management of listed and unlisted real estate funds and real estate joint ventures in Australia, Asia, North America and Europe. The real estate service capabilities of MIRA and its affiliates include portfolio and asset management, development related services, due diligence, investment advisory services, financing and capital management, and investor relations. As of September 30, 2010, MIRA and its affiliates managed a global real estate portfolio with assets valued over $11 billion.
MIRA, and its affiliates, will be primarily responsible for providing our advisor with due diligence, acquisition and management services relating to our acquisition and management of properties located outside the United States and Canada.
The table below highlights current unlisted real estate investment vehicles managed by MIRA and its affiliates.
| Unlisted Vehicles | ||||
Vehicle | Description | Notes(1)(2) | ||
| Macquarie Real Estate Equity Funds | Suite of six wholesale funds focused on development and opportunistic trading projects around Australia. | Expected gross development value of series A$3b | ||
| MWREF Limited | A geographically diversified and growing portfolio of core, retail property comprising shopping mall assets across China. | Initial portfolio value of A$612m | ||
| Macquarie NPS REIT | Wholesale fund investing in stabilized office and retail assets in Korea. | Assets under management of A$189m with mandate to grow assets up to A$1b (KrW500b equity) | ||
| Macquarie NPS REIT #2 | Wholesale fund investing in a single office asset in Seoul, Korea. | Assets value of A$306m | ||
| (1) | As of December 31, 2010. |
| (2) | As of December 31, 2010 foreign exchange rates. |
| 3 | Macquarie Mexican Infrastructure Fund is comprised of parallel listed and unlisted vehicles. |
33
Table of Contents
Macquarie Group — Other Real Estate Activities
In addition to the global real estate platform within MIRA, Macquarie has other real estate-related activities and businesses within both MBL and Macquarie Capital.
Macquarie Bank Limited — Real Estate Banking Division
MBL, through the Real Estate Banking Division, participates in strategic real estate joint ventures on development projects, property acquisitions and funds management. For example, MBL has a joint venture interest in MGPA Limited (“MGPA”), which is an independently managed private equity real estate investment advisory company investing in Europe and Asia. MGPA advises a number of real estate investment funds, the largest being MGPA Fund III which has raised US$5.2 billion in equity.
Macquarie also participates in real estate development projects around the world. In Australia, MBL owns the national award-winning developer Urban Pacific Limited, and has joint venture projects with Great White Shark Enterprises through Medallist Developments (Australia, the United States and South Africa).
Corporate and Asset Finance Group — Real Estate Structured Finance
Additionally, the Real Estate Structured Finance business of Corporate and Asset Finance Group provides financing solutions for real estate projects and clients across all major real estate sectors. The group specializes in full finance solutions encompassing development finance, acquisition and repositioning, tailored financing and structuring complex transactions. The group actively participates in joint ventures with clients.
Macquarie Capital — Real Estate Advisory
Macquarie Capital provides global real estate advisory and equity and debt capital raising services on behalf of institutional and corporate clients as well as to Macquarie’s real estate businesses and the funds they manage. These services seek to create unique real estate opportunities by drawing on extensive market expertise and a variety of capital sources to deliver strategic solutions.
Macquarie Capital — Real Estate Strategy
Macquarie Capital provides forecasts for global real estate markets for Macquarie Capital Advisors and other internal and external clients. The team has extensive international expertise providing strategic advice on opportunities and risks inherent in global real estate markets. In addition to Australia, its research covers the major international markets including the United States, the United Kingdom, Japan, Singapore, Hong Kong, Germany, and France. The combination of specialist real estate knowledge, economic expertise and on-the-ground experience provides valuable insight on future trends in real estate markets.
The following table and footnotes supersede and replace the table and footnotes under the heading “PRIOR PERFORMANCE SUMMARY — Prior Investment Programs – CNL” on pages 98 and 99 of the prospectus. Where applicable, this information and all other information in this section of the prospectus will be updated once 2010 information is available.
Prior Investment Programs — CNL
Information relating to the public offerings of the four REITs sponsored by CNL is as follows. All information is historical.
34
Table of Contents
Name of Program | Dollar Amount Raised | Date Offering Closed | Limited Partnership Units or Shares Sold | Month 90% of Net Proceeds were Fully Invested or Committed to Investment | ||||||
CNL Restaurant Properties, Inc. | $747.5 million | (1) | (1) | February 1999 | ||||||
CNL Hotels & Resorts, Inc. | $3.0 billion | (2) | (2) | March 2004 | ||||||
CNL Retirement Properties, Inc. | $2.7 billion | (3) | (3) | April 2006 | ||||||
CNL Lifestyle Properties, Inc. | $2.6 billion | (4) | (4) | (4) | ||||||
| (1) | From April 1995 through January 1999, CNL Restaurant Properties, Inc. completed three public offerings of its common stock. As of January 1999, 90% or more of such amount had been invested or committed for investment in properties and mortgage loans. In February 2005, the company merged with and into U.S. Restaurant Properties, Inc. The combined company changed its name to Trustreet Properties, Inc. and acquired 18 CNL Income Fund limited partnerships. Trustreet Properties, Inc. was acquired in February 2007 by GE Capital Solutions. |
| (2) | From September 1997 through March 2004, CNL Hotels & Resorts, Inc. completed five public offerings of its common stock. As of February 2004, 90% or more of such amount had been invested or committed for investment in properties and mortgage loans. In April 2007, the company was acquired by Morgan Stanley Real Estate and in connection with such acquisition, certain assets of the company were purchased by Ashford Sapphire Acquisition LLC. |
| (3) | From September 1998 through March 2006, CNL Retirement Properties, Inc. completed five public offerings of its common stock. As of March 2006, 90% or more of such amount had been invested or committed for investment in properties and mortgage loans. In October 2006, the company merged with and into a wholly owned subsidiary of HCP, Inc. |
| (4) | From April 2004 through March 2006, CNL Lifestyle Properties, Inc. received gross proceeds totaling approximately $520.7 million from its first public offering of common stock. The first offering terminated on March 31, 2006 and on April 4, 2006, the second offering commenced. The second offering closed on April 4, 2008, after raising approximately $1.5 billion. The third offering commenced on April 9, 2008 and as of December 31, 2009, the company had raised approximately $548.3 million relating to this offering. Between January 1, 2010 and September 30, 2010, the company raised an additional $286.4 million relating to the third offering. Certain tenants have faced financial difficulties due to the general economic condition, and have been provided temporary relief through modified lease terms to allow for rent deferrals or reductions that then become payable in later periods of their lease terms. |
The following paragraph updates and supplements the information in the section of the prospectus entitled “PRIOR PERFORMANCE SUMMARY – Prior Investment Programs – CNL” which begins on page 98 of the prospectus.
The prior programs sponsored by CNL have been affected by general economic conditions, capital market trends and other external factors during their respective operating periods. For example, CNL Lifestyle Properties, Inc. (“CLP”) has been impacted by the recent economic downturn and the tightened credit markets, which caused tenant liquidity issues and primarily resulted in the deferral of rent and other lease modifications for certain tenants. The rent deferrals and lease modifications resulted in lower operating income and cash flows from operations in 2009 and 2010. In addition, CLP recorded impairment provisions on four of its 122 properties during the quarter ended September 30, 2010. CNL Hotels and Resorts, Inc. (“CHR”) was impacted by the downturn in the hospitality industry following the terrorist attacks of September 11, 2001, which negatively affected its earnings and cash flows. There have been periods in which the respective boards of directors of CLP and CHR set limitations on the amounts of shares to be redeemed under its respective redemption plans. In those instances when redemption requests exceeded the limitations set forth, redemptions were paid on a pro-rata basis and considered for redemption in following periods.
35
Table of Contents
The following sections supersede and replace the corresponding sections of the prospectus entitled “PRIOR PERFORMANCE SUMMARY — Prior Investment Programs – Macquarie Capital Funds” and “PRIOR PERFORMANCE SUMMARY — Prior Investment Programs – CNL and Macquarie Capital Funds” which begin on page 100.
Prior Investment Programs — MIRA
The information in this section and in the Prior Performance Tables in Appendices B and G represents the historical performance and the information of MIRA and affiliate managed programs, both public and non-public, over the past ten years. The programs included have similar investment objectives as ours, in that all have the main objective of investing solely in real estate and real estate-related assets. Altogether, the prior investment programs consist of six public programs, each with more than 300 investors and each of which are listed on the ASX, Singapore Exchange or Korea Exchange, and 19 non-public programs. The information on the six public programs, Charter Hall Retail REIT4, Charter Hall Office REIT4, EDT Retail Trust5, Starhill Global REIT6, Macquarie Central Office CR REIT, or “MCO REIT” and Macquarie ProLogis Trust, is presented in more detail in the applicable Prior Performance Tables in Appendix B. Additionally, Table VI, which is included in Part II of the registration statement filed with the SEC for this offering, includes detailed information regarding acquisitions made by the public programs during the previous three years. All monetary figures presented below are in Australian dollars (A$).
As a result of the transactions described below, MIRA and its affiliates no longer sponsor these programs:
| • | Charter Hall Retail REIT is a REIT listed on the Australian Securities Exchange (ASX code: CQR) which invests primarily in premier grocery anchored shopping centers in Australia, Europe, New Zealand, and the United States. Effective March 1, 2010, Macquarie CountryWide Trust has been renamed Charter Hall Retail REIT. The sale of the majority of Macquarie’s Australian core real estate funds management platform to Charter Hall Group, including the management businesses of Macquarie CountryWide Trust, has been substantially completed. |
| • | Charter Hall Office REIT is a REIT listed on the Australian Securities Exchange (ASX code: CQO) that invests predominantly in high-grade office buildings in major business districts in Australia, Europe, Japan, and the United States. Effective March 1, 2010, Macquarie Office Trust has been renamed Charter Hall Office REIT. The sale of the majority of Macquarie’s Australian core real estate funds management platform to Charter Hall Group, including the management businesses of Macquarie Office Trust, has been substantially completed. |
| • | EDT Retail Trust is a REIT listed on the Australian Securities Exchange (ASX code: EDT) that invests predominantly in premium U.S. shopping centers that focuses on the value and convenience retail sector. On June 18, 2010, Macquarie sold its 50% interest in Macquarie DDR Trust’s (“MDT”) responsible entity to EPN GP, LLC. As a part of this transaction, Macquarie provided transitional services related to the management and administration of the trust until December 18, 2010. Following the transaction, MDT has been renamed EDT Retail Trust. |
| • | Starhill Global REIT is listed on the Singapore Exchange investing in premium retail and office properties in China, Japan, and Singapore. Effective December 31, 2008, Macquarie PRIME REIT has been renamed Starhill Global REIT. On December 31, 2008, Macquarie completed the sale of its |
| 4 | Effective, March 1, 2010, Macquarie Office Trust and Macquarie CountryWide Trust have been renamed Charter Hall Office REIT and Charter Hall Retail REIT, respectively. The sale of the majority of Macquarie’s Australian core real estate funds management platform to Charter Hall Group, including the management businesses of Macquarie Office Trust and Macquarie CountryWide Trust, has been substantially completed. |
| 5 | On June 18, 2010, Macquarie sold its 50% interest in Macquarie DDR Trust’s (“MDT”) responsible entity to EPN GP, LLC. As a part of this transaction, Macquarie provided transitional services related to the management and administration of the trust until December 18, 2010. Following the transaction, MDT was renamed EDT Retail Trust. |
| 6 | Effective December 31, 2008, Macquarie PRIME REIT has been renamed Starhill Global REIT. On December 31, 2008, Macquarie completed the sale of its approximate 26% holding in Macquarie PRIME REIT, as well as its 50% interest in the holding company of Macquarie PRIME REIT’s manager and property manager to YTL Corporation Berhad. |
36
Table of Contents
approximate 26% holding in Macquarie PRIME REIT, as well as its 50% interest in the holding company of Macquarie PRIME REIT’s manager and property manager to YTL Corporation Berhad. |
| • | Macquarie Central Office CR REIT, or “MCO REIT”, was listed on the Korea Exchange and invested in a premium office building in Korea. On August 13, 2009, MCO REIT disposed of its sole asset, and on October 9, 2009, MCO REIT was delisted from the Korea Exchange and is subsequently undergoing liquidation. Details of this completed program are presented in Table IV of Appendix B. |
| • | Macquarie ProLogis Trust was a REIT listed on the Australian Securities Exchange (ASX: MPR) that invested in high quality industrial property in the United States and Mexico. Macquarie ProLogis Trust was managed through a joint venture with ProLogis. The program delisted in July 2007, and was acquired by ProLogis. Details of this completed program are presented in Table IV of Appendix B. |
Capital Raising
Over the past ten years ending June 30, 2009, MIRA and affiliates have raised approximately A$7.5 billion from 72,737 investors through the six prior public programs, and over the past ten years ending June 30, 2010, MIRA and affiliates have raised approximately A$2.0 billion from 19,092 investors through the 19 prior non-public programs. More detail regarding MIRA’s and its affiliates’ experience in raising capital, and compensation paid to MIRA and affiliates in relation to the prior public programs, is included in Appendix B – Tables I and II.
Investments
During the past ten years ending June 30, 2009, MIRA and affiliates have invested in 524 properties valued at approximately A$17.0 billion at time of purchase in its public programs, and over the past ten years ending June 30, 2010, MIRA and affiliates have invested in 70 properties at approximately A$2.7 billion in its non-public programs. These investments have been made across four continents: Asia, Australia, Europe and North America:
| Number of Properties Acquired by Region: | Public Programs | Non-Public Programs | ||||||
Australia | 67 | 58 | ||||||
Asia | 14 | 12 | ||||||
North America | 434 | 0 | ||||||
Europe | 9 | 0 | ||||||
Total: | 524 | 70 | ||||||
Acquisitions by MIRA and its affiliates have been made across several real estate sectors including office, industrial and retail properties. These investments have included mainly existing properties, as well as a small percentage of new and development properties. The following chart describes such properties:
Types of Properties Acquired by Percentage: | Public Programs | Non-Public Programs | ||
Office | 31% | 43% | ||
Retail | 58% | 32% | ||
Industrial | 11% | 4% | ||
Total Commercial: | 100% | 79% | ||
Residential | 0% | 21% | ||
Types of Properties Acquired by Percentage: | Public Programs | Non-Public Programs | ||
New | 8% | 0% | ||
Existing | 92% | 72% | ||
Development | 0% | 28% | ||
37
Table of Contents
Additionally, a summary of all acquisitions made by MIRA and its affiliate sponsored public programs over the previous three fiscal years can be seen in Table VI, which is included in Part II of the registration statement filed with the SEC for this offering. As shown in Table VI, MIRA and affiliates have acquired 72 properties within the previous three years of the public programs. These properties have all been retail or office acquisitions in Asia, Australia, Europe and the United States. In total, approximately 9.7 million of leasable square feet was acquired through these acquisitions over this three-year period. These acquisitions were financed with a combination of debt, offering proceeds and reinvestment of sales proceeds.
Dispositions
MIRA and its affiliate sponsored programs, both public and non-public, have sold approximately 121 and 21 properties, respectively, over the previous ten years ending June 30, 2010. A detailed description of the public program disposals over the past three years can be found in Table V of Appendix B.
Operating Results
Other than due to current global economic conditions, and except as set forth below, all MIRA and affiliated sponsored programs have operated with no major adverse business conditions or developments arising that are material to investors in the programs.
As of June 30, 2009, EDT Retail Trust7 and its joint venture subsidiary had breached certain covenants in loan facilities. As noted in the Notes to the Financial Statements of EDT Retail Trust7 for the year ended June 30, 2009, at June 30, 2009 there was a significant uncertainty with regard to EDT Retail Trust’s7 ability to continue as a going concern. To date no lender has enforced repayment of the amount owed under these loan facilities.
On June 18, 2010, Macquarie sold its 50% interest in the Macquarie DDR Trust (MDT) responsible entity to EPN GL, LLC. As part of this transaction, Macquarie provided transitional services related to the management and administration of the trust until December 2010. Following the transaction, MDT was renamed EDT Retail Trust.
More detail of operating results is provided in Appendix B as part of Table III — Operating Results of Prior Programs.
We will provide, upon request to us and without charge, a copy of the most recent annual reports filed with the ASX by Charter Hall Retail REIT8, Charter Hall Office REIT8 and EDT Retail Trust9; filed with the Singapore Exchange by Starhill Global REIT10; or filed with the Korea Exchange by MCO REIT11.
| 7 | On June 18, 2010, Macquarie sold its 50% interest in Macquarie DDR Trust’s (“MDT”) responsible entity to EPN GP, LLC. As a part of this transaction, Macquarie provided transitional services related to the management and administration of the trust until December 18, 2010. Following the transaction, MDT was renamed EDT Retail Trust. |
| 8 | Effective, March 1, 2010, Macquarie Office Trust and Macquarie CountryWide Trust have been renamed Charter Hall Office REIT and Charter Hall Retail REIT, respectively. The sale of the majority of Macquarie’s Australian core real estate funds management platform to Charter Hall Group, including the management businesses of Macquarie Office Trust and Macquarie CountryWide Trust, has been substantially completed. |
| 9 | On June 18, 2010, Macquarie sold its 50% interest in Macquarie DDR Trust’s (“MDT”) responsible entity to EPN GP, LLC. As a part of this transaction, Macquarie provided transitional services related to the management and administration of the trust until December 18, 2010. Following the transaction, MDT was renamed EDT Retail Trust. |
| 10 | Effective December 31, 2008, Macquarie PRIME REIT has been renamed Starhill Global REIT. On December 31, 2008, Macquarie completed the sale of its approximate 26% holding in Macquarie PRIME REIT, as well as its 50% interest in the holding company of Macquarie PRIME REIT’s manager and property manager to YTL Corporation Berhad. |
| 11 | On August 13, 2009, MCO REIT disposed of its sole asset, and on October 9, 2009, MCO REIT was delisted from the Korea Exchange and is subsequently undergoing liquidation. |
38
Table of Contents
Prior Investment Programs — CNL LLC and MIRA Inc.
The information presented in this section contains certain relevant summary information concerning a public program sponsored by CNL LLC, an affiliate of CNL, and MIRA Inc., a subsidiary of Macquarie Group Limited. The information presented in this section should be read in conjunction with the Prior Performance Tables included in this supplement as Appendix C. By purchasing our shares, investors will not acquire ownership interests in the corporation to which the following information relates.
Pursuant to a registration statement on Form S-11 under the Securities Act of 1933, as amended, effective October 9, 2009, CNL Macquarie Global Growth Trust, Inc. registered for sale up to $1.5 billion in shares of common stock (150 million shares), of which initially 3,750,000 shares are being offered pursuant to CNL Macquarie Global Growth Trust, Inc.’s distribution reinvestment plan. The offering of shares of CNL Macquarie Global Growth Trust, Inc. commenced October 20, 2009. As of March 2, 2011, the Company had raised approximately $10.6 million and had not purchased any properties.
Upon request to the Company, the Company will provide, without charge, a copy of the most recent Annual Report on Form 10-K filed with the Securities and Exchange Commission for CNL Macquarie Global Growth Trust, Inc., as well as a copy, for a reasonable fee, of the exhibits filed with such report.
In order to enable potential investors to evaluate the prior experience of CNL and MIRA concerning prior public programs that have investment objectives similar to one or more of our investment objectives, we have provided the foregoing information and encourage potential investors to examine certain financial and other information in the Prior Performance Tables included as Appendix A of the prospectus and Appendices B and C of this supplement.
The following section is inserted following page 102 of the prospectus.
The following selected financial data for Macquarie CNL Global Income Trust, Inc. should be read in conjunction with “Management’s Discussion and Analysis of Financial Condition and Results of Operations” as reported in the Annual Report on Form 10-K for the fiscal year ended December 31, 2010 filed on March 7, 2011, which is incorporated by reference herein.
| Years Ended December 31, | ||||||||
| 2010(1) | 2009(1) | |||||||
Operating Data: | ||||||||
Net loss | $ | (928,951 | ) | — | ||||
Net loss per share (basic and diluted) | (1.78 | ) | — | |||||
Weighted average shares outstanding (basic and diluted) | 520,975 | — | ||||||
Cash used in operating activities | (62,517 | ) | — | |||||
Cash provided by financing activities | 6,994,805 | — | ||||||
Balance Sheet Data: | ||||||||
Cash and cash equivalents | $ | 7,132,675 | $ | 200,387 | ||||
Total assets | 7,211,670 | 200,387 | ||||||
Total liabilities | 1,064,820 | 387 | ||||||
Stockholders’ equity | 6,146,850 | 200,000 | ||||||
Other Data: | ||||||||
Funds from operations (“FFO”)(2) | $ | (928,951 | ) | — | ||||
FFO per share | (1.78 | ) | — | |||||
Dividends declared | 83,379 | — | ||||||
39
Table of Contents
FOOTNOTES:
| (1) | Operations commenced on October 8, 2010 when we received the minimum offering proceeds and approximately $2.4 million were released from escrow. The results of operations for the years ended December 31, 2010 and 2009 are not necessarily indicative of future performance due to the limited time during which we were operational and having not yet completed our first investment. The results of operations for the year ended December 31, 2010 includes only organizational costs incurred on our behalf by our advisor, and general, operating and administrative expenses. Selected financial data for 2009 covers the period March 4, 2009 (date of inception) through December 31, 2009. |
| (2) | FFO is a non-GAAP financial measure that is widely recognized as a measure of REIT operating performance. We use FFO, as defined by the National Association of Real Estate Investment Trusts (“NAREIT”), as net income (loss) computed in accordance with generally accepted accounting principles (“GAAP”), excluding gains or losses from sales of property, plus depreciation and amortization on real estate assets, and after adjustments for unconsolidated partnerships and joint ventures, as one measure to evaluate our operating performance. |
FFO was developed by NAREIT as a relative measure of performance of an equity REIT in order to recognize that income-producing real estate has historically not depreciated on the basis determined under GAAP. We believe that FFO is helpful to investors and our management as a measure of operating performance because it excludes depreciation and amortization, gains and losses from property dispositions, and extraordinary items, and as a result, when compared year to year, reflects the impact on operations from trends in occupancy rates, rental rates, operating costs, general and administrative expenses, and interest costs, which is not immediately apparent from net income (loss) alone.
Accordingly, we believe that in order to facilitate a clear understanding of our operating performance between periods and as compared to other equity REITs, FFO should be considered in conjunction with our net income (loss) and cash flows as reported in the accompanying consolidated financial statements and notes thereto. FFO (i) does not represent cash generated from operating activities determined in accordance with GAAP (which, unlike FFO, generally reflects all cash effects of transactions and other events that enter into the determination of net income (loss)), (ii) is not necessarily indicative of cash flow available to fund cash needs and (iii) should not be considered as alternatives to net income (loss) determined in accordance with GAAP as an indication of our operating performance, or to cash flow from operating activities determined in accordance with GAAP as a measure of either liquidity or our ability to make distributions. FFO as presented may not be comparable to amounts calculated by other companies.
The following supersedes and replaces in full the “MANAGEMENT — Directors and Executive Officers” section of the prospectus on pages 109 through 112.
Directors and Executive Officers
We have provided below certain information about our executive officers and directors.
| Name | Age* | Position(s) | ||
James M. Seneff, Jr. | 64 | Chairman of the Board and Director | ||
Matthew S. Banks | 49 | Director | ||
Douglas N. Benham | 54 | Independent Director | ||
James P. Dietz | 46 | Independent Director | ||
Stephen J. LaMontagne | 49 | Independent Director | ||
Robert A. Bourne | 63 | Chief Executive Officer | ||
Andrew A. Hyltin | 51 | President | ||
Steven D. Shackelford | 47 | Chief Financial Officer and Secretary | ||
Lilian Wong | 32 | Senior Vice President | ||
Mark D. Mullen | 39 | Senior Vice President | ||
| * | As of January 1, 2011 |
40
Table of Contents
James M. Seneff, Jr. Chairman of the Board and Director. Mr. Seneff has served as the chairman of our board since our inception in March 2009 and as a manager of our advisor since its inception in December 2008. Mr. Seneff also serves as chairman of the board and a director of CNL Macquarie Global Growth Trust, Inc., a corporation that intends to operate as a REIT, and serves as chairman of the board and a manager of its advisor, CNL Macquarie Global Growth Advisors, LLC. He is the sole stockholder of CNL Holdings, LLC (“CNL Holdings”) and has served as the chairman, chief executive officer and/or president of various CNL Holdings’ subsidiaries, including, as chairman (1988 to 2010), chief executive officer (1995 to 2011) and president (1980 to 1995) and currently executive chairman since 2010 of CNL, a diversified real estate company. Mr. Seneff serves or has served in similar capacities for a number of CNL Holdings’ affiliates, including: CNL Lifestyle Properties, Inc., a public, unlisted REIT, and its advisor, CNL Lifestyle Company, LLC (2003 to present); CNL Hotels & Resorts, Inc., a public, unlisted REIT, and its advisor, CNL Hospitality Corp. (1997 to 2006 (became self-advised)); CNL Retirement Properties, Inc., a public, unlisted REIT, and its advisor, CNL Retirement Corp. (1997 to 2006); CNL Restaurant Properties, Inc., a public, unlisted REIT, and its advisor, (1994 to 2005); National Retail Properties, Inc., a publicly traded REIT (1994 to 2005); Trustreet Properties, Inc., a publicly traded REIT (2005 to 2007); CNL Securities Corp., the Managing Dealer of this offering (1979 to present); and CNL Capital Markets Corp. (1990 to present). Mr. Seneff is also the chairman and a principal stockholder of CNL Bancshares, Inc. (1999 to present), which owns CNLBank. Mr. Seneff received his degree in business administration from Florida State University.
As a result of these professional and other experiences, Mr. Seneff possesses particular knowledge of real estate acquisitions, ownership and dispositions in a variety of public and private real estate investment vehicles that strengthens the board’s collective knowledge, capabilities and experience.
Matthew S. Banks. Director. Mr. Banks has served as a director since our inception in March 2009 and as chairman of the board and a manager of our advisor since its inception in December 2008. Mr. Banks also serves as a director of CNL Macquarie Global Growth Trust, Inc., a corporation that intends to operate as a REIT, and serves as a manager of its advisor, CNL Macquarie Global Growth Advisors, LLC. He is currently an executive director of the Macquarie Group and is head of MBL’s Real Estate Banking Division which manages real estate projects and investments located in Australia, Asia, South Africa, North America and Europe as well as being responsible for the procurement, underwriting and management of real estate loans for clients in real estate projects across all major real estate sectors. Mr. Banks joined Macquarie in November 2001 as an executive director within the Macquarie Real Estate Group (now part of MIRA) and has led various business divisions during a period of global expansion for Macquarie. From April 2007 to December 2008, Mr. Banks was co-head of Macquarie Real Estate Group’s Real Estate Capital division. Mr. Banks is also a director of MBL’s associates, MGPA, which has a global real estate investment platform. Mr. Banks commenced his property career in 1984 and was previously with Lend Lease Corporation, holding chief executive officer roles for the property businesses in Australia and the United States. He holds a Bachelor of Architecture (Hons) from the University of Melbourne.
As a result of these professional and other experiences, Mr. Banks possesses particular knowledge of real estate investment, management and dispositions, and real estate lending practices that strengthens the board’s collective knowledge, capabilities and experience.
Douglas N. Benham. Independent Director. Mr. Benham joined our board as an independent member in November 2009. Since April 2006, Mr. Benham has been the president and chief executive officer of DNB Advisors, LLC, a restaurant industry consulting firm. From January 2004 until April 2006, Mr. Benham served as president and chief executive officer of Arby’s Restaurant Group, a quick service restaurant company and subsidiary of Triarc Company (NYSE: TRY). From August 2003 until January 2004, Mr. Benham was president and chief executive officer of DNB Advisors, LLC. From January 1989 until August 2003, Mr. Benham served as chief financial officer, and from 1997 until 2003 also served as a member of the board of directors of RTM Restaurant Group, Inc., an Arby’s franchisee, that was later acquired by Triarc Company in July 2005. Prior to January 1989, Benham held various positions including at Deloitte & Touche, Bell Atlantic Corp., and Cox Enterprises. Since March 2008, Mr. Benham has served as a director of the restaurant operator O’Charley’s Inc. (NASDAQ: CHUX). In August 2009, Mr. Benham joined the board of directors of drive-thru restaurant chain operator Sonic Corp. (NASDAQ: SONC). Mr. Benham earned a BA in accounting from the University of West Florida in 1978.
As a result of these professional and other experiences, Mr. Benham possesses particular knowledge of financial accounting, and business and restaurant management that strengthens the board’s collective knowledge, capabilities and experience.
41
Table of Contents
James P. Dietz.Independent Director. Mr. Dietz joined our board as an independent member in November 2009. Since May 2010, Mr. Dietz has served as vice president of finance and accounting for PetroAlgae Inc. (OTCBB:PALG), which develops and commercializes new technologies to grow and harvest micro-crops for use in alternative fuels and other products. From May 2009 through April 2010, Mr. Dietz served as chief financial officer of U.S. Capital Holdings, LLC, an international private equity investor and developer, whose parent company is Tangshan Ganglu Iron & Steel Co., Ltd., a Chinese industrial company. From May 2008 until May 2009, Mr. Dietz served as vice president – finance and business development for PACT, LLC, a real estate development company, and from January 2008 until April 2008, Mr. Dietz was chief financial officer of American Leisure Group, a real estate investor and timeshare developer. From 1995 until December 2007, Mr. Dietz was with residential community developer WCI Communities, Inc. (NYSE: WCI), and various predecessor firms, as its chief financial officer. In August 2007, shareholders at WCI approved a new composition for WCI’s board of directors which had been submitted to them for vote at their annual meeting pursuant to an agreement between WCI and affiliates of Carl Icahn that resulted from a proxy contest. Mr. Dietz resigned as WCI’s chief financial officer in December 2007. WCI filed a voluntary petition under Chapter 11 of the federal bankruptcy laws on August 4, 2008, from which it emerged on August 31, 2009. From 1993 to 1995, Mr Dietz managed asset-backed financing originations for GTE Leasing Corporation (a subsidiary of GTE, a predecessor to Verizon Communications). He began his professional career in December 1986 joining Arthur Andersen & Co where he advanced to manager, providing audit and financial consulting services to clients in the construction, real estate, healthcare and legal industries. Mr. Dietz earned a BA in accounting and economics from the University of South Florida in 1986. Mr. Dietz is a certified public accountant.
As a result of these professional and other experiences, Mr. Dietz possesses particular knowledge of accounting, real estate investment and finance that strengthens the board’s collective knowledge, capabilities and experience.
Stephen J. LaMontagne. Independent Director. Mr. LaMontagne joined our board as an independent member in November 2009. Mr. LaMontagne is partner-in-charge of the real estate practice of Moore Colson, an Atlanta-based accounting and consulting firm, having joined the firm in December 2007. Prior to joining Moore Colson, Mr. LaMontagne held various positions with KPMG LLC beginning in May 1983 until December 2007, including serving over ten years as an assurance partner and southeast real estate practice leader, as well as serving on several of the firm’s national committees. While at KPMG and currently at Moore Colson, his focus includes real estate finance, financial accounting and reporting, mergers and acquisitions and audit matters. Mr. LaMontagne received a BS degree in accounting and a minor in finance from Florida State University in 1983. Mr. LaMontagne is a certified public accountant.
As a result of these professional and other experiences, Mr. LaMontagne possesses particular knowledge of accounting and tax practices that strengthens the board’s collective knowledge, capabilities and experience.
Robert A. Bourne. Chief Executive Officer. Mr. Bourne has served as our chief executive officer since our inception in March 2009 and as chief executive officer and a manager of our advisor since its inception in December 2008. Mr. Bourne also serves as chief executive officer of CNL Macquarie Global Growth Trust, Inc., a corporation that intends to operate as a REIT, and serves as chief executive officer and a manager of its advisor. He has served in various executive capacities of CNL since 1984 and also serves or has served in a number of executive capacities for a number of CNL Holdings’ affiliates, including: CNL Lifestyle Properties, Inc. and its advisor (2003 to present); CNL Hotels & Resorts, Inc. (1997 to 2007), and its advisor (1997 to 2006); CNL Retirement Properties, Inc. and its advisor (1997 to 2006); CNL Restaurant Properties, Inc., and its advisor (1994 to 2005); Trustreet Properties, Inc., a publicly traded REIT (2005-2007); National Retail Properties (1996 to 2005); CNL Capital Markets Corp. (2000 to present); and CNL Securities Corp. (1979 to present). Mr. Bourne also serves as vice chairman of the board of CNLBancshares, Inc. (1999 to present). Mr. Bourne began his career as a certified public accountant employed by Coopers & Lybrand, Certified Public Accountants (1971 through 1978), where he attained the position of tax manager in 1975. Mr. Bourne graduated from Florida State University with a B.A. in accounting, with honors.
Andrew A. Hyltin.President. Mr. Hyltin has served as our president and as the president and a manager of our advisor since November 1, 2010. Mr. Hyltin also serves as president of CNL Macquarie Global Growth Trust, Inc., a corporation that intends to operate as a REIT, and serves as a manager and president of its advisor. In addition, he serves as the chief executive officer and president of Corporate Capital Trust, Inc., a recently formed business development company currently in the process of registration for its initial public offering. Since 2009,
42
Table of Contents
Mr. Hyltin has held various officer positions with CNL Fund Advisors Company, an affiliate of CNL LLC, one of the Company’s sponsors, becoming that company’s president and investment committee member in 2009 and its chief executive officer in 2010. Since 2005, Mr. Hyltin has also served as president and chief investment officer of CNL Private Equity Corp, the parent entity of CNL Fund Advisors Company, responsible for the overall management of its portfolio and private offerings and alternative investments; and, he served as vice president of investments for that company from 2003 to 2005. From 2009 to 2010, Mr. Hyltin served as president to The CNL Funds, an open-end mutual fund. Mr. Hyltin has a B.A. in Finance from Texas Christian University.
Steven D. Shackelford. Chief Financial Officer and Secretary. Mr. Shackelford has served as our chief financial officer and secretary since inception in March 2009 and as chief financial officer and secretary of our advisor since inception in December 2008. Mr. Shackelford also serves as chief financial officer and secretary of CNL Macquarie Global Growth Trust, Inc., a corporation that intends to operate as a REIT, and serves as chief financial officer and secretary of its advisor. Mr. Shackelford joined CNL Real Estate Advisors Company, an affiliate of CNL, in February 2007, as chief financial officer and chief operating officer. Previously, Mr. Shackelford served as chief financial officer, executive vice president, chief operating officer and secretary of Trustreet Properties, Inc., a publicly traded REIT, from February 2005 to February 2007. Before joining Trustreet Properties, Inc., Mr. Shackelford served as executive vice president and chief operating officer of CNL Restaurant Properties, Inc., which he joined in September 1996. From March 1995 to July 1996, Mr. Shackelford was a senior manager in the national office of Price Waterhouse where he was responsible for advising foreign clients seeking to raise capital by gaining access to capital markets located in the United States. From August 1992 to March 1995, he was a manager in the Paris, France office of Price Waterhouse, serving several multi-national clients. Mr. Shackelford was a member of the audit staff and a senior accountant from 1986 to 1992 in the Orlando, Florida office of Price Waterhouse. Mr. Shackelford received his undergraduate degree in accounting and an M.B.A. from Florida State University. He is a certified public accountant.
Lilian Wong. Senior Vice President. Ms. Wong has served as a senior vice president of our Company and our advisor since March 2, 2011. Ms. Wong also serves as a senior vice president of CNL Macquarie Global Growth Trust, Inc., a corporation that intends to operate as a REIT, and serves as a senior vice president of its advisor. Ms. Wong is a division director within the Real Estate Banking Division of Macquarie Group. She currently is responsible for the business management across a diverse range of global real estate businesses and investments with a primary focus in Australia and Asia. Her key responsibilities include the investment management of the Real Estate Banking Division’s real estate private equity investments, development, principal and funds management activities. Ms. Wong joined Macquarie in February 2000 within the Finance Division of the Property Investment Management and Banking businesses and commenced her role as Business Manager in 2004 where she has been actively involved in establishing operational framework of the business and ongoing operations for real estate products and joint ventures. Ms. Wong holds a Bachelor of Commerce from the University of New South Wales, Sydney and is a member of the Institute of Chartered Accountants in Australia.
Mark D. Mullen. Senior Vice President. Mr. Mullen has served as a senior vice president since our inception in March 2009 and a manager, chief investment officer and a senior vice president of our advisor since its inception in December 2008. Mr. Mullen also serves as a senior vice president of CNL Macquarie Global Growth Trust, Inc., a corporation that intends to operate as a REIT, and serves as a manager and a senior vice president of its advisor. Mr. Mullen is a managing director of MIRA. He is currently responsible for managing Macquarie’s responsibilities relating to the operation of our advisor. Between July 2005 and December 2008, Mr. Mullen was responsible for real estate principal investments and advisory services for the Macquarie Real Estate Group (now part of MIRA) in North and South America. In this role, he supervised real estate acquisitions, the creation of new joint ventures and the development of new real estate fund products for the group. Mr. Mullen also has a broad background in analyzing and investing in publicly traded equity securities with the Macquarie Funds Management Group from prior positions, which have included being the head of UK Enhanced Equities from October 2001 to October 2004 and head of Australian Small Companies from October 2004 to May 2005. Mr. Mullen joined Macquarie in 1993. He has over 15 years of investment experience in both the public and private markets across the United States, United Kingdom and Australia. Mr. Mullen has a masters of commerce from the University of New South Wales, a bachelors of commerce from the University of New South Wales and has earned the right to use the Chartered Financial Analyst designation.
43
Table of Contents
The following first paragraph and the table and footnotes under the section entitled “SECURITY OWNERSHIP” on pages 114 and 115 of the prospectus are superseded and replaced in full by the following.
The following table shows, as of March 2, 2011, the number and percentage of outstanding shares of our common stock beneficially owned (unless otherwise indicated) by (i) any Person who is known by us to be the beneficial owner of more than 5% of our outstanding shares of common stock, (ii) our directors and nominees, (iii) our executive officers, and (iv) all of our directors and executive officers as a group. There were 1,088,627 shares of our common stock issued and outstanding as of March 2, 2011.
Name of Beneficial Owner | Common Stock Beneficially Owned(1) | |||||||
| Number of Shares of Common Stock | Percentage of Class | |||||||
James M. Seneff, Jr.(2)(3) | 11,111 | 1.02% | ||||||
Matthew S. Banks(4)(5) | — | — | ||||||
Douglas N. Benham(5) | — | — | ||||||
James P. Dietz(5) | — | — | ||||||
Stephen J. LaMontagne(5) | — | — | ||||||
Robert A. Bourne(2)(5) | — | — | ||||||
Andrew A. Hyltin (2)(5) | — | — | ||||||
Steven D. Shackelford(2)(5) | — | — | ||||||
Mark D. Mullen(5)(6) | — | — | ||||||
Lilian Wong(4)(5) | — | — | ||||||
All directors and officers as a group | 11,111 | 1.02% | ||||||
| (1) | Beneficial ownership is determined in accordance with the rules of the SEC and generally includes voting or investment power with respect to securities issuable pursuant to options, warrants and similar rights held by the respective Person or group that may be exercised within 60 days following December 31, 2010. Except as otherwise indicated by footnote, and subject to community property laws where applicable, the Persons named in the table above have sole voting and investment power with respect to all shares of common stock shown as beneficially owned by them. |
| (2) | The address for each of James M. Seneff, Jr., Robert A. Bourne, Andrew A. Hyltin and Steven D. Shackelford is CNL Center at City Commons, 450 South Orange Avenue, Orlando, Florida 32801. |
| (3) | Represents less than a 1% beneficial interest owned in our Company through the 50% beneficial interest in our advisor that is owned by CFG V, Inc., an affiliate of CNL. Mr. Seneff indirectly owns 100% of CNL and CFG V, Inc. Mr. Seneff and MIRA Inc. each beneficially own 50% of our advisor and share equal control over our advisor through their control of their respective affiliates. Does not include the less than a 1% beneficial interest held in our Company through our advisor that is controlled by Macquarie Real Estate Advisory Services LLC. |
| (4) | The address for Matthew S. Banks and Lilian Wong is No. 1 Martin Place, Sydney NSW 2000, Australia. |
| (5) | The amount is less than 1%. |
| (6) | The address for Mr. Mullen is 1 N. Wacker Drive, Suite 900, Chicago, Illinois 60606. |
THE ADVISOR AND THE ADVISORY AGREEMENT
The following information supplements and updates “THE ADVISOR AND THE ADVISORY AGREEMENT – Our Advisor,” which begins on page 116 of the prospectus.
Our Advisor
Our advisor’s operating agreement provides that, except where approval of the CNL Member and the Macquarie Member is expressly required by the operating agreement or nonwaivable provisions of applicable law, the business of our advisor is managed by a board of managers consisting of up to three members designated by the CNL
44
Table of Contents
Member and up to three members designated by the Macquarie Member. One of the managers serves as the chairman of the board of managers, presides at all meetings of the board of managers and generally oversees the performance of such other duties that are delegated to the board of managers. The term of office of the chairman is one year, or until his or her successor is designated; provided, however, that the term of the initial chairman began on March 4, 2009 and was to expire on January 1, 2011. On December 15, 2010, the board of managers waived the expiration of the term of the initial chairman and extended the term for an additional year, expiring on January 1, 2012. The initial chairman was designated by the Macquarie Member and the next chairman will be designated by the CNL Member. Thereafter, the right to designate the chairman will alternate between the Macquarie Member and the CNL Member from year to year.
Our advisor currently owns 22,222 shares of our common stock. Neither our advisor, any director, nor any of their affiliates may vote or consent on matters submitted to the stockholders regarding removal of our advisor, directors or any of their affiliates, or any transaction between us and any of them. In determining the requisite percentage interest of shares of common stock necessary to approve a matter on which our advisor, our directors and any of their affiliates may not vote or consent, any shares of common stock owned by any of them will not be included.
The executive officers and managers of our advisor and their respective backgrounds are as follows:
| Name | Age* | Position(s) | ||
Robert A. Bourne | 63 | Manager and Chief Executive Officer | ||
Andrew A. Hyltin | 51 | Manager and President | ||
Matthew S. Banks | 49 | Manager | ||
Mark D. Mullen | 39 | Manager, Chief Investment Officer and Senior Vice President | ||
James M. Seneff, Jr. | 64 | Manager | ||
Steven D. Shackelford | 47 | Chief Financial Officer and Secretary | ||
Lilian Wong | 32 | Senior Vice President | ||
| * | As of January 1, 2011 |
The backgrounds of Messrs. Bourne, Hyltin, Banks, Seneff, Shackelford and Mullen and of Ms. Wong listed above are described under the heading “Management — Directors and Executive Officers.”
The following paragraph updates and replaces the first paragraph entitled “THE ADVISOR AND THE ADVISORY AGREEMENT – The Investment Committee” on page 119 of the prospectus.
The Investment Committee
Our advisor has formed an investment committee (“Investment Committee”) comprised of up to three representatives from each of the CNL Member and the Macquarie Member. The representatives designated by the CNL Member must vote as a group and the representatives designated by the Macquarie Member must vote as a group. Members of the Investment Committee need not be managers of our advisor. One member of the Investment Committee serves as chairman of the Investment Committee, having a term of office of one year, with the chairmanship rotating alternatively each year between a member designated by the Macquarie Member and a member designated by the CNL Member. On December 15, 2010, the board of managers waived the expiration of the term of the initial chairman of the Investment Committee and extended the term for an additional year, expiring on January 1, 2012. The Investment Committee assists our advisor in exercising oversight of our assets, including:
| • | approving the recommendation of the investment and reinvestment of our funds; |
| • | monitoring the management of our funds and the funds of our Operating Partnership by reviewing written reports from investments managers and consultants, and by discussing with sub-advisors and consultants the primary determinants of returns, including asset allocation and investment strategy; |
45
Table of Contents
| • | evaluating our investment performance based on comparison of actual returns with our return objective and with such other benchmarks as the Investment Committee may from time to time select, taking into account compliance with investment policies, guidelines and risk levels; |
| • | developing and presenting an investment strategy to our board of directors for consideration and approval; |
| • | approving the recommendation of the disposition of all, or any portion, of our assets or the assets of our Operating Partnership; |
| • | approving the recommendation of any investment by us or our Operating Partnership in derivative securities or the decision by us to enter into a hedging transaction; |
| • | approving the recommendation to enter into any major lease by us or our Operating Partnership or any of our subsidiaries; and |
| • | approving the recommendation of any financing by us or our Operating Partnership or any of our subsidiaries. |
The following paragraph supersedes and replaces the second bulleted paragraph under the heading “THE ADVISOR AND THE ADVISORY AGREEMENT – The Advisory Agreement -Compensation to our Advisor and its Affiliates and Related Parties,” which begins on page 121 of the prospectus.
| • | We will pay our advisor as compensation for services rendered in connection with the selection, evaluation, structure and purchase of real properties, or Permitted Investments that are not securities, or the making of loans, an Investment Services Fee in the amount (i) with respect to (A) each real property acquired directly by us or our Operating Partnership, 1.85% of the contract purchase price of such asset, or (B) each loan or Permitted Investment that is not real property or a security acquired or made directly by us or our Operating Partnership, 1.85% of the amount invested, and (ii) with respect to each (A) real property acquired indirectly by us or our Operating Partnership through one or more of its affiliates or joint ventures, 1.85% of the contract purchase price of such property multiplied by our, or our Operating Partnership’s, percentage equity interest in such affiliates or joint ventures, or (B) loan or Permitted Investment that is not real property or a security acquired or made indirectly by us or our Operating Partnership through one or more of its affiliates or joint ventures, 1.85% of the amount invested, multiplied by our, or our Operating Partnership’s, percentage equity interest in such affiliates or joint ventures. These fees will be paid to our advisor on the closing of the acquisition of such Asset. No Investment Services Fee will be paid to our advisor in connection with the purchase by us or our Operating Partnership of securities. |
The following paragraph supersedes and replaces the fourth bulleted paragraph under the heading “THE ADVISOR AND THE ADVISORY AGREEMENT – The Advisory Agreement –Compensation to our Advisor and its Affiliates and Related Parties” which begins on page 121 of the prospectus.
| • | If our advisor, an affiliate or related party provides a substantial amount of the services (as determined in good faith by a majority of our Independent Directors) in connection with the sale of one or more Assets (including the sale of all of our Assets or the sale of our Company or portion thereof), we will pay our advisor or affiliate a Disposition Fee in an amount equal to: (i) in the case of the sale of real property, the lesser of (A) one-half of the competitive real estate commission, or (B) 1% of the sales price of such real property or properties; (ii) in the case of the sale of other Assets other than real property, loans or securities investments, 1% of the sales price of such Asset; and (iii) in the case of the sale of loans, our advisor, its affiliates and related parties shall receive a Disposition Fee in an amount equal to 1% of the contract price of any loan. We will not pay a Disposition Fee upon the maturity, prepayment, workout, modification or extension of a loan unless there is a corresponding fee paid by the borrower to us, in which case the Disposition Fee will be the lesser of (i) 1% of the principal amount of the loan or (ii) the amount of the fee paid by the borrower in connection with such transaction. If we take ownership of a property as a result of a workout or foreclosure of a loan, we will pay a Disposition Fee of 1% of the contract price of such real property when sold. Any Disposition Fee |
46
Table of Contents
on any loan in excess of 1% would require approval of the majority of our Independent Directors limited to a maximum amount of the Disposition Fees payable to our advisor, its affiliates and related parties to 1% of the sales price. The total of all real estate and brokerage commissions we pay to all Persons shall not exceed the lesser of (i) a competitive real estate or brokerage commission or (ii) 6% of the gross sales price. No Disposition Fee will be paid to our advisor in connection with the sale by us or our Operating Partnership of investments that are securities; provided, however, a Disposition Fee in the form of a usual and customary brokerage fee may be paid to an affiliate or related party of our advisor if, at the time of such payment, such affiliate or related party is a properly registered and licensed broker-dealer (or equivalent) in the jurisdiction in which the securities are being sold. Any Disposition Fee paid to an affiliate or related party of the advisor in connection with the sale of securities will be included in Total Operating Expenses for purposes of calculating conformance with the 2%/25% Guidelines. |
The following paragraph is added as the last bulleted paragraph under the heading “THE ADVISORY AND THE ADVISORY AGREEMENT – The Advisory Agreement –Compensation to our Advisor and its Affiliates and Related Parties” which begins on page 121 of the prospectus.
| • | We will pay to our advisor for services rendered in connection with the refinancing of any debt obligations of the Company or our subsidiaries, a Financing Coordination Fee in the amount of 1% of the gross amount of the refinancing. Any such Financing Coordination Fee deemed to be earned by the advisor party will be paid to the advisor upon the closing of the refinancing. Such fees are included in Total Operating Expenses for purposes of calculating conformance with the 2%/25% Guidelines. |
The following information updates “THE ADVISOR AND THE ADVISORY AGREEMENT – Sub-advisors” section which begins on page 127 of the prospectus. Specifically, the third full paragraph on page 128 is superseded in full by the following paragraph.
Each of our sub-advisors may assign their respective sub-advisory agreements only with the consent of our advisor. The sub-advisory agreements may not be assigned by our advisor without the consent of the sub-advisor, except for an assignment to any successor to all of our advisor’s assets, rights and obligations. Our sub-advisors may subcontract with any Person they deem qualified, including an affiliate, to perform a portion of their services without obtaining our advisor’s consent.
CERTAIN RELATIONSHIPS AND RELATED TRANSACTIONS
The following information supersedes and replaces in full the first four paragraphs under the heading “CERTAIN RELATIONSHIPS AND RELATED TRANSACTIONS,” on page 134 of the prospectus.
Certain of our directors and officers hold similar positions with our advisor, which is also a stockholder of ours, and CNL Securities Corp., which is the Managing Dealer for our public offerings. Our chairman of the board indirectly owns a controlling interest in CNL, an affiliate of our advisor. These affiliates will receive fees and compensation in connection with this offering and the acquisition, management and disposition of our Assets.
We will pay the Managing Dealer selling commissions of up to 7% of Gross Proceeds and a marketing support fee of 3% of Gross Proceeds in connection with the offering. We also will reimburse our Managing Dealer for actual, bona fide, itemized and detailed due diligence expenses of up to 0.50% of Gross Proceeds from our primary offering. Up to all of such amounts may be reallowed to third-party participating broker-dealers.
We reimburse our advisor, its affiliates and related parties for other actual Organizational and Offering expenses incurred in connection with our formation, qualification and registration and the marketing and distribution of our shares of common stock in the offering. We became obligated to reimburse our advisor and its affiliates and related parties, as applicable, for Organizational and Offering Expenses paid by them on our behalf on October 6, 2010, when we had received and accepted subscriptions for the Minimum Offering of $2.0 million of shares of common stock. Under FINRA rules and the NASAA Guidelines, the total amount of Organizational and Offering Expenses (including selling commissions and marketing support fees) we incur for our primary offering may not
47
Table of Contents
exceed 15% of the Gross Proceeds of our primary offering. Our advisor is obligated to reimburse us to the extent such expenses incurred by us in our primary offering exceed 15% of the Gross Proceeds of our primary offering.
As of the year ended December 31, 2010, the Company paid or accrued approximately $1.2 million of Organizational and Offering Expenses, which amount represents the Company’s maximum liability for Organizational and Offering Expenses as of December 31, 2010. Organizational and Offering Expenses incurred by the advisor become a liability of the Company only to the extent such Organizational and Offering Expenses do not exceed 15% of the Gross Proceeds of the primary offering. The advisor has incurred on the Company’s behalf an additional $5.2 million of Organizational and Offering Expenses in connection with the offering as of December 31, 2010, exceeding the 15% expense limitation. The Organizational and Offering Expenses are recorded by the Company, subject to the limitation of 15% of the Gross Proceeds, as the Gross Proceeds are received. Therefore, these costs will be deducted from future offering proceeds and reimbursed to the advisor and affiliates to the extent that the costs are within the 15% limitation.
We will pay our advisor Investment Services Fees for services in the selection, evaluation, structure and purchase of properties an amount equal to 1.85% of the contract purchase price or the amount invested for properties, as applicable, and of funds advanced for loans or the amount invested in the case of other Assets (except securities); provided that we will not pay our advisor an Investment Services Fee in connection with the purchase of securities.
The following paragraph is added after the seventh paragraph under the heading “CERTAIN RELATIONSHIPS AND RELATED TRANSACTIONS,” on page 134 of the prospectus.
We will pay our advisor Financing Coordination Fees if our advisor provides services in connection with the refinancing of any debt obligations of the Company or our subsidiaries in an amount equal to 1% of the gross amount of such refinancing, subject to certain limitations.
The following paragraphs replace and supersede the eighth and ninth paragraphs under the heading “CERTAIN RELATIONSHIPS AND RELATED TRANSACTIONS,” on pages 134 and 135 of the prospectus.
We will pay our advisor a Disposition Fee in an amount equal to (i) in the case of the sale of real property, the lesser of (A) one-half of a competitive real estate commission, or (B) 1% of the sales price of such property, (ii) in the case of the sale of any Asset other than real property, loans or securities investments, 1% of the sales price of such Asset, or (iii) in the case of the sale of loans, 1% of the contract price of any loan, if our advisor, its affiliates or related parties provide a substantial amount of services, as determined by our Independent Directors, in connection with the sale of one or more Assets (including a sale of all of our Assets or the sale of our Company or a portion thereof). We will not pay our advisor a Disposition Fee in connection with the sale of securities that are investments; however, a Disposition Fee in the form of a usual and customary brokerage fee may be paid to an affiliate or related party of our advisor if, at the time of such payment, such affiliate or related party is a properly registered and licensed broker-dealer (or equivalent) in the jurisdiction in which the securities are being sold. Any Disposition Fee paid to an affiliate or related party of the advisor in connection with the sale of securities will be included in our Total Operating Expenses for purposes of calculating conformance with the 2%/25% Guidelines.
Our advisor, its affiliates and related parties also are entitled to reimbursement of certain expenses incurred on our behalf in connection with our acquisitions, operating activities and other corporate businesses. Pursuant to the Advisory Agreement, commencing with the fourth full fiscal quarter following the initial effective date of this offering, we will not reimburse our advisor any amount by which Total Operating Expenses paid or incurred by us exceed the greater of 2% of Average Invested Assets or 25% of Net Income in any Expense Year. Therefore, to the extent that operating expenses payable or reimbursable by us, in any four consecutive fiscal quarters commencing with April 1, 2011 (the “Expense Year”), exceed the greater of 2% of average invested assets or 25% of net income, the advisor shall reimburse us, within 60 days after the end of the Expense Year, the amount by which the total operating expenses paid or incurred by us exceed the greater of the 2% or 25% threshold. Notwithstanding the foregoing, we may reimburse the advisor for expenses in excess of this limitation if a majority of our Independent Directors determines that such excess expenses are justified based on unusual and non-recurring factors.
48
Table of Contents
The following information supersedes and replaces in full the section of the prospectus entitled “SUMMARY OF DISTRIBUTION REINVESTMENT PLAN AND AUTOMATIC PURCHASE PLAN” beginning on page 137. In addition, all references to the Automatic Purchase Plan throughout the prospectus are to be deemed deleted.
SUMMARY OF DISTRIBUTION REINVESTMENT PLAN
We have adopted a Distribution Reinvestment Plan pursuant to which our stockholders may elect to have the full amount of their cash distributions reinvested in additional shares of our common stock. We are offering 2.5% of the shares of this offering for sale pursuant to our Distribution Reinvestment Plan. Such shares are being offered at a 5% discount from the price of shares offered in our primary offering; therefore, the shares offered pursuant to our Distribution Reinvestment Plan will be offered at an initial price of $9.50 per share. The plan is attached to this supplement as Appendix E.
An independent agent, referred to as the “reinvestment agent,” which is currently Boston Financial Data Services, Inc., will act on behalf of the participants in the Distribution Reinvestment Plan to acquire shares of our common stock with the cash distributions participants are entitled to receive from us. Distributions will be invested in shares promptly following the payment date with respect to such distributions to the extent shares are available. The reinvestment agent will invest all distributions attributable to shares owned by participants in our shares at either:
| • | the per share offering price for Distribution Reinvestment Plan shares under our current best efforts offering; |
| • | $9.50 per share if there is no current best efforts offering, unless adjusted by our board of directors, which price shall in no event be less than 95% of the fair market value as determined by our board of directors at such time; or |
| • | provided that the amount reinvested is reduced by any brokerage commission, the market price following the Listing of our shares on a national stock exchange or the inclusion in an inter-dealer quotation system. |
All shares available for purchase under our Distribution Reinvestment Plan either are registered pursuant to the prospectus or will be registered under the Securities Act through a separate prospectus that includes shares registered for sale under the Distribution Reinvestment Plan. Until this offering has terminated, shares will be available for purchase in connection with this offering. Prior to the conclusion of this offering, if the 2.5% of shares initially designated for our Distribution Reinvestment Plan have been purchased by the reinvestment agent and we anticipate additional demand for our Distribution Reinvestment Plan shares, we may decide to reallocate a portion of our shares initially designated for our primary offering to the Distribution Reinvestment Plan. Similarly, prior to the conclusion of this offering, if any of the 2.5% of shares initially designated for the Distribution Reinvestment Plan remain unsold after meeting anticipated obligations under the plan, we may decide to sell a portion of such shares in our primary offering.
The Distribution Reinvestment Plan may be amended or supplemented by an agreement between the reinvestment agent and us at any time, including, but not limited to, an amendment to the Distribution Reinvestment Plan to substitute a new reinvestment agent to act as agent for the participants or increase the administrative charge payable to the reinvestment agent, by mailing an appropriate notice at least 15 days prior to the effective date thereof to each participant at his or her last address of record; provided, that any such amendment must be approved by a majority of our Independent Directors and by any necessary regulatory authorities. Such amendment or supplement shall be deemed conclusively accepted by each participant except those participants from whom we receive written notice of termination prior to the effective date thereof. Notwithstanding the foregoing, the Distribution Reinvestment Plan may not be amended so as to eliminate a participant’s right to terminate his or her participation in the Distribution Reinvestment Plan, as described below.
Our reinvestment agent will use the aggregate amount of distributions to all participants for each quarter to purchase shares (including fractional shares) for the participants. Distributions will be invested by the reinvestment agent in shares, to the extent available, promptly following the payment date with respect to such distributions. Any distributions that have not been invested in shares within 30 days after such distributions are made by us will be returned to participants.
49
Table of Contents
For each participant, the reinvestment agent will maintain a record which will reflect for each month the distributions received by the reinvestment agent on behalf of such participant. The purchased shares will be allocated among the participants based on the portion of the aggregate distributions received by the reinvestment agent on behalf of each participant. The allocation of shares among participants may result in the ownership of fractional shares. The ownership of our shares purchased under our Distribution Reinvestment Plan will be reflected on our record books.
We will be responsible for all administrative charges and expenses charged by the reinvestment agent. Any interest earned on such distributions will be paid to us to defray certain costs relating to the Distribution Reinvestment Plan.
Subject to the provisions of our articles of incorporation relating to certain restrictions on and after the effective dates of transfer, shares acquired pursuant to the Distribution Reinvestment Plan will entitle the participant to the same rights and to be treated in the same manner as those purchased by the investors in the primary offering. In the event that proceeds from the sale of shares pursuant to the Distribution Reinvestment Plan are used to acquire properties or to invest in loans or other Permitted Investments, we will pay our advisor and other affiliates certain fees and expense reimbursements in accordance with applicable agreements between the parties, as approved by our board of directors, including a majority of our Independent Directors. In addition, we will pay all costs in connection with offering shares pursuant to the Distribution Reinvestment Plan and related offering, including reimbursement to affiliates for amounts incurred on our behalf. However, we will not pay any selling commissions or marketing support fees in connection with the shares issued pursuant to the Distribution Reinvestment Plan.
During each quarter but in no event later than 30 days after the end of each calendar quarter, the reinvestment agent will mail and/or make electronically available to each participant in the Distribution Reinvestment Plan a statement of account describing, as to such participant, the distributions received during the quarter, the number of shares purchased during the quarter and the per share purchase price for such shares. At least annually, we or our reinvestment agent will send each participant tax information for income earned on shares under the Distribution Reinvestment Plan.
Stockholders who purchase shares in this offering may elect to participate in the Distribution Reinvestment Plan by making a written election to participate on their subscription agreements at the time they subscribe for shares or subsequently by completing an authorization form or such other similar form, as applicable. Participation in the Distribution Reinvestment Plan will commence with the next distribution made after receipt of the participant’s notice of participation, and for all months thereafter, provided such notice is received at least 15 business days prior to the last day of the month, as the case may be.
Participants will be able to terminate their participation in the Distribution Reinvestment Plan at any time without penalty by delivering written notice to us at least 15 business days prior to the last day of the month to which such distribution relates. A participant who chooses to terminate participation in the Distribution Reinvestment Plan must terminate his or her entire participation in the plan and will not be allowed to terminate in part. If a participant terminates his or her participation, the reinvestment agent will send him or her a remittance for the amount of any distributions in the participant’s account that have not been reinvested in shares, and our record books will be revised to reflect the ownership records of his or her full and fractional shares. Presenting shares for redemption under our Redemption Plan does not automatically terminate participation in the Distribution Reinvestment Plan. A participant who redeems shares must still provide the written notice of termination in order to terminate participation in the Distribution Reinvestment Plan.
There are no fees associated with a participant’s terminating his or her interest in the Distribution Reinvestment Plan. A participant in the Distribution Reinvestment Plan who terminates his or her participation in such plan will be allowed to participate in the Distribution Reinvestment Plan again upon receipt of a then-current prospectus relating to participation in such plan which contains at a minimum the following: (i) the minimum investment amount; (ii) the type or source of proceeds that may be invested; and (iii) the tax consequences of the reinvestment to the participant.
Prior to the Listing of our shares, if ever, any stockholder’s transfer of shares will terminate such stockholder’s participation in the Distribution Reinvestment Plan with respect to such transferred shares as of the first day of the month in which such transfer is effective, unless the transferee of such shares in connection with such transfer
50
Table of Contents
demonstrates that such transferee meets the requirements for participation in the Distribution Reinvestment Plan and elects to participate by delivering the appropriate, executed authorization forms.
Offers and sales of shares under our Distribution Reinvestment Plan must be registered in certain states in which such offers and sales are made unless an exemption from registration is available. Generally, such registrations are good for a one year period. Accordingly, we may be required to cease our sale of shares under the Distribution Reinvestment Plan if any of the states in which registration is required is not renewed annually.
Our board of directors reserves the right to prohibit Plans from participating in the Distribution Reinvestment Plan if such participation would cause our underlying assets to constitute “plan assets” of Plans. See “Plan of Distribution — ERISA Considerations.”
Stockholders subject to federal taxation who elect to participate in the Distribution Reinvestment Plan will incur a tax liability for distributions allocated to them even though they have elected not to receive their distributions in cash but rather to have their distributions withheld and reinvested pursuant to such plan. Specifically, stockholders will be treated as if they have received the distribution from us and then applied such distribution to purchase shares in the Distribution Reinvestment Plan. In addition, to the extent that a stockholder purchases shares in the Distribution Reinvestment Plan at a discount to their fair market value, the stockholder will be treated for tax purposes as receiving an additional distribution equal to the amount of the discount. In other words, based on the current offering price and discount under our Distribution Reinvestment Plan, participants in our Distribution Reinvestment Plan will be treated as having received an additional distribution of $0.50 for each share acquired by them under our Distribution Reinvestment Plan. A stockholder designating a distribution for reinvestment will be taxed on the amount of such distribution as ordinary income to the extent such distribution is from current or accumulated earnings and profits, unless we have designated all or a portion of the distribution as a capital gain dividend. In such case, such designated portion of the distribution will be taxed as long-term capital gain. For additional discussion of the tax treatment of distributions, see “Federal Income Tax Considerations — Distributions Generally.” Any stockholder that is eligible for a volume discount or any other reduction in selling commissions or other fees, as set forth elsewhere in the prospectus, should consult with its own tax advisor before electing to participate in the Distribution Reinvestment Plan.
We reserve the right to renew, extend, or amend any aspect of the Distribution Reinvestment Plan without the consent of stockholders, provided that notice of the amendment is sent to participants at least 15 days prior to the effective date thereof. Any such amendment must be approved by a majority of our Independent Directors and by any necessary regulatory authority. Any amendment or supplement will be deemed conclusively accepted by each participant except those participants who notify us in writing prior to the effective date of the distribution. We also reserve the right to terminate the Distribution Reinvestment Plan for any reason, at any time, by 15 days’ prior written notice to all participants.
The following information supersedes and replaces in full the first two paragraphs under the heading “SUMMARY OF REDEMPTION PLAN” on page 141 of the prospectus.
Our board of directors has adopted a Redemption Plan designed to provide our eligible stockholders with limited, interim liquidity by enabling them to sell shares back to us prior to the Listing of our shares, if any. We will not pay any fees to our sponsors, advisor, directors or affiliates in connection with the redemption of our shares. Subject to certain restrictions discussed below, we may redeem shares, including fractional shares, from time to time, at the following prices:
| • | 92.5% of the purchase price paid per share for stockholders who have owned those shares for at least one year; |
| • | 95.0% of the purchase price paid per share for stockholders who have owned those shares for at least two years; |
| • | 97.5% of the purchase price paid per share for stockholders who have owned those shares for at least three years; and |
51
Table of Contents
| • | for stockholders who have owned those shares for at least four years, a price determined by our board of directors but in no event less than 100% of the purchase price paid per share. |
During the period of any public offering, the repurchase price will not exceed the then current public offering price for our shares (other than the price at which shares are sold under our Distribution Reinvestment Plan).
Any stockholder who has held shares for not less than one year may present for our consideration all or any portion of such shares to us for redemption at any time. A stockholder may present fewer than all of his or her shares to us for redemption; provided, however, that the minimum number of shares that must be presented for redemption must be at least 25% of his or her shares. In addition, we have the right to waive the holding periods and redemption prices set forth above and the pro rata redemption requirements described below in the event of the death, permanent disability or bankruptcy of a stockholder or other exigent circumstances. Shares that are redeemed in connection with the death, permanent disability, bankruptcy of a stockholder or other exigent circumstances will be redeemed at the lesser of the then current offering price or the price at which the investor purchased such shares while the share redemption program is in effect and sufficient funds are available. In addition, we, in our sole discretion, may redeem such shares prior to the redemption of any other shares. Except for the holding periods, redemption prices and redemption timing, any shares redeemed pursuant to the exercise of this authority will be otherwise subject to the procedures and limitations in the Redemption Plan. There is no assurance that there will be sufficient funds available for redemption or that we will exercise our discretion to redeem such shares and, accordingly, a stockholder’s shares may not be redeemed. Factors that our board of directors, in its discretion, will consider in making our determinations to redeem shares include:
| • | whether such redemption impairs our capital or operations; |
| • | whether an emergency makes such redemption not reasonably practical; |
| • | whether any governmental or regulatory agency with jurisdiction over us demands such action for the protection of our stockholders; |
| • | whether such redemption would be unlawful; and |
| • | whether such redemption, when considered with all other redemptions, sales, assignments, transfers and exchanges of our shares, could prevent us from qualifying as a REIT for tax purposes. |
The following supersedes and replaces in full the discussion under the heading “DISTRIBUTION POLICY” on page 144 of the prospectus.
We make distributions to stockholders pursuant to the provisions of our articles of incorporation, which allow us to make distributions of cash or other property, which may include our own securities. Once our board of directors commenced declaring distributions, whether in cash, our own securities or other property, or combination thereof, we declare distributions daily and pay distributions to our stockholders on a monthly basis providing that our board of directors determines we have, or anticipate having, sufficient cash available to do so. The type, amount, frequency or basis of distributions declared to our stockholders will be determined by our board of directors and is dependent upon a number of factors, including expected and actual net cash flow from operations or FFO for the year, our financial condition, a balanced analysis of value creation reflective of both current and expected long-term stabilized cash flows from our properties, our objective of qualifying as a REIT for U.S. federal income tax purposes, the actual operating results of each month, economic conditions, other operating trends, capital requirements and avoidance of volatility of distributions.
We are required to distribute at least 90% of our taxable income to qualify as a REIT, and maintain our REIT qualification, for tax purposes. See “Federal Income Tax Considerations — Operational Requirements — Annual Distribution Requirement.” We expect to have little, if any, cash flow from operations or FFO available for distribution until we make substantial investments. Therefore, until such time as we have sufficient cash flow from operations or FFO to fund fully the payment of distributions therefrom, some or all of our distributions may be paid from other
52
Table of Contents
sources, such as from cash flows generated by financing activities, a component of which includes borrowings, whether secured by our assets or unsecured, and the proceeds of this offering. We have not established any limit on the extent to which we may use borrowings or proceeds of this offering to pay distributions. Our advisor, its affiliates or related parties also may advance cash to us or waive Asset Management Fees to provide us with additional cash, although they are not required to do so. Because we may receive income from interest or rents at various times during our fiscal year, distributions may not reflect our income and cash flow earned in that particular distribution period, but may be made in anticipation of cash flow that we expect to receive during a later period and may be made in advance of actual receipt of funds in an attempt to make distributions relatively uniform.
Many of the factors that can affect the availability and timing of cash distributions to stockholders are beyond our control, and a change in any one factor could adversely affect our ability to pay future distributions. There can be no assurance that future cash flow will support distributions at the rate that such distributions are paid in any particular distribution period. See “Risk Factors — Company Related Risks.” There can be no assurance that we will be able to achieve expected cash flows necessary to pay distributions or maintain distributions at any particular level, or that distributions will increase over time.
We may distribute our own securities in lieu of making cash distributions to stockholders or issue our own securities as a component of distributions in the future.
The following information supplements the “DISTRIBUTION POLICY” section on page 144 of the prospectus.
On May 25, 2010, our board of directors authorized a daily distribution of $0.0017808 per share of common stock which commenced on October 7, 2010, the day following the date on which we received and accepted subscriptions for the minimum offering of $2.0 million in shares of common stock. Distributions are calculated based on the number of days each stockholder has been a stockholder of record in that month. Distributions that accrued in October, the month the minimum offering was met, and November, the subsequent month, were accumulated and paid in December. Thereafter, at the end of each month, that month’s accrued distributions will be aggregated and paid in the following month. The daily distribution rate is equal to an annualized distribution rate of 6.5%, using our offering price of $10.00 per share. Our board of directors intends to evaluate our distribution policy on a quarterly basis.
For the period October 7, 2010 through November 30, 2010, we distributed $42,647 to our stockholders. For the period December 1, 2010 through December 31, 2010, we had accrued $40,732 in distributions payable to our stockholders which we distributed on January 14, 2011.
We did not have distributable earnings in 2010 and therefore, the distributions were made from financing activities including proceeds from this offering.
We may pay some or all of our distributions from sources other than cash flow from operations, such as cash flows from financing activities, which may include borrowings, cash resulting from a waiver or deferral of fees, and proceeds of our initial public offering. Distributions for stockholders participating in our Distribution Reinvestment Plan will be reinvested into shares of our common stock on the date such distributions are paid.
FEDERAL INCOME TAX CONSIDERATIONS
The following information updates and replaces the first two paragraphs under the heading “FEDERAL INCOME TAX CONSIDERATIONS — REIT Qualification” on page 157 of the prospectus.
REIT Qualification
We plan to make an election to be treated as a REIT under the Code for our taxable year ended December 31, 2010. We believe that, commencing with such taxable year, we are organized and operating in a manner so as to qualify as a REIT for U.S. federal income tax purposes. This section of the prospectus discusses the laws governing the tax treatment of a REIT and its stockholders. These laws are highly technical and complex.
53
Table of Contents
In connection with this offering, Arnold & Porter LLP has delivered an opinion to us that, commencing with our taxable year ended December 31, 2010, we are organized in conformity with the requirements for qualification as a REIT under the Code, and our proposed method of operation will enable us to meet the requirements for qualification and taxation as a REIT.
The following information updates and replaces the first paragraph under the heading “FEDERAL INCOME TAX CONSIDERATIONS — Taxation of Macquarie CNL Global Income Trust, Inc.” on page 158 of the prospectus.
Taxation of Macquarie CNL Global Income Trust, Inc.
If we qualify for taxation as a REIT, we generally will not be subject to federal corporate income taxes on that portion of our ordinary income or capital gain that we distribute currently to our stockholders, because the REIT provisions of the Code generally allow a REIT to deduct distributions paid to its stockholders. This substantially eliminates the federal double taxation on earnings (taxation at both the corporate level and stockholder level) that usually results from an investment in a corporation. For tax years through 2012, most U.S. stockholders that are individuals, trusts or estates are taxed on corporate dividends at a maximum rate of 15% (the same as long-term capital gains). With limited exceptions, however, dividends from us or from other entities that are taxed as REITs are generally not eligible for this rate and will continue to be taxed at rates applicable to ordinary income, which will be as high as 35% based on current laws. See “— Taxation of Taxable U.S. Stockholders.”
The following information updates and replaces the section of the prospectus entitled “FEDERAL INCOME TAX CONSIDERATIONS — Distributions Generally – Capital Gain Distributions” on pages 171 and 172.
Capital Gain Distributions
Distributions to U.S. stockholders that we properly designate as capital gain distributions normally will be treated as long-term capital gains to the extent they do not exceed our actual net capital gain for the taxable year without regard to the period for which the U.S. stockholder has held his shares of common stock. A corporate U.S. stockholder might be required to treat up to 20% of some capital gain distributions as ordinary income. Long-term capital gains are generally taxable at maximum federal rates of 15% (through 2012) in the case of stockholders who are individuals, trusts and estates, and 35% in the case of stockholders that are corporations. Capital gains attributable to the sale of depreciable real property held for more than 12 months are subject to a 25% maximum federal income tax rate for taxpayers who are individuals, to the extent of previously claimed depreciation deductions (unrecaptured Section 1250 gains). See “— Requirements for Qualification as a REIT — Operational Requirements — Annual Distribution Requirement” for the treatment by U.S. stockholders of net long-term capital gains that we elect to retain and pay tax on.
The following information updates and replaces the first paragraph under the heading “FEDERAL INCOME TAX CONSIDERATIONS — Distributions Generally – Certain Dispositions of Our Common Stock” on page 172 of the prospectus.
Certain Dispositions of Our Common Stock
In general, capital gains recognized by individuals upon the sale or disposition of shares of our common stock will be subject to a maximum federal income tax rate of 15% (through 2012) if such shares of common stock are held for more than 12 months, and will be taxed at ordinary income rates (of up to 35% through 2012) if such shares of common stock are held for 12 months or less. Gains recognized by stockholders that are corporations are subject to federal income tax at a maximum rate of 35%, whether or not classified as long-term capital gains. Capital losses recognized by a stockholder upon the disposition of a share of our common stock held for more than one year at the time of disposition will be considered long-term capital losses, and are generally available only to offset capital gain income of the stockholder but not ordinary income (except in the case of individuals, trusts and estates who may offset up to $3,000 of ordinary income each year). In addition, any loss upon a sale or exchange of shares of common stock by a stockholder who has held such shares of common stock for six months or less, after applying holding period rules, will be treated as a long-term capital loss to the extent of distributions received from us that are required to be treated by the stockholder as long-term capital gain. In addition, under the so-called “wash sale” rules (as defined in the Code),
54
Table of Contents
all or a portion of any loss that a stockholder realizes upon a taxable disposition of shares of common stock may be disallowed if the stockholder purchases (including through our Distribution Reinvestment Plan) other shares of our stock (or stock substantially similar to our stock) within 30 days before or after the disposition.
The following information supplements the “FEDERAL INCOME TAX CONSIDERATIONS — Distributions Generally” section of the prospectus and is inserted following the first full paragraph on page 173.
Distributions Generally
Taxation of Distributions
On October 18, 2010, the U.S. Department of the Treasury published final regulations that require us to report the cost basis and gain or loss to a stockholder upon the sale or liquidation of “covered shares.” For purposes of the final regulations, all shares acquired by non-tax exempt stockholders on or after January 1, 2011 will be considered “covered shares” and will be subject to the new reporting requirement. In addition, beginning on January 1, 2012, all shares acquired by non-tax exempt stockholders through our Distribution Reinvestment Plan will also be considered “covered shares.”
Upon the sale or liquidation of “covered shares,” a broker must report both the cost basis of the shares and the gain or loss recognized on the sale of those shares to the selling stockholder and to the IRS on Form 1099-B. In addition, effective January 1, 2011, S-corporations will no longer be exempt from Form 1099-B reporting and shares purchased by an S-corporation on or after January 1, 2012 will be “covered shares” under the final regulations. If we take an organizational action such as a stock split, merger, or acquisition that affects the cost basis of “covered shares,” we will report to each stockholder and to the IRS a description of any such action and the quantitative effect of that action on the cost basis on an information return.
We have elected the first in, first out (FIFO) method as the default for calculating the cost basis and gain or loss upon the sale or liquidation of “covered shares.” Effective January 1, 2011, a non-tax exempt stockholder may elect a different method of computation until the settlement date of the sold or liquidated shares. The election must be made in writing on the Investor Change Form that will be available athttp://www.cnlmacquarieglobalgrowthtrust.com/gopaperless. We recommend that you consult with your tax advisor to determine the appropriate method of accounting for your investment and for any additional information regarding cost basis reporting.
The following information supplements the “PLAN OF DISTRIBUTION – The Offering” on page 182 of the prospectus.
We commenced our initial public offering of shares of our common stock on April 23, 2010. Until our receipt and acceptance of subscriptions aggregating at least $2 million, all subscription proceeds were placed in escrow pursuant to the terms of an escrow agreement with UMB Bank, N.A. As of October 6, 2010, we had received and accepted aggregate subscriptions in excess of the Minimum Offering amount of $2 million in shares of common stock and on October 8, 2010, the funds were released from escrow and we commenced operations. As of March 2, 2011, we had sold 1,066,405 shares of our common stock for approximately $10.6 million, including approximately $34,000 for 3,572 shares issued pursuant to our Distribution Reinvestment Plan. The shares sold and gross offering proceeds received from such sales do not include the 22,222 shares purchased by our advisor for $200,000 preceding the commencement of our offering. As of March 2, 2011, there remained approximately 148.9 million shares of our common stock available for offer and sale pursuant to this offering.
The following paragraphs supersede and replace in full the first two paragraphs under the heading “PLAN OF DISTRIBUTION – Compensation Paid for Sales of Shares” on page 183 of the prospectus.
55
Table of Contents
Compensation Paid for Sales of Shares
We will pay our Managing Dealer selling commissions of up to 7% of Gross Proceeds from the sale of shares through our primary offering. Our Managing Dealer may reallow up to 100% of these selling commissions to participating brokers with respect to shares they sell. We also will pay our Managing Dealer a marketing support fee of up to 3% of Gross Proceeds from the sale of shares through our primary offering. Our Managing Dealer may reallow up to 100% of these marketing support fees to participating brokers who have signed a participating broker agreement with our Managing Dealer or to a participating broker’s broker-dealer affiliate who agrees to assume the participating broker’s obligations as set forth in such participating broker agreement. Generally, our Managing Dealer will reallow up to 100% of the marketing support fees if the participating broker agrees to provide one or more of the following services:
| • | internal marketing support personnel (such as telemarketers or a marketing director) to assist our Managing Dealer’s marketing team; |
| • | internal marketing communications vehicles, such as newsletters, conference calls, interactive CD-ROMs and internal mail to promote us and this offering; |
| • | answers to investors’ inquiries concerning monthly statements, valuations, distribution rates, tax information, annual reports, reinvestment and redemption rights and procedures, our financial status and the real estate markets in which we have invested; |
| • | assistance to investors with reinvestments; |
| • | maintaining the technology necessary to adequately service our investors, as otherwise associated with this offering; or |
| • | other services, as requested by investors from time to time. |
We will not pay selling commissions and the marketing support fee in connection with shares sold pursuant to our Distribution Reinvestment Plan. See the section of this supplement titled “Summary of Distribution Reinvestment Plan.”
The following replaces the first full paragraph, including bullets thereunder, under the heading “PLAN OF DISTRIBUTION – Purchases Net of Selling Commissions and Marketing Support Fee” on page 184 of the prospectus:
Purchases Net of Selling Commissions and Marketing Support Fee
We will not pay selling commissions or marketing support fees in connection with sales of shares pursuant to our Distribution Reinvestment Plan. In addition, investors may pay reduced commissions on certain sales of shares, including sales to:
| • | registered principals or representatives of our Managing Dealer or a participating broker (and immediate family members of any of the foregoing persons); |
| • | our employees, officers and directors or those of our advisor, our property manager or the affiliates of any of the foregoing entities (and the immediate family members of any of the foregoing persons or entities), any Plan established exclusively for the benefit of such persons or entities, and, if approved by our board of directors, joint venture partners, consultants and other service providers; |
| • | clients of an investment adviser registered under the Investment Advisers Act of 1940 or under applicable state securities laws; or |
| • | persons investing in a bank trust account with respect to which the authority for investment decisions made (other than any registered investment advisor that also is registered as a broker-dealer, with the exception of clients who have “wrap” accounts which have asset based fees with such dually registered investment advisor/broker-dealer) has been delegated to the bank trust department. |
56
Table of Contents
The following paragraph supersedes and replaces in full the last paragraph under the heading “PLAN OF DISTRIBUTION – Discount Procedures” on page 186 of the prospectus.
Any reduction in selling commissions and/or the marketing support fee will reduce the effective purchase price per share but will not alter the proceeds available to us at the time of such sale. For purposes of distributions, investors who receive a discounted purchase price will receive higher return on their investments in our common stock than investors who do not receive a discounted purchase price.
The following paragraph supersedes and replaces in full the fourth paragraph under the heading “PLAN OF DISTRIBUTION – Subscription Procedures” which appears on page 188 of the prospectus.
Subscriptions are effective only upon our acceptance, and we reserve the right to reject any subscription in whole or in part; however, at our election, any purchase of shares at a discount (other than shares purchased via the Distribution Reinvestment Plan) will not be effective on any date upon which we pay any dividend or other distribution with respect to our shares. We generally admit stockholders on a daily basis; however, at our election, any purchase of shares at a discount (other than shares purchased via the Distribution Reinvestment Plan) shall not be effective on any date upon which we pay any dividend or other distribution with respect to our shares. Subscriptions will be accepted or rejected within 30 days of receipt by our transfer agent and, if rejected, all funds will be returned to the rejected subscribers within ten business days. We may not accept a subscription for shares until at least five business days after the date you receive the final prospectus. You will receive a confirmation of your purchase. If a subscriber’s check does not clear they will not be admitted as a stockholder and will not be entitled to any distributions.
We are deleting the information “PLAN OF DISTRIBUTION – Escrow Arrangement” on page 187 of the prospectus as a result of having satisfied the escrow conditions for the Minimum Offering on October 6, 2010.
The following paragraph replaces the corresponding paragraph under the heading “EXPERTS” on page 193 of the prospectus.
The consolidated financial statements of Macquarie CNL Global Income Trust, Inc. incorporated in this supplement by reference to the Annual Report on Form 10-K for the year ended December 31, 2010, have been so incorporated in reliance on the report of PricewaterhouseCoopers LLP, an independent registered certified public accounting firm, given on the authority of said firm as experts in auditing and accounting.
The following definitions are added under the heading “DEFINITIONS” commencing on page 195 of the prospectus.
“CNL LLC” or “CNL Financial Group, LLC” means CNL Financial Group, LLC, a Florida limited liability company.
“Financing Coordination Fee” means a fee payable to our advisor for services rendered to us under the Advisory Agreement in connection with the refinancing of any debt obligations of the Company or our subsidiaries equal to 1% of the gross amount of any such refinancing. Any such Financing Coordination Fee deemed to be earned by the advisor party shall be paid upon the closing of the refinancing. Any such Financing Coordination Fee paid to our advisor in connection with the refinancing shall be included in Total Operating Expenses for purposes of calculating conformance with the 2%/25% Guidelines.
“MIRA” means Macquarie Infrastructure and Real Assets, a business platform focused on the creation and management of specific asset class investor funds (“specialist funds”) within Macquarie (formerly known as Macquarie Capital Funds).
57
Table of Contents
“MIRA Inc.” means Macquarie Infrastructure and Real Assets Inc. (formerly known as Macquarie Capital Funds Inc.).
The following definitions supersede and replace in full the corresponding definitions under the heading “DEFINITIONS” commencing on page 195 of the prospectus.
“Disposition Fee” means the fee payable if our advisor or an affiliate provides a substantial amount of services (as determined in good faith by a majority of our Independent Directors) in connection with the sale of one or more Assets (including the sale of all of our Assets or the sale of our Company or a portion thereof).
“Investment Services Fee” means the fee that our advisor shall receive as compensation for services rendered in connection with the selection, evaluation, structure and purchase of real properties or Permitted Investments that are not securities, or the making or acquisition of loans that are not securities, a fee in the amount of (i) with respect to each (A) real property acquired directly by us or our Operating Partnership, 1.85% of the contract purchase price of such asset, or (B) loan or Permitted Investment that is not real property or a security acquired or made directly by us or our Operating Partnership, 1.85% of the amount invested, and (ii) with respect to each (A) real property acquired indirectly by us or our Operating Partnership through one or more of its affiliates or joint ventures, 1.85% of the contract purchase price of such asset multiplied by our, or our Operating Partnership’s, percentage equity interest in such affiliates or joint ventures, or (B) loan or Permitted Investment that is not real property or a security acquired or made indirectly by us or our Operating Partnership through one or more of its affiliates or joint ventures, 1.85% of the amount of the investment, multiplied by our, or our Operating Partnership’s, percentage equity interest in such affiliates or joint ventures. Such fees shall be paid to our advisor as we or our Operating Partnership closes on the acquisition of such asset. Notwithstanding the foregoing, no Investment Services Fee shall be paid to the advisor in connection with the purchase by us or our Operating Partnership of real estate-related securities that are securities, Permitted Investments that are securities or loans that are securities. In the case of a development or construction project, upon completion of the project, our advisor shall determine the actual amounts paid. To the extent the amounts actually paid vary from the budgeted amounts on which the Investment Services Fee was initially based, our advisor will pay or invoice the Company for 1.85% of the budget variance such that the Investment Services Fee is ultimately 1.85% of amounts expended on such development or construction project.
“Macquarie Infrastructure and Real Assets” means the business platform focused on the creation and management of specific asset class investor funds (“specialist funds”) within Macquarie.
“Priority Return” means, as of any date, an aggregate amount equal to a 6% cumulative, non-compounded, annual return on Invested Capital, prorated for any partial year. For purposes of calculating the Priority Return for any calendar year or portion thereof, we will use the daily weighted average amount of Invested Capital for such period.
The following definition is deleted under the heading “DEFINITIONS” commencing on page 195 of the prospectus.
“Automatic Purchase Plan” means that certain automatic purchase plan, a copy of which is attached hereto as Appendix F, pursuant to which our stockholders may elect to purchase additional shares of our common stock at regular intervals through automatic debits to their checking, savings, or other bank account.
This supplement includes updated prior performance tables for MIRA or their affiliates (Appendix B), and updated prior performance tables for another public program co-sponsored by CNL LLC and MIRA Inc. (Appendix C). Attached to this supplement as Appendix D is an updated form of subscription agreement.
58
Table of Contents
ADDENDUM TO
PRIOR PERFORMANCE TABLES — MIRA
THE PRIOR PERFORMANCE TABLES IN THIS ADDENDUM UPDATE AND REPLACE APPENDIX B TO THE PROSPECTUS DATED APRIL 23, 2010.
| ||||||||
Table of Contents
The information in this Appendix B contains certain relevant information concerning the prior performance of certain prior public programs (the “Macquarie Prior Public Programs”) sponsored by MIRA and its affiliates. Macquarie Prior Public Programs selected for inclusion in Appendix B were based on the respective programs’ investment objectives and MIRA’s and its affiliates’ overall management role and control over these objectives. As stated in the Prior Performance Summary, these Macquarie Prior Public Programs are Charter Hall Retail REIT1, Charter Hall Office REIT1, EDT Retail Trust2, Starhill Global REIT3, Macquarie Central Office CR REIT, and Macquarie ProLogis Trust.
As a result of the transactions described below, MIRA and its affiliates no longer sponsor these programs:
| • | Charter Hall Retail REIT is a REIT listed on the Australian Securities Exchange (ASX code: CQR) which invests primarily in premier grocery anchored shopping centers in Australia, Europe, New Zealand, and the United States. Effective March 1, 2010, Macquarie CountryWide Trust has been renamed Charter Hall Retail REIT. The sale of the majority of Macquarie’s Australian core real estate funds management platform to Charter Hall Group, including the management businesses of Macquarie CountryWide Trust, has been substantially completed. |
| • | Charter Hall Office REIT is a REIT listed on the Australian Securities Exchange (ASX code: CQO) that invests predominantly in high-grade office buildings in major business districts in Australia, Europe, Japan, and the United States. Effective March 1, 2010, Macquarie Office Trust has been renamed Charter Hall Office REIT. The sale of the majority of Macquarie’s Australian core real estate funds management platform to Charter Hall Group, including the management businesses of Macquarie Office Trust, has been substantially completed. |
| • | EDT Retail Trust is a REIT listed on the Australian Securities Exchange (ASX code: EDT) that invests predominantly in premium U.S. shopping centers that focuses on the value and convenience retail sector. On June 18, 2010, Macquarie sold its 50% interest in Macquarie DDR Trust’s (“MDT”) responsible entity to EPN GP, LLC. As a part of this transaction, Macquarie will provide transitional services related to the management and administration of the trust until December 2010. Following the transaction, MDT has been renamed EDT Retail Trust. |
| • | Starhill Global REIT is listed on the Singapore Exchange investing in premium retail and office properties in China, Japan, and Singapore. Effective December 31, 2008, Macquarie PRIME REIT has been renamed Starhill Global REIT. On December 31, 2008, Macquarie completed the sale of its approximate 26% holding in Macquarie PRIME REIT, as well as its 50% interest in the holding company of Macquarie PRIME REIT’s manager and property manager to YTL Corporation Berhad. |
| • | Macquarie Central Office CR REIT, or “MCO REIT”, was listed on the Korea Exchange and invested in a premium office building in Korea. On August 13, 2009, MCO REIT disposed of its sole asset, and on October 9, 2009, MCO REIT was delisted from the Korea Exchange and was subsequently liquidated. Details of this completed program are presented in Table IV. |
| • | Macquarie ProLogis Trust was a REIT listed on the Australian Securities Exchange (ASX: MPR) that invested in high quality industrial property in the United States and Mexico. Macquarie ProLogis Trust was managed through a joint venture with ProLogis. The program delisted in July 2007, and was acquired by ProLogis. Details of this completed program are presented in Table IV. |
All Macquarie Prior Public Programs described above have the main objective of investing solely in real estate and real estate-related assets and are managed in whole or in part by MIRA and its affiliates, which has significant control over the investment objectives of the Macquarie Prior Public Programs.
| 1 | Effective March 1, 2010, Macquarie Office Trust and Macquarie CountryWide Trust have been renamed Charter Hall Office REIT and Charter Hall Retail REIT, respectively. The sale of the majority of Macquarie’s Australian core real estate funds management platform to Charter Hall Group, including the management businesses of Macquarie Office Trust and Macquarie CountryWide Trust, has been substantially completed. |
| 2 | On June 18, 2010, Macquarie sold its 50% interest in Macquarie DDR Trust’s (“MDT”) responsible entity to EPN GP, LLC. As a part of this transaction, Macquarie provided transitional services related to the management and administration of the trust until December 18, 2010. Following the transaction, MDT was renamed EDT Retail Trust. |
| 3 | Effective December 31, 2008, Macquarie PRIME REIT has been renamed Starhill Global REIT. On December 31, 2008, Macquarie completed the sale of its approximate 26% holding in Macquarie PRIME REIT, as well as its 50% interest in the holding company of Macquarie PRIME REIT’s manager and property manager to YTL Corporation Berhad. |
B-1
Table of Contents
A more detailed description of the acquisitions by the Macquarie Prior Public Programs is set forth in Part II of the registration statement filed with the Commission for this offering and is available from the Company upon request, without charge. In addition, upon request to the Company, the Company will provide, without charge, a copy of the most recent annual reports filed with the ASX by Charter Hall Retail REIT, Charter Hall Office REIT, EDT Retail Trust, and Macquarie ProLogis Trust; filed with the Singapore Exchange by Starhill Global REIT; or filed with the Korea Exchange by Macquarie Central Office CR REIT.
Stockholders should not construe inclusion of the following tables as implying that the Company will have results comparable to those reflected in such tables or will make investments comparable to those reflected in the tables. Distributable cash flow, federal income tax deductions, or other factors could be substantially different. Stockholders should note that, by acquiring shares in the Company, they will not be acquiring any interest in any Macquarie Prior Public Programs.
Description of Tables
The following tables are included herein:
Table I – | Experience in Raising and Investing Funds | |
Table II – | Compensation to Sponsor | |
Table III – | Operating Results of Prior Programs | |
Table IV – | Results of Completed Programs | |
Table V – | Sales or Disposals of Properties |
Unless otherwise indicated in the Tables, all information contained in these tables is as of fiscal year ending June 30, 2009 and where noted, prior three or five year data is presented as of this date. Additionally, unless otherwise stated all monetary figures are presented in Australian currency. All financial reporting has been in accordance with International Financial Reporting Standards (“IFRS”) as issued by the International Accounting Standards Board (“IASB”), unless otherwise indicated. Where information has been reported under Singapore or Korean standards no material adjustments to IFRS have been deemed necessary.
Table I: Experience in Raising and Investing Funds
Table I presents information on a percentage basis reflecting the experience of MIRA’s and affiliates’ ability to raise and invest funds. Three Macquarie Prior Public Programs have had capital raisings that have closed in the previous three fiscal years: Charter Hall Retail REIT4, Charter Hall Office REIT4, and Starhill Global REIT.5 In addition to capital raisings offered to the public, Table I includes capital raised through institutional placements, unit purchase plans and dividend reinvestment plans. An institutional placement is a capital raise that is only offered to institutional investors. A unit purchase plan is a capital raise that is only offered to existing investors and allows those existing investors to purchase additional shares without incurring brokerage or transaction costs.
The table reflects the total dollar amount offered and raised by each program. Additionally, the table reflects the date and length of offerings as well as offering expenses, reserve for operations, acquisition costs, and amount leveraged, all on a percentage basis.
Table II: Compensation to Sponsor
Table II presents information on an Australian dollar basis, unless otherwise indicated, regarding total fees paid to MIRA and affiliates from four Macquarie Prior Public Programs, the offerings of which have closed in the previous three fiscal years.
| 4 | Effective March 1, 2010, Macquarie Office Trust and Macquarie CountryWide Trust have been renamed Charter Hall Office REIT and Charter Hall Retail REIT, respectively. The sale of the majority of Macquarie’s Australian core real estate funds management platform to Charter Hall Group, including the management businesses of Macquarie Office Trust and Macquarie CountryWide Trust, has been substantially completed. |
| 5 | Effective December 31, 2008, Macquarie PRIME REIT has been renamed Stahill Global REIT. On December 31, 2008, Macquarie completed the sale of its approximate 26% holding in Macquarie PRIME REIT, as well as its 50% interest in the holding company of Macquarie PRIME REIT’s manager and property manager to YTL Corporation Berhad. |
B-2
Table of Contents
Table III: Operating Results of Prior Programs
Table III presents a summary of operating results for four Macquarie Prior Public Programs sponsored by MIRA and affiliates that have had offerings which have closed within the most recent five fiscal years. The information presents a summary of each program’s income or loss for the previous three fiscal years, which is presented on the basis of IFRS as issued by IASB, unless otherwise indicated. Macquarie Central Office CR REIT (“MCO REIT”) reports its financial statements under Korean accounting standards and Starhill Global REIT reports its financials under Singapore accounting standards. No material adjustments from Korean and Singapore Accounting Standards to IFRS have been deemed necessary. The table also includes cash generated from operations, sales, and refinancings and cash generated after distributions. Additionally, the table provides a summary of tax and distribution data per A$1,000 invested, unless otherwise indicated.
Table IV: Results of Completed Programs
Table IV presents the results of the Macquarie Prior Public Programs that have completed operations within the most recent five years.
Macquarie ProLogis Trust was traded on the Australian Securities Exchange until July 2007. The assets were sold to ProLogis. This table presents a summary of information for this program over the life of the program regarding: capital raised, number of properties acquired, closing of program, and tax and distribution data per A$1000 invested.
On August 13, 2009, MCO REIT disposed of its sole asset. On October 9, 2009, MCO REIT was delisted from the Korea Exchange and was subsequently liquidated.
Effective December 31, 2008, Macquarie PRIME REIT has been renamed Starhill Global REIT. On December 31, 2008, Macquarie completed the sale of its approximate 26% holding in Macquarie PRIME REIT, as well as its 50% interest in the holding company of Macquarie PRIME REIT’s manager and property manager to YTL Corporation Berhad. Starhill Global REIT is not included in Table IV as Macquarie’s sale was only that of a management interest. As such, prior performance information for Starhill Global REIT through December 31, 2007 can be found in Tables I, II, III and Part II of the registration statement filed with the Commission for this offering.
Effective March 1, 2010, Macquarie Office Trust and Macquarie CountryWide Trust have been renamed Charter Hall Office REIT and Charter Hall Retail REIT, respectively. The sale of the majority of Macquarie’s Australian core real estate funds management platform to Charter Hall Group, including the management businesses of Macquarie Office Trust and Macquarie CountryWide Trust, has been substantially completed. Charter Hall Office REIT and Charter Hall Retail REIT are not included in Table IV as Macquarie’s sale was only that of a management interest. As such, prior performance information for Charter Hall Office REIT and Charter Hall Retail REIT through June 30, 2009 can be found in Tables I, II, III, V and Part II of the registration statement filed with the Commission for this offering.
On June 18, 2010, Macquarie sold its 50% interest in Macquarie DDR Trust’s (“MDT”) responsible entity to EPN GP, LLC. As a part of this transaction, Macquarie will provide transitional services related to the management and administration of the trust until December 2010. Following the transaction, MDT has been renamed EDT Retail Trust. EDT Retail Trust is not included in Table IV as Macquarie’s sale was only that of a management interest. As such, prior performance information for EDT Retail Trust through June 30, 2009 can be found in Tables II, III, V and Part II of the registration statement filed with the Commission for this offering.
Table V: Sales or Disposals of Properties
Table V presents a summary of all properties owned by a Macquarie Prior Public Program that were sold in the previous three fiscal years. The table includes the selling price of the property, the cost of the property, the date acquired and date of sale.
B-3
Table of Contents
TABLE I(1)
EXPERIENCE IN RAISING & INVESTING FUNDS
(all amounts presented in Australian dollars (A$), unless otherwise stated)
| Charter Hall Retail REIT(2) | Charter Hall Office REIT(2) | Starhill Global REIT(16),(17),(18) | ||||||||||||||||
Dollar amount offered | ||||||||||||||||||
Public & Institutional Offering | 120,000,001 | 508,447,181 | 924,140,000 | (19) | ||||||||||||||
Unit Purchase Plan (“UPP”) | 138,093,757 | 153,390,000 | — | |||||||||||||||
Distribution Reinvestment Plan (“DRP”) | 453,974,933 | (3) | 282,287,139 | (3) | — | |||||||||||||
Total | 712,068,691 | 944,124,321 | 924,140,000 | |||||||||||||||
Dollar amount raised (100%) ($m) | ||||||||||||||||||
Public & Institutional Offering | 120,000,001 | 508,447,181 | 924,140,000 | |||||||||||||||
UPP | 26,730,034 | 9,461,952 | — | |||||||||||||||
DRP | 164,532,449 | (3) | 101,111,111 | (3) | — | |||||||||||||
Total | 311,262,484 | 619,020,244 | 924,140,000 | |||||||||||||||
Less offering expenses: | ||||||||||||||||||
Selling fees & commissions | 0.60% | 3.49% | 3.37% | |||||||||||||||
Organization & offering expenses | 0.02% | 0.39% | — | |||||||||||||||
Marketing support & due diligence expenses | 0.00% | 0.00% | — | |||||||||||||||
Secondary units | 0.93% | 0.00% | — | |||||||||||||||
Total | 1.55% | (4) | 3.88% | (11) | 3.37% | |||||||||||||
Percent available for investment | 98.45% | 96.12% | 96.63% | |||||||||||||||
Repayment of borrowings | — | 78.28% | (12) | — | ||||||||||||||
Capital expenditures, including development cost | 50.91% | (5) | 16.33% | (5) | — | |||||||||||||
Acquisition costs: | ||||||||||||||||||
Cash down payment | 40.06% | 0.18% | 96.54% | |||||||||||||||
Acquisition fees | 6.82% | 0.23% | 0.09% | |||||||||||||||
Acquisition expenses | 0.66% | 1.10% | — | |||||||||||||||
Total acquisition cost | 47.54% | (6),(7) | 1.51% | (7),(13) | 96.63% | |||||||||||||
Percent leverage (mortgage financing divided by total acquisition cost) | 76.82% | (8) | 0.00% | (14) | 33.05% | |||||||||||||
Date offering began | ||||||||||||||||||
Public & Institutional Offering | 04/18/07 | 12/12/08 | 09/13/05 | |||||||||||||||
UPP | 04/23/07 | 06/29/07 | N/A | |||||||||||||||
DRP | Refer Note | (9) | Refer Note | (9) | N/A | |||||||||||||
Length of offering (in months) | ||||||||||||||||||
Public & Institutional Offering | — | (10) | 2 | 1 | ||||||||||||||
UPP | 2 | 1 | N/A | |||||||||||||||
DRP | Refer Note | (9) | Refer Note | (9) | N/A | |||||||||||||
Months to invest 90% of amount available for investment (measured from beginning of offering) | ||||||||||||||||||
Public & Institutional Offering | 2 | Refer Note | (15) | 1 | ||||||||||||||
UPP | 2 | — | N/A | |||||||||||||||
DRP | Refer Note | (9) | Refer Note | (9) | N/A | |||||||||||||
FOOTNOTES:
| 1 | EDT Retail Trust (“EDT”) was omitted from Table I, as EDT only raised funds through DRP issuances over the previous three fiscal years. Total amount raised over this time was approximately A$15,535,000 with associated offering expenses of approximately A$28,000. These funds were not used for acquisitions, but for capital expenditures on existing assets. On June 18, 2010, Macquarie sold its 50% interest in Macquarie DDR Trust’s (“MDT”) responsible entity to EPN GP, LLC. As a part of this transaction, Macquarie will provide transitional services related to the management and administration of the trust until December 2010. Following the transaction, MDT has been renamed EDT Retail Trust. |
| 2 | Information presented in accordance with IFRS. Effective March 1, 2010, Macquarie Office Trust and Macquarie CountryWide Trust have been renamed Charter Hall Office REIT and Charter Hall Retail REIT, respectively. The sale of the majority of Macquarie’s Australian core real estate funds management platform to Charter Hall Group, including the management businesses of Macquarie Office Trust and Macquarie CountryWide Trust, has been substantially completed. |
| 3 | Under the DRP, unit holders can elect to receive distributions as either cash or additional units. As this is offered to all unit holders, the amounts offered equal the total distributions payable to all unit holders for applicable distributions in the period. |
| 4 | Represents percentage of total funds raised, including DRP, that were applied to total offering expenses. Total offering expenses related to non-DRP issuances represents 3.27% of non-DRP funds raised. |
| 5 | Represents percentage of total funds raised, including DRP, that were applied to capital expenditures, including development costs. These expenditures were funded via DRP proceeds. |
B-4
Table of Contents
| 6 | Represents percentage of total funds raised, including DRP, that were applied to acquisition costs. Of the total funds raised, 50.91% was applied to capital expenditures, including development costs. Of the remaining 49.09% of total funds raised, 96.84% was applied to total acquisition costs. |
| 7 | Acquisition costs refer only to properties purchased with funds raised, including DRP, during the previous three fiscal year periods. Because the fund already existed, other properties will have been purchased in the past three years from existing capital, debt, and/or operating income from the fund. The additional acquisitions are reflected in Part II of the registration statement. |
| 8 | Includes acquisitions undertaken directly by Charter Hall Retail REIT and its controlled entities. Excludes capital expenditure and acquisitions undertaken by U.S. joint venture entities which were funded by joint venture operating income and debt. |
| 9 | Unit holders of the Trust can make an election to receive future distributions as additional units under the DRP at any time during the year. To be effective for a particular distribution, the election must be made prior to the relevant ex-dividend date relating to that distribution. |
| 10 | Charter Hall Retail REIT completed a capital raise in April 2007 raising A$120 million. The capital raise was fully underwritten by Macquarie Equity Capital Markets, Merrill Lynch and Morgan Stanley. |
| 11 | Represents percentage of total funds raised, including DRP, that were applied to total offering expenses. The total offering expenses related to non-DRP issuances represents 1.13% of non-DRP funds raised. |
| 12 | Represents percentage of total funds raised, including DRP, that were utilized towards the repayment of borrowings. |
| 13 | Represents percentage of total funds raised, including DRP, that were applied to acquisition costs. Of the total funds raised, 78.28% was applied towards the repayment of borrowings and 16.33% was applied to capital expenditures, including development costs. Of the remaining 5.39% of total funds raised, 28.91% was applied to total acquisition costs. |
| 14 | Properties were purchased utilizing a multi-currency syndicated facility and are not individually encumbered to a fixed amount. |
| 15 | Charter Hall Office REIT completed a capital raise in January 2009. The proceeds of this capital raise were utilized towards the repayment of borrowings. |
| 16 | Information presented in accordance with Singapore accounting standards. No material adjustments to IFRS deemed necessary. |
| 17 | Effective December 31, 2008, Macquarie PRIME REIT was renamed Starhill Global REIT. On December 31, 2008, Macquarie completed the sale of its approximate 26% holding in Macquarie PRIME REIT, as well as its 50% interest in the holding company of Macquarie PRIME REIT’s manager and property manager to YTL Corporation Berhad. As such, prior performance information for Starhill Global REIT is presented for periods through December 31, 2007. |
| 18 | Fiscal year end for Starhill Global REIT is December 31; therefore, information presented is as of December 31, 2007. |
| 19 | Amount presented in Singapore dollars (“SGD”). |
B-5
Table of Contents
TABLE II
COMPENSATION TO SPONSOR
(all amounts presented in Australian dollars (A$)1, unless otherwise stated)
| Other Programs(10) | ||||||||||||||||||||||||||||||||||||||||
| Type of Compensation | Charter Hall Retail REIT (2) | Charter Hall Office REIT (2) | EDT Retail Trust (5) | Starhill Global REIT (7),(8),(9) | Macquarie ProLogis Trust | MCO CR REIT(11) | ||||||||||||||||||||||||||||||||||
Date offering commenced | 07/01/06 | 07/01/06 | 07/01/06 | 09/13/05 | DRP 07/01/2006 | |||||||||||||||||||||||||||||||||||
Dollar amount raised | 311,262,484 | 619,200,000 | 15,535,000 | (6 | ) | 924,140,000 | 7,900,000 | — | ||||||||||||||||||||||||||||||||
Amount paid to sponsor from proceeds of offering: | ||||||||||||||||||||||||||||||||||||||||
Underwriting fees | 960,044 | 14,019,000 | — | 6,902,808 | — | — | ||||||||||||||||||||||||||||||||||
Acquisition and due diligence fees | 3,783,006 | — | — | 4,215,525 | — | — | ||||||||||||||||||||||||||||||||||
Placement and brokerage fee | — | — | — | 6,222,125 | — | — | ||||||||||||||||||||||||||||||||||
| ||||||||||||||||||||||||||||||||||||||||
Total | 4,743,050 | (3 | ) | 14,019,000 | (3 | ) | — | 17,340,458 | (3 | ) | — | — | ||||||||||||||||||||||||||||
Dollar amount of cash generated from operations before deducting payments to sponsor | 591,723,402 | 653,951,830 | 303,170,603 | 175,213,500 | 117,174,526 | 57,117,187,755 | ||||||||||||||||||||||||||||||||||
Amount paid to sponsor from operations: | ||||||||||||||||||||||||||||||||||||||||
Management fees | 26,445,000 | 57,835,000 | 16,881,500 | 11,852,000 | 4,793,500 | 24,862,530,755 | ||||||||||||||||||||||||||||||||||
Accounting services | 1,560,000 | 2,235,000 | 545,000 | — | 185,000 | — | ||||||||||||||||||||||||||||||||||
Other acquisition, due diligence and consultancy services | 4,697,159 | 7,195,830 | 75,271 | 903,000 | 54,247 | — | ||||||||||||||||||||||||||||||||||
Leasing and tenant negotiations | 3,978,045 | 4,811,000 | — | 691,000 | — | — | ||||||||||||||||||||||||||||||||||
Project and contract management services | — | 1,856,000 | — | — | — | — | ||||||||||||||||||||||||||||||||||
Property management services | 6,082,878 | 252,000 | — | — | — | — | ||||||||||||||||||||||||||||||||||
Reimbursements to property manager | — | — | — | 1,089,500 | — | — | ||||||||||||||||||||||||||||||||||
Property financial management fees | — | 370,000 | — | — | — | — | ||||||||||||||||||||||||||||||||||
Development services | 4,139,671 | 3,085,000 | — | — | — | — | ||||||||||||||||||||||||||||||||||
Valuation services | 208,308 | — | 45,820 | — | — | — | ||||||||||||||||||||||||||||||||||
Debt placement fee | — | 2,250,000 | 1,088,617 | — | 298,059 | — | ||||||||||||||||||||||||||||||||||
Advisory services | — | — | — | — | — | — | ||||||||||||||||||||||||||||||||||
Other administrative support | 12,341 | 62,000 | 7,395 | — | 10,720 | — | ||||||||||||||||||||||||||||||||||
| ||||||||||||||||||||||||||||||||||||||||
| 47,123,402 | (3 | ) | 79,951,830 | (3 | ) | 18,643,603 | (3 | ) | 14,535,500 | (3 | ) | 5,341,526 | 24,862,530,755 | |||||||||||||||||||||||||||
Dollar amount of property sales and refinancing before deducting payments to sponsor | 766,200,000 | (4 | ) | 1,115,000,000 | (4 | ) | — | — | — | 310,000,000,000 | ||||||||||||||||||||||||||||||
Amount paid to sponsor from property sales and refinancing: | ||||||||||||||||||||||||||||||||||||||||
Disposal and due diligence fees | 5,655,515 | 2,433,000 | — | — | — | 35,124,844,922 | ||||||||||||||||||||||||||||||||||
FOOTNOTES:
| 1 | Certain payments were made in US$. For the purpose of this table, these amounts were converted to A$ using the yearly average foreign exchange rate. |
| 2 | Effective March 1, 2010, Macquarie Office Trust and Macquarie CountryWide Trust have been renamed Charter Hall Office REIT and Charter Hall Retail REIT, respectively. The sale of the majority of Macquarie’s Australian core real estate funds management platform to Charter Hall Group, including the management businesses of Macquarie Office Trust and Macquarie CountryWide Trust, has been substantially completed. |
| 3 | Amount includes fees paid to Macquarie, Macquarie subsidiaries and related parties. Where amount was paid to a Macquarie joint venture, the amount included in this table represents Macquarie’s applicable share. |
| 4 | Property dispositions include sales of assets purchased prior to closings listed in previous three fiscal years, which reflects a greater dollar amount of dispositions than proceeds from offerings |
| 5 | On June 18, 2010, Macquarie sold its 50% interest in Macquarie DDR Trust’s (“MDT”) responsible entity to EPN GP, LLC. As a part of this transaction, Macquarie will provide transitional services related to the management and administration of the trust until December 2010. Following the transaction, MDT has been renamed EDT Retail Trust. |
| 6 | Information only relates to DRP issuances, which were the only form of capital raised by EDT Retail Trust in the previous three fiscal years. See note 1 in Table I for more details. |
| 7 | Fiscal year for Starhill Global REIT is December 31; therefore information presented for this REIT is as of December 31, 2007. |
| 8 | Amounts presented in Singapore dollars (“SGD”). |
| 9 | Effective December 31, 2008, Macquarie PRIME REIT was renamed Starhill Global REIT. On December 31, 2008, Macquarie completed the sale of its approximate 26% holding in Macquarie PRIME REIT, as well as its 50% interest in the holding company of Macquarie PRIME REIT’s manager and property manager to YTL Corporation Berhad. |
| 10 | Other Programs presented in the table above include the only other Macquarie Prior Public Programs who made payments to Macquarie in the previous three fiscal years. This column presents payments made to Macquarie during the previous three fiscal years by Macquarie ProLogis Trust (“MPR”) and Macquarie Central Office CR REIT (“MCO REIT”), both of which are completed programs. Further details of MPR and MCO REIT are presented in Table IV. |
| 11 | Amounts presented in South-Korean Won. |
B-6
Table of Contents
TABLE III
OPERATING RESULTS OF PRIOR PROGRAMS
(all amounts presented in Australian dollars (A$), unless otherwise stated)
Charter Hall Retail REIT1,2 | Charter Hall Office REIT1,2 | EDT Retail Trust1,4 | Starhill Global REIT6,7,8 | MCO CR REIT10,11,12 | ||||||||||||||||||||||||||||||||||||||||||||||||||||||||||||||||||||||||
| 06/30/07 | 06/30/08 | 06/30/09 | 06/30/07 | 06/30/08 | 06/30/09 | 06/30/07 | 06/30/08 | 06/30/09 | 12/31/05 | 12/31/06 | 12/31/07 | 06/30/07 | 06/30/08 | 06/30/09 | ||||||||||||||||||||||||||||||||||||||||||||||||||||||||||||||
| $000’s | $000’s | $000’s | $000’s | $000’s | $000’s | $000’s | $000’s | $000’s | SGD$000’s | SGD$000’s | SGD$000’s | KRW$000’s | KRW$000’s | KRW$000’s | ||||||||||||||||||||||||||||||||||||||||||||||||||||||||||||||
Gross Revenue | 125,608 | 182,139 | 206,500 | 206,200 | 300,300 | 348,800 | 256,509 | 226,156 | 254,647 | 25,209 | 89,876 | 102,959 | 22,797,499 | 25,219,005 | 26,259,028 | |||||||||||||||||||||||||||||||||||||||||||||||||||||||||||||
Profit/(loss) on | 13,300 | 900 | (29,300 | ) | 14,400 | 46,600 | (138,000 | ) | — | — | (7,904 | ) | — | — | — | — | — | — | ||||||||||||||||||||||||||||||||||||||||||||||||||||||||||
Interest Income | — | — | — | — | — | — | 1,013 | 795 | 439 | 78 | 344 | 222 | 670,041 | 703,105 | 814,506 | |||||||||||||||||||||||||||||||||||||||||||||||||||||||||||||
Less: Operating expenses, | (41,638 | ) | (64,744 | ) | (75,730 | ) | (88,100 | ) | (120,400 | ) | (137,000 | ) | (89,502 | ) | (84,026 | ) | (101,866 | ) | (6,002 | ) | (30,325 | ) | (37,323 | ) | (6,439,852 | ) | (7,576,055 | ) | (8,474,128 | ) | ||||||||||||||||||||||||||||||||||||||||||||||
Interest expense | (35,896 | ) | (66,894 | ) | (64,330 | ) | (69,300 | ) | (120,100 | ) | (124,700 | ) | (82,986 | ) | (70,501 | ) | (83,962 | ) | (3,893 | ) | (13,483 | ) | (16,448 | ) | (5,191,836 | ) | (5,206,060 | ) | (7,104,749 | ) | ||||||||||||||||||||||||||||||||||||||||||||||
Depreciation | — | — | — | — | — | — | — | — | — | — | — | — | (1,258,718 | ) | (1,316,481 | ) | (1,331,909 | ) | ||||||||||||||||||||||||||||||||||||||||||||||||||||||||||
Net (losses)/gains from | 201,524 | 162,274 | (253,800 | ) | 202,100 | 139,200 | (335,500 | ) | 9,394 | 1,174 | (37,807 | ) | — | — | (7,983 | ) | — | — | — | |||||||||||||||||||||||||||||||||||||||||||||||||||||||||
Valuation (losses)/gains | 112,707 | (94,515 | ) | (927,400 | ) | 300,900 | (11,100 | ) | (784,300 | ) | 146,442 | (140,696 | ) | (781,482 | ) | 23,126 | 171,000 | 448,870 | — | — | — | |||||||||||||||||||||||||||||||||||||||||||||||||||||||
Share of profits and | 194,889 | (51,209 | ) | (447,800 | ) | 547,000 | 142,500 | (408,500 | ) | — | — | — | — | — | — | — | — | — | ||||||||||||||||||||||||||||||||||||||||||||||||||||||||||
Net foreign exchange | — | — | — | — | — | — | 21,635 | 29,703 | (35,533 | ) | — | — | — | — | — | — | ||||||||||||||||||||||||||||||||||||||||||||||||||||||||||||
Impairment of goodwill | — | — | — | — | (200,800 | ) | — | — | — | — | — | — | — | — | — | — | ||||||||||||||||||||||||||||||||||||||||||||||||||||||||||||
Tax benefit/(expense) | (77,220 | ) | 32,439 | 156,800 | (145,500 | ) | 32,500 | 206,400 | (77,250 | ) | 29,196 | 177,112 | — | — | (3,188 | ) | — | — | — | |||||||||||||||||||||||||||||||||||||||||||||||||||||||||
Net Income/(loss) | 493,274 | 100,390 | (1,435,060 | ) | 967,700 | 208,700 | (1,372,800 | ) | 185,255 | (8,199 | ) | (616,356 | ) | 38,518 | 217,412 | 487,109 | 10,577,134 | 11,823,514 | 10,162,748 | |||||||||||||||||||||||||||||||||||||||||||||||||||||||||
Taxable Income3 | ||||||||||||||||||||||||||||||||||||||||||||||||||||||||||||||||||||||||||||
— from operations | 109,885 | 113,829 | 67,484 | 95,449 | 140,566 | 79,912 | 48,969 | 47,212 | — | 14,911 | 69,805 | 73,044 | — | — | — | |||||||||||||||||||||||||||||||||||||||||||||||||||||||||||||
— from gain on sale | 23,688 | 2,213 | 17,189 | 19,375 | 30,544 | 33,797 | — | — | — | — | — | — | — | — | — | |||||||||||||||||||||||||||||||||||||||||||||||||||||||||||||
Cash generated | 147,600 | 202,500 | 194,500 | 171,000 | 204,500 | 198,500 | 81,375 | 173,021 | 30,131 | 18,916 | 66,204 | 75,558 | 13,494,573 | 14,141,758 | 23,358,707 | |||||||||||||||||||||||||||||||||||||||||||||||||||||||||||||
Cash generated from sales | 100,400 | 127,100 | 392,400 | 187,700 | 326,100 | 327,600 | — | — | — | — | — | — | — | — | — | |||||||||||||||||||||||||||||||||||||||||||||||||||||||||||||
Cash generated from | — | — | — | — | — | — | — | — | — | — | — | — | — | — | — | |||||||||||||||||||||||||||||||||||||||||||||||||||||||||||||
Cash generated from | 248,000 | 329,600 | 586,900 | 358,700 | 530,600 | 526,100 | 81,375 | 173,021 | 30,131 | 18,916 | 66,204 | 75,558 | 13,494,573 | 14,141,758 | 23,358,707 | |||||||||||||||||||||||||||||||||||||||||||||||||||||||||||||
Less: Cash distributions | ||||||||||||||||||||||||||||||||||||||||||||||||||||||||||||||||||||||||||||
— from operating | (145,100 | ) | (133,300 | ) | (108,800 | ) | (171,000 | ) | (169,800 | ) | (137,600 | ) | (81,375 | )(5) | (89,462 | )(5) | (14,357 | )(5) | — | (55,799 | ) | (56,799 | ) | (9,928,943 | ) | (11,011,384 | ) | (12,943,800 | ) | |||||||||||||||||||||||||||||||||||||||||||||||
— from sales | — | — | — | — | — | — | — | — | — | — | — | — | — | — | — | |||||||||||||||||||||||||||||||||||||||||||||||||||||||||||||
— from other | — | — | — | (6,600 | ) | — | — | (1,199 | ) | — | — | — | — | — | — | — | — | |||||||||||||||||||||||||||||||||||||||||||||||||||||||||||
Cash generated | 102,900 | 196,300 | 478,100 | 181,100 | 360,800 | 388,500 | (1,199 | ) | 83,559 | 15,774 | 18,916 | 10,405 | 18,759 | 3,565,630 | 3,130,374 | 10,414,907 | ||||||||||||||||||||||||||||||||||||||||||||||||||||||||||||
Less: Special items | ||||||||||||||||||||||||||||||||||||||||||||||||||||||||||||||||||||||||||||
Equity raising | 145,200 | — | — | (100 | ) | 9,400 | 484,600 | (17 | ) | — | (11 | ) | 891,447 | 1,539 | — | — | — | — | ||||||||||||||||||||||||||||||||||||||||||||||||||||||||||
Payments for | (32,800 | ) | (144,100 | ) | (24,400 | ) | (500 | ) | (100 | ) | (34,100 | ) | (65 | ) | (135 | ) | (16,218 | ) | — | — | — | — | — | — | ||||||||||||||||||||||||||||||||||||||||||||||||||||
Payments for | — | — | — | — | — | — | — | — | — | — | — | (59,859 | ) | — | — | — | ||||||||||||||||||||||||||||||||||||||||||||||||||||||||||||
Payments for | (99,400 | ) | (664,600 | ) | (37,800 | ) | (317,800 | ) | (889,400 | ) | (43,200 | ) | — | — | — | (1,270,810 | ) | (2,956 | ) | (181,481 | ) | (551,400 | ) | (2,907,600 | ) | (951,800 | ) | |||||||||||||||||||||||||||||||||||||||||||||||||
Payments for | — | — | — | (31,500 | ) | (4,200 | ) | (2,200 | ) | — | — | — | — | — | — | — | — | — | ||||||||||||||||||||||||||||||||||||||||||||||||||||||||||
Payments for | — | — | — | (2,300 | ) | (4,300 | ) | (5,000 | ) | — | — | — | — | — | — | — | — | — | ||||||||||||||||||||||||||||||||||||||||||||||||||||||||||
Proceeds/repayments | 163,700 | 343,800 | (361,200 | ) | 198,300 | 697,900 | (622,600 | ) | (304 | ) | (85,348 | ) | 304 | 385,926 | (14,345 | ) | 245,119 | — | — | 16,660,060 | ||||||||||||||||||||||||||||||||||||||||||||||||||||||||
Loans to joint | — | — | — | (17,000 | ) | (94,700 | ) | — | — | — | — | — | — | — | — | — | — | |||||||||||||||||||||||||||||||||||||||||||||||||||||||||||
Investment/divestment | — | — | — | — | — | — | — | — | — | — | — | — | (551,358 | ) | 793,612 | (33,523,005 | ) | |||||||||||||||||||||||||||||||||||||||||||||||||||||||||||
Cash generated | 279,600 | (268,600 | ) | 54,700 | 10,200 | 75,400 | 166,000 | (1,585 | ) | (1,924 | ) | (151 | ) | 25,479 | (5,357 | ) | 22,538 | 2,462,872 | 1,016,386 | (7,399,838 | ) | |||||||||||||||||||||||||||||||||||||||||||||||||||||||
B-7
Table of Contents
Charter Hall Retail REIT1,2 | Charter Hall Office REIT1,2 | EDT Retail Trust1,4 | Starhill Global REIT6,7,8 | MCO CR REIT10,11,12 | ||||||||||||||||||||||||||||||||||||||||||||||||||||||||||||||||||||||||||||
| 06/30/07 | 06/30/08 | 06/30/09 | 06/30/07 | 06/30/08 | 06/30/09 | 06/30/07 | 06/30/08 | 06/30/09 | 12/31/05 | 12/31/06 | 12/31/07 | 06/30/07 | 06/30/08 | 06/30/09 | ||||||||||||||||||||||||||||||||||||||||||||||||||||||||||||||||||
| $000’s | $000’s | $000’s | $000’s | $000’s | $000’s | $000’s | $000’s | $000’s | SGD$000’s | SGD$000’s | SGD$000’s | KRW$000’s | KRW$000’s | KRW$000’s | ||||||||||||||||||||||||||||||||||||||||||||||||||||||||||||||||||
Tax and Distribution Data Per A$1000 Invested, unless otherwise indicated | ||||||||||||||||||||||||||||||||||||||||||||||||||||||||||||||||||||||||||||||||
Federal Income Tax Results: | ||||||||||||||||||||||||||||||||||||||||||||||||||||||||||||||||||||||||||||||||
Ordinary income (loss) | ||||||||||||||||||||||||||||||||||||||||||||||||||||||||||||||||||||||||||||||||
— from operations | 41.60 | 38.00 | 37.30 | 33.72 | 49.55 | 36.95 | 40.66 | 46.78 | 7.46 | — | 62.11 | (9) | 60.56 | (9) | 650.63 | (13) | 721.56 | (13) | 972.69 | (13) | ||||||||||||||||||||||||||||||||||||||||||||||||||||||||||||
— from recapture | — | — | — | — | — | — | — | — | — | — | — | — | — | — | — | |||||||||||||||||||||||||||||||||||||||||||||||||||||||||||||||||
Capital gain (loss) | 8.96 | 0.74 | 9.50 | 6.84 | 10.77 | 15.63 | — | — | — | — | — | 2.32 | (9) | — | — | — | ||||||||||||||||||||||||||||||||||||||||||||||||||||||||||||||||
Deferred tax | 24.68 | 28.66 | 8.09 | 38.11 | 19.91 | 0.50 | 47.22 | 48.43 | 7.73 | — | — | — | — | — | — | |||||||||||||||||||||||||||||||||||||||||||||||||||||||||||||||||
Cash Distributions to Investors | ||||||||||||||||||||||||||||||||||||||||||||||||||||||||||||||||||||||||||||||||
Source (on net income basis) | ||||||||||||||||||||||||||||||||||||||||||||||||||||||||||||||||||||||||||||||||
— from investment income | 75.24 | 67.40 | 54.89 | 78.67 | 80.23 | 53.08 | 87.88 | 95.21 | 15.19 | — | 62.11 | (9) | 62.88 | (9) | 650.63 | (13) | 721.56 | (13) | 972.69 | (13) | ||||||||||||||||||||||||||||||||||||||||||||||||||||||||||||
— from return of capital | — | — | — | — | — | — | — | — | — | — | — | — | — | — | — | |||||||||||||||||||||||||||||||||||||||||||||||||||||||||||||||||
Total distributions on net income basis | 75.24 | 67.40 | 54.89 | 78.67 | 80.23 | 53.08 | 87.88 | 95.21 | 15.19 | — | 62.11 | 62.88 | 650.63 | 721.56 | 972.69 | |||||||||||||||||||||||||||||||||||||||||||||||||||||||||||||||||
Source (on cash basis) | ||||||||||||||||||||||||||||||||||||||||||||||||||||||||||||||||||||||||||||||||
— from operations | 75.24 | 67.40 | 54.89 | 75.75 | 80.23 | 53.08 | 86.60 | 95.21 | 15.19 | — | 62.11 | (9) | 62.88 | (9) | 650.63 | (13) | 721.56 | (13) | 972.69 | (13) | ||||||||||||||||||||||||||||||||||||||||||||||||||||||||||||
— from sales | — | — | — | 2.92 | — | — | — | — | — | — | — | — | — | — | — | |||||||||||||||||||||||||||||||||||||||||||||||||||||||||||||||||
— from borrowings | — | — | — | — | — | — | — | — | — | — | — | — | — | — | — | |||||||||||||||||||||||||||||||||||||||||||||||||||||||||||||||||
— from other | — | — | — | — | — | — | 1.28 | — | — | — | — | — | — | — | — | |||||||||||||||||||||||||||||||||||||||||||||||||||||||||||||||||
Total distributions on cash basis | 75.24 | 67.40 | 54.89 | 78.67 | 80.23 | 53.08 | 87.88 | 95.21 | 15.19 | — | 62.11 | 62.88 | 650.63 | 721.56 | 972.69 | |||||||||||||||||||||||||||||||||||||||||||||||||||||||||||||||||
| Amount (in percentage terms) remaining invested in program properties at the end of the last year reported in the Table (original total acquisition cost of properties retained divided by original total acquisition cost of all properties in program). | 80 | % | 86 | % | 95 | % | 100 | % | 100 | % | ||||||||||||||||||||||||||||||||||||||||||||||||||||||||||||||||||||||
FOOTNOTES:
| 1 | Information presented in accordance with IFRS. |
| 2 | Effective March 1, 2010, Macquarie Office Trust and Macquarie CountryWide Trust have been renamed Charter Hall Office REIT and Charter Hall Retail REIT, respectively. The sale of the majority of Macquarie’s Australian core real estate funds management platform to Charter Hall Group, including the management businesses of Macquarie Office Trust and Macquarie CountryWide Trust, has been substantially completed. |
| 3 | Taxable income is presented after the dividends paid deduction. |
| 4 | On June 18, 2010, Macquarie sold its 50% interest in Macquarie DDR Trust’s (“MDT”) responsible entity to EPN GP, LLC. As a part of this transaction, Macquarie will provide transitional services related to the management and administration of the trust until December 2010. Following the transaction, MDT has been renamed EDT Retail Trust. |
| 5 | Cash from Operations derived from amount declared from joint venture as a dividend. In 2008 a special dividend of A$83,120 was declared to move a loan from head trust. This was sourced from additional borrowings in the joint venture. |
| 6 | Amounts presented in Singapore Dollar (“SGD”). |
| 7 | Information presented in accordance with Singapore accounting standards. No material adjustments to IFRS noted. |
| 8 | Effective December 31, 2008, Macquarie PRIME REIT was renamed Starhill Global REIT. On December 31, 2008, Macquarie completed the sale of its approximate 26% holding in Macquarie PRIME REIT, as well as its 50% interest in the holding company of Macquarie PRIME REIT’s manager and property manager to YTL Corporation Berhad. As such, prior performance information for Starhill Global REIT is presented for periods through December 31, 2007. |
| 9 | Tax and Distribution data is presented based upon SGD1,000 invested. |
| 10 | Amounts presented in South-Korean Won. |
| 11 | MCO CR REIT was listed on the Korea Exchange January 8, 2004 and Korean fiscal years are 6 months ending June 30 and December 31. Amounts shown reflect yearly data of July 1-June 30 for each year. On August 13, 2009, MCO REIT disposed of its sole asset, and on October 9, 2009, MCO REIT was delisted from the Korea Exchange. MCO REIT is currently being liquidated. |
| 12 | Information presented in accordance with Korean accounting standards. No material adjustments to IFRS noted. |
| 13 | Tax and Distribution data is presented based upon KRW5,000 invested, as shares were issued at KRW 5,000 at par value per share. |
B-8
Table of Contents
TABLE IV
Results of Completed Programs
(all amounts presented in Australian dollars (A$), unless otherwise stated)
Program Name | Macquarie ProLogis Trust | |||
Dollar Amount Raised (inc DRP) | ||||
Gross (1) | 913,183,000 | |||
Costs | (24,942,000 | ) | ||
Net | 888,241,000 | |||
Number of Properties Purchased, Directly or Indirectly | 140 | |||
Date of Closing of Offering(2) | 7/16/2007 | |||
Date of First Sale of Property | 12/29/2005 | |||
Date of Final Sale of Property (3) | 9/18/2006 | |||
Tax and Distribution Data Per A$1000 Investment | ||||
Federal Income Tax Results: | ||||
Ordinary income (loss) —from operations | 1,633.33 | |||
Capital Gain (loss)(4) | — | |||
Deferred tax | 217.79 | |||
Cash Distributions to Investors | ||||
Source (on IFRS basis) | ||||
—Investment income | 456.07 | |||
— Special distribution upon redemption of shares | 1,395.05 | |||
Source (on cash basis) | ||||
—Sales | — | |||
—Refinancing | — | |||
—Operations | 456.07 | |||
— Special distribution upon redemption of shares | 1,395.05 | |||
Receivable on Net Purchase Money Financing | — | |||
FOOTNOTES:
| 1 | Includes capital raised via Dividend Reinvestment Plan (“DRP”) issuances in the amount of A$197.2 million. |
| 2 | In July 2007, Macquarie ProLogis Trust was delisted and the fund was acquired by ProLogis, who was MIRA’s joint venture partner as sponsor of the fund. |
| 3 | Macquarie ProLogis Trust sold two properties while MIRA or its affiliates were a sponsor of the fund. The last property was sold on September 18, 2006. |
| 4 | No capital gains were realized. Capital gains tax was deferred as sales proceeds were utilized for new asset purchases. |
B-9
Table of Contents
TABLE IV
Results of Completed Programs
All Amounts presented in Korean Won (KRW), unless otherwise stated
Program Name | MCO CR REIT | |||
Dollar Amount Raised | 76,303,000,000 | |||
Number of Properties Purchased | 1 | |||
Date of Closing of Offering (1) | 10/9/2009 | |||
Date of First Sale of Property (2) | 8/13/2009 | |||
Date of Final Sale of Property (2) | 8/13/2009 | |||
Tax and Distribution Data Per KRW 5,000 Invested (3) | ||||
Federal Income Tax Results: | ||||
Ordinary income (loss)—from operations | 10,617 | |||
Capital gain (loss) | — | |||
Deferred tax | — | |||
Cash Distributions to Investors Per KRW 5,000 Invested (3) | ||||
Source (per Korean accounting standards) | ||||
—Investment income | 10,617 | |||
—Return of Capital | 3,605 | |||
Source (on cash basis) | ||||
—Sales | 10,490 | |||
—Refinancing | — | |||
—Operations | 3,732 | |||
FOOTNOTES:
| 1 | On October 9, 2009, MCO REIT was delisted from the Korea Exchange. |
| 2 | On August 13, 2009, MCO REIT disposed of its sole asset. |
| 3 | Tax and Distribution data is presented based upon KRW 5,000 invested, as shares were issued at KRW 5,000 par value per share. |
B-10
Table of Contents
TABLE V
Sales or Disposals of Properties(1)
All amounts (‘000s)
Selling Price, Net of Closing Costs and IFRS Adjustments | Cost of Properties Including Closing & Soft Costs | |||||||||||||||||||||||||||||||||||||||||||||||||||||||||||
| Property | Date Acquired | Date of Sale | Currency | Cash Received Net of Closing Costs | Mortgage Balance at time of Sale | Purchase Money Mortgage Taken Back by program | Adjustments | Total | Original Mortgage Financing | Total Acquisition cost, capital Closing costs and soft costs | Total | Excess (Deficiency) of property operating cash receipts over cash expenditures | ||||||||||||||||||||||||||||||||||||||||||||||||
| Charter Hall Retail REIT(2)(3) | ||||||||||||||||||||||||||||||||||||||||||||||||||||||||||||
| Bent Tree Plaza | 12/15/03 | 01/14/09 | US$ | 3,689.8 | 5,730.0 | - | - | 9,419.8 | 4,297.5 | 5,626.5 | 9,924.1 | 3,258.4 | ||||||||||||||||||||||||||||||||||||||||||||||||
| Peachland Promenade | 09/01/05 | 01/14/09 | US$ | 5,777.5 | 2,545.0 | - | - | 8,322.5 | 1,908.8 | 8,167.0 | 10,075.8 | 1,928.0 | ||||||||||||||||||||||||||||||||||||||||||||||||
| Rosewood Shopping Center | 06/26/03 | 01/14/09 | US$ | 3,505.3 | 1,927.0 | - | - | 5,432.3 | 1,445.3 | 4,664.3 | 6,109.6 | 1,906.0 | ||||||||||||||||||||||||||||||||||||||||||||||||
| Southgate Village | 06/26/03 | 01/14/09 | US$ | 3,877.8 | 4,600.0 | - | - | 8,477.8 | 3,450.0 | 5,563.9 | 9,013.9 | 3,163.6 | ||||||||||||||||||||||||||||||||||||||||||||||||
| Thomas Crossroads | 11/01/04 | 01/14/09 | US$ | 2,719.9 | 5,100.0 | - | - | 7,819.9 | 3,825.0 | 9,825.9 | 13,650.9 | 2,489.1 | ||||||||||||||||||||||||||||||||||||||||||||||||
| Rose Creek | 10/01/04 | 01/14/09 | US$ | 4,746.9 | 2,025.5 | - | - | 6,772.5 | 1,519.2 | 8,257.7 | 9,776.9 | 1,868.1 | ||||||||||||||||||||||||||||||||||||||||||||||||
| James Center | 11/25/02 | 01/14/09 | US$ | 20,033.9 | 1,255.4 | - | - | 21,289.3 | 941.6 | 19,762.5 | 20,704.1 | 8,652.9 | ||||||||||||||||||||||||||||||||||||||||||||||||
| Brookville | 06/30/01 | 03/19/09 | US$ | 5,705.3 | - | - | - | 5,705.3 | - | 4,996.0 | 4,996.0 | 3,275.3 | ||||||||||||||||||||||||||||||||||||||||||||||||
| Cheyenne Meadows | 11/25/02 | 03/25/09 | US$ | 4,292.8 | 4,890.0 | - | - | 9,182.8 | 3,667.5 | 5,680.1 | 9,347.6 | 4,426.9 | ||||||||||||||||||||||||||||||||||||||||||||||||
| Centerplace of Greeley | 12/17/04 | 03/25/09 | US$ | 1,268.5 | 17,175.0 | - | - | 18,443.5 | 12,881.3 | 13,935.9 | 26,817.2 | 6,415.1 | ||||||||||||||||||||||||||||||||||||||||||||||||
| Garden Village | 09/25/02 | 03/25/09 | US$ | 4,758.5 | 9,915.0 | - | - | 14,673.5 | 7,436.3 | 10,630.1 | 18,066.4 | 7,820.4 | ||||||||||||||||||||||||||||||||||||||||||||||||
| Coweta | 10/01/04 | 03/26/09 | US$ | 1,008.9 | 3,831.0 | - | - | 4,839.9 | 2,873.3 | 5,627.5 | 8,500.8 | 1,998.6 | ||||||||||||||||||||||||||||||||||||||||||||||||
| Silverlake | 01/25/02 | 03/27/09 | US$ | 4,265.3 | 4,750.0 | - | - | 9,015.3 | 3,562.5 | 6,406.9 | 9,969.4 | 5,103.5 | ||||||||||||||||||||||||||||||||||||||||||||||||
| Bear Creek Village Center | 03/01/05 | 04/29/09 | US$ | 1,755.7 | 15,065.0 | - | - | 16,820.7 | 11,298.8 | 10,890.7 | 22,189.5 | 5,270.0 | ||||||||||||||||||||||||||||||||||||||||||||||||
| Buckhead Crossing | 10/01/04 | 04/29/09 | US$ | 2,035.1 | 33,215.0 | - | - | 35,250.1 | 24,911.3 | 21,305.0 | 46,216.3 | 11,814.6 | ||||||||||||||||||||||||||||||||||||||||||||||||
Campus Marketplace | 09/25/02 | 04/29/09 | US$ | 12,126.7 | 19,215.0 | - | - | 31,341.7 | 14,411.3 | 17,119.8 | 31,531.0 | 14,720.0 | ||||||||||||||||||||||||||||||||||||||||||||||||
| Fairview Market | 10/15/04 | 04/29/09 | US$ | 2,176.1 | 2,748.9 | - | - | 4,925.0 | 2,061.7 | 5,207.6 | 7,269.3 | 1,722.8 | ||||||||||||||||||||||||||||||||||||||||||||||||
| Heritage Plaza | 02/01/05 | 04/29/09 | US$ | (266.6 | ) | 15,242.5 | - | - | 14,975.9 | 11,431.9 | 16,134.3 | 27,566.2 | 4,766.0 | |||||||||||||||||||||||||||||||||||||||||||||||
| Merchants Crossing | 07/06/06 | 04/29/09 | US$ | 2,445.0 | 12,007.3 | - | - | 14,452.3 | 9,005.5 | 16,403.2 | 25,408.7 | 3,534.4 | ||||||||||||||||||||||||||||||||||||||||||||||||
B-11
Table of Contents
Selling Price, Net of Closing Costs and IFRS Adjustments | Cost of Properties Including Closing & Soft Costs | |||||||||||||||||||||||||||||||||||||||||||||||||||||||||
| Property | Date Acquired | Date of Sale | Currency | Cash Received Net of Closing Costs | Mortgage Balance at time of Sale | Purchase Money Mortgage Taken Back by program | Adjustments | Total | Original Mortgage Financing | Total Acquisition cost, capital Closing costs and soft costs | Total | Excess (Deficiency) of property operating cash receipts over cash expenditures | ||||||||||||||||||||||||||||||||||||||||||||||
| Palm Harbor Shopping Village | 12/15/03 | 04/29/09 | US$ | 64.6 | 12,100.0 | - | - | 12,164.6 | 9,075.0 | 10,104.3 | 19,179.3 | 7,000.4 | ||||||||||||||||||||||||||||||||||||||||||||||
| Seaford, SA | 06/23/04 | 10/01/08 | A$ | 72,000.0 | - | (4 | ) | - | - | 72,000.0 | - | (4 | ) | 72,605.1 | 72,605.1 | 13,782.6 | ||||||||||||||||||||||||||||||||||||||||||
| Gatton Target | 06/21/04 | 11/06/08 | A$ | 2,260.0 | - | (4 | ) | - | - | 2,260.0 | - | (4 | ) | 2,235.6 | 2,235.6 | 679.0 | ||||||||||||||||||||||||||||||||||||||||||
| Ascot | 12/21/01 | 12/01/08 | A$ | 10,960.0 | - | (4 | ) | - | - | 10,960.0 | - | (4 | ) | 11,395.4 | 11,395.4 | 5,376.8 | ||||||||||||||||||||||||||||||||||||||||||
| Mooloolaba | 12/01/99 | 12/05/08 | A$ | 13,000.0 | - | (4 | ) | - | - | 13,000.0 | - | (4 | ) | 9,459.7 | 9,459.7 | 7,538.4 | ||||||||||||||||||||||||||||||||||||||||||
| South Preston | 11/15/95 | 12/19/08 | A$ | 10,260.0 | - | (4 | ) | - | - | 10,260.0 | - | (4 | ) | 6,808.5 | 6,808.5 | 8,928.1 | ||||||||||||||||||||||||||||||||||||||||||
| Plympton | 12/09/96 | 12/19/08 | A$ | 4,300.0 | - | (4 | ) | - | - | 4,300.0 | - | (4 | ) | 3,998.7 | 3,998.7 | 2,965.9 | ||||||||||||||||||||||||||||||||||||||||||
| Horsham | 11/15/95 | 12/23/08 | A$ | 8,200.0 | - | (4 | ) | - | - | 8,200.0 | - | (4 | ) | 4,542.1 | 4,542.1 | 5,931.8 | ||||||||||||||||||||||||||||||||||||||||||
| Jerrabombera (land parcel) | 09/27/02 | 12/23/08 | A$ | 40.0 | - | (4 | ) | - | - | 40.0 | - | (4 | ) | - | - | - | ||||||||||||||||||||||||||||||||||||||||||
| Launceston | 02/01/99 | 01/14/09 | A$ | 6,600.0 | - | (4 | ) | - | - | 6,600.0 | - | (4 | ) | 6,002.8 | 6,002.8 | 3,336.6 | ||||||||||||||||||||||||||||||||||||||||||
| Camden | 06/03/03 | 03/24/09 | A$ | 16,200.0 | - | (4 | ) | - | - | 16,200.0 | - | (4 | ) | 17,830.9 | 17,830.9 | 7,770.3 | ||||||||||||||||||||||||||||||||||||||||||
| Coorparoo | 12/09/96 | 03/26/09 | A$ | 13,020.0 | - | (4 | ) | - | - | 13,020.0 | - | (4 | ) | 8,997.9 | 8,997.9 | 8,680.5 | ||||||||||||||||||||||||||||||||||||||||||
| Redcliffe | 12/09/96 | 04/08/09 | A$ | 4,250.0 | - | (4 | ) | - | - | 4,250.0 | - | (4 | ) | 1,943.9 | 1,943.9 | 2,880.0 | ||||||||||||||||||||||||||||||||||||||||||
| Sandy Bay | 12/09/96 | 04/17/09 | A$ | 7,090.0 | - | (4 | ) | - | - | 7,090.0 | - | (4 | ) | 4,389.6 | 4,389.6 | 4,719.1 | ||||||||||||||||||||||||||||||||||||||||||
| Monbulk | 11/15/95 | 04/27/09 | A$ | 8,386.9 | - | (4 | ) | - | - | 8,386.9 | - | (4 | ) | 3,085.2 | 3,085.2 | 6,160.8 | ||||||||||||||||||||||||||||||||||||||||||
| Nambour Central | 04/14/97 | 04/30/09 | A$ | 3,800.0 | - | (4 | ) | - | - | 3,800.0 | - | (4 | ) | 5,584.7 | 5,584.7 | 4,450.6 | ||||||||||||||||||||||||||||||||||||||||||
| Nambour Plaza | 07/31/96 | 04/30/09 | A$ | 51,050.0 | - | (4 | ) | - | - | 51,050.0 | - | (4 | ) | 45,389.9 | 45,389.9 | 27,902.6 | ||||||||||||||||||||||||||||||||||||||||||
| Logan | 03/31/04 | 05/12/09 | A$ | 7,600.0 | - | (4 | ) | - | - | 7,600.0 | - | (4 | ) | 7,763.5 | 7,763.5 | 3,538.0 | ||||||||||||||||||||||||||||||||||||||||||
| Maylands (land) | 10/04/05 | 06/27/08 | A$ | 6,820.0 | - | (4 | ) | - | - | 6,820.0 | - | (4 | ) | 5,612.0 | 5,612.0 | - | ||||||||||||||||||||||||||||||||||||||||||
| Brafferton Center | 06/01/05 | 05/30/08 | US$ | (1,368.0 | ) | 9,545.3 | - | - | 8,177.3 | 9,545.3 | (492.8 | ) | 9,052.5 | 2,930.1 | ||||||||||||||||||||||||||||||||||||||||||||
| Glen Lea Centre | 06/01/05 | 05/30/08 | US$ | 1,002.8 | - | - | - | 1,002.8 | - | 1,841.3 | 1,841.3 | 885.2 | ||||||||||||||||||||||||||||||||||||||||||||||
| Kenhorst Plaza | 06/01/05 | 05/30/08 | US$ | 7,080.8 | 15,585.0 | - | - | 22,665.8 | 15,585.0 | 8,062.5 | 23,647.5 | 3,790.7 | ||||||||||||||||||||||||||||||||||||||||||||||
| Laburnum Park | 06/01/05 | 05/30/08 | US$ | 5,508.8 | 5,490.0 | - | - | 10,998.8 | 5,490.0 | 5,997.8 | 11,487.8 | 1,997.6 | ||||||||||||||||||||||||||||||||||||||||||||||
| Newark | 06/01/05 | 05/30/08 | US$ | (1,317.0 | ) | 8,358.8 | - | - | 7,041.8 | 8,358.8 | 426.8 | 8,785.5 | 2,470.4 | |||||||||||||||||||||||||||||||||||||||||||||
| Northway | 06/01/05 | 05/30/08 | US$ | 5,142.8 | 7,642.5 | - | - | 12,785.3 | 7,642.5 | 5,580.8 | 13,223.3 | 2,665.1 | ||||||||||||||||||||||||||||||||||||||||||||||
| Towamencin Village Square | 06/01/05 | 05/30/08 | US$ | 1,290.8 | 14,709.0 | - | - | 15,999.8 | 14,709.0 | 3,550.5 | 18,259.5 | 4,143.6 | ||||||||||||||||||||||||||||||||||||||||||||||
B-12
Table of Contents
Selling Price, Net of Closing Costs and IFRS Adjustments | Cost of Properties Including Closing & Soft Costs | |||||||||||||||||||||||||||||||||||||||||||||||||||||||||
| Property | Date Acquired | Date of Sale | Currency | Cash Net of | Mortgage Balance at time of Sale | Purchase Money Mortgage Taken Back by program | Adjustments | Total | Original Mortgage Financing | Total Acquisition cost, capital Closing costs and soft costs | Total | Excess (Deficiency) of property operating cash receipts over cash expenditures | ||||||||||||||||||||||||||||||||||||||||||||||
| Georgetown | 02/01/99 | 05/26/08 | NZ$ | 3,709.0 | - | (5) | - | - | 3,709.0 | - | (5) | 2,664.0 | 2,664.0 | 2,063.7 | ||||||||||||||||||||||||||||||||||||||||||||
| Mangere | 09/29/00 | 12/21/07 | NZ$ | 1,053.0 | - | (6) | - | - | 1,053.0 | - | (6) | 779.0 | 779.0 | 2,399.8 | ||||||||||||||||||||||||||||||||||||||||||||
| Palmerston North | 09/29/00 | 12/21/07 | NZ$ | 14,333.0 | - | (6) | - | - | 14,333.0 | - | (6) | 8,519.0 | 8,519.0 | 5,199.0 | ||||||||||||||||||||||||||||||||||||||||||||
| Bethesda Walk | 10/01/04 | 11/30/07 | US$ | 1,389.8 | 4,878.0 | - | - | 6,267.8 | 5,250.0 | 3,301.5 | 8,551.5 | 1,719.6 | ||||||||||||||||||||||||||||||||||||||||||||||
| Brookwood Village | 10/15/04 | 10/31/07 | US$ | 4,006.5 | 1,983.8 | - | - | 5,990.3 | 2,250.0 | 4,731.8 | 6,981.8 | 1,283.1 | ||||||||||||||||||||||||||||||||||||||||||||||
| Cobb Center | 10/01/04 | 10/31/07 | US$ | 1,968.8 | 2,982.0 | - | - | 4,950.8 | 3,334.1 | 2,731.9 | 6,066.0 | 1,259.3 | ||||||||||||||||||||||||||||||||||||||||||||||
| Greystone Village | 10/01/04 | 10/31/07 | US$ | 9,118.5 | - | - | - | 9,118.5 | - | 8,800.5 | 8,800.5 | 2,215.4 | ||||||||||||||||||||||||||||||||||||||||||||||
| Highland Square | 12/15/03 | 10/31/07 | US$ | 29,958.8 | - | - | - | 29,958.8 | - | 23,249.3 | 23,249.3 | 6,743.4 | ||||||||||||||||||||||||||||||||||||||||||||||
| North Pointe | 10/01/04 | 10/31/07 | US$ | 2,590.5 | 2,394.0 | - | - | 4,984.5 | 3,037.5 | 2,628.0 | 5,665.5 | 1,282.2 | ||||||||||||||||||||||||||||||||||||||||||||||
| Peachtree Parkway Plaza | 10/01/04 | 10/31/07 | US$ | 8,827.5 | - | - | - | 8,827.5 | - | 9,845.3 | 9,845.3 | 2,088.7 | ||||||||||||||||||||||||||||||||||||||||||||||
| Poplar Springs | 10/01/04 | 10/31/07 | US$ | 2,187.8 | 2,339.3 | - | - | 4,527.0 | 2,550.0 | 4,014.0 | 6,564.0 | 1,297.1 | ||||||||||||||||||||||||||||||||||||||||||||||
| First Colony Marketplace | 06/01/05 | 08/16/07 | US$ | 9,790.5 | - | - | - | 9,790.5 | - | 14,410.5 | 14,410.5 | 1,689.4 | ||||||||||||||||||||||||||||||||||||||||||||||
New Zealand portfolio (50% disposal of 18 properties) | Various | 04/15/07 | NZ$ | 102,350.0 | - | (6) | - | - | 102,350.0 | - | (6) | 61,205.6 | 61,205.6 | 40,862.2 | ||||||||||||||||||||||||||||||||||||||||||||
| Somerset Crossing | 07/07/04 | 03/28/07 | US$ | 14,788.1 | 9,811.9 | - | - | 24,600.0 | 11,925.0 | 8,008.4 | 19,933.4 | 4,031.4 | ||||||||||||||||||||||||||||||||||||||||||||||
| Hebron Parkway | 06/30/01 | 11/09/06 | US$ | 2,490.0 | 4,410.0 | - | - | 6,900.0 | 4,410.0 | 1,336.3 | 5,746.3 | 2,650.3 | ||||||||||||||||||||||||||||||||||||||||||||||
| Westheimer Marketplace | 06/01/05 | 10/19/06 | US$ | 4,072.9 | 4,336.5 | - | - | 8,409.4 | 9,037.5 | (420.2) | 8,617.3 | 961.6 | ||||||||||||||||||||||||||||||||||||||||||||||
| Lake Forest Village | 06/01/05 | 09/25/06 | US$ | - | 8,100.0 | 16,013.8 | - | 24,113.8 | 8,100.0 | 18,883.0 | 26,983.0 | 1,858.3 | ||||||||||||||||||||||||||||||||||||||||||||||
| Penn Station Shopping Center | 06/01/05 | 08/08/06 | US$ | 2,466.4 | 29,400.0 | - | - | 31,866.4 | 29,400.0 | (3,404.4) | 25,995.6 | 2,434.5 | ||||||||||||||||||||||||||||||||||||||||||||||
B-13
Table of Contents
Selling Price, Net of Closing Costs and IFRS Adjustments | Cost of Properties Including Closing & Soft Costs | |||||||||||||||||||||||||||||||||||||||||||||||||||||||||||
| Property | Date Acquired | Date of Sale | Currency | Cash Net of | Mortgage Balance at time of Sale | Purchase Money Mortgage Taken Back by program | Adjustments | Total | Original Mortgage Financing | Total Acquisition cost, capital Closing costs and soft costs | Total | Excess (Deficiency) of property operating cash receipts over cash expenditures | ||||||||||||||||||||||||||||||||||||||||||||||||
Charter Hall Office REIT(2) | ||||||||||||||||||||||||||||||||||||||||||||||||||||||||||||
| 1100 Hay Street, West Perth WA | 12/19/97 | 06/26/09 | �� | A$ | 37,946.4 | asset in CMBS | (7) | - | - | 37,946.4 | - | (7) | 23,043.0 | 23,043.0 | 21,403.4 | |||||||||||||||||||||||||||||||||||||||||||||
| ATO Building, Northbridge WA | 12/06/93 | 06/10/09 | A$ | 94,048.5 | asset in CMBS | (7) | - | - | 94,048.5 | - | (7) | 60,788.0 | 60,788.0 | 106,096.9 | ||||||||||||||||||||||||||||||||||||||||||||||
| Naylor House, Adelaide SA | 05/31/96 | 03/13/09 | A$ | 47,869.4 | asset in syndicate | (7) | - | - | 47,869.4 | - | (7) | 48,027.0 | 48,027.0 | 63,878.6 | ||||||||||||||||||||||||||||||||||||||||||||||
Wachovia Financial Center, Miami FL | 09/21/04 | 12/12/08 | US$ | 182,500.0 | asset in syndicate | (7) | - | - | 182,500.0 | - | (7) | 149,500.0 | 149,500.0 | 39,315.4 | ||||||||||||||||||||||||||||||||||||||||||||||
| Lang Centre | 07/10/98 | 03/31/08 | A$ | 35,100.2 | asset in CMBS | (7) | - | - | 35,100.2 | - | (7) | 30,497.2 | 30,497.2 | 24,964.6 | ||||||||||||||||||||||||||||||||||||||||||||||
| 505 Little Collins Street | 01/07/00 | 04/30/08 | A$ | 82,139.4 | asset in CMBS | (7) | - | - | 82,139.4 | - | (7) | 38,962.6 | 38,962.6 | 33,841.8 | ||||||||||||||||||||||||||||||||||||||||||||||
| 10 & 30 South Wacker | 09/21/04 | 08/24/07 | US$ | 171,500.0 | asset in CMBS | (7) | - | - | 171,500.0 | - | (7) | - | - | 24,610.5 | ||||||||||||||||||||||||||||||||||||||||||||||
| 52-60 Railway Parade | 04/22/94 | 02/28/07 | A$ | 70,392.0 | asset in CMBS | (7) | - | - | 70,392.0 | - | (7) | 61,136.0 | 61,136.0 | 74,241.8 | ||||||||||||||||||||||||||||||||||||||||||||||
| 2 Elizabeth Plaza | 07/04/97 | 02/28/07 | A$ | 53,480.9 | asset in CMBS | (7) | - | - | 53,480.9 | - | (7) | 41,754.5 | 41,754.5 | 31,864.2 | ||||||||||||||||||||||||||||||||||||||||||||||
EDT Retail Trust(8) | ||||||||||||||||||||||||||||||||||||||||||||||||||||||||||||
| Independence Commons | 11/21/03 | 11/06/08 | US$ | 23,582.1 | 33,800.0 | - | - | 57,382.1 | 35,500.0 | 13,877.0 | 49,377.0 | 22,030.9 | ||||||||||||||||||||||||||||||||||||||||||||||||
| Northridge Plaza | 09/16/05 | 01/08/09 | US$ | 5,052.5 | - | - | - | 5,052.5 | - | 6,978.6 | 6,978.6 | 1,454.2 | ||||||||||||||||||||||||||||||||||||||||||||||||
B-14
Table of Contents
Selling Price, Net of Closing Costs and IFRS Adjustments | Cost of Properties Including Closing & Soft Costs | |||||||||||||||||||||||||||||||||||||||||||||||||||||||||||
| Property | Date Acquired | Date of Sale | Currency | Cash Net of | Mortgage Balance at time of Sale | Purchase Money Mortgage Taken Back by program | Adjustments | Total | Original Mortgage Financing | Total Acquisition cost, capital Closing costs and soft costs | Total | Excess (Deficiency) of property operating cash receipts over cash expenditures | ||||||||||||||||||||||||||||||||||||||||||||||||
| College Grove Shopping Center | 09/16/05 | 01/08/09 | US$ | 8,592.8 | - | - | - | 8,592.8 | - | 11,164.2 | 11,164.2 | 2,021.8 | ||||||||||||||||||||||||||||||||||||||||||||||||
| Nellis Crossing | 09/16/05 | 01/08/09 | US$ | (96.7) | 8,176.3 | - | - | 8,079.6 | 5,655.0 | 3,030.1 | 8,685.1 | 1,879.9 | ||||||||||||||||||||||||||||||||||||||||||||||||
| Pear Tree Center | 09/16/05 | 01/08/09 | US$ | (38.6) | 4,265.9 | - | - | 4,227.3 | 2,600.0 | 1,399.8 | 3,999.8 | 913.1 | ||||||||||||||||||||||||||||||||||||||||||||||||
| Grand Canyon Shopping Center | 09/16/05 | 01/08/09 | US$ | (105.0) | 8,739.5 | - | - | 8,634.5 | 7,540.0 | 4,033.8 | 11,573.8 | 2,455.4 | ||||||||||||||||||||||||||||||||||||||||||||||||
| Tops Plaza, Batavia | 05/14/04 | 06/02/09 | US$ | - | 4,201.6 | - | - | 4,201.6 | 785.7 | 4,586.7 | 5,372.5 | See note | (9) | |||||||||||||||||||||||||||||||||||||||||||||||
| Transit Road, Clarence | 05/14/04 | 06/02/09 | US$ | (642.7) | 2,160.0 | - | - | 1,517.3 | 553.3 | 3,222.7 | 3,776.0 | See note | (9) | |||||||||||||||||||||||||||||||||||||||||||||||
| The Marketplace, Nashville | 05/14/04 | 06/02/09 | US$ | - | 13,843.4 | - | - | 13,843.4 | 10,900.0 | 9,547.0 | 20,447.0 | 7,173.9 | ||||||||||||||||||||||||||||||||||||||||||||||||
FOOTNOTES:
| 1 | Certain properties are held in a joint venture and information is presented based on the fund's percentage interest in the property. |
| 2 | Effective March 1, 2010, Macquarie Office Trust and Macquarie CountryWide Trust have been renamed Charter Hall Office REIT and Charter Hall Retail REIT, respectively. The sale of the majority of Macquarie’s Australian core real estate funds management platform to Charter Hall Group, including the management businesses of Macquarie Office Trust and Macquarie CountryWide Trust, has been substantially completed. |
| 3 | In January 2009, Charter Hall Retail REIT and its joint venture partner Regency Centers Corporation (“Regency”) signed a liquidation agreement to dissolve two of their joint venture entities. The liquidation agreement provides that both parties are to receive in-kind distributions of 100% ownership interests in the joint venture assets as determined in a rotational selection process. Pursuant to the liquidation agreement, Charter Hall Retail REIT is entitled to receive a 100% ownership interest in 36 properties and Regency is entitled to receive a 100% ownership interest in 6 properties. As of June 30, 2009, 28 properties had been distributed to Charter Hall Retail REIT and 4 properties had been distributed to Regency. As of June 30, 2009, Charter Hall Retail REIT had sold 21 of the properties that it received to third parties, the sales of which are listed in this Table V. It is currently anticipated that the remainder of the properties are to be distributed to Charter Hall Retail REIT and Regency on or prior to December 31, 2009. |
| 4 | Funded by National Australian Bank (“NAB”) multi option facility. Property specific data not available. |
| 5 | Funded by NAB term debt facility. Property specific data not available. |
| 6 | Funded by proceeds from equity placement issue and Dividend Reinvestment Plan (“DRP”). |
| 7 | Properties were acquired by Charter Hall Office REIT and are encumbered by a pooled CMBS program. Property specific data not available. |
| 8 | On June 18, 2010, Macquarie sold its 50% interest in Macquarie DDR Trust’s (“MDT”) responsible entity to EPN GP, LLC. As a part of this transaction, Macquarie will provide transitional services related to the management and administration of the trust until December 2010. Following the transaction, MDT has been renamed EDT Retail Trust. |
| 9 | The property sold was a component of an asset that was divided for purposes of this sale. Property specific data not available. |
B-15
Table of Contents
ADDENDUM TO
APPENDIX C
PRIOR PERFORMANCE TABLES — CNL LLC and MIRA Inc.
THE PRIOR PERFORMANCE TABLES IN THIS ADDENDUM UPDATE AND REPLACE APPENDIX C TO THE PROSPECTUSDATED APRIL 23, 2010.
| ||||||||
Table of Contents
PRIOR PERFORMANCE TABLES – CNL LLC and MIRA Inc.
The information in this Appendix C contains certain relevant summary information concerning a prior public program (the “CNL Macquarie Prior Public Program”) sponsored by CNL LLC, an affiliate of CNL Financial Group, Inc. and MIRA Inc., a subsidiary of Macquarie Group Limited (collectively, the “sponsors”). The CNL Macquarie Prior Public Program is CNL Macquarie Global Growth Trust, Inc., which was formed to invest in growth-oriented commercial real estate and commercial real estate-related assets that offer the potential for capital appreciation.
Upon request to the Company, the Company will provide, without charge, a copy of the most recent Annual Report on Form 10-K filed with the Securities and Exchange Commission for CNL Macquarie Global Growth Trust, Inc., as well as a copy, for a reasonable fee, of the exhibits filed with such report.
Prospective investors should not construe inclusion of the following tables as implying that the Company will have results comparable to those reflected in such tables or will make investments comparable to those reflected in the tables. Distributable cash flow, federal income tax deductions, or other factors could be substantially different. Prospective investors should note that, by acquiring shares in the Company, they will not be acquiring any interest in the CNL Macquarie Prior Public Program.
Description of Tables
The following Tables are included herein:
Table I – Experience in Raising and Investing Funds
Table II – Compensation to Sponsor
Unless otherwise indicated in the Tables, all information contained in the Tables is as of December 31, 2010. The following is a brief description of the Tables:
Table I and Table II
Table I and Table II present footnote information only as the CNL Macquarie Prior Public Program just recently commenced operations.
Past performance is not necessarily indicative of future performance.
C-1
Table of Contents
TABLE I
EXPERIENCE IN RAISING AND INVESTING FUNDS
CNL Macquarie Global Growth Trust, Inc.
FOOTNOTE:
| Note 1: | Pursuant to a registration statement on Form S-11 under the Securities Act of 1933, as amended, effective October 9, 2009, CNL Macquarie Global Growth Trust, Inc. registered for sale up to $1.5 billion in shares of common stock (150 million shares), of which initially 3,750,000 shares are being offered pursuant to CNL Macquarie Global Growth Trust, Inc.’s distribution reinvestment plan. The offering of shares of CNL Macquarie Global Growth Trust, Inc. commenced October 20, 2009. |
Past performance is not necessarily indicative of future performance.
C-2
Table of Contents
TABLE II
COMPENSATION TO SPONSOR
CNL Macquarie Global Growth Trust, Inc.
FOOTNOTE:
| Note 1: | Pursuant to a registration statement on Form S-11 under the Securities Act of 1933, as amended, effective October 9, 2009, CNL Macquarie Global Growth Trust, Inc. registered for sale up to $1.5 billion in shares of common stock (150 million shares), of which initially 3,750,000 shares are being offered pursuant to CNL Macquarie Global Growth Trust, Inc.’s distribution reinvestment plan. The offering of shares of CNL Macquarie Global Growth Trust, Inc. commenced October 20, 2009. As of December 31, 2010, CNL Macquarie Global Growth Trust, Inc. had received subscription proceeds of $12,595,865 (1,264,974 shares) from the offering. From commencement of the offering through December 31, 2010, total selling commissions incurred were $847,768, marketing support fees incurred were $363,329, and other offering and organizational costs incurred were $650,599. |
Past performance is not necessarily indicative of future performance.
C-3
Table of Contents
TABLE III
OPERATING RESULTS OF PRIOR PROGRAMS
CNL MACQUARIE GLOBAL GROWTH TRUST, INC.
| 2010 (Note 1) | ||||
Gross revenue | $ | — | ||
Profit on sale of properties | — | |||
Interest and other income | — | |||
Equity in earnings of unconsolidated entities | — | |||
Less: Operating expenses | (1,403,000 | ) | ||
Depreciation and amortization | — | |||
Interest expense and loan cost amortization | — | |||
Income (loss) from discontinued operations | — | |||
Net income (loss) – GAAP basis | (1,403,000 | ) | ||
Taxable income | ||||
- from operations | — | |||
- from gain on sales | — | |||
Cash generated from operations | — | |||
Cash generated from sales | — | |||
Cash generated from refinancing | — | |||
Less: Cash distributions to investors | ||||
- from offering proceeds | — | |||
- from sales, refinancings and borrowings | — | |||
- from cash flow from prior period | — | |||
Cash generated (deficiency) after cash distributions | — | |||
Special items (not including sales of real estate and refinancing): | ||||
Acquisition of properties | — | |||
Capital expenditures | — | |||
Investments in unconsolidated entities | — | |||
Acquisition of partnership interest | — | |||
Distribution of loan proceeds from unconsolidated entities | ||||
Deposit on properties | — | |||
Acquisition fees and costs paid | — | |||
Proceeds from disposal of assets | — | |||
Repayment of mortgage loans receivable | — | |||
Payment of additional carrying costs for mortgage loans receivable | — | |||
Issuance of mortgage loans receivable | — | |||
Short term investments | — | |||
(Increase) decrease in restricted cash | — | |||
Subscriptions received from stockholders | 12,596,000 | |||
Redemption of common stock | — | |||
Effect of exchange rate fluctuation on cash | — | |||
Proceeds from mortgage loans and other notes payable | — | |||
Stock issuance costs | (1,790,000 | ) | ||
Principal payment on capital lease obligations | — | |||
Principal payment on mortgage loans | — | |||
Net borrowings (repayments) on line of credit | — | |||
Payment of loan costs and deposits | — | |||
Cash generated (deficiency) after cash distributions and special items | 10,806,000 | |||
Past performance is not necessarily indicative of future performance.
C-4
Table of Contents
| 2010 (Note 1) | ||||
TAX AND DISTRIBUTION DATA PER $1,000 INVESTED | ||||
Federal income tax results: | ||||
Ordinary income | — | |||
- from operations | — | |||
- from recapture | — | |||
Capital gain | — | |||
Cash distribution to investors | ||||
Source (on GAAP basis) | ||||
- from investment income | — | |||
- from return of capital | — | |||
Total distributions on GAAP basis | — | |||
Source (on cash basis) | ||||
- from sales | — | |||
- from refinancings and borrowings | — | |||
- from operations | — | |||
- from cash flow from prior period | — | |||
Total distributions on cash basis | — | |||
Total cash distributions as a percentage of original $1,000 investment | — | |||
Total cumulative cash distributions per $1,000 investment from inception (March 4, 2009) | — | |||
Amount (in percentage terms) remaining invested in program properties at the end of each year (period) presented (original total acquisition cost of properties retained, divided by original total acquisition cost of all properties in program) | — | |||
FOOTNOTES:
| Note 1: | Pursuant to a registration statement on Form S-11 under the Securities Act of 1933, as amended, effective October 9, 2009, CNL Macquarie Global Growth Trust, Inc. registered for sale up to $1.5 billion in shares of common stock (150 million shares), of which initially 3,750,000 shares are being offered pursuant to CNL Macquarie Global Growth Trust, Inc.’s distribution reinvestment plan. The offering of shares of CNL Macquarie Global Growth Trust, Inc. commenced October 20, 2009. As of December 31, 2010, CNL Macquarie Global Growth Trust, Inc. had received subscription proceeds of $12,595,865 (1,264,974 shares) from the offering. From the commencement of the offering through December 31, 2010, total selling commissions incurred were $847,768, marketing support fees incurred were $363,329, and other offering and organizational costs incurred were $650,599. Activities through April 23, 2010, were devoted to the organization of CNL Macquarie Global Growth Trust, Inc. as operations had not yet begun. |
Past performance is not necessarily indicative of future performance.
C-5
Table of Contents
ADDENDUM TO
APPENDIX D
SUBSCRIPTION AGREEMENT
THE SUBSCRIPTION AGREEMENTINTHIS ADDENDUM UPDATESANDREPLACES APPENDIX DTOTHE PROSPECTUSDATED APRIL 23, 2010. |
Table of Contents
| Return via Standard Mail
Macquarie CNL Global Income Trust, Inc. c/o Boston Financial Data Services P.O. Box 8562 Boston, MA 02266-8562 | Return via Overnight Delivery
Macquarie CNL Global Income Trust, Inc. c/o Boston Financial Data Services 30 Dan Road, Suite 8562 Canton, MA 02021-2809 | CNL Client Services
Toll-Free (866) 650-0650 Fax (877) 694-1116 | |||||||

| Subscription Agreement | ||
FIRST OFFERING | Macquarie CNL Global Income Trust, Inc. | |
| one | Investment |
Select one. | ¨ Initial Investment | ¨ Additional Purchase | ¨ Net of Commissions Purchase* ($9.00 per share) | |||
Enter amount. | Amount of Subscription$ | |||||
Either: | * Investor Representative is required to complete, sign and attach a Net-of-Commissions affirmation letter. | |||||
(a) Attach a check. Cash, money orders, starter or counter checks third-party checks and traveler’s checks will not be accepted. or (b) Wire funds. See Section Seven | Make check payable to Macquarie CNL Global Income Trust, Inc. or thecustodian if purchasing for a Qualified Plan account.
If a check received from an Investor is returned for insufficient funds or otherwise not honored, Macquarie CNL Global Income Trust, Inc. or its agent (collectively, the “REIT”) may return the check with no attempt to redeposit. In such event, any issuance of the shares or declaration of distributions on shares may be rescinded or redeemed by Macquarie CNL Global Income Trust, Inc. The REIT may reject any subscription, in whole or in part, in its sole discretion. | |||||
| two | Investor Information |
Print name(s) and address exactly as they are to be registered on the account. | Name of Investor/Trustee | Social Security or Tax ID Number | ||||||||
Name of Co-Investor/Trustee (if applicable) | Social Security or Tax ID Number | |||||||||
Street Address(required) | Email Address | |||||||||
City
| State
| Zip Code | ||||||||
Daytime Phone Number
| Evening Phone Number
| |||||||||
Optional Mailing Address
| ||||||||||
City
| State
| Zip Code | ||||||||
Select one. | Citizenship:
¨ U.S. citizen |
¨ U.S. citizen residing outside the U.S. Country: |
¨ Resident Alien | |||
| Select one. | Backup Withholding: Subject to backup withholding? ¨ YES ¨ NO | |||||||||||
Custodian Information(if applicable): | ||||||||||||
Name
| Tax ID Number | |||||||||||
Address
| Custodian/Brokerage Acct. Number | |||||||||||
City
| State | Zip Code | ||||||||||
Page 1 of 4
Table of Contents
| three | Form of Ownership | |||||||||
| Select one. | — | Non-Custodial Accounts($5,000 minimum investment): | ||||||||
Single Owner | ||||||||||
¨ Individual ¨ Individual with Transfer on Death* | ||||||||||
Multiple Owners | ||||||||||
¨ Joint Tenants with Right of Survivorship ¨ Joint Tenants with Transfer on Death* | ||||||||||
¨ Community Property | ||||||||||
* RequiresTransfer on Death form that can be found at www.MacquarieCNLGlobalIncomeTrust.com | ||||||||||
Trust | ||||||||||
¨ Taxable Trust ¨ Tax Exempt Trust | ||||||||||
| Name of Trust | Tax ID Number | |||||||||
— | Custodial Accounts: | |||||||||
Qualified Plan ($4,000 minimum investment): | ||||||||||
| ¨ Traditional IRA ¨ ROTH IRA ¨ SEP/IRA ¨ Rollover IRA ¨ Beneficial IRA* | ||||||||||
| * Beneficial IRA Decedent Name | ||||||||||
Non-qualified Plan ($5,000 minimum investment): | ||||||||||
¨ Uniform Gift to Minors Act State of | ||||||||||
¨ Uniform Transfers to Minors Act DOB of Minor | ||||||||||
— | Other Accounts($5,000 minimum investment): | |||||||||
¨ C Corporation ¨ S Corporation ¨ Non-Profit Organization ¨ Other
¨ Partnership ¨ Pension Plan ¨ Profit Sharing Plan | ||||||||||
| Name of Corporation/Plan Name/Other: | ||||||||||
| This information should be compliant with the IRS Form W-9 requirements. Please refer to instructions for Form W-9 at IRS.gov. | ||||||||||
| four | Distributions Instructions | |||||||||
| Custodians must approve directed distributions for Qualified Plan accounts. | ||||||||||
Select one. | ¨ Send a check to Investor/Trustee address entered in Section Two. | |||||||||
| ¨ Reinvest in Macquarie CNL Global Income Trust, Inc. shares.(Refer to the Prospectus for the terms of the distribution reinvestment plan.) | ||||||||||
| ¨ Direct deposit.(Account information must be entered below. This option is not available to Qualified Plan accounts.) | ||||||||||
| The REIT is authorized to deposit distributions to the checking, savings or brokerage account indicated below. This authority will remain in force until the REIT is notified otherwise in writing. If the REIT erroneously deposits funds into the account, the REIT is authorized to debit the account for an amount not to exceed the amount of the erroneous deposit. | ||||||||||
| Name of Financial Institution | ||||||||||
| Address | ||||||||||
| City | State | Zip Code | ||||||||
Select one. | ¨ Checking ¨ Savings ¨ Brokerage or other | |||||||||
Attach a voided check. | Account Number | ABA Routing Number | ||||||||
| Account Name | ||||||||||
| Name of Investor/Trustee | TIN |
Page 2 of 4
Table of Contents
five | Subscriber Signatures | |||||||||||
In order to induce Macquarie CNL Global Income Trust, Inc. to accept this subscription, I hereby represent and warrant as follows: (A power of attorney may not be granted to any person to make such representations on behalf of Investor(s). Only fiduciaries such as trustees, guardians, conservators, custodians and personal representatives may make such representations on behalf of an Investor.)
| ||||||||||||
| Investor | Co- Investor | |||||||||||
| Each Investor must initial each representation. | a) I have received the final prospectus (as amended or supplemented as of the date hereof) for Macquarie CNL Global Income Trust, Inc. | Initials | Initials | |||||||||
b) I have (i) a net worth of at least $250,000 or (ii) a net worth of at least $70,000 and a gross annual income of at least $70,000.(Net worth does not include home, furnishings and personal automobiles.)
If applicable, I also meet the additional suitability requirements imposed by my state of primary residence as set forth in the Prospectus (as defined herein) under the sections entitled “Suitability Standards” and “How to Subscribe.” (Applies toAlabama, California, Iowa, Kentucky, Massachusetts, Michigan, Missouri, Ohio, Oregon, Pennsylvania andTennessee Investors.)
If applicable, I acknowledge the recommendation imposed by the states ofKansas and Massachusetts, one of which is my primary residence, that my aggregate investments in Macquarie CNL Global Income Trust, Inc. and similar direct participating investments do not exceed 10% of my “liquid net worth,” which for these purposes is defined as that portion of net worth that consists of cash, cash equivalents and readily marketable securities. | Initials | Initials | ||||||||||
c) I acknowledge that there is no public market for the shares and thus my investments in the shares is not liquid. | Initials | Initials | ||||||||||
d) I am purchasing the shares for my own account and if I am purchasing shares on behalf of a trust or other entity of which I am trustee or authorized agent, I have due authority to execute this subscription agreement and do hereby legally bind the trust or other entity of which I am trustee or authorized agent. | Initials | Initials | ||||||||||
e) I am not a resident of the State of Pennsylvania. | Initials | Initials | ||||||||||
If you participate in the distribution reinvestment plan or make subsequent purchases of shares of Macquarie CNL Global Income Trust, Inc., and you fail to meet the suitability requirements for making an investment or you can no longer make the representations or warranties set forth in this section, you are expected to promptly notify your broker, financial advisor or other investor representative in writing of the change and to terminate your participation in the distribution reinvestment plan.
| ||||||||
Substitute IRS Form W-9 Certification:
The Investor signing below, under penalties of perjury, certifies that (i) the number shown on this subscription agreement is its correct taxpayer identification number (or it is waiting for a number to be issued to it) and (ii) it is not subject to backup withholding either because (A) it is exempt from backup withholding, (B) it has not been notified by the Internal Revenue Service (“IRS”) that it is subject to backup withholding as a result of a failure to report all interest or dividends, or (C) the IRS has notified it that it is no longer subject to backup withholding, and (iii) it is a U.S. person for federal tax purposes (including a U.S. resident alien).
YOU MUST CROSS OUT CLAUSE (ii) IN THIS CERTIFICATION AND THE “SUBJECT TO BACKUP WITHHOLDING” BOX IN SECTION TWO SHOULD BE CHECKED IF THE INVESTOR HAS BEEN NOTIFIED BY THE IRS THAT IT IS CURRENTLY SUBJECT TO BACKUP WITHHOLDING BECAUSE IT HAS FAILED TO REPORT ALL INTEREST AND DIVIDENDS ON ITS TAX RETURN.
The Internal Revenue Service does not require your consent to any provision of this document other than the certifications required to avoid backup withholding.
| ||||||||||
Each Investor must sign. | Signature of Investor – OR – Beneficial Owner
| Date | ||||||||
| Custodian must sign on a custodial account. | Signature of Co-Investor – OR – Custodian | Date | ||||||||
Name of Investor/Trustee
| TIN
|
Page 3 of 4
Table of Contents
| six | Investor Representative Information & Signatures | |||||||
| The broker, financial advisor or other investor representative (each an “Investor Representative”) signing below hereby warrants that it is duly licensed and may lawfully sell shares in the state designated as the Investor’s legal residence or is exempt from such licensing. | ||||||||
Name of Participating Broker-Dealer or Financial Institution | ¨ Check if recently employed by new Broker-Dealer or Financial Institution. | |||||||
Name of Broker/Financial Advisor/other Investor Representative
| Advisor Number
| |||||||||||||
Mailing Address ¨ Check if updated address
| ||||||||||||||
City
| State
| Zip Code
| ||||||||||||
Telephone
| Fax
| |||||||||||||
Email Address
| ||||||||||||||
| The undersigned confirms by its signature that it (i) has reasonable grounds to believe that the information and representations concerning the Investor identified herein are true, correct and complete in all respects; (ii) has verified that the form of ownership selected is accurate and, if other than individual ownership, has verified that the individual executing on behalf of the Investor is properly authorized and identified; (iii) has discussed such Investor’s prospective purchase of shares with such Investor; (iv) has advised such Investor of all pertinent facts with regard to the liquidity and marketability of the shares; (v) has delivered the Prospectus contained in the registration statement of Macquarie CNL Global Income Trust, Inc. (File No. 333-158478) on file with the Securities and Exchange Commission (as amended or supplemented, the “Prospectus”) to such Investor; (vi) has not completed the sale of shares until at least five business days after the date such Investor received a copy of the Prospectus; and (vii) has reasonable grounds to believe that the purchase of shares is a suitable investment for such Investor, that such Investor meets the suitability standards applicable to such Investor set forth in the Prospectus, and that such Investor is in a financial position to enable such Investor to realize the benefits of such an investment and to suffer any loss that may occur with respect thereto. The above-identified entity, acting in its capacity as agent, broker, financial advisor or other investor representatives, has performed functions required of it by federal and state securities laws, as applicable, and FINRA rules and regulations, including, but not limited to Know Your Customer, Suitability and PATRIOT Act (AML, Customer Identification) as required by their relationship with the Investor(s) identified on this document. | ||||||||||||||
THIS SUBSCRIPTION AGREEMENT AND ALL RIGHTS HEREUNDER SHALL BE GOVERNED BY, AND INTERPRETED IN ACCORDANCE WITH, THE LAWS OF THE STATE OF MARYLAND.
The names “Macquarie” and “Macquarie Group” refer to Macquarie Group Limited (ABN 94 122 169 279) and its direct and indirect subsidiaries, including Macquarie Bank Limited (ABN 46 008 583 542) and Macquarie Infrastructure and Real Assets Inc. (f/k/a Macquarie Capital Funds Inc.). Macquarie Bank Limited maintains representative offices in several jurisdictions in the United States, however, neither Macquarie Group Limited nor Macquarie Bank Limited is authorized to conduct banking business in the United States.
I understand this Subscription Agreement is for the offering of Macquarie CNL Global Income Trust, Inc.
| ||||||||||||||
Signature of Broker/Financial Advisor/other Investor Representative
| Date
| |||||||||||||
Signature of Branch Manager
| Date
| |||||||||||||
| seven | Delivery Instructions | |||||||||||||
All items on the Subscription Agreement must be completed in order for a subscription to be processed. Investors should read the Prospectus in its entirety. Each subscription will be accepted or rejected by Macquarie CNL Global Income Trust, Inc. within 30 days after its receipt. Investors will receive a confirmation of their purchase.
Wire transfers should be made to State Street Bank & Trust Co., ABA Routing , Macquarie CNL Global Income Trust, Inc., Account # , FBO (Investors’ name). | ||||||||||||||
Return via Standard Mail
Macquarie CNL Global Income Trust, Inc. c/o Boston Financial Data Services P.O. Box 8562 Boston, MA 02266-8562 | Return via Overnight Delivery
Macquarie CNL Global Income Trust, Inc. c/o Boston Financial Data Services 30 Dan Road, Suite 8562 Canton, MA 02021-2809 | CNL Client Services
Toll-Free (866) 650-0650 Fax (877) 694-1116 | ||||||||||||
To receive your statements, tax forms and/or proxy materials and annual reports electronically, we invite you to visit www. MacquarieCNLGlobalIncomeTrust.com/gopaperless.
Name of Investor/Trustee
| TIN
|
Page 4 of 4