UNITED STATES
SECURITIES AND EXCHANGE COMMISSION
Washington, D.C. 20549
FORM 10-Q
| x | QUARTERLY REPORT PURSUANT TO SECTION 13 OR 15 (d) OF THE SECURITIES EXCHANGE ACT OF 1934 |
For the quarterly period ended June 30, 2013
OR
| ¨ | TRANSITION REPORT PURSUANT TO SECTION 13 OR 15 (d) OF THE SECURITIES EXCHANGE ACT OF 1934 |
For the transition period from to
Commission file number: 000-54684
Global Income Trust, Inc.
(Exact name of registrant as specified in its charter)
| | |
| Maryland | | 26-4386951 |
(State or other jurisdiction of incorporation or organization) | | (I.R.S. Employer Identification No.) |
| |
CNL Center at City Commons 450 South Orange Avenue Orlando, Florida | | 32801 |
| (Address of principal executive offices) | | (Zip Code) |
Registrant’s telephone number, including area code (407) 650-1000
Indicate by check mark whether the registrant (1) has filed all reports required to be filed by Section 13 or 15(d) of the Securities Exchange Act of 1934 during the preceding 12 months (or for such shorter period that the registrant was required to file such reports), and (2) has been subject to such filing requirements for the past 90 days. Yes x No ¨
Indicate by check mark whether the registrant has submitted electronically and posted on its corporate Web site, if any, every Interactive Data File required to be submitted and posted pursuant to Rule 405 of Regulation S-T (§ 232.405 of this chapter) during the preceding 12 months (or for such shorter period that the registrant was required to submit and post such files). Yes x No ¨
Indicate by check mark whether the registrant is a large accelerated filer, an accelerated filer, a non-accelerated filer, or a smaller reporting company. See definition of “large accelerated filer,” “accelerated filer” and “smaller reporting company” in Rule 12b-2 of the Exchange Act.
| | | | | | |
| Large accelerated filer | | ¨ | | Accelerated filer | | ¨ |
| | | |
| Non-accelerated filer | | x (Do not check if a smaller reporting company) | | Smaller reporting company | | ¨ |
Indicate by check mark whether the registrant is a shell company (as defined in Rule 12b-2 of the Exchange Act). Yes ¨ No x
The number of shares of common stock outstanding as of August 2, 2013 was 8,257,410.
GLOBAL INCOME TRUST, INC. AND SUBSIDIARIES
INDEX
Item 1. Financial Statements
GLOBAL INCOME TRUST, INC. AND SUBSIDIARIES
CONDENSED CONSOLIDATED BALANCE SHEETS
(UNAUDITED)
| | | | | | | | |
| | | June 30,
2013 | | | December 31,
2012 | |
| ASSETS | | | | | | | | |
| | |
Real estate investment properties, net | | $ | 88,568,383 | | | $ | 90,241,221 | |
Lease intangibles, net | | | 22,597,613 | | | | 24,911,906 | |
Cash and cash equivalents | | | 11,604,315 | | | | 2,037,120 | |
Restricted cash | | | 1,303,233 | | | | 1,517,627 | |
Loan costs, net | | | 931,881 | | | | 1,166,497 | |
Deferred rent | | | 860,543 | | | | 480,502 | |
Other assets | | | 421,795 | | | | 602,442 | |
Deferred tax asset, net | | | 283,961 | | | | 293,537 | |
| | | | | | | | |
Total assets | | $ | 126,571,724 | | | $ | 121,250,852 | |
| | | | | | | | |
| | |
| LIABILITIES AND STOCKHOLDERS’ EQUITY | | | | | | | | |
| | |
Liabilities: | | | | | | | | |
Mortgage and other notes payable | | $ | 72,304,888 | | | $ | 77,098,567 | |
Accounts payable and accrued expenses | | | 1,110,145 | | | | 1,408,651 | |
Unearned rent | | | 696,099 | | | | 594,240 | |
Real estate taxes payable | | | 615,861 | | | | 577,178 | |
Other liabilities | | | 441,144 | | | | 396,273 | |
Due to related parties | | | 278,558 | | | | 916,168 | |
Credit facility | | | — | | | | 820,000 | |
| | | | | | | | |
Total liabilities | | | 75,446,695 | | | | 81,811,077 | |
| | | | | | | | |
| | |
Commitments and contingencies (Note 9) | | | | | | | | |
| | |
Stockholders’ equity: | | | | | | | | |
Preferred stock, $0.01 par value per share, authorized and unissued 200,000,000 shares | | | — | | | | — | |
Common stock, $0.01 par value per share, 1,120,000,000 shares authorized, 8,419,689 and 6,438,444 shares issued, and 8,257,410 and 6,406,380 shares outstanding, respectively | | | 82,575 | | | | 64,063 | |
Capital in excess of par value | | | 70,068,395 | | | | 54,438,509 | |
Accumulated distributions | | | (6,867,184 | ) | | | (4,417,093 | ) |
Accumulated deficit | | | (12,170,619 | ) | | | (10,799,016 | ) |
Accumulated other comprehensive income | | | 11,862 | | | | 153,312 | |
| | | | | | | | |
Total stockholders’ equity | | | 51,125,029 | | | | 39,439,775 | |
| | | | | | | | |
Total liabilities and stockholders’ equity | | $ | 126,571,724 | | | $ | 121,250,852 | |
| | | | | | | | |
See accompanying notes to condensed consolidated financial statements.
1
GLOBAL INCOME TRUST, INC. AND SUBSIDIARIES
CONDENSED CONSOLIDATED STATEMENTS OF COMPREHENSIVE LOSS
(UNAUDITED)
| | | | | | | | | | | | | | | | |
| | | Quarter Ended June 30, | | | Six Months Ended June 30, | |
| | | 2013 | | | 2012 | | | 2013 | | | 2012 | |
| | | | |
Revenues: | | | | | | | | | | | | | | | | |
Rental income from operating leases | | $ | 3,071,228 | | | $ | 1,697,488 | | | $ | 6,147,244 | | | $ | 3,304,553 | |
Tenant reimbursement income | | | 394,092 | | | | 303,545 | | | | 757,457 | | | | 576,363 | |
| | | | | | | | | | | | | | | | |
Total revenues | | | 3,465,320 | | | | 2,001,033 | | | | 6,904,701 | | | | 3,880,916 | |
| | | | | | | | | | | | | | | | |
| | | | |
Expenses: | | | | | | | | | | | | | | | | |
Property operating expenses | | | 798,560 | | | | 654,238 | | | | 1,527,835 | | | | 1,269,937 | |
General and administrative | | | 531,215 | | | | 436,248 | | | | 1,061,603 | | | | 955,650 | |
Acquisition fees and expenses | | | 10,902 | | | | 195,739 | | | | 44,595 | | | | 774,840 | |
Asset management fees | | | 301,529 | | | | 149,039 | | | | 603,058 | | | | 284,800 | |
Property management fees | | | 100,482 | | | | 60,983 | | | | 207,412 | | | | 115,109 | |
Depreciation and amortization | | | 1,761,194 | | | | 935,254 | | | | 3,524,410 | | | | 1,838,981 | |
| | | | | | | | | | | | | | | | |
Total expenses | | | 3,503,882 | | | | 2,431,501 | | | | 6,968,913 | | | | 5,239,317 | |
| | | | |
Expense support | | | (453,648 | ) | | | (314,862 | ) | | | (977,591 | ) | | | (314,862 | ) |
| | | | | | | | | | | | | | | | |
Net expenses | | | 3,050,234 | | | | 2,116,639 | | | | 5,991,322 | | | | 4,924,455 | |
| | | | | | | | | | | | | | | | |
| | | | |
Operating income (loss) | | | 415,086 | | | | (115,606 | ) | | | 913,379 | | | | (1,043,539 | ) |
| | | | | | | | | | | | | | | | |
| | | | |
Other income (expense): | | | | | | | | | | | | | | | | |
Interest and other income (expense) | | | 1,459 | | | | 242 | | | | (575 | ) | | | 509 | |
Interest expense and loan cost amortization | | | (1,032,967 | ) | | | (793,036 | ) | | | (2,252,311 | ) | | | (1,535,533 | ) |
| | | | | | | | | | | | | | | | |
Total other expense | | | (1,031,508 | ) | | | (792,794 | ) | | | (2,252,886 | ) | | | (1,535,024 | ) |
| | | | | | | | | | | | | | | | |
| | | | |
Loss before income taxes | | | (616,422 | ) | | | (908,400 | ) | | | (1,339,507 | ) | | | (2,578,563 | ) |
| | | | |
Income tax benefit (expense) | | | (7,887 | ) | | | (1,696 | ) | | | (32,096 | ) | | | 60,568 | |
| | | | | | | | | | | | | | | | |
| | | | |
Net loss | | $ | (624,309 | ) | | $ | (910,096 | ) | | $ | (1,371,603 | ) | | $ | (2,517,995 | ) |
| | | | | | | | | | | | | | | | |
| | | | |
Net loss per share of common stock (basic and diluted) | | $ | (0.08 | ) | | $ | (0.20 | ) | | $ | (0.18 | ) | | $ | (0.62 | ) |
| | | | | | | | | | | | | | | | |
| | | | |
Weighted average number of shares of common stock outstanding (basic and diluted) | | | 8,173,289 | | | | 4,572,840 | | | | 7,599,512 | | | | 4,031,640 | |
| | | | | | | | | | | | | | | | |
See accompanying notes to condensed consolidated financial statements.
2
GLOBAL INCOME TRUST, INC. AND SUBSIDIARIES
CONDENSED CONSOLIDATED STATEMENTS OF COMPREHENSIVE LOSS
(UNAUDITED)
| | | | | | | | | | | | | | | | |
| | | Quarter Ended June 30, | | | Six Months Ended June 30, | |
| | | 2013 | | | 2012 | | | 2013 | | | 2012 | |
| | | | |
Net loss | | $ | (624,309 | ) | | $ | (910,096 | ) | | $ | (1,371,603 | ) | | $ | (2,517,995 | ) |
| | | | | | | | | | | | | | | | |
| | | | |
Other comprehensive income (loss): | | | | | | | | | | | | | | | | |
Unrealized foreign currency translation adjustments | | | 157,204 | | | | (129,955 | ) | | | (141,450 | ) | | | (131,984 | ) |
| | | | | | | | | | | | | | | | |
Total other comprehensive income (loss) | | | 157,204 | | | | (129,955 | ) | | | (141,450 | ) | | | (131,984 | ) |
| | | | | | | | | | | | | | | | |
| | | | |
Comprehensive loss | | $ | (467,105 | ) | | $ | (1,040,051 | ) | | $ | (1,513,053 | ) | | $ | (2,649,979 | ) |
| | | | | | | | | | | | | | | | |
See accompanying notes to condensed consolidated financial statements.
3
GLOBAL INCOME TRUST, INC. AND SUBSIDIARIES
CONDENSED CONSOLIDATED STATEMENTS OF STOCKHOLDERS’ EQUITY
Six Months Ended June 30, 2013 (Unaudited) and the Year Ended December 31, 2012
| | | | | | | | | | | | | | | | | | | | | | | | | | | | |
| | | Common Stock | | | Capital in
Excess of
Par Value | | | Accumulated
Distributions | | | Accumulated
Deficit | | | Accumulated
Other
Comprehensive
Income (Loss) | | | Total
Stockholders’
Equity | |
| | | Number
of Shares | | | Par
Value | | | | | | |
| | | | | | | | |
Balance at December 31, 2011 | | | 2,879,077 | | | $ | 28,791 | | | $ | 24,472,676 | | | $ | (1,217,516 | ) | | $ | (4,564,428 | ) | | $ | — | | | $ | 18,719,523 | |
Subscriptions received for common stock through public offering and reinvestment plan | | | 3,559,367 | | | | 35,593 | | | | 35,488,523 | | | | — | | | | — | | | | — | | | | 35,524,116 | |
Redemptions of common stock | | | (32,064 | ) | | | (321 | ) | | | (309,773 | ) | | | — | | | | — | | | | — | | | | (310,094 | ) |
Stock issuance and offering costs | | | — | | | | — | | | | (5,212,917 | ) | | | — | | | | — | | | | — | | | | (5,212,917 | ) |
Net loss | | | — | | | | — | | | | — | | | | — | | | | (6,234,588 | ) | | | — | | | | (6,234,588 | ) |
Other comprehensive income | | | — | | | | — | | | | — | | | | — | | | | — | | | | 153,312 | | | | 153,312 | |
Distributions declared ($0.0017808 per share per day) | | | — | | | | — | | | | — | | | | (3,199,577 | ) | | | — | | | | — | | | | (3,199,577 | ) |
| | | | | | | | | | | | | | | | | | | | | | | | | | | | |
Balance at December 31, 2012 | | | 6,406,380 | | | | 64,063 | | | | 54,438,509 | | | | (4,417,093 | ) | | | (10,799,016 | ) | | | 153,312 | | | | 39,439,775 | |
Subscriptions received for common stock through public offering and reinvestment plan | | | 1,981,245 | | | | 19,814 | | | | 19,709,534 | | | | — | | | | — | | | | — | | | | 19,729,348 | |
Redemptions of common stock | | | (130,215 | ) | | | (1,302 | ) | | | (1,218,273 | ) | | | — | | | | — | | | | — | | | | (1,219,575 | ) |
Stock issuance and offering costs | | | — | | | | — | | | | (2,861,375 | ) | | | — | | | | — | | | | — | | | | (2,861,375 | ) |
Net loss | | | — | | | | — | | | | — | | | | — | | | | (1,371,603 | ) | | | — | | | | (1,371,603 | ) |
Other comprehensive loss | | | — | | | | — | | | | — | | | | — | | | | — | | | | (141,450 | ) | | | (141,450 | ) |
Distributions declared ($0.0017808 per share per day) | | | — | | | | — | | | | — | | | | (2,450,091 | ) | | | — | | | | — | | | | (2,450,091 | ) |
| | | | | | | | | | | | | | | | | | | | | | | | | | | | |
Balance at June 30, 2013 | | | 8,257,410 | | | $ | 82,575 | | | $ | 70,068,395 | | | $ | (6,867,184 | ) | | $ | (12,170,619 | ) | | $ | 11,862 | | | $ | 51,125,029 | |
| | | | | | | | | | | | | | | | | | | | | | | | | | | | |
See accompanying notes to condensed consolidated financial statements.
4
GLOBAL INCOME TRUST, INC. AND SUBSIDIARIES
CONDENSED CONSOLIDATED STATEMENTS OF CASH FLOWS
(UNAUDITED)
| | | | | | | | |
| | | Six Months Ended June 30, | |
| | | 2013 | | | 2012 | |
Operating activities: | | | | | | | | |
Net loss | | $ | (1,371,603 | ) | | $ | (2,517,995 | ) |
Adjustments to reconcile net loss to net cash provided by (used in) operating activities: | | | | | | | | |
Depreciation and amortization | | | 3,524,410 | | | | 1,838,981 | |
Amortization of above- and below-market lease intangibles | | | 144,499 | | | | 34,130 | |
Amortization of loan costs | | | 128,722 | | | | 257,777 | |
Loss on early extinguishment of debt | | | 99,134 | | | | — | |
Straight-line rent adjustments | | | (380,229 | ) | | | (163,667 | ) |
Deferred income taxes | | | — | | | | (79,612 | ) |
Changes in operating assets and liabilities: | | | | | | | | |
Other assets | | | 176,883 | | | | (209,862 | ) |
Accounts payable and accrued expenses | | | (177,969 | ) | | | 133,189 | |
Due to related parties | | | (587,210 | ) | | | 25,617 | |
Unearned rent | | | 101,859 | | | | 279,266 | |
Real estate taxes payable | | | 38,683 | | | | 97,637 | |
| | | | | | | | |
Net cash provided by (used in) operating activities | | | 1,697,179 | | | | (304,539 | ) |
| | | | | | | | |
| | |
Investing activities: | | | | | | | | |
Acquisition of properties | | | — | | | | (5,244,136 | ) |
Deposits on real estate | | | — | | | | (251,500 | ) |
Capital expenditures | | | — | | | | (2,460 | ) |
Changes in restricted cash | | | 214,394 | | | | (389,047 | ) |
| | | | | | | | |
Net cash provided by (used in) investing activities | | | 214,394 | | | | (5,887,143 | ) |
| | | | | | | | |
Financing activities: | | | | | | | | |
Subscriptions received for common stock through public offering and reinvestment plan | | | 19,729,348 | | | | 22,759,830 | |
Proceeds from mortgage notes payable | | | — | | | | 2,865,190 | |
Repayments of mortgage notes payable | | | (4,590,186 | ) | | | (305,706 | ) |
Repayments on credit facility | | | (820,000 | ) | | | (2,000,000 | ) |
Payment of stock issuance and offering costs | | | (2,911,775 | ) | | | (3,269,653 | ) |
Distributions to stockholders | | | (2,358,524 | ) | | | (1,190,058 | ) |
Payment of loan costs | | | (105,405 | ) | | | (188,457 | ) |
Redemptions of common stock | | | (1,266,272 | ) | | | (112,061 | ) |
| | | | | | | | |
Net cash provided by financing activities | | | 7,677,186 | | | | 18,559,085 | |
| | | | | | | | |
| | |
Effect of exchange rate fluctuation on cash | | | (21,564 | ) | | | (3,654 | ) |
| | | | | | | | |
| | |
Net increase in cash and cash equivalents | | | 9,567,195 | | | | 12,363,749 | |
| | |
Cash and cash equivalents at beginning of period | | | 2,037,120 | | | | 5,429,114 | |
| | | | | | | | |
| | |
Cash and cash equivalents at end of period | | $ | 11,604,315 | | | $ | 17,792,863 | |
| | | | | | | | |
| | |
Supplemental disclosure of non-cash investing and financing transactions: | | | | | | | | |
Amounts incurred but not paid: | | | | | | | | |
Loan costs | | $ | 135,558 | | | $ | — | |
| | | | | | | | |
Stock issuance and offering costs | | $ | — | | | $ | 133,827 | |
| | | | | | | | |
Distributions declared | | $ | 441,144 | | | $ | 266,057 | |
| | | | | | | | |
See accompanying notes to condensed consolidated financial statements.
5
GLOBAL INCOME TRUST, INC. AND SUBSIDIARIES
NOTES TO CONDENSED CONSOLIDATED FINANCIAL STATEMENTS
SIX MONTHS ENDED JUNE 30, 2013
| 1. | Business and Organization |
Global Income Trust, Inc. was organized in Maryland on March 4, 2009. The term “Company” includes, unless the context otherwise requires, Global Income Trust, Inc., Global Income, LP, a Delaware limited partnership (the “Operating Partnership”), Global Income GP, LLC, and other subsidiaries of Global Income Trust, Inc. The Company operates, and has elected to be taxed, as a real estate investment trust (“REIT”) for U.S. federal income tax purposes commencing with its taxable year ended December 31, 2010. The Company was formed to own and operate a portfolio of income-oriented commercial real estate and real estate-related assets on a global basis.
The Company is externally advised by CNL Global Income Advisors, LLC (the “Advisor”) and its property manager is CNL Global Income Managers, LLC (the “Property Manager”), each of which is a Delaware limited liability company and a wholly owned affiliate of CNL Financial Group, LLC, the Company’s sponsor (the “Sponsor”). CNL Financial Group, LLC is an affiliate of CNL Financial Group, Inc. (“CNL”). The Advisor is responsible for managing the Company’s affairs on a day-to-day basis and for identifying and making acquisitions and investments on behalf of the Company pursuant to an advisory agreement between the Company, the Operating Partnership and the Advisor.
Substantially all of the Company’s acquisition, operating, administrative and property management services are provided by sub-advisors to the Advisor and sub-property managers to the Property Manager. Affiliates of CNL, Macquarie Infrastructure and Real Assets Inc. (“MIRA”) and MGPA (Europe) Limited (“MGPA Advisory”) serve as sub-advisors and sub-property managers. MGPA Advisory is a subsidiary of MGPA Limited, an independently managed private equity real estate investment advisory company focused on real estate investments in Europe and Asia. In addition, certain unrelated sub-property managers have been engaged by the Company or sub-property managers to provide certain property management services.
On April 23, 2010, the Company commenced its initial public offering of up to $1.5 billion of shares of common stock (150 million shares of common stock at $10.00 per share) (the “Offering”) pursuant to a registration statement on Form S-11 under the Securities Act. As of April 23, 2013, the Offering closed and the Company had received aggregate offering proceeds of approximately $83.7 million, since inception including proceeds received through the Company’s distribution reinvestment plan.
As of June 30, 2013, the Company owned nine properties located in the U.S. and Germany, with approximately 1.3 million of leasable square feet that were 99.8% leased.
| 2. | Summary of Significant Accounting Policies |
Basis of Presentation and Consolidation – The accompanying unaudited condensed consolidated financial statements have been prepared in accordance with the instructions to Form 10-Q and do not include all of the information and note disclosures required by generally accepted accounting principles in the United States (“GAAP”). The unaudited condensed consolidated financial statements reflect all normal recurring adjustments, which, in the opinion of management are necessary for the fair statement of the Company’s results for the interim periods presented. Operating results for the quarter and six months ended June 30, 2013 may not be indicative of the results that may be expected for the year ending December 31, 2013. Amounts as of December 31, 2012 included in the unaudited condensed consolidated financial statements have been derived from audited consolidated financial statements as of that date but do not include all disclosures required by GAAP. These unaudited condensed consolidated financial statements should be read in conjunction with the audited consolidated financial statements and notes thereto included in the Company’s Annual Report on Form 10-K for the year ended December 31, 2012.
The accompanying condensed consolidated financial statements include the accounts of the Company and its wholly owned subsidiaries. All intercompany accounts and transactions have been eliminated in consolidation.
6
GLOBAL INCOME TRUST, INC. AND SUBSIDIARIES
NOTES TO CONDENSED CONSOLIDATED FINANCIAL STATEMENTS
SIX MONTHS ENDED JUNE 30, 2013
| 2. | Summary of Significant Accounting Policies (continued) |
Reclassifications — Certain prior period amounts in the unaudited condensed consolidated financial statements have been reclassified to conform to the current period presentation with no effect on previously reported total assets and total liabilities, net loss or stockholders’ equity.
Adopted Accounting Pronouncements – In February 2013, the Financial Accounting Standards Board (“FASB”) issued Accounting Standards Update (“ASU”) No. 2013-02, “Comprehensive Income (Topic 220): Reporting of Amounts Reclassified Out of Accumulated Other Comprehensive Income (AOCI).” This update clarified the guidance and requires preparers to report, in one place, information about reclassifications out of AOCI. The ASU also requires companies to report changes in AOCI balances. Effective January 1, 2013, the Company adopted this ASU. The adoption of this update did not have a material impact on the Company’s financial position, results of operations or cash flows.
In December 2011, the FASB issued ASU No. 2011-10, “Property, Plant, and Equipment (Topic 360): Derecognition of in Substance Real Estate – a Scope Clarification.” This update clarified the guidance in subtopic 360-20 as it applies to the derecognition of in substance real estate when the parent ceases to have a controlling financial interest in a subsidiary that is in substance real estate because of a default by the subsidiary on its nonrecourse debt. Effective January 1, 2013, the Company adopted this ASU, which did not have a material impact on the Company’s financial position, results of operations or cash flows.
Recent Accounting Pronouncements – In March 2013, the FASB issued ASU No. 2013-05, “Foreign Currency Matters (Topic 830): Parent’s Accounting for the Cumulative Translation Adjustment upon Derecognition of Certain Subsidiaries or Groups of Assets within a Foreign Entity or of an Investment in a Foreign Entity.” This update affects entities that cease to hold a controlling financial interest (as described in subtopic 810-10) in a subsidiary or group of assets within a foreign entity when the subsidiary or group of assets is a business and there is a cumulative translation adjustment balance associated with that foreign entity. The update also affects entities that lose a controlling financial interest in an investment in a foreign entity (by sale or other transfer event) and those that acquire a business in stages (sometimes also referred to as a step acquisition) by increasing an investment in a foreign entity from one accounted for under the equity method to one accounted for as a consolidated investment. The amendments in this update are effective for fiscal years, and interim periods within those years, beginning on or after December 15, 2013. The Company will continue to assess whether this update will have a material impact on the Company’s financial position, results of operations or cash flows on future annual and interim periods.
In April 2013, the FASB issued ASU No. 2013-07, “Presentation of Financial Statements (Topic 205): Liquidation Basis of Accounting.” This update requires entities to prepare its financial statements using the liquidation basis of accounting when liquidation is imminent. The amendments require financial statements prepared using the liquidation basis of accounting to present relevant information about an entity’s expected resources in liquidation by measuring and presenting assets at the amount of the expected cash proceeds from liquidation. The entity should include in its presentation of assets any items it had not previously recognized under U.S. GAAP but that it expects to either sell in liquidation or use in settling liabilities (for example, trademarks). The amendments in this update are effective for fiscal years, and interim periods within those years, beginning on or after December 15, 2013. The Company will continue to assess whether this update will have a material impact on the Company’s financial position, results of operations or cash flows on future annual and interim periods.
| 3. | Real Estate Investment Properties, net |
There has been no change in the gross carrying value of the Company’s real estate investment properties since December 31, 2012, other than differences attributable to movements in foreign currency exchange rates across periods. As of June 30, 2013 and December 31, 2012, the Company had accumulated depreciation of approximately $3.7 million and $2.4 million, respectively.
7
GLOBAL INCOME TRUST, INC. AND SUBSIDIARIES
NOTES TO CONDENSED CONSOLIDATED FINANCIAL STATEMENTS
SIX MONTHS ENDED JUNE 30, 2013
The gross carrying amount and accumulated amortization of the Company’s intangible assets as of June 30, 2013 and December 31, 2012 are as follows:
| | | | | | | | |
| | | June 30,
2013 | | | December 31,
2012 | |
In place leases | | $ | 26,221,800 | | | $ | 26,255,600 | |
Above-market leases | | | 2,003,479 | | | | 2,008,784 | |
| | | | | | | | |
Gross carrying amount | | | 28,225,279 | | | | 28,264,384 | |
Accumulated amortization | | | (5,627,666 | ) | | | (3,352,478 | ) |
| | | | | | | | |
Net book value | | $ | 22,597,613 | | | $ | 24,911,906 | |
| | | | | | | | |
During the six months ended June 30, 2013, the Company extinguished the outstanding balance of $0.8 million of its credit facility prior to its scheduled expiration, and in addition, extinguished the outstanding balance of $4.0 million of its mezzanine loan that bore interest at a rate of 11% prior to its scheduled expiration. In connection therewith, the Company wrote-off approximately $0.1 million in unamortized loan costs which are included in the accompanying condensed consolidated statement of operations for the six months ended June 30, 2013 as interest expense and loan cost amortization and as a loss on the early extinguishment of debt in the accompanying condensed consolidated statement of cash flows for the six months ended June 30, 2013.
The Company’s debt contains customary covenants, agreements, representations and warranties and events of default, all as set forth in the respective loan documents. Additionally certain of the Company’s agreements contain certain financial covenants, including (but not limited to) the following: minimum debt service coverage ratios and limitations on the incurrence of additional indebtedness. As of June 30, 2013, the Company was in compliance with these covenants.
Maturities of indebtedness for the remainder of 2013 and each of the next four years and thereafter, in the aggregate, as of June 30, 2013 was as follows:
| | | | |
2013 | | $ | 653,665 | |
2014 | | | 1,370,637 | |
2015 | | | 1,452,414 | |
2016(1) | | | 30,882,372 | |
2017 | | | 933,101 | |
Thereafter | | | 37,012,699 | |
| | | | |
| | $ | 72,304,888 | |
| | | | |
FOOTNOTE:
| (1) | For the purposes of the maturity table above, management assumed that the principal amounts outstanding on two of the mortgage notes payable are repaid at the anticipated repayment date, as defined in the respective loan agreements. |
The fair market value and carrying value of the mortgage and other notes payable was approximately $71.1 million and $72.3 million, respectively, as of June 30, 2013, based on then-current rates and spreads the Company would expect to obtain for similar borrowings. Because this methodology includes inputs that are less observable by the public and are not necessarily reflected in active markets, the measurement of the estimated fair values related to the Company’s mortgage and other notes payable is categorized as level 3 on the three-level valuation hierarchy used for GAAP. The estimated fair value of accounts payable and accrued expenses approximates the carrying value as of June 30, 2013 because of the relatively short maturities of the obligations.
8
GLOBAL INCOME TRUST, INC. AND SUBSIDIARIES
NOTES TO CONDENSED CONSOLIDATED FINANCIAL STATEMENTS
SIX MONTHS ENDED JUNE 30, 2013
| 6. | Related Party Arrangements |
For the quarter and six months ended June 30, 2013 and 2012, the Company incurred the following fees to the managing dealer, an affiliate of the Company’s Advisor, in connection with its Offering:
| | | | | | | | | | | | | | | | |
| | | Quarter Ended June 30, | | | Six Months Ended June 30, | |
| | | 2013 | | | 2012 | | | 2013 | | | 2012 | |
| | | | |
Selling commissions | | $ | 473,057 | | | $ | 735,952 | | | $ | 1,300,803 | | | $ | 1,536,900 | |
Marketing support fees | | | 216,546 | | | | 315,408 | | | | 571,295 | | | | 658,671 | |
| | | | | | | | | | | | | | | | |
| | $ | 689,603 | | | $ | 1,051,360 | | | $ | 1,872,098 | | | $ | 2,195,571 | |
| | | | | | | | | | | | | | | | |
For the quarters and six months ended June 30, 2013 and 2012, the Company incurred the following fees and reimbursable expenses due to the Advisor, its affiliates and other related parties:
| | | | | | | | | | | | | | | | |
| | | Quarter Ended June 30, | | | Six Months Ended June 30, | |
| | | 2013 | | | 2012 | | | 2013 | | | 2012 | |
Reimbursable expenses: | | | | | | | | | | | | | | | | |
Offering costs | | $ | 370,814 | | | $ | 557,723 | | | $ | 989,277 | | | $ | 1,140,285 | |
Operating and acquisition expenses | | | 256,704 | | | | 387,265 | | | | 507,962 | | | | 695,108 | |
| | | | | | | | | | | | | | | | |
| | | 627,518 | | | | 944,988 | | | | 1,497,239 | | | | 1,835,393 | |
Investment services fees(1) | | | — | | | | — | | | | — | | | | 97,139 | |
Asset management fees | | | 301,529 | | | | 149,039 | | | | 603,058 | | | | 284,800 | |
Property management fees(1) | | | 100,482 | | | | 60,983 | | | | 207,412 | | | | 115,109 | |
Expense support adjustment(2) | | | (453,648 | ) | | | (314,862 | ) | | | (977,591 | ) | | | (314,862 | ) |
| | | | | | | | | | | | | | | | |
| | $ | 575,881 | | | $ | 840,148 | | | $ | 1,330,118 | | | $ | 2,017,579 | |
| | | | | | | | | | | | | | | | |
FOOTNOTES:
| (1) | Includes amounts paid directly by subsidiaries of the Company to MGPA Advisory or other affiliates of MGPA Limited. MGPA Advisory is a sub-advisor of the Advisor and was indirectly affiliated with one of the Company’s directors during the six months ended June 30, 2013 and the year ended December 31, 2012. |
| (2) | See description of the Expense Support Agreement below. |
9
GLOBAL INCOME TRUST, INC. AND SUBSIDIARIES
NOTES TO CONDENSED CONSOLIDATED FINANCIAL STATEMENTS
SIX MONTHS ENDED JUNE 30, 2013
| 6. | Related Party Arrangements (continued) |
Amounts due to related parties for fees and reimbursable costs and expenses were as follows as of:
| | | | | | | | |
| | | June 30,
2013 | | | December 31,
2012 | |
Due to managing dealer: | | | | | | | | |
Selling commissions | | $ | — | | | $ | 23,520 | |
Marketing support fees | | | — | | | | 10,080 | |
| | | | | | | | |
| | | — | | | | 33,600 | |
| | | | | | | | |
Due to Property Manager: | | | | | | | | |
Property management fees | | | 60,494 | | | | 37,012 | |
| | | | | | | | |
| | | 60,494 | | | | 37,012 | |
| | | | | | | | |
Due to the Advisor, its affiliates and other related parties: | | | | | | | | |
Reimbursable offering costs | | | — | | | | 16,800 | |
Reimbursable operating expenses | | | 218,064 | | | | 406,668 | |
Investment services fees | | | — | | | | 422,088 | |
| | | | | | | | |
| | | 218,064 | | | | 845,556 | |
| | | | | | | | |
| | $ | 278,558 | | | $ | 916,168 | |
| | | | | | | | |
In March 2012, the Company’s board of directors approved an Expense Support and Conditional Reimbursement Agreement with its Advisor (the “Expense Support Agreement”) whereby, effective April 1, 2012, reimbursement of operating-related personnel expenses and asset management fees to the Advisor and its affiliates are deferred and subordinated until such time, if any, that (i) cumulative modified funds from operations (as defined in the Expense Support Agreement) for the period April 1, 2012 through the applicable determination date exceeds (ii) distributions declared to stockholders for the same period. Such reimbursements and payments are further subordinated to the Company’s total operating expenses being within the 2%/25% guideline limitations as such terms are defined in the advisory agreement. For purposes of the above subordinations, all or a portion of the deferred amounts may be paid only to the extent it does not cause the applicable performance measurement to not be met inclusive of the conditional reimbursement amount. The Expense Support Agreement is terminable by the Advisor, but not before December 31, 2013, as amended, and any deferrals are eligible for conditional reimbursement for a period of up to three years from the applicable determination date. Any amounts deferred that have not met the conditions of reimbursement within the time period established in the Expense Support Agreement will be permanently waived by the Advisor and the Company will have no obligation to pay such amounts.
For the quarter and six months ended June 30, 2013, approximately $0.3 million and $0.6 million, respectively, in asset management fees and approximately $0.2 million and $0.4 million, respectively, in operating-related personnel expenses were deferred and subordinated in accordance with the terms of the Expense Support Agreement. As of June 30, 2013, the Advisor had deferred a total of $2.1 million in expenses under the terms of the Expense Support Agreement. The Company will record such amounts as operating expenses in future periods to the extent, if any, it determines that these amounts are probable of being reimbursed to the Advisor. As of June 30, 2013, the Company determined it was not probable that the performance hurdles would be achieved within the applicable reimbursement period due to the cumulative nature of such metrics; therefore, the Company has not recognized any expense for the amounts deferred.
10
GLOBAL INCOME TRUST, INC. AND SUBSIDIARIES
NOTES TO CONDENSED CONSOLIDATED FINANCIAL STATEMENTS
SIX MONTHS ENDED JUNE 30, 2013
| 6. | Related Party Arrangements (continued) |
Organizational and offering costs become a liability to the Company only to the extent selling commissions, the marketing support fees and other organizational and offering costs do not exceed 15% of the gross proceeds of the Company’s Offering. The Advisor has incurred an additional $5.7 million of costs on behalf of the Company in connection with the Offering (exceeding the 15% limitation on costs) as of June 30, 2013. Although the Company’s board of directors could determine to pursue an additional equity offering in the future and further determine that certain costs previously incurred benefit such future offering, generally, the costs incurred in excess of the 15% limitation remain the responsibility of the Advisor following the close of the Company’s Offering on April 23, 2013.
Public Offering – The Company’s Offering closed on April 23, 2013. During the period from April 1, 2013 through April 23, 2013, the Company received additional subscription proceeds of approximately $7.4 million (0.7 million shares) from its Offering. Through April 23, 2013, the Company received aggregate offering proceeds of approximately $83.7 million, including proceeds of approximately $1.9 million from shares sold through its distribution reinvestment plan (“DRP”).
On April 10, 2013, the board of directors approved the termination of the Company’s DRP, effective as of April 26, 2013. As a consequence of the termination of the DRP, beginning with the April 2013 monthly distributions, which were paid in May 2013, stockholders who were previously reinvesting their distributions in shares began receiving cash distributions.
Distributions – During the six months ended June 30, 2013 and 2012, cash distributions totaling approximately $2.5 million and $1.3 million, respectively, were declared payable to stockholders, including approximately $0.4 million and $0.3 million, declared but unpaid as of June 30, 2013 and 2012, respectively, which were paid in July 2013 and July 2012, respectively. For the six months ended June 30, 2013 and 2012, approximately 37% and 100%, of distributions declared to stockholders were considered to be funded with proceeds from our Offering, and 63% and 0% were considered to be funded with cash provided by operations, respectively, for GAAP purposes. In addition, for the six months ended June 30, 2013, approximately 24% of the cash distributions paid to stockholders were considered taxable income and 76% were considered a return of capital to stockholders for federal income tax purposes; whereas, 100% of distributions for the six months ended June 30, 2012 were considered a return of capital for federal income tax purposes.
Redemptions – On April 10, 2013, the board of directors approved the suspension of the Company’s stock redemption plan (the “Redemption Plan”) effective as of April 10, 2013. During the six months ended June 30, 2013, the Company processed and paid all eligible redemption requests that were received through April 10, 2013 for the redemption of an aggregate of 130,215 shares of common stock, all of which were approved for redemption at an average price of $9.37 per share, for a total of approximately $1.2 million. During the month of April we received a request to redeem 6,548 shares which were redeemed at an average price of $10.00 per share. Such redemptions were funded with proceeds from the Offering, including amounts received through the distribution reinvestment plan. The Company does not accept or otherwise process under the Redemption Plan any redemption requests received after April 10, 2013.
For the six months ended June 30, 2013, the income tax expense associated with both state and international operations was $0.02 and $0.01 million, respectively, for a total of $0.03 million; whereas, for the six months ended June 30, 2012, the tax benefit (expense) associated with state and international operations was ($0.02) million and $0.08 million, respectively, for a net benefit of $0.06 million. The effective tax rate for the international properties was 15.8% for the six months ended June 30, 2013 and 2012.
11
GLOBAL INCOME TRUST, INC. AND SUBSIDIARIES
NOTES TO CONDENSED CONSOLIDATED FINANCIAL STATEMENTS
SIX MONTHS ENDED JUNE 30, 2013
| 9. | Commitments and Contingencies |
In the ordinary course of business, the Company may become subject to litigation or claims. There are no material legal proceedings pending or known to be contemplated against the Company.
See Note 6, “Related Party Arrangements” for information on contingent amounts due to the Company’s Advisor in connection with the Expense Support Agreement, the Offering and the expenses thereof.
12
Item 2. Management’s Discussion and Analysis of Financial Condition and Results of Operations
INTRODUCTION
The following discussion is based on the unaudited condensed consolidated financial statements as of June 30, 2013 and December 31, 2012, and for the six months ended June 30, 2013 and 2012. Amounts as of December 31, 2012 included in the unaudited condensed consolidated financial statements have been derived from the audited consolidated financial statements as of that date. This information should be read in conjunction with the accompanying unaudited condensed consolidated financial statements and the notes thereto, as well as the audited consolidated financial statements, notes and management’s discussion and analysis of financial condition and results of operations included in our Annual Report on Form 10-K for the year ended December 31, 2012. Capitalized terms used in the Item 2 have the same meaning as in the accompanying condensed consolidated financial statements.
STATEMENT REGARDING FORWARD-LOOKING INFORMATION
Certain statements under this Item 2. “Management’s Discussion and Analysis of Financial Condition and Results of Operations” and elsewhere in this Quarterly Report on Form 10-Q constitute “forward-looking statements” within the meaning of the Federal Private Securities Litigation Reform Act of 1995. Global Income Trust, Inc. (the “Company”) intends that such forward-looking statements be subject to the safe harbors created by Section 27A of the Securities Act of 1933, as amended, and Section 21E of the Securities Exchange Act of 1934, as amended. Forward-looking statements are statements that do not relate strictly to historical or current facts, but reflect management’s current understandings, intentions, beliefs, plans, expectations, assumptions and/or predictions regarding the future of the Company’s business and its performance, the economy, and other future conditions and forecasts of future events, and circumstances. Forward-looking statements are typically identified by words such as “believes,” “expects,” “anticipates,” “intends,” “estimates,” “plans,” “continues,” “pro forma,” “may,” “will,” “seeks,” “should” and “could,” and words and terms of similar substance in connection with discussions of future operating or financial performance, business strategy and portfolios, projected growth prospects, cash flows, costs and financing needs, legal proceedings, amount and timing of anticipated future distributions, estimated per share value of the Company’s common stock, and other matters. The Company’s forward-looking statements are not guarantees of future performance. While the Company’s management believes its forward-looking statements are reasonable, such statements are inherently susceptible to uncertainty and changes in circumstances. As with any projection or forecast, forward-looking statements are necessarily dependent on assumptions, data and/or methods that may be incorrect or imprecise, and may not be realized. The Company’s forward-looking statements are based on management’s current expectation. Although the Company believes that the expectations reflected in such forward-looking statements are based upon reasonable assumptions, the Company’s actual results could differ materially from those set forth in the forward-looking statements due to a variety of risks, uncertainties and other factors many of which are beyond the Company’s ability to control or accurately predict. Given these uncertainties, the Company cautions you not to place undue reliance on such statements.
Important factors that could cause the Company’s actual results to vary materially from those expressed or implied in its forward-looking statements include, but are not limited to, government regulation, economic, strategic, political and social conditions, and the following: risks associated with the Company’s investment strategy; a worsening economic environment in the U.S. or globally, including financial market fluctuations; risks associated with real estate markets, including declining real estate values; risks associated with the limited amount of proceeds raised in the Company’s offering of its shares, including the limited number of investments made; risks of doing business internationally, including currency risks; the Company’s failure to obtain, renew or extend necessary financing or to access the debt or equity markets; the use of debt to finance the Company’s business activities, including refinancing and interest rate risk and the Company’s failure to comply with debt covenants; the Company’s ability to identify and close on suitable investments; failure to successfully manage growth or integrate acquired properties and operations; the Company’s ability to make necessary improvements to properties on a timely or cost-efficient basis; risks related to property expansions and renovations; competition for properties and/or tenants; defaults on or non-renewal of leases by tenants; failure to lease properties on favorable terms or at all; the impact of current and future environmental, zoning and other governmental regulations affecting the Company’s properties; the impact of changes in accounting rules; the impact of regulations requiring periodic valuation of the Company on a per share basis; inaccuracies of the Company’s accounting estimates; unknown liabilities of acquired properties or liabilities caused by property managers or operators; consequences of our net operating losses;
13
increases in operating costs and other expenses; uninsured losses or losses in excess of the Company’s insurance coverage; the impact of outstanding and/or potential litigation; risks associated with the Company’s tax structuring; failure to qualify for and maintain the Company’s REIT qualification; and the Company’s ability to protect its intellectual property and the value of its brand.
For further information regarding risks and uncertainties associated with the Company’s business, and important factors that could cause the Company’s actual results to vary materially from those expressed or implied in its forward-looking statements, please refer to the factors listed and described under “Management’s Discussion and Analysis of Financial Condition and Results of Operations” and the “Risk Factors” sections of the Company’s documents filed from time to time with the U.S. Securities and Exchange Commission, including, but not limited to, this and the Company’s other quarterly reports on Form 10-Q, and the Company’s annual report on Form 10-K, copies of which may be obtained from the Company’s website at http://www.incometrust.com.
All written and oral forward-looking statements attributable to the Company or persons acting on its behalf are qualified in their entirety by these cautionary statements. Forward-looking statements speak only as of the date on which they are made; the Company undertakes no obligation to, and expressly disclaims any obligation to, update or revise its forward-looking statements to reflect new information, changed assumptions, the occurrence of subsequent events, or changes to future operating results over time unless otherwise required by law.
OVERVIEW
Global Income Trust, Inc. was organized as a Maryland corporation on March 4, 2009 and has elected to be taxed, and currently qualifies as a real estate investment trust (“REIT”) for federal income tax purposes. The terms “us,” “we,” “our,” “our Company” and “Global Income Trust, Inc.” include Global Income Trust, Inc. and each of its subsidiaries.
Our Advisor and Property Manager
Our advisor is CNL Global Income Advisors, LLC (the “Advisor”) and our property manager is CNL Global Income Managers, LLC (the “Property Manager”), each of which is a Delaware limited liability company and wholly owned by affiliates of CNL Financial Group, LLC, our sponsor (the “Sponsor”). The Sponsor is an affiliate of CNL Financial Group, Inc., or “CNL,” which is a leading private investment management firm providing global real estate and alternative investments. The Advisor is responsible for managing our affairs on a day-to-day basis and for identifying and making acquisitions and investments on our behalf pursuant to an advisory agreement.
Substantially all of our acquisition, operating, administrative and property management services are provided by sub-advisors to the Advisor and by sub-property managers to the Property Manager. Affiliates of CNL, Macquarie Infrastructure and Real Assets Inc. (“MIRA”) and MGPA (Europe) Limited (“MGPA Advisory”) serve as sub-advisors and as sub-property managers. MGPA Advisory is a subsidiary of MGPA Limited, an independently managed private equity real estate investment advisory company focused on real estate investment in Europe and Asia in which an affiliate of MIRA has a joint venture interest. On May 21, 2013, MGPA Limited announced that it had entered into an agreement to be acquired by New York-based BlackRock, Inc., the world’s largest asset manager, overseeing $3.9 trillion in assets under management. The announcement indicated that the acquisition is expected to close in the third quarter of 2013, subject to various regulatory approvals. We expect little, if any, disruption from the transaction. Finally, certain unrelated sub-property managers have been engaged to provide certain property management services. This network of sub-advisors and sub-property managers offers us access to professionals experienced in making and managing real estate and real estate-related investments in various regions around the world.
Our Common Stock Offering
In April 2010, we commenced our initial public offering of up to $1.5 billion of shares of common stock (the “Offering”), the net proceeds of which would be used primarily to fund our acquisitions of real estate and real estate-related assets. We commenced significant operations on October 8, 2010, when the minimum required offering proceeds were received and funds were released to us from escrow. Our Offering closed on April 23, 2013 and since inception, we received aggregate proceeds of approximately $83.7 million (8.4 million shares) from our Offering, including approximately $1.9 million (0.2 million shares) from our distribution reinvestment plan. Our board of directors has determined not to pursue an additional offering and to discontinue our distribution reinvestment plan at this time; therefore, we do not anticipate receiving additional equity proceeds in the near term.
14
Our Real Estate Portfolio
We were formed primarily to acquire and operate a diverse portfolio of income-oriented commercial real estate and real estate-related assets on a global basis. As of June 30, 2013, we owned nine properties, with approximately 1.3 million square feet of leasable space and our portfolio was 99.8% leased with a weighted average remaining lease term of 5.2 years based on annual base rents. Our leases generally include terms whereby, in addition to payments of base rent with periodic escalations, tenants are responsible for some, and in two cases substantially all, of the operating expenses of the property. Our tenants include FedEx Ground Package System, Inc., Mercedes Benz Financial Services USA, LLC and Samsonite LLC, as well as a number of popular value retailers in Germany, among others.
Operating Performance
With the completion of our offering and acquisition phases, our focus has shifted to operations, including the operating performance of our portfolio. As we look for ways to increase our cash flows and build value, we are contemplating a number of value creation opportunities relating to our properties, such as seeking lease extensions with tenants in advance of renewal option periods, and driving operating efficiencies to reduce our general and administrative expenses.
We expect the operating cash flows from our properties to increase over time as scheduled rent increases become due on certain properties. Moreover, less than 10% of our annualized base rents are set to expire prior to 2018; therefore, we do not expect any significant lease turnover in the near term.
We expect positive increases in our net cash from operations and funds from operations (“FFO”) in 2013 once we have completed our acquisition phase by investing the last of our Offering proceeds to optimize our rental revenues. However, while still acquiring any assets, we would expect to incur acquisition fees and expenses that negatively impact these financial measures even though we view them as being funded with capital proceeds.
Distributions
We continue to focus on providing stockholders with attractive and stable cash distributions. Until the current year, our distributions have been funded primarily with Offering proceeds rather than funds from operations. With the completion of any additional acquisition later this year using remaining Offering proceeds, and in part as a result of the Expense Support Agreement, described in “Results of Operations – Expense Support Agreement,” being in place, we expect cash from operations and FFO to fund substantially all of our distributions at the current rate for the remainder of 2013. In April 2013, our board of directors determined it was in the best interest of our Company to terminate our distribution reinvestment plan; therefore, all distributions paid, commencing in May 2013, are paid in cash to stockholders. Prior to May 2013, approximately one-third of our monthly distributions were being reinvested in additional shares of common stock by participants of our distribution reinvestment plan. The termination of this plan results in more net cash being required to fund distributions on a monthly basis. Our Advisor could determine not to extend the Expense Support Agreement beyond 2013, and we may have a number of other unforeseen circumstances that could cause us to have less cash available for distribution. Should we not have sufficient cash available for distributions after a reasonable reserve, we may have to amend our current distribution policy.
Exit Strategy
In January 2013, our directors decided against continuing to raise equity capital after the expiration of our initial Offering. Although our existing portfolio is strong by a number of measures (tenant quality, occupancy, and location), it is not as large and diverse as we would have liked. Our Advisor is primarily focused on optimizing the value of our portfolio, but is also making a preliminary assessment of strategic alternatives including potential liquidity events, increasing the likelihood such an event would happen sooner than initially contemplated. The actual date of our liquidity event is difficult to predict and is at the discretion of the board of directors, subject to our governing documents.
15
Liquidity and Capital Resources
General
Through April 2013, we were in our offering and acquisition phase and, therefore, our primary sources of capital were proceeds from our Offering and debt financing.
To date, our principal demands for funds have been for:
| | • | | the acquisition of real estate and real estate-related assets, |
| | • | | the payment of offering and operating expenses, |
| | • | | the payment of debt service on our outstanding indebtedness, and |
| | • | | the payment of distributions. |
Equity and Debt Capital
During the six months ended June 30, 2013, we received proceeds from our Offering, net of stock issuance and offering costs, of approximately $16.9 million. These amounts, as well as cash available as of December 31, 2012, were used primarily to repay the outstanding balances of $0.8 million on our revolving line of credit (“Credit Facility”), repay $4.0 million on our mezzanine loan (“Mezz Loan”) obtained in connection with the acquisition of our Heritage Commons IV property, pay approximately $0.6 million of scheduled principal payments and to pay approximately $1.3 million in redemption requests. As of June 30, 2013, we had unused proceeds from our Offering of approximately $11.6 million. Most of this amount is expected to be invested in the form of one or more additional properties and through select capital improvements designed to improve or extend existing minimum lease terms. We also intend to retain a portion of this cash as a reserve for future working capital and other needs.
During the six months ended June 30, 2013, we incurred stock issuance and offering costs of $2.9 million. In addition, as of June 30, 2013, our Advisor had incurred approximately $5.7 million of unreimbursed additional costs in connection with our Offering since our inception. We are obligated to reimburse the Advisor stock issuance and offering costs in an amount totaling up to 15% of the proceeds of our offerings. Although our board of directors could determine to pursue an additional equity offering in the future and further determine that certain costs previously incurred benefit such future offering, generally, the costs incurred in excess of the 15% limitation remain the responsibility of our Advisor given the close of our Offering on April 23, 2013.
As a REIT, we are required to distribute at least 90% of our taxable income (excluding net capital gains); therefore, as with other REITs, we must obtain debt and/or equity capital in order to fund our growth. With the close of our Offering, we do not expect to access equity capital markets in the near term, if ever, and therefore, will have limited capital to make acquisitions in the near term other than as noted above relating to unused Offering net proceeds at June 30, 2013. Although we anticipate that our board of directors will consider strategic alternatives for providing liquidity to investors earlier than 2017, as initially planned, there is no guarantee as to the timing of any such liquidity event.
Although, in general, our articles of incorporation allow us to borrow up to 300% of our net assets and our board of directors has adopted a policy to permit aggregate borrowings of up to approximately 75% of the aggregate value of our assets, our intent is to target our aggregate borrowings to between 50% and 60% of the aggregate value of our assets. With the repayment of the outstanding balance of $0.8 million on our Credit Facility and $4.0 million on our Mezz Loan, as well as the payment of approximately $0.6 million in scheduled principal payments during the six months ended June 30, 2013, we reduced our aggregate debt leverage ratio to 57.1% of the aggregate book value of our assets as of June 30, 2013, as compared to 64.3% at December 31, 2012. However, if needed, our articles of incorporation and the borrowing policy limitation adopted by our board of directors permit borrowings up to the levels described above, and in certain circumstances, in excess of these levels if approved by the board of directors.
16
We may seek to refinance our properties, but in doing so may face difficulties if the remaining term of our tenant’s lease obligations is less than five years. For example, the senior loans entered into at the time of our purchase of two of our properties each have an expected maturity in 2016. While each such senior loan contains a provision through which the loan can be extended for approximately two years, the extension triggers a substantial increase in the interest rate, and we therefore expect to refinance the debt prior to its initial maturity. The terms of any refinancing could be less favorable than the current terms if the properties’ tenants have not exercised their options to extend the leases.
We are currently considering capital improvements that can be made to several of our properties that would allow us to extend contractual lease maturities and otherwise enhance asset values. Lease extensions are likely to create an obligation to pay lease commissions and may also provide our tenants with some period of free or reduced rent. Some, but not all of our debt instruments require us to fund reserves that can be used to pay capital improvements and lease commissions, but these growing reserves would not necessarily be sufficient to fund all such capital improvements and lease commissions. Therefore we expect to retain for this purpose a portion of the net proceeds of our Offering. In the event of other unforeseen capital expenditures, we may be forced to defer making such improvements which could impact the ability for us to renew an existing lease or obtain a new lease on the property and could negatively impact the value of our property. If necessary, we may use financings or other sources of capital in the event of unforeseen significant capital expenditures or for temporary working capital in the event one or more of tenants experience financial difficulties and there is an interruption in their ability to make lease payments. However, there is no guarantee we would be able to obtain financing on favorable terms, or at all, and we may be forced to sell one or more properties at an unfavorable time to meet our obligations and to continue paying distributions.
Cash from Operating Activities
We generally expect to meet future cash needs for general and administrative expenses, debt service and distributions from the net operating income from our properties, which in general is rental income and tenant reimbursements less the property operating expenses and property management fees (“NOI”). Since we have now invested the majority of our offering proceeds and our properties owned as of June 30, 2013 are over 99% leased, we generally expect to earn an annualized return, before debt service, of approximately 8.2% on the cost of our current properties based on our weighted average going-in cap rates. Due to the nature of our leases, the tenants are responsible for a portion, or in two cases, substantially all, of the property operating expenses; therefore, any increases in property expenses are generally reimbursed by the tenants. In addition, our portfolio had a weighted average remaining lease term of 5.2 years as of June 30, 2013, with approximately 90% of our rental revenues scheduled to expire in 2018 or later. Based on this, we do not expect lease turnover or any increase in property expenses to have a significant impact on our cash flow from operations in the near term. However, we are vulnerable to tenant and geographic concentrations, whereby a default or non-renewal by one of our significant tenants or economic downturns in certain geographic regions would have a negative impact on our results of operations and cash flow from operations.
We experienced positive cash flow from operating activities for the six months ended June 30, 2013 of approximately $1.7 million, as compared to negative cash flow from operating activities for six months ended June 30, 2012 of $0.3 million. The difference in cash flows provided by (used in) operating activities between the periods presented was primarily the result of the following:
| | • | | an increase in property NOI, net of interest expense on property debt, of approximately $2.5 million primarily attributable to the acquisition of five properties subsequent to June 30, 2012; |
| | • | | a decrease in acquisition fees and expenses of approximately $0.7 million primarily due to there being no acquisitions in 2013; |
| | • | | a decrease in certain operating expenses of $0.7 million primarily due to the Expense Support Agreement with our Advisor, described below; and |
| | • | | net cash used of approximately $0.4 million during the six months ended June 30, 2013, as compared to $0.3 million in net cash provided during the six months ended June 30, 2012 due to changes in operating assets and liabilities. |
17
Net cash provided by operating activities for the six months ended June 30, 2013 is net of more than $0.5 million in acquisition fees and expenses paid, including amounts payable as of December 31, 2012. Since we have nearly completed our acquisition phase, we do not expect to incur significant acquisition fees and expenses in the future and generally expect a positive trend in cash from operations in future periods.
As described above, during the six months ended June 30, 2013, our cash from operations was positively impacted by the Expense Support Agreement (described in “Results of Operations – Expense Support Agreement”) which we entered into with our Advisor commencing in April 2012, pursuant to which our Advisor agreed to defer and subordinate up to 100% of its asset management fees and reimbursements of personnel-related operating expenses to the extent that our modified funds from operations (“MFFO”) was less than distributions declared to stockholders. As a result of this agreement, our Advisor deferred approximately $1.0 million in such fees and expenses during the six months ended June 30, 2013. Our Advisor has agreed to defer fees and expenses under the Expense Support Agreement through December 31, 2013. The deferred amounts are subject to reimbursement if we achieve certain performance hurdles within three years of the applicable deferral. As of June 30, 2013, we did not believe it was probable that the performance hurdles would be achieved within the prescribed reimbursement period due to the cumulative nature of such metrics; therefore, we have not recognized any expense for the amounts deferred. We expect these expenses will continue to be deferred during the remainder of 2013 resulting in a continued positive impact to our cash from operations. If our Advisor determines to not extend the Expense Support Agreement beyond 2013, our results from operations, cash from operations and FFO could be negatively impacted.
Foreign Operations
As of June 30, 2013, 23.4% of our net real estate assets and 19.8% of our annualized base rents relate to properties in Germany where the Euro is the functional currency. Because we have not obtained a cash flow hedge relating to foreign currency, we are vulnerable to changes in exchange rates. For the six months ended June 30, 2013, we experienced a negative impact of approximately $0.02 million on cash relating to unrealized foreign currency translation adjustments. Future movements in the exchange rate of Euros could materially impact our financial results and we may sell our assets in Germany at a time when the exchange rates are less favorable.
Our income outside the U.S. is subject to foreign income taxes; thereby, reducing our effective yield on our foreign assets. Generally, excess cash held in foreign subsidiaries is available for our use to fund domestic operations.
Working Capital
As of June 30, 2013, we had repaid in full the outstanding balances of our Credit Facility and the Mezz Loan relating to our Heritage Commons IV property scheduled to mature in November 2016, and we hold $11.6 million in unused net proceeds from our Offering. The mortgage lien against our property in Austin, Texas was released providing us with a potential source of future liquidity should we elect to refinance the asset. We are currently contemplating further investments in one or more additional properties and select capital improvements designed to improve or extend existing minimum lease terms. While these capital improvements and accompanying lease commissions may not be completed by the end of 2013, we are committed to taking advantage of opportunities such as these where we can find creative solutions for our tenants while creating value to our shareholders. We also intend to establish a reserve for future working capital and other needs. Due to the fact that our Offering has closed and we do not have other readily available sources of capital at this time, we prefer to maintain a higher level of working capital in the near term although our operating results would be better if we deployed more of our net Offering proceeds sooner and kept reserves to a minimum. We expect to thoughtfully weigh these options in determining how to deploy the remaining net proceeds.
18
Distributions
In order to qualify as a REIT, we are required to distribute 90% of our annual REIT taxable income (excluding net capital gains) to our stockholders. To date, we have had insufficient cash flows from operating activities or funds from operations to fund a significant portion of our distributions; therefore, such amounts have been substantially funded from proceeds of our Offering. Our board of directors has authorized a daily distribution of $0.0017808 per share of common stock (which is equal to an annualized distribution rate of 6.5% based on a 365 days calendar year) to all common stockholders of record as of the close of business on each day, payable monthly, until terminated or amended.
The payment of distributions is a significant use of cash. Our objective is to maintain a reasonable level of cash reserves to provide for continued distributions at their current level, but there is no assurance that our cash reserves will be sufficient to maintain that level in the event of a tenant defaulting on their obligations and/or our Advisor not continuing to defer certain expenses under the Expense Support Agreement.
Going forward, our primary source of capital for the payment of distributions is expected to be net operating income generated by our leases, net of our general and administrative expenses, debt service payments and other operating expenses. Our ability to sustain the current distribution rate is therefore highly dependent upon our tenants paying their rent as contractually due, our ability to keep our properties leased, and reducing our general and administrative expenses, including beyond 2013 when our Advisor may elect to terminate its Expense Support Agreement with us. For additional information, see “Results of Operations—Expense Support Agreement” below. In addition, as a result of the termination of the DRP on April 10, 2013, the amount of cash required to fund distributions is no longer offset by additional proceeds from DRP shares.
The following table presents total distributions declared and issued, including distributions reinvested in additional shares through our DRP, net cash provided by (used in) operating activities and FFO for the six months ended June 30, 2013 and 2012:
| | | | | | | | | | | | | | | | | | | | | | | | |
| | | Distributions
Declared
Daily Per
Share | | | Total Cash
Distributions
Declared(2) | | | Distributions Paid(1) | | | | | | | |
| | | | Cash | | | Reinvested
via DRP | | | Net Cash
Provided by
(Used In)
Operating
Activities(3) | | | FFO(4) | |
2013 Quarters | | | | | | | | | | | | | | | | | | | | | | | | |
First | | $ | 0.0017808 | | | $ | 1,125,577 | | | $ | 735,545 | | | $ | 390,032 | | | $ | 227,064 | | | $ | 1,015,923 | |
Second | | | 0.0017808 | | | | 1,324,515 | | | | 1,324,515 | | | | — | | | | 1,470,115 | | | | 1,136,884 | |
| | | | | | | | | | | | | | | | | | | | | | | | |
Total | | $ | 0.0035616 | | | $ | 2,450,092 | | | $ | 2,060,060 | | | $ | 390,032 | | | $ | 1,697,179 | | | $ | 2,152,807 | |
| | | | | | | | | | | | | | | | | | | | | | | | |
2012 Quarters | | | | | | | | | | | | | | | | | | | | | | | | |
First | �� | $ | 0.0017808 | | | $ | 565,867 | | | $ | 382,565 | | | $ | 183,302 | | | $ | (447,482 | ) | | $ | (704,172 | ) |
Second | | | 0.0017808 | | | | 741,419 | | | | 493,213 | | | | 248,206 | | | | 142,943 | | | | 25,158 | |
| | | | | | | | | | | | | | | | | | | | | | | | |
Total | | $ | 0.0035616 | | | $ | 1,307,286 | | | $ | 875,778 | | | $ | 431,508 | | | $ | (304,539 | ) | | $ | (679,014 | ) |
| | | | | | | | | | | | | | | | | | | | | | | | |
FOOTNOTES:
| (1) | Represents the amount of cash used to fund distributions and the amount of distributions paid which were reinvested in additional shares through our Distribution Reinvestment Plan, including amounts paid and shares issued subsequent to the period reported. |
| (2) | Our net loss and distributions were approximately $1.4 million and $2.5 million, respectively, for the six months ended June 30, 2013, and approximately $2.5 million and $1.3 million, respectively, for the six months ended June 30. 2012. Due to the fact that distributions declared exceeded GAAP net cash provided by operating activities for the six months ended June 30, 2013, approximately 37% of distributions declared to stockholders were considered funded with proceeds from our Offering for GAAP purposes; whereas, 100% of distributions for the six months ended June 30, 2012 were considered funded with proceeds from our Offering given that we had negative cash flows from operations. |
| (3) | Net cash provided by (used in) operating activities agrees with our Condensed Consolidated Statements of Cash Flows in our condensed consolidated financial statements. Such amounts generally represents net income or loss adjusted for items not using cash, such as depreciation and amortization expense, and items not providing cash, such as straight-line rent adjustments. It can also include cash that resulted from the collection of a receivable or the postponement of making a vendor payment and, alternatively, excludes cash earned that has not been collected or the payment of expenses accrued in an earlier period. Net cash provided by operating activities includes deductions for acquisition fees and expenses in excess |
19
| | of $0.5 million for the six months ended June 30, 2013, including amounts accrued as of December 31, 2012. These payments were offset against net cash provided by operating activities but in our view funded from Offering proceeds. In addition to net cash provided by (used in) operating activities, our board of directors considers other factors in determining distributions, including expected and actual funds from operations as well as other factors. |
| (4) | See reconciliation of funds from operations below in “Results of Operations – Funds from Operations and Modified Funds from Operations.” |
Generally, distributions up to the amount of our current or accumulated earnings and profits will be taxable to the recipient stockholders as ordinary income. We currently intend to continue to pay distributions to our stockholders on a monthly basis although our board of directors reserves the right to change the per share distribution amount or otherwise amend or terminate our distribution policy. Our board of directors considers a number of factors in its determination of the amount and basis of distributions it declares, including expected and actual net cash flow from operations, FFO, our overall financial condition, our Advisor’s determination in regards to deferring certain fees and expenses under the Expense Support Agreement, our objective of qualifying as a REIT for U.S. federal income tax purposes, the determination of reinvestment versus distribution following the sale or refinancing of an asset, as well as other factors, including an objective of maintenance of stable and predictable distributions regardless of the composition. For the six months ended June 30, 2013 and 2012, approximately 37% and 100%, of distributions declared to stockholders were considered funded with proceeds from our Offering for GAAP purposes.
In the event we do not generate sufficient cash from operations, we may have to revise our current distribution policy.
Common Stock Redemptions
As a result of the termination of our distribution reinvestment plan and the close of our Offering in April 2013, our board of directors determined to suspend our stock redemption plan effective April 10, 2013. During the six months ended June 30, 2013, we processed and paid all eligible redemption requests that were received through April 10, 2013 for the redemption of an aggregate of 130,215 shares of common stock, all of which were approved for redemption at an average price of $9.37 per share, for a total of approximately $1.2 million. Redemption requests received after April 10, 2013 are not accepted.
Results of Operations
The following discussion and analysis should be read in conjunction with the accompanying consolidated financial statements and the notes thereto.
We are not aware of any other material trends or uncertainties, favorable or unfavorable, that may be reasonably anticipated to have a material impact on either capital resources or the revenues or income to be derived from our properties, other than those described above, risk factors identified in Part II, Item 1A of this report and the “Risk Factors” section of our Annual Report on Form 10-K for the year ended December 31, 2012.
As of June 30, 2013, we owned nine real estate investment properties and our portfolio was 99.8% leased under operating leases.
In understanding our operating results in the accompanying financial statements and our expectations about the remainder of 2013 and beyond, it is important to understand how the growth in our assets has impacted our results of operations, including our net losses and property-level NOI that we define as property revenues, net of property operating expenses and property management fees.
20
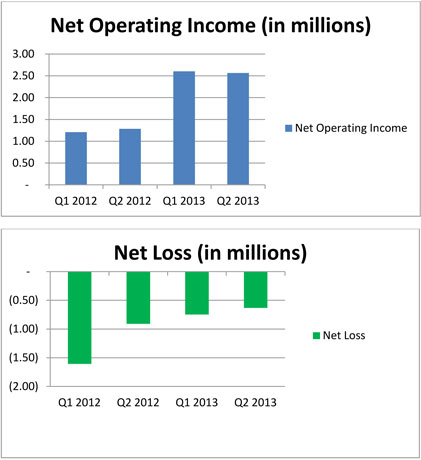
The following table reconciles NOI to net loss (in millions) for the quarters presented, and presents the total amount invested in properties and the number of properties owned as of the end of each applicable period:
| | | | | | | | | | | | | | | | |
| | | Quarters Ended | |
| | | March 31,
2012 | | | June 30,
2012 | | | March 31,
2013 | | | June 30,
2013 | |
Total revenues | | $ | 1.88 | | | $ | 2.00 | | | $ | 3.44 | | | $ | 3.46 | |
Less: | | | | | | | | | | | | | | | | |
Property operating expense | | | 0.62 | | | | 0.65 | | | | 0.73 | | | | 0.80 | |
Property management fees | | | 0.05 | | | | 0.06 | | | | 0.11 | | | | 0.10 | |
| | | | | | | | | | | | | | | | |
NOI | | | 1.21 | | | | 1.29 | | | | 2.60 | | | | 2.56 | |
Less: | | | | | | | | | | | | | | | | |
General and administrative expenses | | | 0.52 | | | | 0.43 | | | | 0.53 | | | | 0.53 | |
Acquisition fees and expenses | | | 0.58 | | | | 0.20 | | | | 0.03 | | | | 0.01 | |
Asset management fees | | | 0.14 | | | | 0.15 | | | | 0.30 | | | | 0.30 | |
Depreciation and amortization | | | 0.90 | | | | 0.94 | | | | 1.76 | | | | 1.76 | |
Expense support | | | — | | | | (0.3 | ) | | | (0.52 | ) | | | (0.46 | ) |
Total other expenses | | | 0.74 | | | | 0.79 | | | | 1.23 | | | | 1.03 | |
Income tax expense (benefit) | | | (0.06 | ) | | | 0.00 | | | | 0.02 | | | | 0.01 | |
| | | | | | | | | | | | | | | | |
Net loss | | $ | (1.61 | ) | | $ | (0.91 | ) | | $ | (0.75 | ) | | $ | (0.62 | ) |
| | | | | | | | | | | | | | | | |
Invested in properties | | $ | 59.5 | | | $ | 59.5 | | | $ | 120.6 | | | $ | 120.6 | |
| | | | | | | | | | | | | | | | |
Number of properties, end of period | | | 4 | | | | 4 | | | | 9 | | | | 9 | |
| | | | | | | | | | | | | | | | |
21
Substantially all of our 2012 acquisitions occurred in the fourth quarter. NOI for the six months ended June 30, 2013 reflects our investments of $120.6 million in properties for the full period presented. We are currently contemplating further investments in one or more additional properties and select capital improvements designed to improve or extend existing minimum lease terms. While these capital improvements and accompanying lease commissions may not be completed by the end of 2013, we are committed to taking advantage of opportunities such as these where we can find creative solutions for our tenants while creating value to our shareholders. In such event, we anticipate additional NOI generated in subsequent periods.
Comparison of the quarter and six months ended June 30, 2013 to the quarter and six months ended June 30, 2012
Revenues. Rental income from operating leases and tenant reimbursement income were approximately $3.5 million and $6.9 million, respectively, for the quarter and six months ended June 30, 2013, as compared to approximately $2.0 million and $3.9 million, respectively, for the quarter and six months ended June 30, 2012. Tenant reimbursement income represents amounts tenants are required to reimburse us in accordance with the lease agreements and are recognized in the period in which the related reimbursable expenses are incurred. The increase in rental income from operating leases and tenant reimbursement income was primarily due to revenues earned on the five properties purchased subsequent to June 30, 2012. Although we expect continued increases in revenues over comparable periods during future quarters in 2013, we expect revenues will only increase beyond their current level to the extent we renegotiate an increase in our current leases or invest in an additional property or real estate-related asset.
Property Operating Expenses. Property operating expenses for the quarter and six months ended June 30, 2013 were approximately $0.8 million and $1.5 million, as compared to approximately $0.7 million and $1.3 million for the quarter and six months ended June 30, 2012. These expenses include property taxes, utilities and other costs to operate the property, some of which are reimbursable with reimbursed amounts included in revenues. The increase in property operating expenses was primarily due to expenses incurred on the five properties purchased subsequent to June 30, 2012.
In general, as property operating expenses increase, tenant reimbursement income will increase as a result of the tenants’ obligations to pay such amounts. Two of our properties are triple-net leased whereby the tenant is responsible for procuring and paying third parties directly for property operating expenses, including real estate taxes, insurance, utilities and other property operating expenses. The property operating expenses incurred and paid directly to third parties by these tenants is not included in our property operating expenses due to these amounts being the obligation of our tenants. In the event these tenants fail to meet their obligations to pay these expenses, we would be responsible for certain of these expenses; such as, real estate taxes of approximately $0.7 million per year. Accordingly, in such event, property operating expenses would increase.
General and Administrative Expenses. General and administrative expenses were approximately $0.5 million and $1.1 million for the quarter and six months ended June 30, 2013 as compared to $0.5 million and $1.0 million for the quarter and six months ended June 30, 2012. General and administrative expenses were comprised primarily of reimbursable personnel expenses of affiliates of our Advisor, directors’ and officers’ insurance, accounting and legal fees, and board of directors’ fees. Although our general and administrative expenses remained consistent across the six month periods presented, we expect general and administrative expenses to decrease as we have completed our acquisition phase and focus on operating efficiencies.
We incurred approximately $0.07 million in expenses related to our annual report and more extensive proxy materials to shareholders, including the submission of a number of matters to a vote. The matters selected to be voted upon were deemed to be advisable because a positive vote would remove a number of provisions unique to non-traded REITs from our articles and bylaws, potentially simplifying the process of an eventual exit event such as listing of our shares on a national exchange or a merger or other business combination. We believe that approximately $0.04 million of the amounts incurred primarily in the quarter ended June 30, 2013 are nonrecurring; and we would not expect to incur this level of costs in future years.
Under the Expense Support Agreement, described below, all or a portion of reimbursable operating-related personnel expenses of affiliates of our Advisor for the period April 1, 2012 through December 31, 2013, may be deferred and subordinated to our achieving certain performance metrics. For the quarter and six months ended
22
June 30, 2013, we deferred approximately $0.2 million and $0.4 million, respectively, of operating-related personnel expenses in accordance with this agreement. We expect that we will defer additional amounts in 2013 under the Expense Support Agreement. See “Expense Support Agreement” below.
Acquisition Fees and Expenses. Acquisition fees and expenses were approximately $0.2 million and $0.8 million for the quarter and six months ended June 30, 2012, respectively, consisting primarily of investment services fees paid to Advisor and acquisition expenses, such as legal and other closing costs in connection with property acquisitions during such period. For the quarter and six months ended June 30, 2013, we did not incur any investment services fees and had only $0.01 million and $0.04 million in acquisition expenses, respectively. Although we anticipate that we will incur additional acquisition fees and expenses to the extent we acquire an additional property or real estate-related asset with unused proceeds from our Offering, with the close of our Offering in April 2013, we do not expect to have significant near term acquisitions and therefore, we do not expect significant acquisition fees and expenses in 2013.
Asset Management Fees. We incurred approximately $0.3 million and $0.6 million in asset management fees payable to our Advisor or sub-advisors during the quarter and six months ended June 30, 2013 and $0.1 million and $0.3 million during the quarter and six months ended June 30, 2012, respectively. We incur asset management fees at an annual rate of approximately 1% of the amount of our real estate assets; therefore, these fees increased due to having made approximately $61.1 million in acquisitions subsequent to June 30, 2012, as well as, the property acquired during the first quarter of 2012 being operational for the full six months in the six months ended June 30, 2013. Under the Expense Support Agreement, all or a portion of asset management fees for the period April 1, 2012 through December 31, 2013, may be deferred and subordinated to certain performance metrics in accordance with the Expense Support Agreement. For the quarter and six months ended June 30, 2013, we deferred approximately $0.3 million and $0.6 million of asset management fees, respectively, in accordance with this agreement. During the quarter and six months ended June 30, 2012 we deferred approximately $0.2 million and $0.2 million respectively. See “Expense Support Agreement” below. Although we expect total asset management fees will increase during the remainder of 2013, we currently anticipate that all or a significant portion of such fees will be deferred in accordance with the terms of the Expense Support Agreement.
Property Management Fees. We incurred approximately $0.1 million and $0.2 million in property management fees payable to our Property Manager and sub-property managers during the quarter and six months ended June 30, 2013, as compared to $0.1 million during the quarter and six months ended June 30, 2012, for services in managing our property operations. Property management fees generally range from 1.5% to 4.5% of property revenues and increased as a result of the increase in rental income from operating leases and tenant reimbursement income brought about by the growth in our assets.
Depreciation and Amortization. Depreciation and amortization expense for the quarter and six months ended June 30, 2013 was approximately $1.8 million and $3.5 million, respectively, as compared to approximately $0.9 million and $1.8 million for the quarter and six months ended June 30, 2012, respectively. The increase in such expense was related to owning nine properties during the six months ended June 30, 2013, as compared to four properties during the six months ended June 30, 2012.
Expense Support. For the quarter and six months ended June 30, 2013, approximately $0.3 million and $0.6 million in asset management fees and $0.2 million and $0.4 million in operating-related personnel expenses, respectively, were deferred and subordinated in accordance with the terms of the Expense Support Agreement, described below. As of June 30, 2013, the Advisor has deferred an aggregate of $2.1 million in expenses under the terms of the Expense Support Agreement. To the extent, if any, we determine all or any portion of such amounts are probable of being reimbursed to our Advisor, we will record such amounts as operating expenses in future periods. The Expense Support Agreement commenced April 1, 2012 and extends until December 31, 2013. Based on the current distribution policy and our expected MFFO, we expect to defer all or a portion of these fees and expenses for the remainder of 2013. Our Advisor is not obligated to continue to defer any amounts subsequent to December 31, 2013; therefore, total expenses are expected to increase after the expiration of the Expense Support Agreement.
Interest Expense and Loan Cost Amortization. Interest expense and loan cost amortization for the quarter and six months ended June 30, 2013 was approximately $1.0 million and $2.3 million, respectively, as compared to approximately $0.8 million and $1.5 million for the quarter and six months ended June 30, 2012, respectively. An
23
increase to $74.7 million in our average debt outstanding during the six months ended June 30, 2013 from $38.0 million during the same period in 2012 equated to an approximately $1 million increase in interest expense and loan cost amortization. The increase in interest expense and loan cost amortization was partially offset by approximately $0.3 million as a result of our weighted average interest rate on our debt decreasing to 5.25% for the six months ended June 30, 2013, as compared to 5.95% for the six months ended June 30, 2012. The decrease in interest rates was primarily the result of repaying our $4.0 million Mezz Loan, which bore interest at a rate of 11% per annum, and the debt on our German portfolio, most of which we acquired in the last half of 2012, having a lower rate of interest. In addition, during the six months ended June 30, 2013, we had lower interest expense and loan cost amortization of as a result of paying off our Credit Facility and Mezz Loan during January and March 2013, respectively; whereas, we incurred interest expense and loan cost amortization on the aforementioned outstanding debt financings during the quarter and six months ended June 30, 2012.
Although we expect continued reductions in interest expense and loan cost amortization during future quarters in 2013 due to our repayment of the outstanding amounts under our Credit Facility and Mezz Loan, we expect interest expense and loan cost amortization will continue to be offset for comparable periods during future quarters in 2013 as result of continued expenses incurred on the five properties purchased subsequent to June 30, 2012. For 2014 and beyond, we expect interest expense and loan cost amortization will only increase to the extent we refinance or add leverage on any new or existing properties.
Income Taxes. During the six months ended June 30, 2013 and 2012, we recognized tax expense of approximately $0.03 million and a tax benefit of approximately $0.06 million, respectively, relating to our state and international operations.
Expense Support Agreement
On March 6, 2012, our board of directors approved an Expense Support and Conditional Reimbursement Agreement with our Advisor (the “Expense Support Agreement”) whereby, effective April 1, 2012, reimbursement of operating-related personnel expenses and asset management fees to our Advisor and its affiliates are deferred and subordinated until such time, if any, that (i) cumulative MFFO (as defined in the agreement) for the period April 1, 2012 through the applicable determination date exceeds (ii) distributions declared to stockholders for the same period. Such reimbursements and payments are further subordinated to our total operating expenses being within the 2%/25% guideline limitations as such terms are defined in the advisory agreement. For purposes of the above subordinations, all or a portion of the deferred amounts may be paid only to the extent it does not cause the applicable performance measurement to not be met inclusive of the conditional reimbursement amount. The Expense Support Agreement, as amended, is terminable by our Advisor, but not before December 31, 2013, and any deferrals are eligible for conditional reimbursement for a period of up to three years from the applicable determination date. Any amounts deferred that have not met the conditions of the subordination within the time period established in the Expense Support Agreement will be permanently waived by our Advisor and we will have no obligation to pay such amounts.
Funds from Operations and Modified Funds from Operations
Due to certain unique operating characteristics of real estate companies, as discussed below, the National Association of Real Estate Investment Trusts (“NAREIT”) promulgated a measure known as FFO, which we believe to be an appropriate supplemental measure to reflect the operating performance of a real estate investment trust, or REIT. The use of FFO is recommended by the REIT industry as a supplemental performance measure. FFO is not equivalent to net income or loss as determined under GAAP.
We define FFO, a non-GAAP measure, consistent with the standards established by the White Paper on FFO approved by the Board of Governors of NAREIT, as revised in February 2004, or the “White Paper.” The White Paper defines FFO as net income or loss computed in accordance with GAAP, excluding gains or losses from sales of property, real estate asset impairment write-downs, depreciation and amortization on real estate assets, and after adjustments for unconsolidated partnerships and joint ventures. Our FFO calculation complies with NAREIT’s policy described above.
24
We may, in the future, make other adjustments to net loss in arriving at FFO as identified above at the time that any such other adjustments become applicable to our results of operations. FFO, for example, may exclude impairment charges of real estate-related investments. Because GAAP impairments represent non-cash charges that are not allowed to be reversed if the underlying fair values improve or because the timing of impairment charges may lag the onset of certain operating consequences, we believe FFO provides useful supplemental information related to current consequences, benefits and sustainability related to rental rates, occupancy and other core operating fundamentals. Investors should note, however, that determinations of whether impairment charges have been incurred are based partly on anticipated operating performance. While impairment charges may be excluded from the calculation of FFO as described above, investors are cautioned that due to the fact that impairments are based on estimated future undiscounted cash flows and the relatively limited term of our operations, it could be difficult to recover any impairment charges. In addition, FFO is not a useful measure in evaluating net asset value because impairments are taken into account in determining net asset value but not in determining FFO.
Notwithstanding the widespread reporting of FFO, changes in accounting and reporting rules under GAAP that were adopted after NAREIT’s definition of FFO have prompted a significant increase in the magnitude of non-operating items included in FFO. For example, acquisition fees and expenses, which we have funded from the proceeds of our Offering and which we do not view as an operating expense of a property, are now deducted as expenses in the determination of GAAP net income. As a result, the Investment Program Association (“IPA”), an industry trade group, has standardized a measure known as modified FFO, or MFFO, which the IPA has recommended as a supplemental measure for publicly registered, non-traded REITs and which we believe to be another additional supplemental measure to reflect the operating performance of a non-traded REIT. Under IPA Guideline 2010-01, Supplemental Performance Measure for Publicly Registered, Non-Listed REITs (“IPA Guideline”), MFFO excludes from FFO additional non-cash or non-recurring items, including the following:
| | • | | acquisition fees and expenses which have been deducted as expenses in the determination of GAAP net income; |
| | • | | non-cash amounts related to straight-line rent; |
| | • | | amortization of above or below market intangible lease assets and liabilities; |
| | • | | accretion of discounts and amortization of premiums on debt investments; |
| | • | | impairments of loans receivable, and equity and debt investments; |
| | • | | realized gains or losses from the early extinguishment of debt; |
| | • | | realized gains or losses on the extinguishment or sales of hedges, foreign exchange, securities and other derivatives holdings except where the trading of such instruments is a fundamental attribute of our operations; |
| | • | | unrealized gains or losses related to fair value adjustments for derivatives not qualifying for hedge accounting, including interest rate and foreign exchange derivatives; |
| | • | | unrealized gains or losses related to consolidation from, or deconsolidation to, equity accounting; |
| | • | | adjustments related to contingent purchase price obligations where such adjustments have been included in the derivation of GAAP net income; and |
| | • | | adjustments related to the above items for unconsolidated entities in the application of equity accounting. |
We consider MFFO as a supplemental measure when assessing our operating performance. We have calculated MFFO in accordance with the IPA Guideline. For the six months ended June 30, 2013 and 2012, our MFFO is FFO, excluding acquisition fees and expenses, straight-line rent adjustments, the amortization of above- and below-market leases and realized gains or losses from the early extinguishment of debt, which we believe is helpful in evaluating our results of operations for the reasons discussed below.
| | • | | Acquisition fees and expenses. In evaluating investments in real estate, management’s investment models and analyses differentiate between costs to acquire the investment and the operating results derived from the investment. Acquisition fees and expenses have been funded from the proceeds of our Offering and other |
25
| | financing sources and not from operations. We believe by excluding acquisition fees and expenses, MFFO provides useful supplemental information that is comparable between differing reporting periods for each type of our real estate investments and is more indicative of future operating results from our investments as consistent with management’s analysis of the investing and operating performance of our properties. The exclusion of acquisition fees and expenses has been the most significant adjustment to us to date, as we have been in our offering and acquisition stages. However, if earnings from the operations of our properties or net sales proceeds from the future disposition of our properties are not sufficient enough to overcome the acquisition costs and fees incurred, then such fees and expenses will have a dilutive impact on our returns. |
| | • | | Amortization of above- and below-market leases. Under GAAP, certain intangibles are assumed to diminish predictably in value over time and are amortized, similar to depreciation and amortization of other real estate-related assets that are excluded from FFO. However, because real estate values and market lease rates historically rise or fall with market conditions, we believe that by excluding charges relating to amortization of these intangibles, MFFO provides useful supplemental information on the performance of the real estate. |
| | • | | Straight-line rent adjustments. Under GAAP, rental receipts are allocated to periods using various methodologies. This may result in income recognition that is significantly different than underlying contract terms. By adjusting for these items (to restate such payments from a GAAP accrual basis to a cash basis), MFFO provides useful supplemental information on the realized economic impact of lease terms, providing insight on the contractual cash flows of such lease terms, and aligns results with management’s analysis of operating performance. |
| | • | | Realized gains or losses from the early extinguishment of debt. Management believes that adjusting for gains or losses on the early extinguishment of debt is appropriate because they are non-recurring, non-cash adjustments that may not be reflective of our ongoing operating performance. |
We may, in the future, make other adjustments to FFO as identified above at the time that any such other adjustments become applicable to our results of operations. MFFO, for example may exclude gains or losses related to fair value adjustments for derivatives not qualifying for hedge accounting and adjustments related to contingent purchase price obligations. These items relate to a fair value adjustment, which is based on the impact of current market fluctuations and underlying assessments of general market conditions and specific performance of the holding, which may not be directly attributable to our current operating performance. As these gains or losses relate to underlying long-term assets and liabilities, where we are not speculating or trading assets, management believes MFFO provides useful supplemental information by focusing on the changes in our core operating fundamentals rather than changes that may reflect anticipated gains or losses. We believe MFFO provides useful supplemental information related to current consequences, benefits and sustainability related to rental rates, occupancy and other core operating fundamentals.
We believe that MFFO is helpful in assisting management to assess the sustainability of our distribution and operating performance in future periods, particularly for periods after our offering and acquisition stages are completed, because MFFO excludes acquisition fees and expenses that affect property operations only in the period in which a property is acquired; however, MFFO should only be used by investors to assess the sustainability of our operating performance after our Offering has been completed and properties have been acquired. Acquisition fees and expenses have a negative effect on our cash flows from operating activities during the periods in which properties are acquired.
Presentation of MFFO also is intended to provide useful information to investors as they compare the operating performance of different non-traded REITs, although it should be noted that not all REITs calculate MFFO the same way, so comparisons with other REITs may not be meaningful. Neither the Securities and Exchange Commission, NAREIT nor any other regulatory body has passed judgment on the acceptability of the adjustments that we use to calculate MFFO. Furthermore, FFO and MFFO are not necessarily indicative of cash flows available to fund cash needs and should not be considered as an alternative to net income (loss) or income (loss) from continuing operations as an indication of our performance, as an alternative to cash flows from operations as an indication of our liquidity, or indicative of funds available to fund our cash needs including our ability to make distributions to our stockholders. FFO and MFFO should not be construed as historic performance measures or as more relevant or accurate than the current GAAP methodology in calculating net income (loss) and its applicability in evaluating our operating performance.
26
The following table presents a reconciliation of net loss to FFO and MFFO for the quarter and six months ended June 30:
| | | | | | | | | | | | | | | | |
| | | Quarter Ended June 30, | | | Six Months Ended June 30, | |
| | | 2013 | | | 2012 | | | 2013 | | | 2012 | |
Net loss | | $ | (624,309 | ) | | $ | (910,096 | ) | | $ | (1,371,603 | ) | | $ | (2,517,995 | ) |
Adjustments: | | | | | | | | | | | | | | | | |
Depreciation and amortization (including amortization of in place lease intangible assets) | | | 1,761,194 | | | | 935,254 | | | | 3,524,410 | | | | 1,838,981 | |
| | | | | | | | | | | | | | | | |
FFO | | | 1,136,885 | | | | 25,158 | | | | 2,152,807 | | | | (679,014 | ) |
Acquisition fees and expenses(1) | | | 10,902 | | | | 195,739 | | | | 44,595 | | | | 774,840 | |
Amortization of above- and below-market lease intangible assets(2) | | | 72,241 | | | | 17,547 | | | | 144,499 | | | | 34,130 | |
Straight-line rent adjustments(3) | | | (177,967 | ) | | | (81,834 | ) | | | (380,229 | ) | | | (163,667 | ) |
Realized loss on early extinguishment of debt(4) | | | — | | | | — | | | | 99,134 | | | | — | |
| | | | | | | | | | | | | | | | |
MFFO | | $ | 1,042,060 | | | $ | 156,610 | | | $ | 2,060,806 | | | $ | (33,711 | ) |
| | | | | | | | | | | | | | | | |
Weighted average number of shares of common stock outstanding (basic and diluted) | | | 8,173,289 | | | | 4,572,840 | | | | 7,599,512 | | | | 4,031,640 | |
| | | | | | | | | | | | | | | | |
Net loss per share (basic and diluted) | | $ | (0.08 | ) | | $ | (0.20 | ) | | $ | (0.18 | ) | | $ | (0.62 | ) |
| | | | | | | | | | | | | | | | |
FFO per share (basic and diluted) | | $ | 0.14 | | | $ | 0.01 | | | $ | 0.28 | | | $ | (0.17 | ) |
| | | | | | | | | | | | | | | | |
MFFO per share (basic and diluted) | | $ | 0.13 | | | $ | 0.03 | | | $ | 0.27 | | | $ | (0.01 | ) |
| | | | | | | | | | | | | | | | |
FOOTNOTES:
| (1) | In evaluating investments in real estate, management differentiates the costs to acquire the investment from the operations derived from the investment. Such information would be comparable only for non-traded REITs that have completed their acquisition activity and have other similar operating characteristics. By excluding expensed acquisition costs, management believes MFFO provides useful supplemental information that is comparable for each type of real estate investment and is consistent with management’s analysis of the investing and operating performance of our properties. Acquisition fees and expenses include payments to our Advisor or third parties. Acquisition fees and expenses under GAAP are considered operating expenses and as expenses included in the determination of net income and income from continuing operations, both of which are performance measures under GAAP. Acquisition fees and expenses will have negative effects on returns to investors, the potential for future distributions, and cash flows generated by us, unless earnings from operations or net sales proceeds from the disposition of properties are generated to cover the purchase price of the property, these fees and expenses and other costs related to the property. |
| (2) | Under GAAP, certain intangibles are accounted for at cost and reviewed at least annually for impairment, and certain intangibles are assumed to diminish predictably in value over time and are amortized, similar to depreciation and amortization of other real estate-related assets that are excluded from FFO. However, because real estate values and market lease rates historically rise or fall with market conditions, management believes that by excluding charges relating to amortization of these intangibles, MFFO provides useful supplemental information on the performance of the real estate. |
| (3) | Under GAAP, rental receipts are allocated to periods using various methodologies. This may result in income recognition that is significantly different than underlying contract terms. By adjusting for these items (to restate such payments from a GAAP accrual basis to a cash basis), MFFO provides useful supplemental information on the realized economic impact of lease terms, providing insight on the contractual cash flows of such lease terms, and aligns results with management’s analysis of operating performance. |
| (4) | Management believes that adjusting for the realized loss on the early extinguishment of debt is appropriate because the write-off of unamortized loan costs are non-recurring, non-cash adjustments that are not reflective of our ongoing operating performance and aligns results with management’s analysis of operating performance. |
27
RELATED PARTY ARRANGEMENTS
We have entered into agreements with our Advisor and its affiliates, whereby we agree to pay certain fees to, or reimburse certain expenses of, our Advisor or its affiliates for acquisition and advisory services, organization and offering costs, selling commissions, marketing support fees, asset and property management fees and reimbursement of operating costs. See Note 6, “Related Party Arrangements” in the accompanying condensed consolidated financial statements and “Item 13. Certain Relationships and Related Transactions, and Director Independence” in our Form 10-K for the year ended December 31, 2012 for a discussion of the various related party transactions, agreements and fees.
OFF BALANCE SHEET ARRANGEMENTS
As of June 30, 2013, we had no off balance sheet arrangements.
CONTRACTUAL OBLIGATIONS
The following table presents our contractual obligations and the related payment periods as of June 30, 2013:
| | | | | | | | | | | | | | | | | | | | |
| | | Payments Due by Period | |
| | | 2013 | | | 2014 - 2015 | | | 2016 - 2017 | | | Thereafter | | | Total | |
Mortgages and other notes payable (principal and interest)(1) | | $ | 2,611,095 | | | $ | 10,244,931 | | | $ | 36,958,288 | | | $ | 45,432,689 | | | $ | 95,247,003 | |
| | | | | | | | | | | | | | | | | | | | |
Total | | $ | 2,611,095 | | | $ | 10,244,931 | | | $ | 36,958,288 | | | | 45,432,689 | | | $ | 95,247,003 | |
| | | | | | | | | | | | | | | | | | | | |
FOOTNOTES:
| (1) | For the purpose of the contractual obligation table above, management assumed that the principal amounts outstanding on the mortgage notes payable are repaid at the anticipated repayment date, as defined in the respective loan agreements. |
CRITICAL ACCOUNTING POLICIES AND ESTIMATES
See Item 1. “Financial Statements” and our Annual Report on Form 10-K for the year ended December 31, 2012 for a summary of our Critical Accounting Policies and Estimates.
IMPACT OF RECENT ACCOUNTING PRONOUNCEMENTS
See Item 1. “Financial Statements” for a summary of the impact of recent accounting pronouncements.
28
Item 3. Quantitative and Qualitative Disclosures about Market Risks
Our interest rate risk management objectives are to limit the impact of interest rate changes on earnings and cash flows and to lower our overall borrowing costs. To achieve our objectives, we borrow primarily at fixed rates or variable rates with the lowest margins available.
The following is a schedule as of June 30, 2013, of our fixed rate debt maturities for the remainder of 2013 and each of the next four years, and thereafter (principal maturities only):
| | | | | | | | | | | | | | | | | | | | | | | | | | | | | | | | |
| | | 2013 | | | 2014 | | | 2015 | | | 2016 | | | 2017 | | | Thereafter | | | Total | | | Fair Value¹ | |
Fixed rate debt | | $ | 653,665 | | | $ | 1,370,637 | | | $ | 1,452,414 | | | $ | 30,882,372 | | | $ | 933,101 | | | $ | 37,012,699 | | | $ | 72,304,888 | | | $ | 71,100,000 | |
| | | | | | | | | | | | | | | | | | | | | | | | | | | | | | | | |
Total debt | | $ | 653,665 | | | $ | 1,370,637 | | | $ | 1,452,414 | | | $ | 30,882,372 | | | $ | 933,101 | | | $ | 37,012,699 | | | $ | 72,304,888 | | | $ | 71,100,000 | |
| | | | | | | | | | | | | | | | | | | | | | | | | | | | | | | | |
| | | | | | | | | | | | | | | | | | | | | | | | | | | | |
| | | | | | | |
| | | 2013 | | | 2014 | | | 2015 | | | 2016 | | | 2017 | | | Thereafter | | | Total | |
Weighted average fixed interest rates of maturities | | | 5.77 | % | | | 5.77 | % | | | 5.77 | % | | | 5.54 | % | | | 5.80 | % | | | 4.94 | % | | | 5.25 | % |
| | | | | | | | | | | | | | | | | | | | | | | | | | | | |
FOOTNOTE:
| (1) | The fair market value of fixed rate debt was determined using discounted cash flows based on market interest rates as of June 30, 2013. We determined market rates through discussions with our existing lenders pricing our loans with similar terms and current rates and spreads. |
Item 4. Controls and Procedures
Evaluation of Disclosure Controls and Procedures
Pursuant to Rule 13a-15(b) under the Exchange Act, under the supervision and with the participation of our management, including our principal executive officer and principal financial officer, we conducted an evaluation of the effectiveness of our disclosure controls and procedures (as defined under Rule 13a-15(e) under the Exchange Act) as of the end of the period covered by this report. Based upon that evaluation, our management, including our principal executive officer and principal financial officer, concluded that our disclosure controls and procedures are effective as of the end of the period covered by this report.
Changes in Internal Control over Financial Reporting
During the most recent fiscal quarter, there was no change in our internal controls over financial reporting (as defined under Rule 13a-15(f) under the Exchange Act) that has materially affected, or is reasonably likely to materially affect, our internal controls over financial reporting.
29
PART II. OTHER INFORMATION
Item 1.Legal Proceedings – None
Item 1A.Risk Factors
There were no material changes in the Company’s risk factors disclosed in Item 1A. Risk Factors of the Company’s Annual Report on Form 10-K for the year ended December 31, 2012.
Item 2.Unregistered Sales of Equity Securities and Use of Proceeds
Unregistered Sales of Equity Securities
During the period covered by this Quarterly Report, we did not sell any equity securities that were not registered under the Securities Act of 1933.
Use of Proceeds from Registered Securities
On April 23, 2010, our Registration Statement (File No. 333-158478), covering a public offering of up to $1.5 billion (150 million shares) of common stock, was declared effective by the SEC, and the Offering commenced and closed on April 23, 2013.
We have used the net proceeds of our Offering primarily to invest in a portfolio of income-oriented commercial real estate and real estate-related assets on a global basis. The use of proceeds from our Offering and borrowings were as follows as of April 23, 2013:
| | | | | | | | | | | | |
| | | Total | | | Payments to
Affiliates(2) | | | Payments to
Others | |
Shares registered | | | 150,000,000 | | | | | | | | | |
| | | | | | | | | | | | |
Aggregate price of offering amount registered | | $ | 1,500,000,000 | | | | | | | | | |
Shares sold(1) | | | 8,257,410 | | | | | | | | | |
| | | | | | | | | | | | |
Aggregate offering price of amount sold | | $ | 83,748,071 | | | | | | | | | |
Offering expenses(3) | | | (12,267,432 | ) | | $ | (8,016,528 | ) | | $ | (4,250,904 | ) |
| | | | | | | | | | | | |
Net offering proceeds to the issuer after deducting Offering expenses | | | 71,480,639 | | | | | | | | | |
Proceeds from borrowings, net of loan costs | | | 54,157,857 | | | | | | | | | |
| | | | | | | | | | | | |
Total net offering proceeds and borrowings | | | 125,638,496 | | | | | | | | | |
Purchases of and additions to real estate assets | | | (93,698,885 | ) | | | | | | | (93,698,885 | ) |
Payment of acquisition fees and expenses(4) | | | (4,850,112 | ) | | | (2,226,784 | ) | | | (2,623,328 | ) |
Distributions to stockholders(4) (5) | | | (4,136,402 | ) | | | (35,892 | ) | | | (4,100,510 | ) |
Principal payments of debt(5) | | | (9,037,308 | ) | | | | | | | (9,037,308 | ) |
Payment of operating expenses(4) (5) | | | (846,794 | ) | | | (608,528 | ) | | | (238,266 | ) |
Redemptions of shares | | | (1,464,680 | ) | | | | | | | (1,464,680 | ) |
| | | | | | | | | | | | |
Unused Offering proceeds | | $ | 11,604,315 | | | | | | | | | |
| | | | | | | | | | | | |
FOOTNOTES:
| (1) | Excludes unregistered shares issued to our Advisor. |
| (2) | For purposes of this table, “Payments to Affiliates” represents direct or indirect payments to directors, officers or general partners of the issuer or their associates; to persons owning 10% or more of any class of equity securities or the issuer; and to affiliates of the issuer. |
30
| (3) | Offering expenses paid to affiliates include selling commissions and marketing support fees paid to the managing dealer of our Offering (all or a portion of which may be paid to unaffiliated participating brokers by the managing dealer). Reimbursements to our Advisor of expenses of the Offering that it has incurred on our behalf from unrelated parties such as legal fees, printing costs, and registration fees are included in Payments to Others for purposes of this table. This table does not include amounts incurred by our Advisor in excess of the 15% limitation on total offering expenses (including selling commissions and marketing support fees) and amounts deferred under the Expense Support Agreement as described in “Related Party Arrangements” in the accompanying consolidated financial statements in Item 1. “Financial Statements” and Item 2. “Management’s Discussion and Analysis of Financial Condition and Results of Operations.” |
| (4) | We fund acquisition fees and expenses, including investment services fees, from net proceeds of our Offering. However, for GAAP purposes, such amounts are treated as an expense in calculating our net income (loss) and as a deduction in calculating our net cash provided by (used in) operating activities. For GAAP purposes, we are required to report distributions in excess of net cash provided by operating activities as funded from other sources (i.e., Offering proceeds), regardless of whether amounts included in the calculation of net cash provided by operating activities were funded from other sources. Offering proceeds used to fund distributions to stockholders, as presented in the table above, represents amounts we consider used for such purposes, after taking into account items such as acquisition fees and expenses being paid from Offering proceeds. |
| (5) | Until such time as we have sufficient operating cash flows from our assets, we will pay distributions, debt service and/or operating expenses from net proceeds of our Offering or reserves established with such proceeds. The amounts presented above represent the net proceeds from our Offering used for such purposes as June 30, 2013. |
Redemption of Shares and Issuer Purchases of Equity Securities
Through April 10, 2013, pursuant to our stock redemption plan, any stockholder who had held shares for not less than one year could present all or any portion equal to at least 25% of their shares to us for redemption at prices based on the amount of time that the redeeming stockholder had held the applicable shares, but in no event greater than the price of shares sold to the public in any offering. We may, at our discretion, redeem the shares, subject to certain conditions and limitations under the redemption plan. However, at no time during a 12-month period may we redeem more than 5% of the weighted average number of our outstanding common stock during such 12-month period. For the six months ended June 30, 2013, we redeemed a total of 130,215 shares at an average share price of $9.37 per share. The total amount of shares redeemed were part of a publicly announced plan. On April 10, 2013, our board of directors approved the suspension of our stock redemption plan (the “Redemption Plan”) effective as of April 10, 2013. During the month of April we received a request to redeem 6,548 shares which were redeemed at an average price of $10.00 per share. As of the date of this filing, we had no outstanding redemption requests. Amounts redeemed during the six months ended June 30, 2013 were funded with proceeds from the issuance of shares pursuant to our distribution reinvestment plan and proceeds from our Offering. We will not accept or otherwise process under the Redemption Plan any redemption requests received after the close of business on April 10, 2013.
Item 3.Defaults Upon Senior Securities – None
Item 4.Mine Safety Disclosures– Not applicable
Item 5.Other Information – None
Item 6.Exhibits
The exhibits required by this item are set forth in the Exhibit Index attached hereto and are filed or incorporated as part of this report.
31
SIGNATURES
Pursuant to the requirements of Section 13 or 15(d) of the Securities Exchange Act of 1934, the registrant has duly caused this report to be signed on its behalf by the undersigned, thereunto duly authorized, on the 13th day of August, 2013.
| | |
| GLOBAL INCOME TRUST, INC. |
| |
| By: | | /s/ Andrew A. Hyltin |
| | ANDREW A. HYLTIN |
| | Chief Executive Officer and President |
| | (Principal Executive Officer) |
| |
| By: | | /s/ Rosemary Q. Mills |
| | ROSEMARY Q. MILLS |
| | Chief Financial Officer |
| | (Principal Financial Officer) |
32
EXHIBIT INDEX
Exhibits:
| | |
| 31.1 | | Certification of the Chief Executive Officer, Pursuant to Rule 13a-14(a), as Adopted Pursuant to Section 302 of the Sarbanes-Oxley Act of 2002.(Filed herewith.) |
| |
| 31.2 | | Certification of the Chief Financial Officer, Pursuant to Rule 13a-14(a), as Adopted Pursuant to Section 302 of the Sarbanes-Oxley Act of 2002.(Filed herewith.) |
| |
| 32.1 | | Certification of the Chief Executive Officer and Chief Financial Officer, Pursuant to 18 U.S.C. Section 1350, as Adopted Pursuant to Section 906 of the Sarbanes-Oxley Act of 2002.(Filed herewith.) |
| |
| 101* | | The following materials from Global Income Trust, Inc. Quarterly Report on Form 10-Q for the six months ended June 30, 2013, formatted in XBRL (Extensible Business Reporting Language): (i) Condensed Consolidated Balance Sheets, (ii) Condensed Consolidated Statements of Operations, (iii) Condensed Consolidated Statements of Comprehensive Loss, (iv) Condensed Consolidated Statements of Stockholders’ Equity, (v) Condensed Consolidated Statement of Cash Flows, and (vi) Notes to the Condensed Consolidated Financial Statements. |
| * | Pursuant to Rule 406T of Regulation S-T, the Interactive Data Files on Exhibit 101 hereto are deemed not filed or part of a registration statement or prospectus for purposes of Sections 11 or 12 of the Securities Act of 1933, as amended, are deemed not filed for purposes of Section 18 of the Securities and Exchange Act of 1934, as amended, and otherwise are not subject to liability under those sections. |
33