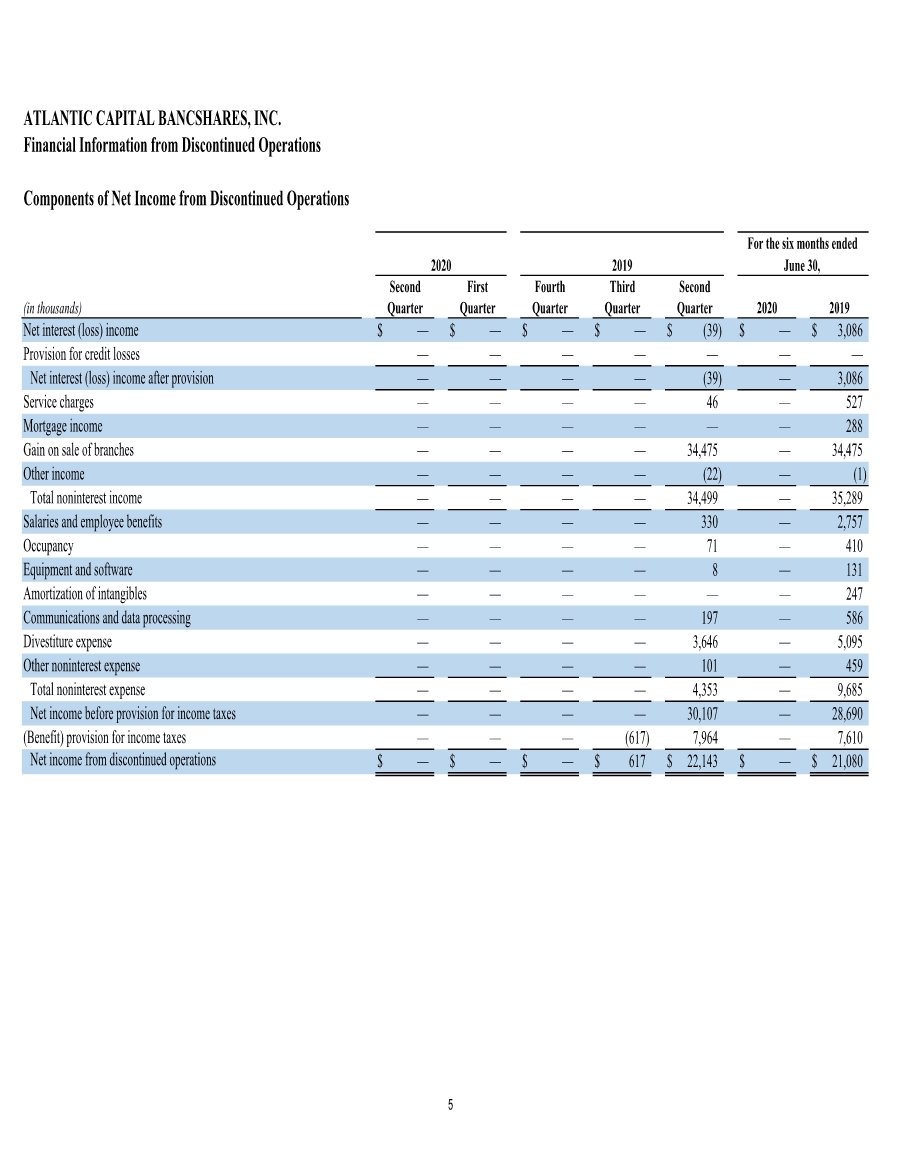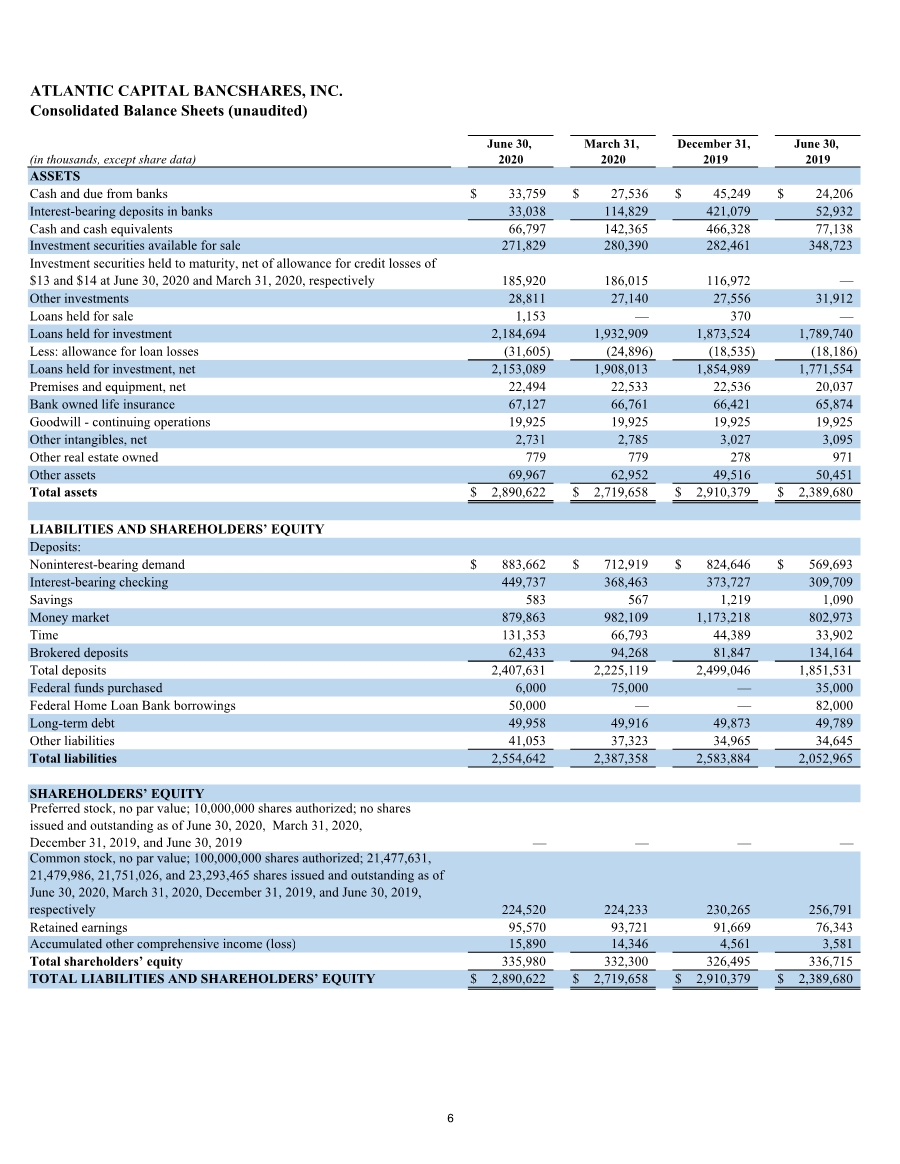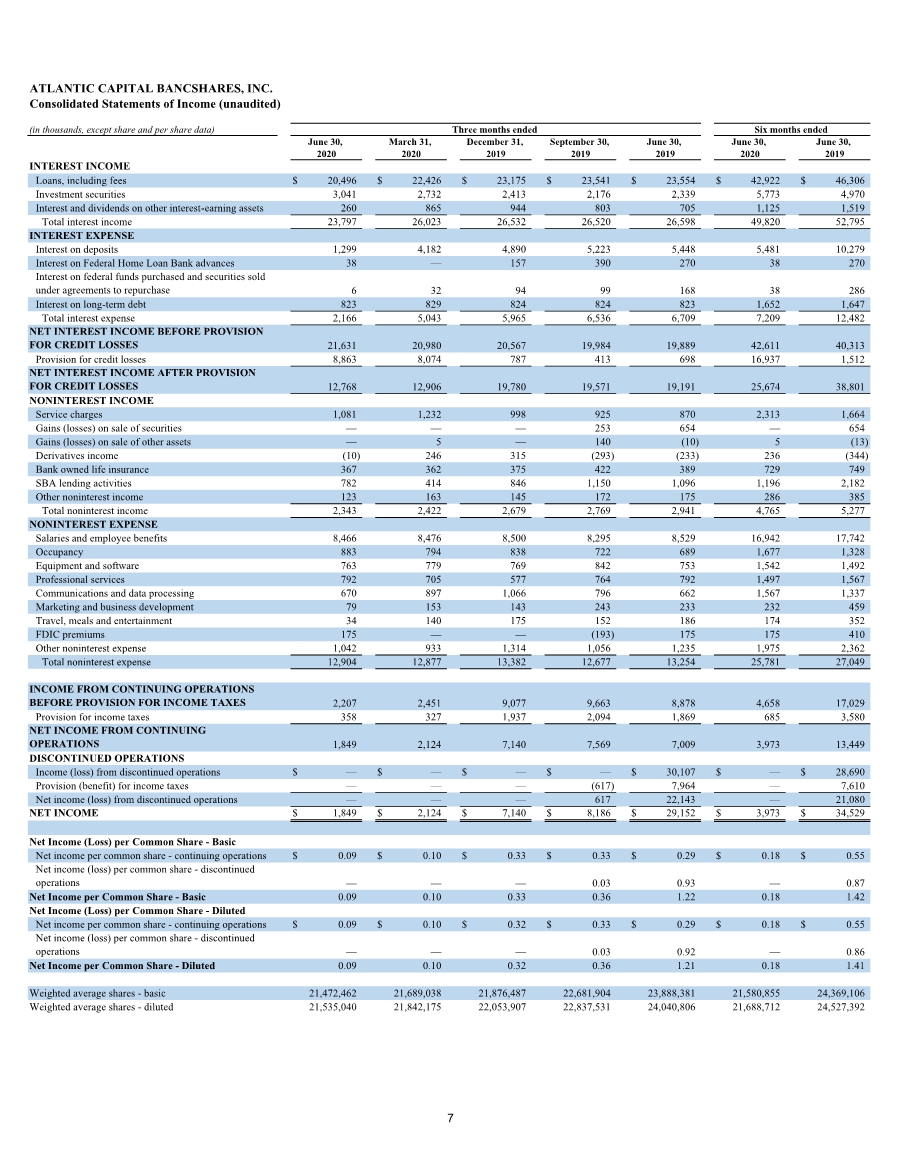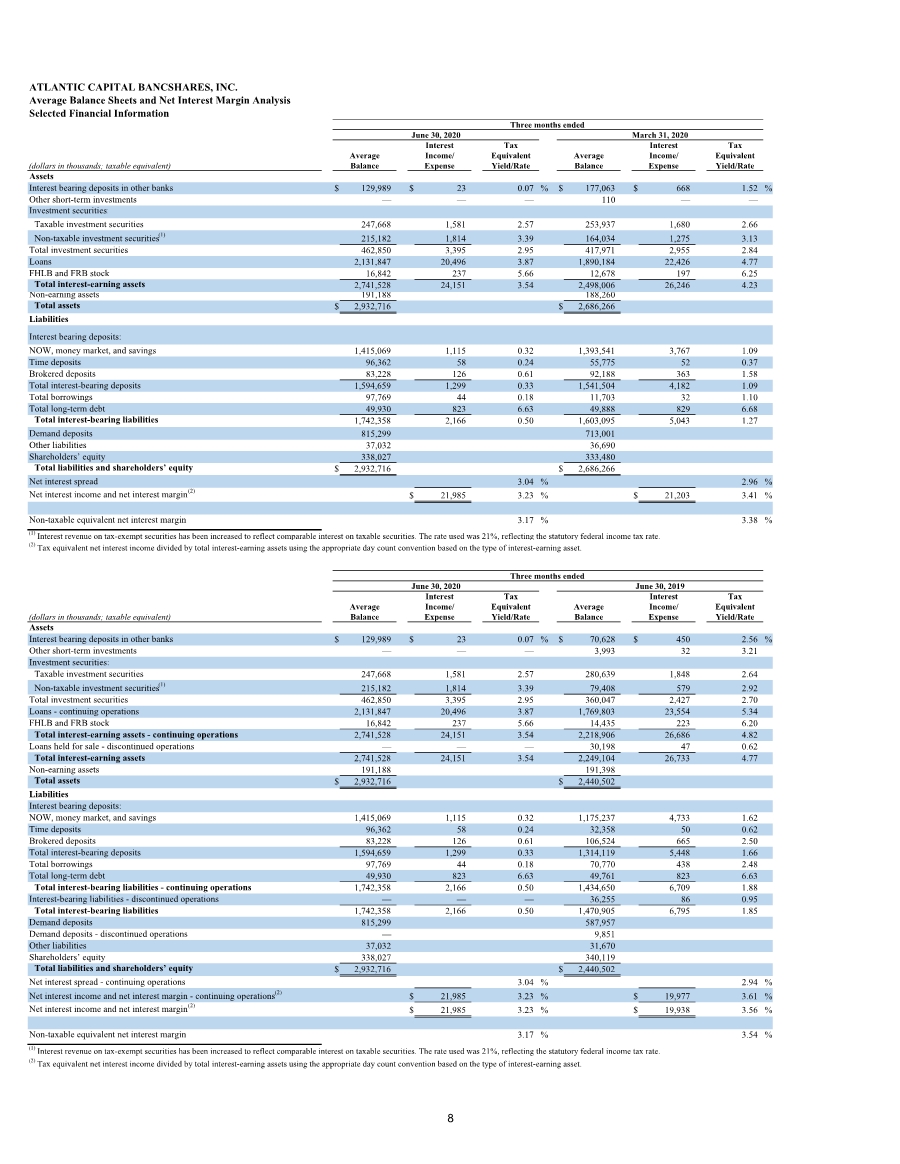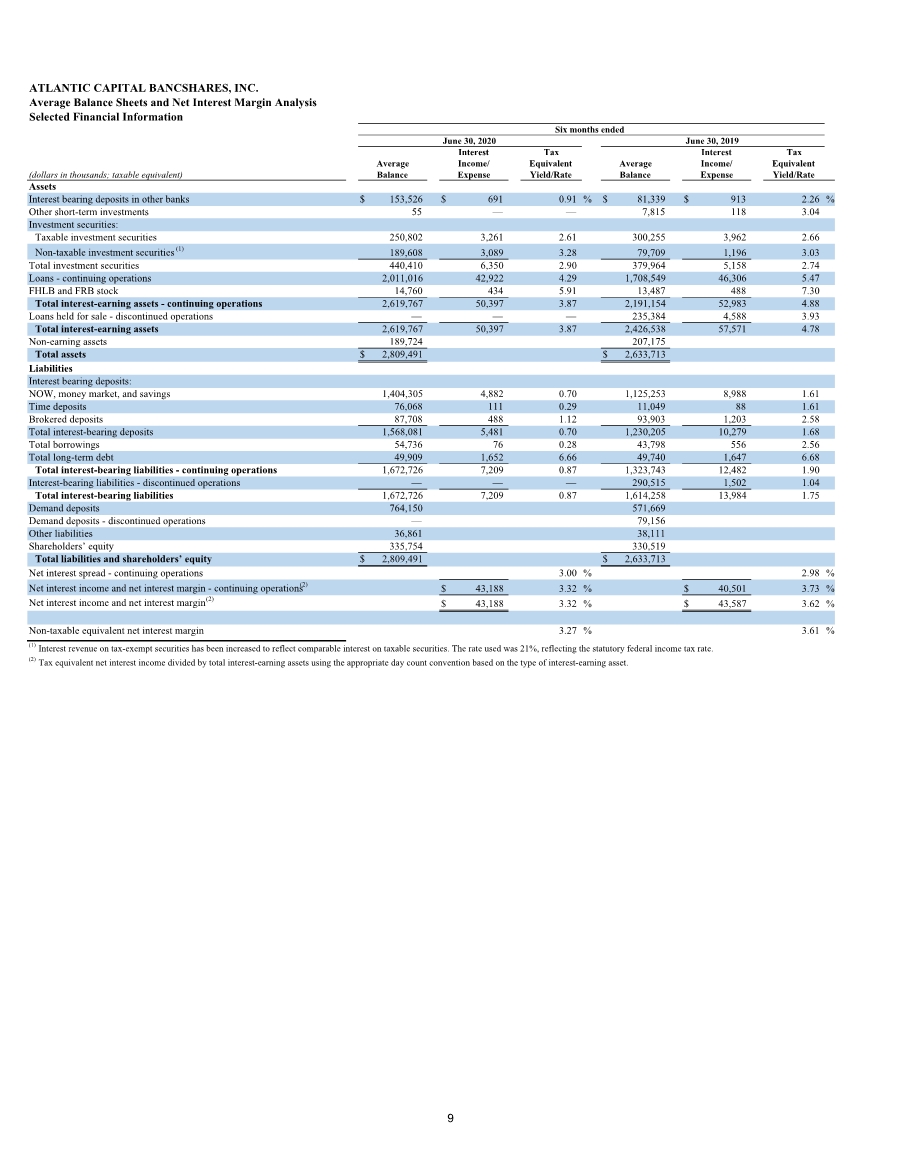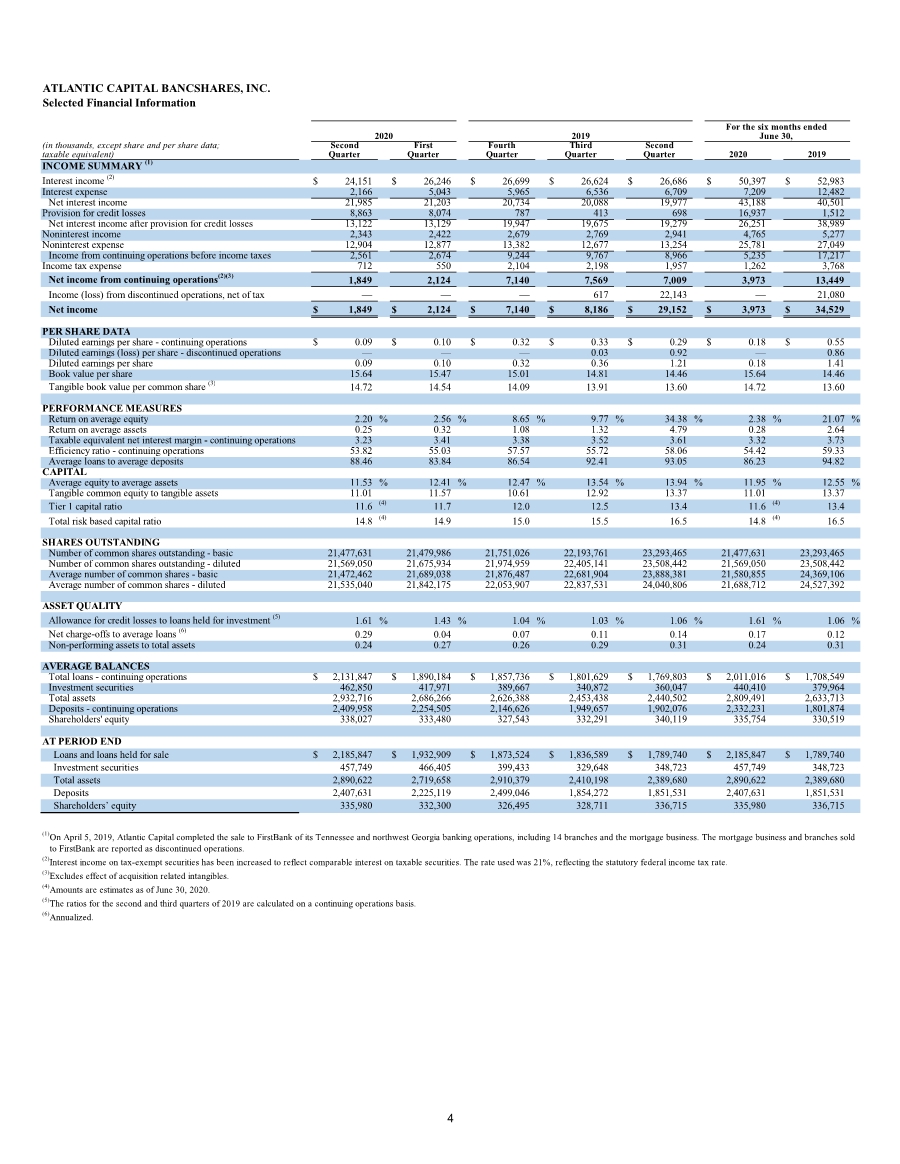
| ATLANTIC CAPITAL BANCSHARES, INC. Selected Financial Information (in thousands, except share and per share data; taxable equivalent) INCOME SUMMARY (1) Interest income (2) $ 24,151 $ 26,246 $ 26,699 $ 26,624 $ 26,686 $ 50,397 $ 52,983 Interest expense 2,166 5,043 5,965 6,536 6,709 7,209 12,482 Net interest income 21,985 21,203 20,734 20,088 19,977 43,188 40,501 Provision for credit losses 8,863 8,074 787 413 698 16,937 1,512 Net interest income after provision for credit losses 13,122 13,129 19,947 19,675 19,279 26,251 38,989 Noninterest income 2,343 2,422 2,679 2,769 2,941 4,765 5,277 Noninterest expense 12,904 12,877 13,382 12,677 13,254 25,781 27,049 Income from continuing operations before income taxes 2,561 2,674 9,244 9,767 8,966 5,235 17,217 Income tax expense 712 550 2,104 2,198 1,957 1,262 3,768 Net income from continuing operations(2)(3) 1,849 2,124 7,140 7,569 7,009 3,973 13,449 Income (loss) from discontinued operations, net of tax — — — 617 22,143 — 21,080 Net income $ 1,849 $ 2,124 $ 7,140 $ 8,186 $ 29,152 $ 3,973 $ 34,529 PER SHARE DATA Diluted earnings per share - continuing operations $ 0.09 $ 0.10 $ 0.32 $ 0.33 $ 0.29 $ 0.18 $ 0.55 Diluted earnings (loss) per share - discontinued operations — — — 0.03 0.92 — 0.86 Diluted earnings per share 0.09 0.10 0.32 0.36 1.21 0.18 1.41 Book value per share 15.64 15.47 15.01 14.81 14.46 15.64 14.46 Tangible book value per common share (3) 14.72 14.54 14.09 13.91 13.60 14.72 13.60 PERFORMANCE MEASURES Return on average equity 2.20 % 2.56 % 8.65 % 9.77 % 34.38 % 2.38 % 21.07 % Return on average assets 0.25 0.32 1.08 1.32 4.79 0.28 2.64 Taxable equivalent net interest margin - continuing operations 3.23 3.41 3.38 3.52 3.61 3.32 3.73 Efficiency ratio - continuing operations 53.82 55.03 57.57 55.72 58.06 54.42 59.33 Average loans to average deposits 88.46 83.84 86.54 92.41 93.05 86.23 94.82 CAPITAL Average equity to average assets 11.53 % 12.41 % 12.47 % 13.54 % 13.94 % 11.95 % 12.55 % Tangible common equity to tangible assets 11.01 11.57 10.61 12.92 13.37 11.01 13.37 Tier 1 capital ratio 11.6 (4) 11.7 12.0 12.5 13.4 11.6 (4) 13.4 Total risk based capital ratio 14.8 (4) 14.9 15.0 15.5 16.5 14.8 (4) 16.5 SHARES OUTSTANDING Number of common shares outstanding - basic 21,477,631 21,479,986 21,751,026 22,193,761 23,293,465 21,477,631 23,293,465 Number of common shares outstanding - diluted 21,569,050 21,675,934 21,974,959 22,405,141 23,508,442 21,569,050 23,508,442 Average number of common shares - basic 21,472,462 21,689,038 21,876,487 22,681,904 23,888,381 21,580,855 24,369,106 Average number of common shares - diluted 21,535,040 21,842,175 22,053,907 22,837,531 24,040,806 21,688,712 24,527,392 ASSET QUALITY Allowance for credit losses to loans held for investment (5) 1.61 % 1.43 % 1.04 % 1.03 % 1.06 % 1.61 % 1.06 % Net charge-offs to average loans (6) 0.29 0.04 0.07 0.11 0.14 0.17 0.12 Non-performing assets to total assets 0.24 0.27 0.26 0.29 0.31 0.24 0.31 AVERAGE BALANCES Total loans - continuing operations $ 2,131,847 $ 1,890,184 $ 1,857,736 $ 1,801,629 $ 1,769,803 $ 2,011,016 $ 1,708,549 Investment securities 462,850 417,971 389,667 340,872 360,047 440,410 379,964 Total assets 2,932,716 2,686,266 2,626,388 2,453,438 2,440,502 2,809,491 2,633,713 Deposits - continuing operations 2,409,958 2,254,505 2,146,626 1,949,657 1,902,076 2,332,231 1,801,874 Shareholders' equity 338,027 333,480 327,543 332,291 340,119 335,754 330,519 AT PERIOD END Loans and loans held for sale $ 2,185,847 $ 1,932,909 $ 1,873,524 $ 1,836,589 $ 1,789,740 $ 2,185,847 $ 1,789,740 Investment securities 457,749 466,405 399,433 329,648 348,723 457,749 348,723 Total assets 2,890,622 2,719,658 2,910,379 2,410,198 2,389,680 2,890,622 2,389,680 Deposits 2,407,631 2,225,119 2,499,046 1,854,272 1,851,531 2,407,631 1,851,531 Shareholders’ equity 335,980 332,300 326,495 328,711 336,715 335,980 336,715 (1)On April 5, 2019, Atlantic Capital completed the sale to FirstBank of its Tennessee and northwest Georgia banking operations, including 14 branches and the mortgage business. The mortgage business and branches sold to FirstBank are reported as discontinued operations. (2)Interest income on tax-exempt securities has been increased to reflect comparable interest on taxable securities. The rate used was 21%, reflecting the statutory federal income tax rate. (3)Excludes effect of acquisition related intangibles. (4)Amounts are estimates as of June 30, 2020. (5)The ratios for the second and third quarters of 2019 are calculated on a continuing operations basis. (6)Annualized. Quarter Quarter Quarter Fourth Quarter 2020 2019 Quarter June 30, Second First Third For the six months ended 2019 2020 Second 4 |