Exhibit 99.2
Investor Presentation | Q2 2020 atlanticcapitalbank.com NASDAQ TICKER: ACBI |
atlanticcapitalbank.com Forward-Looking Statements Disclaimer and Non-GAAP Financial Information 2 This presentation contains forward-looking statements within the meaning of section 27A of the Securities Act of 1933, as amended, and 21E of the Securities Exchange Act of 1934, as amended (the “Exchange Act”). These forward-looking statements reflect our current views with respect to, among other things, future events and our financial performance. These statements are often, but not always, made through the use of words or phrases such as “may,” “should,” “could,” “predict,” “potential,” “believe,” “will likely result,” “expect,” “continue,” “will,” “anticipate,” “seek,” “estimate,” “intend,” “plan,” “strive,” “projection,” “would,” and “outlook,” or the negative version of those words or other comparable words or phrases of a future or forward-looking nature. These forward-looking statements are not historical facts, and are based on current expectations, estimates, and projections about our industry, management’s beliefs, and certain assumptions made by management, many of which, by their nature, are inherently uncertain and beyond our control. Accordingly, we caution you that any such forward-looking statements are not guarantees of future performance and are subject to risks, assumptions, and uncertainties that are difficult to predict. Although we believe that the expectations reflected in these forward-looking statements are reasonable as of the date made, actual results may prove to be materially different from the results expressed or implied by the forward-looking statements. The following risks, among others, could cause actual results to differ materially from the anticipated results or other expectations expressed in the forward-looking statements: The impact of the COVID-19 pandemic and the responses of governmental authorities on our operations, including declines in credit quality, strains on capital and liquidity, fluctuations in our payment processing business, and declines in deposits; our strategic decision to focus on the greater Atlanta market may not positively impact our financial condition in the expected timeframe, or at all; costs associated with our growth and hiring initiatives in the Atlanta market area; risks associated with increased geographic concentration, borrower concentration and concentration in commercial real estate and commercial and industrial loans resulting from our exit of the Tennessee and northwest Georgia markets and our strategic realignment; our strategic decision to increase our focus on SBA and franchise lending may expose us to additional risks associated with these types of lending, including industry concentration risks, our ability to sell the guaranteed portion of SBA loans, the impact of negative economic conditions on small businesses’ ability to repay the non-guaranteed portions of SBA loans, and changes to applicable federal regulations; risks associated with our ability to manage the planned growth of our payment processing business, including evolving regulations, security risks, and unforeseen increases in transaction volume resulting from changes in our customers’ businesses and changes in the competitive landscape for payment processing; changes in asset quality and credit risk; the cost and availability of capital; customer acceptance of our products and services; customer borrowing, repayment, investment and deposit practices; the introduction, withdrawal, success and timing of business initiatives; the impact, extent, and timing of technological changes; severe catastrophic events in our geographic area; a weakening of the economies in which we conduct operations may adversely affect our operating results; the U.S. legal and regulatory framework could adversely affect the operating results of the Company; the interest rate environment may compress margins and adversely affect net interest income; our ability to anticipate or respond to interest rate changes correctly and manage interest rate risk presented through unanticipated changes in our interest rate risk position and/or short- and long-term interest rates; changes in trade, monetary and fiscal policies of various governmental bodies and central banks could affect the economic environment in which we operate; our ability to determine accurate values of certain assets and liabilities; adverse developments in securities, public debt, and capital markets, including changes in market liquidity and volatility; unanticipated changes in our liquidity position, including but not limited to our ability to enter the financial markets to manage and respond to any changes to our liquidity position; the impact of the transition from LIBOR and our ability to adequately manage such transition; adequacy of our risk management program; increased competitive pressure due to consolidation in the financial services industry; risks related to security breaches, cybersecurity attacks, and other significant disruptions in our information technology systems; and other risks and factors identified in our most recent annual report on Form 10-K and our other reports filed with or furnished to the Securities and Exchange Commission (“SEC”) from time to time. Statements included in this presentation include non-GAAP financial measures and should be read along with the accompanying tables, which provide a reconciliation of non-GAAP financial measures to GAAP financial measures. Atlantic Capital management uses non-GAAP financial measures, including: (i) taxable equivalent net interest income, (ii) taxable equivalent net interest margin, (iii) tangible book value per share, (iv) tangible common equity to tangible assets; (v) pre-provision net revenue, and (vi) noncore funding to total assets. Management believes that non-GAAP financial measures provide a greater understanding of ongoing performance and operations, and enhance comparability with prior periods. Non-GAAP financial measures should not be considered as an alternative to any measure of performance or financial condition as determined in accordance with GAAP, and investors should consider Atlantic Capital’s performance and financial condition as reported under GAAP and all other relevant information when assessing the performance or financial condition of the Company. Non-GAAP financial measures have limitations as analytical tools, and investors should not consider them in isolation or as a substitute for analysis of the results or financial condition as reported under GAAP. Non-GAAP financial measures may not be comparable to non-GAAP financial measures presented by other companies. |
atlanticcapitalbank.com Q2 2020 Overview 3 Performance Highlights During Pandemic COVID-19 Update Credit Update • Produced two quarters of solid operating performance with strong growth in pre-provision net revenue. • Reported another quarter of strong growth in core deposits. • Reduced deposit costs to 0.22% in the second quarter. • Continued focus on expense management took the efficiency ratio down to 53.8% in the second quarter. • Well positioned balance sheet with strong capital, credit loss reserves and liquidity. • Facilitated 821 Paycheck Protection Program (PPP) loans totaling $234 million (10.7% of total loans). • A sharp decline in customers with deferred loan payments is underway reflecting resilient borrower performance and optimism. • SBA is making payments through September for approximately $125 million in existing SBA loans through the CARES Act Subsidy. • Enhanced credit monitoring of COVID-impacted relationships. • Bankers remain in contact with all of their borrowers to assess any developing credit situation and needs. • Overall credit quality remained steady in the second quarter • Built allowance for credit losses to 1.80% of loans (excluding PPP loans) to further strengthen Atlantic Capital’s fortress balance sheet for the uncertain economic environment ahead. • Annualized net charge-offs totaled 0.29% in the quarter and focused on pre-COVID credits • Non-performing assets remain at low levels totaling 0.24% of total assets. |
atlanticcapitalbank.com Diluted EPS $ 0.09 $ 0.10 $ 0.29 $ (0.01) -10% $ (0.20) -69% Pre-provision net revenue (PPNR) (2) 11,070 10,525 9,576 545 5% 1,494 16% Total loans held for investment (period-end) $ 2,185 $ 1,933 $ 1,790 $ 252 13% $ 395 22% Total loans excluding PPP loans 1,951 1,933 1,790 18 1% 161 9% Total deposits (quarterly avg) 2,410 2,255 1,902 155 7% 508 27% Non-interest bearing deposits (quarterly avg) 815 713 588 102 14% 227 39% Tangible book value per share $ 14.72 $ 14.54 $ 13.60 Net interest margin (4) 3.23 % 3.41 % 3.61 % Efficiency ratio 53.82 % 55.03 % 58.06 % 18 bps (18 bps) (121 bps) 112 bps (38 bps) (424 bps) Financial Highlights Continuing Operations 4 (1) On April 5, 2019, Atlantic Capital completed the sale to FirstBank of its Tennessee and northwest Georgia banking operations, including 14 branches and the mortgage business. The banking business and branches subsequently sold to FirstBank are reported as discontinued operations. Income in thousands except Diluted EPS. (2) Pre-provision net revenue (PPNR) is calculated as the sum of net interest income and noninterest income less noninterest expense (except provision for credit losses). Dollars in thousands. For a reconciliation of this non-GAAP financial measure, see slides 34-35. (3) Dollars in millions.(4) Taxable equivalent. Please see reconciliation on slides 34-35 for more details. Income(1) Balance Sheet(3) METRICS Q1 2020 Q2 2020 Change vs Performance Measures Q2 2019 Q2 2019 Q1 2020 |
atlanticcapitalbank.com $688 $790 $944 $1,063 $1,119 $1,107 $622 $605 $653 $686 $678 $662 $61 $88 $103 $111 $136 $182 $144 $234 $1,519 Commercial Lending Focus 5 Loans from Continuing Operations Loan yield Residential 3% Construction & Land 6% Commercial Real Estate 24% Consumer & Other 6% Commercial CRE Other Mortgage Warehouse 3.79% 4.27% 5.01% 5.26% 4.77% 3.87% $1,515 $1,728 Dollars in millions Commercial loans include commercial and industrial and owner occupied CRE loans. CRE loans include non-owner occupied and construction and land. Other loans include residential mortgages, home equity, consumer and other loans. Prior periods have been retrospectively adjusted for the impact of discontinued operations. $1,874 12/31/2016 12/31/2017 12/31/2018 12/31/2019 3/31/2020 6/30/2020 Commercial 50% Libor 41% PPP $1,933 $2,185 PPP 11% Fixed 36% Prime 10% PPP 11% Other 2% Loan yield excluding PPP loans: 4.09% |
atlanticcapitalbank.com 28% 32% 33% 33% 32% 34% 56% 56% 61% 61% 62% 59% 1% 1% 1% 1% 2% 4% 15% 4% 3% 11% 5% Strong Core Deposit Franchise 6 Average Deposits from Continuing Operations Dollars in millions Deposit figures represent average balances. Prior periods have been retrospectively adjusted for the impact of discontinued operations. DDA NOW, Money Market & Savings Time $1,540 $1,633 Deposit cost $1,419 $1,805 0.28% 0.38% 0.52% 0.77% 0.75% 0.22% $2,410 $2,255 2016 2017 2018 2019 Q1 2020 Q2 2020 Brokered 5% |
atlanticcapitalbank.com Net interest income 21,631 $ 20,980 $ 19,889 $ Provision for credit losses 8,863 8,074 698 Noninterest income 2,343 2,422 2,941 Noninterest expense 12,904 12,877 13,254 Income before taxes 2,207 2,451 8,878 Income tax expense 358 327 1,869 Net income from continuing operations 1,849 $ 2,124 $ 7,009 $ Diluted EPS - continuing operations 0.09 $ 0.10 $ 0.29 $ Financial Update: Q2 2020 Income Summary 7 Q2 2019 Q1 2020 Q2 2020 Q2 2020 Highlights(2) • Net interest income benefitted from addition of PPP loans • Provision expense includes economic impact from COVID-19 • Noninterest income decreased as lower service charges were offset by an increase in SBA income • Expenses were unchanged as lower benefits costs were offset by higher incentive accruals Dollars in thousands except EPS. (1)Pre-provision net revenue (PPNR) is calculated as the sum of net interest income and noninterest income less noninterest expense (except provision for credit losses). For a reconciliation of this non-GAAP financial measure, see slides 34-35. (2)Q2 2020 results compared to Q1 2020 results. $ in thousands, except EPS |
atlanticcapitalbank.com $39,009 $54,203 $63,738 $76,642 $81,323 2.76% 2.76% 3.07% 3.50% 3.58% 2015 2016 2017 2018 2019 Net Interest Margin 8 $19,977 $20,088 $20,734 $21,203 $21,985 3.61% 3.52% 3.38% 3.41% 3.23% Q2 2019 Q3 2019 Q4 2019 Q1 2020 Q2 2020 Net interest income NIM by Year(1) NIM by Quarter(1) Net interest margin Dollars in thousands Income and margin from continuing operations (1)Net interest income and net interest margin are taxable equivalent and are non-GAAP financial measures. Net interest income is used in calculating net interest margin. Please see reconciliation on slides 34-35 for more details. 0.26% 0.51% 1.10% 1.91% 2.28% 2.50% 2.30% 1.83% 1.40% 0.25% Avg Fed Funds • Strong growth in earning assets has helped to offset NIM compression over the last few quarters from lower rates • The second quarter decrease in NIM primarily the result of: • Decrease in loan yields and addition of lower yielding PPP loans • Offset by a decrease in cost of deposits • PPP loans reduced NIM by approximately 14 basis points in the second quarter |
atlanticcapitalbank.com Disciplined Expense Management 9 Dollars in thousands (1) Continuing operations Noninterest Expense and Efficiency Ratio by Year(1) Noninterest Expense(1) Q2 2020 Q1 2020 Q2 2019 Salaries and employee benefits 8,466 $ 8,476 $ 8,529 $ (63) $ (1%) Occupancy 883 794 689 194 28% Equipment and software 763 779 753 10 1% Professional services 792 705 792 - 0% Communications and data processing 670 897 662 8 1% FDIC 175 - 175 - 0% Other noninterest expense 1,155 1,226 1,654 (499) (30%) Noninterest expense 12,904 $ 12,877 $ 13,254 $ (350) $ (3%) Year-over-Year change $42,435 $50,099 $52,834 $49,991 $53,108 89.1% 76.3% 70.4% 57.9% 58.0% 2015 2016 2017 2018 2019 Noninterest Expense and Efficiency Ratio by Quarter(1) $13,254 $12,677 $13,382 $12,877 $12,904 58.1% 55.7% 57.6% 55.0% 53.8% Q2 2019 Q3 2019 Q4 2019 Q1 2020 Q2 2020 Noninterest Expense Efficiency Ratio |
atlanticcapitalbank.com Balance Sheet Liquidity Average Loan / Deposit Ratio 91% 91% 85% 83% 87% Q2 2019 Q3 2019 Q4 2019 Q1 2020 Q2 2020 Non-Core Funding / Total Assets(1) 11% 8% 3% 6% 2% • Bank’s liquidity position remains strong • The bank is primarily funded by relationship driven core deposits • Q2 2020 loan / deposit ratio is inflated due to the impact from PPP loans • The bank has more than $1.1 billion in unused contingency funding excluding brokered CDs • 93% of marketable securities are unpledged 10 Prior periods have been retrospectively adjusted for the impact of discontinued operations. (1)For a reconciliation of this non-GAAP financial measure, see slides 34-35. 6/30/2019 9/30/2019 12/31/2019 3/31/2020 6/30/2020 |
atlanticcapitalbank.com Strong Capital Position 11 • Capital position remains strong • The company has paused the $25MM share repurchase program in March to maintain flexibility with holding company liquidity. 15.7% 15.1% 14.6% 14.4% 14.4% 16.5% 15.5% 15.0% 14.9% 14.8% 6/30/2019 9/30/2019 12/31/2019 3/31/2020 6/30/2020 13.4% 12.9% 10.6% 11.6% 11.0% 12.0% Total Risk Based Capital Ratio(2) Tangible Common Equity Ratio(1) Bank Holding company 6/30/2019 9/30/2019 12/31/2019 3/31/2020 6/30/2020 excluding PPP loans(2) (1)For a reconciliation of this non-GAAP financial measure, see slides 34-35. (2)Amounts are estimates as of June 30, 2020 |
atlanticcapitalbank.com Summary of Loan Portfolio Borrowers by State(2) Highlights Top 10 Commercial Industry Concentrations(1) (2) CRE Concentrations by Property Type(1) (2) GA $1,394MM, 70% FL $117MM, 6% TN $96MM, 5% NC $38MM, 2% SC $29MM, 1% Other $310MM, 16% (GA 79% if exclude SBA, Franchise, TriNet) (1) Commercial includes commercial and industrial, owner-occupied CRE; CRE includes non-owner occupied CRE, multifamily, construction (2) Excludes PPP loans and fintech partnership consumer loans 12 Retail $155MM, 23% Office $116MM, 17% Hotel $114MM, 17% Industrial $93MM, 14% Multi-family $82MM, 12% Specialty Housing $42MM, 6% Developed Land $22MM, 3% Other $53MM, 8% Restaurants and food $184MM, 16% Manufacturing $140MM, 12% Retail $139MM, 12% Wholesale $93MM, 8% Finance and insurance $79MM, 7% Transportation $68MM, 6% Other $43MM, 4% Other construction $42MM, 4% Real estate lessors $41MM, 4% Administrative support $69MM, 6% • $2.2 billion in total loans as of 6/30/2020 • Includes $234MM of PPP loans • Commercial focused loan portfolio • 91% commercial and CRE(1) • Concentrated in the Southeast • Granular portfolio • Average loan size $572,000(2) • 25 loans larger than $10 million outstanding |
atlanticcapitalbank.com Strong Historical Credit Quality Non-performing Assets / Total Assets Net Charge Offs / Total Average Loans (0.01%) 0.05% 0.11% 0.23% 0.02% 0.11% 0.17% 2014 2015 2016 2017 2018 2019 YTD 2020 0.12% 0.40% 0.13% 0.14% 0.20% 0.26% 0.27% 0.24% Q4 2014 Q4 2015 Q4 2016 Q4 2017 Q4 2018 Q4 2019 Q1 2020 Q2 2020 13 ALLL / Loans Held for Investment Classified / Total Loans 1.10% 1.07% 1.04% 1.00% 1.03% 0.99% 1.29% 1.45% Q4 2014 Q4 2015 Q4 2016 Q4 2017 Q4 2018 Q4 2019 Q1 2020 Q2 2020 1.40% 0.66% 1.68% 1.76% 2.10% 1.99% 2.24% 2.49% Q4 2014 Q4 2015 Q4 2016 Q4 2017 Q4 2018 Q4 2019 Q1 2020 Q2 2020 |
atlanticcapitalbank.com 14 $19,427 $27,734 $35,085 $892 $2,838 $3,480 $18,535 $24,896 $31,605 $421 $7,409 $671 ($194) $8,222 $642 ($1,513) $0 $5,000 $10,000 $15,000 $20,000 $25,000 $30,000 $35,000 $40,000 $0 $5,000 $10,000 $15,000 $20,000 $25,000 $30,000 $35,000 $40,000 12/31/2019 CECL Adoption Provision (Loans) Provision (Unfunded Commitments) Net Charge-offs 3/31/2020 Provision (Loans) Provision (Unfunded Commitments) Net Charge-offs 6/30/2020 Allowance for Loan Losses Allowance for Unfunded Commitments Current Expected Credit Losses (CECL) Dollars in thousands Allowance for credit losses includes allowance for loan losses and allowance for unfunded commitments Allowance for Credit Losses Reserve Build Q2 2020 Q4 2019 Q1 2020 Incl. PPP Excl. PPP ALL / Loans HFI 0.99% 1.29% 1.45% 1.62% ACL / Loans HFI 1.04% 1.43% 1.61% 1.80% |
atlanticcapitalbank.com Borrower Assistance - Deferrals 15 Loan Payment Deferrals % of Initial Expiring by % of Borrowers 2nd Deferral Industry 6/30/2020 7/21/2020 7/31/2020 with PPP(1) Requests ($)(2) Restaurant $ 146,382 $ 10,962 99.7% 69.0% $ 2,520 Real Estate Rental & Leasing 92,646 63,677 31.3% 12.5% - Retail 67,689 49,500 69.3% 56.3% - Hotel 65,546 8,675 92.4% 25.0% 45,418 Healthcare 44,419 8,659 82.5% 33.3% - Other 98,322 21,983 82.6% 46.7% 18,944 Total $ 515,004 $ 163,455 78.0% 52.5% $ 66,882 % of total loans 23.6% 3.1% Active Initial Deferrals • Initial 90 day deferrals offered proactively • Second deferral requests range from one month to three months; underwriting and fee required • Approximately $67 million of initial deferrals have requested a second deferral (3% of total loans as of 06/30/2020) Dollars in thousands (1) Number of borrowers who received PPP loans from ACB divided by number of borrowers who received a deferral (2) Second deferrals expected divided by total loans as of June 30, 2020 A sharp decline in customers with deferred loan payments is underway reflecting resilient borrower performance and optimism |
atlanticcapitalbank.com Borrower Assistance - SBA • PPP fee income amortized over 2 years; acceleration upon repayment or forgiveness • PPP Forgiveness process expected to begin in August but may extend into 2021 • CARES Act Subsidy - SBA making payments through September for approximately $130 million in existing SBA loans 16 Balance Range Count Balance Average Loan Size Fee (%) Fee ($) Less than or equal to $350,000 653 61,854 $ 95 $ 5% 3,093 $ $350,001 - $1,999,999 153 125,665 821 3% 3,770 Greater than or equal to $2,000,000 15 46,530 3,102 1% 465 Totals 821 234,049 $ 285 $ 7,328 $ Paycheck Protection Program Dollars in thousands |
atlanticcapitalbank.com COVID-Sensitive Loan Categories 17 Industry Balance Average loan size % of total loans % with payment deferrals % of borrowers with PPP loans(1) % classified % nonaccrual Hotels, net of SBA/USDA GTY $ 96,293 $ 2,953 4.4% 68.1% 41.4% 0.0% 0.0% Non-essential retail 95,212 1,107 4.4% 37.6% 35.1% 1.8% 0.3% Full service restaurants 13,015 766 0.6% 54.2% 42.9% 0.0% 0.0% Total $ 204,520 9.4% COVID-Sensitive Loan Categories Dollars in thousands Excludes PPP loans (1) Number of borrowers who received PPP loans from ACB divided by number of borrowers who received a deferral Hotels • Average original LTV 66% • CRE segment more impacted but high quality locations and well capitalized owners; average June occupancy 44% • SBA segment more “drive by” properties; average June occupancy 52% Non-essential retail • 33% of total retail • Not currently concerned - primarily national well capitalized brands, anchored or rural retail CRE and new car dealerships Full service restaurants • 7% of total restaurants • $6 million national franchise brands • QSRs excluded - performing well with drive-thru and delivery, overall June revenue up 2% over prior year |
atlanticcapitalbank.com Loan Portfolio by Risk Rating 18 Dollars in thousands Pass Special Mention Substandard Doubtful Total Pass Special Mention Substandard Doubtful Total Commercial - commercial and industrial 891,690 $ 61,096 $ 20,994 $ 38 $ 973,818 $ 690,321 $ 45,190 $ 24,332 $ 219 $ 760,062 $ Commercial - commercial real estate 843,648 24,253 32,420 — 900,321 884,214 8,287 17,630 — 910,131 Commercial - construction and land 120,037 8,954 — — 128,991 126,822 — — — 126,822 Residential - mortgages 29,592 2,327 408 — 32,327 31,493 — 268 — 31,761 Residential - home equity 23,689 — — — 23,689 23,479 — — — 23,479 Consumer 113,149 — — — 113,149 58,164 — — — 58,164 Other 14,904 6,798 458 — 22,160 18,226 6,798 464 — 25,488 Total 2,036,709 $ 103,428 $ 54,280 $ 38 $ 2,194,455 $ 1,832,719 $ 60,275 $ 42,694 $ 219 $ 1,935,907 $ Less net deferred fees and other unearned income (9,761) (2,998) Total loans held for investment 2,184,694 $ 1,932,909 $ Q2 2020 Q1 2020 |
Appendix |
atlanticcapitalbank.com Management Biographies 20 Douglas Williams President and Chief Executive Officer • President and CEO of Atlantic Capital since its inception • Former Managing Director and Head of Wachovia Corporation’s International Corporate Finance Group • Held numerous roles within Wachovia, including EVP and Head of the Global Corporate Banking Division; CRO for all corporate, institutional, and wholesale banking activities; EVP and Co-Head of Wachovia’s Capital Markets Division and EVP and Head of Wachovia’s US Corporate Banking Division • Former chairman of the Community Depository Institutions Advisory Council (CDIAC) of the Federal Reserve Bank of Atlanta and its representative to the CDIAC of the Federal Reserve Board of Governors • Serves on the Boards of the Metro Atlanta Chamber of Commerce and the Georgia Chamber of Commerce, is a Member of the Buckhead Coalition, and former member of YMCA of Metropolitan Atlanta and the High Museum of Art boards • President, Atlanta Division of Atlantic Capital since December 2019 • EVP, General Banking Division Executive of Atlantic Capital from 2017 through 2019 • CRO of Atlantic Capital from its inception through 2017 • Former Chief Credit Officer for Wachovia’s Capital Finance business • Former Head of Risk Management for all of Wachovia’s Capital Markets business • Serves on the Board of Trustees at Children’s Literature for Children • CFO of Atlantic Capital since NASDAQ listing in 2015 • Former CFO of Square 1 Financial, Inc. • Former EVP and CFO of Encore Bancshares, Inc. • Former SVP and Treasurer of Sterling Bancshares, Inc. • Chartered Financial Analyst • EVP and CRO of Atlantic Capital since October 2017 • Senior Risk Management Officer at Atlantic Capital from inception • Former Director in Wachovia’s Risk Management Division supporting Corporate, Investment Banking and Capital Markets groups • Former Client Management and Risk Management Officer in Wachovia’s middle market commercial group in North Carolina Gray Fleming Executive Vice President, Chief Risk Officer • President, Corporate Financial Services Division since December 2019 • EVP at Atlantic Capital from inception through December 2019 • Former Managing Director and Group Head for Wachovia Securities’ Continental European Group • Member of TWIN (The World Innovation Network – Chicago), Fiserv’s Commercial Payments Advisory Board and a former executive in residence at Juniata College in Pennsylvania Kurt Shreiner President, Corporate Financial Services Division Patrick Oakes, CFA Executive Vice President, Chief Financial Officer Rich Oglesby President, Atlanta Division |
atlanticcapitalbank.com Atlantic Capital Our Company Atlanta’s Hometown Business Bank • EMERGING GROWTH and ENTREPRENEURIAL focus • HIGH-TOUCH, customized service delivery • Product BREADTH and DEPTH • Operating in the ATLANTA market • Expertise in PROCESSING BUSINESSES 21 • Proven underwriting; superior credit quality • Core deposit strength • Strong capital • Capitalize on Atlanta market disruption • Expand treasury and processing businesses Fundamentally Sound Positioned for Growth TOTAL ASSETS $2.9 Billion “We needed bankers who could look beyond what they saw on paper and make a decision based on the underlying long-term fundamentals. In today’s environment, it takes a smaller, entrepreneurial bank to do that. This is what led us to Atlantic Capital.” ~ CEO of Atlanta-based business |
atlanticcapitalbank.com Atlanta’s Hometown Business Bank 22 Atlanta metro highlights: • #1 for economic growth potential (among large metro areas) • 14 Fortune 500 headquarters (ranked #3) • #1 world’s busiest airport • #4 metro area for largest increase in population (2017-2018) • #2 moving destination • 70% of all US payments are processed through Georgia Sources: Metro Atlanta Chamber, City Data, Penske and American Transaction Processors Coalition $200 $250 $300 $350 $400 2012 2013 2014 2015 2016 2017 2018 Atlanta MSA GDP Billions |
atlanticcapitalbank.com Atlanta’s Hometown Business Bank 23 • Focusing efforts on core commercial and private banking relationships • Atlantic Capital Exchange (“ACE”) platforms provide distinctive treasury services • Two branches and one loan production office in Atlanta metro • Total of 25 bankers Atlanta Commercial and Private Banking Loans Atlanta Commercial and Private Banking Deposits Atlanta Market Highlights Atlanta Loan and Deposit Composition – 6/30/2020 Loans QTD Average Deposits Commercial & Private Banking 87% Commercial & Private Banking 58% Note: Commercial & Private Banking charts exclude real estate banking $466 $506 $585 $656 $656 3.72% 4.07% 4.72% 4.89% 4.32% 3.67% 2016 2017 2018 2019 3/31/2020 6/30/2020 Loans Yield on Loans $554 $654 $751 $815 $884 $1,069 0.19% 0.21% 0.36% 0.62% 0.50% 0.20% 2016 2017 2018 2019 3/31/2020 6/30/2020 Average Deposits Cost of Deposits Real Estate Banking 40% $1,088 $1,184 Commercial & Private Banking 90% Real Estate Banking 10% Commercial & Private Banking 60% Dollars in millions Focused on commercial clients and individuals that value high touch relationships and expertise $679 |
atlanticcapitalbank.com 10 14 Q2 2019 Q2 2020 Processing Businesses 24 • Atlanta-based bankers focused on processing business with payments and fintech companies • Recognized as a Top 40 ACH Bank in the US by NACHA, the Electronic Payments Association; originated $83 billion in payments in 2019 • Atlantic Capital Bank is part of Atlanta’s “Payments Alley” $185 $240 $246 $342 $496 0.38% 0.46% 0.60% 0.75% 0.35% 2016 2017 2018 2019 YTD 2020 Deposits Cost of Deposits Average Deposits – Payments & Processing Businesses ($ in millions) ACH Items Originated (in millions) Highlights 18 22 28 44 2016 2017 2018 2019 $1,664 $2,313 YTD 2019 YTD 2020 $1,972 $2,734 $3,215 $3,587 2016 2017 2018 2019 Service Charge Income ($ in thousands) |
atlanticcapitalbank.com Investment Portfolio Portfolio Yield Tax-exempt Municipal 47% Taxable Municipal 12% MBS 25% Agency CMO 10% Corporate 5% CDs 1% Sector Allocation at 6/30/2020 1.73% 2.25% 2.48% 2.69% 2.84% 2.95% 2016 2017 2018 2019 Q1 2020 Q2 2020 Municipal Bond Ratings 6/30/2020 AAA 41% AA+ 23% AA 30% AA- 4% Other 2% Portfolio Effective Duration 5.03 4.72 5.26 6.97 6.96 12/31/2016 12/31/2017 12/31/2018 12/31/2019 6/30/2020 Extended portfolio duration to manage interest rate risk 25 |
atlanticcapitalbank.com Hotel Portfolio • $96 million outstanding net of SBA/USDA guaranteed portions • Weighted average original LTV 66% • Breakeven occupancy 45 – 60% • Average occupancy April – 30% (CRE 14%, SBA 35%) • Average occupancy June – 50% (CRE 44%, SBA 52%) • $20 million special mention, $0 classified, $0 non-accrual Hotel Loans by State Hotel Portfolio Highlights Hotel Loans by Type Hotel Loans by Brand CRE $61MM, 53% SBA 504 $21MM, 19% SBA guaranteed $19MM, 16% SBA unguaranteed $14MM, 12% Hilton $40MM, 35% Marriott $27MM, 24% Hyatt $21MM, 19% InterContinental $14MM, 12% Other $12MM, 10% GA $38MM, 33% SC $14MM, 12% TN $52MM, 46% NC $5MM, 4% FL $5MM, 4% Other $1MM, 1% 26 Excludes PPP loans |
atlanticcapitalbank.com Restaurant Portfolio Restaurant Loans by State Restaurant Portfolio Highlights Restaurant Loans by Concept Restaurant Loans by Type • $191 million outstanding • 93% QSR; Dunkin’ 46% of QSR • 97% of QSR locations did not close during shutdowns • 85% of QSRs have drive-thru or existing delivery model • June QSR revenues +2% vs. June 2019 • $12 million special mention, $4 million classified, $1 million non-accrual GA $61MM, 32% FL $37MM, 19% NJ $16MM, 8% IL $13MM, 7% MD $10MM, 5% MO $9MM, 5% NC $6MM, 3% OR $6MM, 3% NY $5MM, 3% Other $28MM, 15% Dunkin’ $83MM, 43% Other QSR $96MM, 50% Full service $13MM, 7% SNC $9MM, 5% Franchise finance $154MM, 80% C&I $4MM, 2% CRE $10MM, 5% SBA $12MM, 6% TriNet $4MM, 2% 27 Excludes PPP loans |
atlanticcapitalbank.com Retail Portfolio Retail Loans by State Retail Portfolio Highlights Retail Loans by Industry ($ in millions) GA $88MM, 31% *CA $66MM, 23% NC $20MM, 7% VA $13MM, 5% FL $13MM, 4% NY $13MM, 4% TN $11MM, 4% Other $63MM, 22% *All of the CA exposure is related to TriNet. Industry TriNet CRE SNC Franchise SBA C&I Total % of Retail Loans Pharmacies and Drug Stores $ 68 $ - $ - $ - $ - $ - $ 68 24% Gasoline Stations with C Stores - 33 9 - 2 - 43 15% Automotive Parts and Accessories Stores 4 - - 32 - - 36 13% All Other General Merchandise Stores 32 - - - - - 32 11% Lessors of Nonresidential Buildings (Retail CRE) - 26 - - - - 26 9% New Car Dealers - 16 - - - 2 18 6% Sporting Goods Stores - - 9 - - - 9 3% Family Clothing Stores - - 8 - - - 8 3% Electronic Shopping and Mail-Order Houses - - 6 - - - 6 2% Other (includes Hardware, Beer/Wine and Dialysis) 15 8 5 - 10 3 41 14% Total $ 118 $ 83 $ 36 $ 32 $ 13 $ 5 $ 287 % of Retail Loans 41% 29% 13% 11% 4% 2% 100% 28 • $95 million non-essential retail of $287 million total retail • $43 million large national retailers / strong brands with good liquidity • $26 million retail CRE not significantly impacted beyond temporary missed rent • $16 million new car dealers – all profitable • $0 special mention, $3 million classified, $0.3 million non-accrual Excludes PPP loans |
atlanticcapitalbank.com Shared National Credit Portfolio SNC Portfolio Highlights SNC Portfolio by Industry • $187 million outstanding • Average commitment $12 million • 30% highly leveraged transactions (outstandings) • No special mention, classified or non-accrual Other $13MM, 7% Aluminum extruded product mfg. $20MM, 11% Air, rail and water transportation $17MM 9% Financial transaction processing $13MM, 7% Professional Employer Services $13MM, 7% General Medical and Surgical Hospitals $10MM, 5% Ready-mix concrete manufacturing $10MM, 5% Electronic computer manufacturing $9MM, 5% Limited service restaurants $9MM, 5% Sporting goods stores $9MM, 5% Gasoline stations with C stores $9MM, 5% Family closing stores $7MM, 4% Continuing care retirement services $7MM, 4% Crushed and broken limestone mining and quarrying $7MM, 4% Commercial Printing $10MM, 5% SNC Loans by State GA $57MM, 30% FL $35MM, 19% TN $25MM, 13% MO $18MM, 10% NC $13MM, 7% DE $13MM, 7% AZ $13MM, 7% TX $9MM, 5% AL $4MM, 2% Paint/varnish supplies merchant wholesalers $6MM, 3% Other airport operations $6MM, 3% Electronic shopping and mail-order houses $6MM, 3% Wine and distilled alcoholic beverage merchant suppliers $6MM, 3% |
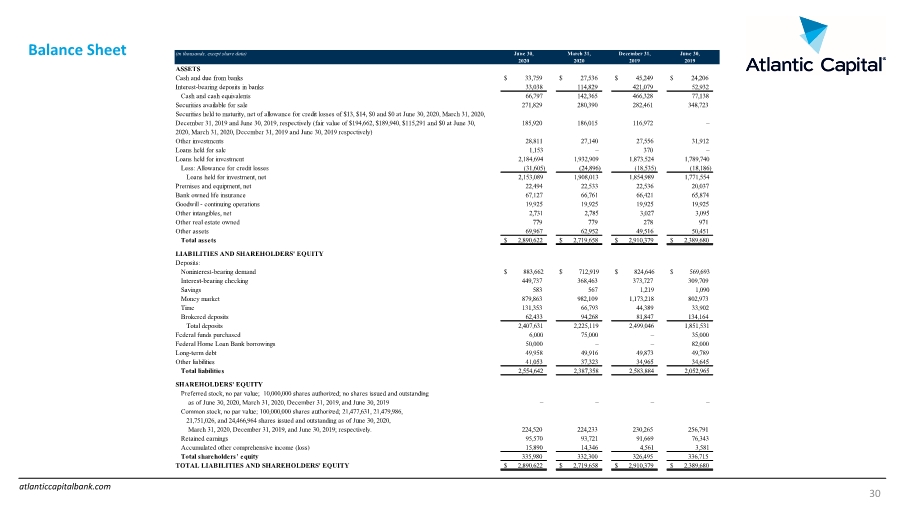
atlanticcapitalbank.com Balance Sheet 30 (in thousands, except share data) June 30, March 31, December 31, June 30, 2020 2020 2019 2019 ASSETS Cash and due from banks $ 33,759 $ 27,536 $ 45,249 $ 24,206 Interest-bearing deposits in banks 33,038 114,829 421,079 52,932 Cash and cash equivalents 66,797 142,365 466,328 77,138 Securities available for sale 271,829 280,390 282,461 348,723 Securities held to maturity, net of allowance for credit losses of $13, $14, $0 and $0 at June 30, 2020, March 31, 2020, December 31, 2019 and June 30, 2019, respectively (fair value of $194,662, $189,940, $115,291 and $0 at June 30, 2020, March 31, 2020, December 31, 2019 and June 30, 2019 respectively) 185,920 186,015 116,972 – Other investments 28,811 27,140 27,556 31,912 Loans held for sale 1,153 – 370 – Loans held for investment 2,184,694 1,932,909 1,873,524 1,789,740 Less: Allowance for credit losses (31,605) (24,896) (18,535) (18,186) Loans held for investment, net 2,153,089 1,908,013 1,854,989 1,771,554 Premises and equipment, net 22,494 22,533 22,536 20,037 Bank owned life insurance 67,127 66,761 66,421 65,874 Goodwill - continuing operations 19,925 19,925 19,925 19,925 Other intangibles, net 2,731 2,785 3,027 3,095 Other real estate owned 779 779 278 971 Other assets 69,967 62,952 49,516 50,451 Total assets $ 2,890,622 $ 2,719,658 $ 2,910,379 $ 2,389,680 LIABILITIES AND SHAREHOLDERS' EQUITY Deposits: Noninterest-bearing demand $ 883,662 $ 712,919 $ 824,646 $ 569,693 Interest-bearing checking 449,737 368,463 373,727 309,709 Savings 583 567 1,219 1,090 Money market 879,863 982,109 1,173,218 802,973 Time 131,353 66,793 44,389 33,902 Brokered deposits 62,433 94,268 81,847 134,164 Total deposits 2,407,631 2,225,119 2,499,046 1,851,531 Federal funds purchased 6,000 75,000 – 35,000 Federal Home Loan Bank borrowings 50,000 – – 82,000 Long-term debt 49,958 49,916 49,873 49,789 Other liabilities 41,053 37,323 34,965 34,645 Total liabilities 2,554,642 2,387,358 2,583,884 2,052,965 SHAREHOLDERS' EQUITY Preferred stock, no par value; 10,000,000 shares authorized; no shares issued and outstanding as of June 30, 2020, March 31, 2020, December 31, 2019, and June 30, 2019 – – – – Common stock, no par value; 100,000,000 shares authorized; 21,477,631, 21,479,986, 21,751,026, and 24,466,964 shares issued and outstanding as of June 30, 2020, March 31, 2020, December 31, 2019, and June 30, 2019; respectively. 224,520 224,233 230,265 256,791 Retained earnings 95,570 93,721 91,669 76,343 Accumulated other comprehensive income (loss) 15,890 14,346 4,561 3,581 Total shareholders’ equity 335,980 332,300 326,495 336,715 TOTAL LIABILITIES AND SHAREHOLDERS' EQUITY $ 2,890,622 $ 2,719,658 $ 2,910,379 $ 2,389,680 |
atlanticcapitalbank.com Period End Loans 31 (dollars in thousands) June 30, 2020 March 31, 2020 December 31, 2019 September 30, 2019 June 30, 2019 Loans held for sale Loans held for sale $ 1,153 $ - $ 370 $ 916 $ - $ 1,153 $ 1,153 Loans held for sale - discontinued operations - - - - - - - Total loans held for sale $ 1,153 $ - $ 370 $ 916 $ - $ 1,153 $ 1,153 Loans held for investment Commercial loans: Commercial and industrial $ 973,818 $ 760,062 $ 705,115 $ 697,412 $ 701,566 $ 213,756 $ 272,252 Commercial real estate: - - M ultifamily 58,909 73,654 98,378 60,398 43,907 (14,745) 15,002 Owner occupied 366,847 359,026 357,912 352,842 313,310 7,821 53,537 Investment 474,565 477,451 460,038 452,285 409,629 (2,886) 64,936 Construction and land: - - 1-4 family residential construction 11 2,706 4,009 5,186 3,696 (2,695) (3,685) Other construction, development, and land 128,980 124,116 123,531 139,991 195,260 4,864 (66,280) Mortgage warehouse loans - - 13,941 23,256 10,665 - (10,665) Total commercial loans 2,003,130 1,797,015 1,762,924 1,731,370 1,678,033 206,115 325,097 Residential: Residential mortgages 32,327 31,761 31,315 31,903 31,338 566 989 Home equity 23,689 23,479 25,002 25,638 24,303 210 (614) Total residential loans 56,016 55,240 56,317 57,541 55,641 776 375 Consumer 113,149 58,164 37,765 27,168 34,618 54,985 78,531 Other 22,160 25,488 19,552 22,533 24,126 (3,328) (1,966) 2,194,455 1,935,907 1,876,558 1,838,612 1,792,418 258,548 402,037 Less net deferred fees and other unearned income (9,761) (2,998) (3,034) (2,939) (2,678) (6,763) (7,083) Total loans held for investment $ 2,184,694 $ 1,932,909 $ 1,873,524 $ 1,835,673 $ 1,789,740 $ 251,785 $ 394,954 Total loans $ 2,185,847 $ 1,932,909 $ 1,873,894 $ 1,836,589 $ 1,789,740 $ 252,938 $ 396,107 PPP loans $ 234,049 $ - $ - $ - $ - $ 234,049 $ 234,049 Total unfunded commitments $ 749,321 $ 689,620 $ 743,958 $ 687,295 $ 637,559 $ 59,701 $ 111,762 Linked Quarter Change Year Over Year Change |
atlanticcapitalbank.com Deposits: Period End and Average 32 Period End Deposits (dollars in thousands) June 30, 2020 March 31, 2020 December 31, 2019 September 30, 2019 June 30, 2019 Linked Quarter Change Year Over Year Change DDA $ 883,662 $ 712,919 $ 824,646 $ 599,657 $ 569,693 $ 170,743 $ 313,969 NOW 449,737 368,463 373,727 240,427 309,709 81,274 140,028 Savings 583 567 1,219 1,081 1,090 16 (507) Money market 879,863 982,109 1,173,218 921,133 802,973 (102,246) 76,890 Time 131,353 66,793 44,389 30,782 33,902 64,560 97,451 Brokered 62,433 94,268 81,847 61,192 134,164 (31,835) (71,731) Total deposits $ 2,407,631 $ 2,225,119 $ 2,499,046 $ 1,854,272 $ 1,851,531 $ 182,512 $ 556,100 Payments clients $ 344,608 $ 483,585 $ 567,597 $ 286,373 $ 301,413 $ (138,977) $ 43,195 Average Deposits Linked (dollars in thousands) S econd Quarter First Quarter Fourth Quarter Third Quarter S econd Quarter Quarter Change DDA $ 815,299 $ 713,001 $ 718,298 $ 637,809 $ 587,957 $ 102,298 $ 227,342 NOW 462,051 382,178 320,637 295,106 314,601 79,873 147,450 Savings 574 650 1,098 1,085 956 (76) (382) Money market 952,444 1,010,713 1,006,449 895,102 859,680 (58,269) 92,764 Time 96,362 55,775 37,388 32,409 32,358 40,587 64,004 Brokered 83,228 92,188 62,757 88,146 106,524 (8,960) (23,296) Total deposits - continuing operations 2,409,958 2,254,505 2,146,627 1,949,657 1,902,076 155,453 507,882 Deposits to be assumed - discontinued operations - - - - 45,350 - (45,350) Total deposits $ 2,409,958 $ 2,254,505 $ 2,146,627 $ 1,949,657 $ 1,947,426 $ 155,453 $ 462,532 Payments clients $ 377,923 $ 419,630 $ 362,327 $ 289,526 $ 285,949 $ (41,707) $ 91,974 Noninterest bearing deposits as a percentage of average deposits - continuing operations 33.8% 31.6% 33.5% 32.7% 30.9% Cost of interest-bearing deposits - continuing operations 0.33% 1.09% 1.36% 1.58% 1.66% Cost of deposits - continuing operations 0.22% 0.75% 0.90% 1.06% 1.15% 2020 2019 Q2 2020 vs Q2 2019 |
atlanticcapitalbank.com Income Statements 33 (in thousands except share and per share data) June 30, 2020 March 31, 2020 December 31, 2019 September 30, 2019 June 30, 2019 Total interest income $ 23,797 $ 26,023 $ 26,532 $ 26,520 $ 26,598 Total interest expense 2,166 5,043 5,965 6,536 6,709 NET INTERES T INCO ME BEFO RE PRO VIS IO N FO R LO AN LO S S ES 21,631 20,980 20,567 19,984 19,889 Provision for credit losses 8,863 8,074 787 413 698 NET INTERES T INCO ME AFTER PRO VIS IO N FO R LO AN LO S S ES 12,768 12,906 19,780 19,571 19,191 NONINTEREST INCOME Service charges 1,081 1,232 998 925 870 Gains (losses) on sale of securities – – – 253 654 Gains (losses) on sale of other assets – 5 – 140 (10) Derivatives income (loss) (10) 246 315 (293) (233) Bank owned life insurance 367 362 375 422 389 SBA lending activities 782 414 846 1,150 1,096 Other noninterest income 123 163 145 172 175 Total noninterest income 2,343 2,422 2,679 2,769 2,941 NO NINTERES T EXPENS E Salaries and employee benefits 8,466 8,476 8,500 8,295 8,529 Occupancy 883 794 838 722 689 Equipment and software 763 779 769 842 753 Professional services 792 705 577 764 792 Communications and data processing 670 897 1,066 796 662 Marketing and business development 79 153 143 243 233 Travel, meals and entertainment 34 140 175 152 186 FDIC premiums 175 – – (193) 175 Other noninterest expense 1,042 933 1,314 1,056 1,235 Total noninterest expense 12,904 12,877 13,382 12,677 13,254 INCOME FROM CONTINUING OPERATIONS BEFORE PROVIS ION FOR INCOME TAXES 2,207 2,451 9,077 9,663 8,878 Provision for income taxes 358 327 1,937 2,094 1,869 NET INCOME FROM CONTINUING OPERATIONS 1,849 2,124 7,140 7,569 7,009 DISCONTINUED OPERATIONS Income (loss) from discontinued operations $ – $ – $ – $ – $ 30,107 Provision (benefit) for income taxes – – – (617) 7,964 Net income (loss) from discontinued operations – – – 617 22,143 NET INCOME $ 1,849 $ 2,124 $ 7,140 $ 8,186 $ 29,152 Net Income (Loss) per Common Share ‑ Basic Net income per common share - continuing operations $ 0.09 $ 0.10 $ 0.33 $ 0.33 $ 0.29 Net income (loss) per common share - discontinued operations – – – 0.03 0.93 Net Income per Common Share ‑ Basic 0.09 0.10 0.33 0.36 1.22 Net Income (Loss) per Common Share ‑ Diluted Net income per common share - continuing operations $ 0.09 $ 0.10 $ 0.32 $ 0.33 $ 0.29 Net income (loss) per common share - discontinued operations – – – 0.03 0.92 Net Income per Common Share ‑ Diluted 0.09 0.10 0.32 0.36 1.21 Weighted average shares - basic 21,472,462 21,689,038 21,876,487 22,681,904 23,888,381 Weighted average shares - diluted 21,535,040 21,842,175 22,053,907 22,837,531 24,040,806 Three months ended |
atlanticcapitalbank.com Non-GAAP Financial Measures 34 (in thousands, except share and per share data) S econd Quarter First Quarter Fourth Quarter Third Quarter S econd Quarter 2020 2019 Taxable equivalent net interest income reconciliation - continuing operations Net interest income - GAAP $ 21,631 $ 20,980 $ 20,567 $ 19,984 $ 19,889 $ 42,611 $ 40,313 Taxable equivalent adjustment 354 223 167 104 88 577 188 Net interest income - taxable equivalent - continuing operations $ 21,985 $ 21,203 $ 20,734 $ 20,088 $ 19,977 $ 43,188 $ 40,501 Taxable equivalent net interest margin reconciliation - continuing operations Net interest margin - GAAP - continuing operations 3.17% 3.38% 3.35% 3.51% 3.60% 3.27% 3.71% Impact of taxable equivalent adjustment 0.06% 0.03% 0.03% 0.01% 0.01% 0.05% 0.02% Net interest margin - taxable equivalent - continuing operations 3.23% 3.41% 3.38% 3.52% 3.61% 3.32% 3.73% Tangible book value per common share reconciliation Total shareholders’ equity $ 335,981 $ 332,300 $ 326,495 $ 328,711 $ 336,715 $ 335,981 $ 336,715 Intangible assets (19,925) (19,925) (19,925) (19,925) (19,925) (19,925) (19,925) Total tangible common equity $ 316,056 $ 312,375 $ 306,570 $ 308,786 $ 316,790 $ 316,056 $ 316,790 Common shares outstanding 21,477,631 21,479,986 21,751,026 22,193,761 23,293,465 21,477,631 23,293,465 Book value per common share - GAAP $ 15.64 $ 15.47 $ 15.01 $ 14.81 $ 14.46 $ 15.64 $ 14.46 Tangible book value 14.72 14.54 14.09 13.91 13.60 14.72 13.60 Tangible common equity to tangible assets reconciliation Total shareholders’ equity $ 335,981 $ 332,300 $ 326,495 $ 328,711 $ 336,715 $ 335,981 $ 336,715 Intangible assets (19,925) (19,925) (19,925) (19,925) (19,925) (19,925) (19,925) Total tangible common equity $ 316,056 $ 312,375 $ 306,570 $ 308,786 $ 316,790 $ 316,056 $ 316,790 Total assets $ 2,890,622 $ 2,719,658 $ 2,910,379 $ 2,410,198 $ 2,389,680 $ 2,890,622 $ 2,389,680 Intangible assets (19,925) (19,925) (19,925) (19,925) (19,925) (19,925) (19,925) Total tangible assets $ 2,870,697 $ 2,699,733 $ 2,890,454 $ 2,390,273 $ 2,369,755 $ 2,870,697 $ 2,369,755 Tangible common equity to tangible assets 11.01% 11.57% 10.61% 12.92% 13.37% 11.01% 13.37% PPP loans $ 234,049 $ - $ - $ - $ - $ 234,049 $ - Total tangible assets excl PPP loans $ 2,636,648 $ 2,699,733 $ 2,890,454 $ 2,390,273 $ 2,369,755 $ 2,636,648 $ 2,369,755 Tangible common equity to tangible assets excl PPP loans 11.99% 11.57% 10.61% 12.92% 13.37% 11.99% 13.37% Pre-provision net revenue and PPNR return on average assets reconciliation Net interest income - GAAP $ 21,631 $ 20,980 $ 20,567 $ 19,984 $ 19,889 $ 42,611 $ 40,313 Noninterest income 2,343 2,422 2,679 2,769 2,941 4,765 5,277 Noninterest expense 12,904 12,877 13,382 12,677 13,254 25,781 27,049 Pre-provision net revenue 11,070 $ 10,525 $ 9,864 $ 10,076 $ 9,576 $ 21,595 $ 18,541 $ Noncore funding to total assets Federal funds purchased $ 6,000 $ 75,000 $ - $ 57,000 $ 35,000 FHLB advances - - - 76,000 82,000 Brokered deposits 62,433 94,268 81,847 61,192 134,164 Total noncore funding $ 68,433 $ 169,268 $ 81,847 $ 194,192 $ 251,164 Total assets $ 2,890,622 $ 2,719,322 $ 2,910,379 $ 2,410,198 $ 2,389,680 Noncore funding to total assets 2% 6% 3% 8% 11% 2019 For the six months ended June 30 2020 |
atlanticcapitalbank.com Non-GAAP Financial Measures 35 (in thousands) 2019 2018 2017 2016 2015 Net interest income reconciliation Net interest income - GAAP $ 80,864 $ 76,247 $ 62,832 $ 53,719 $ 38,946 Taxable equivalent adjustment 459 395 906 484 63 Net interest income - taxable equivalent $ 81,323 $ 76,642 $ 63,738 $ 54,203 $ 39,009 Taxable equivalent net interest margin reconciliation Net interest margin - GAAP - continuing operations 3.52% 3.48% 3.03% 2.74% 2.75% Impact of taxable equivalent adjustment 0.06% 0.02% 0.04% 0.02% 0.01% Net interest margin - taxable equivalent 3.58% 3.50% 3.07% 2.76% 2.76% For the Years Ended December 31, |
atlanticcapitalbank.com Financial Information from Discontinued Operations 36 Components of Net Income (Loss) from Discontinued Operations (in thousands) S econd Quarter First Quarter Fourth Quarter Third Quarter S econd Quarter Net interest income - $ - $ - $ - $ (39) $ Provision for loan losses - - - – – Net interest income after provision - - - - (39) Service charges - - - - 46 Mortgage income - - - – - Gain on sale of branches - - - - 34,475 Other income - - - - (22) Total noninterest income - - - - 34,499 Salaries and employee benefits - - - - 330 Occupancy - - - - 71 Equipment and software - - - - 8 Amortization of intangibles - - - - - Communications and data processing - - - - 197 Divestiture expense - - - - 3,646 Other noninterest expense - - - - 101 Total noninterest expense - - - - 4,353 Net income (loss) before provision for income taxes - - - - 30,107 Provision (benefit) for income taxes - - - (617) 7,964 Net income (loss) from discontinued operations - $ - $ - $ 617 $ 22,143 $ 2019 2020 |
Thank You |