UNITED STATES
SECURITIES AND EXCHANGE COMMISSION
Washington, D.C. 20549
FORM N-CSR
CERTIFIED SHAREHOLDER REPORT OF REGISTERED
MANAGEMENT INVESTMENT COMPANIES
Investment Company Act File Number: 811-22293
| T. Rowe Price U.S. Large-Cap Core Fund, Inc. |
|
| (Exact name of registrant as specified in charter) |
| |
| 100 East Pratt Street, Baltimore, MD 21202 |
|
| (Address of principal executive offices) |
| |
| David Oestreicher |
| 100 East Pratt Street, Baltimore, MD 21202 |
|
| (Name and address of agent for service) |
Registrant’s telephone number, including area code: (410) 345-2000
Date of fiscal year end: December 31
Date of reporting period: December 31, 2013
Item 1. Report to Shareholders
| U.S. Large-Cap Core Fund | December 31, 2013 |
The views and opinions in this report were current as of December 31, 2013. They are not guarantees of performance or investment results and should not be taken as investment advice. Investment decisions reflect a variety of factors, and the managers reserve the right to change their views about individual stocks, sectors, and the markets at any time. As a result, the views expressed should not be relied upon as a forecast of the fund’s future investment intent. The report is certified under the Sarbanes-Oxley Act, which requires mutual funds and other public companies to affirm that, to the best of their knowledge, the information in their financial reports is fairly and accurately stated in all material respects.
REPORTS ON THE WEB
Sign up for our E-mail Program, and you can begin to receive updated fund reports and prospectuses online rather than through the mail. Log in to your account at troweprice.com for more information.
Manager’s Letter
Fellow Shareholders
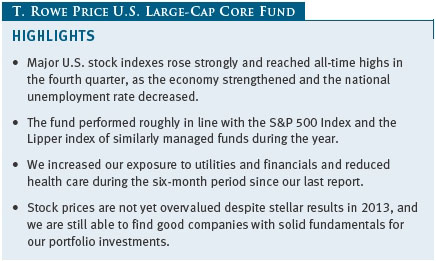
Most major U.S. stock indexes rose strongly and reached all-time highs in the fourth quarter, as the economy strengthened and the national unemployment rate decreased. Equities shrugged off a federal government shutdown and debt ceiling showdown in October. Growth and value stocks were fairly evenly matched across all market capitalizations for the year. In the large-cap universe, all sectors produced positive returns.
PERFORMANCE COMPARISON
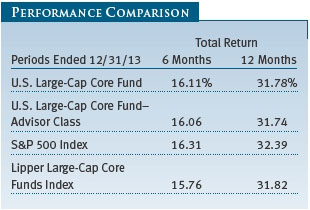
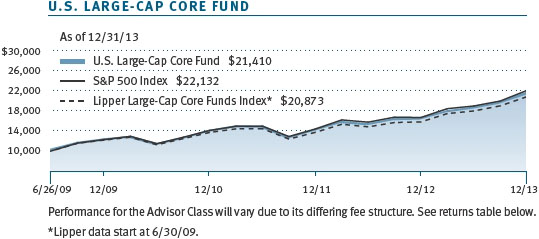
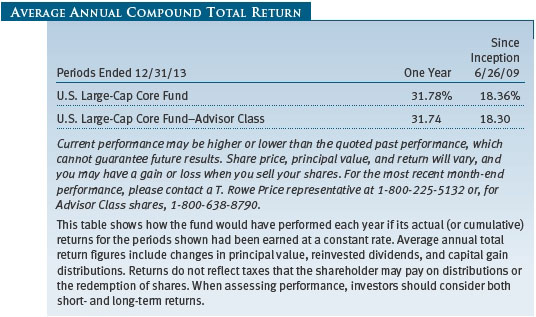
The U.S. Large-Cap Core Fund performed roughly in line with the S&P 500 Index and the Lipper Large-Cap Core Funds Index during the 6- and 12-month periods ended December 31, 2013. Fund returns were 16.11% and 31.78%, respectively. Returns for the benchmarks are also listed in the Performance Comparison table. (The returns for the Advisor Class were slightly lower, reflecting its different fee structure.)
INVESTMENT APPROACH
The U.S. Large-Cap Core Fund seeks long-term capital appreciation by investing in a concentrated portfolio of domestic large-cap growth and value stocks. The fund uses fundamental, bottom-up analysis that also relies on a rigorous valuation assessment to find the stocks with the most potential for appreciation.
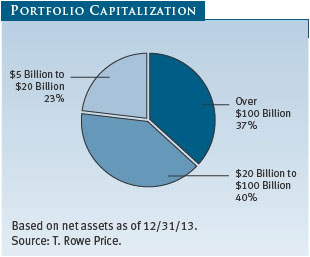
In selecting the stocks for the portfolio, the fund generally starts with companies of more than $5 billion in market capitalization and carry “buy” ratings from T. Rowe Price analysts. In our analysis of these companies, we focus on four key elements: understanding a company’s business model and strategy, developing a relationship with the company’s management, determining the company’s standing within its industry, and assessing the company’s valuation.
The fund has a bias toward high-quality companies that have opportunities to increase their market share or have barriers to entry around their business that protect them and allow them to grow organically. We look for well-managed firms with great products and services within an industry that may be in a cyclical trough. Lastly, we favor companies with characteristics that we believe can drive equity appreciation, such as pricing power, new product cycles, improving margins, and a strategy to earn better returns on their invested capital.
Beyond good fundamentals, we look for management teams that can create value by executing well and improving the business. We also pay close attention to free cash flow and management’s effectiveness in redeploying its capital. We like managements that invest in their business when there is the potential for attractive returns or return of capital to shareholders if conditions warrant.
We also employ a disciplined sell process. After stocks are added to the portfolio, they are subject to continued scrutiny. Criteria for selling stocks include a downgrade by a T. Rowe Price analyst, deterioration in the company’s fundamentals or management, the discovery of a better investment idea, or the fulfillment of our investment thesis when a stock becomes fully valued.
MARKET ENVIRONMENT
As the year began, investors were concerned that tax increases and automatic spending cuts might derail the economic recovery. However, a stronger labor market, a healthy housing market, and the Federal Reserve’s ongoing quantitative easing program quelled investors’ fears. Equities suffered a setback in May, when Fed Chairman Ben Bernanke suggested that the central bank might start to trim its monthly asset purchases, possibly as early as September. Long-term bond yields climbed as a result, weighing on both bonds and equities. In September, the Fed surprised the markets by delaying the widely expected tapering.
At the beginning of the federal government’s new fiscal year on October 1, 2013, many agencies were forced to temporarily furlough employees when the government failed to enact a budget to fund operations. Stocks climbed again after the impasse ended with a solution that put fiscal policy concerns temporarily on hold. As the year ended, investors welcomed the Fed’s announcement that it would reduce its monthly asset purchases by $10 billion in January, since many observers had expected a larger scaleback.
The Fed has pledged to keep short-term interest rates low until the unemployment rate falls further, assuming inflation remains contained. Recently, the federal government enacted a bipartisan budget deal that appears to eliminate the possibility of another government shutdown until after the 2014 midterm elections. Congress and the President also have to deal with an increase in the nation’s borrowing limit, the so-called debt ceiling, early in the year.
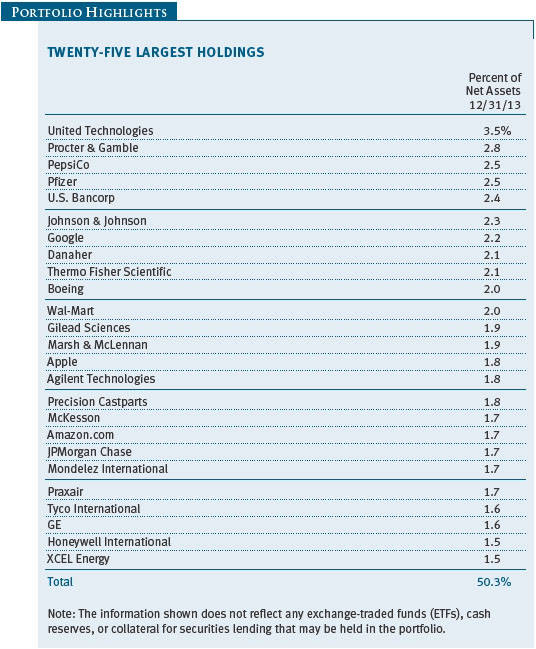
PORTFOLIO HIGHLIGHTS
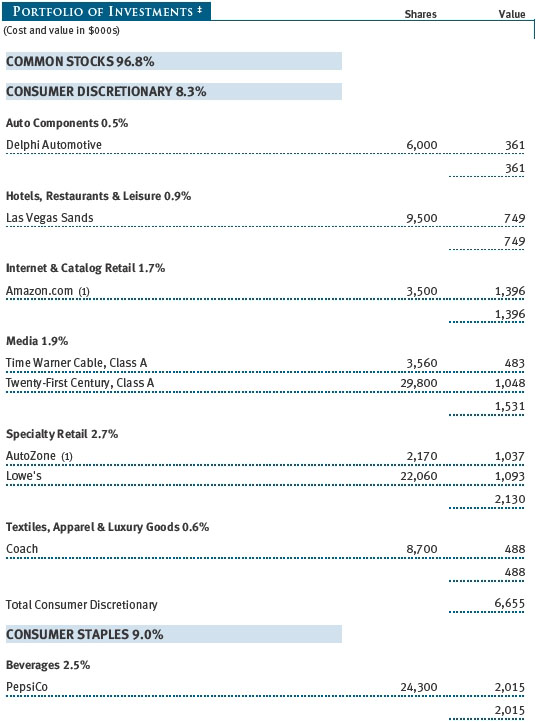
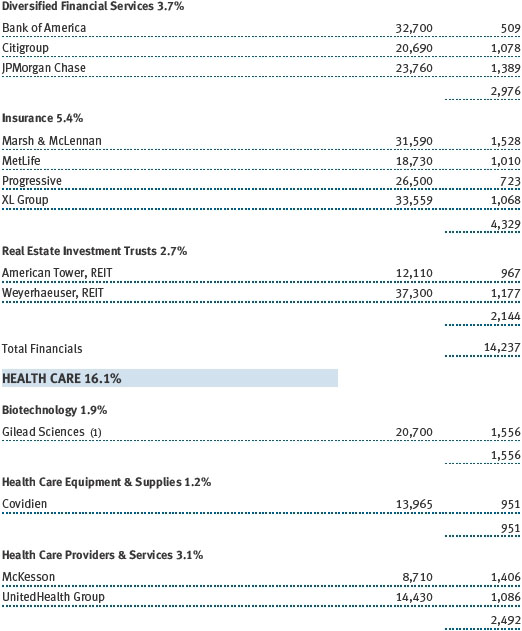
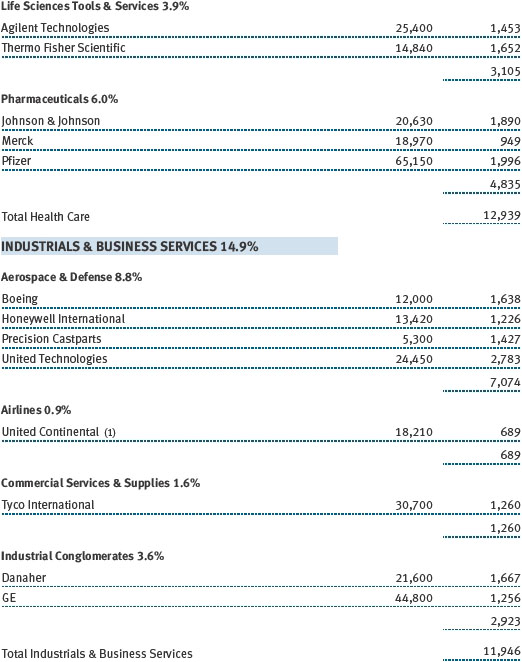
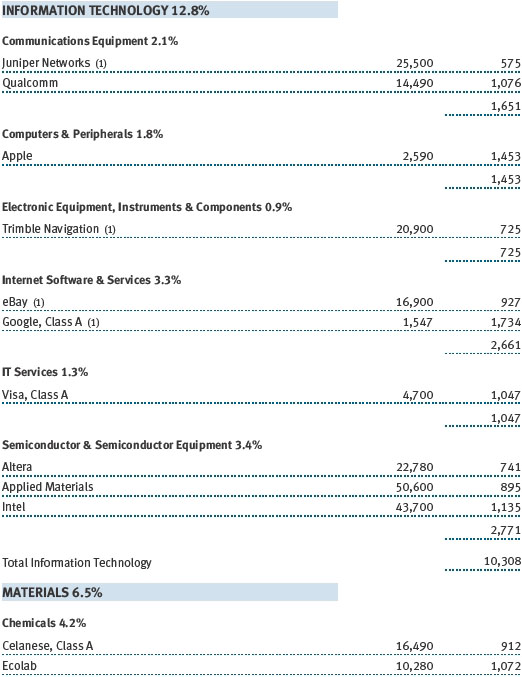
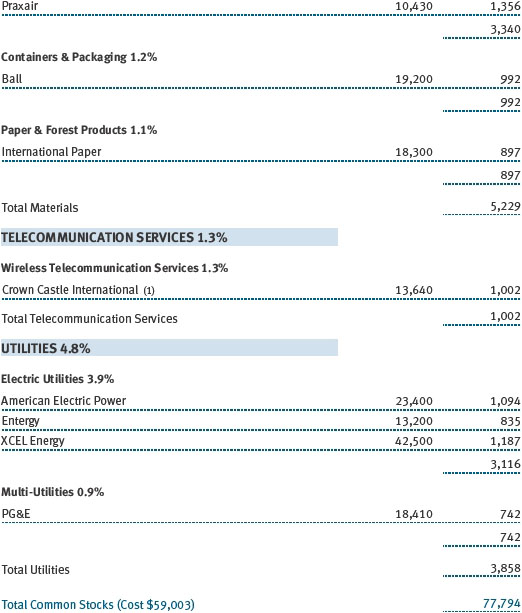
Many of the stocks among our top holdings turned in stellar results in 2013. The winners included aircraft manufacturer Boeing, biotech company Gilead Sciences, major pharmaceuticals Johnson & Johnson and Pfizer, Internet stalwarts Google and Amazon.com, and financial heavyweight JPMorgan Chase. Crown Castle International was a notable exception among the 25 largest positions. The stock failed to perform the way we had hoped earlier in the year due to a fear of rising interest rates. (Please refer to the fund’s portfolio of investments for a complete list of holdings and the amount each represents in the portfolio.)
Other portfolio holdings that underperformed included Carnival, which continued to suffer from execution and management issues. Within technology, Oracle and Red Hat (an open source software provider) performed poorly because of weak enterprise spending on information technology.
Fortunately, our stock selection overall enabled us to keep pace with the broad market in 2013. In addition to the stocks mentioned, McKesson in the health care space and large diversified industrials, including United Technologies and Danaher, were major contributors to fund performance.
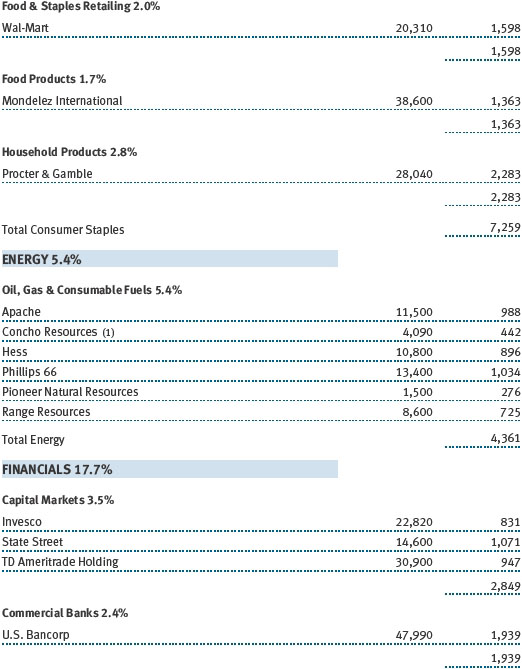
At the end of the year, financials was our largest sector weighting at 17.7% of net assets, closely followed by health care at 16.1%. Industrials and materials represent other sectors that are significantly overweight to the benchmarks. Information technology and energy are the portfolio’s largest underweights.

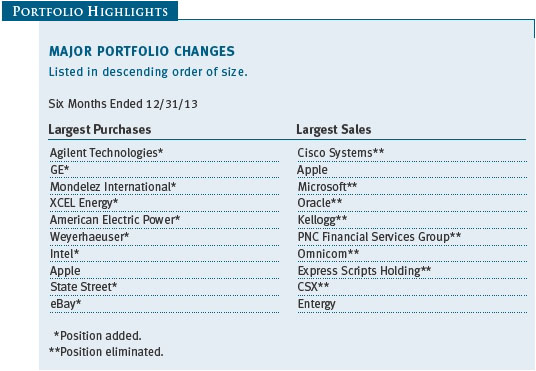
We made several adjustments to the portfolio during the year, adding eBay, State Street, GE, Weyerhaeuser, Agilent Technologies, American Electric Power, and others whose prospects look bright. We eliminated Cisco Systems, Microsoft, Kellogg, PNC Financial Services Group, and other companies whose stock valuations or future fundamentals seemed less appealing to us.
PORTFOLIO STRATEGY
Our sector allocations are largely the result of our focus on bottom-up stock selection. We realize that macroeconomic events have an impact on equity markets, and we may develop a bias for or against a particular industry based on policies emanating from Washington, D.C., that we feel will be helpful or detrimental to a group. However, our primary strategy is directed at seeking individual companies with appealing stock valuations, healthy balance sheets, favorable cash flows, and the potential to increase market share and earnings growth.
Our sector allocations shifted during the past six months as we bought and sold shares that reflected our investment themes. We raised our exposure to utilities with their relatively high dividend yields and consistent underperformance of the market over the last couple of years. We also increased our allocation to financials because of increasing clarity about regulation and the likelihood of interest rates continuing to rise. We lowered our exposure to health care and to information technology.
OUTLOOK
We are reasonably optimistic about the prospects for equities in 2014. The negative effects of last year’s tax hike are well behind us, inflation remains contained, energy prices have fallen, and U.S. economic growth is progressing moderately. The geopolitical and domestic risks remain. We are particularly concerned about the ongoing tensions in the Middle East and the condition of China’s banking system. Domestically, the onset of the Federal Reserve’s tapering of its monthly asset purchases is worrisome, although we believe it will be positive longer term.
The expansion of price/earnings multiples that drove stocks higher last year is likely to moderate, and we believe earnings growth will continue at a modest pace. Stocks are not yet overvalued, and we are still able to find good companies with solid fundamentals for our portfolio investments.
Thank you for your continuing support.
Respectfully submitted,

Jeffrey Rottinghaus
Chairman of the fund’s Investment Advisory Committee
January 17, 2014
The committee chairman has day-to-day responsibility for managing the portfolio and works with committee members in developing and executing the fund’s investment program.
RISKS OF STOCK INVESTING
The fund’s share price can fall because of weakness in the stock markets, a particular industry, or specific holdings. Stock markets can decline for many reasons, including adverse political or economic developments, changes in investor psychology, or heavy institutional selling. The prospects for an industry or company may deteriorate because of a variety of factors, including disappointing earnings or changes in the competitive environment. In addition, the investment manager’s assessment of companies held in a fund may prove incorrect, resulting in losses or poor performance even in rising markets.
GLOSSARY
Dividend yield: The annual dividend of a stock divided by the stock’s price.
Earnings growth rate – current fiscal year: Measures the annualized percent change in earnings per share from the prior fiscal year to the current fiscal year.
Free cash flow: The excess cash a company is generating from its operations that can be taken out of the business for the benefit of shareholders, such as dividends, share repurchases, investments, and acquisitions.
Lipper indexes: Fund benchmarks that consist of a small number (10 to 30) of the largest mutual funds in a particular category as tracked by Lipper Inc.
Price-to-earnings (P/E) ratio – current fiscal year: A valuation measure calculated by dividing the price of a stock by its reported earnings per share from the latest fiscal year. The ratio is a measure of how much investors are willing to pay for the company’s earnings. The higher the P/E, the more investors are paying for a company’s current earnings.
Projected earnings growth rate (IBES): A company’s expected earnings per share growth rate for a given time period based on the forecast from the Institutional Brokers’ Estimate System, which is commonly referred to as IBES.
Performance and Expenses
This table shows the value of a hypothetical $10,000 investment in the fund over the past 10 fiscal year periods or since inception (for funds lacking 10-year records). The result is compared with benchmarks, which may include a broad-based market index and a peer group average or index. Market indexes do not include expenses, which are deducted from fund returns as well as mutual fund averages and indexes.
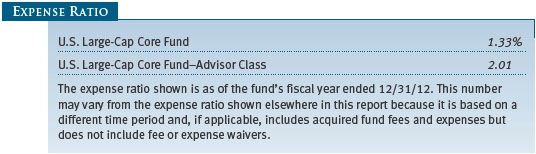
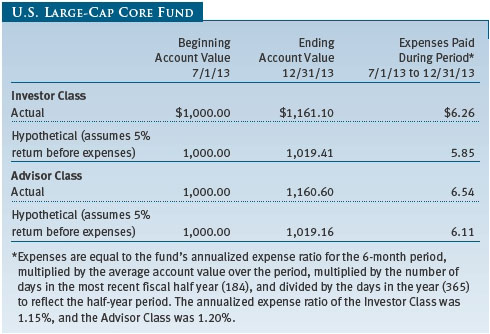
As a mutual fund shareholder, you may incur two types of costs: (1) transaction costs, such as redemption fees or sales loads, and (2) ongoing costs, including management fees, distribution and service (12b-1) fees, and other fund expenses. The following example is intended to help you understand your ongoing costs (in dollars) of investing in the fund and to compare these costs with the ongoing costs of investing in other mutual funds. The example is based on an investment of $1,000 invested at the beginning of the most recent six-month period and held for the entire period.
Please note that the fund has two share classes: The original share class (Investor Class) charges no distribution and service (12b-1) fee, and the Advisor Class shares are offered only through unaffiliated brokers and other financial intermediaries and charge a 0.25% 12b-1 fee. Each share class is presented separately in the table.
Actual Expenses
The first line of the following table (Actual) provides information about actual account values and expenses based on the fund’s actual returns. You may use the information on this line, together with your account balance, to estimate the expenses that you paid over the period. Simply divide your account value by $1,000 (for example, an $8,600 account value divided by $1,000 = 8.6), then multiply the result by the number on the first line under the heading “Expenses Paid During Period” to estimate the expenses you paid on your account during this period.
Hypothetical Example for Comparison Purposes
The information on the second line of the table (Hypothetical) is based on hypothetical account values and expenses derived from the fund’s actual expense ratio and an assumed 5% per year rate of return before expenses (not the fund’s actual return). You may compare the ongoing costs of investing in the fund with other funds by contrasting this 5% hypothetical example and the 5% hypothetical examples that appear in the shareholder reports of the other funds. The hypothetical account values and expenses may not be used to estimate the actual ending account balance or expenses you paid for the period.
Note: T. Rowe Price charges an annual account service fee of $20, generally for accounts with less than $10,000. The fee is waived for any investor whose T. Rowe Price mutual fund accounts total $50,000 or more; accounts electing to receive electronic delivery of account statements, transaction confirmations, prospectuses, and shareholder reports; or accounts of an investor who is a T. Rowe Price Preferred Services, Personal Services, or Enhanced Personal Services client (enrollment in these programs generally requires T. Rowe Price assets of at least $100,000). This fee is not included in the accompanying table. If you are subject to the fee, keep it in mind when you are estimating the ongoing expenses of investing in the fund and when comparing the expenses of this fund with other funds.
You should also be aware that the expenses shown in the table highlight only your ongoing costs and do not reflect any transaction costs, such as redemption fees or sales loads. Therefore, the second line of the table is useful in comparing ongoing costs only and will not help you determine the relative total costs of owning different funds. To the extent a fund charges transaction costs, however, the total cost of owning that fund is higher.

The accompanying notes are an integral part of these financial statements.

The accompanying notes are an integral part of these financial statements.
The accompanying notes are an integral part of these financial statements.
The accompanying notes are an integral part of these financial statements.

The accompanying notes are an integral part of these financial statements.
The accompanying notes are an integral part of these financial statements.
| Notes to Financial Statements |
T. Rowe Price U.S. Large-Cap Core Fund, Inc. (the fund), is registered under the Investment Company Act of 1940 (the 1940 Act) as a diversified, open-end management investment company. The fund seeks to provide long-term capital growth. The fund has two classes of shares: the U.S. Large-Cap Core Fund original share class, referred to in this report as the Investor Class, offered since June 26, 2009, and the U.S. Large-Cap Core Fund–Advisor Class (Advisor Class), offered since June 26, 2009. Advisor Class shares are sold only through unaffiliated brokers and other unaffiliated financial intermediaries that are compensated by the class for distribution, shareholder servicing, and/or certain administrative services under a Board-approved Rule 12b-1 plan. Each class has exclusive voting rights on matters related solely to that class; separate voting rights on matters that relate to both classes; and, in all other respects, the same rights and obligations as the other class.
NOTE 1 - SIGNIFICANT ACCOUNTING POLICIES
Basis of Preparation The fund is an investment company and follows accounting and reporting guidance in the Financial Accounting Standards Board Accounting Standards Codification Topic 946 (ASC 946). The accompanying financial statements were prepared in accordance with accounting principles generally accepted in the United States of America (GAAP), including but not limited to ASC 946. GAAP requires the use of estimates made by management. Management believes that estimates and valuations are appropriate; however, actual results may differ from those estimates, and the valuations reflected in the accompanying financial statements may differ from the value ultimately realized upon sale or maturity.
Investment Transactions, Investment Income, and Distributions Income and expenses are recorded on the accrual basis. Dividends received from mutual fund investments are reflected as dividend income; capital gain distributions are reflected as realized gain/loss. Dividend income and capital gain distributions are recorded on the ex-dividend date. Income tax-related interest and penalties, if incurred, would be recorded as income tax expense. Investment transactions are accounted for on the trade date. Realized gains and losses are reported on the identified cost basis. Distributions to shareholders are recorded on the ex-dividend date. Income distributions are declared and paid by each class annually. Capital gain distributions, if any, are generally declared and paid by the fund annually.
Class Accounting The Advisor Class pays distribution, shareholder servicing, and/or certain administrative expenses in the form of Rule 12b-1 fees, in an amount not exceeding 0.25% of the class’s average daily net assets. Shareholder servicing, prospectus, and shareholder report expenses incurred by each class are charged directly to the class to which they relate. Expenses common to both classes, investment income, and realized and unrealized gains and losses are allocated to the classes based upon the relative daily net assets of each class.
Rebates and Credits Subject to best execution, the fund may direct certain security trades to brokers who have agreed to rebate a portion of the related brokerage commission to the fund in cash. Commission rebates are reflected as realized gain on securities in the accompanying financial statements. Additionally, the fund earns credits on temporarily uninvested cash balances held at the custodian, which reduce the fund’s custody charges. Custody expense in the accompanying financial statements is presented before reduction for credits.
New Accounting Guidance On January 1, 2013, the fund adopted new accounting guidance, issued by the Financial Accounting Standards Board, that requires an entity to disclose information about offsetting and related arrangements to enable users of its financial statements to understand the effect of those arrangements on its financial position. Adoption had no effect on the fund’s net assets or results of operations.
NOTE 2 - VALUATION
The fund’s financial instruments are valued, and each class’s net asset value (NAV) per share is computed at the close of the New York Stock Exchange (NYSE), normally 4 p.m. ET, each day the NYSE is open for business.
Fair Value The fund’s financial instruments are reported at fair value, which GAAP defines as the price that would be received to sell an asset or paid to transfer a liability in an orderly transaction between market participants at the measurement date. The T. Rowe Price Valuation Committee (the Valuation Committee) has been established by the fund’s Board of Directors (the Board) to ensure that financial instruments are appropriately priced at fair value in accordance with GAAP and the 1940 Act. Subject to oversight by the Board, the Valuation Committee develops and oversees pricing-related policies and procedures and approves all fair value determinations. Specifically, the Valuation Committee establishes procedures to value securities; determines pricing techniques, sources, and persons eligible to effect fair value pricing actions; oversees the selection, services, and performance of pricing vendors; oversees valuation-related business continuity practices; and provides guidance on internal controls and valuation-related matters. The Valuation Committee reports to the fund’s Board; is chaired by the fund’s treasurer; and has representation from legal, portfolio management and trading, operations, and risk management.
Various valuation techniques and inputs are used to determine the fair value of financial instruments. GAAP establishes the following fair value hierarchy that categorizes the inputs used to measure fair value:
Level 1 – quoted prices (unadjusted) in active markets for identical financial instruments that the fund can access at the reporting date
Level 2 – inputs other than Level 1 quoted prices that are observable, either directly or indirectly (including, but not limited to, quoted prices for similar financial instruments in active markets, quoted prices for identical or similar financial instruments in inactive markets, interest rates and yield curves, implied volatilities, and credit spreads)
Level 3 – unobservable inputs
Observable inputs are developed using market data, such as publicly available information about actual events or transactions, and reflect the assumptions that market participants would use to price the financial instrument. Unobservable inputs are those for which market data are not available and are developed using the best information available about the assumptions that market participants would use to price the financial instrument. GAAP requires valuation techniques to maximize the use of relevant observable inputs and minimize the use of unobservable inputs. When multiple inputs are used to derive fair value, the financial instrument is assigned to the level within the fair value hierarchy based on the lowest-level input that is significant to the fair value of the financial instrument. Input levels are not necessarily an indication of the risk or liquidity associated with financial instruments at that level but rather the degree of judgment used in determining those values.
Valuation Techniques Equity securities listed or regularly traded on a securities exchange or in the over-the-counter (OTC) market are valued at the last quoted sale price or, for certain markets, the official closing price at the time the valuations are made. OTC Bulletin Board securities are valued at the mean of the closing bid and asked prices. A security that is listed or traded on more than one exchange is valued at the quotation on the exchange determined to be the primary market for such security. Listed securities not traded on a particular day are valued at the mean of the closing bid and asked prices. Actively traded domestic equity securities generally are categorized in Level 1 of the fair value hierarchy. OTC Bulletin Board securities and equity securities traded in inactive markets generally are categorized in Level 2 of the fair value hierarchy.
Investments in mutual funds are valued at the mutual fund’s closing NAV per share on the day of valuation and are categorized in Level 1 of the fair value hierarchy. Assets and liabilities other than financial instruments, including short-term receivables and payables, are carried at cost, or estimated realizable value, if less, which approximates fair value.
Thinly traded financial instruments and those for which the above valuation procedures are inappropriate or are deemed not to reflect fair value are stated at fair value as determined in good faith by the Valuation Committee. The objective of any fair value pricing determination is to arrive at a price that could reasonably be expected from a current sale. Financial instruments fair valued by the Valuation Committee are primarily private placements, restricted securities, warrants, rights, and other securities that are not publicly traded.
Subject to oversight by the Board, the Valuation Committee regularly makes good faith judgments to establish and adjust the fair valuations of certain securities as events occur and circumstances warrant. For instance, in determining the fair value of an equity investment with limited market activity, such as a private placement or a thinly traded public company stock, the Valuation Committee considers a variety of factors, which may include, but are not limited to, the issuer’s business prospects, its financial standing and performance, recent investment transactions in the issuer, new rounds of financing, negotiated transactions of significant size between other investors in the company, relevant market valuations of peer companies, strategic events affecting the company, market liquidity for the issuer, and general economic conditions and events. In consultation with the investment and pricing teams, the Valuation Committee will determine an appropriate valuation technique based on available information, which may include both observable and unobservable inputs. The Valuation Committee typically will afford greatest weight to actual prices in arm’s length transactions, to the extent they represent orderly transactions between market participants; transaction information can be reliably obtained; and prices are deemed representative of fair value. However, the Valuation Committee may also consider other valuation methods such as market-based valuation multiples; a discount or premium from market value of a similar, freely traded security of the same issuer; or some combination. Fair value determinations are reviewed on a regular basis and updated as information becomes available, including actual purchase and sale transactions of the issue. Because any fair value determination involves a significant amount of judgment, there is a degree of subjectivity inherent in such pricing decisions and fair value prices determined by the Valuation Committee could differ from those of other market participants. Depending on the relative significance of unobservable inputs, including the valuation technique(s) used, fair valued securities may be categorized in Level 2 or 3 of the fair value hierarchy.
Valuation Inputs On December 31, 2013, all of the fund’s financial instruments were classified as Level 1, based on the inputs used to determine their fair values.
NOTE 3 - OTHER INVESTMENT TRANSACTIONS
Purchases and sales of portfolio securities other than short-term securities aggregated $56,631,000 and $41,952,000, respectively, for the year ended December 31, 2013.
NOTE 4 - FEDERAL INCOME TAXES
No provision for federal income taxes is required since the fund intends to continue to qualify as a regulated investment company under Subchapter M of the Internal Revenue Code and distribute to shareholders all of its taxable income and gains. Distributions determined in accordance with federal income tax regulations may differ in amount or character from net investment income and realized gains for financial reporting purposes. Financial reporting records are adjusted for permanent book/tax differences to reflect tax character but are not adjusted for temporary differences.
The fund files U.S. federal, state, and local tax returns as required. The fund’s tax returns are subject to examination by the relevant tax authorities until expiration of the applicable statute of limitations, which is generally three years after the filing of the tax return but which can be extended to six years in certain circumstances. Tax returns for open years have incorporated no uncertain tax positions that require a provision for income taxes.
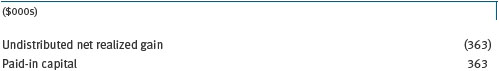
Reclassifications to paid-in capital relate primarily to a tax practice that treats a portion of the proceeds from each redemption of capital shares as a distribution of taxable net investment income or realized capital gain. For the year ended December 31, 2013, the following reclassifications were recorded to reflect tax character (there was no impact on results of operations or net assets):
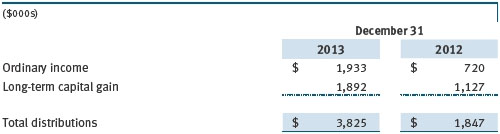
Distributions during the years ended December 31, 2013 and December 31, 2012, were characterized for tax purposes as follows:
At December 31, 2013, the tax-basis cost of investments and components of net assets were as follows:
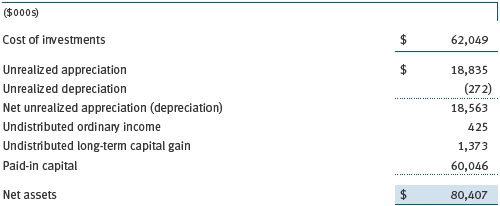
The difference between book-basis and tax-basis net unrealized appreciation (depreciation) is attributable to the deferral of losses from wash sales for tax purposes.
NOTE 5 - RELATED PARTY TRANSACTIONS
The fund is managed by T. Rowe Price Associates, Inc. (Price Associates), a wholly owned subsidiary of T. Rowe Price Group, Inc. (Price Group). The investment management agreement between the fund and Price Associates provides for an annual investment management fee, which is computed daily and paid monthly. The fee consists of an individual fund fee, equal to 0.25% of the fund’s average daily net assets, and a group fee. The group fee rate is calculated based on the combined net assets of certain mutual funds sponsored by Price Associates (the group) applied to a graduated fee schedule, with rates ranging from 0.48% for the first $1 billion of assets to 0.275% for assets in excess of $400 billion. The fund’s group fee is determined by applying the group fee rate to the fund’s average daily net assets. At December 31, 2013, the effective annual group fee rate was 0.29%.
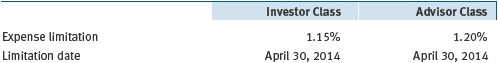
The Investor Class and Advisor Class are also each subject to a contractual expense limitation through the limitation dates indicated in the table below. During the limitation period, Price Associates is required to waive its management fee or reimburse expenses, excluding interest, taxes, brokerage commissions, and extraordinary expenses, that would otherwise cause the class’s ratio of annualized total expenses to average net assets (expense ratio) to exceed its expense limitation. Each class is required to repay Price Associates for expenses previously reimbursed and management fees waived to the extent the class’s net assets grow or expenses decline sufficiently to allow repayment without causing the class’s expense ratio to exceed its expense limitation. However, no repayment will be made more than three years after the date of a reimbursement or waiver.
Pursuant to this agreement, management fees in the amount of $81,000 were repaid and expenses in the amount of $47,000 were reimbursed by Price Associates during the year ended December 31, 2013. Including these amounts, management fees waived and expenses previously reimbursed by Price Associates in the amount of $266,000 remain subject to repayment at December 31, 2013.
In addition, the fund has entered into service agreements with Price Associates and two wholly owned subsidiaries of Price Associates (collectively, Price). Price Associates computes the daily share prices and provides certain other administrative services to the fund. T. Rowe Price Services, Inc., provides shareholder and administrative services in its capacity as the fund’s transfer and dividend-disbursing agent. T. Rowe Price Retirement Plan Services, Inc., provides subaccounting and recordkeeping services for certain retirement accounts invested in the Investor Class. For the year ended December 31, 2013, expenses incurred pursuant to these service agreements were $110,000 for Price Associates; $59,000 for T. Rowe Price Services, Inc.; and $1,000 for T. Rowe Price Retirement Plan Services, Inc. The total amount payable at period-end pursuant to these service agreements is reflected as Due to Affiliates in the accompanying financial statements.
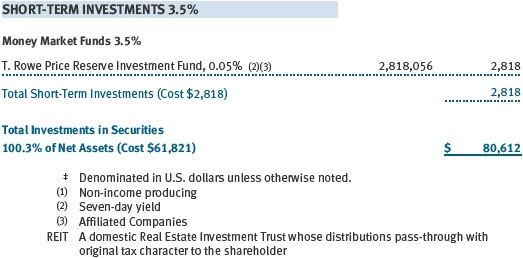
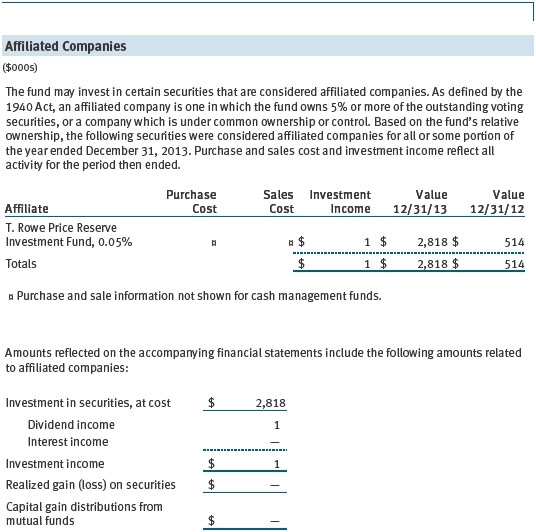
The fund may invest in the T. Rowe Price Reserve Investment Fund, the T. Rowe Price Government Reserve Investment Fund, or the T. Rowe Price Short-Term Reserve Fund (collectively, the Price Reserve Investment Funds), open-end management investment companies managed by Price Associates and considered affiliates of the fund. The Price Reserve Investment Funds are offered as short-term investment options to mutual funds, trusts, and other accounts managed by Price Associates or its affiliates and are not available for direct purchase by members of the public. The Price Reserve Investment Funds pay no investment management fees.
As of December 31, 2013, T. Rowe Price Group, Inc., or its wholly owned subsidiaries owned 575,000 shares of the Investor Class, and 25,000 shares of the Advisor Class, aggregating 14% of the fund’s net assets.
| Report of Independent Registered Public Accounting Firm |
To the Board of Directors and Shareholders of
T. Rowe Price U.S. Large-Cap Core Fund, Inc.
In our opinion, the accompanying statement of assets and liabilities, including the portfolio of investments, and the related statements of operations and of changes in net assets and the financial highlights present fairly, in all material respects, the financial position of T. Rowe Price U.S. Large-Cap Core Fund, Inc. (the “Fund”) at December 31, 2013, and the results of its operations, the changes in its net assets and the financial highlights for each of the periods indicated therein, in conformity with accounting principles generally accepted in the United States of America. These financial statements and financial highlights (hereafter referred to as “financial statements”) are the responsibility of the Fund’s management; our responsibility is to express an opinion on these financial statements based on our audits. We conducted our audits of these financial statements in accordance with the standards of the Public Company Accounting Oversight Board (United States). Those standards require that we plan and perform the audit to obtain reasonable assurance about whether the financial statements are free of material misstatement. An audit includes examining, on a test basis, evidence supporting the amounts and disclosures in the financial statements, assessing the accounting principles used and significant estimates made by management, and evaluating the overall financial statement presentation. We believe that our audits, which included confirmation of securities at December 31, 2013 by correspondence with the custodian and brokers, and confirmation of the underlying funds by correspondence with the transfer agent, provide a reasonable basis for our opinion.
PricewaterhouseCoopers LLP
Baltimore, Maryland
February 14, 2014
| Tax Information (Unaudited) for the Tax Year Ended 12/31/13 |
We are providing this information as required by the Internal Revenue Code. The amounts shown may differ from those elsewhere in this report because of differences between tax and financial reporting requirements.
The fund’s distributions to shareholders included:
- $1,682,000 from short-term capital gains
- $2,095,000 from long-term capital gains, subject to the 15% rate gains category.
For taxable non-corporate shareholders, $ 1,132,000 of the fund’s income represents qualified dividend income subject to the 15% rate category.
For corporate shareholders, $1,078,000 of the fund’s income qualifies for the dividends-received deduction.
| Information on Proxy Voting Policies, Procedures, and Records |
A description of the policies and procedures used by T. Rowe Price funds and portfolios to determine how to vote proxies relating to portfolio securities is available in each fund’s Statement of Additional Information. You may request this document by calling 1-800-225-5132 or by accessing the SEC’s website, sec.gov.
The description of our proxy voting policies and procedures is also available on our website, troweprice.com. To access it, click on the words “Social Responsibility” at the top of our corporate homepage. Next, click on the words “Conducting Business Responsibly” on the left side of the page that appears. Finally, click on the words “Proxy Voting Policies” on the left side of the page that appears.
Each fund’s most recent annual proxy voting record is available on our website and through the SEC’s website. To access it through our website, follow the above directions to reach the “Conducting Business Responsibly” page. Click on the words “Proxy Voting Records” on the left side of that page, and then click on the “View Proxy Voting Records” link at the bottom of the page that appears.
| How to Obtain Quarterly Portfolio Holdings |
The fund files a complete schedule of portfolio holdings with the Securities and Exchange Commission for the first and third quarters of each fiscal year on Form N-Q. The fund’s Form N-Q is available electronically on the SEC’s website (sec.gov); hard copies may be reviewed and copied at the SEC’s Public Reference Room, 100 F St. N.E., Washington, DC 20549. For more information on the Public Reference Room, call 1-800-SEC-0330.
| About the Fund’s Directors and Officers |
Your fund is overseen by a Board of Directors (Board) that meets regularly to review a wide variety of matters affecting or potentially affecting the fund, including performance, investment programs, compliance matters, advisory fees and expenses, service providers, and business and regulatory affairs. The Board elects the fund’s officers, who are listed in the final table. At least 75% of the Board’s members are independent of T. Rowe Price Associates, Inc. (T. Rowe Price), and its affiliates; “inside” or “interested” directors are employees or officers of T. Rowe Price. The business address of each director and officer is 100 East Pratt Street, Baltimore, Maryland 21202. The Statement of Additional Information includes additional information about the fund directors and is available without charge by calling a T. Rowe Price representative at 1-800-638-5660.
Independent Directors
| Name | | |
| (Year of Birth) | | |
| Year Elected* | | |
| [Number of T. Rowe Price | | Principal Occupation(s) and Directorships of Public Companies and |
| Portfolios Overseen] | | Other Investment Companies During the Past Five Years |
| | | |
| William R. Brody, M.D., Ph.D. | | President and Trustee, Salk Institute for Biological Studies (2009 |
| (1944) | | to present); Director, Novartis, Inc. (2009 to present); Director, IBM |
| 2009 | | (2007 to present); President and Trustee, Johns Hopkins University |
| [157] | | (1996 to 2009); Chairman of Executive Committee and Trustee, |
| | Johns Hopkins Health System (1996 to 2009) |
| | | |
| Anthony W. Deering | | Chairman, Exeter Capital, LLC, a private investment firm (2004 to |
| (1945) | | present); Director and Member of the Advisory Board, Deutsche |
| 2009 | | Bank North America (2004 to present); Director, Under Armour |
| [157] | | (2008 to present); Director, Vornado Real Estate Investment Trust |
| | (2004 to 2012) |
| | | |
| Donald W. Dick, Jr. | | Principal, EuroCapital Partners, LLC, an acquisition and management |
| (1943) | | advisory firm (1995 to present) |
| 2009 | | |
| [157] | | |
| | | |
| Bruce W. Duncan | | President, Chief Executive Officer, and Director, First Industrial Realty |
| (1951) | | Trust, owner and operator of industrial properties (2009 to present); |
| 2013 | | Chairman of the Board (2005 to present), Interim Chief Executive |
| [157] | | Officer (2007), and Director (1999 to present), Starwood Hotels & |
| | Resorts, a hotel and leisure company; Senior Advisor, Kohlberg, |
| | Kravis, Roberts & Co. LP, a global investment firm (2008 to 2009); |
| | Trustee, Starwood Lodging Trust, a real estate investment trust and |
| | former subsidiary of Starwood (1995 to 2006) |
| | | |
| Robert J. Gerrard, Jr. | | Advisory Board Member, Pipeline Crisis/Winning Strategies (1997 |
| (1952) | | to present); Chairman of Compensation Committee and Director, |
| 2012 | | Syniverse Holdings, Inc. (2008 to 2011); Executive Vice President |
| [157] | | and General Counsel, Scripps Networks, LLC (1997 to 2009) |
| | | |
| Karen N. Horn | | Limited Partner and Senior Managing Director, Brock Capital Group, |
| (1943) | | an advisory and investment banking firm (2004 to present); Director, |
| 2009 | | Eli Lilly and Company (1987 to present); Director, Simon Property |
| [157] | | Group (2004 to present); Director, Norfolk Southern (2008 to present); |
| | Director, Fannie Mae (2006 to 2008) |
| | | |
| Paul F. McBride | | Former Company Officer and Senior Vice President, Human |
| (1956) | | Resources and Corporate Initiatives (2004 to 2010) |
| 2013 | | |
| [157] | | |
| | | |
| Cecilia E. Rouse, Ph.D. | | Dean, Woodrow Wilson School (2012 to present); Professor and |
| (1963) | | Researcher, Princeton University (1992 to present); Director, MDRC |
| 2012 | | (2011 to present); Member, National Academy of Education (2010 |
| [157] | | to present); Research Associate, National Bureau of Economic |
| | Research’s Labor Studies Program (1998 to 2009 and 2011 to |
| | present); Member, President’s Council of Economic Advisors (2009 to |
| | 2011); Member, The MacArthur Foundation Network on the Transition |
| | to Adulthood and Public Policy (2000 to 2008); Member, National |
| | Advisory Committee for the Robert Wood Johnson Foundation’s |
| | Scholars in Health Policy Research Program (2008); Director and |
| | Member, National Economic Association (2006 to 2008); Member, |
| | Association of Public Policy Analysis and Management Policy Council |
| | (2006 to 2008); Member, Hamilton Project’s Advisory Board at The |
| | Brookings Institute (2006 to 2008); Chair of Committee on the Status |
| | of Minority Groups in the Economic Profession, American Economic |
| | Association (2006 to 2008 and 2012 to present) |
| | | |
| John G. Schreiber | | Owner/President, Centaur Capital Partners, Inc., a real estate |
| (1946) | | investment company (1991 to present); Cofounder and Partner, |
| 2009 | | Blackstone Real Estate Advisors, L.P. (1992 to present); Director, |
| [157] | | General Growth Properties, Inc. (2010 to present); Director, BXMT |
| | (formerly Capital Trust, Inc.), a real estate investment company |
| | (2012 to present); Director and Chairman of the Board, Brixmor |
| | Property Group, Inc. (2013 to present) |
| | | |
| Mark R. Tercek | | President and Chief Executive Officer, The Nature Conservancy (2008 |
| (1957) | | to present); Managing Director, The Goldman Sachs Group, Inc. |
| 2009 | | (1984 to 2008) |
| [157] | | |
| | | |
| *Each independent director serves until retirement, resignation, or election of a successor. |
| | | |
Inside Directors | | |
| | | |
| Name | | |
| (Year of Birth) | | |
| Year Elected* | | |
| [Number of T. Rowe Price | | Principal Occupation(s) and Directorships of Public Companies and |
| Portfolios Overseen] | | Other Investment Companies During the Past Five Years |
| | | |
| Edward C. Bernard | | Director and Vice President, T. Rowe Price; Vice Chairman of the |
| (1956) | | Board, Director, and Vice President, T. Rowe Price Group, Inc.; |
| 2009 | | Chairman of the Board, Director, and President, T. Rowe Price |
| [157] | | Investment Services, Inc.; Chairman of the Board and Director, |
| | | T. Rowe Price Retirement Plan Services, Inc., and T. Rowe Price |
| | Services, Inc.; Chairman of the Board, Chief Executive Officer, |
| | | and Director, T. Rowe Price International; Chairman of the Board, |
| | Chief Executive Officer, Director, and President, T. Rowe Price Trust |
| | Company; Chairman of the Board, all funds |
| | | |
| Brian C. Rogers, CFA, CIC | | Chief Investment Officer, Director, and Vice President, T. Rowe Price; |
| (1955) | | Chairman of the Board, Chief Investment Officer, Director, and Vice |
| 2009 | | President, T. Rowe Price Group, Inc.; Vice President, T. Rowe Price |
| [105] | | Trust Company |
| |
| *Each inside director serves until retirement, resignation, or election of a successor. |
Officers
| Name (Year of Birth) | | |
| Position Held With U.S. Large-Cap | | |
| Core Fund | | Principal Occupation(s) |
| | | |
| Peter J. Bates, CFA (1974) | | Vice President, T. Rowe Price and T. Rowe Price |
| Vice President | | Group, Inc. |
| | | |
| Shawn T. Driscoll (1975) | | Vice President, T. Rowe Price and T. Rowe Price |
| Vice President | | Group, Inc. |
| | | |
| Joseph B. Fath, CPA (1971) | | Vice President, T. Rowe Price and T. Rowe Price |
| Vice President | | Group, Inc. |
| | | |
| Roger L. Fiery III, CPA (1959) | | Vice President, Price Hong Kong, Price |
| Vice President | | Singapore, T. Rowe Price, T. Rowe Price Group, |
| | Inc., T. Rowe Price International, and T. Rowe |
| | Price Trust Company |
| | | |
| Mark S. Finn, CFA, CPA (1963) | | Vice President, T. Rowe Price, T. Rowe Price |
| Vice President | | Group, Inc., and T. Rowe Price Trust Company |
| | | |
| John R. Gilner (1961) | | Chief Compliance Officer and Vice President, |
| Chief Compliance Officer | | T. Rowe Price; Vice President, T. Rowe Price |
| | Group, Inc., and T. Rowe Price Investment |
| | Services, Inc. |
| | | |
| Gregory S. Golczewski (1966) | | Vice President, T. Rowe Price and T. Rowe Price |
| Vice President | | Trust Company |
| | | |
| Gregory K. Hinkle, CPA (1958) | | Vice President, T. Rowe Price, T. Rowe Price |
| Treasurer | | Group, Inc., and T. Rowe Price Trust Company |
| | | |
| John D. Linehan, CFA (1965) | | Vice President, T. Rowe Price, T. Rowe Price |
| Vice President | | Group, Inc., and T. Rowe Price Trust Company |
| | | |
| Patricia B. Lippert (1953) | | Assistant Vice President, T. Rowe Price and |
| Secretary | | T. Rowe Price Investment Services, Inc. |
| | | |
| George A. Marzano (1980) | | Vice President, T. Rowe Price |
| Vice President | | |
| | | |
| David Oestreicher (1967) | | Director, Vice President, and Secretary, T. Rowe |
| Vice President | | Price Investment Services, Inc., T. Rowe |
| | Price Retirement Plan Services, Inc., T. Rowe |
| | Price Services, Inc., and T. Rowe Price Trust |
| | Company; Chief Legal Officer, Vice President, |
| | and Secretary, T. Rowe Price Group, Inc.; Vice |
| | President and Secretary, T. Rowe Price and |
| | T. Rowe Price International; Vice President, |
| | Price Hong Kong and Price Singapore |
| | | |
| Timothy E. Parker, CFA (1974) | | Vice President, T. Rowe Price and T. Rowe Price |
| Vice President | | Group, Inc. |
| | | |
| Robert T. Quinn, Jr. (1972) | | Vice President, T. Rowe Price and T. Rowe Price |
| Vice President | | Group, Inc. |
| | | |
| Jeffrey Rottinghaus, CPA (1970) | | Vice President, T. Rowe Price and T. Rowe Price |
| President | | Group, Inc. |
| | | |
| Deborah D. Seidel (1962) | | Vice President, T. Rowe Price, T. Rowe Price |
| Vice President | | Group, Inc., T. Rowe Price Investment Services, |
| | Inc., and T. Rowe Price Services, Inc. |
| | | |
| Robert W. Sharps, CFA, CPA (1971) | | Vice President, T. Rowe Price, T. Rowe Price |
| Vice President | | Group, Inc., and T. Rowe Price Trust Company |
| | | |
| Julie L. Waples (1970) | | Vice President, T. Rowe Price |
| Vice President | | |
| |
| Unless otherwise noted, officers have been employees of T. Rowe Price or T. Rowe Price International for at least 5 years. |
Item 2. Code of Ethics.
The registrant has adopted a code of ethics, as defined in Item 2 of Form N-CSR, applicable to its principal executive officer, principal financial officer, principal accounting officer or controller, or persons performing similar functions. A copy of this code of ethics is filed as an exhibit to this Form N-CSR. No substantive amendments were approved or waivers were granted to this code of ethics during the period covered by this report.
Item 3. Audit Committee Financial Expert.
The registrant’s Board of Directors/Trustees has determined that Mr. Anthony W. Deering qualifies as an audit committee financial expert, as defined in Item 3 of Form N-CSR. Mr. Deering is considered independent for purposes of Item 3 of Form N-CSR.
Item 4. Principal Accountant Fees and Services.
(a) – (d) Aggregate fees billed for the last two fiscal years for professional services rendered to, or on behalf of, the registrant by the registrant’s principal accountant were as follows:
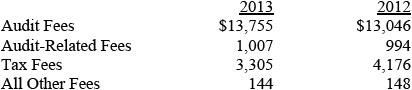
Audit fees include amounts related to the audit of the registrant’s annual financial statements and services normally provided by the accountant in connection with statutory and regulatory filings. Audit-related fees include amounts reasonably related to the performance of the audit of the registrant’s financial statements and specifically include the issuance of a report on internal controls and, if applicable, agreed-upon procedures related to fund acquisitions. Tax fees include amounts related to services for tax compliance, tax planning, and tax advice. The nature of these services specifically includes the review of distribution calculations and the preparation of Federal, state, and excise tax returns. All other fees include the registrant’s pro-rata share of amounts for agreed-upon procedures in conjunction with service contract approvals by the registrant’s Board of Directors/Trustees.
(e)(1) The registrant’s audit committee has adopted a policy whereby audit and non-audit services performed by the registrant’s principal accountant for the registrant, its investment adviser, and any entity controlling, controlled by, or under common control with the investment adviser that provides ongoing services to the registrant require pre-approval in advance at regularly scheduled audit committee meetings. If such a service is required between regularly scheduled audit committee meetings, pre-approval may be authorized by one audit committee member with ratification at the next scheduled audit committee meeting. Waiver of pre-approval for audit or non-audit services requiring fees of a de minimis amount is not permitted.
(2) No services included in (b) – (d) above were approved pursuant to paragraph (c)(7)(i)(C) of Rule 2-01 of Regulation S-X.
(f) Less than 50 percent of the hours expended on the principal accountant’s engagement to audit the registrant’s financial statements for the most recent fiscal year were attributed to work performed by persons other than the principal accountant’s full-time, permanent employees.
(g) The aggregate fees billed for the most recent fiscal year and the preceding fiscal year by the registrant’s principal accountant for non-audit services rendered to the registrant, its investment adviser, and any entity controlling, controlled by, or under common control with the investment adviser that provides ongoing services to the registrant were $1,691,000 and $1,802,000, respectively.
(h) All non-audit services rendered in (g) above were pre-approved by the registrant’s audit committee. Accordingly, these services were considered by the registrant’s audit committee in maintaining the principal accountant’s independence.
Item 5. Audit Committee of Listed Registrants.
Not applicable.
Item 6. Investments.
(a) Not applicable. The complete schedule of investments is included in Item 1 of this Form N-CSR.
(b) Not applicable.
Item 7. Disclosure of Proxy Voting Policies and Procedures for Closed-End Management Investment Companies.
Not applicable.
Item 8. Portfolio Managers of Closed-End Management Investment Companies.
Not applicable.
Item 9. Purchases of Equity Securities by Closed-End Management Investment Company and Affiliated Purchasers.
Not applicable.
Item 10. Submission of Matters to a Vote of Security Holders.
Not applicable.
Item 11. Controls and Procedures.
(a) The registrant’s principal executive officer and principal financial officer have evaluated the registrant’s disclosure controls and procedures within 90 days of this filing and have concluded that the registrant’s disclosure controls and procedures were effective, as of that date, in ensuring that information required to be disclosed by the registrant in this Form N-CSR was recorded, processed, summarized, and reported timely.
(b) The registrant’s principal executive officer and principal financial officer are aware of no change in the registrant’s internal control over financial reporting that occurred during the registrant’s second fiscal quarter covered by this report that has materially affected, or is reasonably likely to materially affect, the registrant’s internal control over financial reporting.
Item 12. Exhibits.
(a)(1) The registrant’s code of ethics pursuant to Item 2 of Form N-CSR is attached.
(2) Separate certifications by the registrant's principal executive officer and principal financial officer, pursuant to Section 302 of the Sarbanes-Oxley Act of 2002 and required by Rule 30a-2(a) under the Investment Company Act of 1940, are attached.
(3) Written solicitation to repurchase securities issued by closed-end companies: not applicable.
(b) A certification by the registrant's principal executive officer and principal financial officer, pursuant to Section 906 of the Sarbanes-Oxley Act of 2002 and required by Rule 30a-2(b) under the Investment Company Act of 1940, is attached.
SIGNATURES
Pursuant to the requirements of the Securities Exchange Act of 1934 and the Investment Company Act of 1940, the registrant has duly caused this report to be signed on its behalf by the undersigned, thereunto duly authorized.
T. Rowe Price U.S. Large-Cap Core Fund, Inc.
| | By | /s/ Edward C. Bernard |
| | Edward C. Bernard |
| | Principal Executive Officer |
| |
| Date February 14, 2014 | | |
Pursuant to the requirements of the Securities Exchange Act of 1934 and the Investment Company Act of 1940, this report has been signed below by the following persons on behalf of the registrant and in the capacities and on the dates indicated.
| | By | /s/ Edward C. Bernard |
| | Edward C. Bernard |
| | Principal Executive Officer |
| |
| Date February 14, 2014 | | |
| |
| |
| By | /s/ Gregory K. Hinkle |
| | Gregory K. Hinkle |
| | Principal Financial Officer |
| |
| Date February 14, 2014 | | |