| UNITED STATES |
| SECURITIES AND EXCHANGE COMMISSION |
| Washington, D.C. 20549 |
| |
FORM N-CSR |
| |
CERTIFIED SHAREHOLDER REPORT OF REGISTERED |
MANAGEMENT INVESTMENT COMPANIES |
| |
| |
| |
| Investment Company Act File Number: 811-22293 |
|
| |
| T. Rowe Price U.S. Large-Cap Core Fund, Inc. |
|
| (Exact name of registrant as specified in charter) |
| |
| 100 East Pratt Street, Baltimore, MD 21202 |
|
| (Address of principal executive offices) |
| |
| David Oestreicher |
| 100 East Pratt Street, Baltimore, MD 21202 |
|
| (Name and address of agent for service) |
| |
| |
| Registrant’s telephone number, including area code: (410) 345-2000 |
| |
| |
| Date of fiscal year end: December 31 |
| |
| |
| Date of reporting period: December 31, 2010 |
Item 1: Report to Shareholders| U.S. Large-Cap Core Fund | December 31, 2010 |
The views and opinions in this report were current as of December 31, 2010. They are not guarantees of performance or investment results and should not be taken as investment advice. Investment decisions reflect a variety of factors, and the managers reserve the right to change their views about individual stocks, sectors, and the markets at any time. As a result, the views expressed should not be relied upon as a forecast of the fund’s future investment intent. The report is certified under the Sarbanes-Oxley Act, which requires mutual funds and other public companies to affirm that, to the best of their knowledge, the information in their financial reports is fairly and accurately stated in all material respects.
REPORTS ON THE WEB
Sign up for our E-mail Program, and you can begin to receive updated fund reports and prospectuses online rather than through the mail. Log in to your account at troweprice.com for more information.
Manager’s Letter
Fellow Shareholders
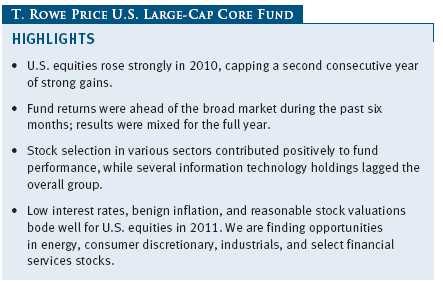
Against a backdrop of healthy earnings, fortified balance sheets, and low borrowing costs for corporations, U.S. equities rose strongly in 2010, capping a second consecutive year of gains. Stocks produced robust returns through late April, extending the rally that started in March 2009, but fell sharply through early July due in part to a European debt crisis and a sluggish U.S. economic recovery. Equities rebounded in late August as the economy showed signs of improvement. The rally was supported by late-year bipartisan legislation to extend the Bush-era tax cuts that were set to expire at the end of 2010, and major indexes rose in late December to their highest levels of the year.
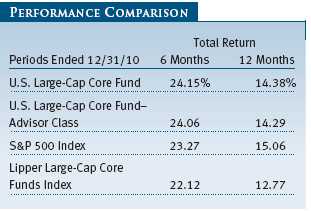
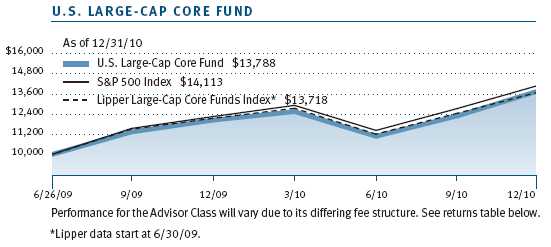
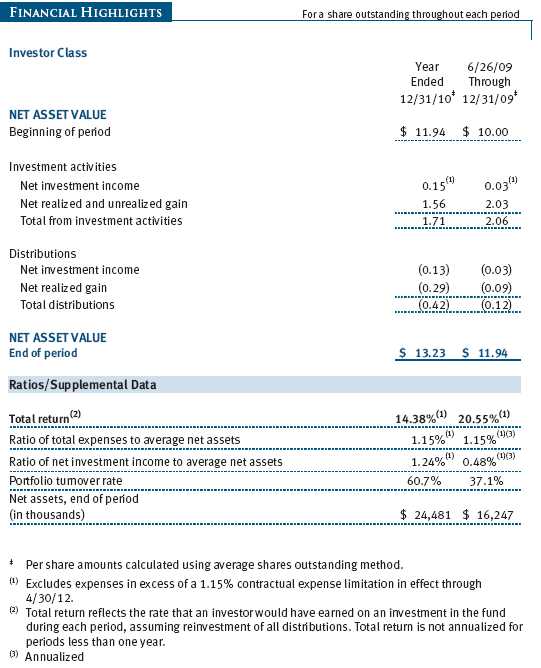
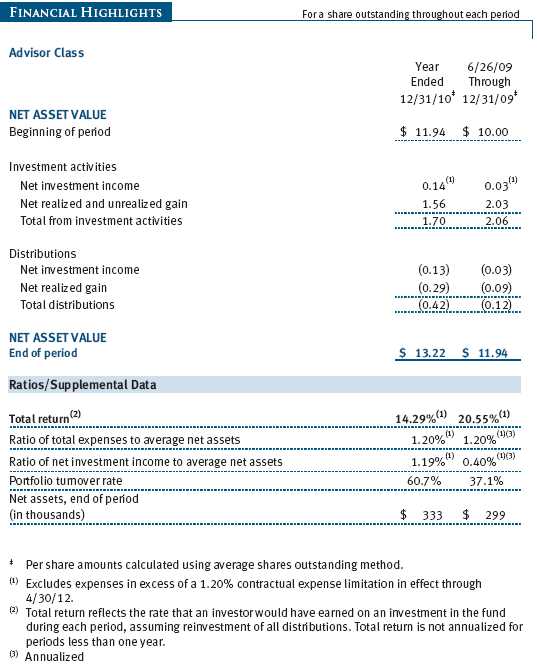
Your fund returned 24.15% during the past six months compared with 23.27% for the broad S&P 500 Index and 22.12% for the Lipper Large-Cap Core Funds Index. For the full year, the returns were 14.38%, 15.06%, and 12.77%, respectively. Our stock selection in various sectors was the primary driver of fund performance through the year. (Returns for the Advisor Class were slightly lower, reflecting their different fee structure.)
INVESTMENT APPROACH
The U.S. Large-Cap Core Fund seeks long-term capital appreciation by investing in a concentrated portfolio of domestic large-cap growth and value stocks. The fund uses a fundamental, bottom-up analysis that also relies on a rigorous valuation assessment to find the stocks with the most potential for appreciation.
In selecting the stocks for the portfolio, the fund generally starts with companies of more than $5 billion market capitalization that carry “buy” ratings from T. Rowe Price analysts. In our analysis of these companies, we focus on four key elements: understanding a company’s business model and strategy, developing a relationship with the company’s management, determining the company’s standing within its industry, and assessing the company’s valuation.
The fund has a bias toward high-quality companies that have opportunities to increase their market share or have barriers to entry around their business that protect them and allow them to grow organically. We invest in well-managed firms with great products and services within an industry that may be in a cyclical trough. Lastly, we favor companies with characteristics that we believe can drive equity appreciation, such as pricing power, new product cycles, improving margins, and a strategy to earn better returns on their invested capital.
Beyond good fundamentals, we look for management teams that can create value by executing well and improving the business. We also pay close attention to free cash flow and management’s effectiveness in redeploying its capital. We like managements that invest in their business when there is the potential for attractive returns or return capital to shareholders if conditions warrant.
We also have in place a disciplined sell process. After stocks are added to the portfolio, they are subject to continued scrutiny. Criteria for selling stocks are a downgrade by a T. Rowe Price analyst, deterioration in the company’s fundamentals or management, the discovery of a better investment idea, or the fulfillment of our investment thesis when a stock becomes fully valued.
MARKET ENVIRONMENT
In the large-cap universe, all sectors produced positive returns in 2010, with growth stocks outpacing value shares across all market capitalizations. Consumer discretionary and industrials and business services shares performed best with robust gains. Investors perceived that companies in these sectors could benefit significantly from a stronger economic recovery. Materials and energy stocks also outperformed, lifted by rising commodity prices. Gold reached $1,400 per ounce, oil surpassed $90 per barrel, and gasoline averaged $3.00 per gallon nationwide by the end of the year. Telecommunication services, consumer staples, financials, and information technology shares produced moderate gains but lagged the broad market. Health care and utilities—two sectors that tend to have low sensitivity to the state of the economy—were flat as equity investors favored riskier investments.
Volatility ruled the markets with stocks peaking in the spring, then suffering through a steep sell-off as antibusiness legislation affecting the financials and health care sectors soured investor sentiment. Anxiety over sovereign debt crises in Europe, Chinese monetary tightening to rein in mounting inflation, and the Deepwater Horizon explosion in the Gulf of Mexico heightened the tension. As these concerns receded in July, stock prices found a bottom in late summer and investors rediscovered their appetites for risk. Federal Reserve Chairman Ben Bernanke laid the foundation for a rebound with his announcement of a new round of quantitative easing, triggering a robust rally in September, which historically is a weak month for equities. Corporate earnings came in stronger than expected, and the November elections resulted in major gains for the Republicans in the House and Senate, forcing President Obama to compromise on extending the Bush-era tax cuts for another two years. Investors fled the bond and money markets and raced into stocks, generating impressive equity returns that lasted through year-end.
Underlining ongoing concerns about high unemployment and the tepid housing market, the Federal Open Market Committee (FOMC) announced that it would maintain its expansive monetary policy for a while longer. The FOMC said, “the economic recovery is continuing, though at a rate that has been insufficient to bring down unemployment.” Inflation remains subdued, with consumer prices rising only 0.1% in November, below expectations. Consumers are beginning to feel a bit more optimistic about their job prospects and the direction of the economy, according to data compiled by the Thomson Reuters/University of Michigan survey released on Thursday, December 23. The government estimated that the U.S. economy grew at an annualized rate of 2.6% in the third quarter, slightly faster than was previously reported, and forecasters have been raising their growth projections for the final quarter of the year.
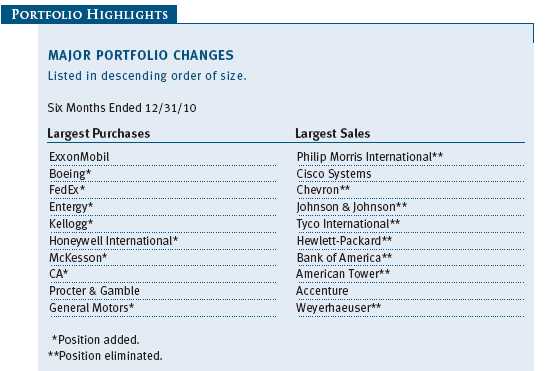
PORTFOLIO HIGHLIGHTS
Stock selection in health care contributed positively to the fund’s relative performance during the year, thanks to excellent results from Express Scripts and McKesson. Express Scripts is a pharmacy benefits management company operating in an industry with high barriers to entry and possessing an attractive business model that generates high returns on invested capital and substantial free cash flow. An upward adjustment to 2010 guidance buoyed the shares during the second half of the year. McKesson is a health care services company competing in two markets: the distribution of health care products and health care information technology services. McKesson shares appreciated after a year of strong earnings growth and the announcement of a significant stock buyback in the second half of the year. (Please refer to the fund’s portfolio of investments for a complete listing of holdings and the amount each represents in the portfolio.)
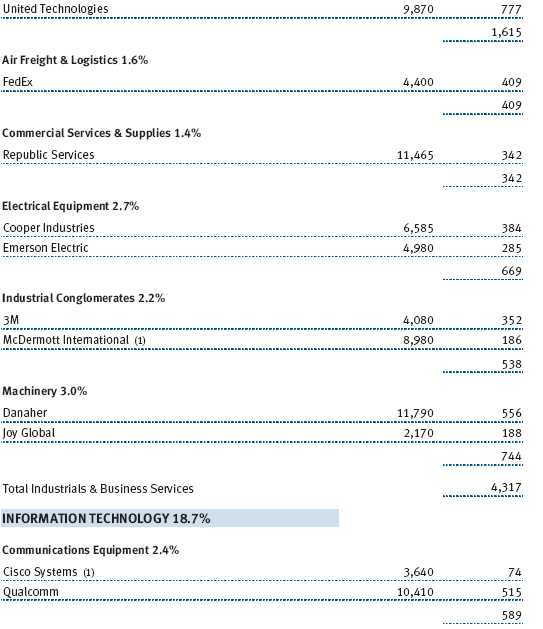
Stock selection and an overweight in energy were also positive. Murphy Oil, Schlumberger, and McDermott delivered excellent results through the year. Murphy Oil was boosted by improvements in its oil and gas business and by its decision to exit its less profitable refining business. Schlumberger, a high-quality oil services company with exploration expertise and unparalleled global reach, sports a balance sheet that permits ongoing investment in research and development, as well as acquisitions that increase the firm’s market share with additional bundled services. McDermott benefited from an increase in oil prices and a strongly building backlog that will convert to cash over the next few years.
Concerns with financial services regulation encouraged us to maintain an underweight in financials, one of the worst-performing groups during the year. Our stock selection in the sector was also fortunate. Timely purchases of CME Group and Schwab positioned the portfolio for a rise in interest rates, and NYSE Euronext and Metlife were both strong performers for the portfolio.
We had our share of detractors, too, which crimped the fund’s relative return over the year. Our stock selection in the information technology sector was poor due to large positions in Google and Microsoft, which lagged the overall group. Google reported lower-than-expected second-quarter earnings as the company continued to increase investment spending. However, we believe the company has exceptional prospects because of its strong revenue growth, robust balance sheet, rapid pace of innovation, and large end markets.

PORTFOLIO STRATEGY
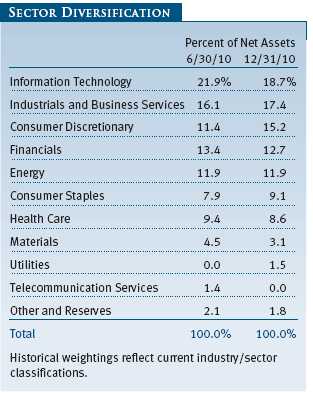
The portfolio is focused on companies that have strong brands, a worldwide presence, and less reliance on the strength of the U.S. economy to drive their revenues and earnings. Accordingly, we are overweight in industrial companies. We believe that many industrial management teams restructured their businesses to improve their returns and cash flows moving into the next economic cycle. Within the sector, we seek to buy high-quality companies with solid balance sheets and compelling valuations.
We maintain an overweight position in energy, which we believe will benefit from a cyclical recovery, an improvement in commodity prices, and strong growth in emerging markets. We have been selectively buying companies that are increasing production or have access to reserves, both of which would allow them to weather potentially volatile energy prices.
The portfolio enters 2011 with an overweight position in consumer discretionary stocks. We like the pricing power that is developing in the cruise line sector and have increased our position in Carnival Cruise Lines. Our focus on high-quality consumer brands is evident in large holdings of Amazon.com, McDonald’s, and Time Warner.
Regulatory reform has encouraged us to enter the year underweight in both the health care and financials sectors. While the passage of the health care bill has lifted a great deal of uncertainty from the sector, we still have a difficult time modeling the earnings power of many health care companies over the next few years and, therefore, struggle to determine the proper valuation for them. We continue to seek companies that can generate strong and consistent growth regardless of government reform efforts or overall economic health. We favor companies that offer unique therapeutic benefits, cater to an aging population, or sell products and services that can reduce health care costs.
Within financial services, we had been underweight but recently purchased new positions in laggards such as CME Group and Schwab. However, we still believe the group is negatively affected by the uncertainty surrounding the long-term ramifications of financial regulation. We are focused on institutions that we believe have significant earnings power coming out of the recession, are less exposed to government intervention, and are likely to emerge in a stronger position from the downturn.
OUTLOOK
We believe we have entered a period of slow, steady, and improving economic growth that will pick up momentum in the months ahead. Consumer confidence is returning, inflation remains contained, and the employment landscape is starting to look healthier. Global growth should continue, with emerging economies advancing more briskly than developed areas. Relatively low interest rates combined with benign inflation and reasonable stock valuations bode well for U.S. equities as 2011 unfolds. We are finding investment opportunities in key sectors such as energy, consumer discretionary, industrials and business services, and select financial services stocks.
Risks remain in the marketplace, which we monitor continuously. These include the eventual removal of monetary and fiscal stimulus, a still-sluggish housing market, ongoing consumer deleveraging, high unemployment, excessive government intervention in various industries, and the prospect of accelerating inflation as the economy strengthens. That said, many of these risks have been overemphasized and are baked into current market conditions.
We have great confidence in our investment thesis and the themes we have been following. Our goal is to identify top-quality companies that we believe can prosper during the next phase of the economic cycle. Though improving, the economic environment is likely to remain difficult for many companies, which could provide opportunities for firms that exited the global recession as even more dominant industry leaders. Many stocks are trading at attractive levels, even when conservative growth and profitability levels are assumed. The market is likely to be roiled by volatility and the path forward will not be smooth, but solid fundamentals should provide compelling investment opportunities through this period of recovery.
Respectfully submitted,
Jeffrey Rottinghaus
Chairman of the fund’s Investment Advisory Committee
January 19, 2011
The committee chairman has day-to-day responsibility for managing the portfolio and works with committee members in developing and executing the fund’s investment program.
RISKS OF STOCK INVESTING
The fund’s share price can fall because of weakness in the stock markets, a particular industry, or specific holdings. Stock markets can decline for many reasons, including adverse political or economic developments, changes in investor psychology, or heavy institutional selling. The prospects for an industry or company may deteriorate because of a variety of factors, including disappointing earnings or changes in the competitive environment. In addition, the investment manager’s assessment of companies held in a fund may prove incorrect, resulting in losses or poor performance even in rising markets.
GLOSSARY
Earnings growth rate (current fiscal year): Measures the annualized percent change in earnings per share from the prior fiscal year to the current fiscal year.
Free cash flow: The excess cash a company is generating from its operations that can be taken out of the business for the benefit of shareholders, such as dividends, share repurchases, investments, and acquisitions.
Lipper indexes: Fund benchmarks that consist of a small number (10 to 30) of the largest mutual funds in a particular category as tracked by Lipper Inc.
S&P 500 Index: An unmanaged index that tracks the stocks of 500 primarily large-cap U.S. companies.

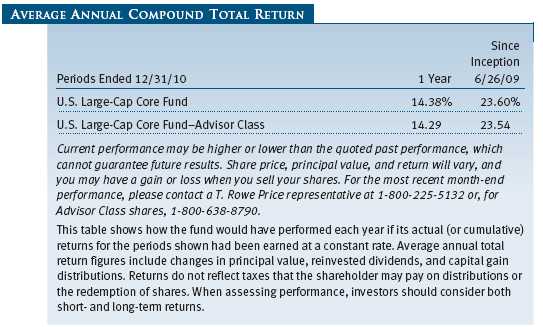
Performance and Expenses
This table shows the value of a hypothetical $10,000 investment in the fund over the past 10 fiscal year periods or since inception (for funds lacking 10-year records). The result is compared with benchmarks, which may include a broad-based market index and a peer group average or index. Market indexes do not include expenses, which are deducted from fund returns as well as mutual fund averages and indexes.

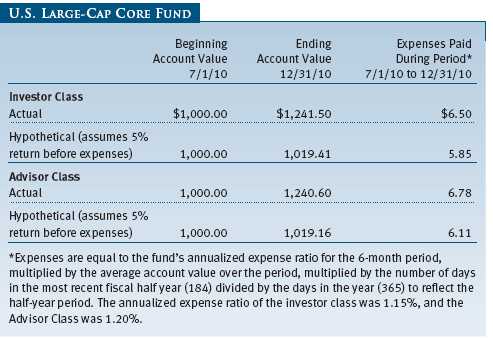
As a mutual fund shareholder, you may incur two types of costs: (1) transaction costs, such as redemption fees or sales loads, and (2) ongoing costs, including management fees, distribution and service (12b-1) fees, and other fund expenses. The following example is intended to help you understand your ongoing costs (in dollars) of investing in the fund and to compare these costs with the ongoing costs of investing in other mutual funds. The example is based on an investment of $1,000 invested at the beginning of the most recent six-month period and held for the entire period.
Please note that the fund has two share classes: The original share class (“investor class”) charges no distribution and service (12b-1) fee, and the Advisor Class shares are offered only through unaffiliated brokers and other financial intermediaries and charge a 0.25% 12b-1 fee. Each share class is presented separately in the table.
Actual Expenses
The first line of the following table (“Actual”) provides information about actual account values and expenses based on the fund’s actual returns. You may use the information in this line, together with your account balance, to estimate the expenses that you paid over the period. Simply divide your account value by $1,000 (for example, an $8,600 account value divided by $1,000 = 8.6), then multiply the result by the number in the first line under the heading “Expenses Paid During Period” to estimate the expenses you paid on your account during this period.
Hypothetical Example for Comparison Purposes
The information on the second line of the table (“Hypothetical”) is based on hypothetical account values and expenses derived from the fund’s actual expense ratio and an assumed 5% per year rate of return before expenses (not the fund’s actual return). You may compare the ongoing costs of investing in the fund with other funds by contrasting this 5% hypothetical example and the 5% hypothetical examples that appear in the shareholder reports of the other funds. The hypothetical account values and expenses may not be used to estimate the actual ending account balance or expenses you paid for the period.
Note: T. Rowe Price charges an annual small-account maintenance fee of $10, generally for accounts with less than $2,000 ($500 for UGMA/UTMA). The fee is waived for any investor whose T. Rowe Price mutual fund accounts total $25,000 or more, accounts employing automatic investing, and IRAs and other retirement plan accounts that utilize a prototype plan sponsored by T. Rowe Price (although a separate custodial or administrative fee may apply to such accounts). This fee is not included in the accompanying table. If you are subject to the fee, keep it in mind when you are estimating the ongoing expenses of investing in the fund and when comparing the expenses of this fund with other funds.
You should also be aware that the expenses shown in the table highlight only your ongoing costs and do not reflect any transaction costs, such as redemption fees or sales loads. Therefore, the second line of the table is useful in comparing ongoing costs only and will not help you determine the relative total costs of owning different funds. To the extent a fund charges transaction costs, however, the total cost of owning that fund is higher.
The accompanying notes are an integral part of these financial statements.
The accompanying notes are an integral part of these financial statements.


The accompanying notes are an integral part of these financial statements.
The accompanying notes are an integral part of these financial statements.
The accompanying notes are an integral part of these financial statements.

The accompanying notes are an integral part of these financial statements.
| NOTES TO FINANCIAL STATEMENTS |
T. Rowe Price U.S. Large-Cap Core Fund, Inc. (the fund), is registered under the Investment Company Act of 1940 (the 1940 Act) as a diversified, open-end management investment company. The fund seeks to provide long-term capital growth. The fund has two classes of shares: the U.S. Large-Cap Core Fund original share class, referred to in this report as the Investor Class, offered since June 26, 2009, and the U.S. Large-Cap Core Fund – Advisor Class (Advisor Class), offered since June 26, 2009. Advisor Class shares are sold only through unaffiliated brokers and other unaffiliated financial intermediaries that are compensated by the class for distribution, shareholder servicing, and/or certain administrative services under a Board-approved Rule 12b-1 plan. Each class has exclusive voting rights on matters related solely to that class; separate voting rights on matters that relate to both classes; and, in all other respects, the same rights and obligations as the other class.
NOTE 1 - SIGNIFICANT ACCOUNTING POLICIES
Basis of Preparation The accompanying financial statements were prepared in accordance with accounting principles generally accepted in the United States of America (GAAP), which require the use of estimates made by fund management. Fund management believes that estimates and valuations are appropriate; however, actual results may differ from those estimates, and the valuations reflected in the accompanying financial statements may differ from the value ultimately realized upon sale or maturity.
Investment Transactions, Investment Income, and Distributions Income and expenses are recorded on the accrual basis. Dividends received from mutual fund investments are reflected as dividend income; capital gain distributions are reflected as realized gain/loss. Dividend income and capital gain distributions are recorded on the ex-dividend date. Income tax-related interest and penalties, if incurred, would be recorded as income tax expense. Investment transactions are accounted for on the trade date. Realized gains and losses are reported on the identified cost basis. Distributions to shareholders are recorded on the ex-dividend date. Income distributions are declared and paid by each class annually. Capital gain distributions, if any, are generally declared and paid by the fund annually.
Class Accounting The Advisor Class pays distribution, shareholder servicing, and/or certain administrative expenses in the form of Rule 12b-1 fees, in an amount not exceeding 0.25% of the class’s average daily net assets. Shareholder servicing, prospectus, and shareholder report expenses incurred by each class are charged directly to the class to which they relate. Expenses common to both classes, investment income, and realized and unrealized gains and losses are allocated to the classes based upon the relative daily net assets of each class.
Rebates and Credits Subject to best execution, the fund may direct certain security trades to brokers who have agreed to rebate a portion of the related brokerage commission to the fund in cash. Commission rebates are reflected as realized gain on securities in the accompanying financial statements. Additionally, the fund earns credits on temporarily uninvested cash balances held at the custodian, which reduce the fund’s custody charges. Custody expense in the accompanying financial statements is presented before reduction for credits.
New Accounting Pronouncement On January 1, 2010, the fund adopted new accounting guidance that requires enhanced disclosures about fair value measurements in the financial statements. Adoption of this guidance had no impact on the fund’s net assets or results of operations.
NOTE 2 - VALUATION
The fund’s financial instruments are reported at fair value as defined by GAAP. The fund determines the values of each class’s assets and liabilities and computes each class’s net asset value per share at the close of the New York Stock Exchange (NYSE), normally 4 p.m. ET, each day that the NYSE is open for business.
Valuation Methods Equity securities listed or regularly traded on a securities exchange or in the over-the-counter (OTC) market are valued at the last quoted sale price or, for certain markets, the official closing price at the time the valuations are made, except for OTC Bulletin Board securities, which are valued at the mean of the latest bid and asked prices. A security that is listed or traded on more than one exchange is valued at the quotation on the exchange determined to be the primary market for such security. Listed securities not traded on a particular day are valued at the mean of the latest bid and asked prices for domestic securities and the last quoted sale price for international securities.
Investments in mutual funds are valued at the mutual fund’s closing net asset value per share on the day of valuation.
Other investments, including restricted securities, and those financial instruments for which the above valuation procedures are inappropriate or are deemed not to reflect fair value are stated at fair value as determined in good faith by the T. Rowe Price Valuation Committee, established by the fund’s Board of Directors.
Valuation Inputs Various inputs are used to determine the value of the fund’s financial instruments. These inputs are summarized in the three broad levels listed below:
Level 1 – quoted prices in active markets for identical financial instruments
Level 2 – observable inputs other than Level 1 quoted prices (including, but not limited to, quoted prices for similar financial instruments, interest rates, prepayment speeds, and credit risk)
Level 3 – unobservable inputs
Observable inputs are those based on market data obtained from sources independent of the fund, and unobservable inputs reflect the fund’s own assumptions based on the best information available. The input levels are not necessarily an indication of the risk or liquidity associated with financial instruments at that level. On December 31, 2010, all of the fund’s financial instruments were classified as Level 1, based on the inputs used to determine their values.
NOTE 3 - OTHER INVESTMENT TRANSACTIONS
Purchases and sales of portfolio securities other than short-term securities aggregated $16,928,000 and $11,071,000, respectively, for the year ended December 31, 2010.
NOTE 4 - FEDERAL INCOME TAXES
No provision for federal income taxes is required since the fund intends to continue to qualify as a regulated investment company under Subchapter M of the Internal Revenue Code and distribute to shareholders all of its taxable income and gains. Distributions determined in accordance with federal income tax regulations may differ in amount or character from net investment income and realized gains for financial reporting purposes. Financial reporting records are adjusted for permanent book/tax differences to reflect tax character but are not adjusted for temporary differences.
The fund files U.S. federal, state, and local tax returns as required. The fund’s tax returns are subject to examination by the relevant tax authorities until expiration of the applicable statute of limitations, which is generally three years after the filing of the tax return but which can be extended to six years in certain circumstances. Tax returns for open years have incorporated no uncertain tax positions that require a provision for income taxes.
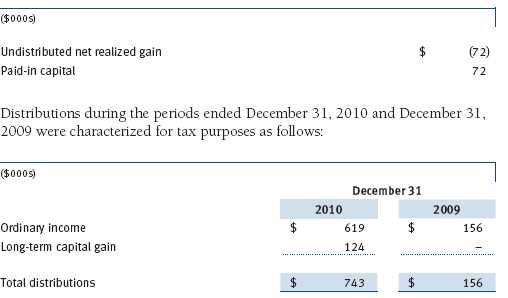
Reclassifications to paid-in capital relate primarily to a tax practice that treats a portion of the proceeds from each redemption of capital shares as a distribution of taxable net investment income and/or realized capital gain. For the year ended December 31, 2010, the following reclassifications were recorded to reflect tax character; there was no impact on results of operations or net assets:
At December 31, 2010, the tax-basis cost of investments and components of net assets were as follows:

The difference between book-basis and tax-basis net unrealized appreciation (depreciation) is attributable to the deferral of losses from wash sales for tax purposes.
NOTE 5 - RELATED PARTY TRANSACTIONS
The fund is managed by T. Rowe Price Associates, Inc. (the manager or Price Associates), a wholly owned subsidiary of T. Rowe Price Group, Inc. The investment management agreement between the fund and the manager provides for an annual investment management fee, which is computed daily and paid monthly. The fee consists of an individual fund fee, equal to 0.25% of the fund’s average daily net assets, and a group fee. The group fee rate is calculated based on the combined net assets of certain mutual funds sponsored by Price Associates (the group) applied to a graduated fee schedule, with rates ranging from 0.48% for the first $1 billion of assets to 0.285% for assets in excess of $220 billion. The fund’s group fee is determined by applying the group fee rate to the fund’s average daily net assets. At December 31, 2010, the effective annual group fee rate was 0.30%.
The Investor Class and Advisor Class are also subject to a contractual expense limitation through the limitation dates indicated in the table below. During the limitation period, the manager is required to waive its management fee and/or reimburse expenses, excluding interest, taxes, brokerage commissions, and extraordinary expenses, that would otherwise cause the class’s ratio of annualized total expenses to average net assets (expense ratio) to exceed its expense limitation. For a period of three years after the date of any reimbursement or waiver, each class is required to repay the manager for expenses previously reimbursed and management fees waived to the extent the class’s net assets have grown or expenses have declined sufficiently to allow repayment without causing the class’s expense ratio to exceed its expense limitation.

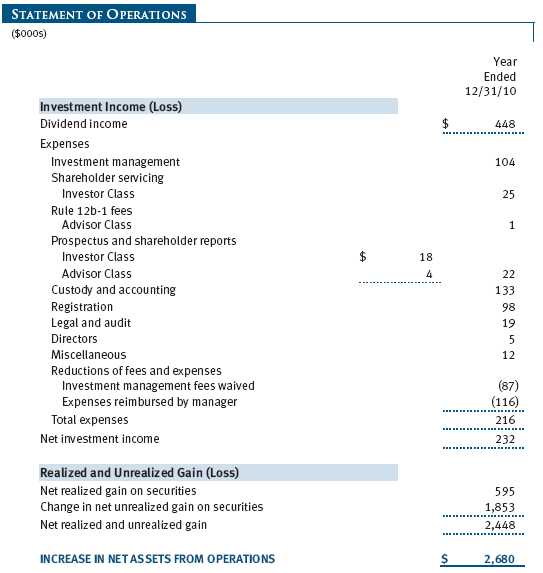
Pursuant to this agreement, management fees in the amount of $87,000 were waived and expenses in the amount of $116,000 were reimbursed by the manager during the year ended December 31, 2010. Including these amounts, management fees waived and expenses previously reimbursed by the manager in the amount of $326,000 remain subject to repayment at December 31, 2010.
In addition, the fund has entered into service agreements with Price Associates and a wholly owned subsidiary of Price Associates (collectively, Price). Price Associates computes the daily share prices and provides certain other administrative services to the fund. T. Rowe Price Services, Inc., provides shareholder and administrative services in its capacity as the fund’s transfer and dividend disbursing agent. For the year ended December 31, 2010, expenses incurred pursuant to these service agreements were $100,000 for Price Associates and $19,000 for T. Rowe Price Services, Inc. The total amount payable at period-end pursuant to these service agreements is reflected as Due to Affiliates in the accompanying financial statements.
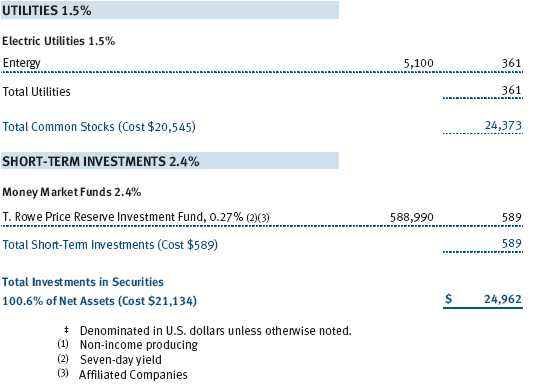
The fund may invest in the T. Rowe Price Reserve Investment Fund and the T. Rowe Price Government Reserve Investment Fund (collectively, the T. Rowe Price Reserve Investment Funds), open-end management investment companies managed by Price Associates and considered affiliates of the fund. The T. Rowe Price Reserve Investment Funds are offered as cash management options to mutual funds, trusts, and other accounts managed by Price Associates and/or its affiliates and are not available for direct purchase by members of the public. The T. Rowe Price Reserve Investment Funds pay no investment management fees.
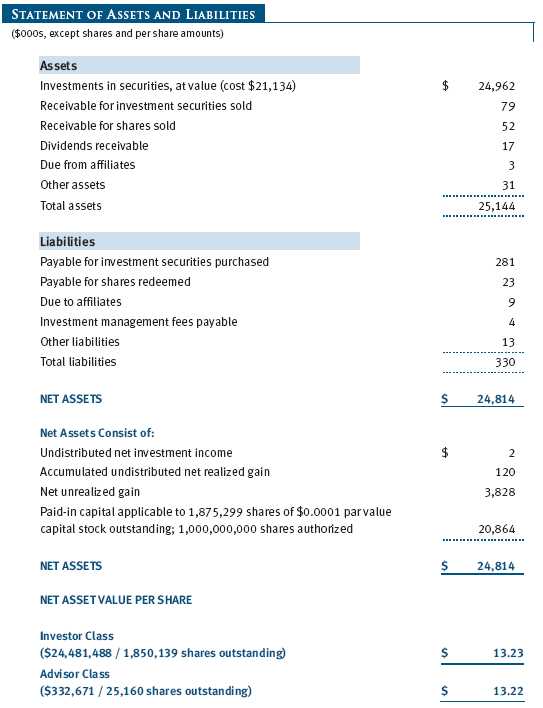
As of December 31, 2010, T. Rowe Price Group, Inc., and/or its wholly owned subsidiaries owned 575,000 shares of the Investor Class and 25,000 shares of the Advisor Class, aggregating 32% of the fund’s net assets.
| REPORT OF INDEPENDENT REGISTERED PUBLIC ACCOUNTING FIRM |
To the Board of Directors and Shareholders of
T. Rowe Price U.S. Large Cap Core Fund, Inc.
In our opinion, the accompanying statement of assets and liabilities, including the portfolio of investments, and the related statements of operations and of changes in net assets and the financial highlights present fairly, in all material respects, the financial position of T. Rowe Price U.S. Large Cap Core Fund, Inc. (the “Fund”) at December 31, 2010, the results of its operations for the year then ended, the changes in its net assets and the financial highlights for each of the fiscal periods presented, in conformity with accounting principles generally accepted in the United States of America. These financial statements and financial highlights (hereafter referred to as “financial statements”) are the responsibility of the Fund’s management; our responsibility is to express an opinion on these financial statements based on our audits. We conducted our audits of these statements in accordance with the standards of the Public Company Accounting Oversight Board (United States). Those standards require that we plan and perform the audit to obtain reasonable assurance about whether the financial statements are free of material misstatement. An audit includes examining, on a test basis, evidence supporting the amounts and disclosures in the financial statements, assessing the accounting principles used and significant estimates made by management, and evaluating the overall financial statement presentation. We believe that our audits, which included confirmation of securities at December 31, 2010 by correspondence with the custodian and brokers; and confirmation of the underlying funds by correspondence with the transfer agent, provide a reasonable basis for our opinion.
PricewaterhouseCoopers LLP
Baltimore, Maryland
February 17, 2011
| TAX INFORMATION (UNAUDITED) FOR THE TAX YEAR ENDED 12/31/10 |
We are providing this information as required by the Internal Revenue Code. The amounts shown may differ from those elsewhere in this report because of differences between tax and financial reporting requirements.
The fund’s distributions to shareholders included:
• $437,000 from short-term capital gains,
• $147,000 from long-term capital gains, subject to the 15% rate gains category
For taxable non-corporate shareholders, $447,000 of the fund’s income represents qualified dividend income subject to the 15% rate category.
For corporate shareholders, $415,000 of the fund’s income qualifies for the dividends-received deduction.
| INFORMATION ON PROXY VOTING POLICIES, PROCEDURES, AND RECORDS |
A description of the policies and procedures used by T. Rowe Price funds and portfolios to determine how to vote proxies relating to portfolio securities is available in each fund’s Statement of Additional Information, which you may request by calling 1-800-225-5132 or by accessing the SEC’s website, sec.gov. The description of our proxy voting policies and procedures is also available on our website, troweprice.com. To access it, click on the words “Our Company” at the top of our corporate homepage. Then, when the next page appears, click on the words “Proxy Voting Policies” on the left side of the page.
Each fund’s most recent annual proxy voting record is available on our website and through the SEC’s website. To access it through our website, follow the directions above, then click on the words “Proxy Voting Records” on the right side of the Proxy Voting Policies page.
| HOW TO OBTAIN QUARTERLY PORTFOLIO HOLDINGS |
The fund files a complete schedule of portfolio holdings with the Securities and Exchange Commission for the first and third quarters of each fiscal year on Form N-Q. The fund’s Form N-Q is available electronically on the SEC’s website (sec.gov); hard copies may be reviewed and copied at the SEC’s Public Reference Room, 450 Fifth St. N.W., Washington, DC 20549. For more information on the Public Reference Room, call 1-800-SEC-0330.
| ABOUT THE FUND’S DIRECTORS AND OFFICERS |
Your fund is overseen by a Board of Directors (Board) that meets regularly to review a wide variety of matters affecting the fund, including performance, investment programs, compliance matters, advisory fees and expenses, service providers, and other business affairs. The Board elects the fund’s officers, who are listed in the final table. At least 75% of the Board’s members are independent of T. Rowe Price Associates, Inc. (T. Rowe Price), and T. Rowe Price International Ltd (T. Rowe Price International); “inside” or “interested” directors are employees or officers of T. Rowe Price. The business address of each director and officer is 100 East Pratt Street, Baltimore, Maryland 21202. The Statement of Additional Information includes additional information about the fund directors and is available without charge by calling a T. Rowe Price representative at 1-800-225-5132.
| Independent Directors | |
| |
| Name | |
| (Year of Birth) | Principal Occupation(s) and Directorships of Public Companies and |
| Year Elected* | Other Investment Companies During the Past Five Years |
| | |
| William R. Brody, M.D., Ph.D. | President and Trustee, Salk Institute for Biological Studies (2009 |
| (1944) | to present); Director, Novartis, Inc. (2009 to present); Director, IBM |
| 2009 | (2007 to present); President and Trustee, Johns Hopkins University |
| | (1996 to 2009); Chairman of Executive Committee and Trustee, |
| | Johns Hopkins Health System (1996 to 2009); Director, Medtronic, |
| | Inc. (1998 to 2007); Director, Mercantile Bankshares (1997 to 2007) |
| | |
| Jeremiah E. Casey | Director, National Life Insurance (2001 to 2005); Director, NLV |
| (1940) | Financial Corporation (2004 to 2005) |
| 2009 | |
| | |
| Anthony W. Deering | Chairman, Exeter Capital, LLC, a private investment firm (2004 |
| (1945) | to present); Director, Under Armour (2008 to present); Director, |
| 2009 | Vornado Real Estate Investment Trust (2004 to present); Director, |
| | Mercantile Bankshares (2002 to 2007); Member, Advisory Board, |
| | Deutsche Bank North America (2004 to present) |
| | |
| Donald W. Dick, Jr. | Principal, EuroCapital Partners, LLC, an acquisition and management |
| (1943) | advisory firm (1995 to present) |
| 2009 | |
| | |
| Karen N. Horn | Senior Managing Director, Brock Capital Group, an advisory and |
| (1943) | investment banking firm (2004 to present); Director, Eli Lilly and |
| 2009 | Company (1987 to present); Director, Simon Property Group (2004 |
| | to present); Director, Norfolk Southern (2008 to present); Director, |
| | Fannie Mae (2006 to 2008); Director, Georgia Pacific (2004 to 2005) |
| | |
| Theo C. Rodgers | President, A&R Development Corporation (1977 to present) |
| (1941) | |
| 2009 | |
| | |
| John G. Schreiber | Owner/President, Centaur Capital Partners, Inc., a real estate |
| (1946) | investment company (1991 to present); Cofounder and Partner, |
| 2009 | Blackstone Real Estate Advisors, L.P. (1992 to present) |
| | |
| Mark R. Tercek | President and Chief Executive Officer, The Nature Conservancy (2008 |
| (1957) | to present); Managing Director, The Goldman Sachs Group, Inc. |
| 2009 | (1984 to 2008) |
| |
| *Each independent director oversees 128 T. Rowe Price portfolios and serves until retirement, |
| resignation, or election of a successor. |
| Inside Directors | |
| |
| Name | |
| (Year of Birth) | |
| Year Elected* | |
| [Number of T. Rowe Price | Principal Occupation(s) and Directorships of Public Companies and |
| Portfolios Overseen] | Other Investment Companies During the Past Five Years |
| | |
| Edward C. Bernard | Director and Vice President, T. Rowe Price; Vice Chairman of the |
| (1956) | Board, Director, and Vice President, T. Rowe Price Group, Inc.; |
| 2009 | Chairman of the Board, Director, and President, T. Rowe Price |
| [128] | Investment Services, Inc.; Chairman of the Board and Director, |
| | T. Rowe Price Retirement Plan Services, Inc., T. Rowe Price Savings |
| | Bank, and T. Rowe Price Services, Inc.; Director and Chief Executive |
| | Officer, T. Rowe Price International; Chief Executive Officer, |
| | Chairman of the Board, Director, and President, T. Rowe Price Trust |
| | Company; Chairman of the Board, all funds |
| | |
| Brian C. Rogers, CFA, CIC | Chief Investment Officer, Director, and Vice President, T. Rowe Price; |
| (1955) | Chairman of the Board, Chief Investment Officer, Director, and Vice |
| 2009 | President, T. Rowe Price Group, Inc.; Vice President, T. Rowe Price |
| [73] | Trust Company |
| |
| *Each inside director serves until retirement, resignation, or election of a successor. |
| Officers | |
| |
| Name (Year of Birth) | |
| Position Held With U.S. Large-Cap | |
| Core Fund | Principal Occupation(s) |
| | |
| Peter J. Bates, CFA (1974) | Vice President, T. Rowe Price and T. Rowe Price |
| Vice President | Group, Inc. |
| | |
| Shawn T. Driscoll (1975) | Vice President, T. Rowe Price Group, Inc.; |
| Vice President | formerly Equity Research Analyst, MTB |
| | Investment Advisors (to 2006) |
| | |
| Joseph B. Fath, CPA (1971) | Vice President, T. Rowe Price and T. Rowe Price |
| Vice President | Group, Inc. |
| | |
| Roger L. Fiery III, CPA (1959) | Vice President, Price Hong Kong, Price |
| Vice President | Singapore, T. Rowe Price, T. Rowe Price Group, |
| | Inc., T. Rowe Price International, and T. Rowe |
| | Price Trust Company |
| | |
| Mark S. Finn, CFA, CPA (1963) | Vice President, T. Rowe Price and T. Rowe Price |
| Vice President | Group, Inc. |
| | |
| John R. Gilner (1961) | Chief Compliance Officer and Vice President, |
| Chief Compliance Officer | T. Rowe Price; Vice President, T. Rowe Price |
| | Group, Inc., and T. Rowe Price Investment |
| | Services, Inc. |
| | |
| Gregory S. Golczewski (1966) | Vice President, T. Rowe Price and T. Rowe Price |
| Vice President | Trust Company |
| | |
| Gregory K. Hinkle, CPA (1958) | Vice President, T. Rowe Price, T. Rowe Price |
| Treasurer | Group, Inc., and T. Rowe Price Trust Company; |
| | formerly Partner, PricewaterhouseCoopers LLP |
| | (to 2007) |
| | |
| John D. Linehan, CFA (1965) | Vice President, T. Rowe Price, T. Rowe Price |
| Vice President | Group, Inc., and T. Rowe Price Trust Company |
| | |
| Patricia B. Lippert (1953) | Assistant Vice President, T. Rowe Price and |
| Secretary | T. Rowe Price Investment Services, Inc. |
| | |
| George Marzano (1980) | Assistant Vice President, T. Rowe Price |
| Vice President | |
| | |
| Jason Nogueira, CFA (1974) | Vice President, T. Rowe Price and T. Rowe Price |
| Vice President | Group, Inc. |
| | |
| David Oestreicher (1967) | Director and Vice President, T. Rowe Price |
| Vice President | Investment Services, Inc., T. Rowe Price Trust |
| | Company, and T. Rowe Price Services, Inc.; Vice |
| | President, Price Hong Kong, Price Singapore, |
| | T. Rowe Price, T. Rowe Price Group, Inc., |
| | T. Rowe Price International, and T. Rowe Price |
| | Retirement Plan Services, Inc. |
| | |
| Timothy E. Parker, CFA (1974) | Vice President, T. Rowe Price and T. Rowe Price |
| Vice President | Group, Inc. |
| | |
| Robert T. Quinn, Jr. (1972) | Vice President, T. Rowe Price and T. Rowe Price |
| Vice President | Group, Inc. |
| | |
| Jeffrey Rottinghaus, CPA (1970) | Vice President, T. Rowe Price and T. Rowe Price |
| President | Group, Inc. |
| | |
| Deborah D. Seidel (1962) | Vice President, T. Rowe Price, T. Rowe Price |
| Vice President | Group, Inc., and T. Rowe Price Investment |
| | Services, Inc.; Vice President and Assistant |
| | Treasurer, T. Rowe Price Services, Inc. |
| | |
| Robert W. Sharps, CFA, CPA (1971) | Vice President, T. Rowe Price, T. Rowe Price |
| Vice President | Group, Inc., and T. Rowe Price Trust Company |
| | |
| Julie L. Waples (1970) | Vice President, T. Rowe Price |
| Vice President | |
| |
| Unless otherwise noted, officers have been employees of T. Rowe Price or T. Rowe Price International |
| for at least 5 years. | |
Item 2. Code of Ethics.
The registrant has adopted a code of ethics, as defined in Item 2 of Form N-CSR, applicable to its principal executive officer, principal financial officer, principal accounting officer or controller, or persons performing similar functions. A copy of this code of ethics is filed as an exhibit to this Form N-CSR. No substantive amendments were approved or waivers were granted to this code of ethics during the period covered by this report.
Item 3. Audit Committee Financial Expert.
The registrant’s Board of Directors/Trustees has determined that Mr. Anthony W. Deering qualifies as an audit committee financial expert, as defined in Item 3 of Form N-CSR. Mr. Deering is considered independent for purposes of Item 3 of Form N-CSR.
Item 4. Principal Accountant Fees and Services.
(a) – (d) Aggregate fees billed to the registrant for the last two fiscal years for professional services rendered by the registrant’s principal accountant were as follows:
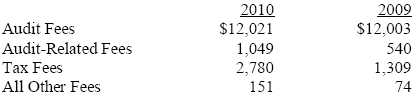
Audit fees include amounts related to the audit of the registrant’s annual financial statements and services normally provided by the accountant in connection with statutory and regulatory filings. Audit-related fees include amounts reasonably related to the performance of the audit of the registrant’s financial statements and specifically include the issuance of a report on internal controls and, if applicable, agreed-upon procedures related to fund acquisitions. Tax fees include amounts related to services for tax compliance, tax planning, and tax advice. The nature of these services specifically includes the review of distribution calculations and the preparation of Federal, state, and excise tax returns. All other fees include the registrant’s pro-rata share of amounts for agreed-upon procedures in conjunction with service contract approvals by the registrant’s Board of Directors/Trustees.
(e)(1) The registrant’s audit committee has adopted a policy whereby audit and non-audit services performed by the registrant’s principal accountant for the registrant, its investment adviser, and any entity controlling, controlled by, or under common control with the investment adviser that provides ongoing services to the registrant require pre-approval in advance at regularly scheduled audit committee meetings. If such a service is required between regularly scheduled audit committee meetings, pre-approval may be authorized by one audit committee member with ratification at the next scheduled audit committee meeting. Waiver of pre-approval for audit or non-audit services requiring fees of a de minimis amount is not permitted.
(2) No services included in (b) – (d) above were approved pursuant to paragraph (c)(7)(i)(C) of Rule 2-01 of Regulation S-X.
(f) Less than 50 percent of the hours expended on the principal accountant’s engagement to audit the registrant’s financial statements for the most recent fiscal year were attributed to work performed by persons other than the principal accountant’s full-time, permanent employees.
(g) The aggregate fees billed for the most recent fiscal year and the preceding fiscal year by the registrant’s principal accountant for non-audit services rendered to the registrant, its investment adviser, and any entity controlling, controlled by, or under common control with the investment adviser that provides ongoing services to the registrant were $1,417,000 and $1,879,000, respectively.
(h) All non-audit services rendered in (g) above were pre-approved by the registrant’s audit committee. Accordingly, these services were considered by the registrant’s audit committee in maintaining the principal accountant’s independence.
Item 5. Audit Committee of Listed Registrants.
Not applicable.
Item 6. Investments.
(a) Not applicable. The complete schedule of investments is included in Item 1 of this Form N-CSR.
(b) Not applicable.
Item 7. Disclosure of Proxy Voting Policies and Procedures for Closed-End Management Investment Companies.
Not applicable.
Item 8. Portfolio Managers of Closed-End Management Investment Companies.
Not applicable.
Item 9. Purchases of Equity Securities by Closed-End Management Investment Company and Affiliated Purchasers.
Not applicable.
Item 10. Submission of Matters to a Vote of Security Holders.
Not applicable.
Item 11. Controls and Procedures.
(a) The registrant’s principal executive officer and principal financial officer have evaluated the registrant’s disclosure controls and procedures within 90 days of this filing and have concluded that the registrant’s disclosure controls and procedures were effective, as of that date, in ensuring that information required to be disclosed by the registrant in this Form N-CSR was recorded, processed, summarized, and reported timely.
(b) The registrant’s principal executive officer and principal financial officer are aware of no change in the registrant’s internal control over financial reporting that occurred during the registrant’s second fiscal quarter covered by this report that has materially affected, or is reasonably likely to materially affect, the registrant’s internal control over financial reporting.
Item 12. Exhibits.
(a)(1) The registrant’s code of ethics pursuant to Item 2 of Form N-CSR is attached.
(2) Separate certifications by the registrant's principal executive officer and principal financial officer, pursuant to Section 302 of the Sarbanes-Oxley Act of 2002 and required by Rule 30a-2(a) under the Investment Company Act of 1940, are attached.
(3) Written solicitation to repurchase securities issued by closed-end companies: not applicable.
(b) A certification by the registrant's principal executive officer and principal financial officer, pursuant to Section 906 of the Sarbanes-Oxley Act of 2002 and required by Rule 30a-2(b) under the Investment Company Act of 1940, is attached.
| | |
SIGNATURES |
| |
| | Pursuant to the requirements of the Securities Exchange Act of 1934 and the Investment |
| Company Act of 1940, the registrant has duly caused this report to be signed on its behalf by the |
| undersigned, thereunto duly authorized. |
| |
| T. Rowe Price U.S. Large-Cap Core Fund, Inc. |
| |
| |
| |
| By | /s/ Edward C. Bernard |
| | Edward C. Bernard |
| | Principal Executive Officer |
| |
| Date | February 17, 2011 |
| |
| |
| |
| | Pursuant to the requirements of the Securities Exchange Act of 1934 and the Investment |
| Company Act of 1940, this report has been signed below by the following persons on behalf of |
| the registrant and in the capacities and on the dates indicated. |
| |
| |
| By | /s/ Edward C. Bernard |
| | Edward C. Bernard |
| | Principal Executive Officer |
| |
| Date | February 17, 2011 |
| |
| |
| |
| By | /s/ Gregory K. Hinkle |
| | Gregory K. Hinkle |
| | Principal Financial Officer |
| |
| Date | February 17, 2011 |