UNITED STATES
SECURITIES AND EXCHANGE COMMISSION
Washington, D.C. 20549
FORM N-CSR
CERTIFIED SHAREHOLDER REPORT OF REGISTERED
MANAGEMENT INVESTMENT COMPANIES
Investment Company Act File Number: 811-22293
| T. Rowe Price U.S. Large-Cap Core Fund, Inc. |
|
| (Exact name of registrant as specified in charter) |
| |
| 100 East Pratt Street, Baltimore, MD 21202 |
|
| (Address of principal executive offices) |
| |
| David Oestreicher |
| 100 East Pratt Street, Baltimore, MD 21202 |
|
| (Name and address of agent for service) |
Registrant’s telephone number, including area code: (410) 345-2000
Date of fiscal year end: December 31
Date of reporting period: June 30, 2014
Item 1. Report to Shareholders
| U.S. Large-Cap Core Fund | June 30, 2014 |
The views and opinions in this report were current as of June 30, 2014. They are not guarantees of performance or investment results and should not be taken as investment advice. Investment decisions reflect a variety of factors, and the managers reserve the right to change their views about individual stocks, sectors, and the markets at any time. As a result, the views expressed should not be relied upon as a forecast of the fund’s future investment intent. The report is certified under the Sarbanes-Oxley Act, which requires mutual funds and other public companies to affirm that, to the best of their knowledge, the information in their financial reports is fairly and accurately stated in all material respects.
REPORTS ON THE WEB
Sign up for our E-mail Program, and you can begin to receive updated fund reports and prospectuses online rather than through the mail. Log in to your account at troweprice.com for more information.
Manager’s Letter
Fellow Shareholders
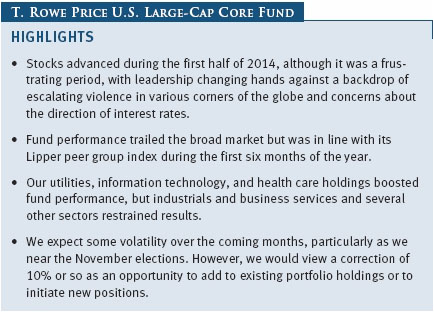
The equities markets advanced over the first half of the year, although stock performance was mixed and trading was volatile at various times during the period. Large-caps led small-caps, although the latter group rallied in the final month of trading. Mid-cap value stocks outperformed in the six-month period, thanks to strong results in the first quarter of the year. All in all, despite the gains, it was a frustrating period, with leadership changing hands against a backdrop of escalating violence in various corners of the globe, slowing growth and credit concerns in China, and mixed U.S. economic data.
PERFORMANCE COMPARISON
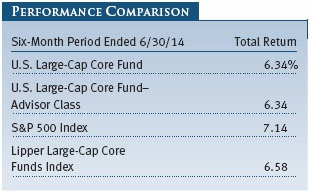
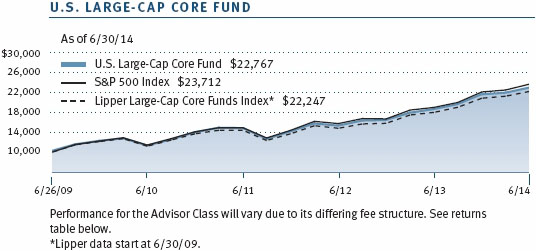
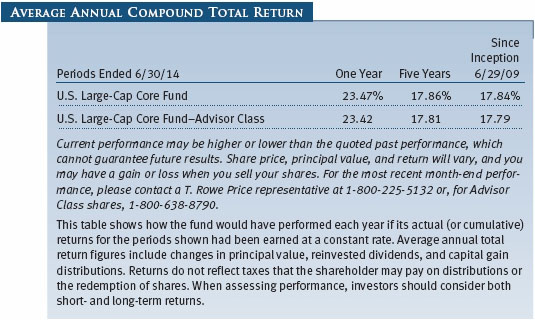
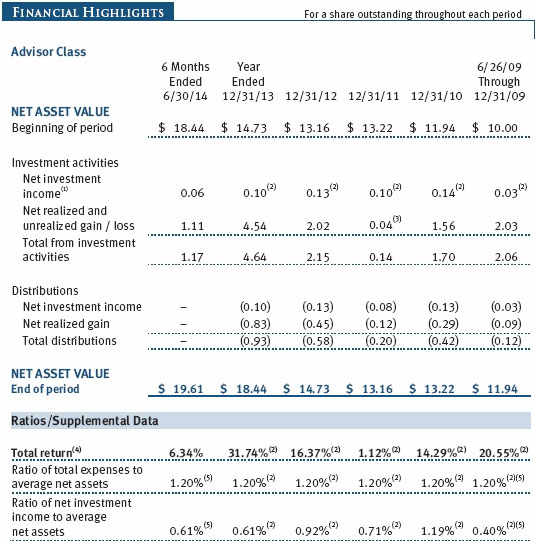
The U.S. Large-Cap Core Fund generated a return of 6.34% during the past six months compared with 7.14% for the S&P 500 Index and 6.58% for the Lipper Large-Cap Core Funds Index. (The return was the same for the Advisor Class shares.)
INVESTMENT APPROACH
The U.S. Large-Cap Core Fund seeks long-term capital appreciation by investing in a concentrated portfolio of domestic large-cap growth and value stocks. The fund uses fundamental, bottom-up analysis that also relies on a rigorous valuation assessment to find the stocks with the most potential for appreciation.
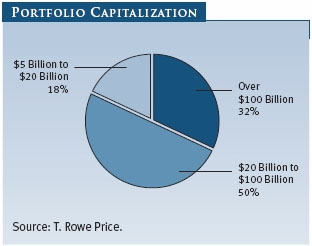
In selecting the stocks for the portfolio, the fund generally starts with companies with more than $5 billion in market capitalization and that carry “buy” ratings from T. Rowe Price analysts. In our analysis of these companies, we focus on four key elements: understanding a company’s business model and strategy, developing a relationship with the company’s management, determining the company’s standing within its industry, and assessing the company’s valuation.
The fund has a bias toward high-quality companies that have opportunities to increase their market share or have barriers to entry around their business that protect them and allow them to grow organically. We invest in well-managed firms with great products and services within an industry that may be in a cyclical trough. Lastly, we favor companies with characteristics that we believe can drive equity appreciation, such as pricing power, new product cycles, improving margins, and a strategy to earn better returns on their invested capital.
Beyond good fundamentals, we look for management teams that can create value by executing well and improving the business. We also pay close attention to free cash flow and management’s effectiveness in redeploying its capital. We like managements that invest in their business when there is the potential for attractive returns or return of capital to shareholders if conditions warrant.
We also employ a disciplined sell process. After stocks are added to the portfolio, they are subject to continued scrutiny. Criteria for selling stocks include a downgrade by a T. Rowe Price analyst, deterioration in the company’s fundamentals or management, the discovery of a better investment idea, or the fulfillment of our investment thesis when a stock becomes fully valued.
MARKET ENVIRONMENT
The Commerce Department sharply lowered its assessment of first-quarter economic growth from an earlier reading of -1.0% on an annualized basis to -2.9%, surprising most analysts who expected a less severe revision. The sluggish reading was attributed to shrinking business inventories, harsh winter weather throughout much of the nation, and a decline in health care spending. The first quarter of 2014 was the worst for U.S. gross domestic product performance since the first quarter of 2009. The economy’s poor performance was all the more startling since it occurred against the backdrop of an improving labor market and healthy overall business activity.
Many analysts, including T. Rowe Price economists, regard the contraction as an aberration—something of a payback for the unsustainable 3.4% advance in the second half of 2013. T. Rowe Price expects stronger U.S. economic growth in the neighborhood of 3% in the second quarter of this year. Total annual growth of 3% for the year, however, is probably unlikely. If growth falls short of 3% during the next 12 to 18 months, it would be due largely to a shortfall in residential and business fixed investment.
All eyes were on the Federal Reserve and its evolving policy stances during the first half of the year. The central bank, under the leadership of Janet Yellen, who replaced Ben Bernanke when she was sworn in on February 3, 2014, has been scaling back its quantitative easing program since the beginning of the year and is scheduled to end it in October. The next step for the Fed will be a widely anticipated ratcheting up of short-term interest rates, but exactly when that will take place is unclear. T. Rowe Price does not expect monetary tightening to occur until around the middle of 2015.
A lot depends on the health of the labor market and the rate of inflation, which has begun to inch up recently. Fed policymakers predicted after their last meeting that the unemployment rate could fall from 6.1% currently to 6.0% by the end of the year—already below the 6.2% they forecast in March. However, the Fed acknowledged that the figure reflects discouraged job seekers who have stopped looking for work; should they return in force, the decline in unemployment could be more gradual. Regarding inflation, the Fed estimates that consumer prices could rise by 1.5% to 1.6% this year, slightly higher than a previous forecast of 1.4% to 1.6%. Others disagree, however, and think inflation is trending higher than the Fed is stating.
PORTFOLIO REVIEW
The past six months witnessed the continuation of an evolving environment for large-cap growth stocks. The early stage of this evolution occurred between May 2013 and February 2014, when momentum and secular growth companies were very much in favor in a low-growth environment marked by receding macroeconomic concerns. Sentiment changed abruptly in March of this year when investors began to focus on several key developments—including the situation in Ukraine, a slowdown in China, shifting Fed policies, and regulatory issues in the U.S.—all of which led to abrupt reversals in market leadership. Against this backdrop, investors sold many of the stocks that had performed well for us earlier in the cycle.
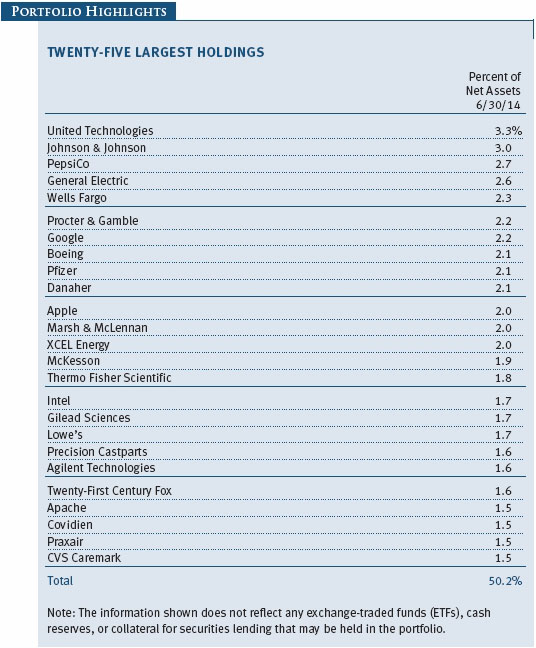
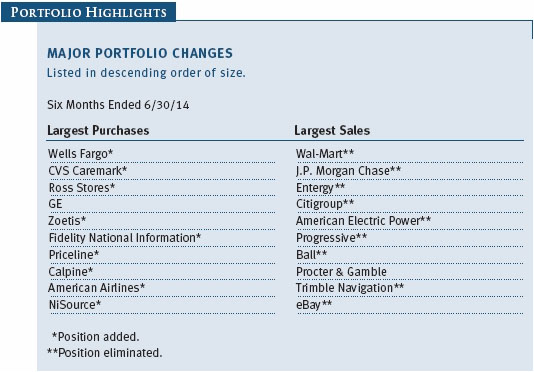
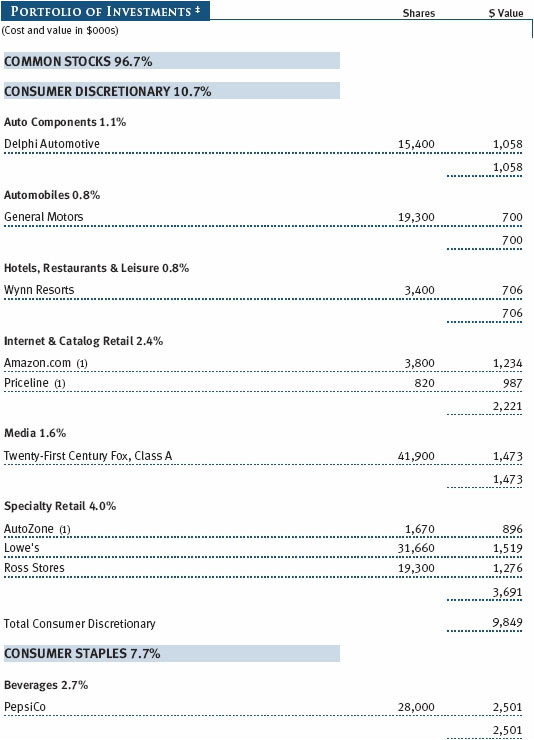
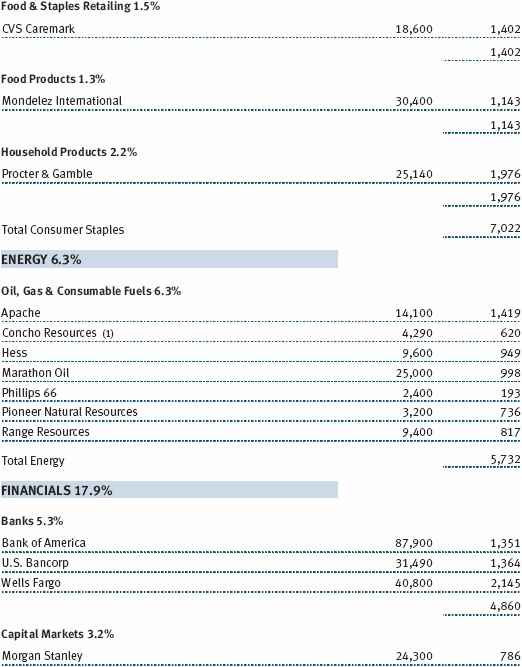
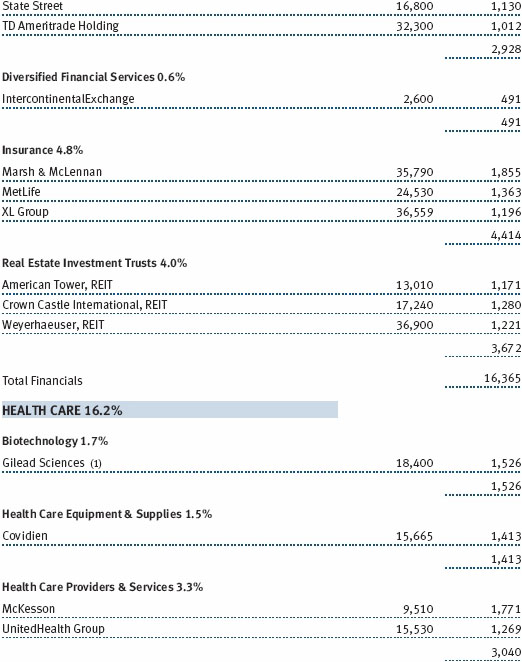
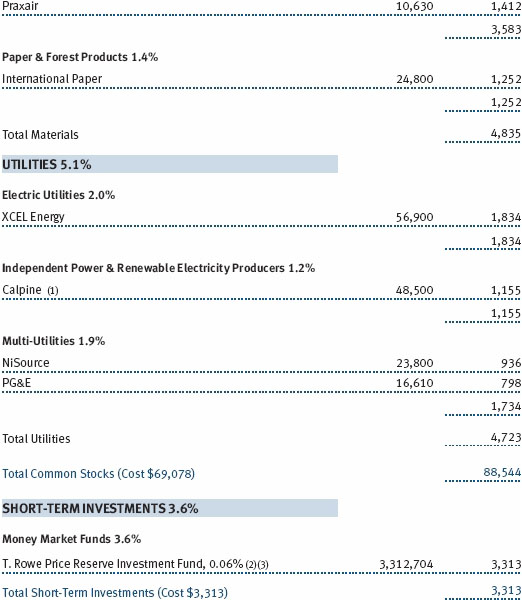
Utilities contributed to fund results during the first half as yield-starved investors continued to search for income-producing securities. Our overweight in the sector also aided performance. We initiated a position in Calpine, which advanced after the company announced it was selling several power plants in the Southeast to focus on wholesale power markets and better align the company’s asset base. Entergy, an integrated energy provider and the second-largest nuclear power generator in the U.S., also served us well as the company announced better-than-expected earnings growth due to cold winter weather and limited pipeline infrastructure in the Northeast. We eliminated the position on strength late in the period. (Please refer to the fund’s portfolio of investments for a complete list of holdings and the amount each represents in the portfolio.)
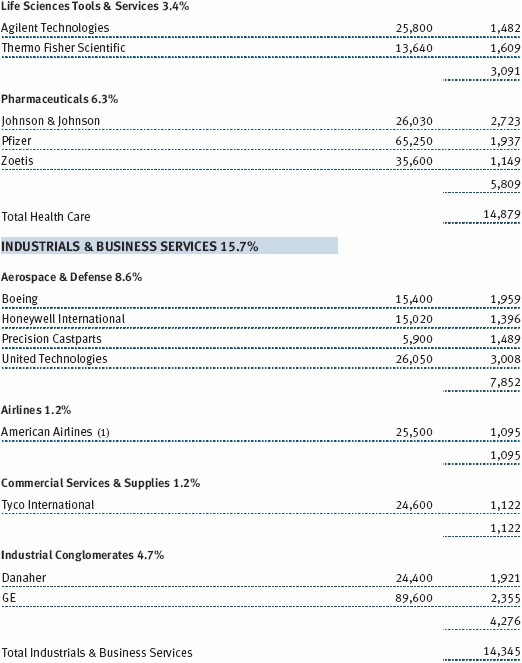
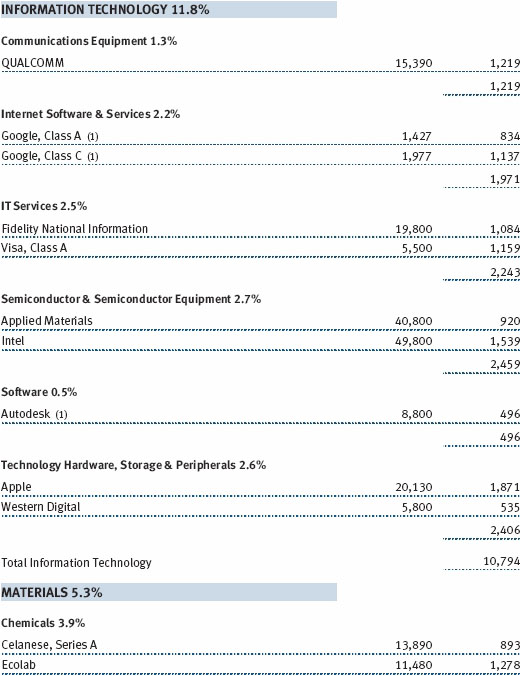
Information technology was another source of strength, thanks to stock selection. Applied Materials benefited from increased revenues in its core semiconductor equipment business, and its merger with a Japanese firm seems to be on track for the second half of 2014. Juniper Networks performed well amid strong earnings and the pending release of a new operational plan. Intel advanced as the company benefited from its data center business and made progress in penetrating the tablet market.
An overweight in health care helped performance. Dublin-based surgical device maker Covidien surged after Medtronic agreed to acquire the company for $42.9 billion in cash and stock. The combined company will reincorporate in Ireland, allowing Medtronic to utilize its overseas cash holdings without any additional taxes. Shares of McKesson advanced because of ongoing strength in generic drug pricing. The company secured a generic drug distribution agreement with Rite Aid, the third-largest drug retailer in the United States.
Unfortunately, we had our share of detractors during the first half. The industrials and business services sector hurt performance due to stock selection and an overweight allocation to the group. Precision Castparts suffered because of execution issues and continued weakness in its defense division. The company continues to be well positioned as a major supplier to the commercial aerospace industry, however, which has seen strong demand as carriers replace their fleets with more fuel-efficient aircraft.
Also within industrials, shares of Boeing declined after the company issued cautious guidance and cash flow estimates. Boeing remains one of our largest holdings and enjoys a sizable backlog of existing orders.
Stock selection within the consumer discretionary sector was another negative. Amazon.com weakened after it reported poor revenue and lower-than-anticipated unit growth. The company remains a dominant retail presence, and we believe its cloud-computing platform provides a long runway for growth.
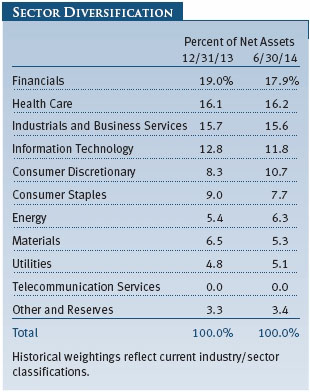
Off-price retailer Ross Stores was hampered by worries about slower growth. We think the company has ample room to expand, however, as it transitions into a national retailer. It is focused on providing compelling branded merchandise at value prices and improving consumer demand. Stock selection within financials was disappointing. State Street struggled because of higher expenses, largely driven by an increase in employee benefits and compensation. Regardless, we believe that better expense management; continued strong capital allocation; organic growth; and the Fed’s first rate increase, which is expected next year, should drive earnings higher over the long term.
Crown Castle International, which began operating as a real estate investment trust on January 1, 2014, is a leading independent owner, operator, and developer of broadcast and wireless communication sites in North America. Shares of the company traded lower on interest rate fears. We think Crown Castle International is well positioned for growth as telecommunications providers continue to spend on infrastructure to support more complex mobile devices.
OUTLOOK
We don’t expect to see a repeat of the expansion in price/earnings multiples that drove stocks last year. Stocks are more likely to be influenced by corporate earnings growth, which we think will continue at a moderate pace through the rest of the year. Valuations are reasonable from a historical perspective, and stock market performance should be more or less in line with the rate of earnings growth.
We are finding value in some sectors—including financials, select IT stocks, and some energy companies—whose prospects look bright and whose share prices are reasonable due to their relative underperformance in some cases. Another positive note is that other investment assets are unappealing compared with stocks, a condition that could attract money to the equities market. We expect some volatility over the coming months, particularly as we near the November elections. However, we would view a correction of 10% or so—should it occur—as an opportunity to add to existing portfolio holdings or to initiate new positions.
As always, our basic investment strategy relies on our fundamental research and bottom-up stock selection as we attempt to position the fund for the changing environment. We will continue to focus on companies with strong corporate cultures that are positioned to exploit opportunities created by change.
Thank you for your continuing support.
Respectfully submitted,

Jeffrey Rottinghaus
Chairman of the fund’s Investment Advisory Committee
July 17, 2014
The committee chairman has day-to-day responsibility for managing the portfolio and works with committee members in developing and executing the fund’s investment program.
RISKS OF STOCK INVESTING
The fund’s share price can fall because of weakness in the stock markets, a particular industry, or specific holdings. Stock markets can decline for many reasons, including adverse political or economic developments, changes in investor psychology, or heavy institutional selling. The prospects for an industry or company may deteriorate because of a variety of factors, including disappointing earnings or changes in the competitive environment. In addition, the investment manager’s assessment of companies held in a fund may prove incorrect, resulting in losses or poor performance even in rising markets.
GLOSSARY
Dividend yield: The annual dividend of a stock divided by the stock’s price.
EBITDA: A measure of earnings before interest, taxes, depreciation, and amortization that is used to focus on a company’s liquid cash flow.
Earnings growth rate–current fiscal year: Measures the annualized percent change in earnings per share from the prior fiscal year to the current fiscal year.
Free cash flow: The excess cash a company is generating from its operations that can be taken out of the business for the benefit of shareholders, such as dividends, share repurchases, investments, and acquisitions.
Lipper indexes: Fund benchmarks that consist of a small number (10 to 30) of the largest mutual funds in a particular category as defined by Lipper Inc.
Price-to-earnings (P/E) ratio–current fiscal year: A valuation measure calculated by dividing the price of a stock by its reported earnings per share from the latest fiscal year. The ratio is a measure of how much investors are willing to pay for the company’s earnings. The higher the P/E, the more investors are paying for a company’s current earnings.
Price-to-earnings (P/E) ratio–next fiscal year: A valuation measure calculated by dividing the price of a stock by its estimated earnings for the next fiscal year. The ratio is a measure of how much investors are willing to pay for the company’s future earnings. The higher the P/E, the more investors are paying for the company’s expected earnings growth in the next fiscal year.
Price-to-earnings (P/E) ratio–12 months forward: A valuation measure calculated by dividing the price of a stock by the analysts’ forecast of the next 12 months’ expected earnings. The ratio is a measure of how much investors are willing to pay for the company’s future earnings. The higher the P/E, the more investors are paying for a company’s earnings growth in the next 12 months.
Projected earnings growth rate (IBES): A company’s expected earnings per share growth rate for a given time period based on the forecast from the Institutional Brokers’ Estimate System, which is commonly referred to as IBES.
S&P 500 Index: An unmanaged index that tracks the stocks of 500 primarily large-cap U.S. companies.
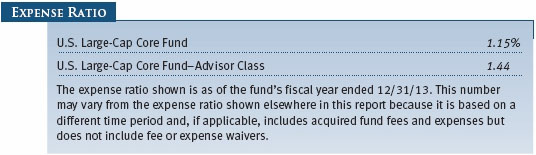
Performance and Expenses
This table shows the value of a hypothetical $10,000 investment in the fund over the past 10 fiscal year periods or since inception (for funds lacking 10-year records). The result is compared with benchmarks, which may include a broad-based market index and a peer group average or index. Market indexes do not include expenses, which are deducted from fund returns as well as mutual fund averages and indexes.
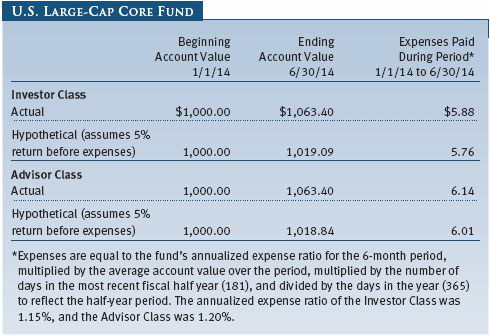
As a mutual fund shareholder, you may incur two types of costs: (1) transaction costs, such as redemption fees or sales loads, and (2) ongoing costs, including management fees, distribution and service (12b-1) fees, and other fund expenses. The following example is intended to help you understand your ongoing costs (in dollars) of investing in the fund and to compare these costs with the ongoing costs of investing in other mutual funds. The example is based on an investment of $1,000 invested at the beginning of the most recent six-month period and held for the entire period.
Please note that the fund has two share classes: The original share class (Investor Class) charges no distribution and service (12b-1) fee, and the Advisor Class shares are offered only through unaffiliated brokers and other financial intermediaries and charge a 0.25% 12b-1 fee. Each share class is presented separately in the table.
Actual Expenses
The first line of the following table (Actual) provides information about actual account values and expenses based on the fund’s actual returns. You may use the information on this line, together with your account balance, to estimate the expenses that you paid over the period. Simply divide your account value by $1,000 (for example, an $8,600 account value divided by $1,000 = 8.6), then multiply the result by the number on the first line under the heading “Expenses Paid During Period” to estimate the expenses you paid on your account during this period.
Hypothetical Example for Comparison Purposes
The information on the second line of the table (Hypothetical) is based on hypothetical account values and expenses derived from the fund’s actual expense ratio and an assumed 5% per year rate of return before expenses (not the fund’s actual return). You may compare the ongoing costs of investing in the fund with other funds by contrasting this 5% hypothetical example and the 5% hypothetical examples that appear in the shareholder reports of the other funds. The hypothetical account values and expenses may not be used to estimate the actual ending account balance or expenses you paid for the period.
Note: T. Rowe Price charges an annual account service fee of $20, generally for accounts with less than $10,000. The fee is waived for any investor whose T. Rowe Price mutual fund accounts total $50,000 or more; accounts electing to receive electronic delivery of account statements, transaction confirmations, prospectuses, and shareholder reports; or accounts of an investor who is a T. Rowe Price Preferred Services, Personal Services, or Enhanced Personal Services client (enrollment in these programs generally requires T. Rowe Price assets of at least $100,000). This fee is not included in the accompanying table. If you are subject to the fee, keep it in mind when you are estimating the ongoing expenses of investing in the fund and when comparing the expenses of this fund with other funds.
You should also be aware that the expenses shown in the table highlight only your ongoing costs and do not reflect any transaction costs, such as redemption fees or sales loads. Therefore, the second line of the table is useful in comparing ongoing costs only and will not help you determine the relative total costs of owning different funds. To the extent a fund charges transaction costs, however, the total cost of owning that fund is higher.
Unaudited
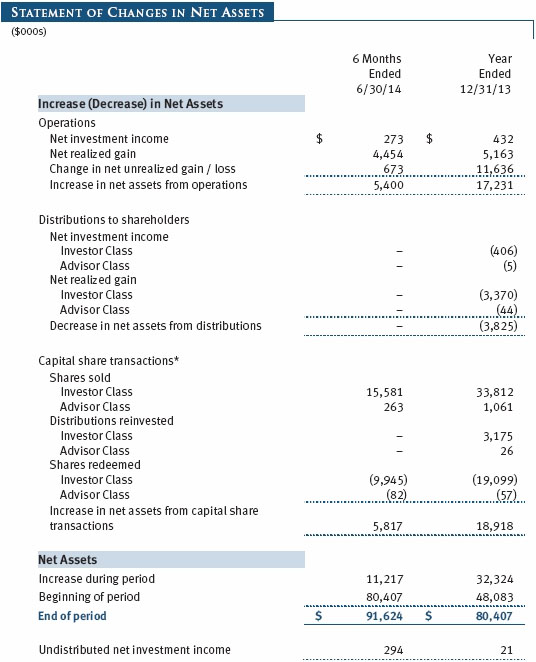
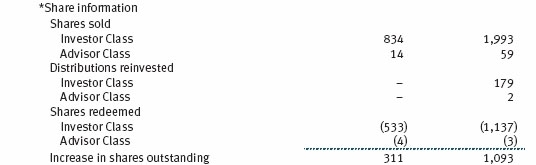
The accompanying notes are an integral part of these financial statements.
Unaudited
The accompanying notes are an integral part of these financial statements.
Unaudited
The accompanying notes are an integral part of these financial statements.
Unaudited
The accompanying notes are an integral part of these financial statements.
Unaudited
The accompanying notes are an integral part of these financial statements.
Unaudited
The accompanying notes are an integral part of these financial statements.
Unaudited
| Notes to Financial Statements |
T. Rowe Price U.S. Large-Cap Core Fund, Inc. (the fund), is registered under the Investment Company Act of 1940 (the 1940 Act) as a diversified, open-end management investment company. The fund seeks to provide long-term capital growth. The fund has two classes of shares: the U.S. Large-Cap Core Fund original share class, referred to in this report as the Investor Class, offered since June 26, 2009, and the U.S. Large-Cap Core Fund–Advisor Class (Advisor Class), offered since June 26, 2009. Advisor Class shares are sold only through unaffiliated brokers and other unaffiliated financial intermediaries that are compensated by the class for distribution, shareholder servicing, and/or certain administrative services under a Board-approved Rule 12b-1 plan. Each class has exclusive voting rights on matters related solely to that class; separate voting rights on matters that relate to both classes; and, in all other respects, the same rights and obligations as the other class.
NOTE 1 - SIGNIFICANT ACCOUNTING POLICIES
Basis of Preparation The fund is an investment company and follows accounting and reporting guidance in the Financial Accounting Standards Board Accounting Standards Codification Topic 946 (ASC 946). The accompanying financial statements were prepared in accordance with accounting principles generally accepted in the United States of America (GAAP), including but not limited to ASC 946. GAAP requires the use of estimates made by management. Management believes that estimates and valuations are appropriate; however, actual results may differ from those estimates, and the valuations reflected in the accompanying financial statements may differ from the value ultimately realized upon sale or maturity.
Investment Transactions, Investment Income, and Distributions Income and expenses are recorded on the accrual basis. Dividends received from mutual fund investments are reflected as dividend income; capital gain distributions are reflected as realized gain/loss. Dividend income and capital gain distributions are recorded on the ex-dividend date. Income tax-related interest and penalties, if incurred, would be recorded as income tax expense. Investment transactions are accounted for on the trade date. Realized gains and losses are reported on the identified cost basis. Distributions to shareholders are recorded on the ex-dividend date. Income distributions are declared and paid by each class annually. Capital gain distributions, if any, are generally declared and paid by the fund annually.
Class Accounting The Advisor Class pays distribution, shareholder servicing, and/or certain administrative expenses in the form of Rule 12b-1 fees, in an amount not exceeding 0.25% of the class’s average daily net assets. Shareholder servicing, prospectus, and shareholder report expenses incurred by each class are charged directly to the class to which they relate. Expenses common to both classes, investment income, and realized and unrealized gains and losses are allocated to the classes based upon the relative daily net assets of each class.
Rebates Subject to best execution, the fund may direct certain security trades to brokers who have agreed to rebate a portion of the related brokerage commission to the fund in cash. Commission rebates are reflected as realized gain on securities in the accompanying financial statements.
NOTE 2 - VALUATION
The fund’s financial instruments are valued and each class’s net asset value (NAV) per share is computed at the close of the New York Stock Exchange (NYSE), normally 4 p.m. ET, each day the NYSE is open for business.
Fair Value The fund’s financial instruments are reported at fair value, which GAAP defines as the price that would be received to sell an asset or paid to transfer a liability in an orderly transaction between market participants at the measurement date. The T. Rowe Price Valuation Committee (the Valuation Committee) has been established by the fund’s Board of Directors (the Board) to ensure that financial instruments are appropriately priced at fair value in accordance with GAAP and the 1940 Act. Subject to oversight by the Board, the Valuation Committee develops and oversees pricing-related policies and procedures and approves all fair value determinations. Specifically, the Valuation Committee establishes procedures to value securities; determines pricing techniques, sources, and persons eligible to effect fair value pricing actions; oversees the selection, services, and performance of pricing vendors; oversees valuation-related business continuity practices; and provides guidance on internal controls and valuation-related matters. The Valuation Committee reports to the fund’s Board; is chaired by the fund’s treasurer; and has representation from legal, portfolio management and trading, operations, and risk management.
Various valuation techniques and inputs are used to determine the fair value of financial instruments. GAAP establishes the following fair value hierarchy that categorizes the inputs used to measure fair value:
Level 1 – quoted prices (unadjusted) in active markets for identical financial instruments that the fund can access at the reporting date
Level 2 – inputs other than Level 1 quoted prices that are observable, either directly or indirectly (including, but not limited to, quoted prices for similar financial instruments in active markets, quoted prices for identical or similar financial instruments in inactive markets, interest rates and yield curves, implied volatilities, and credit spreads)
Level 3 – unobservable inputs
Observable inputs are developed using market data, such as publicly available information about actual events or transactions, and reflect the assumptions that market participants would use to price the financial instrument. Unobservable inputs are those for which market data are not available and are developed using the best information available about the assumptions that market participants would use to price the financial instrument. GAAP requires valuation techniques to maximize the use of relevant observable inputs and minimize the use of unobservable inputs. When multiple inputs are used to derive fair value, the financial instrument is assigned to the level within the fair value hierarchy based on the lowest-level input that is significant to the fair value of the financial instrument. Input levels are not necessarily an indication of the risk or liquidity associated with financial instruments at that level but rather the degree of judgment used in determining those values.
Valuation Techniques Equity securities listed or regularly traded on a securities exchange or in the over-the-counter (OTC) market are valued at the last quoted sale price or, for certain markets, the official closing price at the time the valuations are made. OTC Bulletin Board securities are valued at the mean of the closing bid and asked prices. A security that is listed or traded on more than one exchange is valued at the quotation on the exchange determined to be the primary market for such security. Listed securities not traded on a particular day are valued at the mean of the closing bid and asked prices. Actively traded domestic equity securities generally are categorized in Level 1 of the fair value hierarchy. OTC Bulletin Board securities, certain preferred securities, and equity securities traded in inactive markets generally are categorized in Level 2 of the fair value hierarchy.
Investments in mutual funds are valued at the mutual fund’s closing NAV per share on the day of valuation and are categorized in Level 1 of the fair value hierarchy. Assets and liabilities other than financial instruments, including short-term receivables and payables, are carried at cost, or estimated realizable value, if less, which approximates fair value.
Thinly traded financial instruments and those for which the above valuation procedures are inappropriate or are deemed not to reflect fair value are stated at fair value as determined in good faith by the Valuation Committee. The objective of any fair value pricing determination is to arrive at a price that could reasonably be expected from a current sale. Financial instruments fair valued by the Valuation Committee are primarily private placements, restricted securities, warrants, rights, and other securities that are not publicly traded.
Subject to oversight by the Board, the Valuation Committee regularly makes good faith judgments to establish and adjust the fair valuations of certain securities as events occur and circumstances warrant. For instance, in determining the fair value of an equity investment with limited market activity, such as a private placement or a thinly traded public company stock, the Valuation Committee considers a variety of factors, which may include, but are not limited to, the issuer’s business prospects, its financial standing and performance, recent investment transactions in the issuer, new rounds of financing, negotiated transactions of significant size between other investors in the company, relevant market valuations of peer companies, strategic events affecting the company, market liquidity for the issuer, and general economic conditions and events. In consultation with the investment and pricing teams, the Valuation Committee will determine an appropriate valuation technique based on available information, which may include both observable and unobservable inputs. The Valuation Committee typically will afford greatest weight to actual prices in arm’s length transactions, to the extent they represent orderly transactions between market participants; transaction information can be reliably obtained; and prices are deemed representative of fair value. However, the Valuation Committee may also consider other valuation methods such as market-based valuation multiples; a discount or premium from market value of a similar, freely traded security of the same issuer; or some combination. Fair value determinations are reviewed on a regular basis and updated as information becomes available, including actual purchase and sale transactions of the issue. Because any fair value determination involves a significant amount of judgment, there is a degree of subjectivity inherent in such pricing decisions, and fair value prices determined by the Valuation Committee could differ from those of other market participants. Depending on the relative significance of unobservable inputs, including the valuation technique(s) used, fair valued securities may be categorized in Level 2 or 3 of the fair value hierarchy.
Valuation Inputs On June 30, 2014, all of the fund’s financial instruments were classified as Level 1, based on the inputs used to determine their fair values.
NOTE 3 - OTHER INVESTMENT TRANSACTIONS
Consistent with its investment objective, the fund engages in the following practices to manage exposure to certain risks and/or to enhance performance. The investment objective, policies, program, and risk factors of the fund are described more fully in the fund’s prospectus and Statement of Additional Information.
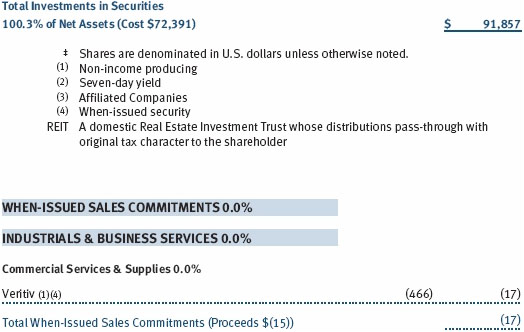
When-Issued Securities The fund may enter into when-issued purchase or sale commitments, pursuant to which it agrees to purchase or sell, respectively, an authorized but not yet issued security for a fixed unit price, with payment and delivery not due until issuance of the security on a scheduled future date. When-issued securities may be new securities or securities issued through a corporate action, such as a reorganization or restructuring. Until settlement, the fund maintains liquid assets sufficient to settle its commitment to purchase a when-issued security or, in the case of a sale commitment, the fund maintains an entitlement to the security to be sold. Amounts realized on when-issued transactions are included in realized gain/loss on securities in the accompanying financial statements.
Other Purchases and sales of portfolio securities other than short-term securities aggregated $33,005,000 and $27,391,000, respectively, for the six months ended June 30, 2014.
NOTE 4 - FEDERAL INCOME TAXES
No provision for federal income taxes is required since the fund intends to continue to qualify as a regulated investment company under Subchapter M of the Internal Revenue Code and distribute to shareholders all of its taxable income and gains. Distributions determined in accordance with federal income tax regulations may differ in amount or character from net investment income and realized gains for financial reporting purposes. Financial reporting records are adjusted for permanent book/tax differences to reflect tax character but are not adjusted for temporary differences. The amount and character of tax-basis distributions and composition of net assets are finalized at fiscal year-end; accordingly, tax-basis balances have not been determined as of the date of this report.
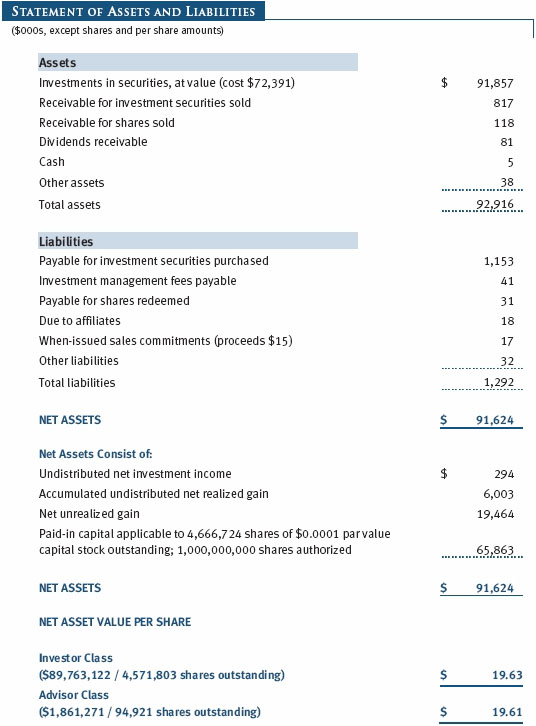
At June 30, 2014, the cost of investments for federal income tax purposes was $72,493,000. Net unrealized gain aggregated $19,362,000 at period-end, of which $19,830,000 related to appreciated investments and $468,000 related to depreciated investments.
NOTE 5 - RELATED PARTY TRANSACTIONS
The fund is managed by T. Rowe Price Associates, Inc. (Price Associates), a wholly owned subsidiary of T. Rowe Price Group, Inc. (Price Group). The investment management agreement between the fund and Price Associates provides for an annual investment management fee, which is computed daily and paid monthly. The fee consists of an individual fund fee, equal to 0.25% of the fund’s average daily net assets, and a group fee. The group fee rate is calculated based on the combined net assets of certain mutual funds sponsored by Price Associates (the group) applied to a graduated fee schedule, with rates ranging from 0.48% for the first $1 billion of assets to 0.275% for assets in excess of $400 billion. The fund’s group fee is determined by applying the group fee rate to the fund’s average daily net assets. At June 30, 2014, the effective annual group fee rate was 0.29%.
The Investor Class and Advisor Class are also subject to a contractual expense limitation through the limitation dates indicated in the table below. During the limitation period, Price Associates is required to waive its management fee or reimburse expenses, excluding interest, taxes, brokerage commissions, and extraordinary expenses that would otherwise cause the class’s ratio of annualized total expenses to average net assets (expense ratio) to exceed its expense limitation. Each class is required to repay Price Associates for expenses previously reimbursed and management fees waived to the extent the class’s net assets grow or expenses decline sufficiently to allow repayment without causing the class’s expense ratio to exceed its expense limitation. However, no repayment will be made more than three years after the date of a reimbursement or waiver.
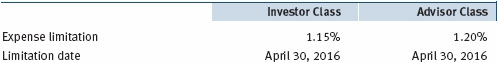
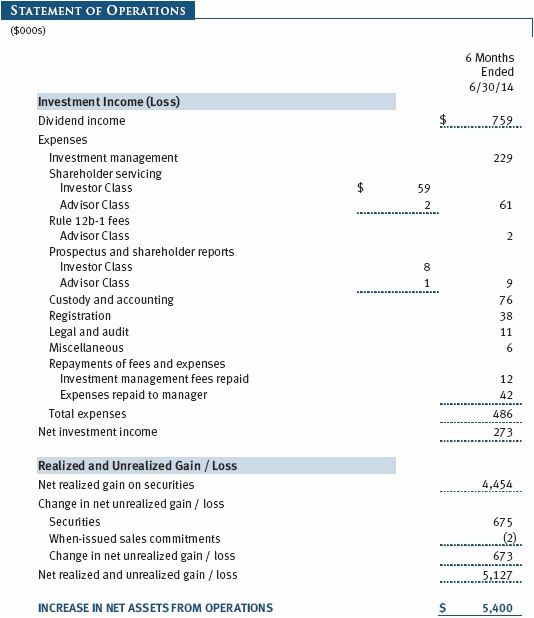
Pursuant to this agreement, management fees in the amount of $12,000 were repaid and expenses in the amount of $42,000 were repaid to Price Associates during the six months ended June 30, 2014. Including these amounts, expenses previously reimbursed by Price Associates in the amount of $203,000 remain subject to repayment at June 30, 2014. For the six months ended June 30, 2014, each class operated below its expense limitation.
In addition, the fund has entered into service agreements with Price Associates and two wholly owned subsidiaries of Price Associates (collectively, Price). Price Associates computes the daily share prices and provides certain other administrative services to the fund. T. Rowe Price Services, Inc., provides shareholder and administrative services in its capacity as the fund’s transfer and dividend-disbursing agent. T. Rowe Price Retirement Plan Services, Inc., provides subaccounting and recordkeeping services for certain retirement accounts invested in the Investor Class. For the six months ended June 30, 2014, expenses incurred pursuant to these service agreements were $59,000 for Price Associates; $44,000 for T. Rowe Price Services, Inc.; and $1,000 for T. Rowe Price Retirement Plan Services, Inc. The total amount payable at period-end pursuant to these service agreements is reflected as Due to Affiliates in the accompanying financial statements.
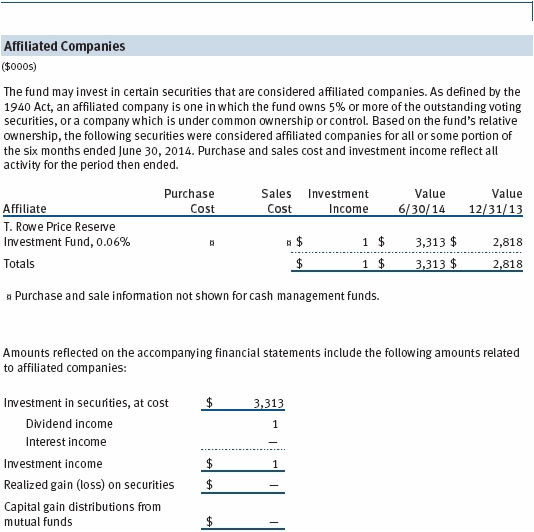
The fund may invest in the T. Rowe Price Reserve Investment Fund and the T. Rowe Price Government Reserve Investment Fund (collectively, the T. Rowe Price Reserve Investment Funds), open-end management investment companies managed by Price Associates and considered affiliates of the fund. The T. Rowe Price Reserve Investment Funds are offered as cash management options to mutual funds, trusts, and other accounts managed by Price Associates and/or its affiliates and are not available for direct purchase by members of the public. The T. Rowe Price Reserve Investment Funds pay no investment management fees.
As of June 30, 2013, T. Rowe Price Group, Inc., and/or its wholly owned subsidiaries owned 575,000 shares of the Investor Class and 25,000 shares of the Advisor Class, aggregating 13% of the fund’s net assets.
| Information on Proxy Voting Policies, Procedures, and Records |
A description of the policies and procedures used by T. Rowe Price funds and portfolios to determine how to vote proxies relating to portfolio securities is available in each fund’s Statement of Additional Information. You may request this document by calling 1-800-225-5132 or by accessing the SEC’s website, sec.gov.
The description of our proxy voting policies and procedures is also available on our website, troweprice.com. To access it, click on the words “Social Responsibility” at the top of our corporate homepage. Next, click on the words “Conducting Business Responsibly” on the left side of the page that appears. Finally, click on the words “Proxy Voting Policies” on the left side of the page that appears.
Each fund’s most recent annual proxy voting record is available on our website and through the SEC’s website. To access it through our website, follow the above directions to reach the “Conducting Business Responsibly” page. Click on the words “Proxy Voting Records” on the left side of that page, and then click on the “View Proxy Voting Records” link at the bottom of the page that appears.
| How to Obtain Quarterly Portfolio Holdings |
The fund files a complete schedule of portfolio holdings with the Securities and Exchange Commission for the first and third quarters of each fiscal year on Form N-Q. The fund’s Form N-Q is available electronically on the SEC’s website (sec.gov); hard copies may be reviewed and copied at the SEC’s Public Reference Room, 100 F St. N.E., Washington, DC 20549. For more information on the Public Reference Room, call 1-800-SEC-0330.
| Approval of Investment Management Agreement |
On April 30, 2014, the fund’s Board of Directors (Board), including a majority of the fund’s independent directors, approved the continuation of the investment management agreement (Advisory Contract) between the fund and its investment advisor, T. Rowe Price Associates, Inc. (Advisor). The April meeting followed a telephonic meeting held on March 4, 2014, during which the Board reviewed information and discussed the continuation of the Advisory Contract. In connection with its deliberations, the Board requested, and the Advisor provided, such information as the Board (with advice from independent legal counsel) deemed reasonably necessary. The Board considered a variety of factors in connection with its review of the Advisory Contract, also taking into account information provided by the Advisor during the course of the year, as discussed below:
Services Provided by the Advisor
The Board considered the nature, quality, and extent of the services provided to the fund by the Advisor. These services included, but were not limited to, directing the fund’s investments in accordance with its investment program and the overall management of the fund’s portfolio, as well as a variety of related activities such as financial, investment operations, and administrative services; compliance; maintaining the fund’s records and registrations; and shareholder communications. The Board also reviewed the background and experience of the Advisor’s senior management team and investment personnel involved in the management of the fund, as well as the Advisor’s compliance record. The Board concluded that it was satisfied with the nature, quality, and extent of the services provided by the Advisor.
Investment Performance of the Fund
The Board reviewed the fund’s three-month, one-year, and year-by-year returns, as well as the fund’s average annualized three-year and since-inception returns, and compared these returns with a wide variety of previously agreed upon comparable performance measures and market data, including those supplied by Lipper and Morningstar, which are independent providers of mutual fund data.
On the basis of this evaluation and the Board’s ongoing review of investment results, and factoring in the relative market conditions during certain of the performance periods, the Board concluded that the fund’s performance was satisfactory.
Costs, Benefits, Profits, and Economies of Scale
The Board reviewed detailed information regarding the revenues received by the Advisor under the Advisory Contract and other benefits that the Advisor (and its affiliates) may have realized from its relationship with the fund, including any research received under “soft dollar” agreements and commission-sharing arrangements with broker-dealers. The Board considered that the Advisor may receive some benefit from soft-dollar arrangements pursuant to which research is received from broker-dealers that execute the applicable fund’s portfolio transactions. The Board received information on the estimated costs incurred and profits realized by the Advisor from managing T. Rowe Price mutual funds.
While the Board did not review information regarding profits realized from managing the fund in particular because the fund had not achieved sufficient scale to produce meaningful profit margin percentages, the Board concluded that the Advisor’s profits were reasonable in light of the services provided to the funds.
The Board also considered whether the fund benefits under the fee levels set forth in the Advisory Contract from any economies of scale realized by the Advisor. Under the Advisory Contract, the fund pays a fee to the Advisor for investment management services composed of two components—a group fee rate based on the combined average net assets of most of the T. Rowe Price mutual funds (including the fund) that declines at certain asset levels and an individual fund fee rate based on the fund’s average daily net assets—and the fund pays its own expenses of operations (subject to an expense limitation agreed to by the Advisor with respect to both the Investor Class and Advisor Class). The Board concluded that the advisory fee structure for the fund continued to provide for a reasonable sharing of benefits from any economies of scale with the fund’s investors.
Fees
The Board was provided with information regarding industry trends in management fees and expenses, and the Board reviewed the fund’s management fee rate, operating expenses, and total expense ratio for the Investor Class and Advisor Class in comparison to fees and expenses of other comparable funds based on information and data supplied by Lipper. The information provided to the Board indicated that the fund’s management fee rate (after including reductions of the management fee that resulted from the contractual expense limitation) was above the median for certain groups of comparable funds and at or below the median for other groups of comparable funds. The information also indicated that the total expense ratio for the Investor Class was above the median for certain groups of comparable funds and at or below the median for other groups of comparable funds, and the total expense ratio for the Advisor Class was at or below the median for comparable funds.
The Board also reviewed the fee schedules for institutional accounts and private accounts with similar mandates that are advised or subadvised by the Advisor and its affiliates. Management provided the Board with information about the Advisor’s responsibilities and services provided to institutional account clients, including information about how the requirements and economics of the institutional business are fundamentally different from those of the mutual fund business. The Board considered information showing that the mutual fund business is generally more complex from a business and compliance perspective than the institutional business and that the Advisor generally performs significant additional services and assumes greater risk in managing the fund and other T. Rowe Price mutual funds than it does for institutional account clients.
On the basis of the information provided and the factors considered, the Board concluded that the fees paid by the fund under the Advisory Contract are reasonable.
Approval of the Advisory Contract
As noted, the Board approved the continuation of the Advisory Contract. No single factor was considered in isolation or to be determinative to the decision. Rather, the Board concluded, in light of a weighting and balancing of all factors considered, that it was in the best interests of the fund and its shareholders for the Board to approve the continuation of the Advisory Contract (including the fees to be charged for services thereunder). The independent directors were advised throughout the process by independent legal counsel.
Item 2. Code of Ethics.
A code of ethics, as defined in Item 2 of Form N-CSR, applicable to its principal executive officer, principal financial officer, principal accounting officer or controller, or persons performing similar functions is filed as an exhibit to the registrant’s annual Form N-CSR. No substantive amendments were approved or waivers were granted to this code of ethics during the registrant’s most recent fiscal half-year.
Item 3. Audit Committee Financial Expert.
Disclosure required in registrant’s annual Form N-CSR.
Item 4. Principal Accountant Fees and Services.
Disclosure required in registrant’s annual Form N-CSR.
Item 5. Audit Committee of Listed Registrants.
Not applicable.
Item 6. Investments.
(a) Not applicable. The complete schedule of investments is included in Item 1 of this Form N-CSR.
(b) Not applicable.
Item 7. Disclosure of Proxy Voting Policies and Procedures for Closed-End Management Investment Companies.
Not applicable.
Item 8. Portfolio Managers of Closed-End Management Investment Companies.
Not applicable.
Item 9. Purchases of Equity Securities by Closed-End Management Investment Company and Affiliated Purchasers.
Not applicable.
Item 10. Submission of Matters to a Vote of Security Holders.
Not applicable.
Item 11. Controls and Procedures.
(a) The registrant’s principal executive officer and principal financial officer have evaluated the registrant’s disclosure controls and procedures within 90 days of this filing and have concluded that the registrant’s disclosure controls and procedures were effective, as of that date, in ensuring that information required to be disclosed by the registrant in this Form N-CSR was recorded, processed, summarized, and reported timely.
(b) The registrant’s principal executive officer and principal financial officer are aware of no change in the registrant’s internal control over financial reporting that occurred during the registrant’s second fiscal quarter covered by this report that has materially affected, or is reasonably likely to materially affect, the registrant’s internal control over financial reporting.
Item 12. Exhibits.
(a)(1) The registrant’s code of ethics pursuant to Item 2 of Form N-CSR is filed with the registrant’s annual Form N-CSR.
(2) Separate certifications by the registrant's principal executive officer and principal financial officer, pursuant to Section 302 of the Sarbanes-Oxley Act of 2002 and required by Rule 30a-2(a) under the Investment Company Act of 1940, are attached.
(3) Written solicitation to repurchase securities issued by closed-end companies: not applicable.
(b) A certification by the registrant's principal executive officer and principal financial officer, pursuant to Section 906 of the Sarbanes-Oxley Act of 2002 and required by Rule 30a-2(b) under the Investment Company Act of 1940, is attached.
SIGNATURES
Pursuant to the requirements of the Securities Exchange Act of 1934 and the Investment Company Act of 1940, the registrant has duly caused this report to be signed on its behalf by the undersigned, thereunto duly authorized.
T. Rowe Price U.S. Large-Cap Core Fund, Inc.
| | By | /s/ Edward C. Bernard |
| | Edward C. Bernard |
| | Principal Executive Officer |
| |
| Date August 18, 2014 | | |
Pursuant to the requirements of the Securities Exchange Act of 1934 and the Investment Company Act of 1940, this report has been signed below by the following persons on behalf of the registrant and in the capacities and on the dates indicated.
| | By | /s/ Edward C. Bernard |
| | Edward C. Bernard |
| | Principal Executive Officer |
| |
| Date August 18, 2014 | | |
| |
| |
| By | /s/ Gregory K. Hinkle |
| | Gregory K. Hinkle |
| | Principal Financial Officer |
| |
| Date August 18, 2014 | | |