UNITED STATES
SECURITIES AND EXCHANGE COMMISSION
Washington, D.C. 20549
FORM N-CSR
CERTIFIED SHAREHOLDER REPORT OF REGISTERED
MANAGEMENT INVESTMENT COMPANIES
Investment Company Act File Number: 811-22293
| T. Rowe Price U.S. Large-Cap Core Fund, Inc. |
|
| (Exact name of registrant as specified in charter) |
| |
| 100 East Pratt Street, Baltimore, MD 21202 |
|
| (Address of principal executive offices) |
| |
| David Oestreicher |
| 100 East Pratt Street, Baltimore, MD 21202 |
|
| (Name and address of agent for service) |
Registrant’s telephone number, including area code: (410) 345-2000
Date of fiscal year end: December 31
Date of reporting period: June 30, 2017
Item 1. Report to Shareholders
| U.S. Large-Cap Core Fund | June 30, 2017 |
The views and opinions in this report were current as of June 30, 2017. They are not guarantees of performance or investment results and should not be taken as investment advice. Investment decisions reflect a variety of factors, and the managers reserve the right to change their views about individual stocks, sectors, and the markets at any time. As a result, the views expressed should not be relied upon as a forecast of the fund’s future investment intent. The report is certified under the Sarbanes-Oxley Act, which requires mutual funds and other public companies to affirm that, to the best of their knowledge, the information in their financial reports is fairly and accurately stated in all material respects.
REPORTS ON THE WEB
Sign up for our Email Program, and you can begin to receive updated fund reports and prospectuses online rather than through the mail. Log in to your account at troweprice.com for more information.
Manager’s Letter
Fellow Shareholders
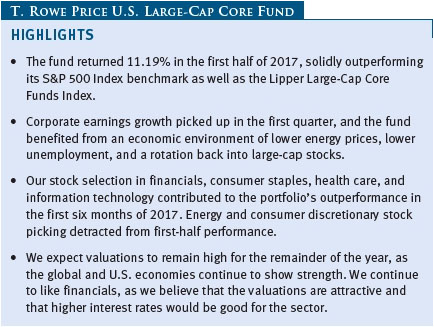
Corporate earnings growth picked up in the first quarter, and the fund benefited from an economic environment of lower energy prices, lower unemployment, and a rotation back into large-cap stocks. Some sectors, including information technology and health care, outperformed the broader index as growth stocks were favored over value and cyclical stocks.
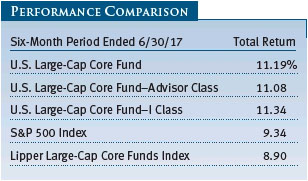
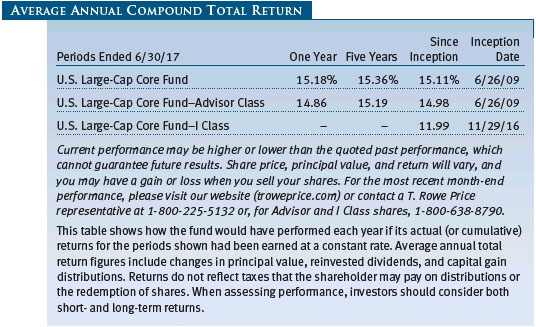
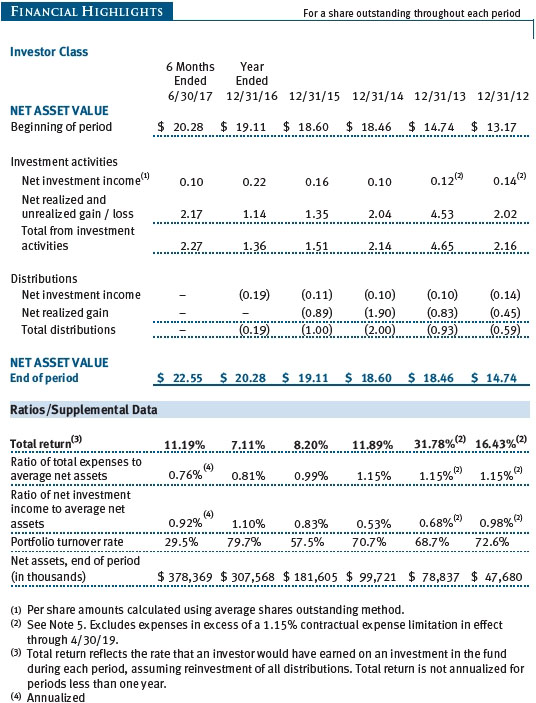
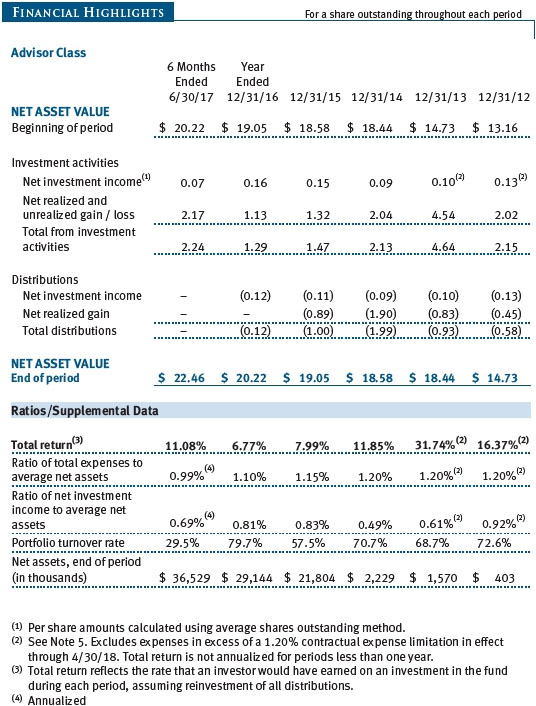
Your fund returned 11.19% for the six-month period ended June 30, 2017, compared with 9.34% for the S&P 500 Index and 8.90% for the Lipper Large-Cap Core Funds Index. (Results for the Advisor and I Class shares will vary, reflecting their different expense ratios.)
INVESTMENT APPROACH
The U.S. Large-Cap Core Fund seeks long-term capital appreciation by investing in a concentrated portfolio of domestic large-cap growth and value stocks. The fund employs fundamental, bottom-up analysis and a rigorous valuation assessment to find the stocks with the most potential for appreciation.
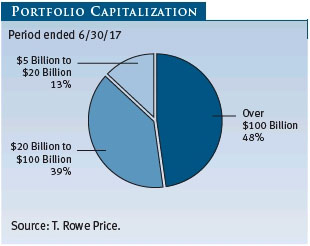
In selecting stocks for the portfolio, the fund generally starts with companies of more than $5 billion in market capitalization that carry “buy” ratings from T. Rowe Price analysts. In our analyses of these companies, we focus on four key elements:
| ● | Understanding a company’s business model and strategy
|
| ● | Developing a relationship with the company’s management
|
| ● | Determining the company’s standing within its industry
|
| ● | Assessing the company’s valuation |
The fund has a bias toward high-quality companies that have opportunities to increase their market share or have barriers to entry around their business that protect them and allow them to grow organically.
We look for well-managed firms with great products and services within an industry that may be in a cyclical trough. Lastly, we favor companies with characteristics that we believe can drive equity appreciation, such as pricing power, new product cycles, improving margins, and a strategy to earn better returns on their invested capital. Beyond good fundamentals, we look for management teams that can create value by executing well and improving the business. We also pay close attention to free cash flow and management’s effectiveness in redeploying its capital. We like managements that invest in their business when there is the potential for attractive returns or return of capital to shareholders if conditions warrant.
We also employ a disciplined sell process. After stocks are added to the portfolio, they are subject to continued scrutiny. Criteria for selling stocks include a downgrade by a T. Rowe Price analyst, deterioration in the company’s fundamentals or management, the discovery of a better investment idea, or the fulfillment of our investment thesis when a stock becomes fully valued.
MARKET AND ECONOMIC REVIEW
Profits for the S&P 500 Index as a whole rose at their fastest year-over-year pace in several years in the first quarter of 2017, a welcome turnaround after five quarters of earnings declines that began in mid-2015. Overseas, indicators signaling rising demand and faster economic growth in many countries lifted confidence in the global outlook. The strong performance in the U.S. and other major developed markets occurred even as the Federal Reserve continued to tighten its accommodative monetary policy in place since the 2008 financial crisis. The S&P 500 Index rose to record levels in June, joining many global stock benchmarks that reached all-time highs in the spring.
Large-cap shares outperformed their smaller peers. In the S&P 500 Index, nine out of 11 sectors advanced and two fell. Information technology performed best, driven by outsized gains in a handful of technology and Internet stocks, followed by health care and consumer discretionary. All three sectors produced double-digit returns. On the other hand, energy stocks fell the most as crude oil prices fell into a bear market amid a persistent global oversupply of oil.
PORTFOLIO PERFORMANCE AND STRATEGY
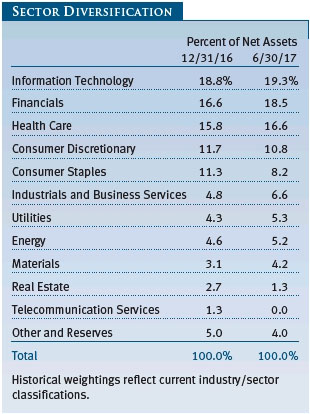
Our stock selection in financials, consumer staples, health care, and information technology contributed to the portfolio’s outperformance in the first six months of 2017. Relative to the S&P 500 Index, our stock selection in consumer discretionary and energy did not perform well.
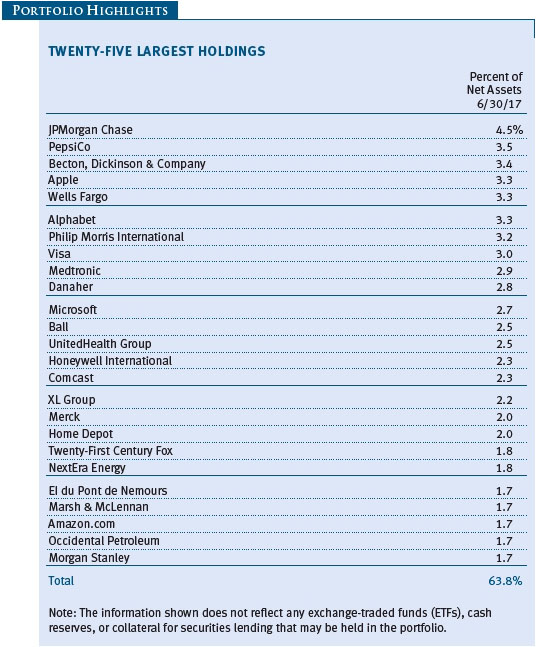
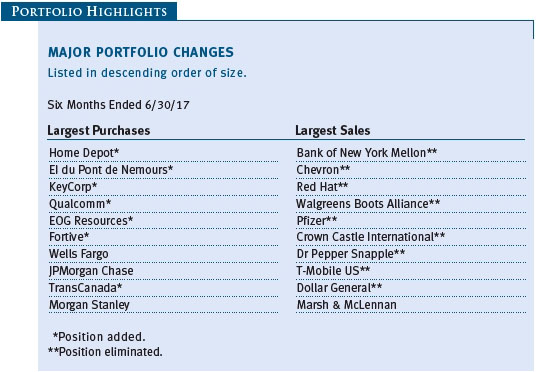
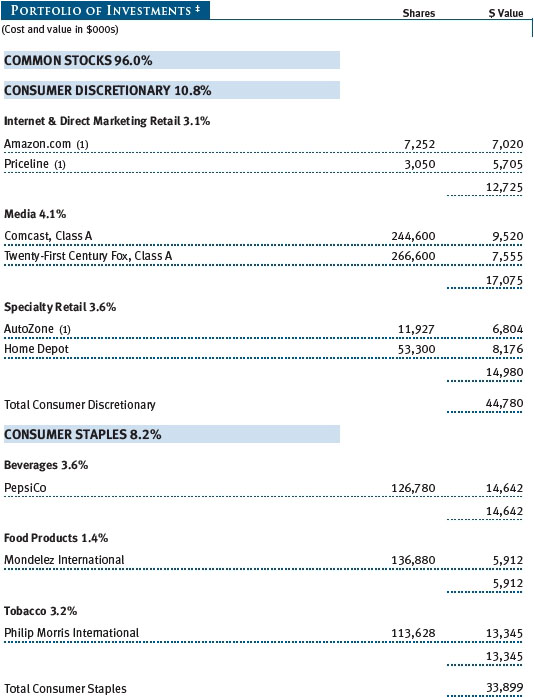
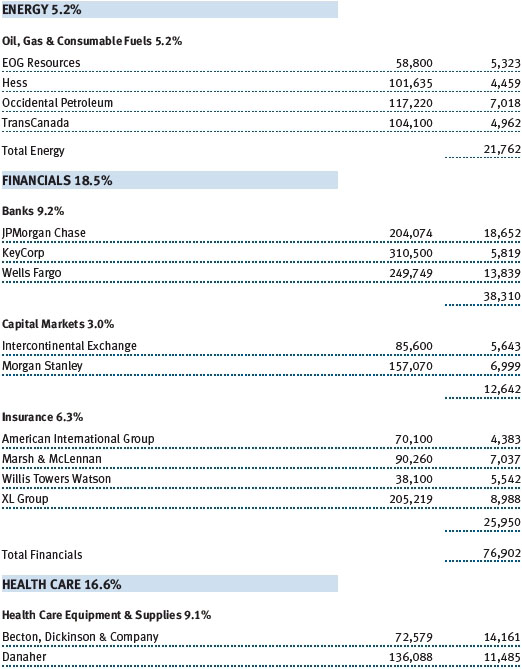
Within the financial sector, the strongest performers in our portfolio were insurance companies, as investors rotated out of interest rate-sensitive banks. XL Group, Willis Towers Watson, and Marsh & McLennan were outstanding performers. In the second quarter, we initiated a position into another insurance company, AIG, which we believe has been undervalued by the market. AIG is poised for a turnaround and has made strong progress in moves to fix its once ailing balance sheet. We eliminated Bank of New York Mellon and put those proceeds into Wells Fargo and KeyCorp. During the period, we have seen some banks saddled with lower valuations due in part to the absence of tax reform or meaningful regulatory reform. Our belief is that the cheaper valuations were a good opportunity to add to some of our existing positions, and financials remained one of our largest absolute positions. (Please refer to the fund’s portfolio of investments for a complete list of holdings and the amount each represents in the portfolio.)
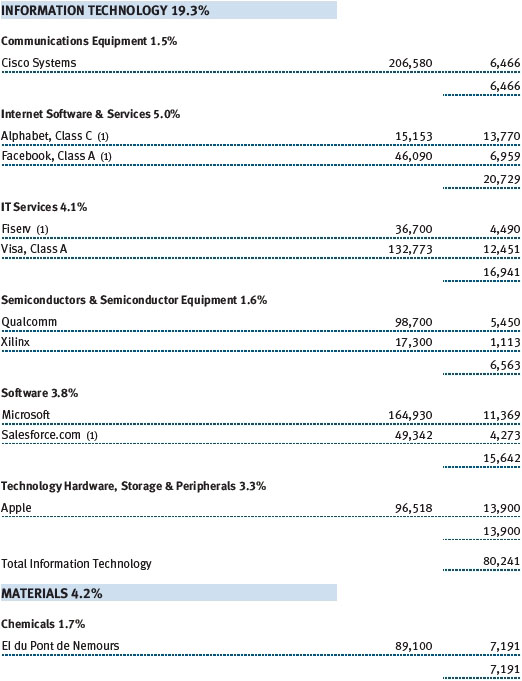
Information technology occupied our largest absolute position, though it is slightly underweight in the portfolio. Visa was a solid performer, benefiting from accelerated growth and strong first-quarter earnings. We also like that the company is reducing its costs and beginning to realize synergies from its Visa Europe acquisition. Open-source software company Red Hat was another strong contributor, which saw shares strengthen on the back of better-than-expected earnings results and a landscape market shift accelerating the adoption of the public cloud. We initiated a position in Xilinx, a semiconductor company that specializes in supplying programmable logic devices. It has been underappreciated by the market, in our opinion, but it has promise of taking additional market share as the growth in data centers is expected to rise. We trimmed our position in Apple during the second quarter on strength.
We reduced our weighting in consumer staples. In particular, we eliminated detractor Walgreens Boots Alliance because we think that Internet-based retailers are eroding its competitive strength. Dr Pepper Snapple was also eliminated, as we became less confident about its ability to find success with BAI drinks. On the other hand, Philip Morris International was an excellent contributor, as the market recognized the strength and growth potential of its smokeless tobacco product iQOS. We believe that the stock will continue to appreciate as iQOS expands its market. Our underweight in the sector also aided performance.
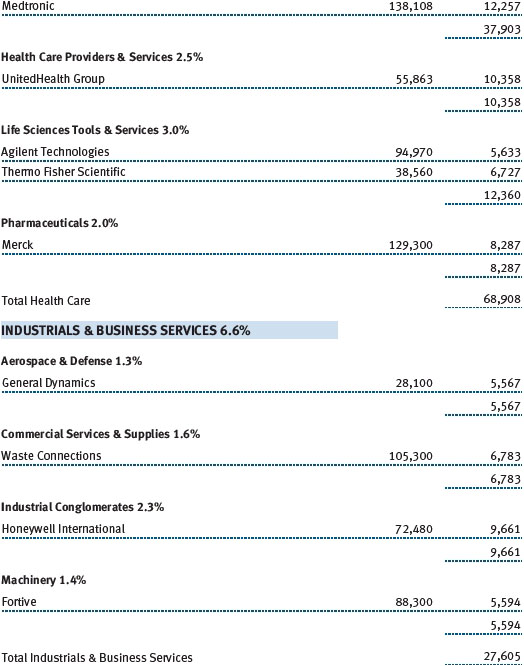
Within the health care sector, our overweight position and stock selection helped performance. We favored medical technology equipment suppliers over biotechnology stocks and in the second quarter added to our positions in Becton, Dickinson & Company, Medtronic, and Danaher, all strong absolute contributors to the portfolio. We believe that medical technology companies offer more durable and growth potential.
Two stocks within consumer discretionary were the main reasons for our disappointing relative performance within the sector. Automotive goods retailer AutoZone was a significant detractor. The stock, which we owned for many years, had been a good addition to the portfolio, but during the period, it began to suffer as investors turned away from brick-and-mortar retailers in favor of online-based sellers. While we think that AutoZone may be unfairly punished, we are no longer confident that the stock will be able to consistently outperform in an increasingly competitive retail market, so we have been reducing our position. Dollar General is much the same story. It is not holding up well in the current retail landscape. Priceline and media company Comcast were strong contributors in the sector.
We remain underweight the energy sector, as we see challenging supply/demand dynamics at play. We eliminated Chevron and used the proceeds to initiate a position in EOG Resources, a lower-cost oil and gas producer. We also initiated a position in TransCanada, a large natural gas pipeline company with attractive dividend growth and a strong recurring revenue business that we like.
INVESTMENT OUTLOOK
We expect valuations to remain high for the remainder of the year, as the global and U.S. economies continue to show strength. We are encouraged that global central banks seem to be poised to begin pulling back from quantitative easing. Corporate tax reform, increased infrastructure spending, and regulatory changes—all goals of early “Trump trade” speculation—are viewed much more skeptically now, but we believe that if lower corporate taxes and fewer government regulations were to come to pass, these actions could provide a stimulus to earnings growth.
Globally, we are watching the ramifications of Brexit, which we believe will become clearer in coming months. China’s debt remains a concern as the government may have to pull back on the significant stimulus it has provided the economy over the last few years.
We continue to like financials as we believe that the valuations are attractive and that higher interest rates would be good for the sector. Meanwhile, moderate gains in consumer spending and housing prices could continue to provide a tailwind to growth. We expect that stock selection will be the primary driver of the portfolio’s longer-term outperformance and believe that our approach will benefit from a more subdued return environment and elevated volatility. As always, we rely on our global research team of industry specialists to uncover fundamentally sound companies and remain committed to providing quality risk-adjusted returns over the long term.
Respectfully submitted,

Jeffrey Rottinghaus
Chairman of the fund’s Investment Advisory Committee
July 20, 2017
The committee chairman has day-to-day responsibility for managing the portfolio and works with committee members in developing and executing the fund’s investment program.
RISKS OF STOCK INVESTING
As with all stock and bond mutual funds, a fund’s share price can fall because of weakness in the stock or bond markets, a particular industry, or specific holdings. Stock markets can decline for many reasons, including adverse political or economic developments, changes in investor psychology, or heavy institutional selling. The prospects for an industry or company may deteriorate because of a variety of factors, including disappointing earnings or changes in the competitive environment. In addition, the investment manager’s assessment of companies held in a fund may prove incorrect, resulting in losses or poor performance even in rising markets. Funds investing in stocks with a dividend orientation may have somewhat lower potential for price appreciation than those concentrating on rapidly growing firms. Also, a company may reduce or eliminate its dividend.
GLOSSARY
Free cash flow: The excess cash a company is generating from its operations that can be taken out of the business for the benefit of shareholders, such as dividends, share repurchases, investments, and acquisitions.
Lipper indexes: Fund benchmarks that consist of a small number (10 to 30) of the largest mutual funds in a particular category as tracked by Lipper Inc.
S&P 500 Index: An unmanaged index that tracks the stocks of 500 primarily large-cap U.S. companies.
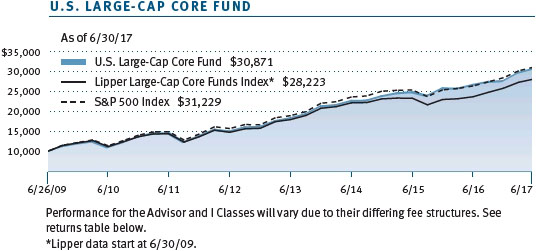
Performance and Expenses
This table shows the value of a hypothetical $10,000 investment in the fund over the past 10 fiscal year periods or since inception (for funds lacking 10-year records). The result is compared with benchmarks, which may include a broad-based market index and a peer group average or index. Market indexes do not include expenses, which are deducted from fund returns as well as mutual fund averages and indexes.
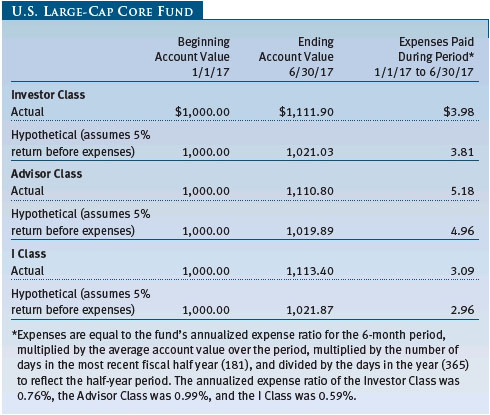
As a mutual fund shareholder, you may incur two types of costs: (1) transaction costs, such as redemption fees or sales loads, and (2) ongoing costs, including management fees, distribution and service (12b-1) fees, and other fund expenses. The following example is intended to help you understand your ongoing costs (in dollars) of investing in the fund and to compare these costs with the ongoing costs of investing in other mutual funds. The example is based on an investment of $1,000 invested at the beginning of the most recent six-month period and held for the entire period.
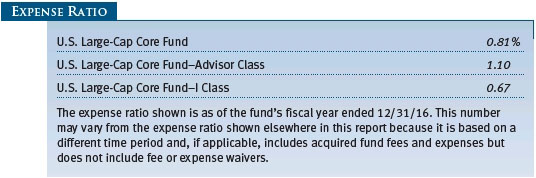
Please note that the fund has three share classes: The original share class (Investor Class) charges no distribution and service (12b-1) fee, the Advisor Class shares are offered only through unaffiliated brokers and other financial intermediaries and charge a 0.25% 12b-1 fee, and I Class shares are available to institutionally oriented clients and impose no 12b-1 or administrative fee payment. Each share class is presented separately in the table.
Actual Expenses
The first line of the following table (Actual) provides information about actual account values and expenses based on the fund’s actual returns. You may use the information on this line, together with your account balance, to estimate the expenses that you paid over the period. Simply divide your account value by $1,000 (for example, an $8,600 account value divided by $1,000 = 8.6), then multiply the result by the number on the first line under the heading “Expenses Paid During Period” to estimate the expenses you paid on your account during this period.
Hypothetical Example for Comparison Purposes
The information on the second line of the table (Hypothetical) is based on hypothetical account values and expenses derived from the fund’s actual expense ratio and an assumed 5% per year rate of return before expenses (not the fund’s actual return). You may compare the ongoing costs of investing in the fund with other funds by contrasting this 5% hypothetical example and the 5% hypothetical examples that appear in the shareholder reports of the other funds. The hypothetical account values and expenses may not be used to estimate the actual ending account balance or expenses you paid for the period.
Note: T. Rowe Price charges an annual account service fee of $20, generally for accounts with less than $10,000. The fee is waived for any investor whose T. Rowe Price mutual fund accounts total $50,000 or more; accounts electing to receive electronic delivery of account statements, transaction confirmations, prospectuses, and shareholder reports; or accounts of an investor who is a T. Rowe Price Preferred Services, Personal Services, or Enhanced Personal Services client (enrollment in these programs generally requires T. Rowe Price assets of at least $100,000). This fee is not included in the accompanying table. If you are subject to the fee, keep it in mind when you are estimating the ongoing expenses of investing in the fund and when comparing the expenses of this fund with other funds.
You should also be aware that the expenses shown in the table highlight only your ongoing costs and do not reflect any transaction costs, such as redemption fees or sales loads. Therefore, the second line of the table is useful in comparing ongoing costs only and will not help you determine the relative total costs of owning different funds. To the extent a fund charges transaction costs, however, the total cost of owning that fund is higher.
Unaudited
The accompanying notes are an integral part of these financial statements.
Unaudited
The accompanying notes are an integral part of these financial statements.
Unaudited
The accompanying notes are an integral part of these financial statements.
Unaudited
The accompanying notes are an integral part of these financial statements.
Unaudited
The accompanying notes are an integral part of these financial statements.
Unaudited
The accompanying notes are an integral part of these financial statements.
Unaudited
The accompanying notes are an integral part of these financial statements.
Unaudited
| Notes to Financial Statements |
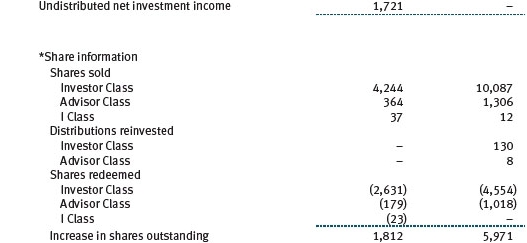
T. Rowe Price U.S. Large-Cap Core Fund, Inc. (the fund), is registered under the Investment Company Act of 1940 (the 1940 Act) as a diversified, open-end management investment company. The fund seeks to provide long term capital growth. The fund has three classes of shares: the U.S. Large-Cap Core Fund (Investor Class), the U.S. Large-Cap Core Fund–Advisor Class (Advisor Class), and the U.S. Large-Cap Core Fund–I Class (I Class). Advisor Class shares are sold only through unaffiliated brokers and other unaffiliated financial intermediaries. I Class shares generally are available only to investors meeting a $1,000,000 minimum investment or certain other criteria. The Advisor Class operates under a Board-approved Rule 12b-1 plan pursuant to which the class compensates financial intermediaries for distribution, shareholder servicing, and/or certain administrative services; the Investor and I Classes do not pay Rule 12b-1 fees. Each class has exclusive voting rights on matters related solely to that class; separate voting rights on matters that relate to all classes; and, in all other respects, the same rights and obligations as the other classes.
NOTE 1 - SIGNIFICANT ACCOUNTING POLICIES
Basis of Preparation The fund is an investment company and follows accounting and reporting guidance in the Financial Accounting Standards Board (FASB) Accounting Standards Codification Topic 946 (ASC 946). The accompanying financial statements were prepared in accordance with accounting principles generally accepted in the United States of America (GAAP), including, but not limited to, ASC 946. GAAP requires the use of estimates made by management. Management believes that estimates and valuations are appropriate; however, actual results may differ from those estimates, and the valuations reflected in the accompanying financial statements may differ from the value ultimately realized upon sale or maturity.
Investment Transactions, Investment Income, and Distributions Income and expenses are recorded on the accrual basis. Dividends received from mutual fund investments are reflected as dividend income; capital gain distributions are reflected as realized gain/loss. Dividend income and capital gain distributions are recorded on the ex-dividend date. Income tax-related interest and penalties, if incurred, would be recorded as income tax expense. Investment transactions are accounted for on the trade date. Realized gains and losses are reported on the identified cost basis. Distributions from REITs are initially recorded as dividend income and, to the extent such represent a return of capital or capital gain for tax purposes, are reclassified when such information becomes available. Income distributions are declared and paid by each class annually. Distributions to shareholders are recorded on the ex-dividend date. A capital gain distribution may also be declared and paid by the fund annually.
Class Accounting Shareholder servicing, prospectus, and shareholder report expenses incurred by each class are charged directly to the class to which they relate. Expenses common to all classes, investment income, and realized and unrealized gains and losses are allocated to the classes based upon the relative daily net assets of each class. The Advisor Class pays Rule 12b-1 fees, in an amount not exceeding 0.25% of the class’s average daily net assets.
Rebates Subject to best execution, the fund may direct certain security trades to brokers who have agreed to rebate a portion of the related brokerage commission to the fund in cash. Commission rebates are reflected as realized gain on securities in the accompanying financial statements and totaled $1,000 for the six months ended June 30, 2017.
New Accounting Guidance In October 2016, the Securities and Exchange Commission (SEC) issued a new rule, Investment Company Reporting Modernization, which, among other provisions, amends Regulation S-X to require standardized, enhanced disclosures, particularly related to derivatives, in investment company financial statements. Compliance with the guidance is effective for financial statements related to periods ending on or after August 1, 2017; adoption will have no effect on the fund’s net assets or results of operations.
NOTE 2 - VALUATION
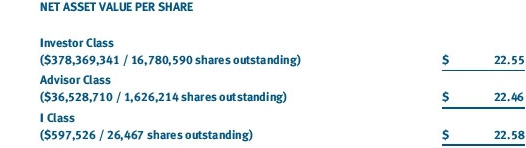
The fund’s financial instruments are valued and each class’s net asset value (NAV) per share is computed at the close of the New York Stock Exchange (NYSE), normally 4 p.m. ET, each day the NYSE is open for business. However, the NAV per share may be calculated at a time other than the normal close of the NYSE if trading on the NYSE is restricted, if the NYSE closes earlier, or as may be permitted by the SEC.
Fair Value The fund’s financial instruments are reported at fair value, which GAAP defines as the price that would be received to sell an asset or paid to transfer a liability in an orderly transaction between market participants at the measurement date. The T. Rowe Price Valuation Committee (the Valuation Committee) is an internal committee that has been delegated certain responsibilities by the fund’s Board of Directors (the Board) to ensure that financial instruments are appropriately priced at fair value in accordance with GAAP and the 1940 Act. Subject to oversight by the Board, the Valuation Committee develops and oversees pricing-related policies and procedures and approves all fair value determinations. Specifically, the Valuation Committee establishes procedures to value securities; determines pricing techniques, sources, and persons eligible to effect fair value pricing actions; oversees the selection, services, and performance of pricing vendors; oversees valuation-related business continuity practices; and provides guidance on internal controls and valuation-related matters. The Valuation Committee reports to the Board and has representation from legal, portfolio management and trading, operations, risk management, and the fund’s treasurer.
Various valuation techniques and inputs are used to determine the fair value of financial instruments. GAAP establishes the following fair value hierarchy that categorizes the inputs used to measure fair value:
Level 1 – quoted prices (unadjusted) in active markets for identical financial instruments that the fund can access at the reporting date
Level 2 – inputs other than Level 1 quoted prices that are observable, either directly or indirectly (including, but not limited to, quoted prices for similar financial instruments in active markets, quoted prices for identical or similar financial instruments in inactive markets, interest rates and yield curves, implied volatilities, and credit spreads)
Level 3 – unobservable inputs
Observable inputs are developed using market data, such as publicly available information about actual events or transactions, and reflect the assumptions that market participants would use to price the financial instrument. Unobservable inputs are those for which market data are not available and are developed using the best information available about the assumptions that market participants would use to price the financial instrument. GAAP requires valuation techniques to maximize the use of relevant observable inputs and minimize the use of unobservable inputs. When multiple inputs are used to derive fair value, the financial instrument is assigned to the level within the fair value hierarchy based on the lowest-level input that is significant to the fair value of the financial instrument. Input levels are not necessarily an indication of the risk or liquidity associated with financial instruments at that level but rather the degree of judgment used in determining those values.
Valuation Techniques Equity securities listed or regularly traded on a securities exchange or in the over-the-counter (OTC) market are valued at the last quoted sale price or, for certain markets, the official closing price at the time the valuations are made. OTC Bulletin Board securities are valued at the mean of the closing bid and asked prices. A security that is listed or traded on more than one exchange is valued at the quotation on the exchange determined to be the primary market for such security. Listed securities not traded on a particular day are valued at the mean of the closing bid and asked prices. Actively traded equity securities listed on a domestic exchange generally are categorized in Level 1 of the fair value hierarchy. OTC Bulletin Board securities, certain preferred securities, and equity securities traded in inactive markets generally are categorized in Level 2 of the fair value hierarchy.
Investments in mutual funds are valued at the mutual fund’s closing NAV per share on the day of valuation and are categorized in Level 1 of the fair value hierarchy. Assets and liabilities other than financial instruments, including short-term receivables and payables, are carried at cost, or estimated realizable value, if less, which approximates fair value.
Thinly traded financial instruments and those for which the above valuation procedures are inappropriate or are deemed not to reflect fair value are stated at fair value as determined in good faith by the Valuation Committee. The objective of any fair value pricing determination is to arrive at a price that could reasonably be expected from a current sale. Financial instruments fair valued by the Valuation Committee are primarily private placements, restricted securities, warrants, rights, and other securities that are not publicly traded.
Subject to oversight by the Board, the Valuation Committee regularly makes good faith judgments to establish and adjust the fair valuations of certain securities as events occur and circumstances warrant. For instance, in determining the fair value of an equity investment with limited market activity, such as a private placement or a thinly traded public company stock, the Valuation Committee considers a variety of factors, which may include, but are not limited to, the issuer’s business prospects, its financial standing and performance, recent investment transactions in the issuer, new rounds of financing, negotiated transactions of significant size between other investors in the company, relevant market valuations of peer companies, strategic events affecting the company, market liquidity for the issuer, and general economic conditions and events. In consultation with the investment and pricing teams, the Valuation Committee will determine an appropriate valuation technique based on available information, which may include both observable and unobservable inputs. The Valuation Committee typically will afford greatest weight to actual prices in arm’s length transactions, to the extent they represent orderly transactions between market participants, transaction information can be reliably obtained, and prices are deemed representative of fair value. However, the Valuation Committee may also consider other valuation methods such as market-based valuation multiples; a discount or premium from market value of a similar, freely traded security of the same issuer; or some combination. Fair value determinations are reviewed on a regular basis and updated as information becomes available, including actual purchase and sale transactions of the issue. Because any fair value determination involves a significant amount of judgment, there is a degree of subjectivity inherent in such pricing decisions, and fair value prices determined by the Valuation Committee could differ from those of other market participants. Depending on the relative significance of unobservable inputs, including the valuation technique(s) used, fair valued securities may be categorized in Level 2 or 3 of the fair value hierarchy.
Valuation Inputs On June 30, 2017, all of the fund’s financial instruments were classified as Level 1, based on the inputs used to determine their fair values. There were no material transfers between Levels 1 and 2 during the six months ended June 30, 2017.
NOTE 3 - OTHER INVESTMENT TRANSACTIONS
Consistent with its investment objective, the fund engages in the following practices to manage exposure to certain risks and/or to enhance performance. The investment objective, policies, program, and risk factors of the fund are described more fully in the fund’s prospectus and Statement of Additional Information.
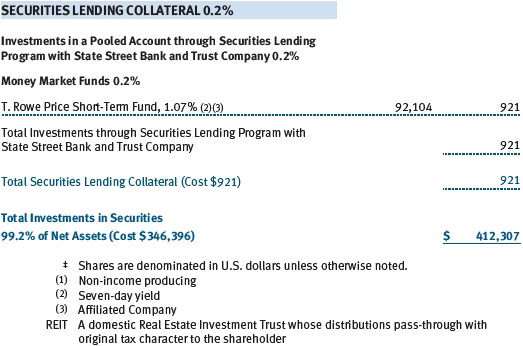
Securities Lending The fund may lend its securities to approved brokers to earn additional income. Its securities lending activities are administered by a lending agent in accordance with a securities lending agreement. Security loans generally do not have stated maturity dates, and the fund may recall a security at any time. The fund receives collateral in the form of cash or U.S. government securities, valued at 102% to 105% of the value of the securities on loan. Collateral is maintained over the life of the loan in an amount not less than the value of loaned securities; any additional collateral required due to changes in security values is delivered to the fund the next business day. Cash collateral is invested by the lending agent(s) in accordance with investment guidelines approved by fund management. Additionally, the lending agent indemnifies the fund against losses resulting from borrower default. Although risk is mitigated by the collateral and indemnification, the fund could experience a delay in recovering its securities and a possible loss of income or value if the borrower fails to return the securities, collateral investments decline in value, and the lending agent fails to perform. Securities lending revenue consists of earnings on invested collateral and borrowing fees, net of any rebates to the borrower, compensation to the lending agent, and other administrative costs. In accordance with GAAP, investments made with cash collateral are reflected in the accompanying financial statements, but collateral received in the form of securities is not. At June 30, 2017 the value of cash collateral and related investments was $921,000, including securities sold but not yet settled, which are not reflected in the accompanying Portfolio of Investments.
Other Purchases and sales of portfolio securities other than short-term securities aggregated $148,702,000 and $107,437,000, respectively, for the six months ended June 30, 2017.
NOTE 4 - FEDERAL INCOME TAXES
No provision for federal income taxes is required since the fund intends to continue to qualify as a regulated investment company under Subchapter M of the Internal Revenue Code and distribute to shareholders all of its taxable income and gains. Distributions determined in accordance with federal income tax regulations may differ in amount or character from net investment income and realized gains for financial reporting purposes. Financial reporting records are adjusted for permanent book/tax differences to reflect tax character but are not adjusted for temporary differences. The amount and character of tax-basis distributions and composition of net assets are finalized at fiscal year-end; accordingly, tax-basis balances have not been determined as of the date of this report.
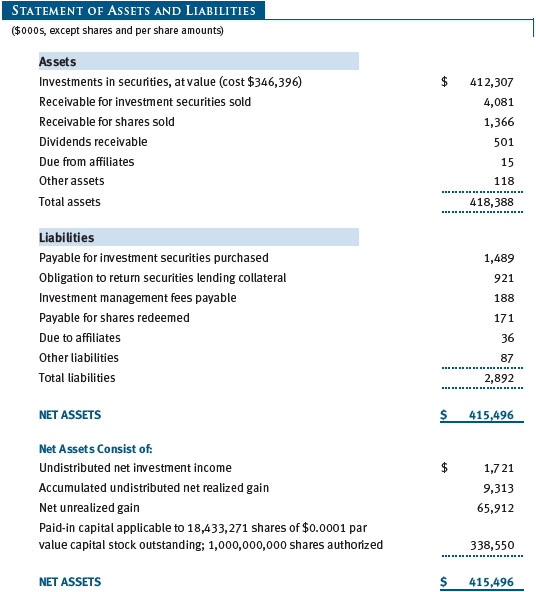
At June 30, 2017, the cost of investments for federal income tax purposes was $346,951,000. Net unrealized gain aggregated $65,356,000 at period-end, of which $69,373,000 related to appreciated investments and $4,017,000 related to depreciated investments.
NOTE 5 - RELATED PARTY TRANSACTIONS
The fund is managed by T. Rowe Price Associates, Inc. (Price Associates), a wholly owned subsidiary of T. Rowe Price Group, Inc. (Price Group). The investment management agreement between the fund and Price Associates provides for an annual investment management fee, which is computed daily and paid monthly. The fee consists of an individual fund fee, equal to 0.25% of the fund’s average daily net assets, and a group fee. The group fee rate is calculated based on the combined net assets of certain mutual funds sponsored by Price Associates (the group) applied to a graduated fee schedule, with rates ranging from 0.48% for the first $1 billion of assets to 0.265% for assets in excess of $650 billion. The fund’s group fee is determined by applying the group fee rate to the fund’s average daily net assets. At June 30, 2017, the effective annual group fee rate was 0.29%.
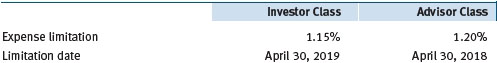
The Investor Class and Advisor Class are each subject to a contractual expense limitation through the limitation dates indicated in the table below. During the limitation period, Price Associates is required to waive its management fee or pay any expenses (excluding interest, expenses related to borrowings, taxes, brokerage, and other non-recurring expenses permitted by the investment management agreement) that would otherwise cause the class’s ratio of annualized total expenses to average net assets (expense ratio) to exceed its expense limitation. Each class is required to repay Price Associates for expenses previously waived/paid to the extent the class’s net assets grow or expenses decline sufficiently to allow repayment without causing the class’s expense ratio to exceed its expense limitation in effect at the time of the waiver. However, no repayment will be made more than three years after the date of a payment or waiver.
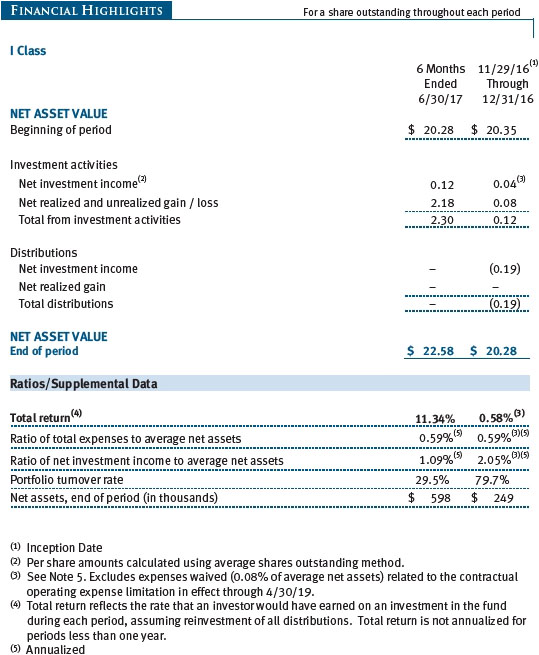
The I Class is also subject to an operating expense limitation (I Class limit) pursuant to which Price Associates is contractually required to pay all operating expenses of the I Class, excluding management fees, interest, expenses related to borrowings, taxes, brokerage, and other non-recurring expenses permitted by the investment management agreement, to the extent such operating expenses, on an annualized basis, exceed 0.05% of average net assets. This agreement will continue until April 30, 2019, and may be renewed, revised, or revoked only with approval of the fund’s Board. The I Class is required to repay Price Associates for expenses previously paid to the extent the class’s net assets grow or expenses decline sufficiently to allow repayment without causing the class’s operating expenses to exceed the I Class limit in effect at the time of the waiver. However, no repayment will be made more than three years after the date of a payment or waiver.
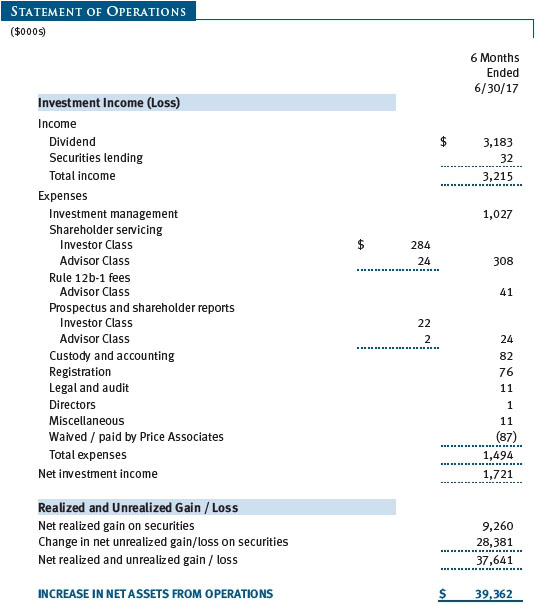
Pursuant to these agreements, $87,000 of expenses were waived/paid by Price Associates during the six months ended June 30, 2017
In addition, the fund has entered into service agreements with Price Associates and two wholly owned subsidiaries of Price Associates (collectively, Price). Price Associates provides certain accounting and administrative services to the fund. T. Rowe Price Services, Inc. provides shareholder and administrative services in its capacity as the fund’s transfer and dividend-disbursing agent. T. Rowe Price Retirement Plan Services, Inc. provides subaccounting and recordkeeping services for certain retirement accounts invested in the Investor Class and I Class. For the six months ended June 30, 2017, expenses incurred pursuant to these service agreements were $41,000 for Price Associates; $152,000 for T. Rowe Price Services, Inc.; and $1,000 for T. Rowe Price Retirement Plan Services, Inc. The total amount payable at period-end pursuant to these service agreements is reflected as Due to Affiliates in the accompanying financial statements.
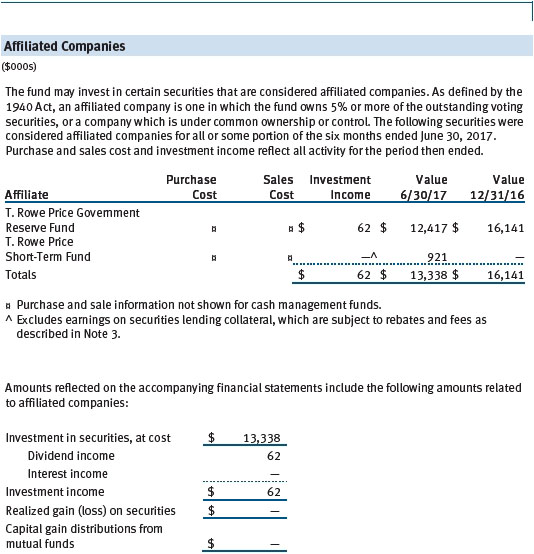
The fund may invest in the T. Rowe Price Government Reserve Fund, the T. Rowe Price Treasury Reserve Fund, or the T. Rowe Price Short-Term Fund (collectively, the Price Reserve Funds), open-end management investment companies managed by Price Associates and considered affiliates of the fund. The Price Reserve Funds are offered as short-term investment options to mutual funds, trusts, and other accounts managed by Price Associates or its affiliates and are not available for direct purchase by members of the public. The Price Reserve Funds pay no investment management fees.
As of June 30, 2017, T. Rowe Price Group, Inc., or its wholly owned subsidiaries owned 25,000 shares of the Advisor Class, representing 2% of the Advisor Class’s net assets and 12,000 shares of the I Class, representing 46% of the I Class’s net assets.
The fund may participate in securities purchase and sale transactions with other funds or accounts advised by Price Associates (cross trades), in accordance with procedures adopted by the fund’s Board and Securities and Exchange Commission rules, which require, among other things, that such purchase and sale cross trades be effected at the independent current market price of the security. During the six months ended June 30, 2017, the fund had no purchases or sales cross trades with other funds or accounts advised by Price Associates.
| Information on Proxy Voting Policies, Procedures, and Records |
A description of the policies and procedures used by T. Rowe Price funds and portfolios to determine how to vote proxies relating to portfolio securities is available in each fund’s Statement of Additional Information. You may request this document by calling 1-800-225-5132 or by accessing the SEC’s website, sec.gov.
The description of our proxy voting policies and procedures is also available on our corporate website. To access it, please visit the following Web page:
https://www3.troweprice.com/usis/corporate/en/utility/policies.html
Scroll down to the section near the bottom of the page that says, “Proxy Voting Policies.” Click on the Proxy Voting Policies link in the shaded box.
Each fund’s most recent annual proxy voting record is available on our website and through the SEC’s website. To access it through T. Rowe Price, visit the website location shown above, and scroll down to the section near the bottom of the page that says, “Proxy Voting Records.” Click on the Proxy Voting Records link in the shaded box.
| How to Obtain Quarterly Portfolio Holdings |
The fund files a complete schedule of portfolio holdings with the Securities and Exchange Commission for the first and third quarters of each fiscal year on Form N-Q. The fund’s Form N-Q is available electronically on the SEC’s website (sec.gov); hard copies may be reviewed and copied at the SEC’s Public Reference Room, 100 F St. N.E., Washington, DC 20549. For more information on the Public Reference Room, call 1-800-SEC-0330.
| Approval of Investment Management Agreement |
Each year, the fund’s Board of Directors (Board) considers the continuation of the investment management agreement (Advisory Contract) between the fund and its investment advisor, T. Rowe Price Associates, Inc. (Advisor). In that regard, at an in-person meeting held on March 6–7, 2017 (Meeting), the Board, including a majority of the fund’s independent directors, approved the continuation of the fund’s Advisory Contract. At the Meeting, the Board considered the factors and reached the conclusions described below relating to the selection of the Advisor and the approval of the Advisory Contract. The independent directors were assisted in their evaluation of the Advisory Contract by independent legal counsel from whom they received separate legal advice and with whom they met separately.
In providing information to the Board, the Advisor was guided by a detailed set of requests for information submitted by independent legal counsel on behalf of the independent directors. In considering and approving the Advisory Contract, the Board considered the information it believed was relevant, including, but not limited to, the information discussed below. The Board considered not only the specific information presented in connection with the Meeting but also the knowledge gained over time through interaction with the Advisor about various topics. The Board meets regularly and, at each of its meetings, covers an extensive agenda of topics and materials and considers factors that are relevant to its annual consideration of the renewal of the T. Rowe Price funds’ advisory contracts, including performance and the services and support provided to the funds and their shareholders.
Services Provided by the Advisor
The Board considered the nature, quality, and extent of the services provided to the fund by the Advisor. These services included, but were not limited to, directing the fund’s investments in accordance with its investment program and the overall management of the fund’s portfolio, as well as a variety of related activities such as financial, investment operations, and administrative services; compliance; maintaining the fund’s records and registrations; and shareholder communications. The Board also reviewed the background and experience of the Advisor’s senior management team and investment personnel involved in the management of the fund, as well as the Advisor’s compliance record. The Board concluded that it was satisfied with the nature, quality, and extent of the services provided by the Advisor.
Investment Performance of the Fund
The Board took into account discussions with the Advisor and reports that it receives throughout the year relating to fund performance. In connection with the Meeting, the Board reviewed the fund’s net annualized total returns for the 1-, 2-, 3-, 4-, and 5-year periods as of September 30, 2016, and compared these returns with the performance of a peer group of funds with similar investment programs and a wide variety of other previously agreed-upon comparable performance measures and market data, including those supplied by Broadridge, which is an independent provider of mutual fund data.
On the basis of this evaluation and the Board’s ongoing review of investment results, and factoring in the relative market conditions during certain of the performance periods, the Board concluded that the fund’s performance was satisfactory.
Costs, Benefits, Profits, and Economies of Scale
The Board reviewed detailed information regarding the revenues received by the Advisor under the Advisory Contract and other benefits that the Advisor (and its affiliates) may have realized from its relationship with the fund, including any research received under “soft dollar” agreements and commission-sharing arrangements with broker-dealers. The Board considered that the Advisor may receive some benefit from soft-dollar arrangements pursuant to which research is received from broker-dealers that execute the fund’s portfolio transactions. The Board received information on the estimated costs incurred and profits realized by the Advisor from managing the T. Rowe Price funds. The Board also reviewed estimates of the profits realized from managing the fund in particular, and the Board concluded that the Advisor’s profits were reasonable in light of the services provided to the fund.
The Board also considered whether the fund benefits under the fee levels set forth in the Advisory Contract from any economies of scale realized by the Advisor. Under the Advisory Contract, the fund pays a fee to the Advisor for investment management services composed of two components—a group fee rate based on the combined average net assets of most of the T. Rowe Price funds (including the fund) that declines at certain asset levels and an individual fund fee rate based on the fund’s average daily net assets—and the fund pays its own expenses of operations (subject to expense limitations agreed to by the Advisor with respect to the fund’s Advisor Class and I Class). At the Meeting, the Board approved an additional 0.005% breakpoint to the group fee schedule, effective May 1, 2017. With the new breakpoint, the group fee rate will decline to 0.265% when the combined average net assets of the applicable T. Rowe Price funds exceed $650 billion. The Board concluded that the advisory fee structure for the fund continued to provide for a reasonable sharing of benefits from any economies of scale with the fund’s investors.
Fees and Expenses
The Board was provided with information regarding industry trends in management fees and expenses. Among other things, the Board reviewed data for peer groups that were compiled by Broadridge, which compared: (i) contractual management fees, total expenses, actual management fees, and non-management expenses of the Investor Class of the fund with a group of competitor funds selected by Broadridge (Investor Class Expense Group); (ii) total expenses and actual management fees of the Advisor Class of the fund with a group of competitor funds selected by Broadridge (Advisor Class Expense Group); and (iii) total expenses, actual management fees, and non-management expenses of the Investor Class of the fund with a broader set of funds within the Lipper investment classification (Expense Universe). The Board considered the fund’s contractual management fee rate, actual management fee rate (which reflects the management fees actually received from the fund by the Advisor after any applicable waivers, reductions, or reimbursements), operating expenses, and total expenses (which reflects the net total expense ratio of the fund after any waivers, reductions, or reimbursements) in comparison with the information for the Broadridge peer groups. Broadridge generally constructed the peer groups by seeking the most comparable funds based on similar investment classifications and objectives, expense structure, asset size, and operating components and attributes and ranked funds into quintiles, with the first quintile representing the funds with the lowest relative expenses and the fifth quintile representing the funds with the highest relative expenses. The information provided to the Board indicated that the fund’s contractual management fee ranked in the first quintile (Investor Class Expense Group), the fund’s actual management fee rate ranked in the first quintile (Investor Class Expense Group) and third quintile (Advisor Class Expense Group and Expense Universe), and the fund’s total expenses ranked in the fourth quintile (Investor Class Expense Group, Advisor Class Expense Group, and Expense Universe).
The Board also reviewed the fee schedules for institutional accounts and private accounts with similar mandates that are advised or subadvised by the Advisor and its affiliates. Management provided the Board with information about the Advisor’s responsibilities and services provided to subadvisory and other institutional account clients, including information about how the requirements and economics of the institutional business are fundamentally different from those of the mutual fund business. The Board considered information showing that the Advisor’s mutual fund business is generally more complex from a business and compliance perspective than its institutional account business and considered various relevant factors, such as the broader scope of operations and oversight, more extensive shareholder communication infrastructure, greater asset flows, heightened business risks, and differences in applicable laws and regulations associated with the Advisor’s proprietary mutual fund business. In assessing the reasonableness of the fund’s management fee rate, the Board considered the differences in the nature of the services required for the Advisor to manage its mutual fund business versus managing a discrete pool of assets as a subadvisor to another institution’s mutual fund or for an institutional account, and that the Advisor generally performs significant additional services and assumes greater risk in managing the fund and other T. Rowe Price funds than it does for institutional account clients.
On the basis of the information provided and the factors considered, the Board concluded that the fees paid by the fund under the Advisory Contract are reasonable.
Approval of the Advisory Contract
As noted, the Board approved the continuation of the Advisory Contract. No single factor was considered in isolation or to be determinative to the decision. Rather, the Board concluded, in light of a weighting and balancing of all factors considered, that it was in the best interests of the fund and its shareholders for the Board to approve the continuation of the Advisory Contract (including the fees to be charged for services thereunder).
Item 2. Code of Ethics.
A code of ethics, as defined in Item 2 of Form N-CSR, applicable to its principal executive officer, principal financial officer, principal accounting officer or controller, or persons performing similar functions is filed as an exhibit to the registrant’s annual Form N-CSR. No substantive amendments were approved or waivers were granted to this code of ethics during the registrant’s most recent fiscal half-year.
Item 3. Audit Committee Financial Expert.
Disclosure required in registrant’s annual Form N-CSR.
Item 4. Principal Accountant Fees and Services.
Disclosure required in registrant’s annual Form N-CSR.
Item 5. Audit Committee of Listed Registrants.
Not applicable.
Item 6. Investments.
(a) Not applicable. The complete schedule of investments is included in Item 1 of this Form N-CSR.
(b) Not applicable.
Item 7. Disclosure of Proxy Voting Policies and Procedures for Closed-End Management Investment Companies.
Not applicable.
Item 8. Portfolio Managers of Closed-End Management Investment Companies.
Not applicable.
Item 9. Purchases of Equity Securities by Closed-End Management Investment Company and Affiliated Purchasers.
Not applicable.
Item 10. Submission of Matters to a Vote of Security Holders.
Not applicable.
Item 11. Controls and Procedures.
(a) The registrant’s principal executive officer and principal financial officer have evaluated the registrant’s disclosure controls and procedures within 90 days of this filing and have concluded that the registrant’s disclosure controls and procedures were effective, as of that date, in ensuring that information required to be disclosed by the registrant in this Form N-CSR was recorded, processed, summarized, and reported timely.
(b) The registrant’s principal executive officer and principal financial officer are aware of no change in the registrant’s internal control over financial reporting that occurred during the registrant’s second fiscal quarter covered by this report that has materially affected, or is reasonably likely to materially affect, the registrant’s internal control over financial reporting.
Item 12. Exhibits.
(a)(1) The registrant’s code of ethics pursuant to Item 2 of Form N-CSR is filed with the registrant’s annual Form N-CSR.
(2) Separate certifications by the registrant's principal executive officer and principal financial officer, pursuant to Section 302 of the Sarbanes-Oxley Act of 2002 and required by Rule 30a-2(a) under the Investment Company Act of 1940, are attached.
(3) Written solicitation to repurchase securities issued by closed-end companies: not applicable.
(b) A certification by the registrant's principal executive officer and principal financial officer, pursuant to Section 906 of the Sarbanes-Oxley Act of 2002 and required by Rule 30a-2(b) under the Investment Company Act of 1940, is attached.
SIGNATURES
Pursuant to the requirements of the Securities Exchange Act of 1934 and the Investment Company Act of 1940, the registrant has duly caused this report to be signed on its behalf by the undersigned, thereunto duly authorized.
T. Rowe Price U.S. Large-Cap Core Fund, Inc.
| By | | /s/ Edward C. Bernard |
| | | Edward C. Bernard |
| | | Principal Executive Officer |
| |
| Date | | August 21, 2017 | | | | |
Pursuant to the requirements of the Securities Exchange Act of 1934 and the Investment Company Act of 1940, this report has been signed below by the following persons on behalf of the registrant and in the capacities and on the dates indicated.
| By | | /s/ Edward C. Bernard |
| | | Edward C. Bernard |
| | | Principal Executive Officer |
| |
| Date | | August 21, 2017 | | | | |
| |
| |
| By | | /s/ Catherine D. Mathews |
| | | Catherine D. Mathews |
| | | Principal Financial Officer |
| |
| Date | | August 21, 2017 | | | | |