Right Place, Right Time Accelerating the Transition to Clean Energy 2020 Analyst and Investor Day October 13, 2020 © 2020 Renewable Energy Group, Inc. All Rights Reserved.

Safe Harbor Statement This presentation contains certain forward-looking statements within the meaning of the Private Securities Litigation Reform Act of 1995 as amended, including estimates on our future delivery and profit potential, our growth strategy, momentum and plans, including renewable diesel expansion, downstream integration margin enhancement, feedstock abundance and capital allocation; industry demand trends; the regulatory environment and the impact of changes to certain government regulations; our product’s role in carbon reduction; the pace of technology developments; the expansion of our feedstock pool and options; shifting discounts toward premium value; the Emden tank farm expansion; updates at Seneca; the Geismar expansion; commitments to carbon reductions by customers, investors, and governments; our competitive advantages; our plans to ensure feedstock abundance including our long term arrangements, feedstock footprints, investments, and innovation; our pursuit of downstream margin capture and margin expansion through fuel distributor ownership, fleet sales, branding agreements; our planned capital investments including increasing renewable diesel capacity, downstream expansion, convertible bond and share repurchases. These forward-looking statements are based on current expectations, estimates, assumptions and projections that are subject to change, and actual results may differ materially from the forward-looking statements. Factors that could cause actual results to differ materially include, but are not limited to, the Company’s inability to obtain the capital needed to complete the expansion project, cost overruns and construction delays, the inability to obtain governmental permits and third party easements required or necessary to initiate or complete the expansion project, the potential impact of COVID-19 on our business and operations, the Company's financial performance, including revenues, cost of revenues and operating expenses; changes in governmental programs and policies requiring or encouraging the use of biofuels, including RFS2 in the United States, renewable fuel policies in Canada and Europe, and state level programs such as California's Low Carbon Fuel Standard, availability of federal and state governmental tax incentives and incentives for bio-based diesel production; changes in the spread between bio-based diesel prices and feedstock costs; the availability, future price, and volatility of feedstocks; the availability, future price and volatility of petroleum and products derived from petroleum; risks associated with fire, explosions, leaks and other natural disasters at our facilities; any disruption of operations at our Geismar renewable diesel refinery (which would have a disproportionately adverse effect on our profitability); the unexpected closure of any of our facilities; the effect of excess capacity in the bio- based diesel industry and announced large plant expansions and potential co-processing of renewable diesel by petroleum refiners; unanticipated changes in the bio-based diesel market from which we generate almost all of our revenues; seasonal fluctuations in our operating results; potential failure to comply with government regulations; competition in the markets in which we operate; our dependence on sales to a single customer; technological advances or new methods of bio-based diesel production or the development of energy alternatives to bio-based diesel; our ability to successfully implement our acquisition strategy; the Company’s ability to retain and recruit key personnel; the Company’s indebtedness and its compliance, or failure to comply, with restrictive and financial covenants in its various debt agreements; risk management transaction, and other risks and uncertainties described in REG's annual report Form 10-K for the period ended December 31, 2019 and subsequent quarterly reports on Form 10-Q and other periodic filings with the Securities and Exchange Commission. All forward-looking statements are made as of the date of this presentation and REG does not undertake to update any forward-looking statements based on new developments or changes in our expectations. © 2020 Renewable Energy Group, Inc. All Rights Reserved. 2

Welcome & Introduction Cynthia J. Warner President & CEO © 2020 Renewable Energy Group, Inc. All Rights Reserved. 3

Analyst and Investor Day 2020 What REG does and why it matters Our track record Key drivers of financial performance Growth strategy and plans © 2020 Renewable Energy Group, Inc. All Rights Reserved. 4

© 2020 Renewable Energy Group, Inc. All Rights Reserved. 5
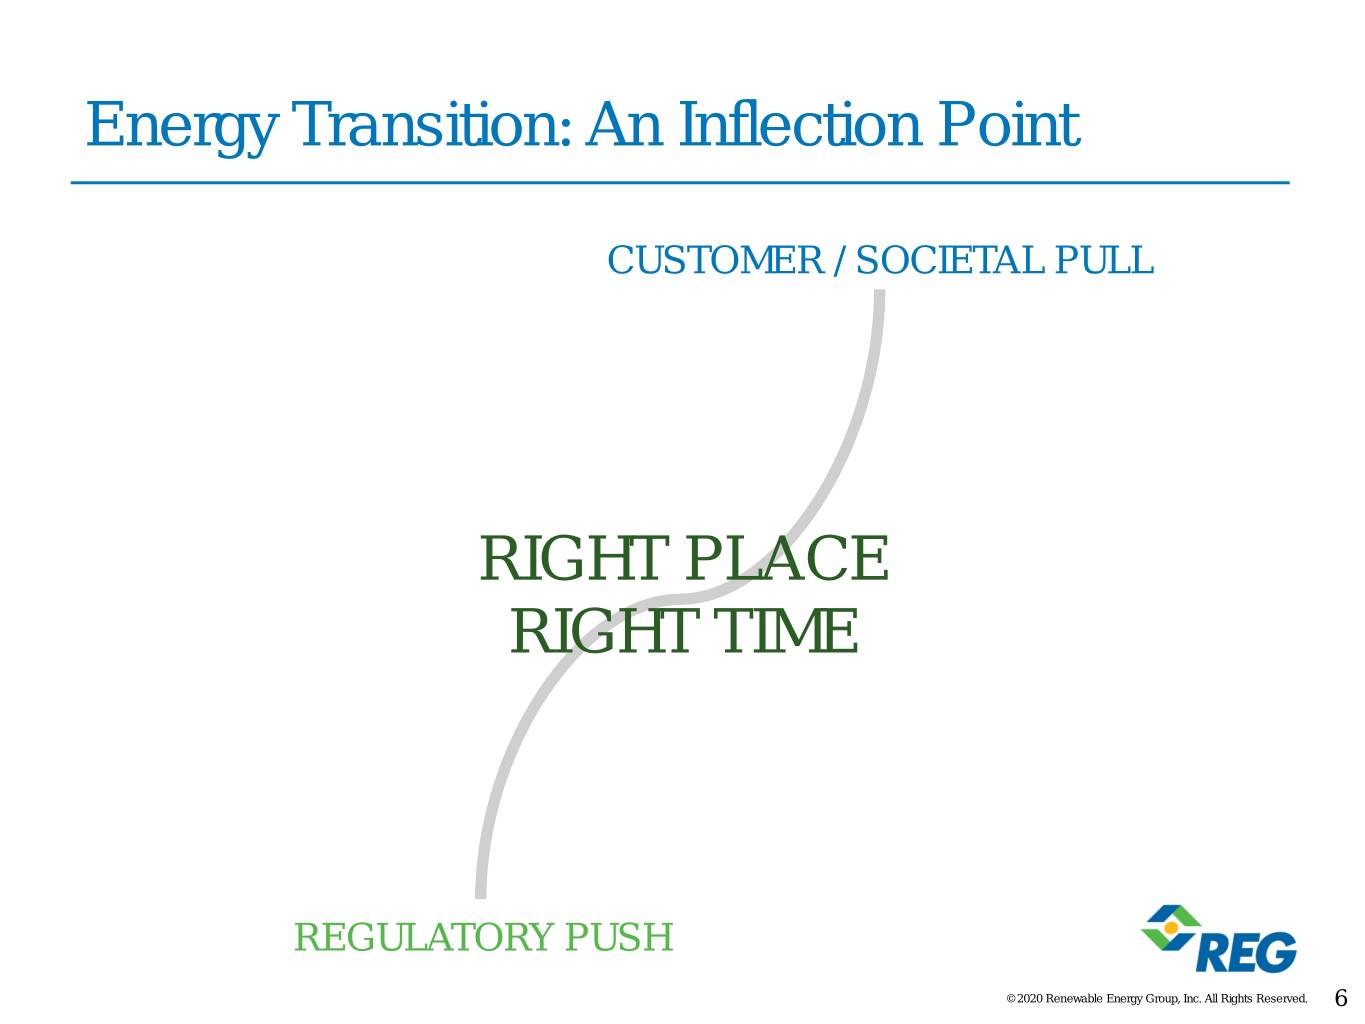
Energy Transition: An Inflection Point CUSTOMER / SOCIETAL PULL RIGHT PLACE RIGHT TIME REGULATORY PUSH © 2020 Renewable Energy Group, Inc. All Rights Reserved. 6
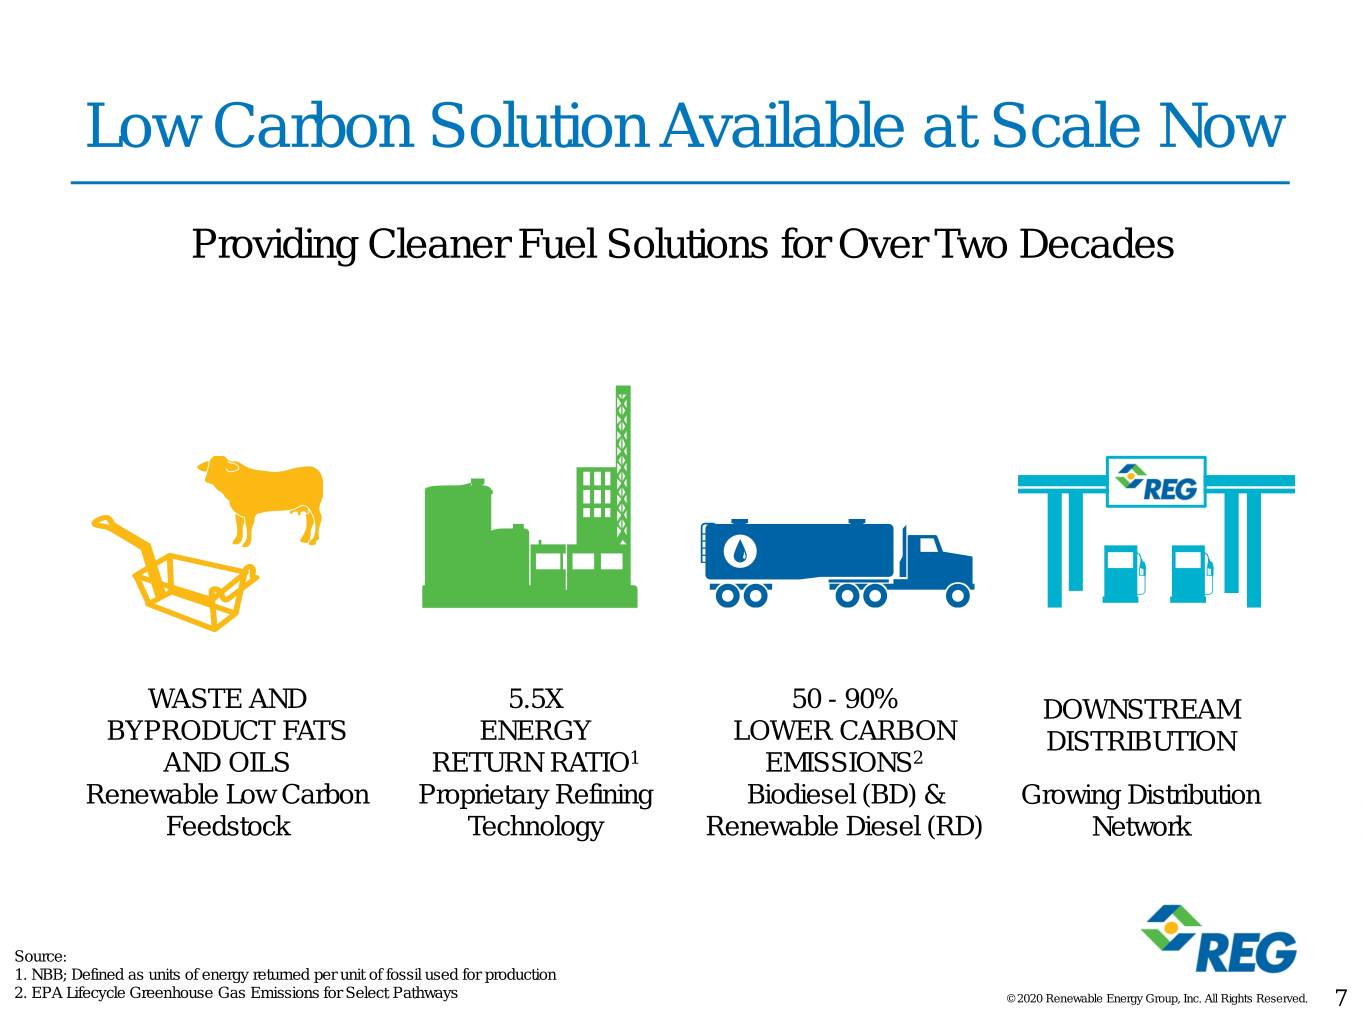
Low Carbon Solution Available at Scale Now Providing Cleaner Fuel Solutions for Over Two Decades WASTE AND 5.5X 50 - 90% DOWNSTREAM BYPRODUCT FATS ENERGY LOWER CARBON DISTRIBUTION AND OILS RETURN RATIO1 EMISSIONS2 Renewable Low Carbon Proprietary Refining Biodiesel (BD) & Growing Distribution Feedstock Technology Renewable Diesel (RD) Network Source: 1. NBB; Defined as units of energy returned per unit of fossil used for production 2. EPA Lifecycle Greenhouse Gas Emissions for Select Pathways © 2020 Renewable Energy Group, Inc. All Rights Reserved. 7

Reducing Carbon at Scale FROM 495 MILLION GALLONS OF BIOFUELS PRODUCED IN 2019 Notes: 1. Carbon reduction based on life cycle analysis of REG-produced fuels versus petroleum diesel. 2. epa.gov/energy/greenhouse-gas-equivalencies-calculator. 3. Assuming annual travel of 11,484 miles/year and national grid average electricity versus gasoline using CA-GREET 3.0. © 2020 Renewable Energy Group, Inc. All Rights Reserved. 8
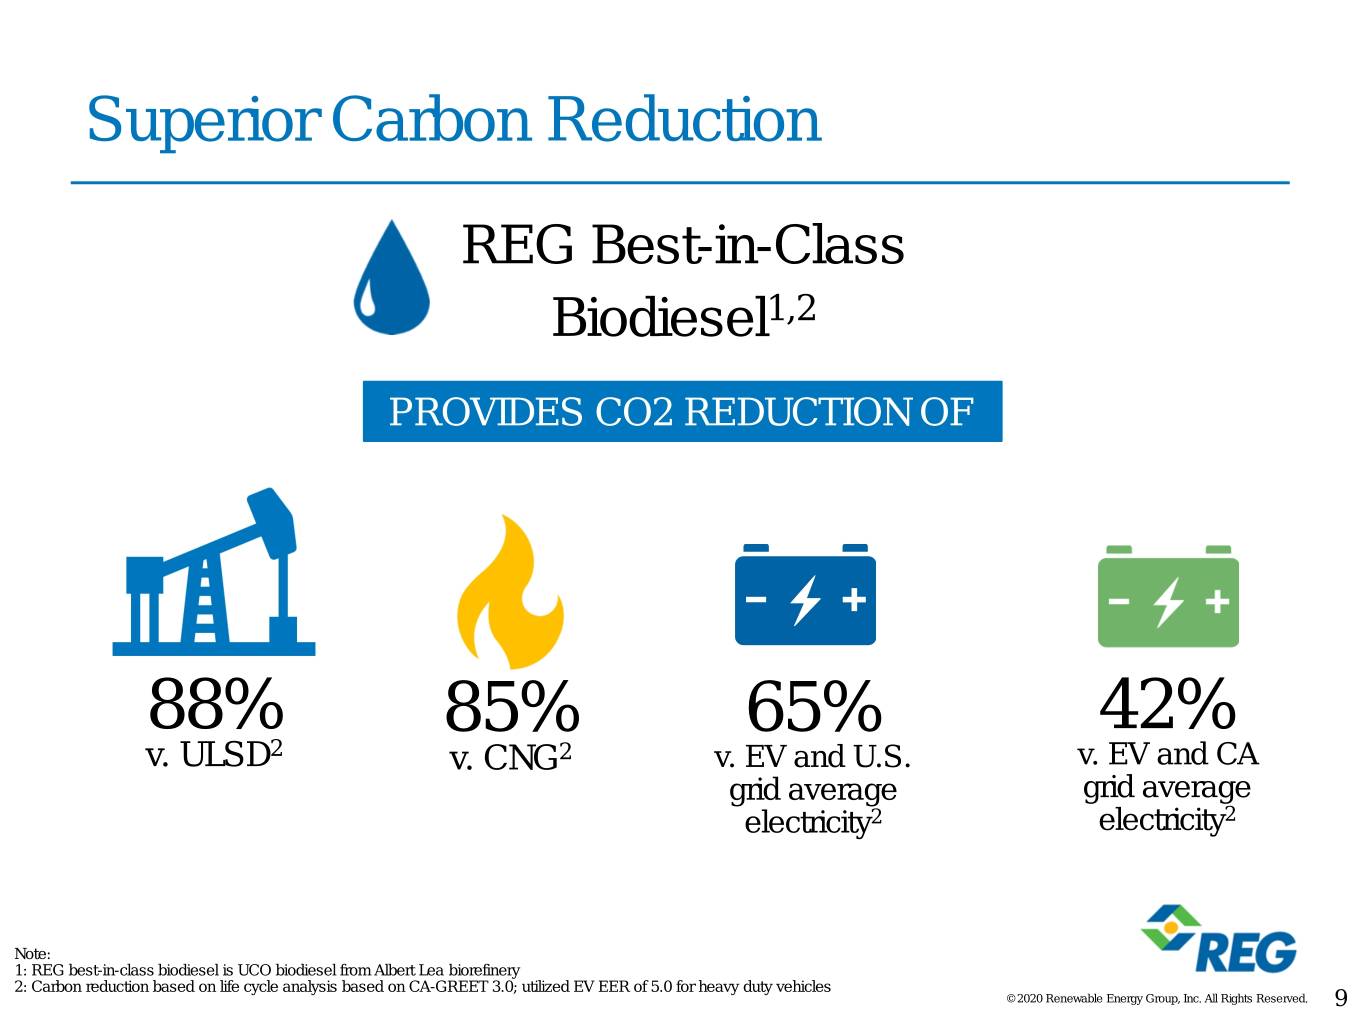
Superior Carbon Reduction REG Best-in-Class Biodiesel1,2 PROVIDES CO2 REDUCTION OF 88% 85% 65% 42% v. ULSD2 v. CNG2 v. EV and U.S. v. EV and CA grid average grid average electricity2 electricity2 Note: 1: REG best-in-class biodiesel is UCO biodiesel from Albert Lea biorefinery 2: Carbon reduction based on life cycle analysis based on CA-GREET 3.0; utilized EV EER of 5.0 for heavy duty vehicles © 2020 Renewable Energy Group, Inc. All Rights Reserved. 9
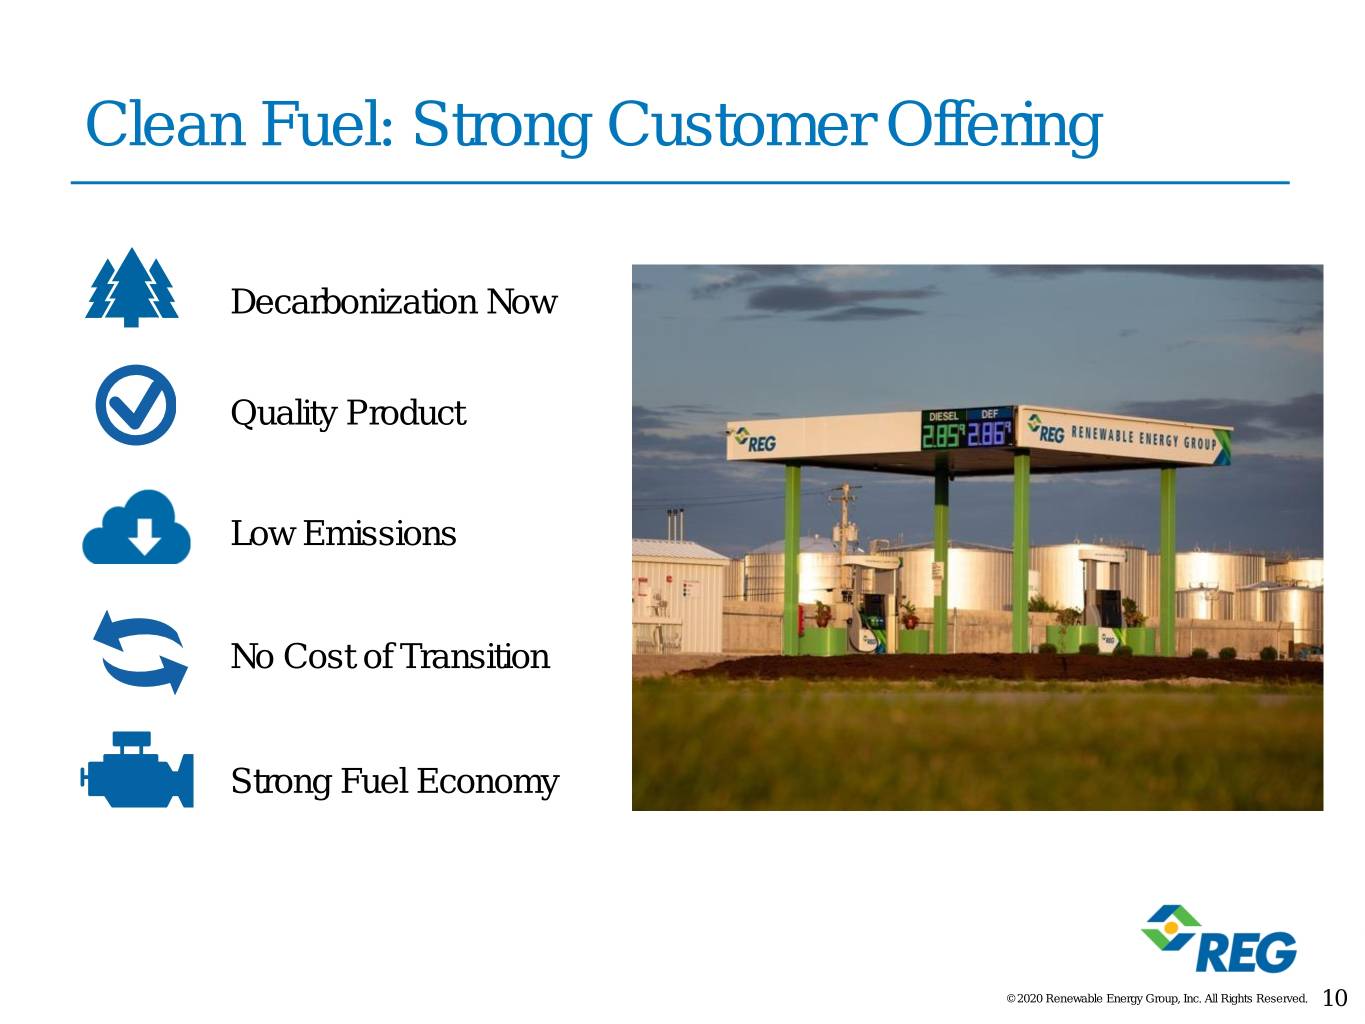
Clean Fuel: Strong Customer Offering Decarbonization Now Quality Product Low Emissions No Cost of Transition Strong Fuel Economy © 2020 Renewable Energy Group, Inc. All Rights Reserved. 10
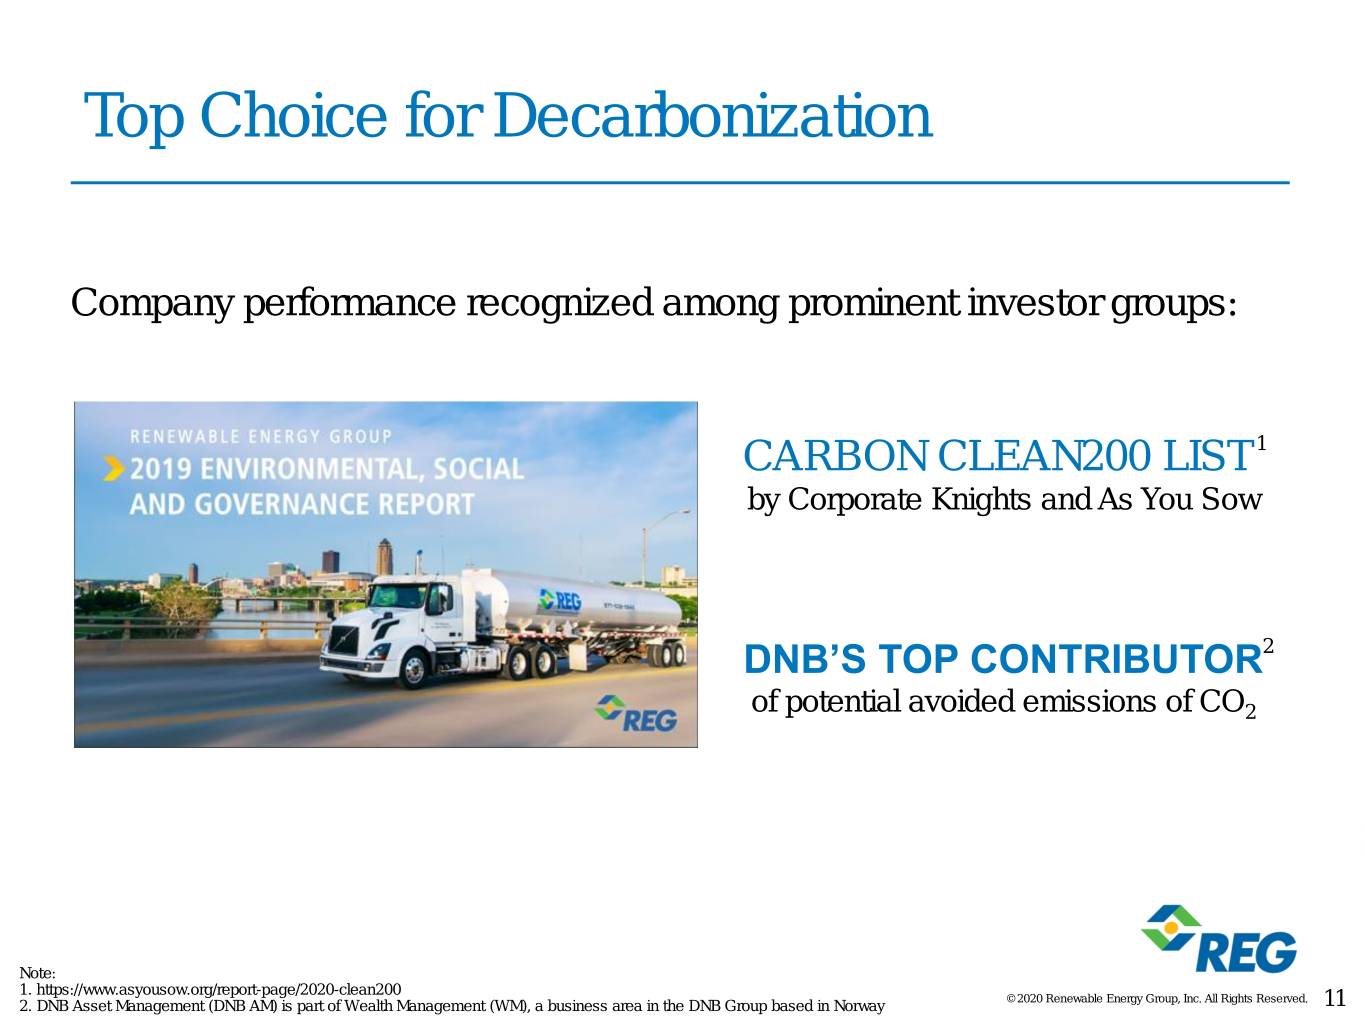
Top Choice for Decarbonization Company performance recognized among prominent investor groups: CARBON CLEAN200 LIST 1 by Corporate Knights and As You Sow DNB’S TOP CONTRIBUTOR2 of potential avoided emissions of CO2 Note: 1. https://www.asyousow.org/report-page/2020-clean200 2. DNB Asset Management (DNB AM) is part of Wealth Management (WM), a business area in the DNB Group based in Norway © 2020 Renewable Energy Group, Inc. All Rights Reserved. 11

A Clean Energy Story: Evolution to Inflection INFLECTION INITIATING EARLY DAYS SCALING UP POINT DEVELOPMENT OF: Technology Feedstock Market Societal Impact © 2020 Renewable Energy Group, Inc. All Rights Reserved. 12

A Clean Energy Story: Evolution to Inflection INFLECTION EARLY DAYS SCALING UP POINT INITIATING The Early Years Identifying a solution Commercializing the technology Early product acceptance © 2020 Renewable Energy Group, Inc. All Rights Reserved. 13
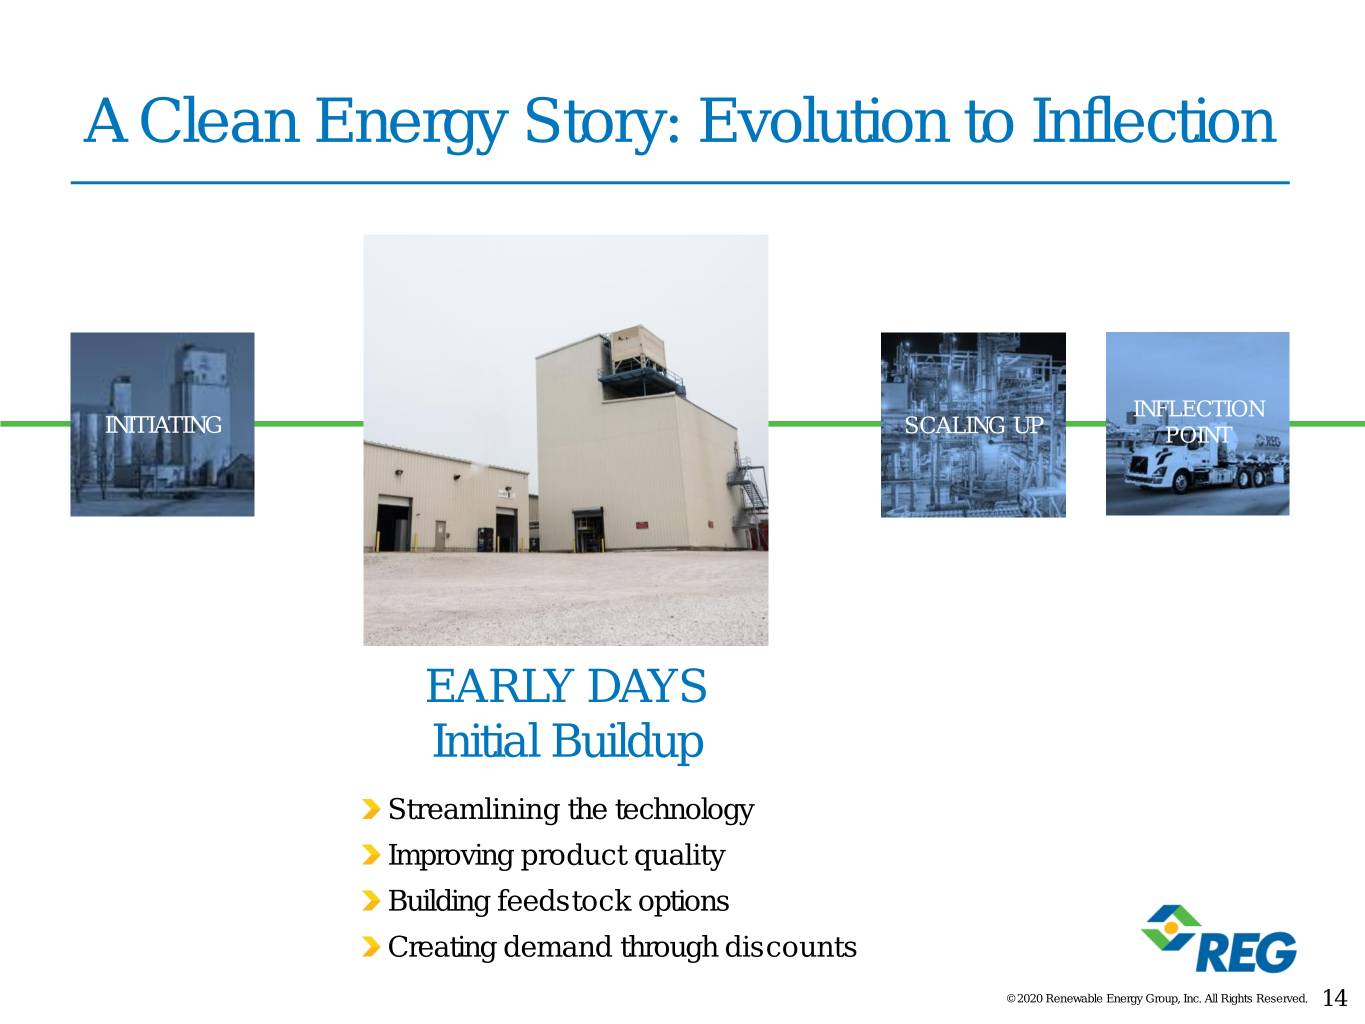
A Clean Energy Story: Evolution to Inflection INFLECTION INITIATING SCALING UP POINT EARLY DAYS Initial Buildup Streamlining the technology Improving product quality Building feedstock options Creating demand through discounts © 2020 Renewable Energy Group, Inc. All Rights Reserved. 14
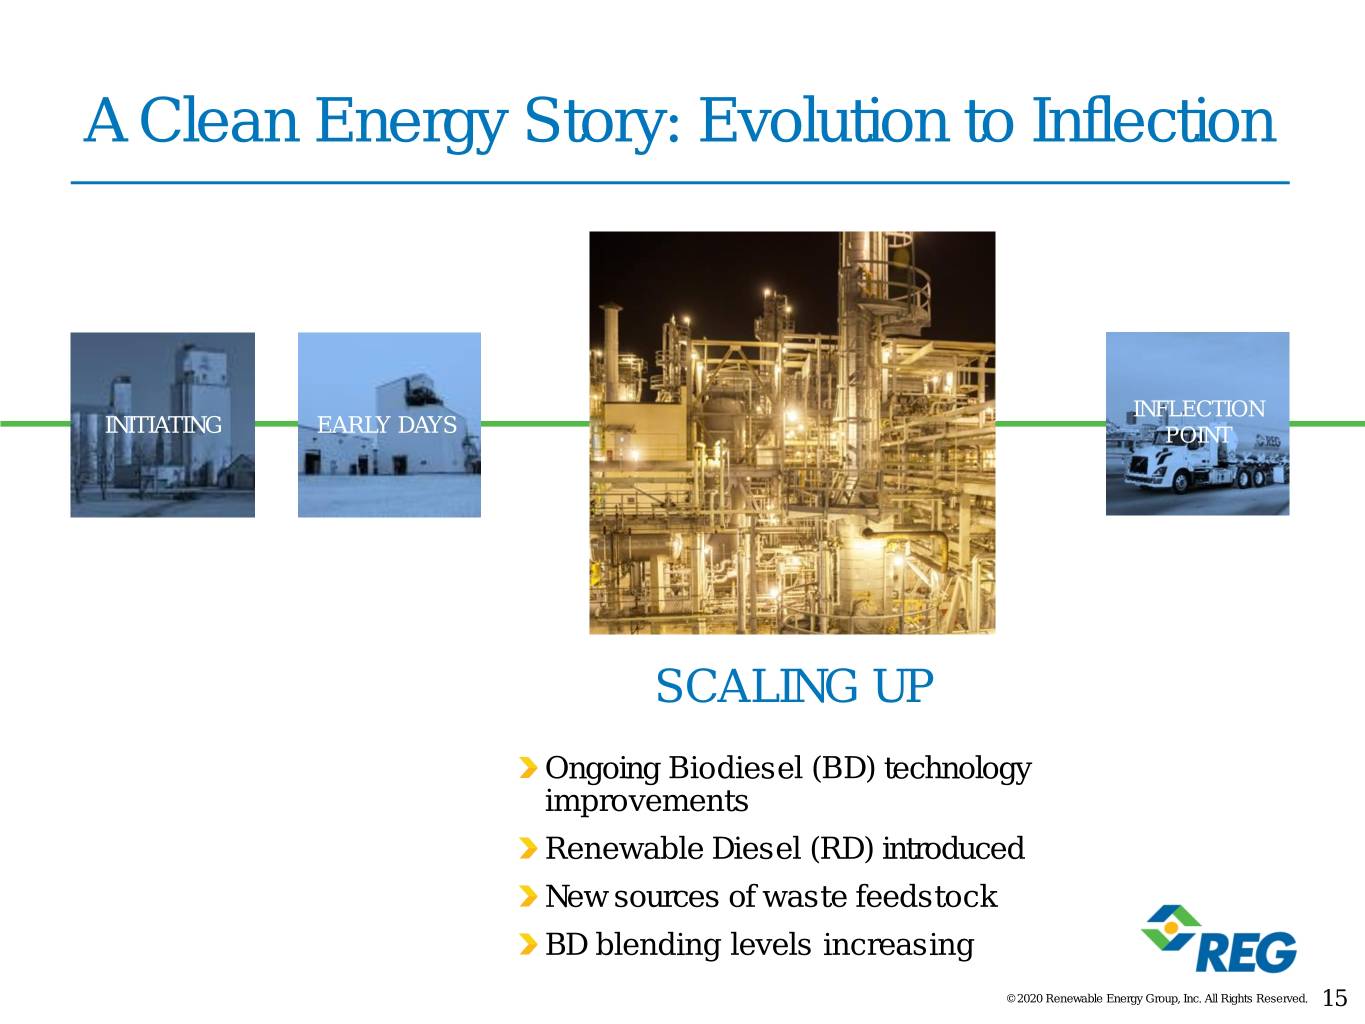
A Clean Energy Story: Evolution to Inflection INFLECTION INITIATING EARLY DAYS POINT SCALING UP Ongoing Biodiesel (BD) technology improvements Renewable Diesel (RD) introduced New sources of waste feedstock BD blending levels increasing © 2020 Renewable Energy Group, Inc. All Rights Reserved. 15

A Clean Energy Story: Evolution to Inflection INITIATING EARLY DAYS SCALING UP INFLECTION POINT Today RD and BD major decarbonizers Technology continues to improve RIGHT PLACE Ongoing expansion of feedstock pool RIGHT TIME Growing societal ‘pull’ Move from discounts to premium value © 2020 Renewable Energy Group, Inc. All Rights Reserved. 16
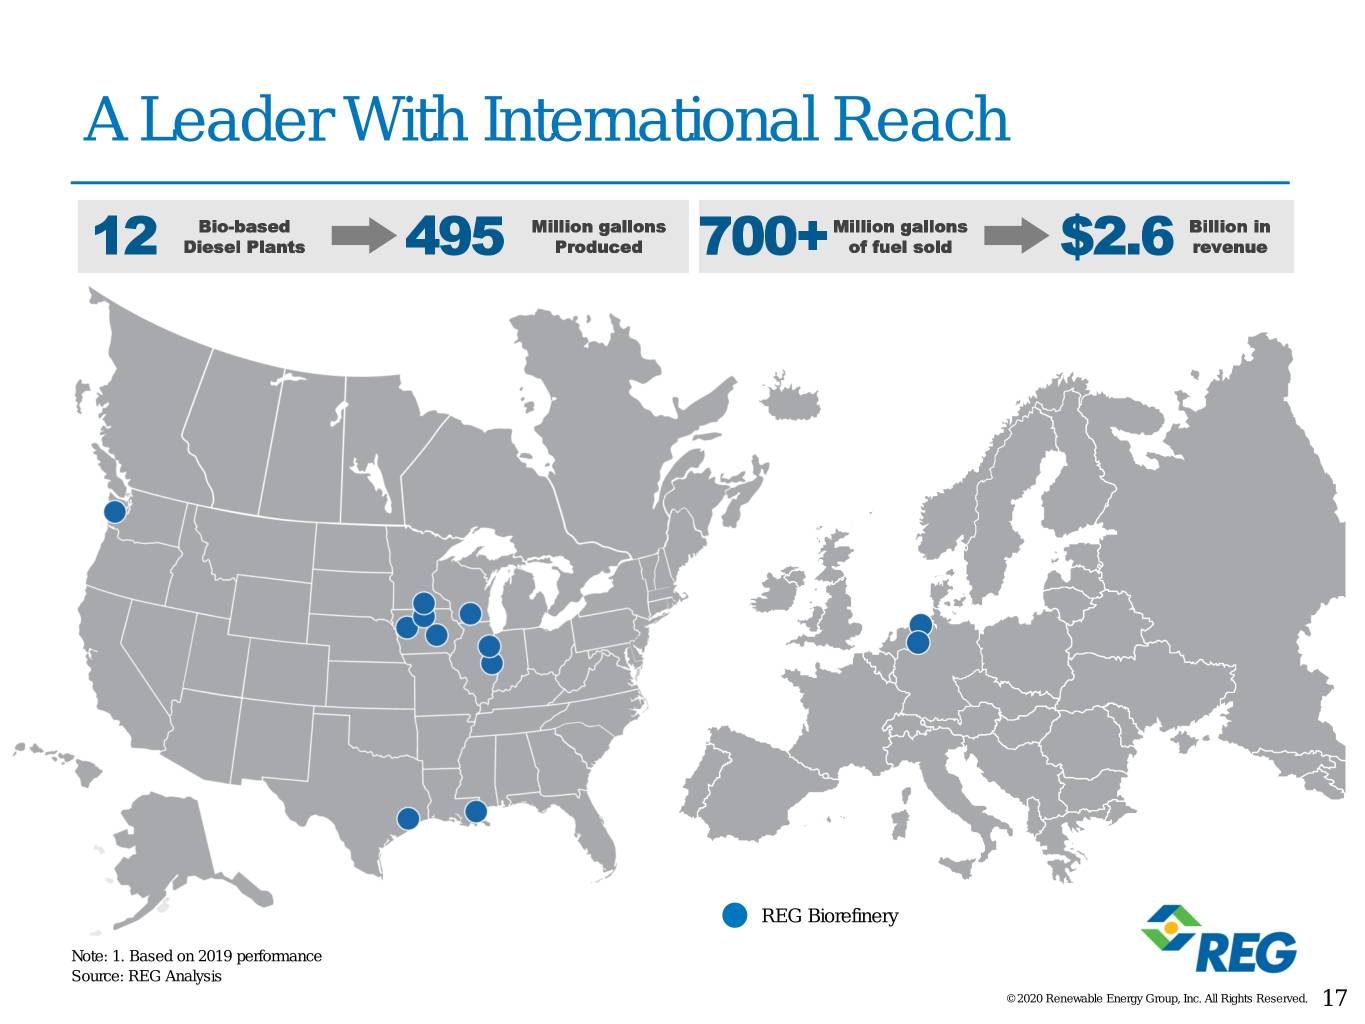
A Leader With International Reach Bio-based Million gallons Million gallons Billion in 12 Diesel Plants 495 Produced 700+ of fuel sold $2.6 revenue REG Biorefinery Note: 1. Based on 2019 performance Source: REG Analysis © 2020 Renewable Energy Group, Inc. All Rights Reserved. 17

Biodiesel and Renewable Diesel Basics BIODIESEL and RENEWABLE DIESEL use the same feedstocks and are both low carbon BIODIESEL RENEWABLE DIESEL – Mild process conditions – Severe process conditions – Low capital intensity – High capital intensity – Blend limitations in – Economies of scale important most applications – Hydrocarbon/no blend limitations – High lubricity – High cetane – Used for on road, mining, – Used for on road and can be marine and heating oil refined to sustainable aviation fuel (SAF) – Sold in all regions with renewable incentives – Sold in carbon and other special incentivized markets REG Ultra Clean®: A biodiesel/renewable diesel blend with specific advantages derived from the positive properties of each fuel. © 2020 Renewable Energy Group, Inc. All Rights Reserved. 18

Strong Sales Growth 800 700 600 1 500 400 300 Gallons Sold (MM) Sold Gallons 200 100 - 2010 2011 2012 2013 2014 2015 2016 2017 2018 2019 Note: Includes all bio-based diesel and petroleum: domestic, international and third party gallons © 2020 Renewable Energy Group, Inc. All Rights Reserved. 19

Experienced Management Team CYNTHIA (CJ) BRAD NATALIE GARY CHAD WARNER ALBIN MERRILL HAER STONE President & Vice President, Vice President, Vice President, Chief Financial Chief Executive Manufacturing Business Development Special Projects Officer Officer & Optimization ERIC BOWEN TRISHA CONLEY BOB KENYON General Counsel Vice President, Vice President, People Development Sales & Marketing DOUG LENHART RAYMOND RICHIE TODD ROBINSON Vice President, Procurement Vice President & Managing Director, Treasurer & Executive Director International Business of Investor Relations Biographies available at www.regi.com © 2020 Renewable Energy Group, Inc. All Rights Reserved. 20

© 2020 Renewable Energy Group, Inc. All Rights Reserved. 21
Defining Our Culture © 2020 Renewable Energy Group, Inc. All Rights Reserved. 22
Today’s Areas Of Focus Underlying performance capability RD expansion Margin drivers Feedstock abundance and procurement expertise Downstream expansion for full BD value capture Capital discipline and financial performance Wrap-up and Q&A © 2020 Renewable Energy Group, Inc. All Rights Reserved. 23
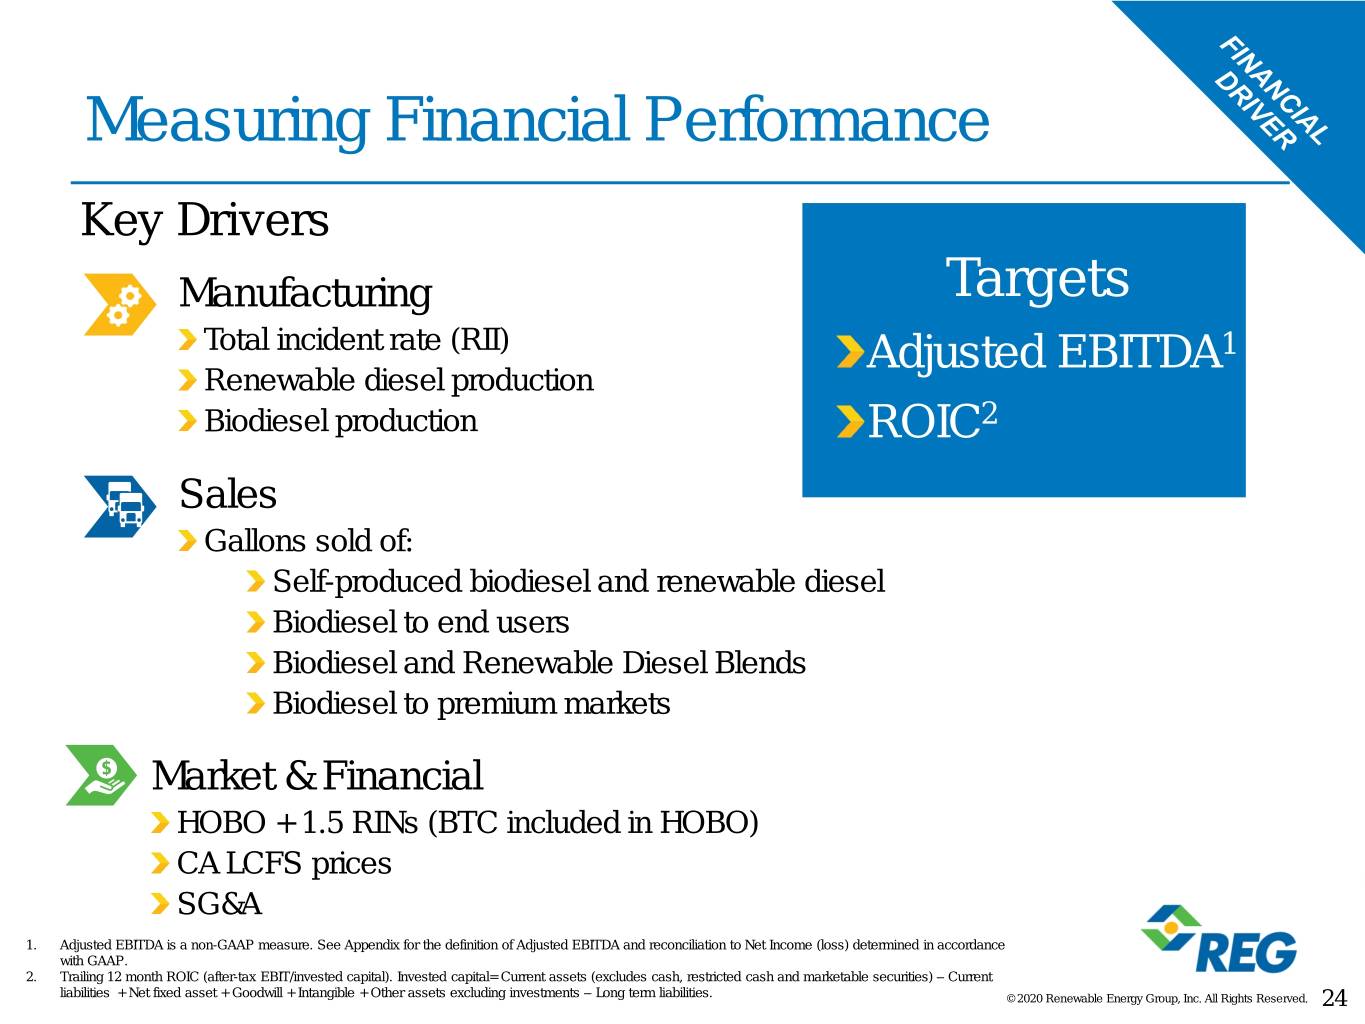
Measuring Financial Performance Key Drivers Manufacturing Targets Total incident rate (RII) Adjusted EBITDA1 Renewable diesel production Biodiesel production ROIC2 Sales Gallons sold of: Self-produced biodiesel and renewable diesel Biodiesel to end users Biodiesel and Renewable Diesel Blends Biodiesel to premium markets Market & Financial HOBO + 1.5 RINs (BTC included in HOBO) CA LCFS prices SG&A 1. Adjusted EBITDA is a non-GAAP measure. See Appendix for the definition of Adjusted EBITDA and reconciliation to Net Income (loss) determined in accordance with GAAP. 2. Trailing 12 month ROIC (after-tax EBIT/invested capital). Invested capital= Current assets (excludes cash, restricted cash and marketable securities) – Current liabilities + Net fixed asset + Goodwill + Intangible + Other assets excluding investments – Long term liabilities. © 2020 Renewable Energy Group, Inc. All Rights Reserved. 24

Key Elements of Strategy Renewable diesel expansion / balancing our product portfolio Downstream integration –Grow margin –Full value for biodiesel –Customer value enhancement Feedstock abundance Capital allocation © 2020 Renewable Energy Group, Inc. All Rights Reserved. 25

Significant Profit Generation Potential Historic Adjusted EBITDA1 Margin 7 – 16%2 Growth Track Record – 30% Sales CAGR3 – 19% ROIC - Trailing 12 month4 Strategic Growth Momentum – Downstream integration margin enhancement – RD production volume expansion 1. Adjusted EBITDA is a non-GAAP measure. See Appendix for the definition of Adjusted EBITDA and reconciliation to Net Income (loss) determined in accordance with GAAP. 2. See slide 100 for Adjusted EBITDA margin reference 3. See slide 19 for Sales CAGR reference 4. See slide 101 for TTM ROIC © 2020 Renewable Energy Group, Inc. All Rights Reserved. 26

Underlying Performance & Growth Brad Albin Vice President, Manufacturing © 2020 Renewable Energy Group, Inc. All Rights Reserved. 27
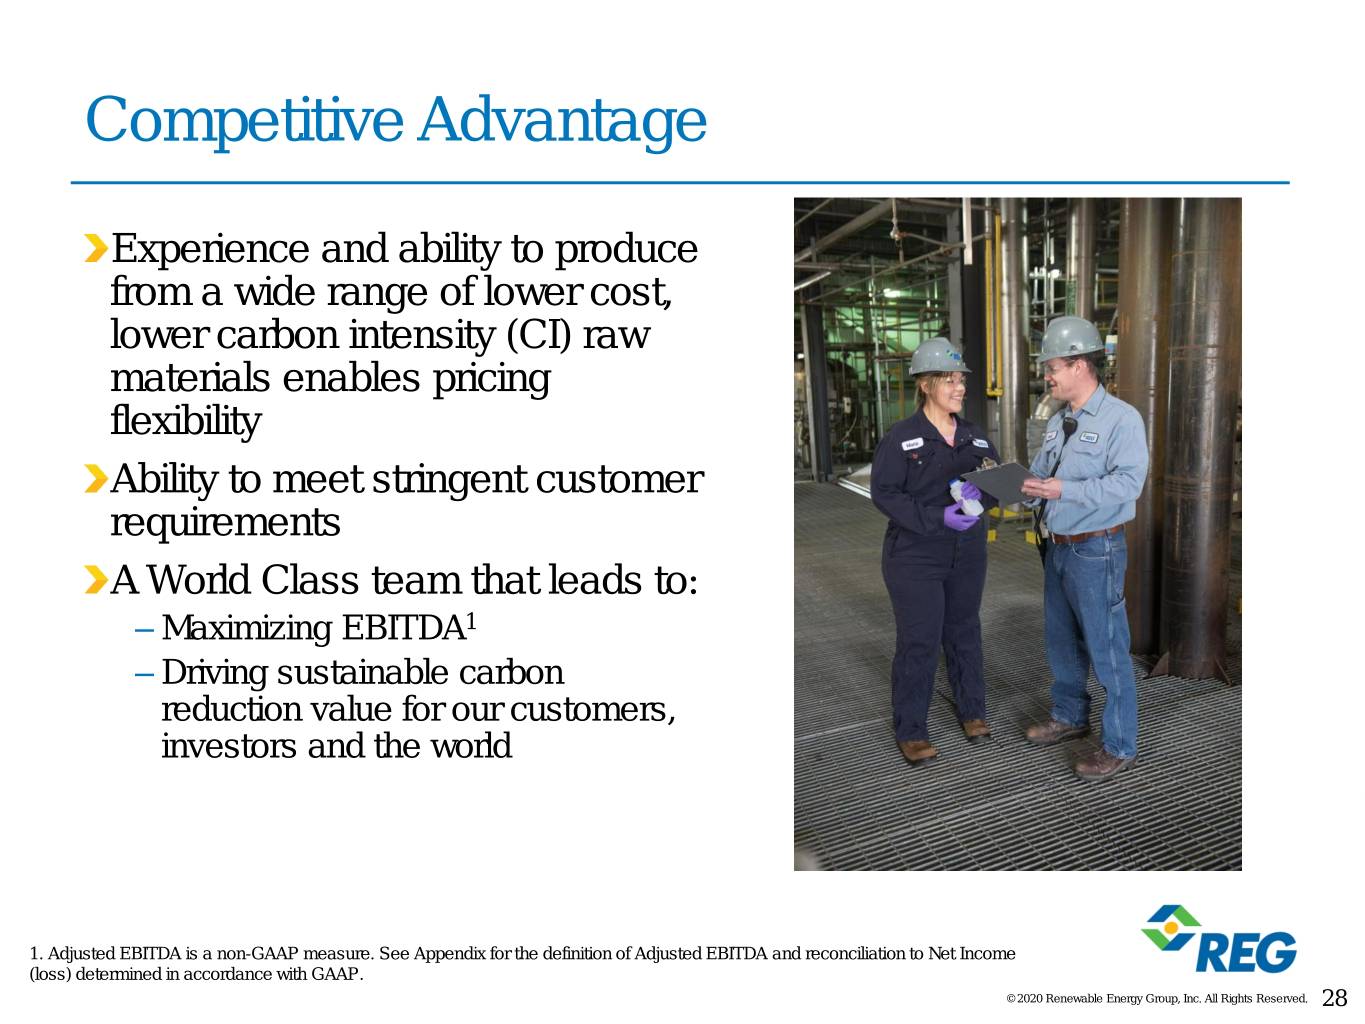
Competitive Advantage Experience and ability to produce from a wide range of lower cost, lower carbon intensity (CI) raw materials enables pricing flexibility Ability to meet stringent customer requirements A World Class team that leads to: – Maximizing EBITDA1 – Driving sustainable carbon reduction value for our customers, investors and the world 1. Adjusted EBITDA is a non-GAAP measure. See Appendix for the definition of Adjusted EBITDA and reconciliation to Net Income (loss) determined in accordance with GAAP. © 2020 Renewable Energy Group, Inc. All Rights Reserved. 28

Safety-Always Is A Core Value 1 VisionZERO SAFETY CULTURE KPI – TOTAL INCIDENT RATE AND DART RATE (GLOBAL) 4.00 RII (Total Incident Rate) DART Rate 3.00 Industry Average: 2.1 2.00 Mindset Commitment to zero accidents Incident Rate Incident June RII (0.57) Expectations Expectations are established, consistent and reinforced 1.00 Committed to our co-workers, visitors and communities Commitment Hold ourselves accountable for our actions Industry Leader: 0.7 Action Safety is ingrained in our practices, behavior and execution 0.00 Jan-14 Jan-15 Jan-16 Jan-17 Jan-18 Jan-19 Jan-20 ______________________________________________________________ Source: Industry average - NAICS 325 Chemical Manufacturing average (2.1). Source: Industry leader - American Chemistry Council member average (0.7). 1. Days Away Restricted Transferred. © 2020 Renewable Energy Group, Inc. All Rights Reserved.

REG Fuel Products – High Quality And High Impact REG-9000® REG REG Biodiesel and REG ® Bio-Residual™ Renewable REG-9000 Ultra Clean® Distilled Oil (BRO) Diesel Biodiesel © 2020 Renewable Energy Group, Inc. All Rights Reserved. 30
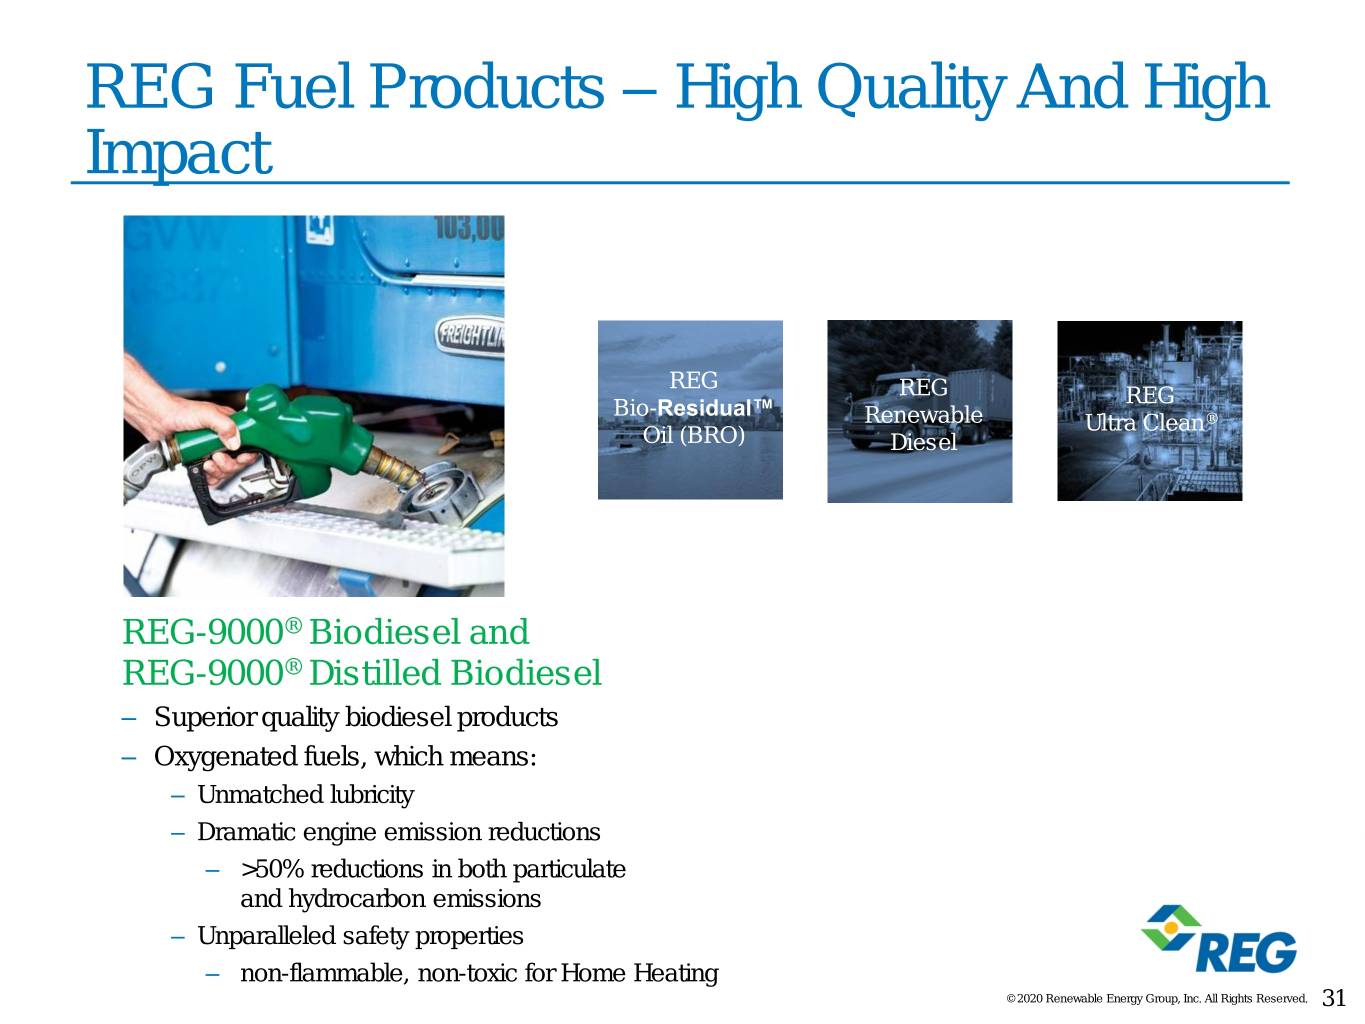
REG Fuel Products – High Quality And High Impact REG REG REG Bio-Residual™ Renewable Ultra Clean® Oil (BRO) Diesel REG-9000® Biodiesel and REG-9000® Distilled Biodiesel – Superior quality biodiesel products – Oxygenated fuels, which means: – Unmatched lubricity – Dramatic engine emission reductions – >50% reductions in both particulate and hydrocarbon emissions – Unparalleled safety properties – non-flammable, non-toxic for Home Heating © 2020 Renewable Energy Group, Inc. All Rights Reserved. 31
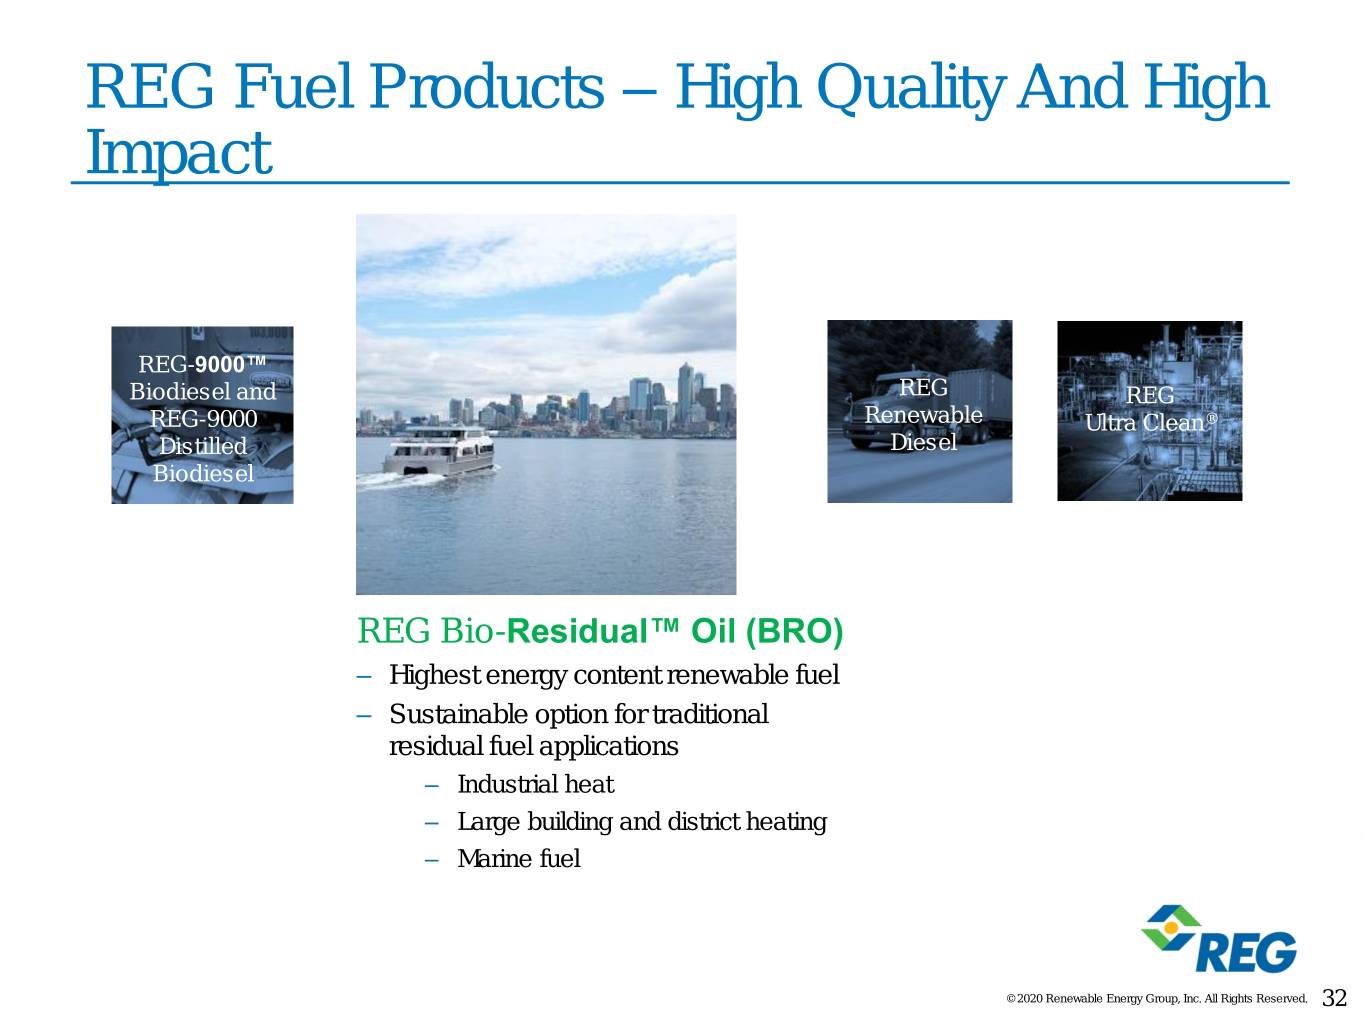
REG Fuel Products – High Quality And High Impact REG-9000™ Biodiesel and REG REG REG-9000 Renewable Ultra Clean® Distilled Diesel Biodiesel REG Bio-Residual™ Oil (BRO) – Highest energy content renewable fuel – Sustainable option for traditional residual fuel applications – Industrial heat – Large building and district heating – Marine fuel © 2020 Renewable Energy Group, Inc. All Rights Reserved. 32
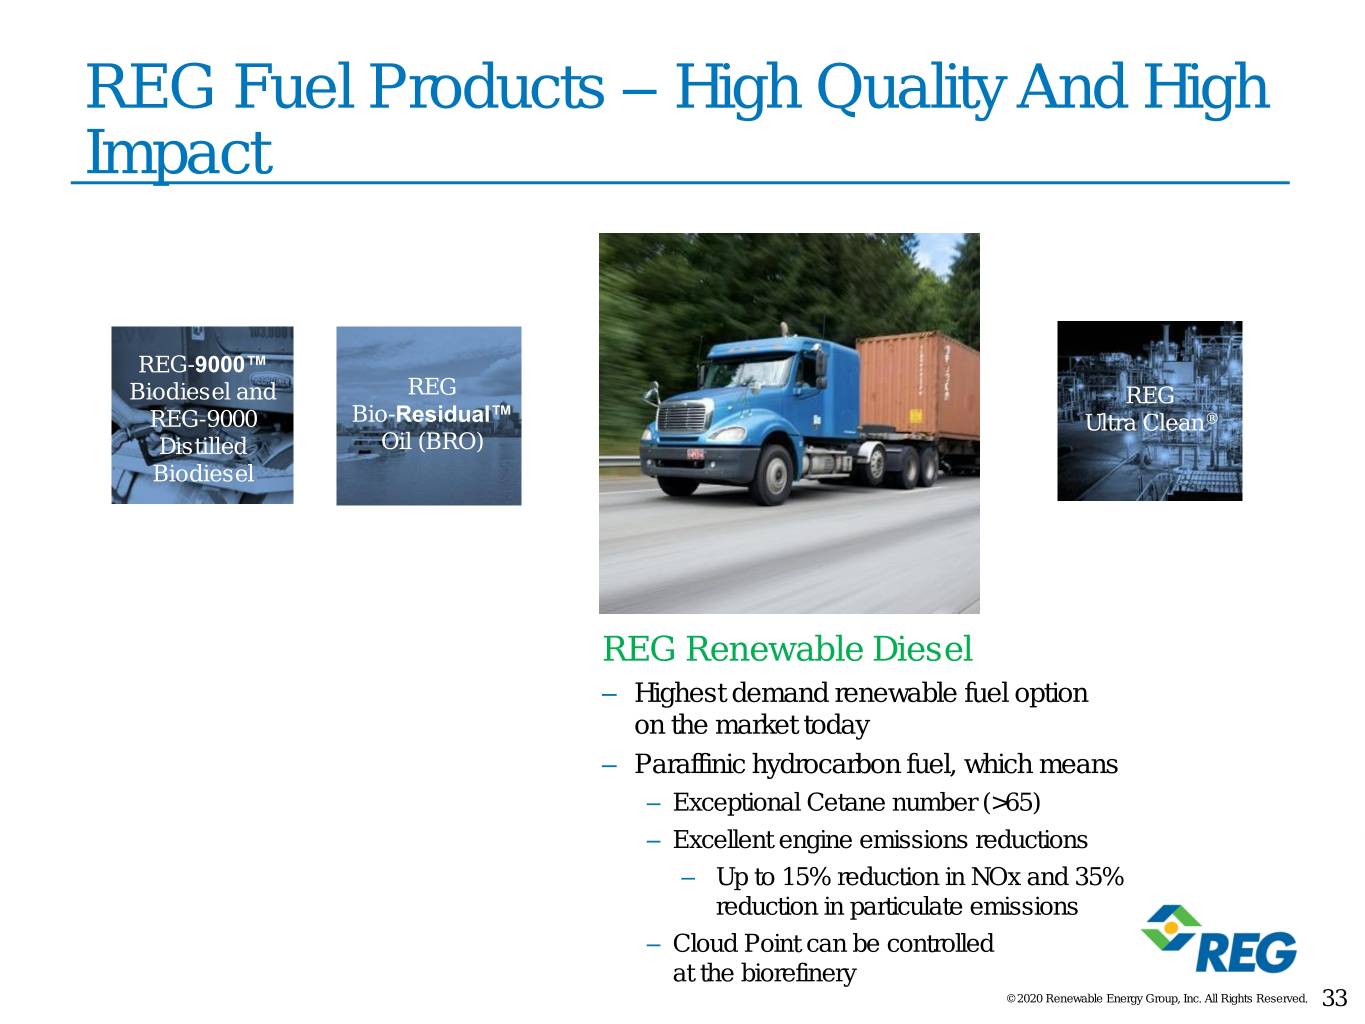
REG Fuel Products – High Quality And High Impact REG-9000™ Biodiesel and REG REG REG-9000 Bio-Residual™ Ultra Clean® Distilled Oil (BRO) Biodiesel REG Renewable Diesel – Highest demand renewable fuel option on the market today – Paraffinic hydrocarbon fuel, which means – Exceptional Cetane number (>65) – Excellent engine emissions reductions – Up to 15% reduction in NOx and 35% reduction in particulate emissions – Cloud Point can be controlled at the biorefinery © 2020 Renewable Energy Group, Inc. All Rights Reserved. 33
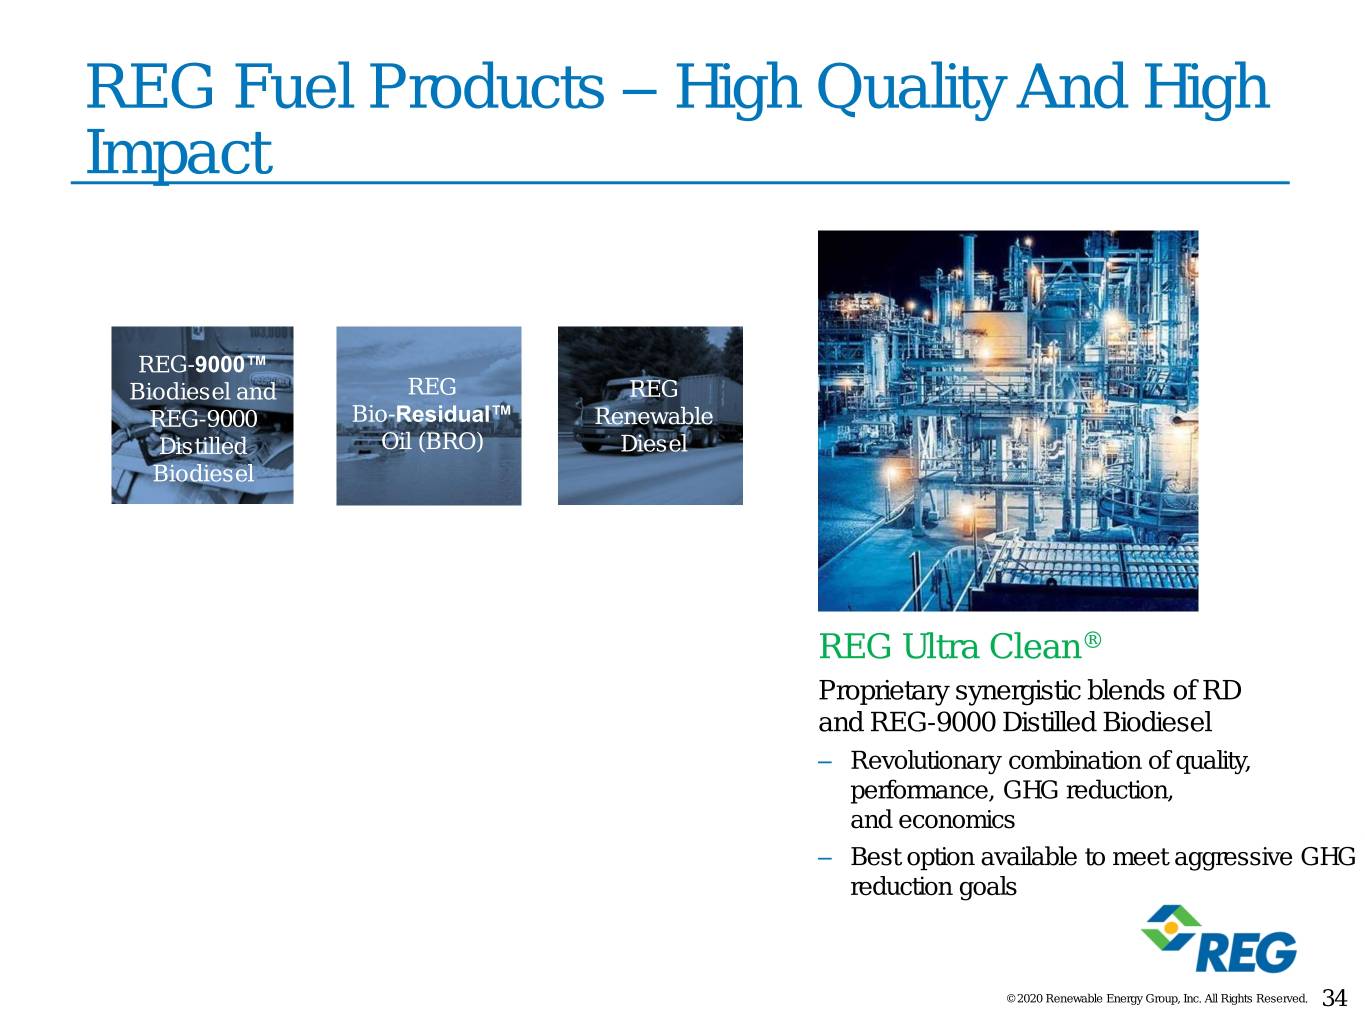
REG Fuel Products – High Quality And High Impact REG-9000™ Biodiesel and REG REG REG-9000 Bio-Residual™ Renewable Distilled Oil (BRO) Diesel Biodiesel REG Ultra Clean® Proprietary synergistic blends of RD and REG-9000 Distilled Biodiesel – Revolutionary combination of quality, performance, GHG reduction, and economics – Best option available to meet aggressive GHG reduction goals © 2020 Renewable Energy Group, Inc. All Rights Reserved. 34
Feedstock Expertise © 2020 Renewable Energy Group, Inc. All Rights Reserved. 35

Our Fleet of Synergistic Biorefineries Albert Lea, MN Danville, IL Emden, Germany Grays Harbor, WA Ralston, IA Madison, WI Mason City, IA Houston, TX Newton, IA Oeding, Germany Seneca, IL Geismar, LA Marine Transportation 36 © 2020 Renewable Energy Group, Inc. All Rights Reserved. 36
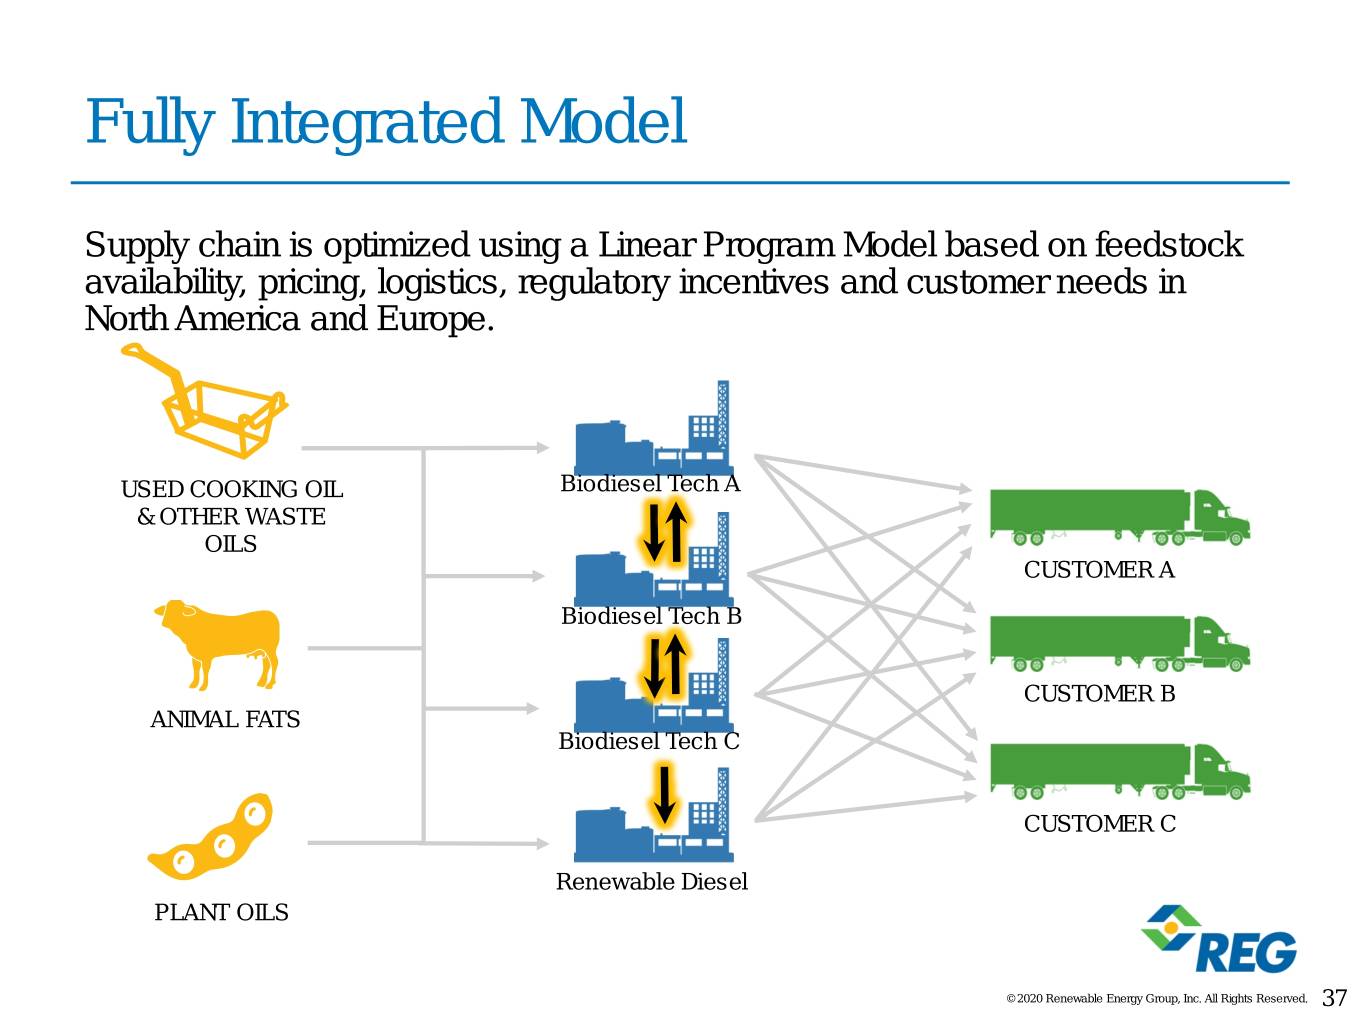
Fully Integrated Model Supply chain is optimized using a Linear Program Model based on feedstock availability, pricing, logistics, regulatory incentives and customer needs in North America and Europe. USED COOKING OIL Biodiesel Tech A & OTHER WASTE OILS CUSTOMER A Biodiesel Tech B CUSTOMER B ANIMAL FATS Biodiesel Tech C CUSTOMER C Renewable Diesel PLANT OILS © 2020 Renewable Energy Group, Inc. All Rights Reserved. 37
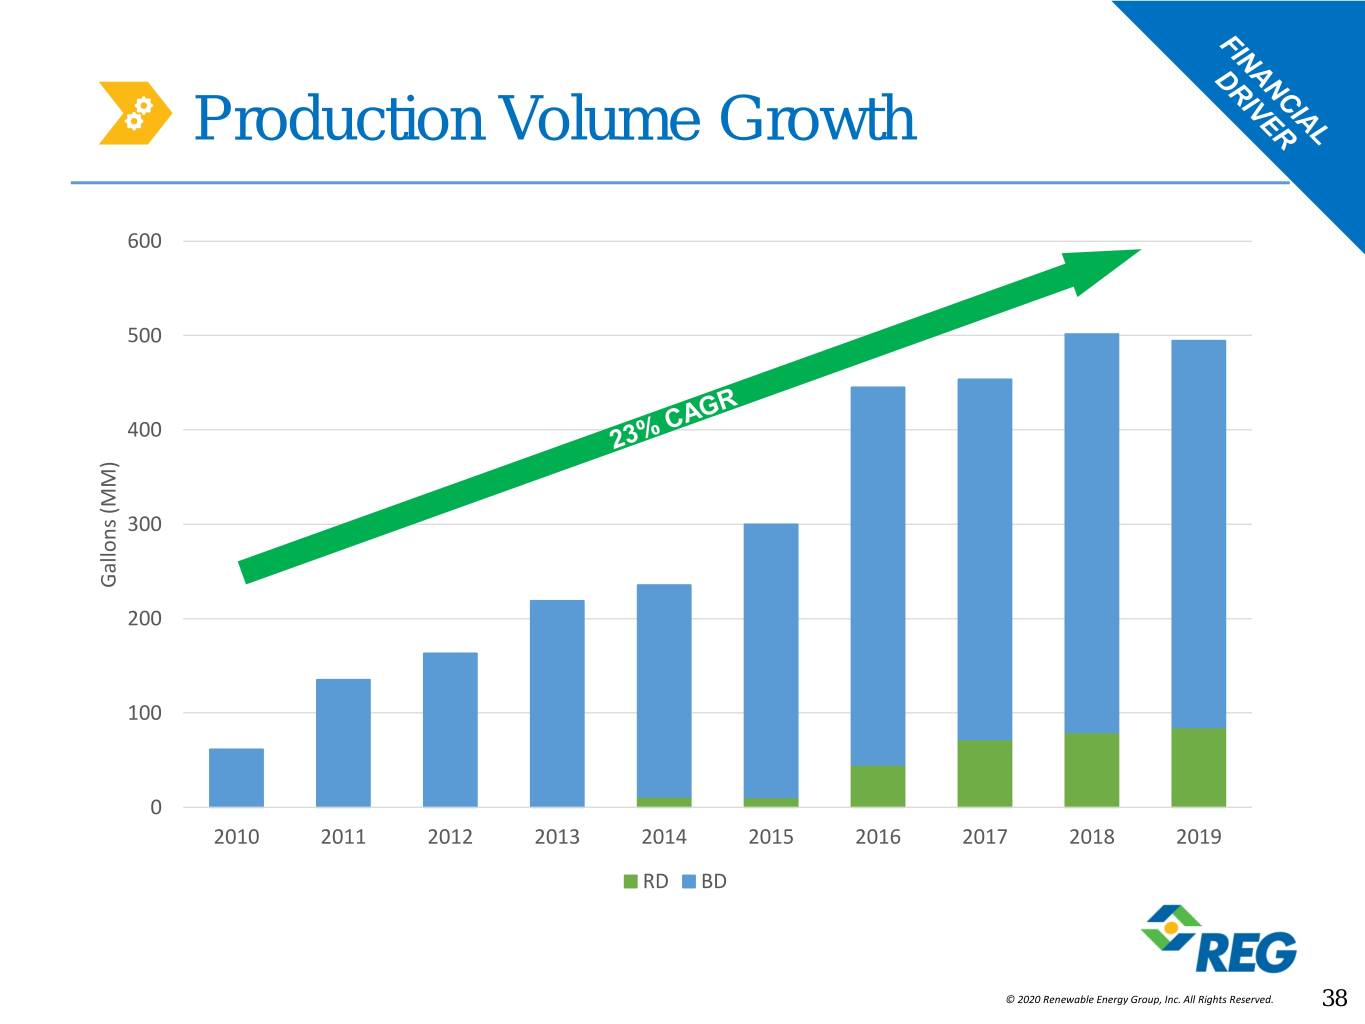
Production Volume Growth 600 500 400 300 Gallons (MM)Gallons 200 100 0 2010 2011 2012 2013 2014 2015 2016 2017 2018 2019 RD BD © 2020 Renewable Energy Group, Inc. All Rights Reserved. 38
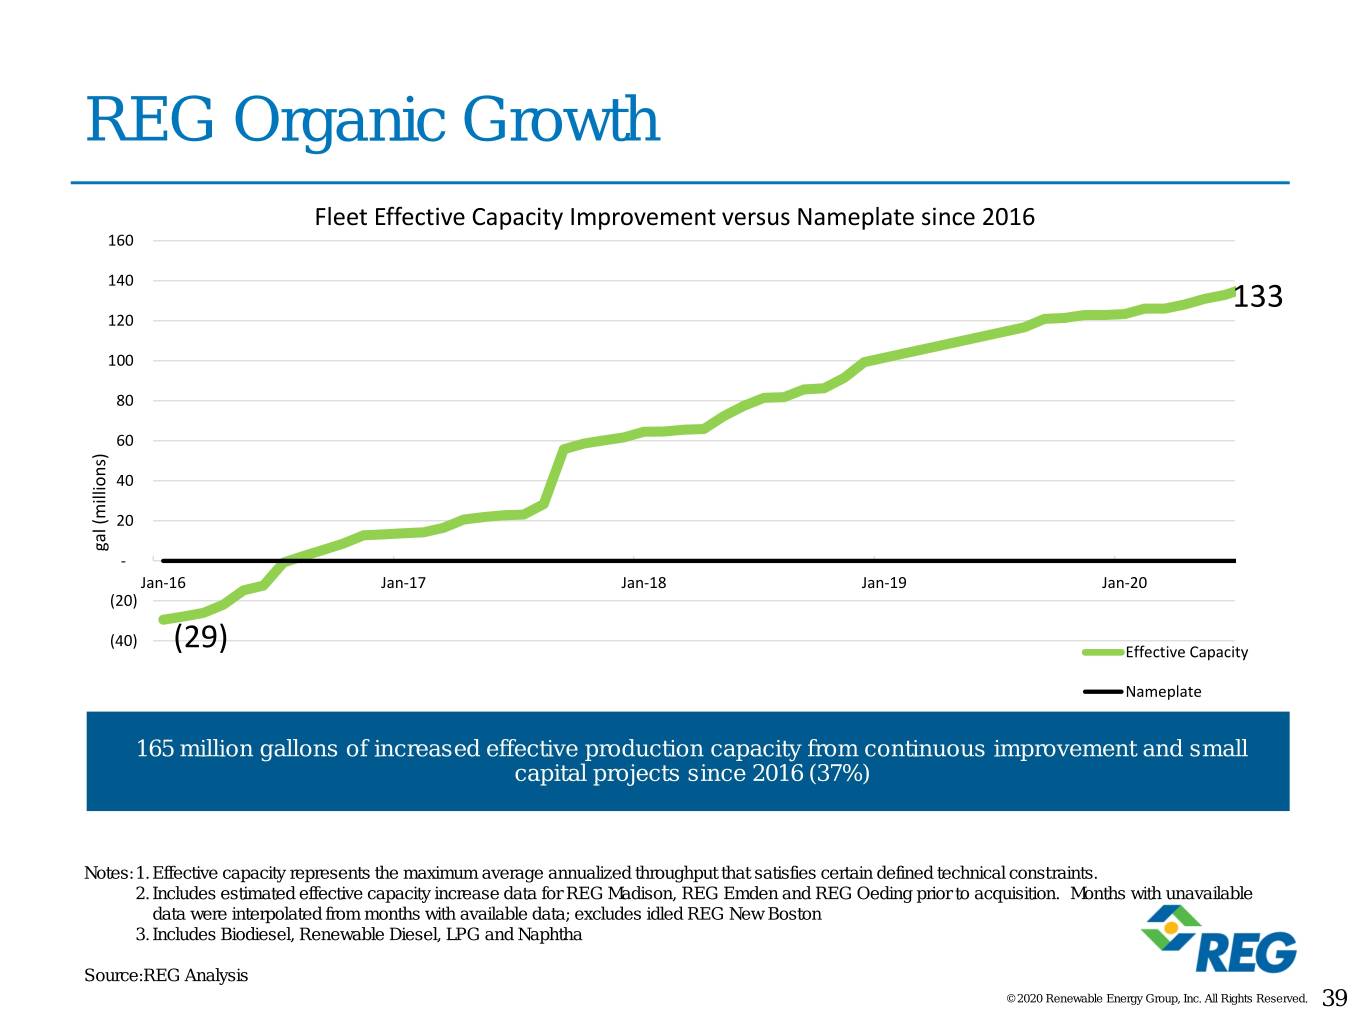
REG Organic Growth Fleet Effective Capacity Improvement versus Nameplate since 2016 160 140 133 120 100 80 60 40 20 gal(millions) - Jan-16 Jan-17 Jan-18 Jan-19 Jan-20 (20) (40) (29) Effective Capacity Nameplate 165 million gallons of increased effective production capacity from continuous improvement and small capital projects since 2016 (37%) Notes:1. Effective capacity represents the maximum average annualized throughput that satisfies certain defined technical constraints. 2. Includes estimated effective capacity increase data for REG Madison, REG Emden and REG Oeding prior to acquisition. Months with unavailable data were interpolated from months with available data; excludes idled REG New Boston 3. Includes Biodiesel, Renewable Diesel, LPG and Naphtha Source:REG Analysis © 2020 Renewable Energy Group, Inc. All Rights Reserved. 39
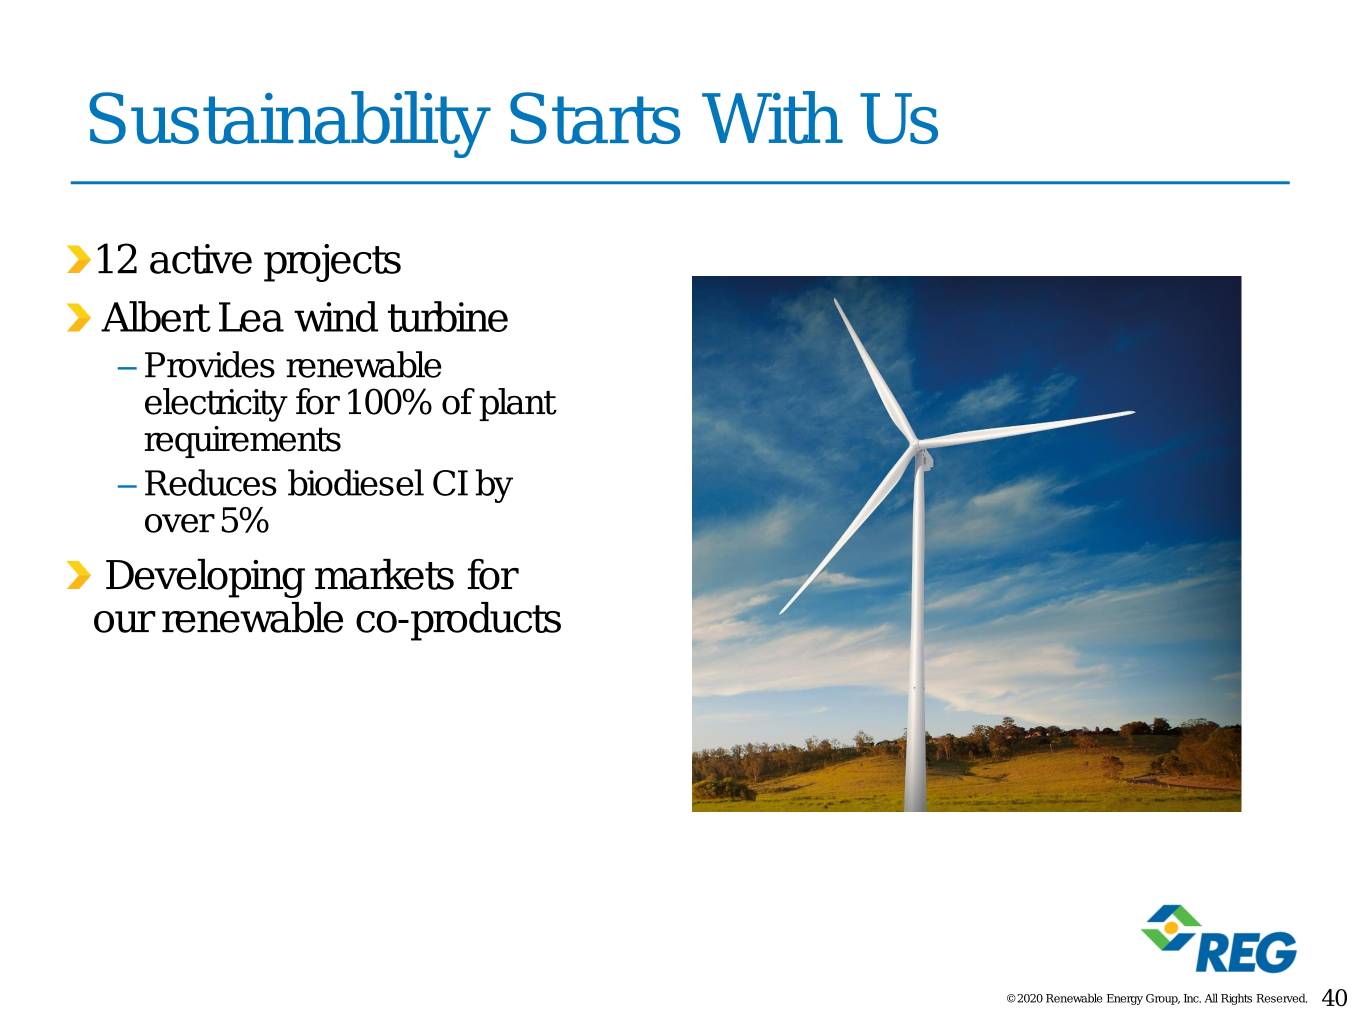
Sustainability Starts With Us 12 active projects Albert Lea wind turbine – Provides renewable electricity for 100% of plant requirements – Reduces biodiesel CI by over 5% Developing markets for our renewable co-products © 2020 Renewable Energy Group, Inc. All Rights Reserved. 40
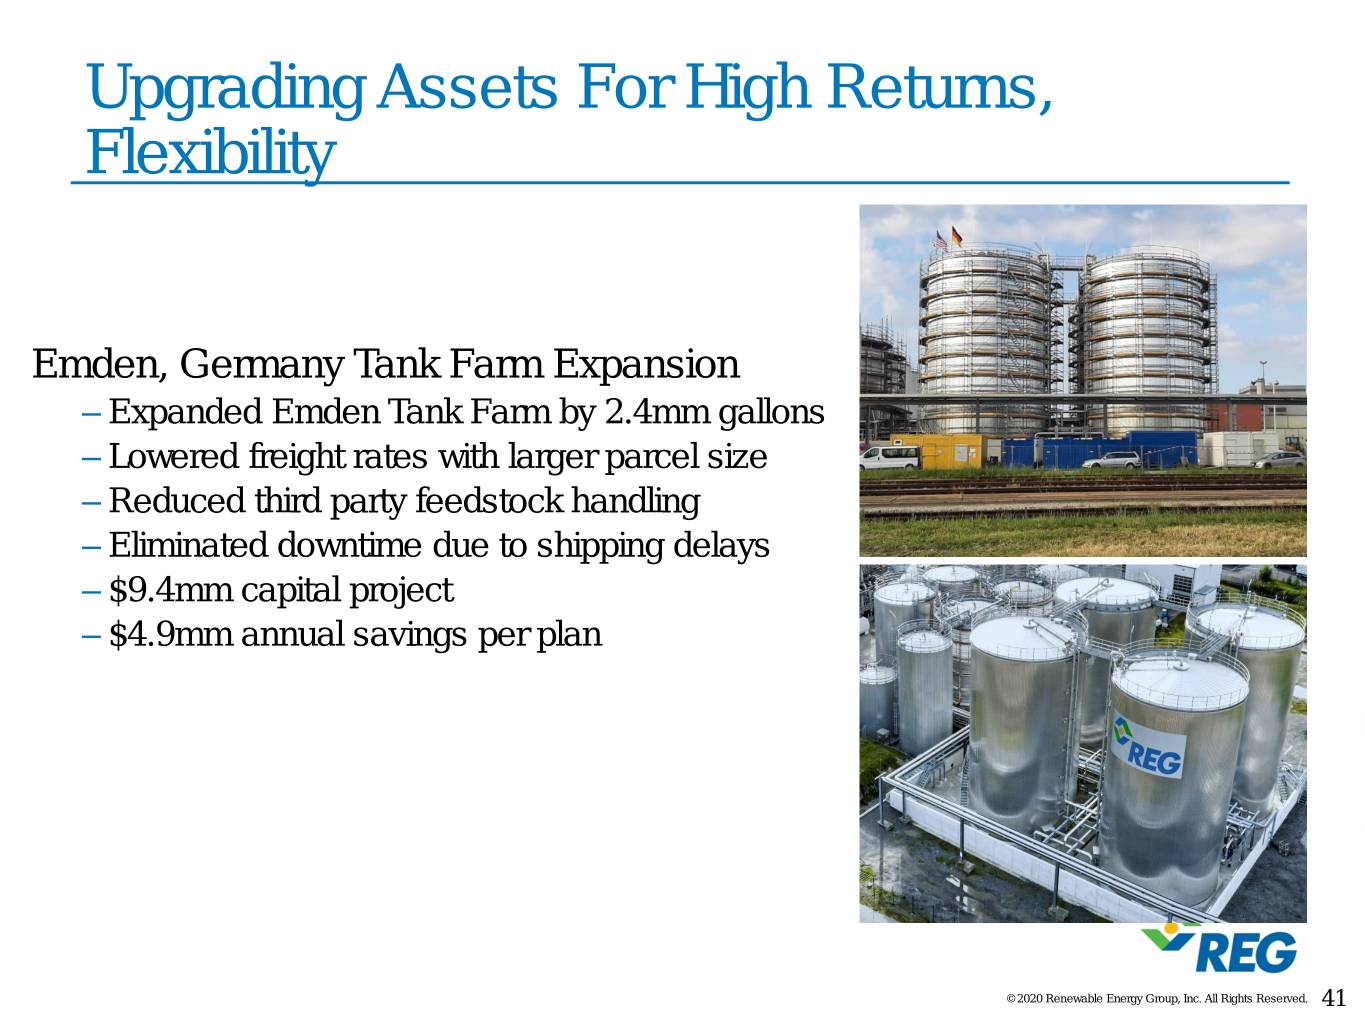
Upgrading Assets For High Returns, Flexibility Emden, Germany Tank Farm Expansion – Expanded Emden Tank Farm by 2.4mm gallons – Lowered freight rates with larger parcel size – Reduced third party feedstock handling – Eliminated downtime due to shipping delays – $9.4mm capital project – $4.9mm annual savings per plan © 2020 Renewable Energy Group, Inc. All Rights Reserved. 41
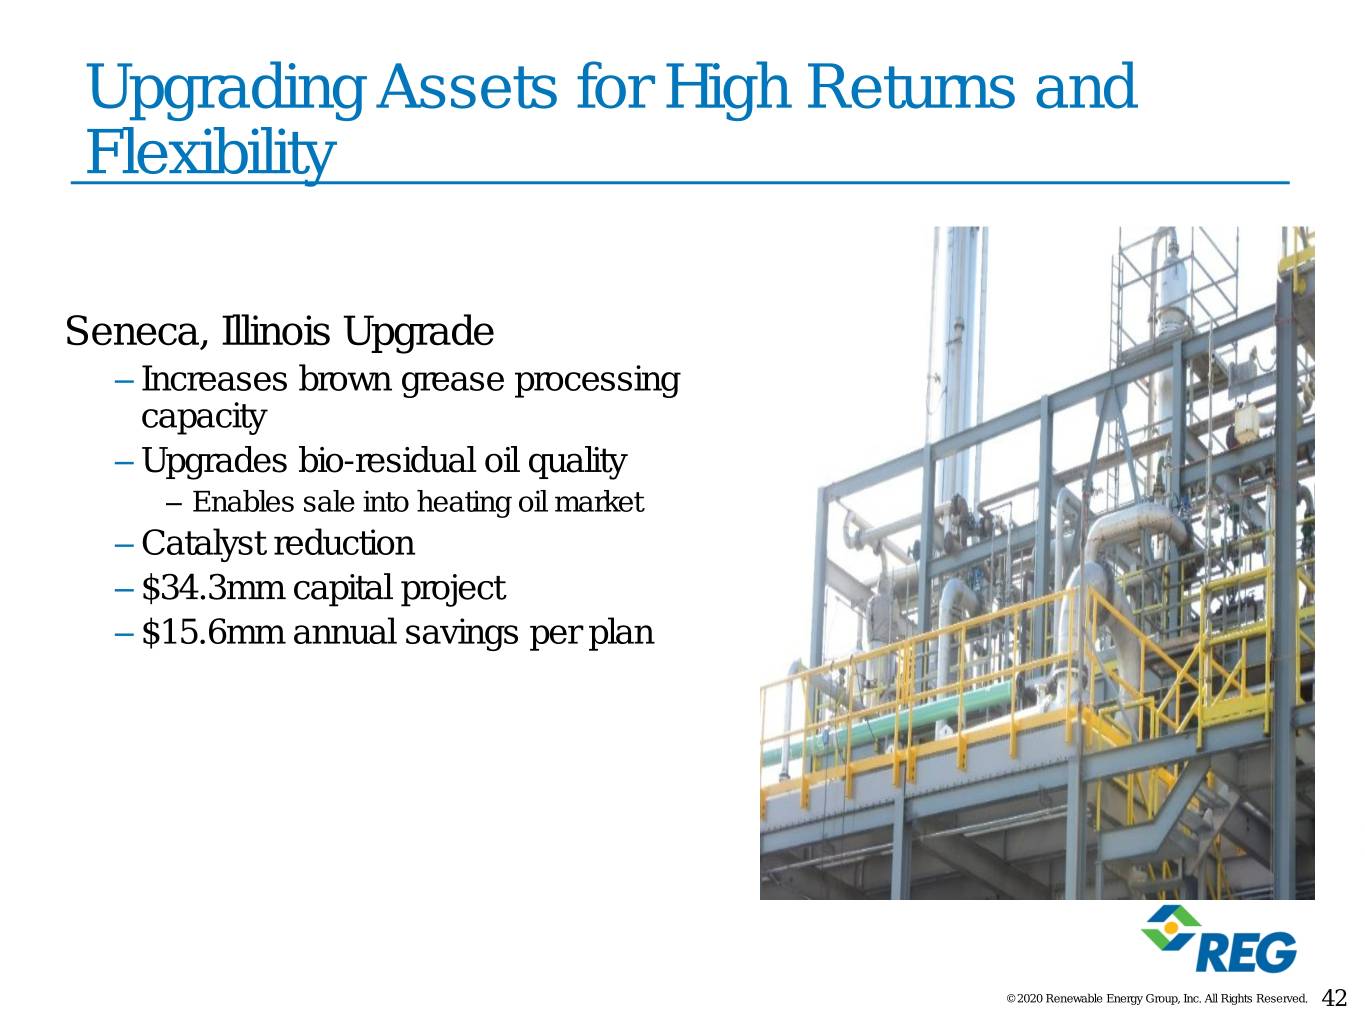
Upgrading Assets for High Returns and Flexibility Seneca, Illinois Upgrade – Increases brown grease processing capacity – Upgrades bio-residual oil quality – Enables sale into heating oil market – Catalyst reduction – $34.3mm capital project – $15.6mm annual savings per plan © 2020 Renewable Energy Group, Inc. All Rights Reserved. 42
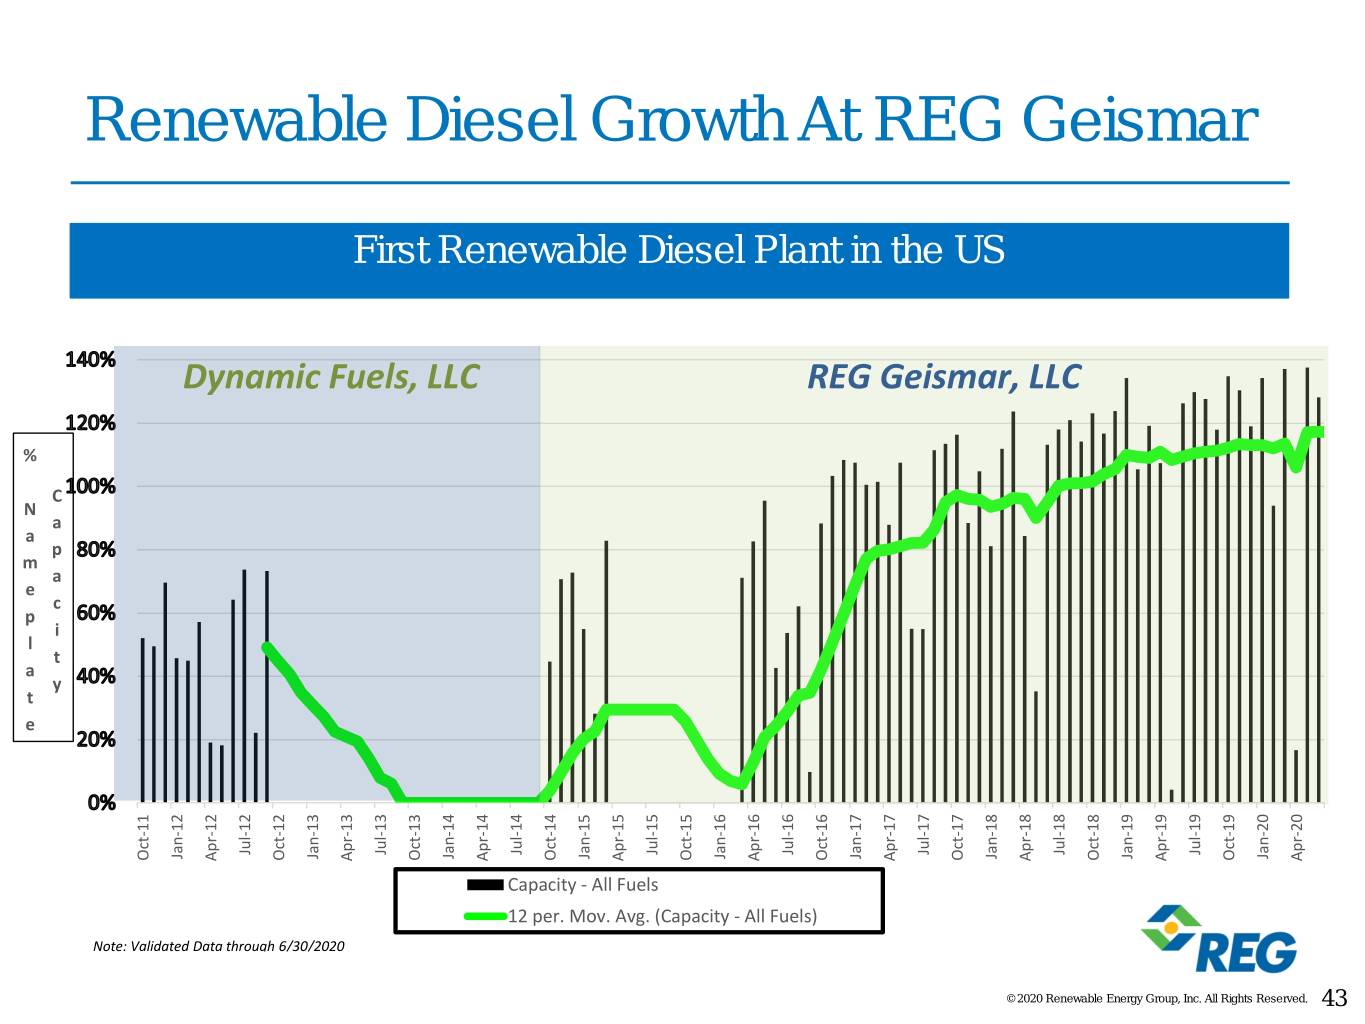
m % N p e a e a t l p C a a y c t i Renewable Diesel Growth At REGGeismar Note: ValidatedData Oct-11 Jan-12 Dynamic Fuels, Apr-12 through Jul-12 6/30/2020 Oct-12 Jan-13 Apr-13 First Renewable Diesel Plantin the Jul-13 Oct-13 LLC Jan-14 Apr-14 12 per. Mov. Avg. (Capacity - All Fuels) CapacityAll - Fuels Jul-14 Oct-14 Jan-15 Apr-15 Jul-15 Oct-15 Jan-16 Apr-16 Jul-16 REG Geismar, LLC Oct-16 Jan-17 Apr-17 Jul-17 Oct-17 US Jan-18 © 2020 Renewable Energy Group, Group, Energy Reserved. Inc. RightsAll © Renewable 2020 Apr-18 Jul-18 Oct-18 Jan-19 Apr-19 Jul-19 Oct-19 Jan-20 Apr-20 43
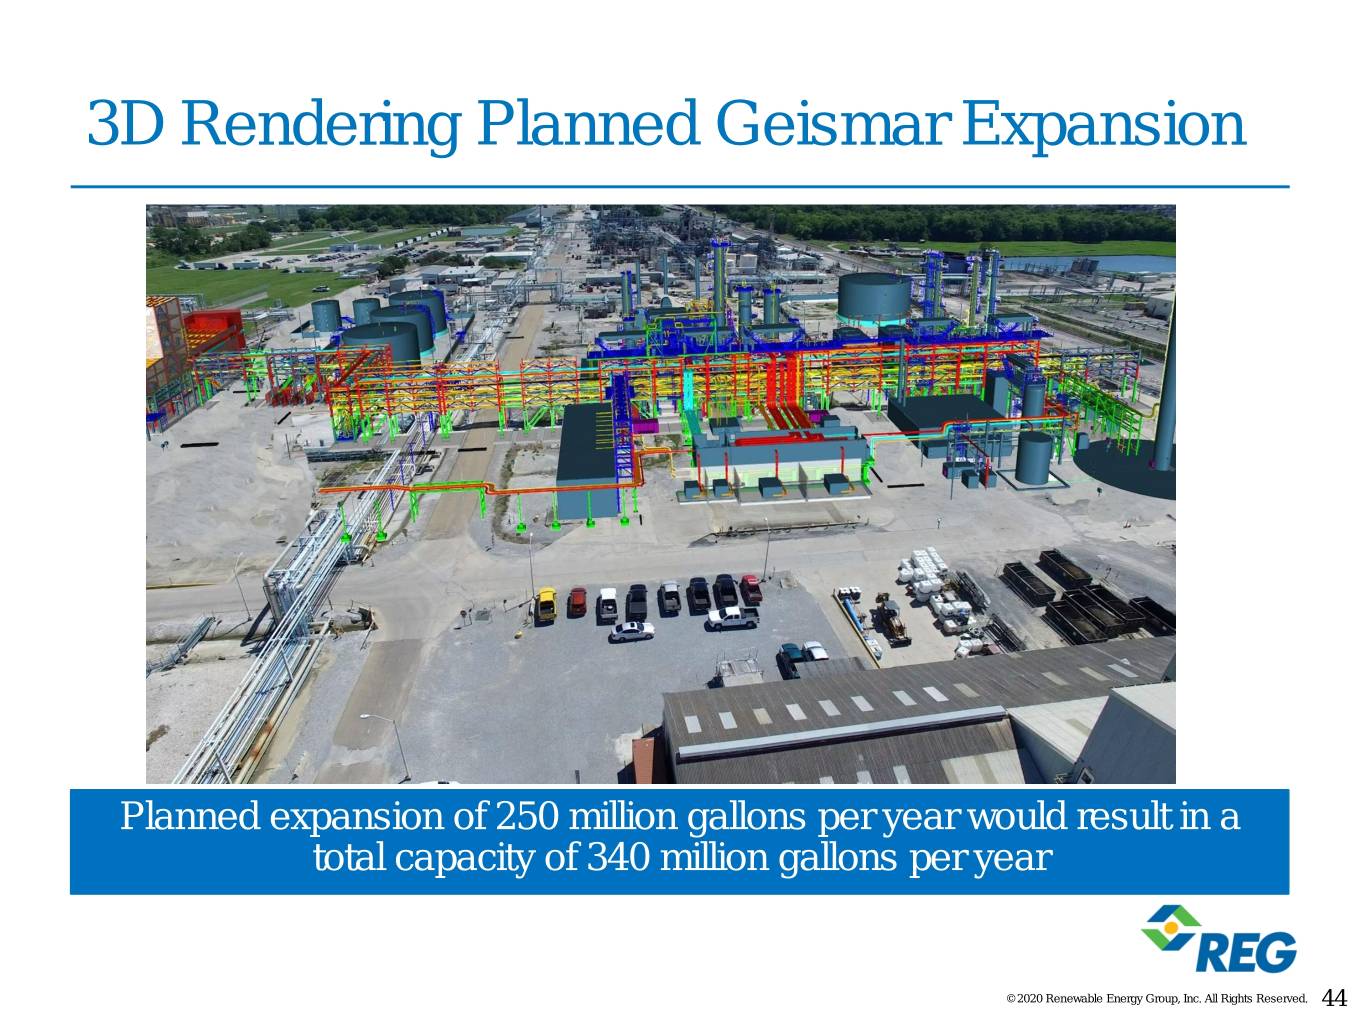
3D Rendering Planned Geismar Expansion Planned expansion of 250 million gallons per year would result in a total capacity of 340 million gallons per year © 2020 Renewable Energy Group, Inc. All Rights Reserved. 44
Geismar Video © 2020 Renewable Energy Group, Inc. All Rights Reserved.

Business Drivers and Market Fundamentals Natalie Merrill Vice President, Business Development and Optimization © 2020 Renewable Energy Group, Inc. All Rights Reserved. 46

Demand Drivers © 2020 Renewable Energy Group, Inc. All Rights Reserved. 47
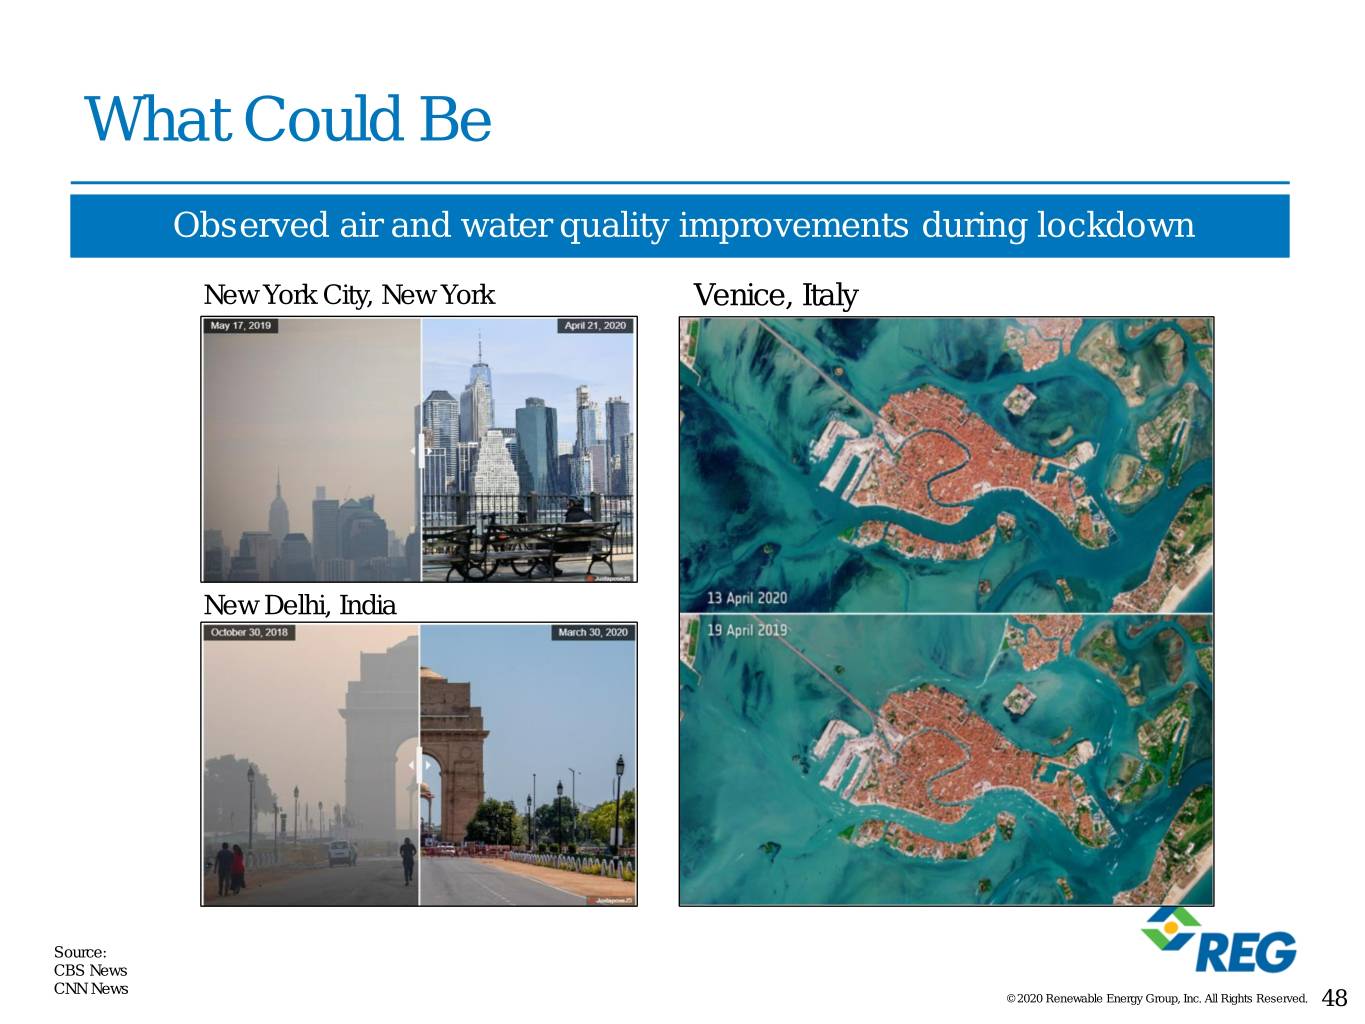
What Could Be Observed air and water quality improvements during lockdown New York City, New York Venice, Italy New Delhi, India Source: CBS News CNN News © 2020 Renewable Energy Group, Inc. All Rights Reserved. 48
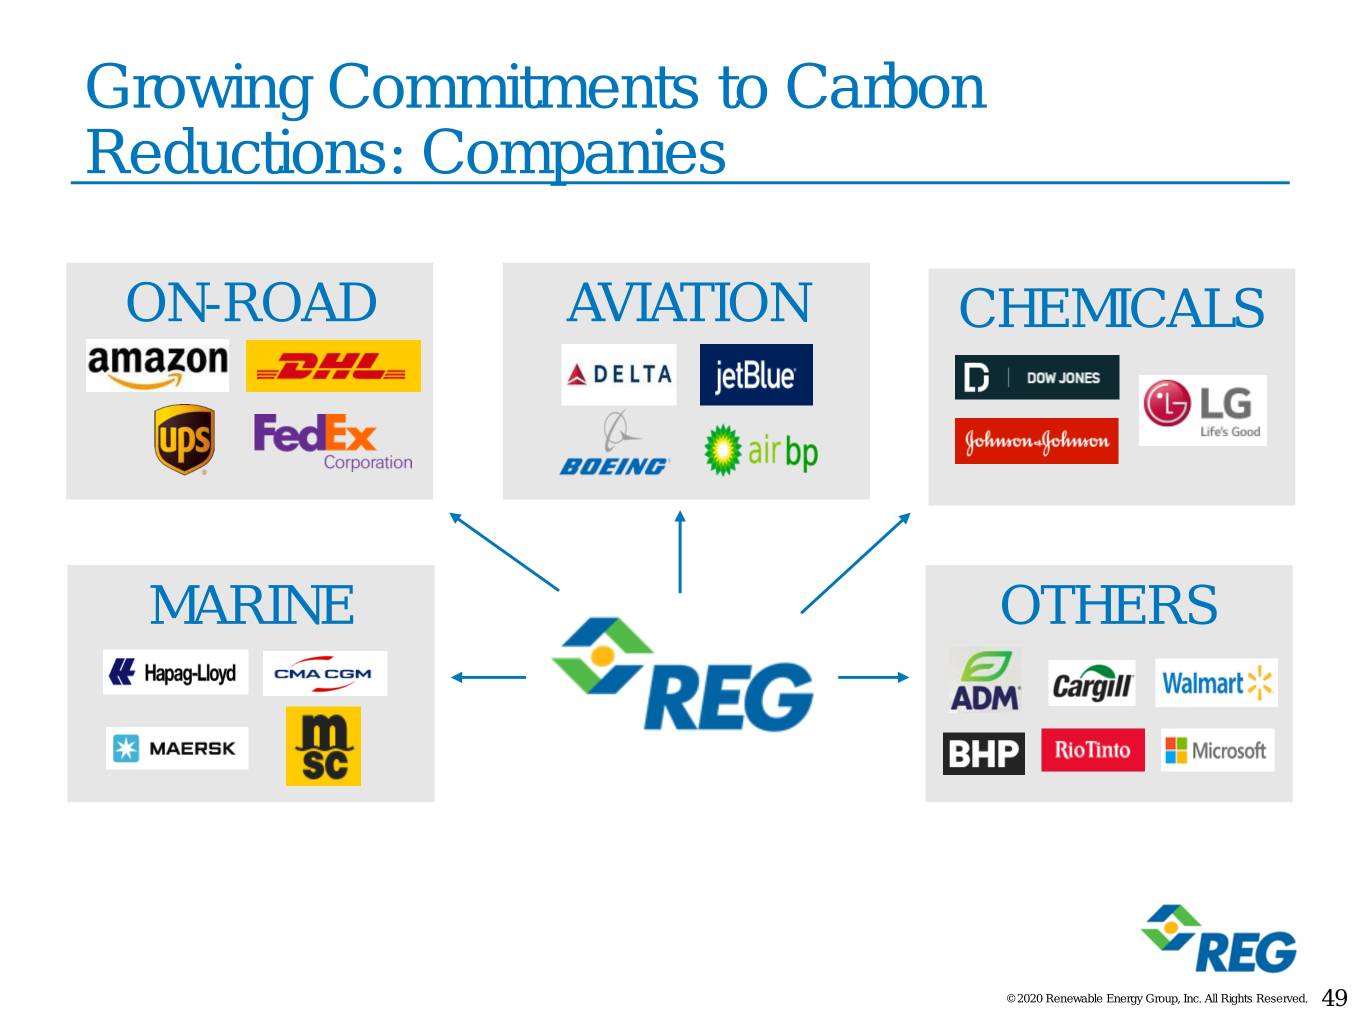
Growing Commitments to Carbon Reductions: Companies ON-ROAD AVIATION CHEMICALS MARINE OTHERS © 2020 Renewable Energy Group, Inc. All Rights Reserved. 49
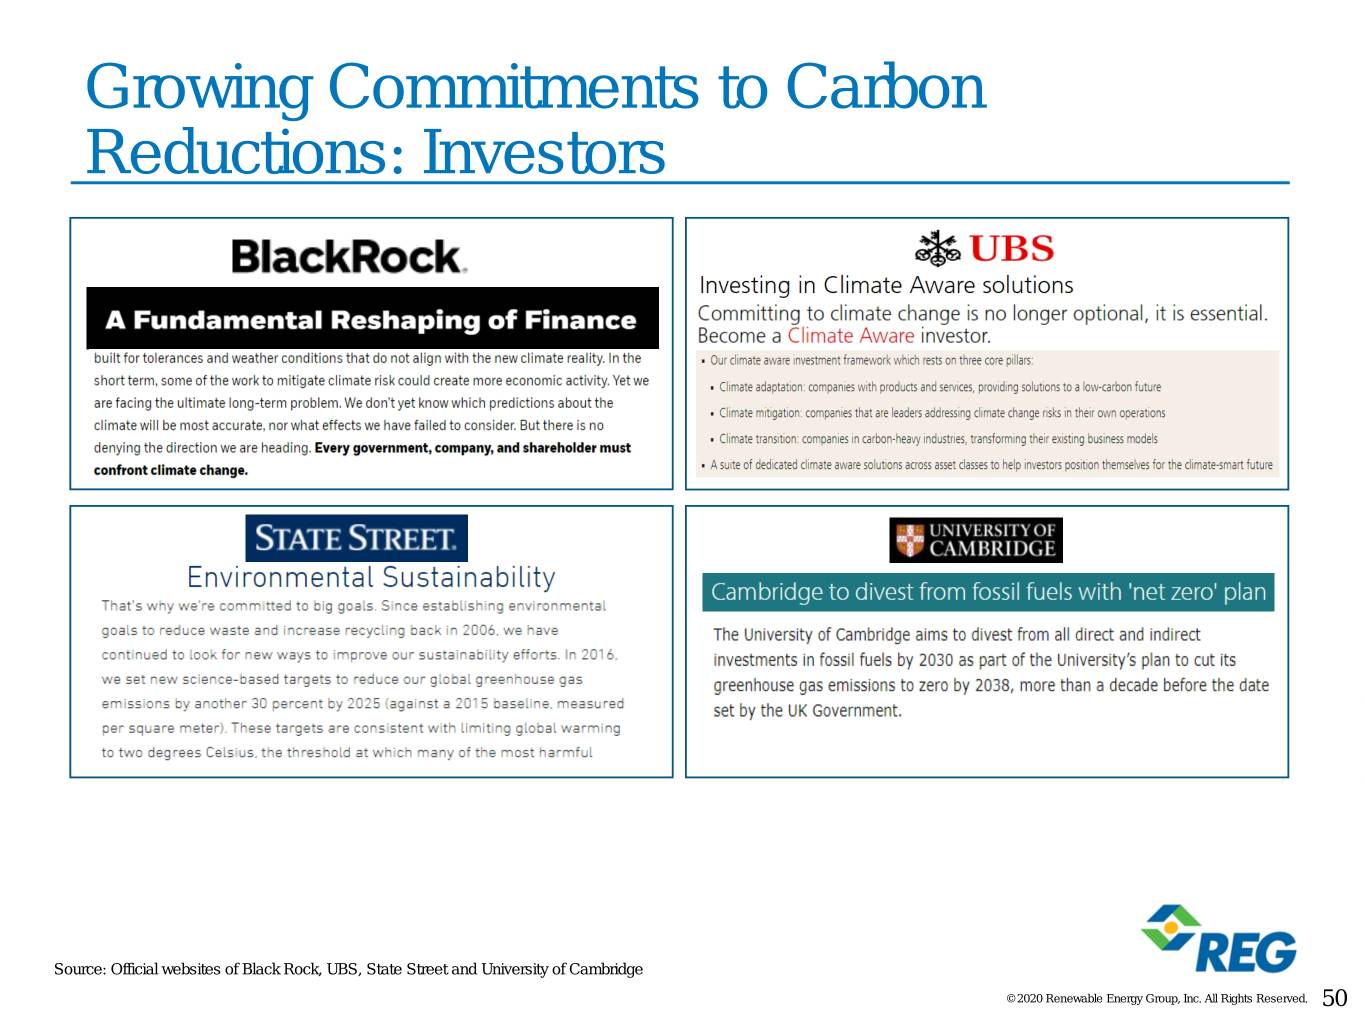
Growing Commitments to Carbon Reductions: Investors Source: Official websites of Black Rock, UBS, State Street and University of Cambridge © 2020 Renewable Energy Group, Inc. All Rights Reserved. 50
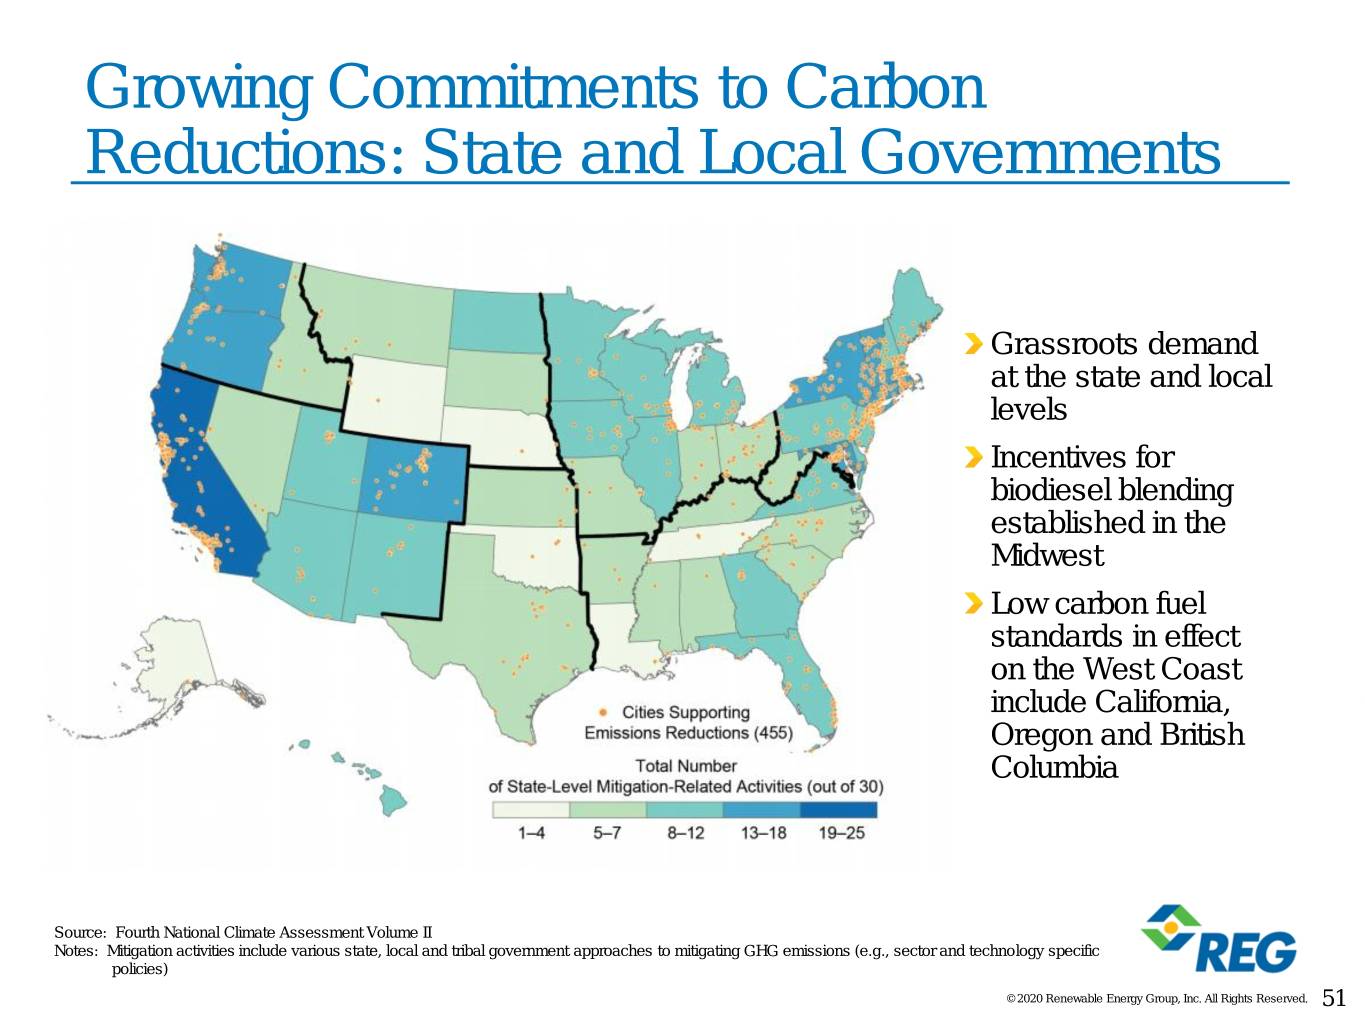
Growing Commitments to Carbon Reductions: State and Local Governments Grassroots demand at the state and local levels Incentives for biodiesel blending established in the Midwest Low carbon fuel standards in effect on the West Coast include California, Oregon and British Columbia Source: Fourth National Climate Assessment Volume II Notes: Mitigation activities include various state, local and tribal government approaches to mitigating GHG emissions (e.g., sector and technology specific policies) © 2020 Renewable Energy Group, Inc. All Rights Reserved. 51
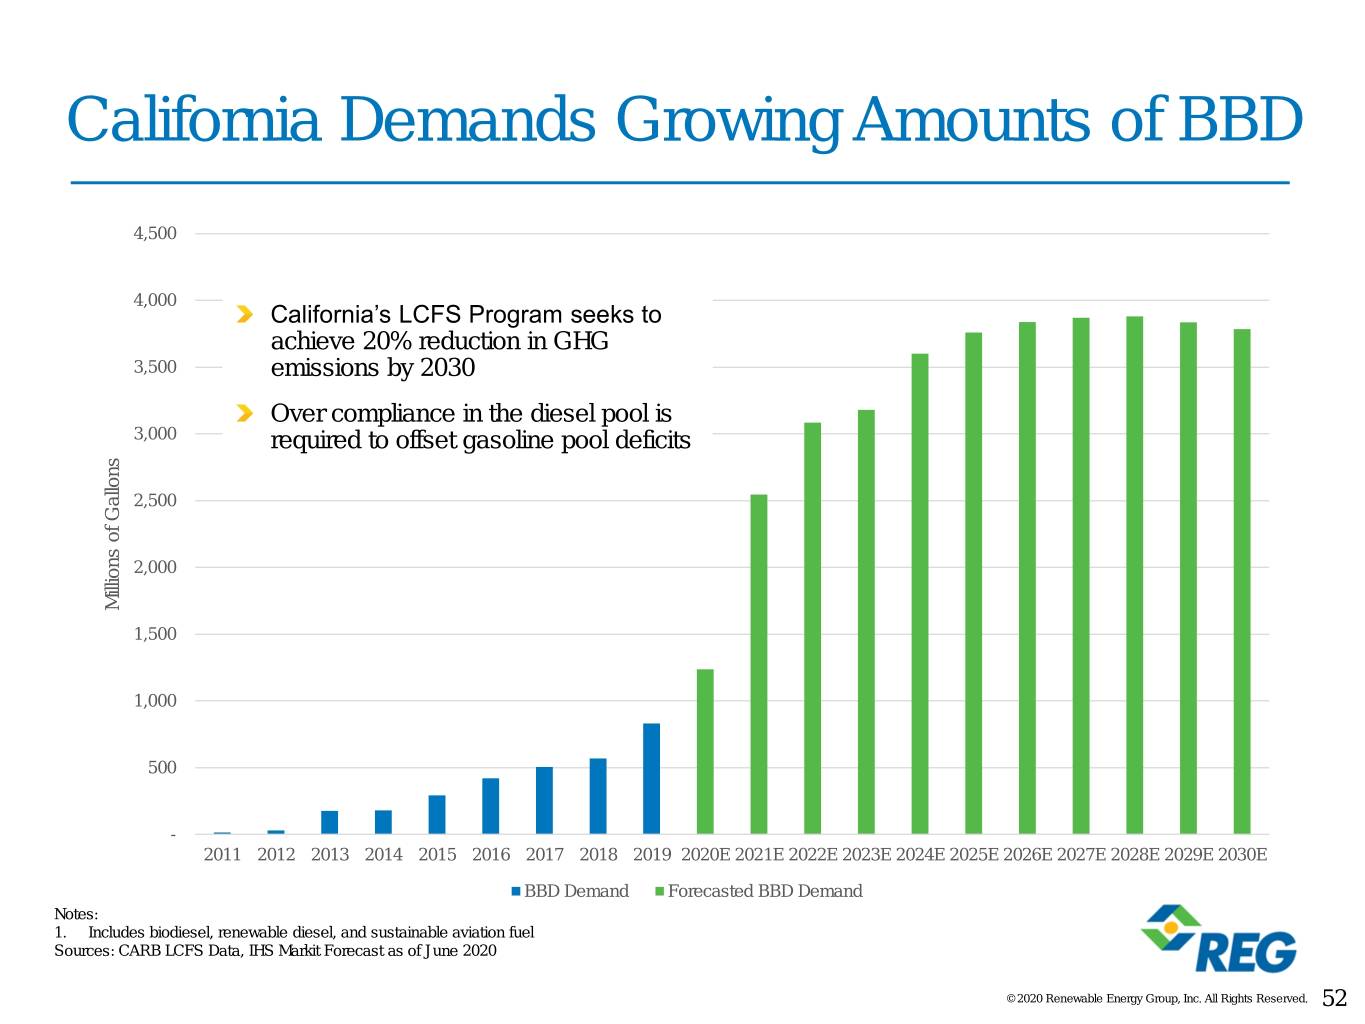
California Demands Growing Amounts of BBD 4,500 4,000 California’s LCFS Program seeks to achieve 20% reduction in GHG 3,500 emissions by 2030 Over compliance in the diesel pool is 3,000 required to offset gasoline pool deficits 2,500 2,000 Millions Millions ofGallons 1,500 1,000 500 - 2011 2012 2013 2014 2015 2016 2017 2018 2019 2020E 2021E 2022E 2023E 2024E 2025E 2026E 2027E 2028E 2029E 2030E BBD Demand Forecasted BBD Demand Notes: 1. Includes biodiesel, renewable diesel, and sustainable aviation fuel Sources: CARB LCFS Data, IHS Markit Forecast as of June 2020 © 2020 Renewable Energy Group, Inc. All Rights Reserved. 52
Growing Commitments to Carbon Reductions: European Countries RED II increases target for renewable energy in EU transport from 10% in 2020 to 14% by 2030 Member states in the process of updating polices to meet these targets Non-EU countries, notably Norway and the U.K., also adopting aggressive renewable fuel policies Diversity of policies creates robust pull for clean fuels © 2020 Renewable Energy Group, Inc. All Rights Reserved. 53
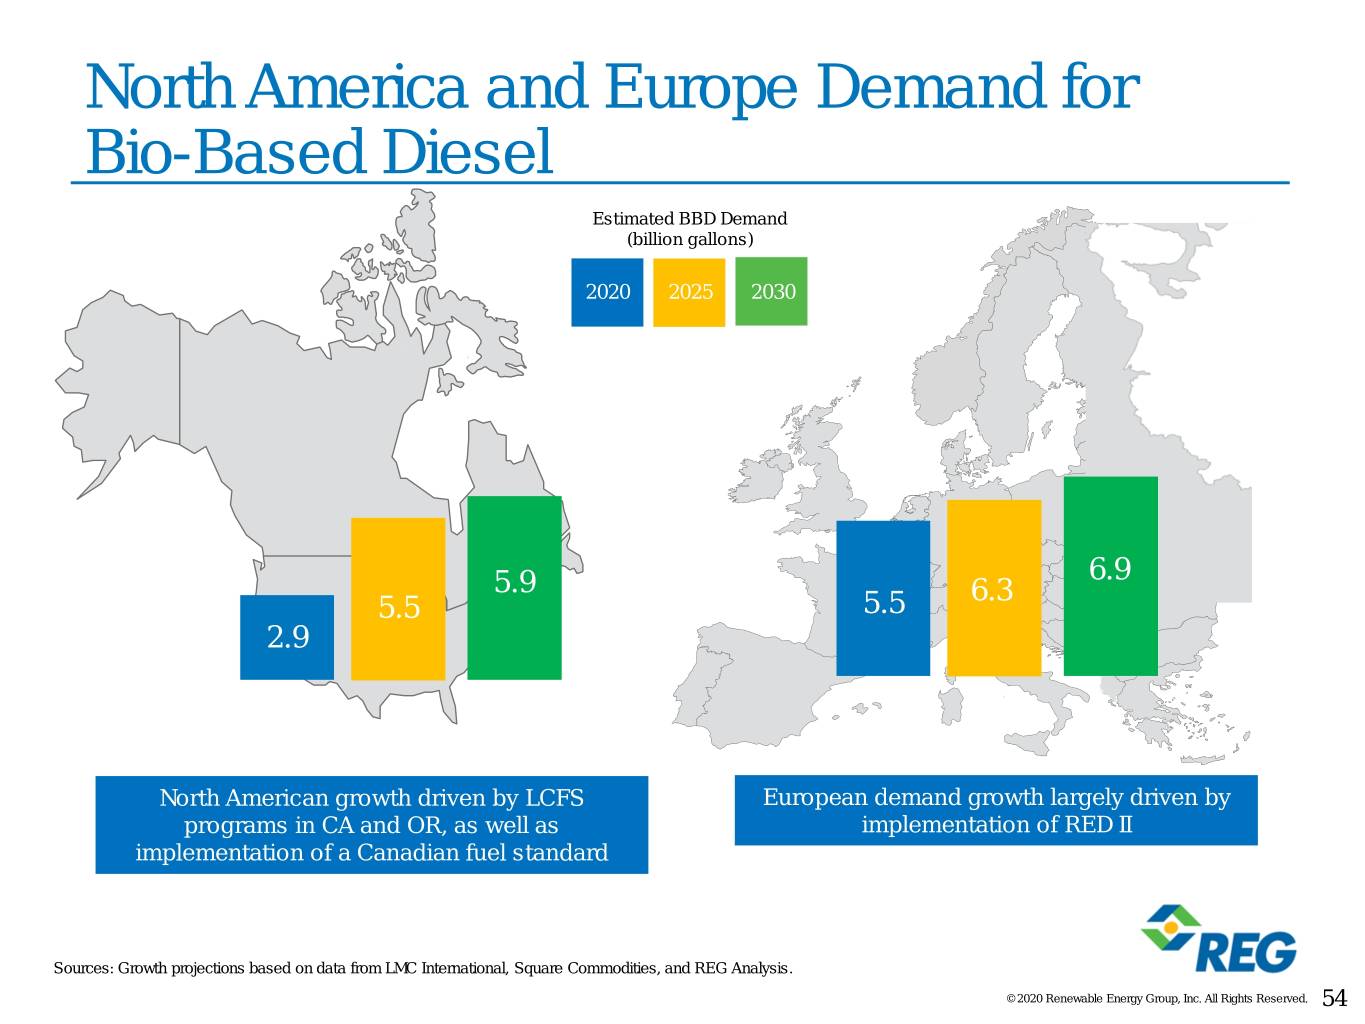
North America and Europe Demand for Bio-Based Diesel Estimated BBD Demand (billion gallons) 2020 2025 2030 6.9 5.9 6.3 5.5 5.5 2.9 North American growth driven by LCFS European demand growth largely driven by programs in CA and OR, as well as implementation of RED II implementation of a Canadian fuel standard Sources: Growth projections based on data from LMC International, Square Commodities, and REG Analysis. © 2020 Renewable Energy Group, Inc. All Rights Reserved. 54

Supply Picture © 2020 Renewable Energy Group, Inc. All Rights Reserved. 55
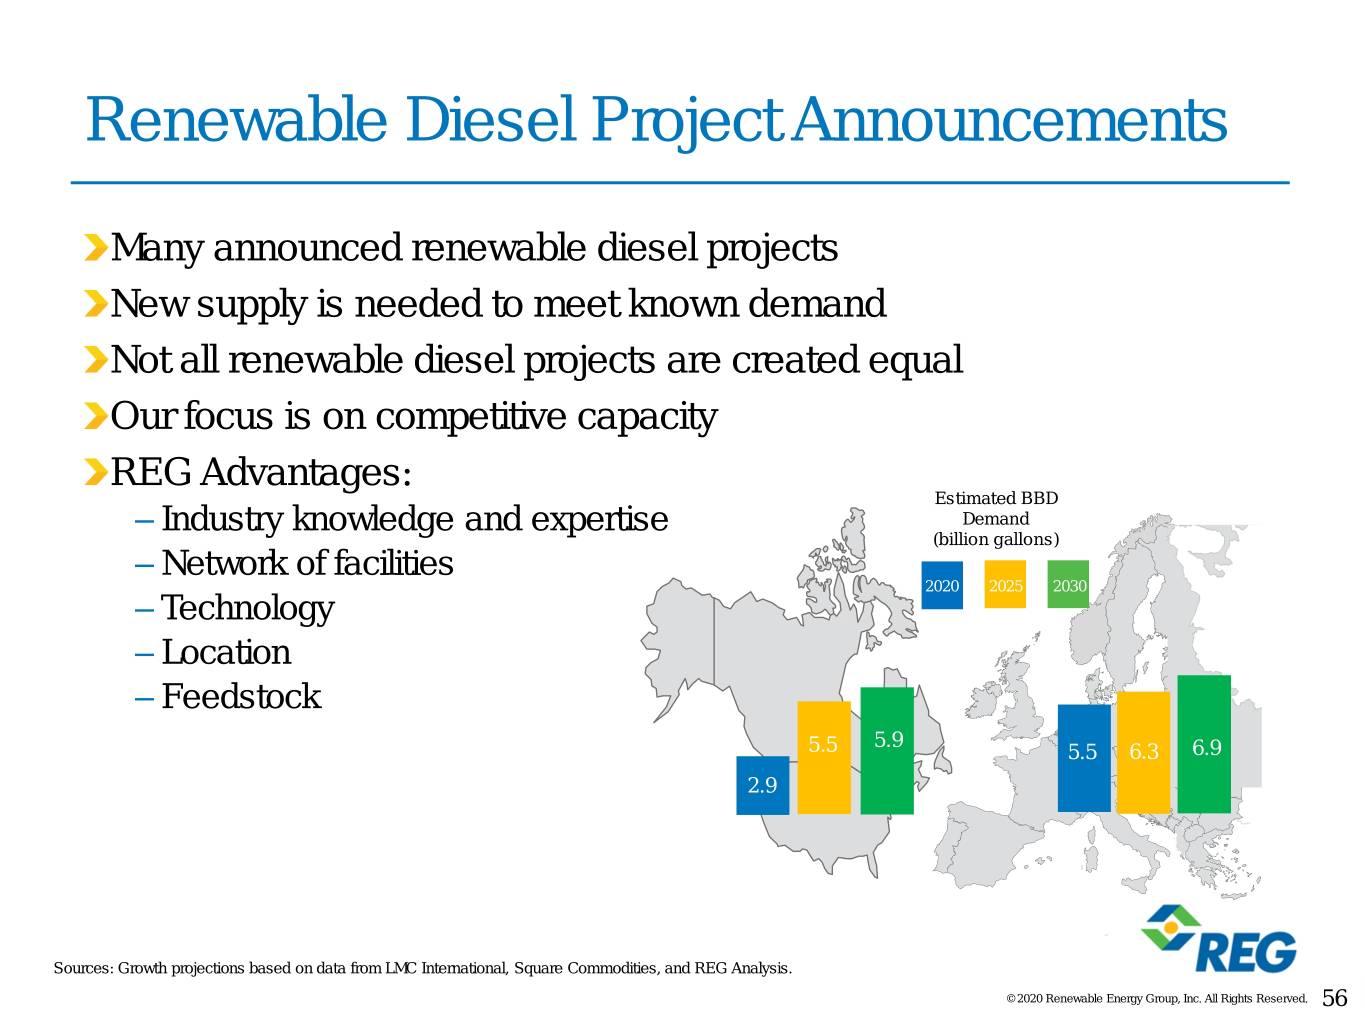
Renewable Diesel Project Announcements Many announced renewable diesel projects New supply is needed to meet known demand Not all renewable diesel projects are created equal Our focus is on competitive capacity REG Advantages: Estimated BBD – Industry knowledge and expertise Demand (billion gallons) – Network of facilities 2020 2025 2030 – Technology – Location – Feedstock 5.9 5.5 5.5 6.3 6.9 2.9 Sources: Growth projections based on data from LMC International, Square Commodities, and REG Analysis. © 2020 Renewable Energy Group, Inc. All Rights Reserved. 56

Margin Drivers © 2020 Renewable Energy Group, Inc. All Rights Reserved. 57
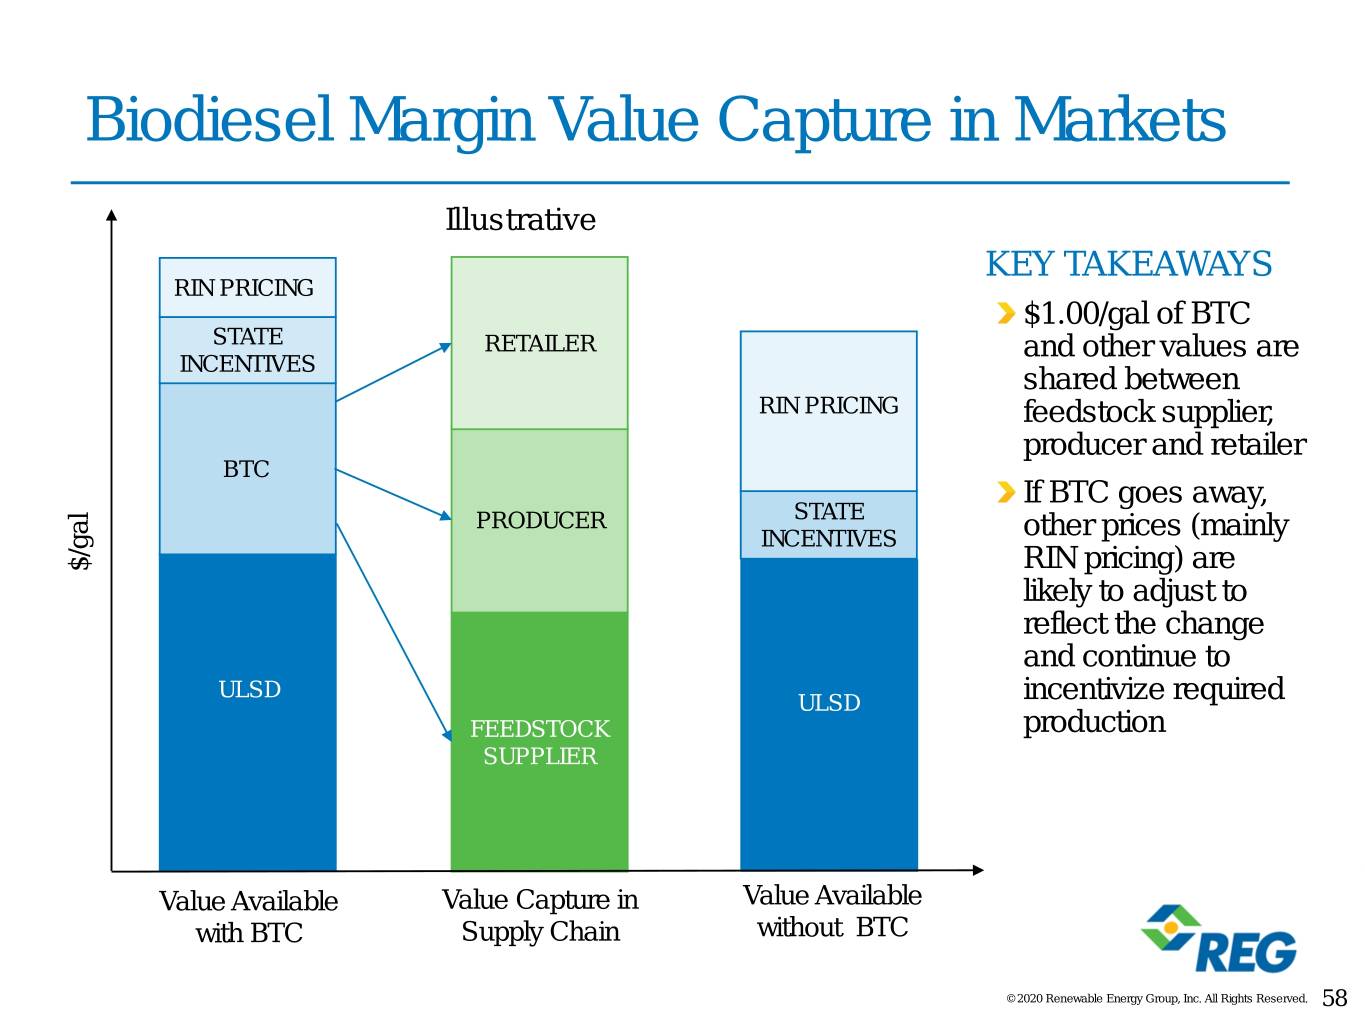
Biodiesel Margin Value Capture in Markets Illustrative KEY TAKEAWAYS RIN PRICING $1.00/gal of BTC STATE RETAILER and other values are INCENTIVES shared between RIN PRICING feedstock supplier, producer and retailer BTC If BTC goes away, PRODUCER STATE INCENTIVES other prices (mainly $/gal RIN pricing) are likely to adjust to reflect the change and continue to ULSD ULSD incentivize required FEEDSTOCK production SUPPLIER Value Available Value Capture in Value Available with BTC Supply Chain without BTC © 2020 Renewable Energy Group, Inc. All Rights Reserved. 58
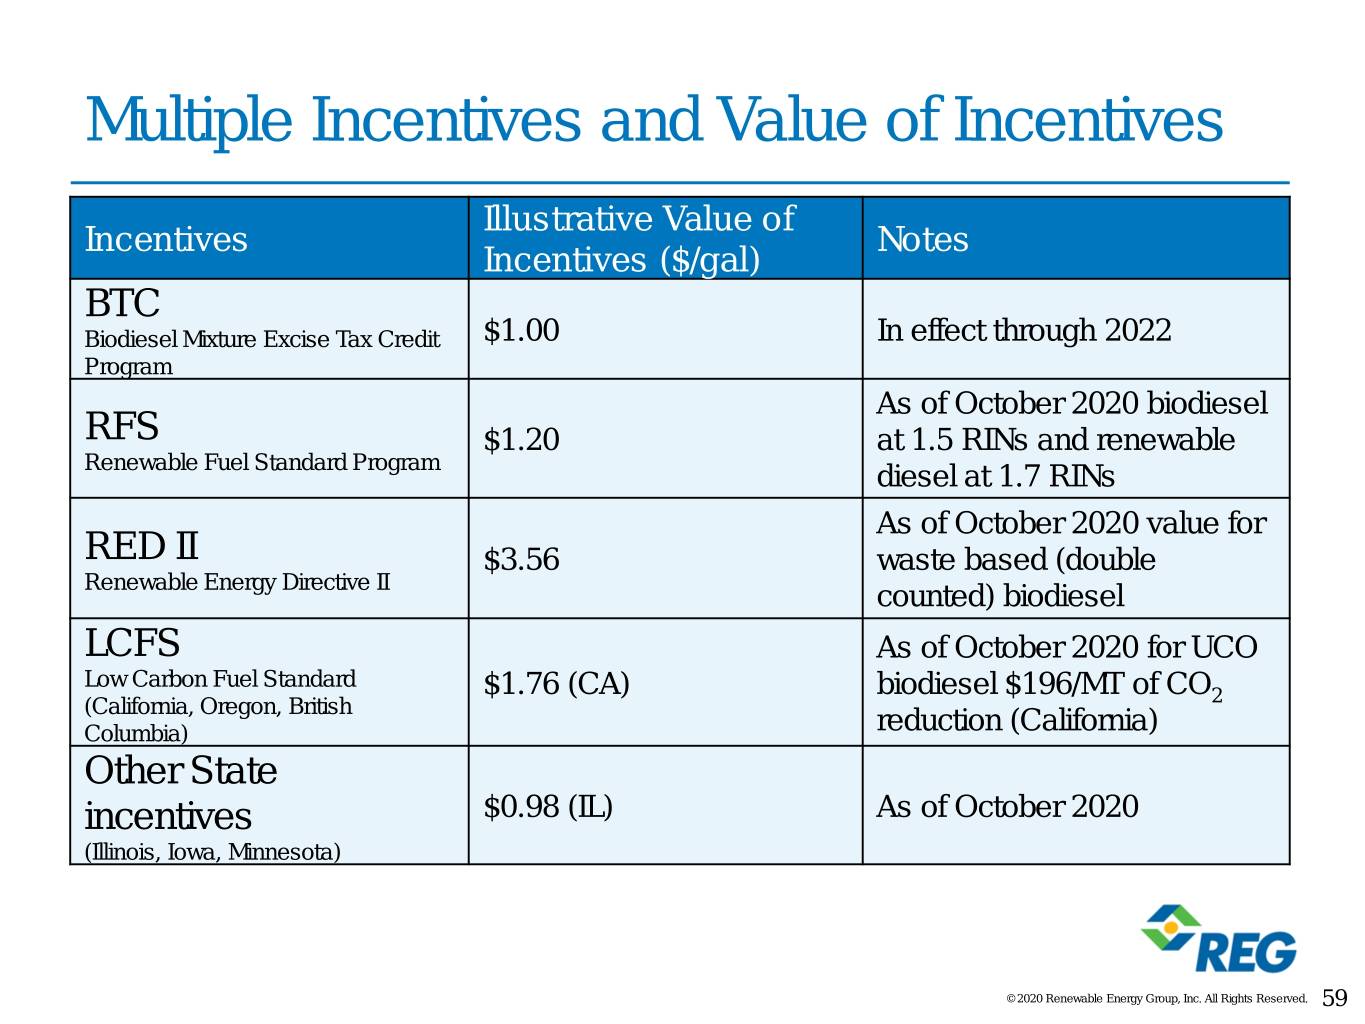
Multiple Incentives and Value of Incentives Illustrative Value of Incentives Notes Incentives ($/gal) BTC Biodiesel Mixture Excise Tax Credit $1.00 In effect through 2022 Program As of October 2020 biodiesel RFS $1.20 at 1.5 RINs and renewable Renewable Fuel Standard Program diesel at 1.7 RINs As of October 2020 value for RED II $3.56 waste based (double Renewable Energy Directive II counted) biodiesel LCFS As of October 2020 for UCO Low Carbon Fuel Standard $1.76 (CA) biodiesel $196/MT of CO (California, Oregon, British 2 Columbia) reduction (California) Other State incentives $0.98 (IL) As of October 2020 (Illinois, Iowa, Minnesota) © 2020 Renewable Energy Group, Inc. All Rights Reserved. 59

Margin Drivers: HOBO & HOBO + 1.5*RINs Spread BTC reinstated BTC reinstated retroactively for $2.20 BTC Reinstated retroactively for 2019 2015 prospectively and prospectively $2.00 for 2016 through 2022 $1.80 COVID Shutdown $1.60 $1.40 $1.20 $1.00 $0.80 $/gal $0.60 $0.40 $0.20 $0.00 Jan-15 Jul-15 Jan-16 Jul-16 Jan-17 Jul-17 Jan-18 Jul-18 Jan-19 Jul-19 Jan-20 Jul-20 ($0.20) ($0.40) ($0.60) HOBO Spread HOBO + RINs HOBO = HO NYMEX + 1 – (CBOT SBO/100*7.5) HOBO + RINs= HOBO + 1.5x D4 RIN D4 RIN as quoted by OPIS © 2020 Renewable Energy Group, Inc. All Rights Reserved. 60

Feedstock Procurement and Optimization © 2020 Renewable Energy Group, Inc. All Rights Reserved. 61

ILLUSTRATIVE BBD Feedstock Development – Early Days Petroleum Oil Production Bio-based Based Diesel Production 1. Offshore Technology, The History of the Oil and Gas Industry from 347 AD to Today, 2019 2. U.S. Energy Information Administration, Petroleum & Other Liquids, 2020 © 2020 Renewable Energy Group, Inc. All Rights Reserved. 62

Global Fats & Oils Supply and Demand Growing bio-based diesel demand remains small portion of total available feedstocks 800 700 600 500 400 300 Billion Pounds Billion 200 13 Billion 12 Billion Gallons Gallons 100 7 Billion Gallons 0 Supply Supply Supply 2018 Actual 2025 Projected 2030 Projected Supply of Fats & Oils Potential Additional Supply Estimated N. America & Europe bio-based Diesel Demand Source: REG Analysis, LMC 2020 Waste Fats & Oil Report, LMC 2020 Biodiesel Report, USDA Global Oilseeds Report © 2020 Renewable Energy Group, Inc. All Rights Reserved. 63
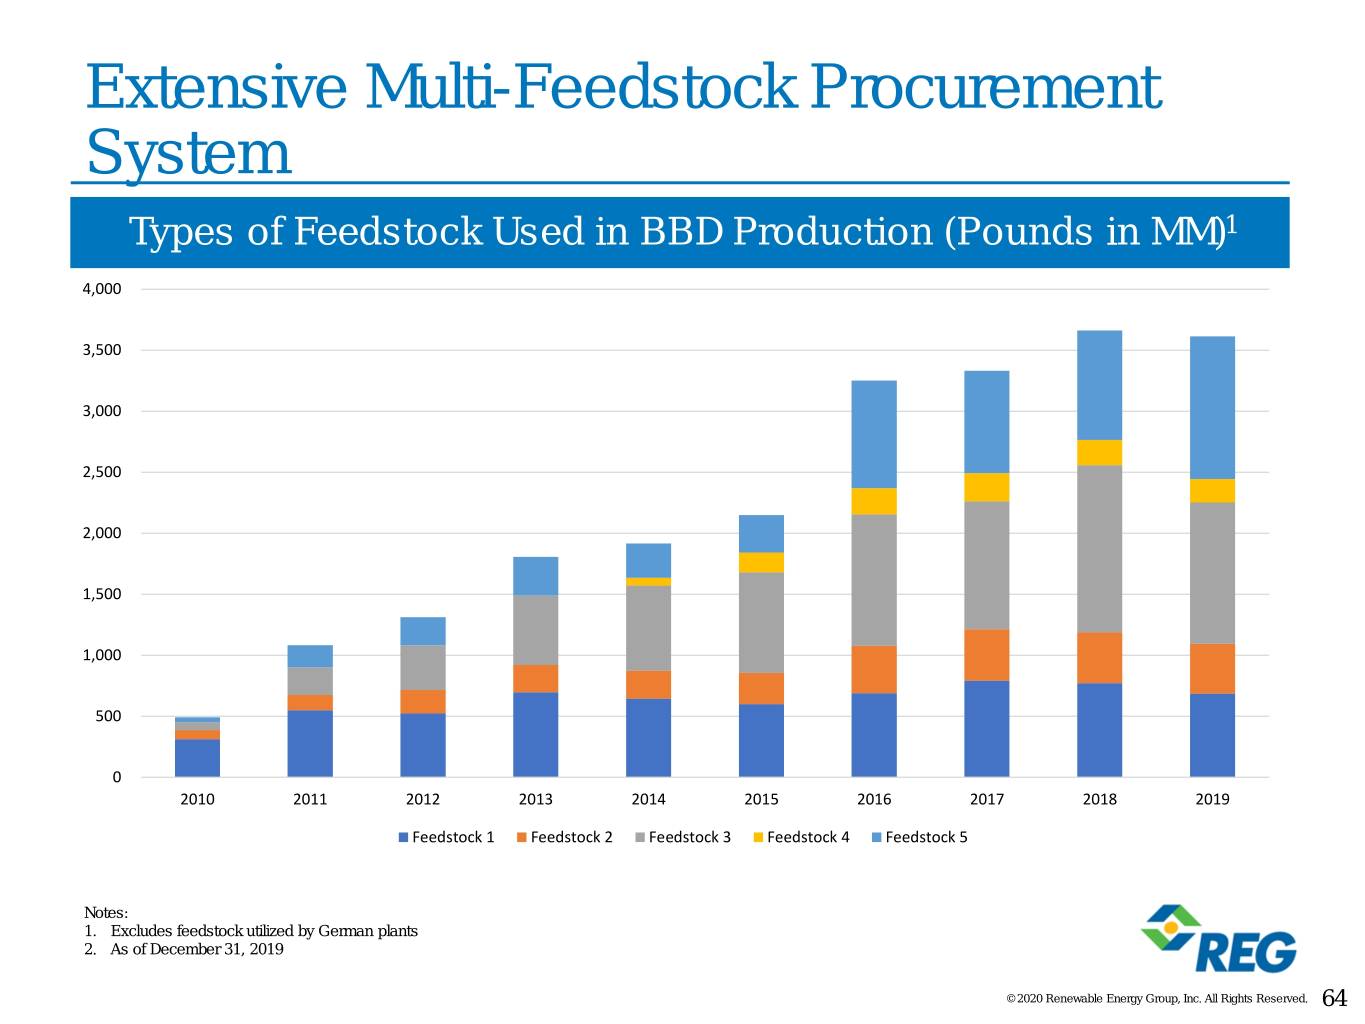
Extensive Multi-Feedstock Procurement System Types of Feedstock Used in BBD Production (Pounds in MM)1 4,000 3,500 3,000 2,500 2,000 1,500 1,000 500 0 2010 2011 2012 2013 2014 2015 2016 2017 2018 2019 Feedstock 1 Feedstock 2 Feedstock 3 Feedstock 4 Feedstock 5 Notes: 1. Excludes feedstock utilized by German plants 2. As of December 31, 2019 © 2020 Renewable Energy Group, Inc. All Rights Reserved. 64
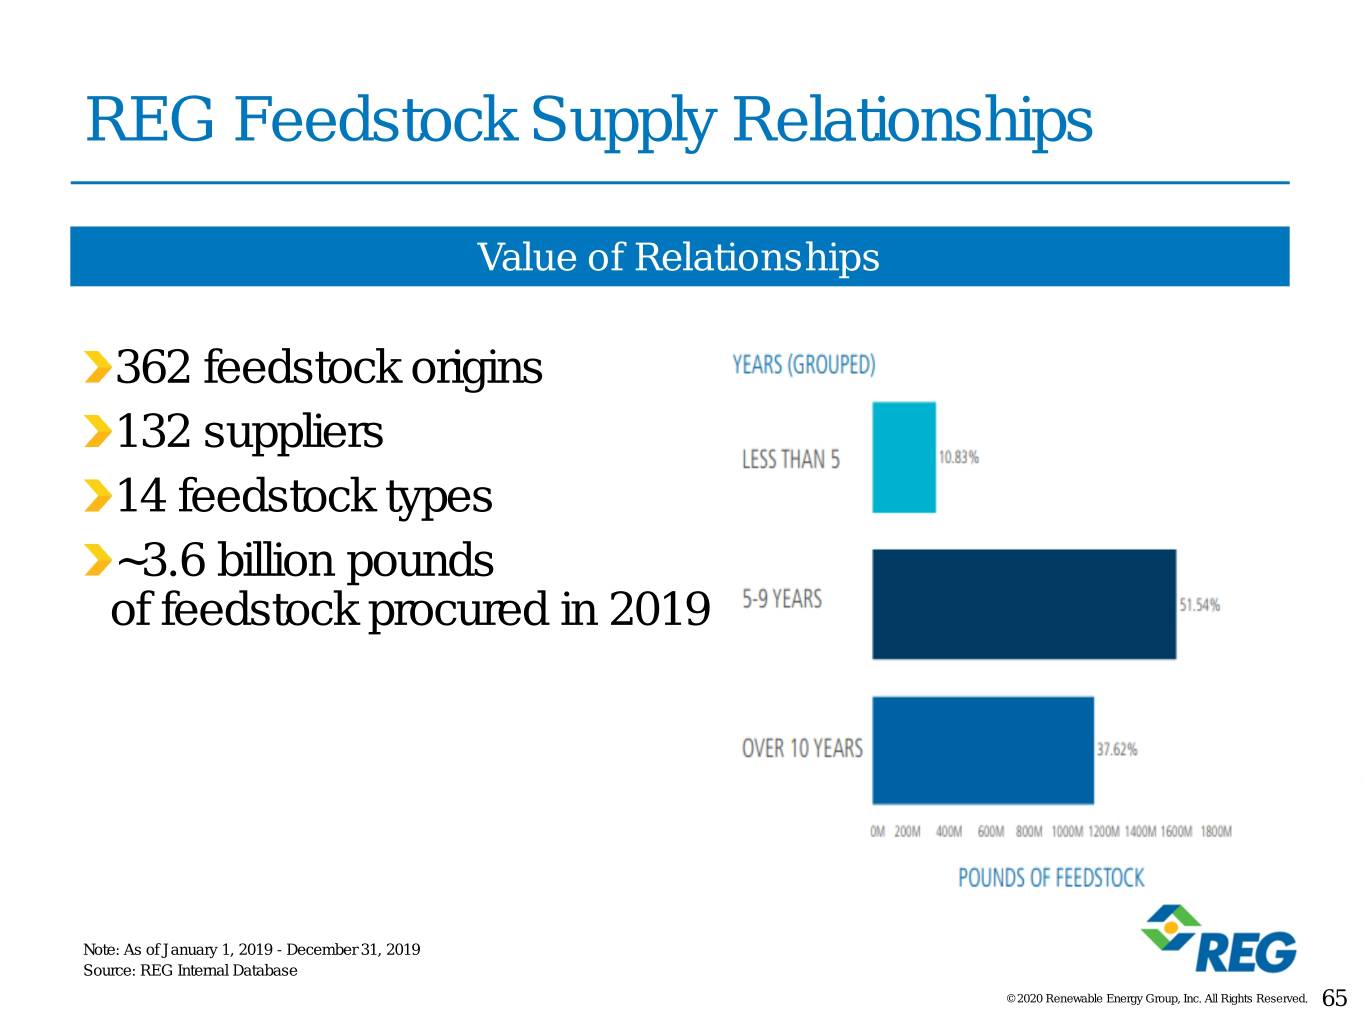
REG Feedstock Supply Relationships Value of Relationships 362 feedstock origins 132 suppliers 14 feedstock types ~3.6 billion pounds of feedstock procured in 2019 Note: As of January 1, 2019 - December 31, 2019 Source: REG Internal Database © 2020 Renewable Energy Group, Inc. All Rights Reserved. 65

Feedstock Diversity Provides a Competitive Advantage Comparison of industry price paid per pound of feedstock and REG prices paid REG Actual – Wdt Avgd Volume (lbs.) Volume Industry – Wdt Avgd $/lb (Lowest to Highest) © 2020 Renewable Energy Group, Inc. All Rights Reserved. 66
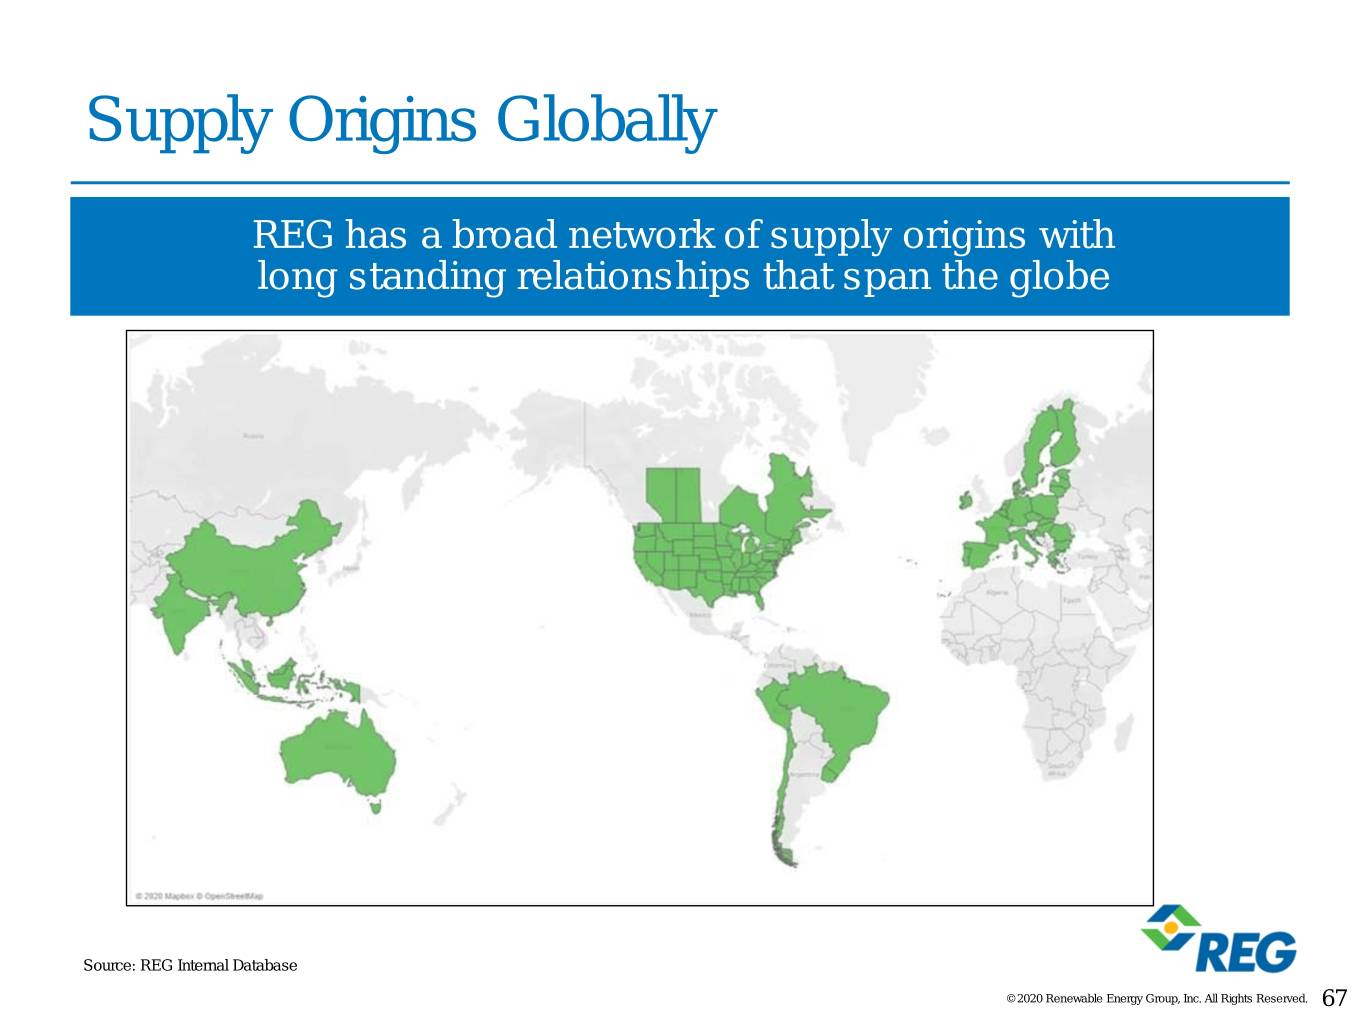
Supply Origins Globally REG has a broad network of supply origins with long standing relationships that span the globe Source: REG Internal Database © 2020 Renewable Energy Group, Inc. All Rights Reserved. 67
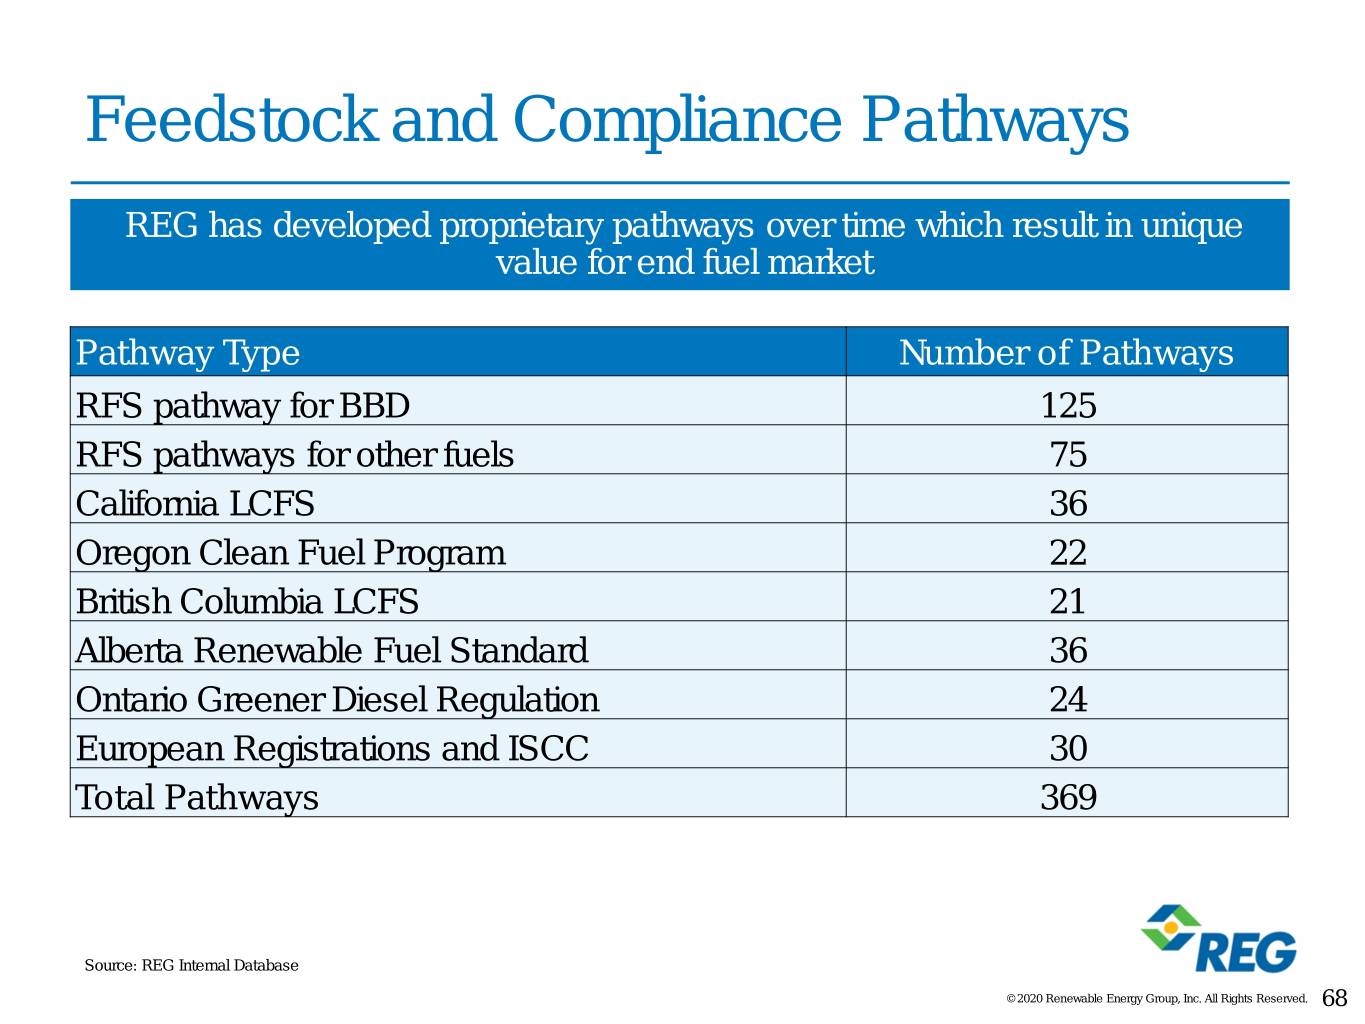
Feedstock and Compliance Pathways REG has developed proprietary pathways over time which result in unique value for end fuel market Pathway Type Number of Pathways RFS pathway for BBD 125 RFS pathways for other fuels 75 California LCFS 36 Oregon Clean Fuel Program 22 British Columbia LCFS 21 Alberta Renewable Fuel Standard 36 Ontario Greener Diesel Regulation 24 European Registrations and ISCC 30 Total Pathways 369 Source: REG Internal Database © 2020 Renewable Energy Group, Inc. All Rights Reserved. 68
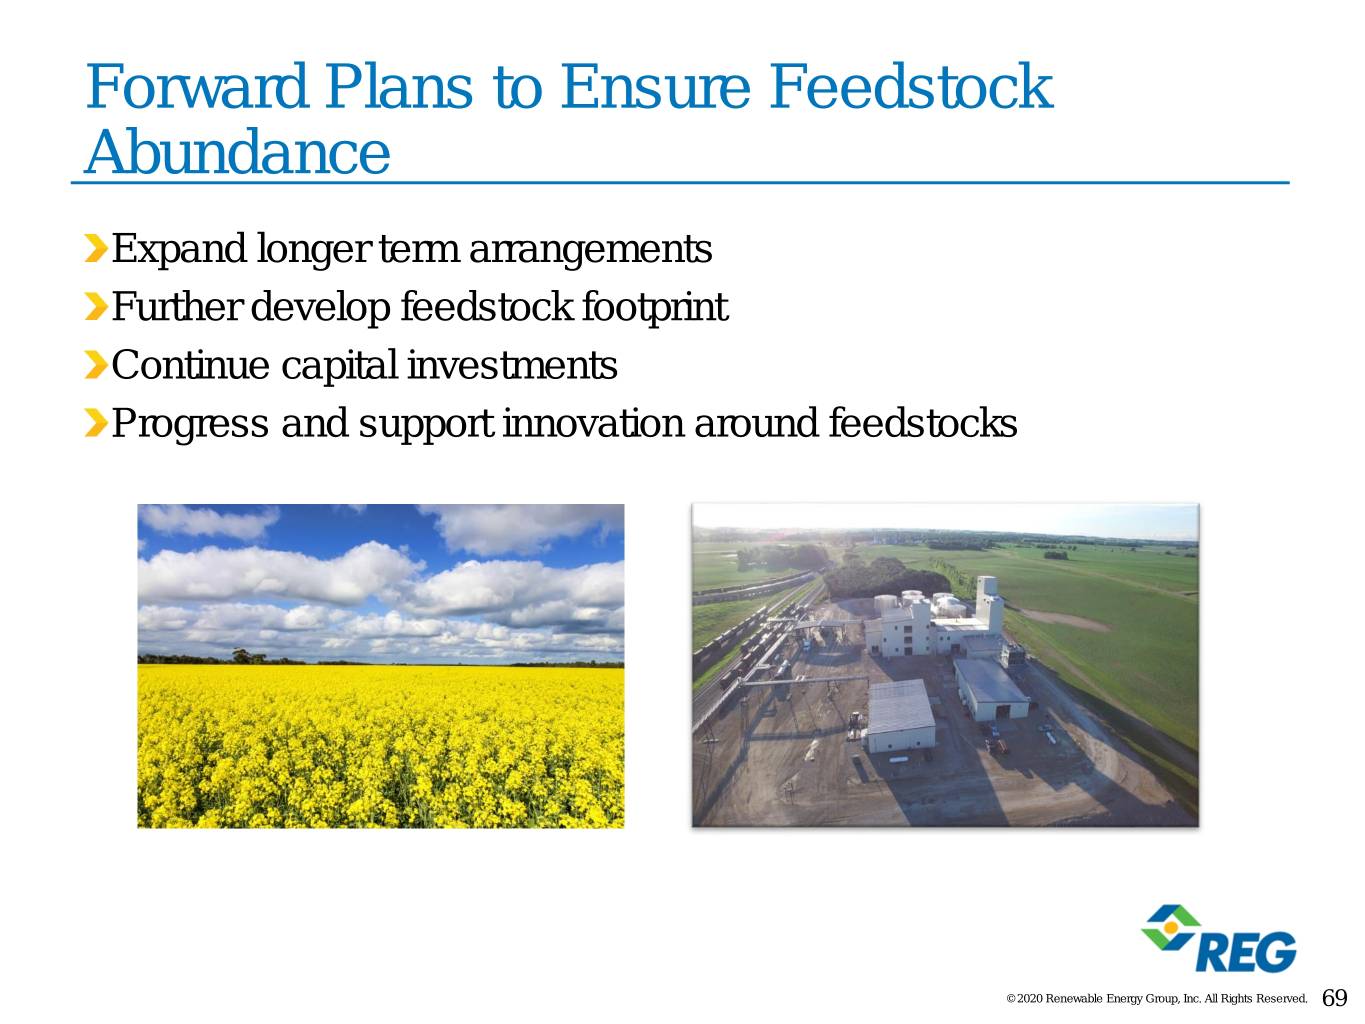
Forward Plans to Ensure Feedstock Abundance Expand longer term arrangements Further develop feedstock footprint Continue capital investments Progress and support innovation around feedstocks © 2020 Renewable Energy Group, Inc. All Rights Reserved. 69
REG Downstream: Driving Sustainable Demand and Margin Expansion Gary Haer Vice President, Special Projects © 2020 Renewable Energy Group, Inc. All Rights Reserved. 70
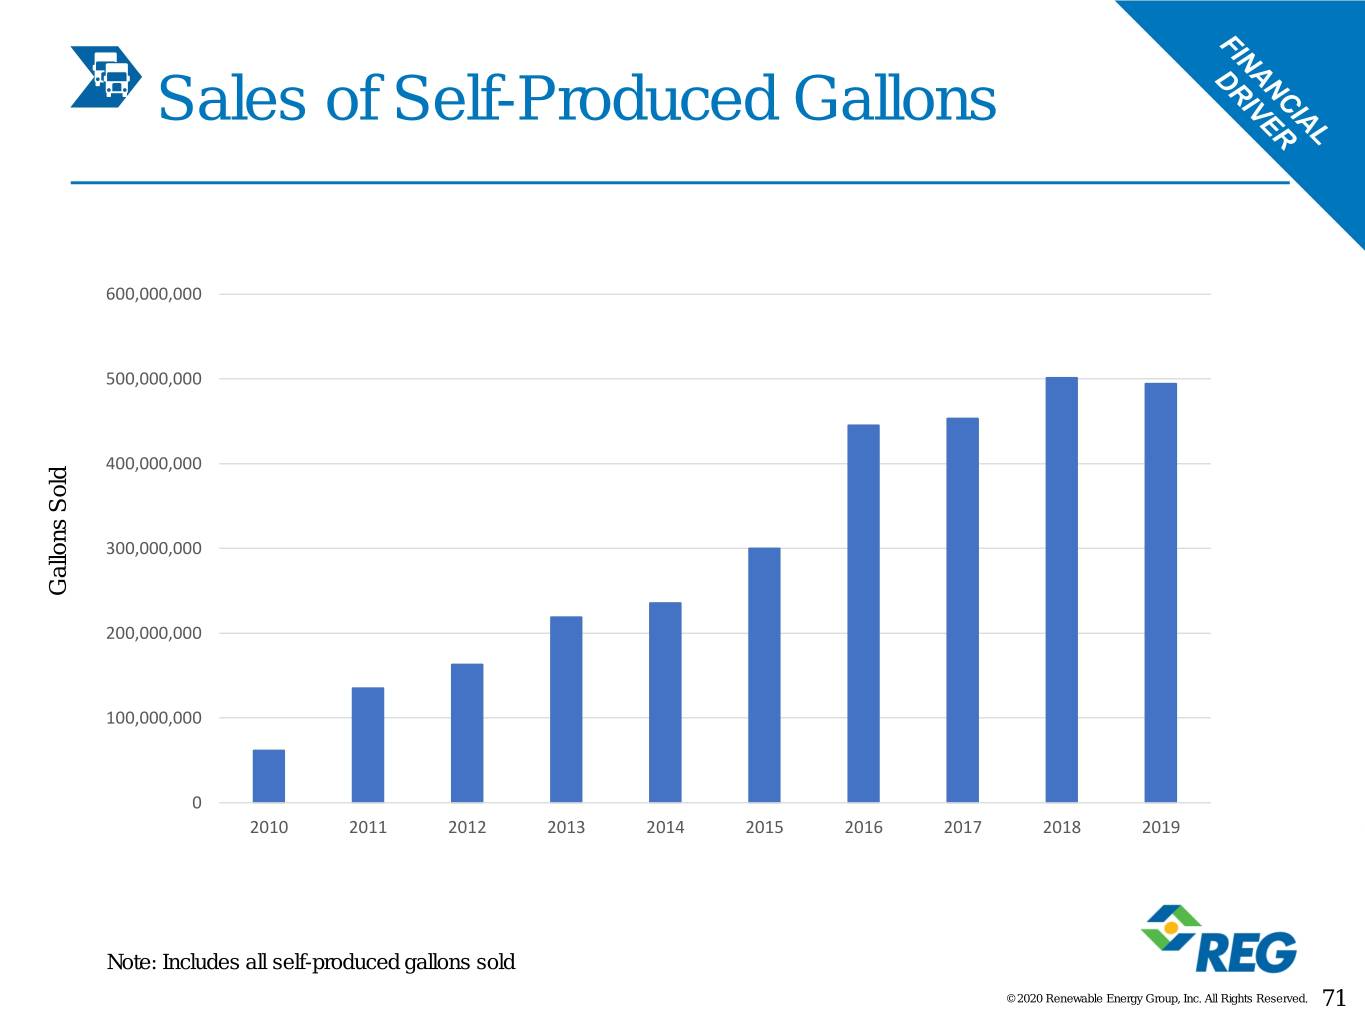
Sales of Self-Produced Gallons 600,000,000 500,000,000 400,000,000 300,000,000 Gallons Sold Gallons 200,000,000 100,000,000 0 2010 2011 2012 2013 2014 2015 2016 2017 2018 2019 Note: Includes all self-produced gallons sold © 2020 Renewable Energy Group, Inc. All Rights Reserved. 71

Serving a Diverse and Global Customer Base 2019 Gallons Sold by Region1 (Gallons in MM) 218 190 159 169 64 58 39 44 19 27 US West US Midwest US South Canada Other Exports 2018 2019 2019 Sales2 by Segment Top 5 Customers: Historical Gallons Sold (MM) 1% 1% 2% Obligated Parties & Customer 2015 2016 2017 2018 2019 Petroleum Refiners Travel Center and Convenience Store 111 133 126 81 75 Convenience Stores & Travel Centers Petro Distributor/Jobber 4 20 28 36 41 28% 37% Petroleum Petroleum Refiner 5 11 7 12 28 Distributors/Jobbers Heating Oil Petroleum Refiner 1 2 10 23 27 Travel Center and Convenience Store 7 23 7 36 25 Fleet & Municipalities Top 5 Customers Total 127 188 178 189 198 Others REG Consolidated Total 375 567 587 649 700 31% Top 5 Customers as % of Total 34% 33% 30% 29% 28% Focus on delivering to advantaged markets and diverse customer base ______________________________________________________________ 1. Total sales less petroleum and European volumes 2. During 2019, REG sold products in 45 states in the US, five Canadian Provinces and eight other countries around the world. 72 © 2020 Renewable Energy Group, Inc. All Rights Reserved.
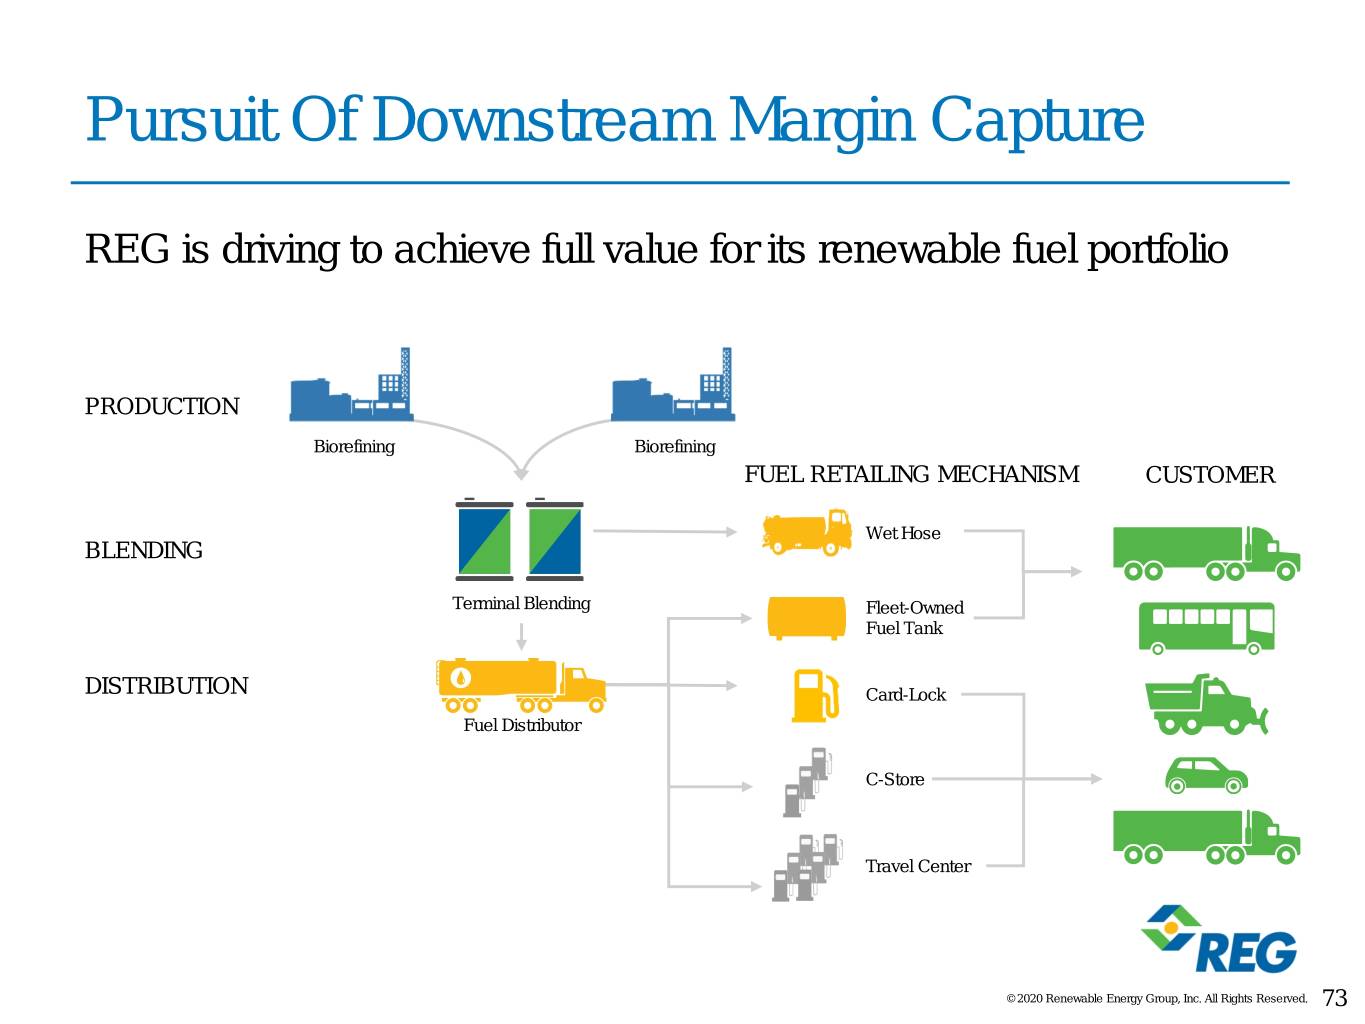
Pursuit Of Downstream Margin Capture REG is driving to achieve full value for its renewable fuel portfolio PRODUCTION Biorefining Biorefining FUEL RETAILING MECHANISM CUSTOMER Wet Hose BLENDING Terminal Blending Fleet-Owned Fuel Tank DISTRIBUTION Card-Lock Fuel Distributor C-Store Travel Center © 2020 Renewable Energy Group, Inc. All Rights Reserved. 73
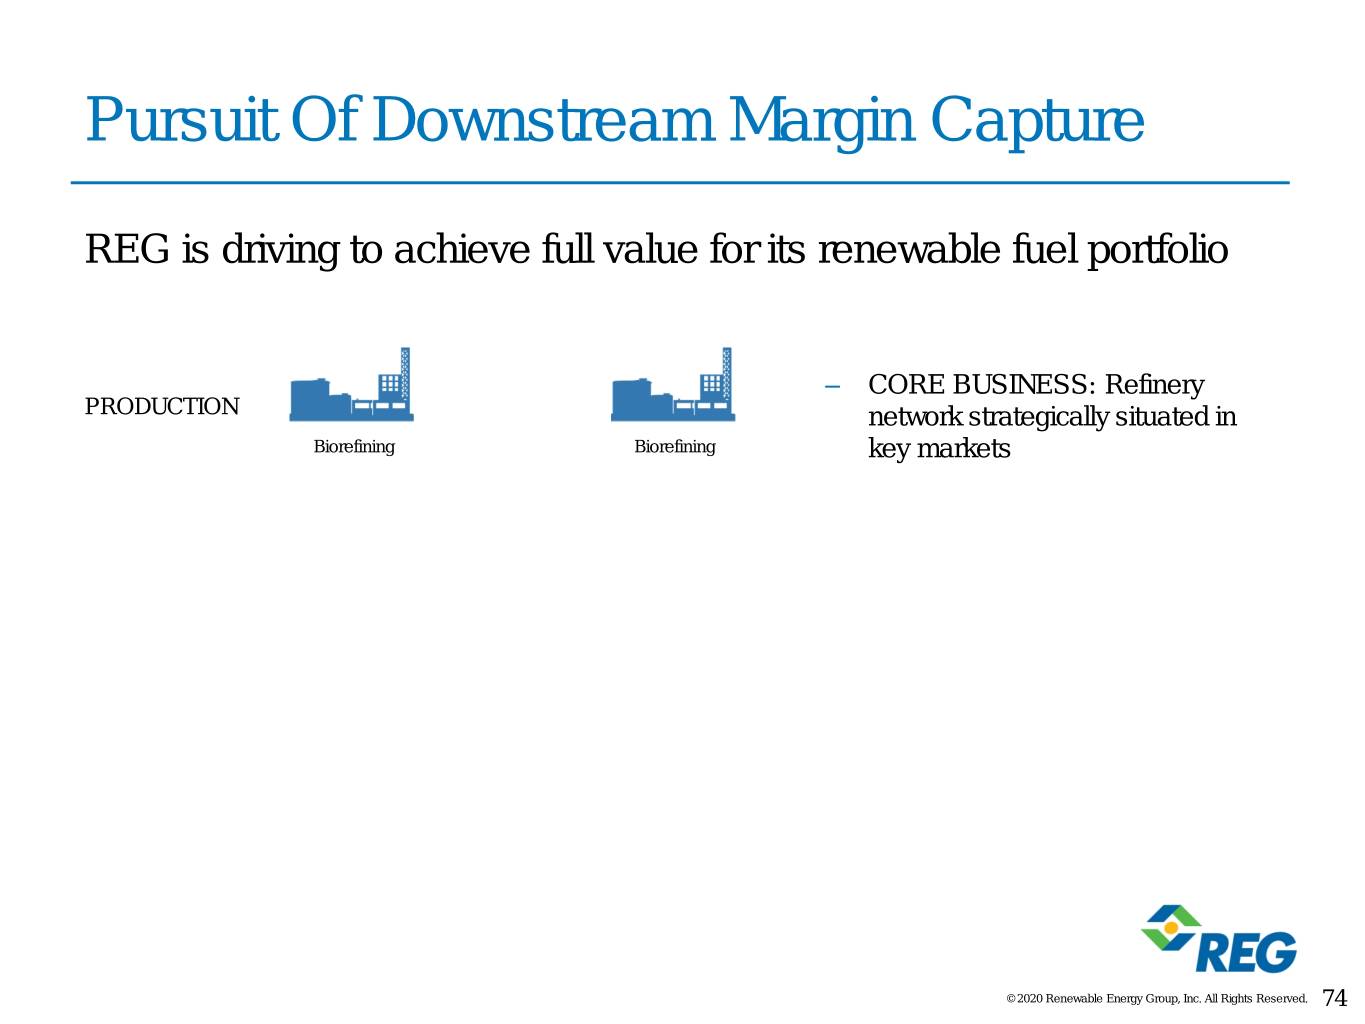
Pursuit Of Downstream Margin Capture REG is driving to achieve full value for its renewable fuel portfolio – CORE BUSINESS: Refinery PRODUCTION network strategically situated in Biorefining Biorefining key markets © 2020 Renewable Energy Group, Inc. All Rights Reserved. 74
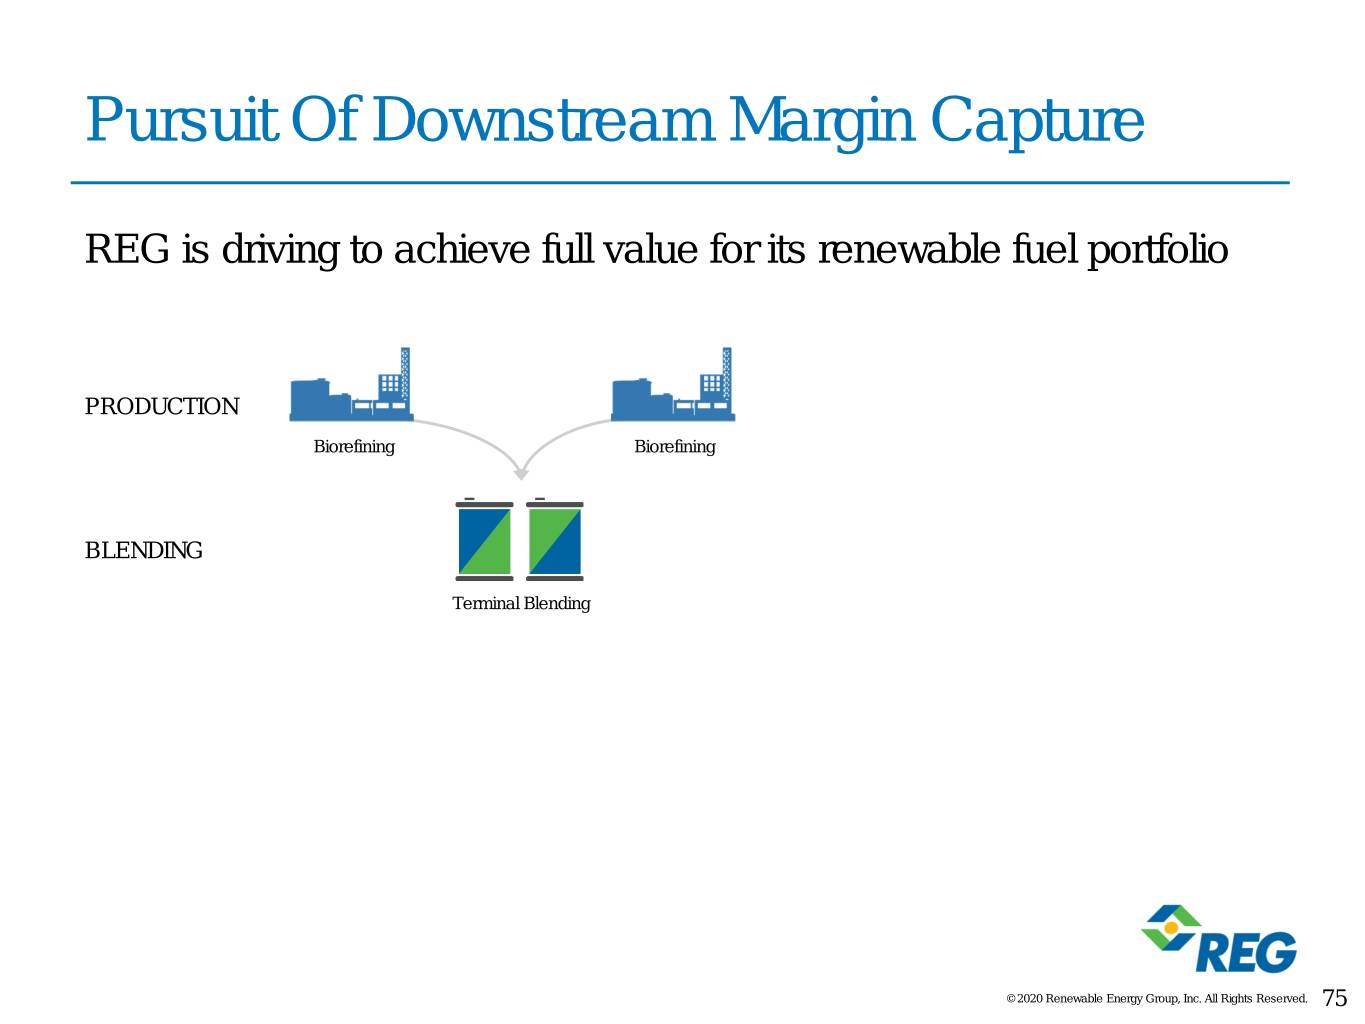
Pursuit Of Downstream Margin Capture REG is driving to achieve full value for its renewable fuel portfolio PRODUCTION Biorefining Biorefining BLENDING Terminal Blending © 2020 Renewable Energy Group, Inc. All Rights Reserved. 75
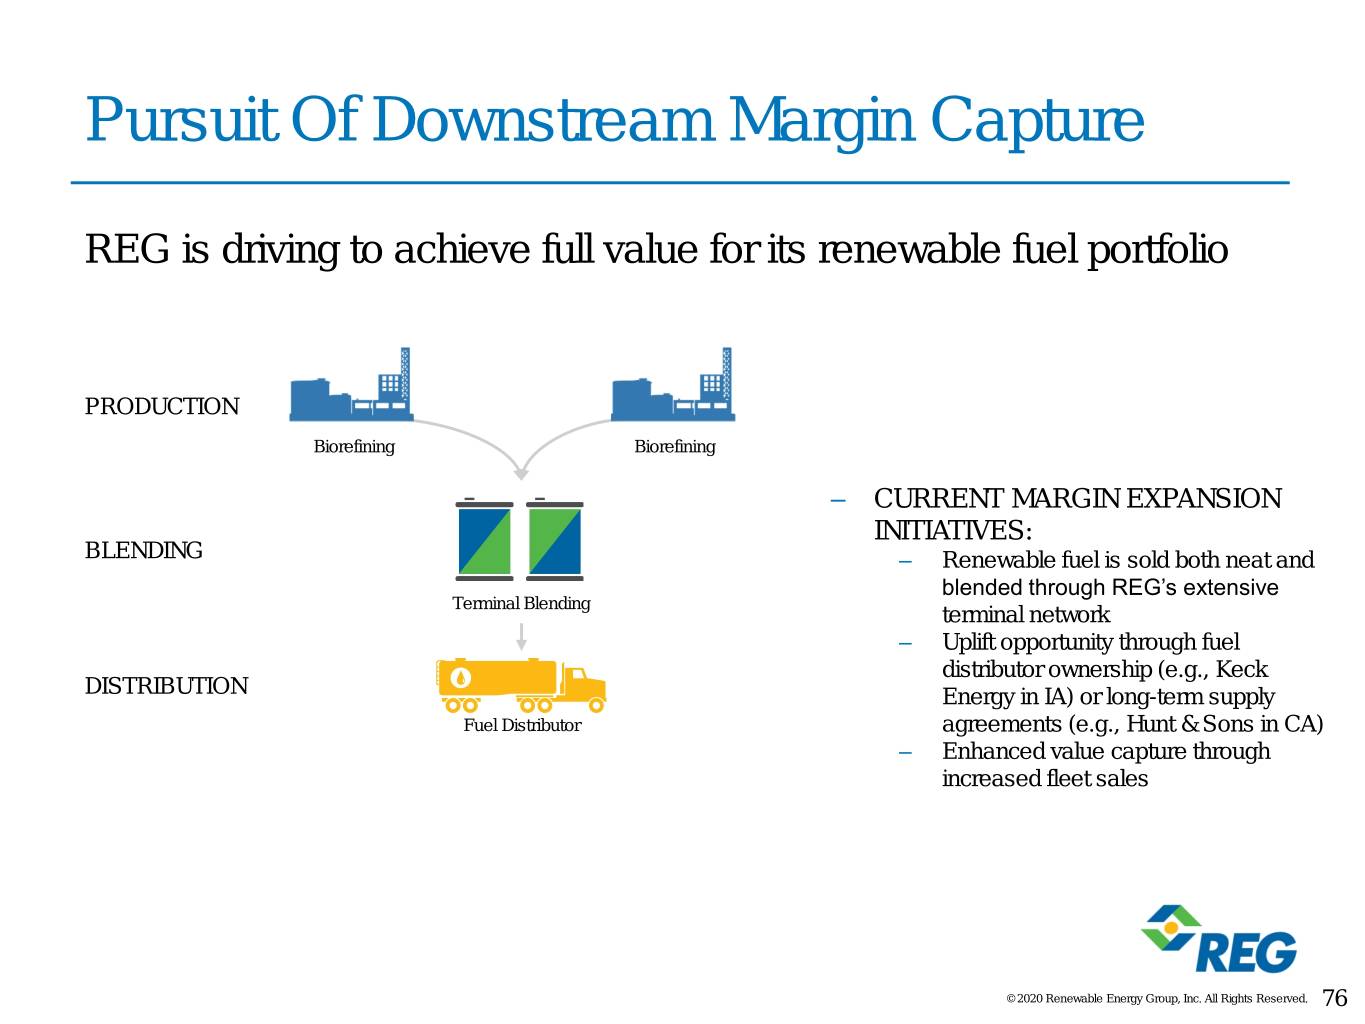
Pursuit Of Downstream Margin Capture REG is driving to achieve full value for its renewable fuel portfolio PRODUCTION Biorefining Biorefining – CURRENT MARGIN EXPANSION INITIATIVES: BLENDING – Renewable fuel is sold both neat and blended through REG’s extensive Terminal Blending terminal network – Uplift opportunity through fuel distributor ownership (e.g., Keck DISTRIBUTION Energy in IA) or long-term supply Fuel Distributor agreements (e.g., Hunt & Sons in CA) – Enhanced value capture through increased fleet sales © 2020 Renewable Energy Group, Inc. All Rights Reserved. 76

Pursuit Of Downstream Margin Capture REG is driving to achieve full value for its renewable fuel portfolio PRODUCTION Biorefining Biorefining FUEL RETAILING MECHANISM Wet Hose BLENDING Terminal Blending Fleet-Owned Fuel Tank DISTRIBUTION Card-Lock Fuel Distributor C-Store Travel Center © 2020 Renewable Energy Group, Inc. All Rights Reserved. 77
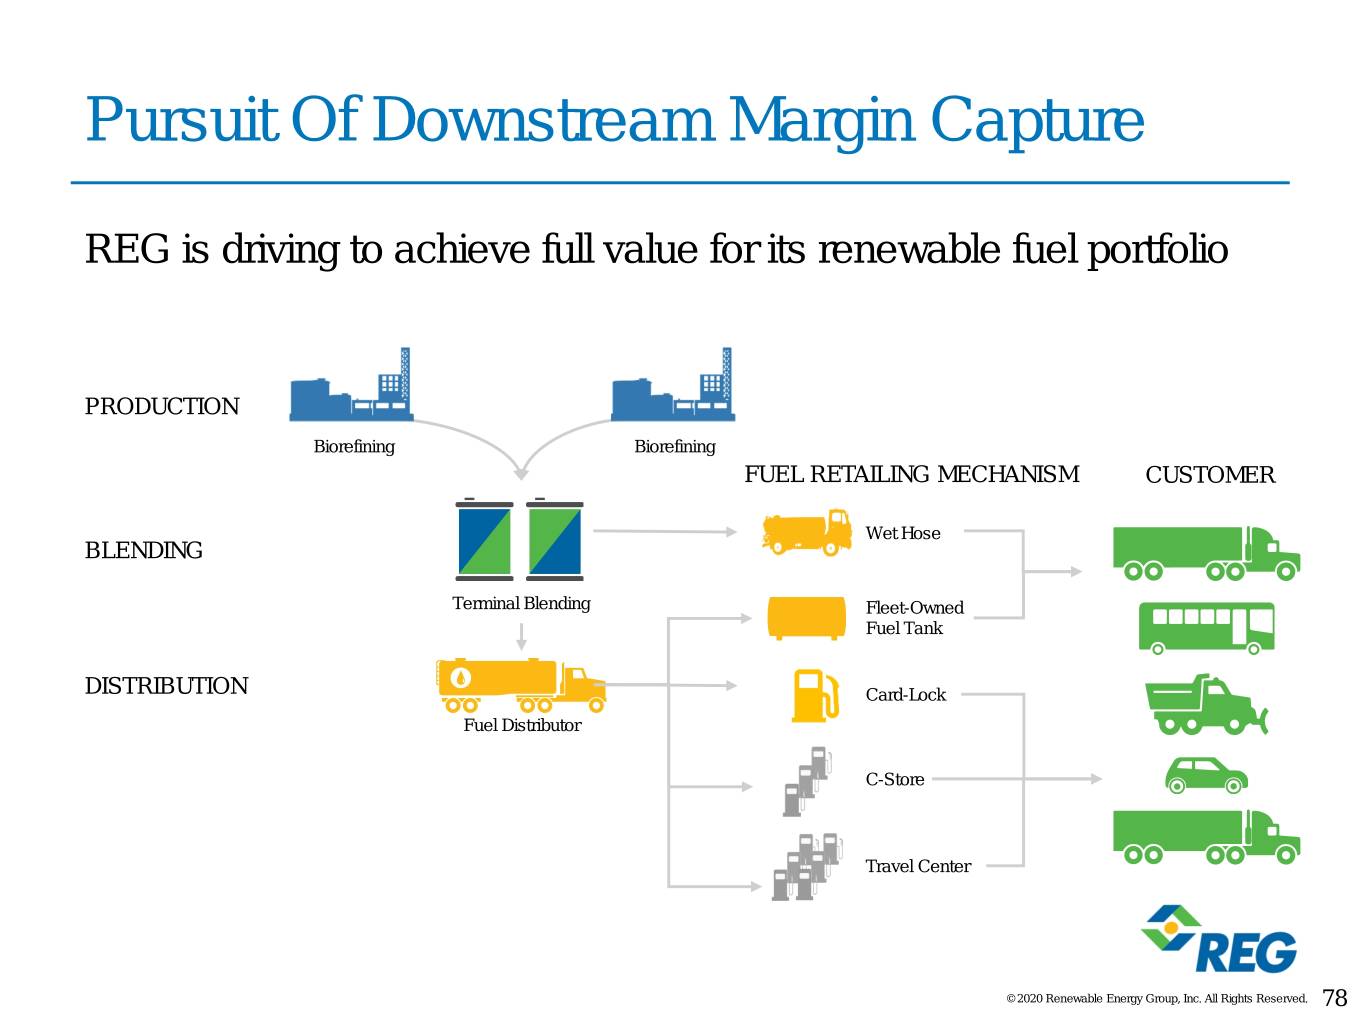
Pursuit Of Downstream Margin Capture REG is driving to achieve full value for its renewable fuel portfolio PRODUCTION Biorefining Biorefining FUEL RETAILING MECHANISM CUSTOMER Wet Hose BLENDING Terminal Blending Fleet-Owned Fuel Tank DISTRIBUTION Card-Lock Fuel Distributor C-Store Travel Center © 2020 Renewable Energy Group, Inc. All Rights Reserved. 78

ILLUSTRATIVE Maximizing Downstream Margin Capture 1 $4.50 Averages for Aug 2020 $4.00 $3.50 $0.84 $1.02 $3.00 $1.00 $2.50 $2.00 $0.98 $1.50 $3.04 $1.00 $0.50 $1.24 $- Component Value Jacobsen B100 Upper Midwest ULSD - NYMEX RIN Value - OPIS BTC State Incentive 2 B100 - Jacobsen Remaining Value 3 Notes: 1. BTC was re-instated for year 2018-2022 on 12/20/2019 2. Represents an average of Iowa and Illinois incentives 3. Represents the difference between the Component Value less illustrative costs © 2020 Renewable Energy Group, Inc. All Rights Reserved. 79
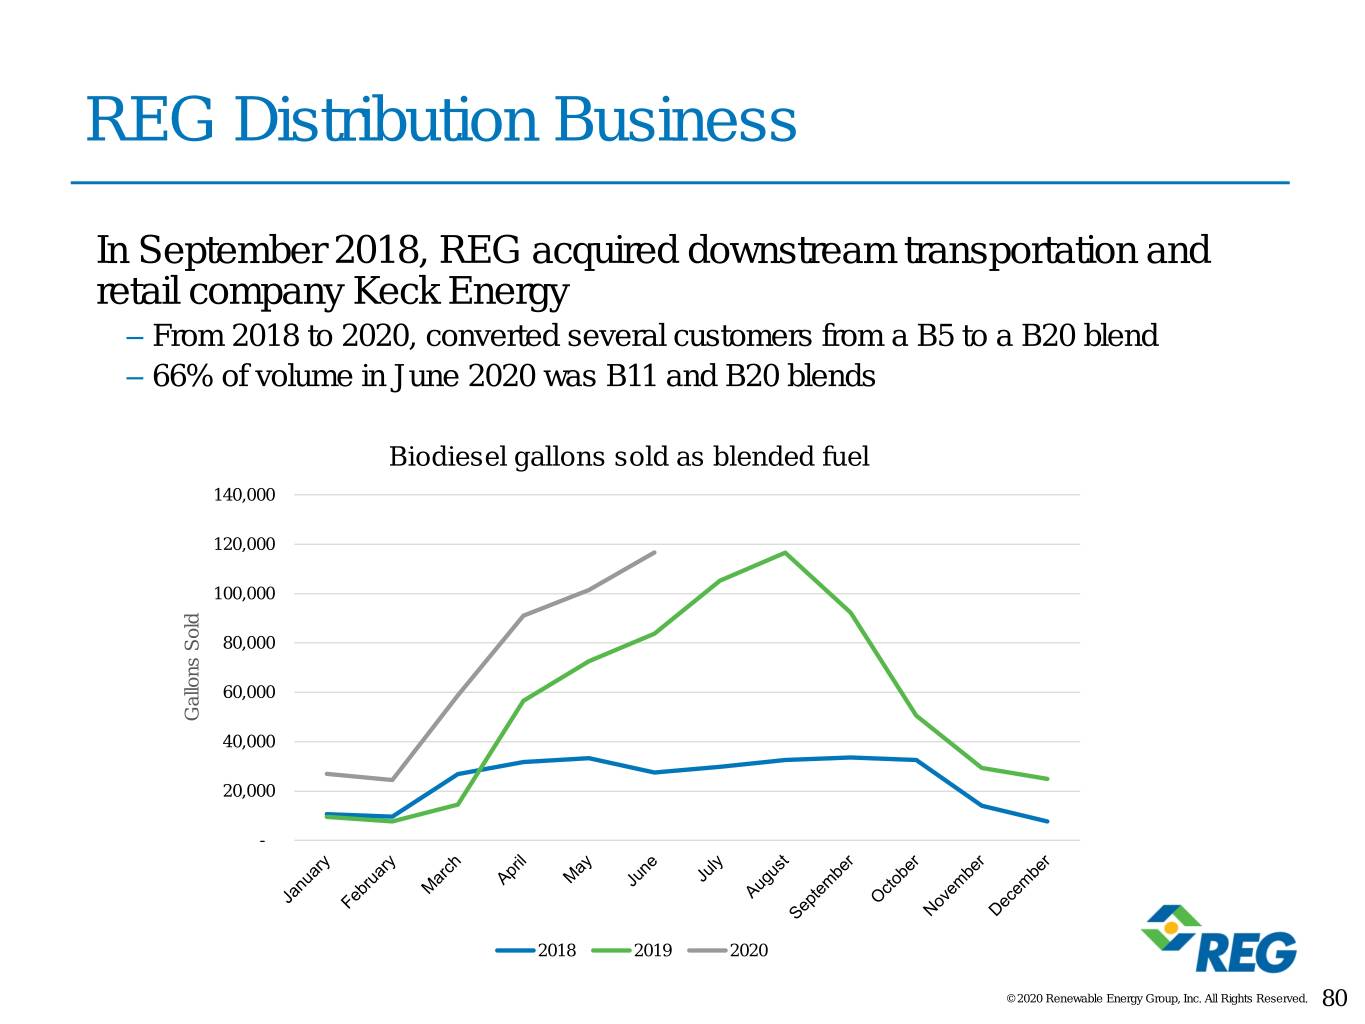
REG Distribution Business In September 2018, REG acquired downstream transportation and retail company Keck Energy – From 2018 to 2020, converted several customers from a B5 to a B20 blend – 66% of volume in June 2020 was B11 and B20 blends Biodiesel gallons sold as blended fuel 140,000 120,000 100,000 80,000 60,000 Gallons Sold 40,000 20,000 - 2018 2019 2020 © 2020 Renewable Energy Group, Inc. All Rights Reserved. 80
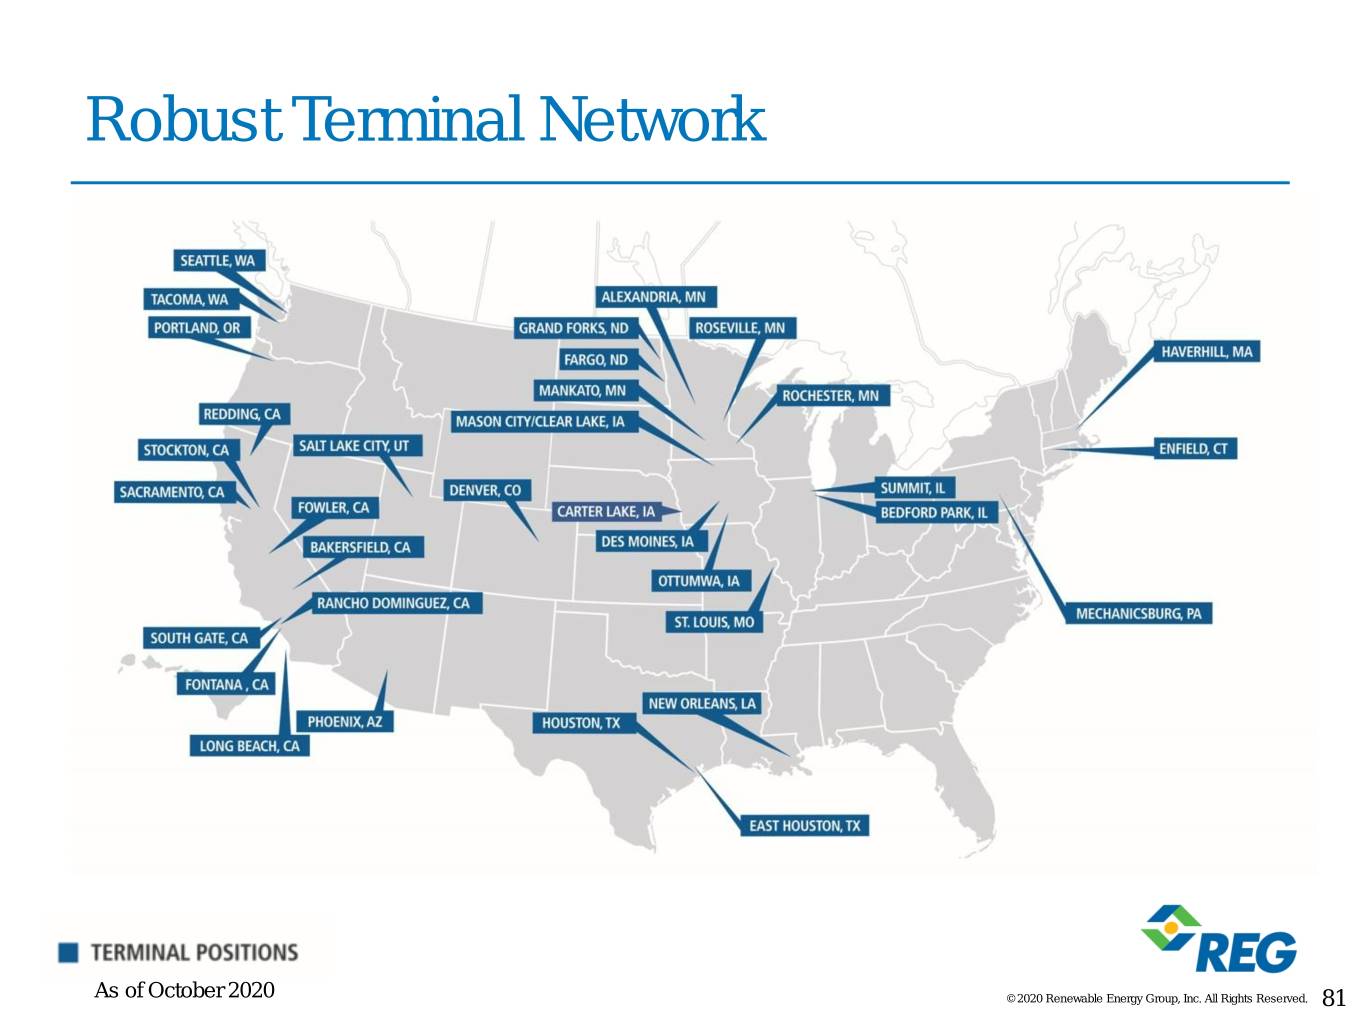
Robust Terminal Network As of October 2020 © 2020 Renewable Energy Group, Inc. All Rights Reserved. 81

End Users Represent A Growing Customer Segment 3,000,000 2,500,000 2,000,000 1,500,000 Gallons SoldGallons 1,000,000 500,000 0 Q1 2018 Q2 2018 Q3 2018 Q4 2018 Q1 2019 Q2 2019 Q3 2019 Q4 2019 Q1 2020 Q2 2020 Note: Includes gallons sold to end users, e.g. fleets, municipalities, mining companies, etc. © 2020 Renewable Energy Group, Inc. All Rights Reserved. 82
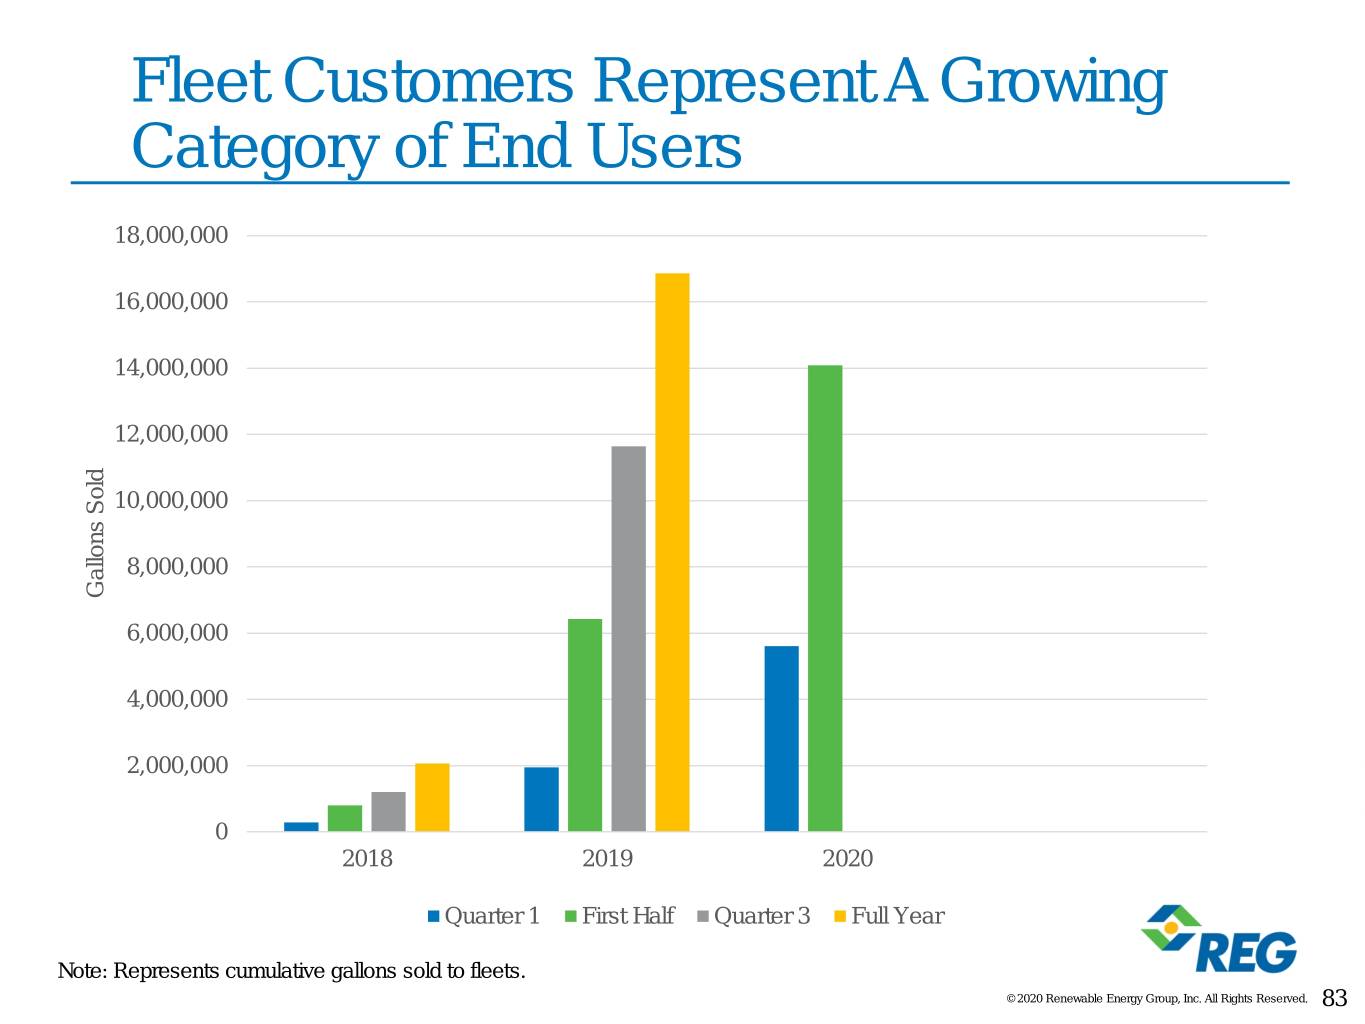
Fleet Customers Represent A Growing Category of End Users 18,000,000 16,000,000 14,000,000 12,000,000 10,000,000 8,000,000 Gallons SoldGallons 6,000,000 4,000,000 2,000,000 0 2018 2019 2020 Quarter 1 First Half Quarter 3 Full Year Note: Represents cumulative gallons sold to fleets. © 2020 Renewable Energy Group, Inc. All Rights Reserved. 83
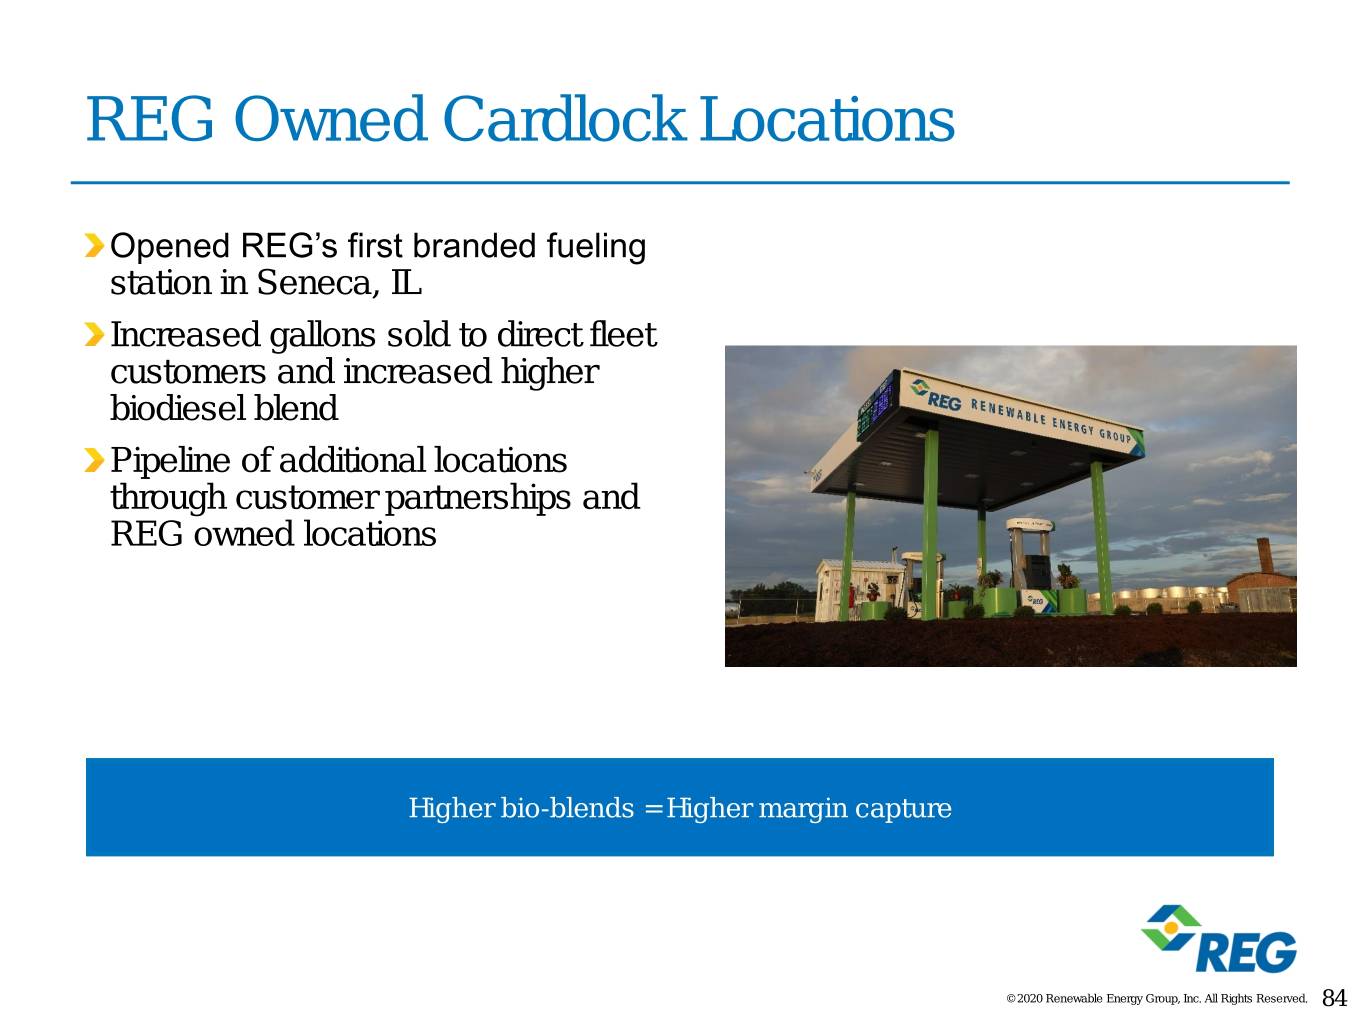
REG Owned Cardlock Locations Opened REG’s first branded fueling station in Seneca, IL Increased gallons sold to direct fleet customers and increased higher biodiesel blend Pipeline of additional locations through customer partnerships and REG owned locations Higher bio-blends = Higher margin capture © 2020 Renewable Energy Group, Inc. All Rights Reserved. 84

Pilot Programs Demonstrate Year-round B100 Use Washington DC Department of Public Works City of Chicago Parks District Renewable Energy Group City of Ames Iowa Department of Transportation © 2020 Renewable Energy Group, Inc. All Rights Reserved. 85

Customer Enthusiasm for Blends of Biodiesel and Renewable Diesel 18,000,000 16,000,000 14,000,000 12,000,000 10,000,000 8,000,000 Gallons SoldGallons 6,000,000 4,000,000 2,000,000 0 Q1 2018 Q2 2018 Q3 2018 Q4 2018 Q1 2019 Q2 2019 Q3 2019 Q4 2019 Q1 2020 Q2 2020 Note: Includes gallons sold of REG Ultra Clean from REG self-produced gallons and 3rd party renewable diesel © 2020 Renewable Energy Group, Inc. All Rights Reserved. 86

REG Branding Agreement With Hunt & Sons REG Ultra Clean® is a premium renewable fuel and one of the lowest carbon intensity liquid transportation fuels on the market REG Ultra Clean is available at 12 cardlock stations Pipeline of other branding agreements are in process for premium markets © 2020 Renewable Energy Group, Inc. All Rights Reserved. 87
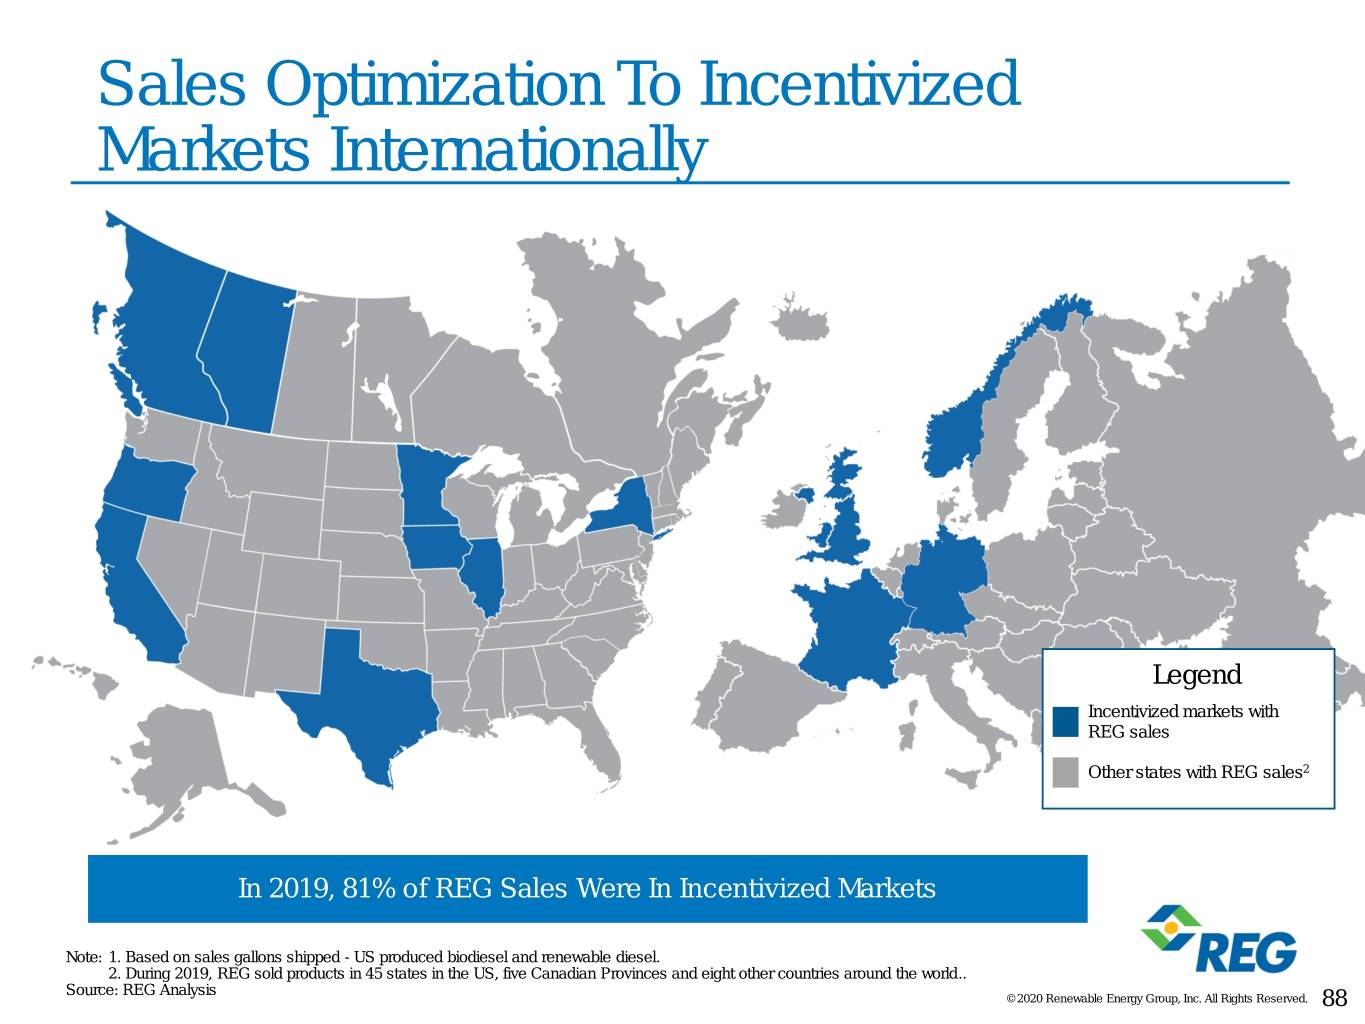
Sales Optimization To Incentivized Markets Internationally Legend Incentivized markets with REG sales Other states with REG sales2 In 2019, 81% of REG Sales Were In Incentivized Markets Note: 1. Based on sales gallons shipped - US produced biodiesel and renewable diesel. 2. During 2019, REG sold products in 45 states in the US, five Canadian Provinces and eight other countries around the world.. Source: REG Analysis © 2020 Renewable Energy Group, Inc. All Rights Reserved. 88

Sales Optimization To Premium Markets 60,000,000 50,000,000 40,000,000 30,000,000 Gallons SoldGallons 20,000,000 10,000,000 0 Q1 2018 Q2 2018 Q3 2018 Q4 2018 Q1 2019 Q2 2019 Q3 2019 Q4 2019 Q1 2020 Q2 2020 Note: Includes sales of biodiesel into CA, OR, BC, Alberta and Norway. All REG Ultra Clean ® gallons are sold into Premium Markets as well. © 2020 Renewable Energy Group, Inc. All Rights Reserved. 89
Downstream Video © 2020 Renewable Energy Group, Inc. All Rights Reserved.
Downstream Summary REG is driving sustainable demand and margin expansion by moving downstream Sales of Self-Produced Gallons End Users Represent A Growing Customer Segment Sales Optimization To Premium Markets Internationally © 2020 Renewable Energy Group, Inc. All Rights Reserved. 91

Intermission © 2020 Renewable Energy Group, Inc. All Rights Reserved.

Financial Discipline, Strong Delivery and Earnings Predictability Chad Stone Chief Financial Officer © 2020 Renewable Energy Group, Inc. All Rights Reserved. 93

Historical Annual Financial Performance Gallons Sold – Annual Historical (MM gal) Revenue – Annual Historical ($MM) $2,641 700 649 $2,383 $2,155 567 587 $2,039 375 $1,387 2015 2016 2017 2018 2019 2015 2016 2017 2018 2019 Adjusted EBITDA – Annual Historical ($MM)1 Term Debt/Total Capitalization – Year end Historical $388 29.5% 28.7% 26.3% $243 19.5% $218 $115 8.6% $62 2015 2016 2017 2018 2019 2015 2016 2017 2018 2019 Source: REG Analysis Note: 1. Adjusted EBITDA is a non-GAAP measure. See Appendix for the definition of Adjusted EBITDA and reconciliation to Net Income (loss) determined in accordance with GAAP Note: 2. In the fourth quarter of 2018, the operations of REG Life Sciences has been classified as discontinued operations. Beginning in the first quarter of 2019, the Company is excluding the results from these discontinued operations from the calculation of Adjusted EBITDA. The corresponding prior period amounts have been reclassified to conform with the current period presentation. © 2020 Renewable Energy Group, Inc. All Rights Reserved. 94

Balanced Approach to Capital Allocation Required Investments in Safety & Maintenance High Return Rapid Payback Projects Cash Flow From Major Capital Projects Operations Repurchase Programs © 2020 Renewable Energy Group, Inc. All Rights Reserved. 95
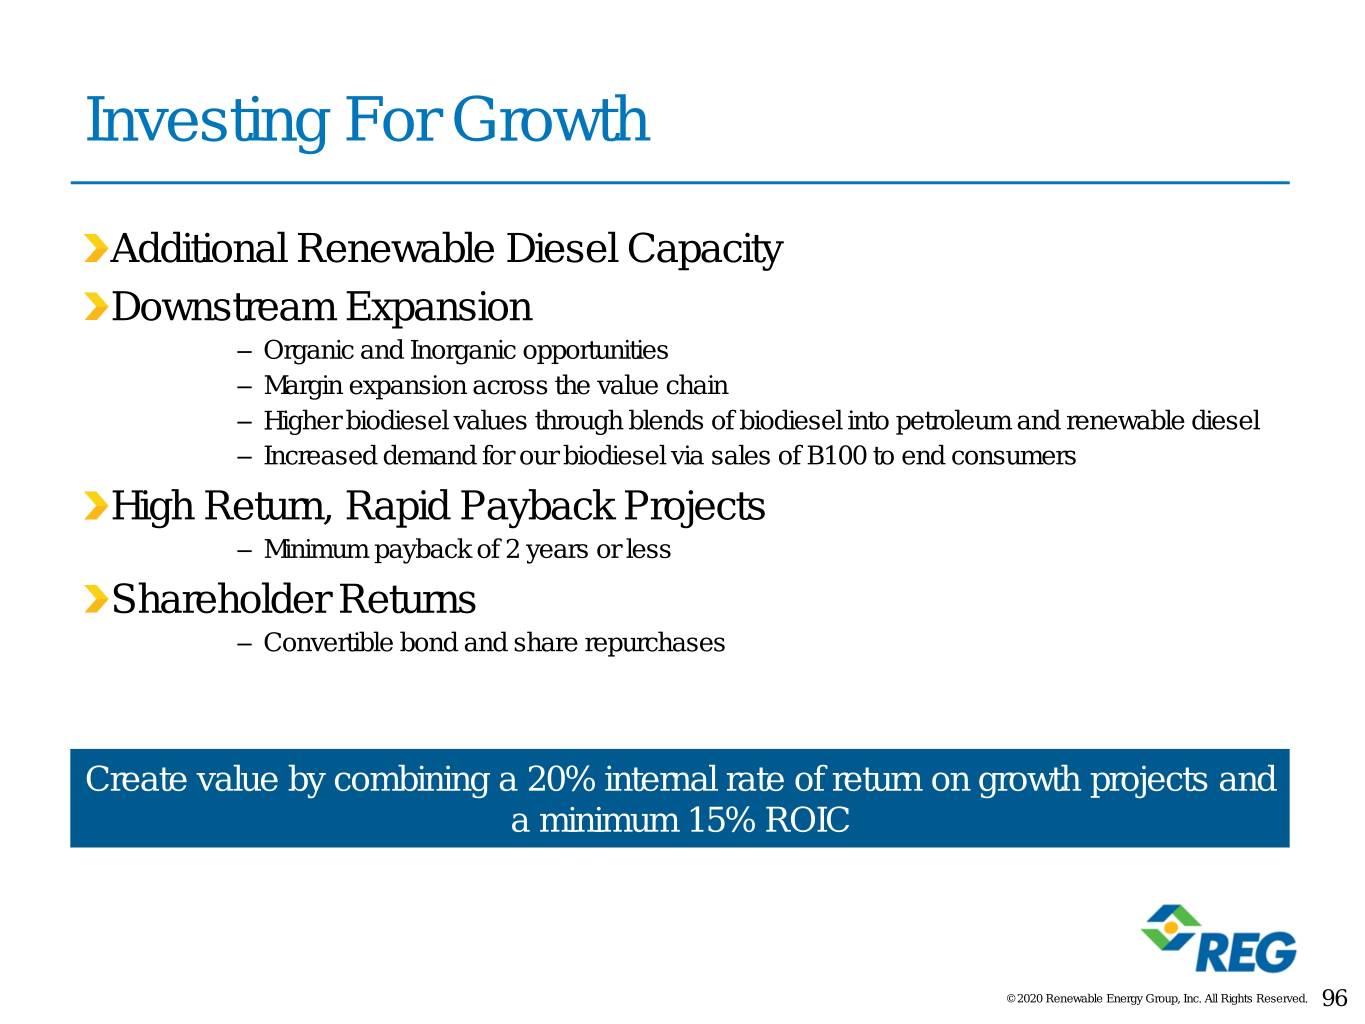
Investing For Growth Additional Renewable Diesel Capacity Downstream Expansion – Organic and Inorganic opportunities – Margin expansion across the value chain – Higher biodiesel values through blends of biodiesel into petroleum and renewable diesel – Increased demand for our biodiesel via sales of B100 to end consumers High Return, Rapid Payback Projects – Minimum payback of 2 years or less Shareholder Returns – Convertible bond and share repurchases Create value by combining a 20% internal rate of return on growth projects and a minimum 15% ROIC © 2020 Renewable Energy Group, Inc. All Rights Reserved. 96
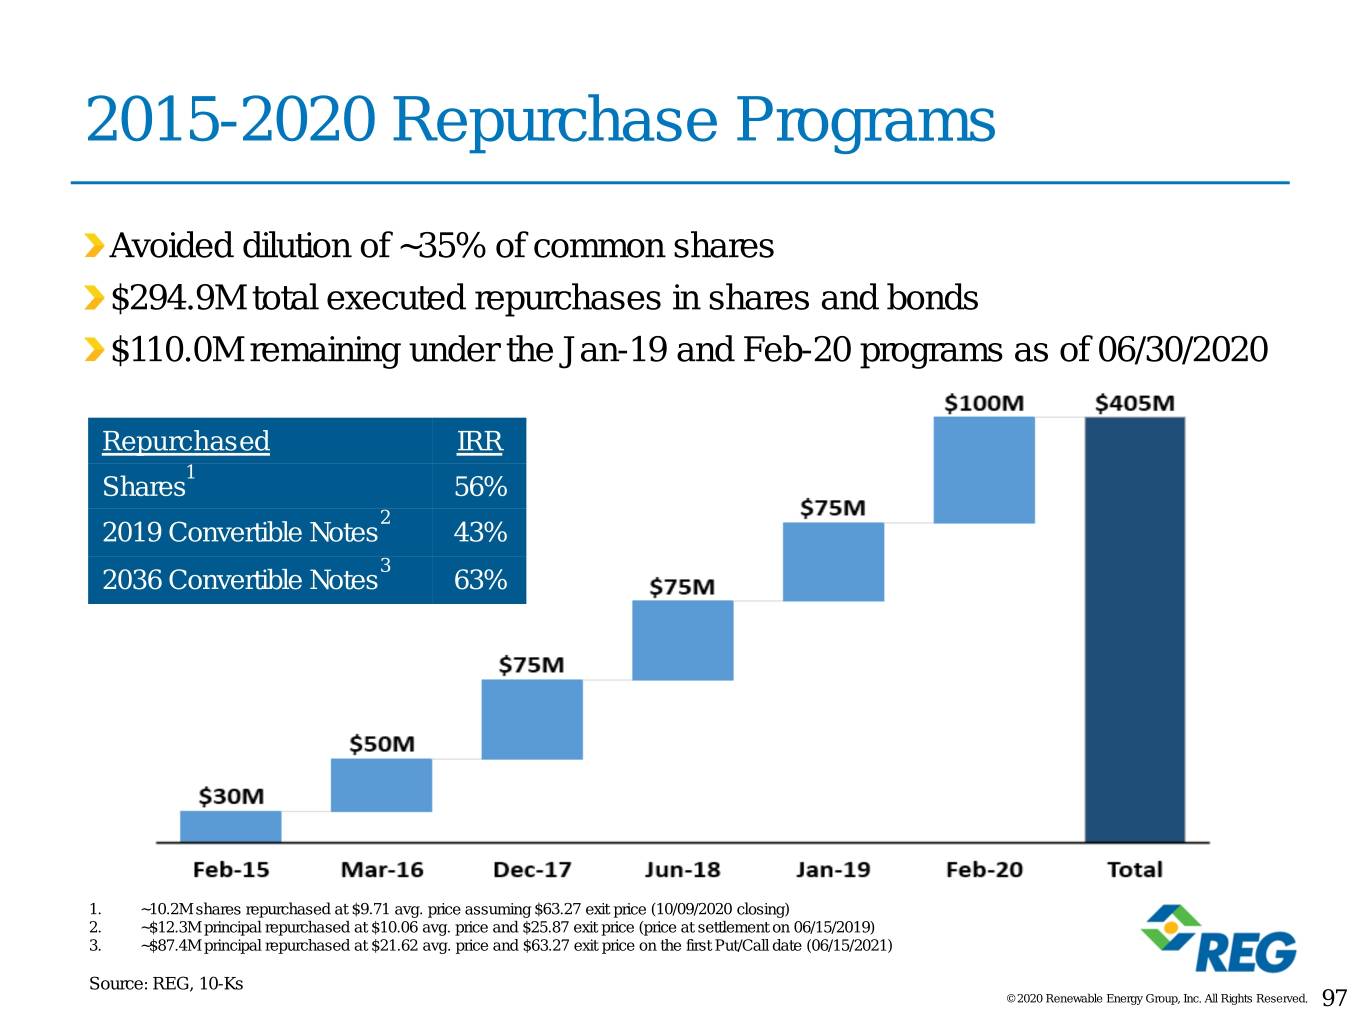
2015-2020 Repurchase Programs Avoided dilution of ~35% of common shares $294.9M total executed repurchases in shares and bonds $110.0M remaining under the Jan-19 and Feb-20 programs as of 06/30/2020 Repurchased IRR 1 Shares 56% 2 2019 Convertible Notes 43% 3 2036 Convertible Notes 63% 1. ~10.2M shares repurchased at $9.71 avg. price assuming $63.27 exit price (10/09/2020 closing) 2. ~$12.3M principal repurchased at $10.06 avg. price and $25.87 exit price (price at settlement on 06/15/2019) 3. ~$87.4M principal repurchased at $21.62 avg. price and $63.27 exit price on the first Put/Call date (06/15/2021) Source: REG, 10-Ks © 2020 Renewable Energy Group, Inc. All Rights Reserved. 97
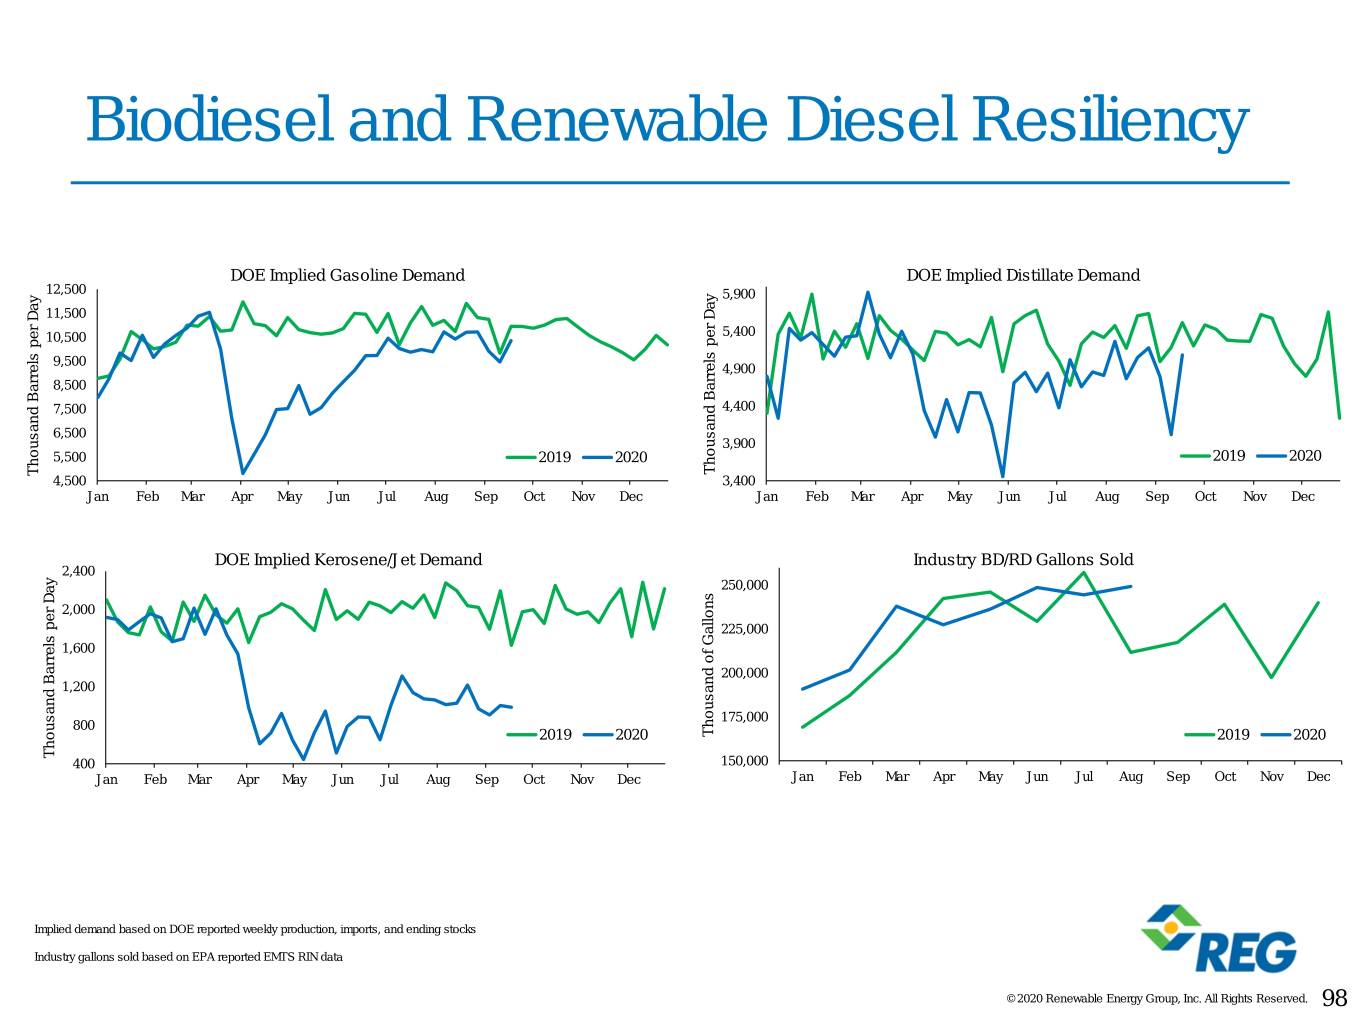
Biodiesel and Renewable Diesel Resiliency DOE Implied Gasoline Demand DOE Implied Distillate Demand 12,500 5,900 11,500 10,500 5,400 9,500 4,900 8,500 7,500 4,400 6,500 3,900 5,500 2019 2020 2019 2020 Thousand Barrels ThousandBarrels Day per Thousand Barrels ThousandBarrels Day per 4,500 3,400 Jan Feb Mar Apr May Jun Jul Aug Sep Oct Nov Dec Jan Feb Mar Apr May Jun Jul Aug Sep Oct Nov Dec DOE Implied Kerosene/Jet Demand Industry BD/RD Gallons Sold 2,400 250,000 2,000 225,000 1,600 200,000 1,200 175,000 800 2019 2020 ThousandofGallons 2019 2020 Thousand Barrels ThousandBarrels Day per 400 150,000 Jan Feb Mar Apr May Jun Jul Aug Sep Oct Nov Dec Jan Feb Mar Apr May Jun Jul Aug Sep Oct Nov Dec Implied demand based on DOE reported weekly production, imports, and ending stocks Industry gallons sold based on EPA reported EMTS RIN data © 2020 Renewable Energy Group, Inc. All Rights Reserved. 98
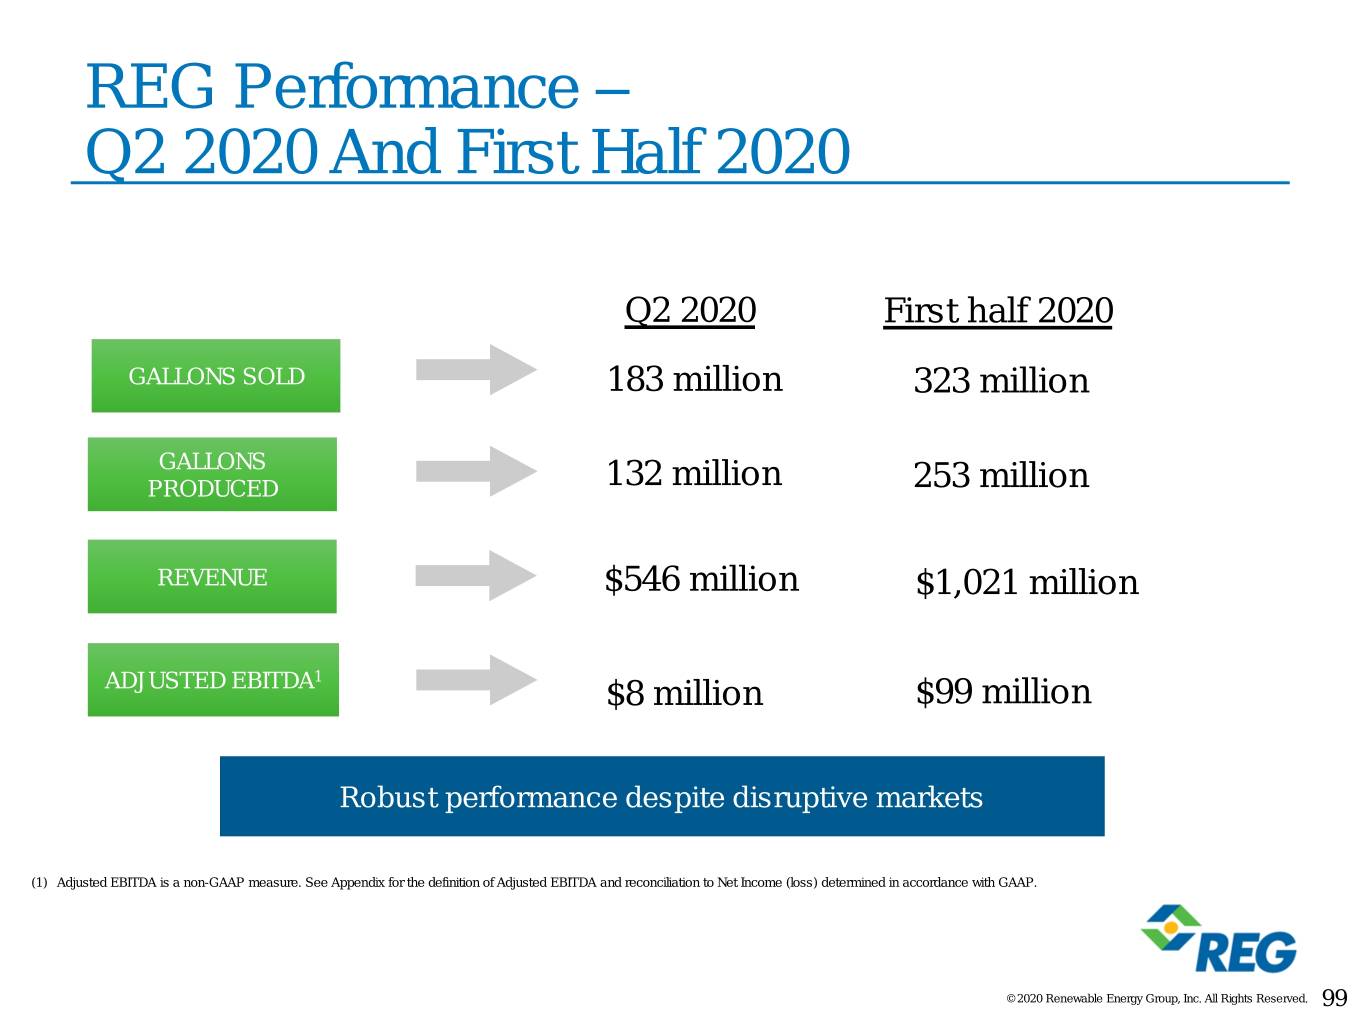
REG Performance – Q2 2020 And First Half 2020 Q2 2020 First half 2020 GALLONS SOLD 183 million 323 million GALLONS PRODUCED 132 million 253 million REVENUE $546 million $1,021 million 1 ADJUSTED EBITDA $8 million $99 million Robust performance despite disruptive markets (1) Adjusted EBITDA is a non-GAAP measure. See Appendix for the definition of Adjusted EBITDA and reconciliation to Net Income (loss) determined in accordance with GAAP. © 2020 Renewable Energy Group, Inc. All Rights Reserved. 99
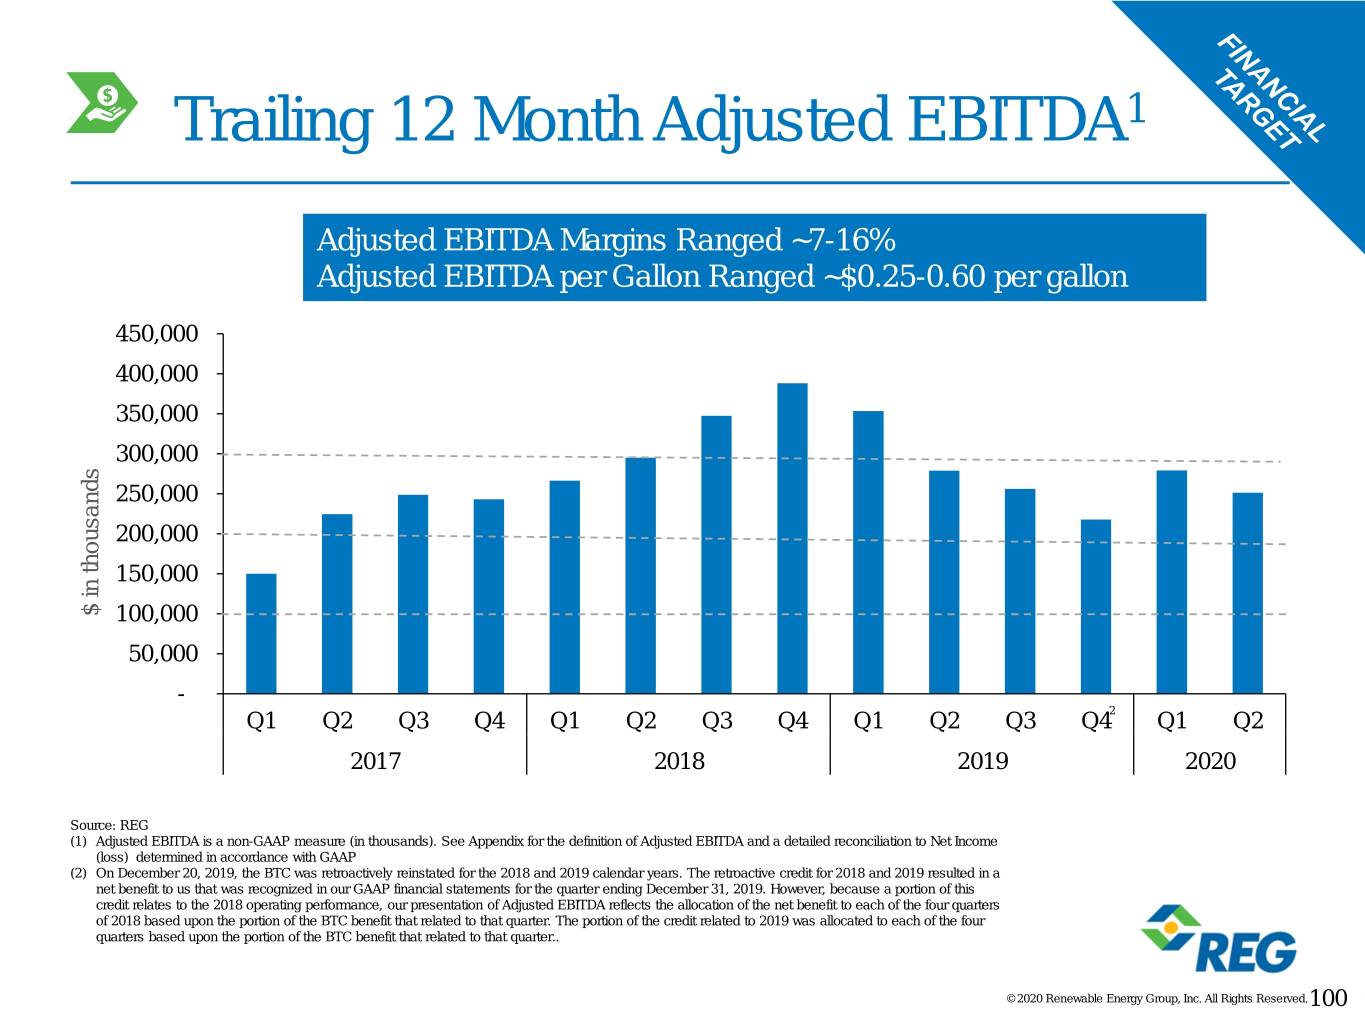
Trailing 12 Month Adjusted EBITDA1 Adjusted EBITDA Margins Ranged ~7-16% Adjusted EBITDA per Gallon Ranged ~$0.25-0.60 per gallon 450,000 400,000 350,000 300,000 250,000 200,000 150,000 $ in in thousands$ 100,000 50,000 - Q1 Q2 Q3 Q4 Q1 Q2 Q3 Q4 Q1 Q2 Q3 Q42 Q1 Q2 2017 2018 2019 2020 Source: REG (1) Adjusted EBITDA is a non-GAAP measure (in thousands). See Appendix for the definition of Adjusted EBITDA and a detailed reconciliation to Net Income (loss) determined in accordance with GAAP (2) On December 20, 2019, the BTC was retroactively reinstated for the 2018 and 2019 calendar years. The retroactive credit for 2018 and 2019 resulted in a net benefit to us that was recognized in our GAAP financial statements for the quarter ending December 31, 2019. However, because a portion of this credit relates to the 2018 operating performance, our presentation of Adjusted EBITDA reflects the allocation of the net benefit to each of the four quarters of 2018 based upon the portion of the BTC benefit that related to that quarter. The portion of the credit related to 2019 was allocated to each of the four quarters based upon the portion of the BTC benefit that related to that quarter.. © 2020 Renewable Energy Group, Inc. All Rights Reserved.100
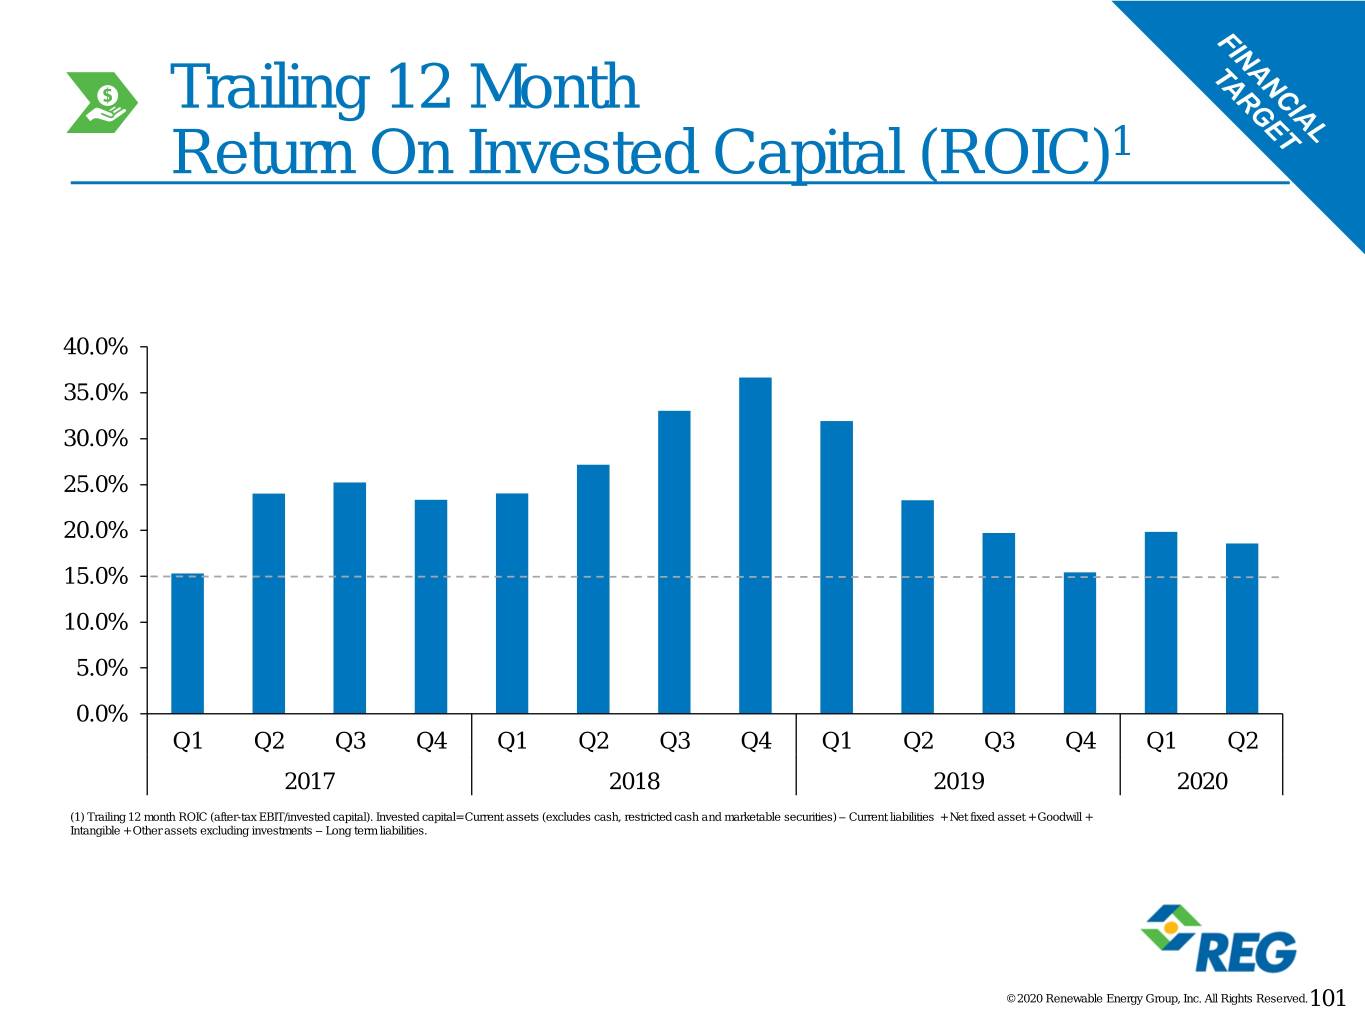
Trailing 12 Month Return On Invested Capital (ROIC)1 40.0% 35.0% 30.0% 25.0% 20.0% 15.0% 10.0% 5.0% 0.0% Q1 Q2 Q3 Q4 Q1 Q2 Q3 Q4 Q1 Q2 Q3 Q4 Q1 Q2 2017 2018 2019 2020 (1) Trailing 12 month ROIC (after-tax EBIT/invested capital). Invested capital= Current assets (excludes cash, restricted cash and marketable securities) – Current liabilities + Net fixed asset + Goodwill + Intangible + Other assets excluding investments – Long term liabilities. © 2020 Renewable Energy Group, Inc. All Rights Reserved.101
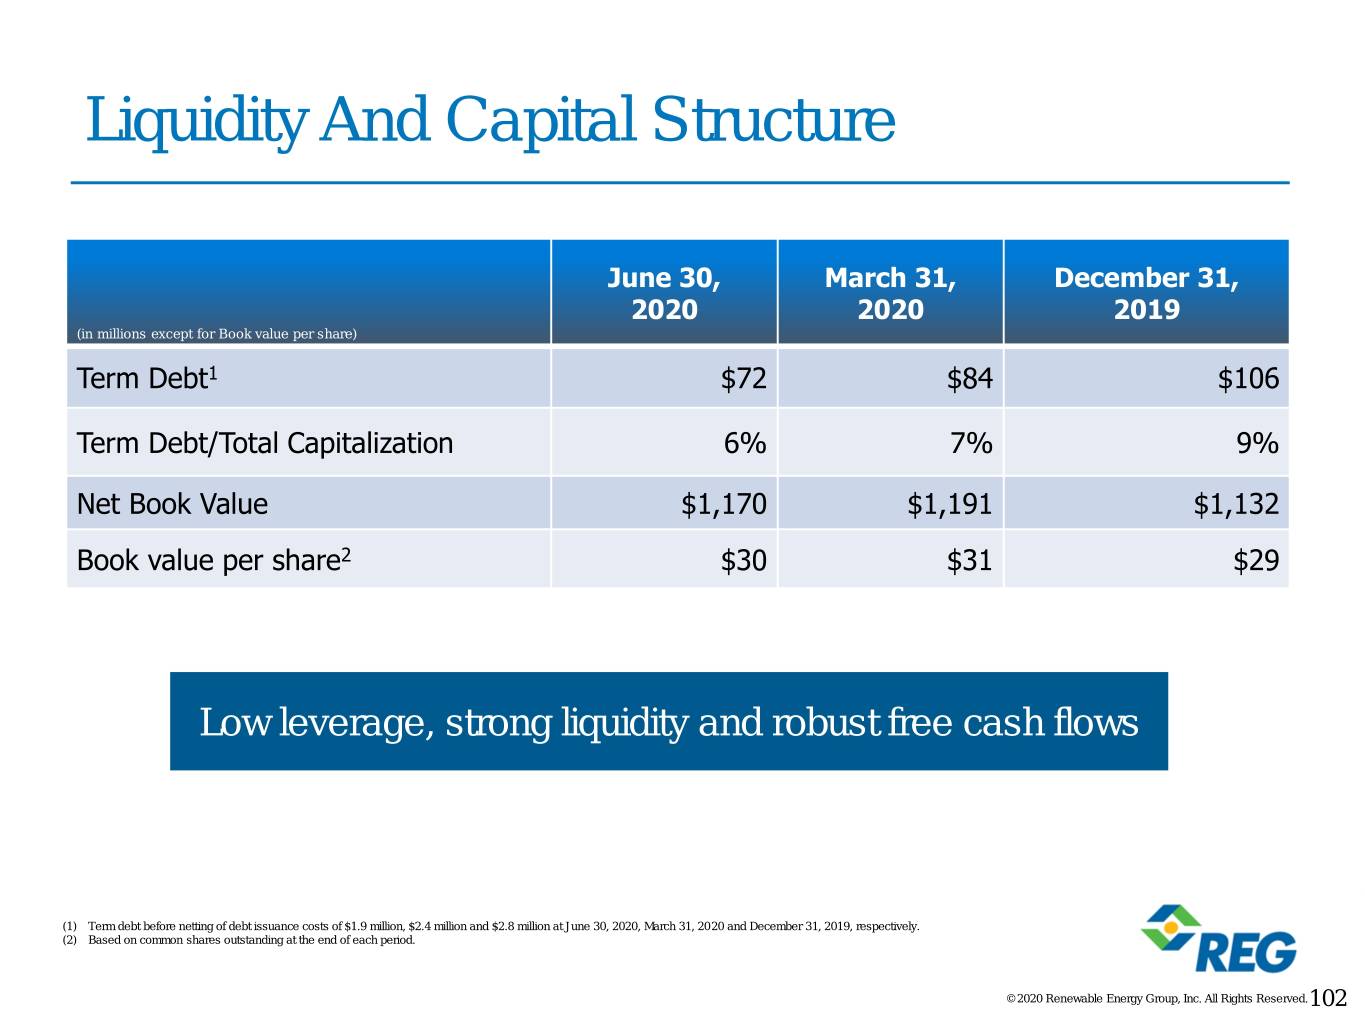
Liquidity And Capital Structure June 30, March 31, December 31, 2020 2020 2019 (in millions except for Book value per share) Term Debt1 $72 $84 $106 Term Debt/Total Capitalization 6% 7% 9% Net Book Value $1,170 $1,191 $1,132 Book value per share2 $30 $31 $29 Low leverage, strong liquidity and robust free cash flows (1) Term debt before netting of debt issuance costs of $1.9 million, $2.4 million and $2.8 million at June 30, 2020, March 31, 2020 and December 31, 2019, respectively. (2) Based on common shares outstanding at the end of each period. © 2020 Renewable Energy Group, Inc. All Rights Reserved.102
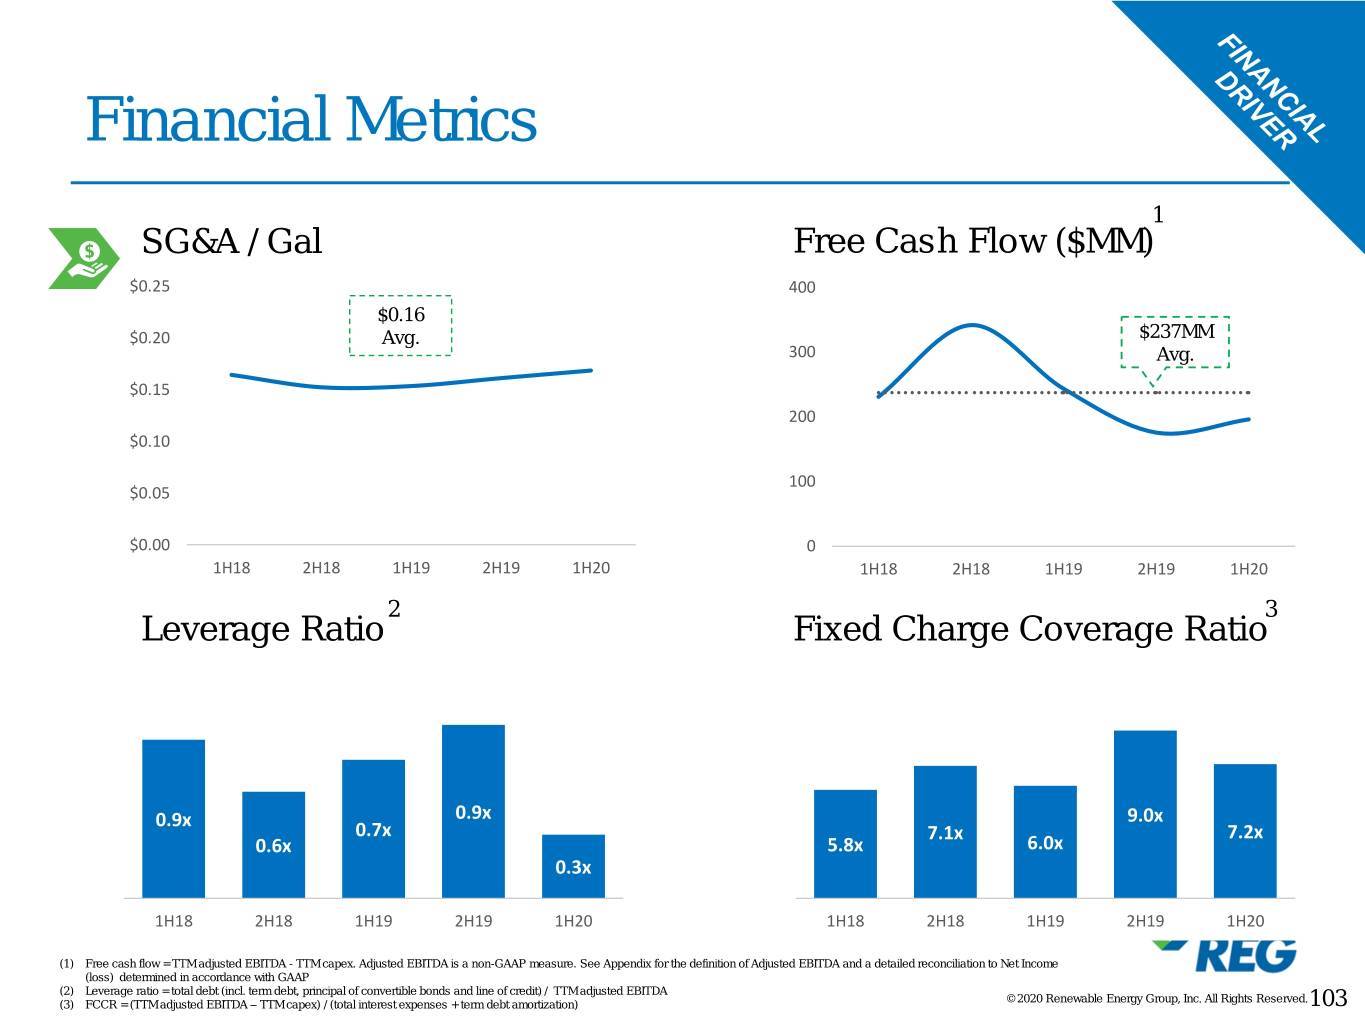
Financial Metrics 1 SG&A / Gal Free Cash Flow ($MM) $0.25 400 $0.16 $0.20 Avg. $237MM 300 Avg. $0.15 200 $0.10 100 $0.05 $0.00 0 1H18 2H18 1H19 2H19 1H20 1H18 2H18 1H19 2H19 1H20 2 3 Leverage Ratio Fixed Charge Coverage Ratio 0.9x 0.9x 9.0x 0.7x 7.1x 7.2x 0.6x 5.8x 6.0x 0.3x 1H18 2H18 1H19 2H19 1H20 1H18 2H18 1H19 2H19 1H20 (1) Free cash flow = TTM adjusted EBITDA - TTM capex. Adjusted EBITDA is a non-GAAP measure. See Appendix for the definition of Adjusted EBITDA and a detailed reconciliation to Net Income (loss) determined in accordance with GAAP (2) Leverage ratio = total debt (incl. term debt, principal of convertible bonds and line of credit) / TTM adjusted EBITDA © 2020 Renewable Energy Group, Inc. All Rights Reserved. (3) FCCR = (TTM adjusted EBITDA – TTM capex) / (total interest expenses + term debt amortization) 103

Key Market Drivers 1 Low-Carbon Credit Prices HOBO+RIN & HOBO Spread $250.00 2.00 HOBO Spread $200.00 1.50 HOBO + RINs $150.00 1.00 $/MT $100.00 $/gal CA LCFS 0.50 $50.00 OR CFP $0.00 0.00 Jul-20 Oct-19 Apr-20 Jan-20 Jun-20 Mar-20 Feb-20 Nov-19 Dec-19 Sep-19 Aug-20 Jul-20 May-20 Oct-19 Apr-20 Jan-20 Jun-20 Mar-20 -0.50 Feb-20 Nov-19 Dec-19 Sep-19 Aug-20 May-20 OPIS Biofuel RIN Values $1.00 Basic Feedstocks 45.00 40.00 $0.75 35.00 $0.50 30.00 $/RIN cts/lb 25.00 $0.25 20.00 D4 BBD D6 Conventional 15.00 CWG DCO RBD SBO TT $0.00 10.00 Jul-20 Oct-19 Apr-20 Jan-20 Jun-20 Mar-20 Feb-20 Nov-19 Dec-19 Sep-19 Aug-20 May-20 Jul-20 Oct-19 Apr-20 Jan-20 Jun-20 Feb-20 Mar-20 Sep-19 Nov-19 Dec-19 Aug-20 May-20 1) HOBO = HO NYMEX + 1 – (CBOT SBO/100*7.5); HOBO + RINs = HOBO + 1.5x D4 RIN; D4 RIN as quoted by OPIS Definition: RINs are the credits that the US EPA uses to track and enforce compliance with the renewable fuels mandates set by the RFS in the US; Biomass based diesel RIN (D4 )- These RINs are created by blending diesel made from soybean oil, canola oil, waste oil or animal fats into diesel Renewable fuel RIN (D6) - These are the most basic RINs and have the highest volume mandate. This RIN is generated by blending corn-based ethanol into gasoline Source: NYMEX, CME, OPIS, and Jacobsen © 2020 Renewable Energy Group, Inc. All Rights Reserved.104

REG YTD Stock Price Performance © 2020 Renewable Energy Group, Inc. All Rights Reserved.105
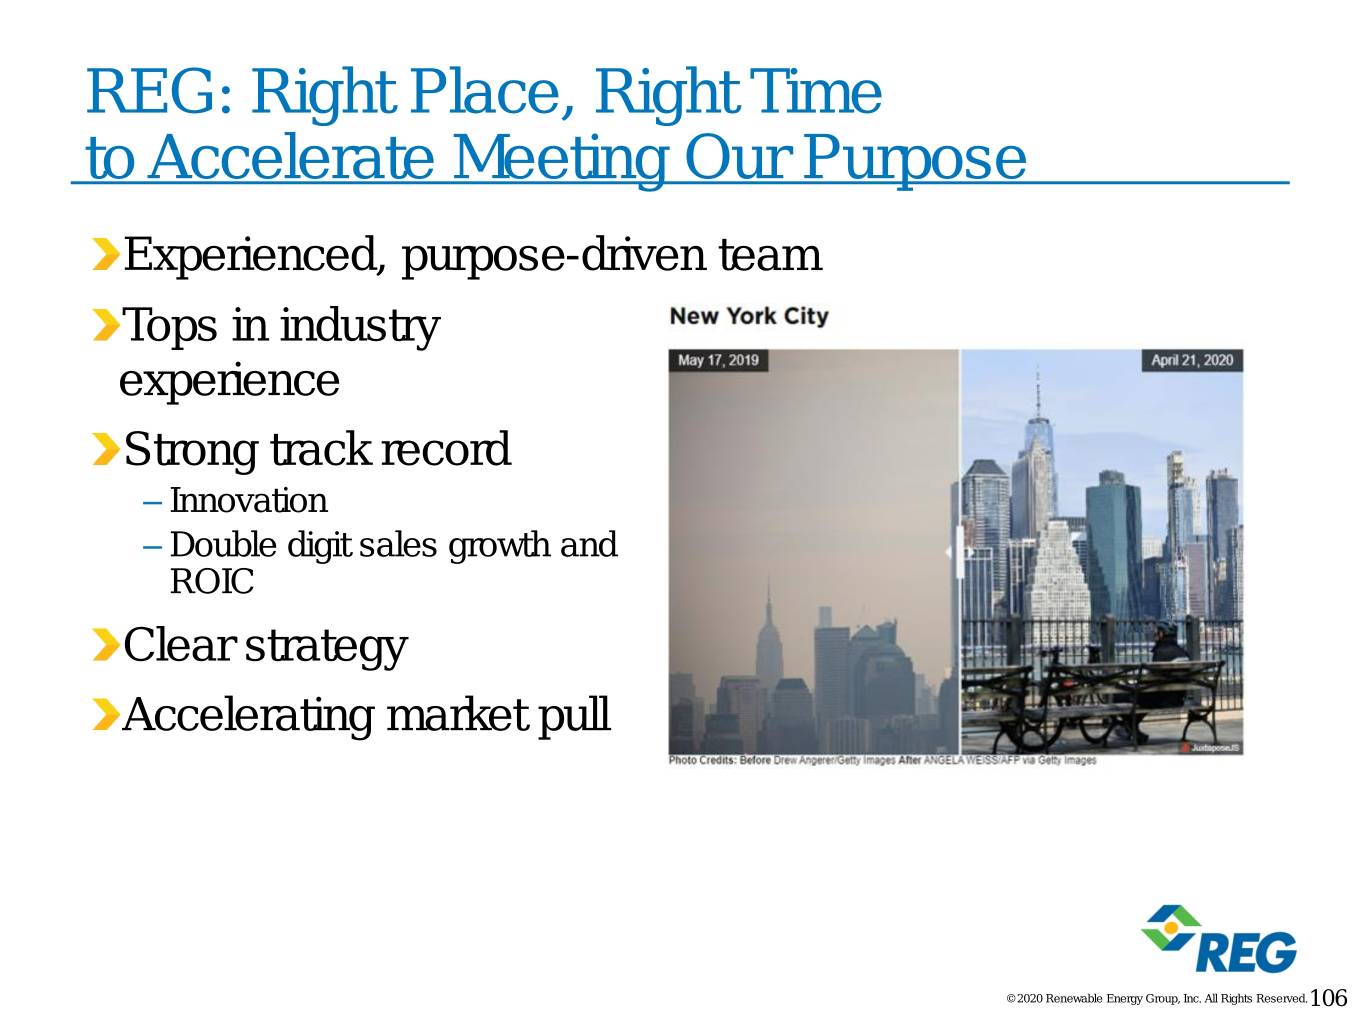
REG: Right Place, Right Time to Accelerate Meeting Our Purpose Experienced, purpose-driven team Tops in industry experience Strong track record – Innovation – Double digit sales growth and ROIC Clear strategy Accelerating market pull © 2020 Renewable Energy Group, Inc. All Rights Reserved.106

Question and Answer Session CYNTHIA (CJ) BRAD NATALIE GARY CHAD WARNER ALBIN MERRILL HAER STONE President & Vice President, Vice President, Vice President, Chief Financial Chief Executive Manufacturing Business Development Special Projects Officer Officer & Optimization ERIC BOWEN TRISHA CONLEY BOB KENYON General Counsel Vice President, Vice President, People Development Sales & Marketing DOUG LENHART RAYMOND RICHIE TODD ROBINSON Vice President, Procurement Vice President & Managing Director, Treasurer & Executive Director International Business of Investor Relations Biographies available at www.regi.com © 2020 Renewable Energy Group, Inc. All Rights Reserved.107

Appendix © 2020 Renewable Energy Group, Inc. All Rights Reserved.108
Adjusted EBITDA Definition Adjusted EBITDA Earnings before interest, taxes, depreciation and amortization ("EBITDA") and adjusted EBITDA are not measures of financial performance under GAAP. We use EBITDA and EBITDA adjusted for certain additional items, identified in the table below, or Adjusted EBITDA, as a supplemental performance measure. We present EBITDA and Adjusted EBITDA because we believe they assist investors in analyzing our performance across reporting periods on a consistent basis by excluding items that we do not believe are indicative of our core operating performance. In addition, we use Adjusted EBITDA to evaluate, assess and benchmark our financial performance on a consistent and a comparable basis and as a factor in determining incentive compensation for our executives. Adjusted EBITDA is a supplemental performance measure that is not required by, or presented in accordance with, generally accepted accounting principles, or GAAP. Adjusted EBITDA should not be considered as an alternative to net income or any other performance measure derived in accordance with GAAP, or as an alternative to cash flows from operating activities or a measure of our liquidity or profitability. Adjusted EBITDA has limitations as an analytical tool, and should not be considered in isolation, or as a substitute for any of our results as reported under GAAP. Some of these limitations are: • Adjusted EBITDA does not reflect our cash expenditures for capital assets or the impact of certain cash charges that we consider not to be an indication of our ongoing operations; • Adjusted EBITDA does not reflect changes in, or cash requirements for, our working capital requirements; • Adjusted EBITDA does not reflect the interest expense, or the cash requirements necessary to service interest or principal payments, on our indebtedness; • although depreciation and amortization are non-cash charges, the assets being depreciated and amortized will often have to be replaced in the future, and Adjusted EBITDA does not reflect cash requirements for such replacements; • stock-based compensation expense is an important element of our long term incentive compensation program, although we have excluded it as an expense when evaluating our operating performance; and • other companies, including other companies in our industry, may calculate these measures differently than we do, limiting their usefulness as a comparative measure. © 2020 Renewable Energy Group, Inc. All Rights Reserved.109
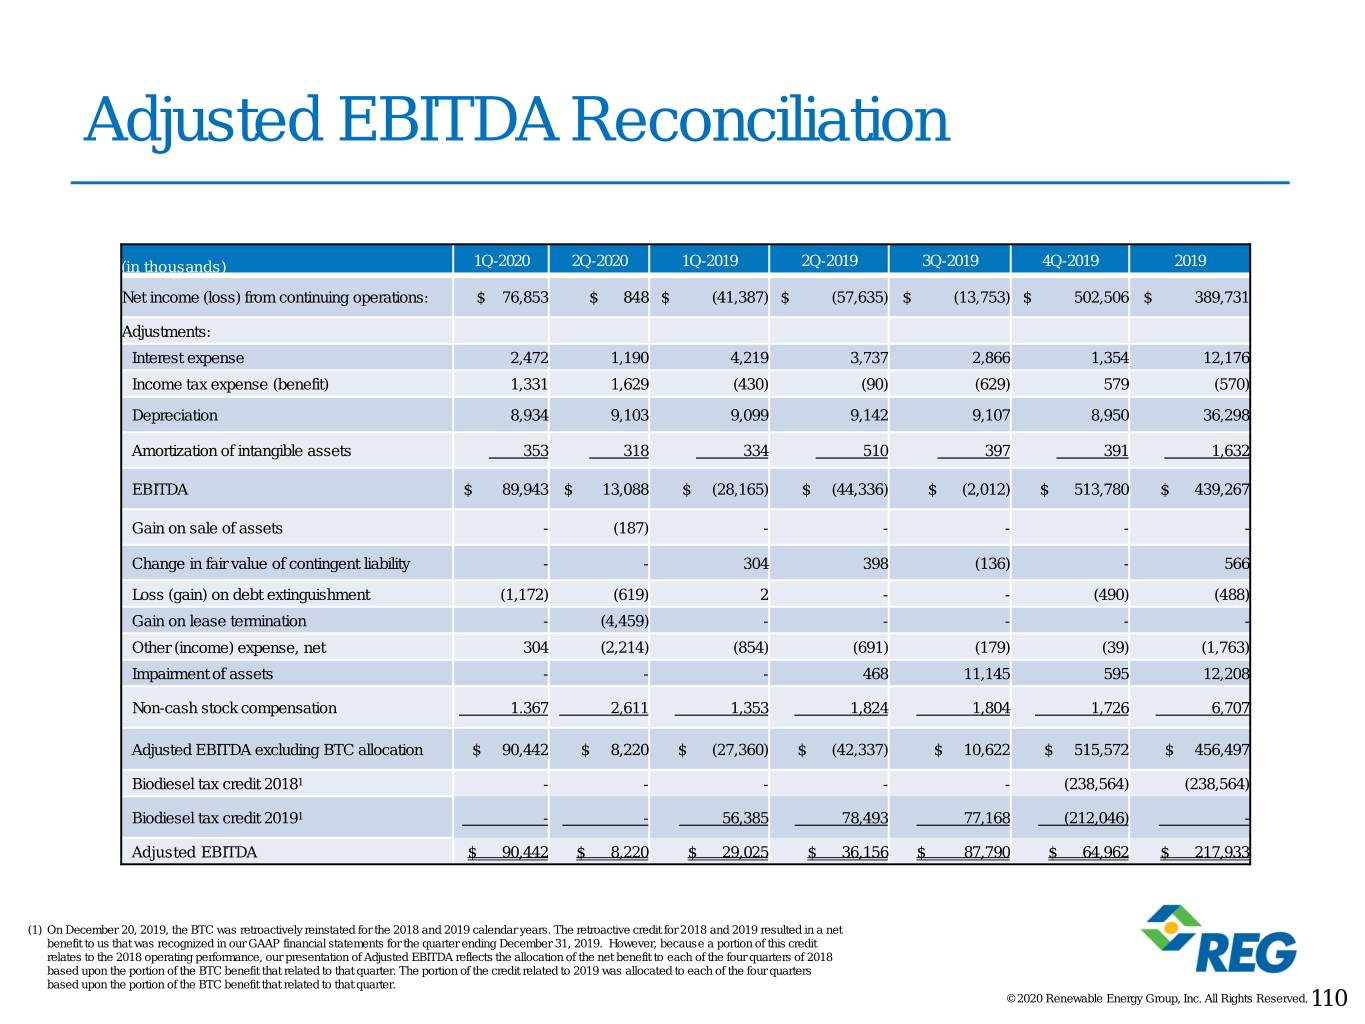
Adjusted EBITDA Reconciliation (in thousands) 1Q-2020 2Q-2020 1Q-2019 2Q-2019 3Q-2019 4Q-2019 2019 Net income (loss) from continuing operations: $ 76,853 $ 848 $ (41,387) $ (57,635) $ (13,753) $ 502,506 $ 389,731 Adjustments: Interest expense 2,472 1,190 4,219 3,737 2,866 1,354 12,176 Income tax expense (benefit) 1,331 1,629 (430) (90) (629) 579 (570) Depreciation 8,934 9,103 9,099 9,142 9,107 8,950 36,298 Amortization of intangible assets 353 318 334 510 397 391 1,632 EBITDA $ 89,943 $ 13,088 $ (28,165) $ (44,336) $ (2,012) $ 513,780 $ 439,267 Gain on sale of assets - (187) - - - - - Change in fair value of contingent liability - - 304 398 (136) - 566 Loss (gain) on debt extinguishment (1,172) (619) 2 - - (490) (488) Gain on lease termination - (4,459) - - - - - Other (income) expense, net 304 (2,214) (854) (691) (179) (39) (1,763) Impairment of assets - - - 468 11,145 595 12,208 Non-cash stock compensation 1.367 2,611 1,353 1,824 1,804 1,726 6,707 Adjusted EBITDA excluding BTC allocation $ 90,442 $ 8,220 $ (27,360) $ (42,337) $ 10,622 $ 515,572 $ 456,497 Biodiesel Totaltax credit balance 2018 may not1 foot due to rounding. - - - - - (238,564) (238,564) Biodiesel tax credit 20191 - - 56,385 78,493 77,168 (212,046) - Adjusted EBITDA $ 90,442 $ 8,220 $ 29,025 $ 36,156 $ 87,790 $ 64,962 $ 217,933 (1) On December 20, 2019, the BTC was retroactively reinstated for the 2018 and 2019 calendar years. The retroactive credit for 2018 and 2019 resulted in a net benefit to us that was recognized in our GAAP financial statements for the quarter ending December 31, 2019. However, because a portion of this credit relates to the 2018 operating performance, our presentation of Adjusted EBITDA reflects the allocation of the net benefit to each of the four quarters of 2018 based upon the portion of the BTC benefit that related to that quarter. The portion of the credit related to 2019 was allocated to each of the four quarters based upon the portion of the BTC benefit that related to that quarter. © 2020 Renewable Energy Group, Inc. All Rights Reserved. 110
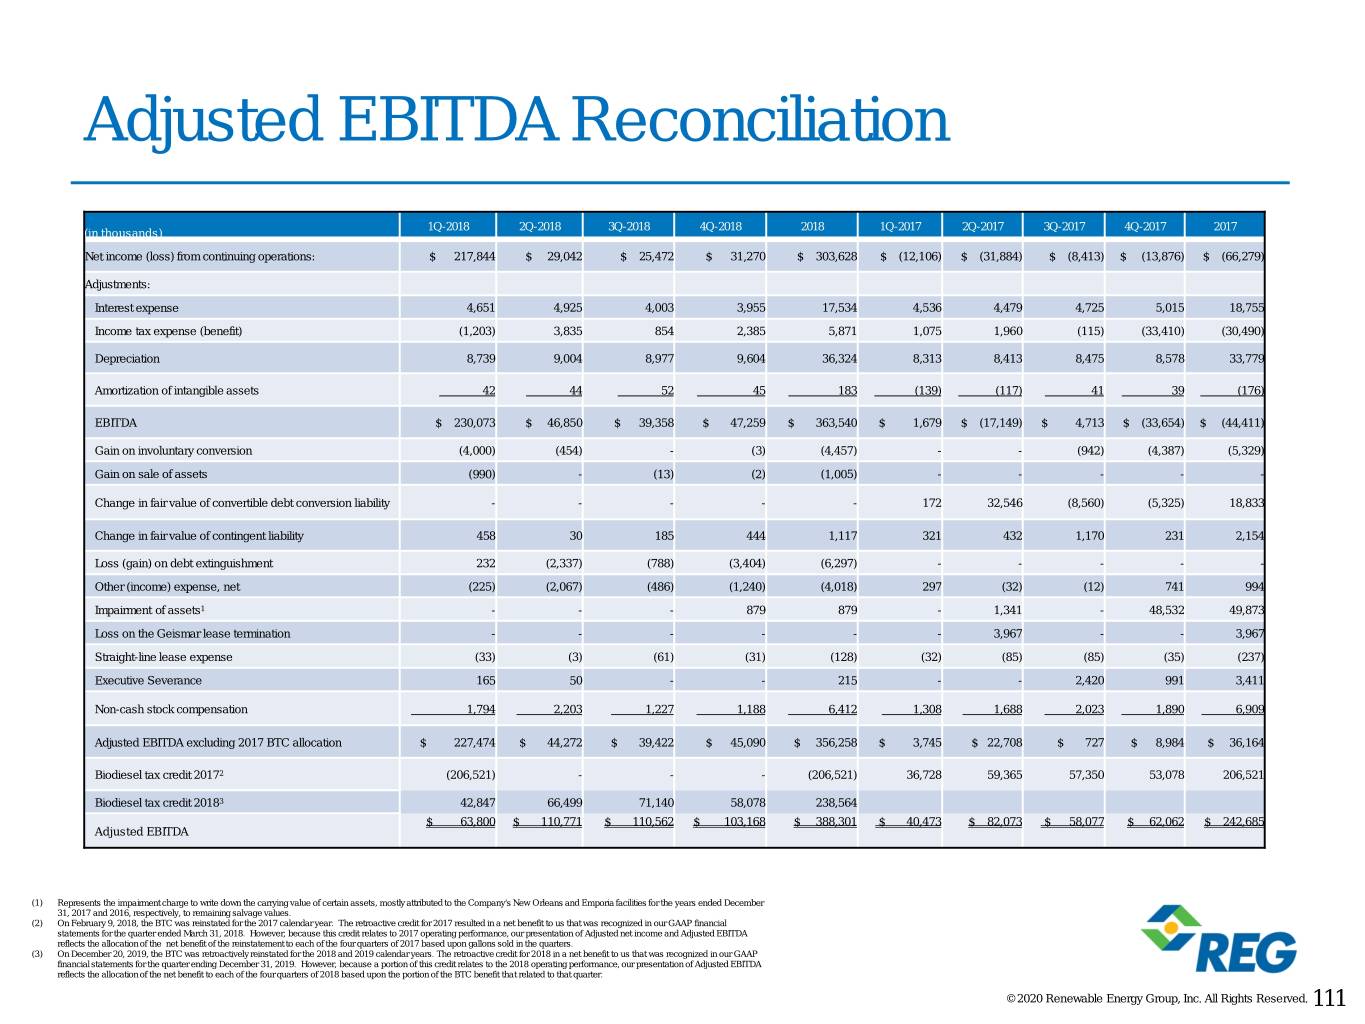
Adjusted EBITDA Reconciliation 1Q-2018 2Q-2018 3Q-2018 4Q-2018 2018 1Q-2017 2Q-2017 3Q-2017 4Q-2017 2017 (in thousands) Net income (loss) from continuing operations: $ 217,844 $ 29,042 $ 25,472 $ 31,270 $ 303,628 $ (12,106) $ (31,884) $ (8,413) $ (13,876) $ (66,279) Adjustments: Interest expense 4,651 4,925 4,003 3,955 17,534 4,536 4,479 4,725 5,015 18,755 Income tax expense (benefit) (1,203) 3,835 854 2,385 5,871 1,075 1,960 (115) (33,410) (30,490) Depreciation 8,739 9,004 8,977 9,604 36,324 8,313 8,413 8,475 8,578 33,779 Amortization of intangible assets 42 44 52 45 183 (139) (117) 41 39 (176) EBITDA $ 230,073 $ 46,850 $ 39,358 $ 47,259 $ 363,540 $ 1,679 $ (17,149) $ 4,713 $ (33,654) $ (44,411) Gain on involuntary conversion (4,000) (454) - (3) (4,457) - - (942) (4,387) (5,329) Gain on sale of assets (990) - (13) (2) (1,005) - - - - - Change in fair value of convertible debt conversion liability - - - - - 172 32,546 (8,560) (5,325) 18,833 Change in fair value of contingent liability 458 30 185 444 1,117 321 432 1,170 231 2,154 Loss (gain) on debt extinguishment 232 (2,337) (788) (3,404) (6,297) - - - - - Other (income) expense, net (225) (2,067) (486) (1,240) (4,018) 297 (32) (12) 741 994 Impairment of assets1 - - - 879 879 - 1,341 - 48,532 49,873 Loss on the Geismar lease termination - - - - - - 3,967 - - 3,967 Straight-line lease expense (33) (3) (61) (31) (128) (32) (85) (85) (35) (237) Executive Severance 165 50 - - 215 - - 2,420 991 3,411 Non-cash stock compensation 1,794 2,203 1,227 1,188 6,412 1,308 1,688 2,023 1,890 6,909 Adjusted EBITDA excluding 2017 BTC allocation $ 227,474 $ 44,272 $ 39,422 $ 45,090 $ 356,258 $ 3,745 $ 22,708 $ 727 $ 8,984 $ 36,164 Biodiesel tax credit 20172 (206,521) - - - (206,521) 36,728 59,365 57,350 53,078 206,521 Biodiesel tax creditTotal 2018 balance3 may not foot due to rounding. 42,847 66,499 71,140 58,078 238,564 $ 63,800 $ 110,771 $ 110,562 $ 103,168 $ 388,301 $ 40,473 $ 82,073 $ 58,077 $ 62,062 $ 242,685 Adjusted EBITDA (1) Represents the impairment charge to write down the carrying value of certain assets, mostly attributed to the Company's New Orleans and Emporia facilities for the years ended December 31, 2017 and 2016, respectively, to remaining salvage values. (2) On February 9, 2018, the BTC was reinstated for the 2017 calendar year. The retroactive credit for 2017 resulted in a net benefit to us that was recognized in our GAAP financial statements for the quarter ended March 31, 2018. However, because this credit relates to 2017 operating performance, our presentation of Adjusted net income and Adjusted EBITDA reflects the allocation of the net benefit of the reinstatement to each of the four quarters of 2017 based upon gallons sold in the quarters. (3) On December 20, 2019, the BTC was retroactively reinstated for the 2018 and 2019 calendar years. The retroactive credit for 2018 in a net benefit to us that was recognized in our GAAP financial statements for the quarter ending December 31, 2019. However, because a portion of this credit relates to the 2018 operating performance, our presentation of Adjusted EBITDA reflects the allocation of the net benefit to each of the four quarters of 2018 based upon the portion of the BTC benefit that related to that quarter. © 2020 Renewable Energy Group, Inc. All Rights Reserved. 111
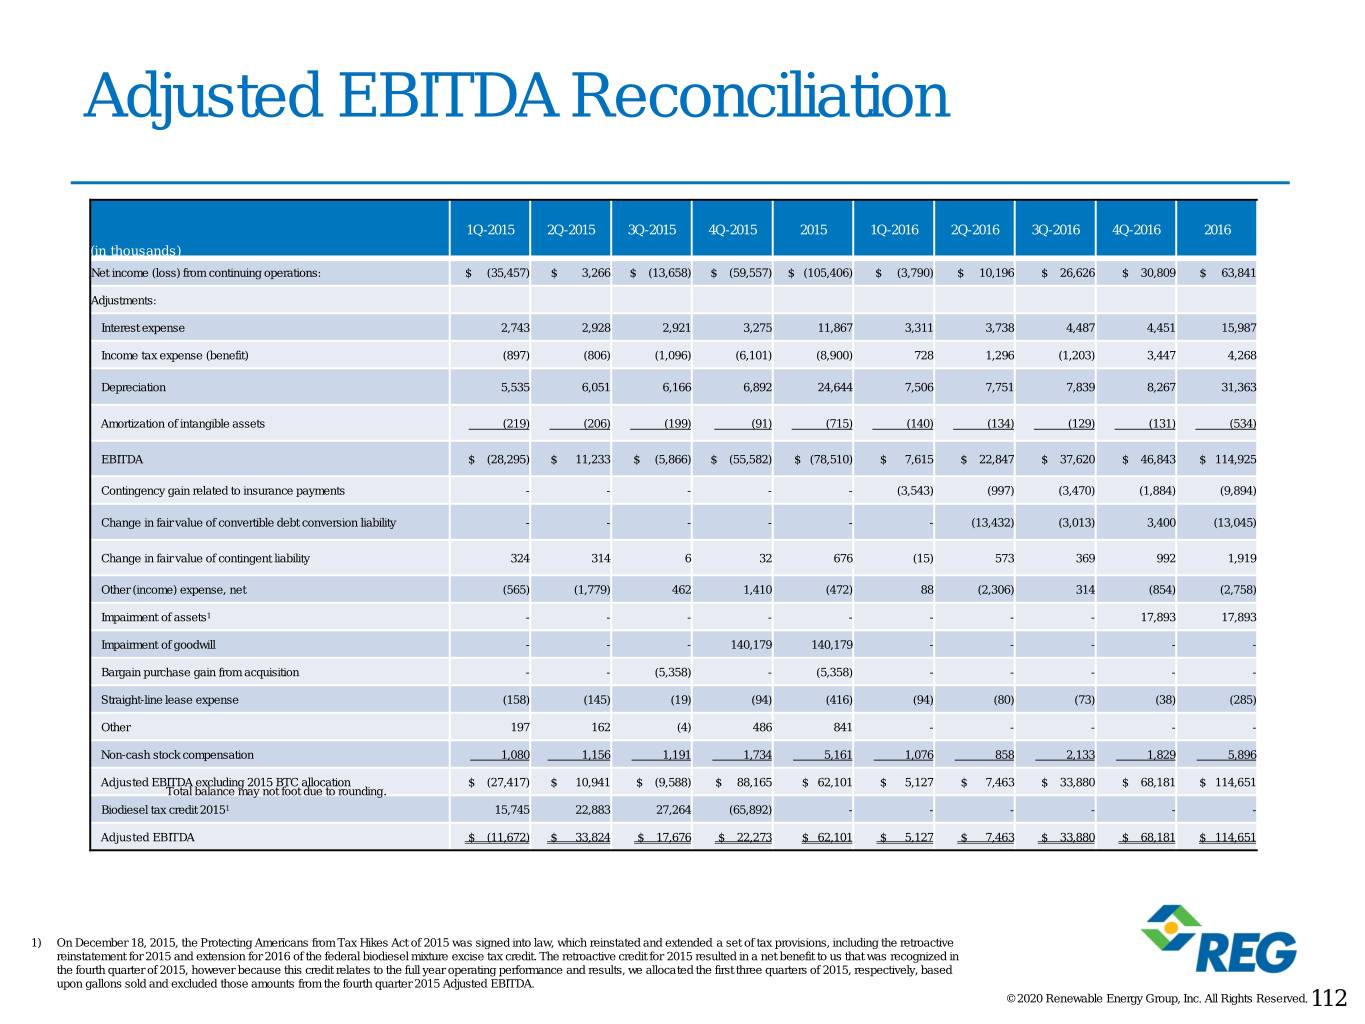
Adjusted EBITDA Reconciliation 1Q-2015 2Q-2015 3Q-2015 4Q-2015 2015 1Q-2016 2Q-2016 3Q-2016 4Q-2016 2016 (in thousands) Net income (loss) from continuing operations: $ (35,457) $ 3,266 $ (13,658) $ (59,557) $ (105,406) $ (3,790) $ 10,196 $ 26,626 $ 30,809 $ 63,841 Adjustments: Interest expense 2,743 2,928 2,921 3,275 11,867 3,311 3,738 4,487 4,451 15,987 Income tax expense (benefit) (897) (806) (1,096) (6,101) (8,900) 728 1,296 (1,203) 3,447 4,268 Depreciation 5,535 6,051 6,166 6,892 24,644 7,506 7,751 7,839 8,267 31,363 Amortization of intangible assets (219) (206) (199) (91) (715) (140) (134) (129) (131) (534) EBITDA $ (28,295) $ 11,233 $ (5,866) $ (55,582) $ (78,510) $ 7,615 $ 22,847 $ 37,620 $ 46,843 $ 114,925 Contingency gain related to insurance payments - - - - - (3,543) (997) (3,470) (1,884) (9,894) Change in fair value of convertible debt conversion liability - - - - - - (13,432) (3,013) 3,400 (13,045) Change in fair value of contingent liability 324 314 6 32 676 (15) 573 369 992 1,919 Other (income) expense, net (565) (1,779) 462 1,410 (472) 88 (2,306) 314 (854) (2,758) Impairment of assets1 - - - - - - - - 17,893 17,893 Impairment of goodwill - - - 140,179 140,179 - - - - - Bargain purchase gain from acquisition - - (5,358) - (5,358) - - - - - Straight-line lease expense (158) (145) (19) (94) (416) (94) (80) (73) (38) (285) Other 197 162 (4) 486 841 - - - - - Non-cash stock compensation 1,080 1,156 1,191 1,734 5,161 1,076 858 2,133 1,829 5,896 Adjusted EBITDA excluding 2015 BTC allocation $ (27,417) $ 10,941 $ (9,588) $ 88,165 $ 62,101 $ 5,127 $ 7,463 $ 33,880 $ 68,181 $ 114,651 Total balance may not foot due to rounding. Biodiesel tax credit 20151 15,745 22,883 27,264 (65,892) - - - - - - Adjusted EBITDA $ (11,672) $ 33,824 $ 17,676 $ 22,273 $ 62,101 $ 5,127 $ 7,463 $ 33,880 $ 68,181 $ 114,651 1) On December 18, 2015, the Protecting Americans from Tax Hikes Act of 2015 was signed into law, which reinstated and extended a set of tax provisions, including the retroactive reinstatement for 2015 and extension for 2016 of the federal biodiesel mixture excise tax credit. The retroactive credit for 2015 resulted in a net benefit to us that was recognized in the fourth quarter of 2015, however because this credit relates to the full year operating performance and results, we allocated the first three quarters of 2015, respectively, based upon gallons sold and excluded those amounts from the fourth quarter 2015 Adjusted EBITDA. © 2020 Renewable Energy Group, Inc. All Rights Reserved. 112


