To our Shareholders:
The start to the new QCI Balanced Fund has been exciting. We opened the fund January 30, 2014 and experience momentum as we close out our fiscal year. While new to the mutual fund world, QCI has been managing money for over 40 years as a RIA (Registered investment Advisor)-Investing is in our DNA – we love what we do and promise an ongoing commitment to excellence.
The QCI Balanced Fund strives to balance the need for current income with the opportunity for long-term principal growth. Our goal is to achieve above benchmark performance over a full market cycle with less volatility.
After a horrific winter where we witnessed the US economy contract by 2.9%, the spring brought solid 4.6% GDP growth in the second quarter. In the third quarter however, the economy resumed the below average growth rate exhibited over the past few years. While the S&P 500 shrugged off this data and broke out to all-time highs in September, other equity markets are not faring nearly as well. US small capitalization stocks have dramatically underperformed, as have many international equity markets. The below charts represent the holdings as a percentage of the portfolio at September 30, 2014.
| QCI Balanced Fund | Benchmark |
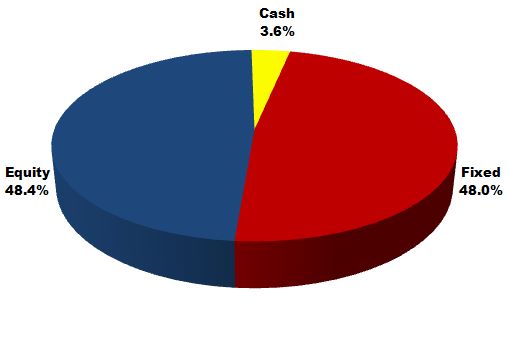 |  |
The QCI Balanced Fund maintains a risk profile at the lower end of our targets, ending the quarter below 50% in stocks. Our bond holdings are of high quality and shorter term in duration, and we find the bond market unattractive at such low nominal yields.
Our forecast for the equity and bond markets remains muted, and we expect increasing volatility as we work our way into 2015. The economy remains sluggish worldwide with many countries experiencing near recessionary growth levels. The strength in the dollar is capping any move upwards in interest rates near term as it tends to be deflationary. We remain in the camp that longer term rates will be working their way higher. The S&P 500 has not had a correction- a decline of at least 10% peak to trough- in over 3 years, and is overdue. Valuations are extended, profit margins are at all-time highs, and complacency relative to the investing public is troublesome. We are holding "dry powder" in terms of excess cash and short-term bonds and will increase equity positions opportunistically on market weakness.
As always, your questions and comments are welcome. On behalf of everyone at QCI Asset Management, thank you for the continued trust you place in us.

H. Edward Shill, CFA | Gerald Furciniti, CFA |
| |
| Chief Investment Officer and Lead Portfolio Manager | Senior Equity Analyst and Co-Portfolio Manager |
| |
| QCI Asset Management, Inc. | QCI Asset Management, Inc. |
| |
Average Annual Total Returns (Unaudited) | Since Inception* | Net Expense Ratio** | Gross Expense Ratio*** |
QCI Balanced Fund – Institutional Class Shares | 5.30% | 1.00% | 1.68% |
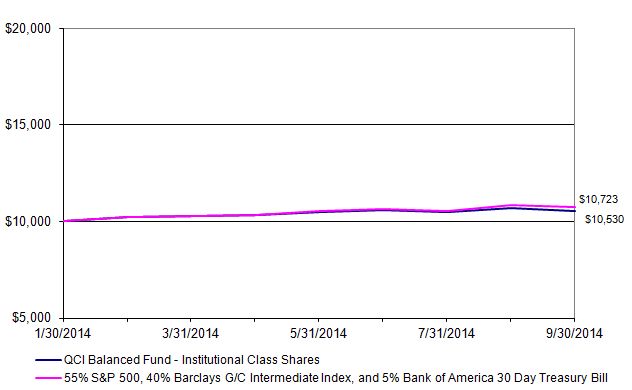
55% S&P 500 Total Return Index, 40% Barclays G/C Intermediate Index, and 5% Bank of America 30 Day Treasury Bill | 7.23% | n/a | n/a |
The performance data quoted above represents past performance, which is not a guarantee of future results. Investment return and principal value of an investment in the Fund will fluctuate so that an investor's shares, when redeemed, may be worth more or less than their original cost. Current performance may be lower or higher than the performance data quoted. To obtain more current performance data regarding the Fund, including performance data current to the Fund's most recent month-end, please visit ncfunds.com or call the Fund at (800) 773-3863. Fee waivers and expenses reimbursements have positively impacted Fund performance.
*The Fund's inception date was January 30, 2014 for the Institutional Class Shares .
**The Advisor has entered into an Expense Limitation Agreement with the Fund under which it has agreed to waive or reduce its fees and to assume other expenses of the Fund, if necessary, in an amount that limits the Fund's annual operating expenses (exclusive of interest, taxes, brokerage fees and commissions, extraordinary expenses, payments under the Rule 12b-1 distribution plan, and acquired fund fees and expenses) to not more than 1.00% of the average daily net assets of the Fund through January 31, 2015. The Expense Limitation Agreement may not be terminated prior to that date. The Expense Limitation Agreement may not be prior to that date. The Advisor cannot recoup from the Fund any amounts paid by the Advisor under the Expense Limitation Agreement. Further, net annual operating expenses for the Fund may exceed those contemplated by the waiver due to acquired fund fees and other expenses that are not waived under the Expense Limitation Agreement.
***Gross expense ratio is from the Fund's prospectus dated January 29, 2014.
Disclosure:
Statements in this Annual Report reflect projections or expectations of future financial or economic performance of the Fund and of the market in general and statements of the Fund's plans and objectives for future operations are forward-looking statements. No assurance can be given that actual results or events will not differ materially from those projected, estimated, assumed or anticipated in any such forward-looking statements. Important factors that could result in such differences, in addition to the other factors noted with such forward-looking statements, include general economic conditions such as inflation, recession and interest rates. There is no affiliation between the Underwriter and Distributor, Capital Investment Group, Inc., and QCI Asset Management, Inc. Investments in the Fund are subject to investment risks, including the possible loss of some or the entire principal amount invested.
| QCI Balanced Fund - Institutional Class Shares | | | | | | | | | | | |
| | | | | | | | | | | | | | | | | | |
| Performance Update (Unaudited) | | | | | | | | | | | | |
| | | | | | | | | | | | | | | | | | |
| | | | | | | | | | | | | | | | | | |
| For the period from January 30, 2014 (Date of Initial Public Investment) to September 30, 2014 | | | |
| | | | | | | | | | | | | | | | | | |
| Comparison of the Change in Value of a $10,000 Investment | | | | | | | | | |
| | | | | | | | | | | | | | | | | | |
| | |
| | | | | | | | | | | | | | | | | | |
| This graph assumes an initial investment of $10,000 at January 30, 2014 (Date of Initial Public Investment). All dividends and distributions are reinvested. This graph depicts performance of the QCI Balanced Fund versus a combination of three indices: 55% of the S&P 500 Total Return Index, 40% of the Barclays G/C Intermediate Index, and 5% of the Bank of America 30 Day Treasury Bill. It is important to note that the Fund is a professionally managed mutual fund while the indices are not available for investment and are unmanaged. The comparison is shown for illustrative purposes only. |
| | | | | | | | | | | | | | | | | | |
| | | | | | | | | | | | | | | | | | |
| Average Annual Total Returns | | | | | | | | | | | | |
| | | | | | | | | | | | | | | | | Gross | |
| | As of | | | | | | | | | Since | | Inception | | Expense | |
| | September 30, 2014 | | | | | | | Inception | | Date | | Ratio* | |
| | QCI Balanced Fund - Institutional Class Shares | | | | 5.30% | | 01/30/14 | | 1.68% | |
| | 55% S&P 500 Total Return Index, 40% Barclays G/C Intermediate Index, | | | | | |
| | | and 5% Bank of America 30 Day Treasury Bill | | | | 7.23% | | N/A | | N/A | |
| | | | | | | | | | | | | | | | | | |
| * The gross expense ratio shown is from the Fund's prospectus dated January 29, 2014. | | | |
| | | | | | | | | | | | | | | | | | |
| Performance quoted above represents past performance, which is no guarantee of future results. Investment return and principal value will fluctuate so that shares, when redeemed, may be worth more or less than their original cost. Current performance may be lower or higher than the performance data quoted. An investor may obtain performance data, current to the most recent month-end, by visiting ncfunds.com. |
| | | | | | | | | | | | | | | | | | |
| The graph and table do not reflect the deduction of taxes that a shareholder would pay on Fund distributions or the redemption of Fund shares. Average annual total returns are historical in nature and measure net investment income and capital gain or loss from portfolio investments assuming reinvestments of distributions. |
| | | | | | | | | | | | | | | | | | |
| | | | | | | | | | | | | | | | | | |
| QCI Balanced Fund | | | | | | | | | |
| | | | | | | | | | | |
| Schedule of Investments | | | | | | | | |
| | | | | | | | | | | |
| As of September 30, 2014 | | | | | | | | |
| | | | | Principal | | Coupon Rate | | Maturity Date | | Value (Note 1) |
| | | | | | | | | | | |
| CORPORATE BONDS - 28.52% | | | | | | | | |
| | Anheuser-Busch InBev Finance, Inc. | $ | 50,000 | | 1.250% | | 1/17/2018 | $ | 49,096 |
| | Anheuser-Busch InBev Worldwide, Inc. | 450,000 | | 1.375% | | 7/15/2017 | | 449,400 |
| | Caterpillar Financial Services Corp. | | 150,000 | | 1.000% | | 3/3/2017 | | 149,467 |
| | Caterpillar Financial Services Corp. | | 50,000 | | 1.625% | | 6/1/2017 | | 50,504 |
| | Caterpillar Financial Services Corp. | | 300,000 | | 5.450% | | 4/15/2018 | | 337,234 |
| | Cisco Systems, Inc. | | 500,000 | | 4.950% | | 2/15/2019 | | 559,588 |
| | Comcast Corp. | | | 500,000 | | 3.125% | | 7/15/2022 | | 502,988 |
| | ConocoPhillips | | | 500,000 | | 5.750% | | 2/1/2019 | | 570,480 |
| | CVS Health Corp. | | 257,000 | | 5.750% | | 6/1/2017 | | 285,570 |
| | Duke Energy Florida, Inc. | | 100,000 | | 5.800% | | 9/15/2017 | | 112,610 |
| | Duke Energy Indiana, Inc. | | 140,000 | | 6.050% | | 6/15/2016 | | 151,883 |
| | EI du Pont de Nemours & Co. | | 215,000 | | 5.250% | | 12/15/2016 | | 235,273 |
| | EI du Pont de Nemours & Co. | | 285,000 | | 6.000% | | 7/15/2018 | | 326,578 |
| | General Mills, Inc. | | 255,000 | | 5.700% | | 2/15/2017 | | 281,700 |
| | General Mills, Inc. | | 245,000 | | 5.650% | | 2/15/2019 | | 278,492 |
| | John Deere Capital Corp. | | 120,000 | | 1.050% | | 10/11/2016 | | 120,275 |
| | John Deere Capital Corp. | | 180,000 | | 2.000% | | 1/13/2017 | | 183,700 |
| | John Deere Capital Corp. | | 225,000 | | 2.800% | | 9/18/2017 | | 234,271 |
| | Kellogg Co. | | | 100,000 | | 1.875% | | 11/17/2016 | | 101,518 |
| | Kellogg Co. | | | 400,000 | | 1.750% | | 5/17/2017 | | 403,138 |
| | Lockheed Martin Corp. | | 500,000 | | 2.125% | | 9/15/2016 | | 511,482 |
| | Marathon Oil Corp. | | 125,000 | | 6.000% | | 10/1/2017 | | 140,710 |
| | Marathon Oil Corp. | | 375,000 | | 5.900% | | 3/15/2018 | | 423,999 |
| | Norfolk Southern Corp. | | 60,000 | | 5.750% | | 1/15/2016 | | 63,686 |
| | Norfolk Southern Corp. | | 250,000 | | 7.700% | | 5/15/2017 | | 290,087 |
| | Norfolk Southern Corp. | | 195,000 | | 3.250% | | 12/1/2021 | | 198,783 |
| | Progress Energy, Inc. | | 100,000 | | 5.625% | | 1/15/2016 | | 106,106 |
| | The Southern Co. | | 285,000 | | 1.950% | | 9/1/2016 | | 290,608 |
| | The Southern Co. | | 215,000 | | 2.450% | | 9/1/2018 | | 218,690 |
| | Verizon Communications, Inc. | | 400,000 | | 2.500% | | 9/15/2016 | | 410,517 |
| | Verizon Communications, Inc. | | 80,000 | | 2.000% | | 11/1/2016 | | 81,255 |
| | | | | | | | | | | |
| | Total Corporate Bonds (Cost $8,162,539) | | | | | | 8,119,688 |
| | | | | | | | | | | |
| FEDERAL AGENCY OBLIGATIONS - 4.68% | | | | | | | |
| | Federal Farm Credit Bank | | 100,000 | | 1.790% | | 3/12/2019 | | 99,139 |
| | Federal Home Loan Bank | | 50,000 | | 2.070% | | 4/15/2019 | | 49,903 |
| | Federal Home Loan Bank | | 50,000 | | 1.900% | | 4/29/2019 | | 49,884 |
| | Federal Farm Credit Bank | | 200,000 | | 1.820% | | 5/22/2019 | | 199,602 |
| | Federal Farm Credit Bank | | 50,000 | | 1.480% | | 6/12/2019 | | 49,087 |
| | Federal Home Loan Bank | | 50,000 | | 2.000% | | 6/27/2019 | | 49,934 |
| | Federal Farm Credit Bank | | 50,000 | | 1.440% | | 8/1/2019 | | 48,724 |
| | | | | | | | | | | |
| | | | | | | | | | | |
| | | | | | | | | | | (Continued) |
| QCI Balanced Fund | | | | | | | | | |
| | | | | | | | | | | |
| Schedule of Investments - Continued | | | | | | | | |
| | | | | | | | | | | |
| As of September 30, 2014 | | | | | | | | |
| | | | | Principal | | Coupon Rate | | Maturity Date | | Value (Note 1) |
| | | | | | | | | | | |
| FEDERAL AGENCY OBLIGATIONS - Continued | | | | | | |
| | Federal Farm Credit Bank | $ | 157,000 | | 1.750% | | 3/26/2020 | $ | 154,802 |
| | Federal Farm Credit Bank | | 575,000 | | 2.375% | | 7/16/2020 | | 573,713 |
| | Federal Home Loan Bank | | 60,000 | | 1.600% | | 10/22/2020 | | 57,834 |
| | | | | | | | | | | |
| | Total Federal Agency Obligations (Cost $1,334,774) | | | | | | 1,332,622 |
| | | | | | | | | | | |
| UNITED STATES TREASURY NOTES - 9.86% | | | | | | |
| | United States Treasury Note | | 1,000,000 | | 1.875% | | 8/31/2017 | | 1,023,203 |
| | United States Treasury Note | | 1,100,000 | | 1.375% | | 6/30/2018 | | 1,096,820 |
| | United States Treasury Note | | 725,000 | | 1.625% | | 11/15/2022 | | 685,182 |
| | | | | | | | | | | |
| | Total United States Treasury Notes (Cost $2,813,734) | | | | | | 2,805,205 |
| | | | | | | | | | | |
| COMMON STOCKS - 47.27% | | | | | | Shares | | |
| | | | | | | | | | | |
| Consumer Discretionary - 5.35% | | | | | | | | |
| | Dick's Sporting Goods, Inc. | | | | | | 6,200 | | 272,056 |
| | Ford Motor Co. | | | | | | | 17,000 | | 251,430 |
| | Lowe's Cos., Inc. | | | | | | 3,300 | | 174,636 |
| | Macy's, Inc. | | | | | | | 3,450 | | 200,721 |
| | Mattel, Inc. | | | | | | | 5,000 | | 153,250 |
| | Starbucks Corp. | | | | | | 3,250 | | 245,245 |
| | Time Warner, Inc. | | | | | | 3,000 | | 225,630 |
| | | | | | | | | | | 1,522,968 |
| Consumer Staples - 4.36% | | | | | | | | |
| | Altria Group, Inc. | | | | | | 5,175 | | 237,740 |
| | Lorillard, Inc. | | | | | | | 3,500 | | 209,685 |
| | PepsiCo, Inc. | | | | | | | 2,785 | | 259,256 |
| | The Procter & Gamble Co. | | | | | | 3,085 | | 258,338 |
| | Wal-Mart Stores, Inc. | | | | | | 3,625 | | 277,204 |
| | | | | | | | | | | 1,242,223 |
| Energy - 6.90% | | | | | | | | | |
| | Apache Corp. | | | | | | | 3,875 | | 363,746 |
| | Chevron Corp. | | | | | | | 2,425 | | 289,351 |
| | ConocoPhillips | | | | | | | 3,850 | | 294,602 |
| | Exxon Mobil Corp. | | | | | | 4,500 | | 423,225 |
| | Schlumberger Ltd. | | | | | | 2,675 | | 272,021 |
| | Transocean Ltd. | | | | | | 10,000 | | 319,700 |
| | | | | | | | | | | 1,962,645 |
| Financials - 8.23% | | | | | | | | | |
| | ACE Ltd. | | | | | | | 2,075 | | 217,605 |
| | Bank of America Corp. | | | | | | 24,600 | | 419,430 |
| * | Berkshire Hathaway, Inc. | | | | | | 2,000 | | 276,280 |
| | | | | | | | | | | |
| | | | | | | | | | | (Continued) |
| QCI Balanced Fund | | | | | | | | | |
| | | | | | | | | | | |
| Schedule of Investments - Continued | | | | | | | | |
| | | | | | | | | | | |
| As of September 30, 2014 | | | | | | | | |
| | | | | | | | | Shares | | Value (Note 1) |
| | | | | | | | | | | |
| COMMON STOCKS - Continued | | | | | | | | |
| | | | | | | | | | | |
| Financials - Continued | | | | | | | | |
| | HSBC Holdings PLC | | | | | | 5,125 | $ | 260,760 |
| | JPMorgan Chase & Co. | | | | | | 4,950 | | 298,188 |
| | State Street Corp. | | | | | | 2,500 | | 184,025 |
| | The Goldman Sachs Group, Inc. | | | | | | 1,200 | | 220,284 |
| | The PNC Financial Services Group, Inc. | | | | 3,050 | | 261,019 |
| | Wells Fargo & Co. | | | | | | 3,950 | | 204,887 |
| | | | | | | | | | | 2,342,478 |
| Health Care - 4.34% | | | | | | | | |
| | Abbott Laboratories | | | | | | 3,300 | | 137,247 |
| | AbbVie, Inc. | | | | | | | 2,625 | | 151,620 |
| | Amgen, Inc. | | | | | | | 1,225 | | 172,064 |
| * | CareFusion Corp. | | | | | | 3,715 | | 168,104 |
| | Johnson & Johnson | | | | | | 1,775 | | 189,197 |
| | Shire PLC | | | | | | | 800 | | 207,240 |
| | Zimmer Holdings, Inc. | | | | | | 2,075 | | 208,641 |
| | | | | | | | | | | 1,234,113 |
| Industrials - 2.99% | | | | | | | | | |
| | Caterpillar, Inc. | | | | | | | 2,000 | | 198,060 |
| | General Electric Co. | | | | | | 11,500 | | 294,630 |
| | The LS Starrett Co. | | | | | | 5,651 | | 78,210 |
| * | Transcat, Inc. | | | | | | | 10,000 | | 91,500 |
| | United Parcel Service, Inc. | | | | | | 1,925 | | 189,208 |
| | | | | | | | | | | 851,608 |
| Information Technology - 10.21% | | | | | | | | |
| | Apple, Inc. | | | | | | | 4,835 | | 487,126 |
| * | Check Point Software Technologies Ltd. | | | | 3,125 | | 216,375 |
| | Cisco Systems, Inc. | | | | | | 9,500 | | 239,115 |
| | Corning, Inc. | | | | | | | 23,000 | | 444,820 |
| | EMC Corp. | | | | | | | 9,200 | | 269,192 |
| * | Google, Inc. - Class C | | | | | | 365 | | 210,736 |
| | Intel Corp. | | | | | | | 6,700 | | 233,294 |
| | International Business Machines Corp. | | | | | 1,165 | | 221,152 |
| | MasterCard, Inc. | | | | | | 2,600 | | 192,192 |
| | Microsoft Corp. | | | | | | | 3,650 | | 169,214 |
| | Palo Alto Networks, Inc. | | | | | | 2,275 | | 223,178 |
| | | | | | | | | | | 2,906,394 |
| Materials - 1.67% | | | | | | | | | |
| | Barrick Gold Corp. | | | | | | 20,000 | | 293,200 |
| | Nucor Corp. | | | | | | | 3,375 | | 183,195 |
| | | | | | | | | | | 476,395 |
| | | | | | | | | | | |
| | | | | | | | | | | |
| | | | | | | | | | | (Continued) |
| QCI Balanced Fund | | | | | | | | | |
| | | | | | | | | | | |
| Schedule of Investments - Continued | | | | | | | | |
| | | | | | | | | | | |
| As of September 30, 2014 | | | | | | | | |
| | | | | | | | | Shares | | Value (Note 1) |
| | | | | | | | | | | |
| COMMON STOCKS - Continued | | | | | | | | |
| | | | | | | | | | | |
| Telecommunications - 1.09% | | | | | | | | |
| | Verizon Communications, Inc. | | | | | | 6,225 | $ | 311,188 |
| | | | | | | | | | | 311,188 |
| Utilities - 2.13% | | | | | | | | | |
| | Duke Energy Corp. | | | | | | 4,000 | | 299,080 |
| | The Southern Co. | | | | | | 7,000 | | 305,550 |
| | | | | | | | | | | 604,630 |
| | | | | | | | | | | |
| | Total Common Stocks (Cost $13,419,099) | | | | | | 13,454,642 |
| | | | | | | | | | | |
| EXCHANGE TRADED PRODUCTS - 2.54% | | | | | | | | |
| * | iShares Gold Trust ETF | | | | | | 22,000 | | 257,400 |
| | PIMCO 0-5 Year High Yield Corporate Bond Index ETF | | | | 4,500 | | 466,425 |
| | | | | | | | | | | |
| | Total Exchange Traded Products (Cost $749,771) | | | | | | 723,825 |
| | | | | | | | | | | |
| OPEN-END FUND - 2.38% | | | | | | | | |
| | Templeton Global Bond Fund | | | | | | 51,241 | | 677,404 |
| | | | | | | | | | | |
| | Total Open-End Fund (Cost $679,062) | | | | | | | 677,404 |
| | | | | | | | | | | |
| SHORT-TERM INVESTMENT - 4.74% | | | | | | | | |
| § | Federated Government Obligations Fund, 0.01% | | | | 1,349,070 | | 1,349,070 |
| | | | | | | | | | | |
| | Total Short-Term Investment (Cost $1,349,070) | | | | | | 1,349,070 |
| | | | | | | | | | | |
| Total Value of Investments (Cost $28,508,049) - 99.99% | | | | | $ | 28,462,456 |
| | | | | | | | | | | |
| Other Assets Less Liabilities - 0.01% | | | | | | | | 3,432 |
| | | | | | | | | | | |
| Net Assets - 100.00% | | | | | | | $ | 28,465,888 |
| | | | | | | | | | | |
| | | | | | | | | | | |
| * | Non-income producing investment | | | | | | | | |
| § | Represents 7 day effective yield | | | | | | | | |
| | | | | | | | | | | |
| The following acronym is used in this portfolio: | | | | | | |
| PLC - Public Limited Company | | | | | | | | |
| | | | | | | | | | | |
| | | | | | | | | | | |
| | | | | | | | | | | |
| | | | | | | | | | | |
| | | | | | | | | | | |
| | | | | | | | | | | (Continued) |
| QCI Balanced Fund | | | | | | | | | |
| | | | | | | | | | | |
| Schedule of Investments - Continued | | | | | | | | |
| | | | | | | | | | | |
| As of September 30, 2014 | | | | | | | | |
| | | | | | | | | | | |
| | | | | | | | | | | |
| | | | | | | | | | | |
| | | | | | | | | | | |
| | | | | | | | | | | |
| | | | | | | | | | | |
| | | Summary of Investments | | | | | | |
| | | | | | | % of Net | | | | |
| | | | | | | Assets | | Value | | |
| | | Corporate Bonds | | | | 28.52% | $ | 8,119,688 | | |
| | | Federal Agency Obligations | | 4.68% | | 1,332,622 | | |
| | | United States Treasury Notes | | 9.86% | | 2,805,205 | | |
| | | Consumer Discretionary | | 5.35% | | 1,522,968 | | |
| | | Consumer Staples | | | | 4.36% | | 1,242,223 | | |
| | | Energy | | | | 6.90% | | 1,962,645 | | |
| | | Financials | | | | 8.23% | | 2,342,478 | | |
| | | Health Care | | | | 4.34% | | 1,234,113 | | |
| | | Industrials | | | | 2.99% | | 851,608 | | |
| | | Information Technology | | | 10.21% | | 2,906,394 | | |
| | | Materials | | | | 1.67% | | 476,395 | | |
| | | Telecommunications | | | | 1.09% | | 311,188 | | |
| | | Utilities | | | | 2.13% | | 604,630 | | |
| | | Exchange Traded Products | | 2.54% | | 723,825 | | |
| | | Open-End Fund | | | | 2.38% | | 677,404 | | |
| | | Short-Term Investment | | | 4.74% | | 1,349,070 | | |
| | | Other Assets less Liabilities | | 0.01% | | 3,432 | | |
| | | Total | | | | 100.00% | $ | 28,465,888 | | |
| | | | | | | | | | | |
| | | | | | | | | | | |
| | | | | | | | | | | |
| | | | | | | | | | | |
| | | | | | | | | | | |
| | | | | | | | | | | |
| | | | | | | | | | | |
| | | | | | | | | | | |
| | | | | | | | | | | |
| | | | | | | | | | | |
| | | | | | | | | | | |
| | | | | | | | | | | |
| | | | | | | | | | | |
| | | | | | | | | | | |
| | | | | | | | | | | |
| | | | | | | | | | | |
| | | | | | | | | | | |
| | | | | | | | | | | |
| | | | | | | | | | | |
| | | | | | | | | | | |
| See Notes to Financial Statements | | | | | | | | |
| QCI Balanced Fund | | |
| | | |
| Statement of Assets and Liabilities | | |
| | | |
| As of September 30, 2014 | | |
| | | |
| Assets: | | |
| | Investments, at value (cost $28,508,049) | $ | 28,462,456 |
| | Receivables: | | |
| | | Fund shares sold | | 307,669 |
| | Dividends and interest | | 95,525 |
| | Prepaid expenses | | |
| | Registration and filing expenses | | 4,861 |
| | Fund accounting fees | | 2,321 |
| | Compliance services fees | | 507 |
| | Trustee fees and meeting expenses | | 500 |
| | | |
| | Total assets | | 28,873,839 |
| | | |
| Liabilities: | | |
| | Payables: | | | |
| | Investments purchased | | 102,413 |
| | Fund shares purchased | | 285,890 |
| | Accrued expenses | | |
| | Audit fees | | 10,400 |
| | Administrative fees | | 4,137 |
| | Miscellaneous expenses | | 2,851 |
| | Custody fees and banking expenses | | 2,010 |
| | Shareholder fulfillment expenses | | 250 |
| | | |
| | Total liabilities | | 407,951 |
| | | |
| Net Assets | $ | 28,465,888 |
| | | |
| Net Assets Consist of: | | |
| | Paid in Interest | $ | 28,327,298 |
| | Undistributed net investment income | | 60,894 |
| | Undistributed net realized gain on investments | | 123,289 |
| | Net unrealized depreciation on investments | | (45,593) |
| | | |
| | Total Net Assets | $ | 28,465,888 |
| | Institutional Class Shares Outstanding, no par value (unlimited authorized shares) | | 2,703,535 |
| | Net Asset Value, Maximum Offering Price and Redemption Price Per Share | $ | 10.53 |
| | | |
| | | |
| | | |
| | | |
| | | |
| | | |
| | | |
| | | |
| | | |
| | | |
| | | |
| See Notes to Financial Statements | | |
| QCI Balanced Fund | | |
| | | |
| Statement of Operations | | |
| | | |
| For the period January 30, 2014 (Date of Initial Public Investment) to September 30, 2014 | | |
| | | |
| Investment Income: | | |
| | Dividend income (net of foreign tax withheld of $189) | $ | 89,878 |
| | Interest income | | 48,773 |
| | | |
| Total Investment Income | | 138,651 |
| | | |
| Expenses: | | |
| | Advisory fees (note 2) | | 56,504 |
| | Fund accounting fees (note 2) | | 19,457 |
| | Administration fees (note 2) | | 18,613 |
| | Transfer agent fees (note 2) | | 15,141 |
| | Audit fees | | 10,400 |
| | Compliance service fees (note 2) | | 8,950 |
| | Custody fees (note 2) | | 8,789 |
| | Securities pricing fees | | 6,132 |
| | Other operating expenses | | 8,244 |
| | Trustee fees and meeting expenses | | 4,944 |
| | Legal fees | | 2,672 |
| | Shareholder fulfillment expenses | | 994 |
| | Printing expenses | | 544 |
| | | |
| | Total Expenses | | 161,384 |
| | | |
| | Expenses reimbursed by advisor (note 2) | | (47,551) |
| | Advisory fees waived (note 2) | | (36,076) |
| | | |
| | Net Expenses | | 77,757 |
| | | |
| Net Investment Income | | 60,894 |
| | | |
| Realized and Unrealized Gain (Loss) on Investments | | |
| | | |
| | Net realized gain from investment transactions | | 123,289 |
| | Net change in unrealized depreciation on investments | | (45,593) |
| | | |
| Net Realized and Unrealized Gain on Investments | | 77,696 |
| | | |
| Net Increase in Net Assets Resulting from Operations | $ | 138,590 |
| | | |
| | | |
| | | |
| | | |
| | | |
| | | |
| | | |
| | | |
| | | |
| | | |
| See Notes to Financial Statements | | |
| QCI Balanced Fund | | | | |
| | | | | | | | |
| Statement of Changes in Net Assets | | | | |
| | | | | | | | |
| For the period January 30, 2014 (Date of Initial Public Investment) to September 30, 2014 |
| | | | | | | | |
| Operations: | | | | | |
| | Net investment income | | | | $ | 60,894 |
| | Net realized gain from investment transactions | | | | 123,289 |
| | Net change in unrealized depreciation on investments | | | | (45,593) |
| | | | | | | | |
| Net Increase in Net Assets Resulting from Operations | | | | 138,590 |
| | | | | | | | |
| Beneficial Interest Transactions: | | | | |
| | Shares sold | | | | | | 38,755,397 |
| | Shares repurchased | | | | | (10,428,099) |
| | | | | | | | |
| Increase from Beneficial Interest Transactions | | | | 28,327,298 |
| | | | | | | | |
| Net Increase in Net Assets | | | | 28,465,888 |
| | | | | | | | |
| Net Assets: | | | | | |
| | Beginning of period | | | | | - |
| | End of period | | | | $ | 28,465,888 |
| | | | | | | | |
| Undistributed Net Investment Income | | | $ | 60,894 |
| | | | | | | | |
| Institutional Share Class Information: | | | | |
| Shares sold | | | | | 3,694,857 |
| Shares repurchased | | | | (991,322) |
| | | | | | | | |
| Net Increase in Shares of Beneficial Interest | | | | 2,703,535 |
| Shares Outstanding, Beginning of Period | | | | - |
| Shares Outstanding, End of Period | | | | 2,703,535 |
| | | | | | | | |
| | | | | | | | |
| | | | | | | | |
| | | | | | | | |
| | | | | | | | |
| | | | | | | | |
| | | | | | | | |
| | | | | | | | |
| | | | | | | | |
| | | | | | | | |
| | | | | | | | |
| | | | | | | | |
| | | | | | | | |
| | | | | | | | |
| | | | | | | | |
| | | | | | | | |
| | | | | | | | |
| | | | | | | | |
| | | | | | | | |
| | | | | | | | |
| See Notes to Financial Statements | | | | |
| QCI Balanced Fund | | | |
| | | | | | | |
| Financial Highlights | | | |
| | | | | | | |
| For a share outstanding during the period from | Institutional Class |
| January 30, 2014 (Date of Initial Public Investment) to September 30, 2014 | | Shares | |
| | | | | | | |
| Net Asset Value, Beginning of Period | $ | 10.00 | |
| | | | | | | |
| Income from Investment Operations | | | |
| | Net investment income | | | 0.02 | |
| | Net realized and unrealized gain on securities | | 0.51 | |
| | | | | | | |
| Total from Investment Operations | | 0.53 | |
| | | | | | | |
| Net Asset Value, End of Period | $ | 10.53 | |
| | | | | | | |
| Total Return | | | 5.30% | (b) |
| | | | | | | |
| Net Assets, End of Period (in thousands) | $ | 28,466 | |
| | | | | | | |
| Ratios of: | | | | | |
| Gross Expenses to Average Net Assets (c) | | 1.65% | (a) |
| Net Expenses to Average Net Assets (c) | | 1.00% | (a) |
| Net Investment Income to Average Net Assets | | 0.80% | (a) |
| | | | | | | |
| Portfolio turnover rate | | 28.77% | (b) |
| | | | | | | |
| | | | | | | |
| | | | | | | |
| | | | | | | |
| (a) | Annualized. | | | | |
| (b) | Not annualized. | | | |
| (c) | Does not include expenses of the investment companies in which the Fund invests. | | | |
| | | | | | | |
| | | | | | | |
| | | | | | | |
| | | | | | | |
| | | | | | | |
| | | | | | | |
| | | | | | | |
| | | | | | | |
| | | | | | | |
| | | | | | | |
| | | | | | | |
| | | | | | | |
| | | | | | | |
| | | | | | | |
| | | | | | | |
| | | | | | | |
| | | | | | | |
| | | | | | | |
| | | | | | | |
| | | | | | | |
| See Notes to Financial Statements | | | |
QCI Balanced Fund
Notes to Financial Statements
1. Organization and Significant Accounting Policies
The QCI Balanced Fund (the "Fund") is a series of the Starboard Investment Trust (the "Trust"). The Trust is organized as a Delaware statutory trust and is registered under the Investment Company Act of 1940, as amended (the "1940 Act"), as an open-end management investment company.
The Fund is a separate diversified series of the Trust and commenced operations on January 30, 2014. The investment objective of the Fund is to balance current income and principal conservation with the opportunity for long-term growth. The Fund seeks to achieve its investment objective by investing in a diverse portfolio of corporate, agency, and U.S. Government fixed income securities, preferred stock, common stock of primarily large and mid-capitalization issuers, and derivative securities. Allocation to equity and fixed income securities will range from 25%-75% of assets.
The Fund currently has an unlimited number of authorized shares, which are divided into two classes - Institutional Class Shares and Advisor Class Shares. Each class of shares has equal rights as to assets of the Fund, and the classes are identical, except for differences in ongoing distribution and service fees. The Advisor Class Shares are subject to distribution plan fees as described in Note 3. Income, expenses (other than distribution and service fees), and realized and unrealized gains or losses on investments are allocated to each class of shares based upon its relative net assets. All classes have equal voting privileges, except where otherwise required by law or when the Trustees determine that the matter to be voted on affects only the interests of the shareholders of a particular class. As of September 30, 2014, no Advisor Class Shares have been issued.
The following is a summary of significant accounting policies consistently followed by the Fund. The policies are in conformity with accounting principles generally accepted in the United States of America ("GAAP").
Investment Valuation
The Fund's investments in securities are carried at fair value. Securities listed on an exchange or quoted on a national market system are valued at the last sales price as of 4:00 p.m. Eastern Time. Securities traded in the NASDAQ over-the-counter market are generally valued at the NASDAQ Official Closing Price. Other securities traded in the over-the-counter market and listed securities for which no sale was reported on that date are valued at the most recent bid price. Securities and assets for which representative market quotations are not readily available (e.g., if the exchange on which the portfolio security is principally traded closes early or if trading of the particular portfolio security is halted during the day and does not resume prior to the Fund's net asset value calculation) or which cannot be accurately valued using the Fund's normal pricing procedures are valued at fair value as determined in good faith under policies approved by the Trustees. A portfolio security's "fair value" price may differ from the price next available for that portfolio security using the Fund's normal pricing procedures. Instruments with maturities of 60 days or less are valued at amortized cost, which approximates market value.
Each Fund may invest in portfolios of open-end investment companies (the "Underlying Funds"). The Underlying Funds value securities in their portfolios for which market quotations are readily available at their market values (generally the last reported sale price) and all other securities and assets at their fair value to the methods established by the board of directors of the Underlying Funds. Open-ended funds are valued at their respective net asset values as reported by such investment companies.
Fair Value Measurement
Various inputs are used in determining the value of the Fund's investments. These inputs are summarized in the three broad levels listed below:
Level 1: quoted prices in active markets for identical securities
Level 2: other significant observable inputs (including quoted prices for similar securities and identical securities in inactive markets, interest rates, credit risk, etc.)
Level 3: significant unobservable inputs (including the Fund's own assumptions in determining fair value of investments)
QCI Balanced Fund
Notes to Financial Statements
The availability of observable inputs can vary from security to security and is affected by a wide variety of factors, including, for example, the type of security, whether the security is new and not yet established in the marketplace, the liquidity of markets, and other characteristics particular to the security. To the extent that valuation is based on models or inputs that are less observable or unobservable in the market, the determination of fair value requires more judgment. Accordingly, the degree of judgment exercised in determining fair value is greatest for instruments categorized in Level 3.
The inputs used to measure fair value may fall into different levels of the fair value hierarchy. In such cases, for disclosure purposes, the level in the fair value hierarchy within which the fair value measurement falls in its entirety, is determined based on the lowest level input that is significant to the fair value measurement in its entirety.
The inputs or methodology used for valuing securities are not necessarily an indication of the risk associated with investing in those securities. The following table summarizes the inputs as of September 30, 2014 for the Fund's assets measured at fair value:
| QCI Balanced Fund | | |
| Investments in Securities (a) | | Total | | Level 1 | | Level 2 | | Level 3 |
| Assets | | | | | | | | |
| Corporate Bonds | $ | 8,119,688 | $ | - | $ | 8,119,688 | $ | - |
| Federal Agency Obligations | | 1,332,622 | | - | | 1,332,622 | | - |
| United States Treasury Notes | | 2,805,205 | | - | | 2,805,205 | | - |
| Common Stocks* | | 13,454,642 | | 13,454,642 | | - | | - |
| Exchange Traded Products | | 723,825 | | 723,825 | | - | | - |
| Open-End Fund | | 677,404 | | 677,404 | | - | | - |
| Short-Term Investment | | 1,349,070 | | 1,349,070 | | - | | - |
| Total Assets | $ | 28,462,456 | $ | 16,204,941 | $ | 12,257,515 | $ | - |
| | | | | | | | |
* Refer to the Schedule of Investments for industry classification.
| (a) | The Fund had no transfers into or out of Level 1, 2, or 3 during the initial period ended September 30, 2014. It is the Fund's policy to record transfers at the end of the year. |
Investment Transactions and Investment Income
Investment transactions are accounted for as of the date purchased or sold (trade date). Dividend income is recorded on the ex-dividend date. Interest income is recorded on the accrual basis and includes accretion/amortization of discounts and premiums. Gains and losses are determined on the identified cost basis, which is the same basis used for Federal income tax purposes.
Expenses
The Fund bears expenses incurred specifically on its behalf as well as a portion of Trust level expenses, which are allocated according to methods reviewed annually by the Trustees.
Distributions
The Fund may declare and distribute dividends from net investment income (if any), monthly. Distributions from capital gains (if any) are generally declared and distributed annually. Dividends and distributions to shareholders are recorded on ex-date.
Estimates
The preparation of financial statements in conformity with GAAP requires management to make estimates and assumptions that affect the reported amounts of assets and liabilities and the disclosure of contingent assets and liabilities at the date of the financial statements and the reported amounts of increases and decreases in the net assets from operations during the reporting period. Actual results could differ from those estimates.
QCI Balanced Fund
Notes to Financial Statements
Federal Income Taxes
No provision for income taxes is included in the accompanying financial statements, as the Fund intends to distribute to shareholders all taxable investment income and realized gains and otherwise comply with Subchapter M of the Internal Revenue Code applicable to regulated investment companies.
| 2. | Transactions with Related Parties and Service Providers |
Advisor
The Fund pays a monthly fee to the Advisor calculated at the annual rate of 0.75% of the Fund's average daily net assets. For the initial period ended September 30, 2014, $56,504 in advisory fees were incurred and $36,076 in advisory fees were waived by the Advisor.
The Advisor has entered into a contractual agreement (the "Expense Limitation Agreement") with the Trust, on behalf of the Fund, under which it has agreed to waive or reduce its fees and to assume other expenses of the Fund, if necessary, in amounts that limit the Fund's total operating expenses (exclusive of interest, taxes, brokerage commissions, borrowing costs, fees and expenses of other investment companies in which the Fund invests, and other expenditures which are capitalized in accordance with generally accepted accounting principles, other extraordinary expenses not incurred in the ordinary course of the Fund's business, and amounts, if any, payable under a Rule 12b-1 distribution plan) to not more than 1.00% of the average daily net assets of the Fund for the current fiscal year. Additionally, under the Expense Limitation Agreement, the Advisor reimbursed the Fund for $47,551 of the expenses incurred for the initial period ended September 30, 2014. The current term of the Expense Limitation Agreement remains in effect until January 31, 2015. While there can be no assurance that the Expense Limitation Agreement will continue after that date, it is expected to continue from year-to-year thereafter.
Administrator
The Fund pays a monthly fee to the Administrator based upon the average daily net assets of the Fund and calculated at the annual rates as shown in the schedule below subject to a minimum of $2,000 per month. The Administrator also receives a fee as to procure and pay the Fund's custodian, as additional compensation for fund accounting and recordkeeping services, and additional compensation for certain costs involved with the daily valuation of securities and as reimbursement for out-of-pocket expenses. A breakdown of these fees is provided in the following table:
| Administration Fees* | Custody Fees* | Fund Accounting Fees (minimum monthly) | Fund Accounting Fees (asset- based fee) | Blue Sky Administration Fees (annual) |
Average Net Assets | Annual Rate | Average Net Assets | Annual Rate |
| First $100 million | 0.100% | First $100 million | 0.020% | $2,250 | 0.01% | $150 per state |
| Next $150 million | 0.080% | Over $100 million | 0.009% | | | |
| Next $250 million | 0.060% | | | | | |
| Next $500 million | 0.050% | *Minimum monthly fees of $2,000 and $417 for Administration and Custody, respectively. |
| Next $1 billion | 0.040% |
| Over $2 billion | 0.030% |
The Fund paid $18,613 of administration fees, $8,789 of custody fees, and $19,457 of fund accounting fees for the initial period ended September 30, 2014.
Compliance Services
Cipperman Compliance Services, LLC provides services as the Trust's Chief Compliance Officer. Cipperman Compliance Services, LLC is entitled to receive customary fees from the Fund for their services pursuant to the Compliance Services agreement with the Fund.
QCI Balanced Fund
Notes to Financial Statements
Transfer Agent
Nottingham Shareholder Services, LLC ("Transfer Agent") serves as transfer, dividend paying, and shareholder servicing agent for the Fund. It receives compensation for its services based upon $15 per shareholder per year, subject to a minimum fee of $1,750 per month, plus $500 for each additional class. For the initial period ended September 30, 2014, the Fund incurred $15,141 in transfer agent fees.
Distributor
Capital Investment Group, Inc. (the "Distributor") serves as the Fund's principal underwriter and distributor. The Distributor receives $5,000 per year paid in monthly installments for services provided and expenses assumed.
Certain Trustees and officers of the Trust are also officers of the Advisor or the Administrator.
| 3. | Distribution and Service Fees |
The Trustees, including a majority of the Trustees who are not "interested persons" of the Trust as defined in the 1940 Act and who have no direct or indirect financial interest in such plan or in any agreement related to such plan, adopted a distribution plan pursuant to Rule 12b-1 of the 1940 Act (the "Plan"). The 1940 Act regulates the manner in which a regulated investment company may assume expenses of distributing and promoting the sales of its shares and servicing of its shareholder accounts. The Plan provides that the Fund may incur certain expenses, which may not exceed 0.25% per annum of the average daily net assets of the Advisor Class Shares for each year elapsed subsequent to adoption of the Plan, for payment to the Distributor and others for items such as advertising expenses, selling expenses, commissions, travel or other expenses reasonably intended to result in sales of shares of the Fund or support servicing of shareholder accounts. For the initial period ended September 30, 2014, no fees were incurred by the Fund.
| 4. | Purchases and Sales of Investment Securities |
For the initial period ended September 30, 2014, the aggregate cost of purchases and proceeds from sales of investment securities (excluding short-term securities) were as follows:
| Purchases of Securities | | Proceeds from Sales of Securities |
| $25,290,829 | | $2,356,281 |
| Purchases of Government Securities | | Proceeds from Sales of Government Securities |
| $5,141,224 | | $995,098 |
5. Federal Income Tax
Distributions are determined in accordance with Federal income tax regulations, which differ from GAAP, and, therefore, may differ significantly in amount or character from net investment income and realized gains for financial reporting purposes. Financial reporting records are adjusted for permanent book/tax differences to reflect tax character but are not adjusted for temporary differences.
Management reviewed the Fund's tax positions taken on federal income tax returns for the open tax year/period ended September 30, 2014. As of and during the initial period ended September 30, 2014, the Fund does not have a liability for uncertain tax positions. The Fund recognizes interest and penalties, if any, related to unrecognized tax benefits as income tax expense in the Statement of Operations. During the initial period, the Fund did not incur any interest or penalties.
There were no distributions from the Fund for the initial period ended September 30, 2014.
QCI Balanced Fund
Notes to Financial Statements
At September 30, 2014, the tax-basis cost of investments and components of distributable earnings were as follows:
| Cost of Investments | $ | 28,512,523 |
| | |
| Unrealized Appreciation | $ | 447,750 |
| Unrealized Depreciation | | (497,817) |
| Net Unrealized Depreciation | | (50,067) |
| Undistributed Net Investment Income | | 188,657 |
| | |
| Distributable Earnings | $ | 138,590 |
| | | | | |
The difference between book-basis and tax-basis net unrealized depreciation is attributable to the tax deferral of losses from wash sales. The difference between book-basis and tax-basis undistributed net investment income and undistributed net realized gain on investments is attributable to the tax deferral of losses from wash sales and the treatment of short-term gains.
6. Commitments and Contingencies
Under the Trust's organizational documents, its officers and Trustees are indemnified against certain liabilities arising out of the performance of their duties to the Fund. In addition, in the normal course of business, the Trust entered into contracts with its service providers, on behalf of the Fund, and others that provide for general indemnifications. The Fund's maximum exposure under these arrangements is unknown, as this would involve future claims that may be made against the Fund. The Fund expects risk of loss to be remote.
In accordance with GAAP, the Fund has evaluated the need for disclosures and/or adjustments resulting from subsequent events through the date of issuance of these financial statements. This evaluation did not result in any subsequent events that necessitated disclosures and/or adjustments.
REPORT OF INDEPENDENT REGISTERED PUBLIC ACCOUNTING FIRM
To the Shareholders of the QCI Balanced Fund and
The Board of Trustees of the Starboard Investment Trust
We have audited the accompanying statement of assets and liabilities of the QCI Balanced Fund (the "Fund"), a series of shares of beneficial interest of the Starboard Investment Trust, including the schedule of the investments, as of September 30, 2014, and the related statements of operations and changes in net assets and the financial highlights for the period January 30, 2014 through September 30, 2014. These financial statements and financial highlights are the responsibility of the Fund's management. Our responsibility is to express an opinion on these financial statements and financial highlights based on our audit.
We conducted our audit in accordance with the standards of the Public Company Accounting Oversight Board (United States). Those standards require that we plan and perform the audit to obtain reasonable assurance about whether the financial statements and financial highlights are free of material misstatement. An audit includes examining, on a test basis, evidence supporting the amounts and disclosures in the financial statements. Our procedures included confirmation of securities owned as of September 30, 2014 by correspondence with the custodian and broker. An audit also includes assessing the accounting principles used and significant estimates made by management, as well as evaluating the overall financial statement presentation. We believe that our audit provides a reasonable basis for our opinion.
In our opinion, the financial statements and financial highlights referred to above present fairly, in all material respects, the financial position of the QCI Balanced Fund as of September 30, 2014, and the results of its operations, changes in its net assets and its financial highlights for the period January 30, 2014 through September 30, 2014, in conformity with accounting principles generally accepted in the United States of America.
BBD, LLP
Philadelphia, Pennsylvania
December 1, 2014
QCI Balanced Fund
Additional Information
(Unaudited)
| 1. | Proxy Voting Policies and Voting Record |
A copy of the Trust's Proxy Voting and Disclosure Policy and the Advisor's Disclosure Policy are included as Appendix B to the Fund's Statement of Additional Information and are available, without charge, upon request, by calling 800-773-3863, and on the website of the Security and Exchange Commission ("SEC") at sec.gov. Information regarding how the Fund voted proxies relating to portfolio securities during the most recent period ended June 30 is available (1) without charge, upon request, by calling the Fund at the number above and (2) on the SEC's website at sec.gov.
| 2. | Quarterly Portfolio Holdings |
The Fund files its complete schedule of portfolio holdings with the SEC for the first and third quarters of each fiscal year on Form N-Q. The Fund's Forms N-Q are available on the SEC's website at sec.gov. You may review and make copies at the SEC's Public Reference Room in Washington, D.C. Information on the operation of the Public Reference Room may be obtained by calling the SEC at 202-942-8090. You may also obtain copies without charge, upon request, by calling the Fund at 800-773-3863.
We are required to advise you within 60 days of the Fund's fiscal year-end regarding federal tax status of certain distributions received by shareholders during each fiscal year. The following information is provided for the Fund's fiscal period ended September 30, 2014.
During the initial period ended September 30, 2014, the Fund paid no distributions.
Dividend and distributions received by retirement plans such as IRAs, Keogh-type plans, and 403(b) plans need not be reported as taxable income. However, many retirement plans may need this information for their annual information meeting.
| 4. | Schedule of Shareholder Expenses |
As a shareholder of the Fund, you incur two types of costs: (1) transaction costs, and (2) ongoing costs, including investment advisory fees; distribution (12b-1) fees; and other Fund expenses. This example is intended to help you understand your ongoing costs (in dollars) of investing in the Fund and to compare these costs with the ongoing costs of investing in other mutual funds. The example is based on an investment of $1,000 invested at the beginning of the period and held for the entire period as indicated below.
Actual Expenses – The first line of the table below provides information about the actual account values and actual expenses. You may use the information in this line, together with the amount you invested, to estimate the expenses that you paid over the period. Simply divide your account value by $1,000 (for example, an $8,600 account value divided by $1,000 = 8.6), then multiply the result by the number in the first line under the heading entitled "Expenses Paid During Period" to estimate the expenses you paid on your account during this period.
Hypothetical Example for Comparison Purposes – The last line of the table below provides information about hypothetical account values and hypothetical expenses based on the Fund's actual expense ratio and an assumed annual rate of return of 5% before expenses, which is not the Fund's actual return. The hypothetical account values and expenses may not be used to estimate the actual ending account balance or expenses you paid for the period. You may use this information to compare the ongoing costs of investing in the Fund and other funds by comparing this 5% hypothetical example with the 5% hypothetical examples that appear in the shareholder reports of other funds.
QCI Balanced Fund
Additional Information
(Unaudited)
| Institutional Class Shares | Beginning Account Value April 1, 2014 | Ending Account Value September 30, 2014 | Expenses Paid During Period* |
Actual Hypothetical (5% annual return before expenses) | | | |
| $1,000.00 | $1,023.30 | $5.07 |
| $1,000.00 | $1,020.05 | $5.06 |
*Expenses are equal to the average account value over the period multiplied by the Fund's annualized expense ratio of 1.00%, multiplied by 183/365 (to reflect the one-half year period).
| 5. | Approval of Investment Advisory Agreement |
The Advisor supervises the Fund's investments pursuant to an Investment Advisory Agreement. At a quarterly meeting of the Fund's Board of Trustees on October 31, 2013, the Trustees approved the Investment Advisory Agreement through January 31, 2015. In considering whether to approve the Investment Advisory Agreement, the Trustees reviewed and considered the information they deemed reasonably necessary, including the following material factors: (i) the nature, extent, and quality of the services provided by the Advisor; (ii) investment performance of the Advisor; (iii) the costs of the services to be provided and profits to be realized by the Advisor and its affiliates from the relationship with the Fund; (iv) the extent to which economies of scale would be realized as the Fund grows and whether advisory fee levels reflect those economies of scale for the benefit of the Fund's investors; (v) the Advisor's practices regarding brokerage and portfolio transactions; and (vi) the Advisor's practices regarding possible conflicts of interest.
At the meeting, the Trustees reviewed various informational materials including, without limitation, the Investment Advisory Agreement for the Fund; a memorandum from the Advisor to the Trustees containing information about the Advisor, its business, its finances, its personnel, its services to the Fund, and comparative expense ratio information for other mutual funds with a strategy similar to the Fund; and a memorandum from the Fund's legal counsel that summarized the fiduciary duties and responsibilities of the Board of Trustees in reviewing and approving the Investment Advisory Agreement, including the types of information and factors that should be considered in order to make an informed decision.
In considering the nature, extent, and quality of the services provided by the Advisor, the Trustees reviewed the responsibilities of the Advisor under the Investment Advisory Agreement. The Trustees reviewed the services to be provided by the Advisor to the Fund including, without limitation, the Advisor's procedures for formulating investment recommendations and assuring compliance with the Fund's investment objectives and limitations, proposed efforts during the Fund's start-up phase, coordination of services for the Fund among the Fund's service providers, and efforts to promote the Fund, grow the Fund's assets, and assist in the distribution of Fund shares. The Trustees noted that the Advisor seeks to achieve its investment objective by investing in a balanced portfolio of fixed income and equity securities. The Trustees further noted that the Fund's principal officers are the President and Chief Operating Officer of the Advisor and will serve the Fund without additional compensation. After reviewing the foregoing information and further information in the memorandum from the Advisor (e.g., the Advisor's Form ADV and descriptions of the Advisor's business and compliance program), the Board of Trustees concluded that the nature, extent, and quality of the services to be provided by the Advisor were satisfactory and adequate for the Fund.
In considering the investment performance of the Advisor, the Trustees discussed the Advisor's experience managing investments and reviewed the historical performance of client accounts with the same investment goals and substantially similar investment strategies and policies as those of the Fund. After reviewing this performance information, the Advisor's experience managing other accounts, and other factors, the Board of Trustees concluded that the investment performance of the Advisor was satisfactory.
In considering the costs of the services to be provided and profits to be realized by the Advisor and its affiliates from the relationship with the Fund, the Trustees evaluated the Advisor's staffing, personnel, and methods of operating; the education and experience of the Advisor's personnel; the Advisor's compliance programs, policies, and procedures; the financial condition of the Advisor; the level of commitment to the Fund and the Advisor by the principals of the Advisor; the projected asset levels of the Fund; the Advisor's payment of startup costs for the Fund; and the overall expenses of the Fund, including the nature and frequency of advisory fee payments. The Trustees reviewed the financial statements of the Advisor and discussed the financial stability and profitability of the firm. The Advisor responded to several questions about the financial condition of the firm and its principals.
QCI Balanced Fund
Additional Information
(Unaudited)
The Trustees discussed the Fund's Expense Limitation Agreement, including the nature and scope of the cost allocation for such fees. The Trustees also considered potential benefits for the Advisor in managing the Fund, including promotion of the Advisor's name, the ability for the Advisor to place small accounts into the Fund, and the potential for the Advisor to generate soft dollars from Fund trades that may benefit the Advisor's other clients. The Trustees then compared the expected fees and expenses of the Fund (including the management fee) to other funds comparable in terms of the type of fund, the nature of its investment strategy, and its style of investment management, among other factors. The Trustees determined that the Fund's management fee was higher than those of some of the funds and lower than others, and higher than the peer group average. The Trustees also determined that the Fund's net expense ratio was higher than those of some of the funds and lower than others, and higher than the peer group average. The Trustees noted that the Fund's asset levels were expected to be much smaller than the industry average during its start-up phase. The Trustees also reviewed the Advisor's fees for other clients as described in the Form ADV Part II. Following further consideration and discussion of the foregoing, the Board of Trustees concluded that the fees to be paid to the Advisor by the Fund were fair and reasonable in relation to the nature and quality of the services provided by the Advisor and that they reflected charges that were within a range of what could have been negotiated at arm's length.
In considering the extent to which economies of scale would be realized as the Fund grows and whether advisory fee levels reflect those economies of scale for the benefit of the Fund's investors, the Trustees considered the Fund's fee arrangements with the Advisor involved both the management fee and Expense Limitation Agreement. The Trustees noted that, while the management fee would remain the same when the Fund reached higher asset levels, the Fund's shareholders would benefit from the Expense Limitation Agreement until the Fund's assets grew to a level where the Fund's expenses fell below the cap set by the agreement and the Advisor began receiving its full fee. Thereafter, the Trustees noted that the Fund's shareholders would benefit from economies of scale under the Fund's agreements with service providers other than the Advisor. Following further discussion of the Fund's projected asset levels, expectations for growth, and fee levels, the Board of Trustees determined that the Fund's fee arrangements with the Advisor were fair and reasonable in relation to the nature and quality of the services provided by the Advisor and that the Expense Limitation Agreement provided potential savings for the benefit of the Fund's investors.
In considering the Advisor's practices regarding brokerage and portfolio transactions, the Trustees reviewed the Advisor's standards, and performance in utilizing those standards, for seeking best execution for Fund portfolio transactions. The Trustees also considered the anticipated portfolio turnover rate for the Fund; the process by which evaluations are made of the overall reasonableness of commissions paid; the method and basis for selecting and evaluating the broker-dealers used; any anticipated allocation of portfolio business to persons affiliated with the Advisor; and the extent to which the Fund allocates portfolio business to broker-dealers who provide research, statistical, or other services ("soft dollars"). After further review and discussion, the Board of
Trustees determined that the Advisor's practices regarding brokerage and portfolio transactions were satisfactory.
In considering the Advisor's practices regarding conflicts of interest, the Trustees evaluated the potential for conflicts of interest and considered such matters as the experience and ability of the advisory personnel assigned to the Fund; the basis of decisions to buy or sell securities for the Fund and the Advisor's other accounts; the method for bunching of portfolio securities transactions; and the substance and administration of the Advisor's code of ethics. Following further consideration and discussion, the Board of Trustees indicated that the Advisor's standards and practices relating to the identification and mitigation of potential conflicts of interests were satisfactory.
Based upon all of the foregoing considerations, the Board of Trustees, including a majority of the Independent Trustees, approved the Investment Advisory Agreement for the Fund.
QCI Balanced Fund
Additional Information
(Unaudited)
| 6. | Information about Trustees and Officers |
The business and affairs of the Fund and the Trust are managed under the direction of the Board of Trustees of the Trust. Information concerning the Trustees and officers of the Trust and Fund is set forth below. Generally, each Trustee and officer serves an indefinite term or until certain circumstances such as their resignation, death, or otherwise as specified in the Trust's organizational documents. Any Trustee may be removed at a meeting of shareholders by a vote meeting the requirements of the Trust's organizational documents. The Statement of Additional Information of the Fund includes additional information about the Trustees and officers and is available, without charge, upon request by calling the Fund toll-free at 800-773-3863. The address of each Trustee and officer, unless otherwise indicated below, is 116 South Franklin Street, Rocky Mount, North Carolina 27804. The Independent Trustees each received aggregate compensation of $2,000 during the initial period ended September 30, 2014 from the Fund for their services to the Fund and Trust.
Name, Age
and Address | Position
held with
Fund or Trust | Length of Time Served | Principal Occupation
During Past 5 Years | Number of Portfolios in Fund Complex Overseen by Trustee | Other Directorships
Held by Trustee
During Past 5 Years |
| Independent Trustees |
|
Michael G. Mosley
Age: 61 | Independent Trustee | Since 7/10 | Owner of Commercial Realty Services (real estate) since 2004. | 23 | None. |
Theo H. Pitt, Jr.
Age: 78 | Independent Trustee | Since 9/10 | Senior Partner, Community Financial Institutions Consulting (financial consulting) since 1999; Partner, Pikar Properties (real estate) since 2001; Account Administrator, Holden Wealth Management Group of Wachovia Securities (money management firm) from 2003-2008. | 23 | Independent Trustee of World Funds Trust for its twelve series, Gardner Lewis Investment Trust for its two series, Vertical Capital Investors Trust for its two series, and Hillman Capital Management Investment Trust for its one series (all registered investment companies); previously, Independent Trustee of, NCM Capital Investment Trust for its one series from 2007 to 2009, New Providence Investment Trust from 2008 to 2009, and Tilson Investment Trust for its two series from 2004 to 2009 (all registered investment companies). |