UNITED STATES
SECURITIES AND EXCHANGE COMMISSION
Washington, D.C. 20549
FORM N-CSR
CERTIFIED SHAREHOLDER REPORT OF REGISTERED
MANAGEMENT INVESTMENT COMPANIES
Investment Company Act file number 811-22298
Starboard Investment Trust
(Exact name of registrant as specified in charter)
116 South Franklin Street, Post Office Box 69, Rocky Mount, North Carolina 27802
(Address of principal executive offices) (Zip code)
Terrence O. Davis
116 South Franklin Street, Post Office Box 69, Rocky Mount, North Carolina 27802
(Name and address of agent for service)
Registrant's telephone number, including area code: 252-972-9922
Date of fiscal year end: August 31
Date of reporting period: August 31, 2014
Item 1. REPORTS TO STOCKHOLDERS.
Statements in this Annual Report that reflect projections or expectations of future financial or economic performance of the Roumell Opportunistic Value Fund ("Fund") and of the market in general and statements of the Fund's plans and objectives for future operations are forward-looking statements. No assurance can be given that actual results or events will not differ materially from those projected, estimated, assumed or anticipated in any such forward-looking statements. Important factors that could result in such differences, in addition to the other factors noted with such forward-looking statements, include, without limitation, general economic conditions such as inflation, recession and interest rates. Past performance is not a guarantee of future results. An investment in the Fund is subject to investment risks, including the possible loss of some or the entire principal amount invested. There can be no assurance that the Fund will be successful in meeting its investment objective. Investment in the Fund is also subject to the following risks: market risk, opportunistic investment strategy risk, sector risk, non-diversified fund risk, investment advisor risk, new fund risk, operating risk, common stocks risk, preferred stock risk, warrants risk, convertible securities risk, large-cap securities risk, small-cap and mid-cap securities risk, micro-cap securities risk, risks related to investing in other investment companies, interest rate and credit risk, maturity risk, inflation risk, investment-grade securities risk, lower-rated securities or "junk bonds" risk, risks of investing in municipal securities, risks of investing in REITs, risk of investing in corporate debt securities, government debt markets may be illiquid or disrupted, foreign securities risk, and currency risk. More information about these risks and other risks can be found in the Fund's prospectus. The performance information quoted in this annual report represents past performance, which is not a guarantee of future results. Investment return and principal value of an investment will fluctuate so that an investor's shares, when redeemed, may be worth more or less than their original cost. Current performance may be lower or higher than the performance data quoted. An investor may obtain performance data current to the most recent month-end by visiting ncfunds.com. An investor should consider the investment objectives, risks, and charges and expenses of the Fund carefully before investing. The prospectus contains this and other information about the Fund. A copy of the prospectus is available at ncfunds.com or by calling Shareholder Services at 800-773-3863. The prospectus should be read carefully before investing. |
This Annual Report was first distributed to shareholders on or about October 30, 2014.
For More Information on Your Roumell Opportunistic Value Fund:
See Our Web site @ ncfunds.com.
or
Call Our Shareholder Services Group at 800-773-3863.
August 31, 2014
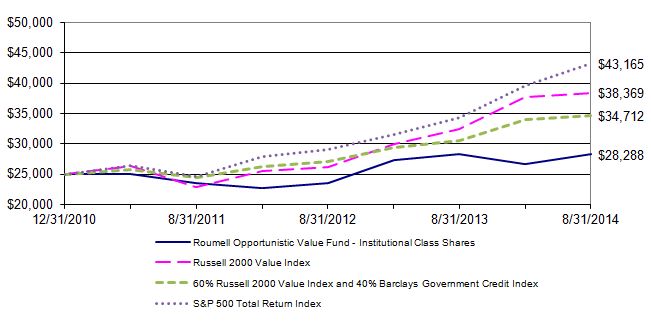
For the year ended August 31, 2014, the return on the Institutional class shares was (0.12)%. The return on the Class A shares was (0.38)%, the return on the Class C shares was (1.09)%. This compares to 18.10% for the Russell 2000 Value Index, 13.66% for the 60% Russell 2000 Value Index/40% Barclays Government Credit Index, and 25.25% for the S&P 500 over the same period. These returns were attained with an allocation of about 36% in cash, 43% in equities, and 21% in fixed income during the fiscal year.
Please see the table below for the Fund's historical performance information through the calendar quarter ended September 30, 2014.
| Average Annual Total Returns (Unaudited) | | | Net | Gross |
Period Ended September 30, 2014 | Past 1 Year | Since Inception* | Expense Ratio** | Expense Ratio*** |
Roumell Opportunistic Value Fund – Institutional Class Shares | (5.52)% | 1.88% | 1.32% | 1.62% |
Roumell Opportunistic Value Fund –Class A Shares | (5.80)% | 1.63% | 1.57% | 1.87% |
| After tax with sales charge**** | (2.08)% | 1.24% | N/A | N/A |
Roumell Opportunistic Value Fund –Class C Shares | (6.54)% | (5.86)% | 2.32% | 2.62% |
After tax with deferred sales charge**** | (2.35)% | (4.84)% | N/A | N/A |
60% Russell 2000 Value Index, and 40% Barclays Capital U.S. Government Credit Index | 4.11% | 7.71% | N/A | N/A |
| S&P 500 Total Return Index | 19.73% | 15.18% | N/A | N/A |
The quoted performance data represents past performance, which is not a guarantee of future results. Investment return and principal value of an investment in the Fund will fluctuate so that an investor's shares, when redeemed, may be worth more or less than their original cost. Current performance may be lower or higher than the performance data quoted. To obtain more current performance data regarding the Fund, including performance data current to the Fund's most recent month-end, please visit ncfunds.com or call the Fund at (800)773-3863. Fee waivers and expenses reimbursements have positively impacted Fund performance.
*The Fund's inception date is December 31, 2010.
**The Advisor has entered into an Operating Plan with the Fund's administrator through January 1, 2015, under which it has agreed to (i) to pay the administrator a fee based on the daily average net assets of the Fund when net assets are below $77 million; (ii) if these payments are less than a designated minimum, then the Advisor pays a fee that makes up the difference; and (iii) to assume expenses of the Fund outlined in the Operating Plan that are not covered by the fee paid under Fund Accounting and Administration Agreement. These measures are intended to limit the Fund's operating expenses to 1.23% of the average daily net assets, exclusive of brokerage fees and commissions, portfolio transaction fees, registration fees, taxes, borrowing costs (such as interest or dividend expenses on securities sold short), acquired fund fees and expenses, extraordinary expenses, and distribution and/or service (12b-1) fees. The Fund's net expense ratio will be higher than 1.23% to the extent the Fund incurs expenses excluded from this arrangement. The Fund also charges a 1.00% redemption fee on the Institutional Class shares, Class A shares, and Class C shares within 60 days of their issuance. The Operating Plan can only be terminated prior to the conclusion of the current term with the approval of the Fund's Board of Trustees. More recent expense ratios are found in the Financial Highlights.
***Gross expense ratio includes acquired fund fees and expenses and other expenses.
****A maximum sales charge imposed on purchases of 4.50% is charged to the Class A shares. A maximum deferred sales charge of 1.00% is applied to the Class C shares. For the fiscal year ended August 31, 2014, the after tax with sales charge return on the Class A shares was 1.22%. The after tax with the deferred sales charge return on the Class C shares was 0.93%.
The Pervasiveness of Short-Termism
Imagine the following scenario. An investment manager watches a stock fall sharply to $10. Through thorough analysis, the manager determines that the company's risk of insolvency is virtually zero and that, in better times, the stock will be worth $30 or more. The manager, of course, should buy the stock. But if he has to worry about short-term performance, he will be reluctant to buy at $10 on the fear that the stock will fall to $5, despite his high conviction that it will ultimately rise to $30. We believe this scenario frequently plays out in various forms in the stock and bond markets. The lesson, of course, is that pressures of short-term performance lead to poor investment decisions.
The average holding period for New York Stock Exchange (NYSE) listed stocks has declined to less than one year from eight years in the 1950s and 1960s.1 The increasing pervasiveness of short-termism creates a favorable environment for opportunistic investors. It is therefore incumbent upon investment managers to cultivate a client base who themselves appreciate the steep cost of impatience and the myriad opportunities available to those who are not constrained by it.
According to Jeremy Grantham, Cofounder and Chief Investment Strategist of GMO LLC, "The central truth of the investment business is that investment behavior is driven by career risk…. The prime directive, as Keynes knew so well, is first and last to keep your job. To do this, he explained that you must never, ever be wrong on your own. To prevent this calamity, professional investors pay ruthless attention to what other investors in general are doing. The great majority 'go with the flow,' either completely or partially. This creates herding, or momentum, which drives prices far above or far below fair price. There are many other inefficiencies in market pricing, but this is by far the largest."
In addition to career risk, recency bias—or the inclination to give too much weight to recent experiences—can drive short-term behavior. Many investors want to be in the market after it surges, and they want out after it declines. The Wall Street Journal profiled a married couple, two doctors living in Texas, who sold all of their stock investments after losing half of their savings in the 2008 bear market. Not until the stock market reached new highs did the couple decide to get back in the market. Therein lies the irony of the investment business. Clients generally want more equity exposure when investment opportunities are few, and redemptions are highest when investment opportunities are great, as they were at the depths of the 2008–2009 bear market.
Career risk and recency bias affect not only the behavior of investors but also that of analysts who sell research for the Wall Street firms. Mirroring similar behavior by investors, Wall Street research analysts compound mispricing in the stock market. We sampled analyst coverage on 60 randomly selected companies from the S&P 500. Of the 1,510 analyst ratings, only 85, or 5.6%, were negative. Yet in the prior five years, on average 37% of stocks in the S&P 500 generated a negative return (including dividends) in each year.
The analyst community tends to be bullish during periods of high prices and more bearish when prices are low, in direct contrast to a profitable investment strategy. Seventy-one
percent of analysts covering Amazon.com, Inc. had bullish ratings when that stock peaked at the end of 1999. Most analysts ignored the fact that it traded for 22x revenue and was unprofitable. When the stock bottomed in the fall of 2001, only 45% of analysts were bullish. Similarly, 69% of analysts covering Wells Fargo & Co. were bullish when that stock peaked in the fall of 2007. As it bottomed in the spring of 2009, only 40% of analysts had bullish ratings.
The analyst community in aggregate simply does not accurately portray risk or opportunity in its rating systems. Wall Street firms are in the business of selling securities as well as servicing corporate clients. An analyst's positive bent, therefore, serves two purposes. It can help sell securities, and it can also help ingratiate analysts with management teams who may be or may become clients. Although regulatory changes preclude analysts from receiving direct compensation from investment banking activity, make no mistake, conflicts remain. Moreover, analysts rarely stray too far from the herd, because if you are wrong with the herd you keep your job. If you are wrong and against the herd, you're fired.
Conventional daily performance reporting adds to the difficulty of maintaining a long-term view. Most people innately feel the need to be proactive because it's hard to distinguish inactivity from laziness. A 2007 study2 concluded that, as a result of action bias, soccer goalkeepers remain in the center of the goal only 6% of the time during penalty kicks, despite the ball being kicked to the center 29% of the time. Investors' collective proclivity toward action and impatience is exactly the reason why value investing has historically been so effective. We believe opportunities for those investors who truly take a multiyear view offer the best reward relative to risk, primarily because of the pervasiveness of impatience elsewhere. Most investors shun these opportunities, which in turn get priced far below intrinsic value.
Value stocks often take a while to return to intrinsic value; these companies are typically under-earning their potential at the time the stocks are purchased. These issues can make for a bumpy ride for the investor. Revered value investor Seth Klarman has said:
Value investors have a perspective that allows them not to suffer these interim losses, but to relish or at least appreciate them—because interim price declines allow an investor to average down, to buy more at an even better price, which results in much greater profits over time than if prices had not declined at all. It is critical that you remind your clients, your investment team, and, as often as necessary, yourself that you can only control your process and approach—that you cannot forecast the vagaries of the market, which in any case are an opportunity and not a problem for value investors.
2 M. Bar-Eli, O. H. Azar, I. Ritov, Y. Keidar-Levin, and G. Schein, "Action Bias among Elite Soccer Goalkeepers: The Case of Penalty Kicks," Journal of Economic Psychology 28 (2007): 606–21.
We agree that volatility provides opportunity. For example, we often take advantage of lower prices in our securities because of our belief in the underlying value of our investment rationale. We believe the best strategy for retail and institutional investors is to select good portfolio managers and stick with them through the volatility. We do not manage for a given quarter or a given year. We manage with a three-year time horizon because the impact of company fundamentals on stocks is diminished over shorter investment periods. To quote Benjamin Graham, the father of value investing, "In the short run the market is a voting machine. In the long run it's a weighing machine."
Top Three Holdings
To our delight, the CEOs of our top three holdings presented at our annual investor conference in September. Bill Gates has written about the importance of backing the right people. In a recent Wall Street Journal article, Gates remarked, "There's an essential human factor in every business endeavor. It doesn't matter if you have a perfect product, production plan and marketing pitch; you'll still need the right people to lead and implement those plans." We have found that our investments have a higher likelihood of making money when we have met management. Some investors take the approach that meeting management can lead to excessive emotional attachment to an investment. Our experience has been that, while one must be vigilant about overemphasizing a relationship in spite of fundamentals, building relationships with management teams is beneficial. We believe making a firsthand assessment of the people behind the business is important to the investment thesis.
SeaChange International, Inc., SEAC. SeaChange, which comprised 6.90% of the portfolio as of August 31, 2014, is a cash-rich, debt-free company with highly desirable software assets that are well positioned to take advantage of cable content distribution. This is our second foray in SeaChange. We exited SEAC in the fourth quarter of 2013 after a dramatic increase in its stock price. Earlier this year, another buying opportunity presented itself as the company announced disappointing top-line revenue that we viewed as noise, which in no way undermined the long-term strength of this unique story. We believe the larger-than-expected decline in its legacy platforms (Axiom, Middleware, Streamers), and the longer sales cycle of next-generation software, concerned investors who do not fully appreciate the below-the-surface dynamism regarding the adoption of its next-gen software tools.
The "noise" from the first quarter not surprisingly persisted in the second quarter. Upon a further weakening in SEAC's stock price, we bought additional shares, thereby reducing our cost basis. In our view, the fundamental thesis of this story has not changed. Although total revenues will decline this year, the driver of the decline is legacy product revenue, which will decrease to about 10% of total revenue. While management believes the company will keep most of what remains from legacy business, any further declines won't have a material impact on overall revenues simply due to how small legacy business has become. Regarding the longer-than-anticipated sales cycle for next-generation products, we believe any concern is more than offset by the stickiness of the revenue, which is due to high switching costs. SEAC has been selected by nearly 50 cable operators, compared to just five in 2011, a clear signal of successful R&D investment. We believe penetration of its 80 million current customer subscribers will rise toward 100% over time from less than 20% today; this is important as it represents built-in organic growth since cable companies pay license fees on a per subscriber basis.
Finally, we believe deeply in SEAC's CEO, Raghu Rau, and the board, in our view, is competent and shareholder friendly. In fact, we believe SEAC's software remains a highly desirable strategic asset for a larger company, and the board would sell the company at the right price. For reference, Cisco Systems acquired NDS, a SEAC competitor, in 2012 for 5x revenue. In 2013, SEAC displaced NDS at Liberty Global, Europe's largest cable operator. We believe valuing SEAC at 2–2.5x revenue is reasonable and would provide us an attractive return.
Sizmek, Inc., SZMK. Sizmek, which comprised 6.90% of the portfolio as of August 31, 2014, manages, distributes, and analyzes online advertising campaigns. The online advertising market has strong secular tailwinds; Raymond James estimates U.S. online ad spending to grow 15% per year for the next three years. Sizmek is a major player in this market, having served 1.5 trillion advertisements in 2013. Sizmek's predecessor company, Digital Generation, sold its TV advertising distribution business in 2013, an event that resulted in a $3/share special dividend to our Fund. The company now focuses exclusively on the online advertising market, and is building a true global platform business that provides advertisers a full suite of end-to-end capabilities (ad serving, analytics, and verification).
Online advertising consists of three basic categories: banner/display, video, and mobile, growing annually at roughly 5%, 25%, and 30%, respectively. While banner makes up more than 50% of SZMK's distribution business, the company is heavily focused on the faster growing video market, with a much smaller presence in mobile. Worldwide, display advertising accounts for roughly $30 billion of the more than $40 billion spent on online advertising. SZMK is positioning itself as a globally integrated platform with a differentiated open-stack architecture able to manage cross-platform advertising campaigns. Roumell Asset Management's independent software consultant has spent considerable time analyzing SZMK's open-stack MDX platform and has reported back highly favorable results. Recently, the company has established new relationships with Tommy Hilfiger, Audi, Toyota, and Volkswagen, and expanded its existing relationships with Time and Unilever. SZMK was also chosen by the German media agency of McDonald's to manage its online World Cup campaign.
A plethora of point solution companies exist, but very few of these have end-to-end capabilities. The dominant player in the space, Google's DoubleClick, is a closed system and requires its ad-serve clients to use its analytic tools. SZMK's customers can choose the company's ad-serving and verification services but are not required to choose Sizmek's analytic products. SZMK is estimated to have the second largest market share, albeit a distant second. Recently, SZMK hired Patrick Meehan from Google, where as head of platform sales he was responsible for large holding-company relationships. He was previously director of agency sales and account management at DoubleClick. The company's three-year goal is to collapse the technologies and tools now in separate silos and move toward a SaaS business model.
In our view, the company is cheap. SZMK is debt-free, and has roughly $100 million in cash with a market capitalization of approximately $300 million. The company has made several acquisitions over the past few years totaling about $400 million (after impairments). SZMK has about $185 million in revenue resulting in an enterprise value to revenue of roughly 1x, while peers trade at an average of roughly 2.5x. Moreover, operational metrics are steadily improving. To wit, management has boosted Earnings before Interest, Taxes, and Depreciation (EBITDA) margins from 5% in 2011 to 14% in 2013 and has a goal of reaching 30% in the medium term. Many of its peers have growth but no margin. SZMK's revenues are growing (profitably) at about 15% annually. We believe after the sale of its legacy TV ad distribution business and resulting emergence as a stand-alone online company, few investors understand the potential value of SZMK. To our knowledge, the company has two firms providing research coverage. Finally, we believe SZMK is a highly desired strategic asset.
Recently, we met with CEO Neil Nguyen and once again walked away with a high level of confidence that Neil possesses a clear vision and the requisite execution skills to grow SZMK into a leading online ad management company. Scott Ginsburg, SZMK's founder, and Neil own roughly 14% of the company. In summary, a debt-free, cash-rich balance sheet, cheap valuation, secular tailwinds, and strong leadership result in what we believe is a compelling investment opportunity.
Rosetta Stone, Inc., RST. Rosetta Stone is the global leader in technology-enabled language learning. The company offers language-learning and reading instruction to consumers, businesses, government entities, and schools via packaged software and online subscriptions. The language offerings emphasize a unique "dynamic immersion" methodology that relies on the associative pairing of images, texts, and sounds to mimic the way people naturally learn native languages. In the past two years, the company has made four acquisitions aimed at strengthening its own language reach and to better leverage its brand by cross-selling related products. Rosetta generates roughly 20% of revenue from overseas and is headquartered in Arlington, Virginia.
RST is a company in transition led by Stephen Swad, CEO, who was brought in three years ago to build a profitable and sustainable business model. Readers may recall seeing Rosetta Stone kiosks in airports a few years back. Today, those (low ROI) kiosks are gone and more of the company's consumer business is delivered online or through selling agreements with retailers such as Amazon, Costco, and Apple's iTunes. However, the consumer business is not the company's primary attraction to us. The company is emphasizing its Enterprise & Education (E&E) business, where its high level of service and support is a differentiated and valued attribute. For instance, a number of agencies within the U.S. Department of Defense contract with RST to provide language learning to its employees and receive a dedicated website and access to key support personnel. Coaching support is highly correlated with language-learning success. E&E revenue is now $115 million annually, with renewal rates of 75%. The company's total SaaS subscription revenue is now about $140 million and represents roughly 50% of total revenue.
One of RST's primary cross-selling opportunities results from its 2013 acquisition of K–12 instructional reading software company Lexia for $22.5 million. RST's products are already used in 20,000 (out of 125,000) K–12 schools in North America. The company's purchase of Fit Brains, a top-five player in brain exercise software (a space in which industry leader Lumosity is spending heavily to increase its popularity), provides another opportunity to leverage the brand. Overall, the company enjoys 80%-plus gross margins and is looking to leverage R&D investments, and reduce sales and marketing expenses, while taking advantage of the already significant sunk brand costs to create a profitable business model with high recurring revenues. The company has guided for approximately $20 million in EBITDA in 2014 and will generate about $10 million in free cash flow this year, which will be held back by integration costs that will likely decline in 2015.
RST is unleveraged and possesses a healthy cash balance. By year-end, we anticipate RST will have $70 million in cash, or roughly 35% of its current $200 million market capitalization. If you back-out an additional $70 million spent on recent acquisitions, the implied value for RST's core business is a mere $60 million. What is the brand worth? It's a difficult question to answer, but we believe nonetheless that it is a significant off-balance-sheet asset. In the last five years, the company has spent more than $500 million on sales and marketing and enjoys a 74% brand recognition rate. Looked at another way, the company's year-end enterprise value of $130 million is less than 1x its highly recurring SaaS revenue, 80% of which comes from its growing E&E business. SaaS companies typically trade for generous multiples of revenue.
In January, The Economist summed up the digital language learning space as follows: "Technology is starting to change language learning. [Berlitz] is a bit of a digital dawdler. Most of its smartphone apps are repurposed versions of its old books.... Rosetta Stone, an American technology company, provides a contrast, supplementing technology with human teaching rather than vice versa. Its software has a clever interface that eschews traditional drills in favour of pictures and examples that gradually and intuitively build vocabulary and grammar skills.… From 2006 to 2009 the company more than tripled R&D spending, customising each language offering and adding cultural and social features. Well-built tablet and smartphone apps let students learn anywhere."
Why is it cheap? The primary reason involves recent negative sales trends in RST's consumer segment. The emergence of free apps for people looking to "get by" for their upcoming trip to Europe has undoubtedly taken market share in this segment. Second, investors are understandably skeptical of the company's ability to integrate recent acquisitions. Our variant view is that while total revenues have been roughly flat over the last three years, the 20% decline in product revenue is masking 48% growth in the more profitable subscription business. Moreover, according to independent sources, the industry is growing. For instance, the global e-learning market research firm Ambient Insight estimates that global digital English-language-learning products are growing by double digits. Universities, K–12 schools, companies, and government entities are all increasingly using technology. RST's institutional business lies in front of this trend.
We sat down with CEO Steve Swad and his team and believe they have a credible vision and well-articulated growth strategy. Steve has taken more than 60% of his total compensation in stock for the last two years. Key industry contacts indicate real excitement within the company's sales force stemming from the new direction and underscore our belief in Steve and his team.
At day's end, we believe RST "weighs" far more today than its price implies. To wit, a mere two times the current SaaS-based revenue plus its estimated year-end cash balance equates to roughly $300 million, compared to the current $200 million market capitalization. This exercise ascribes no value to the company's consumer business, which generates $200 million in revenue. At the price we paid, the odds of a good return appear to us to be strongly in our favor.
Best Regards,
Jim Roumell
Lead Portfolio Manager
Roumell Opportunistic Value Fund
| ROUMELL OPPORTUNISTIC VALUE FUND | | | | | | | | | | |
| Institutional Class Shares | | | | | | | | | | | |
| | | | | | | | | | | | | | | | | | |
| Performance Update (Unaudited) | | | | | | | | | | | | |
| | | | | | | | | | | | | | | | | | |
| For the period from December 31, 2010 (Date of Initial Public Investment) to August 31, 2014 | |
| | | | | | | | | | | | | | | | | | |
| Comparison of the Change in Value of a $25,000 Investment | | | | | | | |
| | | | | | | | | | | | | | | | | | |
| | |
| | | | | | | | | | | | | | | | | | |
| This graph assumes the minimum initial investment of $25,000 at December 31, 2010 (Date of Initial Public Investment). All dividends and distributions are reinvested. This graph depicts the performance of the Roumell Opportunistic Value Fund Institutional Class Shares (the "Fund") versus the Russell 2000 Value Index, a blend of 60% of the Russell 2000 Value Index and 40% of the Barclays Government Credit Index, and the S&P 500 Total Return Index. It is important to note that the Fund is a professionally managed mutual fund while the indices are not available for investment and are unmanaged. The comparison is shown for illustrative purposes only. |
| | | | | | | | | | | | | | | | | | |
| Average Annual Total Returns | |
| | | | | | | | | | | | | | | | | Gross | |
| | As of | | | | | | One | | Since | | Inception | | Expense | |
| | August 31, 2014 | | | | | Year | | Inception | Date | | Ratio* | |
| | Institutional Class Shares | | | | -0.12% | | 3.43% | | 12/31/10 | | 1.23% | |
| | Russell 2000 Value Index | | | | 18.10% | | 12.35% | | N/A | | N/A | |
| | 60% Russell 2000 Value Index and | | | | | | | | | | |
| | | 40% Barclays Government Credit Index | | 13.66% | | 9.34% | | N/A | | N/A | |
| | S&P 500 Total Return Index | | | | 25.25% | | 15.99% | | N/A | | N/A | |
| | | | | | | | | | | | | | | | | | |
| * The gross expense ratio shown is from the Fund's prospectus dated December 30, 2013. | |
| | | | | | | | | | | | | | | | | | |
| Performance quoted above represents past performance, which is no guarantee of future results. Investment return and principal value will fluctuate so that shares, when redeemed, may be worth more or less than their original cost. Current performance may be lower or higher than the performance data quoted. An investor may obtain performance data, current to the most recent month-end, by visiting ncfunds.com. |
| | | | | | | | | | | | | | | | | | |
| The graph and table do not reflect the deduction of taxes that a shareholder would pay on Fund distributions or the redemption of Fund shares. Average annual total returns are historical in nature and measure net investment income and capital gain or loss from portfolio investments assuming reinvestments of distributions. |
| | | | | | | | | | | | | | | | | | |
| | | | | | | | | | | | | | | | | | |
| ROUMELL OPPORTUNISTIC VALUE FUND | | | | | | | | | | |
| Class A Shares | | | | | | | | | | | | |
| | | | | | | | | | | | | | | | | | |
| Performance Update (Unaudited) | | | | | | | | | | | | |
| | | | | | | | | | | | | | | | | | |
| For the period from December 31, 2010 (Date of Initial Public Investment) to August 31, 2014 |
| | | | | | | | | | | | | | | | | | |
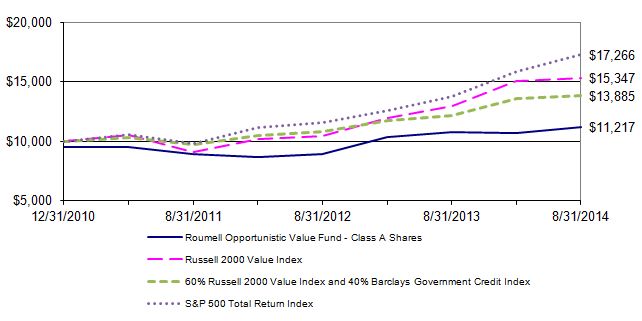
| Comparison of the Change in Value of a $10,000 Investment | | | | | | | |
| | | | | | | | | | | | | | | | | | |
| | |
| | | | | | | | | | | | | | | | | | |
| This graph assumes an initial investment of $10,000 ($9,550 after maximum sales load of 4.50%) at December 31, 2010 (Date of Initial Public Investment). All dividends and distributions are reinvested. This graph depicts the performance of the Roumell Opportunistic Value Fund Class A Shares (the "Fund") versus the Russell 2000 Value Index, a blend of 60% of the Russell 2000 Value Index and 40% of the Barclays Government Credit Index, and the S&P 500 Total Return Index. It is important to note that the Fund is a professionally managed mutual fund while the indices are not available for investment and are unmanaged. The comparison is shown for illustrative purposes only. |
| | | | | | | | | | | | | | | | | | |
| Average Annual Total Returns | |
| | | | | | | | | | | | | | | | | Gross | |
| | As of | | | | | | One | | Since | | Inception | | Expense | |
| | August 31, 2014 | | | | | Year | | Inception | Date | | Ratio* | |
| | Class A Shares - No Sales Load | | | -0.38% | | 3.18% | | 12/31/10 | | 1.48% | |
| | Class A Shares - 4.50% Maximum Sales Load | -4.84% | | 1.89% | | 12/31/10 | | 1.48% | |
| | Russell 2000 Value Index | | | | 18.10% | | 12.35% | | N/A | | N/A | |
| | 60% Russell 2000 Value Index and | | | | | | | | | | |
| | | 40% Barclays Government Credit Index | | 13.66% | | 9.34% | | N/A | | N/A | |
| | S&P 500 Total Return Index | | | | 25.25% | | 15.99% | | N/A | | N/A | |
| * The gross expense ratio shown is from the Fund's prospectus dated December 30, 2013. | |
| | | | | | | | | | | | | | | | | | |
| Performance quoted above represents past performance, which is no guarantee of future results. Investment return and principal value will fluctuate so that shares, when redeemed, may be worth more or less than their original cost. Current performance may be lower or higher than the performance data quoted. An investor may obtain performance data, current to the most recent month-end, by visiting ncfunds.com. |
| | | | | | | | | | | | | | | | | | |
| The graph and table do not reflect the deduction of taxes that a shareholder would pay on Fund distributions or the redemption of Fund shares. Average annual total returns are historical in nature and measure net investment income and capital gain or loss from portfolio investments assuming reinvestments of distributions. |
| | | | | | | | | | | | | | | | | | |
| ROUMELL OPPORTUNISTIC VALUE FUND | | | | | | | | | | |
| Class C Shares | | | | | | | | | | | | |
| | | | | | | | | | | | | | | | | | |
| Performance Update (Unaudited) | | | | | | | | | | | | |
| | | | | | | | | | | | | | | | | | |
| For the period from July 30, 2013 (Date of Initial Public Investment) to August 31, 2014 | |
| | | | | | | | | | | | | | | | | | |
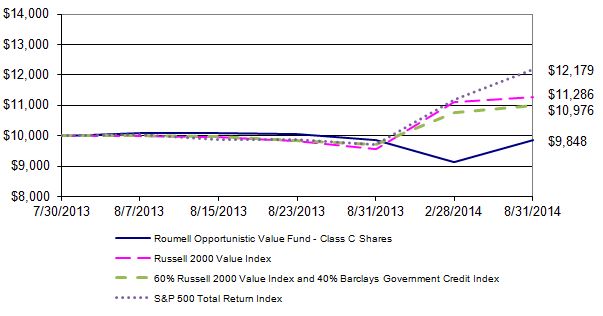
| Comparison of the Change in Value of a $10,000 Investment | | | | | | | |
| | | | | | | | | | | | | | | | | | |
| | |
| | | | | | | | | | | | | | | | | | |
| This graph assumes an initial investment of $10,000 at July 30, 2013 (Date of Initial Public Investment) and includes the 1% maximum deferred sales charge. All dividends and distributions are reinvested. This graph depicts the performance of the Roumell Opportunistic Value Fund Class C Shares (the "Fund") versus the Russell 2000 Value Index, a blend of 60% of the Russell 2000 Value Index and 40% of the Barclays Government Credit Index, and the S&P 500 Total Return Index. It is important to note that the Fund is a professionally managed mutual fund while the indices are not available for investment and are unmanaged. The comparison is shown for illustrative purposes only. |
| | | | | | | | | | | | | | | | | | |
| Average Annual Total Returns | |
| | | | | | | | | | | | | | | | | Gross | |
| | As of | | | | | | One | | Since | | Inception | | Expense |
| | August 31, 2014 | | | | | Year | | Inception | | Date | | Ratio* | |
| | Class C Shares | | | | | | -1.09% | | -1.40% | | 07/30/13 | | 2.23% | |
| | Russell 2000 Value Index | | | | 18.10% | | 11.71% | | N/A | | N/A | |
| | 60% Russell 2000 Value Index and | | | | | | | | | | |
| | | 40% Barclays Government Credit Index | | 13.66% | | 8.91% | | N/A | | N/A | |
| | S&P 500 Total Return Index | | | | 25.25% | | 19.72% | | N/A | | N/A | |
| | | | | | | | | | | | | | | | | | |
| * The gross expense ratio shown is from the Fund's prospectus dated December 30, 2013. | |
| | | | | | | | | | | | | | | | | | |
| Performance quoted above represents past performance, which is no guarantee of future results. Investment return and principal value will fluctuate so that shares, when redeemed, may be worth more or less than their original cost. Current performance may be lower or higher than the performance data quoted. An investor may obtain performance data, current to the most recent month-end, by visiting ncfunds.com. |
| | | | | | | | | | | | | | | | | | |
| The graph and table do not reflect the deduction of taxes that a shareholder would pay on Fund distributions or the redemption of Fund shares. Average annual total returns are historical in nature and measure net investment income and capital gain or loss from portfolio investments assuming reinvestments of distributions. |
| | | | | | | | | | | | | | | | | | |
| | | | | | | | | | | | | | | | | | |
| ROUMELL OPPORTUNISTIC VALUE FUND | | | | | | |
| | | | | | | | | | |
| Schedule of Investments | | | | | | | |
| | | | | | | | | | |
| As of August 31, 2014 | | | | | | | |
| | | | | | Shares | | Cost | | Value (Note 1) |
| | | | | | | | | | |
| COMMON STOCKS - 53.90% | | | | | | | |
| | | | | | | | | | |
| Business Services - 12.43% | | | | | | | |
| * | Rosetta Stone, Inc. | | | 278,530 | $ | 2,807,880 | $ | 2,437,138 |
| * | Sizmek, Inc. | | | 348,570 | | 3,285,245 | | 3,067,416 |
| | | | | | | | | | 5,504,554 |
| Consumer Discretionary - 6.03% | | | | | | |
| * | Aeropostale, Inc. | | | 96,420 | | 845,348 | | 404,000 |
| | Apple, Inc. | | | 8,770 | | 549,867 | | 898,925 |
| | Samsung Electronics Co. Ltd. | | 1,360 | | 1,425,398 | | 1,368,209 |
| | | | | | | | | | 2,671,134 |
| Energy - 7.64% | | | | | | | |
| * | Athabasca Oil Corp. | | | 69,000 | | 467,906 | | 502,649 |
| * | BPZ Resources, Inc. | | | 856,970 | | 2,262,324 | | 2,099,577 |
| * | Gordon Creek Energy, Inc. | | | 27,566 | | 52,224 | | 1,648 |
| * | InterOil Corp. | | | 6,900 | | 347,393 | | 418,485 |
| * | Village Main Reef Ltd. | | | 8,925,000 | | 335,666 | | 360,034 |
| | | | | | | | | | 3,382,393 |
| Health Care - 2.76% | | | | | | | |
| * | Itamar Medical Ltd. | | | 215,000 | | 92,837 | | 124,928 |
| | Transcept Pharmaceuticals, Inc. | | 498,550 | | 1,345,992 | | 1,096,810 |
| | | | | | | | | | 1,221,738 |
| Information Technology - 17.23% | | | | | | |
| | Compuware Corp. | | | 64,390 | | 650,782 | | 602,046 |
| * | Covisint Corp. | | | 111,890 | | 771,086 | | 538,191 |
| * | DSP Group, Inc. | | | 188,270 | | 1,311,443 | | 1,690,665 |
| * | EnerNOC, Inc. | | | 62,200 | | 1,178,944 | | 1,221,608 |
| * | Quantum Corp. | | | 410,130 | | 479,321 | | 512,663 |
| * | SeaChange International, Inc. | | | 404,510 | | 3,769,729 | | 3,070,231 |
| | | | | | | | | | 7,635,404 |
| Materials - 1.08% | | | | | | | |
| * | Colossus Minerals, Inc. | | | 1,159,672 | | 1,670,855 | | 150,758 |
| * | The Phaunos Timber Fund | | | 821,000 | | 316,342 | | 328,727 |
| | | | | | | | | | 479,485 |
| | | | | | | | | | |
| | | | | | | | | | |
| | | | | | | | | | (Continued) |
| ROUMELL OPPORTUNISTIC VALUE FUND | | | | | | |
| | | | | | | | | | |
| Schedule of Investments - Continued | | | | | | | |
| | | | | | | | | | |
| As of August 31, 2014 | | | | | | | |
| | | | | | Shares | | Cost | | Value (Note 1) |
| | | | | | | | | | |
| Real Estate - 6.73% | | | | | | | |
| * | Keck Seng Investments | | | 660,000 | | $ 559,221 | $ | 579,089 |
| * | Lai Sun Development Company Ltd. | | 52,363,000 | | 1,470,879 | | 1,364,798 |
| * | WCI Communities, Inc. | | | 52,000 | | 947,175 | | 1,037,400 |
| | | | | | | | | | 2,981,287 |
| | | | | | | | | | |
| | Total Common Stocks (Cost $26,943,857) | | | | | | 23,875,995 |
| | | | | | | | | | |
| CLOSED-END FUND - 2.90% | | | | | | | |
| | American Select Portfolio | | | 120,160 | | 1,152,342 | | 1,284,510 |
| | | | | | | | | | |
| | Total Closed-End Fund (Cost $1,152,342) | | | | | | 1,284,510 |
| | | | Shares | | Dividend Rate | | Maturity Date | | |
| PREFERRED STOCKS - 7.64% | | | | | | |
| | MVC Capital, Inc. | 33,950 | | 7.250% | | 1/15/2023 | | 870,478 |
| | Oxford Lane Capital Corp. | 65,000 | | 8.500% | | 12/31/2017 | | 1,677,000 |
| | SandRidge Energy, Inc. | 8,200 | | 8.500% | | 12/31/2049 | | 836,400 |
| | | | | | | | | | 3,383,878 |
| | | | | | | | | | |
| | Total Preferred Stocks (Cost $3,315,132) | | | | | | 3,383,878 |
| | | | Par | | Interest Rate | | Maturity Date | | |
| CONVERTIBLE BOND - 2.07% | | | | | | | |
| | Tower Group International Ltd. | $ | 966,000 | | 5.000% | | 9/15/2014 | | 915,889 |
| | | | | | | | | | 915,889 |
| | | | | | | | | | |
| | Total Convertible Bond (Cost $964,650) | | | | | | 915,889 |
| | | | | | | | | | |
| CORPORATE BONDS - 9.63% | Par | | Interest Rate | | Maturity Date | | |
| ᶐ | Athabasca Oil Corp. | 1,319,000 | | 7.500% | | 11/19/2017 | | 1,201,076 |
| | Clayton Williams Energy, Inc. | $ | 841,000 | | 7.750% | | 4/1/2019 | | 887,255 |
| | Goodrich Petroleum Corp. | 1,304,000 | | 8.875% | | 3/15/2019 | | 1,369,200 |
| | Resolute Energy Corp. | 786,000 | | 8.500% | | 5/1/2020 | | 809,580 |
| | | | | | | | | | 4,267,111 |
| | | | | | | | | | |
| | Total Corporate Bonds (Cost $4,115,997) | | | | | | 4,267,111 |
| | | | | | | | | | |
| | | | | | | | | | (Continued) |
| ROUMELL OPPORTUNISTIC VALUE FUND | | | | | | |
| | | | | | | | | | |
| Schedule of Investments - Continued | | | | | | | |
| | | | | | | | | | |
| As of August 31, 2014 | | | | | | | |
| | | | | | | | | | Value (Note 1) |
| WARRANT - 0.01% | Shares | | Strike Price | | Exercise Date | | |
| | Colossus Minerals, Inc. (a) | 580,998 | | $ 1.00 | | 3/17/2019 | $ | 5,810 |
| | | | | | | | | | |
| | Total Warrant (Cost $0) | | | | | | | 5,810 |
| | | | | | | | | | |
| SHORT-TERM INVESTMENT - 24.96% | | | | Shares | | |
| § | Federated Treasury Obligations Fund, 0.01% | | 11,056,609 | $ | 11,056,609 |
| | | | | | | | | | |
| | Total Short-Term Investment (Cost $11,056,609) | | | | 11,056,609 |
| | | | | | | | | | |
| Total Value of Investments (Cost $47,548,587) - 101.11% | | | $ | 44,789,802 |
| | | | | | | | | | |
| Liabilities in Excess of Other Assets - (1.11)% | | | | | | (492,026) |
| | | | | | | | | | |
| Net Assets - 100.00% | | | | | | $ | 44,297,776 |
| | | | | | | | | | |
| | * | Non-income producing investment | | | | | | |
| | § | Represents 7 day effective yield | | | | | | |
| | ᶐ | Rule 144-A Security | | | | | | | |
| | | | | | | | | | |
| | (a) | Security is fair valued and represents 0.01% of net assets. | | |
| | | | | | | | | | |
| | | | | | | | | | |
| | | | | | | | | | |
| | | | | | | | | | |
| | | | | | | | | | |
| | | | | | | | | | |
| | | | | | | | | | |
| | | | | | | | | | |
| | | | | | | | | | |
| | | | | | | | | | |
| | | | | | | | | | |
| | | | | | | | | | |
| | | | | | | | | | |
| | | | | | | | | | |
| | | | | | | | | | |
| | | | | | | | | | |
| | | | | | | | | | (Continued) |
| ROUMELL OPPORTUNISTIC VALUE FUND | | | | | | |
| | | | | | | | | | |
| Schedule of Investments - Continued | | | | | | | |
| | | | | | | | | | |
| As of August 31, 2014 | | | | | | | |
| | | | | | | | | | |
| | | | | | | | | | |
| | | | | | | | | | |
| | | Summary of Investments | | | | | | | |
| | | | | | % of Net | | | | |
| | | Sector | | | Assets | | Value | | |
| | | Business Services | | | 12.43% | $ | 5,504,554 | | |
| | | Consumer Discretionary | | | 6.03% | | 2,671,134 | | |
| | | Energy | | | 7.64% | | 3,382,393 | | |
| | | Health Care | | | 2.76% | | 1,221,738 | | |
| | | Information Technology | | | 17.23% | | 7,635,404 | | |
| | | Materials | | | 1.08% | | 479,485 | | |
| | | Real Estate | | | 6.73% | | 2,981,287 | | |
| | | Closed-End Fund | | | 2.90% | | 1,284,510 | | |
| | | Preferred Stocks | | | 7.64% | | 3,383,878 | | |
| | | Convertible Bond | | | 2.07% | | 915,889 | | |
| | | Corporate Bonds | | | 9.63% | | 4,267,111 | | |
| | | Warrant | | | 0.01% | | 5,810 | | |
| | | Short-Term Investment | | | 24.96% | | 11,056,609 | | |
| | | Liabilities in Excess of Other Assets | | -1.11% | | (492,026) | | |
| | | Total | | | 100.00% | $ | 44,297,776 | | |
| | | | | | | | | | |
| | | | | | | | | | |
| | | | | | | | | | |
| | | | | | | | | | |
| | | | | | | | | | |
| | | | | | | | | | |
| | | | | | | | | | |
| | | | | | | | | | |
| | | | | | | | | | |
| | | | | | | | | | |
| | | | | | | | | | |
| | | | | | | | | | |
| | | | | | | | | | |
| | | | | | | | | | |
| | | | | | | | | | |
| | | | | | | | | | |
| | | | | | | | | | |
| | | | | | | | | | |
| | | | | | | | | | |
| | | | | | | | | | |
| | | | | | | | | | |
| See Notes to Financial Statements | | | | | | | |
| | | | | | | | | | |
| ROUMELL OPPORTUNISTIC VALUE FUND | | |
| | | | | | | |
| Statement of Assets and Liabilities | | |
| | | | | | | |
| As of August 31, 2014 | | | |
| | | | | | | |
| Assets: | | | | | |
| Investments, at value (cost $47,548,587) | $ | 44,789,802 |
| Cash | | | | | 25,442 |
| Receivables: | | | |
| | Fund shares sold | | | 1,409 |
| | Dividends and interest | | 151,360 |
| Total assets | | | 44,968,013 |
| | | | | | | |
| Liabilities: | | | | |
| Payables: | | | | |
| | Investments purchased | | 571,345 |
| | Fund shares repurchased | | 49,845 |
| Accrued expenses | | | |
| | Advisory fees | | | 34,933 |
| | Administration fees | | 11,771 |
| | Distribution and service fees - Class A Shares and Class C Shares | | 2,343 |
| Total liabilities | | | 670,237 |
| | | | | | | |
| Net Assets | | | $ | 44,297,776 |
| | | | | | | |
| Net Assets Consist of: | | | |
| Paid in Beneficial Interest | $ | 43,569,746 |
| Undistributed net investment income | | 360,883 |
| Accumulated net realized gain on investments | | 3,125,932 |
| Net unrealized depreciation on investments | | (2,758,785) |
| Total Net Assets | | $ | 44,297,776 |
| Institutional Class Shares of beneficial interest outstanding, no par value (a) | | 3,793,543 |
| Net Assets | | $ | 39,841,966 |
| Net Asset Value, Offering Price and Redemption Price Per Share (b) | $ | 10.50 |
| Class A Shares of beneficial interest outstanding, no par value (a) | | 193,682 |
| Net Assets | | $ | 2,022,224 |
| Net Asset Value and Redemption Price Per Share (b) | $ | 10.44 |
| Offering Price Per Share ($10.44 ÷ 95.50%) | $ | 10.93 |
| Class C Shares of beneficial interest outstanding, no par value (a) | | 263,891 |
| Net Assets | | $ | 2,433,586 |
| Net Asset Value, Offering Price and Redemption Price Per Share (b)(c) | $ | 9.22 |
| | | | | | | |
| (a) | Unlimited Authorized Shares | | |
| (b) | The fund charges a 1% redemption fee on redemptions made within 60 days of initial purchase. |
| (c) | Contingent deferred sales charge for Class C Shares is imposed on proceeds redeemed within |
| one year of purchase date (note 1). | | |
| | | | | | | |
| See Notes to Financial Statements | | |
| ROUMELL OPPORTUNISTIC VALUE FUND | | |
| | | | | | | |
| Statement of Operations | | |
| | | | | | | |
| | | | | | | |
| For the Year ended August 31, 2014 | | |
| | | | | | | |
| Investment Income: | | |
| Interest | | | $ | 691,231 |
| Dividends (net of foreign taxes withheld of $3,780) | | 404,589 |
| | | | | | | |
| Total Investment Income | | 1,095,820 |
| | | | | | | |
| Expenses: | | | | |
| Advisory fees (note 2) | | 403,478 |
| Administration fees (note 2) | | 135,955 |
| Distribution and service fees - Class A Shares (note 3) | | 6,286 |
| Distribution and service fees - Class C Shares (note 3) | | 20,394 |
| | | | | | | |
| Total Expenses | | 566,113 |
| | | | | | | |
| Net Investment Income | | 529,707 |
| | | | | | | |
| Realized and Unrealized Gain (Loss) on Investments: | | |
| | | | | | | |
| | Net realized gain from investments and foreign currency transactions | | 3,036,028 |
| | Distributions of net realized gains from underlying investment companies | 51,058 |
| Total realized gain | | 3,087,086 |
| | | | | | | |
| Net change in unrealized appreciation on investments and translation of | | |
| | assets and liabilities in foreign currency | | (3,774,240) |
| | | | | | | |
| Net Realized and Unrealized Gain (Loss) on Investments | | (687,154) |
| | | | | | | |
| Net Decrease in Net Assets Resulting from Operations | $ | (157,447) |
| | | | | | | |
| | | | | | | |
| | | | | | | |
| | | | | | | |
| | | | | | | |
| | | | | | | |
| | | | | | | |
| | | | | | | |
| | | | | | | |
| See Notes to Financial Statements | | |
| ROUMELL OPPORTUNISTIC VALUE FUND | | | | |
| | | | | | | | | | | |
| Statements of Changes in Net Assets | | | | | | |
| | | | | | | | | | | |
| | | | | | | | | | | |
| For the Year ended August 31, | | | | | 2014 | | 2013 |
| | | | | | | | | | | |
| Operations: | | | | | | | | |
| Net investment income | | | | $ | 529,707 | $ | 77,321 |
| Net realized gain from investments and foreign | | | | |
| | currency transactions | | | | | 3,036,028 | | 2,676,127 |
| Distributions of net realized gains from underlying investment | | |
| | companies | | | | | 51,058 | | - |
| | Net change in unrealized appreciation (depreciation) on | | | | |
| | on investments and translation of assets and liabilities | | | | |
| | in foreign currency | | | | | (3,774,240) | | 1,924,396 |
| | | | | | | | | | | |
| Net (Decrease) Increase in Net Assets Resulting from Operations | (157,447) | | 4,677,844 |
| | | | | | | | | | | |
Distributions to Shareholders: (note 5) | | | | | | |
| Net investment income | | | | | | | |
| | Institutional Class Shares | | | | (131,223) | | (169,985) |
| | Class A Shares | | | | | (4,611) | | (11,086) |
| | Class C Shares | | | | | (5,882) | | - |
| | | | | | | | | | | |
| Net realized gains | | | | | | | |
| | Institutional Class Shares | | | | (2,142,814) | | - |
| | Class A Shares | | | | | (147,821) | | - |
| | Class C Shares | | | | | (114,528) | | - |
| | | | | | | | | | | |
| Decrease in Net Assets Resulting from Distributions | | (2,546,879) | | (181,071) |
| | | | | | | | | | | |
| Beneficial Interest Transactions: | | | | | | |
| Shares sold | | | | | 26,903,496 | | 17,785,572 |
| Redemption fees | | | | | 1,675 | | 344 |
| Reinvested dividends and distributions | | | | 2,045,628 | | 161,618 |
| Shares repurchased | | | | | (18,733,750) | | (5,334,117) |
| | | | | | | | | | | |
| Increase from Beneficial Interest Transactions | | 10,217,049 | | 12,613,417 |
| | | | | | | | | | | |
| Net Increase in Net Assets | | | | | 7,512,723 | | 17,110,190 |
| | | | | | | | | | | |
| Net Assets: | | | | | | | | |
| Beginning of Year | | | | | 36,785,053 | | 19,674,863 |
| End of Year | | | | $ | 44,297,776 | $ | 36,785,053 |
| | | | | | | | | | | |
| Undistributed Net Investment Income | | | $ | 360,883 | $ | 1,842 |
| See Notes to Financial Statements | | | | | | (Continued) |
| ROUMELL OPPORTUNISTIC VALUE FUND | | | | |
| | | | | | | | | | | |
| Statements of Changes in Net Assets (continued) | | | | | | |
| | | | | | | | | | | |
| | | | | | | | | | | |
| For the Year ended August 31, | 2014 | | | | 2013 | | |
| | | | | | | | | | | |
| Share Information: | | | | | | | |
| Institutional Class Shares | Shares | | Amount | | Shares | | Amount |
| | Shares sold | 2,231,388 | $ | 24,030,091 | | 1,513,598 | $ | 16,237,651 |
| | Redemption fees | - | | 1,548 | | - | | 344 |
| | Reinvested dividends | | | | | | | |
| | | and distributions | 171,100 | | 1,774,205 | | 15,546 | | 150,992 |
| | Shares repurchased | (1,622,933) | | (17,179,993) | | (476,166) | | (5,206,363) |
| Net Increase in Beneficial | | | | | | | |
| Interest and Shares | 779,555 | $ | 8,625,851 | | 1,052,978 | $ | 11,182,624 |
| | | | | | | | | | | |
| Class A Shares | Shares | | Amount | | Shares | | Amount |
| | Shares sold | 78,347 | $ | 827,249 | | 87,457 | $ | 927,154 |
| | Redemption fees | - | | 127 | | - | | - |
| | Reinvested dividends | | | | | | | |
| | | and distributions | 14,647 | | 151,013 | | 1,097 | | 10,626 |
| | Shares repurchased | (129,323) | | (1,347,764) | | (12,217) | | (127,754) |
| Net Increase (Decrease) in | | | | | | | |
| Beneficial Interest and Shares | (36,329) | $ | (369,375) | | 76,337 | $ | 810,026 |
| | | | | | | | | | | |
| Class C Shares | Shares | | Amount | | Shares | | Amount |
| | Shares sold | 211,343 | $ | 2,046,156 | | 61,762 | $ | 620,767 |
| | Reinvested dividends | | | | | | | |
| | | and distributions | 13,132 | | 120,410 | | - | | - |
| | Shares repurchased | (22,346) | | (205,993) | | - | | - |
| Net Increase in Beneficial | | | | | | | |
| Interest and Shares | 202,129 | $ | 1,960,573 | | 61,762 | $ | 620,767 |
| | | | | | | | | | | |
| | | | | | | | | | | |
| | | | | | | | | | | |
| | | | | | | | | | | |
| | | | | | | | | | | |
| | | | | | | | | | | |
| | | | | | | | | | | |
| | | | | | | | | | | |
| | | | | | | | | | | |
| | | | | | | | | | | |
| | | | | | | | | | | |
| See Notes to Financial Statements | | | | | | |
| ROUMELL OPPORTUNISTIC VALUE FUND | | | | | | | |
| | | | | | | | | | | | | |
| Financial Highlights | | | | | | | | | |
| | | | | | | | | | | | | |
| For a share outstanding during the | | Institutional Class Shares |
| fiscal year or period ended August 31, | | 2014 | | 2013 | | 2012 | | 2011 (d) | |
| | | | | | | | | | | | | |
| Net Asset Value, Beginning of Period | $ | 11.15 | $ | 9.31 | $ | 9.42 | $ | 10.00 | |
| | | | | | | | | | | | | |
| Income (Loss) from Investment Operations | | | | | | | | | |
| Net investment income | | 0.13 | | 0.03 | | 0.09 | | 0.03 | |
| Net realized and unrealized gain (loss) | | | | | | | | | |
| | on investments | | (0.16) | | 1.89 | | (0.13) | | (0.61) | |
| Total from Investment Operations | | (0.03) | | 1.92 | | (0.04) | | (0.58) | |
| | | | | | | | | | | | | |
| Less Distributions: | | | | | | | | | |
| From net investment income | | (0.03) | | (0.08) | | (0.07) | | - | |
| From realized gains | | (0.59) | | - | | - | | - | |
| Total Distributions | | (0.62) | | (0.08) | | (0.07) | | - | |
| | | | | | | | | | | | | |
| Paid in Beneficial Interest: | | | | | | | | | |
From redemption fees (note 1) | | 0.00 | (e) | 0.00 | (e) | 0.00 | (e) | - | |
| Total Paid in Beneficial Interest | | 0.00 | (e) | 0.00 | (e) | 0.00 | (e) | - | |
| | | | | | | | | | | | | |
| Net Asset Value, End of Period | $ | 10.50 | $ | 11.15 | $ | 9.31 | $ | 9.42 | |
| | | | | | | | | | | | | |
| Total Return | | (0.12)% | (c) | 20.71% | (c) | (0.36)% | | (5.80)% | (b) |
| | | | | | | | | | | | | |
| Net Assets, End of Period (in thousands) | $ | 39,842 | $ | 33,617 | $ | 18,249 | $ | 12,368 | |
| | | | | | | | | | | | | |
| Ratios of: | | | | | | | | | | |
| Total Expenses to Average Net Assets | | 1.23% | | 1.23% | | 1.23% | | 1.23% | (a) |
| Net Investment Income to Average Net Assets | 1.27% | | 0.31% | | 1.10% | | 1.08% | (a) |
| | | | | | | | | | | | | |
| Portfolio turnover rate | | 92.74% | | 77.73% | | 49.34% | | 33.08% | (b) |
| | | | | | | | | | | | | |
| (a) | Annualized. | | | | | | | | | |
| (b) | Not annualized. | | | | | | | | | |
| (c) | Includes adjustments in accordance with accounting principles generally accepted in the United |
| States of America and, consequently, the net asset value for financial reporting purposes and |
| the returns based upon those net asset values may differ from the net asset values and returns |
| for shareholder transactions. | | | | | | | | | |
| (d) | For a share outstanding for the initial period from December 31, 2010 (Date of Initial Public |
| Investment) to August 31, 2011. | | | | | | | | | |
| (e) | Actual amount is less than $0.01 per share. | | | | | | | |
| | | | | | | | | | | | | |
| | | | | | | | | | | | | |
| See Notes to Financial Statements | | | | | | | | (Continued) |
ROUMELL OPPORTUNISTIC VALUE FUND
| Financial Highlights | | | | | | | | | |
| | | | | | | | | | | | | |
| For a share outstanding during the | | Class A Shares |
| fiscal year or period ended August 31, | | 2014 | | 2013 | | 2012 | | 2011 (e) | |
| | | | | | | | | | | | | |
| Net Asset Value, Beginning of Period | $ | 11.10 | $ | 9.28 | $ | 9.41 | $ | 10.00 | |
| | | | | | | | | | | | | |
| Income (Loss) from Investment Operations | | | | | | | | | |
| Net investment income | | 0.12 | | 0.01 | | 0.08 | | 0.03 | |
| Net realized and unrealized gain (loss) | | | | | | | | | |
| | on investments | | (0.17) | | 1.88 | | (0.15) | | (0.62) | |
| Total from Investment Operations | | (0.05) | | 1.89 | | (0.07) | | (0.59) | |
| | | | | | | | | | | | | |
| Less Distributions: | | | | | | | | | |
| From net investment income | | (0.02) | | (0.07) | | (0.06) | | - | |
| From realized gains | | (0.59) | | - | | - | | - | |
| Total Distributions | | (0.61) | | (0.07) | | (0.06) | | - | |
| | | | | | | | | | | | | |
| Paid in Beneficial Interest: | | | | | | | | | |
From redemption fees (note 1) | | 0.00 | (f) | - | | 0.00 | (f) | - | |
| Total Paid in Beneficial Interest | | 0.00 | (f) | - | | 0.00 | (f) | - | |
| | | | | | | | | | | | | |
| Net Asset Value, End of Period | $ | 10.44 | $ | 11.10 | $ | 9.28 | $ | 9.41 | |
| | | | | | | | | | | | | |
| Total Return (c) | | (0.38)% | (d) | 20.46% | (d) | (0.56)% | | (6.00)% | (b) |
| | | | | | | | | | | | | |
| Net Assets, End of Period (in thousands) | $ | 2,022 | $ | 2,553 | $ | 1,426 | $ | 1,674 | |
| | | | | | | | | | | | | |
| Ratios of: | | | | | | | | | | |
| Total Expenses to Average Net Assets | | 1.48% | | 1.48% | | 1.48% | | 1.48% | (a) |
| Net Investment Income to Average Net Assets | 1.02% | | 3.00% | | 0.89% | | 0.73% | (a) |
| | | | | | | | | | | | | |
| Portfolio turnover rate | | 92.74% | | 77.73% | | 49.34% | | 33.08% | (b) |
| | | | | | | | | | | | | |
| (a) | Annualized. | | | | | | | | | |
| (b) | Not annualized. | | | | | | | | | |
| (c) | Total return does not reflect sales charge, if any. | | | | | | | |
| (d) | Includes adjustments in accordance with accounting principles generally accepted in the United |
| States of America and, consequently, the net asset value for financial reporting purposes and | |
| the returns based upon those net asset values may differ from the net asset values and returns | |
| for shareholder transactions. | | | | | | | | | |
| (e) | For a share outstanding for the initial period from December 31, 2010 (Date of Initial Public | |
| Investment) to August 31, 2011. | | | | | | | | | |
| (f) | Actual amount is less than $0.01 per share. | | | | | | | | |
| | | | | | | | | | | | | |
| See Notes to Financial Statements | | | | | | | | (Continued) |
| ROUMELL OPPORTUNISTIC VALUE FUND | | | | | |
| | | | | | | | | |
| Financial Highlights | | | | | |
| | | | | | | | | |
| For a share outstanding during the | | Class C Shares |
| fiscal year or period ended August 31, | | 2014 | | 2013 | (e) |
| | | | | | | | | |
| Net Asset Value, Beginning of Period | $ | 9.95 | $ | 10.00 | |
| | | | | | | | | |
| Income (Loss) from Investment Operations | | | | | |
| Net investment income (loss) | | 0.03 | | (0.01) | |
| Net realized and unrealized loss on investments | | (0.15) | | (0.04) | |
| Total from Investment Operations | | (0.12) | | (0.05) | |
| | | | | | | | | |
| Less Distributions: | | | | | |
| From net investment income | | (0.02) | | - | |
| From realized gains | | (0.59) | | - | |
| Total Distributions | | (0.61) | | - | |
| | | | | | | | | |
| Net Asset Value, End of Period | $ | 9.22 | $ | 9.95 | |
| | | | | | | | | |
| Total Return (c) | | (1.09)% | (d) | (0.50)% | (b)(d) |
| | | | | | | | | |
| Net Assets, End of Period (in thousands) | $ | 2,434 | $ | 615 | |
| | | | | | | | | |
| Ratios of: | | | | | | | |
| Total Expenses to Average Net Assets | | 2.23% | | 2.23% | (a) |
| Net Investment Income (Loss) to Average Net Assets | | 0.27% | | (1.20)% | (a) |
| | | | | | | | | |
| Portfolio turnover rate | | 92.74% | | 77.73% | (b) |
| | | | | | | | | |
| (a) | Annualized. | | | | | |
| (b) | Not annualized. | | | | | |
| (c) | Total return does not reflect sales charge, if any. | | | | | |
| (d) | Includes adjustments in accordance with accounting principles generally accepted in the United | |
| States of America and, consequently, the net asset value for financial reporting purposes and | | |
| the returns based upon those net asset values may differ from the net asset values and returns | | |
| for shareholder transactions. | | | | | |
| (e) | For a share outstanding for the initial period from July 30, 2013 (Date of Initial Public | | | |
| Investment) to August 31, 2013. | | | | | |
| | | | | | | | | |
| | | | | | | | | |
| | | | | | | | | |
| | | | | | | | | |
| | | | | | | | | |
| See Notes to Financial Statements | | | | | |
ROUMELL OPPORTUNISTIC VALUE FUND
Notes to Financial Statements
| 1. | Organization and Significant Accounting Policies |
The Roumell Opportunistic Value Fund ("Fund") is a series of the Starboard Investment Trust ("Trust"). The Trust is organized as a Delaware statutory trust and is registered under the Investment Company Act of 1940, as amended (the "1940 Act"), as an open-end management investment company. The Fund is a separate non-diversified series of the Trust.
The Fund commenced operations on December 31, 2010. The investment objective of the Fund is to seek capital appreciation and income. Roumell Asset Management, LLC ("Roumell Asset Management" or the "Advisor") seeks to achieve the Fund's investment objective by using an opportunistic investment strategy. The Advisor is an opportunistic capital allocator (OCA) with a deep value bias in selecting individual securities. The Advisor will wait until an investment situation is presented where, in its opinion, the odds of success are favorable relative to the risks. In the absence of such situations, the Fund will stay liquid and on the sidelines invested in Cash and Cash Equivalents. The Advisor's approach to opportunistic investing emphasizes purchasing securities at a meaningful, quantifiable discount to its calculation of intrinsic value taking into consideration the understandability of the business model, the safety of the capital structure, and the competency of the company's management. Using this opportunistic strategy, however, may result in the Advisor finding many suitable investment opportunities for the Fund during certain periods, but finding very few during other periods.
The Fund currently has an unlimited number of authorized shares, which are divided into three classes - Institutional Class Shares, Class A Shares, and Class C Shares. Each class of shares has equal rights as to assets of the Fund, and the classes are identical except for differences in sales charges and ongoing distribution and service fees. Class A Shares are subject to an initial sales charge of 4.50%. Class C Shares are subject to a contingent deferred sales charge of 1% of the proceeds redeemed within one year of the purchase date. Class A Shares and Class C Shares are subject to distribution plan fees, which are further discussed in Note 3. All share classes are subject to redemption fees within 60 days of the issuance of such shares of 1.00%. Income, expenses (other than distribution and service fees), and realized and unrealized gains or losses on investments are allocated to each class of shares based upon its relative net assets. All classes have equal voting privileges, except where otherwise required by law or when the Trustees determine that the matter to be voted on affects only the interests of the shareholders of a particular class.
(Continued)
ROUMELL OPPORTUNISTIC VALUE FUND
Notes to Financial Statements
The following accounting policies have been consistently followed by the Fund and are in conformity with accounting principles generally accepted in the United States of America ("GAAP").
Investment Valuation
The Fund's investments in securities are carried at value. Securities listed on an exchange or quoted on a national market system are valued at the last sales price as of 4:00 p.m. Eastern Time. Securities traded in the NASDAQ over-the-counter market are generally valued at the NASDAQ Official Closing Price. Other securities traded in the over-the-counter market and listed securities for which no sale was reported on that date are valued at the most recent bid price. Securities and assets for which representative market quotations are not readily available (e.g., if the exchange on which the security is principally traded closes early or if trading of the particular security is halted during the day and does not resume prior to the Fund's net asset value calculation) or which cannot be accurately valued using the Fund's normal pricing procedures are valued at fair value as determined in good faith under policies approved by the Trustees. A security's "fair value" price may differ from the price next available for that security using the Fund's normal pricing procedures. Instruments with maturities of 60 days or less are valued at amortized cost, which approximates market value.
Fair Value Measurement
Various inputs are used in determining the value of the Fund's investments. These inputs are summarized in the three broad levels listed below:
Level 1: quoted prices in active markets for identical securities
Level 2: other significant observable inputs (including quoted prices for similar securities, interest rates, credit risk, etc.)
Level 3: significant unobservable inputs (including the Fund's own assumptions in determining fair value of investments)
The availability of observable inputs can vary from security to security and is affected by a wide variety of factors, including, for example, the type of security, whether the security is new and not yet established in the marketplace, the liquidity of markets, and other characteristics particular to the security. To the extent that valuation is based on models or inputs that are less observable or unobservable in the market, the determination of fair value requires more judgment. Accordingly, the degree of judgment exercised in determining fair value is greatest for instruments categorized in Level 3.
(Continued)
ROUMELL OPPORTUNISTIC VALUE FUND
Notes to Financial Statements
The inputs used to measure fair value may fall into different levels of the fair value hierarchy. In such cases, for disclosure purposes, the level in the fair value hierarchy within which the fair value measurement falls in its entirety, is determined based on the lowest level input that is significant to the fair value measurement in its entirety.
The inputs or methodology used for valuing securities are not necessarily an indication of the risk associated with investing in those securities. The following table summarizes the inputs as of August 31, 2014 for the Fund's assets measured at fair value:
| Investments in Securities (a) | | Total | | Level 1 | | Level 2 | | Level 3(b) |
| Common Stocks* | $ | | 23,875,995 | $ | | 23,725,237 | $ | | 150,758 - | $ | | - - |
| Closed-End Fund | | 1,284,510 | | 1,284,510 | | - - | | - - |
| Preferred Stocks | | 3,383,878 | | 1,706,878 | | 1,677,000- | | - - |
| Convertible Bond | | 915,889 | | - | | 915,889 | | - - |
| Corporate Bonds | | 4,267,111 | | - | | 4,267,111 | | - |
| Warrant | | 5,810 | | - | | - | | 5,810 |
| Short-Term Investment | | 11,056,609 | | 11,056,609 | | - | | - - |
| Total | $ | 44,789,802 | $ | 37,773,234 | $ | 7,010,758 | $ | 5,810 |
*Refer to Schedule of Investments for breakdown by Sector
(a) As of August 31, 2014, $1,677,000 transferred from Level 1 to Level 2 based on the valuation input levels assigned to securities on August 31, 2013. This was a result of the security transferring from an active market at the time of pricing to an inactive market. It is the Fund's policy to record transfers at the end of the year.
(b) At the beginning and the end of the reporting period, Level 3 investments were not considered a material portion of the Fund.
Foreign Currency Translation
Portfolio securities and other assets and liabilities denominated in foreign currencies are translated into U.S. dollars based on the exchange rate of such currencies against U.S. dollars on the date of valuation. Purchases and sales of securities and income items denominated in foreign currencies are translated into U.S. dollars at the exchange rate in effect on the transaction date.
(Continued)
ROUMELL OPPORTUNISTIC VALUE FUND
Notes to Financial Statements
The Fund does not separately report the effect of changes in foreign exchange rates from changes in market prices on securities held. Such changes are included in net realized and unrealized gain or loss from investments.
Realized foreign exchange gains or losses arise from sales of foreign currencies, currency gains or losses realized between the trade and settlement dates on securities transactions and the difference between the recorded amounts of dividends, interest, and foreign withholding taxes, and the U.S. dollar equivalent of the amounts actually received or paid. Net unrealized foreign exchange gains and losses arise from changes in foreign exchange rates on foreign denominated assets and liabilities other than investments in securities held at the end of the reporting period.
Investment Transactions and Investment Income
Investment transactions are accounted for as of the date purchased or sold (trade date). Dividend income is recorded on the ex-dividend date. Certain dividends from foreign securities will be recorded as soon as the Fund is informed of the dividend if such information is obtained subsequent to the ex-dividend date. Interest income is recorded on the accrual basis and includes accretion of discounts and amortization of premiums. Gains and losses are determined on the identified cost basis, which is the same basis used for federal income tax purposes.
Expenses
The Fund bears expenses incurred specifically on its behalf as well as a portion of general expenses, which are allocated according to methods reviewed annually by the Trustees.
Distributions
The Fund may declare and distribute dividends from net investment income (if any) quarterly. Distributions from capital gains (if any) are generally declared and distributed annually. Dividends and distributions to shareholders are recorded on ex-date.
Estimates
The preparation of financial statements in conformity with accounting principles generally accepted in the United States of America requires management to make estimates and assumptions that affect the reported amounts of assets and liabilities and disclosure of contingent assets and liabilities at the date of the financial statements and the reported amounts of increases and decreases in the net assets from operations during the reported period. Actual results could differ from those estimates.
(Continued)
ROUMELL OPPORTUNISTIC VALUE FUND
Notes to Financial Statements
Fees on Redemptions
The Fund charges a redemption fee of 1.00% on redemptions of Fund shares occurring within 60 days following the issuance of such shares. The redemption fee is not a fee to finance sales or sales promotion expenses, but is paid to the Fund to defray the costs of liquidating an investor and discouraging short-term trading of the Fund's shares. No redemption fee will be imposed on the redemption of shares representing dividends or capital gains distributions, or on amounts representing capital appreciation of shares.
Federal Income Taxes
No provision for income taxes is included in the accompanying financial statements, as the Fund intends to distribute to shareholders all taxable investment income and realized gains and otherwise comply with Subchapter M of the Internal Revenue Code applicable to regulated investment companies.
| 2. | Transactions with Affiliates and Service Providers |
Advisor
As full compensation for the investment advisory services provided to the Fund, the Advisor receives a monthly fee equal to an annualized rate of 0.92% of the Fund's average daily net assets. The fee paid to the Advisor is calculated by multiplying the average daily net assets of the Fund, computed at the end of each month and payable within five days thereafter.
Administrator
Fund Accounting and Administration Agreement: The Administrator provides the Fund with administrative, fund accounting, and compliance services. The Administrator receives compensation from the Fund at a maximum annual rate of 0.31% and is responsible for the coordination and payment of vendor services and other Fund expenses from such compensation. Pursuant to this arrangement, the Administrator pays the following expenses: (i) compensation and expenses of any employees of the Trust and of any other persons rendering any services to the Fund; (ii) clerical and shareholder service staff salaries; (iii) office space and other office expenses; (iv) fees and expenses incurred by the Fund in connection with membership in investment company organizations; (v) fees and expenses of counsel to the Trustees who are not interested persons of the Fund and Trust;
(Continued)
ROUMELL OPPORTUNISTIC VALUE FUND
Notes to Financial Statements
(vi) fees and expenses of counsel to the Fund and Trust engaged to assist with preparation of Fund and Trust documents and filings and provide other ordinary legal services; (vii) fees and expenses of independent public accountants to the Fund, including fees and expense for tax preparation; (viii) expenses of registering shares under federal and state securities laws; (ix) insurance expenses; (x) fees and expenses of the custodian, shareholder servicing, dividend disbursing and transfer agent, administrator, distributor, and accounting and pricing services agents of the Fund; (xi) compensation for a chief compliance officer for the Trust; (xii) expenses, including clerical expenses, of issue, sale, redemption, or repurchase of shares of the Fund; (xiii) the cost of preparing and distributing reports and notices to shareholders; (xiv) the cost of printing or preparing prospectuses and statements of additional information for delivery to the Fund's current shareholders; (xv) the cost of printing or preparing documents, statements or reports to shareholders; and (xvi) other expenses not specifically assumed by the Fund or Advisor. The Administrator cannot recoup from the Fund any Fund expenses in excess of the administration fees payable under the Fund Accounting and Administration Agreement.
Operating Plan: The Advisor has entered into an Operating Plan with the Administrator under which it has agreed to make the following payments to the Administrator: (i) when the Fund's assets are below $77 million, the Advisor pays the Administrator a fee based on the daily average net assets of the Fund; and (ii) when the consolidated fee collected by the Administrator is less than a designated minimum operating cost, then the Advisor pays the Administrator a fee that makes up the difference. The Advisor is also obligated to pay the following Fund expenses under the Operating Plan: (i) marketing, distribution, and servicing expenses related to the sale or promotion of Fund shares that the Fund is not authorized to pay pursuant to the Investment Company Act; (ii) expenses incurred in connection with the organization and initial registration of shares of the Fund; (iii) expenses incurred in connection with the dissolution and liquidation of the Fund; (iv) expenses related to shareholder meetings and proxy solicitations; (v) fees and expenses related to legal, auditing, and accounting services that are outside of the scope of ordinary services; and (vi) hiring employees and retaining advisers and experts as contemplated by Rule 0-1(a)(7)(vii) of the Investment Company Act.
Compliance Services
Nottingham Compliance Services, LLC ("NCS"), a fully owned affiliate of the Administrator, provides services which assist the Trust's Chief Compliance Officer in monitoring and testing the policies and procedures of the Trust in conjunction with requirements under Rule 38a-1 of the 1940 Act. NCS is entitled to receive compensation from the Administrator pursuant to the Administrator's fee arrangements with the Fund.
(Continued)
ROUMELL OPPORTUNISTIC VALUE FUND
Notes to Financial Statements
In January 2014, Cipperman Compliance Services, LLC assumed providing services as the Trust's Chief Compliance Officer. Cipperman Compliance Services, LLC is entitled to receive compensation from the Administrator pursuant to the Administrator's fee arrangements with the Fund.
Transfer Agent
Nottingham Shareholder Services, LLC ("Transfer Agent") serves as transfer, dividend paying, and shareholder servicing agent for the Fund. For its services, the Transfer Agent is entitled to receive compensation from the Administrator pursuant to the Administrator's fee arrangements with the Fund.
Distributor
Capital Investment Group, Inc. (the "Distributor") serves as the Fund's principal underwriter and distributor. For its services, the Distributor is entitled to receive compensation from the Administrator pursuant to the Administrator's fee arrangements with the Fund.
Certain Trustees and officers of the Trust may also be officers of the Advisor or the Administrator.
| 3. | Distribution and Service Fees |
The Board of Trustees, including a majority of the Trustees who are not "interested persons" as defined in the 1940 Act, adopted a distribution and service plan pursuant to Rule 12b-1 of the 1940 Act (the "Plan") for the Class A Shares and Class C Shares. The 1940 Act regulates the manner in which a registered investment company may assume costs of distributing and promoting the sales of its shares and servicing of its shareholder accounts. The Plan provides that the Fund may incur certain costs, which may not exceed 0.25% per annum of the average daily net assets of the Class A Shares and 1.00% per annum of the average daily net assets of the Class C Shares for each year elapsed subsequent to adoption of the Plan, for payment to the Distributor and others for items such as advertising expenses, selling expenses, commissions, travel, or other expenses reasonably intended to result in sales of the Class A Shares and Class C Shares or servicing of Class A Shares and Class C Shares shareholder accounts.
(Continued)
ROUMELL OPPORTUNISTIC VALUE FUND
Notes to Financial Statements
| 4. | Purchases and Sales of Investment Securities |
For the fiscal year ended August 31, 2014, the aggregate cost of purchases and proceeds from sales of investment securities (excluding short-term securities) were as follows:
| Purchases of Securities | Proceeds from Sales of Securities |
| $41,567,170 | $25,979,675 |
There were no long-term purchases or sales of U.S. Government Obligations during the fiscal year ended August 31, 2014.
The following table shows the realized gains and losses that resulted from sales of securities during the fiscal year ended August 31, 2014:
| Description | | Cost ($) | | Sales Proceeds ($) | Realized Gain/(Loss) Percentage | | Realized Gain (Loss)($) |
| Apple, Inc. | | 1,647,725 | | 2,312,559 | 40.35% - | | 664,834 - |
| Apollo Group, Inc. | | 761,328 | | 962,132 | 26.38% - | | 200,804 - |
| Aeropostale, Inc. | | 764,414 | | 524,928 | (31.33)% - | | (239,486) - |
American Safety Insurance Holdings | | 82,525 | | 151,250 | 83.28% - | | 68,725 - |
| Athabasca Oil Corp.* | | 415,278 | | 389,609 | (6.18)% - | | (25,669) - |
| Cbeyond, Inc. | | 351,421 | | 499,779 | 42.22% - | | 148,358 - |
| Compuware Corp. | | 495,947 | | 471,155 | (5.00)% - | | (24,792) - |
| Cenveo Corp.** | | 946,529 | | 968,625 | 2.33% - | | 22,096 - |
| Digital Generation**** | | - | | - | - | | 408,930 |
| First Acceptance Corp. | | 426,524 | | 658,222 | 54.32% - | | 231,698 - |
| Goodrich Petroleum Corp.** | | 586,377 | | 1,127,287 | 92.25% - | | 540,910 - |
Market Vectors Gold Miners ETF | | 1,110,968 | | 944,947 | (14.94)% - | | (166,021) - |
| GMX Resources, Inc.** | | 198,316 | | 925 | (99.53)% - | | (197,391) - |
(Continued)
ROUMELL OPPORTUNISTIC VALUE FUND
Notes to Financial Statements
| QAD, Inc. | | 458,442 | | 609,538 | 32.96% | | 151,096 |
| QAD, Inc. | | 99,599 | | 132,760 | 33.29% | | 33,161 |
| Randgold Resources | | 470,698 | | 599,573 | 27.38% | | 128,875 |
Sandstorm Metals & Energy Ltd.* | | 3,058,781 | | 2,216,242 | (28.85)% | | (882,404) |
| Sandstorm Gold Ltd.* | | 1,161,642 | | 1,613,444 | 39.79% | | 462,180 |
| Seachange International, Inc. | | 1,291,665 | | 1,689,270 | 30.78% | | 397,605 |
| Sizmek, Inc. | | 457,651 | | 672,640 | 46.98% | | 214,989 |
| Stone Energy Corp.** | | 1,537,215 | | 1,489,701 | (3.09)% | | (47,514) |
| Tecumseh Products Co. | | 527,155 | | 544,363 | 3.26% | | 17,208 |
| Tecumseh Products Co. | | 790,103 | | 1,658,466 | 109.91% | | 868,363 |
| Tecumseh Products Co. | | 35,464 | | 90,686 | 155.71% | | 55,222 |
| Tesco PLC | | 1,149,962 | | 977,246 | (15.02)% | | (172,716) |
| TETRA Technologies, Inc. | | 894,196 | | 1,641,478 | 83.57% | | 747,282 |
Tower Group International Ltd. | | 1,394,170 | | 408,011 | (70.73)% | | (986,159) |
| Ultra Petroleum Corp. | | 1,508,270 | | 2,054,671 | 36.23% | | 546,401 |
Weight Watchers International, Inc. | | 701,261 | | 570,168 | (18.69)% | | (131,093) |
| Athabasca Oil Corp.*** | | 44,085 | | 44,844 | 1.72% | | 759 |
Samsung Electronics Co. Ltd.*** | | 225,660 | | 225,883 | (0.10)% | | (223) |
| Net Realized Gain | | | | | - | $ | 3,036,028 |
*Includes settlement of foreign currency sales.
**Excludes interest earned on bonds over the holding period.
***Realized gain (loss) represents fx gain (loss) on income; security was not sold during the year.
****Realized gain is due to gain on merger reclassification of $408,930.
Distributions are determined in accordance with Federal income tax regulations, which differ from generally accepted accounting principles, and, therefore, may differ significantly in amount or character from net investment income and realized gains for financial reporting purposes. Financial reporting records are adjusted for permanent book/tax differences to reflect tax character but are not adjusted for temporary differences.
(Continued)
ROUMELL OPPORTUNISTIC VALUE FUND
Notes to Financial Statements
The Fund has reviewed all taxable years / periods that are open for examination (i.e., not barred by the applicable statute of limitations) by taxing authorities of all major jurisdictions, including the Internal Revenue Service. As of August 31, 2014, open taxable years consisted of the taxable year / period ended August 31, 2011, August 31, 2012, and August 31, 2013. No examination of tax returns is currently in progress for the Fund.
Reclassifications relate primarily to differing book/tax treatment of foreign currency transactions. For the year ended August 31, 2014, the following reclassifications were made:
| Undistributed Net Investment Income | $ | (28,950) |
| Accumulated Net Realized Gain on Investments | $ | 28,950 |
Distributions during the fiscal years ended were characterized for tax purposes as follows:
| Distributions from |
For the Fiscal Years Ended | Ordinary Income | Long-Term- Capital Gains |
| 08/31/2014 | | $ 388,527 | $ | 2,158,352 |
| 08/31/2013 | | $ 181,071 | $ | - |
At August 31, 2014, the tax-basis cost of investments and components of distributable earnings were as follows:
| Cost of Investments | $ | 47,705,003 |
| | |
| Unrealized Appreciation | $ | 1,653,072 |
| Unrealized Depreciation | | (4,568,273) |
| Net Unrealized Depreciation | | (2,915,201) |
| | |
| Undistributed Ordinary Income | | 856,131 |
| Undistributed Long-Term Gains | | 2,787,100 |
| | |
| Distributable Earnings | $ | 728,030 |
(Continued)
ROUMELL OPPORTUNISTIC VALUE FUND
Notes to Financial Statements
The difference between book-basis and tax-basis net unrealized appreciation (depreciation) is attributable to the tax deferral of losses from wash sales.
| 6. | Commitments and Contingencies |
Under the Trust's organizational documents, its officers and Trustees are indemnified against certain liabilities arising out of the performance of their duties to the Fund. In addition, in the normal course of business, the Trust entered into contracts with its service providers, on behalf of the Fund, and others that provide for general indemnifications. The Fund's maximum exposure under these arrangements is unknown, as this would involve future claims that may be made against the Fund. The Fund expects risk of loss to be remote.
| 7. | Underlying Investments in Other Investment Companies |
The Fund currently invests a portion of its assets in the Federated Treasury Obligations Fund. The Fund may redeem its investment from the Federated Treasury Obligations Fund at any time if the Advisor determines that it is in the best interest of the Fund and its shareholders to do so.
The performance of the Fund may be directly affected by the performance of the Federated Treasury Obligations Fund. The financial statements of the Federated Treasury Obligations Fund, including the portfolio of investments, can be found at Federated's website, federatedinvestors.com or the Securities and Exchange Commission's website at sec.gov, and should only be read in conjunction with the Fund's financial statements. As of August 31, 2014, the percentage of the Fund's net assets invested in the Federated Treasury Obligations Fund was 24.96%.
The Fund has evaluated the need for disclosures and/or adjustments resulting from subsequent events through the date of issuance of these financial statements. This evaluation did not result in any additional subsequent events that necessitated disclosures and/or adjustments.
REPORT OF INDEPENDENT REGISTERED PUBLIC ACCOUNTING FIRM
To the Shareholders of the Roumell Opportunistic Value Fund and
The Board of Trustees of the Starboard Investment Trust
We have audited the accompanying statement of assets and liabilities of the Roumell Opportunistic Value Fund (the "Fund"), a series of shares of beneficial interest in the Starboard Investment Trust, including the schedule of investments, as of August 31, 2014, the statement of operations for the year then ended, and the statements of changes in net assets and financial highlights for each of the years or period in the two-year period then ended. These financial statements and financial highlights are the responsibility of the Fund's management. Our responsibility is to express an opinion on these financial statements and financial highlights based on our audits. The financial highlights for each year or period presented in the period December 31, 2010 to August 31, 2012 have been audited by other auditors, whose report dated October 22, 2012, expressed an unqualified opinion on such financial highlights.
We conducted our audits in accordance with the standards of the Public Company Accounting Oversight Board (United States). Those standards require that we plan and perform the audits to obtain reasonable assurance about whether the financial statements and financial highlights are free of material misstatement. An audit includes examining, on a test basis, evidence supporting the amounts and disclosures in the financial statements. Our procedures included confirmation of securities owned as of August 31, 2014 by correspondence with the custodian and broker. An audit also includes assessing the accounting principles used and significant estimates made by management, as well as evaluating the overall financial statement presentation. We believe that our audits provide a reasonable basis for our opinion.
In our opinion, the financial statements and financial highlights referred to above present fairly, in all material respects, the financial position of Roumell Opportunistic Value Fund as of August 31, 2014, and the results of its operations for the year then ended and the changes in its net assets and its financial highlights for each of the years or period in the two-year period then ended, in conformity with accounting principles generally accepted in the United States of America.
BBD, LLP
Philadelphia, Pennsylvania
October 27, 2014
ROUMELL OPPORTUNISTIC VALUE FUND
Additional Information (Unaudited)
| 1. | Organization and Significant Accounting Policies |
A copy of the Trust's Proxy Voting and Disclosure Policy and the Advisor's Disclosure Policy are included as Appendix B to the Fund's Statement of Additional Information and are available, without charge, upon request, by calling 1-800-773-3863, and on the website of the Security and Exchange Commission ("SEC") at sec.gov. Information regarding how the Fund voted proxies relating to portfolio securities during the most recent period ended June 30, is available (1) without charge, upon request, by calling the Fund at the number above and (2) on the SEC's website at sec.gov.
| 2. | Quarterly Portfolio Holdings |
The Fund files its complete schedule of portfolio holdings with the SEC for the first and third quarters of each fiscal year on Form N-Q. The Fund's Forms N-Q are available on the SEC's website at sec.gov. You may review and make copies at the SEC's public Reference Room in Washington, D.C. Information on the operation of the Public Reference Room may be obtained by calling the SEC at 202-942-8090. You may also obtain copies without charge, upon request, by calling the Fund at 1-800-773-3863.
We are required to advise you within 60 days of the Fund's fiscal year-end regarding the federal tax status of certain distributions received by shareholders during each fiscal year. The following information is provided for the Fund's fiscal year ended August 31, 2014.
During the fiscal year, the Fund paid $2,158,352 in long-term capital gain distributions.
Dividend and distributions received by retirement plans such as IRAs, Keogh-type plans, and 403(b) plans need not be reported as taxable income. However, many retirement plans may need this information for their annual information meeting.
(Continued)
ROUMELL OPPORTUNISTIC VALUE FUND
Additional Information (Unaudited)
| 4. | Schedule of Shareholder Expenses |
As a shareholder of the Fund, you incur two types of costs: (1) transaction costs, which may include sales charges (loads) on purchase payments and (2) ongoing costs, including investment advisory fees; distribution (12b-1) fees; and other Fund expenses. This example is intended to help you understand your ongoing costs (in dollars) of investing in the Fund and to compare these costs with the ongoing costs of investing in other mutual funds. The example is based on an investment of $1,000 invested at the beginning of the period and held for the entire period as indicated below.
Actual Expenses – The first line of the table below provides information about the actual account values and actual expenses. You may use the information in this line, together with the amount you invested, to estimate the expenses that you paid over the period. Simply divide by $1,000 (for example, an $8,600 account value divided by $1,000 = 8.6), then multiply the result by the number in the first line under the heading entitled "Expenses Paid During Period" to estimate the expenses you paid on your account during this period.
Hypothetical Example for Comparison Purposes – The last line of the table below provides information about hypothetical account values and hypothetical expenses based on the Fund's actual expense ratio and an assumed annual rate of return of 5% before expenses, which is not the Fund's actual return. The hypothetical account values and expenses may not be used to estimate the actual ending account balance or expenses you paid for the period. You may use this information to compare the ongoing costs of investing in the Fund and other funds by comparing this 5% hypothetical example with the 5% hypothetical examples that appear in the shareholder reports of other funds.
(Continued)
ROUMELL OPPORTUNISTIC VALUE FUND
Additional Information (Unaudited)
| Institutional Class Shares | Beginning Account Value March 1, 2014 | Ending Account Value August 31, 2014 | Expenses Paid During Period* |
Actual Hypothetical (5% annual return before expenses) | $1,000.00 | $1,002.87 | $6.26 |
| $1,000.00 | $1,018.95 | $6.31 |
*Expenses are equal to the average account value over the period multiplied by the Fund's annualized expense ratio of 1.23% multiplied by 184/365 (to reflect the one-half year period).
| Class A Shares | Beginning Account Value March 1, 2014 | Ending Account Value August 31, 2014 | Expenses Paid During Period* |
Actual Hypothetical (5% annual return before expenses) | $1,000.00 | $ 1,001.92 | $7.52 |
| $1,000.00 | $ 1,017.69 | $7.58 |
*Expenses are equal to the average account value over the period multiplied by the Fund's annualized expense ratio of 1.48% multiplied by 184/365 (to reflect the one-half year period).
| Class C Shares | Beginning Account Value March 1, 2014 | Ending Account Value August 31, 2014 | Expenses Paid During Period* |
Actual Hypothetical (5% annual return before expenses) | $1,000.00 | $ 997.84 | $11.28 |
| $1,000.00 | $ 1,013.91 | $11.37 |
*Expenses are equal to the average account value over the period multiplied by the Fund's annualized expense ratio of 2.23% multiplied by 184/365 (to reflect the one-half year period).
| 5. | Approval of Advisory Agreement |
The Advisor supervises the investments of the Fund pursuant to an Investment Advisory Agreement. At the annual meeting of the Fund's Board of Trustees held on August 28, 2014, the Trustees approved the renewal of the Investment Advisory Agreement for a one-year term. In considering whether to appove the Investment Advisory Agreement, the Trustees reviewed and considered the information they deemed reasonably necessary, including the following material factors: (i) the nature, extent, and quality of the services
(Continued)
ROUMELL OPPORTUNISTIC VALUE FUND
Additional Information (Unaudited)
provided by the Advisor; (ii) the investment performance of the Fund and Advisor; (iii) the costs of the services to be provided and profits to be realized by the Advisor and its affiliates from the relationship with the Fund; (iv) the extent to which economies of scale would be realized as the Fund grows and whether advisory fee levels reflect those economies of scale for the benefit of the Fund's investors; (v) the Advisor's practices regarding brokerage and portfolio transactions; and (vi) the Advisor's practices regarding possible conflicts of interest.
At the meeting, the Trustees reviewed various informational materials including, without limitation, the Investment Advisory Agreement for the Fund; a memorandum from the Advisor to the Trustees containing information about the Advisor, its business, its finances, its personnel, its services to the Fund, and comparative expense ratio information for other mutual funds with a strategy similar to the Fund; and a memorandum from the Fund's legal counsel that summarized the fiduciary duties and responsibilities of the Board of Trustess in reviewing and approving the Investment Advisory Agreement, including the types of information and factors that should be considered in order to make an informed decision.
In considering the nature, extent, and quality of the services provided by the Advisor, the Trustees reviewed the responsibilities of the Advisor under the Investment Advisory Agreement. The Trustees reviewed the services being provided by the Advisor to the Fund including, without limitation, the quality of its investment advisory services since the Fund's inception (including research and recommendations with respect to portfolio securities); its procedures for formulating investment recommendations and assuring compliance with the Fund's investment objectives and limitations; its coordination of services for the Fund among the Fund's service providers; and its efforts to promote the Fund, grow the Fund's assets, and assist in the distribution of Fund shares. The Trustees noted that the Advisor seeks to achieve the Fund's investment objective by using an opportunistic investment strategy with a deep value bias in selecting individual securities. The Trustees further noted that the principal executive and financial officer of the Fund were provided by the Advisor and serve without additional compensation from the Fund. After reviewing the foregoing information and further information in the memorandum from the Advisor (e.g., descriptions of the Advisor's business, the Advisor's compliance program, and the Advisor's Form ADV), the Board concluded that the nature, extent, and quality of the services provided by the Advisor were satisfactory and adequate for the Fund.
(Continued)
ROUMELL OPPORTUNISTIC VALUE FUND
Additional Information (Unaudited)
In considering the investment performance of the Fund and Advisor, the Trustees compared the performance of the Fund with the performance of its benchmark index, comparable funds with similar objectives managed by other investment advisors, and applicable peer group data (e.g., Bloomberg peer group average). The Trustees noted that the return for the one-year period ended July 31, 2014 for the Institutional Class Shares was (1.12)%, which lagged the returns of most of the comparable funds, the peer group average, and the primary benchmark index. The Trustees then noted that the return for the six-month period ended July 31, 2014 for the Institutional Class Shares was 1.75%, which lagged the returns of most of the comparable funds, the peer group average, and the primary benchmark index. The Trustees also considered the consistency of the Advisor's management of the Fund with its investment objective and policies. After reviewing the short and long-term investment performance of the Fund, the Advisor's experience managing the Fund, the Advisor's historical investment performance, and other factors, the Board of Trustees concluded that the investment performance of the Fund and the Advisor was satisfactory.
In considering the costs of the services to be provided and profits to be realized by the Advisor and its affiliates from the relationship with the Fund, including any benefits derived by the Advisor from the relationship with the Fund, the Trustees reviewed the Advisor's staffing, personnel, and methods of operating; the education and experience of the Advisor's personnel; the Advisor's compliance program; the financial condition of the Advisor; the level of commitment to the Fund and the Advisor by the principals of the Advisor; the asset level of the Fund; and the overall expenses of the Fund, including certain prior fee waivers and reimbursements by the Advisor; and the nature and frequency of advisory fee payments. The Trustees reviewed the financial statements for the Advisor and discussed the financial stability and profitability of the firm. The Trustees noted that the Advisor either makes payment to the Administrator or directly pays for certain expenses of the Fund under an Operating Plan in order to help limit the Fund's annual operating
(Continued)
ROUMELL OPPORTUNISTIC VALUE FUND
Additional Information (Unaudited)
expenses. The Trustees agreed that excess profitability was not a concern at this time. The Trustees also considered potential benefits for the Advisor in managing the Fund, including promotion of the Advisor's name, the ability for the Advisor to place small accounts into the Fund, and the potential for the Advisor to generate soft dollars from Fund trades that may benefit the Advisor as well. The Trustees then compared the fees and expenses of the Fund (including the management fee) to other funds comparable in terms of the type of fund, the nature of its investment strategy, and its style of investment management, among other factors. The Trustees determined that the Fund's management fees were higher than some of the comparable funds, were lower than others, and were higher than the peer group average. The Trustees noted that the Fund was smaller than the peer group average. Following this comparison and upon further consideration and discussion of the foregoing, the Board of Trustees concluded that the fees be paid to the Advisor by the Fund were fair and reasonable in relation to the nature and quality of the services provided by the Advisor and that they reflect charges that were within a range of what could have been negotiated at arm's length.
In considering the extent to which economies of scale would be realized as the Fund grows and whether advisory fee levels reflect those economies of scale for the benefit of the Fund's investors, the Trustees considered the Fund's fee arrangements with the Advisor. The Trustees noted that although the maximum management fee under the Investment Advisory Agreement would stay the same regardless of the Fund's asset levels, the Advisor had agreed to make payments to the Administrator at lower asset levels in order to help limit the Fund's expenses. The Trustess pointed out that the Fund would benefit from economies of scale under agreements with service providers other than the Advisor. In particular, it was noted that the Fund's administration fee was a significant component of the gross expense ratio and that the agreement utilized breakpoints in its fee schedule that allowed the Fund's shareholders to benefit from economies of scale. The Trustees also noted that economies of scale were unlikely to be realized in the near future due to the size of the Fund. It was pointed out that breakpoints in the management fee could be reconsidered in the future. Following further discussion of the Fund's asset levels, expectations for growth, and fee levels, the Board of Trustees determined that the Fund's fee arrangements with the Advisor were fair and reasonable in relation to the nature and quality of the services provided by the Advisor.
In considering the Advisor's practices regarding brokerage and portfolio transactions, the Trustees reviewed the Advisor's standards, and performance in utilizing those standards, for seeking best execution for Fund portfolio transactions. The Trustees also considered the portfolio turnover rate for the Fund; the process by which evaluations are made of the overall reasonableness of commissions paid; the method and basis for selecting and evaluating the broker-dealers used; any allocation of portfolio business to persons affiliated
(Continued)
ROUMELL OPPORTUNISTIC VALUE FUND
Additional Information (Unaudited)
with the Advisor; and the extent to which the Fund allocates portfolio business to broker-dealers who provide research, statistical, or other services (soft dollars). The Trustees noted, among other things, that the Fund rarely trades blocks of shares which require special handling and that the average commission rate for the Fund was approximately $0.003 per share. After further review and discussion, the Board of Trustees determined that the Advisor's practices regarding brokerage and portfolio transactions were satisfactory.In considering the Advisor's practices regarding conflicts of interest, the Trustees evaluated the potential for conflicts of interest and considered such matters as the experience and ability of the advisory personnel assigned to the Fund; the basis of decisions to buy or sell securities for the Fund and the Advisor's other accounts; the method for bunching of portfolio securities transactions; and the substance and administration of the Advisor's code of ethics. Following further consideration and discussion, the Board of Trustees indicated that the Advisor's standards and practices relating to the identification and mitigation of potential conflicts of interests were satisfactory.
Based upon all of the foregoing considerations, the Board of Trustees, including a majority of the Independent Trustees, approved the Investment Advisory Agreement for the Fund.
| 6. | Information about Trustees and Officers |
The business and affairs of the Fund and the Trust are managed under the direction of the Board of Trustees of the Trust. Information concerning the Trustees and officers of the Trust and Fund is set forth below. Generally, each Trustee and officer serves an indefinite term or until certain circumstances such as their resignation, death, or otherwise as specified in the Trust's organizational documents. Any Trustee may be removed at a meeting of shareholders by a vote meeting the requirements of the Trust's organizational documents. The Statement of Additional Information of the Fund includes additional information about the Trustees and officers and is available, without charge, upon request by calling the Fund at 1-800-773-3863. The address of each Trustee and officer, unless otherwise indicated below, is 116 South Franklin Street, Rocky Mount, North Carolina 27804. The Independent Trustees each received aggregate compensation of $2,000.00 during the fiscal year ended August 31, 2014 from the Administrator for their services to the Fund and Trust.
(Continued)
ROUMELL OPPORTUNISTIC VALUE FUND
Additional Information (Unaudited)
Name, Age
and Address | Position
held with
Fund or Trust | Length of Time Served | Principal Occupation
During Past 5 Years | Number of Portfolios in Fund Complex Overseen by Trustee | Other Directorships
Held by Trustee
During Past 5 Years |
| Independent Trustees |
Michael G. Mosley
Age: 61 | Independent Trustee | Since 7/10 | Owner of Commercial Realty Services (real estate) since 2004. | 23 | None. |
Theo H. Pitt, Jr.
Age: 78 | Independent Trustee | Since 9/10 | Senior Partner, Community Financial Institutions Consulting (financial consulting) since 1999; Partner, Pikar Properties (real estate) since 2001; Account Administrator, Holden Wealth Management Group of Wachovia Securities (money management firm) from 2003-2008. | 23 | Independent Trustee of World Funds Trust for its two series, Gardner Lewis Investment Trust for its two series, Hanna Investment Trust for its one series, and Hillman Capital Management Investment Trust for its one series (all registered investment companies); previously, Independent Trustee of, NCM Capital Investment Trust for its one series from 2007 to 2009, New Providence Investment Trust from 2008 to 2009, and Centaur Mutual Funds Trust for its one series from 2004 to 2009 (all registered investment companies). |
James H. Speed, Jr.
Age: 61 | Independent Trustee, Chairman | Trustee since 7/09, Chair since 5/12 | President and CEO of NC Mutual Insurance Company (insurance company) since 2003; President of Speed Financial Group, Inc. (consulting and private investments) from 2000 to 2003. | 23 | Independent Trustee of the following Brown Capital Management Funds for its three series, Hillman Capital Management Investment Trust for its one series, and Centaur Mutual Funds Trust for its one series (all registered investment companies). Member of Board of Directors of NC Mutual Life Insurance Company. Member of Board of Directors of M&F Bancorp. Previously, Independent Trustee of New Providence Investment Trust for its one series from 2009 until 2011 (registered investment company). |
J. Buckley Strandberg
Age: 54 | Independent Trustee | Since 7/09 | President of Standard Insurance and Realty (insurance and property management) since 1982. | 23 | None. |
Other Officers |
James C. Roumell
Age: 52
2 Wisconsin Circle
Suite 660
Chevy Chase, MD 20815 | President (Roumell Opportunistic Value Fund) | Since 9/10 | President of Roumell Asset Management, LLC (advisor to the Roumell Opportunistic Value Fund) since 1998. | n/a | n/a |
(Continued)
ROUMELL OPPORTUNISTIC VALUE FUND
Additional Information (Unaudited)
Name, Age
and Address | Position
held with
Fund or Trust | Length of Time Served | Principal Occupation
During Past 5 Years | Number of Portfolios in Fund Complex Overseen by Trustee | Other Directorships
Held by Trustee
During Past 5 Years |
Craig L. Lukin
Age:46
2 Wisconsin Circle
Suite 660
Chevy Chase, MD 20815 | Treasurer (Roumell Opportunistic Value Fund) | Since 9/10 | Chief Operating Officer and Chief Compliance Officer of Roumell Asset Management, LLC since 2007; Research Analyst at Roumell Asset Management, LLC from 2003-2007; Private Equity Analyst for Dent & Company, Inc. (investment services) from 2000-2002; Corporate Value Consulting Manager for PricewaterhouseCoopers, LLP (accountancy and professional services) from 1994-2000. | n/a | n/a |
Katherine M. Honey
Age: 40 | Secretary | Since 10/13 | EVP of The Nottingham Company since 2008. | n/a | n/a |
Martin Dziura
Age: 54 | Chief Compliance Officer | Since 1/14 | Managing Director, Cipperman Compliance Services, LLC since 2010; Chief Compliance Officer, Hanlon Investment Management from 2009-2010; Vice President, Compliance, Morgan Stanley Investment Management from 2000-2009. | n/a | n/a |
Ashley E. Harris
Age: 30 | Assistant Treasurer | Since 4/14 | Director, Financial Reporting, The Nottingham Company; Fund Accounting, The Nottingham Company from 2008-2014. | n/a | n/a |
| (a) | The registrant, as of the end of the period covered by this report, has adopted a code of ethics that applies to its Principal Executive Officer(s), Principal Financial Officer(s), and Principal Accounting Officer(s), or persons performing similar functions, regardless of whether these individuals are employed by the registrant or a third party. |
| (c) | There have been no substantive amendments during the period covered by this report. |
| (d) | The registrant has not granted, during the period covered by this report, any waivers, including an implicit waiver. |
| (f)(1) | A copy of the code of ethics that applies to the registrant's Principal Executive Officers and Principal Financial Officers is filed pursuant to Item 12.(a)(1) below. |
| Item 3. | AUDIT COMMITTEE FINANCIAL EXPERT. |
The registrant's Board of Trustees has determined that the registrant has an audit committee financial expert, as defined in Item 3 of Form N-CSR, serving on its audit committee.
As of the date of this report, August 31, 2014, the registrant's audit committee financial expert is Mr. James H. Speed, Jr. Mr. Speed is "independent" for purposes of Item 3 of Form N-CSR.
Item 4. PRINCIPAL ACCOUNTANT FEES AND SERVICES.
| (a) | Audit Fees – Audit fees billed for the registrant for the last two fiscal years are reflected in the table below. These amounts represent aggregate fees billed by the registrant's independent accountant, BBD, LLP for August 31, 2013 and August 31, 2014 ("Accountant"), in connection with the annual audits of the registrant's financial statements and for services normally provided by the Accountant in connection with the registrant's statutory and regulatory filings for those fiscal years. |
| Fund | 2013 | 2014 |
| Roumell Opportunistic Value Fund | $11,000 | $11,000 |
| (b) | Audit-Related Fees – There were no additional fees billed in the fiscal years ended August 31, 2013 and August 31, 2014 for assurance and related services by the Accountant that were reasonably related to the performance of the audit of the registrant's financial statements that were not reported under paragraph (a) of this Item. |
| (c) | Tax Fees – The tax fees billed in each of the last two fiscal years ended for professional services rendered by the Accountant for tax compliance, tax advice, and tax planning are reflected in the table below. These services were for the completion of each fund's federal and state income tax returns, excise tax returns, and assistance with distribution calculations. |
| Fund | 2013 | 2014 |
| Roumell Opportunistic Value Fund | $2,000 | $2,000 |
| (d) | All Other Fees – There were no other fees paid to the Accountant which were not disclosed in Items (a) through (c) above during the fiscal year. |
| (e) (1) | The registrant's Board of Trustees pre-approved the engagement of the Accountant for the last two fiscal years at an audit committee meeting of the Board of Trustees called for such purpose; and will pre-approve the Accountant for each fiscal year thereafter at an audit committee meeting called for such purpose. The charter of the audit committee states that the audit committee should pre-approve any audit services and, when appropriate, evaluate and pre-approve any non-audit services provided by the Accountant to the registrant and to pre-approve, when appropriate, any non-audit services provided by the Accountant to the registrant's investment adviser, or any entity controlling, controlled by, or under common control with the investment adviser that provides ongoing services to the registrant if the engagement relates directly to the operations and financial reporting of the registrant. |
| (2) | There were no services as described in each of paragraph (b) through (d) of this Item that were approved by the audit committee pursuant to paragraph (c)(7)(i)(C) of Rule 2-01 of Regulation S-X. |
| (g) | Aggregate non-audit fees billed by the Accountant to the registrant for services rendered for the fiscal years ended August 31, 2013 August 31, 2014 were $2,000 and $2,000, respectively. There were no fees billed by the Accountant for non-audit services rendered to the registrant's investment adviser, or any other entity controlling, controlled by, or under common control with the registrant's investment adviser. |
| Item 5. | AUDIT COMMITTEE OF LISTED REGISTRANTS. |
Not applicable.
| Item 6. | SCHEDULE OF INVESTMENTS. |
A copy of the schedule of investments of unaffiliated issuers as of the close of the reporting period is included as part of the report to shareholders filed under Item 1 of this Form.
| Item 7. | DISCLOSURE OF PROXY VOTING POLICIES AND PROCEDURES FOR CLOSED-END MANAGEMENT INVESTMENT COMPANIES. |
Not applicable.
| Item 8. | PORTFOLIO MANAGERS OF CLOSED-END MANAGEMENT INVESTMENT COMPANIES. |
Not applicable.
| Item 9. | PURCHASES OF EQUITY SECURITIES BY CLOSED-END MANAGEMENT INVESTMENT COMPANY AND AFFILIATED PURCHASERS. |
Not applicable.
Item 10. SUBMISSION OF MATTERS TO A VOTE OF SECURITY HOLDERS.
None.
Item 11. CONTROLS AND PROCEDURES.
| (a) | The Principal Executive Officer(s) and the Principal Financial Officer(s) have concluded that the registrant's disclosure controls and procedures are effective based on their evaluation of the disclosure controls and procedures as of a date within 90 days of the filing of this report. |
| (b) | There were no changes in the registrant's internal control over financial reporting that occurred during the registrant's second fiscal quarter of the period covered by this report that have materially affected, or are reasonably likely to materially affect, the registrant's internal control over financial reporting. |
Item 12. EXHIBITS.
| (a)(1) | Code of Ethics required by Item 2 of Form N-CSR is filed herewith as Exhibit 12.(a)(1). |
| (a)(2) | Certifications required by Item 12.(a)(2) of Form N-CSR are filed herewith as Exhibit 12.(a)(2). |
| (b) | Certifications required by Item 12.(b) of Form N-CSR are filed herewith as Exhibit 12.(b). |
SIGNATURES
Pursuant to the requirements of the Securities Exchange Act of 1934 and the Investment Company Act of 1940, the registrant has duly caused this report to be signed on its behalf by the undersigned, thereunto duly authorized.
Starboard Investment Trust
| By: (Signature and Title) | /s/James C. Roumell |
Date: November 10 , 2014 | James C. Roumell President and Principal Executive Officer Roumell Opportunistic Value Fund |
| |
Pursuant to the requirements of the Securities Exchange Act of 1934 and the Investment Company Act of 1940, this report has been signed below by the following persons on behalf of the registrant and in the capacities and on the dates indicated.
| By: (Signature and Title) | /s/James C. Roumell |
Date: November 10, 2014 | James C. Roumell President and Principal Executive Officer Roumell Opportunistic Value Fund |
| |
| By: (Signature and Title) | /s/Craig L. Lukin |
Date: November 10, 2014 | Craig L. Lukin Treasurer and Principal Financial Officer Roumell Opportunistic Value Fund |
| |