UNITED STATES
SECURITIES AND EXCHANGE COMMISSION
Washington, D.C. 20549
FORM N-CSR
CERTIFIED SHAREHOLDER REPORT OF REGISTERED
MANAGEMENT INVESTMENT COMPANIES
Investment Company Act file number 811-22298
Starboard Investment Trust
(Exact name of registrant as specified in charter)
116 South Franklin Street, Post Office Box 69, Rocky Mount, North Carolina 27802
(Address of principal executive offices) (Zip code)
Terrence O. Davis
116 South Franklin Street, Post Office Box 69, Rocky Mount, North Carolina 27802
(Name and address of agent for service)
Registrant's telephone number, including area code: 252-972-9922
Date of fiscal year end: May 31
Date of reporting period: May 31, 2014
Item 1. REPORTS TO STOCKHOLDERS.
Annual Report 2014
May 31, 2014
Goodwood SMID Cap Discovery Fund
This report and the financial statements contained herein are submitted for the general information of the shareholders of the Goodwood SMID Cap Discovery Fund (the "Fund"). The Fund's shares are not deposits or obligations of, or guaranteed by, any depository institution. The Fund's shares are not insured by the FDIC, Federal Reserve Board or any other agency, and are subject to investment risks, including possible loss of principal amount invested. Neither the Fund nor the Fund's distributor is a bank.
The Goodwood SMID Cap Discovery Fund is distributed by Capital Investment Group, Inc., Member FINRA/SIPC, 17 Glenwood Ave, Raleigh, NC, 27603. There is no affiliation between the Goodwood SMID Cap Discovery Fund, including its principals, and Capital Investment Group, Inc.
Statements in this Annual Report that reflect projections or expectations of future financial or economic performance of the Goodwood SMID Cap Discovery Fund ("Fund") and of the market in general and statements of the Fund's plans and objectives for future operations are forward-looking statements. No assurance can be given that actual results or events will not differ materially from those projected, estimated, assumed or anticipated in any such forward-looking statements. Important factors that could result in such differences, in addition to the other factors noted with such forward-looking statements, include, without limitation, general economic conditions such as inflation, recession and interest rates. Past performance is not a guarantee of future results.
An investment in the Fund is subject to investment risks, including the possible loss of some or the entire principal amount invested. There can be no assurance that the Fund will be successful in meeting its investment objective. Investment in the Fund is also subject to the following risks: market risk, portfolio turnover risk, small-cap and mid-cap securities risk, micro-cap securities risk, risks related to investing in other investment companies, short sales risk, investment advisor risk, and operating risk. More information about these risks and other risks can be found in the Fund's prospectus.
The performance information quoted in this annual report represents past performance, which is not a guarantee of future results. Investment return and principal value of an investment will fluctuate so that an investor's shares, when redeemed, may be worth more or less than their original cost. Current performance may be lower or higher than the performance data quoted. An investor may obtain performance data current to the most recent month-end by visiting goodwood-funds.com
An investor should consider the investment objectives, risks, charges and expenses of the Fund carefully before investing. The prospectus contains this and other information about the Fund. A copy of the prospectus is available at ncfunds.com or by calling Shareholder Services at 800-773-3863. The prospectus should be read carefully before investing. |
This Annual Report was first distributed to shareholders on or about July 30, 2014.
For More Information on Your Goodwood SMID Cap Discovery Fund:
See Our Web site @ goodwood-funds.com
or
Call Our Shareholder Services Group at 800-773-3863.
450 Laurel Street
Suite 2105
Baton Rouge, Louisiana 70801
866-841-8060
www.goodwood-funds.com
June 9, 2014
Dear Fellow Shareholders of the Goodwood SMID Cap Discovery Fund:
Enclosed for your review is the Annual Report for the Goodwood SMID Cap Discovery Fund (the "Fund"), a series of the Starboard Investment Trust (the "Trust"), formerly known as the Caritas All-Cap Growth Fund, for the fiscal year ending May 31, 2014. The return for the Fund during this period was 14.11%. This compares to 21.73% for the Russell 3000 Growth Index and 20.45% for the S&P 500 Total Return Index.
Average Annual Total Return for period ended June 30, 2014 | One Year | Since Inception* | Net Expense Ratio** | Gross Expense Ratio*** |
Goodwood SMID Cap Discovery Fund (without load) | 23.16% | 13.92% | 2.03% | 3.35% |
Goodwood SMID Cap Discovery Fund (with load) | 16.08% | 12.43% | 2.03% | 3.35% |
| Russell 3000 Growth Index**** | 26.75% | 16.31% | n/a | n/a |
| S&P 500 Total Return Index**** | 24.61% | 15.41% | n/a | n/a |
The performance data quoted above represents past performance, which is not a guarantee of future results. Investment return and principal value of an investment in the Fund will fluctuate so that an investor's shares, when redeemed, may be worth more or less than their original cost. Current performance may be lower or higher than the performance data quoted. To obtain more current performance data regarding the Fund, including performance data current to the Fund's most recent month-end, please visit ncfunds.com or call the Fund at (800) 773-3863. Fee waivers and expenses reimbursements have positively impacted Fund performance.
*The Fund's inception date is January 4, 2010.
**The Advisor has entered into an Operating Plan with the Administrator, through October 1, 2015, under which it has agreed to (i) make payments to the administrator based upon the Fund's net assets according to a schedule included in the Operating Plan and (ii) assume certain expenses of the Fund outlined in the Operating Plan. These measures are intended to limit the Fund's operating expenses to 1.70% of the average daily net assets, exclusive of taxes, interest, brokerage fees and commissions, distribution and/or service (12b-1) fees, acquired fund fees and expenses, and extraordinary expenses. The Operating Plan can only be terminated at the conclusion of the then-current term by notice of non-renewal to a party or mutual agreement of the parties. The Advisor cannot recoup from the Fund any amounts paid under the Operating Plan.
***Gross expense ratio is from the Fund's prospectus dated September 30, 2013.
****You cannot invest directly in this index. This index does not have an investment advisor and does not pay any commissions, expenses, or taxes. If this index did pay commissions, expenses, or taxes, its returns would be lower.
At the end of July 2013, the previous Advisor, Caritas Capital, LLC sold all of the holdings of the Fund. This liquidation was carried out in anticipation of closing the Fund and returning capital to shareholders. As a result of the sale of securities, long term capital gains were realized. In August 2013, Caritas Capital resigned as advisor to the Fund, and capital was held in cash until late September 2013. Shortly thereafter, the Board elected to seek out a new Advisor in lieu of closing the Fund. On September 20, 2013 Goodwood Advisors became the consultant to CV Investment Advisors, the interim advisor to the Fund. On October 31, 2013 the Board approved an Interim Investment Advisory Agreement with Goodwood Advisors, LLC, an investment advisory firm registered with the U.S. Securities and Exchange Commission under the Investment Advisers Act of 1940. The Fund's name was then changed to the Goodwood SMID Cap Discovery Fund in February 2014. The Fund's shareholders formally approved an Investment Advisory Agreement with Goodwood Advisors at a Special Meeting held on March 31, 2014.
We wanted to take the opportunity to provide some context around the changes in the Caritas All-Cap Growth Fund's (CTSAX) ("Former Fund Name") Net Asset Value ("NAV") per share in the month of December 2013.
The following took place in December 2013:
On December 4, 2013 the Fund's NAV was $15.62.
On December 5, 2013 the Fund distributed $12.16746 per share in Long Term Capital Gains.1
On December 5, 2013 the Fund's NAV was $4.05.
On December 6, 2013 the Fund executed a 1:2.469 reverse stock split.2
On December 6, 2013 the Fund's NAV was $10.03.
1 Investors who initially elected to reinvest their capital gains distributions received additional shares of the Fund at the $4.05 NAV equal to the dollar amount of their pro rata share of the capital gain distribution. It is important to remember that the distribution is a tax event and an investor's total return is not impacted by the distribution.
2 In a reverse stock split, the investors' share count is reduced, and the NAV per share is increased; however, there is zero change in the dollar amount of their investment. The Fund's Administrator and Advisor elected to execute the reverse stock split in order to more closely align the Fund's post-distribution NAV per share with the anticipated approval of a new Institutional Share Class of the Fund.
The Fund's primary objective is capital appreciation, but we strive to achieve this in context of risk-adjusted terms. Portfolio construction is a product of our fundamentally driven, research focused investment process. We take a bottom-up approach to investment selection, marked by deep knowledge of company-specific fundamentals and strict valuation analysis, in an effort to avoid undue risk. Generally, we look for securities that trade at a discount to our estimate of intrinsic value, and seek to invest ahead of catalysts that will cause the gap between current value and our estimate of fair value to dissipate. Availability of these compelling situations varies, and as such, we will use cash and ETF's to provide downside protection when our opportunity set wanes.
While the first seven months of the fiscal year ended 2014 were characterized by a supportive environment for virtually all equities, the last five months of the fiscal year proved more challenging, particularly for Small and Mid-capitalization stocks. Concerns over tepid GDP and employment growth, rising geopolitical tensions and questions around the duration of the Federal Reserve's accommodative monetary policy contributed to a complex backdrop for equities, particularly for Small and Mid-Capitalization stocks. Accordingly, we are pleased with our performance since assuming day-to-day portfolio management responsibilities on October 31, 2013, though we are hardly satisfied. Indeed, calendar 2014 has proved to be a "stock picker's market", one where quality active manager's prove their worth, and we expect this environment to persist in the near-term.
Marco-economic and geopolitical issues continue to consume investors' collective consciousness, but we believe they are largely transient in nature. The fundamentals of the domestic economy are showing undeniable signs of life after a weather-dampened first quarter and we anticipate a swift snapback in Gross Domestic Product from subdued first quarter 2014 levels. The U.S. employment picture continues to improve, with private payrolls having reached and surpassed pre-recession peaks. Underpinning this, the Federal Reserve's easy monetary policy should remain intact over the near-term. Unlike many investors, we are encouraged by the Fed's wind down of asset purchases, as we think it supportive of our favorable intermediate term outlook for the domestic economy.
As bottom-up investors, the Fund's portfolio is invested independent of benchmark sector allocation. Your capital is deployed to those opportunities we find as a result of our diligence in the trenches, and there is no theme more compelling to us than the burgeoning industrial renaissance in the United States, particularly along the U.S. Gulf coast. Energy and Chemical companies are taking advantage of America's renewed energy output brought on by new technologies that have made oil and natural gas more abundant, especially in the Southeastern United States. Today there are over $200 billion in industrial construction projects in the pipeline along the Gulf Coast with the majority of those projects planned along the Mississippi River from Baton Rouge to New Orleans. We are in the early innings in what we view as a 5-7 year investment cycle. We have identified several companies that stand to benefit over the longer-term, and as a result, our sector allocation skews heavily toward Industrials.
Outside of Industrials, we are finding compelling opportunities in several others sectors that we have traditionally targeted, including Healthcare, Technology and Consumer. Generally speaking, while most of our portfolio holdings were able to mostly side-step the first quarter 2014 slowdown, the stocks were not immune from a broader correction in Small and Mid-Cap equities. To the degree that they were impacted, we anticipate a catch up over the balance of the year. Our confidence is rooted in our understanding of the underlying company drivers and our overall favorable view of the domestic economic environment as discussed above. In many cases, portfolio holdings are close to reaching and surpassing prior cycle peak revenue. We believe that due to structural changes, margins have additional room to improve. These factors, coupled with opportunity for an increase in valuations
, leave us very optimistic about the funds prospects as we look to fiscal 2015.
Please call or email us at any time to discuss the Goodwood SMID Cap Discovery Fund and our investment approach.
Respectfully,
Ryan D. Thibodeaux
ryan@goodwoodcapitalmgmt.com
Joshua L. Pesses
josh@goodwoodcapitalmgmt.com
Goodwood Advisors, LLC
The views in the foregoing discussion were those of the Fund's investment advisor as of the date set forth above and may not reflect its views on the date this Annual Report is first published or anytime thereafter. These views are intended to assist shareholders in understanding their investment in the Fund and do not constitute investment advice.
| Goodwood SMID Cap Discovery Fund | | | | | | | | | | | | |
| | | | | | | | | | | | | | | | | | | |
| Performance Update | | | | | | | | | | | | | | |
| (Unaudited) | | | | | | | | | | | | | | |
| | | | | | | | | | | | | | | | | | | |
| For the period from January 4, 2010 (Date of Initial Public Investment) to May 31, 2014 | | |
| | | | | | | | | | | | | | | | | | | |
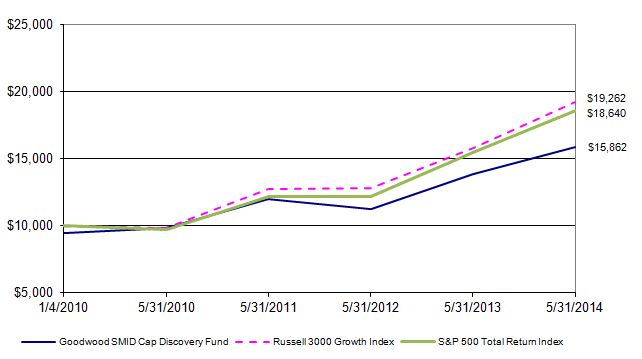
| Comparison of the Change in Value of a $10,000 Investment | | | | | | | | |
| | | | | | | | | | | | | | | | | | | |
| | | |
| | | | | | | | | | | | | | | | | | | |
| | | | | | | | | | | | | | | | | | | |
This graph assumes an initial investment of $10,000 ($9,425 after maximum sales load of 5.75%) at January 4, 2010 (Date of Initial Public Investment). All dividends and distributions are reinvested. This graph depicts the performance of the Goodwood SMID Cap Discovery Fund versus the Russell 3000® Growth Index and the S&P 500 Total Return Index. It is important to note that the Fund is a professionally managed mutual fund while the index is not available for investment and is unmanaged. The comparison is shown for illustrative purposes only. |
| Average Annual Total Returns | | | | | | | | | | | | |
| | | | | | | | | | | | | | | | Gross | |
| As of | | | | | | | One | | Since | | Inception | | Expense | |
| May 31, 2014 | | | | | | Year | | Inception | | Date | | Ratio* | |
| Goodwood SMID Cap Discovery Fund - No Sales Load | 14.11% | | 12.54% | | 01/04/10 | | 3.35% | |
| Goodwood SMID Cap Discovery Fund - 5.75% Maximum Sales Load | 7.55% | | 11.04% | | 01/04/10 | | 3.35% | |
| S&P 500 Total Return Index | | | | | 20.45% | | 15.18% | | N/A | | N/A | |
| Russell 3000 Growth Index | | | | | 21.73% | | 16.04% | | N/A | | N/A | |
* The gross expense ratio shown is from the Fund's prospectus dated September 30, 2013. | | | | |
| | | | | | | | | | | | | | | | | | | |
| Performance quoted above represents past performance, which is no guarantee of future results. Investment return and principal value will fluctuate so that shares, when redeemed, may be worth more or less than their original cost. Current performance may be lower or higher than the performance data quoted. An investor may obtain performance data, current to the most recent month-end, by visiting goodwood-funds.com. |
| | | | | | | | | | | | | | | | | | | |
| The graph and table do not reflect the deduction of taxes that a shareholder would pay on Fund distributions or the redemption of Fund shares. Average annual total returns are historical in nature and measure net investment income and capital gain or loss from portfolio investments assuming reinvestments of distributions. |
| | | | | | | | | | | | | | | | | | | |
| | | | | | | | | | | | | | | | | | | |
| Goodwood SMID Cap Discovery Fund | | | | | |
| | | | | | | | |
| Schedule of Investments | | | | | |
| | | | | | | | |
| | | | | | | | |
| As of May 31, 2014 | | | | | | |
| | | | | | Shares | | Value (note 1) |
| | | | | | | | |
| COMMON STOCKS - 94.10% | | | | | |
| | | | | | | | |
| Consumer Discretionary - 11.98% | | | | | |
| * | Christopher & Banks Corp. | | | 16,554 | $ | 112,898 |
| | Cinemark Holdings, Inc. | | | 7,120 | | 224,422 |
| | Dunkin' Brands Group, Inc. | | | 4,735 | | 211,939 |
| * | Tuesday Morning Corp. | | | 11,341 | | 183,271 |
| | Wolverine World Wide, Inc. | | | 7,552 | | 195,370 |
| | | | | | | | 927,900 |
| | | | | | | | |
| Financials - 4.51% | | | | | |
| * | Green Dot Corp. | | | 10,666 | | 195,934 |
| * | WisdomTree Investments, Inc. | | | 14,812 | | 153,897 |
| | | | | | | | 349,831 |
| Health Care - 29.01% | | | | | |
| * | Alcobra Ltd. | | | | 6,565 | | 112,327 |
| * | BioScrip, Inc. | | | 26,486 | | 207,915 |
| * | Heron Therapeutics, Inc. | | | 9,704 | | 115,866 |
| * | Hologic, Inc. | | | | 9,169 | | 224,090 |
| * | Intuitive Surgical, Inc. | | | 493 | | 182,282 |
| * | OraSure Technologies, Inc. | | | 32,643 | | 206,304 |
| * | Quintiles Transnational Holdings, Inc. | | | 4,807 | | 245,060 |
| * | Retrophin, Inc. | | | 6,377 | | 93,232 |
| * | Salix Pharmaceuticals Ltd. | | | 1,084 | | 123,663 |
| * | Team Health Holdings, Inc. | | | 3,731 | | 189,423 |
| | Teleflex, Inc. | | | | 1,745 | | 186,087 |
| * | WellCare Health Plans, Inc. | | | 2,349 | | 181,930 |
| | Zoetis, Inc. | | | | 5,859 | | 179,871 |
| | | | | | | | 2,248,050 |
| Industrials - 29.26% | | | | | |
| | Chicago Bridge & Iron Co. | | | 3,060 | | 249,084 |
| | Franklin Electric Co., Inc. | | | 3,737 | | 143,127 |
| | Generac Holdings, Inc. | | | 3,893 | | 189,511 |
| * | H&E Equipment Services, Inc. | | | 8,615 | | 298,509 |
| * | Kirby Corp. | | | | 1,629 | | 180,086 |
| | Owens Corning | | | 4,370 | | 179,214 |
| | Powell Industries, Inc. | | | 3,106 | | 192,044 |
| | Rollins, Inc. | | | | 5,222 | | 160,159 |
| * | Team, Inc. | | | | 4,015 | | 168,309 |
| * | The Manitowoc Co., Inc. | | | 5,569 | | 150,641 |
| * | Thermon Group Holdings, Inc. | | | 7,752 | | 182,560 |
| * | TrueBlue, Inc. | | | 6,381 | | 173,627 |
| | | | | | | | 2,266,871 |
| | | | | | | | |
| | | | | | | | (Continued) |
| Goodwood SMID Cap Discovery Fund | | | | | |
| | | | | | | | |
| Schedule of Investments (Continued) | | | | | |
| | | | | | | | |
| | | | | | | | |
| As of May 31, 2014 | | | | | | |
| | | | | | Shares | | Value (note 1) |
| | | | | | | | |
| COMMON STOCKS - (continued) | | | | | |
| | | | | | | | |
| Information Technology - 15.29% | | | | | |
| * | Atmel Corp. | | | | 22,130 | $ | 185,449 |
| * | Cardtronics, Inc. | | | 8,005 | | 231,985 |
| * | Integrated Device Technology, Inc. | | | 14,659 | | 194,965 |
| | Knowles Corp. | | | 9,115 | | 257,134 |
| * | Synaptics, Inc. | | | 3,494 | | 237,872 |
| * | TrueCar, Inc. | | | | 7,000 | | 77,341 |
| | | | | | | | 1,184,746 |
| Materials - 4.05% | | | | | |
| | International Flavors & Fragrances, Inc. | | | 1,377 | | 136,681 |
| | Packaging Corp. of America | | | 2,563 | | 177,257 |
| | | | | | | | 313,938 |
| | | | | | | | |
| | Total Common Stocks (Cost $7,227,322 ) | | | | $ | 7,291,336 |
| | | | | | | | |
| RIGHTS - 0.00% | | Shares | | Strike Price | | Exercise Date | | |
| * | Hologic, Inc. | | 4,724 | $ | 0.001 | | 11/20/2014 | $ | - |
| | | | | | | | |
| | Total Rights (Cost $0) | | | | $ | - |
| | | | | | | | |
| SHORT-TERM INVESTMENT - 1.56% | | | Shares | | |
| § | Fidelity Institutional Money Market Funds - Money Market Portfolio, 0.05% | 121,078 | $ | 121,078 |
| | | | | | | | |
| | Total Short-Term Investment (Cost $121,078) | | | | $ | 121,078 |
| | | | | | | | |
| Total Value of Investments (Cost $7,348,400) - 95.66% | | | | $ | 7,412,414 |
| | | | | | | | |
| Other Assets Less Liabilities - 4.34% | | | | | 336,182 |
| | | | | | | | |
| Net Assets - 100.00% | | | | $ | 7,748,596 |
| | | | | | | | |
| | | | | | | | |
| * | Non-income producing investment | | | | | |
| § | Represents 7 day effective yield | | | | | |
| | | | | | | | |
| | | | | | | | |
| | | | | | | | |
| | | | | | | | |
| | | | | | | | |
| | | | | | | | |
| | | | | | | | |
| | | | | | | | |
| | | | | | | | (Continued) |
| Goodwood SMID Cap Discovery Fund | | | | | |
| | | | | | | | |
| Schedule of Investments (Continued) | | | | | |
| | | | | | | | |
| | | | | | | | |
| As of May 31, 2014 | | | | | | |
| | | | | | | | |
| | | | | | | | |
| | | | | | | | |
| | | | | | | | |
| | | | | | | | |
| | | | | | | | |
| | | Summary of Investments | % of Net | | | | |
| | | by Sector | Assets | | Value | | |
| | | Consumer Discretionary | 11.98% | $ | 927,900 | | |
| | | Financials | 4.51% | | 349,831 | | |
| | | Health Care | 29.01% | | 2,248,050 | | |
| | | Industrials | 29.26% | | 2,266,871 | | |
| | | Information Technology | 15.29% | | 1,184,746 | | |
| | | Materials | 4.05% | | 313,938 | | |
| | | Rights | 0.00% | | - | | |
| | | Short-Term Investment | 1.56% | | 121,078 | | |
| | | Other Assets Less Liabilities | 4.34% | | 336,182 | | |
| | | Total | 100.00% | $ | 7,748,596 | | |
| | | | | | | | |
| | | | | | | | |
| | | | | | | | |
| | | | | | | | |
| | | | | | | | |
| | | | | | | | |
| | | | | | | | |
| | | | | | | | |
| | | | | | | | |
| | | | | | | | |
| | | | | | | | |
| | | | | | | | |
| | | | | | | | |
| | | | | | | | |
| | | | | | | | |
| | | | | | | | |
| | | | | | | | |
| | | | | | | | |
| | | | | | | | |
| | | | | | | | |
| | | | | | | | |
| | | | | | | | |
| | | | | | | | |
| | | | | | | | |
| | | | | | | | |
| | | | | | | | |
| | | | | | | | |
| See Notes to Financial Statements | | | | | |
| Goodwood SMID Cap Discovery Fund | | | |
| | | | | |
| Statement of Assets and Liabilities | | | |
| | | | | |
| | | | | |
| As of May 31, 2014 | | | |
| | | | | |
| Assets: | | | | |
| Investments, at value (cost $7,348,400) | | $ | 7,412,414 |
| Receivables: | | | |
| | Fund shares sold | | | 1,000,568 |
| | Investments sold | | | 481,785 |
| | Dividends and interest | | | 2,875 |
| | | | | |
| Total assets | | | 8,897,642 |
| | | | | |
| Liabilities: | | | | |
| Payables: | | | |
| | Investments purchased | | | 1,138,457 |
| Accrued expenses: | | | |
| | Advisory fees | | | 6,760 |
| | Administration fees | | | 2,434 |
| | Distribution and service fees | | | 1,395 |
| | | | | |
| Total liabilities | | | 1,149,046 |
| | | | | |
| Net Assets | | $ | 7,748,596 |
| | | | | |
| Net Assets Consist of: | | | |
| Paid in interest | | $ | 7,492,055 |
| Accumulated net realized gain on investments | | | 192,527 |
| Net unrealized appreciation on investments | | | 64,014 |
| | | | | |
| Total Net Assets | | $ | 7,748,596 |
| Shares of beneficial interest outstanding, no par value (unlimited authorized shares) | 769,666 |
| Net Asset Value and Redemption Price Per Share (a) | $ | 10.07 |
| | | | | |
| Maximum Offering Price Per Share ($10.07 ÷ 94.25%) | | $ | 10.68 |
| | | | | |
| (a) | The Fund charges a 2% redemption fee on redemptions made within 30 days of initial purchase. |
| | | | | |
| | | | | |
| | | | | |
| | | | | |
| | | | | |
| | | | | |
| | | | | |
| | | | | |
| | | | | |
| | | | | |
| | | | | |
| | | | | |
| See Notes to Financial Statements | | | |
| Goodwood SMID Cap Discovery Fund | | |
| | | |
| Statement of Operations | | |
| | | |
| | | |
| For the Fiscal Year Ended May 31, 2014 | | |
| | | |
| Investment Income: | | |
| | Dividends (net of withholding taxes of $197) | $ | 20,602 |
| | | |
| Total Investment Income | | 20,602 |
| | | |
| Expenses: | | |
| | Advisory fees (note 2) | | 54,649 |
| | Administration fees (note 2) | | 27,192 |
| | Distribution and service fees (note 3) | | 10,930 |
| | | |
| | Total Expenses | | 92,771 |
| | | |
| | Less Fees Waived by Interim Advisor | | (7,870) |
| | | |
| | Net Expenses | | 84,901 |
| | | |
| Net Investment Loss | | (64,299) |
| | | |
| Realized and Unrealized Gain (Loss) on Investments | | |
| | | |
| | Net realized gain from investment transactions | | 2,291,658 |
| | Net change in unrealized depreciation on investments | | (1,838,593) |
| | | |
| Net Realized and Unrealized Gain on Investments | | 453,065 |
| | | |
| Net Increase in Net Assets Resulting from Operations | $ | 388,766 |
| | | |
| | | |
| | | |
| | | |
| | | |
| | | |
| | | |
| | | |
| | | |
| | | |
| | | |
| | | |
| | | |
| | | |
| | | |
| | | |
| | | |
| | | |
| | | |
| | | |
| | | |
| See Notes to Financial Statements | | |
| Goodwood SMID Cap Discovery Fund | | | | | | |
| | | | | | | | | | |
| Statements of Changes in Net Assets | | | | | | |
| | | | | | | | | | |
| | | | | | | | | | |
| For the fiscal year ended May 31, | | | | 2014 | | 2013 |
| | | | | | | | | | |
| Operations: | | | | | | | |
| | Net investment loss | | | $ | (64,299) | $ | (104,286) |
| | Net realized gain from investment transactions | | | | 2,291,658 | | 912,062 |
| | Net change in unrealized (depreciation) appreciation on investments | | (1,838,593) | | 842,144 |
| | | | | | | | | | |
| Net Increase in Net Assets Resulting from Operations | | | 388,766 | | 1,649,920 |
| | | | | | | | | | |
| Distributions to Shareholders From: | | | | | | |
| | Net investment income | | | | (1,383) | | - |
| | Net realized gains | | | | (670,799) | | (24,267) |
| | | | | | | | | | |
| Decrease in Net Assets Resulting from Distributions | | | (672,182) | | (24,267) |
| | | | | | | | | | |
| Beneficial Interest Transactions: | | | | | | |
| | Shares sold | | | | | 15,478,714 | | 1,528,275 |
| | Reinvested dividends and distributions | | | | 672,182 | | 6,731 |
| | Redemption Fees | | | | | 31 | | 69 |
| | Shares repurchased | | | | (15,543,189) | | (3,436,515) |
| | | | | | | | | | |
| Increase (Decrease) from Beneficial Interest Transactions | | | 607,738 | | (1,901,440) |
| | | | | | | | | | |
| Net Increase (Decrease) in Net Assets | | | | 324,322 | | (275,787) |
| | | | | | | | | | |
| Net Assets: | | | | | | | |
| | Beginning of Year | | | | 7,424,274 | | 7,700,061 |
| | End of Year | | | $ | 7,748,596 | $ | 7,424,274 |
| | | | | | | | | | |
| Undistributed Net Investment Income | | | $ | - | $ | - |
| | | | | | | | | | |
| Share Information*: | | | | | | |
| Shares Sold | | | | | 1,349,383 | | 48,409 |
| Reinvested dividends and distributions | | | | 67,217 | | 227 |
| Shares repurchased | | | | (856,608) | | (107,441) |
| Net Increase (Decrease) in Shares | | | | 559,992 | | (58,805) |
| Shares Outstanding, Beginning of Year | | | | 209,674 | | 268,479 |
| Shares Outstanding, End of Year | | | | 769,666 | | 209,674 |
| | | | | | | | | | |
| * Share amounts have been adjusted to reflect the 1:2.469 reverse split that occurred effective December 6, 2013. |
| | | | | | | | | | |
| | | | | | | | | | |
| | | | | | | | | | |
| | | | | | | | | | |
| | | | | | | | | | |
| | | | | | | | | | |
| | | | | | | | | | |
| | | | | | | | | | |
| | | | | | | | | | |
| See Notes to Financial Statements | | | | | | |
| Goodwood SMID Cap Discovery Fund | | | | | | | | |
| | | | | | | | | | | | | | |
| Financial Highlights | | | | | | | | | | | |
| | | | | | | | | | | | | | |
| For a share outstanding during each of the | | | | | | | | |
| fiscal years or period ended May 31, | 2014 | | 2013 | (h) | 2012 | (h) | 2011 | (h) | 2010 (a) | (h) |
| | | | | | | | | | | | | | |
| Net Asset Value, Beginning of Period | $ | 35.41 | $ | 28.69 | $ | 31.36 | $ | 25.70 | $ | 24.69 | |
| Income (Loss) from Investment Operations | | | | | | | | | | |
| | Net investment loss | | (0.07) | | (0.49) | | (0.40) | | (0.27) | | (0.10) | |
| | Net realized and unrealized gain (loss) on | | | | | | | | | | |
| | investments | | 4.79 | | 7.31 | | (1.68) | | 6.00 | | 1.11 | |
| | | | | | | | | | | | | | |
| Total from Investment Operations | 4.72 | | 6.82 | | (2.08) | | 5.73 | | 1.01 | |
| Less Distributions: | | | | | | | | | | | |
| | From net investment income | | (0.02) | | - | | - | | - | | - | |
| | From net realized gains | | (30.04) | | (0.10) | | (0.59) | | (0.07) | | - | |
| | | | | | | | | | | | | | |
| Total Distributions | | (30.06) | | (0.10) | | (0.59) | | (0.07) | | - | |
| Paid in interest | | | | | | | | | | | |
| From redemption fees | | 0.00 | (g) | 0.00 | (g) | - | | 0.00 | (g) | 0.00 | (g) |
| Total paid in interest | | 0.00 | | 0.00 | | - | | 0.00 | | 0.00 | |
| | | | | | | | | | | | | | |
| Net Asset Value, End of Period | $ | 10.07 | $ | 35.41 | $ | 28.69 | $ | 31.36 | $ | 25.70 | |
| | | | | | | | | | | | | | |
| Total Return (d)(e) | | 14.11% | | 23.82% | | (6.47)% | | 22.34% | | 4.10% | (c) |
| | | | | | | | | | | | | | |
| Net Assets, End of Period (in thousands) | $ | 7,749 | $ | 7,424 | $ | 7,700 | $ | 8,730 | $ | 4,864 | |
| | | | | | | | | | | | | | |
| Ratios of: | | | | | | | | | | | | |
| Gross Expenses to Average Net Assets (f) | 2.12% | | 1.95% | | 2.69% | | 3.61% | | 5.56% | (b) |
| Net Expenses to Average Net Assets (f) | 1.95% | | 1.95% | | 1.95% | | 1.96% | | 1.91% | (b) |
| Net Investment Loss to Average Net Assets | (1.47)% | | (1.37)% | | (1.34)% | | (1.11)% | | (1.31)% | (b) |
| | | | | | | | | | | | | | |
| Portfolio turnover rate | | 288.93% | | 60.68% | | 87.49% | | 126.59% | | 50.48% | (c) |
| | | | | | | | | | | | | | |
| (a) | For the period from January 4, 2010 (Date of Initial Public Investment) to May 31, 2010. | | | |
| (b) | Annualized. | | | | | | | | | | | |
| (c) | Not annualized. | | | | | | | | | | | |
| (d) | Total return does not reflect sales charge, if any. | | | | | | | | | |
| (e) | Includes adjustments in accordance with accounting principles generally accepted in the United States of |
| America and, consequently, the net asset value for financial reporting purposes and the returns based upon |
| those net asset values may differ from the net asset values and returns for shareholder transactions. | |
| (f) | The expense ratios listed reflect total expenses prior to any waivers and reimbursements | | | |
| (gross expense ratio) and after any waivers and reimbursements (net expense ratio). | | | |
| (g) | Less than $0.01 per share. | | | | | | | | | | |
| (h) | The Fund had a 1:2.469 reverse stock split effective December 6, 2013. Prior year net asset values and per share |
| amounts have been restated to reflect the impact of the reverse stock split. (See Notes to Financial | |
| Statements.) The net asset value reported at the original fiscal year end dates prior to the reverse stock split were |
| as follows: | | | | | | | | | | | |
| | | | | | | | | | | | | | |
| | | | 2013 | | 2012 | | 2011 | | 2010 | | | | | | |
| | | $ | 14.34 | $ | 11.62 | $ | 12.70 | $ | 10.41 | | | | | | |
| | | | | | | | | | | | | | |
| See Notes to Financial Statements | | | | | | | | | | |
Goodwood SMID Cap Discovery Fund
Notes to Financial Statements
May 31, 2014
1. Organization and Significant Accounting Policies
The Goodwood SMID Cap Discovery Fund ("Fund"), formerly known as the Caritas All-Cap Growth Fund, is a series of the Starboard Investment Trust ("Trust"). The Trust is organized as a Delaware statutory trust and is registered under the Investment Company Act of 1940, as amended (the "1940 Act"), as an open-end management investment company. The Fund is a separate diversified series of the Trust.
The Fund commenced operations on January 4, 2010. The investment objective of the Fund is to seek capital appreciation. In order to achieve its investment objective, Goodwood Advisors, LLC ("Advisor") will seek to invest primarily in a portfolio of common stocks of companies that the Advisor believes have above-average future growth potential relative to their peers, using risk adjusted metrics as a comparative baseline.
On August 22, 2013, Caritas Capital, LLC (the "Former Advisor"), resigned as the Advisor to the Fund. CV Investment Advisors, LLC became the interim Investment Advisor (the "Interim Investment Advisor") for the period August 22, 2013 through October 31, 2013. CV Investment Advisors received no compensation for its services as the interim investment advisor to the Fund. On September 30, 2013, Goodwood Advisors, LLC, became a consultant to CV Investment Advisors, LLC.
For the period October 31, 2013 through March 30, 2014, the Fund entered into another interim Investment Advisory Agreement ("Interim Agreement") with Goodwood Advisors, LLC (the "Advisor"). Effective March 31, 2014, the Fund entered into an Investment Advisory Agreement with the Advisor.
The following is a summary of significant accounting policies consistently followed by the Fund. The policies are in conformity with accounting principles generally accepted in the United States of America ("GAAP").
Investment Valuation
The Fund's investments in securities are carried at fair value. Securities listed on an exchange or quoted on a national market system are valued at the last sales price as of 4:00 p.m. Eastern Time. Securities traded in the NASDAQ over-the-counter market are generally valued at the NASDAQ Official Closing Price. Other securities traded in the over-the-counter market and listed securities for which no sale was reported on that date are valued at the most recent bid price. Securities and assets for which representative market quotations are not readily available (e.g., if the exchange on which the portfolio security is principally traded closes early or if trading of the particular portfolio security is halted during the day and does not resume prior to the Fund's net asset value calculation) or which cannot be accurately valued using the Fund's normal pricing procedures are valued at fair value as determined in good faith under policies approved by the Trustees. A portfolio security's "fair value" price may differ from the price next available for that portfolio security using the Fund's normal pricing procedures. Instruments with maturities of 60 days or less are valued at amortized cost, which approximates market value.
Fair Value Measurement
Various inputs are used in determining the value of the Fund's investments. These inputs are summarized in the three broad levels listed below:
Level 1: quoted prices in active markets for identical securities
Level 2: other significant observable inputs (including quoted prices for similar securities and identical securities in inactive markets, interest rates, credit risk, etc.)
Level 3: significant unobservable inputs (including the Fund's own assumptions in determining fair value of investments)
The availability of observable inputs can vary from security to security and is affected by a wide variety of factors, including, for example, the type of security, whether the security is new and not yet established in the marketplace, the liquidity of markets, and other characteristics particular to the security. To the extent that valuation is based on models or inputs that are less observable or unobservable in the market, the determination of fair value requires more judgment. Accordingly, the degree of judgment exercised in determining fair value is greatest for instruments categorized in Level 3.
(Continued)
Goodwood SMID Cap Discovery Fund
Notes to Financial Statements
May 31, 2014
The inputs used to measure fair value may fall into different levels of the fair value hierarchy. In such cases, for disclosure purposes, the level in the fair value hierarchy within which the fair value measurement falls in its entirety, is determined based on the lowest level input that is significant to the fair value measurement in its entirety.
The inputs or methodology used for valuing securities are not necessarily an indication of the risk associated with investing in those securities. The following table summarizes the inputs as of May 31, 2014 for the Fund's assets measured at fair value:
| Investments in Securities (a) | | Total | | Level 1 | | Level 2 | | Level 3 |
| Common Stocks* | $ | 7,291,336 | $ | 7,291,336 | $ | - | $ | - |
| Rights | | - | | - | | - - | | - - |
| Short-Term Investment | | 121,078 | | 121,078 | | - | | - - |
| Total | $ | 7,412,414 | $ | 7,412,414 | $ | - | $ | - - |
*Refer to Schedule of Investments for breakdown by Industry
(a) The Fund had no significant transfers into or out of Level 1, 2, or 3 during the year ended May 31, 2014. It is the Fund's policy to recognize transfers at the end of the reporting period.
Investment Transactions and Investment Income
Investment transactions are accounted for as of the date purchased or sold (trade date). Dividend income is recorded on the ex-dividend date. Certain dividends from foreign securities will be recorded as soon as the Fund is informed of the dividend if such information is obtained subsequent to the ex-dividend date. Interest income is recorded on the accrual basis and includes amortization of discounts and premiums. Gains and losses are determined on the identified cost basis, which is the same basis used for federal income tax purposes.
Expenses
The Fund bears expenses incurred specifically on its behalf as well as a portion of general expenses, which are allocated according to methods reviewed annually by the Trustees.
Distributions
The Fund may declare and distribute dividends from net investment income (if any) quarterly. Distributions from capital gains (if any) are generally declared and distributed annually. Dividends and distributions to shareholders are recorded on ex-date.
Estimates
The preparation of financial statements in conformity with GAAP requires management to make estimates and assumptions that affect the reported amounts of assets and liabilities and disclosure of contingent assets and liabilities at the date of the financial statements and the reported amounts of increases and decreases in the net assets from operations during the reported period. Actual results could differ from those estimates.
Fees on Redemptions
The Fund charges a redemption fee of 2.00% on redemptions of Fund shares occurring within 30 days following the issuance of such shares. The redemption fee is not a fee to finance sales or sales promotion expenses, but is paid to the Fund to defray the costs of liquidating an investor and discouraging short-term trading of the Fund's shares. No redemption fee will be imposed on the redemption of shares representing dividends or capital gains distributions, or on amounts representing capital appreciation of shares.
Federal Income Taxes
No provision for income taxes is included in the accompanying financial statements, as the Fund intends to distribute to shareholders all taxable investment income and realized gains and otherwise comply with Subchapter M of the Internal Revenue Code applicable to regulated investment companies.
(Continued)
Goodwood SMID Cap Discovery Fund
Notes to Financial Statements
May 31, 2014
| 2. | Transactions with Related Parties & Service Providers |
Advisor
For the period June 1, 2013 through August 21, 2013, the Fund was party to an Investment Advisory Agreement with the Former Advisor. Under the terms of the prior agreement, the Fund was charged an annual advisory fee of 1.25% of the daily average net assets of the Fund. For the period June 1, 2013 through August 21, 2013, the Former Advisor earned $19,790 in advisory fees.
For the period August 22, 2013 through October 30, 2013, the Fund was party to an interim Investment Advisory Agreement with CV Investment Advisor. Under the terms of this interim Investment Advisory Agreement, the Fund was charged an annual advisory fee of 1.25% of the average daily net assets of the Fund. For the period from August 22, 2013 through October 30, 2013, CV Investment Advisor earned $7,870 in advisory fees. CV Investment Advisor waived their advisory compensation.
For the period October 31, 2013 through May 31, 2014, the Fund entered into an interim Investment Advisory Agreement and then a final Investment Advisory Agreement with the Advisor. Under both of these agreements, the Fund was charged 1.25% of the average daily net assets of the Fund. For the period October 31, 2013 through May 31, 2014, the Advisor earned $26,989 in advisory fees.
The Advisor has entered into an Operating Plan with the Administrator, under which it has agreed to (i) make payments to the administrator based upon the Fund's net assets according to a schedule included in the Operating Plan and (ii) assume certain expenses of the Fund outlined in the Operating Plan through October 1, 2015. These measures are intended to limit the Fund's operating expenses to 1.70% of the average daily net assets, exclusive of brokerage fees and commissions, taxes, borrowing costs (such as interest or dividend expenses on securities sold short), acquired fund fees and expenses, extraordinary expenses and distribution and/or service (12b-1) fees. The Fund's net expense ratio will be higher than 1.70% to the extent the Fund incurs expenses excluded from this arrangement. The Operating Plan can only be terminated prior to the conclusion of the current term with the approval of the Fund's Board of Trustees.
Administrator
The Nottingham Company ("Administrator") assists the Trust in the performance of its administrative responsibilities to the Fund, coordinates and pays for the services of each vendor and the operating expenses to the Fund, and provides the Fund with certain administrative, fund accounting, and compliance services. As part of its services and consolidated fee arrangement, the Administrator receives compensation based on the Fund's average daily net assets. The annual rate is 0.45% if the average daily net assets are under $40 million and gradually decreases to an annual rate of 0.094% once the average daily net assets reach $1.82 billion or more.
The fee paid to the Administrator is calculated by multiplying the average daily net assets of the Fund by the highest applicable annual rate. The Administrator pays all expenses not assumed by the Advisor, including, without limitation: the fees and expenses of its independent accountants, of its legal counsel, and of its Trustees; the costs of printing and mailing to shareholders annual and semi-annual reports, proxy statements, prospectuses, statements of additional information and supplements thereto; the costs of printing registration statements; bank transaction charges and custodian's fees; any proxy solicitors' fees and expenses; ongoing filing fees; any federal, state or local income or other taxes; any interest; any membership fees of the Investment Company Institute and similar organizations; fidelity bond and Trustees' liability insurance premiums. The Fund incurred $19,322 in administration fees for the fiscal year ended May 31, 2014. In addition, the $7,870 that was waived by the interim Investment Advisor was paid to the Administrator to offset costs involved in transitioning the Fund to a new Investment Advisor and resulting name change.
Compliance Services
Nottingham Compliance Services, LLC ("NCS"), a fully owned affiliate of the Administrator, provides services which assist the Trust's Chief Compliance Officer in monitoring and testing the policies and procedures of the Trust in conjunction with requirements under Rule 38a-1 of the 1940 Act. NCS was entitled to receive compensation from the Administrator pursuant to the Administrator's fee arrangements with the Fund.
(Continued)
Goodwood SMID Cap Discovery Fund
Notes to Financial Statements
May 31, 2014
In January 2014, Cipperman Compliance Services, LLC assumed providing services as the Trust's Chief Compliance Officer. Cipperman Compliance Services, LLC is entitled to receive compensation from the Administrator pursuant to the Administrator's fee arrangements with the Fund.
Transfer Agent
Nottingham Shareholder Services, LLC ("Transfer Agent") serves as transfer, dividend paying, and shareholder servicing agent for the Fund. For its services, the Transfer Agent is entitled to receive compensation from the Administrator pursuant to the Administrator's fee arrangements with the Fund.
Distributor
Capital Investment Group, Inc. (the "Distributor") serves as the Fund's principal underwriter and distributor. For its services, the Distributor is entitled to receive compensation from the Administrator pursuant to the Administrator's fee arrangements with the Fund.
Certain Trustees and officers of the Trust are also officers of the Advisor or the Administrator.
| 3. | Distribution and Service Fees |
The Trustees, including a majority of the Trustees who are not "interested persons" of the Trust as defined in the 1940 Act and who have no direct or indirect financial interest in such plan or in any agreement related to such plan, adopted a distribution plan pursuant to Rule 12b-1 of the 1940 Act (the "Plan"). The 1940 Act regulates the manner in which a regulated investment company may assume expenses of distributing and promoting the sales of its shares and servicing of its shareholder accounts. The Plan provides that the Fund may incur certain expenses, which may not exceed 0.25% per annum of the Fund's average daily net assets for each year elapsed subsequent to adoption of the Plan, for payment to the Distributor and others for items such as advertising expenses, selling expenses, commissions, travel or other expenses reasonably intended to result in sales of shares of the Fund or support servicing of shareholder accounts. For the fiscal year ended May 31, 2014, $10,930 in fees were incurred by the Fund.
| 4. | Purchases and Sales of Investment Securities |
The aggregate cost of purchases and proceeds from sales of investment securities (excluding short-term securities) were as follows:
| Fiscal Year Ended | Purchases of Securities | Proceeds from Sales of Securities |
| May 31, 2014 | $12,567,851 | $12,263,917 |
There were no long-term purchases or sales of U.S Government Obligations during the fiscal year ended May 31, 2014.
Distributions are determined in accordance with Federal income tax regulations, which differ from generally accepted accounting principles, and, therefore, may differ significantly in amount or character from net investment income and realized gains for financial reporting purposes. Financial reporting records are adjusted for permanent book/tax differences to reflect tax character but are not adjusted for temporary differences.
Management reviewed the Fund's tax positions on federal income tax returns for the open tax years of 2011, 2012, and, 2013, and as of and during the fiscal year ended May 31, 2014, determined that the Fund does not have a liability for uncertain tax positions. The Fund recognizes interest and penalties, if any, related to unrecognized tax benefits as income tax expense in the Statement of Operations. During the fiscal year ended May 31, 2014, the Fund did not incur any interest or penalties.
(Continued)
Goodwood SMID Cap Discovery Fund
Notes to Financial Statements
May 31, 2014
Reclassifications to the capital accounts relate primarily to differing book/tax treatment of ordinary net investment losses, distribution reclassifications, and tax equalization. For the fiscal year ended May 31, 2014, the following reclassifications were made:
| Accumulated Net Investment Loss | $ | 65,682 |
| Accumulated Net Realized Gain on Investments | | (2,210,668) |
| Paid in Capital | | 2,144,986 |
Distributions during the fiscal years ended were characterized for tax purposes as follows:
| | Distibutions from |
For the Fiscal Years Ended | | Ordinary Income | Long-Term- Capital Gains |
| 05/31/2014 | | $ | 1,383 | $ | 670,799 |
| 05/31/2013 | | $ | - | $ | 24,267 |
At May 31, 2014, the tax-basis cost of investments and components of distributable earnings were as follows:
| Cost of Investments | $ | 7,364,576 |
| | |
| Unrealized Appreciation | $ | 278,557 |
| Unrealized Depreciation | | (230,719) |
| Net Unrealized Appreciation | | 47,838 |
| | |
| Undistributed Ordinary Income | | 208,703 |
| | |
| Distributable Earnings | $ | 256,541 |
| | | | | |
The difference between components of distributable earnings on a tax basis and the amounts reflected in the Statement of Assets and Liabilities are primarily due to wash sale losses and the treatment of short-term capital gains as net investment income for tax purposes.
| 6. | Commitments and Contingencies |
Under the Trust's organizational documents, its officers and Trustees are indemnified against certain liabilities arising out of the performance of their duties to the Fund. In addition, in the normal course of business, the Trust entered into contracts with its service providers, on behalf of the Fund, and others that provide for general indemnifications. The Fund's maximum exposure under these arrangements is unknown, as this would involve future claims that may be made against the Fund. The Fund expects risk of loss to be remote.
During the fiscal year ended May 31, 2014, the Fund had a 1 for 2.469 reverse stock split. Each shareholder of record on December 6, 2013, received one share for every 2.469 shares held on that date. The split had no effect on net assets or total return.
8. Accounting Pronouncements
In June 2013, the Financial Accounting Standards Board issued Accounting Standards Update (ASU) No. 2013‑08, Financial Services—Investment Companies. ASU 2013‑08 provides clarifying guidance to determine if an entity qualifies as an investment company. ASU 2013‑08 also requires an investment company to measure non-controlling interests in other investment companies at fair value. The requirements of ASU 2013‑08 are effective for interim and annual reporting periods in fiscal years that begin after December 15, 2013. It is not expected that ASU 2013‑08 will have an impact on financial statement disclosures.
(Continued)
Goodwood SMID Cap Discovery Fund
Notes to Financial Statements
May 31, 2014
9. Subsequent Events
The Fund has evaluated the need for disclosures and/or adjustments resulting from subsequent events through the date of issuance of these financial statements. This evaluation did not result in any additional subsequent events that necessitated disclosures and/or adjustments in addition to the disclosure above.
REPORT OF INDEPENDENT REGISTERED PUBLIC ACCOUNTING FIRM
To the Board of Trustees of Starboard Investment Trust
and the Shareholders of Goodwood SMID Cap Discovery Fund
(formerly, the Caritas All-Cap Growth Fund)
We have audited the accompanying statement of assets and liabilities of the Goodwood SMID Cap Discovery Fund (formerly, the Caritas All-Cap Growth Fund) (the "Fund"), a series of shares of beneficial interest in the Starboard Investment Trust, including the schedule of investments, as of May 31, 2014, the related statement of operations for the year then ended, and the statements of changes in net assets and the financial highlights for each of the two years in the period then ended. These financial statements and financial highlights are the responsibility of the Fund's management. Our responsibility is to express an opinion on these financial statements and financial highlights based on our audits. The financial highlights for each of the years or period presented in the period January 4, 2010 to May 31, 2012 have been audited by other auditors, whose report dated July 26, 2012, expressed an unqualified opinion on such financial highlights.
We conducted our audits in accordance with the standards of the Public Company Accounting Oversight Board (United States). Those standards require that we plan and perform the audits to obtain reasonable assurance about whether the financial statements and financial highlights are free of material misstatement. An audit includes examining, on a test basis, evidence supporting the amounts and disclosures in the financial statements. Our procedures included confirmation of securities owned as of May 31, 2014 by correspondence with the custodian and brokers. An audit also includes assessing the accounting principles used and significant estimates made by management, as well as evaluating the overall financial statement presentation. We believe that our audits provide a reasonable basis for our opinion.
In our opinion, the financial statements and financial highlights referred to above present fairly, in all material respects, the financial position of the Goodwood SMID Cap Discovery Fund as of May 31, 2014, the results of its operations for the year then ended, and the changes in its net assets and its financial highlights for each of the two years in the period then ended, in conformity with accounting principles generally accepted in the United States of A
merica.
BBD, LLP
Philadelphia, Pennsylvania
July 25, 2014
Goodwood SMID Cap Discovery Fund
Additional Information
(Unaudited)
| 1. | Proxy Voting Policies and Voting Record |
A copy of the Trust's Proxy Voting and Disclosure Policy and the Advisor's Disclosure Policy are included as Appendix B to the Fund's Statement of Additional Information and are available, without charge, upon request, by calling 800-773-3863, and on the website of the Security and Exchange Commission ("SEC") at sec.gov. Information regarding how the Fund voted proxies relating to portfolio securities during the most recent period ended June 30, is available (1) without charge, upon request, by calling the Fund at the number above and (2) on the SEC's website at sec.gov.
| 2. | Quarterly Portfolio Holdings |
The Fund files its complete schedule of portfolio holdings with the SEC for the first and third quarters of each fiscal year on Form N-Q. The Fund's Forms N-Q are available on the SEC's website at sec.gov. You may review and make copies at the SEC's Public Reference Room in Washington, D.C. Information on the operation of the Public Reference Room may be obtained by calling the SEC at 202-942-8090. You may also obtain copies without charge, upon request, by calling the Fund at 800-773-3863.
We are required to advise you within 60 days of the Fund's fiscal year-end regarding the federal tax status of certain distributions received by shareholders during each fiscal year. The following information is provided for the Fund's fiscal year ended May 31, 2014.
During the fiscal year, the fund paid a long-term capital gain distribution in the amount of $670,799.
Dividend and distributions received by retirement plans such as IRAs, Keogh-type plans and 403(b) plans need not be reported as taxable income. However, many retirement plans may need this information for their annual information meeting.
| 4. | Schedule of Shareholder Expenses |
As a shareholder of the Fund, you incur two types of costs: (1) transaction costs, which may include sales charges (loads) on purchase payments and (2) ongoing costs, including investment advisory fees; distribution (12b-1) fees; and other Fund expenses. This example is intended to help you understand your ongoing costs (in dollars) of investing in the Fund and to compare these costs with the ongoing costs of investing in other mutual funds. The example is based on an investment of $1,000 invested at the beginning of the period and held for the entire period as indicated below.
Actual Expenses – The first line of the table below provides information about the actual account values and actual expenses. You may use the information in this line, together with the amount you invested, to estimate the expenses that you paid over the period. Simply divide your account value by $1,000 (for example, an $8,600 account value divided by $1,000 = 8.6), then multiply the result by the number in the first line under the heading entitled "Expenses Paid During Period" to estimate the expenses you paid on your account during this period.
Hypothetical Example for Comparison Purposes – The last line of the table below provides information about hypothetical account values and hypothetical expenses based on the Fund's actual expense ratio and an assumed annual rate of return of 5% before expenses, which is not the Fund's actual return. The hypothetical account values and expenses may not be used to estimate the actual ending account balance or expenses you paid for the period. You may use this information to compare the ongoing costs of investing in the Fund and other funds by comparing this 5% hypothetical example with the 5% hypothetical examples that appear in the shareholder reports of other funds.
(Continued)
Goodwood SMID Cap Discovery Fund
Additional Information
(Unaudited)
| Expense Example | Beginning Account Value December 1, 2013 | Ending Account Value May 31, 2014 | Expenses Paid During Period* |
| Actual | $1,000.00 | $1,028.91 | $ 9.76 |
| Hypothetical (5% annual return before expenses) | $1,000.00 | $1,015.31 | $ 9.69 |
Expenses are equal to the average account value over the period multiplied by the Fund's annualized expense ratio, multiplied by the number of days in the most recent period divided by the number of days in the fiscal year (to reflect the six month period).
At a meeting of the shareholders on January 27, 2014, the Advisor received the necessary shareholder votes for approval of the Investment Advisory Agreement. A total of 175,326.539 shares of the Fund were entitled to vote at the shareholder meeting. The holders of 108,998.290 shares entitled to vote for the Fund were present in person or were represented by proxy at the meeting. The percentage of shares present totaled 62.17%. 82,663.270 shares were necessary for quorum, so the Fund received the necessary votes.
| 6. | Approval of Advisory Agreement |
The Advisor supervises the investments of the Fund pursuant to an Investment Advisory Agreement. At a meeting of the Fund's Board of Trustees on March 31, 2014, the Trustees approved the Investment Advisory Agreement for an initial two-year term. In considering whether to approve the Investment Advisory Agreement, the Trustees reviewed and considered the information they deemed reasonably necessary, including the following material factors: (i) the nature, extent, and quality of the services provided by the Advisor; (ii) the costs of the services to be provided and profits to be realized by the Advisor and its affiliates from the relationship with the Fund; (iii) the extent to which economies of scale would be realized as the Fund grows and whether advisory fee levels reflect those economies of scale for the benefit of the Fund's investors; (iv) the Advisor's practices regarding brokerage and portfolio transactions; and (v) the Advisor's practices regarding possible conflicts of interest.
At the meeting, the Trustees reviewed various informational materials, including the Investment Advisory Agreement for the Fund and a memorandum from the Advisor to the Trustees containing information about the advisory firm and its business. The memorandum provided information about the Advisor's finances, personnel, services to the Fund, investment advice, fees, and compliance program. It also contained information on Fund expenses, including comparative expense ratio information for other mutual funds with strategies similar to the Fund. The Trustees also reviewed a memorandum from the Fund's legal counsel that summarized the fiduciary duties and responsibilities of the Board of Trustees in reviewing and approving the Investment Advisory Agreement, including the types of information and factors that should be considered in order to make an informed decision. In addition, the Trustees consulted with separate independent legal counsel retained by them regarding their consideration of the Investment Advisory Agreement.
In considering the nature, extent, and quality of the services provided by the Advisor, the Trustees reviewed the responsibilities of the Advisor under the Investment Advisory Agreement. The Trustees reviewed the services to be provided by the Advisor to the Fund including, without limitation, the Advisor's procedures for formulating investment recommendations and assuring compliance with the Fund's investment objectives and limitations, proposed efforts during the Fund's start-up phase, coordination of services for the Fund among the Fund's service providers, and efforts to promote the Fund, grow the Fund's assets, and assist in the distribution of Fund shares. The Trustees noted that the Advisor seeks to achieve the Fund's investment objective by investing in closed-end funds that are trading at substantial discounts to their net asset values. The Trustees also noted that when selecting investments, the Advisor employs a proprietary research process that uses quantitative information to forecast whether the market discount on a closed-end fund will increase or decrease. The Trustees further noted that the Fund's principal executive officer is the President of the Advisor and will serve the Fund without additional compensation from the Fund. After reviewing the foregoing information and further information in the memorandum from the Advisor (e.g., the Advisor's Form ADV and descriptions of the Advisor's business and compliance program), the Board of Trustees concluded that the nature, extent, and quality of the services to be provided by the Advisor were satisfactory and adequate for the Fund.
(Continued)
Goodwood SMID Cap Discovery Fund
Additional Information
(Unaudited)
In considering the investment performance of the Advisor, the Trustees discussed the Advisor's experience managing investments and reviewed the performance of the Theta strategy run by the Advisor for the previous six years. The Trustees compared the performance of the Theta strategy with the performance of benchmark indices and applicable peer group data. After review of the Advisor's experience managing other accounts, the Board of Trustees concluded that the investment performance of the Advisor was satisfactory.
In considering the costs of the services to be provided and profits to be realized by the Advisor and its affiliates from the relationship with the Fund, including any benefits derived by the Advisor from the relationship with the Fund, the Trustees first noted that the management fee for the Fund would be 1.25% of the average daily net assets of the Fund. The Trustees then reviewed the Advisor's staffing, personnel, and methods of operating; the education and experience of the Advisor's personnel; the Advisor's compliance programs, policies, and procedures; the financial condition of the Advisor; the level of commitment to the Fund and the Advisor by the principals of the Advisor; the projected asset levels of the Fund; the Advisor's payment of startup costs for the Fund; and the overall expenses of the Fund, including the nature and frequency of advisory fee payments. The Trustees noted that the Advisor directly pays for certain expenses of the Fund under an Operating Plan in order to help limit the Fund's annual operating expenses. The Trustees reviewed the financial statements of the Advisor and discussed the financial stability and profitability of the firm. The Advisor responded to questions about the financial condition of the firm and its principals. The Trustees also considered potential benefits for the Advisor in managing the Fund, including promotion of the Advisor's name, the ability for the Advisor to place small accounts into the Fund, and the potential for the Advisor to generate soft dollars from Fund trades that may benefit the Advisor's other clients. The Trustees then compared the expected fees and expenses of the Fund (including the management fee) to other funds comparable in terms of the type of fund, the nature of its investment strategy, and its style of investment management, among other factors. The Trustees determined that the management fee was lower than comparable funds and lower than the peer group average. The Trustees noted that the net expense ratio also was lower than the comparable funds and the peer group average. Following further consideration and discussion of the foregoing, the Board of Trustees concluded that the fees to be paid to the Advisor by the Fund were fair and reasonable in relation to the nature and quality of the services provided by the Advisor and that they reflected charges that were within a range of what could have been negotiated at arm's length.
In considering the extent to which economies of scale would be realized as the Fund grows and whether the advisory fee levels reflect these economies of scale for the benefit of the Fund's investors, the Trustees reviewed the Fund's fee arrangements with the Advisor. The Trustees noted that, while the management fee would remain the same at all asset levels, the Advisor had agreed to directly pays for certain Fund expenses under an Operating Plan in order to help limit the Fund's annual operating expenses. The Trustees also noted that the Fund's shareholders would benefit from economies of scale under the Fund's agreements with service providers other than the Advisor. Following further discussion of the Fund's projected asset levels, expectations for growth, and fee levels, the Board of Trustees determined that the Fund's fee arrangements were fair and reasonable in relation to the nature and quality of the services provided by the Advisor.
In considering the Advisor's practices regarding brokerage and portfolio transactions, the Trustees reviewed the Advisor's standards, and performance in utilizing those standards, for seeking best execution for Fund portfolio transactions. The Trustees also considered the anticipated portfolio turnover rate for the Fund; the process by which evaluations are made of the overall reasonableness of commissions paid; the method and basis for selecting and evaluating the broker-dealers used; any anticipated allocation of portfolio business to persons affiliated with the Advisor; and the extent to which the Fund allocates portfolio business to broker-dealers who provide research, statistical, or other services (soft dollars). After further review and discussion, the Board determined that the Advisor's practices regarding brokerage and portfolio transactions were satisfactory.
In considering the Advisor's practices regarding possible conflicts of interest, the Trustees evaluated the potential for conflicts of interest and considered such matters as the experience and ability of the advisory personnel assigned to the Fund; the basis of decisions to buy or sell securities for the Fund and the Advisor's other accounts; the method for bunching of portfolio securities transactions; and the substance and administration of the Advisor's code of ethics. Following further consideration and discussion, the Board of Trustees indicated that the Advisor's standards and practices relating to the identification and mitigation of potential conflicts of interests were satisfactory.
(Continued)
Goodwood SMID Cap Discovery Fund
Additional Information
(Unaudited)
Based upon all of the foregoing considerations, the Board of Trustees, including a majority of the Independent Trustees, approved the Investment Advisory Agreement for the Fund.
| 7. | Information about Trustees and Officers |
The business and affairs of the Fund and the Trust are managed under the direction of the Board of Trustees of the Trust. Information concerning the Trustees and officers of the Trust and Fund is set forth below. Generally, each Trustee and officer serves an indefinite term or until certain circumstances such as their resignation, death, or otherwise as specified in the Trust's organizational documents. Any Trustee may be removed at a meeting of shareholders by a vote meeting the requirements of the Trust's organizational documents. The Statement of Additional Information of the Fund includes additional information about the Trustees and officers and is available, without charge, upon request by calling the Fund toll-free at 800-773-3863. The address of each Trustee and officer, unless otherwise indicated below, is 116 South Franklin Street, Rocky Mount, North Carolina 27804. The Independent Trustees each received aggregate compensation of $2,000 during the fiscal year ended May 31, 2014 for their services to the Fund and Trust.
Name, Age
and Address | Position
held with
Fund or Trust | Length of Time Served | Principal Occupation
During Past 5 Years | Number of Portfolios in Fund Complex Overseen by Trustee | Other Directorships
Held by Trustee
During Past 5 Years |
| Independent Trustees |
Michael G. Mosley
Age: 61 | Independent Trustee | Since 7/10 | Owner of Commercial Realty Services (real estate) since 2004. | 23 | None. |
Theo H. Pitt, Jr.
Age: 78 | Independent Trustee | Since 9/10 | Senior Partner, Community Financial Institutions Consulting (financial consulting) since 1999; Partner, Pikar Properties (real estate) since 2001; Account Administrator, Holden Wealth Management Group of Wachovia Securities (money management firm) from 2003-2008. | 23 | Independent Trustee of World Funds Trust for its two series, Gardner Lewis Investment Trust for its two series, Hanna Investment Trust for its one series, and Hillman Capital Management Investment Trust for its one series (all registered investment companies); previously, Independent Trustee of, NCM Capital Investment Trust for its one series from 2007 to 2009, New Providence Investment Trust from 2008 to 2009, and Tilson Investment Trust for its two series from 2004 to 2009 (all registered investment companies). |
(Continued)
Goodwood SMID Cap Discovery Fund
Additional Information
(Unaudited)
Name, Age
and Address | Position
held with
Fund or Trust | Length of Time Served | Principal Occupation
During Past 5 Years | Number of Portfolios in Fund Complex Overseen by Trustee | Other Directorships
Held by Trustee
During Past 5 Years |
James H. Speed, Jr.
Age: 61 | Independent Trustee, Chairman | Trustee since 7/09, Chair since 5/12 | President and CEO of NC Mutual Insurance Company (insurance company) since 2003; President of Speed Financial Group, Inc. (consulting and private investments) from 2000 to 2003. | 23 | Independent Trustee of the following Brown Capital Management Funds for its three series, Hillman Capital Management Investment Trust for its one series, and Tilson Investment Trust for its one series (all registered investment companies). Member of Board of Directors of NC Mutual Life Insurance Company. Member of Board of Directors of M&F Bancorp. Previously, Independent Trustee of New Providence Investment Trust for its one series from 2009 until 2011 (registered investment company). |
J. Buckley Strandberg
Age: 54 | Independent Trustee | Since 7/09 | President of Standard Insurance and Realty (insurance and property management) since 1982. | 23 | None. |
| Other Officers |
Ryan D. Thibodeaux Age: 35 | President and Treasurer (Goodwood SMID Cap Discovery Fund) | Since 10/13 | President and Managing Member of Goodwood Capital Management, LLC | n/a | n/a |
Katherine M. Honey
Age: 40 | Secretary | Since 10/13 | EVP of The Nottingham Company since 2008. | n/a | n/a |
Martin Dziura
Age: 54 | Chief Compliance Officer | Since 1/14 | Managing Director, Cipperman Compliance Services, LLC since 2010; Chief Compliance Officer, Hanlon Investment Management from 2009-2010; Vice President, Compliance, Morgan Stanley Investment Management from 2000-2009. | n/a | n/a |
Ashley E. Harris
Age: 30 | Assistant Treasurer | Since 4/14 | Director, Financial Reporting, The Nottingham Company; Fund Accounting, The Nottingham Company from 2008-2014. | n/a | n/a |
Goodwood SMID Cap Discovery Fund
is a series of
The Starboard Investment Trust
| For Shareholder Service Inquiries: | For Investment Advisor Inquiries: |
| Nottingham Shareholder Services, LLC | Goodwood Advisors, LLC |
| 116 South Franklin Street | 450 Laurel Street |
Post Office Drawer 4365 Rocky Mount, North Carolina 27803 Telephone: | Suite 2105 Baton Rouge, Lousiana 70801 Telephone: |
| World Wide Web @: | World Wide Web @: |
| ncfunds.com | goodwood-funds.com |
Item 2. CODE OF ETHICS.
| (a) | The registrant, as of the end of the period covered by this report, has adopted a code of ethics that applies to its Principal Executive Officer(s), Principal Financial Officer(s), and Principal Accounting Officer(s), or persons performing similar functions, regardless of whether these individuals are employed by the registrant or a third party. |
| (c) | There have been no substantive amendments during the period covered by this report. |
| (d) | The registrant has not granted, during the period covered by this report, any waivers, including an implicit waiver. |
| (f)(1) | A copy of the code of ethics that applies to the registrant's Principal Executive Officers and Principal Financial Officers is filed pursuant to Item 12.(a)(1) below. |
| Item 3. | AUDIT COMMITTEE FINANCIAL EXPERT. |
The registrant's Board of Trustees has determined that the registrant has an audit committee financial expert, as defined in Item 3 of Form N-CSR, serving on its audit committee.
As of the date of this report, May 31, 2014, the registrant's audit committee financial expert is Mr. James H. Speed, Jr. Mr. Speed is "independent" for purposes of Item 3 of Form N-CSR.
Item 4. PRINCIPAL ACCOUNTANT FEES AND SERVICES.
| (a) | Audit Fees – Audit fees billed for the registrant for the last two fiscal years are reflected in the table below. These amounts represent aggregate fees billed by the registrant's independent accountant, BBD, LLP ("Accountant"), in connection with the annual audits of the registrant's financial statements and for services normally provided by the Accountant in connection with the registrant's statutory and regulatory filings for those fiscal years. |
| Fund | 2013 | 2014 |
| Goodwood SMID Cap Discovery Fund (formerly known as the Caritas All-Cap Growth Fund) | $11,000 | $11,250 |
| (b) | Audit-Related Fees – There were no additional fees billed in the fiscal years ended May 31, 2013 and May 31, 2014 for assurance and related services by the Accountant that were reasonably related to the performance of the audit of the registrant's financial statements that were not reported under paragraph (a) of this Item. |
| (c) | Tax Fees – The tax fees billed in each of the last two fiscal years ended for professional services rendered by the Accountant for tax compliance, tax advice, and tax planning are reflected in the table below. These services were for the completion of each fund's federal and state income tax returns, excise tax returns, and assistance with distribution calculations. |
| Fund | 2013 | 2014 |
| Goodwood SMID Cap Discovery Fund (formerly known as the Caritas All-Cap Growth Fund) | $2,000 | $2,000 |
| (d) | All Other Fees – There were no other fees paid to the Accountant which were not disclosed in Items (a) through (c) above during the last two fiscal years. |
| (e)(1) | The registrant's Board of Trustees pre-approved the engagement of the Accountant for the last two fiscal years at an audit committee meeting of the Board of Trustees called for such purpose; and will pre-approve the Accountant for each fiscal year thereafter at an audit committee meeting called for such purpose. The charter of the audit committee states that the audit committee should pre-approve any audit services and, when appropriate, evaluate and pre-approve any non-audit services provided by the Accountant to the registrant and to pre-approve, when appropriate, any non-audit services provided by the Accountant to the registrant's investment adviser, or any entity controlling, controlled by, or under common control with the investment adviser that provides ongoing services to the registrant if the engagement relates directly to the operations and financial reporting of the registrant. |
| (2) | | There were no services as described in each of paragraph (b) through (d) of this Item that were approved by the audit committee pursuant to paragraph (c)(7)(i)(C) of Rule 2-01 of Regulation S-X. |
| (g) | Aggregate non-audit fees billed by the Accountant to the registrant for services rendered for the fiscal years ended May 31, 2013 and May 31, 2014 were $2,000 and $2,000, respectively. There were no fees billed by the Accountant for non-audit services rendered to the registrant's investment adviser, or any other entity controlling, controlled by, or under common control with the registrant's investment adviser. |
| Item 5. | AUDIT COMMITTEE OF LISTED REGISTRANTS. |
Not applicable.
| Item 6. | SCHEDULE OF INVESTMENTS. |
A copy of the schedule of investments of unaffiliated issuers as of the close of the reporting period is included as part of the report to shareholders filed under Item 1 of this Form.
| Item 7. | DISCLOSURE OF PROXY VOTING POLICIES AND PROCEDURES FOR CLOSED-END MANAGEMENT INVESTMENT COMPANIES. |
Not applicable.
| Item 8. | PORTFOLIO MANAGERS OF CLOSED-END MANAGEMENT INVESTMENT COMPANIES. |
Not applicable.
| Item 9. | PURCHASES OF EQUITY SECURITIES BY CLOSED-END MANAGEMENT INVESTMENT COMPANY AND AFFILIATED PURCHASERS. |
Not applicable.
Item 10. SUBMISSION OF MATTERS TO A VOTE OF SECURITY HOLDERS.
None.
Item 11. CONTROLS AND PROCEDURES.
| (a) | The Principal Executive Officer(s) and the Principal Financial Officer(s) have concluded that the registrant's disclosure controls and procedures are effective based on their evaluation of the disclosure controls and procedures as of a date within 90 days of the filing of this report. |
| (b) | There were no changes in the registrant's internal control over financial reporting that occurred during the registrant's second fiscal quarter of the period covered by this report that have materially affected, or are reasonably likely to materially affect, the registrant's internal control over financial reporting. |
Item 12. EXHIBITS.
| (a)(1) | Code of Ethics required by Item 2 of Form N-CSR is filed herewith as Exhibit 12.(a)(1). |
| (a)(2) | Certifications required by Item 12.(a)(2) of Form N-CSR are filed herewith as Exhibit 12.(a)(2). |
| (b) | Certifications required by Item 12.(b) of Form N-CSR are filed herewith as Exhibit 12.(b). |
SIGNATURES
Pursuant to the requirements of the Securities Exchange Act of 1934 and the Investment Company Act of 1940, the registrant has duly caused this report to be signed on its behalf by the undersigned, thereunto duly authorized.
Starboard Investment Trust
| By: (Signature and Title) | /s/Ryan D. Thibodeaux |
| Ryan D. Thibodeaux President, Treasurer, Principal Executive Officer and Principal Financial Officer Goodwood SMID Cap Discovery Fund |
| Date: August 5, 2014 | |
Pursuant to the requirements of the Securities Exchange Act of 1934 and the Investment Company Act of 1940, this report has been signed below by the following persons on behalf of the registrant and in the capacities and on the dates indicated.
| By: (Signature and Title) | /s/Ryan D. Thibodeaux |
| Ryan D. Thibodeaux President, Treasurer, Principal Executive Officer and Principal Financial Officer Goodwood SMID Cap Discovery Fund |
| Date: August 5, 2014 | |