P.O. Box 3181
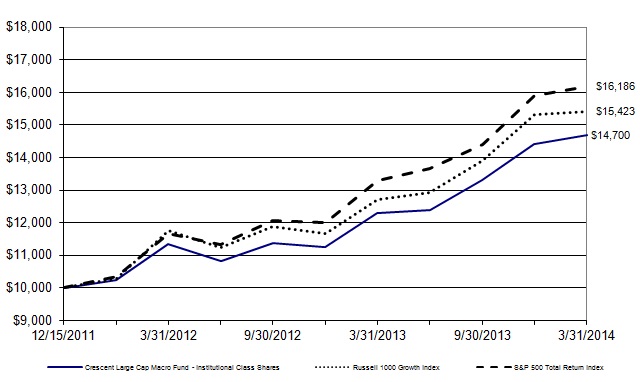
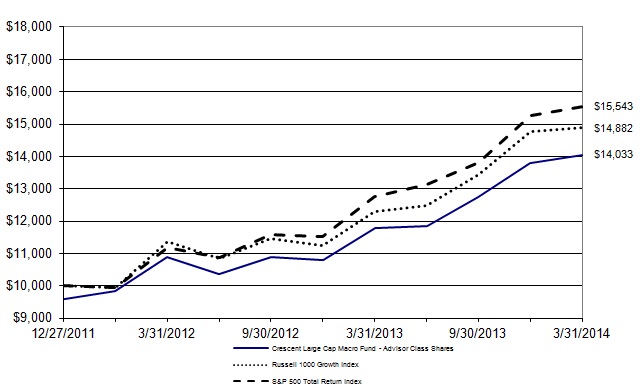
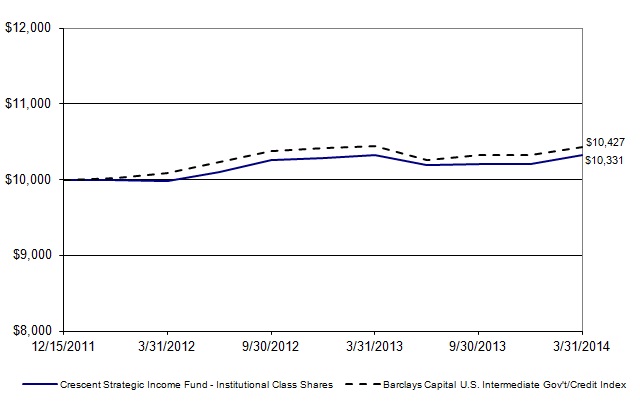
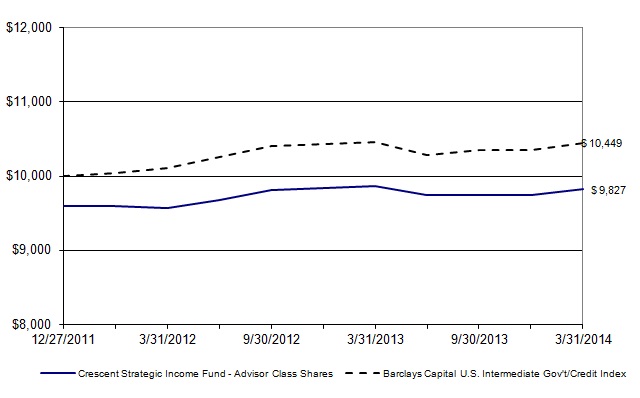
In general, corporate bonds outperformed government bonds for the period. The Fund’s overweight to the credit sector was a positive as credit spreads narrowed. Additionally, the Fund’s preference for lower duration securities was beneficial. Corporate bonds in the financial sector significantly outperformed industrial and utility bonds. The Fund had a slight underweight to the financial sector. The performance for period ended March 31, 2014, is shown below. As a reminder, our process revolves around an active strategy of duration management, sector rotation, and credit selection. We also use a small percentage of fixed income related strategies for tactical opportunities. The objective of the Fund is total return consistent with preservation of capital.
The extremely cold winter weather caused major disruptions in the flow of economic activity. Additionally, there is uncertainty related to the events occurring in Ukraine. Consequently, it may take several months to get a better handle on the underlying strength of the domestic economy. GDP is projected to increase by 1.0% in the first quarter, below the 2.6% increase of the fourth quarter. Other economic indicators have shown increases from January to March, so we are reasonably confident the slowdown was due to weather rather than some other factors causing the weakness in economic reports and that most of the loss in output should be recovered over the next two quarters. Consumer confidence as measured by the Conference Board reached a six-year high in March which should speak well for future spending.
We appreciate your support of the Crescent Funds and I invite any current or prospective shareholders to call or email me directly to discuss the Crescent Strategic Income Fund and our investment approach.
John D. Wiseman
The views in the foregoing discussion were those of the Fund’s investment advisor as of the date set forth above and may not reflect its views on the date this Annual Report is first published or anytime thereafter. These views are intended to assist shareholders in understanding their investment in the Fund and do not constitute investment advice.
Crescent Strategic Income Fund
Notes to Financial Statements
1. Organization and Significant Accounting Policies
The Crescent Strategic Income Fund (the “Fund”) is a series of the Starboard Investment Trust (the “Trust”). The Trust is organized as a Delaware statutory trust and is registered under the Investment Company Act of 1940, as amended (the “1940 Act”), as an open-end management investment company. The Trust is classified as a diversified company as defined in the 1940 Act.
The Fund commenced operations on December 15, 2011. The investment objective of the Fund is total return consistent with preservation of capital. The Fund seeks to achieve its investment objective by investing at least 65% of the portfolio in bonds rated investment grade or better at all times by a nationally recognized securities rating organization or, if no rating exists, of equivalent quality in the determination of the Advisor. Subject to the limitations of this restriction, the Fund is also permitted to invest in securities that are below investment-grade, including junk bonds.
The Fund currently has an unlimited number of authorized shares, which are divided into two classes - Institutional Class Shares and Advisor Class Shares. Each class of shares has equal rights as to assets of the Fund, and the classes are identical, except for differences in ongoing distribution and service fees. The Advisor Class Shares are subject to an initial sales charge fee of 4.00%, redemption fees for certain redemptions within 60 days of the issuance of such shares of 1.00%, and distribution plan fees as described in Note 3. Income, expenses (other than distribution and service fees), and realized and unrealized gains or losses on investments are allocated to each class of shares based upon its relative net assets. All classes have equal voting privileges, except where otherwise required by law or when the Trustees determine that the matter to be voted on affects only the interests of the shareholders of a particular class.
The following is a summary of significant accounting policies consistently followed by the Fund. The policies are in conformity with accounting principles generally accepted in the United States of America (“GAAP”).
Investment Valuation
All investments in securities are recorded at their estimated fair value, as described below (Fair Value Measurement).
Fair Value Measurement
Various inputs are used in determining the value of the Fund's investments. These inputs are summarized in the three broad levels listed below:
Level 1: quoted prices in active markets for identical securities
Level 2: other significant observable inputs (including quoted prices for similar securities and identical securities in inactive markets, interest rates, credit risk, etc.)
Level 3: significant unobservable inputs (including the Fund’s own assumptions in determining fair value of investments)
The availability of observable inputs can vary from security to security and is affected by a wide variety of factors, including, for example, the type of security, whether the security is new and not yet established in the marketplace, the liquidity of markets, and other characteristics particular to the security. To the extent that valuation is based on models or inputs that are less observable or unobservable in the market, the determination of fair value requires more judgment. Accordingly, the degree of judgment exercised in determining fair value is greatest for instruments categorized in Level 3.
The inputs used to measure fair value may fall into different levels of the fair value hierarchy. In such cases, for disclosure purposes, the level in the fair value hierarchy within which the fair value measurement falls in its entirety, is determined based on the lowest level input that is significant to the fair value measurement in its entirety.
A description of the valuation techniques applied to the Fund's major categories of investments measured at fair value on a recurring basis follows.
Equity securities (common stock, preferred stock, exchange traded products). Securities listed on an exchange or quoted on a national market system are valued at the last sales price as of 4:00 p.m.
Crescent Strategic Income Fund
Notes to Financial Statements
Eastern Time. Securities traded in the NASDAQ over-the-counter market are generally valued at the NASDAQ Official Closing Price. Other securities traded in the over-the-counter market and listed securities for which no sale was reported on that date are valued at the most recent bid price. To the extent these securities are actively traded and valuation adjustments are not applied, they are categorized in level 1 of the fair value hierarchy. Preferred stock and other equities traded on inactive markets or valued by reference to similar instruments are categorized in level 2.
Corporate bonds. Debt securities may be valued at prices supplied by the Fund’s pricing agent based on broker or dealer supplied valuations or matrix pricing, a method of valuing securities by reference to the value of other securities with similar characteristics, such as rating, interest rate, and maturity. Most corporate bonds are categorized in level 2 of the fair value hierarchy. However, in instances where lower relative weight is placed on transaction prices, quotations, or similar observable inputs, they are categorized in level 3.
U.S. government obligations (treasury notes). U.S. government obligations are normally valued using a model that incorporates market observable data such as reported sales of similar obligations, broker quotes, yields, bids, offers, and reference data. Certain obligations are valued principally using dealer quotations. U.S. government obligations are categorized in level 2 of the fair value hierarchy depending on the inputs used and market activity levels for specific securities.
U.S. agency obligations (federal agency obligations). U.S. agency obligations are comprised of two main categories consisting of agency issued debt and mortgage pass-throughs. Agency issued debt obligations are generally valued in a manner similar to U.S. government obligations. Mortgage pass-throughs include to-be-announced (TBA) obligations and mortgage pass-through certificates. TBA obligations and mortgage pass-throughs are generally valued using dealer quotations. Depending on market activity levels and whether quotations or other data are used, these obligations are typically categorized in level 2 of the fair value hierarchy.
The inputs or methodology used for valuing securities are not necessarily an indication of the risk associated with investing in those securities. The following table summarizes the inputs as of March 31, 2014 for the Fund’s assets measured at fair value:
| Crescent Strategic Income Fund | | |
| Investments in Securities (a) | | Total | | Level 1 | | Level 2 | | Level 3 |
| Assets | | | | | | | | |
| Corporate Bonds | $ | 11,223,838 | $ | - | $ | 11,223,838 | $ | - |
| Federal Agency Obligations | | 330,151 | | - | | 330,151 | | - |
| United States Treasury Note | | 185,078 | | - | | 185,078 | | - |
| Preferred Stocks | | 638,135 | | - | | 638,135 | | - |
| Common Stocks* | | 106,199 | | 106,199 | | - | | - |
| Exchange Traded Products | | 164,600 | | 164,600 | | - | | - |
| Short-Term Investment | | 195,793 | | 195,793 | | - | | - |
| Total Assets | $ | 12,843,794 | $ | 466,592 | $ | 12,377,202 | $ | - |
| | | | | | | | | |
| (a) | Transfers into and out of the Fund occur at the end of each period. The Fund had no transfers into or out of Level 1, 2, or 3 during the year ended March 31, 2014. |
| * | Refer to the Schedule of Investments for industry classification. |
Investment Transactions and Investment Income
Investment transactions are accounted for as of the date purchased or sold (trade date). Dividend income is recorded on the ex-dividend date. Interest income is recorded on the accrual basis and includes amortization of discounts and premiums. Gains and losses are determined on the identified cost basis, which is the same basis used for Federal income tax purposes.
Crescent Strategic Income Fund
Notes to Financial Statements
ExpensesThe Fund bears expenses incurred specifically on its behalf as well as a portion of trust level expenses, which are allocated according to methods reviewed annually by the Trustees.
Distributions
The Fund may declare and distribute dividends from net investment income (if any), monthly. Distributions from capital gains (if any) are generally declared and distributed annually. Dividends and distributions to shareholders are recorded on ex-date.
Estimates
The preparation of financial statements in conformity with GAAP requires management to make estimates and assumptions that affect the reported amounts of assets and liabilities and the disclosure of contingent assets and liabilities at the date of the financial statements and the reported amounts of increases and decreases in the net assets from operations during the reporting period. Actual results could differ from those estimates.
Fees on Redemptions
The Fund charges a redemption fee of 1.00% on redemptions of Fund shares occurring within 60 days following the issuance of such shares. The redemption fee is not a fee to finance sales or sales promotion expenses, but is paid to the Fund to defray the costs of liquidating an investor and discouraging short-term trading of the Fund’s shares. No redemption fee will be imposed on the redemption of shares representing dividends or capital gains distributions, or on amounts representing capital appreciation of shares.
Federal Income Taxes
No provision for income taxes is included in the accompanying financial statements, as the Fund intends to distribute to shareholders all taxable investment income and realized gains and otherwise comply with Subchapter M of the Internal Revenue Code applicable to regulated investment companies.
| 2. | Transactions with Related Parties and Service Providers |
Advisor
The Fund pays a monthly fee to the Advisor calculated at the annual rate of 0.35% of the Fund’s average daily net assets. For the year ended March 31, 2014, $42,325 in advisory fees were incurred and waived by the Advisor.
The Advisor has entered into a contractual agreement (the “Expense Limitation Agreement”) with the Trust, on behalf of the Fund, under which it has agreed to waive or reduce its fees and to assume other expenses of the Fund, if necessary, in amounts that limit the Fund’s total operating expenses (exclusive of interest, taxes, brokerage commissions, other expenditures which are capitalized in accordance with generally accepted accounting principles, other extraordinary expenses not incurred in the ordinary course of the Fund’s business, and amounts, if any, payable under a Rule 12b-1 distribution plan) to not more than 0.90% of the average daily net assets of the Fund for the current fiscal year. Additionally, the Advisor reimbursed the Fund for $39,456 of the expenses incurred. The current term of the Expense Limitation Agreement remains in effect until the last day of July 2014. While there can be no assurance that the Expense Limitation Agreement will continue after that date, it is expected to continue from year-to-year thereafter.
Administrator
The Fund pays a monthly fee to the Administrator based upon the average daily net assets of the Fund and calculated at the annual rates as shown in the schedule below subject to a minimum of $2,000 per month. The Administrator also receives a fee as to procure and pay the Fund’s custodian, as additional compensation for fund accounting and recordkeeping services, and additional compensation for certain costs involved with the daily valuation of securities and as reimbursement for out-of-pocket expenses. A breakdown of these fees is provided in the following table:
Crescent Strategic Income Fund
Notes to Financial Statements
| Administration Fees* | Custody Fees* | Fund Accounting Fees (monthly) | Fund Accounting Fees | Blue Sky Administration Fees (annual) |
Average Net Assets | Annual Rate | Average Net Assets | Annual Rate |
| First $100 million | 0.100% | First $100 million | 0.020% | $2,250 | 0.01% | $150 per state |
| Next $150 million | 0.080% | Over $100 million | 0.009% | | | |
| Next $250 million | 0.060% | | | | | |
| Next $500 million | 0.050% | *Minimum monthly fees of $2,000 and $400 for Administration and Custody, respectively. |
| Over $1 billion | 0.040% |
The Fund paid $24,008 of administration fees for the fiscal year ended March 31, 2014.
Compliance Services
Nottingham Compliance Services, LLC, a fully owned affiliate of the Administrator, provides services which assist the Trust’s Chief Compliance Officer in monitoring and testing the policies and procedures of the Trust in conjunction with requirements under Rule 38a-1 of the 1940 Act.
In January 2014, Cipperman Compliance Services, LLC assumed providing services as the Trust’s Chief Compliance Officer.
Transfer Agent
Nottingham Shareholder Services, LLC (“Transfer Agent”) serves as transfer, dividend paying, and shareholder servicing agent for the Fund. It receives compensation for its services based upon $15 per shareholder per year, subject to a minimum fee of $1,750 per month, plus $500 for each additional class.
Distributor
Capital Investment Group, Inc. (the “Distributor”) serves as the Fund’s principal underwriter and distributor. The Distributor receives $5,000 per year paid in monthly installments for services provided and expenses assumed.
Certain Trustees and officers of the Trust are also officers of the Advisor or the Administrator.
| 3. | Distribution and Service Fees |
The Trustees, including a majority of the Trustees who are not “interested persons” of the Trust as defined in the 1940 Act and who have no direct or indirect financial interest in such plan or in any agreement related to such plan, adopted a distribution plan pursuant to Rule 12b-1 of the 1940 Act (the “Plan”). The 1940 Act regulates the manner in which a regulated investment company may assume expenses of distributing and promoting the sales of its shares and servicing of its shareholder accounts. The Plan provides that the Advisor Class Shares may incur certain expenses, which may not exceed 0.25% per annum of the Advisor Class Shares’ average daily net assets for each year elapsed subsequent to adoption of the Plan, for payment to the Distributor and others for items such as advertising expenses, selling expenses, commissions, travel or other expenses reasonably intended to result in sales of shares of the Advisor Class or support servicing of shareholder accounts. For the year ended March 31, 2014, $2,314 in fees were incurred by the Advisor Class Shares.
| 4. | Purchases and Sales of Investment Securities |
For the year ended March 31, 2014, the aggregate cost of purchases and proceeds from sales of investment securities (excluding short-term securities) were as follows:
Crescent Strategic Income Fund
Notes to Financial Statements
| Year Ended | Purchases of Securities | Proceeds from Sales of Securities |
| March 31, 2014 | $4,389,677 | $3,365,950 |
5. Federal Income Tax
Distributions are determined in accordance with Federal income tax regulations, which differ from GAAP, and, therefore, may differ significantly in amount or character from net investment income and realized gains for financial reporting purposes. The general ledger is adjusted for permanent book/tax differences to reflect tax character but is not adjusted for temporary differences.
The Fund has reviewed all taxable years / periods that are open for examination (i.e., not barred by the applicable statute of limitations) by taxing authorities of all major jurisdictions, including the Internal Revenue Service. As of March 31, 2014, open taxable years consisted of the taxable year / period ended March 31, 2012 through March 31, 2014. No examination of the Fund’s tax returns is currently in progress.
Reclassifications to paid-in capital relate primarily to differing book/tax treatment of paydown gains (losses). For the period ended March 31, 2014, there was a reclassification that decreased capital gains and increased net investment income by $669, respectively.
Distributions during the fiscal year or period ended were characterized for tax purposes as follows:
| | March 31, 2014 | March 31, 2013 |
| Ordinary Income | $ 182,050 | $130,002 |
| Long-term capital gain | 26,632 | 48,068 |
At March 31, 2014, the tax-basis cost of investments and components of distributable earnings were as follows:
| Cost of Investments | $ | 12,864,110 |
| | | |
| Unrealized Appreciation | $ | 114,958 |
| Unrealized Depreciation | | (135,274) |
| Net Unrealized Appreciation (Depreciation) | | (20,316) |
| Accumulated Net Investment Income | | 516 |
| Other Book/Tax Differences | | 17,174 |
| | | |
| Distributable Earnings | $ | (2,626) |
| | | | | | |
6. Commitments and Contingencies
Under the Trust’s organizational documents, its officers and Trustees are indemnified against certain liabilities arising out of the performance of their duties to the Fund. In addition, in the normal course of business, the Trust entered into contracts with its service providers, on behalf of the Fund, and others that provide for general indemnifications. The Fund’s maximum exposure under these arrangements is unknown, as this would involve future claims that may be made against the Fund. The Fund expects risk of loss to be remote.
7. Recent Accounting Pronouncements
In June 2013, the Financial Accounting Standards Board issued Accounting Standards Update (ASU) No. 2013-08, Financial Services—Investment Companies. ASU 2013-08 provides clarifying guidance to determine if an entity qualifies as an investment company. ASU 2013-08 also requires an investment company to measure non-controlling interests in other investment companies at fair value. The requirements of ASU 2013-08 are effective for interim and annual reporting periods in fiscal years that begin after December 15, 2013. It is not expected that ASU 2013-08 will have an impact on financial statement disclosures.
Crescent Strategic Income Fund
Notes to Financial Statements
8. Subsequent Events
Accounting principles generally accepted in the United States of America require the Fund to recognize in the financial statements the effects of all subsequent events that provide additional evidence about conditions that existed as of the date of the Statement of Assets and Liabilities. For non-recognized subsequent events that must be disclosed to keep the financial statements from being misleading, the Fund is required to disclose the nature of the event as well as an estimate of its financial effect, or a statement that such an estimate cannot be made.
On April 30, 2014, the Fund paid the following per share net investment income distributions related to the period ended April 30, 2014:
| | Institutional Class Shares | Advisor Class Shares |
| Net Investment Income per share | $0.010241 | $0.008083 |
| 1. | Proxy Voting Policies and Voting Record |
A copy of the Trust’s Proxy Voting and Disclosure Policy and the Advisor’s Disclosure Policy are included as Appendix B to the Fund’s Statement of Additional Information and are available, without charge, upon request, by calling 800-773-3863, and on the website of the Security and Exchange Commission (“SEC”) at sec.gov. Information regarding how the Fund voted proxies relating to portfolio securities during the most recent period ended June 30 is available (1) without charge, upon request, by calling the Fund at the number above and (2) on the SEC’s website at sec.gov.
| 2. | Quarterly Portfolio Holdings |
The Fund files its complete schedule of portfolio holdings with the SEC for the first and third quarters of each fiscal year on Form N-Q. The Fund’s Forms N-Q are available on the SEC’s website at sec.gov. You may review and make copies at the SEC’s Public Reference Room in Washington, D.C. Information on the operation of the Public Reference Room may be obtained by calling the SEC at 202-942-8090. You may also obtain copies without charge, upon request, by calling the Fund at 800-773-3863.
We are required to advise you within 60 days of the Fund’s fiscal year-end regarding federal tax status of certain distributions received by shareholders during each fiscal year. The following information is provided for the Fund’s fiscal year ended March 31, 2014.
During the fiscal year, the Fund paid a long-term capital gain distribution of $26,632.
Dividend and distributions received by retirement plans such as IRAs, Keogh-type plans, and 403(b) plans need not be reported as taxable income. However, many retirement plans may need this information for their annual information meeting.
| 4. | Schedule of Shareholder Expenses |
As a shareholder of the Fund, you incur two types of costs: (1) transaction costs, and (2) ongoing costs, including investment advisory fees; distribution (12b-1) fees; and other Fund expenses. This example is intended to help you understand your ongoing costs (in dollars) of investing in the Fund and to compare these costs with the ongoing costs of investing in other mutual funds. The example is based on an investment of $1,000 invested at the beginning of the period and held for the entire period as indicated below.
Actual Expenses – The first line of the table below provides information about the actual account values and actual expenses. You may use the information in this line, together with the amount you invested, to estimate the expenses that you paid over the period. Simply divide your account value by $1,000 (for example, an $8,600 account value divided by $1,000 = 8.6), then multiply the result by the number in the first line under the heading entitled “Expenses Paid During Period” to estimate the expenses you paid on your account during this period.
Hypothetical Example for Comparison Purposes – The last line of the table below provides information about hypothetical account values and hypothetical expenses based on the Fund’s actual expense ratio and an assumed annual rate of return of 5% before expenses, which is not the Fund’s actual return. The hypothetical account values and expenses may not be used to estimate the actual ending account balance or expenses you paid for the period. You may use this information to compare the ongoing costs of investing in the Fund and other funds by comparing this 5% hypothetical example with the 5% hypothetical examples that appear in the shareholder reports of other funds.
Crescent Strategic Income Fund
Additional Information
(Unaudited)
| Institutional Class Shares | Beginning Account Value October 1, 2013 | Ending Account Value March 31, 2014 | Expenses Paid During Period* |
Actual Hypothetical (5% annual return before expenses) | | | |
| $1,000.00 | $1,013.70 | $4.52 |
| $1,000.00 | $1,020.45 | $4.53 |
*Expenses are equal to the average account value over the period multiplied by the Fund’s annualized expense ratio, multiplied by the number of days in the most recent period divided by the number of days in the fiscal year (to reflect the six month period).
| Advisor Class Shares | Beginning Account Value October 1, 2013 | Ending Account Value March, 2014 | Expenses Paid During Period* |
Actual Hypothetical (5% annual return before expenses) | | | |
| $1,000.00 | $1,009.30 | $5.76 |
| $1,000.00 | $1,019.20 | $5.79 |
*Expenses are equal to the average account value over the period multiplied by the Fund’s annualized expense ratio, multiplied by the number of days in the most recent period divided by the number of days in the fiscal year (to reflect the six month period).
| 5. | Information about Trustees and Officers |
The business and affairs of the Fund and the Trust are managed under the direction of the Board of Trustees of the Trust. Information concerning the Trustees and officers of the Trust and Fund is set forth below. Generally, each Trustee and officer serves an indefinite term or until certain circumstances such as their resignation, death, or otherwise as specified in the Trust’s organizational documents. Any Trustee may be removed at a meeting of shareholders by a vote meeting the requirements of the Trust’s organizational documents. The Statement of Additional Information of the Fund includes additional information about the Trustees and officers and is available, without charge, upon request by calling the Fund toll-free at 1-800-773-3863. The address of each Trustee and officer, unless otherwise indicated below, is 116 South Franklin Street, Rocky Mount, North Carolina 27804. The Independent Trustees each received aggregate compensation of $2,000 during the fiscal year ended March 31, 2014 from the Fund for their services to the Fund and Trust.
Crescent Strategic Income Fund
Additional Information
(Unaudited)
Name, Age and Address | Position held with Fund or Trust | Length of Time Served | Principal Occupation During Past 5 Years | Number of Portfolios in Fund Complex Overseen by Trustee | Other Directorships Held by Trustee During Past 5 Years |
| Independent Trustees |
Jack E. Brinson Age: 81 | Independent Trustee | Since 7/09 | Retired; previously, President of Brinson Investment Co. (personal investments) and President of Brinson Chevrolet, Inc. (auto dealership). | 23 | Independent Trustee of Brown Capital Management Mutual Funds for its three series, Gardner Lewis Investment Trust for its two series, Hillman Capital Management Investment Trust for its one series, and Centaur Mutual Funds Trust for its one series (all registered investment companies); previously, Independent Trustee of de Leon Funds Trust for its one series from 2000 to 2005, Giordano Investment Trust for its one series during 2011, and New Providence Investment Trust for its one series from inception until 2011 (all registered investment companies). |
Michael G. Mosley Age: 61 | Independent Trustee | Since 7/10 | Owner of Commercial Realty Services (real estate) since 2004. | 23 | None. |
Theo H. Pitt, Jr. Age: 78 | Independent Trustee | Since 9/10 | Senior Partner, Community Financial Institutions Consulting (financial consulting) since 1999; Partner, Pikar Properties (real estate) since 2001; Account Administrator, Holden Wealth Management Group of Wachovia Securities (money management firm) from 2003-2008. | 23 | Independent Trustee of Gardner Lewis Investment Trust for its two series, Hanna Investment Trust for its one series, Hillman Capital Management Investment Trust for its one series, and World Funds Trust for its one series (all registered investment companies); previously, Independent Trustee of NCM Capital Investment Trust for its one series from 2007 to 2009, New Providence Investment Trust from 2008 to 2009, and Centaur Mutual Funds Trust for its one series from 2004 to 2009 (all registered investment companies). |
Crescent Strategic Income Fund
Additional Information
(Unaudited)
Name, Age and Address | Position held with Fund or Trust | Length of Time Served | Principal Occupation During Past 5 Years | Number of Portfolios in Fund Complex Overseen by Trustee | Other Directorships Held by Trustee During Past 5 Years |
James H. Speed, Jr. Age: 61 | Independent Trustee, Chairman | Trustee since 7/09, Chair since 5/12 | President and CEO of NC Mutual Insurance Company (insurance company) since 2003; President of Speed Financial Group, Inc. (consulting and private investments) from 2000 to 2003. | 23 | Independent Trustee of the following Brown Capital Management Mutual Funds for its three series, Hillman Capital Management Investment Trust for its one series, and Centaur Mutual Funds Trust for its one series (all registered investment companies). Member of Board of Directors of NC Mutual Life Insurance Company. Member of Board of Directors of M&F Bancorp. Previously, Independent Trustee of New Providence Investment Trust for its one series from 2009 until 2011 (registered investment company). |
J. Buckley Strandberg Age: 54 | Independent Trustee | Since 7/09 | President of Standard Insurance and Realty (insurance and property management) since 1982. | 23 | None. |
| Other Officers |
J. Philip Bell Age: 60 104 Maxwell Avenue P.O. Box 3181 Greenwood, SC 29648 | President (Crescent Funds) | Since 10/11 | President and Chief Compliance Officer of Greenwood Capital Associates, LLC (advisor to the Crescent Funds) since 1985. | n/a | n/a |
Walter B. Todd III Age: 42 104 Maxwell Avenue P.O. Box 3181 Greenwood, SC 29648 | Treasurer (Crescent Funds) | Since 7/13 | Chief Investment Officer of Greenwood Capital Associates, LLC (advisor to the Crescent Funds) since 2002. | n/a | n/a |
Katherine M. Honey Age: 40 | Secretary | Since 10/13 | EVP of The Nottingham Company since 2008. | n/a | n/a |
Martin W. Dziura Age: 54 | Chief Compliance Officer | Since 1/14 | Managing Director for Cipperman Compliance Services, LLC | n/a | n/a |