RiskX Funds
Notes to Financial Statements
| 1. | Organization and Significant Accounting Policies |
The RiskX Funds ("Funds") are a series of the Starboard Investment Trust ("Trust"). The Trust is organized as a Delaware statutory trust and is registered under the Investment Company Act of 1940, as amended (the "1940 Act"), as an open-end management investment company. Each Fund is a separate, diversified series of the Trust.
The Funds principally invests in other mutual funds, exchange traded funds, and common stocks. The Funds' investment advisor, FolioMetrix, LLC (the "Advisor"), seeks to achieve each Fund's investment objective by investing in no-load, institutional, and exchange-traded funds registered under the Investment Company Act of 1940 ("Portfolio Funds"). Although each Fund principally invests in Portfolio Funds with no sales related expenses or very low sales related expenses, the Funds are not precluded from investing in Portfolio Funds with sales-related expenses, and/or service fees in excess of 0.25%.
Each Fund currently has an unlimited number of authorized shares, which are divided into two classes – Institutional Class Shares and Advisor Class Shares. Each class of shares has equal rights to assets of the Funds, and the classes are identical except for differences in ongoing distribution and service fees. The Advisor Class Shares are subject to distribution plan fees as described in Note 3. Each Fund's Advisor Class Shares are sold without an initial sales charge; however, they are subject to a contingent deferred sales charge of 1.00% paid to Capital Investment Group, Inc. (the "Distributor"). Income, expenses (other than distribution and service fees), and realized and unrealized gains or losses on investments are allocated to each class of shares based upon its relative net assets. All classes have equal voting privileges, except where otherwise required by law or when the Trustees determine that the matter to be voted on affects only the interests of the shareholders of a particular class.
The Date of Initial Public Investment for each Fund and Class of Shares is as follows:
| Fund | Institutional Class Shares | Advisor Class Shares |
Dividend Income Fund | September 20, 2012 | September 26, 2012 |
| Dynamic Growth Fund | October 2, 2009 | February 18, 2011 |
| Dynamic Total Return Fund | October 2, 2009 | February 25, 2011 |
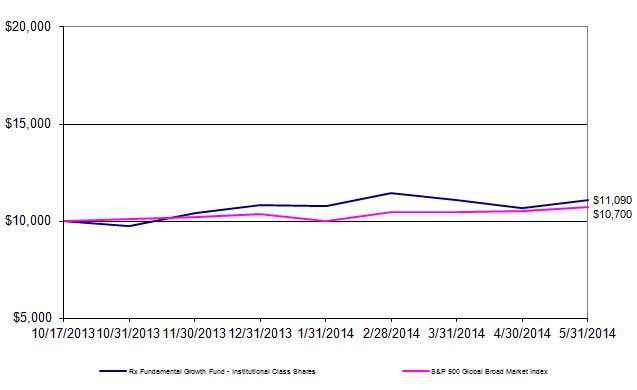
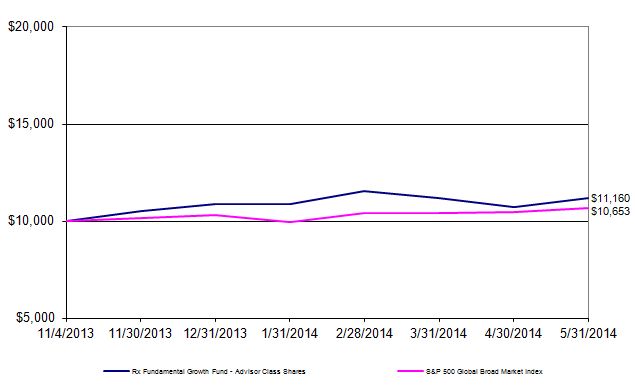
| Fundamental Growth Fund | October 17, 2013 | November 4, 2013 |
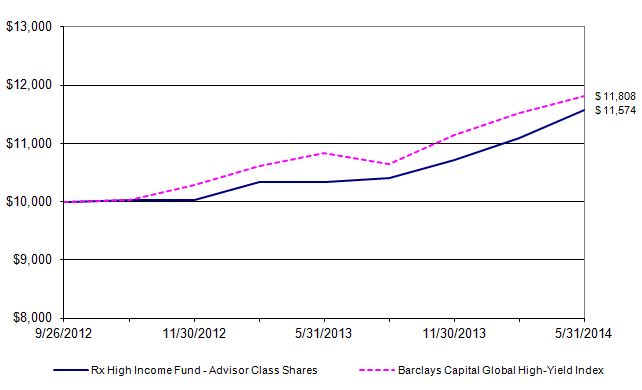
| High Income Fund | September 20, 2012 | September 26, 2012 |
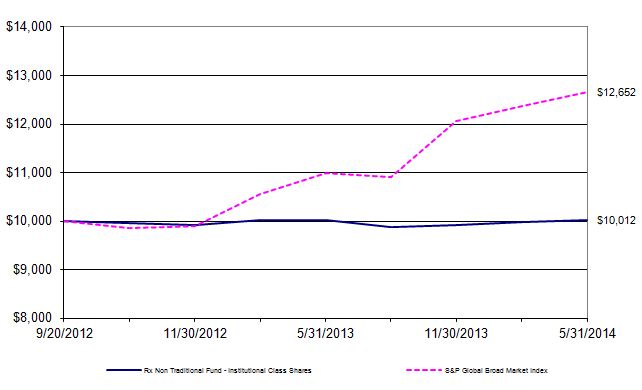
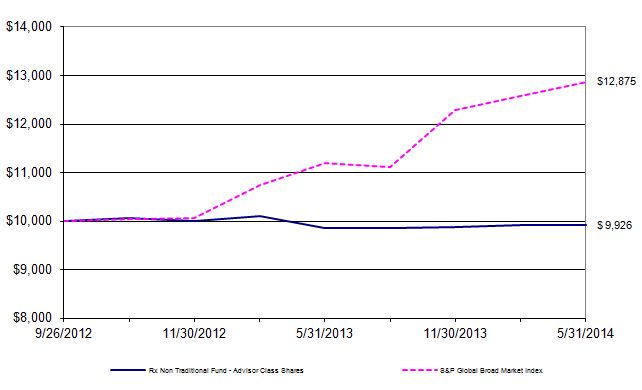
| Non Traditional Fund | September 20, 2012 | September 26, 2012 |
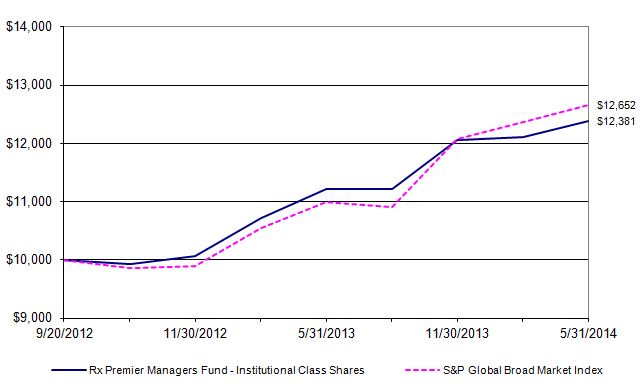
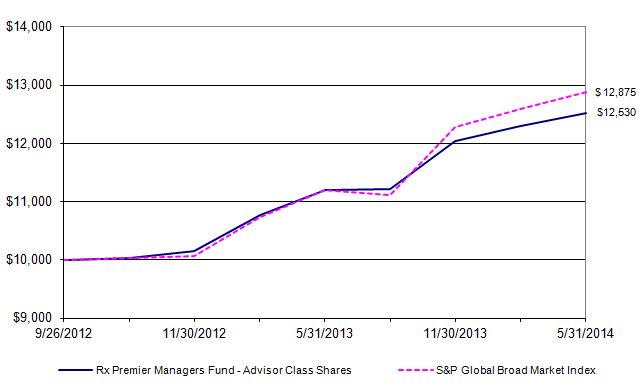
| Premier Managers Fund | September 20, 2012 | September 26, 2012 |
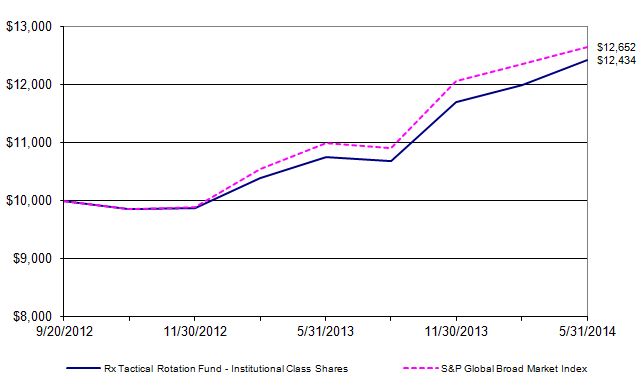
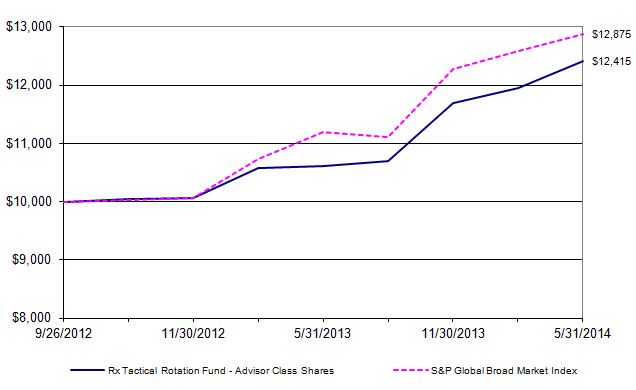
| Tactical Rotation Fund | September 20, 2012 | September 26, 2012 |
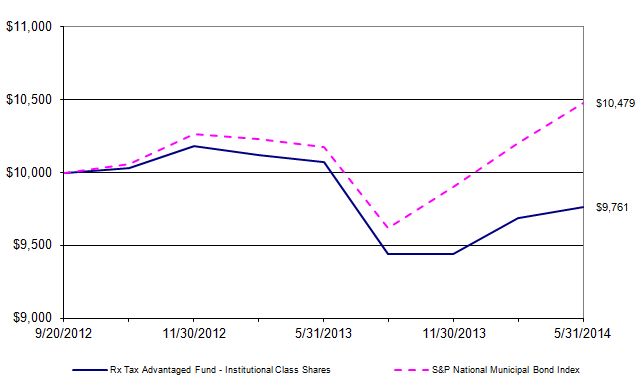
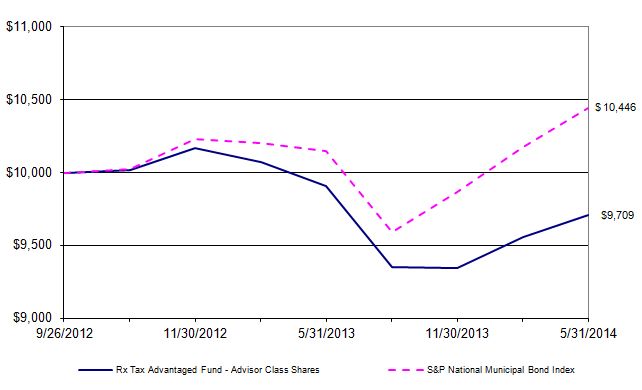
| Tax Advantaged Fund | September 20, 2012 | September 26, 2012 |
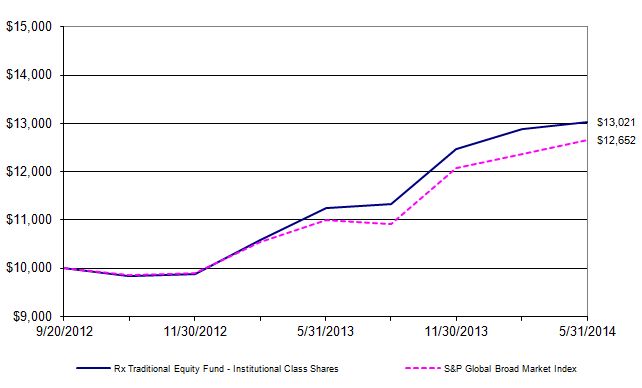
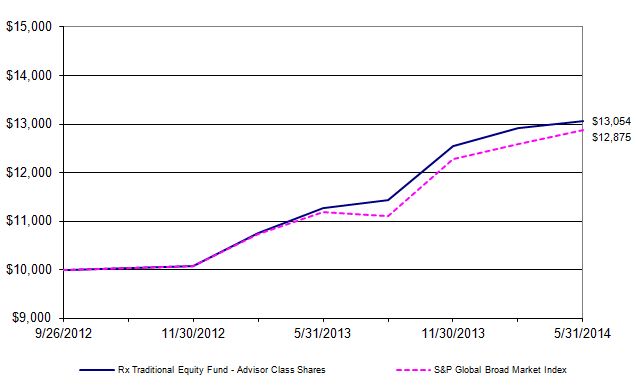
| Traditional Equity Fund | September 20, 2012 | September 26, 2012 |
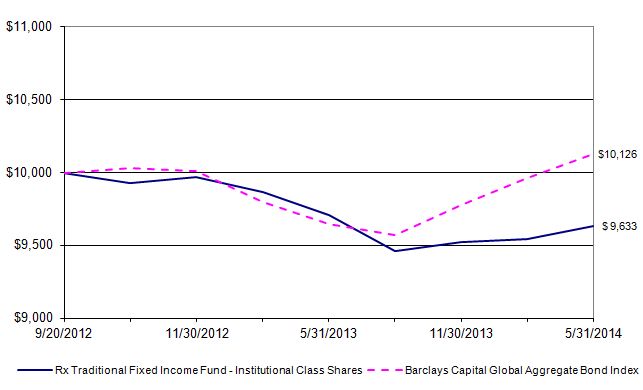
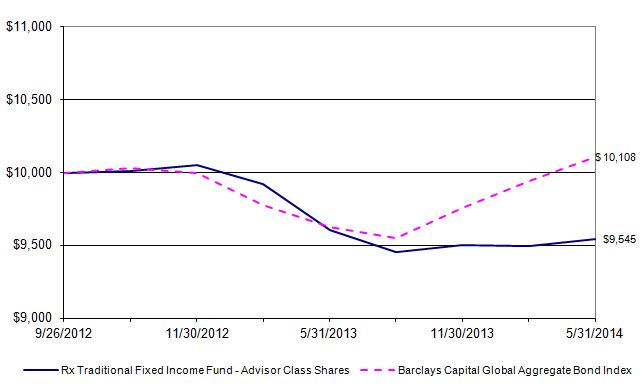
| Traditional Fixed Income Fund | September 20, 2012 | September 26, 2012 |
| | |
The following is a summary of significant accounting policies consistently followed by the Funds. The policies are in conformity with accounting principles generally accepted in the United States of America ("GAAP").
Investment Valuation
Each Fund's investments in securities are carried at fair value. Securities listed on an exchange or quoted on a national market system are valued at the last price as of 4:00 p.m. Eastern Time. Securities traded in the NASDAQ over-the-counter market are generally valued at the NASDAQ Official Closing Price. Other securities traded in the over-the-counter market and listed securities for which no sale was reported on that date are valued at the most recent bid price. Securities and assets for which representative market quotations are not readily available (e.g., if the exchange on which the portfolio security is principally traded closes early or if trading of the particular portfolio security is halted during the day and does not resume prior to each Fund's net asset value calculation) or which cannot be accurately valued using each Fund's normal pricing procedures are valued at fair value as determined in good faith under policies approved by the Trustees. A portfolio security's "fair value" price may differ from the price next available for that portfolio security using each Fund's normal pricing procedures. Instruments with maturities of 60 days or less are valued at amortized cost, which approximates market value.
RiskX Funds
Notes to Financial Statements
Each Fund may invest in portfolios of open-end investment companies (the "Underlying Funds"). The Underlying Funds value securities in their portfolios for which market quotations are readily available at their market values (generally the last reported sale price) and all other securities and assets at their fair value to the methods established by the board of directors of the Underlying Funds. Open-ended funds are valued at their respective net asset values as reported by such investment companies.
The Non Traditional Fund invests a portion of its assets in a Hedge Fund. The Hedge Fund measures its investment assets at fair value, and reports a daily NAV per share. In accordance with Accounting Standards Codification ('ASC") 820, the Fund has elected to apply the practical expedient and to value its investment in the Hedge Fund at its respective NAV each day. As of May 31, 2014, all of the Non Traditional Fund's investments in Hedge Funds were valued at the respective NAVs of the Hedge Funds.
Fair Value Measurement
Each Fund has adopted ASC Topic 820, Fair Value Measurements. ASC Topic 820 defines fair value, establishes a framework for measuring fair value and expands disclosure about fair value measurements.
Various inputs are used in determining the value of each Fund's investments. These inputs are summarized in the three broad levels listed below:
Level 1: Unadjusted quoted prices in active markets for identical securities
Level 2: other significant observable inputs (including quoted prices for similar securities, interest rates, credit risk, etc.)
Level 3: significant unobservable inputs (including each Fund's own assumptions in determining fair value of investments)
The availability of observable inputs can vary from security to security and is affected by a wide variety of factors, including, for example, the type of security, whether the security is new and not yet established in the marketplace, the liquidity of markets, and other characteristics particular to the security. To the extent that valuation is based on models or inputs that are less observable or unobservable in the market, the determination of fair value requires more judgment. Accordingly, the degree of judgment exercised in determining fair value is greatest for instruments categorized in Level 3.
The inputs used to measure fair value may fall into different levels of the fair value hierarchy. In such cases, for disclosure purposes, the level in the fair value hierarchy within which the fair value measurement falls in its entirety, is determined based on the lowest level input that is significant to the fair value measurement in its entirety.
The inputs or methodology used for valuing securities are not necessarily an indication of the risk associated with investing in those securities. The following tables summarize the inputs as of May 31, 2014 for each Fund's investments measured at fair value:
Dividend Income Fund
| Assets | | Total | | Level 1 | | Level 2 | | Level 3 |
| Common Stocks* | $ | 1,865,747 | $ | 1,865,747 | $ | - | $ | - |
| Open-End Fund | | 2,990,723 | | 2,990,723 | | - | | - |
| Short-Term Investment | | 384,144 | | 384,144 | | - | | - |
| Total | $ | 5,240,614 | $ | 5,240,614 | $ | - | $ | - |
Dynamic Growth Fund
| Assets | | Total | | Level 1 | | Level 2 | | Level 3 |
| Common Stocks* | $ | 23,540,638 | $ | 23,540,638 | $ | - | $ | - |
| Short-Term Investment | | 1,775,946 | | 1,775,946 | | - | | - |
| Total | $ | 25,316,584 | $ | 25,316,584 | $ | - | $ | - |
Dynamic Total Return Fund
| Assets | | Total | | Level 1 | | Level 2 | | Level 3 |
| Open-End Funds | $ | 9,907,792 | $ | 9,907,792 | $ | - | $ | - |
| Short-Term Investment | | 110,835 | | 110,835 | | - | | - |
| Total | $ | 10,018,627 | $ | 10,018,627 | $ | - | $ | - |
Fundamental Growth Fund
| Assets | | Total | | Level 1 | | Level 2 | | Level 3 |
| Common Stocks* | $ | 18,314,160 | $ | 18,314,160 | $ | - | $ | - |
| Short-Term Investment | | 431,295 | | 431,295 | | - | | - |
| Total | $ | 18,745,455 | $ | 18,745,455 | $ | - | $ | - |
High Income Fund
| Assets | | Total | | Level 1 | | Level 2 | | Level 3 |
| Common Stocks* | $ | 3,257,400 | $ | 3,257,400 | $ | - | $ | - |
| Open-End Funds | | 12,435,564 | | 12,435,564 | | - | | - |
| Short-Term Investment | | 1,400,556 | | 1,400,556 | | - | | - |
| Total | $ | 17,093,520 | $ | 17,093,520 | $ | - | $ | - |
Non Traditional Fund
| Assets | | Total | | Level 1 | | Level 2 | | Level 3 |
| Exchange Traded Products | $ | 1,610,568 | $ | 1,610,568 | $ | - | $ | - |
| Open-End Funds | | 6,231,195 | | 6,231,195 | | - | | - |
| Hedge Fund | | 853,565 | | - | | 853,565 | | - |
| Short-Term Investment | | 290,532 | | 290,532 | | - | | - |
| Total | $ | 8,985,860 | $ | 8,132,295 | $ | 853,565 - | $ | - |
Premier Managers Fund
| Assets | | Total | | Level 1 | | Level 2 | | Level 3 |
| Common Stock* | $ | 1,152,365 | $ | 1,152,365 | $ | - | $ | - |
| Open-End Funds | | 4,355,380 | | 4,355,380 | | - | | - |
| Short-Term Investment | | 227,596 | | 227,596 | | - | | - |
| Total | $ | 5,735,341 | $ | 5,735,341 | $ | - | $ | - |
RiskX Funds
Notes to Financial Statements
Tactical Rotation Fund
| Assets | | Total | | Level 1 | | Level 2 | | Level 3 |
| Exchange Traded Products | $ | 29,888,699 | $ | 29,888,699 | $ | - | $ | - |
| Short-Term Investment | | 562,855 | | 562,855 | | - | | - |
| Total | $ | 30,451,554 | $ | 30,451,554 | $ | - | $ | - |
Tax Advantaged Fund
| Assets | | Total | | Level 1 | | Level 2 | | Level 3 |
| Exchange Traded Note | $ | 210,722 | $ | 210,722 | $ | - | $ | - |
| Open-End Funds | | 2,112,154 | | 2,112,154 | | - | | - |
| Short-Term Investment | | 41,391 | | 41,391 | | - | | - |
| Total | $ | 2,364,267 | $ | 2,364,267 | $ | - | $ | - |
Traditional Equity Fund
| Assets | | Total | | Level 1 | | Level 2 | | Level 3 |
| Exchange Traded Products | $ | 8,831,540 | $ | 8,831,540 | $ | - | $ | - - |
| Short-Term Investment | | 372,015 | | 372,015 | | - | | - - |
| Total | $ | 9,203,555 | $ | 9,203,555 | $ | - | $ | - - |
Traditional Fixed Income Fund
| Assets | | Total | | Level 1 | | Level 2 | | Level 3 |
| Exchange Traded Products | $ | 12,188,609 | $ | 12,188,609 | $ | - | $ | - |
| Short-Term Investment | | 453,110 | | 453,110 | | - | | - |
| Total | $ | 12,641,719 | $ | 12,641,719 | $ | - | $ | - |
*Refer to the Schedules of Investments for a breakdown by sector.
The Funds had no significant transfers into or out of Level 1, 2, or 3 during the period or year ended May 31, 2014. It is the Funds' policy to recognize transfers at the end of the reporting period.
Investment Transactions and Investment Income
Investment transactions are accounted for as of the date purchased or sold (trade date). Dividend income is recorded on the ex-dividend date. Certain dividends from foreign securities will be recorded as soon as the Fund is informed of the dividend if such information is obtained subsequent to the ex-dividend date. Interest income is recorded on the accrual basis and includes amortization of discounts and premiums. Gains and losses are determined on the identified cost basis, which is the same basis used for federal income tax purposes.
Expenses
Each Fund bears expenses incurred specifically on its behalf as well as a portion of Trust level expenses, which are allocated according to methods reviewed annually by the Trustees.
Distributions
Each Fund will distribute its income and realized gains to its shareholders every year. Income dividends paid by the Funds derived from net investment income, if any, will generally be paid monthly or quarterly and capital gains distributions, if any, will be made at least annually. Dividends and distributions to shareholders are recorded on ex-date.
Estimates
The preparation of financial statements in conformity with GAAP requires management to make estimates and assumptions that affect the reported amounts of assets and liabilities and disclosure of contingent assets and liabilities at the date of the financial statements and the reported amounts of increases and decreases in the net assets from operations during the reporting period. Actual results could differ from those estimates.
RiskX Funds
Notes to Financial Statements
Federal Income Taxes
No provision for income taxes is included in the accompanying financial statements, as each Fund intends to distribute to shareholders all taxable investment income and realized gains and otherwise comply with Subchapter M of the Internal Revenue Code applicable to regulated investment companies.
| 2. | Transactions with Related Parties and Service Providers |
Each Fund pays a monthly advisory fee to the Advisor based upon the average daily net assets and calculated at an annual rate. See the table below for the advisory fee rate and amounts paid to the Advisor for each Fund during the fiscal year or initial period ended May 31, 2014:
| Fund | Advisory Fee Rate | | Amount Incurred |
Dividend Income Fund | 0.45% | $ | 28,446 |
| Dynamic Growth Fund | 0.45% | | 101,061 |
| Dynamic Total Return Fund | 0.45% | | - * |
| Fundamental Growth Fund | 1.00% | | 52,614 |
| High Income Fund | 0.45% | | 57,727 |
| Non Traditional Fund | 0.45% | | 37,164 |
| Premier Managers Fund | 0.45% | | 14,358 |
| Tactical Rotation Fund | 1.00% | | 248,018 |
| Tax Advantaged Fund | 0.45% | | 13,712 |
| Traditional Equity Fund | 0.45% | | 30,058 |
| Traditional Fixed Income Fund | 0.45% | | 83,379 |
| | | |
*According to the terms of the Advisory contract, no advisory fee is incurred for Dynamic Total Return Fund until the average daily net assets of the Fund is greater than $13,000,000.
The Advisor has engaged Navellier & Associates, Inc. and Forward Management, LLC to act as sub-advisors to provide day to day portfolio management for the Fundamental Growth Fund and the Dividend Income Fund, respectively. Both sub-advisors are paid directly by the Advisor.
The Advisor has entered into an Operating Plan with the Funds' administrator under which it has agreed to (i) make payments to the administrator based upon the Fund's net assets according to a schedule included in the Operating Plan and (ii) assume certain expenses of the Fund outlined in the Operating Plan. These measures are intended to limit the Fund's operating expenses to 0.70% of the average daily net assets (for the Dynamic Growth Fund, the Dynamic Total Return Fund, the High Income Fund, the Non Traditional Fund, the Premier Managers Fund, the Tax Advantaged Fund, the Traditional Equity Fund, and the Traditional Fixed Income Fund), 1.25% of the average daily net assets (for the Tactical Rotation Fund and the Fundamental Growth Fund), and 1.15% of the average daily net assets (for the Dividend Income Fund), exclusive of interest, taxes, brokerage fees and commissions, distribution and/or service (12b-1) fees, acquired fund fees and expenses, and extraordinary expenses. The Operating Plan can only be terminated prior to the conclusion of the current term with the approval of the Fund's Board of Trustees. The Advisor cannot recoup from the Fund any amounts paid under the Operating Plan.
RiskX Funds
Notes to Financial Statements
Administrator
The Nottingham Company ("Administrator") assists the Trust in the performance of its administrative responsibilities to the Funds, coordinates and pays for the services of each vendor and the operating expense to the Funds, and provides the Funds with certain administrative, fund accounting, and compliance services. As part of its services and consolidated fee arrangement, the Administrator receives compensation based on the Funds' average daily net assets. The annual rate is 0.25% if the average daily net assets are under $100 million and gradually decreases to an annual rate of 0.096% once the average daily net assets reach $1.805 billion or more.
The fee paid to the Administrator is calculated by multiplying the average daily net assets of each Fund by the highest applicable annual rate. The Administrator pays all expenses not assumed by the Advisor, including, without limitation: the fees and expenses of its independent accountants, of its legal counsel, and of its Trustees; the costs of printing and mailing to shareholders annual and semi-annual reports, proxy statements, prospectuses, statements of additional information and supplements thereto; the costs of printing registration statements; bank transaction charges and custodian's fees; any proxy solicitors' fees and expenses; filing fees; any federal, state or local income or other taxes; any interest; any membership fees of the Investment Company Institute and similar organizations; fidelity bond and Trustees' liability insurance premiums. See the table below for amounts paid to the Administrator by each Fund:
| Fund | | Amount Incurred |
Dividend Income Fund | | $ 8,070 |
| Dynamic Growth Fund | | 59,397 |
| Dynamic Total Return Fund | | 55,279 |
| Fundamental Growth Fund | | 13,154 |
| High Income Fund | | 32,071 |
| Non Traditional Fund | | 20,647 |
| Premier Managers Fund | | 7,977 |
| Tactical Rotation Fund | | 62,004 |
| Tax Advantaged Fund | | 7,618 |
| Traditional Equity Fund | | 16,699 |
| Traditional Fixed Income Fund | | 46,321 |
| | |
Compliance Services
Nottingham Compliance Services, LLC ("NCS"), a fully owned affiliate of the Administrator, provides services which assist the Trust's Chief Compliance Officer in monitoring and testing the policies and procedures of the Trust in conjunction with requirements under Rule 38a-1 of the 1940 Act. NCS was entitled to receive compensation from the Administrator pursuant to the Administrator's fee arrangements with each Fund.
In January 2014, Cipperman Compliance Services, LLC assumed providing services as the Trust's Chief Compliance Officer and is entitled to receive compensation from the Administrator pursuant to the Administrator's fee arrangements with each Fund.
Transfer Agent
Nottingham Shareholder Services, LLC ("Transfer Agent") serves as transfer, dividend paying, and shareholder servicing agent for the Funds. For its services, the Transfer Agent is entitled to receive compensation from the Administrator pursuant to the Administrator's fee arrangements with the Funds.
Distributor
Capital Investment Group, Inc. serves as the Funds' principal underwriter and distributor. For its services, the Distributor is entitled to receive compensation from the Administrator pursuant to the Administrator's fee arrangements with the Funds.
Certain Trustees and officers of the Trust are also officers of the Advisor or the Administrator.
RiskX Funds
Notes to Financial Statements
Because the underlying funds have varied expense and fee levels and the Funds may own different proportions of underlying funds at different times, the amount of fees and expense incurred indirectly by the Funds will vary.
| 3. | Distribution and Service Fees |
The Board of Trustees, including a majority of the Trustees who are not "interested persons" as defined in the 1940 Act, adopted a distribution and service plan pursuant to Rule 12b-1 of the 1940 Act (the "Plan") for the Advisor Class Shares. The 1940 Act regulates the manner in which a registered investment company may assume costs of distributing and promoting the sales of its shares and servicing of its shareholder accounts. The Plan provides that each Fund may incur certain costs, which may not exceed 1.00% per annum of the average daily net assets of the Advisor Class Shares for each year elapsed subsequent to adoption of the Plan, for payment to the Distributor and others for items such as advertising expenses, selling expenses, commissions, travel, or other expenses reasonably intended to result in sales of Advisor Class Shares or servicing of Advisor Class shareholder accounts. See the table below for the amounts incurred by each Fund:
| Fund | Amount Incurred |
Dividend Income Fund | $ 541 |
| Dynamic Growth Fund | 9,840 |
| Dynamic Total Return Fund | 7,306 |
| Fundamental Growth Fund | 370 |
| High Income Fund | 2,351 |
| Non Traditional Fund | 798 |
| Premier Managers Fund | 297 |
| Tactical Rotation Fund | 2,988 |
| Tax Advantaged Fund | 492 |
| Traditional Equity Fund | 794 |
| Traditional Fixed Income Fund | 1,283 |
| |
| 4. | Purchases and Sales of Investment Securities |
For the fiscal year or initial period* ended May 31, 2014, the aggregate cost of purchases and proceeds from sales of investment securities (excluding short-term securities) were as follows:
RiskX Funds
Notes to Financial Statements
| | Purchases of Securities | Proceeds from Sales of Securities |
| Dividend Income Fund | | $ 3,638,760 | $ 81,997 |
| Dynamic Growth Fund | | 101,219,497 | 94,358,276 |
| Dynamic Total Return Fund | | 11,653,367 | 10,072,209 |
| Fundamental Growth Fund* | | 24,509,195 | 6,247,576 |
| High Income Fund | | 15,316,313 | 9,432,260 |
| Non Traditional Fund | | 8,451,755 | 6,495,086 |
| Premier Managers Fund | | 4,216,375 | 850,956 |
| Tactical Rotation Fund | | 109,348,612 | 95,262,972 |
| Tax Advantaged Fund | | 4,822,869 | 6,034,191 |
| Traditional Equity Fund | | 3,999,066 | 203,077 |
| Traditional Fixed Income Fund | | 28,915,136 | 33,540,605 |
There were no long-term purchases or sales of U.S. Government Obligations during the fiscal year or initial period ended May 31, 2014.
Distributions are determined in accordance with Federal income tax regulations, which differ from GAAP, and, therefore, may differ significantly in amount or character from net investment income and realized gains for financial reporting purposes. Financial reporting records are adjusted for permanent book/tax differences to reflect tax character but are not adjusted for temporary differences.
The Funds have reviewed all taxable years / periods that are open for examination (i.e., not barred by the applicable statute of limitations) by taxing authorities of all major jurisdictions, including the Internal Revenue Service. As of May 31, 2014, open taxable years consisted of the taxable year / period ended May 31, 2011, May 31, 2012, and May 31, 2013. No examination of tax returns is currently in progress for any of the Funds.
Reclassifications relate primarily to differing book/tax treatment of ordinary net investment losses, dividends paid/received, 988 reclassifications, partnership adjustments, and PFIC mark-to-market adjustments. For the year or period ended May 31, 2014, the following reclassification of were necessary:
| Paid-in Capital | Accumulated Net Investment Income (Loss) | Accumulated Net Realized Gain (Loss) on Investments |
| Dividend Income Fund | $ - | $ (369) | $ 369 |
| Fundamental Growth Fund | (1,470) | 6,453 | (4,983) |
| High Income Fund | - | 5,922 | (5,922) |
| Non Traditional Fund | - | 7,062 | (7,062) |
| Premier Managers Fund | - | 12,539 | (12,539) |
| Tactical Rotation Fund | - | 22,465 | (22,465) |
RiskX Funds
Notes to Financial Statements
Distributions during the fiscal year or period ended were characterized for tax purposes as follows:
| | Distributions from |
| Fund | Fiscal period ended | Ordinary Income | Long-Term Capital Gains | Return of Capital |
| Dividend Income Fund | 05/31/2014 | $ | 161,036 | $ | 24,572 | $ | - |
| 05/31/2013 | 17,709 | - | - |
| Dynamic Growth Fund | 05/31/2014 | 1,145,063 | 43,906 | - |
| 05/31/2013 | - | - | - |
| Dynamic Total Return Fund | 05/31/2014 | 119,609 | - | - |
| 05/31/2013 | 319,176 | - | 14,318 |
| Fundamental Growth Fund | 05/31/2014 | - | - | - |
| High Income Fund | 05/31/2014 | 726,078 | 13,047 | - |
| 05/31/2013 | 197,556 | - | - |
| Non Traditional Fund | 05/31/2014 | 31,168 | 11,283 | - |
| 05/31/2013 | 7,863 | - | - |
| Premier Managers Fund | 05/31/2014 | 66,927 | 6,230 | - |
| 05/31/2013 | 9,938 | - | - |
| Tactical Rotation Fund | 05/31/2014 | 1,390,471 | - | - |
| 05/31/2013 | 85 | - | - |
| Tax Advantaged Fund | 05/31/2014 | 81,113 | - | - |
| 05/31/2013 | 33,113 | - | - |
| Traditional Equity Fund | 05/31/2014 | 48,411 | - | - |
| 05/31/2013 | 9,270 | - | - |
| Traditional Fixed Income Fund | 05/31/2014 | 80,100 | - | - |
| 05/31/2013 | 68,171 | - | - |
| | | | |
At May 31, 2014, the tax-basis cost of investments and components of distributable earnings were as follows:
| Dividend Income Fund | Dynamic Growth Fund | Dynamic Total Return Fund | Fundamental Growth Fund | High Income Fund |
Cost of Investments | $4,980,691 | $24,242,971 | $9,949,968 | $18,619,626 | $16,322,822 |
| | | | | |
| Unrealized Appreciation | 269,824 | 1,247,876 | 75,997 | 927,052 | 781,233 |
| Unrealized Depreciation | (9,901) | (174,263) | (7,338) | (801,223) | (10,535) |
| Net Unrealized Appreciation | 259,923 | 1,073,613 | 68,659 | 125,829 | 770,698 |
| | | | | |
| Accumulated Net Investment Income | 15,821 | 1,291,733 | 19,330 | - | 127,754 |
| Accumulated Long-Term Gains | 369 | 648,924 | - | - | 95,287 |
| Accumulated Capital Losses | - | - | (147,551) | (1,392) | - |
| Deferred Post October Losses | - | - | - | (77,392) | - |
| Late Year Losses | - | - | - | (27,421) | - |
| Other Book/Tax Differences | (16,819) | - | (9,885) | - | (28,955) |
| | | | | |
| Distributable Earnings/Accumulated Deficit | $259,294 | $3,014,270 | $(69,447) | $19,624 | $964,784 |
RiskX Funds
Notes to Financial Statements
| Non Traditional Fund | Premier Managers Fund | Tactical Rotation Fund | Tax Advantaged Fund | Traditional Equity Fund |
Cost of Investments | $8,916,286 | $5,427,299 | $28,586,811 | $2,396,691 | $7,951,974 |
| | | | | |
| Unrealized Appreciation | 148,032 | 313,675 | 1,864,743 | 25,369 | 1,262,841 |
| Unrealized Depreciation | (78,458) | (5,633) | - | (57,793) | (11,260) |
| Net Unrealized Appreciation (Depreciation) | 69,574 | 308,042 | 1,864,743 | (32,424) | 1,251,581 |
| | | | | |
| Accumulated Net Investment Income | 74,201 | 1,265 | 766,131 | 6,462 | - |
| Accumulated Long-Term Gains | - | 103,831 | 138 | - | 51,307 |
| Accumulated Capital Losses | (92,410) | - | - | (167,266) | - |
| Deferred Post October Losses | - | - | - | (45,546) | - |
| Late Year Losses | - | - | - | - | (566) |
| Other Book/Tax Differences | - | - | - | (2,925) | - |
| | | | | |
| Distributable Earnings/Accumulated Deficit | $51,365 | $413,138 | $2,631,012 | $(241,699) | $1,302,322 |
| Traditional Fixed Income Fund |
Cost of Investments | $12,545,150 |
| |
| Unrealized Appreciation | 103,903 |
| Unrealized Depreciation | (7,334) |
| Net Unrealized Appreciation | 96,569 |
| |
| Accumulated Capital Losses | (848,911) |
| Other Book/Tax Differences | (5,696) |
| |
| Accumulated Deficit | $(758,038) |
The difference between book-basis and tax-basis net unrealized appreciation (depreciation) is attributable to the deferral of losses from wash sales and PFIC mark-to-market adjustments. Accumulated capital losses noted above represent net capital loss carryovers as of May 31, 2014 that are available to offset future realized capital gains, if any, and thereby reduce future taxable gain distributions. The Dynamic Total Return Fund has a loss carryforward of $147,551, of which $120,394 is short term in nature. The Fundamental Growth Fund has a capital loss carryforward of $1,392, which is short-term in nature. The Traditional Fixed Income Fund has a capital loss carryforward of $848,911, of which $817,067 is short-term in nature. The Tax Advantaged Fund has a capital loss carryforward of $167,266, of which $140,419 is short-term in nature. The Non Traditional Fund has a capital loss carryforward of $92,410, which is short-term in nature. The capital loss carryforwards have no expiration date. In addition, realized losses reflected in the accompanying financial statements include net capital losses realized between November 1 and the Funds' fiscal year-end that have not been recognized for tax purposes (Deferred Post-October losses).
RiskX Funds
Notes to Financial Statements
Under federal tax law, qualified late year ordinary and capital losses realized after December 31 and October 31, respectively, may be deferred and treated as occurring on the first day of the following fiscal year. For the fiscal year ended May 31, 2014, the Fundamental Growth Fund and Traditional Equity Fund incurred late year ordinary losses of $27,421 and $566, respectively, which they will elect to defer to the fiscal year ended May 31, 2015. For the fiscal year ended May 31, 2014, the other Funds incurred no late year losses.
During the year ended May 31, 2014, the following portfolio company is considered to have been an affiliate of the Dividend Income Fund. This portfolio company is deemed to be an affiliate due to the fact that the sub-advisor of the Dividend Income Fund is also a manager of the portfolio company. Transactions in this company during the year ended May 31, 2014 were as follows:
| Forward International Dividend Fund |
| 5/31/13 Value | $ 767,531 |
| Purchases | 2,159,995 |
| Change in Unrealized Appreciation | 63,197 |
| 5/31/14 Value | $ 2,990,723 |
| Dividend Income | $ 167,924 |
| Shares held as of 5/31/14 | 362,512 |
| |
| 7. | Commitments and Contingencies |
Under the Trust's organizational documents, its officers and Trustees are indemnified against certain liabilities arising out of the performance of their duties to the Funds. In addition, in the normal course of business, the Trust entered into contracts with its service providers, on behalf of the Funds, and others that provide for general indemnifications. The Funds' maximum exposure under these arrangements is unknown, as this would involve future claims that may be made against the Funds. The Funds expect the risk of loss to be remote.
| 8. | New Accounting Pronouncements |
In June 2013, the Financial Accounting Standards Board issued Accounting Standards Update (ASU) No. 2013‑08, Financial Services—Investment Companies. ASU 2013‑08 provides clarifying guidance to determine if an entity qualifies as an investment company. ASU 2013‑08 also requires an investment company to measure non-controlling interests in other investment companies at fair value. The requirements of ASU 2013‑08 are effective for interim and annual reporting periods in fiscal years that begin after December 15, 2013. It is not expected that ASU 2013‑08 will have an impact on financial statement disclosures
9. Subsequent Events
The Funds have evaluated the need for disclosures and/or adjustments resulting from subsequent events through the date of issuance of these financial statements.
Advisor
Effective June 1, 2014, the Advisor terminated the Operating Plan between the Advisor and the Administrator. Also effective June 1, 2014, the Advisor has entered into an Expense Limitation Agreement with the Funds under which it has agreed to waive or reduce its fees and to assume other expenses of the Funds, if necessary, in an amount that limits the Funds' annual operating expenses (exclusive of interest, taxes, brokerage fees and commissions, extraordinary expenses, payments under the Rule 12b-1 distribution plan, and acquired fund fees and expenses) to not more than 1.25% of the average daily net assets of each Fund through August 31, 2015. The Expense Limitation Agreement may not be terminated prior to that date. The Advisor cannot recoup from the Funds any amounts paid by the Advisor under the Expense Limitation Agreement. Further, net annual operating expenses for the Funds may exceed those contemplated by the waiver due to acquired fund fees and other expenses that are not waived under the Expense Limitation Agreement.
RiskX Funds
Notes to Financial Statements
Also effective June 1, 2014, the Funds entered into new agreements covering fund accounting, administration, and custody. Details of the agreements are as follows:
Administrator
The Funds pay a monthly fee to the Administrator based upon the average daily net assets of the Funds and calculated at the annual rates as shown in the schedule below subject to a minimum of $1,000 per month. The Administrator also receives a fee as to procure and pay the Funds' custodian, as additional compensation for fund accounting and recordkeeping services, and additional compensation for certain costs involved with the daily valuation of securities and as reimbursement for out-of-pocket expenses. A breakdown of these fees is provided in the following table:
| Administration Fees | Custody Fees | Fund Accounting Fees (monthly) | Fund Accounting Fees | Blue Sky Administration Fees (annual) |
Average Net Assets | Annual Rate | Average Net Assets | Annual Rate |
| First $250 million | 0.100% | First $200 million | 0.020% | $2,250 | 0.01% | $150 per state |
| Next $250 million | 0.080% | Over $200 million | 0.009% | | | |
| Next $250 million | 0.060% | | | | | |
| Next $250 million | 0.050% | |
| Over $1 billion | 0.040% |
Distributions
Each of the Funds below paid the following per share net investment income distributions related to the period ended June 30, 2014. The record date of the distributions was June 27, 2014, and the ex date and payable date was June 30, 2014.
| Institutional Class Shares | Advisor Class Shares |
| Rx Dynamic Total Return Fund | $0.01907 | $0.01113 |
| Rx Dividend Income Fund | $0.01611 | $0.00646 |
| Rx High Income Fund | $0.04857 | $0.03986 |
| Rx Traditional Equity Fund | $0.00603 | - |
| Rx Tax Advantaged Fund | $0.02108 | $0.01335 |
126
REPORT OF INDEPENDENT REGISTERED PUBLIC ACCOUNTING FIRM
To the Board of Trustees of Starboard Investment Trust
and the Shareholders of Rx Dividend Income Fund, Rx Dynamic Growth Fund,
Rx Dynamic Total Return Fund, Rx Fundamental Growth Fund, Rx High Income Fund,
Rx Non Traditional Fund, Rx Premier Managers Fund, Rx Tactical Rotation Fund,
Rx Tax Advantaged Fund, Rx Traditional Equity Fund, and Rx Traditional Fixed Income Fund
We have audited the accompanying statements of assets and liabilities of the Rx Dividend Income Fund, Rx Dynamic Growth Fund, Rx Dynamic Total Return Fund, Rx Fundamental Growth Fund, Rx High Income Fund, Rx Non Traditional Fund, Rx Premier Managers Fund, Rx Tactical Rotation Fund, Rx Tax Advantaged Fund, Rx Traditional Equity Fund, and Rx Traditional Fixed Income Fund (the "Funds"), each a series of shares of beneficial interest in the Starboard Investment Trust, including the schedules of investments, as of May 31, 2014, the related statements of operations for the year or period then ended, and the statements of changes in net assets and the financial highlights for each years or period in the two year period then ended These financial statements and financial highlights are the responsibility of the Funds' management. Our responsibility is to express an opinion on these financial statements and financial highlights based on our audits. The financial highlights for each of the years or periods presented in the period October 2, 2009 to May 31, 2012 for Rx Dynamic Growth Fund and Rx Total Return Fund have been audited by other auditors, whose report dated July 26, 2012, expressed an unqualified opinion on such financial highlights.
We conducted our audits in accordance with the standards of the Public Company Accounting Oversight Board (United States). Those standards require that we plan and perform the audits to obtain reasonable assurance about whether the financial statements and financial highlights are free of material misstatement. An audit includes examining, on a test basis, evidence supporting the amounts and disclosures in the financial statements. Our procedures included confirmation of securities owned as of May 31, 2014 by correspondence with the custodian and brokers. An audit also includes assessing the accounting principles used and significant estimates made by management, as well as evaluating the overall financial statement presentation. We believe that our audits provide a reasonable basis for our opinion.
In our opinion, the financial statements and financial highlights referred to above present fairly, in all material respects, the financial position of the Rx Dividend Income Fund, Rx Dynamic Growth Fund, Rx Dynamic Total Return Fund, Rx Fundamental Growth Fund, Rx High Income Fund, Rx Non Traditional Fund, Rx Premier Managers Fund, Rx Tactical Rotation Fund, Rx Tax Advantaged Fund, Rx Traditional Equity Fund, and Rx Traditional Fixed Income Fund as of May 31, 2014, the results of their operations for the year or period then ended, and the changes in their net assets and their financial highlights for each of the years or period in the two year period then ended, in conformity with accounting principles generally accepted in the United States of America.
BBD, LLP
Philadelphia, Pennsylvania
July 25, 2014
RiskX Funds
Additional Information
(Unaudited)
| 1. | Proxy Voting Policies and Voting Record |
A copy of the Trust's Proxy Voting and Disclosure Policy and the Advisor's Disclosure Policy are included as Appendix B to the Fund's Statement of Additional Information and are available, without charge, upon request, by calling 800-773-3863, and on the website of the Security and Exchange Commission ("SEC") at sec.gov. Information regarding how each Fund voted proxies relating to portfolio securities during the most recent period ended June 30, is available (1) without charge, upon request, by calling the Fund at the number above and (2) on the SEC's website at sec.gov.
| 2. | Quarterly Portfolio Holdings |
Each Fund files its complete schedule of portfolio holdings with the SEC for the first and third quarters of each fiscal year on Form N-Q. Each Fund's Form N-Q is available on the SEC's website at sec.gov. You may review and make copies at the SEC's Public Reference Room in Washington, D.C. Information on the operation of the Public Reference Room may be obtained by calling the SEC at 202-942-8090. You may also obtain copies without charge, upon request, by calling the Fund at 800-773-3863.
We are required to advise you within 60 days of each Fund's fiscal year-end regarding the federal tax status of certain distributions received by shareholders during each fiscal year.
Each of the funds listed below had the following per share distribution information for the fiscal year ended May 31, 2014.
| Ordinary Income | Long-Term Capital Gains |
| Rx Dividend Income Fund | $0.86679 | $ - |
| Rx Dynamic Growth Fund | $0.26130 | $0.04378 |
| Rx Dynamic Total Return Fund | $0.23282 | $ - |
| Rx High Income Fund | $0.99710 | $0.02070 |
| Rx Non Traditional Fund | $ - | $0.07276 |
| Rx Premier Managers Fund | $0.21149 | $0.05564 |
| Rx Tactical Rotation Fund | $0.07206 | $ - |
| Rx Tax Advantaged Fund | $0.41261 | $ - |
| Rx Traditional Equity Fund | $0.16844 | $ - |
| Rx Traditional Fixed Income Fund | $0.38401 | $ - |
Dividend and distributions received by retirement plans such as IRAs, Keogh-type plans, and 403(b) plans need not be reported as taxable income. However, many retirement plans may need this information for their annual information meeting.
4. Schedule of Shareholder Expenses
As a shareholder of the Funds, you incur two types of costs: (1) transaction costs, which may include sales charges (loads) on shares redeemed within one year of purchase date and (2) ongoing costs, including investment advisory fees; distribution (12b-1) fees; and other Fund expenses. This example is intended to help you understand your ongoing costs (in dollars) of investing in the Fund and to compare these costs with the ongoing costs of investing in other mutual funds. The example is based on an investment of $1,000 invested at the beginning of the period and held for the entire period as indicated below.
Actual Expenses – The first line of the table below provides information about the actual account values and actual expenses. You may use the information in this line, together with the amount you invested, to estimate the expenses that you paid over the period. Simply divide your account value by $1,000 (for example, an $8,600 account value divided by $1,000 = 8.6), then multiply the result by the number in the first line under the heading entitled "Expenses Paid During Period" to estimate the expenses you paid on your account during this period.
RiskX Funds
Additional Information
(Unaudited)
Hypothetical Example for Comparison Purposes – The last line of the table below provides information about hypothetical account values and hypothetical expenses based on the Funds' actual expense ratio and an assumed annual rate of return of 5% before expenses, which is not the Funds' actual return. The hypothetical account values and expenses may not be used to estimate the actual ending account balance or expenses you paid for the period. You may use this information to compare the ongoing costs of investing in the Funds and other funds by comparing this 5% hypothetical example with the 5% hypothetical examples that appear in the shareholder reports of other funds.
| Dividend Income Fund | Beginning Account Value 12/1/13 | Ending Account Value 5/31/14 | Expenses Paid During Period* | Annualized Expense Ratio* |
| Institutional Class Shares | | | | |
| Actual | $1,000.00 | $1,056.90 | $5.91 | 1.15% |
| Hypothetical (5% annual return before expenses) | $1,000.00 | $1,019.18 | $5.80 | 1.15% |
| Advisor Class Shares | | | | |
| Actual | $1,000.00 | $1,051.80 | $11.02 | 2.15% |
| Hypothetical (5% annual return before expenses) | $1,000.00 | $1,014.19 | $10.82 | 2.15% |
| Dynamic Growth Fund | Beginning Account Value 12/1/13 | Ending Account Value 5/31/14 | Expenses Paid During Period* | Annualized Expense Ratio* |
| Institutional Class Shares | | | | |
| Actual | $1,000.00 | $1,008.40 | $3.51 | 0.70% |
| Hypothetical (5% annual return before expenses) | $1,000.00 | $1,021.44 | $3.53 | 0.70% |
| Advisor Class Shares | | | | |
| Actual | $1,000.00 | $1,004.30 | $8.49 | 1.70% |
| Hypothetical (5% annual return before expenses) | $1,000.00 | $1,016.47 | $8.55 | 1.70% |
| Dynamic Total Return Fund | Beginning Account Value 12/1/13 | Ending Account Value 5/31/14 | Expenses Paid During Period* | Annualized Expense Ratio* |
| Institutional Class Shares | | | | |
| Actual | $1,000.00 | $1,018.20 | $3.53 | 0.70% |
| Hypothetical (5% annual return before expenses) | $1,000.00 | $1,021.44 | $3.53 | 0.70% |
| Advisor Class Shares | | | | |
| Actual | $1,000.00 | $1,012.90 | $8.54 | 1.70% |
| Hypothetical (5% annual return before expenses) | $1,000.00 | $1,016.47 | $8.55 | 1.70% |
RiskX Funds
Additional Information
(Unaudited)
| Fundamental Growth Fund | Beginning Account Value 12/1/13 | Ending Account Value 5/31/14 | Expenses Paid During Period* | Annualized Expense Ratio* |
| Institutional Class Shares | | | | |
| Actual | $1,000.00 | $1,066.30 | $6.44 | 1.25% |
| Hypothetical (5% annual return before expenses) | $1,000.00 | $1,018.70 | $6.29 | 1.25% |
| Advisor Class Shares | | | | |
| Actual | $1,000.00 | $1,062.90 | $11.57 | 2.25% |
| Hypothetical (5% annual return before expenses) | $1,000.00 | $1,013.71 | $11.30 | 2.25% |
| High Income Fund | Beginning Account Value 12/1/13 | Ending Account Value 5/31/14 | Expenses Paid During Period* | Annualized Expense Ratio* |
| Institutional Class Shares | | | | |
| Actual | $1,000.00 | $1,087.70 | $3.90 | 0.70% |
| Hypothetical (5% annual return before expenses) | $1,000.00 | $1,021.44 | $3.53 | 0.70% |
| Advisor Class Shares | | | | |
| Actual | $1,000.00 | $1,081.20 | $8.81 | 1.70% |
| Hypothetical (5% annual return before expenses) | $1,000.00 | $1,016.47 | $8.55 | 1.70% |
| Non Traditional Fund | Beginning Account Value 12/1/13 | Ending Account Value 5/31/14 | Expenses Paid During Period* | Annualized Expense Ratio* |
| Institutional Class Shares | | | | |
| Actual | $1,000.00 | $1,015.20 | $3.53 | 0.70% |
| Hypothetical (5% annual return before expenses) | $1,000.00 | $1,021.44 | $3.53 | 0.70% |
| Advisor Class Shares | | | | |
| Actual | $1,000.00 | $1,011.20 | $8.54 | 1.70% |
| Hypothetical (5% annual return before expenses) | $1,000.00 | $1,016.47 | $8.55 | 1.70% |
| Premier Managers Fund | Beginning Account Value 12/1/13 | Ending Account Value 5/31/14 | Expenses Paid During Period* | Annualized Expense Ratio* |
| Institutional Class Shares | | | | |
| Actual | $1,000.00 | $1,045.30 | $3.57 | 0.70% |
| Hypothetical (5% annual return before expenses) | $1,000.00 | $1,021.44 | $3.53 | 0.70% |
| Advisor Class Shares | | | | |
| Actual | $1,000.00 | $1,040.40 | $8.63 | 1.70% |
| Hypothetical (5% annual return before expenses) | $1,000.00 | $1,016.47 | $8.55 | 1.70% |
RiskX Funds
Additional Information
(Unaudited)
| Tactical Rotation Fund | Beginning Account Value 12/1/13 | Ending Account Value 5/31/14 | Expenses Paid During Period* | Annualized Expense Ratio* |
| Institutional Class Shares | | | | |
| Actual | $1,000.00 | $1,062.50 | $6.43 | 1.25% |
| Hypothetical (5% annual return before expenses) | $1,000.00 | $1,018.70 | $6.29 | 1.25% |
| Advisor Class Shares | | | | |
| Actual | $1,000.00 | $1,058.30 | $11.55 | 2.25% |
| Hypothetical (5% annual return before expenses) | $1,000.00 | $1,013.71 | $11.30 | 2.25% |
| Tax Advantaged Fund | Beginning Account Value 12/1/13 | Ending Account Value 5/31/14 | Expenses Paid During Period* | Annualized Expense Ratio* |
| Institutional Class Shares | | | | |
| Actual | $1,000.00 | $1,044.40 | $3.57 | 0.70% |
| Hypothetical (5% annual return before expenses) | $1,000.00 | $1,021.44 | $3.53 | 0.70% |
| Advisor Class Shares | | | | |
| Actual | $1,000.00 | $1,039.30 | $8.64 | 1.70% |
| Hypothetical (5% annual return before expenses) | $1,000.00 | $1,016.47 | $8.55 | 1.70% |
| Traditional Equity Fund | Beginning Account Value 12/1/13 | Ending Account Value 5/31/14 | Expenses Paid During Period* | Annualized Expense Ratio* |
| Institutional Class Shares | | | | |
| Actual | $1,000.00 | $1,048.40 | $3.58 | 0.70% |
| Hypothetical (5% annual return before expenses) | $1,000.00 | $1,021.44 | $3.53 | 0.70% |
| Advisor Class Shares | | | | |
| Actual | $1,000.00 | $1,042.60 | $8.67 | 1.70% |
| Hypothetical (5% annual return before expenses) | $1,000.00 | $1,016.47 | $8.55 | 1.70% |
| Traditional Fixed Income Fund | Beginning Account Value 12/1/13 | Ending Account Value 5/31/14 | Expenses Paid During Period* | Annualized Expense Ratio* |
| Institutional Class Shares | | | | |
| Actual | $1,000.00 | $1,011.70 | $3.51 | 0.70% |
| Hypothetical (5% annual return before expenses) | $1,000.00 | $1,021.44 | $3.53 | 0.70% |
| Advisor Class Shares | | | | |
| Actual | $1,000.00 | $1,006.60 | $8.50 | 1.70% |
| Hypothetical (5% annual return before expenses) | $1,000.00 | $1,016.47 | $8.55 | 1.70% |
*Expenses are equal to the average account value over the period multiplied by the Fund's annualized expense ratio, multiplied by the number of days in the most recent period divided by the number of days in the fiscal year (to reflect the six month period).
5. Information about Trustees and Officers
The business and affairs of the Funds and the Trust are managed under the direction of the Board of Trustees of the Trust. Information concerning the Trustees and officers of the Trust and Funds is set forth below. Generally, each Trustee and officer serves an indefinite term or until certain circumstances such as their resignation, death, or otherwise as specified in the Trust's organizational documents. Any Trustee may be removed at a meeting of shareholders by a vote meeting the
RiskX Funds
Additional Information
(Unaudited)
requirements of the Trust's organizational documents. The Statement of Additional Information of the Funds includes additional information about the Trustees and officers and is available, without charge, upon request by calling the Fund's toll-free at 1-800-773-3863. The address of each Trustee and officer, unless otherwise indicated below, is 116 South Franklin Street, Rocky Mount, North Carolina 27804. The Independent Trustees each received aggregate compensation of $18,614 ($784 for Fundamental Growth and $1,783 for each of the other Funds) during the fiscal year ended May 31, 2014 for their services to the Funds and Trust.
Name, Age
and Address | Position
held with
Fund or Trust | Length of Time Served | Principal Occupation
During Past 5 Years | Number of Portfolios in Fund Complex Overseen by Trustee | Other Directorships
Held by Trustee
During Past 5 Years |
| Independent Trustees |
Michael G. Mosley
Age: 61 | Independent Trustee | Since 7/10 | Owner of Commercial Realty Services (real estate) since 2004. | 23 | None. |
Theo H. Pitt, Jr.
Age: 78 | Independent Trustee | Since 9/10 | Senior Partner, Community Financial Institutions Consulting (financial consulting) since 1999; Partner, Pikar Properties (real estate) since 2001; Account Administrator, Holden Wealth Management Group of Wachovia Securities (money management firm) from 2003-2008. | 23 | Independent Trustee of World Funds Trust for its two series, Gardner Lewis Investment Trust for its two series, Hanna Investment Trust for its one series, and Hillman Capital Management Investment Trust for its one series (all registered investment companies); previously, Independent Trustee of NCM Capital Investment Trust for its one series from 2007 to 2009, New Providence Investment Trust from 2008 to 2009, and Tilson Investment Trust for its two series from 2004 to 2009 (all registered investment companies). |
James H. Speed, Jr.
Age: 61 | Independent Trustee, Chairman | Trustee since 7/09, Chair since 5/12 | President and CEO of NC Mutual Insurance Company (insurance company) since 2003; President of Speed Financial Group, Inc. (consulting and private investments) from 2000 to 2003. | 23 | Independent Trustee of Brown Capital Management Mutual Funds for its three series, Hillman Capital Management Investment Trust for its one series, and Tilson Investment Trust for its one series (all registered investment companies). Member of Board of Directors of NC Mutual Life Insurance Company. Member of Board of Directors of M&F Bancorp. Previously, Independent Trustee of New Providence Investment Trust for its one series from 2009 until 2011 (registered investment company). |
J. Buckley Strandberg
Age: 54 | Independent Trustee | Since 7/09 | President of Standard Insurance and Realty (insurance and property management) since 1982. | 23 | None. |
RiskX Funds
Additional Information
(Unaudited)
Name, Age
and Address | Position
held with
Fund or Trust | Length of Time Served | Principal Occupation
During Past 5 Years | Number of Portfolios in Fund Complex Overseen by Trustee | Other Directorships
Held by Trustee
During Past 5 Years |
| Other Officers |
D. Jerry Murphey
Age: 55
821 Pacific Street
Omaha, Nebraska 68108 | President (RiskX Funds) | Since 7/09 | Manager, President, and CEO of FolioMetrix, LLC (advisor to the RiskX Funds) since 2009; principal of Uptrade Research Associates, LLC (investment research) since 2009; previously, Investment Management Consultant for Prudential Investments, Wealth Management Solutions (investment management). | n/a | n/a |
Julie M. Koethe
Age: 33
821 Pacific Street
Omaha, Nebraska 68108 | Treasurer (RiskX Funds) | Since 4/10 | Chief Operating Officer of FolioMetrix, LLC (advisor to the RiskX Funds) since 2010; Insurance Accounting Supervisor for Applied Underwriters (workers compensation and payroll service provider) from 2003-2010. | n/a | n/a |
Martin W. Dziura Age: 54 | Chief Compliance Officer | Since 1/14 | Managing Director for Cipperman Compliance Services, LLC | n/a | n/a |
Katherine M. Honey
Age: 40 | Secretary | Since 10/13 | EVP of The Nottingham Company since 2008. | n/a | n/a |
Ashley E. Harris
Age: 30 | Assistant Treasurer | Since 4/14 | Director, Financial Reporting, The Nottingham Company; Fund Accounting, The Nottingham Company from 2008-2014. | n/a | n/a |
(Continued)