This report and the financial statements contained herein are submitted for the general information of the shareholders of the Sector Rotation Fund (the "Fund"). The Fund's shares are not deposits or obligations of, or guaranteed by, any depository institution. The Fund's shares are not insured by the FDIC, Federal Reserve Board or any other agency, and are subject to investment risks, including possible loss of principal amount invested. Neither the Fund nor the Fund's distributor is a bank.
The Sector Rotation Fund is distributed by Capital Investment Group, Inc., Member FINRA/SIPC, 17 Glenwood Ave, Raleigh, NC, 27603. There is no affiliation between The Sector Rotation Fund, including its principals, and Capital Investment Group, Inc.
This Annual Report was first distributed to shareholders on or about December 1, 2014.
Dear Fellow Shareholders:
The extreme turbulence hit the markets in mid-October as fears about Europe's economy, the spread of Ebola in western Africa, and continuing tensions in the Middle East weakened investors' confidence. On October 15, 2014, for example, the Dow Jones Industrial Average fell 460 points in mid-day trading. The Nasdaq Composite Index, meanwhile, fell into correction territory (a 10% drop from a prior high) in mid-day trading. Both indices rebounded, with the Dow ending the day down 173 points and the Nasdaq barely in the red. But, investors were spooked and began to ask: Is it 2008 all over again?
To put the recent correction in perspective, let's look at what happened to the markets in that fateful year. In the fall of 2008, the Dow fell more than 500 points many times—indeed, on October 15, 2008, it fell 773 points. And those point declines were more meaningful than they would be today, because the markets were at much lower starting levels. The Dow's October 15th fall, for example, was nearly 8%. So, the recent sell-off isn't quite like 2008.
Rather, some analysts are comparing it to 2011 when the markets plunged after Standard & Poor's downgraded the United States credit rating. Stocks were up and down for the rest of the year, and, ultimately, the sell-off eliminated all of the market's gains. But stocks rebounded and saw significant gains in 2012.
So, I understand the argument that we're not where we were in 2008. We aren't. But I don't like the implication that we shouldn't worry as a result—because the global economy is not in a good place.
Five years after the end of the financial crisis, the global economy is still getting back on its feet—and doing so very, very slowly. According to the United States Census Bureau, employment is still low, and real median household income has stagnated through July 2014. Indeed, even as gross domestic product purportedly started recovery in the middle of 2009, household income plunged to new lows. Meanwhile, abroad, we've seen some disturbing reports. The latest economic data, for example, suggests that Germany, Europe's largest economy, is on the brink of recession. It's seen a slowdown in industrial production and falling exports. As a result, its economy shrank by 0.2% in the second quarter of 2014, and evidence suggests that another contraction is possible in the third quarter. That would put Germany into recession, and since the country helped prop up some of the weaker Eurozone members during the crisis years, there's fear of contagion.
These are real concerns, and in October, the International Monetary Fund (IMF) lowered its growth forecasts for 2014 and 2015; and Christine Lagarde, head of IMF, said we need to create a "new momentum." Indeed, because in the Eurozone, the economic recovery remains particularly slow, the IMF has urged monetary policymakers in the region to start quantitative easing—i.e., begin buying corporate and sovereign bonds to flood the market with liquidity. It seems like the Eurozone will do so.
Here at home, the U.S. Federal Reserve Board (Fed) has done its best, keeping the federal funds rate low and flooding the market with liquidity through its asset-purchase program. It doesn't seem to have done much good: Growth in consumer credit since 2008 has been dominated by growth in federally held student loans, not in bank loans to consumers,
which would fuel consumption growth. And, it's widely expected that the policymakers will end their asset-buying this fall and raise interest rates by next summer. So, in the wake of the recent market volatility, the Fed seemingly doesn't have the option of doing what it's done in the past: Flood the market with liquidity and vow to keep interest rates low indefinitely. (There is some outlying speculation that the Fed is considering another round of quantitative easing, QE4, which could boost equities, at least fleetingly, but this is just a rumor. QE4 is a program where the Federal Reserve goes on the open market and purchases U.S. Treasury Notes/Bonds and U.S. Government mortgage back obligations. The purpose of the program is twofold – 1. Attempt to keep interest rates as low as possible and 2. Inject dollars into the economy. The number "4" in QE4 represents the number of times the Federal Reserve has used the program since the end of the great recession.)
My concern is that the stock market isn't based on economic reality. The economy seems to be on very unstable footing, regardless of the official word from above. As a result, minor events can lead to irrational fears that can quickly evolve quickly into market surprises. And, we're facing a number of such events, in potential terrorist activity and or public-health crises. Economic data could, at any moment, also put investors on edge. Increasingly negative economic conditions will, in our opinion, continue to show up in various data series, such as retail sales, industrial production and employment; that, in turn, could shift the popular outlook quite rapidly towards the idea of another recession. So, we're worried that we'll see bouts of panicked selling in the in the domestic equity and bond markets—and before they can fully recover, the proverbial cat will be out of the bag when it comes to the U.S. economic recovery.
What should investors do in this environment? On one hand, you might see the market downturn as an opportunity to buy cheap stocks. That's not a bad approach to downturns in general, assuming you have the stomach to ride out the volatility, which could last weeks, months, or years—we just don't know. And it's especially true if you think it's a short-term correction. After all, markets historically haven't cared much for the month of October. The panics of 1907, 1929 and 1987 all occurred during this month. But I think this situation is more than a temporary blip, as I've been saying for a while now. I think we may be on the brink of recession, so I'm not advising investors to make major changes to their investment strategy as a result of the market volatility.
Mark Anthony Grimaldi
Fund Manager
| Please see the table below for the Fund's historical performance information through the calendar quarter ended September 30, 2014: |
Average Annual Total Returns (Unaudited) | | | |
Period Ended September 30, 2014 | One Year | Since Inception* | Gross Expense Ratio** |
Sector Rotation Fund | 14.50% | 8.80% | 1.65% |
S&P 500 Total Return Index*** | 19.73% | 15.16% | N/A |
The performance data quoted above represents past performance, which is not a guarantee of future results. Investment return and principal value of an investment in the Fund will fluctuate so that an investor's shares, when redeemed, may be worth more or less than their original cost. Current performance may be lower or higher than the performance data quoted. To obtain more current performance data regarding the Fund, including performance data current to the Fund's most recent month-end, please visit ncfunds.com or call the Fund at (800) 773-3863. Fee waivers and expenses reimbursements have positively impacted Fund performance.
*The Fund's inception date is December 31, 2009.
**Gross expense ratio is from the Fund's prospectus dated January 28, 2014. More recent expense ratios are found in the Financial Highlights.
***You cannot invest directly in this index. The index does not have an investment advisor and does not pay any commissions, expenses, or taxes. If the index did pay commissions, expenses, or taxes, the return would be lower.
| Sector Rotation Fund | | | | | | | | | | | | | | |
| | | | | | | | | | | | | | | | | | | |
| Performance Update (Unaudited) | | | | | | | | | | | | | |
| | | | | | | | | | | | | | | | | | | |
| | | | | | | | | | | | | | | | | | | |
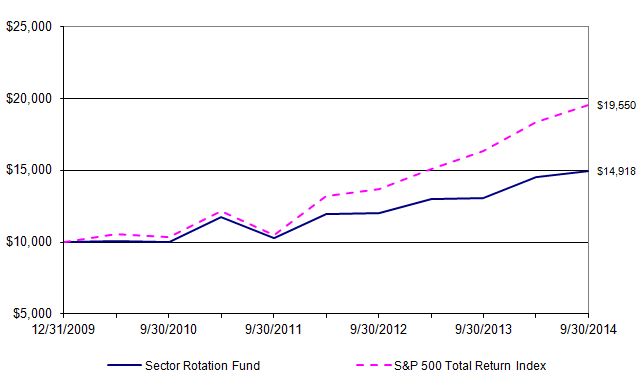
| For the period from December 31, 2009 (Commencement of Operations) to September 30, 2014 |
| | | | | | | | | | | | | | | | | | | |
| Comparison of the Change in Value of a $10,000 Investment | | | | | | | | |
| | | | | | | | | | | | | | | | | | | |
|  | | |
| | | | | | | | | | | | | | | | | | | |
| This graph assumes an initial investment of $10,000 at December 31, 2009 (Commencement of Operations). All dividends and distributions are reinvested. This graph depicts the performance of the Sector Rotation Fund versus the S&P 500 Total Return Index. It is important to note that the Fund is a professionally managed mutual fund while the index is not available for investment and is unmanaged. The comparison is shown for illustrative purposes only. |
| | | | | | | | | | | | | | | | | | | |
| | | | | | | | | | | | | | | | | | | |
| Average Annual Total Returns | | |
| | | | | | | | | | | | | | | | | Gross | | |
| | As of | | | | | | | One | | Since | | Inception | | Expense | | |
| | September 30, 2014 | | | | | Year | | Inception | | Date | | Ratio* | | |
| | Sector Rotation Fund | | | | | 14.50% | | 8.80% | | 12/31/09 | | 1.65% | | |
| | S&P 500 Total Return Index | | | | | 19.73% | | 15.16% | | N/A | | N/A | | |
| | | | | | | | | | | | | | | | | | | |
| * The gross expense ratio shown is from the Fund's prospectus dated January 28, 2014. | | | | |
| | | | | | | | | | | | | | | | | | | |
| Performance quoted above represents past performance, which is no guarantee of future results. Investment return and principal value will fluctuate so that shares, when redeemed, may be worth more or less than their original cost. Current performance may be lower or higher than the performance data quoted. An investor may obtain performance data, current to the most recent month-end, by visiting ncfunds.com. |
| | | | | | | | | | | | | | | | | | | |
| The graph and table do not reflect the deduction of taxes that a shareholder would pay on Fund distributions or the redemption of Fund shares. Average annual total returns are historical in nature and measure net investment income and capital gain or loss from portfolio investments assuming reinvestments of distributions. |
| | | | | | | | | | | | | | | | | | | |
| | | | | | | | | | | | | | | | | | | |
| Sector Rotation Fund | | | | | | | | |
| | | | | | | | | | |
| Schedule of Investments | | | | | | | |
| | | | | | | | | | |
| | | | | | | | | | |
| As of September 30, 2014 | | | | | | | |
| | | | | | | | Shares | | Value (note 1) |
| | | | | | | | | | |
| EXCHANGE-TRADED FUNDS - 95.84% | | | | | | |
| | | | | | | | | | |
| Commodities - 2.30% | | | | | | | |
| * | iShares Silver Trust | | | | | 10,000 | $ | 163,500 |
| * | SPDR Gold Shares | | | | | 3,000 | | 348,630 |
| | | | | | | | | | 512,130 |
| Consumer Services - 13.73% | | | | | | |
| | Powershares Dynamic Food & Beverage Portfolio | | | 20,000 | | 567,600 |
| | Powershares Dynamic Media Portfolio | | | | 15,000 | | 370,800 |
| | Vanguard Consumer Staples ETF | | | | 18,000 | | 2,115,000 |
| | | | | | | | | | 3,053,400 |
| Fixed Income - 14.61% | | | | | | | |
| | iShares iBoxx $ High Yield Corporate Bond ETF | | | 13,000 | | 1,195,350 |
| | iShares TIPS Bond ETF | | | | 4,000 | | 448,280 |
| | SPDR Barclays High Yield Bond ETF | | | | 40,000 | | 1,607,200 |
| | | | | | | | | | 3,250,830 |
| Health Care - 14.35% | | | | | | | |
| | Health Care Select Sector SPDR Fund | | | 35,000 | | 2,236,850 |
| | Powershares Dynamic Pharmaceuticals Portfolio | | | 15,000 | | 954,750 |
| | | | | | | | | | 3,191,600 |
| Industrials - 7.27% | | | | | | | | |
| | PowerShares Aerospace & Defense Portfolio | | | 50,000 | | 1,618,000 |
| | | | | | | | | | 1,618,000 |
| International - 4.86% | | | | | | | |
| | iShares MSCI Hong Kong ETF | | | | 10,000 | | 203,300 |
| | iShares MSCI Japan ETF | | | | 20,000 | | 235,400 |
| | iShares MSCI Malaysia ETF | | | | 10,000 | | 154,000 |
| | iShares MSCI Switzerland Capped ETF | | | 15,000 | | 487,650 |
| | | | | | | | | | 1,080,350 |
| Large Cap - 25.21% | | | | | | | |
| * | ProShares UltraPro Short S&P 500 | | | | 2,000 | | 90,740 |
| | SPDR S&P 500 ETF Trust | | | | 28,000 | | 5,516,560 |
| | | | | | | | | | 5,607,300 |
| Natural Resources - 2.56% | | | | | | |
| | PowerShares Global Water Portfolio | | | | 25,000 | | 569,000 |
| | | | | | | | | | 569,000 |
| Technology - 10.95% | | | | | | | |
| | Market Vectors Semiconductor ETF | | | | 20,000 | | 1,021,800 |
| | Powershares Dynamic Networking Portfolio | | | 12,000 | | 389,640 |
| * | Powershares NASDAQ Internet Portfolio | | | 15,000 | | 1,025,700 |
| | | | | | | | | | 2,437,140 |
| | | | | | | | | | |
| | Total Exchange-Traded Funds (Cost $18,996,801) | | | | | 21,319,750 |
| | | | | | | | | | |
| | | | | | | | | | (Continued) |
| Sector Rotation Fund | | | | | | | | |
| | | | | | | | | | |
| Schedule of Investments - Continued | | | | | | |
| | | | | | | | | | |
| | | | | | | | | | |
| As of September 30, 2014 | | | | | | | |
| | | | | | | | Shares | | Value (note 1) |
| | | | | | | | | | |
| SHORT-TERM INVESTMENT - 2.69% | | | | | | |
| § | Fidelity Institutional Money Market Funds - Treasury Portfolio, 0.01% | 597,770 | $ | 597,770 |
| | | | | | | | | | |
| | Total Short-Term Investment (Cost $597,770) | | | | | 597,770 |
| | | | | | | | | | |
| Total Value of Investments (Cost $19,594,571) - 98.53% | | | | $ | 21,917,520 |
| | | | | | | | | | |
| Other Assets Less Liabilities - 1.47% | | | | | | 326,903 |
| | | | | | | | | | |
| NET ASSETS - 100.00% | | | | | | $ | 22,244,423 |
| | | | | | | | | | |
| * | Non-income producing investment | | | | | | |
| § | Represents 7 day effective yield | | | | | | |
| | | | | | | | | | |
| | | | | | | | | | |
| | | | | | | | | | |
| | | | | | | | | | |
| | | Summary of Investments | | | | | |
| | | | | | % of Net | | | | |
| | | | | | Assets | | Value | | |
| | | Exchange Traded Funds: | | | | | |
| | | | Commodities | | 2.30% | $ | 512,130 | | |
| | | | Consumer Services | 13.73% | | 3,053,400 | | |
| | | | Fixed Income | | 14.61% | | 3,250,830 | | |
| | | | Health Care | | 14.35% | | 3,191,600 | | |
| | | | Industrials | | 7.27% | | 1,618,000 | | |
| | | | International | | 4.86% | | 1,080,350 | | |
| | | | Large Cap | | 25.21% | | 5,607,300 | | |
| | | | Natural Resources | | 2.56% | | 569,000 | | |
| | | | Technology | | 10.95% | | 2,437,140 | | |
| | | Short-Term Investment | | 2.69% | | 597,770 | | |
| | | Other Assets Less Liabilities | 1.47% | | 326,903 | | |
| | | Total | | 100.00% | $ | 22,244,423 | | |
| | | | | | | | | | |
| | | | | | | | | | |
| | | | | | | | | | |
| | | | | | | | | | |
| | | | | | | | | | |
| | | | | | | | | | |
| | | | | | | | | | |
| | | | | | | | | | |
| | | | | | | | | | |
| | | | | | | | | | |
| | | | | | | | | | |
| See Notes to Financial Statements | | | | | | |
| Sector Rotation Fund | | |
| | | |
| Statement of Assets and Liabilities | | |
| | | |
| | | |
| As of September 30, 2014 | | |
| | | |
| Assets: | | |
| | Investments, at value (cost $19,594,571) | $ | 21,917,520 |
| | Receivables: | | |
| | | Investments sold | | 255,444 |
| | | From Administrator | | 3,704 |
| | Fund shares sold | | 70,968 |
| | Dividends and interest | | 26,306 |
| | | |
| | Total assets | | 22,273,942 |
| | | |
| Liabilities: | | |
| | Payables: | | |
| | Fund shares repurchased | | 9,984 |
| | Accrued expenses: | | |
| | Advisory fees | | 19,535 |
| | | |
| | Total liabilities | | | 29,519 |
| | | |
| Net Assets | $ | 22,244,423 |
| | | |
| Net Assets Consist of: | | |
| | Paid in Capital | $ | 16,322,028 |
| | Undistributed net investment income | | 83,275 |
| | Undistributed net realized gain on investments | | 3,516,171 |
| | Net unrealized appreciation on investments | | 2,322,949 |
| | | |
| | Total Net Assets | $ | 22,244,423 |
| | Shares Outstanding, no par value (unlimited authorized shares) | | 1,702,683 |
| | Net Asset Value, Maximum Offering Price and Redemption Price Per Share | $ | 13.06 |
| | | |
| | | |
| | | |
| | | |
| | | |
| | | |
| | | |
| | | |
| | | |
| | | |
| | | |
| | | |
| | | |
| | | |
| | | |
| | | |
| | | |
| | | |
| See Notes to Financial Statements | | |
| Sector Rotation Fund | | |
| | | |
| Statement of Operations | | |
| | | |
| | | |
| For the fiscal year ended September 30, 2014 | | |
| | | |
| Investment Income: | | |
| | Dividends | $ | 546,991 |
| | | |
| Total Investment Income | | 546,991 |
| | | |
| Expenses: | | |
| | Advisory fees (note 2) | | 220,730 |
| | Administration fees (note 2) | | 178,442 |
| | | |
| | Total Expenses | | 399,172 |
| | | |
| Net Investment Income | | 147,819 |
| | | |
| Realized and Unrealized Gain (Loss) on Investments | | |
| | | |
| | Net realized gain from investment transactions | | 3,585,429 |
| | | |
| | Net change in unrealized appreciation on investments | | (760,535) |
| | | |
| Net Realized and Unrealized Gain on Investments | | 2,824,894 |
| | | |
| Net Increase in Net Assets Resulting from Operations | $ | 2,972,713 |
| | | |
| | | |
| | | |
| | | |
| | | |
| | | |
| | | |
| | | |
| | | |
| | | |
| | | |
| | | |
| | | |
| | | |
| | | |
| | | |
| | | |
| | | |
| | | |
| | | |
| | | |
| | | |
| | | |
| | | |
| | | |
| See Notes to Financial Statements | | |
Sector Rotation Fund
Notes to Financial Statements
1. Organization and Significant Accounting Policies
The Sector Rotation Fund ("Fund") is a series of the Starboard Investment Trust ("Trust"). The Trust is organized as a Delaware statutory trust and is registered under the Investment Company Act of 1940, as amended ("1940 Act"), as an open-end management investment company. The Fund is a separate, non-diversified series of the Trust.
The Fund commenced operations on December 31, 2009 as a series of the World Funds Trust ("WFT"). Shareholders approved the reorganization of the Fund as a series of the Trust at a special meeting on June 22, 2011. The reorganization occurred on June 27, 2011. Effective November 29, 2010, the Fund changed its name from the Navigator Fund to the Sector Rotation Fund.
The investment objective of the Fund is to achieve capital appreciation. The Fund utilizes a sector rotation strategy which evaluates the relative strength and momentum of different sectors of the economy in order to identify short-term investment opportunities. Under normal circumstances, the Fund invests in exchange-traded funds ("ETFs"). An ETF is an open-end investment company that holds a portfolio of investments designed to track a particular market segment or underlying index.
The following is a summary of significant accounting policies consistently followed by the Fund. The policies are in conformity with accounting principles generally accepted in the United States of America ("GAAP").
Investment Valuation
The Fund's investments in securities are carried at fair value. Securities listed on an exchange or quoted on a national market system are valued at the last sales price as of 4:00 p.m. Eastern Time. Securities traded in the NASDAQ over-the-counter market are generally valued at the NASDAQ Official Closing Price. Other securities traded in the over-the-counter market and listed securities for which no sale was reported on that date are valued at the most recent bid price. Instruments with maturities of 60 days or less are valued at amortized cost, which approximates market value. Securities and assets for which representative market quotations are not readily available (e.g., if the exchange on which the security is principally traded closes early or if trading of the particular security is halted during the day and does not resume prior to the Fund's net asset value calculation) or which cannot be accurately valued using the Fund's normal pricing procedures are valued at fair value as determined in good faith under policies approved by the Trustees. A security's "fair value" price may differ from the price next available for that security using the Fund's normal pricing procedures.
Fair Value Measurement
Various inputs are used in determining the value of the Fund's investments. These inputs are summarized in the three broad levels listed below:
Level 1: quoted prices in active markets for identical securities
Level 2: other significant observable inputs (including quoted prices for similar securities, interest rates, credit risk, etc.)
Level 3: significant unobservable inputs (including the Fund's own assumptions in determining fair value of investments)
The availability of observable inputs can vary from security to security and is affected by a wide variety of factors, including, for example, the type of security, whether the security is new and not yet established in the marketplace, the liquidity of markets, and other characteristics particular to the security. To the extent that valuation is based on models or inputs that are less observable or unobservable in the market, the determination of fair value requires more judgment. Accordingly, the degree of judgment exercised in determining fair value is greatest for instruments categorized in Level 3.
The inputs used to measure fair value may fall into different levels of the fair value hierarchy. In such cases, for disclosure purposes, the level in the fair value hierarchy within which the fair value measurement falls in its entirety, is determined based on the lowest level input that is significant to the fair value measurement in its entirety.
(Continued)
Sector Rotation Fund
Notes to Financial Statements
The inputs or methodology used for valuing securities are not necessarily an indication of the risk associated with investing in those securities. The following table summarizes the inputs as of September 30, 2014 for the Fund's assets measured at fair value:
| Sector Rotation Fund | | |
| Investments in Securities (a) | | Total | | Level 1 | | Level 2 | | Level 3 |
| Assets | | | | | | | | |
| Exchange-Traded Funds* | $ | 21,319,750 | $ | 21,319,750 | $ | - | $ | - |
| Short-Term Investment | | 597,770 | | 597,770 | | - | | - |
| Total Assets | $ | 21,917,520 | $ | 21,917,520 | $ | - | $ | - |
| | | | | | | | |
| (a) | The Fund had no significant transfers into or out of Level 1, 2, or 3 during the year ended September 30, 2014. The Fund did not hold any Level 3 securities during the year. The Fund recognizes transfers at the end of the year. |
*Refer to Schedule of Investments for breakdown by Industry.
Investment Transactions and Investment Income
Investment transactions are accounted for as of the date purchased or sold (trade date). Dividend income is recorded on the ex-dividend date. Certain dividends from foreign securities will be recorded as soon as the Fund is informed of the dividend if such information is obtained subsequent to the ex-dividend date. Interest income is recorded on the accrual basis and includes accretion of discounts and amortization of premiums. Gains and losses are determined on the identified cost basis, which is the same basis used for federal income tax purposes.
Expenses
The Administrator bears all operating expenses of the Fund not specifically assumed by the Fund.
Distributions
The Fund may declare and distribute dividends from net investment income (if any) quarterly. Distributions from capital gains (if any) are generally declared and distributed annually. Dividends and distributions to shareholders are recorded on ex-date.
Estimates
The preparation of financial statements in conformity with accounting principles generally accepted in the United States of America requires management to make estimates and assumptions that affect the reported amounts of assets and liabilities and the disclosure of contingent assets and liabilities at the date of the financial statements and the reported amounts of increases and decreases in the net assets from operations during the reported period. Actual results could differ from those estimates.
Federal Income Taxes
No provision for income taxes is included in the accompanying financial statements, as the Fund intends to distribute to shareholders all taxable investment income and realized gains and otherwise complies with Subchapter M of the Internal Revenue Code applicable to regulated investment companies.
| 2. | Transactions with Related Parties and Service Providers |
Advisor
As full compensation for the investment advisory services provided to the Fund by Navigator Money Management, Inc. (the "Advisor"), the Advisor receives a monthly fee based on the Fund's average daily net assets. The Advisor shall receive an investment advisory fee equal to an annualized rate of 1.00% of the average daily net assets of the Fund. In accordance with these terms, the Fund incurred $220,730 in advisory fees for the fiscal year ended September 30, 2014.
(Continued)
Sector Rotation Fund
Notes to Financial Statements
Administrator
The Nottingham Company ("Administrator") assists the Trust in the performance of its administrative responsibilities to the Fund, coordinates and pays for the services of each vendor and the operating expense to the Fund, and provides the Fund with certain administrative, fund accounting, and compliance services. As part of its services and consolidated fee arrangement, the Administrator receives compensation based on the Fund's average daily net assets. The annual rate is 1.35% if the average daily net assets are under $12 million and gradually decreases to an annual rate of 0.096% once the average daily net assets reach $2 billion or more. The rate in effect at September 30, 2014 was 0.811% of the average daily net assets of the Fund.
The fee paid to the Administrator is calculated by multiplying the average daily net assets of the Fund by the highest applicable annual rate. The Administrator pays all expenses not assumed by the Advisor, including, without limitation: the fees and expenses of its independent accountants, of its legal counsel, and of its Trustees; the costs of printing and mailing to shareholders annual and semi-annual reports, proxy statements, prospectuses, statements of additional information and supplements thereto; the costs of printing registration statements; bank transaction charges and custodian's fees; any proxy solicitors' fees and expenses; filing fees; any federal, state or local income or other taxes; any interest on securities sold short; any membership fees of the Investment Company Institute and similar organizations; fidelity bond and Trustees' liability insurance premiums. The Fund incurred $178,442 in administration fees for the fiscal year ended September 30, 2014.
Operating Plan: The Advisor has entered into an Operating Plan with the Administrator under which it has agreed make the following payments to the Administrator: (i) when the Fund's net assets are below $12 million, the Advisor pays the Administrator a fee based on the daily average net assets of the Fund; and (ii) when the consolidated fee collected by the Administrator is less than a designated minimum operating cost, then the Advisor pays the Administrator a fee that makes up the difference. The Advisor is also obligated to pay the following Fund expenses under the Operating Plan: (i) marketing, distribution, and servicing expenses related to the sale or promotion of Fund shares that the Fund is not authorized to pay pursuant to the Investment Company Act; (ii) expenses incurred in connection with the organization and initial registration of shares of the Fund; (iii) expenses incurred in connection with the dissolution and liquidation of the Fund; (iv) expenses related to shareholder meetings and proxy solicitations; (v) fees and expenses related to legal, auditing, and accounting services that are outside of the scope of ordinary services; and (vi) hiring employees and retaining advisers and experts as contemplated by Rule 0-1(a)(7)(vii) of the Investment Company Act.
The Operating Plan may be terminated by either party at the conclusion of the then current term upon: (i) written notice of non-renewal to the other party not less than sixty days prior to the end of the term, or (ii) mutual written agreement of the parties. The Advisor cannot recoup from the Fund any amounts paid by the Advisor to the Fund's administrator under the Operating Plan. If the Operating Plan is terminated when the Fund is at lower net asset levels, the administrator would likely need to terminate the Fund Accounting and Administration Agreement in order to avoid incurring expenses without reimbursement from the Advisor. Unless other expense limitation arrangements were put in place, the Fund's expenses would likely increase.
Compliance Services
Nottingham Compliance Services, LLC ("NCS"), a fully owned affiliate of the Administrator, provides services which assist the Trust's Chief Compliance Officer in monitoring and testing the policies and procedures of the Trust in conjunction with requirements under Rule 38a-1 of the 1940 Act. NCS is entitled to receive compensation from the Administrator pursuant to the Administrator's fee arrangements with the Fund.
In January 2014, Cipperman Compliance Services, LLC assumed providing services as the Trust's Chief Compliance Officer. Cipperman Compliance Services, LLC is entitled to receive compensation from the Administrator pursuant to the Administrator's fee arrangements with the Fund.
Transfer Agent
Nottingham Shareholder Services, LLC ("Transfer Agent") serves as transfer, dividend paying, and shareholder servicing agent for the Fund. For its services, the Transfer Agent is entitled to receive compensation from the Administrator pursuant to the Administrator's fee arrangements with the Fund.
(Continued)
Sector Rotation Fund
Notes to Financial Statements
Distributor
Capital Investment Group, Inc. (the "Distributor") serves as the Fund's principal underwriter and distributor. For its services, the Distributor is entitled to receive compensation from the Administrator pursuant to the Administrator's fee arrangements with the Fund.
Certain Trustees and officers of the Trust are also officers of the Advisor or the Administrator.
| 3. | Purchases and Sales of Investment Securities |
For the fiscal year ended September 30, 2014, the aggregate cost of purchases and proceeds from sales of investment securities (excluding short-term securities) were as follows:
| Purchases of Securities | Proceeds from Sales of Securities |
| $45,007,123 | $46,544,616 |
There were no long-term purchases or sales of U.S Government Obligations during the fiscal year ended September 30, 2014.
Distributions are determined in accordance with Federal income tax regulations, which differ from generally accepted accounting principles, and, therefore, may differ significantly in amount or character from net investment income and realized gains for financial reporting purposes. Financial reporting records are adjusted for permanent book/tax differences to reflect tax character, but are not adjusted for temporary differences.
Management reviewed the Fund's tax positions to be taken on federal income tax returns for the open tax years of 2011, 2012, and 2013, and as of and during the fiscal year ended September 30, 2014, and determined that the Fund does not have a liability for uncertain tax positions. The Fund recognizes interest and penalties, if any, related to unrecognized tax benefits as income tax expense in the Statement of Operations. During the year, the Fund did not incur any interest or penalties.
Reclassifications relate primarily to differing book/tax treatment of grantor trusts. For the fiscal year ended September 30, 2014, the following reclassifications were made:
| Undistributed Net Investment Income | $ (1,381) |
| Undistributed Net Realized Gain on Investments | | 1,381 |
Distributions during the fiscal year ended were characterized for tax purposes as follows:
| September 30, 2014 | September 30, 2013 |
| Ordinary Income | $ 63,163 | $ 584,864 |
| Long-term capital gain | 315,319 | 761,822 |
Sector Rotation Fund
Notes to Financial Statements
At September 30, 2014, the tax-basis cost of investments and components of distributable earnings were as follows:
| Cost of Investments | $ | 19,685,080 |
| | |
| Unrealized Appreciation | $ | 2,453,577 |
| Unrealized Depreciation | | (221,137) |
| Net Unrealized Appreciation | | 2,232,440 |
| | |
| Undistributed Ordinary Income | | 1,265,277 |
| Undistributed Long-Term Gains | | 2,424,678 |
| | |
| Distributable Earnings | $ | 5,922,395 |
| | | | | |
The difference between book-basis and tax-basis net unrealized appreciation (depreciation) is attributable to the deferral of losses from wash sales and grantor trust adjustments. The difference between book-basis and tax-basis undistributed net investment income and undistributed net realized gain on investments is attributable to the tax deferral of losses from wash sales and the tax treatment of short-term gains.
| 5. | Commitments and Contingencies |
Under the Trust's organizational documents, its officers and Trustees are indemnified against certain liabilities arising out of the performance of their duties to the Fund. In addition, in the normal course of business, the Trust entered into contracts with its service providers, on behalf of the Fund, and others that provide for general indemnifications. The Fund's maximum exposure under these arrangements is unknown, as this would involve future claims that may be made against the Fund. The Fund expects risk of loss to be remote.
The Fund has evaluated the need for disclosures and/or adjustments resulting from subsequent events through the date of issuance of these financial statements. This evaluation did not result in any subsequent events that necessitated disclosures and/or adjustments.
REPORT OF INDEPENDENT REGISTERED PUBLIC ACCOUNTING FIRM
To the Shareholders of the Sector Rotation Fund and
The Board of Trustees of the Starboard Investment Trust
We have audited the accompanying statement of assets and liabilities of the Sector Rotation Fund (the "Fund"), a series of shares of beneficial interest of the Starboard Investment Trust, including the schedule of investments, as of September 30, 2014, the related statement of operations for the year then ended, and the statements of changes in net assets and the financial highlights for each of the two years in the period then ended. These financial statements and financial highlights are the responsibility of the Fund's management. Our responsibility is to express an opinion on these financial statements and financial highlights based on our audits. The financial highlights for each year or period presented in the period December 31, 2009 to September 30, 2012 have been audited by two other auditors, whose reports dated November 28, 2012 and November 29, 2010, expressed unqualified opinions on such financial highlights.
We conducted our audits in accordance with the standards of the Public Company Accounting Oversight Board (United States). Those standards require that we plan and perform the audit to obtain reasonable assurance about whether the financial statements and financial highlights are free of material misstatement. An audit includes examining, on a test basis, evidence supporting the amounts and disclosures in the financial statements. Our procedures included confirmation of securities owned as of September 30, 2014 by correspondence with the custodian. An audit also includes assessing the accounting principles used and significant estimates made by management, as well as evaluating the overall financial statement presentation. We believe that our audits provide a reasonable basis for our opinion.
In our opinion, the financial statements and financial highlights referred to above present fairly, in all material respects, the financial position of the Sector Rotation Fund as of September 30, 2014, the results of its operations for the year then ended and changes in its net assets and its financial highlights for each of the two years in the period then ended, in conformity with accounting principles generally accepted in the United States of America.
BBD, LLP
Philadelphia, Pennsylvania
December 1, 2014
Sector Rotation Fund
Additional Information (Unaudited)
| 1. | Proxy Voting Policies and Voting Record |
A copy of the Trust's Proxy Voting and Disclosure Policy and the Advisor's Disclosure Policy are included as Appendix B to the Fund's Statement of Additional Information and are available, without charge, upon request, by calling 800-773-3863, and on the website of the Security and Exchange Commission ("SEC") at sec.gov. Information regarding how the Fund voted proxies relating to portfolio securities during the most recent period ended June 30, is available (1) without charge, upon request, by calling the Fund at the number above and (2) on the SEC's website at sec.gov.
| 2. | Quarterly Portfolio Holdings |
The Fund files its complete schedule of portfolio holdings with the SEC for the first and third quarters of each fiscal year on Form N-Q. The Fund's Forms N-Q are available on the SEC's website at sec.gov. You may review and make copies at the SEC's Public Reference Room in Washington, D.C. Information on the operation of the Public Reference Room may be obtained by calling the SEC at 202-942-8090. You may also obtain copies without charge, upon request, by calling the Fund at 800-773-3863.
We are required to advise you within 60 days of the Fund's fiscal year-end regarding the federal tax status of certain distributions received by shareholders during each fiscal year. The following information is provided for the Fund's fiscal year ended September 30, 2014.
During the fiscal year, $315,319 in long-term capital gain distributions and $63,163 in ordinary income distributions were paid from the Fund.
Dividend and distributions received by retirement plans such as IRAs, Keogh-type plans, and 403(b) plans need not be reported as taxable income. However, many retirement plans may need this information for their annual information meeting.
| 4. | Schedule of Shareholder Expenses |
As a shareholder of the Fund, you incur two types of costs: (1) transaction costs, which may include sales charges (loads) on purchase payments and (2) ongoing costs, including investment advisory fees; distribution (12b-1) fees; and other Fund expenses. This example is intended to help you understand your ongoing costs (in dollars) of investing in the Fund and to compare these costs with the ongoing costs of investing in other mutual funds. The example is based on an investment of $1,000 invested at the beginning of the period and held for the entire period as indicated below.
Actual Expenses – The first line of the table below provides information about the actual account values and actual expenses. You may use the information in this line, together with the amount you invested, to estimate the expenses that you paid over the period. Simply divide your account value by $1,000 (for example, an $8,600 account value divided by $1,000 = 8.6), then multiply the result by the number in the first line under the heading entitled "Expenses Paid During Period" to estimate the expenses you paid on your account during this period.
Hypothetical Example for Comparison Purposes – The last line of the table below provides information about hypothetical account values and hypothetical expenses based on the Fund's actual expense ratio and an assumed annual rate of return of 5% before expenses, which is not the Fund's actual return. The hypothetical account values and expenses may not be used to estimate the actual ending account balance or expenses you paid for the period. You may use this information to compare the ongoing costs of investing in the Fund and other funds by comparing this 5% hypothetical example with the 5% hypothetical examples that appear in the shareholder reports of other funds.
(Continued)
Sector Rotation Fund
Additional Information (Unaudited)
| Sector Rotation Fund | Beginning Account Value April 1, 2014 | Ending Account Value September 30, 2014 | Expenses Paid During Period* |
Actual Hypothetical (5% annual return before expenses) | | | |
| $1,000.00 | $1,026.80 | $9.20 |
| $1,000.00 | $1,015.95 | $9.15 |
*Expenses are equal to the average account value over the period multiplied by the Fund's annualized expense ratio of 1.81%, multiplied by 183/365 (to reflect the one-half year period).
| 5. | Approval of Advisory Agreement |
The Advisor supervises the investments of the Fund pursuant to an Investment Advisory Agreement. At the annual meeting of the Fund's Board of Trustees held on August 28, 2014, the Trustees approved the renewal of the Investment Advisory Agreement for a one-year term. In considering whether to approve the Investment Advisory Agreement, the Trustees reviewed and considered the information they deemed reasonably necessary, including the following material factors: (i) the nature, extent, and quality of the services provided by the Advisor; (ii) the investment performance of the Fund and Advisor, (iii) the costs of the services to be provided and profits to be realized by the Advisor and its affiliates from the relationship with the Fund; (iv) the extent to which economies of scale would be realized as the Fund grows and whether advisory fee levels reflect those economies of scale for the benefit of the Fund's investors; (v) the Advisor's practices regarding brokerage and portfolio transactions; and (vi) the Advisor's practices regarding possible conflicts of interest.
At the meeting, the Trustees reviewed various informational materials including, without limitation, the Investment Advisory Agreement for the Fund; a memorandum from the Advisor to the Trustees containing information about the Advisor, its business, its finances, its personnel, its services to the Fund, and comparative expense ratio information for other mutual funds with a strategy similar to the Fund; and a memorandum from the Fund's legal counsel that summarized the fiduciary duties and responsibilities of the Board of Trustees in reviewing and approving the Investment Advisory Agreement, including the types of information and factors that should be considered in order to make an informed decision.
In considering the nature, extent, and quality of the services provided by the Advisor, the Trustees reviewed the responsibilities of the Advisor under the Investment Advisory Agreement. The Trustees reviewed the services to be provided by the Advisor to the Fund including, without limitation, the Advisor's procedures for formulating investment recommendations and assuring compliance with the Fund's investment objectives and limitations, proposed efforts during the Fund's start-up phase, coordination of services for the Fund among the Fund's service providers, and efforts to promote the Fund, grow the Fund's assets, and assist in the distribution of Fund shares. The Trustees also noted that the Fund's principal officer is the chief executive officer of the Advisor and will serve the Fund without additional compensation. After reviewing the foregoing information and further information in the memorandum from the Advisor (e.g., the Advisor's Form ADV and descriptions of the Advisor's business and compliance program), the Board of Trustees concluded that the quality, extent, and nature of the services to be provided by the Advisor were satisfactory and adequate for the Fund.
In considering the investment performance of the Fund and the Advisor, the Trustees compared the performance of the Fund with the performance of its benchmark index, comparable funds with similar objectives managed by other investment advisors, and applicable peer group data (e.g., Morningstar peer group averages). After reviewing the investment performance of the Fund, the Advisor's experience managing the Fund and other advisory accounts, and other factors, the Board of Trustees concluded that the investment performance of the Fund and the Advisor was satisfactory.
In considering the costs of the services to be provided and profits to be realized by the Advisor and its affiliates from the relationship with the Fund, the Trustees evaluated the Advisor's staffing, personnel, and methods of operating; the education and experience of the Advisor's personnel; the Advisor's compliance programs, policies, and procedures; the financial condition of the Advisor; the level of commitment to the Fund and the Advisor by the principals of the Advisor; the projected asset levels of the Fund; the Advisor's payment of startup costs for the Fund; and the overall expenses of the Fund, including the nature and frequency of advisory fee payments. The Trustees reviewed the financial statements of
(Continued)
Sector Rotation Fund
Additional Information (Unaudited)
the Advisor and discussed the financial stability and profitability of the firm. The Advisor responded to several questions about the financial condition of the firm and its principals. The Trustees also considered potential benefits for the Advisor in managing the Fund, including promotion of the Advisor's name, the ability for the Advisor to place small accounts into the Fund, and the potential for the Advisor to generate soft dollars from Fund trades that may benefit the Advisor's other clients. The Trustees then compared the expected fees and expenses of the Fund (including the management fee) to other funds comparable in terms of the type of fund, the nature of its investment strategy, and its style of investment management, among other factors. The Trustees determined that the Fund's management fees were higher than some of the comparable funds and lower than others. The Trustees also determined that the Fund's net expense ratio was higher than some of the comparable funds and lower than others and was higher than the peer group average. The Trustees noted that the Advisor will either make payments to the Administrator or directly pay for certain expenses of the Fund under an Operating Plan in order to help limit the Fund's annual operating expenses. The Trustees also noted that the Fund was much smaller in size than its peer group average. Following this comparison and upon further consideration and discussion of the foregoing, the Board of Trustees concluded that the fees to be paid to the Advisor by the Fund were fair and reasonable in relation to the nature and quality of the services provided by the Advisor and that they reflected charges that were within a range of what could have been negotiated at arm's length.
In considering the extent to which economies of scale would be realized as the Fund grows and whether advisory fee levels reflect those economies of scale for the benefit of the Fund's investors, the Trustees considered the Fund's fee arrangements with the Advisor. The Trustees noted that although the maximum management fee would stay the same when the Fund reached higher asset levels, the Advisor had agreed to make payments to the Administrator at lower asset levels in order to help limit the Fund's expenses. The Trustees pointed out that the Fund would benefit from economies of scale under its agreements with service providers other than the Advisor. In particular, it was noted that the Fund's agreement with its fund accountant and administrator would determine the Fund's gross expenses and that this agreement utilized breakpoints in its fee schedule that allowed the Fund's shareholders to benefit from economies of scale. Following further discussion of the Fund's projected asset levels, expectations for growth, and levels of fees, the Board of Trustees determined that the Fund's fee arrangements with the Advisor were fair and reasonable in relation to the nature and quality of the services provided by the Advisor.
In considering the Advisor's practices regarding brokerage and portfolio transactions, the Trustees reviewed the Advisor's standards, and performance in utilizing those standards, for seeking best execution for Fund portfolio transactions. The Trustees also considered the anticipated portfolio turnover rate for the Fund; the process by which evaluations are made of the overall reasonableness of commissions paid; the method and basis for selecting and evaluating the broker-dealers used; any anticipated allocation of portfolio business to persons affiliated with the Advisor; and the extent to which the Fund allocates portfolio business to broker-dealers who provide research, statistical, or other services ("soft dollars"). After further review and discussion, the Board of
Trustees determined that the Advisor's practices regarding brokerage and portfolio transactions were satisfactory.
In considering the Advisor's practices regarding conflicts of interest, the Trustees evaluated the potential for conflicts of interest and considered such matters as the experience and ability of the advisory personnel assigned to the Fund; the basis of decisions to buy or sell securities for the Fund and the Advisor's other accounts; the method for bunching of portfolio securities transactions; and the substance and administration of the Advisor's code of ethics. Following further consideration and discussion, the Board of Trustees indicated that the Advisor's standards and practices relating to the identification and mitigation of potential conflicts of interests were satisfactory.
Based upon all of the foregoing considerations, the Board of Trustees, including a majority of the Independent Trustees, approved the Investment Advisory Agreement for the Fund.
| 6. | Information about Trustees and Officers |
The business and affairs of the Fund and the Trust are managed under the direction of the Board of Trustees of the Trust. Information concerning the Trustees and officers of the Trust and Fund is set forth below. Generally, each Trustee and officer serves an indefinite term or until certain circumstances such as their resignation, death, or otherwise as specified in the
(Continued)
Sector Rotation Fund
Additional Information (Unaudited)
Trust's organizational documents. Any Trustee may be removed at a meeting of shareholders by a vote meeting the requirements of the Trust's organizational documents. The Statement of Additional Information of the Fund includes additional information about the Trustees and officers and is available, without charge, upon request by calling the Fund toll-free at 1-800-773-3863. The address of each Trustee and officer, unless otherwise indicated below, is 116 South Franklin Street, Rocky Mount, North Carolina 27804. The Independent Trustees each received aggregate compensation of $2,000 during the fiscal year ended September 30, 2014 from the Fund for their services to the Fund and Trust.
Name, Age
and Address | Position
held with
Fund or Trust | Length of Time Served | Principal Occupation
During Past 5 Years | Number of Portfolios in Fund Complex Overseen by Trustee | Other Directorships
Held by Trustee
During Past 5 Years |
| Independent Trustees |
Michael G. Mosley
Age: 61 | Independent Trustee | Since 7/10 | Owner of Commercial Realty Services (real estate) since 2004. | 23 | None. |
Theo H. Pitt, Jr.
Age: 78 | Independent Trustee | Since 9/10 | Senior Partner, Community Financial Institutions Consulting (financial consulting) since 1999; Partner, Pikar Properties (real estate) since 2001; Account Administrator, Holden Wealth Management Group of Wachovia Securities (money management firm) from 2003-2008. | 23 | Independent Trustee of DGHM Investment Trust for its two series, Gardner Lewis Investment Trust for its two series, Vertical Capital Investors Trust for its two series, Hillman Capital Management Investment Trust for its one series, and World Funds Trust for its twelve series (all registered investment companies); previously, Independent Trustee of NCM Capital Investment Trust for its one series from 2007 to 2009, New Providence Investment Trust from 2008 to 2009, and Centaur Mutual Funds Trust for its one series from 2004 to 2009 (all registered investment companies). |
James H. Speed, Jr.
Age: 60 | Independent Trustee, Chairman | Trustee since 7/09, Chair since 5/12 | President and CEO of NC Mutual Insurance Company (insurance company) since 2003; President of Speed Financial Group, Inc. (consulting and private investments) from 2000 to 2003. | 23 | Independent Trustee of the following Brown Capital Management Mutual Funds for its three series, Hillman Capital Management Investment Trust for its one series, and Centaur Mutual Funds Trust for its one series (all registered investment companies). Member of Board of Directors of NC Mutual Life Insurance Company. Member of Board of Directors of M&F Bancorp. Previously, Independent Trustee of New Providence Investment Trust for its one series from 2009 until 2011 (registered investment company). |