UNITED STATES
SECURITIES AND EXCHANGE COMMISSION
Washington, D.C. 20549
FORM N-CSR
CERTIFIED SHAREHOLDER REPORT OF REGISTERED
MANAGEMENT INVESTMENT COMPANIES
Investment Company Act file number 811-22298
Starboard Investment Trust
(Exact name of registrant as specified in charter)
116 South Franklin Street, Post Office Box 69, Rocky Mount, North Carolina 27802
(Address of principal executive offices) (Zip code)
Terrence O. Davis
116 South Franklin Street, Post Office Box 69, Rocky Mount, North Carolina 27802
(Name and address of agent for service)
Registrant's telephone number, including area code: 252-972-9922
Date of fiscal year end: March 31
Date of reporting period: March 31, 2016
Item 1. | REPORTS TO STOCKHOLDERS. |
Annual Report 2016
As of March 31, 2016
Matisse Discounted Closed-End Fund
Strategy
Institutional Class Shares
Class A Shares
This report and the financial statements contained herein are submitted for the general information of the shareholders of the Matisse Discounted Closed-End Fund Strategy (the "Fund"). The Fund's shares are not deposits or obligations of, or guaranteed by, any depository institution. The Fund's shares are not insured by the FDIC, Federal Reserve Board or any other agency, and are subject to investment risks, including possible loss of principal amount invested. Neither the Fund nor the Fund's distributor is a bank.
The Matisse Discounted Closed-End Fund Strategy is distributed by Capital Investment Group, Inc., Member FINRA/SIPC, 100 E. Six Forks Road, Suite 200, Raleigh, NC, 27609. There is no affiliation between the Matisse Discounted Closed-End Fund Strategy, including its principals, and Capital Investment Group, Inc.
Statements in this Annual Report that reflect projections or expectations of future financial or economic performance of the Matisse Discounted Closed-End Fund Strategy ("Fund") and of the market in general and statements of the Fund's plans and objectives for future operations are forward-looking statements. No assurance can be given that actual results or events will not differ materially from those projected, estimated, assumed or anticipated in any such forward-looking statements. Important factors that could result in such differences, in addition to the other factors noted with such forward-looking statements, include, without limitation, general economic conditions such as inflation, recession and interest rates. Past performance is not a guarantee of future results.
An investment in the Fund is subject to investment risks, including the possible loss of some or all of the principal amount invested. There can be no assurance that the Fund will be successful in meeting its investment objective. Generally, the Fund will be subject to the following additional risks: Fund of Funds Risk, Control of Portfolio Funds Risk, Closed-End Fund Risk, Money Market Mutual Fund Risk, Market Risk, Management Style Risk, Quantitative Model Risk, Foreign Securities Risk, Portfolio Turnover Risk, Leverage Risk, Investment Advisor Risk, and Operating Risk. More information about these risks and other risks can be found in the Fund's prospectus.
The performance information quoted in this Annual Report represents past performance, which is not a guarantee of future results. Investment return and principal value of an investment will fluctuate so that an investor's shares, when redeemed, may be worth more or less than their original cost. Current performance may be lower or higher than the performance data quoted. An investor may obtain performance data current to the most recent month-end by visiting ncfunds.com.
An investor should consider the investment objectives, risks, charges and expenses of the Fund carefully before investing. The prospectus contains this and other information about the Fund. A copy of the prospectus is available at ncfunds.com or by calling Shareholder Services at 800-773-3863. The prospectus should be read carefully before investing. | |
This Annual Report was first distributed to shareholders on or about May 30, 2016.
For More Information on Your Matisse Discounted Closed-End Fund Strategy:
See Our Web site @ matissefunds.com
or
Call Our Shareholder Services Group at 800-773-3863.
Dear Fellow Shareholders of the Matisse Discounted Closed-End Fund Strategy:
Please find enclosed for your review the Annual Report for the Matisse Discounted Closed-End Fund Strategy (the "Fund") for the fiscal year ending March 31, 2016. The Fund formally launched on October 31, 2012.
As you can see from the table below, Fund performance for the fiscal year was negative, and behind most benchmarks. This has taken the Fund's performance since inception below its benchmarks as well.
Two major factors contributed during the fiscal year to the Fund's performance relative to these indexes:
| | First, the Fund owns closed-end funds which own foreign and small-cap stocks as well as US large-caps. This is in keeping with our diversified approach. For the fiscal year, even though the S&P 500 rose almost 2%: |
| o | The Russell 2000 fell 10% |
| o | The MSCI Emerging Market Index lost 12% |
| o | The SPDR Barclays High Yield Bond ETF lost 7% |
| | Second, discounts on most types of closed-end funds widened for most of the fiscal year, before bottoming in January. For the fiscal year: |
| o | Balanced CEF discounts widened by 3.8% |
| o | International Equity CEF discounts widened by 2.4% |
| o | US & Sector Equity CEF discounts widened by 1.5% |
Our portfolio, which was 13% discounted on average as of 3/31/15, was 16% discounted as of 3/31/16. These discount-related headwinds hurt our performance for the fiscal year, even though we were able to offset them through our normal process of replacing CEFs whose discounts narrowed with more highly discounted CEFs.
Average Annual Total Returns
Period ended March 31, 2016 | One year | Annualized since inception1 | Gross Expense Ratio2 | Net Expense Ratio2 | Fund Expense Limit3 |
Matisse Discounted Closed-End Fund Strategy – Institutional Class Shares | -6.20% | 3.49% | 2.80% | 2.68% | 1.25% |
S-Network Composite Closed-End Fund Total Return Index4 | -0.48% | 3.88% | N/A | N/A | N/A |
S&P Target Risk Moderate Index4 | -0.59% | 5.12% | N/A | N/A | N/A |
S&P 500 Index4 | 1.78% | 14.15% | N/A | N/A | N/A |
MSCI EAFE Total Return Index4 | -8.27% | 5.17% | N/A | N/A | N/A |
Barclays U.S. Aggregate Bond Total Return Bond Index4 | 1.96% | 2.17% | N/A | N/A | N/A |
Matisse Discounted Closed-End Fund Strategy – - Class A Shares - Class A Shares with 5.75% sales load5 | -6.40% -11.79% | 1.14% -0.93% | 3.05% 3.05% | 2.93% 2.93% | 1.50% 1.50% |
The performance information quoted above represents past performance and past performance does not guarantee future results. Investment return and principal value of an investment will fluctuate so that an investor's shares, when redeemed, may be worth more or less than their original cost. Current performance may be lower or higher than the performance data quoted. Performance data, current to the most recent month end, may be obtained by calling the Fund at 800-773-3863. Fee waivers and expense reimbursements have positively impacted Fund performance.
1The Inception date of the Institutional Class Shares is October 31, 2012. The Inception date of the Class A Shares is May 15, 2013.
2 Gross and net expense ratios are from the Fund's prospectus dated August 17, 2015.
3The Fund expense limit reflects a contractual expense limitation that continues through July 31, 2017.
Thereafter, the expense limitation may be changed or terminated at any time. Performance would have been lower without this expense limitation.
4You cannot invest directly in this index. This index does not have an investment advisor and does not pay any commissions, expenses, or taxes. If this index did pay commissions, expenses, or taxes, its returns would be lower. Performance returns for the indexes shown in this table are since the Inception date of October 31, 2012.
5A maximum sales charge imposed on purchases of 5.75% is charged to the Class A Shares.
Portfolio positioning
We are excited about the opportunity reflected in the large discounts to NAV at which our current holdings trade. As of the end of March, our average holding traded at a 16.3% discount to NAV. The overall CEF universe also trades at an attractive discount (6.0% as of the end of March vs. its long-run average of 3.8%), and most Equity CEFs are even more attractively discounted relative to history. We have enjoyed good relative performance recently. However, this outperformance has come despite the fact that CEF discounts remain at very attractive levels relative to their history.
Where are we finding the greatest opportunities? In several asset classes whose discounts remain unusually wide relative to their history:
| ● | "Allocation" CEFs (which own US/Foreign stocks and bonds) are 11.3% discounted on average, compared to their 7.6% average since 1/1/06. |
| ● | REIT CEFs (both US and Foreign) now sit at an average 12.6% discount vs. their 8.5% average since 1/1/06. |
| ● | International Equity CEFs (broadly diversified funds as well as country-specific funds) are at 10.6% discounts on average vs. their 6.7% average since 1/1/06. |
In addition to these broad opportunities, we own highly discounted CEFs in many different asset classes and sectors. On a lookthrough basis, our portfolio of CEFs is about 69% allocated to stocks, of which approximately 65% is US. We are large-cap tilted. These exposures are in-line with our Strategy's long-term ranges.
A note about cash distributions
During the most recent 12 months the Fund has paid out $.73 per share of the Institutional Class Shares and $.71 per share of the Class A Shares in cash distributions to our shareholders, reflecting the cash we received from our underlying closed-end funds, as well as any gains we might realize through trading.
It has also been our experience that cash distributions we receive from the closed-end funds we own often provide a "tailwind" to Fund results, since they effectively represent liquidations at NAV. For example, a closed-end fund that pays a 10% cash distribution to the Fund, returns 0% for a given year on an underlying NAV basis, and trades throughout the year at a 10% discount to NAV, will give the Fund (and our shareholders) a 1.1% total return rather than a 0% return. (It has been our experience that discounted closed-end funds maintain the same discount after their cash distributions as before, although there is of course no guarantee, and discounts certainly do widen at times.) We incorporate this factor into our quantitative closed-end fund selection model. (Keep in mind, the cash distributions paid by the Fund's underlying closed-end fund holdings include return of capital as well as capital gains and income, and the rate should not be confused with a "yield".)"
Our outlook
We will continue to focus primarily on diligently capturing inefficiencies created by other participants in the niche, retail-dominated closed-end fund space. However, we are also watching several interesting developments as "clues" to guide us in how to "lean" our lookthrough portfolio allocation. (As always, we'll make our primary decision based on the attractiveness of the discounts we see.)
| ● | Bond yields have continued to fall, with the 10-year Treasury closing the quarter at about 1.8%. The economy continues to drip lukewarm water (the last time we had 8 quarters averaging real GDP growth above 3% was 2006), and the Fed, following a token Fed Funds increase in December, has been fretting ever since about whether the economy can possibly deal with short-term rates over half a percent. How did we ever manage to survive the previous couple hundred years, I wonder? Meanwhile, central banks around the world, led by Japan, have breached the "zero bound" and created negative short-term rates. Whatever else all this means, it should certainly solidify CEFs' ability to borrow at attractive rates, and should also make CEF cash distributions increasingly appetizing to retail investors with few income alternatives. |
| ● | Valuations on US stocks bear watching here. The S&P 500 traded at a trailing price per earnings ratio ("PE") of 18.8 as of 3/31/16, and now trades at 19.1. These are the highest trailing PEs in the past 5 years, but are still lower than the since-1987 average of 19.1. In the "concerning" camp, we note that the index's trailing PE throughout 2007 averaged only 16.8, a level which of course preceded a serious market decline. On the other hand, anyone who sold stocks in early 1996 as the S&P 500 PE rose through 18 missed 5 years of nearly 20% annual returns! Today's low interest rates, many say, make it more likely we go up than down from here. |
It's been a tough environment for CEFs recently… in many ways January felt like 2008. Our strategy is calibrated to take advantage of mean reversion, and performs poorly during the rare occasions when momentum (aka "panic") dominates the closed-end fund space. It is the rarity of these occasions, and the history of how our strategy has performed following very wide levels of discounts, which give us confidence in future performance.
We appreciate your interest in, and investment in, our Strategy. We'll continue to keep you updated on the important developments we see in the misunderstood, retail-dominated world of closed-end funds. Check our Strategy website, www.matissefunds.com , for updates, and feel free to contact us at 800-773-3863 to discuss the Matisse Discounted Closed-End Fund Strategy and our investment approach.
Sincerely,
Eric Boughton, CFA Portfolio Manager Matisse Funds | Bryn Torkelson Founder & CIO Matisse Funds |
(RCMAT0516001)
| Matisse Discounted Closed-End Fund Strategy | | | | | | | | | | | |
| Institutional Class Shares | | | | | | | | | | | |
| | | | | | | | | | | | | | | | | | | |
| Performance Update (Unaudited) | | | | | | | | | | | | |
| | | | | | | | | | | | | | | | | | | |
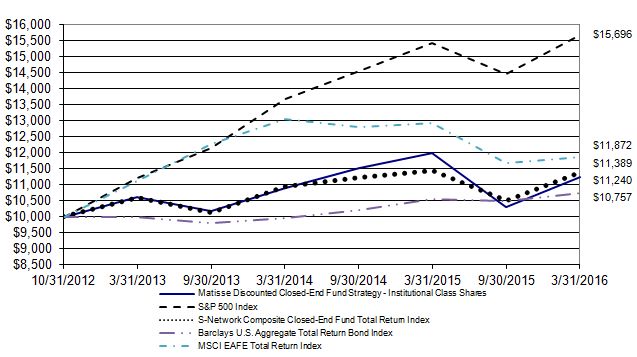
| For the period from October 31, 2012 (Date of Initial Public Investment) through March 31, 2016 |
| | | | | | | | | | | | | | | | | | | |
| Comparison of the Change in Value of a $10,000 Investment | | | | | | | | | |
| This graph assumes an initial investment of $10,000 at October 31, 2012 (Date of Initial Public Investment). All dividends and distributions are reinvested. This graph depicts the performance of the Matisse Discounted Closed-End Fund Strategy versus the Fund's benchmark index, the S&P 500 Index. Other indices shown are the S-Network Composite Closed-End Fund Total Return Index, the Barclays U.S. Aggregate Total Return Bond Index, and the MSCI EAFE Total Return Index. It is important to note that the Fund is a professionally managed mutual fund while the indices are not available for investment and are unmanaged. The comparison is shown for illustrative purposes only. |
| | Average Annual Total Returns |
| | | | | | | | Gross | | Net | | Fund | |
| | | As of | One | | Since | | Expense | | Expense | | Expense | |
| | | March 31, 2016 | Year | | Inception* | | Ratio** | | Ratio** | | Limit** | |
| | | Institutional Class Shares | -6.20% | | 3.49% | | 2.80% | | 2.68% | | 1.25% | |
| | | S&P 500 Index | 1.78% | | 14.15% | | N/A | | N/A | | N/A | |
| | | S-Network Composite Closed-End Fund Total Return Index | -0.48% | | 3.88% | | N/A | | N/A | | N/A | |
| | | Barclays U.S. Aggregate Total Return Bond Index | 1.96% | | 2.17% | | N/A | | N/A | | N/A | |
| | | MSCI EAFE Total Return Index | -8.27% | | 5.17% | | N/A | | N/A | | N/A | |
| | | *For the period from October 31, 2012 (Date of Initial Public Investment) through March 31, 2016. |
| | | **The gross expense ratio, the net expense ratio, and the fund expense limits shown are from the Fund's prospectus dated August 17, 2015. |
| | | | | | | | | | | | | | | | |
| Performance quoted above represents past performance, which is no guarantee of future results. Investment return and principal value will fluctuate so that shares, when redeemed, may be worth more or less than their original cost. Current performance may be lower or higher than the performance data quoted. An investor may obtain performance data, current to the most recent month-end, by visiting ncfunds.com. |
| The graph and table do not reflect the deduction of taxes that a shareholder would pay on Fund distributions or the redemption of Fund shares. Average annual total returns are historical in nature and measure net investment income and capital gain or loss from portfolio investments assuming reinvestments of dividends and distributions. |
| Matisse Discounted Closed-End Fund Strategy | | | | | | | | | | | |
| Class A Shares | | | | | | | | | | | | |
| | | | | | | | | | | | | | | | | | | |
| Performance Update (Unaudited) | | | | | | | | | | | | |
| | | | | | | | | | | | | | | | | | | |
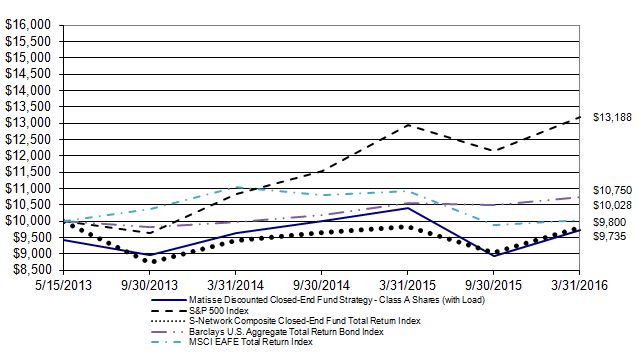
| For the period from May 15, 2013 (Date of Initial Public Investment) through March 31, 2016 |
| | | | | | | | | | | | | | | | | | | |
| Comparison of the Change in Value of a $10,000 Investment | | | | | | | | | |
| This graph assumes an initial investment of $10,000 ($9,425 with 5.75% sales charge) at May 15, 2013 (Date of Initial Public Investment). All dividends and distributions are reinvested. This graph depicts the performance of the Matisse Discounted Closed-End Fund Strategy versus the Fund's benchmark index, the S&P 500 Index. Other indices shown are the S-Network Composite Closed-End Fund Total Return Index, the Barclays U.S. Aggregate Total Return Bond Index, and the MSCI EAFE Total Return Index. It is important to note that the Fund is a professionally managed mutual fund while the indices are not available for investment and are unmanaged. The comparison is shown for illustrative purposes only. |
| | Average Annual Total Returns |
| | | | | | | | Gross | | Net | | Fund | |
| | | As of | One | | Since | | Expense | | Expense | | Expense | |
| | | March 31, 2016 | Year | | Inception* | | Ratio** | | Ratio** | | Limit** | |
| | | Class A Shares - No Sales Load | -6.40% | | 1.14% | | 3.05% | | 2.93% | | 1.50% | |
| | | Cass A Shares - 5.75% Maximum Sales Load | -11.79% | | -0.93% | | 3.05% | | 2.93% | | 1.50% | |
| | | S&P 500 Index | 1.78% | | 10.11% | | N/A | | N/A | | N/A | |
| | | S-Network Composite Closed-End Fund Total Return Index | -0.48% | | -0.70% | | N/A | | N/A | | N/A | |
| | | Barclays U.S. Aggregate Total Return Bond Index | 1.96% | | 2.55% | | N/A | | N/A | | N/A | |
| | | MSCI EAFE Total Return Index | -8.27% | | 0.10% | | N/A | | N/A | | N/A | |
| | | *For the period from May 15, 2013 (Date of Initial Public Investment) through March 31, 2016. |
| | | **The gross expense ratio, the net expense ratio, and the fund expense limits shown are from the Fund's prospectus dated August 17, 2015. |
| | | | | | | | | | | | | | | |
| Performance quoted above represents past performance, which is no guarantee of future results. Investment return and principal value will fluctuate so that shares, when redeemed, may be worth more or less than their original cost. Current performance may be lower or higher than the performance data quoted. An investor may obtain performance data, current to the most recent month-end, by visiting ncfunds.com. |
| The graph and table do not reflect the deduction of taxes that a shareholder would pay on Fund distributions or the redemption of Fund shares. Average annual total returns are historical in nature and measure net investment income and capital gain or loss from portfolio investments assuming reinvestments of dividends and distributions. |
| Matisse Discounted Closed-End Fund Strategy | | |
| | | | | | | | | | |
| Schedule of Investments | | | | | | |
| | | | | | | | | | |
| As of March 31, 2016 | | | | | | |
| | | | | | | | Shares | | Value (Note 1) |
| | | | | | | | | | |
| CLOSED-END FUNDS - 99.20% | | | | | | |
| | * | Aberdeen Israel Fund, Inc. | | | | 30,348 | $ | 518,314 |
| | | Aberdeen Singapore Fund, Inc. | | | | 40 | | 360 |
| | | Adams Diversified Equity Fund, Inc. | | | 16,202 | | 204,955 |
| | | Adams Natural Resources Fund, Inc. | | | 23,609 | | 424,726 |
| | | Advent Claymore Convertible Securities and Income Fund | | 110,100 | | 1,454,421 |
| | | Advent Claymore Convertible Securities and Income Fund II | | 203,000 | | 1,102,290 |
| | | AllianzGI NFJ Dividend Interest & Premium Strategy Fund | | 265,166 | | 3,250,935 |
| | | Alpine Global Dynamic Dividend Fund | | | 525 | | 4,478 |
| | | Alpine Global Premier Properties Fund | | | 1,013,991 | | 5,668,210 |
| | | Alpine Total Dynamic Dividend Fund | | | 430,000 | | 3,225,000 |
| | | ASA Gold and Precious Metals Ltd. | | | 290,872 | | 2,978,529 |
| | | Bancroft Fund Ltd. | | | | 84,196 | | 1,511,327 |
| | | BlackRock Resources & Commodities Strategy Trust | | 484,627 | | 3,494,161 |
| | † | Boulder Growth & Income Fund, Inc. | | | 1,149,300 | | 9,022,005 |
| | | Brookfield Global Listed Infrastructure Income Fund, Inc. | | 343,000 | | 3,893,050 |
| | | Calamos Global Dynamic Income Fund | | | 24,947 | | 175,377 |
| | | CBRE Clarion Global Real Estate Income Fund | | | 3,050 | | 23,821 |
| | | Central Securities Corp. | | | | 182,000 | | 3,483,480 |
| | | Clough Global Allocation Fund | | | | 95,637 | | 1,110,346 |
| | | Clough Global Equity Fund | | | | 164,330 | | 1,787,910 |
| | | Clough Global Opportunities Fund | | | 190,727 | | 1,827,165 |
| | | Cohen & Steers Infrastructure Fund, Inc. | | | 7,300 | | 144,613 |
| | † | Cohen & Steers REIT and Preferred Income Fund, Inc. | | 309,522 | | 5,856,156 |
| | | Delaware Enhanced Global Dividend & Income Fund | | 339,836 | | 3,109,499 |
| | | Deutsche High Income Opportunities Fund, Inc. | | | 301,994 | | 4,025,580 |
| | | Diversified Real Asset Income Fund | | | 41,078 | | 649,032 |
| | | Dividend and Income Fund | | | | 211,700 | | 2,362,572 |
| | | Eagle Growth & Income Opportunities Fund | | | 131,950 | | 2,154,730 |
| | | Gabelli Global Utility & Income Trust | | | 28,240 | | 505,417 |
| | | General American Investors Co., Inc. | | | 112,000 | | 3,497,760 |
| | | Lazard Global Total Return and Income Fund, Inc. | | 180,849 | | 2,247,953 |
| | | Lazard World Dividend & Income Fund, Inc. | | | 206,000 | | 1,860,180 |
| | | Legg Mason BW Global Income Opportunities Fund, Inc. | | 106,306 | | 1,312,879 |
| | | Liberty All Star Equity Fund | | | | 44,694 | | 222,129 |
| | | LMP Capital and Income Fund, Inc. | | | 106,600 | | 1,318,642 |
| | | Macquarie Global Infrastructure Total Return Fund, Inc. | | 123,000 | | 2,471,070 |
| | | Mexico Equity & Income Fund, Inc. | | | 1,830 | | 20,514 |
| | | Morgan Stanley China A Share Fund, Inc, | | | 202,961 | | 3,434,100 |
| | | Morgan Stanley Emerging Markets Debt Fund, Inc. | | 33,124 | | 290,829 |
| | | Morgan Stanley Emerging Markets Domestic Debt Fund, Inc. | | 598,008 | | 4,568,781 |
| | | Nuveen Real Asset Income and Growth Fund | | | 11,173 | | 171,729 |
| | † | RMR Real Estate Income Fund | | | | 229,000 | | 4,419,013 |
| | | Royce Global Value Trust, Inc. | | | | 298,100 | | 2,196,997 |
| | | Royce Micro-Cap Trust, Inc. | | | | 449,094 | | 3,143,658 |
| | | Royce Value Trust, Inc. | | | | 302,000 | | 3,536,420 |
| | | | | | | | | | |
| | | | | | | | | | (Continued) |
| Matisse Discounted Closed-End Fund Strategy | | | | | |
| | | | | | | | | | |
| Schedule of Investments - Continued | | | | | | |
| | | | | | �� | | | | |
| As of March 31, 2016 | | | | | | |
| | | | | | | | Shares | | Value (Note 1) |
| | | | | | | | | | |
| CLOSED-END FUNDS - Continued | | | | | | |
| | | Sprott Focus Trust, Inc. | | | | 122,013 | $ | 743,059 |
| | | Stone Harbor Emerging Markets Total Income Fund | | 10,732 | | 132,540 |
| | | Terra Capital PLC Fund | | | | 1,490,000 | | 1,177,100 |
| | | The Cushing Energy Income Fund | | | 11,909 | | 88,917 |
| | | The Cushing Renaissance Fund | | | | 57,768 | | 809,330 |
| | * | The Gabelli Global Small and Mid Cap Value Trust | | 15,526 | | 163,955 |
| | | The GDL Fund | | | | | 79,265 | | 795,028 |
| | | Tortoise Energy Independence Fund, Inc. | | | 97,821 | | 1,118,094 |
| | | Voya Infrastructure Industrials and Materials Fund | | 50,814 | | 633,651 |
| | | Voya Natural Resources Equity Income Fund | | | 92,172 | | 519,850 |
| | | Wells Fargo Global Dividend Opportunity Fund | | | 219,204 | | 1,308,648 |
| | | Western Asset Emerging Markets Fund, Inc. | | | 424,400 | | 4,354,344 |
| | | Western Asset Emerging Markets Debt Fund, Inc. | | 212,051 | | 3,078,981 |
| | | Western Asset Global Partners Income Fund, Inc. | | 17,718 | | 142,098 |
| | | Western Asset Worldwide Income Fund, Inc. | | | 142,097 | | 1,476,388 |
| | | | | | | | | | |
| | | Total Closed-End Funds (Cost $117,170,528) | | | | | 115,223,096 |
| | | | | | | | | | |
| Total Value of Investments (Cost $117,170,528) - 99.20% | | | $ | 115,223,096 |
| | | | | | | | | | |
| Other Assets Less Liabilities - 0.80% | | | | | | 928,419 |
| | | | | | | | | | |
| | Net Assets - 100.00% | | | | | $ | 116,151,515 |
| | | | | | | | | | |
| | * | Non-income producing investment | | | | | |
| | † | All or a portion of security is pledged as collateral for margin borrowings. | | | | |
| | | | | | | | |
| | | | | | | | | | |
| | The following acronyms or abbreviations are used in this portfolio: | | | | |
| | | PLC - Public Limited Company | | | | | |
| | | REIT - Real Estate Investment Trust | | | | | |
| | | | | | | | | | |
| | | | | | | | | | |
| | | | Summary of Investments | | | | | |
| | | | | | % of Net | | | | |
| | | | | | Assets | | Value | | |
| | | | Closed-End Funds | 99.20% | $ | 115,223,096 | | |
| | | | Other Assets Less Liabilities | 0.80% | | 928,419 | | |
| | | | Total | | 100.00% | $ | 116,151,515 | | |
| | | | | | | | | | |
| | | | | | | | | | |
| | | | | | | | | | |
| | | | | | | | | | |
| | | | | | | | | | |
| | | | | | | | | | |
| See Notes to Financial Statements | | | | | | |
| Matisse Discounted Closed-End Fund Strategy | | |
| | | | |
| Statement of Assets and Liabilities | | |
| | | | |
| As of March 31, 2016 | | |
| | | | |
| Assets: | | |
| Investments, at value (cost $117,170,528) | $ | 115,223,096 |
| Cash | | 77,692 |
| Receivables: | | |
| Investments sold | | 4,517,444 |
| Fund shares sold | | 35,881 |
| Dividends and interest | | 182,941 |
| Prepaid Expenses: | | |
| Fund accounting fees | | 2,927 |
| Registration and filing expenses | | 2,429 |
| Compliance fees | | 750 |
| | | | |
| Total assets | | 120,043,160 |
| | | | |
| Liabilities: | | |
| Payables: | | |
| Investments purchased | | 3,724,513 |
| Fund shares purchased | | 26,021 |
| Distributions | | 7,773 |
| Accrued expenses: | | |
| | Advisory fees | | 102,498 |
| | Professional fees | | 15,197 |
| | Custody fees | | 8,898 |
| | Trustee fees and meeting expenses | | 2,000 |
| | Insurance fees | | 1,800 |
| | Shareholder fulfillment expenses | | 1,648 |
| | Distribution and service fees - Class A Shares (note 3) | | 1,290 |
| | Administration fees | | 7 |
| | | | |
| Total liabilities | | 3,891,645 |
| | | | |
| Net Assets | $ | 116,151,515 |
| | | | |
| Net Assets Consist of: | | |
| Paid in Interest | $ | 130,067,155 |
| Accumulated net investment income | | 935,865 |
| Accumulated net realized loss on investments | | (12,904,073) |
| Net unrealized depreciation on investments | | (1,947,432) |
| | | | |
| Net Assets | $ | 116,151,515 |
| | | | |
| Institutional shares outstanding, no par value (unlimited authorized shares) | | 12,284,224 |
| Net Assets | $ | 109,112,735 |
| Net Asset Value, Maximum Offering Price and Redemption Price Per Share | $ | 8.88 |
| | | | |
| Class A shares outstanding, no par value (unlimited authorized shares) | | 846,722 |
| Net Assets | $ | 7,038,780 |
| Net Asset Value and Redemption Price Per Share | $ | 8.31 |
Offering Price Per Share ($8.31 ÷ 94.25%) | $ | 8.82 |
| | | | |
| | | | |
| | | | |
| | | | |
| See Notes to Financial Statements | | |
| Matisse Discounted Closed-End Fund Strategy | | |
| | | | |
| Statement of Operations | | |
| | | | |
| | | | |
| For the fiscal year ended March 31, 2016 | | |
| | | | |
| Investment Income: | | |
| Dividends | $ | 6,877,293 |
| | | | |
| Total Investment Income | | 6,877,293 |
| | | | |
| Expenses: | | |
Advisory fees (note 2) | | 1,416,758 |
| Interest expense | | 139,113 |
Administration fees (note 2) | | 116,341 |
Fund accounting fees (note 2) | | 44,928 |
| Registration & filing expenses | | 40,566 |
Custody fees (note 2) | | 34,688 |
| Professional fees | | 29,011 |
Transfer agent fees (note 2) | | 27,000 |
| Shareholder fulfillment expenses | | 22,284 |
Distribution and service fees - Class A Shares (note 3) | | 17,457 |
Compliance fees (note 2) | | 10,960 |
| Trustee fees and meeting expenses | | 10,737 |
| Security pricing fees | | 5,829 |
| Insurance fees | | 3,420 |
| | | | |
| Total Expenses | | 1,919,092 |
| | | | |
Advisor fees waived (note 2) | | (283,039) |
| | | | |
| Net Expenses | | 1,636,053 |
| | | | |
| Net Investment Income | | 5,241,240 |
| | | | |
| Realized and Unrealized Gain (Loss) on Investments: | | |
| | | | |
| Net realized gain (loss) from: | | |
| | Investments | | (14,787,187) |
| | Capital gain distributions from underlying funds | | 2,660,593 |
| | Options written | | 45,900 |
| Total net realized loss | | (12,080,694) |
| | | | |
| Net change in unrealized depreciation on investments | | (3,045,431) |
| | | | |
| Net Realized and Unrealized Loss on Investments | | (15,126,125) |
| | | | |
| Net Decrease in Net Assets Resulting from Operations | $ | (9,884,885) |
| | | | |
| | | | |
| | | | |
| | | | |
| | | | |
| See Notes to Financial Statements | | |
| Matisse Discounted Closed-End Fund Strategy | | |
| | | | | | | | | | | | | |
| Statements of Changes in Net Assets | | | | | | | | |
| | | | | | | | | | | | | |
| For the fiscal years ended March 31, | | | | | | 2016 | | 2015 |
| | | | | | | | | | | | | |
| Operations: | | | | | | | | | |
| Net investment income | | | | | $ | 5,241,240 | $ | 4,147,085 |
| Net realized gain (loss) from investment transactions and options written | | (14,741,287) | | 1,703,815 |
| Capital gain distributions from underlying funds | | | | 2,660,593 | | 617,741 |
| Net change in unrealized appreciation (depreciation) on investments | | (3,045,431) | | 720,297 |
| | | | | | | | | | | | | |
| Net Increase (Decrease) in Net Assets Resulting from Operations | | (9,884,885) | | 7,188,938 |
| | | | | | | | | | | | | |
| Distributions to Shareholders: | | | | | | | | |
| Net investment income | | | | | | | | |
| | | Institutional Class Shares | | | | | | (4,656,941) | | (4,530,398) |
| | | Class A Shares | | | | | | (320,063) | | (357,244) |
| | | | | | | | | | | | | |
| Capital Gains | | | | | | | | | |
| | | Institutional Class Shares | | | | | | - | | (1,324,354) |
| | | Class A Shares | | | | | | - | | (121,219) |
| | | | | | | | | | | | | |
| Return of Capital | | | | | | | | | |
| | | Institutional Class Shares | | | | | | (4,006,112) | | - |
| | | Class A Shares | | | | | | (255,709) | | - |
| | | | | | | | | | | | | |
| Decrease in Net Assets Resulting from Distributions | | | | (9,238,825) | | (6,333,215) |
| | | | | | | | | | | | | |
| Beneficial Interest Transactions: | | | | | | | | |
| Shares sold | | | | | | | 57,478,241 | | 47,232,043 |
| Redemption fees | | | | | | | - | | 9,766 |
| Reinvested dividends and distributions | | | | | | 8,419,729 | | 5,314,100 |
| Shares repurchased | | | | | | (57,397,790) | | (9,652,787) |
| | | | | | | | | | | | | |
| Increase from Beneficial Interest Transactions | | | | | 8,500,180 | | 42,903,122 |
| | | | | | | | | | | | | |
| Net Increase (Decrease) in Net Assets | | | | | | (10,623,530) | | 43,758,845 |
| | | | | | | | | | | | | |
| Net Assets: | | | | | | | | | |
| Beginning of year | | | | | | | 126,775,045 | | 83,016,200 |
| End of year | | | | | | $ | 116,151,515 | $ | 126,775,045 |
| | | | | | | | | | | | | |
| Accumulated (Distribution in Excess of) Net Investment Income | $ | 935,865 | $ | (74,883) |
| | | | | | | | | | | | | |
| | | | | | | | | | | | | |
| | | | | | | | | | | | | |
| | | | | | | | | | | | | |
| See Notes to Financial Statements | | | | | | | | (Continued) |
| Matisse Discounted Closed-End Fund Strategy | | | | | | |
| | | | | | | | | | | | | |
| Statements of Changes in Net Assets - Continued | | | | | | |
| | | | | | | | | | | | | |
| For the fiscal years ended March 31, | | 2016 | | 2015 |
| | | | | | | | | | | | | |
| Share Information: | | | | | | | | |
| | Institutional Class Shares | | Shares | | Amount | | Shares | | Amount |
| | | Shares sold | | 5,972,057 | $ | 55,020,380 | | 4,217,249 | $ | 43,685,711 |
| | | Redemption fees | | - | | - | | - | | 8,298 |
| | | Reinvested dividends and distributions | | 906,015 | | 7,928,383 | | 511,318 | | 5,203,230 |
| | | Shares repurchased | | (6,230,771) | | (55,434,615) | | (829,247) | | (8,599,452) |
| | Net Increase in Shares of Beneficial Interest | | 647,301 | $ | 7,514,148 | | 3,899,320 | $ | 40,297,787 |
| | | | | | | | | | | | | |
| Share Information: | | | | | | | | |
| | Class A Shares | | Shares | | Amount | | Shares | | Amount |
| | | Shares sold | | 274,255 | $ | 2,457,861 | | 354,597 | $ | 3,546,332 |
| | | Redemption fees | | - | | - | | - | | 1,468 |
| | | Reinvested dividends and distributions | | 61,020 | | 491,346 | | 11,639 | | 110,870 |
| | | Shares repurchased | | (228,813) | | (1,963,175) | | (109,267) | | (1,053,335) |
| | Net Increase in Shares of Beneficial Interest | | 106,462 | $ | 986,032 | | 256,969 | $ | 2,605,335 |
| | | | | | | | | | | | | |
| | | | | | | | | | | | | |
| | | | | | | | | | | | | |
| | | | | | | | | | | | | |
| | | | | | | | | | | | | |
| | | | | | | | | | | | | |
| | | | | | | | | | | | | |
| See Notes to Financial Statements | | | | | | | | |
| Matisse Discounted Closed-End Fund Strategy | | | | | | | | | |
| | | | | | | | | | | | | | |
| Financial Highlights | | | | | | | | | |
| | | | | | | |
| For a share outstanding during the | | Institutional Class Shares |
| fiscal years or period ended March 31, | | 2016 | | 2015 | | 2014 | | 2013 | (d) |
| | | | | | | | | | | | | | |
| Net Asset Value, Beginning of Period | | $ | 10.28 | | $ | 10.13 | | $ | 10.35 | | $ | 10.00 | |
| | | | | | | | | | | | | | |
| Income from Investment Operations | | | | | | | | | |
| Net investment income | | 0.41 | (g) | 0.46 | | 0.58 | | 0.26 | |
| Net realized and unrealized gain (loss) on investments | | | | | | | |
| | and options written | | (1.08) | | 0.36 | | (0.17) | | 0.35 | |
| | | | | | | | | | | | | | |
| Total from Investment Operations | | (0.67) | | 0.82 | | 0.41 | | 0.61 | |
| | | | | | | | | | | | | | |
| Less Distributions: | | | | | | | | | |
| Dividends (from net investment income) | | (0.40) | | (0.51) | | (0.56) | | (0.26) | |
| Distributions (from capital gains) | | - | | (0.16) | | (0.07) | | - | |
| Return of capital | | (0.33) | | - | | - | | - | |
| | | | | | | | | | | | | | |
| Total Distributions | | (0.73) | | (0.67) | | (0.63) | | (0.26) | |
| | | | | | | | | | | | | | |
| Redemption Fees | | - | | 0.00 | (f) | 0.00 | (f) | 0.00 | (f) |
| | | | | | | | | | | | | | |
| Net Asset Value, End of Period | | $ | 8.88 | | $ | 10.28 | | $ | 10.13 | | $ | 10.35 | |
| | | | | | | | | | | | | | |
| Total Return | | | (6.20)% | | 8.37% | | 4.21% | | 6.26% | (b) |
| | | | | | | | | | | | | | |
| Net Assets, End of Period (in thousands) | | $ | 109,113 | | $ | 119,616 | | $ | ��78,390 | | $ | 21,904 | |
| | | | | | | | | | | | | | |
| Ratios of: | | | | | | | | | | | |
| Interest Expenses to Average Net Assets | | 0.12% | | 0.06% | | 0.09% | | - |
| Gross Expenses to Average Net Assets (c)(e) | | 1.62% | | 1.59% | | 1.59% | | 1.50% | (a) |
| Net Expenses to Average Net Assets (c)(e) | | 1.37% | | 1.43% | | 1.59% | | 1.50% | (a) |
| Net Investment Income to Average Net Assets (c) | | 4.46% | | 4.48% | | 5.96% | | 5.96% | (a) |
| | | | | | | | | | | | | | |
| Portfolio turnover rate | | 134.60% | | 164.94% | | 150.92% | | 84.39% | (b) |
| | | | | | | | | | | | | | |
| | | | | | | | | | | | | | |
| (a) | Annualized. | | | | | | | | | | |
| (b) | Not annualized. | | | | | | | | | |
| (c) | Recognition of the Fund's net investment income is affected by the timing of dividend declarations of underlying funds. The expenses of the underlying funds are excluded from the Fund's expense ratio. |
| (d) | For a share outstanding for the initial period from October 31, 2012 (Date of Initial Public Investment) through March 31, 2013. |
| (e) | Includes interest expense. | | | | | | | | | |
| (f) | Less than $0.01 per share. | | | | | | | | | |
| (g) | Calculated using the average shares method. | | | | | | | | | |
| | | | | | | | | | | | | | |
| | | | | | | | | | | | | | |
| | | | | | | | | | | | | | |
| | | | | | | | | | | | | | |
| | | | | | | | | | | | | | |
| See Notes to Financial Statements | | | | | | | | (Continued) |
| Matisse Discounted Closed-End Fund Strategy | | | | | | | |
| | | | | | | | | | | | |
| Financial Highlights | | | | | | | | | |
| | | | | | | | | | | | |
| For a share outstanding during the | | Class A Shares |
| fiscal years or period ended March 31, | | 2016 | | 2015 | | 2014 | (d) |
| | | | | | | | | | | | |
| Net Asset Value, Beginning of Period | $ | 9.67 | $ | 9.57 | $ | 10.00 | |
| | | | | | | | | | | | |
| Income from Investment Operations | | | | | | | |
| Net investment income | | | | 0.35 | (g) | 0.40 | | 0.50 | |
| Net realized and unrealized gain (loss) on investments | | | | | | | |
| | and options written | | | | (1.00) | | 0.35 | | (0.32) | |
| | | | | | | | | | | | |
| Total from Investment Operations | | (0.65) | | 0.75 | | 0.18 | |
| | | | | | | | | | | | |
| Less Distributions: | | | | | | | | | |
| Dividends (from net investment income) | | (0.40) | | (0.49) | | (0.54) | |
| Distributions (from capital gains) | | - | | (0.16) | | (0.07) | |
| Return of capital | | | | (0.31) | | - | | - | |
| | | | | | | | | | | | |
| Total Distributions | | | | (0.71) | | (0.65) | | (0.61) | |
| | | | | | | | | | | | |
| Redemption Fees | | | | - | | 0.00 | (f) | 0.00 | (f) |
| | | | | | | | | | | | |
| Net Asset Value, End of Period | $ | 8.31 | $ | 9.67 | $ | 9.57 | |
| | | | | | | | | | | | |
| Total Return | | | | | (6.40)% | | 8.11% | | 2.09% | (b) |
| | | | | | | | | | | | |
| Net Assets, End of Period (in thousands) | $ | 7,039 | $ | 7,159 | $ | 4,626 | |
| | | | | | | | | | | | |
| Ratios of: | | | | | | | | | | |
| Interest Expenses to Average Net Assets | | 0.12% | | 0.06% | | 0.09% | |
| Gross Expenses to Average Net Assets (c)(e) | | 1.87% | | 1.84% | | 1.84% | (a) |
| Net Expenses to Average Net Assets (c)(e) | | 1.62% | | 1.68% | | 1.84% | (a) |
| Net Investment Income to Average Net Assets (c) | | 4.10% | | 4.30% | | 6.42% | (a) |
| | | | | | | | | | | | |
| Portfolio turnover rate | | | | 134.60% | | 164.94% | | 150.92% | (b) |
| | | | | | | | | | | | |
| | | | | | | | | | | | |
| (a) | Annualized. | | | | | | | | | |
| (b) | Not annualized. | | | | | | | | | |
| (c) | Recognition of the Fund's net investment income is affected by the timing of dividend declarations of underlying funds. The expenses of the underlying funds are excluded from the Fund's expense ratio. |
| (d) | For a share outstanding for the initial period from May 15, 2013 (Date of Initial Public Investment) through March 31, 2014. | |
| (e) | Includes interest expense. | | | | | | | |
| (f) | Less than $0.01 per share. | | | | | | | |
| (g) | Calculated using the average shares method. | | | | | | | |
| | | | | | | | | | | | |
| | | | | | | | | | | | |
| | | | | | | | | | | | |
| | | | | | | | | | | | |
| | | | | | | | | | | | |
| See Notes to Financial Statements | | | | | | | |
Matisse Discounted Closed-End Fund Strategy
Notes to Financial Statements
1. | Organization and Significant Accounting Policies |
The Matisse Discounted Closed-End Fund Strategy ("Fund") is a series of the Starboard Investment Trust ("Trust"). The Trust is organized as a Delaware statutory trust and is registered under the Investment Company Act of 1940, as amended (the "1940 Act"), as an open-end management investment company. The Fund is a separate diversified series of the Trust.
The Fund's investment advisor, Deschutes Portfolio Strategies (the "Advisor"), seeks to achieve the Fund's investment objective of long-term capital appreciation and income by investing in unaffiliated closed-end funds which pay regular periodic cash distributions, the interests of which typically trade at substantial discounts relative to their underlying net asset values.
The Fund currently has an unlimited number of authorized shares, which are divided into two classes - Institutional Class Shares and Class A Shares. Each class of shares has equal rights as to assets of the Fund, and the classes are identical except that the Class A Shares are subject to distribution and service fees which are further discussed in Note 3. Income, expenses (other than distribution and service fees), and realized and unrealized gains or losses on investments are allocated to each class of shares based upon its relative net assets. All classes have equal voting privileges, except where otherwise required by law or when the Trustees determine that the matter to be voted on affects only the interests of the shareholders of a particular class. The Date of Initial Public Investment for the Institutional Class Shares was October 31, 2012. The Date of Initial Public Investment for the Class A Shares was May 15, 2013.
The following is a summary of significant accounting policies consistently followed by the Fund. The policies are in conformity with accounting principles generally accepted in the United States of America ("GAAP").
Investment Valuation
The Fund's investments in securities are carried at fair value. Securities listed on an exchange or quoted on a national market system are valued at the last sales price as of 4:00 p.m. Eastern Time. Securities traded in the NASDAQ over-the-counter market are generally valued at the NASDAQ Official Closing Price. Other securities traded in the over-the-counter market and listed securities for which no sale was reported on that date are valued at the most recent bid price. Instruments with maturities of 60 days or less are valued at amortized cost, which approximates market value. Investments in open-end investment companies are valued at their respective net asset values as reported by such investment companies. Securities and assets for which representative market quotations are not readily available (e.g., if the exchange on which the security is principally traded closes early or if trading of the particular security is halted during the day and does not resume prior to the Fund's net asset value calculation) or which cannot be accurately valued using the Fund's normal pricing procedures are valued at fair value as determined in good faith under policies approved by the Trustees. A security's "fair value" price may differ from the price next available for that security using the Fund's normal pricing procedures.
Option Valuation
Options are valued at the mean of the last quoted bid and ask prices as of 4:00 p.m. Eastern Time (the "Valuation Time"). Options will be valued on the basis of prices provided by pricing services when such prices are reasonably believed to reflect the market value of such options and may include the use of composite or National Best Bid/Offer (NBBO) pricing information provided by the pricing services. If there is an ask price but no bid price at the Valuation Time, the option shall be priced at the mean of zero and the ask price at the Valuation Time. An option should be valued using fair value pricing when (i) a reliable last quoted ask price at the Valuation Time is not readily available or (ii) the Fund's investment advisor or Fund management does not believe the prices provided by the pricing services reflect the market value of such option.
Fair Value Measurement
Various inputs are used in determining the value of the Fund's investments. These inputs are summarized in the three broad levels listed below:
Level 1: Unadjusted quoted prices in active markets for identical securities
Level 2: Other significant observable inputs (including quoted prices for similar securities, interest rates, credit risk, etc.)
(Continued)
Matisse Discounted Closed-End Fund Strategy
Notes to Financial Statements
Level 3: Significant unobservable inputs (including the Fund's own assumptions in determining fair value of investments)
The availability of observable inputs can vary from security to security and is affected by a wide variety of factors, including, for example, the type of security, whether the security is new and not yet established in the marketplace, the liquidity of markets, and other characteristics particular to the security. To the extent that valuation is based on models or inputs that are less observable or unobservable in the market, the determination of fair value requires more judgment. Accordingly, the degree of judgment exercised in determining fair value is greatest for instruments categorized in Level 3.
The inputs used to measure fair value may fall into different levels of the fair value hierarchy. In such cases, for disclosure purposes, the level in the fair value hierarchy within which the fair value measurement falls in its entirety, is determined based on the lowest level input that is significant to the fair value measurement in its entirety.
The inputs or methodology used for valuing securities are not necessarily an indication of the risk associated with investing in those securities. The following tables summarize the inputs as of March 31, 2016 for the Fund's investments measured at fair value:
| | | |
| Investments in Securities (a) | | Total | | Level 1 | | Level 2 | | Level 3 |
| Closed-End Funds | $ | 115,223,096 | $ | 115,223,096 | $ | - | $ | - |
| Total Assets | $ | 115,223,096 | $ | 115,223,096 | $ | - | $ | - |
| | | | | | | | | |
| (a) | The Fund had no transfers into or out of Level 1, 2, or 3 during the fiscal year ended March 31, 2016. The Fund did not hold any Level 3 securities during the year. The Fund recognizes transfers at the end of the reporting period. |
Purchased Options
When the Fund purchases an option, an amount equal to the premium paid by the Fund is recorded as an investment and is subsequently adjusted to the current value of the option purchased. If an option expires on the stipulated expiration date or if the Fund enters into a closing sale transaction, a gain or loss is realized. If a call option is exercised, the cost of the security acquired is increased by the premium paid for the call. If a put option is exercised, a gain or loss is realized from the sale of the underlying security, and the proceeds from such sale are decreased by the premium originally paid. Purchased options are non-income producing securities.
Option Writing
When the Fund writes an option, an amount equal to the premium received by the Fund is recorded as a liability and is subsequently adjusted to the current fair value of the option written. Premiums received from writing options that expire unexercised are treated by the Fund on the expiration date as realized gains from options written. The difference between the premium and the amount paid on effecting a closing purchase transaction, including brokerage commissions, is also treated as a realized gain or loss (depending on if the premium is less than the amount paid for the closing purchase transaction). If a call option is exercised, the premium is added to the proceeds from the sale of the underlying security in determining whether the Fund has realized a gain or loss. If a put option is exercised, the premium reduces the cost basis of the securities purchased by the Fund. The Fund, as the writer of an option, bears the market risk of an unfavorable change in the price of the security underlying the written option. Written options are non-income producing securities.
(Continued)
Matisse Discounted Closed-End Fund Strategy
Notes to Financial Statements
A summary of option contracts written by the Fund during the fiscal year ended March 31, 2016 were as follows:
| Option Contracts Written for the fiscal year ended March 31, 2016 | Number of Contracts | | Premiums Received |
| Options Outstanding, Beginning of Year | - | $ | - |
| Options written | 2,789 | | 463,908 |
| Options closed | (2,070) | | (408,363) |
| Options expired | (719) | | (55,545) |
| Options Outstanding, End of Year | - | $ | - |
Derivative Financial Instruments
The Fund may invest in derivative financial instruments (derivatives) in order to manage risk or gain exposure to various other investments or markets. Derivatives may contain various risks including the potential inability of the counterparty to fulfill their obligations under the terms of the contract, the potential for an illiquid secondary market, and the potential for market movements which may expose the Fund to gains or losses in excess of the amounts shown on the Statement of Assets and Liabilities.
Derivatives are marked to market daily based upon quotations from market makers or the Fund's independent pricing services and the Fund's net benefit or obligation under the contract, as measured by the fair market value of the contract, is included in the net assets. Realized gain and loss and unrealized appreciation and depreciation on these derivatives for the year are included in the Statement of Operations. The contract amounts listed above in the table serve as an indicator of the volume of derivative activity in the Fund.
There were no derivative instruments outstanding as of March 31, 2016 and the amounts of realized and changes in unrealized gains and losses on derivative instruments during the period as disclosed in the Statement of Operations serve as indicators of the volume of derivative activity for the Fund as shown in the options contracts table above.
The following table sets forth the effect of the option contracts on the Statement of Operations for the fiscal year ended March 31, 2016:
| Derivative Type | Location | | |
| Equity Contracts – written options | Net realized gain from options written | $ | 45,900 |
| | | | |
| Equity Contracts – written options | Change in unrealized depreciation on options written | $ | - |
Investment Transactions and Investment Income
Investment transactions are accounted for as of the date purchased or sold (trade date). Dividend income is recorded on the ex-dividend date. Certain dividends from foreign securities will be recorded as soon as the Fund is informed of the dividend if such information is obtained subsequent to the ex-dividend date. Gains and losses are determined on the identified cost basis, which is the same basis used for federal income tax purposes.
Distributions
The Fund may declare and distribute dividends from net investment income, if any, quarterly. Distributions from capital gains, if any, are generally declared and distributed annually. Dividends and distributions to shareholders are recorded on ex-date.
Expenses
The Fund bears expenses incurred specifically on its behalf as well as a portion of general expenses, which are allocated according to methods reviewed annually by the Trustees. Distribution and service fees in the Class A Shares are 0.25% of the average daily net assets.
(Continued)
Matisse Discounted Closed-End Fund Strategy
Notes to Financial Statements
EstimatesThe preparation of financial statements in conformity with GAAP requires management to make estimates and assumptions that affect the reported amounts of assets and liabilities and disclosure of contingent assets and liabilities at the date of the financial statements and the reported amounts of increases and decreases in the net assets from operations during the reporting period. Actual results could differ from those estimates.
Federal Income Taxes
No provision for income taxes is included in the accompanying financial statements, as the Fund intends to distribute to shareholders all taxable investment income and realized gains and otherwise comply with Subchapter M of the Internal Revenue Code applicable to regulated investment companies.
2. | Transactions with Related Parties and Service Providers |
AdvisorThe Fund pays monthly fees to the Advisor based upon the average daily net assets and calculated at an annual rate of 1.20%. For the fiscal year ended March 31, 2016, $1,416,758 in advisory fees were incurred and $283,039 in advisory fees were waived by the Advisor.
The Advisor has entered into another contractual agreement (the "Expense Limitation Agreement") with the Trust, on behalf of the Fund, under which it had agreed to waive or reduce its fees and to assume other expenses of the Fund, if necessary, in amounts that limit the Fund's total operating expenses (exclusive of interest, taxes, brokerage commissions, borrowing costs, fees and expenses of other investment companies in which the Fund invests, and other expenditures which are capitalized in accordance with generally accepted accounting principles, other extraordinary expenses not incurred in the ordinary course of the Fund's business, and amounts, if any, payable under a Rule 12b-1 distribution plan) to not more than 1.25% of the average daily net assets of the Fund. The current term of the Expense Limitation Agreement remains in effect until July 31, 2017. While there can be no assurance that the Expense Limitation Agreement will continue after that date, it is expected to continue from year-to-year thereafter.
Administrator
The Nottingham Company (the "Administrator") provides the Fund with administrative and fund accounting services. The Fund pays a monthly fee to the Administrator based upon the average daily net assets of the Fund and calculated at the annual rates as shown in the schedule below subject to a minimum of $2,000 per month. The Administrator also receives a fee as to procure and pay the Fund's custodian, as additional compensation for fund accounting and recordkeeping services, and additional compensation for certain costs involved with the daily valuation of securities and as reimbursement for out-of-pocket expenses. A breakdown of these fees is provided in the following table.
(Continued)
Matisse Discounted Closed-End Fund Strategy
Notes to Financial Statements
| Administration Fees* | Custody Fees* | | | | Fund Accounting Fees (asset-based fee) | | Blue Sky Administration Fees (annual) |
| | | | | | | | | | |
| | | | | | | Net Assets | | | Per state |
| | | | | | | | | | |
| First $100 million | 0.100% | First $200 million | 0.020% | | | | | 0.02% | | $150 |
| Next $100 million | 0.090% | Over $200 million | 0.009% | | | | | 0.015% | | |
| Next $100 million | 0.080% | | | | | | | 0.01% | | |
| Next $100 million | 0.070% | *Minimum monthly fees of $2,000 and $417 for Administration and Custody, respectively. |
| Next $100 million | 0.060% |
| Over $500 million | 0.050% |
| Oer $750 million | 0.040% |
| Oer $1 billion | 0.030% |
| | | |
| | | |
The Fund incurred $116,341 in administration fees, $34,688 in custody fees, and $44,928 in fund accounting fees for the fiscal year ended March 31, 2016.
Compliance Services
Cipperman Compliance Services, LLC provides services as the Trust's Chief Compliance Officer. Cipperman Compliance Services, LLC is entitled to receive customary fees from the Fund for their services pursuant to the Compliance Services agreement with the Fund.
Transfer Agent
Nottingham Shareholder Services, LLC ("Transfer Agent") serves as transfer, dividend paying, and shareholder servicing agent for the Fund. For its services, the Transfer Agent is entitled to receive compensation from the Fund pursuant to the Transfer Agent's fee arrangements with the Fund.
Distributor
Capital Investment Group, Inc. (the "Distributor") serves as the Fund's principal underwriter and distributor. For its services, the Distributor is entitled to receive compensation from the Fund pursuant to the Distributor's fee arrangements with the Fund.
Certain officers of the Trust may also be officers of the Administrator.
Because the underlying funds have varied expense and fee levels and the Fund may own different proportions of underlying funds at different times, the amount of fees and expense incurred indirectly by the Fund will vary.
3. | Distribution and Service Fees |
The Trustees, including a majority of the Trustees who are not "interested persons" of the Trust as defined in the 1940 Act and who have no direct or indirect financial interest in such plan or in any agreement related to such plan, adopted a distribution plan pursuant to Rule 12b-1 of the 1940 Act (the "Plan") for the Class A Shares. The 1940 Act regulates the manner in which a regulated investment company may assume expenses of distributing and promoting the sales of its shares and servicing of its shareholder accounts. The Plan provides that the Fund may incur certain expenses, which may not exceed 0.25% per annum of the Fund's average daily net assets attributable to the Class A Shares, for payment to the Distributor and others for items such as advertising expenses, selling expenses, commissions, travel or other expenses reasonably intended to result in sales of shares of the Fund or support servicing of shareholder accounts. For the fiscal year ended March 31, 2016, $17,457 in fees were incurred by the Class A Shares.
(Continued)
Matisse Discounted Closed-End Fund Strategy
Notes to Financial Statements
4. | Purchases and Sales of Investment Securities |
For the fiscal year ended March 31, 2016, the aggregate cost of purchases and proceeds from sales of investment securities (excluding short-term securities) were as follows:
| Purchases of Securities | Proceeds from Sales of Securities |
| $179,825,482 | $169,981,386 |
Distributions are determined in accordance with Federal income tax regulations, which differ from GAAP, and, therefore, may differ significantly in amount or character from net investment income and realized gains for financial reporting purposes. The general ledger is adjusted for permanent book/tax differences to reflect tax character but is not adjusted for temporary differences.
Management has reviewed the Fund's tax positions to be taken on the federal income tax return and, during the period/years ended March 31, 2013 through March 31, 2016, determined that the Fund does not have a liability for uncertain tax positions. The Fund recognizes interest and penalties, if any, related to unrecognized tax benefits as income tax expense in the Statement of Operations. During the period, the Fund did not incur any interest or penalties.
On the Statement of Assets and Liabilities, as a result of permanent book to tax differences, certain amounts have been reclassified for the year ended March 31, 2016. The following reclassifications were the result of partnership reclassifications and differing treatment of distributions and have no impact on net assets of the Fund.
For the fiscal year ended March 31, 2016, the following reclassifications were made:
| Undistributed Net Investment Income | $ 746,512 |
| Paid-In-Interest | | (98,711) |
| Accumulated Realized Loss | | (647,801) |
Distributions during the year ended were characterized for tax purposes as follows:
| | March 31, 2016 | March 31, 2015 |
| Ordinary Income | $ 4,761,414 | $ 5,203,716 |
| Tax-Exempt Income | 215,590 | 154,579 |
| Long-Term Capital Gains | - | 974,920 |
| Return of Capital | 4,621,821 | - |
(Continued)
Matisse Discounted Closed-End Fund Strategy
Notes to Financial Statements
At March 31, 2016, the tax-basis cost of investments and components of distributable earnings were as follows:
| Cost of Investments | $ | 117,859,029 |
| | | |
| Unrealized Appreciation | $ | 4,278,984 |
| Unrealized Depreciation | | (7,099,105) |
| Net Unrealized Depreciation | $ | (2,820,121) |
| | | |
| Accumulated Net Realized Loss | | (3,456,587) |
Other Temporary Differences | | (7,773) |
| Post-October Losses | | (7,631,159) |
| | | |
| Accumulated Deficit | $ | (13,915,640) |
The difference between components of distributable earnings on a tax basis and the amounts reflected in the Statement of Assets and Liabilities are primarily due to wash sale losses and partnerships. For tax purposes, the current year post-October loss was $7,631,159, realized during the period November 1, 2015 through March 31, 2016. These losses will be recognized for tax purposes on the first business day of the Fund's next fiscal year, April 1, 2016.
The Fund has a capital loss carryforward of $3,456,587, of which $2,643,591 is short-term in nature and $812,996 is long-term in nature, and has no expiration.
6. | Commitments and Contingencies |
Under the Trust's organizational documents, its officers and Trustees are indemnified against certain liabilities arising out of the performance of their duties to the Fund. In addition, in the normal course of business, the Trust entered into contracts with its service providers, on behalf of the Fund, and others that provide for general indemnifications. The Fund's maximum exposure under these arrangements is unknown, as this would involve future claims that may be made against the Fund. The Fund expects risk of loss to be remote.
The Fund established a borrowing agreement with Goldman Sachs for investment purposes subject to the limitations of the 1940 Act for borrowings by registered investment companies.
Interest is based on the Federal Funds rate plus 1.25%. The average borrowing during the fiscal year was $11,099,809, and the average interest rate on margin borrowings during the year was 1.27%. Interest expense is charged directly to the Fund based upon actual amounts borrowed by the Fund. Total interest expense for the year was $139,113 as reflected in the Statement of Operations.
The Fund had no borrowings outstanding at March 31, 2016.
The Fund has evaluated the need for disclosures and/or adjustments resulting from subsequent events through the date of issuance of these financial statements. This evaluation did not result in any additional subsequent events that necessitated disclosures and/or adjustments in addition to the disclosure above.
REPORT OF INDEPENDENT REGISTERED PUBLIC ACCOUNTING FIRM
To the Shareholders of Matisse Discounted Closed-End Fund Strategy
and the Board of Trustees of Starboard Investment Trust
We have audited the accompanying statement of assets and liabilities of the Matisse Discounted Closed-End Fund Strategy (the "Fund"), a series of shares of beneficial interest in the Starboard Investment Trust, including the schedule of investments, as of March 31, 2016, the related statement of operations for the year then ended, the statements of changes in net assets for each of the years in the two-year period then ended and the financial highlights for each of the years or periods presented. These financial statements and financial highlights are the responsibility of the Fund's management. Our responsibility is to express an opinion on these financial statements and financial highlights based on our audits.
We conducted our audits in accordance with the standards of the Public Company Accounting Oversight Board (United States). Those standards require that we plan and perform the audits to obtain reasonable assurance about whether the financial statements and financial highlights are free of material misstatement. An audit includes examining, on a test basis, evidence supporting the amounts and disclosures in the financial statements. Our procedures included confirmation of securities owned as of March 31, 2016 by correspondence with the custodian and brokers. An audit also includes assessing the accounting principles used and significant estimates made by management, as well as evaluating the overall financial statement presentation. We believe that our audits provide a reasonable basis for our opinion.
In our opinion, the financial statements and financial highlights referred to above present fairly, in all material respects, the financial position of the Matisse Discounted Closed-End Fund Strategy as of March 31, 2016, and the results of its operations for the year then ended, the changes in its net assets for each of the years in the two-year period then ended and its financial highlights for each of the years or periods presented, in conformity with accounting principles generally accepted in the United States of America.
BBD, LLP
Philadelphia, Pennsylvania
May 31, 2016
Matisse Discounted Closed-End Fund Strategy
Additional Information
(Unaudited)
| 1. | Proxy Voting Policies and Voting Record |
A copy of the Trust's Proxy Voting and Disclosure Policy and the Advisor's Disclosure Policy are included as Appendix B to the Fund's Statement of Additional Information and are available, without charge, upon request, by calling 800-773-3863, and on the website of the Securities and Exchange Commission ("SEC") at sec.gov. Information regarding how the Fund voted proxies relating to portfolio securities during the most recent period ended June 30 is available (1) without charge, upon request, by calling the Fund at the number above and (2) on the SEC's website at sec.gov.
| 2. | Quarterly Portfolio Holdings |
The Fund files its complete schedule of portfolio holdings with the SEC for the first and third quarters of each fiscal year on Form N-Q. The Fund's Forms N-Q are available on the SEC's website at sec.gov. You may review and make copies at the SEC's Public Reference Room in Washington, D.C. Information on the operation of the Public Reference Room may be obtained by calling the SEC at 800-SEC-0330. You may also obtain copies without charge, upon request, by calling the Fund at 800-773-3863.
We are required to advise you within 60 days of the Fund's fiscal year-end regarding federal tax status of certain distributions received by shareholders during each fiscal year. The following information is provided for the Fund's fiscal year ended March 31, 2016.
During the fiscal year, the Fund paid no long-term capital gain distributions.
Dividend and distributions received by retirement plans such as IRAs, Keogh-type plans, and 403(b) plans need not be reported as taxable income. However, many retirement plans may need this information for their annual information meeting.
| 4. | Schedule of Shareholder Expenses |
As a shareholder of the Fund, you incur two types of costs: (1) transaction costs, including sales charges (loads) on purchase payments, loads on reinvestments; redemption fees; and exchange fees; and (2) ongoing costs, including management fees; distribution [and/or service] (12b-1) fees; and other Fund expenses. This Example is intended to help you understand your ongoing costs (in dollars) of investing in the Fund and to compare these costs with the ongoing costs of investing in other mutual funds.
The Example is based on an investment of $1,000 invested at the beginning of the period and held for the entire period from October 1, 2015 through March 31, 2016.
Actual Expenses – The first line of the table below provides information about actual account values and actual expenses. You may use the information in this line, together with the amount you invested, to estimate the expenses that you paid over the period. Simply divide your account value by $1,000 (e.g., an $8,600 account value divided by $1,000 = 8.6), then multiply the result by the number in the first line under the heading entitled "Expenses Paid During Period" to estimate the expenses you paid on your account during this period.
Hypothetical Example for Comparison Purposes – The second line of the table below provides information about hypothetical account values and hypothetical expenses based on the Fund's actual expense ratio and an assumed rate of return of 5% per year before expenses, which is not the Fund's actual return. The hypothetical account values and expenses may not be used to estimate the actual ending account balance or expenses you paid for the period. You may use this information to compare the ongoing costs of investing in the Fund and other funds. To do so, compare this 5% hypothetical example with the 5% hypothetical examples that appear in the shareholder reports of the other funds.
(Continued)
Matisse Discounted Closed-End Fund Strategy
Additional Information
(Unaudited)
Please note that the expenses shown in the table are meant to highlight your ongoing costs only and do not reflect any transactional costs, such as sales charges (loads), redemption fees, or exchange fees. Therefore, the second line of the table is useful in comparing ongoing costs only, and will not help you determine the relative total costs of owning different funds. In addition, if these transactional costs were included, your costs would have been higher.
| Institutional Class Shares | Beginning Account Value October 1, 2015 | Ending Account Value March 31, 2016 | Expenses Paid During Period* |
Actual Hypothetical (5% annual return before expenses) | | | |
| $1,000.00 | $1,090.20 | $6.54 |
| $1,000.00 | $1,018.79 | $6.32 |
*Expenses are equal to the average account value over the period multiplied by the Fund's annualized expense ratio, multiplied by the number of days in the most recent period divided by the number of days in the fiscal year (to reflect the six month period).
| Class A Shares | Beginning Account Value October 1, 2015 | Ending Account Value March 31, 2016 | Expenses Paid During Period* |
Actual Hypothetical (5% annual return before expenses) | | | |
| $1,000.00 | $1,088.50 | $7.85 |
| $1,000.00 | $1,017.53 | $7.59 |
*Expenses are equal to the average account value over the period multiplied by the Fund's annualized expense ratio, multiplied by the number of days in the most recent period divided by the number of days in the fiscal year (to reflect the six month period).
| 5. | Approval of Advisory Agreement |
The Advisor supervises the Fund's investments pursuant to an Investment Advisory Agreement. At a quarterly meeting of the Fund's Board of Trustees on March 10, 2016, the Trustees approved the Investment Advisory Agreement for another term until May 29, 2017. In considering whether to approve the Investment Advisory Agreement, the Trustees reviewed and considered the information they deemed reasonably necessary, including the following material factors: (i) the nature, extent, and quality of the services provided by the Advisor; (ii) investment performance of the Advisor; (iii) the costs of the services to be provided and profits to be realized by the Advisor and its affiliates from the relationship with the Fund; (iv) the extent to which economies of scale would be realized as the Fund grows and whether advisory fee levels reflect those economies of scale for the benefit of the Fund's investors; (v) the Advisor's practices regarding brokerage and portfolio transactions; and (vi) the Advisor's practices regarding possible conflicts of interest.
In considering whether to approve the Investment Advisory Agreement, the Trustees reviewed and considered the information they deemed reasonably necessary, including the following material factors: (i) the nature, extent, and quality of the services provided by the Advisor; (ii) the costs of the services to be provided and profits to be realized by the Advisor and its affiliates from the relationship with the Fund; (iii) the extent to which economies of scale would be realized as the Fund grows and whether advisory fee levels reflect those economies of scale for the benefit of the Fund's investors; (iv) the Advisor's practices regarding brokerage and portfolio transactions; and (v) the Advisor's practices regarding possible conflicts of interest.
At the meeting, the Trustees reviewed various informational materials, including the Investment Advisory Agreement for the Fund and a memorandum from the Advisor to the Trustees containing information about the advisory firm and its business. The memorandum provided information about the Advisor's finances, personnel, services to the Fund, investment advice, fees, and compliance program. It also contained information on Fund expenses, including comparative expense ratio information for other mutual funds with strategies similar to the Fund. The Trustees also reviewed a memorandum from the Fund's legal counsel that summarized the fiduciary duties and responsibilities of the Board of Trustees in reviewing and approving the Investment Advisory Agreement, including the types of information and factors that should be considered in order to make an informed decision. In addition, the Trustees consulted with separate independent legal counsel retained by them regarding their consideration of the Investment Advisory Agreement. The Board also reviewed, among other things, the Advisor's financial statements, the Fund's most recent financial statements, fee and performance comparisons, brokerage commission reports for the prior twelve months, and a copy of the current Investment Advisory Agreement.
(Continued)
Matisse Discounted Closed-End Fund Strategy
Additional Information
(Unaudited)
In considering the nature, extent, and quality of the services provided by the Advisor, the Trustees considered the responsibilities of the Advisor under the Investment Advisory Agreement. The Trustees reviewed the services being provided by the Advisor to the Fund including, without limitation, the quality of its investment advisory services since the Fund's inception (including research and recommendations with respect to portfolio securities); its procedures for formulating investment recommendations and assuring compliance with the Fund's investment objectives and limitations; its coordination of services for the Fund among the Fund's service providers; and its efforts to promote the Fund, grow the Fund's assets, and assist in the distribution of Fund shares. The Trustees noted that the Advisor seeks to construct a diversified portfolio of discounted closed-end funds that generate regular cash income. After reviewing the foregoing information and further information in the memorandum from the Advisor (e.g., descriptions of the Advisor's business, the Advisor's compliance program, and the Advisor's Form ADV), the Board concluded that the nature, extent, and quality of the services provided by the Advisor were satisfactory and adequate for the Fund.
In considering the investment performance of the Advisor, the Trustees compared the performance of the Fund with the performance of its benchmark index, comparable funds with similar objectives managed by other investment advisors, and applicable peer group data (e.g., Lipper peer group average). The Trustees noted that the return for the one-year period ended December 31, 2015 was -6.93%, which underperformed the returns of the comparable funds and the peer group average. The Trustees also considered the consistency of the Advisor's management of the Fund with its investment objective, policies and limitations. After reviewing the short and long-term investment performance of the Fund, the Advisor's experience managing the Fund, the Advisor's historical investment performance, and other factors, the Board concluded that the investment performance of the Fund and the Advisor was satisfactory.
In considering the costs of the services to be provided and profits to be realized by the Advisor and its affiliates from the relationship with the Fund, including any benefits derived by the Advisor from the relationship with the Fund, the Trustees first noted that the management fee for the Fund under the Investment Advisory Agreement was 1.20% of average daily new assets. The Trustees evaluated the Advisor's staffing, personnel, and methods of operating; the education and experience of the Advisor's personnel; the Advisor's compliance program; the financial condition of the Advisor; the level of commitment to the Fund and the Advisor by the principals of the Advisor; the asset level of the Fund; and the overall expenses of the Fund, including certain prior fee waivers and reimbursements by the Advisor and the nature and frequency of advisory fee payments. The Trustees reviewed the financial statements for the Advisor and discussed the financial stability and profitability of the firm. The Advisor responded to several questions about the financial condition of the firm and reviewed a profitability analysis with the Trustees. The Trustees noted that the Advisor either makes payments to the Administrator or directly pays for certain expenses of the Fund under an Operating Plan in order to help limit the Fund's annual operating expenses. The Trustees also considered potential benefits for the Advisor in managing the Fund, including promotion of the Advisor's name, the ability for the Advisor to place small accounts into the Fund, and the potential for the Advisor to generate soft dollars from Fund trades that may benefit the Advisor as well. The Trustees then compared the fees and expenses of the Fund (including the management fee) to other funds comparable in terms of the type of fund, the nature of its investment strategy, and its style of investment management, among other factors. The Trustees determined that the Fund's management fee was higher than most of the comparable funds and higher than the peer group average. The Trustees also determined that the Fund's net expense ratio was higher than most of the comparable funds and the peer group average. The Trustees also noted that the Advisor's fee for separate account clients was typically 1.00%. Following this comparison and upon further consideration and discussion of the foregoing, the Board concluded that the fees to be paid to the Advisor by the Fund were fair and reasonable in relation to the nature and quality of the services provided by the Advisor and that they reflected charges that were within a range of what could have been negotiated at arm's length.
(Continued)
Matisse Discounted Closed-End Fund Strategy
Additional Information
(Unaudited)
In considering the extent to which economies of scale would be realized as the Fund grows and whether the advisory fee levels reflect these economies of scale for the benefit of the Fund's investors, the Trustees reviewed the Fund's operational history and noted that the size of the Fund had not provided an opportunity to realize economies of scale. The Trustees then reviewed the Fund's fee arrangements for breakpoints or other provisions that would allow the Fund's shareholders to benefit from economies of scale in the future as the Fund grows. The Trustees determined that the maximum management fee would stay the same regardless of the Fund's asset levels and, therefore, did not reflect economies of scale. The Trustees noted that the Fund was a relatively small size and economies of scale were unlikely to be achievable in the near future. It was pointed out that breakpoints in the advisory fee could be reconsidered in the future. The Trustees noted that the Fund will benefit from economies of scale under the agreement with the Administrator since it utilized breakpoints. The Trustees also noted that the Advisor had agreed to make payments to the Administrator at lower asset levels in order to help limit the Fund's expenses. The Trustees determined that these arrangements provided potential savings for the benefit of the Fund's investors. Following further discussion of the Fund's asset levels, expectations for growth, and fee levels, the Board determined that the Fund's fee arrangements were fair and reasonable at the present time in relation to the nature and quality of the services provided by the Advisor.
In considering the Advisor's practices regarding brokerage and portfolio transactions, the Trustees reviewed the Advisor's standards, and performance in utilizing those standards, for seeking best execution for Fund portfolio transactions. The Trustees also considered the portfolio turnover rate for the Fund; the process by which evaluations are made of the overall reasonableness of commissions paid; the method and basis for selecting and evaluating the broker-dealers used; any allocation of portfolio business to persons affiliated with the Advisor; and the extent to which the Fund allocates portfolio business to broker-dealers who provide research, statistical, or other services (soft dollars). The Trustees noted, among other things, that the Fund rarely trades blocks of shares which require special handling and that the average commission rate for the Fund was approximately $0.01 per share. After further review and discussion, the Board determined that the Advisor's practices regarding brokerage and portfolio transactions were satisfactory.
In considering the Advisor's practices regarding possible conflicts of interest, the Trustees evaluated the potential for conflicts of interest and considered such matters as the experience and ability of the advisory personnel assigned to the Fund; the basis of decisions to buy or sell securities for the Fund and the Advisor's other accounts; the method for bunching of portfolio securities transactions; and the substance and administration of the Advisor's code of ethics. Following further consideration and discussion, the Board indicated that the Advisor's standards and practices relating to the identification and mitigation of possible conflicts of interests were satisfactory.
Based upon all of the foregoing considerations, the Board of Trustees, including a majority of the Independent Trustees, approved the Investment Advisory Agreement for the Fund.
| 6. | Information about Trustees and Officers |
The business and affairs of the Fund and the Trust are managed under the direction of the Board of Trustees of the Trust. Information concerning the Trustees and officers of the Trust and Fund is set forth below. Generally, each Trustee and officer serves an indefinite term or until certain circumstances such as their resignation, death, or otherwise as specified in the Trust's organizational documents. Any Trustee may be removed at a meeting of shareholders by a vote meeting the requirements of the Trust's organizational documents. The Statement of Additional Information of the Fund includes additional information about the Trustees and officers and is available, without charge, upon request by calling the Fund toll-free at 800-773-3863. The address of each Trustee and officer, unless otherwise indicated below, is 116 South Franklin Street, Rocky Mount, North Carolina 27804. The Independent Trustees each received aggregate compensation of $2,000 during the fiscal year ended March 31, 2016 from the Fund for their services to the Fund and Trust under the Operating Plan.
Matisse Discounted Closed-End Fund Strategy
Additional Information
(Unaudited)
Name, Age
and Address | Position
held with
Fund or Trust | Length of Time Served | Principal Occupation
During Past 5 Years | Number of Portfolios in Fund Complex Overseen by Trustee | Other Directorships
Held by Trustee
During Past 5 Years |
| Independent Trustees |
| |
Michael G. Mosley
Age: 63 | Independent Trustee | Since 7/10 | Owner of Commercial Realty Services (real estate) since 2004. | 26 | None. |
Theo H. Pitt, Jr.
Age: 80 | Independent Trustee | Since 9/10 | Senior Partner, Community Financial Institutions Consulting (financial consulting) since 1999; Partner, Pikar Properties (real estate) since 2001. | 26 | Independent Trustee of World Funds Trust for its twelve series, Gardner Lewis Investment Trust for its two series, Leeward Investment Trust for its one series and Hillman Capital Management Investment Trust for its one series (all registered investment companies). |
James H. Speed, Jr.
Age: 62 | Independent Trustee, Chairman | Trustee since 7/09, Chair since 5/12 | President and CEO of NC Mutual Insurance Company (insurance company) since 2003. | 26 | Independent Trustee of the Brown Capital Management Mutual Funds for its four series, Hillman Capital Management Investment Trust for its one series, and Centaur Mutual Funds Trust for its one series (all registered investment companies). Member of Board of Directors of NC Mutual Life Insurance Company. Member of Board of Directors of M&F Bancorp. Previously, Independent Trustee of Nottingham Investment Trust II for its four series from 2000 until 2010 and New Providence Investment Trust for its one series from 2009 until 2011 (registered investment company). |
J. Buckley Strandberg
Age: 56 | Independent Trustee | Since 7/09 | President of Standard Insurance and Realty (insurance and property management) since 1982. | 26 | None. |
| Other Officers |
Katherine M. Honey
Age: 42 | President and Principal Executive Officer | Since 05/15 | EVP of The Nottingham Company since 2008. | n/a | n/a |
Matthew J. Beck
Age: 27 | Secretary | Since 05/15 | General Counsel of The Nottingham Company since 2014. | n/a | n/a |
Ashley E. Harris
Age: 32 | Treasurer, Assistant Secretary and Principal Financial Officer | Since 05/15 | Fund Accounting Manager and Financial Reporting, The Nottingham Company since 2008. | n/a | n/a |
Matisse Discounted Closed-End Fund Strategy
Additional Information
(Unaudited)
Name, Age
and Address | Position
held with
Fund or Trust | Length of Time Served | Principal Occupation
During Past 5 Years | Number of Portfolios in Fund Complex Overseen by Trustee | Other Directorships
Held by Trustee
During Past 5 Years |
Stacey Gillespie
Age: 41 | Chief Compliance Officer | Since 03/16 | Compliance Director, Cipperman Compliance Services, LLC (09/15-present). Formerly, Chief Compliance Officer of Boenning & Scattergood, Inc. (2013-2015) and Director of Investment Compliance at Boenning & Scattergood, Inc. (2007-2013). | n/a | n/a |
Matisse Discounted Closed-End Fund Strategy
is a series of
The Starboard Investment Trust
For Shareholder Service Inquiries: | For Investment Advisor Inquiries: |
| |
Nottingham Shareholder Services | Deschutes Portfolio Strategies |
116 South Franklin Street | 4949 Meadows Road |
Post Office Box 69 | Suite 200 |
Rocky Mount, North Carolina 27802-0069 | Lake Oswego, Oregon 97035 |
| |
Telephone: | Telephone: |
| | |
| 800-773-3863 | 800-773-3863 |
| | |
| World Wide Web @: | World Wide Web @: |
| | |
| ncfunds.com | matissefunds.com |
| | |
(a) | The registrant, as of the end of the period covered by this report, has adopted a code of ethics that applies to its Principal Executive Officer(s), Principal Financial Officer(s), and Principal Accounting Officer(s), or persons performing similar functions, regardless of whether these individuals are employed by the registrant or a third party. |
| |
| (c) | There have been no substantive amendments during the period covered by this report. |
| | |
| (d) | The registrant has not granted, during the period covered by this report, any waivers, including an implicit waiver. |
| | |
| (f)(1) | A copy of the code of ethics that applies to the registrant's Principal Executive Officers and Principal Financial Officers is filed pursuant to Item 12.(a)(1) below. |
Item 3. | AUDIT COMMITTEE FINANCIAL EXPERT. |
The registrant's Board of Trustees has determined that the registrant has an audit committee financial expert, as defined in Item 3 of Form N-CSR, serving on its audit committee.
As of the date of this report, March 31, 2016, the registrant's audit committee financial expert is Mr. James H. Speed, Jr. Mr. Speed is "independent" for purposes of Item 3 of Form N-CSR.
Item 4. | PRINCIPAL ACCOUNTANT FEES AND SERVICES. |
| (a) | Audit Fees – Audit fees billed for the registrant for the last two fiscal years are reflected in the table below. These amounts represent aggregate fees billed by the registrant's independent accountant, BBD, LLP for March 31, 2015 and March 31, 2016 ("Accountant"), in connection with the annual audits of the registrant's financial statements and for services normally provided by the Accountant in connection with the registrant's statutory and regulatory filings for those fiscal years. |
| Fund | 2015 | 2016 |
| Matisse Discounted Closed-End Fund Strategy | $11,250 | $11,500 |
| (b) | Audit-Related Fees – There were no additional fees billed in the fiscal years ended March 31, 2015 and March 31, 2016 for assurance and related services by the Accountant that were reasonably related to the performance of the audit of the registrant's financial statements that were not reported under paragraph (a) of this Item. |
| (c) | Tax Fees – The tax fees billed in each of the last two fiscal years ended for professional services rendered by the Accountant for tax compliance, tax advice, and tax planning are reflected in the table below. These services were for the completion of each fund's federal and state income tax returns, excise tax returns, and assistance with distribution calculations. |
| Fund | 2015 | 2016 |
| Matisse Discounted Closed-End Fund Strategy | $2,000 | $2,000 |
| (d) | All Other Fees – There were no other fees paid to the Accountant which were not disclosed in Items (a) through (c) above during the last two fiscal years. |
(e)(1) | The registrant's Board of Trustees pre-approved the engagement of the Accountant for the last two fiscal years at an audit committee meeting of the Board of Trustees called for such purpose; and will pre-approve the Accountant for each fiscal year thereafter at an audit committee meeting called for such purpose. The charter of the audit committee states that the audit committee should pre-approve any audit services and, when appropriate, evaluate and pre-approve any non-audit services provided by the Accountant to the registrant and to pre-approve, when appropriate, any non-audit services provided by the Accountant to the registrant's investment adviser, or any entity controlling, controlled by, or under common control with the investment adviser that provides ongoing services to the registrant if the engagement relates directly to the operations and financial reporting of the registrant.
|
(2) | There were no services as described in each of paragraph (b) through (d) of this Item that were approved by the audit committee pursuant to paragraph (c)(7)(i)(C) of Rule 2-01 of Regulation S-X. |
(g) | Aggregate non-audit fees billed by the Accountant to the registrant for services rendered for the fiscal years ended March 31, 2015 and March 31, 2016 were $2,000, respectively. There were no fees billed by the Accountant for non-audit services rendered to the registrant's investment adviser, or any other entity controlling, controlled by, or under common control with the registrant's investment adviser. |
Item 5. | AUDIT COMMITTEE OF LISTED REGISTRANTS. |
Not applicable.
Item 6. | SCHEDULE OF INVESTMENTS. |
A copy of the schedule of investments of unaffiliated issuers as of the close of the reporting period is included as part of the report to shareholders filed under Item 1 of this Form.
Item 7. | DISCLOSURE OF PROXY VOTING POLICIES AND PROCEDURES FOR CLOSED-END MANAGEMENT INVESTMENT COMPANIES. |
Not applicable.
Item 8. | PORTFOLIO MANAGERS OF CLOSED-END MANAGEMENT INVESTMENT COMPANIES. |
Not applicable.
Item 9. | PURCHASES OF EQUITY SECURITIES BY CLOSED-END MANAGEMENT INVESTMENT COMPANY AND AFFILIATED PURCHASERS. |
Not applicable.
Item 10. | SUBMISSION OF MATTERS TO A VOTE OF SECURITY HOLDERS. |
None.
Item 11. | CONTROLS AND PROCEDURES. |
| (a) | The Principal Executive Officer(s) and the Principal Financial Officer(s) have concluded that the registrant's disclosure controls and procedures are effective based on their evaluation of the disclosure controls and procedures as of a date within 90 days of the filing of this report. |
| (b) | There were no changes in the registrant's internal control over financial reporting that occurred during the registrant's second fiscal quarter of the period covered by this report that have materially affected, or are reasonably likely to materially affect, the registrant's internal control over financial reporting. |
| (a)(1) | Code of Ethics required by Item 2 of Form N-CSR is filed herewith as Exhibit 12.(a)(1). |
| (a)(2) | Certifications required by Item 12.(a)(2) of Form N-CSR are filed herewith as Exhibit 12.(a)(2). |
| (b) | Certifications required by Item 12.(b) of Form N-CSR are filed herewith as Exhibit 12.(b). |
SIGNATURES
Pursuant to the requirements of the Securities Exchange Act of 1934 and the Investment Company Act of 1940, the registrant has duly caused this report to be signed on its behalf by the undersigned, thereunto duly authorized.
Starboard Investment Trust
| By: (Signature and Title) | /s/ Katherine M. Honey |
| | Katherine M. Honey |
Date: June 3, 2016 | President and Principal Executive Officer Matisse Discounted Closed-End Fund Strategy |
Pursuant to the requirements of the Securities Exchange Act of 1934 and the Investment Company Act of 1940, this report has been signed below by the following persons on behalf of the registrant and in the capacities and on the dates indicated.
| By: (Signature and Title) | /s/ Katherine M. Honey |
| | Katherine M. Honey |
Date: June 3, 2016 | President and Principal Executive Officer Matisse Discounted Closed-End Fund Strategy |
| By: (Signature and Title) | /s/ Ashley E. Harris |
Date: June 2, 2016 | Ashley E. Harris Treasurer and Principal Financial Officer Matisse Discounted Closed-End Fund Strategy |