UNITED STATES
SECURITIES AND EXCHANGE COMMISSION
Washington, D.C. 20549
FORM N-CSR
CERTIFIED SHAREHOLDER REPORT OF REGISTERED
MANAGEMENT INVESTMENT COMPANIES
Investment Company Act file number 811-22298
Starboard Investment Trust
(Exact name of registrant as specified in charter)
116 South Franklin Street, Post Office Box 69, Rocky Mount, North Carolina 27802
(Address of principal executive offices) (Zip code)
Terrence O. Davis
116 South Franklin Street, Post Office Box 69, Rocky Mount, North Carolina 27802
(Name and address of agent for service)
Registrant's telephone number, including area code: 252-972-9922
Date of fiscal year end: September 30
Date of reporting period: September 30, 2016
Annual Report 2016
September 30, 2016
This report and the financial statements contained herein are submitted for the general information of the shareholders of the Sector Rotation Fund (the "Fund"). The Fund's shares are not deposits or obligations of, or guaranteed by, any depository institution. The Fund's shares are not insured by the FDIC, Federal Reserve Board or any other agency, and are subject to investment risks, including possible loss of principal amount invested. Neither the Fund nor the Fund's distributor is a bank.
The Sector Rotation Fund is distributed by Capital Investment Group, Inc., Member FINRA/SIPC, 100 E. Six Forks Road, Suite 200, Raleigh, NC, 27609. There is no affiliation between the Sector Rotation Fund, including its principals, and Capital Investment Group, Inc.
Statements in this Annual Report that reflect projections or expectations of future financial or economic performance of the Sector Rotation Fund ("Fund") and of the market in general and statements of the Fund's plans and objectives for future operations are forward-looking statements. No assurance can be given that actual results or events will not differ materially from those projected, estimated, assumed or anticipated in any such forward-looking statements. Important factors that could result in such differences, in addition to the other factors noted with such forward-looking statements, include, without limitation, general economic conditions such as inflation, recession and interest rates. Past performance is not a guarantee of future results.
An investment in the Fund is subject to investment risks, including the possible loss of some or all of the principal amount invested. There can be no assurance that the Fund will be successful in meeting its investment objective. Generally, the Fund will be subject to the following additional risks: Investments in ETFs, Foreign Securities Risk, Inverse Correlation Risk, Short Sales Risk, Derivative Risk, Leverage Risk, Market Risk, Small-cap and Mid-cap Securities Risk, Fixed Income Risk, Management Style Risk, Manager Risk, Non-diversified Fund Risk, Sector Focus Risk, Portfolio Turnover Risk, and Operating Risk. More information about these risks and other risks can be found in the Fund's prospectus.
The performance information quoted in this Annual Report represents past performance, which is not a guarantee of future results. Investment return and principal value of an investment will fluctuate so that an investor's shares, when redeemed, may be worth more or less than their original cost. Current performance may be lower or higher than the performance data quoted. An investor may obtain performance data current to the most recent month-end by visiting ncfunds.com.
An investor should consider the investment objectives, risks, charges and expenses of the Fund carefully before investing. The prospectus contains this and other information about the Fund. A copy of the prospectus is available at ncfunds.com or by calling Shareholder Services at 800-773-3863. The prospectus should be read carefully before investing. |
This Annual Report was first distributed to shareholders on or about November 29, 2016.
For More Information on Your Sector Rotation Fund:
See Our Web site @ ncfunds.com
or
Call Our Shareholder Services Group at 800-773-3863.
Down to Earth
U.S. Economic Outlook Becomes More Cloudy
A number of cross currents have been tossing the U.S. economy around, and they're making the outlook a bit cloudier. (That's not to say it wasn't cloudy before, in my opinion.)
First, concerns about growth in foreign countries—particularly those of the emerging markets—have intensified. For example, China's equity market, which began peaking in the spring (as margin lending rose), has returned to Earth. In late October alone, China posted its weakest gross domestic product (GDP) growth since the financial crisis. The prospect of slowing Chinese rippled across key trading partners. In October, for example, Japan reported a sharp decline in export growth.1
This is fueling fears that the global weakness could even reach U.S. shores. Certainly, it's true that the United States doesn't have much direct exposure to emerging economies anyway, with exports to China comprising less than 1 percent of gross domestic product (GDP), but there's always indirect exposure to worry about. Indeed, we're already seeing how sluggish growth abroad and a stronger U.S. dollar are impacting U.S. exporters and manufacturers. And, there's been a sharp decline in global energy prices, which is hurting U.S. energy companies. U.S. crude is around $48 per barrel as of press time, and the country's crude stocks, at 489 million barrels on November 11, were at the upper limit of the average range for this time of year, according to Energy Information Administration (EIA) data.2
Adding insult to injury, we've seen a sharp inventory correction in the United States. October surveys from the New York and Philadelphia Federal Reserve banks showed that the manufacturing sector is in contraction (that is, recession). Production at factories also fell for a second straight month. Granted, there was an inventory excess at the start of the year as a harsh winter and a port slowdown on the West Coast forced many companies to keep their products on the shelf. Companies reached by cutting production to clear the backlog.3
But, will it last? All the turbulence has curbed some discretionary consumer spending. Retail sales rose 0.8% in September, according to the Commerce Department, and September retail sales were revised up to show a 1.0% increase instead of the previously reported 0.6% rise. That was better than expected, but was boosted by demand for building materials as households cleaned up and made repairs in the wake of Hurricane Matthew --- likely a temporary situation.4
All of these factors are complicating decision-making at the U.S. Federal Reserve (Fed). While the policymakers have repeatedly said they haven't taken an increase in the federal funds rate this year off the table, they won't want to raise rates too soon, because doing so risks further hindering an already sluggish economic recovery. Recent developments increase the likelihood the Fed will keep interest rates near zero for the rest of 2016. We'd say there's less than a 50 percent chance that the Fed will hike this year.
1 http://fortune.com/2016/11/20/japan-trade-exports-yen/
2 http://ir.eia.gov/wpsr/wpsrsummary.pdf
3 http://www.businessinsider.com/manufacturing-inventories-correction-2015-10
4 http://www.cnbc.com/2016/11/15/us-retail-sales-oct-2016.html
A stable federal funds rate will likely keep long-term interest U.S. rates low, and could fuel purchases of riskier assets such as stocks. But investors in riskier assets shouldn't get too comfortable. Heightened anxiety about global growth prospects has caused market volatility to spike and risk assets to suffer in the near past. While equities began a pronounced correction in September, high-yield bonds have recently begun to show weakness as well. While fears have subsided a bit, reversing the decline to some degree, there's a lingering sense of unease that could rear its ugly head at any time. The markets, I believe, are susceptible to any trigger, be it news about weakness in China or a Fed rate hike.
While the Fund has underperformed against the S&P 500 Total Return Index, it has outperformed against the average fund in its Morningstar category. The following chart shows the Fund's performance as compared to its Morningstar category. My "macroeconomic sector rotation" approach has provided the shareholders with returns we are very pleased with over the one year period ending September 30, 2016. In fact, since inception, NAVFX has outperformed its Morningstar category by a healthy margin.
I believe an accurate forecast is the foundation to a rewarding allocation. I wrote about this in my book, The Money Compass: Where your money went and how to get it back. Going into 2017, I look for a tepid bond market allowing for the equity markets to exceed levels that the GDP would normally warrant. As always, I appreciate the trust you have placed in me and I will continue to work hard everyday to maintain that trust.
Mark Anthony Grimaldi, Portfolio Manager
Author
Please see the table below for the Fund's historical performance information through the calendar quarter ended September 30, 2016:
Average Annual Total Returns (Unaudited) | | | | |
Period Ended September 30, 2016 | One Year | Five Year | Since Inception* | Gross Expense Ratio** |
Sector Rotation Fund | 7.55% |
9.50%
|
7.56%
|
2.10%
|
S&P 500 Total Return Index*** |
15.43%
|
11.92%
|
12.74%
|
N/A
|
Morningstar Tactical Allocation Category***
|
5.54%
|
2.17%
|
1.44%
|
N/A
|
The performance data quoted above represents past performance, which is not a guarantee of future results. Investment return and principal value of an investment in the Fund will fluctuate so that an investor's shares, when redeemed, may be worth more or less than their original cost. Current performance may be lower or higher than the performance data quoted. To obtain more current performance data regarding the Fund, including performance data current to the Fund's most recent month-end, please visit ncfunds.com or call the Fund at (800) 773-3863. Fee waivers and expenses reimbursements have positively impacted Fund performance.
*The Fund's inception date is December 31, 2009.
**Gross expense ratio is from the Fund's prospectus dated August 1, 2016. More recent expense ratios are found in the Financial Highlights.
***You cannot invest directly in this index. The index does not have an investment advisor and does not pay any commissions, expenses, or taxes. If the index did pay commissions, expenses, or taxes, the return would be lower.
(RCSEC1116001)
| Sector Rotation Fund | | | | | | | | | | | | | | |
| | | | | | | | | | | | | | | | | | | | |
| Performance Update (Unaudited) | | | | | | | | | | | | | |
| | | | | | | | | | | | | | | | | | | | |
| | | | | | | | | | | | | | | | | | | | |
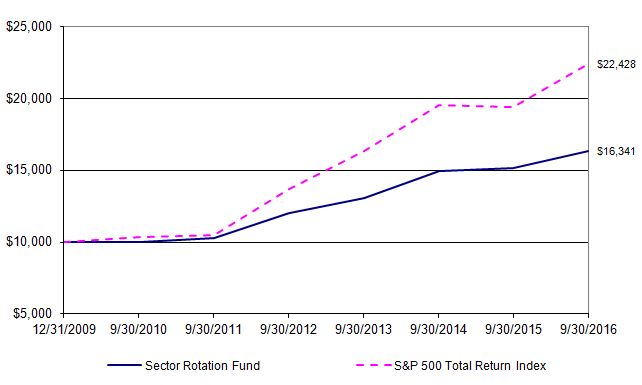
| For the period from December 31, 2009 (Commencement of Operations) through September 30, 2016 |
| �� | | | | | | | | | | | | | | | | | | | |
| Comparison of the Change in Value of a $10,000 Investment | | | | | | | | |
| | | | | | | | | | | | | | | | | | | | |
This graph assumes an initial investment of $10,000 at December 31, 2009 (Commencement of Operations). All dividends and distributions are reinvested. This graph depicts the performance of the Sector Rotation Fund versus the S&P 500 Total Return Index. It is important to note that the Fund is a professionally managed mutual fund while the index is not available for investment and is unmanaged. The comparison is shown for illustrative purposes only.
| Average Annual Total Returns |
| | | | | | | | | | | | | | | | | Gross | |
| | As of | | | | | One | | Five | | Since | | Inception | | Expense | |
| | September 30, 2016 | | | Year | | Year | | Inception | | Date | | Ratio* | |
| | Sector Rotation Fund | | | 7.55% | | 9.50% | | 7.56% | | 12/31/09 | | 2.10% | |
| | S&P 500 Total Return Index | | | 15.43% | | 11.92% | | 12.74% | | N/A | | N/A | |
* The gross expense ratio shown is from the Fund's prospectus dated August 1, 2016.
Performance quoted above represents past performance, which is no guarantee of future results. Investment return and principal value will fluctuate so that shares, when redeemed, may be worth more or less than their original cost. Current performance may be lower or higher than the performance data quoted. An investor may obtain performance data, current to the most recent month-end, by visiting ncfunds.com.
The graph and table do not reflect the deduction of taxes that a shareholder would pay on Fund distributions or the redemption of Fund shares. Average annual total returns are historical in nature and measure net investment income and capital gain or loss from portfolio investments assuming reinvestments of distributions.
| Sector Rotation Fund | | | | | | |
| | | | | | | | | | | |
| Schedule of Investments | | | | | | | |
| | | | | | | | | | | |
| | | | | | | | | | | |
| As of September 30, 2016 | | | | | | | |
| | | | | | | | | Shares | | Value (Note 1) |
| | | | | | | | | | | |
| EXCHANGE-TRADED FUNDS - 91.16% | | | | | | |
| | | | | | | | | | | |
| | Consumer Discretionary - 12.42% | | | | | | |
| | | Vanguard Consumer Discretionary ETF | | | 22,000 | $ | 2,766,280 |
| | | | | | | | | | | |
| | Consumer Services - 3.07% | | | | | | |
| | | Vanguard Consumer Staples ETF | | | | 5,000 | | 684,400 |
| | | | | | | | | | | |
| | Health Care - 10.15% | | | | | | | |
| | | Vanguard Health Care ETF | | | | 17,000 | | 2,259,130 |
| | | | | | | | | | | |
| | High Yield - 7.63% | | | | | | | | |
| | * | PowerShares Fundamental High Yield Corporate Bond ETF | | 90,000 | | 1,698,300 |
| | | | | | | | | | | |
| | Industrials - 8.71% | | | | | | | | |
| | | PowerShares Aerospace & Defense Portfolio | | | 50,000 | | 1,938,450 |
| | | | | | | | | | | |
| | Information Technology - 1.97% | | | | | | |
| | * | PowerShares Nasdaq Internet ETF | | | | 5,000 | | 438,400 |
| | | | | | | | | | | |
| | Large-Cap - 42.55% | | | | | | | |
| | | ProShares Ultra S&P 500 ETF | | | | 10,000 | | 709,700 |
| | | ProShares UltraPro S&P 500 ETF | | | | 25,000 | | 1,841,000 |
| | | SPDR S&P 500 ETF | | | | 32,000 | | 6,921,600 |
| | | | | | | | | | | 9,472,300 |
| | Natural Resources - 4.66% | | | | | | |
| | * | ProShares Ultra Bloomberg Crude Oil | | | | 100,000 | | 1,038,000 |
| | | | | | | | | | | |
| | | Total Exchange-Traded Funds (Cost $17,530,409) | | | | | 20,295,260 |
| | | | | | | | | | | |
| SHORT-TERM INVESTMENT - 3.45% | | | | | | |
| | § | Fidelity Institutional Money Market Funds - Treasury Portfolio, 0.01% | 767,213 | | 767,213 |
| | | | | | | | | | | |
| | | Total Short-Term Investment (Cost $767,213) | | | | | 767,213 |
| | | | | | | | | | | |
| Total Value of Investments (Cost $18,297,622) - 94.61% | | | | $ | 21,062,473 |
| | | | | | | | | | | |
| Other Assets Less Liabilities - 5.39% | | | | | | 1,201,166 |
| | | | | | | | | | | |
| NET ASSETS - 100.00% | | | | | | $ | 22,263,639 |
| | | | | | | | | | | |
| * | Non-income producing investment | | | | | | |
| § | Represents 7 day effective yield | | | | | | |
| | | | | | | | | | | |
| | | | | | | | | | | (Continued) |
| Sector Rotation Fund | | | | | | | | |
| | | | | | | | | | | |
| Schedule of Investments - Continued | | | | | | |
| | | | | | | | | | | |
| | | | | | | | | | | |
| As of September 30, 2016 | | | | | | | |
| | | | | | | | | | |
| | | | | | | | | | | |
| | | | | | | | | | | |
| | | | | | | | | | | |
| | | | Summary of Investments | | | | | |
| | | | | | | % of Net | | | | |
| | | | | | | Assets | | Value | | |
| | | | Exchange Traded Funds: | | | | | |
| | | | | Consumer Discretionary | 12.42% | $ | 2,766,280 | | |
| | | | | Consumer Services | 3.07% | | 684,400 | | |
| | | | | Health Care | | 10.15% | | 2,259,130 | | |
| | | | | High Yield | | 7.63% | | 1,698,300 | | |
| | | | | Industrials | | 8.71% | | 1,938,450 | | |
| | | | | Information Technology | 1.97% | | 438,400 | | |
| | | | | Large-Cap | | 42.55% | | 9,472,300 | | |
| | | | | Natural Resources | | 4.66% | | 1,038,000 | | |
| | | | Short-Term Investment | | 3.45% | | 767,213 | | |
| | | | Other Assets Less Liabilities | 5.39% | | 1,201,166 | | |
| | | | Total | | 100.00% | | $ 22,263,639 | | |
See Notes to Financial Statements
| Sector Rotation Fund | | |
| | | | |
| Statement of Assets and Liabilities | | |
| | | | |
| | | | |
| As of September 30, 2016 | | |
| | | | |
| Assets: | | |
| Investments, at value (cost $18,297,622) | $ | 21,062,473 |
| Receivables: | | |
| Investments sold | | 2,113,178 |
| Fund shares sold | | 5,472 |
| Dividends and interest | | 34,829 |
| Prepaid expenses: | | |
| Registration and filing expenses | | 3,780 |
| Fund accounting fees | | 2,250 |
| Compliance fees | | 934 |
| | | | |
| Total assets | | 23,222,916 |
| | | | |
| Liabilities: | | |
| Payables: | | |
| Investments purchased | | 928,899 |
| Fund shares repurchased | | 6,000 |
| Accrued expenses: | | |
| Advisory fees | | 18,292 |
| Professional fees | | 3,250 |
| Administrative fees | | 1,005 |
| Shareholder fulfillment expenses | | 700 |
| Custody fees | | 397 |
| Miscellaneous compensation expenses | | 351 |
| Insurance fees | | 300 |
| Trustee fees and meeting expenses | | 83 |
| | | | |
| Total liabilities | | 959,277 |
| | | | |
| Net Assets | $ | 22,263,639 |
| | | | |
| Net Assets Consist of: | | |
| Paid in Capital | $ | 19,046,770 |
| Accumulated net investment loss | | (12,997) |
| Accumulated net realized gain on investments | | 465,015 |
| Net unrealized appreciation on investments | | 2,764,851 |
| | | | |
| Total Net Assets | $ | 22,263,639 |
| Shares Outstanding, no par value (unlimited authorized shares) | | 1,918,184 |
| Net Asset Value, Maximum Offering Price and Redemption Price Per Share | $ | 11.61 |
| | | | |
| | | | |
| | | | |
| | | | |
| See Notes to Financial Statements | | |
| Sector Rotation Fund | | |
| | | | |
| Statement of Operations | | |
| | | | |
| | | | |
| For the Fiscal Year Ended September 30, 2016 | | |
| | | | |
| Investment Income: | | |
| Dividends | $ | 524,404 |
| | | | |
| Total Investment Income | | 524,404 |
| | | | |
| Expenses: | | |
Advisory fees (Note 2) | | 239,311 |
Administration fees (Note 2) | | 157,993 |
| Professional fees | | 8,701 |
| Fund accounting fees (Note 2) | | 4,882 |
| Registration and filing expenses | | 4,583 |
Transfer agent fees (Note 2) | | 3,500 |
| Shareholder fulfillment expenses | | 2,203 |
| Trustee fees and meeting expenses | | 1,416 |
Compliance fees (Note 2) | | 1,010 |
Custody fees (Note 2) | | 816 |
Miscellaneous compensation expenses (Note 2) | | 700 |
| Insurance fees | | 300 |
| Security pricing fees | | 187 |
| | | | |
| Total Expenses | | 425,602 |
| | | | |
| Net Investment Income | | 98,802 |
| | | | |
| Realized and Unrealized Gain on Investments: | | |
| | | | |
| Net realized gain from investment transactions | | 529,503 |
| Distributions of capital gains from underlying funds | | 30,213 |
| | | | |
| Net change in unrealized appreciation on investments | | 914,015 |
| | | | |
| Net Realized and Unrealized Gain on Investments | | 1,473,731 |
| | | | |
| Net Increase in Net Assets Resulting from Operations | $ | 1,572,533 |
| | | | |
| | | | |
| | | | |
| See Notes to Financial Statements | | |
| Sector Rotation Fund | | | | | | |
| | | | | | | | | | | |
| Statements of Changes in Net Assets | | | | | | |
| | | | | | | | | | | |
| | | | | | | | | | | |
| For the fiscal years ended September 30, | | | | 2016 | | 2015 |
| | | | | | | | | | | |
| Operations: | | | | | | | |
| Net investment income (loss) | | | $ | 98,802 | $ | (19,515) |
| Net realized gain from investment transactions | | | 529,503 | | 847,105 |
| Distributions of capital gains from underlying funds | | | 30,213 | | 11,310 |
| Net change in unrealized appreciation (depreciation) on investments | | 914,015 | | (472,113) |
| | | | | | | | | | | |
| Net Increase in Net Assets Resulting from Operations | | | 1,572,533 | | 366,787 |
| | | | | | | | | | | |
| Distributions to Shareholders: | | | | | | |
| Net investment income | | | | - | | (172,907) |
| Net realized gain | | | | (797,111) | | (3,674,828) |
| | | | | | | | | | | |
| Decrease in Net Assets Resulting from Distributions | | | (797,111) | | (3,847,735) |
| | | | | | | | | | | |
| Beneficial Interest Transactions: | | | | | | |
| Shares sold | | | | | 6,089,847 | | 6,897,802 |
| Reinvested dividends and distributions | | | | 792,756 | | 3,726,689 |
| Shares repurchased | | | | (7,603,331) | | (7,179,021) |
| | | | | | | | | | | |
| Increase (Decrease) from Beneficial Interest Transactions | | | (720,728) | | 3,445,470 |
| | | | | | | | | | | |
| Net Increase (Decrease) in Net Assets | | | | 54,694 | | (35,478) |
| | | | | | | | | | | |
| Net Assets: | | | | | | | |
| Beginning of year | | | | | 22,208,945 | | 22,244,423 |
| End of year | | | | $ | 22,263,639 | $ | 22,208,945 |
| | | | | | | | | | | |
| Accumulated Net Investment Loss | | | $ | (12,997) | $ | (43,234) |
| | | | | | | | | | | |
| Share Information: | | | | | | |
| Shares sold | | | | | 530,297 | | 563,620 |
| Reinvested distributions | | | | 69,297 | | 332,928 |
| Shares repurchased | | | | (677,690) | | (602,951) |
| Net Increase (Decrease) in Shares of Beneficial Interest | | | (78,096) | | 293,597 |
| | | | | | | | | | | |
| | | | | | | | | | | |
| | | | | | | | | | | |
| | | | | | | | | | | |
| | | | | | | | | | | |
| See Notes to Financial Statements | | | | | | |
| Sector Rotation Fund | | | | | | | | | | | |
| | | | | | | | | | | | | | | | |
| Financial Highlights | | | | | | | | | | | |
| | | | | | | | | | | | | | | | |
| For a share outstanding during the fiscal | | | | | | | | | | | |
| years ended September 30, | | 2016 | | 2015 | | 2014 | | 2013 | | 2012 | |
| | | | | | | | | | | | | | | | |
| Net Asset Value, Beginning of Year | $ | 11.13 | $ | 13.06 | $ | 11.61 | $ | 11.38 | $ | 10.38 | |
| | | | | | | | | | | | | | | | |
| Income (Loss) from Investment Operations | | | | | | | | | | | |
| Net investment income (loss) | | 0.05 | | (0.02) | | 0.09 | | 0.10 | | 0.01 | |
| Net realized and unrealized gain on investments | | 0.79 | | 0.25 | | 1.58 | | 0.83 | | 1.55 | |
| | | | | | | | | | | | | | | | |
| Total from Investment Operations | | 0.84 | | 0.23 | | 1.67 | | 0.93 | | 1.56 | |
| | | | | | | | | | | | | | | | |
| Less Distributions to Shareholders: | | | | | | | | | | | |
| From net investment income | | - | | (0.08) | | (0.04) | | (0.07) | | (0.32) | |
| From net realized gain | | (0.36) | | (2.08) | | (0.18) | | (0.63) | | (0.24) | |
| | | | | | | | | | | | | | | | |
| Total Distributions | | (0.36) | | (2.16) | | (0.22) | | (0.70) | | (0.56) | |
| | | | | | | | | | | | | | | | |
| Net Asset Value, End of Year | $ | 11.61 | $ | 11.13 | $ | 13.06 | $ | 11.61 | $ | 11.38 | |
| | | | | | | | | | | | | | | | |
| Total Return (a) | | 7.55% | | 1.85% | | 14.50% | | 8.67% | | 15.48% | |
| | | | | | | | | | | | | | | | |
| Net Assets, End of Year (in thousands) | $ | 22,264 | $ | 22,209 | $ | 22,244 | $ | 20,918 | $ | 23,386 | |
| | | | | | | | | | | | | | | | |
| Ratios of: | | | | | | | | | | | | | |
| Gross Expenses to Average Net Assets (b) | | 1.77% | | 1.78% | | 1.81% | | 1.65% | | 2.00% | |
| Net Expenses to Average Net Assets (b) | | 1.77% | | 1.78% | | 1.81% | | 1.65% | | 2.00% | |
| Net Investment Income (Loss) to Average Net Assets (c) | 0.41% | | (0.08)% | | 0.67% | | 0.91% | | 0.34% | |
| | | | | | | | | | | | | | | | |
| Portfolio turnover rate | | 345.74% | | 237.04% | | 218.41% | | 146.64% | | 175.18% | |
| | | | | | | | | | | | | | | | |
| | | | | | | | | | | | | | | | |
| | | | | | | | | | | | | | | | |
| | | | | | | | | | | | | | | | |
| (a) | Includes adjustments in accordance with accounting principles generally accepted in the United States of America and, consequently, the net asset value for financial reporting purposes and the returns based upon those net asset values may differ from the net asset values and returns for shareholder transactions. |
| (b) | Does not include expenses of the investment companies in which the Fund invests. | | | | | |
| (c) | Recognition of net investment income (loss) by the Fund is affected by the timing of the declaration of dividends by the underlying investment companies in which the Fund invests. |
| | | | | | | | | |
| | | | | | | | | | | | | | | | |
| | | | | | | | | | | | | | | | |
| See Notes to Financial Statements | | | | | | | | | | | |
Sector Rotation Fund
Notes to Financial Statements
1. Organization and Significant Accounting Policies
The Sector Rotation Fund ("Fund") is a series of the Starboard Investment Trust ("Trust"). The Trust is organized as a Delaware statutory trust and is registered under the Investment Company Act of 1940, as amended ("1940 Act"), as an open-end management investment company. The Fund is a separate, non-diversified series of the Trust.
The Fund commenced operations on December 31, 2009 as a series of the World Funds Trust ("WFT"). Shareholders approved the reorganization of the Fund as a series of the Trust at a special meeting on June 22, 2011. The reorganization occurred on June 27, 2011. Effective November 29, 2010, the Fund changed its name from the Navigator Fund to the Sector Rotation Fund.
The investment objective of the Fund is to achieve capital appreciation. The Fund utilizes a sector rotation strategy which evaluates the relative strength and momentum of different sectors of the economy in order to identify short-term investment opportunities. Under normal circumstances, the Fund invests in exchange-traded funds ("ETFs"). An ETF is an open-end investment company that holds a portfolio of investments designed to track a particular market segment or underlying index.
The following is a summary of significant accounting policies consistently followed by the Fund. The policies are in conformity with accounting principles generally accepted in the United States of America ("GAAP").
Investment Valuation
The Fund's investments in securities are carried at fair value. Securities listed on an exchange or quoted on a national market system are valued at the last sales price as of 4:00 p.m. Eastern Time. Securities traded in the NASDAQ over-the-counter market are generally valued at the NASDAQ Official Closing Price. Other securities traded in the over-the-counter market and listed securities for which no sale was reported on that date are valued at the most recent bid price. Instruments with maturities of 60 days or less are valued at amortized cost, which approximates market value. Securities and assets for which representative market quotations are not readily available (e.g., if the exchange on which the security is principally traded closes early or if trading of the particular security is halted during the day and does not resume prior to the Fund's net asset value calculation) or which cannot be accurately valued using the Fund's normal pricing procedures are valued at fair value as determined in good faith under policies approved by the Trustees. A security's "fair value" price may differ from the price next available for that security using the Fund's normal pricing procedures.
Fair Value Measurement
Various inputs are used in determining the value of the Fund's investments. These inputs are summarized in the three broad levels listed below:
Level 1: quoted prices in active markets for identical securities
Level 2: other significant observable inputs (including quoted prices for similar securities, interest rates, credit risk, etc.)
Level 3: significant unobservable inputs (including the Fund's own assumptions in determining fair value of investments)
The availability of observable inputs can vary from security to security and is affected by a wide variety of factors, including, for example, the type of security, whether the security is new and not yet established in the marketplace, the liquidity of markets, and other characteristics particular to the security. To the extent that valuation is based on models or inputs that are less observable or unobservable in the market, the determination of fair value requires more judgment. Accordingly, the degree of judgment exercised in determining fair value is greatest for instruments categorized in Level 3.
The inputs used to measure fair value may fall into different levels of the fair value hierarchy. In such cases, for disclosure purposes, the level in the fair value hierarchy within which the fair value measurement falls in its entirety, is determined based on the lowest level input that is significant to the fair value measurement in its entirety.
(Continued)
Sector Rotation Fund
Notes to Financial Statements
The inputs or methodology used for valuing securities are not necessarily an indication of the risk associated with investing in those securities. The following table summarizes the inputs as of September 30, 2016 for the Fund's assets measured at fair value:
| Sector Rotation Fund | | |
| Investments in Securities (a) | | Total | | Level 1 | | Level 2 | | Level 3 |
| Assets | | | | | | | | |
| Exchange-Traded Funds* | $ | 20,295,260 | $ | 20,295,260 | $ | - | $ | - |
| Short-Term Investment | | 767,213 | | 767,213 | | - | | - |
| Total Assets | $ | 21,062,473 | $ | 21,062,473 | $ | - | $ | - |
| | | | | | | | | |
| (a) | The Fund had no significant transfers into or out of Level 1, 2, or 3 during the year ended September 30, 2016. The Fund did not hold any Level 3 securities during the year. The Fund recognizes transfers at the end of the reporting period. |
*Refer to Schedule of Investments for breakdown by Industry.
Investment Transactions and Investment Income
Investment transactions are accounted for as of the date purchased or sold (trade date). Dividend income is recorded on the ex-dividend date. Certain dividends from foreign securities will be recorded as soon as the Fund is informed of the dividend if such information is obtained subsequent to the ex-dividend date. Interest income is recorded on the accrual basis and includes accretion of discounts and amortization of premiums using the effective interest method. Gains and losses are determined on the identified cost basis, which is the same basis used for federal income tax purposes.
Expenses
For the period from October 1, 2015 through July 31, 2016, the Administrator was responsible for all operating expenses of the Fund not specifically assumed by the Fund.
For the period from August 1, 2016 through September 30, 2016, the Fund is responsible for all expenses incurred specifically on its behalf as well as a portion of Trust level expenses, which are allocated according to methods reviewed annually by the Trustees.
Distributions
The Fund may declare and distribute dividends from net investment income (if any) annualy. Distributions from capital gains (if any) are generally declared and distributed annually. Dividends and distributions to shareholders are recorded on ex-date.
Estimates
The preparation of financial statements in conformity with GAAP requires management to make estimates and assumptions that affect the reported amounts of assets and liabilities and the disclosure of contingent assets and liabilities at the date of the financial statements and the reported amounts of increases and decreases in the net assets from operations during the reported period. Actual results could differ from those estimates.
Federal Income Taxes
No provision for income taxes is included in the accompanying financial statements, as the Fund intends to distribute to shareholders all taxable investment income and realized gains and otherwise complies with Subchapter M of the Internal Revenue Code applicable to regulated investment companies.
2. Transactions with Related Parties and Service Providers
Advisor
As full compensation for the investment advisory services provided to the Fund by Grimaldi Portfolio Solutions, Inc. (the "Advisor"), the Advisor receives a monthly fee based on the Fund's average daily net assets. The Advisor shall receive an investment advisory fee equal to an annualized rate of 1.00% of the average daily net assets of the Fund. In accordance with these terms, the Fund incurred $239,311 in advisory fees for the fiscal year ended September 30, 2016.
(Continued)
Sector Rotation Fund
Notes to Financial Statements
During the fiscal year ended September 30, 2016, from October 1, 2015 until July 31, 2016, the Advisor had entered into an Operating Plan with the Fund's Administrator, The Nottingham Company, under which it had agreed to make payments to the administrator to the extent that the cost of administering the Fund exceeds the 1.783% of average daily net assets paid by the Fund to the Administrator under its consolidated fee arrangement.
From August 1, 2016 until September 30, 2016, the Advisor entered into a contractual agreement (the "Expense Limitation Agreement") with the Trust, on behalf of the Fund, under which it had agreed to waive or reduce its fees and to assume other expenses of the Fund, if necessary, in amounts that limit the Fund's total operating expenses (exclusive of interest, taxes, brokerage commissions, borrowing costs, fees and expenses of other investment companies in which the Fund invests, and other expenditures which are capitalized in accordance with generally accepted accounting principles, other extraordinary expenses not incurred in the ordinary course of the Fund's business, and amounts, if any, payable under a Rule 12b-1 distribution plan) to not more than 1.89% of the average daily net assets of the Fund. The current term of the Expense Limitation Agreement remains in effect until January 31, 2018. While there can be no assurance that the Expense Limitation Agreement will continue after that date, it is expected to continue from year-to-year thereafter. There were no expense reimbursements from the Advisor to the Fund for the period from August 1, 2016 through September 30, 2016.
Administrator
Effective August 1, 2016, the Fund pays a monthly fee to the Administrator based upon the average daily net assets of the Fund and calculated at the annual rates as shown in the schedule below subject to a minimum of $2,000 per month. The Administrator also receives a fee as to procure and pay the Fund's custodian, as additional compensation for fund accounting and recordkeeping services, and additional compensation for certain costs involved with the daily valuation of securities and as reimbursement for out-of-pocket expenses.
A breakdown of these fees is provided in the following table:
| Administration Fees* | Custody Fees* | | Fund Accounting Fees | | Fund Accounting Fees (asset-based fee) | | Blue Sky Administration Fees (annual) |
Average Net Assets | Annual Rate | Average Net Assets | Annual Rate | | Net Assets | Annual Rate | | Per state |
| First $100 million | 0.100% | First $200 million | 0.020% | | $2,250 | | First $50 million | 0.02% | | $150 |
| Next $100 million | 0.090% | Over $200 million | 0.009% | | $500/ additional class | | Next $50 million | 0.015% | | |
| Next $100 million | 0.080% | | | | | | Over $100 million | 0.01% | | |
| Next $100 million | 0.070% | | *Minimum monthly fees of $2,000 and $417 for Administration and Custody, respectively. |
| Next $100 million | 0.060% | |
| Over $500 million | 0.050% | |
| Over $750 million | 0.040% | | |
| Over $1 billion | 0.030% | | |
The Fund incurred $157,993 in administration fees, $816 in custody fees, and $4,882 in fund accounting fees for the fiscal year ended September 30, 2016.
(Continued)
Sector Rotation Fund
Notes to Financial Statements
Compliance Services
Cipperman Compliance Services, LLC provides services as the Trust's Chief Compliance Officer. Cipperman Compliance Services, LLC is entitled to receive customary fees from the Fund for their services pursuant to the Compliance Services agreement with the Fund. For the period from October 1, 2015 through July 31, 2016, the Administrator was responsible for paying the compliance fees in the Fund. For the period from August 1, 2016 through September 30, 2016, the fees were paid directly from the Fund.
Transfer Agent
Nottingham Shareholder Services, LLC ("Transfer Agent") serves as transfer, dividend paying, and shareholder servicing agent for the Fund. For its services, the Transfer Agent is entitled to receive compensation from the Fund pursuant to the Transfer Agent's fee arrangements with the Fund. For the period from October 1, 2015 through July 31, 2016, the Administrator was responsible for paying the transfer agent fees in the Fund. For the period from August 1, 2016 through September 30, 2016, the fees were paid directly from the Fund.
Distributor
Capital Investment Group, Inc. (the "Distributor") serves as the Fund's principal underwriter and distributor. For its services, the Distributor is entitled to receive compensation from the Fund pursuant to the Distributor's fee arrangements with the Fund. For the period from October 1, 2015 through July 31, 2016, the Administrator was responsible for paying the distributor fees in the Fund. For the period from August 1, 2016 through September 30, 2016, the fees were paid directly from the Fund.
Certain officers of the Trust are also officers of the Administrator.
3. Purchases and Sales of Investment Securities
For the fiscal year ended September 30, 2016, the aggregate cost of purchases and proceeds from sales of investment securities (excluding short-term securities) were as follows:
| Purchases of Securities | Proceeds from Sales of Securities |
| $77,755,695 | $81,365,572 |
There were no long-term purchases or sales of U.S Government Obligations during the fiscal year ended September 30, 2016.
Distributions are determined in accordance with Federal income tax regulations, which differ from GAAP, and, therefore, may differ significantly in amount or character from net investment income and realized gains for financial reporting purposes. Financial reporting records are adjusted for permanent book/tax differences to reflect tax character, but are not adjusted for temporary differences.
Management reviewed the Fund's tax positions taken or to be taken on federal income tax returns for the open tax years of September 30, 2013 through September 30, 2016, and determined that the Fund does not have a liability for uncertain tax positions. The Fund recognizes interest and penalties, if any, related to unrecognized tax benefits as income tax expense in the Statement of Operations. During the year, the Fund did not incur any interest or penalties.
Reclassifications relate primarily to differing book/tax treatment of grantor trusts. For the fiscal year ended September 30, 2016, the following reclassifications were made:
| Undistributed Net Investment Income | $ (417) |
| Accumulated Net Realized Gain on Investments | | 417 |
(Continued)
Sector Rotation Fund
Notes to Financial Statements
Distributions during the fiscal years ended were characterized for tax purposes as follows:
| | September 30, 2016 | September 30, 2015 |
| Ordinary Income | $ - | $ 1,423,051 |
| Long-term capital gain | 797,111 | 2,424,684 |
At September 30, 2016, the tax-basis cost of investments and components of distributable earnings were as follows:
| Cost of Investments | $ | 18,468,935 |
| | | |
| Unrealized Appreciation | $ | 2,804,781 |
| Unrealized Depreciation | | (211,241) |
| Net Unrealized Appreciation | | 2,593,540 |
| | | |
| Accumulated Long-Term Gains | | 636,326 |
| Deferral of Late Year Losses | | (12,997) |
| | | |
| Distributable Earnings | $ | 3,216,869 |
| | | | | | |
The difference between book-basis and tax-basis net unrealized appreciation (depreciation) is attributable to the deferral of losses from wash sales. The difference between book-basis and tax-basis undistributed net investment income and undistributed net realized gain on investments is attributable to the tax deferral of losses from wash sales, the tax treatment of short-term gains, and deferral of late year losses of $12,997.
Late year losses incurred after December 31 within the fiscal year are deemed to arise on the first business day of the following fiscal year for tax purposes. The Fund incurred and elected to defer such late year losses of $12,997.
5. Underlying Investment in Other Investment Company
The Fund currently invests a portion of its assets in the SPDR S&P 500 Exchange-Traded Fund (the "ETF"). The Fund may redeem its investment from the ETF at any time if the Advisor determines that it is in the best interest of the Fund and its shareholders to do so. The performance of the Fund may be directly affected by the performance of the ETF. The financial statements of the ETF, including the portfolio of investments, can be found at the ETF's website, www.spdrs.com, or the Securities and Exchange Commission's website, www.sec.gov, and should be read in conjunction with the ETF's financial statements. As of September 30, 2016, the Fund's net assets in the ETF were 31.09%.
6. Commitments and Contingencies
Under the Trust's organizational documents, its officers and Trustees are indemnified against certain liabilities arising out of the performance of their duties to the Fund. In addition, in the normal course of business, the Trust entered into contracts with its service providers, on behalf of the Fund, and others that provide for general indemnifications. The Fund's maximum exposure under these arrangements is unknown, as this would involve future claims that may be made against the Fund. The Fund expects risk of loss to be remote.
7. Subsequent Events
In accordance with GAAP, the Fund has evaluated the need for disclosures and/or adjustments resulting from subsequent events through the date of issuance of these financial statements. This evaluation did not result in any subsequent events that necessitated disclosures and/or adjustments.
REPORT OF INDEPENDENT REGISTERED PUBLIC ACCOUNTING FIRM
To the Board of Trustees of Starboard Investment Trust
and the Shareholders of Sector Rotation Fund
We have audited the accompanying statement of assets and liabilities of the Sector Rotation Fund (the "Fund"), a series of shares of beneficial interest in the Starboard Investment Trust, including the schedule of investments, as of September 30, 2016, and the related statement of operations for the year then ended, the statements of changes in net assets for each of the years in the two-year period then ended and the financial highlights for each of the years in the four-year period then ended. These financial statements and financial highlights are the responsibility of the Fund's management. Our responsibility is to express an opinion on these financial statements and financial highlights based on our audits. The financial highlights for the year ended September 30, 2012 have been audited by other auditors, whose report dated November 28, 2012, expressed an unqualified opinion on such financial highlights.
We conducted our audits in accordance with the standards of the Public Company Accounting Oversight Board (United States). Those standards require that we plan and perform the audit to obtain reasonable assurance about whether the financial statements and financial highlights are free of material misstatement. An audit includes examining, on a test basis, evidence supporting the amounts and disclosures in the financial statements. Our procedures included confirmation of securities owned as of September 30, 2016 by correspondence with the custodian and brokers. An audit also includes assessing the accounting principles used and significant estimates made by management, as well as evaluating the overall financial statement presentation. We believe that our audits provide a reasonable basis for our opinion.
In our opinion, the financial statements and financial highlights referred to above present fairly, in all material respects, the financial position of the Sector Rotation Fund as of September 30, 2016, and the results of its operations for the year then ended, the changes in its net assets for each of the years in the two-year period then ended and its financial highlights for each of the years in the four-year period then ended, in conformity with accounting principles generally accepted in the United States of America.
BBD, LLP
Philadelphia, Pennsylvania
November 22, 2016
Sector Rotation Fund
Additional Information (Unaudited)
1. Proxy Voting Policies and Voting Record
A copy of the Trust's Proxy Voting and Disclosure Policy and the Advisor's Disclosure Policy are included as Appendix B to the Fund's Statement of Additional Information and are available, without charge, upon request, by calling 800-773-3863, and on the website of the Securities and Exchange Commission ("SEC") at sec.gov. Information regarding how the Fund voted proxies relating to portfolio securities during the most recent period ended June 30, is available (1) without charge, upon request, by calling the Fund at the number above and (2) on the SEC's website at sec.gov.
2. Quarterly Portfolio Holdings
The Fund files its complete schedule of portfolio holdings with the SEC for the first and third quarters of each fiscal year on Form N-Q. The Fund's Form N-Q is available on the SEC's website at sec.gov. You may review and make copies at the SEC's Public Reference Room in Washington, D.C. Information on the operation of the Public Reference Room may be obtained by calling the SEC at 800-SEC-0330. You may also obtain copies without charge, upon request, by calling the Fund at 800-773-3863.
We are required to advise you within 60 days of the Fund's fiscal year-end regarding the federal tax status of certain distributions received by shareholders during each fiscal year. The following information is provided for the Fund's fiscal year ended September 30, 2016.
During the fiscal year, no income distributions were paid from the Fund but $797,111 in long-term capital gain distributions were paid from the Fund.
Dividend and distributions received by retirement plans such as IRAs, Keogh-type plans, and 403(b) plans need not be reported as taxable income. However, many retirement plans may need this information for their annual information meeting.
4. Schedule of Shareholder Expenses
As a shareholder of the Fund, you incur ongoing costs, including management fees; distribution [and/or service] (12b-1) fees; and other Fund expenses. This Example is intended to help you understand your ongoing costs (in dollars) of investing in the Fund and to compare these costs with the ongoing costs of investing in other mutual funds.
The Example is based on an investment of $1,000 invested at the beginning of the period and held for the entire period from April 1, 2016 through September 30, 2016.
Actual Expenses – The first line of the table below provides information about actual account values and actual expenses. You may use the information in this line, together with the amount you invested, to estimate the expenses that you paid over the period. Simply divide your account value by $1,000 (e.g., an $8,600 account value divided by $1,000 = 8.6), then multiply the result by the number in the first line under the heading entitled "Expenses Paid During Period" to estimate the expenses you paid on your account during this period.
Hypothetical Example for Comparison Purposes – The second line of the table below provides information about hypothetical account values and hypothetical expenses based on the Fund's actual expense ratio and an assumed rate of return of 5% per year before expenses, which is not the Fund's actual return. The hypothetical account values and expenses may not be used to estimate the actual ending account balance or expenses you paid for the period. You may use this information to compare the ongoing costs of investing in the Fund and other funds. To do so, compare this 5% hypothetical example with the 5% hypothetical examples that appear in the shareholder reports of the other funds.
(Continued)
Sector Rotation Fund
Additional Information (Unaudited)
Please note that the expenses shown in the table are meant to highlight your ongoing costs only and do not reflect any transactional costs, such as sales charges (loads), redemption fees, or exchange fees. Therefore, the second line of the table is useful in comparing ongoing costs only, and will not help you determine the relative total costs of owning different funds. In addition, if these transactional costs were included, your costs would have been higher.
| Sector Rotation Fund | Beginning Account Value April 1, 2016 | Ending Account Value September 30, 2016 | Expenses Paid During Period* |
Actual Hypothetical (5% annual return before expenses) | | | |
| $1,000.00 | $1,064.20 | $9.48 |
| $1,000.00 | $1,015.82 | $9.26 |
*Expenses are equal to the average account value over the period multiplied by the Fund's annualized expense ratio of 1.84%, multiplied by 183/366 (to reflect the one-half year period).
5. Approval of Advisory Agreement
The Advisor supervises the investments of the Fund pursuant to an Investment Advisory Agreement. At the annual meeting of the Fund's Board of Trustees held on March 10, 2016, the Trustees approved the renewal of the Investment Advisory Agreement through April 28, 2017. In considering whether to approve the Investment Advisory Agreement, the Trustees reviewed and considered the information they deemed reasonably necessary, including the following material factors: (i) the nature, extent, and quality of the services provided by the Advisor; (ii) the investment performance of the Fund and Advisor, (iii) the costs of the services to be provided and profits to be realized by the Advisor and its affiliates from the relationship with the Fund; (iv) the extent to which economies of scale would be realized as the Fund grows and whether advisory fee levels reflect those economies of scale for the benefit of the Fund's investors; (v) the Advisor's practices regarding brokerage and portfolio transactions; and (vi) the Advisor's practices regarding possible conflicts of interest.
At the meeting, the Trustees reviewed various informational materials including, without limitation, the Investment Advisory Agreement for the Fund; a memorandum from the Advisor to the Trustees containing information about the Advisor, its business, its finances, its personnel, its services to the Fund, and comparative expense ratio information for other mutual funds with a strategy similar to the Fund; and a memorandum from the Fund's legal counsel that summarized the fiduciary duties and responsibilities of the Board of Trustees in reviewing and approving the Investment Advisory Agreement, including the types of information and factors that should be considered in order to make an informed decision.
In considering the nature, extent, and quality of the services provided by the Advisor, the Trustees considered the responsibilities of the Advisor under the Investment Advisory Agreement. The Trustees reviewed the services being provided by the Advisor to the Fund including, without limitation, the quality of its investment advisory services since the Fund's inception (including research and recommendations with respect to portfolio securities); its procedures for formulating investment recommendations and assuring compliance with the Fund's investment objective, policies, and limitations; its coordination of services for the Fund among the Fund's service providers; and its efforts to promote the Fund, grow the Fund's assets, and assist in the distribution of Fund shares. The Trustees noted that the Advisor utilizes a sector rotation strategy that evaluates the relative strength and momentum of different sectors of the economy in order to identify short-term investment opportunities. The Trustees further noted that the principal executive and financial officer of the Fund was a principal of the Advisor and serves without additional compensation from the Fund. After reviewing the foregoing information and further information in the memorandum from the Advisor (e.g., descriptions of the Advisor's business, the Advisor's compliance program, and the Advisor's Form ADV), the Board concluded that the nature, extent, and quality of the services provided by the Advisor were satisfactory and adequate for the Fund.
In considering the investment performance of the Fund and the Advisor, the Trustees compared the performance of the Fund with the performance of its benchmark index, comparable funds with similar objectives managed by other investment advisors, and applicable peer group data (e.g., Lipper peer group average). The Trustees noted that the returns for the one-year, three-year and five-year periods ended December 31, 2015 was 2.47%, 9.82% and 7.39%, respectively, which outperformed the returns of the comparable funds and the benchmark index, and were above the peer group average. The Trustees also considered the consistency of the Advisor's management of the Fund with its investment objective, policies, and limitations. After reviewing the short and long-term investment performance of the Fund, the Advisor's experience managing the Fund, the Advisor's historical investment performance, and other factors, the Board concluded that the investment performance of the Fund and the Advisor was satisfactory.
(Continued)
Sector Rotation Fund
Additional Information (Unaudited)
In considering the costs of the services to be provided and profits to be realized by the Advisor and its affiliates from the relationship with the Fund, the Trustees first noted that the management fee for the Fund under the Investment Advisory Agreement was 1.00% of average daily new assets. The Trustees evaluated the Advisor's staffing, personnel, and methods of operating; the education and experience of the Advisor's personnel; the Advisor's compliance program; the financial condition of the Advisor; the level of commitment to the Fund and the Advisor by the principals of the Advisor; the asset level of the Fund; and the overall expenses of the Fund, including certain prior fee waivers and reimbursements by the Advisor and the nature and frequency of advisory fee payments. The Trustees reviewed the financial statements for the Advisor and discussed the financial stability and profitability of the firm. The Advisor responded to several questions about the financial condition of the firm and reviewed a profitability analysis with the Trustees. The Trustees noted that the Advisor either makes payments to the Administrator or directly pays for certain expenses of the Fund under an Operating Plan in order to help limit the Fund's annual operating expenses. The Trustees also considered potential benefits for the Advisor in managing the Fund, including promotion of the Advisor's name, the ability for the Advisor to place small accounts into the Fund, and the potential for the Advisor to generate soft dollars from Fund trades that may benefit the Advisor as well. The Trustees then compared the fees and expenses of the Fund (including the management fee) to other funds comparable in terms of the type of fund, the nature of its investment strategy, and its style of investment management, among other factors. The Trustees determined that the Fund's management fee was higher than most of the comparable funds and lower than others, but higher than the peer group average. The Trustees also determined that the Fund's net expense ratio was higher than the comparable funds and the peer group average. The Trustees noted that the Fund was much smaller than the peer group average. The Trustees also noted that the Advisor's fee for separate account clients was typically between 0.75% and 1.80% annually. Following this comparison and upon further consideration and discussion of the foregoing, the Board concluded that the fees to be paid to the Advisor by the Fund were fair and reasonable in relation to the nature and quality of the services provided by the Advisor and that they reflected charges that were within a range of what could have been negotiated at arm's length.
In considering the extent to which economies of scale would be realized as the Fund grows and whether advisory fee levels reflect those economies of scale for the benefit of the Fund's investors, the Trustees reviewed the Fund's operational history and noted that the size of the Fund had not provided an opportunity to realize economies of scale. The Trustees then reviewed the Fund's fee arrangements for breakpoints or other provisions that would allow the Fund's shareholders to benefit from economies of scale in the future as the Fund grows. The Trustees determined that the maximum management fee would stay the same regardless of the Fund's asset levels and, therefore, did not reflect economies of scale. The Trustees noted that the Fund was a relatively small size and economies of scale were unlikely to be achievable in the near future. It was pointed out that breakpoints in the advisory fee could be reconsidered in the future. The Trustees noted that the Fund will benefit from economies of scale under the agreement with the Administrator since it utilized breakpoints. The Trustees also noted that the Advisor had agreed to make payments to the Administrator at lower asset levels in order to help limit the Fund's expenses. The Trustees determined that these arrangements provided potential savings for the benefit of the Fund's investors. Following further discussion of the Fund's asset levels, expectations for growth, and fee levels, the Board determined that the Fund's fee arrangements were fair and reasonable at the present time in relation to the nature and quality of the services provided by the Advisor.
In considering the Advisor's practices regarding brokerage and portfolio transactions, the Trustees reviewed the Advisor's standards, and performance in utilizing those standards, for seeking best execution for Fund portfolio transactions. The Trustees also considered the portfolio turnover rate for the Fund; the process by which evaluations are made of the overall reasonableness of commissions paid; the method and basis for selecting and evaluating the broker-dealers used; any allocation of portfolio business to persons affiliated with the Advisor; and the extent to which the Fund allocates portfolio business to broker-dealers who provide research, statistical, or other services (soft dollars). The Trustees noted, among other things, that the Fund rarely trades blocks of shares which require special handling and that the average commission rate for the Fund was approximately $0.01 per share. After further review and discussion, the Board determined that the Advisor's practices regarding brokerage and portfolio transactions were satisfactory.
(Continued)
Sector Rotation Fund
Additional Information (Unaudited)
In considering the Advisor's practices regarding conflicts of interest, the Trustees evaluated the potential for conflicts of interest and considered such matters as the experience and ability of the advisory personnel assigned to the Fund; the basis of decisions to buy or sell securities for the Fund and the Advisor's other accounts; the method for bunching of portfolio securities transactions; and the substance and administration of the Advisor's code of ethics. Following further consideration and discussion, the Board indicated that the Advisor's standards and practices relating to the identification and mitigation of possible conflicts of interests were satisfactory.
Based upon all of the foregoing considerations, the Board of Trustees, including a majority of the Independent Trustees, approved the Investment Advisory Agreement for the Fund.
6. Information about Trustees and Officers
The business and affairs of the Fund and the Trust are managed under the direction of the Board of Trustees of the Trust. Information concerning the Trustees and officers of the Trust and Fund is set forth below. Generally, each Trustee and officer serves an indefinite term or until certain circumstances such as their resignation, death, or otherwise as specified in the Trust's organizational documents. Any Trustee may be removed at a meeting of shareholders by a vote meeting the requirements of the Trust's organizational documents. The Statement of Additional Information of the Fund includes additional information about the Trustees and officers and is available, without charge, upon request by calling the Fund toll-free at 1-800-773-3863. The address of each Trustee and officer, unless otherwise indicated below, is 116 South Franklin Street, Rocky Mount, North Carolina 27804. The Independent Trustees each received aggregate compensation of $2,184 during the fiscal year ended September 30, 2016 from the Fund for their services to the Fund and Trust.
Name, Age
and Address | Position
held with
Fund or Trust | Length of Time Served | Principal Occupation
During Past 5 Years | Number of Portfolios in Fund Complex Overseen by Trustee | Other Directorships
Held by Trustee
During Past 5 Years |
| Independent Trustees |
Michael G. Mosley
Date of Birth: 01/1953 | Independent Trustee | Since 7/10 | Owner of Commercial Realty Services (real estate) since 2004. | 17 | None. |
Theo H. Pitt, Jr.
Date of Birth: 04/1936 | Independent Trustee | Since 9/10 | Senior Partner, Community Financial Institutions Consulting (financial consulting) since 1999; Partner, Pikar Properties (real estate) since 2001. | 17 | Independent Trustee of World Funds Trust for its twelve series, Gardner Lewis Investment Trust for its two series, Leeward Investment Trust for its one series and Hillman Capital Management Investment Trust for its one series (all registered investment companies). |
Sector Rotation Fund
Additional Information (Unaudited)
Name, Age
and Address | Position
held with
Fund or Trust | Length of Time Served | Principal Occupation
During Past 5 Years | Number of Portfolios in Fund Complex Overseen by Trustee | Other Directorships
Held by Trustee
During Past 5 Years |
| Independent Trustees |
James H. Speed, Jr.
Date of Birth: 06/1953 | Independent Trustee, Chairman | Trustee since 7/09, Chair since 5/12 | Previously President and CEO of NC Mutual Insurance Company (insurance company) from 2003 to 2015. | 17 | Independent Trustee of the Brown Capital Management Mutual Funds for its four series, Hillman Capital Management Investment Trust for its one series, and Centaur Mutual Funds Trust for its one series (all registered investment companies). Member of Board of Directors of NC Mutual Life Insurance Company. Member of Board of Directors of M&F Bancorp. Previously, Independent Trustee of New Providence Investment Trust for its one series from 2009 until 2011 (registered investment company). |
J. Buckley Strandberg
Date of Birth: 03/1960 | Independent Trustee | Since 7/09 | President of Standard Insurance and Realty (insurance and property management) since 1982. | 17 | None. |
| Other Officers |
Katherine M. Honey
Date of Birth: 09/1973 | President and Principal Executive Officer | Since 05/15 | EVP of The Nottingham Company since 2008. | n/a | n/a |
Matthew J. Beck
Date of Birth: 06/1989 | Secretary | Since 05/15 | General Counsel of The Nottingham Company since 2014. | n/a | n/a |
Ashley E. Harris Date of Birth: 03/1984 | Treasurer, Assistant Secretary and Principal Financial Officer | Since 05/15 | Fund Accounting Manager and Financial Reporting, The Nottingham Company since 2008. | n/a | n/a |
Stacey Gillespie Date of Birth: 05/1974 | Chief Compliance Officer | Since 03/16 | Compliance Director, Cipperman Compliance Services, LLC (09/15-present). Formerly, Chief Compliance Officer of Boenning & Scattergood, Inc. (2013-2015) and Director of Investment Compliance at Boenning & Scattergood, Inc. (2007-2013). | n/a | n/a |
Sector Rotation Fund
is a series of
The Starboard Investment Trust
For Shareholder Service Inquiries: | For Investment Advisor Inquiries: |
| |
Nottingham Shareholder Services | Grimaldi Portfolio Solutions, Inc. |
116 South Franklin Street | Executive Park |
Post Office Drawer 4365 | 1207 Route 9, Suite 10 |
| Rocky Mount, North Carolina 27803 | Wappingers Falls, NY 12590 |
| |
Telephone: | Telephone: |
| |
800-773-3863 | 800-773-3863 |
| |
World Wide Web @: | World Wide Web @: |
| |
ncfunds.com | ncfunds.com |
Item 2. CODE OF ETHICS.
| (a) | The registrant, as of the end of the period covered by this report, has adopted a code of ethics that applies to its Principal Executive Officer(s), Principal Financial Officer(s), and Principal Accounting Officer(s), or persons performing similar functions, regardless of whether these individuals are employed by the registrant or a third party. |
| (b) | There have been no substantive amendments during the period covered by this report. |
| (c) | The registrant has not granted, during the period covered by this report, any waivers, including an implicit waiver. |
| (d)(1) | A copy of the code of ethics that applies to the registrant's Principal Executive Officers and Principal Financial Officers is filed pursuant to Item 12.(a)(1) below. |
Item 3. AUDIT COMMITTEE FINANCIAL EXPERT.
The registrant's Board of Trustees has determined that the registrant has an audit committee financial expert, as defined in Item 3 of Form N-CSR, serving on its audit committee.
As of the date of this report, September 30, 2016, the registrant's audit committee financial expert is Mr. James H. Speed, Jr. Mr. Speed is "independent" for purposes of Item 3 of Form N-CSR.
Item 4. PRINCIPAL ACCOUNTANT FEES AND SERVICES.
| (a) | Audit Fees – Audit fees billed for the registrant for the fiscal years ended September 30, 2015 and September 30, 2016 are reflected in the table below. These amounts represent aggregate fees billed by the registrant's independent accountant, BBP, LLC ("Accountant"), in connection with the annual audits of the registrant's financial statements and for services normally provided by the Accountant in connection with the registrant's statutory and regulatory filings for those fiscal years. |
| Fund | 2015 | 2016 |
| The Sector Rotation Fund | $11,250 | $11,550 |
| (b) | Audit-Related Fees – There were no additional fees billed in the fiscal years ended September 30, 2015 and September 30, 2016 for assurance and related services by the Accountant that were reasonably related to the performance of the audit of the registrant's financial statements that were not reported under paragraph (a) of this Item. |
| (c) | Tax Fees – The tax fees billed in each of the fiscal years ended September 30, 2015 and September 30, 2016 for professional services rendered by the Accountant for tax compliance, tax advice, and tax planning are reflected in the table below. These services were for the completion of each fund's federal and state income tax returns, excise tax returns, and assistance with distribution calculations. |
| Fund | 2015 | 2016 |
| The Sector Rotation Fund | $2,000 | $2,000 |
| (d) | All Other Fees – There were no other fees paid to the Accountant which were not disclosed in Items (a) through (c) above during the last two fiscal years. |
| (e)(1) | The registrant's Board of Trustees pre-approved the engagement of the Accountant for the last two fiscal years at an audit committee meeting of the Board of Trustees called for such purpose; and will pre-approve the Accountant for each fiscal year thereafter at an audit committee meeting called for such purpose. The charter of the audit committee states that the audit committee should pre-approve any audit services and, when appropriate, evaluate and pre-approve any non-audit services provided by the Accountant to the registrant and to pre-approve, when appropriate, any non-audit services provided by the Accountant to the registrant's investment adviser, or any entity controlling, controlled by, or under common control with the investment adviser that provides ongoing services to the registrant if the engagement relates directly to the operations and financial reporting of the registrant. |
| (2) | There were no services as described in each of paragraph (b) through (d) of this Item that were approved by the audit committee pursuant to paragraph (c)(7)(i)(C) of Rule 2-01 of Regulation S-X. |
| (g) | Aggregate non-audit fees billed by the Accountant to the registrant for services rendered for the fiscal years ended September 30, 2015 and September 30, 2016 were $2,000 and $2,000, respectively. There were no fees billed by the Accountant for non-audit services rendered to the registrant's investment adviser, or any other entity controlling, controlled by, or under common control with the registrant's investment adviser. |
Item 5. AUDIT COMMITTEE OF LISTED REGISTRANTS.
Not applicable.
Item 6. SCHEDULE OF INVESTMENTS.
A copy of the schedule of investments of unaffiliated issuers as of the close of the reporting period is included as part of the report to shareholders filed under Item 1 of this Form.
Item 7. DISCLOSURE OF PROXY VOTING POLICIES AND PROCEDURES FOR CLOSED-END MANAGEMENT INVESTMENT COMPANIES.
Not applicable.
Item 8. PORTFOLIO MANAGERS OF CLOSED-END MANAGEMENT INVESTMENT COMPANIES.
Not applicable.
Item 9. PURCHASES OF EQUITY SECURITIES BY CLOSED-END MANAGEMENT INVESTMENT COMPANY AND AFFILIATED PURCHASERS.
Not applicable.
Item 10. SUBMISSION OF MATTERS TO A VOTE OF SECURITY HOLDERS.
None.
Item 11. CONTROLS AND PROCEDURES.
| (a) | The Principal Executive Officer/Principal Financial Officer has concluded that the registrant's disclosure controls and procedures are effective based on his evaluation of the disclosure controls and procedures as of a date within 90 days of the filing of this report. |
| (b) | There were no changes in the registrant's internal control over financial reporting that occurred during the registrant's second fiscal quarter of the period covered by this report that have materially affected, or are reasonably likely to materially affect, the registrant's internal control over financial reporting. |
Item 12. EXHIBITS.
(a)(1) Code of Ethics required by Item 2 of Form N-CSR is filed herewith as Exhibit 12.(a)(1).
(a)(2) Certifications required by Item 12.(a)(2) of Form N-CSR are filed herewith as Exhibit 12.(a)(2).
(a)(3) Not applicable.
(b) Certifications required by Item 12.(b) of Form N-CSR are filed herewith as Exhibit 12.(b).
SIGNATURES
Pursuant to the requirements of the Securities Exchange Act of 1934 and the Investment Company Act of 1940, the registrant has duly caused this report to be signed on its behalf by the undersigned, thereunto duly authorized.
Starboard Investment Trust
| By: (Signature and Title) | /s/ Katherine M. Honey |
Date: December 6, 2016 | Katherine M. Honey President and Principal Executive Officer The Sector Rotation Fund |
| | |
Pursuant to the requirements of the Securities Exchange Act of 1934 and the Investment Company Act of 1940, this report has been signed below by the following persons on behalf of the registrant and in the capacities and on the dates indicated.
| By: (Signature and Title) | /s/ Katherine M. Honey |
Date: December 6, 2016 | Katherine M. Honey President and Principal Executive Officer The Sector Rotation Fund |
| | |
| By: (Signature and Title) | /s/ Ashley E. Harris |
Date: December 6, 2016 | Ashley E. Harris Treasurer and Principal Financial Officer The Sector Rotation Fund |
| | |