This report and the financial statements contained herein are submitted for the general information of the shareholders of the Goodwood SMID Long/Short Fund (the "Fund"). The Fund's shares are not deposits or obligations of, or guaranteed by, any depository institution. The Fund's shares are not insured by the FDIC, Federal Reserve Board or any other agency, and are subject to investment risks, including possible loss of principal amount invested. Neither the Fund nor the Fund's distributor is a bank.
The Goodwood SMID Long/Short Fund is distributed by Capital Investment Group, Inc., Member FINRA/SIPC, 100 E. Six Forks Road, Suite 200, Raleigh, NC 27609. There is no affiliation between the Goodwood SMID Long/Short Fund, including its principals, and Capital Investment Group, Inc.
This Annual Report was first distributed to shareholders on or about August 15, 2017.
450 Laurel Street|Suite 1601
Baton Rouge, Louisiana 70801
866-841-8060 | www.goodwood-funds.com
July 1, 2017
Dear Fellow Shareholders of the Goodwood SMID Long/Short Fund:
Enclosed for your review is the Annual Report for the Goodwood SMID Long/Short Fund (the "Fund"), a series of the Starboard Investment Trust (the "Trust") for the fiscal year ending May 31, 2017.
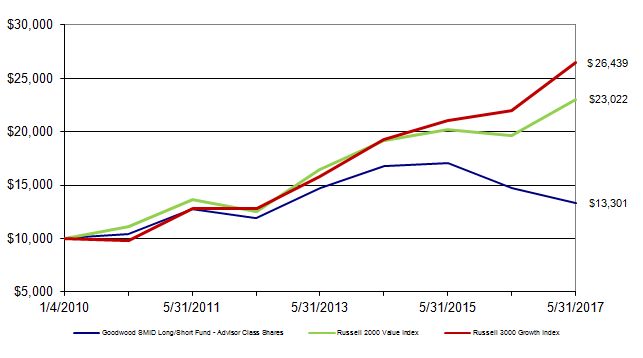
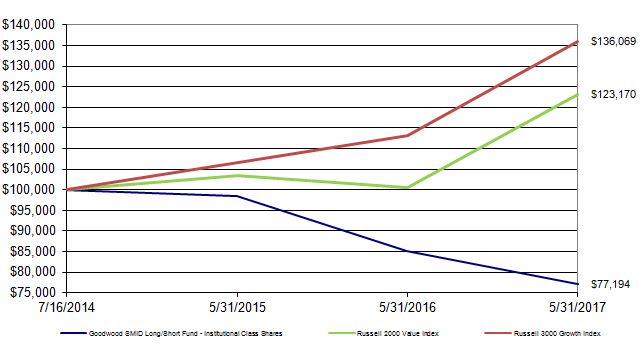
The return for the Fund during the fiscal year ended May 31, 2017 was -9.52% for the Advisor Class Shares and -9.24% for the Institutional Class Shares. This compares to 21.00% for the Russell 2000 Value Index and the 20.23% for the Russell 3000 Growth Index during that same period.
Fiscal 2017 was a particularly exciting time for Goodwood Advisors, LLC and the Goodwood SMID Long/Short Fund. Recall that when Goodwood Advisors, LLC took over portfolio management responsibility of the Fund in October 2013, the strategy was originally positioned as a long only product. A series of opportune evolutions at the firm eventually led us down the path of slightly altering the approach, most importantly, the incorporation of a short portfolio, which we began implementing in early 2016. By the fall of 2016, we'd ramped up our short portfolio to our targeted exposure, and as of October 2016, the Goodwood SMID Long/Short Fund officially became a component of the firm's Long/Short composite.
We have spent the bulk of our investment careers in the Long/Short space and have been running the strategy in separately managed accounts since the beginning of 2008. Simply put, we are long/short investors at our core. It's what we know best and how we believe that over the long-term, we can create the most attractive risk-adjusted return dynamic for our investors.
In our view, the ability to short stocks could not have happened at a more opportune time. Since March of 2009, equity indices have been on a rarely-interrupted, steady march higher and passive investing has proven particularly fruitful over the period. However, we have observed meaningful disconnects that have transpired "under the surface" – across asset classes, industries and cap spectrums, among other factors. In our view, this has created an abundant opportunity set on both the long and short side. We believe that going forward, investors will be rewarded for allocating capital to active managers with focused strategy based on a proven and repeatable process.
In reflecting on this past fiscal year, the most obvious conclusion is that by all accounts, it was a tale of two halves both for our portfolio as well as the broader small and mid-cap classes. After multiple years of underperformance in the small and mid-cap classes relative to their larger cap brethren, the second half of calendar 2016 proved to be a rewarding time, particularly for more value oriented strategies. Certainly, the Presidential election and the anticipation of a pro-growth policy agenda was a catalyst for this, but the improving underlying domestic economic data that preceded that event should not be overlooked.
Thus far in 2017, we observed the opposite. By many counts, domestic growth has softened a bit relative to last year and the anticipation of policy change has shifted to doubt about its implementation. The small cap rally that began in the Fall of 2016 appears to have grinded to a halt.
So where does that leave us? As of June 2017, small cap value had underperformed large cap growth by the largest margin since the height of the energy credit crisis in January 2016, as well as over the last 10 years. While this proved to be a headwind for our strategy, we believe these market dynamics are transitory in the medium to long term, so we have positioned the portfolio accordingly.
As of May 31, 2017, our portfolio exposures were 102% long and 43% short (145% gross and 59% net), representing our lowest net exposure in some time. As of June 30, 2017, our portfolio exposures were 94% long and 43% short (137% gross and 51% net), representing an even lower net exposure in the subsequent period.
The bulk of our long portfolio is and will always be represented by what we characterize as SMID cap compounders, or companies that are well-capitalized with a strong management team and a defensible business model. We generally look to initiate or add to positions in compounder when the market is mis-pricing the equity for we view as temporary or transient matters. Today, compounders represent roughly 75% of our long book.
The balance of our long portfolio (about 25% of our long exposure) is dedicated to more special situation investments. Special situations tend to include opportunities that do not fit neatly into our compounder framework.
On the short side of our portfolio, the bulk of our exposures are "alpha" ideas. These are focused in individual equities that we believe are at risk on both a fundamental and multiple basis. As mentioned previously, there is a wide swath of equities trading at historically stretched multiples on peaking fundamentals, which we believe justifies our higher short exposure. For the fiscal year, net investment losses were approximately equally attributable to both long investments and short sales, with losses from options contributing the least.
In one of our recent blog pieces, we reprinted a letter from March 2000 written by Julian Robertson to his Tiger Management shareholders discussing his rationale for shutting down what was then one of the largest and most successful hedge funds in the world. The gist of the letter was that, for a fundamental investor, conditions were such that it had become difficult to manage money in an environment where the process that was instrumental to his success seemed to no longer have relevance. Our contention in the blog was that even though the drivers may be different, the letter had tremendous relevance in today's environment.
We have done a tremendous amount of work on the market environment leading up to that letter. Tech bubble aside, many of the macro factors influencing equity prices from 1997 to early 2000 were eerily similar to what we have faced over the last three years. The more critical takeaway in our view was what unfolded in the subsequent period. The 2000-2004 time period proved to be a fruitful time for small cap value investors, and it was an even more opportune time to be long/short.
Of course, the underlying premise is that these times are indeed akin to that time period and we would never bet the ranch on a single assumption – particularly one based on a top-down macro view. Whether the '00-'04 phenomenon ends up rhyming with next several years or not, we are confident that a portfolio of high quality, historically cheap longs and historically expensive, fundamentally at-risk shorts leave us well positioned to generate superior risk adjusted returns over the long term.
Thank you for your continued investment consideration. Please call or email us at any time to discuss the Goodwood SMID Long/Short Fund and our investment approach.
Respectfully,
Ryan D. Thibodeaux
ryan@goodwoodcapitalmgmt.com
Joshua L. Pesses
josh@goodwoodcapitalmgmt.com
Goodwood Advisors, LLC
The views in the foregoing discussion were those of the Fund's investment advisor as of the date set forth above and may not reflect its views on the date this Annual Report is first published or anytime thereafter. These views are intended to assist shareholders in understanding their investment in the Fund and do not constitute investment advice.
Average Annual Total Return for the Quarter Ended June 30, 2017 | One Year | Since Inception* | Net Expense Ratio** | Gross Expense Ratio*** |
Goodwood SMID Long/Short Fund – Advisor Class Shares | -0.49% | 4.46% | 1.97% | 3.07% |
Goodwood SMID Long/Short Fund – Institutional Class Shares | -0.13% | -7.04% | 1.72% | 2.82% |
| Russell 2000 Value Index**** | 24.86% | 12.76% | n/a | n/a |
| Russell 3000 Growth Index**** | 20.72% | 13.86% | n/a | n/a |
The performance data quoted above represents past performance, which is not a guarantee of future results. Investment return and principal value of an investment in the Fund will fluctuate so that an investor's shares, when redeemed, may be worth more or less than their original cost. Current performance may be lower or higher than the performance data quoted. To obtain more current performance data regarding the Fund, including performance data current to the Fund's most recent month‐end, please visit ncfunds.com or call the Fund at (800) 773‐3863. Fee waivers and expense reimbursements have positively impacted Fund performance.
*The Fund's inception date is January 4, 2010.
** The Advisor has entered into an Expense Limitation Agreement with the Fund under which it has agreed to waive or reduce its fees in an amount that limits the Fund's annual operating expenses (exclusive of interest, dividends on securities sold short, taxes, brokerage commissions, borrowing costs, fees and expenses of other investment companies in which the Fund invests, and other expenditures which are capitalized in accordance with generally accepted accounting principles, other extraordinary expenses not incurred in the ordinary course of the Fund's business, and amounts, if any, payable under a Rule 12b-1 distribution plan) to not more than 1.70% of the average daily net assets of the Fund through May 31, 2018. The Expense Limitation Agreement may not be terminated prior to that date. Further, net annual operating expenses for the Fund may exceed those contemplated by the waiver due to acquired fund fees and other expenses that are not waived under the Expense Limitation Agreement. Please see the Fund's most recent Prospectus for details. Please refer to the Financial Highlights for actual results of each respective share class.
***Gross expense ratio is from the Fund's prospectus dated September 28, 2016.
****You cannot invest directly in this index. This index does not have an investment advisor and does not pay any commissions, expenses, or taxes. If this index did pay commissions, expenses, or taxes, its returns would be lower. The Fund previously compared its performance only against the Russell 3000 Growth Index. The Advisor believes the Russell 2000 Value Index is a more appropriate and accurate index against which to compare the Fund's investment strategies than the Russell 3000 Growth Index; and, therefore, the Russell 2000 Value Index is replacing the Russell 3000 Growth Index in future comparisons. The Russell 2000 Value Index is a small-cap stock market index of the bottom 2,000 stocks in the Russell 3000 Growth Index.
(RCGDW0617002)
Goodwood SMID Long/Short Fund
Notes to Financial Statements
May 31, 2017
1. Organization and Significant Accounting Policies
The Goodwood SMID Long/Short Fund ("Fund"), formerly known as the Goodwood SMID Cap Discovery Fund, is a series of the Starboard Investment Trust ("Trust"). The Trust is organized as a Delaware statutory trust and is registered under the Investment Company Act of 1940, as amended (the "1940 Act"), as an open-end management investment company. The Fund is a separate diversified series of the Trust.
The Fund commenced operations on January 4, 2010. The investment objective of the Fund is to seek capital appreciation. In order to achieve its investment objective, Goodwood Advisors, LLC ("Advisor") will seek to invest primarily in a portfolio of common stocks of companies that the Advisor believes have above-average future growth potential relative to their peers, using risk adjusted metrics as a comparative baseline.
The Fund currently has an unlimited number of authorized shares, which are divided into two classes – Advisor Class Shares and Institutional Class Shares. Each class of shares has equal rights as to assets of the Fund, and the classes are identical except that the Advisor Class Shares are subject to distribution and service fees which are further discussed in Note 3. Income, expenses (other than distribution and service fees), and realized and unrealized gains or losses on investments are allocated to each class of shares based upon its relative net assets. All classes have equal voting privileges, except where otherwise required by law or when the Trustees determine that the matter to be voted on affects only the interests of the shareholders of a particular class. The Date of Initial Public Investment for the Advisor Class Shares was January 4, 2010. The Date of Initial Public Investment for the Institutional Class Shares was July 16, 2014.
The following is a summary of significant accounting policies consistently followed by the Fund. The policies are in conformity with accounting principles generally accepted in the United States of America ("GAAP"). The Fund follows the accounting and reporting guidance in the Financial Accounting Standards Board ("FASB") Accounting Standards Codification 946 "Financial Services – Investment Companies."
Investment Valuation
The Fund's investments in securities are carried at fair value. Securities listed on an exchange or quoted on a national market system are valued at the last sales price as of 4:00 p.m. Eastern Time. Securities traded in the NASDAQ over-the-counter market are generally valued at the NASDAQ Official Closing Price. Price information on listed securities is taken from the composite exchange listing for securities traded on multiple exchanges. Other securities traded in the over-the-counter market and listed securities for which no sale was reported on that date are valued at the most recent bid price. Securities and assets for which representative market quotations are not readily available (e.g., if the exchange on which the portfolio security is principally traded closes early or if trading of the particular portfolio security is halted during the day and does not resume prior to the Fund's net asset value calculation) or which cannot be accurately valued using the Fund's normal pricing procedures are valued at fair value as determined in good faith under policies approved by the Trustees. A portfolio security's "fair value" price may differ from the price next available for that portfolio security using the Fund's normal pricing procedures. Instruments with maturities of 60 days or less are valued at amortized cost, which approximates market value. Money market securities are highly liquid financial instruments with very short maturities that are valued at their respective net asset values.
Option Valuation
Options are valued at the mean of the last quoted bid and ask prices as of 4:00 p.m. Eastern Time (the "Valuation Time"). Options will be valued on the basis of prices provided by pricing services when such prices are reasonably believed to reflect the market value of such options and may include the use of composite or National Best Bid/Offer (NBBO) pricing information provided by the pricing services. If there is an ask price but no bid price at the Valuation Time, the option shall be priced at the mean of zero and the ask price at the Valuation Time. An option should be valued using fair value pricing when (i) a reliable last quoted ask price at the Valuation Time is not readily available or (ii) the Fund's investment advisor or Fund management does not believe the prices provided by the pricing services reflect the market value of such option.
(Continued)
Goodwood SMID Long/Short Fund
Notes to Financial Statements
May 31, 2017
Fair Value Measurement
Various inputs are used in determining the value of the Fund's investments. These inputs are summarized in the three broad levels listed below:
Level 1: quoted prices in active markets for identical securities
Level 2: other significant observable inputs (including quoted prices for similar securities and identical securities in inactive markets, interest rates, credit risk, etc.)
Level 3: significant unobservable inputs (including the Fund's own assumptions in determining fair value of investments)
The availability of observable inputs can vary from security to security and is affected by a wide variety of factors, including, for example, the type of security, whether the security is new and not yet established in the marketplace, the liquidity of markets, and other characteristics particular to the security. To the extent that valuation is based on models or inputs that are less observable or unobservable in the market, the determination of fair value requires more judgment. Accordingly, the degree of judgment exercised in determining fair value is greatest for instruments categorized in Level 3.
The inputs used to measure fair value may fall into different levels of the fair value hierarchy. In such cases, for disclosure purposes, the level in the fair value hierarchy within which the fair value measurement falls in its entirety, is determined based on the lowest level input that is significant to the fair value measurement in its entirety.
The inputs or methodology used for valuing securities are not necessarily an indication of the risk associated with investing in those securities. The following table summarizes the inputs as of May 31, 2017 for the Fund's assets measured at fair value:
| | | |
| Investments (a) | | Total | | Level 1 | | Level 2 | | Level 3 |
| Assets | | | | | | | | |
| Common Stocks* | $ | 20,824,372 | $ | 20,824,372 | $ | - | $ | - |
| Limited Partnerships | | 1,570,075 | | 1,570,075 | | - | | - |
| Call Options Purchased | | 122,738 | | - | | 122,738 | | - |
| Put Options Purchased | | 362,815 | | - | | 362,815 | | - |
| U.S. Treasury Bills | | 2,747,063 | | - | | 2,747,063 | | - |
| Short-Term Investment | | 169,734 | | 169,734 | | - | | - |
| Total Assets | $ | 25,796,797 | $ | 22,564,181 | $ | 3,232,616 | $ | - |
| | | | | | | | | |
| Liabilities | | | | | | | | |
| Common Stocks* | $ | 10,684,639 | $ | 10,684,639 | $ | - | $ | - |
| Call Options Written | | 7,150 | | - | | 7,150 | | - |
| Put Options Written | | 79,500 | | - | | 79,500 | | - |
| Total Liabilities | $ | 10,771,289 | $ | 10,684,639 | $ | 86,650 | $ | - |
| | | | | | | | | |
* Please refer to the Schedule of Investments for a breakdown by sector.
(a) The Fund had no significant transfers into or out of Level 1, 2, or 3 during the fiscal year ended May 31, 2017. The Fund did not hold any Level 3 securities during the year. It is the Fund's policy to recognize transfers at the end of the reporting period.
Securities Sold Short
The Fund may sell a security short to increase investment returns. The Fund may also sell a security short in anticipation of a decline in the market value of a security. A short sale is a transaction in which the Fund sells a security that it does not own. To complete the transaction, the Fund must borrow the security in order to deliver it to the buyer. The Fund must replace the borrowed security by purchasing it at market price at the time of replacement; the price may be higher or lower than the price at which the Fund sold the security. The Fund incurs a loss from a short sale if the price of the security increases between the date of the short sale and the date on which the Fund replaces the borrowed security. The Fund realizes a profit if the price of the security declines between those dates.
(Continued)
Goodwood SMID Long/Short Fund
Notes to Financial Statements
May 31, 2017
Until the Fund replaces the borrowed security, the Fund will maintain on its books and records cash and long securities to sufficiently cover its short position on a daily basis. The collateral for the securities sold short includes securities held long as shown on the Schedule of Investments. Dividends on securities sold short are recorded as an expense on the Fund's Statement of Operations. The total dividend on securities sold short expense for the fiscal year ended May 31, 2017 was $80,570.
Purchased Options
When the Fund purchases an option, an amount equal to the premium paid by the Fund is recorded as an investment and is subsequently adjusted to the current value of the option purchased. If an option expires on the stipulated expiration date or if the Fund enters into a closing sale transaction, a gain or loss is realized. If a call option is exercised, the cost of the security acquired is increased by the premium paid for the call. If a put option is exercised, a gain or loss is realized from the sale of the underlying security, and the proceeds from such sale are decreased by the premium originally paid. Purchased options are non-income producing securities.
Option Writing
When the Fund writes an option, an amount equal to the premium received by the Fund is recorded as a liability and is subsequently adjusted to the current fair value of the option written. Premiums received from writing options that expire unexercised are treated by the Fund on the expiration date as realized gains from options written. The difference between the premium and the amount paid on effecting a closing purchase transaction, including brokerage commissions, is also treated as a realized gain or loss (depending on if the premium is less than the amount paid for the closing purchase transaction). If a call option is exercised, the premium is added to the proceeds from the sale of the underlying security in determining whether the Fund has realized a gain or loss. If a put option is exercised, the premium reduces the cost basis of the securities purchased by the Fund. The Fund, as the writer of an option, bears the market risk of an unfavorable change in the price of the security underlying the written option. Written options are non-income producing securities.
A summary of option contracts written by the Fund during the fiscal year ended May 31, 2017 were as follows:
| | Call Options | | Put Options |
Option Contracts Written | Number of Contracts | | Premiums Received | | Number of Contracts | | Premiums Received |
Options Outstanding, Beginning of Year | 100 | | $ | 4,333 | | 350 | | $ | 42,179 |
| Options written | 39,511 | | 1,942,453 | | 30,373 | | 1,698,666 |
| Options closed | (37,915) | | (1,921,438) | | (28,481) | | (1,655,228) |
| Options exercised | (300) | | (4,098) | | - | | - |
| Options expired | (616) | | (6,172) | | (667) | | (10,713) |
| Options Outstanding, End of Year | 780 | | $ | 15,078 | | 1,575 | | $ | 74,904 |
Derivative Financial Instruments
The Fund may invest in derivative financial instruments (derivatives) in order to manage risk or gain exposure to various other investments or markets. Derivatives may contain various risks including the potential inability of the counterparty to fulfill their obligations under the terms of the contract, the potential for an illiquid secondary market, and the potential for market movements which may expose the Fund to gains or losses in excess of the amounts shown on the Statement of Assets and Liabilities.
(Continued)
Goodwood SMID Long/Short Fund
Notes to Financial Statements
May 31, 2017
Derivatives are marked to market daily based upon quotations from market makers or the Fund's independent pricing services and the Fund's net benefit or obligation under the contract, as measured by the fair market value of the contract, is included in Investments, at value on the Statement of Assets and Liabilities. Net realized gains and losses and net change in unrealized appreciation and depreciation on these contracts for the year are included in the Realized and Unrealized Loss on Investments on the Statement of Operations.
The derivative instruments outstanding as of May 31, 2017 are disclosed below and the amounts of realized and changes in unrealized gains and losses on derivative instruments during the year as disclosed below serve as indicators of the volume of derivative activity for the Fund.
The following table sets forth the effect of the derivative instruments on the Statement of Assets and Liabilities as of May 31, 2017:
Derivative Type | Location | | Value |
| Equity Contracts – purchased options | Assets-Investments, at value | | $ 485,553 |
| Equity Contracts – written options | Liabilities-Options written, at value | | $ 86,650 |
The following table sets forth the effect of the derivative instruments on the Statement of Operations for the fiscal year ended May 31, 2017:
| Derivative Type | Location | Gains/Losses |
| Equity Contracts – purchased options | Net realized loss from investments | $ | (3,649,368) |
| Equity Contracts – written options | Net realized loss from options written | $ | (299,252) |
| | | |
| Equity Contracts – purchased options | Net change in unrealized appreciation on investments | $ | 220,856 |
| Equity Contracts – written options | Net change in unrealized appreciation on options written | $ | 4,195 |
| | | |
The following table presents the Fund's liabilities available for offset under a master netting arrangement of collateral pledged as of May 31, 2017:
Gross Amounts of Assets Presented in the Statement of Assets & Liabilities |
| | Gross Amounts of Recognized Liabilities | Financial Instruments Pledged | Cash Collateral Pledged | Net Amount of Assets |
Description of Liability: | | | | |
Options Written | $ | 86,650 | $ | - | $ | 86,650 | $ | - |
| Securities Sold Short | 10,684,639 | 7,046,810 | 3,637,829 | - |
Total | $ | 10,771,289 | $ | 7,046,810 | $ | 3,724,479 | $ | - |
The actual financial instruments and cash collateral pledged may be in excess of the amounts shown in the table. The table only reflects collateral amounts up to the amount of the financial instrument disclosed on the Statement of Assets and Liabilities.
Investment Transactions and Investment Income
Investment transactions are accounted for as of the date purchased or sold (trade date). Dividend income is recorded on the ex-dividend date. Certain dividends from foreign securities will be recorded as soon as the Fund is informed of the dividend if such information is obtained subsequent to the ex-dividend date. Interest income is recorded on the accrual basis and includes amortization of discounts and premiums. Gains and losses are determined on the identified cost basis, which is the same basis used for federal income tax purposes.
(Continued)
Goodwood SMID Long/Short Fund
Notes to Financial Statements
May 31, 2017
Expenses
The Fund bears expenses incurred specifically on its behalf as well as a portion of general expenses, which are allocated according to methods reviewed annually by the Trustees.
Distributions
The Fund may declare and distribute dividends from net investment income (if any) annually. Distributions from capital gains (if any) are generally declared and distributed annually. Dividends and distributions to shareholders are recorded on ex-date.
Estimates
The preparation of financial statements in conformity with GAAP requires management to make estimates and assumptions that affect the reported amounts of assets and liabilities and disclosure of contingent assets and liabilities at the date of the financial statements and the reported amounts of increases and decreases in the net assets from operations during the reported period. Actual results could differ from those estimates.
Federal Income Taxes
No provision for income taxes is included in the accompanying financial statements, as the Fund intends to distribute to shareholders all taxable investment income and realized gains and otherwise comply with Subchapter M of the Internal Revenue Code applicable to regulated investment companies.
2. Transactions with Related Parties & Service Providers
Advisor
The Fund pays a monthly fee to the Advisor calculated at the annual rate of 1.25% of the Fund's average daily net assets.
The Advisor has entered into a contractual agreement (the "Expense Limitation Agreement") with the Trust, on behalf of the Fund, under which it had agreed to waive or reduce its fees and to assume other expenses of the Fund, if necessary, in amounts that limit the Fund's total operating expenses (exclusive of interest, dividends on securities sold short, taxes, brokerage commissions, borrowing costs, fees and expenses of other investment companies in which the Fund invests, and other expenditures which are capitalized in accordance with generally accepted accounting principles, other extraordinary expenses not incurred in the ordinary course of the Fund's business, and amounts, if any, payable under a Rule 12b-1 distribution plan) to not more than 1.70% of the average daily net assets of the Fund. The current term of the Expense Limitation Agreement remains in effect until May 31, 2018. While there can be no assurance that the Expense Limitation Agreement will continue after that date, it is expected to continue from year-to-year thereafter. The Advisor cannot recoup any amounts previously waived or reimbursed.
For the fiscal year ended May 31, 2017, $271,035 in advisory fees were incurred, of which $116,463 in advisory fees were waived by the Advisor.
Administrator
The Fund pays a monthly fee to The Nottingham Company (the "Administrator") based upon the average daily net assets of the Fund and calculated at the annual rates as shown in the schedule below subject to a minimum of $2,000 per month. The Administrator also receives a fee as to procure and pay the Fund's custodian, as additional compensation for fund accounting and recordkeeping services, and additional compensation for certain costs involved with the daily valuation of securities and as reimbursement for out-of-pocket expenses. The Administrator also receives a miscellaneous compensation fee for peer group, comparative analysis, and compliance support totaling $350 per month. As of May 31, 2017, the Administrator received $4,294 in miscellaneous expenses.
(Continued)
Goodwood SMID Long/Short Fund
Notes to Financial Statements
May 31, 2017
A breakdown of the fees is provided in the following table:
| Administration Fees* | Custody Fees* | Fund Accounting Fees (minimum monthly) | Fund Accounting Fees (asset- based fee) | Blue Sky Administration Fees (annual) |
Average Net Assets | Annual Rate | Average Net Assets | Annual Rate |
| First $100 million | 0.100% | First $200 million | 0.020% | $2,250 | 0.01% | $150 per state |
| Next $150 million | 0.080% | Over $200 million | 0.009% | $500/additional class | | |
| Next $250 million | 0.060% | | | | | |
| Next $500 million | 0.050% | *Minimum monthly fees of $2,000 and $417 for Administration and Custody, respectively. |
| Next $1 billion | 0.040% |
| Over $2 billion | 0.035% |
The Fund incurred $24,182 in administration fees, $21,774 in custody fees, and $35,174 in fund accounting fees for the fiscal year ended May 31, 2017.
Compliance Services
Cipperman Compliance Services, LLC provides services as the Trust's Chief Compliance Officer. Cipperman Compliance Services, LLC is entitled to receive customary fees from the Fund for their services pursuant to the Compliance Services agreement with the Fund.
Transfer Agent
Nottingham Shareholder Services, LLC ("Transfer Agent") serves as transfer, dividend paying, and shareholder servicing agent for the Fund. For its services, the Transfer Agent is entitled to receive compensation from the Fund pursuant to the Transfer Agent's fee arrangements with the Fund. The Fund incurred $27,000 in transfer agent fees during the fiscal year ended May 31, 2017.
Distributor
Capital Investment Group, Inc. (the "Distributor") serves as the Fund's principal underwriter and distributor. The Distributor receives $5,000 per year paid in monthly installments for services provided and expenses assumed.
Certain officers of the Trust are also officers of the Administrator.
3. Distribution and Service Fees
The Trustees, including a majority of the Trustees who are not "interested persons" of the Trust as defined in the 1940 Act and who have no direct or indirect financial interest in such plan or in any agreement related to such plan, adopted a distribution plan pursuant to Rule 12b-1 of the 1940 Act (the "Plan"). The 1940 Act regulates the manner in which a regulated investment company may assume expenses of distributing and promoting the sales of its shares and servicing of its shareholder accounts. The Plan provides that the Advisor Class Shares may incur certain expenses, which may not exceed 0.25% per annum of the average daily net assets of the Fund's Advisor Class Shares for each year elapsed subsequent to adoption of the Plan, for payment to the Distributor and others for items such as advertising expenses, selling expenses, commissions, travel or other expenses reasonably intended to result in sales of shares of the Advisor Class or support servicing of shareholder accounts. For the fiscal year ended May 31, 2017, $14,063 in fees were incurred by the Advisor Class Shares of the Fund.
(Continued)
Goodwood SMID Long/Short Fund
Notes to Financial Statements
May 31, 2017
4. Purchases and Sales of Investment Securities
The aggregate cost of purchases and proceeds from sales of investment securities (excluding short-term securities) were as follows:
| Purchases of Securities | | Proceeds from Sales of Securities |
| $95,152,295 | | $91,491,120 |
There were no long-term purchases or sales of U.S Government Obligations during the fiscal year ended May 31, 2017.
5. Federal Income Tax
Distributions are determined in accordance with Federal income tax regulations, which differ from GAAP, and, therefore, may differ significantly in amount or character from net investment income and realized gains for financial reporting purposes. Financial reporting records are adjusted for permanent book/tax differences to reflect tax character but are not adjusted for temporary differences.
Management reviewed the Fund's tax positions on federal income tax returns for the open tax years May 31, 2014 through May 31, 2017, and determined that the Fund does not have a liability for uncertain tax positions. The Fund recognizes interest and penalties, if any, related to unrecognized tax benefits as income tax expense in the Statement of Operations. During the fiscal year ended May 31, 2017, the Fund did not incur any interest or penalties.
Reclassifications to the capital accounts relate primarily to differing book/tax treatment of ordinary net investment losses.
For the fiscal year ended May 31, 2017, the following reclassifications were made:
| Accumulated Net Investment Loss | $ | 236,948 |
| Accumulated Net Realized Loss | | (9,772) |
| Paid In Capital | | (227,176) |
Distributions during the fiscal year ended were characterized for tax purposes as follows:
| | | Distributions from |
For the Fiscal Year Ended | | Ordinary Income | Long-Term- Capital Gains |
| 05/31/2017 | | $ - | $ - |
| 05/31/2016 | | $ - | $ 41,749 |
At May 31, 2017, the tax-basis cost of investments and components of distributable earnings were as follows:
| Cost of Investments | $ | 16,693,936 |
| | | |
| Gross Unrealized Appreciation | $ | 716,335 |
| Gross Unrealized Depreciation | | (2,384,763) |
| Net Unrealized Depreciation | | (1,668,428) |
| | | |
| Capital Loss Carryforward | | (1,308,745) |
| Late-Year Losses | | (126,291) |
| Deferred Post-October Losses | | (1,429,197) |
| | | |
| Accumulated Deficit | $ | (4,532,661) |
| | | | | | |
(Continued)
Goodwood SMID Long/Short Fund
Notes to Financial Statements
May 31, 2017
The difference between components of distributable earnings on a tax basis and the amounts reflected in the Statement of Assets and Liabilities are primarily due to wash sale losses.
The Fund has a capital loss carryforward of $1,308,745, of which $1,238,636 is short-term in nature and $70,109 is long-term in nature, and has no expiration.
For tax purposes, the current late year losses of $126,291 were realized during the period from January 3, 2017 through May 31, 2017. These losses will be recognized for tax purposes on the first business day of the Fund's next fiscal year, June 1, 2017.
In addition, the Fund has Deferred Post-October Losses totaling $1,429,197, which are reflected in the accompanying financial statements and include net capital losses realized between November 1 and the Fund's fiscal year end that have not been recognized for tax purposes.
6. Principal Risks
Investments in the Fund are subject to investment risks, including the possible loss of some or the entire principal amount invested. There can be no assurance that the Fund will be successful in meeting its investment objective. Generally, the Fund will be subject to the following principal risks:
Portfolio Turnover Risk
The Advisor will sell portfolio securities when it is in the interests of the Fund and its shareholders to do so without regard to the length of time they have been held. As portfolio turnover may involve paying brokerage commissions and other transaction costs, there could be additional expenses for the Fund. High rates of portfolio turnover may also result in the realization of short-term capital gains and losses. Any distributions resulting from such gains will be considered ordinary income for federal income tax purposes.
Small-Cap and Mid-Cap Securities Risk
The Fund may invest in securities of small-cap and mid-cap companies, which involves greater volatility than investing in larger and more established companies. Small-cap and mid-cap companies can be subject to more abrupt or erratic share price changes than larger, more established companies. Securities of these types of companies have limited market liquidity, and their prices may be more volatile. You should expect that the value of the Fund's shares will be more volatile than a fund that invests exclusively in large-capitalization companies.
Option Risk
Option transactions in which the Fund expects to engage involve the specific risks described below: the Fund, as writer of an option, may be assigned an exercise at any time during the option period; disruptions in the markets for underlying instruments could result in losses on the Fund's investments in options; imperfect or no correlation between the option and the securities being hedged; the insolvency of a broker used by the Fund could present risks for the Fund; and market imposed restrictions may prohibit the exercise of certain options. In addition, the option activities of the Fund may affect its portfolio turnover rate and the amount of brokerage commissions paid by the Fund.
7. Commitments and Contingencies
Under the Trust's organizational documents, its officers and Trustees are indemnified against certain liabilities arising out of the performance of their duties to the Fund. In addition, in the normal course of business, the Trust entered into contracts with its service providers, on behalf of the Fund, and others that provide for general indemnifications. The Fund's maximum exposure under these arrangements is unknown, as this would involve future claims that may be made against the Fund. The Fund expects risk of loss to be remote.
Goodwood SMID Long/Short Fund
Notes to Financial Statements
May 31, 2017
8. New Accounting Pronouncement
In October 2016, the U.S. Securities and Exchange Commission ("SEC") issued a new rule, Investment Company Reporting Modernization, which, among other provisions, amends Regulation S-X to require standardized enhanced disclosures, particularly related to derivatives, in investment company financial statements. The compliance date for the amendments to Regulation S-X is for reporting periods ending after August 1, 2017. Management has reviewed the requirements and believes the adoption of the amendments to Regulation S-X will not have a material impact on the Fund's financial statements and related disclosures.
9. Subsequent Events
In accordance with GAAP, management has evaluated the need for disclosures and/or adjustments resulting from subsequent events through the date of issuance of these financial statements. This evaluation did not result in any subsequent events that necessitated disclosures and/or adjustments.
A copy of the Trust's Proxy Voting and Disclosure Policy and the Advisor's Disclosure Policy are included as Appendix B to the Fund's Statement of Additional Information and are available, without charge, upon request, by calling 800-773-3863, and on the website of the Securities and Exchange Commission ("SEC") at sec.gov. Information regarding how the Fund voted proxies relating to portfolio securities during the most recent period ended June 30, is available (1) without charge, upon request, by calling the Fund at the number above and (2) on the SEC's website at sec.gov.
The Fund files its complete schedule of portfolio holdings with the SEC for the first and third quarters of each fiscal year on Form N-Q. The Fund's Forms N-Q are available on the SEC's website at sec.gov. You may review and make copies at the SEC's Public Reference Room in Washington, D.C. Information on the operation of the Public Reference Room may be obtained by calling the SEC at 800-SEC-0330. You may also obtain copies without charge, upon request, by calling the Fund at 800-773-3863.
We are required to advise you within 60 days of the Fund's fiscal year-end regarding the federal tax status of certain distributions received by shareholders during each fiscal year. The following information is provided for the Fund's fiscal year ended May 31, 2017.
During the fiscal year ended May 31, 2017, the Fund paid no income or long-term capital gain distributions.
Dividend and distributions received by retirement plans such as IRAs, Keogh-type plans and 403(b) plans need not be reported as taxable income. However, many retirement plans may need this information for their annual information meeting.
As a shareholder of the Fund, you incur two types of costs: (1) transaction costs, including reinvested dividends or other distributions; and (2) ongoing costs, including management fees; distribution [and/or service] (12b-1) fees; and other Fund expenses. This Example is intended to help you understand your ongoing costs (in dollars) of investing in the Fund and to compare these costs with the ongoing costs of investing in other mutual funds.
The Example is based on an investment of $1,000 invested at the beginning of the period and held for the entire period from December 1, 2016 through May 31, 2017.
Please note that the expenses shown in the table are meant to highlight your ongoing costs only and do not reflect any transactional costs, such as sales charges (loads), redemption fees, or exchange fees. Therefore, the second line of the table is useful in comparing ongoing costs only, and will not help you determine the relative total costs of owning different funds. In addition, if these transactional costs were included, your costs would have been higher.