Matthew J. Beck
August 31, 2017
For the fiscal year ended August 31, 2017, the return on the Institutional Class Shares was 18.28%. The return on the Class A Shares was 17.99% and the return on the Class C Shares was 17.13%.1 This compares to 13.47% for the Russell 2000 Value Index, 9.06% for the 60% Russell 2000 Value Index/40% Barclays Government Credit Index, and 16.23% for the S&P 500 over the same period. These returns were attained with an allocation of about 40% in cash, 57% in equities, and 3% in fixed income during the fiscal year.
Please see the table below for the Fund's historical performance information through the calendar quarter ended September 30, 2017.
Average Annual Total Returns (Unaudited) | | | Gross | Net |
Period Ended September 30, 2017 | Past 1 Year | Since Inception2 | Expense Ratio3 | Expense Ratio4 |
Roumell Opportunistic Value Fund –Institutional Class Shares | 20.00% | 1.90% | 1.63% | 1.23% |
Roumell Opportunistic Value Fund –Class A Shares | 19.61% | 1.71% | 1.88% | 1.48% |
With 4.50% maximum sales load | 14.22% | 1.02% | 1.88% | 1.48% |
Roumell Opportunistic Value Fund –Class C Shares | 18.77% | -0.93% | 2.63% | 2.23% |
60% Russell 2000 Value Index, and 40% Barclays Capital U.S. Government Credit Index | 13.67% | 8.29% | N/A | N/A |
| Russell 2000 Value Index | 20.55% | 10.93% | N/A | N/A |
| S&P 500 Total Return Index | 18.61% | 13.21% | N/A | N/A |
The quoted performance data represents past performance, which is not a guarantee of future results. Investment return and principal value of an investment in the Fund will fluctuate so that an investor's shares, when redeemed, may be worth more or less than their original cost. Current performance may be lower or higher than the performance data quoted. To obtain more current performance data regarding the Fund, including performance data current to the Fund's most recent month-end, please visit ncfunds.com or call the Fund at (800)773-3863. Fee waivers and expenses reimbursements have positively impacted Fund performance.
1A maximum sales charge imposed on purchases of 4.50% is charged to the Class A shares. A maximum deferred sales charge of 1.00% is applied to the Class C shares. For the fiscal year ended August 31, 2017, the one year return with sales load on the Class A shares was 13.67 %. The one year return with the deferred sales charge on the Class C shares was 16.13%.
2The Fund's inception date is December 31, 2010.
3Gross expense ratio includes acquired fund fees and expenses and other expenses.
4The Advisor has entered into an Expense Limitation Agreement with the Fund under which it has agreed to waive or reduce its fees in an amount that limits the Fund's annual operating expenses (exclusive of acquired fund fees and expenses, interest, taxes, brokerage fees and commissions, extraordinary expenses, and payments under the Rule 12b-1 distribution plan) to not more than 1.23% of the average daily net assets of the Fund through September 30, 2018. The Expense Limitation Agreement may not be terminated prior to that date. Further, net annual operating expenses for the Fund may exceed those contemplated by the waiver due to acquired fund fees and other expenses that are not waived under the Expense Limitation Agreement. During the past fiscal year, this expense ratio was limited by a similar Operating Plan between the Advisor and the Fund's Administrator.
RAM Deep Value Investing vs. "Great Company" Investing
In May, I attended Berkshire Hathaway's annual meeting in Omaha, NE. A few weeks later, I gave a presentation at a value investment conference in Zurich, Switzerland hosted by John Mihaljevic's Manual of Ideas (MOI). MOI is a thoughtful community of value investors from all over the world. At each venue, I spoke to a number of professional investors about their approaches to investing. Buffett's shareholder meeting, often referred to as "Capitalism's Woodstock," is a cult of sorts for investors in search of "great companies." In fact, most investors, even ones with an overall value orientation, are in search of great companies. I often feel like the odd man out at these events. It's worth reflecting on why RAM does not pursue great companies but rather focuses on finding significantly undervalued securities.
What is a "great company"? A great company is most often viewed as one with a high return on invested capital (ROIC) or return on equity (ROE), and with an opportunity to reinvest its cash flows with high returns as well, which is often referred to as a return on incremental invested capital. Moreover, the reinvestment opportunities should have a long runway. Such companies are often longingly referred to as "compounders." For example, Coca Cola, a long time Buffett favorite, has an average return on equity of roughly 35% over the past 25 years - clearly qualifying as a great company.
Do great companies make great investments? Yes and no. They certainly make wonderful investment candidates if held for long enough periods of time and if their ROIC/ROE rates remain intact. Over time, these common stocks' returns will likely track their internally generated investment returns. Thus, the reasoning goes, it's best to find companies that have strong underlying investment returns because these returns will ultimately be reflected in the investor's stock returns.
The great company investor faces one overarching challenge – will the company remain great? History has proven that our dynamic, ever-disrupting economy, can humble even the best of companies. Eastman Kodak, accounting for an estimated 90% of film sales and 85% of camera sales in the mid-1970s, filed for bankruptcy in 2012. A&P, with an estimated 75% market share of U.S. grocery sales in the 1950s, filed for bankruptcy in 2015. Today, IBM is struggling in ways not imagined 10 years ago, while Whole Foods is being acquired by Amazon at a price below where its stock traded five years ago. It's worth asking: How many companies have a true economic moat around their businesses? Remember, investors typically "pay up" for these companies based on the belief that their business models are highly sustainable and consequently there's often little margin of safety, given the price paid.
An additional challenge for the great company investor is the difficulty of adding value to buying such businesses. In other words, given the investment demand for company compounders (high return on invested capital and incremental capital investments) is so high, how does one add investment value? Deep value investor and friend Marty Whitman once noted, "No successful investor ever made money buying what is popular when it is popular." Recent history may challenge Marty on this front, but we believe the basic insight is eminently rational and spot on.
Indexing is the solution commonly put forth to address the difficulty of trying to pick which great companies will remain great and which ones are mispriced. The S&P 500 Index contains many great companies. Some will maintain and/or grow their internal return rates, while others will be disrupted or simply mismanaged. Many believe they should just buy the whole basket at a low fee and go fishing. It's not an unreasonable idea. Think about it…if a business has stable, reliable cash flows and reinvestment rates, everyone has the basic numbers to appropriately price the security.
To be clear, there are investors who seem particularly adept at determining the strength of a company's competitive edge and genuine growth prospects, and can thus capture mispricing if the overall market is not sufficiently pricing in the durability of future cash flows. However, it's not a skill set that RAM possesses. It's not what we do. That said, as we have often noted, we do episodically find great companies that are momentarily in the dog house and priced accordingly. We have no qualms when it comes to purchasing such securities. After all, Wall Street is mostly comprised of followers best described as individuals trafficking in the average opinion of the average opinion. Collectively, Wall Street tends to fall in love or out of love as a group. Savvy contrarians can periodically exploit this communal tendency to hide out in the safety of crowds.
Our investment mantra lies in pursuing value not by searching for great companies, even ones that might be reasonably priced, but rather in sourcing "Out of favor, overlooked and misunderstood" securities. The rationale is simple enough to us – the odds of discovering mispricing are far greater in such an arena. Admittedly, the inputs for RAM securities are not as neat and formulaic as the inputs for great companies. While the vast majority of investors are focused on near-term company cash flow or earnings, we are decidedly interested in areas where investor interest is low because of poor current outlooks or uncertainty - two things which frighten most investors who are comforted by identifiable positive characteristics. RAM is comforted by bargain prices. The fact remains that most investors chase the same investment characteristics and therefore reduce the probability of adding investment value.
In other words, our securities possess "hair," i.e., their current profit profiles often look terrible. They definitely don't screen well, which is precisely why mispricing is much more likely. The inputs are more complicated. To properly analyze such securities, one must possess a rich ecosystem of industry contacts. Walking trade show floors often proves to be invaluable. Assessing probabilities and suitably weighing odds are the tricks of the trade. Thus, while math is at the center of what we do, deep value is not the domain of accountants, economic forecasters, and those never wanting to leave their offices. Deep value investing, as practiced by RAM, more accurately relies on the skill sets of detectives, investigative journalists, and insurance underwriters. Insurance is a game of pricing probabilities and investing similarly boils down to probabilities, not certainties.
It is important to highlight that RAM's approach is anchored in viewing businesses not strictly as going-concern entities, but also as owning assets that are potentially desirable to larger companies operating in the same industry. In fact, building a business most often involves buying smaller ones. Generous premiums to market prices are often paid because the cost to recreate the asset(s) would be even greater, while also consuming the precious commodity of time. RAM's north star has always been driven by answering a simple question: Would we take this company private, in a heartbeat, at its current price? The answer to this question is deeply informed by whether we believe the business could be sold at a materially higher price.
For RAM, resource conversions have always been source of value creation. In the past eighteen months, for instance, we have had five of our holdings bought out by larger companies: WCI Communities (WCIC), Sizmek (SZMK), Fortress Investments (FIG), Atwood Oceanics (ATW) and Covisint (COVS).
RAM mitigates the risk of buying unloved securities in several ways:
| | Balance Sheet Strength – Provides time for investment optionality to play out and ability to average down |
| | Unique Assets – If the company cannot segue to profitability as a going-concern, the assets are desirable to competitors |
| | Multiple Shots on Goal – Like to have several ways to win, providing investment redundancy |
| | Alignment of Interests – Management and board incentives |
| | Price – Demand a sizable discount to our calculation of intrinsic value |
Additionally, we add to our investment differentiation by greater portfolio concentration (often 5% to 7% positions compared to typical portfolios with 2% company weightings). It is in our DNA to be highly opportunistic. As such, we are disciplined enough to hold cash in the absence of compelling investment candidates, and are willing to average down our cost basis. Finally, it is worth noting, as we have done previously, we are committed to maintaining a modest level of assets under management that allows us to optimally execute our strategy, focusing as it does in micro and small cap securities. Simply put, large pools of money seem to be highly correlated with diminishing returns.
There is another factor worth noting when viewing our returns against benchmarks. Indexes are comprised of leveraged companies since most capital structures combine equity and debt financing. RAM is typically holding a basket of unleveraged companies. For example, the current median debt to EBITDA ratio for non-financial companies in the S&P 500 is roughly 2.3x (it's the highest ratio since 2000). Our top ten equity holdings, on the other hand, collectively not only have no debt, but also hold significant amounts of cash. Our top ten holdings as of June 30th have an average cash balance equaling roughly 40% of their market capitalizations. Company leverage flows through to underlying company investment returns as a company's ROE is a function of its return on assets and the degree to which those assets are leveraged.
What is it that we might be doing right wherein unlevered ugly ducklings are beating the debt-enhanced beautiful swans? Notwithstanding our research process and risk mitigation strategies, we believe the answer lies in one word – price. Paying a bargain price has added value. The sizable mispricing that results from the institutional and psychological bias to own what's pretty, combined with the parallel fear of being seen hanging out with the unpopular kids, can be put to profitable use. While others long to belong with the in-crowd, we long to buy cheap.
Finally, a word on the current environment's pricing of corporate assets: plant and equipment, inventory, intellectual property, etc. The compound annual growth rate in book value for the S&P 500 is 4% over the past five years, but the index itself has compounded at nearly 15% during the same period. Notwithstanding the shortcomings of book value as an analytical tool, this fact strongly suggests that prices have outstripped the growth in corporate net worth by a considerable amount in the past five years.
Yes, in the current environment, deep value securities are difficult to find…but it's not impossible. With regularity, the degree to which some security and/or industry is being taken out to the woodshed is often too dramatic. Our job is to find these situations. We feel confident that patience and discipline will pay off and feel well-positioned to take advantage of possible market disruption. However, if valuations stay elevated - a clear possibility if interest rates remain super low - our ability to find pockets of value, and to own them in meaningful size, will provide ample return optionality, in our opinion.
Recent Updates of Top Five Equity Holdings
Rosetta Stone, RST. RST's year-over-year (Y/Y) second quarter revenue was flat despite the company's exiting of several Enterprise & Education (E&E) language markets and a dramatic pull-back in consumer advertising as a result of the company's laser-like focus on profitability over revenue growth. Revenue came in at $48 million compared to FactSet consensus of $45 million. Moreover, operating expenses decreased by 20% Y/Y, representing the company's 10th consecutive quarter of expense reductions.
The gem in RST's portfolio – Lexia Learning – grew revenue at 20% Y/Y and maintained 95% plus renewal rates. In fact, in the second quarter the subscription renewal rate was above 100%, i.e., customers are not only renewing but they're buying more licenses. Bookings were down slightly but John Hass, CEO, made clear that this was the result of schools wanting to sign deals in the 3rd quarter because of new budgeting norms. John also announced that July bookings were in fact up 30% Y/Y.
For the first time in several quarters, E&E Language grew Y/Y revenue, by 4%, after accounting for countries the company chose to exit last year. John continued to communicate a very positive message for the company's new Catalyst E&E offering and noted on the call that the company is being exposed to large corporate opportunities that were previously unavailable to it given the shortcomings of its legacy product which lacked the tracking and reporting software increasingly demanded by corporate and educational clients.
Consumer was a noteworthy bright spot despite a Y/Y revenue decline of 10%. SaaS unit mix is now 66%, up from 26% in the year-ago period. The company's decision to offer a three-month lower cost subscription versus a higher one or two-year subscription, looks – so far – like a winning strategy. While the new model reduces immediate cash flow, it appears to be opening up access to a new class of consumers – paying consumer subscribers grew from 272K in 2Q16 to 375K in 2Q17. Further, the company announced that its calculation of LTV to CAC (long-term expected lifetime value of all products to customer acquisition costs including working media and the people deploying it) went from 1.5x to 1.8x, i.e., the revenue estimated to come from a consumer subscription is estimated to be 80% above cost versus 50% one year ago. Management has worked hard to find the right go-to-market strategy for the consumer business and results so far appear promising.
RST announced the hiring of Matt Hulett to the newly created position of President of Language where he will oversee the Company's language learning business. Mr. Hulett has over 20 years of leadership experience, including President of the corporate travel division of Expedia and CEO of AdXpose. This hire will free up John Hass to further pursue licensing deals that the company has identified as a significant opportunity. Recall, earlier this year RST signed a deal with a Japanese partner in which the company received a $13 million upfront payment (with virtually no associated costs) and also a revenue sharing partnership with Univision. Note, just a year ago investors questioned whether the company's consumer vertical possessed any value at all. RAM's thesis has always been anchored in Lexia first and E&E language second, with a free shot on goal with the consumer business. There's little question now, in our opinion, that the consumer freebie will be icing on the cake of this investment.
As a result of the company's successful turnaround efforts, RST expects to generate cash this year, despite ramping up its growth spending on Lexia. The company reaffirmed its FY '17 guidance, including an estimated year-end cash balance of $44 million while maintaining a debt-free balance sheet.
As of the fiscal year ended August 31, 2017, the Fund held 6.49% in Rosetta Stone, RST.
Paratek Pharmaceuticals, PRTK. "The successful completion of our planned clinical program for omadacycline and our recent pre-NDA meetings with the FDA represent important strategic milestones on our pathway to approval," said Michael Bigham, Chairman and Chief Executive Officer, Paratek. "We believe that omadacycline represents a much-needed new antibiotic treatment option in an era of rising bacterial resistance. With the data generated to date in all three Phase 3 studies, we remain confident in the path to regulatory approval in both the U.S. and EU. Based on our recent pre-NDA meetings with FDA, we will initiate our rolling submission in December of this year."
Recent Highlights
| | Reported positive top-line efficacy, safety, and tolerability data in the OPTIC study, a Phase 3 registration study of IV to once-daily oral omadacycline in community-acquired bacterial pneumonia (CABP) |
| | Reported positive top-line efficacy, safety, and tolerability data in the OASIS-2 study, a Phase 3 registration study of once-daily oral-only omadacycline in acute bacterial skin and skin structure infections (ABSSSI) |
| | Completed two pre-NDA meetings, focused on clinical/non-clinical and CMC topics, with the U.S. Food and Drug Administration confirming plans for NDA submission |
| | Received endorsement of the Pediatric Investigation Plan from the European Medicines Agency |
| | Presented 10 posters and oral presentations at American Society of Microbiology's ASM Microbe 2017 conference in New Orleans |
| | Expanded commercial, medical and drug supply teams |
| | Strengthened balance sheet, extending runway through Q2 2019, including full cost of product launch |
PRTK's announcement of its third Phase 3 trial (an oral-only dosing skin trial) was initially met with investor enthusiasm but was soon replaced with concern about elevated instances of nausea and vomiting. We believe these concerns are misplaced. First, 75% of the nausea/vomiting instances were deemed to be "mild" and occurred in the first two days when dosing is larger than subsequent days. Second, nausea/vomiting did not lead to discontinuation. In fact, more patients completed the OMD arms of all 3 studies than they did the comparator, Linezolid. Third, the efficacy against all the key pathogens tested was better for PRTK's omadacycline compared to the comparator, Linezolid. On its earnings call, the company commented, "The overall response rate with omadacycline was 87.5%, which was five percentage points higher than Linezolid." Fourth, OMD is not a first-line antibiotic, it's a second and third line drug for higher at-risk populations where mild GI is not a big concern, according to doctors to whom we've spoken. To be clear, this issue is solely associated with the oral-only dosing, not the IV to oral dosing regimen.
Omadacycline will have to compete in a competitive antibiotic marketplace with price sensitivities. However, OMD has four attributes in its favor: multiple indications at launch, IV/Oral formulation enabling early hospital discharge, no effective IV/Oral similarly classed drug to displace, and the ability to be price flexible between the IV and oral doses. Finally, PRTK will begin its Phase 2 UTI (urinary tract infection) trial in the fourth quarter of this year. If successful, PRTK will be the first antibiotic in twenty years to have three separate indications along with the other attributes highlighted above.
As of the fiscal year ended August 31, 2017, the Fund held 5.63% in Paratek Pharmaceuticals, PRTK.
Liquidity Services, LQDT. The company reported results in line with our thesis – a strong and growing GovDeals vertical with challenging operations in other segments. GMV (gross market value) of goods liquidated on the company's platforms totaled $161 million, down from $179 million in the prior year. Revenue followed the decline in GMV and came in at $66 million, down from $85 million in the prior year.
LQDT's GovDeals segment, however, continued to shine. It reported record GMV of $76 million, up 18% from last year's comparable quarter. Moreover, the take-rate (commission), is now steady at 10%, up from 8% two years ago.
Another bright spot was the company's retail supply chain marketplace (RSCG), which reported GMV up 5.1% year over year. Recall, roughly 5% of store purchased goods are returned, while roughly 15% of online purchases are returned. The increase in retail returns creates the need for reverse supply chain management and LQDT appears to be participating in this secular trend.
The company's two other verticals – Capital Assets Group (CAG) and DoD Surplus and Scrap contracts – underperformed. Bill Angrick, CEO, commented, "Our capital assets business experienced unexpected headwinds in Q3 due to lower than anticipated client sales activity and delays in large asset sales, as well as lower volumes of goods received and lower service fee revenue in our DoD Surplus contract."
The company maintains an exceptionally strong balance sheet with cash at quarter end of $114 million, down from $116 million. We continue to believe LQDT provides a highly compelling investment narrative anchored in owning the leading municipal online liquidation marketplace platform, optionality on other marketplace verticals and cost savings from the introduction of its Liquidity One initiative.
As of the fiscal year ended August 31, 2017, the Fund held 5.39% in Liquidity Services, LQDT.
Marchex, MCHX. MCHX is making meaningful strides in segueing from being a phone call generating third-party marketplace to one offering distinct phone call software analytic tools. RAM's investment thesis is anchored in the belief that MCHX's call analytics technology is robust and sits in front of positive secular growth trends, it possesses the balance sheet to weather the transition, and was purchased at a price that effectively provides us a free option on the company's successful transition to being a leading call analytics company.
First, the company is managing its transition without putting its balance sheet at risk. In its initial analysis, RAM projected a 2017 cash-burn of $10 million; year to date the company's cash has gone from $104 million to $102.4 million, a drop of only $1.6 million. Cash represents roughly 85% of the company's current market capitalization.
Second, the company's Speech Analytics capabilities are being recognized by the industry as possessing strong technology. Companies are looking for software solutions to help them better understand the raw data across millions of customer phone conversations. MCHX's technology provides real time, actionable intelligence that can be used to increase sales and improve call center operations. Analyzing customer phone conversations for keywords and phrases has reached an inflection point given the sophistication of speech recognition technology. Some industry observers have noted that speech recognition technology is today where online clicking behavior was ten years ago.
MCHX continues to develop key partnering relationships. Last year, the company announced a partnership with Facebook, allowing customers to track the efficacy of their FB ads in generating phone calls. The FB relationship is still nascent but the company reports that more beta-tests producing positive results. In the last quarter, the company announced new integrations with Adobe Cloud, enabling marketers to both increase sales and retain customers by better understanding how customers interact with their brands.
Our own channel checks have provided positive feedback on MCHX's capabilities and value-add to their business.
Finally, the company recently announced the results of an independent product review in automatic speech recognition for call analytics. Enterprise Technology Analyst Frank Ohlhorst put Marchex Speech Analytics head-to-head with recognized leader in automatic speech recognition (ASR) systems, IBM's Watson. Ohlhorst concluded, "We know this is only a sub-set of Watson's full capabilities, but for companies looking to evaluate call data and analyze consumer business phone calls, Marchex Speech Analytics proved superior. That said, there are still elements that can be compared between Marchex and Watson, which include accuracy of how voice is processed and ultimately transcribed, and Marchex outperformed Watson from that perspective."
As of the fiscal year ended August 31, 2017, the Fund held 5.03% in Marchex, MCHX.
Sandstorm Gold, SAND. Nolan Watson, President and CEO, noted, "The record production numbers and strong operating cash flow helped grow our cash balance to more than $32 million by quarter-end, enabling us to add a number of new stream and royalties to the portfolio… The quarterly results are a great example of the power of the stream and royalty business model at work." The company expects attributable gold equivalent production for 2017 to be 45,000 to 55,000 ounces. The company forecasts production to rise to over 65,000 ounces per annum by 2020.
On April 26th, the company made a major announcement of its intention to acquire all the issued shares of Mariana Resources, Ltd. that it did not already own. Mariana shareholders approved the deal. SAND will own 30% of the Hot Maden mine and local operator Lidya Mining will own 70%. Lidya is a subsidiary of Calik Holding, a large Turkish holding company run by Prime Minister Erdogen's brother-in-law with roughly $3 billion in revenue. Turkey has long been a favorite operating environment for major international mining companies. However, one cannot ignore what appears to be heightened political risk in Turkey.
Economically speaking, the Hot Maden asset is exceptionally compelling given a mine level break-even point of roughly $400/ounce as a result of its grade quality. Hot Maden's mine attributes are stunning with a Preliminary Economic Assessment estimate of 11 grams of gold per rock ton compared to the typical range of 3 to 5 grams per ton. SAND's engineers believe the HM asset could in fact yield 13 g/t to 15 g/t of gold. SAND management is quite excited about the investment, which it anticipates converting into a future stream. The effective cost of the transaction is roughly $179 million for an asset expected to begin cash flowing at $50 million beginning in 2021/2022 for what will likely be over ten years based on today's spot prices.
A Preliminary Economic Assessment report was completed by RungePincockMinarco, effective date March 1, 2017. RungePincockMinarco is the world's largest publicly listed independent group of mining technical experts, with history stretching back to 1968. In the report, in which it assumed $1,250/oz gold and $2.75/lb copper, and an 8% discount rate, Runge placed a present value (PV) on the Hot Maden Project at $1.366 billion. This translates into a PV of $410 million for SAND's 30% interest.
Perhaps most importantly, we believe investors do not appreciate the counterparty strength now embedded in SAND's portfolio (79% mid-tier and major miners rising to an estimated 97% in 2022 estimated in the company's current presentation) and the likely eventual take-out of the company in whole. In a take-out, we believe SAND's valuation would be in the 5% cap rate range.
The investment beauty of SAND (at current price levels), is an embedded value of "what is" (greater than 10% FCF generation), and embedded future income from streams simply coming on line wherein SAND has no capital outlays. Moreover, SAND possesses an unlevered capital structure.
As of the fiscal year ended August 31, 2017, the Fund held 4.97% in Sandstorm Gold, SAND.
We will continue to methodically and diligently search for out-of-favor, overlooked and misunderstood investments and stay true to being balance sheet focused, opportunistic, and thoughtful while gathering enough information to make well-informed investment decisions.
Best Regards,
Jim Roumell
Portfolio Manager
Roumell Opportunistic Value Fund
RCRAM1017002
| ROUMELL OPPORTUNISTIC VALUE FUND | | | | | | | |
| Institutional Class Shares | | | | | | | | | | |
| | | | | | | | | | | | | | | | | | |
| Performance Update (Unaudited) | | | | | | | | | | | |
| | | | | | | | | | | | | | | | | | |
| For the period from December 31, 2010 (Date of Initial Public Investment) to August 31, 2017 |
| | | | | | | | | | | | | | | | | | |
| Comparison of the Change in Value of a $25,000 Investment | | | | | | | | |
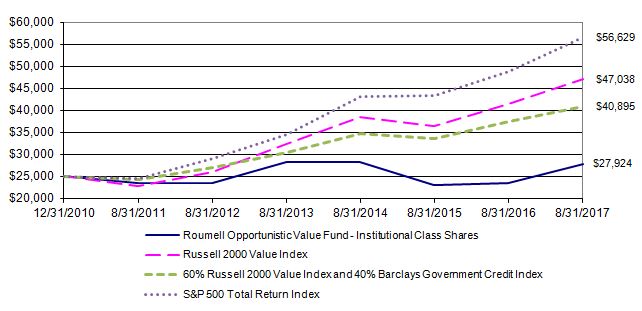
| This graph assumes the minimum initial investment of $25,000 at December 31, 2010 (Date of Initial Public Investment). All dividends and distributions are reinvested. This graph depicts the performance of the Roumell Opportunistic Value Fund Institutional Class Shares (the "Fund") versus the Russell 2000 Value Index, a blend of 60% of the Russell 2000 Value Index and 40% of the Barclays Government Credit Index, and the S&P 500 Total Return Index. It is important to note that the Fund is a professionally managed mutual fund while the indices are not available for investment and are unmanaged. The comparison is shown for illustrative purposes only. |
| | | | | | | | | | | | | | | | | | | |
| | Average Annual Total Returns | |
| | | | | | | | | | | | | | | | | | Gross | |
| | | As of | | | | One | | Five | | Since | | Inception | | Expense | |
| | | August 31, 2017 | | | Year | | Year | | Inception | Date | | Ratio* | |
| | | Institutional Class Shares | | 18.28% | | 3.55% | | 1.74% | | 12/31/10 | | 1.63% | |
| | | Russell 2000 Value Index | | 13.47% | | 12.50% | | 9.94% | | N/A | | N/A | |
| | | 60% Russell 2000 Value Index and | | | | | | | | | | |
| | | 40% Barclays Government Credit Index | 9.06% | | 8.65% | | 7.66% | | N/A | | N/A | |
| | | S&P 500 Total Return Index | | 16.23% | | 14.33% | | 13.04% | | N/A | | N/A | |
| | | | | | | | | | | | | | | | | | | |
| * The gross expense ratio shown is from the Fund's prospectus dated December 29, 2016. | | |
| | | | | | | | | | | | | | | | | | | |
| Performance quoted above represents past performance, which is no guarantee of future results. Investment return and principal value will fluctuate so that shares, when redeemed, may be worth more or less than their original cost. Current performance may be lower or higher than the performance data quoted. An investor may obtain performance data, current to the most recent month-end, by visiting ncfunds.com. |
| | | | | | | | | | | | | | | | | | | |
| The graph and table do not reflect the deduction of taxes that a shareholder would pay on Fund distributions or the redemption of Fund shares. Average annual total returns are historical in nature and measure net investment income and capital gain or loss from portfolio investments assuming reinvestments of distributions. |
| ROUMELL OPPORTUNISTIC VALUE FUND | | | | | | | |
| Class A Shares | | | | | | | | | | | | |
| | | | | | | | | | | | | | | | | | | |
| Performance Update (Unaudited) | | | | | | | | | | | | |
| | | | | | | | | | | | | | | | | | | |
| For the period from December 31, 2010 (Date of Initial Public Investment) to August 31, 2017 | | |
| | | | | | | | | | | | | | | | | | | |
| Comparison of the Change in Value of a $10,000 Investment | | | | | | | |
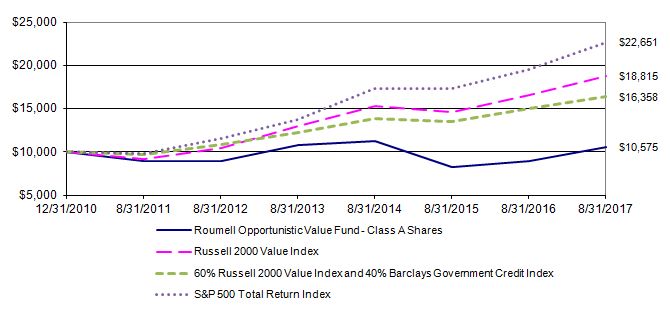
| This graph assumes an initial investment of $10,000 ($9,550 after maximum sales load of 4.50%) at December 31, 2010 (Date of Initial Public Investment). All dividends and distributions are reinvested. This graph depicts the performance of the Roumell Opportunistic Value Fund Class A Shares (the "Fund") versus the Russell 2000 Value Index, a blend of 60% of the Russell 2000 Value Index and 40% of the Barclays Government Credit Index, and the S&P 500 Total Return Index. It is important to note that the Fund is a professionally managed mutual fund while the indices are not available for investment and are unmanaged. The comparison is shown for illustrative purposes only. |
| | | | | | | | | | | | | | | | | | | | |
| | Average Annual Total Returns | |
| | | | | | | | | | | | | | | | | | | Gross | |
| | | As of | | | | | | One | | Five | Since | | Inception | | Expense | |
| | | August 31, 2017 | | | | | Year | | Year | Inception | Date | | Ratio* | |
| | | Class A Shares - No Sales Load | | | 17.99% | | 3.28% | 1.41% | | 12/31/10 | | 1.88% | |
| | | Class A Shares - 4.50% Maximum Sales Load | | 13.67% | | 2.51% | 0.84% | | 12/31/10 | | 1.88% | |
| | | Russell 2000 Value Index | | | | 13.47% | | 12.50% | 9.94% | | N/A | | N/A | |
| | | 60% Russell 2000 Value Index and | | | | | | | | | | | |
| | | | 40% Barclays Government Credit Index | | 9.06% | | 8.65% | 7.66% | | N/A | | N/A | |
| | | S&P 500 Total Return Index | | | | 16.23% | | 14.33% | 13.04% | | N/A | | N/A | |
| * The gross expense ratio shown is from the Fund's prospectus dated December 29, 2016. | | | |
| | | | | | | | | | | | | | | | | | | | |
| Performance quoted above represents past performance, which is no guarantee of future results. Investment return and principal value will fluctuate so that shares, when redeemed, may be worth more or less than their original cost. Current performance may be lower or higher than the performance data quoted. An investor may obtain performance data, current to the most recent month-end, by visiting ncfunds.com. |
| | | | | | | | | | | | | | | | | | | | |
| The graph and table do not reflect the deduction of taxes that a shareholder would pay on Fund distributions or the redemption of Fund shares. Average annual total returns are historical in nature and measure net investment income and capital gain or loss from portfolio investments assuming reinvestments of distributions. |
| ROUMELL OPPORTUNISTIC VALUE FUND | | | | | | | | | | | |
| Class C Shares | | | | | | | | | | | | | | |
| | | | | | | | | | | | | | | | | | | | |
| Performance Update (Unaudited) | | | | | | | | | | | | | |
| | | | | | | | | | | | | | | | | | | | |
| For the period from July 30, 2013 (Date of Initial Public Investment) to August 31, 2017 | | | | | | |
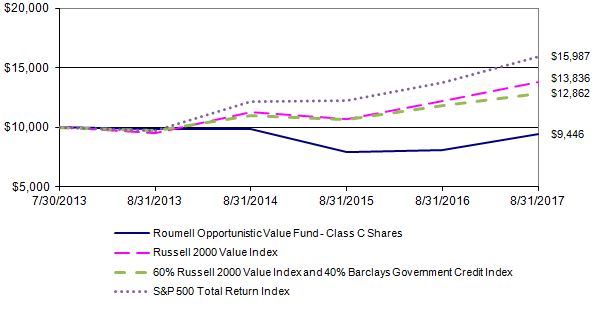
| This graph assumes an initial investment of $10,000 at July 30, 2013 (Date of Initial Public Investment). All dividends and distributions are reinvested. This graph depicts the performance of the Roumell Opportunistic Value Fund Class C Shares (the "Fund") versus the Russell 2000 Value Index, a blend of 60% of the Russell 2000 Value Index and 40% of the Barclays Government Credit Index, and the S&P 500 Total Return Index. It is important to note that the Fund is a professionally managed mutual fund while the indices are not available for investment and are unmanaged. The comparison is shown for illustrative purposes only. |
| | | | | | | | | | | | | | | | | | | |
| | Average Annual Total Returns | |
| | | | | | | | | | | | | | | | | | Gross | |
| | | As of | | | | One | | Three | | Since | | Inception | | Expense | |
| | | August 31, 2017 | | | | Year | | Year | | Inception | | Date | | Ratio* | |
| | | Class C Shares | | | | 17.13% | | -1.38% | | -1.39% | | 07/30/13 | | 2.63% | |
| | | Russell 2000 Value Index | | | 13.47% | | 7.06% | | 8.26% | | N/A | | N/A | |
| | | 60% Russell 2000 Value Index and | | | | | | | | | | |
| | | | 40% Barclays Government Credit Index | 9.06% | | 5.44% | | 6.35% | | N/A | | N/A | |
| | | S&P 500 Total Return Index | | 16.23% | | 9.53% | | 12.15% | | N/A | | N/A | |
| | | | | | | | | | | | | | | | | | | |
| * The gross expense ratio shown is from the Fund's prospectus dated December 29, 2016. | | | |
| | | | | | | | | | | | | | | | | | | |
| Performance quoted above represents past performance, which is no guarantee of future results. Investment return and principal value will fluctuate so that shares, when redeemed, may be worth more or less than their original cost. Current performance may be lower or higher than the performance data quoted. An investor may obtain performance data, current to the most recent month-end, by visiting ncfunds.com. |
| | | | | | | | | | | | | | | | | | | |
| The graph and table do not reflect the deduction of taxes that a shareholder would pay on Fund distributions or the redemption of Fund shares. Average annual total returns are historical in nature and measure net investment income and capital gain or loss from portfolio investments assuming reinvestments of distributions. |
| ROUMELL OPPORTUNISTIC VALUE FUND | | | | |
| | | | | | | | | | | |
| Schedule of Investments | | | | | | | |
| | | | | | | | | | | |
| As of August 31, 2017 | | | | | | | |
| | | | | | | Shares | | Cost | | Value (Note 1) |
| | | | | | | | | | | |
| COMMON STOCKS - 47.99% | | | | | | |
| | | | | | | | | | | |
| | Business Services - 6.49% | | | | | | |
| | * | Rosetta Stone, Inc. | | | 462,554 | $ | 3,477,583 | $ | 4,255,497 |
| | | | | | | | | | | |
| | Consumer Discretionary - 3.07% | | | | | | |
| | | Aimia, Inc. | | | 1,150,000 | | 1,449,857 | | 2,012,500 |
| | | | | | | | | | | |
| | Energy - 0.43% | | | | | | | |
| | * | Goodrich Petroleum Corp. | | 33,030 | | 1,528,466 | | 284,058 |
| | | | | | | | | | | |
| | Financials - 3.66% | | | | | | | |
| | * | Great Elm Capital Group, Inc. | | 363,799 | | 1,234,739 | | 1,200,537 |
| | * | Hallmark Financial Services, Inc. | | 117,000 | | 1,211,983 | | 1,199,250 |
| | | | | | | | | | | 2,399,787 |
| | Health Care - 5.63% | | | | | | | |
| | * | Paratek Pharmaceuticals, Inc. | | 130,941 | | 1,935,534 | | 3,692,536 |
| | | | | | | | | | | |
| | Information Technology - 21.37% | | | | | | |
| | * | Edgewater Technology, Inc. | | 265,900 | | 1,860,256 | | 1,701,760 |
| | * | GSI Technology, Inc. | | | 210,670 | | 1,091,414 | | 1,398,849 |
| | * | Liquidity Services, Inc. | | 619,303 | | 4,173,173 | | 3,530,027 |
| | * | Marchex, Inc. | | | 1,067,000 | | 3,020,807 | | 3,297,030 |
| | * | Seachange International, Inc. | | 867,720 | | 2,212,033 | | 2,264,749 |
| | * | The Rubicon Project, Inc. | | 482,470 | | 2,901,247 | | 1,814,087 |
| | | | | | | | | | | 14,006,502 |
| | Materials - 4.97% | | | | | | | |
| | * | Colossus Minerals, Inc. | | 1,247,121 | | 1,670,952 | | 1,247 |
| | * | Sandstorm Gold Ltd. | | | 686,980 | | 2,467,941 | | 3,256,285 |
| | | | | | | | | | | 3,257,532 |
| | Real Estate - 2.37% | | | | | | | |
| | * | Five Point Holdings LLC | | 107,000 | | 1,575,389 | | 1,514,050 |
| | | Lai Fung Holdings Ltd. | | 24,000 | | 26,410 | | 37,109 |
| | | | | | | | | | | 1,551,159 |
| | | | | | | | | | | |
| | | Total Common Stocks (Cost $31,837,784) | | | | | 31,459,571 |
| | | | | | | | | | | |
| | | | | | | | | | | |
| | | | | | | | | | (Continued) |
| ROUMELL OPPORTUNISTIC VALUE FUND | | | | | |
| | | | | | | | | | | |
| Schedule of Investments - Continued | | | | | | |
| | | | | | | | | | | |
| As of August 31, 2017 | | | | | | | |
| | | | | | | Shares | | Cost | | Value (Note 1) |
| | | | | | | | | | | |
| CLOSED-END FUND - 1.87% | | | | | | |
| | | Medley Capital Corp. | | | 204,000 | $ | 1,316,742 | $ | 1,226,040 |
| | | | | | | | | | | |
| | | Total Closed-End Fund (Cost $1,316,742) | | | | | 1,226,040 |
| PREFERRED STOCKS - 7.63% | | | | | | |
| | | | | Maturity | | | | | | |
| | | Eagle Point Credit | Date | Interest Rate | | | | | |
| | | | Co., Inc. | 9/30/2027 | 6.750% | 52,000 | | 1,300,000 | | 1,330,992 |
| | | Oxford Lane Capital | | | | | | | |
| | | | Corp. | 6/30/2024 | 6.750% | 62,630 | | 1,565,750 | | 1,581,408 |
| | | TICC Capital Corp. | 3/30/2024 | 6.500% | 80,010 | | 2,001,507 | | 2,089,861 |
| | | | | | | | | | | |
| | | Total Preferred Stocks (Cost $4,867,257) | | | | | 5,002,261 |
| | | | | | | Interest | | Maturity | | |
| CONVERTIBLE BOND - 0.00% | Par | Rate | | Date | | |
| | μ | BPZ Resources, Inc. | $ | 1,657,000 | 8.500% | | 10/1/2017 | | 2,071 |
| | | | | | | | | | | |
| | | Total Convertible Bond (Cost $1,550) | | | | | 2,071 |
| | | | | | | Interest | | Maturity | | |
| CORPORATE BOND - 2.56% | Par | Rate | | Date | | |
| | | CSI Compressco LP | $ | 1,856,000 | 7.250% | | 8/15/2022 | | 1,677,360 |
| | | | | | | | | | | |
| | | Total Corporate Bond (Cost $1,390,566) | | | | | 1,677,360 |
| U.S. TREASURY SECURITIES - 29.71% | | Interest | | Maturity | | |
| | | | | | Par | Rate | | Date | | |
| | † | U.S. Treasury Bill | | $ | 1,500,000 | 0.000% | | 9/14/2017 | | 1,499,528 |
| | † | U.S. Treasury Bill | | 4,000,000 | 0.000% | | 9/21/2017 | | 3,998,028 |
| | | U.S. Treasury Bill | | 6,000,000 | 0.000% | | 9/28/2017 | | 5,995,777 |
| | | U.S. Treasury Note | | 5,500,000 | 1.000% | | 3/15/2019 | | 5,475,078 |
| | † | U.S. Treasury Note | | 2,500,000 | 1.750% | | 3/31/2022 | | 2,507,226 |
| | | | | | | | | | | |
| | | Total U.S. Treasury Securities (Cost $19,464,373) | | | | | 19,475,637 |
| | | | | | | Strike | | Exercise | | |
| WARRANTS - 0.01% | | Shares | Price | | Date | | |
| | E*ə | Colossus Minerals, Inc. | 624,807 | $ | 1.00 | | 3/17/2020 | | 6,248 |
| | | | | | | | | | | |
| | | Total Warrants (Cost $438) | | | | | | 6,248 |
| | | | | | | | | | | |
| | | | | | | | | | | (Continued) |
| ROUMELL OPPORTUNISTIC VALUE FUND | | | | |
| | | | | | | | | | | |
| Schedule of Investments - Continued | | | | | | |
| | | | | | | | | | | |
| As of August 31, 2017 | | | | | | | |
| | | | | | | | | Shares | | Value (Note 1) |
| | | | | | | | | | | |
| SHORT-TERM INVESTMENT - 10.36% | | | | | | |
| | | Federated Treasury Obligations Fund - Institutional | | | | |
| | | | Class Shares, 0.87% § | | | | 6,790,566 | $ | 6,790,566 |
| | | | | | | | | | | |
| | | Total Short-Term Investment (Cost $6,790,566) | | | | | 6,790,566 |
| | | | | | | | | | | |
| Total Value of Investments (Cost $65,669,276) - 100.13% | | | | $ | 65,639,754 |
| | | | | | | | | | | |
| Total Value of Options Written (Premiums Received $211,281) - (0.14)% | | | | (89,950) |
| | | | | | | | | | | |
| Other Assets Less Liabilities - 0.01% | | | | | | 2,203 |
| | | | | | | | | | | |
| | Net Assets - 100.00% | | | | | | $ | 65,552,007 |
| | | | | | | | | | | |
| | | * | Non-income producing investment | | | | | |
| | | § | Represents 7 day effective yield | | | | | | |
| | | † | All or a portion of security is segregated as collateral for options written. | | |
| | | | | | | | | | | |
| | | μ | The Fund was issued the escrow security, cusip 055ESC206, as a result of a confirmed Plan of Liquidation for BPZ Resources, Inc., interest rate of 8.500% and maturity date of October 1, 2017. On January 4, 2016, the Fund received a distribution totaling $61,934 and the escrow security. On April 5, 2016, an additional distribution was made to holders totaling $159,539. On October 18, 2016, an additional distribution was made to holders totaling $28,050. The escrow security was established for possible future distributions. As of August 31, 2017, no additional distributions had been made. The security is valued at its closing market price via the primary pricing source established by the Fund's Administrator and approved by the Fund's Board of Trustees. The maturity date of the security is a placeholder and is subject to change until all distributions have been made to the holders of the escrow security as determined by BPZ Resources, Inc. |
| | | | | | | | | | | |
| | | ə | Security is fair valued using the pricing policies approved by the Fund's Board of Trustees. In determining the price of the security, the Board of Trustees considered the issuer, terms, and the size of the Fund's investment in the security. As of August 31, 2017, the security represents 0.01% of net assets and is not considered a material portion of the Fund. |
| | | | |
| See Notes to Financial Statements | | | | | | |
| ROUMELL OPPORTUNISTIC VALUE FUND | | | | |
| | | | | | | | | | | |
| Schedule of Investments - Schedule of Options Written | | | | | |
| | | | | | | | | | | |
| As of August 31, 2017 | | | | | | | |
| | | | | Contracts (a) | Notional Value | Exercise Price | | Expiration Date | | Value (Note 1) |
| | | | | | | | | | | |
| OPTIONS WRITTEN - 0.14% | | | | | | |
| | | | | | | | | | | |
| | PUT OPTIONS WRITTEN - 0.14% | | | | | | |
| | | * | DSW, Inc. | 1,250 | $ | 1,875,000 | $ | 15.00 | | 10/20/2017 | $ | 18,750 |
| | | * | Ford Motor Co. | 1,900 | 1,900,000 | 10.00 | | 12/15/2017 | | 38,950 |
| | | * | Palo Alto Networks, | | | | | | |
| | | | Inc. | 150 | 1,350,000 | 90.00 | | 9/15/2017 | | 32,250 |
| | | | | | | | | | | |
| | | Total Put Options Written (Premiums Received $211,281) | | | $ | 89,950 |
| | | | | | | | | | | |
| | Total Options Written (Premiums Received $211,281) | | | $ | 89,950 |
| | | | | | | | | | | |
| | | (a) | Each contract is equivalent to 100 shares of the underlying common stock. | |
| | | | | | | | | | | |
| | | | | | | | | | | |
| See Notes to Financial Statements | | | | | | |
| ROUMELL OPPORTUNISTIC VALUE FUND | | | | | |
| | | | | | | | | | | |
| Schedule of Investments - Summary of Investments (Unaudited) | | | | | |
| | | | | | | | | | | |
| As of August 31, 2017 | | | | | | | |
| | | | | | | | | | | |
| | | | | | | | | | | |
| | | | Summary of Investments | | | | | | |
| | | | by Sector | | | % of Net | | | | |
| | | | | | | Assets | | Value | | |
| | | | Business Services | | | 6.49% | $ | 4,255,497 | | |
| | | | Consumer Discretionary | | 3.07% | | 2,012,500 | | |
| | | | Energy | | | 0.43% | | 284,058 | | |
| | | | Financials | | | 3.66% | | 2,399,787 | | |
| | | | Health Care | | | 5.63% | | 3,692,536 | | |
| | | | Information Technology | | 21.37% | | 14,006,502 | | |
| | | | Materials | | | 4.97% | | 3,257,532 | | |
| | | | Real Estate | | | 2.37% | | 1,551,159 | | |
| | | | Closed-End Fund | | | 1.87% | | 1,226,040 | | |
| | | | Preferred Stocks | | | 7.63% | | 5,002,261 | | |
| | | | Convertible Bond | | | 0.00% | | 2,071 | | |
| | | | Corporate Bond | | | 2.56% | | 1,677,360 | | |
| | | | U.S. Treasury Securities | | 29.71% | | 19,475,637 | | |
| | | | Warrants | | | 0.01% | | 6,248 | | |
| | | | Short-Term Investment | | 10.36% | | 6,790,566 | | |
| | | | Put Options Written | | (0.14%) | | (89,950) | | |
| | | | Other Assets Less Liabilities | | 0.01% | | 2,203 | | |
| | | | Total Net Assets | | | 100.00% | $ | 65,552,007 | | |
| | | | | | | | | | | |
| | | | | | | | | | | |
| | | | | | | | | | | |
| See Notes to Financial Statements | | | | | | |
| ROUMELL OPPORTUNISTIC VALUE FUND | | |
| | | | | | | | |
| Statement of Assets and Liabilities | | |
| | | | | | | | |
| As of August 31, 2017 | | | |
| | | | | | | | |
| Assets: | | | | | |
| | Investments, at value (Cost $65,669,276) | $ | 65,639,754 |
| | Receivables: | | | |
| | | Deposits at Broker | | | 247,165 |
| | | Fund shares sold | | | 1,070 |
| | | Dividends and interest | | 87,318 |
| | Prepaid expenses: | | | |
| | | Fund accounting fees | | 3,250 |
| | | | | | | | |
| | Total assets | | | 65,978,557 |
| | | | | | | | |
| Liabilities: | | | | | |
| | Options written, at value (Premiums received $211,281) | | 89,950 |
| | Payables: | | | | |
| | | Fund shares repurchased | | 266,282 |
| | Accrued expenses: | | | |
| | | Advisory fees | | | 49,029 |
| | | Professional fees | | | 14,800 |
| | | Trustee fees and meeting expenses | | 1,333 |
| | | Interest expense | | | 1,309 |
| | | Custody fees | | | 1,287 |
| | | Registration and filing fees | | 993 |
| | | Shareholder fulfillment fees | | 470 |
| | | Distribution and service fees - Class A Shares and Class C Shares | | 417 |
| | | Miscellaneous expenses | | 350 |
| | | Compliance fees | | | 182 |
| | | Administration fees | | | 148 |
| | | | | | | | |
| | Total liabilities | | | 426,550 |
| | | | | | | | |
| Net Assets | | | | $ | 65,552,007 |
| | | | | | | | |
| Net Assets Consist of: | | | |
| | Paid in Beneficial Interest | $ | 67,525,895 |
| | Accumulated net investment loss | | (37,202) |
| | Accumulated net realized loss on investments | | (2,028,495) |
| | Net unrealized appreciation on investments and options written | | 91,809 |
| | Total Net Assets | | $ | 65,552,007 |
| | | | | | | | |
| | | | | | | | (Continued) |
| ROUMELL OPPORTUNISTIC VALUE FUND | | |
| | | | | | | | |
| Statement of Assets and Liabilities - Continued | | |
| | | | | | | | |
| As of August 31, 2017 | | | |
| | | | | | | | |
| Institutional Class Shares of beneficial interest outstanding, no par value (a) | | 7,123,993 |
| | Net Assets | | | $ | 64,623,787 |
| | Net Asset Value, Offering Price and Redemption Price Per Share (b) | $ | 9.07 |
| | | | | | | | |
| Class A Shares of beneficial interest outstanding, no par value (a) | | 72,002 |
| | Net Assets | | | $ | 643,664 |
| | Net Asset Value and Redemption Price Per Share (b) | $ | 8.94 |
| | Offering Price Per Share ($8.94÷ 95.50%) | $ | 9.36 |
| | | | | | | | |
| Class C Shares of beneficial interest outstanding, no par value (a) | | 38,098 |
| | Net Assets | | | $ | 284,556 |
| | Net Asset Value, Offering Price and Redemption Price Per Share (b)(c) | $ | 7.47 |
| | | | | | | | |
| (a) | Unlimited Authorized Shares | | |
| (b) | The fund charges a 1% redemption fee on redemptions made within 60 days of initial purchase. |
| (c) | Contingent deferred sales charge for Class C Shares is imposed on proceeds redeemed within one year of purchase date (Note 1). |
| | | | |
| | | | | | | | |
| | | | | | | | |
| See Notes to Financial Statements | | |
| ROUMELL OPPORTUNISTIC VALUE FUND | | |
| | | | | | | | |
| Statement of Operations | | |
| | | | | | | | |
| For the Year Ended August 31, 2017 | | |
| | | | | | | | |
| Investment Income: | | |
| | Interest | | | $ | 522,390 |
| | Dividends | | | | 217,877 |
| | Total Investment Income | | 740,267 |
| | | | | | | | |
| Expenses: | | | | | |
| | Advisory fees (Note 2) | | 512,742 |
| | Administration fees (Note 2) | | 55,733 |
| | Registration and filing fees | | 34,058 |
| | Fund accounting fees (Note 2) | | 31,580 |
| | Professional fees | | 22,599 |
| | Transfer agent fees (Note 2) | | 21,000 |
| | Shareholder fulfillment fees | | 17,622 |
| | Custody fees (Note 2) | | 14,193 |
| | Compliance fees (Note 2) | | 12,001 |
| | Trustee fees and meeting expenses | | 8,058 |
| | Interest expense | | 5,814 |
| | Miscellaneous expenses (Note 2) | | 4,200 |
| | Insurance fees | | 3,756 |
| | Security pricing fees | | 3,710 |
| | Distribution and service fees - Class C Shares (Note 3) | | 3,186 |
| | Distribution and service fees - Class A Shares (Note 3) | | 1,687 |
| | | | | | | | |
| | Total Expenses | | 751,939 |
| | | | | | | | |
| | Advisory fees waived (Note 2) | | (63,173) |
| | | | | | | | |
| | Net Expenses | | | 688,766 |
| | | | | | | | |
| Net Investment Income | | 51,501 |
| | | | | | | | |
| Realized and Unrealized Gain on Investments: | | |
| | | | | | | | |
| | Net realized gain from: | | |
| | | Investments and foreign currency transactions | | 7,182,973 |
| | | Options written | | 40,388 |
| | | | | | | | 7,223,361 |
| | Net change in unrealized appreciation on: | | |
| | | Investments and translation of assets and liabilities of foreign currency | | 1,806,496 |
| | | Options written | | 121,331 |
| | | | | | | | 1,927,827 |
| | | | | | | | |
| Net Realized and Unrealized Gain on Investments | | 9,151,188 |
| | | | | | | | |
| Net Increase in Net Assets Resulting from Operations | $ | 9,202,689 |
| | | | | | | | |
| See Notes to Financial Statements | | |
| | | | | | | | |
| ROUMELL OPPORTUNISTIC VALUE FUND | | | | |
| | | | | | | | | | | | |
| Statements of Changes in Net Assets | | | | | | | |
| | | | | | | | | | | | |
| | | | | | | | | | | | |
| For the Year Ended August 31, | | | | | 2017 | | 2016 |
| | | | | | | | | | | | |
| Operations: | | | | | | | | |
| | Net investment income | | | | $ | 51,501 | $ | 362,393 |
| | Net realized gain (loss) from investments, foreign | | | | | | |
| | | currency transactions, and options written | | | | 7,223,361 | | (9,022,502) |
| | Net change in unrealized appreciation (depreciation) on | | | | |
| | | investments, translation of assets and liabilities | | | | | | |
| | | in foreign currency, and options written | | | | 1,927,827 | | 10,556,791 |
| | | | | | | | | | | | |
| Net Increase in Net Assets Resulting from Operations | | | 9,202,689 | | 1,896,682 |
| | | | | | | | | | | | |
| Distributions to Shareholders: | | | | | | | |
| | Net investment income | | | | | | | |
| | | Institutional Class Shares | | | | | - | | (54,086) |
| | | Class A Shares | | | | | - | | (1,751) |
| | | Class C Shares | | | | | - | | (5,455) |
| | | | | | | | | | | | |
| | Return of capital | | | | | | | |
| | | Institutional Class Shares | | | | | (75,979) | | - |
| | | Class A Shares | | | | | (1,215) | | - |
| | | Class C Shares | | | | | (1,079) | | - |
| | | | | | | | | | | | |
| Decrease in Net Assets Resulting from Distributions | | | (78,273) | | (61,292) |
| | | | | | | | | | | | |
| Beneficial Interest Transactions: | | | | | | | |
| | Shares sold | | | | | | 11,537,821 | | 19,863,818 |
| | Redemption fees | | | | | 454 | | (261) |
| | Reinvested dividends and distributions | | | | 67,389 | | 54,875 |
| | Shares repurchased | | | | | (3,598,868) | | (15,787,586) |
| | | | | | | | | | | | |
| Increase in Net Assets from Beneficial Interest Transactions | | 8,006,796 | | 4,130,846 |
| | | | | | | | | | | | |
| Net Increase in Net Assets | | | | | 17,131,212 | | 5,966,236 |
| | | | | | | | | | | | |
| Net Assets: | | | | | | | | |
| | Beginning of Year | | | | | 48,420,795 | | 42,454,559 |
| | End of Year | | | | | $ | 65,552,007 | $ | 48,420,795 |
| | | | | | | | | | | | |
| Accumulated Net Investment Loss | | | | $ | (37,202) | $ | (128,030) |
| | | | | | | | | | | | |
| | | | | | | | | | | | |
| See Notes to Financial Statements | | | | | | (Continued) |
| ROUMELL OPPORTUNISTIC VALUE FUND | | | | | | |
| | | | | | | | | | | | |
| Statements of Changes in Net Assets - Continued | | | | | | |
| | | | | | | | | | | | |
| | | | | | | | | | | | |
| For the Year ended August 31, | 2017 | | 2016 |
| | | | | | | | | | | | |
| Share Information: | | | | | | | |
| | Institutional Class Shares | Shares | | Amount | | Shares | | Amount |
| | | Shares sold | 1,352,954 | $ | 11,529,651 | | 2,858,824 | $ | 19,832,043 |
| | | Redemption fees | - | | 454 | | - | | (261) |
| | | Reinvested dividends | | | | | | | |
| | | | and distributions | 8,147 | | 65,095 | | 7,041 | | 47,735 |
| | | Shares repurchased | (412,541) | | (3,352,868) | | (2,150,142) | | (15,151,192) |
| Net Increase in Beneficial | | | | | | | |
| Interest and Shares | 948,560 | $ | 8,242,332 | | 715,723 | $ | 4,728,325 |
| | | | | | | | | | | | |
| | Class A Shares | Shares | | Amount | | Shares | | Amount |
| | | Shares sold | 910 | $ | 8,170 | | 2,358 | $ | 16,133 |
| | | Reinvested dividends | | | | | | | |
| | | | and distributions | 154 | | 1,215 | | 251 | | 1,685 |
| | | Shares repurchased | (18,007) | | (154,447) | | (46,860) | | (323,445) |
| Net Decrease in Beneficial | | | | | | | |
| Interest and Shares | (16,943) | $ | (145,062) | | (44,251) | $ | (305,627) |
| | | | | | | | | | | | |
| | Class C Shares | Shares | | Amount | | Shares | | Amount |
| | | Shares sold | - | $ | - | | 2,584 | $ | 15,642 |
| | | Reinvested dividends | | | | | | | |
| | | | and distributions | 163 | | 1,079 | | 959 | | 5,455 |
| | | Shares repurchased | (12,857) | | (91,553) | | (51,540) | | (312,949) |
| Net Decrease in Beneficial | | | | | | | |
| Interest and Shares | (12,694) | $ | (90,474) | | (47,997) | $ | (291,852) |
| | | | | | | | | | | | |
| | | | | | | | | | | | |
| | | | | | | | | | | | |
| | | | | | | | | | | | |
| See Notes to Financial Statements | | | | | | |
| ROUMELL OPPORTUNISTIC VALUE FUND | | | | | | | |
| | | | | | | | | | | | | | | | |
| Financial Highlights - Institutional Class Shares | | | | | | | | | |
| | | | | | | | | | | | | | | | |
| For a share outstanding | | August 31, |
| during the fiscal years ended | | 2017 | | 2016 | | 2015 | | 2014 | | 2013 | |
| | | | | | | | | | | | | | | | |
| Net Asset Value, | | | | | | | | | | | |
| Beginning of Year | $ | 7.68 | $ | 7.48 | $ | 10.50 | $ | 11.15 | $ | 9.31 | |
| | | | | | | | | | | | | | | | |
| Income (Loss) from Investment | | | | | | | | | | | |
| Operations: | | | | | | | | | | | |
| | Net investment income | | 0.01 | (c) | 0.06 | (c) | 0.08 | (c) | 0.13 | | 0.03 | |
| | Net realized and unrealized | | | | | | | | | | | |
| | | gain (loss) on investments | | 1.39 | | 0.15 | | (1.90) | | (0.16) | | 1.89 | |
| Total from Investment Operations | 1.40 | | 0.21 | | (1.82) | | (0.03) | | 1.92 | |
| | | | | | | | | | | | | | | | |
| Less Distributions: | | | | | | | | | | | |
| | From net investment income | | - | | (0.01) | | (0.22) | | (0.03) | | (0.08) | |
| | From realized gains | | - | | - | | (0.98) | | (0.59) | | - | |
| | From return of capital | | (0.01) | | - | | - | | - | | - | |
| Total Distributions | | (0.01) | | (0.01) | | (1.20) | | (0.62) | | (0.08) | |
| Paid in Beneficial Interest: | | | | | | | | | | | |
| | From redemption fees | | 0.00 | (b) | (0.00) | (b) | 0.00 | (b) | 0.00 | (b) | 0.00 | (b) |
| Total Paid in Beneficial Interest | | 0.00 | (b) | (0.00) | (b) | 0.00 | (b) | 0.00 | (b) | 0.00 | (b) |
| | | | | | | | | | | | | | | | |
| Net Asset Value, End of Year | $ | 9.07 | $ | 7.68 | $ | 7.48 | $ | 10.50 | $ | 11.15 | |
| | | | | | | | | | | | | | | | |
| Total Return | | 18.28% | | 2.81% | | (18.82)% | | (0.12)% | (a) | 20.71% | (a) |
| | | | | | | | | | | | | | | | |
| Net Assets, End of Year | | | | | | | | | | | |
| | (in thousands) | $ | 64,624 | $ | 47,421 | $ | 40,835 | $ | 39,842 | $ | 33,617 | |
| | | | | | | | | | | | | | | | |
| Ratios of: | | | | | | | | | | | | |
| Interest Expense to Average | | | | | | | | | | | |
| | Net Assets | | 0.01% | | - | | - | | - | | - | |
| Gross Expenses to Average | | | | | | | | | | | |
| | Net Assets (d) | | 1.34% | | 1.23% | | 1.23% | | 1.23% | | 1.23% | |
| Net Expenses to Average | | | | | | | | | | | |
| | Net Assets (d) | | 1.23% | (e) | 1.23% | | 1.23% | | 1.23% | | 1.23% | |
| Net Investment Income to Average | | | | | | | | | |
| | Net Assets | | 0.10% | | 0.86% | | 0.94% | | 1.27% | | 0.31% | |
| | | | | | | | | | | | | | | | |
| Portfolio turnover rate | | 111.52% | | 71.27% | | 66.14% | | 92.74% | | 77.73% | |
| | | | | | | | | | | | | | | | |
| (a) | Includes adjustments in accordance with accounting principles generally accepted in the United States of America and, consequently, the net asset value for financial reporting purposes and the returns based upon those net asset values may differ from the net asset values and returns for shareholder transactions. |
| (b) | Actual amount is less than $0.01 per share. | | | | | | | | | |
| (c) | Calculated using the average shares method. | | | | | | | | | |
| (d) | The expense ratios listed reflect total expenses prior to any waivers and reimbursements (gross expense ratio) and after any waivers and reimbursements (net expense ratio). |
| (e) | Excludes interest expense of 0.01% of net assets. | | | | | | | | |
| | | | | | | | | | | | | | | | |
| See Notes to Financial Statements | | | | | | | | | | | |
| ROUMELL OPPORTUNISTIC VALUE FUND | | | | | | |
| | | | | | | | | | | | | | | | |
| Financial Highlights - Class A Shares | | | | | | | | | | |
| | | | | | | | | | | | | | | | |
| For a share outstanding | | August 31, |
| during the fiscal years ended | | 2017 | | 2016 | | 2015 | | 2014 | | 2013 | |
| | | | | | | | | | | | | | | | |
| Net Asset Value, | | | | | | | | | | | |
| Beginning of Year | $ | 7.59 | $ | 7.42 | $ | 10.44 | $ | 11.10 | $ | 9.28 | |
| | | | | | | | | | | | | | | | |
| Income (Loss) from Investment | | | | | | | | | | |
| Operations: | | | | | | | | | | | |
| | Net investment income (loss) | (0.01) | (d) | 0.04 | (d) | 0.07 | (d) | 0.12 | | 0.01 | |
| | Net realized and unrealized | | | | | | | | | | |
| | | gain (loss) on investments | 1.37 | | 0.15 | | (1.89) | | (0.17) | | 1.88 | |
| Total from Investment Operations | 1.36 | | 0.19 | | (1.82) | | (0.05) | | 1.89 | |
| | | | | | | | | | | | | | | | |
| Less Distributions: | | | | | | | | | | | |
| | From net investment income | - | | (0.02) | | (0.22) | | (0.02) | | (0.07) | |
| | From realized gains | | - | | - | | (0.98) | | (0.59) | | - | |
| | From return of capital | | (0.01) | | - | | - | | - | | - | |
| Total Distributions | | (0.01) | | (0.02) | | (1.20) | | (0.61) | | (0.07) | |
| Paid in Beneficial Interest: | | | | | | | | | | | |
| | From redemption fees | | - | | - | | - | | 0.00 | (c) | - | |
| Total Paid in Beneficial Interest | - | | - | | - | | 0.00 | (c) | - | |
| | | | | | | | | | | | | | | | |
| Net Asset Value, End of Year | $ | 8.94 | $ | 7.59 | $ | 7.42 | $ | 10.44 | $ | 11.10 | |
| | | | | | | | | | | | | | | | |
| Total Return (a) | | 17.99% | | 2.54% | | (18.92)% | | (0.38)% | (b) | 20.46% | (b) |
| | | | | | | | | | | | | | | | |
| Net Assets, End of Year | | | | | | | | | | | |
| | (in thousands) | $ | 644 | $ | 675 | $ | 988 | $ | 2,022 | $ | 2,553 | |
| | | | | | | | | | | | | | | | |
| Ratios of: | | | | | | | | | | | | |
| Interest Expense to Average | | | | | | | | | | | |
| | Net Assets | | 0.01% | | - | | - | | - | | - | |
| Gross Expenses to Average | | | | | | | | | | | |
| | Net Assets (e) | | 1.59% | | 1.48% | | 1.48% | | 1.48% | | 1.48% | |
| Net Expenses to Average | | | | | | | | | | | |
| | Net Assets (e) | | 1.48% | (f) | 1.48% | | 1.48% | | 1.48% | | 1.48% | |
| Net Investment Income (Loss) to | | | | | | | | | | |
| | Average Net Assets | | (0.13)% | | 0.61% | | 0.80% | | 1.02% | | 3.00% | |
| | | | | | | | | | | | | | | | |
| Portfolio turnover rate | | 111.52% | | 71.27% | | 66.14% | | 92.74% | | 77.73% | |
| | | | | | | | | | | | | | | | |
| (a) | Total return does not reflect sales charge, if any. | | | | | | | | | |
| (b) | Includes adjustments in accordance with accounting principles generally accepted in the United States of America and, consequently, the net asset value for financial reporting purposes and the returns based upon those net asset values may differ from the net asset values and returns for shareholder transactions. |
| (c) | Actual amount is less than $0.01 per share. | | | | | | | | | | |
| (d) | Calculated using the average shares method. | | | | | | | | | | |
| (e) | The expense ratios listed reflect total expenses prior to any waivers and reimbursements (gross expense ratio) and after any waivers and reimbursements (net expense ratio). |
| (f) | Excludes interest expense of 0.01% of net assets. | | | | | | | | | |
| See Notes to Financial Statements | | | | | | | | | | | |
| ROUMELL OPPORTUNISTIC VALUE FUND | | | | | | |
| | | | | | | | | | | | | | | | |
| Financial Highlights - Class C Shares | | | | | | | | | | |
| | | | | | | | | | | | | | | | |
| For a share outstanding during | | August 31, |
| the fiscal year or period ended | 2017 | | 2016 | | 2015 | | 2014 | | 2013 | (e) |
| | | | | | | | | | | | | | | | |
| Net Asset Value, Beginning | | | | | | | | | | | |
| | of Period | $ | 6.40 | $ | 6.39 | $ | 9.22 | $ | 9.95 | $ | 10.00 | |
| Income (Loss) from Investment | | | | | | | | | | |
| | Operations: | | | | | | | | | | | |
| | Net investment income (loss) | (0.06) | (f) | (0.01) | (f) | 0.02 | (f) | 0.03 | | (0.01) | |
| | Net realized and unrealized gain | | | | | | | | | |
| | | (loss) on investments | | 1.15 | | 0.11 | | (1.66) | | (0.15) | | (0.04) | |
| Total from Investment Operations | 1.09 | | 0.10 | | (1.64) | | (0.12) | | (0.05) | |
| Less Distributions: | | | | | | | | | | | |
| | From net investment income | - | | (0.09) | | (0.21) | | (0.02) | | - | |
| | From realized gains | | - | | - | | (0.98) | | (0.59) | | - | |
| | From return of capital | | (0.02) | | - | | - | | - | | - | |
| Total Distributions | | (0.02) | | (0.09) | | (1.19) | | (0.61) | | - | |
| | | | | | | | | | | | | | | | |
| Net Asset Value, End of Period | $ | 7.47 | $ | 6.40 | $ | 6.39 | $ | 9.22 | $ | 9.95 | |
| | | | | | | | | | | | | | | | |
| Total Return (c) | | 17.13% | | 1.78% | | (19.55)% | | (1.09)% | (d) | (0.50)% | (b)(d) |
| | | | | | | | | | | | | | | | |
| Net Assets, End of Period | | | | | | | | | | | |
| | (in thousands) | $ | 285 | $ | 325 | $ | 631 | $ | 2,434 | $ | 615 | |
| | | | | | | | | | | | | | | | |
| Ratios of: | | | | | | | | | | | | |
| Interest Expense to Average | | | | | | | | | | | |
| | Net Assets | | 0.01% | | - | | - | | - | | - | |
| Gross Expenses to Average | | | | | | | | | | | |
| | Net Assets (g) | | 2.34% | | 2.23% | | 2.23% | | 2.23% | | 2.23% | (a) |
| Net Expenses to Average | | | | | | | | | | | |
| | Net Assets (g) | | 2.23% | (h) | 2.23% | | 2.23% | | 2.23% | | 2.23% | (a) |
| Net Investment Income to Average | | | | | | | | | |
| | Net Assets | | (0.88)% | | (0.14)% | | 0.22% | | 0.27% | | (1.20)% | (a) |
| | | | | | | | | | | | | | | | |
| Portfolio turnover rate | | 111.52% | | 71.27% | | 66.14% | | 92.74% | | 77.73% | (b) |
| | | | | | | | | | | | | | | | |
| (a) | Annualized. | | | | | | | | | | | |
| (b) | Not annualized. | | | | | | | | | | | |
| (c) | Total return does not reflect sales charge, if any. | | | | | | | |
| (d) | Includes adjustments in accordance with accounting principles generally accepted in the United States of America and, consequently, the net asset value for financial reporting purposes and the returns based upon those net asset values may differ from the net asset values and returns for shareholder transactions. |
| (e) | For a share outstanding for the initial period from July 30, 2013 (Date of Initial Public Investment) to August 31, 2013. |
| (f) | Calculated using the average shares method. | | | | | | | | |
| (g) | The expense ratios listed reflect total expenses prior to any waivers and reimbursements (gross expense ratio) and after any waivers and reimbursements (net expense ratio). |
| (h) | Excludes interest expense of 0.01% of net assets. | | | | | | | |
| See Notes to Financial Statements | | | | | | | | | |
ROUMELL OPPORTUNISTIC VALUE FUND
Notes to Financial Statements
1. Organization and Significant Accounting Policies
The Roumell Opportunistic Value Fund ("Fund") is a series of the Starboard Investment Trust ("Trust"). The Trust is organized as a Delaware statutory trust and is registered under the Investment Company Act of 1940, as amended (the "1940 Act"), as an open-end management investment company. The Fund is a separate non-diversified series of the Trust.
The Fund commenced operations on December 31, 2010. The investment objective of the Fund is to seek capital appreciation and income. Roumell Asset Management, LLC ("Roumell Asset Management" or the "Advisor") seeks to achieve the Fund's investment objective by using an opportunistic investment strategy. The Advisor is an opportunistic capital allocator (OCA) with a deep value bias in selecting individual securities. The Advisor will wait until an investment situation is presented where, in its opinion, the odds of success are favorable relative to the risks. In the absence of such situations, the Fund will stay liquid and on the sidelines invested in Cash and Cash Equivalents. The Advisor's approach to opportunistic investing emphasizes purchasing securities at a meaningful, quantifiable discount to its calculation of intrinsic value taking into consideration the understandability of the business model, the safety of the capital structure, and the competency of the company's management. Using this opportunistic strategy, however, may result in the Advisor finding many suitable investment opportunities for the Fund during certain periods, but finding very few during other periods.
The Fund currently has an unlimited number of authorized shares, which are available to three classes - Institutional Class Shares, Class A Shares, and Class C Shares. Each class of shares has equal rights as to assets of the Fund, and the classes are identical except for differences in sales charges and ongoing distribution and service fees. Class A Shares are subject to an initial sales charge of 4.50%. Class C Shares are subject to a contingent deferred sales charge of 1% of the proceeds redeemed within one year of the purchase date. Class A Shares and Class C Shares are subject to distribution plan fees, which are further discussed in Note 3. All share classes are subject to redemption fees within 60 days of the issuance of such shares of 1.00%. Income, expenses (other than distribution and service fees), and realized and unrealized gains or losses on investments are allocated to each class of shares based upon its relative net assets. All classes have equal voting privileges, except where otherwise required by law or when the Trustees determine that the matter to be voted on affects only the interests of the shareholders of a particular class.
(Continued)
ROUMELL OPPORTUNISTIC VALUE FUND
Notes to Financial Statements
The following accounting policies have been consistently followed by the Fund and are in conformity with accounting principles generally accepted in the United States of America ("GAAP").
Investment Valuation
The Fund's investments in securities are carried at value. Securities listed on an exchange or quoted on a national market system are valued at the last sales price as of 4:00 p.m. Eastern Time. Securities traded in the NASDAQ over-the-counter market are generally valued at the NASDAQ Official Closing Price. Other securities traded in the over-the-counter market and listed securities for which no sale was reported on that date are valued at the most recent bid price. Securities and assets for which representative market quotations are not readily available (e.g., if the exchange on which the security is principally traded closes early or if trading of the particular security is halted during the day and does not resume prior to the Fund's net asset value calculation) or which cannot be accurately valued using the Fund's normal pricing procedures are valued at fair value as determined in good faith under policies approved by the Trustees. A security's "fair value" price may differ from the price next available for that security using the Fund's normal pricing procedures. Instruments with maturities of 60 days or less are valued at amortized cost, which approximates market value.
Fair Value Measurement
Various inputs are used in determining the value of the Fund's investments. These inputs are summarized in the three broad levels listed below:
Level 1: Quoted prices in active markets for identical securities
Level 2: Other significant observable inputs (including quoted prices for similar securities, interest rates, credit risk, etc.)
Level 3: Significant unobservable inputs (including the Fund's own assumptions in determining fair value of investments)
The availability of observable inputs can vary from security to security and is affected by a wide variety of factors, including, for example, the type of security, whether the security is new and not yet established in the marketplace, the liquidity of markets, and other characteristics particular to the security. To the extent that valuation is based on models or inputs that are less observable or unobservable in the market, the determination of fair value requires more judgment. Accordingly, the degree of judgment exercised in determining fair value is greatest for instruments categorized in Level 3.
(Continued)
ROUMELL OPPORTUNISTIC VALUE FUND
Notes to Financial Statements
The inputs used to measure fair value may fall into different levels of the fair value hierarchy. In such cases, for disclosure purposes, the level in the fair value hierarchy within which the fair value measurement falls in its entirety, is determined based on the lowest level input that is significant to the fair value measurement in its entirety.
The inputs or methodology used for valuing securities are not necessarily an indication of the risk associated with investing in those securities. The following table summarizes the inputs as of August 31, 2017 for the Fund's assets measured at fair value:
| Investments in Securities (a) | | Total | | Level 1 | | Level 2 | | Level 3(b) |
| Assets | | | | | | | | |
| Common Stocks* | $ | 31,459,571 | $ | 31,458,324 | $ | 1,247 | $ | - |
| Closed-End Fund | | 1,226,040 | | 1,226,040 | | - | | - |
| Preferred Stocks | | 5,002,261 | | 5,002,261 | | - | | - |
| Convertible Bond | | 2,071 | | - | | 2,071 | | - |
| Corporate Bond | | 1,677,360 | | - | | 1,677,360 | | - |
| U.S. Treasury Securities | | 19,475,637 | | - | | 19,475,637 | | - |
| Warrants | | 6,248 | | - | | - | | 6,248 |
| Short-Term Investment | | 6,790,566 | | 6,790,566 | | - | | - |
| Total Assets | $ | 65,639,754 | $ | 44,477,191 | $ | 21,156,315 | $ | 6,248 |
| | | | | | | | | |
| Liabilities | | | | | | | | |
| Put Options Written | $ | 89,950 | $ | - | $ | 89,950 | $ | - |
| Total Liabilities | $ | 89,950 | $ | - | $ | 89,950 | $ | - |
| | | | | | | | | |
*Refer to Schedule of Investments for breakdown by Sector.
(a) The Fund had no significant transfers into or out of Level 1, 2, or 3 during the year ended August 31, 2017. It is the Fund's policy to record transfers at the end of the year.
(b) At the beginning and the end of the reporting period, Level 3 investments were not considered a material portion of the Fund, and hence, reconciliation is not provided.
ROUMELL OPPORTUNISTIC VALUE FUND
Notes to Financial Statements
Option Writing
When the Fund writes an option, an amount equal to the premium received by the Fund is recorded as a liability and is subsequently adjusted to the current fair value of the option written. Premiums received from writing options that expire unexercised are treated by the Fund on the expiration date as realized gains (losses) from options written. The difference between the premium and the amount paid on effecting a closing purchase transaction, including brokerage commissions, is also treated as a realized gain or loss (depending on if the premium is less than the amount paid for the closing purchase transaction). If a call option is exercised, the premium is added to the proceeds from the sale of the underlying security in determining whether the Fund has realized a gain or loss. If a put option is exercised, the premium reduces the cost basis of the securities purchased by the Fund. The Fund, as the writer of an option, bears the market risk of an unfavorable change in the price of the security underlying the written option. Written options are non-income producing securities.
Derivative Financial Instruments
The Fund may invest in derivative financial instruments (derivatives) in order to manage risk or gain exposure to various other investments or markets. Derivatives may contain various risks including the potential inability of the counterparty to fulfill their obligations under the terms of the contract, the potential for an illiquid secondary market, and the potential for market movements which may expose the Fund to gains or losses in excess of the amounts shown on the Statement of Assets and Liabilities.
Derivatives are marked to market daily based upon quotations from market makers or the Fund's independent pricing services and the Fund's net benefit or obligation under the contract, as measured by the fair market value of the contract, is included in Investments, at value on the Statement of Assets and Liabilities for options purchased and the Options Written, at value on the Statement of Assets and Liabilities for options written. Net realized gains and losses and net change in unrealized appreciation and depreciation on these contracts for the year are included in the Realized and Unrealized Gain on Investments on the Statement of Operations for options purchased and Realized and Unrealized Gain on Options Written on the Statement of Operations for options written.
The derivative instruments outstanding as of August 31, 2017 are disclosed below and the amounts of realized and changes in unrealized gains and losses on derivative instruments during the year as disclosed below serve as indicators of the volume of derivative activity for the Fund.
(Continued)
ROUMELL OPPORTUNISTIC VALUE FUND
Notes to Financial Statements
The following table sets forth the effect of the derivative instruments on the Statement of Assets and Liabilities as of August 31, 2017:
Derivative Type | Location | | Market Value | Notional Value |
| | | | | |
| Equity Contracts – written options | Liabilities-Options written, at value | | $ 89,950 | $5,125,000 |
The following table sets forth the effect of the derivative instruments on the Statement of Operations for the fiscal year ended August 31, 2017:
| Derivative Type | Location | | Gains/Losses |
| | | | |
| Equity Contracts – written options | Net realized gain from options written | | $ 40,388 |
| | | | |
| Equity Contracts – written options | Net change in unrealized appreciation on options written | | $ 121,331 |
| | | | |
The following table presents the Fund's liabilities available for offset under a master netting arrangement of collateral pledged as of August 31, 2017:
Gross Amounts of Assets Presented in the Statement of Assets & Liabilities |
| | Gross Amounts of Recognized Liabilities | Financial Instruments Pledged | Cash Collateral Pledged | Net Amount of Assets |
Description of Liability: | | | | |
Options Written | $ 89,950 | $ 89,950 | $ - | $ - |
Total | $ 89,950 | $ 89,950 | $ - | $ - |
The actual financial instruments and cash collateral pledged may be in excess of the amounts shown in the table. The table only reflects collateral amounts up to the amount of the financial instrument disclosed on the Statement of Assets and Liabilities.
(Continued)
ROUMELL OPPORTUNISTIC VALUE FUND
Notes to Financial Statements
Foreign Currency Translation
Portfolio securities and other assets and liabilities denominated in foreign currencies are translated into U.S. dollars based on the exchange rate of such currencies against U.S. dollars on the date of valuation. Purchases and sales of securities and income items denominated in foreign currencies are translated into U.S. dollars at the exchange rate in effect on the transaction date.
The Fund does not separately report the effect of changes in foreign exchange rates from changes in market prices on securities held. Such changes are included in net realized and unrealized gain or loss from investments.
Realized foreign exchange gains or losses arise from sales of foreign currencies, currency gains or losses realized between the trade and settlement dates on securities transactions and the difference between the recorded amounts of dividends, interest, and foreign withholding taxes, and the U.S. dollar equivalent of the amounts actually received or paid. Net unrealized foreign exchange gains and losses arise from changes in foreign exchange rates on foreign denominated assets and liabilities other than investments in securities held at the end of the reporting period. These amounts can be found on the Statement of Operations.
Investment Transactions and Investment Income
Investment transactions are accounted for as of the date purchased or sold (trade date). Dividend income is recorded on the ex-dividend date. Certain dividends from foreign securities will be recorded as soon as the Fund is informed of the dividend if such information is obtained subsequent to the ex-dividend date. Interest income is recorded on the accrual basis and includes accretion of discounts and amortization of premiums. Gains and losses are determined on the identified cost basis, which is the same basis used for federal income tax purposes.
Expenses
The Fund bears expenses incurred specifically on its behalf as well as a portion of general expenses, which are allocated according to methods reviewed annually by the Trustees.
Distributions
The Fund may declare and distribute dividends from net investment income (if any) quarterly. Distributions from capital gains (if any) are generally declared and distributed annually. Dividends and distributions to shareholders are recorded on ex-date.
(Continued)
ROUMELL OPPORTUNISTIC VALUE FUND
Notes to Financial Statements
Estimates
The preparation of financial statements in conformity with GAAP requires management to make estimates and assumptions that affect the reported amounts of assets and liabilities and disclosure of contingent assets and liabilities at the date of the financial statements and the reported amounts of increases and decreases in the net assets from operations during the reported period. Actual results could differ from those estimates.
Fees on Redemptions
The Fund charges a redemption fee of 1.00% on redemptions of Fund shares occurring within 60 days following the issuance of such shares. The redemption fee is not a fee to finance sales or sales promotion expenses, but is paid to the Fund to defray the costs of liquidating an investor and discouraging short-term trading of the Fund's shares. No redemption fee will be imposed on the redemption of shares representing dividends or capital gains distributions, or on amounts representing capital appreciation of shares.
Federal Income Taxes
No provision for income taxes is included in the accompanying financial statements, as the Fund intends to distribute to shareholders all taxable investment income and realized gains and otherwise comply with Subchapter M of the Internal Revenue Code applicable to regulated investment companies.
2. Transactions with Affiliates and Service Providers
Advisor
The Fund pays a monthly fee to the Advisor calculated at the annual rate of 0.92% of the Fund's average daily net assets.
The Advisor has entered into a contractual agreement (the "Expense Limitation Agreement") with the Trust, on behalf of the Fund, under which it had agreed to waive or reduce its fees and to assume other expenses of the Fund, if necessary, in amounts that limit the Fund's total operating expenses (exclusive of interest, dividends on securities sold short, taxes, brokerage commissions, borrowing costs, fees and expenses of other investment companies in which the Fund invests, and other expenditures which are capitalized in accordance with generally accepted accounting principles, other extraordinary expenses not incurred in the ordinary course of the Fund's business, and amounts, if any, payable under a Rule 12b-1 distribution plan) to not more than 1.23% of the average daily net assets of the Fund. The current term of the Expense Limitation Agreement remains in effect until September 30, 2018. While there can be no assurance that the Expense Limitation Agreement will continue after that date, it is expected to continue from year-to-year thereafter. The Advisor cannot recoup any amounts previously waived or reimbursed.
(Continued)
ROUMELL OPPORTUNISTIC VALUE FUND
Notes to Financial Statements
For the fiscal year ended August 31, 2017, $512,742 in advisory fees were incurred, of which $63,173 in advisory fees were waived by the Advisor.
Administrator
The Fund pays a monthly fee to The Nottingham Company (the "Administrator") based upon the average daily net assets of the Fund and calculated at the annual rates as shown in the schedule below subject to a minimum of $2,000 per month. The Administrator also receives a fee as to procure and pay the Fund's custodian, as additional compensation for fund accounting and recordkeeping services, and additional compensation for certain costs involved with the daily valuation of securities and as reimbursement for out-of-pocket expenses. The Administrator also receives a miscellaneous compensation fee for peer group, comparative analysis, and compliance support totaling $350 per month. As of August 31, 2017, the Administrator received $4,200 in miscellaneous expenses.
A breakdown of the fees is provided in the following table:
| Administration Fees* | Custody Fees* | Fund Accounting Fees (minimum monthly) | Fund Accounting Fees (asset- based fee) | Blue Sky Administration Fees (annual) |
Average Net Assets | Annual Rate | Average Net Assets | Annual Rate |
| First $250 million | 0.100% | First $200 million | 0.020% | $2,250 | 0.01% | $150 per state |
| Next $250 million | 0.080% | Over $200 million | 0.009% | | | |
| Next $250 million | 0.060% | | | | | |
| Next $250 million | 0.050% | *Minimum monthly fees of $2,000 and $417 for Administration and Custody, respectively. |
| Next $1 billion | 0.040% |
| Over $2 billion | 0.035% |
The Fund incurred $55,733 in administration fees, $14,193 in custody fees, and $31,580 in fund accounting fees for the fiscal year ended August 31, 2017.
(Continued)
ROUMELL OPPORTUNISTIC VALUE FUND
Notes to Financial Statements
Compliance Services
Cipperman Compliance Services, LLC provides services as the Trust's Chief Compliance Officer. Cipperman Compliance Services, LLC is entitled to receive customary fees from the Fund for their services pursuant to the Compliance Services Agreement with the Fund.
Transfer Agent
Nottingham Shareholder Services, LLC ("Transfer Agent") serves as transfer, dividend paying, and shareholder servicing agent for the Fund. For its services, the Transfer Agent is entitled to receive compensation from the Fund pursuant to the Transfer Agent's fee arrangements with the Fund. The Fund incurred $21,000 in transfer agent fees during the fiscal year ended August 31, 2017.
Distributor
Capital Investment Group, Inc. (the "Distributor") serves as the Fund's principal underwriter and distributor. The Distributor receives $5,000 per year paid in monthly installments for services provided and expenses assumed.
Certain officers of the Trust are also officers of the Administrator.
3. Distribution and Service Fees
The Board of Trustees, including a majority of the Trustees who are not "interested persons" as defined in the 1940 Act, adopted a distribution and service plan pursuant to Rule 12b-1 of the 1940 Act (the "Plan") for the Class A Shares and Class C Shares. The 1940 Act regulates the manner in which a registered investment company may assume costs of distributing and promoting the sales of its shares and servicing of its shareholder accounts. The Plan provides that the Fund may incur certain costs, which may not exceed 0.25% per annum of the average daily net assets of the Class A Shares and 1.00% per annum of the average daily net assets of the Class C Shares for each year elapsed subsequent to adoption of the Plan, for payment to the Distributor and others for items such as advertising expenses, selling expenses, commissions, travel, or other expenses reasonably intended to result in sales of the Class A Shares and Class C Shares or servicing of Class A Shares and Class C Shares shareholder accounts. For the fiscal year ended August 31, 2017, $1,687 in fees were incurred by the Class A Shares of the Fund and $3,186 in fees were incurred by the Class C Shares of the Fund.
(Continued)
ROUMELL OPPORTUNISTIC VALUE FUND
Notes to Financial Statements
4. Purchases and Sales of Investment Securities
For the fiscal year ended August 31, 2017, the aggregate cost of purchases and proceeds from sales of investment securities (excluding short-term securities) were as follows:
| Purchases of Securities | Proceeds from Sales of Securities |
| $48,283,094 | $38,679,619 |
For the fiscal year ended August 31, 2017, long-term purchases and sales from U.S. government securities were as follows:
Purchases of U.S. Government Securities | Proceeds from Sales of U.S. Government Securities |
| $ 7,971,724 | $ - |
ROUMELL OPPORTUNISTIC VALUE FUND
Notes to Financial Statements
The following table shows the realized gains and losses that resulted from sales of securities during the fiscal year ended August 31, 2017:
| Description | | Cost ($) | | Sales Proceeds ($) | Realized Gain (Loss) (% of Cost) | | Realized Gain (Loss)($) |
| Apple, Inc. | | 2,531,208 | | 3,359,407 | 32.72% | | 828,199 |
| Atwood Oceanics, Inc.* | | 1,320,574 | | 1,607,006 | 21.69% | | 286,432 |
| Bancorp, Inc. | | 1,115,060 | | 1,479,761 | 32.71% | | 364,701 |
| Covisint Corp. | | 3,464,320 | | 3,315,522 | (4.30)% | | (148,798) |
| DSP Group, Inc. | | 1,720,649 | | 2,402,947 | 39.65% | | 682,298 |
| First Solar, Inc. | | 1,696,246 | | 1,309,329 | (22.81)% | | (386,917) |
Fortress Investment Group, Inc. | | 1,257,126 | | 2,125,641 | 69.09% | | 868,515 |
| GSI Technology, Inc. | | 1,374,997 | | 2,850,919 | 107.34% | | 1,475,922 |
Nuveen Credit Strategies Income Fund | | 858,282 | | 979,420 | 14.11% | | 121,138 |
Nuveen Global High Income Fund | | 511,314 | | 627,904 | 22.80% | | 116,590 |
| Palo Alto Networks, Inc.** | | - | | 40,388 | 0.00% | | 40,388 |
| Paratek Pharmaceuticals, Inc. | | 1,881,036 | | 2,522,411 | 34.10% | | 641,375 |
| Ralph Lauren Corp. | | 1,471,911 | | 1,736,676 | 17.99% | | 264,765 |
| Rapid7, Inc. | | 1,767,690 | | 2,548,581 | 44.18% | | 780,891 |
| Rocket Fuel, Inc. | | 1,010,494 | | 1,449,344 | 43.43% | | 438,850 |
| Rosetta Stone, Inc. | | 1,308,722 | | 1,552,342 | 18.62% | | 243,620 |
| Samsung Electronics, Inc.*** | | 1,467,897 | | 1,979,890 | 34.88% | | 511,993 |
| Sandstorm Gold Ltd. | | 647,025 | | 746,613 | 15.39% | | 99,588 |
| Seaboard Corp. | | 691,240 | | 864,451 | 25.06% | | 173,211 |
| Sizmek, Inc. | | 2,608,379 | | 1,893,390 | (27.41)% | | (714,989) |
| The Rubicon Project, Inc. | | 825,341 | | 688,664 | (16.56)% | | (136,677) |
| TIER REIT, Inc. | | 1,095,749 | | 1,331,771 | 21.54% | | 236,022 |
Tower Group International, Ltd. | | - | | 19,360 | 0.00% | | 19,360 |
| WCI Communities, Inc. | | 864,984 | | 1,281,868 | 48.20% | | 416,884 |
| Net Realized Gain | | | | | - | $ | 7,223,361 |
*Excludes interest earned on bonds over the holding period
**Put options written.
***Includes settlement of foreign currency sales
(Continued)
ROUMELL OPPORTUNISTIC VALUE FUND
Notes to Financial Statements
5. Federal Income Tax
Distributions are determined in accordance with Federal income tax regulations, which differ from GAAP, and, therefore, may differ significantly in amount or character from net investment income and realized gains for financial reporting purposes. Financial reporting records are adjusted for permanent book/tax differences to reflect tax character but are not adjusted for temporary differences.
Management has reviewed the Fund's tax positions to be taken on the federal income tax return and, during the years ended August 31, 2014 through August 31, 2017, determined that the Fund does not have a liability for uncertain tax positions. The Fund recognizes interest and penalties, if any, related to unrecognized tax benefits as income tax expense in the Statement of Operations. During the year, the Fund did not incur any interest or penalties.
Reclassifications relate primarily to differing book/tax treatment of foreign currency transactions and net operating losses. For the year ended August 31, 2017, the following reclassifications were made:
| Accumulated Net Investment Loss | $ 39,327 |
| Paid in Interest | $(45,732) |
| Accumulated Net Realized Loss on Investments | | $ 6,405 |
Distributions during the fiscal years ended were characterized for tax purposes as follows:
| | | Distributions from |
For the Fiscal Years Ended | | | Ordinary Income |
| 08/31/2017 | | | $ | 78,273* |
| 08/31/2016 | | | $ | 61,292 |
*The Roumell Opportunistic Value Fund paid $78,273 in distributions for excise requirements at 12/30/16.
ROUMELL OPPORTUNISTIC VALUE FUND
Notes to Financial Statements
At August 31, 2017, the tax-basis cost of investments and components of distributable earnings were as follows:
| Cost of Investments | $ | 65,779,350 |
| | | |
| Gross Unrealized Appreciation | $ | 5,231,304 |
| Gross Unrealized Depreciation | | (5,460,850) |
| Net Unrealized Depreciation | | (229,546) |
| | | |
| Capital Loss Carryforward | | (1,707,139) |
| Deferred Late Year Losses | | (37,203) |
| | | |
| Accumulated Deficit | $ | (1,973,888) |
The difference between book-basis and tax-basis net unrealized appreciation (depreciation) is attributable to the tax deferral of losses from wash sales. The deferral of late year losses totaled $37,203. The Fund has a capital loss carryforward of $1,707,139, all of which is long-term in nature with no expiration.
6. Commitments and Contingencies
Under the Trust's organizational documents, its officers and Trustees are indemnified against certain liabilities arising out of the performance of their duties to the Fund. In addition, in the normal course of business, the Trust entered into contracts with its service providers, on behalf of the Fund, and others that provide for general indemnifications. The Fund's maximum exposure under these arrangements is unknown, as this would involve future claims that may be made against the Fund. The Fund expects risk of loss to be remote.
7. Subsequent Events
The Fund has evaluated the need for disclosures and/or adjustments resulting from subsequent events through the date of issuance of these financial statements. This evaluation did not result in any additional subsequent events that necessitated disclosures and/or adjustments.
REPORT OF INDEPENDENT REGISTERED PUBLIC ACCOUNTING FIRM
To the Board of Trustees of Starboard Investment Trust
and the Shareholders of Roumell Opportunistic Value Fund
We have audited the accompanying statement of assets and liabilities of Roumell Opportunistic Value Fund, a series of shares of beneficial interest in Starboard Investment Trust, (the "Fund") including the schedule of investments, as of August 31, 2017, and the related statement of operations for the year then ended, the statements of changes in net assets for each of the years in the two-year period then ended and the financial highlights for each of the years or period in the five-year period then ended. These financial statements and financial highlights are the responsibility of the Fund's management. Our responsibility is to express an opinion on these financial statements and financial highlights based on our audits.
We conducted our audits in accordance with the standards of the Public Company Accounting Oversight Board (United States). Those standards require that we plan and perform the audits to obtain reasonable assurance about whether the financial statements and financial highlights are free of material misstatement. An audit includes examining, on a test basis, evidence supporting the amounts and disclosures in the financial statements. Our procedures included confirmation of securities owned as of August 31, 2017 by correspondence with the custodian and broker. An audit also includes assessing the accounting principles used and significant estimates made by management, as well as evaluating the overall financial statement presentation. We believe that our audits provide a reasonable basis for our opinion.
In our opinion, the financial statements and financial highlights referred to above present fairly, in all material respects, the financial position of Roumell Opportunistic Value Fund as of August 31, 2017, and the results of its operations for the year then ended, the changes in its net assets for each of the years in the two-year period then ended and its financial highlights for each of the years or period in the five-year period then ended, in conformity with accounting principles generally accepted in the United States of America.
BBD, LLP
Philadelphia, Pennsylvania
October 30, 2017
ROUMELL OPPORTUNISTIC VALUE FUND
Additional Information (Unaudited)
1. Proxy Voting Policies and Voting Record
A copy of the Trust's Proxy Voting and Disclosure Policy and the Advisor's Disclosure Policy are included as Appendix B to the Fund's Statement of Additional Information and are available, without charge, upon request, by calling 1-800-773-3863, and on the website of the Securities and Exchange Commission ("SEC") at sec.gov. Information regarding how the Fund voted proxies relating to portfolio securities during the most recent period ended June 30, is available (1) without charge, upon request, by calling the Fund at the number above and (2) on the SEC's website at sec.gov.
2. Quarterly Portfolio Holdings
The Fund files its complete schedule of portfolio holdings with the SEC for the first and third quarters of each fiscal year on Form N-Q. The Fund's Form N-Qs are available on the SEC's website at sec.gov. You may review and make copies at the SEC's Public Reference Room in Washington, D.C. Information on the operation of the Public Reference Room may be obtained by calling the SEC at 800-SEC-0330. You may also obtain copies without charge, upon request, by calling the Fund at 1-800-773-3863.
3. Tax Information
The following information is provided for the Fund's fiscal year ended August 31, 2017.
During the fiscal year, the Fund paid $78,273 in income distributions but no long-term capital gain distributions.
Dividend and distributions received by retirement plans such as IRAs, Keogh-type plans, and 403(b) plans need not be reported as taxable income. However, many retirement plans may need this information for their annual information meeting.
(Continued)
ROUMELL OPPORTUNISTIC VALUE FUND
Additional Information (Unaudited)
4. Schedule of Shareholder Expenses
As a shareholder of the Fund, you incur two types of costs: (1) transaction costs, including sales charges (loads) on purchase payments; redemption fees; and exchange fees; and (2) ongoing costs, including management fees; distribution [and/or service] (12b-1) fees; and other Fund expenses. This Example is intended to help you understand your ongoing costs (in dollars) of investing in the Fund and to compare these costs with the ongoing costs of investing in other mutual funds.
The Example is based on an investment of $1,000 invested at the beginning of the period and held for the entire period from March 1, 2017 through August 31, 2017.
Actual Expenses – The first line of the table below provides information about actual account values and actual expenses. You may use the information in this line, together with the amount you invested, to estimate the expenses that you paid over the period. Simply divide your account value by $1,000 (e.g., an $8,600 account value divided by $1,000 = 8.6), then multiply the result by the number in the first line under the heading entitled "Expenses Paid During Period" to estimate the expenses you paid on your account during this period.
Hypothetical Example for Comparison Purposes – The second line of the table below provides information about hypothetical account values and hypothetical expenses based on the Fund's actual expense ratio and an assumed rate of return of 5% per year before expenses, which is not the Fund's actual return. The hypothetical account values and expenses may not be used to estimate the actual ending account balance or expenses you paid for the period. You may use this information to compare the ongoing costs of investing in the Fund and other funds. To do so, compare this 5% hypothetical example with the 5% hypothetical examples that appear in the shareholder reports of the other funds.
Please note that the expenses shown in the table are meant to highlight your ongoing costs only and do not reflect any transactional costs, such as sales charges (loads), redemption fees, or exchange fees. Therefore, the second line of the table is useful in comparing ongoing costs only, and will not help you determine the relative total costs of owning different funds. In addition, if these transactional costs were included, your costs would have been higher.
(Continued)
ROUMELL OPPORTUNISTIC VALUE FUND
Additional Information (Unaudited)
| Institutional Class Shares | Beginning Account Value March 1, 2017 | Ending Account Value August 31, 2017 | Expenses Paid During Period* |
Actual Hypothetical (5% annual return before expenses) | $1,000.00 | $1,084.90 | $6.46 |
| | | |
| $1,000.00 | $1,019.00 | $6.26 |
*Expenses are equal to the average account value over the period multiplied by the Fund's annualized expense ratio of 1.23%, multiplied by 184/365 (to reflect the one-half year period).
| Class A Shares | Beginning Account Value March 1, 2017 | Ending Account Value August 31, 2017 | Expenses Paid During Period* |
Actual Hypothetical (5% annual return before expenses) | $1,000.00 | $1,083.60 | $7.77 |
| | | |
| $1,000.00 | $1,017.74 | $7.53 |
*Expenses are equal to the average account value over the period multiplied by the Fund's annualized expense ratio of 1.48%, multiplied by 184/365 (to reflect the one-half year period).
| Class C Shares | Beginning Account Value March 1, 2017 | Ending Account Value August 31, 2017 | Expenses Paid During Period* |
Actual Hypothetical (5% annual return before expenses) | $1,000.00 | $1,079.50 | $11.69 |
| | | |
| $1,000.00 | $1,013.96 | $11.32 |
*Expenses are equal to the average account value over the period multiplied by the Fund's annualized expense ratio of 2.23%, multiplied by 184/365 (to reflect the one-half year period).
5. Approval of Advisory Agreement
The Advisor supervises the investments of the Fund pursuant to an Investment Advisory Agreement. At the annual meeting of the Fund's Board of Trustees held on September 7, 2017, the Trustees approved the renewal of the Investment Advisory Agreement for a one-year period ending September 15, 2018. In considering whether to approve the Investment Advisory Agreement, the Trustees reviewed and considered the information they deemed reasonably necessary, including the following material factors: (i) the nature, extent, and quality of the services provided by the Advisor; (ii) the investment performance of the Fund and Advisor; (iii) the costs of the services to be provided and profits to be realized by the Advisor and its affiliates from the relationship with the Fund; (iv) the extent to which economies of scale would be realized as the Fund grows and whether advisory fee levels reflect those economies of scale for the benefit of the Fund's investors; (v) the Advisor's practices regarding brokerage and portfolio transactions; and (vi) the Advisor's practices regarding possible conflicts of interest.
(Continued)
ROUMELL OPPORTUNISTIC VALUE FUND
Additional Information (Unaudited)
At the meeting, the Trustees reviewed various informational materials including, without limitation, the Investment Advisory Agreement for the Fund; a memorandum from the Advisor to the Trustees containing information about the Advisor, its business, its finances, its personnel, its services to the Fund, and comparative expense ratio information for other mutual funds with a strategy similar to the Fund; and a memorandum from the Fund's legal counsel that summarized the fiduciary duties and responsibilities of the Board of Trustees in reviewing and approving the Investment Advisory Agreement, including the types of information and factors that should be considered in order to make an informed decision.
In considering the nature, extent, and quality of the services provided by the Advisor, the Trustees reviewed the responsibilities of the Advisor under the Investment Advisory Agreement. The Trustees reviewed the services being provided by the Advisor to the Fund including, without limitation, the quality of its investment advisory services since the Fund's inception (including research and recommendations with respect to portfolio securities); its procedures for formulating investment recommendations and assuring compliance with the Fund's investment objectives and limitations; its coordination of services for the Fund among the Fund's service providers; and its efforts to promote the Fund, grow the Fund's assets, and assist in the distribution of Fund shares. The Trustees noted that the Advisor seeks to achieve the Fund's investment objective by using an opportunistic investment strategy with a deep value bias in selecting individual securities. After reviewing the foregoing information and further information in the memorandum from the Advisor (e.g., descriptions of the Advisor's business, the Advisor's compliance program, and the Advisor's Form ADV), the Board concluded that the nature, extent, and quality of the services provided by the Advisor were satisfactory and adequate for the Fund.
(Continued)
ROUMELL OPPORTUNISTIC VALUE FUND
Additional Information (Unaudited)
In considering the investment performance of the Fund and Advisor, the Trustees compared the performance of the Fund with the performance of its benchmark index, comparable funds with similar objectives managed by other investment advisors, and applicable peer group data (e.g., Bloomberg peer group average). The Trustees noted that the return for the one-year period ended June 30, 2017 for the Institutional Class Shares was 29.60%, which was higher than the returns of most of the comparable funds, the peer group average, and the benchmark index. The Trustees then noted that the return for the six-month period ended June 30, 2017 for the Institutional Class Shares was 14.02%, which was also higher than the returns of most of the comparable funds, the peer group average, and the benchmark index. The Trustees also considered the consistency of the Advisor's management of the Fund with its investment objective and policies. After reviewing the investment performance of the Fund, the Advisor's experience managing the Fund, the Advisor's historical investment performance, and other factors, the Board of Trustees concluded that the investment performance of the Fund and the Advisor was satisfactory.
In considering the costs of the services to be provided and profits to be realized by the Advisor and its affiliates from the relationship with the Fund, including any benefits derived by the Advisor from the relationship with the Fund, the Trustees reviewed the Advisor's staffing, personnel, and methods of operating; the education and experience of the Advisor's personnel; the Advisor's compliance program; the financial condition of the Advisor; the level of commitment to the Fund and the Advisor by the principals of the Advisor; the asset level of the Fund; and the overall expenses of the Fund, including certain prior fee waivers and reimbursements by the Advisor; and the nature and frequency of advisory fee payments. The Trustees reviewed the financial statements for the Advisor and discussed the financial stability and profitability of the firm. The Trustees noted that the Advisor directly pays for certain expenses of the Fund under an Expense Limitation Agreement in order to help limit the Fund's annual operating expenses. The Trustees also considered potential benefits for the Advisor in managing the Fund, including promotion of the Advisor's name, the ability for the Advisor to place small accounts into the Fund, and the potential for the Advisor to generate soft dollars from Fund trades that may benefit the Advisor as well. The Trustees then compared the fees and expenses of the Fund (including the management fee) to other funds comparable in terms of the type of fund, the nature of its investment strategy, and its style of investment management, among other factors. The Trustees determined that the Fund's management fees were higher than some of the comparable funds, were lower than others, and were higher than the peer group average. The Trustees also determined that the Fund's net expense ratio was higher than some of the comparable funds, was lower than others, but was lower than the peer group average. The Trustees noted that the Fund was smaller than the peer group average. Following this comparison and upon further consideration and discussion of the foregoing, the Board of Trustees concluded that the fees to be paid to the Advisor by the Fund were fair and reasonable in relation to the nature and quality of the services provided by the Advisor and that they reflected charges that were within a range of what could have been negotiated at arm's length.
(Continued)
ROUMELL OPPORTUNISTIC VALUE FUND
Additional Information (Unaudited)
In considering the extent to which economies of scale would be realized as the Fund grows and whether advisory fee levels reflect those economies of scale for the benefit of the Fund's investors, the Trustees considered the Fund's fee arrangements with the Advisor. The Trustees noted that although the maximum management fee under the Investment Advisory Agreement would stay the same regardless of the Fund's asset levels, the Advisor had agreed to make payments to the Administrator at lower asset levels in order to help limit the Fund's expenses. The Trustees pointed out that the Fund would benefit from economies of scale under agreements with service providers other than the Advisor. In particular, it was noted that the Fund's administration fee was a significant component of the gross expense ratio and that the agreement utilized breakpoints in its fee schedule that allowed the Fund's shareholders to benefit from economies of scale. The Trustees also noted that economies of scale were unlikely to be realized in the near future due to the size of the Fund. It was pointed out that breakpoints in the management fee could be reconsidered in the future. Following further discussion of the Fund's asset level, expectations for growth, and fee levels, the Board of Trustees determined that the Fund's fee arrangements with the Advisor were fair and reasonable in relation to the nature and quality of the services provided by the Advisor.
In considering the Advisor's practices regarding brokerage and portfolio transactions, the Trustees reviewed the Advisor's standards, and performance in utilizing those standards, for seeking best execution for Fund portfolio transactions. The Trustees also considered the portfolio turnover rate for the Fund; the process by which evaluations are made of the overall reasonableness of commissions paid; the method and basis for selecting and evaluating the broker-dealers used; any allocation of portfolio business to persons affiliated with the Advisor; and the extent to which the Fund allocates portfolio business to broker-dealers who provide research, statistical, or other services (soft dollars). The Trustees noted, among other things, that the Fund rarely trades blocks of shares which require special handling and that the average commission rate for the Fund was approximately $0.003 per share. After further review and discussion, the Board of Trustees determined that the Advisor's practices regarding brokerage and portfolio transactions were satisfactory.
(Continued)
ROUMELL OPPORTUNISTIC VALUE FUND
Additional Information (Unaudited)
In considering the Advisor's practices regarding conflicts of interest, the Trustees evaluated the potential for conflicts of interest and considered such matters as the experience and ability of the advisory personnel assigned to the Fund; the basis of decisions to buy or sell securities for the Fund and the Advisor's other accounts; the method for bunching of portfolio securities transactions; and the substance and administration of the Advisor's code of ethics. Following further consideration and discussion, the Board of Trustees indicated that the Advisor's standards and practices relating to the identification and mitigation of possible conflicts of interests were satisfactory.
Based upon all of the foregoing considerations, the Board of Trustees, including a majority of the Independent Trustees, approved the Investment Advisory Agreement for the Fund.
6. Information about Trustees and Officers
The business and affairs of the Fund and the Trust are managed under the direction of the Board of Trustees of the Trust. Information concerning the Trustees and officers of the Trust and Fund is set forth below. Generally, each Trustee and officer serves an indefinite term or until certain circumstances such as their resignation, death, or otherwise as specified in the Trust's organizational documents. Any Trustee may be removed at a meeting of shareholders by a vote meeting the requirements of the Trust's organizational documents. The Statement of Additional Information of the Fund includes additional information about the Trustees and officers and is available, without charge, upon request by calling the Fund toll-free at 1-800-773-3863. The address of each Trustee and officer, unless otherwise indicated below, is 116 South Franklin Street, Rocky Mount, North Carolina 27804. The Independent Trustees each received aggregate compensation of $2,000 during the fiscal year ended August 31, 2017 from the Administrator for their services to the Fund and Trust.
(Continued)
ROUMELL OPPORTUNISTIC VALUE FUND
Additional Information (Unaudited)
Name, Age
and Address | Position
held with
Fund or Trust | Length of Time Served | Principal Occupation
During Past 5 Years | Number of Portfolios in Fund Complex Overseen by Trustee | Other Directorships
Held by Trustee
During Past 5 Years |
| Independent Trustees |
James H. Speed, Jr.
Date of Birth: 06/1953 | Independent Trustee, Chairman | Trustee since 7/09, Chair since 5/12 | Previously President and CEO of NC Mutual Insurance Company (insurance company) from 2003 to 2015. | 17 | Independent Trustee of the Brown Capital Management Mutual Funds for its four series, Hillman Capital Management Investment Trust for its one series, Centaur Mutual Funds Trust for its one series, Chesapeake Investment Trust, previously known as Gardner Lewis Trust, for its one series and WST Investment Trust for its two series (all registered investment companies). Member of Board of Directors of M&F Bancorp. Member of Board of Directors of Investors Title Company. Previously, Board of Directors of NC Mutual Life Insurance Company. |
Theo H. Pitt, Jr.
Date of Birth: 04/1936 | Independent Trustee | Since 9/10 | Senior Partner, Community Financial Institutions Consulting (financial consulting) since 1999; Partner, Pikar Properties (real estate) since 2001. | 17 | Independent Trustee of World Funds Trust for its forty nine series, Chesapeake Investment Trust, previously known as Gardner Lewis Investment Trust, for its one series, Leeward Investment Trust for its two series and Hillman Capital Management Investment Trust for its one series (all registered investment companies). |
Michael G. Mosley
Date of Birth: 01/1953 | Independent Trustee | Since 7/10 | Owner of Commercial Realty Services (real estate) since 2004. | 17 | None. |
J. Buckley Strandberg
Date of Birth: 03/1960 | Independent Trustee | Since 7/09 | President of Standard Insurance and Realty (insurance and property management) since 1982. | 17 | None. |
| Other Officers |
Katherine M. Honey
Date of Birth: 09/1973 | President and Principal Executive Officer | Since 05/15 | EVP of The Nottingham Company since 2008. | n/a | n/a |
Matthew J. Beck
Date of Birth: 06/1988 | Secretary | Since 05/15 | General Counsel of The Nottingham Company since 2014. | n/a | n/a |
Ashley E. Harris Date of Birth: 03/1984 | Treasurer, Assistant Secretary and Principal Financial Officer | Since 05/15 | Fund Accounting Manager and Financial Reporting, The Nottingham Company since 2008. | n/a | n/a |
ROUMELL OPPORTUNISTIC VALUE FUND
Additional Information (Unaudited)
Name, Age
and Address | Position
held with
Fund or Trust | Length of Time Served | Principal Occupation
During Past 5 Years | Number of Portfolios in Fund Complex Overseen by Trustee | Other Directorships
Held by Trustee
During Past 5 Years |
Stacey Gillespie Date of Birth: 05/1974 | Chief Compliance Officer | Since 03/16 | Compliance Director, Cipperman Compliance Services, LLC (09/15-present). Formerly, Chief Compliance Officer of Boenning & Scattergood, Inc. (2013-2015) and Director of Investment Compliance at Boenning & Scattergood, Inc. (2007-2013). | n/a | n/a |
.
Pursuant to the requirements of the Securities Exchange Act of 1934 and the Investment Company Act of 1940, the registrant has duly caused this report to be signed on its behalf by the undersigned, thereunto duly authorized.
Pursuant to the requirements of the Securities Exchange Act of 1934 and the Investment Company Act of 1940, this report has been signed below by the following persons on behalf of the registrant and in the capacities and on the dates indicated.