Matthew J. Beck
Item 1. REPORTS TO STOCKHOLDERS.
Cavalier Funds
ANNUAL REPORT
May 31, 2017
Cavalier Adaptive Income Fund
Cavalier Dividend Income Fund
Cavalier Dynamic Growth Fund
Cavalier Fundamental Growth Fund
Cavalier Global Opportunities Fund
Cavalier Hedged High Income Fund
Cavalier Multi Strategist Fund
Cavalier Tactical Rotation Fund
This report and the financial statements contained herein are submitted for the general information of the shareholders of the Cavalier Funds (the "Funds"). The Funds' shares are not deposits or obligations of, or guaranteed by, any depository institution. The Funds' shares are not insured by the FDIC, Federal Reserve Board or any other agency, and are subject to investment risks, including possible loss of principal amount invested. Neither the Funds nor the Funds' distributor is a bank.
The Cavalier Funds are distributed by Capital Investment Group, Inc., Member FINRA/SIPC, 100 E. Six Forks Road, Suite 200, Raleigh, NC, 27609. There is no affiliation between the Cavalier Funds, including their principals, and Capital Investment Group, Inc.
| Table of Contents | | |
| | | |
| Letter to Shareholders | | 1 |
| Cavalier Adaptive Income Fund | | 4 |
| Cavalier Dividend Income Fund | | 12 |
| Cavalier Dynamic Growth Fund | | 20 |
| Cavalier Fundamental Growth Fund | | 31 |
| Cavalier Global Opportunities Fund | | 42 |
| Cavalier Hedged High Income Fund | | 50 |
| Cavalier Multi Strategist Fund | | 58 |
| Cavalier Tactical Rotation Fund | | 67 |
| Notes to Financial Statements | | 77 |
| Auditor Opinion | | 91 |
| Additional Information | | 92 |
Statements in this Annual Report that reflect projections or expectations of future financial or economic performance of the Cavalier Funds ("Funds") and of the market in general and statements of the Funds' plans and objectives for future operations are forward-looking statements. No assurance can be given that actual results or events will not differ materially from those projected, estimated, assumed or anticipated in any such forward-looking statements. Important factors that could result in such differences, in addition to the other factors noted with such forward-looking statements, include, without limitation, general economic conditions such as inflation, recession and interest rates. Past performance is not a guarantee of future results.
An investment in the Funds is subject to investment risks, including the possible loss of some or the entire principal amount invested. There can be no assurance that the Funds will be successful in meeting their investment objectives. Investment in the Funds is also subject to the following risks: Fund of Funds Risk, Control of Portfolio Funds Risk, Market Risk, Management Style Risk, Common Stock Risk, Other Equity Securities Risk, Large-Cap Securities Risk, Small-Cap and Mid-Cap Securities Risk, Sector Risk, Foreign Securities and Emerging Markets Risk, Short Sales Risk, Leverage Risk, Portfolio Turnover Risk, Investment Advisor Risk, Fixed Income Risk, Interest Rate Risk, Inflation Risk, High-Yield Risk, Corporate Debt Securities Risk, Convertible Securities Risk, Risks from Treasury Inflation-Protected Securities, Derivatives Risk, Futures Risk, Swaps Risk, Risk from Purchasing Options, Risk from Writing Options, Fixed-Income Market Risk, Commodities Risk, Real Estate Risk, Mortgage and Asset-Backed Securities Risk, General Market Risk, Foreign Investment Risk, Currency Risk, Emerging Markets Risk, Depository Receipts Risk, and Micro-Cap Securities Risk. More information about these risks and other risks can be found in the Funds' prospectus.
The performance information quoted in this Annual Report represents past performance, which is not a guarantee of future results. Investment return and principal value of an investment will fluctuate so that an investor's shares, when redeemed, may be worth more or less than their original cost. Current performance may be lower or higher than the performance data quoted. An investor may obtain performance data current to the most recent month-end by visiting ncfunds.com.
An investor should consider the investment objectives, risks, charges and expenses of the Funds carefully before investing. The prospectus contains this and other information about the Funds. A copy of the prospectus is available at ncfunds.com or by calling Shareholder Services at 800-773-3863. The prospectus should be read carefully before investing. |
This Annual Report was first distributed to shareholders on or about August 15, 2017.
For More Information on Your Cavalier Funds:
See Our Web site @ ncfunds.com
or
Call Our Shareholder Services Group at 800-773-3863.
Dear Investor,
We appreciate the opportunity to present to you the annual report for the period ending May 31st 2017. As we enter the mid-point of 2017 the markets continue a period of historically low volatility. The VIX (CBOE Volatility Index) which measures the equity markets expectations of 30-day volatility has remained at a historically very low level for 2017. Also, the standard deviation so far in 2017 has measured less than 5%, another extremely low measure of volatility for the markets. This bull market that began in 2009 now becomes the second longest bull market in history only surpassed by the 1987 to 2000 bull market. Since the financial crisis ended in 2009 stocks have moved consistently higher. Just observing all Morningstar size and style categories, the 5-year returns ending May 31st, 2017 every single category has appreciated at a double-digit annualized rate. This has brought a level of complacency in the markets where prices may become disconnected from fundamentals. This risk will be most prevalent in businesses that have not had the fundamental earnings growth to support their share price appreciation. With markets today trading at higher valuations, high level of complacency, and heightened geopolitical risks, in our view it will be prudent to avoid unnecessary risks and maintain a disciplined investment philosophy.
The portfolio construction of our Cavalier Equity and Fixed Income funds adhere to the theory of adaptive correlation and offer a flexible way to off-set short-term market events by gradually, but quickly, reallocating assets to where they will be most effective. Our goal is not to completely avoid downside in a severe bear market, but have portfolios that can mitigate downside volatility. The ability to adapt to a changing market will be critical. We believe we are entering an era where risk management and the effective use of tactical risk management will serve investors well, and help them meet their goals.
Macro Commentary
With the first half of 2017 nearly complete, the global equity markets have been very kind for the bulls. The S&P 500 has posted 24 all-time closing highs since the year started. Even with heighted geopolitical risks, tightening monetary policy stance by the Federal Reserve, and modest GDP growth from the US economy, the stock market has quietly climbed higher. The first half of 2017 has been so easy for the bulls, the largest drawdown for the S&P 500 was only -2.80% from March 1st to April 15th. Statistically this is the second smallest drawdown in history for the S&P 500 dating back to 1928. The only year with a smaller drawdown than 2017 was 1995, and that year the S&P 500 performed very well in the second half of the year with about a 13% return. History has shown that years with a lower than average drawdown, market performance has been strong in the second half on the year. As a recap for market performance as of May 31st, the S&P 500 is up 8.66% from the beginning of 2017, and on a total return basis, the Barclays U.S. Aggregate Bond index is up 2.38%. There has been large performance divergence among sectors within the S&P 500. The energy sector is down about 12% and on the contrary the technology sector is up about 20% from the beginning of 2017. Additionally, there is divergence among large cap and small cap US equites, as US large caps have outperformed US small caps with the Russell 2000 up only 1.48% from the beginning of 2017. The YTD% returns for international developed markets have rebounded in 2017 with the S&P Global BMI up 10.20% since the beginning of 2017 through the end of May. High Yield bonds continue to offer attractive income and yields with modest total return. The Markit iBoxx USD Liquid High Yield Index was up 4.3% for the year through the end of May.
In summary, it has been a strong start for U.S. equities as market volatility has remained low through the first half of 2017, and markets have benefited with low drawdowns and strong performance. History has shown that markets ending the first half of the year with a steady increase also tend to rise steady in the second half of the year. For the S&P 500 going back to 1961, the index has averaged a gain of 5.41% in the second half when the market has been up in the first half of the year.
Cavalier Adaptive Income Fund
For the fiscal year ended May 31, 2017 in the Cavalier Adaptive Income Fund, the return on the Institutional Class Shares was 8.54%, and the return on the Class C Shares was 7.46%. This compares to 1.58% for the Barclays Capital US Aggregate Bond Index over the same period.
Cavalier Dividend Income Fund
For the fiscal year ended May 31, 2017 in the Cavalier Dividend Income Fund, the return on the Institutional Class Shares was 4.09%, and the return on the Class C Shares was 3.03%. This compares to 14.80% for the MSCI ACWI High Dividend Yield NR Index and 14.62% for the Russell 1000 Value Index over the same period.
Cavalier Dynamic Growth Fund
For the fiscal year ended May 31, 2017 in the Cavalier Dynamic Growth Fund, the return on the Institutional Class Shares was 16.50%, and the return on the Class C Shares was 15.42%. This compares to 18.13% for the S&P Global Broad Market Index and 17.16% for the S&P 500 Total Return Index over the same period.
Cavalier Fundamental Growth Fund
For the fiscal year ended May 31, 2017 in the Cavalier Fundamental Growth Fund, the return on the Institutional Class Shares was 18.42%, and the return on the Class C Shares was 17.37%. This compares to 18.13% for the S&P Global Broad Market Index over the same period.
Cavalier Global Opportunities Fund
For the fiscal year ended May 31, 2017 in the Cavalier Global Opportunities Fund, the return on the Institutional Class Shares was 23.53%, and the return on the Class C Shares was 22.73%. This compares to 18.13% for the S&P Global Broad Market Index over the same period.
Cavalier Hedged High Income Fund
For the fiscal year ended May 31, 2017 in the Cavalier Hedged High Income Fund, the return on the Institutional Class Shares was 12.45%, and the return on the Class C Shares was 11.38%. This compares to 12.74% for the Barclays Capital Global High-Yield Index over the same period.
Cavalier Multi Strategist Fund
For the fiscal year ended May 31, 2017 in the Cavalier Multi Strategist Fund, the return on the Institutional Class Shares was 11.82%, and the return on the Class C Shares was 10.72%. This compares to 18.13% for the S&P Global Broad Market Index over the same period.
Cavalier Tactical Rotation Fund
For the fiscal year ended May 31, 2017 in the Cavalier Tactical Rotation Fund, the return on the Institutional Class Shares was 13.50%, and the return on the Class C Shares was 12.47%. This compares to 18.13% for the S&P Global Broad Market Index over the same period. The return on the Class P Shares was 12.00% for the period from July 1, 2016 (Date of Initial Public Investment) through May 31, 2017, which compares to a return of 21.60% for the S&P Global Broad Market Index for the same time period.
Summary
Cavalier has designed our suite of products to be suitable for investors seeking the capture of benchmark-like performance in up markets along with the comfort of having a safety net of downside protection built into each Fund offering to reduce asset loss in bear markets. Cavalier Funds are built around the concept that investors can experience benchmark results over a full market cycle, when compared to a static asset allocation, or buy-and- hold investing, with less fear and panic during times of market duress. As markets climb higher and reach new highs in 2017, our goal at Cavalier is to deliver investment products that can achieve market returns in bull markets and tactically seek to manage risk and downside volatility when markets eventually move into bear market territory.
Thank you for the continued opportunity to serve you.
Disclosures:
The performance information quoted above represents past performance and past performance does not guarantee future results. Investment return and principal value of an investment will fluctuate so that an investor's shares, when redeemed, may be worth more or less than their original cost. Current performance may be lower or higher than the performance data quoted. Performance data, current to the most recent month end, may be obtained by calling the Funds at 800-773-3863. Fee waivers and expense reimbursements have positively impacted the Funds' performance.
The inception date of the Institutional Class Shares for the Cavalier Adaptive Income Fund and Cavalier Dynamic Growth Fund is October 2, 2009. The inception date of the Institutional Class Shares for the Cavalier Dividend Income Fund, Cavalier Global Opportunities Fund, Cavalier Hedged High Income Fund, Cavalier Multi Strategist Fund, and Cavalier Tactical Rotation Fund is September 20, 2012. The inception date of the Institutional Class Shares of the Cavalier Fundamental Growth Fund is October 17, 2013.
The inception dates of the Class C Shares for the Cavalier Adaptive Income Fund and Cavalier Dynamic Growth Fund are February 25, 2011 and February 18, 2011, respectively. The inception date of the Institutional Class Shares for the Cavalier Dividend Income Fund, Cavalier Global Opportunities Fund, Cavalier Hedged High Income Fund, Cavalier Multi Strategist Fund, and Cavalier Tactical Rotation Fund is September 26, 2012. The inception date of the Institutional Class Shares of the Cavalier Fundamental Growth Fund is November 4, 2013.
(RCCAV0617001)
| Cavalier Adaptive Income Fund - Institutional Class Shares | | | | | | | | |
| | | | | | | | | | | | | | | | | | |
| Performance Update (Unaudited) | | | | | | | | | | | |
| | | | | | | | | | | | | | | | | | |
| | | | | | | | | | | | | | | | | | |
| For the period from October 2, 2009 (Date of Initial Public Investment) through May 31, 2017 |
| | | | | | | | | | | | | | | | | | |
| Comparison of the Change in Value of a $10,000 Investment | | | | | | | | |
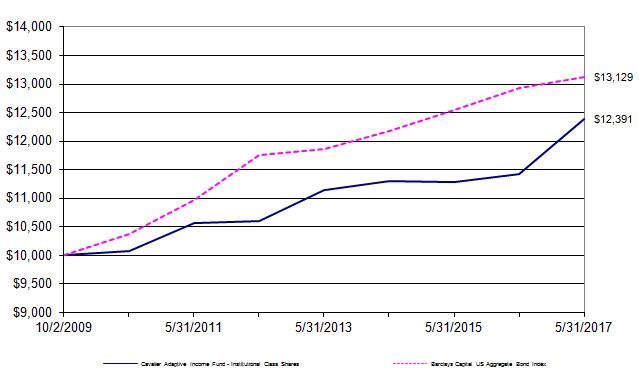
| The graph above assumes an initial $10,000 investment and represents the reinvestment of dividends and capital gains. This graph depicts the performance of Cavalier Adaptive Income Fund - Institutional Class Shares versus the Barclays Capital US Aggregate Bond Index. It is important to note that the Fund is a professionally managed mutual fund while the index is not available for investment and is unmanaged. The comparison is shown for illustrative purposes only. |
| | | | | | | | | | | | | | | | | | | | |
| | Average Annual Total Returns | |
| | | | | | | | | | | | | | | | | | Gross | | |
| | | As of | | | | | One | | Five | | Since | | Inception | | Expense | | |
| | | May 31, 2017 | | | | Year | | Year | | Inception | | Date | | Ratio* | | |
| | | Institutional Class Shares | | | 8.54% | | 3.17% | | 2.84% | | 10/02/09 | | 2.45% | | |
| | | Barclays Capital US Aggregate Bond Index | | 1.58% | | 2.24% | | 3.62% | | N/A | | N/A | | |
| | | | | | | | | | | | | | | | | | | | |
| * The gross expense ratio shown is from the Funds' prospectus dated September 28, 2016. | | | | | |
| | | | | | | | | | | | | | | | | | | | |
| Performance quoted above represents past performance, which is no guarantee of future results. Investment return and principal value will fluctuate so that shares, when redeemed, may be worth more or less than their original cost. Current performance may be lower or higher than the performance data quoted. An investor may obtain performance data, current to the most recent month-end, by visiting ncfunds.com. |
| | | | | | | | | | | | | | | | | | | | |
| The graph and table do not reflect the deduction of taxes that a shareholder would pay on Fund distributions or the redemption of Fund shares. Average annual total returns are historical in nature and measure net investment income and capital gain or loss from portfolio investments assuming reinvestments of distributions. |
| Cavalier Adaptive Income Fund - Class C Shares | | | | | | | | | | | | |
| | | | | | | | | | | | | | | | | | | | |
| Performance Update (Unaudited) | | | | | | | | | | | | | |
| | | | | | | | | | | | | | | | | | | | |
| | | | | | | | | | | | | | | | | | | | |
| For the period from February 25, 2011 (Date of Initial Public Investment) through May 31, 2017 | | |
| | | | | | | | | | | | | | | | | | | | |
| Comparison of the Change in Value of a $10,000 Investment | | | | | | | | | | |
| | | | | | | | | | | | | | | | | | | | |
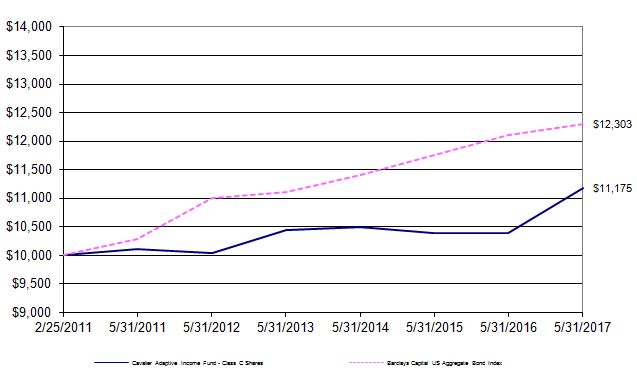
| The graph above assumes an initial $10,000 investment and represents the reinvestment of dividends and capital gains. This graph depicts the performance of Cavalier Adaptive Income Fund - Class C Shares versus the Barclays Capital US Aggregate Bond Index. It is important to note that the Fund is a professionally managed mutual fund while the index is not available for investment and is unmanaged. The comparison is shown for illustrative purposes only. |
| | | | | | | | | | | | | | | | | | | | |
| | Average Annual Total Returns | |
| | | | | | | | | | | | | | | | | | Gross | | |
| | | As of | | | | | One | | Five | | Since | | Inception | | Expense | | |
| | | May 31, 2017 | | | | Year | | Year | | Inception | | Date | | Ratio* | | |
| | | Class C Shares** | | | | 7.46% | | 2.15% | | 1.79% | | 02/25/11 | | 3.45% | | |
| | | Barclays Capital US Aggregate Bond Index | | 1.58% | | 2.24% | | 3.36% | | N/A | | N/A | | |
| * The gross expense ratio shown is from the Funds' prospectus dated September 28, 2016. | | | | |
| ** | As of February 24, 2017, the "Advisor Class" Shares were renamed to the "Class C" Shares. There were no other changes to this class of shares. Class C Shares held longer than 7 years will automatically convert to Institutional Class Shares. Institutional Class Shares are not subject to the distribution and service plan (Rule 12b-1) fees of 1.00%. |
| | |
|
| Performance quoted above represents past performance, which is no guarantee of future results. Investment return and principal value will fluctuate so that shares, when redeemed, may be worth more or less than their original cost. Current performance may be lower or higher than the performance data quoted. An investor may obtain performance data, current to the most recent month-end, by visiting ncfunds.com. |
| | | | | | | | | | | | | | | | | | | | |
| The graph and table do not reflect the deduction of taxes that a shareholder would pay on Fund distributions or the redemption of Fund shares. Average annual total returns are historical in nature and measure net investment income and capital gain or loss from portfolio investments assuming reinvestments of distributions. |
| Cavalier Adaptive Income Fund | | | | | | |
| | | | | | | | | | |
| Schedule of Investments | | | | | | | |
| | | | | | | | | | |
| As of May 31, 2017 | | | | | | | |
| | | | | | | | Shares | | Value (Note 1) |
| | | | | | | | | | |
| CLOSED-END FUNDS - 39.44% | | | | | | |
| | Advent Claymore Convertible Securities and Income Fund | | 30,784 | $ | 499,932 |
| | Avenue Income Credit Strategies Fund | | | | 36,667 | | 529,105 |
| | First Trust/Aberdeen Global Opportunity Income Fund | | | 84,037 | | 1,010,965 |
| | Tortoise Pipeline & Energy Fund, Inc. | | | | 30,174 | | 602,574 |
| | | | | | | | | | |
| | Total Closed-End Funds (Cost $2,534,177) | | | | | | 2,642,576 |
| | | | | | | | | | |
| EXCHANGE-TRADED PRODUCTS - 22.84% | | | | | | |
| | Deutsche X-trackers High Yield Corporate Bond ETF | | | 31,402 | | 734,807 |
| | PowerShares Senior Loan Portfolio | | | | 34,151 | | 796,060 |
| | | | | | | | | | |
| | Total Exchange-Trade Products (Cost $1,531,848) | | | | | | 1,530,867 |
| | | | | | | | | | |
| SHORT-TERM INVESTMENT - 37.25% | | | | | | |
| § | Fidelity Investments Money Market Government Portfolio - | | | | |
| | Institutional Class, 0.69% | | | | 2,496,129 | | 2,496,129 |
| | | | | | | | | | |
| | Total Short-Term Investment (Cost $2,496,129) | | | | | | 2,496,129 |
| | | | | | | | | | |
| Total Value of Investments (Cost $6,562,154) - 99.53% | | | | | $ | 6,669,572 |
| | | | | | | | | | |
| Other Assets Less Liabilities - 0.47% | | | | | | 31,592 |
| | | | | | | | | | |
| | Net Assets - 100.00% | | | | | | $ | 6,701,164 |
| | | | | | | | | | |
| § | Represents 7 day effective yield | | | | | | |
| | | | | | | | | | |
| | | | | | | | | | |
| | | | | | | | | | |
| | | | | | | | | | |
| | | | Summary of Investments | | | | | | |
| | | | | | | | | | |
| | | | | | % of Net Assets | | Value | | |
| | | | Closed-End Funds | | 39.44% | $ | 2,642,576 | | |
| | | | Exchange-Traded Products | | 22.84% | | 1,530,867 | | |
| | | | Short-Term Investment | | 37.25% | | 2,496,129 | | |
| | | | Other Assets Less Liabilities | 0.47% | | 31,592 | | |
| | | | Total Net Assets | | 100.00% | $ | 6,701,164 | | |
| | | | | | | | | | |
| | | | | | | | | | |
| | | | | | | | | | |
| | | | | | | | | | |
| | | | | | | | | | |
| | | | | | | | | | |
| | | | | | | | | | |
| See Notes to Financial Statements | | | | | | |
| Cavalier Adaptive Income Fund | | |
| | | | | | | | |
| Statement of Assets and Liabilities | | |
| | | | | | | | |
| As of May 31, 2017 | | | |
| | | | | | | | |
| Assets: | | | | | |
| | Investments, at value (cost $6,562,154) | $ | 6,669,572 |
| | Receivables: | | | |
| | | Fund shares sold | | | 281 |
| | | Dividends | | | 572 |
| | | Due from Advisor | | | 31,873 |
| | Prepaid expenses: | | | |
| | | Registration and filing expenses | | 17,607 |
| | | Fund accounting fees | | | 2,783 |
| | | Compliance fees | | | 16 |
| | | | | | | | |
| | Total assets | | | 6,722,704 |
| | | | | | | | |
| Liabilities: | | | | | |
| | Accrued expenses: | | | |
| | | Professional fees | | | 15,000 |
| | | Distribution and service fees - Class C Shares | | 1,760 |
| | | Shareholder fulfillment fees | | 1,751 |
| | | Trustee fees and meeting expenses | | 1,337 |
| | | Custody and banking fees | | 913 |
| | | Insurance fees | | | 646 |
| | | Security pricing fees | | | 92 |
| | | Administration fees | | | 41 |
| | | | | | | | |
| | Total liabilities | | | 21,540 |
| | | | | | | | |
| Total Net Assets | | $ | 6,701,164 |
| | | | | | | | |
| Net Assets Consist of: | | | |
| | Paid in capital | | $ | 6,785,560 |
| | Accumulated net realized loss on investments | | (191,814) |
| | Net unrealized appreciation on investments | | 107,418 |
| | | | | | | | |
| Total Net Assets | | $ | 6,701,164 |
| | | | | | | | |
| Institutional Class Shares of beneficial interest outstanding, no par value (unlimited authorized shares) | 431,604 |
| | Net Assets | | | $ | 4,497,634 |
| | Net Asset Value, Offering Price and Redemption Price Per Share | $ | 10.42 |
| | | | | | | | |
| Class C Shares of beneficial interest outstanding, no par value (unlimited authorized shares) | | 218,848 |
| | Net Assets | | | $ | 2,203,530 |
| | Net Asset Value, Offering Price and Redemption Price Per Share (a) | $ | 10.07 |
| | | | | | | | |
| (a) | Contingent deferred sales charge for Class C Shares is imposed on proceeds redeemed within one year of the purchase date (note 1). |
| | | | | | | | |
| | | | | | | | |
| | | | | | | | |
| | | | | | | | |
| | | | | | | | |
| | | | | | | | |
| See Notes to Financial Statements | | |
| Cavalier Adaptive Income Fund | | |
| | | | | | | | |
| Statement of Operations | | |
| | | | | | | | |
| For the year ended May 31, 2017 | | |
| | | | | | | | |
| Investment Income: | | |
| | Dividends | | | $ | 340,684 |
| | | | | | | | |
| | Total Investment Income | | 340,684 |
| | | | | | | | |
| Expenses: | | | | | |
| | Advisory fees (note 2) | | 45,351 |
| | Professional fees | | 41,193 |
| | Fund accounting fees (note 2) | | 38,896 |
| | Registration and filing expenses | | 38,055 |
| | Transfer agent fees (note 2) | | 31,973 |
| | Administration fees (note 2) | | 24,026 |
| | Distribution and service fees - Class C Shares (note 3) | | 16,701 |
| | Shareholder fulfillment fees | | 16,432 |
| | Compliance fees | | 13,056 |
| | Trustee fees and meeting expenses | | 10,367 |
| | Custody and banking fees (note 2) | | 5,115 |
| | Insurance fees | | | 2,241 |
| | Other operating expenses | | 1,907 |
| | Security pricing fees | | 1,674 |
| | | | | | | | |
| | Total Expenses | | | 286,987 |
| | | | | | | | |
| | Fees waived and reimbursed by Advisor (note 2) | | (183,169) |
| | | | | | | | |
| | Net Expenses | | | 103,818 |
| | | | | | | | |
| Net Investment Income | | 236,866 |
| | | | | | | | |
| Realized and Unrealized Gain (Loss) on Investments: | | |
| | | | | | | | |
| | Net realized gain from investment transactions | | 393,578 |
| | Capital gain distributions from underlying funds | | 1,157 |
| | Net change in unrealized appreciation on investments | | (66,415) |
| | | | | | | | |
| Net Realized and Unrealized Gain on Investments | | 328,320 |
| | | | | | | | |
| Net Increase in Net Assets Resulting from Operations | $ | 565,186 |
| | | | | | | | |
| | | | | | | | |
| See Notes to Financial Statements | | |
| Cavalier Adaptive Income Fund | | | | | | | |
| | | | | | | | | | | | |
| Statements of Changes in Net Assets | | | | | | | |
| | | | | | | | | | | | |
| For the years ended May 31, | | | | | 2017 | | 2016 |
| | | | | | | | | | | | |
| Operations: | | | | | | | | |
| | Net investment income | | | | $ | 236,866 | $ | 131,548 |
| | Net realized gain (loss) from investment transactions | | | | 393,578 | | (372,540) |
| | Net realized gain from underlying funds | | | | | 1,157 | | 3,021 |
| | Net change in unrealized appreciation (depreciation) on investments | | (66,415) | | 230,506 |
| | | | | | | | | | | | |
| Net Increase (Decrease) in Net Assets Resulting from Operations | | 565,186 | | (7,465) |
| | | | | | | | | | | | |
| Distributions to Shareholders From: | | | | | | | |
| | Net investment income | | | | | | | |
| | | Institutional Class Shares | | | | | (183,339) | | (145,755) |
| | | Class C Shares | | | | | (55,795) | | (3,706) |
| | | | | | | | | | | | |
| Decrease in Net Assets Resulting from Distributions | | | | (239,134) | | (149,461) |
| | | | | | | | | | | | |
| Beneficial Interest Transactions: | | | | | | | |
| | Shares sold | | | | | | 1,578,382 | | 30,206,617 |
| | Reinvested dividends and distributions | | | | | 236,830 | | 100,209 |
| | Shares repurchased | | | | | (3,925,408) | | (42,233,840) |
| Decrease from Beneficial Interest Transactions | | | | (2,110,196) | | (11,927,014) |
| | | | | | | | | | | | |
| Net Decrease in Net Assets | | | | | (1,784,144) | | (12,083,940) |
| | | | | | | | | | | | |
| Net Assets: | | | | | | | | |
| | Beginning of Year | | | | | 8,485,308 | | 20,569,248 |
| | End of Year | | | | | $ | 6,701,164 | $ | 8,485,308 |
| | | | | | | | | | | | |
| Accumulated Net Investment Loss | | | | $ | - | $ | (4,764) |
| | | | | | Year Ended | | Year Ended |
| Share Information: | May 31, 2017 | | May 31, 2016 |
| | Institutional Class Shares | Shares | | Amount | | Shares | | Amount |
| | | Shares sold | 59,686 | $ | 609,864 | | 2,899,776 | $ | 28,753,137 |
| | | Reinvested dividends and distributions | 17,834 | | 182,579 | | 9,849 | | 96,642 |
| | | Shares repurchased | (353,628) | | (3,617,139) | | (4,186,536) | | (41,431,319) |
| | Net Decrease in Shares of | | | | | | | |
| | Beneficial Interest | (276,108) | $ | (2,824,696) | | (1,276,911) | $ | (12,581,540) |
| | | | | | | | | | | | |
| | Class C Shares | Shares | | Amount | | Shares | | Amount |
| | | Shares sold | 97,493 | $ | 968,518 | | 152,538 | $ | 1,453,480 |
| | | Reinvested dividends and distributions | 5,458 | | 54,251 | | 378 | | 3,567 |
| | | Shares repurchased | (31,198) | | (308,269) | | (83,726) | | (802,521) |
| | Net Increase in Shares of | | | | | | | |
| | Beneficial Interest | 71,753 | $ | 714,500 | | 69,190 | $ | 654,526 |
| | | | | | | | | | | | |
| | | | | | | | | | | | |
| | | | | | | | | | | | |
| | | | | | | | | | | | |
| See Notes to Financial Statements | | | | | | | |
| Cavalier Adaptive Income Fund | | | | | | | | | | | |
| | | | | | | | | | | | | | | | |
| Financial Highlights | | | | | | | | | | | |
| | | | | | | | | | | | | | | | |
| For a share outstanding during each | | Institutional Class Shares |
| of the fiscal years ended May 31, | | 2017 | | 2016 | | 2015 | | 2014 | | 2013 | |
| | | | | | | | | | | | | | | | |
| Net Asset Value, Beginning of Year | $ | 9.98 | $ | 9.98 | $ | 10.15 | $ | 10.19 | $ | 10.16 | |
| | | | | | | | | | | | | | | | |
| Income (Loss) from Investment Operations | | | | | | | | | | | |
| | Net investment income | | 0.38 | (c) | 0.10 | (c) | 0.17 | (c) | 0.17 | (c) | 0.39 | |
| | Net realized and unrealized gain (loss) on | | | | | | | | | |
| | | investments | | 0.46 | | (0.00) | (g)(h) | (0.17) | | (0.05) | | 0.14 | |
| | | | | | | | | | | | | | | | |
| Total from Investment Operations | | 0.84 | | 0.10 | | - | | 0.12 | | 0.53 | |
| | | | | | | | | | | | | | | | |
| Less Distributions: | | | | | | | | | | | |
| | From net investment income | | (0.40) | | (0.10) | | (0.16) | | (0.16) | | (0.48) | |
| | From net realized gains | | - | | - | | (0.01) | | - | | (0.02) | |
| | | | | | | | | | | | | | | | |
| Total Distributions | | | (0.40) | | (0.10) | | (0.17) | | (0.16) | | (0.50) | |
| | | | | | | | | | | | | | | | |
| Net Asset Value, End of Year | $ | 10.42 | $ | 9.98 | $ | 9.98 | $ | 10.15 | $ | 10.19 | |
| | | | | | | | | | | | | | | | |
| Total Return (a) | | | 8.54% | | 1.02% | | (0.04)% | | 1.25% | | 5.33% | |
| | | | | | | | | | | | | | | | |
| Net Assets, End of Year (in thousands) | $ | 4,498 | $ | 7,063 | $ | 19,813 | $ | 9,280 | $ | 7,679 | |
| | | | | | | | | | | | | | | | |
| Ratios of: | | | | | | | | | | | | | | |
| Gross Expenses to Average Net Assets (b) | | 3.90% | | 2.04% | | 1.72% | | 0.70% | | 0.86% | |
| Net Expenses to Average Net Assets (b) | | 1.29% | | 0.94% | (f) | 0.88% | (e) | 0.70% | | 0.84% | |
| Net Investment Income to Average | | | | | | | | | | | |
| | Net Assets (d) | | | 3.68% | | 0.98% | (f) | 1.72% | (e) | 1.73% | | 3.14% | |
| | | | | | | | | | | | | | | | |
| Portfolio turnover rate | | 110.84% | | 246.74% | | 106.26% | | 127.64% | | 82.95% | |
| | | | | | | | | | | | | | | | |
| | | | | | | | | | | | | | | | |
| (a) | Includes adjustments in accordance with accounting principles generally accepted in the United States of America and, consequently, the net asset value for financial reporting purposes and the returns based upon those net asset values may differ from the net asset values and returns for shareholder transactions. |
| (b) | Does not include expenses of the investment companies in which the Fund invests. | | | | | |
| (c) | Calculated using the average shares method. | | | | | | | | | |
| (d) | Recognition of net investment income by the Fund is affected by the timing of the declaration of dividends by the underlying investment companies in which the Fund invests. |
| (e) | Includes reimbursement of acquired fund fees. | | | | | | | | | |
| (f) | Includes reimbursement of acquired fund fees and expenses for the period from June 1, 2015 through December 17, 2015. Expense limitation agreement was updated to exclude acquired fund fees and expenses from the waiver effective December 18, 2015 (see note 2). |
| (g) | Less than $0.01 per share. | | | | | | | | | | | |
| (h) | The amount of net realized and unrealized gain (loss) on investments per share for the year ended May 31, 2016 does not accord with the amount in the Statement of Operations due to the timing of purchases and sales of Fund shares in relation to fluctuating market values. |
| | | | | |
| | | | | | | | | | | | | | | | |
| See Notes to Financial Statements | | | | | | | | | | (Continued) |
| Cavalier Adaptive Income Fund | | | | | | | | | | | |
| | | | | | | | | | | | | | | | |
| Financial Highlights | | | | | | | | | | | |
| | | | | | | | | | | | | | | | |
| For a share outstanding during each | | Class C Shares (h) |
| of the fiscal years ended May 31, | | 2017 | | 2016 | | 2015 | | 2014 | | 2013 | |
| | | | | | | | | | | | | | | | |
| Net Asset Value, Beginning of Year | $ | 9.67 | $ | 9.70 | $ | 9.87 | $ | 9.91 | $ | 9.94 | |
| | | | | | | | | | | | | | | | |
| Income (Loss) from Investment Operations | | | | | | | | | | | |
| | Net investment income (loss) | | 0.29 | (c) | (0.01) | (c) | 0.08 | (c) | 0.07 | (c) | 0.27 | |
| | Net realized and unrealized gain (loss) on | | | | | | | | | | |
| | | investments | | 0.42 | | 0.01 | (g) | (0.17) | | (0.04) | | 0.14 | |
| | | | | | | | | | | | | | | | |
| Total from Investment Operations | | 0.71 | | (0.00) | | (0.09) | | 0.03 | | 0.41 | |
| | | | | | | | | | | | | | | | |
| Less Distributions: | | | | | | | | | | | | |
| | From net investment income | | (0.31) | | (0.03) | | (0.07) | | (0.07) | | (0.42) | |
| | From net realized gains | - | | - | | (0.01) | | - | | (0.02) | |
| | | | | | | | | | | | | | | | |
| Total Distributions | | | (0.31) | | (0.03) | | (0.08) | | (0.07) | | (0.44) | |
| | | | | | | | | | | | | | | | |
| Net Asset Value, End of Year | $ | 10.07 | $ | 9.67 | $ | 9.70 | $ | 9.87 | $ | 9.91 | |
| | | | | | | | | | | | | | | | |
| Total Return (a) | | | 7.46% | | 0.05% | | (0.97)% | | 0.29% | | 4.16% | |
| | | | | | | | | | | | | | | | |
| Net Assets, End of Year (in thousands) | $ | 2,204 | $ | 1,422 | $ | 756 | $ | 818 | $ | 760 | |
| | | | | | | | | | | | | | | | |
| Ratios of: | | | | | | | | | | | | | | |
| Gross Expenses to Average Net Assets (b) | | 5.27% | | 3.17% | | 2.72% | | 1.70% | | 1.86% | |
| Net Expenses to Average Net Assets (b) | | 2.28% | | 2.12% | (f) | 1.88% | (e) | 1.70% | | 1.84% | |
| Net Investment Income (Loss) to Average | | | | | | | | | | | |
| | Net Assets (d) | | | 2.96% | | (0.14)% | (f) | 0.79% | (e) | 0.73% | | 2.14% | |
| | | | | | | | | | | | | | | | |
| Portfolio turnover rate | | 110.84% | | 246.74% | | 106.26% | | 127.64% | | 82.95% | |
| | | | | | | | | | | | | | | | |
| | | | | | | | | | | | | | | | |
| (a) | Includes adjustments in accordance with accounting principles generally accepted in the United States of America and, consequently, the net asset value for financial reporting purposes and the returns based upon those net asset values may differ from the net asset values and returns for shareholder transactions. |
| (b) | Does not include expenses of the investment companies in which the Fund invests. | | | | | | | |
| (c) | Calculated using the average shares method. | | | | | | | | | | | |
| (d) | Recognition of net investment income by the Fund is affected by the timing of the declaration of dividends by the underlying investment companies in which the Fund invests. |
| (e) | Includes reimbursement of acquired fund fees. | | | | | | | | | | | |
| (f) | Includes reimbursement of acquired fund fees and expenses for the period from June 1, 2015 through December 17, 2015. Expense limitation agreement was updated to exclude acquired fund fees and expenses from the waiver effective December 18, 2015 (see note 2). |
| (g) | The amount of net realized and unrealized gain (loss) on investments per share for the year ended May 31, 2016 does not accord with the amount in the Statement of Operations due to the timing of purchases and sales of Fund shares in relation to fluctuating market values. |
| (h) | As of February 24, 2017, the "Advisor Class" Shares were renamed to the "Class C" Shares. There were no other changes to this class of shares. |
| | | | | | | | | | | | | |
| | | | | | | | | | | | | | | | |
| See Notes to Financial Statements | | | | | | | | | | | |
| Cavalier Dividend Income Fund - Institutional Class Shares | | | | | | | | |
| Performance Update (Unaudited) | | | | | | | | | | |
| | | | | | | | | | | | | | | | | | |
| For the period from September 20, 2012 (Date of Initial Public Investment) through May 31, 2017 |
| | | | | | | | | | | | | | | | | | |
| Comparison of the Change in Value of a $10,000 Investment | | | | | | | | |
| | | | | | | | | | | | | | | | | | |

| The graph above assumes an initial $10,000 investment and represents the reinvestment of dividends and capital gains. This graph depicts the performance of Cavalier Dividend Income Fund - Institutional Class Shares versus the MSCI ACWI High Dividend Yield NR Index and the Russell 1000 Value Index. It is important to note that the Fund is a professionally managed mutual fund while the index is not available for investment and is unmanaged. The comparison is shown for illustrative purposes only. |
| | | | | | | | | | | | | | | | | | | | |
| | Average Annual Total Returns | |
| | | | | | | | | | | | | | | | | | Gross | | |
| | | As of | | | | | One | | Three | | Since | | Inception | | Expense | | |
| | | May 31, 2017 | | | | Year | | Year | | Inception | | Date | | Ratio* | | |
| | | Institutional Class Shares | | | 4.09% | | -0.69% | | 4.14% | | 09/20/12 | | 8.58% | | |
| | | MSCI ACWI High Dividend Yield NR Index | | 14.80% | | 3.05% | | 7.30% | | N/A | | N/A | | |
| | | Russell 1000 Value Index** | | | 14.62% | | 7.67% | | 13.03% | | N/A | | N/A | | |
| * The gross expense ratio shown is from the Funds' prospectus dated September 28, 2016. | | | | |
| **The Fund compared its performance against the MSCI ACWI High Dividend Yield NR Index previously, but the Advisor believes the Russell 1000 Index is a more appropriate and accurate index against which to compare the Fund's investment strategies and, therefore, the Russell 1000 Index will replace the MSCI ACWI High Dividend Yield NR Index in future comparisons. The Russell 1000 Index is a market capitalization-weighted index, meaning that the largest companies constitute the largest percentages in the index and will affect performance more than the smallest index members. |
| | | | | | | | | | | | | | | | | | | | |
| Performance quoted above represents past performance, which is no guarantee of future results. Investment return and principal value will fluctuate so that shares, when redeemed, may be worth more or less than their original cost. Current performance may be lower or higher than the performance data quoted. An investor may obtain performance data, current to the most recent month-end, by visiting ncfunds.com. |
| | | | | | | | | | | | | | | | | | | | |
| The graph and table do not reflect the deduction of taxes that a shareholder would pay on Fund distributions or the redemption of Fund shares. Average annual total returns are historical in nature and measure net investment income and capital gain or loss from portfolio investments assuming reinvestment of distributions. |
| Cavalier Dividend Income Fund - Class C Shares | | | | | | | | | | |
| Performance Update (Unaudited) | | | | | | | | | | |
| | | | | | | | | | | | | | | | | | |
| For the period from September 26, 2012 (Date of Initial Public Investment) through May 31, 2017 |
| | | | | | | | | | | | | | | | | | |
| Comparison of the Change in Value of a $10,000 Investment | | | | | | | | |
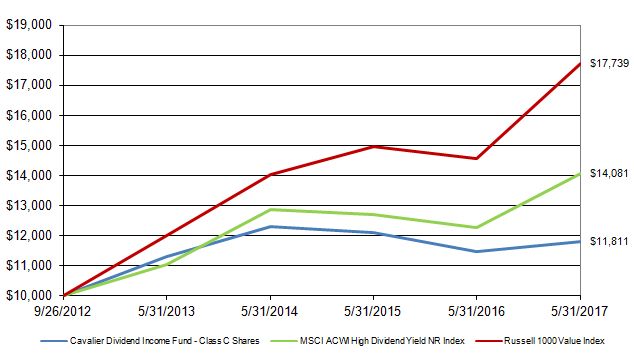
| The graph above assumes an initial $10,000 investment and represents the reinvestment of dividends and capital gains. This graph depicts the performance of Cavalier Dividend Income Fund - Class C Shares versus the MSCI AWI High Dividend Yield NR Index and the Russell 1000 Value Index. It is important to note that the Fund is a professionally managed mutual fund while the index is not available for investment and is unmanaged. The comparison is shown for illustrative purposes only. |
| | | | | | | | | | | | | | | | | | | | |
| | Average Annual Total Returns | | | | | | | | | | | | | |
| | | | | | | | | | | | | | | | | | Gross | | |
| | | As of | | | | One | | Three | | Since | | Inception | | Expense | | |
| | | May 31, 2017 | | | | Year | | Year | | Inception | | Date | | Ratio* | | |
| | | Class C Shares** | | | | 3.03% | | -1.68% | | 3.62% | | 09/26/12 | | 9.58% | | |
| | | MSCI ACWI High Dividend Yield NR Index | | 14.80% | | 3.05% | | 7.59% | | N/A | | N/A | | |
| | | Russell 1000 Value Index*** | | | 14.62% | | 7.67% | | 13.00% | | N/A | | N/A | | |
| * The gross expense ratio shown is from the Funds' prospectus dated September 28, 2016. | | | | |
| ** | As of February 24, 2017, the "Advisor Class" Shares were renamed to the "Class C" Shares. There were no other changes to this class of shares. Class C Shares held longer than 7 years will automatically convert to Institutional Class Shares. Institutional Class Shares are not subject to the distribution and service plan (Rule 12b-1) fees of 1.00%. |
|
| ***The Fund compared its performance against the MSCI ACWI High Dividend Yield NR Index previously, but the Advisor believes the Russell 1000 Index is a more appropriate and accurate index against which to compare the Fund's investment strategies and, therefore, the Russell 1000 Index will replace the MSCI ACWI High Dividend Yield NR Index in future comparisons. The Russell 1000 Index is a market capitalization-weighted index, meaning that the largest companies constitute the largest percentages in the index and will affect performance more than the smallest index members. |
| | | | | | | | | | | | | | | | | | | | |
| Performance quoted above represents past performance, which is no guarantee of future results. Investment return and principal value will fluctuate so that shares, when redeemed, may be worth more or less than their original cost. Current performance may be lower or higher than the performance data quoted. An investor may obtain performance data, current to the most recent month-end, by visiting ncfunds.com. |
| | | | | | | | | | | | | | | | | | | | |
| The graph and table do not reflect the deduction of taxes that a shareholder would pay on Fund distributions or the redemption of Fund shares. Average annual total returns are historical in nature and measure net investment income and capital gain or loss from portfolio investments assuming reinvestment of distributions. |
| Cavalier Dividend Income Fund | | | | | | |
| | | | | | | | | | |
| Schedule of Investments | | | | | | | |
| | | | | | | | | | |
| As of May 31, 2017 | | | | | | | |
| | | | | | | | Shares | | Value (Note 1) |
| | | | | | | | | | |
| COMMON STOCKS - 44.48% | | | | | | |
| | | | | | | | | | |
| | Consumer Discretionary - 6.67% | | | | | | |
| | | | | | | | | | |
| | * | Cabela's, Inc. | | | | | 996 | $ | 52,619 |
| | | | | | | | | | |
| | Financials - 20.31% | | | | | | | |
| | | | | | | | | | |
| | * | Berkshire Hathaway, Inc. - Class B | | | | 618 | | 102,143 |
| | | TD Ameritrade Holding Corp. | | | | 1,553 | | 58,020 |
| | | | | | | | | | 160,163 |
| | Industrials - 17.50% | | | | | | | |
| | | | | | | | | | |
| | | Union Pacific Corp. | | | | 845 | | 93,204 |
| | | Valmont Industries, Inc. | | | | 306 | | 44,798 |
| | | | | | | | | | 138,002 |
| | | | | | | | | | |
| | | Total Common Stocks (Cost $361,287) | | | | | 350,784 |
| | | | | | | | | | |
| EXCHANGE-TRADED PRODUCTS - 44.50% | | | | | | |
| | | iShares Trust Russell 1000 Value ETF | | | 1,541 | $ | 176,491 |
| | | iShares Trust Russell 2000 Value ETF | | | 1,518 | | 174,524 |
| | | | | | | | | | |
| | | Total Exchange-Traded Products (Cost $356,967) | | | | | 351,015 |
| | | | | | | | | | |
| SHORT-TERM INVESTMENT - 5.50% | | | | | | |
| | § | Fidelity Investments Money Market Government Portfolio - | | | | |
| | | Institutional Class, 0.69% | | | | 43,344 | | 43,344 |
| | | | | | | | | | |
| | | Total Short-Term Investment (Cost $43,344) | | | | | 43,344 |
| | | | | | | | | | |
| Total Value of Investments (Cost $761,598) - 94.48% | | | | $ | 745,143 |
| | | | | | | | | | |
| Other Assets Less Liabilities - 5.52% | | | | | | 43,559 |
| | | | | | | | | | |
| | Net Assets - 100.00% | | | | | $ | 788,702 |
| | | | | | | | | | |
| § | Represents 7 day effective yield | | | | | | |
| * | Non income-producing investment | | | | | | |
| | | | | | | | | | |
| | | | | | | | | | |
| | | | | | | | | | |
| | | | Summary of Investments | | | | | |
| | | | | | | | | | |
| | | | by Sector | | % of Net Assets | | Value | | |
| | | | Consumer Discretionary | 6.67% | $ | 52,619 | | |
| | | | Financials | | 20.31% | | 160,163 | | |
| | | | Industrials | | 17.50% | | 138,002 | | |
| | | | Exchange-Traded Products | 44.50% | | 351,015 | | |
| | | | Short-Term Investment | 5.50% | | 43,344 | | |
| | | | Other Assets Less Liabilities | 5.52% | | 43,559 | | |
| | | | Total Net Assets | | 100.00% | $ | 788,702 | | |
| | | | | | | | | | |
| See Notes to Financial Statements | | | | | | |
| Cavalier Dividend Income Fund | | |
| | | | | | | | |
| Statement of Assets and Liabilities | | |
| | | | | | | | |
| As of May 31, 2017 | | | |
| | | | | | | | |
| Assets: | | | | | |
| | Investments, at value (cost $761,598) | $ | 745,143 |
| | Receivables: | | | |
| | | Fund shares sold | | | 694 |
| | | Dividends and interest | | 537 |
| | | Due from Advisor | | | 53,956 |
| | Prepaid expenses: | | | |
| | | Registration and filing expenses | | 15,534 |
| | | Fund accounting fees | | | 2,750 |
| | | | | | | | |
| | Total assets | | | | 818,614 |
| | | | | | | | |
| Liabilities: | | | | | |
| | Accrued expenses: | | | |
| | | Professional fees | | | 25,411 |
| | | Shareholder fulfillment fees | | 1,751 |
| | | Trustee fees and meeting expenses | | 1,337 |
| | | Custody and banking fees | | 968 |
| | | Insurance fees | | | 299 |
| | | Security pricing fees | | | 74 |
| | | Distribution and service fees - Class C Shares | | 62 |
| | | Administration fees | | | 10 |
| | | | | | | | |
| | Total liabilities | | | 29,912 |
| | | | | | | | |
| Total Net Assets | | | $ | 788,702 |
| | | | | | | | |
| Net Assets Consist of: | | | |
| | Paid in capital | | $ | 1,047,337 |
| | Accumulated net realized loss on investments | | (242,180) |
| | Net unrealized depreciation on investments | | (16,455) |
| | | | | | | | |
| Total Net Assets | | | $ | 788,702 |
| | | | | | | | |
| Institutional Class Shares of beneficial interest outstanding, no par value (unlimited authorized shares) | 67,276 |
| | Net Assets | | | $ | 707,268 |
| | Net Asset Value, Offering Price and Redemption Price Per Share | $ | 10.51 |
| | | | | | | | |
| Class C Shares of beneficial interest outstanding, no par value (unlimited authorized shares) | | 7,679 |
| | Net Assets | | | $ | 81,434 |
| | Net Asset Value, Offering Price and Redemption Price Per Share (a)(b) | $ | 10.61 |
| | | | | | | | |
| (a) | Contingent deferred sales charge for Class C Shares is imposed on shares redeemed within one year of the purchase date (note 1). |
| | | | | | | | |
| (b) | Net Asset Value presented does not recalculate due to rounding on the Class C Shares for Financial Statement purposes. |
| | | | |
| | | | | | | | |
| | | | | | | | |
| | | | | | | | |
| | | | | | | | |
| See Notes to Financial Statements | | |
| Cavalier Dividend Income Fund | | |
| | | | | | | | |
| Statement of Operations | | |
| | | | | | | | |
| For the year ended May 31, 2017 | | |
| | | | | | | | |
| Investment Income: | | |
| | Dividends | | | $ | 30,652 |
| | | | | | | | |
| | Total Investment Income | | 30,652 |
| | | | | | | | |
| Expenses: | | | | | |
| | Professional fees | | 54,667 |
| | Fund accounting fees (note 2) | | 38,334 |
| | Registration and filing expenses | | 34,299 |
| | Transfer agent fees (note 2) | | 31,973 |
| | Administration fees (note 2) | | 24,026 |
| | Shareholder fulfillment fees | | 13,644 |
| | Trustee fees and meeting expenses | | 10,367 |
| | Advisory fees (note 2) | | 10,261 |
| | Custody and banking fees (note 2) | | 4,907 |
| | Compliance fees (note 2) | | 4,434 |
| | Other operating expenses | | 3,973 |
| | Insurance fees | | | 1,595 |
| | Security pricing fees | | 1,520 |
| | Distribution and service fees - Class C Shares (note 3) | | 886 |
| | | | | | | | |
| | Total Expenses | | | 234,886 |
| | | | | | | | |
| | Fees waived and reimbursed by Advisor (note 2) | | (215,913) |
| | | | | | | | |
| | Net Expenses | | | 18,973 |
| | | | | | | | |
| Net Investment Income | | 11,679 |
| | | | | | | | |
| Realized and Unrealized Gain (Loss) on Investments: | | |
| | | | | | | | |
| | Net realized gain from: | | |
| | | Investment transactions | | 128,988 |
| | | Capital gain distributions from underlying funds | | 1,301 |
| | | | | | | | |
| | Net change in unrealized depreciation on investments | | (92,219) |
| | | | | | | | |
| Net Realized and Unrealized Gain on Investments | | 38,070 |
| | | | | | | | |
| Net Increase in Net Assets Resulting from Operations | $ | 49,749 |
| | | | | | | | |
| | | | | | | | |
| See Notes to Financial Statements | | |
| Cavalier Dividend Income Fund | | | | | | | |
| | | | | | | | | | | | |
| Statements of Changes in Net Assets | | | | | | | |
| | | | | | | | | | | | |
| For the years ended May 31, | | | | | 2017 | | 2016 |
| | | | | | | | | | | | |
| Operations: | | | | | | | | |
| | Net investment income | | | | $ | 11,679 | $ | 19,541 |
| | Net realized gain (loss) from: | | | | | | | |
| | | Investment transactions | | | | | 128,988 | | (367,643) |
| | | Capital gain distributions from underlying funds | | | | 1,301 | | 9,600 |
| | Net change in unrealized appreciation (depreciation) on investments | | (92,219) | | 56,161 |
| | | | | | | | | | | | |
| Net Increase (Decrease) in Net Assets Resulting from Operations | | 49,749 | | (282,341) |
| | | | | | | | | | | | |
| Distributions to Shareholders From: | | | | | | | |
| | Net investment income | | | | | | | |
| | | Institutional Class Shares | | | | | (4,000) | | (26,727) |
| | | Class C Shares | | | | | (20) | | (472) |
| | | | | | | | | | | | |
| | Return of Capital | | | | | | | |
| | | Institutional Class Shares | | | | | (6,232) | | - |
| | | Class C Shares | | | | | (515) | | - |
| | | | | | | | | | | | |
| Decrease in Net Assets Resulting from Distributions | | | | (10,767) | | (27,199) |
| | | | | | | | | | | | |
| Beneficial Interest Transactions: | | | | | | | |
| | Shares sold | | | | | | 66,574 | | 2,618,175 |
| | Reinvested dividends and distributions | | | | | 10,767 | | 17,044 |
| | Shares repurchased | | | | | (1,134,064) | | (5,888,112) |
| | | | | | | | | | | | |
| Decrease from Beneficial Interest Transactions | | | | | (1,056,723) | | (3,252,893) |
| | | | | | | | | | | | |
| Decrease in Net Assets | | | | | (1,017,741) | | (3,562,433) |
| | | | | | | | | | | | |
| Net Assets: | | | | | | | | |
| | Beginning of Year | | | | | 1,806,443 | | 5,368,876 |
| | End of Year | | | | | $ | 788,702 | $ | 1,806,443 |
| | | | | | | | | | | | |
| Accumulated net investment loss | | | | $ | - | $ | (7,659) |
| | | | | | Year Ended | | Year Ended |
| Share Information: | May 31, 2017 | | May 31, 2016 |
| | Institutional Class Shares | Shares | | Amount | | Shares | | Amount |
| | | Shares sold | 6,267 | $ | 66,015 | | 253,821 | $ | 2,533,046 |
| | | Reinvested dividends and distributions | 978 | | 10,232 | | 1,610 | | 16,606 |
| | | Shares repurchased | (108,624) | | (1,124,142) | | (568,931) | | (5,769,408) |
| | Net Decrease in Shares of | | | | | | | |
| | | Beneficial Interest | (101,379) | $ | (1,047,895) | | (313,500) | $ | (3,219,756) |
| | | | | | | | | | | | |
| | Class C Shares | Shares | | Amount | | Shares | | Amount |
| | | Shares sold | 52 | $ | 559 | | 8,068 | $ | 85,129 |
| | | Reinvested dividends and distributions | 50 | | 535 | | 42 | | 438 |
| | | Shares repurchased | (932) | | (9,922) | | (11,107) | | (118,704) |
| | Net Decrease in Shares of | | | | | | | |
| | | Beneficial Interest | (830) | $ | (8,828) | | (2,997) | $ | (33,137) |
| | | | | | | | | | | | |
| See Notes to Financial Statements | | | | | | | |
| Cavalier Dividend Income Fund | | | | | | | | | | | |
| | | | | | | | | | | | | | | | |
| Financial Highlights | | | | | | | | | | | |
| | | | | | | | | | | | | | | | |
| For a share outstanding during each of the | | Institutional Class Shares |
| fiscal years or period ended May 31, | | 2017 | | 2016 | | 2015 | | 2014 | | 2013 | (f) |
| | | | | | | | | | | | | | | | |
| Net Asset Value, Beginning of Period | $ | 10.19 | $ | 10.87 | $ | 11.41 | $ | 11.02 | $ | 10.00 | |
| | | | | | | | | | | | | | | | |
| Income (Loss) from Investment Operations | | | | | | | | | | | |
| | Net investment income | | 0.12 | (g) | 0.08 | (g) | 0.46 | (g) | 0.55 | (g) | 0.29 | |
| | Net realized and unrealized gain (loss) on | | | | | | | | | | | |
| | | investments | | 0.30 | | (0.68) | | (0.51) | | 0.41 | | 1.02 | |
| | | | | | | | | | | | | | | | |
| Total from Investment Operations | | 0.42 | | (0.60) | | (0.05) | | 0.96 | | 1.31 | |
| | | | | | | | | | | | | | | | |
| Less Distributions: | | | | | | | | | | | | |
| | From net investment income | | (0.04) | | (0.08) | | (0.46) | | (0.49) | | (0.29) | |
| | From net realized gains | | - | | - | | (0.03) | | (0.08) | | - | |
| | From return of capital | | (0.06) | | - | | - | | - | | - | |
| | | | | | | | | | | | | | | | |
| Total Distributions | | | (0.10) | | (0.08) | | (0.49) | | (0.57) | | (0.29) | |
| | | | | | | | | | | | | | | | |
| Net Asset Value, End of Period | $ | 10.51 | $ | 10.19 | $ | 10.87 | $ | 11.41 | $ | 11.02 | |
| | | | | | | | | | | | | | | | |
| Total Return (c) | | | 4.09% | | (5.51)% | | (0.43)% | | 9.03% | | 13.32% | (b) |
| | | | | | | | | | | | | | | | |
| Net Assets, End of Period (in thousands) | $ | 707 | $ | 1,718 | $ | 5,241 | $ | 5,090 | $ | 1,090 | |
| | | | | | | | | | | | | | | | |
| Ratios of: | | | | | | | | | | | | | | |
| Gross Expenses to Average Net Assets (d) | | 20.25% | | 8.23% | | 3.56% | | 1.15% | | 0.70% | (a) |
| Net Expenses to Average Net Assets (d) | | 1.58% | | 1.58% | (i) | 1.23% | (h) | 1.15% | | 0.70% | (a) |
| Net Investment Income to Average | | | | | | | | | | | |
| | Net Assets (e) | | 1.11% | | 0.75% | (i) | 4.19% | (h) | 4.97% | | 4.74% | (a) |
| | | | | | | | | | | | | | | | |
| Portfolio turnover rate | | 83.66% | | 118.07% | | 23.77% | | 2.70% | | 83.50% | (b) |
| | | | | | | | | | | | | | | | |
| (a) | Annualized. | | | | | | | | | | | | |
| (b) | Not annualized. | | | | | | | | | | | |
| (c) | Includes adjustments in accordance with accounting principles generally accepted in the United States of America and, consequently, the net asset value for financial reporting purposes and the returns based upon those net asset values may differ from the net asset values and returns for shareholder transactions. |
| (d) | Does not include expenses of the investment companies in which the Fund invests. | | | | | |
| (e) | Recognition of net investment income by the Fund is affected by the timing of the declaration of dividends by the underlying investment companies in which the Fund invests. |
| (f) | For the period from September 20, 2012 (Date of Initial Public Investment) to May 31, 2013. | | | | | |
| (g) | Calculated using the average shares method. | | | | | | | | | | | |
| (h) | Includes reimbursement of acquired fund fees. | | | | | | | | | | | |
| (i) | Includes reimbursement of acquired fund fees and expenses for the period from June 1, 2015 through December 17, 2015. Expense limitation agreement was updated to exclude acquired fund fees and expenses from the waiver effective December 18, 2015 (see note 2). |
| | | | |
| | | | | | | | | | | | | | | | |
| See Notes to Financial Statements | | | | | | | | | | (Continued) |
| Cavalier Dividend Income Fund | | | | | | | | | | | |
| | | | | | | | | | | | | | | | |
| Financial Highlights | | | | | | | | | | | |
| | | | | | | | | | | | | | | | |
| For a share outstanding during each of the | | Class C Shares (k) |
| fiscal years or period ended May 31, | | 2017 | | 2016 | | 2015 | | 2014 | | 2013 | (f) |
| | | | | | | | | | | | | | | | |
| Net Asset Value, Beginning of Period | $ | 10.36 | $ | 11.12 | $ | 11.68 | $ | 11.18 | $ | 10.00 | |
| | | | | | | | | | | | | | | | |
| Income (Loss) from Investment Operations | | | | | | | | | | | |
| | Net investment income (loss) | | (0.01) | (g) | (0.06) | (g) | 0.43 | (g) | 0.43 | (g) | 0.24 | |
| | Net realized and unrealized gain (loss) on | | | | | | | | | | | |
| | | investments | | 0.32 | | (0.65) | | (0.60) | | 0.53 | | 1.17 | |
| | | | | | | | | | | | | | | | |
| Total from Investment Operations | | 0.31 | | (0.71) | | (0.17) | | 0.96 | | 1.41 | |
| | | | | | | | | | | | | | | | |
| Less Distributions: | | | | | | | | | | | | |
| | From net investment income | | - | (j) | (0.05) | | (0.36) | | (0.38) | | (0.23) | |
| | From net realized gains | | - | | - | | (0.03) | | (0.08) | | - | |
| | From return of capital | | (0.06) | | - | | - | | - | | - | |
| | | | | | | | | | | | | | | | |
| Total Distributions | | | (0.06) | | (0.05) | | (0.39) | | (0.46) | | (0.23) | |
| | | | | | | | | | | | | | | | |
| Net Asset Value, End of Period | $ | 10.61 | $ | 10.36 | $ | 11.12 | $ | 11.68 | $ | 11.18 | |
| | | | | | | | | | | | | | | | |
| Total Return (c) | | | 3.03% | | (6.41)% | | (1.45)% | | 8.79% | | 14.25% | (b) |
| | | | | | | | | | | | | | | | |
| Net Assets, End of Period (in thousands) | $ | 81 | $ | 88 | $ | 128 | $ | 79 | $ | 5 | |
| | | | | | | | | | | | | | | | |
| Ratios of: | | | | | | | | | | | | | | |
| Gross Expenses to Average Net Assets (d) | | 23.68% | | 8.47% | | 4.56% | | 2.15% | | 1.70% | (a) |
| Net Expenses to Average Net Assets (d) | | 2.58% | | 2.66% | (i) | 2.23% | (h) | 2.15% | | 1.70% | (a) |
| Net Investment Income (Loss) to Average | | | | | | | | | | | |
| | Net Assets (e) | | (0.06)% | | (0.61)% | (i) | 3.79% | (h) | 3.84% | | 4.68% | (a) |
| | | | | | | | | | | | | | | | |
| Portfolio turnover rate | | 83.66% | | 118.07% | | 23.77% | | 2.70% | | 83.50% | (b) |
| | | | | | | | | | | | | | | | |
| (a) | Annualized. | | | | | | | | | | | | |
| (b) | Not annualized. | | | | | | | | | | | | |
| (c) | Includes adjustments in accordance with accounting principles generally accepted in the United States of America and, consequently, the net asset value for financial reporting purposes and the returns based upon those net asset values may differ from the net asset values and returns for shareholder transactions. |
| (d) | Does not include expenses of the investment companies in which the Fund invests. | | | | | | | |
| (e) | Recognition of net investment income by the Fund is affected by the timing of the declaration of dividends by the underlying investment companies in which the Fund invests. |
| (f) | For the period from September 26, 2012 (Date of Initial Public Investment) to May 31, 2013. | | | | | | | |
| (g) | Calculated using the average shares method. | | | | | | | | | | | |
| (h) | Includes reimbursement of acquired fund fees. | | | | | | | | | | | |
| (i) | Includes reimbursement of acquired fund fees and expenses for the period from June 1, 2015 through December 17, 2015. Expense limitation agreement was updated to exclude acquired fund fees and expenses from the waiver effective December 18, 2015 (see note 2). |
| (j) | Less than $0.01 per share. | | | | | | | | | | | |
| (k) | As of February 24, 2017, the "Advisor Class" Shares were renamed to the "Class C" Shares. There were no other changes to this class of shares. |
| | | | | | | | | | | | | |
| See Notes to Financial Statements | | | | | | | | | | | |
| Cavalier Dynamic Growth Fund - Institutional Class Shares | | | | | | | | |
| | | | | | | | | | | | | | | | | | |
| Performance Update (Unaudited) | | | | | | | | | | | |
| | | | | | | | | | | | | | | | | | |
| For the period from October 2, 2009 (Date of Initial Public Investment) through May 31, 2017 |
| | | | | | | | | | | | | | | | | | |
| Comparison of the Change in Value of a $10,000 Investment | | | | | | | | |
| | | | | | | | | | | | | | | | | | |

| The graph above assumes an initial $10,000 investment and represents the reinvestment of dividends and capital gains. This graph depicts the performance of Cavalier Dynamic Growth Fund - Institutional Class Shares versus the S&P Global Broad Market Index and the S&P 500 Total Return Index. It is important to note that the Fund is a professionally managed mutual fund while the indices are not available for investment and are unmanaged. The comparison is shown for illustrative purposes only. |
| | | | | | | | | | | | | | | | | | | | |
| | Average Annual Total Returns | |
| | | | | | | | | | | | | | | | | | Gross | | |
| | | As of | | | One | | Five | | Since | | Inception | | Expense | | |
| | | May 31, 2017 | | | | Year | | Year | | Inception | | Date | | Ratio* | | |
| | | Institutional Class Shares | | | 16.50% | | 11.09% | | 8.35% | | 10/02/09 | | 1.92% | | |
| | | S&P Global Broad Market Index | | | 18.13% | | 12.27% | | 6.84% | | N/A | | N/A | | |
| | | S&P 500 Total Return Index | | | 17.16% | | 15.41% | | 3.26% | | N/A | | N/A | | |
| | | | | | | | | | | | | | | | | | | | |
| * The gross expense ratio shown is from the Funds' prospectus dated September 28, 2016. |
| | | | | | | | | | | | | | | | | | | | |
| Performance quoted above represents past performance, which is no guarantee of future results. Investment return and principal value will fluctuate so that shares, when redeemed, may be worth more or less than their original cost. Current performance may be lower or higher than the performance data quoted. An investor may obtain performance data, current to the most recent month-end, by visiting ncfunds.com. |
| | | | | | | | | | | | | | | | | | | | |
| The graph and table do not reflect the deduction of taxes that a shareholder would pay on Fund distributions or the redemption of Fund shares. Average annual total returns are historical in nature and measure net investment income and capital gain or loss from portfolio investments assuming reinvestments of distributions. |
| | | | | | | | | | | | | | | | | | | | |
| | | | | | | | | | | | | | | | | | | | |
| Cavalier Dynamic Growth Fund - Class C Shares | | | | | | | | | | |
| | | | | | | | | | | | | | | | | | |
| Performance Update (Unaudited) | | | | | | | | | | | |
| | | | | | | | | | | | | | | | | | |
| For the period from February 18, 2011 (Date of Initial Public Investment) through May 31, 2017 |
| | | | | | | | | | | | | | | | | | |
| Comparison of the Change in Value of a $10,000 Investment | | | | | | | | |
| | | | | | | | | | | | | | | | | | |

| The graph above assumes an initial $10,000 investment and represents the reinvestment of dividends and capital gains. This graph depicts the performance of Cavalier Dynamic Growth Fund - Class C Shares versus the S&P Global Broad Market Index and the S&P 500 Total Return Index. It is important to note that the Fund is a professionally managed mutual fund while the indices are not available for investment and are unmanaged. The comparison is shown for illustrative purposes only. |
| | | | | | | | | | | | | | | | | | | | |
| | Average Annual Total Returns | |
| | | | | | | | | | | | | | | | | | Gross | | |
| | | As of | | | One | | Five | | Since | | Inception | | Expense | | |
| | | May 31, 2017 | | | | Year | | Year | | Inception | | Date | | Ratio* | | |
| | | Class C Shares** | | | | 15.42% | | 9.97% | | 6.50% | | 02/18/11 | | 2.92% | | |
| | | S&P Global Broad Market Index | | | 18.13% | | 12.27% | | 7.78% | | N/A | | N/A | | |
| | | S&P 500 Total Return Index | | | 17.16% | | 15.41% | | -0.83% | | N/A | | N/A | | |
| * The gross expense ratio shown is from the Funds' prospectus dated September 28, 2016. | | | | |
| ** | As of February 24, 2017, the "Advisor Class" Shares were renamed to the "Class C" Shares. There were no other changes to this class of shares. Class C Shares held longer than 7 years will automatically convert to Institutional Class Shares. Institutional Class Shares are not subject to the distribution and service plan (Rule 12b-1) fees of 1.00%. |
| | |
| Performance quoted above represents past performance, which is no guarantee of future results. Investment return and principal value will fluctuate so that shares, when redeemed, may be worth more or less than their original cost. Current performance may be lower or higher than the performance data quoted. An investor may obtain performance data, current to the most recent month-end, by visiting ncfunds.com. |
| | | | | | | | | | | | | | | | | | | | |
| The graph and table do not reflect the deduction of taxes that a shareholder would pay on Fund distributions or the redemption of Fund shares. Average annual total returns are historical in nature and measure net investment income and capital gain or loss from portfolio investments assuming reinvestments of distributions. |
| | | | | | | | | | | | | | | | | | | | |
| | | | | | | | | | | | | | | | | | | | |
| Cavalier Dynamic Growth Fund | | | | | | |
| | | | | | | | | | | |
| Schedule of Investments | | | | | | | |
| | | | | | | | | | | |
| As of May 31, 2017 | | | | | | | | |
| | | | | | | | | Shares | | Value (Note 1) |
| | | | | | | | | | | |
| COMMON STOCKS - 84.54% | | | | | | | |
| | | | | | | | | | | |
| | Consumer Discretionary - 19.17% | | | | | | | |
| | | adidas AG | | | | | | 1,346 | $ | 129,149 |
| | | Carnival Corp. | | | | | | 1,801 | | 115,390 |
| | | Fast Retailing Co. Ltd. | | | | | 3,301 | | 110,914 |
| | * | IMAX Corp. | | | | | | 4,504 | | 112,825 |
| | μ | Luxottica Group SpA | | | | | 2,782 | | 167,894 |
| | | PulteGroup, Inc. | | | | | | 10,429 | | 236,425 |
| | | The Children's Place, Inc. | | | | | 1,144 | | 123,781 |
| | | Toll Brothers, Inc. | | | | | 6,419 | | 236,925 |
| | * | Ulta Beauty, Inc. | | | | | | 557 | | 169,796 |
| | | | | | | | | | | 1,403,099 |
| | Consumer Staples - 2.76% | | | | | | | |
| | | Sysco Corp. | | | | | | 3,703 | | 202,036 |
| | | | | | | | | | | |
| | Energy - 1.32% | | | | | | | | |
| | | Noble Energy, Inc. | | | | | 3,381 | | 97,001 |
| | | | | | | | | | | |
| | Financials - 8.78% | | | | | | | | |
| | | Chubb Ltd. | | | | | | 1,254 | | 179,560 |
| | | MSCI, Inc. | | | | | | 1,618 | | 164,599 |
| | | The Bank of New York Mellon Corp. | | | | | 2,784 | | 131,182 |
| | | The Goldman Sachs Group, Inc. | | | | | 791 | | 167,107 |
| | | | | | | | | | | 642,448 |
| | Health Care - 14.57% | | | | | | | |
| | | Allergan PLC | | | | | | 840 | | 187,950 |
| | | AmerisourceBergen Corp. | | | | | 1,931 | | 177,208 |
| | * | Celgene Corp. | | | | | | 1,749 | | 200,103 |
| | * | ICON PLC | | | | | | 2,060 | | 193,846 |
| | * | Quintiles IMS Holdings, Inc. | | | | | 1,483 | | 128,191 |
| | | Shire PLC | | | | | | 1,037 | | 179,111 |
| | | | | | | | | | | 1,066,409 |
| | Industrials - 5.24% | | | | | | | | |
| | * | AerCap Holdings NV | | | | | 3,843 | | 169,169 |
| | * | Axon Enterprise, Inc. | | | | | 8,924 | | 214,265 |
| | | | | | | | | | | 383,434 |
| | Information Technology - 25.99% | | | | | | | |
| | * | Alibaba Group Holding Ltd. | | | | | 1,575 | | 192,874 |
| | * | Alphabet, Inc. | | | | | | 212 | | 209,263 |
| | | Applied Materials, Inc. | | | | | 5,233 | | 240,090 |
| | | Broadcom Ltd. | | | | | | 717 | | 171,707 |
| | * | Check Point Software Technologies Ltd. | | | | 2,340 | | 262,197 |
| | * | Facebook, Inc. | | | | | | 1,695 | | 256,725 |
| | | NetEase, Inc. | | | | | | 482 | | 137,264 |
| | * | Qorvo, Inc. | | | | | | 2,430 | | 189,418 |
| | | Visa, Inc. | | | | | | 2,545 | | 242,360 |
| | | | | | | | | | | 1,901,898 |
| | | | | | | | | | | |
| | | | | | | | | | | (Continued) |
| Cavalier Dynamic Growth Fund | | | | | | | |
| | | | | | | | | | | |
| Schedule of Investments - Continued | | | | | | | |
| | | | | | | | | | | |
| As of May 31, 2017 | | | | | | | | |
| | | | | | | | | Shares | | Value (Note 1) |
| | | | | | | | | | | |
| COMMON STOCKS - Continued | | | | | | | |
| | | | | | | | | | | |
| | Real Estate - 2.41% | | | | | | | |
| | | Realogy Holdings Corp. | | | | | 5,797 | $ | 176,577 |
| | | | | | | | | | | |
| | Telecommunication Services - 4.30% | | | | | | | |
| | | KDDI Corp. | | | | | | 14,370 | | 199,312 |
| | | SoftBank Group Corp. | | | | | 2,841 | | 115,259 |
| | | | | | | | | | | 314,571 |
| | | | | | | | | | | |
| | | Total Common Stocks (Cost $5,766,492) | | | | | | 6,187,473 |
| | | | | | | | | | | |
| | | | | Number of | | | | Expiration | | |
| CALL OPTIONS PURCHASED - 0.18% | Contracts (b) | | Exercise Price | | Date | | |
| | * | CBOE Volatility Index | 427 | | $ | 23.00 | | 6/21/2017 | | 5,338 |
| | * | CBOE Volatility Index | 450 | | 22.00 | | 6/21/2017 | | 5,625 |
| | * | SPDR S&P 500 ETF Trust | 468 | | 249.00 | | 6/16/2017 | | 2,574 |
| | | | | | | | | | | |
| | | Total Call Options Purchased (Cost $25,336) | | | | | | 13,537 |
| | | | | | | | | | | |
| | | | | Number of | | | | Expiration | | |
| PUT OPTIONS PURCHASED - 0.49% | Contracts (b) | | Exercise Price | | Date | | |
| | * | SPDR S&P 500 ETF Trust | 18 | | 241.50 | | 6/16/2017 | | 3,483 |
| | * | SPDR S&P 500 ETF Trust | 45 | | 226.00 | | 9/15/2017 | | 9,742 |
| | * | SPDR S&P 500 ETF Trust | 105 | | 236.00 | | 6/16/2017 | | 5,985 |
| | * | SPDR S&P 500 ETF Trust | 132 | | 216.00 | | 9/15/2017 | | 16,302 |
| | | | | | | | | | | |
| | | Total Put Options Purchased (Cost $118,244) | | | | | | 35,512 |
| | | | | | | | | | | |
| EXCHANGE-TRADED PRODUCT - 6.93% | | | | | Shares | | |
| | | SPDR S&P 500 ETF Trust (a) | | | | | 2,100 | | 507,024 |
| | | | | | | | | | | |
| | | Total Exchange-Traded Product (Cost $496,520) | | | | | | 507,024 |
| | | | | | | | | | | |
| LIMITED PARTNERSHIP - 3.26% | | | | | Shares | | |
| | | The Blackstone Group LP | | | | | 7,255 | | 238,544 |
| | | | | | | | | | | |
| | | Total Limited Partnership (Cost $239,200) | | | | | | 238,544 |
| | | | | | | | | | | |
| U.S. TREASURY BILL - 6.12% | Principal | | Yield | | Maturity Date | | |
| | | United States Treasury Bill (a) | $ | 450,000 | | 0.000% | | 11/9/2017 | | 447,925 |
| | | | | | | | | | | |
| | | Total U.S. Treasury Bill (Cost $448,063) | | | | | | 447,925 |
| | | | | | | | | | | |
| Total Value of Investments (Cost $7,093,855) - 101.52% | | | | | | 7,430,015 |
| | | | | | | | | | | |
| Options Written (Premiums Received $89,859) - (1.23)% | | | | | | (89,905) |
| | | | | | | | | | | |
| Liabilities in Excess of Other Assets - (0.29)% | | | | | | (21,457) |
| | | | | | | | | | | |
| | Net Assets - 100.00% | | | | | | $ | 7,318,653 |
| | | | | | | | | | | |
| | * | Non-income producing investment | | | | | | | |
| | μ | American Depositary Receipt | | | | | | | |
| | | | | | | | | | | |
| | (a) | All or a portion of this security is held as collateral for options written. | | | | |
| | (b) | Each contract is equivalent to 100 shares of underlying common stock. | | | | |
| | | | | | | | | | | (Continued) |
| Cavalier Dynamic Growth Fund | | | | | | |
| | | | | | | | | | | |
| Schedule of Investments - Continued | | | | | | | |
| | | | | | | | | | | |
| As of May 31, 2017 | | | | | | | | |
| | | | | | | | | | | |
| | | | | | | | | | | |
| | The following acronyms and abbreviations are used in this portfolio: | | | | |
| | NV - Netherlands security | | | | | | | |
| | PLC - Public Limited Company | | | | | | | |
| | | | | | | | | | | |
| | | | | | | | | | | |
| | | | Summary of Investments by Sector | | | | | | |
| | | | | | | | | | | |
| | | | Sector | | | % of Net Assets | | Value | | |
| | | | Consumer Discretionary | | 19.17% | $ | 1,403,099 | | |
| | | | Consumer Staples | | | 2.76% | | 202,036 | | |
| | | | Energy | | | 1.32% | | 97,001 | | |
| | | | Financials | | | 8.78% | | 642,448 | | |
| | | | Health Care | | | 14.57% | | 1,066,409 | | |
| | | | Industrials | | | 5.24% | | 383,434 | | |
| | | | Information Technology | | 25.99% | | 1,901,898 | | |
| | | | Real Estate | | | 2.41% | | 176,577 | | |
| | | | Telecommunication Services | | 4.30% | | 314,571 | | |
| | | | Call Options Purchased | | 0.18% | | 13,537 | | |
| | | | Put Options Purchased | | 0.49% | | 35,512 | | |
| | | | Exchange-Traded Product | | 6.93% | | 507,024 | | |
| | | | Limited Partnership | | | 3.26% | | 238,544 | | |
| | | | U.S. Treasury Bill | | | 6.12% | | 447,925 | | |
| | | | Call Options Written | | | -1.23% | | (89,905) | | |
| | | | Liabilities in Excess of Other Assets | | -0.29% | | (21,457) | | |
| | | | Total Net Assets | | | 100.00% | $ | 7,318,653 | | |
| | | | | | | | | | | |
| | | | | | | | | | | |
| | | | | | | | | | | |
| | | | | | | | | | | |
| | | | | | | | | | | |
| | | | | | | | | | | |
| | | | | | | | | | | (Continued) |
| Cavalier Dynamic Growth Fund | | | | | | | |
| | | | | | | | | | | |
| Schedule of Investments - Continued | | | | | | | |
| | | | | | | | | | | |
| As of May 31, 2017 | | | | | | | | |
| | | | | Number of Contracts (b) | | Exercise Price | | Expiration Date | | Value (Note 1) |
| | | | | | | | | | | |
| CALL OPTIONS WRITTEN - 1.23% | | | | | | | |
| | * | CBOE Volatility Index | 450 | | $ | 16.00 | | 6/21/2017 | $ | 14,625 |
| | * | CBOE Volatility Index | 134 | | 14.00 | | 6/21/2017 | | 6,700 |
| | * | SPDR S&P500 ETF Trust | 105 | | 236.00 | | 6/16/2017 | | 65,520 |
| | * | SPDR S&P500 ETF Trust | 18 | | 241.50 | | 6/16/2017 | | 3,060 |
| | | | | | | | | | | |
| | | Total Call Options Written (Premiums Received $89,859) | | | | 89,905 |
| | | | | | | | | | | |
| | Total Options Written (Premiums Received $89,859) | | | | | | 89,905 |
| | | | | | | | | | | |
| | | | | | | | | | | |
| | | | | | | | | | | |
| | | | | | | | | | | |
| See Notes to Financial Statements | | | | | | | |
| Cavalier Dynamic Growth Fund | | | |
| | | | | | | | |
| Statement of Assets and Liabilities | | |
| | | | | | | | |
| As of May 31, 2017 | | | |
| | | | | | | | |
| Assets: | | | | | |
| | Investments, at value (cost $7,093,855) | $ | 7,430,015 |
| | Receivables: | | | |
| | | Investments sold | | | 4,048,861 |
| | | Fund shares sold | | | 146,898 |
| | | Due From Advisor | | | 24,667 |
| | | Dividends and interest | | | 1,845 |
| | Prepaid expenses: | | | |
| | | Registration and filing expenses | | 16,296 |
| | | Fund accounting fees | | | 2,694 |
| | | Other expense | | | 89 |
| | | | | | | | |
| | Total assets | | | | 11,671,365 |
| | | | | | | | |
| Liabilities: | | | | | |
| | Options written, at value (premiums received $89,859) | | 89,905 |
| | Due to Custodian | | | 159,542 |
| | Due to Broker | | | 161,688 |
| | Payables: | | | | |
| | | Securities purchased | | | 3,911,938 |
| | | Fund shares repurchased | | 8,073 |
| | Accrued expenses: | | | |
| | | Professional fees | | | 15,000 |
| | | Shareholder fulfillment fees | | 1,750 |
| | | Trustee fees and meeting expenses | | 1,337 |
| | | Distribution and service fees - Class C Shares | | 961 |
| | | Interest expense | | | 918 |
| | | Custody and banking fees | | 826 |
| | | Insurance fees | | | 547 |
| | | Security pricing fees | | | 227 |
| | | | | | | | |
| | Total liabilities | | | 4,352,712 |
| | | | | | | | |
| Total Net Assets | | | $ | 7,318,653 |
| | | | | | | | |
| Net Assets Consist of: | | | |
| | Paid in capital | | $ | 6,062,125 |
| | Accumulated net realized gain on investments | | 920,414 |
| | Net unrealized appreciation on investments | | 336,114 |
| | | | | | | | |
| Total Net Assets | | | $ | 7,318,653 |
| | | | | | | | |
| Institutional Class Shares of beneficial interest outstanding, no par value (unlimited authorized shares) | 599,432 |
| | Net Assets | | | $ | 6,431,227 |
| | Net Asset Value, Offering Price and Redemption Price Per Share | $ | 10.73 |
| | | | | | | | |
| Class C Shares of beneficial interest outstanding, no par value (unlimited authorized shares) | | 87,634 |
| | Net Assets | | | $ | 887,426 |
| | Net Asset Value, Offering Price and Redemption Price Per Share (a) | $ | 10.13 |
| | | | | | | | |
| (a) | Contingent deferred sales charge for Class C Shares is imposed on shares redeemed within one year of the purchase date (note 1). |
| | | | | | | | |
| | | | | | | | |
| See Notes to Financial Statements | | |
| Cavalier Dynamic Growth Fund | | |
| | | | | | | | |
| Statement of Operations | | |
| | | | | | | | |
| For the year ended May 31, 2017 | | |
| | | | | | | | |
| Investment Income: | | |
| | Dividends (net of foreign tax withheld of $2,284) | $ | 100,722 |
| | Interest | | | | | 1,246 |
| | | | | | | | |
| | Total Investment Income | | 101,968 |
| | | | | | | | |
| Expenses: | | | | | |
| | Advisory fees (note 2) | | 59,281 |
| | Professional fees | | 41,326 |
| | Fund accounting fees (note 2) | | 39,159 |
| | Registration and filing expenses | | 35,005 |
| | Transfer agent fees (note 2) | | 31,973 |
| | Administration fees (note 2) | | 24,026 |
| | Compliance fees (note 2) | | 23,643 |
| | Shareholder fulfillment fees | | 21,332 |
| | Trustee fees and meeting expenses | | 10,367 |
| | Distribution and service fees - Class C Shares (note 3) | | 9,203 |
| | Custody and banking fees (note 2) | | 7,051 |
| | Security pricing fees | | 4,393 |
| | Interest expense | | | 4,131 |
| | Insurance fees | | | 2,338 |
| | Other operating expenses | | 1,906 |
| | | | | | | | |
| | Total Expenses | | | 315,134 |
| | | | | | | | |
| | Fees waived and reimbursed by Advisor (note 2) | | (185,619) |
| | | | | | | | |
| | Net Expenses | | | 129,515 |
| | | | | | | | |
| Net Investment Loss | | | (27,547) |
| | | | | | | | |
| Realized and Unrealized Gain (Loss) on Investments: | | |
| | | | | | | | |
| | Net realized gain from: | | |
| | | Investment transactions | | 1,117,496 |
| | | Options written | | 22,828 |
| | | Total realized gain | | 1,140,324 |
| | | | | | | | |
| | Net change in unrealized appreciation (depreciation) on: | | |
| | | Investments | | | 136,935 |
| | | Options written | | (46) |
| | | Total net change in unrealized appreciation | | 136,889 |
| | | | | | | | |
| Net Realized and Unrealized Gain on Investments | | 1,277,213 |
| | | | | | | | |
| Net Increase in Net Assets Resulting from Operations | $ | 1,249,666 |
| | | | | | | | |
| | | | | | | | |
| See Notes to Financial Statements | | |
| Cavalier Dynamic Growth Fund | | | | | | | |
| | | | | | | | | | | | |
| Statements of Changes in Net Assets | | | | | | | |
| | | | | | | | | | | | |
| For the years ended May 31, | | | | | 2017 | | 2016 |
| | | | | | | | | | | | |
| Operations: | | | | | | | | |
| | Net investment loss | | | | $ | (27,547) | $ | (34,349) |
| | Net realized gain from investment transactions and options written | | 1,140,324 | | 1,047,194 |
| | Net change in unrealized appreciation (depreciation) on investments | | | | |
| | | and options written | | | | | 136,889 | | (2,292,376) |
| Net Increase (Decrease) in Net Assets Resulting from Operations | | 1,249,666 | | (1,279,531) |
| | | | | | | | | | | | |
| Distributions to Shareholders From: | | | | | | | |
| | Net realized gains | | | | | | | |
| | | Institutional Class Shares | | | | | (509,409) | | (2,370,611) |
| | | Class C Shares | | | | | (65,174) | | (214,472) |
| Decrease in Net Assets Resulting from Distributions | | | | (574,583) | | (2,585,083) |
| | | | | | | | | | | | |
| Beneficial Interest Transactions: | | | | | | | |
| | Shares sold | | | | | | 753,413 | | 30,327,483 |
| | Reinvested dividends and distributions | | | | | 567,467 | | 2,495,479 |
| | Shares repurchased | | | | | (6,487,245) | | (38,078,303) |
| Decrease from Beneficial Interest Transactions | | | | (5,166,365) | | (5,255,341) |
| | | | | | | | | | | | |
| Net Decrease in Net Assets | | | | | (4,491,282) | | (9,119,955) |
| | | | | | | | | | | | |
| Net Assets: | | | | | | | | |
| | Beginning of Year | | | | | 11,809,935 | | 20,929,890 |
| | End of Year | | | | | $ | 7,318,653 | $ | 11,809,935 |
| | | | | | | | | | | | |
| Accumulated Net Investment Loss | | | | $ | - | $ | (9,025) |
| | | | | | | | | | | | |
| | | | | | Year Ended | | Year Ended |
| Share Information: | May 31, 2017 | | May 31, 2016 |
| | Institutional Class Shares | Shares | | Amount | | Shares | | Amount |
| | | Shares sold | 68,630 | $ | 708,322 | | 2,380,984 | $ | 29,141,711 |
| | | Reinvested dividends and distributions | 52,486 | | 502,292 | | 224,951 | | 2,281,007 |
| | | Shares repurchased | (614,025) | | (6,221,940) | | (3,039,855) | | (36,783,431) |
| | Net Decrease in Shares of Beneficial Interest | (492,909) | $ | (5,011,326) | | (433,920) | $ | (5,360,713) |
| | | | | | | | | | | | |
| | Class C Shares | Shares | | Amount | | Shares | | Amount |
| | | Shares sold | 4,731 | $ | 45,091 | | 102,233 | $ | 1,185,772 |
| | | Reinvested dividends and distributions | 7,178 | | 65,175 | | 21,997 | | 214,472 |
| | | Shares repurchased | (27,399) | | (265,305) | | (117,134) | | (1,294,872) |
| | Net Increase (Decrease) in Shares | | | | | | | |
| | | of Beneficial Interest | (15,490) | $ | (155,039) | | 7,096 | $ | 105,372 |
| | | | | | | | | | | | |
| | | | | | | | | | | | |
| | | | | | | | | | | | |
| | | | | | | | | | | | |
| | | | | | | | | | | | |
| | | | | | | | | | | | |
| | | | | | | | | | | | |
| See Notes to Financial Statements | | | | | | | |
| Cavalier Dynamic Growth Fund | | | | | | | | | | | |
| | | | | | | | | | | | | | | | |
| Financial Highlights | | | | | | | | | | | |
| | | | | | | | | | | | | | | | |
| For a share outstanding during each | | Institutional Class Shares |
| of the fiscal years ended May 31, | | 2017 | | 2016 | | 2015 | | 2014 | | 2013 | |
| | | | | | | | | | | | | | | | |
| Net Asset Value, Beginning of Year | $ | 9.92 | $ | 12.92 | $ | 12.15 | $ | 11.55 | $ | 9.42 | |
| | | | | | | | | | | | | | | | |
| Income (Loss) from Investment Operations | | | | | | | | | | | |
| | Net investment income (loss) | | (0.02) | (d) | (0.02) | (d) | (0.06) | (d) | 0.11 | (d) | 0.21 | |
| | Net realized and unrealized gain (loss) on | | | | | | | | | | | |
| | | investments and options written | | 1.57 | | (0.93) | | 1.88 | | 1.08 | | 1.92 | |
| | | | | | | | | | | | | | | | |
| Total from Investment Operations | | 1.55 | | (0.95) | | 1.82 | | 1.19 | | 2.13 | |
| | | | | | | | | | | | | | | | |
| Less Distributions from: | | | | | | | | | | | |
| | Net investment income | | - | | - | | (0.11) | | (0.13) | | - | |
| | Net realized gains | | (0.74) | | (2.05) | | (0.94) | | (0.46) | | - | |
| | | | | | | | | | | | | | | | |
| Total Distributions | | (0.74) | | (2.05) | | (1.05) | | (0.59) | | - | |
| | | | | | | | | | | | | | | | |
| Net Asset Value, End of Year | $ | 10.73 | $ | 9.92 | $ | 12.92 | $ | 12.15 | $ | 11.55 | |
| | | | | | | | | | | | | | | | |
| Total Return (a) | | 16.50% | | (7.71)% | | 16.26% | | 10.44% | | 22.61% | |
| | | | | | | | | | | | | | | | |
| Net Assets, End of Year (in thousands) | $ | 6,431 | $ | 10,831 | $ | 19,722 | $ | 23,879 | $ | 14,139 | |
| | | | | | | | | | | | | | | | |
| Ratios of: | | | | | | | | | | | | |
| Gross Expenses to Average Net Assets (b) | | 3.61% | (f) | 1.85% | (e) | 1.27% | | 0.70% | | 0.94% | |
| Net Expenses to Average Net Assets (b) | | 1.43% | (f) | 1.37% | (e) | 1.27% | | 0.70% | | 0.88% | |
| | | | | | | | | | | | | | | | |
| Net Investment Income (Loss) to Average | | | | | | | | | | | |
| | Net Assets (c) | | (0.21)% | | (0.14)% | | (0.47)% | | 0.91% | | 1.72% | |
| | | | | | | | | | | | | | | | |
| Portfolio turnover rate | | 159.52% | | 312.56% | | 259.65% | | 425.39% | | 453.00% | |
| | | | | | | | | | | | | | | | |
| | | | | | | | | | | | | | | | |
| | | | | | | | | | | | | | | | |
| (a) | Includes adjustments in accordance with accounting principles generally accepted in the United States of America and, consequently, the net asset value for financial reporting purposes and the returns based upon those net asset values may differ from the net asset values and returns for shareholder transactions. |
| (b) | Does not include expenses of the investment companies in which the Fund invests. | | | | | |
| (c) | Recognition of net investment income (loss) by the Fund is affected by the timing of the declaration of dividends by the underlying investment companies in which the Fund invests. |
| (d) | Calculated using the average shares method. | | | | | | | | | | |
| (e) | Includes reimbursement of acquired fund fees and expenses for the period from June 1, 2015 through December 17, 2015. Expense limitation agreement was updated to exclude acquired fund fees and expenses from the waiver effective December 18, 2015 (see note 2). |
| (f) | Includes interest expense 0.05%. | | | | | | | | | | | |
| | | | | | | | | | | | | | | | |
| | | | | | | | | | | | | | | | |
| | | | | | | | | | | | | | | | |
| | | | | | | | | | | | | | | | |
| See Notes to Financial Statements | | | | | | | | | | (Continued) |
| Cavalier Dynamic Growth Fund | | | | | | | | | | | |
| | | | | | | | | | | | | | | | |
| Financial Highlights | | | | | | | | | | | |
| | | | | | | | | | | | | | | | |
| For a share outstanding during each | | Class C Shares (g) |
| of the fiscal years ended May 31, | | 2017 | | 2016 | | 2015 | | 2014 | | 2013 | |
| | | | | | | | | | | | | | | | |
| Net Asset Value, Beginning of Year | $ | 9.49 | $ | 12.57 | $ | 11.97 | $ | 11.48 | $ | 9.48 | |
| | | | | | | | | | | | | | | | |
| Income (Loss) from Investment Operations | | | | | | | | | | |
| | Net investment income (loss) | | (0.13) | (d) | (0.11) | (d) | (0.18) | (d) | (0.01) | (d) | 0.08 | |
| | Net realized and unrealized gain (loss) | | | | | | | | | | | |
| | | on investments and options written | | 1.51 | | (0.92) | | 1.83 | | 1.09 | | 1.92 | |
| | | | | | | | | | | | | | | | |
| Total from Investment Operations | | 1.38 | | (1.03) | | 1.65 | | 1.08 | | 2.00 | |
| | | | | | | | | | | | | | | | |
| Less Distributions from: | | | | | | | | | | | |
| | Net investment income | | - | | - | | (0.11) | | (0.13) | | - | |
| | Net realized gains | | (0.74) | | (2.05) | | (0.94) | | (0.46) | | - | |
| | | | | | | | | | | | | | | | |
| Total Distributions | | (0.74) | | (2.05) | | (1.05) | | (0.59) | | - | |
| | | | | | | | | | | | | | | | |
| Net Asset Value, End of Year | $ | 10.13 | $ | 9.49 | $ | 12.57 | $ | 11.97 | $ | 11.48 | |
| | | | | | | | | | | | | | | | |
| Total Return (a) | | 15.42% | | (8.64)% | | 15.04% | | 9.53% | | 21.10% | |
| | | | | | | | | | | | | | | | |
| Net Assets, End of Year (in thousands) | $ | 887 | $ | 979 | $ | 1,208 | $ | 1,122 | $ | 865 | |
| | | | | | | | | | | | | | | | |
| Ratios of: | | | | | | | | | | | | | |
| Gross Expenses to Average Net Assets (b) | 4.82% | (f) | 2.95% | (e) | 2.27% | | 1.70% | | 1.92% | |
| Net Expenses to Average Net Assets (b) | 2.43% | (f) | 2.40% | (e) | 2.27% | | 1.70% | | 1.87% | |
| | | | | | | | | | | | | | | | |
| Net Investment Income (Loss) to Average | | | | | | | | | | |
| | Net Assets (c) | | (1.32)% | | (1.02)% | | (1.50)% | | (0.09)% | | 0.88% | |
| | | | | | | | | | | | | | | | |
| Portfolio turnover rate | | 159.52% | | 312.56% | | 259.65% | | 425.39% | | 453.00% | |
| | | | | | | | | | | | | | | | |
| | | | | | | | | | | | | | | | |
| | | | | | | | | | | | | | | | |
| (a) | Includes adjustments in accordance with accounting principles generally accepted in the United States of America and, consequently, the net asset value for financial reporting purposes and the returns based upon those net asset values may differ from the net asset values and returns for shareholder transactions. |
| (b) | Does not include expenses of the investment companies in which the Fund invests. | | | | | |
| (c) | Recognition of net investment income (loss) by the Fund is affected by the timing of the declaration of dividends by the underlying investment companies in which the Fund invests. |
| (d) | Calculated using the average shares method. | | | | | | | | | |
| (e) | Includes reimbursement of acquired fund fees and expenses for the period from June 1, 2015 through December 17, 2015. Expense limitation agreement was updated to exclude acquired fund fees and expenses from the waiver effective December 18, 2015 (see note 2). |
| (f) | Includes interest expense 0.05%. | | | | | | | | | | | |
| (g) | As of February 24, 2017, the "Advisor Class" Shares were renamed the "Class C" Shares. There were no other changes to this class of shares. |
| | | | | | | | | | | | | |
| | | | | | | | | | | | | | | | |
| | | | | | | | | | | | | | | | |
| See Notes to Financial Statements | | | | | | | | | | | |
| Cavalier Fundamental Growth Fund - Institutional Class Shares | | | | | | | | |
| | | | | | | | | | | | | | | | | | |
| Performance Update (Unaudited) | | | | | | | | | | | |
| | | | | | | | | | | | | | | | | | |
| For the period from October 17, 2013 (Date of Initial Public Investment) through May 31, 2017 |
| | | | | | | | | | | | | | | | | | |
| Comparison of the Change in Value of a $10,000 Investment | | | | | | | | |
| | | | | | | | | | | | | | | | | | |
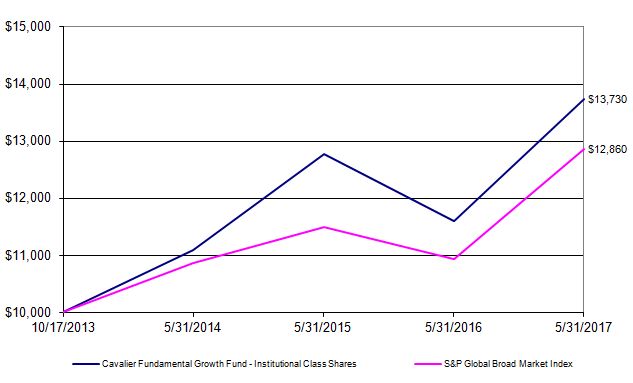
| The graph above assumes an initial $10,000 investment and represents the reinvestment of dividends and capital gains. This graph depicts the performance of Cavalier Fundamental Growth Fund - Institutional Class Shares versus the S&P Global Broad Market Index. It is important to note that the Fund is a professionally managed mutual fund while the index is not available for investment and is unmanaged. The comparison is shown for illustrative purposes only. |
| | | | | | | | | | | | | | | | | | | | |
| | Average Annual Total Returns | |
| | | | | | | | | | | | | | | | | | Gross | | |
| | | As of | | | | | One | | Three | | Since | | Inception | | Expense | | |
| | | May 31, 2017 | | | | Year | | Year | | Inception | | Date | | Ratio* | | |
| | | Institutional Class Shares | | | 18.42% | | 7.34% | | 9.15% | | 10/17/13 | | 1.52% | | |
| | | S&P Global Broad Market Index | | | 18.13% | | 5.95% | | 7.18% | | N/A | | N/A | | |
| | | | | | | | | | | | | | | | | | | | |
| * The gross expense ratio shown is from the Fund's prospectus dated September 28, 2016. | | | | |
| | | | | | | | | | | | | | | | | | | | |
| Performance quoted above represents past performance, which is no guarantee of future results. Investment return and principal value will fluctuate so that shares, when redeemed, may be worth more or less than their original cost. Current performance may be lower or higher than the performance data quoted. An investor may obtain performance data, current to the most recent month-end, by visiting ncfunds.com. |
| | | | | | | | | | | | | | | | | | | | |
| The graph and table do not reflect the deduction of taxes that a shareholder would pay on Fund distributions or the redemption of Fund shares. Average annual total returns are historical in nature and measure net investment income and capital gain or loss from portfolio investments assuming reinvestment of distributions. |
| | | | | | | | | | | | | | | | | | | | |
| | | | | | | | | | | | | | | | | | | | |
| | | | | | | | | | | | | | | | | | | | |
| Cavalier Fundamental Growth Fund - Class C Shares | | | | | | | | | | |
| | | | | | | | | | | | | | | | | | |
| Performance Update (Unaudited) | | | | | | | | | | | |
| | | | | | | | | | | | | | | | | | |
| For the period from November 4, 2013 (Date of Initial Public Investment) through May 31, 2017 |
| | | | | | | | | | | | | | | | | | |
| Comparison of the Change in Value of a $10,000 Investment | | | | | | | | |

| The graph above assumes an initial $10,000 investment and represents the reinvestment of dividends and capital gains. This graph depicts the performance of Cavalier Fundamental Growth Fund - Class C Shares versus the S&P Global Broad Market Index. It is important to note that the Fund is a professionally managed mutual fund while the index is not available for investment and is unmanaged. The comparison is shown for illustrative purposes only. | | |
| | | | | | | | | | | | | | | | | | | | |
| | Average Annual Total Returns | | |
| | | | | | | | | | | | | | | | | | Gross | | |
| | | As of | | | | One | | Three | | Since | | Inception | | Expense | | |
| | | May 31, 2017 | | | | Year | | Year | | Inception | | Date | | Ratio* | | |
| | | Class C Shares** | | | | 17.37% | | 6.30% | | 8.58% | | 11/04/13 | | 2.52% | | |
| | | S&P Global Broad Market Index | | | 18.13% | | 5.95% | | 7.20% | | N/A | | N/A | | |
| | | | | | |
| * The gross expense ratio shown is from the Fund's prospectus dated September 28, 2016. | | | | | |
| ** | As of February 24, 2017, the "Advisor Class" Shares were renamed to the "Class C" Shares. There were no other changes to this class of shares. Class C Shares held longer than 7 years will automatically convert to Institutional Class Shares. Institutional Class Shares are not subject to the distribution and service plan (Rule 12b-1) fees of 1.00%. |
| | |
| Performance quoted above represents past performance, which is no guarantee of future results. Investment return and principal value will fluctuate so that shares, when redeemed, may be worth more or less than their original cost. Current performance may be lower or higher than the performance data quoted. An investor may obtain performance data, current to the most recent month-end, by visiting ncfunds.com. |
| | | | | | | | | | | | | | | | | | | | |
| The graph and table do not reflect the deduction of taxes that a shareholder would pay on Fund distributions or the redemption of Fund shares. Average annual total returns are historical in nature and measure net investment income and capital gain or loss from portfolio investments assuming reinvestment of distributions. |
| | | | | | | | | | | | | | | | | | | | |
| | | | | | | | | | | | | | | | | | | | |
| Cavalier Fundamental Growth Fund | | | | |
| | | | | | | | | | |
| Schedule of Investments | | | | | | |
| | | | | | | | | | |
| As of May 31, 2017 | | | | | | |
| | | | | | | | Shares | | Value (Note 1) |
| | | | | | | | | | |
| COMMON STOCKS - 95.61% | | | | | |
| | | | | | | | | | |
| | Consumer Discretionary - 15.05% | | | | | |
| | * | Amazon.com, Inc. | | | | 1,700 | $ | 1,690,854 |
| | | Big 5 Sporting Goods Corp. | | | 12,400 | | 172,360 |
| | * | China Lodging Group Ltd. | | | 5,300 | | 404,920 |
| | | Domino's Pizza, Inc. | | | 3,500 | | 741,020 |
| | | Ferrari NV | | | | | 8,400 | | 728,448 |
| | * | Fox Factory Holding Corp. | | | 6,000 | | 197,100 |
| | *μ | JD.com, Inc. | | | | 16,000 | | 640,480 |
| | * | Netflix, Inc. | | | | 2,000 | | 326,140 |
| | | Nutrisystem, Inc. | | | | 11,600 | | 603,780 |
| | * | SodaStream International Ltd. | | | 19,700 | | 1,043,706 |
| | * | SORL Auto Parts, Inc. | | | 42,300 | | 368,856 |
| | | TAL Education Group | | | 4,100 | | 477,527 |
| | * | Ulta Beauty, Inc. | | | | 8,100 | | 2,469,204 |
| | | | | | | | | | 9,864,395 |
| | Consumer Staples - 1.69% | | | | | |
| | | Altria Group, Inc. | | | | 14,700 | | 1,108,968 |
| | | | | | | | | | 1,108,968 |
| | Energy - 1.32% | | | | | | |
| | | Devon Energy Corp. | | | 9,300 | | 316,014 |
| | * | Geopark Ltd. | | | | 22,700 | | 196,809 |
| | | Pioneer Natural Resources Co. | | | 2,100 | | 350,406 |
| | | | | | | | | | 863,229 |
| | Financials - 4.04% | | | | | | |
| | | Arbor Realty Trust, Inc. | | | 37,400 | | 306,680 |
| | μ | Bancolombia SA | | | | 11,800 | | 519,318 |
| | | First Bank | | | | 10,000 | | 116,500 |
| | | New Residential Investment Corp. | | | 33,200 | | 534,188 |
| | * | NMI Holdings, Inc. | | | | 27,900 | | 290,160 |
| | * | Sunshine Bancorp, Inc. | | | 7,900 | | 174,195 |
| | * | Walker & Dunlop, Inc. | | | 15,100 | | 705,321 |
| | | | | | | | | | 2,646,362 |
| | Health Care - 8.32% | | | | | | |
| | * | Align Technology, Inc. | | | 5,000 | | 726,000 |
| | | Baxter International, Inc. | | | 18,500 | | 1,097,235 |
| | * | CRH Medical Corp. | | | | 24,100 | | 145,805 |
| | * | Exelixis, Inc. | | | | 22,100 | | 413,491 |
| | * | Glaukos Corp. | | | | 19,400 | | 789,774 |
| | * | IDEXX Laboratories, Inc. | | | 4,300 | | 724,077 |
| | * | Intuitive Surgical, Inc. | | | 685 | | 626,556 |
| | * | Mettler-Toledo International, Inc. | | | 1,600 | | 932,496 |
| | | | | | | | | | 5,455,434 |
| | | | | | | | | | |
| | | | | | | | | | |
| | | | | | | | | | (Continued) |
| Cavalier Fundamental Growth Fund | | | | |
| | | | | | | | | | |
| Schedule of Investments - Continued | | | | | |
| | | | | | | | | | |
| As of May 31, 2017 | | | | | | |
| | | | | | | | Shares | | Value (Note 1) |
| | | | | | | | | | |
| COMMON STOCKS - Continued | | | | | |
| | | | | | | | | | |
| | Industrials - 9.60% | | | | | | |
| | *μ | 51job, Inc. | | | | | 7,600 | $ | 331,284 |
| | | Argan, Inc. | | | | | 6,000 | | 354,300 |
| | | CSX Corp. | | | | | 13,700 | | 742,129 |
| | | Lockheed Martin Corp. | | | 2,400 | | 674,712 |
| | * | MasTec, Inc. | | | | 46,200 | | 1,958,880 |
| | | Republic Services, Inc. | | | 8,700 | | 553,407 |
| | μ | Vinci SA | | | | | 14,000 | | 305,620 |
| | | Waste Management, Inc. | | | 13,800 | | 1,006,158 |
| | * | Willdan Group, Inc. | | | | 11,000 | | 365,970 |
| | | | | | | | | | 6,292,460 |
| | Information Technology - 44.02% | | | | | |
| | * | Advanced Energy Industries, Inc. | | | 3,800 | | 292,334 |
| | | Applied Materials, Inc. | | | 22,500 | | 1,032,300 |
| | * | Applied Optoelectronics, Inc. | | | 15,400 | | 1,075,228 |
| | * | Arista Networks, Inc. | | | 3,700 | | 545,306 |
| | * | Asure Software, Inc. | | | 36,700 | | 568,850 |
| | * | Baozun, Inc. | | | | 21,300 | | 437,715 |
| | | Broadcom Ltd. | | | | 5,500 | | 1,317,140 |
| | | Cabot Microelectronics Corp. | | | 9,000 | | 679,410 |
| | | Cognex Corp. | | | | 14,200 | | 1,299,442 |
| | * | Finisar Corp. | | | | 18,850 | | 464,841 |
| | * | Finjan Holdings, Inc. | | | 61,200 | | 181,152 |
| | | InterDigital, Inc. | | | | 3,900 | | 315,900 |
| | * | Intevac, Inc. | | | | 18,600 | | 249,240 |
| | * | Kulicke & Soffa Industries, Inc. | | | 29,400 | | 651,210 |
| | | Lam Research Corp. | | �� | 2,200 | | 341,374 |
| | * | Micron Technology, Inc. | | | 38,700 | | 1,190,799 |
| | | MKS Instruments, Inc. | | | 2,500 | | 204,375 |
| | * | Momo, Inc. | | | | 18,300 | | 696,132 |
| | * | Nanometrics, Inc. | | | | 10,900 | | 303,020 |
| | * | Nova Measuring Instruments Ltd. | | | 19,200 | | 470,016 |
| | | NVIDIA Corp. | | | | 20,900 | | 3,016,915 |
| | * | Oclaro, Inc. | | | | 219,400 | | 1,948,272 |
| | * | Orbotech Ltd. | | | | 30,300 | | 1,081,104 |
| | * | PCM, Inc. | | | | | 11,800 | | 232,460 |
| | | QUALCOMM, Inc. | | | | 22,700 | | 1,300,029 |
| | * | Rogers Corp. | | | | 1,500 | | 159,315 |
| | * | SINA Corp. | | | | 10,400 | | 1,018,888 |
| | | STMicroelectronics NV | | | 90,900 | | 1,497,123 |
| | | Texas Instruments, Inc. | | | 3,900 | | 321,711 |
| | * | Tower Semiconductor Ltd. | | | 26,000 | | 659,360 |
| | * | Ultra Clean Holdings, Inc. | | | 41,300 | | 943,292 |
| | * | Vantiv, Inc. | | | | 10,500 | | 658,560 |
| | * | Vmware, Inc. | | | | 4,700 | | 456,605 |
| | | | | | | | | | |
| | | | | | | | | | (Continued) |
| Cavalier Fundamental Growth Fund | | | | |
| | | | | | | | | | |
| Schedule of Investments - Continued | | | | | |
| | | | | | | | | | |
| As of May 31, 2017 | | | | | | |
| | | | | | | | Shares | | Value (Note 1) |
| | | | | | | | | | |
| COMMON STOCKS - Continued | | | | | |
| | | | | | | | | | |
| | Information Technology - Continued | | | | | |
| | * | Weibo Corp. | | | | 35,500 | $ | 2,610,315 |
| | | Western Digital Corp. | | | 3,700 | | 333,222 |
| | * | Yirendai Ltd. | | | | 13,400 | | 310,612 |
| | | | | | | | | | 28,863,567 |
| | Materials - 5.03% | | | | | | |
| | | Packaging Corp of America | | | 10,300 | | 1,052,248 |
| | μ | Sociedad Quimica y Minera de Chile SA | | | 23,700 | | 853,911 |
| | | Teck Resources Ltd. | | | 26,000 | | 464,360 |
| | | The Chemours Co. | | | | 23,200 | | 927,768 |
| | | | | | | | | | 3,298,287 |
| | Real Estate - 4.08% | | | | | | |
| | | Armada Hoffler Properties, Inc. | | | 21,100 | | 278,731 |
| | | CareTrust REIT, Inc. | | | 12,500 | | 228,125 |
| | | Digital Realty Trust, Inc. | | | 11,000 | | 1,300,090 |
| | | Rexford Industrial Realty, Inc. | | | 31,800 | | 866,550 |
| | | | | | | | | | 2,673,496 |
| | Telecommunications - 0.51% | | | | | |
| | * | Zayo Group Holdings, Inc. | | | 10,500 | | 337,680 |
| | | | | | | | | | 337,680 |
| | Utilities - 1.95% | | | | | | |
| | | CMS Energy Corp. | | | | 12,000 | | 568,920 |
| | | UGI Corp. | | | | | 13,900 | | 711,402 |
| | | | | | | | | | 1,280,322 |
| | | | | | | | | | |
| | | Total Common Stocks (Cost $51,130,471) | | | | | 62,684,200 |
| | | | | | | | | | |
| LIMITED PARTNERSHIPS - 2.74% | | | | | |
| | | Cone Midstream Partners LP | | | 50,300 | | 1,067,869 |
| | | Enviva Partners LP | | | | 14,500 | | 407,450 |
| | | Brookfield Infrastructure Partners LP | | | 7,900 | | 319,950 |
| | | | | | | | | | |
| | | Total Limited Partnerships (Cost $1,856,404) | | | | 1,795,269 |
| | | | | | | | | | |
| SHORT-TERM INVESTMENT - 1.55% | | | | | |
| | § | Fidelity Investments Money Market Government Portfolio - | | | |
| | | Institutional Class, 0.69% | | | 1,019,000 | | 1,019,000 |
| | | | | | | | | | |
| | | Total Short-Term Investment (Cost $1,019,000) | | | | 1,019,000 |
| | | | | | | | | | |
| Total Value of Investments (Cost $54,005,875) - 99.90% | | | $ | 65,498,469 |
| | | | | | | | | | |
| Other Assets Less Liabilities - 0.10% | | | | | 66,519 |
| | | | | | | | | | |
| | Net Assets - 100.00% | | | | | $ | 65,564,988 |
| | | | | | | | | | |
| | | | | | | | | | |
| | | | | | | | | | (Continued) |
| Cavalier Fundamental Growth Fund | | | | | |
| | | | | | | | | | |
| Schedule of Investments - Continued | | | | | |
| | | | | | | | | | |
| As of May 31, 2017 | | | | | | |
| | | | | | | | | | |
| | | | | | | | | | |
| * | Non-income producing investment | | | | | |
| § | Represents 7 day effective yield | | | | | |
| μ | American Depositary Receipt | | | | | |
| | | | | | | | | | |
| The following acronym or abbreviation is used in this portfolio: | | | | |
| | NV - Netherlands Security | | | | | |
| | | | | | | | | | |
| | | | | | | | | | |
| | | | | | | | | | |
| | | | Summary of Investments by Sector | | | | |
| | | | | | % of Net | | | | |
| | | | Sector | | Assets | | Value | | |
| | | | Consumer Discretionary | 15.05% | $ | 9,864,395 | | |
| | | | Consumer Staples | 1.69% | | 1,108,968 | | |
| | | | Energy | | 1.32% | | 863,229 | | |
| | | | Financials | 4.04% | | 2,646,362 | | |
| | | | Health Care | 8.32% | | 5,455,434 | | |
| | | | Industrials | 9.60% | | 6,292,460 | | |
| | | | Information Technology | 44.02% | | 28,863,567 | | |
| | | | Materials | 5.03% | | 3,298,287 | | |
| | | | Real Estate | 4.08% | | 2,673,496 | | |
| | | | Telecommunications | 0.51% | | 337,680 | | |
| | | | Utilities | | 1.95% | | 1,280,322 | | |
| | | | Limited Partnerships | 2.74% | | 1,795,269 | | |
| | | | Short-Term Investment | 1.55% | | 1,019,000 | | |
| | | | Other Assets Less Liabilities | 0.10% | | 66,519 | | |
| | | | Total Net Assets | 100.00% | $ | 65,564,988 | | |
| | | | | | | | | | |
| | | | | | | | | | |
| | | | | | | | | | |
| See Notes to Financial Statements | | | | | |
| Cavalier Fundamental Growth Fund | | |
| | | | | | | | |
| Statement of Assets and Liabilities | | |
| | | | | | | | |
| As of May 31, 2017 | | | |
| | | | | | | | |
| Assets: | | | | | |
| | Investments, at value (cost $54,005,875) | $ | 65,498,469 |
| | Receivables: | | | |
| | | Investments sold | | | 408,152 |
| | | Fund shares sold | | | 325,732 |
| | | Dividends and interest | | | 41,639 |
| | Prepaid expenses: | | | |
| | | Registration and filing expenses | | 16,197 |
| | | Fund accounting fees | | | 2,788 |
| | | | | | | | |
| | Total assets | | | 66,292,977 |
| | | | | | | | |
| Liabilities: | | | | | |
| | Payables: | | | | |
| | | Investments purchased | | | 550,423 |
| | | Fund shares repurchased | | 154,060 |
| | Accrued expenses: | | | |
| | | Professional fees | | | 14,000 |
| | | Advisory fees | | | 2,662 |
| | | Distribution and service fees - Class C Shares | | 1,916 |
| | | Trustee fees and meeting expenses | | 1,898 |
| | | Shareholder fulfillment fees | | 1,751 |
| | | Administration fees | | | 578 |
| | | Custody and banking fees | | 324 |
| | | Insurance fees | | | 298 |
| | | Security pricing fees | | | 79 |
| | | | | | | | |
| | Total liabilities | | | 727,989 |
| | | | | | | | |
| Total Net Assets | | $ | 65,564,988 |
| | | | | | | | |
| Net Assets Consist of: | | | |
| | Paid in capital | | $ | 56,298,883 |
| | Undistributed net investment income | | 38,981 |
| | Accumulated net realized loss on investments | | (2,265,470) |
| | Net unrealized appreciation on investments | | 11,492,594 |
| | | | | | | | |
| Total Net Assets | | $ | 65,564,988 |
| | | | | | | | |
| Institutional Class Shares of beneficial interest outstanding, no par value (unlimited authorized shares) | 4,610,816 |
| | Net Assets | | | $ | 63,142,219 |
| | Net Asset Value, Offering Price and Redemption Price Per Share | $ | 13.69 |
| | | | | | | | |
| Class C Shares of beneficial interest outstanding, no par value (unlimited authorized shares) | | 181,131 |
| | Net Assets | | | $ | 2,422,769 |
| | Net Asset Value, Offering Price and Redemption Price Per Share (a) | $ | 13.38 |
| | | | | | | | |
| (a) | Contingent deferred sales charge for Class C Shares is imposed on shares redeemed within one year of the purchase date (note 1). |
| | | | | | | | |
| | | | | | | | |
| | | | | | | | |
| See Notes to Financial Statements | | |
| Cavalier Fundamental Growth Fund | | |
| | | | | | | | |
| Statement of Operations | | |
| | | | | | | | |
| For the year ended May 31, 2017 | | |
| | | | | | | | |
| Investment Income: | | |
| | Dividends (net of withholding taxes of $7,960) | $ | 817,883 |
| | | | | | | | |
| | Total Investment Income | | 817,883 |
| | | | | | | | |
| Expenses: | | | | | |
| | Advisory fees (note 2) | | 559,904 |
| | Administration fees (note 2) | | 55,225 |
| | Distribution and service fees - Class C Shares (note 3) | | 49,014 |
| | Professional fees | | 43,945 |
| | Fund accounting fees (note 2) | | 43,676 |
| | Registration and filing expenses | | 37,720 |
| | Shareholder fulfillment fees | | 32,654 |
| | Transfer agent fees (note 2) | | 30,473 |
| | Custody and banking fees (note 2) | | 18,829 |
| | Trustee fees and meeting expenses | | 10,367 |
| | Compliance fees (note 2) | | 9,384 |
| | Security pricing fees | | 7,472 |
| | Insurance fees | | | 4,032 |
| | Other operating expenses | | 1,906 |
| | | | | | | | |
| | Total Expenses | | | 904,601 |
| | | | | | | | |
| | Advisory fees waived (note 2) | | (206,022) |
| | | | | | | | |
| | Net Expenses | | | 698,579 |
| | | | | | | | |
| Net Investment Income | | 119,304 |
| | | | | | | | |
| Realized and Unrealized Gain on Investments: | | |
| | | | | | | | |
| | Net realized gain from investment transactions | | 1,768,352 |
| | Net change in unrealized appreciation on investments | | 8,024,670 |
| | | | | | | | |
| Net Realized and Unrealized Gain on Investments | | 9,793,022 |
| | | | | | | | |
| Net Increase in Net Assets Resulting from Operations | $ | 9,912,326 |
| | | | | | | | |
| | | | | | | | |
| | | | | | | | |
| See Notes to Financial Statements | | |
| Cavalier Fundamental Growth Fund | | | | | | | | |
| | | | | | | | | | | | | |
| Statements of Changes in Net Assets | | | | | | | | |
| | | | | | | | | | | | | |
| For the years ended May 31, | | | | | | 2017 | | 2016 |
| | | | | | | | | | | | | |
| Operations: | | | | | | | | | | |
| | Net investment income (loss) | | | | | $ | 119,304 | $ | (50,897) |
| | Net realized gain (loss) from investment transactions | | | | 1,768,352 | | (2,341,481) |
| | Net change in unrealized appreciation (depreciation) on investments | | 8,024,670 | | (3,257,869) |
| | | | | | | | | | | | | |
| Net Increase (Decrease) in Net Assets Resulting from Operations | | 9,912,326 | | (5,650,247) |
| | | | | | | | | | | | | |
| Distributions to Shareholders From: | | | | | | | | |
| | Net Investment income | | | | | | | | |
| | | Institutional Class Shares | | | | | | (73,709) | | (55,656) |
| | Class C Shares | | | | | | (6,614) | | (9,691) |
| | | | | | | | | | | | | |
| Decrease in Net Assets Resulting from Distributions | | | | (80,323) | | (65,347) |
| | | | | | | | | | | | | |
| Beneficial Interest Transactions: | | | | | | | | |
| | Shares sold | | | | | | | 30,586,438 | | 45,596,054 |
| | Reinvested dividends and distributions | | | | | | 70,120 | | 57,997 |
| | Shares repurchased | | | | | | (27,958,966) | | (47,456,100) |
| | | | | | | | | | | | | |
| Increase (Decrease) from Beneficial Interest Transactions | | | | 2,697,592 | | (1,802,049) |
| | | | | | | | | | | | | |
| Net Increase (Decrease) in Net Assets | | | | | | 12,529,595 | | (7,517,643) |
| | | | | | | | | | | | | |
| Net Assets: | | | | | | | | | | |
| | Beginning of Year | | | | | | 53,035,393 | | 60,553,036 |
| | End of Year | | | | | | $ | 65,564,988 | $ | 53,035,393 |
| | | | | | | | | | | | | |
| Accumulated Net Investment Income | | | | | $ | 38,981 | $ | - |
| | | | | | | | | | | | | |
| | | | | | | Year Ended | | Year Ended |
| Share Information: | | May 31, 2017 | | May 31, 2016 |
| | Institutional Class Shares | | Shares | | Amount | | Shares | | Amount |
| | | Shares sold | | 2,488,601 | $ | 30,265,015 | | 3,426,443 | $ | 41,336,593 |
| | | Reinvested dividends and distributions | 5,355 | | 63,507 | | 4,187 | | 48,497 |
| | | Shares repurchased | | (1,808,777) | | (21,986,248) | | (3,712,131) | | (44,866,358) |
| | Net Increase (Decrease) in Shares of | | | | | | | | |
| | | Beneficial Interest | | 685,179 | $ | 8,342,274 | | (281,501) | $ | (3,481,268) |
| | | | | | | | | | | | | |
| | Class C Shares | | Shares | | Amount | | Shares | | Amount |
| | | Shares sold | | 26,999 | $ | 321,423 | | 351,060 | $ | 4,259,461 |
| | | Reinvested dividends and distributions | 569 | | 6,613 | | 828 | | 9,500 |
| | | Shares repurchased | | (510,326) | | (5,972,718) | | (225,766) | | (2,589,742) |
| | Net Increase (Decrease) in Shares of | | | | | | | | |
| | | Beneficial Interest | | (482,758) | $ | (5,644,682) | | 126,122 | $ | 1,679,219 |
| | | | | | | | | | | | | |
| | | | | | | | | | | | | |
| | | | | | | | | | | | | |
| | | | | | | | | | | | | |
| See Notes to Financial Statements | | | | | | | | |
| Cavalier Fundamental Growth Fund | | | | | | | | | |
| | | | | | | | | | | | | | |
| Financial Highlights | | | | | | | | | |
| | | | | | | | | | | | | | |
| For a share outstanding during each of the | Institutional Class Shares |
| fiscal years or period ended May 31, | | 2017 | | 2016 | | 2015 | | 2014 | (f) |
| | | | | | | | | | | | | | |
| Net Asset Value, Beginning of Period | $ | 11.58 | $ | 12.77 | $ | 11.09 | $ | 10.00 | |
| | | | | | | | | | | | | | |
| Income (Loss) from Investment Operations | | | | | | | | | |
| | Net investment income (loss) (e) | | 0.03 | | 0.01 | | 0.03 | | (0.04) | |
| | Net realized and unrealized gain (loss) on | | | | | | | | | |
| | | investments | | 2.10 | | (1.19) | | 1.65 | | 1.13 | |
| | | | | | | | | | | | | | |
| Total from Investment Operations | | 2.13 | | (1.18) | | 1.68 | | 1.09 | |
| | | | | | | | | | | | | | |
| Less Distributions from: | | | | | | | | | |
| | Net investment income | | (0.02) | | (0.01) | | - | | - | |
| | | | | | | | | | | | | | |
| Total Distributions | | (0.02) | | (0.01) | | - | | - | |
| | | | | | | | | | | | | | |
| Net Asset Value, End of Period | $ | 13.69 | $ | 11.58 | $ | 12.77 | $ | 11.09 | |
| | | | | | | | | | | | | | |
| Total Return (c) | | | 18.42% | | (9.21)% | | 15.15% | | 10.90% | (b) |
| | | | | | | | | | | | | | |
| Net Assets, End of Period (in thousands) | $ | 63,142 | $ | 45,453 | $ | 53,713 | $ | 18,202 | |
| | | | | | | | | | | | | | |
| Ratios of: | | | | | | | | | | | |
| Gross Expenses to Average Net Assets | | 1.55% | | 1.51% | | 1.55% | | 1.25% | (a) |
| Net Expenses to Average Net Assets | | 1.18% | | 1.11% | (g) | 1.13% | | 1.25% | (a) |
| Net Investment Income (Loss) to Average Net Assets | 0.29% | | 0.05% | (g) | 0.23% | | (0.64)% | (a) |
| | | | | | | | | | | | | | |
| Portfolio turnover rate | | 135.58% | | 172.08% | | 95.22% | | 71.01% | (b) |
| | | | | | | | | | | | | | |
| | | | | | | | | | | | | | |
| | | | | | | | | | | | | | |
| (a) | Annualized. | | | | | | | | | | |
| (b) | Not annualized. | | | | | | | | | |
| (c) | Includes adjustments in accordance with accounting principles generally accepted in the United States of America and, consequently, the net asset value for financial reporting purposes and the returns based upon those net asset values may differ from the net asset values and returns for shareholder transactions. |
| (d) | Does not include expenses of the investment companies in which the Fund invests. | | | |
| (e) | Calculated using the average shares method. | | | | | | | | | |
| (f) | For the period from October 17, 2013 (Date of Initial Public Investment) to May 31, 2014. | | | |
| (g) | Includes reimbursement of acquired fund fees and expenses for the period from June 1, 2015 through December 17, 2015. Expense limitation agreement was updated to exclude acquired fund fees and expenses from the waiver effective December 18, 2015 (see note 2). |
| | |
| | | | | | | | | | | | | | |
| See Notes to Financial Statements | | | | | | | | (Continued) |
| Cavalier Fundamental Growth Fund | | | | | | | | | |
| | | | | | | | | | | | | | |
| Financial Highlights | | | | | | | | | |
| | | | | | | | | | | | | | |
| For a share outstanding during each of the | | Class C Shares (h) |
| fiscal years or period ended May 31, | | 2017 | | 2016 | | 2015 | | 2014 | (f) |
| | | | | | | | | | | | | | |
| Net Asset Value, Beginning of Period | $ | 11.42 | $ | 12.72 | $ | 11.16 | $ | 10.00 | |
| | | | | | | | | | | | | | |
| Income (Loss) from Investment Operations | | | | | | | | | |
| | Net investment loss (e) | | (0.06) | | (0.11) | | (0.11) | | (0.10) | |
| | Net realized and unrealized gain (loss) on | | | | | | | | | |
| | | investments | | 2.04 | | (1.18) | | 1.67 | | 1.26 | |
| | | | | | | | | | | | | | |
| Total from Investment Operations | | 1.98 | | (1.29) | | 1.56 | | 1.16 | |
| | | | | | | | | | | | | | |
| Less Distributions from: | | | | | | | | | |
| | Net investment income | | (0.02) | | (0.01) | | - | | - | |
| | | | | | | | | | | | | | |
| Total from Investment Operations | | (0.02) | | (0.01) | | - | | - | |
| | | | | | | | | | | | | | |
| Net Asset Value, End of Period | $ | 13.38 | $ | 11.42 | $ | 12.72 | $ | 11.16 | |
| | | | | | | | | | | | | | |
| Total Return (c) | | | 17.37% | | (10.11)% | | 13.98% | | 11.60% | (b) |
| | | | | | | | | | | | | | |
| Net Assets, End of Period (in thousands) | $ | 2,423 | $ | 7,582 | $ | 6,840 | $ | 233 | |
| | | | | | | | | | | | | | |
| Ratios of: | | | | | | | | | | | |
| Gross Expenses to Average Net Assets | | 2.49% | | 2.51% | | 2.55% | | 2.25% | (a) |
| Net Expenses to Average Net Assets | | 2.13% | | 2.11% | (g) | 2.13% | | 2.25% | (a) |
| Net Investment Loss to Average Net Assets | | (0.51)% | | (0.96)% | (g) | (0.93)% | | (1.69)% | (a) |
| | | | | | | | | | | | | | |
| Portfolio turnover rate | | 135.58% | | 172.08% | | 95.22% | | 71.01% | (b) |
| | | | | | | | | | | | | | |
| | | | | | | | | | | | | | |
| | | | | | | | | | | | | | |
| (a) | Annualized. | | | | | | | | | | |
| (b) | Not annualized. | | | | | | | | | |
| (c) | Includes adjustments in accordance with accounting principles generally accepted in the United States of America and, consequently, the net asset value for financial reporting purposes and the returns based upon those net asset values may differ from the net asset values and returns for shareholder transactions. |
| (d) | Does not include expenses of the investment companies in which the Fund invests. | | | | |
| (e) | Calculated using the average shares method. | | | | | | | | | |
| (f) | For the period from November 4, 2013 (Date of Initial Public Investment) to May 31, 2014. | | | |
| (g) | Includes reimbursement of acquired fund fees and expenses for the period from June 1, 2015 through December 17, 2015. Expense limitation agreement was updated to exclude acquired fund fees and expenses from the waiver effective December 18, 2015 (see note 2). |
| (h) | As of February 24, 2017, the "Advisor Class" Shares were renamed to the "Class C" Shares. There were no other changes to this class of shares. |
| | | | | | | | | | | |
| | | | | | | | | | | | | | |
| | | | | | | | | | | | | | |
| | | | | | | | | | | | | | |
| | | | | | | | | | | | | | |
| | | | | | | | | | | | | | |
| See Notes to Financial Statements | | | | | | | | | |
| Cavalier Global Opportunities Fund - Institutional Class Shares | | | | | | |
| | | | | | | | | | | | | | | | | | |
| Performance Update (Unaudited) | | | | | | | | | | | |
| | | | | | | | | | | | | | | | | | |
| For the period from September 20, 2012 (Date of Initial Public Investment) through May 31, 2017 |
| | | | | | | | | | | | | | | | | | |
| Comparison of the Change in Value of a $10,000 Investment | | | | | | |
| | | | | | | | | | | | | | | | | | |
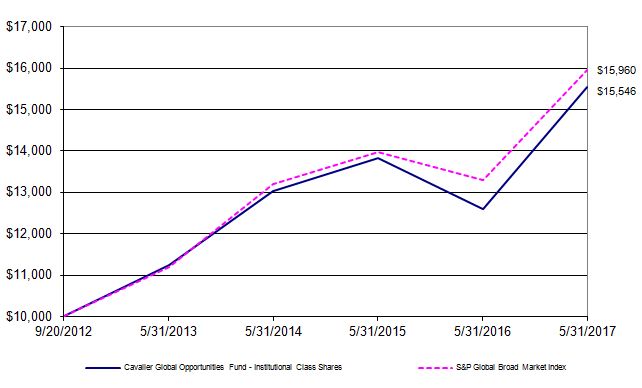
| The graph above assumes an initial $10,000 investment and represents the reinvestment of dividends and capital gains. This graph depicts the performance of Cavalier Global Opportunities Fund - Institutional Class Shares versus the S&P Global Broad Market Index. It is important to note that the Fund is a professionally managed mutual fund while the index is not available for investment and is unmanaged. The comparison is shown for illustrative purposes only. |
| | | | | | | | | | | | | | | | | | | | |
| | Average Annual Total Returns | |
| | | | | | | | | | | | | | | | | | Gross | | |
| | | As of | | | | | One | | Three | | Since | | Inception | | Expense | | |
| | | May 31, 2017 | | | | Year | | Year | | Inception | | Date | | Ratio* | | |
| | | Institutional Class Shares | | | 23.53% | | 5.92% | | 9.85% | | 09/20/12 | | 1.49% | | |
| | | S&P Global Broad Market Index | | | 18.13% | | 5.95% | | 10.45% | | N/A | | N/A | | |
| | | | | | | | | | | | | | | | | | | | |
| * The gross expense ratio shown is from the Funds' prospectus dated September 28, 2016. | | | | |
| | | | | | | | | | | | | | | | | | | | |
| Performance quoted above represents past performance, which is no guarantee of future results. Investment return and principal value will fluctuate so that shares, when redeemed, may be worth more or less than their original cost. Current performance may be lower or higher than the performance data quoted. An investor may obtain performance data, current to the most recent month-end, by visiting ncfunds.com. |
| | | | | | | | | | | | | | | | | | | | |
| The graph and table do not reflect the deduction of taxes that a shareholder would pay on Fund distributions or the redemption of Fund shares. Average annual total returns are historical in nature and measure net investment income and capital gain or loss from portfolio investments assuming reinvestment of distributions. |
| | | | | | | | | | | | | | | | | | | | |
| | | | | | | | | | | | | | | | | | | | |
| Cavalier Global Opportunities Fund - Class C Shares | | | | | | | | |
| | | | | | | | | | | | | | | | | | |
| Performance Update (Unaudited) | | | | | | | | | | | |
| | | | | | | | | | | | | | | | | | |
| For the period from September 26, 2012 (Date of Initial Public Investment) through May 31, 2017 |
| | | | | | | | | | | | | | | | | | |
| Comparison of the Change in Value of a $10,000 Investment | | | | | | |
| | | | | | | | | | | | | | | | | | |
| | | | | | | | | | | | | | | | | | |
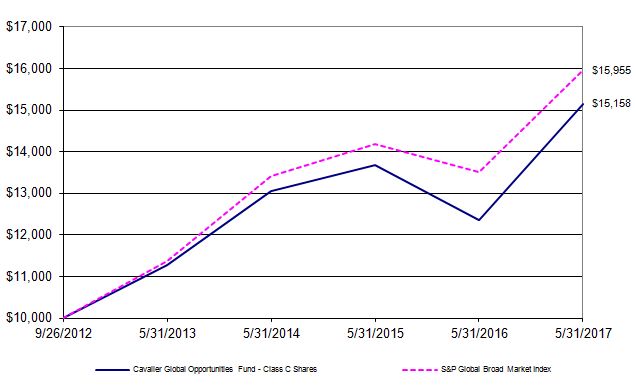
| The graph above assumes an initial $10,000 investment and represents the reinvestment of dividends and capital gains. This graph depicts the performance of Cavalier Global Opportunities Fund - Class C Shares versus the S&P Global Broad Market Index. It is important to note that the Fund is a professionally managed mutual fund while the index is not available for investment and is unmanaged. The comparison is shown for illustrative purposes only. |
| | | | | | | | | | | | | | | | | | | | |
| | Average Annual Total Returns | |
| | | | | | | | | | | | | | | | | | Gross | | |
| | | As of | | | | | One | | Three | | Since | | Inception | | Expense | | |
| | | May 31, 2017 | | | | Year | | Year | | Inception | | Date | | Ratio* | | |
| | | Class C Shares** | | | | 22.73% | | 5.00% | | 9.30% | | 09/26/12 | | 2.49% | | |
| | | S&P Global Broad Market Index | | 18.13% | | 5.95% | | 10.46% | | N/A | | N/A | | |
| * The gross expense ratio shown is from the Funds' prospectus dated September 28, 2016. | | |
| ** | As of February 24, 2017, the "Advisor Class" Shares were renamed to the "Class C" Shares. There were no other changes to this class of shares. Class C Shares held longer than 7 years will automatically convert to Institutional Class Shares. Institutional Class Shares are not subject to the distribution and service plan (Rule 12b-1) fees of 1.00%. |
|
| Performance quoted above represents past performance, which is no guarantee of future results. Investment return and principal value will fluctuate so that shares, when redeemed, may be worth more or less than their original cost. Current performance may be lower or higher than the performance data quoted. An investor may obtain performance data, current to the most recent month-end, by visiting ncfunds.com. |
| | | | | | | | | | | | | | | | | | | | |
| The graph and table do not reflect the deduction of taxes that a shareholder would pay on Fund distributions or the redemption of Fund shares. Average annual total returns are historical in nature and measure net investment income and capital gain or loss from portfolio investments assuming reinvestment of distributions. |
| | | | | | | | | | | | | | | | | | | | |
| | | | | | | | | | | | | | | | | | | | |
| Cavalier Global Opportunities Fund | | | | | | |
| | | | | | | | | | |
| Schedule of Investments | | | | | | |
| | | | | | | | | | |
| As of May 31, 2017 | | | | | | |
| | | | | | | | Shares | | Value (Note 1) |
| | | | | | | | | | |
| EXCHANGE-TRADED PRODUCTS - 57.01% | | | | | |
| | * | First Trust Dow Jones Internet Index Fund | | | 14,177 | $ | 1,342,420 |
| | | iShares India 50 ETF | | | | 38,065 | | 1,298,016 |
| | | iShares MSCI Taiwan Capped ETF | | | 38,262 | | 1,315,448 |
| | | iShares PHLX Semiconductor ETF | | | 9,386 | | 1,389,034 |
| | | iShares Russell 1000 Growth ETF | | | 11,003 | | 1,313,098 |
| | | iShares U.S. Consumer Services ETF | | | 7,760 | | 1,300,033 |
| | | iShares U.S. Medical Devices ETF | | | 8,279 | | 1,331,263 |
| | | iShares US Aerospace & Defense ETF | | | 8,344 | | 1,316,767 |
| | | SPDR Bloomberg Barclays Convertible Securities ETF | | 26,012 | | 1,277,970 |
| | | SPDR S&P Biotech ETF | | | | 18,303 | | 1,239,296 |
| | | | | | | | | | |
| | | Total Exchange-Traded Products (Cost $12,234,973) | | | | 13,123,345 |
| | | | | | | | | | |
| SHORT-TERM INVESTMENT - 42.78% | | | | | | |
| | § | Fidelity Investments Money Market Government Portfolio - | | | |
| | | Institutional Class, 0.69% | | | | 9,848,669 | | 9,848,669 |
| | | | | | | | | | |
| | | Total Short-Term Investment (Cost $9,848,669) | | | | | 9,848,669 |
| | | | | | | | | | |
| Total Value of Investments (Cost $22,083,642) - 99.79% | | | | $ | 22,972,014 |
| | | | | | | | | | |
| Other Assets Less Liabilities - 0.21% | | | | | | 47,917 |
| | | | | | | | | | |
| | Net Assets - 100.00% | | | | | $ | 23,019,931 |
| | | | | | | | | | |
| § | Represents 7 day effective yield | | | | | | |
| * | Non income-producing investment | | | | | | |
| | | | | | | | | | |
| | | | | | | | | | |
| | | | Summary of Investments | | | | | |
| | | | | | | | | | |
| | | | | | % of Net Assets | | Value | | |
| | | | Exchange-Traded Products | 57.01% | $ | 13,123,345 | | |
| | | | Short-Term Investment | 42.78% | | 9,848,669 | | |
| | | | Other Assets Less Liabilities | 0.21% | | 47,917 | | |
| | | | Total Net Assets | | 100.00% | $ | 23,019,931 | | |
| | | | | | | | | | |
| | | | | | | | | | |
| | | | | | | | | | |
| | | | | | | | | | |
| See Notes to Financial Statements | | | | | | |
| Cavalier Global Opportunities Fund | |
| | | | | | | |
| Statement of Assets and Liabilities | |
| | | | | | | |
| As of May 31, 2017 | | |
| | | | | | | |
| Assets: | | | | | |
| | Investments, at value (cost $22,083,642) | $ | 22,972,014 |
| | Receivables: | | |
| | | Fund shares sold | | 22 |
| | | Dividends and interest | 403 |
| | | Due from Advisor | | 48,091 |
| | Prepaid expenses: | | |
| | | Registration and filing expenses | 16,890 |
| | | Fund accounting fees | 2,785 |
| | | | | | | |
| | Total assets | | 23,040,205 |
| | | | | | | |
| Liabilities: | | | | |
| | Payables: | | |
| | | Fund shares repurchased | 72 |
| | Accrued expenses: | | |
| | | Professional fees | | 15,000 |
| | | Trustee fees and meeting expenses | 1,899 |
| | | Shareholder fulfillment fees | 1,751 |
| | | Distribution and service fees - Class C Shares | 605 |
| | | Custody and banking fees | 400 |
| | | Insurance fees | | 305 |
| | | Administration fees | 163 |
| | | Security pricing fees | 79 |
| | | | | | | |
| | Total liabilities | | 20,274 |
| | | | | | | |
| Net Assets | | | $ | 23,019,931 |
| | | | | | | |
| Net Assets Consist of: | | |
| | Paid in capital | $ | 23,972,740 |
| | Accumulated net investment income | 35,430 |
| | Accumulated net realized loss on investments | (1,876,611) |
| | Net unrealized appreciation on investments | 888,372 |
| | | | | | | |
| | Total Net Assets | $ | 23,019,931 |
| | | | | | | |
| Institutional Class Shares of beneficial interest outstanding, no par value (unlimited authorized shares) |
| | Net Assets | $ | 22,149,345 |
| | Net Asset Value, Offering Price and Redemption Price Per Share | $ | 14.56 |
| | | | | | | |
| Class C Shares of beneficial interest outstanding, no par value (unlimited authorized shares) |
| | Net Assets | $ | 870,586 |
| | Net Asset Value, Offering Price and Redemption Price Per Share (a) | $ | 14.22 |
| | | | | | | |
| (a) | Contingent deferred sales charge for Class C Shares is imposed on shares redeemed within one year of the purchase date (note 1). |
| | | |
| | | | | | | |
| | | | | | | |
| See Notes to Financial Statements | |
| Cavalier Global Opportunities Fund | | |
| | | | | | | | |
| Statement of Operations | | |
| | | | | | | | |
| For the year ended May 31, 2017 | | |
| | | | | | | | |
| Investment Income: | | |
| | Dividends | | | $ | 235,001 |
| | | | | | | | |
| | Total Investment Income | | 235,001 |
| | | | | | | | |
| Expenses: | | | | | |
| | Advisory fees (note 2) | | 96,603 |
| | Professional fees | | 40,537 |
| | Fund accounting fees (note 2) | | 39,531 |
| | Distribution and service fees - Class C Shares (note 3) | | 36,364 |
| | Registration and filing expenses | | 35,226 |
| | Transfer agent fees (note 2) | | 31,973 |
| | Administration fees (note 2) | | 24,027 |
| | Shareholder fulfillment fees | | 22,850 |
| | Trustee fees and meeting expenses | | 10,367 |
| | Compliance fees (note 2) | | 8,707 |
| | Custody and banking fees (note 2) | | 5,752 |
| | Security pricing fees | | 2,010 |
| | Insurance fees | | | 2,000 |
| | Other operating expenses | | 1,906 |
| | | | | | | | |
| | Total Expenses | | | 357,853 |
| | | | | | | | |
| | Fees waived and reimbursed by the Advisor (note 2) | | (158,282) |
| | | | | | | | |
| | Net Expenses | | | 199,571 |
| | | | | | | | |
| Net Investment Income | | 35,430 |
| | | | | | | | |
| Realized and Unrealized Gain on Investments: | | |
| | | | | | | | |
| | Net realized gain from investment transactions | | 2,409,934 |
| | Net change in unrealized appreciation on investments | | 312,798 |
| | | | | | | | |
| Net Realized and Unrealized Gain on Investments | | 2,722,732 |
| | | | | | | | |
| Net Increase in Net Assets Resulting from Operations | $ | 2,758,162 |
| | | | | | | | |
| | | | | | | | |
| See Notes to Financial Statements | | |
| Cavalier Global Opportunities Fund | | | | | | | |
| | | | | | | | | | | | |
| Statements of Changes in Net Assets | | | | | | | |
| | | | | | | | | | | | |
| For the years ended May 31, | | | | | 2017 | | 2016 |
| | | | | | | | | | | | |
| Operations: | | | | | | | | |
| | Net investment income | | | | $ | 35,430 | $ | 74,765 |
| | Net realized gain (loss) from investment transactions | | | | 2,409,934 | | (4,267,333) |
| | Net change in unrealized appreciation (depreciation) on investments | | 312,798 | | (721,836) |
| | | | | | | | | | | | |
| Net Increase (Decrease) in Net Assets Resulting from Operations | | 2,758,162 | | (4,914,404) |
| | | | | | | | | | | | |
| Distributions to Shareholders: | | | | | | | |
| | Net investment income | | | | | | | |
| | | Institutional Class Shares | | | | | (19,937) | | - |
| | | Class C Shares | | | | | (5,533) | | - |
| | Net realized gains | | | | | | | |
| | | Institutional Class Shares | | | | | - | | (468,463) |
| | | Class C Shares | | | | | - | | (83,379) |
| | | | | | | | | | | | |
| Decrease in Net Assets Resulting from Distributions | | | | (25,470) | | (551,842) |
| | | | | | | | | | | | |
| Beneficial Interest Transactions: | | | | | | | |
| | Shares sold | | | | | | 16,890,444 | | 19,946,677 |
| | Reinvested dividends and distributions | | | | | 25,283 | | 312,132 |
| | Shares repurchased | | | | | (10,901,469) | | (48,797,766) |
| | | | | | | | | | | | |
| Increase (Decrease) from Beneficial Interest Transactions | | | | 6,014,258 | | (28,538,957) |
| | | | | | | | | | | | |
| Net Increase (Decrease) in Net Assets | | | | | 8,746,950 | | (34,005,203) |
| | | | | | | | | | | | |
| Net Assets: | | | | | | | | |
| | Beginning of Year | | | | | 14,272,981 | | 48,278,184 |
| | End of Year | | | | | $ | 23,019,931 | $ | 14,272,981 |
| | | | | | | | | | | | |
| Accumulated Net Investment Income | | | | $ | 35,430 | $ | 25,470 |
| | | | | | Year Ended | | Year Ended |
| Share Information: | May 31, 2017 | | May 31, 2016 |
| | Institutional Class Shares | Shares | | Amount | | Shares | | Amount |
| | | Shares sold | 1,198,483 | $ | 16,661,021 | | 1,500,145 | $ | 18,703,510 |
| | | Reinvested dividends and distributions | 1,506 | | 19,750 | | 19,530 | | 232,212 |
| | | Shares repurchased | (365,570) | | (4,733,933) | | (3,959,676) | | (47,206,701) |
| | Net Increase (Decrease) in Shares of | | | | | | | |
| | | Beneficial Interest | 834,419 | $ | 11,946,838 | | (2,440,001) | $ | (28,270,979) |
| | | | | | | | | | | | |
| | Class C Shares | Shares | | Amount | | Shares | | Amount |
| | | Shares sold | 17,754 | $ | 229,423 | | 103,299 | $ | 1,243,167 |
| | | Reinvested dividends and distributions | 431 | | 5,533 | | 6,802 | | 79,920 |
| | | Shares repurchased | (487,464) | | (6,167,536) | | (133,864) | | (1,591,065) |
| | Net Decrease in Shares of | | | | | | | |
| | | Beneficial Interest | (469,279) | $ | (5,932,580) | | (23,763) | $ | (267,978) |
| | | | | | | | | | | | |
| | | | | | | | | | | | |
| See Notes to Financial Statements | | | | | | | |
| Cavalier Global Opportunities Fund | | | | | | | | |
| | | | | | | | | | | | | | | | |
| Financial Highlights | | | | | | | | | | | | | | |
| | | | | | | | | | | | | | | | |
| For a share outstanding during each of the | Institutional Class Shares |
| fiscal years or period ended May 31, | | 2017 | | 2016 | | 2015 | | 2014 | | 2013 | (f) |
| | | | | | | | | | | | | | | | |
| Net Asset Value, Beginning of Period | $ | 11.81 | $ | 13.13 | $ | 12.93 | $ | 11.19 | $ | 10.00 | |
| | | | | | | | | | | | | | | | |
| Income from Investment Operations | | | | | | | | | | | | |
| | Net investment income | | | | | 0.05 | (g) | 0.05 | (g) | 0.05 | (g) | 0.09 | (g) | 0.02 | |
| | Net realized and unrealized gain (loss) | | | | | | | | | | |
| | on investments | | | | | 2.73 | | (1.22) | | 0.65 | | 1.74 | | 1.22 | |
| | | | | | | | | | | | | | | | |
| Total from Investment Operations | | | 2.78 | | (1.17) | | 0.70 | | 1.83 | | 1.24 | |
| | | | | | | | | | | | | | | | |
| Less Distributions From: | | | | | | | | | | | | | | |
| | Net investment income | | | | | (0.03) | | - | | (0.06) | | (0.09) | | (0.05) | |
| | Net realized gains | | | | | - | | (0.15) | | (0.44) | | - | | - | |
| | | | | | | | | | | | | | | | |
| Total Distributions | | | | | (0.03) | | (0.15) | | (0.50) | | (0.09) | | (0.05) | |
| | | | | | | | | | | | | | | | |
| Net Asset Value, End of Period | | | $ | 14.56 | $ | 11.81 | $ | 13.13 | $ | 12.93 | $ | 11.19 | |
| | | | | | | | | | | | | | | | |
| Total Return (c) | | | | | 23.53% | | (8.92)% | | 5.63% | | 16.36% | | 12.41% | (b) |
| | | | | | | | | | | | | | | | |
| Net Assets, End of Period (in thousands) | $ | 22,149 | $ | 8,113 | $ | 41,049 | $ | 9,080 | $ | 4,536 | |
| | | | | | | | | | | | | | | | |
| | | | | | | | | | | | | | | | |
| Ratios of: | | | | | | | | | | | | | | |
| Gross Expenses to Average Net Assets (d) | 2.56% | | 1.22% | | 1.25% | | 0.70% | | 0.70% | (a) |
| Net Expenses to Average Net Assets (d) | 1.24% | | 0.91% | (i) | 0.93% | (h) | 0.70% | | 0.70% | (a) |
| Net Investment Income to Average | | | | | | | | | | | | |
| | Net Assets (e) | | | | | 0.39% | | 0.41% | (i) | 0.41% | (h) | 0.72% | | 0.57% | (a) |
| | | | | | | | | | | | | | | | |
| Portfolio turnover rate | | | | | 439.72% | | 284.69% | | 50.59% | | 3.26% | | 0.00% | (b) |
| | | | | | | | | | | | | | | | |
| (a) | Annualized. | | | | | | | | | | | | | | |
| (b) | Not annualized. | | | | | | | | | | | | | | |
| (c) | Includes adjustments in accordance with accounting principles generally accepted in the United States of America and, consequently, the net asset value for financial reporting purposes and the returns based upon those net asset values may differ from the net asset values and returns for shareholder transactions. |
| (d) | Does not include expenses of the investment companies in which the Fund invests. | | | | |
| (e) | Recognition of net investment income by the Fund is affected by the timing of the declaration of dividends by the underlying investment companies in which the Fund invests. |
| (f) | For a share outstanding during the period from September 20, 2012 (Date of Initial Public Investment) to May 31, 2013. |
| (g) | Calculated using the average shares method. | | | | | | | | | |
| (h) | Includes reimbursement of acquired fund fees. | | | | | | | | | |
| (i) | Includes reimbursement of acquired fund fees and expenses for the period from June 1, 2015 through December 17, 2015. Expense limitation agreement was updated to exclude acquired fund fees and expenses from the waiver effective December 18, 2015 (see note 2). |
| | |
| | | | | | | | | | | | | | | | |
| See Notes to Financial Statements | | | | | | | | | | | | (Continued) |
| Cavalier Global Opportunities Fund | | | | | | | | | | | | |
| | | | | | | | | | | | | | | | |
| Financial Highlights | | | | | | | | | | | | | | |
| | | | | | | | | | | | | | | | |
| For a share outstanding during each of the | Class C Shares (j) |
| fiscal years or period ended May 31, | | 2017 | | 2016 | | 2015 | | 2014 | | 2013 | (f) |
| | | | | | | | | | | | | | | | |
| Net Asset Value, Beginning of Period | $ | 11.61 | $ | 13.04 | $ | 12.97 | $ | 11.28 | $ | 10.00 | |
| | | | | | | | | | | | | | | | |
| Income from Investment Operations | | | | | | | | | | | | |
| | Net investment loss | | | | | (0.01) | (g) | (0.07) | (g) | (0.13) | (g) | (0.03) | (g) | (0.01) | |
| | Net realized and unrealized gain (loss) | | | | | | | | | |
| | on investments | | | | | 2.65 | | (1.21) | | 0.70 | | 1.80 | | 1.32 | |
| | | | | | | | | | | | | | | | |
| Total from Investment Operations | | | 2.64 | | (1.28) | | 0.57 | | 1.77 | | 1.31 | |
| | | | | | | | | | | | | | | | |
| Less Distributions From: | | | | | | | | | | | | | | |
| | Net investment income | | | | | (0.03) | | - | | (0.06) | | (0.08) | | (0.03) | |
| | Net realized gains | | | | | - | | (0.15) | | (0.44) | | - | | - | |
| | | | | | | | | | | | | | | | |
| Total Distributions | | | | | (0.03) | | (0.15) | | (0.50) | | (0.08) | | (0.03) | |
| | | | | | | | | | | | | | | | |
| Net Asset Value, End of Period | | | $ | 14.22 | $ | 11.61 | $ | 13.04 | $ | 12.97 | $ | 11.28 | |
| | | | | | | | | | | | | | | | |
| Total Return (c) | | | | | 22.73% | | (9.84)% | | 4.64% | | 15.72% | | 13.12% | (b) |
| | | | | | | | | | | | | | | | |
| Net Assets, End of Period (in thousands) | $ | 871 | $ | 6,160 | $ | 7,229 | $ | 178 | $ | 48 | |
| | | | | | | | | | | | | | | | |
| | | | | | | | | | | | | | | | |
| Ratios of: | | | | | | | | | | | | | | |
| Gross Expenses to Average Net Assets (d) | 2.91% | | 2.22% | | 2.25% | | 1.70% | | 1.70% | (a) |
| Net Expenses to Average Net Assets (d) | 2.14% | | 1.84% | (i) | 1.93% | (h) | 1.70% | | 1.70% | (a) |
| Net Investment Income (Loss) to Average | | | | | | | | | | |
| | Net Assets (e) | | | | | (0.09)% | | (0.56)% | (i) | (1.00)% | (h) | (0.28)% | | (0.87)% | (a) |
| | | | | | | | | | | | | | | | |
| Portfolio turnover rate | | | | | 439.72% | | 284.69% | | 50.59% | | 3.26% | | 0.00% | (b) |
| | | | | | | | | | | | | | | | |
| (a) | Annualized. | | | | | | | | | | | | | | |
| (b) | Not annualized. | | | | | | | | | | | | | | |
| (c) | Includes adjustments in accordance with accounting principles generally accepted in the United States of America and, consequently, the net asset value for financial reporting purposes and the returns based upon those net asset values may differ from the net asset values and returns for shareholder transactions. |
| (d) | Does not include expenses of the investment companies in which the Fund invests. | | | | |
| (e) | Recognition of net investment income by the Fund is affected by the timing of the declaration of dividends by the underlying investment companies in which the Fund invests. |
| (f) | For a share outstanding during the period from September 26, 2012 (Date of Initial Public Investment) to May 31, 2013. |
| (g) | Calculated using the average shares method. | | | | | | | | | |
| (h) | Includes reimbursement of acquired fund fees. | | | | | | | | | |
| (i) | Includes reimbursement of acquired fund fees and expenses for the period from June 1, 2015 through December 17, 2015. Expense limitation agreement was updated to exclude acquired fund fees and expenses from the waiver effective December 18, 2015 (see note 2). |
| (j) | As of February 24, 2017, the "Advisor Class" Shares were renamed to the "Class C" Shares. There were no other changes to this class of shares. |
| | | | | | | | | | | | | | |
| See Notes to Financial Statements | | | | | | | | | | | | | |
| Cavalier Hedged High Income Fund - Institutional Class Shares | | | | | | |
| | | | | | | | | | | | | | | | | | |
| Performance Update (Unaudited) | | | | | | | | | | | |
| | | | | | | | | | | | | | | | | | |
| | | | | | | | | | | | | | | | | | |
| For the period from September 20, 2012 (Date of Initial Public Investment) through May 31, 2017 |
| | | | | | | | | | | | | | | | | | |
| Comparison of the Change in Value of a $10,000 Investment | | | | | | |
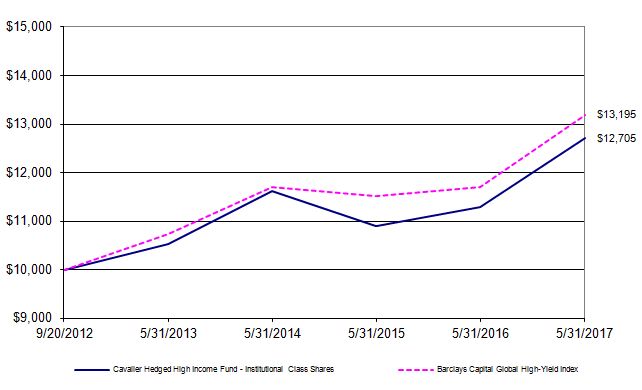
| The graph above assumes an initial $10,000 investment and represents the reinvestment of dividends and capital gains. This graph depicts the performance of Cavalier Hedged High Income Fund - Institutional Class Shares versus the Barclays Capital Global High-Yield Index. It is important to note that the Fund is a professionally managed mutual fund while the index is not available for investment and is unmanaged. The comparison is shown for illustrative purposes only. |
| | | | | | | | | | | | | | | | | | | | |
| | Average Annual Total Returns | |
| | | | | | | | | | | | | | | | | | Gross | | |
| | | As of | | | | | One | | Three | | Since | | Inception | | Expense | | |
| | | May 31, 2017 | | | | Year | | Year | | Inception | | Date | | Ratio* | | |
| | | Institutional Class Shares | | | 12.45% | | 2.74% | | 5.23% | | 09/20/12 | | 2.49% | | |
| | | Barclays Capital Global High-Yield Index | | 12.74% | | 4.05% | | 6.08% | | N/A | | N/A | | |
| | | | | | | | | | | | | | | | | | | | |
| * The gross expense ratio shown is from the Funds' prospectus dated September 28, 2016. | | | | |
| | | | | | | | | | | | | | | | | | | | |
| Performance quoted above represents past performance, which is no guarantee of future results. Investment return and principal value will fluctuate so that shares, when redeemed, may be worth more or less than their original cost. Current performance may be lower or higher than the performance data quoted. An investor may obtain performance data, current to the most recent month-end, by visiting ncfunds.com. |
| | | | | | | | | | | | | | | | | | | | |
| The graph and table do not reflect the deduction of taxes that a shareholder would pay on Fund distributions or the redemption of Fund shares. Average annual total returns are historical in nature and measure net investment income and capital gain or loss from portfolio investments assuming reinvestment of distributions. |
| | | | | | | | | | | | | | | | | | | | |
| | | | | | | | | | | | | | | | | | | | |
| Cavalier Hedged High Income Fund - Class C Shares | | | | | | | | | |
| | | | | | | | | | | | | | | | | | | |
| Performance Update (Unaudited) | | | | | | | | | | | | |
| | | | | | | | | | | | | | | | | | | |
| | | | | | | | | | | | | | | | | | | |
| For the period from September 26, 2012 (Date of Initial Public Investment) through May 31, 2017 |
| | | | | | | | | | | | | | | | | | | |
| Comparison of the Change in Value of a $10,000 Investment | | | | | | | |
| | | | | | | | | | | | | | | | | | | |
| | | | | | | | | | | | | | | | | | | |
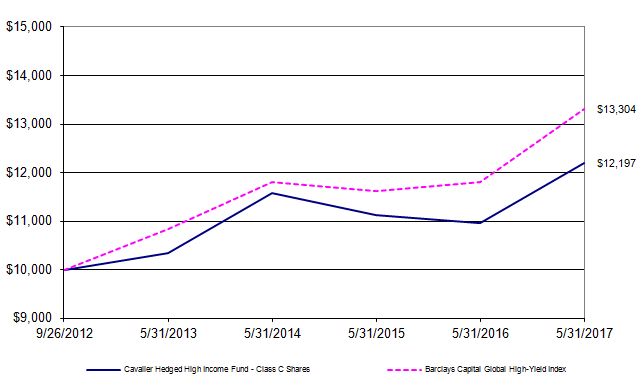
| The graph above assumes an initial $10,000 investment and represents the reinvestment of dividends and capital gains. This graph depicts the performance of Cavalier Hedged High Income Fund - Class C Shares versus the Barclays Capital Global High-Yield Index. It is important to note that the Fund is a professionally managed mutual fund while the index is not available for investment and is unmanaged. The comparison is shown for illustrative purposes only. |
| | | | | | | | | | | | | | | | | | | | |
| | Average Annual Total Returns | |
| | | | | | | | | | | | | | | | | | Gross | | |
| | | As of | | | | | One | | Three | | Since | | Inception | | Expense | | |
| | | May 31, 2017 | | | | Year | | Year | | Inception | | Date | | Ratio* | | |
| | | Class C Shares** | | | | 11.38% | | 1.76% | | 4.34% | | 09/26/12 | | 3.49% | | |
| | | Barclays Capital Global High-Yield Index | | 12.74% | | 4.05% | | 6.29% | | N/A | | N/A | | |
| * The gross expense ratio shown is from the Funds' prospectus dated September 28, 2016. | | |
| ** | As of February 24, 2017, the "Advisor Class" Shares were renamed to the "Class C" Shares. There were no other changes to this class of shares. Class C Shares held longer than 7 years will automatically convert to Institutional Class Shares. Institutional Class Shares are not subject to the distribution and service plan (Rule 12b-1) fees of 1.00%. |
|
| Performance quoted above represents past performance, which is no guarantee of future results. Investment return and principal value will fluctuate so that shares, when redeemed, may be worth more or less than their original cost. Current performance may be lower or higher than the performance data quoted. An investor may obtain performance data, current to the most recent month-end, by visiting ncfunds.com. |
| | | | | | | | | | | | | | | | | | | | |
| The graph and table do not reflect the deduction of taxes that a shareholder would pay on Fund distributions or the redemption of Fund shares. Average annual total returns are historical in nature and measure net investment income and capital gain or loss from portfolio investments assuming reinvestment of distributions. |
| | | | | | | | | | | | | | | | | | | | |
| | | | | | | | | | | | | | | | | | | | |
| Cavalier Hedged High Income Fund | | | | | | |
| | | | | | | | | | |
| Schedule of Investments | | | | | | |
| | | | | | | | | | |
| As of May 31, 2017 | | | | | | | |
| | | | | | | | Shares | | Value (Note 1) |
| | | | | | | | | | |
| EXCHANGE-TRADED PRODUCTS - 19.34% | | | | | |
| | | InfraCap MLP ETF | | | | 44,100 | $ | 444,528 |
| | | iShares 1-3 Year Treasury Bond ETF | | | 1,595 | | 134,969 |
| | * | VelocityShares Daily Inverse VIX Short Term ETN | | | 8,065 | | 639,635 |
| | | | | | | | | | |
| | | Total Exchange-Traded Products (Cost $1,229,969) | | | | | 1,219,132 |
| | | | | | | | | | |
| MUTUAL FUND - 78.30% | | | | | | |
| | | Vanguard High-Yield Corporate Fund | | | 828,229 | | 4,936,243 |
| | | | | | | | | | |
| | | Total Mutual Fund (Cost $4,853,930) | | | | | 4,936,243 |
| | | | | | | | | | |
| SHORT-TERM INVESTMENT - 1.95% | | | | | | |
| | § | Fidelity Investments Money Market Government Portfolio - | | | | |
| | | Institutional Class, 0.69% | | | | 122,644 | | 122,644 |
| | | | | | | | | | |
| | | Total Short-Term Investment (Cost $122,644) | | | | | 122,644 |
| | | | | | | | | | |
| Total Value of Investments (Cost $6,206,543) - 99.59% | | | | $ | 6,278,019 |
| | | | | | | | | | |
| Other Assets Less Liabilities - 0.41% | | | | | | 25,876 |
| | | | | | | | | | |
| | Net Assets - 100.00% | | | | | $ | 6,303,895 |
| | | | | | | | | | |
| § | Represents 7 day effective yield | | | | | | |
| * | Non income-producing investment | | | | | | |
| | | | | | | | | | |
| | | | | | | | | | |
| | | | Summary of Investments | | | | | |
| | | | | | | | | | |
| | | | | | % of Net Assets | | Value | | |
| | | | Exchange-Traded Products | 19.34% | $ | 1,219,132 | | |
| | | | Mutual Fund | | 78.30% | | 4,936,243 | | |
| | | | Short-Term Investment | 1.95% | | 122,644 | | |
| | | | Other Assets Less Liabilities | 0.41% | | 25,876 | | |
| | | | Total Net Assets | | 100.00% | $ | 6,303,895 | | |
| | | | | | | | | | |
| | | | | | | | | | |
| | | | | | | | | | |
| See Notes to Financial Statements | | | | | | |
| Cavalier Hedged High Income Fund | | |
| | | | | | | | |
| Statement of Assets and Liabilities | | |
| | | | | | | | |
| As of May 31, 2017 | | | |
| | | | | | | | |
| Assets: | | | | | |
| | Investments, at value (cost $6,206,543) | $ | 6,278,019 |
| | Receivables: | | | |
| | | Due from Advisor | | | 28,810 |
| | | Dividends | | | 257 |
| | Prepaid expenses: | | | |
| | | Registration and filing expenses | | 15,153 |
| | | Fund accounting fees | | | 2,783 |
| | | | | | | | |
| | Total assets | | | 6,325,022 |
| | | | | | | | |
| Liabilities: | | | | | |
| | Accrued expenses: | | | |
| | | Professional fees | | | 15,000 |
| | | Shareholder fulfillment fees | | 1,751 |
| | | Trustee fees and meeting expenses | | 1,337 |
| | | Custody and banking fees | | 1,188 |
| | | Distribution and service fees - Class C Shares | | 1,145 |
| | | Insurance fees | | | 470 |
| | | Security pricing fees | | | 230 |
| | | Administration fees | | | 6 |
| | | | | | | | |
| | Total liabilities | | | 21,127 |
| | | | | | | | |
| Net Assets | | | | $ | 6,303,895 |
| | | | | | | | |
| Net Assets Consist of: | | | |
| | Paid in capital | | $ | 8,077,084 |
| | Accumulated net investment income | | 76,916 |
| | Accumulated net realized loss on investments | | (1,921,581) |
| | Net unrealized appreciation on investments | | 71,476 |
| | | | | | | | |
| | Total Net Assets | | $ | 6,303,895 |
| | | | | | | | |
| Institutional Class Shares of beneficial interest outstanding, no par value (unlimited authorized shares) | 469,608 |
| | Net Assets | | | $ | 4,788,865 |
| | Net Asset Value, Offering Price and Redemption Price Per Share | $ | 10.20 |
| | | | | | | | |
| Class C Shares of beneficial interest outstanding, no par value (unlimited authorized shares) | | 150,168 |
| | Net Assets | | | $ | 1,515,030 |
| | Net Asset Value, Offering Price and Redemption Price Per Share (a) | $ | 10.09 |
| | | | | | | | |
| (a) | Contingent deferred sales charge for Class C Shares is imposed on proceeds redeemed within one year of the purchase date (note 1). |
| | | | | | | | |
| | | | | | | | |
| See Notes to Financial Statements | | |
| Cavalier Hedged High Income Fund | | |
| | | | | | | | |
| Statement of Operations | | |
| | | | | | | | |
| For the year ended May 31, 2017 | | |
| | | | | | | | |
| Investment Income: | | |
| | Dividends | | | $ | 269,507 |
| | | | | | | | |
| | Total Investment Income | | 269,507 |
| | | | | | | | |
| Expenses: | | | | | |
| | Advisory fees (note 2) | | 42,923 |
| | Professional fees | | 40,537 |
| | Fund accounting fees (note 2) | | 38,864 |
| | Registration and filing expenses | | 35,461 |
| | Transfer agent fees (note 2) | | 31,973 |
| | Administration fees (note 2) | | 24,027 |
| | Shareholder fulfillment fees | | 19,645 |
| | Trustee fees and meeting expenses | | 10,367 |
| | Distribution and service fees - Class C Shares (note 3) | | 9,564 |
| | Compliance fees | | 9,328 |
| | Custody and banking fees (note 2) | | 6,367 |
| | Other operating expenses | | 2,798 |
| | Insurance expenses | | 1,621 |
| | Security pricing fees | | 1,542 |
| | | | | | | | |
| | Total Expenses | | | 275,017 |
| | | | | | | | |
| | Fees waived and reimbursed by Advisor (note 2) | | (175,750) |
| | | | | | | | |
| | Net Expenses | | | 99,267 |
| | | | | | | | |
| Net Investment Income | | 170,240 |
| | | | | | | | |
| Realized and Unrealized Gain on Investments: | | |
| | | | | | | | |
| | Net realized gain from investment transactions | | 495,629 |
| | Net change in unrealized appreciation on investments | | 79,485 |
| | | | | | | | |
| Realized and Unrealized Gain on Investments | | 575,114 |
| | | | | | | | |
| Net Increase in Net Assets Resulting from Operations | $ | 745,354 |
| | | | | | | | |
| | | | | | | | |
| | | | | | | | |
| See Notes to Financial Statements | | |
| Cavalier Hedged High Income Fund | | | | | | | |
| | | | | | | | | | | | |
| Statements of Changes in Net Assets | | | | | | | |
| | | | | | | | | | | | |
| For the years ended May 31, | | | | | 2017 | | 2016 |
| | | | | | | | | | | | |
| Operations: | | | | | | | | | |
| | Net investment income | | | | $ | 170,240 | $ | 400,459 |
| | Net realized gain (loss) from investment transactions | | | | 495,629 | | (1,272,830) |
| | Net change in unrealized appreciation (depreciation) on investments | | 79,485 | | 334,139 |
| | | | | | | | | | | | |
| Net Increase (Decrease) in Net Assets Resulting from Operations | | | 745,354 | | (538,232) |
| | | | | | | | | | | | |
| Distributions to Shareholders From: | | | | | | | |
| | Net investment income | | | | | | | |
| | | Institutional Class Shares | | | | | (96,075) | | (363,742) |
| | | Class C Shares | | | | | (19,235) | | (9,297) |
| | Net realized gains | | | | | | | |
| | | Institutional Class Shares | | | | | - | | (146,803) |
| | | Class C Shares | | | | | - | | (2,865) |
| | | | | | | | | | | | |
| Decrease in Net Assets Resulting from Distributions | | | | (115,310) | | (522,707) |
| | | | | | | | | | | | |
| Beneficial Interest Transactions: | | | | | | | |
| | Shares sold | | | | | | 1,983,128 | | 22,246,469 |
| | Reinvested dividends and distributions | | | | | 113,557 | | 352,920 |
| | Shares repurchased | | | | | (4,664,341) | | (46,086,811) |
| | | | | | | | | | | | |
| Decrease from Beneficial Interest Transactions | | | | | (2,567,656) | | (23,487,422) |
| | | | | | | | | | | | |
| Net Decrease in Net Assets | | | | | (1,937,612) | | (24,548,361) |
| | | | | | | | | | | | |
| Net Assets: | | | | | | | | | |
| | Beginning of Year | | | | | 8,241,507 | | 32,789,868 |
| | End of Year | | | | | $ | 6,303,895 | $ | 8,241,507 |
| | | | | | | | | | | | |
| Undistributed Net Investment Income | | | | $ | 76,916 | $ | 21,986 |
| | | | | | Year Ended | | Year Ended |
| Share Information: | May 31, 2017 | | May 31, 2016 |
| | Institutional Class Shares | Shares | | Amount | | Shares | Amount |
| | | Shares sold | 137,718 | $ | 1,347,627 | | 2,294,138 | $ | 21,514,856 |
| | | Reinvested dividends and distributions | 9,415 | | 94,322 | | 36,506 | | 341,317 |
| | | Shares repurchased | (476,718) | | (4,598,222) | | (4,875,278) | | (45,642,288) |
| | Net Decrease in Shares of | | | | | | | |
| | | Beneficial Interest | (329,585) | $ | (3,156,273) | | (2,544,634) | $ | (23,786,115) |
| | | | | | | | | | | | |
| | Class C Shares | Shares | | Amount | | Shares | | Amount |
| | | Shares sold | 62,807 | $ | 635,501 | | 78,858 | $ | 731,613 |
| | | Reinvested dividends and distributions | 1,924 | | 19,235 | | 1,238 | | 11,603 |
| | | Shares repurchased | (6,685) | | (66,119) | | (47,518) | | (444,523) |
| | Net Increase in Shares of | | | | | | | |
| | | Beneficial Interest | 58,046 | $ | 588,617 | | 32,578 | $ | 298,693 |
| | | | | | | | | | | | |
| | | | | | | | | | | | |
| | | | | | | | | | | | |
| See Notes to Financial Statements | | | | | | | |
| Cavalier Hedged High Income Fund | | | | | | | | | | | |
| | | | | | | | | | | | | | | | |
| Financial Highlights | | | | | | | | | | | |
| | | | | | | | | | | | | | | | |
| For a share outstanding during each of the | | Institutional Class Shares |
| fiscal years or period ended May 31, | | 2017 | | 2016 | | 2015 | | 2014 | | 2013 | (f) |
| | | | | | | | | | | | | | | | |
| Net Asset Value, Beginning of Period | $ | 9.25 | $ | 9.63 | $ | 10.74 | $ | 10.23 | $ | 10.00 | |
| | | | | | | | | | | | | | | | |
| Income from Investment Operations | | | | | | | | | | | |
| | Net investment income | | 0.27 | (g) | 0.27 | (g) | 0.38 | (g) | 0.52 | (g) | 0.33 | |
| | Net realized and unrealized gain (loss) | | | | | | | | | | | |
| | | on investments | | 0.88 | | (0.41) | | (0.93) | | 0.58 | | 0.20 | |
| | | | | | | | | | | | | | | | |
| Total from Investment Operations | | 1.15 | | (0.14) | | (0.55) | | 1.10 | | 0.53 | |
| | | | | | | | | | | | | | | | |
| Less Distributions: | | | | | | | | | | | |
| | From net investment income | | (0.20) | | (0.20) | | (0.34) | | (0.55) | | (0.30) | |
| | From net realized gains | | - | | (0.04) | | (0.22) | | (0.04) | | - | |
| | | | | | | | | | | | | | | | |
| Total Distributions | | (0.20) | | (0.24) | | (0.56) | | (0.59) | | (0.30) | |
| | | | | | | | | | | | | | | | |
| Net Asset Value, End of Period | $ | 10.20 | $ | 9.25 | $ | 9.63 | $ | 10.74 | $ | 10.23 | |
| | | | | | | | | | | | | | | | |
| Total Return (c) | | | 12.45% | | (1.40)% | | (2.19)% | | 11.18% | | 5.37% | (b) |
| | | | | | | | | | | | | | | | |
| Net Assets, End of Period (in thousands) | $ | 4,789 | $ | 7,392 | $ | 32,214 | $ | 16,552 | $ | 9,366 | |
| | | | | | | | | | | | | | | | |
| Ratios of: | | | | | | | | | | | | | |
| Gross Expenses to Average Net Assets (d) | | 4.06% | | 2.00% | | 1.23% | | 0.70% | | 0.70% | (a) |
| Net Expenses to Average Net Assets (d) | | 1.40% | | 1.01% | (i) | 0.90% | (h) | 0.70% | | 0.70% | (a) |
| Net Investment Income to Average Net Assets (e) | 2.77% | | 2.89% | (i) | 5.40% | (h) | 5.26% | | 6.59% | (a) |
| | | | | | | | | | | | | | | | |
| Portfolio turnover rate | | 184.78% | | 327.01% | | 64.51% | | 75.79% | | 78.00% | (b) |
| | | | | | | | | | | | | | | | |
| | | | | | | | | | | | | | | | |
| (a) | Annualized. | | | | | | | | | | | | |
| (b) | Not annualized. | | | | | | | | | | | |
| (c) | Includes adjustments in accordance with accounting principles generally accepted in the United States of America and, consequently, the net asset value for financial reporting purposes and the returns based upon those net asset values may differ from the net asset values and returns for shareholder transactions. |
| (d) | Does not include expenses of the investment companies in which the Fund invests. | | | | |
| (e) | Recognition of net investment income by the Fund is affected by the timing of the declaration of dividends by the underlying investment companies in which the Fund invests. |
| (f) | For a share outstanding during the period from September 20, 2012 (Date of Initial Public Investment) to May 31, 2013. |
| (g) | Calculated using the average shares method. | | | | | | | | | |
| (h) | Includes reimbursement of acquired fund fees. | | | | | | | | | |
| (i) | Includes reimbursement of acquired fund fees and expenses for the period from June 1, 2015 through December 17, 2015. Expense limitation agreement was updated to exclude acquired fund fees and expenses from the waiver effective December 18, 2015 (see note 2). |
| | |
| | | | | | | | | | |
| | | | | | | | | | | | | | | | |
| See Notes to Financial Statements | | | | | | | | | | (Continued) |
| Cavalier Hedged High Income Fund | | | | | | | | | | | |
| | | | | | | | | | | | | | | | |
| Financial Highlights | | | | | | | | | | | |
| | | | | | | | | | | | | | | | |
| For a share outstanding during each of the | Class C Shares (j) |
| fiscal years or period ended May 31, | | 2017 | | 2016 | | 2015 | | 2014 | | 2013 | (f) |
| | | | | | | | | | | | | | | | |
| Net Asset Value, Beginning of Period | $ | 9.22 | $ | 9.67 | $ | 10.76 | $ | 10.17 | $ | 10.00 | |
| | | | | | | | | | | | | | | | |
| Income from Investment Operations | | | | | | | | | | | |
| | Net investment income | | 0.19 | (g) | 0.01 | (g) | 0.49 | (g) | 0.47 | (g) | 0.24 | |
| | Net realized and unrealized gain (loss) | | | | | | | | | | | |
| | | on investments | | 0.86 | | (0.26) | | (0.82) | | 0.61 | | 0.19 | |
| | | | | | | | | | | | | | | | |
| Total from Investment Operations | | 1.05 | | (0.25) | | (0.33) | | 1.08 | | 0.43 | |
| | | | | | | | | | | | | | | | |
| Less Distributions: | | | | | | | | | | | |
| | From net investment income | | (0.18) | | (0.16) | | (0.42) | | (0.45) | | (0.26) | |
| | From net realized gains | | - | | (0.04) | | (0.34) | | (0.04) | | - | |
| | | | | | | | | | | | | | | | |
| Total Distributions | | (0.18) | | (0.20) | | (0.76) | | (0.49) | | (0.26) | |
| | | | | | | | | | | | | | | | |
| Net Asset Value, End of Period | $ | 10.09 | $ | 9.22 | $ | 9.67 | $ | 10.76 | $ | 10.17 | |
| | | | | | | | | | | | | | | | |
| Total Return (c) | | | 11.38% | | (2.53)% | | (3.01)% | | 11.00% | | 4.36% | (b) |
| | | | | | | | | | | | | | | | |
| Net Assets, End of Period (in thousands) | $ | 1,515 | $ | 850 | $ | 576 | $ | 644 | $ | 48 | |
| | | | | | | | | | | | | | | | |
| Ratios of: | | | | | | | | | | | | | |
| Gross Expenses to Average Net Assets (d) | | 5.48% | | 3.00% | | 2.23% | | 1.70% | | 1.76% | (a) |
| Net Expenses to Average Net Assets (d) | | 2.37% | | 2.21% | (i) | 1.90% | (h) | 1.70% | | 1.76% | (a) |
| Net Investment Income to Average Net Assets (e) | 1.93% | | 0.08% | (i) | 4.40% | (h) | 4.26% | | 5.71% | (a) |
| | | | | | | | | | | | | | | | |
| Portfolio turnover rate | | 184.78% | | 327.01% | | 64.51% | | 75.79% | | 78.00% | (b) |
| | | | | | | | | | | | | | | | |
| | | | | | | | | | | | | | | | |
| (a) | Annualized. | | | | | | | | | | | | |
| (b) | Not annualized. | | | | | | | | | | | |
| (c) | Includes adjustments in accordance with accounting principles generally accepted in the United States of America and, consequently, the net asset value for financial reporting purposes and the returns based upon those net asset values may differ from the net asset values and returns for shareholder transactions. |
| (d) | Does not include expenses of the investment companies in which the Fund invests. | | | | |
| (e) | Recognition of net investment income by the Fund is affected by the timing of the declaration of dividends by the underlying investment companies in which the Fund invests. |
| (f) | For a share outstanding during the period from September 26, 2012 (Date of Initial Public Investment) to May 31, 2013. |
| (g) | Calculated using the average shares method. | | | | | | | | | | |
| (h) | Includes reimbursement of acquired fund fees. | | | | | | | | | |
| (i) | Includes reimbursement of acquired fund fees and expenses for the period from June 1, 2015 through December 17, 2015. Expense limitation agreement was updated to exclude acquired fund fees and expenses from the waiver effective December 18, 2015 (see note 2). |
| (j) | As of February 24, 2017, the "Advisor Class" Shares were renamed to the "Class C" Shares. There were no other changes to this class of shares. |
| | | | | | | | | | | | | |
| | | | | | | | | | | | | | | | |
| See Notes to Financial Statements | | | | | | | | | | | |
| Cavalier Multi Strategist Fund - Institutional Class Shares | | | | | | |
| | | | | | | | | | | | | | | | | | |
| Performance Update (Unaudited) | | | | | | | | | | | |
| | | | | | | | | | | | | | | | | | |
| For the period from September 20, 2012 (Date of Initial Public Investment) through May 31, 2017 |
| | | | | | | | | | | | | | | | | | |
| Comparison of the Change in Value of a $10,000 Investment | | | | | | | | |
| | | | | | | | | | | | | | | | | | |
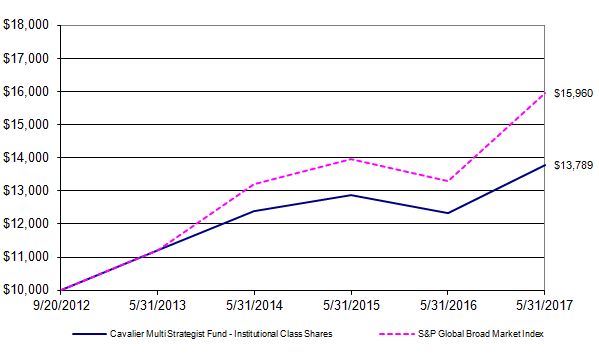
| The graph above assumes an initial $10,000 investment and represents the reinvestment of dividends and capital gains. This graph depicts the performance of Cavalier Multi Strategist Fund - Institutional Class Shares versus the S&P Global Broad Market Index. It is important to note that the Fund is a professionally managed mutual fund while the index is not available for investment and is unmanaged. The comparison is shown for illustrative purposes only. |
| | | | | | | | | | | | | | | | | | | | |
| | Average Annual Total Returns | |
| | | | | | | | | | | | | | | | | | Gross | | |
| | | As of | | | | | One | | Three | | Since | | Inception | | Expense | | |
| | | May 31, 2017 | | | | Year | | Year | | Inception | | Date | | Ratio* | | |
| | | Institutional Class Shares | | | 11.82% | | 3.02% | | 7.08% | | 09/20/12 | | 4.50% | | |
| | | S&P Global Broad Market Index | | | 18.13% | | 5.95% | | 10.45% | | N/A | | N/A | | |
| | | | | | | | | | | | | | | | | | | | |
| * The gross expense ratio shown is from the Funds' prospectus dated September 28, 2016. | | | | |
| | | | | | | | | | | | | | | | | | | | |
| Performance quoted above represents past performance, which is no guarantee of future results. Investment return and principal value will fluctuate so that shares, when redeemed, may be worth more or less than their original cost. Current performance may be lower or higher than the performance data quoted. An investor may obtain performance data, current to the most recent month-end, by visiting ncfunds.com. |
| | | | | | | | | | | | | | | | | | | | |
| The graph and table do not reflect the deduction of taxes that a shareholder would pay on Fund distributions or the redemption of Fund shares. Average annual total returns are historical in nature and measure net investment income and capital gain or loss from portfolio investments assuming reinvestment of distributions. |
| | | | | | | | | | | | | | | | | | | | |
| | | | | | | | | | | | | | | | | | | | |
| Cavalier Multi Strategist Fund - Class C Shares | | | | | | | | | | | | | |
| | | | | | | | | | | | | | | | | | | | | |
| Performance Update (Unaudited) | | | | | | | | | | | | | | |
| | | | | | | | | | | | | | | | | | | | | |
| For the period from September 26, 2012 (Date of Initial Public Investment) through May 31, 2017 | | | | | |
| | | | | | | | | | | | | | | | | | | | | |
| Comparison of the Change in Value of a $10,000 Investment | | | | | | | | | | | |
| | | | | | | | | | | | | | | | | | | | | |
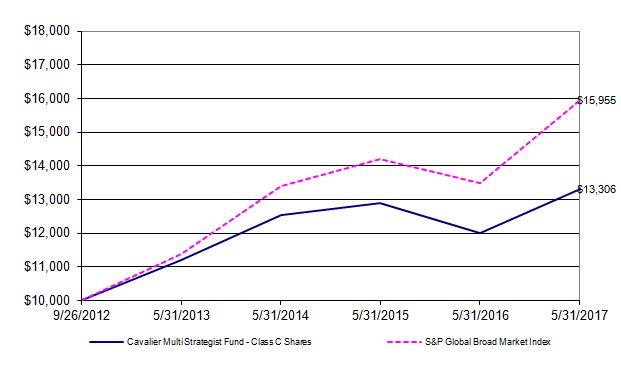
| The graph above assumes an initial $10,000 investment and represents the reinvestment of dividends and capital gains. This graph depicts the performance of Cavalier Multi Strategist Fund - Class C Shares versus the S&P Global Broad Market Index. It is important to note that the Fund is a professionally managed mutual fund while the index is not available for investment and is unmanaged. The comparison is shown for illustrative purposes only. |
| | | | | | | | | | | | | | | | | | | | |
| | Average Annual Total Returns | |
| | | | | | | | | | | | | | | | | | Gross | | |
| | | As of | | | | | One | | Three | | Since | | Inception | | Expense | | |
| | | May 31, 2017 | | | | Year | | Year | | Inception | | Date | | Ratio* | | |
| | | Class C Shares** | | | | 10.72% | | 2.02% | | 6.29% | | 09/26/12 | | 5.50% | | |
| | | S&P Global Broad Market Index | | | 18.13% | | 5.95% | | 10.46% | | N/A | | N/A | | |
| * The gross expense ratio shown is from the Funds' prospectus dated September 28, 2016. | | | | |
| ** | As of February 24, 2017, the "Advisor Class" Shares were renamed to the "Class C" Shares. There were no other changes to this class of shares. Class C Shares held longer than 7 years will automatically convert to Institutional Class Shares. Institutional Class Shares are not subject to the distribution and service plan (Rule 12b-1) fees of 1.00%. |
|
| |
| Performance quoted above represents past performance, which is no guarantee of future results. Investment return and principal value will fluctuate so that shares, when redeemed, may be worth more or less than their original cost. Current performance may be lower or higher than the performance data quoted. An investor may obtain performance data, current to the most recent month-end, by visiting ncfunds.com. |
| | | | | | | | | | | | | | | | | | | | |
| The graph and table do not reflect the deduction of taxes that a shareholder would pay on Fund distributions or the redemption of Fund shares. Average annual total returns are historical in nature and measure net investment income and capital gain or loss from portfolio investments assuming reinvestment of distributions. |
| | | | | | | | | | | | | | | | | | | | |
| | | | | | | | | | | | | | | | | | | | |
| Cavalier Multi Strategist Fund | | | | | |
| | | | | | | | | | |
| Schedule of Investments | | | | | | | |
| | | | | | | | | | |
| As of May 31, 2017 | | | | | | | |
| | | | | | | | Shares | | Value (Note 1) |
| | | | | | | | | | |
| COMMON STOCKS - 2.98% | | | | | | |
| | | | | | | | | | |
| | Financials - 1.16% | | | | | | | |
| | | Barclays PLC | | | | | 6,045 | $ | 65,105 |
| | | JPMorgan Chase & Co. | | | | 601 | | 49,372 |
| | | | | | | | | | 114,477 |
| | Health Care - 1.11% | | | | | | | |
| | | Johnson & Johnson | | | | 423 | | 54,250 |
| | | Merck & Co., Inc. | | | | | 839 | | 54,627 |
| | | | | | | | | | 108,877 |
| | Information Technology - 0.71% | | | | | | |
| | | Apple, Inc. | | | | | 455 | | 69,506 |
| | | | | | | | | | |
| | | Total Common Stocks (Cost $251,277) | | | | | 292,860 |
| | | | | | | | | | |
| EXCHANGE-TRADED PRODUCTS - 85.88% | | | | | | |
| | | Consumer Discretionary Select Sector SPDR Fund | | 1,741 | | 158,518 |
| | | Energy Select Sector SPDR Fund | | | | 3,082 | | 201,686 |
| | | First Trust Financial AlphaDEX Fund | | | | 8,970 | | 247,123 |
| | * | First Trust Health Care AlphaDEX Fund | | | 3,799 | | 244,618 |
| | | First Trust Industrials/Producer Durables AlphaDEX Fund | | 7,377 | | 257,974 |
| | | First Trust Large Cap Growth AlphaDEX Fund | | | 7,293 | | 398,490 |
| | | First Trust Large Cap Value AlphaDEX Fund | | | 6,806 | | 337,578 |
| | | First Trust Materials AlphaDEX Fund | | | | 6,902 | | 260,550 |
| | | First Trust Mid Cap Core AlphaDEX Fund | | | 5,714 | | 331,298 |
| | | First Trust Small Cap Core AlphaDEX Fund | | | 4,051 | | 217,174 |
| | | First Trust Technology AlphaDEX Fund | | | 5,944 | | 266,172 |
| | | Health Care Select Sector SPDR Fund | | | 1,731 | | 131,694 |
| | | Industrial Select Sector SPDR Fund | | | | 3,152 | | 212,823 |
| | | iShares Core S&P 500 ETF | | | | 2,724 | | 661,660 |
| | | iShares Core S&P Mid-Cap ETF | | | | 2,993 | | 514,287 |
| | | iShares Edge MSCI Min Vol USA ETF | | | | 13,658 | | 674,159 |
| | | iShares Russell 2000 Value ETF | | | | 3,221 | | 370,318 |
| | | iShares Transportation Average ETF | | | | 638 | | 105,551 |
| | | iShares US Aerospace & Defense ETF | | | 340 | | 53,655 |
| | | SPDR Doubleline Total Return Tactical ETF | | | 7,716 | | 381,247 |
| | | SPDR S&P Biotech ETF | | | | 731 | | 49,496 |
| | | SPDR S&P Oil & Gas Exploration & Production ETF | | 1,496 | | 48,725 |
| | | SPDR S&P Regional Banking ETF | | | | 3,387 | | 175,548 |
| | | Technology Select Sector SPDR Fund | | | 4,807 | | 271,740 |
| | | Vanguard Consumer Staples ETF | | | | 919 | | 133,521 |
| | | Vanguard Financials ETF | | | | 4,352 | | 257,160 |
| | | Vanguard Information Technology ETF | | | 753 | | 109,125 |
| | | | | | | | | | |
| | | | | | | | | | |
| | | | | | | | | | (Continued) |
| Cavalier Multi Strategist Fund | | | | | | |
| | | | | | | | | | |
| Schedule of Investments - Continued | | | | | | |
| | | | | | | | | | |
| As of May 31, 2017 | | | | | | | |
| | | | | | | | Shares | | Value (Note 1) |
| | | | | | | | | | |
| EXCHANGE-TRADED PRODUCTS - CONTINUED | | | | | |
| | | Vanguard Mid-Cap Value ETF | | | | 2,044 | $ | 209,326 |
| | | Vanguard Small-Cap Value ETF | | | | 1,060 | | 127,613 |
| | | Vanguard Telecommunication Services ETF | | | 539 | | 50,655 |
| | * | VelocityShares Daily Inverse VIX Short Term ETN | | | 12,289 | | 974,641 |
| | | | | | | | | | |
| | | Total Exchange-Traded Products (Cost $8,135,554) | | | | 8,434,125 |
| | | | | | | | | | |
| SHORT-TERM INVESTMENT - 10.71% | | | | | | |
| | § | Fidelity Investments Money Market Government Portfolio - | | | | |
| | | Institutional Class, 0.69% | | | | 1,051,718 | | 1,051,718 |
| | | | | | | | | | |
| | | Total Short-Term Investment (Cost $1,051,718) | | | | | 1,051,718 |
| | | | | | | | | | |
| Total Value of Investments (Cost $9,438,549) - 99.57% | | | | $ | 9,778,703 |
| | | | | | | | | | |
| Other Assets Less Liabilities - 0.43% | | | | | | 42,421 |
| | | | | | | | | | |
| | Net Assets - 100.00% | | | | | $ | 9,821,124 |
| | | | | | | | | | |
| * | Non-income producing investment | | | | | | |
| § | Represents 7 day effective yield | | | | | | |
| | | | | | | | | | |
| | | | Summary of Investments by Sector | | | | |
| | | | | | | | | | |
| | | | Sector | | % of Net Assets | | Value | | |
| | | | Financials | | 1.16% | $ | 114,477 | | |
| | | | Health Care | | 1.11% | | 108,877 | | |
| | | | Information Technology | 0.71% | | 69,506 | | |
| | | | Exchange-Traded Products | 85.88% | | 8,434,125 | | |
| | | | Short-Term Investment | 10.71% | | 1,051,718 | | |
| | | | Other Assets Less Liabilities | 0.43% | | 42,421 | | |
| | | | Total Net Assets | | 100.00% | $ | 9,821,124 | | |
| | | | | | | | | | |
| | | | | | | | | | |
| See Notes to Financial Statements | | | | | | |
| Cavalier Multi Strategist Fund | | |
| | | | | | | | |
| Statement of Assets and Liabilities | | |
| | | | | | | | |
| As of May 31, 2017 | | | |
| | | | | | | | |
| Assets: | | | | | |
| | Investments, at value (cost $9,438,549) | $ | 9,778,703 |
| | Receivables: | | | |
| | | Fund shares sold | | | 337 |
| | | Dividends | | | 1,040 |
| | | Due from Advisor | | | 42,983 |
| | Prepaid expenses: | | | |
| | | Registration and filing expenses | | 16,034 |
| | | Fund accounting fees | | | 2,784 |
| | | | | | | | |
| | Total assets | | | 9,841,881 |
| | | | | | | | |
| Liabilities: | | | | | |
| | Payables: | | | | |
| | | Fund shares repurchased | | 45 |
| | Accrued expenses: | | | |
| | | Professional fees | | | 15,000 |
| | | Trustee fees and meeting expenses | | 1,899 |
| | | Shareholder fulfillment fees | | 1,751 |
| | | Custody and banking fees | | 1,056 |
| | | Distribution and service fees - Class C Shares | | 485 |
| | | Insurance fees | | | 299 |
| | | Security pricing fees | | | 180 |
| | | Administration fees | | | 42 |
| | | | | | | | |
| | Total liabilities | | | 20,757 |
| | | | | | | | |
| Total Net Assets | | $ | 9,821,124 |
| | | | | | | | |
| Net Assets Consist of: | | | |
| | Paid in capital | | $ | 9,397,351 |
| | Accumulated net realized gain on investments | | 83,619 |
| | Net unrealized appreciation on investments | | 340,154 |
| | | | | | | | |
| Total Net Assets | | $ | 9,821,124 |
| | | | | | | | |
| Institutional Class Shares of beneficial interest outstanding, no par value (unlimited authorized shares) | 746,380 |
| | Net Assets | | | $ | 9,178,112 |
| | Net Asset Value, Offering Price and Redemption Price Per Share | $ | 12.30 |
| | | | | | | | |
| Class C Shares of beneficial interest outstanding, no par value (unlimited authorized shares) | | 54,136 |
| | Net Assets | | | $ | 643,012 |
| | Net Asset Value, Offering Price and Redemption Price Per Share (a) | $ | 11.88 |
| | | | | | | | |
| (a) | Contingent deferred sales charge for Class C Shares is imposed on shares redeemed within one year of the purchase date (note 1). |
| | | | | | | | |
| | | | | | | | |
| | | | | | | | |
| See Notes to Financial Statements | | |
| Cavalier Multi Strategist Fund | | |
| | | | | | | | |
| Statement of Operations | | |
| | | | | | | | |
| For the year ended May 31, 2017 | | |
| | | | | | | | |
| Investment Income: | | |
| | Dividends | | | $ | 83,529 |
| | | | | | | | |
| | Total Investment Income | | 83,529 |
| | | | | | | | |
| Expenses: | | | | | |
| | Advisory fees (note 2) | | 47,554 |
| | Professional fees | | 41,607 |
| | Fund accounting fees (note 2) | | 38,843 |
| | Compliance fees | | 35,972 |
| | Registration and filing expenses | | 35,379 |
| | Transfer agent fees (note 2) | | 31,973 |
| | Shareholder fulfillment fees | | 24,102 |
| | Administration fees (note 2) | | 24,027 |
| | Trustee fees and meeting expenses | | 10,367 |
| | Custody and banking fees (note 2) | | 7,505 |
| | Distribution and service fees - Class C Shares (note 3) | | 6,473 |
| | Security pricing fees | | 5,225 |
| | Other operating expenses | | 2,406 |
| | Insurance fees | | | 1,714 |
| | | | | | | | |
| | Total Expenses | | | 313,147 |
| | | | | | | | |
| | Fees waived and reimbursed by Advisor (note 2) | | (217,732) |
| | | | | | | | |
| | Total Expenses | | | 95,415 |
| | | | | | | | |
| Net Investment Loss | | (11,886) |
| | | | | | | | |
| Realized and Unrealized Gain on Investments: | | |
| | | | | | | | |
| | Net realized gain from: | | |
| | | Investment transactions | | 413,245 |
| | | Capital gain distributions from underlying funds | | 548 |
| | Net change in unrealized appreciation on investments | | 262,674 |
| | | | | | | | |
| Net Realized and Unrealized Gain on Investments | | 676,467 |
| | | | | | | | |
| Net Increase in Net Assets Resulting from Operations | $ | 664,581 |
| | | | | | | | |
| | | | | | | | |
| | | | | | | | |
| See Notes to Financial Statements | | |
| Cavalier Multi Strategist Fund | | | | | | | |
| | | | | | | | | | | | |
| Statements of Changes in Net Assets | | | | | | | |
| | | | | | | | | | | | |
| For the years ended May 31, | | | | | 2017 | | 2016 |
| | | | | | | | | | | | |
| Operations: | | | | | | | | | |
| | Net investment loss | | | | $ | (11,886) | $ | (4,663) |
| | Net realized gain (loss) from: | | | | | | | |
| | | Investment transactions | | | | | 413,245 | | (306,757) |
| | | Capital gain distributions from underlying funds | | | | 548 | | 3,421 |
| | Net change in unrealized appreciation (depreciation) on investments | | 262,674 | | (176,712) |
| | | | | | | | | | | | |
| Net Increase (Decrease) in Net Assets Resulting from Operations | | 664,581 | | (484,711) |
| | | | | | | | | | | | |
| Distributions to Shareholders From: | | | | | | | |
| | Net realized gains | | | | | | | |
| | | Institutional Class Shares | | | | | - | | (148,245) |
| | | Class C Shares | | | | | - | | (12,736) |
| | | | | | | | | | | | |
| Decrease in Net Assets Resulting from Distributions | | | | - | | (160,981) |
| | | | | | | | | | | | |
| Beneficial Interest Transactions: | | | | | | | |
| | Shares sold | | | | | | 8,009,560 | | 7,680,640 |
| | Reinvested dividends and distributions | | | | | - | | 158,722 |
| | Shares repurchased | | | | | (3,153,741) | | (14,806,374) |
| | | | | | | | | | | | |
| Increase (Decrease) from Beneficial Interest Transactions | | | | 4,855,819 | | (6,967,012) |
| | | | | | | | | | | | |
| Net Increase (Decrease) in Net Assets | | | | | 5,520,400 | | (7,612,704) |
| | | | | | | | | | | | |
| Net Assets: | | | | | | | | |
| | Beginning of Year | | | | | 4,300,724 | | 11,913,428 |
| | End of Year | | | | | $ | 9,821,124 | $ | 4,300,724 |
| | | | | | | | | | | | |
| | Accumulated Net Investment Loss | | | | $ | - | $ | (14,952) |
| | | | | | | | | | | | |
| | | | | | Year Ended | | Year Ended |
| Share Information: | May 31, 2017 | | May 31, 2016 |
| | Institutional Class Shares | Shares | | Amount | | Shares | | Amount |
| | | Shares sold | 525,858 | $ | 6,220,433 | | 645,644 | $ | 7,341,427 |
| | | Reinvested dividends and distributions | - | | - | | 13,117 | | 145,986 |
| | | Shares repurchased | (135,746) | | (1,552,902) | | (1,266,456) | | (14,605,558) |
| | Net Increase (Decrease) in Shares of | | | | | | | |
| | | Beneficial Interest | 390,112 | $ | 4,667,531 | | (607,695) | $ | (7,118,145) |
| | | | | | | | | | | | |
| | Class C Shares | Shares | | Amount | | Shares | | Amount |
| | | Shares sold | 160,311 | $ | 1,789,127 | | 30,015 | $ | 339,213 |
| | | Reinvested dividends and distributions | - | | - | | 1,167 | | 12,736 |
| | | Shares repurchased | (141,652) | | (1,600,839) | | (17,860) | | (200,816) |
| | Net Increase in Shares of | | | | | | | |
| | | Beneficial Interest | 18,659 | $ | 188,288 | | 13,322 | $ | 151,133 |
| | | | | | | | | | | | |
| | | | | | | | | | | | |
| | | | | | | | | | | | |
| | | | | | | | | | | | |
| See Notes to Financial Statements | | | | | | | |
| Cavalier Multi Strategist Fund | | | | | | | | | | | |
| | | | | | | | | | | | | | | | |
| Financial Highlights | | | | | | | | | | | |
| | | | | | | | | | | | | | | | |
| For a share outstanding during each of the | | Institutional Class Shares |
| fiscal years or period ended May 31, | | 2017 | | 2016 | | 2015 | | 2014 | | 2013 | (e) |
| | | | | | | | | | | | | | | | |
| Net Asset Value, Beginning of Period | $ | 11.00 | $ | 12.09 | $ | 12.09 | $ | 11.06 | $ | 10.00 | |
| | | | | | | | | | | | | | | | |
| Income (Loss) from Investment Operations | | | | | | | | | | |
| | Net investment income (loss) | | (0.01) | (f) | (0.00) | (f)(i) | 0.10 | (f) | 0.06 | (f) | 0.12 | |
| | Net realized and unrealized gain (loss) | | | | | | | | | | | |
| | | on investments | | 1.31 | | (0.71) | | 0.35 | | 1.29 | | 1.09 | |
| | | | | | | | | | | | | | | | |
| Total from Investment Operations | | 1.30 | | (0.71) | | 0.45 | | 1.35 | | 1.21 | |
| | | | | | | | | | | | | | | | |
| Less Distributions: | | | | | | | | | | | |
| | From net investment income | | - | | - | | (0.11) | | (0.11) | | (0.15) | |
| | From net realized gains | | - | | (0.38) | | (0.34) | | (0.21) | | - | |
| | | | | | | | | | | | | | | | |
| Total Distributions | | - | | (0.38) | | (0.45) | | (0.32) | | (0.15) | |
| | | | | | | | | | | | | | | | |
| Net Asset Value, End of Period | $ | 12.30 | $ | 11.00 | $ | 12.09 | $ | 12.09 | $ | 11.06 | |
| | | | | | | | | | | | | | | | |
| Total Return | | | 11.82% | | (5.89)% | | 3.91% | | 12.37% | | 12.23% | (b) |
| | | | | | | | | | | | | | | | |
| Net Assets, End of Period (in thousands) | $ | 9,178 | $ | 3,920 | $ | 11,650 | $ | 5,697 | $ | 1,862 | |
| | | | | | | | | | | | | | | | |
| Ratios of: | | | | | | | | | | | | | |
| Gross Expenses to Average Net Assets (c) | | 4.87% | | 3.92% | | 2.12% | | 0.70% | | 0.70% | (a) |
| Net Expenses to Average Net Assets (c) | | 1.41% | | 1.20% | (h) | 0.94% | (g) | 0.70% | | 0.70% | (a) |
| Net Investment Income (Loss) to Average | | | | | | | | | | | (a) |
| | Net Assets (d) | | (0.09)% | | (0.02)% | (h) | 0.81% | (g) | 0.56% | | 0.77% | (a) |
| | | | | | | | | | | | | | | | |
| Portfolio turnover rate | | 190.49% | | 173.62% | | 69.31% | | 26.97% | | 8.94% | (b) |
| | | | | | | | | | | | | | | | |
| (a) | Annualized. | | | | | | | | | | | | |
| (b) | Not annualized. | | | | | | | | | | | |
| (c) | Does not include expenses of the investment companies in which the Fund invests. | | | | | |
| (d) | Recognition of net investment income by the Fund is affected by the timing of the declaration of dividends by the underlying investment companies in which the Fund invests. |
| (e) | For a share outstanding during the period from September 20, 2012 (Date of Initial Public Investment) to May 31, 2013. |
| (f) | Calculated using the average shares method. | | | | | | | | | |
| (g) | Includes reimbursement of acquired fund fees. | | | | | | | | | |
| (h) | Includes reimbursement of acquired fund fees and expenses for the period from June 1, 2015 through December 17, 2015. Expense limitation agreement was updated to exclude acquired fund fees and expenses from the waiver effective December 18, 2015 (note 2). |
| (i) | Less than $0.01 per share. | | | | | | | | | | | |
| | | | | | | | | | | | | | | | |
| | | | | | | | | | | | | | | | |
| See Notes to Financial Statements | | | | | | | | | | | (Continued) |
| Cavalier Multi Strategist Fund | | | | | | | | | | | |
| | | | | | | | | | | | | | | | |
| Financial Highlights | | | | | | | | | | | |
| | | | | | | | | | | | | | | | |
| For a share outstanding during each of the | | Class C Shares (i) |
| fiscal years or period ended May 31, | | 2017 | | 2016 | | 2015 | | 2014 | | 2013 | (e) |
| | | | | | | | | | | | | | | | |
| Net Asset Value, Beginning of Period | $ | 10.73 | $ | 11.91 | $ | 12.04 | $ | 11.16 | $ | 10.00 | |
| | | | | | | | | | | | | | | | |
| Income (Loss) from Investment Operations | | | | | | | | | | | |
| | Net investment income (loss) | | (0.12) | (f) | (0.12) | (f) | 0.01 | (f) | (0.05) | (f) | - | |
| | Net realized and unrealized gain (loss) | | | | | | | | | | | |
| | | on investments | | 1.27 | | (0.68) | | 0.31 | | 1.24 | | 1.29 | |
| | | | | | | | | | | | | | | | |
| Total from Investment Operations | | 1.15 | | (0.80) | | 0.32 | | 1.19 | | 1.29 | |
| | | | | | | | | | | | | | | | |
| Less Distributions: | | | | | | | | | | | |
| | From net investment income | | - | | - | | (0.11) | | (0.10) | | (0.13) | |
| | From net realized gains | | - | | (0.38) | | (0.34) | | (0.21) | | - | |
| | | | | | | | | | | | | | | | |
| Total Distributions | | - | | (0.38) | | (0.45) | | (0.31) | | (0.13) | |
| | | | | | | | | | | | | | | | |
| Net Asset Value, End of Period | $ | 11.88 | $ | 10.73 | $ | 11.91 | $ | 12.04 | $ | 11.16 | |
| | | | | | | | | | | | | | | | |
| Total Return | | | 10.72% | | (6.75)% | | 2.82% | | 10.84% | | 13.04% | (b) |
| | | | | | | | | | | | | | | | |
| Net Assets, End of Period (in thousands) | $ | 643 | $ | 381 | $ | 264 | $ | 122 | $ | 9 | |
| | | | | | | | | | | | | | | | |
| Ratios of: | | | | | | | | | | | | | |
| Gross Expenses to Average Net Assets (c) | | 5.85% | | 5.25% | | 3.12% | | 1.70% | | 1.70% | (a) |
| Net Expenses to Average Net Assets (c) | | 2.44% | | 2.27% | (h) | 1.94% | (g) | 1.70% | | 1.70% | (a) |
| Net Investment Income (Loss) to Average | | | | | | | | | | | |
| | Net Assets (d) | | (1.06)% | | (1.05)% | (h) | 0.04% | (g) | (0.43)% | | 0.68% | (a) |
| | | | | | | | | | | | | | | | |
| Portfolio turnover rate | | 190.49% | | 173.62% | | 69.31% | | 26.97% | | 8.94% | (b) |
| | | | | | | | | | | | | | | | |
| (a) | Annualized. | | | | | | | | | | | | |
| (b) | Not annualized. | | | | | | | | | | | |
| (c) | Does not include expenses of the investment companies in which the Fund invests. | | | | | |
| (d) | Recognition of net investment income by the Fund is affected by the timing of the declaration of dividends by the underlying investment companies in which the Fund invests. |
| (e) | For a share outstanding during the period from September 26, 2012 (Date of Initial Public Investment) to May 31, 2013. |
| (f) | Calculated using the average shares method. | | | | | | | | | | |
| (g) | Includes reimbursement of acquired fund fees. | | | | | | | | | | |
| (h) | Includes reimbursement of acquired fund fees and expenses for the period from June 1, 2015 through December 17, 2015. Expense limitation agreement was updated to exclude acquired fund fees and expenses from the waiver effective December 18, 2015 (note 2). |
| (i) | As of February 24, 2017, the "Advisor Class" Shares were renamed to the "Class C" Shares. There were no other changes to this class of shares. |
| | | | | | | | | | | | | |
| | | | | | | | | | | | | | | | |
| | | | | | | | | | | | | | | | |
| See Notes to Financial Statements | | | | | | | | | | | |
| Cavalier Tactical Rotation Fund - Institutional Class Shares | | | | | | | | |
| | | | | | | | | | | | | | | | | | |
| Performance Update (Unaudited) | | | | | | | | | | | |
| | | | | | | | | | | | | | | | | | |
| For the period from September 20, 2012 (Date of Initial Public Investment) through May 31, 2017 |
| | | | | | | | | | | | | | | | | | |
| Comparison of the Change in Value of a $10,000 Investment | | | | | | | | |
| | | | | | | | | | | | | | | | | | |
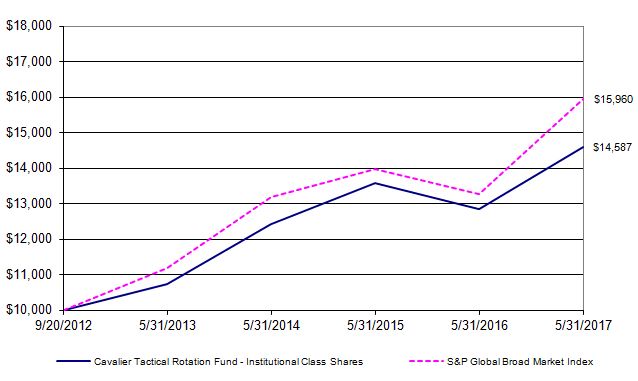
| The graph above assumes an initial $10,000 investment and represents the reinvestment of dividends and capital gains. This graph depicts the performance of Cavalier Tactical Rotation Fund - Institutional Class Shares versus the S&P Global Broad Market Index. It is important to note that the Fund is a professionally managed mutual fund while the index is not available for investment and is unmanaged. The comparison is shown for illustrative purposes only. |
| | | | | | | | | | | | | | | | | | | | |
| | Average Annual Total Returns | |
| | | | | | | | | | | | | | | | | | Gross | | |
| | | As of | | | | | One | | Three | | Since | | Inception | | Expense | | |
| | | May 31, 2017 | | | | Year | | Year | | Inception | | Date | | Ratio* | | |
| | | Institutional Class Shares | | | 13.50% | | 5.47% | | 8.37% | | 09/20/12 | | 1.79% | | |
| | | S&P Global Broad Market Index | | | 18.13% | | 5.95% | | 10.45% | | N/A | | N/A | | |
| | | | | | | | | | | | | | | | | | | | |
| * The gross expense ratio shown is from the Funds' prospectus dated September 28, 2016. | | | | |
| | | | | | | | | | | | | | | | | | | | |
| Performance quoted above represents past performance, which is no guarantee of future results. Investment return and principal value will fluctuate so that shares, when redeemed, may be worth more or less than their original cost. Current performance may be lower or higher than the performance data quoted. An investor may obtain performance data, current to the most recent month-end, by visiting ncfunds.com. |
| | | | | | | | | | | | | | | | | | | | |
| The graph and table do not reflect the deduction of taxes that a shareholder would pay on Fund distributions or the redemption of Fund shares. Average annual total returns are historical in nature and measure net investment income and capital gain or loss from portfolio investments assuming reinvestment of distributions. |
| | | | | | | | | | | | | | | | | | | | |
| | | | | | | | | | | | | | | | | | | | |
| Cavalier Tactical Rotation Fund - Class C Shares | | | | | | | | | | |
| | | | | | | | | | | | | | | | | | |
| Performance Update (Unaudited) | | | | | | | | | | | |
| | | | | | | | | | | | | | | | | | |
| For the period from September 26, 2012 (Date of Initial Public Investment) through May 31, 2017 |
| | | | | | | | | | | | | | | | | | |
| Comparison of the Change in Value of a $10,000 Investment | | | | | | | | |
| | | | | | | | | | | | | | | | | | |
| | | | | | | | | | | | | | | | | | |
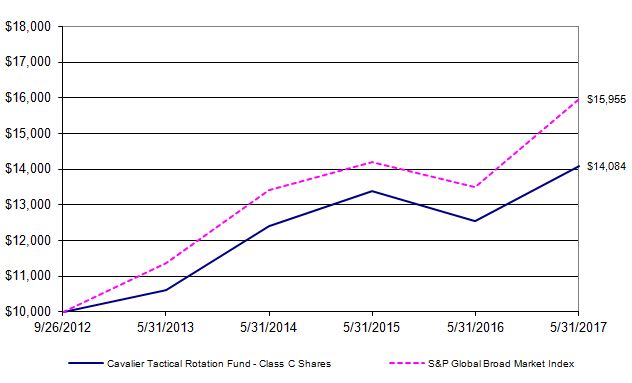
| The graph above assumes an initial $10,000 investment and represents the reinvestment of dividends and capital gains. This graph depicts the performance of Cavalier Tactical Rotation Fund - Class C Shares versus the S&P Global Broad Market Index. It is important to note that the Fund is a professionally managed mutual fund while the index is not available for investment and is unmanaged. The comparison is shown for illustrative purposes only. |
| | | | | | | | | | | | | | | | | | | | |
| | Average Annual Total Returns | |
| | | | | | | | | | | | | | | | | | Gross | | |
| | | As of | | | One | | Three | | Since | | Inception | | Expense | | |
| | | May 31, 2017 | | | | Year | | Year | | Inception | | Date | | Ratio* | | |
| | | Class C Shares** | | | | 12.47% | | 4.44% | | 7.59% | | 09/26/12 | | 2.79% | | |
| | | S&P Global Broad Market Index | | | 18.13% | | 5.95% | | 10.46% | | N/A | | N/A | | |
| * The gross expense ratio shown is from the Funds' prospectus dated September 28, 2016. | | | | |
| ** | As of February 24, 2017, the "Advisor Class" Shares were renamed to the "Class C" Shares. There were no other changes to this class of shares. Class C Shares held longer than 7 years will automatically convert to Institutional Class Shares. Institutional Class Shares are not subject to the distribution and service plan (Rule 12b-1) fees of 1.00%. |
|
| Performance quoted above represents past performance, which is no guarantee of future results. Investment return and principal value will fluctuate so that shares, when redeemed, may be worth more or less than their original cost. Current performance may be lower or higher than the performance data quoted. An investor may obtain performance data, current to the most recent month-end, by visiting ncfunds.com. |
| | | | | | | | | | | | | | | | | | | | |
| The graph and table do not reflect the deduction of taxes that a shareholder would pay on Fund distributions or the redemption of Fund shares. Average annual total returns are historical in nature and measure net investment income and capital gain or loss from portfolio investments assuming reinvestment of distributions. |
| | | | | | | | | | | | | | | | | | | | |
| | | | | | | | | | | | | | | | | | | | |
| Cavalier Tactical Rotation Fund - Class P Shares | | | | | | | | | | |
| | | | | | | | | | | | | | | | | | |
| Performance Update (Unaudited) | | | | | | | | | | | |
| | | | | | | | | | | | | | | | | | |
| For the period from July 1, 2016 (Date of Initial Public Investment) through May 31, 2017 |
| | | | | | | | | | | | | | | | | | |
| Comparison of the Change in Value of a $10,000 Investment | | | | | | | | |
| | | | | | | | | | | | | | | | | | |

| The graph above assumes an initial $10,000 investment and represents the reinvestment of dividends and capital gains. This graph depicts the performance of Cavalier Tactical Rotation Fund - Class P Shares versus the S&P Global Broad Market Index. It is important to note that the Fund is a professionally managed mutual fund while the index is not available for investment and is unmanaged. The comparison is shown for illustrative purposes only. |
| | | | | | | | | | | | | | | | | | | | |
| | Average Annual Total Returns | | |
| | | | | | | | | | | | | | | | | | Gross | | |
| | | As of | | | | | | Since | | | | Inception | | Expense | | |
| | | May 31, 2017 | | | | | | Inception** | | | | Date | | Ratio* | | |
| | | Class P Shares | | | | | | 12.00% | | | | 07/01/16 | | 1.79% | | |
| | | S&P Global Broad Market Index | | | | | 21.60% | | | | N/A | | N/A | | |
| * The gross expense ratio shown is from the Funds' prospectus dated September 28, 2016. | | | | |
| ** Not annualized. | | | | | | | | | | | | | | |
| | | | | | | | | | | | | | | | | | | | |
| Performance quoted above represents past performance, which is no guarantee of future results. Investment return and principal value will fluctuate so that shares, when redeemed, may be worth more or less than their original cost. Current performance may be lower or higher than the performance data quoted. An investor may obtain performance data, current to the most recent month-end, by visiting ncfunds.com. |
| | | | | | | | | | | | | | | | | | | | |
| The graph and table do not reflect the deduction of taxes that a shareholder would pay on Fund distributions or the redemption of Fund shares. Average annual total returns are historical in nature and measure net investment income and capital gain or loss from portfolio investments assuming reinvestment of distributions. |
| | | | | | | | | | | | | | | | | | | | |
| | | | | | | | | | | | | | | | | | | | |
| Cavalier Tactical Rotation Fund | | | | | | |
| | | | | | | | | | |
| Schedule of Investments | | | | | | |
| | | | | | | | | | |
| As of May 31, 2017 | | | | | | |
| | | | | | | | Shares | | Value (Note 1) |
| | | | | | | | | | |
| EXCHANGE-TRADED PRODUCTS - 95.95% | | | | | |
| | Consumer Discretionary Select Sector SPDR Fund | | | 99,933 | $ | 9,098,900 |
| | Consumer Staples Select Sector SPDR Fund | | | 158,330 | | 8,967,811 |
| | Financial Select Sector SPDR Fund | | | 353,828 | | 8,226,501 |
| | Health Care Select Sector SPDR Fund | | | 129,241 | | 9,832,655 |
| | Industrial Select Sector SPDR Fund | | | 131,542 | | 8,881,716 |
| | John Hancock Multi-Factor Consumer Discretionary ETF | | 33,378 | | 934,250 |
| | John Hancock Multi-Factor Consumer Staples ETF | | | 36,255 | | 979,248 |
| | John Hancock Multi-Factor Financials ETF | | | 38,400 | | 1,198,464 |
| | John Hancock Multi-Factor Industrials ETF | | | 36,389 | | 1,128,059 |
| | John Hancock Multi-Factor Materials ETF | | | 31,534 | | 960,368 |
| | John Hancock Multi-Factor Utilities ETF | | | 22,601 | | 632,376 |
| | Materials Select Sector SPDR Fund | | | 165,359 | | 8,777,256 |
| | Real Estate Select Sector SPDR Fund | | | 308,235 | | 9,820,367 |
| | Technology Select Sector SPDR Fund | | | 181,072 | | 10,236,000 |
| | Utilities Select Sector SPDR Fund | | | 174,235 | | 9,380,812 |
| | | | | | | | | | |
| | | Total Exchange-Traded Products (Cost $81,444,173) | | | | 89,054,783 |
| | | | | | | | | | |
| SHORT-TERM INVESTMENT - 1.98% | | | | | | |
| § | Fidelity Investments Money Market Government Portfolio - | | | | |
| | Institutional Class, 0.69% | | | | 1,840,523 | | 1,840,523 |
| | | | | | | | | | |
| | | Total Short-Term Investment (Cost $1,840,523) | | | | | 1,840,523 |
| | | | | | | | | | |
| Total Value of Investments (Cost $83,284,696) - 97.93% | | | | $ | 90,895,306 |
| | | | | | | | | | |
| Other Assets Less Liabilities - 2.07% | | | | | 1,917,139 |
| | | | | | | | | | |
| | Net Assets - 100.00% | | | | | $ | 92,812,445 |
| | | | | | | | | | |
| § | Represents 7 day effective yield | | | | | | |
| | | | | | | | | | |
| | | | Summary of Investments | | | | | |
| | | | | | | | | | |
| | | | | | % of Net Assets | | Value | | |
| | | | Exchange-Traded Products | 95.95% | $ | 89,054,783 | | |
| | | | Short-Term Investment | 1.98% | | 1,840,523 | | |
| | | | Other Assets Less Liabilities | 2.07% | | 1,917,139 | | |
| | | | Total Net Assets | | 100.00% | $ | 92,812,445 | | |
| | | | | | | | | | |
| | | | | | | | | | |
| | | | | | | | | | |
| | | | | | | | | | |
| | | | | | | | | | |
| | | | | | | | | | |
| See Notes to Financial Statements | | | | | | |
| Cavalier Tactical Rotation Fund | | |
| | | | | | | | |
| Statement of Assets and Liabilities | | |
| | | | | | | | |
| As of May 31, 2017 | | | |
| | | | | | | | |
| Assets: | | | | | |
| | Investments, at value (cost $83,284,696) | $ | 90,895,306 |
| | Receivables: | | | |
| | | Fund shares sold | | | 2,003,986 |
| | | Dividends | | | 836 |
| | Prepaid expenses: | | | |
| | | Registration and filing expenses | | 14,377 |
| | | Fund accounting fees | | | 2,804 |
| | | | | | | | |
| | Total assets | | | | 92,917,309 |
| | | | | | | | |
| Liabilities: | | | | | |
| | Payables: | | | | |
| | | Investments purchased | | | 31,881 |
| | | Fund shares repurchased | | 5,644 |
| | Accrued expenses: | | | |
| | | Advisory fees | | | 45,598 |
| | | Professional fees | | | 15,000 |
| | | Trustee fees and meeting expenses | | 1,900 |
| | | Shareholder fulfillment fees | | 1,751 |
| | | Distribution and service fees - Class C Shares | | 1,455 |
| | | Administration fees | | | 826 |
| | | Custody and banking fees | | 445 |
| | | Insurance fees | | | 296 |
| | | Security pricing fees | | | 68 |
| | | | | | | | |
| | Total liabilities | | | 104,864 |
| | | | | | | | |
| Total Net Assets | | $ | 92,812,445 |
| | | | | | | | |
| Net Assets Consist of: | | | |
| | Paid in capital | | $ | 84,589,222 |
| | Undistributed net investment income | | 428,202 |
| | Accumulated net realized gain on investments | | 184,411 |
| | Net unrealized appreciation on investments | | 7,610,610 |
| | | | | | | | |
| Total Net Assets | | $ | 92,812,445 |
| | | | | | | | |
| Institutional Class Shares of beneficial interest outstanding, no par value (unlimited authorized shares) | 7,032,243 |
| | Net Assets | | | $ | 89,871,780 |
| | Net Asset Value, Offering Price and Redemption Price Per Share | $ | 12.78 |
| | | | | | | | |
| Class C Shares of beneficial interest outstanding, no par value (unlimited authorized shares) | | 167,923 |
| | Net Assets | | | $ | 2,075,697 |
| | Net Asset Value, Offering Price and Redemption Price Per Share (a) | $ | 12.36 |
| | | | | | | | |
| Class P Shares of beneficial interest outstanding, no par value (unlimited authorized shares) | | 77,232 |
| | Net Assets | | | $ | 864,968 |
| | Net Asset Value, Offering Price and Redemption Price Per Share | $ | 11.20 |
| | | | | | | | |
| (a) | Contingent deferred sales charge for Class C Shares is imposed on shares redeemed within one year of the purchase date (note 1). |
| | | | | | | | |
| | | | | | | | |
| See Notes to Financial Statements | | |
| Cavalier Tactical Rotation Fund | | |
| | | | | | | | |
| Statement of Operations | | |
| | | | | | | | |
| For the year ended May 31, 2017 | | |
| | | | | | | | |
| Investment Income: | | |
| | Dividends | | | $ | 1,770,229 |
| | | | | | | | |
| | Total Investment Income | | 1,770,229 |
| | | | | | | | |
| Expenses: | | | | | |
| | Advisory fees (note 2) | | 864,159 |
| | Administration fees (note 2) | | 86,416 |
| | Shareholder fulfillment fees | | 58,958 |
| | Distribution and service fees - Class C Shares (note 3) | | 49,678 |
| | Fund accounting fees (note 2) | | 46,765 |
| | Professional fees | | 40,543 |
| | Registration and filing expenses | | 39,243 |
| | Transfer agent fees (note 2) | | 33,100 |
| | Custody and banking fees (note 2) | | 16,892 |
| | Trustee fees and meeting expenses | | 10,367 |
| | Compliance fees (note 2) | | 8,712 |
| | Insurance fees | | | 6,157 |
| | Other operating expenses | | 1,906 |
| | Security pricing fees | | 1,903 |
| | | | | | | | |
| | Total Expenses | | | 1,264,799 |
| | | | | | | | |
| | Advisory fees waived (note 2) | | (5,023) |
| | | | | | | | |
| | Net Expenses | | | 1,259,776 |
| | | | | | | | |
| Net Investment Income | | 510,453 |
| | | | | | | | |
| Realized and Unrealized Gain on Investments: | | |
| | | | | | | | |
| | Net realized gain from investment transactions | | 3,641,419 |
| | Net change in unrealized appreciation on investments | | 6,479,161 |
| | | | | | | | |
| Net Realized and Unrealized Gain on Investments | | 10,120,580 |
| | | | | | | | |
| Net Increase in Net Assets Resulting from Operations | $ | 10,631,033 |
| | | | | | | | |
| | | | | | | | |
| See Notes to Financial Statements | | |
| Cavalier Tactical Rotation Fund | | | | | | |
| | | | | | | | | | | |
| Statements of Changes in Net Assets | | | | | | |
| | | | | | | | | | | |
| For the years ended May 31, | | | | 2017 | | 2016 |
| | | | | | | | | | | |
| Operations: | | | | | | | |
| | Net investment income (loss) | | | | $ | 510,453 | | $ | (107,575) |
| | Net realized gain (loss) from investment transactions | | | 3,641,419 | | (3,457,008) |
| | Net change in unrealized appreciation (depreciation) on investments | 6,479,161 | | (1,102,291) |
| | | | | | | | | | | |
| Net Increase (Decrease) in Net Assets Resulting from Operations | 10,631,033 | | (4,666,874) |
| | | | | | | | | | | |
| Distributions to Shareholders From: | | | | | | |
| | Net realized gains | | | | | | |
| | | Institutional Class Shares | | | | - | | (1,992,210) |
| | | Class C Shares | | | | - | | (247,967) |
| | | | | | | | | | | |
| Decrease in Net Assets Resulting from Distributions | | | - | | (2,240,177) |
| | | | | | | | | | | |
| Beneficial Interest Transactions: | | | | | | |
| | Shares sold | | | | | 38,987,429 | | 59,050,378 |
| | Reinvested dividends and distributions | | | | - | | 1,469,843 |
| | Shares repurchased | | | | (46,495,374) | | (65,976,398) |
| | | | | | | | | | | |
| Decrease from Beneficial Interest Transactions | | | (7,507,945) | | (5,456,177) |
| | | | | | | | | | | |
| Net Increase (Decrease) in Net Assets | | | | 3,123,088 | | (12,363,228) |
| | | | | | | | | | | |
| Net Assets: | | | | | | | |
| | Beginning of Year | | | | 89,689,357 | | 102,052,585 |
| | End of Year | | | | | $ | 92,812,445 | | $ | 89,689,357 |
| | | | | | | | | | | |
| Accumulated Net Investment Income (Loss) | | | $ | 428,202 | | $ | (82,251) |
| | | | | | Year Ended | Year Ended |
| Share Information: | May 31, 2017 | May 31, 2016 |
| | Institutional Class Shares | Shares | | Amount | Shares | | Amount |
| | | Shares sold | 3,059,108 | | $ | 36,852,585 | 5,029,489 | | $ | 57,560,188 |
| | | Reinvested dividends and distributions | - | | - | 108,341 | | 1,229,666 |
| | | Shares repurchased | (3,295,426) | | (38,933,674) | (5,401,502) | | (63,030,610) |
| | Net Increase (Decrease) in Shares of | | | | | | |
| | | Beneficial Interest | (236,318) | | $ | (2,081,089) | (263,672) | | $ | (4,240,756) |
| | Class C Shares | Shares | | Amount | Shares | | Amount |
| | | Shares sold | 80,062 | | $ | 940,628 | 130,774 | | $ | 1,490,190 |
| | | Reinvested dividends and distributions | - | | - | 21,579 | | 240,177 |
| | | Shares repurchased | (624,035) | | (7,143,982) | (266,169) | | (2,945,788) |
| | Net Increase (Decrease) in Shares of | | | | | | |
| | | Beneficial Interest | (543,973) | | $ | (6,203,354) | (113,816) | | $ | (1,215,421) |
| | Class P Shares (a) | Shares | | Amount | | | |
| | | Shares sold | 117,230 | | $ | 1,194,216 | | | |
| | | Reinvested dividends and distributions | - | | - | | | |
| | | Shares repurchased | (39,998) | | (417,718) | | | |
| | Net Increase (Decrease) in Shares of | | | | | | |
| | | Beneficial Interest | 77,232 | | $ | 776,498 | | | |
| | | | | | | | | | | |
| | | | | | | | | | | |
| See Notes to Financial Statements | | | | | | |
| Cavalier Tactical Rotation Fund | | | | | | | | | | | |
| | | | | | | | | | | | | | | | |
| Financial Highlights | | | | | | | | | | | |
| | | | | | | | | | | | | | | | |
| For a share outstanding during each of the | Institutional Class Shares |
| fiscal years or period ended May 31, | | 2017 | | 2016 | | 2015 | | 2014 | | 2013 | (f) |
| | | | | | | | | | | | | | | | |
| Net Asset Value, Beginning of Period | $ | 11.26 | $ | 12.23 | $ | 11.74 | $ | 10.67 | $ | 10.00 | |
| | | | | | | | | | | | | | | | |
| Income from Investment Operations | | | | | | | | | | | |
| | Net investment income (loss) | | 0.08 | (g) | (0.00) | (g)(j) | 0.04 | (g) | 0.04 | (g) | (0.01) | |
| | Net realized and unrealized gain (loss) | | | | | | | | | | |
| | | on investments | | 1.44 | | (0.66) | | 1.02 | | 1.60 | | 0.75 | |
| | | | | | | | | | | | | | | | |
| Total from Investment Operations | | 1.52 | | (0.66) | | 1.06 | | 1.64 | | 0.74 | |
| | | | | | | | | | | | | | | | |
| Less Distributions: | | | | | | | | | | | |
| | From net investment income | | - | | - | | (0.06) | | (0.04) | | (0.07) | |
| | From net realized gains | | - | | (0.31) | | (0.51) | | (0.53) | | - | |
| | | | | | | | | | | | | | | | |
| Total Distributions | | - | | (0.31) | | (0.57) | | (0.57) | | (0.07) | |
| | | | | | | | | | | | | | | | |
| Net Asset Value, End of Period | $ | 12.78 | $ | 11.26 | $ | 12.23 | $ | 11.74 | $ | 10.67 | |
| | | | | | | | | | | | | | | | |
| Total Return (c) | | | 13.50% | | (5.41)% | | 9.29% | | 15.71% | | 7.46% | (b) |
| | | | | | | | | | | | | | | | |
| Net Assets, End of Period (in thousands) | $ | 89,872 | $ | 81,866 | $ | 92,098 | $ | 30,116 | $ | 12,573 | |
| | | | | | | | | | | | | | | | |
| Ratios of: | | | | | | | | | | | | | |
| Gross Expenses to Average Net Assets (d) | | 1.41% | | 1.42% | | 1.41% | | 1.25% | | 1.20% | (a) |
| Net Expenses to Average Net Assets (d) | 1.40% | | 1.26% | (i) | 1.20% | (h) | 1.25% | | 1.20% | (a) |
| Net Investment Income (Loss) to Average | | | | | | | | | | |
| | Net Assets (e) | | 0.64% | | (0.03)% | (i) | 0.36% | (h) | 0.36% | | (0.33)% | (a) |
| | | | | | | | | | | | | | | | |
| Portfolio turnover rate | | 166.56% | | 633.50% | | 323.99% | | 394.35% | | 98.01% | (b) |
| | | | | | | | | | | | | | | | |
| | | | | | | | | | | | | | | | |
| | | | | | | | | | | | | | | | |
| (a) | Annualized. | | | | | | | | | | | | |
| (b) | Not annualized. | | | | | | | | | | | |
| (c) | Includes adjustments in accordance with accounting principles generally accepted in the United States of America and, consequently, the net asset value for financial reporting purposes and the returns based upon those net asset values may differ from the net asset values and returns for shareholder transactions. |
| (d) | Does not include expenses of the investment companies in which the Fund invests. | | | | |
| (e) | Recognition of net investment income by the Fund is affected by the timing of the declaration of dividends by the underlying investment companies in which the Fund invests. |
| (f) | For a share outstanding during the period from September 20, 2012 (Date of Initial Public Investment) to May 31, 2013. |
| (g) | Calculated using the average shares method. | | | | | | | | | |
| (h) | Includes reimbursement of acquired fund fees. | | | | | | | | | |
| (i) | Includes reimbursement of acquired fund fees and expenses for the period from June 1, 2015 through December 17, 2015. Expense limitation agreement was updated to exclude acquired fund fees and expenses from the waiver effective December 18, 2015 (see note 2). |
| (j) | Less than $0.01 per share. | | | | | | | | | | | |
| | | | | | | | | | | | | |
| See Notes to Financial Statements | | | | | | | | | | (Continued) |
| Cavalier Tactical Rotation Fund | | | | | | | | | | | |
| | | | | | | | | | | | | | | | |
| Financial Highlights | | | | | | | | | | | |
| | | | | | | | | | | | | | | | |
| For a share outstanding during each of | Class C Shares (j) |
| the fiscal years or period ended May 31, | 2017 | | 2016 | | 2015 | | 2014 | | 2013 | (f) |
| | | | | | | | | | | | | | | | |
| Net Asset Value, Beginning of Period | $ | 10.99 | $ | 12.06 | $ | 11.69 | $ | 10.65 | $ | 10.00 | |
| | | | | | | | | | | | | | | | |
| Income from Investment Operations | | | | | | | | | | | |
| | Net investment loss | | (0.02) | (g) | (0.11) | (g) | (0.11) | (g) | (0.09) | (g) | (0.02) | |
| | Net realized and unrealized gain (loss) | | | | | | | | | | |
| | | on investments | | 1.39 | | (0.65) | | 1.04 | | 1.69 | | 0.73 | |
| | | | | | | | | | | | | | | | |
| Total from Investment Operations | | 1.37 | | (0.76) | | 0.93 | | 1.60 | | 0.71 | |
| | | | | | | | | | | | | | | | |
| Less Distributions: | | | | | | | | | | | |
| | From net investment income | | - | | - | | (0.05) | | (0.03) | | (0.06) | |
| | From net realized gains | | - | | (0.31) | | (0.51) | | (0.53) | | - | |
| | | | | | | | | | | | | | | | |
| Total Distributions | | - | | (0.31) | | (0.56) | | (0.56) | | (0.06) | |
| | | | | | | | | | | | | | | | |
| Net Asset Value, End of Period | $ | 12.36 | $ | 10.99 | $ | 12.06 | $ | 11.69 | $ | 10.65 | |
| | | | | | | | | | | | | | | | |
| Total Return (c) | | | 12.47% | | (6.33)% | | 8.24% | | 15.37% | | 7.15% | (b) |
| | | | | | | | | | | | | | | | |
| Net Assets, End of Period (in thousands) | $ | 2,076 | $ | 7,823.29 | $ | 9,955 | $ | 558 | $ | 126 | |
| | | | | | | | | | | | | | | | |
| Ratios of: | | | | | | | | | | | | | |
| Gross Expenses to Average Net Assets (d) | 2.41% | | 2.41% | | 2.41% | | 2.25% | | 2.20% | (a) |
| Net Expenses to Average Net Assets (d) | 2.40% | | 2.25% | (i) | 2.20% | (h) | 2.25% | | 2.20% | (a) |
| Net Investment Loss to Average | | | | | | | | | | | |
| | Net Assets (e) | | (0.14)% | | (0.99)% | (i) | (0.95)% | (h) | (0.78)% | | (2.19)% | (a) |
| | | | | | | | | | | | | | | | |
| Portfolio turnover rate | | 166.56% | | 633.50% | | 323.99% | | 394.35% | | 98.01% | (b) |
| | | | | | | | | | | | | | | | |
| | | | | | | | | | | | | | | | |
| (a) | Annualized. | | | | | | | | | | | | |
| (b) | Not annualized. | | | | | | | | | | | |
| (c) | Includes adjustments in accordance with accounting principles generally accepted in the United States of America and, consequently, the net asset value for financial reporting purposes and the returns based upon those net asset values may differ from the net asset values and returns for shareholder transactions. |
| (d) | Does not include expenses of the investment companies in which the Fund invests. | | | | |
| (e) | Recognition of net investment income by the Fund is affected by the timing of the declaration of dividends by the underlying investment companies in which the Fund invests. |
| (f) | For a share outstanding during the period from September 26, 2012 (Date of Initial Public Investment) to May 31, 2013. |
| (g) | Calculated using the average shares method. | | | | | | | | | |
| (h) | Includes reimbursement of acquired fund fees. | | | | | | | | | |
| (i) | Includes reimbursement of acquired fund fees and expenses for the period from June 1, 2015 through December 17, 2015. Expense limitation agreement was updated to exclude acquired fund fees and expenses from the waiver effective December 18, 2015 (see note 2). |
| (j) | As of February 24, 2017, the "Advisor Class" Shares were renamed to the "Class C" Shares. There were no other changes to this class of shares. |
| | | | | | | | | | | | |
| See Notes to Financial Statements | | | | | | | | | | (Continued) |
| Cavalier Tactical Rotation Fund | | | |
| | | | | | | | |
| Financial Highlights | | | |
| | | | | | | | |
| For a share outstanding for the period from | | | |
| July 1, 2016 (Date of Initial Public Investment) through May 31, 2017 | | Class P Shares | |
| | | | | | | | |
| Net Asset Value, Beginning of Period | $ | 10.00 | |
| | | | | | | | |
| Income from Investment Operations | | | |
| | Net investment income | | 0.03 | (f) |
| | Net realized and unrealized gain on investments | | 1.17 | |
| | | | | | | | |
| Total from Investment Operations | | 1.20 | |
| | | | | | | | |
| Net Asset Value, End of Period | $ | 11.20 | |
| | | | | | | | |
| Total Return (c) | | | 12.00% | (b) |
| | | | | | | | |
| Net Assets, End of Period (in thousands) | $ | 865 | |
| | | | | | | | |
| Ratios of: | | | | | |
| Gross Expenses to Average Net Assets (d) | | 1.47% | (a) |
| Net Expenses to Average Net Assets (d) | | 1.40% | (a) |
| Net Investment Income to Average Net Assets (e) | | 0.35% | (a) |
| | | | | | | | |
| Portfolio turnover rate | | 166.56% | (b) |
| | | | | | | | |
| | | | | | | | |
| | | | | | | | |
| (a) | Annualized. | | | | |
| (b) | Not annualized. | | | |
| (c) | Includes adjustments in accordance with accounting principles generally accepted in the United States of America and, consequently, the net asset value for financial reporting purposes and the returns based upon those net asset values may differ from the net asset values and returns for shareholder transactions. |
| (d) | Does not include expenses of the investment companies in which the Fund invests. | |
| (e) | Recognition of net investment income by the Fund is affected by the timing of the declaration of dividends by the underlying investment companies in which the Fund invests. |
| (f) | Calculated using the average shares method. | | | |
| | | | | | | | |
| | | | | | | | |
| | | | | | | | |
| See Notes to Financial Statements | | | |
Cavalier Funds
Notes to Financial Statements
1. Organization and Significant Accounting Policies
The Cavalier Funds ("Funds") are a series of the Starboard Investment Trust ("Trust"). The Trust is organized as a Delaware statutory trust and is registered under the Investment Company Act of 1940, as amended (the "1940 Act"), as an open-end management investment company. Each Fund is a separate, diversified series of the Trust.
The Funds seek to achieve each Fund's investment objective by principally investing in no-load, institutional, and exchange-traded products registered under the Investment Company Act of 1940 ("Underlying Funds"), common stocks, preferred stocks, and fixed income securities. Although most Funds principally invest in Underlying Funds with no sales related expenses or very low sales related expenses, the Funds are not precluded from investing in Underlying Funds with sales-related expenses, and/or service fees in excess of 0.25%.
Each Fund currently has an unlimited number of authorized shares, which are divided into three classes – Institutional Class Shares, Class C Shares (formerly known as the "Advisor Class" Shares), and Class P Shares. Each class of shares has equal rights to assets of the Funds, and the classes are identical except for differences in ongoing distribution and service fees.
As of February 24, 2017, the "Advisor Class" Shares were renamed to the "Class C" Shares, but there have been no other changes to this class of shares. The Class C Shares are subject to distribution plan fees as described in Note 3. Each Fund's Class C Shares are sold without an initial sales charge; however, they are subject to a contingent deferred sales charge of 1.00% on shares redeemed within one year of the purchase date. This amount is paid to Capital Investment Group, Inc. (the "Distributor"). Income, expenses (other than distribution and service fees), and realized and unrealized gains or losses on investments are allocated to each class of shares based upon its relative net assets. All classes have equal voting privileges, except where otherwise required by law or when the Trustees determine that the matter to be voted on affects only the interests of the shareholders of a particular class. Class C Shares held longer than seven years will automatically convert into Institutional Class Shares. Class P Shares have no initial sales charge but are only available through certain financial firms. There is also no conversion of the Class P Shares into other Shares of the Funds.
As of May 31, 2017, the Cavalier Tactical Rotation Fund was the only Fund with active Class P Shares, which commenced operations on July 1, 2016.
The Date of Initial Public Investment for each Fund and Class of Shares is as follows:
| Fund | Institutional Class Shares | Class C Shares | Class P Shares |
Cavalier Adaptive Income Fund | October 2, 2009 | February 25, 2011 | - |
(formerly known as "Cavalier Stable Income Fund") | | | |
| Cavalier Dividend Income Fund | September 20, 2012 | September 26, 2012 | - |
| Cavalier Dynamic Growth Fund | October 2, 2009 | February 18, 2011 | - |
| Cavalier Fundamental Growth Fund | October 17, 2013 | November 4, 2013 | - |
| Cavalier Global Opportunities Fund | September 20, 2012 | September 26, 2012 | - |
| Cavalier Hedged High Income Fund | September 20, 2012 | September 26, 2012 | - |
| Cavalier Multi Strategist Fund | September 20, 2012 | September 26, 2012 | - |
| Cavalier Tactical Rotation Fund | September 20, 2012 | September 26, 2012 | July 1, 2016 |
| | | | |
The following is a summary of significant accounting policies consistently followed by the Funds. The policies are in conformity with accounting principles generally accepted in the United States of America ("GAAP"). The Funds follow the accounting and reporting guidance in the Financial Accounting Standards Board ("FASB") Accounting Standards Codification 946 "Financial Services – Investment Companies."
(Continued)
Cavalier Funds
Notes to Financial Statements
Investment Valuation
Each Fund's investments in securities are carried at fair value. Securities listed on an exchange or quoted on a national market system are valued at the last price as of 4:00 p.m. Eastern Time. Securities traded in the NASDAQ over-the-counter market are generally valued at the NASDAQ Official Closing Price. Other securities traded in the over-the-counter market and listed securities for which no sale was reported on that date are valued at the most recent bid price. Securities and assets for which representative market quotations are not readily available (e.g., if the exchange on which the portfolio security is principally traded closes early or if trading of the particular portfolio security is halted during the day and does not resume prior to each Fund's net asset value calculation) or which cannot be accurately valued using each Fund's normal pricing procedures are valued at fair value as determined in good faith under policies approved by the Trustees. A portfolio security's "fair value" price may differ from the price next available for that portfolio security using each Fund's normal pricing procedures. Instruments with maturities of 60 days or less are valued at amortized cost, which approximates market value.
Underlying Funds
Open-End Funds - Each Fund may invest in portfolios of open-end investment companies. The open-end funds value securities in their portfolios for which market quotations are readily available at their market values (generally the last reported sale price) and all other securities and assets at their fair value to the methods established by the boards of directors of the open-end funds. Open-end funds are valued at their respective net asset values as reported by such investment companies.
Closed-End Funds - Each Fund may invest in portfolios of closed-end portfolios. Closed-end funds are valued a discount or premium to their net asset value based on supply and demand of investors in the market and the risk and return profile of the closed-end portfolio.
Limited Partnerships - Each Fund may also invest in limited partnerships. Limited partnerships are valued at their net asset value as reported by the entity. In determining the fair value level, the Trust considers the information available on each limited partnership, including, but not limited to, market pricing, selling restrictions, nature of the portfolios of the underlying investment vehicles, and their ability to liquidate their portfolio investments.
Fair Value Measurement
Each Fund has adopted ASC Topic 820, Fair Value Measurements. ASC Topic 820 defines fair value, establishes a framework for measuring fair value and expands disclosure about fair value measurements.
Various inputs are used in determining the value of each Fund's investments. These inputs are summarized in the three broad levels listed below:
Level 1: Unadjusted quoted prices in active markets for identical securities
Level 2: Other significant observable inputs (including quoted prices for similar securities, interest rates, credit risk, etc.)
Level 3: Significant unobservable inputs (including each Fund's own assumptions in determining fair value of investments)
The availability of observable inputs can vary from security to security and is affected by a wide variety of factors, including, for example, the type of security, whether the security is new and not yet established in the marketplace, the liquidity of markets, and other characteristics particular to the security. To the extent that valuation is based on models or inputs that are less observable or unobservable in the market, the determination of fair value requires more judgment. Accordingly, the degree of judgment exercised in determining fair value is greatest for instruments categorized in Level 3.
(Continued)
Cavalier Funds
Notes to Financial Statements
The inputs used to measure fair value may fall into different levels of the fair value hierarchy. In such cases, for disclosure purposes, the level in the fair value hierarchy within which the fair value measurement falls in its entirety, is determined based on the lowest level input that is significant to the fair value measurement in its entirety.
The inputs or methodology used for valuing securities are not necessarily an indication of the risk associated with investing in those securities. The following tables summarize the inputs as of May 31, 2017 for each Fund's investments measured at fair value:
Cavalier Adaptive Income Fund
| Assets | | Total | | Level 1 | | Level 2 | | Level 3 |
| Closed-End Funds | $ | 2,642,576 | $ | 2,642,576 | $ | - | $ | - |
| Exchange-Traded Products | | 1,530,867 | | 1,530,867 | | - | | - |
| Short-Term Investment | | 2,496,129 | | 2,496,129 | | - | | - |
| Total | $ | 6,669,572 | $ | 6,669,572 | $ | - | $ | - |
Cavalier Dividend Income Fund
| Assets | | Total | | Level 1 | | Level 2 | | Level 3 |
| Common Stocks* | $ | 350,784 | $ | 350,784 | $ | - | $ | - |
| Exchange-Traded Products | | 351,015 | | 351,015 | | - | | - |
| Short-Term Investment | | 43,344 | | 43,344 | | - | | - |
| Total | $ | 745,143 | $ | 745,143 | $ | - | $ | - |
Cavalier Dynamic Growth Fund
| Assets | | Total | | Level 1 | | Level 2 | | Level 3 |
| Common Stocks* | $ | 6,187,473 | $ | 6,187,473 | $ | - | $ | - |
| Call Options Purchased | | 13,537 | | - | | 13,537 | | - |
| Put Options Purchased | | 35,512 | | - | | 35,512 | | - |
| Exchange-Traded Product | | 507,024 | | 507,024 | | - | | - |
| Limited Partnership | | 238,544 | | 238,544 | | - | | - |
| U.S. Treasury Bill | | 447,925 | | - | | 447,925 | | - |
| Total Assets | $ | 7,430,015 | $ | 6,933,041 | $ | 496,974 | $ | - |
| | | | | | | | | |
| Liabilities | | | | | | | | |
| Call Options Written | $ | 89,905 | $ | - | $ | 89,905 | $ | - |
| Total Liabilities | $ | 89,905 | $ | - | $ | 89,905 | $ | - |
| | | | | | | | | |
Cavalier Fundamental Growth Fund
| Assets | | Total | | Level 1 | | Level 2 | | Level 3 |
| Common Stocks* | $ | 62,684,200 | $ | 62,684,200 | $ | - | $ | - |
| Limited Partnerships | | 1,795,269 | | 1,795,269 | | - | | - |
| Short-Term Investment | | 1,019,000 | | 1,019,000 | | - | | - |
| Total | $ | 65,498,469 | $ | 65,498,469 | $ | - | $ | - |
(Continued)
Cavalier Funds
Notes to Financial Statements
Cavalier Global Opportunities Fund
| Assets | | Total | | Level 1 | | Level 2 | | Level 3 |
| Exchange-Traded Products | $ | 13,123,345 | $ | 13,123,345 | $ | - | $ | - |
| Short-Term Investment | | 9,848,669 | | 9,848,669 | | - | | - |
| Total | $ | 22,972,014 | $ | 22,972,014 | $ | - | $ | - |
Cavalier Hedged High Income Fund
| Assets | | Total | | Level 1 | | Level 2 | | Level 3 |
| Exchange-Traded Products | $ | 1,219,132 | $ | 1,219,132 | $ | - | $ | - |
| Mutual Fund | | 4,936,243 | | 4,936,243 | | - | | - |
| Short-Term Investment | | 122,644 | | 122,644 | | - | | - |
| Total | $ | 6,278,019 | $ | 6,278,019 | $ | - | $ | - |
Cavalier Multi Strategist Fund
| Assets | | Total | | Level 1 | | Level 2 | | Level 3 |
| Common Stocks* | $ | 292,860 | $ | 292,860 | $ | - | $ | - |
| Exchange-Traded Products | | 8,434,125 | | 8,434,125 | | - | | - |
| Short-Term Investment | | 1,051,718 | | 1,051,718 | | - | | - |
| Total | $ | 9,778,703 | $ | 9,778,703 | $ | - | $ | - |
Cavalier Tactical Rotation Fund
| Assets | | Total | | Level 1 | | Level 2 | | Level 3 |
| Exchange-Traded Products | $ | 89,054,783 | $ | 89,054,783 | $ | - | $ | - |
| Short-Term Investment | | 1,840,523 | | 1,840,523 | | - | | - |
| Total | $ | 90,895,306 | $ | 90,895,306 | $ | - | $ | - |
*Refer to the Schedules of Investments for a breakdown by sector.
The Funds had no significant transfers into or out of Level 1, 2, or 3 during the year ended May 31, 2017. It is the Funds' policy to recognize transfers at the end of the reporting period.
Investment Transactions and Investment Income
Investment transactions are accounted for as of the date purchased or sold (trade date). Dividend income is recorded on the ex-dividend date. Certain dividends from foreign securities will be recorded as soon as the Fund is informed of the dividend if such information is obtained subsequent to the ex-dividend date. Interest income is recorded on the accrual basis and includes accretion and amortization of discounts and premiums. Gains and losses are determined on the identified cost basis, which is the same basis used for federal income tax purposes.
Expenses
The Fund bears expenses incurred specifically on its behalf as well as a portion of general expenses, which are allocated according to methods reviewed annually by the Trustees.
Distributions
Each Fund will distribute its income and realized gains to its shareholders every year. Income dividends paid by the Funds derived from net investment income, if any, will generally be paid monthly or quarterly and capital gains distributions, if any, will be made at least annually. Dividends and distributions to shareholders are recorded on ex-date.
Estimates
The preparation of financial statements in conformity with GAAP requires management to make estimates and assumptions that affect the reported amounts of assets and liabilities and disclosure of contingent assets and liabilities at the date of the financial statements and the reported amounts of increases and decreases in the net assets from operations during the reporting period. Actual results could differ from those estimates.
(Continued)
Cavalier Funds
Notes to Financial Statements
Federal Income Taxes
No provision for income taxes is included in the accompanying financial statements, as each Fund intends to distribute to shareholders all taxable investment income and realized gains and otherwise comply with Subchapter M of the Internal Revenue Code applicable to regulated investment companies.
Purchased Options
When one of the Funds purchases an option, an amount equal to the premium paid by the Fund is recorded as an investment and is subsequently adjusted to the current value of the option purchased. If an option expires on the stipulated expiration date or if the Fund enters into a closing sale transaction, a gain or loss is realized. If a call option is exercised, the cost of the security acquired is increased by the premium paid for the call. If a put option is exercised, a gain or loss is realized from the sale of the underlying security, and the proceeds from such sale are decreased by the premium originally paid. Purchased options are non-income producing securities. As of the fiscal year ended May 31, 2017, the Cavalier Dynamic Growth Fund is the only fund that purchased options during the year.
Option Writing
When one of the Funds writes an option, an amount equal to the premium received by the Fund is recorded as a liability and is subsequently adjusted to the current fair value of the option written. Premiums received from writing options that expire unexercised are treated by the Fund on the expiration date as realized gains from options written. The difference between the premium and the amount paid on effecting a closing purchase transaction, including brokerage commissions, is also treated as a realized gain or loss (depending on if the premium is less than the amount paid for the closing purchase transaction). If a call option is exercised, the premium is added to the proceeds from the sale of the underlying security in determining whether the Fund has realized a gain or loss. If a put option is exercised, the premium reduces the cost basis of the securities purchased by the Fund. The Fund, as the writer of an option, bears the market risk of an unfavorable change in the price of the security underlying the written option. Written options are non-income producing securities. As of the fiscal year ended May 31, 2017, the Cavalier Dynamic Growth Fund is the only Fund that held options written during the year.
A summary of option contracts written by the Cavalier Dynamic Growth Fund during the fiscal year ended May 31, 2017 were as follows:
| | | | Call Options | | |
| | Option Contracts Written | Number of Contracts | | Premiums Received | |
| | Options Outstanding, Beginning of Year | - | | $ | - | |
| | Options written | 2,153 | | 275,593 | |
| | Options closed | (1,446) | | (185,734) | |
| | Options exercised | - | | - | |
| | Options expired | - | | - | |
| | Options Outstanding, End of Year | 707 | | $ | 89,859 | |
Derivative Financial Instruments
The Cavalier Dynamic Growth Fund may invest in derivative financial instruments (derivatives) in order to manage risk or gain exposure to various other investments or markets. Derivatives may contain various risks including the potential inability of the counterparty to fulfill their obligations under the terms of the contract, the potential for an illiquid secondary market, and the potential for market movements which may expose the Fund to gains or losses in excess of the amounts shown on the Statement of Assets and Liabilities.
(Continued)
Cavalier Funds
Notes to Financial Statements
Derivatives are marked to market daily based upon quotations from market makers or the Fund's independent pricing services and the Fund's net benefit or obligation under the contract, as measured by the fair market value of the contract, is included in Investments, at value on the Statement of Assets and Liabilities. Net realized gains and losses and net change in unrealized appreciation and depreciation on these contracts for the year are included in the Realized and Unrealized Loss on Investments on the Statement of Operations.
The derivative instruments outstanding as of May 31, 2017 are disclosed below and the amounts of realized and changes in unrealized gains and losses on derivative instruments during the period as disclosed below serve as indicators of the volume of derivative activity for the Cavalier Dynamic Growth Fund.
The following table sets forth the effect of the derivative instruments on the Statement of Assets and Liabilities as of May 31, 2017 for the Cavalier Dynamic Growth Fund:
Derivative Type | Location | | Value |
| Equity Contracts – purchased options | Assets-Investments, at value | | $ | 49,049 |
| Equity Contracts – written options | Liabilities-Options written, at value | | $ | 89,905 |
The following table sets forth the effect of the derivative instruments on the Statement of Operations for the fiscal year ended May 31, 2017 for the Cavalier Dynamic Growth Fund:
| Derivative Type | Location | Gains/Losses |
| Equity Contracts – purchased options | Net realized gain from investment transactions | $ | (128,703) |
| Equity Contracts – written options | Net realized gain from options written | $ | 22,828 |
| | | |
| Equity Contracts – purchased options | Net change in unrealized appreciation on investments | $ | (94,531) |
| Equity Contracts – written options | Net change in unrealized depreciation on options written | $ | (46) |
| | | |
The following table presents the Fund's liabilities available for offset under a master netting arrangement of collateral pledged as of May 31, 2017 for the Cavalier Dynamic Growth Fund:
Gross Amounts of Assets Presented in the Statement of Assets & Liabilities |
| | Gross Amounts of Recognized Liabilities | Financial Instruments Pledged | Cash Collateral Pledged | Net Amount of Assets |
Description of Assets: | | | | |
Options Written | $89,905 | $89,905 | $ - | $ - |
Total | $89,905 | $89,905 | $ - | $ - |
| | | | | |
Cavalier Funds
Notes to Financial Statements
2. Transactions with Related Parties and Service Providers
Advisor
Each Fund pays a monthly advisory fee to Cavalier Investments, LLC (the "Advisor") based upon the average daily net assets and calculated at an annual rate. See the table below for the advisory fee rates and amounts paid to the Advisor for each Fund during fiscal year ended May 31, 2017:
| Fund | Advisory Fee Rate June 1, 2016 - December 28, 2016 | Advisory Fee Rate December 29 2016 - May 31, 2017 | Amount Incurred | Amount Waived by Advisor | Expenses Reimbursed by Advisor |
Cavalier Adaptive Income Fund | 0.45% | 1.00% | $ | 45,351 | $ | 45,351 | $ | 137,818 |
| Cavalier Dividend Income Fund | 0.90% | 0.90% | 10,261 | 10,261 | 205,652 |
| Cavalier Dynamic Growth Fund | 0.45% | 1.15% | 59,281 | 59,281 | 126,338 |
| Cavalier Fundamental Growth Fund | 1.00% | 1.00% | 559,904 | 206,022 | - |
| Cavalier Global Opportunities Fund | 0.45% | 1.10% | 96,603 | 96,603 | 61,679 |
| Cavalier Hedged High Income Fund | 0.45% | 1.00% | 42,923 | 42,923 | 132,827 |
| Cavalier Multi Strategist Fund | 0.45% | 1.00% | 47,554 | 47,554 | 170,178 |
| Cavalier Tactical Rotation Fund | 1.00% | 1.00% | 864,159 | 5,023 | - |
| | | | | | |
The Advisor has engaged sub-advisors to provide day to day portfolio management for the Funds. Each sub-advisor is paid directly by the Advisor. The Advisor has engaged sub-advisors for the following Funds:
| Fund | Sub-Advisors |
Cavalier Dynamic Growth Fund | Stratifi, LLC | Validus Growth Investors, LLC | - |
| Cavalier Fundamental Growth Fund | - | Navellier & Associates, Inc. | - |
| Cavalier Global Opportunities Fund | - | Beaumont Capital Management, LLC | - |
| Cavalier Hedged High Income Fund | - | Carden Capital, LLC | - |
| Cavalier Multi Strategist Fund | Carden Capital, LLC | Bluestone Capital Management, LLC | Julex Capital, LLC |
| Cavalier Tactical Rotation Fund | - | Beaumont Capital Management, LLC | - |
| | | | |
All Due from Advisor amounts indicated in each Fund's Statement of Assets and Liabilities were paid prior to July 31, 2017.
(Continued)
Cavalier Funds
Notes to Financial Statements
Expense Limitation
The Advisor entered into a contractual agreement (the "Expense Limitation Agreement") with the Trust, on behalf of the Funds, under which it had agreed to waive or reduce its fees and to assume other expenses of the Funds, if necessary, in amounts that limit the Funds' total operating expenses (exclusive of interest, taxes, brokerage commissions, borrowing costs, other expenditures which are capitalized in accordance with GAAP, other extraordinary expenses not incurred in the ordinary course of the Funds' business, and amounts, if any, payable under a Rule 12b-1 distribution plan, and acquired fund fees and expenses) to not more than the following percentages of the average daily net assets of the Institutional Class Shares and Class C Shares of the Funds:
| Fund | | | June 1, 2016 – December 28, 2016 | December 29, 2016 – February 26, 2017 | February 27, 2017 – May 31, 2017 |
Cavalier Adaptive Income Fund | | | 1.30% | 1.30% | 1.25% |
| Cavalier Dividend Income Fund | | | 1.88% | 0.99% | 0.99% |
| Cavalier Dynamic Growth Fund | | | 1.40% | 1.40% | 1.40% |
| Cavalier Fundamental Growth Fund | | | 1.10% | 1.35% | 1.25% |
| Cavalier Global Opportunities Fund | | | 1.10% | 1.40% | 1.35% |
| Cavalier Hedged High Income Fund | | | 1.44% | 1.44% | 1.25% |
| Cavalier Multi Strategist Fund | | | 1.48% | 1.48% | 1.25% |
| Cavalier Tactical Rotation Fund | | | 1.45% | 1.45% | 1.25% |
For the period from July 1, 2016 (Date of Initial Public Investment) through February 26, 2017, the Expense Limitation for the Class P Shares in the Cavalier Tactical Rotation Fund was limited to not more than 1.60% of average daily net assets of the Class P Shares of the Fund. For the period from February 27, 2017 through May 31, 2017, the percentage was limited to not more than 1.40% of the average daily net assets of the Class P Shares of the Cavalier Tactical Rotation Fund.
There shall be no recoupment of fees waived or reimbursed by the Advisor. The Advisor reimbursed the Funds for the acquired fund fees and expenses for the period from June 1, 2015 through December 17, 2015. The Expense Limitation Agreement was updated to exclude acquired fund fees and expenses from the waiver effective December 18, 2015. (Please refer to the Financial Highlights section of each Funds' Financial Statements for additional information on the expense ratios during this period.)
(Continued)
Cavalier Funds
Notes to Financial Statements
Administrator
Each Fund pays a monthly fee to the Administrator, The Nottingham Company, based upon the average daily net assets of each Fund and calculated at the annual rates as shown in the schedule below subject to a minimum of $2,000 per month. The Administrator also receives a fee as to procure and pay the Fund's custodian, additional compensation for fund accounting and recordkeeping services, and additional compensation for certain costs involved with the daily valuation of securities and as reimbursement for out-of-pocket expenses. A breakdown of these fees is provided in the following table:
| Administration Fees* | Custody Fees* | Fund Accounting Fees (base fee) (monthly fee) | Fund Accounting Fees (asset-based fee) | Blue Sky Administration Fees (annual) |
Average Net Assets | Annual Rate | Average Net Assets | Annual Rate |
| First $250 million | 0.100% | First $100 million | 0.020% | $2,250 plus $500/additional share class | 0.01% | $150 per state |
| Next $250 million | 0.080% | Over $100 million | 0.009% | | | |
| Next $250 million | 0.060% | | | | | |
| Next $250 million | 0.050% | *Minimum monthly fees of $2,000 and $416 for Administration and Custody, respectively. |
| On the next $1 billion | 0.040% |
| On all assets over $2 billion | 0.035% | |
Compliance Services
Cipperman Compliance Services, LLC provides services as the Trust's Chief Compliance Officer. Cipperman Compliance Services, LLC is entitled to receive customary fees from the Funds for their services pursuant to the Compliance Services agreement with the Funds.
Transfer Agent
Nottingham Shareholder Services, LLC ("Transfer Agent"), an affiliate of the Administrator, serves as transfer, dividend paying, and shareholder servicing agent for the Funds. For its services, the Transfer Agent is entitled to receive compensation from the Funds pursuant to the Transfer Agent's fee arrangements with the Funds.
Distributor
Capital Investment Group, Inc. serves as the Funds' principal underwriter and distributor. For its services, the Distributor is entitled to receive compensation from the Funds pursuant to the Funds' fee arrangements with the Distributor.
Certain officers of the Trust are also officers of the Administrator.
3. Distribution and Service Fees
The Board of Trustees, including a majority of the Trustees who are not "interested persons" as defined in the 1940 Act, adopted a distribution and service plan pursuant to Rule 12b-1 of the 1940 Act (the "Plan") for the Class C Shares. The 1940 Act regulates the manner in which a registered investment company may assume costs of distributing and promoting the sales of its shares and servicing of its shareholder accounts. The Plan provides that each Fund may incur certain costs, which may not exceed 1.00% per annum of the average daily net assets of the Class C Shares for each year elapsed subsequent to adoption of the Plan, for payment to the Distributor and others for items such as advertising expenses, selling expenses, commissions, travel, or other expenses reasonably intended to result in sales of Class C Shares or servicing of Class C shareholder accounts.
Cavalier Funds
Notes to Financial Statements
See the table below for the Distribution and Service Fees of the Class C Shares for each Fund during the fiscal year ended May 31, 2017:
| Fund | | | | Amount Incurred |
| | | | | | |
Cavalier Adaptive Income Fund | | | | $ | 16,701 |
| Cavalier Dividend Income Fund | | | | 886 |
| Cavalier Dynamic Growth Fund | | | | 9,203 |
| Cavalier Fundamental Growth Fund | | | | 49,014 |
| Cavalier Global Opportunities Fund | | | | 36,364 |
| Cavalier Hedged High Income Fund | | | | 9,564 |
| Cavalier Multi Strategist Fund | | | | 6,473 |
| Cavalier Tactical Rotation Fund | | | | 49,678 |
| | | | | |
4. Purchases and Sales of Investment Securities
For the fiscal year ended May 31, 2017, the aggregate cost of purchases and proceeds from sales of investment securities (excluding short-term securities) were as follows:
| | | Purchases of Securities | Proceeds from Sales of Securities |
| Cavalier Adaptive Income Fund | | $ | 6,516,426 | $ | 9,051,056 |
| Cavalier Dividend Income Fund | | 901,140 | 1,908,406 |
| Cavalier Dynamic Growth Fund | | 13,080,652 | 19,471,581 |
| Cavalier Fundamental Growth Fund | | 76,831,688 | 74,436,053 |
| Cavalier Global Opportunities Fund | | 57,799,982 | 60,831,233 |
| Cavalier Hedged High Income Fund | | 10,924,099 | 13,003,051 |
| Cavalier Multi Strategist Fund | | 13,827,047 | 9,871,580 |
| Cavalier Tactical Rotation Fund | | 140,689,868 | 143,791,104 |
| | | | |
There were no long-term purchases or sales of U.S. Government Obligations during the fiscal year ended May 31, 2017.
5. Federal Income Tax
Distributions are determined in accordance with Federal income tax regulations, which differ from GAAP, and, therefore, may differ significantly in amount or character from net investment income and realized gains for financial reporting purposes. Financial reporting records are adjusted for permanent book/tax differences to reflect tax character but are not adjusted for temporary differences.
Management has reviewed all taxable years / periods that are open for examination (i.e., not barred by the applicable statute of limitations) by taxing authorities of all major jurisdictions, including the Internal Revenue Service. As of May 31, 2017, open taxable years consisted of the taxable years ended May 31, 2014 through May 31, 2017. No examination of tax returns is currently in progress for any of the Funds.
Cavalier Funds
Notes to Financial Statements
Reclassifications relate primarily to differing book/tax treatment of ordinary net investment losses, dividends paid/received, partnership adjustments, and PFIC mark-to-market adjustments and have no impact on the net assets of the Funds. For the year ended May 31, 2017, the following reclassifications were necessary:
| | Paid-In- Capital | Accumulated Net Investment Income | Accumulated Net Realized Loss on Investments |
| Cavalier Adaptive Income Fund | $ | (7,032) | $ | 7,032 | $ | - |
| Cavalier Dynamic Growth Fund | - | 36,572 | (36,572) |
| Cavalier Multi Strategist Fund | - | 26,838 | (26,838) |
| Cavalier Tactical Rotation Fund | (4) | - | 4 |
Distributions during the fiscal years ended were characterized for tax purposes as follows:
| | | Distributions from |
| Fund | Fiscal year ended | Ordinary Income | Long-Term Capital Gains | Return of Capital |
| Cavalier Adaptive Income Fund | 05/31/2017 | $ | 239,134 | $ | - | $ | - |
| | 05/31/2016 | 149,461 | - | - |
| Cavalier Dividend Income Fund | 05/31/2017 | 4,020 | - | 6,747 |
| | 05/31/2016 | 27,199 | - | - |
| Cavalier Dynamic Growth Fund | 05/31/2017 | - | 574,583 | - |
| | 05/31/2016 | - | 2,585,083 | - |
| Cavalier Fundamental Growth Fund | 05/31/2017 | 80,323 | - | - |
| | 05/31/2016 | 65,347 | - | - |
| Cavalier Global Opportunities Fund | 05/31/2017 | 25,470 | - | - |
| | 05/31/2016 | - | 551,842 | - |
| Cavalier Hedged High Income Fund | 05/31/2017 | 115,310 | - | - |
| | 05/31/2016 | 373,039 | 149,668 | - |
| Cavalier Multi Strategist Fund | 05/31/2017 | - | - | - |
| | 05/31/2016 | - | 160,981 | - |
| Cavalier Tactical Rotation Fund | 05/31/2017 | - | - | - |
| | 05/31/2016 | - | 2,240,177 | - |
| | | | | |
Cavalier Funds
Notes to Financial Statements
At May 31, 2017, the tax-basis cost of investments and components of distributable earnings were as follows:
| | | Cavalier Adaptive Income Fund | Cavalier Dividend Income Fund | Cavalier Dynamic Growth Fund | Cavalier Fundamental Growth Fund |
Cost of Investments | | $ | 6,562,154 | $ | 761,598 | $ | 7,023,179 | $ | 54,005,875 |
| | | | | | |
| Gross Unrealized Appreciation | | 117,476 | 10,664 | 494,597 | 12,403,763 |
| Gross Unrealized Depreciation | | (10,058) | (27,119) | (177,666) | (911,169) |
| Net Unrealized Appreciation (Depreciation) | | 107,418 | (16,455) | 316,931 | 11,492,594 |
| | | | | | |
Undistributed Ordinary Income | | - | - | 817,634 | 38,981 |
| Undistributed Long-Term Capital Gains | | - | - | 121,963 | - |
| Accumulated Net Capital Losses | | (166,160) | (242,180) | - | (2,265,470) |
Deferred Post October Capital Losses | | (25,654) | - | - | - |
| | | | | | |
| Distributable Earnings (Accumulated Deficit) | | $ | (84,396) | $ | (258,635) | $ | 1,256,528 | $ | 9,266,105 |
| | Cavalier Global Opportunities Fund | Cavalier Hedged High Income Fund | Cavalier Multi Strategist Fund | Cavalier Tactical Rotation Fund |
Cost of Investments | $ | 22,083,642 | $ | 6,259,824 | $ | 9,520,280 | $ | 83,339,720 |
| | | | | |
| Gross Unrealized Appreciation | 903,229 | 84,959 | 396,666 | 7,627,673 |
| Gross Unrealized Depreciation | (14,857) | (66,764) | (138,243) | (72,087) |
| Net Unrealized Appreciation (Depreciation) | 888,372 | 18,195 | 258,423 | 7,555,586 |
| | | | | |
| Undistributed Ordinary Income | 35,430 | 76,916 | 165,350 | 667,637 |
| Accumulated Net Capital Losses | (1,876,611) | (1,868,300) | - | - |
| | | | | |
| Distributable Earnings (Accumulated Deficit) | $ | (952,809) | $ | (1,773,189) | $ | 423,773 | $ | 8,223,223 |
The difference between book-basis and tax-basis net unrealized appreciation (depreciation) is attributable to the deferral of losses from wash sales. Accumulated capital losses noted above represent net capital loss carryovers as of May 31, 2017 that are available to offset future realized capital gains, if any, and thereby reduce future taxable gain distributions. The Cavalier Adaptive Income Fund has a loss carryforward of $166,160, of which $47,717 is short term in nature and $118,443 is long term in nature. The Cavalier Dividend Income Fund has a loss carryforward of $242,180, of which $115,040 is short term in nature and $127,140 is long term in nature. The Cavalier Fundamental Growth Fund has a loss carryforward of $2,265,470, all of which is short-term in nature. The Cavalier Global Opportunities Fund has a loss carryforward of $1,876,611, of which $1,865,725 is short term in nature and $10,886 is long term in nature. The Cavalier Hedged High Income Fund has a loss carryforward of $1,868,300, of which $1,417,250 is short term in nature and $451,050 is long term in nature. The capital loss carryforwards have no expiration date.
(Continued)
Cavalier Funds
Notes to Financial Statements
In addition, realized losses reflected in the accompanying financial statements include net capital losses realized between November 1 and the Funds' fiscal year-end that have not been recognized for tax purposes (Deferred Post October Capital Losses).
6. Commitments and Contingencies
Under the Trust's organizational documents, its officers and Trustees are indemnified against certain liabilities arising out of the performance of their duties to the Funds. In addition, in the normal course of business, the Trust entered into contracts with its service providers, on behalf of the Funds, and others that provide for general indemnifications. The Funds' maximum exposure under these arrangements is unknown, as this would involve future claims that may be made against the Funds. The Funds expect the risk of loss to be remote.
7. Underlying Investment in Other Investment Company
Some of the Funds currently invest a significant portion of their assets in the Fidelity Investments Money Market Government Portfolio ("Fidelity Portfolio"). The Funds may redeem their investment from the Fidelity Portfolio at any time if the Advisor determines that it is in the best interest of the Funds and their shareholders to do so. The performance of the Funds may be directly affected by the performance of the Fidelity Portfolio. The financial statements of the Fidelity Portfolio, including the portfolio of investments, can be found at Fidelity's website www.fidelity.com or the Securities and Exchange Commission's website www.sec.gov and should be read in conjunction with the Funds' financial statements.
As of May 31, 2017, the Funds with a significant amount of net assets invested in the Fidelity Portfolio consisted of the following:
| | | | Percentage (%) of Net Assets at May 31, 2017 |
| Cavalier Adaptive Income Fund | | | 37.25% |
| Cavalier Global Opportunities Fund | | | 42.78% |
The Cavalier Hedged High Income Fund currently seeks to achieve its investment objective by investing a portion of its assets in the Vanguard High-Yield Corporate Fund (the "Vanguard Fund"). The Vanguard Fund is a registered open-end management investment company organized as a Delaware statutory trust. The Cavalier Hedged High Income Fund may redeem its investments from the Vanguard Fund at any time if the Advisor determines that it is in the best interest of the Cavalier Hedged High Income Fund and the Fund's shareholders to do so. The financial statements for the Vanguard Fund can be found at www.sec.gov. The performance of the Cavalier Hedged High Income Fund may be directly affected by the performance of the Vanguard Fund. As of May 31, 2017, the percentage of net assets invested in the Vanguard Fund by the Cavalier Hedged High Income Fund was 78.30%.
9. New Accounting Pronouncement
In October 2016, the U.S. Securities and Exchange Commission ("SEC") issued a new rule, Investment Company Reporting Modernization, which, among other provisions, amends Regulation S-X to require standardized enhanced disclosures, particularly related to derivatives, in investment company financial statements. The compliance date for the amendments to Regulation S-X is for reporting periods ending after August 1, 2017. Management has reviewed the requirements and believes the adoption of the amendments to Regulation S-X will not have a material impact on the Funds' financial statements and related disclosures.
10. Subsequent Events
The Funds have evaluated the need for disclosures and/or adjustments resulting from subsequent events through the date of issuance of these financial statements.
(Continued)
Cavalier Funds
Notes to Financial Statements
Distributions
Per share distributions during the subsequent period were as follows:
| | | | |
| Fund | Class | Record Date | Pay Date | Ordinary Income |
Cavalier Adaptive Income Fund | Institutional | 6/27/2017 | 6/28/2017 | $ | 0.017165 |
| Class C | 6/27/2017 | 6/28/2017 | 0.023632 |
| | Institutional | 7/26/2017 | 7/27/2017 | 0.036743 |
| | Class C | 7/26/2017 | 7/27/2017 | 0.027408 |
| | Institutional | 6/27/2017 | 6/28/2017 | 0.018168 |
| Cavalier Hedged High Income Fund | Class C | 6/27/2017 | 6/28/2017 | 0.024351 |
| | Institutional | 7/26/2017 | 7/27/2017 | 0.059780 |
| | Class C | 7/26/2017 | 7/27/2017 | 0.050419 |
| | | | | |
Cavalier Dividend Income Fund
At a special meeting of the Board of Trustees on February 24, 2017, the Trustees approved the name change of the Cavalier Dividend Income Fund to the Nebraska Index Fund. Subsequent to the February 24, 2017 meeting, through written consent on August 7, 2017, the name of the Fund has been approved to be changed from the Nebraska Index Fund to the Nebraska Fund, to take effect as of the date of the effectiveness of the next post-effective amendment to the registration statement.
Liquidation of the Class P Shares
At a meeting held on June 8, 2017, the Funds' Board of Trustees, in consultation with the Funds' investment advisor, Cavalier Investments, LLC, determined that the dissolution and liquidation of the Class P Shares of the Funds was in the best interests of the Funds and their shareholders. In accordance with the decision, the Board of Trustees directed that (i) all of the Class P Shares' portfolio securities be liquidated in an orderly manner and (ii) all outstanding shareholder accounts on August 11, 2017 be closed and the proceeds of each account sent to the shareholder's address of record or to such other address as directed by the shareholder. As of June 12, 2017, the Funds were no longer accepting the sale of new Class P Shares and will no longer accept purchase orders. The Funds accepted redemption orders until August 11, 2017 and agreed to waive any redemption fees that would otherwise be imposed by the Funds. As of the closing date of the Class P Shares on August 11, 2017, the only Fund with investors in the Class P Shares was the Cavalier Tactical Rotation Fund.
Management has concluded there are no additional matters, other than those noted above, requiring recognition or disclosure.
REPORT OF INDEPENDENT REGISTERED PUBLIC ACCOUNTING FIRM
To the Board of Trustees of Starboard Investment Trust
and the Shareholders of Cavalier Adaptive Income Fund, Cavalier Dividend Income Fund, Cavalier Dynamic Growth Fund, Cavalier Fundamental Growth Fund, Cavalier Global Opportunities Fund, Cavalier Hedged High Income Fund, Cavalier Multi Strategist Fund, and Cavalier Tactical Rotation Fund
We have audited the accompanying statements of assets and liabilities of Cavalier Adaptive Income Fund (formerly Cavalier Stable Income Fund), Cavalier Dividend Income Fund, Cavalier Dynamic Growth Fund, Cavalier Fundamental Growth Fund, Cavalier Global Opportunities Fund, Cavalier Hedged High Income Fund, Cavalier Multi Strategist Fund, and Cavalier Tactical Rotation Fund, each a series of shares of beneficial interest in Starboard Investment Trust (the "Funds"), including the schedules of investments, as of May 31, 2017, and the related statements of operations for the year then ended, the statements of changes in net assets for each of the years in the two-year period then ended and the financial highlights for each of the years or periods in the five-year period then ended. These financial statements and financial highlights are the responsibility of the Funds' management. Our responsibility is to express an opinion on these financial statements and financial highlights based on our audits.
We conducted our audits in accordance with the standards of the Public Company Accounting Oversight Board (United States). Those standards require that we plan and perform the audits to obtain reasonable assurance about whether the financial statements and financial highlights are free of material misstatement. An audit includes examining, on a test basis, evidence supporting the amounts and disclosures in the financial statements. Our procedures included confirmation of securities owned as of May 31, 2017 by correspondence with the custodian and brokers. An audit also includes assessing the accounting principles used and significant estimates made by management, as well as evaluating the overall financial statement presentation. We believe that our audits provide a reasonable basis for our opinion.
In our opinion, the financial statements and financial highlights referred to above present fairly, in all material respects, the financial position of Cavalier Adaptive Income Fund, Cavalier Dividend Income Fund, Cavalier Dynamic Growth Fund, Cavalier Fundamental Growth Fund, Cavalier Global Opportunities Fund, Cavalier Hedged High Income Fund, Cavalier Multi Strategist Fund, and Cavalier Tactical Rotation Fund as of May 31, 2017, and the results of their operations for the year then ended, the changes in their net assets for each of the years in the two-year period then ended and their financial highlights for each of the years or periods in the five-year period then ended, in conformity with accounting principles generally accepted in the United States of America.
BBD, LLP
Philadelphia, Pennsylvania
August 15, 2017
Cavalier Funds
Additional Information
(Unaudited)
1. Proxy Voting Policies and Voting Record
A copy of the Trust's Proxy Voting and Disclosure Policy and the Advisor's Disclosure Policy are included as Appendix B to the Funds' Statement of Additional Information and are available, without charge, upon request, by calling 800-773-3863, and on the website of the Securities and Exchange Commission ("SEC") at sec.gov. Information regarding how each Fund voted proxies relating to portfolio securities during the most recent period ended June 30, is available (1) without charge, upon request, by calling the Funds at the number above and (2) on the SEC's website at sec.gov.
2. Quarterly Portfolio Holdings
Distributions are determined in accordance with Federal income tax regulations, which differ from GAAP, and, therefore, may differ significantly in amount or character from net investment income and realized gains for financial reporting purposes. Financial reporting records are adjusted for permanent book/tax differences to reflect tax character but are not adjusted for temporary differences.
3. Tax Information
We are required to advise you within 60 days of each Fund's fiscal year-end regarding the federal tax status of certain distributions received by shareholders during each fiscal year.
Each of the funds listed below had the following distribution information for the fiscal year ended May 31, 2017.
| | Ordinary Income | Long-Term Capital Gains | Return of Capital |
| Cavalier Adaptive Income Fund | $ | 239,134 | $ | - | $ | - |
| Cavalier Dividend Income Fund | 4,020 | - | 6,747 |
| Cavalier Dynamic Growth Fund | - | 574,583 | - |
| Cavalier Fundamental Growth Fund | 80,323 | - | - |
| Cavalier Global Opportunities Fund | 25,470 | - | - |
| Cavalier Hedged High Income Fund | 115,310 | - | - |
| Cavalier Multi Strategist Fund | - | - | - |
| Cavalier Tactical Rotation Fund | - | - | - |
Dividend and distributions received by retirement plans such as IRAs, Keogh-type plans, and 403(b) plans need not be reported as taxable income. However, many retirement plans may need this information for their annual information meeting.
4. Schedule of Shareholder Expenses
As a shareholder of the Fund, you incur two types of costs: (1) transaction costs, including contingent deferred sales charges; and (2) ongoing costs, including management fees; distribution [and/or service] (12b-1) fees; and other Fund expenses. This Example is intended to help you understand your ongoing costs (in dollars) of investing in the Fund and to compare these costs with the ongoing costs of investing in other mutual funds.
The Example is based on an investment of $1,000 invested at the beginning of the period and held for the entire period from December 1, 2016 through May 31, 2017.
Actual Expenses – The first line of the table below provides information about actual account values and actual expenses. You may use the information in this line, together with the amount you invested, to estimate the expenses that you paid over the period. Simply divide your account value by $1,000 (e.g., an $8,600 account value divided by $1,000 = 8.6), then multiply the result by the number in the first line under the heading entitled "Expenses Paid During Period" to estimate the expenses you paid on your account during this period.
(Continued)
Cavalier Funds
Additional Information
(Unaudited)
Hypothetical Example for Comparison Purposes – The second line of the table below provides information about hypothetical account values and hypothetical expenses based on the Fund's actual expense ratio and an assumed rate of return of 5% per year before expenses, which is not the Fund's actual return. The hypothetical account values and expenses may not be used to estimate the actual ending account balance or expenses you paid for the period. You may use this information to compare the ongoing costs of investing in the Fund and other funds. To do so, compare this 5% hypothetical example with the 5% hypothetical examples that appear in the shareholder reports of the other funds.
Please note that the expenses shown in the table are meant to highlight your ongoing costs only and do not reflect any transactional costs, such as sales charges (loads), redemption fees, or exchange fees. Therefore, the second line of the table is useful in comparing ongoing costs only, and will not help you determine the relative total costs of owning different funds. In addition, if these transactional costs were included, your costs would have been higher.
| Cavalier Adaptive Income Fund | Beginning Account Value December 1, 2016 | Ending Account Value May 31, 2017 | Expenses Paid During Period* | Annualized Expense Ratio* |
| Institutional Class Shares | | | | |
| Actual | $1,000.00 | $1,031.37 | $6.35 | 1.25% |
| Hypothetical (5% annual return before expenses) | $1,000.00 | $1,018.70 | $6.31 | 1.25% |
| Class C Shares | | | | |
| Actual | $1,000.00 | $1,025.88 | $11.43 | 2.25% |
| Hypothetical (5% annual return before expenses) | $1,000.00 | $1,013.79 | $11.36 | 2.25% |
| Cavalier Dividend Income Fund | Beginning Account Value December 1, 2016 | Ending Account Value May 31, 2017 | Expenses Paid During Period* | Annualized Expense Ratio* |
| Institutional Class Shares | | | | |
| Actual | $1,000.00 | $1,014.26 | $5.67 | 1.13% |
| Hypothetical (5% annual return before expenses) | $1,000.00 | $1,019.30 | $5.69 | 1.13% |
| Class C Shares | | | | |
| Actual | $1,000.00 | $1,009.00 | $10.67 | 2.13% |
| Hypothetical (5% annual return before expenses) | $1,000.00 | $1,014.31 | $10.70 | 2.13% |
| Cavalier Dynamic Growth Fund | Beginning Account Value December 1, 2016 | Ending Account Value May 31, 2017 | Expense Paid During Period* | Annualized Expense Ratio* |
| Institutional Class Shares | | | | |
| Actual | $1,000.00 | $1,123.20 | $7.41 | 1.40% |
| Hypothetical (5% annual return before expenses) | $1,000.00 | $1,017.95 | $7.04 | 1.40% |
| Class C Shares | | | | |
| Actual | $1,000.00 | $1,042.27 | $12.22 | 2.40% |
| Hypothetical (5% annual return before expenses) | $1,000.00 | $1,012.96 | $12.04 | 2.40% |
(Continued)
Cavalier Funds
Additional Information
(Unaudited)
| Cavalier Fundamental Growth Fund | Beginning Account Value December 1, 2016 | Ending Account Value May 31, 2017 | Expenses Paid During Period* | Annualized Expense Ratio* |
| Institutional Class Shares | | | | |
| Actual | $1,000.00 | $1,177.10 | $6.84 | 1.26% |
| Hypothetical (5% annual return before expenses) | $1,000.00 | $1,018.65 | $6.34 | 1.26% |
| Class C Shares | | | | |
| Actual | $1,000.00 | $1,171.60 | $12.24 | 2.26% |
| Hypothetical (5% annual return before expenses) | $1,000.00 | $1,013.66 | $11.35 | 2.26% |
| Cavalier Global Opportunities Fund | Beginning Account Value December 1, 2016 | Ending Account Value May 31, 2017 | Expenses Paid During Period* | Annualized Expense Ratio* |
| Institutional Class Shares | | | | |
| Actual | $1,000.00 | $1,124.00 | $7.03 | 1.33% |
| Hypothetical (5% annual return before expenses) | $1,000.00 | $1,018.31 | $6.68 | 1.33% |
| Class C Shares | | | | |
| Actual | $1,000.00 | $1,122.90 | $12.40 | 2.33% |
| Hypothetical (5% annual return before expenses) | $1,000.00 | $1,013.32 | $11.76 | 2.33% |
| Cavalier Hedged High Income Fund | Beginning Account Value December 1, 2016 | Ending Account Value May 31, 2017 | Expenses Paid During Period* | Annualized Expense Ratio* |
| Institutional Class Shares | | | | |
| Actual | $1,000.00 | $1,096.10 | $7.01 | 1.34% |
| Hypothetical (5% annual return before expenses) | $1,000.00 | $1,018.24 | $6.75 | 1.34% |
| Class C Shares | | | | |
| Actual | $1,000.00 | $1,091.12 | $12.72 | 2.44% |
| Hypothetical (5% annual return before expenses) | $1,000.00 | $1,012.76 | $12.24 | 2.44% |
| Cavalier Multi Strategist Fund | Beginning Account Value December 1, 2016 | Ending Account Value May 31, 2017 | Expenses Paid During Period* | Annualized Expense Ratio* |
| Institutional Class Shares | | | | |
| Actual | $1,000.00 | $1,078.00 | $7.05 | 1.36% |
| Hypothetical (5% annual return before expenses) | $1,000.00 | $1,018.14 | $6.85 | 1.36% |
| Class C Shares | | | | |
| Actual | $1,000.00 | $1,072.20 | $12.20 | 2.36% |
| Hypothetical (5% annual return before expenses) | $1,000.00 | $1,013.16 | $11.85 | 2.36% |
(Continued)
Cavalier Funds
Additional Information
(Unaudited)
| Cavalier Tactical Rotation Fund | Beginning Account Value December 1, 2016 | Ending Account Value May 31, 2017 | Expenses Paid During Period* | Annualized Expense Ratio* |
| Institutional Class Shares | | | | |
| Actual | $1,000.00 | $1,083.10 | $6.80 | 1.31% |
| Hypothetical (5% annual return before expenses) | $1,000.00 | $1,018.40 | $6.59 | 1.31% |
| Class C Shares | | | | |
| Actual | $1,000.00 | $1,078.53 | $11.97 | 2.31% |
| Hypothetical (5% annual return before expenses) | $1,000.00 | $1,013.38 | $11.60 | 2.31% |
| Class P Shares | | | | |
| Actual | $1,000.00 | $1,082.13 | $7.58 | 1.46% |
| Hypothetical (5% annual return before expenses) | $1,000.00 | $1,017.60 | $7.34 | 1.46% |
*Expenses are equal to the average account value over the period multiplied by each Fund's annualized expense ratio, multiplied by the number of days in the most recent period divided by the number of days in the fiscal year (to reflect the six month period).
5. Approval of Advisory and Sub-Advisory Agreements
Shareholder Votes
At a special meeting of the Shareholders on December 29, 2016, Matthew J. Beck, Secretary of the Trust, served as Chairman of the meeting and recorded the minutes. Kristen Wisdom, Assistant Vice President of Broadridge Financial Solutions, Inc., served as Inspector of Election for the meeting. Mr. Beck served as a proxy holder representing shares of the Fund.
The Chairman noted that as of the Record Date, there were 624,880.891 shares of the Cavalier Adaptive Income Fund, 101,504.421 shares of the Cavalier Dividend Income Fund, 803,541.188 shares of the Cavalier Dynamic Growth Fund, 4,131,308.198 shares of the Cavalier Fundamental Growth Fund, 985,234.171 shares of the Cavalier Global Opportunities Fund, 704,967.977 shares of the Cavalier Hedged High Income Fund, 528,698.053 shares of the Cavalier Multi Strategist Fund and 7,125,639.732 shares of the Cavalier Tactical Rotation Fund that were outstanding and entitled to vote at the meeting.
The Chairman first stated that 344,793.648 shares of the Cavalier Adaptive Income Fund were present by proxy at the meeting, 50,789.630 shares of the Cavalier Dividend Income Fund were present by proxy at the meeting, 438,033.339 shares of the Cavalier Dynamic Growth Fund were present by proxy at the meeting, 2,286,847.625 shares of the Cavalier Fundamental Growth Fund were present by proxy at the meeting, 555,479.708 shares of the Cavalier Global Opportunities Fund were present by proxy at the meeting, 362,233.247 shares of the Cavalier Hedged High Income Fund were present by proxy at the meeting, 316,494.442 shares of the Cavalier Multi Strategist Fund were present by proxy at the meeting, and 4,037,413.154 shares of the Cavalier Tactical Rotation Fund were present by proxy at the meeting. The Chairman noted that the shares present by proxy at the meeting exceeded a majority of the outstanding shares of the Funds as of the Record Date and, accordingly, a quorum was present for the Funds for purposes of transaction of business at the meeting.
The Chairman stated that approval of the proposals submitted to the Funds' shareholders required the approval of a "majority of the outstanding voting shares" entitled to vote thereon, which meant the affirmative vote of the lesser of: (i) more than 50% of the outstanding shares of the Funds; or (ii) 67% or more of the shares of the Funds present at the meeting, provided more than 50% of the Funds' outstanding shares are present in person or by proxy at the meeting. Thereafter, upon motion duly made and seconded, the item was submitted to the shareholders of the Funds for consideration.
The Chairman stated that the first item of business was to consider a proposal to shareholders of the Cavalier Funds to approve an Investment Advisory Agreement with Cavalier Investments, LLC, the Funds' proposed investment advisor, including proposed increases in the management fee for the Cavalier Adaptive Income Fund, the Cavalier Dynamic Growth Fund, the Cavalier Global Opportunities Fund, the Cavalier Hedged High Income Fund and the Cavalier Multi Strategist Fund. The Chairman announced that, for the Cavalier Adaptive Income Fund, 252,129.430 shares had been voted in favor of the item, 16,389.683 shares had been voted against the item, and 8,539.535 shares had abstained from voting on the item. The Chairman then announced that, for the Cavalier Dividend Income Fund, 47,263.457 shares had been voted in favor of the item, 884.173 shares had been voted against the item, and no shares has abstained from voting on the item. The Chairman then announced that, for the Cavalier Dynamic Growth Fund, 355,426.230 shares had been voted in favor of the item, 6,560.609 shares has been voted against the item, and 1,206.500 shares had abstained from voting on the item. The Chairman then announced that, for the Cavalier Fundamental Growth Fund, 1,627,478.422 shares have been voted in favor of the item, 271,640.492 shares had been voted against the item, and 47,338.711 shares has abstained from voting on the item. The Chairman then announced that, for the Cavalier Global Opportunities Fund, 389,505.721 shares had voted in favor of the item, 2,935.411 shares has voted against the item, and 11,578.576 shares had abstained from voting on the item. The Chairman then announced that, for the Cavalier Hedged High Income Fund, 292,407.122 shares had been voted in favor of the item, 5,505.579 shares had been voted against the item, and 5,209.546 shares had abstained from voting on the item. The Chairman then announce that, for the Cavalier Multi Strategist Fund, 261,128.840 shares has voted in favor of the item, 2,038.916 shares has voted against the item, and 12,504.686 shares had abstained from voting on the item. The Chairman then announced that, for the Cavalier Tactical Rotation Fund, 2,837,889.066 shares had voted for the item, 114,105.950 shares has voted against the item, and 40,974.138 shares has abstained from voting on the item. Since both a majority of the shares of the Funds and more than 67% of the shares of the Funds present voted in favor of the item, the proposal to approve the Investment Advisory Agreement for the Cavalier Funds, including increases in the management fees for the Cavalier Adaptive Income Fund, Cavalier Dynamic Growth Fund, Cavalier Global Opportunities Fund, Cavalier Hedged High Income Fund and Cavalier Multi Strategist Fund was approved.
(Continued)
Cavalier Funds
Additional Information
(Unaudited)
The Chairman stated that the next item of business was to consider a proposal of shareholders of the Cavalier Fundamental Growth Fund to approve an Investment Sub-Advisory Agreement with Cavalier Investments, LLC, the Fund's proposed investment advisor, and Navellier & Associates, Inc., the Fund's proposed investment sub-advisor. The Chairman announced that 1,845,041.776 shares had been voted in favor of the item, 54,077.138 shares had been voted against the item, and 47,338.771 shares had abstained from voting on the item. Since both a majority of the shares of the Fund and more than 67% of the shares of the Fund present voted in favor of the item, the proposal to approve the Investment Sub-Advisory Agreement for the Cavalier Fundamental Growth Fund was approved.
The Chairman stated that the next item of business was to consider a proposal of shareholders of the Cavalier Global Opportunities Fund and Cavalier Tactical Rotation Fund to approve an Investment Sub-Advisory Agreement with Cavalier Investments, LLC, the Funds' proposed investment advisor, and Beaumont Financial Partners, LLC, the Funds' proposed investment sub-advisor. The Chairman announced that, for the Cavalier Global Opportunities Fund, 391,426.756 shares had been voted in favor of the item, 1,014.376 shares had been voted against the item, and 11,578.576 shares had abstained from voting on the item. The Chairman then announced that, for the Cavalier Tactical Rotation Fund, 2,843,927.656 shares voted in favor of the item, 108,067.360 shares voted against the item, and 40,974.138 shares abstained from voting on the item. Since both a majority of the shares of the Funds and more than 67% of the shares of the Funds present voted in favor of the item, the proposal to approve the Investment Sub-Advisory Agreement for the Cavalier Global Opportunities Fund and Cavalier Tactical Rotation Fund was approved.
The Chairman stated that the next item of business was to consider a proposal of shareholders of the Cavalier Multi Strategist Fund to approve an Investment Sub-Advisory Agreement with Cavalier Investments, LLC, the Fund's proposed investment advisor, and Bluestone Capital Management, LLC, the Fund's proposed investment sub-advisor. The Chairman announced that 262,891.565 shares had been voted in favor of the item, 276.191 shares had been voted against the item, and 12,504.686 shares had abstained from voting on the item. Since both a majority of the shares of the Fund and more than 67% of the shares of the Fund present voted in favor of the item, the proposal to approve the Investment Sub-Advisory Agreement for the Cavalier Multi Strategist Fund was approved.
(Continued)
Cavalier Funds
Additional Information
(Unaudited)
The Chairman stated that the next item of business was to consider a proposal of shareholders of the Cavalier Hedged High Income Fund and Cavalier Multi Strategist Fund to approve an Investment Sub-Advisory Agreement with Cavalier Investments, LLC, the Funds' proposed investment advisor, and Carden Capital LLC, the Funds' proposed investment sub-advisor. The Chairman announced that, for the Cavalier Hedged High Income Fund, 292,988.831 shares had been voted in favor of the item, 5,488.446 shares had been voted against the item, and 4,644.970 shares had abstained from voting on the item. The Chairman then announced that, for the Cavalier Multi Strategist Fund, 262,891.565 shares had been voted in favor of the item, 276.191 shares had been voted against the item, and 12,504.686 shares had abstained from voting on the item. Since both a majority of the shares of the Funds and more than 67% of the shares of the Funds present voted in favor of the item, the proposal to approve the Investment Sub-Advisory Agreement for the Cavalier Hedged High Income Fund and Cavalier Multi Strategist Fund was approved.
The Chairman stated that the next item of business was to consider a proposal of shareholders of the Cavalier Multi Strategist Fund to approve an Investment Sub-Advisory Agreement with Cavalier Investments, LLC, the Fund's proposed investment advisor, and Julex Capital Management, LLC, the Fund's proposed investment sub-advisor. The Chairman announced that 262,891.565 shares had been voted in favor of the item, 276.191 shares had been voted against the item, and 12,504.686 shares had abstained from voting on the item. Since both a majority of the shares of the Fund and more than 67% of the shares of the Fund present voted in favor of the item, the proposal to approve the Investment Sub-Advisory Agreement for the Cavalier Multi Strategist Fund was approved.
The Chairman stated that the next item of business was to consider a proposal of shareholders of the Cavalier Multi Strategist Fund to approve an Investment Sub-Advisory Agreement with Cavalier Investments, LLC, the Fund's proposed investment advisor, and Parasol Capital Management, LLC, the Fund's proposed investment sub-advisor. The Chairman announced that 261,014.104 shares had been voted in favor of the item, 2,153.652 shares had been voted against the item, and 12,504.686 shares had abstained from voting on the item. Since both a majority of the shares of the Fund and more than 67% of the shares of the Fund present voted in favor of the item, the proposal to approve the Investment Sub-Advisory Agreement for the Cavalier Multi Strategist Fund was approved.
The Chairman stated that the next item of business was to consider a proposal of shareholders of the Cavalier Dynamic Growth Fund to approve an Investment Sub-Advisory Agreement with Cavalier Investments, LLC, the Fund's proposed investment advisor, and Stratifi, LLC, the Fund's proposed investment sub-advisor. The Chairman announced that 355,512.884 shares had been voted in favor of the item, 1,734.544 shares had been voted against the item, and 5,945.911 shares had abstained from voting on the item. Since both a majority of the shares of the Fund and more than 67% of the shares of the Fund present voted in favor of the item, the proposal to approve the Investment Sub-Advisory Agreement for the Cavalier Dynamic Growth Fund was approved.
The Chairman stated that the next item of business was to consider a proposal of shareholders of the Cavalier Dynamic Growth Fund to approve an Investment Sub-Advisory Agreement with Cavalier Investments, LLC, the Fund's proposed investment advisor, and Validus Growth Investors, LLC, the Fund's proposed investment sub-advisor. The Chairman announced that 355,512.884 shares had been voted in favor of the item, 1,734.544 shares had been voted against the item, and 5,945.911 shares had abstained from voting on the item. Since both a majority of the shares of the Fund and more than 67% of the shares of the Fund present voted in favor of the item, the proposal to approve the Investment Sub-Advisory Agreement for the Cavalier Dynamic Growth Fund was approved.
The Chairman stated that the next item of business was to consider a proposal of shareholders of the Cavalier Adaptive Income Fund to approve an Investment Sub-Advisory Agreement with Cavalier Investments, LLC, the Fund's proposed investment advisor, and Efficient Market Advisors, LLC, the Fund's proposed investment sub-advisor. The Chairman announced that 264,457.592 shares had been voted in favor of the item, 656.852 shares had been voted against the item, and 11,944.204 shares had abstained from voting on the item. Since both a majority of the shares of the Fund and more than 67% of the shares of the Fund present voted in favor of the item, the proposal to approve the Investment Sub-Advisory Agreement for the Cavalier Adaptive Income Fund was approved.
(Continued)
Cavalier Funds
Additional Information
(Unaudited)
The Chairman stated that the next item of business was to consider a proposal of shareholders of the Cavalier Funds to approve a reliance on an order by the Securities and Exchange Commission for which the Trust and Advisor have applied for exemption from Section 15(a) of the Investment Company Act of 1940, as amended (the "1940 Act"), which shall allow the Funds' investment advisor to hire sub-advisors without shareholder approval. The Chairman announced that, for the Cavalier Adaptive Income Fund, 255,784.782 shares had been voted in favor of the item, 12,734.331 shares had been voted against the item, and 8,539.535 shares had abstained from voting on the item. The Chairman then announced that, for the Cavalier Dividend Income Fund, 47,263.457 shares had been voted in favor of the item, 884.173 shares had been voted against the item, and no shares had abstained from voting on the item. The Chairman then announced that, for the Cavalier Dynamic Growth Fund, 355,159.619 shares had been voted in favor of the item, 6,827.220 shares had been voted against the item, and 1,206.500 shares had abstained from voting on the item. The Chairman then announced that, for the Cavalier Fundamental Growth Fund, 1,826,219.394 shares had been voted in favor of the item, 78,102.192 shares had been voted against the item, and 42,136.039 shares had abstained from voting on the item. The Chairman then announced that, for the Cavalier Global Opportunities Fund, 390,337.142 shares had been voted in favor of the item 2,103.990 shares had been voted against the item, and 11,578.576 shares had abstained from voting on the item. The Chairman then announced that, for the Cavalier Hedged High Income Fund, 292,599.122 shares had been voted in favor of the item, 5,895.288 shares had been voted against the item, and 4,627.837 shares had abstained from voting on the item. The Chairman then announced that, for the Cavalier Multi Strategist Fund, 260,922.925 shares had been voted in favor of the item, 2,244.831 shares had been voted against the item, and 12,504.686 shares had abstained from voting on the item. The Chairman then announced that, for the Cavalier Tactical Rotation Fund, 2,860,972.168 shares had been voted in favor of the item, 97,936.047 shares had been voted against the item, and 34,060.939 shares had abstained from voting on the item. Since both a majority of the shares of the Funds and more than 67% of the shares of the Funds present voted in favor of the item, the proposal to approve the Investment Sub-Advisory Agreement for the Cavalier Funds was approved.
The Chairman stated that the next item of business was to consider a proposal of shareholders of the Cavalier Dividend Income Fund to approve a change in the diversification status of the Fund from diversified to non-diversified. The Chairman announced that 47,263.457 shares had been voted in favor of the item, 884.173 shares had been voted against the item, and no shares had abstained from voting on the item. Since both a majority of the shares of the Fund and more than 67% of the shares of the Fund present voted in favor of the item, the proposal to approve the Investment Sub-Advisory Agreement for the Cavalier Dividend Income Fund was approved.
There being no further business to come before the meeting, the same, upon motion duly made and seconded, was adjourned.
6. Information about Trustees and Officers
The business and affairs of the Funds and the Trust are managed under the direction of the Board of Trustees of the Trust. Information concerning the Trustees and officers of the Trust and Funds is set forth below. Generally, each Trustee and officer serves an indefinite term or until certain circumstances such as their resignation, death, or otherwise as specified in the Trust's organizational documents. Any Trustee may be removed at a meeting of shareholders by a vote meeting the requirements of the Trust's organizational documents. The Statement of Additional Information of the Funds includes additional information about the Trustees and officers and is available, without charge, upon request by calling the Funds toll-free at 1-800-773-3863. The address of each Trustee and officer, unless otherwise indicated below, is 116 South Franklin Street, Rocky Mount, North Carolina 27804. The Independent Trustees each received aggregate compensation of $20,945 during the fiscal year ended May 31, 2017 for their services to the Funds and Trust.
(Continued)
Cavalier Funds
Additional Information
(Unaudited)
Name, Age
and Address | Position
held with
Fund or Trust | Length of Time Served | Principal Occupation
During Past 5 Years | Number of Portfolios in Fund Complex Overseen by Trustee | Other Directorships
Held by Trustee
During Past 5 Years |
| Independent Trustees |
James H. Speed, Jr.
Date of Birth: 06/1953 | Independent Trustee, Chairman | Trustee since 7/09, Chair since 5/12 | Previously President and CEO of NC Mutual Insurance Company (insurance company) from 2003 to 2015. | 17 | Independent Trustee of the Brown Capital Management Mutual Funds for its four series, Hillman Capital Management Investment Trust for its one series, Centaur Mutual Funds Trust for its one series, Chesapeake Investment Trust, previously known as Gardner Lewis Trust, for its one series and WST Investment Trust for its two series (all registered investment companies). Member of Board of Directors of M&F Bancorp. Member of Board of Directors of Investors Title Company. Previously, Board of Directors of NC Mutual Life Insurance Company. |
Theo H. Pitt, Jr.
Date of Birth: 04/1936 | Independent Trustee | Since 9/10 | Senior Partner, Community Financial Institutions Consulting (financial consulting) since 1999; Partner, Pikar Properties (real estate) since 2001. | 17 | Independent Trustee of World Funds Trust for its forty nine series, Chesapeake Investment Trust, previously known as Gardner Lewis Investment Trust, for its one series, Leeward Investment Trust for its two series and Hillman Capital Management Investment Trust for its one series (all registered investment companies). |
Michael G. Mosley
Date of Birth: 01/1953 | Independent Trustee | Since 7/10 | Owner of Commercial Realty Services (real estate) since 2004. | 17 | None. |
J. Buckley Strandberg
Date of Birth: 03/1960 | Independent Trustee | Since 7/09 | President of Standard Insurance and Realty (insurance and property management) since 1982. | 17 | None. |
| Other Officers |
Katherine M. Honey
Date of Birth: 09/1973 | President and Principal Executive Officer | Since 05/15 | EVP of The Nottingham Company since 2008. | n/a | n/a |
Matthew J. Beck
Date of Birth: 06/1988 | Secretary | Since 05/15 | General Counsel of The Nottingham Company since 2014. | n/a | n/a |
Ashley E. Harris Date of Birth: 03/1984 | Treasurer, Assistant Secretary and Principal Financial Officer | Since 05/15 | Fund Accounting Manager and Financial Reporting, The Nottingham Company since 2008. | n/a | n/a |
(Continued)
Cavalier Funds
Additional Information
(Unaudited)
Name, Age
and Address | Position
held with
Fund or Trust | Length of Time Served | Principal Occupation
During Past 5 Years | Number of Portfolios in Fund Complex Overseen by Trustee | Other Directorships
Held by Trustee
During Past 5 Years |
Stacey Gillespie Date of Birth: 05/1974 | Chief Compliance Officer | Since 03/16 | Compliance Director, Cipperman Compliance Services, LLC (09/15-present). Formerly, Chief Compliance Officer of Boenning & Scattergood, Inc. (2013-2015) and Director of Investment Compliance at Boenning & Scattergood, Inc. (2007-2013). | n/a | n/a |
The Cavalier Funds
are a series of
The Starboard Investment Trust
For Shareholder Service Inquiries: | For Investment Advisor Inquiries: |
| |
| Nottingham Shareholder Services | Cavalier Investments |
| 116 South Franklin Street | 50 Braintree Hill Office Park |
| Post Office Box 69 | Suite 105 |
| Rocky Mount, North Carolina 27802-0069 | Braintree, Massachusetts 02184 |
| | |
| Telephone: | Telephone: |
| | |
| 800-773-3863 | 800-773-3863 |
| | |
| World Wide Web @: | World Wide Web @: |
| | |
| ncfunds.com | ncfunds.com |
Pursuant to the requirements of the Securities Exchange Act of 1934 and the Investment Company Act of 1940, the registrant has duly caused this report to be signed on its behalf by the undersigned, thereunto duly authorized.
Pursuant to the requirements of the Securities Exchange Act of 1934 and the Investment Company Act of 1940, this report has been signed below by the following persons on behalf of the registrant and in the capacities and on the dates indicated.

