Beginning on January 1, 2021, paper copies of the Fund’s shareholder reports will no longer be sent by mail, unless you specifically request paper copies of the reports. Instead, the reports will be made available on the Fund’s website at https://www.nottinghamco.com/fundpages/Roumell, and you will be notified by mail each time a report is posted and provided with a website link to access the report.
As of January 1, 2019, you may, notwithstanding the availability of shareholder reports online, elect to receive all future shareholder reports in paper free of charge. If you invest through a financial intermediary, you can contact your financial intermediary to request that you continue to receive paper copies of your shareholder reports. If you invest directly with a Fund, you can call 800-773-3863 to let the Fund know you wish to continue receiving paper copies of your shareholder reports.
If you have previously elected to receive shareholder reports electronically, you will not be affected by this change and you need not take any action. You may elect to receive shareholder reports and other communications from a Fund electronically anytime by contacting your financial intermediary (such as a broker-dealer or bank) or, if you are a direct investor, by clicking Enroll at https://www.nottinghamco.com/fundpages/Roumell.
(Unaudited)

August 31, 2019
For the fiscal year ended August 31, 2019, the return on the Institutional Class Shares was -3.12%. This compares to -7.79% for the 60% Russell 2000 Value Index/40% Barclays Capital U.S. Government Credit Index, -14.89% for the Russell 2000 Value Index, 11.42% for the Barclays Capital U.S. Government Credit Index, and 2.92% for the S&P 500 over the same period. These returns were attained with an allocation of about 26% in cash, 58% in equities, and 16% in fixed income during the fiscal year. Premiums from put options had a de minimis positive impact on performance over the period. Although the overall market (i.e., S&P 500) rose modestly over this period, small cap value in particular underperformed. The Roumell Opportunistic Value Fund slightly outperformed the 60% Russell 2000 Value Index/40% Barclays Capital U.S. Government Credit Index. Significant positive contributors to performance were Rubicon Project and SeaChange International, and significant negative contributors to performance were Dundee and Paratek Pharmaceuticals. Our investment style of selecting securities of individual companies that are deeply researched and out of favor, overlooked, or misunderstood by Wall Street and, thus, able to be bought at a significant discount to our calculation of intrinsic value means that our investment returns will unlikely mirror market averages.
Please see the table below for the Fund’s historical performance information through the calendar quarter ended September 30, 2019.
Average Annual Returns (Unaudited) Period Ended September 30, 2019
| Past 1 Year | Since Inception1 | Gross Expense Ratio2 | Net Expense Ratio3 |
Roumell Opportunistic Value Fund – Institutional Class Shares | 1.63% | 2.32% | 1.31% | 1.25% |
60% Russell 2000 Value Index, and 40% Barclays Capital U.S. Government Credit Index | -2.90% | 6.71% | N/A | N/A |
| Russell 2000 Value Index | -8.24% | 8.37% | N/A | N/A |
Barclays Capital U.S. Government Credit Index | 11.32% | 3.78% | N/A | N/A |
S&P 500 Total Return Index | 4.25% | 12.67% | N/A | N/A |
The quoted performance data represents past performance, which is not a guarantee of future results. Investment return and principal value of an investment in the Fund will fluctuate so that an investor's shares, when redeemed, may be worth more or less than their original cost. Current performance may be lower or higher than the performance data quoted. To obtain more current performance data regarding the Fund, including performance data current to the Fund’s most recent month-end, please visit ncfunds.com or call the Fund at (800)773-3863. Fee waivers and expenses reimbursements have positively impacted Fund performance.
1The Fund’s inception date is December 31, 2010.
2Gross expense ratio as of the Fund’s most recent Prospectus dated January 1, 2019 and includes Acquired Fund Fees and Expenses.
3 Net expense ratio is as of the Fund’s most recent Prospectus dated January 1, 2019 and includes Acquired Fund Fees and Expenses. The Advisor has entered into an Expense Limitation Agreement with the Fund under which it has agreed to waive or reduce its fees in an amount that limits the Fund’s annual operating expenses (exclusive of acquired fund fees and expenses, interest, taxes, brokerage fees and commissions, extraordinary expenses, and payments under the Rule 12b-1 distribution plan) to not more than 1.23% of the average daily net assets of the Fund through January 31, 2020. The Expense Limitation Agreement may not be terminated prior to that date. Further, net annual operating expenses for the Fund may exceed those contemplated by the waiver due to acquired fund fees and other expenses that are not waived under the Expense Limitation Agreement.
Turnarounds
Most investors avoid turnarounds, and for good reason…they’re difficult to execute and most fail. As a result of overall investor disdain for turnarounds, such securities can fall deeply out of favor and, in our opinion, offer exceptional pricing opportunities. We’re attracted to securities experiencing investor fatigue and love outright investor capitulation. Roumell Asset Management (“RAM”) has a disciplined, highly duplicable process that we believe provides a material investment edge.
First, we leverage an industrial-strength network of contacts that provides us with a steady source of investment ideas. This network is made up of like-minded investors whose work we value and trust, C-level executives we’ve built relationships with over many years, rank and file employees to whom we’ve been introduced, and other key industry participants and/or thought leaders. We do not source ideas by using traditional screens because screening, at day’s end, is a commodity. On the other hand, building long-lasting, valuable relationships with key industry participants will never be commoditized, in our view. As investment generalists, we utilize our network to understand the current dynamics and the emerging trends inside the industries being analyzed.
Second, we stress companies with strong balance sheets. We want very long-dated turnaround options without liquidity and/or refinancing risks or, if such risks are present, we demand a substantially greater discount to our calculation of intrinsic value.
Third, we want to possess multiple shots on goal. The most common investment narrative for us - RAM’s “sweet spot” - is a company with a legacy business in some type of stress or disruption that is the focus of investor sentiment and pricing, masking emerging investment stories that are being wholly, or largely, ignored. In our minds, this is an effective way to potentially capture early stage investment returns for free since the nascent opportunities within these businesses are not currently appreciated by public market participants. We want investment redundancy. The fewer shots on goal, the larger the discount demanded to own the security.
Lastly, we need to understand the company’s culture and whether the board and management are fundamentally on the side of shareholders. There is always a degree of tension between insiders and outside passive investors. We want to be partnered with people appropriately incentivized and who we believe are ethical and trustworthy. We seek to align ourselves with value creators who are looking to restructure their businesses through corporate actions, which will ultimately lead to a re-rating of the security in the public markets or perhaps draw the attention of strategic or financial buyers.
In executing our turnaround-focused strategy, we think probabilistically. Sherman Kent is a legend in intelligence circles. “Estimating,” Kent said, “is what you do when you do not know.” In investing, we rarely “know,” so we’re always handicapping probabilities. In short, Kent discovered that terms like “fair chance” meant vastly different things to different people and “possible” implied a probability of almost 0% to almost 100%. He replaced gauzy predictive terms with quantifiable ranges to be used by intelligence officers. For example, in Kent’s framework, “Almost certain” should meet a 93% threshold (give or take about 6%) for occurring, while a term like “Probably not” should meet a threshold of 30% (give or take about 10%) for not occurring. We force ourselves to think deeply about probabilities.
Precisely because forecasting and assessing probabilities is difficult, we try to tilt the odds in our favor with our strategy of focusing on situations where we have multiple ways to win, and/or protect our downside against serious loss. For example, let’s say a given security has three distinct investment options each possessing a 50% chance of experiencing a favorable outcome with “favorable outcome” defined as the value creation needed to equal the company’s current market capitalization. The probability that all three options will not occur is 12.5% (50% of 50% of 50%), providing meaningful downside protection in our view. To be clear, the three options must be genuinely uncorrelated in order to capture the full downside protection of the strategy. The point of this illustration is simply to demonstrate the value of probabilistic thinking and RAM’s goal to construct a portfolio with what it believes to be an overall high margin of safety.
“Pure plays” (those investments with little to no investment redundancy) are often more rewarding when we get them right. For the majority of our high conviction ideas, however, we basically trade the optionality of achieving individual home runs for singles, doubles and the occasional triple. However, we weight our core holdings in a manner that can effectively provide home run-like returns to our overall portfolio. We like the safety that comes with our “multiple shots on goal” investment emphasis and are not shy about heavily weighting such securities to provide real investment value to our investors.
Recent Updates of Top Five Equity Holdings
ZAGG, Inc., ZAGG. ZAGG is a leading mobile accessory product company (in protection, power and productivity) with a portfolio of brands including InvisibleShield, HALO, Gear4 and Braven. ZAGG announced a much worse than expected 2nd Quarter sending its shared down to the $6 level. The company reset 2019 expectations and explained the shortfall overwhelming on weak mobile device sales as the iPhone 11 offers an insufficient number of new features to get consumers to the stores. The shortfall was explained, and we believe, is a cycle issue that will be corrected with the introduction of 5G phones in 2020 (Samsung in the 1st Q and Apple in the typical fall launch season). The company’s newly acquired businesses (HALO, Gear4 and Braven) all came in ahead of company revenue expectations. Thus, the company indicated 2019 should be a trough as the mobile replacement cycle begins next year driving its core screen protector business.
The company’s newly issued 2019 mid-point guidance indicates a very cheap stock and compelling investment opportunity, in our opinion.
Revenue
| $535 million |
| |
EBITDA | $57 million |
| |
Earnings | $0.88/share |
| |
FCF
| $40 million |
At $6/share, ZAGG trades at roughly $175 million market cap and a $260 million enterprise value based on about $80 million of net debt. This translates to: 4.5x EV/EBITDA; 6.8x earnings, and a 15% FCF yield. The company also announced the hiring of Bank of America to look at strategic options, evidently in part due to unsolicited private-equity interest as well as the company’s own belief that its shares are not being properly value in the public marketplace. Given RAM’s confidence in this core holding, it should be no surprise that we’ve been buyers on the sell-off.
As of the fiscal year ended August 31, 2019, the Fund held 8.59% in ZAGG.
Liquidity Services, Inc., LQDT. LQDT is an industry leader in the reverse supply chain industry and has 3 primary segments: GovDeals (online surplus goods marketplace serving North American municipalities), Retail Supply Chain (merchandise returns), and Capital Assets (energy and industrial commercial goods). Liquidity’s Q3 fiscal year 2019 ended June 30, 2019 performance was within the guidance range for GAAP Net Loss, GAAP EPS, and Gross Merchandise Volume (GMV) and exceeded the guidance range for Non-GAAP Adjusted EBITDA and Non-GAAP Adjusted EPS. Q3-FY19 marked its fifth consecutive quarter of organic GMV year-over-year growth.
GMV was $168.1 million, up from $163.6 million in the prior year’s comparable period. GovDeals GMV grew 6%, Retail Supply Chain Group GMV grew18%, and Capital Assets Group (CAG) GMV declined 12%, excluding its Scrap contract with the Department of Defense (DoD). LQDT is winding down its Scrap contract. We view this as a positive step toward profitability and reallocation of company resources.
After several years of development, Liquidity announced the completion of LiquidityOne, its new core e-commerce technology platform. LiquidityOne will provide users a unified set of common services ranging from self-directed to fully-managed services. LiquidityOne should further enhance the company’s operating leverage and efficiency.
Additionally, registered buyers increased 10.7% year-over year to approximately 3.6 million and completed transactions increased 10.3% to approximately 160,000 year-over-year.
The company maintains a solid balance sheet with $76 million in cash and investments and no debt. We are excited about (i) the company’s ability to take advantage of the growth in online sales as higher merchandise returns increase the demand of LQDT’s liquidation services, (ii) the steady growth in in its GovDeals division, and (iii) its overall goal of being a self-serve liquidation model, i.e., the eBay for industry.
As of the fiscal year ended August 31, 2019, the Fund held 7.01% in Liquidity Services.
SeaChange International, Inc., SEAC. For those of you who have been long-term shareholders, SEAC is a name that may be familiar as it is our fourth time investing in the company. SEAC is an industry leader in the delivery of multiscreen, advertising and premium over-the-top (“OTT”) video management solutions. Its software products and services are designed to empower video providers to create, manage and monetize the increasingly personalized, highly engaging experiences that viewers demand.
SEAC announced the release of the Framework 7th generation Backoffice, a major milestone for this product family. Framework is an “all you can eat” offering as that is more easily deployed as opposed to prior software offerings that had separate modules that needed a lot of customization for each customer. SEAC won seven customers since the beginning of the fiscal year covering multi-year commitments for the Framework video delivery platform amounting to more than $20 million in total deal value.
As important, in our opinion, is that SEAC announced that Yossi Aloni was appointed President and CEO. Yossi joined SEAC in January 2019 as Chief Commercial Officer. He strategized, developed and implemented the Framework solution and go-to-market strategy that is responsible for the company’s recent growth. We believe Yossi is the proper individual to lead SEAC into the future.
Also of note: backlog increased $5 million to $16 million over the prior quarter; GAAP earnings were nearly break-even; non-GAAP operating income were $1 million; and a share repurchase program was instituted. SEAC continues to execute towards its goals announced earlier in the year.
As of the fiscal year ended August 31, 2019, the Fund held 4.66% in SeaChange International.
A10 Networks, Inc., ATEN. ATEN is a leading provider of secure application solutions and services that enable a new generation of intelligently connected companies with the ability to continuously improve cyber protection and digital responsiveness across dynamic Information Technology (“IT”) and network infrastructures.
ATEN reported lower than expected revenue of $49.2 million for the second quarter of 2019. This was down from $60.7 million in the second quarter of 2018. Gross profit margin remained strong at 77.1%. Second quarter revenue came in below our expectation as a number of large deals in ATEN’s pipeline pushed into future quarters or were downsized. These deals were primarily in North America and within the service provider and web giant verticals where opportunities can be large, but the timing is difficult to predict.
ATEN remains very well positioned to capitalize on significant opportunities in the second half of 2020, when many 5G conversions are expected to occur. ATEN has been winning early competitive mandates and winning numerous security industry awards for their technology.
ATEN’s balance sheet is very strong with $119.3 million of cash and no debt.
We believe that ATEN’s well regarded technology, its apparent advantages in the 5G area and its strong balance sheet make it a very attractive acquisition candidate. During the second quarter several actions occurred that may lead to a sale of the company. First, Lee Chen resigned as CEO. Lee will continue to serve until a replacement is found, and he will remain as Chairman of the Board. Second, an activist investor who is also a large shareholder was elected to ATEN’s Board. As part of the election of the activist to the Board, the company also formed a Strategy Committee, which consists of the new Board member and existing director Peter Chung. Peter is a senior executive at a technology private equity firm that owns about 12% of ATEN’s stock. The Strategy Committee is tasked with executing activities directed to increasing shareholder value. ATEN, like ZAGG, has retained Bank of America to advise the company on strategic matters, including a near term exploration of a potential sale transaction.
As of the fiscal year ended August 31, 2019, the Fund held 4.33% in A10 Networks.
Dundee Corp., DDEJF/DC’A-T. (Note all figures are in Canadian dollars). Dundee is a holding company that invests directly and indirectly in private companies as well as public ones. Jonathan Goodman, CEO, has been diligently working over the past year to reduce the number of portfolio holdings to a more manageable level from 100 to now under 40. DDEJF’s most significant holdings are Dundee Precious Metals (DPM-T) and United Hydrocarbon.
The most meaningful event in the quarter was that the company improved its capital structure and lowered future interest expenses with the successful conversion of its Preference Shares, series 5 to Class A subordinate voting shares. The company continues to look for ways to optimize its capital structure, lower interest payments and reduce overall expenses.
Additionally, there have been operational improvements at Parq Vancouver, ongoing efforts to monetize TauRx and Blue Goose (two non-core investments), as well as the re-launching of the Employee Share Repurchase Plan.
As of the fiscal year ended August 31, 2019, the Fund held 4.23% in Dundee.
We will continue to methodically and diligently search for out-of-favor, overlooked and misunderstood investments and stay true to being balance sheet focused, opportunistic, and thoughtful while gathering enough information to make well-informed investment decisions.
Best Regards,
Jim Roumell
Portfolio Manager
Roumell Opportunistic Value Fund
RCRAM1019001
| ROUMELL OPPORTUNISTIC VALUE FUND | | | | | | | | | |
| Institutional Class Shares | | | | | | | | | | |
| | | | | | | | | | | | | | | | | | |
| Performance Update (Unaudited) | | | | | | | | | | | |
| | | | | | | | | | | | | | | | | | |
| For the period from December 31, 2010 (Date of Initial Public Investment) through August 31, 2019 |
| | | | | | | | | | | | | | | | | | |
| Comparison of the Change in Value of a $10,000 Investment | | | | | | | | |
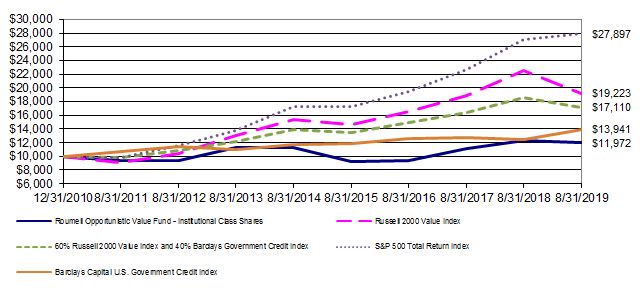
| This graph assumes the minimum initial investment of $10,000 at December 31, 2010 (Date of Initial Public Investment). All dividends and distributions are reinvested. This graph depicts the performance of the Roumell Opportunistic Value Fund - Institutional Class Shares (the “Fund”) versus the Russell 2000 Value Index, the Barclays Capital U.S. Government Credit Index, a blend of 60% of the Russell 2000 Value Index and 40% of the Barclays Capital U.S. Government Credit Index, and the S&P 500 Total Return Index. It is important to note that the Fund is a professionally managed mutual fund while the indices are not available for investment and are unmanaged. The comparison is shown for illustrative purposes only. |
| | | | | | | | | | | | | | | | | | |
| | Average Annual Total Returns |
| | | | | | | | | | | | | | | | | | |
| | | As of | | | | | | One | | Five | | Since | | Inception |
| | | August 31, 2019 | | | | | Year | | Year | | Inception | | Date |
| | | Institutional Class Shares | | | | -3.12% | | 1.14% | | 2.17% | | 12/31/10 |
| | | Russell 2000 Value Index | | | | -14.89% | | 4.63% | | 7.83% | | N/A |
| | | Barclays Capital U.S. Government | | | | | | | | | |
| | | Credit Index | | | | | | 11.42% | | 3.58% | | 3.91% | | N/A |
| | | 60% Russell 2000 Value Index and | | | | | | | | �� | |
| | | 40% Barclays Capital U.S. | | | | | | | | | | |
| | | Government Credit Index | | | | -7.79% | | 4.28% | | 6.39% | | N/A |
| | | S&P 500 Total Return Index | | | | 2.92% | | 10.11% | | 12.56% | | N/A |
| | | | | | | | | | | | | | | | | | |
| | | | | | | | | | | | | | | | | | |
| | | | | | | | | | | | | | | | | | (Continued) |
| ROUMELL OPPORTUNISTIC VALUE FUND | | | | | | | | | |
| Institutional Class Shares | | | | | | | | | | |
| | | | | | | | | | | | | | | | | | |
| Performance Update (Unaudited) | | | | | | | | | | | |
| | | | | | | | | | | | | | | | | | |
| For the period from December 31, 2010 (Date of Initial Public Investment) through August 31, 2019 |
Performance quoted in the previous graph represents past performance, which is no guarantee of future results. Investment return and principal value will fluctuate so that shares, when redeemed, may be worth more or less than their original cost. Current performance may be lower or higher than the performance data quoted. The Advisor has entered into an Expense Limitation Agreement with the Fund under which it had agreed to waive or reduce its fees and to assume other expenses of the Fund, if necessary, in amounts that limit the Fund’s total operating expenses (exclusive of (i) any front-end or contingent deferred sales loads; (ii) brokerage fees and commissions; (iii) acquired fund fees and expenses; (iv) fees and expenses associated with investments in other collective investment vehicles or derivative instruments (including for example option and swap fees and expenses); (v) borrowing costs (such as interest and dividend expense on securities sold short); (vi) taxes; and (vii) extraordinary expenses, such as litigation expenses (which may include indemnification of Fund officers and Trustees and contractual indeminification of Fund service providers (other than the Advisor)) to not more than 1.23% of the average daily net assets of the Fund through January 31, 2020. The Expense Limitation Agreement may be terminated by the Board of Trustees of the Trust at any time. The Advisor cannot recoup from the Fund any amounts paid by the Advisor under the Expense Limitation Agreement. Without the waiver, the expenses would be 1.31% per the Fund’s most recent prospectus dated January 1, 2019. An investor may obtain performance data, current to the most recent month-end, by visiting ncfunds.com. |
| | | | | | | | | | | | | | | | | | |
| The graph and table do not reflect the deduction of taxes that a shareholder would pay on Fund distributions or the redemption of Fund shares. Average annual total returns are historical in nature and measure net investment income and capital gain or loss from portfolio investments assuming reinvestment of distributions. |
| | | | | | | | | | | | | | | | | | |
| ROUMELL OPPORTUNISTIC VALUE FUND | | | | | |
| | | | | | | | | | | |
| Schedule of Investments | | | | | | | |
| | | | | | | | | | | |
| As of August 31, 2019 | | | | | | | |
| | | | | | |
Shares | |
Cost | | Value (Note 1) |
| | | | | | | | | | | |
| COMMON STOCKS - 50.85% | | | | | | |
| | | | | | | | | | | |
| | Communication Services - 8.70% | | | | | | |
| | * | A10 Networks, Inc. | | | 494,939 | $ | 3,132,917 | $ | 3,434,877 |
| | * | comScore, Inc. | | | 1,071,130 | | 3,470,578 | | 1,992,302 |
| | * | Sierra Wireless, Inc. | | 136,957 | | 1,999,942 | | 1,479,135 |
| | | | | | | | | | | 6,906,314 |
| | Consumer Discretionary - 19.17% | | | | | | |
| | * | Destination XL Group, Inc. | | 297,134 | | 549,635 | | 531,870 |
| | * | Leaf Group Ltd. | | | 326,001 | | 2,165,854 | | 1,362,684 |
| | * | Liquidity Services, Inc. | | 733,909 | | 4,207,344 | | 5,555,691 |
| | | Tailored Brands, Inc. | | 175,110 | | 1,365,453 | | 949,096 |
| | * | ZAGG, Inc. | | | 1,062,914 | | 7,461,346 | | 6,813,279 |
| | | | | | | | | | | 15,212,620 |
| | Energy - 0.68% | | | | | | | |
| | * | SandRidge Energy, Inc. | | 115,000 | | 1,093,405 | | 538,200 |
| | | | | | | | | | | |
| | Health Care - 3.04% | | | | | | | |
| | * | Paratek Pharmaceuticals, Inc. | | 644,350 | | 5,234,609 | | 2,409,869 |
| | | | | | | | | | | |
| | Industrials - 2.01% | | | | | | | |
| | * | HC2 Holdings, Inc. | | | 334,800 | | 1,856,515 | | 669,600 |
| | * | Houston Wire & Cable Co. | | 203,860 | | 1,204,215 | | 921,447 |
| | | | | | | | | | | 1,591,047 |
| | Information Technology - 12.53% | | | | | | |
| | * | CalAmp Corp. | | | 181,709 | | 1,898,319 | | 1,744,406 |
| | * | GSI Technology, Inc. | | 387,392 | | 2,391,305 | | 3,254,093 |
| | * | Intermolecular, Inc. | | | 1,049,783 | | 1,165,268 | | 1,249,242 |
| | * | Seachange International, Inc. | | 1,593,836 | | 2,288,357 | | 3,697,699 |
| | | | | | | | | | | 9,945,440 |
| | Materials - 4.72% | | | | | | | |
| | * | Dundee Corp. - Class A | | 4,087,382 | | 5,617,871 | | 3,354,514 |
| | * | Dundee Precious Metals, Inc. | | 100,000 | | 307,850 | | 392,320 |
| | | | | | | | | | | 3,746,834 |
| | | | | | | | | | | |
| | | Total Common Stocks (Cost $47,410,783) | | | | | 40,350,324 |
| | | | | | | | | | | |
| | | | | | | | | | | |
| | | | | | | | | | | |
| | | | | | | | | | | (Continued) |
| ROUMELL OPPORTUNISTIC VALUE FUND | | | | | |
| | | | | | | | | | | |
| Schedule of Investments - Continued | | | | | | |
| | | | | | | | | | | |
| As of August 31, 2019 | | | | | | | |
| | | | | | |
Shares | |
Cost | | Value (Note 1) |
| | | | | | | | | | | |
| CLOSED-END FUND - 2.93% | | | | | | |
| | Financials - 2.93% | | | | | | | |
| | | Medley Capital Corp. | | 903,821 | $ | 4,836,459 | $ | 2,322,820 |
| | | | | | | | | | | |
| | | Total Closed-End Fund (Cost $4,836,459) | | | | | 2,322,820 |
| PREFERRED STOCKS - 14.42% | | | | | | |
| | | | | Maturity | Dividend | | | | | |
| | | | | Date | Rate | | | | | |
| | Financials - 14.42% | |
| | | | | |
| | | B. Riley Financial, | | | | | | | |
| | | | Inc. | 12/31/2027 | 7.250% | 66,610 | | 1,664,544 | | 1,682,569 |
| | | Capital Southwest | | | | | | | |
| | | | Corp. | 12/15/2022 | 5.950% | 44,035 | | 1,100,991 | | 1,147,112 |
| | | Eagle Point Credit | | | | | | | |
| | | | Co., Inc. | 9/30/2027 | 6.750% | 47,753 | | 1,195,947 | | 1,227,730 |
| | | Gladstone Investment | | | | | | |
| | | | Corp. | 8/31/2025 | 6.375% | 30,000 | | 750,000 | | 773,100 |
| | | Medley Capital | | | | | | | |
| | | | Corp. | 3/30/2023 | 6.125% | 37,969 | | 785,199 | | 915,053 |
| | | MVC Capital, | | | | | | | |
| | | | Inc. | 11/30/2022 | 6.250% | 89,990 | | 2,254,709 | | 2,317,242 |
| | | Oaktree Specialty | | | | | | | |
| | | | Lending Corp. | 10/30/2024 | 5.875% | 27,183 | | 679,470 | | 691,965 |
| | | Oxford Square | | | | | | | |
| | | | Capital Corp. | 3/30/2024 | 6.500% | 46,349 | | 1,164,771 | | 1,189,084 |
| | | Oxford Square | | | | | | | |
| | | | Capital Corp. | 4/30/2026 | 6.250% | 60,000 | | 1,500,000 | | 1,500,000 |
| | | | | | | | | | | |
| | | Total Preferred Stocks (Cost $11,095,631) | | | | | 11,443,855 |
| | | | | | | | | | | |
| U.S. TREASURY SECURITIES - 15.76% | | Interest
| |
| | |
| | | | | | Par | Rate | | Maturity Date | | |
| | | United States Treasury Note | $ 10,000,000 | 1.500% | | 11/30/2019 | | 9,988,281 |
| | † | United States Treasury Note | 2,500,000 | 1.750% | | 3/31/2022 | | 2,518,945 |
| | | | | | | | | | | |
| | | Total U.S. Treasury Securities (Cost $12,486,070) | | | | | 12,507,226 |
| | | | | | | | | | | |
| | | | | | | | | | | |
| | | | | | | | | | | |
| | | | | | | | | | | (Continued) |
| ROUMELL OPPORTUNISTIC VALUE FUND | | | | | |
| | | | | | | | | | | |
| Schedule of Investments - Continued | | | | | | |
| | | | | | | | | | | |
| As of August 31, 2019 | | | | | | | |
| | | | | | | | | | | Value (Note 1) |
| | | | | | | | | | | |
| CORPORATE BOND - 2.05% | | Interest | |
| | |
| | | | | | Par | Rate | | Maturity Date | | |
| | | QEP Resources, Inc. | $ 1,870,000 | 5.250% | | 5/1/2023 | $ | 1,626,900 |
| | | | | | | | | | | |
| | | Total Corporate Bond (Cost $1,655,356) | | | | | 1,626,900 |
| | | | | | | | | | | |
| SHORT-TERM INVESTMENT - 16.07% | | | | | | |
| | | Federated Treasury Obligations Fund - Institutional | | Shares | | |
| | | | | | | 12,754,182 | | 12,754,182 |
| | | | | | | | | | | |
| | | Total Short-Term Investment (Cost $12,754,182) | | | | | 12,754,182 |
| | | | | | | | | | | |
| Investments, at Value (Cost $90,238,481) - 102.08% | | | | | 81,005,307 |
| | | | | | | | | | | |
| Liabilities in Excess of Other Assets - (2.08)% | | | | | (1,652,438) |
| | | | | | | | | | | |
| | Net Assets - 100.00% | | | | | $ | 79,352,869 |
| | | | | | | | | | | |
| | * | Non-income producing investment | | † All or a portion of security is segregated as |
| | § | Represents 7 day effective yield | | collateral for options written. | | |
| | | | | | | | | | | |
| | | | Summary of Investments | | | | | | |
| | | | by Sector | | | % of Net | | | | |
| | | | | | | Assets | | Value | | |
| | | | Common Stocks: | | | | | | |
| | | | Communication Services | | 8.70% | $ | 6,906,314 | | |
| | | | Consumer Discretionary | | 19.17% | | 15,212,620 | | |
| | | | Energy | | | 0.68% | | 538,200 | | |
| | | | Health Care | | | 3.04% | | 2,409,869 | | |
| | | | Industrials | | | 2.01% | | 1,591,047 | | |
| | | | Information Technology | | 12.53% | | 9,945,440 | | |
| | | | Materials | | | 4.72% | | 3,746,834 | | |
| | | | Closed-End Fund: | | | | | | |
| | | | Financials | | | 2.93% | | 2,322,820 | | |
| | | | Preferred Stocks: | | | | | | |
| | | | Financials | | | 14.42% | | 11,443,855 | | |
| | | | U.S. Treasury Securities | | 15.76% | | 12,507,226 | | |
| | | | Corporate Bond | | | 2.05% | | 1,626,900 | | |
| | | | Short-Term Investment | | 16.07% | | 12,754,182 | | |
| | | | Liabilities in Excess of Other Assets | -2.08% | | (1,652,438) | | |
| | | | Total Net Assets | | | 100.00% | $ | 79,352,869 | | |
| | | | | | | | | | | |
| See Notes to Financial Statements | | | | | | |
| | | | | | | | | | | |
| ROUMELL OPPORTUNISTIC VALUE FUND | | |
| | | | | | | | |
| Statement of Assets and Liabilities | | |
| | | | | | | | |
| As of August 31, 2019 | | | |
| | | | | | | | |
| Assets: | | | | | |
| | Investments, at value (Cost $90,238,481) | $ | 81,005,307 |
| | Deposits at Broker | | | 4,593 |
| | Receivables: | | | |
| | | Investments sold | | | 4,130 |
| | | Fund shares sold | | | 61,060 |
| | | Dividends and interest | | 126,509 |
| | Prepaid expenses: | | | |
| | | Registration and filing expenses | | 7,366 |
| | | Fund accounting fees | | 2,320 |
| | | Insurance fees | | | 112 |
| | | Transfer agent fees | | | 55 |
| | | | | | | | |
| | Total assets | | | 81,211,452 |
| | | | | | | | |
| Liabilities: | | | | | |
| | Payables: | | | | |
| | | Investments purchased | | 1,790,785 |
| | Accrued expenses: | | | |
| | | Advisory fees | | | 44,304 |
| | | Professional fees | | | 19,591 |
| | | Custody fees | | | 1,506 |
| | | Trustee fees and meeting expenses | | 1,339 |
| | | Shareholder fulfillment fees | | 629 |
| | | Miscellaneous expenses | | 346 |
| | | Compliance fees | | | 83 |
| | | | | | | | |
| | Total liabilities | | | 1,858,583 |
| | | | | | | | |
| Net Assets | | | | $ | 79,352,869 |
| | | | | | | | |
| Net Assets Consist of: | | | |
| | Paid in Beneficial Interest | $ | 80,764,628 |
| | Accumulated Deficit | | | (1,411,759) |
| | Total Net Assets | | $ | 79,352,869 |
| | | | | | | | |
| Institutional Class Shares of beneficial interest outstanding, no par value (a) | | 8,671,048 |
| | Net Assets | | | $ | 79,352,869 |
| | Net Asset Value, Offering Price and Redemption Price Per Share (b) | $ | 9.15 |
| | | | | | | | |
| (a) | Unlimited Authorized Shares | | |
| (b) | The Fund charges a 1% redemption fee on redemptions made within 60 days of initial purchase. |
| | | | | | | | |
| See Notes to Financial Statements | | |
| | | | | | | | |
| ROUMELL OPPORTUNISTIC VALUE FUND | | |
| | | | | | | | |
| Statement of Operations | | |
| | | | | | | | |
| | | | | | | | |
| For the fiscal year ended August 31, 2019 | | |
| | | | | | | | |
| Investment Income: | | |
| | Dividends | | | $ | 1,195,349 |
| | Interest | | | | 235,418 |
| | | | | | | | |
| | Total Investment Income | | 1,430,767 |
| | | | | | | | |
| Expenses: | | | | | |
| | Advisory fees (Note 2) | | 691,951 |
| | Administration fees (Note 2) | | 75,212 |
| | Professional fees | | 58,278 |
| | Fund accounting fees (Note 2) | | 34,471 |
| | Registration and filing expenses | | 30,859 |
| | Custody fees (Note 2) | | 21,523 |
| | Transfer agent fees (Note 2) | | 21,000 |
| | Shareholder fulfillment fees | | 14,781 |
| | Compliance fees (Note 2) | | 11,083 |
| | Trustee fees and meeting expenses (Note 3) | | 8,129 |
| | Miscellaneous expenses (Note 2) | | 4,198 |
| | Security pricing fees | | 4,136 |
| | Insurance fees | | 3,820 |
| | | | | | | | |
| | Total Expenses | | 979,441 |
| | | | | | | | |
| | Advisory fees waived (Note 2) | | (54,294) |
| | | | | | | | |
| | Net Expenses | | | 925,147 |
| | | | | | | | |
| Net Investment Income | $ | 505,620 |
| | | | | | | | |
| | | | | | | | |
| | | | | | | | (Continued) |
| ROUMELL OPPORTUNISTIC VALUE FUND | | |
| | | | | | | | |
| Statement of Operations - Continued | | |
| | | | | | | | |
| | | | | | | | |
| For the fiscal year ended August 31, 2019 | | |
| | | | | | | | |
| Realized and Unrealized Gain (Loss): | | |
| | | | | | | | |
| | Net realized gain from: | | |
| | | Investments | $ | 7,859,172 |
| | | Options written | | 63,413 |
| | | | | | | | 7,922,585 |
| | Net change in unrealized depreciation on: | | |
| | | Investments | | (11,351,996) |
| | | Options written | | 269,490 |
| | | | | | | | (11,082,506) |
| | | | | | | | |
| Net Realized and Unrealized Loss | | (3,159,921) |
| | | | | | | | |
| Net Decrease in Net Assets Resulting from Operations | $ | (2,654,301) |
| | | | | | | | |
| | | | | | | | |
| | | | | | | | |
| See Notes to Financial Statements | | |
| ROUMELL OPPORTUNISTIC VALUE FUND | | | | | | | |
| | | | | | | | | | | | | |
| Statements of Changes in Net Assets | | | | | | | | |
| | | | | | | | | | | | | |
| For the fiscal years ended August 31, | | | | 2019 | | 2018 | |
| | | | | | | | | | | | | |
| Operations: | | | | | | | | | | |
| | Net investment income | | | | $ | 505,620 | $ | 1,059,612 | |
| | Net realized gain from investments and | | | | | | | |
| | | options written | | | | | 7,922,585 | | 4,343,746 | |
| | Net change in unrealized appreciation (depreciation) | | | | | |
| | | on investments and options written | | | | (11,082,506) | | 1,757,523 | |
| | | | | | | | | | | | | |
| Net Increase (Decrease) in Net Assets Resulting from | | | | | | |
| | Operations | | | | | | (2,654,301) | | 7,160,881 | |
| | | | | | | | | | | | | |
| Distributions to Shareholders: | | | | | | | | |
| | | Institutional Class Shares | | | | | (3,912,239) | | (32,212) | |
| | | | | | | | | | | | | |
| Decrease in Net Assets Resulting from Distributions | | | | (3,912,239) | | (32,212) | (a) |
| | | | | | | | | | | | | |
| Beneficial Interest Transactions: | | | | | | | | |
| | Shares sold | | | | | 16,628,712 | | 15,456,683 | |
| | Redemption fee | | | | | 972 | | - | |
| | Reinvested dividends and distributions | | | | 3,038,263 | | 25,667 | |
| | Shares repurchased | | | | | (9,665,652) | | (12,245,912) | |
| | | | | | | | | | | | | |
| Increase in Net Assets from Beneficial Interest Transactions | | 10,002,295 | | 3,236,438 | |
| | | | | | | | | | | | | |
| Net Increase in Net Assets | | | | | 3,435,755 | | 10,365,107 | |
| | | | | | | | | | | | | |
| Net Assets: | | | | | | | | | |
| | Beginning of Year | | | | | 75,917,114 | | 65,552,007 | |
| | End of Year | | | | $ | 79,352,869 | $ | 75,917,114 | (b) |
| | | | | | | | | | | | | |
| | | | | | | | | | | | | |
| (a) | Distributions for August 31, 2018 were the result of net realized gains and net investment income. Net investment income for the fiscal year ended August 31, 2018 totaled $32,212, and there were no capital gains. |
| (b) | Net Assets - End of Year includes accumulated net investment income of $1,977,164 as of August 31, 2018. The requirement to disclose the corresponding amount as of August 31, 2019 was eliminated. |
| |
| | | |
| |
| | | | | | | |
| | | | | | | | | | | | | |
| See Notes to Financial Statements | | | | | | (Continued) |
| ROUMELL OPPORTUNISTIC VALUE FUND | | | | | | | |
| | | | | | | | | | | | | |
| Statements of Changes in Net Assets - Continued | | | | | | | |
| | | | | | | | | | | | | |
| For the fiscal years | | | | | | | | |
| ended August 31, | | 2019 | | 2018 | |
| | | | | | | | | | | | | |
| Share Information: | | | | | | | | |
| | Institutional Class Shares | Shares | | Amount | | Shares | | Amount | |
| | | Shares sold | 1,795,293 | $ | 16,628,712 | | 1,639,705 | $ | 15,456,683 | |
| | | Redemption fee | - | | 972 | | - | | - | |
| | | Reinvested dividends | | | | | | | | |
| | | | and distributions | 360,780 | | 3,038,263 | | 2,716 | | 25,667 | |
| | | Shares repurchased | (1,056,490) | | (9,665,652) | | (1,194,949) | | (11,299,031) | |
| Net Increase in Beneficial | | | | | | | | |
| Interest and Shares | 1,099,583 | $ | 10,002,295 | | 447,472 | $ | 4,183,319 | |
| | | | | | | | | | | | | |
| | Class A Shares (a) | Shares | | Amount | | Shares | | Amount | |
| | | Shares sold | - | $ | - | | - | $ | - | |
| | | Reinvested dividends | | | | | | | | |
| | | | and distributions | - | | - | | - | | - | |
| | | Shares repurchased | - | | - | | (72,002) | | (653,830) | |
| Net Decrease in Beneficial | | | | | | | | |
| Interest and Shares | - | $ | - | | (72,002) | $ | (653,830) | |
| | | | | | | | | | | | | |
| | Class C Shares (b) | Shares | | Amount | | Shares | | Amount | |
| | | Shares sold | - | $ | - | | - | $ | - | |
| | | Reinvested dividends | | | | | | | | |
| | | | and distributions | - | | - | | - | | - | |
| | | Shares repurchased | - | | - | | (38,098) | | (293,051) | |
| Net Decrease in Beneficial | | | | | | | | |
| Interest and Shares | - | $ | - | | (38,098) | $ | (293,051) | |
| | | | | | | | | | | | | |
| (a) The Class A Shares liquidated as of December 19, 2017. | | | | | |
| (b) The Class C Shares liquidated as of December 19, 2017. | | | | | |
| | | | | | | | | | | | | |
| | | | | | | | | | | | | |
| | | | | | | | | | | | | |
| See Notes to Financial Statements | | | | | | | |
| ROUMELL OPPORTUNISTIC VALUE FUND | | | | | | | | | |
| | | | | | | | | | | | | | | | |
| Financial Highlights - Institutional Class Shares | | | | | | | | | |
| | | | | | | | | | | | | | | | |
| For a share outstanding | August 31, |
| during the fiscal years ended | | 2019 | | 2018 | | 2017 | | 2016 | | 2015 | |
| | | | | | | | | | | | | | | | |
| Net Asset Value, | | | | | | | | | | | |
| Beginning of Year | $ | 10.03 | $ | 9.07 | $ | 7.68 | $ | 7.48 | $ | 10.50 | |
| | | | | | | | | | | | | | | | |
| Income (Loss) from Investment | | | | | | | | | | | |
| Operations: | | | | | | | | | | | |
| | Net investment income (b) | | 0.07 | | 0.14 | | 0.01 | | 0.06 | | 0.08 | |
| | Net realized and unrealized | | | | | | | | | | | |
| | | gain (loss) on investments (b) | | (0.43) | | 0.82 | | 1.39 | | 0.15 | | (1.90) | |
| Total from Investment Operations | | (0.36) | | 0.96 | | 1.40 | | 0.21 | | (1.82) | |
| | | | | | | | | | | | | | | | |
| Less Distributions: | | | | | | | | | | | |
| | From net investment income | | (0.17) | | (0.00) | (a) | - | | (0.01) | | (0.22) | |
| | From realized gains | | (0.35) | | - | | - | | - | | (0.98) | |
| | From return of capital | | - | | - | | (0.01) | | - | | - | |
| Total Distributions | | (0.52) | | (0.00) | (a) | (0.01) | | (0.01) | | (1.20) | |
| Paid in Beneficial Interest: | | | | | | | | | | | |
| | From redemption fees | | 0.00 | (a) | - | | 0.00 | (a) | (0.00) | (a) | 0.00 | (a) |
| Total Paid in Beneficial Interest | | 0.00 | (a) | - | | 0.00 | (a) | (0.00) | (a) | 0.00 | (a) |
| | | | | | | | | | | | | | | | |
| Net Asset Value, End of Year | $ | 9.15 | $ | 10.03 | $ | 9.07 | $ | 7.68 | $ | 7.48 | |
| | | | | | | | | | | | | | | | |
| Total Return | | (3.12)% | | 10.63% | | 18.28% | | 2.81% | | (18.82)% | |
| | | | | | | | | | | | | | | | |
| Net Assets, End of Year | | | | | | | | | | | |
| | (in thousands) | $ | 79,353 | $ | 75,917 | $ | 64,624 | $ | 47,421 | $ | 40,835 | |
| | | | | | | | | | | | | | | | |
| Ratios of: | | | | | | | | | | | | |
| Interest Expense to Average Net Assets | - | | 0.00% | (e) | 0.01% | | - | | - | |
| Gross Expenses to Average Net Assets (c) | 1.30% | | 1.29% | | 1.34% | | 1.23% | | 1.23% | |
| Net Expenses to Average Net Assets (c) | 1.23% | | 1.23% | (d) | 1.24% | (d) | 1.23% | | 1.23% | |
| Net Investment Income to Average | | | | | | | | | | | |
| | Net Assets | | 0.67% | | 1.52% | | 0.10% | | 0.86% | | 0.94% | |
| | | | | | | | | | | | | | | | |
| Portfolio turnover rate | | 79.74% | | 62.59% | | 111.52% | | 71.27% | | 66.14% | |
| | | | | | | | | | | | | | | | |
| | | | | | | | | | | | | | | | |
| | | | | | | | | | | | | | | | |
| (a) | Actual amount is less than $0.01 per share. | | | | | | | | | |
| (b) | Calculated using the average shares method. | | | | | | | | | |
| (c) | The expense ratios listed reflect total expenses prior to any waivers and reimbursements (gross expense ratio) and after any waivers and reimbursements (net expense ratio). |
| (d) | Includes interest expense. | | | | | | | | | | | |
| (e) | Less than 0.01% of net assets. | | | | | | | | | | | |
| | | | | | | | | | | | | | | | |
| | | | | | | | | | | | | | | | |
| | | | | | | | | | | | | | | | |
| | | | | | | | | | | | | | | | |
| See Notes to Financial Statements | | | | | | | | | | | |
ROUMELL OPPORTUNISTIC VALUE FUND
Notes to Financial Statements
As of August 31, 2019
1. Organization and Significant Accounting Policies
The Roumell Opportunistic Value Fund (“Fund”) is a series of the Starboard Investment Trust (“Trust”). The Trust is organized as a Delaware statutory trust and is registered under the Investment Company Act of 1940, as amended (the “1940 Act”), as an open-end management investment company. The Fund is a separate non-diversified series of the Trust.
The investment objective of the Fund is to seek capital appreciation and income. Roumell Asset Management, LLC (“Roumell Asset Management” or the “Advisor”) seeks to achieve the Fund’s investment objective by using an opportunistic investment strategy. The Fund's portfolio will primarily consist of (i) domestic and foreign equity securities (common stock, preferred stock, warrants, and securities convertible into common stocks); (ii) domestic and foreign fixed income securities consisting of government and corporate debt securities, "junk" bonds, municipal securities, and real estate investment trusts ("REITs"); and (iii) interest-bearing instruments consisting of treasury bills, other U.S. government obligations and bonds, collateralized repurchase contracts, money market instruments, and money market funds (collectively referred to as cash and cash equivalents).
The Fund currently has an unlimited number of authorized shares, the Institutional Class Shares. Fund shares are subject to redemption fees of 1.00% if redeemed within 60 days of the issuance. The Date of Initial Public Investment of the Fund shares was December 31, 2010.
The following is a summary of significant accounting policies consistently followed by the Fund. The policies are in conformity with accounting principles generally accepted in the United States of America (“GAAP”). The Fund follows the accounting and reporting guidance in the Financial Accounting Standards Board (“FASB”) Accounting Standards Codification 946 “Financial Services – Investment Companies,” and Financial Accounting Standards Update (“ASU”) 2013-08.
Investment Valuation
The Fund’s investments in securities are carried at value. Securities listed on an exchange or quoted on a national market system are valued at the last sales price as of 4:00 p.m. Eastern Time. Securities traded in the NASDAQ over-the-counter market are generally valued at the NASDAQ Official Closing Price. Other securities traded in the over-the-counter market and listed securities for which no sale was reported on that date are valued at the most recent bid price. Securities and assets for which representative market quotations are not readily available (e.g., if the exchange on which the security is principally traded closes early or if trading of the particular security is halted during the day and does not resume prior to the Fund’s net asset value calculation) or which cannot be accurately valued using the Fund’s normal pricing procedures are valued at fair value as determined in good faith under policies approved by the Board of Trustees (the “Board”). A security’s “fair value” price may differ from the price next available for that security using the Fund’s normal pricing procedures. Instruments with maturities of 60 days or less are valued at amortized cost, which approximates market value.
ROUMELL OPPORTUNISTIC VALUE FUND
Notes to Financial Statements
As of August 31, 2019
Fair Value Measurement
Various inputs are used in determining the value of the Fund's investments. These inputs are summarized in the three broad levels listed below:
Level 1: Quoted prices in active markets for identical securities
Level 2: Other significant observable inputs (including quoted prices for similar securities, interest rates, credit risk, etc.)
Level 3: Significant unobservable inputs (including the Fund’s own assumptions in determining fair value of investments)
The availability of observable inputs can vary from security to security and is affected by a wide variety of factors, including, for example, the type of security, whether the security is new and not yet established in the marketplace, the liquidity of markets, and other characteristics particular to the security. To the extent that valuation is based on models or inputs that are less observable or unobservable in the market, the determination of fair value requires more judgment. Accordingly, the degree of judgment exercised in determining fair value is greatest for instruments categorized in Level 3.
The inputs used to measure fair value may fall into different levels of the fair value hierarchy. In such cases, for disclosure purposes, the level in the fair value hierarchy within which the fair value measurement falls in its entirety, is determined based on the lowest level input that is significant to the fair value measurement in its entirety.
The inputs or methodology used for valuing securities are not necessarily an indication of the risk associated with investing in those securities.
(Continued)
ROUMELL OPPORTUNISTIC VALUE FUND
Notes to Financial Statements
As of August 31, 2019
The following table summarizes the inputs as of August 31, 2019 for the Fund’s assets measured at fair value:
| Investments in Securities |
| Total | Level 1 | | Level 2 | | Level 3 (a) |
| Assets | | | | | | | $
| - |
| Common Stocks* | $ | 40,350,324 | $ | 40,350,324 | $ | - | | - |
| Closed-End Fund | | 2,322,820 | | 2,322,820 | | - | | - |
| Preferred Stocks* | | 11,443,855 | | 11,443,855 | | - | | - |
| U.S. Treasury Securities | 12,507,226 | - | | 12,507,226 | | - |
| Corporate Bond | 1,626,900 | - | | 1,626,900 | | - |
| Short-Term Investment |
| 12,754,182 |
| 12,754,182 | | - | | - |
| Total Assets | $
| 81,005,307 | $
| 66,871,181 | $ | 14,134,126 | $ | -
|
| | | | | | | |
*Please refer to Schedule of Investments for breakdown by Sector.
(a) The Fund did not hold any Level 3 securities during the fiscal year ended August 31, 2019.
Option Writing
When the Fund writes an option, an amount equal to the premium received by the Fund is recorded as a liability and is subsequently adjusted to the current fair value of the option written. Premiums received from writing options that expire unexercised are treated by the Fund on the expiration date as realized gains from options written. The difference between the premium and the amount paid on effecting a closing purchase transaction, including brokerage commissions, is also treated as a realized gain or loss (depending on if the premium is less than the amount paid for the closing purchase transaction). If a call option is exercised, the premium is added to the proceeds from the sale of the underlying security in determining whether the Fund has realized a gain or loss. If a put option is exercised, the premium reduces the cost basis of the securities purchased by the Fund. The Fund, as the writer of an option, bears the market risk of an unfavorable change in the price of the security underlying the written option. Written options are non-income producing securities.
Derivative Financial Instruments
During the fiscal year ended August 31, 2019, the Fund invested in derivative financial instruments (derivatives) in order to receive the premiums on options and potentially hold the underlying security holdings at a lower price. Derivatives may contain various risks including the potential inability of the counterparty to fulfill their obligations under the terms of the contract, the potential for an illiquid secondary market, and the potential for market movements which may expose the Fund to gains or losses in excess of the amounts shown on the Statement of Assets and Liabilities. There were no derivatives outstanding as of the fiscal year ended August 31, 2019.
(Continued)
ROUMELL OPPORTUNISTIC VALUE FUND
Notes to Financial Statements
As of August 31, 2019
Derivatives are marked to market daily based upon quotations from market makers or the Fund’s independent pricing services and the Fund’s net benefit or obligation under the contract, as measured by the fair market value of the contract, is included in Investments, at value on the Statement of Assets and Liabilities for options purchased and the Options Written, at value on the Statement of Assets and Liabilities for options written. Net realized gains and losses and net change in unrealized appreciation and depreciation on these contracts for the year are included in the Realized and Unrealized Gain on Investments on the Statement of Operations for options purchased and Realized and Unrealized Gain on Options Written on the Statement of Operations for options written.
Although the Fund held derivatives during the fiscal year, there were no derivative instruments outstanding as of August 31, 2019. The amounts of realized and changes in unrealized gains and losses on derivative instruments during the period are disclosed below and in the Statement of Operations.
The following table sets forth the effect of the derivative instruments on the Statement of Operations for the fiscal year ended August 31, 2019:
| Derivative Type | Location | Gains |
| | | |
| Equity Contracts – written options | Net realized gain from options written | $ 63,413 |
| | | |
| Equity Contracts – written options | Net change in unrealized depreciation on options written | $ 269,490 |
| | | |
(Continued)
ROUMELL OPPORTUNISTIC VALUE FUND
Notes to Financial Statements
As of August 31, 2019
The following table represents the average monthly market values of options held during the fiscal year, which serve as an indicator of volume for options during the fiscal year ended August 31, 2019:
Month | |
Value
|
September 2018 | |
$155,250 |
| October 2018 | | 524,750
|
| November 2018 | | 433,750
|
| December 2018 | | 662,310
|
| | | |
Foreign Currency Translation
Portfolio securities and other assets and liabilities denominated in foreign currencies are translated into U.S. dollars based on the exchange rate of such currencies against U.S. dollars on the date of valuation. Purchases and sales of securities and income items denominated in foreign currencies are translated into U.S. dollars at the exchange rate in effect on the transaction date.
The Fund does not separately report the effect of changes in foreign exchange rates from changes in market prices on securities held. Such changes are included in net realized and unrealized gain or loss from investments.
Realized foreign exchange gains or losses arise from sales of foreign currencies, currency gains or losses realized between the trade and settlement dates on securities transactions and the difference between the recorded amounts of dividends, interest, and foreign withholding taxes, and the U.S. dollar equivalent of the amounts actually received or paid. Net unrealized foreign exchange gains and losses arise from changes in foreign exchange rates on foreign denominated assets and liabilities other than investments in securities held at the end of the reporting period. These amounts can be found on the Statement of Operations, if applicable.
Investment Transactions and Investment Income
Investment transactions are accounted for as of the date purchased or sold (trade date). Dividend income is recorded on the ex-dividend date. Certain dividends from foreign securities will be recorded as soon as the Fund is informed of the dividend if such information is obtained subsequent to the ex-dividend date. Interest income is recorded on the accrual basis and includes accretion of discounts and amortization of premiums. Gains and losses are determined on the identified cost basis, which is the same basis used for federal income tax purposes.
(Continued)
ROUMELL OPPORTUNISTIC VALUE FUND
Notes to Financial Statements
As of August 31, 2019
Expenses
The Fund bears expenses incurred specifically on its behalf as well as a portion of general expenses, which are allocated according to methods reviewed annually by the Board.
Distributions
The Fund may declare and distribute dividends from net investment income (if any) annually. Distributions from capital gains (if any) are generally declared and distributed annually. Dividends and distributions to shareholders are recorded on ex-date.
Estimates
The preparation of financial statements in conformity with GAAP requires management to make estimates and assumptions that affect the reported amounts of assets and liabilities and disclosure of contingent assets and liabilities at the date of the financial statements and the reported amounts of increases and decreases in the net assets from operations during the reported period. Actual results could differ from those estimates.
Fees on Redemptions
The Fund charges a redemption fee of 1.00% on redemptions of Fund shares occurring within 60 days following the issuance of such shares. The redemption fee is not a fee to finance sales or sales promotion expenses but is paid to the Fund to defray the costs of liquidating an investor and discourage short-term trading of the Fund’s shares. No redemption fee will be imposed on the redemption of shares representing dividends or capital gains distributions, or on amounts representing capital appreciation of shares.
Federal Income Taxes
No provision for income taxes is included in the accompanying financial statements, as the Fund intends to distribute to shareholders all taxable investment income and realized gains and otherwise comply with Subchapter M of the Internal Revenue Code applicable to regulated investment companies.
(Continued)
ROUMELL OPPORTUNISTIC VALUE FUND
Notes to Financial Statements
As of August 31, 2019
2. Transactions with Affiliates and Service Providers
Advisor
The Fund pays a monthly fee to the Advisor calculated at the annual rate of 0.92% of the Fund’s average daily net assets. For the fiscal year ended August 31, 2019, $691,951 in advisory fees were incurred by the Fund, of which $54,294 were waived by the Advisor.
The Advisor has entered into a contractual agreement (the “Expense Limitation Agreement”) with the Trust, on behalf of the Fund, under which it has agreed to waive or reduce its fees and to assume other expenses of the Fund, if necessary, in amounts that limit the Fund’s total operating expenses (exclusive of (i) any front-end or contingent deferred loads; (ii) brokerage fees and commissions, (iii) acquired fund fees and expenses; (iv) fees and expenses associated with investments in other collective investment vehicles or derivative instruments (including for example option and swap fees and expenses); (v) borrowing costs (such as interest and dividend expense on securities sold short); (vi) taxes; and (vii) extraordinary expenses, such as litigation expenses (which may include indemnification of Fund officers and Trustees and contractual indemnification of Fund service providers (other than the Adviser)) to not more than 1.23% of the average daily net assets of the Fund for the current fiscal year. The current term of the Expense Limitation Agreement remains in effect until January 31, 2020.
Administrator
The Fund pays a monthly fee to The Nottingham Company (the “Administrator”) based upon the average daily net assets of the Fund and calculated at the annual rates as shown in the schedule below subject to a minimum of $2,000 per month. The Administrator also receives a fee to procure and pay the Fund’s custodian, additional compensation for fund accounting and recordkeeping services, and additional compensation for certain costs involved with the daily valuation of securities and as reimbursement for out-of-pocket expenses. The Administrator also receives a miscellaneous compensation fee for peer group, comparative analysis, and compliance support totaling $350 per month. As of August 31, 2019, the Administrator received $4,198 in miscellaneous expenses.
(Continued)
ROUMELL OPPORTUNISTIC VALUE FUND
Notes to Financial Statements
As of August 31, 2019
A breakdown of the fees is provided in the following table:
| Administration Fees* | Custody Fees* | Fund Accounting Fees (minimum monthly) | Fund Accounting Fees (asset- based fee) | Blue Sky Administration Fees (annual) |
Average Net Assets | Annual Rate | Average Net Assets | Annual Rate |
| First $250 million | 0.100% | First $200 million | 0.020% | $2,250 | 0.01% | $150 per state |
| Next $250 million | 0.080% | Over $200 million | 0.009% | | | |
| Next $250 million | 0.060% | | | | | |
| Next $250 million | 0.050% | *Minimum monthly fees of $2,000 and $417 for Administration and Custody, respectively. |
| Next $1 billion | 0.040% |
| Over $2 billion | 0.035% |
The Fund incurred $75,212 in administration fees, $21,523 in custody fees, and $34,471 in fund accounting fees for the fiscal year ended August 31, 2019.
Compliance Services
Cipperman Compliance Services, LLC provides services as the Trust’s Chief Compliance Officer. Cipperman Compliance Services, LLC is entitled to receive customary fees from the Fund for their services pursuant to the Compliance Services Agreement with the Fund.
Transfer Agent
Nottingham Shareholder Services, LLC (“Transfer Agent”) serves as transfer, dividend paying, and shareholder servicing agent for the Fund. For its services, the Transfer Agent is entitled to receive compensation from the Fund pursuant to the Transfer Agent’s fee arrangements with the Fund. The Fund paid the Transfer Agent $21,000 in transfer agent fees during the fiscal year ended August 31, 2019.
Distributor
Capital Investment Group, Inc. (the “Distributor”) serves as the Fund’s principal underwriter and distributor. The Distributor receives $5,000 per year paid in monthly installments for services provided and expenses assumed.
3. Trustees and Officers
The Board is responsible for the management and supervision of the Fund. The Board approves all significant agreements between the Trust, on behalf of the Fund, and those companies that furnish services to the Fund; reviews performance of the Advisor and the Fund; and oversee activities of the Fund. Officers of the Trust and Trustees who are interested persons of the Trust or the Advisor will receive no salary or fees from the Trust. Trustees who are not “interested persons” of the Trust or the Advisor within the meaning of the 1940 Act (the “Independent Trustees”) receive $2,000 each year from each Fund. The Trust will reimburse each Trustee and officer of the Trust for his or her travel and other expenses relating to attendance of Board meetings. Additional fees may also be incurred during the year as special meetings are necessary in addition to the regularly scheduled meetings of the Board.
(Continued)
ROUMELL OPPORTUNISTIC VALUE FUND
Notes to Financial Statements
As of August 31, 2019
Certain officers of the Trust may also be officers of the Administrator.
4. Purchases and Sales of Investment Securities
For the fiscal year ended August 31, 2019, the aggregate cost of purchases and proceeds from sales of investment securities (excluding short-term securities) were as follows:
| Purchases of Securities | Proceeds from Sales of Securities |
| $47,274,114 | $47,456,194 |
For the fiscal year ended August 31, 2019, there were no long-term purchases or sales of U.S. government securities.
The following table shows the realized gains and losses that resulted from sales of securities during the fiscal year ended August 31, 2019:
| Description | | Cost ($) | | Sales Proceeds ($) | Realized Gain (Loss) (% of Cost) | | Realized Gain (Loss)($) |
| A10 Networks, Inc. | | 167,301 | | 214,198 | 28.03% | | 46,897 |
| Alithya Group, Inc. | | 2,009,090 | | 1,270,523 | -36.76% | | (738,567) |
| Capital Southwest Co. | | 653,125 | | 650,424 | -0.41% | | (2,701) |
| Colossus Minerals, Inc. | | 526 | | - | -100.00% | | (526) |
| Criteo SA | | 1,835,616 | | 2,032,539 | 10.73% | | 196,923 |
| Destination XL Group, Inc. | | 1,110,298 | | 1,263,035 | 13.76% | | 152,737 |
| Eagle Point Credit Co. | | 225,175 | | 221,122 | -1.80% | | (4,053) |
| El Dorado Gold Corp. | | 887,351 | | 810,571 | -8.65% | | (76,780) |
| Enzo Biochem, Inc. | | 5,932,195 | | 6,329,998 | 6.71% | | 397,803 |
| Five Point Holdings, LLC | | 2,778,062 | | 1,493,095 | -46.25% | | (1,284,967) |
(Continued)
ROUMELL OPPORTUNISTIC VALUE FUND
Notes to Financial Statements
As of August 31, 2019
| Description | | Cost ($) | | Sales Proceeds ($) | Realized Gain
(Loss) (% of Cost) | | Realized Gain (Loss)($) |
| General Motors Co. | | 1,126,551 | | 1,280,598 | 13.67% | | 154,047 |
| Great Elm Capital Co. | | 1,748,808 | | 1,743,680 | -0.29% | | (5,128) |
| GSI Technology, Inc. | | 349,840 | | 655,182 | 87.28% | | 305,342 |
Hallmark Financial Services, Inc. | | 2,503,456 | | 2,671,763 | 6.72% | | 168,307 |
| Liquidity Services, Inc. | | 2,240,508 | | 2,789,488 | 24.50% | | 548,980 |
| Marchex, Inc. | | 3,173,518 | | 4,423,966 | 39.40% | | 1,250,448 |
| Medley Capital Corp. | | 375,498 | | 211,097 | -43.78% | | (164,401) |
Newtek Business Services Corp. | | 1,925,473 | | 1,910,529 | -0.78% | | (14,944) |
| Oxford Square Capital Corp. | | 1,030,525 | | 1,024,316 | -0.60% | | (6,209) |
| Rosetta Stone | | 859,828 | | 1,202,909 | 39.90% | | 343,081 |
| Sandstorm Gold Ltd. | | 2,568,143 | | 3,691,028 | 43.72% | | 1,122,885 |
| Sierra Wireless, Inc. | | 828,302 | | 642,720 | -22.41% | | (185,582) |
**Skechers USA, Inc. 1/18/19 @ $21.00 | | (99,584) | | (51,109) | 48.68% | | 48,475 |
| The Rubicon Project, Inc. | | 3,020,258 | | 8,547,887 | 183.02% | | 5,527,629 |
| Tower Semiconductor Ltd. | | 2,237,731 | | 2,375,527 | 6.16% | | 137,796 |
**Tower Semiconductor, Ltd. 1/18/19 @ $18.00 | | (14,938) | | - | 100.00% | | 14,938 |
*United States Treasury Note - 1.75%, 10/31/18 | | 3,498,662 | | 3,497,797 | -0.02% | | (865) |
*United States Treasury Note - 1.00%, 3/15/2019 | | 5,497,754 | | 5,488,774 | -0.16% | | (8,980) |
| Net Realized Gain | | | | | - | $ | 7,922,585 |
*Excludes interest earned on bonds over the holding period
**Put options written
5. Federal Income Tax
Distributions are determined in accordance with Federal income tax regulations, which differ from GAAP, and, therefore, may differ significantly in amount or character from net investment income and realized gains for financial reporting purposes. Financial reporting records are adjusted for permanent book/tax differences to reflect tax character but are not adjusted for temporary differences.
(Continued)
ROUMELL OPPORTUNISTIC VALUE FUND
Notes to Financial Statements
As of August 31, 2019
Management has reviewed the Fund’s tax positions to be taken on the federal income tax return and, during the years ended August 31, 2016 through August 31, 2019, and determined that the Fund does not have a liability for uncertain tax positions. The Fund recognizes interest and penalties, if any, related to unrecognized tax benefits as income tax expense in the Statement of Operations. During the fiscal year, the Fund did not incur any interest or penalties.
Distributions during the fiscal years indicated below were characterized for tax purposes as follows:
| For the Fiscal | Distributions from |
| Year Ended | Ordinary Income |
| 08/31/2019 | | $ 3,912,239 | |
| 08/31/2018 | | 32,212 | |
At August 31, 2019, the tax-basis cost of investments and components of distributable earnings were as follows:
| Cost of Investments | | $ 90,251,077 |
| | | |
| Gross Unrealized Appreciation | | 4,448,765 |
| Gross Unrealized Depreciation | | (13,694,535) |
| Net Unrealized Depreciation | | (9,245,770) |
| | | |
| Undistributed Ordinary Income | | 3,256,185 |
| Undistributed Long-Term Gains | | 4,577,826 |
| | | |
| Accumulated Deficit | | $ (1,411,759) |
| | | |
The difference between book-basis and tax-basis net unrealized appreciation (depreciation) is attributable to the tax deferral of losses from wash sales.
(Continued)
ROUMELL OPPORTUNISTIC VALUE FUND
Notes to Financial Statements
As of August 31, 2019
6. New Accounting Pronouncements
In March 2017, the Financial Accounting Standards Board (FASB) issued Accounting Standards Update (ASU) No. 2017-08, Receivables—Nonrefundable Fees and Other Costs (Subtopic 310-20): Premium Amortization on Purchased Callable Debt Securities. The amendments in the ASU shorten the amortization period for certain callable debt securities, held at a premium, to be amortized to the earliest call date. The ASU does not require an accounting change for securities held at a discount; which continues to be amortized to maturity. The ASU is effective for fiscal years and interim periods within those fiscal years beginning after December 15, 2018. Management is currently evaluating the impact, if any, of applying this provision.
In August 2018, the Securities and Exchange Commission adopted amendments to certain disclosure requirements under Regulation S-X to conform to US GAAP, including: (i) an amendment to require presentation of the total, rather than the components, of distributable earnings on the Statement of Assets and Liabilities; and (ii) an amendment to require presentation of the total, rather than the components, of distributions to shareholders, except for tax return of capital distributions, if any, on the Statement of Changes in Net Assets. The amendments also removed the requirement for parenthetical disclosure of undistributed net investment income on the Statement of Changes in Net Assets. This amendment facilitates compliance of the disclosure of information without significantly altering the information provided to investors. These amendments have been adopted with these financial statements. The changes have been applied to the Fund’s financial statements as of the fiscal year ended August 31, 2019.
In August 2018, the Financial Accounting Standards Board (FASB) issued Accounting Standards Update (ASU) No. 2018-13, Fair Value Measurement (Topic 820) – Disclosure Framework–Changes to the Disclosure Requirements for Fair Value Measurement. The amendments eliminate certain disclosure requirements for fair value measurements for all entities, requires public entities to disclose certain new information, and modifies some disclosure requirements. The new guidance is effective for all entities for fiscal years beginning after December 15, 2019 and for interim periods within those fiscal years. An entity is permitted to early adopt either the entire standard or portions of the standard.
(Continued)
ROUMELL OPPORTUNISTIC VALUE FUND
Notes to Financial Statements
As of August 31, 2019
7. Beneficial Ownership
The beneficial ownership, either directly or indirectly, of 25% or more of the voting securities of a fund creates a presumption of control of a fund, under Section 2(a)(9) of the Investment Company Act of 1940. As of August 31, 2019, Charles Schwab held 41.40% of the Fund and National Financial Services held 33.50% of the Fund. The Fund has no knowledge as to whether all or any portion of the shares owned of record by Charles Schwab or National Financial Services are also owned beneficially.
8. Commitments and Contingencies
Under the Trust’s organizational documents, its officers and Trustees are indemnified against certain liabilities arising out of the performance of their duties to the Fund. In addition, in the normal course of business, the Trust entered into contracts with its service providers, on behalf of the Fund, and others that provide for general indemnifications. The Fund’s maximum exposure under these arrangements is unknown, as this would involve future claims that may be made against the Fund. The Fund expects risk of loss to be remote.
9. Subsequent Events
In accordance with GAAP, management has evaluated the need for disclosures and/or adjustments resulting from subsequent events through the date of issuance of the financial statements. This evaluation did not result in any additional subsequent events that necessitated disclosures and/or adjustments.

REPORT OF INDEPENDENT REGISTERED PUBLIC ACCOUNTING FIRM
To the Board of Trustees of Starboard Investment Trust
and the Shareholders of Roumell Opportunistic Value Fund
Opinion on the Financial Statements
We have audited the accompanying statement of assets and liabilities of Roumell Opportunistic Value Fund, a series of shares of beneficial interest in Starboard Investment Trust (the “Fund”), including the schedule of investments, as of August 31, 2019, and the related statement of operations for the year then ended, the statements of changes in net assets for each of the years in the two-year period then ended and the financial highlights for each of the years in the five-year period then ended, and the related notes (collectively referred to as the “financial statements”). In our opinion, the financial statements present fairly, in all material respects, the financial position of the Fund as of August 31, 2019, and the results of its operations for the year then ended, the changes in its net assets for each of the years in the two-year period then ended and its financial highlights for each of the years in the five-year period then ended, in conformity with accounting principles generally accepted in the United States of America.
Basis for Opinion
These financial statements are the responsibility of the Fund's management. Our responsibility is to express an opinion on the Fund’s financial statements based on our audits. We are a public accounting firm registered with the Public Company Accounting Oversight Board (United States) (“PCAOB”) and are required to be independent with respect to the Fund in accordance with the U.S. federal securities law and the applicable rules and regulations of the Securities and Exchange Commission and the PCAOB.
We conducted our audits in accordance with the standards of the PCAOB. Those standards require that we plan and perform the audits to obtain reasonable assurance about whether the financial statements are free of material misstatement, whether due to error or fraud. The Fund is not required to have, nor were we engaged to perform, an audit of its internal control over financial reporting. As part of our audits we are required to obtain an understanding of internal control over financial reporting but not for the purpose of expressing an opinion on the effectiveness of the Fund’s internal control over financial reporting. Accordingly, we express no such opinion.
Our audits included performing procedures to assess the risk of material misstatement of the financial statements, whether due to error or fraud, and performing procedures that respond to those risks. Such procedures include examining, on a test basis, evidence regarding the amounts and disclosures in the financial statements. Our procedures included confirmation of securities owned as of August 31, 2019 by correspondence with the custodian and brokers. Our audits also included evaluating the accounting principles used and significant estimates made by management, as well as evaluating the overall presentation of the financial statements. We believe that our audits provide a reasonable basis for our opinion.
We have served as the auditor of one or more of the Funds in the Starboard Investment Trust since 2012.
Philadelphia, Pennsylvania
October 29 2019
ROUMELL OPPORTUNISTIC VALUE FUND
Additional Information
(Unaudited)
As of August 31, 2019
1. Proxy Voting Policies and Voting Record
A copy of the Advisor’s Proxy Voting and Disclosure Policy is included as Appendix B to the Fund’s Statement of Additional Information and is available, without charge, upon request, by calling 800-773-3863, and on the website of the Securities and Exchange Commission (“SEC”) at sec.gov. Information regarding how the Fund voted proxies relating to portfolio securities during the most recent 12-month period ended June 30, is available (1) without charge, upon request, by calling the Fund at the number above and (2) on the SEC’s website at sec.gov.
2. Quarterly Portfolio Holdings
The Fund files its complete schedule of portfolio holdings with the SEC for the first and third quarters of each fiscal year on Form N-Q. The Fund’s Form N-Qs are available on the SEC’s website at sec.gov. You may review and make copies at the SEC’s Public Reference Room in Washington, D.C. Information on the operation of the Public Reference Room may be obtained by calling the SEC at 800-SEC-0330. You may also obtain copies without charge, upon request, by calling the Fund at 800-773-3863.
3. Tax Information
The following information is provided for the Fund’s fiscal year ended August 31, 2019.
During the fiscal year, the Fund paid $1,284,133 in income distributions, $2,628,106 in short-term capital gain distributions, but no long-term capital gain distributions.
Dividend and distributions received by retirement plans such as IRAs, Keogh-type plans, and 403(b) plans need not be reported as taxable income. However, many retirement plans may need this information for their annual information meeting.
4. Schedule of Shareholder Expenses
As a shareholder of the Fund, you incur ongoing costs, including management fees and other Fund expenses. This Example is intended to help you understand your ongoing costs (in dollars) of investing in the Fund and to compare these costs with the ongoing costs of investing in other mutual funds.
ROUMELL OPPORTUNISTIC VALUE FUND
Additional Information
(Unaudited)
As of August 31, 2019
The Example is based on an investment of $1,000 invested at the beginning of the period and held for the entire period from March 1, 2019 through August 31, 2019.
Actual Expenses – The first line of the table below provides information about actual account values and actual expenses. You may use the information in this line, together with the amount you invested, to estimate the expenses that you paid over the period. Simply divide your account value by $1,000 (e.g., an $8,600 account value divided by $1,000 = 8.6), then multiply the result by the number in the first line under the heading entitled “Expenses Paid During Period” to estimate the expenses you paid on your account during this period.
Hypothetical Example for Comparison Purposes – The second line of the table below provides information about hypothetical account values and hypothetical expenses based on the Fund’s actual expense ratio and an assumed rate of return of 5% per year before expenses, which is not the Fund’s actual return. The hypothetical account values and expenses may not be used to estimate the actual ending account balance or expenses you paid for the period. You may use this information to compare the ongoing costs of investing in the Fund and other funds. To do so, compare this 5% hypothetical example with the 5% hypothetical examples that appear in the shareholder reports of the other funds.
Please note that the expenses shown in the table are meant to highlight your ongoing costs only and do not reflect any transactional costs, such as sales charges (loads), redemption fees, or exchange fees. Therefore, the second line of the table is useful in comparing ongoing costs only, and will not help you determine the relative total costs of owning different funds. In addition, if these transactional costs were included, your costs would have been higher.
(Continued)
ROUMELL OPPORTUNISTIC VALUE FUND
Additional Information
(Unaudited)
As of August 31, 2019
| Institutional Class Shares | Beginning Account Value March 1, 2019 | Ending Account Value August 31, 2019 | Expenses Paid During Period* |
Actual Hypothetical (5% annual return before expenses) | $1,000.00 | $ 953.10 | $6.06 |
| | | |
| $1,000.00 | $1,019.00 | $6.26 |
*Expenses are equal to the average account value over the period multiplied by the Fund’s annualized expense ratio of 1.23%, multiplied by 183/365 (to reflect the one-half year period).
4. Advisory Agreement Approval
In connection with the regular Board meeting held on September 6, 2018, the Board, including a majority of the Independent Trustees, discussed the approval of a management agreement between the Trust and the Advisor, with respect to the Fund (the "Investment Advisory Agreement"). The Trustees were assisted by legal counsel throughout the review process. The Trustees relied upon the advice of legal counsel and their own business judgment in determining the material factors to be considered in evaluating the Investment Advisory Agreement and the weight to be given to each factor considered. The conclusions reached by the Trustees were based on a comprehensive evaluation of all of the information provided and were not the result of any one factor. Moreover, each Trustee may have afforded different weight to the various factors in reaching his conclusions with respect to the approval of the Investment Advisory Agreement. In connection with their deliberations regarding approval of the Investment Advisory Agreement, the Trustees reviewed materials prepared by the Advisor.
In deciding on whether to approve the renewal of the Investment Advisory Agreement, the Trustees considered numerous factors, including:
(i) | Nature, Extent, and Quality of Services. The Trustees considered the responsibilities of the Advisor under the Investment Advisory Agreement. The Trustees reviewed the services being provided by the Advisor to the Fund including, without limitation, the quality of its investment advisory services since the Fund’s inception (including research and recommendations with respect to portfolio securities); its procedures for formulating investment recommendations and assuring compliance with the Fund’s investment objectives, policies and limitations; its coordination of services for the Fund among the Fund’s service providers; and its efforts to promote the Fund, grow the Fund’s assets, and assist in the distribution of Fund shares. The Trustees evaluated: the Advisor’s staffing, personnel, and methods of operating; the education and experience of the Advisor’s personnel; the Advisor’s compliance program; and the financial condition of the Advisor. |
(Continued)
ROUMELL OPPORTUNISTIC VALUE FUND
Additional Information
(Unaudited)
As of August 31, 2019
After reviewing the foregoing information and further information in the memorandum from the Advisor (e.g., descriptions of the Advisor’s business, the Advisor’s compliance program, and the Advisor’s Form ADV), the Board concluded that the nature, extent, and quality of the services provided by the Advisor were satisfactory and adequate for the Fund.
(ii) Performance. The Trustees compared the performance of the Fund with the performance of its benchmark index, comparable funds with similar strategies managed by other investment advisers, and applicable peer group data (e.g., Lipper peer group average). The Trustees noted that, while the Fund’s performance lagged that of its peers, the Advisor had indicated that the Fund was performing as expected compared to its peers under the market conditions that existed during the periods shown and that performance was improving. The Trustees also considered the consistency of the Advisor’s management of the Fund with its investment objective, policies and limitations. After reviewing the investment performance of the Fund, the Advisor’s experience managing the Fund, the Advisor’s historical investment performance, and other factors, the Board concluded that the investment performance of the Fund and the Advisor was satisfactory.
(iii) Fees and Expenses. The Trustees first noted the management fee for the Fund under the Investment Advisory Agreement. The Trustees then compared the advisory fee and expense ratio of the Fund to other comparable funds. The Trustees noted that the management fee and expense ratio were higher than the peer group averages. The Trustees considered the Advisor’s unique research and investment process in evaluating the reasonableness of its management fee, and the Trustees noted that the Advisor had explained that the Fund’s net expense ratio was higher than the peer group averages due to the small size of the Fund compared to its peers. the Advisor notes that as the Fund’s assets under management grow, the net expense ratio may decline.
(Continued)
ROUMELL OPPORTUNISTIC VALUE FUND
Additional Information
(Unaudited)
As of August 31, 2019
Following this comparison, and upon further consideration and discussion of the foregoing, the Board concluded that the fees to be paid to the Advisor by the Fund were not unreasonable in relation to the nature and quality of the services provided by the Advisor and that they reflected charges that were within a range of what could have been negotiated at arm’s length.
(iv) Profitability. The Board reviewed the Advisor’s profitability analysis in connection with its management of the Fund over the past twelve months. The Board noted that the Advisor did realize a small profit for the prior twelve months of operations. The Board considered the quality of the Advisor’s service to the Fund, and after further discussion, concluded that the Advisor’s level of profitability was not excessive.
(v) Economies of Scale. In this regard, the Trustees reviewed the Fund’s operational history and noted that the size of the Fund had not provided an opportunity to realize economies of scale. The Trustees then reviewed the Fund’s fee arrangements for breakpoints or other provisions that would allow the Fund’s shareholders to benefit from economies of scale in the future as the Fund grows. The Trustees determined that the maximum management fee would stay the same regardless of the Fund’s asset levels. The Trustees noted that the Fund was a relatively small size and economies of scale were unlikely to be achievable in the near future. It was pointed out that breakpoints in the advisory fee could be reconsidered in the future as the Fund grows.
Conclusion. Having reviewed and discussed in depth such information from the Advisor as the Trustees believed to be reasonably necessary to evaluate the terms of the Investment Advisory Agreement and as assisted by the advice of legal counsel, the Trustees concluded that renewal of the Investment Advisory Agreement was in the best interest of the shareholders of the Fund.
5. Information about Trustees and Officers
The business and affairs of the Fund and the Trust are managed under the direction of the Board of Trustees of the Trust. Information concerning the Trustees and officers of the Trust and Fund is set forth below. Generally, each Trustee and officer serves an indefinite term or until certain circumstances such as their resignation, death, or otherwise as specified in the Trust’s organizational documents. Any Trustee may be removed at a meeting of shareholders by a vote meeting the requirements of the Trust’s organizational documents. The Statement of Additional Information of the Fund includes additional information about the Trustees and officers and is available, without charge, upon request by calling the Fund toll-free at 800-773-3863. The address of each Trustee and officer, unless otherwise indicated below, is 116 South Franklin Street, Rocky Mount, North Carolina 27804. The Independent Trustees each received aggregate compensation of $2,000 during the fiscal year ended August 31, 2019 from the Fund for their services to the Fund and Trust.
(Continued)
ROUMELL OPPORTUNISTIC VALUE FUND
Additional Information
(Unaudited)
As of August 31, 2019
Name, Age
and Address | Position
held with
Fund or Trust | Length of Time Served | Principal Occupation
During Past 5 Years | Number of Portfolios in Fund Complex Overseen by Trustee | Other Directorships
Held by Trustee
During Past 5 Years |
| Independent Trustees |
James H. Speed, Jr.
Date of Birth: 06/1953 | Independent Trustee, Chairman | Trustee since 7/09, Chair since 5/12 | Previously President and CEO of NC Mutual Insurance Company (insurance company) from 2003 to 2015. | 16 | Independent Trustee of the Brown Capital Management Mutual Funds for all its series, Hillman Capital Management Investment Trust for its series, Centaur Mutual Funds Trust for all its series, Chesapeake Investment Trust for all its series, Leeward Investment Trust for all its series, and WST Investment Trust for all its series (all registered investment companies). Member of Board of Directors of M&F Bancorp. Member of Board of Directors of Investors Title Company. Previously, Board of Directors of NC Mutual Life Insurance Company. |
(Continued)
ROUMELL OPPORTUNISTIC VALUE FUND
Additional Information
(Unaudited)
As of August 31, 2019
Name, Age
and Address | Position
held with
Fund or Trust | Length of Time Served | Principal Occupation
During Past 5 Years | Number of Portfolios in Fund Complex Overseen by Trustee | Other Directorships
Held by Trustee
During Past 5 Years |
Theo H. Pitt, Jr.
Date of Birth: 04/1936 | Independent Trustee | Since 9/10 | Senior Partner, Community Financial Institutions Consulting (financial consulting) since 1999; Partner, Pikar Properties (real estate) since 2001. | 16 | Independent Trustee of World Funds Trust for all its series, Chesapeake Investment Trust for all its series, DGHM Investment Trust for all its series, Leeward Investment Trust for all its series and Hillman Capital Management Investment Trust for its series (all registered investment companies). |
Michael G. Mosley
Date of Birth: 01/1953 | Independent Trustee | Since 7/10 | Owner of Commercial Realty Services (real estate) since 2004. | 16 | None. |
J. Buckley Strandberg
Date of Birth: 03/1960 | Independent Trustee | Since 7/09 | President of Standard Insurance and Realty since 1982. | 16 | None. |
| Other Officers |
Katherine M. Honey
Date of Birth: 09/1973 | President and Principal Executive Officer | Since 05/15 | EVP of The Nottingham Company since 2008. | n/a | n/a |
Ashley E. Harris Date of Birth: 03/1984 | Treasurer, Assistant Secretary and Principal Financial Officer | Since 05/15 | Fund Accounting Manager and Financial Reporting, The Nottingham Company since 2008. | n/a | n/a |
Stacey Gillespie
Date of Birth: 05/1974 | Chief Compliance Officer | Since 03/16 | Compliance Director, Cipperman Compliance Services, LLC (09/15-present). Formerly, Chief Compliance Officer of Boenning & Scattergood, Inc. (2013-2015) and Director of Investment Compliance at Boenning & Scattergood, Inc. (2007-2013). | n/a | n/a |
Item 2. CODE OF ETHICS.
| (a) | The registrant, as of the end of the period covered by this report, has adopted a code of ethics that applies to the registrant’s principal executive officer, principal financial officer, principal accounting officer or controller, or persons performing similar functions, regardless of whether these individuals are employed by the registrant or a third party (the “Code of Ethics”). |
| (c) | During the period covered by this report, there have been no substantive amendments to the provisions of the Code of Ethics. |
| (d) | During the period covered by this report, the registrant did not grant any waivers to the provisions of the Code of Ethics. |
| (f)(1) | A copy of the Code of Ethics is filed with this Form N-CSR as Exhibit 13(a)(1). |
Item 3. AUDIT COMMITTEE FINANCIAL EXPERT.
The registrant’s Board of Trustees has determined that there is at least one member who qualifies as an audit committee financial expert, as that term is defined under Item 3(b) and Item 3(c) of Form N-CSR, serving on its audit committee.
As of the date of this report, the registrant’s audit committee financial expert is Mr. James H. Speed, Jr. Mr. Speed is “independent” for purposes of Item 3 of Form N-CSR.
Item 4. PRINCIPAL ACCOUNTANT FEES AND SERVICES.
(a) | Audit Fees – Audit fees billed for the Roumell Opportunistic Value Fund (the Fund”), a series of the Trust, for the last two fiscal years are reflected in the table below. These amounts represent aggregate fees billed for each of the last two fiscal years for professional services rendered by the registrant’s independent accountant, BBD, LLP (“Accountant”), for the audit of the Fund’s annual financial statements or services that are normally provided by the Accountant in connection with the registrant’s statutory and regulatory filings or engagements for those fiscal years. |
| Fund | August 31, 2018 | August 31, 2019 |
Roumell Opportunistic Value Fund | $11,800 | $12,000 |
(b) | Audit-Related Fees – There were no additional fees billed in the fiscal years ended August 31, 2018 and August 31, 2019 for assurance and related services by the Accountant that were reasonably related to the performance of the audit of the Fund’s financial statements and that were not reported under paragraph (a) of this Item. |
(c) | Tax Fees – The tax fees billed in each of the last two fiscal years ended for professional services rendered by the Accountant for tax compliance, tax advice, and tax planning are reflected in the table below. These services were for the completion of the Fund’s federal and state income tax returns, excise tax returns, and assistance with distribution calculations. |
| Fund | August 31, 2018 | August 31, 2019 |
Roumell Opportunistic Value Fund | $2,000 | $2,000 |
(a) | All Other Fees – There were no other fees billed in each of the fiscal years ended August 31, 2018 and August 31, 2019 for products and services provided by the Accountant, other than the services reported in paragraphs (a) through (c) of this Item. |
| (e)(1) | The registrant’s Board of Trustees pre-approved the engagement of the Accountant for the last two fiscal years at an audit committee meeting of the Board of Trustees called for such purpose; and will pre-approve the Accountant for each fiscal year thereafter at an audit committee meeting called for such purpose. The charter of the audit committee states that the audit committee should pre-approve any audit services and, when appropriate, evaluate and pre-approve any non-audit services provided by the Accountant to the registrant and to pre-approve, when appropriate, any non-audit services provided by the Accountant to the registrant’s investment adviser, or any entity controlling, controlled by, or under common control with the investment adviser that provides ongoing services to the registrant if the engagement relates directly to the operations and financial reporting of the registrant. |
| (2) | There were no services as described in each of paragraph (b) through (d) of this Item that were approved by the audit committee pursuant to paragraph (c)(7)(i)(C) of Rule 2-01 of Regulation S-X. |
| (g) | The aggregate non-audit fees billed by the Accountant to the Fund for services rendered for the fiscal years ended August 31, 2018 and August 31, 2019 were $2,000 and $2,000, respectively. There were no fees billed by the Accountant for non-audit services rendered to the Fund’s investment adviser, or any other entity controlling, controlled by, or under common control with the Fund’s investment adviser. |
Item 5. AUDIT COMMITTEE OF LISTED REGISTRANTS.
Not applicable.
Item 6. SCHEDULE OF INVESTMENTS.
A copy of the schedule of investments in securities of unaffiliated issuers as of the close of the reporting period is included as part of the report to shareholders filed under Item 1 of this Form.
Item 7. DISCLOSURE OF PROXY VOTING POLICIES AND PROCEDURES FOR CLOSED-END MANAGEMENT INVESTMENT COMPANIES.
Not applicable.
Item 8. PORTFOLIO MANAGERS OF CLOSED-END MANAGEMENT INVESTMENT COMPANIES.
Not applicable.
Item 9. PURCHASES OF EQUITY SECURITIES BY CLOSED-END MANAGEMENT INVESTMENT COMPANY AND AFFILIATED PURCHASERS.
Not applicable.
Item 10. SUBMISSION OF MATTERS TO A VOTE OF SECURITY HOLDERS.
None.
Item 11. CONTROLS AND PROCEDURES.
| (a) | The President and Principal Executive Officer and the Treasurer and Principal Financial Officer have concluded that the registrant’s disclosure controls and procedures (as defined in Rule 30a-3(c) under the Investment Company Act of 1940) are effective based on their evaluation of these disclosure controls and procedures required by Rule 30a-3(b) under the Investment Company Act of 1940 and Rules 13a-15(b) or 15d-15(b) under the Exchange Act of 1934, as of a date within 90 days of the filing of this report. |
| (b) | There were no changes in the registrant's internal control over financial reporting (as defined in Rule 30a-3(d) under the Investment Company Act of 1940) that occurred during the period covered by this report that have materially affected, or are reasonably likely to materially affect, the registrant’s internal control over financial reporting. |
Item 12. DISCLOSURE OF SECURITIES LENDING ACTIVITIES FOR CLOSED-END MANAGEMENT INVESTMENT COMPANIES.
Not applicable.
Item 13. EXHIBITS.
| (a)(1) | Code of Ethics required by Item 2 of Form N-CSR is filed herewith. |
| (a)(2) | Certifications pursuant to Rule 30a-2(a) under the Investment Company Act of 1940 are filed herewith. |
| (b) | Certifications pursuant to Rule 30a-2(b) under the Act and Section 906 of the Sarbanes-Oxley Act of 2002 are filed herewith. |
SIGNATURES
Pursuant to the requirements of the Securities Exchange Act of 1934 and the Investment Company Act of 1940, the registrant has duly caused this report to be signed on its behalf by the undersigned, thereunto duly authorized.
| | Starboard Investment Trust |
| | | |
| | | |
| | By:
| /s/ Katherine M. Honey
|
| |
| Katherine M. Honey President and Principal Executive Officer |
| | | |
| | Date: | November 4, 2019 |
| | | |
Pursuant to the requirements of the Securities Exchange Act of 1934 and the Investment Company Act of 1940, this report has been signed below by the following persons on behalf of the registrant and in the capacities and on the dates indicated.
| | | |
| | By:
| /s/ Katherine M. Honey
|
| | | Katherine M. Honey President and Principal Executive Officer |
| | | |
| | Date: | November 4, 2019 |
| | | |
| |
| |
| | By:
| /s/ Ashley E. Harris
|
| |
| Ashley E. Harris Treasurer and Principal Financial Officer |
| | | |
| | Date: | November 4, 2019 |