Statements in this Annual Report that reflect projections or expectations of future financial or economic performance of the Roumell Opportunistic Value Fund (the “Fund”) and of the market in general and statements of the Fund’s plans and objectives for future operations are forward-looking statements. No assurance can be given that actual results or events will not differ materially from those projected, estimated, assumed or anticipated in any such forward-looking statements. Important factors that could result in such differences, in addition to the other factors noted with such forward-looking statements, include, without limitation, general economic conditions such as inflation, recession and interest rates. Past performance is not a guarantee of future results.
An investor should consider the investment objectives, risks, and charges and expenses of the Fund carefully before investing. The prospectus contains this and other information about the Fund. A copy of the prospectus is available at ncfunds.com/fundpages/812.htm or by calling Shareholder Services at 800-773-3863. The prospectus should be read carefully before investing. |
For More Information on the Roumell Opportunistic Value Fund:
See Our Web site @ roumellfund.com
or
Call Our Shareholder Services Group at 800-773-3863.
Beginning on January 1, 2021, paper copies of the Fund’s shareholder reports will no longer be sent by mail, unless you specifically request paper copies of the reports. Instead, the reports will be made available on the Fund’s website at https://www.nottinghamco.com/fundpages/Roumell, and you will be notified by mail each time a report is posted and provided with a website link to access the report.
If you have previously elected to receive shareholder reports electronically, you will not be affected by this change and you need not take any action. You may elect to receive shareholder reports and other communications from a Fund electronically anytime by contacting your financial intermediary (such as a broker-dealer or bank) or, if you are a direct investor, by clicking Enroll at https://www.nottinghamco.com/fundpages/Roumell.
You may, notwithstanding the availability of shareholder reports online, elect to receive all future shareholder reports in paper free of charge. If you invest through a financial intermediary, you can contact your financial intermediary to request that you continue to receive paper copies of your shareholder reports. If you invest directly with a Fund, you can call 800-773-3863 to let the Fund know you wish to continue receiving paper copies of your shareholder reports.
(Unaudited)
August 31, 2020
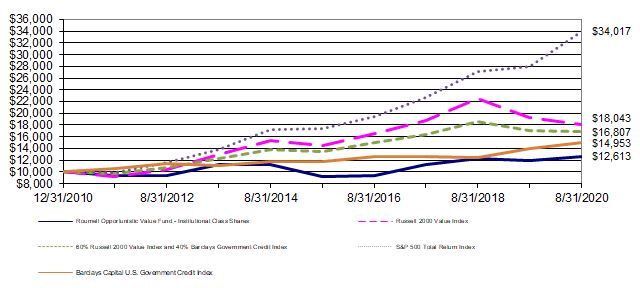
For the fiscal year ended August 31, 2020, the return on the Institutional Class Shares was 5.35%. This compares to -1.77% for the 60% Russell 2000 Value Index/40% Barclays Capital U.S. Government Credit Index, -6.14% for the Russell 2000 Value Index, 7.26% for the Barclays Capital U.S. Government Credit Index, and 21.94% for the S&P 500 Total Return Index over the same period. These returns were attained with an allocation of about 32% in cash, 54% in equities, and 14% in fixed income during the fiscal year. Although the overall market (i.e., S&P 500) rose over this period, small cap value in particular underperformed. The Roumell Opportunistic Value Fund outperformed the 60% Russell 2000 Value Index/40% Barclays Capital U.S. Government Credit Index and the Russell 2000 Value Index and underperformed the Barclays Capital U.S. Government Credit Index and the S&P 500 Total Return Index. Significant positive contributors to performance were Dundee and Tetra Tech, and significant negative contributors to performance were ZAGG and Medley Capital. Our investment style of selecting securities of individual companies that are deeply researched and out of favor, overlooked, or misunderstood by Wall Street and, thus, able to be bought at a significant discount to our calculation of intrinsic value means that our investment returns are unlikely to mirror market averages.
Please see the table below for the Fund’s historical performance information through the calendar quarter ended September 30, 2020.
Average Annual Returns (Unaudited)
Period Ended September 30, 2020 | Past 1 Year | Five Year | Since Inception1 | Gross Expense Ratio2 | Net Expense Ratio3
|
| Roumell Opportunistic Value Fund –Institutional Class Shares | -1.17% | 6.89% | 1.95% | 1.32% | 1.25% |
| 60% Russell 2000 Value Index, and 40% Barclays Capital U.S. Government Credit Index | -7.70% | 4.31% | 5.14% | N/A | N/A |
| Russell 2000 Value Index | -14.88% | 4.11% | 5.72% | N/A | N/A |
Barclays Capital U.S. Government Credit Index | 8.03% | 4.66% | 4.21% | N/A | N/A |
| S&P 500 Total Return Index | 15.15% | 14.15% | 12.92% | N/A | N/A |
The quoted performance data represents past performance, which is not a guarantee of future results. Investment return and principal value of an investment in the Fund will fluctuate so that an investor's shares, when redeemed, may be worth more or less than their original cost. Current performance may be lower or higher than the performance data quoted. To obtain more current performance data regarding the Fund, including performance data current to the Fund’s most recent month-end, please visit ncfunds.com or call the Fund at (800)773-3863. Fee waivers and expenses reimbursements have positively impacted Fund performance.
1The Fund’s inception date is December 31, 2010.
2Gross expense ratio as of the Fund’s most recent Prospectus dated January 1, 2020 and includes Acquired Fund Fees and Expenses.
3 Net expense ratio is as of the Fund’s most recent Prospectus dated January 1, 2020 and includes Acquired Fund Fees and Expenses. The Advisor has entered into an Expense Limitation Agreement with the Fund under which it has agreed to waive or reduce its management fees and assume other expenses of the Fund in an amount that limits the Fund’s annual operating expenses (exclusive of (i) any front-end or contingent deferred loads; (ii) brokerage fees and commissions, (iii) acquired fund fees and expenses; (iv) fees and expenses associated with investments in other collective investment vehicles or derivative instruments (including for example option and swap fees and expenses); (v) borrowing costs (such as interest and dividend expense on securities sold short); (vi) taxes; and (vii) extraordinary expenses, such as litigation expenses (which may include indemnification of Fund officers and Trustees and contractual indemnification of Fund service providers (other than the Advisor)) to not more than 1.23% of the average daily net assets of the Fund through January 31, 2021. The Expense Limitation Agreement may be terminated by the Board of Trustees of the Trust at any time. Further, net annual operating expenses for the Fund may exceed those contemplated by the waiver due to acquired fund fees and other expenses that are not waived under the Expense Limitation Agreement.
Rain or Shine, We Pursue Out of Favor, Overlooked or Misunderstood Securities
Back in mid-March, as the markets were sinking in the early days of struggling to absorb the ultimate impact of the coronavirus, and the ensuing country-wide shut down, here was our view as communicated to clients:
“When liquidity evaporates for small and micro-cap securities, no matter how well-capitalized, bids drop. During these times, we must reexamine our company-specific assumptions, in light of their current (lower) prices, and decide whether any action is needed. Our belief in the underlying value of our investments is overwhelmingly intact.
Time and again, our security selections have ultimately performed and moved us up the field, while episodically providing us roller-coaster rides along the way. We believe our securities will again work out to our investment satisfaction. To recap, our securities are well-financed. Such investments will not face liquidity challenges, which provides us time.
We have little to nothing to say about coronavirus that hasn’t already been said, its impact on markets, and, ultimately, how it plays out for the economy. What we can say, as far as the securities we hold, is that we believe the current marks reflect panic selling. Thus, we’ve opportunistically added to several of our existing positions and also purchased a few starter positions in securities that were “on the shelf” waiting for what we deemed an attractive entry point. We believe we hold a portfolio of securities possessing excellent risk-reward dynamics. Our equity position has moved from roughly 50% to 60% in the past two weeks, underscoring our conviction.”
Further, in a late March conference call with our family wealth office clients, we said the following:
“Our job with our companies and potential new investments is trying to generate reasonable scenarios of a) how long will it take to cross the bridge and b) what will our businesses and balance sheets look like once we reach the other side? Those are the two primary questions. These are tough questions, particularly for companies that are debt financed (fortunately, we don’t really have that problem) but also for companies well capitalized because there is likely some reduction in company resources.
So, how exactly are we navigating this environment? Same as always and remaining focused on one overriding, core question – Would we take this business private in heartbeat? Full stop. There are more things to consider now, but that is, was and always will be our central investment question.
Investment-wise, we are also staying very close to home. What do I mean by that phrase? This is a time to really call upon our network, and to stay close to it, because uncertainty is higher than normal…and we are doing just that. Further, we have a library we’ve built up over the past several years to call upon.”
Our approach appears to have paid off. Our thoughts remain essentially the same as they were in March.
Recently, we decided to increase our level of portfolio concentration in order to take better advantage of our skill set. We know we are at our best managing “out of favor, overlooked and misunderstood” small and micro-cap equity investments. As you know, our Fund has held a high level of cash (or BDC fixed-income securities) for several years. We’ve had difficulty finding a sufficient number of equity investments to get fully invested. We want to manage the Fund with a greater focus in our sweet spot – small/micro equities. We will continue to pursue fixed income special situations to the extent we believe they are available at equity-like returns.
We will be increasing our typical portfolio holding weighting from the 3% to 6% range to the 5% to 10% range. We will, however, continue to have smaller sized positions based on our assessment of the risk/reward dynamics.
It’s our strong belief that we will better serve our clients by taking advantage of our highest conviction ideas with greater portfolio weightings. Our skill set should be put to its highest and best use, and that’s what we intend to do. We expect volatility to remain at elevated levels. We see such a dynamic as an opportunity for our investors.
Recent Updates of Top Five Equity Holdings
Dundee, DC’A-T/DDEJF. (Note: Values are expressed in Canadian dollars unless otherwise indicated). On May 13th, Dundee announced a transformative event – the sale of two-thirds of its investment in Dundee Precious Metals, DPM-T/DPMLF – resulting in a cash infusion of roughly $152 million. The buying group also received warrants giving them the ability to purchase the remaining one-third of Dundee’s DPM shares at $8/share, or roughly $95 million. DPM shares currently trade above $9/share, thus it is likely the warrants to purchase DDEJF’s remaining shares will be exercised. Dundee’s current market cap is about $130 million. The company has $125 million in perpetual preferred securities that currently trade at roughly 60% of their par value, i.e. $75 million.
On July 22nd, DDEJF announced a $44 million buy-back of its Series 2 Preferred shares at a roughly 35% discount to par value, providing immediate NAV accretion to common shareholders. On August 24th, after receiving confirmation of support from a few of the largest Series 2 Preferred shareholders, the company amended the buyback by increasing it to $61 million and reducing the discount to 26%. We expect the company to make further announcements that will positively impact common shareholders. The company’s next moves likely involve: 1) a common stock tender, which we expect to be at an attractive premium to the current market price and 2) a tender offer for its Series 3 Preferred shares at a deep discount to par value. Recall, in RAM’s analysis, we did not value the perpetual shares liability at par because we never believed that they were a par liability.
From the beginning, our thesis on Dundee has been predicated on CEO Jonathan Goodman executing on a plan of simplification, monetization and return of capital to shareholders. Since our original purchase, the company has gone from 70 employees to under 30 and the number of investments has similarly dropped by two-thirds. To be clear, a number of sales have not occurred as we expected, and one in particular, the Vancouver Parq Hotel and Casino, turned out to be a debt-for-equity swap.
Nonetheless, we believe our original “multiple shots on goal” narrative will provide us with a favorable investment outcome, albeit not as great as we once imagined. While other investors capitulated and threw in the towel, we steadily, and persistently, accumulated shares as they fell further out of favor during our holding period. Our lowest share purchase was at roughly $0.60 USD/share.
As of the fiscal year ended August 31, 2020, the Fund held 8.25% in DDEJF.
TETRA Technologies, TTI. This is the second time we’ve been invested in TTI. We met then-CEO Stu Brightman back in 2013. Stu spoke at RAM’s Investor Day in 2013 and 2016. TTI is an oil and gas services company and provider of calcium chloride and bromide products to the industrial market. TTI has three business segments as follows:
Completion Fluids & Products - Manufactures and markets clear brine fluids, additives, and associated products and services for use in completions, well drilling and workover operations.
Water & Flowback Services – A key to the completion stage of an oil and gas well is hydraulic fracturing, which requires large quantities of water. TTI provides onshore oil and gas operators with comprehensive water management services.
Compression – TTI’s consolidated investment in publicly traded CSI Compressco LP (CCLP) provides compression services for natural gas and oil production, gathering, artificial lift, transmission, processing, and storage.
We believe that TTI is misunderstood and overlooked by the investment community because of a perceived complicated capital structure. Summarized below are several attractive investment considerations that we believe will significantly enhance TTI’s valuation over time.
| • | Consolidation of CCLP’s highly levered balance sheet with the accounts of TTI is not fully understood. A screen of TTI’s financial statements shows a highly levered balance sheet. However, the consolidated balance sheet includes CCLP’s debt for which TTI has no responsibility with no cross defaults, no cross collateral and no cross guarantees. On a standalone basis, TTI has a much better balance sheet and two valuable business segments with no near-term debt maturities. TTI has indicated that it is supportive of actions to enhance shareholder value, including the potential to deconsolidate CCLP in the near term. |
| • | TTI’s standalone debt does not mature until September 2025. TTI’s debt schedule provides a long liquidity runway. While the investment thesis is not dependent upon higher energy prices, it is a valuable “option” providing considerable time for a recovery in energy prices. |
| • | TTI is an industry leader, and technology innovator, in its core Completion Fluids business segment. It has an estimated 30% market share in the important Completion Fluids industry for high end fluids that is generating mid-20% EBITDA margins even during a period of uncertainty in the energy sector. |
| •
| Favorable raw material supply agreement. TTI has a long-term supply agreement with Lanxess, under which it purchases bromine. The long-term Lanxess supply agreement provides a secure supply of bromine at materially more favorable terms as compared to spot prices. TTI entered into this agreement several years ago in a more favorable pricing environment. We understand there are approximately 8 years remaining on this supply agreement. Additionally, TTI recently announced that it has entered into another long-term supply agreement for another key raw material to produce calcium chloride. |
| •
| TTI’s profitable Completion Fluids segment has a sizable business that is not correlated to the oil and gas industry. About 40% of revenue in the Completion Fluids & Products segment is to non-energy market industrial customers. TTI is the largest supplier of Calcium Chloride in Northern Europe (market leader in Scandinavia) and the second largest in the United States. The industrial applications of calcium chloride are many, including de-icing, road maintenance/dust control, paper products and food additives. It is also a key component in the manufacture of flame-retardant products. Bottom line: TTI’s non-energy fluids business is estimated to be a $100 million plus revenue business with low 20% EBITDA margins and is expected to generate roughly $20 million in FCF in ’20. In fact, 1H 2020 revenue was essentially unchanged from 1H 2019. |
| •
| TTI developed “TETRA CS Neptune” which are high-density fluids that are free of undissolved solids, zinc (which is very corrosive), priority pollutants, and formate ions. This is an environmentally friendly alternative to traditional zinc bromide high-density completion fluids and environmentally friendly and cost-effective alternatives to cesium formate high-density completion fluids. TTI received the prestigious E&P Special Meritorious for Engineering Award, Innovation for Drilling Fluids and Stimulation category for this technology. High-pressure wells, typically deep-water, are Neptune’s sweet spot. TTI expects the solution to “breakthrough” in 2021 and expects major wins next year in the North Sea. Basically, Neptune provides the weight and density of zinc without the corrosive effects. In many jurisdictions (Brazil, N. Sea), zinc is banned. In these locations, the solution used is Cesium Formate, but it is over 2x the cost of Neptune. This technology is patented, and the company is seeking additional patents. We estimate Neptune has a two-year head start on potential competing solutions. |
| • | TTI’s Water and Flowback segment has an essential recurring business that is not dependent on new oil wells being drilled (i.e. transfer and treatment of produced water, and sand recovery, from existing producing wells). We believe the company’s technology innovations are resulting in market share gains in the areas of sand mitigation and in water recycling at the wellhead. |
| • | Valuable option on Compression business. CCLP generated $26 million of EBITDA in the first quarter of 2020 and $26.3 million in the second quarter of 2020. Additionally, CCLP recently restructured its capital structure by pushing out significant debt maturities several years, reducing its liquidity risk. The company has a modest $80 million due in August of ’22. The ’22 maturity should be relatively easy to resolve as the company will likely have $60 million plus of cash on its balance sheet at that time as a result of eliminating growth cap-ex and focusing on FCF generation. CCLP’s next maturity is not until 2025. The current (depressed) $108 million EBTIDA run rate (based on annualizing 2nd Q 2020), results in roughly $30 million in annual FCF. After the ’22 maturity is resolved, CCLP’s debt will be $570 million, or roughly 4.5x its current (depressed) EBITDA run-rate. Assuming no increase in utilization/pricing, FCF would be over $35 million post the ’22 payoff versus a current CCLP market cap of $40 million. If natural gas demand requires more compression services, and CCLP can increase EBITDA to $125 million, the company’s annual FCF generation goes from $30 million to $50 million. As cash builds, and CCLP’s leverage ratio declines, we believe value will be transferred from TTI’s debt to its equity. 8x the current depressed EBITDA run-rate of $108 million translates into to $75 million for TTI shareholders ($108 mill * 8 = $864 million less $640 million debt = $224 million * TTI’s 34% ownership = $75 million), or roughly $0.60/share – versus today’s share price of $0.53. The above analysis ascribes no value to TTI’s 100% ownership of CCLP’s GP. Recent M&A comparables in the compression sector have been between 8.0x to 10x EBITDA given the persistence and stickiness of these assets. |
| • | Management is aligned with shareholders – 60% of the CEO’s 2019 compensation was in equity and 35% of the CFO’s compensation was in equity. Directors and officers as a group own 5.4% of the stock. We noted that in June 2020 several Directors purchased an aggregate of about one million shares. Change of control payments are appropriate and incentivize Management to consider all strategic alternative to create value for shareholders. On August 20th, there was a $60K open-market purchase of CCLP by one of its directors. |
Valuation Based on EBITDA Multiples
Fluids Business: 6x 2020 EBITDA of $65 million
| $390 million |
Water & Flowback 4.5x Midpoint EBITDA of $35 million
| $158 million |
CCLP Equity Stake: 8x EBITDA of $108 mm less $640 mm debt * 34%
|
$ 75 million |
Sum
| $623 million |
Corporate Overhead ($22 million at 5x)
| $110 million |
Net Debt
| $170 million |
Total Sum @126 million shares = $2.70
| $343 million
|
Based on the above, we feel we have downside protection from the attractive Completion Fluids and Water/Flowback businesses weathering the storm of low oil prices, combined with the significant time afforded to shareholders as a result of TTI’s debt maturity schedule.
Finally, another important contributor to value is the fact that TTI has a U.S. tax loss carryforward of over $250 million. It will likely be a long time before TTI is paying any cash taxes in the US. It will probably incur about $3 million internationally. Additionally, if TTI were to sell any of its businesses, or its CCLP shares, it has enough tax loss carryforwards to offset significant gains.
In summary, TTI enjoys a key RAM attribute – multiple shots on goal from three distinct assets (Fluids, Water and Compression). It also possesses another coveted attribute – time.
As of the fiscal year ended August 31, 2020, the Fund held 7.57% in TETRA Technologies.
Marchex, MCHX. MCHX is a leading conversational/call analytics company. RAM exited MCHX at the beginning of 2019 at roughly $4/share. As Covid-19 took hold, and country-wide shutdowns were implemented, call volume to MCHX’s software platform dramatically dropped. MCHX gets paid per minute of calls, i.e., fewer minutes, less revenue. MCHX’s stock dropped 70%. RAM took advantage of the sell-off and quickly became a large shareholder (again). We now own nearly 9% of the company’s shares with an average purchase price of roughly $1.80/share. MCHX spoke at RAM’s 2017 Investor Day.
MCHX’s current market cap is roughly $80 million. It has $44 million of cash on its balance sheet (and no debt), leaving an enterprise value of $35 million, an absurd valuation, in our opinion, given the company’s IP, customer list, long-term secular trends and industry M&A. MCHX spent $35 million in product development over the past two years alone to enhance the capabilities of its conversational analytics platform. Net equity is 75% of total assets, further underscoring a capital structure unencumbered by liabilities. What are the odds that the company isn’t worth the past two years’ product development expenditures? We believe it’s quite low, thus providing free upside optionality.
Last year, MCHX landed an exclusive (OEM level) with GM. GM is encouraging its dealerships to sign-up for the MCHX conversational analytics software platform by offering to pay the first year’s cost.
MCHX has multiple options going forward. MCHX charges the customer about 5 cents/minute, its cost of goods is about 1.5 cents/minute (roughly 30%). If Marchex was able to separate its software from its underlying costs it could achieve SaaS-like margins. One way to do this may be to partner with larger call-center technology players (Cisco, Avaya, Genesys, etc.). It’s like putting some cargo onto a Fed Ex truck that has extra capacity as opposed to running your own truck, i.e., there’s no extra fuel cost.
Russ Horowitz, founder and co-CEO, owns roughly 13% of the company’s shares and will be the ultimate decider as he owns 100% of the company’s super-voting A shares. Russ is a first-class competitor (played soccer – Center Forward - at Columbia), and a serial entrepreneur (Go2Net, Inc., Xanthus Capital, LP, Active Apparel Group). Russ is the 2003 Henry Crown Fellow of the Aspen Institute. We believe he will “get it done”.
On August 10th, the company announced its intent to launch a tender offer with Edenbrook Capital, which owns 19.5% of Marchex’s Class B common stock, to purchase up to 10 million shares between $1.80/share and $1.96/share. On September 23rd, the company increased its offer to $2.15/share.
As of the fiscal year ended August 31, 2020, the Fund held 7.18% in Marchex.
Barnes & Noble Education, BNED. BNED is one of the largest contract operators of physical and virtual bookstores for college and university campuses and K-12 institutions across the United States. It also one of the largest textbook wholesalers, inventory management hardware and software providers, and a leading provider of digital education solutions. BNED operates 1,442 physical, virtual, and custom bookstores and serve more than 6 million students, delivering essential educational content and tools within a dynamic omni channel retail environment. Additionally, it offers direct-to-student products and services to help students study more effectively and improve academic performance.
BNED has three reportable segments: Retail, Wholesale and DSS.
The Retail Segment operates 1,442 college, university, and K-12 school bookstores, comprised of 772 physical bookstores and 670 virtual bookstores. BNED bookstores typically operate under agreements with the college, university, or K-12 schools to be the official bookstore and the exclusive seller of course materials and supplies, including physical and digital products.
The Wholesale Segment is comprised of BNED’s wholesale textbook business and is one of the largest textbook wholesalers in the country.
The Digital Student Solutions (“DSS”) Segment includes direct-to-student products and services to assist students to study more effectively and improve academic performance. The DSS Segment is comprised of the operations of Student Brands, LLC, a leading direct-to-student subscription-based writing services business, and bartleby®, a direct-to-student subscription-based offering providing textbook solutions, expert questions and answers, writing and tutoring.
BNED’s business experienced an unprecedented and significant impact as a result of COVID-19 related campus store closures. Beginning in March 2020, colleges and universities nationwide began to close their campuses in light of safety concerns and as a result of local and state issued stay-at-home orders. By mid-March, during its fiscal fourth quarter, it closed the majority of its physical campus stores to protect the health and safety of its customers and employees.
While campus stores were closed, BNED continued to serve institutions and students through its campus websites, providing free shipping on all orders and an expanded digital content offering to provide immediate access to course materials to students at the campuses that closed due to COVID-19. The company developed and implemented plans to safely reopen campus stores based on national, state and local guidelines, as well as the campus policies set by the school administration.
BNED’s Q1 (July) results showed the resilience of the company’s business model and largely met estimates despite temporary store closures and reduced campus activity. The company signed new agreements during the quarter worth an estimated $70 million in annual revenue. First Day Complete, where BNED supplies books to a school’s students that are billed directly through the school at a discounted rate, is showing good traction with an increase from 4 schools last year to 12 this year. Additionally, as a result of the pandemic, it appears that more schools may be willing move to an outsourced bookstore relationship instead of operating bookstores themselves in order to lower costs and improve profitability.
In Fiscal 2020, the company retained Morgan Stanley & Co. LLC to serve as a financial advisor in connection with a review of strategic opportunities. On August 24, 2020, BNED announced that it had concluded its review of strategic opportunities. After extensive evaluation and deliberation, and in consultation with its financial and legal advisors, the Board unanimously determined that the continued execution of the company’s current business plan was the best path forward for the company and its shareholders.
As of the fiscal year ended August 31, 2020, the Fund held 6.35% in Barnes & Noble Education.
Allot, ALLT. Allot was founded in 1996 and is headquartered in Hod-Hasharon, Israel. Allot is a provider of network intelligence and security solutions that empower communications service providers (CSPs) and enterprises worldwide to enhance the value they bring to their customers. Allot’s solutions turn network, application, usage and security data into actionable intelligence that make their customers’ networks smarter and their users more secure.
Allot provides a network-based security platform that positions CSPs as leading Security-as-a-Service providers protecting over 20 million subscribers worldwide. Recently introduced modules, IoTSecure and HomeSecure, enable service providers to secure enterprise and consumer IoT deployments at the network layer, in both fixed and mobile networks. Allot’s multi-service platforms are deployed globally, by over 500 mobile, fixed and cloud service providers and over a thousand enterprises.
ALLT has a solid balance sheet with $109 million in cash and investments (no debt), representing roughly 30% of its market capitalization. We have multiple confirmation points that the company’s cybersecurity technology is exceptionally strong.
In its 2Q20 earnings release, Eres Antebi, President and CEO, commented, “We are very pleased with our performance in the second quarter. We grew revenues 23% year-over-year, while improving gross margins and continuing our advance to profitability. COVID-19 continues to present Allot with both challenges and opportunities. While it is taking longer to close deals and the absence of travel is challenging business development activities, we are continuing to work towards meeting our goals and are on track to achieving our original 2020 plan. I believe that in the long-term, the growing need for successful connectivity and the increased amount of threats consumers face on the internet, will further increase demand for Allot’s solutions.”
As of the fiscal year ended August 31, 2020, the Fund held 6.41% in Allot.
We will continue to methodically and diligently search for out-of-favor, overlooked and misunderstood investments and stay true to being balance sheet focused, opportunistic, and thoughtful while gathering enough information to make well-informed investment decisions.
Thank you again for your trust and confidence…and stay safe.
Best Regards,
Jim Roumell
Portfolio Manager
Roumell Opportunistic Value Fund
RCRAM0920001