UNITED STATES
SECURITIES AND EXCHANGE COMMISSION
Washington, D.C. 20549
FORM 6-K
REPORT OF FOREIGN PRIVATE ISSUER PURSUANT TO RULE 13a-16 OR 15d-16 UNDER THE SECURITIES EXCHANGE ACT OF 1934
For the month of March 2023
Commission File Number: 001-36298
GeoPark Limited
(Exact name of registrant as specified in its charter)
Calle 94 N° 11-30 8° piso
Bogota, Colombia
(Address of principal executive office)
Indicate by check mark whether the registrant files or will file annual reports under cover of Form 20-F or Form 40-F:
Form 20-F | X |
| Form 40-F |
Indicate by check mark if the registrant is submitting the Form 6-K in paper as permitted by Regulation S-T Rule 101(b)(1):
Yes |
| No | X |
Indicate by check mark if the registrant is submitting the Form 6-K in paper as permitted by Regulation S-T Rule 101(b)(7):
Yes |
| No | X |
GEOPARK LIMITED
TABLE OF CONTENTS
ITEM
| 1. | GeoPark Limited Consolidated Financial Statements as of and for the year ended December 31, 2022 |
Item 1
GEOPARK LIMITED
CONSOLIDATED
FINANCIAL STATEMENTS
As of and for the year ended December 31, 2022
| |
| |
2 | Report of Independent Registered Public Accounting Firm |
4 | Consolidated Statement of Income |
5 | Consolidated Statement of Comprehensive Income |
6 | Consolidated Statement of Financial Position |
7 | Consolidated Statement of Changes in Equity |
8 | Consolidated Statement of Cash Flow |
9 | Notes to the Consolidated Financial Statements |
| |
| |
| |
REPORT OF INDEPENDENT REGISTERED PUBLIC ACCOUNTING FIRM
To the shareholders and the Board of Directors of
GeoPark Limited
Opinion on the Financial Statements
We have audited the accompanying consolidated statements of financial position of GeoPark Limited (the Company) as of December 31, 2022 and 2021, the related consolidated statements of income, comprehensive income, changes in equity and cash flow for each of the three years in the period ended December 31, 2022 and the related notes (collectively referred to as the “consolidated financial statements”). In our opinion, the consolidated financial statements present fairly, in all material respects, the financial position of the Company at December 31, 2022 and 2021, and the results of its operations and its cash flows for each of the three years in the period ended December 31, 2022, in conformity with International Financial Reporting Standards (IFRS) as issued by the International Accounting Standards Board (IASB).
Basis for Opinion
These financial statements are the responsibility of the Company’s management. Our responsibility is to express an opinion on the Company’s financial statements based on our audits. We are a public accounting firm registered with the Public Company Accounting Oversight Board (United States) (PCAOB) and are required to be independent with respect to the Company in accordance with the U.S. federal securities laws and the applicable rules and regulations of the Securities and Exchange Commission and the PCAOB.
We conducted our audits in accordance with the standards of the PCAOB. Those standards require that we plan and perform the audit to obtain reasonable assurance about whether the financial statements are free of material misstatement, whether due to error or fraud. Our audits included performing procedures to assess the risks of material misstatement of the financial statements, whether due to error or fraud, and performing procedures that respond to those risks. Such procedures included examining, on a test basis, evidence regarding the amounts and disclosures in the financial statements. Our audits also included evaluating the accounting principles used and significant estimates made by management, as well as evaluating the overall presentation of the financial statements. We believe that our audits provide a reasonable basis for our opinion.
Critical Audit Matter
The critical audit matter communicated below is a matter arising from the current period audit of the financial statements that was communicated or required to be communicated to the audit committee and that: (i) relates to accounts or disclosures that are material to the financial statements and (ii) involved our especially challenging, subjective or complex judgments. The communication of the critical audit matter does not alter in any way our opinion on the consolidated financial statements, taken as a whole, and we are not, by communicating the critical audit matter below, providing a separate opinion on the critical audit matter or on the accounts or disclosures to which it relates.
Effect of estimated proved and probable oil and gas reserves on the depreciation of property, plant and equipment
Description of the Matter
At December 31, 2022, the carrying value of the Company’s property, plant and equipment was US$ 667 million and depreciation expense was US$ 91 million for the year then ended. As discussed in Note 2.11 the proved and probable reserves are used by the Company in the successful efforts method of accounting for its oil and gas properties. Under such method oil and gas properties are depreciated using the unit-of-production method based on commercial proved and probable oil and gas reserves, as estimated by an independent international oil and gas consulting firm. Proved and probable oil and gas reserves estimates are based on geological, geophysical and engineering assessments of expected reservoir characteristics, future production rates based on historical performance and expected future operating and investment activities. Estimating reserves also requires the selection of inputs, including future oil and gas prices and quality differentials, assumed effects of regulation by governmental agencies, tax rates by jurisdiction and future development and operating costs, among others.
2
Auditing the Company’s depreciation calculations is complex because of the use of the work of the independent international oil and gas consulting firm and the evaluation of management’s determination of the inputs described above used by the engineers in estimating commercial proved and probable oil and gas reserves. Also, the assumptions used by management are subject to changes due to future events and conditions and evaluating them requires significant auditor judgement.
How We Addressed the Matter in Our Audit
We obtained an understanding, evaluated the design and tested the operating effectiveness of the Company’s internal controls over its process to calculate depreciation expense, including management’s controls over proved and probable oil and gas reserves’ estimation process.
Our audit procedures included, among others, evaluating the professional qualifications and objectivity of the Company’s internal reservoir engineers primarily responsible for overseeing the preparation of the reserve estimates and the independent international oil and gas consulting firm hired by the Company. In addition, we evaluated the completeness and accuracy of the financial data and inputs used in estimating proved and probable oil and gas reserves and we identified and evaluated corroborative and contrary evidence. For proved undeveloped reserves, we evaluated management’s development plan by assessing consistency of the development projections with the Company’s drill plan and the availability of capital to develop such plan. We also tested the mathematical accuracy of the depreciation computations of property, plant and equipment, including comparing the proved and probable oil and gas reserve amounts used in the calculations to the Reserve Reports prepared by the independent international oil and gas consulting firm.
/s/ PISTRELLI, HENRY MARTIN Y ASOCIADOS S.R.L.
Member of Ernst & Young Global Limited
We have served as the Company’s auditor since 2020.
Buenos Aires, Argentina
March 8, 2023
3
CONSOLIDATED STATEMENT OF INCOME
| | | | | | | | |
Amounts in US$´000 | | Note | | 2022 | | 2021 | | 2020 |
REVENUE | | 7 | | 1,049,579 | | 688,543 | | 393,692 |
Commodity risk management contracts (loss) gain | | 8 | | (70,221) | | (109,191) | | 8,081 |
Production and operating costs | | 9 | | (359,779) | | (212,790) | | (125,072) |
Geological and geophysical expenses | | 12 | | (10,529) | | (7,891) | | (14,951) |
Administrative expenses | | 13 | | (50,024) | | (46,828) | | (50,315) |
Selling expenses | | 14 | | (7,995) | | (8,730) | | (5,844) |
Depreciation | | | | (96,692) | | (88,969) | | (118,073) |
Write-off of unsuccessful exploration efforts | | 20 | | (25,789) | | (12,262) | | (52,652) |
Impairment loss for non-financial assets, net | | 20‑37 | | — | | (4,334) | | (133,864) |
Other income (expenses) | | | | 527 | | (11,739) | | (11,665) |
OPERATING PROFIT (LOSS) | | | | 429,077 | | 185,809 | | (110,663) |
Financial expenses | | 15 | | (57,073) | | (64,112) | | (64,582) |
Financial income | | 15 | | 3,180 | | 1,652 | | 3,166 |
Foreign exchange gain (loss) | | 15 | | 19,725 | | 5,049 | | (13,008) |
PROFIT (LOSS) BEFORE INCOME TAX | | | | 394,909 | | 128,398 | | (185,087) |
Income tax expense | | 17 | | (170,474) | | (67,271) | | (47,863) |
PROFIT (LOSS) FOR THE YEAR | | | | 224,435 | | 61,127 | | (232,950) |
Earnings (Losses) per share (in US$). Basic | | 19 | | 3.78 | | 1.00 | | (3.84) |
Earnings (Losses) per share (in US$). Diluted | | 19 | | 3.75 | | 0.99 | | (3.84) |
The notes on pages 9 to 81 are an integral part of these Consolidated Financial Statements.
4
CONSOLIDATED STATEMENT OF COMPREHENSIVE INCOME
| | | | | | |
Amounts in US$´000 | | 2022 | | 2021 | | 2020 |
Profit (Loss) for the year | | 224,435 | | 61,127 | | (232,950) |
Other comprehensive income: | |
| |
| |
|
Items that may be subsequently reclassified to profit or loss | |
| |
| |
|
Currency translation differences | | 2,121 | | (1,438) | | (8,449) |
Gain (Loss) on cash flow hedges | | 966 | | — | | (6,770) |
Income tax (expense) benefit relating to cash flow hedges | | (483) | | — | | 2,166 |
Other comprehensive profit (loss) for the year | | 2,604 | | (1,438) | | (13,053) |
| | | | | | |
Total comprehensive profit (loss) for the year | | 227,039 | | 59,689 | | (246,003) |
The notes on pages 9 to 81 are an integral part of these Consolidated Financial Statements.
5
CONSOLIDATED STATEMENT OF FINANCIAL POSITION
| | | | | | |
Amounts in US$´000 | | Note | | 2022 | | 2021 |
ASSETS | | | | | | |
NON-CURRENT ASSETS | | | | | | |
Property, plant and equipment | | 20 | | 666,879 | | 614,047 |
Right-of-use assets | | 28 | | 37,011 | | 21,014 |
Prepayments and other receivables | | 22 | | 121 | | 148 |
Other financial assets | | 25 | | 12,877 | | 13,883 |
Deferred income tax asset | | 18 | | 18,943 | | 14,072 |
TOTAL NON-CURRENT ASSETS | |
| | 735,831 | | 663,164 |
CURRENT ASSETS | |
| |
| |
|
Inventories | | 23 | | 14,434 | | 10,915 |
Trade receivables | | 24 | | 71,794 | | 70,531 |
Prepayments and other receivables | | 22 | | 22,106 | | 22,650 |
Derivative financial instrument assets | | 25 | | 967 | | 126 |
Other financial assets | | 25 | | — | | 864 |
Cash and cash equivalents | | 25 | | 128,843 | | 100,604 |
Assets held for sale | | 36 | | — | | 26,887 |
TOTAL CURRENT ASSETS | |
| | 238,144 | | 232,577 |
TOTAL ASSETS | |
| | 973,975 | | 895,741 |
EQUITY | |
| |
| |
|
Equity attributable to owners of the Company | |
| |
| |
|
Share capital | | 26.1 | | 58 | | 60 |
Share premium | | | | 134,798 | | 169,220 |
Reserves | | | | 61,876 | | 83,554 |
Accumulated losses | | | | (81,147) | | (314,779) |
TOTAL EQUITY | |
| | 115,585 | | (61,945) |
LIABILITIES | |
| |
| |
|
NON-CURRENT LIABILITIES | |
| |
| |
|
Borrowings | | 27 | | 485,114 | | 656,176 |
Lease liabilities | | 28 | | 22,051 | | 12,513 |
Provisions and other long-term liabilities | | 29 | | 51,947 | | 62,848 |
Deferred income tax liability | | 18 | | 70,123 | | 20,947 |
Trade and other payables | | 30 | | — | | 1,540 |
TOTAL NON-CURRENT LIABILITIES | |
| | 629,235 | | 754,024 |
CURRENT LIABILITIES | |
| |
| |
|
Borrowings | | 27 | | 12,528 | | 17,916 |
Lease liabilities | | 28 | | 10,000 | | 8,231 |
Derivative financial instrument liabilities | | 25 | | 19 | | 20,757 |
Current income tax liabilities | | | | 65,002 | | 8,801 |
Trade and other payables | | 30 | | 141,606 | | 127,513 |
Liabilities associated with assets held for sale | | 36 | | — | | 20,444 |
TOTAL CURRENT LIABILITIES | |
| | 229,155 | | 203,662 |
TOTAL LIABILITIES | |
| | 858,390 | | 957,686 |
TOTAL EQUITY AND LIABILITIES | |
| | 973,975 | | 895,741 |
The notes on pages 9 to 81 are an integral part of these Consolidated Financial Statements.
6
CONSOLIDATED STATEMENT OF CHANGES IN EQUITY
| | | | | | | | | | | | |
| | Attributable to owners of the Company | | | ||||||||
| | Share | | Share | | Other | | Translation | | Accumulated | | |
Amount in US$‘000 | | Capital | | Premium | | Reserve | | Reserve | | Losses | | Total |
Equity as of January 1, 2020 | | 59 | | 173,716 | | 116,291 | | (3,820) | | (153,361) | | 132,885 |
Comprehensive income: | |
| |
| |
| |
| |
| | |
Loss for the year | | — | | — | | — | | — | | (232,950) | | (232,950) |
Other comprehensive loss for the year | | — | | — | | (4,604) | | (8,449) | | — | | (13,053) |
Total Comprehensive loss for the year 2020 | | — | | — | | (4,604) | | (8,449) | | (232,950) | | (246,003) |
Transactions with owners: | |
| |
| |
| |
| |
| | |
Share-based payment (a) (Note 31) | | 2 | | 7,349 | | — | | — | | 5,445 | | 12,796 |
Repurchase of shares (Note 26.1) | | (1) | | (4,008) | | — | | — | | — | | (4,009) |
Cash distribution (Note 26.2) | | — | | — | | (4,859) | | — | | — | | (4,859) |
Stock distribution (Note 26.3) | | 1 | | 2,342 | | (2,343) | | — | | — | | — |
Total 2020 | | 2 | | 5,683 | | (7,202) | | — | | 5,445 | | 3,928 |
Balances as of December 31, 2020 | | 61 | | 179,399 | | 104,485 | | (12,269) | | (380,866) | | (109,190) |
Comprehensive income: | |
| |
| |
| |
| |
| | |
Profit for the year | | — | | — | | — | | — | | 61,127 | | 61,127 |
Other comprehensive loss for the year | | — | | — | | — | | (1,438) | | — | | (1,438) |
Total Comprehensive (loss) profit for the year 2021 | | — | | — | | — | | (1,438) | | 61,127 | | 59,689 |
Transactions with owners: | |
| |
| |
| |
| |
| | |
Share-based payment (Note 31) | | — | | 1,661 | | — | | — | | 4,960 | | 6,621 |
Repurchase of shares (Note 26.1) | | (1) | | (11,840) | | — | | — | | — | | (11,841) |
Cash distribution (Note 26.2) | | — | | — | | (7,224) | | — | | — | | (7,224) |
Total 2021 | | (1) | | (10,179) | | (7,224) | | — | | 4,960 | | (12,444) |
Balances as of December 31, 2021 | | 60 | | 169,220 | | 97,261 | | (13,707) | | (314,779) | | (61,945) |
Comprehensive income: | |
| |
| |
| |
| |
| | |
Profit for the year | | — | | — | | — | | — | | 224,435 | | 224,435 |
Other comprehensive profit for the year | | — | | — | | 483 | | 2,121 | | — | | 2,604 |
Total Comprehensive profit for the year 2022 | | — | | — | | 483 | | 2,121 | | 224,435 | | 227,039 |
Transactions with owners: | |
| |
| |
| |
| |
| | |
Share-based payment (Note 31) | | 1 | | 1,840 | | — | | — | | 9,197 | | 11,038 |
Repurchase of shares (Note 26.1) | | (3) | | (36,262) | | — | | — | | — | | (36,265) |
Cash distribution (Note 26.2) | | — | | — | | (24,282) | | — | | — | | (24,282) |
Total 2022 | | (2) | | (34,422) | | (24,282) | | — | | 9,197 | | (49,509) |
Balances as of December 31, 2022 | | 58 | | 134,798 | | 73,462 | | (11,586) | | (81,147) | | 115,585 |
| (a) | Includes issuance of shares to certain employees as part of their 2019 bonus compensation of US$ 4,352,000. |
The notes on pages 9 to 81 are an integral part of these Consolidated Financial Statements.
7
CONSOLIDATED STATEMENT OF CASH FLOW
| | | | | | | | |
Amounts in US$‘000 | | Note | | 2022 | | 2021 | | 2020 |
Cash flows from operating activities | |
| |
| |
| |
|
Profit (Loss) for the year | | | | 224,435 | | 61,127 | | (232,950) |
Adjustments for: | |
| |
| |
| |
|
Income tax expense | | 17 | | 170,474 | | 67,271 | | 47,863 |
Depreciation | | | | 96,692 | | 88,969 | | 118,073 |
Loss on disposal of property, plant and equipment | | | | 73 | | 787 | | 417 |
Impairment loss for non-financial assets | | 20‑37 | | — | | 4,334 | | 133,864 |
Write-off of unsuccessful exploration efforts | | 20 | | 25,789 | | 12,262 | | 52,652 |
Accrual of borrowing’s interests | | | | 36,360 | | 44,378 | | 48,690 |
Borrowings cancellation costs | | 15 | | 5,141 | | 6,308 | | — |
Amortization of other long-term liabilities | | 29 | | (2,407) | | (223) | | (387) |
Unwinding of long-term liabilities | | 15 | | 6,026 | | 5,079 | | 5,894 |
Accrual of share-based payment | | | | 11,038 | | 6,621 | | 8,444 |
Foreign exchange (gain) loss | | 15 | | (19,725) | | (5,049) | | 3,594 |
Unrealized (gain) loss on commodity risk management contracts | | 8 | | (13,023) | | (463) | | 12,978 |
Income tax paid | | | | (33,355) | | (65,273) | | (25,193) |
Changes in working capital | | 5 | | (40,047) | | (9,351) | | (5,240) |
Cash flows from operating activities – net | | | | 467,471 | | 216,777 | | 168,699 |
Cash flows from investing activities | |
| |
| |
| |
|
Purchase of property, plant and equipment | | | | (168,808) | | (129,258) | | (75,298) |
Acquisition of business, net of cash acquired | | 36.1 | | — | | — | | (272,335) |
Proceeds from disposal of long-term assets | | 36.2-36.3 | | 15,135 | | 2,700 | | — |
Cash flows used in investing activities – net | | | | (153,673) | | (126,558) | | (347,633) |
Cash flows from financing activities | |
| |
| |
| |
|
Proceeds from borrowings | | 5 | | — | | 172,174 | | 350,000 |
Debt issuance costs paid | | 5 | | — | | (2,019) | | (7,507) |
Principal paid | | 5 | | (172,522) | | (274,934) | | (3,575) |
Interest paid | | 5 | | (36,514) | | (42,592) | | (37,594) |
Borrowings cancellation and other costs paid | | 5 | | (9,118) | | (12,908) | | — |
Lease payments | | 5 | | (7,851) | | (7,518) | | (9,380) |
Repurchase of shares | | 26.1 | | (36,265) | | (11,841) | | (4,009) |
Cash distribution | | 26.2 | | (24,282) | | (7,224) | | (4,859) |
Payments for transactions with former non-controlling interest | | | | — | | (3,580) | | (11,931) |
Cash flows (used in) from financing activities – net | | | | (286,552) | | (190,442) | | 271,145 |
Net increase (decrease) in cash and cash equivalents | | | | 27,246 | | (100,223) | | 92,211 |
| | | | | | | | |
Cash and cash equivalents at January 1 | | | | 100,604 | | 201,907 | | 111,180 |
Currency translation differences | | | | 993 | | (1,080) | | (1,484) |
Cash and cash equivalents at the end of the year | | | | 128,843 | | 100,604 | | 201,907 |
| | | | | | | | |
Ending Cash and cash equivalents are specified as follows: | |
| |
| |
| |
|
Cash in bank and bank deposits | | | | 128,831 | | 100,587 | | 201,884 |
Cash in hand | | | | 12 | | 17 | | 23 |
Cash and cash equivalents | | | | 128,843 | | 100,604 | | 201,907 |
The notes on pages 9 to 81 are an integral part of these Consolidated Financial Statements.
8
NOTES TO CONSOLIDATED FINANCIAL STATEMENTS
Note 1 General Information
GeoPark Limited (the “Company”) is a company incorporated under the law of Bermuda. The Registered Office address is Clarendon House, 2 Church Street, Hamilton HM11, Bermuda.
The principal activities of the Company and its subsidiaries (the “Group” or “GeoPark”) are exploration, development and production for oil and gas reserves in Colombia, Chile, Brazil and Ecuador.
These Consolidated Financial Statements were authorized for issue by the Board of Directors on March 7, 2023.
Note 2 Summary of significant accounting policies
The principal accounting policies applied in the preparation of these Consolidated Financial Statements are set out below. These policies have been consistently applied to the years presented, unless otherwise stated.
2.1 Basis of preparation
The Consolidated Financial Statements of GeoPark Limited have been prepared in accordance with International Financial Reporting Standards (“IFRS”) as issued by the International Accounting Standards Board (“IASB”), under the historical cost basis, except for the following: certain financial assets and liabilities (including derivative instruments) measured at fair value, and assets held for sale – measured at fair value less costs to sell.
The Consolidated Financial Statements are presented in thousands of United States Dollars (US$’000) and all values are rounded to the nearest thousand (US$’000), except in the footnotes and where otherwise indicated.
The preparation of financial statements in conformity with IFRS requires the use of certain critical accounting estimates. It also requires management to exercise its judgement in the process of applying the Group’s accounting policies. The areas involving a higher degree of judgement or complexity, or areas where assumptions and estimates are significant to the Consolidated Financial Statements are disclosed in this note under the title “Accounting estimates and assumptions”.
All the information included in these Consolidated Financial Statements corresponds to the Group, except where otherwise indicated.
2.1.1 Changes in accounting policy and disclosure
2.1.1.1 New and amended standards and interpretations
The Group applied for the first-time certain standards and amendments, which are effective for annual periods beginning on or after January 1, 2022. The Group has not early adopted any other standard, interpretation or amendment that has been issued but is not yet effective.
Onerous Contracts – Costs of Fulfilling a Contract – Amendments to IAS 37
An onerous contract is a contract under which the unavoidable costs of meeting the obligations under the contract exceed the economic benefits expected to be received under it.
The amendments specify that when assessing whether a contract is onerous or loss-making, an entity needs to include costs that relate directly to a contract to provide goods or services including both incremental costs and an allocation of costs directly related to contract activities. General and administrative costs do not relate directly to a contract and are excluded unless they are explicitly chargeable to the counterparty under the contract.
The Group applied the amendments at the beginning of the reporting period. These amendments had no impact on the Consolidated Financial Statements of the Group as there were no contracts for which it had not fulfilled all of its obligations during the reporting period.
9
Note 2 Summary of significant accounting policies (continued)
2.1 Basis of preparation (continued)
2.1.1 Changes in accounting policy and disclosure (continued)
2.1.1.1 New and amended standards and interpretations (continued)
Reference to the Conceptual Framework – Amendments to IFRS 3
The amendments replace a reference to a previous version of the IASB’s Conceptual Framework with a reference to the current version issued in March 2018 without significantly changing its requirements.
The amendments add an exception to the recognition principle of IFRS 3 Business Combinations to avoid the issue of potential ‘day 2’ gains or losses arising for liabilities and contingent liabilities that would be within the scope of IAS 37 Provisions, Contingent Liabilities and Contingent Assets or IFRIC 21 Levies, if incurred separately. The exception requires entities to apply the criteria in IAS 37 or IFRIC 21, respectively, instead of the Conceptual Framework, to determine whether a present obligation exists at the acquisition date.
The amendments also add a new paragraph to IFRS 3 to clarify that contingent assets do not qualify for recognition at the acquisition date.
In accordance with the transitional provisions, the Group applies the amendments prospectively, i.e., to business combinations occurring after the beginning of the annual reporting period in which it first applies the amendments (the date of initial application).
These amendments had no impact on the Consolidated Financial Statements of the Group as there were no business combinations during the reporting period.
Property, Plant and Equipment: Proceeds before Intended Use – Amendments to IAS 16 Leases
The amendment prohibits entities from deducting from the cost of an item of property, plant and equipment, any proceeds of the sale of items produced while bringing that asset to the location and condition necessary for it to be capable of operating in the manner intended by management. Instead, an entity recognizes the proceeds from selling such items, and the costs of producing those items, in profit or loss.
In accordance with the transitional provisions, the Group applies the amendments retrospectively only to items of PP&E made available for use on or after the beginning of the earliest period presented when the entity first applies the amendment (the date of initial application).
These amendments had no significant impact on the Consolidated Financial Statements of the Group as there were only sales of such items produced by property, plant and equipment made available for use in Ecuador during 2022.
IFRS 1 First-time Adoption of International Financial Reporting Standards – Subsidiary as a first-time adopter
The amendment permits a subsidiary that elects to apply paragraph of IFRS 1 to measure cumulative translation differences using the amounts reported in the parent’s consolidated financial statements, based on the parent’s date of transition to IFRS, if no adjustments were made for consolidation procedures and for the effects of the business combination in which the parent acquired the subsidiary. This amendment is also applied to an associate or joint venture that elects to apply paragraph of IFRS 1.
These amendments had no impact on the Consolidated Financial Statements of the Group as it is not a first-time adopter.
10
Note 2 Summary of significant accounting policies (continued)
2.1 Basis of preparation (continued)
2.1.1 Changes in accounting policy and disclosure (continued)
2.1.1.1 New and amended standards and interpretations (continued)
IFRS 9 Financial Instruments – Fees in the ‘10 per cent’ test for derecognition of financial liabilities
The amendment clarifies the fees that an entity includes when assessing whether the terms of a new or modified financial liability are substantially different from the terms of the original financial liability. These fees include only those paid or received between the borrower and the lender, including fees paid or received by either the borrower or lender on the other’s behalf. There is no similar amendment proposed for IAS 39 Financial Instruments: Recognition and Measurement.
In accordance with the transitional provisions, the Group applies the amendment to financial liabilities that are modified or exchanged on or after the beginning of the annual reporting period in which the entity first applies the amendment (the date of initial application). These amendments had no impact on the Consolidated Financial Statements of the Group as there were no modifications of the Group’s financial instruments during the period.
2.1.1.2 Standards issued but not yet effective
The new and amended standards and interpretations that are issued, but not yet effective, up to the date of issuance of these Consolidated Financial Statements are disclosed below. The Group intends to adopt these new and amended standards and interpretations, if applicable, when they become effective.
Classification of Liabilities as Current or Non-current – Amendments to IAS 1
In January 2020, the IASB issued amendments to paragraphs 69 to 76 of IAS 1 to specify the requirements for classifying liabilities as current or non-current. The amendments clarify:
| ● | what is meant by a right to defer settlement, |
| ● | that a right to defer must exist at the end of the reporting period, |
| ● | that classification is unaffected by the likelihood that an entity will exercise its deferral right, and |
| ● | that only if an embedded derivative in a convertible liability is itself an equity instrument would the terms of a liability not impact its classification. |
The amendments are effective for annual periods beginning on or after January 1, 2023 and must be applied retrospectively. The Group is currently assessing the impact the amendments will have on current practice and whether existing loan agreements may require renegotiation.
Definition of Accounting Estimates - Amendments to IAS 8
In February 2021, the IASB issued amendments to IAS 8, in which it introduces a definition of ‘accounting estimates’. The amendments clarify the distinction between changes in accounting estimates and changes in accounting policies and the correction of errors. Also, they clarify how entities use measurement techniques and inputs to develop accounting estimates.
The amendments are effective for annual periods beginning on or after January 1, 2023 and apply to changes in accounting policies and changes in accounting estimates that occur on or after the start of that period. Earlier application is permitted as long as this fact is disclosed.
The amendments are not expected to have a material impact on the Group’s Consolidated Financial Statements.
11
Note 2 Summary of significant accounting policies (continued)
2.1 Basis of preparation (continued)
2.1.1 Changes in accounting policy and disclosure (continued)
2.1.1.2 Standards issued but not yet effective (continued)
Disclosure of Accounting Policies - Amendments to IAS 1 and IFRS Practice Statement 2
In February 2021, the IASB issued amendments to IAS 1 and IFRS Practice Statement 2 Making Materiality Judgements, in which it provides guidance and examples to help entities apply materiality judgements to accounting policy disclosures. The amendments aim to help entities provide accounting policy disclosures that are more useful by replacing the requirement for entities to disclose their ‘significant’ accounting policies with a requirement to disclose their ‘material’ accounting policies and adding guidance on how entities apply the concept of materiality in making decisions about accounting policy disclosures.
The amendments to IAS 1 are applicable for annual periods beginning on or after January 1, 2023 with earlier application permitted. Since the amendments to the Practice Statement 2 provide non-mandatory guidance on the application of the definition of material to accounting policy information, an effective date for these amendments is not necessary.
The Group is currently revisiting their accounting policy information disclosures to ensure consistency with the amended requirements.
2.2 Going concern
The Directors regularly monitor the Group’s cash position and liquidity risks throughout the year to ensure that it has sufficient funds to meet forecasted operational and investment funding requirements. Sensitivities are run to reflect latest expectations of expenditures, oil and gas prices and other factors to enable the Group to manage the risk of any funding short falls and/or potential debt covenant breaches.
Considering the performance of the operations, the Group’s cash position of US$ 128,843,000, the oil hedge strategy to mitigate the price risk exposure within the next twelve months, the deleveraging process executed in 2021 and 2022 (see Note 27), and the fact that its total indebtedness as of December 31, 2022 matures in 2027, the Directors have formed a judgement, at the time of approving the Consolidated Financial Statements, that there is a reasonable expectation that the Group has adequate resources to meet all its obligations for the foreseeable future. For this reason, the Directors have continued to adopt the going concern basis in preparing the Consolidated Financial Statements.
2.3 Consolidation
Subsidiaries are all entities (including structured entities) over which the Group has control. The Group controls an entity when the Group is exposed to, or has rights to, variable returns from its involvement with the entity and has the ability to affect those returns through its power over the entity. Subsidiaries are fully consolidated from the date on which control is transferred to the Group. They are deconsolidated from the date that control ceases.
Intercompany transactions, balances and unrealized gains on transactions between the Group and its subsidiaries are eliminated. Unrealized losses are also eliminated unless the transaction provides evidence of an impairment of the asset transferred. Amounts reported in the financial statements of subsidiaries have been adjusted where necessary to ensure consistency with the accounting policies adopted by the Group.
12
Note 2 Summary of significant accounting policies (continued)
2.4 Segment reporting
Operating segments are reported in a manner consistent with the internal reporting provided to the chief operating decision-maker. The chief operating decision-maker, who is responsible for allocating resources and assessing performance of the operating segments, has been identified as the Executive Committee. This committee is integrated by the Chief Executive Officer, Chief Financial Officer, Chief Technical Officer, Chief Operating Officer, Chief Strategy, Sustainability and Legal Officer and Chief People Officer. This committee reviews the Group’s internal reporting in order to assess performance and allocate resources. Management has determined the operating segments based on these reports.
2.5 Foreign currency translation
2.5.1 Functional and presentation currency
The Consolidated Financial Statements are presented in US Dollars, which is the Group’s presentation currency.
Items included in the Consolidated Financial Statements of each of the Group’s entities are measured using the currency of the primary economic environment in which the entity operates (the “functional currency”). The functional currency of Group companies incorporated in Colombia, Chile, Argentina and Ecuador is the US Dollar, meanwhile for the Group´s Brazilian company the functional currency is the local currency, which is the Brazilian Real.
2.5.2 Transactions and balances
Foreign currency transactions are translated into the functional currency using the exchange rates prevailing at the dates of the transactions. Foreign exchange gains and losses resulting from the settlement of such transactions and from the translation at period-end exchange rates of monetary assets and liabilities denominated in foreign currencies are recognized in the Consolidated Statement of Income.
The results and financial position of foreign operations that have a functional currency different from the presentation currency are translated into the presentation currency as follows: assets and liabilities are translated at the closing rate, and income and expenses are translated at average exchange rates. All resulting exchange differences are recognized in Other comprehensive income.
2.6 Joint arrangements
Under IFRS 11, investments in joint arrangements are classified as either joint operations or joint ventures depending on the contractual rights and obligations of each investor. The Group has assessed the nature of its joint arrangements and determined them to be joint operations. The Group combines its share in the joint operations individual assets, liabilities, results and cash flows on a line-by-line basis with similar items in its Consolidated Financial Statements.
2.7 Business combinations
Business combinations are accounted for using the acquisition method. The cost of an acquisition is measured as the aggregate of the consideration transferred, which is measured at the acquisition date fair value, and the amount of any non-controlling interests in the acquiree. For each business combination, the Group elects whether to measure the non-controlling interests in the acquiree at fair value or at the proportionate share of the acquiree’s identifiable net assets. Acquisition-related costs are expensed as incurred and included in administrative expenses.
The Group determines that it has acquired a business when the acquired set of activities and assets include an input and a substantive process that together significantly contribute to the ability to create outputs. The acquired process is considered substantive if it is critical to the ability to continue producing outputs, and the inputs acquired include an organized workforce with the necessary skills, knowledge, or experience to perform that process or it significantly contributes to the ability to continue producing outputs and is considered unique or scarce or cannot be replaced without significant cost, effort, or delay in the ability to continue producing outputs.
13
Note 2 Summary of significant accounting policies (continued)
2.7 Business combinations (continued)
When the Group acquires a business, it assesses the financial assets and liabilities assumed for appropriate classification and designation in accordance with the contractual terms, economic circumstances and pertinent conditions as at the acquisition date. This includes the separation of embedded derivatives in host contracts by the acquiree.
Any contingent consideration to be transferred by the acquirer will be recognized at fair value at the acquisition date. Contingent consideration classified as equity is not remeasured and its subsequent settlement is accounted for within equity. Contingent consideration classified as an asset or liability that is a financial instrument and within the scope of IFRS 9 Financial Instruments, is measured at fair value with the changes in fair value recognized in the statement of profit or loss in accordance with IFRS 9. Other contingent consideration that is not within the scope of IFRS 9 is measured at fair value at each reporting date with changes in fair value recognized in profit or loss.
Goodwill is initially measured at cost (being the excess of the aggregate of the consideration transferred and the amount recognized for non-controlling interests and any previous interest held over the net identifiable assets acquired and liabilities assumed). If the fair value of the net assets acquired is in excess of the aggregate consideration transferred, the Group re-assesses whether it has correctly identified all of the assets acquired and all of the liabilities assumed and reviews the procedures used to measure the amounts to be recognized at the acquisition date. If the reassessment still results in an excess of the fair value of net assets acquired over the aggregate consideration transferred, then the gain is recognized in profit or loss.
Revenue from the sale of crude oil and gas is recognized at the point in time when control of the product is transferred to the customer, which is generally when the product is physically transferred into a pipe or other delivery mechanism and the customer accepts the product. Consequently, the Group’s performance obligations are considered to relate only to the sale of crude oil and gas, with each barrel of crude oil equivalent considered to be a separate performance obligation under the contractual arrangements in place.
The Group’s sales of crude oil are priced based on market prices. The sales price is linked to US dollar denominated crude oil international benchmarks, such as Brent, adjusted for certain marketing and quality discounts based on, among other things, American Petroleum Institute (“API”) gravity, viscosity, sulphur content, delivery point and transport costs. The Group’s sales of natural gas are priced based on long-term Gas Supply contracts with customers.
Revenue is shown net of VAT, discounts related to the sale and overriding royalties due to the ex-owners of oil and gas properties where the royalty arrangements represent a retained working interest in the property. See Note 33.1.
2.9 Production and operating costs
Production and operating costs are recognized in the Consolidated Statement of Income on the accrual basis of accounting. These costs include wages and salaries incurred to achieve the revenue for the year. Direct and indirect costs of raw materials and consumables, rentals, and royalties are also included within this account.
2.10 Financial results
Financial results include interest expenses, interest income, bank charges, the amortization of financial assets and liabilities, and foreign exchange gains and losses. The Group has capitalized the borrowing cost directly attributable to wells and facilities identified as qualifying assets, if applicable. Qualifying assets are assets that necessarily take a substantial period of time to get ready for their intended use or sale. The capitalization rate used to determine the amount of borrowing costs to be capitalized, if any, is the weighted average interest rate applicable to the Group’s general borrowings.
14
Note 2 Summary of significant accounting policies (continued)
2.11 Property, plant and equipment
Property, plant and equipment are stated at historical cost less depreciation and impairment charges, if applicable. Historical cost includes expenditure that is directly attributable to the acquisition of the items; including provisions for asset retirement obligation.
Oil and gas exploration and production activities are accounted for in accordance with the successful efforts method on a field by field basis. The Group accounts for exploration and evaluation activities in accordance with IFRS 6, Exploration for and Evaluation of Mineral Resources, capitalizing exploration and evaluation costs until such time as the economic viability of producing the underlying resources is determined. Costs incurred prior to obtaining legal rights to explore are expensed immediately to the Consolidated Statement of Income.
Exploration and evaluation costs may include: license acquisition, geological and geophysical studies (i.e.: seismic), direct labor costs and drilling costs of exploratory wells. No depreciation and/or amortization are charged during the exploration and evaluation phase. Upon completion of the evaluation phase, the prospects are either transferred to oil and gas properties or charged to expense (exploration costs) in the period in which the determination is made, depending whether they have discovered reserves or not. If not developed, exploration and evaluation assets are written off after three years, unless it can be clearly demonstrated that the carrying value of the investment is recoverable.
A charge of US$ 25,789,000 has been recognized in the Consolidated Statement of Income within Write-off of unsuccessful exploration efforts (US$ 12,262,000 in 2021 and US$ 52,652,000 in 2020). See Note 20.
All field development costs are considered construction in progress until they are finished and capitalized within oil and gas properties, and are subject to depreciation once completed. Such costs may include the acquisition and installation of production facilities, development drilling costs (including dry holes, service wells and seismic surveys for development purposes), project-related engineering and the acquisition costs of rights and concessions related to proved properties.
Workovers of wells made to develop reserves and/or increase production are capitalized as development costs. Maintenance costs are charged to the Consolidated Statement of Income when incurred.
Capitalized costs of proved oil and gas properties and production facilities and machinery are depreciated on a licensed area by the licensed area basis, using the unit of production method, based on commercial proved and probable oil and gas reserves. The calculation of the “unit of production” depreciation considers estimated future finding and development costs and is based on current year-end unescalated price levels. Changes in reserves and cost estimates are recognized prospectively. Reserves are converted to equivalent units on the basis of approximate relative energy content.
Depreciation of the remaining property, plant and equipment assets (i.e. furniture and vehicles) not directly associated with oil and gas activities has been calculated by means of the straight-line method by applying such annual rates as required to write-off their value at the end of their estimated useful lives. The useful lives range between 3 years and 10 years.
Depreciation is allocated in the Consolidated Statement of Income as a separate line to better follow the performance of the business.
An asset’s carrying amount is written down immediately to its recoverable amount if the asset’s carrying amount is greater than its estimated recoverable amount (see Impairment of non-financial assets in Note 2.13).
2.12 Provisions and other long-term liabilities
Provisions for asset retirement obligations and other environmental liabilities, deferred income, restructuring obligations and legal claims are recognized when the Group has a present legal or constructive obligation as a result of past events, it is probable that an outflow of resources will be required to settle the obligation, and the amount has been reliably estimated. Restructuring provisions, if any, comprise lease termination penalties and employee services termination payments.
15
Note 2 Summary of significant accounting policies (continued)
2.12 Provisions and other long-term liabilities (continued)
Provisions are measured at the present value of the expenditures expected to be required to settle the obligation using a pre-tax rate that reflects current market assessments of the time value of money and the risks specific to the obligation. The increase in the provision due to the passage of time is recognized as financial expense.
2.12.1 Asset Retirement Obligation
The Group records the fair value of the liability for asset retirement obligations in the period in which the wells are drilled. When the liability is initially recorded, the Group capitalizes the cost by increasing the carrying amount of the related long-lived asset. Over time, the liability is accreted to its present value at each reporting period, and the capitalized cost is depreciated over the estimated useful life of the related asset. According to interpretations and the application of current legislation, and on the basis of the changes in technology and the variations in the costs of restoration necessary to protect the environment, the Group has considered it appropriate to periodically re-evaluate future costs of well-capping. The effects of this recalculation are included in the Consolidated Financial Statements in the period in which this recalculation is determined and reflected as an adjustment to the provision and the corresponding property, plant and equipment asset.
2.12.2 Deferred Income
Government grants and other contributions relating to the purchase of property, plant and equipment are included in non-current liabilities as deferred income and they are credited to the Consolidated Statement of Income over the expected lives of the related assets. Grants from the government are recognized at their fair value where there is a reasonable assurance that the grant will be received and the Group will comply with all attached conditions.
2.13 Impairment of non-financial assets
Assets that are not subject to depreciation and/or amortization are tested annually for impairment. Assets that are subject to depreciation and/or amortization are reviewed for impairment whenever events or changes in circumstances indicate that the carrying amount may not be recoverable.
An impairment loss is recognized for the excess of the asset’s carrying amount over its recoverable amount. The recoverable amount is the higher of an asset’s fair value less costs to sell and value in use. For the purposes of assessing impairment, assets are grouped at the lowest levels for which there are separately identifiable cash flows (cash-generating units), generally a licensed area. Non-financial assets other than goodwill that suffered impairment are reviewed for possible reversal of the impairment at each reporting date.
No asset should be kept as an exploration and evaluation asset for a period of more than three years, except if it can be clearly demonstrated that the carrying value of the investment will be recoverable.
During 2022, no impairment losses were recognized or reversed. Net impairment losses were recognized for US$ 4,334,000 and US$ 133,864,000 in 2021 and 2020, respectively. See Note 37. The write-offs are detailed in Note 20.
2.14 Lease contracts
The Group assesses at contract inception whether a contract is, or contains, a lease. That is, if the contract conveys the right to control the use of an identified asset for a period of time in exchange for consideration.
2.14.1 Right-of-use assets
The Group recognizes right-of-use assets at the commencement date of the lease. Right of use assets are measured at cost, less any accumulated depreciation and impairment losses, an adjusted for any measurement of lease liabilities.
16
Note 2 Summary of significant accounting policies (continued)
2.14 Lease contracts (continued)
2.14.1 Right-of-use assets (continued)
The cost of right-of-use assets comprise the following:
| ● | the amount of the initial measurement of lease liability, |
| ● | any lease payments made at or before the commencement date less any lease incentives received, |
| ● | any initial direct costs, and |
| ● | restoration costs. |
The Group leases various offices, facilities, machinery and equipment. Lease contracts are typically made for fixed periods of 1 to 15 years but may have extension options. Lease terms are negotiated on an individual basis and contain a wide range of different terms and conditions. Right-of-use assets are depreciated on a straight-line basis over the shorter of the lease term and the estimated useful lives of the assets.
If ownership of the leased asset transfers to the Group at the end of the lease term or the cost reflects the exercise of a purchase option, depreciation is calculated using the estimated useful life of the asset. The right-of-use assets are also subject to impairment.
2.14.2 Lease liabilities
At the commencement date of the lease, the Group recognizes lease liabilities measured at the present value of lease payments to be made over the lease term. Lease liabilities include the net present value of the following lease payments:
| ● | fixed payments, less any lease incentives receivable, |
| ● | variable lease payments that are based on an index or a rate, |
| ● | amounts expected to be payable by the lessee under residual value guarantees, |
| ● | the exercise price of a purchase option if the lessee is reasonably certain to exercise that option, and |
| ● | payments of penalties for terminating the lease, if the lease term reflects the lessee exercising that option. |
In calculating the present value, the lease payments are discounted using the interest rate implicit in the lease. If that rate cannot be determined, the Group’s incremental borrowing rate is used, being the rate that the lessee would have to pay to borrow the funds necessary to obtain an asset of similar value in a similar economic environment with similar terms and conditions. After the commencement date, the amount of lease liabilities is increased to reflect the accretion of interest and reduced for the lease payments made. In addition, the carrying amount of lease liabilities is remeasured if there is a modification, a change in the lease term, a change in the lease payments (e.g., changes to future payments resulting from a change in an index or rate used to determine such lease payments) or a change in the assessment of an option to purchase the underlying asset.
2.14.3 Short-term leases and leases of low-value assets
The Group applies the short-term lease recognition exemption to its short-term leases of machinery and equipment (i.e., those leases that have a lease term of 12 months or less from the commencement date and do not contain a purchase option). It also applies the lease of low-value assets recognition exemption to leases of IT equipment and small items of office furniture that are considered to be low value. Lease payments on short-term leases and leases of low-value assets are recognized as expense on a straight-line basis over the lease term.
2.15 Inventories
Inventories comprise crude oil and materials.
Crude oil is measured at the lower of cost and net realizable value. Materials are measured at the lower of cost and recoverable amount. The cost of materials and consumables is calculated at acquisition price with the addition of transportation and similar costs. Cost is determined using the first-in, first-out (FIFO) method.
17
Note 2 Summary of significant accounting policies (continued)
2.16 Current and deferred income tax
The tax expense for the year comprises current and deferred income tax. Income tax is recognized in the Consolidated Statement of Income.
The current income tax charge is calculated on the basis of the tax laws enacted or substantially enacted at the financial statements date in the countries where the Company’s subsidiaries operate and generate taxable income. The computation of the income tax expense involves the interpretation of applicable tax laws and regulations in many jurisdictions. The resolution of tax positions taken by the Group, through negotiations with relevant tax authorities or through litigation, can take several years to complete and, in some cases, it is difficult to predict the ultimate outcome.
Deferred income tax is recognized, using the liability method, on temporary differences arising between the tax bases of assets and liabilities and their carrying amounts in the Consolidated Financial Statements. Deferred income tax is determined using tax rates (and laws) that have been enacted or substantially enacted as of the financial statements date and are expected to apply when the related deferred income tax asset is realized, or the deferred income tax liability is settled.
In addition, the Group has tax-loss carry-forwards in certain tax jurisdictions that are available to be offset against future taxable profit. However, deferred income tax assets are recognized only to the extent that it is probable that taxable profit will be available against which the unused tax losses can be utilized. Management judgment is exercised in assessing whether this is the case. To the extent that actual outcomes differ from management’s estimates, taxation charges or credits may arise in future periods.
Deferred income tax liabilities are provided on taxable temporary differences arising from investments in subsidiaries and joint arrangements, except for deferred income tax liability where the timing of the reversal of the temporary difference is controlled by the Group and it is probable that the temporary difference will not reverse in the foreseeable future. The Group is able to control the timing of dividends from its subsidiaries and hence does not expect taxable profit. Hence deferred income tax is recognized in respect of the retained earnings of overseas subsidiaries only if at the date of the Consolidated Financial Statements, dividends have been accrued as receivable or a binding agreement to distribute past earnings in future has been entered into by the subsidiary. As mentioned above the Group does not expect that the temporary differences will revert in the foreseeable future.
Deferred income tax balances are provided in full, with no discounting.
2.17 Non-current assets or disposal groups held for sale
Non-current assets or disposal groups are classified as held for sale if their carrying amount will be recovered principally through a sale transaction rather than through continuing use and a sale is considered highly probable. They are measured at the lower of their carrying amount and fair value less costs to sell, except for assets such as deferred tax assets, assets arising from employee benefits, financial assets and investment property that are carried at fair value and contractual rights under insurance contracts, which are specifically exempt from this requirement.
An impairment loss is recognized for any initial or subsequent write-down of the asset or disposal group to fair value less costs to sell. A gain is recognized for any subsequent increases in fair value less costs to sell of an asset or disposal group, but not in excess of any cumulative impairment loss previously recognized. A gain or loss not previously recognized by the date of the sale of the non-current asset or disposal group is recognized at the date of derecognition.
Non-current assets (including those that are part of a disposal group) are not depreciated or amortized while they are classified as held for sale. Interest and other expenses attributable to the liabilities of a disposal group classified as held for sale continue to be recognized.
Non-current assets classified as held for sale and the assets of a disposal group classified as held for sale are presented separately from the other assets in the Consolidated Statement of Financial Position. The liabilities of a disposal group classified as held for sale are presented separately from other liabilities in the Consolidated Statement of Financial Position.
18
Note 2 Summary of significant accounting policies (continued)
2.18 Financial assets
Financial assets are divided into the following categories: amortized cost; financial assets at fair value through profit or loss and fair value through other comprehensive income. The classification depends on the Group’s business model for managing the financial assets and the contractual terms of the cash flows. The Group reclassifies debt investments when and only when its business model for managing those assets changes.
All financial assets not at fair value through profit or loss are initially recognized at fair value, plus transaction costs. Transaction costs of financial assets carried at fair value through profit or loss, if any, are expensed to profit or loss.
Derecognition of financial assets occurs when the rights to receive cash flows from the investments expire or are transferred and substantially all of the risks and rewards of ownership have been transferred. An assessment for impairment is undertaken at each balance sheet date.
Interest and other cash flows resulting from holding financial assets are recognized in the Consolidated Statement of Income when receivable, regardless of how the related carrying amount of financial assets is measured.
Amortized cost are non-derivative financial assets with fixed or determinable payments that are not quoted in an active market. They are included in current assets, except for maturities greater than twelve months after the balance sheet date. These are classified as non-current assets. These financial assets comprise trade and other receivables and cash and cash equivalents in the Consolidated Statement of Financial Position. They arise when the Group provides money, goods or services directly to a debtor with no intention of trading the receivables. These financial assets are subsequently measured at amortized cost using the effective interest method, less provision for impairment, if applicable.
Any change in their value through impairment or reversal of impairment is recognized in the Consolidated Statement of Income. All of the Group’s financial assets are classified as amortized cost.
2.19 Other financial assets
Non-current other financial assets include contributions made for environmental obligations according to a Colombian and Brazilian government request and are restricted for those purposes.
Current other financial assets include short-term investments with original maturities up to twelve months and over three months.
2.20 Impairment of financial assets
The Group assesses on a forward-looking basis the expected credit losses associated with its debt instruments. The impairment methodology applied depends on whether there has been a significant increase in credit risk. For trade receivables, the Group applies the simplified approach permitted by IFRS 9, which requires expected lifetime losses to be recognized from initial recognition of the receivables.
2.21 Cash and cash equivalents
Cash and cash equivalents includes cash in hand, deposits held at call with banks, other short-term highly liquid investments with original maturities of three months or less that are readily convertible to known amounts of cash and which are subject to an insignificant risk of changes in value, and bank overdrafts. Bank overdrafts, if any, are shown within borrowings in the current liabilities section of the Consolidated Statement of Financial Position.
19
Note 2 Summary of significant accounting policies (continued)
2.22 Trade and other payables
Trade payables are obligations to pay for goods or services that have been acquired in the ordinary course of the business from suppliers. Accounts payable are classified as current liabilities if payment is due within one year or less (or in the normal operating cycle of the business if longer). If not, they are presented as non-current liabilities.
Trade payables are recognized initially at fair value and subsequently measured at amortized cost using the effective interest method.
2.23 Derivatives and hedging activities
Derivative financial instruments are recognized in the Consolidated Statement of Financial Position as assets or liabilities and initially and subsequently measured at fair value. They are presented as current assets or liabilities if they are expected to be settled within 12 months after the end of the reporting period.
The mark-to-market fair value of the Group's outstanding derivative instruments is based on independently provided market rates and determined using standard valuation techniques, including the impact of counterparty credit risk and are within level 2 of the fair value hierarchy.
2.23.1 Cash flow hedges that qualify for hedge accounting
The effective portion of changes in the fair value of derivatives that are designated and qualify as cash flow hedges is recognized in Other Reserve within Equity. The gain or loss relating to the ineffective portion is recognized immediately in the Consolidated Statement of Income.
When forward contracts are used to hedge forecast transactions, the Group designates the change in fair value of the forward contract as the hedging instrument. Gains or losses relating to the effective portion of the change in the fair value of the forward contracts are recognized in Other Reserve within Equity.
Where the hedged item subsequently results in the recognition of a non-financial asset, both the deferred hedging gains and losses and the deferred time value of the option contracts or deferred forward points, if any, are included within the initial cost of the asset.
When a hedging instrument expires, or is sold or terminated, or when a hedge no longer meets the criteria for hedge accounting, any cumulative deferred gain or loss and deferred costs of hedging in Equity at that time remains in Equity until the forecast transaction occurs, resulting in the recognition of a non-financial asset. When the forecast transaction is no longer expected to occur, the cumulative gain or loss and deferred costs of hedging that were reported in Equity are immediately reclassified to the Consolidated Statement of Income.
For more information about derivatives designated as cash flow hedges please refer to Note 36.1 and Note 8.
2.23.2 Other Derivatives
Certain derivative instruments do not qualify for hedge accounting. Changes in the fair value of any derivative instrument that does not qualify for hedge accounting are recognized immediately in the Consolidated Statement of Income.
For more information about derivatives related to commodity risk management please refer to Note 8 and for more information about derivatives related to currency risk management please refer to Note 3 Currency risk.
2.24 Borrowings
Borrowings are obligations to pay cash and are recognized when the Group becomes a party to the contractual provisions of the instrument.
20
Note 2 Summary of significant accounting policies (continued)
2.24 Borrowings (continued)
Borrowings are recognized initially at fair value, net of transaction costs incurred. Borrowings are subsequently stated at amortized cost; any difference between the proceeds (net of transaction costs) and the redemption value is recognized in the Consolidated Statement of Income over the period of the borrowings using the effective interest method.
Direct issue costs are charged to the Consolidated Statement of Income on an accrual basis using the effective interest method.
2.25 Share capital
Equity comprises the following:
| ● | "Share capital" representing the nominal value of equity shares. |
| ● | "Share premium" representing the excess over nominal value of the fair value of consideration received for equity shares, net of expenses of the share issuance. |
| ● | "Other reserve" representing: |
| - | the difference between the proceeds from the transaction with non-controlling interests received against the book value of the shares acquired in the Chilean and Colombian subsidiaries, and |
| - | the changes in the fair value of the effective portion of derivatives designated as cash flow hedges. |
| ● | "Translation reserve" representing the differences arising from translation of investments in overseas subsidiaries. |
| ● | "(Accumulated losses) Retained earnings" representing: |
| - | accumulated earnings and losses, and |
| - | the equity element attributable to shares granted according to IFRS 2 but not issued at year end. |
The Group operates a number of equity-settled share-based compensation plans comprising share awards payments to employees and other third-party contractors. Share-based payment transactions are measured in accordance with IFRS 2.
The fair value of the share awards payments is determined at the grant date by reference to the market value of the shares, calculated using the Geometric Brownian Motion method or the Monte Carlo simulation, and recognized as an expense over the vesting period.
Service and non-market performance conditions are not taken into account when determining the grant date fair value of awards, but the likelihood of the conditions being met is assessed as part of the Group’s best estimate of the number of equity instruments that will ultimately vest. Market performance conditions are reflected within the grant date fair value. Any other conditions attached to an award, but without an associated service requirement, are considered to be non-vesting conditions. Non-vesting conditions are reflected in the fair value of an award and lead to an immediate expensing of an award unless there are also service and/or performance conditions.
No expense is recognized for awards that do not ultimately vest because non-market performance and/or service conditions have not been met. Where awards include a market or non-vesting condition, the transactions are treated as vested irrespective of whether the market or non-vesting condition is satisfied, provided that all other performance and/or service conditions are satisfied.
At each reporting date, the entity revises its estimates of the number of options that are expected to vest. It recognizes the impact of the revision to original estimates, if any, in the Consolidated Statement of Income, with a corresponding adjustment to equity.
When the awards are exercised, the Company issues new shares. The proceeds received net of any directly attributable transaction costs are credited to share capital (nominal value) and share premium.
21
Note 3 Financial Instruments-risk management
The Group is exposed through its operations to the following financial risks:
| ● | Currency risk |
| ● | Price risk |
| ● | Credit risk– concentration |
| ● | Funding and liquidity risk |
| ● | Interest rate risk |
| ● | Capital risk |
The policy for managing these risks is set by the Board of Directors. Certain risks are managed centrally, while others are managed locally following guidelines communicated from the corporate department. The policy for each of the above risks is described in more detail below.
Currency risk
In Colombia, Chile, Argentina and Ecuador the functional currency is the US Dollar. The fluctuation of the local currencies of these countries against the US Dollar, except for Ecuador where the local currency is the US Dollar, does not impact the loans, costs and revenue held in US Dollars; but it does impact receivables or payables originated in local currency mainly corresponding to VAT and income tax.
The Group minimises the local currency positions in Colombia, Chile and Argentina by seeking to balance local and foreign currency assets and liabilities. However, tax receivables (VAT) seldom match with local currency liabilities. Therefore, the Group maintains a net exposure to them, except for what it is described below.
Since December 2018, GeoPark decided to manage its future exposure to local currency fluctuation with respect to income tax balances in Colombia. Consequently, from time to time the Group entered into derivative financial instruments in order to anticipate any currency fluctuation with respect to income taxes to be paid during the first half of the following year. As of December 31, 2022 and 2021, there were no currency risk management contracts in place. In 2023, GeoPark entered into derivative financial instruments (zero-premium collars) with local banks in Colombia, for an amount equivalent to US$ 38,000,000, in order to anticipate any currency fluctuation with respect to a portion of the estimated income taxes to be paid in April and June 2023.
Most of the Group's assets held in those countries are associated with oil and gas productive assets. Those assets, even in the local markets, are generally settled in US Dollar equivalents.
During 2022, the Colombian Peso devalued by 21% (16% and 5% in 2021 and 2020, respectively) and the Chilean Peso devalued by 1% (devalued by 19% in 2021 and revalued by 5% in 2020), both against the US Dollar.
If the Colombian Peso and the Chilean Peso had each devalued an additional 10% against the US dollar, with all other variables held constant, post-tax profit for the year would have been higher by US$ 14,695,000 (post-tax profit would have been higher by US$ 9,070,000 in 2021 and post-tax loss would have been lower by US$ 9,057,000 in 2020).
In Brazil, the functional currency is the local currency, which is the Brazilian Real. The fluctuation of the US Dollars against the Brazilian Real does not impact the loans, costs and revenues held in Brazilian Real; but it does impact the balances denominated in US Dollars. Such is the case of the provision for asset retirement obligation and the lease liabilities.
22
Note 3 Financial Instruments-risk management (continued)
Currency risk (continued)
During 2022, the Brazilian Real revalued by 7% against the US Dollar (devalued by 7% and 29% in 2021 and 2020, respectively). If the Brazilian Real had devalued an additional 10% against the US dollar, with all other variables held constant, post-tax profit for the year would have been lower by US$ 726,000 (post-tax profit would have been lower by US$ 780,000 in 2021 and post-tax loss would have been higher by US$ 909,000 in 2020).
As currency rate changes between the US Dollar and the local currencies, the Group recognizes gains and losses in the Consolidated Statement of Income.
Price risk
The realized oil price for the Group is linked to US dollar denominated crude oil international benchmarks. The market price of this commodity is subject to significant volatility and has historically fluctuated widely in response to relatively minor changes in the global supply and demand for oil, the geopolitical landscape, armed conflicts, the economic conditions and a variety of additional factors. The main factors affecting realized prices for gas sales vary across countries with some closely linked to international references while others are more domestically driven.
In Colombia, the realized oil price is linked to either the Vasconia crude reference price, a marker broadly used in the Llanos Basin, or the Oriente crude reference price, a marker broadly used for crude sales in Esmeraldas, Ecuador, for the crude oil of the Putumayo Basin that is transported through Ecuador. In both basins, the reference price is then adjusted for certain marketing and quality discounts based on, among other things, API, viscosity, sulphur content, delivery point and transport costs.
In Chile, the oil price is linked to Dated Brent minus certain marketing and quality discounts such as, API, sulphur content and others.
GeoPark has signed a long-term Gas Supply Contract with Methanex in Chile. The price of the gas sold under this contract is determined by a formula that considers a basket of international methanol prices, including US and European price indices.
In Brazil, prices for gas produced in the Manati Field are based on a long-term off-take contract with Petrobras. The price of gas sold under this contract is denominated in Brazilian Real and is adjusted annually for inflation pursuant to the Brazilian General Market Price Index (Indice Geral de Preços do Mercado), or IGPM.
In Ecuador, the oil price is linked to Brent and adjusted by a differential that varies month to month and resembles Oriente crude reference.
23
Note 3 Financial Instruments-risk management (continued)
Price risk (continued)
If oil and methanol prices had fallen by 10% compared to actual prices during the year, with all other variables held constant, considering the impact of the derivative contracts in place, post-tax profit for the year would have been lower by US$ 47,330,000 (post-tax profit would have been lower by US$ 17,899,000 in 2021 and post-tax loss would have been higher by US$ 21,014,000 in 2020).
GeoPark manages part of the exposure to crude oil price volatility using derivatives. The Group considers these derivative contracts to be an effective manner of properly managing commodity price risk. The price risk management activities mainly employ combinations of options and key parameters are based on forecasted production and budget price levels. GeoPark has also obtained credit lines from industry leading counterparties to minimize the potential cash exposure of the derivative contracts (see Note 8).
Credit risk– concentration
The Group’s credit risk relates mainly to accounts receivable where the credit risks correspond to the recognized values of commodities sold or hedged. GeoPark considers that there is no significant risk associated to the Group’s major customers and hedging counterparties.
In Colombia, GeoPark allocates its sales on a competitive basis to industry leading participants including traders and other producers. During 2022, the oil and gas production was sold to three clients which concentrate 97% of the Colombian subsidiaries’ revenue, accounting for 90% of the consolidated revenue (99% and 98% of the Colombian subsidiaries’ revenue, accounting for 89% and 83% of the consolidated revenue in 2021 and 2020). Delivery points include wellhead and other locations on the Colombian pipeline system for the Llanos Basin production. The Putumayo Basin production is delivered to clients FOB in Esmeraldas, Ecuador, and to the Colombian pipeline system in case of contingencies in Ecuador that affect the transport through the Ecuadorian pipeline system. The outstanding contracts for Colombian production extend through the first half of 2023. GeoPark manages its counterparty credit risk associated to sales contracts by periodic evaluation of the counterparties’ credit profile and, in certain contracts, including early payment conditions to minimize the exposure.
In Chile, the oil production is sold to ENAP, the State-owned oil and gas company (1% of the consolidated revenue in 2022, 2021 and 2020), and the gas production is sold to the local subsidiary of Methanex, a Canadian public company (1% of the consolidated revenue in 2022, 2% in 2021 and 4% in 2020).
In Brazil, all the hydrocarbons from Manati Field are sold to Petrobras, the State-owned company, which is the operator of the Manati Field (2% of the consolidated revenue in 2022, 3% in 2021 and 2020).
In Ecuador, oil is transported through the Ecuadorean pipeline system, with Esmeraldas as the delivery point, and 100% of the sales are exported on a competitive basis to industry leading participants including traders and other producers. Sales of crude oil in Ecuador accounted for 1% of the consolidated revenue in 2022.
GeoPark Limited has entered into a crude purchase agreement with an oil producer in the Putumayo Basin. The volumes purchased are transported and exported alongside the Group’s Putumayo Basin production. Sales of crude oil purchased from third parties accounted for 1% of the consolidated revenue in 2022.
The forementioned companies all have a good credit standing and despite the concentration of the credit risk, the Directors do not consider there to be a significant collection risk.
GeoPark executes oil prices hedges via over-the-counter derivatives. Should oil prices drop, the Group could stand to collect from its counterparties under the derivative contracts. The Group’s hedging counterparties are leading financial institutions and trading companies, therefore the Directors do not consider there to be a significant collection risk. See disclosure in Notes 8 and 25.
24
Note 3 Financial Instruments-risk management (continued)
Funding and Liquidity risk
In the past, the Group has been able to raise capital through different sources of funding including equity, strategic partnerships and financial debt.
The Group is positioned at the end of 2022 with a cash balance of US$ 128,843,000 and its total indebtedness matures in 2027. In addition, the Group has a large portfolio of attractive and largely discretional projects - both oil and gas - in multiple countries with 37,700 boepd in production at year end. This scale and positioning permit the Group to protect its financial condition and selectively allocate capital to the optimal projects subject to prevailing macroeconomic conditions.
The Indentures governing the Company Notes 2027 include incurrence test covenants related to compliance with certain thresholds of Net Debt to Adjusted EBITDA ratio and Adjusted EBITDA to Interest ratio. Failure to comply with the incurrence test covenants does not trigger an event of default. However, this situation may limit the Group’s capacity to incur additional indebtedness, as specified in the indentures governing the Notes. As of the date of these Consolidated Financial Statements, the Group is in compliance with all the indentures’ provisions and covenants.
The Group’s interest rate risk could arise from long-term borrowings issued at variable rates, which would expose the Group to interest rate risk.
The Group does not face interest rate risk on its US$ 500,000,000 Notes which carry a fixed rate coupon of 5.50% per annum. Consequently, the accruals and interest payments are not substantially affected by the market interest rate changes.
As of December 31, 2022, there were no outstanding borrowings affected by a variable rate.
Capital risk
The Group’s objectives when managing capital are to safeguard the Group’s ability to continue as a going concern in order to provide returns for shareholders and benefits for other stakeholders and to maintain an optimal capital structure to reduce the cost of capital.
Consistent with others in the industry, the Group monitors capital on the basis of the gearing ratio. This ratio is calculated as net debt divided by total capital. Net debt is calculated as total borrowings (including ‘current and non-current borrowings’ as shown in the Consolidated Statement of Financial Position) less cash and cash equivalents. Total capital is calculated as ‘equity’ as shown in the Consolidated Statement of Financial Position plus net debt.
The Group’s strategy is to keep the gearing ratio within a 60% to 80% range, in normal market conditions. Due to the market conditions prevailing in 2021, the gearing ratio was above such range at that year-end.
The gearing ratios as of December 31, 2022 and 2021 were as follows:
| | | | | |
Amounts in US$‘000 | | 2022 | | 2021 | |
Net Debt | | 368,799 | | 573,488 | |
Total Equity | | 115,585 | | (61,945) | |
Total Capital | | 484,384 | | 511,543 | |
Gearing Ratio | | 76% | | 112% | |
25
Note 4 Accounting estimates and assumptions
Estimates and assumptions are used in preparing financial statements. Although these estimates are based on management’s best knowledge of current events and actions, actual results may differ. Estimates and judgements are continually evaluated and are based on historical experience and other factors, including expectations of future events that are believed to be reasonable under the circumstances.
The key estimates and assumptions used in these Consolidated Financial Statements are noted below:
| ● | The process of estimating reserves is complex. It requires significant judgements and decisions based on available geological, geophysical, engineering and economic data. The estimation of economically recoverable oil and natural gas reserves and related future net cash flows was performed based on the Reserve Report as of December 31, 2022, prepared by DeGolyer and MacNaughton Corp., an independent international oil and gas consulting firm based in Dallas, Texas, in line with the principles contained in the Society of Petroleum Engineers (SPE) and the Petroleum Resources Management Reporting System (PRMS) framework. |
It incorporates many factors and assumptions including:
| o | expected reservoir characteristics based on geological, geophysical and engineering assessments; |
| o | future production rates based on historical performance and expected future operating and investment activities; |
| o | future oil and gas prices and quality differentials; |
| o | assumed effects of regulation by governmental agencies; |
| o | tax rates by jurisdiction; and |
| o | future development and operating costs. |
Management believes these factors and assumptions are reasonable based on the information available to them at the time of preparing the estimates. However, these estimates may change substantially as additional data from ongoing development activities and production performance becomes available and as economic conditions impacting oil and gas prices and costs change.
Such changes may impact the Group’s reported financial position and results, which include: (a) the carrying value of exploration and evaluation assets; oil and gas properties and other property, plant and equipment; may be affected due to changes in estimated future cash flows, (b) depreciation and amortization charges in the Consolidated Statement of Income may change where such charges are determined using the unit of production method, or where the useful life of the related assets change, (c) provisions for abandonment may require revision -where changes to reserves estimates affect expectations about when such activities will occur and the associated cost of these activities- and, (d) the recognition and carrying value of deferred income tax assets may change due to changes in the judgements regarding the existence of such assets and in estimates of the likely recovery of such assets.
| ● | Cash flow estimates for impairment assessments of non-financial assets require assumptions about two primary elements: future prices and reserves. Estimates of future prices require significant judgments about highly uncertain future events. Historically, oil and gas prices have exhibited significant volatility. The Group’s forecasts for oil and gas revenues are based on prices derived from future price forecasts amongst industry analysts and internal assessments. Estimates of future cash flows are generally based on assumptions of long-term prices and operating and development costs. Given the significant assumptions required and the possibility that actual conditions may differ, management considers the assessment of impairment to be a critical accounting estimate (see Note 37). |
26
Note 4 Accounting estimates and assumptions (continued)
| ● | The Group adopted the successful efforts method of accounting. The Management of the Group makes assessments and estimates regarding whether an exploration and evaluation asset should continue to be carried forward as such when insufficient information exists. This assessment is made on a quarterly basis considering the advice from qualified experts. |
The application of the Group’s accounting policy for exploration and evaluation expenditure requires judgement to determine whether future economic benefits are likely from future either exploitation or sale, or whether activities have not reached a stage which permits a reasonable assessment of the existence of reserves. The determination of reserves and resources is, in itself, an estimation process that involves varying degrees of uncertainty depending on how the resources are classified. These estimates directly impact when the Group defers exploration and evaluation expenditure. The deferral policy requires management to make certain estimates and assumptions about future events and circumstances, in particular, whether an economically viable extraction operation can be established. Any such estimates and assumptions may change as new information becomes available. If, after expenditure is capitalized, information becomes available suggesting that the recovery of the expenditure is unlikely, the relevant capitalized amount is written-off in the Consolidated Statement of Income in the period when the new information becomes available.
| ● | Oil and gas assets held in property plant and equipment are mainly depreciated on a unit of production (“UOP”) basis at a rate calculated by reference to proven and probable reserves and incorporating the estimated future cost of developing and extracting those reserves. Future development costs are estimated using assumptions as to the numbers of wells required to produce those reserves, the cost of the wells and future production facilities. This results in a depreciation charge proportional to the depletion of the anticipated remaining production from the block. |
The life of each item, which is assessed at least annually, has regard to both its physical life limitations and present assessments of economically recoverable reserves of the block at which the asset is located. These calculations require the use of estimates and assumptions, including the amount of recoverable reserves and estimates of future capital expenditure. The calculation of the UOP rate of depreciation will be impacted to the extent that actual production in the future is different from current forecast production based on total proved and probable reserves, or future capital expenditure estimates change. Changes to proved and probable reserves could arise due to changes in the factors or assumptions used in estimating reserves, including: (a) the effect on proved and probable reserves of differences between actual commodity prices and commodity price assumptions and (b) unforeseen operational issues.
| ● | Obligations related to the abandonment of wells once operations are terminated may result in the recognition of significant obligations. Estimating the future abandonment costs is difficult and requires management to make estimates and judgments because most of the obligations are many years in the future. Technologies and costs are constantly changing as well as political, environmental, safety and public relations considerations. The Group has adopted the following criterion for recognizing well plugging and abandonment related costs: the present value of future costs necessary for well plugging and abandonment is calculated for each area at the present value of the estimated future expenditure. The liabilities recognized are based upon estimated future abandonment costs, wells subject to abandonment, time to abandonment, and future inflation rates. |
The expected timing, extent and amount of expenditure may also change, for example, in response to changes in oil and gas reserves or changes in laws and regulations or their interpretation. Therefore, significant estimates and assumptions are made in determining the provision for decommissioning. As a result, there could be significant adjustments to the provisions established which would affect future financial results.
The provision at reporting date represents management’s best estimate of the present value of the future abandonment costs required.
27
Note 4 Accounting estimates and assumptions (continued)
| ● | From time to time, the Group may be subject to various lawsuits, claims and proceedings that arise in the normal course of business, including employment, commercial, tax, environmental, safety and health matters. For example, from time to time, the Group receives notice of environmental, health and safety violations. Based on what the Group’s Management currently knows, such claims are not expected to have a material impact on the Consolidated Financial Statements. |
Note 5 Consolidated Statement of Cash Flow
The Consolidated Statement of Cash Flow shows the Group’s cash flows for the year for operating, investing and financing activities and the change in cash and cash equivalents during the year.
Cash flows from operating activities are computed from the results for the year adjusted for non-cash operating items, changes in net working capital and corporate tax. Income tax paid is presented as a separate item under operating activities.
Cash flows from investing activities include payments in connection with the purchase and sale of property, plant and equipment and cash flows relating to the purchase and sale of enterprises to third parties, if any.
Cash flows from financing activities include changes in equity and proceeds from borrowings and repayment of loans.
Cash and cash equivalents include bank overdraft, if any, and liquid funds with a term of less than three months.
The following chart describes non-cash transactions related to the Consolidated Statement of Cash Flow:
| | | | | | |
Amounts in US$‘000 | | 2022 | | 2021 | | 2020 |
Decrease in asset retirement obligation | | (4,942) | | (651) | | (1,812) |
Decrease in provisions for other long-term liabilities | | (2,616) | | (443) | | (1,051) |
Purchase of property, plant and equipment | | 7,864 | | — | | — |
Additions / changes in estimates of right-of-use assets | | 22,462 | | 5,288 | | 560 |
Changes in working capital shown in the Consolidated Statement of Cash Flow are disclosed as follows:
| | | | | | |
Amounts in US$‘000 | | 2022 | | 2021 | | 2020 |
(Increase) Decrease in Inventories | | (6,694) | | 1,241 | | 1,220 |
(Increase) Decrease in Trade receivables | | (1,425) | | (23,290) | | 3,190 |
(Increase) Decrease in Prepayments and other receivables and Other assets (a) | | (30,929) | | (13,817) | | 38,742 |
(Decrease) Increase in Trade and other payables | | (999) | | 26,515 | | (48,392) |
| | (40,047) | | (9,351) | | (5,240) |
| (a) | Includes withholding taxes from clients for US$ 27,256,000, US$ 16,361,000 and US$ 10,046,000, in 2022, 2021 and 2020, respectively. |
28
Note 5 Consolidated Statement of Cash Flow (continued)
The following chart shows the movements in the borrowings and lease liabilities for each of the periods presented:
| | | | | | |
| | | | Lease | | |
Amounts in US$‘000 | | Borrowings | | Liabilities | | Total |
As of January 1, 2020 | | 437,419 | | 13,243 | | 450,662 |
Proceeds from borrowings | | 350,000 | | — | | 350,000 |
Debt issuance costs paid | | (7,507) | | — | | (7,507) |
Acquisitions (Note 36.1) | | — | | 17,851 | | 17,851 |
Addition to lease liabilities | | — | | 561 | | 561 |
Accrual of borrowing's interests | | 48,232 | | — | | 48,232 |
Exchange difference | | — | | 466 | | 466 |
Foreign currency translation | | (2,389) | | (1,641) | | (4,030) |
Unwinding of discount | | — | | 1,247 | | 1,247 |
Principal paid | | (3,575) | | — | | (3,575) |
Interest paid | | (37,594) | | — | | (37,594) |
Lease payments | | — | | (9,380) | | (9,380) |
As of December 31, 2020 | | 784,586 | | 22,347 | | 806,933 |
Proceeds from borrowings | | 172,174 | | — | | 172,174 |
Debt issuance costs paid | | (2,019) | | — | | (2,019) |
Addition to lease liabilities | | — | | 5,288 | | 5,288 |
Accrual of borrowing's interests | | 44,323 | | — | | 44,323 |
Exchange difference | | (581) | | (365) | | (946) |
Foreign currency translation | | (265) | | (461) | | (726) |
Unwinding of discount | | — | | 1,453 | | 1,453 |
Principal paid | | (274,934) | | — | | (274,934) |
Interest paid | | (42,592) | | — | | (42,592) |
Borrowings cancellation costs | | 6,308 | | — | | 6,308 |
Borrowings cancellation and other costs paid | | (12,908) | | — | | (12,908) |
Lease payments | | — | | (7,518) | | (7,518) |
As of December 31, 2021 | | 674,092 | | 20,744 | | 694,836 |
Addition to lease liabilities | | — | | 22,462 | | 22,462 |
Accrual of borrowing's interests | | 36,360 | | — | | 36,360 |
Exchange difference | | — | | (6,426) | | (6,426) |
Foreign currency translation | | 203 | | 284 | | 487 |
Unwinding of discount | | — | | 2,838 | | 2,838 |
Principal paid | | (172,522) | | — | | (172,522) |
Interest paid | | (36,514) | | — | | (36,514) |
Borrowings cancellation costs | | 5,141 | | — | | 5,141 |
Borrowings cancellation and other costs paid | | (9,118) | | — | | (9,118) |
Lease payments | | — | | (7,851) | | (7,851) |
As of December 31, 2022 | | 497,642 | | 32,051 | | 529,693 |
29
Note 6 Segment information
Operating segments are reported in a manner consistent with the internal reporting provided to the chief operating decision-maker. The chief operating decision-maker, who is responsible for allocating resources and assessing performance of the operating segments, has been identified as the Executive Committee. This committee is integrated by the Chief Executive Officer, Chief Financial Officer, Chief Technical Officer, Chief Operating Officer, Chief Strategy, Sustainability and Legal Officer and Chief People Officer. This committee reviews the Group’s internal reporting in order to assess performance and allocate resources. Management has determined the operating segments based on these reports. The committee considers the business from a geographic perspective.
The Executive Committee assesses the performance of the operating segments based on a measure of Adjusted EBITDA. Adjusted EBITDA is defined as profit (loss) for the period (determined as if IFRS 16 Leases has not been adopted), before net finance cost, income tax, depreciation, amortization, certain non-cash items such as impairments and write-offs of unsuccessful exploration efforts, accrual of share-based payment, unrealized result on commodity risk management contracts, geological and geophysical expenses allocated to capitalized projects, and other non-recurring events. Other information provided to the Executive Committee is measured in a manner consistent with that in the Consolidated Financial Statements.
Segment areas (geographical segments)
| | | | | | | | | | | | | | |
Amounts in US$ ‘000 | | Colombia | | Chile | | Brazil | | Argentina | | Ecuador (b) | | Corporate | | Total |
2022 | | | | | | | | | | | | | | |
Revenue | | 978,423 | | 29,196 | | 19,873 | | 1,962 | | 10,671 | | 9,454 | | 1,049,579 |
Sale of crude oil | | 977,184 | | 14,460 | | 796 | | 1,664 | | 10,671 | | — | | 1,004,775 |
Sale of purchased crude oil | | — | | — | | — | | — | | — | | 9,454 | | 9,454 |
Sale of gas | | 1,239 | | 14,736 | | 19,077 | | 298 | | — | | — | | 35,350 |
Realized loss on commodity risk management contracts | | (83,244) | | — | | — | | — | | — | | — | | (83,244) |
Production and operating costs | | (327,626) | | (14,126) | | (5,299) | | (1,579) | | (3,220) | | (7,929) | | (359,779) |
Royalties | | (60,314) | | (1,165) | | (1,546) | | (273) | | — | | — | | (63,298) |
Economic rights | | (188,989) | | — | | — | | — | | — | | — | | (188,989) |
Share-based payment | | (843) | | (103) | | — | | 1 | | (10) | | — | | (955) |
Other operating costs | | (77,480) | | (12,858) | | (3,753) | | (1,307) | | (3,210) | | (7,929) | | (106,537) |
Adjusted EBITDA | | 525,593 | | 11,753 | | 11,654 | | (3,643) | | 4,197 | | (8,775) | | 540,779 |
Depreciation | | (78,775) | | (14,076) | | (2,796) | | (254) | | (788) | | (3) | | (96,692) |
Write-off of unsuccessful exploration efforts | | (21,318) | | — | | — | | — | | (4,471) | | — | | (25,789) |
Total assets | | 797,390 | | 63,379 | | 34,329 | | 1,296 | | 35,690 | | 41,891 | | 973,975 |
Employees (average) (a) | | 362 | | 53 | | 5 | | 33 | | 7 | | 9 | | 469 |
Employees at year end (a) | | 388 | | 49 | | 4 | | 24 | | 8 | | 9 | | 482 |
| (a) | Unaudited. |
| (b) | Includes certain expenses that correspond to the Peruvian subsidiary, which acts as a holding company of the Ecuadorian subsidiary since Peru is no longer an operating segment due to the retirement from the Morona Block. |
30
Note 6 Segment information (continued)
| | | | | | | | | | | | | | |
Amounts in US$ ‘000 | | Colombia | | Chile | | Brazil | | Argentina | | Ecuador (b) | | Corporate | | Total |
2021 | | | | | | | | | | | | | | |
Revenue | | 618,268 | | 21,471 | | 20,109 | | 28,695 | | — | | — | | 688,543 |
Sale of crude oil | | 616,133 | | 6,297 | | 661 | | 24,468 | | — | | — | | 647,559 |
Sale of gas | | 2,135 | | 15,174 | | 19,448 | | 4,227 | | — | | — | | 40,984 |
Realized gain on commodity risk management contracts | | (109,654) | | — | | — | | — | | — | | — | | (109,654) |
Production and operating costs | | (178,384) | | (11,050) | | (4,596) | | (18,760) | | — | | — | | (212,790) |
Royalties | | (33,385) | | (770) | | (1,575) | | (4,270) | | — | | — | | (40,000) |
Economic rights | | (72,956) | | — | | (67) | | — | | — | | — | | (73,023) |
Share-based payment | | (334) | | (31) | | — | | 26 | | — | | — | | (339) |
Other operating costs | | (71,709) | | (10,249) | | (2,954) | | (14,516) | | — | | — | | (99,428) |
Adjusted EBITDA | | 294,847 | | 7,639 | | 12,569 | | 2,124 | | (2,071) | | (14,308) | | 300,800 |
Depreciation | | (61,279) | | (14,275) | | (4,082) | | (9,130) | | (200) | | (3) | | (88,969) |
Recognition of impairment losses | | — | | (17,641) | | — | | 13,307 | | — | | — | | (4,334) |
Write-off of unsuccessful exploration efforts | | (7,827) | | (4,435) | | — | | — | | — | | — | | (12,262) |
Total assets | | 689,401 | | 71,515 | | 38,846 | | 38,111 | | 7,782 | | 50,086 | | 895,741 |
Employees (average) (a) | | 308 | | 55 | | 4 | | 92 | | 8 | | 9 | | 476 |
Employees at year end (a) | | 321 | | 52 | | 4 | | 74 | | 3 | | 9 | | 463 |
| | | | | | | | | | | | | | | | |
Amounts in US$ ‘000 | | Colombia | | Chile | | Brazil | | Argentina | | Peru (c) | | Ecuador | | Corporate | | Total |
2020 | | | | | | | | | | | | | | | | |
Revenue | | 334,606 | | 21,704 | | 12,783 | | 24,599 | | — | | — | | — | | 393,692 |
Sale of crude oil | | 332,461 | | 5,103 | | 891 | | 21,185 | | — | | — | | — | | 359,640 |
Sale of gas | | 2,145 | | 16,601 | | 11,892 | | 3,414 | | — | | — | | — | | 34,052 |
Realized gain on commodity risk management contracts | | 21,059 | | — | | — | | — | | — | | — | | — | | 21,059 |
Production and operating costs | | (92,319) | | (10,244) | | (3,876) | | (18,633) | | — | | — | | — | | (125,072) |
Royalties | | (15,493) | | (753) | | (1,025) | | (3,620) | | — | | — | | — | | (20,891) |
Economic rights | | (14,960) | | — | | (24) | | — | | — | | — | | — | | (14,984) |
Share-based payment | | (362) | | (94) | | — | | (72) | | — | | — | | — | | (528) |
Other operating costs | | (61,504) | | (9,397) | | (2,827) | | (14,941) | | — | | — | | — | | (88,669) |
Adjusted EBITDA | | 218,524 | | 8,148 | | 4,784 | | 1,195 | | (1,952) | | (773) | | (12,395) | | 217,531 |
Depreciation | | (63,687) | | (33,571) | | (3,732) | | (16,564) | | (401) | | (52) | | (66) | | (118,073) |
Recognition of impairment losses | | — | | (81,967) | | (1,717) | | (16,205) | | (33,975) | | — | | — | | (133,864) |
Write-off of unsuccessful exploration efforts | | (1,949) | | (50,167) | | (536) | | — | | — | | — | | — | | (52,652) |
Total assets | | 680,828 | | 101,742 | | 38,172 | | 36,803 | | 4,656 | | 1,127 | | 96,938 | | 960,266 |
Employees (average) (a) | | 238 | | 68 | | 11 | | 114 | | 10 | | 2 | | 4 | | 447 |
Employees at year end (a) | | 268 | | 57 | | 5 | | 97 | | 5 | | 2 | | 3 | | 437 |
| (a) | Unaudited. |
| (b) | Includes certain expenses and 4 average employees (who were no longer in the Group at year-end) that corresponded to the Peruvian subsidiaries, which act as holding companies of the Ecuadorian branch since Peru is no longer an operating segment due to the retirement from the Morona Block. |
| (c) | As of the date of these Consolidated Financial Statements, Peru is no longer an operating segment due to the retirement from the Morona Block. |
In 2022, approximately 82% of capital expenditure was incurred by Colombia (93% in 2021 and 82% in 2020), 7% was incurred by Chile (3% in 2021 and 16% in 2020), and 11% was incurred by Ecuador (4% in 2021 and 1% in 2020).
31
Note 6 Segment information (continued)
A reconciliation of total Adjusted EBITDA to total profit (loss) before income tax is provided as follows:
| | | | | | |
Amounts in US$ ‘000 | | 2022 | | 2021 | | 2020 |
Adjusted EBITDA | | 540,779 | | 300,800 | | 217,531 |
Unrealized gain (loss) on commodity risk management contracts | | 13,023 | | 463 | | (12,978) |
Depreciation (a) | | (96,692) | | (88,969) | | (118,073) |
Share-based payment | | (11,038) | | (6,621) | | (8,444) |
Impairment and write-off of unsuccessful exploration efforts, net | | (25,789) | | (16,596) | | (186,516) |
Lease accounting - IFRS 16 | | 7,851 | | 7,518 | | 9,380 |
Others (b) | | 943 | | (10,786) | | (11,563) |
Operating profit (loss) | | 429,077 | | 185,809 | | (110,663) |
Financial expenses | | (57,073) | | (64,112) | | (64,582) |
Financial income | | 3,180 | | 1,652 | | 3,166 |
Foreign exchange gain (loss) | | 19,725 | | 5,049 | | (13,008) |
Profit (Loss) before tax | | 394,909 | | 128,398 | | (185,087) |
| (a) | Net of capitalized costs for oil stock included in Inventories. |
| (b) | Includes allocation to capitalized projects. In 2022, also includes gain from the sale of the Aguada Baguales, El Porvenir and Puesto Touquet Blocks in Argentina. In 2021, also includes termination costs and write-down of tax credits in Argentina. In 2020, also includes termination costs, and write-down of VAT credits and recognition of a provision for environmental liabilities in Peru. See Note 36. |
Note 7 Revenue
| | | | | | |
Amounts in US$ ‘000 | | 2022 | | 2021 | | 2020 |
Sale of crude oil | | 1,004,775 | | 647,559 | | 359,640 |
Sale of purchased crude oil | | 9,454 | | — | | — |
Sale of gas | | 35,350 | | 40,984 | | 34,052 |
| | 1,049,579 | | 688,543 | | 393,692 |
Note 8 Commodity risk management contracts
The Group has entered into derivative financial instruments to manage its exposure to oil price risk. These derivatives are zero-premium collars and were placed with major financial institutions and commodity traders. The Group entered into the derivatives under ISDA Master Agreements and Credit Support Annexes, which provide credit lines for collateral posting thus alleviating possible liquidity needs under the instruments and protect the Group from potential non-performance risk by its counterparties.
The Group’s derivatives that hedge cash flows from the sales of crude oil for periods through December 31, 2022 are accounted for as non-hedge derivatives and therefore all changes in the fair values of these derivative contracts are recognized immediately as gains or losses in the results of the periods in which they occur.
The Group’s derivatives that hedge cash flows from the sales of crude oil for periods from January 1, 2023 onwards are designated and qualify as cash flow hedges. The effective portion of changes in the fair values of these derivative contracts are recognized in Other Reserve within Equity. The gain or loss relating to the ineffective portion, if any, is recognized immediately as gains or losses in the results of the periods in which they occur. The amount accumulated in Other Reserves is reclassified to profit or loss as a reclassification adjustment in the same period or periods during which the hedged cash flows affect profit or loss.
32
Note 8 Commodity risk management contracts (continued)
The following table presents the Group’s production hedged during the year ended December 31, 2022 and for the following periods as a consequence of the derivative contracts in force as of December 31, 2022:
| | | | | | | | |
Period | | Reference | | Type | | Volume bbl/d | | Weighted average price US$/bbl |
ACCOUNTED FOR AS NON-HEDGE DERIVATIVES | ||||||||
January 1, 2022 - March 31, 2022 | | ICE BRENT | | Zero Premium Collars | | 14,500 | | 49.10 Put 74.81 Call |
April 1, 2022 - June 30, 2022 | | ICE BRENT | | Zero Premium Collars | | 12,500 | | 53.35 Put 79.38 Call |
July 1, 2022 - September 30, 2022 | | ICE BRENT | | Zero Premium Collars | | 13,000 | | 58.63 Put 86.50 Call |
October 1, 2022 - December 31, 2022 | | ICE BRENT | | Zero Premium Collars | | 12,000 | | 60.63 Put 92.55 Call |
ACCOUNTED FOR AS CASH FLOW HEDGES | ||||||||
January 1, 2023 - March 31, 2023 | | ICE BRENT | | Zero Premium Collars | | 9,500 | | 66.05 Put 112.59 Call |
April 1, 2023 - June 30, 2023 | | ICE BRENT | | Zero Premium Collars | | 8,500 | | 69.12 Put 113.13 Call |
July 1, 2023 - September 30, 2023 | | ICE BRENT | | Zero Premium Collars | | 2,000 | | 70.00 Put 101.13 Call |
The table below summarizes the gain (loss) on the commodity risk management contracts:
| | | | | | |
| | 2022 | | 2021 | | 2020 |
Realized (loss) gain on commodity risk management contracts | | (83,244) | | (109,654) | | 21,059 |
Unrealized gain (loss) on commodity risk management contracts | | 13,023 | | 463 | | (12,978) |
| | (70,221) | | (109,191) | | 8,081 |
Note 9 Production and operating costs
| | | | | | |
Amounts in US$ '000 | | 2022 | | 2021 | | 2020 |
Staff costs (Note 11) | | 13,114 | | 16,655 | | 14,689 |
Share-based payment (Note 11) | | 955 | | 339 | | 528 |
Royalties | | 63,298 | | 40,000 | | 20,891 |
Economic rights | | 188,989 | | 73,023 | | 14,984 |
Well and facilities maintenance | | 20,779 | | 17,989 | | 15,039 |
Operation and maintenance | | 6,545 | | 7,826 | | 7,491 |
Consumables | | 21,789 | | 19,270 | | 16,776 |
Equipment rental | | 7,580 | | 8,127 | | 8,570 |
Transportation costs | | 4,021 | | 3,383 | | 5,622 |
Field camp | | 4,070 | | 4,386 | | 3,130 |
Safety and insurance costs | | 3,745 | | 4,216 | | 4,505 |
Personnel transportation | | 2,480 | | 2,397 | | 2,115 |
Consultant fees | | 2,133 | | 1,732 | | 1,043 |
Gas plant costs | | 1,680 | | 2,596 | | 1,591 |
Non-operated blocks costs | | 12,650 | | 4,941 | | 3,442 |
Crude oil stock variation | | (6,449) | | 1,271 | | (305) |
Purchased crude oil | | 7,929 | | — | | — |
Other costs | | 4,471 | | 4,639 | | 4,961 |
| | 359,779 | | 212,790 | | 125,072 |
33
Note 10 DepreciationS | | | | | | |
Note 10 Depreciation
| | | | | | |
Amounts in US$ ‘000 | | 2022 | | 2021 | | 2020 |
Oil and gas properties | | 76,720 | | 66,011 | | 89,344 |
Production facilities and machinery | | 12,244 | | 12,468 | | 16,820 |
Furniture, equipment and vehicles | | 1,344 | | 1,960 | | 2,317 |
Buildings and improvements | | 672 | | 700 | | 490 |
Depreciation of property, plant and equipment (a) | | 90,980 | | 81,139 | | 108,971 |
Related to: | |
| |
| |
|
Productive assets | | 88,964 | | 78,479 | | 106,164 |
Administrative assets | | 2,016 | | 2,660 | | 2,807 |
Depreciation total (a) | | 90,980 | | 81,139 | | 108,971 |
| (a) | Depreciation without considering capitalized costs for oil stock included in Inventories nor depreciation of right-of-use assets. |
Note 11 Staff costs and Directors’ Remuneration
| | | | | | |
| | 2022 | | 2021 | | 2020 |
Number of employees at year end (a) | | 482 | | 463 | | 437 |
Amounts in US$ ‘000 | | | | | |
|
Wages and salaries | | 38,354 | | 42,236 | | 49,338 |
Share-based payments (Note 31) | | 11,038 | | 6,621 | | 8,444 |
Social security charges | | 5,528 | | 6,863 | | 5,712 |
Director’s fees and allowance | | 1,172 | | 2,853 | | 2,094 |
| | 56,092 | | 58,573 | | 65,588 |
Recognized as follows: | |
| |
| |
|
Production and operating costs | | 14,069 | | 16,994 | | 15,217 |
Geological and geophysical expenses | | 7,490 | | 6,219 | | 12,893 |
Administrative expenses | | 34,533 | | 35,360 | | 37,478 |
| | 56,092 | | 58,573 | | 65,588 |
Board of Directors’ and key managers’ remuneration | |
| |
| |
|
Salaries and fees | | 10,317 | | 9,069 | | 8,641 |
Share-based payments | | 8,728 | | 5,759 | | 7,170 |
Other benefits in kind | | 171 | | 296 | | 232 |
| | 19,216 | | 15,124 | | 16,043 |
| (a) | Unaudited. |
34
Note 11 Staff costs and Directors’ Remuneration (continued)
Directors’ Remuneration
| | | | | | | | |
| | Executive | | Non-Executive | | Director Fees | | Cash Equivalent |
| | Directors’ Fees | | Directors’ Fees | | Paid in Shares | | Total Remuneration |
| | (in US$) | | (in US$) | | (No. of Shares) | | (in US$) |
James F. Park (a) | | 601,002 | | — | | — | | 601,002 |
Andrés Ocampo (b) | | — | | — | | — | | — |
Carlos Gulisano (c) | | — | | 61,087 | | 5,110 | | 131,739 |
Robert Bedingfield (d) | | — | | 30,000 | | 14,803 | | 235,000 |
Constantin Papadimitriou (e) (f) | | — | | 167,500 | | 7,335 | | 267,500 |
Somit Varma (f) (g) | | — | | 32,500 | | 27,306 | | 409,755 |
Sylvia Escovar Gomez (h) | | — | | 35,000 | | 15,510 | | 249,755 |
Brian Maxted (i) | | — | | 32,718 | | 2,244 | | 61,953 |
Carlos Macellari | | — | | 30,462 | | 2,244 | | 60,082 |
Marcela Vaca (j) | | — | | 14,130 | | 1,084 | | 28,260 |
| (a) | Chief Executive Officer until his resignation on June 30, 2022. As of July 1, 2022, Mr. Park signed a consulting agreement with the Company to act as CEO advisor and provide support and assistance in addition to his role as Vicechair, non-executive Director and Strategy and Risk Committee Chairman. |
| (b) | As of July 1, 2022, Andrés Ocampo has a service contract to act as Chief Executive Officer, and he relinquished his fees as a member of the Board. |
| (c) | Director until his resignation on July 15, 2022. |
| (d) | Audit Committee Chairman. |
| (e) | Compensation Committee Chairman. |
| (f) | Constantin Papadimitriou and Somit Varma, as members of the Strategy and Risk Committee, instructed by the Board, were awarded additional fees on their work related to specific projects and activities. The additional fees are included in the table above. |
| (g) | Nomination and Corporate Governance Committee Chairman. |
| (h) | Independent Chair of the Board. |
| (i) | Technical Committee Chairman. |
| (j) | SPEED Committee Chairman. |
Note 12 Geological and geophysical expenses
| | | | | | |
Amounts in US$ ‘000 | | 2022 | | 2021 | | 2020 |
Staff costs (Note 11) | | 7,097 | | 6,042 | | 12,653 |
Share-based payment (Note 11) | | 393 | | 177 | | 240 |
Communication and IT costs | | 1,743 | | 1,071 | | 850 |
Consultant fees | | 917 | | 854 | | 545 |
Allocation to capitalized project | | (416) | | (953) | | (102) |
Other services | | 795 | | 700 | | 765 |
| | 10,529 | | 7,891 | | 14,951 |
35
Note 13 Administrative expenses
| | | | | | |
Amounts in US$ ‘000 | | 2022 | | 2021 | | 2020 |
Staff costs (Note 11) | | 23,671 | | 26,402 | | 27,708 |
Share-based payment (Note 11) | | 9,690 | | 6,105 | | 7,676 |
Consultant fees | | 9,574 | | 10,806 | | 8,570 |
Safety and insurance costs | | 3,834 | | 3,142 | | 2,394 |
Travel expenses | | 2,336 | | 719 | | 939 |
Non-operated blocks expenses | | 1,390 | | 799 | | 319 |
Director’s fees and allowance (Note 11) | | 1,172 | | 2,853 | | 2,094 |
Communication and IT costs | | 3,419 | | 4,214 | | 2,937 |
Allocation to joint operations | | (9,642) | | (8,574) | | (6,720) |
Other administrative expenses | | 4,580 | | 362 | | 4,398 |
| | 50,024 | | 46,828 | | 50,315 |
Note 14 Selling expenses
| | | | | | |
Amounts in US$ ‘000 | | 2022 | | 2021 | | 2020 |
Transportation | | 4,881 | | 4,233 | | 4,787 |
Selling taxes and other | | 3,114 | | 4,497 | | 1,057 |
| | 7,995 | | 8,730 | | 5,844 |
Note 15 Financial results
| | | | | | |
Amounts in US$ '000 | | 2022 | | 2021 | | 2020 |
Financial expenses | |
| |
| |
|
Interest and amortization of debt issue costs | | (36,360) | | (44,713) | | (48,779) |
Borrowings cancellation costs | | (5,141) | | (6,308) | | — |
Bank charges and other financial results | | (9,546) | | (8,012) | | (9,909) |
Unwinding of long-term liabilities | | (6,026) | | (5,079) | | (5,894) |
| | (57,073) | | (64,112) | | (64,582) |
Financial income | |
| |
| |
|
Interest received | | 3,180 | | 1,652 | | 3,166 |
| | 3,180 | | 1,652 | | 3,166 |
Foreign exchange gains and losses | |
| |
| |
|
Foreign exchange gain (loss), net | | 19,725 | | 5,049 | | (2,720) |
Realized result on currency risk management contracts | | — | | — | | (9,414) |
Unrealized result on currency risk management contracts | | — | | — | | (874) |
| | 19,725 | | 5,049 | | (13,008) |
Total Financial results | | (34,168) | | (57,411) | | (74,424) |
36
Colombia
In November 2022, the Colombian Congress approved a Tax Reform (“Law 2277”) which contemplates an increase in the effective tax rate and the government take for certain entities of the oil and gas industry.
The main impacts derived from the Law 2277 for GeoPark as part of the oil and gas industry include a provision that prevents the deduction of royalties for Corporate Income Tax (“CIT”) calculation purposes. Royalties paid in cash are assessed at a commercial value net of production costs while, royalties paid in-kind are assessed at their production cost.
A second relevant provision included in the Law 2277 establishes a permanent surtax for companies developing crude oil extractive activities, ranging between 5% and 15%. The surtax triggers when the Brent price average during the fiscal year meets percentiles 30 and upwards of the Brent price average of the last 10 years (as shown in the table below regarding fiscal year 2023) and is calculated as additional percentage points of the CIT rate that is applicable to the taxable base determined on a regular basis for CIT purposes. Income derived from gas production is exempted of surtax.
| | |
2023 Surcharge Price Triggers | | Surcharge rate |
< US$ 65.28 /bbl | | 0% |
US$ 65.28 to US$ 73.77 /bbl | | 5% |
US$ 73.78 to US$ 78.69 /bbl | | 10% |
> US$ 78.69 /bbl | | 15% |
In addition to the aforementioned rules, the Law 2277 includes other measures such as the strike off of the straight-line amortization method for new exploratory assets which will pass to be calculated under the ‘unit of production’ method, and repeals the tax credit of 50% of the industry and commerce tax paid during the year, which will no longer be treated as a tax credit but as a common deduction. The tax rate for dividends tax increases to 20% as well as the rate for capital gains tax that increases to 15%.
The new tax provisions will go into effect in 2023 and do not affect current tax bases or tax rate for fiscal year 2022. Nevertheless, the surtax has been considered for deferred income tax purposes as of December 31, 2022.
Spain
As from December 2021, tax regulations turned a full income tax exemption on dividend and capital gains income into a 95% exemption.
Note 17 Income tax
| | | | | | |
Amounts in US$ ‘000 | | 2022 | | 2021 | | 2020 |
Current income tax charge | | (125,786) | | (49,291) | | (41,927) |
Deferred income tax charge (Note 18) | | (44,688) | | (17,980) | | (5,936) |
| | (170,474) | | (67,271) | | (47,863) |
37
Note 17 Income tax (continued)
The tax on the Group’s profit (loss) before tax differs from the theoretical amount that would arise using the weighted average tax rate applicable to profits of the consolidated entities as follows:
| | | | | | |
Amounts in US$ ‘000 | | 2022 | | 2021 | | 2020 |
Profit (Loss) before tax | | 394,909 | | 128,398 | | (185,087) |
Tax losses from non-taxable jurisdictions | | 53,005 | | 91,351 | | 53,652 |
Taxable profit | | 447,914 | | 219,749 | | (131,435) |
| |
| |
| |
|
Income tax calculated at domestic tax rates applicable to Profit in the respective countries | | (157,315) | | (71,086) | | 12,450 |
Tax losses where no deferred income tax benefit is recognized | | (2,832) | | (7,510) | | (23,117) |
Effect of currency translation on tax base | | (10,797) | | (10,354) | | (923) |
Effect of inflation adjustment for tax purposes | | — | | 2,482 | | (867) |
Changes in the income tax rate (Note 16) | | (3,820) | | (1,703) | | (925) |
Write-down of deferred income tax benefits previously recognized (a) | | (2,938) | | (7,261) | | (32,565) |
Previously unrecognized tax losses | | 9,067 | | 9,593 | | — |
Income tax on dividends (b) | | (3,038) | | — | | — |
Fiscal recognition of property, plant and equipment | | — | | 8,919 | | — |
Non-taxable results (c) | | 1,199 | | 9,649 | | (1,916) |
Income tax | | (170,474) | | (67,271) | | (47,863) |
| (a) | Includes write-down of the deferred income tax asset in Peru due to the decision to retire from the Morona Block (see Note 36.4.1) in 2020, and write-down of a portion of tax losses and other deferred income tax assets in Chile, Brazil and Argentina where there is insufficient evidence of future taxable profits to offset them, in accordance with the expected future cash-flows as of December 31, 2022, 2021 and 2020. |
| (b) | Includes income tax payable in Spain due to dividends received from subsidiaries. See Note 16. |
| (c) | Includes non-deductible expenses and non-taxable gains in each jurisdiction. |
Under current Bermuda law, the Company is not required to pay any taxes in Bermuda on income or capital gains. The Company has received an undertaking from the Minister of Finance in Bermuda that, in the event of any taxes being imposed, they will be exempt from taxation in Bermuda until March 2035. Income tax rates in those countries where the Group operates (Colombia, Chile, Brazil and Ecuador) ranges from 15% to 50% (see Note 16). There are no income tax consequences attached to the payment of dividends by the Group to its shareholders.
The Group has tax losses available which can be utilized against future taxable profit in the following countries:
| | | | | | |
Amounts in US$ ‘000 | | 2022 | | 2021 | | 2020 |
Colombia (a) | | 4,837 | | 15,557 | | 16,493 |
Chile (a) | | 323,929 | | 285,456 | | 403,258 |
Brazil (a) | | 26,736 | | 26,781 | | 32,452 |
Argentina (b) | | 24,065 | | 35,773 | | 20,734 |
Spain (a) | | 7,205 | | 9,443 | | 9,694 |
Total tax losses as of December 31 | | 386,772 | | 373,010 | | 482,631 |
| (a) | Taxable losses have no expiration date. |
| (b) | Tax losses accumulated as of December 31, 2022 are: US$ 994,000, US$ 4,757,000, US$ 3,285,000, US$ 10,496,000 and US$ 4,533,000 expiring in 2023, 2024, 2025, 2026 and 2027, respectively. |
As of December 31, 2022, deferred income tax assets in respect of tax losses in Argentina and a portion of tax losses in Chile and Brazil have not been recognized as there is insufficient evidence of future taxable profits to offset them.
38
Note 18 Deferred income tax
The gross movement on the deferred income tax account is as follows:
| | | | |
Amounts in US$ ‘000 | | 2022 | | 2021 |
Deferred income tax as of January 1 | | (6,875) | | 10,978 |
Currency translation differences | | 383 | | 127 |
Income statement charge | | (44,688) | | (17,980) |
Deferred income tax as of December 31 | | (51,180) | | (6,875) |
The breakdown and movement of deferred income tax assets and liabilities as of December 31, 2022 and 2021 are as follows:
| | | | | | | | |
| | At the | | | | Currency | | |
| | beginning | | Charged to | | translation | | At the end |
Amounts in US$ ‘000 | | of year | | net profit | | differences | | of year |
Deferred income tax assets | |
| |
| |
| |
|
Difference in depreciation rates and other | | (344) | | 4,720 | | 383 | | 4,759 |
Tax losses | | 14,416 | | (232) | | — | | 14,184 |
Total 2022 | | 14,072 | | 4,488 | | 383 | | 18,943 |
Total 2021 | | 18,168 | | (4,223) | | 127 | | 14,072 |
| | | | | | |
| | At the beginning | | Charged to | | At the end |
Amounts in US$ ‘000 | | of year | | net profit | | of year |
Deferred income tax liabilities | |
| |
| |
|
Difference in depreciation rates and other | | (20,947) | | (49,176) | | (70,123) |
Total 2022 | | (20,947) | | (49,176) | | (70,123) |
Total 2021 | | (7,190) | | (13,757) | | (20,947) |
Note 19 Earnings per share
| | | | | | |
Amounts in US$ ‘000 except for shares | | 2022 | | 2021 | | 2020 |
Numerator: Profit (Loss) for the year | | 224,435 | | 61,127 | | (232,950) |
Denominator: Weighted average number of shares used in basic EPS | | 59,330,421 | | 60,901,109 | | 60,668,185 |
Earnings (Losses) after tax per share (US$) – basic | | 3.78 | | 1.00 | | (3.84) |
| | | | | | |
Amounts in US$ ‘000 except for shares | | 2022 | | 2021 | | 2020 |
Weighted average number of shares used in basic EPS | | 59,330,421 | | 60,901,109 | | 60,668,185 |
Effect of dilutive potential common shares (a) | | | | | |
|
Stock awards at US$ 0.001 | | 552,466 | | 559,012 | | — |
Weighted average number of common shares for the purposes of diluted earnings per shares | | 59,882,887 | | 61,460,121 | | 60,668,185 |
Earnings (Losses) after tax per share (US$) – diluted | | 3.75 | | 0.99 | | (3.84) |
| (a) | For the year ended December 31, 2020, the effect of the potential shares that could have a dilutive impact was considered antidilutive due to negative earnings. |
39
Note 20 Property, plant and equipment
| | | | | | | | | | | | | | |
| | | | Furniture, | | Production | | Buildings | | | | Exploration | | |
| | Oil & gas | | equipment | | facilities and | | and | | Construction in | | and evaluation | | |
Amounts in US$’000 | | properties | | and vehicles | | machinery | | improvements | | progress | | assets(a) | | Total |
Cost as of January 1, 2020 | | 830,937 | | 19,549 | | 172,507 | | 11,770 | | 69,587 | | 48,036 | | 1,152,386 |
Additions | | (2,863) | (b) | 1,180 | | — | | 422 | | 55,267 | | 18,429 | | 72,435 |
Acquisitions (Note 36.1) | | 185,533 | | 553 | | 16,181 | | 212 | | 1,199 | | 73,310 |
| 276,988 |
Currency translation differences | | (14,399) | | (194) | | (1,036) | | (59) | | (47) | | (401) | | (16,136) |
Disposals | | — | | (555) | | — | | (227) | | (33) | | — | | (815) |
Write-off / Impairment | | (77,667) | (c) | — | | (11,357) | (c) | — | | (44,840) | (c) | (52,652) | (d) | (186,516) |
Transfers | | 48,361 | | 174 | | 21,534 | | 324 | | (62,285) | | (8,108) |
| — |
Assets held for sale (Note 36.2.2) | | (1,285) | | — | | — | | — | | — | | — | | (1,285) |
Cost as of December 31, 2020 | | 968,617 | | 20,707 | | 197,829 | | 12,442 | | 18,848 | | 78,614 |
| 1,297,057 |
Additions | | (1,094) | (b) | 930 | | — | | — | | 82,094 | | 46,234 |
| 128,164 |
Currency translation differences | | (3,284) | | (43) | | (246) | | (16) | | (18) | | (30) |
| (3,637) |
Disposals | | — | | (1,762) | | (900) | | (978) | | (3,372) | | (338) |
| (7,350) |
Write-off / Impairment | | (1,575) | (c) | — | | (2,759) | (c) | — | | — | | (12,262) | (e) | (16,596) |
Transfers | | 68,315 | | 58 | | 13,305 | | 391 | | (70,321) | | (11,748) | | — |
Assets held for sale (Note 36.3.1) | | (73,047) | | (1,178) | | (6,052) | | (177) | | (27) | | — | | (80,481) |
Cost as of December 31, 2021 | | 957,932 | | 18,712 | | 201,177 | | 11,662 | | 27,204 | | 100,470 | | 1,317,157 |
Additions | | (7,558) | (b) | 1,620 | | 6 | | (14) | | 107,171 | | 67,889 | | 169,114 |
Currency translation differences | | 2,921 | | 37 | | 232 | | 6 | | 18 | | 19 | | 3,233 |
Disposals | | — | | (1,290) | | (26) | | (774) | | — | | — | | (2,090) |
Write-off / Impairment | | — | | — | | — | | — | | — | | (25,789) | (f) | (25,789) |
Transfers | | 125,962 | | 14 | | 21,338 | | 147 | | (117,913) | | (29,548) | | — |
Cost as of December 31, 2022 | | 1,079,257 | | 19,093 | | 222,727 | | 11,027 | | 16,480 | | 113,041 | | 1,461,625 |
| | | | | | | | | | | | | | |
Depreciation and write-down as of January 1, 2020 | | (467,806) | | (15,149) | | (95,047) | | (6,596) | | — | | — | | (584,598) |
Depreciation | | (89,344) | | (2,317) | | (16,820) | | (490) | | — | | — | | (108,971) |
Disposals | | — | | 326 | | — | | 72 | | — | | — | | 398 |
Currency translation differences | | 8,572 | | 155 | | 1,880 | | 39 | | — | | — | | 10,646 |
Assets held for sale (Note 36.2.2) | | 133 | | — | | — | | — | | — | | — | | 133 |
Depreciation and write-down as of December 31, 2020 | | (548,445) | | (16,985) | | (109,987) | | (6,975) | | — | | — | | (682,392) |
Depreciation | | (66,011) | | (1,960) | | (12,468) | | (700) | | — | | — | | (81,139) |
Disposals | | — | | 1,325 | | 900 | | 838 | | — | | — | | 3,063 |
Currency translation differences | | 2,219 | | 37 | | 246 | | 16 | | — | | — | | 2,518 |
Assets held for sale (Note 36.3.1) | | 49,080 | | 915 | | 4,692 | | 153 | | — | | — | | 54,840 |
Depreciation and write-down as of December 31, 2021 | | (563,157) | | (16,668) | | (116,617) | | (6,668) | | — | | — | | (703,110) |
Depreciation | | (76,720) | | (1,344) | | (12,244) | | (672) | | — | | — | | (90,980) |
Disposals | | — | | 1,246 | | 19 | | 752 | | — | | — | | 2,017 |
Currency translation differences | | (2,403) | | (33) | | (231) | | (6) | | — | | — | | (2,673) |
Depreciation and write-down as of December 31, 2022 | | (642,280) | | (16,799) | | (129,073) | | (6,594) | | — | | — | | (794,746) |
| |
| |
| |
| |
| |
| |
| | |
Carrying amount as of December 31, 2020 | | 420,172 | | 3,722 | | 87,842 | | 5,467 | | 18,848 | | 78,614 | | 614,665 |
Carrying amount as of December 31, 2021 | | 394,775 | | 2,044 | | 84,560 | | 4,994 | | 27,204 | | 100,470 | | 614,047 |
Carrying amount as of December 31, 2022 | | 436,977 | | 2,294 | | 93,654 | | 4,433 | | 16,480 | | 113,041 | | 666,879 |
40
Note 20 Property, plant and equipment (continued)
| (a) | Exploration wells movement and balances are shown in the table below; mining property associated with unproved reserves and resources, seismic and other exploratory assets amount to US$ 96,041,000 (US$ 90,166,000 in 2021 and US$ 75,485,000 in 2020). |
| | |
Amounts in US$ ‘000 | | Total |
Exploration wells as of December 31, 2020 | | 3,129 |
Additions | | 25,795 |
Write-offs | | (6,814) |
Transfers | | (11,806) |
Exploration wells as of December 31, 2021 | | 10,304 |
Additions | | 56,491 |
Write-offs | | (21,460) |
Transfers | | (28,335) |
Exploration wells as of December 31, 2022 | | 17,000 |
As of December 31, 2022, there were six exploratory wells that have been capitalized for a period less than a year amounting to US$ 17,000,000.
| (b) | Corresponds to the effect of change in estimate of assets retirement obligations. |
| (c) | See Note 37. |
| (e) | Corresponds to two unsuccessful exploratory wells drilled in the Llanos 32 Block (Colombia), other exploration costs incurred in the Fell Block (Chile), an exploratory well drilled in previous years in the CPO-5 Block (Colombia) and other exploration costs incurred in previous years in the PUT-30 Block (Colombia) for which no additional work would be performed. |
| (f) | Corresponds to exploration costs incurred in previous years in the Tacacho and Terecay Blocks (Colombia) for which no additional work would be performed, four exploratory wells drilled in the CPO-5, Platanillo, Llanos 34 and Llanos 94 Blocks (Colombia), and certain exploration costs incurred in the Espejo Block (Ecuador). |
41
Note 21 Subsidiary undertakings
The following chart illustrates main companies of the Group structure as of December 31, 2022:
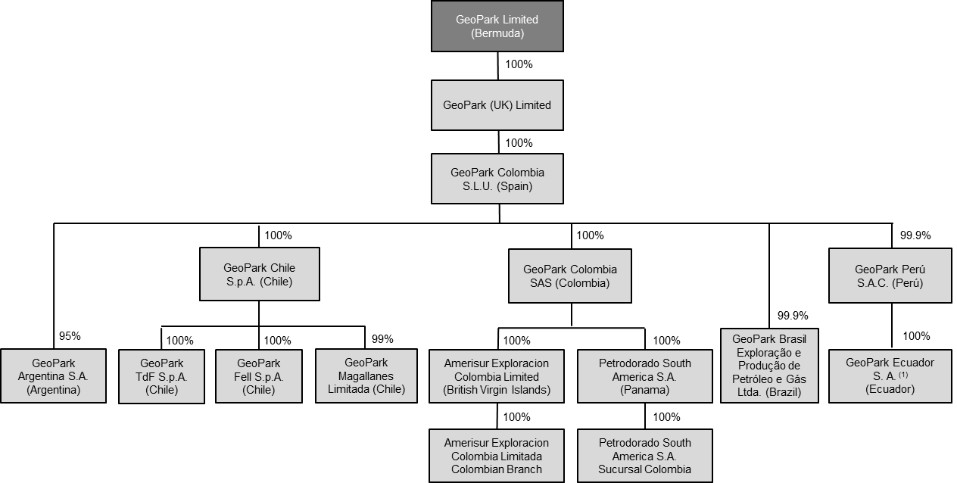
| (1) | GeoPark Ecuador S.A. holds 50% working interest in the consortiums that operate the Espejo and Perico Blocks. |
During the year ended December 31, 2022, the following changes to the Group structure have taken place:
| ● | GeoPark Colombia S.A.S. acquired the shares of GeoPark Colombia E&P previously owned by GeoPark Latin America S.L.U. |
| ● | GeoPark Colombia S.A.S. was assigned a 50% non-operated working interest in the CPO-4-1 Block. |
| ● | The Ecuadorean Branch named “GeoPark Perú S.A.C. Sucursal Ecuador” was transformed into a local company in Ecuador named “GeoPark Ecuador S.A.” |
| ● | The Spanish subsidiaries finalized a merger process by which GeoPark Latin America S.L.U. merged with and into GeoPark Colombia S.L.U., with the latter being the surviving company. |
In January 2023, the merger process between GeoPark Colombia S.A.S., GeoPark Colombia E&P S.A. and Petrodorado South America S.A., with GeoPark Colombia S.A.S. being the surviving company, was approved by the relevant Colombian authorities and the merger became effective as of its registration in the Public Registry of the Chamber of Commerce of Bogota on January 27, 2023.
42
Note 21 Subsidiary undertakings (continued)
Details of all the subsidiaries of the Group as of December 31, 2022 are set out below:
| | | | |
| | Name and registered office | | Ownership interest |
Subsidiaries | | GeoPark Argentina S.A. (Argentina) | | 100% (a) |
| | GeoPark Brasil Exploração e Produção de Petróleo e Gás Ltda. (Brazil) | | 100% (a) |
| | GeoPark Chile S.p.A. (Chile) | | 100% (a) |
| | GeoPark Fell S.p.A. (Chile) | | 100% (a) |
| | GeoPark Magallanes Limitada (Chile) | | 100% (a) |
| | GeoPark TdF S.p.A. (Chile) | | 100% (a) |
| | GeoPark Colombia S.A.S. (Colombia) | | 100% (a) |
| | GeoPark Colombia S.L.U. (Spain) | | 100% (a) |
| | GeoPark Perú S.A.C. (Peru) | | 100% (a) |
| | GeoPark Colombia E&P S.A. (Panama) | | 100% (a) |
| | GeoPark Colombia E&P Sucursal Colombia (Colombia) | | 100% (a) |
| | GeoPark Mexico S.A.P.I. de C.V. (Mexico) | | 100% (a) (b) |
| | GeoPark E&P S.A.P.I. de C.V. (Mexico) | | 100% (a) (b) |
| | GeoPark Ecuador S.A. (Ecuador) | | 100% (a) |
| | GeoPark (UK) Limited (United Kingdom) | | 100% |
| | Amerisur Resources Limited (United Kingdom) | | 100% (a) |
| | Amerisur Exploración Colombia Limited (British Virgin Islands) | | 100% (a) |
| | Amerisur Exploración Colombia Limited Sucursal Colombia (Colombia) | | 100% (a) |
| | Yarumal S.A.S. (Colombia) | | 100% (a) (b) |
| | Petrodorado South America S.A. (Panama) | | 100% (a) |
| | Petrodorado South America S.A. Sucursal Colombia (Colombia) | | 100% (a) |
| | Fenix Oil & Gas Limited (British Virgin Islands) | | 100% (a) (b) |
| | Fenix Oil & Gas Limited Sucursal Colombia (Colombia) | | 100% (a) (b) |
| | Amerisurexplor Ecuador S.A. (Ecuador) | | 100% (a) (b) |
| | Amerisur S.A. (Paraguay) | | 100% (a) (b) |
| | Market Access LLP (United States) | | 9% |
| (a) | Indirectly owned. |
| (b) | Dormant companies. |
43
Note 21 Subsidiary undertakings (continued)
Details of the joint operations of the Group as of December 31, 2022 are set out below:
| | | | |
| | Name and registered office | | Ownership interest |
Joint operations | | Flamenco Block (Chile) | | 50% (a) |
| | Campanario Block (Chile) | | 50% (a) |
| | Isla Norte Block (Chile) | | 60% (a) |
| | Llanos 34 Block (Colombia) | | 45% (a) |
| | Llanos 32 Block (Colombia) | | 12.5% |
| | Puelen Block (Argentina) | | 18% (b) |
| | Los Parlamentos (Argentina) | | 50% |
| | Manati Field (Brazil) | | 10% |
| | POT-T-785 Block (Brazil) | | 70% (a) |
| | Espejo Block (Ecuador) | | 50% (a) |
| | Perico Block (Ecuador) | | 50% |
| | Llanos 86 Block (Colombia) | | 50% (a) |
| | Llanos 87 Block (Colombia) | | 50% (a) |
| | Llanos 104 Block (Colombia) | | 50% (a) |
| | Llanos 123 Block (Colombia) | | 50% (a) |
| | Llanos 124 Block (Colombia) | | 50% (a) |
| | CPO-5 Block (Colombia) | | 30% |
| | Mecaya Block (Colombia) | | 50% (a) |
| | PUT-8 Block (Colombia) | | 50% (a) |
| | PUT-9 Block (Colombia) | | 50% (a) |
| | Tacacho Block (Colombia) | | 50% (a) (b) |
| | Terecay Block (Colombia) | | 50% (a) (b) |
| | Llanos 94 Block (Colombia) | | 50% |
| | PUT-36 Block (Colombia) | | 50% (a) |
| | CPO-4-1 Block (Colombia) | | 50% |
| (a) | GeoPark is the operator. |
| (b) | In process of relinquishment. |
44
Note 22 Prepayments and other receivables
| | | | |
Amounts in US$ '000 | | 2022 | | 2021 |
V.A.T. | | 1,826 | | 1,711 |
Income tax payments in advance | | 3,156 | | 3,227 |
Other prepaid taxes | | 37 | | 996 |
To be recovered from co-venturers (Note 34) | | 8,750 | | 4,680 |
Prepayments and other receivables | | 8,458 | | 12,184 |
| | 22,227 | | 22,798 |
Classified as follows: | |
| |
|
Current | | 22,106 | | 22,650 |
Non-current | | 121 | | 148 |
| | 22,227 | | 22,798 |
Movements on the Group provision for impairment are as follows:
| | | | |
Amounts in US$ '000 | | 2022 | | 2021 |
At January 1 | | 7 | | 144 |
Additions | | 10 | | — |
Foreign exchange loss | | (3) | | (13) |
Uses | | — | | (124) |
| | 14 | | 7 |
Note 23 Inventories
| | | | |
Amounts in US$ '000 | | 2022 | | 2021 |
Crude oil | | 12,630 | | 5,419 |
Materials and spares | | 1,804 | | 5,496 |
| | 14,434 | | 10,915 |
Note 24 Trade receivables
| | | | |
Amounts in US$ '000 | | 2022 | | 2021 |
Trade receivables | | 71,794 | | 70,531 |
| | 71,794 | | 70,531 |
As of December 31, 2022 and 2021, there are no balances that were aged by more than 3 months. Trade receivables that are aged by less than three months are not considered impaired.
The credit period for trade receivables is 30 days. The maximum exposure to credit risk at the reporting date is the carrying value of each class of receivable. The Group does not hold any collateral as security related to trade receivables.
The carrying value of trade receivables is considered to represent a reasonable approximation of its fair value due to their short-term nature.
45
Note 25 Financial instruments by category
| | | | |
| | Assets as per statement | ||
| | of financial position | ||
Amounts in US$ '000 | | 2022 | | 2021 |
Financial assets at fair value through profit or loss | | | | |
Derivative financial instrument assets | | 967 | | 126 |
Cash and cash equivalents | | 242 | | 427 |
| | 1,209 | | 553 |
Other financial assets at amortized cost | |
| |
|
Trade receivables | | 71,794 | | 70,531 |
To be recovered from co-venturers (Note 34) | | 8,750 | | 4,680 |
Other financial assets (a) | | 12,877 | | 14,747 |
Cash and cash equivalents | | 128,601 | | 100,177 |
| | 222,022 | | 190,135 |
Total financial assets | | 223,231 | | 190,688 |
| (a) | Non-current other financial assets relate to restricted deposits made for environmental obligations according to Brazilian government regulations. Current other financial assets correspond to short-term investments with original maturities up to twelve months and over three months. |
| | | | |
| | Liabilities as per statement | ||
| | of financial position | ||
Amounts in US$ ‘000 | | 2022 | | 2021 |
Liabilities at fair value through profit and loss | |
| |
|
Derivative financial instrument liabilities | | 19 | | 20,757 |
| | 19 | | 20,757 |
Other financial liabilities at amortized cost | |
| |
|
Trade payables | | 102,125 | | 86,672 |
To be paid to co-venturers (Note 34) | | 2,815 | | 953 |
Lease liabilities | | 32,051 | | 20,744 |
Borrowings | | 497,642 | | 674,092 |
| | 634,633 | | 782,461 |
Total financial liabilities | | 634,652 | | 803,218 |
46
Note 25 Financial instruments by category (continued)
25.1 Credit quality of financial assets
The credit quality of financial assets that are neither past due nor impaired can be assessed by reference to external credit ratings (if available) or to historical information about counterparty default rates:
| | | | |
Amounts in US$ ‘000 | | 2022 | | 2021 |
Trade receivables | |
| |
|
Counterparties with an external credit rating (Moody’s, S&P, Fitch) | |
| |
|
Aa2 | | — | | 7,132 |
Aa3 | | 2,013 | | — |
A3 | | 1,557 | | — |
Baa1 | | 99 | | — |
Baa3 | | 198 | | 24,163 |
Ba1 | | 23,755 | | 4,984 |
Ba3 | | 2,745 | | — |
B2 | | 4,085 | | 70 |
Counterparties without an external credit rating | | | | |
Group 1 (a) | | 37,342 | | 34,182 |
Total trade receivables | | 71,794 | | 70,531 |
| (a) | Group 1 – existing customers (more than 6 months) with no defaults in the past. |
All trade receivables are denominated in US Dollars, except in Brazil where they are denominated in Brazilian Real.
Cash at bank and other financial assets (a)
| | | | |
Amounts in US$ ‘000 | | 2022 | | 2021 |
Counterparties with an external credit rating (Moody’s, S&P, Fitch, BRC Investor Services) | |
| |
|
Aaa | | — | | 3,529 |
Aa3 | | 10,362 | | 8 |
A1 | | 96,077 | | — |
A2 | | 57 | | 53,114 |
A3 | | 10,389 | | 27,257 |
Baa1 | | 39 | | 1,605 |
Baa2 | | 7,030 | | 3,708 |
Baa3 | | 1,352 | | — |
Ba1 | | 64 | | 67 |
Ba2 | | 268 | | 21 |
Ba3 | | 3,066 | | 5,117 |
B3 | | 51 | | — |
Counterparties without an external credit rating | | 12,953 | | 20,908 |
Total | | 141,708 | | 115,334 |
| (a) | The remaining balance sheet item ‘cash and cash equivalents’ corresponds to cash on hand amounting to US$ 12,000 (US$ 17,000 in 2021). |
47
Note 25 Financial instruments by category (continued)
25.2 Financial liabilities- contractual undiscounted cash flows
The table below analyses the Group’s financial liabilities into relevant maturity groupings based on the remaining period at the balance sheet to the contractual maturity date. The amounts disclosed in the table are the contractual undiscounted cash flows.
| | | | | | | | |
| | Less than 1 | | Between 1 | | Between 2 | | Over 5 |
Amounts in US$ ‘000 | | year | | and 2 years | | and 5 years | | years |
As of December 31, 2022 | | | | | | | | |
Borrowings | | 27,500 | | 27,500 | | 568,750 | | — |
Lease liabilities | | 10,939 | | 5,653 | | 11,209 | | 25,012 |
Trade payables | | 102,125 | | — | | — | | — |
To be paid to co-venturers (Note 34) | | 2,815 | | — | | — | | — |
| | 143,379 | | 33,153 | | 579,959 | | 25,012 |
As of December 31, 2021 | |
| |
| |
| |
|
Borrowings | | 40,943 | | 38,550 | | 263,550 | | 513,750 |
Lease liabilities | | 9,230 | | 6,558 | | 5,820 | | 2,871 |
Trade payables | | 85,132 | | 1,540 | | — | | — |
To be paid to co-venturers (Note 34) | | 953 | | — | | — | | — |
| | 136,258 | | 46,648 | | 269,370 | | 516,621 |
25.3 Fair value measurement of financial instruments
Accounting policies for financial instruments have been applied to classify as either: amortized cost, financial assets at fair value through profit or loss and fair value through other comprehensive income. For financial instruments that are measured in the statement of financial position at fair value, IFRS 13 requires a disclosure of fair value measurements by level according to the following fair value measurement hierarchy:
Level 1 - Quoted prices (unadjusted) in active markets for identical assets or liabilities.
Level 2 - Inputs other than quoted prices included within Level 1 that are observable for the asset or liability, either directly (that is, as prices) or indirectly (that is, derived from prices).
Level 3 - Inputs for the asset or liability that are not based on observable market data (that is, unobservable inputs).
48
Note 25 Financial instruments by category (continued)
25.3 Fair value measurement of financial instruments (continued)
25.3.1 Fair value hierarchy
The following table presents the Group’s financial assets and financial liabilities measured and recognized at fair value as of December 31, 2022 and 2021 on a recurring basis:
| | | | | | |
| | | | | | As of December 31, |
Amounts in US$ ‘000 | | Level 1 | | Level 2 | | 2022 |
Assets | |
| |
| |
|
Cash and cash equivalents | |
| |
| |
|
Money market funds | | 242 | | — | | 242 |
Derivative financial instrument assets | |
| |
| |
|
Commodity risk management contracts | | — | | 967 | | 967 |
Total Assets | | 242 | | 967 | | 1,209 |
Liabilities | | | | | | |
Derivative financial instrument liabilities | | | | | | |
Commodity risk management contracts | | — | | 19 | | 19 |
Total Liabilities | | — | | 19 | | 19 |
| | | | | | |
| | | | | | As of December 31, |
Amounts in US$ ‘000 | | Level 1 | | Level 2 | | 2021 |
Assets | |
| |
| |
|
Cash and cash equivalents | |
| |
| |
|
Money market funds | | 427 | | — | | 427 |
Derivative financial instrument assets | |
| |
| |
|
Commodity risk management contracts | | — | | 126 | | 126 |
Total Assets | | 427 | | 126 | | 553 |
Liabilities | | | | | | |
Derivative financial instrument liabilities | | | | | | |
Commodity risk management contracts | | — | | 20,757 | | 20,757 |
Total Liabilities | | — | | 20,757 | | 20,757 |
There were no transfers between Level 2 and 3 during the period.
The Group did not measure any financial assets or financial liabilities at fair value on a non-recurring basis as of December 31, 2022.
49
Note 25 Financial instruments by category (continued)
25.3 Fair value measurement of financial instruments (continued)
25.3.2 Valuation techniques used to determine fair values
Specific valuation techniques used to value financial instruments include:
| ● | The use of quoted market prices or dealer quotes for similar instruments. |
| ● | The mark-to-market fair value of the Group’s outstanding derivative instruments is based on independently provided market rates and determined using standard valuation techniques, including the impact of counterparty credit risk and are within level 2 of the fair value hierarchy. |
| ● | The fair value of the remaining financial instruments is determined using discounted cash flow analysis. All of the resulting fair value estimates are included in level 2. |
25.3.3 Fair values of other financial instruments (unrecognized)
The Group also has a number of financial instruments which are not measured at fair value in the balance sheet. For the majority of these instruments, the fair values are not materially different to their carrying amounts, since the interest receivable/payable is either close to current market rates or the instruments are short-term in nature.
Borrowings are comprised primarily of fixed rate debt and variable rate debt with a short-term portion where interest has already been fixed. They are classified under other financial liabilities and measured at their amortized cost.
The fair value of these financial instruments as of December 31, 2022 amounts to US$ 431,660,000 (US$ 661,404,000 in 2021). The fair values are based on market price for the Notes and cash flows discounted for other borrowings using a rate based on the borrowing rate and are within level 1 and level 2 of the fair value hierarchy, respectively.
Note 26 Equity
26.1 Share capital and Share premium
| | | | |
Issued share capital | | 2022 | | 2021 |
Common stock (amounts in US$ ‘000) | | 58 | | 60 |
The share capital is distributed as follows: | |
| |
|
Common shares, of nominal US$ 0.001 | | 57,621,998 | | 60,238,026 |
Total common shares in issue | | 57,621,998 | | 60,238,026 |
| |
| |
|
Authorized share capital | |
| |
|
US$ per share | | 0.001 | | 0.001 |
| |
| |
|
Number of common shares (US$ 0.001 each) | | 5,171,949,000 | | 5,171,949,000 |
Amount in US$ | | 5,171,949 | | 5,171,949 |
Details regarding the share capital of the Company are set out below.
50
Note 26 Equity (continued)
26.1 Share capital and Share premium (continued)
26.1.1 Common shares
As of December 31, 2022, the outstanding common shares confer the following rights on the holder:
| ● | the right to one vote per share |
| ● | ranking pari passu, the right to any dividend declared and payable on common shares |
| | | | | | | | |
| | | | Shares | | Shares | | |
| | | | issued | | closing | | US$(`000) |
GeoPark common shares history | | Month | | (millions) | | (millions) | | Closing |
Shares outstanding at the end of 2020 | |
| |
| | 61.0 | | 61 |
Stock awards | | May 2021 | | 0.2 | | 61.2 | | 61 |
Buyback program | | Jun 2021 | | (0.1) | | 61.1 | | 61 |
Buyback program | | Sep 2021 | | (0.4) | | 60.7 | | 61 |
Buyback program | | Dec 2021 | | (0.5) | | 60.2 | | 60 |
Shares outstanding at the end of 2021 | | | |
| | 60.2 | | 60 |
Buyback program | | Mar 2022 | | (0.2) | | 60.0 | | 60 |
Buyback program | | Jun 2022 | | (0.5) | | 59.5 | | 60 |
Stock awards | | Jul 2022 | | 0.1 | | 59.6 | | 60 |
Buyback program | | Sep 2022 | | (1.1) | | 58.5 | | 59 |
Buyback program | | Dec 2022 | | (0.9) | | 57.6 | | 58 |
Shares outstanding at the end of 2022 | |
| |
| | 57.6 | | 58 |
26.1.2 Stock Award Program and Other Share Based Payments
Non-Executive Directors Fees
During 2022, the Company issued 75,636 (64,269 in 2021 and 60,204 in 2020) shares to Non-Executive Directors in accordance with contracts as compensation, generating a share premium of US$ 1,040,000 (US$ 861,000 in 2021 and US$ 665,000 in 2020). The amount of shares issued is determined considering the contractual compensation and the fair value of the shares for each relevant period.
Stock Award Program and Other Share Based Payments
On July 15, 2022, 52,058 common shares were issued as part of the founding executive employment agreement in place with the former Chief Executive Officer (104,439 in 2021), generating a share premium of US$ 800,000 (US$ 800,000 in 2021).
On November 12, 2020, 499,614 common shares were allotted to the trustee of the Employee Beneficiary Trust (“EBT”) to be assigned to certain employees as part of their 2019 bonus compensation, generating a share capital and share premium of US$ 1,000 and US$ 4,351,000, respectively.
On January 2, 2020 and 2019 (50% each year, as set up in the plan), the vested Value Creation Plan (“VCP”) awards, representing 2,976,781 common shares, was issued to key management (including 878,150 common shares issued to Directors involved in the performance of the Company), generating a share premium of US$ 4,668,000 (50% each year).
51
Note 26 Equity (continued)
26.1 Share capital and Share premium (continued)
26.1.3 Buyback Program
On February 10, 2020, the Company’s Board of Directors approved a program to repurchase up to 10% of its shares outstanding or approximately 5,930,000 shares. The repurchase program began on February 11, 2020 and was suspended in April 2020 as part of the revised work program for 2020 because of the COVID-19 pandemic and the oil price crisis. During 2020, the Company purchased 316,445 common shares for a total amount of US$ 3,071,000. These transactions had no impact on the Group’s results.
On November 4, 2020, the Company’s Board of Directors approved a new program to repurchase up to 10% of its shares outstanding or approximately 6,062,000 shares. The repurchase program began on November 5, 2020 and was set to expire on November 15, 2021. On November 10, 2021, the Company’s Board of Directors approved the renewal of this repurchase program until November 10, 2022. Finally, on November 9, 2022, the Company’s Board of Directors approved a new renewal of the program to repurchase up to 10% of our shares outstanding or approximately 5,854,285 shares until December 31, 2023. During 2022, the Company purchased 2,743,722 common shares (960,454 in 2021 and 101,986 in 2020) for a total amount of US$ 36,265,000 (US$ 11,841,000 in 2021 and US$ 938,000 in 2020). These transactions had no impact on the Group’s results.
26.2 Cash distributions
On November 6, 2019, the Company’s Board of Directors declared the initiation of quarterly cash distribution.
The following table summarizes the cash distributions for each of the years presented:
| | | | | | |
| | | | | | Total amount |
Date of declaration | | Date of distribution | | US$ per share | | in US$ ‘000 |
March 4, 2020 (a) | | April 8, 2020 | | 0.0413 | | 2,343 |
November 4, 2020 (a) | | December 9, 2020 | | 0.0206 | | 1,258 |
November 4, 2020 (a) | | December 9, 2020 | | 0.0206 | | 1,258 |
Cash distributions for the year ended December 31, 2020 | | 4,859 | ||||
March 10, 2021 | | April 13, 2021 | | 0.0205 | | 1,133 |
May 5, 2021 | | May 28, 2021 | | 0.0205 | | 1,220 |
August 4, 2021 | | August 31, 2021 | | 0.0410 | | 2,442 |
November 10, 2021 | | December 7, 2021 | | 0.0410 | | 2,429 |
Cash distributions for the year ended December 31, 2021 | | 7,224 | ||||
March 9, 2022 | | March 31, 2022 | | 0.0820 | | 4,847 |
May 11, 2022 | | June 10, 2022 | | 0.0820 | | 4,809 |
August 10, 2022 | | September 8, 2022 | | 0.1270 | | 7,345 |
November 9, 2022 | | December 7, 2022 | | 0.1270 | | 7,281 |
Cash distributions for the year ended December 31, 2022 | | 24,282 | ||||
| (a) | The quarterly cash distributions were temporary suspended in April 2020 as part of the revised work program for 2020 due to the COVID-19 pandemic and the oil price crisis. On November 4, 2020, the Company’s Board of Directors declared an extraordinary cash distribution and also resumed the quarterly cash distributions. |
These distributions are deducted from Other Reserve.
26.3 Stock distribution
On February 10, 2020, the Company’s Board of Directors declared a special stock distribution of 0.004 shares per share. Consequently, on March 11, 2020, 242,650 common shares were distributed to the shareholders of record at the close of business on February 25, 2020.
52
Note 27 Borrowings
| | | | |
Amounts in US$ ‘000 | | 2022 | | 2021 |
Outstanding amounts as of December 31 | |
| |
|
2024 Notes | | — | | 171,880 |
2027 Notes | | 497,642 | | 499,893 |
Banco Santander | | — | | 2,319 |
| | 497,642 | | 674,092 |
Classified as follows: | |
| |
|
Current | | 12,528 | | 17,916 |
Non-current | | 485,114 | | 656,176 |
On September 21, 2017, the Company successfully placed US$ 425,000,000 aggregate principal amount of 6.500% Senior Secured Notes due 2024 (the “2024 Notes”), which were offered to qualified institutional buyers in accordance with Rule 144A under the United States Securities Act (the “Securities Act”), and outside the United States to non-U.S. persons in accordance with Regulation S under the Securities Act. The 2024 Notes carry a coupon of 6.50% per annum. The debt issuance cost for this transaction amounted to US$ 6,683,000 (debt issuance effective rate: 6.90%).
On January 17, 2020, the Company successfully placed US$ 350,000,000 aggregate principal amount of 5.500% Senior Secured Notes due 2027 (the “2027 Notes”), which were offered in a private placement to qualified institutional buyers in accordance with Rule 144A under the Securities Act, and outside the United States to non U.S. persons in accordance with Regulation S under the Securities Act. The 2027 Notes were priced at 99.285% and carry a coupon of 5.50% per annum (yield 5.625% per annum). The debt issuance cost for this transaction amounted to US$ 5,004,000 (debt issuance effective rate: 5.88%). Final maturity of the 2027 Notes will be January 17, 2027.
In April 2021, the Company executed a series of transactions that included a successful tender to purchase US$ 255,000,000 of the 2024 Notes that was funded with a combination of cash in hand and a US$ 150,000,000 aggregate principal amount new issuance from the reopening of the 2027 Notes. The new notes offering and the tender offer closed on April 23, 2021, and April 26, 2021, respectively.
The tender total consideration included the tender offer consideration of US$ 1,000 for each US$ 1,000 principal amount of the 2024 Notes plus the early tender payment of US$ 50 for each US$ 1,000 principal amount of the 2024 Notes. The tender also included a consent solicitation to align the covenants of the 2024 Notes to those of the 2027 Notes.
The reopening of the 2027 Notes was priced above par at 101.875%, representing a yield to maturity of 5.117%. The debt issuance cost for this transaction amounted to US$ 2,019,000. The 2027 Notes were offered in a private placement to qualified institutional buyers in accordance with Rule 144A under the Securities Act, and outside the United States to non-U.S. persons in accordance with Regulation S under the Securities Act. The 2027 Notes are fully and unconditionally guaranteed jointly and severally by two principal subsidiaries of the Company.
Between March and July 2022, the Company continued its deleveraging process, by repurchasing and cancelling, with the Trustee, a total nominal amount of US$ 102,876,000 of its 2024 Notes. Of this total amount, US$ 57,876,000 were repurchased in open market transactions at prices below the call option level and US$ 45,000,000 were redeemed at a redemption price stated in the indenture governing the 2024 Notes. On September 21, 2022, GeoPark fully repaid its 2024 Notes by redeeming the remaining aggregate principal amount of US$ 67,124,000. Pursuant to the terms of the indenture governing the 2024 Notes, the Notes were redeemed at a redemption price equal to 101.625% of the principal amount of the Notes redeemed, plus accrued and unpaid interests. The difference between the carrying amount of debt that was repurchased or redeemed and the consideration paid was recognized within financial expenses in the Consolidated Statement of Income.
53
Note 27 Borrowings (continued)
The indenture governing the 2027 Notes includes incurrence test covenants that provide, among other things, that the Net Debt to Adjusted EBITDA ratio should not exceed 3.25 times and the Adjusted EBITDA to Interest ratio should exceed 2.5 times. Failure to comply with the incurrence test covenants does not trigger an event of default. However, this situation may limit the Company’s capacity to incur additional indebtedness, as specified in the indentures governing the Notes. Incurrence covenants, as opposed to maintenance covenants, must be tested by the Company before incurring additional debt or performing certain corporate actions including but not limited to dividend payments, restricted payments and others. As of the date of these Consolidated Financial Statements, the Company is in compliance of all the indentures’ provisions and covenants.
On June 17, 2022, the Company received requisite consents from holders of the 2027 Notes for certain amendments to the indenture governing the 2027 Notes. The amendments intended to (i) address the impact of adverse market conditions and related drop in the price of crude oil during 2020 on the Company’s results, which in turn negatively impacted the restricted payments builder basket, and (ii) increase and reset the general restricted payments basket in the indenture to provide the Company additional restricted payments capacity, giving the Company additional financial flexibility. Consequently, on June 27, 2022, the Company paid a consent fee equal to $10.00 per $1,000 to holders of the 2027 Notes that delivered their consents for the abovementioned amendments to the indenture governing the 2027 Notes. The consent fee and other related fees were deducted from the carrying value of the 2027 Notes and will be amortized over its term.
In October 2018, GeoPark Brasil Exploração e Produção de Petróleo e Gás Ltda. (“GeoPark Brazil”) executed a loan agreement with Banco Santander for Brazilian Real 77,640,000 (equivalent to US$ 20,000,000 at the moment of the loan execution) to repay an existing US$-denominated intercompany loan. In September 2020, GeoPark Brazil executed the refinancing of the outstanding principal with Banco Santander for Brazilian Real 19,410,000 (equivalent to US$ 3,441,000 at the moment of the refinancing execution). The interest rate was CDI plus 3.55% per annum. “CDI” (Interbank certificate of deposit) represents the average rate of all inter-bank overnight transactions in Brazil. Interests were paid on a monthly basis, and principal was paid semi-annually in three equal instalments. The loan was fully repaid in October 2022.
As of the date of these Consolidated Financial Statements, the Group has available credit lines for US$ 111,198,000.
54
Note 28 Leases
The Consolidated Statement of Financial Position shows the following amounts relating to leases:
| | | | |
Amounts in US$ ‘000 | | 2022 | | 2021 |
Right of use assets | |
| |
|
Production, facilities and machinery | | 32,034 | | 15,175 |
Buildings and improvements | | 4,977 | | 5,839 |
| | 37,011 | | 21,014 |
Lease liabilities | |
| |
|
Current | | 10,000 | | 8,231 |
Non-current | | 22,051 | | 12,513 |
| | 32,051 | | 20,744 |
The Consolidated Statement of Income shows the following amounts relating to leases:
| | | | | | |
Amounts in US$ ‘000 | | 2022 | | 2021 | | 2019 |
Depreciation charge of Right of use assets | |
| |
| |
|
Production, facilities and machinery | | (6,057) | | (5,526) | | (6,472) |
Buildings and improvements | | (988) | | (1,136) | | (1,600) |
| | (7,045) | | (6,662) | | (8,072) |
Unwinding of long-term liabilities (included in Financial results) | | (2,838) | | (1,453) | | (1,247) |
Expenses related to short-term leases (included in Production and operating cost and Administrative expenses) | | (2,614) | | (1,101) | | (1,317) |
Expenses related to low-value leases (included in Administrative expenses) | | (708) | | (906) | | (736) |
The table below summarizes the amounts of Right-of-use assets recognized and the movements during the reporting years:
| | | | |
Amounts in US$‘000 | | 2022 | | 2021 |
Right-of-use assets as of January 1 | | 21,014 | | 21,402 |
Additions / changes in estimates | | 22,462 | | 5,288 |
Foreign currency translation | | 580 | | 986 |
Depreciation | | (7,045) | | (6,662) |
Right-of-use assets as of December 31 | | 37,011 | | 21,014 |
The table below summarizes the amounts of Lease liabilities recognized and the movements during the reporting years:
| | | | |
Amounts in US$‘000 | | 2022 | | 2021 |
Lease liabilities as of January 1 | | 20,744 | | 22,347 |
Additions / changes in estimates | | 22,462 | | 5,288 |
Exchange difference | | (6,426) | | (365) |
Foreign currency translation | | 284 | | (461) |
Unwinding of discount | | 2,838 | | 1,453 |
Lease payments | | (7,851) | | (7,518) |
Lease liabilities as of December 31 | | 32,051 | | 20,744 |
55
Note 29 Provisions and other long-term liabilities
| | | | | | | | |
| | Asset retirement | | Deferred | | | | |
Amounts in US$ ‘000 | | obligation | | Income | | Other | | Total |
As of January 1, 2021 | | 64,040 | | 3,828 | | 14,502 | | 82,370 |
Addition to provision / changes in estimates | | (651) | | (46) | | 59 | | (638) |
Exchange difference | | (668) | | (228) | ��� | (1,079) | | (1,975) |
Foreign currency translation | | (651) | | — | | (2) | | (653) |
Amortization | | — | | (223) | | — | | (223) |
Unwinding of discount | | 3,140 | | — | | 486 | | 3,626 |
Amounts used during the year | | (170) | | — | | (291) | | (461) |
Liabilities associated with assets held for sale | | (19,198) | | — | | — | | (19,198) |
As of December 31, 2021 | | 45,842 | | 3,331 | | 13,675 | | 62,848 |
Addition to provision / changes in estimates | | (4,942) | | — | | (2,670) | | (7,612) |
Exchange difference | | (669) | | (167) | | (1,147) | | (1,983) |
Foreign currency translation | | (577) | | — | | 14 | | (563) |
Amortization | | — | | (2,407) | | — | | (2,407) |
Unwinding of discount | | 2,641 | | — | | 547 | | 3,188 |
Amounts used during the year | | (1,392) | | — | | (132) | | (1,524) |
As of December 31, 2022 | | 40,903 | | 757 | | 10,287 | | 51,947 |
The provision for asset retirement obligation relates to the estimation of future disbursements related to the abandonment and decommissioning of oil and gas wells (see Note 4).
Deferred income relates to government grants and other contributions relating to the purchase of property, plant and equipment in Colombia. The amortization is in line with the related assets.
Other includes the provision for an environmental contingency in the United Kingdom and other environmental obligations in Colombia and Peru.
Environmental contingency in the United Kingdom
On January 8, 2020, Amerisur received a copy of a claim form issued in the High Court of England and Wales (the “Court”) by Leigh Day solicitors on behalf of a group of claimants (the “Claimants”) described as members of a farming community in the department of Putumayo in Colombia. The claim stated that the Claimants seek compensation for economic and non-economic damages said to be caused by alleged environmental contamination and pollution caused by Amerisur’s operations in the region. Amerisur stated that the accusations of environmental damage referenced in the claim were being investigated by Colombian authorities and to-date had been deemed to be without merit. Following court hearings held in January and February 2020, an interim freezing order was imposed on Amerisur for an amount of GBP 4,465,600 of its assets located in the United Kingdom. On November 10, 2020, the freezing order was discharged by agreement between the parties as Amerisur provided alternative security in the form of a letter of credit from an international bank in the UK.
On January 12, 2021 a hearing was held, where the Court ordered the Claimants to serve the Group Particulars of Claim (the “GPoC”) by February 26, 2021. During April and May 2021, the general pollution claims were struck out by the Court leaving only the claims arising from the attack on the oil-trucks on 2015. Amerisur presented its defence to the GPoC on May 21, 2021. A case management conference was held on July 7, 2021, after which the Court ordered on July 15, 2021 among others: i) to schedule a preliminary issues trial on two Colombian law issues, namely, limitation period for bringing the claims and limitation of parent company liability; and ii) to schedule a costs management conference. The costs management conference was held on October 26, 2021. The Court made a costs award in Amerisur’s favour in respect of all the general pollution claims which is enforceable against the 102 Claimants whose claims had been discontinued or struck out by the Court but only after the conclusion of the proceedings and when those costs have been either assessed or agreed.
56
Note 29 Provisions and other long-term liabilities (continued)
In July 2022, the preliminary issues trial hearing was held, with experts from both parties addressing their written opinions on the two Colombian law issues. On January 26, 2023, the Court ruled in favor of the Claimants in respect of the two issues, allowing the claims to continue before the Courts in London. Amerisur requested permission to appeal before the Court on the same day. On February 6, 2023, the Court issued its ruling on the written submissions, and reply submissions, filed by the parties on costs and permission to appeal, ordering Amerisur to pay the sum of GBP 330,022 (equivalent to US$ 397,089), and refusing permission to appeal. Consequently, on February 23, 2023, Amerisur requested permission to appeal before the court of appeal.
GeoPark has recognized a provision in its Consolidated Financial Statements for GBP 4,465,600 (equivalent to US$ 5,384,000 as of December 31, 2022) related to this contingent liability, which was originally recognized at the moment of the acquisition of Amerisur in 2020.
Note 30 Trade and other payables
| | | | |
Amounts in US$ ‘000 | | 2022 | | 2021 |
V.A.T | | 8,513 | | 7,473 |
Trade payables | | 102,125 | | 86,672 |
Customer advance payments | | 481 | | 426 |
Other short-term advance payments (a) | | — | | 1,558 |
Staff costs to be paid | | 9,306 | | 17,973 |
Royalties to be paid | | 9,403 | | 7,347 |
Taxes and other debts to be paid | | 8,963 | | 6,651 |
To be paid to co-venturers (Note 34) | | 2,815 | | 953 |
| | 141,606 | | 129,053 |
Classified as follows: | |
| |
|
Current | | 141,606 | | 127,513 |
Non-current | | — | | 1,540 |
| (a) | Advance payment collected in relation with the sale of the Aguada Baguales, El Porvenir and Puesto Touquet Blocks (see Note 36.3.1). |
The average credit period (expressed as creditor days) during the year ended December 31, 2022 was 69 days (2021: 89 days).
The fair value of these short-term financial instruments is not individually determined as the carrying amount is a reasonable approximation of fair value.
The Group has established different stock awards programs and other share-based payment plans to incentivize the Directors, senior management and employees, enabling them to benefit from the increased market capitalization of the Company.
During 2018, GeoPark announced the 2018 Equity Incentive Plan (the “Plan”) to motivate and reward those employees, directors, consultants and advisors of the Group to perform at the highest level and to further the best interests of the Company and its shareholders. This Plan is designed as a master plan, with a 10-year term, and embraces all equity incentive programs that the Company decides to implement throughout such term. The maximum number of Shares available for issuance under the Plan is 5,000,000 Shares.
57
Note 31 Share-based payment (continued)
In November 2019, the Group approved a share-based compensation program for approximately 800,000 shares to be granted in 2020. The main characteristics of the Stock Awards Programs were:
| ● | Employees not included in the VCP and new hiring were eligible. |
| ● | Exercise price was equal to the nominal value of shares. |
| ● | Vesting date: January 2, 2023. |
| ● | Each employee could receive between three and six salaries (to be pro-rated between the hiring date and the vesting date for new hiring) by achieving the following conditions: continue to be an employee, the stock market price at the date of vesting should be higher than the share price at the date of grant and obtain the Group minimum production, adjusted EBITDA and reserves target for the year of vesting. |
The vested shares will be issued after the filing of the Consolidated Financial Statements.
On March 8, 2022, the Company’s Board of Directors approved a pool of approximately 215,000 shares oriented for retention of key employees and new hires bonuses, under the Stock Awards Program. Vesting of the plan is in a three-years period from the grant date.
During 2022, the Company’s Board of Directors, as per recommendation of the Compensation Committee, approved a Long-Term Incentive program (“LTIP”) oriented to senior management team. Main characteristics of the program are:
| ● | All the senior management team is eligible. |
| ● | Grants are awarded annually for executives. |
| ● | The components of the Program are the following: |
| - | 20% Time-based Restricted Share Units (RSUs) vesting ratably in three equal installments on each of the first three anniversaries of the grant date; |
| - | 35% Relative Performance Share Units based on relative total shareholder return (TSR) and measured over three-year performance period relative to peer group; |
| - | 45% Absolute Performance Share Units (PSUs) based on absolute total shareholder return (TSR) and measured over three-year performance period. |
In February 2023, 246,110 common shares were allotted to the trustee of the Employee Beneficiary Trust (“EBT”) as a consequence of the vesting of the first tranche of the abovementioned plan.
Details of these costs and the characteristics of the different stock awards programs and other share-based payments are described in the following table:
| | | | | | | | | | | | | | | | |
| | Awards at the | | Awards granted | | Awards | | Awards | | Awards at | | Charged to net profit/loss | ||||
| | beginning | | in the year | | forfeited | | exercised | | year end | | 2022 | | 2021 | | 2020 |
Year of issuance | | No. of Shares | | Amounts in US$ '000 | ||||||||||||
2022 | | — | | 191,400 | | — | | — | | 191,400 | | 619 | | — | | — |
2020 | | 414,065 | | — | | (8,146) | | — | | 405,919 | | 1,691 | | 862 | | 1,274 |
Subtotal | | 414,065 | | 191,400 | | (8,146) | | — | | 597,319 | | 2,310 | | 862 | | 1,274 |
Shares granted to Non-Executive Directors | | — | | 75,636 | | — | | (75,636) | | — | | 1,041 | | 861 | | 665 |
Shares granted to Executive Directors (a) | | 170,330 | | 257,665 | | — | | (52,058) | | 375,937 | | 3,560 | | 800 | | 800 |
VCP (b) | | — | | — | | — | | — | | — | | 2,016 | | 4,098 | | 5,705 |
LTIP for executives | | — | | 571,984 | | — | | — | | 571,984 | | 2,111 | | — | | — |
| | 584,395 | | 1,096,685 | | (8,146) | | (127,694) | | 1,545,240 | | 11,038 | | 6,621 | | 8,444 |
| (a) | Includes compensation agreements from CEO transition. |
| (b) | During 2019, the Group approved a plan named Value Creation Plan (“VCP”) oriented to key management. As of December 31, 2021, the performance metrics were not achieved to execute this program and is not currently in place. |
The awards that are forfeited correspond to employees that had left the Group before vesting date.
58
Note 32 Interests in Joint operations
The Group has interests in joint operations, which are engaged in the exploration of hydrocarbons in Colombia, Chile, Brazil, Argentina and Ecuador.
GeoPark is the operator in the Llanos 34, Llanos 86, Llanos 87, Llanos 104, Llanos 123, Llanos 124, Mecaya, PUT-8, PUT-9, PUT-36, Tacacho and Terecay Blocks in Colombia, in the Flamenco, Campanario and Isla Norte Blocks in Chile, in the POT-T-785 Block in Brazil, and in the Espejo Block in Ecuador.
The following amounts represent the Group’s share in the assets, liabilities and results of the joint operations which have been recognized in the Consolidated Statement of Financial Position and Statement of Income:
| | | | | | | | | | | | | | | | |
Subsidiary / | | |
| | | Other | | Total | | Total | | Net Assets/ | | | | Operating |
Joint operation | | Interest | | PP&E | | Assets | | Assets | | Liabilities | | (Liabilities) | | Revenue | | profit (loss) |
2022 | | | | | | | | | | | | | | | | |
GeoPark Colombia S.A.S. | | | | | | | | | | | | | | | | |
Llanos 34 Block | | 45 | % | 295,639 | | 2,284 | | 297,923 | | (2,104) | | 295,819 | | 721,326 | | 402,425 |
Llanos 32 Block | | 12.5 | % | 2,324 | | — | | 2,324 | | (371) | | 1,953 | | 9,791 | | 7,066 |
Llanos 86 Block | | 50 | % | 970 | | — | | 970 | | — | | 970 | | — | | (60) |
Llanos 87 Block | | 50 | % | 15,038 | | — | | 15,038 | | (41) | | 14,997 | | — | | (390) |
Llanos 94 Block | | 50 | % | 576 | | — | | 576 | | (233) | | 343 | | — | | (5,632) |
Llanos 104 Block | | 50 | % | 1,001 | | — | | 1,001 | | — | | 1,001 | | — | | (60) |
Llanos 123 Block | | 50 | % | 1,172 | | — | | 1,172 | | — | | 1,172 | | — | | (60) |
Llanos 124 Block | | 50 | % | 1,207 | | — | | 1,207 | | — | | 1,207 | | — | | (60) |
CPO-5 Block | | 30 | % | 199,748 | | — | | 199,748 | | (344) | | 199,404 | | 184,160 | | 69,422 |
CPO-4-1 Block | | 50 | % | 102 | | — | | 102 | | — | | 102 | | — | | — |
Amerisur Exploración Colombia Limitada Sucursal Colombia | | | | | | | | | | | | | | | | |
Mecaya Block | | 50 | % | 3,908 | | — | | 3,908 | | (17) | | 3,891 | | — | | (62) |
PUT-8 Block | | 50 | % | 7,927 | | — | | 7,927 | | — | | 7,927 | | — | | (61) |
PUT-9 Block | | 50 | % | 4,420 | | — | | 4,420 | | — | | 4,420 | | — | | (62) |
PUT-36 Block | | 50 | % | 2,931 | | — | | 2,931 | | — | | 2,931 | | — | | (60) |
Tacacho Block | | 50 | % | — | | — | | — | | — | | — | | — | | (3,699) |
Terecay Block | | 50 | % | — | | — | | — | | — | | — | | — | | (300) |
GeoPark TdF S.p.A. | | |
| | | | | | | | |
| | | | |
Flamenco Block | | 50 | % | — | | — | | — | | (1,314) | | (1,314) | | — | | (261) |
Campanario Block | | 50 | % | — | | — | | — | | (422) | | (422) | | — | | (115) |
Isla Norte Block | | 60 | % | — | | — | | — | | (160) | | (160) | | — | | (131) |
GeoPark Brasil Exploração y Produção de Petróleo e Gas Ltda. | | |
| | | | | | | | |
| | | | |
Manati Field | | 10 | % | 5,665 | | 18,537 | | 24,202 | | (12,602) | | 11,600 | | 19,873 | | 11,240 |
POT-T‑785 | | 70 | % | 168 | | — | | 168 | | — | | 168 | | — | | — |
GeoPark Argentina S.A.U. | | |
| | | | | | | | |
| | | | |
CN-V Block | | 50 | % | — | | — | | — | | (14) | | (14) | | — | | (131) |
Los Parlamentos Block | | 50 | % | — | | — | | — | | (93) | | (93) | | — | | (176) |
Puelen Block | | 18 | % | — | | 10 | | 10 | | (105) | | (95) | | — | | (69) |
Sierra del Nevado Block | | 18 | % | — | | 1 | | 1 | | (4) | | (3) | | — | | (8) |
GeoPark Perú S.A.C. - Sucursal Ecuador | | | | | | | | | | | | | | | | |
Espejo | | 50 | % | 10,727 | | 593 | | 11,320 | | (5,406) | | 5,914 | | — | | (5,151) |
Perico | | 50 | % | 15,195 | | 8,506 | | 23,701 | | (5,315) | | 18,386 | | 10,671 | | 4,533 |
59
Note 32 Interests in Joint operations (continued)
| | | | | | | | | | | | | | | | |
Subsidiary / | | |
| | | Other | | Total | | Total | | Net Assets/ | | | | Operating |
Joint operation | | Interest | | PP&E | | Assets | | Assets | | Liabilities | | (Liabilities) | | Revenue | | profit (loss) |
2021 | | | | | | | | | | | | | | | | |
GeoPark Colombia S.A.S. | | | | | | | | | | | | | | | | |
Llanos 34 Block | | 45 | % | 260,589 | | 1,866 | | 262,455 | | (5,573) | | 256,882 | | 486,779 | | 341,473 |
Llanos 32 Block | | 12.5 | % | 2,730 | | — | | 2,730 | | (197) | | 2,533 | | 7,690 | | 5,378 |
Llanos 86 Block | | 50 | % | 408 | | — | | 408 | | — | | 408 | | — | | (60) |
Llanos 87 Block | | 50 | % | 1,220 | | — | | 1,220 | | — | | 1,220 | | — | | (60) |
Llanos 94 Block | | 50 | % | 1,489 | | — | | 1,489 | | (270) | | 1,219 | | — | | (171) |
Llanos 104 Block | | 50 | % | 434 | | — | | 434 | | — | | 434 | | — | | (60) |
Llanos 123 Block | | 50 | % | 907 | | — | | 907 | | — | | 907 | | — | | (60) |
Llanos 124 Block | | 50 | % | 841 | | — | | 841 | | — | | 841 | | — | | (60) |
CPO-5 Block | | 30 | % | 210,154 | | — | | 210,154 | | (929) | | 209,225 | | 88,479 | | 55,131 |
Amerisur Exploración Colombia Limitada Sucursal Colombia | | | | | | | | | | | | | | | | |
Mecaya Block | | 50 | % | 3,837 | | — | | 3,837 | | (84) | | 3,753 | | — | | — |
PUT-8 Block | | 50 | % | 7,070 | | — | | 7,070 | | — | | 7,070 | | — | | — |
PUT-9 Block | | 50 | % | 4,342 | | — | | 4,342 | | — | | 4,342 | | — | | — |
PUT-36 Block | | 50 | % | 2,870 | | — | | 2,870 | | — | | 2,870 | | — | | — |
Tacacho Block | | 50 | % | 3,629 | | — | | 3,629 | | — | | 3,629 | | — | | — |
Terecay Block | | 50 | % | 226 | | — | | 226 | | — | | 226 | | — | | — |
GeoPark TdF S.p.A. | | |
| | | | | | | | |
| | | | |
Flamenco Block | | 50 | % | — | | — | | — | | (2,082) | | (2,082) | | — | | (137) |
Campanario Block | | 50 | % | — | | — | | — | | (551) | | (551) | | — | | (106) |
Isla Norte Block | | 60 | % | — | | — | | — | | (138) | | (138) | | — | | (122) |
GeoPark Brasil Exploração y Produção de Petróleo e Gas Ltda. | | |
| | | | | | | | |
| | | | |
Manati Field | | 10 | % | 6,851 | | 18,269 | | 25,120 | | (13,657) | | 11,463 | | 20,109 | | 9,899 |
POT-T‑785 | | 70 | % | 157 | | — | | 157 | | — | | 157 | | — | | — |
GeoPark Argentina S.A.U. | | |
| | | | | | | | |
| | | | |
CN-V Block | | 50 | % | — | | 149 | | 149 | | (528) | | (379) | | — | | (839) |
Los Parlamentos Block | | 50 | % | — | | — | | — | | — | | — | | — | | (285) |
Puelen Block | | 18 | % | — | | 12 | | 12 | | (18) | | (6) | | — | | (55) |
Sierra del Nevado Block | | 18 | % | — | | 1 | | 1 | | (5) | | (4) | | — | | (10) |
GeoPark Perú S.A.C. - Sucursal Ecuador | | | | | | | | | | | | | | | | |
Espejo | | 50 | % | 1,132 | | 78 | | 1,210 | | (610) | | 600 | | — | | (589) |
Perico | | 50 | % | 4,658 | | 1,449 | | 6,107 | | (4,535) | | 1,572 | | — | | (669) |
60
Note 32 Interests in Joint operations (continued)
| | | | | | | | | | | | | | | | |
Subsidiary / | | |
| | | Other | | Total | | Total | | Net Assets/ | | | | Operating |
Joint operation | | Interest | | PP&E | | Assets | | Assets | | Liabilities | | (Liabilities) | | Revenue | | profit (loss) |
2020 | | | | | | | | | | | | | | | | |
GeoPark Colombia S.A.S. | | | | | | | | | | | | | | | | |
Llanos 34 Block | | 45 | % | 212,914 | | 2,834 | | 215,748 | | (6,829) | | 208,919 | | 273,077 | | 203,386 |
Llanos 32 Block | | 12.5 | % | 1,484 | | — | | 1,484 | | (273) | | 1,211 | | 5,885 | | 4,248 |
Llanos 86 Block | | 50 | % | 137 | | — | | 137 | | — | | 137 | | — | | — |
Llanos 87 Block | | 50 | % | 333 | | — | | 333 | | — | | 333 | | — | | — |
Llanos 94 Block | | 50 | % | 42 | | — | | 42 | | (68) | | (26) | | — | | — |
Llanos 104 Block | | 50 | % | 145 | | — | | 145 | | — | | 145 | | — | | — |
Llanos 123 Block | | 50 | % | 248 | | — | | 248 | | — | | 248 | | — | | — |
Llanos 124 Block | | 50 | % | 240 | | — | | 240 | | — | | 240 | | — | | — |
Petrodorado South America S.A. Sucursal Colombia | | | | | | | | | | | | | | | | |
CPO-5 Block | | 30 | % | 218,298 | | — | | 218,298 | | (455) | | 217,843 | | 29,552 | | 14,398 |
Amerisur Exploración Colombia Limitada Sucursal Colombia | | | | | | | | | | | | | | | | |
Mecaya Block | | 50 | % | 1,301 | | — | | 1,301 | | (128) | | 1,173 | | — | | — |
PUT-8 Block | | 50 | % | 2,334 | | — | | 2,334 | | — | | 2,334 | | — | | — |
PUT-9 Block | | 50 | % | 924 | | — | | 924 | | — | | 924 | | — | | — |
PUT-12 Block | | 60 | % | 610 | | — | | 610 | | — | | 610 | | — | | — |
PUT-36 Block | | 50 | % | 31 | | — | | 31 | | — | | 31 | | — | | — |
Tacacho Block | | 50 | % | 3,591 | | — | | 3,591 | | — | | 3,591 | | — | | — |
Terecay Block | | 50 | % | 173 | | — | | 173 | | — | | 173 | | — | | — |
GeoPark TdF S.p.A. | | |
| | | | | | | | |
| | | | |
Flamenco Block | | 50 | % | — | | — | | — | | (1,577) | | (1,577) | | — | | (7,532) |
Campanario Block | | 50 | % | — | | — | | — | | (372) | | (372) | | — | | (16,913) |
Isla Norte Block | | 60 | % | — | | — | | — | | (132) | | (132) | | — | | (9,418) |
GeoPark Brasil Exploração y Produção de Petróleo e Gas Ltda. | | |
| | | | | | | | |
| | | | |
Manati Field | | 10 | % | 13,280 | | 15,557 | | 28,837 | | (11,515) | | 17,322 | | 12,286 | | 3,339 |
REC-T‑128 | | 70 | % | — | | 1,152 | | 1,152 | | (52) | | 1,100 | | 497 | | (72) |
POT-T‑785 | | 70 | % | 79 | | — | | 79 | | — | | 79 | | — | | — |
GeoPark Argentina S.A.U. | | |
| | | | | | | | |
| | | | |
CN-V Block | | 50 | % | — | | 107 | | 107 | | (164) | | (57) | | — | | (289) |
Los Parlamentos Block | | 50 | % | — | | — | | — | | — | | — | | — | | (244) |
Puelen Block | | 18 | % | — | | 20 | | 20 | | (106) | | (86) | | — | | (156) |
Sierra del Nevado Block | | 18 | % | — | | 7 | | 7 | | (6) | | 1 | | — | | (13) |
GeoPark Perú S.A.C. | | |
| | | | | | | | |
| | | | |
Morona | | 75 | % | 3,651 | | 607 | | 4,258 | | (6,622) | | (2,364) | | — | | (36,980) |
GeoPark Perú S.A.C. - Sucursal Ecuador | | | | | | | | | | | | | | | | |
Espejo | | 50 | % | 409 | | 29 | | 438 | | (131) | | 307 | | — | | (464) |
Perico | | 50 | % | 397 | | 52 | | 449 | | (229) | | 220 | | — | | (543) |
Capital commitments are disclosed in Note 33.2.
61
Note 33 Commitments
33.1 Royalty and economic rights commitments
33.1.1 Royalty
In Colombia, royalties on production are payable to the Colombian Government and are determined on a field-by-field basis using the level of production sliding scale detailed below:
| | |
Average daily production in barrels | | Production Royalty rate |
Up to 5,000 | | 8% |
5,000 to 125,000 | | 8% + (production - 5,000) * 0.1 |
125,000 to 400,000 | | 20% |
400,000 to 600,000 | | 20% + (production - 400,000) * 0.025 |
Greater than 600,000 | | 25% |
The production royalty rate depends on the crude quality. When the API is lower than 15°, the payment is reduced to the 75% of the total calculation.
In Chile, royalties are payable to the Chilean Government. In the Fell Block, royalties are calculated at 5% of crude oil production sold and 3% of gas production sold. In the Flamenco Block, Campanario Block and Isla Norte Block, royalties are calculated at 5% of oil and gas production sold.
In Brazil, the Brazilian National Petroleum, Natural Gas and Biofuels Agency (ANP) is responsible for determining monthly minimum prices for petroleum produced in concessions for purposes of royalties payable with respect to production. Royalties generally correspond to a percentage ranging between 5% and 10% applied to reference prices for oil or natural gas, as established in the relevant bidding guidelines (edital de licitação) and concession agreement. In determining the percentage of royalties applicable to a concession, the ANP takes into consideration, among other factors, the geological risks involved and the production levels expected. In the Manati Block, royalties are calculated at 7.5% of gas production.
33.1.2 Overriding royalty
GeoPark is obligated to pay an overriding royalty of 4% and 2.5%, respectively, to the previous owners of the Llanos 34 and CPO-5 Blocks, based on the production and sale of hydrocarbons discovered in the blocks. During 2022, the Group has accrued US$ 34,032,000 (US$ 22,562,000 in 2021 and US$ 14,018,000 in 2020) in relation with these overriding royalty agreements. Furthermore, there are overriding royalty agreements in place from 1.2% to 8.5% of the net production in the Andaquies, Coati, Mecaya, PUT-8, PUT-9, Tacacho and Terecay Blocks. Since they are exploratory blocks with no production during 2022, these agreements had no impact on the Group’s results.
33.1.3 Economic rights
According to each E&P Contract, the Colombian National Hydrocarbons Agency (“ANH”) has an economic right, offered by the operator at the moment of the ANH bid. This economic right, which is based on the production of the block after royalty discount, is equal to 1% in the Llanos 34 and Llanos 32 Blocks, 23% in the CPO-5 Block and 0% in the Platanillo Block.
When the accumulated production of each field, including the royalties’ volume, exceeds 5,000,000 of barrels and the WTI price exceeds certain price level previously determined, the Group should also deliver to ANH a share of the production net of royalties in accordance with a formula defined in each E&P Contract, which basically depends on the WTI price and the crude quality.
62
Note 33 Commitments (continued)
During 2022, the Group incurred investments of US$ 55,245,000 to fulfil its commitments, at GeoPark’s working interest.
33.2.1 Colombia
The future investment commitments assumed by GeoPark, at its working interest, are up to:
| ● | Llanos 32 Block: 5 exploratory wells before February 20, 2022. Pursuant to a private agreement with the partner in the block, the investment commitment incurred by GeoPark amounts to US$ 9,225,000. As of the date of these Consolidated Financial Statements, the five exploratory wells have already been drilled and ANH approval of the fulfillment of the investment commitment is pending. |
| ● | Llanos 86 Block: 3D seismic and 1 exploratory well (US$ 9,895,000) before March 14, 2025. |
| ● | Llanos 87 Block: 3D seismic reprocessing, aerogeophysic and 4 exploratory wells (US$ 13,837,000) before March 9, 2023. As of the date of these Consolidated Financial Statements, GeoPark has drilled three of the four committed exploratory wells and ANH approval of the fulfillment of the investment commitment is pending. |
| ● | Llanos 94 Block: 3D seismic acquisition and reprocessing and 3 exploratory wells (US$ 11,470,000) before October 1, 2023. One of the three committed exploratory wells has already been drilled. During 2022, operator of the block submitted to the ANH requests to transfer part of the pending commitments to the Llanos 34 Block. As of the date of these Consolidated Financial Statements, the investments needed to accomplish with those commitments assigned to the Llanos 34 Block have already been incurred and the ANH approval is pending. |
| ● | Llanos 104 Block: 3D seismic and 1 exploratory well (US$ 8,767,000) before March 14, 2025. |
| ● | Llanos 123 Block: 3D seismic reprocessing, geochemistry and 2 exploratory wells (US$ 7,130,000) before January 14, 2024. |
| ● | Llanos 124 Block: 3D seismic acquisition and reprocessing, geochemistry and 3 exploratory wells (US$ 10,555,000) before January 14, 2024. |
| ● | CPO-4-1 Block: 1 exploratory well (US$ 2,922,000) before September 19, 2025. |
| ● | CPO-5 Block: 3D seismic acquisition, processing and interpretation and 1 exploratory well (US$ 2,794,000) before October 9, 2025. Pursuant to a private agreement with the partner in the block, the investment commitment to be incurred by GeoPark amounts to US$ 9,313,000. |
| ● | Coati Block: 3D seismic and 2D seismic acquisition (US$ 4,500,000). The evaluation area is currently suspended. On November 3, 2022, GeoPark submitted to the ANH a request to withdraw from the exploration period of the Coati E&P contract and transfer the pending commitments to other E&P contracts. As of the date of these Consolidated Financial Statements, transfer of investment is being carried out by GeoPark. |
| ● | Mecaya Block: 3D seismic or 1 exploratory well (US$ 2,000,000). The exploratory period is currently suspended. Pursuant to a private agreement with the partner in the block, the investment commitment to be incurred by GeoPark amounts to US$ 600,000. |
63
Note 33 Commitments (continued)
33.2 Capital commitments (continued)
33.2.1 Colombia (continued)
| ● | PUT-8 Block: 3D seismic acquisition and reprocessing and 3 exploratory wells (US$ 13,107,000) before October 15, 2023. Part of the 3D seismic committed in the block has already been acquired during 2020 and 2021. On October 25, 2022, GeoPark submitted to the ANH a request to transfer the investment commitment related to the pending 3D seismic to the Platanillo Block. As of the date of these Consolidated Financial Statements, such investment has been fulfilled and the ANH approval is pending. |
| ● | PUT-9 Block: 3D seismic acquisition and 2 exploratory wells (US$ 10,550,000). GeoPark has signed a private agreement with the other partner in the block resulting in the total investment commitment to be incurred by GeoPark amounting to US$ 4,365,000. The exploratory period is currently suspended. |
| ● | PUT-14 Block: 2D seismic acquisition and 1 exploratory well (US$ 16,122,000). On March 10, 2022, GeoPark submitted to the ANH a request to withdraw from the PUT-14 E&P contract and transfer the pending commitments to the Platanillo and CPO-5 Blocks. Once total investment is reached through such transfers, ANH will continue with the contract’s termination. As of the date of these Consolidated Financial Statements, part of the abovementioned investment has already been incurred and the ANH approval is pending. |
| ● | The PUT-36 Block is in a preliminary phase that is suspended as of the date of these Consolidated Financial Statements. During this preliminary phase, GeoPark must request from the Ministry of Interior a certificate that indicates presence or no presence of indigenous communities and develop previous consultation, if applicable. Only when this process has been completed and the corresponding regulatory approvals have been obtained, the blocks will enter into phase 1, where the exploratory commitments are mandatory. The investment commitments for the block over three-years term of phase 1 would be 3D seismic acquisition and 2 exploratory wells (US$ 11,891,000). |
| ● | Tacacho Block: 2D seismic acquisition, processing and interpretation (US$ 4,080,000). GeoPark has signed a private agreement with the other partner in the block resulting in the total investment commitment to be incurred by GeoPark amounting to US$ 1,224,000. The exploratory period is currently suspended. On September 21, 2022, GeoPark submitted to the ANH a request for termination of the E&P contract. As of the date of these Consolidated Financial Statements, the request is under review by the ANH. |
| ● | Terecay Block: 2D seismic acquisition, processing and interpretation (US$ 4,046,000). GeoPark has signed a private agreement with the other partner in the block resulting in the total investment commitment to be incurred by GeoPark amounting to US$ 2,856,000. The exploratory period is currently suspended. On September 21, 2022, GeoPark submitted to the ANH a request for termination of the E&P contract. As of the date of these Consolidated Financial Statements, the request is under review by the ANH. |
33.2.2 Chile
The remaining investment commitment to be assumed 100% by GeoPark for the second exploratory phase in the Campanario and Isla Norte Blocks are up to:
| ● | Campanario Block: 2 exploratory wells before April 25, 2024 (US$ 5,002,000) |
| ● | Isla Norte Block: 1 exploratory well before February 19, 2024 (US$ 867,000) |
As of December 31, 2022, the Group has established guarantees for its total commitments.
64
Note 33 Commitments (continued)
33.2 Capital commitments (continued)
33.2.3 Brazil
The future investment commitments assumed by GeoPark are up to:
| ● | POT-T-785 Block: 3D seismic and electromagnetic survey before October 29, 2023 (US$ 67,000). |
| ● | REC-T-58 Block: 3D seismic and electromagnetic survey before February 14, 2025 (US$ 140,000). |
| ● | REC-T-67 Block: 3D seismic and electromagnetic survey before February 14, 2025 (US$ 140,000). |
| ● | REC-T-77 Block: 3D seismic and electromagnetic survey before February 14, 2025 (US$ 140,000). |
| ● | POT-T-834 Block: 3D seismic and electromagnetic survey before February 14, 2025 (US$ 140,000) |
33.2.4 Argentina
The investment commitment in the Los Parlamentos Block (50% working interest) for the first exploratory period, ending on October 30, 2022, which includes 1 exploratory well and 3D seismic, amounts to US$ 6,000,000, at GeoPark’s working interest. As of the date of these Consolidated Financial Statements, suspension of the terms of the exploratory period and transfer of the investment commitment to another block is under negotiation.
33.2.5 Ecuador
The investment commitments assumed by GeoPark, at its 50% working interest, in the Espejo and Perico Blocks during the first exploratory period are up to:
| ● | Espejo Block: 3D seismic and 4 exploratory wells before June 17, 2025 (US$ 20,912,000). As of the date of these Consolidated Financial Statements, GeoPark has already performed the 3D seismic and drilled two of the four committed exploratory wells. |
| ● | Perico Block: 4 exploratory wells before June 16, 2025 (US$ 18,084,000). As of the date of these Consolidated Financial Statements, three of the four committed exploratory wells have been drilled. |
65
Note 34 Related parties
Controlling interest
The main shareholders of GeoPark Limited, based solely on the 13D and 13G filed with the SEC, as of December 31, 2022, are:
| | | | | |
| | Common | | Percentage of outstanding |
|
Shareholder | | shares | | common shares |
|
James F. Park (a) | | 8,817,251 | | 15.30 | % |
Compass Group LLC (b) | | 7,525,160 | | 13.06 | % |
Gerald E. O’Shaughnessy (c) | | 5,545,080 | | 9.62 | % |
Renaissance Technologies LLC (d) | | 3,106,263 | | 5.39 | % |
Other shareholders | | 32,628,244 | | 56.62 | % |
| | 57,621,998 | | 100.00 | % |
| (a) | Held by James F. Park directly and indirectly through GoodRock, LLC, which is controlled by Mr. Park. The information set forth above and listed in the table is based solely on the disclosure set forth in Mr. Park’s most recent Schedule 13G filed with the SEC on February 13, 2023. 602,400 of Mr. Park’s shares have been pledged pursuant to lending arrangements. |
| (b) | The information set forth above and listed in the table is based solely on the disclosure set forth in Compass Group LLC’s most recent Schedule 13G filed with the SEC on February 14, 2023. |
| (c) | Held by Mr. O’Shaughnessy directly and indirectly through GP Investments LLP; GPK Holdings, LLC; The Globe Resources Group, Inc.; and other investment vehicles. The information set forth above and listed in the table is based solely on the disclosure set forth in Mr. O’Shaughnessy most recent Schedule 13D filed with the SEC on November 30, 2022. |
| (d) | The information set forth above and listed in the table is based solely on the disclosure set forth in Renaissance’s most recent Schedule 13G filed with the SEC on February 13, 2023. |
Balances outstanding and transactions with related parties
| | | | | | | | |
| | | | Balances | | | | |
| | Transaction | | at year | | | | |
Account (Amounts in US$´000) | | in the year | | end | | Related Party | | Relationship |
2022 | | | | | | | | |
To be recovered from co-venturers | | — | | 8,750 | | Joint Operations | | Joint Operations |
To be paid to co-venturers | | — | | (2,815) | | Joint Operations | | Joint Operations |
Geological and geophysical expenses | | 160 | | — | | Carlos Gulisano | | Non-Executive Director (a) |
Administrative expenses | | 492 | | — | | Pedro E. Aylwin | | Former Executive Director (b) |
2021 | |
| |
| |
| |
|
To be recovered from co-venturers | | — | | 4,680 | | Joint Operations | | Joint Operations |
To be paid to co-venturers | | — | | (953) | | Joint Operations | | Joint Operations |
Geological and geophysical expenses | | 160 | | — | | Carlos Gulisano | | Non-Executive Director (a) |
Administrative expenses | | 656 | | — | | Pedro E. Aylwin | | Executive Director (b) |
2020 | |
| |
| |
| |
|
To be recovered from co-venturers | | — | | 2,236 | | Joint Operations | | Joint Operations |
To be paid to co-venturers | | — | | (5,760) | | Joint Operations | | Joint Operations |
Geological and geophysical expenses | | 130 | | — | | Carlos Gulisano | | Non-Executive Director (a) |
Administrative expenses | | 561 | | — | | Pedro E. Aylwin | | Executive Director (b) |
| (a) | Corresponding to consultancy services. Carlos Gulisano acted as a Director of the Company until July 2022. |
| (b) | Corresponding to wages and salaries acting as Director of Legal and Governance. In 2022, also includes consultancy services. In addition, Aylwin, Mendoza, Luksic & Valencia Law firm, where Pedro Aylwin is a partner and has a participation through Asesorías e Inversiones A&P Ltda, provided general legal services to all the Chilean entities, in Chilean corporate, labor, environmental, regulatory, and commercial laws. |
66
Note 34 Related parties (continued)
Balances outstanding and transactions with related parties (continued)
There have been no other transactions with the Board of Directors, Executive officers, significant shareholders or other related parties during the year besides the intercompany transactions which have been eliminated in the Consolidated Financial Statements, the normal remuneration of Board of Directors and other benefits informed in Note 11.
Note 35 Auditors Fees
| | | | | | |
Amounts in US$‘000 | | 2022 | | 2021 | | 2020 |
Audit fees | | 885 | | 1,023 | | 926 |
Audit related fees | | 85 | | 65 | | — |
Tax services fees | | 27 | | 47 | | 35 |
Total Auditors Fees | | 997 | | 1,135 | | 961 |
Fees are shown net of VAT and other associated tax charges.
Note 36 Business transactions
36.1 Acquisition of Amerisur Resources Plc
On January 16, 2020, GeoPark acquired the 100% share capital of Amerisur Resources Plc, a company listed on the Alternative Investment Market (“AIM”) of the London Stock Exchange. After the acquisition, the company was delisted and its name changed to Amerisur Resources Limited. The principal activities of Amerisur Resources Limited and its subsidiaries (“Amerisur”) are exploration, development and production for oil and gas reserves in Latin America. Amerisur owns thirteen production, development and exploration blocks in Colombia (twelve operated blocks in the Putumayo basin and one non-operated block in the Llanos basin) and an export oil pipeline from Colombia to Ecuador named Oleoducto Binacional Amerisur (“OBA”).
GeoPark paid a cash consideration of British Pound Sterling (“GBP”) 241,682,496, equivalent to US$ 314,163,077 at the transaction date. In relation to the cash consideration, GeoPark was exposed to fluctuations of the GBP as of December 31, 2019. Consequently, the Group decided to manage this exposure by entering into a “Deal Contingent Forward” with a UK Bank, in order to anticipate any currency fluctuation. This forward contract was accounted for as a cash flow hedge as of December 31, 2019 and therefore the effective portion of the changes in its fair value was recognized in Other Reserve within Equity. On January 16, 2020, GeoPark removed that amount from the cash flow hedge reserve and included it directly in the initial cost of the acquired business.
In accordance with the acquisition method of accounting, the acquisition cost was allocated to the underlying assets acquired and liabilities assumed based primarily upon their estimated fair values at the date of acquisition. An income approach (being the net present value of expected future cash flows) was adopted to determine the fair values of the mineral interest. Estimates of expected future cash flows reflect estimates of projected future revenues, production costs and capital expenditures based on our business model. The excess of acquisition cost, if any, over the net identifiable assets acquired represents goodwill.
67
Note 36 Business transactions (continued)
36.1 Acquisition of Amerisur Resources Plc (continued)
The following table summarizes the combined consideration paid for the acquired business and the final allocation of fair value of the assets acquired and liabilities assumed for the abovementioned transaction:
| | |
Amounts in US$‘000 | | Total |
Cash | | 314,163 |
Total consideration | | 314,163 |
Property, plant and equipment (including mineral interest) | | 276,988 |
Right-of-use assets | | 16,674 |
Deferred income tax asset | | 4,071 |
Prepayments and other receivables | | 30,024 |
Trade receivables | | 5,964 |
Inventories | | 4,128 |
Other assets | | 5,991 |
Cash and cash equivalents | | 41,828 |
Lease liabilities | | (17,851) |
Provision for other long-term liabilities | | (16,519) |
Current income tax liability | | (3,426) |
Trade and other payables | | (33,709) |
Total identifiable net assets | | 314,163 |
36.2 Brazil
36.2.1 Manati Block
On November 22, 2020, GeoPark signed an agreement to sell its 10% non-operated working interest in the Manati Block in Brazil. The total consideration amounted to Brazilian reais 144,400,000 (equivalent to US$ 30,478,000 as of March 31, 2022), including a fixed payment of Brazilian reais 124,400,000 plus an earn-out of Brazilian reais 20,000,000, which was subject to obtaining certain regulatory approvals. The transaction was subject to certain conditions that should have been met before March 31, 2022. As of March 31, 2022, the required conditions were not met and GeoPark decided not to extend this deadline. As a result, GeoPark continues to own its 10% interest in the block.
36.2.2 REC-T-128 Block
In 2021, GeoPark performed a farm-out transaction to sell its 70% interest in the REC-T-128 Block in Brazil. The total consideration was US$ 1,100,000, which was collected at closing in 2021, plus a contingent payment of up to US$ 710,000, subject to international oil price and field production performance. On August 1, 2022, GeoPark collected the contingent payment of US$ 710,000.
68
Note 36 Business transactions (continued)
36.3 Argentina
36.3.1 Aguada Baguales, El Porvenir and Puesto Touquet Blocks
In August 2021, the Company’s Board of Directors approved the decision to evaluate farm-out or divestment opportunities to sell its 100% working interest and operatorship in the Aguada Baguales, El Porvenir and Puesto Touquet Blocks in Argentina, including the associated gas transportation license through the Puesto Touquet pipeline.
On November 3, 2021, GeoPark signed a sale and purchase and assignment agreement for a total consideration of US$ 16,000,000, subject to working capital adjustment. At that moment, GeoPark collected an advance payment of US$ 1,600,000.
The closing of the transaction took place on January 31, 2022, after the corresponding regulatory approvals were granted and GeoPark received the remaining outstanding payment from the purchaser. In April 2022, GeoPark paid a working capital adjustment amounting to US$ 370,000. As a consequence of this transaction, GeoPark recognized a gain of US$ 3,983,000 within Other income (expenses).
As of December 31, 2021, the amount of Property, plant and equipment related to the blocks and the liabilities associated with them had been classified as held for sale. Immediately before the classification as held for sale, the recoverable amount of the blocks was estimated and an impairment reversal of US$ 13,307,000 was recognized in the Consolidated Statement of Income. The reversal was limited so that the carrying amount of the blocks does not exceed the lower of its recoverable amount, or the carrying amount that would have been determined, net of depreciation, had no impairment loss been recognized for the blocks in prior years (see Note 37).
36.4 Peru
On July 15, 2020, GeoPark notified its irrevocable decision to retire from the non-producing Morona Block (Block 64) in Peru, due to extended force majeure, which allows for the termination of the license contract. On April 6, 2021, the final agreement with Petroperu was signed and, on May 31, 2021, the joint operation agreement was terminated. On September 28, 2021, the supreme decree approving the assignment was issued by the Peruvian Government, and the public deed corresponding to that assignment was finally executed by GeoPark and Petroperu on November 15, 2021. Consequently, from such date, all the rights and obligations under the Morona Block license contract are the exclusive responsibility of Petroperu.
During 2020, the Group recognized an impairment of its Property, plant and equipment for a total amount of US$ 33,976,000, wrote-down VAT credits for US$ 6,017,000 and Deferred income tax asset for US$ 8,353,000, recognizing those charges within Other expenses and Income tax expenses, respectively, in the Consolidated Statement of Income, and recognized a provision for environmental obligations for a present value of US$ 1,886,000, with impact in Other expenses in the Consolidated Statement of Income.
69
Note 37 Impairment test on Property, plant and equipment
The management of the Group considers as cash-generating unit (“CGU”) each of the blocks or group of blocks in which the Group has working or economic interests. The blocks with no material investment on property, plant and equipment or with operations that are not linked to oil and gas prices were not subject to the impairment test.
During 2022, a new tax reform approved in Colombia (see Note 16) negatively impacted the expected cash flows for the following years. Additionally, a revision of the estimation of the total proved and probable reserves in the CPO-5 Block (Colombia) at year-end evidenced a decline as compared to the prior year estimation. Management considered these to be impairment indicators for the CPO-5 and the Platanillo Blocks and the Group carried out an impairment review of these CGUs. No impairment indicators were noted in the other CGUs.
The main assumptions taken into account for the impairment tests were:
| - | The future oil prices have been calculated taking into consideration the oil price curves available in the market, provided by international advisory companies, and weighted through internal estimations in accordance with price curves used by D&M. |
| - | Three oil price scenarios were projected and weighted in order to minimize misleading estimations: low-price, middle-price and high-price (see below table “Oil price scenarios”). |
| - | The table “Oil price scenarios” was based on Brent future price estimations; the Group adjusted this market price on its model valuation to reflect the effective price applicable in each location (see Note 3 “Price risk”). |
| - | The model valuation was based on the expected cash flow approach. |
| - | The revenues were calculated linking price curves with levels of production according to certified reserves. |
| - | The levels of production have been linked to certified risked P1, P2 and P3 reserves case by case (see Note 4). |
| - | Production and structure costs were estimated considering internal historical data according to GeoPark’s own records and aligned to the 2023 approved budget. |
| - | The capital expenditures were estimated considering the drilling campaign necessary to develop the certified reserves. |
| - | The assets subject to impairment test are the ones classified as Oil and Gas properties, Production facilities and machinery and Construction in progress. |
| - | The carrying amount subject to impairment test includes mineral interest, if any. |
| - | The income tax charges have considered future changes in the applicable income tax rates (see Note 16). |
Table Oil price scenarios (a):
| | | | | | | | |
| | Amounts in US$ per Bbl | ||||||
| | | | | | | | Weighted market price |
| | | | | | | | used for the |
Year | | Low price (15%) | | Middle price (60%) | | High price (25%) | | impairment test |
2023 | | 83.22 | | 92.47 | | 101.71 | | 93.39 |
2024 | | 60.57 | | 67.30 | | 74.03 | | 67.97 |
2025 | | 62.02 | | 68.91 | | 75.80 | | 69.60 |
2026 | | 63.51 | | 70.57 | | 77.62 | | 71.27 |
Over 2027 | | 65.03 | | 72.26 | | 79.49 | | 72.98 |
| (a) | The percentages indicated between brackets represent the Group estimation regarding each price scenario. |
70
Note 37 Impairment test on Property, plant and equipment (continued)
As a consequence of the evaluation, the following amounts of impairment loss were (recognized) reversed:
| | | | | | |
Amounts in US$‘000 | | 2022 | | 2021 | | 2020 |
Chile (a) | | — | | (17,641) | | (81,967) |
Brazil (b) | | — | | — | | (1,717) |
Argentina (c) | | — | | 13,307 | | (16,205) |
Peru (d) | | — | | — | | (33,975) |
| | — | | (4,334) | | (133,864) |
| (a) | Recognition of impairment loss in the Fell Block due to the decline in the proved reserves estimation in 2021 and the commercial viability has been decreased significantly as a consequence of the lower crude prices relative to its high cash costs of production in 2020. |
| (b) | Recognition of impairment loss in the REC-T-128 Block due to the fair value less cost to sale determined in the context of the farm-out process described in Note 36.2.2. |
| (c) | Reversal of impairment loss in the Aguada Baguales and El Porvenir Blocks in 2021 due to the known market price of the blocks in the context of the transaction described in Note 36.3.1. Recognition of impairment loss in the Aguada Baguales and El Porvenir Blocks in 2020 due to the commercial viability has been decreased significantly as a consequence of the lower crude prices relative to its high cash costs of production, which also led to reduced estimates of the quantities of hydrocarbons recoverable. |
| (d) | Recognition of impairment loss in the Morona Block due to the situation described in Note 36.4.1. |
With regard to the assessment of value in use for the identified CGUs subject to impairment indicators, Management believes that there are no reasonably possible changes in any of the above key assumptions that would cause the carrying value of the CGUs to materially exceed its recoverable amount.
71
Note 38 Supplemental information on oil and gas activities (unaudited)
The following information is presented in accordance with ASC No. 932 “Extractive Activities- Oil and Gas”, as amended by ASU 2010 - 03 “Oil and Gas Reserves. Estimation and Disclosures”, issued by FASB in January 2010 in order to align the current estimation and disclosure requirements with the requirements set in the SEC final rules and interpretations, published on December 31, 2008. This information includes the Group’s oil and gas production activities carried out in each country.
Table 1 - Costs incurred in exploration, property acquisitions and development
The following table presents those costs capitalized as well as expensed that were incurred during each of the years ended December 31, 2022, 2021 and 2020. The acquisition of properties includes the cost of acquisition of proved or unproved oil and gas properties. Exploration costs include geological and geophysical costs, costs necessary for retaining undeveloped properties, drilling costs and exploratory wells equipment. Development costs include drilling costs and equipment for developmental wells, the construction of facilities for extraction, treatment and storage of hydrocarbons and all necessary costs to maintain facilities for the existing developed reserves.
| | | | | | | | | | | | |
Amounts in US$‘000 | | Colombia | | Chile | | Brazil | | Argentina | | Ecuador | | Total |
Year ended December 31, 2022 | |
| |
| |
| |
| |
| |
|
Acquisition of properties | |
| |
| |
| |
| |
| |
|
Proved | | — | | — | | — | | — | | — | | — |
Unproved | | — | | — | | — | | — | | — | | — |
Total property acquisition | | — | | — | | — | | — | | — | | — |
Exploration | | 48,771 | | 116 | | — | | 779 | | 26,521 | | 76,187 |
Development (a) | | 89,231 | | 9,952 | | (212) | | — | | 648 | | 99,619 |
Total costs incurred | | 138,002 | | 10,068 | | (212) | | 779 | | 27,169 | | 175,806 |
| | | | | | | | | | | | |
Amounts in US$‘000 | | | | Colombia | | Chile | | Brazil | | Argentina | | Total |
Year ended December 31, 2021 | | | |
| |
| |
| |
| |
|
Acquisition of properties | | | |
| |
| |
| |
| |
|
Proved | | | | — | | — | | — | | — | | — |
Unproved | | | | — | | — | | — | | — | | — |
Total property acquisition | | | | — | | — | | — | | — | | — |
Exploration | | | | 40,828 | | 3,940 | | 3 | | 998 | | 45,769 |
Development (a) | | | | 81,310 | | 1,900 | | (2,212) | | 2 | | 81,000 |
Total costs incurred | | | | 122,138 | | 5,840 | | (2,209) | | 1,000 | | 126,769 |
| | | | | | | | | | | | |
Amounts in US$‘000 | | | | Colombia | | Chile | | Brazil | | Argentina | | Total |
Year ended December 31, 2020 | | | |
| |
| |
| |
| |
|
Acquisition of properties | | | | | | | | | | | |
|
Proved | | | | 202,913 | | — | | — | | — | | 202,913 |
Unproved | | | | 73,310 | | — | | — | | — | | 73,310 |
Total property acquisition | | | | 276,223 | | — | | — | | — | | 276,223 |
Exploration | | | | 19,142 | | 9,447 | | 668 | | 694 | | 29,951 |
Development (a) | | | | 51,793 | | 3,580 | | 412 | | (3,855) | | 51,930 |
Total costs incurred | | | | 70,935 | | 13,027 | | 1,080 | | (3,161) | | 81,881 |
| (a) | Includes the effect of change in estimate of assets retirement obligations. |
72
Note 38 Supplemental information on oil and gas activities (unaudited - continued)
Table 2 - Capitalized costs related to oil and gas producing activities
The following table presents the capitalized costs as of December 31, 2022, 2021 and 2020, for proved and unproved oil and gas properties, and the related accumulated depreciation as of those dates.
| | | | | | | | | | |
Amounts in US$‘000 | | Colombia | | Chile | | Brazil | | Ecuador | | Total |
As of December 31, 2022 | |
| |
| |
| |
| |
|
Proved properties (a) | |
| |
| |
| |
| |
|
Equipment, camps and other facilities | | 144,672 | | 74,490 | | 3,565 | | — | | 222,727 |
Mineral interest and wells | | 672,424 | | 343,926 | | 44,716 | | 18,191 | | 1,079,257 |
Other uncompleted projects | | 16,099 | | 113 | | 268 | | — | | 16,480 |
Unproved properties | | 102,760 | | — | | 290 | | 9,991 | | 113,041 |
Gross capitalized costs | | 935,955 | | 418,529 | | 48,839 | | 28,182 | | 1,431,505 |
Accumulated depreciation | | (354,981) | | (371,171) | | (42,885) | | (2,316) | | (771,353) |
Total net capitalized costs | | 580,974 | | 47,358 | | 5,954 | | 25,866 | | 660,152 |
| (a) | Includes capitalized amounts related to asset retirement obligations. |
| | | | | | | | | | |
Amounts in US$‘000 | | Colombia | | Chile | | Brazil | | Argentina | | Total |
As of December 31, 2021 | |
| |
| |
| |
| |
|
Proved properties (a) | |
| |
| |
| |
| |
|
Equipment, camps and other facilities | | 125,078 | | 72,766 | | 3,333 | | — | | 201,177 |
Mineral interest and wells | | 580,931 | | 334,993 | | 42,008 | | — | | 957,932 |
Other uncompleted projects | | 26,136 | | 818 | | 250 | | — | | 27,204 |
Unproved properties (b) | | 94,419 | | — | | 271 | | — | | 94,690 |
Gross capitalized costs | | 826,564 | | 408,577 | | 45,862 | | — | | 1,281,003 |
Accumulated depreciation | | (282,616) | | (358,417) | | (38,741) | | — | | (679,774) |
Total net capitalized costs | | 543,948 | | 50,160 | | 7,121 | | — | | 601,229 |
| (a) | Includes capitalized amounts related to asset retirement obligations, impairment loss recognized in Chile for US$ 17,641,000 and impairment loss reversed in Argentina for US$ 13,307,000. |
| (b) | Do not include Ecuador capitalized costs. |
| | | | | | | | | | |
Amounts in US$‘000 | | Colombia | | Chile | | Brazil | | Argentina | | Total |
As of December 31, 2020 | |
| |
| |
| |
| |
|
Proved properties (a) | |
| |
| |
| |
| |
|
Equipment, camps and other facilities | | 115,577 | | 74,363 | | 3,580 | | 4,309 | | 197,829 |
Mineral interest and wells | | 511,040 | | 348,366 | | 47,729 | | 61,482 | | 968,617 |
Other uncompleted projects (b) | | 13,048 | | 2,158 | | 245 | | 26 | | 15,477 |
Unproved properties (c) | | 77,388 | | — | | 432 | | — | | 77,820 |
Gross capitalized costs | | 717,053 | | 424,887 | | 51,986 | | 65,817 | | 1,259,743 |
Accumulated depreciation | | (228,929) | | (345,611) | | (38,273) | | (45,619) | | (658,432) |
Total net capitalized costs | | 488,124 | | 79,276 | | 13,713 | | 20,198 | | 601,311 |
| (a) | Includes capitalized amounts related to asset retirement obligations, impairment loss in Chile, Argentina and Brazil for US$ 81,967,000, US$ 16,205,000 and US$ 1,717,000, respectively. |
| (b) | Do not include Peru capitalized costs. |
| (c) | Do not include Ecuador capitalized costs. |
73
Note 38 Supplemental information on oil and gas activities (unaudited - continued)
Table 3 - Results of operations for oil and gas producing activities
The breakdown of results of the operations shown below summarizes revenues and expenses directly associated with oil and gas producing activities for the years ended December 31, 2022, 2021 and 2020. Income tax for the years presented was calculated utilizing the statutory tax rates.
| | | | | | | | | | | | |
Amounts in US$‘000 | | Colombia | | Chile | | Brazil | | Argentina | | Ecuador | | Total |
Year ended December 31, 2022 | |
| |
| |
| |
| |
| |
|
Revenue | | 978,423 | | 29,196 | | 19,873 | | 1,962 | | 10,671 | | 1,040,125 |
Production costs, excluding depreciation | | | | | | | | | | | | |
Operating costs | | (78,323) | | (12,961) | | (3,753) | | (1,306) | | (3,220) | | (99,563) |
Royalties and economic rights | | (249,303) | | (1,165) | | (1,546) | | (273) | | — | | (252,287) |
Total production costs | | (327,626) | | (14,126) | | (5,299) | | (1,579) | | (3,220) | | (351,850) |
Exploration expenses | | (28,424) | | (116) | | — | | (779) | | (4,768) | | (34,087) |
Accretion expense (b) | | (621) | | (1,516) | | (504) | | — | | — | | (2,641) |
Depreciation, depletion and amortization | | (72,386) | | (12,754) | | (1,509) | | — | | (2,315) | | (88,964) |
Results of operations before income tax | | 549,366 | | 684 | | 12,561 | | (396) | | 368 | | 562,583 |
Income tax (expense) benefit | | (192,278) | | (103) | | (4,271) | | — | | (92) | | (196,744) |
Results of oil and gas operations | | 357,088 | | 581 | | 8,290 | | (396) | | 276 | | 365,839 |
| | | | | | | | | | | | |
Amounts in US$‘000 | | | | Colombia | | Chile | | Brazil | | Argentina | | Total |
Year ended December 31, 2021 | | | |
| |
| |
| |
| |
|
Revenue | | | | 618,268 | | 21,471 | | 20,109 | | 28,695 | | 688,543 |
Production costs, excluding depreciation | | | | | | | | | | | | |
Operating costs | | | | (72,043) | | (10,280) | | (2,954) | | (14,490) | | (99,767) |
Royalties and economic rights | | | | (106,341) | | (770) | | (1,642) | | (4,270) | | (113,023) |
Total production costs | | | | (178,384) | | (11,050) | | (4,596) | | (18,760) | | (212,790) |
Exploration expenses (a) | | | | (11,276) | | (4,509) | | — | | (998) | | (16,783) |
Accretion expense (b) | | | | (576) | | (1,319) | | (535) | | (710) | | (3,140) |
Impairment loss for non-financial assets | | | | — | | (17,641) | | — | | 13,307 | | (4,334) |
Depreciation, depletion and amortization | | | | (54,588) | | (12,806) | | (2,933) | | (8,152) | | (78,479) |
Results of operations before income tax | | | | 373,444 | | (25,854) | | 12,045 | | 13,382 | | 373,017 |
Income tax (expense) benefit | | | | (115,768) | | 3,878 | | (4,095) | | (4,684) | | (120,669) |
Results of oil and gas operations | | | | 257,676 | | (21,976) | | 7,950 | | 8,698 | | 252,348 |
| | | | | | | | | | | | |
Amounts in US$‘000 | | | | Colombia | | Chile | | Brazil | | Argentina | | Total |
Year ended December 31, 2020 | | | |
| |
| |
| |
| |
|
Revenue | | | | 334,606 | | 21,704 | | 12,783 | | 24,599 | | 393,692 |
Production costs, excluding depreciation | | | | | | | | | | | | |
Operating costs | | | | (61,866) | | (9,491) | | (2,827) | | (15,013) | | (89,197) |
Royalties and economic rights | | | | (30,453) | | (753) | | (1,049) | | (3,620) | | (35,875) |
Total production costs | | | | (92,319) | | (10,244) | | (3,876) | | (18,633) | | (125,072) |
Exploration expenses (a) | | | | (12,493) | | (50,301) | | (1,000) | | (694) | | (64,488) |
Accretion expense (b) | | | | (670) | | (1,358) | | (867) | | (1,381) | | (4,276) |
Impairment loss for non-financial assets | | | | — | | (81,967) | | (1,717) | | (16,205) | | (99,889) |
Depreciation, depletion and amortization | | | | (56,720) | | (32,233) | | (2,488) | | (14,723) | | (106,164) |
Results of operations before income tax | | | | 172,404 | | (154,399) | | 2,835 | | (27,037) | | (6,197) |
Income tax (expense) benefit | | | | (55,169) | | 23,160 | | (964) | | 8,111 | | (24,862) |
Results of oil and gas operations | | | | 117,235 | | (131,239) | | 1,871 | | (18,926) | | (31,059) |
| (a) | Do not include Peru and Ecuador costs. |
| (b) | Represents accretion of ARO and other environmental liabilities. |
74
Note 38 Supplemental information on oil and gas activities (unaudited - continued)
Table 4 - Reserve quantity information
Estimated oil and gas reserves
Proved reserves represent estimated quantities of oil (including crude oil and condensate) and natural gas, which available geological and engineering data demonstrates with reasonable certainty to be recoverable in the future from known reservoirs under existing economic and operating conditions. Proved developed reserves are proved reserves that can reasonably be expected to be recovered through existing wells with existing equipment and operating methods. The choice of method or combination of methods employed in the analysis of each reservoir was determined by the stage of development, quality and reliability of basic data, and production history.
The Group believes that its estimates of remaining proved recoverable oil and gas reserve volumes are reasonable and such estimates have been prepared in accordance with the SEC Modernization of Oil and Gas Reporting rules, which were issued by the SEC at the end of 2008.
The Group estimates its reserves at least once a year. The Group’s reserves estimation as of December 31, 2022, 2021, 2020 and 2019 was based on the DeGolyer and MacNaughton Reserves Report (the “D&M Reserves Report”). DeGolyer and MacNaughton Corp. prepared its proved oil and natural gas reserve estimates in accordance with Rule 4-10 of Regulation S–X, promulgated by the SEC, and in accordance with the oil and gas reserves disclosure provisions of ASC 932 of the FASB Accounting Standards Codification (ASC) relating to Extractive Activities - Oil and Gas (formerly SFAS no. 69 Disclosures about Oil and Gas Producing Activities).
Reserves engineering is a subjective process of estimation of hydrocarbon accumulation, which cannot be exactly measured, and the reserve estimation depends on the quality of available information and the interpretation and judgement of the engineers and geologists. Therefore, the reserves estimations, as well as future production profiles, are often different than the quantities of hydrocarbons which are finally recovered. The accuracy of such estimations depends, in general, on the assumptions on which they are based.
75
Note 38 Supplemental information on oil and gas activities (unaudited - continued)
Table 4 - Reserve quantity information (continued)
The estimated GeoPark net proved reserves for the properties evaluated as of December 31, 2022, 2021, 2020 and 2019 are summarized as follows, expressed in thousands of barrels (Mbbl) and millions of cubic feet (MMcf):
| | | | | | | | | | | | | | | | |
| | As of December 31, 2022 | | As of December 31, 2021 | | As of December 31, 2020 | | As of December 31, 2019 | ||||||||
| | Oil and | | | | Oil and | | | | Oil and | | | | Oil and | | |
| | condensate | | Natural gas | | condensate | | Natural gas | | condensate | | Natural gas | | condensate | | Natural gas |
| | (Mbbl) | | (MMcf) | | (Mbbl) | | (MMcf) | | (Mbbl) | | (MMcf) | | (Mbbl) | | (MMcf) |
Net proved developed | |
| |
| |
| |
| |
| |
| |
| |
|
Colombia (a) | | 46,623 | | 1,065 | | 47,766 | | 1,207 | | 43,817 | | 1,695 | | 39,397 | | 2,319 |
Chile (b) | | 1,115 | | 14,103 | | 755 | | 15,196 | | 798 | | 19,054 | | 898 | | 14,406 |
Brazil (c) | | 8 | | 9,443 | | 43 | | 13,601 | | 34 | | 13,927 | | 48 | | 14,872 |
Argentina (d) | | — | | — | | 1,186 | | 3,379 | | 1,685 | | 5,599 | | 1,658 | | 5,785 |
Ecuador (e) | | 322 | | — | | — | | — | | — | | — | | — | | — |
Total consolidated | | 48,068 | | 24,611 | | 49,750 | | 33,383 | | 46,334 | | 40,275 | | 42,001 | | 37,382 |
| | | | | | | | | | | | | | | | |
Net proved undeveloped | |
| |
| |
| |
| |
| |
| |
| | |
Colombia (f) | | 17,765 | | — | | 31,019 | | — | | 45,240 | | — | | 51,212 | | — |
Chile (b) | | 476 | | — | | 575 | | 1,563 | | 1,229 | | 5,661 | | 2,809 | | 6,413 |
Argentina (g) | | — | | — | | 603 | | — | | 104 | | — | | 1,370 | | 450 |
Peru (h) | | — | | — | | — | | — | | — | | — | | 19,210 | | — |
Total consolidated | | 18,241 | | — | | 32,197 | | 1,563 | | 46,573 | | 5,661 | | 74,601 | | 6,863 |
| | | | | | | | | | | | | | | | |
Total proved reserves | | 66,309 | | 24,611 | | 81,947 | | 34,946 | | 92,907 | | 45,936 | | 116,602 | | 44,245 |
| (a) | Llanos 34 Block, CPO-5 Block, Llanos 32 Block and Platanillo Block account for 84%, 11%, 1% and 4% (Llanos 34 Block, CPO-5 Block, Llanos 32 Block and Platanillo Block account for 88%, 8%, 2% and 2% in 2021, Llanos 34 Block, CPO-5 Block, Llanos 32 Block and Platanillo Block account for 86%, 8%, 3% and 3% in 2020, and Llanos 34 Block and Llanos 32 Block account for 97% and 3% in 2019) of the proved developed reserves, respectively. |
| (b) | Fell Block accounts for 100% of the reserves. |
| (c) | BCAM-40 Block accounts for 100% of the reserves. |
| (d) | Aguada Baguales Block, Puesto Touquet Block, and El Porvenir Block account for 45%, 21% and 33% in 2021 (50%, 26% and 24% in 2020, and 49%, 30% and 21% in 2019) of the proved developed reserves, respectively. |
| (e) | Perico Block and Espejo Block account for 85% and 15% of the reserves, respectively. |
| (f) | Llanos 34 Block, Llanos 32 Block, CPO-5 Block and Platanillo Block account 85%, 7%, 3% and 5% (Llanos 34 Block, Llanos 32 Block, CPO-5 Block and Platanillo Block account 88%, 5%, 5% and 3% in 2021, Llanos 34 Block, Llanos 32 Block and CPO-5 Block account 91%, 5% and 4% in 2020, and Llanos 34 Block and Llanos 32 Block account 96% and 4% in 2019) of the proved undeveloped reserves, respectively. |
| (g) | Aguada Baguales Block accounts for 100% of the proved undeveloped reserves. |
| (h) | Morona Block accounted for 100% of the reserves. |
76
Note 38 Supplemental information on oil and gas activities (unaudited - continued)
Table 5 - Net proved reserves of oil, condensate and natural gas
Net proved reserves (developed and undeveloped) of oil and condensate:
| | | | | | | | | | | | | | |
Thousands of barrels | | Colombia | | Chile | | Brazil | | Argentina | | Peru | | Ecuador | | Total |
Reserves as of December 31, 2019 | | 90,609 | | 3,707 | | 48 | | 3,028 | | 19,210 | | — | | 116,602 |
Increase (decrease) attributable to: | | | | | | | | | | | | | | |
Revisions (a) | | (1,964) | | (1,825) | | (7) | | (734) | | — | | — | | (4,530) |
Extensions and discoveries (b) | | 4,545 | | 279 | | — | | — | | — | | — | | 4,824 |
Purchase or (Disposal) of Minerals in place (c) | | 6,853 | | — | | — | | — | | (19,210) | | — | | (12,357) |
Production | | (10,986) | | (134) | | (7) | | (505) | | — | | — | | (11,632) |
Reserves as of December 31, 2020 | | 89,057 | | 2,027 | | 34 | | 1,789 | | — | | — | | 92,907 |
Increase (decrease) attributable to: | | | | | | | | | | | | | | |
Revisions (d) | | (3,207) | | (597) | | 18 | | (169) | | — | | — | | (3,955) |
Extensions and discoveries (e) | | 3,375 | | — | | — | | 603 | | — | | — | | 3,978 |
Production | | (10,440) | | (100) | | (9) | | (434) | | — | | — | | (10,983) |
Reserves as of December 31, 2021 | | 78,785 | | 1,330 | | 43 | | 1,789 | | — | | — | | 81,947 |
Increase (decrease) attributable to: | | | | | | | | | | | | | | |
Revisions (f) | | (2,677) | | 422 | | (27) | | — | | — | | — | | (2,282) |
Extensions and discoveries (g) | | 204 | | — | | — | | — | | — | | 632 | | 836 |
Disposal of Minerals in place (h) | | — | | — | | — | | (1,760) | | — | | — | | (1,760) |
Production | | (11,924) | | (161) | | (8) | | (29) | | — | | (310) | | (12,432) |
Reserves as of December 31, 2022 | | 64,388 | | 1,591 | | 8 | | — | | — | | 322 | | 66,309 |
| (a) | For the year ended December 31, 2020, the Group’s oil and condensate proved reserves were revised downward by 4.5 mmbbl. The primary factors leading to the above were: |
- Lower average oil prices resulted in a 4.2 mmbbl, 1.1 mmbbl and 0.3 mmbbl decrease in reserves from the blocks in Colombia, Argentina and Chile, respectively.
- A reduction of 1.6 mmbbl in Chile due to the revision of the type well in the Kiaku and Loij fields and a reduction in Argentina of 0.2 mmbbl associated to the revision of the type of well in the Aguada Baguales fields.
- Lower than expected performance from the existing wells in Colombia that reduced the proved developed reserves from the Jacana, Tigana and Tigui fields (2.8 mmbbl).
- Such decrease was partially offset by a better performance of proved undeveloped reserves in Colombia (5.1 mmbbl) originated by a new estimation of original oil in place and better type wells considered in the Jacana and Tigana fields. In addition, the proved developed reserves increased in the Aguada Baguales Block in Argentina (0.5 mmbbl) and the Konawentru and Guanaco Fields in Chile of 0.1 mmbbl due to better performance of the existing wells.
| (b) | In Colombia, the extensions and discoveries are primary due to the Tigui Field appraisal wells and in Chile are due to the Jauke Field discovery in the Fell Block. |
| (c) | Purchase of Minerals in place refers to the CPO-5 and Platanillo Blocks acquisition during 2020 in Colombia. The reduction in Peru is due to the decision to retire from the Morona Block (see Note 36.4.1). |
| (d) | For the year ended December 31, 2021, the Group’s oil and condensate proved reserves were revised downward by 4.0 mmbbl. The primary factors leading to the above were: |
- Lower than expected performance from the existing wells that reduced the proved developed reserves in Colombia (8.9 mmbbl), in Argentina (0.3 mmbbl), and in Chile (0.3 mmbbl).
- A decrease of 0.6 mmbbl in Chile due to a change in a previously adopted development plan in the Fell Block.
- Such decrease was partially offset by a higher average oil prices resulted in a 5.7 mmbbl, 0.1 mmbbl and 0.3 mmbbl increase in reserves from the blocks in Colombia, Argentina and Chile, respectively.
| (e) | In Colombia, the extensions and discoveries are primary due to the Tigui Field appraisal wells and in Argentina are due to the Aguada Baguales Field. |
77
Note 38 Supplemental information on oil and gas activities (unaudited - continued)
Table 5 - Net proved reserves of oil, condensate and natural gas (continued)
| (f) | For the year ended December 31, 2022, the Group’s oil and condensate proved reserves were revised downward by 2.3 mmbbl. The primary factors leading to the above were: |
- A decrease of 3.6 mmbbl in Colombia due to a change in the royalties payment in certain fields from cash to kind.
- Such decrease was partially offset by a higher average oil prices resulted in a 0.6 mmbbl and 0.1 mmbbl increase in reserves from the blocks in Colombia and Chile, respectively.
- Higher than expected performance from the existing wells that increase the proved reserves in Colombia (0.3 mmbbl) and in Chile (0.3 mmbbl).
| (g) | In Colombia, the extensions and discoveries are primary due to the Cante Flamenco new field in CPO-5 Block and in Ecuador are due to the Jandaya, Yin, Tiu new fields in the Perico Block and the Pashuri field in the Espejo Block. |
| (h) | The disposal in Argentina is due to the decision of selling the Group’s working interest and operatorship in the Aguada Baguales, El Porvenir and Puesto Touquet Blocks in Argentina (see Note 36.3.1). |
Net proved reserves (developed and undeveloped) of natural gas:
| | | | | | | | | | |
Millions of cubic feet | | Colombia | | Chile | | Brazil | | Argentina | | Total |
Reserves as of December 31, 2019 | | 2,319 | | 20,819 | | 14,872 | | 6,235 | | 44,245 |
Increase (decrease) attributable to: | |
| |
| |
| |
| | |
Revisions (a) | | (211) | | (385) | | 1,840 | | 889 | | 2,133 |
Extensions and discoveries (b) | | — | | 10,456 | | — | | — | | 10,456 |
Production | | (413) | | (6,175) | | (2,785) | | (1,525) | | (10,898) |
Reserves as of December 31, 2020 | | 1,695 | | 24,715 | | 13,927 | | 5,599 | | 45,936 |
Increase (decrease) attributable to: | |
| |
| |
| |
| | |
Revisions (c) | | 14 | | (3,553) | | 3,470 | | (636) | | (705) |
Production | | (502) | | (4,403) | | (3,796) | | (1,584) | | (10,285) |
Reserves as of December 31, 2021 | | 1,207 | | 16,759 | | 13,601 | | 3,379 | | 34,946 |
Increase (decrease) attributable to: | |
| | | |
| |
| | |
Revisions (d) | | 141 | | 1,501 | | (886) | | — | | 756 |
Disposal of Minerals in place (e) | | — | | — | | — | | (3,227) | | (3,227) |
Production | | (283) | | (4,157) | | (3,272) | | (152) | | (7,864) |
Reserves as of December 31, 2022 | | 1,065 | | 14,103 | | 9,443 | | — | | 24,611 |
| (a) | For the year ended December 31, 2020, the Group’s proved natural gas reserves were revised upwards by 2.1 billion cubic feet. This was the combined effect of: |
- An increase of proved developed reserves due to better performance of existing wells in Chile (7.9 billion cubic feet) mostly associated to the Jauke and Ache Fields, in Brazil (3.0 billion cubic feet) associated to new gas sales plateau in 2021 and forward which leads to better-than-expected performance of the Manati Field and in Argentina (1.9 billion cubic feet) due to better performance of the Puesto Touquet and El Porvenir Blocks.
- The above was partially offset by lower-than-expected performance of proved undeveloped reserves in Chile (5.8 billion cubic feet) due to revisions of the type of well in the Pampa Larga Field.
- Lower average prices resulted in a decrease of 2.5 billion cubic feet, 1.2 billion cubic feet and 1.2 billion cubic feet reduction in gas reserves in Chile, Brazil and Argentina, respectively.
| (b) | The extensions and discoveries are primary due to the Jauke Field discovery in the Fell Block, in Chile. |
78
Note 38 Supplemental information on oil and gas activities (unaudited - continued)
Table 5 - Net proved reserves of oil, condensate and natural gas (continued)
| (c) | For the year ended December 31, 2021, the Group’s proved natural gas reserves were revised downward by 0.7 billion cubic feet. This was the combined effect of: |
- A decrease of proved developed reserves due to lower performance of existing wells in Argentina (1.6 billion cubic feet) and in Chile (2.7 billion cubic feet) partially offset by better-than-expected performance in the Manati Field in Brazil (2.5 billion cubic feet).
- A decrease of 3.4 billion cubic feet in Chile due to the revision of the type well associated with the incremental activity that reduced the proved undeveloped reserves.
- A decrease of 1.5 billion cubic feet in Chile due to a change in a previously adopted development plan in the Fell Block.
-Such decrease was partially offset by higher average prices which resulted in an increase of 4.0 billion cubic feet, 1 billion cubic feet and 1 billion cubic feet in Chile, Brazil, and Argentina, respectively.
| (d) | For the year ended December 31, 2022, the Group’s proved natural gas reserves were revised upwards by 0.8 billion cubic feet. This was the combined effect of: |
- An increase of proved reserves due to better performance of existing wells in Chile (0.8 billion cubic feet) and the Llanos 32 block in Colombia (0.1 billion cubic feet).
- Higher average prices resulted in an increase of 0.7 billion cubic feet and 0.8 billion cubic feet increase in gas reserves in Chile and Brazil, respectively.
- The above was partially offset by lower-than-expected performance of Manati Field in Brazil (1.6 billion cubic feet).
| (e) | The disposal in Argentina is due to the decision of selling the Group’s working interest and operatorship in the Aguada Baguales, El Porvenir and Puesto Touquet Blocks in Argentina (see Note 36.3.1). |
Revisions refer to changes in interpretation of discovered accumulations and some technical and logistical needs in the area obliged to modify the timing and development plan of certain fields under appraisal and development phases.
79
Note 38 Supplemental information on oil and gas activities (unaudited - continued)
Table 6 - Standardized measure of discounted future net cash flows related to proved oil and gas reserves
The following table discloses estimated future net cash flows from future production of proved developed and undeveloped reserves of crude oil, condensate and natural gas. As prescribed by SEC Modernization of Oil and Gas Reporting rules and ASC 932 of the FASB Accounting Standards Codification (ASC) relating to Extractive Activities – Oil and Gas (formerly SFAS no. 69 Disclosures about Oil and Gas Producing Activities), such future net cash flows were estimated using the average first day-of-the-month price during the 12-month period for 2022, 2021 and 2020 and using a 10% annual discount factor. Future development and abandonment costs include estimated drilling costs, development and exploitation installations and abandonment costs. These future development costs were estimated based on evaluations made by the Group. The future income tax was calculated by applying the statutory tax rates in effect in the respective countries in which we have interests, as of the date this supplementary information was filed.
This standardized measure is not intended to be and should not be interpreted as an estimate of the market value of the Group’s reserves. The purpose of this information is to give standardized data to help the users of the financial statements to compare different companies and make certain projections. It is important to point out that this information does not include, among other items, the effect of future changes in prices, costs and tax rates, which past experience indicates that are likely to occur, as well as the effect of future cash flows from reserves which have not yet been classified as proved reserves, of a discount factor more representative of the value of money over the lapse of time and of the risks inherent to the production of oil and gas. These future changes may have a significant impact on the future net cash flows disclosed below. For all these reasons, this information does not necessarily indicate the perception the Group has on the discounted future net cash flows derived from the reserves of hydrocarbons.
| | | | | | | | | | | | |
Amounts in US$‘000 | | Colombia | | Chile | | Brazil | | Argentina | | Ecuador | | Total |
As of December 31, 2022 | | | | | | | | | | | |
|
Future cash inflows | | 5,229,599 | | 190,449 | | 65,002 | | — | | 26,553 | | 5,511,603 |
Future production costs | | (1,633,818) | | (72,411) | | (29,519) | | — | | (8,094) | | (1,743,842) |
Future development costs | | (182,701) | | (40,659) | | (1,955) | | — | | (297) | | (225,612) |
Future income taxes | | (1,191,658) | | — | | (1,761) | | — | | — | | (1,193,419) |
Undiscounted future net cash flows | | 2,221,422 | | 77,379 | | 31,767 | | — | | 18,162 | | 2,348,730 |
10% annual discount | | (839,621) | | (13,094) | | (8,856) | | — | | (2,504) | | (864,075) |
Standardized measure of discounted future net cash flows | | 1,381,801 | | 64,285 | | 22,911 | | — | | 15,658 | | 1,484,655 |
As of December 31, 2021 | |
| |
| |
| |
| |
| | |
Future cash inflows | | 4,381,191 | | 136,152 | | 89,208 | | 109,678 | | — | | 4,716,229 |
Future production costs | | (1,715,554) | | (69,067) | | (34,930) | | (61,660) | | — | | (1,881,211) |
Future development costs | | (197,461) | | (40,339) | | (1,955) | | (49,200) | | — | | (288,955) |
Future income taxes | | (754,205) | | — | | (3,449) | | (2,947) | | — | | (760,601) |
Undiscounted future net cash flows | | 1,713,971 | | 26,746 | | 48,874 | | (4,129) | | — | | 1,785,462 |
10% annual discount | | (496,150) | | 6,121 | | (7,171) | | 4,471 | | — | | (492,729) |
Standardized measure of discounted future net cash flows | | 1,217,821 | | 32,867 | | 41,703 | | 342 | | — | | 1,292,733 |
As of December 31, 2020 | |
| |
| |
| |
| |
| | |
Future cash inflows | | 2,561,947 | | 130,200 | | 68,857 | | 83,125 | | — | | 2,844,129 |
Future production costs | | (850,029) | | (82,290) | | (36,254) | | (65,536) | | — | | (1,034,109) |
Future development costs | | (197,859) | | (28,620) | | (2,355) | | (24,640) | | — | | (253,474) |
Future income taxes | | (409,276) | | — | | (327) | | — | | — | | (409,603) |
Undiscounted future net cash flows | | 1,104,783 | | 19,290 | | 29,921 | | (7,051) | | — | | 1,146,943 |
10% annual discount | | (345,550) | | (2,258) | | (4,543) | | 7,032 | | — | | (345,319) |
Standardized measure of discounted future net cash flows | | 759,233 | | 17,032 | | 25,378 | | (19) | | — | | 801,624 |
80
Note 38 Supplemental information on oil and gas activities (unaudited - continued)
Table 7 - Changes in the standardized measure of discounted future net cash flows from proved reserves
| | | | | | | | | | | | | | |
Amounts in US$‘000 | | Colombia | | Chile | | Brazil | | Argentina | | Peru | | Ecuador | | Total |
Present value as of December 31, 2019 | | 1,313,572 | | 104,223 | | 43,382 | | 11,341 | | 121,217 | | — | | 1,593,735 |
Sales of hydrocarbon, net of production costs | | (221,620) | | (12,803) | | 8,080 | | (10,454) | | — | | — | | (236,797) |
Net changes in sales price and production costs | | (975,716) | | (117,895) | | (14,580) | | (113) | | — | | — | | (1,108,304) |
Changes in estimated future development costs | | 514,317 | | 20,870 | | (19,606) | | (2,587) | | — | | — | | 512,994 |
Extensions and discoveries less related costs | | 59,898 | | 13,914 | | — | | — | | — | | — | | 73,812 |
Development costs incurred | | 69,694 | | 10,743 | | 394 | | 445 | | — | | — | | 81,276 |
Revisions of previous quantity estimates | | (27,190) | | (13,002) | | 3,519 | | (10) | | — | | — | | (36,683) |
Purchase or (Disposal) of Minerals in place | | 90,315 | | — | | — | | — | | (121,217) | | — | | (30,902) |
Net changes in income taxes | | (281,264) | | — | | (290) | | — | | — | | — | | (281,554) |
Accretion of discount | | 217,227 | | 10,982 | | 4,479 | | 1,359 | | — | | — | | 234,047 |
Present value as of December 31, 2020 | | 759,233 | | 17,032 | | 25,378 | | (19) | | — | | — | | 801,624 |
Sales of hydrocarbon, net of production costs | | (516,844) | | (11,520) | | (15,677) | | (16,855) | | — | | — | | (560,896) |
Net changes in sales price and production costs | | 924,875 | | 64,048 | | 19,393 | | (3,145) | | — | | — | | 1,005,171 |
Changes in estimated future development costs | | 96,364 | | (18,731) | | 861 | | 20,674 | | — | | — | | 99,168 |
Extensions and discoveries less related costs | | 80,933 | | — | | — | | (1,020) | | — | | — | | 79,913 |
Development costs incurred | | 87,877 | | 4,111 | | — | | — | | — | | — | | 91,988 |
Revisions of previous quantity estimates | | (76,850) | | (23,776) | | 11,957 | | 465 | | — | | — | | (88,204) |
Net changes in income taxes | | (254,618) | | — | | (2,780) | | 244 | | — | | — | | (257,154) |
Accretion of discount | | 116,851 | | 1,703 | | 2,571 | | (2) | | — | | — | | 121,123 |
Present value as of December 31, 2021 | | 1,217,821 | | 32,867 | | 41,703 | | 342 | | — | | — | | 1,292,733 |
Sales of hydrocarbon, net of production costs | | (891,534) | | (15,317) | | (14,697) | | — | | — | | (2,732) | | (924,280) |
Net changes in sales price and production costs | | 956,926 | | 39,457 | | (6,909) | | — | | — | | — | | 989,474 |
Changes in estimated future development costs | | 93,657 | | (22,675) | | (933) | | — | | — | | (10,483) | | 59,566 |
Extensions and discoveries less related costs | | 6,754 | | — | | — | | — | | — | | 28,873 | | 35,627 |
Development costs incurred | | 94,195 | | 11,153 | | — | | — | | — | | — | | 105,348 |
Revisions of previous quantity estimates | | (87,851) | | 15,513 | | (2,441) | | — | | — | | — | | (74,779) |
Disposal of Minerals in place | | — | | — | | — | | (342) | | — | | — | | (342) |
Net changes in income taxes | | (205,370) | | — | | 1,673 | | — | | — | | — | | (203,697) |
Accretion of discount | | 197,203 | | 3,287 | | 4,515 | | — | | — | | �� | | 205,005 |
Present value as of December 31, 2022 | | 1,381,801 | | 64,285 | | 22,911 | | — | | — | | 15,658 | | 1,484,655 |
81
SIGNATURE
Pursuant to the requirements of the Securities Exchange Act of 1934, the registrant has duly caused this report to be signed on its behalf by the undersigned, thereunto duly authorized.
| | |
| GeoPark Limited | |
| | |
| | |
| | |
| By: | /s/ Verónica Dávila |
| | Name: Verónica Dávila |
| | Title: Chief Financial Officer |
Date: March 8, 2023
82