UNITED STATES
SECURITIES AND EXCHANGE COMMISSION
Washington, D.C. 20549
FORM 6-K
REPORT OF FOREIGN PRIVATE ISSUER PURSUANT TO RULE 13a-16 OR 15d-16 UNDER THE SECURITIES EXCHANGE ACT OF 1934
For the month of May 2023
Commission File Number: 001-36298
GeoPark Limited
(Exact name of registrant as specified in its charter)
Calle 94 N° 11-30 8° piso
Bogota, Colombia
(Address of principal executive office)
Indicate by check mark whether the registrant files or will file annual reports under cover of Form 20-F or Form 40-F:
Form 20-F | X |
| Form 40-F |
GEOPARK LIMITED
TABLE OF CONTENTS
ITEM
| |
1. | Interim Condensed Consolidated Financial Statements and Explanatory Notes for the three-month periods ended March 31, 2022 and 2023. |
Item 1
GEOPARK LIMITED
INTERIM CONDENSED CONSOLIDATED
FINANCIAL STATEMENTS
AND EXPLANATORY NOTES
For the three-month periods ended March 31, 2022 and 2023
2
CONDENSED CONSOLIDATED STATEMENT OF INCOME
| | | | | | |
|
| |
| Three-month |
| Three-month |
| | |
| period ended |
| period ended |
| | | | March 31, 2023 | | March 31, 2022 |
Amounts in US$ '000 | | Note |
| (Unaudited) |
| (Unaudited) |
REVENUE |
| 3 |
| 182,451 |
| 249,151 |
Commodity risk management contracts |
| 4 |
| — |
| (78,153) |
Production and operating costs |
| 5 |
| (52,496) |
| (80,603) |
Geological and geophysical expenses |
| 6 |
| (2,517) |
| (2,744) |
Administrative expenses |
| 7 |
| (9,361) |
| (9,946) |
Selling expenses |
| 8 |
| (2,353) |
| (1,995) |
Depreciation |
|
|
| (27,203) |
| (21,580) |
Write-off of unsuccessful exploration efforts | | 10 | | (10,580) |
| — |
Other (expenses) income |
|
|
| (1,356) |
| 4,512 |
OPERATING PROFIT |
|
|
| 76,585 |
| 58,642 |
Financial expenses |
| 9 |
| (10,920) |
| (15,452) |
Financial income |
| 9 |
| 1,092 |
| 312 |
Foreign exchange loss |
| 9 |
| (3,392) |
| (6,633) |
PROFIT BEFORE INCOME TAX |
|
|
| 63,365 |
| 36,869 |
Income tax expense |
|
|
| (37,108) |
| (5,865) |
PROFIT FOR THE PERIOD |
|
|
| 26,257 |
| 31,004 |
Earnings per share (in US$). Basic |
|
|
| 0.45 |
| 0.52 |
Earnings per share (in US$). Diluted |
|
|
| 0.45 |
| 0.51 |
The above condensed consolidated statement of income should be read in conjunction with the accompanying notes.
3
CONDENSED CONSOLIDATED STATEMENT OF COMPREHENSIVE INCOME
| | | | |
|
| Three-month |
| Three-month |
|
| period ended |
| period ended |
| | March 31, 2023 |
| March 31, 2022 |
Amounts in US$ '000 |
| (Unaudited) |
| (Unaudited) |
Profit for the period |
| 26,257 |
| 31,004 |
Other comprehensive income |
|
|
|
|
Items that may be subsequently reclassified to profit or loss: |
|
|
|
|
Currency translation differences | | 601 | | 3,987 |
Profit (Loss) on cash flow hedges | | 1,142 | | (3,551) |
Income tax (expense) benefit relating to cash flow hedges |
| (571) |
| 1,243 |
Other comprehensive profit for the period |
| 1,172 |
| 1,679 |
Total comprehensive profit for the period |
| 27,429 |
| 32,683 |
The above condensed consolidated statement of comprehensive income should be read in conjunction with the accompanying notes.
4
CONDENSED CONSOLIDATED STATEMENT OF FINANCIAL POSITION
| | | | | | |
|
| Note |
| At March 31, 2023 |
| Year ended |
Amounts in US$ '000 | | |
| (Unaudited) |
| December 31, 2022 |
ASSETS |
|
|
|
|
|
|
NON CURRENT ASSETS |
|
|
|
|
|
|
Property, plant and equipment |
| 10 |
| 673,031 |
| 666,879 |
Right-of-use assets |
|
|
| 36,834 |
| 37,011 |
Prepayments and other receivables |
|
|
| 127 |
| 121 |
Other financial assets |
|
|
| 13,300 |
| 12,877 |
Deferred income tax asset |
|
|
| 18,365 |
| 18,943 |
TOTAL NON CURRENT ASSETS |
|
|
| 741,657 |
| 735,831 |
CURRENT ASSETS |
|
|
|
|
|
|
Inventories |
|
|
| 18,781 |
| 14,434 |
Trade receivables |
|
|
| 56,672 |
| 71,794 |
Prepayments and other receivables |
|
|
| 19,767 |
| 22,106 |
Derivative financial instrument assets |
| 15 |
| 2,994 |
| 967 |
Cash and cash equivalents |
|
|
| 145,373 |
| 128,843 |
TOTAL CURRENT ASSETS |
|
|
| 243,587 |
| 238,144 |
TOTAL ASSETS |
|
|
| 985,244 |
| 973,975 |
EQUITY |
|
|
|
|
|
|
Equity attributable to owners of the Company |
|
|
|
|
|
|
Share capital |
| 11 |
| 58 |
| 58 |
Share premium |
|
|
| 133,844 |
| 134,798 |
Reserves |
|
|
| 55,543 |
| 61,876 |
Accumulated losses |
|
|
| (60,021) |
| (81,147) |
TOTAL EQUITY |
|
|
| 129,424 |
| 115,585 |
LIABILITIES |
|
|
|
|
|
|
NON CURRENT LIABILITIES |
|
|
|
|
|
|
Borrowings |
| 12 |
| 485,933 |
| 485,114 |
Lease liabilities |
|
|
| 23,069 |
| 22,051 |
Provisions and other long-term liabilities |
| 13 |
| 54,883 |
| 51,947 |
Deferred income tax liability |
|
|
| 77,336 |
| 70,123 |
TOTAL NON CURRENT LIABILITIES |
|
|
| 641,221 |
| 629,235 |
CURRENT LIABILITIES |
|
|
|
|
|
|
Borrowings |
| 12 |
| 5,653 |
| 12,528 |
Lease liabilities |
|
|
| 10,186 |
| 10,000 |
Derivative financial instrument liabilities |
| 15 |
| — |
| 19 |
Current income tax liability |
|
|
| 85,079 |
| 65,002 |
Trade and other payables |
| 14 |
| 113,681 |
| 141,606 |
TOTAL CURRENT LIABILITIES |
|
|
| 214,599 |
| 229,155 |
TOTAL LIABILITIES |
|
|
| 855,820 |
| 858,390 |
TOTAL EQUITY AND LIABILITIES |
|
|
| 985,244 |
| 973,975 |
The above condensed consolidated statement of financial position should be read in conjunction with the accompanying notes.
5
CONDENSED CONSOLIDATED STATEMENT OF CHANGES IN EQUITY
| | | | | | | | | | | | |
|
| Attributable to owners of the Company | ||||||||||
|
| Share |
| Share |
| Other |
| Translation |
| Accumulated |
| |
Amount in US$ '000 |
| Capital |
| Premium |
| Reserve |
| Reserve |
| losses | | Total |
Equity at January 1, 2022 |
| 60 |
| 169,220 |
| 97,261 |
| (13,707) |
| (314,779) |
| (61,945) |
Comprehensive income: |
|
|
|
|
|
|
|
|
|
|
|
|
Profit for the three-month period |
| — |
| — |
| — |
| — |
| 31,004 |
| 31,004 |
Other comprehensive (loss) profit for the period |
| — |
| — |
| (2,308) |
| 3,987 |
| — |
| 1,679 |
Total comprehensive (loss) profit for the period ended March 31, 2022 |
| — |
| — |
| (2,308) |
| 3,987 |
| 31,004 |
| 32,683 |
Transactions with owners: |
|
|
|
|
|
|
|
|
|
|
|
|
Share-based payment |
| — |
| 125 |
| — |
| — |
| 901 |
| 1,026 |
Repurchase of shares |
| — |
| (3,123) |
| — |
| — |
| — |
| (3,123) |
Cash distribution | | — |
| — |
| (4,847) |
| — |
| — |
| (4,847) |
Total transactions with owners for the period ended March 31, 2022 |
| — |
| (2,998) |
| (4,847) |
| — |
| 901 |
| (6,944) |
Balance at March 31, 2022 (Unaudited) |
| 60 |
| 166,222 |
| 90,106 |
| (9,720) |
| (282,874) |
| (36,206) |
| | | | | | | | | | | | |
Balance at January 1, 2023 |
| 58 |
| 134,798 |
| 73,462 |
| (11,586) |
| (81,147) |
| 115,585 |
Comprehensive income: |
|
|
|
|
|
|
|
|
|
|
|
|
Profit for the three-month period |
| — |
| — |
| — |
| — |
| 26,257 |
| 26,257 |
Other comprehensive profit for the period |
| — |
| — |
| 571 |
| 601 |
| — |
| 1,172 |
Total comprehensive profit for the period ended March 31, 2023 |
| — |
| — |
| 571 |
| 601 |
| 26,257 |
| 27,429 |
Transactions with owners: |
|
|
|
|
|
|
|
|
|
|
|
|
Share-based payment |
| 1 |
| 6,588 |
| — |
| — |
| (5,131) |
| 1,458 |
Repurchase of shares |
| (1) |
| (7,542) |
| — |
| — |
| — |
| (7,543) |
Cash distribution | | — |
| — |
| (7,505) |
| — |
| — |
| (7,505) |
Total transactions with owners for the period ended March 31, 2023 |
| — |
| (954) |
| (7,505) |
| — |
| (5,131) |
| (13,590) |
Balance at March 31, 2023 (Unaudited) |
| 58 | | 133,844 |
| 66,528 |
| (10,985) |
| (60,021) |
| 129,424 |
The above condensed consolidated statement of changes in equity should be read in conjunction with the accompanying notes.
6
CONDENSED CONSOLIDATED STATEMENT OF CASH FLOW
| | | | |
|
| Three-month |
| Three-month |
|
| period ended |
| period ended |
|
| March 31, 2023 |
| March 31, 2022 |
Amounts in US$ '000 |
| (Unaudited) |
| (Unaudited) |
Cash flows from operating activities |
|
|
|
|
Profit for the period |
| 26,257 |
| 31,004 |
Adjustments for: |
|
|
|
|
Income tax expense |
| 37,108 |
| 5,865 |
Depreciation |
| 27,203 |
| 21,580 |
Loss on disposal of property, plant and equipment | | — | | 7 |
Write-off of unsuccessful exploration efforts | | 10,580 | | — |
Amortization of other long-term liabilities |
| (31) |
| (47) |
Accrual of borrowing interests |
| 7,694 |
| 10,335 |
Borrowings cancellation costs | | — | | 819 |
Unwinding of long-term liabilities |
| 1,544 |
| 1,225 |
Accrual of share-based payment |
| 1,458 |
| 1,026 |
Foreign exchange loss |
| 3,392 |
| 6,633 |
Unrealized loss on commodity risk management contracts |
| — |
| 47,613 |
Income tax paid |
| (6,002) |
| (967) |
Change in working capital |
| (17,280) |
| (35,355) |
Cash flows from operating activities – net |
| 91,923 |
| 89,738 |
Cash flows from investing activities |
|
|
|
|
Purchase of property, plant and equipment |
| (44,959) |
| (39,407) |
Proceeds from disposal of long-term assets | | — | | 14,425 |
Cash flows used in investing activities – net |
| (44,959) |
| (24,982) |
Cash flows from financing activities |
|
|
|
|
Principal paid |
| — |
| (23,111) |
Interest paid |
| (13,750) |
| (19,246) |
Borrowings cancellation costs paid | | — |
| (802) |
Lease payments |
| (1,900) |
| (1,782) |
Repurchase of shares |
| (7,543) |
| (3,123) |
Cash distribution | | (7,505) | | (4,847) |
Cash flows used in financing activities - net |
| (30,698) |
| (52,911) |
Net increase in cash and cash equivalents |
| 16,266 |
| 11,845 |
Cash and cash equivalents at January 1 |
| 128,843 |
| 100,604 |
Currency translation differences |
| 264 |
| 1,690 |
Cash and cash equivalents at the end of the period |
| 145,373 |
| 114,139 |
Ending Cash and cash equivalents are specified as follows: |
|
|
|
|
Cash at bank and bank deposits |
| 145,361 |
| 114,126 |
Cash in hand |
| 12 |
| 13 |
Cash and cash equivalents |
| 145,373 |
| 114,139 |
The above condensed consolidated statement of cash flow should be read in conjunction with the accompanying notes.
7
EXPLANATORY NOTES TO THE INTERIM CONDENSED CONSOLIDATED FINANCIAL STATEMENTS
Note 1
General information
GeoPark Limited (the “Company”) is a company incorporated under the laws of Bermuda. The Registered Office address is Clarendon House, 2 Church Street, Hamilton HM11, Bermuda.
The principal activity of the Company and its subsidiaries (the “Group” or “GeoPark”) is the exploration, development and production for oil and gas reserves in Colombia, Chile, Brazil and Ecuador.
These interim condensed consolidated financial statements were authorized for issue by the Board of Directors on May 3, 2023.
Basis of Preparation
The interim condensed consolidated financial statements of GeoPark Limited are presented in accordance with IAS 34 “Interim Financial Reporting”. They do not include all of the information required for full annual financial statements, and should be read in conjunction with the annual consolidated financial statements as of and for the year ended December 31, 2022, which have been prepared in accordance with IFRS.
The interim condensed consolidated financial statements have been prepared in accordance with the accounting policies applied in the most recent annual consolidated financial statements. The Group has not early adopted any standard, interpretation or amendment that has been issued but is not yet effective. The amendments and interpretations detailed in the annual consolidated financial statements as of and for the year ended December 31, 2022, that apply for the first time in 2023, do not have an impact on the interim condensed consolidated financial statements of the Group.
Whenever necessary, certain comparative amounts have been reclassified to conform to changes in presentation in the current period.
Taxes on income in the interim periods are accrued using the tax rate that would be applicable to expected total annual profit or loss.
The activities of the Group are not subject to significant seasonal changes.
Estimates
The preparation of interim financial information requires the use of certain critical accounting estimates. It also requires management to exercise its judgement in the process of applying the Group’s accounting policies. Actual results may differ from these estimates.
In preparing these interim condensed consolidated financial statements, the significant judgements made by management in applying the Group’s accounting policies and the key sources of estimation uncertainty were the same as those that applied to the annual consolidated financial statements as of and for the year ended December 31, 2022.
Financial risk management
The Group’s activities expose it to a variety of financial risks: currency risk, price risk, credit risk concentration, funding and liquidity risk, interest risk and capital risk. The interim condensed consolidated financial statements do not include all the financial risk management information and disclosures required in the annual consolidated financial statements, and should be read in conjunction with the Group’s annual consolidated financial statements as of and for the year ended December 31, 2022.
8
Note 1 (Continued)
Financial risk management (Continued)
The Group is continually reviewing its exposure to the current market conditions and adjusting the capital expenditures program which remains flexible, quickly adaptable and expandable as oil and gas prices increase. The Group also continues to add new oil hedges, increasing its price risk protection within the upcoming four quarters. GeoPark maintained a cash position of US$ 145,373,000 and has available US$ 87,900,000 in uncommitted credit lines as of March 31, 2023.
Subsidiary undertakings
The following chart illustrates the main companies of the Group structure as of March 31, 2023:
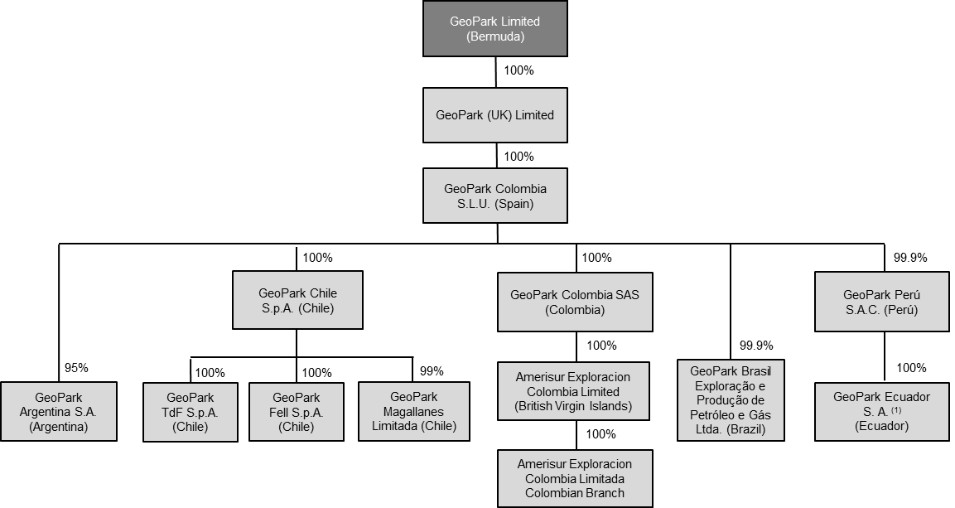
| (1) | GeoPark Ecuador S.A. holds 50% working interest in the consortiums that operate the Espejo and Perico Blocks. |
Details of the subsidiaries and joint operations of the Group are set out in Note 21 to the annual consolidated financial statements as of and for the year ended December 31, 2022.
During the three-month period ended March 31, 2023, the following change took place:
| ● | The merger process between GeoPark Colombia S.A.S., GeoPark Colombia E&P S.A. and Petrodorado South America S.A., with GeoPark Colombia S.A.S. being the surviving company, was approved by the relevant Colombian authorities and the merger became effective as of its registration in the Public Registry of the Chamber of Commerce of Bogota on January 27, 2023. |
9
Note 2
Segment Information
Operating segments are reported in a manner consistent with the internal reporting provided to the chief operating decision-maker. The chief operating decision-maker, who is responsible for allocating resources and assessing performance of the operating segments, has been identified as the Executive Committee. This committee is integrated by the Chief Executive Officer, Chief Financial Officer, Chief Technical Officer, Chief Operating Officer, Chief Strategy, Sustainability and Legal Officer and Chief People Officer. This committee reviews the Group’s internal reporting in order to assess performance and allocate resources. Management has determined the operating segments based on these reports. The committee considers the business from a geographic perspective.
The Executive Committee assesses the performance of the operating segments based on a measure of Adjusted EBITDA. Adjusted EBITDA is defined as profit (loss) for the period (determined as if IFRS 16 Leases has not been adopted), before net finance cost, income tax, depreciation, amortization, certain non-cash items such as impairments and write-offs of unsuccessful exploration efforts, accrual of share-based payment, unrealized result on commodity risk management contracts, geological and geophysical expenses allocated to capitalized projects, and other non-recurring events. Other information provided to the Executive Committee is measured in a manner consistent with that in the consolidated financial statements.
Three-month period ended March 31, 2023:
| | | | | | | | | | | | | | |
Amounts in US$ '000 |
| Total |
| Colombia |
| Chile |
| Brazil |
| Argentina |
| Ecuador |
| Corporate |
Revenue |
| 182,451 |
| 170,900 |
| 4,461 |
| 3,254 |
| — |
| 3,044 |
| 792 |
Sale of crude oil |
| 175,114 |
| 170,717 |
| 1,241 |
| 112 |
| — |
| 3,044 |
| — |
Sale of purchased crude oil | | 792 | | — |
| — |
| — |
| — |
| — |
| 792 |
Sale of gas |
| 6,545 |
| 183 |
| 3,220 |
| 3,142 |
| — |
| — |
| — |
Production and operating costs |
| (52,496) |
| (47,389) |
| (2,101) |
| (985) |
| — |
| (1,342) |
| (679) |
Royalties |
| (7,180) |
| (6,762) |
| (159) |
| (259) |
| — |
| — |
| — |
Economic rights | | (16,112) | | (16,112) |
| — |
| — |
| — |
| — |
| — |
Share-based payment |
| (25) |
| (25) |
| — |
| — |
| — |
| — |
| — |
Operating costs |
| (29,179) |
| (24,490) |
| (1,942) |
| (726) |
| — |
| (1,342) |
| (679) |
Depreciation |
| (27,203) |
| (22,527) |
| (2,784) |
| (551) |
| (6) |
| (1,334) |
| (1) |
Adjusted EBITDA |
| 114,923 |
| 113,537 |
| 1,474 |
| 1,572 |
| (653) |
| 958 |
| (1,965) |
Three-month period ended March 31, 2022:
| | | | | | | | | | | | | | |
Amounts in US$ '000 |
| Total |
| Colombia |
| Chile |
| Brazil |
| Argentina |
| Ecuador |
| Corporate |
Revenue |
| 249,151 |
| 234,493 |
| 6,721 |
| 5,975 |
| 1,962 |
| — |
| — |
Sale of crude oil |
| 238,996 |
| 233,974 |
| 3,124 |
| 234 |
| 1,664 |
| — |
| — |
Sale of gas |
| 10,155 |
| 519 |
| 3,597 |
| 5,741 |
| 298 |
| — |
| — |
Production and operating costs |
| (80,603) |
| (73,364) |
| (3,958) |
| (1,702) |
| (1,579) |
| — |
| — |
Royalties |
| (14,792) |
| (13,774) |
| (264) |
| (481) |
| (273) |
| — |
| — |
Economic rights | | (43,248) | | (43,248) |
| — |
| — |
| — |
| — |
| — |
Share-based payment |
| (118) |
| (104) |
| (15) |
| — |
| 1 |
| — |
| — |
Operating costs |
| (22,445) |
| (16,238) |
| (3,679) |
| (1,221) |
| (1,307) |
| — |
| — |
Depreciation |
| (21,580) |
| (17,403) |
| (3,312) |
| (754) |
| (101) |
| (9) |
| (1) |
Adjusted EBITDA |
| 122,567 |
| 121,776 |
| 2,123 |
| 3,594 |
| (1,701) |
| (451) |
| (2,774) |
| | | | | | | | | | | | | | |
Total Assets |
| Total |
| Colombia |
| Chile |
| Brazil |
| Argentina |
| Ecuador |
| Corporate |
March 31, 2023 |
| 985,244 |
| 840,958 |
| 61,205 |
| 31,811 |
| 1,187 |
| 36,232 |
| 13,851 |
December 31, 2022 |
| 973,975 |
| 797,390 | | 63,379 | | 34,329 | | 1,296 | | 35,690 | | 41,891 |
10
Note 2 (Continued)
Segment Information (Continued)
A reconciliation of total Adjusted EBITDA to total Profit before income tax is provided as follows:
| | | | |
|
| Three-month |
| Three-month |
|
| period ended |
| period ended |
| | March 31, 2023 |
| March 31, 2022 |
Adjusted EBITDA |
| 114,923 |
| 122,567 |
Unrealized loss on commodity risk management contracts |
| — |
| (47,613) |
Depreciation (a) |
| (27,203) |
| (21,580) |
Write-off of unsuccessful exploration efforts | | (10,580) |
| — |
Share-based payment |
| (1,458) |
| (1,026) |
Lease accounting - IFRS 16 |
| 1,900 |
| 1,782 |
Others (b) |
| (997) |
| 4,512 |
Operating profit |
| 76,585 |
| 58,642 |
Financial expenses |
| (10,920) |
| (15,452) |
Financial income |
| 1,092 |
| 312 |
Foreign exchange loss |
| (3,392) |
| (6,633) |
Profit before tax |
| 63,365 |
| 36,869 |
| (a) | Net of capitalized costs for oil stock included in Inventories. Depreciation for the three-month period ended March 31, 2023, includes US$ 486,000 (US$ 539,000 in 2022) generated by assets not related to production activities. |
| (b) | Includes allocation to capitalized projects. In 2022, it also includes the gain from the sale of the Aguada Baguales, El Porvenir and Puesto Touquet Blocks in Argentina. |
Note 3
Revenue
| | | | |
| | Three-month |
| Three-month |
| | period ended | | period ended |
Amounts in US$ '000 | | March 31, 2023 | | March 31, 2022 |
Sale of crude oil | | 175,114 | | 238,996 |
Sale of purchased crude oil | | 792 | | — |
Sale of gas | | 6,545 | | 10,155 |
| | 182,451 | | 249,151 |
11
Note 4
Commodity risk management contracts
The Group has entered into derivative financial instruments to manage its exposure to oil price risk. These derivatives are zero-premium collars and were placed with major financial institutions and commodity traders. The Group entered into the derivatives under ISDA Master Agreements and Credit Support Annexes, which provide credit lines for collateral posting thus alleviating possible liquidity needs under the instruments and protect the Group from potential non-performance risk by its counterparties.
The Group’s derivatives that hedge cash flows from the sales of crude oil for periods through December 31, 2022, are accounted for as non-hedge derivatives and therefore all changes in the fair values of these derivative contracts are recognized immediately as gains or losses in the results of the periods in which they occur.
The Group’s derivatives that hedge cash flows from the sales of crude oil for periods from January 1, 2023 onwards, are designated and qualify as cash flow hedges. The effective portion of changes in the fair values of these derivative contracts are recognized in Other Reserve within Equity. The gain or loss relating to the ineffective portion, if any, is recognized immediately as gains or losses in the results of the periods in which they occur. The amount accumulated in Other Reserves is reclassified to profit or loss as a reclassification adjustment in the same period or periods during which the hedged cash flows affect profit or loss.
The following table summarizes the Group’s production hedged during the three-month period ended March 31, 2023, and for the following periods as a consequence of the derivative contracts in force as of March 31, 2023:
| | | | | | | | |
|
| |
| |
| Volume |
| Average |
Period | | Reference | | Type | | bbl/d | | price US$/bbl |
January 1, 2023 - March 31, 2023 | | ICE BRENT | | Zero Premium Collars | | 9,500 | | 66.05 Put 112.59 Call |
April 1, 2023 - June 30, 2023 | | ICE BRENT | | Zero Premium Collars | | 10,000 | | 69.25 Put 110.56 Call |
July 1, 2023 - September 30, 2023 | | ICE BRENT | | Zero Premium Collars | | 5,000 | | 70.00 Put 98.68 Call |
October 1, 2023 - December 31, 2023 | | ICE BRENT | | Zero Premium Collars | | 2,500 | | 70.00 Put 90.70 Call |
The table below summarizes the loss on the commodity risk management contracts:
| | | | |
| | Three-month |
| Three-month |
| | period ended | | period ended |
Amounts in US$ '000 | | March 31, 2023 | | March 31, 2022 |
Realized loss on commodity risk management contracts | | — | | (30,540) |
Unrealized loss on commodity risk management contracts | | — | | (47,613) |
Total | | — | | (78,153) |
12
Note 5
Production and operating costs
| | | | |
| | Three-month |
| Three-month |
| | period ended | | period ended |
Amounts in US$ '000 | | March 31, 2023 | | March 31, 2022 |
Staff costs | | 3,111 | | 3,497 |
Share-based payment | | 25 | | 118 |
Royalties | | 7,180 | | 14,792 |
Economic rights | | 16,112 | | 43,248 |
Well and facilities maintenance | | 5,373 | | 4,787 |
Operation and maintenance | | 1,632 | | 1,785 |
Consumables | | 7,645 | | 5,313 |
Equipment rental | | 1,215 | | 2,387 |
Transportation costs | | 1,542 | | 981 |
Field camp | | 1,205 | | 995 |
Safety and insurance costs | | 727 | | 1,088 |
Personnel transportation | | 760 | | 601 |
Consultant fees | | 486 | | 322 |
Gas plant costs | | 549 | | 682 |
Non-operated blocks costs | | 4,501 | | 1,262 |
Crude oil stock variation | | (1,159) | | (2,332) |
Purchased crude oil | | 679 | | — |
Other costs | | 913 | | 1,077 |
| | 52,496 | | 80,603 |
Note 6
Geological and geophysical expenses
| | | | |
| | Three-month |
| Three-month |
| | period ended | | period ended |
Amounts in US$ '000 | | March 31, 2023 | | March 31, 2022 |
Staff costs | | 1,987 | | 1,972 |
Share-based payment | | 80 | | (137) |
Communication and IT costs | | 477 | | 662 |
Consultant fees | | 203 | | 102 |
Allocation to capitalized project | | (359) | | — |
Other services | | 129 | | 145 |
| | 2,517 | | 2,744 |
13
Note 7
Administrative expenses
| | | | |
|
| Three-month |
| Three-month |
| | period ended |
| period ended |
Amounts in US$ '000 | | March 31, 2023 | | March 31, 2022 |
Staff costs |
| 5,696 |
| 6,076 |
Share-based payment |
| 1,353 |
| 1,045 |
Consultant fees |
| 1,955 |
| 1,657 |
Safety and insurance costs | | 1,124 |
| 930 |
Travel expenses |
| 491 |
| 173 |
Non-operated blocks expenses | | 326 |
| 213 |
Director fees and allowance |
| 200 |
| 693 |
Communication and IT costs |
| 567 |
| 701 |
Allocation to joint operations |
| (3,142) |
| (2,269) |
Other administrative expenses |
| 791 |
| 727 |
| | 9,361 |
| 9,946 |
Note 8
Selling expenses
| | | | |
|
| Three-month |
| Three-month |
|
| period ended |
| period ended |
Amounts in US$ '000 | | March 31, 2023 | | March 31, 2022 |
Transportation |
| 1,435 |
| 1,378 |
Selling taxes and other |
| 918 |
| 617 |
| | 2,353 |
| 1,995 |
Note 9
Financial results
| | | | |
|
| Three-month |
| Three-month |
|
| period ended |
| period ended |
Amounts in US$ '000 | | March 31, 2023 | | March 31, 2022 |
Financial expenses |
|
|
|
|
Bank charges and other financial costs |
| (1,682) |
| (3,037) |
Borrowings cancellation costs | | — |
| (819) |
Interest and amortization of debt issue costs |
| (7,694) |
| (10,371) |
Unwinding of long-term liabilities |
| (1,544) |
| (1,225) |
| | (10,920) |
| (15,452) |
Financial income |
|
|
|
|
Interest received |
| 1,092 |
| 312 |
| | 1,092 |
| 312 |
Foreign exchange gains and losses |
|
|
|
|
Foreign exchange loss |
| (4,277) |
| (6,633) |
Unrealized result on currency risk management contracts | | 885 | | — |
| | (3,392) |
| (6,633) |
Total financial results |
| (13,220) |
| (21,773) |
14
Note 10
Property, plant and equipment
| | | | | | | | | | | | | | |
|
| |
| Furniture, |
| |
| |
| |
| Exploration |
| |
| | | | equipment | | Production | | Buildings | | | | and | | |
| | Oil & gas | | and | | facilities and | | and | | Construction | | evaluation | | |
Amounts in US$ '000 | | properties |
| vehicles | | machinery | | improvements | | in progress |
| assets | | Total |
Cost at January 1, 2022 |
| 957,932 |
| 18,421 |
| 201,177 |
| 11,662 |
| 27,204 |
| 100,470 |
| 1,316,866 |
Additions |
| (2,647) | (a) | 186 | | — | | 5 | | 29,761 | | 9,455 | | 36,760 |
Transfers |
| 30,058 | | 14 | | 1,547 | | — | | (25,017) | | (6,602) | | — |
Currency translation differences |
| 7,472 | | 98 | | 593 | | 17 | | 45 | | 48 | | 8,273 |
Disposals | | — | | (7) | | (26) | | — | | — | | — | | (33) |
Cost at March 31, 2022 |
| 992,815 | | 18,712 | | 203,291 | | 11,684 | | 31,993 | | 103,371 | | 1,361,866 |
| | | | | | | | | | | | | | |
Cost at January 1, 2023 |
| 1,079,257 |
| 19,093 |
| 222,727 |
| 11,027 |
| 16,480 |
| 113,041 |
| 1,461,625 |
Additions |
| 1,340 | (a) | 225 | | 12 | | 3 | | 25,434 | | 15,466 | | 42,480 |
Transfers |
| 24,034 | | — | | 2,943 | | 5 | | (24,361) | | (2,621) | | — |
Currency translation differences |
| 1,208 | | 16 | | 96 | | 3 | | 7 | | 8 | | 1,338 |
Disposals | | — | | (44) | | — | | — | | — | | — | | (44) |
Write-offs | | — | | — | | — | | — | | — | | (10,580) | (b) | (10,580) |
Cost at March 31, 2023 |
| 1,105,839 | | 19,290 | | 225,778 | | 11,038 | | 17,560 | | 115,314 | | 1,494,819 |
| | | | | | | | | | | | | | |
Depreciation and write-down at January 1, 2022 |
| (563,157) |
| (16,377) |
| (116,617) |
| (6,668) |
| — |
| — |
| (702,819) |
Depreciation |
| (16,384) | | (367) | | (2,914) | | (172) | | — | | — |
| (19,837) |
Currency translation differences |
| (6,334) | | (85) | | (593) | | (17) | | — | | — |
| (7,029) |
Disposals | | — | | 6 | | 20 | | — | | — | | — | | 26 |
Depreciation and write-down at March 31, 2022 |
| (585,875) |
| (16,823) |
| (120,104) |
| (6,857) |
| — |
| — |
| (729,659) |
| | | | | | | | | | | | | | |
Depreciation and write-down at January 1, 2023 |
| (642,280) | | (16,799) | | (129,073) | | (6,594) | | — | | — |
| (794,746) |
Depreciation |
| (22,175) | | (339) | | (3,251) | | (147) | | — | | — | | (25,912) |
Currency translation differences |
| (1,061) | | (14) | | (96) | | (3) | | — | | — | | (1,174) |
Disposals | | — | | 44 | | — | | — | | — | | — | | 44 |
Depreciation and write-down at March 31, 2023 |
| (665,516) |
| (17,108) |
| (132,420) |
| (6,744) |
| — |
| — |
| (821,788) |
| | | | | | | | | | | | | | |
Carrying amount at March 31, 2022 |
| 406,940 |
| 1,889 |
| 83,187 |
| 4,827 |
| 31,993 |
| 103,371 |
| 632,207 |
Carrying amount at March 31, 2023 |
| 440,323 |
| 2,182 |
| 93,358 |
| 4,294 |
| 17,560 |
| 115,314 |
| 673,031 |
| (a) | Corresponds to the effect of the change in the estimate of assets retirement obligations. |
| (b) | Corresponds to two unsuccessful exploratory wells drilled in the Llanos 87 Block (Colombia) and other exploration costs incurred in the Llanos 94 Block (Colombia) for which no additional work was performed. |
15
Note 11
Equity
Share capital
| | | | |
|
| At |
| Year ended |
Issued share capital |
| March 31, 2023 |
| December 31, 2022 |
Common stock (US$ '000) |
| 58 |
| 58 |
The share capital is distributed as follows: |
|
|
| |
Common shares, of nominal US$ 0.001 |
| 57,596,400 |
| 57,621,998 |
Total common shares in issue |
| 57,596,400 |
| 57,621,998 |
| | | | |
Authorized share capital |
|
|
|
|
US$ per share |
| 0.001 |
| 0.001 |
| | | | |
Number of common shares (US$ 0.001 each) |
| 5,171,949,000 |
| 5,171,949,000 |
Amount in US$ |
| 5,171,949 |
| 5,171,949 |
GeoPark’s share capital only consists of common shares. The authorized share capital consists of 5,171,949,000 common shares, par value US$ 0.001 per share. All of the Company issued and outstanding common shares are fully paid and nonassessable.
Cash distributions
On March 8, 2023, the Company’s Board of Directors declared a cash dividend of US$ 0.13 per share which was paid on March 31, 2023.
Buyback program
On November 9, 2022, the Company’s Board of Directors approved the renewal of the program to repurchase up to 10% of its shares outstanding or approximately 5,854,285 shares until December 31, 2023. During the three-month period ended March 31, 2023, the Company purchased 642,048 common shares for a total amount of US$ 7,543,000. These transactions have no impact on the Group’s results.
Beginning in 2022, GeoPark applies hedge accounting for the derivative financial instruments entered to manage its exposure to oil price risk. Consequently, the Group’s derivatives that hedge cash flows from the sales of crude oil for periods from January 1, 2023 onwards, are designated and qualify as cash flow hedges and therefore the effective portion of changes in the fair values of these derivative contracts and the income tax relating to those results are recognized in Other Reserve within Equity. The amount accumulated in Other Reserves is reclassified to profit or loss as a reclassification adjustment in the same period or periods during which the hedged cash flows affect profit or loss.
16
Note 12
Borrowings
The outstanding amounts are as follows:
| | | | |
|
| At |
| Year ended |
Amounts in US$ '000 |
| March 31, 2023 |
| December 31, 2022 |
2027 Notes |
| 491,586 |
| 497,642 |
| | 491,586 |
| 497,642 |
Classified as follows:
| | | | |
Current |
| 5,653 |
| 12,528 |
Non-Current |
| 485,933 |
| 485,114 |
Note 13
Provisions and other long-term liabilities
The outstanding amounts are as follows:
| | | | |
|
| At |
| Year ended |
Amounts in US$ '000 |
| March 31, 2023 |
| December 31, 2022 |
Assets retirement obligation |
| 42,708 |
| 40,903 |
Deferred income |
| 756 |
| 757 |
Other |
| 11,419 |
| 10,287 |
| | 54,883 |
| 51,947 |
Note 14
Trade and other payables
The outstanding amounts are as follows:
| | | | |
|
| At |
| Year ended |
Amounts in US$ '000 |
| March 31, 2023 |
| December 31, 2022 |
Trade payables |
| 88,496 |
| 102,125 |
To be paid to co-venturers |
| 2,524 |
| 2,815 |
Customer advance payments | | 350 |
| 481 |
Staff costs to be paid |
| 10,420 |
| 9,306 |
Royalties to be paid |
| 3,142 |
| 9,403 |
V.A.T. |
| 2,184 |
| 8,513 |
Taxes and other debts to be paid |
| 6,565 |
| 8,963 |
| | 113,681 |
| 141,606 |
Classified as follows:
| | | | |
Current |
| 113,681 |
| 141,606 |
Non-Current |
| — |
| — |
17
Note 15
Fair value measurement of financial instruments
Fair value hierarchy
The following table presents the Group’s financial assets and financial liabilities measured and recognized at fair value at March 31, 2023, and December 31, 2022, on a recurring basis:
| | | | | | |
|
| |
| |
| As of |
Amounts in US$ '000 | | Level 1 | | Level 2 |
| March 31, 2023 |
Assets |
|
|
|
|
|
|
Cash and cash equivalents |
|
|
|
|
| |
Money market funds |
| 5,285 |
| — |
| 5,285 |
Derivative financial instrument assets | | | | | | |
Commodity risk management contracts | | — | | 2,109 | | 2,109 |
Currency risk management contracts | | — | | 885 | | 885 |
Total Assets | | 5,285 | | 2,994 | | 8,279 |
| | | | | | |
|
| |
| |
| As of |
Amounts in US$ '000 | | Level 1 | | Level 2 |
| December 31, 2022 |
Assets |
|
|
|
|
|
|
Cash and cash equivalents |
|
|
|
|
|
|
Money market funds |
| 242 |
| — |
| 242 |
Derivative financial instrument assets |
|
|
|
|
|
|
Commodity risk management contracts |
| — |
| 967 |
| 967 |
Total Assets |
| 242 |
| 967 |
| 1,209 |
Liabilities |
|
|
|
|
|
|
Derivative financial instrument liabilities |
|
|
|
|
|
|
Commodity risk management contracts |
| — |
| 19 |
| 19 |
Total Liabilities |
| — |
| 19 |
| 19 |
There were no transfers between Level 2 and 3 during the period. The Group did not measure any financial assets or financial liabilities at fair value on a non-recurring basis as of March 31, 2023.
Fair values of other financial instruments (unrecognized)
The Group also has a number of financial instruments which are not measured at fair value in the balance sheet. For the majority of these instruments, the fair values are not materially different to their carrying amounts, since the interest receivable/payable is either close to current market rates or the instruments are short-term in nature.
Borrowings are comprised of fixed rate debt and are measured at their amortized cost. The Group estimates that the fair value of its financial liabilities is approximately 85% of its carrying amount, including interests accrued as of March 31, 2023. Fair value was calculated based on market price for the Notes and is within Level 1 of the fair value hierarchy.
18
Capital commitments
Capital commitments are detailed in Note 33.2 to the audited Consolidated Financial Statements as of December 31, 2022. The following updates have taken place during the three-month period ended March 31, 2023:
The Group incurred investments of US$ 9,934,000 to fulfil its commitments, at GeoPark’s working interest.
Colombia
The Colombian National Hydrocarbons Agency (“ANH”) approved GeoPark’s request to extend the exploratory phase in the Llanos 87 Block until May 14, 2023. As of the date of these interim condensed consolidated financial statements, the investments needed to fullfil the commitments in the block have already been incurred and the ANH approval is pending.
Brazil
The Brazilian National Petroleum, Natural Gas and Biofuels Agency (“ANP”) approved GeoPark’s request to extend the exploratory phase in the POT-T-785 until April 29, 2025.
19
SIGNATURE
Pursuant to the requirements of the Securities Exchange Act of 1934, the registrant has duly caused this report to be signed on its behalf by the undersigned, thereunto duly authorized.
| | |
| GeoPark Limited | |
| | |
| | |
| | |
| By: | /s/ Verónica Dávila |
| | Name: Verónica Dávila |
| | Title: Chief Financial Officer |
Date: May 3, 2023
20