UNITED STATES
SECURITIES AND EXCHANGE COMMISSION
WASHINGTON, D.C. 20549
FORM 8-K
CURRENT REPORT
Pursuant to Section 13 or 15(d)
of the Securities Exchange Act of 1934
Date of Report (Date of earliest event reported): December 23, 2020
ALTIMAR ACQUISITION CORPORATION
(Exact name of registrant as specified in its charter)
| Cayman Islands | 001-39653 | 98-1554235 | ||
(State or other jurisdiction of incorporation or organization) | (Commission File Number) | (I.R.S. Employer Identification Number) | ||
40 West 57th Street 33rd Floor New York, NY | 10019 | |||
| (Address of principal executive offices) | (Zip Code) | |||
(212) 287-6767
Registrant’s telephone number, including area code
Not Applicable
(Former name or former address, if changed since last report)
Check the appropriate box below if the Form 8-K filing is intended to simultaneously satisfy the filing obligation to the registrant under any of the following provisions:
| ☒ | Written communications pursuant to Rule 425 under the Securities Act (17 CFR 230.425) |
| ☐ | Soliciting material pursuant to Rule 14a-12 under the Exchange Act (17 CFR 240.14a-12) |
| ☐ | Pre-commencement communications pursuant to Rule 14d-2(b) under the Exchange Act (17 CFR 240.14d-2(b)) |
| ☐ | Pre-commencement communications pursuant to Rule 13e-4(c) under the Exchange Act (17 CFR 240.13e-4(c)) |
Securities registered pursuant to Section 12(b) of the Act:
Title of each class | Trading Symbol(s) | Name of each exchange on which registered | ||
| Units, each consisting of one Class A Ordinary Share, $0.0001 par value, and one-third of one redeemable warrant | ATACU | New York Stock Exchange | ||
| Class A Ordinary Shares included as part of the units | ATAC | New York Stock Exchange | ||
| Redeemable warrants included as part of the units, each whole warrant exercisable for one Class A Ordinary Share at an exercise price of $11.50 | ATACW | New York Stock Exchange |
Indicate by check mark whether the registrant is an emerging growth company as defined in Rule 405 of the Securities Act of 1933 or Rule 12b-2 of the Securities Exchange Act of 1934.
Emerging growth company ☒
If an emerging growth company, indicate by check mark if the registrant has elected not to use the extended transition period for complying with any new or revised financial accounting standards provided pursuant to Section 13(a) of the Exchange Act. ☐
Item 7.01. Regulation FD Disclosure.
On December 23, 2020 Owl Rock, Dyal and Altimar (each as defined under Item 8.01) held a joint investor conference call to discuss the transaction disclosed under Item 8.01. A copy of the transcript of the investor call is furnished as Exhibit 99.2 hereto and incorporated by reference into this Item 7.01. A copy of the presentation that Altimar, Owl Rock and Dyal prepared for use in connection with various meetings and conferences with investors is furnished as Exhibit 99.3 hereto and incorporated by reference into this Item 7.01.
The foregoing (including Exhibit 99.1) is being furnished pursuant to Item 7.01 and will not be deemed to be filed for purposes of Section 18 of the Securities and Exchange Act of 1934, as amended (the “Exchange Act”), or otherwise be subject to the liabilities of that section, nor will it be deemed to be incorporated by reference in any filing under the Securities Act of 1933, as amended (the “Securities Act”), or the Exchange Act.
Item 8.01. Other Events.
On December 23, 2020, Altimar Acquisition Corporation (NYSE: ATAC) (“Altimar”) announced that it had entered into a definitive business combination agreement with Owl Rock Capital Group (“Owl Rock”) and the Dyal Capital Partners (“Dyal”) division of Neuberger Berman Group LLC to form Blue Owl Capital Inc. (“Blue Owl”), a publicly-traded alternative asset management firm with over $45.0 billion in assets under management. A copy of the press release announcing the transaction is furnished as Exhibit 99.1 hereto.
Pursuant to the transaction, Altimar, which currently holds $275 million in cash in trust, will combine with Blue Owl at an estimated $12.5 billion pro forma equity value. Cash proceeds in connection with the transaction will be funded through a combination of Altimar’s cash in trust and a $1.5 billion fully committed, oversubscribed, common stock private investment in public equity at $10.00 per share.
The information in this Item 8.01 and Exhibit 99.1 attached hereto shall not be deemed “filed” for purposes of Section 18 of the Exchange Act, or otherwise subject to the liabilities of that section, nor shall it be deemed incorporated by reference in any filing under the Securities Act or the Exchange Act, except as expressly set forth by specific reference in such filing.
Additional Information and Where to Find It
Altimar intends to file a registration statement on Form S-4 with the Securities and Exchange Commission (the “SEC”), which will include a proxy statement and a prospectus of Altimar, and each party will file other documents with the SEC regarding the proposed transaction. A definitive proxy statement/prospectus will also be sent to the stockholders of Altimar, seeking any required stockholder approval. Before making any voting or investment decision, investors and security holders of Altimar are urged to carefully read the entire registration statement and proxy statement/prospectus, when they become available, and any other relevant documents filed with the SEC, as well as any amendments or supplements to these documents, because they will contain important information about the proposed transaction. The documents filed by Altimar with the SEC may be obtained free of charge at the SEC’s website at www.sec.gov. In addition, the documents filed by Altimar may be obtained free of charge from Altimar at www.altimarspac.com. Alternatively, these documents, when available, can be obtained free of charge from Altimar upon written request to Altimar Acquisition Corp., 40 West 57th Street, New York, New York 10019, Attn: Secretary, or by calling 212-287-6767.
Forward Looking Statements
Certain statements made in this Current Report on Form 8-K, and oral statements made from time to time by representatives of the Company are “forward looking statements” within the meaning of the “safe harbor” provisions of the United States Private Securities Litigation Reform Act of 1995. Statements regarding the proposed business combination and expectations regarding the combined business are “forward looking statements.” In addition, words such as “estimates,” “projects,” “expects,” “anticipates,” “forecasts,” “plans,” “intends,” “believes,” “seeks,” “may,” “will,” “would,” “should,” “future,” “propose,” “target,” “goal,” “objective,” “outlook” and variations of these
words or similar expressions (or the negative versions of such words or expressions) are intended to identify forward-looking statements. These forward-looking statements are not guarantees of future performance, conditions or results, and involve a number of known and unknown risks, uncertainties, assumptions and other important factors, many of which are outside Altimar’s control, that could cause actual results or outcomes to differ materially from those discussed in the forward-looking statements. Important factors, among others, that may affect actual results or outcomes include: the inability of Altimar to complete the contemplated transactions with Owl Rock and Dyal; the risk that the approval of the stockholders of Altimar for the proposed business combination is not obtained; the inability to recognize the anticipated benefits of the proposed business combination, which may be affected by, among other things, the amount of funds available in Altimar’s trust account following any redemptions by Altimar’s stockholders; the ability to meet the NYSE’s listing standards following the consummation of the transactions contemplated by the proposed business combination; costs related to the proposed business combination; and those factors discussed in Altimar’s prospectus, dated October 22, 2020 under the heading “Risk Factors,” and other documents of Altimar filed, or to be filed, with the SEC. Altimar does not undertake any obligation to update or revise any forward-looking statements, whether as a result of new information, future events or otherwise, except as required by law.
Participants in the Solicitation
Altimar and certain of its respective directors and executive officers may be deemed to be participants in the solicitation of proxies from the stockholders of Altimar, in favor of the approval of the business combination. Additional information regarding the interests of those participants and other persons who may be deemed participants in the transaction may be obtained by reading the registration statement and the proxy statement/prospectus and other relevant documents filed with the SEC when they become available. Free copies of these documents may be obtained as described in the preceding paragraph.
Non-Solicitation
The disclosure herein is not a proxy statement or solicitation of a proxy, consent or authorization with respect to any securities or in respect of the potential transaction and shall not constitute an offer to sell or a solicitation of an offer to buy the securities of Altimar, nor shall there be any sale of any such securities in any state or jurisdiction in which such offer, solicitation, or sale would be unlawful prior to registration or qualification under the securities laws of such state or jurisdiction. No offer of securities shall be made except by means of a definitive document.
Item 9.01. Financial Statements and Exhibits.
(d) Exhibits:
Exhibit | Description | |
| 99.1 | Press Release, dated December 23, 2020. | |
| 99.2 | Investor Call Transcript, dated December 23, 2020. | |
| 99.3 | Investor Presentation, dated December 23, 2020 | |
SIGNATURE
Pursuant to the requirements of the Securities Exchange Act of 1934, the registrant has duly caused this report to be signed on its behalf by the undersigned hereunto duly authorized.
Dated: December 23, 2020
| ALTIMAR ACQUISITION CORPORATION | ||
| By: | /s/ Tom Wasserman | |
| Name: | Tom Wasserman | |
| Title: | Chief Executive Officer | |
Exhibit 99.1
Owl Rock Capital Group and Dyal Capital Partners Execute Definitive Business Combination Agreement to Form Blue Owl Capital and List on NYSE via a Business Combination with Altimar Acquisition Corporation
| • | Owl Rock and Dyal to combine to form Blue Owl, a differentiated alternative asset manager with industry leading Direct Lending and GP Capital Solutions businesses |
| • | Combined firm to manage over $45.0 billion in assets |
| • | Blue Owl to become publicly listed through a business combination with Altimar, a SPAC sponsored by an affiliate of HPS Investment Partners (NYSE:ATAC) |
| • | Blue Owl is expected to be listed on the NYSE under the ticker symbol “OWL” following the expected close of the transaction in the first half of 2021 |
| • | Transaction expected to provide approximately $1.8 billion in gross proceeds, comprised of Altimar’s $275 million of cash held in trust (assuming no redemptions) and a $1.5 billion fully committed, oversubscribed, common stock PIPE at $10.00 per share, including investments from ICONIQ Capital, CH Investment Partners, Koch Companies Defined Benefit Master Trust, the Federated Hermes Kaufmann Funds, and Liberty Mutual Investments |
| • | The founders and senior managers of Blue Owl will retain their equity stakes through the combined entity’s transition into a publicly listed company, promoting continued alignment |
NEW YORK – December 23, 2020—Owl Rock Capital Group (“Owl Rock”) and the Dyal Capital Partners (“Dyal”) division of Neuberger Berman Group LLC (“Neuberger Berman”) today announced they entered into a definitive business combination agreement with Altimar Acquisition Corporation (NYSE: ATAC) (“Altimar”) to form Blue Owl Capital Inc. (“Blue Owl”), an alternative asset management firm with over $45.0 billion in assets under management.
Blue Owl will enter the public market through a business combination with Altimar, a special purpose acquisition company sponsored by an affiliate of HPS Investment Partners, LLC. The combined entity is expected to have a post-transaction market capitalization of approximately $12.5 billion. As a result of the transaction, Blue Owl is expected to be listed on the NYSE under the new ticker “OWL”.
The new firm’s main business will focus on two of the fastest growing areas of alternative asset management: Direct Lending, where Owl Rock is one of the leading private credit providers to middle and upper middle market businesses backed by top-tier financial sponsors, and GP Capital Solutions, where Dyal has been a leader and innovator since its founding. The Owl Rock and Dyal businesses will be autonomous but complementary. By bringing together two preeminent businesses in their respective fields, Blue Owl will be positioned as a differentiated provider of holistic solutions to the alternative asset management community. Each business will be led by its current long-tenured management, and its respective investment teams will continue to employ the disciplined investment philosophies that they have delivered since inception.
Doug Ostrover, co-founder of Owl Rock, will serve as Chief Executive Officer of Blue Owl. On the announcement of the strategic combination, he stated: “Blue Owl’s expertise, agility and scale, supported by a substantial permanent capital base, will enable us to offer a holistic platform of capital solutions to private equity firms and privately held businesses. We believe this will broaden and deepen our relationships and provide us with unrivaled access to compelling investment opportunities. In addition, this permanent capital base will allow Blue Owl to continue to strongly grow its business in a consistent and predictable manner. The foundation of our success is the trust our clients and partners place in us based on our experience, investment approach, and commitment to serving them. We look forward to solidifying our position as the capital partner and investment manager of choice for our stakeholders.”
Michael Rees, Dyal founder, and Marc Lipschultz, Owl Rock co-founder, will be co-Presidents of Blue Owl. Rees said: “Our businesses will combine robust growth and a strong margin profile with a high level of earnings visibility and stability, offering investors a compelling way to access the alternative asset management industry.” Lipschultz added: “By building on this strong foundation, we believe we are well positioned to continue to expand our current platforms and pursue new, complementary business lines to provide differentiated sources of returns for our investors.”
George Walker, Chairman and Chief Executive Officer of Neuberger Berman, added: “This partnership is a clear and natural fit. Neuberger Berman, as a meaningful shareholder, looks forward to seeing Blue Owl continue to grow as an industry leader. Moreover, Neuberger Berman has the privilege of continuing to manage $80 billion in alternatives distinct from the Dyal business, and our culture of innovation from which Dyal began will continue to help us deliver for clients in the years to come.”
Upon completion of the transaction, Blue Owl will be a stand-alone firm and Owl Rock and Dyal founders, alongside Neuberger Berman, will own meaningful equity positions in Blue Owl.
Blue Owl is expected to combine these strengths:
Owl Rock Direct Lending Highlights:
| • | Scaled direct lending business with $23.7 billion in assets under management as of September 30, 2020 |
| • | Focused on lending to middle- and upper-middle-market, private equity-sponsored companies |
| • | Technology lending strategy capitalizing on the large and growing demand for technology products and services |
| • | Led by an investment team dedicated to direct lending |
| • | Demonstrated ability to source proprietary investment opportunities with $24 billion in originations since inception |
| • | Industry-leading credit performance historically and throughout the COVID-19 pandemic |
Dyal GP Capital Solutions Platform Highlights:
| • | Industry leading GP capital solutions business with a proven track record, having completed 57 transactions with 49 GPs to date |
| • | Deep and extensive relationships across the alternative asset management ecosystem |
| • | Large permanent capital base totaling $23.3 billion in assets under management (as of November 30, 2020) promotes the formation of strong, value-added partnerships |
| • | Unique Business Services Platform assists GPs in the portfolio with a leading set of strategic and capital raising advisory services |
| • | Led by founder Michael Rees and a senior management team that has an average of 18 years of experience and more than a decade of working together in the GP Capital Solutions business |
Blue Owl management believes it will have a uniquely attractive financial profile due to its combination of strong growth and margins with a focus on permanent capital and fee related earnings (“FRE”). Specifically, the firm will have over $45.0 billion in combined assets under management, 92% of which would be permanent capital, and initially will derive its distributable earnings from FRE, which allows for enhanced predictability of earnings. Blue Owl will be well positioned to grow its asset base and distributable earnings due to the complementary client relationships and skillsets of Dyal and Owl Rock, which we believe will further enable new product expansion.
We believe investors in Blue Owl sponsored funds will benefit from a strategic combination without disruption to the service they receive or the investment programs they rely upon. Investment strategies, processes and teams for the company’s funds will remain consistent, while expecting that their investors will gain from the combined company’s expanded platform, broadened and deepened relationships across the alternative asset management landscape, and a broader range of expertise across the firm.
Owl Rock Capital Corporation (“ORCC”), Owl Rock Capital Corporation II, Owl Rock Capital Corporation III, Owl Rock Technology Finance Corp. and Owl Rock Core Income Corp. (the “Owl Rock BDCs”) will continue to be led by their Chief Executive Officer and Owl Rock co-founder, Craig Packer, and will not undertake any change to their investment strategies, team or process from this transaction. This includes ORCC, which is publicly traded under the “ORCC” ticker.
The closing of the transaction will result in a change of control of the registered investment adviser (the “Owl Rock Advisers”) to each of the Owl Rock BDCs under the Investment Company Act of 1940, as amended (“1940 Act”), and will require the assignment of each Owl Rock BDC’s current investment advisory agreement in accordance with the 1940 Act. As a result, each BDC’s shareholders will be asked to approve an amended and restated investment advisory agreement between such Owl Rock BDC and the applicable Owl Rock Adviser, which will replace its current investment advisory agreement upon the consummation of the transaction. All material terms will remain unchanged from the Owl Rock BDCs’ current investment advisory agreements, and such agreements, if approved by the applicable Owl Rock BDCs’ shareholders, will become effective upon the closing of the transaction.
Transaction Overview
Pursuant to the transaction, Altimar, which currently holds $275 million in cash in trust, will combine with Blue Owl at an estimated $12.5 billion pro forma equity value at closing. Assuming no redemptions by Altimar’s existing public stockholders, the existing equityholders of Owl Rock and Dyal (including Neuberger Berman) will hold approximately 85% of Blue Owl immediately following the closing of the business combination. The founders and senior managers of Blue Owl will retain their equity stakes immediately following the transaction, promoting continued alignment with the combined company’s public investors and clients.
Cash proceeds in connection with the transaction will be funded through a combination of Altimar’s cash in trust and a $1.5 billion fully committed, oversubscribed, common stock private investment in public equity (“PIPE”) at $10.00 per share, including commitments from leading investors including ICONIQ Capital, CH Investment Partners, Koch Companies Defined Benefit Master Trust, the Federated Hermes Kaufmann Funds, and Liberty Mutual Investments.
The board of directors for each of Altimar and Neuberger Berman, as well as the Executive Committee of Owl Rock, have unanimously approved the proposed transaction. Completion of the proposed transaction is subject to approvals of Altimar’s stockholders, the equityholders of each of the Owl Rock BDCs to the assignment of its advisory agreement, as discussed above, and Dyal-sponsored fund’s limited partners, in addition to other customary closing conditions, including a registration statement being declared effective by the Securities and Exchange Commission. The transaction is expected to be completed in the first half of 2021.
Management and Board of Directors
Upon completion of the strategic combination, Blue Owl will be led by Doug Ostrover (Owl Rock co-founder) as Chief Executive Officer. The senior management team will also include Michael Rees (founder of Dyal) and Marc Lipschultz (Owl Rock co-founder) as co-Presidents and Alan Kirshenbaum as Chief Financial Officer. Craig Packer (Owl Rock co-founder) will continue as Chief Executive Officer of the Owl Rock BDCs.
Blue Owl’s nine-person board of directors will be initially composed of three independent directors, three Owl Rock-appointed directors, two Dyal-appointed directors and one Neuberger Berman-appointed director.
Advisors
Perella Weinberg Partners LP, Goldman Sachs & Co. LLC and BofA Securities, Inc. are serving as financial advisors and Kirkland & Ellis LLP is serving as legal counsel to Owl Rock.
Ardea Partners LP is serving as financial advisor for Neuberger Berman and Dyal. Skadden, Arps, Slate, Meagher & Flom LLP is serving as legal counsel to Neuberger Berman. Additionally, Citigroup and UBS are serving as advisors to Neuberger Berman. Evercore Group LLC is serving as financial advisor and Fried, Frank, Harris, Shriver & Jacobson LLP is serving as legal counsel to Dyal.
J.P. Morgan Securities LLC is serving as exclusive financial advisor and Paul, Weiss, Rifkind, Wharton & Garrison LLP is serving as legal counsel to Altimar Acquisition Corporation.
Goldman Sachs & Co. LLC and J.P. Morgan Securities LLC acted as joint placement agents on the PIPE.
Investor Conference Call Information
An investor call and presentation discussing the transaction is available at the link below:
https://dpregister.com/sreg/10150767/dfccfb54ba
Participant Dial In (Toll Free): 1-866-777-2509
Participant International Dial In: 1-412-317-5413
A transcript of the call will also be filed by Altimar with the SEC.
On the call, the presenters will be reviewing an investor presentation, which will be filed with the SEC as an exhibit to a Current Report on Form 8-K prior to the call, and available on the SEC website at www.sec.gov.
About Altimar Acquisition Corporation
Altimar Acquisition Corporation is a special purpose acquisition company sponsored by Altimar Sponsor, LLC, an affiliate of HPS Investment Partners, LLC, formed for the purpose of effecting a merger, share exchange, asset acquisition, share purchase, reorganization or similar business combination with one or more businesses. For more information, visit www.altimarspac.com.
About Owl Rock
Owl Rock Capital Group, together with its subsidiaries, is a New York-based direct lending platform with approximately $23.7 billion of assets under management as of September 30, 2020. Owl Rock’s platform consists of multiple investment funds and products including business development companies (“BDCs”). Owl Rock is comprised of a team of seasoned investment professionals with significant and diverse experience from some of the world’s leading investment firms and financial institutions. Owl Rock’s relationship-oriented approach to investing seeks to provide companies with sizeable commitments to facilitate transactions and support their growth needs with certainty, speed and transparency throughout the entire investment process.
About Dyal Capital
Dyal Capital seeks to acquire minority equity stakes in and provide financing to established alternative asset managers. With over a decade of experience transacting with institutional financial firms, Dyal has completed over 50 equity and debt transactions and manages approximately $23.3 billion in aggregate capital commitments as of November 30, 2020. Central to Dyal’s success is our Business Services Platform (the “BSP”). The BSP is a team that provides strategic support to underlying management company partners in various areas, primarily including capital strategy and advisory services. Part of Neuberger Berman, the Dyal team is located in New York, London, and Hong Kong.
About Neuberger Berman
Neuberger Berman Group LLC, founded in 1939, is a private, independent, employee-owned investment manager. The firm manages a range of strategies—including equity, fixed income, quantitative and multi-asset class, private equity, real estate and hedge funds—on behalf of institutions, advisors and individual investors globally. With offices in 24 countries, Neuberger Berman’s diverse team has over 2,300 professionals. For six consecutive years, the company has been named first or second in Pensions & Investments Best Places to Work in Money Management survey (among those with 1,000 employees or more). In 2020, the PRI named Neuberger Berman a Leader, a designation awarded to fewer than 1% of investment firms for excellence in Environmental, Social and Governance (ESG) practices. The PRI also awarded Neuberger Berman an A+ in every eligible category for its approach to ESG integration across asset classes. The firm manages $374 billion in client assets as of September 30, 2020, including $103 billion in alternative assets.
Important Additional Information and Where to Find It
This communication is being made in respect of the proposed business combination transaction involving Altimar and Blue Owl. Altimar intends to file a registration statement on Form S-4 with the Securities and Exchange Commission (the “SEC”), which will include a proxy statement and a prospectus of Altimar, and each party will file other documents with the SEC regarding the proposed transaction. A definitive proxy statement/prospectus will also be sent to the stockholders of Altimar, seeking any required stockholder approval. Before making any voting or investment decision, investors and security holders of Altimar are urged to carefully read the entire registration statement and proxy statement/prospectus, when they become available, and any other relevant documents filed with the SEC, as well as any amendments or supplements to these documents, because they will contain important information about the proposed transaction. The documents filed by Altimar with the
SEC may be obtained free of charge at the SEC’s website at www.sec.gov. In addition, the documents filed by Altimar may be obtained free of charge from Altimar at www.altimarspac.com. Alternatively, these documents, when available, can be obtained free of charge from Altimar upon written request to Altimar Acquisition Corp., 40 West 57th Street, New York, New York 10019, Attn: Secretary, or by calling 212-287-6767.
In connection with the proposed transaction which will result in the change in control of the Owl Rock Advisers, the applicable Owl Rock BDCs intend to file proxy statements in preliminary and definitive form with the Securities and Exchange Commission (the “SEC”) that will contain important information about the proposed transaction and related matters, and deliver a copy of the proxy statement to its shareholders. Investors of the Owl Rock BDCs are urged to read the definitive proxy statement and other relevant documents carefully and in their entirety when they become available because they will contain important information about the proposed transaction and related matters. Investors may obtain a free copy of these materials when they are available, and other documents filed by the Owl Rock BDCs, with the SEC at the SEC’s website at www.sec.gov or at Owl Rock’s website at www.owlrock.com or www.owlrock.com/proxy/ or, for Owl Rock Capital Corporation, at www.owlrockcapitalcorporation.com. Investors and security holders may also obtain free copies of the proxy statement and other documents filed with the SEC from the Owl Rock BDCs by contacting Investor Relations at (212) 651-4705.
Participants in the Solicitation
Altimar and certain of its respective directors and executive officers may be deemed to be participants in the solicitation of proxies from the stockholders of Altimar, in favor of the approval of the business combination. For information regarding Altimar’s directors and executive officers, please see Altimar’s final prospectus related to its initial public offering filed with the SEC on October 23, 2020. Additional information regarding the interests of those participants and other persons who may be deemed participants in the transaction may be obtained by reading the registration statement and the proxy statement/prospectus and other relevant documents filed with the SEC when they become available. Free copies of these documents may be obtained as described in the preceding section.
The applicable Owl Rock BDCs and their directors, executive officers, employees and other persons certain of their respective directors and executive officers may be deemed to be participants in the solicitation of proxies from the stockholders or shareholders of the applicable Owl Rock BDCs’ common stock in respect of the change in control Transaction. For information regarding the Owl Rock BDCs’ directors and executive officers, please see: Owl Rock Capital Corporation’s definitive proxy statement filed with the SEC on April 17, 2020, in connection with its 2020 annual meeting of shareholders; Owl Rock Capital Corporation II’s definitive proxy statement filed with the SEC on April 17, 2020, in connection with its 2020 annual meeting of shareholders; Owl Rock Technology Finance Corp.’s definitive proxy statement filed with the SEC on April 17, 2020, in connection with its 2020 annual meeting of shareholders; and Owl Rock Capital Corporation III’s registration statement on Form 10 filed with the SEC on July 17, 2020. Other information regarding persons who may be deemed participants in the proxy solicitation and a description of their direct and indirect interests, by security holdings or otherwise, will be contained in the proxy statement and other relevant materials to be filed with the SEC when they become available.
This communication does not constitute an offer to sell or the solicitation of an offer to buy any securities or a solicitation of any vote or approval, nor shall there be any sale of any securities in any state or jurisdiction in which such offer, solicitation, or sale would be unlawful prior to registration or qualification under the securities laws of such other jurisdiction.
Forward-Looking Statements
Certain statements made in this press release, and oral statements made from time to time by representatives of Owl Rock, Dyal and Neuberger Berman are “forward-looking statements” within the meaning of the safe harbor provisions of the United States Private Securities Litigation Reform Act of 1995. Statements regarding the potential combination and expectations regarding the combined business are forward-looking statements. In addition, words such as “estimates,” “projects,” “expects,” “anticipates,” “forecasts,” “plans,” “intends,” “believes,” “seeks,” “may,” “will,” “would,” “should,” “future,” “propose,” “target,” “goal,” “objective,” “outlook” and variations of these words or similar expressions (or the negative versions of such words or expressions) are intended to identify forward-looking statements. These forward-looking statements are not guarantees of future performance, conditions or results, and involve a number of known and unknown risks, uncertainties, assumptions and other important factors, many of which are outside the control of the parties, that could cause actual results or outcomes to differ materially from those discussed in the forward-looking statements.
In addition to factors previously disclosed in Altimar’s reports filed with the SEC, including its registration statement on Form S-1 filed in connection with its initial public offering, and those identified elsewhere in this communication, important factors that could cause actual results and outcomes to differ materially from those indicated in the forward-looking statements include, among others, the following: (i) the inability of the parties to enter into a definitive agreement with respect to the potential combination or to complete the contemplated transactions; (ii) matters discovered by any of the parties as they complete their respective due diligence investigation of the other parties; (iii) the risk that requisite regulatory, corporate and other approvals and consents for the potential transaction are not obtained or are delayed; (iv) the inability to recognize the anticipated benefits of the proposed combination; (v) delays in signing or closing a transaction; (vi) difficulties, delays or unanticipated costs in integrating the operations or personnel of Owl Rock and Dyal; (vii) unexpected costs resulting from the transaction; (viii) changes in general economic conditions, including as a result of the COVID-19 pandemic and (ix) regulatory conditions and developments. Forward-looking statements speak only as of the date they are made, and none of Owl Rock, Dyal or Neuberger Berman undertakes any obligation, and expressly disclaims any obligation, to update, alter or otherwise revise any forward-looking statements, whether as a result of new information, future events or otherwise, except as required by law. Readers should carefully review the statements set forth in the reports, which Altimar has filed or will file from time to time with the SEC.
Non-GAAP Financial Measures
This press release includes references to fee related earnings, or FRE, which is a supplemental measure that is not required by, or prepared in accordance with, accounting principles generally accepted in the United States (“GAAP”).
FRE is used to assess core operating performance by determining whether recurring revenue is sufficient to cover operating expenses and to generate profits. FRE is derived from and reconciled to, but not equivalent to, its most directly comparable GAAP measure of Net Income (Loss) Before Income Taxes. FRE differs from income before taxes computed in accordance with GAAP as it excludes performance income, performance related compensation, investment net gains (losses) and certain other items that we believe are not indicative of our core operating performance. We use FRE as a non-GAAP measure to assess and track our performance. FRE is not a measurement of our financial performance under GAAP and should be considered in addition to, and not in lieu of, the results of operations which are derived in accordance with GAAP.
Altimar Contact
Prosek Partners
Mike Geller
mgeller@prosek.com
Owl Rock and Dyal Contacts
Prosek Partners
David Wells / Andy Merrill / Josh Clarkson / Emily Goldberg
dwells@prosek.com / amerrill@prosek.com / jclarkson@prosek.com / egoldberg@prosek.com
Exhibit 99.2
Call Announcing Owl Rock Capital Group and Dyal Capital Partners Enter Definitive Business Combination Agreement with Altimar Acquisition Corporation to Form Blue Owl Capital, Inc. |
Wednesday, December 23, 2020 |
PARTICIPANTS
Douglas Ostrover - Co-Founder Owl Rock
Marc Lipschultz - Co-Founder Owl Rock
Michael Rees - Founder Dyal Capital
Alan Kirshenbaum - Chief Financial Officer, Owl Rock
Tom Wasserman - Chief Executive Officer, Altimar Acquisition Corporation
Scott Kapnick - Chief Executive Officer, HPS Investment Partners |
The following is a transcript of a recording of a presentation posted on December 23, 2020. This transcript should be read in conjunction with, and is qualified in all respects by, the written material accompanying that presentation, which was furnished as Exhibit 99.3 to Altimar Acquisition Corporation’s Current Report on Form 8-K filed with the Securities and Exchange Commission on December 23, 2020.
Operator
Welcome to the call announcing that Owl Rock Capital Group and Dyal Capital Partners have entered into a definitive business combination agreement with Altimar Acquisition Corporation to form Blue Owl Capital, Inc. and list on the New York Stock Exchange.
Before we begin, I would like to note that this call may contain forward-looking statements, including Blue Owl’s expectations of future financial and business performance and conditions, the industry outlook, and the timing and completion of the transaction.
Forward-looking statements are inherently subject to risks, uncertainties, and assumptions, and they are not guarantees of performance. I encourage you to read the press release issued today, the accompanying presentation that is available on Altimar’s website, and filings with the SEC for a discussion of the risks that can affect business combination and the business of Blue Owl after completion of the proposed transaction.
All participants will be in a listen-only mode. I would now like to turn the conference over to Doug Ostrover, Co-Founder of Owl Rock, who will serve at Chief Executive Officer of Blue Owl. Please go ahead.
Doug Ostrover
Good morning, everyone. Thank you for joining us today. This is an exciting day for us, and we appreciate you taking the time to learn more about Blue Owl. I want to thank the HPS Altimar team for their commitment and partnership, as well as the world-class group of institutional investors who committed an additional $1.5 billion of capital to the transaction.
I’d like to start off by explaining why I think Blue Owl is a truly differentiated alternative asset manager. We are a business that is focused exclusively on the private markets. We have two major lines of business. We are one of the largest players in the direct lending markets, and we are the single largest manager of GP solutions. I am confident that Blue Owl’s expertise, agility and scale, underpinned by a substantial permanent capital base, will enable us to offer a platform of capital solutions and, in turn, provide us with unrivaled access to compelling investment opportunities.
On page three, what I tried to do is describe to you a few of the attributes that I hope you and your team will find attractive. First, and this is probably the most important point, our capital base is permanent. We have on the slide approximately $50 billion of assets. We believe in the very near future that will be almost $60 billion.
It’s important to understand that $60 billion is permanent. It will not go down. You will hear a lot of alternative managers talk about their net assets grew by X. We don’t have this phenomenon. Our assets start at $50 billion to $60 billion, and they will only grow from there.
Call Announcing Owl Rock Capital Group and Dyal Capital Partners Enter Definitive Business
Combination Agreement with Altimar Acquisition Corporation to Form Blue Owl Capital, Inc.
Wednesday, December 23, 2020
2
Secondly, our distributable earnings are 100% from FRE. Our profit margins are best in class. You’ll see that our growth over the next two years is the highest in the industry, and it’s primarily from funds raised but not yet deployed.
We’ll also take a moment to talk about some of our growth initiatives that are not in our projections. And then finally, we have a leadership team with a proven record of success. On the right-hand side of the slide, you can see how we compared to the best traded names in the alternative space. Whether it’s FRE, pretax margins, or our growth rate, you will see all of these metrics are best in class.
The next slide is an overview of what our business looks like and the strategic rationale behind the combination of Owl Rock and Dyal. As I said earlier, we have two major lines of business that make up Blue Owl. On the left, we have the direct lending side, Owl Rock, which is the business that I co-founded with Marc Lipschultz and Craig Packer in 2016. Our direct lending platform provides lending solutions to leading private market sponsors. This side of the business has $23.7 billion in assets under management, $19.7 billion of which is permanent capital.
The other side of the business, Dyal, which is GP Capital Solutions, was founded by Michael Rees in 2010. This side of the business provides minority stake equity and financing solutions to leading private market sponsors. The GP Capital Solutions side has $23.3 billion in assets under management, 100% of which is permanent capital.
By bringing these two businesses together, Blue Owl will be positioned as a differentiated provider of solutions to the alternative asset management community. The two businesses of Blue Owl will be autonomous but complementary. There will be enhanced origination opportunities for our direct lending businesses through ownership relationships in our GP Cap Solutions businesses. There will also be enhanced origination opportunities for the GP Capital Solutions business through our large origination network and in-depth firm insights.
Additionally, both sides of the business bring together investment veterans and experienced professionals who can work together to develop new, superior products for our clients. And lastly, there is significant opportunity for enhanced fundraising across all products due to limited overlap of our current product investors.
So, my goal today is to present you to the team, let us walk into the business, and show you that this combination of permanent capital combined with very high growth, it should allow us not day one but over the near term to hopefully trade equal or at a premium to all of the names you see on the page on the right-hand side.
Let’s move forward for a moment. So, as I mentioned, we have one of the largest pools of permanent capital focused on the needs of the private marketplace. It’s important to remember we look at ourselves as a solutions provider. And what this slide is meant to show you is obviously some of the PE firms we work with and, in the middle of the page, some of the solutions we offer.
What we’re trying to do is we’re trying to meet all of the needs, whether it be a PE firm or a VC firm or a debt firm. Our goal is to have a pool of capital to meet whatever the needs are of those firms. You can see in the boxes we have two products we hope to go after in the near term, and co-investments is a great example of something that we are in the process of creating. I like to think about it, for our originators and for our stakes teams, just another tool in the toolshed.
Call Announcing Owl Rock Capital Group and Dyal Capital Partners Enter Definitive Business
Combination Agreement with Altimar Acquisition Corporation to Form Blue Owl Capital, Inc.
Wednesday, December 23, 2020
3
On the debt side, we call on well over 600 private equity firms. We talk to many of these firms on a weekly basis. We are presented with co-invest constantly. On the stakes side of the business, these are firms--we have founder level relationships and we see a lot of proprietary ideas from them. I can tell you that we believe we can build one of the largest co-invest businesses in the industry. And I have to be honest. I’d be disappointed if we didn’t become one of the largest managers in this asset class in the next three years.
So, I’m not going to spend too much time on this page. I think many of you have probably seen something similar, but I think it’s important to realize that we have tremendous tailwinds in both private equity and the private debt sectors. What the slide is meant to show you is Preqin is forecasting 16% growth in basically both of these asset classes. And I think as a team at Blue Owl we believe those numbers could be light.
Most of you are aware we have a 10 year Treasury that is well below 1%. But what you may not be focused on is that 80% of investment-grade debt today trades below 1%. 50% of high-yield yields under 4%. And because of this phenomenon, we expect a substantial amount of capital to continue to flow into the alternative asset sector. Remember, our products, they generate meaningful current income as well as they offer attractive upside. And so, we’re confident that we will continue to get more than our fair share as these assets continue to grow.
This is a very important story and begins to tell why we’re so excited about our equity story. If you think about what we’ve created, we’ve created a very large pool of permanent capital. That pool of capital will generate meaningful revenue for the foreseeable future. In other words, it’s certainty of cash flow.
What that means to shareholders, a certainty of high dividends and growing dividends, and then you combine that with meaningful growth and we think we have something that’s truly unique. We believe we have all the best attributes of the most highly valued alts firms that you see on the bottom right-hand page, but our capital base is permanent.
Also, I think it’s important to keep in mind we’re very well positioned in our respective businesses. And as we go through this, you’ll see we’ve shown that we have the ability, if a meaningful opportunity exists, to innovate and create interesting new products for our investors. I want to highlight just three bullets.
The second bullet, first of all it says best in class FRE generation and EBITDA margins; the third bullet, industry-leading growth generated from highly visible embedded AUM profitability. And the fifth bullet is something I really want to spend a few moments on. When you take a look at our LP roster, it’s a blue-chip roster of investors, and we’d be happy to share that with any of you.
But you’ll also see we mention our retail distribution channel. We often refer to this as our hidden gem. We have built out--we have spent tens of millions of dollars building out a retail distribution channel that we believe is--that is best in class and can compete with anyone in the marketplace. Just to give you an idea how powerful this is, Blackstone, pre-COVID in their retail channel, was bringing in over $1 billion a month in the non-traded REIT space. We are getting ready to launch a comparable product but in the credit space.
Call Announcing Owl Rock Capital Group and Dyal Capital Partners Enter Definitive Business
Combination Agreement with Altimar Acquisition Corporation to Form Blue Owl Capital, Inc.
Wednesday, December 23, 2020
4
Now, we’re not expecting to bring in $1 billion a month, but we do think it’s reasonable that we could bring in $200 million, $250 million a month. You should know that those numbers are not in our projections. When I go through numbers, when Alan, our CFO goes through numbers, none of that is in there, yet we think we could generate $2.5 billion to $3 billion a year through retail.
I think if you look to the right and the upper right-hand side, the light blue bar is meant to just show you our after-tax profit. You can see it’s going from about $300 million to $560 million; a couple points I want to make on that. Almost all of that, and Alan will walk you through this, comes from money that has been raised but not yet deployed.
The other thing I want to point out is we think $560 million is a conservative number. You will see we have some fee waivers rolling off and capital in the ground. With no growth, we believe we should generate well over $600 million of net income, so we think that is a highly achievable number.
You can see down below Hamilton Lane, EQT Partners Group, StepStone, all incredible firms, and they’re trading in and around 30x ’22 P/E. Now, we’re not expecting to come out and trade and price at 30x. We will come at a very nice discount to that. But we feel highly confident, as we continue to go through this, you’ll see that we should trade at least in line with those firms and, hopefully over time, trade at a premium to those firms.
So, this is a slide I think that speaks for itself, but I think it’s pretty compelling. You can see in the upper right-hand quadrant Blue Owl, in terms a fee related earnings and growth, is heads and tails above its peers; 100% FRE, 65% growth over the next few years. But what’s not on this chart which really differentiates us is 91% of our capital is permanent.
This is really, I think, a very important slide to understand the story. On the right-hand side are what we refer to as the diversified managers. These are incredible firms, but you should know that a big part of their distributable earnings come from carry. And the market puts a premium on fee related income and they discount carry. You can see in the middle are the firms I just referenced. And a larger percent of their distributable earnings come from fee-related earnings, and they trade at a premium.
Now, all the way to the left, take a look at Blue Owl. Our FRE as a percentage of our distributable earnings is 100%. Our growth over the next two years is 65%; our long-term growth 33%. That compares to the middle column, 23% and 17%, and to the more established firms’ short-term growth of 20%, longer-term 14%. So, we believe we’ll have a large premium. We should earn a premium because of that growth.
Our visibility of earnings; you’ll hear from the team shortly 82% of the growth over the next two years will come from existing funds and some early fee waivers that will be expiring or have expired. You can see versus our peers they also have relatively high visibility, but I don’t think it’s at 82%. Permanence of capital, 91%; you can see the middle column, nothing of substance, and the firms on the right are at 20%.
I think this is a really important column, and that’s because if you listen to the earnings calls of virtually every alternative manager, one of the things they all stress is they want to increase the amount of permanent capital they have. And so, we are starting light years ahead of our peers. And then on margins, you can see we’re at 67% versus 53% for the higher growth FRE centric firms and 50% for the alts managers.
Call Announcing Owl Rock Capital Group and Dyal Capital Partners Enter Definitive Business
Combination Agreement with Altimar Acquisition Corporation to Form Blue Owl Capital, Inc.
Wednesday, December 23, 2020
5
So, we’re really excited about what we’ve built. And now, why don’t we take a moment and go into our lines of business? Marc, I’ll hand it off to you.
Marc Lipschultz
Thank you, Doug. I’m Marc Lipschultz, co-founder and co-president of Blue Owl. Let me talk to you just a bit about the direct lending side of our business.
So, as Doug talked about, we’ve really achieved a distinctive level of scale in this business. With nearly $24 billion of assets and growing just in our direct lending line, we’re really in a specifically capable position of delivering solutions for just about any private equity or non-sponsor financing need.
We really believe in what we do. We have a lot of our own capital in it. We’ll come onto this later, but in point of fact in this offering we, the co-founders and the management team, are not selling a single share of stock. We are big believers in what Doug just talked to you about.
Very importantly, we deliver results for our investors. And we intend to deliver that for you as an investor if you should join us. But for our existing investors in our products, we have delivered an 11.8% realized return. Contextualize that to Doug’s earlier comments and I think it helps us all understand why alternatives are this inexorable force driving through the system.
In a world of sub 1% investment grade in Treasuries and 4% for high-yield, we offer a substantial premium for a modest increment of risk. And I think that is what has been attractive and will continue to attract people to this particular component of the private markets asset arena.
Just breaking down our products a little further, I’m not going to go through each product but I’m going to make an observation about the spectrum of products that you see. They are all organic products. They’re all built on identifying a need in the marketplace. We see an opportunity, we see a way we can deliver a distinctive value proposition, and we build a product into it.
And we’ve been able to do this very, very successfully, and we expect fully to be able to continue to do so. Doug talked about co-investments, for example, as another block if you look along this is spectrum. But we have our diversified lending business, and then we observe from the platform opportunities like first lien lending, the safest part of the leveraged lending landscape, and we see actually it’s very thinly occupied by alternative providers. So, we said let’s quit the business there in one of the safest arenas where we can generate attractive returns for investors.
Technology; we were very, very early to focus in on the incredibly attractive credit attributes of software businesses. We today manage the largest software dedicated, technology dedicated direct lending product in the world. And we see enormous opportunity. This has been an area of tremendous success for us. We are really married to and growing with the technology sector writ large and many of the sponsors that serve this sector.
Call Announcing Owl Rock Capital Group and Dyal Capital Partners Enter Definitive Business
Combination Agreement with Altimar Acquisition Corporation to Form Blue Owl Capital, Inc.
Wednesday, December 23, 2020
6
And now we can move forward opportunistically, providing solutions when things are more complex, when there’s a need to bridge through the chasm, for example, of a pandemic like we have now, and providing a way for owners of businesses to get from here to the brighter future.
So, this is really an array that will continue to grow really over to the right as we go up and down. We should be able to deliver new products and better solutions and high returns for our investors, and that allows us to deliver high returns for you.
With that, I am going to turn it over to my good friend and co-president and co-founder, Michael Rees.
Michael Rees
Hello, everyone. My name is Michael Rees. And I am the co-president of Blue Owl and the founder of Dyal Capital, and lead our team that focuses on GP Capital Solutions.
For the last decade, this team has focused on providing capital and strategic relationships to some of the best alternative managers in the industry. Over this time, we have made 50 plus minority equity investments into the management companies of these leading firms or provided long-term debt financing at the GP level.
This is a relatively new field that has grown up throughout the alternatives industry, and we believe we are the leader in the space. We’re certainly the leader by size, market share, and prominence within the industry. We run $23 billion of permanent capital and are in the process of raising our fifth minority stakes fund, and are continuing to deploy our permanent capital debt financing fund.
Within this area of GP Capital Solutions, many of the industry’s leading buyout firms, real estate firms, infrastructure, VC, or private credit firms are often looking for a capital partner. They’re looking to find someone to invest permanent capital into their business so that they can initiate growth initiatives, they can put more money into their funds alongside their investors, and also they’d like to add a partner that doesn’t just bring capital but brings a strategic angle as well.
We, within this business of GP Capital Solutions, have an industry-leading team of 34 people. And they work with each of our underlying GP partners in a myriad of areas, helping these businesses become institutional, more institutional, and to continue the growth trajectory that many of them are on. Our team was founded over 10 years ago, and we have a tremendous amount of experience focusing on this very specialized portion of the alternatives industry.
Moving on, you can see the layout of our business. The largest component is in the first column, our five funds that are permanent capital in nature and take permanent investments, capital investments, in minority stakes in the leading money managers throughout the alternative space. Those funds aggregate to about $19 billion in total commitments. And as I mentioned, we’re in the process of raising our fifth permanent capital fund. In that, we have 49 underlying partners.
As we have continued to make those type of minority stake investments, many of our partners have asked us if we could also provide long-term debt financing. Surprising, but many banks and other financial institutions cannot lend to a duration that meets the needs of these firms. So, we can lend through that vehicle to a tenor of 10 or even 15 years. We continue to deploy that capital, and that is the fastest growing part of our business at the moment.
Call Announcing Owl Rock Capital Group and Dyal Capital Partners Enter Definitive Business
Combination Agreement with Altimar Acquisition Corporation to Form Blue Owl Capital, Inc.
Wednesday, December 23, 2020
7
As Doug alluded to at the outset of this meeting, we do think there is a tremendous opportunity in the co-investment and structured equity space. Across all of the embedded GP relationships in the Blue Owl business, we think we can come with many arrows in our quiver to help with these types of co-investments and structured deals to provide some element of liquidity to our very best partners in some of the deals that they have within their portfolio where they’re not looking for a full monetization and they want some strategic capital from a known and trusted party. And oftentimes who better to look to than a minority stake owner in the overall complex?
And finally, we’re proud to be a partner, an exclusive partner, with the NBA, the National Basketball Association, where we’re the only approved buyer of a portfolio of minority equity stakes in the 30 teams in the NBA. That business is just being launched, and we’re hoping to have our first closing in the not-too-distant future. And we think we can grow certainly a very attractive basketball strategy off of this platform, but also possibly expand to a broader sports business that could have tremendous upside. None of that extra growth is embedded in the financials that we’re presenting today.
And then just to highlight some of the key attributes of this GP Capital Solutions business, as I mentioned, we believe we are the market leader. We focus on the best blue-chip firms throughout the industry that are the biggest and we believe have the longest staying power. This provides to our investors a very attractive long-term stream of income and really separates us from two very prominent players in the space, Blackstone and Goldman Sachs, but who focus on smaller or midsize firms. We believe we are really a standout competitor within this space, as is evidenced by our growth, the number of partners that we have, and our market share.
I will now turn it over to Alan, who will take you through the Blue Owl financials.
Alan Kirshenbaum
Thank you, Michael. I am Alan Kirshenbaum. I am the chief financial officer of Blue Owl.
What you see here is two already scaled businesses coming together. You’ll see, starting at the top on the revenue line, the management fee, a very consistent up and to the right management fee line. You’ll see considerable growth over the projection period here, and that translates to considerable growth in distributable earnings toward the bottom of the page. You’ll see, as Doug mentioned earlier in the presentation, a best in class FRE and EBITDA business here.
We have a significant amount of earnings power that’s embedded in our business. And this slide really maps that out. So, what we’re showing here is that our distributable earnings of $304 million on the left side of the slide will grow, of course subject to the execution of putting our existing capital to work, to over $600 million of distributable earnings with no new products.
And so, what you’ll see here is $145 million of that growth is due to just deployment of our existing capital; again, the execution of putting our capital (inaudible). You’ll see $83 million is driven by finishing the fundraising for fund V, and then you’ll see $71 million is already embedded in our products, the fee rate increases. And that all contributes to the $602 million, so a significant amount, again, of earnings power embedded in our business. And to be clear, incremental fund raise from new product launches, which is not on this page, only accelerates the embedded up and to the right growth.
On the next slide, I’ll show you a bridge of our distributable earnings over the next two years. We’re bridging from the $304 million of distributable earnings in 2022 to, right in the middle of the page, the $445 million. And what I would point out here is only $8 million of that $445 million of DE is driven by other new funds, new product launches. And then to bridge from the $445 million to the $561 million in 2022, only $37 million of that is driven by new fund launches. So, as you can see, there is a very significant amount of earnings power embedded in our business.
Call Announcing Owl Rock Capital Group and Dyal Capital Partners Enter Definitive Business
Combination Agreement with Altimar Acquisition Corporation to Form Blue Owl Capital, Inc.
Wednesday, December 23, 2020
8
You’ll see on the top left corner organic AUM growth, so very strong CAGRs for AUM growth. You’ll see in the bottom right very strong CAGRs for DE growth. Our total revenues, again Doug touched on this, is 100% FRE business. And considerable up and to the right growth here driven by that, again, embedded power of--earnings power of our business, and then best in class EBITDA margin of 65% to 70%.
Tom Wasserman
Hi, everyone. This is Tom Wasserman, CEO of Altimar Acquisition Corporation. By way of background, Altimar is a $275 million special purpose acquisition company sponsored by HPS Investment Partners who went public in late October.
And I think the number one thing that I and our board want to convey in this call is just how excited we are to be working with the founders of Blue Owl and bringing a company of this quality to the market. And between Doug and Michael and Marc and Alan, we just couldn’t have hoped to find a better set of command leaders.
As a repeat SPAC sponsor, we firmly believe this transaction has all the qualities of a long-term compounding equity story. Between the top-tier founders that I previously mentioned and their alignment with the shareholders, a differentiated set of high-margin products that both Michael and Marc just walked you through, and really what’s a massive and growing total addressable market, between all of those we think we’re delivering exactly what long-term holders are looking for.
Additionally, the one thing we always look for in every investment that we make as a firm is an ability to add real value to the situation. And I think my colleague, Scott Kapnick, is going to walk you through just exactly how we’re going to do that.
Scott Kapnick
Thanks, Tom. It’s Scott Kapnick. I’m the CEO of HPS. And I would just like to add that, given who we are, HPS is really uniquely qualified as a SPAC sponsor to partner with the Blue Owl team and to add real tangible value.
We know the business because we’re in the business. We have deep and long-term relationships with the principals of Blue Owl. And you’ve heard from them today very eloquently about the strength of the world-class franchise they’ve built.
We also believe there will be several opportunities to work and partner with the business, as we have a series of complementary strategies and partners and relationships. I do truly believe they’ve built a world-class franchise. At Dyal, we’ve known them for years, given their investment in the direct lending business we know.
And I really think they’ve highlighted really well today two very important things, one on growth. And you heard Doug articulate it on page 8 and again Alan on page 18 and page 19. Near term earnings growth of this combined entity is just very significant.
Call Announcing Owl Rock Capital Group and Dyal Capital Partners Enter Definitive Business
Combination Agreement with Altimar Acquisition Corporation to Form Blue Owl Capital, Inc.
Wednesday, December 23, 2020
9
And we think that the longer term growth, which was also really well articulated by Michael, this is a carve-out from Neuberger and there are lots of opportunities that come from that. Michael articulated those, but also the discussion around the retail franchise here that they have built, bringing alts to the masses. That is a huge TAM and long-term just a very large opportunity, and they are ahead of really everyone in the space.
Alan Kirshenbaum
Okay. So, picking up on the next slide, the transaction summary slide, you can see I’ll start with the key transaction terms on the top left part of the slide. We come in at a pre-money equity valuation of $12.15 billion. We will retain $10.7 billion in equity. That’s a pro forma economic ownership of 85%.
It’s important to note, and I’ll note it again when we get to the bottom, but we are not selling a single share. Owners are retaining 100%, not taking any money off the table as a result of this transaction.
You’ll see the sources and uses here of the $1.45 billion on the left side of the page. That is $350 million going to third party Owl Rock investors, not the management team, and $1.1 billion to Neuberger, which is representing a partial sale of its interest. And again, we’re noting here that we have and are retaining all of our existing ownership interest, so we have a very significant matching up of alignment here.
A hundred million share earn-out, so that’ll go in two equal tranches at $12.50 and $15.00 per share. And I mentioned the $1.5 billion, the biggest part of the sources and uses, that’s coming through the private placements. And then in the bottom left corner, you can see the pro forma economic ownership. 24% will remain with Blue Owl management and founders.
I covered the sources and uses on the right side of the page. We have the SPAC, the PIPE, and then our existing equity rollover. That’s the $12.5 billion. And then you can see the uses right below that, which I just talked through a moment ago.
In the bottom right corner, the pro forma cap, we have a pro forma enterprise value of $12.7 billion, a pro forma market cap of $12.5 billion, and then you can see the 2022 earnings of 22 times. The comps right now are at or over 30x. When you look back to earlier in the discussion, the FRE centric high growth peers of ours all trading at or around or above 30x. And so, we’re coming out at a significant discount to that at 22x.
We intend to target net debt to EBITDA of approximately 1.0x. We do expect to go out and begin dialogues with the rating agencies, and so we think that we can create a very cost efficient, a very low levered cap structure here.
And on the dividend policy, we expect to pay a meaningful dividend that we believe can grow significantly over time. So, you can see here some pretty strong CAGR estimates based on the illustrative dividends that we included here on the right side of the slide.
And then wrapping up with our governance, corporate structure will be an Up-C structure, including a pub co and two new limited partnerships. The SPAC shares represent ownership interest in the pub co. And we will put in place and have in place a customary TRA arrangement that’ll be 85%.
Call Announcing Owl Rock Capital Group and Dyal Capital Partners Enter Definitive Business
Combination Agreement with Altimar Acquisition Corporation to Form Blue Owl Capital, Inc.
Wednesday, December 23, 2020
10
We will have a multi share class structure where seven of us will hold high vote shares in the pub co, and these shares will control approximately 90% of the voting power in the pub co. And the high vote shares will automatically convert, as you can see at the bottom, to single vote shares upon customary terms.
And then our board composition will be three independent directors, three Owl Rock appointed directors, two Dyal appointed directors, and one Neuberger appointed director.
And with that, we’ll wrap up the presentation.
Important Additional Information and Where to Find It
This communication is being made in respect of the proposed business combination transaction involving Altimar and Blue Owl. Altimar intends to file a registration statement on Form S-4 with the Securities and Exchange Commission (the “SEC”), which will include a proxy statement and a prospectus of Altimar, and each party will file other documents with the SEC regarding the proposed transaction. A definitive proxy statement/prospectus will also be sent to the stockholders of Altimar, seeking any required stockholder approval. Before making any voting or investment decision, investors and security holders of Altimar are urged to carefully read the entire registration statement and proxy statement/prospectus, when they become available, and any other relevant documents filed with the SEC, as well as any amendments or supplements to these documents, because they will contain important information about the proposed transaction. The documents filed by Altimar with the SEC may be obtained free of charge at the SEC’s website at www.sec.gov. In addition, the documents filed by Altimar may be obtained free of charge from Altimar at www.altimarspac.com. Alternatively, these documents, when available, can be obtained free of charge from Altimar upon written request to Altimar Acquisition Corp., 40 West 57th Street, New York, New York 10019, Attn: Secretary, or by calling 212-287-6767.
Participants in the Solicitation
Altimar and certain of its respective directors and executive officers may be deemed to be participants in the solicitation of proxies from the stockholders of Altimar, in favor of the approval of the business combination. For information regarding Altimar’s directors and executive officers, please see Altimar’s final prospectus related to its initial public offering filed with the SEC on October 23, 2020. Additional information regarding the interests of those participants and other persons who may be deemed participants in the transaction may be obtained by reading the registration statement and the proxy statement/prospectus and other relevant documents filed with the SEC when they become available. Free copies of these documents may be obtained as described in the preceding section.
This communication does not constitute an offer to sell or the solicitation of an offer to buy any securities or a solicitation of any vote or approval, nor shall there be any sale of any securities in any state or jurisdiction in which such offer, solicitation, or sale would be unlawful prior to registration or qualification under the securities laws of such other jurisdiction.
Forward Looking Statements
Certain statements made in this communication, and oral statements made from time to time by representatives of Altimar are “forward looking statements” within the meaning of the “safe harbor” provisions of the United States Private Securities Litigation Reform Act of 1995. Statements regarding the proposed business combination and expectations regarding the combined business are “forward looking statements.” In addition, words such as “estimates,” “projects,” “expects,” “anticipates,” “forecasts,” “plans,” “intends,” “believes,” “seeks,” “may,” “will,” “would,” “should,” “future,” “propose,” “target,” “goal,” “objective,” “outlook” and variations of these words or similar expressions (or the negative versions of such words or expressions)
Call Announcing Owl Rock Capital Group and Dyal Capital Partners Enter Definitive Business
Combination Agreement with Altimar Acquisition Corporation to Form Blue Owl Capital, Inc.
Wednesday, December 23, 2020
11
are intended to identify forward-looking statements. These forward-looking statements are not guarantees of future performance, conditions or results, and involve a number of known and unknown risks, uncertainties, assumptions and other important factors, many of which are outside Altimar’s control, that could cause actual results or outcomes to differ materially from those discussed in the forward-looking statements. Important factors, among others, that may affect actual results or outcomes include: the inability of Altimar to complete the contemplated transactions with Owl Rock Capital Group and Dyal Capital Partners; the risk that the approval of the stockholders of Altimar for the proposed business combination is not obtained; the inability to recognize the anticipated benefits of the proposed business combination, which may be affected by, among other things, the amount of funds available in Altimar’s trust account following any redemptions by Altimar’s stockholders; the ability to meet the NYSE’s listing standards following the consummation of the transactions contemplated by the proposed business combination; costs related to the proposed business combination; and those factors discussed in Altimar’s prospectus, dated October 22, 2020 under the heading “Risk Factors,” and other documents of Altimar filed, or to be filed, with the SEC. Altimar does not undertake any obligation to update or revise any forward-looking statements, whether as a result of new information, future events or otherwise, except as required by law.
Call Announcing Owl Rock Capital Group and Dyal Capital Partners Enter Definitive Business
Combination Agreement with Altimar Acquisition Corporation to Form Blue Owl Capital, Inc.
Wednesday, December 23, 2020
12
Exhibit 99.3 Blue Owl Overview December 2020Exhibit 99.3 Blue Owl Overview December 2020
Disclaimers This presentation (this “Investor Presentation”) is provided for informational purposes only and has been prepared to assist interested parties in making their own evaluation with respect to a potential business combination between the Dyal Capital Partners (“Dyal”) division of Neuberger Berman Group LLC ( Neuberger Berman ), Owl Rock Capital Group (“Owl Rock”) and Altimar Acquisition Corporation (“Altimar”) to form Blue Owl Capital Inc. (“Blue Owl” or the “Company”) and related transactions (the “Transaction”) and for no other purpose. No representations or warranties, express or implied are given in, or respect of, this Investor Presentation. To the fullest extent permitted by law, in no circumstances will Blue Owl, Owl Rock, Dyal, Neuberger Berman, Altimar, or any of their respective subsidiaries, stockholders, affiliates, representatives, partners, directors, officers, employees, advisers or agents be responsible or liable for any direct, indirect or consequential loss or loss of profit arising from use of this Investor Presentation, its contents, its omissions, reliance on the information contained within it, or on opinions communicated in relation thereto or otherwise arising in connection therewith. This Investor Presentation does not purport to be all-inclusive or to contain all of the information that may be required to make a full analysis of Blue Owl or the Transaction. Viewers of this Investor Presentation should each make their own evaluation of Blue Owl and of their relevance and adequacy of the information and should make sure other investigations as they deem necessary. This communication does not constitute an offer to sell or the solicitation of an offer to buy any securities or a solicitation of any vote or approval, nor shall there be any sale of any securities in any state or jurisdiction in which such offer, solicitation, or sale would be unlawful prior to registration or qualification under the securities laws of such other jurisdiction. Use of Projections This Investor Presentation contains financial forecasts or projections with respect to Dyal, Owl Rock or the Company. Projected performance with respect to Dyal, Owl Rock, the Company, the investment vehicles they manage or expect to manage, and the investments such vehicles make or expect to make is provided on a pro forma basis and is based on certain good faith assumptions that Dyal and Owl Rock believe are reasonable (including, without limitation, estimates and targets of future operating results or cash flows). The actual performance will depend on, among other factors, future operating results, including of the investment vehicles and their portfolio companies, the value of certain assets and market conditions at the time of establishment, acquisition or disposition, any related transaction costs, and time and manner of establishment, acquisition and disposition, all of which may differ from the underlying assumptions on which the projected performance data contained herein are based. In addition, there are many risk factors that could cause Dyal and Owl Rock’s assumptions to prove to be incorrect. These risks therefore could cause the actual performance of the Company to be materially different from the current projected, targeted or estimated performance. These projections are provided solely for illustrative purposes, and there can be no assurances that any projections or targets will ultimately be realized, in the manner illustrated herein or at all. No independent registered public accounting firm of Dyal, Owl Rock or the Company has audited, reviewed, compiled, or performed any procedures with respect to the financial forecasts or projections for the purpose of their inclusion in this Investor Presentation, and accordingly, none of them expresses an opinion or provides any other form of assurance with respect thereto for the purpose of this Investor Presentation. These financial forecasts and projections should not be relied upon as being necessarily indicative of future results. Forward Looking Statements This Investor Presentation includes “forward looking statements” within the meaning of the “safe harbor” provisions of the United States Private Securities Litigation Reform Act of 1995. Forward-looking statements may be identified by the use of words such as “estimates,” “projects,” “expects,” “anticipates,” “forecasts,” “plans,” “intends,” “believes,” “seeks,” “may,” “will,” “would,” “should,” “future,” “propose,” “target,” “goal,” “objective,” and “outlook,” and other similar expressions that predict or indicate future events or trends or that are not statements of historical matters. Such forward looking statements include estimated financial information. Such forward looking statements with respect to revenues, earnings, performance, strategies, prospects and other aspects of the businesses of the Company are based on current expectations that are subject to risks and uncertainties, including those described below. A number of factors could cause actual results or outcomes to differ materially from those indicated by such forward looking statements. Investing in unseasoned companies and in sponsors of alternative investment platforms carries significant risk. Operating results in a specified period will be difficult to predict. The performance of Dyal and Owl Rock, and thus the Company, will depend upon their success in structuring, distributing and operating alternative investment vehicles, including current and potential future vehicles, which will impact the operating results of each of Dyal, Owl Rock, the Company, the investment vehicles they manage or expect to manage, and the investments such vehicles make or expect to make are and will be subject to various risks relating to such entities’ operations, including, but not limited to: weaker than anticipated market acceptance of products and services; disruptions in technology development; an inability to successfully manage expanding operations; an inability to attract and retain key management and technical personnel; competition posed by established enterprises; changes in accounting rules or government regulation; weakness in the applicable industries as well as the U.S. and global economy; currency fluctuations; and the effects of other geopolitical events. Each of Dyal, Owl Rock, the Company, the investment vehicles they manage or expect to manage, and the investments such vehicles make or expect to make is subject to the ongoing effects of the COVID-19 pandemic, the impact of which is particularly difficult to forecast. Because all forward-looking statements involve risks and uncertainties, actual results of Dyal, Owl Rock and the Company may differ materially from any expectations, projections or predictions made or implicated in such forward-looking statements. Prospective investors are therefore cautioned not to place undue reliance on such forward-looking statements, which speak only as of the date made. None of Owl Rock, Dyal or the Company commits to update or revise the forward-looking statements, whether as a result of new information, future events or otherwise, except as may be required by law. Non-GAAP Financial Measures; Other Financial and Operational Data This presentation includes certain non-GAAP financial measures that are not prepared in accordance with accounting principles generally accepted in the United States (“GAAP”) and that may be different from non-GAAP financial measures used by other companies. Each of Dyal, Owl Rock and the Company believes that the use of these non-GAAP financial measures provides an additional tool for investors and potential investors to use in evaluating its ongoing operating results and trends. These non-GAAP measures should not be considered in isolation from, or as an alternative to, financial measures determined in accordance with GAAP. See the footnotes on the slides where these measures are discussed. To the extent that forward-looking non-GAAP financial measures are provided, they are presented on a non-GAAP basis without reconciliations of such forward-looking non-GAAP measures due to the inherent difficulty in forecasting and quantifying certain amounts that are necessary for such reconciliation. As used herein and unless otherwise indicated, all IRRs and multiples are presented on a gross basis (i.e., they do not reflect management or other fees, taxes, transaction costs, expenses and general partner carried interest, which will reduce returns and, in the aggregate, are expected to be substantial) unless otherwise indicated. Exact net IRRs and multiples cannot be calculated for individual investments held by Dyal and Owl Rock’s investment vehicles, or a subset of such investments, due to the lack of a mechanism to precisely allocate fees, taxes, transaction costs, expenses and general partner carried interest. Valuations are as of the dates provided herein and do not take into account subsequent events, including the continued impact of COVID-19, which can be expected to have an adverse effect on certain entities identified or contemplated herein. Additional Information and Where to Find It This communication is being made in respect of the proposed Transaction involving Altimar, Blue Owl, Owl Rock and Dyal. Altimar intends to file a registration statement on Form S-4 with the Securities and Exchange Commission (the “SEC”), which will include a proxy statement and a prospectus of Altimar, and each party will file other documents with the SEC regarding the proposed Transaction. A definitive proxy statement/prospectus will also be sent to the stockholders of Altimar, seeking any required stockholder approval. Before making any voting or investment decision, investors and security holders of Altimar are urged to carefully read the entire registration statement and proxy statement/prospectus, when they become available, and any other relevant documents filed with the SEC, as well as any amendments or supplements to these documents, because they will contain important information about the proposed Transaction. The documents filed by Altimar with the SEC may be obtained free of charge at the SEC’s website at www.sec.gov. In addition, the documents filed by Altimar may be obtained free of charge from Altimar at www.altimarspac.com. Alternatively, these documents, when available, can be obtained free of charge from Altimar upon written request to Altimar Acquisition Corp., 40 West 57th Street, New York, New York 10019, Attn: Secretary, or by calling 212-287-6767. Participants in Solicitation Altimar and certain of its respective directors and executive officers may be deemed to be participants in the solicitation of proxies from the stockholders of Altimar, in favor of the approval of the proposed Transaction. For information regarding Altimar’s directors and executive officers, please see Altimar’s final prospectus relating to its initial public offering filed with the SEC on October 23, 2020. Additional information regarding the interests of those participants and other persons who may be deemed participants in the Transaction may be obtained by reading the registration statement and the proxy statement/prospectus and other relevant documents filed with the SEC when they become available. Free copies of these documents may be obtained as described in the preceding section. Industry and Market Data This Investor Presentation has been prepared by Altimar, Blue Owl, Owl Rock and Dyal and includes market data and other statistical information from sources believed by Altimar, Blue Owl, Owl Rock and Dyal to be reliable, including independent industry publications, governmental publications or other published independent sources. Some data is also based on the good faith estimates of Altimar, Blue Owl, Owl Rock or Dyal, which in each case are derived from its review of internal sources as well as the independent sources described above. Although Altimar, Blue Owl, Owl Rock and Dyal believe these sources are reliable, Altimar, Blue Owl, Owl Rock and Dyal have not independently verified the information and cannot guarantee its accuracy and completeness. Trademarks This Investor Presentation contains trademarks, service marks, trade names and copyrights of Altimar, Blue Owl, Owl Rock and Dyal and other companies, which are the property of their respective owners. 2Disclaimers This presentation (this “Investor Presentation”) is provided for informational purposes only and has been prepared to assist interested parties in making their own evaluation with respect to a potential business combination between the Dyal Capital Partners (“Dyal”) division of Neuberger Berman Group LLC ( Neuberger Berman ), Owl Rock Capital Group (“Owl Rock”) and Altimar Acquisition Corporation (“Altimar”) to form Blue Owl Capital Inc. (“Blue Owl” or the “Company”) and related transactions (the “Transaction”) and for no other purpose. No representations or warranties, express or implied are given in, or respect of, this Investor Presentation. To the fullest extent permitted by law, in no circumstances will Blue Owl, Owl Rock, Dyal, Neuberger Berman, Altimar, or any of their respective subsidiaries, stockholders, affiliates, representatives, partners, directors, officers, employees, advisers or agents be responsible or liable for any direct, indirect or consequential loss or loss of profit arising from use of this Investor Presentation, its contents, its omissions, reliance on the information contained within it, or on opinions communicated in relation thereto or otherwise arising in connection therewith. This Investor Presentation does not purport to be all-inclusive or to contain all of the information that may be required to make a full analysis of Blue Owl or the Transaction. Viewers of this Investor Presentation should each make their own evaluation of Blue Owl and of their relevance and adequacy of the information and should make sure other investigations as they deem necessary. This communication does not constitute an offer to sell or the solicitation of an offer to buy any securities or a solicitation of any vote or approval, nor shall there be any sale of any securities in any state or jurisdiction in which such offer, solicitation, or sale would be unlawful prior to registration or qualification under the securities laws of such other jurisdiction. Use of Projections This Investor Presentation contains financial forecasts or projections with respect to Dyal, Owl Rock or the Company. Projected performance with respect to Dyal, Owl Rock, the Company, the investment vehicles they manage or expect to manage, and the investments such vehicles make or expect to make is provided on a pro forma basis and is based on certain good faith assumptions that Dyal and Owl Rock believe are reasonable (including, without limitation, estimates and targets of future operating results or cash flows). The actual performance will depend on, among other factors, future operating results, including of the investment vehicles and their portfolio companies, the value of certain assets and market conditions at the time of establishment, acquisition or disposition, any related transaction costs, and time and manner of establishment, acquisition and disposition, all of which may differ from the underlying assumptions on which the projected performance data contained herein are based. In addition, there are many risk factors that could cause Dyal and Owl Rock’s assumptions to prove to be incorrect. These risks therefore could cause the actual performance of the Company to be materially different from the current projected, targeted or estimated performance. These projections are provided solely for illustrative purposes, and there can be no assurances that any projections or targets will ultimately be realized, in the manner illustrated herein or at all. No independent registered public accounting firm of Dyal, Owl Rock or the Company has audited, reviewed, compiled, or performed any procedures with respect to the financial forecasts or projections for the purpose of their inclusion in this Investor Presentation, and accordingly, none of them expresses an opinion or provides any other form of assurance with respect thereto for the purpose of this Investor Presentation. These financial forecasts and projections should not be relied upon as being necessarily indicative of future results. Forward Looking Statements This Investor Presentation includes “forward looking statements” within the meaning of the “safe harbor” provisions of the United States Private Securities Litigation Reform Act of 1995. Forward-looking statements may be identified by the use of words such as “estimates,” “projects,” “expects,” “anticipates,” “forecasts,” “plans,” “intends,” “believes,” “seeks,” “may,” “will,” “would,” “should,” “future,” “propose,” “target,” “goal,” “objective,” and “outlook,” and other similar expressions that predict or indicate future events or trends or that are not statements of historical matters. Such forward looking statements include estimated financial information. Such forward looking statements with respect to revenues, earnings, performance, strategies, prospects and other aspects of the businesses of the Company are based on current expectations that are subject to risks and uncertainties, including those described below. A number of factors could cause actual results or outcomes to differ materially from those indicated by such forward looking statements. Investing in unseasoned companies and in sponsors of alternative investment platforms carries significant risk. Operating results in a specified period will be difficult to predict. The performance of Dyal and Owl Rock, and thus the Company, will depend upon their success in structuring, distributing and operating alternative investment vehicles, including current and potential future vehicles, which will impact the operating results of each of Dyal, Owl Rock, the Company, the investment vehicles they manage or expect to manage, and the investments such vehicles make or expect to make are and will be subject to various risks relating to such entities’ operations, including, but not limited to: weaker than anticipated market acceptance of products and services; disruptions in technology development; an inability to successfully manage expanding operations; an inability to attract and retain key management and technical personnel; competition posed by established enterprises; changes in accounting rules or government regulation; weakness in the applicable industries as well as the U.S. and global economy; currency fluctuations; and the effects of other geopolitical events. Each of Dyal, Owl Rock, the Company, the investment vehicles they manage or expect to manage, and the investments such vehicles make or expect to make is subject to the ongoing effects of the COVID-19 pandemic, the impact of which is particularly difficult to forecast. Because all forward-looking statements involve risks and uncertainties, actual results of Dyal, Owl Rock and the Company may differ materially from any expectations, projections or predictions made or implicated in such forward-looking statements. Prospective investors are therefore cautioned not to place undue reliance on such forward-looking statements, which speak only as of the date made. None of Owl Rock, Dyal or the Company commits to update or revise the forward-looking statements, whether as a result of new information, future events or otherwise, except as may be required by law. Non-GAAP Financial Measures; Other Financial and Operational Data This presentation includes certain non-GAAP financial measures that are not prepared in accordance with accounting principles generally accepted in the United States (“GAAP”) and that may be different from non-GAAP financial measures used by other companies. Each of Dyal, Owl Rock and the Company believes that the use of these non-GAAP financial measures provides an additional tool for investors and potential investors to use in evaluating its ongoing operating results and trends. These non-GAAP measures should not be considered in isolation from, or as an alternative to, financial measures determined in accordance with GAAP. See the footnotes on the slides where these measures are discussed. To the extent that forward-looking non-GAAP financial measures are provided, they are presented on a non-GAAP basis without reconciliations of such forward-looking non-GAAP measures due to the inherent difficulty in forecasting and quantifying certain amounts that are necessary for such reconciliation. As used herein and unless otherwise indicated, all IRRs and multiples are presented on a gross basis (i.e., they do not reflect management or other fees, taxes, transaction costs, expenses and general partner carried interest, which will reduce returns and, in the aggregate, are expected to be substantial) unless otherwise indicated. Exact net IRRs and multiples cannot be calculated for individual investments held by Dyal and Owl Rock’s investment vehicles, or a subset of such investments, due to the lack of a mechanism to precisely allocate fees, taxes, transaction costs, expenses and general partner carried interest. Valuations are as of the dates provided herein and do not take into account subsequent events, including the continued impact of COVID-19, which can be expected to have an adverse effect on certain entities identified or contemplated herein. Additional Information and Where to Find It This communication is being made in respect of the proposed Transaction involving Altimar, Blue Owl, Owl Rock and Dyal. Altimar intends to file a registration statement on Form S-4 with the Securities and Exchange Commission (the “SEC”), which will include a proxy statement and a prospectus of Altimar, and each party will file other documents with the SEC regarding the proposed Transaction. A definitive proxy statement/prospectus will also be sent to the stockholders of Altimar, seeking any required stockholder approval. Before making any voting or investment decision, investors and security holders of Altimar are urged to carefully read the entire registration statement and proxy statement/prospectus, when they become available, and any other relevant documents filed with the SEC, as well as any amendments or supplements to these documents, because they will contain important information about the proposed Transaction. The documents filed by Altimar with the SEC may be obtained free of charge at the SEC’s website at www.sec.gov. In addition, the documents filed by Altimar may be obtained free of charge from Altimar at www.altimarspac.com. Alternatively, these documents, when available, can be obtained free of charge from Altimar upon written request to Altimar Acquisition Corp., 40 West 57th Street, New York, New York 10019, Attn: Secretary, or by calling 212-287-6767. Participants in Solicitation Altimar and certain of its respective directors and executive officers may be deemed to be participants in the solicitation of proxies from the stockholders of Altimar, in favor of the approval of the proposed Transaction. For information regarding Altimar’s directors and executive officers, please see Altimar’s final prospectus relating to its initial public offering filed with the SEC on October 23, 2020. Additional information regarding the interests of those participants and other persons who may be deemed participants in the Transaction may be obtained by reading the registration statement and the proxy statement/prospectus and other relevant documents filed with the SEC when they become available. Free copies of these documents may be obtained as described in the preceding section. Industry and Market Data This Investor Presentation has been prepared by Altimar, Blue Owl, Owl Rock and Dyal and includes market data and other statistical information from sources believed by Altimar, Blue Owl, Owl Rock and Dyal to be reliable, including independent industry publications, governmental publications or other published independent sources. Some data is also based on the good faith estimates of Altimar, Blue Owl, Owl Rock or Dyal, which in each case are derived from its review of internal sources as well as the independent sources described above. Although Altimar, Blue Owl, Owl Rock and Dyal believe these sources are reliable, Altimar, Blue Owl, Owl Rock and Dyal have not independently verified the information and cannot guarantee its accuracy and completeness. Trademarks This Investor Presentation contains trademarks, service marks, trade names and copyrights of Altimar, Blue Owl, Owl Rock and Dyal and other companies, which are the property of their respective owners. 2

Blue Owl: A Differentiated Alternative Investment Manager 2022E % FRE (% of FRE + Realized PRE) Market leading permanent capital base with approximately (1) P 100% $51bn in permanent capital AUM 82% 74% 71% 62% Best in class FRE generation P Blue Owl (2) 2022E Pre-Tax Operating Margin Highly attractive, robust profit margins P 67% 64% 60% 46% 35% Industry leading embedded growth profile P Blue Owl (3) Scalable growth opportunities not currently included in 2020 – 2022E DE CAGR P projections 68% 65% 25% 20% 13% Proven, experienced leadership with demonstrated track record P Blue Owl Source: Company filings, IBES and GS Research as of 12/18/20 Note: Assets Under Management (“AUM”) is calculated as the sum of the total assets managed (including assets acquired with leverage), undrawn debt (at the product-level including certain amounts subject to restrictions) and uncalled committed capital (including commitments to products that have yet to commence their investment periods) for Direct Lending Platform and as the sum of the LP and GP capital commitments for GP Capital Solutions. Permanent Capital refers to capital of funds that do not have ordinary redemption provisions or a requirement to exit investments after a prescribed period of time and to return to investors the proceeds representing the capital invested in such investments, except as required by applicable law or pursuant to redemption requests that can only be made after significant lock-up periods. Such funds may be required, or elect, to return all of a portion of capital gains and investment income. Permanent capital may be subject to management fee step downs or roll-offs over time. (1) Metrics based on Owl Rock AUM as of 9/30/20 and Dyal AUM as of 11/30/20 pro forma for expected final close of Dyal Fund V (2) Based on pre-tax distributable earnings before minority interest for Blue Owl 3 (3) Represents after-tax DE for Blue Owl and adjusted cash EPS for EQT, HLNE, PGHN and STEP; Distributable Earnings (“DE”) is a non-GAAP measure used to assess performance and amounts available for dividends to members; DE is FRE less income taxes and includes realized performance income and performance related compensation; DE is derived from and reconciled to, but not equivalent to, its most directly comparable GAAP measure of Net Income (Loss) Before Income Taxes; DE differs from income before taxes computed in accordance with GAAP as it adjusts for certain items that we believe are indicative of our ability to make our dividend paymentsBlue Owl: A Differentiated Alternative Investment Manager 2022E % FRE (% of FRE + Realized PRE) Market leading permanent capital base with approximately (1) P 100% $51bn in permanent capital AUM 82% 74% 71% 62% Best in class FRE generation P Blue Owl (2) 2022E Pre-Tax Operating Margin Highly attractive, robust profit margins P 67% 64% 60% 46% 35% Industry leading embedded growth profile P Blue Owl (3) Scalable growth opportunities not currently included in 2020 – 2022E DE CAGR P projections 68% 65% 25% 20% 13% Proven, experienced leadership with demonstrated track record P Blue Owl Source: Company filings, IBES and GS Research as of 12/18/20 Note: Assets Under Management (“AUM”) is calculated as the sum of the total assets managed (including assets acquired with leverage), undrawn debt (at the product-level including certain amounts subject to restrictions) and uncalled committed capital (including commitments to products that have yet to commence their investment periods) for Direct Lending Platform and as the sum of the LP and GP capital commitments for GP Capital Solutions. Permanent Capital refers to capital of funds that do not have ordinary redemption provisions or a requirement to exit investments after a prescribed period of time and to return to investors the proceeds representing the capital invested in such investments, except as required by applicable law or pursuant to redemption requests that can only be made after significant lock-up periods. Such funds may be required, or elect, to return all of a portion of capital gains and investment income. Permanent capital may be subject to management fee step downs or roll-offs over time. (1) Metrics based on Owl Rock AUM as of 9/30/20 and Dyal AUM as of 11/30/20 pro forma for expected final close of Dyal Fund V (2) Based on pre-tax distributable earnings before minority interest for Blue Owl 3 (3) Represents after-tax DE for Blue Owl and adjusted cash EPS for EQT, HLNE, PGHN and STEP; Distributable Earnings (“DE”) is a non-GAAP measure used to assess performance and amounts available for dividends to members; DE is FRE less income taxes and includes realized performance income and performance related compensation; DE is derived from and reconciled to, but not equivalent to, its most directly comparable GAAP measure of Net Income (Loss) Before Income Taxes; DE differs from income before taxes computed in accordance with GAAP as it adjusts for certain items that we believe are indicative of our ability to make our dividend payments
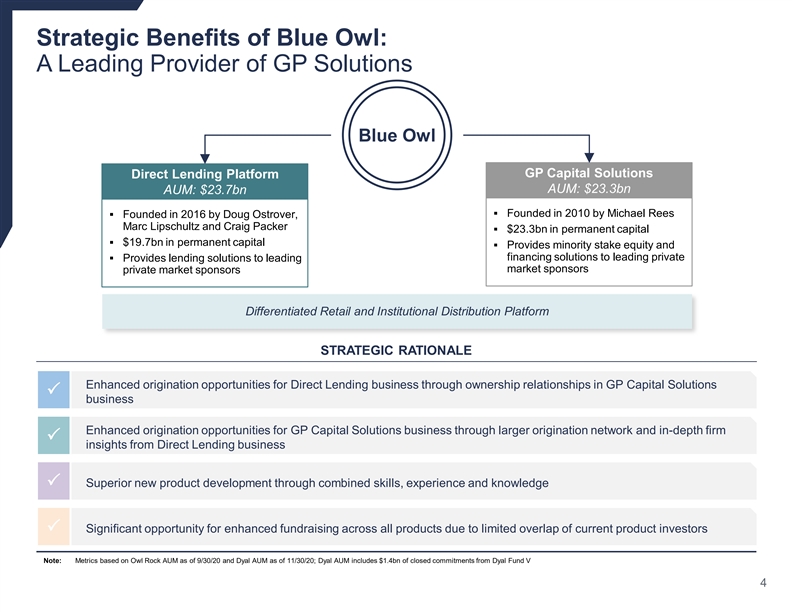
Strategic Benefits of Blue Owl: A Leading Provider of GP Solutions Blue Owl GP Capital Solutions Direct Lending Platform AUM: $23.3bn AUM: $23.7bn § Founded in 2010 by Michael Rees § Founded in 2016 by Doug Ostrover, Marc Lipschultz and Craig Packer § $23.3bn in permanent capital § $19.7bn in permanent capital § Provides minority stake equity and financing solutions to leading private § Provides lending solutions to leading market sponsors private market sponsors Differentiated Retail and Institutional Distribution Platform STRATEGIC RATIONALE Enhanced origination opportunities for Direct Lending business through ownership relationships in GP Capital Solutions P business Enhanced origination opportunities for GP Capital Solutions business through larger origination network and in-depth firm P insights from Direct Lending business Superior new product development through combined skills, experience and knowledge P P Significant opportunity for enhanced fundraising across all products due to limited overlap of current product investors Note: Metrics based on Owl Rock AUM as of 9/30/20 and Dyal AUM as of 11/30/20; Dyal AUM includes $1.4bn of closed commitments from Dyal Fund V 4Strategic Benefits of Blue Owl: A Leading Provider of GP Solutions Blue Owl GP Capital Solutions Direct Lending Platform AUM: $23.3bn AUM: $23.7bn § Founded in 2010 by Michael Rees § Founded in 2016 by Doug Ostrover, Marc Lipschultz and Craig Packer § $23.3bn in permanent capital § $19.7bn in permanent capital § Provides minority stake equity and financing solutions to leading private § Provides lending solutions to leading market sponsors private market sponsors Differentiated Retail and Institutional Distribution Platform STRATEGIC RATIONALE Enhanced origination opportunities for Direct Lending business through ownership relationships in GP Capital Solutions P business Enhanced origination opportunities for GP Capital Solutions business through larger origination network and in-depth firm P insights from Direct Lending business Superior new product development through combined skills, experience and knowledge P P Significant opportunity for enhanced fundraising across all products due to limited overlap of current product investors Note: Metrics based on Owl Rock AUM as of 9/30/20 and Dyal AUM as of 11/30/20; Dyal AUM includes $1.4bn of closed commitments from Dyal Fund V 4

Table of Contents I. Blue Owl Platform Highlights II. Business Overviews III. Blue Owl Financial Highlights IV. Transaction Summary Appendix 5Table of Contents I. Blue Owl Platform Highlights II. Business Overviews III. Blue Owl Financial Highlights IV. Transaction Summary Appendix 5
I. Blue Owl Platform HighlightsI. Blue Owl Platform Highlights
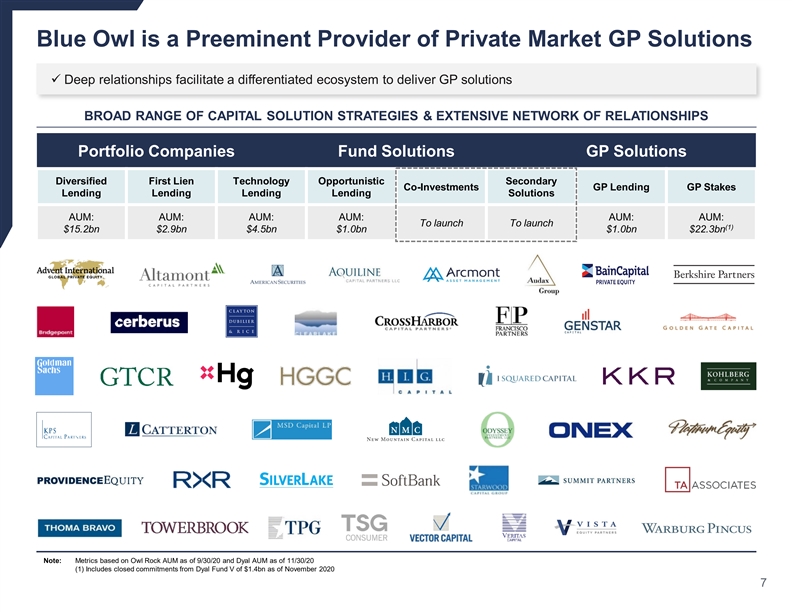
Blue Owl is a Preeminent Provider of Private Market GP Solutions ü Deep relationships facilitate a differentiated ecosystem to deliver GP solutions BROAD RANGE OF CAPITAL SOLUTION STRATEGIES & EXTENSIVE NETWORK OF RELATIONSHIPS Portfolio Companies Fund Solutions GP Solutions Diversified First Lien Technology Opportunistic Secondary Co-Investments GP Lending GP Stakes Lending Lending Lending Lending Solutions AUM: AUM: AUM: AUM: AUM: AUM: To launch To launch (1) $15.2bn $2.9bn $4.5bn $1.0bn $1.0bn $22.3bn Note: Metrics based on Owl Rock AUM as of 9/30/20 and Dyal AUM as of 11/30/20 (1) Includes closed commitments from Dyal Fund V of $1.4bn as of November 2020 7Blue Owl is a Preeminent Provider of Private Market GP Solutions ü Deep relationships facilitate a differentiated ecosystem to deliver GP solutions BROAD RANGE OF CAPITAL SOLUTION STRATEGIES & EXTENSIVE NETWORK OF RELATIONSHIPS Portfolio Companies Fund Solutions GP Solutions Diversified First Lien Technology Opportunistic Secondary Co-Investments GP Lending GP Stakes Lending Lending Lending Lending Solutions AUM: AUM: AUM: AUM: AUM: AUM: To launch To launch (1) $15.2bn $2.9bn $4.5bn $1.0bn $1.0bn $22.3bn Note: Metrics based on Owl Rock AUM as of 9/30/20 and Dyal AUM as of 11/30/20 (1) Includes closed commitments from Dyal Fund V of $1.4bn as of November 2020 7
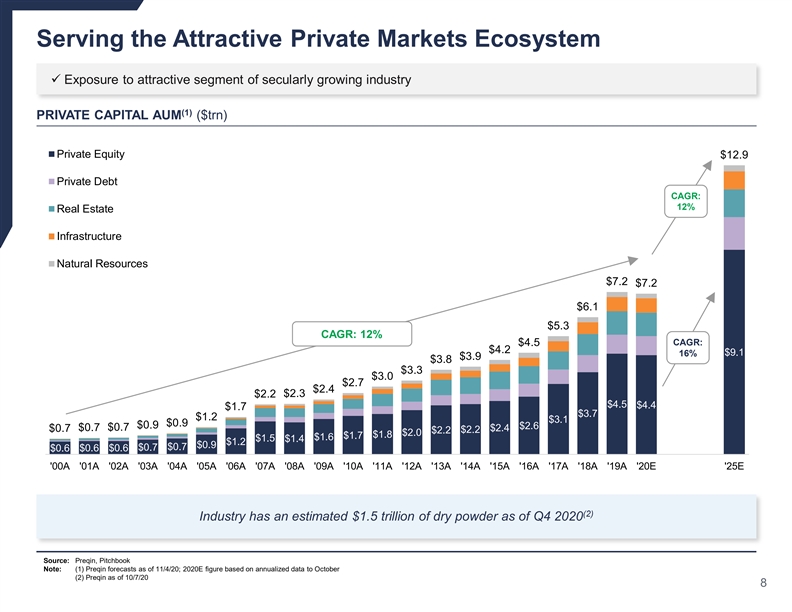
Serving the Attractive Private Markets Ecosystem ü Exposure to attractive segment of secularly growing industry (1) PRIVATE CAPITAL AUM ($trn) Private Equity $12.9 Private Debt CAGR: 12% Real Estate Infrastructure Natural Resources $7.2 $7.2 $6.1 $5.3 CAGR: 12% $4.5 CAGR: $4.2 16% $9.1 $3.9 $3.8 $3.3 $3.0 $2.7 $2.4 $2.3 $2.2 $4.5 $4.4 $1.7 $3.7 $1.2 $3.1 $0.9 $0.9 $2.6 $0.7 $0.7 $2.4 $0.7 $2.2 $2.2 $2.0 $1.8 $1.7 $1.6 $1.5 $1.4 $1.2 $0.9 $0.7 $0.6 $0.6 $0.7 $0.6 '00A '01A '02A '03A '04A '05A '06A '07A '08A '09A '10A '11A '12A '13A '14A '15A '16A '17A '18A '19A '20E '25E (2) Industry has an estimated $1.5 trillion of dry powder as of Q4 2020 Source: Preqin, Pitchbook Note: (1) Preqin forecasts as of 11/4/20; 2020E figure based on annualized data to October (2) Preqin as of 10/7/20 8Serving the Attractive Private Markets Ecosystem ü Exposure to attractive segment of secularly growing industry (1) PRIVATE CAPITAL AUM ($trn) Private Equity $12.9 Private Debt CAGR: 12% Real Estate Infrastructure Natural Resources $7.2 $7.2 $6.1 $5.3 CAGR: 12% $4.5 CAGR: $4.2 16% $9.1 $3.9 $3.8 $3.3 $3.0 $2.7 $2.4 $2.3 $2.2 $4.5 $4.4 $1.7 $3.7 $1.2 $3.1 $0.9 $0.9 $2.6 $0.7 $0.7 $2.4 $0.7 $2.2 $2.2 $2.0 $1.8 $1.7 $1.6 $1.5 $1.4 $1.2 $0.9 $0.7 $0.6 $0.6 $0.7 $0.6 '00A '01A '02A '03A '04A '05A '06A '07A '08A '09A '10A '11A '12A '13A '14A '15A '16A '17A '18A '19A '20E '25E (2) Industry has an estimated $1.5 trillion of dry powder as of Q4 2020 Source: Preqin, Pitchbook Note: (1) Preqin forecasts as of 11/4/20; 2020E figure based on annualized data to October (2) Preqin as of 10/7/20 8
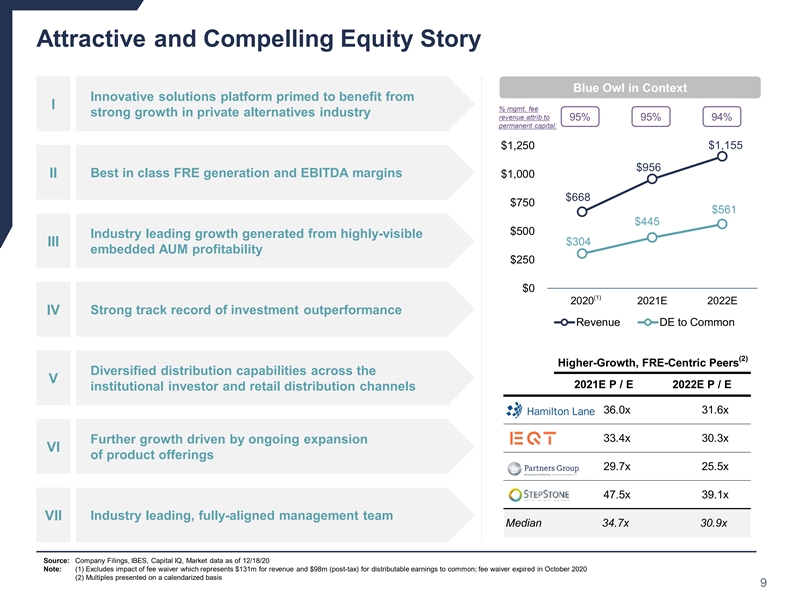
Attractive and Compelling Equity Story Blue Owl in Context Innovative solutions platform primed to benefit from I % mgmt. fee strong growth in private alternatives industry revenue attrib.to 95% 95% 94% permanent capital: $1,250 $1,155 $956 Best in class FRE generation and EBITDA margins II $1,000 $668 $750 $561 $445 $500 Industry leading growth generated from highly-visible $304 III embedded AUM profitability $250 $0 (1) 2020 2021E 2022E Strong track record of investment outperformance IV Revenue DE to Common (2) Higher-Growth, FRE-Centric Peers Diversified distribution capabilities across the V 2021E P / E 2022E P / E institutional investor and retail distribution channels 36.0x 31.6x 33.4x 30.3x Further growth driven by ongoing expansion VI of product offerings 29.7x 25.5x 47.5x 39.1x VII Industry leading, fully-aligned management team Median 34.7x 30.9x Source: Company Filings, IBES, Capital IQ, Market data as of 12/18/20 Note: (1) Excludes impact of fee waiver which represents $131m for revenue and $98m (post-tax) for distributable earnings to common; fee waiver expired in October 2020 (2) Multiples presented on a calendarized basis 9Attractive and Compelling Equity Story Blue Owl in Context Innovative solutions platform primed to benefit from I % mgmt. fee strong growth in private alternatives industry revenue attrib.to 95% 95% 94% permanent capital: $1,250 $1,155 $956 Best in class FRE generation and EBITDA margins II $1,000 $668 $750 $561 $445 $500 Industry leading growth generated from highly-visible $304 III embedded AUM profitability $250 $0 (1) 2020 2021E 2022E Strong track record of investment outperformance IV Revenue DE to Common (2) Higher-Growth, FRE-Centric Peers Diversified distribution capabilities across the V 2021E P / E 2022E P / E institutional investor and retail distribution channels 36.0x 31.6x 33.4x 30.3x Further growth driven by ongoing expansion VI of product offerings 29.7x 25.5x 47.5x 39.1x VII Industry leading, fully-aligned management team Median 34.7x 30.9x Source: Company Filings, IBES, Capital IQ, Market data as of 12/18/20 Note: (1) Excludes impact of fee waiver which represents $131m for revenue and $98m (post-tax) for distributable earnings to common; fee waiver expired in October 2020 (2) Multiples presented on a calendarized basis 9
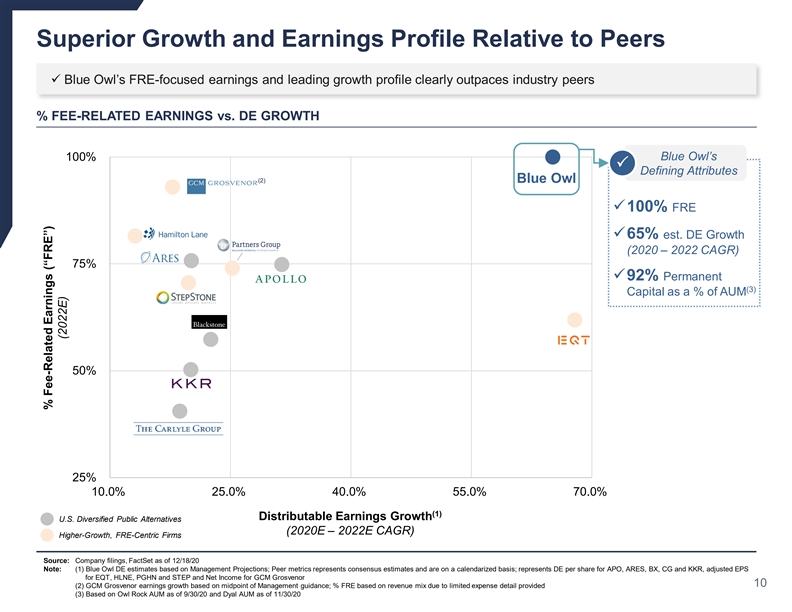
Superior Growth and Earnings Profile Relative to Peers ü Blue Owl’s FRE-focused earnings and leading growth profile clearly outpaces industry peers % FEE-RELATED EARNINGS vs. DE GROWTH Blue Owl’s 100% P Defining Attributes (2) Blue Owl ü100% FRE ü65% est. DE Growth (2020 – 2022 CAGR) 75% ü92% Permanent (3) Capital as a % of AUM 50% 25% 10.0% 25.0% 40.0% 55.0% 70.0% (1) Distributable Earnings Growth U.S. Diversified Public Alternatives (2020E – 2022E CAGR) Higher-Growth, FRE-Centric Firms Source: Company filings, FactSet as of 12/18/20 Note: (1) Blue Owl DE estimates based on Management Projections; Peer metrics represents consensus estimates and are on a calendarized basis; represents DE per share for APO, ARES, BX, CG and KKR, adjusted EPS for EQT, HLNE, PGHN and STEP and Net Income for GCM Grosvenor 10 (2) GCM Grosvenor earnings growth based on midpoint of Management guidance; % FRE based on revenue mix due to limited expense detail provided (3) Based on Owl Rock AUM as of 9/30/20 and Dyal AUM as of 11/30/20 % Fee-Related Earnings (“FRE”) (2022E)Superior Growth and Earnings Profile Relative to Peers ü Blue Owl’s FRE-focused earnings and leading growth profile clearly outpaces industry peers % FEE-RELATED EARNINGS vs. DE GROWTH Blue Owl’s 100% P Defining Attributes (2) Blue Owl ü100% FRE ü65% est. DE Growth (2020 – 2022 CAGR) 75% ü92% Permanent (3) Capital as a % of AUM 50% 25% 10.0% 25.0% 40.0% 55.0% 70.0% (1) Distributable Earnings Growth U.S. Diversified Public Alternatives (2020E – 2022E CAGR) Higher-Growth, FRE-Centric Firms Source: Company filings, FactSet as of 12/18/20 Note: (1) Blue Owl DE estimates based on Management Projections; Peer metrics represents consensus estimates and are on a calendarized basis; represents DE per share for APO, ARES, BX, CG and KKR, adjusted EPS for EQT, HLNE, PGHN and STEP and Net Income for GCM Grosvenor 10 (2) GCM Grosvenor earnings growth based on midpoint of Management guidance; % FRE based on revenue mix due to limited expense detail provided (3) Based on Owl Rock AUM as of 9/30/20 and Dyal AUM as of 11/30/20 % Fee-Related Earnings (“FRE”) (2022E)
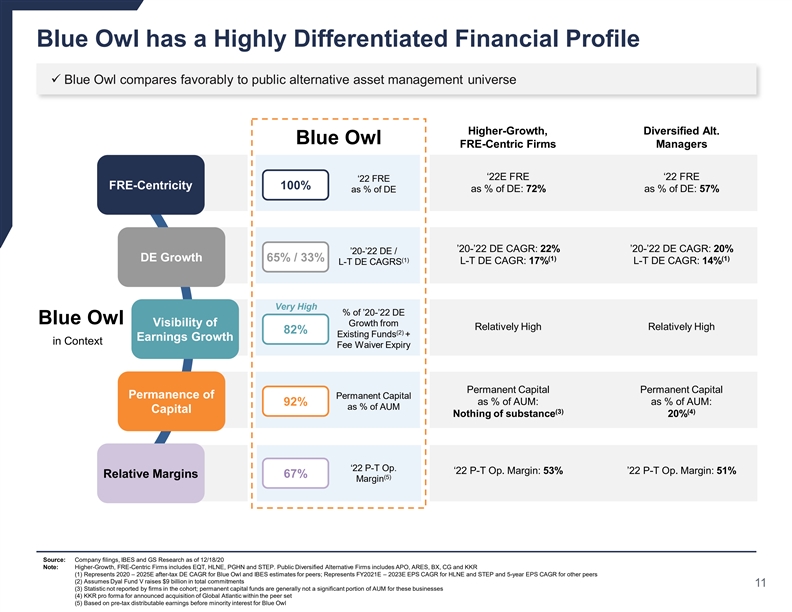
Blue Owl has a Highly Differentiated Financial Profile ü Blue Owl compares favorably to public alternative asset management universe Higher-Growth, Diversified Alt. Blue Owl FRE-Centric Firms Managers ‘22E FRE ‘22 FRE ‘22 FRE FRE-Centricity 100% as % of DE: 72% as % of DE: 57% as % of DE ’20-’22 DE CAGR: 22% ’20-’22 DE CAGR: 20% ’20-’22 DE / (1) (1) DE Growth 65% / 33% (1) L-T DE CAGR: 17% L-T DE CAGR: 14% L-T DE CAGRS Very High % of ’20-’22 DE Blue Owl Visibility of Growth from Relatively High Relatively High 82% (2) Existing Funds + Earnings Growth in Context Fee Waiver Expiry Permanent Capital Permanent Capital Permanence of Permanent Capital as % of AUM: as % of AUM: 92% as % of AUM Capital (3) (4) Nothing of substance 20% ‘22 P-T Op. ‘22 P-T Op. Margin: 53% ’22 P-T Op. Margin: 51% Relative Margins 67% (5) Margin Source: Company filings, IBES and GS Research as of 12/18/20 Note: Higher-Growth, FRE-Centric Firms includes EQT, HLNE, PGHN and STEP. Public Diversified Alternative Firms includes APO, ARES, BX, CG and KKR (1) Represents 2020 – 2025E after-tax DE CAGR for Blue Owl and IBES estimates for peers; Represents FY2021E – 2023E EPS CAGR for HLNE and STEP and 5-year EPS CAGR for other peers (2) Assumes Dyal Fund V raises $9 billion in total commitments 11 (3) Statistic not reported by firms in the cohort; permanent capital funds are generally not a significant portion of AUM for these businesses (4) KKR pro forma for announced acquisition of Global Atlantic within the peer set (5) Based on pre-tax distributable earnings before minority interest for Blue OwlBlue Owl has a Highly Differentiated Financial Profile ü Blue Owl compares favorably to public alternative asset management universe Higher-Growth, Diversified Alt. Blue Owl FRE-Centric Firms Managers ‘22E FRE ‘22 FRE ‘22 FRE FRE-Centricity 100% as % of DE: 72% as % of DE: 57% as % of DE ’20-’22 DE CAGR: 22% ’20-’22 DE CAGR: 20% ’20-’22 DE / (1) (1) DE Growth 65% / 33% (1) L-T DE CAGR: 17% L-T DE CAGR: 14% L-T DE CAGRS Very High % of ’20-’22 DE Blue Owl Visibility of Growth from Relatively High Relatively High 82% (2) Existing Funds + Earnings Growth in Context Fee Waiver Expiry Permanent Capital Permanent Capital Permanence of Permanent Capital as % of AUM: as % of AUM: 92% as % of AUM Capital (3) (4) Nothing of substance 20% ‘22 P-T Op. ‘22 P-T Op. Margin: 53% ’22 P-T Op. Margin: 51% Relative Margins 67% (5) Margin Source: Company filings, IBES and GS Research as of 12/18/20 Note: Higher-Growth, FRE-Centric Firms includes EQT, HLNE, PGHN and STEP. Public Diversified Alternative Firms includes APO, ARES, BX, CG and KKR (1) Represents 2020 – 2025E after-tax DE CAGR for Blue Owl and IBES estimates for peers; Represents FY2021E – 2023E EPS CAGR for HLNE and STEP and 5-year EPS CAGR for other peers (2) Assumes Dyal Fund V raises $9 billion in total commitments 11 (3) Statistic not reported by firms in the cohort; permanent capital funds are generally not a significant portion of AUM for these businesses (4) KKR pro forma for announced acquisition of Global Atlantic within the peer set (5) Based on pre-tax distributable earnings before minority interest for Blue Owl

II. Business OverviewsII. Business Overviews
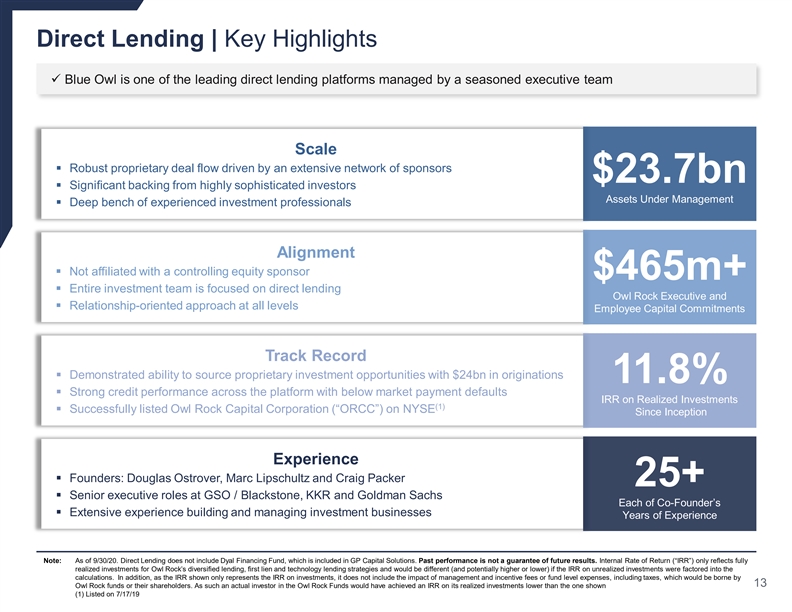
Direct Lending | Key Highlights ü Blue Owl is one of the leading direct lending platforms managed by a seasoned executive team Scale § Robust proprietary deal flow driven by an extensive network of sponsors $23.7bn § Significant backing from highly sophisticated investors Assets Under Management § Deep bench of experienced investment professionals Alignment § Not affiliated with a controlling equity sponsor $465m+ § Entire investment team is focused on direct lending Owl Rock Executive and § Relationship-oriented approach at all levels Employee Capital Commitments Track Record § Demonstrated ability to source proprietary investment opportunities with $24bn in originations 11.8% § Strong credit performance across the platform with below market payment defaults IRR on Realized Investments (1) § Successfully listed Owl Rock Capital Corporation (“ORCC”) on NYSE Since Inception Experience § Founders: Douglas Ostrover, Marc Lipschultz and Craig Packer 25+ § Senior executive roles at GSO / Blackstone, KKR and Goldman Sachs Each of Co-Founder’s § Extensive experience building and managing investment businesses Years of Experience Note: As of 9/30/20. Direct Lending does not include Dyal Financing Fund, which is included in GP Capital Solutions. Past performance is not a guarantee of future results. Internal Rate of Return (“IRR”) only reflects fully realized investments for Owl Rock’s diversified lending, first lien and technology lending strategies and would be different (and potentially higher or lower) if the IRR on unrealized investments were factored into the calculations. In addition, as the IRR shown only represents the IRR on investments, it does not include the impact of management and incentive fees or fund level expenses, including taxes, which would be borne by 13 Owl Rock funds or their shareholders. As such an actual investor in the Owl Rock Funds would have achieved an IRR on its realized investments lower than the one shown (1) Listed on 7/17/19Direct Lending | Key Highlights ü Blue Owl is one of the leading direct lending platforms managed by a seasoned executive team Scale § Robust proprietary deal flow driven by an extensive network of sponsors $23.7bn § Significant backing from highly sophisticated investors Assets Under Management § Deep bench of experienced investment professionals Alignment § Not affiliated with a controlling equity sponsor $465m+ § Entire investment team is focused on direct lending Owl Rock Executive and § Relationship-oriented approach at all levels Employee Capital Commitments Track Record § Demonstrated ability to source proprietary investment opportunities with $24bn in originations 11.8% § Strong credit performance across the platform with below market payment defaults IRR on Realized Investments (1) § Successfully listed Owl Rock Capital Corporation (“ORCC”) on NYSE Since Inception Experience § Founders: Douglas Ostrover, Marc Lipschultz and Craig Packer 25+ § Senior executive roles at GSO / Blackstone, KKR and Goldman Sachs Each of Co-Founder’s § Extensive experience building and managing investment businesses Years of Experience Note: As of 9/30/20. Direct Lending does not include Dyal Financing Fund, which is included in GP Capital Solutions. Past performance is not a guarantee of future results. Internal Rate of Return (“IRR”) only reflects fully realized investments for Owl Rock’s diversified lending, first lien and technology lending strategies and would be different (and potentially higher or lower) if the IRR on unrealized investments were factored into the calculations. In addition, as the IRR shown only represents the IRR on investments, it does not include the impact of management and incentive fees or fund level expenses, including taxes, which would be borne by 13 Owl Rock funds or their shareholders. As such an actual investor in the Owl Rock Funds would have achieved an IRR on its realized investments lower than the one shown (1) Listed on 7/17/19

Direct Lending | Platform Breakdown ü Complementary verticals that leverage existing origination and underwriting functions $23.7bn Assets Under Management Diversified First Lien Technology Opportunistic Lending Lending Lending Lending ORCC, ORCC II, First Lien Fund, Opportunistic Fund, Funds Tech. Finance Corp. ORCC III, ORDL, ORCIC Managed Accounts Managed Accounts Assets Under (2) $15.2 billion $2.9 billion $4.5 billion $1.0 billion (1) Management Public, Private, and non-traded Limited Partnership, Limited Partnership, Structure(s) Private BDC BDCs, Limited Partnership Managed Accounts Managed Accounts ORCC / ORCC II: 2016 / 2017 Commencement ORCC III / ORDL 2020: 2020 2018 2018 2020 of Strategy ORCIC: 2021 ORCC: $5.9 billion Equity Raised ORCC II: $1.2 billion $1.6 billion $3.0 billion $1.0 billion (1) ORCC III: $1.2 billion • Private equity sponsored • Private equity sponsored • Private equity and late stage • Private equity sponsored companies and other companies and other venture capital sponsored companies and other corporate situations corporate situations companies and other corporate situations corporate situations • Directly originated senior • Directly originated senior • Directly originated debt and Focus secured, floating rate loans secured, floating rate first • Directly originated debt and equity investments in U.S. (first lien, second lien, lien loans equity investments in U.S. companies facing challenges unitranche) companies in the technology sector Note: As of 9/30/20. Past performance is not a guarantee of future results (1) AUM may not sum due to rounding (2) Represents the total capital commitments provided by investors, the total accepted by ORCC III is a lower amount 14Direct Lending | Platform Breakdown ü Complementary verticals that leverage existing origination and underwriting functions $23.7bn Assets Under Management Diversified First Lien Technology Opportunistic Lending Lending Lending Lending ORCC, ORCC II, First Lien Fund, Opportunistic Fund, Funds Tech. Finance Corp. ORCC III, ORDL, ORCIC Managed Accounts Managed Accounts Assets Under (2) $15.2 billion $2.9 billion $4.5 billion $1.0 billion (1) Management Public, Private, and non-traded Limited Partnership, Limited Partnership, Structure(s) Private BDC BDCs, Limited Partnership Managed Accounts Managed Accounts ORCC / ORCC II: 2016 / 2017 Commencement ORCC III / ORDL 2020: 2020 2018 2018 2020 of Strategy ORCIC: 2021 ORCC: $5.9 billion Equity Raised ORCC II: $1.2 billion $1.6 billion $3.0 billion $1.0 billion (1) ORCC III: $1.2 billion • Private equity sponsored • Private equity sponsored • Private equity and late stage • Private equity sponsored companies and other companies and other venture capital sponsored companies and other corporate situations corporate situations companies and other corporate situations corporate situations • Directly originated senior • Directly originated senior • Directly originated debt and Focus secured, floating rate loans secured, floating rate first • Directly originated debt and equity investments in U.S. (first lien, second lien, lien loans equity investments in U.S. companies facing challenges unitranche) companies in the technology sector Note: As of 9/30/20. Past performance is not a guarantee of future results (1) AUM may not sum due to rounding (2) Represents the total capital commitments provided by investors, the total accepted by ORCC III is a lower amount 14
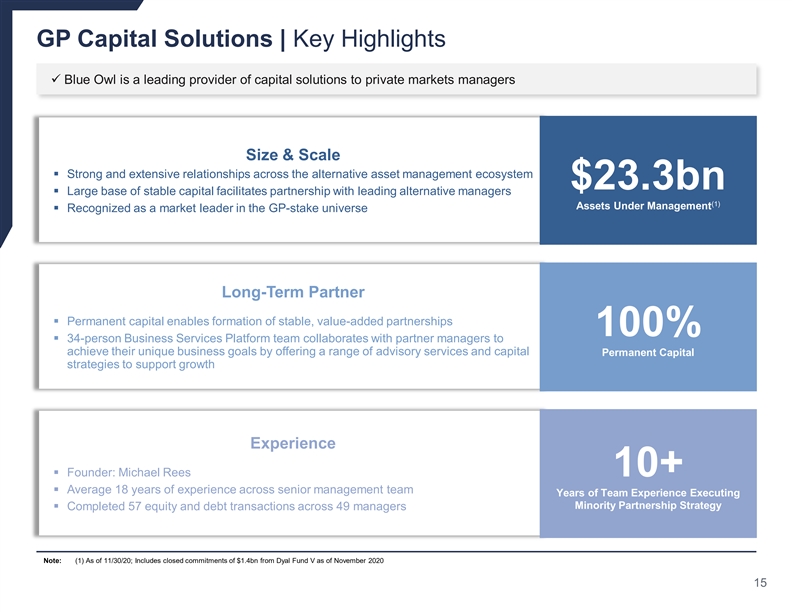
GP Capital Solutions | Key Highlights ü Blue Owl is a leading provider of capital solutions to private markets managers Size & Scale § Strong and extensive relationships across the alternative asset management ecosystem $23.3bn § Large base of stable capital facilitates partnership with leading alternative managers (1) Assets Under Management § Recognized as a market leader in the GP-stake universe Long-Term Partner § Permanent capital enables formation of stable, value-added partnerships 100% § 34-person Business Services Platform team collaborates with partner managers to achieve their unique business goals by offering a range of advisory services and capital Permanent Capital strategies to support growth Experience § Founder: Michael Rees 10+ § Average 18 years of experience across senior management team Years of Team Experience Executing Minority Partnership Strategy § Completed 57 equity and debt transactions across 49 managers Note: (1) As of 11/30/20; Includes closed commitments of $1.4bn from Dyal Fund V as of November 2020 15GP Capital Solutions | Key Highlights ü Blue Owl is a leading provider of capital solutions to private markets managers Size & Scale § Strong and extensive relationships across the alternative asset management ecosystem $23.3bn § Large base of stable capital facilitates partnership with leading alternative managers (1) Assets Under Management § Recognized as a market leader in the GP-stake universe Long-Term Partner § Permanent capital enables formation of stable, value-added partnerships 100% § 34-person Business Services Platform team collaborates with partner managers to achieve their unique business goals by offering a range of advisory services and capital Permanent Capital strategies to support growth Experience § Founder: Michael Rees 10+ § Average 18 years of experience across senior management team Years of Team Experience Executing Minority Partnership Strategy § Completed 57 equity and debt transactions across 49 managers Note: (1) As of 11/30/20; Includes closed commitments of $1.4bn from Dyal Fund V as of November 2020 15
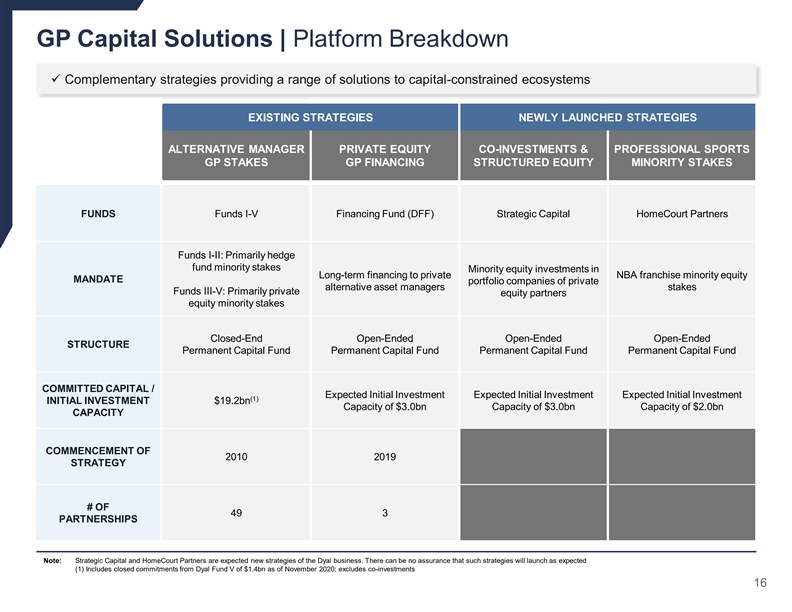
GP Capital Solutions | Platform Breakdown ü Complementary strategies providing a range of solutions to capital-constrained ecosystems EXISTING STRATEGIES NEWLY LAUNCHED STRATEGIES ALTERNATIVE MANAGER PRIVATE EQUITY CO-INVESTMENTS & PROFESSIONAL SPORTS GP STAKES GP FINANCING STRUCTURED EQUITY MINORITY STAKES FUNDS Funds I-V Financing Fund (DFF) Strategic Capital HomeCourt Partners Funds I-II: Primarily hedge fund minority stakes Minority equity investments in Long-term financing to private NBA franchise minority equity MANDATE portfolio companies of private alternative asset managers stakes Funds III-V: Primarily private equity partners equity minority stakes Closed-End Open-Ended Open-Ended Open-Ended STRUCTURE Permanent Capital Fund Permanent Capital Fund Permanent Capital Fund Permanent Capital Fund COMMITTED CAPITAL / Expected Initial Investment Expected Initial Investment Expected Initial Investment (1) INITIAL INVESTMENT $19.2bn Capacity of $3.0bn Capacity of $3.0bn Capacity of $2.0bn CAPACITY COMMENCEMENT OF 2010 2019 STRATEGY # OF 49 3 PARTNERSHIPS Note: Strategic Capital and HomeCourt Partners are expected new strategies of the Dyal business. There can be no assurance that such strategies will launch as expected (1) Includes closed commitments from Dyal Fund V of $1.4bn as of November 2020; excludes co-investments 16GP Capital Solutions | Platform Breakdown ü Complementary strategies providing a range of solutions to capital-constrained ecosystems EXISTING STRATEGIES NEWLY LAUNCHED STRATEGIES ALTERNATIVE MANAGER PRIVATE EQUITY CO-INVESTMENTS & PROFESSIONAL SPORTS GP STAKES GP FINANCING STRUCTURED EQUITY MINORITY STAKES FUNDS Funds I-V Financing Fund (DFF) Strategic Capital HomeCourt Partners Funds I-II: Primarily hedge fund minority stakes Minority equity investments in Long-term financing to private NBA franchise minority equity MANDATE portfolio companies of private alternative asset managers stakes Funds III-V: Primarily private equity partners equity minority stakes Closed-End Open-Ended Open-Ended Open-Ended STRUCTURE Permanent Capital Fund Permanent Capital Fund Permanent Capital Fund Permanent Capital Fund COMMITTED CAPITAL / Expected Initial Investment Expected Initial Investment Expected Initial Investment (1) INITIAL INVESTMENT $19.2bn Capacity of $3.0bn Capacity of $3.0bn Capacity of $2.0bn CAPACITY COMMENCEMENT OF 2010 2019 STRATEGY # OF 49 3 PARTNERSHIPS Note: Strategic Capital and HomeCourt Partners are expected new strategies of the Dyal business. There can be no assurance that such strategies will launch as expected (1) Includes closed commitments from Dyal Fund V of $1.4bn as of November 2020; excludes co-investments 16
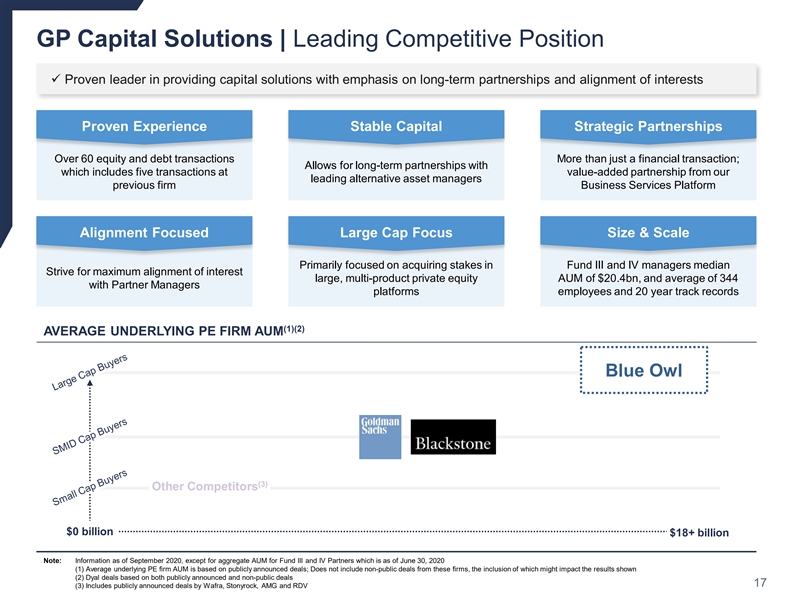
GP Capital Solutions | Leading Competitive Position ü Proven leader in providing capital solutions with emphasis on long-term partnerships and alignment of interests Proven Experience Stable Capital Strategic Partnerships Over 60 equity and debt transactions More than just a financial transaction; Allows for long-term partnerships with which includes five transactions at value-added partnership from our leading alternative asset managers previous firm Business Services Platform Alignment Focused Large Cap Focus Size & Scale Primarily focused on acquiring stakes in Fund III and IV managers median Strive for maximum alignment of interest large, multi-product private equity AUM of $20.4bn, and average of 344 with Partner Managers platforms employees and 20 year track records (1)(2) AVERAGE UNDERLYING PE FIRM AUM Blue Owl (3) Other Competitors $0 billion $18+ billion Note: Information as of September 2020, except for aggregate AUM for Fund III and IV Partners which is as of June 30, 2020 (1) Average underlying PE firm AUM is based on publicly announced deals; Does not include non-public deals from these firms, the inclusion of which might impact the results shown (2) Dyal deals based on both publicly announced and non-public deals 17 (3) Includes publicly announced deals by Wafra, Stonyrock, AMG and RDVGP Capital Solutions | Leading Competitive Position ü Proven leader in providing capital solutions with emphasis on long-term partnerships and alignment of interests Proven Experience Stable Capital Strategic Partnerships Over 60 equity and debt transactions More than just a financial transaction; Allows for long-term partnerships with which includes five transactions at value-added partnership from our leading alternative asset managers previous firm Business Services Platform Alignment Focused Large Cap Focus Size & Scale Primarily focused on acquiring stakes in Fund III and IV managers median Strive for maximum alignment of interest large, multi-product private equity AUM of $20.4bn, and average of 344 with Partner Managers platforms employees and 20 year track records (1)(2) AVERAGE UNDERLYING PE FIRM AUM Blue Owl (3) Other Competitors $0 billion $18+ billion Note: Information as of September 2020, except for aggregate AUM for Fund III and IV Partners which is as of June 30, 2020 (1) Average underlying PE firm AUM is based on publicly announced deals; Does not include non-public deals from these firms, the inclusion of which might impact the results shown (2) Dyal deals based on both publicly announced and non-public deals 17 (3) Includes publicly announced deals by Wafra, Stonyrock, AMG and RDV

III. Blue Owl Financial HighlightsIII. Blue Owl Financial Highlights

Blue Owl | Summary Combined Projections (1) Projections for Year Ending December 31, Adjusted $ in millions 2020E 2021E 2022E 2023E 2024E 2025E Revenues (2) $668 $956 $1,155 $1,309 $1,664 $1,785 Management Fee-Related Revenue Expenses (3) $152 $238 $295 $352 $418 $469 Compensation G&A 91 93 70 67 78 91 (4) $243 $331 $365 $419 $495 $561 Adj. Total Expenses Earnings (5) $425 $624 $790 $890 $1,169 $1,224 EBITDA (−) Interest Expense (20) (20) (20) (20) (20) (20) Pre-Tax Distributable Earnings $405 $604 $770 $870 $1,148 $1,204 (−) Minority Interest (1) (11) (22) (35) (54) (67) Pre-Tax Distributable Earnings to Common $405 $593 $748 $835 $1,095 $1,137 (6) (101) (148) (187) (209) (274) (284) (−) Income Taxes Distributable Earnings to Common $304 $445 $561 $626 $821 $853 Key Metrics FRE as a % of Total Earnings 100% 100% 100% 100% 100% 100% EBITDA Margin 64% 65% 68% 68% 70% 69% (7) $0 $4 $19 $36 $49 $73 Memo: Accrued Carry Note: Blue Owl projections assume the combination of standalone estimated management cash projections for Owl Rock and Dyal, with incremental middle / back-office costs as described below For purposes of this presentation, metrics are represented on a cash basis (1) Excludes impact of fee waiver which represents $131m for revenue and EBITDA and $98m (post-tax) for distributable earnings to common; fee waiver expired in October 2020; (2) Includes BDC Part I Fees and 19 other; (3) Includes additional compensation expense for middle / back-office build-out for Blue Owl as a result of the merger; represents $3.0m - $6.7m expense from 2021E to 2025E; (4) Total expenses are adjusted for distribution costs at the time cash payment is expected and represent a non-GAAP measure; (5) Assumes de minimis D&A; (6) Assumes illustrative 25% tax rate; (7) Represents annual carry accrual; carry is not realized during projection period but is expected to materialize in future periodsBlue Owl | Summary Combined Projections (1) Projections for Year Ending December 31, Adjusted $ in millions 2020E 2021E 2022E 2023E 2024E 2025E Revenues (2) $668 $956 $1,155 $1,309 $1,664 $1,785 Management Fee-Related Revenue Expenses (3) $152 $238 $295 $352 $418 $469 Compensation G&A 91 93 70 67 78 91 (4) $243 $331 $365 $419 $495 $561 Adj. Total Expenses Earnings (5) $425 $624 $790 $890 $1,169 $1,224 EBITDA (−) Interest Expense (20) (20) (20) (20) (20) (20) Pre-Tax Distributable Earnings $405 $604 $770 $870 $1,148 $1,204 (−) Minority Interest (1) (11) (22) (35) (54) (67) Pre-Tax Distributable Earnings to Common $405 $593 $748 $835 $1,095 $1,137 (6) (101) (148) (187) (209) (274) (284) (−) Income Taxes Distributable Earnings to Common $304 $445 $561 $626 $821 $853 Key Metrics FRE as a % of Total Earnings 100% 100% 100% 100% 100% 100% EBITDA Margin 64% 65% 68% 68% 70% 69% (7) $0 $4 $19 $36 $49 $73 Memo: Accrued Carry Note: Blue Owl projections assume the combination of standalone estimated management cash projections for Owl Rock and Dyal, with incremental middle / back-office costs as described below For purposes of this presentation, metrics are represented on a cash basis (1) Excludes impact of fee waiver which represents $131m for revenue and EBITDA and $98m (post-tax) for distributable earnings to common; fee waiver expired in October 2020; (2) Includes BDC Part I Fees and 19 other; (3) Includes additional compensation expense for middle / back-office build-out for Blue Owl as a result of the merger; represents $3.0m - $6.7m expense from 2021E to 2025E; (4) Total expenses are adjusted for distribution costs at the time cash payment is expected and represent a non-GAAP measure; (5) Assumes de minimis D&A; (6) Assumes illustrative 25% tax rate; (7) Represents annual carry accrual; carry is not realized during projection period but is expected to materialize in future periods

Significant Earnings Power Embedded in Blue Owl Platform ü Deployment of capital already raised and contractual fee-rate increases creates significant earnings power (1) BLUE OWL EARNINGS FROM AUM ALREADY RAISED ($m) Reflects net impact from (3) Dyal Fund V ; first close occurred in November 2020 $602 Reflects impact from fee-rate increases $83 upon IPO for key funds $145 $71 $304 Reflects net impact from deployment potential built-into current AUM 2020E Impact from Impact from Current (2) Adj. Earnings Full Fee Rates Full Deployment Earnings Power Note: Blue Owl projections assume the combination of standalone estimated management cash projections for Owl Rock and Dyal, with incremental middle / back-office costs as previously described For purposes of this presentation, metrics are represented on a cash basis (1) Impact to earnings assumes 66% pre-tax margin and illustrative 25% tax rate 20 (2) Excludes impact of $98m post-tax fee waiver, which expired in October 2020 (3) Assumes Dyal Fund V raises $9 billion in total commitmentsSignificant Earnings Power Embedded in Blue Owl Platform ü Deployment of capital already raised and contractual fee-rate increases creates significant earnings power (1) BLUE OWL EARNINGS FROM AUM ALREADY RAISED ($m) Reflects net impact from (3) Dyal Fund V ; first close occurred in November 2020 $602 Reflects impact from fee-rate increases $83 upon IPO for key funds $145 $71 $304 Reflects net impact from deployment potential built-into current AUM 2020E Impact from Impact from Current (2) Adj. Earnings Full Fee Rates Full Deployment Earnings Power Note: Blue Owl projections assume the combination of standalone estimated management cash projections for Owl Rock and Dyal, with incremental middle / back-office costs as previously described For purposes of this presentation, metrics are represented on a cash basis (1) Impact to earnings assumes 66% pre-tax margin and illustrative 25% tax rate 20 (2) Excludes impact of $98m post-tax fee waiver, which expired in October 2020 (3) Assumes Dyal Fund V raises $9 billion in total commitments
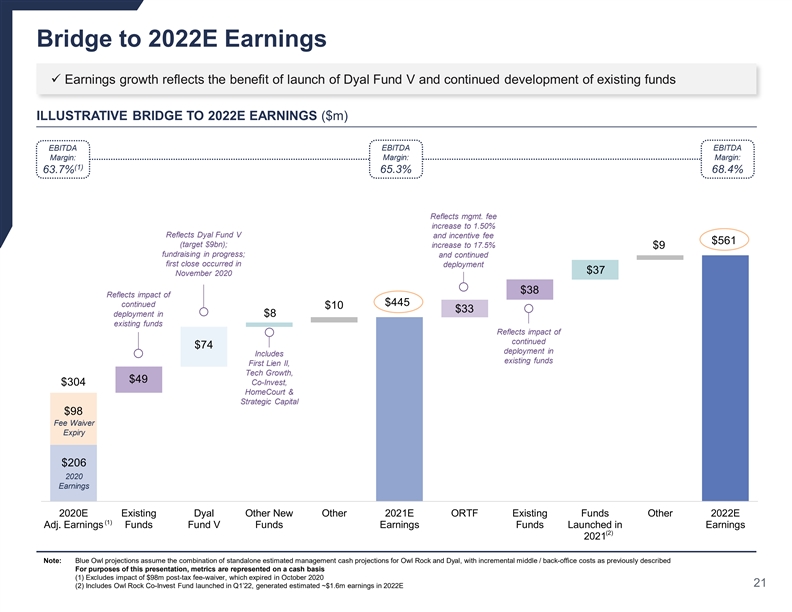
Bridge to 2022E Earnings ü Earnings growth reflects the benefit of launch of Dyal Fund V and continued development of existing funds ILLUSTRATIVE BRIDGE TO 2022E EARNINGS ($m) EBITDA EBITDA EBITDA Margin: Margin: Margin: (1) 63.7% 65.3% 68.4% Reflects mgmt. fee increase to 1.50% Reflects Dyal Fund V and incentive fee $561 (target $9bn); increase to 17.5% $9 fundraising in progress; and continued first close occurred in deployment $37 November 2020 $38 Reflects impact of $445 continued $10 $33 deployment in $8 existing funds Reflects impact of continued $74 deployment in Includes existing funds First Lien II, Tech Growth, $49 Co-Invest, $304 HomeCourt & Strategic Capital $98 Fee Waiver Expiry $206 2020 Earnings 2020E Existing Dyal Other New Other 2021E ORTF Existing Funds Other 2022E (1) Adj. Earnings Funds Fund V Funds Earnings Funds Launched in Earnings (2) 2021 Note: Blue Owl projections assume the combination of standalone estimated management cash projections for Owl Rock and Dyal, with incremental middle / back-office costs as previously described For purposes of this presentation, metrics are represented on a cash basis (1) Excludes impact of $98m post-tax fee-waiver, which expired in October 2020 21 (2) Includes Owl Rock Co-Invest Fund launched in Q1’22, generated estimated ~$1.6m earnings in 2022EBridge to 2022E Earnings ü Earnings growth reflects the benefit of launch of Dyal Fund V and continued development of existing funds ILLUSTRATIVE BRIDGE TO 2022E EARNINGS ($m) EBITDA EBITDA EBITDA Margin: Margin: Margin: (1) 63.7% 65.3% 68.4% Reflects mgmt. fee increase to 1.50% Reflects Dyal Fund V and incentive fee $561 (target $9bn); increase to 17.5% $9 fundraising in progress; and continued first close occurred in deployment $37 November 2020 $38 Reflects impact of $445 continued $10 $33 deployment in $8 existing funds Reflects impact of continued $74 deployment in Includes existing funds First Lien II, Tech Growth, $49 Co-Invest, $304 HomeCourt & Strategic Capital $98 Fee Waiver Expiry $206 2020 Earnings 2020E Existing Dyal Other New Other 2021E ORTF Existing Funds Other 2022E (1) Adj. Earnings Funds Fund V Funds Earnings Funds Launched in Earnings (2) 2021 Note: Blue Owl projections assume the combination of standalone estimated management cash projections for Owl Rock and Dyal, with incremental middle / back-office costs as previously described For purposes of this presentation, metrics are represented on a cash basis (1) Excludes impact of $98m post-tax fee-waiver, which expired in October 2020 21 (2) Includes Owl Rock Co-Invest Fund launched in Q1’22, generated estimated ~$1.6m earnings in 2022E

Blue Owl’s High-Growth, FRE-Focused Earnings Profile ü Highly-attractive business model focused on strong growth, FRE generation, and best-in-class margins (1) ORGANIC AUM GROWTH ($bn) TOTAL REVENUES ($m) (2) Management Fee Revenue (%) 100% 100% 100% 100% 100% 100% Total CAGR: 23.8% $137.2 $120.4 $1,785 $1,664 $99.2 $1,309 $87.7 37% $1,155 $74.4 42% $956 39% $47.2 42% $668 48% 63% 43% 58% 61% 58% 52% 57% (3) 2020E 2021E 2022E 2023E 2024E 2025E 2020E 2021E 2022E 2023E 2024E 2025E (2) Owl Rock Dyal (5) EBITDA ($m) DISTRIBUTABLE EARNINGS TO COMMON ($m) EBITDA Margin (%) Illustrative Dividends at 75% Payout ($) 63.7% 65.3% 68.4% 68.0% 70.2% 68.6% $154m $334m $421m $470m $616m $640m $1,224 $1,169 Total CAGR: 32.9% $890 $853 $821 $790 $626 $624 $561 $445 $425 $206 (3) (4) 2020E 2021E 2022E 2023E 2024E 2025E 2020E 2021E 2022E 2023E 2024E 2025E Note: Blue Owl projections assume the combination of standalone estimated management cash projections for Owl Rock and Dyal, with incremental middle / back-office costs as previously described For purposes of this presentation, metrics are represented on a cash basis (1) Projected AUM for GP Capital Solutions excludes co-investments (2) Includes BDC Part I Fees and other fees 22 (3) Excludes impact of $131m pre-tax fee waiver, which expired in October 2020 (4) Includes impact of $98m post-tax fee waiver, which expired in October 2020; CAGR excluding impact of fee-waiver is 22.9% (5) Assumes illustrative 25% tax rateBlue Owl’s High-Growth, FRE-Focused Earnings Profile ü Highly-attractive business model focused on strong growth, FRE generation, and best-in-class margins (1) ORGANIC AUM GROWTH ($bn) TOTAL REVENUES ($m) (2) Management Fee Revenue (%) 100% 100% 100% 100% 100% 100% Total CAGR: 23.8% $137.2 $120.4 $1,785 $1,664 $99.2 $1,309 $87.7 37% $1,155 $74.4 42% $956 39% $47.2 42% $668 48% 63% 43% 58% 61% 58% 52% 57% (3) 2020E 2021E 2022E 2023E 2024E 2025E 2020E 2021E 2022E 2023E 2024E 2025E (2) Owl Rock Dyal (5) EBITDA ($m) DISTRIBUTABLE EARNINGS TO COMMON ($m) EBITDA Margin (%) Illustrative Dividends at 75% Payout ($) 63.7% 65.3% 68.4% 68.0% 70.2% 68.6% $154m $334m $421m $470m $616m $640m $1,224 $1,169 Total CAGR: 32.9% $890 $853 $821 $790 $626 $624 $561 $445 $425 $206 (3) (4) 2020E 2021E 2022E 2023E 2024E 2025E 2020E 2021E 2022E 2023E 2024E 2025E Note: Blue Owl projections assume the combination of standalone estimated management cash projections for Owl Rock and Dyal, with incremental middle / back-office costs as previously described For purposes of this presentation, metrics are represented on a cash basis (1) Projected AUM for GP Capital Solutions excludes co-investments (2) Includes BDC Part I Fees and other fees 22 (3) Excludes impact of $131m pre-tax fee waiver, which expired in October 2020 (4) Includes impact of $98m post-tax fee waiver, which expired in October 2020; CAGR excluding impact of fee-waiver is 22.9% (5) Assumes illustrative 25% tax rate
IV. Transaction SummaryIV. Transaction Summary

Senior Leadership Doug Ostrover Marc Lipschultz Michael Rees Alan Kirshenbaum CEO Co-President Co-President CFO § Co-Founder and CEO of § Co-Founder and President § Managing Director and § Chief Operating Officer & Owl Rock Capital Partners of Owl Rock Capital Head of Dyal Capital Chief Financial Officer of and a member of the Partners Partners and a member of Owl Rock Capital Partners, Advisors’ Investment Neuberger Berman’s ORCC, ORTF and Owl § Co-CIO of Owl Rock Capital Committee Partnership Committee Rock Capital Advisors, as Advisors well as the Chief Operating § Prior to founding Dyal, was § Co-CIO of Owl Rock Capital Officer of ORCC III a founding employee and § Prior to founding Owl Rock, Advisors shareholder of Neuberger spent more than two § Prior to Owl Rock, was the Berman Group and the first § Prior to founding Owl Rock, decades at KKR, serving on CFO of TPG Specialty Chief Operating Officer of was one of the founders of the firm’s Management Lending, Inc. the NB Alternatives GSO Capital Partners and a Committee and as the business Senior Managing Director at Global Head of Energy and § 25+ years of experience Blackstone Infrastructure § 20+ years of experience § 25+ years of experience§ 25+ years of experience 24Senior Leadership Doug Ostrover Marc Lipschultz Michael Rees Alan Kirshenbaum CEO Co-President Co-President CFO § Co-Founder and CEO of § Co-Founder and President § Managing Director and § Chief Operating Officer & Owl Rock Capital Partners of Owl Rock Capital Head of Dyal Capital Chief Financial Officer of and a member of the Partners Partners and a member of Owl Rock Capital Partners, Advisors’ Investment Neuberger Berman’s ORCC, ORTF and Owl § Co-CIO of Owl Rock Capital Committee Partnership Committee Rock Capital Advisors, as Advisors well as the Chief Operating § Prior to founding Dyal, was § Co-CIO of Owl Rock Capital Officer of ORCC III a founding employee and § Prior to founding Owl Rock, Advisors shareholder of Neuberger spent more than two § Prior to Owl Rock, was the Berman Group and the first § Prior to founding Owl Rock, decades at KKR, serving on CFO of TPG Specialty Chief Operating Officer of was one of the founders of the firm’s Management Lending, Inc. the NB Alternatives GSO Capital Partners and a Committee and as the business Senior Managing Director at Global Head of Energy and § 25+ years of experience Blackstone Infrastructure § 20+ years of experience § 25+ years of experience§ 25+ years of experience 24

Overview of Altimar Acquisition Corporation ü Altimar is sponsored by an affiliate of HPS Investment Partners (“HPS”), a natural partner for Blue Owl with a proven track record in the alternative asset management industry and experienced leadership (1) ALTIMAR ACQUISITION CORPORATION HPS INVESTMENT PARTNERS KEY STATS HPS Investment Proven SPAC AUM Employees # of Offices Track Record Partners § Altimar is a $275m SPAC § HPS has valuable experience $47bn 150+ Investment sponsored by an affiliate of with SPACs, including with the Private Credit Professionals HPS Investment Partners, one capital raising and business 12 Offices of the world’s largest combination process, via Globally $20bn 380+ Total alternative asset managers HPS’s co-sponsorship of Trine Public Credit Employees Acquisition Corp. and its § HPS has ~$67bn of assets business combination with (1) under management and (2) Desktop Metal (NYSE: DM) invests in various strategies HPS SPAC EXPERIENCE | TRINE + DESKTOP METAL across the capital structure § In August 2020, Trine, a $300m SPAC co-sponsored by HPS, announced its HPS Experienced merger with Desktop Metal, a leader in mass production and turnkey additive Value Add manufacturing solutions Leadership ‒ Transaction closed in December 2020 § HPS is led by Scott Kapnick§ As a leader in the alternative (Governing Partner and CEO), asset management industry, ‒ Desktop Metal (NYSE: DM) has been well received by the market former Partner and Co-Head of HPS has deep industry § Transaction introduced Desktop Metal as a publicly listed company Investment Banking at G.S. expertise and is uniquely positioned to support Blue Owl ‒ Entry enterprise value of $1.8bn § Altimar CEO, Tom Wasserman, is a career § HPS employs an active ‒ Represents 1.9x the company’s 2025E Revenue of $942m Growth Equity investor and led approach to help its partners’ § Raised $575m, including $300m from Trine’s cash in trust and $275m from HPS’s co-sponsorship of Trine business development efforts leading institutional investors in a PIPE Acquisition Corp. to drive top line growth ‒ Will support Desktop Metal’s commercialization of its next-gen 3D printing § Altimar’s team of Directors has § Track record of supporting systems a diverse set of backgrounds businesses through their across a variety of industries lifecycles with capital § Select investors that participated in the PIPE include Miller Value Partners investments and business (Bill Miller), XN, Baron Capital Group, Chamath Palihapitiya, JB Straubel (ex- development support Tesla CTO), and HPS (as an anchor) Note: (1) AUM as of December 1, 2020; Employees as of November 30, 2020 (2) Trine was co-sponsored by HPS and an entity controlled by Leo Hindery, Jr. 25Overview of Altimar Acquisition Corporation ü Altimar is sponsored by an affiliate of HPS Investment Partners (“HPS”), a natural partner for Blue Owl with a proven track record in the alternative asset management industry and experienced leadership (1) ALTIMAR ACQUISITION CORPORATION HPS INVESTMENT PARTNERS KEY STATS HPS Investment Proven SPAC AUM Employees # of Offices Track Record Partners § Altimar is a $275m SPAC § HPS has valuable experience $47bn 150+ Investment sponsored by an affiliate of with SPACs, including with the Private Credit Professionals HPS Investment Partners, one capital raising and business 12 Offices of the world’s largest combination process, via Globally $20bn 380+ Total alternative asset managers HPS’s co-sponsorship of Trine Public Credit Employees Acquisition Corp. and its § HPS has ~$67bn of assets business combination with (1) under management and (2) Desktop Metal (NYSE: DM) invests in various strategies HPS SPAC EXPERIENCE | TRINE + DESKTOP METAL across the capital structure § In August 2020, Trine, a $300m SPAC co-sponsored by HPS, announced its HPS Experienced merger with Desktop Metal, a leader in mass production and turnkey additive Value Add manufacturing solutions Leadership ‒ Transaction closed in December 2020 § HPS is led by Scott Kapnick§ As a leader in the alternative (Governing Partner and CEO), asset management industry, ‒ Desktop Metal (NYSE: DM) has been well received by the market former Partner and Co-Head of HPS has deep industry § Transaction introduced Desktop Metal as a publicly listed company Investment Banking at G.S. expertise and is uniquely positioned to support Blue Owl ‒ Entry enterprise value of $1.8bn § Altimar CEO, Tom Wasserman, is a career § HPS employs an active ‒ Represents 1.9x the company’s 2025E Revenue of $942m Growth Equity investor and led approach to help its partners’ § Raised $575m, including $300m from Trine’s cash in trust and $275m from HPS’s co-sponsorship of Trine business development efforts leading institutional investors in a PIPE Acquisition Corp. to drive top line growth ‒ Will support Desktop Metal’s commercialization of its next-gen 3D printing § Altimar’s team of Directors has § Track record of supporting systems a diverse set of backgrounds businesses through their across a variety of industries lifecycles with capital § Select investors that participated in the PIPE include Miller Value Partners investments and business (Bill Miller), XN, Baron Capital Group, Chamath Palihapitiya, JB Straubel (ex- development support Tesla CTO), and HPS (as an anchor) Note: (1) AUM as of December 1, 2020; Employees as of November 30, 2020 (2) Trine was co-sponsored by HPS and an entity controlled by Leo Hindery, Jr. 25
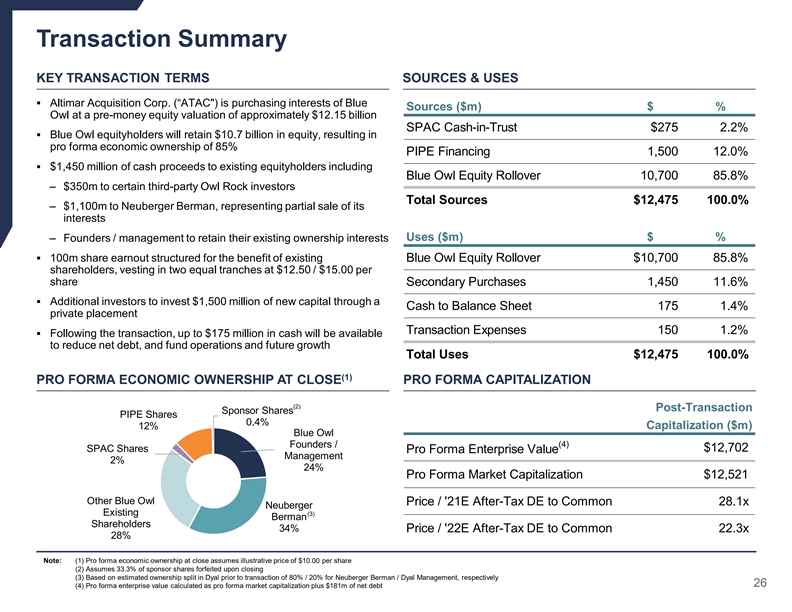
Transaction Summary KEY TRANSACTION TERMS SOURCES & USES § Altimar Acquisition Corp. (“ATAC ) is purchasing interests of Blue Sources ($m) $ % Owl at a pre-money equity valuation of approximately $12.15 billion SPAC Cash-in-Trust $275 2.2% § Blue Owl equityholders will retain $10.7 billion in equity, resulting in pro forma economic ownership of 85% PIPE Financing 1,500 12.0% § $1,450 million of cash proceeds to existing equityholders including Blue Owl Equity Rollover 10,700 85.8% ‒ $350m to certain third-party Owl Rock investors Total Sources $12,475 100.0% ‒ $1,100m to Neuberger Berman, representing partial sale of its interests Uses ($m) $ % ‒ Founders / management to retain their existing ownership interests § 100m share earnout structured for the benefit of existing Blue Owl Equity Rollover $10,700 85.8% shareholders, vesting in two equal tranches at $12.50 / $15.00 per share Secondary Purchases 1,450 11.6% § Additional investors to invest $1,500 million of new capital through a Cash to Balance Sheet 175 1.4% private placement Transaction Expenses 150 1.2% § Following the transaction, up to $175 million in cash will be available to reduce net debt, and fund operations and future growth Total Uses $12,475 100.0% (1) PRO FORMA ECONOMIC OWNERSHIP AT CLOSE PRO FORMA CAPITALIZATION (2) Post-Transaction Sponsor Shares PIPE Shares 0.4% 12% Capitalization ($m) Blue Owl (4) Founders / SPAC Shares $12,702 Pro Forma Enterprise Value Management 2% 24% Pro Forma Market Capitalization $12,521 Other Blue Owl Price / '21E After-Tax DE to Common 28.1x Neuberger Existing (3) Berman Shareholders 34% Price / '22E After-Tax DE to Common 22.3x 28% Note: (1) Pro forma economic ownership at close assumes illustrative price of $10.00 per share (2) Assumes 33.3% of sponsor shares forfeited upon closing (3) Based on estimated ownership split in Dyal prior to transaction of 80% / 20% for Neuberger Berman / Dyal Management, respectively 26 (4) Pro forma enterprise value calculated as pro forma market capitalization plus $181m of net debtTransaction Summary KEY TRANSACTION TERMS SOURCES & USES § Altimar Acquisition Corp. (“ATAC ) is purchasing interests of Blue Sources ($m) $ % Owl at a pre-money equity valuation of approximately $12.15 billion SPAC Cash-in-Trust $275 2.2% § Blue Owl equityholders will retain $10.7 billion in equity, resulting in pro forma economic ownership of 85% PIPE Financing 1,500 12.0% § $1,450 million of cash proceeds to existing equityholders including Blue Owl Equity Rollover 10,700 85.8% ‒ $350m to certain third-party Owl Rock investors Total Sources $12,475 100.0% ‒ $1,100m to Neuberger Berman, representing partial sale of its interests Uses ($m) $ % ‒ Founders / management to retain their existing ownership interests § 100m share earnout structured for the benefit of existing Blue Owl Equity Rollover $10,700 85.8% shareholders, vesting in two equal tranches at $12.50 / $15.00 per share Secondary Purchases 1,450 11.6% § Additional investors to invest $1,500 million of new capital through a Cash to Balance Sheet 175 1.4% private placement Transaction Expenses 150 1.2% § Following the transaction, up to $175 million in cash will be available to reduce net debt, and fund operations and future growth Total Uses $12,475 100.0% (1) PRO FORMA ECONOMIC OWNERSHIP AT CLOSE PRO FORMA CAPITALIZATION (2) Post-Transaction Sponsor Shares PIPE Shares 0.4% 12% Capitalization ($m) Blue Owl (4) Founders / SPAC Shares $12,702 Pro Forma Enterprise Value Management 2% 24% Pro Forma Market Capitalization $12,521 Other Blue Owl Price / '21E After-Tax DE to Common 28.1x Neuberger Existing (3) Berman Shareholders 34% Price / '22E After-Tax DE to Common 22.3x 28% Note: (1) Pro forma economic ownership at close assumes illustrative price of $10.00 per share (2) Assumes 33.3% of sponsor shares forfeited upon closing (3) Based on estimated ownership split in Dyal prior to transaction of 80% / 20% for Neuberger Berman / Dyal Management, respectively 26 (4) Pro forma enterprise value calculated as pro forma market capitalization plus $181m of net debt
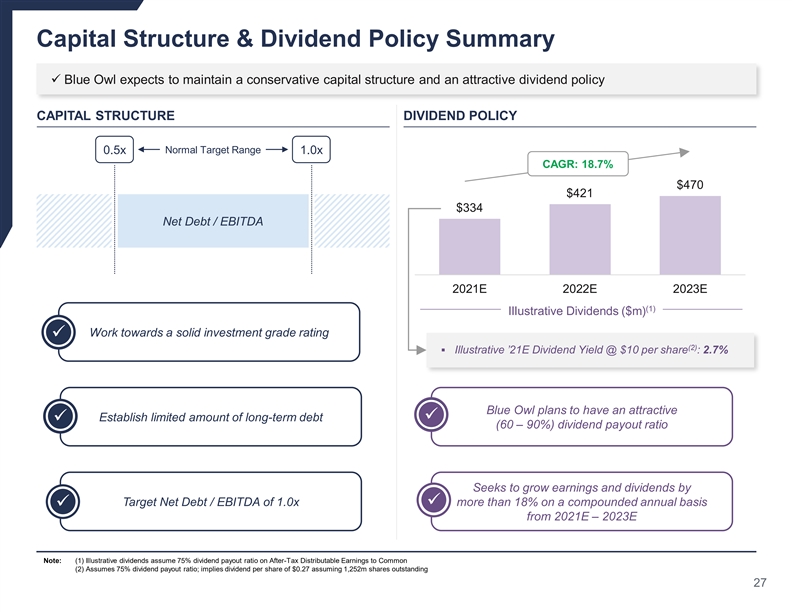
Capital Structure & Dividend Policy Summary ü Blue Owl expects to maintain a conservative capital structure and an attractive dividend policy CAPITAL STRUCTURE DIVIDEND POLICY Normal Target Range 0.5x 1.0x CAGR: 18.7% $470 $421 $334 Net Debt / EBITDA 2021E 2022E 2023E (1) Illustrative Dividends ($m) Work towards a solid investment grade rating ü (2) § Illustrative ’21E Dividend Yield @ $10 per share : 2.7% Blue Owl plans to have an attractive Establish limited amount of long-term debtü ü (60 – 90%) dividend payout ratio Seeks to grow earnings and dividends by Target Net Debt / EBITDA of 1.0x more than 18% on a compounded annual basis ü ü from 2021E – 2023E Note: (1) Illustrative dividends assume 75% dividend payout ratio on After-Tax Distributable Earnings to Common (2) Assumes 75% dividend payout ratio; implies dividend per share of $0.27 assuming 1,252m shares outstanding 27Capital Structure & Dividend Policy Summary ü Blue Owl expects to maintain a conservative capital structure and an attractive dividend policy CAPITAL STRUCTURE DIVIDEND POLICY Normal Target Range 0.5x 1.0x CAGR: 18.7% $470 $421 $334 Net Debt / EBITDA 2021E 2022E 2023E (1) Illustrative Dividends ($m) Work towards a solid investment grade rating ü (2) § Illustrative ’21E Dividend Yield @ $10 per share : 2.7% Blue Owl plans to have an attractive Establish limited amount of long-term debtü ü (60 – 90%) dividend payout ratio Seeks to grow earnings and dividends by Target Net Debt / EBITDA of 1.0x more than 18% on a compounded annual basis ü ü from 2021E – 2023E Note: (1) Illustrative dividends assume 75% dividend payout ratio on After-Tax Distributable Earnings to Common (2) Assumes 75% dividend payout ratio; implies dividend per share of $0.27 assuming 1,252m shares outstanding 27
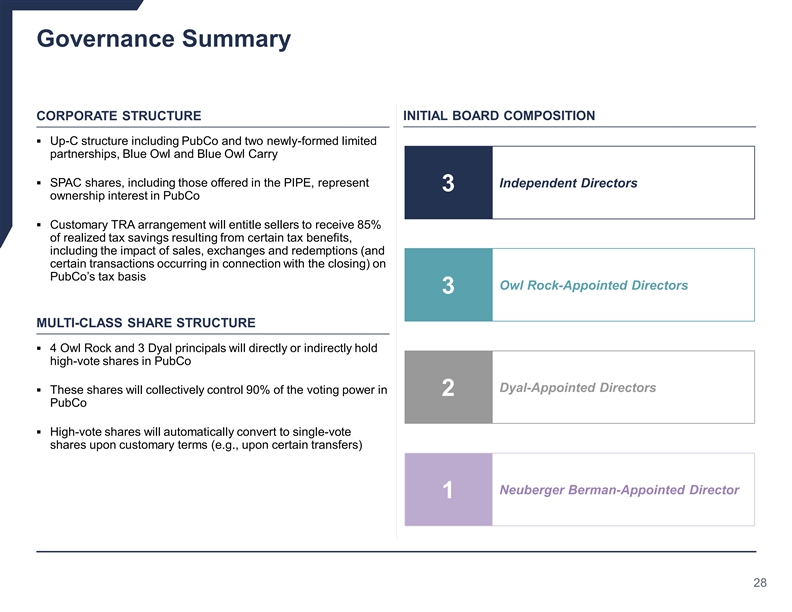
Governance Summary CORPORATE STRUCTURE INITIAL BOARD COMPOSITION § Up-C structure including PubCo and two newly-formed limited partnerships, Blue Owl and Blue Owl Carry § SPAC shares, including those offered in the PIPE, represent Independent Directors 3 ownership interest in PubCo § Customary TRA arrangement will entitle sellers to receive 85% of realized tax savings resulting from certain tax benefits, including the impact of sales, exchanges and redemptions (and certain transactions occurring in connection with the closing) on PubCo’s tax basis Owl Rock-Appointed Directors 3 MULTI-CLASS SHARE STRUCTURE § 4 Owl Rock and 3 Dyal principals will directly or indirectly hold high-vote shares in PubCo Dyal-Appointed Directors § These shares will collectively control 90% of the voting power in 2 PubCo § High-vote shares will automatically convert to single-vote shares upon customary terms (e.g., upon certain transfers) Neuberger Berman-Appointed Director 1 28Governance Summary CORPORATE STRUCTURE INITIAL BOARD COMPOSITION § Up-C structure including PubCo and two newly-formed limited partnerships, Blue Owl and Blue Owl Carry § SPAC shares, including those offered in the PIPE, represent Independent Directors 3 ownership interest in PubCo § Customary TRA arrangement will entitle sellers to receive 85% of realized tax savings resulting from certain tax benefits, including the impact of sales, exchanges and redemptions (and certain transactions occurring in connection with the closing) on PubCo’s tax basis Owl Rock-Appointed Directors 3 MULTI-CLASS SHARE STRUCTURE § 4 Owl Rock and 3 Dyal principals will directly or indirectly hold high-vote shares in PubCo Dyal-Appointed Directors § These shares will collectively control 90% of the voting power in 2 PubCo § High-vote shares will automatically convert to single-vote shares upon customary terms (e.g., upon certain transfers) Neuberger Berman-Appointed Director 1 28

AppendixAppendix
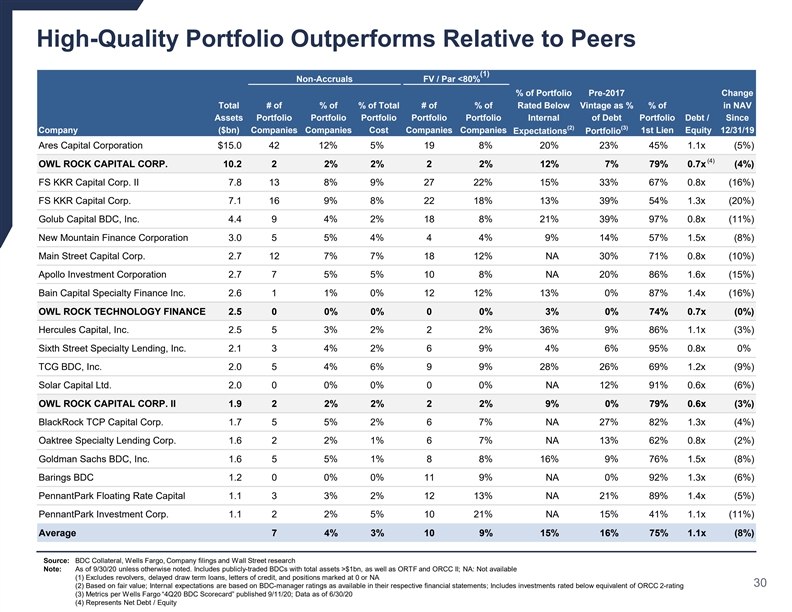
High-Quality Portfolio Outperforms Relative to Peers (1) Non-Accruals FV / Par <80% % of Portfolio Pre-2017 Change Total # of % of % of Total # of % of Rated Below Vintage as % % of in NAV Assets Portfolio Portfolio Portfolio Portfolio Portfolio Internal of Debt Portfolio Debt / Since (2) (3) Company ($bn) Companies Companies Cost Companies Companies 1st Lien Equity 12/31/19 Expectations Portfolio Ares Capital Corporation $15.0 42 12% 5% 19 8% 20% 23% 45% 1.1x (5%) (4) OWL ROCK CAPITAL CORP. 10.2 2 2% 2% 2 2% 12% 7% 79% 0.7x (4%) FS KKR Capital Corp. II 7.8 13 8% 9% 27 22% 15% 33% 67% 0.8x (16%) FS KKR Capital Corp. 7.1 16 9% 8% 22 18% 13% 39% 54% 1.3x (20%) Golub Capital BDC, Inc. 4.4 9 4% 2% 18 8% 21% 39% 97% 0.8x (11%) New Mountain Finance Corporation 3.0 5 5% 4% 4 4% 9% 14% 57% 1.5x (8%) Main Street Capital Corp. 2.7 12 7% 7% 18 12% NA 30% 71% 0.8x (10%) Apollo Investment Corporation 2.7 7 5% 5% 10 8% NA 20% 86% 1.6x (15%) Bain Capital Specialty Finance Inc. 2.6 1 1% 0% 12 12% 13% 0% 87% 1.4x (16%) OWL ROCK TECHNOLOGY FINANCE 2.5 0 0% 0% 0 0% 3% 0% 74% 0.7x (0%) Hercules Capital, Inc. 2.5 5 3% 2% 2 2% 36% 9% 86% 1.1x (3%) Sixth Street Specialty Lending, Inc. 2.1 3 4% 2% 6 9% 4% 6% 95% 0.8x 0% TCG BDC, Inc. 2.0 5 4% 6% 9 9% 28% 26% 69% 1.2x (9%) Solar Capital Ltd. 2.0 0 0% 0% 0 0% NA 12% 91% 0.6x (6%) OWL ROCK CAPITAL CORP. II 1.9 2 2% 2% 2 2% 9% 0% 79% 0.6x (3%) BlackRock TCP Capital Corp. 1.7 5 5% 2% 6 7% NA 27% 82% 1.3x (4%) Oaktree Specialty Lending Corp. 1.6 2 2% 1% 6 7% NA 13% 62% 0.8x (2%) Goldman Sachs BDC, Inc. 1.6 5 5% 1% 8 8% 16% 9% 76% 1.5x (8%) Barings BDC 1.2 0 0% 0% 11 9% NA 0% 92% 1.3x (6%) PennantPark Floating Rate Capital 1.1 3 3% 2% 12 13% NA 21% 89% 1.4x (5%) PennantPark Investment Corp. 1.1 2 2% 5% 10 21% NA 15% 41% 1.1x (11%) Average 7 4% 3% 10 9% 15% 16% 75% 1.1x (8%) Source: BDC Collateral, Wells Fargo, Company filings and Wall Street research Note: As of 9/30/20 unless otherwise noted. Includes publicly-traded BDCs with total assets >$1bn, as well as ORTF and ORCC II; NA: Not available (1) Excludes revolvers, delayed draw term loans, letters of credit, and positions marked at 0 or NA 30 (2) Based on fair value; Internal expectations are based on BDC-manager ratings as available in their respective financial statements; Includes investments rated below equivalent of ORCC 2-rating (3) Metrics per Wells Fargo “4Q20 BDC Scorecard” published 9/11/20; Data as of 6/30/20 (4) Represents Net Debt / EquityHigh-Quality Portfolio Outperforms Relative to Peers (1) Non-Accruals FV / Par <80% % of Portfolio Pre-2017 Change Total # of % of % of Total # of % of Rated Below Vintage as % % of in NAV Assets Portfolio Portfolio Portfolio Portfolio Portfolio Internal of Debt Portfolio Debt / Since (2) (3) Company ($bn) Companies Companies Cost Companies Companies 1st Lien Equity 12/31/19 Expectations Portfolio Ares Capital Corporation $15.0 42 12% 5% 19 8% 20% 23% 45% 1.1x (5%) (4) OWL ROCK CAPITAL CORP. 10.2 2 2% 2% 2 2% 12% 7% 79% 0.7x (4%) FS KKR Capital Corp. II 7.8 13 8% 9% 27 22% 15% 33% 67% 0.8x (16%) FS KKR Capital Corp. 7.1 16 9% 8% 22 18% 13% 39% 54% 1.3x (20%) Golub Capital BDC, Inc. 4.4 9 4% 2% 18 8% 21% 39% 97% 0.8x (11%) New Mountain Finance Corporation 3.0 5 5% 4% 4 4% 9% 14% 57% 1.5x (8%) Main Street Capital Corp. 2.7 12 7% 7% 18 12% NA 30% 71% 0.8x (10%) Apollo Investment Corporation 2.7 7 5% 5% 10 8% NA 20% 86% 1.6x (15%) Bain Capital Specialty Finance Inc. 2.6 1 1% 0% 12 12% 13% 0% 87% 1.4x (16%) OWL ROCK TECHNOLOGY FINANCE 2.5 0 0% 0% 0 0% 3% 0% 74% 0.7x (0%) Hercules Capital, Inc. 2.5 5 3% 2% 2 2% 36% 9% 86% 1.1x (3%) Sixth Street Specialty Lending, Inc. 2.1 3 4% 2% 6 9% 4% 6% 95% 0.8x 0% TCG BDC, Inc. 2.0 5 4% 6% 9 9% 28% 26% 69% 1.2x (9%) Solar Capital Ltd. 2.0 0 0% 0% 0 0% NA 12% 91% 0.6x (6%) OWL ROCK CAPITAL CORP. II 1.9 2 2% 2% 2 2% 9% 0% 79% 0.6x (3%) BlackRock TCP Capital Corp. 1.7 5 5% 2% 6 7% NA 27% 82% 1.3x (4%) Oaktree Specialty Lending Corp. 1.6 2 2% 1% 6 7% NA 13% 62% 0.8x (2%) Goldman Sachs BDC, Inc. 1.6 5 5% 1% 8 8% 16% 9% 76% 1.5x (8%) Barings BDC 1.2 0 0% 0% 11 9% NA 0% 92% 1.3x (6%) PennantPark Floating Rate Capital 1.1 3 3% 2% 12 13% NA 21% 89% 1.4x (5%) PennantPark Investment Corp. 1.1 2 2% 5% 10 21% NA 15% 41% 1.1x (11%) Average 7 4% 3% 10 9% 15% 16% 75% 1.1x (8%) Source: BDC Collateral, Wells Fargo, Company filings and Wall Street research Note: As of 9/30/20 unless otherwise noted. Includes publicly-traded BDCs with total assets >$1bn, as well as ORTF and ORCC II; NA: Not available (1) Excludes revolvers, delayed draw term loans, letters of credit, and positions marked at 0 or NA 30 (2) Based on fair value; Internal expectations are based on BDC-manager ratings as available in their respective financial statements; Includes investments rated below equivalent of ORCC 2-rating (3) Metrics per Wells Fargo “4Q20 BDC Scorecard” published 9/11/20; Data as of 6/30/20 (4) Represents Net Debt / Equity

Peer Operating Benchmarking ü Blue Owl is a clear positive outlier vis-à-vis other comparables Higher-Growth, FRE-Centric Firms Broadly Diversified, Public Alternative Firms Other U.S. Higher- Blue Growth, Div. Pub. (1)(2) Alts. FRE-Centric Owl Median Median (3) AUM ($bn) $47 $55 $73 $96 $72 $72 $179 $433 $584 $230 $234 $234 $59 ’20-’22 AUM 36.3 % (2.2)% 9.9 % 10.9 % 19.8 % 10.4 % 12.2 % 9.9 % 13.0 % 10.1 % 13.7 % 12.2 % 11.2 % (4) CAGR (3) FEAUM / AUM 81.9 100.0 53.8 ND 61.5 61.5 62.9 77.6 76.1 72.4 75.8 75.8 85.2 4% 10% 12% 8% 13% 16% 13% 17% 23% Range of Range of Primarily 33% 37% (4) 18% 44% 16% 37% 45% 43% 46% 48% 18% 55% ’20 AUM Private Business 24% Business 57% 23% 41% 31% 72% 72% Equity 40% Mixes Mixes 30% 32% 23% Credit Private Equity Real Assets / Real Estate Other 7% 18% 26% 24% 25% 28% 29% 38% 50% ‘22 FRE / Realized 43% 41% 43% 50% 57% 62% 59% 57% PRE 74% 71% (8) 72% 82% 93% 100% 76% 75% FRE Realized PRE (5) ’20-’22 DE CAGR 65.1 % 67.9 % 13.1 % 25.2 % 19.8 % 22.5 % 20.1 % 31.4 % 22.5 % 18.7 % 20.0 % 20.1 % 17.8 % Long-Term DE 32.9 41.1 14.8 3.5 19.9 17.4 16.6 6.3 13.5 14.5 12.3 13.5 ND (6) CAGR ‘20 Pre-Tax 41.1 35.6 48.7 59.6 32.8 42.1 33.3 46.5 54.5 31.1 45.8 45.8 28.3 (7) Operating Margin ‘22 Pre-Tax 66.6 60.4 46.2 64.2 34.5 53.3 39.8 53.8 58.5 38.1 50.7 50.7 38.2 (7) Operating Margin Source: Company filings, IBES and GS Research as of 12/18/20 Note: (1) Assumes 40% compensation ratio for realized performance income; (2) Shown on standalone basis (excl. pending Global Atlantic acquisition); (3) As of 12/31/20 for Blue Owl, 6/30/20 for PGHN and 9/30/20 for other firms; (4) Based on fee-earning AUM for HLNE, STEP and GCM Grosvenor; GCM Grosvenor discloses private markets and public markets AUM, classified here as Private Equity and Other, respectively; 31 (5) Based on after-tax DE for Blue Owl, adjusted cash EPS for EQT, HLNE, PGHN and STEP, realized income per share for ARES and DE per share for rest of peers; (6) Represents 2020 – 2025E after-tax DE CAGR for Blue Owl and IBES estimates for peers; Represents FY2021E – 2023E EPS CAGR for HLNE and STEP and 5-year EPS CAGR for other peers; (7) Based on pre-tax distributable earnings before minority interest for Blue Owl; (8) GCM Grosvenor FRE / PRE mix based on revenue mix due to limited expense detail provided Earnings 1 Profitability Business Mix AUM GrowthPeer Operating Benchmarking ü Blue Owl is a clear positive outlier vis-à-vis other comparables Higher-Growth, FRE-Centric Firms Broadly Diversified, Public Alternative Firms Other U.S. Higher- Blue Growth, Div. Pub. (1)(2) Alts. FRE-Centric Owl Median Median (3) AUM ($bn) $47 $55 $73 $96 $72 $72 $179 $433 $584 $230 $234 $234 $59 ’20-’22 AUM 36.3 % (2.2)% 9.9 % 10.9 % 19.8 % 10.4 % 12.2 % 9.9 % 13.0 % 10.1 % 13.7 % 12.2 % 11.2 % (4) CAGR (3) FEAUM / AUM 81.9 100.0 53.8 ND 61.5 61.5 62.9 77.6 76.1 72.4 75.8 75.8 85.2 4% 10% 12% 8% 13% 16% 13% 17% 23% Range of Range of Primarily 33% 37% (4) 18% 44% 16% 37% 45% 43% 46% 48% 18% 55% ’20 AUM Private Business 24% Business 57% 23% 41% 31% 72% 72% Equity 40% Mixes Mixes 30% 32% 23% Credit Private Equity Real Assets / Real Estate Other 7% 18% 26% 24% 25% 28% 29% 38% 50% ‘22 FRE / Realized 43% 41% 43% 50% 57% 62% 59% 57% PRE 74% 71% (8) 72% 82% 93% 100% 76% 75% FRE Realized PRE (5) ’20-’22 DE CAGR 65.1 % 67.9 % 13.1 % 25.2 % 19.8 % 22.5 % 20.1 % 31.4 % 22.5 % 18.7 % 20.0 % 20.1 % 17.8 % Long-Term DE 32.9 41.1 14.8 3.5 19.9 17.4 16.6 6.3 13.5 14.5 12.3 13.5 ND (6) CAGR ‘20 Pre-Tax 41.1 35.6 48.7 59.6 32.8 42.1 33.3 46.5 54.5 31.1 45.8 45.8 28.3 (7) Operating Margin ‘22 Pre-Tax 66.6 60.4 46.2 64.2 34.5 53.3 39.8 53.8 58.5 38.1 50.7 50.7 38.2 (7) Operating Margin Source: Company filings, IBES and GS Research as of 12/18/20 Note: (1) Assumes 40% compensation ratio for realized performance income; (2) Shown on standalone basis (excl. pending Global Atlantic acquisition); (3) As of 12/31/20 for Blue Owl, 6/30/20 for PGHN and 9/30/20 for other firms; (4) Based on fee-earning AUM for HLNE, STEP and GCM Grosvenor; GCM Grosvenor discloses private markets and public markets AUM, classified here as Private Equity and Other, respectively; 31 (5) Based on after-tax DE for Blue Owl, adjusted cash EPS for EQT, HLNE, PGHN and STEP, realized income per share for ARES and DE per share for rest of peers; (6) Represents 2020 – 2025E after-tax DE CAGR for Blue Owl and IBES estimates for peers; Represents FY2021E – 2023E EPS CAGR for HLNE and STEP and 5-year EPS CAGR for other peers; (7) Based on pre-tax distributable earnings before minority interest for Blue Owl; (8) GCM Grosvenor FRE / PRE mix based on revenue mix due to limited expense detail provided Earnings 1 Profitability Business Mix AUM Growth
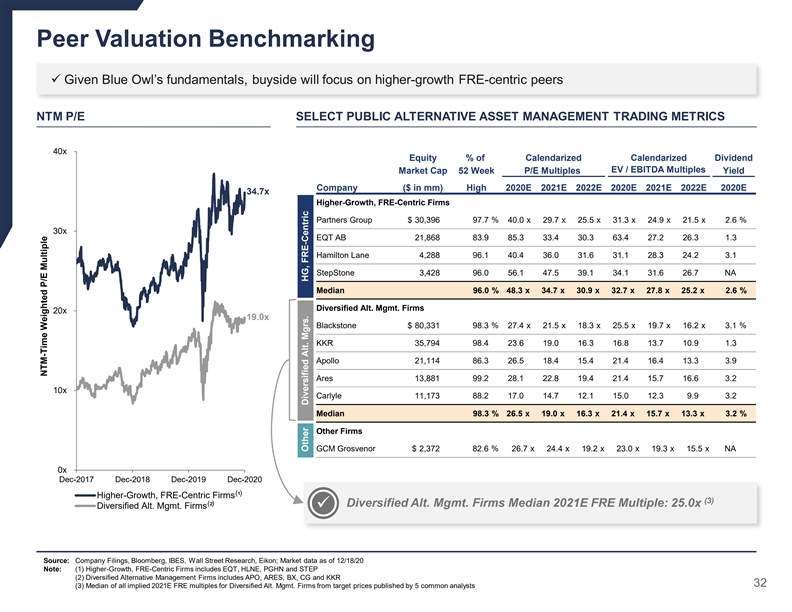
Peer Valuation Benchmarking ü Given Blue Owl’s fundamentals, buyside will focus on higher-growth FRE-centric peers NTM P/E SELECT PUBLIC ALTERNATIVE ASSET MANAGEMENT TRADING METRICS 40x Equity % of Calendarized Calendarized Dividend EV / EBITDA Multiples Market Cap 52 Week P/E Multiples Yield Company ($ in mm) High 2020E 2021E 2022E 2020E 2021E 2022E 2020E 34.7x Higher-Growth, FRE-Centric Firms Partners Group $ 30,396 97.7 % 40.0 x 29.7 x 25.5 x 31.3 x 24.9 x 21.5 x 2.6 % 30x EQT AB 21,868 83.9 85.3 33.4 30.3 63.4 27.2 26.3 1.3 Hamilton Lane 4,288 96.1 40.4 36.0 31.6 31.1 28.3 24.2 3.1 StepStone 3,428 96.0 56.1 47.5 39.1 34.1 31.6 26.7 NA Median 96.0 % 48.3 x 34.7 x 30.9 x 32.7 x 27.8 x 25.2 x 2.6 % Diversified Alt. Mgmt. Firms 20x 19.0x Blackstone $ 80,331 98.3 % 27.4 x 21.5 x 18.3 x 25.5 x 19.7 x 16.2 x 3.1 % KKR 35,794 98.4 23.6 19.0 16.3 16.8 13.7 10.9 1.3 Apollo 21,114 86.3 26.5 18.4 15.4 21.4 16.4 13.3 3.9 Ares 13,881 99.2 28.1 22.8 19.4 21.4 15.7 16.6 3.2 10x Carlyle 11,173 88.2 17.0 14.7 12.1 15.0 12.3 9.9 3.2 Median 98.3 % 26.5 x 19.0 x 16.3 x 21.4 x 15.7 x 13.3 x 3.2 % Other Firms GCM Grosvenor $ 2,372 82.6 % 26.7 x 24.4 x 19.2 x 23.0 x 19.3 x 15.5 x NA 0x Dec-2017 Dec-2018 Dec-2019 Dec-2020 ( ) Higher-Growth, FRE-Centric Firms ¹ (3) ( ) Diversified Alt. Mgmt. Firms Median 2021E FRE Multiple: 25.0x Diversified Alt. Mgmt. Firms ² ü Source: Company Filings, Bloomberg, IBES, Wall Street Research, Eikon; Market data as of 12/18/20 Note: (1) Higher-Growth, FRE-Centric Firms includes EQT, HLNE, PGHN and STEP (2) Diversified Alternative Management Firms includes APO, ARES, BX, CG and KKR 32 (3) Median of all implied 2021E FRE multiples for Diversified Alt. Mgmt. Firms from target prices published by 5 common analysts NTM-Time Weighted P/E Multiple Other Diversified Alt. Mgrs. HG, FRE-CentricPeer Valuation Benchmarking ü Given Blue Owl’s fundamentals, buyside will focus on higher-growth FRE-centric peers NTM P/E SELECT PUBLIC ALTERNATIVE ASSET MANAGEMENT TRADING METRICS 40x Equity % of Calendarized Calendarized Dividend EV / EBITDA Multiples Market Cap 52 Week P/E Multiples Yield Company ($ in mm) High 2020E 2021E 2022E 2020E 2021E 2022E 2020E 34.7x Higher-Growth, FRE-Centric Firms Partners Group $ 30,396 97.7 % 40.0 x 29.7 x 25.5 x 31.3 x 24.9 x 21.5 x 2.6 % 30x EQT AB 21,868 83.9 85.3 33.4 30.3 63.4 27.2 26.3 1.3 Hamilton Lane 4,288 96.1 40.4 36.0 31.6 31.1 28.3 24.2 3.1 StepStone 3,428 96.0 56.1 47.5 39.1 34.1 31.6 26.7 NA Median 96.0 % 48.3 x 34.7 x 30.9 x 32.7 x 27.8 x 25.2 x 2.6 % Diversified Alt. Mgmt. Firms 20x 19.0x Blackstone $ 80,331 98.3 % 27.4 x 21.5 x 18.3 x 25.5 x 19.7 x 16.2 x 3.1 % KKR 35,794 98.4 23.6 19.0 16.3 16.8 13.7 10.9 1.3 Apollo 21,114 86.3 26.5 18.4 15.4 21.4 16.4 13.3 3.9 Ares 13,881 99.2 28.1 22.8 19.4 21.4 15.7 16.6 3.2 10x Carlyle 11,173 88.2 17.0 14.7 12.1 15.0 12.3 9.9 3.2 Median 98.3 % 26.5 x 19.0 x 16.3 x 21.4 x 15.7 x 13.3 x 3.2 % Other Firms GCM Grosvenor $ 2,372 82.6 % 26.7 x 24.4 x 19.2 x 23.0 x 19.3 x 15.5 x NA 0x Dec-2017 Dec-2018 Dec-2019 Dec-2020 ( ) Higher-Growth, FRE-Centric Firms ¹ (3) ( ) Diversified Alt. Mgmt. Firms Median 2021E FRE Multiple: 25.0x Diversified Alt. Mgmt. Firms ² ü Source: Company Filings, Bloomberg, IBES, Wall Street Research, Eikon; Market data as of 12/18/20 Note: (1) Higher-Growth, FRE-Centric Firms includes EQT, HLNE, PGHN and STEP (2) Diversified Alternative Management Firms includes APO, ARES, BX, CG and KKR 32 (3) Median of all implied 2021E FRE multiples for Diversified Alt. Mgmt. Firms from target prices published by 5 common analysts NTM-Time Weighted P/E Multiple Other Diversified Alt. Mgrs. HG, FRE-Centric