UNITED STATES
SECURITIES AND EXCHANGE COMMISSION
Washington, D.C. 20549
FORM N-CSR
CERTIFIED SHAREHOLDER REPORT OF REGISTERED
MANAGEMENT INVESTMENT COMPANIES
Investment Company Act file number 811- 22303
John Hancock Collateral Investment Trust
(Exact name of registrant as specified in charter)
601 Congress Street, Boston, Massachusetts 02210
(Address of principal executive offices) (Zip code)
Salvatore Schiavone
Treasurer
601 Congress Street
Boston, Massachusetts 02210
(Name and address of agent for service)
Registrant’s telephone number, including area code: 617-663-4497
Date of fiscal year end: | December 31 |
Date of reporting period: | December 31, 2014 |
John Hancock
Collateral Investment Trust
Annual report 12/31/14
A message to shareholders
Dear fellow shareholder,
Robust economic growth in the United States set the global standard in 2014. The portfolio teams in our network are generally optimistic about continued relative strength in the United States, supported by rising employment, healthy consumer spending, and falling oil prices. Stocks at all-time highs remain vulnerable to a correction, but the long-term bull market appears intact. We believe a more selective approach continues to make sense in overseas markets, but note that opportunities are growing and could reward investors should recoveries in those markets begin in earnest.
The coming year will likely present greater challenges for bond investors, however. The U.S. Federal Reserve has signaled its intention to raise short-term interest rates in 2015, and that change will have an adverse effect on many fixed-income portfolios, particularly those that invest in less liquid markets. At John Hancock Investments, we are closely monitoring our fixed-income portfolios and communicating regularly with their portfolio managers about these issues. Now may also be a good time for you to discuss your fixed-income strategy with your financial advisor to determine if that portion of your portfolio continues to match your long-term goals.
A new look
I am pleased to introduce you to our redesigned shareholder reports. As part of an effort to elevate the educational substance in our communications, we undertook an initiative to make our reports more engaging and easier to navigate. Included in the changes are a performance snapshot that shows your fund's performance against that of its benchmark, and a Q&A with your fund's lead portfolio manager. We hope these enhancements give you better insight into your fund's activity and performance.
On behalf of everyone at John Hancock Investments, I'd like to take this opportunity to thank you for the continued trust you've placed in us.
Sincerely,
Andrew G. Arnott
President and Chief Executive Officer
John Hancock Investments
This commentary reflects the CEO's views as of December 31, 2014. They are subject to change at any time. For more up-to-date information, you can visit our website at jhinvestments.com.
John Hancock
Collateral Investment Trust
1
INVESTMENT OBJECTIVE
The fund seeks current income while maintaining adequate liquidity, safeguarding the return of principal and minimizing risk of default.
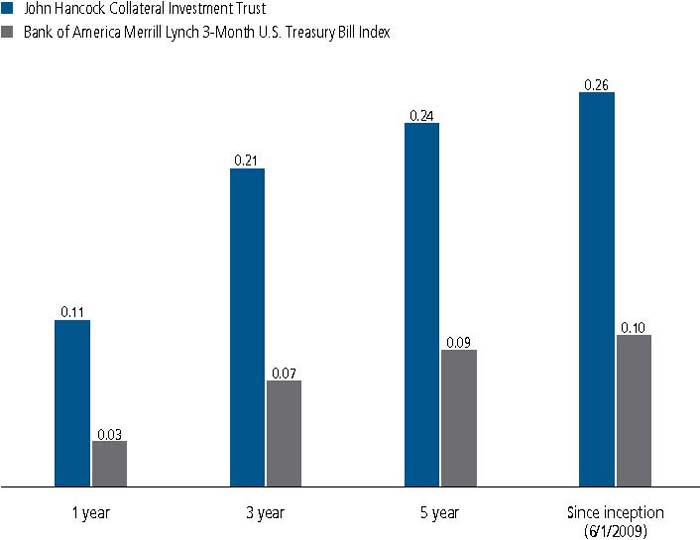
AVERAGE ANNUAL TOTAL RETURNS AS OF 12/31/14 (%)
The Bank of America Merrill Lynch 3-Month U.S. Treasury Bill Index is composed of a single issue purchased at the beginning of the month and held for a full month. Each month the index is rebalanced and the issue selected is the outstanding U.S. Treasury Bill that matures closest to, but not beyond, three months from the rebalancing date.
It is not possible to invest directly in an index. Index figures do not reflect expenses, which would have resulted in lower values
The past performance shown here assumes reinvested distributions and the beneficial effect of any expense reductions, and does not guarantee future results. Returns for periods shorter than one year are cumulative. Shares will fluctuate in value and, when redeemed, may be worth more or less than their original cost. Current performance may be lower or higher than the performance cited, and can be found at jhinvestments.com or by calling 800-225-5291. For further information on the fund's objectives, risks, and strategy, see the fund's registration statement.
2
PERFORMANCE HIGHLIGHTS OVER THE LAST TWELVE MONTHS
Fed set the stage for rate hikes
While the federal funds rate remained unchanged all year, the Fed wrapped up its asset repurchase program in October.
Fund shortened its maturity profile
The fund's maturity profile was shortened to accommodate liquidity needs and a relatively flat yield curve.
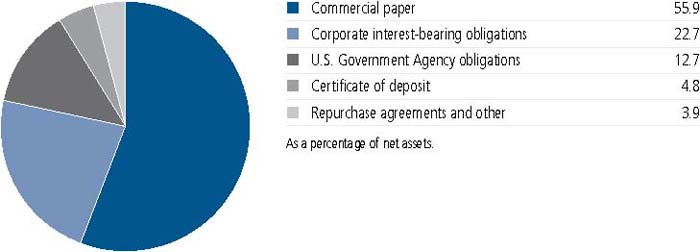
PORTFOLIO COMPOSITION AS OF 12/31/14 (%)
A note about risks
Fixed-income investments are subject to interest-rate and credit risk; their value will normally decline as interest rates rise or if a creditor or grantor is unable or unwilling to make principal or interest payments. Investing in foreign securities may entail the risk of currency fluctuations or heightened economic and political instability. Events in the financial markets have resulted, and may continue to result, in an unusually high degree of volatility in the financial markets, both domestic and foreign. In addition, reduced liquidity in credit and fixed-income markets may adversely affect issuers worldwide. Certain market conditions, including reduced trading volume, heightened volatility, or rising interest rates, may impair liquidity, the ability of the fund to sell securities at advantageous prices. A portfolio concentrated in one sector or that holds a limited number of securities may fluctuate more than a diversified portfolio. Investments in a non-diversified fund may magnify the fund's losses from adverse events affecting a particular issuer. A fund that invests in particular sectors is particularly susceptible to the impact of market, economic, regulatory, and other factors affecting those sectors. Please see the fund's registration statement for additional risks.
3
Jeffrey N. Given, CFA |
What factors impacted the market over the past year?
The year started off somewhat sluggish with mixed economic data, blamed in part by adverse winter weather, leading to very low volatility in the second quarter with the U.S. economy showing slow improvements. Geopolitical unrest and conflicts abroad led the headlines in the third quarter, bringing volatility back into the U.S. and global markets. This was amplified in the fourth quarter with weak global growth data, lower inflation expectations, and a dramatic drop in oil prices. Year over year, the U.S. unemployment rate decreased from 6.7% to 5.8%, the lowest level since 2008. However, the labor force participation rate remained rangebound between 62.7%- 63.2%, ending the year at 62.8%, and disappointing hourly and weekly earnings numbers curbed the enthusiasm of the unemployment rate drop.
The U.S. Federal Reserve (Fed) continued to taper its asset purchase program in $10 billion increments, officially ending the program during the October Federal Open Market Committee meeting, raising speculation of the Fed's timing of the first rate hike. The federal funds rate remained unchanged all year at 0.00%-0.25%. The three-month London Interbank Offered Rate began the year at 24.30 basis points and ended slightly up at 25.56 basis points.
How did these occurrences impact the fund?
Throughout the year we shortened up the maturity profile of the fund to accommodate increased liquidity needs and a relatively flat yield curve. Year over year, the only material change in sector distribution was a decrease in corporate bond exposure. This decrease was mostly in response to adding liquidity in the 1-month maturity bucket via shorter investments. In the 0-30-day average maturity bucket, we increased the fund's weight from under 50.0% of assets up to 67.4%. Similiarly, we decreased the fund's weight in the over-90-day average maturity bucket from over 25.0% down to 7.2% of net assets. Although the weighted average maturity and weighted average life of the portfolio decreased (to 26 days and 51 days, respectively), the fund's gross yield remained relatively stable throughout the year.
4
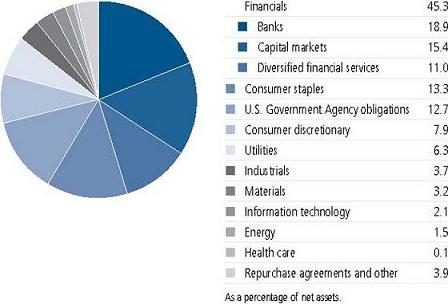
How did you position the fund at the end of the period?
SECTOR COMPOSITION AS OF 12/31/14 (%)
5
MANAGED BY
Jeffrey N. Given, CFA On the fund since 2009 Investing since 1993 | |
TOP 10 ISSUERS AS OF 12/31/14 (%)
Federal Farm Credit Bank, 0.130% to 0.240%, 2-19-15 to 4-13-15 | 12.7 |
Electricite de France SA, 0.300% to 0.450%, 1-2-15 to 1-6-15 | 6.3 |
Toyota Motor Credit Corp., 0.234%, 8-26-15 | 6.3 |
Wells Fargo, 0.235% to 3.625%, 2-13-15 to 6-26-15 | 5.6 |
Credit Suisse, 0.440% to 4.875%, 1-12-15 to 3-23-15 | 5.5 |
Bank of Tokyo-Mitsubishi UFJ, Ltd., 0.140%, 1-6-15 | 5.2 |
Reckitt Benckiser Treasury Services PLC, 0.300% to 0.350%, 3-4-15 to 4-21-15 | 5.2 |
BNP Paribas, 0.020%, 1-2-15 | 4.7 |
Caisse Centrale Desjardins, 0.120% to 0.200%, 1-5-15 to 1-22-15 | 4.6 |
Cargill Global Funding PLC, 0.110% to 0.120%, 1-2-15 to 1-6-15 | 4.5 |
Total | 60.6 |
As a percentage of net assets. |
6
TOTAL RETURNS FOR THE PERIOD ENDED DECEMBER 31, 2014
Average annual total returns (%) | Cumulative total returns (%) | ||||||
1-year | 5-year | Since Inception1 | 5-year | Since Inception1 | |||
John Hancock Collateral Investment Trust | 0.11 | 0.24 | 0.26 | 1.19 | 1.48 | ||
Index† | 0.03 | 0.09 | 0.10 | 0.45 | 0.57 |
Performance figures assume all distributions are reinvested.
The expense ratio of the fund is set forth according to the Financial highlights of the fund's annual report dated December 31, 2013. The net expenses equal the gross expenses of 0.06%.
The returns reflect past results and should not be considered indicative of future performance. The return and principal value of an investment will fluctuate so that shares, when redeemed, may be worth more or less than their original cost. Due to market volatility, the fund's current performance may be higher or lower than the performance shown. For current to the most recent month-end performance data, please call 800-225-5291 or visit the fund's website at jhinvestments.com.
The performance table above and the chart below do not reflect the deduction of taxes that a shareholder would pay on fund distributions or the redemption of fund shares. The fund's performance results reflect any applicable fee waivers or expense reductions, without which the expenses would increase and results would have been less favorable.
† | Index is the Bank of America Merrill Lynch 3-Month U.S. Treasury Bill Index. |
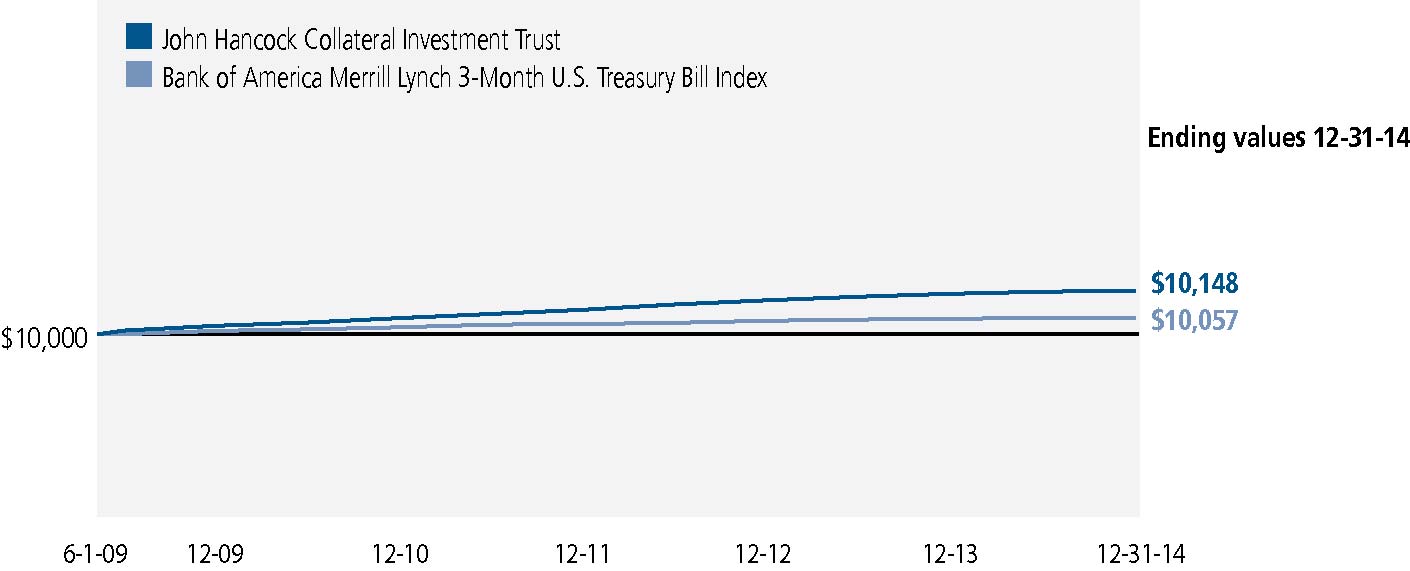
This chart shows what happened to a hypothetical $10,000 investment in John Hancock Collateral Investment Trust for the periods indicated, assuming all distributions were reinvested. For comparison, we've shown the same investment in the Bank of America Merrill Lynch 3-Month U.S. Treasury Bill Index.
The Bank of America Merrill Lynch 3-Month U.S. Treasury Bill Index is comprised of a single issue purchased at the beginning of the month and held for a full month. Each month the index is rebalanced and the issue selected is the outstanding U.S. Treasury Bill that matures closest to, but not beyond, three months from the rebalancing date.
It is not possible to invest directly in an index. Index figures do not reflect sales charges or direct expenses, which would have resulted in lower values.
1 | From 6-1-09. |
7
These examples are intended to help you understand your ongoing operating expenses of investing in the fund so you can compare these costs with the ongoing costs of investing in other mutual funds.
Understanding fund expenses
As a shareholder of the fund, you incur two types of costs:
• | Transaction costs, which include sales charges (loads) on purchases or redemptions (varies by share class), minimum account fee charge, etc. |
• | Ongoing operating expenses, including management fees, distribution and service fees (if applicable), and other fund expenses. |
We are presenting only your ongoing operating expenses here.
Actual expenses/actual returns
This example is intended to provide information about the fund's actual ongoing operating expenses, and is based on the fund's actual return. It assumes an account value of $1,000.00 on July 1, 2014, with the same investment held until December 31, 2014.
Account value on 7-1-2014 | Ending value on 12-31-2014 | Expenses paid during period ended 12-31-20141 | Annualized expense ratio | |
Shares | $1,000.00 | $1,000.40 | $0.50 | 0.10% |
Together with the value of your account, you may use this information to estimate the operating expenses that you paid over the period. Simply divide your account value at December 31, 2014, by $1,000.00, then multiply it by the "expenses paid" for your share class from the table above. For example, for an account value of $8,600.00, the operating expenses should be calculated as follows:
8
Hypothetical example for comparison purposes
This table allows you to compare the fund's ongoing operating expenses with those of any other fund. It provides an example of the fund's hypothetical account values and hypothetical expenses based on the fund's actual expense ratio and an assumed 5% annualized return before expenses (which is not the fund's actual return). It assumes an account value of $1,000.00 on July 1, 2014, with the same investment held until December 31, 2014. Look in any other fund shareholder report to find its hypothetical example and you will be able to compare these expenses. Please remember that these hypothetical account values and expenses may not be used to estimate the actual ending account balance or expenses you paid for the period.
Account value on 7-1-2014 | Ending value on 12-31-2014 | Expenses paid during period ended 12-31-20141 | Annualized expense ratio | |
Shares | $1,000.00 | $1,024.70 | $0.51 | 0.10% |
Remember, these examples do not include any transaction costs, therefore, these examples will not help you to determine the relative total costs of owning different funds. If transaction costs were included, your expenses would have been higher. See the prospectus for details regarding transaction costs.
1 | Expenses are equal to the fund's annualized expense ratio, multiplied by the average account value over the period, multiplied by 184/365 (to reflect the one-half year period). |
9
Fund's investments
As of 12-31-14 | ||||||||||||||||||||||||||||||||
Maturity Date | Yield* (%) | Par value^ | Value | |||||||||||||||||||||||||||||
Commercial paper 55.9% | $949,642,828 | |||||||||||||||||||||||||||||||
(Cost $949,642,828) | ||||||||||||||||||||||||||||||||
Bank of Tokyo-Mitsubishi UFJ, Ltd. | 01-06-15 | 0.140 | 88,000,000 | 87,998,289 | ||||||||||||||||||||||||||||
BNP Paribas | 01-02-15 | 0.020 | 80,000,000 | 80,000,000 | ||||||||||||||||||||||||||||
CAFCO LLC | 02-02-15 to 02-04-15 | 0.180 to 0.240 | 74,550,000 | 74,535,377 | ||||||||||||||||||||||||||||
Caisse Centrale Desjardins | 01-05-15 to 01-22-15 | 0.120 to 0.200 | 78,000,000 | 77,994,826 | ||||||||||||||||||||||||||||
Cargill Global Funding PLC | 01-02-15 to 01-06-15 | 0.110 to 0.120 | 76,000,000 | 75,999,113 | ||||||||||||||||||||||||||||
Caterpillar Financial Services Corp. | 01-05-15 | 0.120 | 10,000,000 | 9,999,867 | ||||||||||||||||||||||||||||
Chariot Funding LLC | 04-24-15 | 0.270 | 20,000,000 | 19,983,050 | ||||||||||||||||||||||||||||
Electricite de France SA | 01-02-15 to 01-06-15 | 0.300 to 0.450 | 107,150,000 | 107,146,074 | ||||||||||||||||||||||||||||
Emerson Electric Company | 01-05-15 to 01-06-15 | 0.080 to 0.140 | 32,000,000 | 31,999,610 | ||||||||||||||||||||||||||||
Exxon Mobil Corp. | 01-21-15 | 0.120 | 25,000,000 | 24,998,333 | ||||||||||||||||||||||||||||
Henkel of America, Inc. | 01-14-15 | 0.210 to 0.330 | 62,000,000 | 61,993,478 | ||||||||||||||||||||||||||||
IBM Corp. | 01-02-15 | 0.100 | 35,000,000 | 34,999,903 | ||||||||||||||||||||||||||||
Illinois Tool Works, Inc. | 01-22-15 | 0.110 | 20,000,000 | 19,998,717 | ||||||||||||||||||||||||||||
Johnson & Johnson | 01-08-15 | 0.070 | 2,500,000 | 2,499,966 | ||||||||||||||||||||||||||||
National Rural Utilities Cooperative Finance Corp. | 01-06-15 to 01-16-15 | 0.100 to 0.130 | 19,000,000 | 18,999,616 | ||||||||||||||||||||||||||||
Old Line Funding LLC | 01-02-15 | 0.080 | 27,461,000 | 27,460,939 | ||||||||||||||||||||||||||||
Rabobank USA Financial Corp. | 01-05-15 | 0.125 | 2,000,000 | 1,999,972 | ||||||||||||||||||||||||||||
Reckitt Benckiser Treasury Services PLC | 03-04-15 to 04-21-15 | 0.300 to 0.350 | 88,000,000 | 87,939,863 | ||||||||||||||||||||||||||||
Sigma-Aldrich Corp. | 01-07-15 to 01-09-15 | 0.150 to 0.270 | 55,000,000 | 54,997,720 | ||||||||||||||||||||||||||||
Sumitomo Mitsui Trust Bank, Ltd. | 01-12-15 to 04-13-15 | 0.140 to 0.250 | 23,000,000 | 22,990,364 | ||||||||||||||||||||||||||||
Swedbank AB | 01-27-15 | 0.245 | 20,000,000 | 19,996,461 | ||||||||||||||||||||||||||||
UBS Finance Delaware LLC | 01-26-15 | 0.200 | 5,112,000 | 5,111,290 | ||||||||||||||||||||||||||||
Corporate interest-bearing obligations 22.7% | $386,105,576 | |||||||||||||||||||||||||||||||
(Cost $386,139,365) | ||||||||||||||||||||||||||||||||
American Honda Finance Corp. (P) | 06-04-15 | 0.235 | 25,000,000 | 24,998,875 | ||||||||||||||||||||||||||||
American Honda Finance Corp. (S) | 02-27-15 | 1.450 | 3,000,000 | 3,004,620 | ||||||||||||||||||||||||||||
Bank of Nova Scotia | 01-12-15 | 1.850 | 15,405,000 | 15,408,389 | ||||||||||||||||||||||||||||
Commonwealth Bank of Australia (S) | 03-19-15 | 3.500 | 11,000,000 | 11,069,861 | ||||||||||||||||||||||||||||
Credit Suisse New York | 03-23-15 | 3.500 | 22,655,000 | 22,808,035 | ||||||||||||||||||||||||||||
Credit Suisse USA, Inc. | 01-15-15 | 4.875 | 39,173,000 | 39,239,007 | ||||||||||||||||||||||||||||
National Rural Utilities Cooperative Finance Corp. (P) | 05-01-15 | 0.282 | 51,000,000 | 51,001,632 | ||||||||||||||||||||||||||||
Old Line Funding LLC (P)(S) | 02-02-15 | 0.184 | 26,500,000 | 26,500,000 | ||||||||||||||||||||||||||||
PNC Bank NA | 02-24-15 | 0.290 | 17,000,000 | 17,000,000 | ||||||||||||||||||||||||||||
Toyota Motor Credit Corp. (P) | 08-26-15 | 0.234 | 107,000,000 | 106,982,130 |
10SEE NOTES TO FINANCIAL STATEMENTS
Maturity Date | Yield* (%) | Par value^ | Value | |||||||||||||||||||||||||||||
UBS AG | 01-15-15 | 3.875 | 9,000,000 | $9,009,513 | ||||||||||||||||||||||||||||
Wells Fargo & Company (P) | 06-26-15 | 1.175 | 25,000,000 | 25,110,675 | ||||||||||||||||||||||||||||
Wells Fargo & Company | 02-13-15 to 04-15-15 | 1.250 to 3.625 | 33,791,000 | 33,972,839 | ||||||||||||||||||||||||||||
U.S. Government Agency obligations 12.7% | $215,535,365 | |||||||||||||||||||||||||||||||
(Cost $215,497,022) | ||||||||||||||||||||||||||||||||
Federal Farm Credit Bank (P) | 02-19-15 to 04-13-15 | 0.130 to 0.240 | 215,500,000 | 215,535,365 | ||||||||||||||||||||||||||||
Certificate of deposit 4.8% | $80,603,641 | |||||||||||||||||||||||||||||||
(Cost $80,603,641) | ||||||||||||||||||||||||||||||||
Credit Suisse New York (P) | 01-12-15 to 01-23-15 | 0.440 to 0.633 | 30,600,000 | 30,603,641 | ||||||||||||||||||||||||||||
JPMorgan Chase & Company | 01-07-15 | 0.380 | 14,000,000 | 14,000,000 | ||||||||||||||||||||||||||||
Wells Fargo Bank NA (P) | 03-06-15 | 0.235 | 36,000,000 | 36,000,000 | ||||||||||||||||||||||||||||
Par value | Value | |||||||||||||||||||||||||||||||
Repurchase agreement 3.1% | $52,700,000 | |||||||||||||||||||||||||||||||
(Cost $52,700,000) | ||||||||||||||||||||||||||||||||
Barclays Bank Tri-Party Repurchase Agreement dated 12-31-14 at 0.040% to be repurchased at $50,000,111 on 1-2-15, collateralized by $36,996,400 U.S. Treasury Inflation Indexed Bonds, 2.000% due 1-15-26 (valued at $51,000,227, including interest) | 50,000,000 | 50,000,000 | ||||||||||||||||||||||||||||||
Repurchase Agreement with State Street Corp. dated 12-31-14 at 0.000% to be repurchased at $2,700,000 on 1-2-15, collateralized by $2,695,000 U.S. Treasury Inflation Indexed Notes, 0.125% due 4-15-18 (valued at $2,755,638, including interest) | 2,700,000 | 2,700,000 | ||||||||||||||||||||||||||||||
Total investments (Cost $1,684,582,856)† 99.2% | $1,684,587,410 | |||||||||||||||||||||||||||||||
Other assets and liabilities, net 0.8% | $13,508,557 | |||||||||||||||||||||||||||||||
Total net assets 100.0% | $1,698,095,967 |
The percentage shown for each investment category is the total value of the category as a percentage of the net assets of the fund. | ||||||||||
^All par values are denominated in U.S. dollars unless otherwise indicated. | ||||||||||
(P) | Variable rate obligation. The coupon rate shown represents the rate at period end. | |||||||||
(S) | These securities are exempt from registration under Rule 144A of the Securities Act of 1933. Such securities may be resold, normally to qualified institutional buyers, in transactions exempt from registration. | |||||||||
* | Yield represents either the annualized yield at the date of purchase, the stated coupon rate or, for floating rate securities, the rate at period end. | |||||||||
† | At 12-31-14, the aggregate cost of investment securities for federal income tax purposes was $1,684,582,856. Net unrealized appreciation aggregated $4,554 of which $46,413 related to appreciated investment securities and $41,859 related to depreciated investment securities. |
11
Financial statements
STATEMENT OF ASSETS AND LIABILITIES 12-31-14
Assets | |||||||||||||||
Investments, at value (Cost $1,684,582,856) | $1,684,587,410 | ||||||||||||||
Cash | 12,042,567 | ||||||||||||||
Interest receivable | 2,000,816 | ||||||||||||||
Total assets | 1,698,630,793 | ||||||||||||||
Liabilities | |||||||||||||||
Distributions payable | 230,331 | ||||||||||||||
Payable to affiliates | |||||||||||||||
Chief compliance officer fees | 11,667 | ||||||||||||||
Transfer agent fees | 8,332 | ||||||||||||||
Trustees' fees | 39,751 | ||||||||||||||
Other liabilities and accrued expenses | 244,745 | ||||||||||||||
Total liabilities | 534,826 | ||||||||||||||
Net assets | $1,698,095,967 | ||||||||||||||
Net assets consist of | |||||||||||||||
Paid-in capital | $1,698,405,929 | ||||||||||||||
Accumulated distributions in excess of net investment income | (307,519 | ) | |||||||||||||
Accumulated net realized gain (loss) on | (6,997 | ) | |||||||||||||
Net unrealized appreciation (depreciation) on investments | 4,554 | ||||||||||||||
Net assets | $1,698,095,967 | ||||||||||||||
Net asset value per share | |||||||||||||||
Based on 169,718,506 shares of beneficial interest outstanding — unlimited number of shares authorized with no par value | $10.01 |
12SEE NOTES TO FINANCIAL STATEMENTS
STATEMENT OF OPERATIONS For the year ended 12-31-14
Investment income | ||||||||||||||||||||||||||||||||||||||||
Interest | $5,850,048 | |||||||||||||||||||||||||||||||||||||||
Expenses | ||||||||||||||||||||||||||||||||||||||||
Investment management fees | 1,123,692 | |||||||||||||||||||||||||||||||||||||||
Administrative service fees | 300,000 | |||||||||||||||||||||||||||||||||||||||
Transfer agent fees | 100,000 | |||||||||||||||||||||||||||||||||||||||
Trustees' fees | 158,682 | |||||||||||||||||||||||||||||||||||||||
Professional fees | 294,773 | |||||||||||||||||||||||||||||||||||||||
Custodian fees | 329,873 | |||||||||||||||||||||||||||||||||||||||
Chief compliance officer fees | 35,000 | |||||||||||||||||||||||||||||||||||||||
Other | 87,743 | |||||||||||||||||||||||||||||||||||||||
Total expenses | 2,429,763 | |||||||||||||||||||||||||||||||||||||||
Net investment income | 3,420,285 | |||||||||||||||||||||||||||||||||||||||
Realized and unrealized gain (loss) | ||||||||||||||||||||||||||||||||||||||||
Net realized gain (loss) on | ||||||||||||||||||||||||||||||||||||||||
Investments | — | |||||||||||||||||||||||||||||||||||||||
Change in net unrealized appreciation (depreciation) of | ||||||||||||||||||||||||||||||||||||||||
Investments | (286,541 | ) | ||||||||||||||||||||||||||||||||||||||
Net realized and unrealized loss | (286,541 | ) | ||||||||||||||||||||||||||||||||||||||
Increase in net assets from operations | $3,133,744 |
STATEMENT OF CHANGES IN NET ASSETS
Year ended 12-31-14 | Year ended 12-31-13 | ||||||||||||||||||||||||||||||||||||||||||
Increase (decrease) in net assets | |||||||||||||||||||||||||||||||||||||||||||
From operations | |||||||||||||||||||||||||||||||||||||||||||
Net investment income | $3,420,285 | $10,135,209 | |||||||||||||||||||||||||||||||||||||||||
Net realized gain (loss) | — | (5,197 | |||||||||||||||||||||||||||||||||||||||||
Change in net unrealized appreciation (depreciation) | (286,541 | ) | 145,008 | ||||||||||||||||||||||||||||||||||||||||
Increase in net assets resulting from operations | 3,133,744 | 10,275,020 | |||||||||||||||||||||||||||||||||||||||||
Distributions to shareholders | |||||||||||||||||||||||||||||||||||||||||||
From net investment income | (3,498,923 | ) | (10,146,837 | ||||||||||||||||||||||||||||||||||||||||
From fund share transactions | (1,477,980,660 | ) | (1,924,126,625 | ||||||||||||||||||||||||||||||||||||||||
Total decrease | (1,478,345,839 | ) | (1,923,998,442 | ||||||||||||||||||||||||||||||||||||||||
Net assets | |||||||||||||||||||||||||||||||||||||||||||
Beginning of year | 3,176,441,806 | 5,100,440,248 | |||||||||||||||||||||||||||||||||||||||||
End of year | $1,698,095,967 | $3,176,441,806 | |||||||||||||||||||||||||||||||||||||||||
Accumulated distributions in excess of net investment income | ($307,519 | ) | ($229,676 |
Financial highlights
Period ended | 12-31-14 | 12-31-13 | 12-31-12 | 12-31-11 | 12-31-10 | ||||||||||||||||||||||||||||||||||||||||||||||||||||||||||||||||||||||||||||||||||||||||||||||||
Per share operating performance | |||||||||||||||||||||||||||||||||||||||||||||||||||||||||||||||||||||||||||||||||||||||||||||||||||||
Net asset value, beginning of period | $10.01 | $10.01 | $10.01 | $10.01 | $10.01 | ||||||||||||||||||||||||||||||||||||||||||||||||||||||||||||||||||||||||||||||||||||||||||||||||
Net investment income1 | 0.01 | 0.02 | 0.03 | 0.03 | 0.03 | ||||||||||||||||||||||||||||||||||||||||||||||||||||||||||||||||||||||||||||||||||||||||||||||||
Net realized and unrealized gain (loss) on investments | — | 2 | — | 2 | — | 2 | — | 2 | — | 2 | |||||||||||||||||||||||||||||||||||||||||||||||||||||||||||||||||||||||||||||||||||||||||||
Total from investment operations | 0.01 | 0.02 | 0.03 | 0.03 | 0.03 | ||||||||||||||||||||||||||||||||||||||||||||||||||||||||||||||||||||||||||||||||||||||||||||||||
Less distributions | |||||||||||||||||||||||||||||||||||||||||||||||||||||||||||||||||||||||||||||||||||||||||||||||||||||
From net investment income | (0.01 | ) | (0.02 | ) | (0.03 | ) | (0.03 | ) | (0.03 | ) | |||||||||||||||||||||||||||||||||||||||||||||||||||||||||||||||||||||||||||||||||||||||||||
From net realized gain | — | — | — | — | 2 | — | |||||||||||||||||||||||||||||||||||||||||||||||||||||||||||||||||||||||||||||||||||||||||||||||
Total distributions | (0.01 | ) | (0.02 | ) | (0.03 | ) | (0.03 | ) | (0.03 | ) | |||||||||||||||||||||||||||||||||||||||||||||||||||||||||||||||||||||||||||||||||||||||||||
Net asset value, end of period | $10.01 | $10.01 | $10.01 | $10.01 | $10.01 | ||||||||||||||||||||||||||||||||||||||||||||||||||||||||||||||||||||||||||||||||||||||||||||||||
Total return (%) | 0.11 | 0.21 | 0.32 | 0.28 | 0.27 | ||||||||||||||||||||||||||||||||||||||||||||||||||||||||||||||||||||||||||||||||||||||||||||||||
Ratios and supplemental data | |||||||||||||||||||||||||||||||||||||||||||||||||||||||||||||||||||||||||||||||||||||||||||||||||||||
Net assets, end of period (in millions) | $1,698 | $3,176 | $5,100 | $5,139 | $6,756 | ||||||||||||||||||||||||||||||||||||||||||||||||||||||||||||||||||||||||||||||||||||||||||||||||
Ratios (as a percentage of average net assets): | |||||||||||||||||||||||||||||||||||||||||||||||||||||||||||||||||||||||||||||||||||||||||||||||||||||
Expenses | 0.09 | 0.06 | 0.06 | 0.05 | 0.06 | ||||||||||||||||||||||||||||||||||||||||||||||||||||||||||||||||||||||||||||||||||||||||||||||||
Net investment income | 0.12 | 0.22 | 0.34 | 0.27 | 0.27 | ||||||||||||||||||||||||||||||||||||||||||||||||||||||||||||||||||||||||||||||||||||||||||||||||
Portfolio turnover (%)3 | 21 | 79 | 109 | 91 | 153 |
1 | Based on average daily shares outstanding. | |||||||||||||||||||||||||||||||||||
2 | Less than $0.005 per share. | |||||||||||||||||||||||||||||||||||
3 | The calculation of portfolio turnover excludes amounts from all securities whose maturities or expiration dates at the time of acquisition were one year or less, which represents a significant amount of the investments held by the fund. |
Note 1 — Organization
John Hancock Collateral Investment Trust (the fund) is a Massachusetts business trust organized on May 19, 2009. The fund is an open-end management investment company registered under the Investment Company Act of 1940, as amended (the 1940 Act). However, beneficial interests of the fund are not being registered under the Securities Act of 1933, as amended. The current investors in the fund are investment companies advised by affiliates of John Hancock Asset Management, a division of Manulife Asset Management (US) LLC, the fund's investment advisor (the Advisor). The fund serves primarily as an investment vehicle for cash received as collateral by such affiliated funds for participation in securities lending.
The investment objective of the fund is to maximize current income while maintaining adequate liquidity, safeguarding the return of principal and minimizing risk of default. The fund invests only in U.S. dollar denominated securities rated, at the time of investment, within the two highest short-term credit categories and their unrated equivalents. The fund's net asset value (NAV) varies daily.
At the close of business on January 30, 2015, the fund transferred its net assets to the John Hancock Collateral Trust (JHCT). Shareholders of the fund received shares in JHCT equal to their interest in the fund. The investment objective of JHCT and the fund are similar. The Board of Trustees approved liquidation of the fund on February 12, 2015.
Note 2 — Significant accounting policies
The financial statements have been prepared in conformity with accounting principles generally accepted in the United States of America (US GAAP), which require management to make certain estimates and assumptions as of the date of the financial statements. Actual results could differ from those estimates and those differences could be significant. The fund qualifies as an investment company under Topic 946 of Accounting Standards Codification of US GAAP.
Events or transactions occurring after the end of the fiscal period through the date that the financial statements were issued have been evaluated in the preparation of the financial statements. The following summarizes the significant accounting policies of the fund:
Security valuation. Investments are stated at value as of the close of regular trading on the New York Stock Exchange (NYSE), normally at 4:00 P.M., Eastern Time. In order to value the securities, the fund uses the following valuation techniques: Debt obligations are valued based on the evaluated prices provided by an independent pricing vendor or from broker-dealers. Independent pricing vendors utilize matrix pricing which takes into account factors such as institutional-size trading in similar groups of securities, yield, quality, coupon rate, maturity, type of issue, trading characteristics and other market data, as well as broker supplied prices. Securities that trade only in the over-the-counter market are valued using bid prices. Certain short-term securities with maturities of 60 days or less at the time of purchase are valued at amortized cost. Other portfolio securities and assets, for which reliable market quotations are not readily available, are valued at fair value as determined in good faith by the fund's Pricing Committee following procedures established by the Board of Trustees. The frequency with which these fair valuation procedures are used cannot be predicted and fair value of securities may differ significantly from the value that would have been used had a ready market for such securities existed.
The fund uses a three-tier hierarchy to prioritize the pricing assumptions, referred to as inputs, used in valuation techniques to measure fair value. Level 1 includes securities valued using quoted prices in active markets for identical securities. Level 2 includes securities valued using other significant observable inputs. Observable inputs may include quoted prices for similar securities, interest rates, prepayment speeds and credit risk. Prices for securities valued using these inputs are received from independent pricing vendors and brokers and are based on an evaluation of the inputs described. Level 3 includes securities valued using significant unobservable inputs when market prices are not readily available or reliable, including the fund's own assumptions in determining the fair value of investments. Factors used in determining value may include market or issuer specific events or trends, changes in interest rates and credit quality. The inputs or methodology used for valuing securities are not necessarily an indication of the risks associated with investing in those securities. Changes in valuation techniques may result in transfers into or out of an assigned level within the disclosure hierarchy.
As of December 31, 2014, all investments are categorized as Level 2 under the hierarchy described above.
16
Repurchase agreements. The fund may enter into repurchase agreements. When the fund enters into a repurchase agreement, it receives collateral that is held in a segregated account by the fund's custodian, or for tri-party repurchase agreements, collateral is held at a third-party custodian bank in a segregated account for the benefit of the fund. The collateral amount is marked-to-market and monitored on a daily basis to ensure that the collateral held is in an amount not less than the principal amount of the repurchase agreement plus any accrued interest. Collateral received by the fund for repurchase agreements is disclosed in the Fund's investments as part of the caption related to the repurchase agreement.
Repurchase agreements are typically governed by the terms and conditions of the Master Repurchase Agreement and/or Global Master Repurchase Agreement (collectively, MRA). Upon an event of default, the non-defaulting party may close out all transactions traded under the MRA and net amounts owed. Absent an event of default, the MRA does not result in an offset of the reported amounts of assets and liabilities in the Statement of assets and liabilities. In the event of a default by the counterparty, realization of the collateral proceeds could be delayed, during which time the collateral value may decline or the counterparty may have insufficient assets to pay back claims resulting from close-out of the transactions.
Security transactions and related investment income. Investment security transactions are accounted for on a trade date plus one basis for daily net asset value calculations. However, for financial reporting purposes, investment transactions are reported on trade date. Interest income is accrued as earned. Interest income includes coupon interest and amortization/accretion of premiums/discounts on debt securities. Debt obligations may be placed in a non-accrual status and related interest income may be reduced by stopping current accruals and writing off interest receivable when the collection of all or a portion of interest has become doubtful. Gains and losses on securities sold are determined on the basis of identified cost and may include proceeds from litigation.
Expenses. Expense estimates are accrued in the period to which they relate and adjustments are made when actual amounts are known.
Federal income taxes. The fund intends to continue to qualify as a regulated investment company by complying with the applicable provisions of the Internal Revenue Code and will not be subject to federal income tax on taxable income that is distributed to shareholders. Therefore, no federal income tax provision is required.
Under the Regulated Investment Company Modernization Act of 2010, the fund is permitted to carry forward capital losses for an unlimited period. Capital losses that are carried forward will retain their character as either short-term or long-term capital losses rather than being considered all short-term as under previous law.
For federal income tax purposes, as of December 31, 2014, the fund has a short-term capital loss carryforward of $6,997 available to offset future net realized capital gains. This carryforward does not expire.
As of December 31, 2014, the fund had no uncertain tax positions that would require financial statement recognition, derecognition or disclosure. The fund's federal tax returns are subject to examination by the Internal Revenue Service for a period of three years.
Distribution of income and gains. Distributions to shareholders from net investment income and net realized gains, if any, are recorded on the ex-date. The fund generally declares dividends daily and pays them monthly. Capital gains distributions, net of fees paid to the fund's securities lending agent, if any, are distributed annually. The tax character of distributions for the years ended December 31, 2014 and 2013 was as follows:
December 31, 2014 | December 31, 2013 | |
Ordinary Income | $3,498,923 | $10,146,837 |
Such distributions and distributable earnings, on a tax basis, are determined in conformity with income tax regulations, which may differ from US GAAP. Distributions in excess of tax basis earnings and profits, if any, are reported in the fund's financial statements as a return of capital.
17
Capital accounts within the financial statements are adjusted for permanent book-tax differences. These adjustments have no impact on net assets or the results of operations. Temporary book-tax differences, if any, will reverse in a subsequent period. The fund had no material book-tax differences at December 31, 2014.
Note 3 — Guarantees and indemnifications
Under the fund's organizational documents, its Officers and Trustees are indemnified against certain liabilities arising out of the performance of their duties to the fund. Additionally, in the normal course of business, the fund enters into contracts with service providers that contain general indemnification clauses. The fund's maximum exposure under these arrangements is unknown, as this would involve future claims that may be made against the fund that have not yet occurred. The risk of material loss from such claims is considered remote.
Note 4 — Fees and transactions with affiliates
The Advisor serves as investment advisor for the fund. John Hancock Funds, LLC (the Placement Agent) performs services related to the offering and sale of shares of the fund. The Advisor and Placement Agent are indirect wholly owned subsidiaries of Manulife Financial Corporation.
Management fee. The fund has an investment management agreement with the Advisor. Under the investment management contract, the fund pays a daily management fee to the Advisor at the annual rate of: (a) 0.05% of the first $1.5 billion of the fund's average daily net assets and (b) 0.03% of the fund's average daily net assets in excess of $1.5 billion.
The investment management fees incurred for the year ended December 31, 2014 were equivalent to a net annual effective rate of 0.04% of the fund's average daily net assets.
Administrative services. The fund has entered into an Administrative Services Agreement with John Hancock Advisers, LLC ("JHA") under which JHA provides accounting, valuation, financial reporting and certain other services for an annual fee of 0.02% of the fund's average daily net assets. JHA has voluntarily undertaken to limit its total annual fee to $300,000. The administrative service fees incurred for the year ended December 31, 2014 were equivalent to an annual effective rate of 0.01% of the fund's average daily net assets.
Chief Compliance Officer services. The fund has contracted with the Advisor and the fund's Chief Compliance Officer (CCO) to provide certain services, including ongoing evaluation of the fund's policies and procedures under the federal securities laws. In addition, the CCO will provide annual reporting to the Board of Trustees detailing the results of this review. The fund pays an annual flat rate of $35,000 to the Advisor, paid monthly in arrears, for these services.
Trustee expenses. The fund compensates each Trustee who is not an employee of the Advisor or its affiliates.
Transfer agent fees. The fund has a transfer agent agreement with John Hancock Signature Services, Inc. (the Transfer Agent), an affiliate of the Advisor. Monthly, the fund pays the Transfer Agent a fee which is based on an annual rate of $100,000. The fund also pays certain out-of-pocket expenses to the Transfer Agent.
Note 5 — Fund share transactions
Transactions in fund shares for the years ended December 31, 2014 and 2013 were as follows:
Year ended 12-31-14 | Year ended 12-31-13 | |||||||||||||||||||||||||
Shares | Amount | Shares | Amount | |||||||||||||||||||||||
Common shares | ||||||||||||||||||||||||||
Sold | 2,597,277,683 | $25,990,714,824 | 3,067,209,271 | $30,696,810,099 | ||||||||||||||||||||||
Repurchased | (2,744,970,319 | ) | (27,468,695,484 | ) | (3,259,465,287 | ) | (32,620,936,724 | ) | ||||||||||||||||||
Net decrease | (147,692,636 | ) | ($1,477,980,660 | ) | (192,256,016 | ) | ($1,924,126,625 | ) |
18
Note 6 — Purchase and sale of securities
Purchases and proceeds from sales or maturities of securities, other than short-term securities, during the year ended December 31, 2014, aggregated $127,672,781 and $985,738,411, respectively.
19
Report of Independent Registered Public Accounting Firm
To the Board of Trustees and Shareholders of John Hancock Collateral Investment Trust:
In our opinion, the accompanying statement of assets and liabilities, including the fund's investments, and the related statements of operations and of changes in net assets and the financial highlights present fairly, in all material respects, the financial position of John Hancock Collateral Investment Trust (the "Fund") at December 31, 2014, the results of its operations for the year then ended, the changes in its net assets for each of the two years in the period then ended and the financial highlights for each of the five years in the period then ended, in conformity with accounting principles generally accepted in the United States of America. These financial statements and financial highlights (hereafter referred to as "financial statements") are the responsibility of the Fund's management; our responsibility is to express an opinion on these financial statements based on our audits. We conducted our audits of these financial statements in accordance with the standards of the Public Company Accounting Oversight Board (United States). Those standards require that we plan and perform the audit to obtain reasonable assurance about whether the financial statements are free of material misstatement. An audit includes examining, on a test basis, evidence supporting the amounts and disclosures in the financial statements, assessing the accounting principles used and significant estimates made by management, and evaluating the overall financial statement presentation. We believe that our audits, which included confirmation of securities at December 31, 2014 by correspondence with the custodian and the application of alternative auditing procedures where securities purchased confirmations had not been received, provide a reasonable basis for the opinion expressed above.
As disclosed in Note 1 of the Notes to financial statements, the Board of Trustees approved a plan of liquidation on February 12, 2015. Our opinion is not modified with respect to this matter.
PricewaterhouseCoopers LLP
Boston, Massachusetts
February 12, 2015
20
This chart provides information about the Trustees and Officers who oversee your John Hancock fund. Officers elected by the Trustees manage the day-to-day operations of the fund and execute policies formulated by the Trustees.
Independent Trustees
Name, year of birth Position(s) held with fund Principal occupation(s) and other directorships during past 5 years | Trustee of the Trust since1 | Number of John Hancock funds overseen by Trustee |
Harlan D. Platt,2 Born: 1950 | 2009 | 1 |
Chairman Professor of Finance, Northeastern University College of Business Administration (since 1980); Director, Republic Financial Corporation (since 2005); Advisory Board Member, Millennium Custodial Trust, 2010-Present; Director and Audit Committee Member, CypressTree Alternative Income Fund Inc. (2003-2004); Director and Audit Committee Member, Prospect Street Debt Strategies Fund Inc. (1999-2003); Director and Audit Committee Chairman, VSI Enterprises, Inc. (1998-2000); Director and Audit Committee Member, Prospect Street High Income Portfolio Inc. (1988-2000). | ||
John A. Frabotta,2 Born: 1942 | 2009 | 1 |
Trustee Retired. Former founding partner and Chief Investment Officer of Cypress Tree Investment Management, LLC (1988-2009); Head of High Yield Research at Merrill Lynch, Pierce, Fenner & Smith (1979-1988). |
Non-Independent Trustees*
Name, year of birth Position(s) held with fund Principal occupation(s) and other directorships during past 5 years | Trustee of the Trust since1 | Number of John Hancock funds overseen by Trustee |
William P. Callan, Jr., Born: 1961 | 2012 | 1 |
President (1993-2012), Declaration Management & Research LLC ("Declaration"), an independent wholly owned subsidiary of Manulife. Mr. Callan helped form Declaration in 1989. Prior to joining Declaration, Mr. Callan was a Vice President and member of the Mortgage Products Group of Merrill Lynch Capital Markets, starting his career there in 1984. |
Principal officers who are not Trustees†
Name, year of birth Position(s) held with fund Principal occupation(s) and other directorships during past 5 years | Officer of the Trust since |
Barry H. Evans, Born: 1960 | 2009 |
President and Chief Executive Officer Barry Evans is the President, Chief Investment Officer, Global Fixed Income & Country Head, US at John Hancock Asset Management a division of Manulife Asset Management (US) LLC (JHAM). He is responsible for all US and international fixed income strategies managed by JHAM, some of which incorporate exposure to high yield and emerging market debt asset classes. He is a member of the firm's Senior Investment Policy Committee. Mr. Evans began his career in the financial industry in 1986 when he joined John Hancock Advisers, the sister firm of JHAM. |
21
Principal officers who are not Trustees*
Name, year of birth Position(s) held with fund Principal occupation(s) and other directorships during past 5 years | Officer of the Trust since |
Carolyn M. Flanagan, Born: 1967 | 2009 |
Secretary and Chief Legal Officer Carolyn M. Flanagan is a vice president and the general counsel at JHAM. She provides legal support for the firm's mutual fund and institutional investment management business. Ms. Flanagan also serves as a member of the firm's Senior Investment Policy Committee. Prior to joining the firm, Ms. Flanagan served as vice president and counsel at Wellington Management Company, LLP, and prior to that assistant vice president and counsel at State Street Bank and Trust Company. She is a member of the Massachusetts, Florida, and District of Columbia Bars. | |
Paul Donahue, Born: 1967 | 2014 |
Chief Compliance Officer Mr. Donahue is Managing Director and Assistant Chief Compliance Officer of JHAM (since 2011), charged with oversight of all aspects of the firm's compliance program. Mr. Donahue was previously responsible for Investment Compliance for the John Hancock Group of Funds. Mr. Donahue began his financial services career when he joined the firm in 1992. He has held a variety of positions at the firm, the last twelve years of which have been in Compliance related roles. Mr. Donahue holds his FINRA Series 6, 7, 24 and 63 licenses. | |
Charles A. Rizzo, Born: 1957 | 2009 |
Chief Financial Officer Vice President, John Hancock Financial Services (since 2008); Senior Vice President, John Hancock Advisers, LLC and John Hancock Investment Management Services, LLC (since 2008); Chief Financial Officer, John Hancock retail funds,3 John Hancock Variable Insurance Trust and John Hancock Funds II (since 2007). | |
Salvatore Schiavone, Born: 1965 | 2013 |
Treasurer Assistant Vice President, John Hancock Financial Services (since 2007); Vice President, John Hancock Advisers, LLC and John Hancock Investment Management Services, LLC (since 2007); Treasurer, John Hancock retail funds3 (since 2007, including prior positions); Treasurer, John Hancock Variable Insurance Trust and John Hancock Funds II (since 2010 and 2007-2009, including prior positions). |
The business address for Harlan D. Platt, John A. Frabotta, William P. Callan, Jr., Barry H. Evans, Carolyn M. Flanagan and Paul Donahue is 101 Huntington Avenue, Boston, Massachusetts 02199. The business address for Charles A. Rizzo and Salvatore Schiavone is 601 Congress Street, Boston, Massachusetts 02210.
Part B of the fund's registration statement includes additional information about members of the Board of Trustees of the fund and is available without charge, upon request, by calling 800-225-5291.
1 | Each Trustee serves until resignation, retirement age or until his successor is elected. |
2 | Member of Audit Committee. |
3 | "John Hancock retail funds" comprises John Hancock Funds III and 37 other John Hancock funds consisting of 27 series of other John Hancock trusts and 10 closed-end funds. |
† | Non-Independent Trustees hold positions with the fund's investment adviser, underwriter and certain other affiliates. |
* | The officers are elected annually by the Board of Trustees. |
22
Trustees Harlan D. Platt* *Member of the Audit Committee Officers Barry H. Evans, President and Chief Executive Officer **Effective February 11, 2014 | Investment advisor Manulife Asset Management (US) LLC Placement agent John Hancock Funds, LLC Custodian State Street Bank and Trust Company Transfer agent John Hancock Signature Services, Inc. Legal counsel Pillsbury Winthrop Shaw Pittman LLP Independent registered public accounting firm PricewaterhouseCoopers LLP |
The report is certified under the Sarbanes-Oxley Act, which requires mutual funds and other public companies to affirm that, to the best of their knowledge, the information in their financial reports is fairly and accurately stated in all material respects.
The fund's proxy voting policies and procedures, as well as the fund's proxy voting record for the most recent twelve-month period ended June 30, are available free of charge on the Securities and Exchange Commission (SEC) website at sec.gov. Requests should be made by calling 800-225-5291.
The fund's complete list of portfolio holdings, for the first and third fiscal quarters, is filed with the SEC on Form N-Q. The fund's Form N-Q is available on the SEC's Web site, sec.gov, and can be reviewed and copied (for a fee) at the SEC's Public Reference Room in Washington, DC. Call 800-SEC-0330 to receive information on the operation of the SEC's Public Reference Room.
23
Family of funds
DOMESTIC EQUITY FUNDS Balanced Classic Value Disciplined Value Disciplined Value Mid Cap Fundamental All Cap Core Fundamental Large Cap Core Fundamental Large Cap Value Large Cap Equity Select Growth Small Cap Equity Small Cap Value Small Company Strategic Growth U.S. Equity U.S. Global Leaders Growth Value Equity GLOBAL AND INTERNATIONAL EQUITY FUNDS Disciplined Value International Emerging Markets Global Equity Global Opportunities Global Shareholder Yield Greater China Opportunities International Core International Growth International Small Company International Value Equity INCOME FUNDS Bond California Tax-Free Income Core High Yield Emerging Markets Debt Floating Rate Income Focused High Yield Global Income Government Income High Yield Municipal Bond Income Investment Grade Bond | INCOME FUNDS (continued) Money Market Short Duration Credit Opportunities Strategic Income Opportunities Tax-Free Bond ALTERNATIVE AND SPECIALTY FUNDS Absolute Return Currency Alternative Asset Allocation Enduring Equity Financial Industries Global Absolute Return Strategies Global Conservative Absolute Return Natural Resources Redwood Regional Bank Seaport Technical Opportunities ASSET ALLOCATION Income Allocation Fund Lifestyle Aggressive Portfolio Lifestyle Balanced Portfolio Lifestyle Conservative Portfolio Lifestyle Growth Portfolio Lifestyle Moderate Portfolio Retirement Choices Portfolios (2010-2055) Retirement Living Portfolios (2010-2055) Retirement Living II Portfolios (2010-2055) CLOSED-END FUNDS Financial Opportunities Hedged Equity & Income Income Securities Trust Investors Trust Preferred Income Preferred Income II Preferred Income III Premium Dividend Tax-Advantaged Dividend Income Tax-Advantaged Global Shareholder Yield |
The fund's investment objective's, risks, charges, and expenses are included in the prospectus and should be considered carefully before investing. For a prospectus, contact your financial professional, call John Hancock Investments at 800-225-5291, or visit the fund's website at jhinvestments.com. Please read the prospectus carefully before investing or sending money.
John Hancock Investments
A trusted brand
John Hancock has helped individuals and institutions build and
protect wealth since 1862. Today, we are one of America's strongest
and most-recognized brands.
A better way to invest
As a manager of managers, we search the world to find proven
portfolio teams with specialized expertise for every fund we offer,
then apply vigorous investment oversight to ensure they continue
to meet our uncompromising standards.
Results for investors
Our unique approach to asset management has led to a diverse set
of investments deeply rooted in investor needs, along with strong
risk-adjusted returns across asset classes.
| John Hancock Funds, LLC n Member FINRA, SIPC 601 Congress Street n Boston, MA 02210-2805 800-225-5291 n jhinvestments.com | |
This report is for the information of the shareholders of John Hancock Collateral Investment Trust. It is not authorized for distribution to prospective investors unless preceded or accompanied by a prospectus. | ||
305A 12/14 2/15 |
ITEM 2. CODE OF ETHICS.
As of the end of the year, December 31, 2014, the registrant has adopted a code of ethics, as defined in Item 2 of Form N-CSR, that applies to its Chief Executive Officer, Chief Financial Officer and Treasurer (respectively, the principal executive officer, the principal financial officer and the principal accounting officer, the “Senior Financial Officers”). A copy of the code of ethics is filed as an exhibit to this Form N-CSR.
ITEM 3. AUDIT COMMITTEE FINANCIAL EXPERT.
The Trustees have determined that a member of the audit committee, Mr. John Frabotta, is an audit committee financial expert. Mr. Frabotta is an independent trustee by virtue of being not an "interested" person of the Trust (as defined under the Investment Company Act of 1940, as amended) whose sole compensation from the Trust is his Trustees' fees.
ITEM 4. PRINCIPAL ACCOUNTANT FEES AND SERVICES.
(a) Audit Fees
The aggregate fees billed for professional services rendered by the principal accountant(s) for the audit of the registrant’s annual financial statements or services that are normally provided by the accountant(s) in connection with statutory and regulatory filings or engagements amounted to $55,423 for the fiscal year ended December 31, 2014 and $53,817 for the fiscal year ended December 31, 2013 for John Hancock Collateral Investment Trust. These fees were billed to the registrant and were approved by the registrant’s audit committee.
(b) Audit-Related Services
Audit-related service fees amounted to $519 for the fiscal year ended December 31, 2014 and $1,692 for the fiscal year ended December 31, 2013 for John Hancock Collateral Investment Trust billed to the registrant or to the registrant's investment adviser (not including any sub-adviser whose role is primarily portfolio management and is subcontracted with or overseen by another investment adviser), and any entity controlling, controlled by, or under common control with the adviser that provides ongoing services to the registrant ("control affiliates"). In addition, amounts billed to control affiliates for service provider internal controls reviews were $103,940 and $98,642 for the fiscal years ended December 31, 2014 and 2013, respectively.
(c) Tax Fees
The aggregate fees billed for professional services rendered by the principal accountant(s) for the tax compliance, tax advice and tax planning (“tax fees”) amounted to $2,700 for the fiscal year ended December 31, 2014 and $2,785 for the fiscal year ended December 31, 2013 for John Hancock Collateral Investment Trust. The nature of the services comprising the tax fees was the review of the registrant’s tax returns and tax distribution requirements. These fees were billed to the registrant and were approved by the registrant’s audit committee.
(d) All Other Fees
Other fees amounted to $27 for the fiscal year ended December 31, 2014 and $25 for the fiscal year ended December 31, 2013 for John Hancock Collateral Investment Trust billed to the registrant or to the control affiliates.
(e)(1) Audit Committee Pre-Approval Policies and Procedures:
The trust’s Audit Committee must pre-approve all audit and non-audit services provided by the independent registered public accounting firm (the “Auditor”) relating to the operations or financial reporting of the funds. Prior to the commencement of any audit or non-audit services to a fund, the Audit Committee reviews the services to determine whether they are appropriate and permissible under applicable law.
The trust’s Audit Committee has adopted policies and procedures to, among other purposes, provide a framework for the Committee’s consideration of audit-related and non-audit services by the Auditor. The policies and procedures require that any audit-related and non-audit service provided by the Auditor and any non-audit service provided by the Auditor to a fund service provider that relates directly to the operations and financial reporting of a fund are subject to approval by the Audit Committee before such service is provided. Audit-related services provided by the Auditor that are expected to exceed $10,000 per instance/per fund are subject to specific pre-approval by the Audit Committee. Tax services provided by the Auditor that are expected to exceed $10,000 per instance/per fund are subject to specific pre-approval by the Audit Committee.
All audit services, as well as the audit-related and non-audit services that are expected to exceed the amounts stated above, must be approved in advance of provision of the service by formal resolution of the Audit Committee. At the regularly scheduled Audit Committee meetings, the Committee reviews a report summarizing the services, including fees, provided by the Auditor.
(e)(2) Services approved pursuant to paragraph (c)(7)(i)(C) of Rule 2-01 of Regulation S-X:
Audit-Related Fees, Tax Fees and All Other Fees:
There were no amounts that were approved by the Audit Committee pursuant to the de minimis exception under Rule 2-01 of Regulation S-X.
(f) According to the registrant’s principal accountant, for the fiscal year ended December 31, 2014, the percentage of hours spent on the audit of the registrant's financial statements for the most recent fiscal year that were attributed to work performed by persons who were not full-time, permanent employees of principal accountant was less than 50%.
(g) The aggregate non-audit fees billed by the registrant's accountant(s) for services rendered to the registrant and rendered to the registrant's control affiliates of the registrant was $5,315,696 for the fiscal year ended December 31, 2014 and $5,951,454 for the fiscal year ended December 31, 2013.
(h) The audit committee of the registrant has considered the non-audit services provided by the registrant’s principal accountant(s) to the control affiliates and has determined that the services that were not pre-approved are compatible with maintaining the principal accountant(s)' independence.
ITEM 5. AUDIT COMMITTEE OF LISTED REGISTRANTS.
The registrant has a separately-designated standing audit committee comprised of independent trustees. The members of the audit committee are as follows:
Harlan D. Platt - Chairman
John A. Frabotta
ITEM 6. SCHEDULE OF INVESTMENTS.
(a) Not applicable.
(b) Not applicable.
ITEM 7. DISCLOSURE OF PROXY VOTING POLICIES AND PROCEDURES FOR CLOSED-END MANAGEMENT INVESTMENT COMPANIES.
Not applicable.
ITEM 8. PORTFOLIO MANAGERS OF CLOSED-END MANAGEMENT INVESTMENT COMPANIES.
Not applicable.
ITEM 9. PURCHASES OF EQUITY SECURITIES BY CLOSED-END MANAGEMENT INVESTMENT COMPANY AND AFFILIATED PURCHASERS.
Not applicable.
ITEM 10. SUBMISSION OF MATTERS TO A VOTE OF SECURITY HOLDERS.
Not applicable.
ITEM 11. CONTROLS AND PROCEDURES.
(a) Based upon their evaluation of the registrant's disclosure controls and procedures as conducted within 90 days of the filing date of this Form N-CSR, the registrant's principal executive officer and principal financial officer have concluded that those disclosure controls and procedures provide reasonable assurance that the material information required to be disclosed by the registrant on this report is recorded, processed, summarized and reported within the time periods specified in the Securities and Exchange Commission's rules and forms.
(b) There were no changes in the registrant's internal control over financial reporting that occurred during the registrant's most recent fiscal half-year (the registrant's second fiscal half-year in the case of an annual report) that have materially affected, or are reasonably likely to materially affect, the registrant's internal control over financial reporting.
ITEM 12. EXHIBITS.
(a)(1) See attached Code of Ethics.
(a)(2) Separate certifications for the registrant's principal executive officer and principal financial officer, as required by Section 302 of the Sarbanes-Oxley Act of 2002 and Rule 30a-2(a) under the Investment Company Act of 1940, are attached.
(b) Separate certifications for the registrant's principal executive officer and principal financial officer, as required by 18 U.S.C. Section 1350, as adopted pursuant to Section 906 of the Sarbanes-Oxley Act of 2002, and Rule 30a-2(b) under the Investment Company Act of 1940, are attached. The certifications furnished pursuant to this paragraph are not deemed to be "filed" for purposes of Section 18 of the Securities Exchange Act of 1934, or otherwise subject to the liability of that section. Such certifications are not deemed to be incorporated by reference into any filing under the Securities Act of 1933 or the Securities Exchange Act of 1934, except to the extent that the Registrant specifically incorporates them by reference.
(c) Contact person at the registrant.
SIGNATURES
Pursuant to the requirements of the Securities Exchange Act of 1934 and the Investment Company Act of 1940, the registrant has duly caused this report to be signed on its behalf by the undersigned, thereunto duly authorized.
John Hancock Collateral Investment Trust
By: | /s/ Barry H. Evans |
Barry H. Evans | |
President and Chief Executive Officer |
Date: February 10, 2015
Pursuant to the requirements of the Securities Exchange Act of 1934 and the Investment Company Act of 1940, this report has been signed below by the following persons on behalf of the registrant and in the capacities and on the dates indicated.
By: | /s/ Barry H. Evans |
Barry H. Evans | |
President and Chief Executive Officer |
Date: February 10, 2015
By: | /s/ Charles A. Rizzo |
Charles A. Rizzo | |
Chief Financial Officer |
Date: February 10, 2015