Exhibit 99.2
HD Supply August 18, 2017 Lender Presentation
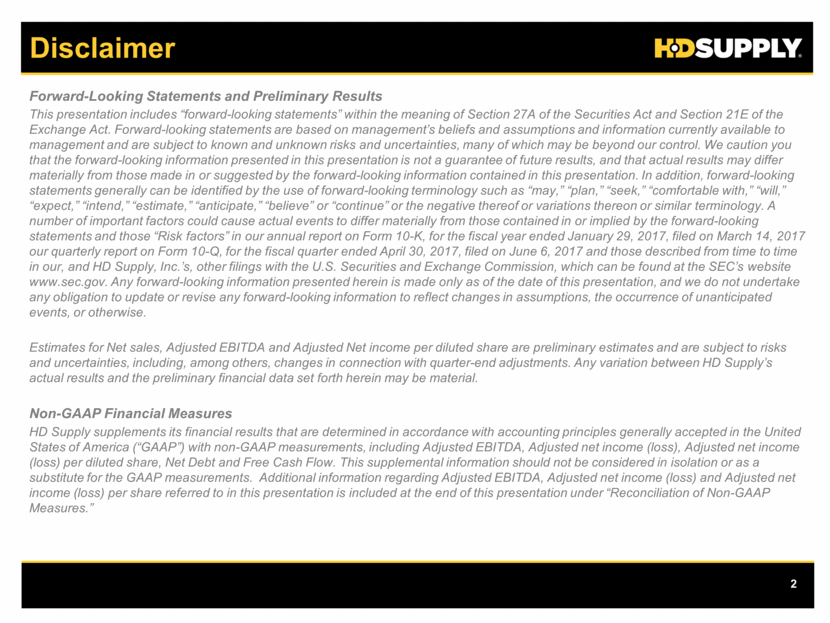
Disclaimer Forward-Looking Statements and Preliminary Results This presentation includes “forward-looking statements” within the meaning of Section 27A of the Securities Act and Section 21E of the Exchange Act. Forward-looking statements are based on management’s beliefs and assumptions and information currently available to management and are subject to known and unknown risks and uncertainties, many of which may be beyond our control. We caution you that the forward-looking information presented in this presentation is not a guarantee of future results, and that actual results may differ materially from those made in or suggested by the forward-looking information contained in this presentation. In addition, forward-looking statements generally can be identified by the use of forward-looking terminology such as “may,” “plan,” “seek,” “comfortable with,” “will,” “expect,” “intend,” “estimate,” “anticipate,” “believe” or “continue” or the negative thereof or variations thereon or similar terminology. A number of important factors could cause actual events to differ materially from those contained in or implied by the forward-looking statements and those “Risk factors” in our annual report on Form 10-K, for the fiscal year ended January 29, 2017, filed on March 14, 2017 our quarterly report on Form 10-Q, for the fiscal quarter ended April 30, 2017, filed on June 6, 2017 and those described from time to time in our, and HD Supply, Inc.’s, other filings with the U.S. Securities and Exchange Commission, which can be found at the SEC’s website www.sec.gov. Any forward-looking information presented herein is made only as of the date of this presentation, and we do not undertake any obligation to update or revise any forward-looking information to reflect changes in assumptions, the occurrence of unanticipated events, or otherwise. Estimates for Net sales, Adjusted EBITDA and Adjusted Net income per diluted share are preliminary estimates and are subject to risks and uncertainties, including, among others, changes in connection with quarter-end adjustments. Any variation between HD Supply’s actual results and the preliminary financial data set forth herein may be material. Non-GAAP Financial Measures HD Supply supplements its financial results that are determined in accordance with accounting principles generally accepted in the United States of America (“GAAP”) with non-GAAP measurements, including Adjusted EBITDA, Adjusted net income (loss), Adjusted net income (loss) per diluted share, Net Debt and Free Cash Flow. This supplemental information should not be considered in isolation or as a substitute for the GAAP measurements. Additional information regarding Adjusted EBITDA, Adjusted net income (loss) and Adjusted net income (loss) per share referred to in this presentation is included at the end of this presentation under “Reconciliation of Non-GAAP Measures.”
Presenters Evan Levitt Senior Vice President and Chief Financial Officer Paul Liptak Bank of America Merrill Lynch
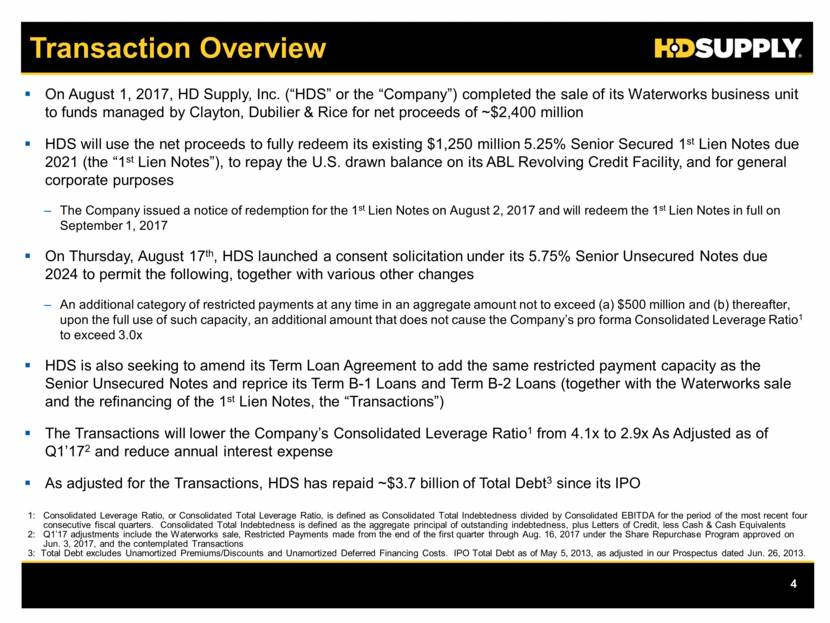
On August 1, 2017, HD Supply, Inc. (“HDS” or the “Company”) completed the sale of its Waterworks business unit to funds managed by Clayton, Dubilier & Rice for net proceeds of ~$2,400 million HDS will use the net proceeds to fully redeem its existing $1,250 million 5.25% Senior Secured 1st Lien Notes due 2021 (the “1st Lien Notes”), to repay the U.S. drawn balance on its ABL Revolving Credit Facility, and for general corporate purposes The Company issued a notice of redemption for the 1st Lien Notes on August 2, 2017 and will redeem the 1st Lien Notes in full on September 1, 2017 On Thursday, August 17th, HDS launched a consent solicitation under its 5.75% Senior Unsecured Notes due 2024 to permit the following, together with various other changes An additional category of restricted payments at any time in an aggregate amount not to exceed (a) $500 million and (b) thereafter, upon the full use of such capacity, an additional amount that does not cause the Company’s pro forma Consolidated Leverage Ratio1 to exceed 3.0x HDS is also seeking to amend its Term Loan Agreement to add the same restricted payment capacity as the Senior Unsecured Notes and reprice its Term B-1 Loans and Term B-2 Loans (together with the Waterworks sale and the refinancing of the 1st Lien Notes, the “Transactions”) The Transactions will lower the Company’s Consolidated Leverage Ratio1 from 4.1x to 2.9x As Adjusted as of Q1’172 and reduce annual interest expense As adjusted for the Transactions, HDS has repaid ~$3.7 billion of Total Debt3 since its IPO Transaction Overview 1: Consolidated Leverage Ratio, or Consolidated Total Leverage Ratio, is defined as Consolidated Total Indebtedness divided by Consolidated EBITDA for the period of the most recent four consecutive fiscal quarters. Consolidated Total Indebtedness is defined as the aggregate principal of outstanding indebtedness, plus Letters of Credit, less Cash & Cash Equivalents 2: Q1’17 adjustments include the Waterworks sale, Restricted Payments made from the end of the first quarter through Aug. 16, 2017 under the Share Repurchase Program approved on Jun. 3, 2017, and the contemplated Transactions 3: Total Debt excludes Unamortized Premiums/Discounts and Unamortized Deferred Financing Costs. IPO Total Debt as of May 5, 2013, as adjusted in our Prospectus dated Jun. 26, 2013.
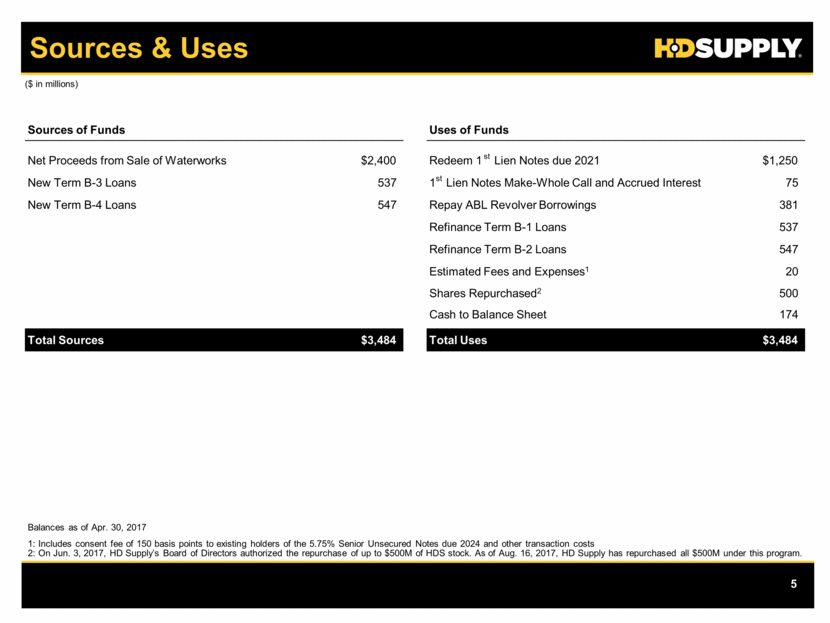
Sources & Uses Balances as of Apr. 30, 2017 1: Includes consent fee of 150 basis points to existing holders of the 5.75% Senior Unsecured Notes due 2024 and other transaction costs 2: On Jun. 3, 2017, HD Supply’s Board of Directors authorized the repurchase of up to $500M of HDS stock. As of Aug. 16, 2017, HD Supply has repurchased all $500M under this program. Sources of Funds Uses of Funds Net Proceeds from Sale of Waterworks $2,400 Redeem 1 st Lien Notes due 2021 $1,250 New Term B-3 Loans 537 1 st Lien Notes Make-Whole Call and Accrued Interest 75 New Term B-4 Loans 547 Repay ABL Revolver Borrowings 381 Refinance Term B-1 Loans 537 Refinance Term B-2 Loans 547 Estimated Fees and Expenses1 20 Cash to Balance Sheet 174 Total Sources $3,484 Total Uses $3,484 Shares Repurchased2 500 ($ in millions)
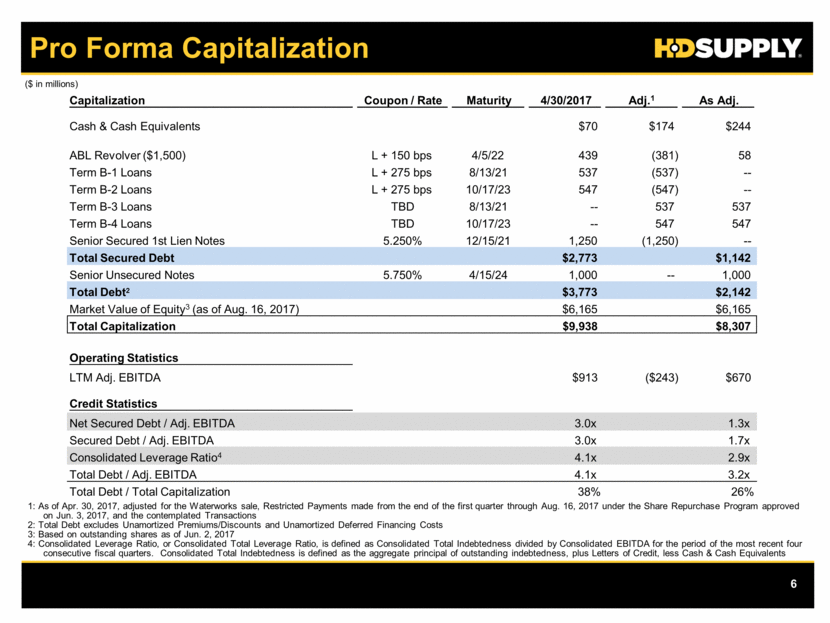
Pro Forma Capitalization 1: As of Apr. 30, 2017, adjusted for the Waterworks sale, Restricted Payments made from the end of the first quarter through Aug. 16, 2017 under the Share Repurchase Program approved on Jun. 3, 2017, and the contemplated Transactions 2: Total Debt excludes Unamortized Premiums/Discounts and Unamortized Deferred Financing Costs 3: Based on outstanding shares as of Jun. 2, 2017 4: Consolidated Leverage Ratio, or Consolidated Total Leverage Ratio, is defined as Consolidated Total Indebtedness divided by Consolidated EBITDA for the period of the most recent four consecutive fiscal quarters. Consolidated Total Indebtedness is defined as the aggregate principal of outstanding indebtedness, plus Letters of Credit, less Cash & Cash Equivalents Capitalization Coupon / Rate Maturity 4/30/2017 Adj.1 As Adj. Cash & Cash Equivalents $70 $174 $244 ABL Revolver ($1,500) L + 150 bps 4/5/22 439 (381) 58 Term B-1 Loans L + 275 bps 8/13/21 537 (537) -- Term B-2 Loans L + 275 bps 10/17/23 547 (547) -- Term B-3 Loans TBD 8/13/21 -- 537 537 Term B-4 Loans TBD 10/17/23 -- 547 547 Senior Secured 1st Lien Notes 5.250% 12/15/21 1,250 (1,250) -- Total Secured Debt $2,773 $1,142 Senior Unsecured Notes 5.750% 4/15/24 1,000 -- 1,000 Total Debt2 $3,773 $2,142 Market Value of Equity3 (as of Aug. 16, 2017) $6,165 $6,165 Total Capitalization $9,938 $8,307 Operating Statistics LTM Adj. EBITDA $913 ($243) $670 Credit Statistics Net Secured Debt / Adj. EBITDA 3.0x 1.3x Secured Debt / Adj. EBITDA 3.0x 1.7x Consolidated Leverage Ratio4 4.1x 2.9x Total Debt / Adj. EBITDA 4.1x 3.2x Total Debt / Total Capitalization 38% 26% ($ in millions)
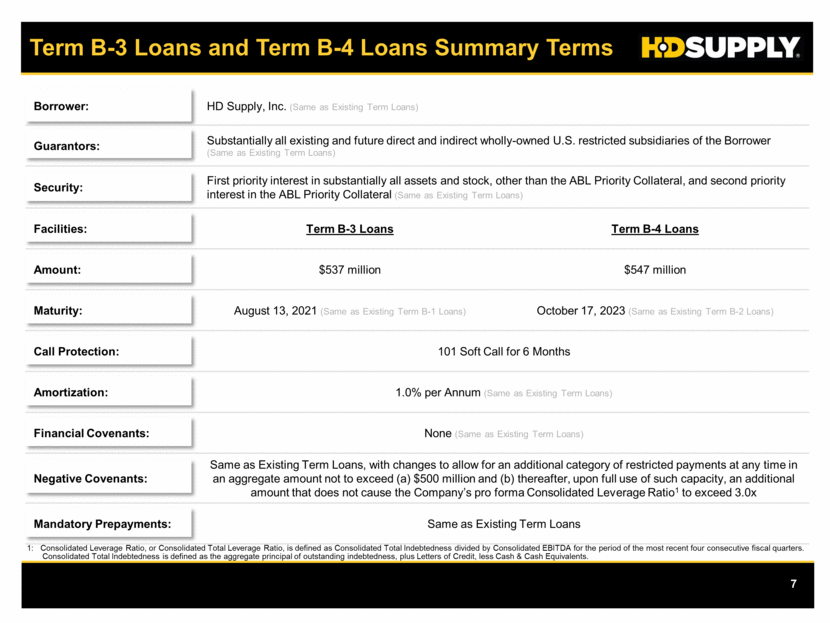
Term B-3 Loans and Term B-4 Loans Summary Terms Borrower: HD Supply, Inc. (Same as Existing Term Loans) Guarantors: Substantially all existing and future direct and indirect wholly-owned U.S. restricted subsidiaries of the Borrower (Same as Existing Term Loans) Security: First priority interest in substantially all assets and stock, other than the ABL Priority Collateral, and second priority interest in the ABL Priority Collateral (Same as Existing Term Loans) Facilities: Term B-3 Loans Term B-4 Loans Amount: $537 million $547 million Maturity: August 13, 2021 (Same as Existing Term B-1 Loans) October 17, 2023 (Same as Existing Term B-2 Loans) Call Protection: 101 Soft Call for 6 Months Amortization: 1.0% per Annum (Same as Existing Term Loans) Financial Covenants: None (Same as Existing Term Loans) Negative Covenants: Same as Existing Term Loans, with changes to allow for an additional category of restricted payments at any time in an aggregate amount not to exceed (a) $500 million and (b) thereafter, upon full use of such capacity, an additional amount that does not cause the Company’s pro forma Consolidated Leverage Ratio1 to exceed 3.0x Mandatory Prepayments: Same as Existing Term Loans 1: Consolidated Leverage Ratio, or Consolidated Total Leverage Ratio, is defined as Consolidated Total Indebtedness divided by Consolidated EBITDA for the period of the most recent four consecutive fiscal quarters. Consolidated Total Indebtedness is defined as the aggregate principal of outstanding indebtedness, plus Letters of Credit, less Cash & Cash Equivalents.
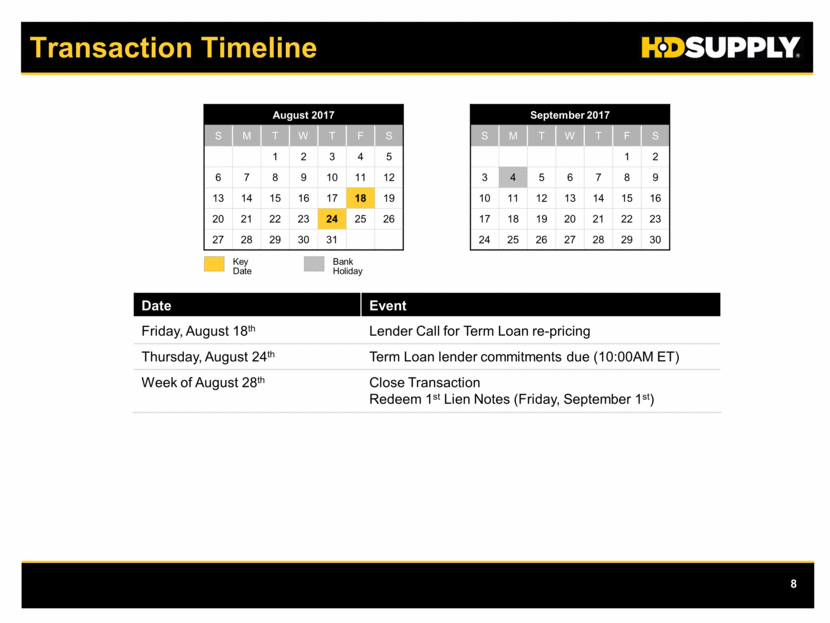
Date Event Friday, August 18th Lender Call for Term Loan re-pricing Thursday, August 24th Term Loan lender commitments due (10:00AM ET) Week of August 28th Close Transaction Redeem 1st Lien Notes (Friday, September 1st) August 2017 S M T W T F S 1 2 3 4 5 6 7 8 9 10 11 12 13 14 15 16 17 18 19 20 21 22 23 24 25 26 27 28 29 30 31 September 2017 S M T W T F S 1 2 3 4 5 6 7 8 9 10 11 12 13 14 15 16 17 18 19 20 21 22 23 24 25 26 27 28 29 30 Key Date Bank Holiday Transaction Timeline
Business and Strategy Overview
Transformational Transaction Waterworks Transaction Overview Closed sale of HD Supply Waterworks on August 1st, 2017 for ~$2.5B in Cash and ~$2.4B After-tax Net Proceeds Use of Proceeds to Repay Debt and Invest in Next-Generation Growth and Innovation Transaction Overview Strategic Rationale Simplifies Business Mix and Focuses Execution Accelerates Debt Reduction Accelerates Next-Generation Growth and Innovation Investment Improves Profitability Profile Reduces Cyclicality
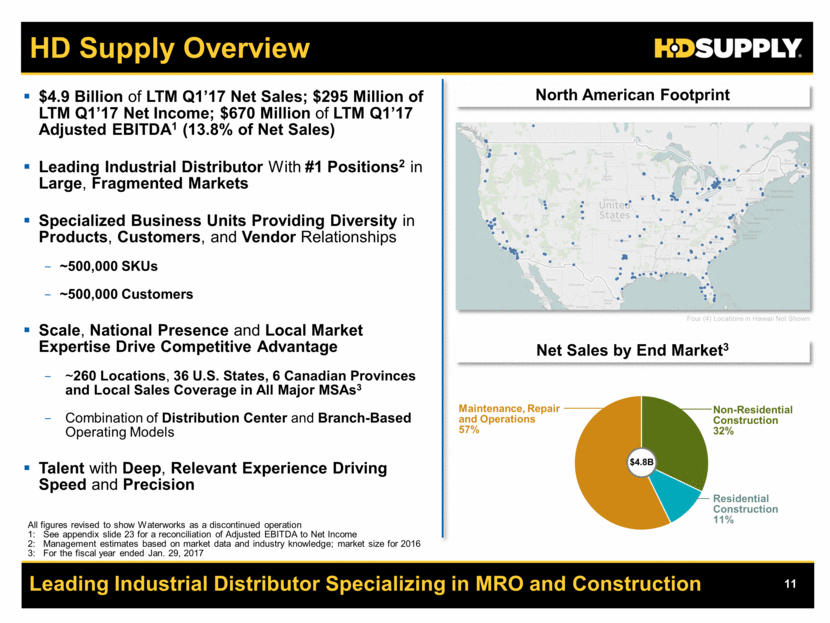
HD Supply Overview Leading Industrial Distributor Specializing in MRO and Construction $4.9 Billion of LTM Q1’17 Net Sales; $295 Million of LTM Q1’17 Net Income; $670 Million of LTM Q1’17 Adjusted EBITDA1 (13.8% of Net Sales) Leading Industrial Distributor With #1 Positions2 in Large, Fragmented Markets Specialized Business Units Providing Diversity in Products, Customers, and Vendor Relationships ~500,000 SKUs ~500,000 Customers Scale, National Presence and Local Market Expertise Drive Competitive Advantage ~260 Locations, 36 U.S. States, 6 Canadian Provinces and Local Sales Coverage in All Major MSAs3 Combination of Distribution Center and Branch-Based Operating Models Talent with Deep, Relevant Experience Driving Speed and Precision North American Footprint Net Sales by End Market3 Maintenance, Repair and Operations 57% Residential Construction 11% Non-Residential Construction 32% $4.8B Four (4) Locations in Hawaii Not Shown All figures revised to show Waterworks as a discontinued operation 1: See appendix slide 23 for a reconciliation of Adjusted EBITDA to Net Income 2: Management estimates based on market data and industry knowledge; market size for 2016 3: For the fiscal year ended Jan. 29, 2017
HD Supply Investment Highlights Leading Industrial Distributor Specializing in MRO and Construction Trusted Local Execution, Market and Product Knowledge, Customer Relationships Based on Reliability of Service and Supplier Alignment Based on Performance #1 Positions with ~6% Share in Estimated ~$75 Billion Addressable Fragmented Market1 Attractive MRO and Construction End Market Exposure Strategic High Return Growth Investments Which We Believe Will Deliver Growth in Excess of Estimated Market Growth Focused on Getting Better and Faster Through Teamwork, Process Excellence and Trusted Relationships Strong Balance Sheet with significant de-leveraging since IPO from Total Debt2 to Adj. EBITDA of 8.1x to 3.2x As Adjusted as of Q1’173 1: Management estimates based on market data and industry knowledge; market size for 2016 2: Total Debt excludes Unamortized Premiums/Discounts and Unamortized Deferred Financing Costs. IPO Total Debt as of May 5, 2013, as adjusted in our Prospectus dated Jun. 26, 2013. 3: As of Apr. 30, 2017, adjusted for Waterworks sale and the contemplated Transactions
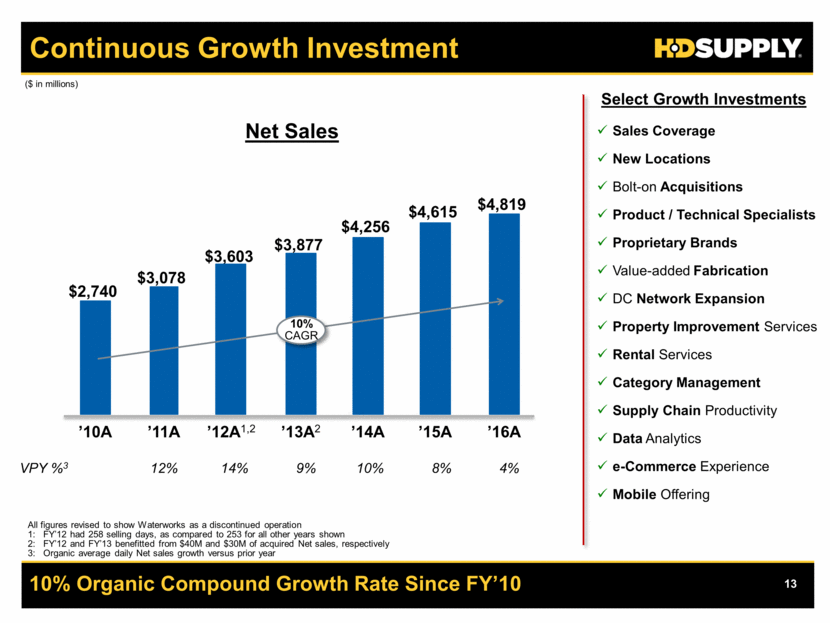
Continuous Growth Investment 10% Organic Compound Growth Rate Since FY’10 Net Sales VPY %3 $4,256 ’14A 10% $2,740 ’10A $4,819 ’16A 4% $4,615 ’15A 8% $3,603 ’12A1,2 14% $3,078 ’11A 12% $3,877 ’13A2 9% 10% CAGR Select Growth Investments Sales Coverage New Locations Bolt-on Acquisitions Product / Technical Specialists Proprietary Brands Value-added Fabrication DC Network Expansion Property Improvement Services Rental Services Category Management Supply Chain Productivity Data Analytics e-Commerce Experience Mobile Offering All figures revised to show Waterworks as a discontinued operation 1: FY’12 had 258 selling days, as compared to 253 for all other years shown 2: FY’12 and FY’13 benefitted from $40M and $30M of acquired Net sales, respectively 3: Organic average daily Net sales growth versus prior year ($ in millions)
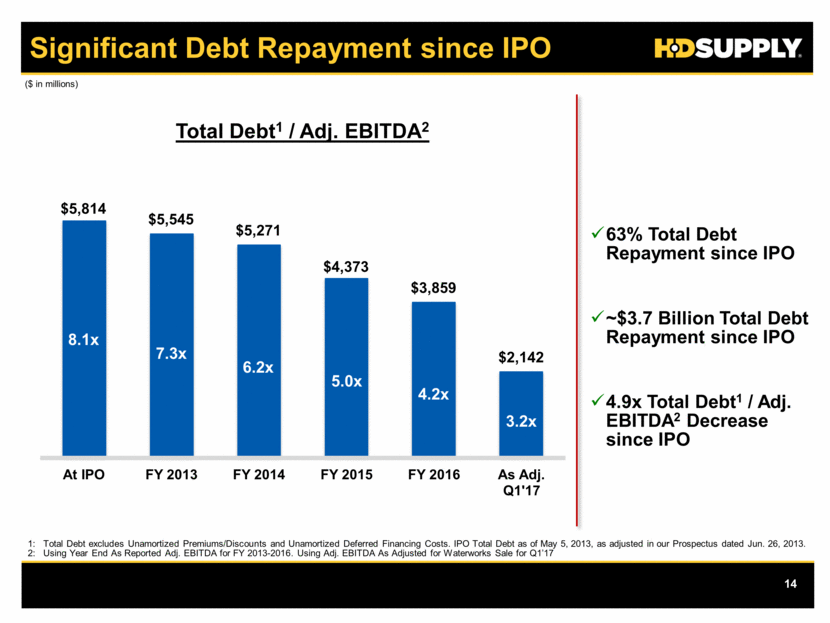
Significant Debt Repayment since IPO Total Debt1 / Adj. EBITDA2 63% Total Debt Repayment since IPO ~$3.7 Billion Total Debt Repayment since IPO 4.9x Total Debt1 / Adj. EBITDA2 Decrease since IPO 1: Total Debt excludes Unamortized Premiums/Discounts and Unamortized Deferred Financing Costs. IPO Total Debt as of May 5, 2013, as adjusted in our Prospectus dated Jun. 26, 2013. 2: Using Year End As Reported Adj. EBITDA for FY 2013-2016. Using Adj. EBITDA As Adjusted for Waterworks Sale for Q1’17 ($ in millions) $5,814 $5,545 $5,271 $4,373 $3,859 $2,142 At IPO FY 2013 FY 2014 FY 2015 FY 2016 As Adj. Q1'17 8.1x 7.3x 6.2x 5.0x 4.2x 3.2x
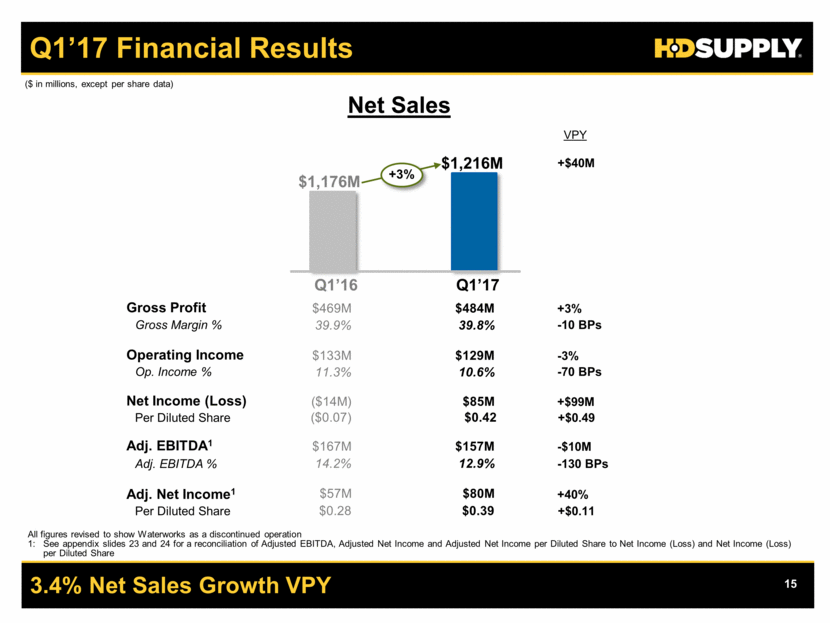
$1,176M $1,216M +3% Gross Profit Gross Margin % Operating Income Adj. EBITDA % Op. Income % $469M $484M 39.9% 39.8% $167M $157M $133M $129M 14.2% 12.9% 10.6% +3% -10 BPs -130 BPs -$10M ($ in millions, except per share data) $57M $80M -3% Net Sales Q1’16 Adj. EBITDA1 VPY Adj. Net Income1 11.3% -70 BPs Q1’17 $0.28 $0.39 +$0.11 Per Diluted Share +$40M +40% Net Income (Loss) ($14M) $85M +$99M ($0.07) $0.42 +$0.49 Per Diluted Share 3.4% Net Sales Growth VPY Q1’17 Financial Results All figures revised to show Waterworks as a discontinued operation 1: See appendix slides 23 and 24 for a reconciliation of Adjusted EBITDA, Adjusted Net Income and Adjusted Net Income per Diluted Share to Net Income (Loss) and Net Income (Loss) per Diluted Share
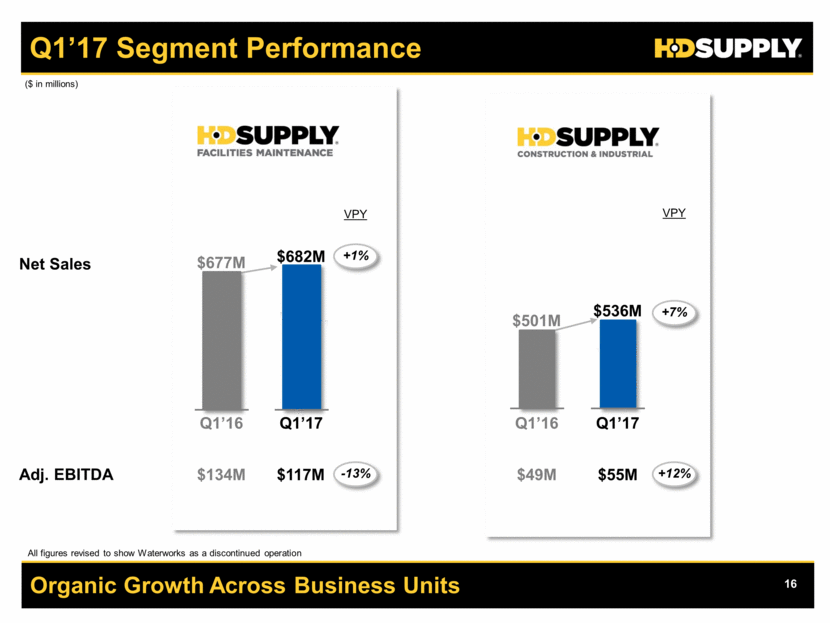
Organic Growth Across Business Units Q1’17 Segment Performance Adj. EBITDA Net Sales ($ in millions) $536M $55M $501M VPY +7% +12% $49M Q1’17 Q1’16 Q1’17 $682M $117M Q1’16 $677M $134M VPY +1% -13% All figures revised to show Waterworks as a discontinued operation
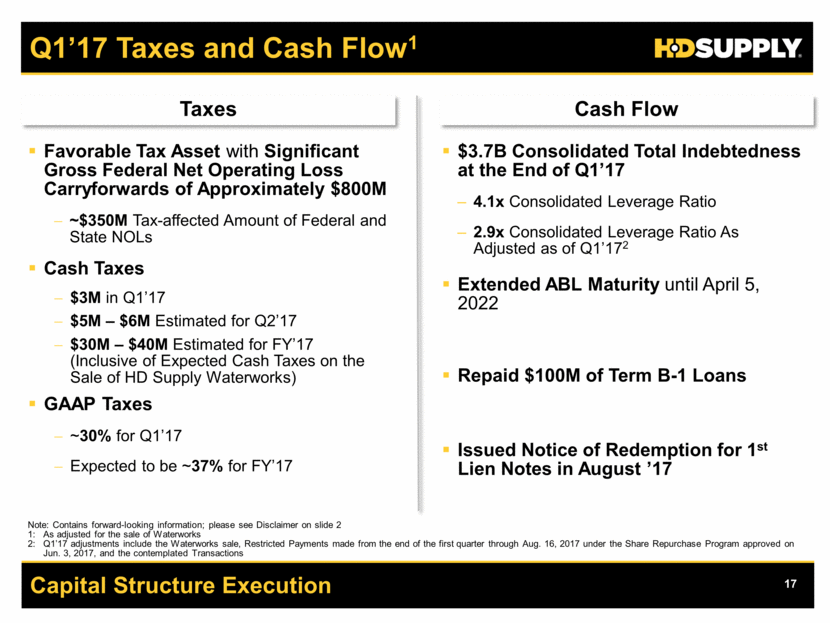
Q1’17 Taxes and Cash Flow1 Favorable Tax Asset with Significant Gross Federal Net Operating Loss Carryforwards of Approximately $800M ~$350M Tax-affected Amount of Federal and State NOLs Cash Taxes $3M in Q1’17 $5M – $6M Estimated for Q2’17 $30M – $40M Estimated for FY’17 (Inclusive of Expected Cash Taxes on the Sale of HD Supply Waterworks) GAAP Taxes ~30% for Q1’17 Expected to be ~37% for FY’17 $3.7B Consolidated Total Indebtedness at the End of Q1’17 4.1x Consolidated Leverage Ratio 2.9x Consolidated Leverage Ratio As Adjusted as of Q1’172 Extended ABL Maturity until April 5, 2022 Repaid $100M of Term B-1 Loans Issued Notice of Redemption for 1st Lien Notes in August ’17 Taxes Cash Flow Capital Structure Execution Note: Contains forward-looking information; please see Disclaimer on slide 2 1: As adjusted for the sale of Waterworks 2: Q1’17 adjustments include the Waterworks sale, Restricted Payments made from the end of the first quarter through Aug. 16, 2017 under the Share Repurchase Program approved on Jun. 3, 2017, and the contemplated Transactions
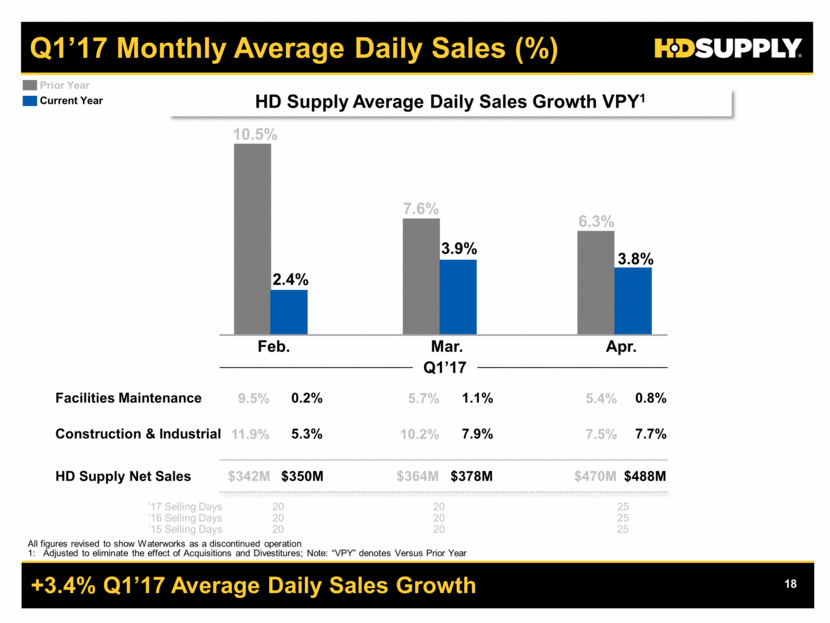
+3.4% Q1’17 Average Daily Sales Growth Q1’17 Monthly Average Daily Sales (%) 0.8% 7.7% 1.1% ’16 Selling Days 25 20 7.9% Facilities Maintenance Construction & Industrial 2.4% 3.9% 3.8% 0.2% 5.3% 20 10.5% Feb. Mar. Apr. Prior Year $488M $378M HD Supply Net Sales $350M 7.6% 6.3% ’15 Selling Days Q1’17 5.4% 7.5% $470M 5.7% 10.2% $364M 9.5% 11.9% $342M HD Supply Average Daily Sales Growth VPY1 ’17 Selling Days 25 20 20 Current Year 25 20 20 All figures revised to show Waterworks as a discontinued operation 1: Adjusted to eliminate the effect of Acquisitions and Divestitures; Note: “VPY” denotes Versus Prior Year
Q&A Q&A
Concluding Remarks Significant Moment in Time for HD Supply Leap Forward to Extend Customer-Centric Differentiation Enables Focus, Growth Investment and Innovation Success is Earned with Hard Work and Team Performance One Team, Driving Customer Success and Value Creation
Q&A APPENDIX
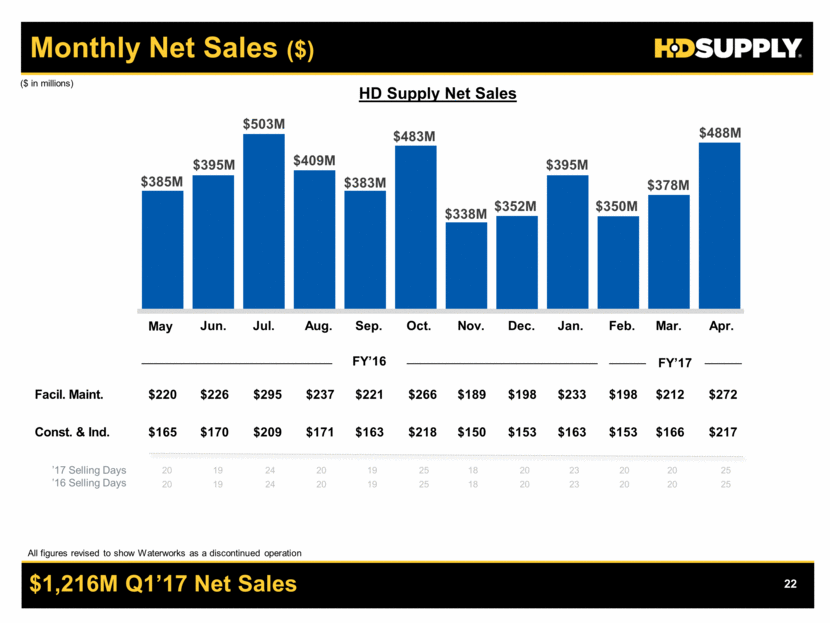
$1,216M Q1’17 Net Sales Monthly Net Sales ($) FY’16 Facil. Maint. Const. & Ind. ’17 Selling Days ’16 Selling Days ($ in millions) HD Supply Net Sales FY’17 Jun. Jul. Aug. Sep. Oct. Nov. Dec. Jan. Feb. Mar. Apr. May $385M $395M $503M $409M $383M $483M $378M $338M $352M $488M $395M $350M $226 $295 $237 $221 $266 $189 $198 $233 $198 $212 $272 $170 $209 $171 $163 $218 $150 $153 $163 $153 $166 $217 $220 $165 20 19 24 20 19 25 18 20 23 20 20 25 20 19 24 20 19 25 18 20 23 20 20 25 All figures revised to show Waterworks as a discontinued operation
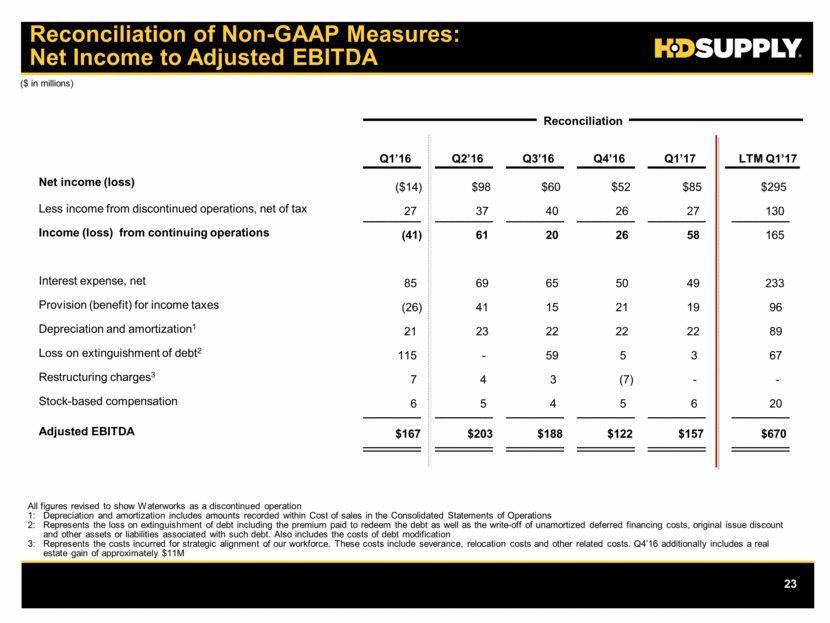
Reconciliation of Non-GAAP Measures: Net Income to Adjusted EBITDA All figures revised to show Waterworks as a discontinued operation 1: Depreciation and amortization includes amounts recorded within Cost of sales in the Consolidated Statements of Operations 2: Represents the loss on extinguishment of debt including the premium paid to redeem the debt as well as the write-off of unamortized deferred financing costs, original issue discount and other assets or liabilities associated with such debt. Also includes the costs of debt modification 3: Represents the costs incurred for strategic alignment of our workforce. These costs include severance, relocation costs and other related costs. Q4’16 additionally includes a real estate gain of approximately $11M ($ in millions) Net income (loss) Less income from discontinued operations, net of tax Income (loss) from continuing operations Interest expense, net Provision (benefit) for income taxes Depreciation and amortization1 Loss on extinguishment of debt2 Restructuring charges3 Stock-based compensation Adjusted EBITDA Reconciliation Q2’16 $98 37 61 69 41 23 - 4 5 $203 Q1’17 $85 27 58 49 19 22 3 - 6 $157 Q4’16 $52 26 26 50 21 22 5 (7) 5 $122 Q3’16 $60 40 20 65 15 22 59 3 4 $188 LTM Q1’17 $295 130 165 233 96 89 67 - 20 $670 Q1’16 ($14) 27 (41) 85 (26) 21 115 7 6 $167
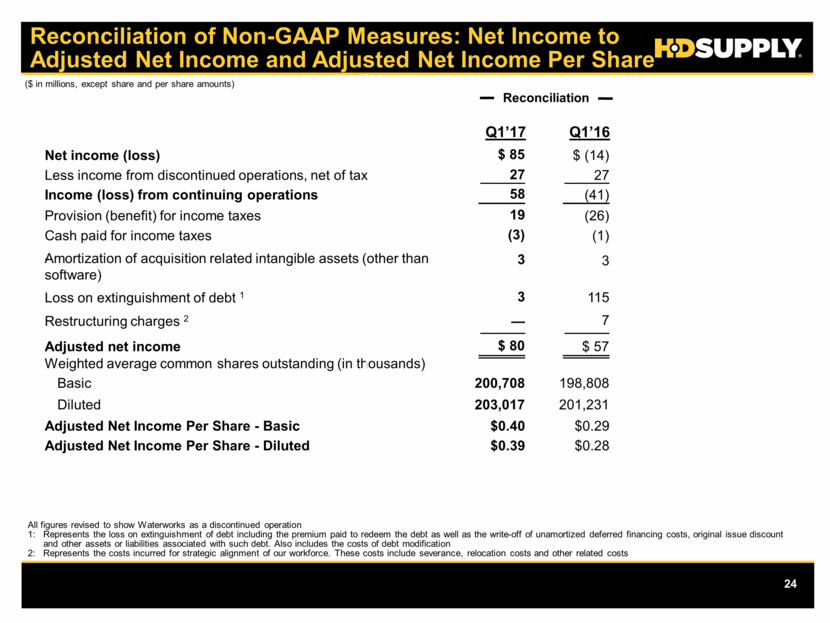
Reconciliation of Non-GAAP Measures: Net Income to Adjusted Net Income and Adjusted Net Income Per Share ($ in millions, except share and per share amounts) Weighted average common shares outstanding (in thousands) Basic Diluted Adjusted Net Income Per Share - Basic Adjusted Net Income Per Share - Diluted Net income (loss) $ 85 $ (14) Less income from discontinued operations, net of tax 27 Income (loss) from continuing operations 58 (41) Provision (benefit) for income taxes 19 (26) Cash paid for income taxes (3) (1) Amortization of acquisition related intangible assets (other than - software) Restructuring charges 2 7 — Loss on extinguishment of debt 1 3 Adjusted net income $ 80 $ 57 200,708 198,808 203,017 201,231 $0.40 $0.29 $0.39 $0.28 27 115 3 3 Q1’17 Q1’16 Reconciliation All figures revised to show Waterworks as a discontinued operation 1: Represents the loss on extinguishment of debt including the premium paid to redeem the debt as well as the write-off of unamortized deferred financing costs, original issue discount and other assets or liabilities associated with such debt. Also includes the costs of debt modification 2: Represents the costs incurred for strategic alignment of our workforce. These costs include severance, relocation costs and other related costs