U.S. Bank Global Fund Services, LLC

Semi-Annual Report
March 31, 2020
ETFMG Prime Junior Silver Miners ETF

ETFMG Prime Cyber Security ETF

ETFMG Prime Mobile Payments ETF

ETFMG Sit Ultra Short ETF

ETFMG Travel Tech ETF

Beginning on January 1, 2021, as permitted by regulations adopted by the SEC, paper copies of the Fund’s shareholder reports will no longer be sent by mail, unless you specifically request paper copies of the Fund’s reports from your financial intermediary, such as a broker-dealer or bank. Instead, the reports will be made available on a website, and you will be notified by mail each time a report is posted and provided with a website link to access the report.
If you already elected to receive shareholder reports electronically, you will not be affected by this change and you need not take any action. Please contact your financial intermediary to elect to receive shareholder reports and other Fund communications electronically.
You may elect to receive all future Fund reports in paper free of charge. Please contact your financial intermediary to inform them that you wish to continue receiving paper copies of Fund shareholder reports and for details about whether your election to receive reports in paper will apply to all funds held with your financial intermediary.
The funds are a series of ETF Managers Trust.
Page Intentionally Left Blank
ETFMG™ ETFs
TABLE OF CONTENTS
March 31, 2020 (Unaudited)
ETFMG™ ETFs
Dear Shareholder,
On behalf of the entire team, we want to express our appreciation for the confidence you have placed in these ETFs. The following information pertains to the fiscal period from October 1, 2019 to March 31, 2020.
Performance Overview
During the 6-month period ended March 31, 2020, the S&P 500 Information Technology Sector Index, a broad measure of US listed technology companies, returned 0.07%. During the same period, the S&P Global 1200 Information Technology Sector Index, a broad measure of global technology companies, returned -0.74%. Below is a performance overview for each Fund for the same 6-month period, except as noted otherwise.
ETFMG Prime Junior Silver Miners ETF (SILJ)
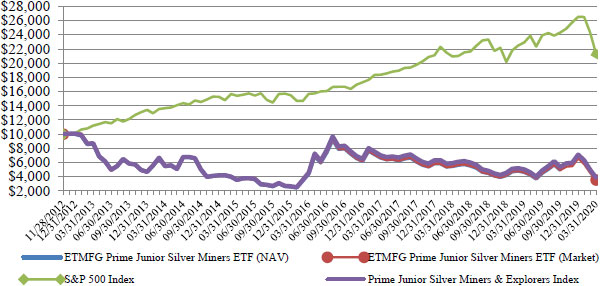
The ETFMG Prime Junior Silver Miners ETF (the “Fund”) seeks to provide investment results that, before fees and expenses, correspond generally to the price and yield performance of the Prime Junior Silver Miners & Explorers Index (the “Index”).
Over the period, the total return for the Fund was -27.66%, while the total return for the Index was -28.04%. The worst performers in the Fund on the basis of contribution to return were Hochschild Mining, First Majestic Silver, and Hecla Mining.
ETFMG Prime Cyber Security ETF (HACK)
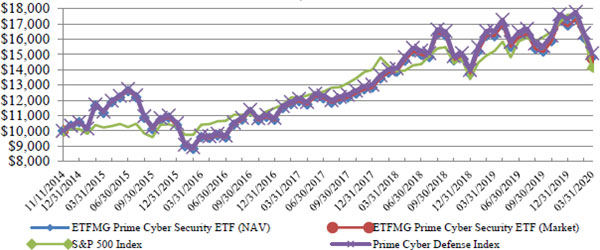
The ETFMG Prime Cyber Security ETF (the “Fund”) seeks to provide investment results that, before fees and expenses, correspond generally to the price and yield performance of the Prime Cyber Defense Index (the “Index”).
Over the period, the total return for the Fund was -2.44%, while the total return for the Index was -2.98%. The best performers in the Fund on the basis of contribution to return were Sophos Group, Carbonite, and Fortinet, while the worst performers were Tufin Software Technologies, Cisco Systems, and Fingerprint Cards.
ETFMG Prime Mobile Payments ETF (IPAY)
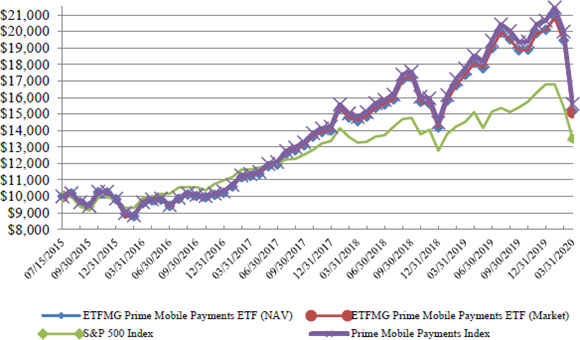
The ETFMG Prime Mobile Payments ETF (the “Fund”) seeks to provide investment results that, before fees and expenses, correspond generally to the price and yield performance of the Prime Mobile Payments Index (the “Index”).
Over the period, the total return for the Fund was -19.65%, while the total return for the Index was -19.33%. The best performers in the Fund on the basis of contribution to return were Adyen, Nexi Spa, and GMO Payment Gateway, while the worst performers were PagSeguro Digital, Discover Financial Services, and American Express.
ETFMG Sit Ultra Short ETF (VALT)
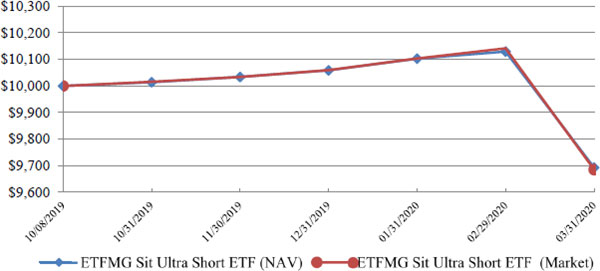
The following information pertains to the fiscal period from the Fund’s inception, October 8, 2019 to March 31, 2020.
The ETFMG Sit Ultra Short ETF (the “Fund”) is an actively managed exchange-traded fund (“ETF”) that seeks maximum current income, consistent with preservation of capital and daily liquidity.
Over the fiscal period, the total return for the Fund was -3.07%, while the total return for its benchmark, the Bloomberg Barclays U.S. Treasury Bills Index: 1-3 month Index, was 0.91%.
The Fund seeks to achieve its investment objective by investing in a diversified portfolio of high-quality, short-term U.S. dollar-denominated domestic and foreign debt securities and other instruments. The Fund uses the Bloomberg Barclays U.S. Treasury Bills Index: 1-3-month Index as its benchmark index. The Fund seeks to maintain an average effective duration within a range of 2 months to 1 year.
ETFMG Travel Tech ETF (AWAY)
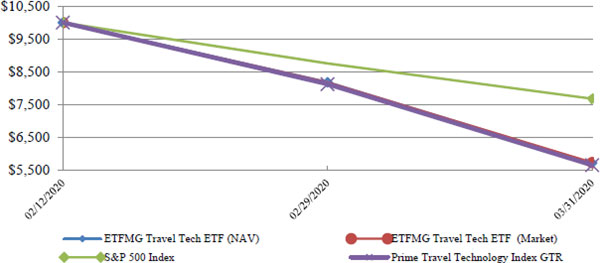
The following information pertains to the fiscal period from the Fund’s inception, February 12, 2020 to March 31, 2020.
The ETFMG Travel Tech ETF (the “Fund”) seeks to provide investment results that, before fees and expenses, correspond generally to the price and yield performance of the Prime Travel Technology Index NTR (the “Index”).
Over the fiscal period, the total return for the Fund was -42.91%, while the total return the Index, was -43.59%. The best performers in the Fund on the basis of contribution to return were Lotte Tour Development and Hana Tour Service, while the worst performers were Webjet, Expedia Group, and Despegar.com.
In late February, as COVID-19, the disease caused by the coronavirus, spread into regions beyond China, global stock markets began to experience significant declines and turbulence. As we write this letter in late April, the course of the coronavirus outbreak remains uncertain, and markets are likely to remain volatile in response to any news or government action concerning the virus. While markets continue working to assess the economic impact of the virus and the public health measures taken in response, it is still unclear what the costs will be and how long the effects will last, but history has shown that markets recover from downturns. For investors, we believe the most important course of action is to remain focused on your long-term goals, and to consult with your financial advisor.
You can find further details about SILJ, HACK, IPAY, VALT and AWAY by visiting www.etfmgfunds.com, or by calling 1-844-383-6477.
Sincerely,

Samuel Masucci III
Chairman of the Board
ETFMG Prime Junior Silver Miners ETF
Growth of $10,000 (Unaudited)
Average Annual Returns
Period Ended March 31, 2020 | | 1 Year
Return | | 5 Year
Return | | Since Inception
(11/28/12) | | Value of $10,000
(3/31/20) |
| ETFMG Prime Junior Silver Miners ETF (NAV) | | -23.01% | | 0.30% | | -13.05% | | $3,583 |
| ETFMG Prime Junior Silver Miners ETF (Market) | | -23.58% | | -0.08% | | -13.22% | | $3,534 |
| S&P 500 Index | | -6.98% | | 6.73% | | 10.88% | | $21,329 |
| Prime Junior Silver Miners & Explorers Index | | -23.25% | | 1.66% | | -12.18% | | $3,856 |
Performance data quoted represents past performance and does not guarantee future results. The investment return and principal value of an investment will fluctuate so that an investor’s shares, when redeemed, may be worth more or less than their original cost. Current performance of the Fund may be lower or higher than the performance quoted. All performance is historical and includes reinvestment of dividends and capital gains. Performance data current to the most recent month end may be obtained by calling 1-844-ETF-MGRS (1-844-383-6477).
The chart illustrates the performance of a hypothetical $10,000 investment made on November 28, 2012, and is not intended to imply any future performance. The returns shown do not reflect the deduction of taxes that a shareholder would pay on fund distributions from the sale of Fund shares. The chart assumes reinvestment of capital gains and dividends, if any. The index returns do not reflect fees or expenses and are not available for direct investment.
ETFMG Prime Junior Silver Miners ETF
Top Ten Holdings as of March 31, 2020* (Unaudited)
| | | | Security | | | % of Total Investments |
| 1 | | Pan American Silver Corp. | | 13.41% |
| 2 | | Hecla Mining Co. | | 11.15% |
| 3 | | First Majestic Silver Corp. | | 11.07% |
| 4 | | Coeur Mining, Inc. | | 8.86% |
| 5 | | SilverCrest Metals, Inc. | | 4.70% |
| 6 | | Hochschild Mining PLC | | 4.56% |
| 7 | | MAG Silver Corp. | | 4.28% |
| 8 | | Silvercorp Metals, Inc. | | 4.10% |
| 9 | | SSR Mining, Inc. | | 4.10% |
| 10 | | Yamana Gold, Inc. | | 3.83% |
Top Ten Holdings = 70.06% of Total Investments
* Current portfolio holdings may not be indicative of future fund holdings.
ETFMG Prime Cyber Security ETF
Growth of $10,000 (Unaudited)
Average Annual Returns
Period Ended March 31, 2020 | | 1 Year
Return | | 5 Year
Return | | Since
Inception
(11/11/14) | | Value of
$10,000
(3/31/20) |
| ETFMG Prime Cyber Security ETF (NAV) | | -8.52% | | 5.81% | | 7.59% | | $14,824 |
| ETFMG Prime Cyber Security ETF (Market) | | -9.04% | | 5.69% | | 7.49% | | $14,752 |
| S&P 500 Index | | -6.98% | | 6.73% | | 6.67% | | $14,154 |
| Prime Cyber Defense Index | | -8.78% | | 6.01% | | 7.93% | | $15,077 |
Performance data quoted represents past performance and does not guarantee future results. The investment return and principal value of an investment will fluctuate so that an investor’s shares, when redeemed, may be worth more or less than their original cost. Current performance of the Fund may be lower or higher than the performance quoted. All performance is historical and includes reinvestment of dividends and capital gains. Performance data current to the most recent month end may be obtained by calling 1-844-ETF-MGRS (1-844-383-6477).
The chart illustrates the performance of a hypothetical $10,000 investment made on November 11, 2014, and is not intended to imply any future performance. The returns shown do not reflect the deduction of taxes that a shareholder would pay on fund distributions from the sales of Fund shares. The chart assumes reinvestment of capital gains and dividends. The chart assumes reinvestment of capital gains and dividends, if any. The Index Returns do not reflect fees or expenses and are not available for direct investment.
ETFMG Prime Cyber Security ETF
Top Ten Holdings as of March 31, 2020* (Unaudited)
| | | | Security | | | % of Total Investments |
| 1 | | CloudFlare, Inc. | | 3.35% |
| 2 | | ETFMG Sit Ultra Short ETF | | 3.31% |
| 3 | | Cisco Systems, Inc. | | 3.17% |
| 4 | | Akamai Technologies, Inc. | | 2.87% |
| 5 | | Qualys, Inc. | | 2.62% |
| 6 | | Splunk, Inc. | | 2.60% |
| 7 | | Fortinet, Inc. | | 2.56% |
| 8 | | Trend Micro, Inc. | | 2.41% |
| 9 | | Ping Identity Holding Corp. | | 2.37% |
| 10 | | Proofpoint, Inc. | | 2.35% |
Top Ten Holdings = 27.61% of Total Investments
* Current portfolio holdings may not be indicative of future Fund holdings.
ETFMG Prime Mobile Payments ETF
Growth of $10,000 (Unaudited)
Average Annual Returns
Period Ended March 31, 2020 | | 1 Year
Return | | Since
Inception
(7/15/15) | | Value of
$10,000
(3/31/20) |
| ETFMG Prime Mobile Payments ETF (NAV) | | -12.73% | | 9.23% | | $15,161 |
| ETFMG Prime Mobile Payments ETF (Market) | | -13.22% | | 9.13% | | $15,092 |
| S&P 500 Index | | -6.98% | | 6.59% | | $13,509 |
| Prime Mobile Payments Index | | -12.08% | | 9.91% | | $15,611 |
Performance data quoted represents past performance and does not guarantee future results. The investment return and principal value of an investment will fluctuate so that an investor’s shares, when redeemed, may be worth more or less than their original cost. Current performance of the Fund may be lower or higher than the performance quoted. All performance is historical and includes reinvestment of dividends and capital gains. Performance data current to the most recent month end may be obtained by calling 1-844-ETF-MGRS (1-844-383-6477).
The chart illustrates the performance of a hypothetical $10,000 investment made on July 15, 2015, and is not intended to imply any future performance. The returns shown do not reflect the deduction of taxes that a shareholder would pay on fund distributions from the sales of Fund shares. The chart assumes reinvestment of capital gains and dividends. The chart assumes reinvestment of capital gains and dividends, if any. The Index Returns do not reflect fees or expenses and are not available for direct investment.
ETFMG Prime Mobile Payments ETF
Top Ten Holdings as of March 31, 2020* (Unaudited)
| | | | Security | | | % of Total Investments |
| 1 | | PayPal Holdings, Inc. | | 5.73% |
| 2 | | Fidelity National Information Services, Inc. | | 5.67% |
| 3 | | Visa, Inc. | | 5.60% |
| 4 | | MasterCard, Inc. | | 5.25% |
| 5 | | Fiserv, Inc. | | 5.24% |
| 6 | | Global Payments, Inc. | | 4.95% |
| 7 | | ETFMG Sit Ultra Short ETF | | 4.94% |
| 8 | | American Express Co. | | 4.42% |
| 9 | | Adyen N.V. | | 4.10% |
| 10 | | Square, Inc. | | 3.32% |
| | | | | |
Top Ten Holdings= 49.22% of Total Investments
* Current Fund holdings may not be indicative of future Fund holdings.
ETFMG Sit Ultra Short ETF
Growth of $10,000 (Unaudited)
Average Annual Returns
Period Ended March 31, 2020 | | Since Inception
(10/8/2019) | | Value of $10,000
(3/31/20) |
| ETFMG Sit Ultra Short ETF (NAV) | | -3.07% | | $9,693 |
| ETFMG Sit Ultra Short ETF (Market) | | -3.15% | | $9,685 |
Performance data quoted represents past performance and does not guarantee future results. The investment return and principal value of an investment will fluctuate so that an investor’s shares, when redeemed, may be worth more or less than their original cost. Current performance of the Fund may be lower or higher than the performance quoted. All performance is historical and includes reinvestment of dividends and capital gains. Performance data current to the most recent month end may be obtained by calling 1-844-ETF-MGRS (1-844-383-6477).
The chart illustrates the performance of a hypothetical $10,000 investment made on October 8, 2019, and is not intended to imply any future performance. The returns shown do not reflect the deduction of taxes that a shareholder would pay on fund distributions from the sales of Fund shares. The chart assumes reinvestment of capital gains and dividends. The chart assumes reinvestment of capital gains and dividends, if any.
ETFMG Sit Ultra Short ETF
Top Ten Holdings as of March 31, 2020* (Unaudited)
| | | | Security | | | % of Total Investments |
| 1 | | Carvana Auto Receivables Trust | | 3.47% |
| 2 | | Albemarle Corp. | | 2.99% |
| 3 | | Hyundai Capital America | | 2.99% |
| 4 | | Westlake Automobile Receivables Trust | | 2.91% |
| 5 | | AbbVie, Inc. | | 2.86% |
| 6 | | HSBC Holdings PLC | | 2.64% |
| 7 | | Arrow Electronics, Inc. | | 2.53% |
| 8 | | Commonwealth Bank of Australia | | 2.49% |
| 9 | | Westpac Banking Corp. | | 2.47% |
| 10 | | Daimler Finance North America LLC | | 2.33% |
Top Ten Holdings =27.68% of Total Investments
* Current Fund holdings may not be indicative of future Fund holdings.
ETFMG Travel Tech ETF
Growth of $10,000 (Unaudited)
| | | | | |
Average Annual Returns
Period Ended March 31, 2020 | | Since Inception
(2/12/2020) | | Value of $10,000
(3/31/20) |
| ETFMG Travel Tech ETF (NAV) | | -42.91% | | $5,709 |
| ETFMG Travel Tech ETF (Market) | | -42.80% | | $5,720 |
| S&P 500 Index | | -23.28% | | $7,672 |
| Prime Travel Technology Index GTR | | -43.59% | | $5,641 |
Performance data quoted represents past performance and does not guarantee future results. The investment return and principal value of an investment will fluctuate so that an investor’s shares, when redeemed, may be worth more or less than their original cost. Current performance of the Fund may be lower or higher than the performance quoted. All performance is historical and includes reinvestment of dividends and capital gains. Performance data current to the most recent month end may be obtained by calling 1-844-ETF-MGRS (1-844-383-6477).
The chart illustrates the performance of a hypothetical $10,000 investment made on February 12, 2020, and is not intended to imply any future performance. The returns shown do not reflect the deduction of taxes that a shareholder would pay on fund distributions from the sales of Fund shares. The chart assumes reinvestment of capital gains and dividends. The chart assumes reinvestment of capital gains and dividends, if any. The Index Returns do not reflect fees or expenses and are not available for direct investment.
ETFMG Travel Tech ETF
Top Ten Holdings as of March 31, 2020* (Unaudited)
| | | | Security | | | % of Total Investments |
| 1 | | Uber Technologies, Inc. | | 13.25% |
| 2 | | Booking holdings, Inc. | | 9.40% |
| 3 | | Lyft, Inc. | | 7.84% |
| 4 | | Trip.com Group, Ltd. | | 7.21% |
| 5 | | Amadeus IT Group S.A. | | 6.28% |
| 6 | | Trainline PLC | | 5.05% |
| 7 | | Hongcheng-Elong Holdings, Ltd. | | 4.74% |
| 8 | | TravelSky, Ltd. | | 4.51% |
| 9 | | Expedia Group, Inc. | | 4.18% |
| 10 | | TripAdvisor, Inc. | | 4.02% |
Top Ten Holdings = 66.48% of Total Investments
* Current Fund holdings may not be indicative of future Fund holdings.
ETFMG™ ETFs
Important Disclosures and Key Risk Factors
Investing involves risk, including the possible loss of principal. Shares of any ETF are bought and sold at market price (not NAV), may trade at a discount or premium to NAV and are not individually redeemed from the Fund. Brokerage commissions will reduce returns. Narrowly focused investments typically exhibit higher volatility.
Past performance is not indicative of future return. A fund’s performance for very short time periods may not be indicative of future performance.
SILJ
The ETFMG Prime Junior Silver Miners ETF (the “Fund” or the “Junior Silver ETF”) seeks to provide investment results that, before fees and expenses, correspond generally to the price and yield performance of the Prime Junior Silver Miners & Explorers Index (the “Index”).
Investments in foreign securities involve political, economic and currency risks, greater volatility and differences in accounting methods. These risks are greater for investments in emerging markets. The Fund is non-diversified, meaning it may concentrate its assets in fewer individual holdings than a diversified fund. Therefore, the Fund is more exposed to individual issuer volatility than a diversified fund. Funds that are less diversified across countries or geographic regions are generally riskier than more geographically diversified funds and risks associated with such countries or geographic regions may negatively affect a Fund. Investments in small capitalization companies tend to have limited liquidity and greater price volatility than large-capitalization companies. The ETFMG Prime Junior Silver Miners ETF is subject to risks associated with the worldwide price of silver and the costs of extraction and production. Worldwide silver prices may fluctuate substantially over short periods of time, so the Fund’s share price may be more volatile than other types of economic conditions, tax treatment, government regulation and intervention, and world events in the regions in which the companies operation. Several foreign countries have begun a process of privatizing certain entities and industries. Privatized entities may lose money or be renationalized. The Fund invests in some economies that are heavily dependent upon trading with key partners. Any reduction in this trading may cause an adverse impact on the economy in which the Fund invests. The Fund’s return may not match or achieve a high degree of correlation with the return of the Prime Junior Silver Miners & Explorers Index. To the extent the Fund utilizes a sampling approach, it may experience tracking error to a greater extent than if the Fund had sought to replicate the Prime Junior Silver Miners & Explorers Index. IOPV or indicative optimized portfolio value is an estimated intraday fair value of one share of an ETF determined by the last trade price of the fund’s underlying securities.
The Prime Junior Silver Miners & Explorers Index is designed to provide a benchmark for investors interested in tracking public, small-cap companies that are active in silver mining exploration and production industry. The stocks are screened for liquidity and weighted according to modified freefloat market capitalization. The Index generally is comprised of 25-35 securities. An investment cannot be made directly in an index.
Unlike with an actively managed fund, the Fund’s adviser does not use techniques or defensive strategies designed to lessen the effects of market volatility or to reduce the impact of periods of market decline. This means that, based on market and economic conditions, the Fund’s performance could be lower than other types of funds that may actively shift their portfolio assets to take advantage of market opportunities or to lessen the impact of a market decline.
Natural or environmental disasters, such as earthquakes, fires, floods, hurricanes, tsunamis and other severe weather-related phenomena generally, and widespread disease, including pandemics and epidemics, have been and may be highly disruptive to economies and markets, adversely impacting individual companies, sectors, industries, markets, currencies, interest and inflation rates, credit ratings, investor sentiment, and other factors affecting the value of the Fund’s investments. Given the increasing interdependence among global economies and markets, conditions in one country, market, or region are increasingly likely to adversely affect markets, issuers, and/or foreign exchange rates in other countries, including the U.S. Any such events could have a significant adverse impact on the value of the Fund’s investments.
ETFMG™ ETFs
Additionally, natural or environmental disasters, widespread disease or other public health issues, war, acts of terrorism or other events could result in increased premiums or discounts to the Fund’s NAV.
HACK
The Fund seeks to provide investment results that, before fees and expenses, correspond generally to the price and yield performance of the Prime Cyber Defense Index (the “Index”).
The fund is concentrated in technology-related companies face intense competition, both domestically and internationally, which may have an adverse effect on profit margins. Such companies may have limited product lines, markets, financial resources or personnel. The products of such companies may face obsolescence due to rapid technological developments, frequent new product introduction, unpredictable changes in growth rates, competition for the services of qualified personnel, and competition from foreign competitors with lower production costs. Technology companies are heavily dependent on patent and intellectual property rights. The loss or impairment of these rights may adversely affect the profitability of these companies. Investments in foreign securities involve political, economic and currency risks, greater volatility and differences in accounting methods. The Funds are non-diversified, meaning they may concentrate its assets in fewer individual holdings than a diversified fund. Investments in smaller companies tend to have limited liquidity and greater price volatility than large-capitalization companies. Diversification does not assure a profit or protect against a loss in a declining market. The Fund’s return may not match or achieve a high degree of correlation with the return of the Prime Cyber Defense Index . To the extent the Fund utilizes a sampling approach, it may experience tracking error to a greater extent than if the Fund had sought to replicate the Prime Cyber Defense Index.
The Prime Cyber Defense Index provides a benchmark for investors interested in tracking companies actively involved in providing cyber security technology and services. The Index uses a market capitalization weighted allocation across the infrastructure provider and service provider categorizations as well as an equal weighted allocation methodology for all components within each sector allocation. Index components are reviewed semi-annually for eligibility, and the weights are reset accordingly. An investment cannot be made directly in an index.
Unlike with an actively managed fund, the Fund’s adviser does not use techniques or defensive strategies designed to lessen the effects of market volatility or to reduce the impact of periods of market decline. This means that, based on market and economic conditions, the Fund’s performance could be lower than other types of funds that may actively shift their portfolio assets to take advantage of market opportunities or to lessen the impact of a market decline.
Natural or environmental disasters, such as earthquakes, fires, floods, hurricanes, tsunamis and other severe weather-related phenomena generally, and widespread disease, including pandemics and epidemics, have been and may be highly disruptive to economies and markets, adversely impacting individual companies, sectors, industries, markets, currencies, interest and inflation rates, credit ratings, investor sentiment, and other factors affecting the value of the Fund’s investments. Given the increasing interdependence among global economies and markets, conditions in one country, market, or region are increasingly likely to adversely affect markets, issuers, and/or foreign exchange rates in other countries, including the U.S. Any such events could have a significant adverse impact on the value of the Fund’s investments.
Additionally, natural or environmental disasters, widespread disease or other public health issues, war, acts of terrorism or other events could result in increased premiums or discounts to the Fund’s NAV.
ETFMG™ ETFs
IPAY
The ETFMG Prime Mobile Payments ETF (the “Fund” or the “Mobile Payments ETF”) seeks to provide investment results that, before fees and expenses, correspond generally to the price and yield performance of the Prime Mobile Payments Index (the “Index”).
Mobile Payment Companies face intense competition, both domestically and internationally, and are subject to increasing regulatory constraints, particularly with respect to fees, competition and antitrust matters, cybersecurity and privacy. Mobile Payment Companies may be highly dependent on their ability to enter into agreements with merchants and other third parties to utilize a particular payment method, system, software or service, and such agreements may be subject to increased regulatory scrutiny. Additionally, certain Mobile Payment Companies have recently faced increased costs related to class-action litigation challenging such agreements. Such factors may adversely affect the profitability and value of such companies. The Fund is non-diversified, meaning it may concentrate its assets in fewer individual holdings than a diversified fund. Investments in smaller companies tend to have limited liquidity and greater price volatility than large-capitalization companies. The Fund’s return may not match or achieve a high degree of correlation with the return of the Prime Mobile Payments Index. To the extent the Fund utilizes a sampling approach, it may experience tracking error to a greater extent than if the Fund had sought to replicate the Index. Diversification does not guarantee a profit, nor does it protect against a loss in a declining market.
The Prime Mobile Payments Index is designed to provide a benchmark for investors interested in tracking the mobile and electronic payments industry. The stocks are screened for liquidity and weighted according to a modified linear-based capitalization-weighted methodology. The Index generally is comprised of 25-40 securities. An investment cannot be made directly in an index.
Unlike with an actively managed fund, the Fund’s adviser does not use techniques or defensive strategies designed to lessen the effects of market volatility or to reduce the impact of periods of market decline. This means that, based on market and economic conditions, the Fund’s performance could be lower than other types of funds that may actively shift their portfolio assets to take advantage of market opportunities or to lessen the impact of a market decline.
Natural or environmental disasters, such as earthquakes, fires, floods, hurricanes, tsunamis and other severe weather-related phenomena generally, and widespread disease, including pandemics and epidemics, have been and may be highly disruptive to economies and markets, adversely impacting individual companies, sectors, industries, markets, currencies, interest and inflation rates, credit ratings, investor sentiment, and other factors affecting the value of the Fund’s investments. Given the increasing interdependence among global economies and markets, conditions in one country, market, or region are increasingly likely to adversely affect markets, issuers, and/or foreign exchange rates in other countries, including the U.S. Any such events could have a significant adverse impact on the value of the Fund’s investments.
Additionally, natural or environmental disasters, widespread disease or other public health issues, war, acts of terrorism or other events could result in increased premiums or discounts to the Fund’s NAV.
VALT
The ETFMG Sit Ultra Short ETF (the “Fund” or the “Ultra Short ETF”) seeks maximum current income, consistent with preservation of capital and daily liquidity.
The market price of the Fund’s fixed-income instruments may change, sometimes rapidly or unpredictably, in response to changes in interest rates, factors affecting securities markets generally, and other factors. Generally, when interest rates rise, the values of fixed-income instruments fall, and vice versa. The Fund may invest in floating rate securities, which are generally less sensitive to interest rate changes than securities with fixed interest rates but may decline in value if their interest rates do not rise as much, or as quickly, as comparable market interest rates. The Fund may invest in U.S. dollar-denominated debt obligations of foreign issuers. Mortgage- and asset-backed securities are subject to interest rate risk. Modest movements in interest rates (both increases and decreases) may quickly and significantly reduce the value of certain types of these securities. From time to time the Fund may invest a substantial amount of its assets in taxable or tax-exempt municipal securities whose interest is paid solely from revenues of similar projects.
ETFMG™ ETFs
Natural or environmental disasters, such as earthquakes, fires, floods, hurricanes, tsunamis and other severe weather-related phenomena generally, and widespread disease, including pandemics and epidemics, have been and may be highly disruptive to economies and markets, adversely impacting individual companies, sectors, industries, markets, currencies, interest and inflation rates, credit ratings, investor sentiment, and other factors affecting the value of the Fund’s investments. Given the increasing interdependence among global economies and markets, conditions in one country, market, or region are increasingly likely to adversely affect markets, issuers, and/or foreign exchange rates in other countries, including the U.S. Any such events could have a significant adverse impact on the value of the Fund’s investments.
The Fund is recently organized with a limited operating history. The Fund may not meet its investment objective based on the success or failure to implement investment strategies for the Fund.
The Fund’s investment strategy may require it to redeem shares for cash or to otherwise include cash as part of its redemption proceeds. In the event of large shareholder redemptions, the Fund may have to sell portfolio securities at times when it would not otherwise do so, which may negatively impact the Fund’s performance.
AWAY
The ETFMG Travel Tech ETF (the “Fund” or the “Travel Tech ETF”) seeks investment results that correspond generally to the price and yield, before fund fees and expenses, of the Prime Travel Technology Index (the “Index”).
Investing involves risk, including loss of principal. Shares of any ETF are bought and sold at market price (not NAV), may trade at a discount or premium to NAV and are not individually redeemed from the Fund. Brokerage commissions will reduce returns. Narrowly focused investments typically exhibit higher volatility. Companies in the technology field, including companies in the computers, telecommunications and electronics industries, face intense competition, which may have an adverse effect on profit margins. Technology companies may have limited product lines, markets, financial resources or personnel. The products of technology companies may face obsolescence due to rapid technological developments and frequent new product introduction, and such companies may face unpredictable changes in growth rates, competition for the services of qualified personnel and competition from foreign competitors with lower production costs. Companies in the technology sector are heavily dependent on patent and intellectual property rights. The loss or impairment of these rights may adversely affect the profitability of these companies.
Unlike with an actively managed fund, the Fund’s adviser does not use techniques or defensive strategies designed to lessen the effects of market volatility or to reduce the impact of periods of market decline. This means that, based on market and economic conditions, the Fund’s performance could be lower than other types of funds that may actively shift their portfolio assets to take advantage of market opportunities or to lessen the impact of a market decline.
ETFMG™ ETFs
Natural or environmental disasters, such as earthquakes, fires, floods, hurricanes, tsunamis and other severe weather-related phenomena generally, and widespread disease, including pandemics and epidemics, have been and may be highly disruptive to economies and markets, adversely impacting individual companies, sectors, industries, markets, currencies, interest and inflation rates, credit ratings, investor sentiment, and other factors affecting the value of the Fund’s investments. Given the increasing interdependence among global economies and markets, conditions in one country, market, or region are increasingly likely to adversely affect markets, issuers, and/or foreign exchange rates in other countries, including the U.S. Any such events could have a significant adverse impact on the value of the Fund’s investments.
Additionally, natural or environmental disasters, widespread disease or other public health issues, war, acts of terrorism or other events could result in increased premiums or discounts to the Fund’s NAV.
The Fund is a recently organized, diversified management investment company with limited operating history.
ETFMG™ ETFs
As of March 31, 2020 (Unaudited)
| | | ETFMG
Prime
Junior
Silver
Miners
ETF | | | ETFMG
Prime
Cyber
Security
ETF | | | ETFMG
Prime
Mobile
Payments
ETF | | | ETFMG
Sit
Ultra ETF | | | ETFMG
Travel
Tech
ETF | |
| As a percent of Net Assets: | | | | | | | | | | | | | | | |
| Australia | | | — | % | | | — | % | | | 0.4 | % | | | — | % | | | 1.8 | % |
| Brazil | | | — | | | | — | | | | 1.2 | | | | — | | | | 1.4 | |
| Canada | | | 66.4 | | | | — | | | | — | | | | — | | | | — | |
| China | | | — | | | | — | | | | — | | | | — | | | | 4.4 | |
| Cyprus | | | — | | | | — | | | | 1.2 | | | | — | | | | 0.1 | |
| Finland | | | — | | | | 0.1 | | | | — | | | | — | | | | — | |
| France | | | — | | | | — | | | | 6.2 | | | | — | | | | — | |
| Germany | | | — | | | | — | | | | 3.7 | | | | — | | | | — | |
| Hong Kong | | | — | | | | — | | | | 0.8 | | | | — | | | | — | |
| Israel | | | — | | | | 7.2 | | | | — | | | | — | | | | — | |
| Italy | | | — | | | | — | | | | 3.2 | | | | — | | | | — | |
| Japan | | | — | | | | 4.4 | | | | 3.7 | | | | — | | | | 11.2 | |
| Mauritus | | | — | | | | — | | | | — | | | | — | | | | 3.2 | |
| Netherlands | | | — | | | | 5.0 | | | | — | | | | 0.8 | | | | | |
| Peru | | | 4.5 | | | | — | | | | — | | | | — | | | | — | |
| Republic of Korea | | | — | | | | 0.7 | | | | — | | | | — | | | | 5.1 | |
| Spain | | | — | | | | — | | | | — | | | | — | | | | 6.2 | |
| Sweden | | | — | | | | 1.6 | | | | — | | | | — | | | | — | |
| United Kingdom | | | — | | | | 6.9 | | | | 0.4 | | | | — | | | | 7.4 | |
| United States | | | 22.6 | | | | 76.3 | | | | 74.0 | | | | — | | | | 54.4 | |
| Asset Backed Securities | | | — | | | | — | | | | — | | | | 12.4 | | | | — | |
| Coporate Obligations | | | — | | | | — | | | | — | | | | 86.6 | | | | — | |
| Exchange Traded Funds | | | — | | | | 4.1 | | | | 6.0 | | | | — | | | | — | |
| Municipal Debt Obligations | | | — | | | | — | | | | — | | | | 1.1 | | | | — | |
| Short-Term and other Net Assets | | | | | | | | | | | | | | | | | | | | |
| (Liabilities) | | | 6.5 | | | | (1.3 | ) | | | (5.8 | ) | | | (0.1 | ) | | | 4.0 | |
| | | | 100.0 | % | | | 100.0 | % | | | 100.0 | % | | | 100.0 | % | | | 100.0 | % |
ETFMG™ ETFs
ETFMG Prime Junior Silver Miners ETF
March 31, 2020 (Unaudited)
| | | Shares | | | Value | |
| COMMON STOCKS - 93.5% | | | | | | |
| Canada - 66.4% | | | | | | |
| Commercial Services & Supplies - 2.1% | | | | | | |
| Alexco Resource Corp. (a) | | | 1,578,031 | | | $ | 1,925,198 | |
| Metals & Mining - 64.3% (c) | | | | | | | | |
| Americas Gold & Silver Corp. (a) | | | 1,072,154 | | | | 1,630,363 | |
| Bear Creek Mining Corp. (a) | | | 1,434,762 | | | | 1,203,026 | |
| Canada Cobalt Works, Inc. (a) | | | 1,277,161 | | | | 290,408 | |
| Endeavour Silver Corp. (a) | | | 1,705,255 | | | | 2,285,042 | |
| Excellon Resources, Inc. (a) | | | 2,596,733 | | | | 1,014,853 | |
| First Majestic Silver Corp. (a) | | | 1,647,051 | | | | 10,195,246 | |
| Fortuna Silver Mines, Inc. (a) | | | 768,164 | | | | 1,768,529 | |
| Great Panther Mining, Ltd. (a) | | | 3,379,410 | | | | 1,041,534 | |
| Hudbay Minerals, Inc. | | | 1,034,782 | | | | 1,955,887 | |
| Kootenay Silver, Inc. (a)(e) | | | 6,570,289 | | | | 770,339 | |
| MAG Silver Corp. (a) | | | 511,153 | | | | 3,944,519 | |
| Mandalay Resources Corp. (a)(d) | | | 1,612,061 | | | | 824,759 | |
| Maya Gold & Silver, Inc. (a)(d) | | | 1,512,882 | | | | 1,042,774 | |
| Minaurum Gold, Inc. (a)(d) | | | 4,773,140 | | | | 1,017,510 | |
| Minco Silver Corp. (a)(d) | | | 1,088,483 | | | | 344,187 | |
| Mirasol Resources, Ltd. (a) | | | 1,002,891 | | | | 224,480 | |
| Pan American Silver Corp. | | | 858,551 | | | | 12,353,910 | |
| Sabina Gold & Silver Corp. (a) | | | 1,619,094 | | | | 1,346,081 | |
| Sierra Metals, Inc. (a)(d) | | | 1,266,951 | | | | 963,290 | |
| Silvercorp Metals, Inc. (a) | | | 1,152,850 | | | | 3,776,479 | |
| SilverCrest Metals, Inc. (a) | | | 827,326 | | | | 4,332,689 | |
| SSR Mining, Inc. (a) | | | 331,084 | | | | 3,775,953 | |
| Trevali Mining Corp. (a) | | | 9,444,252 | | | | 570,427 | |
| Yamana Gold, Inc. | | | 1,283,721 | | | | 3,530,233 | |
| Total Metals & Mining | | | | | | | 60,202,518 | |
| Total Canada | | | | | | | 62,127,716 | |
| | | | | | | | | |
| Peru - 4.5% | | | | | | | | |
| Metals & Mining - 4.5% (c) | | | | | | | | |
| Hochschild Mining PLC | | | 3,175,899 | | | | 4,197,241 | |
| | | | | | | | | |
| United States - 22.6% | | | | | | | | |
| Metals & Mining - 22.6% (c) | | | | | | | | |
| Coeur Mining, Inc. (a) | | | 2,544,256 | | | | 8,167,062 | |
| Gold Resource Corp. | | | 398,261 | | | | 1,095,218 | |
| Golden Minerals Co. (a) | | | 1,524,317 | | | | 320,259 | |
| Hecla Mining Co. | | | 5,641,832 | | | | 10,268,134 | |
| McEwen Mining, Inc. | | | 2,056,696 | | | | 1,359,064 | |
| Total Metals & Mining | | |
| | | | 21,209,737 | |
| Total United States | | |
| | | | 21,209,737 | |
| TOTAL COMMON STOCKS (Cost $138,760,933) | | | | | | | 87,534,694 | |
The accompanying notes are an integral part of these financial statements.
ETFMG™ ETFs
ETFMG Prime Junior Silver Miners ETF
Schedule of Investments
March 31, 2020 (Unaudited) (Continued)
| | | Shares | | | Value | |
| SHORT-TERM INVESTMENTS - 4.9% | | | | | | |
| MONEY MARKET FUNDS - 4.9% | | | | | | |
| Invesco Advisers, Inc. STIT-Treasury Portfolio - Institutional Class, 0.30% (b) | | | 4,596,605 | | | $ | 4,596,605 | |
| TOTAL MONEY MARKET FUNDS (Cost $4,596,605) | | | | | | | 4,596,605 | |
| | | | | | | | | |
| Total Investments (Cost $143,357,538) - 98.4% | | | | | | | 92,131,299 | |
| Liabilities in Excess of Other Assets - 1.6% | | | | | | | 1,543,389 | |
| TOTAL NET ASSETS - 100.0% | | | | | | $ | 93,674,688 | |
Percentages are stated as a percent of net assets.
| (a) | Non-income producing security. |
| (b) | The rate quoted is the annualized seven-day yield at March 31, 2020. |
| (c) | As of March 31, 2020, the Fund had a significant portion of its assets invested in the Metals & Mining Industry. |
| (d) | These securities have been deemed illiquid according to the Fund’s liquidity guidelines. The value of these securities total $4,192,520, which represents 4.48% of total net assets. |
| (e) | Affiliated security. Please refer to Note 9 of the Notes to Financial Statements. |
The Global Industry Classification Standard (GICS®) was developed by and/or is the exclusive property of MSCI, Inc. and Standard & Poor’s Financial Services LLC (“S&P”). GICS is a service mark of MSCI and S&P and has been licensed for use by U.S. Bancorp Fund Services, LLC., doing business as U.S. Bank Global Fund Services (“Fund Services”).
The accompanying notes are an integral part of these financial statements.
ETFMG™ ETFs
ETFMG Prime Cyber Security ETF
Schedule of Investments
March 31, 2020 (Unaudited)
| | | Shares | | | Value | |
| COMMON STOCKS - 97.2% | | | | | | |
| Finland - 0.1% | | | | | | |
| Software - 0.1% | | | | | | |
| F-Secure Oyj | | | 574,485 | | | $ | 1,504,800 | |
| | | | | | | | | |
| Israel - 7.2% | | | | | | | | |
| Communications Equipment - 0.9% | | | | | | | | |
| Radware, Ltd. (a) | | | 524,590 | | | | 11,053,111 | |
| Software - 6.3% | | | | | | | | |
| Check Point Software Technologies, Ltd. (a)(b) | | | 336,574 | | | | 33,839,150 | |
| CyberArk Software, Ltd. (a)(b) | | | 300,454 | | | | 25,706,844 | |
| Tufin Software Technologies Ltd. (a)(b) | | | 1,543,242 | | | | 13,549,665 | |
| Total Software | | | | | | | 73,095,659 | |
| Total Israel | | | | | | | 84,148,770 | |
| | | | | | | | | |
| Japan - 4.4% | | | | | | | | |
| Software - 4.4% | | | | | | | | |
| Digital Arts, Inc. | | | 262,454 | | | | 11,398,839 | |
| FFRI, Inc. (a)(b) | | | 247,124 | | | | 4,332,283 | |
| Trend Micro, Inc. | | | 704,187 | | | | 34,971,947 | |
| Total Software | | | | | | | 50,703,069 | |
| | | | | | | | | |
| Republic of Korea - 0.7% | | | | | | | | |
| Software - 0.7% | | | | | | | | |
| Ahnlab, Inc. | | | 174,174 | | | | 8,141,045 | |
| | | | | | | | | |
| Sweden - 1.6% | | | | | | | | |
| Electronic Equipment, Instruments & Components - 1.6% | | | | | | | | |
| Fingerprint Cards AB - Class B (b) | | | 13,980,838 | | | | 18,598,625 | |
| | | | | | | | | |
| United Kingdom - 6.9% | | | | | | | | |
| Aerospace & Defense - 2.9% | | | | | | | | |
| BAE Systems PLC | | | 1,727,848 | | | | 11,198,637 | |
| QinetiQ Group PLC | | | 2,713,148 | | | | 10,851,379 | |
| Ultra Electronics Holdings PLC | | | 455,628 | | | | 11,363,960 | |
| Total Aerospace & Defense | | | | | | | 33,413,976 | |
| IT Services - 0.4% | | | | | | | | |
| NCC Group PLC | | | 2,362,776 | | | | 4,871,763 | |
| Software - 3.6% | | | | | | | | |
| Avast Plc | | | 6,468,133 | | | | 31,605,951 | |
| Mimecast, Ltd. (a) | | | 294,017 | | | | 10,378,800 | |
| Total Software | | | | | | | 41,984,751 | |
| Total United Kingdom | | | | | | | 80,270,490 | |
| | | | | | | | | |
| United States - 76.3% | | | | | | | | |
| Aerospace & Defense - 2.5% | | | | | | | | |
| Parsons Corp. (a) | | | 895,115 | | | | 28,607,875 | |
The accompanying notes are an integral part of these financial statements.
ETFMG™ ETFs
ETFMG Prime Cyber Security ETF
Schedule of Investments
March 31, 2020 (Unaudited) (Continued)
| | | Shares | | | Value | |
| Communications Equipment - 8.6% | | | | | | |
| Cisco Systems, Inc. | | | 1,172,172 | | | $ | 46,078,081 | |
| F5 Networks, Inc. (a)(b) | | | 102,189 | | | | 10,896,413 | |
| Juniper Networks, Inc. | | | 1,595,766 | | | | 30,542,961 | |
| NetScout Systems, Inc. (a)(b) | | | 539,188 | | | | 12,762,580 | |
| Total Communications Equipment | | | | | | | 100,280,035 | |
| Internet Software & Services - 0.5% | | | | | | | | |
| Zix Corp. (a)(b) | | | 1,241,005 | | | | 5,348,732 | |
| IT Services - 15.3% | | | | | | | | |
| Akamai Technologies, Inc. (a) | | | 455,318 | | | | 41,657,044 | |
| Booz Allen Hamilton Holding Corp. (b) | | | 205,250 | | | | 14,088,360 | |
| CACI International, Inc. - Class A (a) | | | 155,503 | | | | 32,834,459 | |
| Leidos Holdings, Inc. | | | 150,679 | | | | 13,809,730 | |
| ManTech International Corp. - Class A | | | 164,059 | | | | 11,922,168 | |
| Okta, Inc. (a)(b) | | | 137,944 | | | | 16,865,034 | |
| Science Applications International Corp. | | | 441,935 | | | | 32,981,609 | |
| VeriSign, Inc. (a) | | | 76,196 | | | | 13,722,138 | |
| Total IT Services | | | | | | | 177,880,542 | |
| Software - 49.4% (e) | | | | | | | | |
| A10 Networks, Inc. (a) | | | 996,736 | | | | 6,189,731 | |
| Cloudflare, Inc. - Class A (a)(b) | | | 2,068,926 | | | | 48,578,383 | |
| CommVault Systems, Inc. (a)(b) | | | 816,050 | | | | 33,033,704 | |
| Crowdstrike Holdings, Inc. - Class A (a)(b) | | | 318,327 | | | | 17,724,447 | |
| Everbridge, Inc. (a)(b) | | | 164,373 | | | | 17,482,712 | |
| FireEye, Inc. (a) | | | 2,319,805 | | | | 24,543,537 | |
| ForeScout Technologies, Inc. (a) | | | 374,114 | | | | 11,818,261 | |
| Fortinet, Inc. (a) | | | 367,930 | | | | 37,223,478 | |
| MobileIron, Inc. (a) | | | 1,899,444 | | | | 7,217,887 | |
| NortonLifeLock, Inc. | | | 1,530,622 | | | | 28,637,938 | |
| OneSpan, Inc. (a) | | | 751,017 | | | | 13,630,959 | |
| Palo Alto Networks, Inc. (a) | | | 189,069 | | | | 30,999,753 | |
| Ping Identity Holding Corp. (a)(b) | | | 1,715,868 | | | | 34,351,677 | |
| Proofpoint, Inc. (a)(b) | | | 332,499 | | | | 34,111,073 | |
| Qualys, Inc. (a)(b) | | | 437,810 | | | | 38,085,092 | |
| Rapid7, Inc. (a) | | | 230,249 | | | | 9,976,689 | |
| SailPoint Technologies Holding, Inc. (a)(b) | | | 1,572,855 | | | | 23,938,853 | |
| SecureWorks Corp. - Class A (a)(b)(d) | | | 909,155 | | | | 10,464,374 | |
| SolarWinds Corp. (a)(b) | | | 2,076,684 | | | | 32,541,638 | |
| Splunk, Inc. (a) | | | 298,680 | | | | 37,702,376 | |
| Tenable Holdings, Inc. (a) | | | 1,494,784 | | | | 32,675,978 | |
| Varonis Systems, Inc. (a)(b) | | | 171,105 | | | | 10,894,255 | |
| Verint Systems, Inc. (a)(b) | | | 254,123 | | | | 10,927,289 | |
| Zscaler, Inc. (a)(b) | | | 322,584 | | | | 19,632,462 | |
| Total Software | | | | | | | 572,382,546 | |
| Total United States | | | | | | | 884,499,730 | |
| TOTAL COMMON STOCKS (Cost $1,217,436,977) | | | | | | | 1,127,866,529 | |
The accompanying notes are an integral part of these financial statements.
ETFMG™ ETFs
ETFMG Prime Cyber Security ETF
Schedule of Investments
March 31, 2020 (Unaudited) (Continued)
| | | Shares | | | Value | |
| INVESTMENTS PURCHASED WITH PROCEEDS FROM SECURITIES LENDING COLLATERAL – 25.1% | | | | | | |
| ETFMG Sit Ultra Short ETF (d) | | | 1,000,000 | | | $ | 48,080,000 | |
| Mount Vernon Liquid Assets Portfolio, LLC, 0.91% (c) | | | 243,676,366 | | | | 243,676,366 | |
| TOTAL INVESTMENTS PURCHASED WITH PROCEEDS FROM SECURITIES LENDING COLLATERAL (Cost $293,785,243) | | | | | | | 291,756,366 | |
| | | | | | | | | |
| SHORT-TERM INVESTMENTS - 2.9% | | | | | | | | |
| Money Market Funds - 2.9% | | | | | | | | |
| Invesco Advisers, Inc. STIT-Treasury Portfolio - Institutional Class 0.30% (c) | | | 32,213,192 | | | | 32,213,192 | |
| TOTAL SHORT-TERM INVESTMENTS (Cost $32,213,192) | | | | | | | 32,213,192 | |
| | | | | | | | | |
| Total Investments (Cost $1,543,435,412) - 125.2% | | | | | | | 1,451,836,087 | |
| Liabilities in Excess of Other Assets - (25.2)% | | | | | | | (291,965,062 | ) |
| TOTAL NET ASSETS - 100.0% | | | | | | $ | 1,159,871,025 | |
Percentages are stated as a percent of net assets.
| (a) | Non-income producing security. |
| (b) | All or a portion of this security is out on loan as of March 31, 2020. |
| (c) | The rate quoted is the annualized seven-day yield at March 31, 2020. |
| (d) | Affiliated security. Please refer to Note 9 of the Notes to Financial Statements. |
| (e) | As of March 31, 2020 the Fund had a significant portion of its assets in the Software Industry. |
The accompanying notes are an integral part of these financial statements.
ETFMG™ ETFs
ETFMG Prime Mobile Payments ETF
Schedule of Investments
March 31, 2020 (Unaudited)
| | | Shares | | | Value | |
| COMMON STOCKS - 99.8% | | | | | | |
| Australia - 0.4% | | | | | | |
| IT Services - 0.4% (d) | | | | | | |
| EML Payments, Ltd. (a) | | | 1,357,165 | | | $ | 1,920,024 | |
| | | | | | | | | |
| Brazil - 1.2% | | | | | | | | |
| IT Services - 1.2% (d) | | | | | | | | |
| Cielo SA | | | 6,526,129 | | | | 5,639,291 | |
| | | | | | | | | |
| Cyprus - 1.2% | | | | | | | | |
| IT Services - 1.2% (d) | | | | | | | | |
| QIWI PLC - ADR | | | 551,683 | | | | 5,908,525 | |
| | | | | | | | | |
| France - 6.2% | | | | | | | | |
| Electronic Equipment, Instruments & Components - 3.1% | | | | | | | | |
| Ingenico Group SA | | | 136,554 | | | | 14,599,697 | |
| IT Services - 3.1% (d) | | | | | | | | |
| Worldline SA (a) | | | 250,646 | | | | 14,844,701 | |
| Total France | | | | | | | 29,444,398 | |
| | | | | | | | | |
| Germany - 3.7% | | | | | | | | |
| IT Services - 3.7% (d) | | | | | | | | |
| Wirecard AG (b) | | | 153,344 | | | | 17,698,742 | |
| | | | | | | | | |
| Hong Kong - 0.8% | | | | | | | | |
| Electronic Equipment, Instruments & Components - 0.4% | | | | | | | | |
| PAX Global Technology, Ltd. (a) | | | 5,157,894 | | | | 1,942,672 | |
| IT Services - 0.4% (d) | | | | | | | | |
| Huifu Payment, Ltd. (a) | | | 5,972,171 | | | | 1,764,054 | |
| Total Hong Kong | | | | | | | 3,706,726 | |
| | | | | | | | | |
| Italy - 3.2% | | | | | | | | |
| IT Services - 3.2% (d) | | | | | | | | |
| Nexi SpA (a) | | | 1,188,016 | | | | 15,537,106 | |
| | | | | | | | | |
| Japan - 3.7% | | | | | | | | |
| Consumer Finance - 0.6% | | | | | | | | |
| Jaccs Co, Ltd. | | | 157,917 | | | | 2,693,511 | |
| IT Services - 2.9% (d) | | | | | | | | |
| GMO Payment Gateway, Inc. | | | 199,794 | | | | 14,084,525 | |
| Software - 0.2% | | | | | | | | |
| Intelligent Wave, Inc. | | | 191,977 | | | | 885,567 | |
| Total Japan | | | | | | | 17,663,603 | |
| | | | | | | | | |
| Netherlands - 5.0% | | | | | | | | |
| IT Services - 5.0% (d) | | | | | | | | |
| Adyen NV (a) | | | 28,160 | | | | 23,933,050 | |
The accompanying notes are an integral part of these financial statements.
ETFMG™ ETFs
ETFMG Prime Mobile Payments ETF
Schedule of Investments
March 31, 2020 (Unaudited) (Continued)
| | | Shares | | | Value | |
| United Kingdom - 0.4% | | | | | | |
| Commercial Services & Supplies - 0.4% | | | | | | |
| PayPoint PLC | | | 304,455 | | | $ | 2,026,952 | |
| | | | | | | | | |
| United States - 74.0% | | | | | | | | |
| Consumer Finance - 9.8% | | | | | | | | |
| American Express Co. (b) | | | 301,605 | | | | 25,820,403 | |
| Discover Financial Services | | | 272,977 | | | | 9,737,090 | |
| Green Dot Corp. - Class A (a) | | | 449,427 | | | | 11,410,952 | |
| Total Consumer Finance | | | | | | | 46,968,445 | |
| IT Services - 61.0% (d) | | | | | | | | |
| Euronet Worldwide, Inc. (a) | | | 97,351 | | | | 8,344,928 | |
| EVERTEC, Inc. | | | 386,511 | | | | 8,785,395 | |
| Evo Payments, Inc. - Class A (a) | | | 458,754 | | | | 7,018,936 | |
| Fidelity National Information Services, Inc. | | | 272,210 | | | | 33,111,624 | |
| Fiserv, Inc. (a) | | | 322,206 | | | | 30,606,348 | |
| FleetCor Technologies, Inc. (a) | | | 76,557 | | | | 14,280,943 | |
| Global Payments, Inc. (b) | | | 200,343 | | | | 28,895,471 | |
| I3 Verticals, Inc. - Class A (a) | | | 139,779 | | | | 2,668,381 | |
| International Money Express, Inc. (a) | | | 169,694 | | | | 1,549,306 | |
| MasterCard, Inc. - Class A | | | 127,049 | | | | 30,689,956 | |
| Net 1 UEPS Technologies, Inc. (a)(b) | | | 594,512 | | | | 1,730,030 | |
| Pagseguro Digital, Ltd. - Class A (a)(b) | | | 519,483 | | | | 10,041,606 | |
| PayPal Holdings, Inc. (a) | | | 349,442 | | | | 33,455,577 | |
| Paysign, Inc. (a)(b) | | | 210,597 | | | | 1,086,681 | |
| Square, Inc. - Class A (a) | | | 369,907 | | | | 19,375,729 | |
| StoneCo, Ltd. - Class A (a)(b) | | | 410,848 | | | | 8,944,161 | |
| Visa, Inc. - Class A (b) | | | 203,191 | | | | 32,738,134 | |
| Western Union Co. (b) | | | 603,960 | | | | 10,949,795 | |
| WEX, Inc. (a) | | | 75,004 | | | | 7,841,668 | |
| Total IT Services | | | | | | | 292,114,669 | |
| Software - 1.8% | | | | | | | | |
| ACI Worldwide, Inc. (a) | | | 359,902 | | | | 8,691,633 | |
| Technology Hardware, Storage & Peripherals - 1.4% | | | | | | | | |
| NCR Corp. (a) | | | 386,919 | | | | 6,848,466 | |
| Total United States | | | | | | | 354,623,213 | |
| TOTAL COMMON STOCKS (Cost $627,584,432) | | | | | | | 478,101,630 | |
| | | | | | | | | |
| INVESTMENTS PURCHASED WITH PROCEEDS FROM SECURITIES LENDING COLLATERAL - 22.0% | | | | | | | | |
| ETFMG Sit Ultra Short ETF (e) | | | 600,000 | | | | 28,848,000 | |
| Mount Vernon Liquid Assets Portfolio, LLC, 0.91% (c) | | | 76,435,279 | | | | 76,435,279 | |
| TOTAL INVESTMENTS PURCHASED WITH PROCEEDS FROM SECURITIES LENDING COLLATERAL (Cost $106,517,546) | | | | | | | 105,283,279 | |
The accompanying notes are an integral part of these financial statements.
ETFMG™ ETFs
ETFMG Prime Mobile Payments ETF
Schedule of Investments
March 31, 2020 (Unaudited) (Continued)
| | | Shares | | | Value | |
| SHORT-TERM INVESTMENTS - 0.2% | | | | | | |
| Money Market Funds - 0.2% | | | | | | |
| Invesco Advisers, Inc. STIT-Treasury Portfolio - Institutional Class, 0.30% (c) | | | 882,104 | | | $ | 882,104 | |
| TOTAL SHORT-TERM INVESTMENTS (Cost $882,104) | | | | | | | 882,104 | |
| | | | | | | | | |
| Total Investments (Cost $734,984,082) - 122.0% | | | | | | | 584,267,013 | |
| Liabilities in Excess of Other Assets - (22.0)% | | | | | | | (105,209,208 | ) |
| TOTAL NET ASSETS - 100.0% | | | | | | $ | 479,057,805 | |
Percentages are stated as a percent of net assets.
ADR American Depositary Receipt
| (a) | Non-income producing security. |
| (b) | All or a portion of this security is out on loan as of March 31, 2020. |
| (c) | The rate quoted is the annualized seven-day yield at March 31, 2020. |
| (d) | As of March 31, 2020 the Fund had a significant portion of its assets in the IT Services Industry. |
| (e) | Affiliated security. Please refer to Note 9 of the Notes to Financial Statements. |
The accompanying notes are an integral part of these financial statements.
ETFMG™ ETFs
ETFMG Sit Ultra Short ETF
Schedule of Investments
March 31, 2020 (Unaudited)
| | | Principal
Amount | | | Value | |
| ASSET BACKED SECURITIES - 12.4% | | | | | | |
| Air Canada Class B Pass Through Trust | | | | | | |
| Series 2013-1, 5.375%, 11/15/2022 (a) | | $ | 1,078,096 | | | $ | 1,093,617 | |
| Carvana Auto Receivables Trust | | | | | | | | |
| Series 2019-2, 2.580%, 03/15/2023 (a) | | | 3,480,000 | | | | 3,406,551 | |
| Continental Airlines Class A Pass Through Trust | | | | | | | | |
| Series 2010-1, 4.750%, 01/12/2021 | | | 499,350 | | | | 503,794 | |
| DT Auto Owner Trust | | | | | | | | |
| Series 2019-4, 2.360%, 01/16/2024 (a) | | | 1,105,000 | | | | 1,084,922 | |
| Hertz Vehicle Financing II LP | | | | | | | | |
| Series 2017-2, 3.290%, 10/25/2023 (a) | | | 1,950,000 | | | | 1,886,054 | |
| United Auto Credit Securitization Trust | | | | | | | | |
| Series 2018-2, 4.260%, 05/10/2023 (a) | | | 1,000,000 | | | | 990,663 | |
| Westlake Automobile Receivables Trust | | | | | | | | |
| Serires 2019-2, 2.570%, 02/15/2023 (a) | | | 2,862,948 | | | | 2,853,948 | |
| TOTAL ASSET BACKED SECURITIES (Cost $12,096,804) | | | | | | | 11,819,549 | |
| | | | | | | | | |
| CORPORATE OBLIGATIONS - 86.6% | | | | | | | | |
| Aerospace & Defense - 2.9% | | | | | | | | |
| General Dynamics Corp. | | | | | | | | |
| 2.875%, 05/11/2020 | | | 430,000 | | | | 430,306 | |
| 2.021% (3 Month LIBOR + 0.290%) 05/11/2020 (b) | | | 643,000 | | | | 643,121 | |
| 3.000%, 05/11/2021 | | | 340,000 | | | | 342,728 | |
| Lockheed Martin Corp. | | | | | | | | |
| 2.500%, 11/23/2020 | | | 599,000 | | | | 601,973 | |
| Textron, Inc. | | | | | | | | |
| 2.284% (3 Month LIBOR + 0.550%) 11/10/2020 (b) | | | 700,000 | | | | 700,036 | |
| | | | | | | | 2,718,164 | |
| Airlines - 0.6% | | | | | | | | |
| United Airlines 2014-2 Class B Pass Through Trust | | | | | | | | |
| 4.625%, 03/03/2024 | | | 580,877 | | | | 544,119 | |
| | | | | | | | | |
| Automotive - 4.2% | | | | | | | | |
| American Honda Finance Corp. | | | | | | | | |
| 2.043% (3 Month LIBOR + 0.280%) 11/02/2020 (b) | | | 1,000,000 | | | | 987,535 | |
| Hyundai Capital America | | | | | | | | |
| 2.850%, 11/01/2022 (a) | | | 3,000,000 | | | | 2,933,546 | |
| | | | | | | | 3,921,081 | |
| | | | | | | | | |
| Automotive Equipment Rental and Leasing - 1.6% | | | | | | | | |
| General Motors Financial Co. Inc. | | | | | | | | |
| 3.150%, 06/30/2022 | | | 1,688,000 | | | | 1,522,370 | |
The accompanying notes are an integral part of these financial statements.
ETFMG™ ETFs
ETFMG Sit Ultra Short ETF
Schedule of Investments
March 31, 2020 (Unaudited) (Continued)
| | | Principal
Amount | | | Value | |
| Banks - 18.6% | | | | | | |
| Bank of America Corp. | | | | | | |
| 2.250%, 04/21/2020 | | $ | 123,000 | | | $ | 122,982 | |
| 2.369%, 07/21/2021 | | | 1,000,000 | | | | 999,506 | |
| Bank of Nova Scotia | | | | | | | | |
| 1.639% (3 Month LIBOR + 0.640%) 03/07/2022 (b) | | | 150,000 | | | | 144,592 | |
| Barclays PLC | | | | | | | | |
| 3.844% (3 Month LIBOR + 2.110%) 08/10/2021 (b) | | | 450,000 | | | | 434,729 | |
| 3.459% (3 Month LIBOR + 1.625%) 01/10/2023 (b) | | | 1,300,000 | | | | 1,250,524 | |
| Commonwealth Bank of Australia | | | | | | | | |
| 1.569% (3 Month LIBOR + 0.680%) 09/18/2022 (a)(b) | | | 2,539,000 | | | | 2,442,961 | |
| Fulton Financial Corp. | | | | | | | | |
| 3.600%, 03/16/2022 | | | 600,000 | | | | 605,045 | |
| HSBC Holdings PLC | | | | | | | | |
| 3.400% (3 Month LIBOR + 1.500%) 01/05/2022 (b) | | | 2,700,000 | | | | 2,589,419 | |
| JPMorgan Chase & Co. | | | | | | | | |
| 4.250%, 10/15/2020 (c) | | | 65,000 | | | | 65,747 | |
| JPMorgan Chase Bank NA | | | | | | | | |
| 3.086%, 04/26/2021 | | | 1,000,000 | | | | 999,611 | |
| PNC Bank NA | | | | | | | | |
| 2.053% (3 Month LIBOR + 0.360%) 05/19/2020 (b) | | | 340,000 | | | | 339,502 | |
| Swedbank AB | | | | | | | | |
| 1.441% (3 Month LIBOR + 0.700%) 03/14/2022 (a)(b) | | | 200,000 | | | | 193,879 | |
| Truist Bank | | | | | | | | |
| 2.250% (3 Month LIBOR + 0.590%) 06/01/2020 (b) | | | 1,175,000 | | | | 1,172,860 | |
| 2.353%, 08/02/2022 | | | 1,655,000 | | | | 1,562,536 | |
| US Bank NA | | | | | | | | |
| 2.051% (3 Month LIBOR + 0.250%) 07/24/2020 (b) | | | 2,000,000 | | | | 1,995,377 | |
| Wells Fargo & Co. | | | | | | | | |
| 2.600%, 07/22/2020 | | | 298,000 | | | | 298,074 | |
| Westpac Banking Corp. | | | | | | | | |
| 2.418% (3 Month LIBOR + 0.570%) 01/11/2023 (b) | | | 2,500,000 | | | | 2,421,343 | |
| | | | | | | | 17,638,687 | |
| Beverages - 1.1% | | | | | | | | |
| Constellation Brands, Inc. | | | | | | | | |
| 2.392% (3 Month LIBOR + 0.700%) 11/15/2021 (b) | | | 1,175,000 | | | | 1,107,897 | |
| Biotechnology - 3.5% | | | | | | | | |
| AbbVie, Inc. | | | | | | | | |
| 2.346% (3 Month LIBOR + 0.650%) 11/21/2022 (a)(b) | | | 3,000,000 | | | | 2,807,840 | |
| GlaxoSmithKline Capital PLC | | | | | | | | |
| 3.125%, 05/14/2021 | | | 495,000 | | | | 501,952 | |
| 2.054% (3 Month LIBOR + 0.350%) 05/14/2021 (b) | | | 120,000 | | | | 115,312 | |
| | | | | | | | 3,425,104 | |
The accompanying notes are an integral part of these financial statements.
ETFMG™ ETFs
ETFMG Sit Ultra Short ETF
Schedule of Investments
March 31, 2020 (Unaudited) (Continued)
| | | Principal
Amount | | | Value | |
| Business Support Services - 2.3% | | | | | | | | |
| Glencore Finance Canada, Ltd. | | | | | | | | |
| 4.950%, 11/15/2021 (a) | | $ | 1,200,000 | | | $ | 1,189,332 | |
| 4.250%, 10/25/2022 (a) | | | 1,000,000 | | | | 959,777 | |
| Pentair Finance Sarl | | | | | | | | |
| 3.625%, 09/15/2020 | | | 50,000 | | | | 49,746 | |
| | | | | | | | 2,198,855 | |
| Capital Markets - 6.3% | | | | | | | | |
| Ares Capital Corp. | | | | | | | | |
| 3.625%, 01/19/2022 | | | 1,500,000 | | | | 1,406,765 | |
| Bank of New York Mellon Corp. | | | | | | | | |
| 2.562% (3 Month LIBOR + 0.870%) 08/17/2020 (b) | | | 175,000 | | | | 175,037 | |
| 2.450%, 11/27/2020 | | | 1,565,000 | | | | 1,559,058 | |
| Charles Schwab Corp. | | | | | | | | |
| 2.016% (3 Month LIBOR + 0.320%) 05/21/2021 (b) | | | 500,000 | | | | 490,584 | |
| Morgan Stanley | | | | | | | | |
| 2.800%, 06/16/2020 | | | 1,000,000 | | | | 999,897 | |
| 3.219% (3 Month LIBOR + 1.400%) 04/21/2021 (b) | | | 150,000 | | | | 148,970 | |
| State Street Corp. | | | | | | | | |
| 2.592% (3 Month LIBOR + 0.900%) 08/18/2020 (b) | | | 1,200,000 | | | | 1,193,365 | |
| | | | | | | | 5,973,676 | |
| Chemicals - 3.1% | | | | | | | | |
| Albemarle Corp. | | | | | | | | |
| 2.742% (3 Month LIBOR + 1.050%) 11/15/2022 (a)(b) | | | 3,085,000 | | | | 2,938,985 | |
| Consumer Finance - 0.4% | | | | | | | | |
| American Express Credit Corp. | | | | | | | | |
| 1.791% (3 Month LIBOR + 1.050%) 09/14/2020 (b) | | | 350,000 | | | | 348,133 | |
| Converted Paper Product Manufacturing - 0.3% | | | | | | | | |
| Georgia-Pacific LLC | | | | | | | | |
| 5.400%, 11/01/2020 | | | 325,000 | | | | 328,136 | |
| Cosmetics & Toiletries - 0.7% | | | | | | | | |
| Unilever Capital Corp. | | | | | | | | |
| 1.800%, 05/05/2020 | | | 675,000 | | | | 674,551 | |
| Depository Credit Intermediation - 3.5% | | | | | | | | |
| BBVA USA | | | | | | | | |
| 1.498% (3 Month LIBOR + 0.730%) 06/11/2021 (b) | | | 500,000 | | | | 485,273 | |
| Citibank NA | | | | | | | | |
| 2.295% (3 Month LIBOR + 0.600%) 05/20/2022 (b) | | | 200,000 | | | | 193,313 | |
| Fifth Third Bank | | | | | | | | |
| 2.200%, 10/30/2020 | | | 1,700,000 | | | | 1,694,698 | |
| Manufacturers & Traders Trust Co. | | | | | | | | |
| 2.064% (3 Month LIBOR + 0.270%) 01/25/2021 (b) | | | 400,000 | | | | 394,447 | |
| 2.220% (3 Month LIBOR + 0.640%) 12/01/2021 (c) | | | 340,000 | | | | 330,401 | |
| Wells Fargo Bank NA | | | | | | | | |
| 2.082%, 09/09/2022 | | | 200,000 | | | | 199,216 | |
| | | | | | | | 3,297,348 | |
The accompanying notes are an integral part of these financial statements.
ETFMG™ ETFs
ETFMG Sit Ultra Short ETF
Schedule of Investments
March 31, 2020 (Unaudited) (Continued)
| | | Principal
Amount | | | Value | |
| Diversed Financial Services - 1.1% | | | | | | | | |
| Century Housing Corp. | | | | | | | | |
| 3.824%, 11/01/2020 | | $ | 1,000,000 | | | $ | 1,015,435 | |
| Diversified Telecommunication Services - 1.1% | | | | | | | | |
| Verizon Communications, Inc. | | | | | | | | |
| 2.233% (3 Month LIBOR + 0.550%) 05/22/2020 (b) | | | 1,100,000 | | | | 1,099,869 | |
| Electric Power Generation, Transmission and Distribution - 1.6% | | | | | | | | |
| Duke Energy Indiana LLC | | | | | | | | |
| 3.750%, 07/15/2020 | | | 1,500,000 | | | | 1,505,515 | |
| Electronic Equipment, Instruments & Components - 2.6% | | | | | | | | |
| Arrow Electronics, Inc. | | | | | | | | |
| 3.500%, 04/01/2022 | | | 2,500,000 | | | | 2,487,492 | �� |
| Equity Real Estate Investment Trusts (REITs) - 2.7% | | | | | | | | |
| AvalonBay Communities, Inc. | | | | | | | | |
| 2.261% (3 Month LIBOR + 0.430%) 01/15/2021 (b) | | | 1,565,000 | | | | 1,540,406 | |
| Weyerhaeuser Co. | | | | | | | | |
| 4.700%, 03/15/2021 | | | 1,000,000 | | | | 1,009,400 | |
| | | | | | | | 2,549,806 | |
| Finance - 1.6% | | | | | | | | |
| Avolon Holdings Funding, Ltd. | | | | | | | | |
| 3.625%, 05/01/2022 (a) | | | 1,750,000 | | | | 1,553,550 | |
| Food Products - 0.6% | | | | | | | | |
| Conagra Brands, Inc. | | | | | | | | |
| 2.552% (3 Month LIBOR + 0.750%) 10/22/2020 (b) | | | 533,000 | | | | 527,407 | |
| Grain and Oilseed Milling - 0.7% | | | | | | | | |
| Bunge Ltd Finance Corp. | | | | | | | | |
| 3.000%, 09/25/2022 | | | 706,000 | | | | 695,936 | |
| Health Care Providers & Services - 1.4% | | | | | | | | |
| Cigna Corp. | | | | | | | | |
| 1.493%, (3 Month LIBOR + 0.650%) 09/17/2021 (b) | | | 1,350,000 | | | | 1,296,351 | |
| Hotels, Restaurants & Leisure - 0.2% | | | | | | | | |
| Choice Hotels International, Inc. | | | | | | | | |
| 5.750%, 07/01/2022 | | | 200,000 | | | | 184,500 | |
| Industrials - 0.6% | | | | | | | | |
| Perrigo Finance Unlimited Co. | | | | | | | | |
| 3.500%, 12/15/2021 | | | 200,000 | | | | 206,690 | |
| 3.500%, 03/15/2021 | | | 500,000 | | | | 499,878 | |
| | | | | | | | 706,568 | |
The accompanying notes are an integral part of these financial statements.
ETFMG™ ETFs
ETFMG Sit Ultra Short ETF
Schedule of Investments
March 31, 2020 (Unaudited) (Continued)
| | | Principal
Amount | | | Value | |
| Insurance - 6.1% | | | | | | |
| Infinity Property & Casualty Corp. | | | | | | | | |
| 5.000%, 09/19/2022 | | $ | 1,050,000 | | | $ | 1,023,322 | |
| Jackson National Life Global Funding | | | | | | | | |
| 2.154% (3 Month LIBOR + 0.600%) 01/06/2023 (a)(b) | | | 2,000,000 | | | | 1,933,801 | |
| Metropolitan Life Global Funding I | | | | | | | | |
| 2.145% (3 Month SOFR + 0.570%) 01/13/2023 (a)(b) | | | 2,000,000 | | | | 1,748,834 | |
| Progressive Corp. | | | | | | | | |
| 3.750%, 08/23/2021 | | | 1,000,000 | | | | 1,022,225 | |
| | | | | | | | 5,728,182 | |
| Insurance and Employee Benefit Funds - 0.2% | | | | | | | | |
| Athene Global Funding | | | | | | | | |
| 3.138% (3 Month LIBOR + 1.230%) 07/01/2022 (a)(b) | | | 200,000 | | | | 201,341 | |
| Media - 1.2% | | | | | | | | |
| Comcast Corp. | | | | | | | | |
| 2.239% (3 Month LIBOR + 0.330%) 10/01/2020 (b) | | | 1,100,000 | | | | 1,093,025 | |
| Motor Vehicle Manufacturing - 3.5% | | | | | | | | |
| BMW US Capital LLC | | | | | | | | |
| 2.540% (3 Month LIBOR + 0.640%) 04/06/2022 (a)(b) | | | 990,000 | | | | 945,094 | |
| Daimler Finance North America LLC | | | | | | | | |
| 2.563% (3 Month LIBOR + 0.880%) 02/22/2022 (a)(b) | | | 2,422,000 | | | | 2,284,927 | |
| | | | | | | | 3,230,021 | |
| Multiline Retail - 1.1% | | | | | | | | |
| Dollar Tree, Inc. | | | | | | | | |
| 2.536%, (3 Month LIBOR + 0.700%) 04/17/2020 (b) | | | 1,097,000 | | | | 1,096,771 | |
| Multi-Utilities - 3.9% | | | | | | | | |
| Ameren Corp. | | | | | | | | |
| 2.700%, 11/15/2020 | | | 1,000,000 | | | | 997,163 | |
| CenterPoint Energy Houston Electric LLC | | | | | | | | |
| 1.850%, 06/01/2021 | | | 350,000 | | | | 344,353 | |
| Duke Energy Florida LLC | | | | | | | | |
| 4.550%, 04/01/2020 | | | 2,000,000 | | | | 2,000,000 | |
| NextEra Energy Capital Holdings, Inc. | | | | | | | | |
| 4.500%, 06/01/2021 | | | 150,000 | | | | 153,074 | |
| WEC Energy Group, Inc. | | | | | | | | |
| 2.450%, 06/15/2020 | | | 225,000 | | | | 224,822 | |
| | | | | | | | 3,719,412 | |
| Oil, Gas & Consumable Fuels - 2.2% | | | | | | | | |
| BP Capital Markets PLC | | | | | | | | |
| 1.702% (3 Month LIBOR + 0.650%) 09/19/2022 (b) | | | 130,000 | | | | 129,826 | |
| Marathon Petroleum Corp. | | | | | | | | |
| 5.125%, 03/01/2021 | | | 100,000 | | | | 96,985 | |
| MPLX LP | | | | | | | | |
| 2.099%, (3 Month LIBOR + 1.100%) 09/09/2022 (b) | | | 1,859,000 | | | | 1,730,341 | |
| Phillips 66 | | | | | | | | |
| 2.247% (3 Month LIBOR + 0.600%) 02/26/2021 (b) | | | 224,000 | | | | 209,559 | |
| | | | | | | | 2,166,711 | |
The accompanying notes are an integral part of these financial statements.
ETFMG™ ETFs
ETFMG Sit Ultra Short ETF
Schedule of Investments
March 31, 2020 (Unaudited) (Continued)
| | | Principal
Amount | | | Value | |
| Other Financial Investment Activities - 1.1% | | | | | | | | |
| Diageo Capital PLC | | | | | | | | |
| 4.828%, 07/15/2020 | | $ | 1,000,000 | | | $ | 1,007,584 | |
| Professional Services - 1.8% | | | | | | | | |
| Equifax, Inc. (b) | | | | | | | | |
| 2.562%, (3 Month LIBOR + 0.870%) 08/15/2021 | | | 1,747,000 | | | | 1,705,299 | |
| Semiconductors & Semiconductor Equipment - 0.5% | | | | | | | | |
| Intel Corp. | | | | | | | | |
| 1.850%, 05/11/2020 | | | 200,000 | | | | 199,864 | |
| 1.811% (3 Month LIBOR + 0.080%) 05/11/2020 (b) | | | 300,000 | | | | 299,813 | |
| | | | | | | | 499,677 | |
| Specialty Retail - 1.2% | | | | | | | | |
| AutoZone, Inc. | | | | | | | | |
| 2.500%, 04/15/2021 | | | 100,000 | | | | 99,604 | |
| Home Depot, Inc. | | | | | | | | |
| 1.464% (3 Month LIBOR + 0.150%) 06/05/2020 (b) | | | 1,000,000 | | | | 995,894 | |
| | | | | | | | 1,095,498 | |
| Trading Companies & Distributors - 0.5% | | | | | | | | |
| GATX Corp. | | | | | | | | |
| 2.461% (3 Month LIBOR + 0.720%) 11/05/2021 (b) | | | 500,000 | | | | 490,260 | |
| TOTAL CORPORATE OBLIGATIONS (Cost $85,179,119) | | | | | | | 82,293,316 | |
| | | | | | | | | |
| MUNICIPAL DEBT OBLIGATIONS - 1.1% | | | | | | | | |
| California Housing Finance | | | | | | | | |
| 4.950%, 08/01/2020 | | | 1,000,000 | | | | 1,011,110 | |
| TOTAL MUNICIPAL DEBT OBLIGATIONS (Cost $1,004,125) | | | | | | | 1,011,110 | |
| | | | | | | | | |
| SHORT-TERM INVESTMENTS - 3.2% | | | | | | | | |
| Money Market Funds - 3.2% | | | | | | | | |
| First American Government Obligations Fund - Class X, 0.45% (d) | | | 3,084,894 | | | | 3,084,894 | |
| TOTAL SHORT TERM INVESTMENTS (Cost $3,084,894) | | | | | | | 3,084,894 | |
| | | | | | | | | |
| Total Investments (Cost $101,364,942) - 103.3% | | | | | | | 98,208,869 | |
| Liabilities in Excess of Other Assets - (3.3)% | | | | | | | (3,170,610 | ) |
| TOTAL NET ASSETS - 100.0% | | | | | | $ | 95,038,259 | |
Percentages are stated as a percent of net assets.
ADR American Depositary Receipt
| (a) | Restricted security as defined in Rule 144(a) under the Securities Act of 1933. Resale to the public may require registration or may extend only to qualified institutional buyers. At March 31, 2020, the market value of these securities total $33,449,622, which represents 35.20% of total net assets. |
| (b) | Variable rate security based on a reference index and spread. The rate reported is the rate in effect as of March 31, 2020. |
| (c) | Variable rate security. The coupon is based on an underlying pool of assets. The rate reported is the rate in effect as of March 31, 2020. |
| (d) | The rate quoted is the annualized seven-day yield at March 31, 2020. |
The accompanying notes are an integral part of these financial statements.
ETFMG™ ETFs
ETFMG Travel Tech ETF
Schedule of Investments
March 31, 2020 (Unaudited)
| | | Shares | | | Value | |
| COMMON STOCKS - 96.0% | | | | | | | | |
| Australia - 1.8% | | | | | | | | |
| Internet & Direct Marketing Retail - 1.8% | | | | | | | | |
| Webjet, Ltd. | | | 11,422 | | | $ | 25,784 | |
| | | | | | | | | |
| Brazil - 1.4% | | | | | | | | |
| Hotels, Restaurants & Leisure - 1.4% | | | | | | | | |
| CVC Brasil Operadora e Agencia de Viagens SA | | | 9,272 | | | | 20,128 | |
| | | | | | | | | |
| China - 4.4% | | | | | | | | |
| IT Services - 4.4% | | | | | | | | |
| TravelSky Technology, Ltd. (a) | | | 35,812 | | | | 63,192 | |
| | | | | | | | | |
| Cyprus - 0.1% | | | | | | | | |
| Internet & Direct Marketing Retail - 0.1% | | | | | | | | |
| Yatra Online, Inc. (a) | | | 2,066 | | | | 2,128 | |
| | | | | | | | | |
| Japan - 11.2% | | | | | | | | |
| Hotels, Restaurants & Leisure - 1.9% | | | | | | | | |
| Adventure, Inc. | | | 1,600 | | | | 26,784 | |
| Internet & Direct Marketing Retail - 9.3% | | | | | | | | |
| Airtrip Corp. | | | 3,800 | | | | 25,375 | |
| Open Door, Inc. (a) | | | 5,200 | | | | 35,690 | |
| Temairazu, Inc. | | | 1,600 | | | | 56,247 | |
| Veltra Corp. (a) | | | 4,200 | | | | 15,702 | |
| Total Internet & Direct Marketing Retail | | | | | | | 133,014 | |
| Total Japan | | | | | | | 159,798 | |
| | | | | | | | | |
| Mauritius - 3.2% | | | | | | | | |
| Internet & Direct Marketing Retail - 3.2% | | | | | | | | |
| MakeMyTrip, Ltd. (a) | | | 3,856 | | | | 46,098 | |
| | | | | | | | | |
| Netherlands - 0.8% | | | | | | | | |
| Interactive Media & Services - 0.8% | | | | | | | | |
| Trivago NV - ADR (a) | | | 7,378 | | | | 10,772 | |
| | | | | | | | | |
| Republic of Korea - 5.1% | | | | | | | | |
| Hotels, Restaurants & Leisure - 5.1% | | | | | | | | |
| Hana Tour Service, Inc. | | | 1,518 | | | | 46,263 | |
| Lotte Tour Development Co., Ltd. (a) | | | 3,777 | | | | 26,559 | |
| Total Hotels, Restaurants & Leisure | | | | | | | 72,822 | |
| | | | | | | | | |
| Spain - 6.2% | | | | | | | | |
| IT Services - 6.2% | | | | | | | | |
| Amadeus IT Group SA (a) | | | 1,850 | | | | 88,143 | |
The accompanying notes are an integral part of these financial statements.
ETFMG™ ETFs
ETFMG Travel Tech ETF
Schedule of Investments
March 31, 2020 (Unaudited) (Continued)
| | | Shares | | | Value | |
| United Kingdom - 7.4% | | | | | | | | |
| Electronic Equipment, Instruments & Components - 0.3% | | | | | | | | |
| Accesso Technology Group PLC (a) | | | 1,978 | | | $ | 4,545 | |
| Internet & Direct Marketing Retail - 7.1% | | | | | | | | |
| Hostelworld Group PLC | | | 18,390 | | | | 12,175 | |
| On the Beach Group PLC | | | 6,068 | | | | 16,582 | |
| Trainline PLC (a) | | | 16,770 | | | | 70,822 | |
| Total Internet & Direct Marketing Retail | | | | | | | 99,579 | |
| Total United Kingdom | | | | | | | 104,124 | |
| | | | | | | | | |
| United States - 54.4% | | | | | | | | |
| Interactive Media & Services - 3.9% | | | | | | | | |
| TripAdvisor, Inc. | | | 3,241 | | | | 56,361 | |
| Internet & Direct Marketing Retail - 28.0% | | | | | | | | |
| Booking Holdings, Inc. (a) | | | 98 | | | | 131,842 | |
| Despegar.com Corp. (a) | | | 7,399 | | | | 41,952 | |
| Expedia Group, Inc. (a) | | | 1,041 | | | | 58,577 | |
| Tongcheng-Elong Holdings, Ltd. (a) | | | 47,268 | | | | 66,457 | |
| Trip.com Group, Ltd. - ADR (a) | | | 4,311 | | | | 101,093 | |
| Total Internet & Direct Marketing Retail | | | | | | | 399,921 | |
| IT Services - 1.8% | | | | | | | | |
| Sabre Corp. | | | 4,261 | | | | 25,268 | |
| Road & Rail - 20.7% | | | | | | | | |
| Lyft, Inc. - Class A (a) | | | 4,096 | | | | 109,978 | |
| Uber Technologies, Inc. (a) | | | 6,654 | | | | 185,779 | |
| Total Road & Rail | | | | | | | 295,757 | |
| Total United States | | | | | | | 777,307 | |
| TOTAL COMMON STOCKS (Cost $2,404,424) | | | | | | | 1,370,296 | |
| | | | | | | | | |
| SHORT-TERM INVESTMENTS - 2.3% | | | | | | | | |
| Money Market Funds - 2.3% | | | | | | | | |
| Invesco Advisers, Inc. STIT-Treasury Portfolio - Institutional Class, 0.30% (b) | | | 32,288 | | | | 32,288 | |
| TOTAL SHORT-TERM INVESTMENTS (Cost $32,288) | | | | | | | 32,288 | |
| | | | | | | | | |
| Total Investments (Cost $2,436,712) - 98.3% | | | | | | | 1,402,584 | |
| Other Assets in Excess of Liabilities - 1.7% | | | | | | | 24,505 | |
| TOTAL NET ASSETS - 100.0% | | | | | | $ | 1,427,089 | |
Percentages are stated as a percent of net assets.
ADR American Depositary Receipt
| (a) | Non-income producing security. |
| (c) | The rate quoted is the annualized seven-day yield at March 31, 2020. |
The accompanying notes are an integral part of these financial statements.
ETFMG™ ETFs
STATEMENTS OF ASSETS AND LIABILITIES
As of March 31, 2020 (Unaudited)
| | | ETFMG
Prime Junior
Silver
Miners ETF | | | ETFMG
Prime Cyber
Security ETF | | | ETFMG
Prime Mobile
Payments ETF | | | ETFMG
Sit Ultra
Short ETF | | | ETFMG
Travel
Tech ETF | |
| ASSETS | | | | | | | | | | | | | | | |
| Investments in unaffiliated | | | | | | | | | | | | | | | | | | | | |
| securities, at value* | | $ | 91,360,960 | | | $ | 1,393,291,713 | | | $ | 555,419,013 | | | $ | 98,208,869 | | | $ | 1,402,584 | |
| Investments in affiliated securities, at value* | | | 770,339 | | | | 58,544,374 | | | | 28,848,000 | | | | — | | | | — | |
| Total Investments in securities, at value | | $ | 92,131,299 | | | $ | 1,451,836,087 | | | $ | 584,267,013 | | | $ | 98,208,869 | | | $ | 1,402,584 | |
| Cash | | | 1,653,045 | | | | 6,636,382 | | | | 152 | | | | — | | | | — | |
| Foreign currency* | | | — | | | | — | | | | 72 | | | | — | | | | 24,905 | |
| Receivables: | | | | | | | | | | | | | | | | | | | | |
| Dividends and interest receivable | | | 14,112 | | | | 236,611 | | | | 125,381 | | | | 611,463 | | | | 615 | |
| Securities lending income receivable | | | — | | | | 248,394 | | | | 66,022 | | | | — | | | | — | |
| Receivable for investments sold | | | — | | | | — | | | | — | | | | 707,357 | | | | — | |
| Total Assets | | | 93,798,456 | | | | 1,458,957,474 | | | | 584,458,640 | | | | 99,527,689 | | | | 1,428,104 | |
| | | | | | | | | | | | | | | | | | | | | |
| LIABILITIES | | | | | | | | | | | | | | | | | | | | |
| Collateral received for securities loaned (Note 7) | | $ | — | | | $ | 291,376,366 | | | $ | 105,055,279 | | | $ | — | | | $ | — | |
| Payables: | | | | | | | | | | | | | | | | | | | | |
| Payable for investments purchased | | | — | | | | — | | | | — | | | | 3,459,191 | | | | — | |
| Payable for fund shares redeemed | | | — | | | | 7,108,520 | | | | — | | | | — | | | | — | |
| Management fees payable | | | 63,465 | | | | 601,563 | | | | 345,556 | | | | 24,650 | | | | 1,015 | |
| Foreign currency transactions | | | 60,303 | | | | — | | | | — | | | | 1,005,589 | | | | — | |
| Total Liabilities | | | 123,768 | | | | 299,086,449 | | | | 105,400,835 | | | | 4,489,430 | | | | 1,015 | |
| Net Assets | | $ | 93,674,688 | | | $ | 1,159,871,025 | | | $ | 479,057,805 | | | $ | 95,038,259 | | | $ | 1,427,089 | |
| | | | | | | | | | | | | | | | | | | | | |
| NET ASSETS CONSIST OF: | | | | | | | | | | | | | | | | | | | | |
| Paid-in Capital | | $ | 184,636,898 | | | $ | 1,453,587,285 | | | $ | 612,278,105 | | | $ | 98,996,130 | | | $ | 2,500,000 | |
| Total Distributable Earnings | | | (90,962,210 | ) | | | (293,716,260 | ) | | | (133,220,300 | ) | | | (3,957,871 | ) | | | (1,072,911 | ) |
| Net Assets | | $ | 93,674,688 | | | $ | 1,159,871,025 | | | $ | 479,057,805 | | | $ | 95,038,259 | | | $ | 1,427,089 | |
| | | | | | | | | | | | | | | | | | | | | |
| *Identified Cost: | | | | | | | | | | | | | | | | | | | | |
| | | | | | | | | | | | | | | | | | | | | |
| Investments in unaffiliated securities | | $ | 142,096,828 | | | $ | 1,480,654,562 | | | $ | 704,901,815 | | | $ | 101,364,942 | | | $ | 2,436,712 | |
| Investments in affiliated securities | | | 1,260,710 | | | | 62,780,850 | | | | 30,082,267 | | | | — | | | | — | |
| Foreign currency | | | — | | | | 4,839 | | | | 77 | | | | — | | | | 24,899 | |
| | | | | | | | | | | | | | | | | | | | | |
| Shares Outstanding^ | | | 13,900,000 | | | | 32,350,000 | | | | 12,800,000 | | | | 1,975,000 | | | | 100,000 | |
| | | | | | | | | | | | | | | | | | | | | |
| Net Asset Value, Offering and Redemption Price per Share | | $ | 6.74 | | | $ | 35.85 | | | $ | 37.43 | | | $ | 48.12 | | | $ | 14.27 | |
| ^ | No par value, unlimited number of shares authorized |
The accompanying notes are an integral part of these financial statements.
ETFMG™ ETFs
STATEMENTS OF OPERATIONS
For the Period ended March 31, 2020 (Unaudited)
| | | ETFMG
Prime Junior
Silver
Miners ETF | | | ETFMG
Prime Cyber
Security ETF | | | ETFMG
Prime Mobile
Payments ETF | | | ETFMG Sit
Ultra
Short ETF | | | ETFMG
Travel
Tech ETF | |
| INVESTMENT INCOME | | | | | | | | | | | | | | | |
| Income: | | | | | | | | | | | | | | | |
| Dividends from unaffiliated securities | | | | | | | | | | | | | | | | | | | | |
| (net of foreign withholdings tax of $19,153, $150,187, $21,189, $-, $-) | | $ | 136,327 | | | $ | 23,825,071 | | | $ | 1,902,740 | | | $ | — | | | $ | 1,635 | |
| Interest | | | 3,511 | | | | 74,291 | | | | 14,307 | | | | 587,694 | | | | 25 | |
| Securities lending income | | | — | | | | 984,438 | | | | 279,819 | | | | — | | | | — | |
| Total Investment Income | | | 139,838 | | | | 24,883,800 | | | | 2,196,866 | | | | 587,694 | | | | 1,660 | |
| | | | | | | | | | | | | | | | | | | | | |
| Expenses: | | | | | | | | | | | | | | | | | | | | |
| Management fees | | | 428,999 | | | | 4,354,996 | | | | 2,567,398 | | | | 75,139 | | | | 1,792 | |
| Total Expenses | | | 428,999 | | | | 4,354,996 | | | | 2,567,398 | | | | 75,139 | | | | 1,792 | |
| Net Investment Income (Loss) | | | (289,161 | ) | | | 20,528,804 | | | | (370,532 | ) | | | 512,555 | | | | (132 | ) |
| | | | | | | | | | | | | | | | | | | | | |
| REALIZED & UNREALIZED GAIN (LOSS) ON INVESTMENTS | | | | | | | | | | | | | | | | | | | | |
| Net Realized Gain (Loss) on: | | | | | | | | | | | | | | | | | | | | |
| Unaffiliated Investments | | | (3,804,655 | ) | | | (18,035,026 | ) | | | (2,314,544 | ) | | | (969,255 | ) | | | (39,247 | ) |
| Affiliated Investments | | | (46,488 | ) | | | — | | | | — | | | | — | | | | — | |
| In-Kind redemptions | | | 4,738,927 | | | | 88,747,743 | | | | 46,216,275 | | | | — | | | | — | |
| Foreign currency and foreign currency translation | | | (1,750 | ) | | | 33,509 | | | | (35,512 | ) | | | — | | | | 590 | |
| Net Realized Gain (Loss) on | | | | | | | | | | | | | | | | | | | | |
| Investments and In-Kind redemptions | | | 886,034 | | | | 70,746,226 | | | | 43,866,219 | | | | (969,255 | ) | | | (38,657 | ) |
| Net Change in Unrealized Appreciation (Depreciation) of: | | | | | | | | | | | | | | | | | | | | |
| Unaffiliated Investments | | | (45,888,877 | ) | | | (110,330,742 | ) | | | (168,175,238 | ) | | | (3,156,073 | ) | | | (1,034,123 | ) |
| Affiliated Investments | | | (573,281 | ) | | | (4,236,476 | ) | | | (1,234,267 | ) | | | — | | | | — | |
| Foreign currency and foreign currency translation | | | 395 | | | | 16,623 | | | | 4,583 | | | | — | | | | — | |
| Net change in Unrealized Appreciation (Depreciation) of Investments | | | (46,461,763 | ) | | | (114,550,595 | ) | | | (169,404,922 | ) | | | (3,156,073 | ) | | | (1,034,122 | ) |
| Net Realized and Unrealized Gain (Loss) on Investments | | | (45,575,729 | ) | | | (43,804,369 | ) | | | (125,538,703 | ) | | | (4,125,328 | ) | | | (1,072,779 | ) |
| NET INCREASE (DECREASE) IN NET ASSETS RESULTING FROM OPERATIONS | | $ | (45,864,890 | ) | | $ | (23,275,565 | ) | | $ | (125,909,235 | ) | | $ | (3,612,773 | ) | | $ | (1,072,911 | ) |
The accompanying notes are an integral part of these financial statements.
ETFMG Prime Junior Silver Miners ETF
STATEMENTS OF CHANGES IN NET ASSETS
| | | Period Ended March 31, 2020 (Unaudited) | | | Year Ended September 30, 2019 | |
| OPERATIONS | | | | | | |
| Net investment gain (loss) | | $ | (289,161 | ) | | $ | (119,940 | ) |
| Net realized gain (loss) on investments and In-Kind Redemptions | | | 886,034 | | | | (6,657,841 | ) |
| Net change in unrealized appreciation (depreciation) of investments and foreign currency and foreign currency translation | | | (46,461,763 | ) | | | 10,893,314 | |
| Net increase (decrease) in net assets resulting from operations | | | (45,864,890 | ) | | | 4,115,533 | |
| | | | | | | | | |
| DISTRIBUTIONS TO SHAREHOLDERS | | | | | | | | |
| Total distributions from distributable earnings | | | (1,980,500 | ) | | | (815,294 | ) |
| | | | | | | | | |
| CAPITAL SHARE TRANSACTIONS | | | | | | | | |
| Net increase (decrease) in net assets derived from net change in outstanding shares | | | 41,401,505 | | | | 51,552,865 | |
| Net increase (decrease) in net assets | | $ | (6,443,885 | ) | | $ | 54,853,104 | |
| | | | | | | | | |
| NET ASSETS | | | | | | | | |
| Beginning of Year/Period | | | 100,118,573 | | | | 45,265,469 | |
| End of Year/Period | | $ | 93,674,688 | | | $ | 100,118,573 | |
Summary of share transactions is as follows:
| | | | Period Ended
March 31, 2020
(Unaudited) | | | Year Ended
September 30, 2019 | |
| | | | Shares | | | Amount | | | Shares | | | Amount | |
| Shares Sold | | | 5,950,000 | | | $ | 65,126,775 | | | | 7,000,000 | | | $ | 67,300,540 | |
| Shares Redeemed | | | (2,650,000 | ) | | | (23,725,270 | ) | | | (1,600,000 | ) | | | (15,747,675 | ) |
| Net Transactions in Fund Shares | | | 3,300,000 | | | $ | 41,401,505 | | | | 5,400,000 | | | $ | 51,552,865 | |
| Beginning Shares | | | 10,600,000 | | | | | | | | 5,200,000 | | | | | |
| Ending Shares | | | 13,900,000 | | | | | | | | 10,600,000 | | | | | |
The accompanying notes are an integral part of these financial statements.
ETFMG Prime Cyber Security ETF
STATEMENTS OF CHANGES IN NET ASSETS
| | | Period Ended
March 31, 2020 (Unaudited) | | | Year Ended
September 30, 2019 | |
| OPERATIONS | | | | | | |
| Net investment gain (loss) | | $ | 20,528,804 | | | $ | 2,971,168 | |
| Net realized gain (loss) on investments and In-Kind Redemptions | | | 70,746,226 | | | | 119,111,232 | |
| Net change in unrealized appreciation (depreciation) of investments and foreign currency and foreign currency translation | | | (114,550,595 | ) | | | (254,577,838 | ) |
| Net increase (decrease) in net assets resulting from operations | | | (23,275,565 | ) | | | (132,495,438 | ) |
| | | | | | | | | |
| DISTRIBUTIONS TO SHAREHOLDERS | | | | | | | | |
| Total distributions from distributable earnings | | | (20,696,000 | ) | | | (2,039,082 | ) |
| | | | | | | | | |
| CAPITAL SHARE TRANSACTIONS | | | | | | | | |
| Net increase (decrease) in net assets derived from net change | | | | | | | | |
| in outstanding shares | | | (223,375,045 | ) | | | (274,135,215 | ) |
| Transaction Fees (See Note 1) | | | 17,258 | | | | 8,658 | |
| Net increase (decrease) in net assets from capital share transactions | | | (223,357,787 | ) | | | (274,126,557 | ) |
| Total increase (decrease) in net assets | | $ | (267,329,352 | ) | | $ | (408,661,077 | ) |
| | | | | | | | | |
| NET ASSETS | | | | | | | | |
| Beginning of Year/Period | | | 1,427,200,377 | | | | 1,835,861,454 | |
| End of Year/Period | | $ | 1,159,871,025 | | | $ | 1,427,200,377 | |
Summary of share transactions is as follows:
| | | Period Ended March 31, 2020 (Unaudited) | | | Year Ended September 30, 2019 | |
| | | Shares | | | Amount | | | Shares | | | Amount | |
| Shares Sold | | | 3,150,000 | | | $ | 132,392,715 | | | | 11,550,000 | | | $ | 440,845,035 | |
| Transaction Fees (See Note 1) | | | — | | | | 17,258 | | | | — | | | | 8,658 | |
| Shares Redeemed | | | (8,900,000 | ) | | | (355,767,760 | ) | | | (19,250,000 | ) | | | (714,980,250 | ) |
| Net Transactions in Fund Shares | | | (5,750,000 | ) | | $ | (223,357,787 | ) | | | (7,700,000 | ) | | $ | (274,126,557 | ) |
| Beginning Shares | | | 38,100,000 | | | | | | | | 45,800,000 | | | | | |
| Ending Shares | | | 32,350,000 | | | | | | | | 38,100,000 | | | | | |
The accompanying notes are an integral part of these financial statements.
ETFMG Prime Mobile Payments ETF
STATEMENTS OF CHANGES IN NET ASSETS
| | | Period Ended
March 31, 2020 (Unaudited) | | | Year Ended
September 30, 2019 | |
| OPERATIONS | | | | | | |
| Net investment gain (loss) | | $ | (370,532 | ) | | $ | 322,006 | |
| Net realized gain (loss) on investments and In-Kind Redemptions | | | 43,866,219 | | | | 82,012,727 | |
| Net change in unrealized appreciation (depreciation) of investments and foreign currency and foreign currency translation | | | (169,404,922 | ) | | | (59,701,724 | ) |
| Net increase (decrease) in net assets resulting from operations | | | (125,909,235 | ) | | | 22,633,009 | |
| | | | | | | | | |
| DISTRIBUTIONS TO SHAREHOLDERS | | | | | | | | |
| Total distributions from distributable earnings | | | (216,000 | ) | | | (2,286,407 | ) |
| | | | | | | | | |
| CAPITAL SHARE TRANSACTIONS | | | | | | | | |
| Net increase (decrease) in net assets derived from net change in outstanding shares | | | (138,080,930 | ) | | | 199,832,445 | |
| Transaction Fees (See Note 1) | | | 66,443 | | | | 144,218 | |
| Net increase (decrease) in net assets from capital share transactions | | | (138,014,487 | ) | | | 199,976,663 | |
| Total increase (decrease) in net assets | | $ | (264,139,722 | ) | | $ | 220,323,265 | |
| | | | | | | | | |
| NET ASSETS | | | | | | | | |
| Beginning of Year/Period | | | 743,197,527 | | | | 522,874,262 | |
| End of Year/Period | | $ | 479,057,805 | | | $ | 743,197,527 | |
Summary of share transactions is as follows:
| | | Period Ended March 31, 2020 (Unaudited) | | | Year Ended September 30, 2019 | |
| | | Shares | | | Amount | | | Shares | | | Amount | |
| Shares Sold | | 4,350,000 | | | $ | 214,443,685 | | | | 14,050,000 | | | $ | 645,140,560 | |
| Transaction Fees (See Note 1) | | — | | | | 66,443 | | | | — | | | | 144,218 | |
| Shares Redeemed | | (7,500,000 | ) | | | (352,524,615 | ) | | | (10,300,000 | ) | | | (445,308,115 | ) |
| Net Transactions in Fund Shares | | (3,150,000 | ) | | $ | (138,014,487 | ) | | | 3,750,000 | | | $ | 199,976,663 | |
| Beginning Shares | | 15,950,000 | | | | | | | | 12,200,000 | | | | | |
| Ending Shares | | 12,800,000 | | | | | | | | 15,950,000 | | | | | |
The accompanying notes are an integral part of these financial statements.
ETFMG Sit Ultra Short ETF
STATEMENTS OF CHANGES IN NET ASSETS
| | | Period Ended March 31, 2020 (Unaudited)1 | |
| OPERATIONS | | | |
| Net investment gain (loss) | | $ | 512,555 | |
| Net realized gain (loss) on investments | | | (969,255 | ) |
| Net change in unrealized appreciation (depreciation) of investments | | | (3,156,073 | ) |
| Net increase (decrease) in net assets resulting from operations | | | (3,612,773 | ) |
| | | | | |
| DISTRIBUTIONS TO SHAREHOLDERS | | | | |
| Total distributions from distributable earnings | | | (345,098 | ) |
| | | | | |
| CAPITAL SHARE TRANSACTIONS | | | | |
| Net increase (decrease) in net assets derived from net change in outstanding shares | | | 98,996,130 | |
| Net increase (decrease) in net assets | | $ | 95,038,259 | |
| | | | | |
| NET ASSETS | | | | |
| Beginning of Year/Period | | | — | |
| End of Year/Period | | $ | 95,038,259 | |
Summary of share transactions is as follows:
| | | | Period Ended
March 31, 2020
(Unaudited)1 | |
| | | | Shares | | | Amount | |
| Shares Sold | | | 2,025,000 | | | $ | 101,512,190 | |
| Shares Redeemed | | | (50,000 | ) | | | (2,516,060 | ) |
| Net Transactions in Fund Shares | | | 1,975,000 |
| | $ | 98,996,130 | |
| Beginning Shares | | | — | | | | | |
| Ending Shares | | | 1,975,000 | | | | | |
| 1 | Fund commenced operations on October 8, 2019. The information presented is for the period from October 8, 2019 to March 31, 2020. |
The accompanying notes are an integral part of these financial statements.
ETFMG Travel Tech ETF
STATEMENTS OF CHANGES IN NET ASSETS
| | | Period Ended March 31, 2020 (Unaudited)1 | |
| OPERATIONS | | | |
| Net investment gain (loss) | | $ | (132 | ) |
| Net realized gain (loss) on investments and In-Kind Redemptions | | | (38,657 | ) |
| Net change in unrealized appreciation (depreciation) of investments and foreign currency and foreign currency translation | | | (1,034,122 | ) |
| Net increase (decrease) in net assets resulting from operations | | | (1,072,911 | ) |
| | | | | |
| DISTRIBUTIONS TO SHAREHOLDERS | | | | |
| Total distributions from distributable earnings | | | — | |
| | | | | |
| CAPITAL SHARE TRANSACTIONS | | | | |
| Net increase (decrease) in net assets derived from net change in outstanding shares | | | 2,500,000 | |
| Net increase (decrease) in net assets | | $ | 1,427,089 | |
| | | | | |
| NET ASSETS | | | | |
| Beginning of Year/Period | | | — | |
| End of Year/Period | | $ | 1,427,089 | |
| | | | | |
Summary of share transactions is as follows:
| | | | Period Ended
March 31, 2020
(Unaudited)1 | |
| | | | Shares | | | Amount | |
| Shares Sold | | | 100,000 | | | $ | 2,500,000 | |
| Shares Redeemed | | | — | | | | — | |
| Net Transactions in Fund Shares | | | 100,000 | | | $ | 2,500,000 | |
| Beginning Shares | | | — | | | | | |
| Ending Shares | | | 100,000 | | | | | |
| 1 | Fund commenced operations on February 12, 2020. The information presented is for the period from February 12, 2020 to March 31, 2020. |
The accompanying notes are an integral part of these financial statements.
ETFMG Prime Junior Silver Miners ETF
FINANCIAL HIGHLIGHTS
For a capital share outstanding throughout the year/period
| | | Period Ended March 31, 2020 (Unaudited) | | | Year Ended September 30, 2019 | | | Year Ended September 30, 2018 | | | Year Ended September 30, 2017 | | | Year Ended September 30, 2016 | | | Year Ended September 30, 2015 | |
| | | | | | | | | | | | | | | | | | | |
| Net Asset Value, Beginning Year/Period | | $ | 9.45 | | | $ | 8.70 | | | $ | 11.84 | | | $ | 15.57 | | | $ | 5.28 | | | $ | 10.00 | |
| Income (Loss) from Investment Operations: | | | | | | | | | | | | | | | | | | | | | | | | |
| Net investment (loss) 1 | | | (0.02 | ) | | | (0.02 | ) | | | (0.03 | ) | | | (0.06 | ) | | | (0.06 | ) | | | (0.03 | ) |
| Net realized and unrealized gain (loss) on investments | | | (2.69 | ) | | | 0.91 | | | | (3.11 | ) | | | (3.61 | ) | | | 10.47 | | | | (4.69 | ) |
| Total from investment operations | | | (2.71 | ) | | | 0.89 | | | | (3.14 | ) | | | (3.67 | ) | | | 10.41 | | | | (4.72 | ) |
| Less Distributions: | | | | | | | | | | | | | | | | | | | | | | | | |
| Distributions from net investment income | | | — | | | | (0.14 | ) | | | — | | | | (0.06 | ) | | | (0.12 | ) | | | — | |
| Total distributions | | | — | | | | (0.14 | ) | | | — | | | | (0.06 | ) | | | (0.12 | ) | | | — | |
| Net asset value, end year/period | | $ | 6.74 | | | $ | 9.45 | | | $ | 8.70 | | | $ | 11.84 | | | $ | 15.57 | | | $ | 5.28 | |
| Total Return | | | -27.66 | %2 | | | 10.45 | % | | | -26.50 | % | | | -23.53 | % | | | 201.99 | % | | | -47.20 | % |
| | | | | | | | | | | | | | | | | | | | | | | | | |
| Ratios/Supplemental | | | | | | | | | | | | | | | | | | | | | | | | |
| Data: | | | | | | | | | | | | | | | | | | | | | | | | |
| Net assets at end year/period (000's) | | $ | 93,675 | | | $ | 100,119 | | | $ | 45,265 | | | $ | 58,033 | | | $ | 77,065 | | | $ | 3,432 | |
| | | | | | | | | | | | | | | | | | | | | | | | | |
| Expenses to Average Net Assets before legal expense | | | 0.69 | %3 | | | 0.69 | % | | | 0.69 | % | | | 0.69 | % | | | 0.69 | % | | | 0.69 | % |
| Gross Expenses to Average Net Assets | | | 0.69 | %3 | | | 0.69 | % | | | 0.69 | % | | | 0.72 | %2 | | | 0.69 | % | | | 0.69 | % |
| Net Investment Loss to Average Net Assets | | | -0.46 | %3 | | | -0.21 | % | | | -0.32 | % | | | -0.48 | % | | | -0.45 | % | | | -0.39 | % |
| Portfolio Turnover Rate | | | 14 | %2 | | | 34 | % | | | 36 | % | | | 69 | % | | | 33 | % | | | 55 | % |
| 1 | Calculated based on average shares outstanding during the year/period. |
| 4 | The ratio of expenses to average net assets includes legal expense. See note 11 in the Notes to the Financial Statements. |
The accompanying notes are an integral part of these financial statements.
ETFMG Prime Cyber Security ETF
FINANCIAL HIGHLIGHTS
For a capital share outstanding throughout the year/period
| | | Period Ended March 31, 2020 (Unaudited) | | | Year Ended September 30, 2019 | | | Year Ended September 30, 2018 | | | Year Ended September 30, 2017 | | | Year Ended September 30, 2016 | | | Period Ended September 30, 20151 | |
| | | | | | | | | | | | | | | | | | | |
| Net Asset Value, Beginning Year/Period | | $ | 37.46 | | | $ | 40.08 | | | $ | 30.11 | | | $ | 27.91 | | | $ | 25.28 | | | $ | 25.00 | |
| Income (Loss) from Investment Operations: | | | | | | | | | | | | | | | | | | | | | | | | |
| Net investment income (loss) 2 | | | 0.57 | | | | 0.07 | | | | 0.03 | | | | (0.01 | ) | | | 0.30 | | | | (0.05 | ) |
| Net realized and unrealized gain (loss) on investments | | | (1.56 | ) | | | (2.64 | ) | | | 9.94 | | | | 2.34 | | | | 2.52 | | | | 0.33 | |
| Total from investment operations | | | (0.99 | ) | | | (2.57 | ) | | | 9.97 | | | | 2.33 | | | | 2.82 | | | | 0.28 | |
| Less Distributions: | | | | | | | | | | | | | | | | | | | | | | | | |
| Distributions from net investment income | | | (0.62 | ) | | | (0.05 | ) | | | (0.00 | )3 | | | (0.13 | ) | | | (0.19 | ) | | | — | |
| Total distributions | | | (0.62 | ) | | | (0.05 | ) | | | (0.00 | )3 | | | (0.13 | ) | | | (0.19 | ) | | | — | |
| Net asset value, end year/period | | $ | 35.85 | | | $ | 37.46 | | | $ | 40.08 | | | $ | 30.11 | | | $ | 27.91 | | | $ | 25.28 | |
| Total Return | | | -2.44 | %4 | | | -6.42 | % | | | 33.16 | % | | | 8.42 | % | | | 11.23 | % | | | 1.11 | %4 |
| | | | | | | | | | | | | | | | | | | | | | | | | |
| Ratios/Supplemental | | | | | | | | | | | | | | | | | | | | | | | | |
| Data: | | | | | | | | | | | | | | | | | | | | | | | | |
| Net assets at end of year/period (000's) | | $ | 1,159,871 | | | $ | 1,427,200 | | | $ | 1,835,861 | | | $ | 1,097,360 | | | $ | 803,794 | | | $ | 1,059,125 | |
| | | | | | | | | | | | | | | | | | | | | | | | | |
| Expenses to Average Net Assets before legal expense | | | 0.60 | %5 | | | 0.60 | % | | | 0.60 | % | | | 0.68 | % | | | 0.75 | % | | | 0.75 | %5 |
| Gross Expenses to Average Net Assets | | | 0.60 | %5 | | | 0.60 | % | | | 0.60 | % | | | 0.72 | %6 | | | 0.75 | % | | | 0.75 | %5 |
| Net Investment Income (Loss) to Average Net Assets | | | 0.19 | %5 | | | 0.19 | % | | | 0.07 | % | | | -0.03 | % | | | 1.21 | % | | | -0.19 | %5 |
| Portfolio Turnover Rate | | | 16 | %4 | | | 36 | % | | | 41 | % | | | 53 | % | | | 34 | % | | | 31 | %4 |
| 1 | Commencement of operations on November 11, 2014. |
| 2 | Calculated based on average shares outstanding during the year/period. |
| 3 | Per share amount is less than $0.01. |
| 6 | The ratio of expenses to average net assets includes legal expense. See note 11 in the Notes to the Financial Statements. |
The accompanying notes are an integral part of these financial statements.
ETFMG Prime Mobile Payments ETF
FINANCIAL HIGHLIGHTS
For a capital share outstanding throughout the year/period
| | | Period Ended March 31, 2020 (Unaudited) | | | Year Ended September 30, 2019 | | | Year Ended September 30, 2018 | | | Year Ended September 30, 2017 | | | Year Ended September 30, 2016 | | | Period Ended September 30, 20151 | |
| | | | | | | | | | | | | | | | | | | |
| Net Asset Value, Beginning Year/Period | | $ | 46.60 | | | $ | 42.86 | | | $ | 32.57 | | | $ | 24.96 | | | $ | 23.53 | | | $ | 25.00 | |
| Income (Loss) from Investment Operations: | | | | | | | | | | | | | | | | | | | | | | | | |
| Net investment income (loss) 2 | | | (0.02 | ) | | | 0.03 | | | | 0.07 | | | | 0.03 | | | | 0.15 | | | | (0.01 | ) |
| Net realized and unrealized gain (loss) on investments | | | (9.13 | ) | | | 3.93 | | | | 10.22 | | | | 7.60 | | | | 1.39 | | | | (1.46 | ) |
| Total from investment operations | | | (9.15 | ) | | | 3.96 | | | | 10.29 | | | | 7.63 | | | | 1.54 | | | | (1.47 | ) |
| Less Distributions: | | | | | | | | | | | | | | | | | | | | | | | | |
| Distributions from net investment income | | | (0.02 | ) | | | (0.05 | ) | | | (0.01 | ) | | | (0.02 | ) | | | (0.11 | ) | | | — | |
| Net realized gains | | | — | | | | (0.18 | ) | | | — | | | | — | | | | — | | | | — | |
| Total distributions | | | (0.02 | ) | | | (0.23 | ) | | | (0.01 | ) | | | (0.02 | ) | | | (0.11 | ) | | | — | |
| Capital Share Transactions: | | | | | | | | | | | | | | | | | | | | | | | | |
| Transaction fees added to paid-in capital | | | — | | | | 0.01 | | | | 0.01 | | | | — | | | | — | | | | — | |
| Net asset value, end year/period | | $ | 37.43 | | | $ | 46.60 | | | $ | 42.86 | | | $ | 32.57 | | | $ | 24.96 | | | $ | 23.53 | |
| Total Return | | | -19.65 | %3 | | | 9.49 | % | | | 31.62 | % | | | 30.59 | % | | | 6.51 | % | | | -5.86 | %3 |
| | | | | | | | | | | | | | | | | | | | | | | | | |
| Ratios/Supplemental Data: | | | | | | | | | | | | | | | | | | | | | | | | |
| Net assets at end year/period (000's) | | $ | 479,058 | | | $ | 743,198 | | | $ | 522,874 | | | $ | 170,993 | | | $ | 8,734 | | | $ | 4,707 | |
| | | | | | | | | | | | | | | | | | | | | | | | | |
| Expenses to Average Net Assets before legal expense | | | 0.75 | %4 | | | 0.75 | % | | | 0.75 | % | | | 0.75 | % | | | 0.75 | % | | | 0.75 | %4 |
| Gross Expenses to Average Net Assets | | | 0.75 | %4 | | | 0.75 | % | | | 0.75 | % | | | 0.80 %5 | | | | 0.75 | % | | | 0.75 | %4 |
| Net Investment Income (Loss) to Average Net Assets | | | -0.09 | %4 | | | 0.06 | % | | | 0.16 | % | | | 0.12 | % | | | 0.63 | % | | | -0.23 | %4 |
| Portfolio Turnover Rate | | | 5 | %3 | | | 28 | % | | | 16 | % | | | 31 | % | | | 32 | % | | | 8 | %3 |
| 1 | Commencement of operations on July 15, 2015. |
| 2 | Calculated based on average shares outstanding during the year/period. |
| 5 | The ratio of expenses to average net assets includes legal expense. See note 11 in the Notes to the Financial Statements. |
The accompanying notes are an integral part of these financial statements.
ETFMG Sit Ultra Short ETF
FINANCIAL HIGHLIGHTS
For a capital share outstanding throughout the year/period
| | | Period Ended March 31, 2020 (Unaudited)1 | |
| | | | |
| Net Asset Value, Beginning Year/Period | | $ | 50.00 | |
| Income from Investment Operations: | | | | |
| Net investment income (loss)2 | | | 0.49 | |
| Net realized and unrealized gain (loss) on investments | | | (2.01 | ) |
| Total from investment operations | | | (1.52 | ) |
| Less Distributions: | | | | |
| Distributions from net investment income | | | (0.36 | ) |
| Total distributions | | | (0.36 | ) |
| Net asset at end of year/period | | $ | 48.12 | |
| Total Return | | | -3.07 | %3 |
| | | | | |
| Ratios/Supplemental Data: | | | | |
| Net assets at end of year/period (000's) | | $ | 95,038 | |
| | | | | |
| Gross Expenses to Average Net Assets | | | 0.30 | %4 |
| Net Investment Income (Loss) to Average Net Assets | | | 2.04 | %4 |
| Portfolio Turnover Rate | | | 111 | %3 |
| 1 | Commencement of operations on October 8, 2019. |
| 2 | Calculated based on average shares outstanding during the year/period. |
The accompanying notes are an integral part of these financial statements.
ETFMG Travel Tech ETF
FINANCIAL HIGHLIGHTS
For a capital share outstanding throughout the year/period
| | | Period Ended March 31, 2020 (Unaudited) 1 | |
| | | | | |
| Net Asset Value, Beginning Year/Period | | $ | 25.00 | |
| Income from Investment Operations: | | | | |
| Net investment income (loss)2 | | | — | |
| Net realized and unrealized gain (loss) on investments | | | (10.73 | ) |
| Total from investment operations | | | (10.73 | ) |
| Less Distributions: | | | | |
| Distributions from net investment income | | | — | |
| Total distributions | | | — | |
| Net asset at end of year/period | | $ | 14.27 | |
| Total Return | | | -42.91 | %3 |
| | | | | |
| Ratios/Supplemental Data: | | | | |
| Net assets at end of year/period (000's) | | $ | 1,427 | |
| | | | | |
| Gross Expenses to Average Net Assets | | | 0.75 | %4 |
| Net Investment Income (Loss) to Average Net Assets | | | -0.06 | %4 |
| Portfolio Turnover Rate | | | 8 | %3 |
| 1 | Commencement of operations on October 8, 2019. |
| 2 | Calculated based on average shares outstanding during the year/period. |
The accompanying notes are an integral part of these financial statements.
ETFMG™ ETFs
NOTES TO FINANCIAL STATEMENTS
March 31, 2020 (Unaudited)
NOTE 1 – ORGANIZATION
ETFMG Prime Junior Silver Miners ETF (“SILJ”), ETFMG Prime Cyber Security ETF (“HACK”), ETFMG Prime Mobile Payments ETF (“IPAY”), ETFMG Sit Ultra Short ETF (“VALT”), and ETFMG Travel Tech ETF (“AWAY”), (each a “Fund”, or collectively the “Funds”) are series of ETF Managers Trust (the “Trust”), an open-end management investment company consisting of multiple investment series, organized as a Delaware statutory trust on July 1, 2009. The Trust is registered with the SEC under the Investment Company Act of 1940, as amended (the “1940 Act”), as an open-end management investment company and the offering of the Funds’ shares (“Shares”) is registered under the Securities Act of 1933, as amended (the “Securities Act”).
The following table is a summary of the Strategy Commencement Date and Strategy of the Funds:
| Fund Ticker | Strategy
Commencement
Date | Strategy |
| SILJ | 8/1/2017 | Seeks to provide investment results that, before fees and expenses, correspond generally to the price and yield performance of the Prime Junior Silver Miners & Explorers Index (“Prime Silver Index”). |
| HACK | 8/1/2017 | Seeks to provide investment results that, before fees and expenses, correspond generally to the price and yield of the Prime Cyber Defense Index (“Prime Cyber Index”). |
| IPAY | 8/1/2017 | Seeks to provide investment results that, before fees and expenses, correspond generally to the price and yield performance of the Prime Mobile Payments Index (“Prime Mobile Index”). |
| VALT | 10/8/2019 | Seeks to achieve its investment objective by investing in a diversified portfolio of high-quality short- term U.S. dollar denominated domestic and foreign debt securities and other instruments. |
| AWAY | 2/12/2020 | Seeks to provide investment results that, before fees and expenses, correspond generally to the total return performance of the Prime Travel Technology Index NTR (the “Index”). |
The Funds each currently offer one class of shares, which have no front end sales load, no deferred sales charges, and no redemption fees. The Funds may issue an unlimited number of shares of beneficial interest, with no par value. All shares of each Fund have equal rights and privileges.
Shares of the Funds are listed and traded on the NYSE Arca, Inc. Market prices for the Shares may be different from their net asset value (“NAV”). Each Fund issues and redeems Shares on a continuous basis at NAV only in blocks of 50,000 shares, called “Creation Units.” Creation Units are issued and redeemed principally in-kind for securities included in a specified Index. Once created, Shares generally trade in the secondary market at market prices that change throughout the day in quantities less than a Creation Unit. Except when aggregated in Creation Units, Shares are not redeemable securities of a Fund. Shares of a Fund may only be purchased or redeemed by certain financial institutions (“Authorized Participants”). An Authorized Participant is either (i) a broker-dealer or other participant in the clearing process through the Continuous Net Settlement System of the National Securities Clearing Corporation or (ii) a DTC participant and, in each case, must have executed a Participant Agreement with the Distributor. Most retail investors do not qualify as Authorized Participants nor have the resources to buy and sell whole Creation Units. Therefore, they are unable to purchase or redeem the Shares directly from a Fund. Rather, most retail investors may purchase Shares in the secondary market with the assistance of a broker and may be subject to customary brokerage commissions or fees.
ETFMG™ ETFs
NOTES TO FINANCIAL STATEMENTS
March 31, 2020 (Unaudited) (Continued)
Authorized Participants transacting in Creation Units for cash may pay an additional variable charge to compensate the relevant Fund for certain transaction costs (i.e., brokerage costs) and market impact expenses relating to investing in portfolio securities. Such variable charges, if any, are included in “Transaction Fees” in the Statements of Changes in Net Assets.
NOTE 2 – SIGNIFICANT ACCOUNTING POLICIES
The following is a summary of significant accounting policies consistently followed by the Funds. These policies are in conformity with accounting principles generally accepted in the United States of America (“U.S. GAAP”).
The Funds follow the investment company accounting and reporting guidance of the Financial Accounting Standards Board Accounting Standard Codification Topic 946 Financial Services – Investment Companies.
The Funds may invest in certain other investment companies (underlying funds). For specific investments in underlying funds, please refer to the complete schedule of portfolio holdings on Form N–CSR(S) for this reporting period, which is filed with the U.S. Securities and Exchange Commission (SEC). For more information about the underlying Fund’s operations and policies, please refer to those Fund’s semiannual and annual reports, which are filed with the SEC.
| A. | Security Valuation. Securities listed on a securities exchange, market or automated quotation system for which quotations are readily available (except for securities traded on NASDAQ), including securities traded over the counter, are valued at the last quoted sale price on the primary exchange or market (foreign or domestic) on which they are traded on the valuation date (or at approximately 4:00 pm Eastern Time if a security’s primary exchange is normally open at that time), or, if there is no such reported sale on the valuation date, at the most recent quoted bid price. For securities traded on NASDAQ, the NASDAQ Official Closing Price will be used. |
Securities for which quotations are not readily available are valued at their respective fair values as determined in good faith by the Board of Trustees (the “Board”). When a security is “fair valued,” consideration is given to the facts and circumstances relevant to the particular situation, including a review of various factors set forth in the pricing procedures adopted by the Funds’ Board. The use of fair value pricing by a Fund may cause the net asset value of its shares to differ significantly from the net asset value that would be calculated without regard to such considerations. As of March 31, 2020, the Funds did not hold any securities that were fair valued by the Board.
As described above, the Funds utilize various methods to measure the fair value of their investments on a recurring basis. U.S. GAAP establishes a hierarchy that prioritizes inputs to valuation methods. The three levels of inputs are:
| Level 1 | Unadjusted quoted prices in active markets for identical assets or liabilities that the Funds have the ability to access. |
| Level 2 | Observable inputs other than quoted prices included in Level 1 that are observable for the asset or liability, either directly or indirectly. These inputs may include quoted prices for the identical instrument on an inactive market, prices for similar instruments, interest rates, prepayment speeds, credit risk, yield curves, default rates and similar data. |
ETFMG™ ETFs
NOTES TO FINANCIAL STATEMENTS
March 31, 2020 (Unaudited) (Continued)
| Level 3 | Unobservable inputs for the asset or liability, to the extent relevant observable inputs are not available; representing the Funds’ own assumptions about the assumptions a market participant would use in valuing the asset or liability, and would be based on the best information available. |
The availability of observable inputs can vary from security to security and is affected by a wide variety of factors, including, for example, the type of security, whether the security is new and not yet established in the marketplace, the liquidity of markets, and other characteristics particular to the security. To the extent that valuation is based on models or inputs that are less observable or unobservable in the market, the determination of fair value requires more judgment. Accordingly, the degree of judgment exercised in determining fair value is greatest for instruments categorized in Level 3.
The inputs used to measure fair value may fall into different levels of the fair value hierarchy. In such cases, for disclosure purposes, the level in the fair value hierarchy within which the fair value measurement falls in its entirety, is determined based on the lowest level input that is significant to the fair value measurement in its entirety.
The following is a summary of the inputs used to value the Funds’ net assets as of March 31, 2020:
| SILJ | | | | | | | | | | | | |
| Assets^ | | Level 1 | | | Level 2 | | | Level 3 | | | Total | |
| Common Stocks | | $ | 87,534,694 | | | $ | — | | | $ | — | | | $ | 87,534,694 | |
| Short Term Investments | | | 4,596,605 | | | | — | | | | — | | | | 4,596,605 | |
| Total Investments in Securities | | $ | 92,131,299 | | | $ | — | | | $ | — | | | $ | 92,131,299 | |
| | | | | | | | | | | | | | | | | |
| HACK | | | | | | | | | | | | |
| Assets^ | | Level 1 | | | Level 2 | | | Level 3 | | | Total | |
| Common Stocks | | $ | 1,127,866,529 | | | $ | — | | | $ | — | | | $ | 1,127,866,529 | |
| Short Term Investments | | | 32,213,192 | | | | — | | | | — | | | | 32,213,192 | |
| Investments Purchased with Securities Lending | | | | | | | | | | | | | | | | |
| Collateral* | | | - | | | | — | | | | — | | | $ | 291,756,366 | |
| Total Investments in Securities | | $ | 1,160,079,721 | | | $ | — | | | $ | — | | | $ | 1,451,836,087 | |
| IPAY | | | | | | | | | | | | |
| Assets^ | | Level 1 | | | Level 2 | | | Level 3 | | | Total | |
| Common Stocks | | $ | 478,101,630 | | | $ | — | | | $ | — | | | $ | 478,101,630 | |
| Short Term Investments | | | 882,104 | | | | — | | | | — | | | | 882,104 | |
| Investments Purchased with Securities Lending | | | | | | | | | | | | | | | | |
| Collateral* | | | - | | | | — | | | | — | | | | 105,283,279 | |
| Total Investments in Securities | | $ | 478,983,734 | | | $ | — | | | $ | — | | | $ | 584,267,013 | |
ETFMG™ ETFs
NOTES TO FINANCIAL STATEMENTS
March 31, 2020 (Unaudited) (Continued)
| VALT | | | | | | | | | | | | |
| Assets^ | | Level 1 | | | Level 2 | | | Level 3 | | | Total | |
| Asset Backed Securities | | $ | — | | | $ | 11,819,549 | | | $ | — | | | $ | 11,819,549 | |
| Coporate Obligations | | | — | | | | 82,293,316 | | | | — | | | | 82,293,316 | |
| Municipal Obligations | | | — | | | | 1,011,110 | | | | — | | | | 1,011,110 | |
| Short Term Investments | | | 3,084,894 | | | | — | | | | — | | | | 3,084,894 | |
| Total Investments in Securities | | $ | 3,084,894 | | | $ | 95,123,975 | | | $ | — | | | $ | 98,208,869 | |
| | | | | | | | | | | | | | | | | |
| AWAY | | | | | | | | | | | | |
| Assets^ | | Level 1 | | | Level 2 | | | Level 3 | | | Total | |
| Common Stocks | | $ | 1,344,512 | | | $ | — | | | $ | 25,784 | | | $ | 1,370,296 | |
| Short Term Investments | | | 32,288 | | | | — | | | | — | | | | 32,288 | |
| Total Investments in Securities | | $ | 1,376,800 | | | $ | — | | | $ | 25,784 | | | $ | 1,402,584 | |
| ^ | See Schedule of Investments for classifications by country and industry. |
| * | Certain investments that are measured at fair value using the net asset value per share (or its equivalent) practical expedient have not been categorized in the fair value hierarchy. The fair value amounts presented in the table are intended to permit reconciliation of the fair value hierarchy to the amounts presented in the Schedules of Investments. |
| B. | Federal Income Taxes. The Funds have each elected to be taxed as a “regulated investment company” and intend to distribute substantially all taxable income to their shareholders and otherwise comply with the provisions of the Internal Revenue Code applicable to regulated investment companies. Therefore, no provisions for federal income taxes or excise taxes have been made. |
To avoid imposition of the excise tax applicable to regulated investment companies, each Fund intends to declare each year as dividends, in each calendar year, at least 98.0% of its net investment income (earned during the calendar year) and 98.2% of its net realized capital gains (earned during the twelve months ended October 31) plus undistributed amounts, if any, from prior years.
Net capital losses incurred after October 31, within the taxable year are deemed to arise on the first business day of each Fund’s next taxable year.
Each Fund recognizes the tax benefits of uncertain tax positions only where the position is “more likely than not” to be sustained assuming examination by tax authorities. Each Fund has analyzed its tax position and has concluded that no liability for unrecognized tax benefits should be recorded related to uncertain tax positions expected to be taken in the Funds’ 2019 tax returns. The Funds identify their major tax jurisdictions as U.S. Federal, the State of New Jersey, and the State of Delaware; however the Funds are not aware of any tax positions for which it is reasonably possible that the total amounts of unrecognized tax benefits will change materially in the next twelve months.
As of March 31, 2020, management has reviewed the tax positions for open periods (for Federal purposes, four years from the date of filing and for state purposes, four years from the date of filing), as applicable to the Funds, and has determined that no provision for income tax is required in the Funds’ financial statements.
ETFMG™ ETFs
NOTES TO FINANCIAL STATEMENTS
March 31, 2020 (Unaudited) (Continued)
| C. | Security Transactions and Investment Income. Investment securities transactions are accounted for on the trade date. Gains and losses realized on sales of securities are determined on a specific identification basis. Discounts/premiums on debt securities purchased are accreted/amortized over the life of the respective securities using the effective interest method. Dividend income is recorded on the ex-dividend date. Interest income is recorded on an accrual basis. Income, including gains, from investments in foreign securities received by the Funds may be subject to income, withholding or other taxes imposed by foreign countries. |
| D. | Foreign Currency Translations and Transactions. The Funds may engage in foreign currency transactions. Foreign currency transactions are translated into U.S. dollars on the following basis: (i) market value of investment securities, assets and liabilities at the daily rates of exchange, and (ii) purchases and sales of investment securities, dividend and interest income and certain expenses at the rates of exchange prevailing on the respective dates of such transactions. For financial reporting purposes, the Funds do not isolate changes in the exchange rate of investment securities from the fluctuations arising from changes in the market prices of securities for unrealized gains and losses. However, for federal income tax purposes, the Funds do isolate and treat as ordinary income the effect of changes in foreign exchange rates on realized gains or losses from the sale of investment securities and payables and receivables arising from trade-date and settlement-date differences. |
| E. | Distributions to Shareholders. Distributions to shareholders from net investment income are generally declared and paid by each of the Funds on a quarterly basis. Distributions to shareholders from realized gains on securities for each Fund normally are declared and paid on an annual basis. Distributions are recorded on the ex-dividend date. |
| F. | Use of Estimates. The preparation of financial statements in conformity with U.S. GAAP requires management to make estimates and assumptions that affect the reported amounts of assets and liabilities at the date of the financial statements, as well as the reported amounts of revenues and expenses during the reporting period. Actual results could differ from those estimates. |
| G. | Share Valuation. The net asset value (“NAV”) per share of each Fund is calculated by dividing the sum of the value of the securities held by the Fund, plus cash and other assets, minus all liabilities (including estimated accrued expenses) by the total number of shares outstanding for the Fund, rounded to the nearest cent. The Funds’ shares will not be priced on the days on which the NYSE is closed for trading. For Authorized Participants, the offering and redemption price per share for the Funds are equal to the Funds’ respective net asset value per share. |
| H. | Guarantees and Indemnifications. In the normal course of business, the Funds enter into contracts with service providers that contain general indemnification clauses. The Funds’ maximum exposure under these arrangements is unknown as this would involve future claims that may be made against the Funds that have not yet occurred. However, based on experience, the Funds expect the risk of loss to be remote. |
NOTE 3 – RISK FACTORS
Investing in the Funds may involve certain risks, as discussed in the Funds’ prospectus, including, but not limited to, those described below. Any of these risks could cause an investor to lose money.
ETFMG™ ETFs
NOTES TO FINANCIAL STATEMENTS
March 31, 2020 (Unaudited) (Continued)
Market Risk. Financial markets rise and fall in response to a variety of factors, sometimes rapidly and unpredictably. As with any investment whose performance is tied to these markets, the value of an investment in a Fund will fluctuate, which means that an investor could lose money over short or long periods.
Investment Style Risk. The Funds are not actively managed. Therefore, the Funds follow the securities included in its respective index during upturns as well as downturns. Because of their indexing strategies, the Funds do not take steps to reduce market exposure or to lessen the effects of a declining market. In addition, because of the Funds’ expenses, the Funds’ performance may be below that of their respective index.
Equity Risk. The prices of equity securities rise and fall daily. These price movements may result from factors affecting individual companies, industries or the securities market as a whole. In addition, equity markets tend to move in cycles which may cause stock prices to fall over short or extended periods of time.
Securities Lending Risk. Securities lending involves the risk of loss of rights in, or delay in recovery of, the loaned securities if the borrower fails to return the security loaned or becomes insolvent.
Concentration Risk. To the extent that a Fund’s or an index’s portfolio is concentrated in the securities of issuers in a particular market, industry, group of industries, sector or asset class, the fund may be adversely affected by the performance of those securities, may be subject to increased price volatility and may be more vulnerable to adverse economic, market, political or regulatory occurrences affecting that market, industry, group of industries, sector or asset class.
NOTE 4 – COMMITMENTS AND OTHER RELATED PARTY TRANSACTIONS
ETF Managers Group, LLC (the “Advisor”), serves as the investment advisor to the Funds. Pursuant to an Investment Advisory Agreement (“Advisory Agreement”) between the Trust, on behalf of the Funds, and the Advisor, the Advisor provides investment advice to the Funds and oversees the day-to-day operations of the Funds, subject to the direction and control of the Board and the officers of the Trust. Under the Advisory Agreement, the Advisor is also responsible for arranging transfer agency, custody, fund administration and accounting, and other non-distribution related services necessary for the Funds to operate.
Under the Investment Advisory Agreement the Advisor has overall responsibility for the general management and administration of the Funds and arranges for sub-advisory, transfer agency, custody, fund administration, securities lending, and all other non-distribution related services necessary for the Funds to operate. The Funds unitary fees are accrued daily and paid monthly. The Advisor bears the costs of all advisory and non-advisory services required to operate the Funds, in exchange for a single unitary fee at the following annual rates:
| SILJ | 0.69% |
| HACK | 0.60% |
| IPAY | 0.75% |
| VALT | 0.30% |
| AWAY | 0.75% |
ETFMG™ ETFs
NOTES TO FINANCIAL STATEMENTS
March 31, 2020 (Unaudited) (Continued)
The Advisor has an agreement with, and is dependent on, a third party to pay the Funds’ expenses in excess of the annual expense rates of each Funds’ average daily net assets. Additionally, under the Investment Advisory Agreement, the Advisor has agreed to pay all expenses of the Funds, except for: the fee paid to the Advisor pursuant to the Investment Advisory Agreement, interest charges on any borrowings, taxes, brokerage commissions and other expenses incurred in placing orders for the purchase and sale of securities and other investment instruments, acquired fund fees and expenses, accrued deferred tax liability, extraordinary expenses, and distribution (12b-1) fees and expenses (collectively, “Excluded Expenses”). The Sponsor provides marketing support for the Funds, including distributing marketing materials related to the Funds. The Advisor has entered into an agreement with ETFMG Financial, LLC (“the Sponsor”). The Sponsor provides marketing support for the Funds, including distributing marketing materials related to the Funds. Level ETF Ventures, LLC serves as the index provider for SILJ, HACK, IPAY and AWAY. Reality Shares, LLC serves as the index provider for IFLY. VALT is actively-managed and does not seek to track the performance of any particular index.
U.S. Bancorp Fund Services, LLC doing business as U.S. Bank Global Fund Services (the “Administrator”) provides fund accounting, fund administration, and transfer agency services to the Funds. The Advisor compensates the Administrator for these services under an administration agreement between the two parties.
The Advisor pays each independent Trustee a quarterly fee for service to the Funds. Each Trustee is also reimbursed by the Advisor for all reasonable out-of-pocket expenses incurred in connection with his duties as Trustee, including travel and related expenses incurred in attending Board meetings.
NOTE 5 – DISTRIBUTION PLAN
The Funds have each adopted a Plan of Distribution pursuant to Rule 12b-1 under the 1940 Act. Under the Plan, each Fund may pay compensation to the Distributor or any other distributor or financial institution with which the Trust has an agreement with respect to each Fund, with the amount of such compensation not to exceed an annual rate of 0.25% of each Fund’s average daily net assets. During the period ended March 31, 2020, the Funds did not incur any 12b-1 expenses.
NOTE 6 - PURCHASES AND SALES OF SECURITIES
The costs of purchases and sales of securities, excluding short-term securities and in-kind transactions, during the period ended March 31, 2020:
| | | | | | | | |
| | | | Purchases | | | Sales | |
| SILJ | | | $ | 27,467,186 | | | $ | 16,541,951 | |
| HACK | | | | 259,719,478 | | | | 224,171,587 | |
| IPAY | | | | 65,080,708 | | | | 33,924,106 | |
| VALT | | | | 126,477,919 | | | | 63,174,917 | |
| AWAY | | | | 144,431 | | | | 157,488 | |
| | | | | | | | | | |
The costs of purchases and sales of in-kind transactions associated with creations and redemptions during the period ended March 31, 2020:
| | | | Purchases In-Kind | | | Sales In-Kind | |
| SILJ | | | $ | 45,866,429 | | | $ | 23,508,834 | |
| HACK | | | | 119,011,230 | | | | 347,010,073 | |
| IPAY | | | | 197,051,915 | | | | 336,912,210 | |
| VALT | | | | — | | | | — | |
| AWAY | | | | 2,456,688 | | | | — | |
| | | | | | | | | | |
ETFMG™ ETFs
NOTES TO FINANCIAL STATEMENTS
March 31, 2020 (Unaudited) (Continued)
Purchases in-kind are the aggregate of all in-kind purchases and sales in-kind are the aggregate of all in-kind sales. Net capital gains or losses resulting from in-kind redemptions are excluded from the Funds’ determination of taxable gains and are not distributed to shareholders.
There were no purchases or sales of U.S. Government obligations during the period ended March 31, 2020.
NOTE 7 — SECURITIES LENDING
The Funds, except for SILJ, may lend up to 33 1/3% of the value of the securities in their portfolios to brokers, dealers and financial institutions (but not individuals) under terms of participation in a securities lending program administered by U.S. Bank N.A. (“the Custodian”). The securities lending agreement requires that loans are collateralized at all times in an amount equal to at least 102% of the value of any loaned securities at the time of the loan, plus accrued interest. The Funds receive compensation in the form of fees and earn interest on the cash collateral. The amount of fees depends on a number of factors including the type of security and length of the loan. The Funds continue to receive interest payments or dividends on the securities loaned during the borrowing period. Gain or loss on the fair value of securities loaned that may occur during the term of the loan will be for the account of the Funds. The Funds have the right under the terms of the securities lending agreement to recall the securities from the borrower on demand. During the period ended March 31, 2020, the Funds had loaned securities and received cash collateral for the loans. The cash collateral is invested by the Custodian in accordance with approved investment guidelines. Those guidelines require the cash collateral to be invested in readily marketable, high quality, short-term obligations; however, such investments are subject to risk of payment delays or default on the part of the issuer or counterparty or otherwise may not generate sufficient interest to support the costs associated with securities lending. The Funds could also experience delays in recovering their securities and possible loss of income or value if the borrower fails to return the borrowed securities, although the Fund is indemnified from this risk by contract with the securities lending agent.
As of the period ended March 31, 2020 the value of the securities on loan and payable for collateral due to broker were as follows:
Value of Securities on Loan Collateral Received
| Fund | | | Values of Securities on Loan | | | Fund Collateral Received* | |
| HACK | | | $ | 283,060,683 | | | $ | 291,303,604 | |
| IPAY | | | | 99,485,388 | | | | 105,011,622 | |
* The cash collateral received was invested in the ETFMG Sit Ultra Short ETF and the Mount Vernon Liquid Assets Portfolio as shown on the Schedule of Investments, a money market fund with an overnight and continuous maturity.
ETFMG™ ETFs
NOTES TO FINANCIAL STATEMENTS
March 31, 2020 (Unaudited) (Continued)
NOTE 8 – FEDERAL INCOME TAXES
The components of distributable earnings (losses) and cost basis of investments for federal income tax purposes at September 30, 2019 were as follows:
| | | | Cost | | | Gross Unrealized Appreciation | | | Gross Unrealized Depreciation | | | Net Unrealized Appreciation (Depreciation) | |
| SILJ | | | $ | 117,382,850 | | | $ | 5,646,858 | | | $ | (22,798,705 | ) | | $ | (17,151,847 | ) |
| HACK | | | | 1,749,536,332 | | | | 205,354,606 | | | | (240,742,383 | ) | | | (35,387,777 | ) |
| IPAY | | | | 859,972,547 | | | | 39,313,020 | | | | (35,922,484 | ) | | | 3,390,536 | |
The difference between the tax cost of investments and the cost of investments for GAAP purposes is primarily due to the tax treatment of wash sale losses.
As of September 30, 2019, the components of distributable earnings (loss) on a tax basis were as follows:
| | | | Undistributed Ordinary Income | | | Undistributed Long-Term Gain | | | Total Distributable Earnings | | | Other Accumulated Loss | | | Total Accumulated Gain (Loss) | |
| SILJ | | | | 1,429,166 | | | $ | — | | | $ | 1,429,166 | | | $ | (27,394,249 | ) | | $ | (43,116,820 | ) |
| HACK | | | | 287,885 | | | | — | | | | 287,885 | | | | (214,644,803 | ) | | | (249,744,695 | ) |
| IPAY | | | | 207,319 | | | | — | | | | 207,319 | | | | (10,692,920 | ) | | | (7,095,065 | ) |
The difference between the tax cost of investments and the cost of investments for GAAP purposes is primarily due to the tax treatment of wash sale losses.
As of September 30, 2019, the Funds had accumulated capital loss carryovers of:
| | | | Capital Loss Carryforward ST | | | Capital Loss Carryforward LT | | | Expires | |
| SILJ | | | $ | (13,259,745 | ) | | $ | (14,134,394 | ) | | | Indefinite | |
| HACK | | | | (117,867,305 | ) | | | (96,756,036) | | | | Indefinite | |
| IPAY | | | | (3,677,255 | ) | | | (7,011,361) | | | | Indefinite | |
Under current tax law, capital and currency losses realized after October 31 of a Fund’s fiscal year may be deferred and treated as occurring on the first business day of the following fiscal year for tax purposes. The following Funds had deferred post-October capital and currency losses, which will be treated as arising on the first business day of the year ending September 30, 2019.
| | | | | Late Year Ordinary Loss | | | | Post- October Capital Loss | |
| SILJ | | | $ | — | | | $ | — | |
| HACK | | | | — | | | | — | |
| IPAY | | | | — | | | | — | |
ETFMG™ ETFs
NOTES TO FINANCIAL STATEMENTS
March 31, 2020 (Unaudited) (Continued)
U.S. GAAP requires that certain components of net assets relating to permanent differences be reclassified between financial and tax reporting. These reclassifications have no effect on net assets or net asset value per share. For the fiscal year ended September 30, 2019, the following table shows the reclassifications made:
| | | | Total Distributable Earnings/(Loss) | | | Paid-In Capital | |
| SILJ | | | $ | (1,934,408 | ) | | $ | 1,934,408 | |
| HACK | | | | (151,282,049 | ) | | | 151,282,049 | |
| IPAY | | | | (105,161,737 | ) | | | 105,161,737 | |
The tax charter of distributions paid during the year ended September 30, 2019, and the year ended September 30, 2018 were as follows:
| | | | Year Ended September 30, 2019 | | | Year Ended September 30, 2018 | |
| | | | From Ordinary Income | | | From Capital Gains | | | From Ordinary Income | | | From Capital Gains | |
| SILJ | | | $ | 815,294 | | | $ | — | | | $ | — | | | $ | — | |
| HACK | | | | 2,039,082 | | | | — | | | | 125,955 | | | | — | |
| IPAY | | | | 1,559,846 | | | | 726,561 | | | | 61,070 | | | | — | |
NOTE 9 – INVESTMENTS IN AFFILIATES
ETFMG Prime Cyber Security ETF
ETFMG Prime Cyber Security ETF owned 5% or more of the voting securities of the following companies during the period ended March 31, 2020. Secure Works Corp, and ETFMG Sit Ultra Short ETF are deemed to be affiliates of the Fund as defined by the 1940 Act as of the period ended March 31, 2020. Transactions during the period in these securities were as follows:
| Security Name | | Value at
September 30,
2019 | | | Purchases | | | Sales | | | Realized Gain (Loss)(1) | | | Change in
Unrealized
Appreciation
(Depreciation) | | | Dividend
Income | | | Value at
March 31,
2020 | | | Ending
Shares | |
| SecureWorks Corp * | | $ | — | | | | 4,797,703 | | | | (2,568,769 | ) | | $ | 186,237 | | | $ | (2,072,543 | ) | | $ | — | | | $ | 10,464,374 | | | | 909,155 | |
| ETFMG Sit Ultra Short | | | | | | | | | | | | | | | | | | | | | | | | | | | | | | | | |
| ETF * | | $ | — | | | | 50,108,877 | | | | — | | | | — | | | $ | (2,028,877 | ) | | $ | — | | | $ | 48,080,000 | | | | 1,000,000 | |
| Total | | $ | — | | | | 54,906,580 | | | | (2,568,769 | ) | | | 186,237 | | | $ | (4,101,420 | ) | | $ | — | | | $ | 58,544,374 | | | | 1,909,155 | |
ETFMG Prime Junior Silver Miners ETF
ETFMG Prime Junior Silver Miners ETF owned 5% or more of the voting securities of the following Company during the period ended March 31, 2020. Kootenay Silver, Inc, is deemed to be an affiliate of the Fund as of the period ended March 31, 2020 as defined by the 1940 Act. Transactions during the period in this security were as follows:
| Security Name | | Value at
September 30,
2019 | | | Purchases | | | Sales | | | Realized Gain (Loss)(1) | | | Change in
Unrealized
Appreciation
(Depreciation) | | | Dividend
Income | | | Value at
March 31,
2020 | | | Ending
Shares | |
| Kootenay Silver, Inc.* | | $ | — | | | | 694,532 | | | | (159,440 | ) | | $ | 47,612 | | | $ | (490,371 | ) | | $ | — | | | $ | 770,339 | | | | 6,570,289 | |
ETFMG™ ETFs
NOTES TO FINANCIAL STATEMENTS
March 31, 2020 (Unaudited) (Continued)
ETFMG Prime Mobile Payments ETF
ETFMG Sit Ultra Short ETF is deemed to be affiliates of the Fund as defined by the 1940 Act as of the period ended March 31, 2020. Transactions during the period in these securities were as follows:
| Security Name | | Value at
September 30,
2019 | | | Purchases | | | Sales | | | Realized Gain (Loss)(1) | | | Change in
Unrealized
Appreciation
(Depreciation) | | | Dividend
Income | | | Value at
March 31,
2020 | | | Ending
Shares | |
| ETFMG Sit Ultra Short | | | | | | | | | | | | | | | | | | | | | | | | | | | | | | | | |
| ETF * | | $ | — | | | | 30,082,267 | | | | — | | | $ | — | | | $ | (1,234,267 | ) | | $ | — | | | $ | 28,848,000 | | | | 600,000 | |
| | | | | | | | | | | | | | | | | | | | | | | | | | | | | | | | | |
| * | Affiliate as of March 31, 2020. |
| 1 | Realized Losses include transactions in affiliated investments and affiliated in-kind redemptions. |
NOTE 10 – NEW ACCOUNTING PRONOUNCEMENTS
In August 2018, FASB issued Accounting Standards Update (“ASU”) 2018-13, Fair Value Measurement (Topic 820): Disclosure Framework – Changes to the Disclosure Requirements for Fair Value Measurement (“ASU 2019-13”). The primary focus of ASU 2018-13 is to improve the effectiveness of the disclosure requirements for fair value measurements. The changes affect all companies that are required to include fair value measurement disclosures. In general, the amendments in ASU 2018-13 are effective for all entities for fiscal years and interim periods within those fiscal years, beginning after December 15, 2019. An entity is permitted to early adopt the removed or modified disclosures upon the issuance of ASU 2018-13 and may delay adoption of the additional disclosures, which are required for public companies only, until their effective date. Management has evaluated ASU 2018-13 and has early adopted the relevant provisions of the disclosure framework.
NOTE 11 – LEGAL MATTERS
The Trust, a former and current trustee of the Trust, the Adviser and certain officers of the Adviser were defendants in an action filed May 2, 2017 in the Superior Court of New Jersey captioned PureShares, LLC d/b/a PureFunds et al. v. ETF Managers Group, LLC et al. (“Nasdaq”), Docket No. C-63-17. The PureShares action alleged claims based on disputes arising out of contractual relationships with the Adviser relating to certain series of the Trust. The action sought damages in unspecified amounts and injunctive relief based on breach of contract, wrongful termination, and several other claims.
The Adviser and its parent, Exchange Traded Managers Group, LLC (“ETFMG”), were defendants in a case filed on October 26, 2017 in the United States District Court for the Southern District of New York by NASDAQ, Inc. (“Nasdaq”) captioned Nasdaq, Inc. v. Exchange Traded Managers Group, LLC et al., Case 1:17-cv-08252. This action arose out of the same facts and circumstances, and relates to the same series of the Trust, as the New Jersey litigation and asserted claims for breach of contract, conversion and certain other claims. The matter was the subject of a bench trial in May 2019, and on December 20, 2019, the Court issued an Opinion and Order awarding compensatory damages to Plaintiff in the amount of $78,403,172.36, plus prejudgment interest. The Court also denied Plaintiff’s requests for punitive damages and equitable relief.
ETFMG™ ETFs
NOTES TO FINANCIAL STATEMENTS
March 31, 2020 (Unaudited) (Continued)
On May 1, 2020, Nasdaq, PureShares LLC (“PureShares”), and ETFMG announced a global settlement that resolves all claims in both the PureShares action and the Nasdaq action. The settlement is subject to future negotiations and approvals among independent third parties. As part of the settlement, Nasdaq and ETFMG have agreed to certain cash payments from ETFMG to Nasdaq and PureShares, and have executed an asset purchase agreement to transfer certain ETFMG intellectual property and related assets, to a Nasdaq affiliate. The transaction is expected to close in the last half of 2020. The Adviser does not believe that the resolution of these matters will have a material adverse effect on the Funds' financial statements. If the events set forth in the settlement agreement do not occur, and a subsequent settlement is not reached, the resulting conditions may adversely affect the Adviser's future operations.
NOTE 12 – SUBSEQUENT EVENTS
In preparing these financial statements, the Funds have evaluated events and transactions for potential recognition or disclosure through the date the financial statements were issued. This evaluation did not result in any subsequent events that necessitated disclosures and/or adjustments to the Financial statements, other than those disclosed in Note 11 above.
ETFMG™ ETFs
APPROVAL OF ADVISORY AGREEMENTS AND BOARD CONSIDERATIONS
For the Period Ended March 31, 2020 (Unaudited)
Pursuant to Section 15(c) of the Investment Company Act of 1940 (the “1940 Act”), at a meeting held on March 24, 2020, the Board of Trustees (the “Board”) of ETF Managers Trust (the “Trust”) considered the renewal of the Amended and Restated Investment Advisory Agreement (the “Advisory Agreement”) between ETF Managers Group LLC (the “Adviser”) and the Trust, on behalf of each of ETFMG Prime Junior Silver Miners ETF (“SILJ”), ETFMG Prime Cyber Security ETF (“HACK”) and ETFMG Prime Mobile Payments ETF (“IPAY”) (each a “Fund” and collectively, the “Funds”).
Pursuant to Section 15(c) of the 1940 Act, the Board must annually review and approve the Advisory Agreement after its initial two-year term: (i) by the vote of the Trustees or by a vote of the shareholders of the Fund; and (ii) by the vote of a majority of the Trustees who are not parties to the Advisory Agreement or “interested persons” of any party thereto, as defined in the 1940 Act (the “Independent Trustees”), cast in person at a meeting called for the purpose of voting on such approval. Each year, the Board calls and holds a meeting to decide whether to renew the Advisory Agreement for an additional one-year term. In preparation for such meeting, the Board requests and reviews a wide variety of information from the Adviser.
In reaching its decision, the Board, including the Independent Trustees, considered all factors it believed relevant, including: (i) the nature, extent and quality of the services provided to the Funds’ shareholders by the Adviser; (ii) the investment performance of the Funds; (iii) the Adviser’s costs and profits realized in providing services to the Funds, including any fall-out benefits enjoyed by the Adviser; (iv) comparative fee and expense data for the Funds in relation to other similar investment companies; (v) the extent to which economies of scale would be realized as the Funds grow and whether the advisory fees for the Funds reflect these economies of scale for the benefit of the Funds; and (vi) other financial benefits to the Adviser and its affiliates resulting from services rendered to the Funds. The Board’s review included written and oral information furnished to the Board prior to and at the meeting held on March 24, 2020, and throughout the year. Among other things, the Adviser provided responses to a detailed series of questions, which included information about the Adviser’s operations, service offerings, personnel, compliance program and financial condition. The Board then discussed the written and oral information that it received before the meeting and throughout the year, and the Adviser’s oral presentations and any other information that the Board received at the meeting, and deliberated on the renewal of the Advisory Agreement in light of this information.
The Independent Trustees were assisted throughout the contract review process by independent legal counsel. The Independent Trustees relied upon the advice of such counsel and their own business judgment in determining the material factors to be considered in evaluating the renewal of the Advisory Agreement, and the weight to be given to each such factor. The conclusions reached with respect to the Advisory Agreement were based on a comprehensive evaluation of all the information provided and not any single factor. Moreover, each Trustee may have placed varying emphasis on particular factors in reaching conclusions with respect to each Fund. The Independent Trustees conferred amongst themselves and independent legal counsel during a telephonic contract renewal meeting held prior to the March 24, 2020 meeting and also conferred in executive sessions both with and without representatives of management before and during the March 24th meeting. The Independent Trustees requested, received and considered additional information arising out of these executive sessions.
Nature, Extent and Quality of Services Provided by the Adviser
The Trustees considered the scope of services provided under the Advisory Agreement, noting that the Adviser provides investment management services to the Funds. The Board discussed the responsibilities of the Adviser, including: responsibility for the general management of the day-to-day investment and reinvestment of the assets of the Funds; determining the daily baskets of deposit securities and cash components; executing portfolio security trades for purchases and redemptions of Fund shares conducted on a cash-in-lieu basis; responsibility for daily monitoring of tracking error and quarterly reporting to the Board; and implementation of Board directives as they relate to the Funds. In considering the nature, extent and quality of the services provided by the Adviser, the Board considered the qualifications, experience and responsibilities of the Adviser’s investment personnel and the quality of the Adviser’s compliance infrastructure. The Board also considered the Adviser’s experience managing exchange-traded funds (“ETFs”), as well as the Adviser’s response to the market volatility and uncertainty during the recent pandemic.
ETFMG™ ETFs
APPROVAL OF ADVISORY AGREEMENTS AND BOARD CONSIDERATIONS
For the Period Ended March 31, 2020 (Unaudited) (Continued)
The Board also considered other services provided to the Funds, such as overseeing the Funds’ service providers, monitoring adherence to the Funds’ investment restrictions, and monitoring compliance with various policies and procedures and with applicable securities laws.
Based on the factors above, as well as those discussed below, the Board concluded that it was satisfied with the nature, extent and quality of the services provided to the Funds by the Adviser.
Historical Performance
The Board then considered the past performance of the Funds. The Board reviewed information regarding each Fund’s performance with the performance of a group of peer funds and with the performance of the Fund’s underlying index for various time periods. The Board noted management’s explanation that analysis of investment performance, in absolute terms, is less relevant for the Funds than it is for actively managed funds, given the Funds’ index-based investment objectives. The Board also noted management’s further explanation that it is more relevant to review the performance of the Funds by focusing on the extent to which each Fund tracked its underlying index. The Board reviewed information regarding each Fund’s index tracking, discussing, as applicable, factors which contributed to each Fund’s tracking error. The Board noted that the Funds had underperformed their underlying indexes over certain periods, but that such underperformance was, at least in part, a result of costs incurred by the Funds not incurred by their underlying indexes. The Board considered other factors that contributed to the Funds’ tracking error, including cash drag and the process of rebalancing the Funds’ portfolios. The Board noted management’s representations that the Funds’ performance satisfactorily tracked their underlying indexes. The Board concluded that, after taking these factors into account, each of the Funds satisfactorily tracked its underlying index. The Board further noted that it had received and would continue to receive regular reports regarding each Fund’s performance, including with respect to its tracking error, at its quarterly meetings.
Cost of Services Provided, Profits and Economies of Scale
The Board reviewed the advisory fees for the Funds and compared them to the total operating expenses of comparable ETFs, as determined by an independent third party. Among other information, the Board noted that the advisory fee for each of the Funds was higher than the average and median expense ratios for its peer ETFs. The Board took into consideration management’s discussion of the fees, including that the Funds have niche investment strategies that are substantially different than the strategies of many of the peer ETFs.
The Board noted the importance of the fact that the advisory fee for each Fund is a “unified fee,” meaning that the shareholders of the Funds pay no expenses other than the advisory fee and certain other costs such as interest charges on any borrowings, taxes, brokerage commissions and other expenses incurred in placing orders for the purchase and sale of securities and other investment instruments, acquired fund fees and expenses, accrued deferred tax liability, extraordinary expenses (such as, among other things and subject to Board approval, non-standard Board-related expenses and litigation against the Board, Trustees, Funds, Adviser, and officers of the Adviser), and distribution (12b-1) fees and expenses. The Board also noted that the Adviser was responsible for compensating the Trust’s other service providers and paying the Funds’ other expenses (except as noted above) out of its own fees and resources. The Board concluded that the advisory fee for each of the Funds is reasonable in light of the factors considered.
ETFMG™ ETFs
APPROVAL OF ADVISORY AGREEMENTS AND BOARD CONSIDERATIONS
For the Period Ended March 31, 2020 (Unaudited) (Continued)
The Board also evaluated the compensation and other benefits received by the Adviser from its relationship with the Funds, taking into account the profitability analysis provided by the Adviser. The Board received and reviewed a profitability analysis that detailed the revenues earned and the expenses incurred by the Adviser on a fund by fund basis and considered how profit margins could affect the Adviser’s ability to attract and retain high quality personnel. Based on the information provided to the Trustees, the Trustees concluded that the level of profits realized by the Adviser from providing services to each Fund was not excessive in view of the nature, extent and quality of services provided to each Fund. The Board further considered other benefits derived by the Adviser and its affiliates from the Adviser’s relationship with the Funds, including services provided by certain brokerage firms.
In addition, the Board considered whether economies of scale may be realized for the Funds. The Board noted that the Adviser regularly considers whether fee reductions are appropriate as the Funds grow in size. The Board noted that a unitary fee provides a level of certainty in expenses for the Funds and effectively acts as a cap on the fees and expenses (except as noted above) that are borne by the Funds. The Board noted that the Adviser still bears most of the ordinary fees and expenses of each Fund and that the Funds would likely experience benefits from the unitary fee at the Funds’ projected asset levels. With respect to SILJ, the Board also noted that the Fund commenced operations on November 28, 2012 and that, as of February 29, 2020, the Fund had approximately $146 million in assets. The Board recognized that there would not likely be any additional economies of scale until the Fund’s assets grow. With respect to HACK and IPAY, the Board recognized that there were not likely to be any additional economies of scale for the Funds in the near term.
In its deliberations, the Board did not identify any single piece of information discussed above that was all-important, controlling or determinative of its decision.
Based on the Board’s deliberations and its evaluation of the information described above, the Board, including the Independent Trustees, unanimously: (a) concluded that the terms of the Advisory Agreement are fair and reasonable; (b) concluded that the Adviser’s fees are reasonable in light of the services that the Adviser provides to the Funds; and (c) approved the renewal of the Advisory Agreement for another year.
ETFMG™ ETFs
EXPENSE EXAMPLES
Six Months Ended March 31, 2020 (Unaudited)
As a shareholder of the Funds you incur two types of costs: (1) transaction costs, including brokerage commissions on purchases and sales of Fund shares, and (2) ongoing costs, including management fees and other Fund expenses. These examples are intended to help you understand your ongoing costs (in dollars) of investing in the Funds and to compare these costs with the ongoing costs of investing in other funds. The examples are based on an investment of $1,000 invested for the period of time as indicated in the table below.
Actual Expenses
The first line of the table provides information about actual account values based on actual returns and actual expenses. You may use the information in this line, together with the amount you invested, to estimate the expenses that you paid over the period. Simply divide your account value by $1,000 (for example, an $8,600 account value divided by $1,000 = 8.6), then, multiply the result by the number in the first line under the heading entitled “Expenses Paid During Period'' to estimate the expenses you paid on your account during this period.
Hypothetical Example for Comparison Purposes
The second line of the table provides information about hypothetical account values based on a hypothetical return and hypothetical expenses based on the Fund's actual expense ratio and an assumed rate of return of 5% per year before expenses, which is not the Fund's actual return. The hypothetical account values and expenses may not be used to estimate the actual ending account balance or expenses you paid for the period. You may use this information to compare the ongoing costs of investing in the Fund and other funds. To do so, compare this 5% hypothetical example with the 5% hypothetical examples that appear in the shareholder reports of the other funds. Please note that the expenses shown in the table are meant to highlight your ongoing costs only and do not reflect any transactional costs, such as brokerage commissions paid on purchases and sales of Fund shares. Therefore, the second line of the table is useful in comparing ongoing costs only and will not help you determine the relative total costs of owning different funds. If these transactional costs were included, your costs would have been higher.
| | | | | | | | | | | | | |
| Fund Name | | Beginning Account Value October 1, 2019 | | | Ending Account Value March 31, 2020 | | | Expenses Paid During the Period | | | Annualized Expense Ratio During the Period October 1, 2019 to March 31, 2020 | |
| ETFMG Prime Junior Silver Miners ETF | | | | | | | | | | | | | | | | |
| Actual | | $ | 1,000.00 | | | $ | 723.40 | | | $ | 2.971 | | | | 0.69 | % |
| Hypothetical (5% annual) | | | 1,000.00 | | | | 1,021.55 | | | | 3.491 | | | | 0.69 | % |
| ETFMG Prime Cyber Security ETF | | | | | | | | | | | | | | | | |
| Actual | | | 1,000.00 | | | | 975.60 | | | | 2.961 | | | | 0.60 | % |
| Hypothetical (5% annual) | | | 1,000.00 | | | | 1,022.00 | | | | 3.031 | | | | 0.60 | % |
| ETFMG Prime Mobile Payments ETF | | | | | | | | | | | | | | | | |
| Actual | | | 1,000.00 | | | | 803.50 | | | | 3.381 | | | | 0.75 | % |
| Hypothetical (5% annual) | | | 1,000.00 | | | | 1,021.25 | | | | 3.791 | | | | 0.75 | % |
| | | | | | | | | | | | | | | | | |
| | | | | | | | | | | | | | | | | |
ETFMG™ ETFs
EXPENSE EXAMPLES
Six Months Ended March 31, 2020 (Unaudited) (Continued)
| Fund Name | | Beginning Account Value October 8, 2019 | | | Ending Account Value March 31, 2020 | | | Expenses Paid During the Period | | | Annualized Expense Ratio During the Period October 1, 2019 to March 31, 2020 | |
| ETFMG Sit Ultra Short ETF | | | | | | | | | | | | | | | | |
| Actual | | | 1,000.00 | | | | 969.30 | | | | 1.422 | | | | 0.30 | % |
| Hypothetical (5% annual) | | | 1,000.00 | | | | 1,023.57 | | | | 1.522 | | | | 0.30 | % |
| | | | | | | | | | | | | | | | | |
| Fund Name | | Beginning Account Value February 12, 2020 | | | Ending Account Value March 31, 2020 | | | Expenses Paid During the Period | | | Annualized Expense Ratio During the Period October 1, 2019 to March 31, 2020 | |
| ETFMG Travel Tech ETF | | | | | | | | | | | | | | | | |
| Actual | | | 1,000.00 | | | | 570.90 | | | | 0.793 | | | | 0.75 | % |
| Hypothetical (5% annual) | | | 1,000.00 | | | | 1,021.25 | | | | 3.793 | | | | 0.75 | % |
| 1 | The dollar amounts shown as expenses paid during the period are equal to the annualized six-month expense ratio multiplied by the average account value during the period, multiplied by 183/366 to reflect the number of days in the period). |
| 2 | The dollar amounts shown as expenses paid during the period are equal to the annualized six-month expense ratio multiplied by the average account value during the period, multiplied by 176/366 (to reflect the number of days in the period). |
| 3 | The dollar amounts shown as expenses paid during the period are equal to the annualized six-month expense ratio multiplied by the average account value during the period, multiplied by 49/366 (to reflect the number of days in the period). |
ETFMGTM ETFs
Statement Regarding Liquidity Risk Management Program (unaudited)
ETF Managers Trust (the “Trust”) has adopted a liquidity risk management program (the “Program”). The Trust’s Board of Trustees (the “Board”) has designated ETF Managers Group LLC (the “Program Administrator”) as the administrator of the Program. The Program Administrator has designated a committee (the “Committee”), composed of personnel from multiple departments, including investment operations and compliance, that is responsible for the implementation and ongoing administration of the Program, which includes assessing the liquidity risk of ETFMG Prime Junior Silver Miners ETF, ETFMG Prime Cyber Security ETF, ETFMG Prime Mobile Payments ETF, ETFMG Sit Ultra Short ETF, and ETFMG Travel Tech ETF (each a “Fund” and, collectively, the “Funds”) under both normal and reasonably foreseeable stressed conditions.
Under the Program, the Program Administrator assesses, manages and periodically reviews each Fund’s liquidity risk, based on factors specific to the circumstances of the Fund. Liquidity risk is the risk that a Fund could not meet shareholder redemption requests without significant dilution of remaining shareholders’ interests in that Fund. This risk is managed by monitoring the degree of liquidity of each Fund’s investments and limiting the amount of the Fund’s illiquid investments, among other means. The Program Administrator’s process of determining the degree of liquidity of each Fund’s investments is supported by one or more third-party liquidity assessment vendors.
At a meeting of the Board on March 24, 2020, the Adviser provided a written report to the Board addressing the operation, and the adequacy and effectiveness of the implementation, of the Program, including, the operation of any Highly Liquid Investment Minimum, where applicable, and any material changes to the Program, for the initial period from December 1, 2018 through February 29, 2020 (the “Reporting Period”). No significant liquidity events impacting any Fund were noted in the report and it was represented that, as of December 31, 2019, each Fund was primarily highly liquid and, during the Reporting Period, each Fund held less than 15% in illiquid securities. In addition, the Program Administrator provided its assessment that Program implementation was effective and that the Program operated adequately and effectively to enable the Program Administrator to oversee and manage liquidity risk and ensure each Fund is able to meet requests to redeem shares without significant dilution to the remaining investors’ interest in the Fund.
There can be no assurance that the Program will achieve its objectives in the future. Please refer to your Fund’s prospectus for more information regarding the Fund’s exposure to liquidity risk and other principal risks to which an investment in the Fund may be subject.
ETFMG™ ETFs
Board of Trustees
Set forth below are the names, birth years, positions with the Trust, length of term of office, and the principal occupations and other directorships held during at least the last five years of each of the persons currently serving as a Trustee of the Trust, as well as information about each officer. The business address of each Trustee and officer is 30 Maple Street, 2nd Floor, Summit, New Jersey 07901. The SAI includes additional information about Fund directors and is available, without charge, upon request by calling 1-844-ETF-MGRS (1-844-383-6477).
Name
and Year
of Birth | Position(s)
Held with the
Trust, Term
of Office and
Length of
Time Served | Principal Occupation(s) During
Past 5 Years | Number of
Portfolios
in Fund
Complex
Overseen
By Trustee | Other
Directorships
Held by
Trustee
During Past 5
Years |
| Interested Trustee and Officers |
Samuel Masucci, III (1962) | Trustee, Chairman of the Board and President (since 2012); Secretary (since 2014) | Chief Executive Officer, Exchange Traded Managers Group LLC (since 2013); Chief Executive Officer, ETF Managers Group LLC (since 2016); Chief Executive Officer, ETF Managers Capital LLC (commodity pool operator) (since 2014); Chief Executive Officer (2012-2016) and Chief Compliance Officer (2012-2014), Factor Advisors, LLC (investment adviser); President and Chief Executive Officer, Factor Capital Management LLC (2012-2014) (commodity pool operator); | 11 | None |
John A. Flanagan, (1946) | Treasurer (since 2015) | President, John A. Flanagan CPA, LLC (accounting services) (since 2010); Treasurer, ETF Managers Trust (since 2015); Principal Financial Officer, ETF Managers Capital, LLC (commodity pool operator) (since 2015) | n/a | n/a |
Reshma A. Tanczos (1978) | Chief Compliance Officer (since 2016) | Chief Compliance Officer, ETF Managers Group LLC (since 2016); Chief Compliance Officer, ETF Managers Capital LLC (since 2016); Partner, Crow & Cushing (law firm) (2007-2016). | n/a | n/a |
* Mr. Masucci is an interested Trustee by virtue of his role as the Chief Executive Officer of the Adviser.
ETFMG™ ETFs
Board of Trustees (Continued)
Name and Year of Birth | Position(s) Held with the Trust, Term of Office and Length of Time Served | Principal Occupation(s) During Past 5 Years | Number of Portfolios in Fund Complex Overseen By Trustee | Other Directorships Held by Trustee During Past 5 Years |
| Independent Trustees |
| Samuel Masucci, III (1962) | Trustee, Chairman of the Board and President (since 2012); Secretary (since 2014) | Chief Executive Officer, Exchange Traded Managers Group LLC (since 2013); Chief Executive Officer, ETF Managers Group LLC (since 2016); Chief Executive Officer, ETF Managers Capital LLC (commodity pool operator) (since 2014); Chief Executive Officer (2012-2016) and Chief Compliance Officer (2012-2014), Factor Advisors, LLC (investment adviser); President and Chief Executive Officer, Factor Capital Management LLC (2012-2014) (commodity pool operator); | 11 | None |
| John A. Flanagan, (1946) | Treasurer (since 2015) | President, John A. Flanagan CPA, LLC (accounting services) (since 2010); Treasurer, ETF Managers Trust (since 2015); Principal Financial Officer, ETF Managers Capital, LLC (commodity pool operator) (since 2015) | n/a | n/a |
| Reshma A. Tanczos (1978) | Chief Compliance Officer (since 2016) | Chief Compliance Officer, ETF Managers Group LLC (since 2016); Chief Compliance Officer, ETF Managers Capital LLC (since 2016); Partner, Crow & Cushing (law firm) (2007-2016). | n/a | n/a |
ETFMG™ ETFs
SUPPLEMENTARY INFORMATION
March 31, 2020 (Unaudited)
NOTE 1 – FREQUENCY DISTRIBUTION OF PREMIUMS AND DISCOUNTS
Information regarding how often shares of each Fund traded on the Exchange at a price above (i.e., at a premium) or below (i.e., at a discount) the NAV is available on the Fund’s website at www.etfmgfunds.com.
NOTE 2 – FEDERAL TAX INFORMATION
Qualified Dividend Income/Dividends Received Deduction
For the fiscal year ended September 30, 2019, certain dividends paid by the Funds may be subject to a maximum tax rate of 15%, as provided for by the Jobs and Growth Tax Reconciliation Act of 2003. The percentage of dividends declared from ordinary income designated as qualified dividend income was as follows:
| Fund Name | Qualified Dividend Income |
| SILJ | 24.52% |
| HACK | 100.00% |
| IPAY | 100.00% |
For corporate shareholders, the percent of ordinary income distributions qualifying for the corporate dividends received deduction for the fiscal year ended September 30, 2019 was as follows:
| Fund Name | Dividends Received Deduction |
| SILJ | 22.47% |
| HACK | 100.00% |
| IPAY | 85.17% |
Short Term Capital Gain
The percentage of taxable ordinary income distributions that are designated as short-term capital gain distributions under Internal Revenue Section 871 (k)(2)(C) for each Fund were as follows:
| Fund Name | Short-Term Capital Gain |
| SILJ | 0.00% |
| HACK | 0.00% |
| IPAY | 68.95% |
During the year ended September 30, 2019, the Funds did not declare any long-term realized gains distributions.
Pursuant to Section 853 of the Internal Revenue Code the Fund designated the following amounts as foreign taxes paid for the year ended September 30, 2019. Foreign taxes paid for purposes of Section 853 may be less than actual foreign taxes paid for financial statement purposes.
| | | | | | | | | | Per Share | | | |
| Fund | | | Gross Foreign Source Income | | | Foreign Taxes Passthrough | | | Gross Foreign Source Income | | | Foreign Taxes Passthrough | | | Shares Outstanding at 9/30/19 |
| SILJ | | | $ | 258,662 | | | $ | 19,609 | | | $ | 0.02440207 | | | $ | 0.00184987 | | | $ | 10,600,000 |
ETFMG™ ETFs
SUPPLEMENTARY INFORMATION
September 30, 2019 (Unaudited) (Continued)
NOTE 3 – INFORMATION ABOUT PORTFOLIO HOLDINGS
The Funds file their complete schedule of portfolio holdings for their first and third fiscal quarters with the Securities and Exchange Commission (“SEC”) on Form N-Q or Part F of Form N-PORT. The Funds' Form N-Q or Part F of Form N-PORT is available on the website of the SEC at www.sec.gov. Each Fund's portfolio holdings are posted on their website at www.etfmgfunds.com daily.
NOTE 4 – INFORMATION ABOUT PROXY VOTING
A description of the policies and procedures the Funds use to determine how to vote proxies relating to portfolio securities is provided in the Statement of Additional Information (“SAI”). The SAI is available without charge upon request by calling toll-free at (877) 756-7873, by accessing the SEC’s website at www.sec.gov, or by accessing the Funds’ website at www.etfmgfunds.com.
Information regarding how the Funds voted proxies relating to portfolio securities during the period ending June 30 is available by calling toll-free at (877) 756-7873 or by accessing the SEC’s website at www.sec.gov.
Carefully consider the Fund’s investment objectives, risk factors, charges, and expenses before investing. This and additional information can be found in the Fund’s prospectus, which may be obtained by calling 1-844-ETF-MGRS (1-844-383-6477) or by visiting www.etfmgfunds.com. Read the prospectus carefully before investing.
Advisor
ETF Managers Group, LLC
30 Maple Street, Suite 2, Summit, NJ 07901
Distributor
ETFMG Financial, Inc.
30 Maple Street, Suite 2, Summit, NJ 07901
Custodian
U.S. Bank National Association
Custody Operations
1555 North River Center Drive, Suite 302, Milwaukee, Wisconsin 53212
Transfer Agent
Foreside Financial Group, LLC
111 E Kilbourn Ave, Suite 1250, Milwaukee, WI 53202
Securities Lending Agent
U.S Bank, National Association
Securities Lending
800 Nicolet Mall
Minneapolis, MN 55402-7020
Independent Registered Public Accounting Firm
WithumSmith + Brown, PC
1411 Broadway, 9th Floor, New York, NY 10018
Legal Counsel
Sullivan & Worcester LLP
1666 K Street NW, Washington, DC 20006

Semi-Annual Report
March 31, 2020
Wedbush ETFMG Video Game Tech ETF

Wedbush ETFMG Global Cloud Technology ETF

Beginning on January 1, 2021, as permitted by regulations adopted by the SEC, paper copies of the Fund’s shareholder reports will no longer be sent by mail, unless you specifically request paper copies of the Fund’s reports from your financial intermediary, such as a broker-dealer or bank. Instead, the reports will be made available on a website, and you will be notified by mail each time a report is posted and provided with a website link to access the report.
If you already elected to receive shareholder reports electronically, you will not be affected by this change and you need not take any action. Please contact your financial intermediary to elect to receive shareholder reports and other Fund communications electronically.
You may elect to receive all future Fund reports in paper free of charge. Please contact your financial intermediary to inform them that you wish to continue receiving paper copies of Fund shareholder reports and for details about whether your election to receive reports in paper will apply to all funds held with your financial intermediary.
The funds are a series of ETF Managers Trust.
Page Intentionally Left Blank
Wedbush ETFMG TM ETF
TABLE OF CONTENTS
March 31, 2020 (Unaudited)
Wedbush ETFMG TM ETF
Dear Shareholder,
On behalf of the entire team, we want to express our appreciation for the confidence you have placed in these ETFs. The following information pertains to the fiscal period from October 1, 2019 to March 31, 2020.
Performance Overview
During the 6-month period ended March 31, 2020, the S&P 500 Information Technology Sector Index, a broad measure of US listed technology companies, returned 0.07%. During the same period, the S&P Global 1200 Information Technology Sector Index, a broad measure of global technology companies, returned -0.74%. Below is a performance overview for each Fund for the same 6-month period.
Wedbush ETFMG Global Cloud Technology ETF (IVES)*
The Wedbush ETFMG Global Cloud Technology ETF (the “Fund”) seeks to provide investment results that, before fees and expenses, correspond generally to the price and yield performance of the Reality Shares Drone Index (the “Index”).
Over the period, the total return for the Fund was -22.87%, while the total return for the Index was -23.17%. The best performers in the Fund on the basis of contribution to return were Nvidia, AeroVironment, and Ballard Power Systems, while the worst performers were Boeing, Workhorse Group, and Autonomous Control Systems.
Wedbush ETFMG Video Game Tech ETF (GAMR)*
The Wedbush ETFMG Video Game Tech ETF (the “Fund”) seeks to provide investment results that, before fees and expenses, correspond generally to the price and yield performance of the EEFund Video Game Tech Index (the “Index”).
Over the period, the total return for the Fund was 3.63%, while the total return for the Index was 4.03%. The best performers in the Fund on the basis of contribution to return were Bilibili, Nvidia, and Advanced Micro Devices, while the worst performers were Konami Holdings, Razer, and Aeria.
In late February, as COVID-19, the disease caused by the coronavirus, spread into regions beyond China, global stock markets began to experience significant declines and turbulence. As we write this letter in late April, the course of the coronavirus outbreak remains uncertain, and markets are likely to remain volatile in response to any news or government action concerning the virus. While markets continue working to assess the economic impact of the virus and the public health measures taken in response, it is still unclear what the costs will be and how long the effects will last, but history has shown that markets recover from downturns. For investors, we believe the most important course of action is to remain focused on your long-term goals, and to consult with your financial advisor.
You can find further details about IVES* and GAMR* by visiting www.etfmgfunds.com, or by calling 1-844-383-6477.
Sincerely,

Samuel Masucci III
Chairman of the Board
Wedbush ETFMG Global Cloud Technology ETF
Growth of $10,000 (Unaudited)
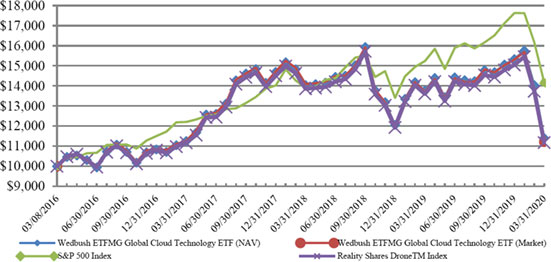
| | | | | | | |
Average Annual Returns
Period Ended March 31, 2020 | | 1 Year
Return | | Since Inception
(3/8/2016) | | Value of $10,000
(3/31/2020) |
| Wedbush ETFMG Global Cloud | | | -17.16 | % | | | 3.28 | % | | $ | 11,400 | |
| Technology ETF (NAV) | | | | | | | | | | | | |
| Wedbush ETFMG Global Cloud | | | -18.11 | % | | | 2.88 | % | | $ | 11,222 | |
| Technology ETF (Market) | | | | | | | | | | | | |
| S&P 500 Index | | | -6.98 | % | | | 8.96 | % | | $ | 14,174 | |
| Reality Shares DroneTM Index | | | -17.81 | % | | | 2.78 | % | | $ | 11,179 | |
Performance data quoted represents past performance and does not guarantee future results. The investment return and principal value of an investment will fluctuate so that an investor’s shares, when redeemed, may be worth more or less than their original cost. Current performance of the Fund may be lower or higher than the performance quoted. All performance is historical and includes reinvestment of dividends and capital gains. Performance data current to the most recent month end may be obtained by calling 1-844-ETF-MGRS (1-844-383-6477).
The chart illustrates the performance of a hypothetical $10,000 investment made on March 8, 2016, and is not intended to imply any future performance. The returns shown do not reflect the deduction of taxes that a shareholder would pay on fund distributions from the sales of Fund shares. The chart assumes reinvestment of capital gains and dividends. The chart assumes reinvestment of capital gains and dividends, if any. The Index Returns do not reflect fees or expenses and are not available for direct investment.
Wedbush ETFMG TM ETF
Top Ten Holdings as of March 31, 2020* (Unaudited)
| | | | Security | | | % of Total Investments |
| 1 | | Aerovironment, Inc. | | 4.89% |
| 2 | | ETFMG Sit Ultra Short ETF | | 3.93% |
| 3 | | Parrot | | 2.56% |
| 4 | | Ambarella, Inc. | | 2.38% |
| 5 | | Thales SA | | 2.13% |
| 6 | | BAE Sysbems PLC | | 2.10% |
| 7 | | Drone Delivery Canada Corp. | | 2.04% |
| 8 | | Intel Corp. | | 1.96% |
| 9 | | NVIDIA Corp. | | 1.96% |
| 10 | | Honeywell International, Inc. | | 1.91% |
| | | Top Ten Holdings =25.86% of Total Investments | | |
| | | * Current Fund holdings may not be indicative of future Fund holdings. | | |
Wedbush ETFMG Video Game Tech ETF
Growth of $10,000 (Unaudited)
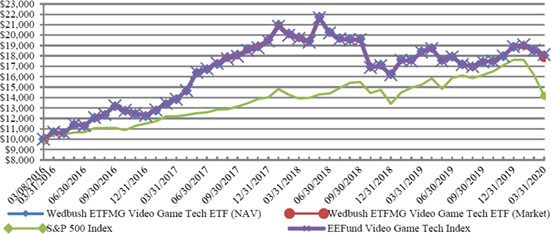
| | | | | | | |
Average Annual Returns
Period Ended March 31, 2020 | | 1 Year
Return | | Since Inception
(3/8/2016) | | Value of $10,000
(3/31/2020) |
| Wedbush ETFMG Video Game Tech | | | -2.00 | % | | | 15.66 | % | | $ | 18,061 | |
| ETF (NAV) | | | | | | | | | | | | |
| Wedbush ETFMG Video Game Tech | | | -3.17 | % | | | 15.44 | % | | $ | 17,923 | |
| ETF (Market) | | | | | | | | | | | | |
| S&P 500 Index | | | -6.98 | % | | | 8.96 | % | | $ | 14,174 | |
| EEFund Video Game Tech Index | | | -1.20 | % | | | 15.78 | % | | $ | 18,131 | |
Performance data quoted represents past performance and does not guarantee future results. The investment return and principal value of an investment will fluctuate so that an investor’s shares, when redeemed, may be worth more or less than their original cost. Current performance of the Fund may be lower or higher than the performance quoted. All performance is historical and includes reinvestment of dividends and capital gains. Performance data current to the most recent month end may be obtained by calling 1-844-ETF-MGRS (1-844-383-6477).
The chart illustrates the performance of a hypothetical $10,000 investment made on March 8, 2016, and is not intended to imply any future performance. The returns shown do not reflect the deduction of taxes that a shareholder would pay on fund distributions from the sales of Fund shares. The chart assumes reinvestment of capital gains and dividends. The chart assumes reinvestment of capital gains and dividends, if any. The Index Returns do not reflect fees or expenses and are not available for direct investment.
Wedbush ETFMG TM ETF
Top Ten Holdings as of March 31, 2020* (Unaudited)
| | | | Security | | | % of Total Investments |
| 1 | | Embracer Group AB | | 3.09% |
| 2 | | Bilibili, Inc. | | 2.99% |
| 3 | | ETFMG Sit Ultra Short ETF | | 2.89% |
| 4 | | NEXON Co., Ltd. | | 2.78% |
| 5 | | Capcom Co., Ltd | | 2.69% |
| 6 | | NCSoft Corp. | | 2.69% |
| 7 | | Ubisoft Entertainment S.A. | | 2.53% |
| 8 | | Zynga, Inc. | | 2.51% |
| 9 | | CD Projekt S.A. | | 2.42% |
| 10 | | Glu Mobile, Inc. | | 2.40% |
| | | Top Ten Holdings = 26.99% of Total Investments | | |
| | | * Current Fund holdings may not be indicative of future Fund holdings. | | |
Wedbush ETFMG TM ETF
Important Disclosures and Key Risk Factors
Investing involves risk, including the possible loss of principal. Shares of any ETF are bought and sold at market price (not NAV), may trade at a discount or premium to NAV and are not individually redeemed from the Fund. Brokerage commissions will reduce returns. Narrowly focused investments typically exhibit higher volatility.
Past performance is not indicative of future return. A fund’s performance for very short time periods may not be indicative of future performance.
IVES
The Wedbsuh ETFMG Global Cloud Technology ETF (the “Fund” or the “Drone Economy ETF”) seeks to provide investment results that, before fees and expenses, correspond generally to the price and yield performance of the Dan Ives Global Cloud Technology Prime Index (the “Index”).
Investing involves risk, including the possible loss of principal. Shares of any ETF are bought and sold at market price (not NAV), may trade at a discount or premium to NAV and are not individually redeemed from the Fund. Brokerage commissions will reduce returns. Narrowly focused investments typically exhibit higher volatility. Cloud Technology Companies may have limited product lines, markets, financial resources or personnel. These companies typically face intense competition and potentially rapid product obsolescence. In addition, many Cloud Technology Companies store sensitive consumer information and could be the target of cybersecurity attacks and other types of theft, which could have a negative impact on these companies. As a result, Cloud Technology Companies may be adversely impacted by government regulations and may be subject to additional regulatory oversight with regard to privacy concerns and cybersecurity risk. These companies are also heavily dependent on intellectual property rights and may be adversely affected by loss or impairment of those rights. Cloud computing companies could be negatively impacted by disruptions in service caused by hardware or software failure, or by interruptions or delays in service by third-party data center hosting facilities and maintenance providers. Cloud Technology Companies, especially smaller companies, tend to be more volatile than companies that do not rely heavily on technology. Companies in the technology field, including companies in the computers, telecommunications and electronics industries, face intense competition, which may have an adverse effect on profit margins.
Unlike with an actively managed fund, the Fund’s adviser does not use techniques or defensive strategies designed to lessen the effects of market volatility or to reduce the impact of periods of market decline. This means that, based on market and economic conditions, the Fund’s performance could be lower than other types of funds that may actively shift their portfolio assets to take advantage of market opportunities or to lessen the impact of a market decline.
Natural or environmental disasters, such as earthquakes, fires, floods, hurricanes, tsunamis and other severe weather-related phenomena generally, and widespread disease, including pandemics and epidemics, have been and may be highly disruptive to economies and markets, adversely impacting individual companies, sectors, industries, markets, currencies, interest and inflation rates, credit ratings, investor sentiment, and other factors affecting the value of the Fund’s investments. Given the increasing interdependence among global economies and markets, conditions in one country, market, or region are increasingly likely to adversely affect markets, issuers, and/or foreign exchange rates in other countries, including the U.S. Any such events could have a significant adverse impact on the value of the Fund’s investments.
Additionally, natural or environmental disasters, widespread disease or other public health issues, war, acts of terrorism or other events could result in increased premiums or discounts to the Fund’s NAV.
The Fund is distributed by ETFMG Financial LLC, which is not affiliated with Wedbush Securities, Prime Indexes, or Level ETF Ventures.
Wedbush ETFMG TM ETF
Important Disclosures and Key Risks Factors (Continued)
GAMR
The Wedbush ETFMG Video Game Tech ETF (the “Fund” or the “Video Game Tech ETF”) seeks to provide investment results that, before fees and expenses, correspond generally to the price and yield performance of the EEFund Video Game Tech Index™ (the “Index”).
Investing involves risk, including the possible loss of principal. The fund is new with limited operating history. Shares of any ETF are bought and sold at market price (not NAV), may trade at a discount or premium to NAV and are not individually redeemed from the Fund. Brokerage commissions will reduce returns. Narrowly focused investments typically exhibit higher volatility. Video Game Tech Companies face intense competition, both domestically and internationally, may have limited product lines, markets, financial resources or personnel, may have products that face rapid obsolescence, and are heavily dependent on the protection of patent and intellectual property rights. Video Game Tech Companies are also subject to increasing regulatory constraints, particularly with respect to cybersecurity and privacy. Such factors may adversely affect the profitability and value of such companies. Investments in foreign securities involve political, economic and currency risks, greater volatility and differences in accounting methods. The Fund is non-diversified, meaning it may concentrate its assets in fewer individual holdings than a diversified fund. Investments in smaller companies tend to have limited liquidity and greater price volatility than large-capitalization companies. The Fund’s return may not match or achieve a high degree of correlation with the return of the EEFund Video Game Tech Index™. To the extent the Fund utilizes a sampling approach, it may experience tracking error to a greater extent than if the Fund had sought to replicate the Index. Diversification does not guarantee a profit, nor does it protect against a loss in a declining market.
The EEFund Video Game Tech™ Index provides a benchmark for investors interested in tracking companies actively involved in the electronic gaming industry including the entertainment, education and simulation segments. The Index uses a market capitalization weighted allocation across the pure play and non-pure play sectors and a set weight for the conglomerate sector as well as an equal weighted allocation methodology for all components within each sector allocation. The index was created and is maintained by EEFund Management. You cannot invest directly in an index.
Unlike with an actively managed fund, the Fund’s adviser does not use techniques or defensive strategies designed to lessen the effects of market volatility or to reduce the impact of periods of market decline. This means that, based on market and economic conditions, the Fund’s performance could be lower than other types of funds that may actively shift their portfolio assets to take advantage of market opportunities or to lessen the impact of a market decline.
Natural or environmental disasters, such as earthquakes, fires, floods, hurricanes, tsunamis and other severe weather-related phenomena generally, and widespread disease, including pandemics and epidemics, have been and may be highly disruptive to economies and markets, adversely impacting individual companies, sectors, industries, markets, currencies, interest and inflation rates, credit ratings, investor sentiment, and other factors affecting the value of the Fund’s investments. Given the increasing interdependence among global economies and markets, conditions in one country, market, or region are increasingly likely to adversely affect markets, issuers, and/or foreign exchange rates in other countries, including the U.S. Any such events could have a significant adverse impact on the value of the Fund’s investments.
Additionally, natural or environmental disasters, widespread disease or other public health issues, war, acts of terrorism or other events could result in increased premiums or discounts to the Fund’s NAV.
The Fund is distributed by ETFMG Financial LLC, which is not affiliated with Wedbush Securities, Prime Indexes, or Level ETF Ventures.
Wedbush ETFMG TM ETF
PORTFOLIO ALLOCATIONS
As of March 31, 2020 (Unaudited)
| | | Wedbush
ETFMG
Global
Cloud
Technology
ETF | | | Wedbush
ETFMG
Video
Game
Tech
ETF | |
| As a percent of Net Assets: | | | | |
| Canada | | | 3.4 | % | | | —% | |
| France | | | 7.1 | | | | 2.9 | |
| Germany | | | 1.3 | | | | 0.4 | |
| Hong Kong | | | — | | | | 5.5 | |
| Israel | | | 2.3 | | | | — | |
| Italy | | | 1.7 | | | | — | |
| Japan | | | 12.1 | | | | 20.3 | |
| Netherlands | | | 2.4 | | | | 0.5 | |
| Norway | | | — | | | | 0.4 | |
| Poland | | | — | | | | 2.8 | |
| Republic of Korea | | | 1.5 | | | | 14.0 | |
| Spain | | | 1.6 | | | | — | |
| Sweden | | | 2.7 | | | | 7.8 | |
| Switzerland | | | — | | | | 0.5 | |
| Taiwan, Province of China | | | — | | | | 4.2 | |
| Turkey | | | 3.7 | | | | — | |
| United Kingdom | | | 4.8 | | | | 4.1 | |
| United States | | | 54.9 | | | | 36.2 | |
| Exchange Traded Funds | | | 4.6 | | | | 3.3 | |
| Short-Term and other Net Assets (Liabilities) | | | (4.1 | ) | | | (2.9 | ) |
| | | | 100.0 | % | | | 100.0 | % |
Wedbush ETFMG TM ETF
Wedbush ETFMG Global Cloud Technology ETF
Schedule of Investments
March 31, 2020 (Unaudited)
| | | Shares | | | Value | |
| COMMON STOCKS - 99.5% | | | | | | | | |
| Canada - 3.4% | | | | | | | | |
| Aerospace & Defense - 2.4% (d) | | | | | | | | |
| Drone Delivery Canada Corp. (a) | | | 1,253,771 | | | $ | 623,634 | |
| Electrical Equipment - 1.0% | | | | | | | | |
| Ballard Power Systems, Inc. (a)(b) | | | 34,118 | | | | 259,638 | |
| Total Canada | | | | | | | 883,272 | |
| | | | | | | | | |
| France - 7.1% | | | | | | | | |
| Aerospace & Defense - 4.1% (d) | | | | | | | | |
| Dassault Aviation SA (a) | | | 551 | | | | 455,166 | |
| Thales SA | | | 7,725 | | | | 650,751 | |
| Total Aerospace & Defense | | | | | | | 1,105,917 | |
| Communications Equipment - 3.0% | | | | | | | | |
| Parrot SA (a)(b)(e) | | | 285,467 | | | | 783,956 | |
| Total France | | | | | | | 1,889,873 | |
| | | | | | | | | |
| Germany - 1.3% | | | | | | | | |
| Industrial Conglomerates - 1.3% | | | | | | | | |
| Rheinmetall AG | | | 4,634 | | | | 327,401 | |
| | | | | | | | | |
| Israel - 2.3% | | | | | | | | |
| Aerospace & Defense - 2.3% (d) | | | | | | | | |
| Elbit Systems, Ltd. | | | 3,161 | | | | 412,720 | |
| RADA Electronic Industries, Ltd. (a) | | | 55,011 | | | | 192,539 | |
| Total Aerospace & Defense | | | | | | | 605,259 | |
| | | | | | | | | |
| Italy - 1.7% | | | | | | | | |
| Aerospace & Defense - 1.7% (d) | | | | | | | | |
| Leonardo SpA | | | 65,311 | | | | 437,376 | |
| | | | | | | | | |
| Japan - 12.1% | | | | | | | | |
| Automobiles - 2.7% | | | | | | | | |
| Subaru Corp. | | | 20,932 | | | | 403,650 | |
| Yamaha Motor Co., Ltd. | | | 24,196 | | | | 294,110 | |
| Total Automobiles | | | | | | | 697,760 | |
| Electronic Equipment, Instruments & Components - 5.2% | | | | | | | | |
| Autonomous Control Systems Laboratory, Ltd. (a)(b) | | | 31,230 | | | | 568,980 | |
| Hitachi, Ltd. | | | 13,379 | | | | 391,074 | |
| TDK Corp. | | | 4,715 | | | | 367,465 | |
| Total Electronic Equipment, Instruments & Components | | | | | | | 1,327,519 | |
| Household Durables - 1.6% | | | | | | | | |
| Sony Corp. - ADR (a)(b) | | | 7,499 | | | | 443,791 | |
| IT Services - 2.1% | | | | | | | | |
| NEC Corp. | | | 15,139 | | | | 555,437 | |
| Software - 0.5% | | | | | | | | |
| Kudan, Inc. (a)(b) | | | 5,389 | | | | 135,671 | |
| Total Japan | | | | | | | 3,160,178 | |
The accompanying notes are an integral part of these financial statements.
Wedbush ETFMG TM ETF
Wedbush ETFMG Global Cloud Technology ETF
Schedule of Investments
March 31, 2020 (Unaudited) (Continued)
| | | Shares | | | Value | |
| Netherlands - 2.4% | | | | |
| Aerospace & Defense - 1.1% (d) | | | | | | | | |
| Airbus SE | | | 4,271 | | | $ | 279,520 | |
| Semiconductors & Semiconductor Equipment - 1.3% | | | | | | | | |
| STMicroelectronics NV | | | 15,950 | | | | 349,626 | |
| Total Netherlands | | | | | | | 629,146 | |
| | | | | | | | | |
| Republic of Korea - 1.5% | | | | | | | | |
| Aerospace & Defense - 1.5% (d) | | | | | | | | |
| Korea Aerospace Industries, Ltd. | | | 22,433 | | | | 386,061 | |
| | | | | | | | | |
| Spain - 1.6% | | | | | | | | |
| IT Services - 1.6% | | | | | | | | |
| Indra Sistemas SA (a) | | | 50,635 | | | | 418,840 | |
| | | | | | | | | |
| Sweden - 2.7% | | | | | | | | |
| Aerospace & Defense - 1.1% (d) | | | | | | | | |
| Saab AB - Class B | | | 14,318 | | | | 276,372 | |
| Electronic Equipment, Instruments & Components - 1.6% | | | | | | | | |
| Hexagon AB - Class B | | | 9,971 | | | | 427,362 | |
| Total Sweden | | | | | | | 703,734 | |
| | | | | | | | | |
| Turkey - 3.7% | | | | | | | | |
| Aerospace & Defense - 2.2% (d) | | | | | | | | |
| Aselsan Elektronik Sanayi Ve Ticaret AS | | | 161,215 | | | | 575,311 | |
| Household Durables - 1.5% | | | | | | | | |
| Vestel Elektronik Sanayi ve Ticaret AS (a) | | | 240,811 | | | | 384,162 | |
| Total Turkey | | | | | | | 959,473 | |
| | | | | | | | | |
| United Kingdom - 4.8% | | | | | | | | |
| Aerospace & Defense - 4.8% (d) | | | | | | | | |
| BAE Systems PLC | | | 99,113 | | | | 642,377 | |
| Meggitt PLC | | | 54,473 | | | | 196,419 | |
| QinetiQ Group PLC | | | 102,959 | | | | 411,790 | |
| Total Aerospace & Defense | | | | | | | 1,250,586 | |
The accompanying notes are an integral part of these financial statements.
Wedbush ETFMG TM ETF
Wedbush ETFMG Global Cloud Technology ETF
Schedule of Investments
March 31, 2020 (Unaudited) (Continued)
| | | Shares | | | Value | |
| United States - 54.9% | | | | | | | | |
| Aerospace & Defense - 28.6% (d) | | | | | | | | |
| Aerojet Rocketdyne Holdings, Inc. (a) | | | 10,205 | | | $ | 426,875 | |
| AeroVironment, Inc. (a) | | | 24,542 | | | | 1,496,079 | |
| Boeing Co. | | | 3,139 | | | | 468,150 | |
| Cubic Corp. (b) | | | 5,541 | | | | 228,899 | |
| General Dynamics Corp. | | | 3,408 | | | | 450,912 | |
| HEICO Corp. | | | 3,229 | | | | 240,916 | |
| Kratos Defense & Security Solutions, Inc. (a)(b) | | | 41,228 | | | | 570,596 | |
| L3Harris Technologies, Inc. | | | 2,166 | | | | 390,140 | |
| Lockheed Martin Corp. | | | 1,595 | | | | 540,625 | |
| Mercury Systems, Inc. (a) | | | 4,664 | | | | 332,730 | |
| Northrop Grumman Corp. | | | 1,786 | | | | 540,354 | |
| Raytheon Co. | | | 2,804 | | | | 367,745 | |
| Teledyne Technologies, Inc. (a) | | | 1,107 | | | | 329,078 | |
| Textron, Inc. | | | 16,903 | | | | 450,803 | |
| TransDigm Group, Inc. | | | 847 | | | | 271,201 | |
| United Technologies Corp. | | | 4,114 | | | | 388,074 | |
| Total Aerospace & Defense | | | | | | | 7,493,177 | |
| Auto Components - 1.7% | | | | | | | | |
| Workhorse Group, Inc. (a)(b) | | | 240,973 | | | | 436,161 | |
| Building Products - 0.9% | | | | | | | | |
| Griffon Corp. (b) | | | 17,834 | | | | 225,600 | |
| Communications Equipment - 0.7% | | | | | | | | |
| KVH Industries, Inc. (a) | | | 20,501 | | | | 193,324 | |
| Electronic Equipment, Instruments & Components - 6.6% | | | | | | | | |
| FLIR Systems, Inc. | | | 7,791 | | | | 248,455 | |
| II-VI, Inc. (a)(b) | | | 11,742 | | | | 334,647 | |
| Jabil, Inc. | | | 14,475 | | | | 355,796 | |
| Littelfuse, Inc. (b) | | | 2,839 | | | | 378,779 | |
| Trimble, Inc. (a) | | | 12,685 | | | | 403,764 | |
| Total Electronic Equipment, Instruments & Components | | | | | | | 1,721,441 | |
| Household Durables - 1.0% | | | | | | | | |
| GoPro, Inc. - Class A (a)(b) | | | 98,420 | | | | 257,860 | |
| Industrial Conglomerates - 2.2% | | | | | | | | |
| Honeywell International, Inc. (b) | | | 4,359 | | | | 583,190 | |
| Semiconductors & Semiconductor Equipment - 11.9% | | | | | | | | |
| Ambarella, Inc. (a) | | | 14,969 | | | | 726,894 | |
| Intel Corp. | | | 11,097 | | | | 600,570 | |
| Microchip Technology, Inc. (b) | | | 2,972 | | | | 201,502 | |
| NVIDIA Corp. | | | 2,273 | | | | 599,163 | |
| Qualcomm, Inc. (a)(b) | | | 5,792 | | | | 391,829 | |
| Texas Instruments, Inc. | | | 2,825 | | | | 282,302 | |
| Xilinx, Inc. (b) | | | 3,724 | | | | 290,249 | |
| Total Semiconductors & Semiconductor Equipment | | | | | | | 3,092,509 | |
| Software - 1.3% | | | | | | | | |
| Synopsys, Inc. (a) | | | 2,628 | | | | 338,460 | |
| Total United States | | | | | | | 14,341,722 | |
| TOTAL COMMON STOCKS (Cost $33,204,159) | | | | | | | 25,992,921 | |
The accompanying notes are an integral part of these financial statements.
Wedbush ETFMG TM ETF
Wedbush ETFMG Global Cloud Technology ETF
Schedule of Investments
March 31, 2020 (Unaudited) (Continued)
| | | Shares | | | Value | |
| INVESTMENTS PURCHASED WITH PROCEEDS FROM SECURITIES LENDING COLLATERAL – 17.3% | | | | | | | | |
| ETFMG Sit Ultra Short ETF (f) | | | 25,000 | | | $ | 1,202,000 | |
| Mount Vernon Liquid Assets Portfolio, LLC, 0.91% (c) | | | 3,325,443 | | | | 3,325,443 | |
| TOTAL INVESTMENTS PURCHASED WITH PROCEEDS FROM SECURITIES LENDING COLLATERAL (Cost $4,581,871) | | | | | | $ | 4,527,443 | |
| | | | | | | | | |
| SHORT-TERM INVESTMENTS - 0.3% | | | | | | | | |
| Money Market Funds - 0.3% | | | | | | | | |
| Invesco Advisers, Inc. STIT-Treasury Portfolio - Institutional Class, 0.30% (c) | | | 78,018 | | | | 78,018 | |
| TOTAL SHORT-TERM INVESTMENTS (Cost $78,018) | | | | | | | 78,018 | |
| | | | | | | | | |
| Total Investments (Cost $37,864,048) - 117.1% | | | | | | | 30,598,382 | |
| Liabilities in Excess of Other Assets - (17.1)% | | | | | | | (4,465,090 | ) |
| TOTAL NET ASSETS - 100.0% | | | | | | $ | 26,133,292 | |
Percentages are stated as a percent of net assets.
| ADR | American Depositary Receipt |
| (a) | Non-income producing security. |
| (b) | All or a portion of this security was out on loan as of March 31, 2020. |
| (c) | The rate shown is the annualized seven-day yield at March 31, 2020. |
| (d) | As of March 31, 2020, the Fund had a significant portion of its assets in the Aerospace & Defense Industry. |
| (e) | This security has been deemed illiquid according to the Fund's liquidity guidelines. The value of these securities total $783,956, which represents 3.00% of total net assets. |
| (f) | Affiliated security. Please refer to Note 9 of the Notes to Financial Statements. |
The accompanying notes are an integral part of these financial statements.
Wedbush ETFMG TM ETF
Wedbush ETFMG Video Game Tech ETF
Schedule of Investments
March 31, 2020 (Unaudited)
| | | Shares | | | Value | |
| COMMON STOCKS - 99.6% | | | | | | | | |
| France - 2.9% | | | | | | | | |
| Entertainment - 2.9% | | | | | | | | |
| Ubisoft Entertainment SA (a) | | | 28,352 |
| | $ | 2,100,681 | |
| | | | | | | | | |
| Germany - 0.4% | | | | | | | | |
| Health Care Equipment & Supplies - 0.4% | | | | | | | | |
| Carl Zeiss Meditec AG | | | 3,156 | | | | 307,525 | |
| | | | | | | | | |
| Hong Kong - 5.5% | | | | | | | | |
| Entertainment - 3.9% (d) | | | | | | | | |
| IGG, Inc. | | | 2,612,492 | | | | 1,560,200 | |
| Leyou Technologies Holdings, Ltd. (a) | | | 2,545,528 | | | | 745,329 | |
| NetDragon Websoft Holdings, Ltd. | | | 234,072 | | | | 564,593 | |
| Total Entertainment | | | | | | | 2,870,122 | |
| Interactive Media & Services - 1.6% | | | | | | | | |
| Tencent Holdings, Ltd. | | | 24,783 | | | | 1,215,375 | |
| Total Hong Kong | | | | | | | 4,085,497 | |
| | | | | | | | | |
| Japan - 20.3% | | | | | | | | |
| Entertainment - 17.1% (d) | | | | | | | | |
| Aeria, Inc. | | | 36,822 | | | | 182,869 | |
| Aiming, Inc. (b) | | | 121,541 | | | | 533,526 | |
| Capcom Co., Ltd. | | | 71,107 | | | | 2,241,830 | |
| COLOPL, Inc. | | | 34,360 | | | | 254,365 | |
| Cyberstep, Inc. | | | 21,600 | | | | 259,341 | |
| DeNa Co., Ltd. | | | 23,795 | | | | 261,573 | |
| Gumi, Inc. (a) | | | 39,052 | | | | 219,730 | |
| GungHo Online Entertainment, Inc. | | | 17,660 | | | | 248,332 | |
| KLab, Inc. | | | 41,936 | | | | 264,428 | |
| Koei Tecmo Holdings Co., Ltd. | | | 15,093 | | | | 390,923 | |
| Konami Holdings Corp. | | | 45,554 | | | | 1,404,432 | |
| Marvelous, Inc. | | | 45,195 | | | | 224,451 | |
| Nexon Co., Ltd. | | | 141,117 | | | | 2,316,405 | |
| Nintendo Co., Ltd. | | | 4,795 | | | | 1,855,568 | |
| Square Enix Holdings Co., Ltd. | | | 37,015 | | | | 1,660,985 | |
| Total Entertainment | | | | | | | 12,318,758 | |
| Household Durables - 1.3% | | | | | | | | |
| Sony Corp. - ADR (b) | | | 16,768 | | | | 992,330 | |
| Interactive Media & Services - 1.0% | | | | | | | | |
| Gree, Inc. | | | 185,339 | | | | 718,776 | |
| Leisure Products - 0.9% | | | | | | | | |
| Bandai Namco Holdings, Inc. | | | 6,269 | | | | 305,565 | |
| Sega Sammy Holdings, Inc. | | | 25,985 | | | | 317,789 | |
| Total Leisure Products | | | | | | | 623,354 | |
| Total Japan | | | | | | | 14,653,218 | |
The accompanying notes are an integral part of these financial statements.
Wedbush ETFMG TM ETF
Wedbush ETFMG Video Game Tech ETF
Schedule of Investments
March 31, 2020 (Unaudited) (Continued)
| | | Shares | | | Value | |
| Netherlands - 0.5% | | | | |
| Entertainment - 0.5% (d) | | | | |
| Funcom Se (a) | | | 226,341 | | | $ | 369,889 | |
| | | | | | | | | |
| Norway - 0.4% | | | | | | | | |
| Semiconductors & Semiconductor Equipment - 0.4% | | | | | | | | |
| Nordic Semiconductor ASA (a) | | | 64,804 | | | | 287,853 | |
| | | | | | | | | |
| Poland - 2.8% | | | | | | | | |
| Entertainment - 2.8% (d) | | | | | | | | |
| CD Projekt SA | | | 28,816 | | | | 2,013,926 | |
| | | | | | | | | |
| Republic of Korea - 14.0% | | | | | | | | |
| Entertainment - 13.2% (d) | | | | | | | | |
| Com2uS Corp. | | | 18,663 | | | | 1,293,923 | |
| Gravity Co., Ltd. - ADR | | | 8,218 | | | | 249,827 | |
| NCSoft Corp. | | | 4,173 | | | | 2,235,015 | |
| Neowiz | | | 22,230 | | | | 315,915 | |
| Netmarble Corp. | | | 24,905 | | | | 1,906,720 | |
| Nexon GT Co., Ltd. | | | 51,749 | | | | 180,666 | |
| NHN Corp. (a) | | | 21,134 | | | | 1,189,205 | |
| Pearl Abyss Corp. (a) | | | 11,560 | | | | 1,699,791 | |
| Webzen, Inc. (a) | | | 22,447 | | | | 233,256 | |
| WeMade Entertainment Co., Ltd. | | | 11,548 | | | | 190,672 | |
| Wysiwyg Studios Co., Ltd. (a) | | | 72,463 | | | | 219,053 | |
| Total Entertainment | | | | | | | 9,714,043 | |
| Hotels, Restaurants & Leisure - 0.4% | | | | | | | | |
| ME2ON Co., Ltd. (a) | | | 65,180 | | | | 260,752 | |
| Interactive Media & Services - 0.4% | | | | | | | | |
| AfreecaTV Co., Ltd. | | | 6,558 | | | | 282,823 | |
| Total Republic of Korea | | | | | | | 10,257,618 | |
| | | | | | | | | |
| Sweden - 7.8% | | | | | | | | |
| Entertainment - 7.2% (d) | | | | | | | | |
| Embracer Group AB (a) | | | 258,876 | | | | 2,572,914 | |
| G5 Entertainment AB | | | 33,276 | | | | 366,648 | |
| Modern Times Group MTG - Class B | | | 33,933 | | | | 267,209 | |
| Paradox Interactive AB | | | 24,616 | | | | 395,148 | |
| Stillfront Group AB (a) | | | 36,298 | | | | 1,625,467 | |
| Total Entertainment | | | | | | | 5,227,386 | |
| Hotels, Restaurants & Leisure - 0.3% | | | | | | | | |
| LeoVegas AB | | | 97,636 | | | | 281,877 | |
| Technology Hardware, Storage & Peripherals - 0.3% | | | | | | | | |
| Tobii AB (a) | | | 84,353 | | | | 219,995 | |
| Total Sweden | | | | | | | 5,729,258 | |
| | | | | | | | | |
| Switzerland - 0.5% | | | | | | | | |
| Technology Hardware, Storage & Peripherals - 0.5% | | | | | | | | |
| Logitech International SA (b) | | | 8,618 | | | | 369,971 | |
The accompanying notes are an integral part of these financial statements.
Wedbush ETFMG TM ETF
Wedbush ETFMG Video Game Tech ETF
Schedule of Investments
March 31, 2020 (Unaudited) (Continued)
| | | Shares | | | Value | |
| Taiwan, Province of China - 4.2% | | | | | | | | |
| Entertainment - 0.5% (d) | | | | | | | | |
| Gamania Digital Entertainment Co., Ltd. (a) | | | 164,266 | | | $ | 245,518 | |
| Softstar Entertainment, Inc. (a) | | | 103,634 | | | | 174,771 | |
| Total Entertainment | | | | | | | 420,289 | |
| Technology Hardware, Storage & Peripherals - 3.7% | | | | | | | | |
| Acer, Inc. | | | 660,315 | | | | 340,622 | |
| Asustek Computer, Inc. (a) | | | 50,285 | | | | 340,039 | |
| Micro-Star International Co., Ltd. | | | 672,272 | | | | 1,971,810 | |
| Total Technology Hardware, Storage & Peripherals | | | | | | | 2,652,471 | |
| Total Taiwan, Province of China | | | | | | | 3,072,760 | |
| | | | | | | | | |
| United Kingdom - 4.1% | | | | | | | | |
| Entertainment - 1.6% (d) | | | | | | | | |
| Frontier Developments PLC (a) | | | 28,128 | | | | 432,529 | |
| Team17 Group PLC (a) | | | 98,574 | | | | 702,797 | |
| Total Entertainment | | | | | | | 1,135,326 | |
| IT Services - 2.5% | | | | | | | | |
| Keywords Studios PLC | | | 102,380 | | | | 1,840,091 | |
| Total United Kingdom | | | | | | | 2,975,417 | |
| | | | | | | | | |
| United States - 36.2% | | | | | | | | |
| Entertainment - 22.5% (d) | | | | | | | | |
| Activision Blizzard, Inc. | | | 32,420 | | | | 1,928,342 | |
| Bilibili, Inc. - ADR (a)(b) | | | 106,227 | | | | 2,487,835 | |
| Changyou.com, Ltd. - ADR | | | 88,729 | | | | 949,400 | |
| Electronic Arts, Inc. (a) | | | 18,187 | | | | 1,821,792 | |
| Glu Mobile, Inc. (a)(b) | | | 316,908 | | | | 1,993,351 | |
| HUYA, Inc. - ADR (a) | | | 22,897 | | | | 388,104 | |
| iDreamSky Technology Holdings, Ltd. (a) | | | 871,906 | | | | 566,819 | |
| NetEase, Inc. - ADR | | | 1,277 | | | | 409,866 | |
| Sciplay Corp. - Class A (a) | | | 150,432 | | | | 1,432,865 | |
| Sea, Ltd. - ADR (a)(b) | | | 10,493 | | | | 464,945 | |
| Take-Two Interactive Software, Inc. (a) | | | 15,609 | | | | 1,851,383 | |
| Zynga, Inc. - Class A (a) | | | 305,408 | | | | 2,092,045 | |
| Total Entertainment | | | | | | | 16,386,747 | |
| Household Durables - 0.3% | | | | | | | | |
| Turtle Beach Corp. (a)(b) | | | 35,130 | | | | 219,211 | |
| Interactive Media & Services - 3.0% | | | | | | | | |
| JOYY, Inc. - (a)(b) | | | 6,962 | | | | 370,796 | |
| Momo, Inc. - ADR (a) | | | 10,753 | | | | 233,233 | |
| SINA Corp. (a) | | | 10,523 | | | | 335,052 | |
| Sohu.com, Ltd. - ADR (a) | | | 31,349 | | | | 195,304 | |
| Alphabet, Inc. - Class C (a)(b) | | | 847 | | | | 984,900 | |
| Total Interactive Media & Services | | | | | | | 2,119,285 | |
The accompanying notes are an integral part of these financial statements.
Wedbush ETFMG TM ETF
Wedbush ETFMG Video Game Tech ETF
Schedule of Investments
March 31, 2020 (Unaudited) (Continued)
| | | Shares | | | Value | |
| Semiconductors & Semiconductor Equipment - 5.4% | | | | | | | | |
| Advanced Micro Devices, Inc. (a)(b) | | | 27,737 | | | $ | 1,261,479 | |
| Intel Corp. | | | 19,751 | | | | 1,068,924 | |
| NVIDIA Corp. | | | 5,096 | | | | 1,343,306 | |
| Qualcomm, Inc. (a)(b) | | | 4,419 | | | | 298,945 | |
| Total Semiconductors & Semiconductor Equipment | | | | | | | 3,972,654 | |
| Software - 1.6% | | | | | | | | |
| Cheetah Mobile, Inc. - ADR | | | 95,011 | | | | 198,573 | |
| Kingsoft Corp., Ltd. (a) | | | 157,628 | | | | 514,397 | |
| Microsoft Corp. (b) | | | 7,386 | | | | 1,164,846 | |
| Total Software | | | | | | | 1,877,816 | |
| Specialty Retail - 0.3% | | | | | | | | |
| GameStop Corp. - Class A (b) | | | 56,138 | | | | 196,483 | |
| Technology Hardware, Storage & Peripherals - 2.1% | | | | | | | | |
| Apple, Inc. (b) | | | 4,148 | | | | 1,054,794 | |
| Immersion Corp. (a) | | | 43,862 | | | | 235,100 | |
| Razer, Inc. (a) | | | 2,160,947 | | | | 267,584 | |
| Total Technology Hardware, Storage & Peripherals | | | | | | | 1,557,478 | |
| Total United States | | | | | | | 26,329,674 | |
| TOTAL COMMON STOCKS (Cost $76,676,854) | | | | | | | 72,553,287 | |
| | | | | | | | | |
| INVESTMENTS PURCHASED WITH PROCEEDS FROM SECURITIES LENDING COLLATERAL – 14.5% | | | | | | | | |
| ETFMG Sit Ultra Short ETF (e) | | | 50,000 | | | | 2,404,000 | |
| Mount Vernon Liquid Assets Portfolio, LLC, 0.91% (c) | | | 8,154,573 | | | | 8,154,573 | |
| TOTAL INVESTMENTS PURCHASED WITH PROCEEDS FROM SECURITIES LENDING COLLATERAL (Cost $10,658,958) | | | | | | | 10,558,573 | |
| | | | | | | | | |
| SHORT-TERM INVESTMENS - 0.1% | | | | | | | | |
| Money Market Funds - 0.1% | | | | | | | | |
| Invesco Advisers, Inc. STIT-Treasury Portfolio - Institutional Class, 0.30% (c) | | | 80,820 | | | | 80,820 | |
| TOTAL SHORT -TERM INVESTMENTS (Cost $80,820) | | | | | | | 80,820 | |
| | | | | | | | | |
| Total Investments (Cost $87,416,632) - 114.2% | | | | | | | 83,192,680 | |
| Liabilities in Excess of Other Assets - (14.2)% | | | | | | | (10,358,817 | ) |
| TOTAL NET ASSETS - 100.0% | | | | | | $ | 72,833,863 | |
Percentages are stated as a percent of net assets.
| ADR | American Depositary Receipt |
| | | |
| (a) | Non-income producing security. |
| (b) | All or a portion of this security was out on loan as of March 31, 2020. |
| (c) | The rate shown is the annualized seven-day yield at March 31, 2020. |
| (d) | As of March 31, 2020, the Fund had a significant portion of its assets in the Entertainment Industry. |
| (e) | Affiliated security. Please refer to Note 9 of the Notes to Financial Statements. |
The accompanying notes are an integral part of these financial statements.
Wedbush ETFMG TM ETF
STATEMENT OF ASSETS AND LIABILITIES
As of March 31, 2020 (Unaudited)
| | | Wedbush
ETFMG Global
Cloud
Technology ETF | | | Wedbush
ETFMG
Video Game
Tech ETF | |
| ASSETS | | | | |
| Investments in unaffiliated securities, at value* | | $ | 29,341,954 | | | $ | 80,788,680 | |
| Investments in affiliated securities, at value* | | | 1,256,428 | | | | 2,404,000 | |
| Total Investments in securities, at value | | | 30,598,382 | | | | 83,192,680 | |
| Dividends and interest receivable | | | 45,698 | | | | 216,362 | |
| Securities lending income receivable | | | 24,551 | | | | 9,058 | |
| Total Assets | | | 30,668,631 | | | | 83,418,100 | |
| | | | | | | | | |
| LIABILITIES | | | | | | | | |
| Collateral received for securities loaned (Note 7) | | $ | 4,517,943 | | | $ | 10,539,573 | |
| Payables: | | | | | | | | |
| Management fees payable | | | 17,396 | | | | 44,664 | |
| Total Liabilities | | | 4,535,339 | | | | 10,584,237 | |
| Net Assets | | $ | 26,133,292 | | | $ | 72,833,863 | |
| | | | | | | | | |
| NET ASSETS CONSIST OF: | | | | | | | | |
| Paid-in Capital | | $ | 37,771,230 | | | $ | 98,258,659 | |
| Total Distributable Earnings | | | (11,637,938 | ) | | | (25,424,796 | ) |
| Net Assets | | $ | 26,133,292 | | | $ | 72,833,863 | |
| | | | | | | | | |
| *Identified Cost: | | | | | | | | |
| | | | | | | | | |
| Investments in unaffiliated securities | | $ | 36,607,620 | | | $ | 84,912,247 | |
| Investments in affiliated securities | | | 1,256,428 | | | | 2,504,385 | |
| | | | | | | | | |
| Shares Outstanding^ | | | 950,000 | | | | 1,700,000 | |
| | | | | | | | | |
| Net Asset Value, Offering and Redemption Price per Share | | $ | 27.51 | | | $ | 42.84 | |
| ^ | No par value, unlimited number of shares authorized |
The accompanying notes are an integral part of these financial statements.
Wedbush ETFMG TM ETF
STATEMENT OF OPERATIONS
For the Period Ended March 31, 2020 (Unaudited)
| | | Wedbush
Global
Cloud
Technology
ETF | | | Wedbush
ETFMG
Video
Game
Tech ETF | |
| INVESTMENT INCOME | | | | |
| Income: | | | | |
| Dividends from unaffiliated securities (net of foreign withholdings tax of $8,885, $27,135) | | $ | 196,155 | | | $ | 277,535 | |
| Interest | | | 1,133 | | | | 1,785 | |
| Securities lending income | | | 211,157 | | | | 119,054 | |
| Total Investment Income | | | 408,445 | | | | 398,374 | |
| | | | | | | | | |
| Expenses: | | | | | | | | |
| Management fees | | | 134,295 | | | | 300,799 | |
| Total Expenses | | | 134,295 | | | | 300,799 | |
| Net Investment Income (Loss) | | | 274,150 | | | | 97,575 | |
| | | | | | | | | |
| REALIZED & UNREALIZED GAIN (LOSS) ON INVESTMENTS | | | | | | | | |
| Net Realized Gain (Loss) on: | | | | | | | | |
| Unaffiliated Investments | | | (240,992 | ) | | | (4,209,494 | ) |
| Affiliated Investments | | | — | | | | — | |
| In-Kind redemptions | | | 1,343,707 | | | | 3,176,379 | |
| Foreign currency and foreign currency translation | | | (1,473 | ) | | | (4,592 | ) |
| Net Realized Gain (Loss) on Investments and In-Kind redemptions | | | 1,101,242 | | | | (1,037,707 | ) |
| Net Change in Unrealized Appreciation (Depreciation) of: | | | | | | | | |
| Unaffiliated Investments | | | (8,906,387 | ) | | | 4,445,601 | |
| Affiliated Investments | | | (54,428 | ) | | | (100,385 | ) |
| Foreign currency and foreign currency translation | | | 1,294 | | | | (1,086 | ) |
| Net change in Unrealized Appreciation (Depreciation) of Investments | | | (8,959,521 | ) | | | 4,344,130 | |
| Net Realized and Unrealized Gain (Loss) on Investments | | | (7,858,279 | ) | | | 3,306,423 | |
| NET INCREASE (DECREASE) IN NET ASSETS RESULTING FROM OPERATIONS | | $ | (7,584,129 | ) | | $ | 3,403,998 | |
The accompanying notes are an integral part of these financial statements.
Wedbush ETFMG TM ETF
Wedbush ETFMG Global Cloud Technology ETF
STATEMENTS OF CHANGES IN NET ASSETS
| | | Period
Ended
March 31,
2020
(Unaudited) | | | Year Ended
September 30,
2019 | |
| OPERATIONS | | | | |
| Net investment gain (loss) | | $ | 274,150 | | | $ | 326,490 | |
| Net realized gain (loss) on investments and In-Kind Redemptions | | | 1,101,242 | | | | (1,104,431 | ) |
| Net change in unrealized appreciation (depreciation) of investments and foreign currency and foreign currency translation | | | (8,959,521 | ) | | | (3,859,005 | ) |
| Net increase (decrease) in net assets resulting from operations | | | (7,584,129 | ) | | | (4,636,946 | ) |
| | | | | | | | | |
| DISTRIBUTIONS TO SHAREHOLDERS | | | | | | | | |
| Total distributions from distributable earnings | | | (226,000 | ) | | | (326,484 | ) |
| | | | | | | | | |
| CAPITAL SHARE TRANSACTIONS | | | | | | | | |
| Net decrease in net assets derived from net change in outstanding shares | | | (3,777,130 | ) | | | (8,088,245 | ) |
| Transaction Fees (See Note 1) | | | 347 | | | | 1,012 | |
| Net increase (decrease) in net assets from capital share transactions | | | (3,776,783 | ) | | | (8,087,233 | ) |
| Total increase (decrease) in net assets | | $ | (11,586,912 | ) | | $ | (13,050,663 | ) |
| | | | | | | | | |
| NET ASSETS | | | | | | | | |
| Beginning of Year/Period | | | 37,720,204 | | | | 50,770,867 | |
| End of Year/Period | | $ | 26,133,292 | | | $ | 37,720,204 | |
Summary of share transactions is as follows:
| | | Period Ended
March 31,
2020
(Unaudited) | | | Year Ended
September 30,
2019 | |
| | | Shares | | | Amount | | | Shares | | | Amount | |
| Shares Sold | | | 50,000 | | | $ | 1,856,550 | | | | 250,000 | | | $ | 8,965,040 | |
| Transaction Fees (See Note 1) | | | — | | | | 347 | | | | — | | | | 1,012 | |
| Shares Redeemed | | | (150,000 | ) | | | (5,633,680 | ) | | | (500,000 | ) | | | (17,053,285 | ) |
| Net Transactions in Fund Shares | | | (100,000 | ) | | $ | (3,776,783 | ) | | | (250,000 | ) | | $ | (8,087,233 | ) |
| Beginning Shares | | | 1,050,000 | | | | | | | | 1,300,000 | | | | | |
| Ending Shares | | | 950,000 | | | | | | | | 1,050,000 | | | | | |
The accompanying notes are an integral part of these financial statements.
Wedbush ETFMG TM ETF
Wedbush ETFMG Video Game Tech ETF
STATEMENTS OF CHANGES IN NET ASSETS
| | | Period
Ended
March 31,
2020
(Unaudited) | | | Year Ended
September 30,
2019 | |
| OPERATIONS | | | | | | |
| Net investment gain (loss) | | $ | 97,575 | | | $ | 1,178,862 | |
| Net realized gain (loss) on investments and In-Kind Redemptions | | | (1,037,707 | ) | | | (14,064,092 | ) |
| Net change in unrealized appreciation (depreciation) of investments and foreign currency and foreign currency translation | | | 4,344,130 | | | | (3,031,697 | ) |
| Net increase (decrease) in net assets resulting from operations | | | 3,403,998 | | | | (15,916,927 | ) |
| | | | | | | | | |
| DISTRIBUTIONS TO SHAREHOLDERS | | | | | | | | |
| Total distributions from distributable earnings | | | (297,000 | ) | | | (1,402,817 | ) |
| | | | | | | | | |
| CAPITAL SHARE TRANSACTIONS | | | | | | | | |
| Net increase (decrease) in net assets derived from net change in outstanding shares | | | (13,280,755 | ) | | | (30,318,420 | ) |
| Transaction Fees (See Note 1) | | | 7,132 | | | | 29,433 | |
| Net increase (decrease) in net assets from capital share transactions | | | (13,273,623 | ) | | | (30,288,987 | ) |
| Total increase (decrease) in net assets | | $ | (10,166,625 | ) | | $ | (47,608,731 | ) |
| | | | | | | | | |
| NET ASSETS | | | | | | | | |
| Beginning of Year/Period | | | 83,000,488 | | | | 130,609,219 | |
| End of Year/Period | | $ | 72,833,863 | | | $ | 83,000,488 | |
Summary of share transactions is as follows:
| | | Period Ended
March 31,
2020
(Unaudited) | | | Year Ended
September 30,
2019 | |
| | | Shares | | | Amount | | | Shares | | | Amount | |
| Shares Sold | | | 100,000 | | | $ | 4,438,270 | | | | 350,000 | | | $ | 14,348,180 | |
| Transaction Fees (See Note 1) | | | — | | | | 7,132 | | | | — | | | | 29,433 | |
| Shares Redeemed | | | (400,000 | ) | | | (17,719,025 | ) | | | (1,100,000 | ) | | | (44,666,600 | ) |
| Net Transactions in Fund Shares | | | (300,000 | ) | | $ | (13,273,623 | ) | | | (750,000 | ) | | $ | (30,288,987 | ) |
| Beginning Shares | | | 2,000,000 | | | | | | | | 2,750,000 | | | | | |
| Ending Shares | | | 1,700,000 | | | | | | | | 2,000,000 | | | | | |
The accompanying notes are an integral part of these financial statements.
Wedbush ETFMG TM ETF
Wedbush ETFMG Global Cloud Technology ETF
FINANCIAL HIGHLIGHTS
For a capital share outstanding throughout the year/period
| | | Period
Ended
March 31,
2020
(Unaudited) | | | Year
Ended
September
30,
2019 | | | Year
Ended
September
30,
2018 | | | Year
Ended
September
30,
2017 | | | Period
Ended
September
30,
20161 | |
| | | | | | | | | | | | | | | | |
| Net Asset Value, Beginning of Year/Period | | $ | 35.92 | | | $ | 39.05 | | | $ | 36.14 | | | $ | 26.75 | | | $ | 25.00 | |
| Income from Investment Operations: | | | | | | | | | | | | | | | | | | | | |
| Net investment income 2 | | | 0.27 | | | | 0.28 | | | | 0.15 | | | | 0.27 | | | | 0.11 | |
| Net realized and unrealized gain (loss) on investments | | | (8.45 | ) | | | (3.11 | ) | | | 3.08 | | | | 9.26 | | | | 1.68 | |
| Total from investment operations | | | (8.18 | ) | | | (2.83 | ) | | | 3.23 | | | | 9.53 | | | | 1.79 | |
| Less Distributions: | | | | | | | | | | | | | | | | | | | | |
| Distributions from net investment income | | | (0.23 | ) | | | (0.30 | ) | | | (0.13 | ) | | | (0.04 | ) | | | (0.04 | ) |
| Net realized gains | | | — | | | | — | | | | (0.19 | ) | | | (0.10 | ) | | | — | |
| Total distributions | | | (0.23 | ) | | | (0.30 | ) | | | (0.32 | ) | | | (0.14 | ) | | | (0.04 | ) |
| Net asset value, end of year/period | | $ | 27.51 | | | $ | 35.92 | | | $ | 39.05 | | | $ | 36.14 | | | $ | 26.75 | |
| Total Return | | | -22.87 | %3 | | | -7.23 | % | | | 9.03 | % | | | 36.39 | % | | | 7.15 % | 3 |
| | | | | | | | | | | | | | | | | | | | | |
| Ratios/Supplemental Data: | | | | | | | | | | | | | | | | | | | | |
| Net assets at end of year/period (000's) | | $ | 26,133 | | | $ | 37,720 | | | $ | 50,771 | | | $ | 37,948 | | | $ | 6,686 | |
| | | | | | | | | | | | | | | | | | | | | |
| Expenses to Average Net Assets before legal expense | | | 0.75 | %4 | | | 0.75 | % | | | 0.75 | % | | | 0.75 | % | | | 0.75 % | 4 |
| Gross Expenses to Average Net Assets | | | 0.75 | %4 | | | 0.75 | % | | | 0.75 | % | | | 0.79 | %5 | | | 0.75 % | 4 |
| Net Investment Income to Average Net Assets | | | 1.53 | %4 | | | 0.83 | % | | | 0.42 | % | | | 0.87 | % | | | 0.68 % | 4 |
| Portfolio Turnover Rate | | | 4 | %3 | | | 38 | % | | | 42 | % | | | 21 | % | | | 13 % | 3 |
| 1 | Commencement of operations on March 8, 2016. |
| 2 | Calculated based on average shares outstanding during the year/period. |
| 5 | The ratio of expenses to average net assets includes legal expense. See note 11 in the Notes to the Financial Statements. |
The accompanying notes are an integral part of these financial statements.
Wedbush ETFMG TM ETF
Wedbush ETFMG Video Game Tech ETF
FINANCIAL HIGHLIGHTS
For a capital share outstanding throughout the year/period
| | | Period
Ended
March 31,
2020
(Unaudited) | | | Year
Ended
September
30,
2019 | | | Year
Ended
September
30,
2018 | | | Year
Ended
September
30,
2017 | | | Period
Ended
September
30,
20161 | |
| | | | | | | | | | | | | | | | |
| Net Asset Value, Beginning Year/Period | | $ | 41.50 | | | $ | 47.49 | | | | 44.37 | | | $ | 32.90 | | | $ | 25.00 | |
| Income from Investment Operations: | | | | | | | | | | | | | | | | | | | | |
| Net investment income 2 | | | 0.06 | | | | 0.52 | | | | 0.74 | | | | 0.33 | | | | 0.08 | |
| Net realized and unrealized gain (loss) on investments | | | 1.45 | | | | (5.87 | ) | | | 2.98 | | | | 11.71 | | | | 7.82 | |
| Total from investment operations | | | 1.51 | | | | (5.35 | ) | | | 3.72 | | | | 12.04 | | | | 7.90 | |
| Less Distributions: | | | | | | | | | | | | | | | | | | | | |
| Distributions from net investment income | | | (0.17 | ) | | | (0.65 | ) | | | (0.59 | ) | | | (0.18 | ) | | | — | |
| Net realized gains | | | — | | | | — | | | | (0.03 | ) | | | (0.39 | ) | | | — | |
| Total distributions | | | (0.17 | ) | | | (0.65 | ) | | | (0.62 | ) | | | (0.57 | ) | | | — | |
| Capital Share Transactions: | | | | | | | | | | | | | | | | | | | | |
| Transaction fees added to paid-in capital | | | — | | | | 0.01 | | | | 0.02 | | | | — | | | | — | |
| Net asset at end of year/period | | $ | 42.84 | | | $ | 41.50 | | | | 47.49 | | | $ | 44.37 | | | $ | 32.90 | |
| Total Return | | | 3.63 | %3 | | | -11.26 | % | | | 8.38 | % | | | 37.67 | % | | | 31.62 % | 3 |
| | | | | | | | | | | | | | | | | | | | | |
| Ratios/Supplemental Data: | | | | | | | | | | | | | | | | | | | | |
| Net assets at end of year/period (000's) | | $ | 72,834 | | | $ | 83,000 | | | $ | 130,609 | | | $ | 39,934 | | | $ | 6,581 | |
| | | | | | | | | | | | | | | | | | | | | |
| Expenses to Average Net Assets before legal expense | | | 0.75 | %4 | | | 0.75 | % | | | 0.75 | % | | | 0.75 | % | | | 0.74 % | 4 |
| Gross Expenses to Average Net Assets | | | 0.75 | %4 | | | 0.75 | % | | | 0.75 | % | | | 0.82 | %5 | | | 0.74 % | 4 |
| Net Investment Income to Average Net Assets | | | 0.26 | %4 | | | 1.22 | % | | | 1.48 | % | | | 0.86 | % | | | 0.44 % | 4 |
| Portfolio Turnover Rate | | | 14 | %3 | | | 38 | % | | | 42 | % | | | 49 | % | | | 10 % | 3 |
| 1 | Commencement of operations on March 8, 2016. |
| 2 | Calculated based on average shares outstanding during the year/period. |
| 5 | The ratio of expenses to average net assets includes legal expense. See note 11 in the Notes to the Financial Statements. |
The accompanying notes are an integral part of these financial statements.
Wedbush ETFMG TM ETF
NOTES TO FINANCIAL STATEMENTS
March 31, 2020 (Unaudited)
NOTE 1 – ORGANIZATION
Wedbush ETFMG Global Cloud Technology ETF (“IVES”), formerly known as ETFMG Drone Economy Strategy ETF, and Wedbush ETFMG Video Game Tech ETF (“GAMR”), formerly known as ETFMG Video Game Tech ETF (each a “Fund”, or collectively the “Funds”) are each a series of ETF Managers Trust (the “Trust”), an open-end management investment company consisting of multiple investment series, organized as a Delaware statutory trust on July 1, 2009. The Trust is registered with the SEC under the Investment Company Act of 1940, as amended (the “1940 Act”), as an open-end management investment company and the offering of the Fund’s shares (“Shares”) is registered under the Securities Act of 1933, as amended (the “Securities Act”).
The following table is a summary of the Strategy Commencement Date and Strategy of the Funds:
| Fund Ticker | Strategy Commencement Date | Strategy |
| IVES | 4/7/2020 | Seeks to provide investment results that, before fees and expenses, correspond generally to the price and yield performance of the Dan Ives Global Cloud Technology Prime™ Index NTR.* |
| GAMR | 3/8/2016 | Seeks to provide investment results that, before fees and expenses, correspond generally to the price and yield performance of the EEFund Video Game Tech™ Index. |
*As of April 7th the Fund’s Strategy was changed, see Note 12- Subsequent Events for further details.
The Funds currently offer one class of shares, which have no front end sales load, no deferred sales charges, and no redemption fees. The Funds may issue an unlimited number of shares of beneficial interest, with no par value. All shares of the Funds have equal rights and privileges.
Shares of the Funds are listed and traded on the NASDAQ Stock Market, LLC. Market prices for the Shares may be different from their net asset value (“NAV”). Each Fund issue and redeems Shares on a continuous basis at NAV only in blocks of 50,000 shares, called “Creation Units.” Creation Units are issued and redeemed principally in-kind for securities included in the Index. Once created, Shares generally trade in the secondary market at market prices that change throughout the day in quantities less than a Creation Unit. Except when aggregated in Creation Units, Shares are not redeemable securities of the Funds. Shares of the Funds may only be purchased or redeemed by certain financial institutions (“Authorized Participants”). An Authorized Participant is either (i) a broker-dealer or other participant in the clearing process through the Continuous Net Settlement System of the National Securities Clearing Corporation or (ii) a DTC participant and, in each case, must have executed a Participant Agreement with the Distributor. Most retail investors do not qualify as Authorized Participants nor have the resources to buy and sell whole Creation Units. Therefore, they are unable to purchase or redeem the Shares directly from a Fund. Rather, most retail investors may purchase Shares in the secondary market with the assistance of a broker and may be subject to customary brokerage commissions or fees.
Authorized Participants transacting in Creation Units for cash may pay an additional variable charge to compensate the relevant Fund for certain transaction costs (i.e., brokerage costs) and market impact expenses relating to investing in portfolio securities. Such variable charges, if any, are included in “Transaction Fees” in the Statements of Changes in Net Assets.
Wedbush ETFMG TM ETF
NOTES TO FINANCIAL STATEMENTS
March 31, 2020 (Unaudited) (Continued)
NOTE 2 – SIGNIFICANT ACCOUNTING POLICIES
The following is a summary of significant accounting policies consistently followed by the Funds. These policies are in conformity with accounting principles generally accepted in the United States of America (“U.S. GAAP”).
The Funds follow the investment company accounting and reporting guidance of the Financial Accounting Standards Board Accounting Standard Codification Topic 946 Financial Services – Investment Companies.
The Funds may invest in certain other investment companies (underlying funds). For specific investments in underlying funds, please refer to the complete schedule of portfolio holdings on Form N-CSR(S) for this reporting period, which is filed with the U.S. Securities and Exchange Commission (SEC). For more information about the underlying Fund’s operations and policies, please refer to those Funds’ semiannual and annual reports, which are filed with the SEC.
| A. | Security Valuation. Securities listed on a securities exchange, market or automated quotation system for which quotations are readily available (except for securities traded on NASDAQ), including securities traded over the counter, are valued at the last quoted sale price on the primary exchange or market (foreign or domestic) on which they are traded on the valuation date (or at approximately 4:00 pm Eastern Time if a security’s primary exchange is normally open at that time), or, if there is no such reported sale on the valuation date, at the most recent quoted bid price. For securities traded on NASDAQ, the NASDAQ Official Closing Price will be used. |
Securities for which quotations are not readily available are valued at their respective fair values as determined in good faith by the Board of Trustees (the “Board”). When a security is “fair valued,” consideration is given to the facts and circumstances relevant to the particular situation, including a review of various factors set forth in the pricing procedures adopted by the Fund’s Board. The use of fair value pricing by the Fund may cause the net asset value of its shares to differ significantly from the net asset value that would be calculated without regard to such considerations. As of March 31, 2020, the Funds did not hold any fair valued securities.
As described above, the Funds utilize various methods to measure the fair value of its investments on a recurring basis. U.S. GAAP establishes a hierarchy that prioritizes inputs to valuation methods. The three levels of inputs are:
| Level 1 | Unadjusted quoted prices in active markets for identical assets or liabilities that the Fund has the ability to access. |
| Level 2 | Observable inputs other than quoted prices included in Level 1 that are observable for the asset or liability, either directly or indirectly. These inputs may include quoted prices for the identical instrument on an inactive market, prices for similar instruments, interest rates, prepayment speeds, credit risk, yield curves, default rates and similar data. |
| Level 3 | Unobservable inputs for the asset or liability, to the extent relevant observable inputs are not available; representing the Fund’s own assumptions about the assumptions a market participant would use in valuing the asset or liability, and would be based on the best information available. |
Wedbush ETFMG TM ETF
NOTES TO FINANCIAL STATEMENTS
March 31, 2020 (Unaudited) (Continued)
The availability of observable inputs can vary from security to security and is affected by a wide variety of factors, including, for example, the type of security, whether the security is new and not yet established in the marketplace, the liquidity of markets, and other characteristics particular to the security. To the extent that valuation is based on models or inputs that are less observable or unobservable in the market, the determination of fair value requires more judgment. Accordingly, the degree of judgment exercised in determining fair value is greatest for instruments categorized in Level 3.
The inputs used to measure fair value may fall into different levels of the fair value hierarchy. In such cases, for disclosure purposes, the level in the fair value hierarchy within which the fair value measurement falls in its entirety, is determined based on the lowest level input that is significant to the fair value measurement in its entirety.
The following is a summary of the inputs used to value the Funds’ net assets as of March 31, 2020:
| IVES | | | | | | | | | | | | |
| Assets^ | | Level 1 | | | Level 2 | | | Level 3 | | | Total | |
| Common Stocks | | $ | 25,208,965 | | | $ | 783,956 | | | $ | — | | | $ | 25,992,921 | |
| Short Term Investments | | | 78,018 | | | | — | | | | — | | | | 78,018 | |
| Investments Purchased with Securities Lending Collateral* | | | — | | | | — | | | | — | | | | 4,527,443 | |
| Total Investments in Securities | | $ | 25,286,983 | | | $ | 783,956 | | | $ | — | | | $ | 30,598,382 | |
| GAMR | | | | | | | | | | | | |
| Assets^ | | Level 1 | | | Level 2 | | | Level 3 | | | Total | |
| Common Stocks | | $ | 72,553,287 | | | $ | — | | | $ | — | | | $ | 72,553,287 | |
| Short Term Investments | | | 80,820 | | | | — | | | | — | | | | 80,820 | |
| Investments Purchased with Securities Lending Collateral* | | | — | | | | — | | | | — | | | | 10,558,573 | |
| Total Investments in Securities | | $ | 72,634,107 | | | $ | — | | | $ | — | | | $ | 83,558,573 | |
| ^ | See Schedule of Investments for classifications by country and industry |
| * | Certain investments that are measured at fair value used the net asset value per share (or its equivalent) practical expediant have not beencategorized in the fair value hierarchy. The fair value amounts presented in the table are intended to permit reconciliation of the fair value hierarchy to the amounts presented in the Schedules of Investments. |
| B. | Federal Income Taxes. The Funds have elected to be taxed as a “regulated investment company” and intends to distribute substantially all taxable income to its shareholders and otherwise comply with the provisions of the Internal Revenue Code applicable to regulated investment companies. Therefore, no provisions for federal income taxes or excise taxes have been made. |
To avoid imposition of the excise tax applicable to regulated investment companies, the Funds intend to declare each year as dividends, in each calendar year, at least 98.0% of its net investment income (earned during the calendar year) and 98.2% of its net realized capital gains (earned during the twelve months ended October 31) plus undistributed amounts, if any, from prior years.
Net capital losses incurred after October 31, within the taxable year are deemed to arise on the first business day of the Fund’s next taxable year.
Wedbush ETFMG TM ETF
NOTES TO FINANCIAL STATEMENTS
March 31, 2020 (Unaudited) (Continued)
The Funds recognize the tax benefits of uncertain tax positions only where the position is “more likely than not” to be sustained assuming examination by tax authorities. The Funds have analyzed its tax position and has concluded that no liability for unrecognized tax benefits should be recorded related to uncertain tax positions expected to be taken in the Fund’s 2019 tax returns. The Fund identifies its major tax jurisdictions as U.S. Federal, the State of New Jersey, and the State of Delaware; however the Fund is not aware of any tax positions for which it is reasonably possible that the total amounts of unrecognized tax benefits will change materially in the next twelve months.
As of March 31, 2020, management has reviewed the tax positions for open periods (for federal purposes, three years from the date of filing and for state purposes, four years from the date of filing) as applicable to the Funds, and has determined that no provision for income tax is required in the Funds’ financial statements.
| C. | Security Transactions and Investment Income. Investment securities transactions are accounted for on the trade date. Gains and losses realized on sales of securities are determined on a specific identification basis. Discounts/premiums on debt securities purchased are accreted/amortized over the life of the respective securities using the effective interest method. Dividend income is recorded on the ex-dividend date. Interest income is recorded on an accrual basis. Income, including gains, from investments in foreign securities received by the Funds may be subject to income, withholding or other taxes imposed by foreign countries. |
| D. | Foreign Currency Translations and Transactions. The Funds may engage in foreign currency transactions. Foreign currency transactions are translated into U.S. dollars on the following basis: (i) market value of investment securities, assets and liabilities at the daily rates of exchange, and (ii) purchases and sales of investment securities, dividend and interest income and certain expenses at the rates of exchange prevailing on the respective dates of such transactions. For financial reporting purposes, the Funds do not isolate changes in the exchange rate of investment securities from the fluctuations arising from changes in the market prices of securities for unrealized gains and losses. However, for federal income tax purposes, the Funds do isolate and treat as ordinary income the effect of changes in foreign exchange rates on realized gains or losses from the sale of investment securities and payables and receivables arising from trade-date and settlement-date differences. |
| E. | Distributions to Shareholders. Distributions to shareholders from net investment income, if any are generally declared and paid by the Funds on a quarterly basis. Net realized gains on securities of the Funds normally are declared and paid on an annual basis. Distributions are recorded on the ex-dividend date. |
| F. | Use of Estimates. The preparation of financial statements in conformity with U.S. GAAP requires management to make estimates and assumptions that affect the reported amounts of assets and liabilities at the date of the financial statements, as well as the reported amounts of revenues and expenses during the period. Actual results could differ from those estimates. |
| G. | Share Valuation. The net asset value (“NAV”) per share of the Funds are calculated by dividing the sum of the value of the securities held by the Funds, plus cash and other assets, minus all liabilities (including estimated accrued expenses) by the total number of shares outstanding of the Funds, rounded to the nearest cent. The Funds’ shares will not be priced on the days on which the NYSE is closed for trading. The offering and redemption price per share for the Funds are equal to the Funds’ net asset value per share. |
| H. | Guarantees and Indemnifications. In the normal course of business, the Funds enter into contracts with service providers that contain general indemnification clauses. The Funds’ maximum exposure under these arrangements is unknown as this would involve future claims that may be made against the Funds that have not yet occurred. However, based on experience, the Funds expects the risk of loss to be remote. |
Wedbush ETFMG TM ETF
NOTES TO FINANCIAL STATEMENTS
March 31, 2020 (Unaudited) (Continued)
NOTE 3 – RISK FACTORS
Investing in Wedbush Global Cloud Technology ETF and the Wedbush Video Game Tech ETF may involve certain risks, as discussed in the Funds’ prospectus, including, but not limited to, those described below. Any of these risks could cause an investor to lose money.
Market Risk. Financial markets rise and fall in response to a variety of factors, sometimes rapidly and unpredictably. As with any investment whose performance is tied to these markets, the value of an investment in a fund will fluctuate, which means that an investor could lose money over short or long periods.
Investment Style Risk. The Fund is not actively managed. Therefore, the Funds follow the securities included in its respective index during upturns as well as downturns. Because of its indexing strategy, the Funds do not take steps to reduce market exposure or to lessen the effects of a declining market. In addition, because of the Funds’ expenses, the Funds’ performance may be below that of its index.
Equity Risk. The prices of equity securities rise and fall daily. These price movements may result from factors affecting individual companies, industries or the securities market as a whole. In addition, equity markets tend to move in cycles which may cause stock prices to fall over short or extended periods of time.
Securities Lending Risk. Securities lending involves the risk of loss of rights in, or delay in recovery of, the loaned securities if the borrower fails to return the security loaned or becomes insolvent.
Concentration Risk. To the extent that the Funds’ or its underlying index’s portfolio is concentrated in the securities of issuers in a particular market, industry, group of industries, sector or asset class, the Funds may be adversely affected by the performance of those securities, may be subject to increased price volatility and may be more vulnerable to adverse economic, market, political or regulatory occurrences affecting that market, industry, group of industries, sector or asset class.
NOTE 4 – COMMITMENTS AND OTHER RELATED PARTY TRANSACTIONS
ETF Managers Group, LLC (the “Advisor”), serves as the investment advisor to the Funds. Pursuant to an Investment Advisory Agreement (“Advisory Agreement”) between the Trust, on behalf of the Funds, and the Advisor, the Advisor provides investment advice to the Funds and oversees the day-to-day operations of the Funds, subject to the direction and control of the Board and the officers of the Trust. Under the Advisory Agreement, the Advisor is also responsible for arranging transfer agency, custody, fund administration and accounting, and other non-distribution related services necessary for the Funds to operate.
Under the Investment Advisory Agreement, the Advisor has overall responsibility for the general management and administration of the Funds and arranges for sub-advisory, transfer agency, custody, fund administration, securities lending, and all other non-distribution related services necessary for the Funds to operate. The Funds unitary fees are accrued daily and paid monthly. The Advisor bears the costs of all advisory and non-advisory services required to operate the Funds, in exchange for a single unitary fee at the following annual rates:
| * | As of April 7, 2020 the unitary fee changed to 0.68%, see Note 12- Subsequent Events for further details |
Wedbush ETFMG TM ETF
NOTES TO FINANCIAL STATEMENTS
March 31, 2020 (Unaudited) (Continued)
The Advisor has an agreement with, and is dependent on, a third party to pay the Funds’ expenses in excess of the annual expense rates of each Funds’ average daily net assets. Additionally, under the Investment Advisory Agreement, the Advisor has agreed to pay all expenses of the Funds, except for: the fee paid to the Advisor pursuant to the Investment Advisory Agreement, interest charges on any borrowings, taxes, brokerage commissions and other expenses incurred in placing orders for the purchase and sale of securities and other investment instruments, acquired fund fees and expenses, accrued deferred tax liability, extraordinary expenses, and distribution (12b-1) fees and expenses (collectively, “Excluded Expenses”). The Sponsor provides marketing support for the Funds, including distributing marketing materials related to the Funds. The Advisor has entered into an agreement with Wedbush Securities Inc. (“Wedbush”), (“the Sponsor”). The Sponsor provides marketing support for the Funds, including distributing marketing materials related to the Funds. Level ETF Ventures, LLC serves as the index provider for GAMR and reality Shares, LLC serves as the index provider for IVES.
U.S. Bancorp Fund Services, LLC doing business as U.S. Bank Global Fund Services (the “Administrator”) provides fund accounting, fund administration, and transfer agency services to the Funds. The Advisor compensates the Administrator for these services under an administration agreement between the two parties.
The Advisor pays each independent Trustee a quarterly fee for service to the Funds. Each Trustee is also reimbursed by the Advisor for all reasonable out-of-pocket expenses incurred in connection with his duties as Trustee, including travel and related expenses incurred in attending Board meetings.
NOTE 5 – DISTRIBUTION PLAN
The Fund has adopted a Plan of Distribution pursuant to Rule 12b-1 under the 1940 Act. Under the Plan, the Fund may pay compensation to the Distributor or any other distributor or financial institution with which the Trust has an agreement with respect to the Fund, with the amount of such compensation not to exceed an annual rate of 0.25% of each Fund’s average daily net assets. For the period ended March 31, 2020, the Fund did not incur any 12b-1 expenses.
NOTE 6 - PURCHASES AND SALES OF SECURITIES
The costs of purchases and sales of securities, excluding short-term securities and in-kind transactions, during the period ended March 31, 2020:
| | | Purchases | | | Sales | |
| IVES | | $ | 2,824,899 | | | $ | 1,358,535 | |
| GAMR | | | 11,840,753 | | | | 11,327,355 | |
The costs of purchases and sales of in-kind transactions associated with creations and redemptions during the period ended March 31, 2020:
| | | | Purchases
In-Kind | | | | Sales
In-Kind | |
| | | | | | | | | |
| IVES | | $ | 1,654,151 | | | $ | 5,525,919 | |
| GAMR | | | 22,394,626 | | | | 12,075,772 | |
Purchases in-kind are the aggregate of all in-kind purchases and sales in-kind are the aggregate of all in-kind sales. Net capital gains or losses resulting from in-kind redemptions are excluded from the Funds’ determination of taxable gains and are not distributed to shareholders.
Wedbush ETFMG TM ETF
NOTES TO FINANCIAL STATEMENTS
March 31, 2020 (Unaudited) (Continued)
There were no purchases or sales of U.S. Government obligations during the period ended March 31, 2020.
NOTE 7 — SECURITIES LENDING
The Funds may lend up to 331/3% of the value of the securities in its portfolio to brokers, dealers and financial institutions (but not individuals) under terms of participation in a securities lending program administered by U.S. Bank N.A. (“the Custodian”). The securities lending agreement requires that loans are collateralized at all times in an amount equal to at least 102% of the value of any loaned securities at the time of the loan, plus accrued interest. The Funds receive compensation in the form of fees and earns interest on the cash collateral. The amount of fees depends on a number of factors including the type earns of security and length of the loan. The Funds continue to receive interest payments or dividends on the securities loaned during the borrowing period. Gain or loss in the fair value of securities loaned that may occur during the term of the loan will be for the account of the Funds. The Funds have the right under the terms of the securities lending agreement to recall the securities from the borrower on demand. As of March 31, 2020, the Funds had loaned securities and received cash collateral for the loans. The cash collateral is invested by the Custodian in accordance with approved investment guidelines. Those guidelines require the cash collateral to be invested in readily marketable, high quality, short-term obligations; however, such investments are subject to risk of payment delays or default on the part of the issuer or counterparty or otherwise may not generate sufficient interest to support the costs associated with securities lending. The Fund could also experience delays in recovering its securities and possible loss of income or value if the borrower fails to return the borrowed securities, although the Funds are indemnified from this risk by contract with the securities lending agent.
As of March 31, 2020, the value of the securities on loan and payable for collateral due to broker were as follows:
Value of Securities on Loan Collateral Received
| Fund | | Values of
Securities
on Loan | | | Fund
Collateral
Received* | |
| IVES | | $ | 4,266,298 | | | $ | 4,516,123 | |
| GAMR | | | 10,234,674 | | | | 10,535,934 | |
| * | The cash collateral received was invested in the ETFMG Sit Ultra Short ETF and the Mount Vernon Liquid Assets Portfolio, an investment with an overnight and continuous maturity, as shown on the Schedule of Investments. |
NOTE 8 – FEDERAL INCOME TAXES
The components of distributable earnings (losses) and cost basis of investments for federal income tax purposes at September 30, 2019 were as follows:
| | | Cost | | | Gross
Unrealized
Appreciation | | | Gross
Unrealized
Depreciation | | | Net Unrealized
Appreciation
(Depreciation) | |
| IVES | | $ | 43,100,694 | | | $ | 4,650,275 | | | $ | (4,183,895 | ) | | $ | 466,380 | |
| GAMR | | | 108,068,315 | | | | 8,434,786 | | | | (21,914,616 | ) | | | (13,479,830 | ) |
The difference between the tax cost of investments and the cost of investments for GAAP purposes is primarily due to the tax treatment of wash sale losses.
Wedbush ETFMG TM ETF
NOTES TO FINANCIAL STATEMENTS
March 31, 2020 (Unaudited) (Continued)
As of September 30, 2019, the components of distributable earnings (loss) on a tax basis were as follows:
| | | Undistributed
Ordinary
Income | | | Undistributed
Long-Term
Gain | | | Total
Distributable
Earnings | | | Other
Accumulated
Loss | | | Total
Accumulated
Gain (Loss) | |
| IVES | | $ | 4,196 | | | $ | — | | | $ | 4,196 | | | $ | (4,296,985 | ) | | $ | (3,827,809 | ) |
| GAMR | | | 293,255 | | | | — | | | | 293,255 | | | | (15,345,219 | ) | | | (28,531,794 | ) |
The difference between the tax cost of investments and the cost of investments for GAAP purposes is primarily due to the tax treatment of wash sale losses.
As of September 30, 2019, the Funds had accumulated capital loss carryovers of:
| | | Capital Loss
Carryforward
ST | | | Capital Loss
Carryforward
LT | | | Expires | |
| IVES | | $ | (662,548 | ) | | $ | (3,634,436 | ) | | | Indefinite | |
| GAMR | | | (8,192,239 | ) | | | (7,151,997 | ) | | | Indefinite | |
| | | | | | | | | | | | | |
Under current tax law, capital and currency losses realized after October 31 of a Fund’s fiscal year may be deferred and treated as occurring on the first business day of the following fiscal year for tax purposes. The following Funds had deferred post-October capital and currency losses, which will be treated as arising on the first business day of the year ending September 30, 2019.
| | | | Late Year
Ordinary
Loss | | | | Post-
October
Capital
Loss | |
| IVES | | | — | | | | — | |
| GAMR | | | — | | | | — | |
U.S. GAAP requires that certain components of net assets relating to permanent differences be reclassified between financial and tax reporting. These reclassifications have no effect on net assets or net asset value per share. For the fiscal year ended September 30, 2019, the following table shows the reclassifications made:
| | | Total
Distributable
Earnings/(Loss) | | | Paid-In
Capital | |
| IVES | | $ | (3,012,440 | ) | | $ | 3,012,440 | |
| GAMR | | | (1,718,561 | ) | | | 1,718,561 | |
The tax character of distributions paid during the year ended September 30, 2019, and the year ended September 30, 2018 were as follows:
| | | Year Ended September 30, 2019 | | | Year Ended September 30, 2018 | |
| | | | From Ordinary
Income | | | | From Capital
Gains | | | | From Ordinary
Income | | | | From Capital
Gains | |
| IVES | | $ | 326,484 | | | $ | — | | | $ | 401,757 | | | $ | 2,383 | |
| GAMR | | | 1,402,817 | | | | — | | | | 1,401,544 | | | | — | |
Wedbush ETFMG TM ETF
NOTES TO FINANCIAL STATEMENTS
March 31, 2020 (Unaudited) (Continued)
NOTE 9 – INVESTMENTS IN AFFILIATES
Wedbush ETFMG Global Cloud Technology ETF
ETFMG Sit Ultra Short ETF is deemed to be affiliates of the Fund as defined by the 1940 Act as of the period ended March 31, 2020. Transactions during the period in these securities were as follows:
Security
Name | | Value at
September
30, 2019 | | | Purchases | | | Sales | | | Realized
Gain
(Loss)(1) | | | Change in
Unrealized
Appreciation
(Depreciation) | | | Dividend
Income | | | Value at
March 31,
2020 | | | Ending
Shares | |
| ETFMG Sit Ultra Short ETF * | | $ | — | | | $ | 1,256,428 | | | | — | | | $ | — | | | $ | (54,428 | ) | | $ | — | | | $ | 1,202,000 | | | | 25,000 | |
Wedbush ETFMG Video Game Tech ETF
ETFMG Sit Ultra Short ETF is deemed to be affiliates of the Fund as defined by the 1940 Act as of the period ended March 31, 2020. Transactions during the period in these securities were as follows:
Security
Name | | Value at
September
30, 2019 | | | Purchases | | | Sales | | | Realized
Gain
(Loss) | | | Change in
Unrealized
Appreciation
(Depreciation) | | | Dividend
Income | | | Value at
March 31,
2020 | | | Ending
Shares | |
| ETFMG Sit Ultra Short ETF * | | $ | — | | | $ | 2,504,385 | | | | — | | | $ | — | | | $ | (100,385 | ) | | $ | — | | | $ | 2,404,000 | | | | 50,000 | |
*Affiliate as of March 31, 2020.
NOTE 10 – NEW ACCOUNTING PRONOUNCEMENTS
In August 2018, FASB issued Accounting Standards Update (“ASU”) 2018-13, Fair Value Measurement (Topic 820): Disclosure Framework – Changes to the Disclosure Requirements for Fair Value Measurement (“ASU 2018-13”). The primary focus of ASU 2018-13 is to improve the effectiveness of the disclosure requirements for fair value measurements. The changes affect all companies that are required to include fair value measurement disclosures. In general, the amendments in ASU 2018-13 are effective for all entities for fiscal years and interim periods within those fiscal years, beginning after December 15, 2019. An entity is permitted to early adopt the removed or modified disclosures upon the issuance of ASU 2018-13 and may delay adoption of the additional disclosures, which are required for public companies only, until their effective date. Management has evaluated ASU 2018-13 and has early adopted the relevant provisions of the disclosure framework.
NOTE 11 – LEGAL MATTERS
The Trust, a former and current trustee of the Trust, the Adviser and certain officers of the Adviser were defendants in an action filed May 2, 2017 in the Superior Court of New Jersey captioned PureShares, LLC d/b/a PureFunds et al. v. ETF Managers Group, LLC et al. (“Nasdaq”), Docket No. C-63-17. The PureShares action alleged claims based on disputes arising out of contractual relationships with the Adviser relating to certain series of the Trust. The action sought damages in unspecified amounts and injunctive relief based on breach of contract, wrongful termination, and several other claims.
Wedbush ETFMG TM ETF
NOTES TO FINANCIAL STATEMENTS
March 31, 2020 (Unaudited) (Continued)
The Adviser and its parent, Exchange Traded Managers Group, LLC (“ETFMG”), were defendants in a case filed on October 26, 2017 in the United States District Court for the Southern District of New York by NASDAQ, Inc. (“Nasdaq”) captioned Nasdaq, Inc. v. Exchange Traded Managers Group, LLC et al., Case 1:17-cv-08252. This action arose out of the same facts and circumstances, and relates to the same series of the Trust, as the New Jersey litigation and asserted claims for breach of contract, conversion and certain other claims. The matter was the subject of a bench trial in May 2019, and on December 20, 2019, the Court issued an Opinion and Order awarding compensatory damages to Plaintiff in the amount of $78,403,172.36, plus prejudgment interest. The Court also denied Plaintiff’s requests for punitive damages and equitable relief.
On May 1, 2020, Nasdaq, PureShares LLC (“PureShares”), and ETFMG announced a global settlement that resolves all claims in both the PureShares action and the Nasdaq action. The settlement is subject to future negotiations and approvals among independent third parties. As part of the settlement, Nasdaq and ETFMG have agreed to certain cash payments from ETFMG to Nasdaq and PureShares, and have executed an asset purchase agreement to transfer certain ETFMG intellectual property and related assets, to a Nasdaq affiliate. The transaction is expected to close in the last half of 2020. The Adviser does not believe that the resolution of these matters will have a material adverse effect on the Funds' financial statements. If the events set forth in the settlement agreement do not occur, and a subsequent settlement is not reached, the resulting conditions may adversely affect the Adviser's future operations.
NOTE 12 – SUBSEQUENT EVENTS
The Board of Trustees of ETF Managers Trust has approved the following changes to the ETFMG Drone Economy Strategy ETF, effective on April 7, 2020. The Fund’s name will be changed to the Wedbush ETFMG Global Cloud Technology ETF. The Fund’s current underlying index, the Reality Shares Drone Index, will be replaced with the Dan Ives Global Cloud Technology Prime Index. Fund’s investment objective will be changed to the following: “The Wedbush ETFMG Global Cloud Technology ETF seeks to provide investment results that, before fees and expenses, correspond generally to the price and yield performance of the Dan Ives Global Cloud Technology Prime Index”. Also, effective on April 7, 2020 the Fund's expense ratio was reduced to 0.68%.
The Semi-Annual report reflects the performance of the ETFMG Drone Economy Strategy ETF as of March 31, 2020, the new name is presented to only reflect the current change in name.
Wedbush ETFMG TM ETF
APPROVAL OF ADVISORY AGREEMENT AND BOARD CONSIDERATIONS
For the Period Ended March 31, 2020 (Unaudited)
Pursuant to Section 15(c) of the Investment Company Act of 1940 (the “1940 Act”), at a meeting held on March 24, 2020, the Board of Trustees (the “Board”) of ETF Managers Trust (the “Trust”) considered the renewal of the Amended and Restated Investment Advisory Agreement (the “Advisory Agreement”) between ETF Managers Group LLC (the “Adviser”) and the Trust, on behalf of each of Wedbush ETFMG Global Cloud Technology ETF (formerly, the ETFMG Drone Economy Strategy ETF) and Wedbush ETFMG Video Game Tech ETF (formerly, the ETFMG Video Game Tech ETF) (each a “Fund” and collectively, the “Funds”).
Pursuant to Section 15(c) of the 1940 Act, the Board must annually review and approve the Advisory Agreement after its initial two-year term: (i) by the vote of the Trustees or by a vote of the shareholders of the Fund; and (ii) by the vote of a majority of the Trustees who are not parties to the Advisory Agreement or “interested persons” of any party thereto, as defined in the 1940 Act (the “Independent Trustees”), cast in person at a meeting called for the purpose of voting on such approval. Each year, the Board calls and holds a meeting to decide whether to renew the Advisory Agreement for an additional one-year term. In preparation for such meeting, the Board requests and reviews a wide variety of information from the Adviser.
In reaching its decision, the Board, including the Independent Trustees, considered all factors it believed relevant, including: (i) the nature, extent and quality of the services provided to the Funds’ shareholders by the Adviser; (ii) the investment performance of the Funds; (iii) the Adviser’s costs and profits realized in providing services to the Funds, including any fall-out benefits enjoyed by the Adviser; (iv) comparative fee and expense data for the Funds in relation to other similar investment companies; (v) the extent to which economies of scale would be realized as the Funds grow and whether the advisory fees for the Funds reflect these economies of scale for the benefit of the Funds; and (vi) other financial benefits to the Adviser and its affiliates resulting from services rendered to the Funds. The Board’s review included written and oral information furnished to the Board prior to and at the meeting held on March 24, 2020, and throughout the year. Among other things, the Adviser provided responses to a detailed series of questions, which included information about the Adviser’s operations, service offerings, personnel, compliance program and financial condition. The Board then discussed the written and oral information that it received before the meeting and throughout the year, and the Adviser’s oral presentations and any other information that the Board received at the meeting, and deliberated on the renewal of the Advisory Agreement in light of this information.
The Independent Trustees were assisted throughout the contract review process by independent legal counsel. The Independent Trustees relied upon the advice of such counsel and their own business judgment in determining the material factors to be considered in evaluating the renewal of the Advisory Agreement, and the weight to be given to each such factor. The conclusions reached with respect to the Advisory Agreement were based on a comprehensive evaluation of all the information provided and not any single factor. Moreover, each Trustee may have placed varying emphasis on particular factors in reaching conclusions with respect to each Fund. The Independent Trustees conferred amongst themselves and independent legal counsel during a telephonic contract renewal meeting held prior to the March 24, 2020 meeting and also conferred in executive sessions both with and without representatives of management before and during the March 24th meeting. The Independent Trustees requested, received and considered additional information arising out of these executive sessions.
Nature, Extent and Quality of Services Provided by the Adviser
The Trustees considered the scope of services provided under the Advisory Agreement, noting that the Adviser provides investment management services to the Funds. The Board discussed the responsibilities of the Adviser, including: responsibility for the general management of the day-to-day investment and reinvestment of the assets of the Funds; determining the daily baskets of deposit securities and cash components; executing portfolio security trades for purchases and redemptions of Fund shares conducted on a cash-in-lieu basis; responsibility for daily monitoring of tracking error and quarterly reporting to the Board; and implementation of Board directives as they relate to the Funds. In considering the nature, extent and quality of the services provided by the Adviser, the Board considered the qualifications, experience and responsibilities of the Adviser’s investment personnel and the quality of the Adviser’s compliance infrastructure. The Board also considered the Adviser’s experience managing exchange-traded funds (“ETFs”), as well as the Adviser’s response to the market volatility and uncertainty during the recent pandemic.
Wedbush ETFMG TM ETF
APPROVAL OF ADVISORY AGREEMENT AND BOARD CONSIDERATIONS
For the Period Ended March 31, 2020 (Unaudited) (Continued)
The Board also considered other services provided to the Funds, such as overseeing the Funds’ service providers, monitoring adherence to the Funds’ investment restrictions, and monitoring compliance with various policies and procedures and with applicable securities laws.
Based on the factors above, as well as those discussed below, the Board concluded that it was satisfied with the nature, extent and quality of the services provided to the Funds by the Adviser.
Historical Performance
The Board then considered the past performance of the Funds. The Board reviewed information regarding each Fund’s performance with the performance of a group of peer funds and with the performance of the Fund’s underlying index for various time periods. The Board noted management’s explanation that analysis of investment performance, in absolute terms, is less relevant for the Funds than it is for actively managed funds, given the Funds’ index-based investment objectives. The Board also noted management’s further explanation that it is more relevant to review the performance of the Funds by focusing on the extent to which each Fund tracked its underlying index. The Board reviewed information regarding each Fund’s index tracking, discussing, as applicable, factors which contributed to each Fund’s tracking error. The Board noted that the Funds had underperformed their underlying indexes over certain periods, but that such underperformance was, at least in part, a result of costs incurred by the Funds not incurred by their underlying indexes. The Board considered other factors that contributed to the Funds’ tracking error, including cash drag and the process of rebalancing the Funds’ portfolios. The Board noted management’s representations that the Funds’ performance satisfactorily tracked their underlying indexes. The Board concluded that, after taking these factors into account, each of the Funds satisfactorily tracked its underlying index. The Board further noted that it had received and would continue to receive regular reports regarding each Fund’s performance, including with respect to its tracking error, at its quarterly meetings.
Cost of Services Provided, Profits and Economies of Scale
The Board reviewed the advisory fees for the Funds and compared them to the total operating expenses of comparable ETFs, as determined by an independent third party. Among other information, the Board noted that the advisory fee for each of the Funds was higher than the average and median expense ratios for its peer ETFs. The Board took into consideration management’s discussion of the fees, including that the Funds have niche investment strategies that are substantially different than the strategies of many of the peer ETFs.
The Board noted the importance of the fact that the advisory fee for each Fund is a “unified fee,” meaning that the shareholders of the Funds pay no expenses other than the advisory fee and certain other costs such as interest charges on any borrowings, taxes, brokerage commissions and other expenses incurred in placing orders for the purchase and sale of securities and other investment instruments, acquired fund fees and expenses, accrued deferred tax liability, extraordinary expenses (such as, among other things and subject to Board approval, non-standard Board-related expenses and litigation against the Board, Trustees, Funds, Adviser, and officers of the Adviser), and distribution (12b-1) fees and expenses. The Board also noted that the Adviser was responsible for compensating the Trust’s other service providers and paying the Funds’ other expenses (except as noted above) out of its own fees and resources. The Board concluded that the advisory fee for each of the Funds is reasonable in light of the factors considered.
Wedbush ETFMG TM ETF
APPROVAL OF ADVISORY AGREEMENT AND BOARD CONSIDERATIONS
For the Period Ended March 31, 2020 (Unaudited) (Continued)
The Board also evaluated the compensation and other benefits received by the Adviser from its relationship with the Funds, taking into account the profitability analysis provided by the Adviser. The Board received and reviewed a profitability analysis that detailed the revenues earned and the expenses incurred by the Adviser on a fund by fund basis and considered how profit margins could affect the Adviser’s ability to attract and retain high quality personnel. Based on the information provided to the Trustees, the Trustees concluded that the level of profits realized by the Adviser from providing services to each Fund was not excessive in view of the nature, extent and quality of services provided to each Fund. The Board further considered other benefits derived by the Adviser and its affiliates from the Adviser’s relationship with the Funds, including services provided by certain brokerage firms.
In addition, the Board considered whether economies of scale may be realized for the Funds. The Board noted that the Adviser regularly considers whether fee reductions are appropriate as the Funds grow in size. The Board noted that a unitary fee provides a level of certainty in expenses for the Funds and effectively acts as a cap on the fees and expenses (except as noted above) that are borne by the Funds. The Board noted that the Adviser still bears most of the ordinary fees and expenses of each Fund and that the Funds would likely experience benefits from the unitary fee at the Funds’ projected asset levels. The Board recognized that there would not likely be any additional economies of scale until the Funds’ assets grow.
In its deliberations, the Board did not identify any single piece of information discussed above that was all-important, controlling or determinative of its decision.
Based on the Board’s deliberations and its evaluation of the information described above, the Board, including the Independent Trustees, unanimously: (a) concluded that the terms of the Advisory Agreement are fair and reasonable; (b) concluded that the Adviser’s fees are reasonable in light of the services that the Adviser provides to the Funds; and (c) approved the renewal of the Advisory Agreement for another year.
Wedbush ETFMG TM
ETF Expense Example
Six Months Ended March 31, 2020 (Unaudited)
As a shareholder of the Funds you incur two types of costs: (1) transaction costs, including brokerage commissions on purchases and sales of Fund shares, and (2) ongoing costs, including management fees and other Fund expenses. These examples are intended to help you understand your ongoing costs (in dollars) of investing in the Funds and to compare these costs with the ongoing costs of investing in other funds. The examples are based on an investment of $1,000 for the period of time as indicated in the table below.
Actual Expenses
The first line of the table provides information about actual account values based on actual returns and actual expenses. You may use the information in this line, together with the amount you invested, to estimate the expenses that you paid over the period. Simply divide your account value by $1,000 (for example, an $8,600 account value divided by $1,000 = 8.6), then, multiply the result by the number in the first line under the heading entitled "Expenses Paid During Period'' to estimate the expenses you paid on your account during this period.
Hypothetical Example for Comparison Purposes
The second line of the table provides information about hypothetical account values based on a hypothetical return and hypothetical expenses based on the Fund's actual expense ratio and an assumed rate of return of 5% per year before expenses, which is not the Fund's actual return. The hypothetical account values and expenses may not be used to estimate the actual ending account balance or expenses you paid for the period. You may use this information to compare the ongoing costs of investing in the Fund and other funds. To do so, compare this 5% hypothetical example with the 5% hypothetical examples that appear in the shareholder reports of the other funds. Please note that the expenses shown in the table are meant to highlight your ongoing costs only and do not reflect any transactional costs, such as brokerage commissions paid on purchases and sales of Fund shares. Therefore, the second line of the table is useful in comparing ongoing costs only and will not help you determine the relative total costs of owning different funds. If these transactional costs were included, your costs would have been higher.
| Fund Name | | Beginning
Account
Value
October 1,
2019 | | | Ending
Account
Value
March
31, 2020 | | | Expenses
Paid
During
the
Period ^ | | | Annualized
Expense
Ratio
During the
Period
October 1,
2019 to
March 31,
2020 | |
| Wedbush ETFMG Global Cloud Technology | | | | | | | | | | | | | | | | |
| ETF | | | | | | | | | | | | | | | | |
| Actual | | $ | 1,000.00 | | | $ | 771.30 | | | $ | 2.97 | | | | 0.75 | % |
| Hypothetical (5% annual) | | | 1,000.00 | | | | 1,021.25 | | | | 3.49 | | | | 0.75 | % |
| Wedbush ETFMG Video Game Tech ETF | | | | | | | | | | | | | | | | |
| Actual | | $ | 1,000.00 | | | $ | 1,036.30 | | | $ | 3.82 | | | | 0.75 | % |
| Hypothetical (5% annual) | | | 1,000.00 | | | | 1,021.25 | | | | 3.79 | | | | 0.75 | % |
^ The dollar amounts shown as expenses paid during the period are equal to the annualized six-month expense ratio multiplied by the average account value during the period, multiplied by 183/366 (to reflect the number of days in the period).
Wedbush ETFMG TM ETF
Statement Regarding Liquidity Risk Management Program
ETF Managers Trust (the “Trust”) has adopted a liquidity risk management program (the “Program”). The Trust’s Board of Trustees (the “Board”) has designated ETF Managers Group LLC (the “Program Administrator”) as the administrator of the Program. The Program Administrator has designated a committee (the “Committee”), composed of personnel from multiple departments, including investment operations and compliance, that is responsible for the implementation and ongoing administration of the Program, which includes assessing the liquidity risk of Wedbush ETFMG Global Cloud Technology ETF and Wedbush ETFMG Video Game Tech ETF (each a “Fund” and, collectively, the “Funds”) under both normal and reasonably foreseeable stressed conditions.
Under the Program, the Program Administrator assesses, manages and periodically reviews each Fund’s liquidity risk, based on factors specific to the circumstances of the Fund. Liquidity risk is the risk that a Fund could not meet shareholder redemption requests without significant dilution of remaining shareholders’ interests in that Fund. This risk is managed by monitoring the degree of liquidity of each Fund’s investments and limiting the amount of the Fund’s illiquid investments, among other means. The Program Administrator’s process of determining the degree of liquidity of each Fund’s investments is supported by one or more third-party liquidity assessment vendors.
At a meeting of the Board on March 24, 2020, the Adviser provided a written report to the Board addressing the operation, and the adequacy and effectiveness of the implementation, of the Program, including, the operation of any Highly Liquid Investment Minimum, where applicable, and any material changes to the Program, for the initial period from December 1, 2018 through February 29, 2020 (the “Reporting Period”). No significant liquidity events impacting any Fund were noted in the report and it was represented that, as of December 31, 2019, each Fund was primarily highly liquid and, during the Reporting Period, each Fund held less than 15% in illiquid securities. In addition, the Program Administrator provided its assessment that Program implementation was effective and that the Program operated adequately and effectively to enable the Program Administrator to oversee and manage liquidity risk and ensure each Fund is able to meet requests to redeem shares without significant dilution to the remaining investors’ interest in the Fund.
There can be no assurance that the Program will achieve its objectives in the future. Please refer to your Fund’s prospectus for more information regarding the Fund’s exposure to liquidity risk and other principal risks to which an investment in the Fund may be subject.
Wedbush ETFMG TM ETF
SUPPLEMENTARY INFORMATION
March 31, 2020 (Unaudited)
NOTE 1 – FREQUENCY DISTRIBUTION OF PREMIUMS AND DISCOUNTS
Information regarding how often shares of each Fund traded on the Exchange at a price above (i.e., at a premium) or below (i.e., at a discount) the NAV is available on the Fund’s website at www.etfmgfunds.com.
NOTE 2 – FEDERAL TAX INFORMATION
Qualified Dividend Income/Dividends Received Deduction
For the fiscal year ended September 30, 2019, certain dividends paid by the Funds may be subject to a maximum tax rate of 15%, as provided for by the Jobs and Growth Tax Reconciliation Act of 2003. The percentage of dividends declared from ordinary income designated as qualified dividend income was as follows:
| Fund Name | Qualified Dividend Income |
| IVES | 100.00% |
| GAMR | 98.84% |
For corporate shareholders, the percent of ordinary income distributions qualifying for the corporate dividends received deduction for the fiscal year ended September 30, 2019 was as follows:
| Fund Name | Dividends Received Deduction |
| IVES | 82.39% |
| GAMR | 19.58% |
Short Term Capital Gain
The percentage of taxable ordinary income distributions that are designated as short-term capital gain distributions under Internal Revenue Section 871 (k)(2)(C) for each Fund were as follows:
| Fund Name | Short-Term Capital Gain |
| IVES | 0.00% |
| GAMR | 0.00% |
During the year ended September 30, 2019, the Funds did not declare any long-term realized gains distributions. Pursuant to Section 853 of the Internal Revenue Code the Fund designated the following amounts as foreign taxes paid for the year ended September 30, 2019. Foreign taxes paid for purposes of Section 853 may be less than actual foreign taxes paid for financial statement purposes.
| | | | | | | | | | Per Share | | | | |
| Fund | | | Gross Foreign
Source Income | | | Foreign Taxes
Passthrough | | | Gross Foreign
Source Income | | | Foreign Taxes
Passthrough | | | Shares
Outstanding at
9/30/19 | |
| GAMR | | | $ | 1,456,586 | | | $ | 89,469 | | | $ | 0.72829292 | | | $ | 0.04473450 | | | | 2,000,000 | |
Foreign taxes paid or withheld should be included to taxable income with an offsetting deduction from gross income or as a credit for taxes paid to foreign governments.
Above figures may differ from those cited elsewhere in this report due to difference in the calculation of income and gains under GAAP purposes and Internal Revenue Service purposes.
Wedbush ETFMG TM ETF
SUPPLEMENTARY INFORMATION
March 31, 2020 (Unaudited) (Continued)
Shareholders are strongly advised to consult their own tax advisors with respect to their investments in the Funds.
NOTE 3 – INFORMATION ABOUT PORTFOLIO HOLDINGS
The Funds file their complete schedule of portfolio holdings for their first and third fiscal quarters with the Securities and Exchange Commission ("SEC") on Form N-Q or Part F of Form N-PORT. The Funds' Form N-Q or Part F of Form N-PORT is available on the website of the SEC at www.sec.gov. Each Fund's portfolio holdings are posted on their website at www.etfmgfunds.com daily.”
NOTE 4 – INFORMATION ABOUT PROXY VOTING
A description of the policies and procedures the Funds use to determine how to vote proxies relating to portfolio securities is provided in the Statement of Additional Information (“SAI”). The SAI is available without charge upon request by calling toll-free at (877) 756-7873, by accessing the SEC’s website at www.sec.gov, or by accessing the Funds’ website at www.etfmgfunds.com.
Information regarding how the Funds voted proxies relating to portfolio securities during the period ending June 30 is available by calling toll-free at (877) 756-7873 or by accessing the SEC’s website at www.sec.gov.
Carefully consider the Fund’s investment objectives, risk factors, charges, and expenses before investing. This and additional information can be found in the Fund’s prospectus, which may be obtained by calling 1-844-ETF-MGRS (1-844-383-6477) or by visiting www.etfmgfunds.com. Read the prospectus carefully before investing.
Wedbush ETFMG TM ETF
Board of Trustees
Set forth below are the names, birth years, positions with the Trust, length of term of office, and the principal occupations and other directorships held during at least the last five years of each of the persons currently serving as a Trustee of the Trust, as well as information about each officer. The business address of each Trustee and officer is 30 Maple Street, 2nd Floor, Summit, New Jersey 07901. The SAI includes additional information about Fund directors and is available, without charge, upon request by calling 1-844-ETF-MGRS (1-844-383-6477).
Name
and Year
of Birth | Position(s)
Held with the
Trust, Term
of Office and
Length of
Time Served | Principal Occupation(s) During
Past 5 Years | Number of
Portfolios
in Fund
Complex
Overseen
By Trustee | Other
Directorships
Held by
Trustee
During Past 5
Years |
| Interested Trustee and Officers |
Samuel Masucci, III (1962) | Trustee, Chairman of the Board and President (since 2012); Secretary (since 2014) | Chief Executive Officer, Exchange Traded Managers Group LLC (since 2013); Chief Executive Officer, ETF Managers Group LLC (since 2016); Chief Executive Officer, ETF Managers Capital LLC (commodity pool operator) (since 2014); Chief Executive Officer (2012-2016) and Chief Compliance Officer (2012-2014), Factor Advisors, LLC (investment adviser); President and Chief Executive Officer, Factor Capital Management LLC (2012-2014) (commodity pool operator); | 11 | None |
John A. Flanagan, (1946) | Treasurer (since 2015) | President, John A. Flanagan CPA, LLC (accounting services) (since 2010); Treasurer, ETF Managers Trust (since 2015); Principal Financial Officer, ETF Managers Capital, LLC (commodity pool operator) (since 2015) | n/a | n/a |
Reshma A. Tanczos (1978) | Chief Compliance Officer (since 2016) | Chief Compliance Officer, ETF Managers Group LLC (since 2016); Chief Compliance Officer, ETF Managers Capital LLC (since 2016); Partner, Crow & Cushing (law firm) (2007-2016). | n/a | n/a |
* Mr. Masucci is an interested Trustee by virtue of his role as the Chief Executive Officer of the Adviser.
Wedbush ETFMG TM ETF
Board of Trustees (Continued)
Name
and
Year of
Birth | Position(s) Held
with the Trust,
Term of Office
and Length of
Time Served | Principal Occupation(s) During Past
5 Years | Number of
Portfolios in
Fund
Complex
Overseen By
Trustee | Other
Directorships
Held by Trustee
During Past 5
Years |
| Independent Trustees |
| Terry Loebs (1963) | Trustee (since 2014) | Founder and Managing Member, | 11 | None |
| | | Pulsenomics LLC (index product development and consulting firm) (since 2011); Managing Director, MacroMarkets, LLC (exchange-traded products firm) (2006-2011). | | |
| Jared A. Chase (1955) | Trustee (since 2018) | Chief Operating and Financial Officer, Root Capital (a 501(c)(3) non-profit lender); Chairman, State Street Global Alliance LLC, State Street Corporation (2007-2012); Head of Global Treasury, Liability Management, Money Markets & Derivatives, State Street Corporation (2004-2007) | 11 | None |
Page Intentionally Left Blank
Page Intentionally Left Blank
Page Intentionally Left Blank
Advisor
ETF Managers Group, LLC
30 Maple Street, Suite 2, Summit, NJ 07901
Distributor
ETFMG Financial, Inc.
30 Maple Street, Suite 2, Summit, NJ 07901
Custodian
U.S. Bank National Association
Custody Operations
1555 North River Center Drive, Suite 302, Milwaukee, Wisconsin 53212
Transfer Agent
Foreside Financial Group, LLC
111 E Kilbourn Ave, Suite 1250, Milwaukee, WI 53202
Securities Lending Agent
U.S Bank, National Association
Securities Lending
800 Nicolet Mall
Minneapolis, MN 55402-7020
Independent Registered Public Accounting Firm
WithumSmith + Brown, PC
1411 Broadway, 9th Floor, New York, NY 10018
Legal Counsel
Sullivan & Worcester LLP
1666 K Street NW, Washington, DC 20006

Semi-Annual Report
March 31, 2019
ETFMG Alternative Harvest ETF
Ticker: MJ
Beginning on January l, 2021, as permitted by regulations adopted by the SEC, paper copies of the Fund’s shareholder reports will no longer be sent by mail, unless you specifically request paper copies of the Fund’s reports from your financial intermediary, such as a broker-dealer or bank. Instead, the reports will be made available on a website, and you will be notified by mail each time a report is posted and provided with a website link to access the report.
If you already elected to receive shareholder reports electronically, you will not be affected by this change and you need not take any action. Please contact your financial intermediary to elect to receive shareholder reports and other Fund communications electronically.
You may elect to receive all future Fund reports in paper free of charge. Please contact your financial intermediary to inform them that you wish to continue receiving paper copies of Fund shareholder reports and for details about whether your election to receive reports in paper will apply to all funds held with your financial intermediary.

The fund is a series of ETF Managers Trust.
ETFMG Alternative Harvest ETF
TABLE OF CONTENTS
March 31, 2019 (Unaudited)
ETFMG Alternative Harvest ETF
Dear Shareholder,
On behalf of the entire team, we want to express our appreciation for the confidence you have placed in the ETFMG Alternative Harvest Exchange-Traded Fund (“MJ” or the “Fund”). The following information pertains to the fiscal period from October 1, 2018 to March 31, 2019.
The Fund seeks to provide investment results that, before fees and expenses, correspond generally to the price and yield performance of the Prime Alternative Harvest Index (the “Index”).
Over the period, the total return for the Fund was - 6.85%, while the total return for the Index was - 8.46%. The best performers on the basis of contribution to return were Cronos, Organigram Holdings, and Schweitzer-Mauduit, while the worst performers were Tilray, Insys Therapeutics, and Aurora Cannabis.
We thank you for your interest in the Fund. You can find further details about MJ by visiting www.etfmj.com, or by calling 1-844-ETF-MGRS (1-844-383-6477).
Sincerely,

Samuel Masucci III
Chairman of the Board
ETFMG Alternative Harvest ETF
Growth of $10,000 (Unaudited)
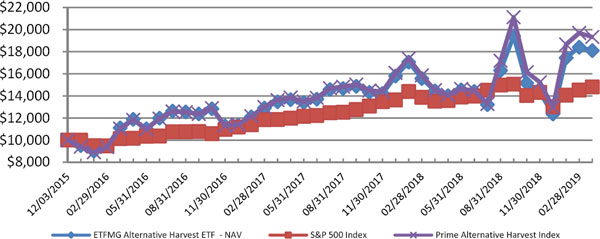
The Fund's performance figures* for the periods ended March 31, 2019, as compared to its benchmarks:
| | Six Months | One Year | Annualized Three Year | Annualized Since Inception** - March 31, 2019 |
| ETFMG Alternative Harvest ETF - NAV | (6.85)% | 25.19% | 17.65% | 19.53% |
| ETFMG Alternative Harvest ETF - Market Price | (7.40)% | 25.94% | 16.68% | 18.26% |
| S&P 500 Index *** (1) | (1.72)% | 9.50% | 13.51% | 12.53% |
| Prime Alternative Harvest Index **** (1) | (8.46)% | 33.11% | 20.53% | 21.93% |
| | | | | |
| Total Fund Operating Expenses (2) | | | | 0.75% |
*The Fund’s past performance does not guarantee future results. The investment return and principal value of an investment in the Fund will fluctuate so that an investor’s shares, when redeemed, may be worth more or less than their original cost. The returns shown do not reflect the deduction of taxes a shareholder would pay on Fund distributions or the redemption of the Fund shares. Current performance of the Fund may be lower or higher than the performance quoted. Returns are calculated using the traded Net Asset Value "NAV" on March 31, 2019. Performance data current to the most recent month end may be obtained by visiting www.etfmj.com or by calling 1- 844-383-6477.
The Fund’s per share NAV is the value of one share of the Fund as calculated in accordance with the standard formula for valuing shares. The NAV return is based on the NAV of the Fund and the market return is based on the market price per share of the Fund. The price used to calculate market return (“Market Price”) is determined by using the midpoint between the highest bid and the lowest offer on the primary stock exchange on which shares of the Fund are listed for trading, as of the time that the Fund’s NAV is calculated. Market and NAV returns assume that dividends and capital gain distributions have been reinvested in the Fund at Market Price and NAV, respectively. The Fund’s total annual operating expenses are 0.75% per the January 31, 2019 prospectus. Please see the Financial Highlights for a more recent expense ratio.
** As of the close of business on the day of commencement of trading on December 3, 2015.
*** The S&P 500 Index is a widely accepted, unmanaged index of U.S. stock market performance which does not take into account charges, fees and other expenses.
**** The Prime Alternative Harvest Index has been created to provide investors with a product that enables them to take advantage of both event-driven news and long-term trends in the cannabis industry as well as the industries likely to be influenced by the medicinal and recreational cannabis legalization initiatives taking place in many locations globally.
| (1) | The return reflects the actual performance through March 29, 2018 (the last day of the New York Stock Exchange was open) to maintain consistency with the Fund's net asset value calculations used for shareholder transactions. |
| (2) | The expense ratio is taken from the Fund’s most recent prospectus dated January 31, 2019. |
ETFMG Alternative Harvest ETF
Top Ten Holdings*
| | | % of Total |
| | Security | | Investments† |
| 1 | Aurora Cannabis, Inc | 8.0% |
| 2 | GW Pharmaceuticals PLC | 7.3% |
| 3 | Cronos Group, Inc. | 5.8% |
| 4 | Canopy Growth Corp. | 5.5% |
| 5 | Tilray, Inc. | 5.1% |
| 6 | Green Organic Dutchman Holdings Ltd. | 4.2% |
| 7 | HEXO CORP. | 3.7% |
| 8 | Aphria, Inc. | 3.3% |
| 9 | CannTrust Holdings, Inc. | 3.1% |
| 10 | Corbus Pharmaceuticals Holdings, Inc. | 2.8% |
Top Ten Holdings = 48.8% of Total Investments†
* Current Fund holdings may not be indicative of future Fund holdings.
† Percentage of total investments less cash.
Please refer to the Portfolio of Investments in this Semi-Annual report for a detailed listing of the Fund’s holdings.
ETFMG Alternative Harvest ETF
Important Disclosures and Key Risk Factors
Investing involves risk, including the possible loss of principal. Shares of any ETF are bought and sold at market price (not NAV), may trade at a discount or premium to NAV and are not individually redeemed from the Fund. Brokerage commissions will reduce returns. Narrowly focused investments typically exhibit higher volatility.
This is not a complete list of risks that may affect the Fund. For additional information concerning the risks applicable to the Fund, please see the Fund’s prospectus.
The possession and use of marijuana, even for medical purposes, is illegal under federal and certain states’ laws, which may negatively impact the value of the Fund’s investments. Use of marijuana is regulated by both the federal government and state governments, and state and federal laws regarding marijuana often conflict. Even in those states in which the use of marijuana has been legalized, its possession and use remains a violation of federal law. Federal law criminalizing the use of marijuana pre-empts state laws that legalizes its use for medicinal and recreational purposes. Cannabis companies and pharmaceutical companies may never be able to legally produce and sell products in the United States or other national or local jurisdictions.
The Fund’s investments will be concentrated in an industry or group of industries to the extent that the Index is so concentrated. In such event, the value of the Fund’s shares may rise and fall more than the value of shares of a fund that invests in securities of companies in a broader range of industries.
The consumer staples sector may be affected by the permissibility of using various product components and production methods, marketing campaigns and other factors affecting consumer demand. Tobacco companies, in particular, may be adversely affected by new laws, regulations and litigation. The consumer staples sector may also be adversely affected by changes or trends in commodity prices, which may be influenced or characterized by unpredictable factors.
ETF shares are not individually redeemable and owners of the shares may acquire those shares from the Fund and tender those shares for redemption to the Fund in Creation Units only and Redemption Units only, typically consisting of aggregations of 50,000 shares.
ETFMG Alternative Harvest ETF
PORTFOLIO ALLOCATIONS
As of March 31, 2019 (Unaudited)
| | | ETFMG | |
| | | Alternative | |
| | | Harvest ETF | |
| As a percent of Net Assets: | | | |
| Canada | | 54.7 | % |
| United States | | 26.2 | % |
| United Kingdom | | 12.8 | % |
| Sweden | | 2.1 | % |
| Italy | | 2.0 | % |
| Japan | | 1.8 | % |
| Stock Warrant | | 0.1 | % |
| Mexico | | 0.0 | ^% |
| Short-Term and other Net Assets (Liabilities) | | 0.3 | % |
| | | 100.0 | % |
^ Less than 0.05%.
ETFMG Alternative Harvest ETF
Schedule of Investments
March 31, 2019 (Unaudited)
| | | Shares | | | Value | |
| COMMON STOCKS - 99.6% | | | | | | | | |
| Canada - 54.7% | | | | | | | | |
| Investment Companies - 7.8% | | | | | | | | |
| Canopy Rivers, Inc. (a) | | | 3,137,626 | | | $ | 8,828,132 | |
| Cronos Group, Inc. (a) ^ | | | 4,704,384 | | | | 86,701,797 | |
| Total Investment Companies | | | | | | | 95,529,929 | |
| Pharmaceuticals - 46.9% | | | | | | | | |
| Aphria, Inc. (a) ^ | | | 5,251,532 | | | | 48,944,278 | |
| Aurora Cannabis, Inc. (a) ^ | | | 13,087,656 | | | | 118,574,163 | |
| Auxly Cannabis Group, Inc. (a) | | | 16,929,523 | | | | 10,894,893 | |
| CannTrust Holdings, Inc. (a) | | | 6,000,635 | | | | 46,519,683 | |
| Canopy Growth Corp. (a) ^ | | | 1,903,096 | | | | 82,537,274 | |
| Emerald Health Therapeutics, Inc. (a) | | | 4,948,066 | | | | 14,958,796 | |
| Green Organic Dutchman Holdings Ltd. (a) | | | 17,338,029 | | | | 62,535,488 | |
| HEXO Corp. (a) | | | 8,231,167 | | | | 54,572,637 | |
| Newstrike Resources Ltd. (a) | | | 11,027,666 | | | | 4,456,123 | |
| Organigram Holdings, Inc. (a) | | | 6,014,477 | | | | 40,506,075 | |
| Supreme Cannabis Co., Inc. (a) | | | 6,954,152 | | | | 11,448,449 | |
| Tilray, Inc. (a) ^ | | | 1,148,938 | | | | 75,278,418 | |
| Vivo Cannabis, Inc. (a) | | | 5,967,775 | | | | 4,376,413 | |
| Total Pharmaceuticals | | | | | | | 575,602,690 | |
| Total Canada | | | | | | | 671,132,619 | |
| | | | | | | | | |
| Italy - 2.0% | | | | | | | | |
| Machinery - 2.0% | | | | | | | | |
| Gima TT SpA | | | 3,109,858 | | | | 24,851,961 | |
| | | | | | | | | |
| Japan - 1.8% | | | | | | | | |
| Tobacco - 1.8% | | | | | | | | |
| Japan Tobacco, Inc. | | | 886,333 | | | | 21,952,396 | |
| | | | | | | | | |
| Mexico - 0.00% | | | | | | | | |
| Construction & Engineering - 0.00% | | | | | | | | |
| Empresas ICA SAB de CV (a)(b) | | | 155,893 | | | | — | |
| | | | | | | | | |
| Sweden - 2.1% | | | | | | | | |
| Tobacco - 2.1% | | | | | | | | |
| Swedish Match AB | | | 505,893 | | | | 25,790,603 | |
| | | | | | | | | |
| United Kingdom - 12.8% | | | | | | | | |
| Pharmaceuticals - 8.8% | | | | | | | | |
| GW Pharmaceuticals PLC - ADR (a) | | | 641,656 | | | | 108,163,952 | |
| Tobacco - 4.0% | | | | | | | | |
| British American Tobacco PLC | | | 637,595 | | | | 26,524,123 | |
| Imperial Brands PLC | | | 684,049 | | | | 23,382,719 | |
| Total Tobacco | | | | | | | 49,906,842 | |
| Total United Kingdom | | | | | | | 158,070,794 | |
The accompanying notes are an integral part of these financial statements.
ETFMG Alternative Harvest ETF
Schedule of Investments
March 31, 2019 (Unaudited) (Continued)
| | | Shares | | | Value | |
| United States - 26.2% | | | | | | | | |
| Biotechnology - 10.1% | | | | | | | | |
| Arena Pharmaceuticals, Inc. (a) | | | 494,343 | | | $ | 22,161,397 | |
| Cara Therapeutics, Inc. (a) | | | 1,491,336 | | | | 29,260,012 | |
| Corbus Pharmaceuticals Holdings, Inc. (a) | | | 6,112,993 | | | | 42,485,301 | |
| Insys Therapeutics, Inc. (a) ^ | | | 6,606,491 | | | | 30,521,988 | |
| Total Biotechnology | | | | | | | 124,428,698 | |
| Chemicals - 2.0% | | | | | | | | |
| Scotts Miracle-Gro Co. | | | 310,835 | | | | 24,425,414 | |
| Paper & Forest Products - 2.3% | | | | | | | | |
| Schweitzer-Mauduit International, Inc. | | | 725,069 | | | | 28,074,672 | |
| Tobacco - 11.8% | | | | | | | | |
| 22nd Century Group, Inc. (a) ^ | | | 9,982,769 | | | | 17,070,535 | |
| Altria Group, Inc. | | | 460,069 | | | | 26,421,763 | |
| Philip Morris International, Inc. | | | 296,499 | | | | 26,207,547 | |
| Turning Point Brands, Inc. | | | 642,549 | | | | 29,615,083 | |
| Universal Corp. | | | 389,116 | | | | 22,424,755 | |
| Vector Group Ltd. | | | 2,097,121 | | | | 22,627,936 | |
| Total Tobacco | | | | | | | 144,367,619 | |
| Total United States | | | | | | | 321,296,403 | |
| TOTAL COMMON STOCKS (Cost $1,116,660,943) | | | | | | | 1,223,094,776 | |
| | | | | | | | | |
| COLLATERAL FOR SECURITIES LOANED - 21.6% + | | | | | | | | |
| Stock Loan Cash Collateral - 21.6% | | | | | | | | |
| Stock Loan Cash Collateral (Cost $264,861,677) | | | | | | | 264,861,677 | |
| | | | | | | | | |
| STOCK WARRANT - 0.1% | | | | | | | | |
| Canada - 0.1% | | | | | | | | |
| SpinCo Unit Warrant (a) (Cost $995,678) | | | | | | | 831,169 | |
| | | | | | | | | |
| Total Investments (Cost $1,382,518,298) - 121.3% | |
|
| | | $ | 1,488,787,622 | |
| Liabilities in Excess of Other Assets - (21.3)% | | | | | | | (261,038,140 | ) |
| NET ASSETS - 100.0% | |
|
| | | $ | 1,227,749,482 | |
Percentages are stated as a percent of net assets.
ADR - American Depositary Receipt
PLC - Public Limited Company
| (a) | Non-income producing security. |
(b) Includes a security that is categorized as Level 3 per the Trust's fair value hierarchy. This security represents $0 or 0.00% of the Fund's net assets and is classified as a Level 3 security.
+ Investments purchased with cash proceeds from securities lending. Total cash collateral has a value of $264,861,677 as of March 31, 2019.
^ All or a portion of this security is out on loan as of March 31, 2019. Total value of securities out on loan is $264,861,677.
The Global Industry Classification Standard (GICS®) was developed by and/or is the exclusive property of MSCI, Inc. and Standard & Poor's Financial Services LLC ("S&P"). GICS® is a service mark of MSCI, Inc. and S&P.
The accompanying notes are an integral part of these financial statements.
ETFMG Alternative Harvest ETF
STATEMENT OF ASSETS AND LIABILITIES
As of March 31, 2019 (Unaudited)
| | |
| ETFMG Alternative Harvest ETF |
|
| ASSETS | | | | |
| Investment securities: | | | | |
| At cost | | $ | 1,382,518,298 | |
| At value | | $ | 1,488,787,622 | |
| Cash | | | 5,984,486 | |
| Foreign Cash (Cost $726,053) | | | 723,913 | |
| Receivable for Fund shares sold | | | 1,799,319 | |
| Securities lending income | | | 1,586,753 | |
| Dividends and interest receivable | | | 1,180,881 | |
| TOTAL ASSETS | | | 1,500,062,974 | |
| | | | | |
LIABILITIES | | | | |
| Collateral received for securities loaned (Note 7) | | | 264,861,677 | |
| Payable for investments purchased | | | 6,750,263 | |
| Management fees payable | | | 701,552 | |
| TOTAL LIABILITIES | | | 272,313,492 | |
| NET ASSETS | | $ | 1,227,749,482 | |
| | | | | |
Net Assets Consist Of: | | | | |
| Paid in capital | | $ | 1,208,366,072 | |
| Accumulated earnings | | | 19,383,410 | |
| NET ASSETS | | $ | 1,227,749,482 | |
| | | | | |
Net Asset Value Per Share: | | | | |
| Net Assets | | $ | 1,227,749,482 | |
| Shares of beneficial interest outstanding ($0 par value, unlimited shares authorized) | | | 33,850,000 | |
| Net asset value (Net Assets ÷ Shares Outstanding) | | $ | 36.27 | |
The accompanying notes are an integral part of these financial statements.
ETFMG Alternative Harvest ETF
STATEMENT OF OPERATIONS
Six Months Ended March 31, 2019 (Unaudited)
| | | ETFMG | |
| | | Alternative | |
| | | Harvest | |
| | | ETF | |
| INVESTMENT INCOME | | | | |
| Dividends (Foreign tax withholdings $168,417) | | $ | 4,844,158 | |
| Securities Iending Income | | | 11,136,976 | |
| TOTAL INVESTMENT INCOME | | | 15,981,134 | |
| | | | | |
| EXPENSES | | | | |
| Management fees | | | 3,038,633 | |
| TOTAL EXPENSES | | | 3,038,633 | |
| NET INVESTMENT INCOME | | | 12,942,501 | |
| | | | | |
| REALIZED AND UNREALIZED GAIN (LOSS) ON INVESTMENTS | | | | |
| Net realized gain/(loss) on: | | | | |
| In-kind redemptions | | | 66,259,078 | |
| Investments | | | (89,972,600 | ) |
| Foreign currency transactions | | | (1,131,567 | ) |
| | | | (24,845,089 | ) |
| | | | | |
| Net change in unrealized appreciation (depreciation) on: | | | | |
| Investments | | | (19,045,747 | ) |
| Foreign currency translations | | | 759,558 | |
| | | | (18,286,189 | ) |
| | | | | |
| NET REALIZED AND UNREALIZED LOSS ON INVESTMENTS | | | (43,131,278 | ) |
| | | | | |
| NET DECREASE IN NET ASSETS RESULTING FROM OPERATIONS | | $ | (30,188,777 | ) |
The accompanying notes are an integral part of these financial statements.
ETFMG Alternative Harvest ETF
| STATEMENTS OF CHANGES IN NET ASSETS | |
| | | Six Months | | | | | |
| | | Ended | | | | | |
| | | March 31, | | | Year Ended | |
| | | 2019 | | | September 30, | |
| | | (Unaudited) | | | 2018 | |
| FROM OPERATIONS | | | | | | | | |
| Net investment income | | $ | 12,942,501 | | | $ | 3,481,427 | |
| Net realized loss on investments and foreign currency | | | | | | | | |
| transactions | | | (24,845,089 | ) | | | (58,906,465 | ) |
| Net change in unrealized appreciation (deppreciation) on | | | | | | | | |
| investments | | | (18,286,189 | ) | | | 123,759,815 | |
| Net increase (decrease) in net assets resulting from operations | | | (30,188,777 | ) | | | 68,334,777 | |
| | | | | | | | | |
DISTRIBUTIONS TO SHAREHOLDERS | | | | | | | | |
| Total distributions paid: * | | | (13,033,500 | ) | | | — | |
| From net investment income | | | — | | | | (2,416,185 | ) |
| From net realized gains | | | — | | | | (40,848 | ) |
| Net decrease in net assets resulting from distributions to | | | | | | | | |
| shareholders | | | (13,033,500 | ) | | | (2,457,033 | ) |
| | | | | | | | | |
FROM SHARES OF BENEFICIAL INTEREST | | | | | | | | |
| Proceeds from shares sold | | | 728,322,840 | | | | 666,343,766 | |
| Cost of shares redeemed | | | (137,566,338 | ) | | | (58,977,855 | ) |
| Transaction Fees (Note 1) | | | 656,005 | | | | 44,190 | |
| Net increase in net assets resulting from shares of beneficial | | | | | | | | |
| interest | | | 591,412,507 | | | | 607,410,101 | |
| | | | | | | | | |
TOTAL INCREASE IN NET ASSETS | | | 548,190,230 | | | | 673,287,845 | |
| | | | | | | | | |
| NET ASSETS | | | | | | | | |
| Beginning of Period | | | 679,559,252 | | | | 6,271,407 | |
| End of Period | | $ | 1,227,749,482 | | | $ | 679,559,252 | |
| | | | | | | | | |
SHARE ACTIVITY | | | | | | | | |
| Shares Sold | | | 20,850,000 | | | | 19,000,000 | |
| Shares Redeemed | | | (4,100,000 | ) | | | (2,100,000 | ) |
| Net increase in shares of beneficial interest outstanding | | | 16,750,000 | | | | 16,900,000 | |
* Distributions from net investment income and net realized capital gains are combined for the six months ended March 31, 2019. See “New Accounting Pronouncements” in the Notes to Financial Statements for more information. The distributions to shareholders for the year ended September 30, 2018 have not been reclassified to conform to the current year presentation.
The accompanying notes are an integral part of these financial statements.
ETFMG Alternative Harvest ETF
FINANCIAL HIGHLIGHTS
For a capital share outstanding throughout the period
| | | Six Months
Ended
March 31,
2019
(Unaudited) |
| | Year Ended
September 30,
2018 | | | Year Ended
September 30,
2017 | | | Period Ended
September 30,
2016 (1) |
|
| Net asset value, beginning of period | | $ | 39.74 | | | $ | 31.36 | | | $ | 29.64 | | | $ | 25.00 | |
| | | | | | | | | | | | | | | | | |
| Activity from investment operations: | | | | | | | | | | | | | | | | |
| Net investment income (2) | | | 0.52 | | | | 0.37 | | | | 0.57 | | | | 0.98 | |
| Net realized and unrealized | | | | | | | | | | | | | | | | |
| gain (loss) on investments | | | (3.48 | ) | | | 8.95 | | | | 4.42 | | | | 4.59 | |
| Total from investment operations | | | (2.96 | ) | | | 9.32 | | | | 4.99 | | | | 5.57 | |
| | | | | | | | | | | | | | | | | |
| Less distributions from: | | | | | | | | | | | | | | | | |
| Net investment income | | | (0.51 | ) | | | (0.74 | ) | | | (2.56 | ) | | | (0.93 | ) |
| Net realized gains | | | — | | | | (0.20 | ) | | | (0.71 | ) | | | — | |
| Total distributions | | | (0.51 | ) | | | (0.94 | ) | | | (3.27 | ) | | | (0.93 | ) |
| | | | | | | | | | | | | | | | | |
| Net asset value, end of period | | $ | 36.27 | | | $ | 39.74 | | | $ | 31.36 | | | $ | 29.64 | |
| | | | | | | | | | | | | | | | | |
| Total return (4) | | | (6.85 | )%(6) | | | 33.85 | % | | | 20.23 | % | | | 22.63 | %(6) |
| | | | | | | | | | | | | | | | | |
| Net assets, at end of period (000s) | | $ | 1,227,749 | | | $ | 679,559 | | | $ | 6,271 | | | $ | 2,964 | |
| | | | | | | | | | | | | | | | | |
| Ratio of net expenses to average | | | | | | | | | | | | | | | | |
| net assets (5) | | | 0.75 | % | | | 0.75 | % | | | 0.79 | % | | | 0.79 | % |
| Ratio of net investment income | | | | | | | | | | | | | | | | |
| to average net assets (5) | | | 3.19 | % | | | 1.18 | % | | | 1.98 | % | | | 5.88 | % |
| | | | | | | | | | | | | | | | | |
| Portfolio Turnover Rate (3) | | | 127 | %(6) | | | 97 | % | | | 44 | % | | | 44 | %(6) |
| (1) | Commencement of operations on December 2, 2015. |
| (2) | Per share amounts calculated using the average shares method, which more appropriately presents the per share data for the period. |
| (3) | Portfolio turnover rate excludes portfolio securities received or delivered as a result of processing capital share transactions in Creation Units. |
| (4) | Includes adjustments in accordance with accounting principles generally accepted in the United States and, consequently, the net asset value for financial reporting purposes and the returns based upon those net asset values may differ from the net asset values and returns for shareholder transactions. |
| (5) | Annualized for periods less than one year. |
The accompanying notes are an integral part of these financial statements.
ETFMG Alternative Harvest ETF
NOTES TO FINANCIAL STATEMENTS
March 31, 2019 (Unaudited)
1. ORGANIZATION
ETFMG Alternative Harvest ETF (the “Fund”) is a series of ETF Managers Trust (the “Trust”), an open-end management investment company consisting of multiple investment series, organized as a Delaware statutory trust on July 1, 2009. The Trust is registered with the SEC under the Investment Company Act of 1940, as amended (the “1940 Act”), as an open-end management investment company and the offering of the Fund’s shares (“Shares”) is registered under the Securities Act of 1933, as amended (the “Securities Act”). The Fund seeks to provide investment results that, before fees and expenses, correspond generally to the total return performance of the Prime Alternative Harvest Index (the “Index”). The Fund commenced operations on December 2, 2015 as the Tierra XP Latin America Real Estate ETF.
Effective December 26, 2017, the Board of Trustees of the Trust approved the following changes to the Fund: a) The Fund’s name was changed to the ETFMG Alternative Harvest ETF; b) the Fund’s underlying index, the Solactive Latin America Real Estate Index, was replaced with the Prime Alternative Harvest Index; c) The Fund’s investment objective was changed to the following: “The ETFMG Alternative Harvest ETF seeks to provide investment results that, before fees and expenses, correspond generally to the total return performance of the Prime Alternative Harvest Index” (the “New Index”); and d) the non-fundamental policy that, under normal circumstances, the Fund will not invest less than 80% of its net assets, plus the amount of any borrowings for investment purposes, in securities of real estate related companies in Latin America was eliminated.
The Fund currently offers one class of shares, which has no front end sales load, no deferred sales charges, and no redemption fees. The Fund may issue an unlimited number of shares of beneficial interest, with no par value. All shares of the Fund have equal rights and privileges.
Shares of the Fund are listed and traded on the NYSE Arca, Inc. Market prices for the Shares may be different from their net asset value (“NAV”). The Fund issues and redeems Shares on a continuous basis at NAV only in blocks of 50,000 shares, called “Creation Units.” Creation Units are issued and redeemed principally in-kind for securities included in the Index. Once created, Shares generally trade in the secondary market at market prices that change throughout the day in quantities less than a Creation Unit. Except when aggregated in Creation Units, Shares are not redeemable securities of the Fund. Shares of the Fund may only be purchased or redeemed by certain financial institutions (“Authorized Participants”). An Authorized Participant is a DTC participant and, in each case, must have executed a Participant Agreement with the Distributor. Most retail investors do not qualify as Authorized Participants nor have the resources to buy and sell whole Creation Units. Therefore, they are unable to purchase or redeem the Shares directly from the Fund. Rather, most retail investors may purchase Shares in the secondary market with the assistance of a broker and are subject to customary brokerage commissions or fees.
Authorized Participants transacting in Creation Units for cash may pay an additional variable charge to compensate the Fund for certain transaction costs (i.e., brokerage costs) and market impact expenses relating to investing in portfolio securities. Such variable charges are included in “Transaction Fees” in the Statement of Changes in Net Assets.
2. SIGNIFICANT ACCOUNTING POLICIES
The following is a summary of significant accounting policies consistently followed by the Fund. These policies are in conformity with accounting principles generally accepted in the United States of America (“U.S. GAAP”).
ETFMG Alternative Harvest ETF
NOTES TO FINANCIAL STATEMENTS
March 31, 2019 (Unaudited)(Continued)
The Fund follows the investment company accounting and reporting guidance of the Financial Accounting Standards Board Accounting Standard Codification Topic 946 Financial Services – Investment Companies.
The Fund may invest in certain other investment companies (underlying funds). For specific investments in underlying funds, please refer to the complete schedule of portfolio holdings on Form N-CSR(S) for this reporting period, which is filed with the U.S. Securities and Exchange Commission (SEC). For more information about the underlying Fund’s operations and policies, please refer to those Funds’ semiannual and annual reports, which are filed with the SEC.
Security Valuation - Securities listed on a securities exchange, market or automated quotation system for which quotations are readily available (except for securities traded on NASDAQ), including securities traded over the counter, are valued at the last quoted sale price on the primary exchange or market (foreign or domestic) on which they are traded on the valuation date (or at approximately 4:00 pm Eastern Time if a security’s primary exchange is normally open at that time), or, if there is no such reported sale on the valuation date, at the most recent quoted bid price. For securities traded on NASDAQ, the NASDAQ Official Closing Price will be used.
Securities for which quotations are not readily available are valued at their respective fair values as determined in good faith by the Board of Trustees (the “Board”). When a security is “fair valued,” consideration is given to the facts and circumstances relevant to the particular situation, including a review of various factors set forth in the pricing procedures adopted by the Fund’s Board. The use of fair value pricing by the Fund may cause the net asset value of its shares to differ significantly from the net asset value that would be calculated without regard to such considerations. As of March 31, 2019, the Fund held one fair valued security which was without value.
As described above, the Fund utilizes various methods to measure the fair value of its investments on a recurring basis. U.S. GAAP establishes a hierarchy that prioritizes inputs to valuation methods. The three levels of inputs are:
Level 1 – Unadjusted quoted prices in active markets for identical assets and liabilities that the Fund has the ability to access.
Level 2 – Observable inputs other than quoted prices included in Level 1 that are observable for the asset or liability, either directly or indirectly. These inputs may include quoted prices for the identical instrument in an inactive market, prices for similar instruments, interest rates, prepayment speeds, credit risk, yield curves, default rates and similar data.
Level 3 – Unobservable inputs for the asset or liability, to the extent relevant observable inputs are not available, representing the Fund’s own assumptions about the assumptions a market participant would use in valuing the asset or liability, and would be based on the best information available.
The availability of observable inputs can vary from security to security and is affected by a wide variety of factors, including, for example, the type of security, whether the security is new and not yet established in the marketplace, the liquidity of markets, and other characteristics particular to the security. To the extent that valuation is based on models or inputs that are less observable or unobservable in the market, the determination of fair value requires more judgment. Accordingly, the degree of judgment exercised in determining fair value is greatest for instruments categorized in Level 3.
ETFMG Alternative Harvest ETF
NOTES TO FINANCIAL STATEMENTS
March 31, 2019 (Unaudited)(Continued)
The inputs used to measure fair value may fall into different levels of the fair value hierarchy. In such cases, for disclosure purposes, the level in the fair value hierarchy within which the fair value measurement falls in its entirety, is determined based on the lowest level input that is significant to the fair value measurement in its entirety.
The following table presents a summary of the Funds’ assets measured at fair value as of March 31, 2019:
ETFMG Alternative Harvest ETF
| Assets^ | | Level 1 | | Level 2 | | Level 3 | | Total |
| Common Stocks | | $ | 1,223,094,776 | | | $ | — | | | $ | — | (a) | | $ | 1,223,094,776 | |
| Collateral for Securities Loaned* | | | — | | | | — | | | | — | | | | 264,861,677 | |
| Stock Warrant | | | — | | | | 831,169 | | | | — | | | | 831,169 | |
| Total Investments in Securities | | $ | 1,223,094,776 | | | $ | 831,169 |
| | $ | — | | | $ | 1,488,787,622 | |
^ See Schedule of Investments for classifications by country and industry.
(a) Includes a security valued at $0.
The ETFMG Alternative Harvest ETF held a Level 3 security at the end of the period. The security classified as Level 3 is deemed immaterial. This security transferred from Level 1 to Level 3 due to being previously priced in an active market. There were no transfers into or out of Level 2 during the six months ended March 31, 2019. Transfers between levels are recognized at the end of the reporting period.
* Certain investments that are measured at fair value using the net asset value per share (or its equivalent) practical expedient have not been categorized in the fair value hierarchy. The fair value amounts presented in the table are intended to permit reconciliation of the fair value hierarchy to the amounts presented in the Schedule of Investments.
Federal Income Taxes - The Fund has elected to be taxed as a “regulated investment company” and intends to distribute substantially all taxable income to its shareholders and otherwise comply with the provisions of the Internal Revenue Code applicable to regulated investment companies. Therefore, no provisions for federal income taxes or excise taxes have been made.
To avoid imposition of the excise tax applicable to regulated investment companies, the Fund intends to declare each year as dividends, in each calendar year, at least 98.0% of its net investment income (earned during the calendar year) and 98.2% of its net realized capital gains (earned during the twelve months ended October 31) plus undistributed amounts, if any, from prior years.
Net capital losses incurred after October 31, within the taxable year are deemed to arise on the first business day of the Fund’s next taxable year.
The Fund recognizes the tax benefits of uncertain tax positions only where the position is “more likely than not” to be sustained assuming examination by tax authorities. The Fund has analyzed its tax position and has concluded that no liability for unrecognized tax benefits should be recorded related to uncertain tax positions expected to be taken in the Fund’s 2018 tax returns. The Fund identifies its major tax jurisdictions as U.S. Federal, the State of New Jersey, and the State of Delaware; however the Fund is not aware of any tax positions for which it is reasonably possible that the total amounts of unrecognized tax benefits will change materially in the next twelve months.
ETFMG Alternative Harvest ETF
NOTES TO FINANCIAL STATEMENTS
March 31, 2019 (Unaudited)(Continued)
Management has reviewed the tax positions for open periods (for federal purposes, three years from the date of filing and for state purposes, four years from the date of filing) as applicable to the Fund, and has determined that no provision for income tax is required in the Fund’s financial statements.
Security transactions and Investment Income – Investment securities transactions are accounted for on the trade date. Gains and losses realized on sales of securities are determined on a specific identification basis. Discounts/premiums on debt securities purchased are accreted/amortized over the life of the respective securities using the effective interest method. Dividend income is recorded on the ex-dividend date. Interest income is recorded on an accrual basis. Income, including gains from investments in foreign securities received by the Fund may be subject to income, withholding or other taxes imposed by foreign countries.
Foreign Currency Translations and Transactions - The Fund may engage in foreign currency transactions. Foreign currency transactions are translated into U.S. dollars on the following basis:
| (i) | market value of investment securities, assets and liabilities at the daily rates of exchange, and |
| (ii) | purchases and sales of investment securities, dividend and interest income and certain expenses at the rates of exchange prevailing on the respective dates of such transactions. For financial reporting purposes, the Fund does not isolate changes in the exchange rate of investment securities from the fluctuations arising from changes in the market prices of securities for unrealized gains and losses. However, for federal income tax purposes, the Fund does isolate and treat as ordinary income the effect of changes in foreign exchange rates on realized gains or losses from the sale of investment securities and payables and receivables arising from trade-date and settlement-date differences. |
Distributions to shareholders – Distributions to shareholders from net investment income are declared and paid by the Fund on a quarterly basis. Distributions to Shareholders from net realized gains on securities of the Fund normally are declared and paid on an annual basis. Distributions are recorded on the ex-dividend date.
Use of Estimates - The preparation of financial statements in conformity with U.S. GAAP requires management to make estimates and assumptions that affect the reported amounts of assets and liabilities at the date of the financial statements, as well as the reported amounts of revenues and expenses during the period. Actual results could differ from those estimates.
Share Valuation - The net asset value (“NAV”) per share of the Fund is calculated by dividing the sum of the value of the securities held by the Fund, plus cash and other assets, minus all liabilities (including estimated accrued expenses) by the total number of shares outstanding of the Fund, rounded to the nearest cent. The Fund’s shares will not be priced on the days on which the NYSE is closed for trading. The offering and redemption price per share for the Fund is equal to the Fund’s net asset value per share.
Guarantees and Indemnification – In the normal course of business, the Fund enters into contracts with service providers that contain general indemnification clauses. The Fund’s maximum exposure under these arrangements is unknown as this would involve future claims that may be made against the Fund that have not yet occurred. However, based on experience, the Fund expects the risk of loss to be remote.
ETFMG Alternative Harvest ETF
NOTES TO FINANCIAL STATEMENTS
March 31, 2019 (Unaudited)(Continued)
3. RISK FACTORS
Investing in the ETFMG Alternative Harvest ETF may involve certain risks, as discussed in the Fund’s prospectus, including, but not limited to, those described below. Any of these risks could cause an investor to lose money.
United States Regulatory Risks of the Marijuana Industry: The possession and use of marijuana, even for medical purposes, is illegal under federal and certain states’ laws, which may negatively impact the value of the Fund’s investments. Use of marijuana is regulated by both the federal government and state governments, and state and federal laws regarding marijuana often conflict. Even in those states in which the use of marijuana has been legalized, its possession and use remains a violation of federal law. Federal law criminalizing the use of marijuana pre-empts state laws that legalizes its use for medicinal and recreational purposes. Members of the Trump Administration, including former Attorney General Jeff Sessions, have made statements indicating that the Trump Administration intends to take a harsher stance on federal marijuana laws. Any such change in the federal government’s enforcement of current federal laws could adversely affect the ability of the companies in which the Fund invests to possess or cultivate marijuana, including in connection with pharmaceutical research, or it could shrink the customer pool for certain of the Fund’s portfolio companies. Any of these outcomes would negatively affect the profitability and value of the Fund’s investments. The Cannabis Companies and Pharmaceutical Companies may never be able to legally produce and sell products in the United States or other national or local jurisdictions.
Marijuana is a Schedule I controlled substance under the Controlled Substances Act (“CSA”) (21 U.S.C. § 811), meaning that it has a high potential for abuse, has no currently “accepted medical use” in the United States, lacks accepted safety for use under medical supervision, and may not be prescribed, marketed or sold in the United States. No drug product containing natural cannabis or naturally-derived cannabis extracts have been approved by the FDA for use in the United States or obtained registrations from the United States Drug Enforcement Administration (“DEA”) for commercial production and the DEA may never issue the registrations required for the commercialization of such products.
Facilities conducting research, manufacturing, distributing, importing or exporting, or dispensing controlled substances must be registered (licensed) to perform these activities and have the security, control, recordkeeping, reporting and inventory mechanisms required by the DEA to prevent drug loss and diversion. Failure to obtain the necessary registrations or comply with necessary regulatory requirements may significantly impair the ability of certain companies in which the Fund invests to pursue medical marijuana research or to otherwise cultivate, possess or distribute marijuana.
Non-U.S. Regulatory Risks of the Marijuana Industry - The companies in which the Fund invests are subject to various laws, regulations and guidelines relating to the manufacture, management, transportation, storage and disposal of marijuana, as well as being subject to laws and regulations relating to health and safety, the conduct of operations and the protection of the environment. Even if a company’s operations are permitted under current law, they may not be permitted in the future, in which case such company may not be in a position to carry on its operations in its current locations. Additionally, controlled substance legislation differs between countries and legislation in certain countries may restrict or limit the ability of certain companies in which the Fund invests to sell their products.
ETFMG Alternative Harvest ETF
NOTES TO FINANCIAL STATEMENTS
March 31, 2019 (Unaudited)(Continued)
Operational Risks of the Marijuana Industry - Companies involved in the marijuana industry face intense competition, may have limited access to the services of banks, may have substantial burdens on company resources due to litigation, complaints or enforcement actions, and are heavily dependent on receiving necessary permits and authorizations to engage in medical marijuana research or to otherwise cultivate, possess or distribute marijuana. Since the use of marijuana is illegal under United States federal law, federally regulated banking institutions may be unwilling to make financial services available to growers and sellers of marijuana.
Concentration Risk - The Fund’s investments will be concentrated in an industry or group of industries to the extent that the Index is so concentrated. In such event, the value of the Fund’s shares may rise and fall more than the value of shares of a fund that invests in securities of companies in a broader range of industries.
Consumer Staples Sector Risk - The consumer staples sector may be affected by the permissibility of using various product components and production methods, marketing campaigns and other factors affecting consumer demand. Tobacco companies, in particular, may be adversely affected by new laws, regulations and litigation. The consumer staples sector may also be adversely affected by changes or trends in commodity prices, which may be influenced or characterized by unpredictable factors.
Equity Market Risk - The equity securities held in the Fund’s portfolio may experience sudden, unpredictable drops in value or long periods of decline in value. This may occur because of factors that affect securities markets generally or factors affecting specific issuers, industries, or sectors in which the Fund invests such as political, market and economic developments, as well as events that impact specific issuers.
New Fund Risk - There can be no assurance that the Fund will grow to or maintain an economically viable size.
Non-Diversification Risk - Because the Fund is “non-diversified,” it may invest a greater percentage of its assets in the securities of a single issuer or a small number of issuers than if it was a diversified fund. As a result, a decline in the value of an investment in a single issuer or a small number of issuers could cause the Fund’s overall value to decline to a greater degree than if the Fund held a more diversified portfolio. This may increase the Fund’s volatility and have a greater impact on the Fund’s performance.
Securities Lending Risk - Securities lending involves exposure to certain risks, including operational risk (i.e., the risk of losses resulting from problems in the settlement and accounting process), “gap” risk (i.e., the risk of a mismatch between the return on cash collateral reinvestments and the fees a Fund has agreed to pay a borrower), and credit, legal, counterparty and market risk. In the event a borrower does not return a Fund’s securities as agreed, the Fund may experience losses if the proceeds received from liquidating the collateral do not at least equal the value of the loaned security at the time the collateral is liquidated plus the transaction costs incurred in purchasing replacement securities.
ETFMG Alternative Harvest ETF
NOTES TO FINANCIAL STATEMENTS
March 31, 2019 (Unaudited)(Continued)
4. COMMITMENTS AND OTHER RELATED PARTY TRANSACTIONS
ETF Managers Group, LLC (the “Advisor”), serves as the investment advisor to the Fund. Pursuant to an Investment Advisory Agreement (“Advisory Agreement”) between the Trust, on behalf of the Fund, and the Advisor, the Advisor provides investment advice to the Fund and oversees the day-to-day operations of the Fund, subject to the direction and control of the Board and the officers of the Trust. Under the Advisory Agreement, the Advisor is also responsible for arranging transfer agency, custody, fund administration and accounting, and other non-distribution related services necessary for the Fund to operate.
Under the Investment Advisory Agreement with the Fund, the Advisor has overall responsibility for the general management and administration of the Fund and arranges for sub-advisory, transfer agency, custody, fund administration, securities lending, and all other non-distribution related services necessary for the Fund to operate. The Advisor bears the costs of all advisory and non-advisory services required to operate the Fund, in exchange for a single management fee. For services provided the Fund pays the Advisor at an annual rate of 0.75% of the Fund’s average daily net assets. Under the Investment Advisory Agreement, the Advisor has agreed to pay all expenses of the Fund, except for: the fee paid to the Advisor pursuant to the Investment Advisory Agreement, interest charges on any borrowings, taxes, brokerage commissions and other expenses incurred in placing orders for the purchase and sale of securities and other investment instruments, acquired fund fees and expenses, accrued deferred tax liability, extraordinary expenses, and distribution (12b-1) fees and expenses (collectively, “Excluded Expenses”). From the period October 1, 2017 to December 25, 2017, the Fund’s Sponsor was Tierra Funds, LLC. Tierra Funds, LLC agreed to sublicense the use of the Underlying Index to the Advisor. Effective December 26, 2017, the Advisor has entered into an Agreement with ETFMG Financial, LLC (the “Sponsor”). The Sponsor provides marketing support for the Fund, including distributing marketing materials related to the Fund.
The Advisor pays each independent Trustee a quarterly fee for service to the Fund. Each Trustee is also reimbursed by the Advisor for all reasonable out-of-pocket expenses incurred in connection with his duties as Trustee, including travel and related expenses incurred in attending Board meetings.
5. DISTRIBUTION PLAN
The Fund has adopted a Plan of Distribution pursuant to Rule 12b-1 under the 1940 Act. Under the Plan, the Fund may pay compensation to the Distributor or any other distributor or financial institution with which the Trust has an agreement with respect to the Fund, with the amount of such compensation not to exceed an annual rate of 0.25% of each Fund’s average daily net assets. For the six months ended March 31, 2019, the Fund did not incur any 12b-1 expenses.
ETFMG Alternative Harvest ETF
NOTES TO FINANCIAL STATEMENTS
March 31, 2019 (Unaudited)(Continued)
6. PURCHASES AND SALES OF SECURITIES
The costs of purchases and sales of securities, excluding short-term securities and in-kind transactions, for the six months ended March 31, 2019:
| | | | Purchases | | | | Sales | |
| ETFMG Alternative Harvest ETF | | $ | 672,957,614 | | | $ | 308,848,502 | |
The costs of purchases and sales of in-kind transactions associated with creations and redemptions for the six months ended March 31, 2019:
| | | | Purchases | | | | Sales In- | |
| | | | In-Kind | | | | Kind | |
| ETFMG Alternative Harvest ETF | | $ | 366,448,165 | | | $ | 134,295,429 | |
7. SECURITIES LENDING
The Fund may lend up to 33 1∕3% of the value of the securities in its portfolio to brokers, dealers and financial institutions (but not individuals) under terms of participation in a securities lending program administered by Wedbush Securities Inc (“the Custodian”). The securities lending agreement requires that loans are collateralized at all times in an amount equal to at least 100% of the value of any loaned securities at the time of the loan. The Fund receives compensation in the form of fees. The amount of fees depends on a number of factors including the type of security and length of the loan. The Fund continues to receive interest payments or dividends on the securities loaned during the borrowing period. Gain or loss in the fair value of securities loaned that may occur during the term of the loan will be for the account of the Fund. The Fund has the right under the terms of the securities lending agreement to recall the securities from the borrower on demand. The cash collateral is held by the Custodian in accordance with the custody agreement. The Fund could experience delays in recovering its securities and possible loss of income or value if the borrower fails to return the borrowed securities, although the Fund is indemnified from this risk by contract with the securities lending agent.
As of March 31, 2019, the value of the securities on loan and payable for collateral due to broker were as follows:
Value of Securities on Loan Collateral Received
| | | | Values of | | | | Fund | |
| | | | Securities on | | | | Collateral | |
| Fund | | | Loan | | | | Received* | |
| ETFMG Alternative Harvest ETF | | $ | 264,861,677 | | | $ | 264,861,677 | |
* The securities on loan were collateralized in full with cash, as shown on the Schedule of Investments.
ETFMG Alternative Harvest ETF
NOTES TO FINANCIAL STATEMENTS
March 31, 2019 (Unaudited)(Continued)
8. DISTRIBUTIONS TO SHAREHOLDERS AND TAX COMPONENTS OF CAPITAL
The components of distributable earnings (losses) and cost basis of investments for federal income tax purposes at September 30, 2018 were as follows:
| | | | �� | | | | | | Net | |
| | | | | | Gross | | | | Gross | | | | Unrealized | |
| | | | | | Unrealized | | | | Unrealized | | | | Appreciation | |
| | | | Cost | | | | Appreciation | | | | Depreciation | | | | (Depreciation) | |
| ETFMG Alternative Harvest ETF | | $ | 578,537,004 | | | $ | 155,913,673 | | | $ | (30,598,602 | ) | | $ | 125,315,071 | |
| | | | Undistributed | | | | Total | | | | Other | | | | Total | |
| | | | Ordinary | | | | Distributable | | | | Accumulated | | | | Accumulated | |
| | | | Income | | | | Earnings | | | | Loss | | | | Gain | |
| ETFMG Alternative Harvest ETF | | $ | 1,057,477 | | | $ | 1,057,477 | | | $ | (63,766,861 | ) | | $ | 62,605,687 | |
As of September 30, 2018, the Fund had accumulated capital loss carryovers of:
| | | | Capital Loss | | | |
| | | | Carryover | | | | Expires | |
| ETFMG Alternative Harvest ETF | | $ | 63,766,861 | | | | Indefinite | |
Under current tax law, capital and currency losses realized after October 31 of a Fund’s fiscal year may be deferred and treated as occurring on the first business day of the following fiscal year for tax purposes. The Fund had deferred post-October capital and currency losses, which will be treated as arising on the first business day of the year ended September 30, 2018.
| | | Late Year | | |
| | | Ordinary | | Post-October |
| | | Loss | | Capital Loss |
| ETFMG Alternative Harvest ETF | | None | | None |
U.S. GAAP requires that certain components of net assets relating to permanent differences be reclassified between financial and tax reporting. These reclassifications have no effect on net assets or net asset value per share. For the fiscal year ended September 30, 2018, the following table shows the reclassifications made:
| | | | Undistributed Accumulated Net Investment Income | | | | Accumulated Net Realized Loss | | | | Paid-In Capital | |
| ETFMG Alternative Harvest ETF | | $ | 44,190 | | | $ | (4,003,590 | ) | | $ | (3,959,400 | ) |
ETFMG Alternative Harvest ETF
NOTES TO FINANCIAL STATEMENTS
March 31, 2019 (Unaudited)(Continued)
9. DISTRIBUTIONS TO SHAREHOLDERS
The tax character of distributions paid by the Fund during the fiscal years ended September 30, 2018 and September 30, 2017 are as follows:
| | | Year Ended
September 30, 2018 | | | Year Ended
September 30, 2017 | |
| | | | From Ordinary Income | | | | From Capital Gains | | | | From Ordinary Income | | | | From Capital Gains | |
| ETFMG Alternative Harvest ETF | | $ | 2,416,185 | | | $ | 40,848 | | | $ | 263,218 | | | $ | 70,581 | |
10. AGGREGATE UNREALIZED APPRECIATION AND DEPRECIATION – TAX BASIS
| | | | | | | | | | | | | | | | Net | |
| | | | | | | | Gross | | | | Gross | | | | Unrealized | |
| | | | | | | | Unrealized | | | | Unrealized | | | | Appreciation | |
| | | | Tax Cost | | | | Appreciation | | | | Depreciation | | | | (Depreciation) | |
| ETFMG Alternative Harvest ETF | | $ | 1,382,518,298 | | | $ | 149,408,195 | | | $ | (43,138,871 | ) | | $ | (106,269,324 | ) |
11. LEGAL MATTERS
The Trust, the trustees of the Trust, the Adviser and certain officers of the Adviser are defendants in an action filed May 2, 2017 in the Superior Court of New Jersey captioned PureShares, LLC d/b/a PureFunds et al. v. ETF Managers Group, LLC et al., Docket No. C-63-17. The PureShares action alleges claims based on disputes arising out of contractual relationships with the Adviser. The action seeks damages in unspecified amounts and injunctive relief based on breach of contract, wrongful termination, and several other theories. At the outset of the litigation, and again a few weeks later, plaintiffs sought temporary injunctive relief. Both motions were denied, and the matter is now proceeding through pretrial discovery. The defendants believe the lawsuit is without merit and intend to vigorously defend themselves against the allegations.
The Adviser and its parent, Exchange Traded Managers Group, LLC are defendants in a case filed on October 26, 2017 in the United States District Court for the Southern District of New York by NASDAQ, Inc. captioned Nasdaq, Inc. v. Exchange Traded Managers Group, LLC et al., Case 1:17- cv-08252. This action arises out of related facts and circumstances in the New Jersey litigation and asserts claims for breach of contract, wrongful termination and certain other theories with respect to the same exchange traded Fund discussed above. The defendants in the Southern District actions believe the lawsuit is without merit asserted counterclaims against NASDAQ for breaches of its duties under the related index license agreement and various other agreements. A bench trial on this matter began on May 13, 2019 and is ongoing as of the date of the mailing of the Funds’ semi-annual reports. Management of the Trust and the Fund, after consultation with legal counsel, believes that the resolution of these matters will not have a material adverse effect on the Fund’s financial statements.
12. RECENT ACCOUNTING PRONOUNCEMENTS AND REPORTING UPDATES
In March 2017, the FASB issued ASU No. 2017-08, Receivables—Nonrefundable Fees and Other Costs (Subtopic 310-20): Premium Amortization on Purchased Callable Debt Securities. The amendments in the ASU shorten the amortization period for certain callable debt securities, held at a premium, to be amortized to the earliest call date. The ASU does not require an accounting change for securities held at a discount; which continues to be amortized to maturity. The ASU is effective for fiscal years and interim periods within those fiscal years beginning after December 15, 2018. Management is currently evaluating the impact, if any, of applying this provision.
ETFMG Alternative Harvest ETF
NOTES TO FINANCIAL STATEMENTS
March 31, 2019 (Unaudited)(Continued)
In August 2018, the FASB issued Accounting Standards Update (“ASU”) No. 2018-13, which changes certain fair value measurement disclosure requirements. The new ASU, in addition to other modifications and additions, removes the requirement to disclose the amount and reasons for transfers between Level 1 and Level 2 of the fair value hierarchy, and the policy for the timing of transfers between levels. For investment companies, the amendments are effective for financial statements issued for fiscal years beginning after December 15, 2019, and interim periods within those fiscal years. Early adoption is allowed. At this time, management is evaluating the implications of the ASU and any impact on the financial statement disclosures.
In August 2018, the Securities and Exchange Commission adopted amendments to certain disclosure requirements under Regulation S-X to conform to US GAAP, including: (i) an amendment to require presentation of the total, rather than the components, of distributable earnings on the Statement of Assets and Liabilities; and (ii) an amendment to require presentation of the total, rather than the components, of distributions to shareholders, except for tax return of capital distributions, on the Statement of Changes in Net Assets. The amendments also removed the requirement for parenthetical disclosure of undistributed net investment income on the Statement of Changes in Net Assets. These amendments have been adopted with these financial statements.
13. SUBSEQUENT EVENTS
Subsequent events after the date of the Statement of Assets and Liabilities have been evaluated through the date the financial statements were issued.
Management has determined that no events or transactions occurred requiring adjustment or disclosure in the financial statements.
ETFMG Alternative Harvest ETF
APPROVAL OF ADVISORY AGREEMENT AND BOARD CONSIDERATIONS
For the Period Ended March 31, 2019 (Unaudited)
Pursuant to Section 15(c) of the Investment Company Act of 1940 (the “1940 Act”), at a meeting held on March 22, 2019, the Board of Trustees (the “Board”) of ETF Managers Trust (the “Trust”) considered the renewal of the Investment Advisory Agreement (the “Advisory Agreement”) between ETF Managers Group LLC (the “Adviser”) and the Trust, on behalf of ETFMG Alternative Harvest ETF (the “Fund”).
Pursuant to Section 15(c) of the 1940 Act, the Board must annually review and approve the Advisory Agreement after its initial two-year term: (i) by the vote of the Trustees or by a vote of the shareholders of the Fund; and (ii) by the vote of a majority of the Trustees who are not parties to the Advisory Agreement or “interested persons” of any party thereto, as defined in the 1940 Act (the “Independent Trustees”), cast in person at a meeting called for the purpose of voting on such approval. Each year, the Board calls and holds a meeting to decide whether to renew the Advisory Agreement for an additional one-year term. In preparation for such meeting, the Board requests and reviews a wide variety of information from the Adviser.
In reaching its decision, the Board, including the Independent Trustees, considered all factors it believed relevant, including: (i) the nature, extent and quality of the services provided to the Fund’s shareholders by the Adviser; (ii) the investment performance of the Fund; (iii) the Adviser’s costs and profits realized in providing services to the Fund, including any fall-out benefits enjoyed by the Adviser; (iv) comparative fee and expense data for the Fund in relation to other similar investment companies; (v) the extent to which economies of scale would be realized as the Fund grows and whether the advisory fees for the Fund reflects these economies of scale for the benefit of the Fund; and (vi) other financial benefits to the Adviser and its affiliates resulting from services rendered to the Fund. The Board’s review included written and oral information furnished to the Board prior to and at the meeting held on March 22, 2019, and throughout the year. Among other things, the Adviser provided responses to a detailed series of questions, which included information about the Adviser’s operations, service offerings, personnel, compliance program and financial condition. The Board then discussed the written and oral information that it received before the meeting and throughout the year, and the Adviser’s oral presentations and any other information that the Board received at the meeting, and deliberated on the renewal of the Advisory Agreement in light of this information.
The Independent Trustees were assisted throughout the contract review process by independent legal counsel. The Independent Trustees relied upon the advice of such counsel and their own business judgment in determining the material factors to be considered in evaluating the renewal of the Advisory Agreement, and the weight to be given to each such factor. The conclusions reached with respect to the Advisory Agreement were based on a comprehensive evaluation of all the information provided and not any single factor. Moreover, each Trustee may have placed varying emphasis on particular factors in reaching conclusions with respect to the Fund. The matters discussed were also considered separately by the Independent Trustees in executive session with independent legal counsel, at which no representatives of management were present.
Nature, Extent and Quality of Services Provided by the Adviser
The Trustees considered the scope of services provided under the Advisory Agreement, noting that the Adviser provides investment management services to the Fund. The Board discussed the responsibilities of the Adviser, including: responsibility for the general management of the day-to-day investment and reinvestment of the assets of the Fund; determining the daily baskets of deposit securities and cash components; executing portfolio security trades for purchases and redemptions of Fund shares conducted on a cash-in-lieu basis; responsibility for daily monitoring of tracking error and quarterly reporting to the Board; and implementation of Board directives as they relate to the Fund. In considering the nature, extent and quality of the services provided by the Adviser, the Board considered the qualifications, experience and responsibilities of the Adviser’s investment personnel and the quality of the Adviser’s compliance infrastructure. The Board also considered the Adviser’s experience managing exchange-traded funds (“ETFs”).
ETFMG Alternative Harvest ETF
APPROVAL OF ADVISORY AGREEMENT AND BOARD CONSIDERATIONS
For the Period Ended March 31, 2019 (Unaudited) (Continued)
The Board also considered other services provided to the Fund, such as overseeing the Fund’s service providers, monitoring adherence to the Fund’s investment restrictions, and monitoring compliance with various policies and procedures and with applicable securities laws.
Based on the factors above, as well as those discussed below, the Board concluded that it was satisfied with the nature, extent and quality of the services provided to the Fund by the Adviser.
Historical Performance
The Board then considered the past performance of the Fund. The Board reviewed information regarding the performance history of the Fund over various time periods ending January 31, 2019, including the year-to-date period, the most recent one-year period and the period since the Fund’s inception. The Board noted management’s explanation that analysis of investment performance, in absolute terms, is less relevant for the Fund than it is for actively managed funds, given the Fund’s index-based investment objectives. The Board also noted management’s further explanation that it is more relevant to review the performance of the Fund by focusing on the extent to which the Fund tracked its underlying index. The Board reviewed information regarding the Fund’s index tracking, discussing, as applicable, factors which contributed to the Fund’s tracking error over certain periods of time. The Board noted that the Fund had underperformed its underlying index over certain periods, but that such underperformance was, at least in part, a result of costs incurred by the Fund not incurred by its underlying index. The Board considered other factors that contributed to the Fund’s tracking error, including cash drag and the effect of trading stocks denominated in foreign currencies, as well as the tracking error that resulted from the rebalances of the Fund’s underlying Index. The Board noted management’s representation that the Fund’s performance was in an acceptable range relative to its underlying index. The Board concluded that, after taking these factors into account, the Fund satisfactorily tracked its underlying index. The Board further noted that it had received and would continue to receive regular reports regarding the Fund’s performance, including with respect to its tracking error, at its quarterly meetings.
Cost of Services Provided and Economies of Scale
The Board reviewed the advisory fee for the Fund and compared it to the total operating expenses of comparable ETFs, as determined by the Adviser. The Board noted that the advisory fee of the Fund was as low as or lower than the expense ratios of its comparable ETFs. The Board took into consideration management’s discussion of the fees, including that the Fund has a niche investment strategy and limited comparable ETFs.
The Board also noted the importance of the fact that the advisory fee for the Fund is a “unified fee,” meaning that the shareholders of the Fund pay no expenses other than the advisory fee and certain other costs such as interest, brokerage and extraordinary expenses and, to the extent it is implemented, fees pursuant to a Distribution and/or Shareholder Servicing (12b-1) Plan. The Board further noted that the Adviser was responsible for compensating the Trust’s other service providers and paying the Fund’s other expenses (except as noted above) out of its own fees and resources. The Board also evaluated the compensation and benefits received by the Adviser from its relationship with the Fund, taking into account the profitability analysis provided by the Adviser. The Board concluded that the advisory fee for the Fund was reasonable in light of the factors considered.
In addition, the Board considered whether economies of scale may be realized for the Fund. The Board noted that the Adviser regularly considers whether fee reductions are appropriate as the Fund grows in size. The Board noted that a unitary fee provides a level of certainty in expenses for the Fund. The Trustees concluded that the flat advisory fee was reasonable.
ETFMG Alternative Harvest ETF
APPROVAL OF ADVISORY AGREEMENT AND BOARD CONSIDERATIONS
For the Period Ended March 31, 2019 (Unaudited) (Continued)
In its deliberations, the Board did not identify any single piece of information discussed above that was all-important, controlling or determinative of its decision.
Based on the Board’s deliberations and its evaluation of the information described above, the Board, including the Independent Trustees, unanimously: (a) concluded that the terms of the Advisory Agreement are fair and reasonable; (b) concluded that the Adviser’s fees are reasonable in light of the services that the Adviser provides to the Fund; and (c) approved the renewal of the Advisory Agreement for another year.
ETFMG Alternative Harvest ETF
EXPENSE EXAMPLE
Six Months Ended March 31, 2019 (Unaudited)
As a shareholder of the Fund, you incur two types of costs: (1) transaction costs, including brokerage commissions on purchases and sales of Fund shares; (2) ongoing costs, including management fees and other Fund expenses. This example is intended to help you understand your ongoing costs (in dollars) of investing in the Fund and to compare these costs with the ongoing costs of investing in other mutual funds.
The example is based on an investment of $1,000 invested at the beginning of the period and held for the entire period from October 1, 2018 through March 31, 2019.
Actual Expenses
The “Actual” line in the table below provides information about actual account values and actual expenses. You may use the information below, together with the amount you invested, to estimate the expenses that you paid over the period. Simply divide your account value by $1,000 (for example, an $8,600 account value divided by $1,000 = 8.6), then multiply the result by the number in the table under the heading entitled “Expenses Paid During Period” to estimate the expenses you paid on your account during this period.
Hypothetical Example for Comparison Purposes
The “Hypothetical” line in the table below provides information about hypothetical account values and hypothetical expenses based on the Fund’s actual expense ratio and an assumed rate of return of 5% per year before expenses, which is not the Fund’s actual return. The hypothetical account values and expenses may not be used to estimate the actual ending account balances or expenses you paid for the period. You may use this information to compare this 5% hypothetical example with the 5% hypothetical examples that appear in the shareholder reports of other funds.
Please note that the expenses shown in the table are meant to highlight your ongoing costs only and do not reflect any transactional costs, such as brokerage commissions paid on purchases and sales of Fund shares. Therefore, the table is useful in comparing ongoing costs only, and will not help you determine the relative total costs of owning different funds. In addition, if these transactional costs were included, your costs would have been higher.
| | | Beginning Account Value | | Ending Account Value | | Expenses Paid During Period* | | Expenses Paid During Period** |
| | | | 10/1/18 | | | | 3/31/19 | | | | 10/1/18 - 3/31/19 | | | | 10/1/18 - 3/31/19 | |
| Actual | | $ | 1,000.00 | | | $ | 931.50 | | | $ | 3.61 | | | | 0.75 | % |
| | | | | | | | | | | | | | | | | |
| Hypothetical | | $ | 1,000.00 | | | $ | 1,021.19 | | | $ | 3.78 | | | | 0.75 | % |
| (5% return before expenses) | | | | | | | | | | | | | | | | |
*”Actual” expense information for the Fund is for the period from October 1, 2018 to March 31, 2019. Actual expenses are equal to the Fund's annualized net expense ratio multiplied by 182/365 (to reflect the period from October 1, 2018 to March 31, 2019). "Hypothetical" expense information for the Fund is presented on the basis of the full one-half year period to enable comparison to other funds. It is based on assuming the same net expense ratio and average account value over the period, but it is multiplied by 182/365 (to reflect the full half-year period).
** Annualized.
ETFMG Alternative Harvest ETF
SUPPLEMENTARY INFORMATION
March 31, 2019 (Unaudited)
INFORMATION ABOUT PORTFOLIO HOLDINGS
The Fund files a Form N-Q with the Securities and Exchange Commission (the ‘‘SEC’’) no more than sixty days after the Fund’s first and third fiscal quarters. For the Fund, this would be for the fiscal quarters ending June 30 and December 31. Form N-Q includes a complete schedule of the Funds’ portfolio holdings as of the end of those fiscal quarters. The Fund’s N-Q filings can be found free of charge on the SEC’s website at http://www.sec.gov, or they may be reviewed and copied at the SEC’s Public Reference Room in Washington, D.C. (call 800-SEC-0330 for information on the operation of the Public Reference Room). The Fund’s portfolio holdings are posted on the Fund’s website at www.etfmj.com daily.
INFORMATION ABOUT PROXY VOTING
A description of the policies and procedures the Fund uses to determine how to vote proxies relating to portfolio securities is provided in the Statement of Additional Information (“SAI”). The SAI is available without charge upon request by calling toll-free at 1-844-ETF-MGRS (1-844-383-6477), by accessing the SEC’s website at www.sec.gov, or by accessing the Fund’s website at www.etfmj.com.
Information regarding how the Fund voted proxies relating to portfolio securities during the period ending June 30 is available by calling toll-free at 1-844-ETF-MGRS (1-844-383-6477) or by accessing the SEC’s website at www.sec.gov.
Carefully consider the Fund’s investment objectives, risk factors, charges, and expenses before investing. This and additional information can be found in the Fund’s prospectus, which may be obtained by calling 1-844-ETF-MGRS (1-844-383-6477) or by visiting www.etfmj.com.
Read the prospectus carefully before investing.
ETFMG Alternative Harvest ETF
ETF MANAGERS TRUST
Privacy Policy and Procedures
ETF Managers Trust, (the “Trust”) has adopted the following privacy policies in order to safeguard the personal information of the Trust’s customers and consumers in accordance with Regulation S-P as promulgated by the U.S. Securities and Exchange Commission.
Trust officers are responsible for ensuring that the following policies and procedures are implemented:
1) The Trust is committed to protecting the confidentiality and security of the information they collect and will handle personal customer and consumer information only in accordance with Regulation S-P and any other applicable laws, rules and regulations1. The Trust will ensure: (a) the security and confidentiality of customer records and information; (b) that customer records and information are protected from any anticipated threats and hazards; and (c) that customer records and information are protected from unauthorized access or use.
2) The Trust conducts its business affairs through its trustees, officers and third parties that provide services pursuant to agreements with the Trust. The Trust has no employees. It is anticipated that the trustees and officers of the Trust who are not employees of service providers of the Trust will not have access to customer records and information in the performance of their normal responsibilities for the Trust.
3) The Trust may share customer information with its affiliates, subject to the customers’ right to prohibit such sharing.
4) The Trust may share customer information with unaffiliated third parties only in accordance with the requirements of Regulation S-P. Pursuant to this policy, the Trust will not share customer information with unaffiliated third parties other than as permitted by law, unless authorized to do so by the customer.
Consistent with these policies, the Trust has adopted the following procedures:
1) The Trust will determine that the policies and procedures of its affiliates and Service Providers are reasonably designed to safeguard customer information and only permit appropriate and authorized access to and use of customer information through the application of appropriate administrative, technical and physical protections.
2) The Trust will direct each of its Service Providers to adhere to the privacy policy of the Trust and to its privacy policies with respect to all customer information of the Trust and to take all actions reasonably necessary so that the Trust is in compliance with the provisions of Regulation S-P, including, as applicable, the development and delivery of privacy notices and the maintenance of appropriate and adequate records.
3) The Trust requires its Service Providers to provide periodic reports to the Trust’s Board of Trustees outlining their privacy policies and the implementation of such policies. Each Service Provider is required to promptly report to the Trust’s Board any material changes to its privacy policy before, or promptly after, the adoption of such changes.
(1) Generally, the Funds have institutional clients which are not considered “customers” for purposes of regulation S-P.
Advisor
ETF Managers Group, LLC
30 Maple Street, Suite 2, Summit, NJ 07901
Distributor
ETFMG Financial, LLC
30 Maple Street, Suite 2, Summit, NJ 07901
Custodian
Wedbush Securities Inc.
1000 Wilshire Boulevard, Los Angeles, California 90017
Transfer Agent
Computershare Investor Services
480 Washington Boulevard, Jersey City, New Jersey 07310
Securities Lending Agent
Wedbush Securities Inc.
1000 Wilshire Boulevard, Los Angeles, California 90017
Independent Registered Public Accounting Firm
WithumSmith + Brown, PC
1411 Broadway, 9th Floor, New York, NY 10018
Legal Counsel
Sullivan & Worcester LLP
1666 K Street NW, Washington, DC 20006

Semi-Annual Report
March 31, 2020
BlueStar Israel Technology ETF
Ticker: ITEQ
Beginning on January 1, 2021, as permitted by regulations adopted by the SEC, paper copies of the Fund’s shareholder reports will no longer be sent by mail, unless you specifically request paper copies of the Fund’s reports from your financial intermediary, such as a broker-dealer or bank. Instead, the reports will be made available on a website, and you will be notified by mail each time a report is posted and provided with a website link to access the report.
If you already elected to receive shareholder reports electronically, you will not be affected by this change and you need not take any action. Please contact your financial intermediary to elect to receive shareholder reports and other Fund communications electronically.
You may elect to receive all future Fund reports in paper free of charge. Please contact your financial intermediary to inform them that you wish to continue receiving paper copies of Fund shareholder reports and for details about whether your election to receive reports in paper will apply to all funds held with your financial intermediary.

The fund is a series of ETF Managers Trust.
Page Intentionally Left Blank
BlueStar Israel Technology ETF
TABLE OF CONTENTS
March 31, 2020 (Unaudited)
BlueStar Israel Technology ETF
Dear Shareholder,
On behalf of the entire team, we want to express our appreciation for the confidence you have placed in the BlueStar Israel Technology Exchange-Traded Fund (“ITEQ” or the “Fund”). The following information pertains to the fiscal period from October 1, 2019 to March 31, 2020.
The Fund seeks to provide investment results that, before fees and expenses, correspond generally to the price and yield performance of the BlueStar Israel Global Technology Index (the “Index”).
Over the 6-month period ending March 31, 2020, the total return for the Fund was -9.48% while the total return for the Index was -9.09%. The difference was primarily attributable to Fund expenses that are not a part of the Index. The best performers in the Fund on the basis of contribution to its return were Mellanox Technologies, Plus500, and Compugen, while the worst performers were Amdocs, Elbit Systems, and Wix.com.
We believe Israeli companies play an essential role in the global high technology value chain. Most technology users, from online shoppers to Fortune 500 companies, use Israeli technology applications and solutions every day without ever being aware of it. From cybersecurity and defense to clean energy and agriculture, Israeli innovations power some of the biggest names in the tech industry today.
Even in industries where Israeli companies do not have dominant individual market share, the collective footprint of Israeli companies is significant in many key technology subsectors, and Israel-based Research & Development and non-public companies are usually significant contributors to that same sub-industry’s ecosystem.
In late February, as COVID-19, the disease caused by the coronavirus, spread into regions beyond China, global stock markets began to experience significant declines and turbulence. As we write this letter in late April, the course of the coronavirus outbreak remains uncertain, and markets are likely to remain volatile in response to any news or government action concerning the virus. While markets continue working to assess the economic impact of the virus and the public health measures taken in response, it is still unclear what the costs will be and how long the effects will last, but history has shown that markets recover from downturns. For investors, we believe the most important course of action is to remain focused on your long-term goals, and to consult with your financial advisor.
There is much ahead for Israeli Technology companies and we are thankful you have joined us. You can find further details about ITEQ by visiting www.etfmg.com, or by calling 1-844-ETF-MGRS. (1-844-383-6477).
Sincerely,

Samuel Masucci III
Chairman of the Board
BlueStar Israel Technology ETF
Growth of $10,000 (Unaudited)
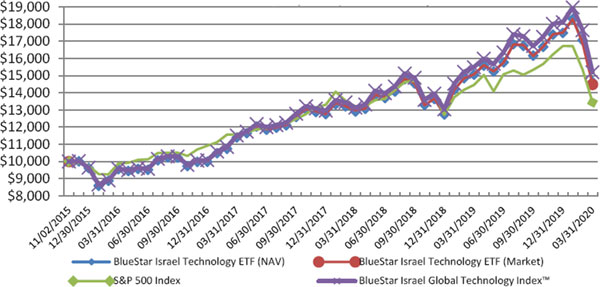
Average Annual Returns
Period Ended March 31, 2020 | | 1 Year
Return | | | Since Inception
(11/2/2015) | | | Value of
$10,000
(3/31/2020) | |
| BlueStar Israel Technology ETF (NAV) | | | -2.81 | % | | | 9.02 | % | | $ | 14,634 | |
| BlueStar Israel Technology ETF (Market) | | | -3.95 | % | | | 8.76 | % | | $ | 14,485 | |
| S&P 500 Index | | | -6.98 | % | | | 6.95 | % | | $ | 13,451 | |
| BlueStar Israel Global Technology IndexTM | | | -1.88 | % | | | 9.96 | % | | $ | 15,201 | |
Performance data quoted represents past performance and does not guarantee future results. The investment return and principal value of an investment will fluctuate so that an investor’s shares, when redeemed, may be worth more or less than their original cost. Current performance of the Fund may be lower or higher than the performance quoted. All performance is historical and includes reinvestment of dividends and capital gains. Performance data current to the most recent month end may be obtained by calling 1-844- ETF-MGRS (1-844-383-6477).
The chart illustrates the performance of a hypothetical $10,000 investment made on November 2, 2015, and is not intended to imply any future performance. The returns shown do not reflect the deduction of taxes that a shareholder would pay on fund distributions from the sales of Fund shares. The chart assumes reinvestment of capital gains and dividends. The chart assumes reinvestment of capital gains and dividends, if any. The Index Returns do not reflect fees or expenses and are not available for direct investment.
BlueStar Israel Technology ETF
Top Ten Holdings as of March 31, 2020 (Unaudited)*
| | | | Security |
| | % of Total
Investments |
| 1 | | Nice, Ltd. | | 6.79% |
| 2 | | Mellanox Technologies, Ltd. | | 6.27% |
| 3 | | Check Point Software Technologies, Ltd. | | 5.96% |
| 4 | | Novocure, Ltd. | | 5.30% |
| 5 | | Amdocs, Ltd. | | 5.30% |
| 6 | | Wix.com, Ltd. | | 4.70% |
| 7 | | SolarEdge Technologies, Inc. | | 3.94% |
| 8 | | Elbit Systems, Ltd. | | 3.20% |
| 9 | | CyberArk Software, Ltd. | | 3.17% |
| 10 | | Ormat Technologies | | 3.13% |
|
| Top Ten Holdings = 47.76% of Total Investments |
|
| * Current Fund holdings may not be indicative of future Fund holdings. |
BlueStar Israel Technology ETF
Important Disclosures and Key Risk Factors
Investing involves risk, including the possible loss of principal. Shares of any ETF are bought and sold at market price (not NAV), may trade at a discount or premium to NAV and are not individually redeemed from the Fund. Brokerage commissions will reduce returns. Narrowly focused investments typically exhibit higher volatility.
Past performance is not indicative of future return. A fund’s performance for very short time periods may not be indicative of future performance.
ITEQ
The BlueStar Israel Technology ETF (the “Fund”) seeks to provide investment results that, before fees and expenses, correspond generally to the price and yield performance of the BlueStar Israel Global Technology IndexTM (the “Index”).
Investing involves risk, including the possible loss of principal. Shares of any ETF are bought and sold at market price (not NAV), may trade at a discount or premium to NAV and are not individually redeemed from the Fund. Brokerage commissions will reduce returns. Narrowly focused investments typically exhibit higher volatility.
The Fund invests in Israeli companies. Foreign investing involves special risks such as currency fluctuations and political uncertainty. Funds that invest in smaller companies may experience greater volatility. Funds that emphasize investments in technology generally will experience greater price volatility. The Fund is non-diversified, meaning it may concentrate its assets in fewer individual holdings than a diversified fund.
ETF shares are not individually redeemable and owners of the shares may acquire those shares from the Fund and tender those shares for redemption to the Fund in Creation Units only, in blocks of 50,000 shares.
Unlike with an actively managed fund, the Fund’s adviser does not use techniques or defensive strategies designed to lessen the effects of market volatility or to reduce the impact of periods of market decline. This means that, based on market and economic conditions, the Fund’s performance could be lower than other types of funds that may actively shift their portfolio assets to take advantage of market opportunities or to lessen the impact of a market decline.
Natural or environmental disasters, such as earthquakes, fires, floods, hurricanes, tsunamis and other severe weather-related phenomena generally, and widespread disease, including pandemics and epidemics, have been and may be highly disruptive to economies and markets, adversely impacting individual companies, sectors, industries, markets, currencies, interest and inflation rates, credit ratings, investor sentiment, and other factors affecting the value of the Fund’s investments. Given the increasing interdependence among global economies and markets, conditions in one country, market, or region are increasingly likely to adversely affect markets, issuers, and/or foreign exchange rates in other countries, including the U.S. Any such events could have a significant adverse impact on the value of the Fund’s investments.
Additionally, natural or environmental disasters, widespread disease or other public health issues, war, acts of terrorism or other events could result in increased premiums or discounts to the Fund’s NAV.
Distributed by ETFMG Financial LLC. ETF Managers Group LLC and ETFMG Financial LLC are wholly owned subsidiaries of Exchange Traded Managers Group LLC (collectively, “ETFMG”). ETFMG Financial LLC is not affiliated with BlueStar Indexes.
BlueStar Israel Technology ETF
PORTFOLIO ALLOCATIONS
As of March 31, 2020 (Unaudited)
| | | BlueStar Israel Technology ETF | |
| As a percent of Net Assets: | | | |
| Guernsey | | | 6.9 | % |
| Israel | | | 61.8 | |
| Jersey | | | 7.1 | |
| United Kingdom | | | 2.1 | |
| United States | | | 21.8 | |
| Exchange Traded Funds | | | 2.9 | |
| Short-Term and other Net Assets (Liabilities) | |
| (2.6 | ) |
| | | | 100.0 | % |
BlueStar Israel Technology ETF
Schedule of Investments
March 31, 2020 (Unaudited)
| | | Shares | | | Value | |
| COMMON STOCKS - 99.7% | | | | | | | | |
| Guernsey - 6.9% | | | | | | | | |
| IT Services - 6.9% | | | | | | | | |
| Amdocs, Ltd. | | | 102,631 | | | $ | 5,641,627 | |
| | | | | | | | | |
| Israel - 61.8% | | | | | | | | |
| Aerospace & Defense - 4.5% | | | | | | | | |
| Elbit Systems, Ltd. | | | 26,042 | | | | 3,400,203 | |
| RADA Electronic Industries, Ltd. (a) | | | 69,191 | | | | 242,169 | |
| Total Aerospace & Defense | | | | | | | 3,642,372 | |
| Biotechnology - 1.2% | | | | | | | | |
| FOAMIX PHARMACE - CVR (a)(b) | | | 127,997 | | | | — | |
| Galmed Pharmaceuticals, Ltd. (a) | | | 41,548 | | | | 143,756 | |
| Intec Pharma, Ltd. (a) | | | 332,461 | | | | 63,201 | |
| Kamada, Ltd. (a) | | | 49,399 | | | | 299,756 | |
| UroGen Pharma, Ltd. (a)(b) | | | 23,590 | | | | 420,845 | |
| Total Biotechnology | | | | | | | 927,558 | |
| Communications Equipment - 3.7% | | | | | | | | |
| AudioCodes, Ltd. | | | 29,353 | | | | 701,243 | |
| Ceragon Networks, Ltd. (a)(b) | | | 161,448 | | | | 203,424 | |
| Gilat Satellite Networks, Ltd. | | | 49,563 | | | | 367,366 | |
| Ituran Location and Control, Ltd. | | | 27,914 | | | | 396,658 | |
| Radware, Ltd. (a) | | | 48,528 | | | | 1,022,485 | |
| Silicom, Ltd. (a) | | | 12,242 | | | | 330,534 | |
| Total Communications Equipment | | | | | | | 3,021,710 | |
| Diversified Financial Services - 1.9% | | | | | | | | |
| Plus500, Ltd. | | | 117,091 | | | | 1,570,735 | |
| Health Care Equipment & Supplies - 0.9% | | | | | | | | |
| Brainsway, Ltd. (a)(b) | | | 52,026 | | | | 192,591 | |
| Inmode, Ltd. (a) | | | 16,167 | | | | 347,590 | |
| Intercure, Ltd. (a) | | | 202,576 | | | | 246,535 | |
| Total Health Care Equipment & Supplies | | | | | | | 786,716 | |
| Household Durables - 0.5% | | | | | | | | |
| Maytronics, Ltd. | | | 63,711 | | | | 402,255 | |
| Independent Power and Renewable Electricity Producers - 1.8% | | | | | | | | |
| Energix-Renewable Energies, Ltd. (a) | | | 229,385 | | | | 661,308 | |
| Enlight Renewable Energy, Ltd. (a) | | | 783,277 | | | | 789,138 | |
| Total Independent Power and Renewable Electricity Producers | | | | | | | 1,450,446 | |
| Internet & Direct Marketing Retail - 0.6% | | | | | | | | |
| Fiverr International, Ltd. (a)(b) | | | 18,911 | | | | 475,990 | |
| IT Services - 7.8% | | | | | | | | |
| Formula Systems 1985, Ltd. | | | 9,773 | | | | 543,634 | |
| Matrix IT, Ltd. | | | 41,236 | | | | 676,496 | |
| Splitit, Ltd. (a) | | | 556,363 | | | | 111,221 | |
| Wix.com, Ltd. (a)(b) | | | 49,620 | | | | 5,002,688 | |
| Total IT Services | | | | | | | 6,334,039 | |
| Life Sciences Tools & Services - 0.9% | | | | | | | | |
| Compugen, Ltd. (a)(b) | | | 98,081 | | | | 712,068 | |
The accompanying notes are an integral part of these financial statements.
BlueStar Israel Technology ETF
Schedule of Investments
March 31, 2020 (Unaudited) (Continued)
| | | Shares | | | Value | |
| | | | | |
| Machinery - 1.4% | | | | | | | | |
| Kornit Digital, Ltd. (a)(b) | | | 47,045 | | | $ | 1,170,950 | |
| Media - 0.4% | | | | | | | | |
| Tremore International, Ltd. (a) | | | 176,919 | | | | 307,651 | |
| Pharmaceuticals - 0.3% | | | | | | | | |
| Redhill Biopharma, Ltd. - ADR (a)(b) | | | 61,935 | | | | 280,566 | |
| Semiconductors & Semiconductor Equipment - 11.8% | | | | | | | | |
| Camtek, Ltd. | | | 40,162 | | | | 338,164 | |
| Mellanox Technologies, Ltd. (a) | | | 54,962 | | | | 6,667,990 | |
| Nova Measuring Instruments, Ltd. (a) | | | 30,076 | | | | 993,616 | |
| Tower Semiconductor, Ltd. (a) | | | 104,190 | | | | 1,676,925 | |
| Total Semiconductors & Semiconductor Equipment | | | | | | | 9,676,695 | |
| Software - 22.9% (d) | | | | | | | | |
| Allot Communications, Ltd. (a) | | | 54,148 | | | | 511,699 | |
| Check Point Software Technologies, Ltd. (a)(b) | | | 63,083 | | | | 6,342,365 | |
| CyberArk Software, Ltd. (a)(b) | | | 39,430 | | | | 3,373,631 | |
| Hilan, Ltd. | | | 19,215 | | | | 605,504 | |
| Magic Software Enterprises, Ltd. | | | 43,194 | | | | 346,991 | |
| Nice, Ltd. (a) | | | 48,920 | | | | 7,231,291 | |
| Tufin Software Technologies Ltd. (a) | | | 24,217 | | | | 212,625 | |
| Total Software | | | | | | | 18,624,106 | |
| Technology Hardware, Storage & Peripherals - 1.2% | | | | | | | | |
| Stratasys, Ltd. (a)(b) | | | 61,605 | | | | 982,600 | |
| Total Israel | | | | | | | 50,366,457 | |
| | | | | | | | | |
| Jersey - 7.1% | | | | | | | | |
| Health Care Equipment & Supplies - 7.0% | | | | | | | | |
| Novocure, Ltd. (a)(b) | | | 83,803 | | | | 5,643,293 | |
| Interactive Media & Services - 0.1% | | | | | | | | |
| XLMedia PLC | | | 397,272 | | | | 76,485 | |
| Total Jersey | | | | | | | 5,719,778 | |
| | | | | | | | | |
| United Kingdom - 2.1% | | | | | | | | |
| Communications Equipment - 0.5% | | | | | | | | |
| BATM Advanced Communications (a) | | | 677,800 | | | | 378,852 | |
| Hotels, Restaurants & Leisure - 0.8% | | | | | | | | |
| 888 Holdings PLC | | | 432,619 | | | | 668,470 | |
| Software - 0.8% (d) | | | | | | | | |
| Sapiens International Corp. NV | | | 33,443 | | | | 650,635 | |
| Total United Kingdom | | | | | | | 1,697,957 | |
| | | | | | | | | |
| United States - 21.8% | | | | | | | | |
| Biotechnology - 1.1% | | | | | | | | |
| BrainStorm Cell Therapeutics, Inc. (a)(b) | | | 66,197 | | | | 307,154 | |
| Oncocyte Corp. (a) | | | 147,305 | | | | 360,897 | |
| Pluristem Therapeutics, Inc. (a) | | | 64,854 | | | | 253,446 | |
| Total Biotechnology | | | | | | | 921,497 | |
The accompanying notes are an integral part of these financial statements.
BlueStar Israel Technology ETF
Schedule of Investments
March 31, 2020 (Unaudited) (Continued)
| | | Shares | | | Value | |
| Electric Utilities - 4.1% | | | | | | | | |
| Ormat Technologies, Inc. | | | 48,871 | | | $ | 3,325,684 | |
| Electronic Equipment, Instruments & Components - 0.3% | | | | | | | | |
| Powerfleet, Inc. (a) | | | 60,249 | | | | 208,462 | |
| Semiconductors & Semiconductor Equipment - 6.7% | | | | | | | | |
| CEVA, Inc. (a) | | | 28,881 | | | | 720,003 | |
| DSP Group, Inc. (a) | | | 34,959 | | | | 468,451 | |
| SolarEdge Technologies, Inc. (a)(b) | | | 51,223 | | | | 4,194,139 | |
| Total Semiconductors & Semiconductor Equipment | | | | | | | 5,382,593 | |
| Software - 9.6% (d) | | | | | | | | |
| ForeScout Technologies, Inc. (a) | | | 42,537 | | | | 1,343,744 | |
| LivePerson, Inc. (a) | | | 66,257 | | | | 1,552,825 | |
| Varonis Systems, Inc. (a)(b) | | | 31,919 | | | | 2,032,283 | |
| Verint Systems, Inc. (a) | | | 65,297 | | | | 2,807,771 | |
| Total Software | | | | | | | 7,736,623 | |
| Total United States | | | | | | | 17,574,859 | |
| TOTAL COMMON STOCKS (Cost $79,986,098) | | | | | | | 81,000,678 | |
| | | | | | | | | |
| INVESTMENTS PURCHASED WITH PROCEEDS FROM SECURITIES LENDING COLLATERAL – 31.9% | | | | | | | | |
| ETFMG Sit Ultra Short ETF (e) | | | 50,000 | | | | 2,404,000 | |
| Mount Vernon Liquid Assets Portfolio, LLC, 0.91% (c) | | | 22,780,067 | | | | 22,780,067 | |
| TOTAL INVESTMENTS PURCHASED WITH PROCEEDS FROM SECURITIES LENDING COLLATERAL (Cost $25,292,923) | | | | | | | 25,184,067 | |
| | | | | | | | | |
| SHORT-TERM INVESTMENTS - 0.3% | | | | | | | | |
| Money Market Funds - 0.3% | | | | | | | | |
| Invesco Advisers, Inc. STIT-Treasury Portfolio - Institutional Class, 0.30% (c) | | | 236,059 | | | | 236,059 | |
| TOTAL SHORT-TERM INVESTMENTS (Cost $236,059) | | | | | | | 236,059 | |
| | | | | | | | | |
| Total Investments (Cost $105,515,080) - 130.9% | | | | | | | 106,420,804 | |
| Liabilities in Excess of Other Assets - (30.9)% | | | | | | | (25,123,553 | ) |
| TOTAL NET ASSETS - 100.0% | | | | | | $ | 81,297,251 | |
Percentages are stated as a percent of net assets.
| ADR | American Depositary Receipt |
| | |
| (a) | Non-income producing security. |
| (b) | All or a portion of this security was out on loan as of March 31, 2020. |
| (c) | The rate quoted is the annualized seven-day yield at March 31, 2020. |
| (d) | As of March 31, 2020, the Fund had a significant portion of its assets invested in the Software Industry. Please refer to Note 9 of the Notes to Financial Statements. |
| (e) | Affiliated security. Please refer to Note 9 of the Notes to Financial Statements. |
The Global Industry Classification Standard (GICS®) was developed by and/or is the exclusive property of MSCI, Inc. and Standard & Poor’s Financial Services LLC (“S&P”). GICS is a service mark of MSCI and S&P and has been licensed for use by U.S. Bancorp Fund Services, LLC, doing business as U.S. Bank Global Fund Services (“Fund Services”).
The accompanying notes are an integral part of these financial statements.
BlueStar Israel Technology ETF
STATEMENT OF ASSETS AND LIABILITIES
As of March 31, 2020 (Unaudited)
| | | BlueStar Israel | |
| | | Technology | |
| | | ETF | |
| ASSETS | | |
| Investments in unaffiliated securities, at value* | | $ | 104,016,804 | |
| Investments in affiliated securities, at value* | | | 2,404,000 | |
| Total investments in securities, at value | | | 106,420,804 | |
| Cash | | | 5,377 | |
| Foreign currency* | | | 188 | |
| Receivables: | | | | |
| Dividends and interest receivable | | | 72,536 | |
| Securities lending income receivable | | | 16,240 | |
| Total Assets | | $ | 106,515,145 | |
| | | | | |
| LIABILITIES | | | | |
| Collateral received for securities loaned (Note 7) | | | 25,165,067 | |
| Payables: | | | | |
| Management fees payable | | | 52,827 | |
| Total Liabilities | | | 25,217,894 | |
| Net Assets | | $ | 81,297,251 | |
| | | | | |
| NET ASSETS CONSIST OF: | | | | |
| Paid-in Capital | | $ | 83,603,680 | |
| Total Distributable Earnings | | | (2,306,429 | ) |
| Net Assets | | $ | 81,297,251 | |
| | | | | |
| *Identified Cost: | | | | |
| Investments in unaffiliated securities | | $ | 103,002,224 | |
| Investments in affiliated securities | | | 2,512,856 | |
| Foreign currency | | | 212 | |
| | | | | |
| Shares Outstanding^ | | | 2,250,000 | |
| Net Asset Value, Offering and Redemption Price per Share | | $ | 36.13 | |
^ No par value, unlimited number of shares authorized
The accompanying notes are an integral part of these financial statements.
BlueStar Israel Technology ETF
STATEMENT OF OPERATIONS
For the Period Ended March 31, 2020 (Unaudited)
| | | BlueStar | |
| | | Israel | |
| | | Technology | |
| | | ETF | |
| INVESTMENT INCOME | | | | |
| Income: | | | | |
| Dividends from unaffiliated securities (net of foreign withholdings tax of $29,972) | | $ | 142,010 | |
| Interest | | | 1,442 | |
| Securities lending income | | | 96,925 | |
| Total Investment Income | | | 240,377 | |
| Expenses: | | | | |
| Management fees | | | 322,478 | |
| Total Expenses | | | 322,478 | |
| Net Investment Income (Loss) | | | (82,101 | ) |
| | | | | |
| REALIZED & UNREALIZED GAIN (LOSS) ON INVESTMENTS | | | | |
| Net Realized Gain (Loss) on: | | | | |
| Unaffiliated Investments | | | (1,409,182 | ) |
| Affiliated Investments | | | — | |
| In-Kind redemptions | | | 1,758,143 | |
| Foreign currency and foreign currency translation | | | (3,666 | ) |
| Net Realized Gain on Investments and Foreign Currency | | | 345,295 | |
| Net Change in Unrealized Appreciation (Depreciation) of: | | | | |
| Unaffiliated Investments | | | (11,081,746 | ) |
| Affiliated Investments | | | (108,856 | ) |
| Foreign currency and foreign currency translation | | | 2 | |
| Net Change in Unrealized Appreciation (Depreciation) of Investments and | | | | |
| Foreign Currency | | | (11,190,600 | ) |
| Net Realized and Unrealized Gain (loss) on Investments | | | (10,845,305 | ) |
| NET INCREASE (DECREASE) IN NET ASSETS RESULTING FROM OPERATIONS | | $ | (10,927,406 | ) |
The accompanying notes are an integral part of these financial statements.
BlueStar Israel Technology ETF
STATEMENTS OF CHANGES IN NET ASSETS
| | | Period | | | |
| | | Ended | | | |
| | | March 31, | | | Year Ended | |
| | | 2020 | | | September 30, | |
| | | (Unaudited) | | | 2019 | |
| | | | | |
| OPERATIONS | | | | | | | | |
| Net investment income (loss) | | $ | (82,101 | ) | | $ | (72,720 | ) |
| Net realized gain (loss) on investments | | | 345,295 | | | | 340,737 | |
| Net change in unrealized appreciation (depreciation) of investments | | | (11,190,600 | ) | | | 5,481,582 | |
| Net increase (decrease) in net assets resulting from operations | | | (10,927,406 | ) | | | 5,749,599 | |
| | | | | | | | | |
| DISTRIBUTIONS TO SHAREHOLDERS | | | | | | | | |
| Net investment income | | | — | | | | (150,718 | ) |
| Return of Capital | | | — | | | | (14,773 | ) |
| Total distributions from distributable earnings | | | — | | | | (165,491 | ) |
| | | | | | | | | |
| CAPITAL SHARE TRANSACTIONS | | | | | | | | |
| Net increase (decrease) in net assets derived from net change in outstanding shares | | | 18,378,005 | | | | 7,019,455 | |
| Net increase (decrease) in net assets | | $ | 7,450,599 | | | $ | 12,603,563 | |
| NET ASSETS | | | | | | | | |
| Beginning of Year/Period | | | 73,846,652 | | | | 61,243,089 | |
| End of Year/Period | | $ | 81,297,251 | | | $ | 73,846,652 | |
Summary of share transactions is as follows:
| | | Period Ended | | | | | |
| | | March 31, 2020 | | | Year Ended | |
| | | (Unaudited) | | | September 30, 2019 | |
| | | Shares | | | Amount | | | Shares | | | Amount | |
| Shares Sold | | | 550,000 | | | $ | 24,541,275 | | | | 500,000 | | | $ | 19,192,040 | |
| Shares Redeemed | | | (150,000 | ) | | | (6,163,270 | ) | | | (350,000 | ) | | | (12,172,585 | ) |
| | | | 400,000 | | | $ | 18,378,005 | | | | 150,000 | | | $ | 7,019,455 | |
| Beginning Shares | | | 1,850,000 | | | | | | | | 1,700,000 | | | | | |
| Ending Shares | | | 2,250,000 | | | | | | | | 1,850,000 | | | | | |
The accompanying notes are an integral part of these financial statements.
BlueStar Israel Technology ETF
FINANCIAL HIGHLIGHTS
For a capital share outstanding throughout the year/period
| | | | | | | | | | | |
| | | Period Ended
March 31,
2020
(Unaudited) | | | Year Ended
September 30,
2019 | | | Year Ended
September 30,
2018 | | | Year Ended
September 30,
2017 | | | Period Ended
September 30,
20161 | |
| | | | | | | | | | | |
| Net Asset Value, Beginning of Year/Period | | $ | 39.92 | | | $ | 36.03 | | | $ | 31.38 | | | $ | 25.58 | | | $ | 25.00 | |
| Income from Investment Operations: | | | | | | | | | | | | | | | | | | | | |
| Net investment income (loss) 2 | | | (0.04 | ) | | | (0.04 | ) | | | 0.04 | | | | 0.02 | | | | 0.05 | |
| Net realized and unrealized gain (loss) on investments | | | (3.75 | ) | | | 4.03 | | | | 4.78 | | | | 5.87 | | | | 0.53 | |
| Total from investment operations | | | (3.79 | ) | | | 3.99 | | | | 4.82 | | | | 5.89 | | | | 0.58 | |
| Less Distributions: | | | | | | | | | | | | | | | | | | | | |
| Distributions from net investment income | | | — | | | | (0.09 | ) | | | (0.17 | ) | | | (0.09 | ) | | | — | |
| Return of Captial | | | — | | | | (0.01 | ) | | | — | | | | — | | | | — | |
| Total Distributions | | | — | | | | (0.10 | ) | | | (0.17 | ) | | | (0.09 | ) | | | — | |
| Net asset value, end of year/period | | $ | 36.13 | | | $ | 39.92 | | | $ | 36.03 | | | $ | 31.38 | | | $ | 25.58 | |
| Total Return | | | -9.48 | %3 | | | 11.17 | % | | | 15.41 | % | | | 23.16 | % | | | 2.31 | %3 |
| | | | | | | | | | | | | | | | | | | | | |
| Ratios/Supplemental Data: | | | | | | | | | | | | | | | | | | | | |
| Net assets at end of year/period (000's) | | $ | 81,297 | | | $ | 73,847 | | | $ | 61,243 | | | $ | 23,538 | | | $ | 5,116 | |
| Expenses to Average Net Assets | | | 0.75 | %4 | | | 0.75 | % | | | 0.75 | % | | | 0.75 | % | | | 0.75 | %4 |
| Net Investment Income (Loss) to Average Net Assets | | | -0.19 | %4 | | | -0.12 | % | | | 0.12 | % | | | 0.07 | % | | | 0.23 | %4 |
| Portfolio Turnover Rate | | | 5 | % | | | 24 | % | | | 11 | % | | | 19 | % | | | 14 | %3 |
| 1 | Commencement of operations on November 2, 2015. |
| 2 | Calculated based on average shares outstanding during the year/period. |
The accompanying notes are an integral part of these financial statements.
BlueStar Israel Technology ETF
NOTES TO FINANCIAL STATEMENTS
March 31, 2020 (Unaudited)
NOTE 1 – ORGANIZATION
BlueStar Israel Technology ETF (the “Fund”) is a series of ETF Managers Trust (the “Trust”), an open-end management investment company consisting of multiple investment series, organized as a Delaware statutory trust on July 1, 2009. The Trust is registered with the SEC under the Investment Company Act of 1940, as amended (the “1940 Act”), as an open-end management investment company and the offering of the Fund’s shares (“Shares”) is registered under the Securities Act of 1933, as amended (the “Securities Act”). The Fund seeks to provide investment results that, before fees and expenses, correspond generally to the total return performance of the BlueStar Israel Global Technology Index® (BIGITech®” or the “Index”). The Fund commenced operations on November 2, 2015.
The Fund currently offers one class of shares, which has no front end sales load, no deferred sales charges, and no redemption fees. The Fund may issue an unlimited number of shares of beneficial interest, with no par value. All shares of the Fund have equal rights and privileges.
Shares of the Fund are listed and traded on the NASDAQ Stock Market, LLC. Market prices for the Shares may be different from their net asset value (“NAV”). The Fund issues and redeems Shares on a continuous basis at NAV only in blocks of 50,000 shares, called “Creation Units.” Creation Units are issued and redeemed principally in-kind for securities included in the Index. Once created, Shares generally trade in the secondary market at market prices that change throughout the day in quantities less than a Creation Unit. Except when aggregated in Creation Units, Shares are not redeemable securities of the Fund. Shares of the Fund may only be purchased or redeemed by certain financial institutions (“Authorized Participants”). An Authorized Participant is either (i) a broker-dealer or other participant in the clearing process through the Continuous Net Settlement System of the National Securities Clearing Corporation or (ii) a DTC participant and, in each case, must have executed a Participant Agreement with the Distributor. Most retail investors do not qualify as Authorized Participants nor have the resources to buy and sell whole Creation Units. Therefore, they are unable to purchase or redeem the Shares directly from the Fund. Rather, most retail investors may purchase Shares in the secondary market with the assistance of a broker and may be subject to customary brokerage commissions or fees.
Authorized Participants transacting in Creation Units for cash may pay an additional variable charge to compensate the relevant Fund for certain transaction costs (i.e., brokerage costs) and market impact expenses relating to investing in portfolio securities. Such variable charges, if any, are included in “Transaction Fees” in the Statements of Changes in Net Assets.
NOTE 2 – SIGNIFICANT ACCOUNTING POLICIES
The following is a summary of significant accounting policies consistently followed by the Fund. These policies are in conformity with accounting principles generally accepted in the United States of America (“U.S. GAAP”).
The Fund follows the investment company accounting and reporting guidance of the Financial Accounting Standards Board Accounting Standard Codification Topic 946 Financial Services –Investment Companies.
The Fund may invest in certain other investment companies (underlying funds). For specific investments in underlying funds, please refer to the complete schedule of portfolio holdings on Form N-CSR(S) for this reporting period, which is filed with the U.S. Securities and Exchange Commission (SEC). For more information about the underlying Fund’s operations and policies, please refer to those Funds’ semiannual and annual reports, which are filed with the SEC.
BlueStar Israel Technology ETF
NOTES TO FINANCIAL STATEMENTS
March 31, 2020 (Unaudited) (Continued)
| A. | Security Valuation. Securities listed on a securities exchange, market or automated quotation system for which quotations are readily available (except for securities traded on NASDAQ), including securities traded over the counter, are valued at the last quoted sale price on the primary exchange or market (foreign or domestic) on which they are traded on the valuation date (or at approximately 4:00 pm Eastern Time if a security’s primary exchange is normally open at that time), or, if there is no such reported sale on the valuation date, at the most recent quoted bid price. For securities traded on NASDAQ, the NASDAQ Official Closing Price will be used. |
Securities for which quotations are not readily available are valued at their respective fair values as determined in good faith by the Board of Trustees (the “Board”). When a security is “fair valued,” consideration is given to the facts and circumstances relevant to the particular situation, including a review of various factors set forth in the pricing procedures adopted by the Fund’s Board. The use of fair value pricing by the Fund may cause the net asset value of its shares to differ significantly from the net asset value that would be calculated without regard to such considerations. As of March 31, 2020, the Fund did not hold any fair valued securities.
As described above, the Fund utilizes various methods to measure the fair value of its investments on a recurring basis. U.S. GAAP establishes a hierarchy that prioritizes inputs to valuation methods. The three levels of inputs are:
| Level 1 | Unadjusted quoted prices in active markets for identical assets or liabilities that the Fund has the ability to access. |
| Level 2 | Observable inputs other than quoted prices included in Level 1 that are observable for the asset or liability, either directly or indirectly. These inputs may include quoted prices for the identical instrument on an inactive market, prices for similar instruments, interest rates, prepayment speeds, credit risk, yield curves, default rates and similar data. |
| Level 3 | Unobservable inputs for the asset or liability, to the extent relevant observable inputs are not available; representing the Fund’s own assumptions about the assumptions a market participant would use in valuing the asset or liability, and would be based on the best information available. |
The availability of observable inputs can vary from security to security and is affected by a wide variety of factors, including, for example, the type of security, whether the security is new and not yet established in the marketplace, the liquidity of markets, and other characteristics particular to the security. To the extent that valuation is based on models or inputs that are less observable or unobservable in the market, the determination of fair value requires more judgment. Accordingly, the degree of judgment exercised in determining fair value is greatest for instruments categorized in Level 3.
The inputs used to measure fair value may fall into different levels of the fair value hierarchy. In such cases, for disclosure purposes, the level in the fair value hierarchy within which the fair value measurement falls in its entirety, is determined based on the lowest level input that is significant to the fair value measurement in its entirety.
BlueStar Israel Technology ETF
NOTES TO FINANCIAL STATEMENTS
March 31, 2020 (Unaudited) (Continued)
The following is a summary of the inputs used to value the Funds’ net assets as of March 31, 2020:
BlueStar Israel Technology ETF
| Assets^ | | Level 1 | | | Level 2 | | | Level 3 | | | Total |
|
| Common Stocks | | $ | 81,000,678 | | | $ | — | | | $ | — | | | $ | 81,000,678 | |
| Short-Term Investments | | | 236,059 | | | | — | | | | — | | | | 236,059 | |
| Investments Purchased with Securities Lending | | | | | | | | | | | | | | | | |
| Collateral* | | | — | | | | — | | | | — | | | | 25,184,067 | |
| Total Investments in Securities | | $ | 81,236,737 | | | $ | — | | | $ | — | | | $ | 106,420,804 | |
^ See Schedule of Investments for classifications by country and industry.
* Certain investments that are measured at fair value using the net asset value per share (or its equivalent) practical expedient have not been categorized in the fair value hierarchy. The fair value amounts presented in the table are intended to permit reconciliation of the fair value hierarchy to the amounts presented in the Schedule of Investments.
| B. | Federal Income Taxes. The Fund has elected to be taxed as a “regulated investment company” and intends to distribute substantially all taxable income to its shareholders and otherwise comply with the provisions of the Internal Revenue Code applicable to regulated investment companies. Therefore, no provisions for federal income taxes or excise taxes have been made. |
To avoid imposition of the excise tax applicable to regulated investment companies, the Fund intends to declare each year as dividends, in each calendar year, at least 98.0% of its net investment income (earned during the calendar year) and 98.2% of its net realized capital gains (earned during the twelve months ended October 31) plus undistributed amounts, if any, from prior years.
Net capital losses incurred after October 31, within the taxable year are deemed to arise on the first business day of the Fund’s next taxable year.
The Fund recognizes the tax benefits of uncertain tax positions only where the position is “more likely than not” to be sustained assuming examination by tax authorities. The Fund has analyzed its tax position and has concluded that no liability for unrecognized tax benefits should be recorded related to uncertain tax positions expected to be taken in the Fund’s 2017 tax returns. The Fund identifies its major tax jurisdictions as U.S. Federal, the State of New Jersey, and the State of Delaware; however the Fund is not aware of any tax positions for which it is reasonably possible that the total amounts of unrecognized tax benefits will change materially in the next twelve months.
As of March 31, 2020, management has reviewed the tax positions for open periods (for federal purposes, three years from the date of filing and for state purposes, four years from the date of filing) as applicable to the Fund, and has determined that no provision for income tax is required in the Fund’s financial statements.
| C. | Security Transactions and Investment Income. Investment securities transactions are accounted for on the trade date. Gains and losses realized on sales of securities are determined on a specific identification basis. Discounts/premiums on debt securities purchased are accreted/amortized over the life of the respective securities using the effective interest method. Dividend income is recorded on the ex-dividend date. Interest income is recorded on an accrual basis. Income, including gains, from investments in foreign securities received by the Fund may be subject to income, withholding or other taxes imposed by foreign countries. |
BlueStar Israel Technology ETF
NOTES TO FINANCIAL STATEMENTS
March 31, 2020 (Unaudited) (Continued)
| D. | Foreign Currency Translations and Transactions. The Fund may engage in foreign currency transactions. Foreign currency transactions are translated into U.S. dollars on the following basis: (i) market value of investment securities, assets and liabilities at the daily rates of exchange, and (ii) purchases and sales of investment securities, dividend and interest income and certain expenses at the rates of exchange prevailing on the respective dates of such transactions. For financial reporting purposes, the Fund does not isolate changes in the exchange rate of investment securities from the fluctuations arising from changes in the market prices of securities for unrealized gains and losses. However, for federal income tax purposes, the Fund does isolate and treat as ordinary income the effect of changes in foreign exchange rates on realized gains or losses from the sale of investment securities and payables and receivables arising from trade-date and settlement-date differences. |
| E. | Distributions to Shareholders. Distributions to shareholders from net investment income, if any are generally declared and paid by the Fund on a quarterly basis. Net realized gains on securities of the Fund normally are declared and paid on an annual basis. Distributions are recorded on the ex-dividend date. |
| F. | Use of Estimates. The preparation of financial statements in conformity with U.S. GAAP requires management to make estimates and assumptions that affect the reported amounts of assets and liabilities at the date of the financial statements, as well as the reported amounts of revenues and expenses during the period. Actual results could differ from those estimates. |
| G. | Share Valuation. The net asset value (“NAV”) per share of the Fund is calculated by dividing the sum of the value of the securities held by the Fund, plus cash and other assets, minus all liabilities (including estimated accrued expenses) by the total number of shares outstanding of the Fund, rounded to the nearest cent. The Fund’s shares will not be priced on the days on which the NYSE is closed for trading. The offering and redemption price per share for the Fund is equal to the Fund’s net asset value per share. |
| H. | Guarantees and Indemnifications. In the normal course of business, the Fund enters into contracts with service providers that contain general indemnification clauses. The Fund’s maximum exposure under these arrangements is unknown as this would involve future claims that may be made against the Fund that have not yet occurred. However, based on experience, the Fund expects the risk of loss to be remote. |
NOTE 3 – RISK FACTORS
Investing in the BlueStar Israel Technology ETF may involve certain risks, as discussed in the Fund’s prospectus, including, but not limited to, those described below. Any of these risks could cause an investor to lose money.
Market Risk. Financial markets rise and fall in response to a variety of factors, sometimes rapidly and unpredictably. As with any investment whose performance is tied to these markets, the value of an investment in a fund will fluctuate, which means that an investor could lose money over short or long periods.
Investment Style Risk. The Fund is not actively managed. Therefore, the Fund follows the securities included in its respective index during upturns as well as downturns. Because of its indexing strategy, the Fund does not take steps to reduce market exposure or to lessen the effects of a declining market. In addition, because of the Fund's expenses, the Fund's performance may be below that of its index.
BlueStar Israel Technology ETF
NOTES TO FINANCIAL STATEMENTS
March 31, 2020 (Unaudited) (Continued)
Equity Risk. The prices of equity securities rise and fall daily. These price movements may result from factors affecting individual companies, industries or the securities market as a whole. In addition, equity markets tend to move in cycles which may cause stock prices to fall over short or extended periods of time.
Securities Lending Risk. Securities lending involves the risk of loss of rights in, or delay in recovery of, the loaned securities if the borrower fails to return the security loaned or becomes insolvent.
Concentration Risk. To the extent that the Fund's or its underlying index's portfolio is concentrated in the securities of issuers in a particular market, industry, group of industries, sector or asset class, the Fund may be adversely affected by the performance of those securities, may be subject to increased price volatility and may be more vulnerable to adverse economic, market, political or regulatory occurrences affecting that market, industry, group of industries, sector or asset class.
NOTE 4 – COMMITMENTS AND OTHER RELATED PARTY TRANSACTIONS
ETF Managers Group, LLC (the “Advisor”), serves as the investment advisor to the Fund. Pursuant to an Investment Advisory Agreement (“Advisory Agreement”) between the Trust, on behalf of the Fund, and the Advisor, the Advisor provides investment advice to the Fund and oversees the day-today operations of the Fund, subject to the direction and control of the Board and the officers of the Trust.
Under the Investment Advisory Agreement with the Fund, the Advisor has overall responsibility for the general management and administration of the Fund and arranges for sub-advisory, transfer agency, custody, fund administration, securities lending, and all other non-distribution related services necessary for the Fund to operate. The Advisor bears the costs of all advisory and non-advisory services required to operate the Fund, in exchange for a single unitary fee. For services provided the Fund pays the Advisor at an annual rate of 0.75% of the Fund’s average daily net assets. The Advisor has an agreement with, and is dependent on, a third party to pay the Fund’s expenses in excess of 0.75% of the Fund’s average daily net assets. Additionally, under the Investment Advisory Agreement, the Advisor has agreed to pay all expenses of the Fund, except for: the fee paid to the Advisor pursuant to the Investment Advisory Agreement, interest charges on any borrowings, taxes, brokerage commissions and other expenses incurred in placing orders for the purchase and sale of securities and other investment instruments, acquired fund fees and expenses, accrued deferred tax liability, extraordinary expenses, and distribution (12b-1) fees and expenses (collectively, “Excluded Expenses”). The Advisor has entered into an Agreement with ITEQ ETF Partners, LLC (the “Sponsor”), under which the Sponsor agrees to sublicense the use of the Underlying Index to the Advisor. The Sponsor also provides marketing support for the Fund, including distributing marketing materials related to the Fund. ITEQ ETF Partners, LLC is a privately held business focused on bringing exchange-traded investment products to investors in the U.S. The Sponsor does not make investment decisions, provide investment advice, or otherwise act in the capacity of an investment adviser to the Fund. Additionally, the Sponsor is not involved in the maintenance of the Underlying Index and does not otherwise act in the capacity of an index provider.
U.S. Bancorp Fund Services, LLC, doing business as U.S. Bank Global Fund Services (the “Administrator”), provides fund accounting, fund administration, and transfer agency services to the Fund. The Advisor compensates the Administrator for these services under an administration agreement between the two parties.
The Advisor pays each independent Trustee a quarterly fee for service to the Fund. Each Trustee is also reimbursed by the Advisor for all reasonable out-of-pocket expenses incurred in connection with his duties as Trustee, including travel and related expenses incurred in attending Board meetings.
BlueStar Israel Technology ETF
NOTES TO FINANCIAL STATEMENTS
March 31, 2020 (Unaudited) (Continued)
NOTE 5 – DISTRIBUTION PLAN
The Fund has adopted a Plan of Distribution pursuant to Rule 12b-1 under the 1940 Act. Under the Plan, the Fund may pay compensation to the Distributor or any other distributor or financial institution with which the Trust has an agreement with respect to the Fund, with the amount of such compensation not to exceed an annual rate of 0.25% of each Fund’s average daily net assets. For the period ended March 31, 2020, the Fund did not incur any 12b-1 expenses.
NOTE 6 - PURCHASES AND SALES OF SECURITIES
The costs of purchases and sales of securities, excluding short-term securities and in-kind transactions, for the period ended March 31, 2020:
| | | Purchases | | | Sales | |
| BlueStar Israel Technology ETF | | $ | 5,764,286 | | | $ | 4,626,831 | |
The costs of purchases and sales of in-kind transactions associated with creations and redemptions for the period ended March 31, 2020:
| | | Purchases
In-Kind | | | Sales
In-Kind | |
| BlueStar Israel Technology ETF | | $ | 24,461,482 | | | $ | 4,942,001 | |
Purchases in-kind are the aggregate of all in-kind purchases and sales in-kind are the aggregate of all proceeds from in-kind sales. Net capital gains or losses resulting from in-kind redemptions are excluded from the determination of the Fund’s taxable gains and are not distributed to shareholders.
There were no purchases or sales of U.S. Government obligations for the period ended March 31, 2020.
NOTE 7 — SECURITIES LENDING
The Fund may lend up to 33 1/3% of the value of the securities in its portfolio to brokers, dealers and financial institutions (but not individuals) under terms of participation in a securities lending program administered by U.S. Bank N.A. (“the Custodian”). The securities lending agreement requires that loans are collateralized at all times in an amount equal to at least 102% of the value of any loaned securities at the time of the loan, plus accrued interest. The Fund receives compensation in the form of fees and earns interest on the cash collateral. The amount of fees depends on a number of factors including the type earns of security and length of the loan. The Fund continues to receive interest payments or dividends on the securities loaned during the borrowing period. Gain or loss in the fair value of securities loaned that may occur during the term of the loan will be for the account of the Fund. The Fund has the right under the terms of the securities lending agreement to recall the securities from the borrower on demand. As of March 31, 2020, the Fund had loaned securities and received cash collateral for the loans. The cash collateral is invested by the Custodian in accordance with approved investment guidelines. Those guidelines require the cash collateral to be invested in readily marketable, high quality, short-term obligations; however, such investments are subject to risk of payment delays or default on the part of the issuer or counterparty or otherwise may not generate sufficient interest to support the costs associated with securities lending. The Fund could also experience delays in recovering its securities and possible loss of income or value if the borrower fails to return the borrowed securities, although the Fund is indemnified from this risk by contract with the securities lending agent.
BlueStar Israel Technology ETF
NOTES TO FINANCIAL STATEMENTS
March 31, 2020 (Unaudited) (Continued)
As of March 31, 2020, the value of the securities on loan and payable for collateral due to broker were as follows:
Value of Securities on Loan Collateral Received
| Fund | | Values of
Securities
on Loan | | | Fund
Collateral
Received* | |
| BlueStar Israel Technology ETF | | $ | 24,378,184 | | | $ | 25,161,429 | |
* The cash collateral received was invested in the ETFMG Sit Ultra Short ETF and the Mount Vernon Liquid Assets Portfolio, an investment with an overnight and continuous maturity, as shown on the Schedule of Investments.
NOTE 8 – FEDERAL INCOME TAXES
The components of distributable earnings (losses) and cost basis of investments for federal income tax purposes at September 30, 2019 were as follows:
| | | Cost | | | Gross
Unrealized
Appreciation | | | Gross
Unrealized
Depreciation | | | Net
Unrealized
Appreciation
(Depreciation) | |
| BlueStar Israel Technology ETF | | $ | 78,365,379 | | | $ | 16,143,037 | | | $ | (5,606,688 | ) | | $ | 10,536,349 | |
| | | Undistributed
Ordinary
Income | | | Undistributed
Long-Term
Gain | | | Total
Distributable
Earnings | | | Other Accumulated
(Loss) | | | Total
Accumulated
Gain | |
| BlueStar Israel | | | | | | | | | | | | | | | |
| Technology ETF | | $ | — | | | $ | — | | | $ | — | | | $ | (1,915,372 | ) | | $ | 8,620,977 | |
As of September 30, 2019, the Fund had accumulated capital loss carryovers of:
| | | Capital
Loss
Carryover
ST | | | Capital
Loss
Carryover
LT | | | Expires | |
| BlueStar Israel Technology ETF | | $ | (731,492 | ) | | $ | (1,152,612 | ) | | | Indefinite | |
Under current tax law, capital and currency losses realized after October 31 of a Fund’s fiscal year may be deferred and treated as occurring on the first business day of the following fiscal year for tax purposes. The following Funds had deferred post-October capital and currency losses, which will be treated as arising on the first business day of the year ended September 30, 2019.
| | | Late
Year
Ordinary
Loss | | | Post-
October
Capital
Loss |
| BlueStar Israel Technology ETF | | $ | (31,266 | ) | | None |
U.S. GAAP requires that certain components of net assets relating to permanent differences be reclassified between financial and tax reporting. These reclassifications have no effect on net assets or net asset value per share. For the fiscal year ended September 30, 2019, the following table shows the reclassifications made:
BlueStar Israel Technology ETF
NOTES TO FINANCIAL STATEMENTS
March 31, 2020 (Unaudited) (Continued)
| | | Total
Distributable
Earnings/(Loss) | | | Paid-In
Capital | |
| BlueStar Israel Technology ETF | | $ | (3,103,855 | ) | | $ | 3,103,855 | |
The tax character of distributions paid by the Fund during the fiscal years ended September 30, 2019 and September 30, 2018 are as follows:
| | | Year Ended
September 30, 2019 | | | Year Ended
September 30, 2018 | |
| | | From
Ordinary
Income | | | Return
of
Capital | | | From
Ordinary
Income | | | From
Capital
Gains | |
| BlueStar Israel Technology ETF | | $ | 150,718 | | | $ | 14,773 | | | $ | 163,624 | | | $ | — | |
NOTE 9 – INVESTMENTS IN AFFILIATES
BlueStar Israel Technology ETF
ETFMG Sit Ultra Short ETF is deemed to be an affiliate of the Fund as defined by the 1940 Act as of the period ended March 31, 2020. Transactions during the period in this security were as follows:
| Security Name | | Value at
September 30,
2019 | | | Purchases | | | Sales | | | Realized
Gain
(Loss)(1) | | | Change in
Unrealized
Appreciation
(Depreciation) | | | Dividend
Income | | | Value at
March 31,
2020 | | | Ending
Shares | |
| ETFMG Sit Ultra | | | | | | | | | | | | | | | | | | | | | | | | | | | | | | | | |
| Short ETF * | | $ | — | | | | 2,512,856 | | | | — | | | $ | — | | | $ | (108,856 | ) | | $ | — | | | $ | 2,404,000 | | | | 50,000 | |
*Affiliate as of March 31, 2020.
1 Realized Losses include transactions in affiliated investments and affiliated in-kind redemptions.
NOTE 10 – NEW ACCOUNTING PRONOUNCEMENTS
In August 2018, FASB issued Accounting Standards Update (“ASU”) 2018-13, Fair Value Measurement (Topic 820): Disclosure Framework – Changes to the Disclosure Requirements for Fair Value Measurement (“ASU 2018-13”). The primary focus of ASU 2018-13 is to improve the effectiveness of the disclosure requirements for fair value measurements. The changes affect all companies that are required to include fair value measurement disclosures. In general, the amendments in ASU 2018-13 are effective for all entities for fiscal years and interim periods within those fiscal years, beginning after December 15, 2019. An entity is permitted to early adopt the removed or modified disclosures upon the issuance of ASU 2018-13 and may delay adoption of the additional disclosures, which are required for public companies only, until their effective date. Management has evaluated ASU 2018-13 and has early adopted the relevant provisions of the disclosure framework.
NOTE 11 – LEGAL MATTERS
The Trust, a former and current trustee of the Trust, the Adviser and certain officers of the Adviser were defendants in an action filed May 2, 2017 in the Superior Court of New Jersey captioned PureShares, LLC d/b/a PureFunds et al. v. ETF Managers Group, LLC et al. (“Nasdaq”), Docket No. C-63-17. The PureShares action alleged claims based on disputes arising out of contractual relationships with the Adviser relating to certain series of the Trust. The action sought damages in unspecified amounts and injunctive relief based on breach of contract, wrongful termination, and several other claims.
BlueStar Israel Technology ETF
NOTES TO FINANCIAL STATEMENTS
March 31, 2020 (Unaudited) (Continued)
The Adviser and its parent, Exchange Traded Managers Group, LLC (“ETFMG”), were defendants in a case filed on October 26, 2017 in the United States District Court for the Southern District of New York by NASDAQ, Inc. (“Nasdaq”) captioned Nasdaq, Inc. v. Exchange Traded Managers Group, LLC et al., Case 1:17-cv-08252. This action arose out of the same facts and circumstances, and relates to the same series of the Trust, as the New Jersey litigation and asserted claims for breach of contract, conversion and certain other claims. The matter was the subject of a bench trial in May 2019, and on December 20, 2019, the Court issued an Opinion and Order awarding compensatory damages to Plaintiff in the amount of $78,403,172.36, plus prejudgment interest. The Court also denied Plaintiff’s requests for punitive damages and equitable relief.
On May 1, 2020, Nasdaq, PureShares LLC (“PureShares”), and ETFMG announced a global settlement that resolves all claims in both the PureShares action and the Nasdaq action. The settlement is subject to future negotiations and approvals among independent third parties. As part of the settlement, Nasdaq and ETFMG have agreed to certain cash payments from ETFMG to Nasdaq and PureShares, and have executed an asset purchase agreement to transfer certain ETFMG intellectual property and related assets, to a Nasdaq affiliate. The transaction is expected to close in the last half of 2020. The Adviser does not believe that the resolution of these matters will have a material adverse effect on the Funds' financial statements. If the events set forth in the settlement agreement do not occur, and a subsequent settlement is not reached, the resulting conditions may adversely affect the Adviser's future operations.
NOTE 12 – SUBSEQUENT EVENTS
In preparing these financial statements, the Fund has evaluated events and transactions for potential recognition or disclosure through the date the financial statements were issued. The evaluation did not result in any subsequent events that necessitated disclosures and/or adjustments to the Financial statements, other than those disclosed in Note 11 above.
BlueStar Israel Technology ETF
APPROVAL OF ADVISORY AGREEMENT AND BOARD CONSIDERATIONS
For the Period Ended March 31, 2020 (Unaudited)
Pursuant to Section 15(c) of the Investment Company Act of 1940 (the “1940 Act”), at a meeting held on March 24, 2020, the Board of Trustees (the “Board”) of ETF Managers Trust (the “Trust”) considered the renewal of the Amended and Restated Investment Advisory Agreement (the “Advisory Agreement”) between ETF Managers Group LLC (the “Adviser”) and the Trust, on behalf of BlueStar Israel Technology ETF (the “Fund”).
Pursuant to Section 15(c) of the 1940 Act, the Board must annually review and approve the Advisory Agreement after its initial two-year term: (i) by the vote of the Trustees or by a vote of the shareholders of the Fund; and (ii) by the vote of a majority of the Trustees who are not parties to the Advisory Agreement or “interested persons” of any party thereto, as defined in the 1940 Act (the “Independent Trustees”), cast in person at a meeting called for the purpose of voting on such approval. Each year, the Board calls and holds a meeting to decide whether to renew the Advisory Agreement for an additional one-year term. In preparation for such meeting, the Board requests and reviews a wide variety of information from the Adviser.
In reaching its decision, the Board, including the Independent Trustees, considered all factors it believed relevant, including: (i) the nature, extent and quality of the services provided to the Fund’s shareholders by the Adviser; (ii) the investment performance of the Fund; (iii) the Adviser’s costs and profits realized in providing services to the Fund, including any fall-out benefits enjoyed by the Adviser; (iv) comparative fee and expense data for the Fund in relation to other similar investment companies; (v) the extent to which economies of scale would be realized as the Fund grows and whether the advisory fees for the Fund reflects these economies of scale for the benefit of the Fund; and (vi) other financial benefits to the Adviser and its affiliates resulting from services rendered to the Fund. The Board’s review included written and oral information furnished to the Board prior to and at the meeting held on March 24, 2020, and throughout the year. Among other things, the Adviser provided responses to a detailed series of questions, which included information about the Adviser’s operations, service offerings, personnel, compliance program and financial condition. The Board then discussed the written and oral information that it received before the meeting and throughout the year, and the Adviser’s oral presentations and any other information that the Board received at the meeting, and deliberated on the renewal of the Advisory Agreement in light of this information.
The Independent Trustees were assisted throughout the contract review process by independent legal counsel. The Independent Trustees relied upon the advice of such counsel and their own business judgment in determining the material factors to be considered in evaluating the renewal of the Advisory Agreement, and the weight to be given to each such factor. The conclusions reached with respect to the Advisory Agreement were based on a comprehensive evaluation of all the information provided and not any single factor. Moreover, each Trustee may have placed varying emphasis on particular factors in reaching conclusions with respect to the Fund. The Independent Trustees conferred amongst themselves and independent legal counsel during a telephonic contract renewal meeting held prior to the March 24, 2020 meeting and also conferred in executive sessions both with and without representatives of management before and during the March 24th meeting. The Independent Trustees requested, received and considered additional information arising out of these executive sessions.
Nature, Extent and Quality of Services Provided by the Adviser
The Trustees considered the scope of services provided under the Advisory Agreement, noting that the Adviser provides investment management services to the Fund. The Board discussed the responsibilities of the Adviser, including: responsibility for the general management of the day-to-day investment and reinvestment of the assets of the Fund; determining the daily baskets of deposit securities and cash components; executing portfolio security trades for purchases and redemptions of Fund shares conducted on a cash-in-lieu basis; responsibility for daily monitoring of tracking error and quarterly reporting to the Board; and implementation of Board directives as they relate to the Fund. In considering the nature, extent and quality of the services provided by the Adviser, the Board considered the qualifications, experience and responsibilities of the Adviser’s investment personnel and the quality of the Adviser’s compliance infrastructure. The Board also considered the Adviser’s experience managing exchange-traded funds (“ETFs”), as well as the Adviser’s response to the market volatility and uncertainty during the recent pandemic.
BlueStar Israel Technology ETF
APPROVAL OF ADVISORY AGREEMENT AND BOARD CONSIDERATIONS
For the Period Ended March 31, 2020 (Unaudited) (Continued)
The Board also considered other services provided to the Fund, such as overseeing the Fund’s service providers, monitoring adherence to the Fund’s investment restrictions, and monitoring compliance with various policies and procedures and with applicable securities laws.
Based on the factors above, as well as those discussed below, the Board concluded that it was satisfied with the nature, extent and quality of the services provided to the Fund by the Adviser.
Historical Performance
The Board then considered the past performance of the Fund. The Board reviewed information regarding the Fund’s performance with the performance of a group of peer funds and with the performance of the Fund’s underlying index for various time periods. The Board noted management’s explanation that analysis of investment performance, in absolute terms, is less relevant for the Fund than it is for actively managed funds, given the Fund’s index-based investment objectives. The Board also noted management’s further explanation that it is more relevant to review the performance of the Fund by focusing on the extent to which the Fund tracked its underlying index. The Board reviewed information regarding the Fund’s index tracking, discussing, as applicable, factors which contributed to the Fund’s tracking error. The Board noted that the Fund had underperformed its underlying index over certain periods, but that such underperformance was, at least in part, a result of costs incurred by the Fund not incurred by its underlying index. The Board considered other factors that contributed to the Fund’s tracking error, including cash drag and the process of rebalancing the Fund’s portfolio. The Board noted management’s representations that the Fund’s performance satisfactorily tracked its underlying index. The Board concluded that, after taking these factors into account, the Fund satisfactorily tracked its underlying index. The Board further noted that it had received and would continue to receive regular reports regarding the Fund’s performance, including with respect to its tracking error, at its quarterly meetings.
Cost of Services Provided, Profits and Economies of Scale
The Board reviewed the advisory fee for the Fund and compared it to the total operating expenses of comparable ETFs, as determined by an independent third party. Among other information, the Board noted that the advisory fee for the Fund was higher than the average and median expense ratios for its peer ETFs. The Board took into consideration management’s discussion of the fees, including that the Fund has a niche investment strategy that is substantially different than the strategies of many of the peer ETFs.
The Board noted the importance of the fact that the advisory fee for the Fund is a “unified fee,” meaning that the shareholders of the Fund pay no expenses other than the advisory fee and certain other costs such as interest charges on any borrowings, taxes, brokerage commissions and other expenses incurred in placing orders for the purchase and sale of securities and other investment instruments, acquired fund fees and expenses, accrued deferred tax liability, extraordinary expenses (such as, among other things and subject to Board approval, non-standard Board-related expenses and litigation against the Board, Trustees, Fund, Adviser, and officers of the Adviser), and distribution (12b-1) fees and expenses. The Board also noted that the Adviser was responsible for compensating the Trust’s other service providers and paying the Fund’s other expenses (except as noted above) out of its own fees and resources. The Board concluded that the advisory fee for the Fund is reasonable in light of the factors considered.
BlueStar Israel Technology ETF
APPROVAL OF ADVISORY AGREEMENT AND BOARD CONSIDERATIONS
For the Period Ended March 31, 2020 (Unaudited) (Continued)
The Board also evaluated the compensation and other benefits received by the Adviser from its relationship with the Fund, taking into account the profitability analysis provided by the Adviser. The Board received and reviewed a profitability analysis that detailed the revenues earned and the expenses incurred by the Adviser with respect to the Fund and considered how profit margins could affect the Adviser’s ability to attract and retain high quality personnel. Based on the information provided to the Trustees, the Trustees concluded that the level of profits realized by the Adviser from providing services to the Fund was not excessive in view of the nature, extent and quality of services provided to the Fund. The Board further considered other benefits derived by the Adviser and its affiliates from the Adviser’s relationship with the Fund, including services provided by certain brokerage firms.
In addition, the Board considered whether economies of scale may be realized for the Fund. The Board noted that the Adviser regularly considers whether fee reductions are appropriate as the Fund grows in size. The Board noted that a unitary fee provides a level of certainty in expenses for the Fund and effectively acts as a cap on the fees and expenses (except as noted above) that are borne by the Fund. The Board noted that the Adviser still bears most of the ordinary fees and expenses of the Fund and that the Fund would likely experience benefits from the unitary fee at the Fund’s projected asset levels. The Board also noted that the Fund commenced operations on November 2, 2015 and that, as of February 29, 2020, the Fund had approximately $100 million in assets. The Board recognized that there would not likely be any additional economies of scale until the Fund’s assets grow
In its deliberations, the Board did not identify any single piece of information discussed above that was all-important, controlling or determinative of its decision.
Based on the Board’s deliberations and its evaluation of the information described above, the Board, including the Independent Trustees, unanimously: (a) concluded that the terms of the Advisory Agreement are fair and reasonable; (b) concluded that the Adviser’s fees are reasonable in light of the services that the Adviser provides to the Fund; and (c) approved the renewal of the Advisory Agreement for another year.
BlueStar Israel Technology ETF
EXPENSE EXAMPLE
Six Months Ended March 31, 2020 (Unaudited)
As a shareholder of the Fund you incur two types of costs: (1) transaction costs, including brokerage commissions on purchases and sales of Fund shares, and (2) ongoing costs, including management fees and other Fund expenses. These examples are intended to help you understand your ongoing costs (in dollars) of investing in the Fund and to compare these costs with the ongoing costs of investing in other funds. The example is based on an investment of $1,000 invested for the period of time as indicated in the table below.
Actual Expenses
The first line of the table provides information about actual account values based on actual returns and actual expenses. You may use the information in this line, together with the amount you invested, to estimate the expenses that you paid over the period. Simply divide your account value by $1,000 (for example, an $8,600 account value divided by $1,000 = 8.6), then, multiply the result by the number in the first line under the heading entitled “Expenses Paid During Period’’ to estimate the expenses you paid on your account during this period.
Hypothetical Example for Comparison Purposes
The second line of the table provides information about hypothetical account values based on a hypothetical return and hypothetical expenses based on the Fund’s actual expense ratio and an assumed rate of return of 5% per year before expenses, which is not the Fund’s actual return. The hypothetical account values and expenses may not be used to estimate the actual ending account balance or expenses you paid for the period. You may use this information to compare the ongoing costs of investing in the Fund and other funds. To do so, compare this 5% hypothetical example with the 5% hypothetical examples that appear in the shareholder reports of the other funds. Please note that the expenses shown in the table are meant to highlight your ongoing costs only and do not reflect any transactional costs, such as brokerage commissions paid on purchases and sales of Fund shares. Therefore, the second line of the table is useful in comparing ongoing costs only and will not help you determine the relative total costs of owning different funds. If these transactional costs were included, your costs would have been higher.
| BlueStar Israel Technology ETF | | Beginning Account
Value October 1, 2019 | | | Ending
Account
Value March 31, 2020 | | | Expenses Paid
During
the Period^ | | | Annualized
Expense Ratio
During Period October 1, 2019
to March 31, 2020 | |
| Actual | | $ | 1,000.00 | | | $ | 905.20 | | | $ | 3.57 | | | | 0.75 | % |
| | | | | | | | | | | | | | | | | |
| Hypothetical (5% annual) | | $ | 1,000.00 | | | $ | 1,021.25 | | | $ | 3.79 | | | | 0.75 | % |
^ The dollar amounts shown as expenses paid during the period are equal to the annualized six-month expense ratio multiplied by the average account value during the period, multiplied by 183/366 (to reflect the number of days in the period).
BlueStar Israel Technology ETF
Statement Regarding Liquidity Risk Management Program (unaudited)
ETF Managers Trust (the “Trust”) has adopted a liquidity risk management program (the “Program”). The Trust’s Board of Trustees (the “Board”) has designated ETF Managers Group LLC (the “Program Administrator”) as the administrator of the Program. The Program Administrator has designated a committee (the “Committee”), composed of personnel from multiple departments, including investment operations and compliance, that is responsible for the implementation and ongoing administration of the Program, which includes assessing the liquidity risk of the BlueStar Israel Technology ETF (the “Fund”) under both normal and reasonably foreseeable stressed conditions.
Under the Program, the Program Administrator assesses, manages and periodically reviews the Fund’s liquidity risk, based on factors specific to the circumstances of the Fund. Liquidity risk is the risk that the Fund could not meet shareholder redemption requests without significant dilution of remaining shareholders’ interests in the Fund. This risk is managed by monitoring the degree of liquidity of the Fund’s investments and limiting the amount of the Fund’s illiquid investments, among other means. The Program Administrator’s process of determining the degree of liquidity of the Fund’s investments is supported by one or more third-party liquidity assessment vendors.
At a meeting of the Board on March 24, 2020, the Adviser provided a written report to the Board addressing the operation, and the adequacy and effectiveness of the implementation, of the Program, including, the operation of any Highly Liquid Investment Minimum, where applicable, and any material changes to the Program, for the initial period from December 1, 2018 through February 29, 2020 (the “Reporting Period”). No significant liquidity events impacting the Fund were noted in the report and it was represented that, as of December 31, 2019, the Fund was primarily highly liquid and, during the Reporting Period, the Fund held less than 15% in illiquid securities. In addition, the Program Administrator provided its assessment that Program implementation was effective and that the Program operated adequately and effectively to enable the Program Administrator to oversee and manage liquidity risk and ensure the Fund is able to meet requests to redeem shares without significant dilution to the remaining investors’ interest in the Fund.
There can be no assurance that the Program will achieve its objectives in the future. Please refer to the Fund’s prospectus for more information regarding the Fund’s exposure to liquidity risk and other principal risks to which an investment in the Fund may be subject.
BlueStar Israel Technology ETF
SUPPLEMENTARY INFORMATION
March 31, 2020 (Unaudited)
NOTE 1 – FREQUENCY DISTRIBUTION OF PREMIUMS AND DISCOUNTS
Information regarding how often shares of the Fund traded on the Exchange at a price above (i.e., at a premium) or below (i.e., at a discount) the NAV is available on the Fund’s website at www.iteqetf.com.
NOTE 2 – FEDERAL TAX INFORMATION
Qualified Dividend Income/Dividends Received Deduction
For the fiscal year ended September 30, 2019, certain dividends paid by the Fund may be subject to a maximum tax rate of 15%, as provided for by the Jobs and Growth Tax Reconciliation Act of 2003. The percentage of dividends declared from ordinary income designated as qualified dividend income was as follows:
| Fund Name | QDI |
| BlueStar-Israel Technology ETF | 100.00% |
For corporate shareholders, the percent of ordinary income distributions qualifying for the corporate dividends received deduction for the fiscal year ended September 30, 2019 was as follows:
| Fund Name | DRD |
| BlueStar-Israel Technology ETF | 5.77% |
Short Term Capital Gain
The percentage of taxable ordinary income distributions that are designated as short-term capital gain distributions under Internal Revenue Section 871 (k)(2)(C) for the Fund was as follows:
| Fund Name | Short-Term Capital Gain |
| BlueStar-Israel Technology ETF | 0.00% |
NOTE 3 – INFORMATION ABOUT PORTFOLIO HOLDINGS
The Fund files a complete schedule of portfolio holdings with the SEC for its first and third fiscal quarters on Part F of Form N-PORT. Once filed, the Fund’s Part F of Form N-PORT is available without charge, upon request on the SEC’s website (www.sec.gov) and is available by calling (877) 756-7873. The Fund’s portfolio holdings are posted on the Fund’s website at www.iteqetf.com daily.
NOTE 4 – INFORMATION ABOUT PROXY VOTING
A description of the policies and procedures the Fund uses to determine how to vote proxies relating to portfolio securities is provided in the Statement of Additional Information (“SAI”). The SAI is available without charge upon request by calling toll-free at 1-844-ETF-MGRS (1-844-383-6477), by accessing the SEC’s website at www.sec.gov, or by accessing the Fund’s website at www.iteqetf.com.
Information regarding how the Fund voted proxies relating to portfolio securities during the period ending June 30 is available by calling toll-free at 1-844-ETF-MGRS (1 844-383-6477) or by accessing the SEC’s website at www.sec.gov. Carefully consider the Fund’s investment objectives, risk factors, charges, and expenses before investing. This and additional information can be found in the Fund’s prospectus, which may be obtained by calling 1-844-ETF MGRS (1-844-383-6477) or by visiting www.iteqetf.com. Read the prospectus carefully before investing.
BlueStar Israel Technology ETF
Board of Trustees
Set forth below are the names, birth years, positions with the Trust, length of term of office, and the principal occupations and other directorships held during at least the last five years of each of the persons currently serving as a Trustee of the Trust, as well as information about each officer. The business address of each Trustee and officer is 30 Maple Street, 2nd Floor, Summit, New Jersey 07901. The SAI includes additional information about Fund directors and is available, without charge, upon request by calling 1-844-ETF-MGRS (1-844-383-6477).
Name
and Year
of Birth | Position(s)
Held with the
Trust, Term
of Office and
Length of
Time Served | Principal Occupation(s) During Past 5 Years | Number of
Portfolios in
Fund
Complex
Overseen By Trustee | Other
Directorships
Held by
Trustee During Past 5 Years |
| Interested Trustee and Officers |
Samuel Masucci,
III (1962) | Trustee, Chairman of the Board and President (since 2012); Secretary (since 2014) | Chief Executive Officer, Exchange Traded Managers Group LLC (since 2013); Chief Executive Officer, ETF Managers Group LLC (since 2016); Chief Executive Officer, ETF Managers Capital LLC (commodity pool operator) (since 2014); Chief Executive Officer (2012-2016) and Chief Compliance Officer (2012-2014), Factor Advisors, LLC (investment adviser); President and Chief Executive Officer, Factor Capital Management LLC (2012-2014) (commodity pool operator); | 11 | None |
John A. Flanagan,
(1946) | Treasurer (since 2015) | President, John A. Flanagan CPA, LLC (accounting services) (since 2010); Treasurer, ETF Managers Trust (since 2015); Principal Financial Officer, ETF Managers Capital, LLC (commodity pool operator) (since 2015) | n/a | n/a |
Reshma A. Tanczos
(1978) | Chief Compliance Officer (since 2016) | Chief Compliance Officer, ETF Managers Group LLC (since 2016); Chief Compliance Officer, ETF Managers Capital LLC (since 2016); Partner, Crow & Cushing (law firm) (2007-2016). | n/a | n/a |
| * | Mr. Masucci is an interested Trustee by virtue of his role as the Chief Executive Officer of the Adviser. |
BlueStar Israel Technology ETF
Board of Trustees (Continued)
Name
and Year
of Birth | Position(s)
Held with the
Trust, Term
of Office and
Length of
Time Served | Principal Occupation(s) During Past 5 Years | Number of
Portfolios in
Fund
Complex
Overseen By Trustee | Other
Directorships
Held by
Trustee During Past 5 Years |
| Independent Trustees |
Terry Loebs
(1963) | Trustee (since 2014) | Founder and Managing Member, Pulsenomics LLC (index product development and consulting firm) (since 2011); Managing Director, MacroMarkets, LLC (exchange-traded products firm) (2006-2011). | 11 | None |
Jared A. Chase
(1955) | Trustee (since 2018) | Chief Operating and Financial Officer, Root Capital (a 501(c)(3) non-profit lender); Chairman, State Street Global Alliance LLC, State Street Corporation (2007-2012); Head of Global Treasury, Liability Management, Money Markets & Derivatives, State Street Corporation (2004-2007) | 11 | None |
Page Intentionally Left Blank
Page Intentionally Left Blank
Page Intentionally Left Blank
Advisor
ETF Managers Group, LLC
30 Maple Street, Suite 2, Summit, NJ 07901
Distributor
ETFMG Financial, Inc.
30 Maple Street, Suite 2, Summit, NJ 07901
Custodian
U.S. Bank National Association
Custody Operations
1555 North River Center Drive, Suite 302, Milwaukee, Wisconsin 53212
Transfer Agent
Foreside Financial Group, LLC
111 E Kilbourn Ave, Suite 1250, Milwaukee, WI 53202
Securities Lending Agent
U.S Bank, National Association
Securities Lending
800 Nicolet Mall
Minneapolis, MN 55402-7020
Independent Registered Public Accounting Firm
WithumSmith + Brown, PC
1411 Broadway, 9th Floor, New York, NY 10018
Legal Counsel
Sullivan & Worcester LLP
1666 K Street NW, Washington, DC 20006

Semi-Annual Report
March 31, 2020
Etho Climate Leadership U.S. ETF
Ticker: ETHO
Beginning on January 1, 2021, as permitted by regulations adopted by the SEC, paper copies of the Fund’s shareholder reports will no longer be sent by mail, unless you specifically request paper copies of the Fund’s reports from your financial intermediary, such as a broker-dealer or bank. Instead, the reports will be made available on a website, and you will be notified by mail each time a report is posted and provided with a website link to access the report.
If you already elected to receive shareholder reports electronically, you will not be affected by this change and you need not take any action. Please contact your financial intermediary to elect to receive shareholder reports and other Fund communications electronically.
You may elect to receive all future Fund reports in paper free of charge. Please contact your financial intermediary to inform them that you wish to continue receiving paper copies of Fund shareholder reports and for details about whether your election to receive reports in paper will apply to all funds held with your financial intermediary.

The fund is a series of ETF Managers Trust.
Page Intentionally Left Blank
Etho Climate Leadership U.S. ETF
TABLE OF CONTENTS
March 31, 2020 (Unaudited)
Etho Climate Leadership U.S. ETF
Dear Shareholder,
On behalf of the entire team, we want to express our appreciation for the confidence you have placed in the Etho Climate Leadership U.S. Exchange-Traded Fund (“ETHO” or the “Fund”). The following information pertains to the fiscal period from October 1, 2019 to March 31, 2020.
The Fund seeks to provide investment results that, before fees and expenses, correspond generally to the price and yield performance of the Etho Climate Leadership Index – U.S. (the “Index”).
For the fiscal period ended March 31, 2020, the total return for the Fund was -16.37% while the total return for the Index was -16.63%. The worst performers in the Fund on the basis of contribution to return were Consumer Discretionary and Industrials.
As you may know, the Etho Climate Leadership U.S. ETF offers broad diversification across companies that have demonstrated efficiency and leadership with their use of resources and their supply chains when compared to industry peers. The Fund holds roughly 270 equities equally weighted and results in a carbon emissions profile that is, on average, 50-70% lower per dollar invested than conventional U.S. benchmark indices.1 ETHO avoids investment in any direct fossil fuel companies, as well as enablers of that industry, along with a series of other unsustainable industries such as Tobacco/Weapons/Gambling, etc. Equal weighting of the Fund allows for the elimination of equities that do not meet ETHO’s standards without there being a significant impact on the diversification or performance of the Fund. It also creates broad exposure to both the sectors and factors that potentially make for greater stability and higher performance.
In late February, as COVID-19, the disease caused by the coronavirus, spread into regions beyond China, global stock markets began to experience significant declines and turbulence. As we write this letter in late April, the course of the coronavirus outbreak remains uncertain, and markets are likely to remain volatile in response to any news or government action concerning the virus. While markets continue working to assess the economic impact of the virus and the public health measures taken in response, it is still unclear what the costs will be and how long the effects will last, but history has shown that markets recover from downturns. For investors, we believe the most important course of action is to remain focused on your long-term goals, and to consult with your financial advisor.
There is much ahead for environmentally sustainable and socially responsible investing. We are thankful you have joined us by investing in the Etho Climate Leadership U.S. ETF.You can find further details about ETHO by visiting www.etfmg.com, or by calling 1- 844-ETF-MGRS (1-844-383-6477).
Sincerely,
Samuel Masucci III
Chairman of the Board
1 Etho Capital. www.ethocapital.com
Etho Climate Leadership U.S. ETF
Growth of $10,000 (Unaudited)
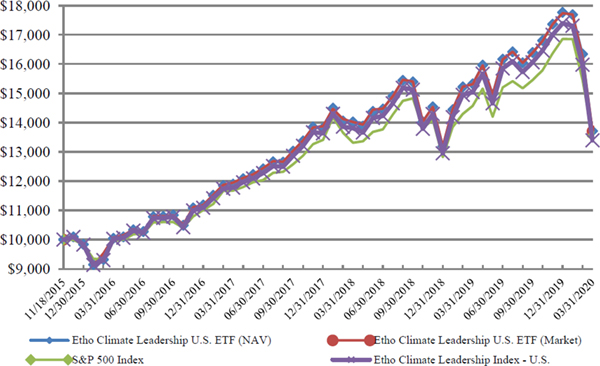
Average Annual Returns
Period Ended March 31, 2020 | | 1 Year
Return | | Since Inception
(11/18/2015) | | Value of $10,000
(3/31/2020) |
| Etho Climate Leadership U.S. ETF (NAV) | | -10.53% | | 7.50% | | $ | 13,712 |
| Etho Climate Leadership U.S. ETF (Market) | | -10.53% | | 7.48% | | $ | 13,704 |
| S&P 500 Index | | -6.98% | | 7.22% | | $ | 13,559 |
| Etho Climate Leadership Index - U.S. | | -10.97% | | 6.92% | | $ | 13,393 |
Performance data quoted represents past performance and does not guarantee future results. The investment return and principal value of an investment will fluctuate so that an investor’s shares, when redeemed, may be worth more of less than their original cost. Current performance of the Fund may be lower or higher than the performance quoted. All performance is historical and includes reinvestment of dividends and capital gains. Performance data current to the most recent month end may be obtained by calling 1-844-ETF-MGRS (1-844-383-6477).
The chart illustrates the performance of a hypothetical $10,000 investment made on November 18, 2015, and is not intended to imply any future performance. The returns shown do not reflect the deduction of taxes that a shareholder would pay on fund distributions from the sales of Fund shares. The chart assumes reinvestment of capital gains and dividends. The chart assumes reinvestment of capital gains and dividends, if any. The Index Returns do not reflect fees or expenses and are not available for direct investment.
Etho Climate Leadership U.S. ETF
Top Ten Holdings as of March 31, 2020 (Unaudited)*
| | | Security |
| | | % of Total
Investments |
| 1 | | ETFMG Sit Ultra Short ETF | | 3.15% |
| 2 | | DexCom, Inc. | | 0.83% |
| 3 | | Tesla, Inc. | | 0.67% |
| 4 | | Advanced Micro Devices, Inc. | | 0.64% |
| 5 | | Cypress Semiconductor Corp. | | 0.58% |
| 6 | | Seattle Genetics, Inc. | | 0.57% |
| 7 | | NVIDIA Corp. | | 0.53% |
| 8 | | MSCI, Inc. | | 0.52% |
| 9 | | ResMed, Inc. | | 0.51% |
| 10 | | Teradyne, Inc. | | 0.50% |
| | | | | |
| | | Top Ten Holdings 8.50% of Total Investments |
| | | * Current Fund holdings may not be indicative of future Fund holdings. |
Etho Climate Leadership U.S. ETF
Important Disclosures and Key Risk Factors
Investing involves risk, including the possible loss of principal. Shares of any ETF are bought and sold at market price (not NAV), may trade at a discount or premium to NAV and are not individually redeemed from the Fund. Brokerage commissions will reduce returns. Narrowly focused investments typically exhibit higher volatility.
Past performance is not indicative of future return. A fund’s performance for very short time periods may not be indicative of future performance.
ETHO
The ETHO Climate Leadership U.S. ETF (the “Fund”) seeks to provide investment results that, before fees and expenses, correspond generally to the price and yield performance of the Etho Climate Leadership Index (the “Index”).
Investing involves risk, including the possible loss of principal. Shares of any ETF are bought and sold at market price (not NAV), may trade at a discount or premium to NAV and are not individually redeemed from the Fund. Brokerage commissions will reduce returns. Narrowly focused investments typically exhibit higher volatility. The Fund’s return may not match or achieve a high degree of correlation with the return of the Etho Climate Leadership Index — U.S.
To the extent the Fund utilizes a sampling approach, it may experience tracking error to a greater extent than if the Fund had sought to replicate the Index.
Unlike with an actively managed fund, the Fund’s adviser does not use techniques or defensive strategies designed to lessen the effects of market volatility or to reduce the impact of periods of market decline. This means that, based on market and economic conditions, the Fund’s performance could be lower than other types of funds that may actively shift their portfolio assets to take advantage of market opportunities or to lessen the impact of a market decline.
Natural or environmental disasters, such as earthquakes, fires, floods, hurricanes, tsunamis and other severe weather-related phenomena generally, and widespread disease, including pandemics and epidemics, have been and may be highly disruptive to economies and markets, adversely impacting individual companies, sectors, industries, markets, currencies, interest and inflation rates, credit ratings, investor sentiment, and other factors affecting the value of the Fund’s investments. Given the increasing interdependence among global economies and markets, conditions in one country, market, or region are increasingly likely to adversely affect markets, issuers, and/or foreign exchange rates in other countries, including the U.S. Any such events could have a significant adverse impact on the value of the Fund’s investments.
Additionally, natural or environmental disasters, widespread disease or other public health issues, war, acts of terrorism or other events could result in increased premiums or discounts to the Fund’s NAV.
ETF Managers Group LLC serves as the investment adviser to the Fund.
The Fund is distributed by ETFMG Financial LLC. Both ETF Managers Group LLC and ETFMG Financial LLC are wholly owned subsidiaries of Exchange Traded Managers Group LLC (collectively, “ETFMG”). ETFMG Financial LLC is not affiliated with Etho Capital.
Etho Climate Leadership U.S. ETF
PORTFOLIO ALLOCATIONS
As of March 31, 2020 (Unaudited)
| | | Etho
Climate
Leadership
U.S.
ETF | |
| As a percent of Net Assets: | | | |
| Canada | | | 0.5 | % |
| Ireland | | | 0.3 | |
| Switzerland | | | 0.6 | |
| United States | | | 96.8 | |
| Exchange Traded Funds | | | 3.8 | |
| Closed-End Funds | | | 0.3 | |
| Short-Term and other Net Assets (Liabilities) | | | (2.3 | ) |
| | | | 100.0 | % |
Etho Climate Leadership U.S. ETF
Schedule of Investments
March 31, 2020 (Unaudited)
| | | Shares | | | Value | |
| COMMON STOCKS - 98.2% | | | | | | | | |
| Canada - 0.5% | | | | | | | | |
| Textiles, Apparel & Luxury Goods - 0.5% | | | | | | | | |
| Lululemon Athletica, Inc. (a) | | | 1,680 | | | $ | 318,445 | |
| | | | | | | | | |
| Ireland - 0.3% | | | | | | | | |
| Building Products - 0.3% | | | | | | | | |
| Trane Technologies PLC (b) | | | 2,560 | | | | 211,430 | |
| | | | | | | | | |
| Switzerland - 0.6% | | | | | | | | |
| Electronic Equipment, Instruments & Components - 0.3% | | | | | | | | |
| TE Connectivity, Ltd. | | | 3,436 | | | | 216,399 | |
| Insurance - 0.3% | | | | | | | | |
| Chubb, Ltd. | | | 1,971 | | | | 220,141 | |
| Total Switzerland | | | | | | | 436,540 | |
| | | | | | | | | |
| United States - 96.8% | | | | | | | | |
| Airlines - 0.5% | | | | | | | | |
| Southwest Airlines Co. | | | 5,327 | | | | 189,695 | |
| United Airlines Holdings, Inc. (a)(b) | | | 3,448 | | | | 108,784 | |
| Total Airlines | | | | | | | 298,479 | |
| Auto Components - 0.5% | | | | | | | | |
| Gentex Corp. | | | 13,815 | | | | 306,140 | |
| Automobiles - 0.8% | | | | | | | | |
| Tesla, Inc. (a)(b) | | | 982 | | | | 514,568 | |
| Banks - 1.9% | | | | | | | | |
| Bank of Hawaii Corp. | | | 3,532 | | | | 195,108 | |
| Commerce Bancshares, Inc. | | | 5,010 | | | | 252,254 | |
| First Republic Bank | | | 2,747 | | | | 226,023 | |
| KeyCorp | | | 17,770 | | | | 184,275 | |
| Popular, Inc. | | | 5,329 | | | | 186,515 | |
| SVB Financial Group (a) | | | 1,230 | | | | 185,828 | |
| Total Banks | | | | | | | 1,230,003 | |
| Biotechnology - 1.6% | | | | | | | | |
| Agios Pharmaceuticals, Inc. (a) | | | 4,076 | | | | 144,616 | |
| Alnylam Pharmaceuticals, Inc. (a) | | | 2,942 | | | | 320,237 | |
| Ionis Pharmaceuticals, Inc. (a) | | | 3,395 | | | | 160,516 | |
| Seattle Genetics, Inc. (a)(b) | | | 3,757 | | | | 433,482 | |
| Total Biotechnology | | | | | | | 1,058,851 | |
| Building Products - 2.7% | | | | | | | | |
| A.O. Smith Corp. | | | 5,199 | | | | 196,574 | |
| Apogee Enterprises, Inc. | | | 7,663 | | | | 159,544 | |
| Armstrong World Industries, Inc. | | | 3,476 | | | | 276,064 | |
| Lennox International, Inc. (b) | | | 1,036 | | | | 188,334 | |
| Masco Corp. | | | 7,268 | | | | 251,255 | |
| Simpson Manufacturing Co., Inc. | | | 4,803 | | | | 297,690 | |
| Trex Co., Inc. (a) | | | 4,485 | | | | 359,428 | |
| Total Building Products | | | | | | | 1,728,889 | |
The accompanying notes are an integral part of these financial statements.
Etho Climate Leadership U.S. ETF
Schedule of Investments
March 31, 2020 (Unaudited) (Continued)
| | | Shares | | | Value | |
| Capital Markets - 5.5% | | | | | | | | |
| Affiliated Managers Group, Inc. | | | 2,583 | | | $ | 152,759 | |
| Ameriprise Financial, Inc. (b) | | | 2,165 | | | | 221,869 | |
| Cboe Global Markets, Inc. | | | 2,897 | | | | 258,557 | |
| CME Group, Inc. | | | 1,681 | | | | 290,662 | |
| E*TRADE Financial Corp. | | | 5,967 | | | | 204,787 | |
| Eaton Vance Corp. | | | 6,911 | | | | 222,880 | |
| FactSet Research Systems, Inc. (b) | | | 1,107 | | | | 288,573 | |
| Federated Investors, Inc. | | | 9,499 | | | | 180,956 | |
| Intercontinental Exchange, Inc. | | | 3,633 | | | | 293,365 | |
| Invesco, Ltd. | | | 14,761 | | | | 134,030 | |
| Lazard, Ltd. - Class A | | | 7,810 | | | | 184,004 | |
| Morningstar, Inc. | | | 2,246 | | | | 261,098 | |
| Nasdaq, Inc. (a)(b) | | | 3,169 | | | | 300,896 | |
| S&P Global, Inc. | | | 1,344 | | | | 329,346 | |
| SEI Investments Co. | | | 5,287 | | | | 245,000 | |
| T. Rowe Price Group, Inc. | | | 2,776 | | | | 271,076 | |
| Total Capital Markets | | | | | | | 3,839,858 | |
| Chemicals - 1.7% | | | | | | | | |
| Albemarle Corp. | | | 3,378 | | | | 190,418 | |
| Axalta Coating Systems, Ltd. (a) | | | 10,930 | | | | 188,761 | |
| Ecolab, Inc. | | | 1,564 | | | | 243,718 | |
| Ingevity Corp. (a) | | | 2,598 | | | | 91,450 | |
| International Flavors & Fragrances, Inc. (b) | | | 2,153 | | | | 219,778 | |
| Intrepid Potash, Inc. (a) | | | 72,715 | | | | 58,172 | |
| RPM International, Inc. | | | 4,935 | | | | 293,633 | |
| Total Chemicals | | | | | | | 1,285,930 | |
| Commercial Services & Supplies - 1.7% | | | | | | | | |
| Brink’s Co. | | | 3,666 | | | | 190,815 | |
| Copart, Inc. (a) | | | 4,543 | | | | 311,287 | |
| Herman Miller, Inc. | | | 7,890 | | | | 175,158 | |
| SP Plus Corp. (a) | | | 8,076 | | | | 167,577 | |
| Stericycle, Inc. (a)(b) | | | 5,055 | | | | 245,572 | |
| Total Commercial Services & Supplies | | | | | | | 1,090,409 | |
| Communications Equipment - 1.5% | | | | | | | | |
| Ciena Corp. (a) | | | 7,378 | | | | 293,718 | |
| Cisco Systems, Inc. | | | 5,348 | | | | 210,230 | |
| F5 Networks, Inc. (a)(b) | | | 1,756 | | | | 187,242 | |
| Motorola Solutions, Inc. | | | 1,966 | | | | 261,321 | |
| Total Communications Equipment | | | | | | | 952,511 | |
| Construction & Engineering - 0.8% | | | | | | | | |
| EMCOR Group, Inc. | | | 3,880 | | | | 237,922 | |
| Northwest Pipe Co. (a) | | | 11,524 | | | | 256,409 | |
| Total Construction & Engineering | | | | | | | 494,331 | |
| Consumer Finance - 0.6% | | | | | | | | |
| American Express Co. (b) | | | 2,614 | | | | 223,785 | |
| Capital One Financial Corp. | | | 3,394 | | | | 171,125 | |
| Total Consumer Finance | | | | | | | 394,910 | |
The accompanying notes are an integral part of these financial statements.
Etho Climate Leadership U.S. ETF
Schedule of Investments
March 31, 2020 (Unaudited) (Continued)
| | | Shares | | | Value | |
| Containers & Packaging - 1.6% | | | | | | | | |
| AptarGroup, Inc. | | | 2,595 | | | $ | 258,306 | |
| Avery Dennison Corp. | | | 2,444 | | | | 248,970 | |
| Ball Corp. | | | 4,773 | | | | 308,622 | |
| Sonoco Products Co. | | | 4,510 | | | | 209,039 | |
| Total Containers & Packaging | | | | | | | 1,024,937 | |
| Distributors - 0.6% | | | | | | | | |
| Genuine Parts Co. | | | 2,478 | | | | 166,844 | |
| LKQ Corp. (a) | | | 9,713 | | | | 199,213 | |
| Total Distributors | | | | | | | 366,057 | |
| Diversified Consumer Services - 0.3% | | | | | | | | |
| H&R Block, Inc. (b) | | | 11,671 | | | | 164,328 | |
| Diversified Financial Services - 0.6% | | | | | | | | |
| MSCI, Inc. | | | 1,383 | | | | 399,632 | |
| Electrical Equipment - 0.7% | | | | | | | | |
| First Solar, Inc. (a)(b) | | | 5,207 | | | | 187,764 | |
| Rockwell Automation, Inc. | | | 1,577 | | | | 237,985 | |
| Total Electrical Equipment | | | | | | | 425,749 | |
| Electronic Equipment, Instruments & Components - 4.1% | | | | | | | | |
| Badger Meter, Inc. | | | 4,969 | | | | 266,338 | |
| CDW Corp. (b) | | | 2,863 | | | | 267,032 | |
| Dolby Laboratories, Inc. - Class A | | | 4,387 | | | | 237,819 | |
| IPG Photonics Corp. (a)(b) | | | 1,811 | | | | 199,717 | |
| Itron, Inc. (a) | | | 6,032 | | | | 336,767 | |
| Keysight Technologies, Inc. (a) | | | 3,160 | | | | 264,429 | |
| Littelfuse, Inc. | | | 1,506 | | | | 200,931 | |
| National Instruments Corp. | | | 6,259 | | | | 207,048 | |
| OSI Systems, Inc. (a) | | | 3,138 | | | | 216,271 | |
| Trimble, Inc. (a) | | | 6,810 | | | | 216,762 | |
| Zebra Technologies Corp. - Class A (a) | | | 1,307 | | | | 239,965 | |
| Total Electronic Equipment, Instruments & Components | | | | | | | 2,653,079 | |
| Entertainment - 1.8% | | | | | | | | |
| Activision Blizzard, Inc. | | | 6,051 | | | | 359,913 | |
| Electronic Arts, Inc. (a) | | | 2,706 | | | | 271,060 | |
| Netflix, Inc. (a) | | | 763 | | | | 286,507 | |
| Walt Disney Co. | | | 2,482 | | | | 239,761 | |
| Total Entertainment | | | | | | | 1,157,241 | |
| Food & Staples Retailing - 1.0% | | | | | | | | |
| Northern Trust Corp. | | | 3,068 | | | | 231,511 | |
| PriceSmart, Inc. | | | 4,694 | | | | 246,670 | |
| Sysco Corp. | | | 4,272 | | | | 194,931 | |
| Total Food & Staples Retailing | | | | | | | 673,112 | |
| Food Products - 0.5% | | | | | | | | |
| Hain Celestial Group, Inc. (a) | | | 11,913 | | | | 309,381 | |
The accompanying notes are an integral part of these financial statements.
Etho Climate Leadership U.S. ETF
Schedule of Investments
March 31, 2020 (Unaudited) (Continued)
| | | Shares | | | Value | |
| Health Care Equipment & Supplies - 5.2% | | | | | | | | |
| Align Technology, Inc. (a) | | | 959 | | | $ | 166,818 | |
| Becton Dickinson & Co. (b) | | | 1,103 | | | | 253,436 | |
| Boston Scientific Corp. (a) | | | 7,180 | | | | 234,283 | |
| Cooper Cos. | | | 920 | | | | 253,616 | |
| DexCom, Inc. (a)(b) | | | 2,366 | | | | 637,094 | |
| Edwards Lifesciences Corp. (a) | | | 1,482 | | | | 279,535 | |
| GenMark Diagnostics, Inc. (a) | | | 38,865 | | | | 160,124 | |
| IDEXX Laboratories, Inc. (a) | | | 1,226 | | | | 296,986 | |
| Intuitive Surgical, Inc. (a) | | | 490 | | | | 242,653 | |
| ResMed, Inc. | | | 2,659 | | | | 391,645 | |
| Stryker Corp. | | | 1,389 | | | | 231,255 | |
| Varian Medical Systems, Inc. (a) | | | 1,934 | | | | 198,544 | |
| Total Health Care Equipment & Supplies | | | | | | | 3,345,989 | |
| Health Care Providers & Services - 3.6% | | | | | | | | |
| AMN Healthcare Services, Inc. (a) | | | 5,852 | | | | 338,303 | |
| Anthem, Inc. | | | 956 | | | | 217,050 | |
| Centene Corp. (a) | | | 5,190 | | | | 308,338 | |
| Henry Schein, Inc. (a) | | | 4,579 | | | | 231,331 | |
| Humana, Inc. | | | 1,032 | | | | 324,069 | |
| Laboratory Corp. of America Holdings (a) | | | 1,799 | | | | 227,376 | |
| MEDNAX, Inc. (a) | | | 10,159 | | | | 118,251 | |
| Quest Diagnostics, Inc. | | | 3,174 | | | | 254,872 | |
| UnitedHealth Group, Inc. | | | 1,113 | | | | 277,560 | |
| Total Health Care Providers & Services | | | | | | | 2,297,150 | |
| Health Care Technology - 0.8% | | | | | | | | |
| Allscripts Healthcare Solutions, Inc. (a) | | | 28,882 | | | | 203,329 | |
| Cerner Corp. (b) | | | 4,837 | | | | 304,683 | |
| Total Health Care Technology | | | | | | | 508,012 | |
| Hotels, Restaurants & Leisure - 0.4% | | | | | | | | |
| Chipotle Mexican Grill, Inc. (a) | | | 396 | | | | 259,142 | |
| Household Durables - 1.7% | | | | | | | | |
| Leggett & Platt, Inc. | | | 6,616 | | | | 176,515 | |
| PulteGroup, Inc. | | | 9,906 | | | | 221,102 | |
| Stanley Black & Decker, Inc. | | | 2,036 | | | | 203,600 | |
| Tempur Sealy International, Inc. (a) | | | 4,773 | | | | 208,628 | |
| TopBuild Corp. (a) | | | 4,346 | | | | 311,347 | |
| Total Household Durables | | | | | | | 1,121,192 | |
| Household Products - 0.4% | | | | | | | | |
| Church & Dwight Co., Inc. (b) | | | 3,879 | | | | 248,954 | |
| Independent Power and Renewable Electricity Producers - 0.5% | | | | | | | | |
| Ormat Technologies, Inc. | | | 5,005 | | | | 338,638 | |
| Industrial Conglomerates - 0.6% | | | | | | | | |
| Nordstrom, Inc. (b) | | | 6,305 | | | | 96,719 | |
| Teleflex, Inc. (b) | | | 908 | | | | 265,917 | |
| Total Industrial Conglomerates | | | | | | | 362,636 | |
The accompanying notes are an integral part of these financial statements.
Etho Climate Leadership U.S. ETF
Schedule of Investments
March 31, 2020 (Unaudited) (Continued)
| | | Shares | | | Value | |
| Insurance - 1.8% | | | | | | |
| Aflac, Inc. | | | 5,549 | | | $ | 189,998 | |
| Cincinnati Financial Corp. | | | 3,222 | | | | 243,100 | |
| Globe Life, Inc. | | | 3,472 | | | | 249,880 | |
| Marsh & McLennan Cos., Inc. | | | 3,054 | | | | 264,049 | |
| Travelers Cos., Inc. (b) | | | 2,015 | | | | 200,190 | |
| White Mountains Insurance Group, Ltd. | | | 297 | | | | 270,270 | |
| Total Insurance | | | | | | | 1,417,487 | |
| Interactive Media & Services - 0.1% | | | | | | | | |
| TripAdvisor, Inc. | | | 5,353 | | | | 93,089 | |
| Internet & Direct Marketing Retail - 1.0% | | | | | | | | |
| Amazon.com, Inc. (a) | | | 158 | | | | 308,056 | |
| Booking Holdings, Inc. (a) | | | 160 | | | | 215,251 | |
| Expedia Group, Inc. | | | 2,317 | | | | 130,378 | |
| Total Internet & Direct Marketing Retail | | | | | | | 653,685 | |
| IT Services - 4.0% | | | | | | | | |
| Broadridge Financial Solutions, Inc. | | | 2,667 | | | | 252,912 | |
| Cognizant Technology Solutions Corp. - Class A | | | 3,822 | | | | 177,608 | |
| Fidelity National Information Services, Inc. | | | 2,438 | | | | 296,558 | |
| Fiserv, Inc. (a) | | | 3,123 | | | | 296,655 | |
| FleetCor Technologies, Inc. (a)(b) | | | 1,110 | | | | 207,059 | |
| Global Payments, Inc. (b) | | | 2,010 | | | | 289,902 | |
| MasterCard, Inc. - Class A | | | 1,171 | | | | 282,867 | |
| Paychex, Inc. | | | 3,472 | | | | 218,458 | |
| PayPal Holdings, Inc. (a) | | | 2,654 | | | | 254,094 | |
| Visa, Inc. - Class A (b) | | | 1,765 | | | | 284,377 | |
| Total IT Services | | | | | | | 2,560,490 | |
| Leisure Products - 0.4% | | | | | | | | |
| Hasbro, Inc. | | | 3,341 | | | | 239,049 | |
| Life Sciences Tools & Services - 3.0% | | | | | | | | |
| Agilent Technologies, Inc. | | | 3,436 | | | | 246,086 | |
| Bio-Techne Corp. (b) | | | 1,383 | | | | 262,244 | |
| Illumina, Inc. (a) | | | 878 | | | | 239,799 | |
| IQVIA Holdings, Inc. (a) | | | 1,915 | | | | 206,552 | |
| Mettler-Toledo International, Inc. (a) | | | 372 | | | | 256,870 | |
| PerkinElmer, Inc. (b) | | | 2,857 | | | | 215,075 | |
| Thermo Fisher Scientific, Inc. | | | 998 | | | | 283,033 | |
| Waters Corp. (a) | | | 1,094 | | | | 199,163 | |
| Total Life Sciences Tools & Services | | | | | | | 1,908,822 | |
The accompanying notes are an integral part of these financial statements.
Etho Climate Leadership U.S. ETF
Schedule of Investments
March 31, 2020 (Unaudited) (Continued)
| | | Shares | | | Value | |
| Machinery - 5.6% | | | | | | | | |
| Deere & Co. | | | 1,730 | | | $ | 239,017 | |
| Donaldson Co., Inc. | | | 5,524 | | | | 213,392 | |
| Dover Corp. | | | 2,950 | | | | 247,623 | |
| Fortive Corp. | | | 3,286 | | | | 181,354 | |
| Graco, Inc. (b) | | | 5,587 | | | | 272,255 | |
| Ingersoll Rand, Inc. (a) | | | 2,258 | | | | 55,998 | |
| ITT, Inc. | | | 4,768 | | | | 216,276 | |
| Lincoln Electric Holdings, Inc. | | | 3,301 | | | | 227,769 | |
| Lindsay Corporation (b) | | | 2,964 | | | | 271,443 | |
| Mueller Water Products, Inc. - Class A | | | 27,656 | | | | 221,525 | |
| Parker-Hannifin Corp. | | | 1,612 | | | | 209,125 | |
| Snap-on, Inc. | | | 1,770 | | | | 192,611 | |
| Toro Co. (b) | | | 4,020 | | | | 261,662 | |
| WABCO Holdings, Inc. (a) | | | 2,084 | | | | 281,444 | |
| Watts Water Technologies, Inc. - Class A | | | 3,522 | | | | 298,137 | |
| Xylem, Inc. | | | 3,493 | | | | 227,499 | |
| Total Machinery | | | | | | | 3,617,130 | |
| Media - 1.7% | | | | | | | | |
| Charter Communications, Inc. - Class A (a)(b) | | | 806 | | | | 351,666 | |
| Discovery Communications, Inc. - Class C (a) | | | 10,844 | | | | 190,204 | |
| Liberty Broadband Corp. - Class C (a) | | | 3,004 | | | | 332,603 | |
| Omnicom Group, Inc. (b) | | | 3,809 | | | | 209,114 | |
| Total Media | | | | | | | 1,083,587 | |
| Metals & Mining - 0.4% | | | | | | | | |
| Reliance Steel & Aluminum Co. | | | 3,066 | | | | 268,551 | |
| Personal Products - 0.4% | | | | | | | | |
| Estee Lauder Cos., Inc. - Class A | | | 1,661 | | | | 264,664 | |
| Pharmaceuticals - 1.8% | | | | | | | | |
| Bristol-Myers Squibb Co. | | | 6,020 | | | | 335,554 | |
| Merck & Co., Inc. | | | 3,336 | | | | 256,672 | |
| Pfizer, Inc. | | | 6,566 | | | | 214,314 | |
| Zoetis, Inc. | | | 2,740 | | | | 322,471 | |
| Total Pharmaceuticals | | | | | | | 1,129,011 | |
| Professional Services - 1.0% | | | | | | | | |
| CoStar Group, Inc. (a)(b) | | | 601 | | | | 352,913 | |
| Verisk Analytics, Inc. | | | 2,075 | | | | 289,214 | |
| Total Professional Services | | | | | | | 642,127 | |
The accompanying notes are an integral part of these financial statements.
Etho Climate Leadership U.S. ETF
Schedule of Investments
March 31, 2020 (Unaudited) (Continued)
| | | Shares | | | Value | |
| Real Estate Investment Trusts (REITs) - 6.2% | | | | | | | | |
| Alexandria Real Estate Equities, Inc. (b) | | | 1,851 | | | $ | 253,698 | |
| AvalonBay Communities, Inc. | | | 1,381 | | | | 203,242 | |
| Crown Castle International Corp. (b) | | | 2,168 | | | | 313,059 | |
| Duke Realty Corp. | | | 9,098 | | | | 294,593 | |
| Equity Commonwealth | | | 8,706 | | | | 276,067 | |
| Equity Residential | | | 3,686 | | | | 227,463 | |
| Essex Property Trust, Inc. (b) | | | 954 | | | | 210,109 | |
| Extra Space Storage, Inc. | | | 2,733 | | | | 261,712 | |
| Federal Realty Investment Trust | | | 2,009 | | | | 149,891 | |
| Gladstone Land Corp. | | | 22,061 | | | | 261,423 | |
| Prologis, Inc. | | | 3,866 | | | | 310,710 | |
| Realty Income Corp. | | | 3,794 | | | | 189,169 | |
| Regency Centers Corp. | | | 3,993 | | | | 153,451 | |
| SBA Communications Corp. | | | 1,377 | | | | 371,749 | |
| Simon Property Group, Inc. | | | 1,534 | | | | 84,155 | |
| UDR, Inc. | | | 6,305 | | | | 230,385 | |
| Welltower, Inc. | | | 3,600 | | | | 164,808 | |
| Total Real Estate Investment Trusts (REITs) | | | | | | | 3,955,684 | |
| Real Estate Management & Development - 0.7% | | | | | | | | |
| Jones Lang LaSalle, Inc. (b) | | | 1,780 | | | | 179,744 | |
| St. Joe Co. (a)(b) | | | 16,708 | | | | 280,360 | |
| Total Real Estate Management & Development | | | | | | | 460,104 | |
| Road & Rail - 0.5% | | | | | | | | |
| Amerco | | | 746 | | | | 216,751 | |
| Lyft, Inc. - Class A (a)(b) | | | 3,517 | | | | 94,431 | |
| Total Road & Rail | | | | | | | 311,182 | |
| Semiconductors & Semiconductor Equipment - 9.4% | | | | | | | | |
| Advanced Micro Devices, Inc. (a) | | | 10,803 | | | | 491,320 | |
| Analog Devices, Inc. | | | 2,630 | | | | 235,780 | |
| Applied Materials, Inc. | | | 6,992 | | | | 320,373 | |
| Cree, Inc. (a) | | | 4,811 | | | | 170,598 | |
| Cypress Semiconductor Corp. | | | 19,034 | | | | 443,873 | |
| Intel Corp. | | | 5,169 | | | | 279,746 | |
| KLA Corp. | | | 2,323 | | | | 333,908 | |
| Lam Research Corp. | | | 1,583 | | | | 379,920 | |
| Maxim Integrated Products, Inc. | | | 5,242 | | | | 254,814 | |
| Microchip Technology, Inc. | | | 3,439 | | | | 233,164 | |
| Micron Technology, Inc. (a) | | | 6,669 | | | | 280,498 | |
| NVIDIA Corp. | | | 1,532 | | | | 403,835 | |
| ON Semiconductor Corp. (a)(b) | | | 13,392 | | | | 166,596 | |
| Power Integrations, Inc. | | | 3,949 | | | | 348,815 | |
| Qorvo, Inc. (a) | | | 3,836 | | | | 309,297 | |
| Skyworks Solutions, Inc. | | | 3,363 | | | | 300,585 | |
| SunPower Corp. (a)(b) | | | 43,372 | | | | 219,896 | |
| Teradyne, Inc. | | | 7,105 | | | | 384,878 | |
| Texas Instruments, Inc. | | | 2,619 | | | | 261,717 | |
| Universal Display Corp. | | | 1,801 | | | | 237,336 | |
| Total Semiconductors & Semiconductor Equipment | | | | | | | 6,056,949 | |
The accompanying notes are an integral part of these financial statements.
Etho Climate Leadership U.S. ETF
Schedule of Investments
March 31, 2020 (Unaudited) (Continued)
| | | Shares | | | Value | |
| Software - 4.2% | | | | | | |
| Adobe, Inc. (a) | | | 1,028 | | | $ | 327,151 | |
| Ansys, Inc. (a)(b) | | | 1,501 | | | | 348,937 | |
| Autodesk, Inc. (a) | | | 1,765 | | | | 275,517 | |
| Cadence Design System, Inc. (a) | | | 4,336 | | | | 286,349 | |
| Intuit, Inc. | | | 1,056 | | | | 242,880 | |
| Palo Alto Networks, Inc. (a) | | | 1,134 | | | | 185,931 | |
| salesforce.com, Inc. (a) | | | 1,733 | | | | 249,517 | |
| ServiceNow, Inc. (a)(b) | | | 1,111 | | | | 318,390 | |
| Splunk, Inc. (a) | | | 2,203 | | | | 278,085 | |
| Workday, Inc. - Class A (a) | | | 1,421 | | | | 185,043 | |
| Total Software | | | | | | | 2,697,800 | |
| Specialty Retail - 3.1% | | | | | | | | |
| Advance Auto Parts, Inc. | | | 1,612 | | | | 150,432 | |
| American Eagle Outfitters, Inc. | | | 13,226 | | | | 105,147 | |
| Foot Locker, Inc. | | | 4,817 | | | | 106,215 | |
| Gap, Inc. (b) | | | 11,321 | | | | 79,700 | |
| Guess?, Inc. | | | 14,200 | | | | 96,134 | |
| Lowe's Cos., Inc. | | | 2,535 | | | | 218,137 | |
| Ross Stores, Inc. | | | 2,969 | | | | 258,213 | |
| The Home Depot, Inc. (b) | | | 1,448 | | | | 270,355 | |
| TJX Cos., Inc. | | | 5,204 | | | | 248,803 | |
| Ulta Beauty, Inc. (a) | | | 787 | | | | 138,276 | |
| Urban Outfitters, Inc. (a) | | | 9,296 | | | | 132,375 | |
| Williams-Sonoma, Inc. (b) | | | 4,953 | | | | 210,602 | |
| Total Specialty Retail | | | | | | | 2,014,389 | |
| Technology Hardware, Storage & Peripherals - 1.8% | | | | | | | | |
| Apple, Inc. (b) | | | 1,454 | | | | 369,739 | |
| Hewlett Packard Enterprise Co. | | | 18,061 | | | | 175,372 | |
| HP, Inc. | | | 14,354 | | | | 249,185 | |
| Seagate Technology PLC | | | 5,869 | | | | 286,407 | |
| Total Technology Hardware, Storage & Peripherals | | | | | | | 1,080,703 | |
| Textiles, Apparel & Luxury Goods - 1.5% | | | | | | | | |
| Hanesbrands, Inc. (b) | | | 15,647 | | | | 123,142 | |
| Nike, Inc. - Class B | | | 3,283 | | | | 271,635 | |
| Ralph Lauren Corp. | | | 2,146 | | | | 143,417 | |
| Tapestry, Inc. | | | 8,636 | | | | 111,836 | |
| Total Textiles, Apparel & Luxury Goods | | | | | | | 650,030 | |
| Thrifts & Mortgage Finance - 0.4% | | | | | | | | |
| Capitol Federal Financial, Inc. | | | 21,083 | | | | 244,774 | |
| Trading Companies & Distributors - 0.7% | | | | | | | | |
| MSC Industrial Direct Co., Inc. - Class A | | | 3,358 | | | | 184,589 | |
| United Rentals, Inc. (a)(b) | | | 2,478 | | | | 254,986 | |
| Total Trading Companies & Distributors | | | | | | | 439,575 | |
The accompanying notes are an integral part of these financial statements.
Etho Climate Leadership U.S. ETF
Schedule of Investments
March 31, 2020 (Unaudited) (Continued)
| | | Shares | | | Value | |
| Water Utilities - 2.3% | | | | | | | | |
| American States Water Co. | | | 3,878 | | | $ | 316,988 | |
| American Water Works Co., Inc. | | | 2,520 | | | | 301,291 | |
| California Water Service Group | | | 5,092 | | | | 256,229 | |
| Essential Utilities, Inc. (b) | | | 7,620 | | | | 310,134 | |
| Middlesex Water Co. | | | 4,939 | | | | 296,933 | |
| Total Water Utilities | | | | | | | 1,481,575 | |
| Total United States | | | | | | | 62,120,565 | |
| TOTAL COMMON STOCKS (Cost $72,010,269) | | | | | | | 63,086,980 | |
| | | | | | | | | |
| INVESTMENT COMPANIES - 0.3% | | | | | | | | |
| Closed-End Funds - 0.3% | | | | | | | | |
| Oaktree Specialty Lending Corp. | | | 54,540 | | | | 176,710 | |
| TOTAL INVESTMENT COMPANIES (Cost $284,768) | | | | | | | 176,710 | |
| | | | | | | | | |
| INVESTMENTS PURCHASED WITH PROCEEDS FROM | | | | | | | | |
| SECURITIES LENDING COLLATERAL – 18.9% | | | | | | | | |
| ETFMG Sit Ultra Short ETF | | | 50,000 | | | | 2,404,000 | |
| Mount Vernon Liquid Assets Portfolio, LLC. | | | 9,712,206 | | | | 9,712,206 | |
| TOTAL INVESTMENTS PURCHASED WITH PROCEEDS FROM SECURITIES LENDING COLLATERAL (Cost $12,225,062) | | | | | | | 12,116,206 | |
| | | | | | | | | |
| SHORT-TERM INVESTMENTS - 1.4% | | | | | | | | |
| Money Market Funds - 1.4% | | | | | | | | |
| Invesco Advisers, Inc. STIT-Treasury Portfolio - Institutional Class, 0.30% (c) | | | 937,944 | | | | 937,944 | |
| TOTAL SHORT-TERM INVESTMENTS (Cost $937,944) | | | | | | | 937,944 | |
| | | | | | | | | |
| Total Investments (Cost $85,458,043) - 118.8% | | | | | | | 76,317,840 | |
| Liabilities in Excess of Other Assets - (18.8)% | | | | | | | (12,054,639 | ) |
| TOTAL NET ASSETS - 100.0% | | | | | | $ | 64,263,201 | |
Percentages are stated as a percent of net assets.
| (a) | Non-income producing security. |
| (b) | All or a portion of this security is out on loan as of March 31, 2020. |
| (c) | The rate quoted is the annualized seven-day yield at March 31, 2020. |
| (d) | Affiliated security. Please refer to Note 9 of the Notes to Financial Statements. |
The Global Industry Classification Standard (GICS®) was developed by and/or is the exclusive property of MSCI, Inc. and Standard & Poor's Financial Services LLC (“S&P”). GICS is a service mark of MSCI and S&P and has been licensed for use by U.S. Bancorp Fund Services, LLC, doing business as U.S. Bank Global Fund Services ("Fund Services").
The accompanying notes are an integral part of these financial statements.
Etho Climate Leadership U.S. ETF
STATEMENT OF ASSETS AND LIABILITIES
As of March 31, 2020 (Unaudited)
| | | Etho Climate
Leadership U.S.
ETF | |
| ASSETS | | | |
| Investments in unaffiliated securities, at value* | | $ | 73,913,840 | |
| Investments in affiliated securities, at value* | | | 2,404,000 | |
| Total Investments in securities, at value | | | 76,317,840 | |
| Cash | | | 653 | |
| Receivables: | | | | |
| Dividends and interest receivable | | | 61,032 | |
| Securities lending income receivable | | | 5,435 | |
| Total Assets | | | 76,384,960 | |
| | | | | |
| LIABILITIES | | | | |
| Collateral received for securities loaned (Note 7) | | | 12,097,206 | |
| Payables: | | | | |
| Management fees payable | | | 24,553 | |
| Total Liabilities | | | 12,121,759 | |
| Net Assets | | $ | 64,263,201 | |
| | | | | |
| NET ASSETS CONSIST OF: | | | | |
| Paid-in Capital | | $ | 73,307,516 | |
| Total Distributable Earnings | | | (9,044,315 | ) |
| Net Assets | | $ | 64,263,201 | |
| | | | | |
| *Identified Cost: | | | | |
| Investments in unaffiliated securities | | $ | 82,945,187 | |
| Investments in affiliated securities | | | 2,512,856 | |
| | | | | |
| Shares Outstanding^ | | | 1,950,000 | |
| Net Asset Value, Offering and Redemption Price per Share | | $ | 32.96 | |
| ^ | No par value, unlimited number of shares authorized |
The accompanying notes are an integral part of these financial statements.
Etho Climate Leadership U.S. ETF
STATEMENT OF OPERATIONS
For the Period Ended March 31, 2020 (Unaudited)
| | | Etho Climate
Leadership U.S.
ETF | |
| INVESTMENT INCOME | | | |
| Income: | | | |
| Dividends from unaffiliated securities (net of foreign withholdings tax of $248) | | $ | 512,837 | |
| Interest | | | 2,060 | |
| Securities lending income | | | 12,881 | |
| Total Investment Income | | | 527,778 | |
| Expenses: | | | | |
| Management fees | | | 154,640 | |
| Total Expenses | | | 154,640 | |
| Net Investment Income | | | 373,138 | |
| | | | | |
| REALIZED & UNREALIZED GAIN (LOSS) ON INVESTMENTS | | | | |
| Net Realized Gain (Loss) on: | | | | |
| Unaffiliated investments | | | 87,937 | |
| Affiliated investments | | | — | |
| In-Kind redemptions | | | 587,399 | |
| Closed-End Funds | | | 140 | |
| Net Realized Gain (Loss) on Investments and In-Kind Redemptions | | | 675,476 | |
| Net Change in Unrealized Appreciation (Depreciation) of: | | | | |
| Unaffiliated investments | | | (14,169,951 | ) |
| Affiliated investments | | | (108,856 | ) |
| Net change in Unrealized Appreciation (Depreciation) of Investments | | | (14,278,807 | ) |
| Net Realized and Unrealized Gain (Loss) on Investments | | | (13,603,331 | ) |
| NET INCREASE (DECREASE) IN NET ASSETS RESULTING FROM OPERATIONS | | $ | (13,230,193 | ) |
The accompanying notes are an integral part of these financial statements.
Etho Climate Leadership U.S. ETF
STATEMENTS OF CHANGES IN NET ASSETS
| | | Period
Ended
March 31,
2019
(Unaudited) | | | Year
Ended
September
30,
2019 | |
| | | | | | | |
| OPERATIONS | | | | | | | | |
| Net investment income | | $ | 373,138 | | | $ | 393,689 | |
| Net realized gain (loss) on investments and In-Kind Redemptions | | | 675,476 | | | | 3,707,775 | |
| Net change in unrealized appreciation (depreciation) of investments | | | (14,278,807 | ) | | | (487,529 | ) |
| Net increase (decrease) in net assets resulting from operations | | $ | (13,230,193 | ) | | $ | 3,613,935 | |
| | | | | | | | | |
| DISTRIBUTIONS TO SHAREHOLDERS | | | | | | | | |
| Total Distributions to Shareholders | | | (302,500 | ) | | | (412,276 | ) |
| | | | | | | | | |
| CAPITAL SHARE TRANSACTIONS | | | | | | | | |
| Net increase (decrease) in net assets derived from net change in outstanding shares | | | 24,364,840 | | | | 14,602,580 | |
| Net increase (decrease) in net assets | | $ | 10,832,147 | | | $ | 17,804,239 | |
| | | | | | | | | |
| NET ASSETS | | | | | | | | |
| Beginning of Period/Year | | | 53,431,054 | | | | 35,626,815 | |
| End of Period/Year | | $ | 64,263,201 | | | $ | 53,431,054 | |
Summary of share transactions is as follows:
| | | | Period Ended March
31, 2019 (Unaudited) | | | Year Ended September
30, 2019 | |
| | | | Shares | | | Amount | | | Shares | | | Amount | |
| Shares Sold | | | | 650,000 | | | $ | 26,428,540 | | | | 900,000 | | | $ | 33,675,925 | |
| Shares Redeemed | | | | (50,000 | ) | | | (2,063,700 | ) | | | (500,000 | ) | | | (19,073,345 | ) |
| Net Transactions in Fund Shares | | | | 600,000 | | | $ | 24,364,840 | | | | 400,000 | | | $ | 14,602,580 | |
| Beginning Shares | | | | 1,350,000 | | | | | | | | 950,000 | | | | | |
| Ending Shares | | | | 1,950,000 | | | | | | | | 1,350,000 | | | | | |
The accompanying notes are an integral part of these financial statements.
Etho Climate Leadership U.S. ETF
FINANCIAL HIGHLIGHTS
For a capital share outstanding throughout the period/year
| | | Period
Ended
March 31,
2019
(Unaudited) | | | Year
Ended
September
30, 2019 | | | Year
Ended
September
30, 2018 | | | Year
Ended
September
30, 2017 | | | Period
Ended
September
30, 20161 | |
| | | | | | | | | | | | | | | | |
| Net Asset Value, Beginning of Period/Year | | $ | 39.58 | | | $ | 37.50 | | | $ | 32.01 | | | $ | 27.00 | | | $ | 25.00 | |
| Income from Investment Operations: | | | | | | | | | | | | | | | | | | | | |
| Net investment income 2 | | | 0.22 | | | | 0.33 | | | | 0.29 | | | | 0.31 | | | | 0.23 | |
| Net realized and unrealized gain (loss) on investments | | | (6.67 | ) | | | 2.08 | | | | 5.51 | | | | 5.09 | | | | 1.87 | |
| Total from investment operations | | | (6.45 | ) | | | 2.41 | | | | 5.80 | | | | 5.40 | | | | 2.10 | |
| Less Distributions: | | | | | | | | | | | | | | | | | | | | |
| Distributions from net investment income | | | (0.17 | ) | | | (0.33 | ) | | | (0.29 | ) | | | (0.25 | ) | | | (0.10 | ) |
| Net realized gains | | | — | | | | — | | | | (0.02 | ) | | | (0.14 | ) | | | — | |
| Total distributions | | | (0.17 | ) | | | (0.33 | ) | | | (0.31 | ) | | | (0.39 | ) | | | (0.10 | ) |
| Net asset value, end of period/year | | $ | 32.96 | | | $ | 39.58 | | | $ | 37.50 | | | $ | 32.01 | | | $ | 27.00 | |
| Total Return | | | -16.37 | %3 | | | 6.53 | % | | | 18.16 | % | | | 20.14 | % | | | 8.43 | %3 |
| | | | | | | | | | | | | | | | | | | | | |
| Ratios/Supplemental | | | | | | | | | | | | | | | | | | | | |
| Data: | | | | | | | | | | | | | | | | | | | | |
| Net assets at end of period/year (000's) | | $ | 64,263 | | | $ | 53,431 | | | $ | 35,627 | | | $ | 19,208 | | | $ | 6,751 | |
| | | | | | | | | | | | | | | | | | | | | |
| Expenses to Average Net Assets | | | 0.69 | %4 | | | 0.45 | % | | | 0.45 | % | | | 0.45 | % | | | 0.50 | %4 |
| Net Investment Income to | | | | | | | | | | | | | | | | | | | | |
| Average Net Assets | | | 1.66 | %4 | | | 0.88 | % | | | 0.82 | % | | | 1.03 | % | | | 1.04 | %4 |
| Portfolio Turnover Rate | | | 1 | %3 | | | 41 | % | | | 19 | % | | | 45 | % | | | 25 | %3 |
| 1 | Commencement of operations on November 18, 2015. |
| 2 | Calculated based on average shares outstanding during the period/year. |
The accompanying notes are an integral part of these financial statements.
Etho Climate Leadership U.S. ETF
NOTES TO FINANCIAL STATEMENTS
March 31, 2020 (Unaudited)
NOTE 1 – ORGANIZATION
Etho Climate Leadership U.S. ETF (the “Fund”) is a series of ETF Managers Trust (the “Trust”), an open-end management investment company consisting of multiple investment series, organized as a Delaware statutory trust on July 1, 2009. The Trust is registered with the SEC under the Investment Company Act of 1940, as amended (the “1940 Act”), as an open-end management investment company and the offering of the Fund’s shares (“Shares”) is registered under the Securities Act of 1933, as amended (the “Securities Act”). The Fund seeks to provide investment results that, before fees and expenses, correspond generally to the price and yield performance of the Etho Climate Leadership Index™ Index (“the Index”). The Fund commenced operations on November 18, 2015.
The Fund currently offers one class of shares, which has no front end sales load, no deferred sales charges, and no redemption fees. The Fund may issue an unlimited number of shares of beneficial interest, with no par value. All shares of the Fund have equal rights and privileges.
Shares of the Fund are listed and traded on the NYSE Arca, Inc. Market prices for the Shares may be different from their net asset value (“NAV”). The Fund issues and redeems Shares on a continuous basis at NAV only in blocks of 50,000 shares, called “Creation Units.” Creation Units are issued and redeemed principally in-kind for securities included in the Index. Once created, Shares generally trade in the secondary market at market prices that change throughout the day in quantities less than a Creation Unit. Except when aggregated in Creation Units, Shares are not redeemable securities of the Fund. Shares of the Fund may only be purchased or redeemed by certain financial institutions (“Authorized Participants”). An Authorized Participant is either (i) a broker-dealer or other participant in the clearing process through the Continuous Net Settlement System of the National Securities Clearing Corporation or (ii) a DTC participant and, in each case, must have executed a Participant Agreement with the Distributor. Most retail investors do not qualify as Authorized Participants nor have the resources to buy and sell whole Creation Units. Therefore, they are unable to purchase or redeem the Shares directly from the Fund. Rather, most retail investors may purchase Shares in the secondary market with the assistance of a broker and may be subject to customary brokerage commissions or fees.
Authorized Participants transacting in Creation Units for cash may pay an additional variable charge to compensate the relevant Fund for certain transaction costs (i.e., brokerage costs) and market impact expenses relating to investing in portfolio securities. Such variable charges, if any, are included in “Transaction Fees” in the Statements of Changes in Net Assets.
NOTE 2 – SIGNIFICANT ACCOUNTING POLICIES
The following is a summary of significant accounting policies consistently followed by the Fund. These policies are in conformity with accounting principles generally accepted in the United States of America (“U.S. GAAP”).
The Fund follows the investment company accounting and reporting guidance of the Financial Accounting Standards Board Accounting Standard Codification Topic 946 Financial Services –Investment Companies.
The Fund may invest in certain other investment companies (underlying funds). For specific investments in underlying funds, please refer to the complete schedule of portfolio holdings on Form N-CSR(S) for this reporting period, which is filed with the U.S. Securities and Exchange Commission (SEC). For more information about the underlying Fund’s operations and policies, please refer to those Funds’ semiannual and annual reports, which are filed with the SEC.
Etho Climate Leadership U.S. ETF
NOTES TO FINANCIAL STATEMENTS
March 31, 2020 (Unaudited) (Continued)
| A. | Security Valuation. Securities listed on a securities exchange, market or automated quotation system for which quotations are readily available (except for securities traded on NASDAQ), including securities traded over the counter, are valued at the last quoted sale price on the primary exchange or market (foreign or domestic) on which they are traded on the valuation date (or at approximately 4:00 pm Eastern Time if a security’s primary exchange is normally open at that time), or, if there is no such reported sale on the valuation date, at the most recent quoted bid price. For securities traded on NASDAQ, the NASDAQ Official Closing Price will be used. |
Securities for which quotations are not readily available are valued at their respective fair values as determined in good faith by the Board of Trustees (the “Board”). When a security is “fair valued,” consideration is given to the facts and circumstances relevant to the particular situation, including a review of various factors set forth in the pricing procedures adopted by the Fund’s Board. The use of fair value pricing by the Fund may cause the net asset value of its shares to differ significantly from the net asset value that would be calculated without regard to such considerations. As of March 31, 2020, the Fund did not hold any fair valued securities.
As described above, the Fund utilizes various methods to measure the fair value of its investments on a recurring basis. U.S. GAAP establishes a hierarchy that prioritizes inputs to valuation methods. The three levels of inputs are:
| Level 1 | Unadjusted quoted prices in active markets for identical assets or liabilities that the Fund has the ability to access. |
| Level 2 | Observable inputs other than quoted prices included in Level 1 that are observable for the asset or liability, either directly or indirectly. These inputs may include quoted prices for the identical instrument on an inactive market, prices for similar instruments, interest rates, prepayment speeds, credit risk, yield curves, default rates and similar data. |
| Level 3 | Unobservable inputs for the asset or liability, to the extent relevant observable inputs are not available; representing the Fund’s own assumptions about the assumptions a market participant would use in valuing the asset or liability, and would be based on the best information available. |
The availability of observable inputs can vary from security to security and is affected by a wide variety of factors, including, for example, the type of security, whether the security is new and not yet established in the marketplace, the liquidity of markets, and other characteristics particular to the security. To the extent that valuation is based on models or inputs that are less observable or unobservable in the market, the determination of fair value requires more judgment. Accordingly, the degree of judgment exercised in determining fair value is greatest for instruments categorized in Level 3.
The inputs used to measure fair value may fall into different levels of the fair value hierarchy. In such cases, for disclosure purposes, the level in the fair value hierarchy within which the fair value measurement falls in its entirety, is determined based on the lowest level input that is significant to the fair value measurement in its entirety.
Etho Climate Leadership U.S. ETF
NOTES TO FINANCIAL STATEMENTS
March 31, 2020 (Unaudited) (Continued)
The following table presents a summary of the inputs used to value the Funds’ net assets as of March 31, 2020:
Etho Climate Leadership U.S. ETF
| Assets^ | | Level 1 | | | Level 2 | | | Level 3 | | | Total | |
| Common Stocks | | $ | 63,086,980 | | | $ | — | | | $ | — | | | $ | 63,086,980 | |
| Closed-End Funds | | | 176,710 | | | | — | | | | — | | | | 176,710 | |
| Short-Term Investments | | | 937,944 | | | | — | | | | — | | | | 937,944 | |
| Investments Purchased with Securities Lending Collateral* | | | — | | | | — | | | | — | | | | 12,116,206 | |
| Total Investments in Securities | | $ | 64,201,634 | | | $ | — | | | $ | — | | | $ | 76,317,840 | |
^ See Schedule of Investments for classifications by sector or country.
* Certain investments that are measured at fair value using the net asset value per share (or its equivalent) practical expedient have not been categorized in the fair value hierarchy. The fair value amounts presented in the table are intended to permit reconciliation of the fair value hierarchy to the amounts presented in the Schedule of Investments.
| B. | Federal Income Taxes. The Fund has elected to be taxed as a “regulated investment company” and intends to distribute substantially all taxable income to its shareholders and otherwise comply with the provisions of the Internal Revenue Code applicable to regulated investment companies. Therefore, no provisions for federal income taxes or excise taxes have been made. |
To avoid imposition of the excise tax applicable to regulated investment companies, the Fund intends to declare each year as dividends, in each calendar year, at least 98.0% of its net investment income (earned during the calendar year) and 98.2% of its net realized capital gains (earned during the twelve months ended October 31) plus undistributed amounts, if any, from prior years.
Net capital losses incurred after October 31, within the taxable year are deemed to arise on the first business day of the Fund’s next taxable year.
The Fund recognizes the tax benefits of uncertain tax positions only where the position is “more likely than not” to be sustained assuming examination by tax authorities. The Fund has analyzed its tax position and has concluded that no liability for unrecognized tax benefits should be recorded related to uncertain tax positions expected to be taken in the Fund’s 2019 tax returns. The Fund identifies its major tax jurisdictions as U.S. Federal, the State of New Jersey, and the State of Delaware; however the Fund is not aware of any tax positions for which it is reasonably possible that the total amounts of unrecognized tax benefits will change materially in the next twelve months.
As of March 31, 2020, management has reviewed the tax positions for open periods (for federal purposes, three years from the date of filing and for state purposes, four years from the date of filing) as applicable to the Fund, and has determined that no provision for income tax is required in the Fund’s financial statements.
| C. | Security Transactions and Investment Income. Investment securities transactions are accounted for on the trade date. Gains and losses realized on sales of securities are determined on a specific identification basis. Discounts/premiums on debt securities purchased are accreted/amortized over the life of the respective securities using the effective interest method. Dividend income is recorded on the ex-dividend date. Interest income is recorded on an accrual basis. Income, including gains, from investments in foreign securities received by the Fund may be subject to income, withholding or other taxes imposed by foreign countries. |
Etho Climate Leadership U.S. ETF
NOTES TO FINANCIAL STATEMENTS
March 31, 2020 (Unaudited) (Continued)
| D. | Foreign Currency Translations and Transactions. The Fund may engage in foreign currency transactions. Foreign currency transactions are translated into U.S. dollars on the following basis: (i) market value of investment securities, assets and liabilities at the daily rates of exchange, and (ii) purchases and sales of investment securities, dividend and interest income and certain expenses at the rates of exchange prevailing on the respective dates of such transactions. For financial reporting purposes, the Fund does not isolate changes in the exchange rate of investment securities from the fluctuations arising from changes in the market prices of securities for unrealized gains and losses. However, for federal income tax purposes, the Fund does isolate and treat as ordinary income the effect of changes in foreign exchange rates on realized gains or losses from the sale of investment securities and payables and receivables arising from trade-date and settlement-date differences. |
| E. | Distributions to Shareholders. Distributions to shareholders from net investment income, if any, are declared and paid by the Fund on a quarterly basis. Distributions to shareholders from net realized gains on securities of the Fund normally are declared and paid on an annual basis. Distributions are recorded on the ex-dividend date. |
| F. | Use of Estimates. The preparation of financial statements in conformity with U.S. GAAP requires management to make estimates and assumptions that affect the reported amounts of assets and liabilities at the date of the financial statements, as well as the reported amounts of revenues and expenses during the period. Actual results could differ from those estimates. |
| G. | Share Valuation. The net asset value (“NAV”) per share of the Fund is calculated by dividing the sum of the value of the securities held by the Fund, plus cash and other assets, minus all liabilities (including estimated accrued expenses) by the total number of shares outstanding by the Fund, rounded to the nearest cent. The Fund’s shares will not be priced on the days on which the NYSE is closed for trading. The offering and redemption price per share for the Fund is equal to the Fund’s net asset value per share. |
| H. | Guarantees and Indemnifications. In the normal course of business, the Fund enters into contracts with service providers that contain general indemnification clauses. The Fund’s maximum exposure under these arrangements is unknown as this would involve future claims that may be made against the Fund that have not yet occurred. However, based on experience, the Fund expects the risk of loss to be remote. |
NOTE 3 – RISK FACTORS
Investing in the Etho Climate Leadership U.S. ETF may involve certain risks, as discussed in the Fund’s prospectus, including, but not limited to, those described below. Any of these risks could cause an investor to lose money.
Market Risk. Financial markets rise and fall in response to a variety of factors, sometimes rapidly and unpredictably. As with any investment whose performance is tied to these markets, the value of an investment in a fund will fluctuate, which means that an investor could lose money over short or long periods.
Investment Style Risk. The Fund is not actively managed. Therefore, the Fund follows the securities included in its respective index during upturns as well as downturns. Because of its indexing strategy, the Fund does not take steps to reduce market exposure or to lessen the effects of a declining market. In addition, because of the Fund's expenses, the Fund's performance may be below that of its index.
Etho Climate Leadership U.S. ETF
NOTES TO FINANCIAL STATEMENTS
March 31, 2020 (Unaudited) (Continued)
Equity Risk. The prices of equity securities rise and fall daily. These price movements may result from factors affecting individual companies, industries or the securities market as a whole. In addition, equity markets tend to move in cycles which may cause stock prices to fall over short or extended periods of time.
Securities Lending Risk. Securities lending involves the risk of loss of rights in, or delay in recovery of, the loaned securities if the borrower fails to return the security loaned or becomes insolvent.
Concentration Risk. To the extent that the Fund's or its underlying index's portfolio is concentrated in the securities of issuers in a particular market, industry, group of industries, sector or asset class, the Fund may be adversely affected by the performance of those securities, may be subject to increased price volatility and may be more vulnerable to adverse economic, market, political or regulatory occurrences affecting that market, industry, group of industries, sector or asset class.
NOTE 4 – COMMITMENTS AND OTHER RELATED PARTY TRANSACTIONS
ETF Managers Group, LLC (the “Advisor”), serves as the investment advisor to the Fund. Pursuant to an Investment Advisory Agreement (“Advisory Agreement”) between the Trust, on behalf of the Fund, and the Advisor, the Advisor provides investment advice to the Fund and oversees the day-today operations of the Fund, subject to the direction and control of the Board and the officers of the Trust. Under the Advisory Agreement, the Advisor is also responsible for arranging transfer agency, custody, fund administration and accounting, and other non-distribution related services necessary for the Fund to operate.
Under the Investment Advisory Agreement with the Fund, the Advisor has overall responsibility for the general management and administration of the Fund and arranges for sub-advisory, transfer agency, custody, fund administration, securities lending, and all other non-distribution related services necessary for the Fund to operate. The Advisor bears the costs of all advisory and non-advisory services required to operate the Fund, in exchange for a single unitary fee. For services provided the Fund pays the Advisor at an annual rate of 0.45% of the Fund’s average daily net assets. The Advisor has an agreement with, and is dependent on, a third party to pay the Fund’s expenses in excess of 0.45% of the Fund’s average daily net assets. Additionally, under the Investment Advisory Agreement, the Advisor has agreed to pay all expenses of the Fund, except for: the fee paid to the Advisor pursuant to the Investment Advisory Agreement, interest charges on any borrowings, taxes, brokerage commissions and other expenses incurred in placing orders for the Purchase and sale of securities and other investment instruments, acquired fund fees and expenses, accrued deferred tax liability, extraordinary expenses, and distribution (12b-1) fees and expenses (collectively, “Excluded Expenses”). The Advisor has entered into an Agreement with Etho Climate Leadership U.S. (the “Sponsor”), under which the Sponsor agrees to sublicense the use of the Underlying Index to the Advisor. The Sponsor also provides marketing support for the Fund, including distributing marketing materials related to the Fund. Etho Climate Leadership U.S. is a privately held business focused on bringing exchange-traded investment products to investors in the U.S. The Sponsor does not make investment decisions, provide investment advice, or otherwise act in the capacity of an investment adviser to the Fund. Additionally, the Sponsor is not involved in the maintenance of the Underlying Index and does not otherwise act in the capacity of an index provider.
U.S. Bancorp Fund Services, LLC doing business as U.S. Bank Global Fund Services (the “Administrator”) provides fund accounting, fund administration, and transfer agency services to the Fund. The Advisor compensates the Administrator for these services under an administration agreement between the two parties.
Etho Climate Leadership U.S. ETF
NOTES TO FINANCIAL STATEMENTS
March 31, 2020 (Unaudited) (Continued)
The Advisor pays each independent Trustee a quarterly fee for service to the Fund. Each Trustee is also reimbursed by the Advisor for all reasonable out-of-pocket expenses incurred in connection with his duties as Trustee, including travel and related expenses incurred in attending Board meetings.
NOTE 5 – DISTRIBUTION PLAN
The Fund has adopted a Plan of Distribution pursuant to Rule 12b-1 under the 1940 Act. Under the Plan, the Fund may pay compensation to the Distributor or any other distributor or financial institution with which the Trust has an agreement with respect to the Fund, with the amount of such compensation not to exceed an annual rate of 0.25% of each Fund’s average daily net assets. For the period ended March 31, 2020, the Fund did not incur any 12b-1 expenses.
NOTE 6 - PURCHASES AND SALES OF SECURITIES
The costs of purchases and sales of securities, excluding short-term securities and in-kind transactions, for the period ended March 31, 2020:
| | | Purchases | | Sales |
| Etho Climate Leadership U.S. ETF | | $3,358,527 | | $ 848,890 |
The costs of purchases and sales of in-kind transactions associated with creations and redemptions for the period ended March 31, 2020:
| | | Purchases
In-Kind | | Sales
In-Kind |
| | | | | |
| Etho Climate Leadership U.S. ETF | | $25,969,077 | | $2,010,538 |
Purchases in-kind are the aggregate of all in-kind purchases and sales in-kind are the aggregate of all proceeds from in-kind sales. Net capital gains or losses resulting from in-kind redemptions are excluded from the determination of the Fund’s taxable gains and are not distributed to shareholders.
There were no purchases or sales of U.S. Government obligations for the period ended March 31, 2020.
NOTE 7 — SECURITIES LENDING
The Fund may lend up to 33 1/3% of the value of the securities in its portfolio to brokers, dealers and financial institutions (but not individuals) under terms of participation in a securities lending program administered by U.S. Bank N.A. (“the Custodian”). The securities lending agreement requires that loans are collateralized at all times in an amount equal to at least 102% of the value of any loaned securities at the time of the loan, plus accrued interest. The Fund receives compensation in the form of fees and earn interest on the cash collateral. The amount of fees depends on a number of factors including the type of security and length of the loan. The Fund continues to receive interest payments or dividends on the securities loaned during the borrowing period. Gain or loss in the fair value of securities loaned that may occur during the term of the loan will be for the account of the Fund. The Fund has the right under the terms of the securities lending agreement to recall the securities from the borrower on demand. As of March 31, 2020, the Fund had loaned securities and received cash collateral for the loans. The cash collateral is invested by the Custodian in accordance with approved investment guidelines. Those guidelines require the cash collateral to be invested in readily marketable, high quality, short-term obligations; however, such investments are subject to risk of payment delays or default on the part of the issuer or counterparty or otherwise may not generate sufficient interest to support the costs associated with securities lending. The Fund could also experience delays in recovering its securities and possible loss of income or value if the borrower fails to return the borrowed securities, although the Fund is indemnified from this risk by contract with the securities lending agent.
Etho Climate Leadership U.S. ETF
NOTES TO FINANCIAL STATEMENTS
March 31, 2020 (Unaudited) (Continued)
As of March 31, 2020, the value of the securities on loan and payable for collateral due to broker were as follows:
Value of Securities on Loan Collateral Received
| Fund | | Values of
Securities
on Loan | | Fund
Collateral
Received* | |
| Etho Climate Leadership U.S. ETF | | $11,603,638 | | $12,093,568 | |
* The cash collateral received was invested in the ETFMG Sit Ultra Short ETF and the Mount Vernon Liquid Assets Portfolio as shown on the Schedule of Investments, an investment with an overnight and continuous maturity.
NOTE 8 – FEDERAL INCOME TAXES
The components of distributable earnings (losses) and cost basis of investments for federal income tax purposes at September 30, 2019 were as follows:
| | | Cost | | | Gross
Unrealized
Appreciation | | | Gross
Unrealized
Depreciation | | | Net
Unrealized
Appreciation
(Depreciation) | |
| Etho Climate Leadership U.S. ETF | | $ | 64,893,325 | | | $ | 6,816,865 | | | $ | (1,945,148 | ) | | $ | 4,871,717 | |
| | | Undistributed
Ordinary
Income | | | Undistributed
Long-Term
Gain | | | Total
Distributable
Earnings | | Other
Accumulated (Loss) | | | Total
Accumulated
Gain | |
| Etho Climate | | | | | | | | | | | | | | |
| Leadership U.S. ETF | | $ | 1,750 | | | $ | — | | | $ 1,750 | | $ | (385,089 | ) | | $ | 4,488,378 | |
As of September 30, 2019, the Fund had accumulated capital loss carryovers of:
| | | Capital
Loss
Carryover
ST | | | Capital
Loss
Carryover
LT | | | Expires | |
| Etho Climate Leadership U.S. ETF | | $ | 215,102 | | | $ | 169,987 | | | | Indefinite | |
Under current tax law, capital and currency losses realized after October 31 of a Fund’s fiscal year may be deferred and treated as occurring on the first business day of the following fiscal year for tax purposes. The following Funds had deferred post-October capital and currency losses, which will be treated as arising on the first business day of the year ended September 30, 2019.
| | | Late
Year
Ordinary
Loss | | Post-
October
Capital
Loss | |
| Etho Climate Leadership U.S. ETF | | None | | None | |
Etho Climate Leadership U.S. ETF
NOTES TO FINANCIAL STATEMENTS
March 31, 2020 (Unaudited) (Continued)
U.S. GAAP requires that certain components of net assets relating to permanent differences be reclassified between financial and tax reporting. These reclassifications have no effect on net assets or net asset value per share. For the fiscal year ended September 30, 2019, the following table shows the reclassifications made:
| | | Total
Distributable
Earnings/(Loss) | | | Paid-In
Capital | |
| Etho Climate Leadership U.S. ETF | | $ | (3,890,630 | ) | | $ | 3,890,630 | |
The tax character of distributions paid by the Fund during the fiscal years ended September 30, 2019 and September 30, 2018 are as follows:
| | | Year Ended
September 30, 2019 | | | Year Ended
September 30, 2018 | |
| | | From
Ordinary
Income | | | From
Capital
Gains | | | From
Ordinary
Income | | | From
Capital
Gains | |
| Etho Climate Leadership U.S. ETF | | $ | 412,276 | | | $ | — | | | $ | 248,686 | | | $ | — | |
NOTE 9 – INVESTMENTS IN AFFILIATES
ETFMG Etho Climate Leadership U.S. ETF
ETFMG Sit Ultra Short ETF is deemed to be affiliates of the Fund as defined by the 1940 Act as of the period ended March 31, 2020. Transactions during the period in these securities were as follows:
| Security Name | | Value at
September
30, 2019 | | | Purchases | | | Sales | | | Realized
Gain
(Loss) | | | Change in
Unrealized
Appreciation
(Depreciation) | | | Dividend
Income | | | Value at
March 31,
2020 | | | Ending
Shares | |
| ETFMG Sit Ultra | | | | | | | | | | | | | | | | | | | | | | | | | | | | | | | | |
| Short ETF * | | $ | — | | | | 2,512,856 | | | | — | | | $ | — | | | $ | (108,856 | ) | | $ | — | | | $ | 2,404,000 | | | | 50,000 | |
*Affiliate as of March 31, 2020.
NOTE 10 – NEW ACCOUNTING PRONOUNCEMENTS
In August 2018, FASB issued Accounting Standards Update (“ASU”) 2018-13, Fair Value Measurement (Topic 820): Disclosure Framework – Changes to the Disclosure Requirements for Fair Value Measurement (“ASU 2018-13”). The primary focus of ASU 2018-13 is to improve the effectiveness of the disclosure requirements for fair value measurements. The changes affect all companies that are required to include fair value measurement disclosures. In general, the amendments in ASU 2018-13 are effective for all entities for fiscal years and interim periods within those fiscal years, beginning after December 15, 2019. An entity is permitted to early adopt the removed or modified disclosures upon the issuance of ASU 2018-13 and may delay adoption of the additional disclosures, which are required for public companies only, until their effective date. Management has evaluated ASU 2018-13 and has early adopted the relevant provisions of the disclosure framework.
Etho Climate Leadership U.S. ETF
NOTES TO FINANCIAL STATEMENTS
March 31, 2020 (Unaudited) (Continued)
NOTE 11 – LEGAL MATTERS
The Trust, a former and current trustee of the Trust, the Adviser and certain officers of the Adviser were defendants in an action filed May 2, 2017 in the Superior Court of New Jersey captioned PureShares, LLC d/b/a PureFunds et al. v. ETF Managers Group, LLC et al. (“Nasdaq”), Docket No. C-63-17. The PureShares action alleged claims based on disputes arising out of contractual relationships with the Adviser relating to certain series of the Trust. The action sought damages in unspecified amounts and injunctive relief based on breach of contract, wrongful termination, and several other claims.
The Adviser and its parent, Exchange Traded Managers Group, LLC (“ETFMG”), were defendants in a case filed on October 26, 2017 in the United States District Court for the Southern District of New York by NASDAQ, Inc. (“Nasdaq”) captioned Nasdaq, Inc. v. Exchange Traded Managers Group, LLC et al., Case 1:17-cv-08252. This action arose out of the same facts and circumstances, and relates to the same series of the Trust, as the New Jersey litigation and asserted claims for breach of contract, conversion and certain other claims. The matter was the subject of a bench trial in May 2019, and on December 20, 2019, the Court issued an Opinion and Order awarding compensatory damages to Plaintiff in the amount of $78,403,172.36, plus prejudgment interest. The Court also denied Plaintiff’s requests for punitive damages and equitable relief.
On May 1, 2020, Nasdaq, PureShares LLC (“PureShares”), and ETFMG announced a global settlement that resolves all claims in both the PureShares action and the Nasdaq action. The settlement is subject to future negotiations and approvals among independent third parties. As part of the settlement, Nasdaq and ETFMG have agreed to certain cash payments from ETFMG to Nasdaq and PureShares, and have executed an asset purchase agreement to transfer certain ETFMG intellectual property and related assets, to a Nasdaq affiliate. The transaction is expected to close in the last half of 2020. The Adviser does not believe that the resolution of these matters will have a material adverse effect on the Funds' financial statements. If the events set forth in the settlement agreement do not occur, and a subsequent settlement is not reached, the resulting conditions may adversely affect the Adviser's future operations.
NOTE 12 – SUBSEQUENT EVENTS
In preparing these financial statements, the Fund has evaluated events and transactions for potential recognition or disclosure through the date the financial statements were issued. The evaluation did not result in any subsequent events that necessitated disclosures and/or adjustments to the Financial statements, other than those disclosed in Note 11 above.
Etho Climate Leadership U.S. ETF
APPROVAL OF ADVISORY AGREEMENT AND BOARD CONSIDERATIONS
For the Period Ended March 31, 2020 (Unaudited)
Pursuant to Section 15(c) of the Investment Company Act of 1940 (the “1940 Act”), at a meeting held on March 24, 2020, the Board of Trustees (the “Board”) of ETF Managers Trust (the “Trust”) considered the renewal of the Amended and Restated Investment Advisory Agreement (the “Advisory Agreement”) between ETF Managers Group LLC (the “Adviser”) and the Trust, on behalf of Etho Climate Leadership U.S. ETF (the “Fund”).
Pursuant to Section 15(c) of the 1940 Act, the Board must annually review and approve the Advisory Agreement after its initial two-year term: (i) by the vote of the Trustees or by a vote of the shareholders of the Fund; and (ii) by the vote of a majority of the Trustees who are not parties to the Advisory Agreement or “interested persons” of any party thereto, as defined in the 1940 Act (the “Independent Trustees”), cast in person at a meeting called for the purpose of voting on such approval. Each year, the Board calls and holds a meeting to decide whether to renew the Advisory Agreement for an additional one-year term. In preparation for such meeting, the Board requests and reviews a wide variety of information from the Adviser.
In reaching its decision, the Board, including the Independent Trustees, considered all factors it believed relevant, including: (i) the nature, extent and quality of the services provided to the Fund’s shareholders by the Adviser; (ii) the investment performance of the Fund; (iii) the Adviser’s costs and profits realized in providing services to the Fund, including any fall-out benefits enjoyed by the Adviser; (iv) comparative fee and expense data for the Fund in relation to other similar investment companies; (v) the extent to which economies of scale would be realized as the Fund grows and whether the advisory fees for the Fund reflects these economies of scale for the benefit of the Fund; and (vi) other financial benefits to the Adviser and its affiliates resulting from services rendered to the Fund. The Board’s review included written and oral information furnished to the Board prior to and at the meeting held on March 24, 2020, and throughout the year. Among other things, the Adviser provided responses to a detailed series of questions, which included information about the Adviser’s operations, service offerings, personnel, compliance program and financial condition. The Board then discussed the written and oral information that it received before the meeting and throughout the year, and the Adviser’s oral presentations and any other information that the Board received at the meeting, and deliberated on the renewal of the Advisory Agreement in light of this information.
The Independent Trustees were assisted throughout the contract review process by independent legal counsel. The Independent Trustees relied upon the advice of such counsel and their own business judgment in determining the material factors to be considered in evaluating the renewal of the Advisory Agreement, and the weight to be given to each such factor. The conclusions reached with respect to the Advisory Agreement were based on a comprehensive evaluation of all the information provided and not any single factor. Moreover, each Trustee may have placed varying emphasis on particular factors in reaching conclusions with respect to the Fund. The Independent Trustees conferred amongst themselves and independent legal counsel during a telephonic contract renewal meeting held prior to the March 24, 2020 meeting and also conferred in executive sessions both with and without representatives of management before and during the March 24th meeting. The Independent Trustees requested, received and considered additional information arising out of these executive sessions.
Nature, Extent and Quality of Services Provided by the Adviser
The Trustees considered the scope of services provided under the Advisory Agreement, noting that the Adviser provides investment management services to the Fund. The Board discussed the responsibilities of the Adviser, including: responsibility for the general management of the day-to-day investment and reinvestment of the assets of the Fund; determining the daily baskets of deposit securities and cash components; executing portfolio security trades for purchases and redemptions of Fund shares conducted on a cash-in-lieu basis; responsibility for daily monitoring of tracking error and quarterly reporting to the Board; and implementation of Board directives as they relate to the Fund. In considering the nature, extent and quality of the services provided by the Adviser, the Board considered the qualifications, experience and responsibilities of the Adviser’s investment personnel and the quality of the Adviser’s compliance infrastructure. The Board also considered the Adviser’s experience managing exchange-traded funds (“ETFs”), as well as the Adviser’s response to the market volatility and uncertainty during the recent pandemic.
Etho Climate Leadership U.S. ETF
APPROVAL OF ADVISORY AGREEMENT AND BOARD CONSIDERATIONS
For the Period Ended March 31, 2020 (Unaudited) (Continued)
The Board also considered other services provided to the Fund, such as overseeing the Fund’s service providers, monitoring adherence to the Fund’s investment restrictions, and monitoring compliance with various policies and procedures and with applicable securities laws.
Based on the factors above, as well as those discussed below, the Board concluded that it was satisfied with the nature, extent and quality of the services provided to the Fund by the Adviser.
Historical Performance
The Board then considered the past performance of the Fund. The Board reviewed information regarding the Fund’s performance with the performance of a group of peer funds and with the performance of the Fund’s underlying index for various time periods. The Board noted management’s explanation that analysis of investment performance, in absolute terms, is less relevant for the Fund than it is for actively managed funds, given the Fund’s index-based investment objectives. The Board also noted management’s further explanation that it is more relevant to review the performance of the Fund by focusing on the extent to which the Fund tracked its underlying index. The Board reviewed information regarding the Fund’s index tracking, discussing, as applicable, factors which contributed to the Fund’s tracking error. The Board noted management’s representations that the Fund’s performance satisfactorily tracked its underlying index, and the Board concluded that the Fund satisfactorily tracked its underlying index. The Board further noted that it had received and would continue to receive regular reports regarding the Fund’s performance, including with respect to its tracking error, at its quarterly meetings.
Cost of Services Provided, Profits and Economies of Scale
The Board reviewed the advisory fee for the Fund and compared it to the total operating expenses of comparable ETFs, as determined by an independent third party. Among other information, the Board noted that the advisory fee of the Fund was lower than the average and median expense ratios of its peer ETFs. The Board took into consideration management’s discussion of the fees, including that the Fund has a niche investment strategy that is substantially different than the strategies of many of the peer ETFs.
The Board noted the importance of the fact that the advisory fee for the Fund is a “unified fee,” meaning that the shareholders of the Fund pay no expenses other than the advisory fee and certain other costs such as interest charges on any borrowings, taxes, brokerage commissions and other expenses incurred in placing orders for the purchase and sale of securities and other investment instruments, acquired fund fees and expenses, accrued deferred tax liability, extraordinary expenses (such as, among other things and subject to Board approval, non-standard Board-related expenses and litigation against the Board, Trustees, Fund, Adviser, and officers of the Adviser), and distribution (12b-1) fees and expenses. The Board also noted that the Adviser was responsible for compensating the Trust’s other service providers and paying the Fund’s other expenses (except as noted above) out of its own fees and resources. The Board concluded that the advisory fee for the Fund is reasonable in light of the factors considered.
The Board also evaluated the compensation and other benefits received by the Adviser from its relationship with the Fund, taking into account the profitability analysis provided by the Adviser. The Board received and reviewed a profitability analysis that detailed the revenues earned and the expenses incurred by the Adviser with respect to the Fund and considered how profit margins could affect the Adviser’s ability to attract and retain high quality personnel. Based on the information provided to the Trustees, the Trustees concluded that the level of profits realized by the Adviser from providing services to the Fund was not excessive in view of the nature, extent and quality of services provided to the Fund. The Board further considered other benefits derived by the Adviser and its affiliates from the Adviser’s relationship with the Fund, including contributions by the Fund’s index provider for the payment of Fund expenses and services provided by certain brokerage firms.
Etho Climate Leadership U.S. ETF
APPROVAL OF ADVISORY AGREEMENT AND BOARD CONSIDERATIONS
For the Period Ended March 31, 2020 (Unaudited) (Continued)
In addition, the Board considered whether economies of scale may be realized for the Fund. The Board noted that the Adviser regularly considers whether fee reductions are appropriate as the Fund grows in size. The Board noted that a unitary fee provides a level of certainty in expenses for the Fund and effectively acts as a cap on the fees and expenses (except as noted above) that are borne by the Fund. The Board noted that the Adviser still bears most of the ordinary fees and expenses of the Fund and that the Fund would likely experience benefits from the unitary fee at the Fund’s projected asset levels. The Board also noted that the Fund commenced operations on November 18, 2015 and that, as of February 29, 2020, the Fund had approximately $74 million in assets. The Board recognized that there would not likely be any additional economies of scale until the Fund’s assets grow.
In its deliberations, the Board did not identify any single piece of information discussed above that was all-important, controlling or determinative of its decision.
Based on the Board’s deliberations and its evaluation of the information described above, the Board, including the Independent Trustees, unanimously: (a) concluded that the terms of the Advisory Agreement are fair and reasonable; (b) concluded that the Adviser’s fees are reasonable in light of the services that the Adviser provides to the Fund; and (c) approved the renewal of the Advisory Agreement for another year.
Etho Climate Leadership U.S. ETF
Expense Example
Six Months Ended March 31, 2020 (Unaudited)
As a shareholder of the Fund you incur two types of costs: (1) transaction costs, including brokerage commissions on purchases and sales of Fund shares, and (2) ongoing costs, including management fees and other Fund expenses. These examples are intended to help you understand your ongoing costs (in dollars) of investing in the Fund and to compare these costs with the ongoing costs of investing in other funds. The example is based on an investment of $1,000 invested for the period of time as indicated in the table below.
Actual Expenses
The first line of the table provides information about actual account values based on actual returns and actual expenses. You may use the information in this line, together with the amount you invested, to estimate the expenses that you paid over the period. Simply divide your account value by $1,000 (for example, an $8,600 account value divided by $1,000 = 8.6), then, multiply the result by the number in the first line under the heading entitled “Expenses Paid During Period’’ to estimate the expenses you paid on your account during this period.
Hypothetical Example for Comparison Purposes
The second line of the table provides information about hypothetical account values based on a hypothetical return and hypothetical expenses based on the Fund’s actual expense ratio and an assumed rate of return of 5% per year before expenses, which is not the Fund’s actual return. The hypothetical account values and expenses may not be used to estimate the actual ending account balance or expenses you paid for the period. You may use this information to compare the ongoing costs of investing in the Fund and other funds. To do so, compare this 5% hypothetical example with the 5% hypothetical examples that appear in the shareholder reports of the other funds. Please note that the expenses shown in the table are meant to highlight your ongoing costs only and do not reflect any transactional costs, such as brokerage commissions paid on purchases and sales of Fund shares. Therefore, the second line of the table is useful in comparing ongoing costs only and will not help you determine the relative total costs of owning different funds. If these transactional costs were included, your costs would have been higher.
Etho Climate Leadership U.S. ETF
| | | Beginning
Account Value
October 1,
2019 | | Ending
Account Value
March 31, 2020 | | Expenses Paid
During the
Period^ | | Annualized
Expense Ratio
During Period
October 1,
2019 to
March 31,
2020 | |
| Actual | | $ | 1,000.00 | | $ | 836.30 | | $ | 2.07 | | | 0.45 | % |
| | | | | | | | | | | | | | |
| Hypothetical (5% annual) | | $ | 1,000.00 | | $ | 1,022.75 | | $ | 2.28 | | | 0.45 | % |
^ The dollar amounts shown as expenses paid during the period are equal to the annualized six-month expense ratio multiplied by the average account value during the period, multiplied by 183/366 (to reflect the number of days in the period).
Etho Climate Leadership U.S. ETF
Statement Regarding Liquidity Risk Management Program (unaudited)
ETF Managers Trust (the “Trust”) has adopted a liquidity risk management program (the “Program”). The Trust’s Board of Trustees (the “Board”) has designated ETF Managers Group LLC (the “Program Administrator”) as the administrator of the Program. The Program Administrator has designated a committee (the “Committee”), composed of personnel from multiple departments, including investment operations and compliance, that is responsible for the implementation and ongoing administration of the Program, which includes assessing the liquidity risk of the Etho Climate Leadership U.S. ETF (the “Fund”) under both normal and reasonably foreseeable stressed conditions.
Under the Program, the Program Administrator assesses, manages and periodically reviews the Fund’s liquidity risk, based on factors specific to the circumstances of the Fund. Liquidity risk is the risk that the Fund could not meet shareholder redemption requests without significant dilution of remaining shareholders’ interests in the Fund. This risk is managed by monitoring the degree of liquidity of the Fund’s investments and limiting the amount of the Fund’s illiquid investments, among other means. The Program Administrator’s process of determining the degree of liquidity of the Fund’s investments is supported by one or more third-party liquidity assessment vendors.
At a meeting of the Board on March 24, 2020, the Adviser provided a written report to the Board addressing the operation, and the adequacy and effectiveness of the implementation, of the Program, including, the operation of any Highly Liquid Investment Minimum, where applicable, and any material changes to the Program, for the initial period from December 1, 2018 through February 29, 2020 (the “Reporting Period”). No significant liquidity events impacting the Fund were noted in the report and it was represented that, as of December 31, 2019, the Fund was primarily highly liquid and, during the Reporting Period, the Fund held less than 15% in illiquid securities. In addition, the Program Administrator provided its assessment that Program implementation was effective and that the Program operated adequately and effectively to enable the Program Administrator to oversee and manage liquidity risk and ensure the Fund is able to meet requests to redeem shares without significant dilution to the remaining investors’ interest in the Fund.
There can be no assurance that the Program will achieve its objectives in the future. Please refer to the Fund’s prospectus for more information regarding the Fund’s exposure to liquidity risk and other principal risks to which an investment in the Fund may be subject.
Etho Climate Leadership U.S. ETF
SUPPLEMENTARY INFORMATION
March 31, 2020 (Unaudited)
NOTE 1 – FREQUENCY DISTRIBUTION OF PREMIUMS AND DISCOUNTS
Information regarding how often shares of the Fund traded on the Exchange at a price above (i.e., at a premium) or below (i.e., at a discount) the NAV is available on the Fund’s website at www.ethoetf.com.
NOTE 2 - FEDERAL TAX INFORMATION
Qualified Dividend Income/Dividends Received Deduction
For the fiscal year ended September 30, 2019, certain dividends paid by the Fund may be subject to a maximum tax rate of 15%, as provided for by the Jobs and Growth Tax Reconciliation Act of 2003. The percentage of dividends declared from ordinary income designated as qualified dividend income was as follows:
| Fund Name | QDI |
| Etho Climate Leadership U.S. ETF | 100.00% |
For corporate shareholders, the percent of ordinary income distributions qualifying for the corporate dividends received deduction for the fiscal year ended September 30, 2019 was as follows:
| Fund Name | DRD |
| Etho Climate Leadership U.S. ETF | 100.00% |
Short Term Capital Gain
The percentage of taxable ordinary income distributions that are designated as short-term capital gain distributions under Internal Revenue Section 871 (k)(2)(C) for the Fund was as follows:
| Fund Name | Short-Term Capital Gain |
| Etho Climate Leadership U.S. ETF | 0.00% |
NOTE 3 - INFORMATION ABOUT PORTFOLIO HOLDINGS
The Fund files a complete schedule of portfolio holdings with the SEC for its first and third fiscal quarters on Part F of Form N-PORT. Once filed, the Fund’s Part F of Form N-PORT is available without charge, upon request on the SEC’s website (www.sec.gov) and is available by calling (877) 756-7873. The Fund’s portfolio holdings are posted on the Fund’s website at www.ethoetf.com daily.
NOTE 4 - INFORMATION ABOUT PROXY VOTING
A description of the policies and procedures the Fund uses to determine how to vote proxies relating to portfolio securities is provided in the Statement of Additional Information (“SAI”). The SAI is available without charge upon request by calling toll-free at 1-844-ETF-MGRS (1-844-383-6477), by accessing the SEC’s website at www.sec.gov, or by accessing the Fund’s website at www.ethoetf.com.
Information regarding how the Fund voted proxies relating to portfolio securities during the period ending June 30 is available by calling toll-free at 1-844-ETF-MGRS (1-844-383-6477) or by accessing the SEC’s website at www.sec.gov.
Carefully consider the Fund’s investment objectives, risk factors, charges, and expenses before investing. This and additional information can be found in the Fund’s prospectus, which may be obtained by calling 1-844-ETF-MGRS (1-844-383-6477) or by visiting www.ethoetf.com. Read the prospectus carefully before investing.
Etho Climate Leadership U.S. ETF
Board of Trustees
Set forth below are the names, birth years, positions with the Trust, length of term of office, and the principal occupations and other directorships held during at least the last five years of each of the persons currently serving as a Trustee of the Trust, as well as information about each officer. The business address of each Trustee and officer is 30 Maple Street, 2nd Floor, Summit, New Jersey 07901. The SAI includes additional information about Fund directors and is available, without charge, upon request by calling 1-844-ETF-MGRS (1-844-383-6477).
Name
and Year
of Birth | Position(s)
Held with the
Trust, Term
of Office and
Length of
Time Served | Principal Occupation(s) During Past
5 Years | Number of
Portfolios in
Fund
Complex
Overseen
By Trustee | Other
Directorships
Held by
Trustee During
Past 5 Years |
| Interested Trustee and Officers |
Samuel
Masucci,
III (1962) | Trustee,
Chairman of
the Board and
President
(since 2012);
Secretary
(since 2014) | Chief Executive Officer, Exchange Traded Managers Group LLC (since 2013); Chief Executive Officer, ETF Managers Group LLC (since 2016); Chief Executive Officer, ETF Managers Capital LLC (commodity pool operator) (since 2014); Chief Executive Officer (2012-2016) and Chief Compliance Officer (2012-2014), Factor Advisors, LLC (investment adviser); President and Chief Executive Officer, Factor Capital Management LLC (2012-2014) (commodity pool operator); | 11 | None |
John A.
Flanagan,
(1946) | Treasurer
(since 2015) | President, John A. Flanagan CPA, LLC (accounting services) (since 2010); Treasurer, ETF Managers Trust (since 2015); Principal Financial Officer, ETF Managers Capital, LLC (commodity pool operator) (since 2015) | n/a | n/a |
Reshma
A.
Tanczos
(1978) | Chief
Compliance
Officer (since
2016) | Chief Compliance Officer, ETF Managers Group LLC (since 2016); Chief Compliance Officer, ETF Managers Capital LLC (since 2016); Partner, Crow & Cushing (law firm) (2007-2016). | n/a | n/a |
* Mr. Masucci is an interested Trustee by virtue of his role as the Chief Executive Officer of the Adviser.
Etho Climate Leadership U.S. ETF
Board of Trustees (Continued)
Name
and
Year of
Birth | Position(s)
Held with the
Trust, Term of
Office and
Length of Time
Served | Principal Occupation(s) During
Past 5 Years | Number of
Portfolios in
Fund
Complex
Overseen By
Trustee | Other
Directorships
Held by Trustee
During Past 5
Years |
| Independent Trustees | | |
Terry
Loebs
(1963) | Trustee (since
2014) | Founder and Managing Member, Pulsenomics LLC (index product development and consulting firm) (since 2011); Managing Director, MacroMarkets, LLC (exchange-traded products firm) (2006-2011). | 11 | None |
Jared
A.
Chase
(1955) | Trustee (since
2018) | Chief Operating and Financial Officer, Root Capital (a 501(c)(3) non-profit lender); Chairman, State Street Global Alliance LLC, State Street Corporation (2007-2012); Head of Global Treasury, Liability Management, Money Markets & Derivatives, State Street Corporation (2004-2007) | 11 | None |
Page Intentionally Left Blank
Advisor
ETF Managers Group, LLC
30 Maple Street, Suite 2, Summit, NJ 07901
Distributor
ETFMG Financial, Inc.
30 Maple Street, Suite 2, Summit, NJ 07901
Custodian
U.S. Bank National Association
Custody Operations
1555 North River Center Drive, Suite 302, Milwaukee, Wisconsin 53212
Transfer Agent
Foreside Financial Group, LLC
111 E Kilbourn Ave, Suite 1250, Milwaukee, WI 53202
Securities Lending Agent
U.S Bank, National Association
Securities Lending
800 Nicolet Mall
Minneapolis, MN 55402-7020
Independent Registered Public Accounting Firm
WithumSmith + Brown, PC
1411 Broadway, 9th Floor, New York, NY 10018
Legal Counsel
Sullivan & Worcester LLP
1666 K Street NW, Washington, DC 20006

Semi-Annual Report
March 31, 2020
AI Powered Equity ETF
Ticker: AIEQ
Beginning on January 1, 2021, as permitted by regulations adopted by the SEC, paper copies of the Fund’s shareholder reports will no longer be sent by mail, unless you specifically request paper copies of the Fund’s reports from your financial intermediary, such as a broker-dealer or bank. Instead, the reports will be made available on a website, and you will be notified by mail each time a report is posted and provided with a website link to access the report.
If you already elected to receive shareholder reports electronically, you will not be affected by this change and you need not take any action. Please contact your financial intermediary to elect to receive shareholder reports and other Fund communications electronically.
You may elect to receive all future Fund reports in paper free of charge. Please contact your financial intermediary to inform them that you wish to continue receiving paper copies of Fund shareholder reports and for details about whether your election to receive reports in paper will apply to all funds held with your financial intermediary.
The fund is a series of ETF Managers Trust.
Page Intentionally Left Blank
AI Powered Equity ETF
TABLE OF CONTENTS
March 31, 2020 (Unaudited)
AI Powered Equity ETF
Dear Shareholder,
On behalf of the entire team, we want to express our appreciation for the confidence you have placed in the AI Powered Equity Exchange-Traded Fund (“AIEQ” or the “Fund”). The following information pertains to the fiscal period from October 1, 2019 to March 31, 2020.
The AI Powered Equity ETF is actively managed and seeks capital appreciation. Over the fiscal period, the total return for the Fund was -14.07%, while the total return for its benchmark, the S&P 500 Index, was -12.31%.
AIEQ invests primarily in equity securities listed on a U.S. exchange based on the results of a proprietary, quantitative model developed by EquBot LLC that runs on the Watson™ platform. Each day, the EquBot Model ranks each company based on the probability of the company benefiting from current economic conditions, trends, and world events and identifies approximately 30 to 125 companies with the greatest potential over the next twelve months for appreciation and weights those companies to seek a level of volatility comparable to that of the broader U.S. equity market. EquBot, the Fund’s sub-adviser, is a technology based company focused on applying artificial intelligence (“AI”) based solutions to investment analyses.
In late February, as COVID-19, the disease caused by the coronavirus, spread into regions beyond China, global stock markets began to experience significant declines and turbulence. As we write this letter in late April, the course of the coronavirus outbreak remains uncertain, and markets are likely to remain volatile in response to any news or government action concerning the virus. While markets continue working to assess the economic impact of the virus and the public health measures taken in response, it is still unclear what the costs will be and how long the effects will last, but history has shown that markets recover from downturns. For investors, we believe the most important course of action is to remain focused on your long-term goals, and to consult with your financial advisor.
You can find further details about AIEQ by visiting www.etfmgfunds.com, or by calling 1-844-ETF-MGRS (1-844-383-6477).
Sincerely,
Samuel Masucci III
Chairman of the Board
AI Powered Equity ETF
Growth of $10,000 (Unaudited)

Average Annual Returns
Period Ended March 31, 2020 | | 1 Year
Return | | | Since Inception
(10/17/17) | | | Value of $10,000
(3/31/2020) | |
| AI Powered Equity ETF (NAV) | | | -12.97 | % | | | -0.21 | % | | $ | 9,949 | |
| AI Powered Equity ETF (Market) | | | -12.89 | % | | | -0.46 | % | | $ | 9,887 | |
| S&P 500 Index | | | -6.98 | % | | | 2.42 | % | | $ | 10,603 | |
Performance data quoted represents past performance and does not guarantee future results. The investment return and principal value of an investment will fluctuate so that an investor's shares, when redeemed, may be worth more or less than their original cost. Current performance of the Fund may be lower or higher than the performance quoted. All performance is historical and includes reinvestment of dividends and capital gains. Performance data current to the most recent month end may be obtained by calling 1-844-ETF-MGRS (1-844-383-6477)
The chart illustrates the performance of a hypothetical $10,000 investment made on October 17, 2017, and is not intended to imply any future performance. The returns shown do not reflect the deduction of taxes that a shareholder would pay on fund distributions from the sales of Fund shares. The chart assumes reinvestment of capital gains and dividends. The chart assumes reinvestment of capital gains and dividends, if any. The index returns do not reflect fees or expenses and are not available for direct investment.
AI Powered Equity ETF
Top Ten Holdings as of March 31, 2020* (Unaudited)
| | | Security | | | % of Total
Investments |
| 1 | | Amazon.com, Inc. | | 3.47% |
| 2 | | Alphabet, Inc. – Class A | | 2.76% |
| 3 | | Teledoc Health, Inc. | | 2.29% |
| 4 | | Costco Wholesale Corp. | | 2.20% |
| 5 | | Microsoft Corp. | | 2.07% |
| 6 | | Intuit, Inc. | | 1.92% |
| 7 | | Moderna, Inc. | | 1.88% |
| 8 | | Facebook, Inc. | | 1.69% |
| 9 | | Thermo Fisher Scientific, Inc. | | 1.64% |
| 10 | | NVIDIA Corp. | | 1.58% |
Top Ten Holdings = 21.50% of Total Investments
* Current Fund holdings may not be indicative of future Fund holdings.
AI Powered Equity ETF
Important Disclosures and Key Risks Factors
Investing involves risk, including the possible loss of principal. Shares of any ETF are bought and sold at market price (not NAV), may trade at a discount or premium to NAV and are not individually redeemed from the Fund. Brokerage commissions will reduce returns. Narrowly focused investments typically exhibit higher volatility.
Past performance is not indicative of future return. A fund’s performance for very short time periods may not be indicative of future performance.
AIEQ
The AI Powered Equity ETF (the “Fund”) seeks long-term capital appreciation within risk constraints commensurate with broad market US equity indices.
Investing involves risk, including the possible loss of principal. Shares of any ETF are bought and sold at market price (not NAV), may trade at a discount or premium to NAV and are not individually redeemed from the Fund. Brokerage commissions will reduce returns. Narrowly focused investments typically exhibit higher volatility. The equity securities held in the Fund’s portfolio may experience sudden, unpredictable drops in value or long periods of decline in value. This may occur because of factors that affect securities markets generally or factors affecting specific issuers, industries, or sectors in which the Fund invests such as political, market and economic developments, as well as events that impact specific issuers.
The Fund is actively-managed and may not meet its investment objective based on the success or failure of the Equbot Model to identify investment opportunities.
Fund holdings are subject to change.
The portfolio managers may actively and frequently trade securities or other instruments in the Fund’s portfolio to carry out its investment strategies. A high portfolio turnover rate increases transaction costs, which may increase the Fund’s expenses.
Natural or environmental disasters, such as earthquakes, fires, floods, hurricanes, tsunamis and other severe weather-related phenomena generally, and widespread disease, including pandemics and epidemics, have been and may be highly disruptive to economies and markets, adversely impacting individual companies, sectors, industries, markets, currencies, interest and inflation rates, credit ratings, investor sentiment, and other factors affecting the value of the Fund’s investments. Given the increasing interdependence among global economies and markets, conditions in one country, market, or region are increasingly likely to adversely affect markets, issuers, and/or foreign exchange rates in other countries, including the U.S. Any such events could have a significant adverse impact on the value of the Fund’s investments.
Additionally, natural or environmental disasters, widespread disease or other public health issues, war, acts of terrorism or other events could result in increased premiums or discounts to the Fund’s NAV.
Some of the models used by the Adviser for the Fund are predictive in nature. The use of predictive models has inherent risks. When Models and Data prove to be incorrect or incomplete, any decisions made in reliance thereon expose the Fund to potential risks. For example, by relying on Models and Data, the Adviser may be induced to buy certain investments at prices that are too high, to sell certain other investments at prices that are too low, or to miss favorable opportunities altogether. Similarly, any hedging based on faulty Models and Data may prove to be unsuccessful.
The Fund is distributed by ETFMG Financial LLC, which is not affiliated with Equbot. ETF Managers Group LLC and ETFMG Financial LLC are wholly owned subsidiaries of Exchange Traded Managers Group LLC (collectively, “ETFMG”).
AI Powered Equity ETF
PORTFOLIO ALLOCATIONS
As of March 31, 2020 (Unaudited)
| | | AI Powered
Equity ETF | |
| As a percent of Net Assets: | | | |
| Canada | | | 0.6 | % |
| United States | | | 89.5 | |
| Closed-End Funds | | | 0.5 | |
| Rights | | | — | |
| Short-Term and other Net Assets (Liabilities) | |
| 9.4 | |
| | | | 100 | % |
AI Powered Equity ETF
Schedule of Investments
March 31, 2020 (Unaudited)
| | | Shares | | | Value | |
| COMMON STOCKS - 90.1% | | | | | | | | |
| Canada - 0.6% | | | | | | | | |
| Commercial Services & Supplies - 0.6% | | | | | | | | |
| Waste Connections, Inc. | | | 6,025 | | | $ | 466,938 | |
| | | | | | | | | |
| United States - 89.5% | | | | | | | | |
| Aerospace & Defense - 1.6% | | | | | | | | |
| Lockheed Martin Corp. | | | 1,512 | | | | 512,492 | |
| Northrop Grumman Corp. | | | 1,271 | | | | 384,541 | |
| Raytheon Co. | | | 2,813 | | | | 368,925 | |
| Total Aerospace & Defense | | | | | | | 1,265,958 | |
| Banks - 0.9% | | | | | | | | |
| CIT Group, Inc. | | | 5,670 | | | | 97,864 | |
| Citizens Financial Group, Inc. | | | 6,268 | | | | 117,901 | |
| Hancock Whitney Corp. | | | 11,157 | | | | 217,785 | |
| KeyCorp | | | 19,128 | | | | 198,357 | |
| SVB Financial Group (a) | | | 1,040 | | | | 157,123 | |
| Total Banks | | | | | | | 789,030 | |
| Beverages - 1.0% | | | | | | | | |
| Brown-Forman Corp. - Class B (b) | | | 8,693 | | | | 482,548 | |
| Constellation Brands, Inc. - Class A | | | 2,208 | | | | 316,539 | |
| Total Beverages | | | | | | | 799,087 | |
| Biotechnology - 5.2% | | | | | | | | |
| AbbVie, Inc. (b) | | | 7,216 | | | | 549,787 | |
| ACADIA Pharmaceuticals, Inc. (a) | | | 9,384 | | | | 396,474 | |
| Exelixis, Inc. (a) | | | 27,257 | | | | 469,366 | |
| Gilead Sciences, Inc. (b) | | | 14,127 | | | | 1,056,135 | |
| Moderna, Inc. (a)(b) | | | 53,243 | | | | 1,594,627 | |
| Total Biotechnology | | | | | | | 4,066,389 | |
| Capital Markets - 0.6% | | | | | | | | |
| Cboe Global Markets, Inc. | | | 1,773 | | | | 158,240 | |
| Moody’s Corp. | | | 834 | | | | 176,392 | |
| State Street Corp. | | | 2,057 | | | | 109,576 | |
| Total Capital Markets | | | | | | | 444,208 | |
| Chemicals - 0.8% | | | | | | | | |
| Albemarle Corp. (b) | | | 3,749 | | | | 211,331 | |
| Ecolab, Inc. | | | 2,579 | | | | 401,885 | |
| Total Chemicals | | | | | | | 613,216 | |
| Commercial Services & Supplies - 2.6% | | | | | | | | |
| Rollins, Inc. | | | 24,031 | | | | 868,480 | |
| Waste Management, Inc. | | | 11,741 | | | | 1,086,746 | |
| Total Commercial Services & Supplies | | | | | | | 1,955,226 | |
| Communications Equipment - 0.2% | | | | | | | | |
| Arista Networks, Inc. (a) | | | 883 | | | | 178,852 | |
| Construction Materials - 0.2% | | | | | | | | |
| Martin Marietta Materials, Inc. | | | 938 | | | | 177,498 | |
| Consumer Finance - 0.2% | | | | | | | | |
| Discover Financial Services | | | 4,128 | | | | 147,246 | |
The accompanying notes are an integral part of these financial statements.
AI Powered Equity ETF
Schedule of Investments
March 31, 2020 (Unaudited) (Continued)
| | | | | | | |
| Containers & Packaging - 0.7% | | | | | | |
| Westrock Co. | | | 18,665 | | | $ | 527,473 | |
| Electric Utilities - 1.1% | | | | | | | | |
| Alliant Energy Corp. | | | 3,437 | | | | 165,973 | |
| Duke Energy Corp. (b) | | | 3,162 | | | | 255,742 | |
| Eversource Energy | | | 2,842 | | | | 222,273 | |
| Exelon Corporation | | | 5,965 | | | | 219,572 | |
| Total Electric Utilities | | | | | | | 863,560 | |
| Electronic Equipment, Instruments & Components - 0.8% | | | | | | | | |
| Amphenol Corp. - Class A | | | 4,462 | | | | 325,190 | |
| Dolby Laboratories, Inc. - Class A | | | 1,022 | | | | 55,403 | |
| Zebra Technologies Corp. - Class A (a) | | | 1,427 | | | | 261,997 | |
| Total Electronic Equipment, Instruments & Components | | | | | | | 642,590 | |
| Entertainment - 2.8% | | | | | | | | |
| Activision Blizzard, Inc. | | | 7,452 | | | | 443,245 | |
| Netflix, Inc. (a) | | | 1,904 | | | | 714,953 | |
| Roku, Inc. (a)(b) | | | 5,661 | | | | 495,224 | |
| Take-Two Interactive Software, Inc. (a) | | | 4,330 | | | | 513,581 | |
| Total Entertainment | | | | | | | 2,167,003 | |
| Food & Staples Retailing - 4.0% | | | | | | | | |
| Costco Wholesale Corp. | | | 6,533 | | | | 1,862,754 | |
| Sysco Corp. | | | 15,940 | | | | 727,342 | |
| Walmart, Inc. | | | 4,124 | | | | 468,569 | |
| Total Food & Staples Retailing | | | | | | | 3,058,665 | |
| Food Products - 1.0% | | | | | | | | |
| Campbell Soup Co. | | | 7,574 | | | | 349,616 | |
| Lamb Weston Holdings, Inc. | | | 6,773 | | | | 386,738 | |
| Total Food Products | | | | | | | 736,354 | |
| Gas Utilities - 0.9% | | | | | | | | |
| Atmos Energy Corp. (b) | | | 4,352 | | | | 431,849 | |
| Spire, Inc. | | | 3,506 | | | | 261,127 | |
| Total Gas Utilities | | | | | | | 692,976 | |
| Health Care Equipment & Supplies - 5.0% | | | | | | | | |
| Abbott Laboratories | | | 5,886 | | | | 464,464 | |
| Baxter International, Inc. | | | 2,997 | | | | 243,326 | |
| DexCom, Inc. (a) | | | 3,604 | | | | 970,450 | |
| Globus Medical, Inc. - Class A (a) | | | 12,714 | | | | 540,726 | |
| Haemonetics Corp. (a) | | | 6,732 | | | | 670,911 | |
| Hill-Rom Holdings, Inc. | | | 4,137 | | | | 416,182 | |
| Stryker Corp. | | | 3,269 | | | | 544,256 | |
| Total Health Care Equipment & Supplies | | | | | | | 3,850,315 | |
| Health Care Providers & Services - 4.9% | | | | | | | | |
| AmerisourceBergen Corp. | | | 6,035 | | | | 534,098 | |
| Anthem, Inc. | | | 2,973 | | | | 674,990 | |
| Centene Corp. (a) | | | 9,915 | | | | 589,050 | |
| HCA Healthcare, Inc. | | | 9,384 | | | | 843,152 | |
| UnitedHealth Group, Inc. | | | 4,488 | | | | 1,119,217 | |
| Total Health Care Providers & Services | | | | | | | 3,760,507 | |
The accompanying notes are an integral part of these financial statements.
AI Powered Equity ETF
Schedule of Investments
March 31, 2020 (Unaudited) (Continued)
| | | | | | | |
| Health Care Technology - 3.3% | | | | | | |
| Teladoc Health, Inc. (a)(b) | | | 12,498 | | | $ | 1,937,315 | |
| Veeva Systems, Inc. (a)(b) | | | 4,170 | | | | 652,063 | |
| Total Health Care Technology | | | | | | | 2,589,378 | |
| Hotels, Restaurants & Leisure - 1.2% | | | | | | | | |
| Domino’s Pizza, Inc. (b) | | | 2,667 | | | | 864,294 | |
| Marriott International Inc. - Class A (b) | | | 792 | | | | 59,250 | |
| Total Hotels, Restaurants & Leisure | | | | | | | 923,544 | |
| Household Durables - 0.4% | | | | | | | | |
| DR Horton, Inc. | | | 1,807 | | | | 61,438 | |
| NVR, Inc. (a) | | | 108 | | | | 277,464 | |
| Total Household Durables | | | | | | | 338,902 | |
| Household Products - 4.0% | | | | | | | | |
| Church & Dwight Co., Inc. | | | 13,529 | | | | 868,292 | |
| Clorox Co. | | | 2,919 | | | | 505,717 | |
| Energizer Holdings, Inc. (b) | | | 14,513 | | | | 439,018 | |
| Kimberly-Clark Corp. | | | 4,524 | | | | 578,484 | |
| Procter & Gamble Co. | | | 7,153 | | | | 786,830 | |
| Total Household Products | | | | | | | 3,178,341 | |
| Industrial Conglomerates - 0.6% | | | | | | | | |
| General Electric Co. | | | 54,506 | | | | 432,778 | |
| Insurance - 0.3% | | | | | | | | |
| Prudential Financial, Inc. | | | 3,756 | | | | 195,838 | |
| Interactive Media & Services - 5.5% | | | | | | | | |
| Alphabet, Inc. - Class A (a) | | | 2,015 | | | | 2,341,329 | |
| Facebook, Inc. - Class A (a)(b) | | | 8,567 | | | | 1,428,976 | |
| IAC/InterActiveCorp. (a) | | | 2,573 | | | | 461,159 | |
| Total Interactive Media & Services | | | | | | | 4,231,464 | |
| Internet & Direct Marketing Retail - 4.6% | | | | | | | | |
| Amazon.com, Inc. (a) | | | 1,509 | | | | 2,942,127 | |
| Etsy, Inc. (a) | | | 15,265 | | | | 586,787 | |
| Total Internet & Direct Marketing Retail | | | | | | | 3,528,914 | |
| IT Services - 2.4% | | | | | | | | |
| Cognizant Technology Solutions Corp. - Class A | | | 2,562 | | | | 119,056 | |
| FleetCor Technologies, Inc. (a)(b) | | | 825 | | | | 153,896 | |
| Leidos Holdings, Inc. | | | 6,312 | | | | 578,495 | |
| MasterCard, Inc. - Class A | | | 2,408 | | | | 581,676 | |
| Visa, Inc. - Class A (b) | | | 2,453 | | | | 395,227 | |
| Total IT Services | | | | | | | 1,828,350 | |
| Life Sciences Tools & Services - 3.2% | | | | | | | | |
| IQVIA Holdings, Inc. (a) | | | 4,259 | | | | 459,376 | |
| Syneos Health, Inc. (a) | | | 16,155 | | | | 636,830 | |
| Thermo Fisher Scientific, Inc. | | | 4,884 | | | | 1,385,102 | |
| Total Life Sciences Tools & Services | | | | | | | 2,481,308 | |
| Machinery - 0.1% | | | | | | | | |
| Fortive Corp. | | | 1,425 | | | | 78,646 | |
| Media - 0.6% | | | | | | | | |
| Liberty Broadband Corp. - Class C (a) | | | 1,793 | | | | 198,521 | |
| New York Times Co. - Class A (b) | | | 9,702 | | | | 297,948 | |
| Total Media | | | | | | | 496,469 | |
The accompanying notes are an integral part of these financial statements.
AI Powered Equity ETF
Schedule of Investments
March 31, 2020 (Unaudited) (Continued)
| | | | | | | |
| Metals & Mining - 0.6% | | | | | | |
| Royal Gold, Inc. | | | 5,641 | | | $ | 494,772 | |
| Multiline Retail - 0.7% | | | | | | | | |
| Target Corp. | | | 5,632 | | | | 523,607 | |
| Multi-Utilities - 0.5% | | | | | | | | |
| DTE Energy Co. | | | 3,111 | | | | 295,452 | |
| Sempra Energy | | | 997 | | | | 112,651 | |
| Total Multi-Utilities | | | | | | | 408,103 | |
| Oil, Gas & Consumable Fuels - 0.3% | | | | | | | | |
| Cimarex Energy Co. | | | 3,702 | | | | 62,305 | |
| Devon Energy Corp. | | | 9,126 | | | | 63,061 | |
| ONEOK, Inc. | | | 3,315 | | | | 72,299 | |
| Total Oil, Gas & Consumable Fuels | | | | | | | 197,665 | |
| Personal Products - 0.9% | | | | | | | | |
| Estee Lauder Cos., Inc. - Class A | | | 4,264 | | | | 679,426 | |
| Pharmaceuticals - 3.8% | | | | | | | | |
| Bristol-Myers Squibb Co. | | | 12,523 | | | | 698,032 | |
| Catalent, Inc. (a) | | | 11,286 | | | | 586,308 | |
| Johnson & Johnson | | | 7,363 | | | | 965,510 | |
| Pfizer, Inc. | | | 21,076 | | | | 687,921 | |
| Total Pharmaceuticals | | | | | | | 2,937,771 | |
| Professional Services - 0.5% | | | | | | | | |
| Verisk Analytics, Inc. | | | 2,705 | | | | 377,023 | |
| Real Estate Investment Trusts (REITs) - 0.8% | | | | | | | | |
| Invitation Homes, Inc. | | | 7,992 | | | | 170,789 | |
| Medical Properties Trust, Inc. | | | 24,096 | | | | 416,620 | |
| Total Equity Real Estate Investment Trusts (REITs) | | | | | | | 587,409 | |
| Real Estate Management & Development - 0.5% | | | | | | | | |
| Redfin Corp. (a) | | | 22,835 | | | | 352,116 | |
| Road & Rail - 0.3% | | | | | | | | |
| Union Pacific Corp. | | | 1,722 | | | | 242,871 | |
| Semiconductors & Semiconductor Equipment - 4.6% | | | | | | | | |
| Advanced Micro Devices, Inc. (a) | | | 9,665 | | | | 439,564 | |
| Broadcom, Inc. | | | 1,549 | | | | 367,268 | |
| KLA Corp. | | | 1,337 | | | | 192,180 | |
| Microchip Technology, Inc. (b) | | | 8,949 | | | | 606,742 | |
| NVIDIA Corp. | | | 5,067 | | | | 1,335,662 | |
| Qualcomm, Inc. | | | 6,509 | | | | 440,334 | |
| Skyworks Solutions, Inc. | | | 2,137 | | | | 191,005 | |
| Total Semiconductors & Semiconductor Equipment | | | | | | | 3,572,755 | |
The accompanying notes are an integral part of these financial statements.
AI Powered Equity ETF
Schedule of Investments
March 31, 2020 (Unaudited) (Continued)
| | | | | | | |
| Software - 11.4% | | | | | | |
| Autodesk, Inc. (a) | | | 1,907 | | | $ | 297,683 | |
| Box, Inc. - Class A (a) | | | 38,691 | | | | 543,222 | |
| Citrix Systems, Inc. | | | 7,251 | | | | 1,026,379 | |
| Cloudera, Inc. (a) | | | 38,184 | | | | 300,508 | |
| Coupa Software, Inc. (a)(b) | | | 4,354 | | | | 608,384 | |
| Everbridge, Inc. (a)(b) | | | 5,844 | | | | 621,568 | |
| Intuit, Inc. | | | 7,059 | | | | 1,623,570 | |
| Microsoft Corp. | | | 11,102 | | | | 1,750,897 | |
| New Relic, Inc. (a)(b) | | | 5,024 | | | | 232,310 | |
| Paylocity Holding Corp. (a) | | | 2,482 | | | | 219,210 | |
| Q2 Holdings, Inc. (a) | | | 1,054 | | | | 62,249 | |
| salesforce.com, Inc. (a) | | | 4,610 | | | | 663,748 | |
| SS&C Technologies Holdings, Inc. (b) | | | 12,753 | | | | 558,836 | |
| Synopsys, Inc. (a) | | | 869 | | | | 111,919 | |
| Zendesk, Inc. (a)(b) | | | 2,316 | | | | 148,247 | |
| Total Software | | | | | | | 8,768,730 | |
| Technology Hardware, Storage & Peripherals - 2.0% | | | | | | | | |
| Apple, Inc. (b) | | | 2,284 | | | | 580,799 | |
| NetApp, Inc. | | | 11,728 | | | | 488,940 | |
| Pure Storage, Inc. - Class A (a) | | | 21,697 | | | | 266,873 | |
| Western Digital Corporation | | | 5,449 | | | | 226,787 | |
| Total Technology Hardware, Storage & Peripherals | | | | | | | 1,563,399 | |
| Textiles, Apparel & Luxury Goods - 0.2% | | | | | | | | |
| Ralph Lauren Corp. | | | 2,640 | | | | 176,431 | |
| Trading Companies & Distributors - 0.2% | | | | | | | | |
| Fastenal Co. (b) | | | 6,071 | | | | 189,719 | |
| Water Utilities - 1.5% | | | | | | | | |
| Essential Utilities, Inc. (b) | | | 28,236 | | | | 1,149,205 | |
| Total United States | | | | | | | 69,261,087 | |
| TOTAL COMMON STOCKS (Cost $76,094,028) | | | | | | | 69,728,025 | |
| | | | | | | | | |
| CLOSED-END FUNDS - 0.5% | | | | | | | | |
| United States - 0.5% | | | | | | | | |
| Ares Capital Corp. | | | 33,872 | | | | 365,140 | |
| TOTAL CLOSED-END FUNDS (Cost $504,592) | | | | | | | | |
| | | | | | | | | |
| RIGHTS - 0% | | | | | | | | |
| United States - 0.0% | | | | | | | | |
| NewStar Financial, Inc. (c) | | | 115,783 | | | | 0 | |
| TOTAL RIGHTS (Cost $0) | | | | | | | 0 | |
The accompanying notes are an integral part of these financial statements.
AI Powered Equity ETF
Schedule of Investments
March 31, 2020 (Unaudited) (Continued)
| | | | | | | |
| INVESTMENTS PURCHASED WITH SECURITIES LENDING COLLATERAL - 14.3% | | | | | | |
| Mount Vernon Liquid Assets Portfolio, LLC, 0.91% (d) | | | 11,094,622 | | | $ | 11,094,622 | |
| TOTAL INVESTMENTS PURCHASED WITH SECURITIES LENDING COLLATERAL (Cost $11,094,622) | | | | | | | | |
| | | | | | | | | |
| SHORT-TERM INVESTMENTS - 4.5% | | | | | | | | |
| Money Market Funds - 4.5% | | | | | | | | |
| Invesco Advisers, Inc. STIT-Treasury Portfolio - Institutional Class, 0.30% (d) | | | 3,491,331 | | | | 3,491,331 | |
| TOTAL MONEY MARKET FUNDS (Cost $3,491,331) | | | | | | | | |
| | | | | | | | | |
| Total Investments (Cost $91,184,573) - 109.4% | | | | | | | 84,679,118 | |
| Liabilities in Excess of Other Assets - (9.4)% | | | | | | | (7,282,502 | ) |
| TOTAL NET ASSETS - 100.0% | | | | | | $ | 77,396,616 | |
Percentages are stated as a percent of net assets.
| (a) | All or a portion of this security was out on loan at March 31, 2020. |
| (b) | Non-income producing security. |
| (c) | Value determined based on estimated fair value. Classified as Level 3 in the fair value hierarchy. |
| (d) | The rate quote is the annualized seven-day yield at March 31, 2020. |
The Global Industry Classification Standard (GICS®) was developed by and/or is the exclusive property of MSCI, Inc. and Standard & Poor’s Financial Services LLC (“S&P”). GICS® is a service mark of MSCI and S&P and has been licensed for use by U.S. Bancorp Fund Services, LLC, doing business as U.S. Bank Global Fund Services (“Fund Services”).
The accompanying notes are an integral part of these financial statements.
AI Powered Equity ETF
ST
ATEMENT OF ASSETS AND LIABILITIES
As of March 31, 2020 (Unaudited)
| | | AI Powered
Equity ETF | |
| ASSETS | | | | |
| Investments in securities, at value* | | $ | 84,679,118 | |
| Cash | | | 5,215,061 | |
| Receivables: | | | | |
| Dividends and interest receivable | | | 38,765 | |
| Securities lending income receivable | | | 5,335 | |
| Receivable for investments sold | | | 1,361,157 | |
| Total Assets | | | 91,299,436 | |
| | | | | |
| LIABILITIES | | | | |
| Collateral received for securities loaned (Note 7) | | | 11,094,622 | |
| Payables: | | | | |
| Payable for investments purchased | | | 2,754,619 | |
| Management fees payable | | | 53,579 | |
| Total Liabilities | | | 13,902,820 | |
| Net Assets | | $ | 77,396,616 | |
| | | | | |
| NET ASSETS CONSIST OF: | | | | |
| Paid-in Capital | | $ | 97,494,559 | |
| Total Distibutable Earnings | | | (20,097,943 | ) |
| Net Assets | | $ | 77,396,616 | |
| | | | | |
| *Identified Cost: | | | | |
| Investments in securities | | $ | 91,184,573 | |
| | | | | |
| Shares Outstanding^ | | | 3,450,000 | |
| Net Asset Value, Offering and Redemption Price per Share | | $ | 22.43 | |
| ^ | No par value, unlimited number of shares authorized |
The accompanying notes are an integral part of these financial statements.
AI Powered Equity ETF
For the Period Ended March 31, 2020 (Unaudited)
| | | AI Powered
Equity ETF | |
| INVESTMENT INCOME | | | | |
| Income: | | | | |
| Dividend Income (net of foreign withholdings tax of $739) | | $ | 678,148 | |
| Interest | | | 21,824 | |
| Securities lending income | | | 15,829 | |
| Total Investment Income | | | 715,801 | |
| Expenses: | | | | |
| Management fees | | | 409,841 | |
| Total Expenses | | | 409,841 | |
| Net Investment Income | | | 305,960 | |
| REALIZED & UNREALIZED GAIN (LOSS) ON INVESTMENTS | | | | |
| Net Realized Gain (Loss) on: | | | | |
| Investments | | | (4,439,729 | ) |
| In-Kind redemptions | | | 1,310,489 | |
| Closed-End Funds | | | (76,511 | ) |
| Net Realized Gain (Loss) on Investments and Foreign Currency | | | (3,205,751 | ) |
| Net Change in Unrealized Appreciation (Depreciation) of: | | | | |
| Investments | | | (9,516,222 | ) |
| Net Realized and Unrealized Gain (Loss) on Investments | | | (12,721,973 | ) |
| NET INCREASE (DECREASE) IN NET ASSETS RESULTING FROM OPERATIONS | | $ | (12,416,013 | ) |
The accompanying notes are an integral part of these financial statements.
AI Powered Equity ETF
ST
ATEMENTS OF CHANGES IN NET ASSETS
| | | Period Ended
March 31,
2020
(Unaudited) | | | Year Ended
September 30,
2019 | |
| | | | | | | |
| OPERATIONS | | | | | | |
| Net investment income | | $ | 305,960 | | | $ | 905,874 | |
| Net realized gain (loss) on investments | | | (3,205,751 | ) | | | (10,405,925 | ) |
| Net change in unrealized appreciation (depreciation) of investments | | | (9,516,222 | ) | | | (3,012,955 | ) |
| Net increase (decrease) in net assets resulting from operations | | | (12,416,013 | ) | | | (12,513,006 | ) |
| DISTRIBUTIONS TO SHAREHOLDERS | | | | | | | | |
| Total distributions from distributable earnings | | | (254,750 | ) | | | (12,575,043 | ) |
| | | | | | | | | |
| CAPITAL SHARE TRANSACTIONS | | | | | | | | |
| Net increase (decrease) in net assets derived from net change in outstanding shares | | | (24,505,875 | ) | | | (66,811,078 | ) |
| Net increase (decrease) in net assets | | | (37,176,638 | ) | | | (91,899,127 | ) |
| NET ASSETS | | | | | | | | |
| Beginning of Year/Period | | | 114,573,254 | | | | 206,472,381 | |
| End of Year/Period | | $ | 77,396,616 | | | $ | 114,573,254 | |
Summary of share transactions is as follows:
| | | Period Ended
March 31,
2020
(Unaudited) | | | Year Ended
September 30,
2019 | |
| | | Shares | | | Amount | | | Shares | | | Amount | |
| Shares Sold | | | 100,000 | | | $ | 2,931,290 | | | | 175,000 | | | $ | 4,859,175 | |
| Shares Redeemed | | | (1,025,000 | ) | | | (27,437,165 | ) | | | (2,800,000 | ) | | | (71,670,253 | ) |
| | | | (925,000 | ) | | $ | (24,505,875 | ) | | | (2,625,000 | ) | | $ | (66,811,078 | ) |
| Beginning Shares | | | 4,375,000 | | | | | | | | 7,000,000 | | | | | |
| Ending Shares | | | 3,450,000 | | | | | | | | 4,375,000 | | | | | |
The accompanying notes are an integral part of these financial statements.
AI Powered Equity ETF
For a capital share outstanding throughout the year/period
| | | Period Ended
March 31,
2020
(Unaudited) | | Year Ended
September 30,
2019 | | Period Ended
September 30,
20181 | |
| | | | | | | | | | | |
| Net Asset Value, Beginning of Year/Period | | $ | 26.19 | | $ | 29.50 | | $ | 25.00 | |
| Income from Investment Operations: | | | | | | | | | | |
Net investment income2 | | | 0.08 | | | 0.16 | | | 0.14 | |
| Net realized and unrealized gain (loss) on investments | | | (3.77 | ) | | (1.41 | ) | | 4.49 | |
| Total from investment operations | | | (3.69 | ) | | (1.25 | ) | | 4.63 | |
| Less Distributions: | | | | | | | | | | |
| Distributions from net investment income | | | (0.07 | ) | | (0.17 | ) | | (0.12 | ) |
| Net realized gains | | | — | | | (1.89 | ) | | (0.01 | ) |
| Total distributions | | | (0.07 | ) | | (2.06 | ) | | (0.13 | ) |
| Net asset value, end of Year/Period | | | 22.43 | | | 26.19 | | | 29.50 | |
| Total Return | | | -14.07 | %3 | | -2.32 | % | | 18.53 | %3 |
| | | | | | | | | | | |
| Ratios/Supplemental Data: | | | | | | | | | | |
| Net assets at end of Year/Period (000’s) | | $ | 77,397 | | $ | 114,573 | | $ | 206,472 | |
| Expenses to Average Net Assets | | | 0.75 | %4 | | 0.75 | % | | 0.75 | %4 |
| Net Investment Income to Average Net Assets | | | 0.56 | %4 | | 0.64 | % | | 0.52 | %4 |
| Portfolio Turnover Rate | | | 105 | %3 | | 129 | % | | 260 | %3 |
| 1 | Commencement of operations on October 18, 2017. |
| 2 | Calculated based on average shares outstanding during the year/period. |
The accompanying notes are an integral part of these financial statements.
AI Powered Equity ETF
N
OTES TO FINANCIAL STATEMENTS
March 31, 2020 (Unaudited)
NOTE 1 – ORGANIZATION
The AI Powered Equity ETF (the “Fund”) is a series of ETF Managers Trust (the “Trust”), an openend management investment company consisting of multiple investment series, organized as a Delaware statutory trust on July 1, 2009. The Trust is registered with the SEC under the Investment Company Act of 1940, as amended (the “1940 Act”), as an open-end management investment company and the offering of the Fund’s shares (“Shares”) is registered under the Securities Act of 1933, as amended (the “Securities Act”). The investment objective of the Fund is capital appreciation. The Fund commenced operations on October 17, 2017.
The Fund currently offers one class of shares, which has no front end sales load, no deferred sales charges, and no redemption fees. The Fund may issue an unlimited number of shares of beneficial interest, with no par value. All shares of the Fund have equal rights and privileges.
Shares of the Fund are listed and traded on the NYSE Arca, Inc. Market prices for the Shares may be different from their net asset value (“NAV”). The Fund issues and redeems Shares on a continuous basis at NAV only in blocks of 25,000 shares, called “Creation Units.” Creation Units are issued and redeemed principally in-kind for securities included in a specified Index. Once created, Shares generally trade in the secondary market at market prices that change throughout the day in quantities less than a Creation Unit. Except when aggregated in Creation Units, Shares are not redeemable securities of the Fund. Shares of the Fund may only be purchased or redeemed by certain financial institutions (“Authorized”). An Authorized Participant is either (i) a broker-dealer or other participant in the clearing process through the Continuous Net Settlement System of the National Securities Clearing Corporation or (ii) a DTC participant and, in each case, must have executed a Participant Agreement with the Distributor. Most retail investors do not qualify as Authorized Participants nor have the resources to buy and sell whole Creation Units. Therefore, they are unable to purchase or redeem the Shares directly from the Fund. Rather, most retail investors may purchase Shares in the secondary market with the assistance of a broker and are subject to customary brokerage commissions or fees.
Authorized Participants transacting in Creation Units for cash may pay an additional variable charge to compensate the relevant Fund for certain transaction costs (i.e., brokerage costs) and market impact expenses relating to investing in portfolio securities. Such variable charges, if any, are included in “Transaction Fees” in the Statements of Changes in Net Assets.
NOTE 2 – SIGNIFICANT ACCOUNTING POLICIES
The following is a summary of significant accounting policies consistently followed by the Fund. These policies are in conformity with accounting principles generally accepted in the United States of America (“U.S. GAAP”).
The Fund follows the investment company accounting and reporting guidance of the Financial Accounting Standards Board Accounting Standard Codification Topic 946 Financial Services – Investment Companies.
The Fund may invest in certain other investment companies (underlying funds). For specific investments in underlying funds, please refer to the complete schedule of portfolio holdings on Form N-CSR for this reporting period, which is filed with the U.S. Securities and Exchange Commission (SEC). For more information about the underlying Fund’s operations and policies, please refer to those Fund’s semiannual and annual reports, which are filed with the SEC.
AI Powered Equity ETF
NOTES TO FINANCIAL STATEMENTS
March 31, 2020 (Unaudited) (Continued)
| A. | Security Valuation. Securities listed on a securities exchange, market or automated quotation system for which quotations are readily available (except for securities traded on NASDAQ), including securities traded over the counter, are valued at the last quoted sale price on the primary exchange or market (foreign or domestic) on which they are traded on the valuation date (or at approximately 4:00 pm Eastern Time if a security’s primary exchange is normally open at that time), or, if there is no such reported sale on the valuation date, at the most recent quoted bid price. For securities traded on NASDAQ, the NASDAQ Official Closing Price will be used. |
Securities for which quotations are not readily available are valued at their respective fair values as determined in good faith by the Board of Trustees (the “Board”). When a security is “fair valued,” consideration is given to the facts and circumstances relevant to the particular situation, including a review of various factors set forth in the pricing procedures adopted by the Fund’s Board. The use of fair value pricing by a fund may cause the net asset value of its shares to differ significantly from the net asset value that would be calculated without regard to such considerations. As of March 31, 2020, the Fund held one fair valued security. More detail about this security can be found in the Schedule of Investments.
As described above, the Fund utilizes various methods to measure the fair value of its investments on a recurring basis. U.S. GAAP establishes a hierarchy that prioritizes inputs to valuation methods. The three levels of inputs are:
| Level 1 | Unadjusted quoted prices in active markets for identical assets or liabilities that the Fund has the ability to access. |
| Level 2 | Observable inputs other than quoted prices included in Level 1 that are observable for the asset or liability, either directly or indirectly. These inputs may include quoted prices for the identical instrument on an inactive market, prices for similar instruments, interest rates, prepayment speeds, credit risk, yield curves, default rates and similar data. |
| Level 3 | Unobservable inputs for the asset or liability, to the extent relevant observable inputs are not available; representing the Fund’s own assumptions about the assumptions a market participant would use in valuing the asset or liability, and would be based on the best information available. |
The availability of observable inputs can vary from security to security and is affected by a wide variety of factors, including, for example, the type of security, whether the security is new and not yet established in the marketplace, the liquidity of markets, and other characteristics particular to the security. To the extent that valuation is based on models or inputs that are less observable or unobservable in the market, the determination of fair value requires more judgment. Accordingly, the degree of judgment exercised in determining fair value is greatest for instruments categorized in Level 3.
The inputs used to measure fair value may fall into different levels of the fair value hierarchy. In such cases, for disclosure purposes, the level in the fair value hierarchy within which the fair value measurement falls in its entirety, is determined based on the lowest level input that is significant to the fair value measurement in its entirety.
AI Powered Equity ETF
NOTES TO FINANCIAL STATEMENTS
March 31, 2020 (Unaudited) (Continued)
The following table presents a summary of the inputs used to value the Funds' net assets as of March 31, 2020:
AI Powered Equity ETF
| Assets^ | | Level 1 | | | Level 2 | | | Level 3 | | | Total | |
Common Stocks
| | $ | 69,728,025 | | | $ | — | | | $ | — | | | $ | 69,728,025 | |
| Closed-End Funds | | | 365,140 | | | | — | | | | — | | | | 365,140 | |
| Rights | | | — | | | | — | | | | — | (1) | | | — | |
| Short Term Investments | | | 3,491,331 | | | | — | | | | — | | | | 3,491,331 | |
| Investments Purchased with Securities | | | | | | | | | | | | | | | | |
| Lending Collateral* | | | — | | | | — | | | | — | | | | 11,097,645 | |
| Total Investments in Securities | | $ | 73,584,496 | | | $ | — | | | $ | — | | | $ | 84,682,141 | |
(1) Includes a security valued at $0.
The AI Powered Equity ETF held a Level 3 security at the end of the period. The security valuation classified as Level 3 is deemed immaterial.
^ For further information regarding security characteristics, see the Schedule of Investments.
* Certain investments that are measured at fair value using the net asset value per share (or its equivalent) practical expedient have not been categorized in the fair value hierarchy. The fair value amounts presented in the table are intended to permit reconciliation of the fair value hierarchy to the amounts presented in the Schedule of Investments.
| B. | Federal Income Taxes. The Fund has elected to be taxed as a “regulated investment company” and intends to distribute substantially all taxable income to its shareholders and otherwise comply with the provisions of the Internal Revenue Code applicable to regulated investment companies. Therefore, no provisions for federal income taxes or excise taxes have been made. |
To avoid imposition of the excise tax applicable to regulated investment companies, the Fund intends to declare each year as dividends, in each calendar year, at least 98.0% of its net investment income (earned during the calendar year) and 98.2% of its net realized capital gains (earned during the twelve months ended October 31) plus undistributed amounts, if any, from prior years.
Net capital losses incurred after October 31, within the taxable year are deemed to arise on the first business day of the Fund’s next taxable year.
The Fund recognizes the tax benefits of uncertain tax positions only where the position is “more likely than not” to be sustained assuming examination by tax authorities. The Fund has analyzed its tax position and has concluded that no liability for unrecognized tax benefits should be recorded related to uncertain tax positions expected to be taken in the Fund’s 2019 tax returns. The Fund identifies its major tax jurisdictions as U.S. Federal, the State of New Jersey, and the State of Delaware; however, the Fund is not aware of any tax positions for which it is reasonably possible that the total amounts of unrecognized tax benefits will change materially in the next twelve months.
AI Powered Equity ETF
NOTES TO FINANCIAL STATEMENTS
March 31, 2020 (Unaudited) (Continued)
As of March 31, 2020, management has reviewed the tax positions for open periods (for Federal purposes, three years from the date of filing and for state purposes, four years from the date of filing), as applicable to the Funds, and has determined that no provision for income tax is required in the Funds’ financial statements.
| C. | Security Transactions and Investment Income. Investment securities transactions are accounted for on the trade date. Gains and losses realized on sales of securities are determined on a specific identification basis. Discounts/premiums on debt securities purchased are accreted/amortized over the life of the respective securities using the effective interest method. Dividend income is recorded on the ex-dividend date. Interest income is recorded on an accrual basis. Income, including gains, from investments in foreign securities received by the Fund may be subject to income, withholding or other taxes imposed by foreign countries. |
| D. | Foreign Currency Translations and Transactions. The Fund may engage in foreign currency transactions. Foreign currency transactions are translated into U.S. dollars on the following basis: (i) market value of investment securities, assets and liabilities at the daily rates of exchange, and (ii) purchases and sales of investment securities, dividend and interest income and certain expenses at the rates of exchange prevailing on the respective dates of such transactions. For financial reporting purposes, the Fund does not isolate changes in the exchange rate of investment securities from the fluctuations arising from changes in the market prices of securities for unrealized gains and losses. However, for federal income tax purposes, the Fund does isolate and treat as ordinary income the effect of changes in foreign exchange rates on realized gains or losses from the sale of investment securities and payables and receivables arising from trade-date and settlement-date differences. |
| E. | Distributions to Shareholders. Distributions to shareholders from net investment income are declared and paid for the Fund on a quarterly basis. Net realized gains on securities for the Fund normally are declared and paid on an annual basis. Distributions are recorded on the ex-dividend date. |
| F. | Use of Estimates. The preparation of financial statements in conformity with U.S. GAAP requires management to make estimates and assumptions that affect the reported amounts of assets and liabilities at the date of the financial statements, as well as the reported amounts of revenues and expenses during the period. Actual results could differ from those estimates. |
| G. | Share Valuation. The net asset value (“NAV”) per share of the Fund is calculated by dividing the sum of the value of the securities held by the Fund, plus cash and other assets, minus all liabilities (including estimated accrued expenses) by the total number of shares outstanding for the Fund, rounded to the nearest cent. The Fund’s shares will not be priced on the days on which the NYSE is closed for trading. The offering and redemption price per share for the Fund is equal to the Fund’s net asset value per share. |
| H. | Guarantees and Indemnifications. In the normal course of business, the Fund enters into contracts with service providers that contain general indemnification clauses. The Fund’s maximum exposure under these arrangements is unknown as this would involve future claims that may be made against the Fund that have not yet occurred. However, based on experience, the Fund expects the risk of loss to be remote. |
NOTE 3 – RISK FACTORS
Investing in the AI Powered Equity ETF may involve certain risks, as discussed in the Fund’s prospectus, including, but not limited to, those described below. Any of these risks could cause an investor to lose money.
AI Powered Equity ETF
NOTES TO FINANCIAL STATEMENTS
March 31, 2020 (Unaudited) (Continued)
Equity Market Risk. The equity securities held in the Fund’s portfolio may experience sudden, unpredictable drops in value or long periods of decline in value. This may occur because of factors that affect securities markets generally or factors affecting specific issuers, industries, or sectors in which the Fund invests such as political, market and economic developments, as well as events that impact specific issuers.
Management Risk. The Fund is subject to management risk as an actively-managed investment portfolio. The Adviser’s investment approach may fail to produce the intended results. If the Adviser’s implementation of the EquBot Model is inaccurate or incomplete, the Fund may not perform as expected and your investment could lose value over short or long-term periods. Additionally, the Adviser has not previously managed a Fund whose strategy relies on the use of AI, which may create additional risks for the Fund.
Market Trading Risk. An investment in the Fund faces numerous market trading risks, including the potential lack of an active market for Fund shares, losses from trading in secondary markets, periods of high volatility and disruption in the creation/redemption process of the Fund. Any of these factors, among others, may lead to the Fund’s shares trading at a premium or discount to NAV.
Models and Data Risk. The Fund relies heavily on proprietary quantitative models as well as information and data supplied by third parties (“Models and Data”). When Models and Data prove to be incorrect or incomplete, any decisions made in reliance thereon expose the Fund to potential risks.
Non-Diversification Risk. Because the Fund is “non-diversified,” it may invest a greater percentage of its assets in the securities of a single issuer or a small number of issuers than if it was a diversified fund. As a result, a decline in the value of an investment in a single issuer or a small number of issuers could cause the Fund’s overall value to decline to a greater degree than if the Fund held a more diversified portfolio. This may increase the Fund’s volatility and have a greater impact on the Fund’s performance.
Portfolio Turnover Risk. The portfolio managers may actively and frequently trade securities or other instruments in the Fund’s portfolio to carry out its investment strategies. A high portfolio turnover rate increases transaction costs, which may increase the Fund’s expenses.
REIT Investment Risk. Investments in REITs involve unique risks. REITs may have limited financial resources, may trade less frequently and in limited volume, and may be more volatile than other securities. REITs may be affected by changes in the value of their underlying properties or mortgages or by defaults by their borrowers or tenants. Furthermore, these entities depend upon specialized management skills, have limited diversification and are, therefore, subject to risks inherent in financing a limited number of projects. In addition, the performance of a REIT may be affected by changes in the tax laws or by its failure to qualify for tax-free pass-through of income.
Sector Risk. To the extent the Fund invests more heavily in particular sectors of the economy, its performance will be especially sensitive to developments that significantly affect those sectors.
AI Powered Equity ETF
NOTES TO FINANCIAL STATEMENTS
March 31, 2020 (Unaudited) (Continued)
Smaller Companies Risk. Smaller companies in which the Fund may invest may be more vulnerable to adverse business or economic events than larger, more established companies, and may underperform other segments of the market or the equity market as a whole. The securities of smaller companies also tend to be bought and sold less frequently and at significantly lower trading volumes than the securities of larger companies. As a result, it may be more difficult for the Fund to buy or sell a significant amount of the securities of a smaller company without an adverse impact on the price of the company’s securities, or the Fund may have to sell such securities in smaller quantities over a longer period of time, which may increase the Fund’s tracking error.
NOTE 4 – COMMITMENTS AND OTHER RELATED PARTY TRANSACTIONS
ETF Managers Group, LLC (the “Advisor”), serves as the investment advisor to the Fund. Pursuant to an Investment Advisory Agreement (“Advisory Agreement”) between the Trust, on behalf of the Fund, and the Advisor, the Advisor provides investment advice to the Fund and oversees the day-today operations of the Fund, subject to the direction and control of the Board and the officers of the Trust.
Under the Investment Advisory Agreement with the Fund, the Advisor has overall responsibility for the general management and administration of the Fund and arranges for sub-advisory, transfer agency, custody, fund administration, securities lending, and all other non-distribution related services necessary for the Fund to operate. The Advisor bears the costs of all advisory and non-advisory services required to operate the Fund, in exchange for a single unitary fee. For services provided the Fund pays the Advisor at an annual rate of 0.75% of the Fund’s average daily net assets. The Advisor has an agreement with, and is dependent on, a third party to pay the Fund’s expenses in excess of 0.75% of the Fund’s average daily net assets. Additionally, under the Investment Advisory Agreement, the Advisor has agreed to pay all expenses of the Fund, except for: the fee paid to the Advisor pursuant to the Investment Advisory Agreement, interest charges on any borrowings, taxes, brokerage commissions and other expenses incurred in placing orders for the purchase and sale of securities and other investment instruments, acquired fund fees and expenses, accrued deferred tax liability, extraordinary expenses, and distribution (12b-1) fees and expenses (collectively, “Excluded Expenses”). The Advisor has entered into an Agreement with EquBot, LLC (the “Sponsor”), under which the Sponsor agrees to sublicense the use of the Underlying Index to the Advisor. The Sponsor also provides marketing support for the Fund, including distributing marketing materials related to the Fund. EquBot, LLC is a privately held business focused on bringing exchange-traded investment products to investors in the U.S. The Sponsor does not make investment decisions, provide investment advice, or otherwise act in the capacity of an investment adviser to the Fund. Additionally, the Sponsor is not involved in the maintenance of the Underlying Index and does not otherwise act in the capacity of an index provider.
U.S. Bancorp Fund Services, LLC doing business as U.S. Bank Global Fund Services (the “Administrator”) provides fund accounting, fund administration, and transfer agency services to the Fund. The Advisor compensates the Administrator for these services under an administration agreement between the two entities.
The Advisor pays each independent Trustee a quarterly fee for service to the Fund. Each Trustee is also reimbursed by the Advisor for all reasonable out-of-pocket expenses incurred in connection with his duties as Trustee, including travel and related expenses incurred in attending Board meetings.
AI Powered Equity ETF
NOTES TO FINANCIAL STATEMENTS
March 31, 2020 (Unaudited) (Continued)
NOTE 5 – DISTRIBUTION PLAN
The Fund has adopted a Plan of Distribution pursuant to Rule 12b-1 under the 1940 Act. Under the Plan, the Fund may pay compensation to the Distributor or any other distributor or financial institution with which the Trust has an agreement with respect to the Fund, with the amount of such compensation not to exceed an annual rate of 0.25% of each Fund’s daily average net assets. For the period ended March 31, 2020, the Fund did not incur any 12b-1 expenses.
NOTE 6 – PURCHASES AND SALES OF SECURITIES
The costs of purchases and sales of securities, excluding short-term securities and in-kind transactions, for the period ended March 31, 2020:
| | | Purchases | | | Sales | |
| AI Powered Equity ETF | | $ | 109,350,294 | | | $ | 114,595,717 | |
| | | | | | | | | |
The costs of purchases and sales of in-kind transactions associated with creations and redemptions for the period ended March 31, 2020:
| | | Purchases
In-Kind | | | Sales
In-Kind | |
| AI Powered Equity ETF | | $ | 2,775,957 | | | $ | 26,113,209 | |
Purchases in-kind are the aggregate of all in-kind purchases and sales in-kind are the aggregate of all in-kind sales. Net capital gains or losses resulting from in-kind redemptions are excluded from the Fund’s taxable gains and are not distributed to shareholders.
There were no purchases or sales of U.S. Government obligations for the period ended March 31, 2020.
NOTE 7 – SECURITIES LENDING
The Fund may lend up to 33 1 3% of the value of the securities in its portfolio to brokers, dealers and financial institutions (but not individuals) under terms of participation in a securities lending program administered by U.S. Bank N.A. (“the Custodian”). The securities lending agreement requires that loans are collateralized at all times in an amount equal to at least 102% of the value of any loaned securities at the time of the loan, plus accrued interest. The Fund receives compensation in the form of fees and earn interest on the cash collateral. The amount of fees depends on a number of factors including the type of security and length of the loan. The Fund continues to receive interest payments or dividends on the securities loaned during the borrowing period. Gain or loss in the fair value of securities loaned that may occur during the term of the loan will be for the account of the Fund. The Fund has the right under the terms of the securities lending agreement to recall the securities from the borrower on demand. The cash collateral is invested by the Custodian in accordance with approved investment guidelines. Those guidelines require the cash collateral to be invested in readily marketable, high quality, short-term obligations; however, such investments are subject to risk of payment delays or default on the part of the issuer or counterparty or otherwise may not generate sufficient interest to support the costs associated with securities lending. The Fund could also experience delays in recovering its securities and possible loss of income or value if the borrower fails to return the borrowed securities, although the Fund is indemnified from this risk by contract with the securities lending agent.
AI Powered Equity ETF
NOTES TO FINANCIAL STATEMENTS
March 31, 2020 (Unaudited) (Continued)
As of March 31, 2020, the value of the securities on loan and payable for collateral due to broker were as follows:
Value of Securities on Loan Collateral Received
| Fund | | Values of Securities on Loan | | | Fund Collateral Received* | |
| AI Powered Equity ETF | | $ | 10,537,576 | | | $ | 11,094,622 | |
* The cash collateral received was invested in the Mount Vernon Liquid Assets Portfolio as shown on the Schedule of Investments, a money market fund with an overnight and continuous maturity.
NOTE 8 – FEDERAL INCOME TAXES
The components of distributable earnings (losses) and cost basis of investments for federal income tax purposes at September 30, 2019 were as follows:
| | | Cost | | | Gross
Unrealized
Appreciation | | | Gross
Unrealized
Depreciation | | | Net
Unrealized
Appreciation
(Depreciation) | |
| AI Powered Equity ETF | | $ | 136,826,516 | | | $ | 7,337,699 | | | $ | (4,475,676 | ) | | $ | 2,862,023 | |
| | | Undistributed
Ordinary
Income | | | Undistributed
Long-term
Gain | | | Total
Distributable
Earnings | | | Other
Accumulated
(Loss) | | | Total
Accumulated
Gain | |
| AI Powered Equity ETF | | $ | 20,212 | | | $ | — | | | $ | 20,212 | | | $ | (10,309,415 | ) | | $ | (7,427,180 | ) |
As of September 30, 2019, the Fund had accumulated capital loss carryovers of:
| | | Capital
Loss
Carryover
ST | | | Capital
Loss
Carryover
LT | | | Expires | |
| AI Powered Equity ETF | | $ | (8,964,165 | ) | | $ | (1,345,250 | ) | | | Indefinite | |
Under current tax law, capital and currency losses realized after October 31 of a Fund’s fiscal year may be deferred and treated as occurring on the first business day of the following fiscal year for tax purposes. The following Funds had deferred post-October capital and currency losses, which will be treated as arising on the first business day of the year ended September 30, 2019.
| | | Late Year
Ordinary
Loss | | Post-October
Capital Loss |
| AI Powered Equity ETF | | None | | None |
AI Powered Equity ETF
NOTES TO FINANCIAL STATEMENTS
March 31, 2020 (Unaudited) (Continued)
U.S. GAAP requires that certain components of net assets relating to permanent differences be reclassified between financial and tax reporting. These reclassifications have no effect on net assets or net asset value per share. For the fiscal year ended September 30, 2019, the following table shows the reclassifications made:
| | | Total
Distributable
Earnings/(Loss) | | | Paid-In
Capital | |
| AI Powered Equity ETF | | $ | 1,252,068 | | | $ | (1,252,068 | ) |
The tax character of distributions paid by the Fund during the fiscal years ended September 30, 2019 and September 30, 2018 are as follows:
| | | | | | | | | | | | | |
| | | Year Ended | | | Year Ended | |
| | | September 30, 2019 | | | September 30, 2018 | |
| | | From
Ordinary
Income | | | From
Capital
Gains | | | From
Ordinary
Income | | | From
Capital
Gains | |
| AI Powered Equity ETF | | $ | 12,571,140 | | | $ | 3,903 | | | $ | 610,275 | | | $ | — | |
NOTE 9 – NEW ACCOUNTING PRONOUNCEMENTS
In August 2018, FASB issued Accounting Standards Update (“ASU”) 2018-13, Fair Value Measurement (Topic 820): Disclosure Framework – Changes to the Disclosure Requirements for Fair Value Measurement (“ASU 2018-13”). The primary focus of ASU 2018-13 is to improve the effectiveness of the disclosure requirements for fair value measurements. The changes affect all companies that are required to include fair value measurement disclosures. In general, the amendments in ASU 2018-13 are effective for all entities for fiscal years and interim periods within those fiscal years, beginning after December 15, 2019. An entity is permitted to early adopt the removed or modified disclosures upon the issuance of ASU 2018-13 and may delay adoption of the additional disclosures, which are required for public companies only, until their effective date. Management has evaluated ASU 2018-13 and has early adopted the relevant provisions of the disclosure framework.
NOTE 10 – LEGAL MATTERS
The Trust, a former and current trustee of the Trust, the Adviser and certain officers of the Adviser were defendants in an action filed May 2, 2017 in the Superior Court of New Jersey captioned PureShares, LLC d/b/a PureFunds et al. v. ETF Managers Group, LLC et al. (“Nasdaq”), Docket No. C-63-17. The PureShares action alleged claims based on disputes arising out of contractual relationships with the Adviser relating to certain series of the Trust. The action sought damages in unspecified amounts and injunctive relief based on breach of contract, wrongful termination, and several other claims.
The Adviser and its parent, Exchange Traded Managers Group, LLC (“ETFMG”), were defendants in a case filed on October 26, 2017 in the United States District Court for the Southern District of New York by NASDAQ, Inc. (“Nasdaq”) captioned Nasdaq, Inc. v. Exchange Traded Managers Group, LLC et al., Case 1:17-cv-08252. This action arose out of the same facts and circumstances, and relates to the same series of the Trust, as the New Jersey litigation and asserted claims for breach of contract, conversion and certain other claims. The matter was the subject of a bench trial in May 2019, and on December 20, 2019, the Court issued an Opinion and Order awarding compensatory damages to Plaintiff in the amount of $78,403,172.36, plus prejudgment interest. The Court also denied Plaintiff’s requests for punitive damages and equitable relief.
AI Powered Equity ETF
NOTES TO FINANCIAL STATEMENTS
March 31, 2020 (Unaudited) (Continued)
On May 1, 2020, Nasdaq, PureShares LLC (“PureShares”), and ETFMG announced a global settlement that resolves all claims in both the PureShares action and the Nasdaq action. The settlement is subject to future negotiations and approvals among independent third parties. As part of the settlement, Nasdaq and ETFMG have agreed to certain cash payments from ETFMG to Nasdaq and PureShares, and have executed an asset purchase agreement to transfer certain ETFMG intellectual property and related assets, to a Nasdaq affiliate. The transaction is expected to close in the last half of 2020. The Adviser does not believe that the resolution of these matters will have a material adverse effect on the Funds' financial statements. If the events set forth in the settlement agreement do not occur, and a subsequent settlement is not reached, the resulting conditions may adversely affect the Adviser's future operations.
NOTE 11 – SUBSEQUENT EVENTS
In preparing these financial statements, the Fund has evaluated events and transactions for potential recognition or disclosure through the date the financial statements were issued. This evaluation did not result in any subsequent events that necessitated disclosures and/or adjustments to the financial statements, other than those disclosed in Note 10 above.
AI Powered Equity ETF
APPROVAL OF ADVISORY AGREEMENT AND BOARD CONSIDERATIONS
For the Period Ended March 31, 2020 (Unaudited)
Pursuant to Section 15(c) of the Investment Company Act of 1940 (the “1940 Act”), at a meeting held on March 24, 2020, the Board of Trustees (the “Board”) of ETF Managers Trust (the “Trust”) considered the renewal of the following agreements:
| ● | an Amended and Restated Investment Advisory Agreement between ETF Managers Group, LLC (the “Adviser”) and the Trust, on behalf of AI Powered Equity ETF (the “Fund”) (the “Advisory Agreement”); and |
| ● | a Sub-Advisory Agreement between the Adviser and Equbot LLC (the “Sub-Adviser”) with respect to the Fund (the “Sub-Advisory Agreement” and, together with the Advisory Agreement, the “Agreements”). |
Pursuant to Section 15(c) of the 1940 Act, the Board must annually review and approve the Agreements after their initial two-year term: (i) by the vote of the Trustees or by a vote of the shareholders of the Fund; and (ii) by the vote of a majority of the Trustees who are not parties to the Agreements or “interested persons” of any party thereto, as defined in the 1940 Act (the “Independent Trustees”), cast in person at a meeting called for the purpose of voting on such approval. Each year, the Board calls and holds a meeting to decide whether to renew the Agreements for an additional one-year term. In preparation for such meeting, the Board requests and reviews a wide variety of information from the Adviser and Sub-Adviser.
In reaching its decision, the Board, including the Independent Trustees, considered all factors it believed relevant, including: (i) the nature, extent and quality of the services provided to the Fund’s shareholders by the Adviser and Sub-Adviser; (ii) the investment performance of the Fund; (iii) the Adviser’s costs and profits realized in providing services to the Fund, including any fall-out benefits enjoyed by the Adviser; (iv) comparative fee and expense data for the Fund in relation to other similar investment companies; (v) the extent to which economies of scale would be realized as the Fund grows and whether the advisory fees for the Fund reflects these economies of scale for the benefit of the Fund; and (vi) other financial benefits to the Adviser or Sub-Adviser and their affiliates resulting from services rendered to the Fund. The Board’s review included written and oral information furnished to the Board prior to and at the meeting held on March 24, 2020, and throughout the year. Among other things, each of the Adviser and Sub-Adviser provided responses to a detailed series of questions, which included information about the Adviser’s and Sub-Adviser’s operations, service offerings, personnel, compliance program and financial condition. The Board then discussed the written and oral information that it received before the meeting and throughout the year, and the Adviser’s oral presentations and any other information that the Board received at the meeting, and deliberated on the renewal of the Agreements in light of this information.
The Independent Trustees were assisted throughout the contract review process by independent legal counsel. The Independent Trustees relied upon the advice of such counsel and their own business judgment in determining the material factors to be considered in evaluating the approval of the Agreements, and the weight to be given to each such factor. The conclusions reached with respect to the Agreements were based on a comprehensive evaluation of all the information provided and not any single factor. Moreover, each Trustee may have placed varying emphasis on particular factors in reaching conclusions with respect to the Fund. The Independent Trustees conferred amongst themselves and independent legal counsel during a telephonic contract renewal meeting held prior to the March 24, 2020 meeting and also conferred in executive sessions both with and without representatives of management before and during the March 24th meeting. The Independent Trustees requested, received and considered additional information arising out of these executive sessions.
AI Powered Equity ETF
APPROVAL OF ADVISORY AGREEMENT AND BOARD CONSIDERATIONS
For the Period Ended March 31, 2020 (Unaudited) (Continued)
Nature, Extent and Quality of Services Provided by the Adviser
The Trustees considered the scope of services provided under the Advisory Agreement, noting that the Adviser provides investment management services to the Fund. The Board discussed the responsibilities of the Adviser, including: responsibility for the general management of the day-to-day investment and reinvestment of the assets of the Fund, based on recommendations provided by the Sub-Adviser; determining the daily baskets of deposit securities and cash components; executing portfolio security trades for purchases and redemptions of Fund shares conducted on a cash-in-lieu basis; responsibility for daily monitoring of tracking error and quarterly reporting to the Board; and implementation of Board directives as they relate to the Fund. In considering the nature, extent and quality of the services provided by the Adviser, the Board considered the qualifications, experience and responsibilities of the Adviser’s investment personnel and the quality of the Adviser’s compliance infrastructure. The Board also considered the Adviser’s experience managing exchange-traded funds (“ETFs”), as well as the Adviser’s response to the market volatility and uncertainty during the recent pandemic.
The Board further considered other services provided to the Fund, such as overseeing the activities of the Sub-Adviser, as well as the Fund’s other service providers, monitoring adherence to the Fund’s investment restrictions, and monitoring compliance with various policies and procedures and with applicable securities laws.
The Board then considered the scope of services provided under the Sub-Advisory Agreement, noting that the Sub-Adviser provides investment sub-advisory services to the Adviser in the form of recommendations based on the Sub-Adviser’s algorithm-based model. The Board noted that the responsibility for trading the Fund’s portfolio securities would continue to rest with the Adviser. In considering the nature, extent and quality of the services provided by the Sub-Adviser, the Board noted that it had received a copy of the Sub-Adviser’s Form ADV, as well as the response of the Sub-Adviser to a detailed series of questions which included, among other things, information about the background and experience of the Sub-Adviser’s personnel. The Board considered the experience of the Sub-Adviser’s personnel in the financial services and artificial intelligence businesses. The Board also considered the quality of the Sub-Adviser’s compliance program and Code of Ethics.
Based on the factors above, as well as those discussed below, the Board concluded that it was satisfied with the nature, extent and quality of the services provided to the Fund by the Adviser and Sub-Adviser.
Historical Performance
The Board then considered the Fund’s performance history over various time periods ending February 29, 2020, including the year-to-date period, the most recent one-year period and the period since the Fund’s inception. The Board noted that the Fund underperformed in relation to its peer group for the one-year period and the period since the Fund’s inception. The Board considered management’s discussion of AIEQ’s performance, noting that, over time, the model powered by artificial intelligence employed in the management of the Fund becomes more refined. The Board further noted that it had received and would continue to receive regular reports regarding the Fund’s performance at its quarterly meetings.
Cost of Services Provided, Profits and Economies of Scale
The Board reviewed the advisory fee for the Fund and compared it to the total operating expenses of comparable ETFs, as determined by an independent third party. The Board noted that the expense ratio for the Fund was higher than the average and median expense ratios of its peer ETFs. The Board considered the additional effort required to manage an active fund, as opposed to an index-based fund.
AI Powered Equity ETF
APPROVAL OF ADVISORY AGREEMENT AND BOARD CONSIDERATIONS
For the Period Ended March 31, 2020 (Unaudited) (Continued)
The Board noted the importance of the fact that the advisory fee for the Fund is a “unified fee,” meaning that the shareholders of the Fund pay no expenses other than the advisory fee and certain other costs such as interest charges on any borrowings, taxes, brokerage commissions and other expenses incurred in placing orders for the purchase and sale of securities and other investment instruments, acquired fund fees and expenses, accrued deferred tax liability, extraordinary expenses (such as, among other things and subject to Board approval, non-standard Board-related expenses and litigation against the Board, Trustees, Fund, Adviser, and officers of the Adviser), and distribution (12b-1) fees and expenses. The Board also noted that the Adviser was responsible for compensating the Trust’s other service providers (including the Sub-Adviser) and paying the Fund’s other expenses (except as noted above) out of its own fees and resources. The Board concluded that the advisory fee for the Fund is reasonable in light of the factors considered.
The Board also evaluated the compensation and other benefits received by the Adviser from its relationship with the Fund, taking into account the profitability analysis provided by the Adviser. The Board received and reviewed a profitability analysis that detailed the revenues earned and the expenses incurred by the Adviser with respect to the Fund and considered how profit margins could affect the Adviser’s ability to attract and retain high quality personnel. Based on the information provided to the Trustees, the Trustees concluded that the level of profits realized by the Adviser from providing services to the Fund was not excessive in view of the nature, extent and quality of services provided to the Fund. The Board further considered other benefits derived by the Adviser and its affiliates from the Adviser’s relationship with the Fund, including services provided by certain brokerage firms.
In addition, the Board considered whether economies of scale may be realized for the Fund. The Board noted that the Adviser regularly considers whether fee reductions are appropriate as the Fund grows in size. The Board noted that a unitary fee provides a level of certainty in expenses for the Fund and effectively acts as a cap on the fees and expenses (except as noted above) that are borne by the Fund. The Board noted that the Adviser still bears most of the ordinary fees and expenses of the Fund and that the Fund would likely experience benefits from the unitary fee at the Fund’s projected asset levels. The Board also noted that the Fund commenced operations on October 17, 2017 and that, as of February 29, 2020, the Fund had approximately $100 million in assets. The Board recognized that there would not likely be any additional economies of scale until the Fund’s assets grow.
The Board also reviewed the sub-advisory fee paid to the Sub-Adviser for its services to the Fund under the Sub-Advisory Agreement. The Board considered this fee in light of the services the Sub-Adviser provides as investment sub-adviser to the Fund. The Board determined that the fee reflected an appropriate allocation of the advisory fee paid to the Adviser and Sub-Adviser given the work performed by each firm.
The Board also considered that the sub-advisory fee paid to the Sub-Adviser is paid out of the Adviser’s unified fee and represents an arm’s-length negotiation between the Adviser and the Sub-Adviser. For these reasons, the Trustees determined that the profitability to the Sub-Adviser from its relationship with the Fund was not a material factor in their deliberations with respect to consideration of approval of the Sub-Advisory Agreement. The Board concluded that the proposed sub-advisory fee was reasonable in light of the services rendered. The Board considered that, because the proposed sub-advisory fee would be paid by the Adviser out of its unified fee, any economies of scale would not benefit shareholders and, thus, were not relevant for the consideration of the approval of the sub-advisory fee.
In its deliberations, the Board did not identify any single piece of information discussed above that was all-important, controlling or determinative of its decision.
Based on the Board’s deliberations and its evaluation of the information described above, the Board, including the Independent Trustees, unanimously: (a) concluded that the terms of the Agreements are fair and reasonable; (b) concluded that the Adviser’s and Sub-Adviser’s fee is reasonable in light of the services that the Adviser and Sub-Adviser each provide to the Fund; and (c) approved the renewal of the Agreements for another year.
AI Powered Equity ETF
Expense Example
For the period Ended March 31, 2020 (Unaudited)
As a shareholder of the Fund you incur two types of costs: (1) transaction costs, including brokerage commissions on purchases and sales of Fund shares, and (2) ongoing costs, including management fees and other Fund expenses. These examples are intended to help you understand your ongoing costs (in dollars) of investing in the Fund and to compare these costs with the ongoing costs of investing in other funds. The example is based on an investment of $1,000 invested for the period of time as indicated in the table below.
Actual Expenses
The first line of the table provides information about actual account values based on actual returns and actual expenses. You may use the information in this line, together with the amount you invested, to estimate the expenses that you paid over the period. Simply divide your account value by $1,000 (for example, an $8,600 account value divided by $1,000 = 8.6), then, multiply the result by the number in the first line under the heading entitled “Expenses Paid During Period’’ to estimate the expenses you paid on your account during this period.
Hypothetical Example for Comparison Purposes
The second line of the table provides information about hypothetical account values based on a hypothetical return and hypothetical expenses based on the Fund’s actual expense ratio and an assumed rate of return of 5% per year before expenses, which is not the Fund’s actual return. The hypothetical account values and expenses may not be used to estimate the actual ending account balance or expenses you paid for the period. You may use this information to compare the ongoing costs of investing in the Fund and other funds. To do so, compare this 5% hypothetical example with the 5% hypothetical examples that appear in the shareholder reports of the other funds. Please note that the expenses shown in the table are meant to highlight your ongoing costs only and do not reflect any transactional costs, such as brokerage commissions paid on purchases and sales of Fund shares. Therefore, the second line of the table is useful in comparing ongoing costs only and will not help you determine the relative total costs of owning different funds. If these transactional costs were included, your costs would have been higher.
| | | Beginning Account
Value October 1, 2019 | | | Ending Account
Value March 31, 2020 | | | Expenses Paid
During
the Period^ | | | Annualized
Expense
Ratio During
Period October 1, 2019 to
March 31, 2020 | |
| Actual | | $ | 1,000.00 | | | $ | 859.30 | | | $ | 3.49 | | | | 0.75 | % |
| | | | | | | | | | | | | | | | | |
| Hypothetical (5% annual) | | $ | 1,000.00 | | | $ | 1,021.25 | | | $ | 3.79 | | | | 0.75 | % |
| ^ | The dollar amounts shown as expenses paid during the period are equal to the annualized six-month expense ratio multiplied by the average account value during the period, multiplied by 183/366 (to reflect the number of days in the period). |
AI Powered Equity ETF
Statement Regarding Liquidity Risk Management Program (unaudited)
ETF Managers Trust (the “Trust”) has adopted a liquidity risk management program (the “Program”). The Trust’s Board of Trustees (the “Board”) has designated ETF Managers Group LLC (the “Program Administrator”) as the administrator of the Program. The Program Administrator has designated a committee (the “Committee”), composed of personnel from multiple departments, including investment operations and compliance, that is responsible for the implementation and ongoing administration of the Program, which includes assessing the liquidity risk of the AI Powered Equity ETF (the “Fund”) under both normal and reasonably foreseeable stressed conditions.
Under the Program, the Program Administrator assesses, manages and periodically reviews the Fund’s liquidity risk, based on factors specific to the circumstances of the Fund. Liquidity risk is the risk that the Fund could not meet shareholder redemption requests without significant dilution of remaining shareholders’ interests in the Fund. This risk is managed by monitoring the degree of liquidity of the Fund’s investments and limiting the amount of the Fund’s illiquid investments, among other means. The Program Administrator’s process of determining the degree of liquidity of the Fund’s investments is supported by one or more third-party liquidity assessment vendors.
At a meeting of the Board on March 24, 2020, the Adviser provided a written report to the Board addressing the operation, and the adequacy and effectiveness of the implementation, of the Program, including, the operation of any Highly Liquid Investment Minimum, where applicable, and any material changes to the Program, for the initial period from December 1, 2018 through February 29, 2020 (the “Reporting Period”). No significant liquidity events impacting the Fund were noted in the report and it was represented that, as of December 31, 2019, the Fund was primarily highly liquid and, during the Reporting Period, the Fund held less than 15% in illiquid securities. In addition, the Program Administrator provided its assessment that Program implementation was effective and that the Program operated adequately and effectively to enable the Program Administrator to oversee and manage liquidity risk and ensure the Fund is able to meet requests to redeem shares without significant dilution to the remaining investors’ interest in the Fund.
There can be no assurance that the Program will achieve its objectives in the future. Please refer to the Fund’s prospectus for more information regarding the Fund’s exposure to liquidity risk and other principal risks to which an investment in the Fund may be subject.
AI Powered Equity ETF
SUPPLEMENTARY INFORMATION
March 31, 2020 (Unaudited)
NOTE 1 – FREQUENCY DISTRIBUTION OF PREMIUMS AND DISCOUNTS
Information regarding how often shares of each Fund traded on the Exchange at a price above (i.e., at a premium) or below (i.e., at a discount) the NAV is available on the Fund’s website at www.etfmgfunds.com.
NOTE 2 – FEDERAL TAX INFORMATION
Qualified Dividend Income/Dividends Received Dedumattction
For the fiscal year ended September 30, 2019, certain dividends paid by the Fund may be subject to a maximum tax rate of 15%, as provided for by the Jobs and Growth Tax Reconciliation Act of 2003. The percentage of dividends declared from ordinary income designated as qualified dividend income was as follows:
| Fund Name | QDI |
| AI Powered Equity ETF | 15.55% |
For corporate shareholders, the percent of ordinary income distributions qualifying for the corporate dividends received deduction for the fiscal year ended September 30, 2019 was as follows:
| Fund Name | DRD |
| AI Powered Equity ETF | 15.55% |
Short Term Capital Gain
The percentage of taxable ordinary income distributions that are designated as short-term capital gain distributions under Internal Revenue Section 871 (k)(2)(C) for the Fund was as follows:
| Fund Name | Short-Term Capital Gain |
| AI Powered Equity ETF | 92.84% |
NOTE 3 – INFORMATION ABOUT PORTFOLIO HOLDINGS
The Fund files a complete schedule of portfolio holdings with the SEC for its first and third fiscal quarters on Part F of Form N-PORT. Once filed, the Fund’s Part F of Form N-PORT is available without charge, upon request on the SEC’s website (www.sec.gov) and is available by calling (877) 756-7873.
NOTE 4 – INFORMATION ABOUT PROXY VOTING
A description of the policies and procedures the Fund uses to determine how to vote proxies relating to portfolio securities is provided in the Statement of Additional Information (“SAI”). The SAI is available without charge upon request by calling toll-free at 1-844-ETF-MGRS (1-844-383-6477), by accessing the SEC’s website at www.sec.gov, or by accessing the Fund’s website at www.AIEQetf.com.
Information regarding how the Fund voted proxies relating to portfolio securities during the period ending June 30 is available by calling toll-free at 1-844-ETF-MGRS (1-844-383-6477) or by accessing the SEC’s website at www.sec.gov.
Carefully consider the Fund’s investment objectives, risk factors, charges, and expenses before investing. This and additional information can be found in the Fund’s prospectus, which may be obtained by calling 1-844-ETF-MGRS (1-844-383-6477) or by visiting www.AIEQetf.com. Read the prospectus carefully before investing.
AI Powered Equity ETF
Board of Trustees
Set forth below are the names, birth years, positions with the Trust, length of term of office, and the principal occupations and other directorships held during at least the last five years of each of the persons currently serving as a Trustee of the Trust, as well as information about each officer. The business address of each Trustee and officer is 30 Maple Street, 2nd Floor, Summit, New Jersey 07901. The SAI includes additional information about Fund directors and is available, without charge, upon request by calling 1-844-ETF-MGRS (1-844-383-6477).
Name
and Year
of Birth | Position(s) Held with the Trust, Term of Office and Length of Time Served | Principal Occupation(s)
During Past 5 Years | Number of Portfolios in Fund Complex Overseen By Trustee | Other Directorships Held by Trustee During Past 5 Years |
| Interested Trustee and Officers |
Samuel Masucci, III
(1962) | Trustee, Chairman of the Board and President (since 2012); Secretary (since 2014) | Chief Executive Officer, Exchange Traded Managers Group LLC (since 2013); Chief Executive Officer, ETF Managers Group LLC (since 2016); Chief Executive Officer, ETF Managers Capital LLC (commodity pool operator) (since 2014); Chief Executive Officer (2012-2016) and Chief Compliance Officer (2012-2014), Factor Advisors, LLC (investment adviser); President and Chief Executive Officer, Factor Capital Management LLC (2012-2014) (commodity pool operator); | 11 | None |
John A. Flanagan,
(1946) | Treasurer (since 2015) | President, John A. Flanagan CPA, LLC (accounting services) (since 2010); Treasurer, ETF Managers Trust (since 2015); Principal Financial Officer, ETF Managers Capital, LLC (commodity pool operator) (since 2015) | n/a | n/a |
Reshma A. Tanczos
(1978) | Chief Compliance Officer (since 2016) | Chief Compliance Officer, ETF Managers Group LLC (since 2016); Chief Compliance Officer, ETF Managers Capital LLC (since 2016); Partner, Crow & Cushing (law firm) (2007-2016). | n/a | n/a |
| * | Mr. Masucci is an interested Trustee by virtue of his role as the Chief Executive Officer of the Adviser. |
AI Powered Equity ETF
Board of Trustees (Continued)
Name
and Year
of Birth | Position(s) Held with the Trust, Term of Office and Length of Time Served | Principal Occupation(s)
During Past 5 Years | Number of Portfolios in Fund Complex Overseen By Trustee | Other Directorships Held by Trustee During Past 5 Years |
| Independent Trustees |
Terry Loebs
(1963) | Trustee (since 2014) | Founder and Managing Member, Pulsenomics LLC (index product development and consulting firm) (since 2011); Managing Director, MacroMarkets, LLC (exchange-traded products firm) (2006-2011). | 11 | None |
Jared A. Chase
(1955) | Trustee (since 2018) | Chief Operating and Financial Officer, Root Capital (a 501(c)(3) non-profit lender); Chairman, State Street Global Alliance LLC, State Street Corporation (2007-2012); Head of Global Treasury, Liability Management, Money Markets & Derivatives, State Street Corporation (2004-2007) | 11 | None |
Page Intentionally Left Blank
Page Intentionally Left Blank
Page Intentionally Left Blank
Advisor
ETF Managers Group, LLC
30 Maple Street, Suite 2, Summit, NJ 07901
Distributor
ETFMG Financial, Inc.
30 Maple Street, Suite 2, Summit, NJ 07901
Custodian
U.S. Bank National Association
Custody Operations
1555 North River Center Drive, Suite 302, Milwaukee, Wisconsin 53212
Transfer Agent
Foreside Financial Group, LLC
111 E Kilbourn Ave, Suite 1250, Milwaukee, WI 53202
Securities Lending Agent
U.S Bank, National Association
Securities Lending
800 Nicolet Mall
Minneapolis, MN 55402-7020
Independent Registered Public Accounting Firm
WithumSmith + Brown, PC
1411 Broadway, 9th Floor, New York, NY 10018
Legal Counsel
Sullivan & Worcester LLP
1666 K Street NW, Washington, DC 20006