Semi-Annual Report
March 31, 2021
(Unaudited)
ETFMG Prime Cyber Security ETF

ETFMG Prime Junior Silver Miners ETF

ETFMG Prime Mobile Payments ETF

ETFMG Sit Ultra Short ETF

ETFMG Travel Tech ETF

ETFMG Treatments, Testing and Advancements ETF

The Funds are a series of ETF Managers Trust.
ETFMG™ ETFs
TABLE OF CONTENTS |
March 31, 2021 (Unaudited) |
ETFMG™ ETFs
Dear Shareholder,
On behalf of the entire team, we want to express our appreciation for the confidence you have placed in these ETFs. The following information pertains to the fiscal period from October 1, 2020 to March 31, 2021.
Performance Overview
During the 6-month period ended March 31, 2021, the S&P 500 Information Technology Sector Index, a broad measure of US listed technology companies, returned 13.85%. During the same period, the S&P Global 1200 Information Technology Sector Index, a broad measure of global technology companies, returned 16.97%. Below is a performance overview for each Fund for the same 6-month period.
ETFMG Prime Cyber Security ETF (HACK)
The ETFMG Prime Cyber Security ETF (the “Fund”) seeks to provide investment results that, before fees and expenses, correspond generally to the total return performance of the Prime Cyber Defense Index (the “Index”).
Over the period, the total return for the Fund was 17.60%, while the total return for the Index was 18.06%. The best performers in the Fund on the basis of contribution to return were Cloudflare Inc - Class A, Blackberry Ltd, Fireeye Inc, Fortinet Inc, and Commvault Systems Inc, while the worst performers were Sumo Logic Inc, Ping Identity Holding Corp, Splunk Inc, Trend Micro Inc, and Solarwinds Corp.
At the end of the reporting period, the Fund saw an average approximate allocation of 64.0% to Software, 10.1% to Communications Equipment and 8.5% to IT Services. The Fund was exposed predominately to the United States 72.5%, followed by Israel 9.7% and the United Kingdom 6.8%.
ETFMG Prime Junior Silver Miners ETF (SILJ)
The ETFMG Prime Junior Silver ETF (the “Fund”) seeks to provide investment results that, before fees and expenses, correspond generally to the total return performance of the Prime Junior Silver Miners & Explorers Index (the “Index”).
Over the period, the total return for the Fund was 5.43%, while the total return for the Index, which does not incur Fund expenses, was 5.80%. The best performers in the Fund on the basis of contribution to return were First Majestic Silver Corp, Turquoise Hill Resources Ltd, Hecla Mining Co, Capstone Mining Corp, and Hudbay Minerals Inc, while the worst performers in the Fund on the basis of contribution to return were Yamana Gold Inc, Silvercorp Metals Inc, Pan American Silver Corp, Ssr Mining Inc, and Harmony Gold Mng-Spon Adr.
At the end of the reporting period, the Fund saw an average approximate allocation of 98.3% to Metals and Mining and 1.2% to Commercial Services & Supplies. The Fund was exposed predominately to Canada 75.1%, followed by the United States 12.4% and the United Kingdom 4.7%.
ETFMG Prime Mobile Payments ETF (IPAY)
The ETFMG Prime Mobile Payments ETF (the “Fund”) seeks to provide investment results that, before fees and expenses, correspond generally to the total return performance of the Prime Mobile Payments Index (the “Index”).
Over the period, the total return for the Fund was 22.55%, while the total return for the Index was 22.91%. The best performers in the Fund on the basis of contribution to return were Square Inc - A, American Express Co, Discover Financial Services, Paypal Holdings Inc, and Ncr Corporation, while the worst performers were Affirm Holdings Inc, Nexi Spa, Fidelity National Info Serv, Qiwi Plc-Sponsored Adr, and Green Dot Corp-Class A.
At the end of the reporting period, the Fund saw an average approximate allocation of 83.7% to IT Services, 10.9% to Consumer Finance and 1.7% to Software. The Fund was exposed predominately to the United States 70.1%, followed by the Cayman Islands 5.0%, Netherlands 4.9% and Australia 3.6%.
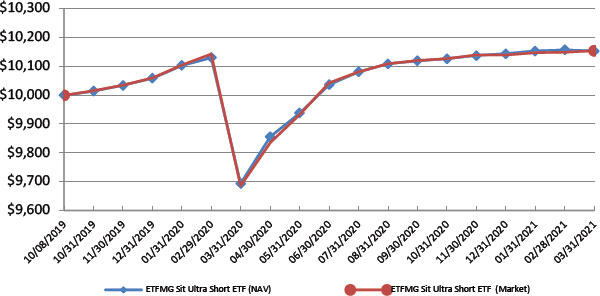
ETFMG Sit Ultra Short ETF (VALT)
The ETFMG Sit Ultra Short ETF (the “Fund”) is an actively managed exchange-traded fund (“ETF”) that seeks maximum current income, consistent with preservation of capital and daily liquidity.
Over the fiscal period, the total return for the Fund was 0.33%, while the total return for its benchmark, the Bloomberg Barclays U.S. Treasury Bills Index: 1-3 month Index, was 0.04%.
The Fund seeks to achieve its investment objective by investing in a diversified portfolio of high-quality, short-term U.S. dollar-denominated domestic and foreign debt securities and other instruments. The Fund uses the Bloomberg Barclays U.S. Treasury Bills Index: 1-3-month Index as its benchmark index. The Fund seeks to maintain an average effective duration within a range of 2 months to 1 year.
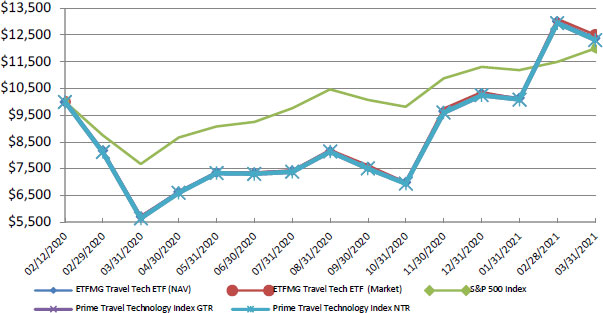
ETFMG Travel Tech ETF (AWAY)
The ETFMG Travel Tech ETF (the “Fund”) seeks to provide investment results that, before fees and expenses, correspond generally to the total return performance of the Prime Travel Technology Index NTR (the “Index”).
Over the fiscal period, the total return for the Fund was 64.05%, while the total return the for the Index was 64.19%. The best performers in the Fund on the basis of contribution to return were Tripadvisor Inc, Trivago Nv, Facedrive Inc, Lyft Inc-A, and Sabre Corp, while the worst performers were Tuniu Corp-Spon, Veltra Corp, Temairazu Inc, Adventure Inc, and Cvc Brasil Operadora.
At the end of the reporting period, the Fund saw an average approximate allocation of 46.4% to Internet & Direct Marketing Retail, 18.4% to Hotels, Restaurants & Leisure, and 11.9% to Road & Rail. The Fund was exposed predominately to the United States 31.2%, followed by the United Kingdom 12.8%, the Cayman Islands 11.1% and the Japan 8.0%.
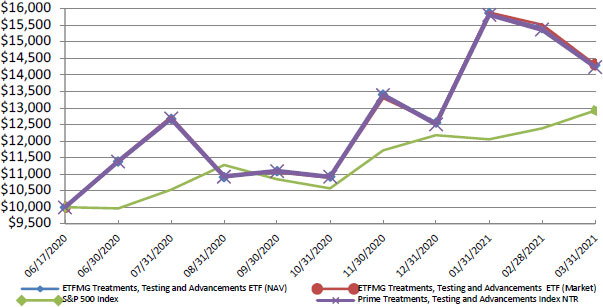
ETFMG Treatments, Testing and Advancements ETF (GERM)
The ETFMG Treatments, Testing and Advancements ETF (the “Fund”) seeks to provide investment results that, before fees and expenses, correspond generally to the total return performance of the Prime Treatments, Testing and Advancements Index (the “Index”).
Over the fiscal period, the total return for the Fund was 28.90%, while the total return the for the Index was 28.30%. The best performers in the Fund on the basis of contribution to return were Moderna Inc, Biontech Se-Adr, Curevac Nv, Zai Lab Ltd-Adr, and Novavax Inc, while the worst performers were Quidel Corp, Vaxcyte Inc, Adaptive Biotechnologies, Assembly Biosciences Inc, and Emergent Biosolutions Inc.
At the end of the reporting period, the Fund saw an average approximate allocation of 57.5% to Biotechnology, 14.0% to Life Sciences Tools & Services and 10.5% to Health Care Providers & Services. The Fund was exposed predominately to the United States 71.0%, followed by Germany 6.5% and Canada 5.9%.
You can find further details about HACK, SILJ, IPAY, VALT, AWAY and GERM by visiting www.etfmg.com, or by calling 1-844-383-6477.
Sincerely,

Samuel Masucci III
Chairman of the Board
ETFMG Prime Junior Silver Miners ETF
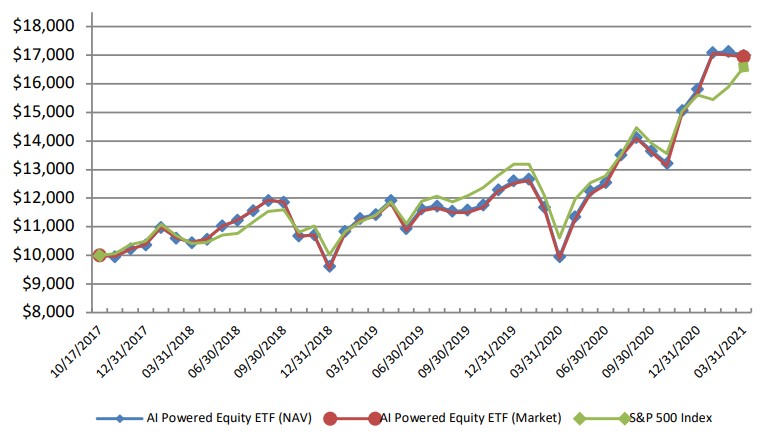
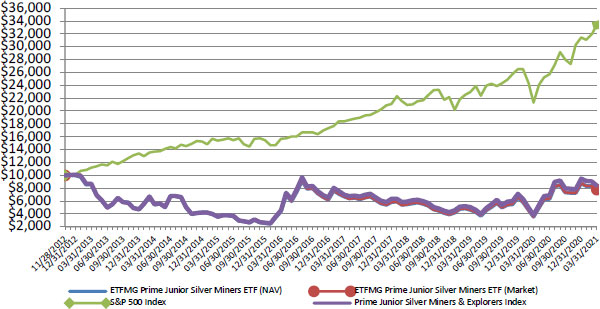
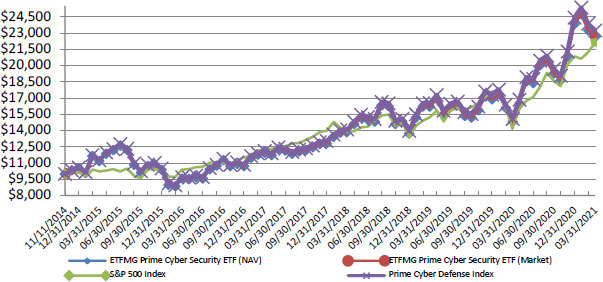
Growth of $10,000 (Unaudited)
Average Annual Returns | 1 Year | 5 Year | Since Inception | Value of $10,000 |
Period Ended March 31, 2021 | Return | Return | (11/28/12) | (3/31/21) |
ETFMG Prime Junior Silver Miners ETF (NAV) | 115.80% | 11.86% | -3.04% | $7,733 |
ETFMG Prime Junior Silver Miners ETF (Market) | 119.88% | 11.74% | -2.98% | $7,770 |
S&P 500 Index | 56.35% | 16.29% | 15.54% | $33,348 |
Prime Junior Silver Miners & Explorers Index | 118.34% | 12.94% | -2.04% | $8,418 |
Performance data quoted represents past performance and does not guarantee future results. The investment return and principal value of an investment will fluctuate so that an investor’s shares, when redeemed, may be worth more or less than their original cost. Current performance of the Fund may be lower or higher than the performance quoted. All performance is historical and includes reinvestment of dividends and capital gains. Performance data current to the most recent month end may be obtained by calling 1-844-ETF-MGRS (1-844-383-6477).
The chart illustrates the performance of a hypothetical $10,000 investment made on November 28, 2012, and is not intended to imply any future performance. The returns shown do not reflect the deduction of taxes that a shareholder would pay on fund distributions from the sale of Fund shares. The chart assumes reinvestment of capital gains and dividends, if any. The index returns do not reflect fees or expenses and are not available for direct investment.
ETFMG Prime Junior Silver Miners ETF
Top Ten Holdings as of March 31, 2021* (Unaudited)
Security | | % of Total Investments |
1 Pan American Silver Corp. | | 12.62% |
2 First Majestic Silver Corp. | | 10.67% |
3 Hecla Mining Co. | | 8.96% |
4 MAG Silver Corp.** | | 6.21% |
5 Hochschild Mining PLC | | 4.68% |
6 Yamana Gold, Inc. | | 4.58% |
7 Turquoise Hill Resources, Ltd. | | 3.80% |
8 SilverCrest Metals, Inc. | | 3.69% |
9 SSR Mining, Inc. | | 3.68% |
10 Harmony Gold Mining Co., Ltd. | | 3.07% |
Top Ten Holdings = 61.96% of Total Investments
* Current Fund holdings may not be indicative of future Fund holdings.
** Affiliated security. Please refer to Note 9 of the Notes to Financial Statements.
ETFMG Prime Cyber Security ETF
Growth of $10,000 (Unaudited)
Average Annual Returns
Period Ended March 31, 2021 | 1 Year
Return | 5 Year
Return | Since
Inception
(11/11/14) | Value of
$10,000
(3/31/21) |
ETFMG Prime Cyber Security ETF (NAV) | 52.78% | 18.75% | 13.66% | $22,647 |
ETFMG Prime Cyber Security ETF (Market) | 54.09% | 18.85% | 13.73% | $22,732 |
S&P 500 Index | 56.35% | 16.29% | 13.25% | $22,130 |
Prime Cyber Defense Index | 54.11% | 19.09% | 14.12% | $23,235 |
Performance data quoted represents past performance and does not guarantee future results. The investment return and principal value of an investment will fluctuate so that an investor’s shares, when redeemed, may be worth more or less than their original cost. Current performance of the Fund may be lower or higher than the performance quoted. All performance is historical and includes reinvestment of dividends and capital gains. Performance data current to the most recent month end may be obtained by calling 1-844-ETF-MGRS (1-844-383-6477).
The chart illustrates the performance of a hypothetical $10,000 investment made on November 11, 2014, and is not intended to imply any future performance. The returns shown do not reflect the deduction of taxes that a shareholder would pay on fund distributions from the sales of Fund shares. The chart assumes reinvestment of capital gains and dividends, if any. The Index Returns do not reflect fees or expenses and are not available for direct investment.
ETFMG Prime Cyber Security ETF |
Top Ten Holdings as of March 31, 2021* (Unaudited)
| | Security | % of Total Investments |
1 | | Cisco Systems, Inc. | 3.81% |
2 | | Fortinet, Inc. | 2.70% |
3 | | Akamai Technologies, Inc. | 2.60% |
4 | | CloudFlare, Inc. - Class A | 2.59% |
5 | | Qualys, Inc. | 2.59% |
6 | | CACI International, Inc. - Class A | 2.58% |
7 | | Parsons Corp. | 2.52% |
8 | | Proofpoint, Inc. | 2.51% |
9 | | ETFMG Sit Ultra Short ETF** | 2.48% |
10 | | Juniper Networks, Inc. | 2.47% |
Top Ten Holdings = 26.85% of Total Investments
* | Current Fund holdings may not be indicative of future Fund holdings. |
** | Affiliated security. Please refer to Note 9 of the Notes to Financial Statements. |
ETFMG Prime Mobile Payments ETF
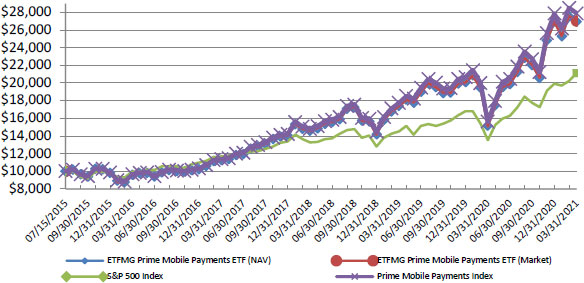
Growth of $10,000 (Unaudited)
Average Annual Returns
Period Ended March 31, 2021 | 1 Year
Return | 5 Year
Return | Since
Inception
(7/15/15) | Value of
$10,000
(3/31/21) |
ETFMG Prime Mobile Payments ETF (NAV) | 77.79% | 22.96% | 18.96% | $26,955 |
ETFMG Prime Mobile Payments ETF (Market) | 79.21% | 23.01% | 19.03% | $27,046 |
S&P 500 Index | 56.35% | 16.29% | 13.98% | $21,122 |
Prime Mobile Payments Index | 78.73% | 23.67% | 19.68% | $27,902 |
Performance data quoted represents past performance and does not guarantee future results. The investment return and principal value of an investment will fluctuate so that an investor’s shares, when redeemed, may be worth more or less than their original cost. Current performance of the Fund may be lower or higher than the performance quoted. All performance is historical and includes reinvestment of dividends and capital gains. Performance data current to the most recent month end may be obtained by calling 1-844-ETF-MGRS (1-844-383-6477).
The chart illustrates the performance of a hypothetical $10,000 investment made on July 15, 2015, and is not intended to imply any future performance. The returns shown do not reflect the deduction of taxes that a shareholder would pay on fund distributions from the sales of Fund shares. The chart assumes reinvestment of capital gains and dividends, if any. The Index Returns do not reflect fees or expenses and are not available for direct investment.
ETFMG Prime Mobile Payments ETF
Top Ten Holdings as of March 31, 2021* (Unaudited)
| | Security | % of Total Investments |
1 | | Square, Inc. - Class A | 6.23% |
2 | | MasterCard, Inc. - Class A | 6.10% |
3 | | PayPal Holdings, Inc. | 6.09% |
4 | | Fidelity National Information Services, Inc. | 6.03% |
5 | | Visa, Inc. - Class A | 6.00% |
6 | | American Express Co. | 5.94% |
7 | | Fiserv, Inc. | 5.62% |
8 | | Adyen NV | 4.93% |
9 | | Global Payments, Inc. | 4.54% |
10 | | Discover Financial Services | 2.84% |
Top Ten Holdings = 54.32% of Total Investments
* | Current Fund holdings may not be indicative of future Fund holdings. |
ETFMG Sit Ultra Short ETF
Growth of $10,000 (Unaudited)
Average Annual Returns
Period Ended March 31, 2021 | 1 Year
Return | Since Inception
(10/8/2019) | Value of $10,000
(3/31/2021) |
ETFMG Sit Ultra Short ETF (NAV) | 4.75% | 1.03% | $10,153 |
ETFMG Sit Ultra Short ETF (Market) | 4.85% | 1.04% | $10,154 |
Performance data quoted represents past performance and does not guarantee future results. The investment return and principal value of an investment will fluctuate so that an investor’s shares, when redeemed, may be worth more or less than their original cost. Current performance of the Fund may be lower or higher than the performance quoted. All performance is historical and includes reinvestment of dividends and capital gains. Performance data current to the most recent month end may be obtained by calling 1-844-ETF-MGRS (1-844-383-6477).
The chart illustrates the performance of a hypothetical $10,000 investment made on October 8, 2019, and is not intended to imply any future performance. The returns shown do not reflect the deduction of taxes that a shareholder would pay on fund distributions from the sales of Fund shares. The chart assumes reinvestment of capital gains and dividends, if any. The Index Returns do not reflect fees or expenses and are not available for direct investment.
ETFMG Sit Ultra Short ETF |
Top Ten Holdings as of March 31, 2021* (Unaudited)
| | Security | % of Total Investments |
1 | | Florida Power & Light Co. | 2.47% |
2 | | Hewlett Packard Enterprise Co. | 2.38% |
3 | | Commonwealth Bank of Australia | 2.29% |
4 | | Verizon Communications, Inc. | 2.24% |
5 | | Daimler Finance North America LLC | 2.18% |
6 | | Equifax, Inc. | 2.16% |
7 | | Otis Worldwide Corp. | 2.14% |
8 | | Capital One Financial Corp. | 2.06% |
9 | | Honeywell International, Inc. | 2.03% |
10 | | AstraZeneca PLC | 1.98% |
Top Ten Holdings = 21.93% of Total Investments
* | Current Fund holdings may not be indicative of future Fund holdings. |
ETFMG Travel Tech ETF
Growth of $10,000 (Unaudited)
Average Annual Returns
Period Ended March 31, 2021 | 1 Year
Return | | Since Inception
(2/12/2020) | | Value of $10,000
(3/31/2021) |
ETFMG Travel Tech ETF (NAV) | 116.96% | | 20.81% | | $12,386 |
ETFMG Travel Tech ETF (Market) | 118.69% | | 21.88% | | $12,509 |
S&P 500 Index | 56.35% | | 17.45% | | $11,996 |
Prime Travel Technology Index GTR | 118.31% | | 20.21% | | $12,315 |
Prime Travel Technology Index NTR | 118.29% | | 20.17% | | $12,311 |
Performance data quoted represents past performance and does not guarantee future results. The investment return and principal value of an investment will fluctuate so that an investor’s shares, when redeemed, may be worth more or less than their original cost. Current performance of the Fund may be lower or higher than the performance quoted. All performance is historical and includes reinvestment of dividends and capital gains. Performance data current to the most recent month end may be obtained by calling 1-844-ETF-MGRS (1-844-383-6477).
The chart illustrates the performance of a hypothetical $10,000 investment made on February 12, 2020, and is not intended to imply any future performance. The returns shown do not reflect the deduction of taxes that a shareholder would pay on fund distributions from the sales of Fund shares. The chart assumes reinvestment of capital gains and dividends, if any. The Index Returns do not reflect fees or expenses and are not available for direct investment.
ETFMG Travel Tech ETF
Top Ten Holdings as of March 31, 2021* (Unaudited)
| Security | % of Total Investments |
1 | Expedia Group, Inc. | 4.88% |
2 | Booking Holdings, Inc. | 4.72% |
3 | Airbnb, Inc. | 4.69% |
4 | Trivago NV** | 4.62% |
5 | Uber Technologies, Inc. | 4.62% |
6 | Despegar.com Corp. | 4.25% |
7 | TripAdvisor, Inc. | 4.16% |
8 | Tongcheng-Elong Holdings, Ltd. | 4.16% |
9 | Lyft, Inc. | 4.08% |
10 | Trip.com Group, Ltd. | 4.05% |
Top Ten Holdings = 44.23% of Total Investments
* Current Fund holdings may not be indicative of future Fund holdings.
** Affiliated security. Please refer to Note 9 of the Notes to Financial Statements.
ETFMG Treatments, Testing and Advancements ETF
Growth of $10,000 (Unaudited)
Average Cumulative Returns | Since Inception | | Value of $10,000 |
Period Ended March 31, 2021 | (6/17/2020) | | (3/31/2021) |
ETFMG Treatments, Testing and Advancements ETF (NAV) | 42.85% | | $14,285 |
ETFMG Treatments, Testing and Advancements ETF (Market) | 43.14% | | $14,314 |
S&P 500 Index | 29.22% | | $12,922 |
Prime Treatments, Testing and Advancements Index NTR | 42.26% | | $14,235 |
Performance data quoted represents past performance and does not guarantee future results. The investment return and principal value of an investment will fluctuate so that an investor’s shares, when redeemed, may be worth more or less than their original cost. Current performance of the Fund may be lower or higher than the performance quoted. All performance is historical and includes reinvestment of dividends and capital gains. Performance data current to the most recent month end may be obtained by calling 1-844-ETF-MGRS (1-844-383-6477).
The chart illustrates the performance of a hypothetical $10,000 investment made on June 17, 2020, and is not intended to imply any future performance. The returns shown do not reflect the deduction of taxes that a shareholder would pay on fund distributions from the sales of Fund shares. The chart assumes reinvestment of capital gains and dividends, if any. The Index Returns do not reflect fees or expenses and are not available for direct investment.
ETFMG Treatments, Testing and Advancements ETF
Top Ten Holdings as of March 31, 2021* (Unaudited)
| Security | % of Total Investments |
1 | BioNTech SE | 6.61% |
2 | Laboratory Corp. of America Holdings | 6.24% |
3 | Alnylam Pharmaceuticals, Inc. | 5.92% |
4 | Bio-Rad Laboratories, Inc. - Class A | 5.85% |
5 | Moderna, Inc. | 5.70% |
6 | Novavax, Inc. | 4.39% |
7 | AbCellera Biologics, Inc. | 4.35% |
8 | CureVac NV | 4.32% |
9 | Quest Diagnostics, Inc. | 4.19% |
10 | Zai Lab, Ltd. | 3.84% |
Top Ten Holdings = 51.41% of Total Investments
* Current Fund holdings may not be indicative of future Fund holdings.
ETFMG™ ETFs
Important Disclosures and Key Risk Factors
Past performance is not indicative of future return. A fund’s performance for very short time periods may not be indicative of future performance.
SILJ
The ETFMG Prime Junior Silver Miners ETF (the “Fund” or the “Junior Silver ETF”) seeks to provide investment results that, before fees and expenses, correspond generally to the price and yield performance of the Prime Junior Silver Miners & Explorers Index (the “Index”).
Investing involves risk, including the possible loss of principal. Shares of any ETF are bought and sold at market price (not NAV), may trade at a discount or premium to NAV and are not individually redeemed from the Fund. Brokerage commissions will reduce returns. Narrowly focused investments typically exhibit higher volatility. Investments in foreign securities involve political, economic and currency risks, greater volatility and differences in accounting methods. These risks are greater for investments in emerging markets. The Fund is non-diversified, meaning it may concentrate its assets in fewer individual holdings than a diversified fund. Therefore, the Fund is more exposed to individual issuer volatility than a diversified fund. Funds that are less diversified across countries or geographic regions are generally riskier than more geographically diversified funds and risks associated with such countries or geographic regions may negatively affect a Fund. Investments in small capitalization companies tend to have limited liquidity and greater price volatility than large-capitalization companies. The ETFMG Prime Junior Silver Miners ETF is subject to risks associated with the worldwide price of silver and the costs of extraction and production. Worldwide silver prices may fluctuate substantially over short periods of time, so the Fund’s share price may be more volatile. Several foreign countries have begun a process of privatizing certain entities and industries. Privatized entities may lose money or be renationalized. The Fund invests in some economies that are heavily dependent upon trading with key partners. Any reduction in this trading may cause an adverse impact on the economy in which the Fund invests. The Fund’s return may not match or achieve a high degree of correlation with the return of the Prime Junior Silver Miners & Explorers Index. To the extent the Fund utilizes a sampling approach, it may experience tracking error to a greater extent than if the Fund had sought to replicate the Prime Junior Silver Miners & Explorers Index. IOPV or indicative optimized portfolio value is an estimated intraday fair value of one share of an ETF determined by the last trade price of the fund’s underlying securities.
Unlike with an actively managed fund, the Fund’s adviser does not use techniques or defensive strategies designed to lessen the effects of market volatility or to reduce the impact of periods of market decline. This means that, based on market and economic conditions, the Fund’s performance could be lower than other types of funds that may actively shift their portfolio assets to take advantage of market opportunities or to lessen the impact of a market decline.
Natural or environmental disasters, such as earthquakes, fires, floods, hurricanes, tsunamis and other severe weather-related phenomena generally, and widespread disease, including pandemics and epidemics, have been and may be highly disruptive to economies and markets, adversely impacting individual companies, sectors, industries, markets, currencies, interest and inflation rates, credit ratings, investor sentiment, and other factors affecting the value of the Fund’s investments. Given the increasing interdependence among global economies and markets, conditions in one country, market, or region are increasingly likely to adversely affect markets, issuers, and/or foreign exchange rates in other countries, including the U.S. Any such events could have a significant adverse impact on the value of the Fund’s investments.
ETF Managers Group LLC is the investment adviser to the Fund.
The Fund is distributed by ETFMG Financial LLC, ETF Managers Group LLC and ETFMG Financial LLC are wholly owned subsidiaries of Exchange Traded Managers Group LLC (collectively, “ETFMG”). ETFMG is not affiliated with Prime Indexes.
ETFMG™ ETFs
HACK
The ETFMG Prime Cyber Security ETF (the “Fund”) seeks to provide investment results that, before fees and expenses, correspond generally to the price and yield performance of the Prime Cyber Defense Index (the “Index”).
Investing involves risk, including the possible loss of principal. Shares of any ETF are bought and sold at market price (not NAV), may trade at a discount or premium to NAV and are not individually redeemed from the Fund. Brokerage commissions will reduce returns. Narrowly focused investments typically exhibit higher volatility. The fund is concentrated in technology-related companies that face intense competition, both domestically and internationally, which may have an adverse effect on profit margins. Such companies may have limited product lines, markets, financial resources or personnel. The products of such companies may face obsolescence due to rapid technological developments, frequent new product introduction, unpredictable changes in growth rates, competition for the services of qualified personnel, and competition from foreign competitors with lower production costs. Technology companies are heavily dependent on patent and intellectual property rights. The loss or impairment of these rights may adversely affect the profitability of these companies. Investments in foreign securities involve political, economic and currency risks, greater volatility and differences in accounting methods. Investments in smaller companies tend to have limited liquidity and greater price volatility than large-capitalization companies. Diversification does not assure a profit or protect against a loss in a declining market. The Fund’s return may not match or achieve a high degree of correlation with the return of the Prime Cyber Defense Index. To the extent the Fund utilizes a sampling approach, it may experience tracking error to a greater extent than if the Fund had sought to replicate the Prime Cyber Defense Index.
Unlike with an actively managed fund, the Fund’s adviser does not use techniques or defensive strategies designed to lessen the effects of market volatility or to reduce the impact of periods of market decline. This means that, based on market and economic conditions, the Fund’s performance could be lower than other types of funds that may actively shift their portfolio assets to take advantage of market opportunities or to lessen the impact of a market decline.
Natural or environmental disasters, such as earthquakes, fires, floods, hurricanes, tsunamis and other severe weather-related phenomena generally, and widespread disease, including pandemics and epidemics, have been and may be highly disruptive to economies and markets, adversely impacting individual companies, sectors, industries, markets, currencies, interest and inflation rates, credit ratings, investor sentiment, and other factors affecting the value of the Fund’s investments. Given the increasing interdependence among global economies and markets, conditions in one country, market, or region are increasingly likely to adversely affect markets, issuers, and/or foreign exchange rates in other countries, including the U.S. Any such events could have a significant adverse impact on the value of the Fund’s investments.
ETF Managers Group LLC is the investment adviser to the Fund.
The Fund is distributed by ETFMG Financial LLC, ETF Managers Group LLC and ETFMG Financial LLC are wholly owned subsidiaries of Exchange Traded Managers Group LLC (collectively, “ETFMG”). ETFMG is not affiliated with Prime Indexes.
IPAY
The ETFMG Prime Mobile Payments ETF (the “Fund” or the “Mobile Payments ETF”) seeks to provide investment results that, before fees and expenses, correspond generally to the price and yield performance of the Prime Mobile Payments Index (the “Index”).
ETFMG™ ETFs
Investing involves risk, including the possible loss of principal. Shares of any ETF are bought and sold at market price (not NAV), may trade at a discount or premium to NAV and are not individually redeemed from the Fund. Brokerage commissions will reduce returns. Narrowly focused investments typically exhibit higher volatility. Mobile Payment Companies face intense competition, both domestically and internationally, and are subject to increasing regulatory constraints, particularly with respect to fees, competition and anti-trust matters, cybersecurity and privacy. Mobile Payment Companies may be highly dependent on their ability to enter into agreements with merchants and other third parties to utilize a particular payment method, system, software or service, and such agreements may be subject to increased regulatory scrutiny. Additionally, certain Mobile Payment Companies have recently faced increased costs related to class-action litigation challenging such agreements. Such factors may adversely affect the profitability and value of such companies. The Fund is non-diversified, meaning it may concentrate its assets in fewer individual holdings than a diversified fund. Investments in smaller companies tend to have limited liquidity and greater price volatility than large-capitalization companies. The Fund’s return may not match or achieve a high degree of correlation with the return of the Prime Mobile Payments Index. To the extent the Fund utilizes a sampling approach, it may experience tracking error to a greater extent than if the Fund had sought to replicate the Index. Diversification does not guarantee a profit, nor does it protect against a loss in a declining market.
Unlike with an actively managed fund, the Fund’s adviser does not use techniques or defensive strategies designed to lessen the effects of market volatility or to reduce the impact of periods of market decline. This means that, based on market and economic conditions, the Fund’s performance could be lower than other types of funds that may actively shift their portfolio assets to take advantage of market opportunities or to lessen the impact of a market decline.
Natural or environmental disasters, such as earthquakes, fires, floods, hurricanes, tsunamis and other severe weather-related phenomena generally, and widespread disease, including pandemics and epidemics, have been and may be highly disruptive to economies and markets, adversely impacting individual companies, sectors, industries, markets, currencies, interest and inflation rates, credit ratings, investor sentiment, and other factors affecting the value of the Fund’s investments. Given the increasing interdependence among global economies and markets, conditions in one country, market, or region are increasingly likely to adversely affect markets, issuers, and/or foreign exchange rates in other countries, including the U.S. Any such events could have a significant adverse impact on the value of the Fund’s investments.
ETF Managers Group LLC is the investment adviser to the Fund.
The Fund is distributed by ETFMG Financial LLC, ETF Managers Group LLC and ETFMG Financial LLC are wholly owned subsidiaries of Exchange Traded Managers Group LLC (collectively, “ETFMG”). ETFMG is not affiliated with Prime Indexes.
VALT
The ETFMG Sit Ultra Short ETF (the “Fund” or the “Ultra Short ETF”) seeks maximum current income, consistent with preservation of capital and daily liquidity.
Investing involves risk. Shares of any ETF are bought and sold at market price (not NAV), may trade at a discount or premium to NAV and are not individually redeemed from the Fund. Brokerage commissions will reduce returns. Although the Fund’s shares are approved for listing on the Exchange, there can be no assurance that an active trading market will be maintained for Fund shares.
The market price of the Fund’s fixed-income instruments may change, sometimes rapidly or unpredictably, in response to changes in interest rates, factors affecting securities markets generally, and other factors. Generally, when interest rates rise, the values of fixed-income instruments fall, and vice versa. The Fund may invest in floating rate securities, which are generally less sensitive to interest rate changes than securities with fixed interest rates but may decline in value if their interest rates do not rise as much, or as quickly, as comparable market interest rates. The Fund may invest in U.S. dollar-denominated debt obligations of foreign issuers. Mortgage- and asset-backed securities are subject to interest rate risk. Modest movements in interest rates (both increases and decreases) may quickly and significantly reduce the value of certain types of these securities. From time to time the Fund may invest a substantial amount of its assets in taxable or tax-exempt municipal securities whose interest is paid solely from revenues of similar projects.
ETFMG™ ETFs
The Fund is recently organized with a limited operating history. The Fund may not meet its investment objective based on the success or failure to implement investment strategies for the Fund.
The Fund’s investment strategy may require it to redeem shares for cash or to otherwise include cash as part of its redemption proceeds. In the event of large shareholder redemptions, the Fund may have to sell portfolio securities at times when it would not otherwise do so, which may negatively impact the Fund’s performance.
ETF Managers Group LLC is the investment advisor to the Fund. Sit Fixed Income Advisors II LLC (“Sit Advisors”) is the sub-advisor to the Fund. Sit Advisors is a subsidiary of Sit Investment Associates Inc. (“Sit”). Sit is a full product global asset manager offering management expertise in domestic equities, international equities and fixed income instruments.
ETFMG Financial LLC is the distributor of the Fund. ETF Managers Group LLC and ETFMG Financial LLC are wholly owned subsidiaries of Exchange Traded Managers Group LLC (collectively, “ETFMG”). ETFMG is not affiliated with Sit.
AWAY
The ETFMG Travel Tech ETF (the “Fund” or the “Travel Tech ETF”) seeks investment results that correspond generally to the price and yield, before fund fees and expenses, of the Prime Travel Technology Index (the “Index”).
Investing involves risk, including loss of principal. Shares of any ETF are bought and sold at market price (not NAV), may trade at a discount or premium to NAV and are not individually redeemed from the Fund. Brokerage commissions will reduce returns. Narrowly focused investments typically exhibit higher volatility. Companies in the technology field, including companies in the computers, telecommunications and electronics industries, face intense competition, which may have an adverse effect on profit margins. Technology companies may have limited product lines, markets, financial resources or personnel. The products of technology companies may face obsolescence due to rapid technological developments and frequent new product introduction, and such companies may face unpredictable changes in growth rates, competition for the services of qualified personnel and competition from foreign competitors with lower production costs. Companies in the technology sector are heavily dependent on patent and intellectual property rights. The loss or impairment of these rights may adversely affect the profitability of these companies.
Unlike with an actively managed fund, the Fund’s adviser does not use techniques or defensive strategies designed to lessen the effects of market volatility or to reduce the impact of periods of market decline. This means that, based on market and economic conditions, the Fund’s performance could be lower than other types of funds that may actively shift their portfolio assets to take advantage of market opportunities or to lessen the impact of a market decline.
Natural or environmental disasters, such as earthquakes, fires, floods, hurricanes, tsunamis and other severe weather-related phenomena generally, and widespread disease, including pandemics and epidemics, have been and may be highly disruptive to economies and markets, adversely impacting individual companies, sectors, industries, markets, currencies, interest and inflation rates, credit ratings, investor sentiment, and other factors affecting the value of the Fund’s investments. Given the increasing interdependence among global economies and markets, conditions in one country, market, or region are increasingly likely to adversely affect markets, issuers, and/or foreign exchange rates in other countries, including the U.S. Any such events could have a significant adverse impact on the value of the Fund’s investments.
ETFMG™ ETFs
The Fund is a recently organized, diversified management investment company with limited operating history.
ETF Managers Group LLC is the investment advisor to the Fund.
The Fund is distributed by ETFMG Financial LLC, ETF Managers Group LLC and ETFMG Financial LLC are wholly owned subsidiaries of Exchange Traded Managers Group LLC (collectively, “ETFMG”). ETFMG is not affiliated with Prime Indexes.
GERM
The ETFMG Treatments, Testing and Advancements ETF (the “Fund”) seeks to provide investment results that, before fees and expenses, correspond generally to the total return performance of the Prime Treatments, Testing and Advancements Index (the “Index”).
Investing involves risk, including loss of principal. Shares of any ETF are bought and sold at market price (not NAV), may trade at a discount or premium to NAV and are not individually redeemed from the Fund. Brokerage commissions will reduce returns. Narrowly focused investments typically exhibit higher volatility. Treatment Companies and Testing Companies are involved in discovering, developing and commercializing novel drugs or tests with significant market potential. These companies face challenges including pre-clinical testing and clinical trial stages of development. Clinical trials may be delayed and certain programs may never advance in the clinic or may be more costly to conduct than anticipated. Such companies may be dependent on their ability to secure significant funding for research, development, and commercialization of therapeutics, vaccines, tests, and other health care products or services. If there are delays in obtaining required regulatory and marketing approvals for products, the ability of such companies to generate revenue may be materially impaired. If regulatory approval is obtained, products will still remain subject to regulatory scrutiny with regulatory authorities having the ability to impose significant restrictions on the indicated uses or marketing. Lastly, even if a licensed product is achieved, such companies may encounter difficulties in manufacturing, product release, shelf life, testing, storage, supply chain management, or shipping. The Fund is a recently organized, non-diversified management investment company with limited operating history.
Natural or environmental disasters, such as earthquakes, fires, floods, hurricanes, tsunamis and other severe weather-related phenomena generally, and widespread disease, including pandemics and epidemics, have been and may be highly disruptive to economies and markets, adversely impacting individual companies, sectors, industries, markets, currencies, interest and inflation rates, credit ratings, investor sentiment, and other factors affecting the value of the Fund’s investments. Given the increasing interdependence among global economies and markets, conditions in one country, market, or region are increasingly likely to adversely affect markets, issuers, and/or foreign exchange rates in other countries, including the U.S. Any such events could have a significant adverse impact on the value of the Fund’s investments.
Additionally, natural or environmental disasters, widespread disease or other public health issues, war, acts of terrorism or other events could result in increased premiums or discounts to the Fund’s NAV.
ETF Managers Group LLC is the investment adviser to the Fund.
The Fund is distributed by ETFMG Financial LLC, ETF Managers Group LLC and ETFMG Financial LLC are wholly owned subsidiaries of Exchange Traded Managers Group LLC (collectively, “ETFMG”). ETFMG is not affiliated with Prime Indexes.
ETFMG™ ETFs
PORTFOLIO ALLOCATIONS
As of March 31, 2021 (Unaudited)
| | ETFMG Prime Junior Silver Miners ETF | | | ETFMG Prime Cyber Security ETF | | | ETFMG Prime Mobile Payments ETF | | | ETFMG Sit Ultra Short ETF | | | ETFMG Travel Tech ETF | | | ETFMG
Treatments,
Testing and Advancements
ETF | |
As a percent of Net Assets: Australia | | | — | % | | | — | % | | | 3.6 | % | | | — | % | | | 3.9 | % | | | — | % |
Bermuda | | | — | | | | — | | | | 1.5 | | | | — | | | | — | | | | — | |
Brazil | | | — | | | | — | | | | 1.5 | | | | — | | | | 3.1 | | | | — | |
Canada | | | 75.1 | | | | 3.3 | | | | 2.0 | | | | — | | | | 3.2 | | | | 5.9 | |
Cayman Islands | | | — | | | | — | | | | 5.0 | | | | — | | | | 11.1 | | | | 5.7 | |
China | | | — | | | | — | | | | — | | | | — | | | | 3.8 | | | | — | |
Cyprus | | | — | | | | — | | | | 0.4 | | | | — | | | | — | | | | — | |
Denmark | | | — | | | | — | | | | — | | | | — | | | | — | | | | 0.1 | |
Finland | | | — | | | | 0.2 | | | | — | | | | — | | | | — | | | | — | |
France | | | — | | | | — | | | | 2.5 | | | | — | | | | — | | | | 0.6 | |
Germany | | | — | | | | — | | | | — | | | | — | | | | — | | | | 6.5 | |
Israel | | | — | | | | 9.7 | | | | — | | | | — | | | | — | | | | — | |
Italy | | | — | | | | — | | | | 1.8 | | | | — | | | | — | | | | — | |
Japan | | | — | | | | 3.8 | | | | 3.0 | | | | — | | | | 8.0 | | | | 0.7 | |
Jersey | | | — | | | | 1.2 | | | | — | | | | — | | | | — | | | | — | |
Luxembourg | | | 1.6 | | | | — | | | | — | | | | — | | | | 2.9 | | | | — | |
Mauritius | | | — | | | | — | | | | — | | | | — | | | | 3.9 | | | | — | |
Netherlands | | | — | | | | — | | | | 4.9 | | | | — | | | | 4.6 | | | | 4.4 | |
Peru | | | 2.6 | | | | — | | | | — | | | | — | | | | — | | | | — | |
Puerto Rico | | | — | | | | — | | | | 1.4 | | | | — | | | | — | | | | — | |
Republic of Korea | | | — | | | | 0.8 | | | | — | | | | — | | | | 7.3 | | | | — | |
South Africa | | | 3.1 | | | | — | | | | — | | | | — | | | | — | | | | — | |
Spain | | | — | | | | — | | | | — | | | | — | | | | 3.8 | | | | — | |
Sweden | | | — | | | | 1.1 | | | | — | | | | — | | | | — | | | | — | |
United Kingdom | | | 4.7 | | | | 6.8 | | | | 1.8 | | | | — | | | | 12.8 | | | | 4.7 | |
United States | | | 12.4 | | | | 72.5 | | | | 70.1 | | | | — | | | | 31.2 | | | | 71.0 | |
Asset Backed Securities | | | — | | | | — | | | | — | | | | 0.6 | | | | — | | | | — | |
Coporate Obligations | | | — | | | | — | | | | — | | | | 97.4 | | | | — | | | | — | |
Municipal Debt Obligations | | | — | | | | — | | | | — | | | | 0.9 | | | | — | | | | — | |
Short-Term and other Net Assets
(Liabilities) | | | 0.5 | | | | 0.6 | | | | 0.5 | | | | 1.1 | | | | 0.4 | | | | 0.4 | |
| | | 100.0 | % | | | 100.0 | % | | | 100.0 | % | | | 100.0 | % | | | 100.0 | % | | | 100.0 | % |
ETFMG™ ETFs
ETFMG Prime Junior Silver Miners ETF
Schedule of Investments
March 31, 2021 (Unaudited)
| | Shares | | | Value | |
COMMON STOCKS - 99.5% Canada - 75.1% Commercial Services & Supplies - 1.2% Alexco Resource Corp. (a) | | | 3,603,264 | | | $ | 9,044,193 | |
Metals & Mining - 73.9% (c) Americas Gold & Silver Corp. (a) | | | 3,367,073 | | | | 7,635,998 | |
Aya Gold & Silver, Inc. (a) | | | 2,475,432 | | | | 9,711,053 | |
Bear Creek Mining Corp. (a) | | | 2,949,712 | | | | 5,093,400 | |
Canada Silver Cobalt Works, Inc. (a) | | | 1,057,376 | | | | 349,177 | |
Capstone Mining Corp. (a) | | | 3,575,534 | | | | 11,779,033 | |
Discovery Metals Corp. (a) | | | 8,431,314 | | | | 14,759,999 | |
Dundee Precious Metals, Inc. | | | 1,586,317 | | | | 9,681,747 | |
Eldorado Gold Corp. (a) | | | 1,528,548 | | | | 16,517,611 | |
Endeavour Silver Corp. (a) | | | 4,135,941 | | | | 20,514,267 | |
Excellon Resources, Inc. (a) | | | 849,245 | | | | 2,426,028 | |
First Majestic Silver Corp. (a) | | | 5,098,215 | | | | 79,430,190 | |
Fortuna Silver Mines, Inc. (a) | | | 1,610,722 | | | | 10,445,917 | |
Gran Colombia Gold Corp. | | | 540,819 | | | | 2,319,579 | |
Great Panther Mining, Ltd. (a) | | | 3,075,195 | | | | 2,367,900 | |
GT Gold Corp. (a) | | | 1,117,140 | | | | 2,862,410 | |
Hudbay Minerals, Inc. | | | 2,284,722 | | | | 15,635,083 | |
Kootenay Silver, Inc. (a)(f) | | | 8,355,076 | | | | 2,160,738 | |
Liberty Gold Corp. (a) | | | 2,285,629 | | | | 2,637,194 | |
MAG Silver Corp. (a)(f) | | | 3,069,556 | | | | 46,213,097 | |
Mandalay Resources Corp. (a)(e) | | | 797,743 | | | | 1,237,844 | |
Metalla Royalty & Streaming, Ltd. | | | 353,331 | | | | 3,157,402 | |
Minaurum Gold, Inc. (a)(e) | | | 2,978,640 | | | | 1,042,891 | |
Minco Silver Corp. (a)(e) | | | 1,600,920 | | | | 605,106 | |
Mirasol Resources, Ltd. (a) | | | 473,225 | | | | 199,578 | |
New Gold, Inc. (a)(f) | | | 5,911,571 | | | | 9,125,844 | |
New Pacific Metals Corp. (a) | | | 1,342,731 | | | | 5,545,296 | |
Orla Mining, Ltd. (a) | | | 2,010,218 | | | | 7,486,131 | |
Pan American Silver Corp. | | | 3,131,909 | | | | 93,954,778 | |
Premier Gold Mines, Ltd. (a) | | | 2,089,929 | | | | 4,623,222 | |
Sabina Gold & Silver Corp. (a) | | | 2,855,683 | | | | 4,112,983 | |
Seabridge Gold, Inc. (a) | | | 648,591 | | | | 10,482,122 | |
Sierra Metals, Inc. (a) | | | 1,422,367 | | | | 4,470,717 | |
Silvercorp Metals, Inc. | | | 4,600,316 | | | | 22,659,311 | |
SilverCrest Metals, Inc. (a) | | | 3,393,360 | | | | 27,488,187 | |
Sombrero Resources, Inc. (a)(b) | | | 585,867 | | | | 130,064 | |
SSR Mining, Inc. | | | 1,916,087 | | | | 27,398,809 | |
Tier One Silver, Inc. (a)(b) | | | 585,867 | | | | 153,713 | |
Trevali Mining Corp. (a) | | | 8,649,224 | | | | 1,342,085 | |
Turquoise Hill Resources, Ltd. (a) | | | 1,758,022 | | | | 28,314,129 | |
Yamana Gold, Inc. | | | 7,849,211 | | | | 34,065,576 | |
Total Metals & Mining | | | | | | | 550,136,209 | |
Total Canada | | | | | | | 559,180,402 | |
The accompanying notes are an integral part of these financial statements.
ETFMG™ ETFs
ETFMG Prime Junior Silver Miners ETF
Schedule of Investments
March 31, 2021 (Unaudited) (Continued)
| | Shares | | | Value | |
Luxembourg - 1.6% Metals & Mining - 1.6% (c) Nexa Resources SA | | | 1,156,565 | | | $ | 11,854,791 | |
| | | | | | | | |
Peru - 2.6% Metals & Mining - 2.6% (c) Cia de Minas Buenaventura SAA - ADR (a) | | | 1,965,086 | | | | 19,709,813 | |
| | | | | | | | |
South Africa - 3.1% Metals & Mining - 3.1% (c) Harmony Gold Mining Co., Ltd. - ADR | | | 5,242,292 | | | | 22,856,393 | |
| | | | | | | | |
United Kingdom - 4.7% Metals & Mining - 4.7% (c) Hochschild Mining PLC | | | 12,924,703 | | | | 34,869,989 | |
| | | | | | | | |
United States - 12.4% | | | | | | | | |
Metals & Mining - 12.4% (c) Coeur Mining, Inc. (a) | | | 2,127,108 | | | | 19,207,785 | |
Gold Resource Corp. | | | 650,068 | | | | 1,716,180 | |
Golden Minerals Co. (a) | | | 1,418,821 | | | | 935,429 | |
Hecla Mining Co. | | | 11,718,928 | | | | 66,680,700 | |
McEwen Mining, Inc. (a) | | | 4,009,249 | | | | 4,169,619 | |
Total Metals & Mining | | | | | | | 92,709,713 | |
Total United States | | | | | | | 92,709,713 | |
TOTAL COMMON STOCKS (Cost $728,848,593) | | | | | | | 741,181,101 | |
| | | | | | | | | |
SHORT-TERM INVESTMENTS - 0.5% Money Market Funds - 0.5% Invesco Advisers, Inc. STIT - Treasury Portfolio – Institutional Class, 0.01% (d) | | | 3,587,114 | | | | 3,587,114 | |
TOTAL SHORT-TERM INVESTMENTS (Cost $3,587,114) | | | | | | | 3,587,114 | |
| | | | | | | | | |
Total Investments (Cost $732,435,707) - 100.0% | | | | | | | 744,768,215 | |
Liabilities in Excess of Other Assets - (0.0)% (g) | | | | | | | (234,691 | ) |
TOTAL NET ASSETS - 100.0% | | | | | | $ | 744,533,524 | |
The accompanying notes are an integral part of these financial statements.
ETFMG™ ETFs
ETFMG Prime Junior Silver Miners ETF
Schedule of Investments
March 31, 2021 (Unaudited) (Continued)
Percentages are stated as a percent of net assets.
ADR American Depositary Receipt
PLC Public Limited Company
(a) | Non-income producing security. |
(b) | Value determined based on estimated fair value. The value of these securities total $283,777, which represents 0.04% of total net assets. Classified as Level 3 in the fair value hierarchy. Please refer to Note 2 of the Notes to Financial Statements. |
(c) | As of March 31, 2021, the Fund had a significant portion of its assets invested in the Metals & Mining Industry. |
(d) | The rate quoted is the annualized seven-day yield at March 31, 2021. |
(e) | These securities have been deemed illiquid according to the Fund’s liquidity guidelines. The value of these securities total $2,885,841, which represents 0.4% of total net assets. |
(f) | Affiliated security. Please refer to Note 9 of the Notes to Financial Statements. |
The Global Industry Classification Standard (GICS®) was developed by and/or is the exclusive property of MSCI, Inc. and Standard & Poor’s Financial Services LLC (“S&P”). GICS is a service mark of MSCI and S&P and has been licensed for use by U.S. Bancorp Fund Services, LLC, doing business as U.S. Bank Global Fund Services (“Fund Services”).
The accompanying notes are an integral part of these financial statements.
ETFMG™ ETFs
ETFMG Prime Cyber Security ETF
Schedule of Investments
March 31, 2021 (Unaudited)
| | Shares | | | Value | |
COMMON STOCKS - 99.4% | | | | | | | | |
Canada - 3.3% | | | | | | | | |
Software - 3.3% (d) | | | | | | | | |
Absolute Software Corp. | | | 1,565,742 | | | $ | 21,741,225 | |
BlackBerry, Ltd. (a) | | | 5,279,788 | | | | 44,281,822 | |
Total Canada | | | | | | | 66,023,047 | |
| | | | | | | | | |
Finland - 0.2% | | | | | | | | |
Software - 0.2% (d) | | | | | | | | |
F-Secure Oyj | | | 785,704 | | | | 3,722,449 | |
| | | | | | | | | |
Israel - 9.7% | | | | | | | �� | |
Communications Equipment - 1.2% | | | | | | | | |
Radware, Ltd. (a) | | | 934,192 | | | | 24,363,727 | |
Software - 8.5% (d) | | | | | | | | |
Allot Communications, Ltd. (a) | | | 1,059,627 | | | | 16,922,243 | |
Check Point Software Technologies, Ltd. (a) | | | 429,197 | | | | 48,057,188 | |
Cognyte Software, Ltd. (a) | | | 1,654,398 | | | | 46,008,809 | |
CyberArk Software, Ltd. (a) | | | 328,909 | | | | 42,541,090 | |
Tufin Software Technologies Ltd. (a) | | | 1,523,446 | | | | 15,996,183 | |
Total Software | | | | | | | 169,525,513 | |
Total Israel | | | | | | | 193,889,240 | |
| | | | | | | | | |
Japan - 3.8% | | | | | | | | |
Software - 3.8% (d) | | | | | | | | |
Digital Arts, Inc. | | | 262,243 | | | | 22,949,963 | |
FFRI Security, Inc. (a) | | | 319,876 | | | | 6,349,853 | |
Trend Micro, Inc. | | | 960,808 | | | | 48,072,940 | |
Total Japan | | | | | | | 77,372,756 | |
| | | | | | | | | |
Jersey - 1.2% | | | | | | | | |
Software - 1.2% (d) | | | | | | | | |
Mimecast, Ltd. (a) | | | 587,678 | | | | 23,630,533 | |
| | | | | | | | | |
Republic of Korea - 0.8% | | | | | | | | |
Software - 0.8% (d) | | | | | | | | |
Ahnlab, Inc. | | | 274,035 | | | | 15,859,768 | |
| | | | | | | | | |
Sweden - 1.1% | | | | | | | | |
Electronic Equipment, Instruments & | | | | | | | | |
Components - 1.1% | | | | | | | | |
Fingerprint Cards AB - Class B (b) | | | 6,672,657 | | | | 22,271,605 | |
The accompanying notes are an integral part of these financial statements.
ETFMG™ ETFs
ETFMG Prime Cyber Security ETF
Schedule of Investments
March 31, 2021 (Unaudited) (Continued)
| | Shares | | | Value | |
United Kingdom - 6.8% | | | | | | | | |
Aerospace & Defense - 3.6% | | | | | | | | |
BAE Systems PLC | | | 3,659,706 | | | $ | 25,478,743 | |
QinetiQ Group PLC | | | 5,299,506 | | | | 23,086,754 | |
Ultra Electronics Holdings PLC | | | 856,484 | | | | 23,945,704 | |
Total Aerospace & Defense | | | | | | | 72,511,201 | |
IT Services - 1.0% | | | | | | | | |
NCC Group PLC | | | 5,447,380 | | | | 19,375,271 | |
Software - 2.2% (d) | | | | | | | | |
Avast PLC (f) | | | 7,185,134 | | | | 45,168,964 | |
Total United Kingdom | | | | | | | 137,055,436 | |
| | | | | | | | | |
United States - 72.5% | | | | | | | | |
Aerospace & Defense - 2.5% | | | | | | | | |
Parsons Corp. (a)(b) | | | 1,251,208 | | | | 50,598,852 | |
Communications Equipment - 8.9% | | | | | | | | |
Cisco Systems, Inc. | | | 1,477,938 | | | | 76,424,174 | |
F5 Networks, Inc. (a) | | | 136,998 | | | | 28,580,523 | |
Juniper Networks, Inc. | | | 1,958,236 | | | | 49,602,118 | |
NetScout Systems, Inc. (a) | | | 872,325 | | | | 24,564,672 | |
Total Communications Equipment | | | | | | | 179,171,487 | |
Internet Software & Services - 0.8% | | | | | | | | |
Zix Corp. (a) | | | 2,129,728 | | | | 16,079,446 | |
IT Services - 7.5% | | | | | | | | |
Akamai Technologies, Inc. (a) | | | 511,957 | | | | 52,168,418 | |
LiveRamp Holdings, Inc. (a) | | | 826,754 | | | | 42,891,998 | |
Okta, Inc. (a)(b) | | | 129,311 | | | | 28,504,024 | |
VeriSign, Inc. (a) | | | 136,751 | | | | 27,180,629 | |
Total IT Services | | | | | | | 150,745,069 | |
Professional Services - 8.8% | | | | | | | | |
Booz Allen Hamilton Holding Corp. | | | 326,679 | | | | 26,307,460 | |
CACI International, Inc. - Class A (a) | | | 210,153 | | | | 51,836,339 | |
Leidos Holdings, Inc. | | | 282,187 | | | | 27,168,964 | |
ManTech International Corp. - Class A | | | 305,786 | | | | 26,588,093 | |
Science Applications International Corp. | | | 527,208 | | | | 44,069,317 | |
Total Professional Services | | | | | | | 175,970,173 | |
Software - 44.0% (d) | | | | | | | | |
A10 Networks, Inc. (a) | | | 2,583,826 | | | | 24,830,568 | |
Cloudflare, Inc. - Class A (a) | | | 741,252 | | | | 52,080,365 | |
CommVault Systems, Inc. (a) | | | 748,243 | | | | 48,261,673 | |
Crowdstrike Holdings, Inc. - Class A (a) | | | 181,179 | | | | 33,066,979 | |
Everbridge, Inc. (a)(b) | | | 172,331 | | | | 20,883,071 | |
FireEye, Inc. (a) | | | 2,490,549 | | | | 48,740,044 | |
Fortinet, Inc. (a) | | | 293,629 | | | | 54,151,060 | |
McAfee Corp. - Class A (b) | | | 1,135,106 | | | | 25,812,310 | |
NortonLifeLock, Inc. (b) | | | 2,320,240 | | | | 49,328,302 | |
OneSpan, Inc. (a) | | | 950,692 | | | | 23,291,954 | |
The accompanying notes are an integral part of these financial statements.
ETFMG™ ETFs
ETFMG Prime Cyber Security ETF
Schedule of Investments
March 31, 2021 (Unaudited) (Continued)
| | Shares | | | Value | |
Palo Alto Networks, Inc. (a) | | | 152,353 | | | $ | 49,066,807 | |
Ping Identity Holding Corp. (a)(b) | | | 1,933,640 | | | | 42,404,725 | |
Proofpoint, Inc. (a) | | | 401,104 | | | | 50,454,872 | |
Qualys, Inc. (a)(b) | | | 495,977 | | | | 51,968,470 | |
Rapid7, Inc. (a)(b) | | | 306,201 | | | | 22,845,657 | |
Sailpoint Technologies Holdings, Inc. (a)(b) | | | 846,233 | | | | 42,853,239 | |
SecureWorks Corp. - Class A (a)(b)(e) | | | 1,388,102 | | | | 18,572,805 | |
SolarWinds Corp. (a)(b) | | | 2,840,964 | | | | 49,546,412 | |
Splunk, Inc. (a) | | | 358,926 | | | | 48,627,294 | |
Sumo Logic, Inc. (a)(b) | | | 1,662,115 | | | | 31,347,489 | |
Tenable Holdings, Inc. (a) | | | 1,191,767 | | | | 43,124,089 | |
Varonis Systems, Inc. (a) | | | 457,220 | | | | 23,473,675 | |
Zscaler, Inc. (a) | | | 161,634 | | | | 27,747,709 | |
Total Software | | | | | | | 882,479,569 | |
Total United States | | | | | | | 1,455,044,596 | |
TOTAL COMMON STOCKS (Cost $1,655,085,573) | | | | | | | 1,994,869,430 | |
| | | | | | | | | |
INVESTMENTS PURCHASED WITH PROCEEDS FROM | | | | | | | | |
SECURITIES LENDING COLLATERAL - 8.1% | | | | | | | | |
ETFMG Sit Ultra Short ETF (e) | | | 1,000,000 | | | | 49,745,500 | |
Mount Vernon Liquid Assets Portfolio, LLC, 0.11% (c) | | | 112,946,580 | | | | 112,946,580 | |
TOTAL INVESTMENTS PURCHASED WITH PROCEEDS | | | | | | | | |
FROM SECURITIES LENDING COLLATERAL (Cost $163,055,457) | | | | | | | 162,692,080 | |
| | | | | | | | | |
SHORT-TERM INVESTMENTS - 0.5% | | | | | | | | |
Money Market Funds - 0.5% | | | | | | | | |
Invesco Advisers, Inc. STIT-Treasury Portfolio - Institutional Class, 0.01% (c) | | | 10,720,628 | | | | 10,720,628 | |
TOTAL SHORT-TERM INVESTMENTS (Cost $10,720,628) | | | | | | | 10,720,628 | |
Total Investments (Cost $1,828,861,658) - 108.0% | | | | | | | 2,168,282,138 | |
Liabilities in Excess of Other Assets - (8.0)% | | | | | | | (160,443,257 | ) |
TOTAL NET ASSETS - 100.0% | | | | | | $ | 2,007,838,881 | |
Percentages are stated as a percent of net assets.
PLC Public Limited Company
(a) | Non-income producing security. |
(b) | All or a portion of this security is out on loan as of March 31, 2021. |
(c) | The rate quoted is the annualized seven-day yield at March 31, 2021. |
(d) | As of March 31, 2021 the Fund had a significant portion of its assets in the Software Industry. |
(e) | Affiliated security. Please refer to Note 9 of the Notes to Financial Statements. |
(f) | Acquired in a transaction exempt from registration under Rule 144A or Section 4(a)(2) of the Securities Act of 1933. May be resold in the U.S. in transactions exempt from registration, normally to qualified institutional buyers. The total value of all such securities was $45,168,964, which represented 2.25% of the net assets of the Fund. |
The accompanying notes are an integral part of these financial statements.
ETFMG™ ETFs
ETFMG Prime Mobile Payments ETF
Schedule of Investments
March 31, 2021 (Unaudited)
| | Shares | | | Value | |
COMMON STOCKS - 99.5% | | | | | | | | |
Australia - 3.6% | | | | | | | | |
IT Services - 3.6% (d) | | | | | | | | |
Afterpay, Ltd. (a) | | | 354,228 | | | $ | 27,308,948 | |
EML Payments, Ltd. (a) | | | 4,155,044 | | | | 15,464,210 | |
Total IT Services | | | | | | | 42,773,158 | |
Bermuda - 1.5% | | | | | | | | |
Electronic Equipment, Instruments & Components - 1.5% | | | | | | | | |
PAX Global Technology, Ltd. | | | 17,073,078 | | | | 18,337,840 | |
Brazil - 1.5% | | | | | | | | |
IT Services - 1.5% (d) | | | | | | | | |
Cielo SA | | | 26,841,617 | | | | 17,787,432 | |
Canada - 2.0% | | | | | | | | |
IT Services - 2.0% (d) | | | | | | | | |
Nuvei Corp. (a)(f) | | | 396,668 | | | | 23,894,141 | |
Cayman Islands - 5.0% | | | | | | | | |
IT Services - 5.0% (d) | | | | | | | | |
Pagseguro Digital, Ltd. - Class A (a)(b) | | | 506,097 | | | | 23,432,291 | |
StoneCo., Ltd. - Class A (a) | | | 400,151 | | | | 24,497,244 | |
Yeahka, Ltd. (a) | | | 1,773,249 | | | | 12,203,190 | |
Total IT Services | | | | | | | 60,132,725 | |
Cyprus - 0.4% | | | | | | | | |
IT Services - 0.4% (d) | | | | | | | | |
QIWI PLC - ADR (b) | | | 405,093 | | | | 4,314,240 | |
France - 2.5% | | | | | | | | |
IT Services - 2.5% (d) | | | | | | | | |
Worldline SA (a)(f) | | | 364,271 | | | | 30,517,890 | |
Italy - 1.8% | | | | | | | | |
IT Services - 1.8% (d) | | | | | | | | |
Nexi SpA (a)(f) | | | 1,276,537 | | | | 22,275,363 | |
Japan - 3.0% | | | | | | | | |
Consumer Finance - 0.4% | | | | | | | | |
Jaccs Co., Ltd. | | | 220,199 | | | | 4,512,364 | |
IT Services - 2.4% (d) | | | | | | | | |
GMO Financial Gate, Inc. | | | 29,276 | | | | 6,052,180 | |
GMO Payment Gateway, Inc. | | | 169,743 | | | | 22,504,649 | |
Total IT Services | | | | | | | 28,556,829 | |
The accompanying notes are an integral part of these financial statements.
ETFMG™ ETFs
ETFMG Prime Mobile Payments ETF
Schedule of Investments
March 31, 2021 (Unaudited) (Continued)
Software - 0.2% | | Shares | | | Value | |
| | | | | | | |
Intelligent Wave, Inc. | | | 287,926 | | | $ | 1,817,659 | |
Total Japan | | | | | | | 34,886,852 | |
Netherlands - 4.9% | | | | | | | | |
IT Services - 4.9% (d) | | | | | | | | |
Adyen NV (a)(f) | | | 26,669 | | | | 59,531,671 | |
Puerto Rico - 1.4% | | | | | | | | |
IT Services - 1.4% (d) | | | | | | | | |
EVERTEC, Inc. | | | 466,456 | | | | 17,361,492 | |
United Kingdom - 1.8% | | | | | | | | |
Commercial Services & Supplies - 0.3% | | | | | | | | |
PayPoint PLC | | | 371,823 | | | | 3,024,326 | |
IT Services - 1.5% (d) | | | | | | | | |
Network International Holdings PLC (a)(f) | | | 3,245,138 | | | | 18,503,510 | |
Total United Kingdom | | | | | | | 21,527,836 | |
United States - 70.1% | | | | | | | | |
Consumer Finance - 10.2% | | | | | | | | |
American Express Co. | | | 507,145 | | | | 71,730,589 | |
Discover Financial Services (b) | | | 361,129 | | | | 34,303,644 | |
Green Dot Corp. - Class A (a) | | | 369,276 | | | | 16,909,148 | |
Total Consumer Finance | | | | | | | 122,943,381 | |
IT Services - 56.7% (d) | | | | | | | | |
Affirm Holdings, Inc. (a)(b) | | | 349,653 | | | | 24,727,460 | |
Boku, Inc. (a)(f) | | | 1,942,415 | | | | 4,739,753 | |
Euronet Worldwide, Inc. (a) | | | 134,681 | | | | 18,626,382 | |
Evo Payments, Inc. - Class A (a)(b) | | | 652,824 | | | | 17,965,716 | |
Fidelity National Information Services, Inc. | | | 518,266 | | | | 72,873,382 | |
Fiserv, Inc. (a) | | | 570,574 | | | | 67,921,129 | |
FleetCor Technologies, Inc. (a) | | | 109,598 | | | | 29,441,311 | |
Global Payments, Inc. | | | 271,889 | | | | 54,807,385 | |
I3 Verticals, Inc. - Class A (a)(b) | | | 496,865 | | | | 15,464,923 | |
International Money Express, Inc. (a) | | | 214,928 | | | | 3,226,069 | |
MasterCard, Inc. - Class A | | | 207,035 | | | | 73,714,812 | |
Net 1 UEPS Technologies, Inc. (a) | | | 584,276 | | | | 3,271,946 | |
PayPal Holdings, Inc. (a) | | | 302,671 | | | | 73,500,626 | |
Paysign, Inc. (a)(b) | | | 645,132 | | | | 2,819,227 | |
Sezzle, Inc. (a) | | | 796,083 | | | | 4,450,330 | |
Shift4 Payments, Inc. - Class A (a) | | | 249,485 | | | | 20,460,265 | |
Square, Inc. - Class A (a) | | | 331,298 | | | | 75,221,212 | |
USA Technologies, Inc. (a) | | | 448,687 | | | | 5,258,612 | |
Visa, Inc. - Class A (b) | | | 342,126 | | | | 72,438,338 | |
Western Union Co. (b) | | | 920,965 | | | | 22,710,997 | |
WEX, Inc. (a) | | | 101,973 | | | | 21,334,791 | |
Total IT Services | | | | | | | 684,974,666 | |
The accompanying notes are an integral part of these financial statements.
ETFMG™ ETFs
ETFMG Prime Mobile Payments ETF
Schedule of Investments
March 31, 2021 (Unaudited) (Continued)
Software - 1.5% | | Shares | | | Value | |
| | | | | | | |
ACI Worldwide, Inc. (a) | | | 491,835 | | | $ | 18,714,322 | |
Technology Hardware, Storage & Peripherals - 1.7% | | | | | | | | |
NCR Corp. (a) | | | 533,262 | | | | 20,237,293 | |
Total United States | | | | | | | 846,869,662 | |
TOTAL COMMON STOCKS (Cost $1,011,463,970) | | | | | | | 1,200,210,302 | |
INVESTMENTS PURCHASED WITH PROCEEDS FROM | | | | | | | | |
SECURITIES LENDING COLLATERAL - 9.4% | | | | | | | | |
ETFMG Sit Ultra Short ETF (e) | | | 600,000 | | | | 29,847,300 | |
Mount Vernon Liquid Assets Portfolio, LLC, 0.11% (c) | | | 84,242,577 | | | | 84,242,577 | |
TOTAL INVESTMENTS PURCHASED WITH PROCEEDS | | | | | | | | |
FROM SECURITIES LENDING COLLATERAL (Cost | | | | | | | | |
$114,324,845) | | | | | | | 114,089,877 | |
SHORT-TERM INVESTMENTS - 0.1% | | | | | | | | |
Money Market Funds - 0.1% | | | | | | | | |
Invesco Advisers, Inc. STIT-Treasury Portfolio – | | | | | | | | |
Institutional Class, 0.01% (c) | | | 1,767,533 | | | | 1,767,533 | |
TOTAL SHORT-TERM INVESTMENTS (Cost $1,767,533) | | | | | | | 1,767,533 | |
Total Investments (Cost $1,127,556,348) - 109.0% | | | | | | | 1,316,067,712 | |
Liabilities in Excess of Other Assets - (9.0)% | | | | | | | (108,362,693 | ) |
TOTAL NET ASSETS - 100.0% | | | | | | $ | 1,207,705,019 | |
Percentages are stated as a percent of net assets.
ADR American Depositary Receipt
PLC Public Limited Company
(a) | Non-income producing security. |
(b) | All or a portion of this security is out on loan as of March 31, 2021. |
(c) | The rate quoted is the annualized seven-day yield at March 31, 2021. |
(d) | As of March 31, 2021 the Fund had a significant portion of its assets in the IT Services Industry. |
(e) | Affiliated security. Please refer to Note 9 of the Notes to Financial Statements. |
(f) | Acquired in a transaction exempt from registration under Rule 144A or Section 4(a)(2) of the Securities Act of 1933. May be resold in the U.S. in transactions exempt from registration, normally to qualified institutional buyers. The total value of all such securities was $159,462,328, which represented 13.20% of the net assets of the Fund. |
The accompanying notes are an integral part of these financial statements.
ETFMG™ ETFs
ETFMG Sit Ultra Short ETF
Schedule of Investments
March 31, 2021 (Unaudited)
| | Principal Amount | | | Value | |
ASSET BACKED SECURITIES - 0.6% | | | | | | | | |
Carvana Auto Receivables Trust | | | | | | | | |
Series 2019-2, 2.580%, 03/15/2023 (a) | | $ | 649,074 | | | $ | 650,050 | |
TOTAL ASSET BACKED SECURITIES (Cost $650,104) | | | | | | | 650,050 | |
CORPORATE OBLIGATIONS - 97.4% | | | | | | | | |
Agriculture - 0.2% | | | | | | | | |
| Bunge, Ltd. Finance Corp. | | | | | | | | |
3.000%, 09/25/2022 | | | 206,000 | | | | 212,464 | |
Automotive - 9.9% | | | | | | | | |
| American Honda Finance Corp. | | | | | | | | |
0.545% (3 Month LIBOR + 0.350%) 11/05/2021 (b) | | | 450,000 | | | | 450,866 | |
0.503% (3 Month LIBOR + 0.280%) 01/12/2024 (b) | | | 2,000,000 | | | | 2,000,347 | |
BMW US Capital LLC | | | | | | | | |
0.634% (3 Month LIBOR + 0.410%) 04/12/2021 (a)(b) | | | 500,000 | | | | 500,054 | |
0.698% (3 Month LIBOR + 0.500%) 08/13/2021 (a)(b) | | | 160,000 | | | | 160,251 | |
0.877%(3 Month LIBOR + 0.640%) 04/06/2022 (a)(b) | | | 1,290,000 | | | | 1,295,705 | |
Daimler Finance North America LLC | | | | | | | | |
1.062% (3 Month LIBOR + 0.880%) 02/22/2022 (a)(b) | | | 2,422,000 | | | | 2,437,035 | |
| General Motors Financial Co., Inc. | | | | | | | | |
3.150%, 06/30/2022 | | | 1,488,000 | | | | 1,530,027 | |
Hyundai Capital America | | | | | | | | |
2.850%, 11/01/2022 (a) | | | 2,000,000 | | | | 2,063,512 | |
| PACCAR Financial Corp. | | | | | | | | |
0.455% (3 Month LIBOR + 0.260%) 05/10/2021 (b) | | | 190,000 | | | | 190,062 | |
| Toyota Motor Credit Corp. | | | | | | | | |
0.592% (3 Month LIBOR + 0.400%) 05/17/2022 (b) | | | 500,000 | | | | 501,561 | |
| | | | | | | 11,129,420 | |
Banks - 27.5% (e) | | | | | | | | |
Bank of America Corp. | | | | | | | | |
1.643% (3 Month LIBOR + 1.420%) 04/19/2021 (b) | | | 1,000,000 | | | | 1,000,556 | |
1.404% (3 Month LIBOR + 1.180%) 10/21/2022 (b) | | | 100,000 | | | | 100,603 | |
1.218% (3 Month LIBOR + 1.000%) 04/24/2023 (b) | | | 1,000,000 | | | | 1,008,638 | |
1.178% (3 Month LIBOR + 0.960%) 07/23/2024 (b) | | | 1,250,000 | | | | 1,268,751 | |
Bank of Montreal | | | | | | | | |
0.807% (3 Month LIBOR + 0.630%) 09/11/2022 (b) | | | 250,000 | | | | 251,904 | |
Bank of Nova Scotia | | | | | | | | |
0.816% (3 Month LIBOR + 0.640%) 03/07/2022 (b) | | | 150,000 | | | | 150,783 | |
Barclays PLC | | | | | | | | |
1.850% (3 Month LIBOR + 1.625%) 01/10/2023 (b) | | | 1,500,000 | | | | 1,513,210 | |
Citibank NA | | | | | | | | |
0.782% (3 Month LIBOR + 0.600%) 05/20/2022 (b) | | | 1,821,000 | | | | 1,822,520 | |
| Citizens Financial Group, Inc. | | | | | | | | |
4.150%, 09/28/2022 (a) | | | 672,000 | | | | 703,413 | |
Commonwealth Bank of Australia | | | | | | | | |
0.870% (3 Month LIBOR + 0.680%) 09/18/2022 (a)(b) | | | 2,539,000 | | | | 2,559,537 | |
The accompanying notes are an integral part of these financial statements.
ETFMG™ ETFs
ETFMG Sit Ultra Short ETF
Schedule of Investments
March 31, 2021 (Unaudited) (Continued)
| Principal Amount | | Value | |
Cooperatieve Rabobank UA | | | | | | |
0.705% (3 Month LIBOR + 0.480%) 01/10/2023 (b) | $ | 895,000 | | $ | 900,151 | |
Credit Suisse AG | | | | | | |
0.531% (3 Month SOFR + 0.450%) 02/04/2022 (b) | | 1,490,000 | | | 1,490,952 | |
Fifth Third Bank NA | | | | | | |
0.845% (3 Month LIBOR + 0.640%) 02/01/2022 (b) | | 2,000,000 | | | 2,009,686 | |
First Niagara Financial Group, Inc. | | | | | | |
7.250%, 12/15/2021 | | 1,050,000 | | | 1,099,028 | |
Fulton Financial Corp. | | | | | | |
3.600%, 03/16/2022 | | 87,000 | | | 89,459 | |
Goldman Sachs Group, Inc. | | | | | | |
0.992% (3 Month LIBOR + 0.780%) 10/31/2022 (b) | | 698,000 | | | 700,391 | |
Huntington Bancshares, Inc. | | | | | | |
4.350%, 02/04/2023 | | 766,000 | | | 815,027 | |
JPMorgan Chase & Co. | | | | | | |
1.241% (3 Month LIBOR + 1.000%) 01/15/2023 (b) | | 1,000,000 | | | 1,007,063 | |
1.118% (3 Month LIBOR + 0.900%) 04/25/2023 (b) | | 1,155,000 | | | 1,164,033 | |
0.590% (3 Month SOFR + 0.580%) 03/16/2024 (b) | | 1,000,000 | | | 1,003,556 | |
Mitsubishi UFJ Financial Group, Inc. | | | | | | |
1.008% (3 Month LIBOR + 0.790%) 07/25/2022 (b) | | 409,000 | | | 412,147 | |
Mizuho Financial Group, Inc. | | | | | | |
1.063% (3 Month LIBOR + 0.840%) 07/16/2023 (b) | | 500,000 | | | 503,373 | |
Morgan Stanley | | | | | | |
0.725% (3 Month SOFR + 0.700%) 01/20/2023 (b) | | 1,678,000 | | | 1,683,355 | |
PNC Bank NA | | | | | | |
0.713% (3 Month LIBOR + 0.500%) 07/27/2022 (b) | | 2,160,000 | | | 2,172,218 | |
Royal Bank of Canada | | | | | | |
0.602% (3 Month LIBOR + 0.390%) 04/30/2021 (b) | | 445,000 | | | 445,154 | |
0.583% (3 Month LIBOR + 0.360%) 01/17/2023 (b) | | 1,000,000 | | | 1,003,899 | |
Swedbank AB | | | | | | |
0.884% (3 Month LIBOR + 0.700%) 03/14/2022 (a)(b) | | 200,000 | | | 201,106 | |
Truist Bank | | | | | | |
0.792% (3 Month LIBOR + 0.590%) 08/02/2022 (b) | | 590,000 | | | 591,010 | |
US Bank NA | | | | | | |
0.615% (3 Month LIBOR + 0.440%) 05/23/2022 (b) | | 805,000 | | | 808,024 | |
Wells Fargo Bank NA | | | | | | |
0.845% (3 Month LIBOR + 0.660%) 09/09/2022 (b) | | 750,000 | | | 752,527 | |
2.082%, 09/09/2022 (c) | | 200,000 | | | 201,540 | |
Westpac Banking Corp. | | | | | | |
0.795% (3 Month LIBOR + 0.570%) 01/11/2023 (b) | | 1,500,000 | | | 1,510,986 | |
Business Support Services - 2.4% | | | | | 30,944,600 | |
| | | | | |
Glencore Finance Canada, Ltd. | | | | | | |
4.950%, 11/15/2021 (a) | | 1,200,000 | | | 1,233,769 | |
4.250%, 10/25/2022 (a) | | 1,000,000 | | | 1,053,585 | |
Pentair Finance | | | | | | |
5.000%, 05/15/2021 | | 400,000 | | | 401,226 | |
| | | | | | 2,688,580 | |
The accompanying notes are an integral part of these financial statements.
ETFMG™ ETFs
ETFMG Sit Ultra Short ETF
Schedule of Investments
March 31, 2021 (Unaudited) (Continued)
| Principal Amount | | Value | |
Capital Markets - 5.0% | | | | | | |
Bank of New York Mellon Corp. | | | | | | |
1.262% (3 Month LIBOR + 1.050%) 10/30/2023 (b) | $ | 400,000 | | $ | 405,611 | |
BGC Partners, Inc. | | | | | | |
5.125%, 05/27/2021 | | 1,148,000 | | | 1,154,079 | |
5.375%, 07/24/2023 | | 1,245,000 | | | 1,354,183 | |
Charles Schwab Corp. | | | | | | |
0.502% (3 Month LIBOR + 0.320%) 05/21/2021 (b) | | 649,000 | | | 649,105 | |
0.510% (3 Month SOFR + 0.500%) 03/18/2024 (b) | | 2,000,000 | | | 2,013,561 | |
Chemicals - 3.1% | | | | | 5,576,539 | |
| | | | | |
LYB International Finance III LLC | | | | | | |
1.202% (3 Month LIBOR + 1.000%) 10/01/2023 (b) | | 2,000,000 | | | 2,006,056 | |
Sherwin-Williams Co. | | | | | | |
2.750%, 06/01/2022 | | 293,000 | | | 299,632 | |
Westlake Chemical Corp. | | | | | | |
3.600%, 07/15/2022 | | 1,150,000 | | | 1,176,761 | |
Communications Equipment - 0.3% | | | | | 3,482,449 | |
| | | | | |
Motorola Solutions, Inc. | | | | | | |
3.500%, 03/01/2023 | | 361,000 | | | 379,633 | |
Consumer Finance - 3.2% | | | | | | |
AIG Global Funding | | | | | | |
0.661% (3 Month LIBOR + 0.460%) 06/25/2021 (a)(b) | | 1,132,000 | | | 1,133,246 | |
2.700%, 12/15/2021 (a) | | 75,000 | | | 76,289 | |
Capital One Financial Corp. | | | | | | |
0.932% (3 Month LIBOR + 0.720%) 01/30/2023 (b) | | 2,291,000 | | | 2,308,170 | |
Containers & Packaging - 0.5% | | | | | 3,517,705 | |
| | | | | |
WestRock RKT LLC | | | | | | |
4.000%, 03/01/2023 | | 500,000 | | | 526,771 | |
Diversified Telecommunication Services - 2.2% | | | | | | |
Verizon Communications, Inc. | | | | | | |
0.510% (3 Month SOFR + 0.500%) 03/22/2024 (b) | | 2,500,000 | | | 2,507,841 | |
Electronic Products - 0.5% | | | | | | |
Arrow Electronics, Inc. | | | | | | |
3.500%, 04/01/2022 | | 500,000 | | | 511,807 | |
Energy - 0.1% | | | | | | |
ConocoPhillips Co. | | | | | | |
1.098% (3 Month LIBOR + 0.900%) 05/15/2022 (b) | | 150,000 | | | 151,161 | |
Food Products - 1.5% | | | | | | |
General Mills, Inc. | | | | | | |
1.233% (3 Month LIBOR + 1.010%) 10/17/2023 (b) | | 1,650,000 | | | 1,674,695 | |
The accompanying notes are an integral part of these financial statements.
ETFMG™ ETFs
ETFMG Sit Ultra Short ETF
Schedule of Investments
March 31, 2021 (Unaudited) (Continued)
| | Principal
Amount | | Value | |
Health Care Providers & Services - 2.0% | | | | | | | |
Cigna Corp. | | | | | | | |
1.131% (3 Month LIBOR + 0.890%) 07/15/2023 (b) | | $ | 1,920,000 | | $ | 1,944,020 | |
UnitedHealth Group, Inc. | | | | | | | |
0.444% (3 Month LIBOR + 0.260%) 06/15/2021 (b) | | | 270,000 | | | 270,101 | |
Household Products - 0.2% | | | | | | 2,214,121 | |
| | | | | | |
Reckitt Benckiser Treasury Services PLC | | | | | | | |
0.751% (3 Month LIBOR + 0.560%) 06/24/2022 (a)(b) | | | 200,000 | | | 201,156 | |
Industrial Conglomerates - 2.0% | | | | | | | |
Honeywell International, Inc. | | | | | | | |
0.411% (3 Month LIBOR + 0.230%) 08/19/2022 (b) | | | 2,270,000 | | | 2,271,825 | |
Insurance - 7.2% | | | | | | | |
Allstate Corp. | | | | | | | |
0.823% (3 Month LIBOR + 0.630%) 03/29/2023 (b) | | | 1,683,000 | | | 1,696,989 | |
Athene Global Funding | | | | | | | |
1.468% (3 Month LIBOR + 1.230%) 07/01/2022 (a)(b) | | | 200,000 | | | 202,180 | |
Fidelity National Financial, Inc. | | | | | | | |
5.500%, 09/01/2022 | | | 500,000 | | | 534,106 | |
Infinity Property and Casualty Corp. | | | | | | | |
5.000%, 09/19/2022 | | | 295,000 | | | 311,362 | |
Jackson National Life Global Funding | | | | | | | |
0.657% (3 Month LIBOR + 0.480%) 06/11/2021 (a)(b) | | | 250,000 | | | 250,200 | |
0.692% (3 Month SOFR + 0.600%) 01/06/2023 (a)(b) | | | 2,000,000 | | | 2,010,466 | |
Metropolitan Life Global Funding I | | | | | | | |
0.662% (3 Month SOFR + 0.570%) 01/13/2023 (a)(b) | | | 2,000,000 | | | 2,012,380 | |
Progressive Corp. | | | | | | | |
3.750%, 08/23/2021 | | | 1,000,000 | | | 1,013,533 | |
Insurance Carriers - 1.2% | | | | | | 8,031,216 | |
| | | | | | |
John Hancock Life Insurance Co. | | | | | | | |
7.375%, 02/15/2024 (a) | | | 245,000 | | | 287,478 | |
Metropolitan Life Insurance Co. | | | | | | | |
7.875%, 02/15/2024 (a) | | | 825,000 | | | 985,156 | |
Internet & Direct Marketing Retail - 1.4% | | | | | | 1,272,634 | |
| | | | | | |
Expedia Group, Inc. | | | | | | | |
3.600%, 12/15/2023 (a) | | | 1,500,000 | | | 1,597,252 | |
Investment & Miscellaneous Financial Services - 1.1% | | | | | | | |
FMR LLC | | | | | | | |
5.350%, 11/15/2021 (a) | | | 200,000 | | | 205,933 | |
Intercontinental Exchange, Inc. | | | | | | | |
0.834% (3 Month LIBOR + 0.650%) 06/15/2023 (b) | | | 1,000,000 | | | 1,001,383 | |
| | | | | | 1,207,316 | |
The accompanying notes are an integral part of these financial statements.
ETFMG™ ETFs
ETFMG Sit Ultra Short ETF
Schedule of Investments
March 31, 2021 (Unaudited) (Continued)
| | Principal
Amount | | Value | |
Machinery - 2.4% | | | | | | | |
Caterpillar Financial Services Corp. | | | | | | | |
0.456% (3 Month LIBOR + 0.280%) 09/07/2021 (b) | | $ | 260,000 | | $ | 260,294 | |
Otis Worldwide Corp. | | | | | | | |
0.653% (3 Month LIBOR + 0.450%) 04/05/2023 (b) | | | 2,400,000 | | | 2,400,130 | |
Machinery - Construction / Farm - 0.3% | | | | | | 2,660,424 | |
| | | | | | |
John Deere Capital Corp. | | | | | | | |
0.443% (3 Month LIBOR + 0.260%) 09/10/2021 (b) | | | 300,000 | | | 300,339 | |
Motion Picture and Video Industries - 0.7% | | | | | | | |
Historic TW, Inc. | | | | | | | |
9.150%, 02/01/2023 | | | 650,000 | | | 741,512 | |
Multi Utilities - 5.9% | | | | | | | |
CenterPoint Energy Houston Electric LLC | | | | | | | |
1.850%, 06/01/2021 | | | 350,000 | | | 350,412 | |
Dominion Energy, Inc. | | | | | | | |
0.714% (3 Month LIBOR + 0.530%) 09/15/2023 (b) | | | 1,000,000 | | | 1,001,657 | |
Duke Energy Florida LLC | | | | | | | |
0.440% (3 Month LIBOR + 0.250%) 11/26/2021 (b) | | | 520,000 | | | 520,562 | |
Duke Energy Florida Project Finance LLC | | | | | | | |
1.731%, 09/01/2024 | | | 153,729 | | | 155,422 | |
Duke Energy Progress LLC | | | | | | | |
0.369% (3 Month LIBOR + 0.180%) 02/18/2022 (b) | | | 1,000,000 | | | 999,860 | |
Duquesne Light Holdings, Inc. | | | | | | | |
5.900%, 12/01/2021 (a) | | | 395,000 | | | 407,949 | |
Florida Power & Light Co. | | | | | | | |
0.599% (3 Month LIBOR + 0.380%) 07/28/2023 (b) | | | 2,761,000 | | | 2,761,066 | |
Wisconsin Power and Light Co. | | | | | | | |
2.250%, 11/15/2022 | | | 442,000 | | | 452,735 | |
Nondepository Credit Intermediation - 0.4% | | | | | | 6,649,663 | |
| | | | | | |
7-Eleven, Inc. | | | | | | | |
0.645% (3 Month LIBOR + 0.450%) 08/10/2022 (a)(b) | | | 500,000 | | | 500,539 | |
Oil, Gas & Consumable Fuels - 4.2% | | | | | | | |
BP Capital Markets PLC | | | | | | | |
0.840% (3 Month LIBOR + 0.650%) 09/19/2022 (b) | | | 100,000 | | | 100,470 | |
Kinder Morgan, Inc. | | | | | | | |
1.521% (3 Month LIBOR + 1.280%) 01/15/2023 (b) | | | 1,508,000 | | | 1,531,715 | |
Phillips 66 | | | | | | | |
0.814% (3 Month LIBOR + 0.620%) 02/15/2024 (b) | | | 1,900,000 | | | 1,903,101 | |
Valero Energy Corp. | | | | | | | |
1.334% (3 Month LIBOR + 1.150%) 09/15/2023 (b) | | | 1,158,000 | | | 1,162,022 | |
| | | | | | 4,697,308 | |
The accompanying notes are an integral part of these financial statements.
ETFMG™ ETFs
ETFMG Sit Ultra Short ETF
Schedule of Investments
March 31, 2021 (Unaudited) (Continued)
| | Principal
Amount | | Value | |
Pharmaceuticals - 4.5% | | | | | | | |
AbbVie, Inc. | | | | | | | |
0.832% (3 Month LIBOR + 0.650%) 11/21/2022 (b) | | $ | 2,000,000 | | $ | 2,012,934 | |
AstraZeneca PLC | | | | | | | |
0.857% (3 Month LIBOR + 0.665%) 08/17/2023 (b) | | | 2,195,000 | | | 2,215,558 | |
Perrigo Co. PLC | | | | | | | |
4.000%, 11/15/2023 | | | 400,000 | | | 422,696 | |
Pfizer, Inc. | | | | | | | |
0.514% (3 Month LIBOR + 0.330%) 09/15/2023 (b) | | | 386,000 | | | 388,007 | |
Professional Services - 2.3% | | | | | | 5,039,195 | |
| | | | | | |
Equifax, Inc. | | | | | | | |
1.064% (3 Month LIBOR + 0.870%) 08/15/2021 (b) | | | 2,411,000 | | | 2,416,373 | |
Semiconductors & Semiconductor Equipment - 1.1% | | | | | | | |
QUALCOMM, Inc. | | | | | | | |
0.942% (3 Month LIBOR + 0.730%) 01/30/2023 (b) | | | 1,267,000 | | | 1,280,525 | |
Technology Hardware, Storage & Peripherals - 3.9% | | | | | | | |
Apple, Inc. | | | | | | | |
0.553% (3 Month LIBOR + 0.350%) 05/11/2022 (b) | | | 1,650,000 | | | 1,656,764 | |
Hewlett Packard Enterprise Co. | | | | | | | |
0.958% (3 Month LIBOR + 0.720%) 10/05/2021 (b) | | | 2,662,000 | | | 2,662,449 | |
| | | | | | 4,319,213 | |
Trading Companies & Distributors - 0.2% | | | | | | |
GATX Corp. | | | | | | | |
0.915% (3 Month LIBOR + 0.720%) 11/05/2021 (b) | | | 140,000 | | | 140,484 | |
SMBC Aviation Capital Finance DAC | | | | | | | |
3.000%, 07/15/2022 (a) | | | 200,000 | | | 204,943 | |
TOTAL CORPORATE OBLIGATIONS (Cost $108,583,883) | | | | | | 345,427 | |
| | | | | 109,049,703 | |
| | | | | | |
MUNICIPAL DEBT OBLIGATIONS - 0.9% | | | | | | | |
City of Moline IL | | | | | | | |
2.080%, 12/01/2021 | | | 135,000 | | | 135,286 | |
2.130%, 12/01/2022 | | | 100,000 | | | 100,619 | |
City of Oakland CA | | | | | | | |
4.000%, 12/15/2022 | | | 700,000 | | | 741,251 | |
TOTAL MUNICIPAL MUNICIPAL DEBT OBLIGATIONS | | | | | | | |
(Cost $974,664) | | | | | | 977,156 | |
The accompanying notes are an integral part of these financial statements.
ETFMG™ ETFs
ETFMG Sit Ultra Short ETF
Schedule of Investments
March 31, 2021 (Unaudited) (Continued)
| | Shares | | Value | |
SHORT-TERM INVESTMENTS - 0.8% | | | | | | | |
MONEY MARKET FUNDS - 0.8% | | | | | | | |
First American Government Obligations Fund – Class X, 0.04% (d) | | | 904,647 | | $ | 904,647 | |
TOTAL SHORT-TERM INVESTMENTS (Cost $904,647) | | | | | | 904,647 | |
| | | | | | | |
Total Investments (Cost $111,113,298) - 99.7% | | | | | | 111,581,556 | |
Other Assets in Excess of Liabilities - 0.3% | | | | | | 334,396 | |
TOTAL NET ASSETS - 100.0% | | | | | $ | 111,915,952 | |
Percentages are stated as a percent of net assets.
(a) | Acquired in a transaction exempt from registration under Rule 144A or Section 4(a)(2) of the Securities Act of 1933. May be resold in the U.S. in transactions exempt from registration, normally to qualified institutional buyers. The total value of all such securities was $22,933,184, which represented 20.49% of the net assets of the Fund. |
(b) | Variable rate security based on a reference index and spread. The rate reported is the rate in effect as of March 31, 2021. |
(c) | Variable rate security. The coupon is based on an underlying pool of assets. The rate reported is the rate in effect as of March 31, 2021. |
(d) | The rate quoted is the annualized seven-day yield at March 31, 2021. |
(e) | As of March 31, 2021, the Fund had a significant portion of its assets invested in the Banking Industry. |
The accompanying notes are an integral part of these financial statements.
ETFMG™ ETFs
ETFMG Travel Tech ETF |
|
Schedule of Investments |
March 31, 2021 (Unaudited) |
| | Shares | | Value | |
COMMON STOCKS - 99.6% | | | | | | | |
Australia - 3.9% | | | | | | | |
Internet & Direct Marketing Retail - 3.9% (d) | | | | | | | |
Webjet, Ltd. (b) | | | 2,896,157 | | $ | 12,274,741 | |
| | | | | | | |
Brazil - 3.1% | | | | | | | |
Hotels, Restaurants & Leisure - 3.1% | | | | | | | |
CVC Brasil Operadora e Agencia de Viagens SA (b) | | | 2,805,761 | | | 9,815,042 | |
| | | | | | | |
Canada - 3.2% | | | | | | | |
Road & Rail - 3.2% | | | | | | | |
Facedrive, Inc. (a)(b) | | | 524,103 | | | 10,280,209 | |
| | | | | | | |
Cayman Islands - 11.1% | | | | | | | |
Hotels, Restaurants & Leisure - 1.8% | | | | | | | |
Tuniu Corp. - ADR (a)(b) | | | 1,668,432 | | | 5,772,775 | |
Internet & Direct Marketing Retail - 8.3% (d) | | | | | | | |
Tongcheng-Elong Holdings, Ltd. (a) | | | 5,845,998 | | | 13,189,798 | |
Trip.com Group, Ltd. - ADR (a) | | | 324,557 | | | 12,862,194 | |
Total Internet & Direct Marketing Retail | | | | | | 26,051,992 | |
Software - 1.0% | | | | | | | |
Lvji Technology Holdings, Inc. (a) | | | 20,766,380 | | | 3,018,486 | |
Total Cayman Islands | | | | | | 34,843,253 | |
| | | | | | | |
China - 3.8% | | | | | | | |
IT Services - 3.8% | | | | | | | |
TravelSky Technology, Ltd. | | | 5,208,277 | | | 12,179,735 | |
| | | | | | | |
Japan - 8.0% | | | | | | | |
Hotels, Restaurants & Leisure - 1.5% | | | | | | | |
Adventure, Inc. | | | 97,063 | | | 4,768,776 | |
Internet & Direct Marketing Retail - 6.5% (d) | | | | | | | |
Airtrip Corp. | | | 302,516 | | | 6,275,721 | |
Open Door, Inc. (a) | | | 446,212 | | | 7,394,888 | |
Temairazu, Inc. | | | 92,486 | | | 4,410,260 | |
Veltra Corp. (a) | | | 467,226 | | | 2,641,531 | |
Total Internet & Direct Marketing Retail | | | | | | 20,722,400 | |
Total Japan | | | | | | 25,491,176 | |
| | | | | | | |
Luxembourg - 2.9% | | | | | | | |
Internet & Direct Marketing Retail - 2.9% (d) | | | | | | | |
eDreams ODIGEO SA (a) | | | 1,688,858 | | | 9,328,300 | |
| | | | | | | |
Mauritius - 3.9% | | | | | | | |
Internet & Direct Marketing Retail - 3.9% (d) | | | | | | | |
MakeMyTrip, Ltd. (a) | | | 394,066 | | | 12,444,604 | |
The accompanying notes are an integral part of these financial statements.
ETFMG™ ETFs
ETFMG Travel Tech ETF |
|
Schedule of Investments |
March 31, 2021 (Unaudited) (Continued) |
| | Shares | | Value | |
Netherlands - 4.6% | | | | | | | |
Interactive Media & Services - 4.6% | | | | | | | |
Trivago NV - ADR (a)(b)(e) | | | 3,407,932 | | $ | 14,654,107 | |
| | | | | | | |
Republic of Korea - 7.3% | | | | | | | |
Hotels, Restaurants & Leisure - 7.3% | | | | | | | |
Hana Tour Service, Inc. (a) | | | 197,621 | | | 11,838,925 | |
Lotte Tour Development Co., Ltd. (a) | | | 693,874 | | | 11,464,938 | |
Total Hotels, Restaurants & Leisure | | | | | | 23,303,863 | |
| | | | | | | |
Spain - 3.8% | | | | | | | |
IT Services - 3.8% | | | | | | | |
Amadeus IT Group SA (a) | | | 171,191 | | | 12,121,671 | |
| | | | | | | |
United Kingdom - 12.8% | | | | | | | |
Internet & Direct Marketing Retail - 11.2% (d) | | | | | | | |
Despegar.com Corp. (a) | | | 988,520 | | | 13,473,528 | |
On the Beach Group PLC | | | 1,947,892 | | | 10,902,631 | |
Trainline PLC (a) | | | 1,823,280 | | | 11,537,361 | |
Total Internet & Direct Marketing Retail | | | | | | 35,913,520 | |
Software - 1.6% | | | | | | | |
accesso Technology Group PLC (a) | | | 580,709 | | | 5,083,615 | |
Total United Kingdom | | | | | | 40,997,135 | |
| | | | | | | |
United States - 31.2% | | | | | | | |
Hotels, Restaurants & Leisure - 4.7% | | | | | | | |
Airbnb, Inc. (a)(b) | | | 79,132 | | | 14,872,068 | |
Interactive Media & Services - 4.2% | | | | | | | |
TripAdvisor, Inc. (a)(b) | | | 245,263 | | | 13,192,697 | |
Internet & Direct Marketing Retail - 9.7% (d) | | | | | | | |
Booking Holdings, Inc. (a) | | | 6,425 | | | 14,969,222 | |
Expedia Group, Inc. | | | 90,028 | | | 15,495,620 | |
Total Internet & Direct Marketing Retail | | | | | | 30,464,842 | |
IT Services - 3.9% | | | | | | | |
Sabre Corp. | | | 828,041 | | | 12,263,287 | |
Road & Rail - 8.7% | | | | | | | |
Lyft, Inc. - Class A (a)(b) | | | 204,898 | | | 12,945,456 | |
Uber Technologies, Inc. (a) | | | 268,726 | | | 14,648,254 | |
Total Road & Rail | | | | | | 27,593,710 | |
Total United States | | | | | | 98,386,604 | |
TOTAL COMMON STOCKS (Cost $309,460,197) | | | | | | 316,120,440 | |
The accompanying notes are an integral part of these financial statements.
ETFMG™ ETFs
ETFMG Travel Tech ETF |
|
Schedule of Investments |
March 31, 2021 (Unaudited) (Continued) |
| | Shares | | Value | |
INVESTMENTS PURCHASED WITH PROCEEDS FROM | | | | | | | |
SECURITIES LENDING COLLATERAL – 15.0% | | | | | | | |
ETFMG Sit Ultra Short ETF (e) | | | 200,000 | | $ | 9,949,100 | |
Mount Vernon Liquid Assets Portfolio, LLC, 0.11% (c) | | | 37,492,170 | | | 37,492,170 | |
TOTAL INVESTMENTS PURCHASED WITH PROCEEDS | | | | | | | |
FROM SECURITIES LENDING COLLATERAL (Cost $47,439,870) | | | | | | 47,441,270 | |
| | | | | | | |
SHORT-TERM INVESTMENTS - 0.4% | | | | | | | |
Money Market Funds - 0.4% | | | | | | | |
Invesco Advisers, Inc. STIT-Treasury Portfolio – | | | | | | | |
Institutional Class, 0.01% (c) | | | 1,165,850 | | | 1,165,850 | |
TOTAL SHORT-TERM INVESTMENTS (Cost $1,165,850) | | | | | | 1,165,850 | |
| | | | | | | |
Total Investments (Cost $358,065,917) - 115.0% | | | | | | 364,727,560 | |
Liabilities in Excess of Other Assets - (15.0)% | | | | | | (47,466,725 | ) |
TOTAL NET ASSETS - 100.0% | | | | | $ | 317,260,835 | |
Percentages are stated as a percent of net assets.
ADR American Depositary Receipt
PLC Public Limited Company
(a) | Non-income producing security. |
(b) | All or a portion of this security is out on loan as of March 31, 2021. |
(c) | The rate quoted is the annualized seven-day yield at March 31, 2021. |
(d) | As of March 31, 2021 the Fund had a significant portion of its assets in the Internet & Direct Marketing Retail Industry. |
(e) | Affiliated security. Please refer to Note 9 of the Notes to Financial Statements. |
The accompanying notes are an integral part of these financial statements.
ETFMG™ ETFs
ETFMG Treatments, Testing and Advancements ETF
Schedule of Investments
March 31, 2021 (Unaudited)
| | Shares | | | Value | |
COMMON STOCKS - 99.6% | | | | | | | |
Canada - 5.9% | | | | | | | |
Biotechnology - 1.5% (d) | | | | | | | |
Arbutus Biopharma Corp. (a) | | 26,009 | | | $ | 86,610 | |
IMV, Inc. (a)(b) | | 20,519 | | | | 68,123 | |
VBI Vaccines, Inc. (a)(b) | | 155,649 | | | | 484,068 | |
XBiotech, Inc. (a) | | 8,963 | | | | 153,895 | |
Total Biotechnology | | | | | | 792,696 | |
Life Sciences Tools & Services - 4.4% | | | | | | | |
AbCellera Biologics, Inc. (a)(b) | | 72,624 | | | | 2,466,311 | |
Total Canada | | | | | | 3,259,007 | |
| | | | | | | |
Cayman Islands - 5.7% | | | | | | | |
Biotechnology - 5.7% (d) | | | | | | | |
I-Mab - ADR (a) | | 22,040 | | | | 1,068,279 | |
Zai Lab Ltd. - ADR (a) | | 16,315 | | | | 2,176,910 | |
Total Biotechnology | | | | | | 3,245,189 | |
| | | | | | | |
Denmark - 0.1% | | | | | | | |
Biotechnology - 0.1% (d) | | | | | | | |
Evaxion Biotech A/S - ADR (a) | | 5,918 | | | | 34,916 | |
France - 0.6% | | | | | | | |
Pharmaceuticals - 0.6% | | | | | | | |
Sanofi - ADR | | 7,894 | | | | 390,437 | |
| | | | | | | |
Germany - 6.5% | | | | | | | |
Biotechnology - 6.5% (d) | | | | | | | |
BioNTech SE - ADR (a)(b) | | 34,288 | | | | 3,743,907 | |
| | | | | | | |
Japan - 0.7% | | | | | | | |
Pharmaceuticals - 0.7% | | | | | | | |
Takeda Pharmaceutical Co., Ltd. - ADR (b) | | 20,773 | | | | 379,315 | |
| | | | | | | |
Netherlands - 4.4% | | | | | | | |
Biotechnology - 4.4% (d) | | | | | | | |
CureVac NV (a)(b) | | 26,744 | | | | 2,446,006 | |
InflaRx NV (a) | | 13,326 | | | | 51,971 | |
Total Biotechnology | | | | | | 2,497,977 | |
| | | | | | | |
United Kingdom - 4.7% | | | | | | | |
Biotechnology - 1.0% (d) | | | | | | | |
Immunocore Holdings PLC - ADR (a) | | 13,211 | | | | 562,392 | |
Health Care Equipment & Supplies - 2.3% | | | | | | | |
Ortho Clinical Diagnostics Holdings PLC (a) | | 68,618 | | | | 1,323,984 | |
The accompanying notes are an integral part of these financial statements.
ETFMG™ ETFs
ETFMG Treatments, Testing and Advancements ETF
Schedule of Investments
March 31, 2021 (Unaudited) (Continued)
| | Shares | | | Value | |
Pharmaceuticals - 1.4% | | | | | | | |
AstraZeneca PLC - ADR (b) | | 7,672 | | | $ | 381,452 | |
GlaxoSmithKline PLC - ADR (b) | | 10,569 | | | | 377,208 | |
Total Pharmaceuticals | | | | | | 758,660 | |
Total United Kingdom | | | | | | 2,645,036 | |
| | | | | | | |
United States - 71.0% | | | | | | | |
Biotechnology - 38.3% (d) | | | | | | | |
AbbVie, Inc. | | 3,428 | | | | 370,978 | |
Alexion Pharmaceuticals, Inc. (a) | | 2,437 | | | | 372,642 | |
Aligos Therapeutics, Inc. (a)(b) | | 11,675 | | | | 265,490 | |
Alnylam Pharmaceuticals, Inc. (a) | | 23,760 | | | | 3,354,674 | |
Arcturus Therapeutics Holdings, Inc. (a)(b) | | 8,053 | | | | 332,589 | |
Assembly Biosciences, Inc. (a) | | 11,726 | | | | 53,940 | |
Athersys, Inc. (a)(b) | | 60,558 | | | | 109,004 | |
BioCryst Pharmaceuticals, Inc. (a)(b) | | 54,272 | | | | 551,946 | |
CEL-SCI Corp. (a)(b) | | 12,418 | | | | 188,878 | |
Chimerix, Inc. (a) | | 26,290 | | | | 253,436 | |
Codiak Biosciences, Inc. (a) | | 6,603 | | | | 99,573 | |
ContraFect Corp. (a) | | 8,519 | | | | 40,891 | |
Cue Biopharma, Inc. (a) | | 9,275 | | | | 113,155 | |
Dicerna Pharmaceuticals, Inc. (a) | | 23,379 | | | | 597,801 | |
Dynavax Technologies Corp. (a) | | 34,697 | | | | 341,072 | |
Emergent BioSolutions, Inc. (a) | | 16,326 | | | | 1,516,849 | |
Enanta Pharmaceuticals, Inc. (a) | | 6,179 | | | | 304,748 | |
Enochian Biosciences, Inc. (a) | | 14,319 | | | | 50,689 | |
Gilead Sciences, Inc. | | 5,727 | | | | 370,136 | |
Hookipa Pharma, Inc. (a) | | 10,086 | | | | 135,657 | |
iBio, Inc. (a)(b) | | 66,233 | | | | 101,999 | |
ImmunityBio, Inc. (a)(b) | | 33,386 | | | | 792,584 | |
Immunome, Inc. (a) | | 3,250 | | | | 110,110 | |
Inovio Pharmaceuticals, Inc. (a)(b) | | 63,673 | | | | 590,885 | |
Moderna, Inc. (a) | | 24,656 | | | | 3,228,703 | |
Novavax, Inc. (a) | | 13,733 | | | | 2,489,930 | |
OPKO Health, Inc. (a)(b) | | 205,229 | | | | 880,432 | |
PhaseBio Pharmaceuticals, Inc. (a) | | 8,995 | | | | 31,123 | |
Regeneron Pharmaceuticals, Inc. (a) | | 806 | | | | 381,351 | |
Silverback Therapeutics, Inc. (a)(b) | | 10,726 | | | | 467,975 | |
SQZ Biotechnologies Co. (a) | | 8,532 | | | | 116,718 | |
Tonix Pharmaceuticals Holding Corp. (a) | | 99,855 | | | | 127,814 | |
Translate Bio, Inc. (a)(b) | | 23,039 | | | | 379,913 | |
Vaxart, Inc. (a)(b) | | 36,090 | | | | 218,345 | |
Vaxcyte, Inc. (a) | | 15,606 | | | | 308,219 | |
Vir Biotechnology, Inc. (a) | | 39,157 | | | | 2,007,579 | |
Total Biotechnology | | | | | | 21,657,828 | |
The accompanying notes are an integral part of these financial statements.
ETFMG™ ETFs
ETFMG Treatments, Testing and Advancements ETF
Schedule of Investments
March 31, 2021 (Unaudited) (Continued)
| | Shares | | | Value | |
Health Care Equipment & Supplies - 5.9% | | | | | | | |
Abbott Laboratories | | 3,121 | | | $ | 374,021 | |
Co-Diagnostics, Inc. (a)(b) | | 8,659 | | | | 82,607 | |
Hologic, Inc. (a) | | 5,145 | | | | 382,685 | |
Lucira Health, Inc. (a) | | 11,395 | | | | 137,880 | |
Meridian Bioscience, Inc. (a) | | 13,215 | | | | 346,894 | |
OraSure Technologies, Inc. (a) | | 22,037 | | | | 257,172 | |
Quidel Corp. (a) | | 13,000 | | | | 1,663,089 | |
Talis Biomedical Corp. (a) | | 7,876 | | | | 101,207 | |
Total Health Care Equipment & Supplies | | | | | | 3,345,555 | |
Health Care Providers & Services - 10.5% | | | | | | | |
Enzo Biochem, Inc. (a) | | 14,671 | | | | 50,468 | |
Laboratory Corp. of America Holdings (a) | | 13,866 | | | | 3,536,246 | |
Quest Diagnostics, Inc. | | 18,496 | | | | 2,373,777 | |
Total Health Care Providers & Services | | | | | | 5,960,491 | |
Life Sciences Tools & Services - 9.6% | | | | | | | |
Adaptive Biotechnologies Corp. (a) | | 42,727 | | | | 1,720,189 | |
Bio-Rad Laboratories, Inc. - Class A (a) | | 5,800 | | | | 3,312,786 | |
Luminex Corp. | | 14,301 | | | | 456,202 | |
Total Life Sciences Tools & Services | | | | | | 5,489,177 | |
Pharmaceuticals - 6.7% | | | | | | | |
Atea Pharmaceuticals, Inc. (a)(b) | | 25,312 | | | | 1,563,015 | |
Bristol-Myers Squibb Co. | | 6,105 | | | | 385,409 | |
CorMedix, Inc. (a) | | 9,843 | | | | 98,332 | |
Eli Lilly and Co. | | 1,803 | | | | 336,836 | |
Johnson & Johnson | | 2,366 | | | | 388,852 | |
Merck & Co., Inc. | | 5,021 | | | | 387,069 | |
Paratek Pharmaceuticals, Inc. (a) | | 13,981 | | | | 98,706 | |
Pfizer, Inc. | | 10,597 | | | | 383,929 | |
SIGA Technologies, Inc. (a) | | 23,709 | | | | 154,109 | |
Total Pharmaceuticals | | | | | | 3,796,257 | |
Total United States | | | | | | 40,249,308 | |
TOTAL COMMON STOCKS (Cost $53,459,991) | | | | | | 56,445,092 | |
| | | | | | | |
INVESTMENTS PURCHASED WITH PROCEEDS FROM SECURITIES LENDING COLLATERAL - 25.0% | | | | | | | |
ETFMG Sit Ultra Short ETF (e) | | 25,000 | | | | 1,243,637 | |
Mount Vernon Liquid Assets Portfolio, LLC, 0.11% (c) | | 12,912,840 | | | | 12,912,840 | |
TOTAL INVESTMENTS PURCHASED WITH PROCEEDS FROM SECURITIES LENDING COLLATERAL (Cost $14,156,814) | | | | | | 14,156,477 | |
The accompanying notes are an integral part of these financial statements.
ETFMG™ ETFs
ETFMG Treatments, Testing and Advancements ETF |
|
Schedule of Investments |
March 31, 2021 (Unaudited) (Continued) |
| | Shares | | | Value | |
SHORT-TERM INVESTMENTS - 0.4% | | | | | | | | |
Money Market Funds - 0.4% | | | | | | | | |
Invesco Advisers, Inc. STIT-Treasury Portfolio – Institutional Class, 0.01% (c) | | | 219,057 | | | $ | 219,057 | |
TOTAL SHORT-TERM INVESTMENTS (Cost $219,057) | | | | | | | 219,057 | |
| | | | | | | | |
Total Investments (Cost $67,835,862) - 125.0% | | | | | | | 70,820,626 | |
Liabilities in Excess of Other Assets - (25.0)% | | | | | | | (14,152,368 | ) |
TOTAL NET ASSETS - 100.0% | | | | | | $ | 56,668,258 | |
Percentages are stated as a percent of net assets.
ADR American Depositary Receipt
PLC Public Limited Company
(a) | Non-income producing security. |
(b) | All or a portion of this security is out on loan as of March 31, 2021. |
(c) | The rate quoted is the annualized seven-day yield at March 31, 2021. |
(d) | As of March 31, 2021 the Fund had a significant portion of its assets in the Biotechnology Industry. |
(e) | Affiliated security. Please refer to Note 9 of the Notes to Financial Statements. |
The accompanying notes are an integral part of these financial statements.
ETFMG™ ETFs
STATEMENTS OF ASSETS AND LIABILITIES |
As of March 31, 2021 (Unaudited) |
| | ETFMG | | | | | | | | | | | | | | | ETFMG | |
| | Prime Junior | | | ETFMG | | | ETFMG | | | | | | | | | Treatments, | |
| | Silver | | | Prime Cyber | | | Prime Mobile | | | ETFMG Sit | | | ETFMG | | | Testing and | |
| | Miners | | | Security | | | Payments | | | Ultra Short | | | Travel Tech | | | Advancements | |
| | ETF | | | ETF | | | ETF | | | ETF | | | ETF | | | ETF | |
ASSETS | | | | | | | | | | | | | | | | | | | | | | | | |
Investments in unaffiliated securities, at value* | | $ | 687,268,536 | | | $ | 2,099,963,833 | | | $ | 1,286,220,412 | | | $ | 111,581,556 | | | $ | 340,124,353 | | | $ | 69,576,989 | |
Investments in affiliated | | | | | | | | | | | | | | | | | | | | | | | | |
securities, at value* | | | 57,499,679 | | | | 68,318,305 | | | | 29,847,300 | | | | — | | | | 24,603,207 | | | | 1,243,637 | |
Cash | | | 1,804 | | | | — | | | | 648 | | | | — | | | | — | | | | — | |
Foreign currency* | | | — | | | | — | | | | 20,812 | | | | — | | | | — | | | | — | |
Receivables: | | | | | | | | | | | | | | | | | | | | | | | | |
Receivable for fund shares issued | | | — | | | | — | | | | 6,608,780 | | | | — | | | | — | | | | — | |
Dividends and interest receivable | | | 221,089 | | | | 377,221 | | | | 336,081 | | | | 361,902 | | | | 3,766 | | | | 13,299 | |
Securities lending income receivable | | | — | | | | 43,806 | | | | 16,615 | | | | — | | | | 157,644 | | | | 24,555 | |
Receivable for investments sold | | | — | | | | 833,936 | | | | 4,842,039 | | | | — | | | | — | | | | — | |
Total Assets | | | 744,991,108 | | | | 2,169,537,101 | | | | 1,327,892,687 | | | | 111,943,458 | | | | 364,888,970 | | | | 70,858,480 | |
LIABILITIES | | | | | | | | | | | | | | | | | | | | | | | | |
Collateral received for securities loaned (Note 7) | | $ | — | | | $ | 160,646,580 | | | $ | 112,862,577 | | | $ | — | | | $ | 47,439,870 | | | $ | 14,156,814 | |
Payables: | | | | | | | | | | | | | | | | | | | | | | | | |
Payable for investments purchased | | | — | | | | — | | | | 6,562,986 | | | | — | | | | 2,184 | | | | — | |
Management fees payable | | | 457,584 | | | | 1,051,640 | | | | 762,105 | | | | 27,506 | | | | 186,081 | | | | 33,408 | |
Total Liabilities | |
| 457,584 | | | | 161,698,220 | | | | 120,187,668 | | | | 27,506 | | | | 47,628,135 | | | | 14,190,222 | |
Net Assets | | $ | 744,533,524 | | | $ | 2,007,838,881 | | | $ | 1,207,705,019 | | | $ | 111,915,952 | | | $ | 317,260,835 | | | $ | 56,668,258 | |
| | | | | | | | | | | | | | | | | | | | | | | | |
NET ASSETS CONSIST OF: | | | | | | | | | | | | | | | | | | | | | | | | |
Paid-in Capital | | $ | 769,543,616 | | | $ | 1,802,570,840 | | | $ | 1,021,444,431 | | | $ | 112,679,083 | | | $ | 297,818,271 | | | $ | 51,961,093 | |
Total Distributable Earnings | | | | | | | | | | | | | | | | | | | | | | | | |
(Accumulated Losses) | | | (25,010,092 | ) | | | 205,268,041 | | | | 186,260,588 | | | | (763,131 | ) | | | 19,442,564 | | | | 4,707,165 | |
Net Assets | | $ | 744,533,524 | | | $ | 2,007,838,881 | | | $ | 1,207,705,019 | | | $ | 111,915,952 | | | $ | 317,260,835 | | | $ | 56,668,258 | |
| | | | | | | | | | | | | | | | | | | | | | | | | |
*Identified Cost: | | | | | | | | | | | | | | | | | | | | | | | | |
| | | | | | | | | | | | | | | | | | | | | | | | | |
Investments in unaffiliated securities | | $ | 669,847,676 | | | $ | 1,760,035,635 | | | $ | 1,097,474,080 | | | $ | 111,113,298 | | | $ | 334,735,131 | | | $ | 66,591,888 | |
Investments in affiliated securities | | | 62,588,031 | | | | 68,826,023 | | | | 30,082,268 | | | | — | | | | 23,330,786 | | | | 1,243,974 | |
Foreign currency | | | — | | | | — | | | | 20,703 | | | | — | | | | — | | | | — | |
Shares Outstanding^ | | | 51,950,000 | | | | 36,700,000 | | | | 18,150,000 | | | | 2,250,000 | | | | 10,250,000 | | | | 1,600,000 | |
Net Asset Value, Offering and Redemption Price per Share | | $ | 14.33 | | | $ | 54.71 | | | $ | 66.54 | | | $ | 49.74 | | | $ | 30.95 | | | $ | 35.42 | |
^ No par value, unlimited number of shares authorized
The accompanying notes are an integral part of these financial statements.
ETFMG™ ETFs
STATEMENTS OF OPERATIONS |
For the Period ended March 31, 2021 (Unaudited) |
| | ETFMG | | | | | | ETFMG | | | | | | | | | ETFMG | |
| | | Prime | | | ETFMG | | | Prime | | | ETFMG | | | | | | Treatments, | |
| | | Junior Silver | | | Prime Cyber | | | Mobile | | | Sit Ultra | | | ETFMG | | | Testing and | |
| | | Miners | | | Security | | | Payments | | | Short | | | Travel Tech | | | Advancements | |
| | | ETF | | | ETF | | | ETF | | | ETF | | | ETF | | | ETF | |
INVESTMENT INCOME | | | | | | | | | | | | | | | | | | | | | | | | |
Income: | | | | | | | | | | | | | | | | | | | | | | | | |
Dividends from unaffiliated securities (net of foreign withholdings tax of $195,194, $217,481, $46,458, $-, $-, $-) | | $ | 1,691,660 | | | $ | 5,846,098 | | | $ | 2,674,568 | | | $ | — | | | $ | — | | | $ | 102,852 | |
Interest | | | 82 | | | | 488 | | | | 376 | | | | 554,856 | | | | 37 | | | | 16 | |
Securities lending income | | | — | | | | 376,335 | | | | 108,213 | | | | — | | | | 295,756 | | | | 484,647 | |
Total Investment Income | | | 1,691,742 | | | | 6,222,921 | | | | 2,783,157 | | | | 554,856 | | | | 295,793 | | | | 587,515 | |
| | | | | | | | | | | | | | | | | | | | | | | | | |
Expenses: | | | | | | | | | | | | | | | | | | | | | | | | |
Management fees | | | 2,100,621 | | | | 5,670,474 | | | | 3,778,766 | | | | 157,654 | | | | 394,344 | | | | 198,681 | |
Total Expenses | | | 2,100,621 | | | | 5,670,474 | | | | 3,778,766 | | | | 157,654 | | | | 394,344 | | | | 198,681 | |
Net Investment Income (Loss) | | | (408,879 | ) | | | 552,447 | | | | (995,609 | ) | | | 397,202 | | | | (98,551 | ) | | | 388,834 | |
| | | | | | | | | | | | | | | | | | | | | | | | |
REALIZED & UNREALIZED GAIN (LOSS) ON INVESTMENTS | | | | | | | | | | | | | | | | | | | | | | | | |
Net Realized Gain (Loss) on: | | | | | | | | | | | | | | | | | | | | | | | | |
Unaffiliated Investments | | | (13,832,734 | ) | | | 3,718,155 | | | | (2,527,791 | ) | | | 116,869 | | | | (10,595,408 | ) | | | (1,430,487 | ) |
Affiliated Investments | | | 1,105,303 | | | | (156,439 | ) | | | — | | | | — | | | | 3,533,147 | | | | — | |
In-Kind redemptions | | | 39,371,282 | | | | 106,758,041 | | | | 66,687,888 | | | | — | | | | 20,886,508 | | | | 5,949,884 | |
Foreign currency and foreign currency translation | | | (45,294 | ) | | | (56,541 | ) | | | (134,143 | ) | | | — | | | | (59,899 | ) | | | — | |
Net Realized Gain (Loss) on Investments and In-Kind redemptions | | | 26,598,557 | | | | 110,263,216 | | | | 64,025,954 | | | | 116,869 | | | | 13,764,348 | | | | 4,519,397 | |
Net Change in Unrealized Appreciation (Depreciation) of: | | | | | | | | | | | | | | | | | | | | | | | | |
Unaffiliated Investments | | | (32,629,538 | ) | | | 146,948,010 | | | | 115,447,394 | | | | (159,525 | ) | | | 5,642,460 | | | | 8,183,635 | |
Affiliated Investments | | | (10,337,376 | ) | | | 2,244,068 | | | | (23,700 | ) | | | — | | | | 1,398,189 | | | | (988 | ) |
Foreign currency and foreign currency translation | | | 3,295 | | | | (5,107 | ) | | | (5,630 | ) | | | — | | | | 53 | | | | — | |
Net change in Unrealized Appreciation (Depreciation) of Investments | | | (42,963,619 | ) | | | 149,186,971 | | | | 115,418,064 | | | | (159,525 | ) | | | 7,040,702 | | | | 8,182,647 | |
Net Realized and Unrealized Gain (Loss) on Investments | | | (16,365,062 | ) | | | 259,450,187 | | | | 179,444,018 | | | | (42,656 | ) | | | 20,805,050 | | | | 12,702,044 | |
NET INCREASE (DECREASE) IN NET ASSETS RESULTING FROM OPERATIONS | | $ | (16,773,941 | ) | | $ | 260,002,634 | | | $ | 178,448,409 | | | $ | 354,546 | | | $ | 20,706,499 | | | $ | 13,090,878 | |
The accompanying notes are an integral part of these financial statements.
ETFMG Prime Junior Silver Miners ETF
STATEMENTS OF CHANGES IN NET ASSETS
| | Period Ended | | | |
| | March 31, 2021 (Unaudited) | | Year Ended September 30, 2020 | |
OPERATIONS | | | | | | | |
Net investment income (loss) | | $ | (408,879 | ) | $ | (940,100 | ) |
Net realized gain (loss) on investments and In-Kind | | | | | | | |
Redemptions | | | 26,598,557 | | | 11,084,085 | |
Net change in unrealized appreciation (depreciation) of | | | | | | | |
investments and foreign currency and foreign currency | | | | | | | |
translation | | | (42,963,619 | ) | | 60,060,330 | |
Net increase (decrease) in net assets resulting from | | | | | | | |
operations | | | (16,773,941 | ) | | 70,204,315 | |
| | | | | | | | |
DISTRIBUTIONS TO SHAREHOLDERS | | | | | | | |
Total distributions from distributable earnings | | | (7,160,000 | ) | | (1,980,500 | ) |
| | | | | | | | |
CAPITAL SHARE TRANSACTIONS | | | | | | | |
Net increase (decrease) in net assets derived | | | | | | | |
from net change in outstanding shares | | | 360,148,060 | | | 239,976,195 | |
Transaction Fees (See Note 1) | | | 822 | | | — | |
Net increase (decrease) in net assets from capital share | | | | | | | |
transactions | | | 360,148,882 | | | 239,976,195 | |
Total increase (decrease) in net assets | | $ | 336,214,941 | | $ | 308,200,010 | |
| | | | | | | | |
NET ASSETS | | | | | | | |
Beginning of Year/Period | | | 408,318,583 | | | 100,118,573 | |
End of Year/Period | | $ | 744,533,524 | | $ | 408,318,583 | |
Summary of share transactions is as follows: | | | | | | | | | | | | |
| | Period Ended March 31, 2021 (Unaudited) | | | Year Ended September 30, 2020 | |
| | | |
| | | |
| | Shares | | | Amount | | | Shares | | | Amount | |
Shares Sold | | | 28,000,000 | | | $ | 445,760,425 | | | | 26,050,000 | | | $ | 330,230,225 | |
Transaction Fees (See Note 1) | | | — | | | | 822 | | | | — | | | | — | |
Shares Redeemed | | | (5,650,000 | ) | | | (85,612,365 | ) | | | (7,050,000 | ) | | | (90,254,030 | ) |
Net Transactions in Fund Shares | | | 22,350,000 | | | $ | 360,148,882 | | | | 19,000,000 | | | $ | 239,976,195 | |
Beginning Shares | | | 29,600,000 | | | | | | | | 10,600,000 | | | | | |
Ending Shares | | | 51,950,000 | | | | | | | | 29,600,000 | | | | | |
The accompanying notes are an integral part of these financial statements.
ETFMG Prime Cyber Security ETF
STATEMENTS OF CHANGES IN NET ASSETS
| Period Ended | | | |
| | March 31, 2021 (Unaudited) | | Year Ended September 30, 2020 | |
| | | |
| | | |
OPERATIONS | | | | | | | |
Net investment income (loss) | | $ | 552,447 | | $ | 21,528,502 | |
Net realized gain (loss) on investments and In-Kind | | | | | | | |
Redemptions | | | 110,263,216 | | | 126,566,289 | |
Net change in unrealized appreciation (depreciation) of | | | | | | | |
investments and foreign currency and foreign currency | | | | | | | |
translation | | | 149,186,971 | | | 167,281,470 | |
Net increase (decrease) in net assets resulting from | | | | | | | |
operations | | | 260,002,634 | | | 315,376,261 | |
| | | | | | | | |
DISTRIBUTIONS TO SHAREHOLDERS | | | | | | | |
Total distributions from distributable earnings | | | (1,330,000 | ) | | (21,333,000 | ) |
| | | | | | | | |
CAPITAL SHARE TRANSACTIONS | | | | | | | |
Net increase (decrease) in net assets derived from net change | | | | | | | |
in outstanding shares | | | 245,332,080 | | | (217,450,615 | ) |
Transaction Fees (See Note 1) | | | 20,179 | | | 20,965 | |
Net increase (decrease) in net assets from capital share | | | | | | | |
transactions | | | 245,352,259 | | | (217,429,650 | ) |
Total increase (decrease) in net assets | | $ | 504,024,893 | | $ | 76,613,611 | |
| | | | | | | | |
NET ASSETS | | | | | | | |
Beginning of Year/Period | | | 1,503,813,988 | | | 1,427,200,377 | |
| End of Year/Period | | $ | 2,007,838,881 | | $ | 1,503,813,988 | |
Summary of share transactions is as follows: | | | | | | | | |
| | Period Ended March 31, 2021 (Unaudited) | | | Year Ended September 30, 2020 | |
| | Shares | | | | Amount | | | Shares | | | Amount | |
Shares Sold | | | 8,050,000 | | | $ | 452,570,505 | | | | 6,000,000 | | | $ | 265,419,220 | |
Transaction Fees (See Note 1) | | | — | | | | 20,179 | | | | — | | | | 20,965 | |
Shares Redeemed | | | (3,650,000 | ) | | | (207,238,425 | ) | | | (11,800,000 | ) | | | (482,869,835 | ) |
Net Transactions in Fund Shares | | | 4,400,000 | | | $ | 245,352,259 | | | | (5,800,000 | ) | | $ | (217,429,650 | ) |
Beginning Shares | | | 32,300,000 | | | | | | | | 38,100,000 | | | | | |
Ending Shares | | | 36,700,000 | | | | | | | | 32,300,000 | | | | | |
The accompanying notes are an integral part of these financial statements.
ETFMG Prime Mobile Payments ETF
STATEMENTS OF CHANGES IN NET ASSETS
| |
| | | |
| | Period Ended
March 31, 2021 (Unaudited) | | Year Ended September 30, 2020 | |
OPERATIONS | | | | | | | |
Net investment income (loss) | | $ | (995,609 | ) | $ | (520,736 | ) |
Net realized gain (loss) on investments and In-Kind | | | | | | | |
Redemptions | | | 64,025,954 | | | 46,567,698 | |
Net change in unrealized appreciation (depreciation) of | | | | | | | |
investments and foreign currency and foreign currency | | | | | | | |
translation | | | 115,418,064 | | | 54,396,310 | |
Net increase (decrease) in net assets resulting from | | | | | | | |
operations | | | 178,448,409 | | | 100,443,272 | |
| | | | | | | | |
DISTRIBUTIONS TO SHAREHOLDERS | | | | | | | |
Total distributions from distributable earnings | | | — | | | (216,000 | ) |
| | | | | | | | |
CAPITAL SHARE TRANSACTIONS | | | | | | | |
Net increase (decrease) in net assets derived from net change in | | | | | | | |
outstanding shares | | | 231,085,065 | | | (45,375,255 | ) |
Transaction Fees (See Note 1) | | | 29,105 | | | 92,896 | |
Net increase (decrease) in net assets from capital share | | | | | | | |
transactions | | | 231,114,170 | | | (45,282,359 | ) |
Total increase (decrease) in net assets | | $ | 409,562,579 | | $ | 54,944,913 | |
| | | | | | | | |
NET ASSETS | | | | | | | |
Beginning of Year/Period | | | 798,142,440 | | | 743,197,527 | |
End of Year/Period | | $ | 1,207,705,019 | | $ | 798,142,440 | |
| Summary of share transactions is as follows: | | | | | | |
| | Period Ended | | | | | |
| | March 31, 2021 | | Year Ended | |
| | (Unaudited) | | September 30, 2020 | |
| | Shares | | Amount | | Shares | | Amount | |
Shares Sold | | | 5,650,000 | | $ | 378,156,715 | | | 9,650,000 | | $ | 474,195,120 | |
Transaction Fees (See Note 1) | | | — | | | 29,105 | | | — | | | 92,896 | |
Shares Redeemed | | | (2,200,000 | ) | | (147,071,650 | ) | | (10,900,000 | ) | | (519,570,375 | ) |
Net Transactions in Fund Shares | | | 3,450,000 | | $ | 231,114,170 | | | (1,250,000 | ) | $ | (45,282,359 | ) |
Beginning Shares | | | 14,700,000 | | | | | | 15,950,000 | | | | |
Ending Shares | | | 18,150,000 | | | | | | 14,700,000 | | | | |
The accompanying notes are an integral part of these financial statements.
ETFMG Sit Ultra Short ETF
STATEMENTS OF CHANGES IN NET ASSETS
| | | Period Ended
March 31,
2021
(Unaudited) | | | Period Ended September 30, 20201 | |
| OPERATIONS | | | | | | | | |
| Net investment income (loss) | | $ | 397,202 | | | $ | 1,331,200 | |
| Net realized gain (loss) on investments and In-Kind Redemptions | | | 116,869 | | | | (1,407,472 | ) |
| Net change in unrealized appreciation (depreciation) of | | | | | | | | |
| Net change in unrealized appreciation (depreciation) of investments and foreign currency and foreign currency translation | | | (159,525 | ) | | | 627,783 | |
| Net increase (decrease) in net assets resulting from operations | | | 354,546 | | | | 551,511 | |
| | | | | | | | | |
| DISTRIBUTIONS TO SHAREHOLDERS | | | | | | | | |
| Total distributions from distributable earnings | | | (418,932 | ) | | | (1,250,256 | ) |
| | | | | | | | | |
| CAPITAL SHARE TRANSACTIONS | | | | | | | | |
| Net increase in net assets derived from net change in outstanding shares | | | 6,210,178 | | | | 106,468,905 | |
| Net increase in net assets | | $ | 6,145,792 | | | $ | 105,770,160 | |
| | | | | | | | | |
| NET ASSETS | | | | | | | | |
| Beginning of Period | | | 105,770,160 | | | | — | |
| End of Period | | $ | 111,915,952 | | | $ | 105,770,160 | |
Summary of share transactions is as follows:
| | | | Period Ended March 31, 2021 (Unaudited) | | | Year Ended September 30, 20201 | |
| | | | Shares | | | Amount | | | Shares | | | Amount | |
Shares Sold | | | | 225,000 | | | $ | 11,190,038 | | | | 2,200,000 | | | $ | 110,191,975 | |
Shares Redeemed | | | | (100,000 | ) | | | (4,979,860 | ) | | | (75,000 | )
| | | (3,723,070 | ) |
Net Transactions in Fund Shares | | | | 125,000 | | | $ | 6,210,178 | | | | 2,125,000 | | | $ | 106,468,905 | |
Beginning Shares | | | | 2,125,000 | | | | | | | | — | | | | | |
Ending Shares | | | | 2,250,000 | | | | | | | | 2,125,000 | | | | | |
1 | Fund commenced operations on October 8, 2019. The information presented is for the period from October 8, 2019 to September 30, 2020. |
The accompanying notes are an integral part of these financial statements.
ETFMG Travel Tech ETF
STATEMENTS OF CHANGES IN NET ASSETS
| | | Period Ended
March 31,
2021 (Unaudited) | | | Period Ended September 30, 20201 | |
| | | | | | | |
| OPERATIONS | | | | | | | | |
| Net investment income (loss) | | $ | (98,551 | ) | | $ | (12,667 | ) |
| Net realized gain (loss) on investments and In-Kind Redemptions | | | 13,764,348 | | | | (585,565 | ) |
| Net change in unrealized appreciation (depreciation) of | | | | | | | | |
| Net change in unrealized appreciation (depreciation) of investments and foreign currency and foreign currency translation | | | 7,040,702 | | | | (378,893 | ) |
| Net increase (decrease) in net assets resulting from operations | | | 20,706,499 | | | | (977,125 | ) |
| | | | | | | | | |
| DISTRIBUTIONS TO SHAREHOLDERS | | | | | | | | |
| Total distributions from distributable earnings | | | (24,500 | ) | | | — | |
| | | | | | | | | |
| CAPITAL SHARE TRANSACTIONS | | | | | | | | |
Net increase in net assets derived from net change in outstanding shares 2 | | | 281,375,165 | | | | 16,070,650 | |
| Transaction Fees (See Note 1) | | | 103,652 | | | | 6,494 | |
| Net increase in net assets from capital share transactions | | | 281,478,817 | | | | 16,077,144 | |
| Net increase in net assets | | $ | 302,160,816 | | | $ | 15,100,019 | |
| | | | | | | | | |
| NET ASSETS | | | | | | | | |
| Beginning of Period | | | 15,100,019 | | | | — | |
| End of Period | | $ | 317,260,835 | | | $ | 15,100,019 | |
Summary of share transactions is as follows:
| | | Period Ended
March 31, 2021
(Unaudited) | | | Period Ended September 30, 20201 | |
| | | Shares | | | Amount | | | Shares | | | Amount | |
| Shares Sold | | | 11,350,000 | | | $ | 340,592,245 | | | | 900,000 | | | $ | 18,057,660 | |
| Transaction Fees (See Note 1) | | | — | | | | 103,652 | | | | — | | | | 6,494 | |
| Shares Redeemed | | | (1,900,000 | ) | | | (59,217,080 | )
| | | (100,000 | | | | (1,987,010 | )
|
| Net Transactions in Fund Shares | | | 9,450,000 | | | $ | 281,478,817 | | | | 800,000 | | | $ | 16,077,144 | |
| Beginning Shares | | | 800,000 | | | | | | | | — | | | | | |
| Ending Shares | | | 10,250,000 | | | | | | | | 800,000 | | | | | |
1 | Fund commenced operations on February 12, 2020. The information presented is for the period from February 12, 2020 to September 30, 2020. |
2 | Includes reimbursement of $1,545 due to net asset value error. |
The accompanying notes are an integral part of these financial statements.
ETFMG Treatments, Testing and Advancements ETF
STATEMENTS OF CHANGES IN NET ASSETS
| | | Period Ended March 31, 2021 (Unaudited) | | | PeriodEnded September 30, 20201 | |
| OPERATIONS | | | | | | | | |
| Net investment income (loss) | | $ | 388,834 | | | $ | 36,158 | |
| Net realized gain (loss) on investments and In-Kind Redemptions | | | 4,519,397 | | | | (1,086,125 | ) |
| Net change in unrealized appreciation (depreciation) of investments and foreign currency and foreign currency translation | | | 8,182,647 | | | | (5,197,883 | ) |
| Net increase (decrease) in net assets resulting from operations | | | 13,090,878 | | | | (6,247,850 | ) |
| | | | | | | | | |
| DISTRIBUTIONS TO SHAREHOLDERS | | | | | | | | |
| Total distributions from distributable earnings | | | (498,750 | ) | | | — | |
| | | | | | | | | |
| CAPITAL SHARE TRANSACTIONS | | | | | | | | |
| Net increase in net assets derived from net change in outstanding shares | | | (9,953,760 | ) | | | 60,277,740 | |
| Net increase in net assets | | $ | 2,638,368 | | | $ | 54,029,890 | |
| | | | | | | | | |
| NET ASSETS | | | | | | | | |
| Beginning of Period | | | 54,029,890 | | | | — | |
| End of Period | | $ | 56,668,258 | | | $ | 54,029,890 | |
Summary of share transactions is as follows:
| | | | Period Ended March 31, 2021 (Unaudited) | | | Period Ended September 30, 20201 | |
| | | | Shares | | | Amount | | | Shares | | | Amount | |
Shares Sold | | |
| 400,000 | | | $ | 14,496,795 | | |
| 2,500,000 | | | $ | 75,601,825 | |
Shares Redeemed | | | | (750,000 | ) | | | (24,450,555 | ) | | | (550,000 | ) | | | (15,324,085 | ) |
Net Transactions in Fund Shares | | | | (350,000 | )
| | $ | (9,953,760 | ) | | | 1,950,000 | | | $ | 60,277,740 | |
Beginning Shares | | | | 1,950,000 | | | | | | | | — | | | | | |
Ending Shares | | | | 1,600,000 | | | | | | | | 1,950,000 | | | | | |
1 | Fund commenced operations on June 17, 2020. The information presented is for the period from June 17, 2020 to September 30, 2020. |
The accompanying notes are an integral part of these financial statements.
ETFMG Prime Junior Silver Miners ETF
FINANCIAL HIGHLIGHTS
For a capital share outstanding throughout the year/period
| | | Period Ended March 31, 2021 (Unaudited) | | | Year Ended September 30, 2020 | | | Year Ended September 30, 2019 | | | Year Ended September 30, 2018 | | | Year Ended September 30, 2017 | | | Year Ended September 30, 2016 | |
| Net Asset Value, Beginning Year/Period | | $ | 13.79 | | | $ | 9.45 | | | $ | 8.70 | | | $ | 11.84 | | | $ | 15.57 | | | $ | 5.28 | |
| Income (Loss) from | | | | | | | | | | | | | | | | | | | | | | | | |
| Investment Operations: | | | | | | | | | | | | | | | | | | | | | | | | |
| Net investment (loss)1 | | | (0.01 | ) | | | (0.05 | ) | | | (0.02 | ) | | | (0.03 | ) | | | (0.06 | ) | | | (0.06 | ) |
| Net realized and unrealized gain (loss) on investments | | | 0.75 | | | | 4.56 | | | | 0.91 | | | | (3.11 | ) | | | (3.61 | ) | | | 10.47 | |
| Total from investment operations | | | 0.74 | | | | 4.51 | | | | 0.89 | | | | (3.14 | ) | | | (3.67 | ) | | | 10.41 | |
| Less Distributions: | | | | | | | | | | | | | | | | | | | | | | | | |
| Distributions from net investment income | | | (0.20 | ) | | | (0.17 | ) | | | (0.14 | ) | | | — | | | | (0.06 | ) | | | (0.12 | ) |
| Total distributions | | | (0.20 | ) | | | (0.17 | ) | | | (0.14 | ) | | | — | | | | (0.06 | ) | | | (0.12 | ) |
| Net asset value, end year/period | | $ | 14.33 | | | $ | 13.79 | | | $ | 9.45 | | | $ | 8.70 | | | $ | 11.84 | | | $ | 15.57 | |
| Total Return | | | 5.43 | %3 | | | 48.06 | % | | | 10.45 | % | | | -26.50 | % | | | -23.53 | % | | | 201.99 | % |
| | | | | | | | | | | | | | | | | | | | | | | | | |
| Ratios/Supplemental Data: | | | | | | | | | | | | | | | | | | | | | | | | |
| Net assets at end year/period (000’s) | | $ | 744,534 | | | $ | 408,319 | | | $ | 100,119 | | | $ | 45,265 | | | $ | 58,033 | | | $ | 77,065 | |
| | | | | | | | | | | | | | | | | | | | | | | | | |
| Expenses to Average Net Assets before legal expense | | | 0.69 | %4 | | | 0.69 | % | | | 0.69 | % | | | 0.69 | % | | | 0.69 | % | | | 0.69 | % |
| Gross Expenses to Average Net Assets | | | 0.69 | %4 | | | 0.69 | % | | | 0.69 | % | | | 0.69 | % | | | 0.72 | %2 | | | 0.69 | % |
| Net Investment Loss to Average Net Assets | | | -0.13 | %4 | | | -0.46 | % | | | -0.21 | % | | | -0.32 | % | | | -0.48 | % | | | -0.45 | % |
| Portfolio Turnover Rate | | | 8 | %3 | | | 71 | % | | | 34 | % | | | 36 | % | | | 69 | % | | | 33 | % |
| 1 | Calculated based on average shares outstanding during the year/period. |
| 2 | The ratio of expenses to average net assets includes legal expense. |
The accompanying notes are an integral part of these financial statements.
ETFMG Prime Cyber Security ETF
FINANCIAL HIGHLIGHTS
For a capital share outstanding throughout the year/period
| | | Period Ended March 31, 2021 (Unaudited) | | | Year Ended September 30, 2020 | | | Year Ended September 30, 2019 | | | Year Ended September 30, 2018 | | | Year Ended September 30, 2017 | | | Year Ended September 30, 2016 | |
| Net Asset Value, Beginning Year/Period | | $ | 46.56 | | | $ | 37.46 | | | $ | 40.08 | | | $ | 30.11 | | | $ | 27.91 | | | $ | 25.28 | |
| Income (Loss) from | | | | | | | | | | | | | | | | | | | | | | | | |
| Investment Operations: | | | | | | | | | | | | | | | | | | | | | | | | |
| Net investment income (loss)1 | | | 0.02 | | | | 0.64 | | | | 0.07 | | | | 0.03 | | | | (0.01 | ) | | | 0.30 | |
| Net realized and unrealized gain (loss) on investments | | | 8.17 | | | | 9.10 | | | | (2.64 | ) | | | 9.94 | | | | 2.34 | | | | 2.52 | |
| Total from investment operations | | | 8.19 | | | | 9.74 | | | | (2.57 | ) | | | 9.97 | | | | 2.33 | | | | 2.82 | |
| Less Distributions: | | | | | | | | | | | | | | | | | | | | | | | | |
| Distributions from net investment income | | | (0.04 | ) | | | (0.64 | ) | | | (0.05 | ) | | | (0.00 | )3 | | | (0.13 | ) | | | (0.19 | ) |
| Total distributions | | | (0.04 | ) | | | (0.64 | ) | | | (0.05 | ) | | | (0.00 | )3 | | | (0.13 | ) | | | (0.19 | ) |
| Net asset value, end year/period | | $ | 54.71 | | | $ | 46.56 | | | $ | 37.46 | | | $ | 40.08 | | | $ | 30.11 | | | $ | 27.91 | |
| Total Return | | | 17.60 | %4 | | | 26.75 | % | | | -6.42 | % | | | 33.16 | % | | | 8.42 | % | | | 11.23 | % |
| | | | | | | | | | | | | | | | | | | | | | | | | |
| Ratios/Supplemental Data: | | | | | | | | | | | | | | | | | | | | | | | | |
| Net assets at end of year/period (000’s) | | $ | 2,007,839 | | | $ | 1,503,814 | | | $ | 1,427,200 | | | $ | 1,835,861 | | | $ | 1,097,360 | | | $ | 803,794 | |
| | | | | | | | | | | | | | | | | | | | | | | | | |
| Expenses to Average Net Assets before legal expense | | | 0.60 | %5 | | | 0.60 | % | | | 0.60 | % | | | 0.60 | % | | | 0.68 | % | | | 0.75 | % |
| Gross Expenses to Average Net Assets | | | 0.60 | %5 | | | 0.60 | % | | | 0.60 | % | | | 0.60 | % | | | 0.72 | %2 | | | 0.75 | % |
| Net Investment Income (Loss) to Average Net Assets | | | 0.06 | %5 | | | 1.50 | % | | | 0.19 | % | | | 0.07 | % | | | -0.03 | % | | | 1.21 | % |
| Portfolio Turnover Rate | | | 16 | %4 | | | 33 | % | | | 36 | % | | | 41 | % | | | 53 | % | | | 34 | % |
| 1 | Calculated based on average shares outstanding during the year/period. |
| 2 | The ratio of expenses to average net assets includes legal expense. |
| 3 | Per share amount is less than $0.01. |
The accompanying notes are an integral part of these financial statements.
ETFMG Prime Mobile Payments ETF
FINANCIAL HIGHLIGHTS
For a capital share outstanding throughout the year/period
| | | Period Ended March 31, 2021 (Unaudited) | | | Year Ended September 30, 2020 | | | Year Ended September 30, 2019 | | | Year Ended September 30, 2018 | | | Year Ended September 30, 2017 | | | Year Ended September 30, 2016 | |
| Net Asset Value, Beginning Year/Period | | $ | 54.30 | | | $ | 46.60 | | | $ | 42.86 | | | $ | 32.57 | | | $ | 24.96 | | | $ | 23.53 | |
| Income (Loss) from | | | | | | | | | | | | | | | | | | | | | | | | |
| Investment Operations: | | | | | | | | | | | | | | | | | | | | | | | | |
| Net investment income (loss)1 | | | (0.06 | ) | | | (0.04 | ) | | | 0.03 | | | | 0.07 | | | | 0.03 | | | | 0.15 | |
| Net realized and unrealized gain (loss) on investments | | | 12.30 | | | | 7.75 | | | | 3.93 | | | | 10.22 | | | | 7.60 | | | | 1.39 | |
| Total from investment operations | | | 12.24 | | | | 7.71 | | | | 3.96 | | | | 10.29 | | | | 7.63 | | | | 1.54 | |
| Less Distributions: | | | | | | | | | | | | | | | | | | | | | | | | |
| Distributions from net | | | | | | | | | | | | | | | | | | | | | | | | |
| investment income | | | — | | | | (0.02 | ) | | | (0.05 | ) | | | (0.01 | ) | | | (0.02 | ) | | | (0.11 | ) |
| Net realized gains | | | — | | | | — | | | | (0.18 | ) | | | — | | | | — | | | | — | |
| Total distributions | | | — | | | | (0.02 | ) | | | (0.23 | ) | | | (0.01 | ) | | | (0.02 | ) | | | (0.11 | ) |
| Capital Share Transactions: | | | | | | | | | | | | | | | | | | | | | | | | |
| Transaction fees added to paid-in capital | | | �� | | | | 0.01 | | | | 0.01 | | | | 0.01 | | | | — | | | | — | |
| Net asset value, end year/period | | $ | 66.54 | | | $ | 54.30 | | | $ | 46.60 | | | $ | 42.86 | | | $ | 32.57 | | | $ | 24.96 | |
| Total Return | | | 22.55 | %3 | | | 16.56 | % | | | 9.49 | % | | | 31.62 | % | | | 30.59 | % | | | 6.51 | % |
| | | | | | | | | | | | | | | | | | | | | | | | |
| Ratios/Supplemental Data: | | | | | | | | | | | | | | | | | | | | | | | | |
| Net assets at end year/period (000’s) | | $ | 1,207,705 | | | $ | 798,142 | | | $ | 743,198 | | | $ | 522,874 | | | $ | 170,993 | | | $ | 8,734 | |
| | | | | | | | | | | | | | | | | | | | | | | | | |
| Expenses to Average Net Assets before legal expense | | | 0.75 | %4 | | | 0.75 | % | | | 0.75 | % | | | 0.75 | % | | | 0.75 | % | | | 0.75 | % |
| Gross Expenses to Average Net Assets | | | 0.75 | %4 | | | 0.75 | % | | | 0.75 | % | | | 0.75 | % | | | 0.80 | %2 | | | 0.75 | % |
| Net Investment Income (Loss) to Average Net Assets | | | -0.19 | %4 | | | -0.08 | % | | | 0.06 | % | | | 0.16 | % | | | 0.12 | % | | | 0.63 | % |
| Portfolio Turnover Rate | | | 14 | %3 | | | 19 | % | | | 28 | % | | | 16 | % | | | 31 | % | | | 32 | % |
| 1 | Calculated based on average shares outstanding during the year/period. |
| 2 | The ratio of expenses to average net assets includes legal expense. |
The accompanying notes are an integral part of these financial statements.
ETFMG Sit Ultra Short ETF
FINANCIAL HIGHLIGHTS
For a capital share outstanding throughout the year/period
| | | Period Ended March 31, 2021 (Unaudited) | | | Period Ended September 30, 20201 | |
| Net Asset Value, Beginning Year/Period | | $ | 49.77 | | | $ | 50.00 | |
| Income from Investment Operations: | | | | | | | | |
| Net investment income 2 | | | 0.19 | | | | 0.86 | |
| Net realized and unrealized gain (loss) on investments | | | (0.02 | ) | | | (0.27 | ) |
| Total from investment operations | | | 0.17 | | | | 0.59 | |
| Less Distributions: | | | | | | | | |
| Distributions from net investment income | | | (0.20 | ) | | | (0.82 | ) |
| Total distributions | | | (0.20 | ) | | | (0.82 | ) |
| Net asset value at end of year/period | | $ | 49.74 | | | $ | 49.77 | |
| Total Return | | | 0.33 | %3 | | | 1.19 | %3 |
| | | | | | | | | |
| Ratios/Supplemental Data: | | | | | | | | |
| Net assets at end of year/period (000’s) | | $ | 111,916 | | | $ | 105,770 | |
| | | | | | | | | |
| Expenses to Average Net Assets before legal expense | | | 0.30 | %4 | | | 0.30 | %4 |
| Gross Expenses to Average Net Assets | | | 0.30 | %4 | | | 0.30 | %4 |
| Net Investment Income to Average Net Assets | | | 0.76 | %4 | | | 1.78 | %4 |
| Portfolio Turnover Rate | | | 27 | %3 | | | 132 | %3 |
| 1 | Commencement of operations on October 8, 2019. |
| 2 | Calculated based on average shares outstanding during the year/period. |
The accompanying notes are an integral part of these financial statements.
ETFMG Travel Tech ETF
FINANCIAL HIGHLIGHTS
For a capital share outstanding throughout the year/period
| | | Period Ended March 31, 2021 (Unaudited) | | | Period Ended September 30, 20201 | |
| Net Asset Value, Beginning Year/Period | | $ | 18.88 | | | $ | 25.00 | |
| Income (Loss) from Investment Operations: | | | | | | | | |
| Net investment income (loss)2 | | | (0.01 | ) | | | (0.02 | ) |
| Net realized and unrealized gain (loss) on investments | | | 12.06 | | | | (6.12 | ) |
| Total from investment operations | | | 12.05 | | | | (6.14 | ) |
| Less Distributions: | | | | | | | | |
| Distributions from net investment income | | | (0.01 | ) | | | — | |
| Total distributions | | | (0.01 | ) | | | — | |
| Capital Share Transactions: | | | | | | | | |
| Transaction fees added to paid-in capital | | | 0.03 | | | | 0.02 | |
| Net asset value at end of year/period | | $ | 30.95 | | | $ | 18.88 | |
| Total Return | | | 64.05 | %3 | | | -24.50 | %3 |
| | | | | | | | | |
| Ratios/Supplemental Data: | | | | | | | | |
| Net assets at end of year/period (000’s) | | $ | 317,261 | | | $ | 15,100 | |
| | | | | | | | | |
| Expenses to Average Net Assets before legal expense | | | 0.75 | %4 | | | 0.75 | %4 |
| Gross Expenses to Average Net Assets | | | 0.75 | %4 | | | 0.75 | %4 |
| Net Investment Income to Average Net Assets | | | 0.01 | %4 | | | 0.30 | %4 |
| Portfolio Turnover Rate | | | 24 | %3 | | | 49 | %3 |
| 1 | Commencement of operations on February 12, 2020. |
| 2 | Calculated based on average shares outstanding during the year/period. |
The accompanying notes are an integral part of these financial statements.
ETFMG Treatments, Testing and Advancements ETF
FINANCIAL HIGHLIGHTS
For a capital share outstanding throughout the year/period
| | | Period Ended March 31, 2021 (Unaudited) | | | Period Ended September 30, 20201 | |
| Net Asset Value, Beginning Year/Period | | $ | 27.71 | | | $ | 25.00 | |
| Income from Investment Operations: | | | | | | | | |
| Net investment income2 | | | 0.22 | | | | 0.02 | |
| Net realized and unrealized gain (loss) on investments | | | 7.78 | | | | 2.69 | |
| Total from investment operations | | | 8.00 | | | | 2.71 | |
| Less Distributions: | | | | | | | | |
| Distributions from net investment income | | | (0.29 | ) | | | — | |
| Total distributions | | | (0.29 | ) | | | — | |
| Net asset value at end of year/period | | $ | 35.42 | | | $ | 27.71 | |
| Total Return | | | 28.90 | %3 | | | 10.82 | %3 |
| | | | | | | | | |
| Ratios/Supplemental Data: | | | | | | | | |
| Net assets at end of year/period (000’s) | | $ | 56,668 | | | $ | 54,030 | |
| | | | | | | | | |
| Expenses to Average Net Assets before legal expense | | | 0.68 | %4 | | | 0.68 | %4 |
| Gross Expenses to Average Net Assets | | | 0.68 | %4 | | | 0.68 | %4 |
| Net Investment Income to Average Net Assets | | | 1.33 | %4 | | | 0.25 | %4 |
| Portfolio Turnover Rate | | | 26 | %3 | | | 41 | %3 |
| 1 | Commencement of operations on June 17, 2020. |
| 2 | Calculated based on average shares outstanding during the year/period. |
| 3 | Not annualized. |
| 4 | Annualized. |
The accompanying notes are an integral part of these financial statements.
ETFMG™ ETFs
NOTES TO FINANCIAL STATEMENTS
March 31, 2021 (Unaudited)
NOTE 1 – ORGANIZATION
ETFMG Prime Junior Silver Miners ETF (“SILJ”), ETFMG Prime Cyber Security ETF (“HACK”), ETFMG Prime Mobile Payments ETF (“IPAY”), ETFMG Sit Ultra Short ETF (“VALT”), ETFMG Travel Tech ETF (“AWAY”), and ETFMG Treatments, Testing and Advancements ETF (GERM) (each a “Fund”, or collectively the “Funds”) are series of ETF Managers Trust (the “Trust”), an open-end management investment company consisting of multiple investment series, organized as a Delaware statutory trust on July 1, 2009. The Trust is registered with the SEC under the Investment Company Act of 1940, as amended (the “1940 Act”), as an open-end management investment company and the offering of the Funds’ shares (“Shares”) is registered under the Securities Act of 1933, as amended (the “Securities Act”).
On June 29, 2020 the Board of Trustees of the Trust approved an Agreement and Plan of Reorganization (the “Agreement”) providing for the reorganization of IPAY and HACK into corresponding new funds, the ISE Mobile Payments ETF and the ISE Cyber Security ETF (collectively, the “Acquiring Funds”), which are newly created series of ETF Series Solutions, with similar investment objectives and lower fees and expenses than IPAY or HACK (the “Reorganization”). The Reorganization is subject to certain conditions including approval by shareholders of IPAY and HACK, respectively. Shareholders of record, as of July 10, 2020, have received proxy materials soliciting their vote with respect to the proposed Reorganization. Pursuant to the Agreement and upon shareholder approval, each of IPAY and HACK will transfer all of its assets to the respective Acquiring Fund in return for shares of beneficial interest of the Acquiring Fund and each Acquiring Fund will assume all of the respective liabilities of IPAY and HACK, respectively. Exchange Traded Concepts, LLC (“ETC”) is the investment adviser to the Acquiring Funds. The Joint Special Meeting of Shareholders of IPAY and HACK (the “Special Meeting”), originally scheduled to be held on October 9, 2020, was adjourned until December 7, 2020 and has now been adjourned until May 28, 2021. If approved at the Special Meeting, shareholders of IPAY and HACK will become shareholders of the respective Acquiring Fund. The proposed Reorganization is expected to be a tax-free transaction for federal income tax purposes. The following table is a summary of the Strategy Commencement Date and Strategy of the Funds:
| Fund | Strategy
Commencement
Date | Strategy |
ETFMG Prime
Junior Silver
Miners ETF | 8/1/2017 | Seeks to provide investment results that, before fees and expenses, correspond generally to the price and yield performance of the Prime Junior Silver Miners & Explorers Index (“Prime Silver Index”). |
ETFMG Prime
Cyber Security
ETF | 8/1/2017 | Seeks to provide investment results that, before fees and expenses, correspond generally to the price and yield of the Prime Cyber Defense Index (“Prime Cyber Index”). |
ETFMG Prime
Mobile
Payments ETF | 8/1/2017 | Seeks to provide investment results that, before fees and expenses, correspond generally to the price and yield performance of the Prime Mobile Payments Index (“Prime Mobile Index”). |
ETFMG Sit
Ultra Short
ETF | 10/8/2019 | Seeks to achieve its investment objective by investing in a diversified portfolio of high-quality short-term U.S. dollar denominated domestic and foreign debt securities and other instruments. |
ETFMG Travel
Tech ETF | 2/12/2020 | Seeks to provide investment results that, before fees and expenses, correspond generally to the total return performance of the Prime Travel Technology Index NTR (the “Index”). |
ETFMG
Treatments,
Testing and
Advancements
ETF | 6/17/2020 | Seeks to provide investment results that, before fees and expenses, correspond generally to the price and yield performance of the Prime Treatments, Testing and Advancements Index. |
ETFMG™ ETFs
NOTES TO FINANCIAL STATEMENTS
March 31, 2021 (Unaudited) (Continued)
The Funds each currently offer one class of shares, which have no front end sales load, no deferred sales charges, and no redemption fees. The Funds may issue an unlimited number of shares of beneficial interest, with no par value. All shares of each Fund have equal rights and privileges.
Shares of the Funds are listed and traded on the NYSE Arca, Inc. Market prices for the shares may be different from their net asset value (“NAV”). Each Fund issues and redeems shares on a continuous basis at NAV only in blocks of 50,000 shares, called “Creation Units.” Except for VALT, VALT is the only fund that trades in blocks of 25,000 shares. Creation Units are issued and redeemed principally in-kind for securities included in a specified Index. Once created, shares generally trade in the secondary market at market prices that change throughout the day in quantities less than a Creation Unit. Except when aggregated in Creation Units, shares are not redeemable securities of a Fund. Shares of a Fund may only be purchased or redeemed by certain financial institutions (“Authorized Participants”). An Authorized Participant is either (i) a broker-dealer or other participant in the clearing process through the Continuous Net Settlement System of the National Securities Clearing Corporation or (ii) a DTC participant and, in each case, must have executed a Participant Agreement with the Distributor. Most retail investors do not qualify as Authorized Participants nor have the resources to buy and sell whole Creation Units. Therefore, they are unable to purchase or redeem the shares directly from a Fund. Rather, most retail investors may purchase Shares in the secondary market with the assistance of a broker and may be subject to customary brokerage commissions or fees.
Authorized Participants transacting in Creation Units for cash may pay an additional variable charge to compensate the relevant Fund for certain transaction costs (i.e., brokerage costs) and market impact expenses relating to investing in portfolio securities. Such variable charges, if any, are included in “Transaction Fees” in the Statements of Changes in Net Assets.
NOTE 2 – SIGNIFICANT ACCOUNTING POLICIES
The following is a summary of significant accounting policies consistently followed by the Funds. These policies are in conformity with accounting principles generally accepted in the United States of America (“U.S. GAAP”).
The Funds follow the investment company accounting and reporting guidance of the Financial Accounting Standards Board Accounting Standard Codification Topic 946 Financial Services – Investment Companies.
The Funds may invest in certain other investment companies (underlying funds). For specific investments in underlying funds, please refer to the complete schedule of portfolio holdings on Form N-CSR(S) for this reporting period, which is filed with the U.S. Securities and Exchange Commission (“SEC”). For more information about the underlying fund’s operations and policies, please refer to those fund’s semiannual and annual reports, which are filed with the SEC.
| A. | Security Valuation. Securities listed on a securities exchange, market or automated quotation system for which quotations are readily available (except for securities traded on NASDAQ), including securities traded over the counter, are valued at the last quoted sale price on the primary exchange or market (foreign or domestic) on which they are traded on the valuation date (or at approximately 4:00 pm Eastern Time if a security’s primary exchange is normally open at that time), or, if there is no such reported sale on the valuation date, at the most recent quoted bid price. For securities traded on NASDAQ, the NASDAQ Official Closing Price will be used. |
ETFMG™ ETFs
NOTES TO FINANCIAL STATEMENTS
March 31, 2021 (Unaudited) (Continued)
Debt obligations are generally valued on the basis of valuations provided by third party pricing services, as derived from such services’ pricing models. Inputs to the models may include, but are not limited to, reported trades, executable bid and ask prices, broker/dealer quotations, prices or yields of securities with similar characteristics, interest rates, anticipated prepayments, benchmark curves or information pertaining to the issuer, as well as industry and economic events. The pricing services may use a matrix approach, which considers information regarding securities with similar characteristics to determine the valuation for a security.
Securities for which quotations are not readily available are valued at their respective fair values as determined in good faith by the Board of Trustees (the “Board”). When a security is “fair valued,” consideration is given to the facts and circumstances relevant to the particular situation, including a review of various factors set forth in the pricing procedures adopted by the Funds’ Board. The use of fair value pricing by a Fund may cause the net asset value of its shares to differ significantly from the net asset value that would be calculated without regard to such considerations. As of March 31, 2021, the Funds did not hold any securities that were fair valued by the Board.
As described above, the Funds utilize various methods to measure the fair value of their investments on a recurring basis. U.S. GAAP establishes a hierarchy that prioritizes inputs to valuation methods. The three levels of inputs are:
| Level 1 | Unadjusted quoted prices in active markets for identical assets or liabilities that the Funds have the ability to access. |
| | |
| Level 2 | Observable inputs other than quoted prices included in Level 1 that are observable for the asset or liability, either directly or indirectly. These inputs may include quoted prices for the identical instrument on an inactive market, prices for similar instruments, interest rates, prepayment speeds, credit risk, yield curves, default rates and similar data. |
| | |
| Level 3 | Unobservable inputs for the asset or liability, to the extent relevant observable inputs are not available; representing the Funds’ own assumptions about the assumptions a market participant would use in valuing the asset or liability, and would be based on the best information available. |
The availability of observable inputs can vary from security to security and is affected by a wide variety of factors, including, for example, the type of security, whether the security is new and not yet established in the marketplace, the liquidity of markets, and other characteristics particular to the security. To the extent that valuation is based on models or inputs that are less observable or unobservable in the market, the determination of fair value requires more judgment. Accordingly, the degree of judgment exercised in determining fair value is greatest for instruments categorized in Level 3.
The inputs used to measure fair value may fall into different levels of the fair value hierarchy. In such cases, for disclosure purposes, the level in the fair value hierarchy within which the fair value measurement falls in its entirety, is determined based on the lowest level input that is significant to the fair value measurement in its entirety.
ETFMG™ ETFs
NOTES TO FINANCIAL STATEMENTS
March 31, 2021 (Unaudited) (Continued)
The following is a summary of the inputs used to value the Funds’ net assets as of March 31, 2021:
| ETFMG Prime Junior Silver Miners ETF | | | | | | | | | | | | |
| Assets^ | | Level 1 | | | Level 2 | | | Level 3 | | | Total | |
| Common Stocks | | $ | 740,897,324 | | | $ | — | | | $ | 283,777 | | | $ | 741,181,101 | |
| Short-Term Investments | | | 3,587,114 | | | | — | | | | — | | | | 3,587,114 | |
| Total Investments in Securities | | $ | 744,484,438 | | | $ | — | | | $ | 283,777 | | | $ | 744,768,215 | |
| | | | | | | | | | | | | | | | | |
| ETFMG Prime Cyber Security ETF | | | | | | | | | | | | | | | | |
| Assets^ | | Level 1 | | | Level 2 | | | Level 3 | | | Total | |
| Common Stocks | | $ | 1,994,869,430 | | | $ | — | | | $ | — | | | $ | 1,994,869,430 | |
| Short-Term Investments | | | 10,720,628 | | | | — | | | | — | | | | 10,720,628 | |
| ETFMG Sit Ultra Short ETF** | | | 49,745,500 | | | | — | | | | — | | | | 49,745,500 | |
| Investments Purchased with Securities Lending Collateral* | | | — | | | | — | | | | — | | | | 112,946,580 | |
| Total Investments in Securities | | $ | 2,055,335,558 | | | $ | — | | | $ | — | | | $ | 2,168,282,138 | |
| | | | | | | | | | | | | | | | | |
| ETFMG Prime Mobile Payments ETF | | | | | | | | | | | | | | | | |
| Assets^ | | Level 1 | | | Level 2 | | | Level 3 | | | Total | |
| Common Stocks | | $ | 1,200,210,302 | | | $ | — | | | $ | — | | | $ | 1,200,210,302 | |
| Short-Term Investments | | | 1,767,533 | | | | — | | | | — | | | | 1,767,533 | |
| ETFMG Sit Ultra Short ETF** | | | 29,847,300 | | | | — | | | | — | | | | 29,847,300 | |
| Investments Purchased with Securities Lending Collateral* | | | — | | | | — | | | | — | | | | 84,242,577 | |
| Total Investments in Securities | | $ | 1,231,825,135 | | | $ | — | | | $ | — | | | $ | 1,316,067,712 | |
| | | | | | | | | | | | | | | | | |
| ETFMG Sit Ultra Short ETF | | | | | | | | | | | | | | | | |
| Assets^ | | Level 1 | | | Level 2 | | | Level 3 | | | Total | |
| Fixed Income | | | | | | | | | | | | | | | | |
| Asset Backed Securities | | $ | — | | | $ | 650,050 | | | $ | — | | | $ | 650,050 | |
| Corporate Obligations | | | — | | | | 109,049,703 | | | | — | | | | 109,049,703 | |
| Municipal Debt Obligations | | | — | | | | 977,156 | | | | — | | | | 977,156 | |
| Short-Term Investments | | | 904,647 | | | | — | | | | — | | | | 904,647 | |
| Total Investments in Securities | | $ | 904,647 | | | $ | 110,676,909 | | | $ | — | | | $ | 111,581,556 | |
| | | | | | | | | | | | | | | | | |
| ETFMG Travel Tech ETF | | | | | | | | | | | | | | | | |
| Assets^ | | Level 1 | | | Level 2 | | | Level 3 | | | Total | |
| Common Stocks | | $ | 316,120,440 | | | $ | — | | | $ | — | | | $ | 316,120,440 | |
| Short-Term Investments | | | 1,165,850 | | | | — | | | | — | | | | 1,165,850 | |
| ETFMG Sit Ultra Short ETF** | | | 9,949,100 | | | | — | | | | — | | | | 9,949,100 | |
| Investments Purchased with Securities Lending Collateral* | | | — | | | | — | | | | — | | | | 37,492,170 | |
| Total Investments in Securities | | $ | 327,235,390 | | | $ | — | | | $ | — | | | $ | 364,727,560 | |
ETFMG™ ETFs
NOTES TO FINANCIAL STATEMENTS
March 31, 2021 (Unaudited) (Continued)
| ETFMG Treatments, Testing and Advancements ETF | | | | | | | | | | | | |
| Assets^ | | Level 1 | | | Level 2 | | | Level 3 | | | Total | |
| Common Stocks | | $ | 56,445,092 | | | $ | — | | | $ | — | | | $ | 56,445,092 | |
| Short-Term Investments | | | 219,057 | | | | — | | | | — | | | | 219,057 | |
| ETFMG Sit Ultra Short ETF** | | | 1,243,637 | | | | — | | | | — | | | | 1,243,637 | |
| Investments Purchased with Securities Lending Collateral* | | | — | | | | — | | | | — | | | | 12,912,840 | |
| Total Investments in Securities | | $ | 57,907,786 | | | $ | — | | | $ | — | | | $ | 70,820,626 | |
^ See Schedule of Investments for classifications by country and industry.
| * | Certain investments that are measured at fair value used the net asset value per share (or its equivalent) practical expedient have not been categorized in the fair value hierarchy. The fair value amounts presented in the table are intended to permit reconciliation of the fair value hierarchy to the amounts presented in the Schedules of Investments. |
| ** | Investment was purchased with collateral. |
| B. | Federal Income Taxes. The Funds have each elected to be taxed as a “regulated investment company” and intend to distribute substantially all taxable income to their shareholders and otherwise comply with the provisions of the Internal Revenue Code applicable to regulated investment companies. Therefore, no provisions for federal income taxes or excise taxes have been made. |
To avoid imposition of the excise tax applicable to regulated investment companies, each Fund intends to declare each year as dividends, in each calendar year, at least 98.0% of its net investment income (earned during the calendar year) and 98.2% of its net realized capital gains (earned during the twelve months ended October 31) plus undistributed amounts, if any, from prior years.
Net capital losses incurred after October 31, within the taxable year are deemed to arise on the first business day of each Fund’s next taxable year.
Each Fund recognizes the tax benefits of uncertain tax positions only where the position is “more likely than not” to be sustained assuming examination by tax authorities. Each Fund has analyzed its tax position and has concluded that no liability for unrecognized tax benefits should be recorded related to uncertain tax positions expected to be taken in the Funds’ 2020 tax returns. The Funds identify their major tax jurisdictions as U.S. Federal, the State of New Jersey, and the State of Delaware; however the Funds are not aware of any tax positions for which it is reasonably possible that the total amounts of unrecognized tax benefits will change materially in the next twelve months.
As of March 31, 2021, management has reviewed the tax positions for open periods (for Federal purposes, four years from the date of filing and for state purposes, four years from the date of filing), as applicable to the Funds, and has determined that no provision for income tax is required in the Funds’ financial statements.
| C. | Security Transactions and Investment Income. Investment securities transactions are accounted for on the trade date. Gains and losses realized on sales of securities are determined on a specific identification basis. Discounts/premiums on debt securities purchased are accreted/amortized over the life of the respective securities using the effective interest method. Dividend income is recorded on the ex-dividend date. Interest income is recorded on an accrual basis. Income, including gains, from investments in foreign securities received by the Funds may be subject to income, withholding or other taxes imposed by foreign countries. |
ETFMG™ ETFs
NOTES TO FINANCIAL STATEMENTS
March 31, 2021 (Unaudited) (Continued)
| D. | Foreign Currency Translations and Transactions. The Funds may engage in foreign currency transactions. Foreign currency transactions are translated into U.S. dollars on the following basis: (i) market value of investment securities, assets and liabilities at the daily rates of exchange, and (ii) purchases and sales of investment securities, dividend and interest income and certain expenses at the rates of exchange prevailing on the respective dates of such transactions. For financial reporting purposes, the Funds do not isolate changes in the exchange rate of investment securities from the fluctuations arising from changes in the market prices of securities for unrealized gains and losses. However, for federal income tax purposes, the Funds do isolate and treat as ordinary income the effect of changes in foreign exchange rates on realized gains or losses from the sale of investment securities and payables and receivables arising from trade-date and settlement-date differences. |
| E. | Distributions to Shareholders. Distributions to shareholders from net investment income are generally declared and paid by each of the Funds on a quarterly basis. Distributions to shareholders from realized gains on securities for each Fund normally are declared and paid on an annual basis. Distributions are recorded on the ex-dividend date. |
| F. | Use of Estimates. The preparation of financial statements in conformity with U.S. GAAP requires management to make estimates and assumptions that affect the reported amounts of assets and liabilities at the date of the financial statements, as well as the reported amounts of revenues and expenses during the reporting period. Actual results could differ from those estimates. |
| G. | Share Valuation. The net asset value (“NAV”) per share of each Fund is calculated by dividing the sum of the value of the securities held by the Fund, plus cash and other assets, minus all liabilities (including estimated accrued expenses) by the total number of shares outstanding for the Fund, rounded to the nearest cent. The Funds’ shares will not be priced on the days on which the NYSE is closed for trading. For Authorized Participants, the offering and redemption price per share for the Funds are equal to the Funds’ respective net asset value per share. |
| H. | Guarantees and Indemnifications. In the normal course of business, the Funds enter into contracts with service providers that contain general indemnification clauses. The Funds’ maximum exposure under these arrangements is unknown as this would involve future claims that may be made against the Funds that have not yet occurred. However, based on experience, the Funds expect the risk of loss to be remote. |
NOTE 3 – RISK FACTORS
Investing in the Funds may involve certain risks, as discussed in the Funds’ prospectus, including, but not limited to, those described below. Any of these risks could cause an investor to lose money.
Market Risk. Financial markets rise and fall in response to a variety of factors, sometimes rapidly and unpredictably. As with any investment whose performance is tied to these markets, the value of an investment in a Fund will fluctuate, which means that an investor could lose money over short or long periods.
Investment Style Risk. The Funds, other than VALT, are not actively managed (“Index Funds”). Therefore, those Funds follow the securities included in its respective index during upturns as well as downturns. Because of their indexing strategies, the Index Funds do not take steps to reduce market exposure or to lessen the effects of a declining market. In addition, because of the Index Funds’ expenses, the Index Funds’ performance may be below that of their respective index.
ETFMG™ ETFs
NOTES TO FINANCIAL STATEMENTS
March 31, 2021 (Unaudited) (Continued)
Equity Risk. The prices of equity securities rise and fall daily. These price movements may result from factors affecting individual companies, industries or the securities market as a whole. In addition, equity markets tend to move in cycles which may cause stock prices to fall over short or extended periods of time.
Securities Lending Risk. Securities lending involves the risk of loss of rights in, or delay in recovery of, the loaned securities if the borrower fails to return the security loaned or becomes insolvent.
Concentration Risk. To the extent that a Fund’s or an index’s portfolio is concentrated in the securities of issuers in a particular market, industry, group of industries, sector or asset class, the fund may be adversely affected by the performance of those securities, may be subject to increased price volatility and may be more vulnerable to adverse economic, market, political or regulatory occurrences affecting that market, industry, group of industries, sector or asset class.
Natural Disaster/Epidemic Risk. Natural or environmental disasters, such as earthquakes, fires, floods, hurricanes, tsunamis and other severe weather-related phenomena generally, and widespread disease, including pandemics and epidemics (for example, the novel coronavirus COVID-19), have been and can be highly disruptive to economies and markets and have recently led, and may continue to lead, to increased market volatility and significant market losses. Such natural disaster and health crises could exacerbate political, social, and economic risks previously mentioned, and result in significant breakdowns, delays, shutdowns, social isolation, and other disruptions to important global, local and regional supply chains affected, with potential corresponding results on the operating performance of the Funds and their investments. A climate of uncertainty and panic, including the contagion of infectious viruses or diseases, may adversely affect global, regional, and local economies and reduce the availability of potential investment opportunities, and increases the difficulty of performing due diligence and modeling market conditions, potentially reducing the accuracy of financial projections. Under the circumstances, the Funds may have difficulty achieving their investment objectives which may adversely impact performance. Further, such events can be highly disruptive to economies and markets, significantly disrupt the operations of individual companies (including, but not limited to, the Funds’ Sponsor and third party service providers), sectors, industries, markets, securities and commodity exchanges, currencies, interest and inflation rates, credit ratings, investor sentiment, and other factors affecting the value of the Funds’ investments. These factors can cause substantial market volatility, exchange trading suspensions and closures and can impact the ability of the Funds to complete redemptions and otherwise affect Fund performance and Fund trading in the secondary market. A widespread crisis may also affect the global economy in ways that cannot necessarily be foreseen at the current time. How long such events will last and whether they will continue or recur cannot be predicted. Impacts from these events could have significant impact on a Fund’s performance, resulting in losses to the Funds.
NOTE 4 – MANAGEMENT AND OTHER CONTRACTS
ETF Managers Group, LLC (the “Advisor”), serves as the investment advisor to the Funds. Pursuant to an Investment Advisory Agreement (“Advisory Agreement”) between the Trust, on behalf of the Funds, and the Advisor, the Advisor provides investment advice to the Funds and oversees the day-to-day operations of the Funds, subject to the direction and control of the Board and the officers of the Trust. Under the Advisory Agreement, the Advisor is also responsible for arranging transfer agency, custody, fund administration and accounting, and other non-distribution related services necessary for the Funds to operate.
ETFMG™ ETFs
NOTES TO FINANCIAL STATEMENTS
March 31, 2021 (Unaudited) (Continued)
Under the Investment Advisory Agreement, the Advisor has overall responsibility for the general management and administration of the Funds and arranges for sub-advisory, transfer agency, custody, fund administration, securities lending, and all other non-distribution related services necessary for the Funds to operate. The Funds unitary fees are accrued daily and paid monthly. The Advisor bears the costs of all advisory and non-advisory services required to operate the Funds, in exchange for a single unitary fee at the following annual rates:
| ETFMG Prime Junior Silver Miners ETF | | | 0.69 | % |
| ETFMG Prime Cyber Security ETF | | | 0.60 | % |
| ETFMG Prime Mobile Payments ETF | | | 0.75 | % |
| ETFMG Sit Ultra Short ETF | | | 0.30 | % |
| ETFMG Travel Tech ETF | | | 0.75 | % |
| ETFMG Treatments, Testing and Advancements ETF | | | 0.68 | % |
Under the Investment Advisory Agreement, the Advisor has agreed to pay all expenses of the Funds, except for: the fee paid to the Advisor pursuant to the Investment Advisory Agreement, interest charges on any borrowings, taxes, brokerage commissions and other expenses incurred in placing orders for the purchase and sale of securities and other investment instruments, acquired fund fees and expenses, accrued deferred tax liability, extraordinary expenses, and distribution (12b-1) fees and expenses (collectively, “Excluded Expenses”). The Advisor has entered into an agreement with its affiliate ETFMG Financial LLC to serve as distributor to the Funds (the “Distributor”). The Distributor provides marketing support for the Funds, including distributing marketing materials related to the Funds. Level ETF Ventures, LLC (“Level”) serves as the index provider for SILJ, HACK, IPAY, AWAY, and GERM. Level is not affiliated with the Trust or the Advisor.
U.S. Bancorp Fund Services, LLC doing business as U.S. Bank Global Fund Services (the “Administrator”) provides fund accounting, fund administration, and transfer agency services to the Funds. The Advisor compensates the Administrator for these services under an administration agreement between the two parties.
The Advisor pays each independent Trustee a quarterly fee for service to the Funds. Each Trustee is also reimbursed by the Advisor for all reasonable out-of-pocket expenses incurred in connection with his duties as Trustee, including travel and related expenses incurred in attending Board meetings.
NOTE 5 – DISTRIBUTION PLAN
The Funds have each adopted a Plan of Distribution pursuant to Rule 12b-1 under the 1940 Act. Under the Plan, each Fund may pay compensation to the Distributor or any other distributor or financial institution with which the Trust has an agreement with respect to each Fund, with the amount of such compensation not to exceed an annual rate of 0.25% of each Fund’s average daily net assets. During the period ended March 31, 2021, the Funds did not incur any 12b-1 expenses.
NOTE 6 - PURCHASES AND SALES OF SECURITIES
The costs of purchases and sales of securities, excluding short-term securities and in-kind transactions, during the period ended March 31, 2021:
| | | Purchases | | | Sales | |
| ETFMG Prime Junior Silver Miners ETF | | $ | 48,766,666 | | | $ | 57,834,448 | |
| ETFMG Prime Cyber Security ETF | | | 307,292,920 | | | | 300,751,800 | |
| ETFMG Prime Mobile Payments ETF | | | 148,358,404 | | | | 143,476,663 | |
| ETFMG Sit Ultra Short ETF | | | 45,894,347 | | | | 23,458,525 | |
| ETFMG Travel Tech ETF | | | 87,323,760 | | | | 28,534,140 | |
| ETFMG Treatments, Testing and Advancements ETF | | | 14,776,739 | | | | 15,104,722 | |
ETFMG™ ETFs
NOTES TO FINANCIAL STATEMENTS
March 31, 2021 (Unaudited) (Continued)
The costs of purchases and sales of in-kind transactions associated with creations and redemptions during the period ended March 31, 2021:
| | | Purchases In-Kind | | | Sales In-Kind | |
| ETFMG Prime Junior Silver Miners ETF | | $ | 442,881,280 | | | $ | 83,098,934 | |
| ETFMG Prime Cyber Security ETF | | | 433,900,630 | | | | 200,288,119 | |
| ETFMG Prime Mobile Payments ETF | | | 366,944,586 | | | | 144,038,383 | |
| ETFMG Sit Ultra Short ETF | | | — | | | | — | |
| ETFMG Travel Tech ETF | | | 283,122,016 | | | | 51,717,555 | |
| ETFMG Treatments, Testing and Advancements ETF | | | 14,433,926 | | | | 24,134,899 | |
Purchases in-kind are the aggregate of all in-kind purchases and sales in-kind are the aggregate of all in-kind sales. Net capital gains or losses resulting from in-kind redemptions are excluded from the Funds’ determination of taxable gains and are not distributed to shareholders.
There were no purchases or sales of U.S. Government obligations during the period ended March 31, 2021.
NOTE 7 — SECURITIES LENDING
The Funds, except for SILJ and VALT, may lend up to 33 1⁄3% of the value of the securities in their portfolios to brokers, dealers and financial institutions (but not individuals) under terms of participation in a securities lending program administered by U.S. Bank N.A. (the “Custodian”). The securities lending agreement requires that loans are collateralized at all times in an amount equal to at least 102% of the value of any loaned securities at the time of the loan, plus accrued interest. The Funds receive compensation in the form of fees and earn interest on the cash collateral. The amount of fees depends on a number of factors including the type of security and length of the loan. The Funds continue to receive interest payments or dividends on the securities loaned during the borrowing period. Gain or loss on the fair value of securities loaned that may occur during the term of the loan will be for the account of the Funds. The Funds have the right under the terms of the securities lending agreement to recall the securities from the borrower on demand. The cash collateral is invested by the Custodian in accordance with approved investment guidelines. Those guidelines require the cash collateral to be invested in readily marketable, high quality, short-term obligations, either directly on behalf of each Fund or through one or more joint accounts, money market funds, or short-term bond funds, including those advised by or affiliated with the Advisor; however, all such investments are subject to risk of payment delays or default on the part of the issuer or counterparty or otherwise may not generate sufficient interest to support the costs associated with securities lending. Other investment companies in which a Fund may invest cash collateral can be expected to incur fees and expenses for operations, such as investment advisory and administration fees, which would be in addition to those incurred by the Fund, and which may be received in full or in part by the Advisor. Pursuant to guidance issued by the SEC staff, fees and expenses of money market funds used for cash collateral received in connection with loans of securities are not treated as Acquired Fund Fees and Expenses, which reflect a Fund’s pro rata share of the fees and expenses incurred by other investment companies in which the Fund invests (as disclosed in the Prospectus, as applicable). The Funds could also experience delays in recovering their securities and possible loss of income or value if the borrower fails to return the borrowed securities, although the Fund is indemnified from this risk by contract with the securities lending agent.
ETFMG™ ETFs
NOTES TO FINANCIAL STATEMENTS
March 31, 2021 (Unaudited) (Continued)
As of the period ended March 31, 2021 the value of the securities on loan and payable for collateral due to broker were as follows:
Value of Securities on Loan Collateral Received
| Fund | | Values of Securities on Loan | | | Fund Collateral Received* | |
| ETFMG Prime Cyber Security ETF | | $ | 161,619,360 | | | $ | 163,055,457 | |
| ETFMG Prime Mobile Payments ETF | | | 113,520,296 | | | | 114,324,845 | |
| ETFMG Travel Tech ETF | | | 46,881,776 | | | | 47,439,870 | |
| ETFMG Treatments, Testing and Advancements ETF | | | 14,788,812 | | | | 14,156,814 | |
* The cash collateral received was invested in the Mount Vernon Liquid Assets Portfolio, a money market fund with an overnight and continuous maturity, and ETFMG Sit Ultra Short ETF as shown on the Schedule of Investments.
NOTE 8 – FEDERAL INCOME TAXES
The components of distributable earnings (losses) and cost basis of investments for federal income tax purposes at September 30, 2020 were as follows:
| | | Cost | | | Gross Unrealized Appreciation | | | Gross Unrealized Depreciation | | | Net Unrealized Appreciation (Depreciation) | |
| ETFMG Prime Junior Silver Miners ETF | | $ | 380,118,215 | | | $ | 71,538,065 | | | $ | (42,215,328 | ) | | $ | 29,322,737 | |
| ETFMG Prime Cyber Security ETF | | | 1,592,035,516 | | | | 276,804,520 | | | | (132,584,561 | ) | | | 144,219,959 | |
| ETFMG Prime Mobile Payments ETF | | | 834,183,894 | | | | 133,568,333 | | | | (80,211,507 | ) | | | 53,356,826 | |
| ETFMG Sit Ultra Short ETF | | | 104,598,990 | | | | 648,594 | | | | (20,811 | ) | | | 627,783 | |
| ETFMG Travel Tech ETF | | | 18,518,532 | | | | 734,322 | | | | (1,917,702 | ) | | | (1,183,380 | ) |
| ETFMG Treatments, Testing and Advancements ETF | | | 76,989,904 | | | | 2,005,700 | | | | (7,773,581 | ) | | | (5,767,881 | ) |
The difference between the tax cost of investments and the cost of investments for GAAP purposes is primarily due to the tax treatment of wash sale losses.
As of September 30, 2020, the components of distributable earnings (loss) on a tax basis were as follows:
| | | Undistributed Ordinary Income | | | Undistributed Long-Term Gain | | | Total Distributable Earnings | | | Other Accumulated Loss | | | Total Accumulated Gain (Loss) | |
| ETFMG Prime Junior Silver Miners ETF | | $ | 6,942,754 | | | $ | — | | | $ | 6,942,754 | | | $ | (37,341,642 | ) | | $ | (1,076,151 | ) |
| ETFMG Prime Cyber Security ETF | | | 267,547 | | | | — | | | | 267,547 | | | | (197,892,099 | ) | | | (53,404,593 | ) |
| ETFMG Prime Mobile Payments ETF | | | — | | | | — | | | | — | | | | (45,544,647 | ) | | | 7,812,179 | |
| ETFMG Sit Ultra Short ETF | | | 88,164 | | | | — | | | | 88,164 | | | | (1,414,692 | ) | | | (698,745 | ) |
| ETFMG Travel Tech ETF | | | 24,389 | | | | — | | | | 24,389 | | | | (59,289 | ) | | | (1,218,280 | ) |
| ETFMG Treatments, Testing and Advancements ETF | | | 95,210 | | | | — | | | | 95,210 | | | | (2,212,292 | ) | | | (7,884,963 | ) |
ETFMG™ ETFs
NOTES TO FINANCIAL STATEMENTS
March 31, 2021 (Unaudited) (Continued)
The difference between the tax cost of investments and the cost of investments for GAAP purposes is primarily due to the tax treatment of wash sale losses.
As of September 30, 2020, the Funds had accumulated capital loss carryovers of:
| | | Capital Loss Carryforward ST | | | Capital Loss Carryforward LT | | | | Expires | |
| ETFMG Prime Junior Silver Miners ETF | | $ | (19,782,810 | ) | | $ | (17,555,549 | ) | | | Indefinite | |
| ETFMG Prime Cyber Security ETF | | | (86,782,369 | ) | | | (111,109,228 | ) | | | Indefinite | |
| ETFMG Prime Mobile Payments ETF | | | (21,125,249 | ) | | | (24,081,540 | ) | | | Indefinite | |
| ETFMG Sit Ultra Short ETF | | | (1,414,692 | ) | | | — | | | | Indefinite | |
| ETFMG Travel Tech ETF | | | (59,402 | ) | | | — | | | | Indefinite | |
| ETFMG Treatments, Testing and Advancements ETF | | | (2,212,292 | ) | | | — | | | | Indefinite | |
Under current tax law, capital and currency losses realized after October 31 of a Fund’s fiscal year may be deferred and treated as occurring on the first business day of the following fiscal year for tax purposes. The following Funds had deferred post-October capital and currency losses, which will be treated as arising on the first business day of the year ending September 30, 2020.
| | | Late Year Ordinary Loss | | | Post-October Capital Loss | |
| ETFMG Prime Junior Silver Miners ETF | | $ | — | | | $ | — | |
| ETFMG Prime Cyber Security ETF | | | — | | | | — | |
| ETFMG Prime Mobile Payments ETF | | | (339,075 | ) | | | — | |
| ETFMG Sit Ultra Short ETF | | | — | | | | — | |
| ETFMG Travel Tech ETF | | | — | | | | — | |
| ETFMG Treatments, Testing and Advancements ETF | | | — | | | | — | |
The tax character of distributions paid during the period ended March 31, 2021, and the year ended September 30, 2020 were as follows:
| | | Period Ended March 31, 2021 | | | Year Ended September 30, 2020 | |
| | | From Ordinary Income | | | From Capital Gains | | | From Ordinary Income | | | From Capital Gains | |
| ETFMG Prime Junior Silver Miners ETF | | $ | 7,160,000 | | | $ | — | | | $ | 1,980,500 | | | $ | — | |
| ETFMG Prime Cyber Security ETF | | | 1,330,000 | | | | — | | | | 21,333,000 | | | | — | |
| ETFMG Prime Mobile Payments ETF | | | — | | | | — | | | | 216,000 | | | | — | |
| ETFMG Sit Ultra Short ETF | | | 418,932 | | | | — | | | | 1,250,256 | | | | — | |
| ETFMG Travel Tech ETF | | | 24,500 | | | | — | | | | — | | | | — | |
| ETFMG Treatments, Testing and Advancements ETF | | | 498,750 | | | | — | | | | — | | | | — | |
ETFMG™ ETFs
NOTES TO FINANCIAL STATEMENTS
March 31, 2021 (Unaudited) (Continued)
NOTE 9 – INVESTMENTS IN AFFILIATES
ETFMG Prime Junior Silver Miners ETF
ETFMG Prime Junior Silver Miners ETF owned the following companies during the period ended March 31, 2021. Kootenay Silver, Inc., MAG Silver Corp. and New Gold, Inc. are deemed to be affiliates of the Fund as defined by the 1940 Act as of the period ended March 31, 2021. Transactions during the period in these securities were as follows:
| Security Name | | Value at September 30, 2020 | | | Purchases | | | Sales | | | Realized Gain (Loss)(1) | | | Change in Unrealized Appreciation (Depreciation) | | | Dividend Income | | | Value at
March 31, 2021 | | | Ending Shares | |
| Kootenay Silver, Inc.* | | $ | 1,371,967 | | | $ | 1,422,233 | | | $ | (305,630 | ) | | $ | 110,609 | | | $ | (438,441 | ) | | $ | — | | | $ | 2,160,738 | | | | 8,355,076 | |
| MAG Silver Corp. * | | | 20,520,080 | | | | 35,551,130 | | | | (2,583,885 | ) | | | 493,442 | | | | (7,767,670 | ) | | | — | | | | 46,213,097 | | | | 3,069,556 | |
| New Gold, Inc. * | | | 6,281,951 | | | | 6,549,850 | | | | (2,075,944 | ) | | | 501,252 | | | | (2,131,265 | ) | | | — | | | | 9,125,844 | | | | 5,911,571 | |
| Total | | $ | 28,173,998 | | | | 43,523,213 | | | | (4,965,459 | ) | | $ | 1,105,303 | | | $ | (10,337,376 | ) | | $ | — | | | $ | 57,499,679 | | | | 17,336,203 | |
ETFMG Prime Cyber Security ETF
ETFMG Prime Cyber Security ETF owned the following companies during the period ended March 31, 2021. Secure Works Corp. – Class A, and ETFMG Sit Ultra Short ETF are deemed to be affiliates of the Fund as defined by the 1940 Act as of the period ended March 31, 2021. Transactions during the period in these securities were as follows:
| Security Name | | Value at September 30, 2020 | | | Purchases | | | Sales | | | Realized Gain (Loss)(1) | | | Change in Unrealized Appreciation (Depreciation) | | | Dividend Income | | | Value at
March 31, 2021 | | | Ending Shares | |
| SecureWorks Corp. -Class A* | | $ | 12,800,697 | | | $ | 5,393,949 | | | $ | (1,748,970 | ) | | $ | (156,439 | ) | | $ | 2,283,568 | | | $ | — | | | $ | 18,572,805 | | | | 1,388,102 | |
| ETFMG Sit Ultra Short ETF * | | | 49,785,000 | | | | — | | | | — | | | | — | | | | (39,500 | ) | | | — | | | | 49,745,500 | | | | 1,000,000 | |
| Tufin Software Technologies, Ltd.** | | | 16,657,303 | | | | 8,566,164 | | | | (13,395,136 | ) | | | (13,597,765 | ) | | | 17,765,617 | | | | — | | | | 15,996,183 | | | | 1,523,446 | |
| Total | | $ | 79,243,000 | | | $ | 13,960,113 | | | $ | (15,144,106 | ) | | $ | (13,754,204 | ) | | $ | 20,009,685 | | | $ | — | | | $ | 84,314,488 | | | | 3,911,548 | |
ETFMG Prime Mobile Payments ETF
ETFMG Prime Mobile Payments ETF owned the following company during the period ended March 31, 2021. ETFMG Sit Ultra Short ETF is deemed to be an affiliate of the Fund as defined by the 1940 Act as of the period ended March 31, 2021. Transactions during the period in this security was as follows:
| Security Name | | Value at September 30, 2020 | | | Purchases | | | Sales | | | Realized Gain (Loss)(1) | | | Change in Unrealized Appreciation (Depreciation) | | | Dividend Income | | | Value at
March 31, 2021 | | | Ending Shares | |
| ETFMG Sit Ultra Short ETF * | | $ | 29,871,000 | | | $ | — | | | $ | — | | | $ | — | | | $ | (23,700 | ) | | $ | — | | | $ | 29,847,300 | | | | 600,000 | |
ETFMG™ ETFs
NOTES TO FINANCIAL STATEMENTS
March 31, 2021 (Unaudited) (Continued)
ETFMG Travel Tech ETF
ETFMG Travel Tech ETF owned the following companies during the period ended March 31, 2021. ETFMG Sit Ultra Short ETF and Trivago NV are deemed to be affiliates of the Fund as defined by the 1940 Act as of the period ended March 31, 2021. Transactions during the period in these securities were as follows:
| Security Name | | Value at September 30, 2020 | | | Purchases | | | Sales | | | Realized Gain (Loss)(1) | | | Change in Unrealized Appreciation (Depreciation) | | | Dividend Income | | | Value at
March 31, 2021 | | | Ending Shares | |
| ETFMG Sit Ultra Short ETF * | | $ | — | | | $ | 9,947,700 | | | $ | — | | | $ | — | | | $ | 1,400 | | | $ | — | | | $
| 9,949,100 | | | | 200,000 | |
| Trivago NV * | | | 560,015 | | | | 17,405,790 | | | | (8,241,634 | ) | | | 3,533,147 | | | | 1,396,789 | | | | — | | | | 14,654,107 | | | | 3,407,932 | |
| Total | | $ | 560,015 | | | $ | 27,353,490 | | | $ | (8,241,634 | ) | | $ | 3,533,147 | | | $ | 1,398,189 | | | $ | — | | | $
| 24,603,207 | | | | 3,607,932 | |
ETFMG Treatments, Testing and Advancements ETF
ETFMG Treatments, Testing and Advancements ETF owned the following company during the period ended March 31, 2021. ETFMG Sit Ultra Short ETF is deemed to be an affiliate of the Fund as defined by the 1940 Act as of the period ended March 31, 2021. Transactions during the period in this security was as follows:
| Security Name | | Value at September 30, 2020 | | | Purchases | | | Sales | | | Realized Gain (Loss)1 | | | Change in Unrealized Appreciation (Depreciation) | | | Dividend Income | | | Value at
March 31, 2021 | | | Ending Shares | |
| ETFMG Sit Ultra Short ETF * | | $ | 1,244,625 | | | $ | — | | | $ | — | | | $ | — | | | $ | (988 | ) | | $ | — | | | $ | 1,243,637 | | | | 25,000 | |
| * | Affiliate as of March 31, 2021. |
| ** | These securities were not affiliated as of March 31, 2021. |
1 Realized Losses include transactions in affiliated investments and affiliated in-kind redemptions.
NOTE 10 – LEGAL MATTERS
The Trust, a former and current trustee of the Trust, the Adviser and certain officers of the Adviser were defendants in an action filed May 2, 2017 in the Superior Court of New Jersey captioned PureShares, LLC d/b/a PureFunds et al. v. ETF Managers Group, LLC et al., Docket No. C-63-17. The PureShares action alleged claims based on disputes arising out of contractual relationships with the Adviser relating to certain series of the Trust. The action sought damages in unspecified amounts and injunctive relief based on breach of contract, wrongful termination, and several other claims.
The Adviser and its parent, Exchange Traded Managers Group, LLC (“ETFMG”), were defendants in a case filed on October 26, 2017 in the United States District Court for the Southern District of New York by NASDAQ, Inc. ("Nasdaq") captioned Nasdaq, Inc. v. Exchange Traded Managers Group, LLC et al., Case 1:17-cv-08252. This action arose out of the same facts and circumstances, and relates to the same series of the Trust, as the New Jersey litigation and asserted claims for breach of contract, conversion and certain other claims. The matter was the subject of a bench trial in May 2019, and on December 20, 2019, the Court issued an Opinion and Order awarding compensatory damages to Plaintiff in the amount of $78,403,172.36, plus prejudgment interest. The Court also denied Plaintiffs requests for punitive damages and equitable relief.
ETFMG™ ETFs
NOTES TO FINANCIAL STATEMENTS
March 31, 2021 (Unaudited) (Continued)
On May 1, 2020, Nasdaq, PureShares LLC ("PureShares"), and ETFMG announced a global settlement that resolves all claims in both the PureShares action and the Nasdaq action. The settlement is subject to future negotiations and approvals among independent third parties. As part of the settlement, Nasdaq and ETFMG have agreed to certain cash payments from ETFMG to Nasdaq and PureShares, and have executed an asset purchase agreement to transfer certain ETFMG intellectual property and related assets, to a Nasdaq affiliate. The transaction is expected to close prior to July 31, 2021. The Adviser does not believe that the resolution of these matters will have a material adverse effect on the Fund’s financial statements. If the events set forth in the settlement agreement do not occur, and a subsequent settlement is not reached, the resulting conditions may adversely affect the Adviser’s future operations.
NOTE 11 – SUBSEQUENT EVENTS
In preparing these financial statements, the Funds have evaluated events and transactions for potential recognition or disclosure through the date the financial statements were issued. This evaluation did not result in any subsequent events that necessitated disclosures and/or adjustments to the financial statements.
ETFMG Prime Junior Silver Miners ETF
ETFMG Prime Cyber Security ETF
ETFMG Prime Mobile Payments ETF
ETFMG Sit Ultra Short ETF
ETFMG Travel Tech ETF
APPROVAL OF ADVISORY AGREEMENTS AND BOARD CONSIDERATIONS
For the Period Ended March 31, 2021 (Unaudited)
Pursuant to Section 15(c) of the Investment Company Act of 1940 (the “1940 Act”), at a meeting held on March 30, 2021, the Board of Trustees (the “Board”) of ETF Managers Trust (the “Trust”) considered the renewal of:
| • | the Amended and Restated Investment Advisory Agreement (the “Advisory Agreement”) between ETF Managers Group LLC (the “Adviser”) and the Trust, on behalf of each of ETFMG Prime Junior Silver Miners ETF (“SILJ”), ETFMG Prime Cyber Security ETF (“HACK”), ETFMG Prime Mobile Payments ETF (“IPAY”), ETFMG Sit Ultra Short ETF (“VALT”) and ETFMG Travel Tech ETF (“AWAY”) (each a “Fund” and collectively, the “Funds”); and |
| • | a Sub-Advisory Agreement between the Adviser and Sit Fixed Income Advisors II, LLC (the “Sub-Adviser”) with respect to the Fund (the “Sub-Advisory Agreement” and, together with the Advisory Agreement, the “Agreements”). |
Pursuant to Section 15(c) of the 1940 Act, the Board must annually review and approve the Agreements after their initial two-year term: (i) by the vote of the Trustees or by a vote of the shareholders of the Funds; and (ii) by the vote of a majority of the Trustees who are not parties to the Agreements or “interested persons” of any party thereto, as defined in the 1940 Act (the “Independent Trustees”), cast in person at a meeting called for the purpose of voting on such approval. Each year, the Board calls and holds a meeting to decide whether to renew the Agreements for an additional one-year term. In preparation for such meeting, the Board requests and reviews a wide variety of information from the Adviser and Sub-Adviser.
In reaching its decision, the Board, including the Independent Trustees, considered all factors it believed relevant, including: (i) the nature, extent and quality of the services provided to the Funds’ shareholders by the Adviser and Sub-Adviser; (ii) the investment performance of the Funds; (iii) the Adviser’s costs and profits realized in providing services to the Funds, including any fall-out benefits enjoyed by the Adviser; (iv) comparative fee and expense data for the Funds in relation to other similar investment companies; (v) the extent to which economies of scale would be realized as the Funds grow and whether the advisory fees for the Funds reflect these economies of scale for the benefit of the Funds; and (vi) other financial benefits to the Adviser or Sub-Adviser and their affiliates resulting from services rendered to the Funds. The Board’s review included written and oral information furnished to the Board prior to and at the meeting held on March 30, 2021, and throughout the year. Among other things, each of the Adviser and Sub-Adviser provided responses to a detailed series of questions, which included information about the Adviser’s and Sub-Adviser’s operations, service offerings, personnel, compliance program and financial condition. The Board then discussed the written and oral information that it received before the meeting and throughout the year, and the Adviser’s oral presentations and any other information that the Board received at the meeting, and deliberated on the renewal of the Agreements in light of this information.
The Independent Trustees were assisted throughout the contract review process by independent legal counsel. The Independent Trustees relied upon the advice of such counsel and their own business judgment in determining the material factors to be considered in evaluating the renewal of the Agreements, and the weight to be given to each such factor. The conclusions reached with respect to the Agreements were based on a comprehensive evaluation of all the information provided and not any single factor. Moreover, each Trustee may have placed varying emphasis on particular factors in reaching conclusions with respect to each Fund. The Independent Trustees conferred amongst themselves and independent legal counsel during a telephonic contract renewal meeting held prior to the March 30, 2021 meeting and also conferred in executive sessions both with and without representatives of management before and during the March 30th meeting. The Independent Trustees requested, received and considered additional information arising out of these executive sessions.
ETFMG Prime Junior Silver Miners ETF
ETFMG Prime Cyber Security ETF
ETFMG Prime Mobile Payments ETF
ETFMG Sit Ultra Short ETF
ETFMG Travel Tech ETF
APPROVAL OF ADVISORY AGREEMENTS AND BOARD CONSIDERATIONS
For the Period Ended March 31, 2021 (Unaudited) (Continued)
Nature, Extent and Quality of Services Provided by the Adviser
The Trustees considered the scope of services provided under the Advisory Agreement, noting that the Adviser provides investment management services to the Funds. The Board discussed the responsibilities of the Adviser, including: responsibility for the general management of the day-to-day investment and reinvestment of the assets of the Funds; determining the daily baskets of deposit securities and cash components; executing portfolio security trades for purchases and redemptions of Fund shares conducted on a cash-in-lieu basis; responsibility for daily monitoring of tracking error and quarterly reporting to the Board; and implementation of Board directives as they relate to the Funds. In considering the nature, extent and quality of the services provided by the Adviser, the Board considered the qualifications, experience and responsibilities of the Adviser’s investment personnel and the quality of the Adviser’s compliance and risk assessment infrastructure. The Board also considered the Adviser’s experience managing exchange-traded funds (“ETFs”), as well as the Adviser’s response to the market volatility and uncertainty during the recent pandemic.
The Board also considered other services provided to the Funds, such as overseeing the activities of the Sub-Adviser, as well as the Funds’ other service providers, monitoring adherence to the Fund’s investment restrictions, and monitoring compliance with various policies and procedures and with applicable securities laws.
With respect to VALT, the Board then considered the scope of services provided under the Sub- Advisory Agreement, noting that the Sub-Adviser will be providing investment sub-advisory services to the Adviser in the form of selecting and trading portfolio securities on behalf of the Fund and selecting broker-dealers to execute purchase and sale transactions, subject to the supervision of the Adviser and the oversight of the Board.
In considering the nature, extent and quality of the services to be provided by the Sub-Adviser, the Board noted that it had received a copy of the Sub-Adviser’s Form ADV, as well as the response of the Sub-Adviser to a detailed series of questions which included, among other things, information about the background and experience of the Sub-Adviser’s personnel. The Board considered the experience of the Sub-Adviser’s personnel in the financial services industry, particularly in regards to fixed-income securities. The Board also considered the quality of the Sub-Adviser’s compliance program and Code of Ethics.
Based on the factors above, as well as those discussed below, the Board concluded that it was satisfied with the nature, extent and quality of the services provided to the Funds by the Adviser and Sub- Adviser, as applicable.
Historical Performance
The Board then considered the past performance of the Funds. The Board reviewed information regarding each Fund’s performance with the performance of a group of peer funds and with the performance of each Fund’s underlying index, as applicable, for various time periods.
ETFMG Prime Junior Silver Miners ETF
ETFMG Prime Cyber Security ETF
ETFMG Prime Mobile Payments ETF
ETFMG Sit Ultra Short ETF
ETFMG Travel Tech ETF
APPROVAL OF ADVISORY AGREEMENTS AND BOARD CONSIDERATIONS
For the Period Ended March 31, 2021 (Unaudited) (Continued)
With respect to SILJ, HACK, IPAY, and AWAY, which are index-based ETFs, the Board noted management’s explanation that analysis of investment performance, in absolute terms, is less relevant for the index-based Funds than it is for actively managed funds, given the Funds’ index-based investment objectives. The Board also noted management’s further explanation that it is more relevant to review the performance of the Funds by focusing on the extent to which each Fund tracked its underlying index. The Board reviewed information regarding each Fund’s index tracking, discussing, as applicable, factors which contributed to each Fund’s tracking error. The Board noted that the Funds had underperformed their underlying indexes over certain periods, but that such underperformance was, at least in part, a result of costs incurred by the Funds not incurred by their underlying indexes. The Board considered other factors that contributed to the Funds’ tracking error, including cash drag and the process of rebalancing the Funds’ portfolios. The Board noted management’s representations that the Funds’ performance satisfactorily tracked their underlying indexes. The Board concluded that, after taking these factors into account, each of the Funds satisfactorily tracked its underlying index.
With respect to VALT, the Board noted that the Fund underperformed in relation to its peer group for the one-year period and the period since the Fund’s inception. The Board considered management’s discussion of VALT’s performance, noting the effect of adverse credit market developments at the beginning of the COVID-19 pandemic on the Fund’s performance.
The Board further noted that it had received and would continue to receive regular reports regarding each Fund’s performance, including with respect to its tracking error, at its quarterly meetings.
Cost of Services Provided, Profits and Economies of Scale
The Board reviewed the advisory fees for the Funds and compared them to the total operating expenses of comparable ETFs, as determined by an independent third party and the Adviser. Among other information, the Board noted that the advisory fee for each of the Funds was higher than the average and median expense ratios for its peer ETFs. The Trustees also considered the total expense ratios of other ETFs that they considered to be comparable, based on the investment objectives and strategies of the ETFs. The Board took into consideration management’s discussion of the fees, including that the Funds have niche investment strategies that are substantially different than the strategies of many of the peer ETFs and, therefore, the information provided about the comparable ETFs may not provide meaningful direct comparisons to the Funds.
The Board noted the importance of the fact that the advisory fee for each Fund is a “unified fee,” meaning that the shareholders of the Funds pay no expenses other than the advisory fee and certain other costs such as interest charges on any borrowings, taxes, brokerage commissions and other expenses incurred in placing orders for the purchase and sale of securities and other investment instruments, acquired fund fees and expenses, accrued deferred tax liability, extraordinary expenses (such as, among other things and subject to Board approval, non-standard Board-related expenses and litigation against the Board, Trustees, Funds, Adviser, and officers of the Adviser), and distribution (12b-1) fees and expenses. The Board also noted that the Adviser was responsible for compensating the Trust’s other service providers and paying the Funds’ other expenses (except as noted above) out of its own fees and resources. The Board concluded that the advisory fee for each of the Funds is reasonable in light of the factors considered.
ETFMG Prime Junior Silver Miners ETF
ETFMG Prime Cyber Security ETF
ETFMG Prime Mobile Payments ETF
ETFMG Sit Ultra Short ETF
ETFMG Travel Tech ETF
APPROVAL OF ADVISORY AGREEMENTS AND BOARD CONSIDERATIONS
For the Period Ended March 31, 2021 (Unaudited) (Continued)
The Board also evaluated the compensation and other benefits received by the Adviser from its relationship with the Funds, taking into account profitability information provided by the Adviser. The Board received and reviewed profitability information on a fund by fund basis and considered how profit margins could affect the Adviser’s long-term viability and ability to attract and retain high-quality personnel. The Board also considered the impact on the Adviser’s profitability of payments made to, or received from, partners involved with certain of the Funds. Based on the information provided to the Trustees, the Trustees concluded that the net revenue retained by the Adviser from providing services to each Fund was not excessive in view of the nature, extent and quality of services provided to each Fund. The Board further considered other benefits derived by the Adviser and its affiliates from the Adviser’s relationship with the Funds.
In addition, the Board considered whether economies of scale may be realized for the Funds. The Board noted that the Adviser regularly considers whether fee reductions are appropriate as the Funds grow in size. The Board noted that a unitary fee provides a level of certainty in expenses for the Funds and effectively acts as a cap on the fees and expenses (except as noted above) that are borne by the Funds. The Board also took into account the significant investments that the Adviser has made in its business to help ensure the continued provision of high-quality services to the Funds, such as the hiring of new trading, legal and compliance personnel, and enhancements to technology and related systems. The Board concluded that no changes to the advisory fee structure of the Funds were necessary.
The Board also reviewed the sub-advisory fee paid to the Sub-Adviser for its services to VALT under the Sub-Advisory Agreement. The Board considered this fee in light of the services the Sub-Adviser provides as investment sub-adviser to VALT. The Board determined that the fee reflected an appropriate allocation of the advisory fee paid to the Adviser and Sub-Adviser given the work performed by each firm. The Board concluded that the proposed sub-advisory fee was reasonable in light of the services rendered.
The Board also considered that the sub-advisory fee paid to the Sub-Adviser is paid out of the Adviser’s unified fee and represents an arm’s-length negotiation between the Adviser and the Sub- Adviser. For these reasons, the Trustees determined that the profitability to the Sub-Adviser from its relationship with VALT was not a material factor in their deliberations with respect to consideration of approval of the Sub-Advisory Agreement. The Board considered that, because the sub-advisory fee was paid by the Adviser out of its unified fee, any economies of scale would not benefit shareholders and, thus, were not relevant for the consideration of the approval of the sub-advisory fee.
In its deliberations, the Board did not identify any single piece of information discussed above that was all-important, controlling or determinative of its decision.
Based on the Board’s deliberations and its evaluation of the information described above, the Board, including the Independent Trustees, unanimously: (a) concluded that the terms of the Agreements are fair and reasonable; (b) concluded that the Adviser’s and Sub-Adviser’s fee is reasonable in light of the services that the Adviser and Sub-Adviser each provide to the Funds, as applicable; and (c) approved the renewal of the Agreements for another year.
ETFMG™ ETFs
EXPENSE EXAMPLES
Period Ended March 31, 2021 (Unaudited)
As a shareholder of the Funds you incur two types of costs: (1) transaction costs, including brokerage commissions on purchases and sales of Fund shares, and (2) ongoing costs, including management fees and other Fund expenses. These examples are intended to help you understand your ongoing costs (in dollars) of investing in the Funds and to compare these costs with the ongoing costs of investing in other funds. The examples are based on an investment of $1,000 invested for the period of time as indicated in the table below.
Actual Expenses
The first line of the table provides information about actual account values based on actual returns and actual expenses. You may use the information in this line, together with the amount you invested, to estimate the expenses that you paid over the period. Simply divide your account value by $1,000 (for example, an $8,600 account value divided by $1,000 = 8.6), then, multiply the result by the number in the first line under the heading entitled “Expenses Paid During Period’’ to estimate the expenses you paid on your account during this period.
Hypothetical Example for Comparison Purposes
The second line of the table provides information about hypothetical account values based on a hypothetical return and hypothetical expenses based on the Fund’s actual expense ratio and an assumed rate of return of 5% per year before expenses, which is not the Fund’s actual return. The hypothetical account values and expenses may not be used to estimate the actual ending account balance or expenses you paid for the period. You may use this information to compare the ongoing costs of investing in the Fund and other funds. To do so, compare this 5% hypothetical example with the 5% hypothetical examples that appear in the shareholder reports of the other funds. Please note that the expenses shown in the table are meant to highlight your ongoing costs only and do not reflect any transactional costs, such as brokerage commissions paid on purchases and sales of Fund shares. Therefore, the second line of the table is useful in comparing ongoing costs only and will not help you determine the relative total costs of owning different funds. If these transactional costs were included, your costs would have been higher.
ETFMG™ ETFs
EXPENSE EXAMPLES
Period Ended March 31, 2021 (Unaudited) (Continued)
Fund Name | | Beginning Account Value October 1, 2020 | | | Ending Account Value March 31, 2021 | | | Expenses Paid During the Period ^ | | | Annualized Expense Ratio During the Period October 1, 2020 to March 31, 2021 | |
ETFMG Prime Junior Silver Miners ETF | | | | | | | | | | | | | | | | |
Actual | | $ | 1,000.00 | | | $ | 1,054.30 | | | $ | 3.53 | | | | 0.69 | % |
Hypothetical (5% annual) | | | 1,000.00 | | | | 1,021.49 | | | | 3.48 | | | | 0.69 | % |
ETFMG Prime Cyber Security ETF | | | | | | | | | | | | | | | | |
Actual | | | 1,000.00 | | | | 1,176.00 | | | | 3.26 | | | | 0.60 | % |
Hypothetical (5% annual) | | | 1,000.00 | | | | 1,021.94 | | | | 3.02 | | | | 0.60 | % |
ETFMG Prime Mobile Payments ETF | | | | | | | | | | | | | | | | |
Actual | | | 1,000.00 | | | | 1,225.50 | | | | 4.16 | | | | 0.75 | % |
Hypothetical (5% annual) | | | 1,000.00 | | | | 1,021.19 | | | | 3.78 | | | | 0.75 | % |
ETFMG Sit Ultra Short ETF | | | | | | | | | | | | | | | | |
Actual | | | 1,000.00 | | | | 1,003.30 | | | | 1.50 | | | | 0.30 | % |
Hypothetical (5% annual) | | | 1,000.00 | | | | 1,023.44 | | | | 1.51 | | | | 0.30 | % |
ETFMG Travel Tech ETF | | | | | | | | | | | | | | | | |
Actual | | | 1,000.00 | | | | 1,640.50 | | | | 4.94 | | | | 0.75 | % |
Hypothetical (5% annual) | | | 1,000.00 | | | | 1,021.19 | | | | 3.78 | | | | 0.75 | % |
ETFMG Treatments, Testing and | | | | | | | | | | | | | | | | |
Advancements ETF | | | | | | | | | | | | | | | | |
Actual | | | 1,000.00 | | | | 1,289.00 | | | | 3.88 | | | | 0.68 | % |
Hypothetical (5% annual) | | | 1,000.00 | | | | 1,021.54 | | | | 3.43 | | | | 0.68 | % |
^ The dollar amounts shown as expenses paid during the period are equal to the annualized six-month expense ratio multiplied by the average account value during the period, multiplied by 182/365 (to reflect the one-half year period).
ETFMG™ ETFs
Statement Regarding Liquidity Risk Management Program (Unaudited)
ETF Managers Trust (the “Trust”) has adopted a liquidity risk management program (the “Program”). The Trust’s Board of Trustees (the “Board”) has designated ETF Managers Group LLC (the “Program Administrator”) as the administrator of the Program. The Program Administrator has designated a committee (the “Committee”), composed of personnel from multiple departments, including investment operations and compliance, that is responsible for the implementation and ongoing administration of the Program, which includes assessing the liquidity risk of the ETFMG Prime Junior Silver Miners ETF, ETFMG Prime Cyber Security ETF, ETFMG Prime Mobile Payments ETF, ETFMG Sit Ultra Short ETF, ETFMG Travel Tech ETF, and ETFMG Treatments, Testing and Advancements ETF (each a “Fund” and, collectively, the “Funds”) under both normal and reasonably foreseeable stressed conditions.
Under the Program, the Program Administrator assesses, manages and periodically reviews each Fund’s liquidity risk, based on factors specific to the circumstances of the Fund. Liquidity risk is the risk that a Fund could not meet shareholder redemption requests without significant dilution of remaining shareholders’ interests in that Fund. This risk is managed by monitoring the degree of liquidity of each Fund’s investments and limiting the amount of the Fund’s illiquid investments, among other means. The Program Administrator’s process of determining the degree of liquidity of each Fund’s investments is supported by one or more third-party liquidity assessment vendors.
At a meeting of the Board on March 30, 2021, the Adviser provided a written report to the Board addressing the operation, and the adequacy and effectiveness of the implementation, of the Program, including, the operation of any Highly Liquid Investment Minimum, where applicable, and any material changes to the Program, for the initial period from February 29, 2020 through March 30, 2021 (the “Reporting Period”). No significant liquidity events impacting any Fund were noted in the report and it was represented that, as of March 30, 2021, each Fund was primarily highly liquid and, during the Reporting Period, each Fund held less than 15% in illiquid securities. In addition, the Program Administrator provided its assessment that Program implementation was effective and that the Program operated adequately and effectively to enable the Program Administrator to oversee and manage liquidity risk and ensure each Fund is able to meet requests to redeem shares without significant dilution to the remaining investors’ interest in the Fund.
There can be no assurance that the Program will achieve its objectives in the future. Please refer to your Fund’s prospectus for more information regarding the Fund’s exposure to liquidity risk and other principal risks to which an investment in the Fund may be subject.
ETFMG™ ETFs
Board of Trustees (Unaudited)
Set forth below are the names, birth years, positions with the Trust, length of term of office, and the principal occupations and other directorships held during at least the last five years of each of the persons currently serving as a Trustee of the Trust, as well as information about each officer. The business address of each Trustee and officer is 30 Maple Street, 2nd Floor, Summit, New Jersey 07901. The SAI includes additional information about Fund directors and is available, without charge, upon request by calling 1-844-ETF-MGRS (1-844-383-6477).
Name and Year of Birth | Position(s) Held with the Trust, Term of Office and Length of Time Served | Principal Occupation(s) During Past 5 Years | Number of Portfolios in Fund Complex Overseen By Trustee | Other Directorships Held by Trustee During Past 5 Years |
Interested Trustee and Officers |
Samuel Masucci, III (1962) | Trustee, Chairman of the Board and President (since 2012); Secretary (since 2014) | Chief Executive Officer, Exchange Traded Managers Group LLC (since 2013); Chief Executive Officer, ETF Managers Group LLC (since 2016); Chief Executive Officer, ETF Managers Capital LLC (commodity pool operator) (since 2014); Chief Executive Officer (2012-2016) and Chief Compliance Officer (2012-2014), Factor Advisors, LLC (investment adviser); President and Chief Executive Officer, Factor Capital Management LLC (2012-2014) (commodity pool operator). | 11 | None |
John A. Flanagan, (1946) | Treasurer (since 2015) | President, John A. Flanagan CPA, LLC (accounting services) (since 2010); Treasurer, ETF Managers Trust (since 2015); Chief Financial Officer, ETF Managers Capital, LLC (commodity pool operator) (since 2015). | n/a | n/a |
Reshma A. Tanczos (1978) | Chief Compliance Officer (since 2016) | Chief Compliance Officer of ETFMG Financial LLC (Since 2017); Chief Compliance Officer, ETF Managers Group LLC (since 2016); Chief Compliance Officer, ETF Managers Capital LLC (since 2016); Partner, Crow & Cushing (law firm) (2007-2016). | n/a | n/a |
* Mr. Masucci is an interested Trustee by virtue of his role as the Chief Executive Officer of the Adviser.
ETFMG™ ETFs
Board of Trustees (Unaudited) (Continued)
Name and Year of Birth | Position(s) Held with the Trust, Term of Office and Length of Time Served | Principal Occupation(s) During Past 5 Years | Number of Portfolios in Fund Complex Overseen By Trustee | Other Directorships Held by Trustee During Past 5 Years |
Matthew J. Bromberg (1973) | Assistant Secretary (since 2020) | General Counsel and Secretary of Exchange Traded Managers Group LLC (since 2020); ETF Managers Group LLC (since 2020); ETFMG Financial LLC (since 2020); ETF Managers Capital LLC (since 2020); Partner of Dorsey & Whitney LLP (law firm) (2019-2020); General Counsel of WBI Investments, Inc. (2016-2019); Millington Securities, Inc. (2016-2019); and Partner of Reed Smith (law firm) (2015-2016). | n/a | n/a |
Independent Trustees |
Terry Loebs (1963) | Trustee (since 2014); Lead Independent Trustee (since 2020) | Founder and Managing Member, Pulsenomics LLC (index product development and consulting firm) (since 2011); Managing Director, MacroMarkets, LLC (exchange- traded products firm) (2006-2011). | 11 | None |
Eric Wiegel (1960) | Trustee (since 2020) | Senior Portfolio Manager, Little House Capital (2019-present); Managing Partner, Global Focus Capital LLC (2013-present); Chief Investment Officer, Insight Financial Strategist LLC (2017- 2018). | 11 | None |
ETFMG™ ETFs
SUPPLEMENTARY INFORMATION
March 31, 2021 (Unaudited)
NOTE 1 – FREQUENCY DISTRIBUTION OF PREMIUMS AND DISCOUNTS
Information regarding how often shares of each Fund traded on the Exchange at a price above (i.e., at a premium) or below (i.e., at a discount) the NAV is available on the Fund’s website at www.etfmgfunds.com.
NOTE 2 – FEDERAL TAX INFORMATION
Qualified Dividend Income/Dividends Received Deduction
For the fiscal year ended September 30, 2020, certain dividends paid by the Funds may be subject to a maximum tax rate of 15%, as provided for by the Jobs and Growth Tax Reconciliation Act of 2003. The percentage of dividends declared from ordinary income designated as qualified dividend income was as follows:
Fund Name | Qualified Dividend Income |
ETFMG Prime Junior Silver Miners ETF | 13.35% |
ETFMG Prime Cyber Security ETF | 100.00% |
ETFMG Prime Mobile Payments ETF | 100.00% |
For corporate shareholders, the percent of ordinary income distributions qualifying for the corporate dividends received deduction for the fiscal year ended September 30, 2020 was as follows:
Fund Name | Dividends Received Deduction |
ETFMG Prime Junior Silver Miners ETF | 1.49% |
ETFMG Prime Cyber Security ETF | 100.00% |
ETFMG Prime Mobile Payments ETF | 100.00% |
Short Term Capital Gain
The percentage of taxable ordinary income distributions that are designated as short-term capital gain distributions under Internal Revenue Section 871 (k)(2)(C) for each Fund were as follows:
Fund Name | Short-Term Capital Gain |
ETFMG Prime Junior Silver Miners ETF | 0.00% |
ETFMG Prime Cyber Security ETF | 0.00% |
ETFMG Prime Mobile Payments ETF | 0.00% |
During the year ended September 30, 2020, the Funds did not declare any long-term realized gains distributions.
Pursuant to Section 853 of the Internal Revenue Code the Fund designated the following amounts as foreign taxes paid for the year ended September 30, 2020. Foreign taxes paid for purposes of Section 853 may be less than actual foreign taxes paid for financial statement purposes.
| | | | | | Per Share | | | |
Fund | | Gross Foreign
Source
Income | | Foreign Taxes
Passthrough | | Gross Foreign
Source
Income | | Foreign Taxes
Passthrough | | Shares
Outstanding
at 9/30/20 | |
ETFMG Prime Junior Silver Miners ETF | | $ | 462,841 | | $ | 64,426 | | $ | 0.01563652 | | $ | 0.00234548 | | $ | 29,600,000 | |
ETFMG™ ETFs
SUPPLEMENTARY INFORMATION
March 31, 2021 (Unaudited) (Continued)
NOTE 3 – INFORMATION ABOUT PORTFOLIO HOLDINGS
The Funds file their complete schedule of portfolio holdings for their first and third fiscal quarters with the Securities and Exchange Commission (“SEC”) on Part F of Form N-PORT. The Funds’ Part F of Form N-PORT is available on the website of the SEC at www.sec.gov and the Funds’ website at www.etfmgfunds.com. Each Fund’s portfolio holdings are posted on their website at www.etfmgfunds.com daily.
NOTE 4 – INFORMATION ABOUT PROXY VOTING
A description of the policies and procedures the Funds use to determine how to vote proxies relating to portfolio securities is provided in the Statement of Additional Information (“SAI”). The SAI is available without charge upon request by calling toll-free at (877) 756-7873, by accessing the SEC’s website at www.sec.gov, or by accessing the Funds’ website at www.etfmgfunds.com.
Information regarding how the Funds voted proxies relating to portfolio securities during the period ending June 30 is available by calling toll-free at (877) 756-7873 or by accessing the SEC’s website at www.sec.gov.
Carefully consider the Fund’s investment objectives, risk factors, charges, and expenses before investing. This and additional information can be found in the Fund’s prospectus, which may be obtained by calling 1-844-ETF-MGRS (1-844-383-6477) or by visiting www.etfmgfunds.com. Read the prospectus carefully before investing.
Advisor
ETF Managers Group, LLC
30 Maple Street, Suite 2, Summit, NJ 07901
Distributor
ETFMG Financial LLC
30 Maple Street, Suite 2, Summit, NJ 07901
Custodian
U.S. Bank National Association
Custody Operations
1555 North River Center Drive, Suite 302, Milwaukee, Wisconsin 53212
Transfer Agent
U.S. Bancorp Fund Services, LLC doing business as U.S. Bank Global Fund Services
615 East Michigan Street, Milwaukee, Wisconsin 53202
Securities Lending Agent
U.S. Bank, National Association
Securities Lending
800 Nicolet Mall
Minneapolis, MN 55402-7020
Independent Registered Public Accounting Firm
WithumSmith + Brown, PC
1411 Broadway, 9th Floor, New York, NY 10018
Legal Counsel
Sullivan & Worcester LLP
1666 K Street NW, Washington, DC 20006

Semi-Annual Report
March 31, 2021
(Unaudited)
Wedbush ETFMG Video Game Tech ETF

Wedbush ETFMG Global Cloud Technology ETF

The Funds are a series of ETF Managers Trust.
Wedbush ETFMG TM ETFs
TABLE OF CONTENTS
March 31, 2021 (Unaudited)
Wedbush ETFMG TM ETFs
Dear Shareholder,
On behalf of the entire team, we want to express our appreciation for the confidence you have placed in these ETFs. The following information pertains to the fiscal period from October 1, 2020 to March 31, 2021
Performance Overview
During the 6-month period ended March 31, 2021, the S&P 500 Information Technology Sector Index, a broad measure of US listed technology companies, returned 13.85%. During the same period, the S&P Global 1200 Information Technology Sector Index, a broad measure of global technology companies, returned 16.97%. Below is a performance overview for each Fund for the same 6-month period.
Wedbush ETFMG Global Cloud Technology ETF (IVES)*
The Wedbush ETFMG Global Cloud Technology ETF (the “Fund”) seeks to provide investment results that, before fees and expenses, correspond generally to the total return performance of the Dan Ives Global Cloud Technology Prime Index (the “Index”).
Over the period, the total return for the Fund was 13.54%, while the total return for the Index was 13.99%. The best performers in the Fund on the basis of contribution to return were Sinch AB., Cloudflare Inc., Netapp Inc., Appian Corp. and Kingsoft Cloud Holdings-ADR. while the worst performers were Datadog Inc., Itochu Techno-Solutions Corp., Fastly Inc., Chindata Group Holdings-ADR and Software AG.
At the end of the reporting period, the Fund saw an average approximate allocation of 57.4% to Software, 32.0% to IT Services, 4.8% to Equity Real Estate Investment Trusts and 4.8% to Technology Hardware, Storage & Peripherals. The Fund was exposed predominately to the United States 65.4%, followed by Japan 8.9%, Canada 4.9%, Israel 4.5% and Sweden 4.5%.
Wedbush ETFMG Video Game Tech ETF (GAMR)**
The Wedbush ETFMG Video Game Tech ETF (the “Fund”) seeks to provide investment results that, before fees and expenses, correspond generally to the total return performance of the EEFund Video Game Tech Index (the “Index”).
Over the period, the total return for the Fund was 43.49%, while the total return for the Index was 43.80%. The best performers in the Fund on the basis of contribution to return were Gamestop Corp., Corsair Gaming Inc., Bilbili Inc., Codemasters Group Holdings, Plc and Wemade Co Ltd. while the worst performers were CD Projekt SA., Paradox Interactive AB., Stillfront Group AB, Square Enix Holdings Co., Ltd., and Netmarble Corp.
At the end of the reporting period, the Fund saw an average approximate allocation of 69.5% to Entertainment, 9.8% to Technology Hardware, Storage & Peripherals and 4.6% to Interactive Media & Services. The Fund was exposed predominately to the United States 37.8%, followed by the Republic of Korea 18.5%, Japan 16.7%, and Sweden 9.5%.
You can find further details about IVES* and GAMR* by visiting www.etfmg.com, or by calling 1-844-383-6477.
Sincerely,

Samuel Masucci III
Chairman of the Board
*Please be aware that as of Tuesday, April 7, 2020 the following changes went into effect for the ETFMG Drone Economy Strategy ETF (IFLY):
1. The Fund’s name was changed to the Wedbush ETFMG Global Cloud Technology ETF;
2. The Fund’s previous underlying index, the Reality Shares Drone Index (the “Previous Index”), was replaced with the Dan Ives Global Cloud Technology Prime Index; and
3. The Fund’s investment objective was changed to the following: “The Wedbush ETFMG Global Cloud Technology ETF seeks to provide investment results that, before fees and expenses, correspond generally to the total return performance of the Dan Ives Global Cloud Technology Prime Index” (the “Index”).
4. The Fund’s ticker was changed to “IVES”.
**Please be aware that as of Friday, April 17, 2020 the name of the ETFMG Video Game Tech ETF changed to the “Wedbush ETFMG Video Game Tech ETF”.
Wedbush ETFMG Global Cloud Technology ETF
Growth of $10,000 (Unaudited)

Average Annual Returns
Period Ended March 31, 2021 | | 1 Year
Return | | 5 Year
Return | | Since
Inception
(3/8/2016) | | Value of
$10,000
(3/31/2021) |
| Wedbush ETFMG Global Cloud Technology ETF (NAV) | | 74.55% | | 13.72% | | 14.56% | | $19,899 |
| Wedbush ETFMG Global Cloud Technology ETF (Market) | | 78.03% | | 13.68% | | 14.65% | | $19,979 |
| S&P 500 Index | | 56.35% | | 16.29% | | 17.02% | | $22,161 |
| ETFMG Global Cloud Blended Index | | 75.97% | | 13.43% | | 14.30% | | $19,672 |
Performance data quoted represents past performance and does not guarantee future results. The investment return and principal value of an investment will fluctuate so that an investor’s shares, when redeemed, may be worth more or less than their original cost. Current performance of the Fund may be lower or higher than the performance quoted. All performance is historical and includes reinvestment of dividends and capital gains. Performance data current to the most recent month end may be obtained by calling 1-844-ETF-MGRS (1-844-383-6477).
The chart illustrates the performance of a hypothetical $10,000 investment made on March 8, 2016, and is not intended to imply any future performance. The returns shown do not reflect the deduction of taxes that a shareholder would pay on fund distributions from the sales of Fund shares. The chart assumes reinvestment of capital gains and dividends, if any. The Index Returns do not reflect fees or expenses and are not available for direct investment.
Wedbush ETFMG TM ETFs
Wedbush ETFMG Global Cloud Technology ETF
Top Ten Holdings as of March 31, 2021* (Unaudited)
| | | Security | | % of Total Investments |
| 1 | | Open Text Corp. | 4.87% |
| 2 | | ETFMG Sit Ultra Short ETF** | 4.72% |
| 3 | | Nice, Ltd. | 4.54% |
| 4 | | Sinch AB | 4.53% |
| 5 | | Elastic NV | 4.13% |
| 6 | | GDS Holdings, Ltd. | 4.07% |
| 7 | | Cloudflare, Inc. - Class A | 3.59% |
| 8 | | Itochu Techno-Solutions Corp. | 3.42% |
| 9 | | Datadog, Inc. - Class A | 3.37% |
| 10 | | Kingsoft Cloud Holdings, Ltd. | 3.37% |
| | | | |
| | | Top Ten Holdings = 40.61% of Total Investments |
| | | |
| | | * Current Fund holdings may not be indicative of future Fund holdings. ** Affiliated security. Please refer to Note 9 of the Notes to the Financial Statements. |
Wedbush ETFMG Video Game Tech ETF
Growth of $10,000 (Unaudited)
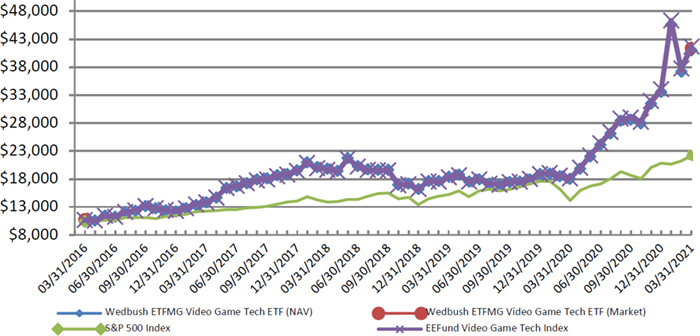
Average Annual Returns
Period Ended March 31, 2021 | | 1 Year
Return | | 5 Year
Return | | Since
Inception
(3/8/2016) | | Value of
$10,000
(3/31/2021) |
| Wedbush ETFMG Video Game Tech ETF (NAV) | | 127.24% | | 30.92% | | 32.17% | | $41,041 |
| Wedbush ETFMG Video Game Tech ETF (Market) | | 130.80% | | 31.01% | | 32.37% | | $41,365 |
| S&P 500 Index | | 56.35% | | 16.29% | | 17.02% | | $22,161 |
| EEFund Video Game Tech Index | | 129.94% | | 31.31% | | 32.57% | | $41,689 |
Performance data quoted represents past performance and does not guarantee future results. The investment return and principal value of an investment will fluctuate so that an investor’s shares, when redeemed, may be worth more or less than their original cost. Current performance of the Fund may be lower or higher than the performance quoted. All performance is historical and includes reinvestment of dividends and capital gains. Performance data current to the most recent month end may be obtained by calling 1-844-ETF-MGRS (1-844-383-6477).
The chart illustrates the performance of a hypothetical $10,000 investment made on March 8, 2016, and is not intended to imply any future performance. The returns shown do not reflect the deduction of taxes that a shareholder would pay on fund distributions from the sales of Fund shares. The chart assumes reinvestment of capital gains and dividends, if any. The Index Returns do not reflect fees or expenses and are not available for direct investment.
Wedbush ETFMG TM ETFs
Wedbush ETFMG Video Game Tech ETF
Top Ten Holdings as of March 31, 2021* (Unaudited)
| | | Security | | % of Total Investments |
| 1 | | ETFMG Sit Ultra Short ETF** | 3.23% |
| 2 | | WeMade Entertainment Co., Ltd. | 2.38% |
| 3 | | Com2uS Corp. | 2.04% |
| 4 | | LeoVegas AB | 1.95% |
| 5 | | Webzen, Inc. | 1.95% |
| 6 | | Team17 Group PLC | 1.86% |
| 7 | | Razer, Inc. | 1.86% |
| 8 | | Micro-Star International Co., Ltd. | 1.84% |
| 9 | | Netmarble Corp. | 1.77% |
| 10 | | Kakao Games Corp. | 1.76% |
| | | | |
| | | Top Ten Holdings = 20.64% of Total Investments |
| | | |
| | | * Current Fund holdings may not be indicative of future Fund holdings. ** Affiliated security. Please refer to Note 9 of the Notes to Financial Statements. |
Wedbush ETFMG TM ETFs
Important Disclosures and Key Risk Factors
Past performance is not indicative of future return. A fund’s performance for very short time periods may not be indicative of future performance.
IVES
The Wedbush ETFMG Global Cloud Technology ETF (the “Fund”) seeks to provide investment results that, before fees and expenses, correspond generally to the price and yield performance of the Dan Ives Global Cloud Technology Prime Index (the “Index”).
Investing involves risk, including the possible loss of principal. Shares of any ETF are bought and sold at market price (not NAV), may trade at a discount or premium to NAV and are not individually redeemed from the Fund. Brokerage commissions will reduce returns. Narrowly focused investments typically exhibit higher volatility. Cloud Technology Companies may have limited product lines, markets, financial resources or personnel. These companies typically face intense competition and potentially rapid product obsolescence. In addition, many Cloud Technology Companies store sensitive consumer information and could be the target of cybersecurity attacks and other types of theft, which could have a negative impact on these companies. As a result, Cloud Technology Companies may be adversely impacted by government regulations, and may be subject to additional regulatory oversight with regard to privacy concerns and cybersecurity risk. These companies are also heavily dependent on intellectual property rights and may be adversely affected by loss or impairment of those rights. Cloud computing companies could be negatively impacted by disruptions in service caused by hardware or software failure, or by interruptions or delays in service by third-party data center hosting facilities and maintenance providers. Cloud Technology Companies, especially smaller companies, tend to be more volatile than companies that do not rely heavily on technology. Companies in the technology field, including companies in the computers, telecommunications and electronics industries, face intense competition, which may have an adverse effect on profit margins.
Unlike with an actively managed fund, the Fund’s adviser does not use techniques or defensive strategies designed to lessen the effects of market volatility or to reduce the impact of periods of market decline. This means that, based on market and economic conditions, the Fund’s performance could be lower than other types of funds that may actively shift their portfolio assets to take advantage of market opportunities or to lessen the impact of a market decline.
Natural or environmental disasters, such as earthquakes, fires, floods, hurricanes, tsunamis and other severe weather-related phenomena generally, and widespread disease, including pandemics and epidemics, have been and may be highly disruptive to economies and markets, adversely impacting individual companies, sectors, industries, markets, currencies, interest and inflation rates, credit ratings, investor sentiment, and other factors affecting the value of the Fund’s investments. Given the increasing interdependence among global economies and markets, conditions in one country, market, or region are increasingly likely to adversely affect markets, issuers, and/or foreign exchange rates in other countries, including the U.S. Any such events could have a significant adverse impact on the value of the Fund’s investments.
ETF Managers Group LLC is the investment advisor to the Fund.
The Fund is distributed by ETFMG Financial LLC. ETF Managers Group LLC and ETFMG Financial LLC are wholly owned subsidiaries of Exchange Traded Managers Group LLC (collectively, “ETFMG”). ETFMG is not affiliated with Wedbush Securities LLC, Prime Indexes or Level ETF Ventures.
GAMR
The Wedbush ETFMG Video Game Tech ETF (the “Fund” or the “Video Game Tech ETF”) seeks to provide investment results that, before fees and expenses, correspond generally to the price and yield performance of the EEFund Video Game Tech Index™ (the “Index”).
Investing involves risk, including the possible loss of principal. Shares of any ETF are bought and sold at market price (not NAV), may trade at a discount or premium to NAV and are not individually redeemed from the Fund. Brokerage commissions will reduce returns. Narrowly focused investments typically exhibit higher volatility. Video Game Tech Companies face intense competition, both domestically and internationally, may have limited product lines, markets, financial resources or personnel, may have products that face rapid obsolescence, and are heavily dependent on the protection of patent and intellectual property rights. Video Game Tech Companies are also subject to increasing regulatory constraints, particularly with respect to cybersecurity and privacy. Such factors may adversely affect the profitability and value of such companies. Investments in foreign securities involve political, economic and currency risks, greater volatility and differences in accounting methods. Investments in smaller companies tend to have limited liquidity and greater price volatility than large-capitalization companies. The Fund’s return may not match or achieve a high degree of correlation with the return of the EEFund Video Game Tech Index. To the extent the Fund utilizes a sampling approach, it may experience tracking error to a greater extent than if the Fund had sought to replicate the Index. Diversification does not guarantee a profit, nor does it protect against a loss in a declining market.
Unlike with an actively managed fund, the Fund’s adviser does not use techniques or defensive strategies designed to lessen the effects of market volatility or to reduce the impact of periods of market decline. This means that, based on market and economic conditions, the Fund’s performance could be lower than other types of funds that may actively shift their portfolio assets to take advantage of market opportunities or to lessen the impact of a market decline.
Natural or environmental disasters, such as earthquakes, fires, floods, hurricanes, tsunamis and other severe weather-related phenomena generally, and widespread disease, including pandemics and epidemics, have been and may be highly disruptive to economies and markets, adversely impacting individual companies, sectors, industries, markets, currencies, interest and inflation rates, credit ratings, investor sentiment, and other factors affecting the value of the Fund’s investments. Given the increasing interdependence among global economies and markets, conditions in one country, market, or region are increasingly likely to adversely affect markets, issuers, and/or foreign exchange rates in other countries, including the U.S. Any such events could have a significant adverse impact on the value of the Fund’s investments.
ETF Managers Group LLC is the investment adviser to the Fund.
The Fund is distributed by ETFMG Financial LLC. ETF Managers Group LLC and ETFMG Financial LLC are wholly owned subsidiaries of Exchange Traded Managers Group LLC (collectively, “ETFMG”). ETFMG is not affiliated with EEFund Management or Wedbush Securities LLC.
Wedbush ETFMG TM ETFs
PORTFOLIO ALLOCATIONS
As of March 31, 2021 (Unaudited)
| | | Wedbush
ETFMG
Global
Cloud
Technology
ETF | | | Wedbush
ETFMG
Video
Game
Tech ETF | |
| As a percent of Net Assets: | | | | | | |
| Australia | | | 2.4 | % | | | — | % |
| Canada | | | 4.9 | | | | — | |
| France | | | — | | | | 3.0 | |
| Germany | | | 1.4 | | | | — | |
| Israel | | | 4.5 | | | | — | |
| Italy | | | — | | | | 0.4 | |
| Japan | | | 8.9 | | | | 16.7 | |
| Netherlands | | | 4.1 | | | | — | |
| Norway | | | — | | | | 0.2 | |
| Poland | | | — | | | | 1.8 | |
| Republic of Korea | | | 0.2 | | | | 18.5 | |
| Singapore | | | 1.4 | | | | — | |
| Sweden | | | 4.5 | | | | 9.5 | |
| Switzerland | | | — | | | | 0.3 | |
| Taiwan, Province of China | | | — | | | | 5.5 | |
| United Kingdom | | | 1.7 | | | | 5.8 | |
| United States | | | 65.4 | | | | 37.8 | |
| Exchange Traded Funds | | | 4.7 | | | | 3.2 | |
| Short-Term and other Net Assets (Liabilities) | | | (4.1 | ) | | | (2.7 | ) |
| | | | 100.0 | % | | | 100.0 | % |
Wedbush ETFMG TM ETFs
Wedbush ETFMG Global Cloud Technology ETF
Schedule of Investments
March 31, 2021 (Unaudited)
| | | Shares | | | Value | |
| | | | | | | |
| COMMON STOCKS - 99.4% | | | | | | | | |
| Australia - 2.4% | | | | | | | | |
| IT Services - 2.4% (d) | | | | | | | | |
| Data#3, Ltd. | | | 35,240 | | | $ | 138,918 | |
| Megaport, Ltd. (a) | | | 36,472 | | | | 307,218 | |
| NEXTDC, Ltd. (a) | | | 104,621 | | | | 828,023 | |
| Total IT Services | | | | | | | 1,274,159 | |
| | | | | | | | | |
| Canada - 4.9% | | | | | | | | |
| Software - 4.9% (d) | | | | | | | | |
| Open Text Corp. | | | 53,807 | | | | 2,565,542 | |
| | | | | | | | | |
| Germany - 1.4% | | | | | | | | |
| Software - 1.4% (d) | | | | | | | | |
| Software AG | | | 17,398 | | | | 733,273 | |
| | | | | | | | | |
| Israel - 4.5% | | | | | | | | |
| Software - 4.5% (d) | | | | | | | | |
| Nice, Ltd. (a) | | | 11,064 | | | | 2,389,461 | |
| | | | | | | | | |
| Japan - 8.9% | | | | | | | | |
| IT Services - 8.4% (d) | | | | | | | | |
| Hennge KK (a) | | | 3,788 | | | | 252,818 | |
| i3 Systems, Inc. (a) | | | 1,139 | | | | 49,839 | |
| Itochu Techno-Solutions Corp. | | | 55,964 | | | | 1,801,867 | |
| NS Solutions Corp. | | | 22,565 | | | | 715,314 | |
| SCSK Corp. | | | 24,330 | | | | 1,441,452 | |
| TechMatrix Corp. | | | 10,481 | | | | 186,192 | |
| Total IT Services | | | | | | | 4,447,482 | |
| Software - 0.5% (d) | | | | | | | | |
| Cybozu, Inc. | | | 12,175 | | | | 245,424 | |
| Total Japan | | | | | | | 4,692,906 | |
| | | | | | | | | |
| Netherlands - 4.1% | | | | | | | | |
| Software - 4.1% (d) | | | | | | | | |
| Elastic NV (a) | | | 19,588 | | | | 2,178,186 | |
| | | | | | | | | |
| Republic of Korea - 0.2% | | | | | | | | |
| Diversified Telecommunication Services - 0.2% | | | | | | | | |
| KINX, Inc. | | | 1,162 | | | | 76,799 | |
| | | | | | | | | |
| Singapore - 1.4% | | | | | | | | |
| Real Estate Investment Trusts (REITs) - 1.4% | | | | | | | | |
| Keppel DC REIT | | | 377,416 | | | | 757,525 | |
The accompanying notes are an integral part of these financial statements.
Wedbush ETFMG TM ETFs
Wedbush ETFMG Global Cloud Technology ETF
Schedule of Investments
March 31, 2021 (Unaudited) (Continued)
| | | Shares | | | Value | |
| Sweden - 4.5% | | | | | | |
| Software - 4.5% (d) | | | | | | |
| Sinch AB (a)(f) | | | 13,562 | | | $ | 2,385,224 | |
| | | | | | | | | |
| United Kingdom - 1.7% | | | | | | | | |
| Software - 1.7% (d) | | | | | | | | |
| Bytes Technology Group PLC (a) | | | 56,055 | | | | 308,648 | |
| Micro Focus International PLC | | | 78,135 | | | | 595,893 | |
| Total Software | | | | | | | 904,541 | |
| | | | | | | | | |
| United States - 65.4% | | | | | | | | |
| Communications Equipment - 0.2% | | | | | | | | |
| Inseego Corp. (a)(b) | | | 10,612 | | | | 106,120 | |
| IT Services - 21.2% (d) | | | | | | | | |
| 21Vianet Group, Inc. - ADR (a) | | | 31,671 | | | | 1,022,973 | |
| Chinasoft International, Ltd. | | | 682,605 | | | | 734,050 | |
| Chindata Group Holdings, Ltd. - ADR (a)(b) | | | 85,720 | | | | 1,417,809 | |
| Fastly, Inc. - Class A (a)(b) | | | 11,957 | | | | 804,467 | |
| GDS Holdings, Ltd. - ADR (a)(b) | | | 26,422 | | | | 2,142,561 | |
| Grid Dynamics Holdings, Inc. (a) | | | 5,294 | | | | 84,333 | |
| Kingsoft Cloud Holdings, Ltd. - ADR (a) | | | 45,108 | | | | 1,773,648 | |
| Limelight Networks, Inc. (a) | | | 12,922 | | | | 46,132 | |
| MongoDB, Inc. (a) | | | 5,521 | | | | 1,476,481 | |
| Rackspace Technology, Inc. (a)(b) | | | 21,444 | | | | 509,938 | |
| SUNeVision Holdings, Ltd. | | | 544,622 | | | | 561,148 | |
| Switch, Inc. - Class A | | | 25,112 | | | | 408,321 | |
| Unisys Corp. (a) | | | 6,562 | | | | 166,806 | |
| Total IT Services | | | | | | | 11,148,667 | |
| Real Estate Investment Trusts (REITs) - 3.4% | | | | | | | | |
| CoreSite Realty Corp. | | | 4,462 | | | | 534,771 | |
| CyrusOne, Inc. | | | 12,568 | | | | 851,105 | |
| QTS Realty Trust, Inc. - Class A (b) | | | 6,729 | | | | 417,467 | |
| Total Real Estate Investment Trusts (REITs) | | | | | | | 1,803,343 | |
| Software - 35.8% (d) | | | | | | | | |
| 8x8, Inc. (a) | | | 11,189 | | | | 362,971 | |
| Alteryx, Inc. - Class A (a)(b) | | | 6,976 | | | | 578,729 | |
| Anaplan, Inc. (a) | | | 14,805 | | | | 797,249 | |
| Appfolio, Inc. - Class A (a)(b) | | | 3,589 | | | | 507,520 | |
| Appian Corp. (a)(b) | | | 7,376 | | | | 980,639 | |
| Blackbaud, Inc. (a) | | | 5,035 | | | | 357,888 | |
| Box, Inc. - Class A (a) | | | 16,514 | | | | 379,161 | |
| Cloudera, Inc. (a) | | | 32,554 | | | | 396,182 | |
| Cloudflare, Inc. - Class A (a) | | | 26,933 | | | | 1,892,313 | |
| CommVault Systems, Inc. (a) | | | 4,892 | | | | 315,534 | |
| Coupa Software, Inc. (a) | | | 6,046 | | | | 1,538,586 | |
| Datadog, Inc. - Class A (a)(b) | | | 21,325 | | | | 1,777,226 | |
| Datto Holding Corp. (a) | | | 16,754 | | | | 383,834 | |
| Domo, Inc. - Class B (a) | | | 3,118 | | | | 175,512 | |
The accompanying notes are an integral part of these financial statements.
Wedbush ETFMG TM ETFs
Wedbush ETFMG Global Cloud Technology ETF
Schedule of Investments
March 31, 2021 (Unaudited) (Continued)
| | | Shares | | | Value | |
| Dropbox, Inc. - Class A (a)(b) | | | 43,270 | | | $ | 1,153,578 | |
| Everbridge, Inc. (a)(b) | | | 3,774 | | | | 457,333 | |
| Jamf Holding Corp. (a) | | | 12,165 | | | | 429,668 | |
| MicroStrategy, Inc. - Class A (a)(b) | | | 1,000 | | | | 678,800 | |
| nCino, Inc. (a) | | | 9,630 | | | | 642,514 | |
| New Relic, Inc. (a)(b) | | | 6,566 | | | | 403,678 | |
| Nutanix, Inc. - Class A (a) | | | 21,029 | | | | 558,530 | |
| PagerDuty, Inc. (a)(b) | | | 8,530 | | | | 343,162 | |
| Smartsheet, Inc. - Class A (a) | | | 12,755 | | | | 815,300 | |
| SolarWinds Corp. (a)(b) | | | 32,931 | | | | 574,317 | |
| Sumo Logic, Inc. (a) | | | 10,653 | | | | 200,916 | |
| Teradata Corp. (a)(b) | | | 11,373 | | | | 438,315 | |
| Xunlei, Ltd. - ADR (a)(b) | | | 15,654 | | | | 102,377 | |
| Zendesk, Inc. (a)(b) | | | 12,286 | | | | 1,629,369 | |
| Total Software | | | | | | | 18,871,201 | |
| Technology Hardware, Storage & Peripherals - 4.8% | | | | | | | | |
| NetApp, Inc. | | | 23,225 | | | | 1,687,760 | |
| Pure Storage, Inc. - Class A (a) | | | 28,464 | | | | 613,115 | |
| Super Micro Computer, Inc. (a) | | | 5,263 | | | | 205,573 | |
| Total Technology Hardware, Storage & Peripherals | | | | | | | 2,506,448 | |
| Total United States | | | | | | | 34,435,779 | |
| TOTAL COMMON STOCKS (Cost $36,083,324) | | | | | | | 52,393,395 | |
| | | | | | | | | |
| INVESTMENTS PURCHASED WITH PROCEEDS FROM SECURITIES LENDING COLLATERAL - 21.2% | | | | | | | | |
| ETFMG Sit Ultra Short ETF (e) | | | 50,000 | | | | 2,487,275 | |
| Mount Vernon Liquid Assets Portfolio, LLC, 0.11% (c) | | | 8,680,083 | | | | 8,680,083 | |
| TOTAL INVESTMENTS PURCHASED WITH PROCEEDS FROM SECURITIES LENDING COLLATERAL (Cost $11,168,033) | | | | | | | 11,167,358 | |
| | | | | | | | | |
| SHORT-TERM INVESTMENTS - 0.5% | | | | | | | | |
| Money Market Funds - 0.5% | | | | | | | | |
| Invesco Advisers, Inc. STIT-Treasury Portfolio – Institutional Class, 0.01% (c) | | | 248,357 | | | | 248,357 | |
| TOTAL SHORT-TERM INVESTMENTS (Cost $248,357) | | | | | | | 248,357 | |
| Total Investments (Cost $47,499,714) - 121.1% | | | | | | | 63,809,110 | |
| Liabilities in Excess of Other Assets - (21.1)% | | | | | | | (11,125,204 | ) |
| TOTAL NET ASSETS - 100.0% | | | | | | $ | 52,683,906 | |
The accompanying notes are an integral part of these financial statements.
Wedbush ETFMG TM ETFs
Wedbush ETFMG Global Cloud Technology ETF
Schedule of Investments
March 31, 2021 (Unaudited) (Continued)
Percentages are stated as a percent of net assets.
| ADR | American Depositary Receipt |
| PLC | Public Limited Company |
| (a) | Non-income producing security. |
| (b) | All or a portion of this security was out on loan as of March 31, 2021. |
| (c) | The rate shown is the annualized seven-day yield at March 31, 2021. |
| (d) | As of March 31, 2021, the Fund had a significant portion of its assets in the Software & IT Services Industries. |
| (e) | Affiliated security. Please refer to Note 9 of the Notes to Financial Statements. |
| (f) | Security exempt from registration pursuant to Rule 144A under the Securities Act of 1933, as amended. This security may be resold in transactions exempt from registration to qualified institutional investors. |
The Global Industry Classification Standard (GICS®) was developed by and/or is the exclusive property of MSCI, Inc. and Standard & Poor’s Financial Services LLC (“S&P”). GICS is a service mark of MSCI and S&P and has been licensed for use by U.S. Bancorp Fund Services, LLC, doing business as U.S. Bank Global Fund Services (“Fund Services”).
The accompanying notes are an integral part of these financial statements.
Wedbush ETFMG TM ETFs
Wedbush ETFMG Video Game Tech ETF
Schedule of Investments
March 31, 2021 (Unaudited)
| | | Shares | | | Value | |
| COMMON STOCKS - 99.5% | | | | | | | | |
| France - 3.0% | | | | | | | | |
| Entertainment - 2.6% (d) | | | | | | | | |
| Atari SA (a) | | | 763,281 | | | $ | 730,404 | |
| Focus Home Interactive SA (a) | | | 5,442 | | | | 433,966 | |
| Ubisoft Entertainment SA (a) | | | 23,959 | | | | 1,822,922 | |
| Total Entertainment | | | | | | | 2,987,292 | |
| Technology Hardware, Storage & Peripherals - 0.4% | | | | | | | | |
| Guillemot Corp. (a) | | | 28,211 | | | | 499,556 | |
| Total France | | | | | | | 3,486,848 | |
| | | | | | | | | |
| Italy - 0.4% | | | | | | | | |
| Entertainment - 0.4% (d) | | | | | | | | |
| Digital Bros SpA | | | 15,466 | | | | 451,612 | |
| | | | | | | | | |
| Japan - 16.7% | | | | | | | | |
| Distributors - 0.3% | | | | | | | | |
| Happinet Corp. | | | 28,835 | | | | 399,745 | |
| Entertainment - 13.1% (d) | | | | | | | | |
| Aeria, Inc. | | | 85,697 | | | | 485,275 | |
| Aiming, Inc. (a)(b) | | | 113,205 | | | | 433,497 | |
| Akatsuki, Inc. | | | 48,112 | | | | 1,944,468 | |
| Capcom Co., Ltd. | | | 61,156 | | | | 1,985,602 | |
| COLOPL, Inc. | | | 36,192 | | | | 272,604 | |
| DeNa Co., Ltd. | | | 14,524 | | | | 283,593 | |
| Gumi, Inc. | | | 52,578 | | | | 431,641 | |
| GungHo Online Entertainment, Inc. | | | 14,097 | | | | 278,312 | |
| Imagineer Co., Ltd. | | | 36,416 | | | | 411,437 | |
| KLab, Inc. (a) | | | 55,641 | | | | 404,525 | |
| Koei Tecmo Holdings Co., Ltd. | | | 6,357 | | | | 285,053 | |
| Konami Holdings Corp. | | | 28,547 | | | | 1,699,027 | |
| Marvelous, Inc. | | | 54,194 | | | | 421,414 | |
| Nexon Co., Ltd. | | | 60,351 | | | | 1,956,740 | |
| Nintendo Co., Ltd. | | | 3,455 | | | | 1,928,684 | |
| Square Enix Holdings Co., Ltd. | | | 34,515 | | | | 1,917,067 | |
| Total Entertainment | | | | | | | 15,138,939 | |
| Household Durables - 1.2% | | | | | | | | |
| Sony Corp. - ADR (a) | | | 12,706 | | | | 1,346,963 | |
| Interactive Media & Services - 1.6% | | | | | | | | |
| Gree, Inc. | | | 355,861 | | | | 1,796,581 | |
| Leisure Products - 0.5% | | | | | | | | |
| Bandai Namco Holdings, Inc. | | | 3,918 | | | | 279,294 | |
| Sega Sammy Holdings, Inc. | | | 18,202 | | | | 283,900 | |
| Total Leisure Products | | | | | | | 563,194 | |
| Total Japan | | | | | | | 19,245,422 | |
The accompanying notes are an integral part of these financial statements.
Wedbush ETFMG TM ETFs
Wedbush ETFMG Video Game Tech ETF
Schedule of Investments
March 31, 2021 (Unaudited) (Continued)
| | | Shares | | | Value | |
| Norway - 0.2% | | | | | | | | |
| Semiconductors & Semiconductor Equipment - 0.2% | | | | | | | | |
| Nordic Semiconductor ASA (a) | | | 16,045 | | | $ | 287,578 | |
| | | | | | | | | |
| Poland - 1.8% | | | | | | | | |
| Entertainment - 1.8% (d) | | | | | | | | |
| 11 bit studios SA (a) | | | 3,165 | | | | 442,086 | |
| CD Projekt SA (a) | | | 32,941 | | | | 1,587,910 | |
| Total Entertainment | | | | | | | 2,029,996 | |
| | | | | | | | | |
| Republic of Korea - 18.5% | | | | | | | | |
| Entertainment - 17.8% (d) | | | | | | | | |
| Actoz Soft Co., Ltd. (a) | | | 56,696 | | | | 457,375 | |
| Com2uS Corp. | | | 15,767 | | | | 2,354,427 | |
| Gravity Co., Ltd. - ADR (a) | | | 13,688 | | | | 1,574,120 | |
| Kakao Games Corp. (a) | | | 43,858 | | | | 2,030,624 | |
| NCSoft Corp. | | | 2,308 | | | | 1,780,326 | |
| Neowiz (a) | | | 21,311 | | | | 440,625 | |
| Netmarble Corp. | | | 17,909 | | | | 2,041,317 | |
| Nexon GT Co., Ltd. (a) | | | 36,441 | | | | 441,124 | |
| NHN Corp. (a) | | | 31,604 | | | | 2,024,555 | |
| Pearl Abyss Corp. (a) | | | 7,251 | | | | 1,973,963 | |
| Webzen, Inc. (a) | | | 61,402 | | | | 2,248,830 | |
| WeMade Entertainment Co., Ltd. | | | 51,910 | | | | 2,752,021 | |
| Wysiwyg Studios Co., Ltd. (a) | | | 52,632 | | | | 597,589 | |
| Total Entertainment | | | | | | | 20,716,896 | |
| Hotels, Restaurants & Leisure - 0.4% | | | | | | | | |
| ME2ON Co., Ltd. | | | 69,894 | | | | 423,039 | |
| Interactive Media & Services - 0.3% | | | | | | | | |
| AfreecaTV Co., Ltd. | | | 4,246 | | | | 294,509 | |
| Total Republic of Korea | | | | | | | 21,434,444 | |
| | | | | | | | | |
| Sweden - 9.5% | | | | | | | | |
| Electronic Equipment, Instruments & Components - 0.3% | | | | | | | | |
| Thunderful Group AB (a) | | | 62,412 | | | | 392,333 | |
| Entertainment - 7.0% (d) | | | | | | | | |
| Embracer Group AB (a) | | | 72,068 | | | | 1,982,119 | |
| Enad Global 7 AB (a) | | | 165,003 | | | | 1,877,986 | |
| G5 Entertainment AB | | | 7,826 | | | | 445,359 | |
| Modern Times Group MTG - Class B (a) | | | 19,993 | | | | 289,589 | |
| Paradox Interactive AB | | | 82,417 | | | | 1,859,076 | |
| Stillfront Group AB (a) | | | 176,607 | | | | 1,632,919 | |
| Total Entertainment | | | | | | | 8,087,048 | |
| Hotels, Restaurants & Leisure - 2.0% | | | | | | | | |
| LeoVegas AB | | | 385,587 | | | | 2,258,302 | |
The accompanying notes are an integral part of these financial statements.
Wedbush ETFMG TM ETFs
Wedbush ETFMG Video Game Tech ETF
Schedule of Investments
March 31, 2021 (Unaudited) (Continued)
| | | Shares | | | Value | |
| Technology Hardware, Storage & Peripherals - 0.2% | | | | | | | | |
| Tobii AB (a) | | | 38,867 | | | $ | 277,480 | |
| Total Sweden | | | | | | | 11,015,163 | |
| | | | | | | | | |
| Switzerland - 0.3% | | | | | | | | |
| Technology Hardware, Storage & Peripherals - 0.3% | | | | | | | | |
| Logitech International SA (b) | | | 2,883 | | | | 301,274 | |
| | | | | | | | | |
| Taiwan, Province of China - 5.5% | | | | | | | | |
| Entertainment - 1.5% (d) | | | | | | | | |
| Chinese Gamer International Corp. (a) | | | 219,532 | | | | 453,944 | |
| Gamania Digital Entertainment Co., Ltd. | | | 185,284 | | | | 432,479 | |
| Softstar Entertainment, Inc. | | | 189,723 | | | | 438,185 | |
| Userjoy Technology Co., Ltd. | | | 131,234 | | | | 445,220 | |
| Total Entertainment | | | | | | | 1,769,828 | |
| Technology Hardware, Storage & Peripherals - 4.0% | | | | | | | | |
| Acer, Inc. | | | 295,482 | | | | 325,690 | |
| Asustek Computer, Inc. | | | 25,453 | | | | 332,290 | |
| HTC Corp. (a) | | | 1,249,640 | | | | 1,351,116 | |
| Micro-Star International Co., Ltd. | | | 348,316 | | | | 2,124,101 | |
| Thermaltake Technology Co., Ltd. | | | 154,644 | | | | 432,502 | |
| Total Technology Hardware, Storage & Peripherals | | | | | | | 4,565,699 | |
| Total Taiwan, Province of China | | | | | | | 6,335,527 | |
| | | | | | | | | |
| United Kingdom - 5.8% | | | | | | | | |
| Entertainment - 4.1% (d) | | | | | | | | |
| Frontier Developments PLC (a) | | | 42,110 | | | | 1,579,045 | |
| Sumo Group PLC (a) | | | 205,636 | | | | 995,054 | |
| Team17 Group PLC (a) | | | 194,279 | | | | 2,153,388 | |
| Total Entertainment | | | | | | | 4,727,487 | |
| IT Services - 1.7% | | | | | | | | |
| Keywords Studios PLC (a) | | | 55,463 | | | | 1,968,123 | |
| Total United Kingdom | | | | | | | 6,695,610 | |
| | | | | | | | | |
| United States - 37.8% | | | | | | | | |
| Electronic Equipment, Instruments & Components - 0.3% | | | | | | | | |
| VSTECS Holdings, Ltd. | | | 332,029 | | | | 301,957 | |
| Entertainment - 21.2% (d) | | | | | | | | |
| Activision Blizzard, Inc. | | | 20,471 | | | | 1,903,803 | |
| Bilibili, Inc. - ADR (a)(b) | | | 17,227 | | | | 1,844,323 | |
| DouYu International Holdings, Ltd. - ADR (a)(b) | | | 133,141 | | | | 1,385,998 | |
| Electronic Arts, Inc. | | | 14,486 | | | | 1,960,970 | |
| Glu Mobile, Inc. (a) | | | 152,573 | | | | 1,904,111 | |
| HUYA, Inc. - ADR (a)(b) | | | 10,943 | | | | 213,170 | |
| iDreamSky Technology Holdings, Ltd. (a) | | | 3,521,106 | | | | 1,689,421 | |
| IGG, Inc. | | | 1,308,669 | | | | 1,686,737 | |
The accompanying notes are an integral part of these financial statements.
Wedbush ETFMG TM ETFs
Wedbush ETFMG Video Game Tech ETF
Schedule of Investments
March 31, 2021 (Unaudited) (Continued)
| | | Shares | | | Value | |
| NetDragon Websoft Holdings, Ltd. | | | 787,715 | | | $ | 2,006,246 | |
| NetEase, Inc. - ADR | | | 2,653 | | | | 273,949 | |
| Playtika Holding Corp. (a)(b) | | | 68,586 | | | | 1,866,225 | |
| ROBLOX Corp. - Class A (a) | | | 25,746 | | | | 1,669,113 | |
| Sciplay Corp. - Class A (a)(b) | | | 110,487 | | | | 1,787,680 | |
| Sea, Ltd. - ADR (a) | | | 1,215 | | | | 271,224 | |
| Skillz, Inc. (a)(b) | | | 10,352 | | | | 197,102 | |
| Take-Two Interactive Software, Inc. (a) | | | 11,152 | | | | 1,970,558 | |
| Zynga, Inc. - Class A (a)(b) | | | 186,346 | | | | 1,902,593 | |
| Total Entertainment | | | | | | | 24,533,223 | |
| Household Durables - 0.4% | | | | | | | | |
| Turtle Beach Corp. (a)(b) | | | 15,670 | | | | 417,919 | |
| Interactive Media & Services - 2.7% | | | | | | | | |
| Alphabet, Inc. - Class C (a) | | | 614 | | | | 1,270,139 | |
| JOYY, Inc. - ADR (b) | | | 2,254 | | | | 211,267 | |
| Momo, Inc. - ADR | | | 17,189 | | | | 253,366 | |
| Sohu.com, Ltd. - ADR (a) | | | 16,120 | | | | 253,406 | |
| Tencent Holdings, Ltd. | | | 14,703 | | | | 1,153,681 | |
| Total Interactive Media & Services | | | | | | | 3,141,859 | |
| Semiconductors & Semiconductor Equipment - 3.9% | | | | | | | | |
| Advanced Micro Devices, Inc. (a)(b) | | | 15,875 | | | | 1,246,188 | |
| Intel Corp. | | | 20,369 | | | | 1,303,616 | |
| Kopin Corp. (a)(b) | | | 27,598 | | | | 289,503 | |
| NVIDIA Corp. | | | 2,481 | | | | 1,324,680 | |
| Qualcomm, Inc. | | | 2,183 | | | | 289,444 | |
| Total Semiconductors & Semiconductor Equipment | | | | | | | 4,453,431 | |
| Software - 3.2% | | | | | | | | |
| Cheetah Mobile, Inc. - ADR | | | 160,086 | | | | 360,194 | |
| Kingsoft Corp., Ltd. | | | 41,473 | | | | 275,274 | |
| Microsoft Corp. | | | 5,438 | | | | 1,282,117 | |
| Unity Software, Inc. (a)(b) | | | 17,848 | | | | 1,790,333 | |
| Total Software | | | | | | | 3,707,918 | |
| Specialty Retail - 1.2% | | | | | | | | |
| GameStop Corp. - Class A (a)(b) | | | 7,317 | | | | 1,388,913 | |
| Technology Hardware, Storage & Peripherals - 4.9% | | | | | | | | |
| Apple, Inc. | | | 10,574 | | | | 1,291,614 | |
| Corsair Gaming, Inc. (a)(b) | | | 56,190 | | | | 1,870,565 | |
| Immersion Corp. (a) | | | 37,972 | | | | 363,772 | |
| Razer, Inc. (a) | | | 6,335,530 | | | | 2,151,477 | |
| Total Technology Hardware, Storage & Peripherals | | | | | | | 5,677,428 | |
| Total United States | | | | | | | 43,622,648 | |
| TOTAL COMMON STOCKS (Cost $94,163,528) | | | | | | | 114,906,122 | |
The accompanying notes are an integral part of these financial statements.
Wedbush ETFMG TM ETFs
Wedbush ETFMG Video Game Tech ETF
Schedule of Investments
March 31, 2021 (Unaudited) (Continued)
| | | Shares | | | Value | |
| INVESTMENTS PURCHASED WITH PROCEEDS FROM | | | | | | | | |
| SECURITIES LENDING COLLATERAL - 12.4% | | | | | | | | |
| ETFMG Sit Ultra Short ETF (e) | | | 75,000 | | | $ | 3,730,913 | |
| Mount Vernon Liquid Assets Portfolio, LLC, 0.11% (c) | | | 10,594,914 | | | | 10,594,914 | |
| TOTAL INVESTMENTS PURCHASED WITH PROCEEDS | | | | | | | | |
| FROM SECURITIES LENDING COLLATERAL (Cost $14,342,762) | | | | | | | 14,325,827 | |
| | | | | | | | | |
| SHORT-TERM INVESTMENTS - 0.2% | | | | | | | | |
| Money Market Funds - 0.2% | | | | | | | | |
| Invesco Advisers, Inc. STIT-Treasury Portfolio – Institutional Class, 0.01% (c) | | | 262,885 | | | | 262,885 | |
| TOTAL SHORT-TERM INVESTMENTS (Cost $262,885) | | | | | | | 262,885 | |
| | | | | | | | | |
| Total Investments (Cost $108,769,175) - 112.1% | | | | | | | 129,494,834 | |
| Liabilities in Excess of Other Assets - (12.1)% | | | | | | | (13,940,066 | ) |
| TOTAL NET ASSETS - 100.0% | | | | | | $ | 115,554,768 | |
| Percentages are stated as a percent of net assets. | | | | | | | | |
| ADR | American Depositary Receipt |
| PLC | Public Limited Company |
| (a) | Non-income producing security. |
| (b) | All or a portion of this security is out on loan as of March 31, 2021. |
| (c) | The rate shown is the annualized seven-day yield at March 31, 2021. |
| (d) | As of March 31, 2021, the Fund had a significant portion of its assets in the Entertainment Industry. |
| (e) | Affiliated security. Please refer to Note 9 of the Notes to Financial Statements. |
The Global Industry Classification Standard (GICS®) was developed by and/or is the exclusive property of MSCI, Inc. and Standard & Poor’s Financial Services LLC (“S&P”). GICS is a service mark of MSCI and S&P and has been licensed for use by U.S. Bancorp Fund Services, LLC, doing business as U.S. Bank Global Fund Services ("Fund Services").
The accompanying notes are an integral part of these financial statements.
Wedbush ETFMG TM ETFs
STATEMENTS OF ASSETS AND LIABILITIES
As of March 31, 2021 (Unaudited)
| | | Wedbush ETFMG Global Cloud Technology ETF | | | Wedbush ETFMG Video Game Tech ETF | |
| ASSETS | | | | | | | | |
| Investments in unaffiliated securities, at value* | | $ | 61,321,835 | | | $ | 125,763,921 | |
| Investments in affiliated securities, at value* | | | 2,487,275 | | | | 3,730,913 | |
| Total Investments in securities, at value | | | 63,809,110 | | | | 129,494,834 | |
| Foreign currency* | | | 1,774 | | | | 26,615 | |
| Dividends and interest receivable | | | 70,740 | | | | 322,936 | |
| Securities lending income receivable | | | 1,638 | | | | 7,967 | |
| Total Assets | | | 63,883,262 | | | | 129,852,352 | |
| | | | | | | | | |
| LIABILITIES | | | | | | | | |
| Collateral received for securities loaned (Note 7) | | | 11,168,033 | | | | 14,223,377 | |
| Payables: | | | | | | | | |
| Management fees payable | | | 31,323 | | | | 74,207 | |
| Total Liabilities | | | 11,199,356 | | | | 14,297,584 | |
| Net Assets | | $ | 52,683,906 | | | $ | 115,554,768 | |
| | | | | | | | | |
| NET ASSETS CONSIST OF: | | | | | | | | |
| Paid-in Capital | | $ | 45,148,308 | | | $ | 49,837,458 | |
| Total Distributable Earnings | | | 7,535,598 | | | | 65,717,310 | |
| Net Assets | | $ | 52,683,906 | | | $ | 115,554,768 | |
| | | | | | | | | |
| *Identified Cost: | | | | | | | | |
| | | | | | | | | |
| Investments in unaffiliated securities | | $ | 45,011,765 | | | $ | 105,021,327 | |
| Investments in affiliated securities | | | 2,487,949 | | | | 3,747,848 | |
| Foreign currency | | | 1,775 | | | | 26,607 | |
| Shares Outstanding^ | | | 1,100,000 | | | | 1,200,000 | |
| | | | | | | | | |
| Net Asset Value, Offering and Redemption Price per Share | | $ | 47.89 | | | $ | 96.30 | |
| ^ | No par value, unlimited number of shares authorized |
The accompanying notes are an integral part of these financial statements.
Wedbush ETFMG TM ETFs
STATEMENTS OF OPERATIONS
For the Period Ended March 31, 2021 (Unaudited)
| | | Wedbush
ETFMG
Global Cloud
Technology ETF | | | Wedbush
ETFMG Video
Game Tech
ETF | |
| INVESTMENT INCOME | | | | | | | | |
| Income: | | | | | | | | |
| Dividends from unaffiliated securities (net of foreign withholdings tax of $8,275, $52,059) | | $ | 146,416 | | | $ | 436,968 | |
| Interest | | | 10 | | | | 39 | |
| Securities lending income | | | 18,994 | | | | 205,133 | |
| Total Investment Income | | | 165,420 | | | | 642,140 | |
| | | | | | | | | |
| Expenses: | | | | | | | | |
| Management fees | | | 184,882 | | | | 498,321 | |
| Total Expenses | | | 184,882 | | | | 498,321 | |
| Net Investment Income (Loss) | | | (19,462 | ) | | | 143,819 | |
| | | | | | | | | |
| REALIZED & UNREALIZED GAIN (LOSS) ON INVESTMENTS | | | | | | | | |
| Net Realized Gain (Loss) on: | | | | | | | | |
| Unaffiliated Investments | | | 468,839 | | | | 56,446,309 | |
| In-Kind redemptions | | | 1,588,343 | | | | 7,589,323 | |
| Foreign currency and foreign currency translation | | | (2,476 | ) | | | (72,235 | ) |
| Net Realized Gain on Investments | | | 2,054,706 | | | | 63,963,397 | |
| Net Change in Unrealized Appreciation (Depreciation) of: | | | | | | | | |
| Unaffiliated Investments | | | 4,279,259 | | | | (6,533,874 | ) |
| Affiliated Investments | | | (1,975 | ) | | | (1,800 | ) |
| Foreign currency and foreign currency translation | | | (293 | ) | | | (1,272 | ) |
| Net change in Unrealized Appreciation (Depreciation) of Investments | | | 4,276,991 | | | | (6,536,946 | ) |
| Net Realized and Unrealized Gain on Investments | | | 6,331,697 | | | | 57,426,451 | |
| NET INCREASE IN NET ASSETS RESULTING FROM OPERATIONS | | $ | 6,312,235 | | | $ | 57,570,270 | |
The accompanying notes are an integral part of these financial statements.
Wedbush ETFMG TM ETFs
Wedbush ETFMG Global Cloud Technology ETF
STATEMENTS OF CHANGES IN NET ASSETS
| | | Period Ended
March 31,
2021 | | | Year Ended
September 30, | |
| | | (Unaudited) | | | 2020 | |
| OPERATIONS | | | | | | | | |
| Net investment income (loss) | | $ | (19,462 | ) | | $ | 261,974 | |
| Net realized gain (loss) on investments and In-Kind Redemptions | | | 2,054,706 | | | | (3,421,749 | ) |
| Net change in unrealized appreciation of investments and foreign currency and foreign currency translation | | | 4,276,991 | | | | 10,336,862 | |
| Net increase in net assets resulting from operations | | | 6,312,235 | | | | 7,177,087 | |
| | | | | | | | | |
| DISTRIBUTIONS TO SHAREHOLDERS | | | | | | | | |
| Total distributions from distributable earnings | | | (137,500 | ) | | | (226,000 | ) |
| | | | | | | | | |
| CAPITAL SHARE TRANSACTIONS | | | | | | | | |
| Net increase (decrease) in net assets derived from net change in outstanding shares | | | (6,320 | ) | | | 1,842,050 | |
| Transaction Fees (See Note 1) | | | — | | | | 2,150 | |
| Net increase (decrease) in net assets from capital share transactions | | | (6,320 | ) | | | 1,844,200 | |
| Total increase in net assets | | $ | 6,168,415 | | | $ | 8,795,287 | |
| | | | | | | | | |
| NET ASSETS | | | | | | | | |
| Beginning of Period | | | 46,515,491 | | | | 37,720,204 | |
| End of Period | | $ | 52,683,906 | | | $ | 46,515,491 | |
Summary of share transactions is as follows:
| | | Period Ended | | | | | | | |
| | | March 31, 2021 | | | Year Ended | |
| | | (Unaudited) | | | September 30, 2020 | |
| | | Shares | | | Amount | | | Shares | | | Amount | |
| Shares Sold | | | 100,000 | | | $ | 5,212,020 | | | | 350,000 | | | $ | 12,901,765 | |
| Transaction Fees (See Note 1) | | | — | | | | — | | | | — | | | | 2,150 | |
| Shares Redeemed | | | (100,000 | ) | | | (5,218,340 | ) | | | (300,000 | ) | | | (11,059,715 | ) |
| Net Transactions in Fund Shares | | | — | | | $ | (6,320 | ) | | | 50,000 | | | $ | 1,844,200 | |
| Beginning Shares | | | 1,100,000 | | | | | | | | 1,050,000 | | | | | |
| Ending Shares | | | 1,100,000 | | | | | | | | 1,100,000 | | | | | |
The accompanying notes are an integral part of these financial statements.
Wedbush ETFMG TM ETFs
Wedbush ETFMG Video Game Tech ETF
STATEMENTS OF CHANGES IN NET ASSETS
| | | Period Ended
March 31,
2021 | | | Year Ended
September 30, | |
| | | (Unaudited) | | | 2020 | |
| OPERATIONS | | | | | | | | |
| Net investment income | | $ | 143,819 | | | $ | 451,211 | |
| Net realized gain on investments and In-Kind Redemptions | | | 63,963,397 | | | | 10,026,884 | |
| Net change in unrealized appreciation (depreciation) of investments and foreign currency and foreign currency translation | | | (6,536,946 | ) | | | 35,830,476 | |
| Net increase in net assets resulting from operations | | | 57,570,270 | | | | 46,308,571 | |
| | | | | | | | | |
| DISTRIBUTIONS TO SHAREHOLDERS | | | | | | | | |
| Total distributions from distributable earnings | | | (1,039,000 | ) | | | (726,000 | ) |
| | | | | | | | | |
| CAPITAL SHARE TRANSACTIONS | | | | | | | | |
| Net decrease in net assets derived from net change in outstanding shares | | | (62,761,220 | ) | | | (6,893,375 | ) |
| Transaction Fees (See Note 1) | | | 86,112 | | | | 8,922 | |
| Net decrease in net assets from capital share transactions | | | (62,675,108 | ) | | | (6,884,453 | ) |
| Total increase (decrease) in net assets | | $ | (6,143,838 | ) | | $ | 38,698,118 | |
| | | | | | | | | |
| NET ASSETS | | | | | | | | |
| Beginning of Period | | | 121,698,606 | | | | 83,000,488 | |
| End of Period | | $ | 115,554,768 | | | $ | 121,698,606 | |
Summary of share transactions is as follows:
| | | Period Ended | | | | | | | |
| | | March 31, 2021 | | | Year Ended | |
| | | (Unaudited) | | | September 30, 2020 | |
| | | Shares | | | Amount | | | Shares | | | Amount | |
| Shares Sold | | | 700,000 | | | $ | 60,910,445 | | | | 400,000 | | | $ | 24,396,890 | |
| Transaction Fees (See Note 1) | | | — | | | | 86,112 | | | | — | | | | 8,922 | |
| Shares Redeemed | | | (1,300,000 | ) | | | (123,671,665 | ) | | | (600,000 | ) | | | (31,290,265 | ) |
| Net Transactions in Fund Shares | | | (600,000 | ) | | $ | (62,675,108 | ) | | | (200,000 | ) | | $ | (6,884,453 | ) |
| Beginning Shares | | | 1,800,000 | | | | | | | | 2,000,000 | | | | | |
| Ending Shares | | | 1,200,000 | | | | | | | | 1,800,000 | | | | | |
The accompanying notes are an integral part of these financial statements.
Wedbush ETFMG TM ETFs
Wedbush ETFMG Global Cloud Technology ETF
FINANCIAL HIGHLIGHTS
For a capital share outstanding throughout the year/period
| | | Period
Ended
March 31,
2021
(Unaudited) | | | Year Ended
September 30,
2020 | | | Year Ended
September 30,
2019 | | | Year Ended
September 30,
2018 | | | Year Ended
September 30,
2017 | | | Period Ended
September 30,
20161 | |
| | | | | | | | | | | | | | | | | | | |
| Net Asset Value, | | | | | | | | | | | | | | | | | | | | | | | | |
| Beginning of | | | | | | | | | | | | | | | | | | | | | | | | |
| Year/Period | | $ | 42.29 | | | $ | 35.92 | | | $ | 39.05 | | | $ | 36.14 | | | $ | 26.75 | | | $ | 25.00 | |
| Income (Loss) from | | | | | | | | | | | | | | | | | | | | | | | | |
| Investment Operations: | | | | | | | | | | | | | | | | | | | | | | | | |
| Net investment income (loss)2 | | | (0.02 | ) | | | 0.26 | | | | 0.28 | | | | 0.15 | | | | 0.27 | | | | 0.11 | |
| Net realized and unrealized gain (loss) on investments | | | 5.75 | | | | 6.34 | | | | (3.11 | ) | | | 3.08 | | | | 9.26 | | | | 1.68 | |
| Total from investment operations | | | 5.73 | | | | 6.60 | | | | (2.83 | ) | | | 3.23 | | | | 9.53 | | | | 1.79 | |
| Less Distributions: | | | | | | | | | | | | | | | | | | | | | | | | |
| Distributions from net investment income | | | (0.13 | ) | | | (0.23 | ) | | | (0.30 | ) | | | (0.13 | ) | | | (0.04 | ) | | | (0.04 | ) |
| Net realized gains | | | — | | | | — | | | | — | | | | (0.19 | ) | | | (0.10 | ) | | | — | |
| Total distributions | | | (0.13 | ) | | | (0.23 | ) | | | (0.30 | ) | | | (0.32 | ) | | | (0.14 | ) | | | (0.04 | ) |
| Net asset value, end of year/period | | $ | 47.89 | | | $ | 42.29 | | | $ | 35.92 | | | $ | 39.05 | | | $ | 36.14 | | | $ | 26.75 | |
| Total Return | | | 13.54 | %3 | | | 18.58 | % | | | -7.23 | % | | | 9.03 | % | | | 36.39 | % | | | 7.15 | %3 |
| | | | | | | | | | | | | | | | | | | | | | | | | |
| Ratios/Supplemental | | | | | | | | | | | | | | | | | | | | | | | | |
| Data: | | | | | | | | | | | | | | | | | | | | | | | | |
| Net assets at end of year/period (000’s) | | $ | 52,684 | | | $ | 46,515 | | | $ | 37,720 | | | $ | 50,771 | | | $ | 37,948 | | | $ | 6,686 | |
| | | | | | | | | | | | | | | | | | | | | | | | | |
| Expenses to Average Net Assets before legal expense | | | 0.68 | %4 | | | 0.71 | %5 | | | 0.75 | % | | | 0.75 | % | | | 0.75 | % | | | 0.75 | %4 |
| Gross Expenses to Average Net Assets | | | 0.68 | %4 | | | 0.71 | %5 | | | 0.75 | % | | | 0.75 | % | | | 0.79 | %6 | | | 0.75 | %4 |
| Net Investment Income (Loss) to Average Net Assets | | | -0.07 | %4 | | | 0.70 | % | | | 0.83 | % | | | 0.42 | % | | | 0.87 | % | | | 0.68 | %4 |
| Portfolio Turnover Rate | | | 8 | %3 | | | 104 | % | | | 38 | % | | | 42 | % | | | 21 | % | | | 13 | %3 |
| 1 | Commencement of operations on March 8, 2016. |
| 2 | Calculated based on average shares outstanding during the year/period. |
| 5 | Effective April 7, 2020, the Fund’s expense ratio was reduced to 0.68%. |
| 6 | The ratio of expenses to average net assets includes legal expense. |
The accompanying notes are an integral part of these financial statements.
Wedbush ETFMG TM ETFs
Wedbush ETFMG Video Game Tech ETF
FINANCIAL HIGHLIGHTS
For a capital share outstanding throughout the year/period
| | | Period Ended
March 31,
2021
(Unaudited) | | | Year Ended
September 30,
2020 | | | Year Ended
September 30,
2019 | | | Year Ended
September 30,
2018 | | | Year Ended
September 30,
2017 | | | Period Ended
September 30,
20161 | |
| | | | | | | | | | | | | | | | | | | |
| Net Asset Value, | | | | | | | | | | | | | | | | | | | | | | | | |
| Beginning Year/Period | | $ | 67.61 | | | $ | 41.50 | | | $ | 47.49 | | | | 44.37 | | | $ | 32.90 | | | $ | 25.00 | |
| Income (Loss) from | | | | | | | | | | | | | | | | | | | | | | | | |
| Investment Operations: | | | | | | | | | | | | | | | | | | | | | | | | |
| Net investment income2 | | | 0.14 | | | | 0.25 | | | | 0.52 | | | | 0.74 | | | | 0.33 | | | | 0.08 | |
| Net realized and unrealized gain (loss) on investments | | | 29.08 | | | | 26.26 | | | | (5.87 | ) | | | 2.98 | | | | 11.71 | | | | 7.82 | |
| Total from investment operations | | | 29.22 | | | | 26.51 | | | | (5.35 | ) | | | 3.72 | | | | 12.04 | | | | 7.90 | |
| Less Distributions: | | | | | | | | | | | | | | | | | | | | | | | | |
| Distributions from net investment income | | | (0.58 | ) | | | (0.41 | ) | | | (0.65 | ) | | | (0.59 | ) | | | (0.18 | ) | | | — | |
| Net realized gains | | | — | | | | — | | | | — | | | | (0.03 | ) | | | (0.39 | ) | | | — | |
| Total distributions | | | (0.58 | ) | | | (0.41 | ) | | | (0.65 | ) | | | (0.62 | ) | | | (0.57 | ) | | | — | |
| Capital Share | | | | | | | | | | | | | | | | | | | | | | | | |
| Transactions: | | | | | | | | | | | | | | | | | | | | | | | | |
| Transaction fees added to paid-in capital | | | 0.05 | | | | 0.01 | | | | 0.01 | | | | 0.02 | | | | — | | | | — | |
| Net asset at end of year/period | | $ | 96.30 | | | $ | 67.61 | | | $ | 41.50 | | | | 47.49 | | | $ | 44.37 | | | $ | 32.90 | |
| Total Return | | | 43.49 | %3 | | | 64.12 | % | | | -11.26 | % | | | 8.38 | % | | | 37.67 | % | | | 31.62 | %3 |
| | | | | | | | | | | | | | | | | | | | | | | | | |
| Ratios/Supplemental | | | | | | | | | | | | | | | | | | | | | | | | |
| Data: | | | | | | | | | | | | | | | | | | | | | | | | |
| Net assets at end of year/period (000’s) | | $ | 115,555 | | | $ | 121,699 | | | $ | 83,000 | | | $ | 130,609 | | | $ | 39,934 | | | $ | 6,581 | |
| | | | | | | | | | | | | | | | | | | | | | | | | |
| Expenses to Average Net Assets before legal expense | | | 0.75 | %4 | | | 0.75 | % | | | 0.75 | % | | | 0.75 | % | | | 0.75 | % | | | 0.74 | %4 |
| Gross Expenses to Average Net Assets | | | 0.75 | %4 | | | 0.75 | % | | | 0.75 | % | | | 0.75 | % | | | 0.82 | %5 | | | 0.74 | %4 |
| Net Investment Income to Average Net Assets | | | 0.35 | %4 | | | 0.51 | % | | | 1.22 | % | | | 1.48 | % | | | 0.86 | % | | | 0.44 | %4 |
| Portfolio Turnover Rate | | | 33 | %3 | | | 53 | % | | | 38 | % | | | 42 | % | | | 49 | % | | | 10 | %3 |
| 1 | Commencement of operations on March 8, 2016. |
| 2 | Calculated based on average shares outstanding during the year/period. |
| 5 | The ratio of expenses to average net assets includes legal expense. |
The accompanying notes are an integral part of these financial statements.
Wedbush ETFMG TM ETFs
NOTES TO FINANCIAL STATEMENTS
March 31, 2021 (Unaudited)
NOTE 1 – ORGANIZATION
Wedbush ETFMG Global Cloud Technology ETF (“IVES”) and Wedbush ETFMG Video Game Tech ETF (“GAMR”) (each a “Fund”, or collectively the “Funds”) are a series of ETF Managers Trust (the “Trust”), an open-end management investment company consisting of multiple investment series, organized as a Delaware statutory trust on July 1, 2009. The Trust is registered with the U.S. Securities and Exchange Commission (“SEC”) under the Investment Company Act of 1940, as amended (the “1940 Act”), as an open-end management investment company and the offering of the Fund’s shares (“Shares”) is registered under the Securities Act of 1933, as amended (the “Securities Act”).
The Wedbush ETFMG Global Cloud Technology ETF seeks to provide investment results that, before fees and expenses, correspond generally to the price and yield performance of the Dan Ives Global Cloud Technology Prime Index (the “Index”). The Index is designed to include the securities of companies across the globe that are: i) engaged in providing infrastructure, equipment, connectivity, data back-up and storage services, and data center management for enterprise- based software applications, or ii) engaged in providing cloud-based software platforms that enable businesses to move data and software applications onto the cloud - cloud-enabling Software as a Service (SaaS) technologies. These companies are known collectively as “Cloud Technology Companies.” The Cloud Technology Companies will have a minimum market capitalization of $200 million and a maximum market capitalization of $10 billion.
Effective April 17, 2020, the name ETFMG Video Game Tech ETF has changed to the Wedbush ETFMG Video Game Tech ETF.
The following table is a summary of the Strategy Commencement Date and Strategy of the Funds:
| Fund Name | Strategy
Commencement
Date | Strategy |
Wedbush
ETFMG Global
Cloud
Technology ETF | 4/7/2020 | Seeks to provide investment results that, before fees and expenses, correspond generally to the price and yield performance of the Dan Ives Global Cloud Technology Prime™ Index NTR. |
Wedbush
ETFMG Video
Game Tech ETF | 3/8/2016 | Seeks to provide investment results that, before fees and expenses, correspond generally to the price and yield performance of the EEFund Video Game Tech™ Index. |
The Funds currently offer one class of shares, which has no front end sales load, no deferred sales charges, and no redemption fees. The Funds may issue an unlimited number of shares of beneficial interest, with no par value. All shares of the Funds have equal rights and privileges.
Shares of the Funds are listed and traded on the NASDAQ Stock Market, LLC. Market prices for the Shares may be different from their net asset value (“NAV”). The Funds issue and redeem Shares on a continuous basis at NAV only in blocks of 50,000 shares, called “Creation Units.” Creation Units are issued and redeemed principally in-kind for securities included in the Index. Once created, Shares generally trade in the secondary market at market prices that change throughout the day in quantities less than a Creation Unit. Except when aggregated in Creation Units, Shares are not redeemable securities of the Funds. Shares of the Funds may only be purchased or redeemed by certain financial institutions (“Authorized Participants”). An Authorized Participant is either (i) a broker-dealer or other participant in the clearing process through the Continuous Net Settlement System of the National Securities Clearing Corporation or (ii) a DTC participant and, in each case, must have executed a Participant Agreement with the Distributor. Most retail investors do not qualify as Authorized Participants nor have the resources to buy and sell whole Creation Units. Therefore, they are unable to purchase or redeem the Shares directly from the Funds. Rather, most retail investors may purchase Shares in the secondary market with the assistance of a broker and may be subject to customary brokerage commissions or fees.
Wedbush ETFMG TM ETFs
NOTES TO FINANCIAL STATEMENTS
March 31, 2021 (Unaudited) (Continued)
Authorized Participants transacting in Creation Units for cash may pay an additional variable charge to compensate the relevant Fund for certain transaction costs (i.e., brokerage costs) and market impact expenses relating to investing in portfolio securities. Such variable charges, if any, are included in “Transaction Fees” in the Statements of Changes in Net Assets.
NOTE 2 – SIGNIFICANT ACCOUNTING POLICIES
The following is a summary of significant accounting policies consistently followed by the Funds. These policies are in conformity with accounting principles generally accepted in the United States of America (“U.S. GAAP”).
The Funds follow the investment company accounting and reporting guidance of the Financial Accounting Standards Board Accounting Standard Codification Topic 946 Financial Services –Investment Companies.
The Funds may invest in certain other investment companies (underlying funds). For specific investments in underlying funds, please refer to the complete schedule of portfolio holdings on Form N-CSR(S) for this reporting period, which is filed with the SEC. For more information about the underlying fund’s operations and policies, please refer to those funds’ semiannual and annual reports, which are filed with the SEC.
| A. | Security Valuation. Securities listed on a securities exchange, market or automated quotation system for which quotations are readily available (except for securities traded on NASDAQ), including securities traded over the counter, are valued at the last quoted sale price on the primary exchange or market (foreign or domestic) on which they are traded on the valuation date (or at approximately 4:00 pm Eastern Time if a security’s primary exchange is normally open at that time), or, if there is no such reported sale on the valuation date, at the most recent quoted bid price. For securities traded on NASDAQ, the NASDAQ Official Closing Price will be used. |
Securities for which quotations are not readily available are valued at their respective fair values as determined in good faith by the Board of Trustees (the “Board”). When a security is “fair valued,” consideration is given to the facts and circumstances relevant to the particular situation, including a review of various factors set forth in the pricing procedures adopted by the Funds’ Board. The use of fair value pricing by the Funds may cause the NAV of its shares to differ significantly from the NAV that would be calculated without regard to such considerations. As of March 31, 2021, the Fund did not hold any fair valued securities. As described above, the Funds utilize various methods to measure the fair value of its investments on a recurring basis. U.S. GAAP establishes a hierarchy that prioritizes inputs to valuation methods. The three levels of inputs are:
| Level 1 | Unadjusted quoted prices in active markets for identical assets or liabilities that the Funds have the ability to access. |
| Level 2 | Observable inputs other than quoted prices included in Level 1 that are observable for the asset or liability, either directly or indirectly. These inputs may include quoted prices for the identical instrument on an inactive market, prices for similar instruments, interest rates, prepayment speeds, credit risk, yield curves, default rates and similar data. |
Wedbush ETFMG TM ETFs
NOTES TO FINANCIAL STATEMENTS
March 31, 2021 (Unaudited) (Continued)
| Level 3 | Unobservable inputs for the asset or liability, to the extent relevant observable inputs are not available; representing the Funds’ own assumptions about the assumptions a market participant would use in valuing the asset or liability, and would be based on the best information available. |
The availability of observable inputs can vary from security to security and is affected by a wide variety of factors, including, for example, the type of security, whether the security is new and not yet established in the marketplace, the liquidity of markets, and other characteristics particular to the security. To the extent that valuation is based on models or inputs that are less observable or unobservable in the market, the determination of fair value requires more judgment. Accordingly, the degree of judgment exercised in determining fair value is greatest for instruments categorized in Level 3.
The inputs used to measure fair value may fall into different levels of the fair value hierarchy. In such cases, for disclosure purposes, the level in the fair value hierarchy within which the fair value measurement falls in its entirety, is determined based on the lowest level input that is significant to the fair value measurement in its entirety.
The following is a summary of the inputs used to value the Funds’ net assets as of March 31, 2021:
Wedbush ETFMG Global Cloud Technology ETF
| Assets^ | | Level 1 | | | Level 2 | | | Level 3 | | | Total | |
| Common Stocks | | $ | 52,393,395 | | | $ | — | | | $ | — | | | $ | 52,393,395 | |
| Short Term Investments | | | 248,357 | | | | — | | | | — | | | | 248,357 | |
| ETFMG Sit Ultra Short ETF** | | | 2,487,275 | | | | — | | | | — | | | | 2,487,275 | |
| Investments Purchased with Securities Lending Collateral* | | | — | | | | — | | | | — | | | | 8,680,083 | |
| Total Investments in Securities | | $ | 55,129,027 | | | $ | — | | | $ | — | | | $ | 63,809,110 | |
Wedbush ETFMG Video Game Tech ETF
| Assets^ | | Level 1 | | | Level 2 | | | Level 3 | | | Total | |
| Common Stocks | | $ | 114,906,122 | | | $ | — | | | $ | — | | | $ | 114,906,122 | |
| Short Term Investments | | | 262,885 | | | | — | | | | — | | | | 262,885 | |
| ETFMG Sit Ultra Short ETF** | | | 3,730,913 | | | | — | | | | — | | | | 3,730,913 | |
| Investments Purchased with Securities Lending Collateral* | | | — | | | | — | | | | — | | | | 10,594,914 | |
| Total Investments in Securities | | $ | 118,899,920 | | | $ | — | | | $ | — | | | $ | 129,494,834 | |
| ^ | See Schedule of Investments for classifications by country and industry |
| * | Certain investments that are measured at fair value used the net asset value per share (or its equivalent) practical expediant have not been categorized in the fair value hierarchy. The fair value amounts presented in the table are intended to permit reconciliation of the fair value hierarchy to the amounts presented in the Schedules of Investments. |
| ** | Investment was purchased with collateral. |
| B. | Federal Income Taxes. The Funds have elected to be taxed as a “regulated investment company” and intend to distribute substantially all taxable income to their shareholders and otherwise comply with the provisions of the Internal Revenue Code applicable to regulated investment companies. Therefore, no provisions for federal income taxes or excise taxes have been made. To avoid imposition of the excise tax applicable to regulated investment companies, the Funds intend to declare each year as dividends, in each calendar year, at least 98.0% of its net investment income (earned during the calendar year) and 98.2% of its net realized capital gains (earned during the twelve months ended October 31) plus undistributed amounts, if any, from prior years. |
Wedbush ETFMG TM ETFs
NOTES TO FINANCIAL STATEMENTS
March 31, 2021 (Unaudited) (Continued)
Net capital losses incurred after October 31, within the taxable year are deemed to arise on the first business day of the Funds’ next taxable year.
The Funds recognize the tax benefits of uncertain tax positions only where the position is “more likely than not” to be sustained assuming examination by tax authorities. The Funds have analyzed their tax position and have concluded that no liability for unrecognized tax benefits should be recorded related to uncertain tax positions expected to be taken in the Funds’ 2020 tax returns. The Funds identify its major tax jurisdictions as U.S. Federal, the State of New Jersey, and the State of Delaware; however the Funds are not aware of any tax positions for which it is reasonably possible that the total amounts of unrecognized tax benefits will change materially in the next twelve months.
As of March 31, 2021, management has reviewed the tax positions for open periods (for federal purposes, three years from the date of filing and for state purposes, four years from the date of filing) as applicable to the Funds, and has determined that no provision for income tax is required in the Funds’ financial statements.
| C. | Security Transactions and Investment Income. Investment securities transactions are accounted for on the trade date. Gains and losses realized on sales of securities are determined on a specific identification basis. Discounts/premiums on debt securities purchased are accreted/amortized over the life of the respective securities using the effective interest method. Dividend income is recorded on the ex-dividend date. Interest income is recorded on an accrual basis. Income, including gains, from investments in foreign securities received by the Funds may be subject to income, withholding or other taxes imposed by foreign countries. |
| D. | Foreign Currency Translations and Transactions. The Funds may engage in foreign currency transactions. Foreign currency transactions are translated into U.S. dollars on the following basis: (i) market value of investment securities, assets and liabilities at the daily rates of exchange, and (ii) purchases and sales of investment securities, dividend and interest income and certain expenses at the rates of exchange prevailing on the respective dates of such transactions. For financial reporting purposes, the Funds do not isolate changes in the exchange rate of investment securities from the fluctuations arising from changes in the market prices of securities for unrealized gains and losses. However, for federal income tax purposes, the Funds do isolate and treat as ordinary income the effect of changes in foreign exchange rates on realized gains or losses from the sale of investment securities and payables and receivables arising from trade-date and settlement-date differences. |
| E. | Distributions to Shareholders. Distributions to shareholders from net investment income, if any are generally declared and paid by the Funds on a quarterly basis. Net realized gains on securities of the Funds normally are declared and paid on an annual basis. Distributions are recorded on the ex-dividend date. |
| F. | Use of Estimates. The preparation of financial statements in conformity with U.S. GAAP requires management to make estimates and assumptions that affect the reported amounts of assets and liabilities at the date of the financial statements, as well as the reported amounts of revenues and expenses during the period. Actual results could differ from those estimates. |
| G. | Share Valuation. The NAV per share of each Fund is calculated by dividing the sum of the value of the securities held by each Fund, plus cash and other assets, minus all liabilities (including estimated accrued expenses) by the total number of shares outstanding of each Fund, rounded to the nearest cent. Each Fund’s shares will not be priced on the days on which the NYSE is closed for trading. The offering and redemption price per share for each Fund is equal to each Fund’s NAV per share. |
Wedbush ETFMG TM ETFs
NOTES TO FINANCIAL STATEMENTS
March 31, 2021 (Unaudited) (Continued)
| H. | Guarantees and Indemnifications. In the normal course of business, the Funds enter into contracts with service providers that contain general indemnification clauses. The Funds’ maximum exposure under these arrangements is unknown as this would involve future claims that may be made against the Funds that have not yet occurred. However, based on experience, the Funds expect the risk of loss to be remote. |
NOTE 3 – RISK FACTORS
Investing in Wedbush ETFMG Global Cloud Technology ETF and the Wedbush ETFMG Video Game Tech ETF may involve certain risks, as discussed in each Fund’s prospectus, including, but not limited to, those described below. Any of these risks could cause an investor to lose money.
Market Risk. Financial markets rise and fall in response to a variety of factors, sometimes rapidly and unpredictably. As with any investment whose performance is tied to these markets, the value of an investment in a fund will fluctuate, which means that an investor could lose money over short or long periods.
Investment Style Risk. The Funds are not actively managed. Therefore, the Funds follow the securities included in its respective index during upturns as well as downturns. Because of its indexing strategy, the Funds do not take steps to reduce market exposure or to lessen the effects of a declining market. In addition, because of the Funds’ expenses, the Funds’ performance may be below that of its index.
Equity Risk. The prices of equity securities rise and fall daily. These price movements may result from factors affecting individual companies, industries or the securities market as a whole. In addition, equity markets tend to move in cycles which may cause stock prices to fall over short or extended periods of time.
Securities Lending Risk. Securities lending involves the risk of loss of rights in, or delay in recovery of, the loaned securities if the borrower fails to return the security loaned or becomes insolvent.
Concentration Risk. To the extent that the Funds’ or its underlying index’s portfolio is concentrated in the securities of issuers in a particular market, industry, group of industries, sector or asset class, the Funds may be adversely affected by the performance of those securities, may be subject to increased price volatility and may be more vulnerable to adverse economic, market, political or regulatory occurrences affecting that market, industry, group of industries, sector or asset class.
Natural Disaster/Epidemic Risk. Natural or environmental disasters, such as earthquakes, fires, floods, hurricanes, tsunamis and other severe weather-related phenomena generally, and widespread disease, including pandemics and epidemics (for example, the novel coronavirus COVID-19), have been and can be highly disruptive to economies and markets and have recently led, and may continue to lead, to increased market volatility and significant market losses. Such natural disaster and health crises could exacerbate political, social, and economic risks previously mentioned, and result in significant breakdowns, delays, shutdowns, social isolation, and other disruptions to important global, local and regional supply chains affected, with potential corresponding results on the operating performance of the Funds and their investments. A climate of uncertainty and panic, including the contagion of infectious viruses or diseases, may adversely affect global, regional, and local economies and reduce the availability of potential investment opportunities, and increases the difficulty of performing due diligence and modeling market conditions, potentially reducing the accuracy of financial projections. Under the circumstances, the Funds may have difficulty achieving their investment objectives which may adversely impact performance. Further, such events can be highly disruptive to economies and markets, significantly disrupt the operations of individual companies (including, but not limited to, the Funds’ Sponsor and third party service providers), sectors, industries, markets, securities and commodity exchanges, currencies, interest and inflation rates, credit ratings, investor sentiment, and other factors affecting the value of the Funds’ investments. These factors can cause substantial market volatility, exchange trading suspensions and closures and can impact the ability of the Funds to complete redemptions and otherwise affect Fund performance and Fund trading in the secondary market. A wide spread crisis may also affect the global economy in ways that cannot necessarily be foreseen at the current time. How long such events will last and whether they will continue or recur cannot be predicted. Impacts from these events could have significant impact on a Fund’s performance, resulting in losses to the Funds.
Wedbush ETFMG TM ETFs
NOTES TO FINANCIAL STATEMENTS
March 31, 2021 (Unaudited) (Continued)
NOTE 4 – MANAGEMENT AND OTHER CONTRACTS
Under the Investment Advisory Agreement, the Adviser has agreed to pay all expenses of the Funds, except for: the fee paid to the Adviser pursuant to the Investment Advisory Agreement, interest charges on any borrowings, taxes, brokerage commissions and other expenses incurred in placing orders for the purchase and sale of securities and other investment instruments, acquired fund fees and expenses, accrued deferred tax liability, extraordinary expenses, and distribution (12b-1) fees and expenses (collectively, “Excluded Expenses”).
Wedbush Securities, Inc. (“Wedbush”) has entered into a licensing and marketing support agreement with Exchange Traded Managers Group LLC (“Parent”), the parent company of the Adviser (the “Wedbush Agreement”). Pursuant to the Wedbush Agreement, Wedbush has agreed to (i) license the name Wedbush for the use of the Adviser; (ii) consult with the Adviser and prepare educational materials, research materials, and updates on regulation of the global video gaming technology and global cloud computing ecosystem; and (iii) provide support in connection with phone calls, appearances, and written content relating to the marketing of IVES and GAMR. Wedbush will also assumes the obligation of the Adviser to pay certain expenses of IVES and GAMR. Although Wedbush has agreed to be responsible for the payment of certain expenses of IVES and GAMR, the Adviser retains the ultimate obligation to the Funds to pay such expenses.
Advisory Fees:
Wedbush ETFMG Global Cloud Technology ETF 0.68%
Wedbush ETFMG Video Game Tech ETF 0.75%
The Adviser has entered into an agreement with its affiliate, ETFMG Financial LLC to serve as distributor to the Funds (the “Distributor”). The Distributor provides marketing support for the Funds, including distributing marketing materials related to the Funds.
In May, 2020, Wedbush acquired a minority, non-voting, equity interest in Parent. Wedbush is not however, an affiliate of the Funds, the Adviser, the Funds’ distributor or any of their respective affiliates. Wedbush does not make investment decisions, provide investment advice, or otherwise act in the capacity of an investment adviser to the Funds. Additionally, Wedbush is not involved in the maintenance of the Index and does not otherwise act in the capacity of an index provider.
Level ETF Ventures, LLC serves as the index provider for GAMR and IVES.
U.S. Bancorp Fund Services, LLC doing business as U.S. Bank Global Fund Services (the “Administrator”) provides fund accounting, fund administration, and transfer agency services to the Funds. The Advisor compensates the Administrator for these services under an administration agreement between the two parties.
Wedbush ETFMG TM ETFs
NOTES TO FINANCIAL STATEMENTS
March 31, 2021 (Unaudited) (Continued)
The Advisor pays each independent Trustee a quarterly fee for service to the Funds. Each Trustee is also reimbursed by the Advisor for all reasonable out-of-pocket expenses incurred in connection with his duties as Trustee, including travel and related expenses incurred in attending Board meetings.
NOTE 5 – DISTRIBUTION PLAN
Each Fund has adopted a Plan of Distribution pursuant to Rule 12b-1 under the 1940 Act. Under the Plan, the Funds may pay compensation to the Distributor or any other distributor or financial institution with which the Trust has an agreement with respect to the Funds, with the amount of such compensation not to exceed an annual rate of 0.25% of each Fund’s average daily net assets. For the period ended March 31, 2021, the Funds did not incur any 12b-1 expenses.
NOTE 6 - PURCHASES AND SALES OF SECURITIES
The costs of purchases and sales of securities, excluding short-term securities and in-kind transactions, during the period ended March 31, 2021:
| | | Purchases | | | Sales | |
| Wedbush ETFMG Global Cloud Technology ETF | | $ | 4,369,345 | | | $ | 6,744,332 | |
| Wedbush ETFMG Video Game Tech ETF | | $ | 43,212,812 | | | $ | 49,325,516 | |
The costs of purchases and sales of in-kind transactions associated with creations and redemptions during the period ended March 31, 2021:
| | | Purchases
In-Kind | | | Sales
In-Kind | |
| Wedbush ETFMG Global Cloud Technology ETF | | $ | 5,179,223 | | | $ | 3,018,053 | |
| Wedbush ETFMG Video Game Tech ETF | | $ | 48,004,715 | | | $ | 104,302,106 | |
Purchases in-kind are the aggregate of all in-kind purchases and sales in-kind are the aggregate of all in-kind sales. Net capital gains or losses resulting from in-kind redemptions are excluded from the Funds’ determination of taxable gains and are not distributed to shareholders.
There were no purchases or sales of U.S. Government obligations during the period ended March 31, 2021.
Wedbush ETFMG TM ETFs
NOTES TO FINANCIAL STATEMENTS
March 31, 2021 (Unaudited) (Continued)
NOTE 7 — SECURITIES LENDING
The Funds may lend up to 33 1/3% of the value of the securities in their portfolio to brokers, dealers and financial institutions (but not individuals) under terms of participation in a securities lending program administered by U.S. Bank N.A. (“the Custodian”). The securities lending agreement requires that loans are collateralized at all times in an amount equal to at least 102% of the value of any loaned securities at the time of the loan, plus accrued interest. The Funds receive compensation in the form of fees and earns interest on the cash collateral. The amount of fees depends on a number of factors including the type of security and length of the loan. The Funds continue to receive interest payments or dividends on the securities loaned during the borrowing period. Gain or loss in the fair value of securities loaned that may occur during the term of the loan will be for the account of the Funds. The Funds have the right under the terms of the securities lending agreement to recall the securities from the borrower on demand. The cash collateral is invested by the Custodian in accordance with approved investment guidelines. Those guidelines require the cash collateral to be invested in readily marketable, high quality, short-term obligations, either directly on behalf of each Fund or through one or more joint accounts, money market funds, or short-term bond funds, including those advised by or affiliated with the Advisor; however, all such investments are subject to risk of payment delays or default on the part of the issuer or counterparty or otherwise may not generate sufficient interest to support the costs associated with securities lending. Other investment companies in which a Fund may invest cash collateral can be expected to incur fees and expenses for operations, such as investment advisory and administration fees, which would be in addition to those incurred by the Fund, and which may be received in full or in part by the Advisor. Pursuant to guidance issued by the SEC staff, fees and expenses of money market funds used for cash collateral received in connection with loans of securities are not treated as Acquired Fund Fees and Expenses, which reflect a Fund’s pro rata share of the fees and expenses incurred by other investment companies in which the Fund invests (as disclosed in the Prospectus, as applicable). The Fund could also experience delays in recovering its securities and possible loss of income or value if the borrower fails to return the borrowed securities, although the Fund is indemnified from this risk by contract with the securities lending agent.
As of March 31, 2021, the value of the securities on loan and payable for collateral due to broker were as follows:
Value of Securities on Loan Collateral Received
| Fund | | Values of
Securities
on Loan | | | Fund
Collateral
Received* | |
| Wedbush ETFMG Global Cloud Technology ETF | | $ | 11,224,617 | | | $ | 11,168,033 | |
| Wedbush ETFMG Video Game Tech ETF | | | 14,146,299 | | | | 14,342,762 | |
* The cash collateral received was invested in the Mount Vernon Liquid Assets Portfolio, an investment with an overnight and continuous maturity, and ETFMG Sit Ultra Short ETF, as shown on the Schedule of Investments.
Wedbush ETFMG TM ETFs
NOTES TO FINANCIAL STATEMENTS
March 31, 2021 (Unaudited) (Continued)
NOTE 8 – FEDERAL INCOME TAXES
The components of distributable earnings (losses) and cost basis of investments for federal income tax purposes at September 30, 2020, the Funds’ most recent fiscal year end, were as follows:
| | | Cost | | | Gross
Unrealized
Appreciation | | | Gross
Unrealized
Depreciation | | | Net Unrealized
Appreciation
(Depreciation) | |
| Wedbush ETFMG Global Cloud Technology ETF | | $ | 46,702,361 | | | $ | 12,236,018 | | | $ | (491,781 | ) | | $ | 11,744,237 | |
| Wedbush ETFMG Video Game Tech ETF | | | 107,515,556 | | | | 31,424,288 | | | | (8,676,326 | ) | | | 22,747,962 | |
The difference between the tax cost of investments and the cost of investments for GAAP purposes is primarily due to the tax treatment of wash sale losses.
As of September 30, 2020, the Funds’ most recent fiscal year end, the components of distributable earnings (loss) on a tax basis were as follows:
| | | Undistributed
Ordinary
Income | | | Undistributed
Long-Term
Gain | | | Total
Distributable
Earnings | | | Other
Accumulated
Loss | | | Total
Accumulated
Gain (Loss) | |
| Wedbush ETFMG Global Cloud Technology ETF | | $ | 134,746 | | | $ | — | | | $ | 134,746 | | | $ | (10,518,120 | ) | | $ | 1,360,863 | |
| Wedbush ETFMG Video Game Tech ETF | | | 930,834 | | | | — | | | | 930,834 | | | | (14,492,756 | ) | | | 9,186,040 | |
The difference between the tax cost of investments and the cost of investments for GAAP purposes is primarily due to the tax treatment of wash sale losses.
As of September 30, 2020, the Funds’ most recent fiscal year end, the Funds had accumulated capital loss carryovers of:
| | | Capital Loss
Carryforward
ST | | | Capital Loss
Carryforward
LT | | | Expires | |
| Wedbush ETFMG Global Cloud Technology ETF | | $ | (1,596,689 | ) | | $ | (8,921,431 | ) | | | Indefinite | |
| Wedbush ETFMG Video Game Tech ETF | | | (4,527,161 | ) | | | (9,964,588 | ) | | | Indefinite | |
Under current tax law, capital and currency losses realized after October 31 of a Fund’s fiscal year may be deferred and treated as occurring on the first business day of the following fiscal year for tax purposes. The following Funds had deferred post-October capital and currency losses, which will be treated as arising on the first business day of the year ending September 30, 2020, the Funds’ most recent fiscal year end.
| | | | Late Year
Ordinary
Loss | | | | Post-
October
Capital
Loss | |
| Wedbush ETFMG Global Cloud Technology ETF | | $ | — | | | $ | — | |
| Wedbush ETFMG Video Game Tech ETF | | | — | | | | — | |
Wedbush ETFMG TM ETFs
NOTES TO FINANCIAL STATEMENTS
March 31, 2021 (Unaudited) (Continued)
The tax charter of distributions paid during the period ended March 31, 2021, and the year ended September 30, 2020 were as follows:
| | | Period Ended March 31, 2021 | | | Year Ended September 30, 2020 | |
| | | From Ordinary Income | | | From Capital Gains | | | From Ordinary Income | | | From Capital Gains | |
| Wedbush ETFMG Global Cloud Technology ETF | | $ | 137,500 | | | $ | — | | | $ | 226,000 | | | $ | — | |
| Wedbush ETFMG Video Game Tech ETF | | | 1,039,000 | | | | — | | | | 726,000 | | | | — | |
NOTE 9 – INVESTMENTS IN AFFILIATES
Wedbush ETFMG Global Cloud Technology ETF
Wedbush ETFMG Global Cloud Technology ETF owned the following company during the period ended March 31, 2021. ETFMG Sit Ultra Short ETF is deemed to be an affiliate of the Fund as defined by the 1940 Act as of the period ended March 31, 2021. Transactions during the period in the security were as follows:
| Security Name | | Value, at September 30, 2020 | | | Purchases | | | Sales | | | Realized Gain (Loss) | | | Change in Unrealized Appreciation (Depreciation) | | | Dividend Income | | | Value, at March 31, 2021 | | | Ending Shares | |
| ETFMG Sit Ultra Short ETF | | $ | 2,489,250 | | | $ | — | | | $ | — | | | $ | — | | | $ | (1,975 | ) | | $ | — | | | $ | 2,487,275 | | | | 50,000 | |
Wedbush ETFMG Video Game Tech ETF
Wedbush ETFMG Video Game Tech ETF owned the following company during the period ended March 31, 2021. ETFMG Sit Ultra Short ETF is deemed to be an affiliate of the Fund as defined by the 1940 Act as of the period ended March 31, 2021. Transactions during the period in the security were as follows:
| Security Name | | Value, at September 30, 2020 | | | Purchases | | | Sales | | | Realized Gain (Loss) | | | Change in Unrealized Appreciation (Depreciation) | | | Dividend Income | | | Value, at March 31, 2021 | | | Ending Shares | |
| ETFMG Sit Ultra Short ETF | | $ | 2,489,250 | | | $ | 1,243,463 | | | $ | — | | | $ | — | | | $ | (1,800 | ) | | $ | — | | | $ | 3,730,913 | | | | 75,000 | |
NOTE 10 – LEGAL MATTERS
The Trust, a former and current trustee of the Trust, the Adviser and certain officers of the Adviser were defendants in an action filed May 2, 2017 in the Superior Court of New Jersey captioned PureShares, LLC d/b/a PureFunds et al. v. ETF Managers Group, LLC et al., Docket No. C-63-17. The PureShares action alleged claims based on disputes arising out of contractual relationships with the Adviser relating to certain series of the Trust. The action sought damages in unspecified amounts and injunctive relief based on breach of contract, wrongful termination, and several other claims.
Wedbush ETFMG TM ETFs
NOTES TO FINANCIAL STATEMENTS
March 31, 2021 (Unaudited) (Continued)
The Adviser and its parent, Exchange Traded Managers Group, LLC (“ETFMG”), were defendants in a case filed on October 26, 2017 in the United States District Court for the Southern District of New York by NASDAQ, Inc. ("Nasdaq") captioned Nasdaq, Inc. v. Exchange Traded Managers Group, LLC et al., Case 1:17-cv-08252. This action arose out of the same facts and circumstances, and relates to the same series of the Trust, as the New Jersey litigation and asserted claims for breach of contract, conversion and certain other claims. The matter was the subject of a bench trial in May 2019, and on December 20, 2019, the Court issued an Opinion and Order awarding compensatory damages to Plaintiff in the amount of $78,403,172.36, plus prejudgment interest. The Court also denied Plaintiffs requests for punitive damages and equitable relief.
On May 1, 2020, Nasdaq, PureShares LLC ("PureShares"), and ETFMG announced a global settlement that resolves all claims in both the PureShares action and the Nasdaq action. The settlement is subject to future negotiations and approvals among independent third parties. As part of the settlement, Nasdaq and ETFMG have agreed to certain cash payments from ETFMG to Nasdaq and PureShares, and have executed an asset purchase agreement to transfer certain ETFMG intellectual property and related assets, to a Nasdaq affiliate. The transaction is expected to close prior to July 31, 2021. The Adviser does not believe that the resolution of these matters will have a material adverse effect on the Funds’ financial statements. If the events set forth in the settlement agreement do not occur, and a subsequent settlement is not reached, the resulting conditions may adversely affect the Adviser’s future operations.
NOTE 11 – SUBSEQUENT EVENTS
In preparing these financial statements, the Funds have evaluated events and transactions for potential recognition or disclosure through the date the financial statements were issued. This evaluation did not result in any subsequent events that necessitated disclosures and/or adjustments to the financial statements.
Wedbush ETFMG TM ETFs
APPROVAL OF ADVISORY AGREEMENT AND BOARD CONSIDERATIONS For the Period Ended March 31, 2021 (Unaudited)
Pursuant to Section 15(c) of the Investment Company Act of 1940 (the “1940 Act”), at a meeting held on March 30, 2021, the Board of Trustees (the “Board”) of ETF Managers Trust (the “Trust”) considered the renewal of the Amended and Restated Investment Advisory Agreement (the “Advisory Agreement”) between ETF Managers Group LLC (the “Adviser”) and the Trust, on behalf of each of Wedbush ETFMG Global Cloud Technology ETF (formerly, the ETFMG Drone Economy Strategy ETF) (“IVES”) and Wedbush ETFMG Video Game Tech ETF (formerly, the ETFMG Video Game Tech ETF) (“GAMR”) (each a “Fund” and collectively, the “Funds”).
Pursuant to Section 15(c) of the 1940 Act, the Board must annually review and approve the Advisory Agreement after its initial two-year term: (i) by the vote of the Trustees or by a vote of the shareholders of the Fund; and (ii) by the vote of a majority of the Trustees who are not parties to the Advisory Agreement or “interested persons” of any party thereto, as defined in the 1940 Act (the “Independent Trustees”), cast in person at a meeting called for the purpose of voting on such approval. Each year, the Board calls and holds a meeting to decide whether to renew the Advisory Agreement for an additional one-year term. In preparation for such meeting, the Board requests and reviews a wide variety of information from the Adviser.
In reaching its decision, the Board, including the Independent Trustees, considered all factors it believed relevant, including: (i) the nature, extent and quality of the services provided to the Funds’ shareholders by the Adviser; (ii) the investment performance of the Funds; (iii) the Adviser’s costs and profits realized in providing services to the Funds, including any fall-out benefits enjoyed by the Adviser; (iv) comparative fee and expense data for the Funds in relation to other similar investment companies; (v) the extent to which economies of scale would be realized as the Funds grow and whether the advisory fees for the Funds reflect these economies of scale for the benefit of the Funds; and (vi) other financial benefits to the Adviser and its affiliates resulting from services rendered to the Funds. The Board’s review included written and oral information furnished to the Board prior to and at the meeting held on March 30, 2021, and throughout the year. Among other things, the Adviser provided responses to a detailed series of questions, which included information about the Adviser’s operations, service offerings, personnel, compliance program and financial condition. The Board then discussed the written and oral information that it received before the meeting and throughout the year, and the Adviser’s oral presentations and any other information that the Board received at the meeting, and deliberated on the renewal of the Advisory Agreement in light of this information.
The Independent Trustees were assisted throughout the contract review process by independent legal counsel. The Independent Trustees relied upon the advice of such counsel and their own business judgment in determining the material factors to be considered in evaluating the renewal of the Advisory Agreement, and the weight to be given to each such factor. The conclusions reached with respect to the Advisory Agreement were based on a comprehensive evaluation of all the information provided and not any single factor. Moreover, each Trustee may have placed varying emphasis on particular factors in reaching conclusions with respect to each Fund. The Independent Trustees conferred amongst themselves and independent legal counsel during a telephonic contract renewal meeting held prior to the March 30, 2021 meeting and also conferred in executive sessions both with and without representatives of management before and during the March 30th meeting. The Independent Trustees requested, received and considered additional information arising out of these executive sessions.
Nature, Extent and Quality of Services Provided by the Adviser
The Trustees considered the scope of services provided under the Advisory Agreement, noting that the Adviser provides investment management services to the Funds. The Board discussed the responsibilities of the Adviser, including: responsibility for the general management of the day-to-day investment and reinvestment of the assets of the Funds; determining the daily baskets of deposit securities and cash components; executing portfolio security trades for purchases and redemptions of Fund shares conducted on a cash-in-lieu basis; responsibility for daily monitoring of tracking error and quarterly reporting to the Board; and implementation of Board directives as they relate to the Funds. In considering the nature, extent and quality of the services provided by the Adviser, the Board considered the qualifications, experience and responsibilities of the Adviser’s investment personnel and the quality of the Adviser’s compliance and risk assessment infrastructure. The Board also considered the Adviser’s experience managing exchange-traded funds (“ETFs”), as well as the Adviser’s response to the market volatility and uncertainty during the recent pandemic.
Wedbush ETFMG TM ETFs
APPROVAL OF ADVISORY AGREEMENT AND BOARD CONSIDERATIONS For the Period Ended March 31, 2021 (Unaudited) (Continued)
The Board also considered other services provided to the Funds, such as overseeing the Funds’ service providers, monitoring adherence to the Funds’ investment restrictions, and monitoring compliance with various policies and procedures and with applicable securities laws.
Based on the factors above, as well as those discussed below, the Board concluded that it was satisfied with the nature, extent and quality of the services provided to the Funds by the Adviser.
Historical Performance
The Board then considered the past performance of the Funds. The Board reviewed information regarding each Fund’s performance with the performance of a group of peer funds and with the performance of the Fund’s underlying index for various time periods. The Board noted management’s explanation that analysis of investment performance, in absolute terms, is less relevant for the Funds than it is for actively managed funds, given the Funds’ index-based investment objectives. The Board also noted management’s further explanation that it is more relevant to review the performance of the Funds by focusing on the extent to which each Fund tracked its underlying index. The Board reviewed information regarding each Fund’s index tracking, discussing, as applicable, factors which contributed to each Fund’s tracking error. The Board noted that the Funds had underperformed their underlying indexes over certain periods, but that such underperformance was, at least in part, a result of costs incurred by the Funds not incurred by their underlying indexes. The Board considered other factors that contributed to the Funds’ tracking error, including cash drag and the process of rebalancing the Funds’ portfolios. The Board also considered that the underlying index for IVES was changed during the prior year. The Board noted management’s representations that the Funds’ performance satisfactorily tracked their underlying indexes. The Board concluded that, after taking these factors into account, each of the Funds satisfactorily tracked its underlying index. The Board further noted that it had received and would continue to receive regular reports regarding each Fund’s performance, including with respect to its tracking error, at its quarterly meetings.
Cost of Services Provided, Profits and Economies of Scale
The Board reviewed the advisory fees for the Funds and compared them to the total operating expenses of comparable ETFs, as determined by an independent third party and the Adviser. Among other information, the Board noted that the advisory fee for each of the Funds was higher than the average and median expense ratios for its peer ETFs. The Trustees also considered the total expense ratios of other ETFs that they considered to be comparable, based on the investment objectives and strategies of the ETFs. The Board took into consideration management’s discussion of the fees, including that the Funds have niche investment strategies that are substantially different than the strategies of many of the peer ETFs and, therefore, the information provided about the comparable ETFs may not provide meaningful direct comparisons to the Funds.
The Board noted the importance of the fact that the advisory fee for each Fund is a “unified fee,” meaning that the shareholders of the Funds pay no expenses other than the advisory fee and certain other costs such as interest charges on any borrowings, taxes, brokerage commissions and other expenses incurred in placing orders for the purchase and sale of securities and other investment instruments, acquired fund fees and expenses, accrued deferred tax liability, extraordinary expenses (such as, among other things and subject to Board approval, non-standard Board-related expenses and litigation against the Board, Trustees, Funds, Adviser, and officers of the Adviser), and distribution (12b-1) fees and expenses. The Board also noted that the Adviser was responsible for compensating the Trust’s other service providers and paying the Funds’ other expenses (except as noted above) out of its own fees and resources. The Board concluded that the advisory fee for each of the Funds is reasonable in light of the factors considered.
Wedbush ETFMG TM ETFs
APPROVAL OF ADVISORY AGREEMENT AND BOARD CONSIDERATIONS For the Period Ended March 31, 2021 (Unaudited) (Continued)
The Board also evaluated the compensation and other benefits received by the Adviser from its relationship with the Funds, taking into account profitability information provided by the Adviser. The Board received and reviewed profitability information on a fund by fund basis and considered how profit margins could affect the Adviser’s long-term viability and ability to attract and retain high-quality personnel. The Board also considered the impact on the Adviser’s profitability of payments made to, or received from, partners involved with the Funds. Based on the information provided to the Trustees, the Trustees concluded that the net revenue retained by the Adviser from providing services to each Fund was not excessive in view of the nature, extent and quality of services provided to each Fund. The Board further considered other benefits derived by the Adviser and its affiliates from the Adviser’s relationship with the Funds.
In addition, the Board considered whether economies of scale may be realized for the Funds. The Board noted that the Adviser regularly considers whether fee reductions are appropriate as the Funds grow in size. The Board noted that a unitary fee provides a level of certainty in expenses for the Funds and effectively acts as a cap on the fees and expenses (except as noted above) that are borne by the Funds. The Board also took into account the significant investments that the Adviser has made in its business to help ensure the continued provision of high-quality services to the Funds, such as the hiring of new trading, legal and compliance personnel, and enhancements to technology and related systems. The Board concluded that no changes to the advisory fee structure of the Funds were necessary.
In its deliberations, the Board did not identify any single piece of information discussed above that was all-important, controlling or determinative of its decision.
Based on the Board’s deliberations and its evaluation of the information described above, the Board, including the Independent Trustees, unanimously: (a) concluded that the terms of the Advisory Agreement are fair and reasonable; (b) concluded that the Adviser’s fees are reasonable in light of the services that the Adviser provides to the Funds; and (c) approved the renewal of the Advisory Agreement for another year.
Wedbush ETFMG TM ETFs
Expense Example
Period Ended March 31, 2021 (Unaudited)
As a shareholder of the Funds you incur two types of costs: (1) transaction costs, including brokerage commissions on purchases and sales of Fund shares, and (2) ongoing costs, including management fees and other Fund expenses. These examples are intended to help you understand your ongoing costs (in dollars) of investing in the Funds and to compare these costs with the ongoing costs of investing in other funds. The examples are based on an investment of $1,000 for the period of time as indicated in the table below.
Actual Expenses
The first line of the table provides information about actual account values based on actual returns and actual expenses. You may use the information in this line, together with the amount you invested, to estimate the expenses that you paid over the period. Simply divide your account value by $1,000 (for example, an $8,600 account value divided by $1,000 = 8.6), then, multiply the result by the number in the first line under the heading entitled "Expenses Paid During Period’’ to estimate the expenses you paid on your account during this period.
Hypothetical Example for Comparison Purposes
The second line of the table provides information about hypothetical account values based on a hypothetical return and hypothetical expenses based on the Fund’s actual expense ratio and an assumed rate of return of 5% per year before expenses, which is not the Fund’s actual return. The hypothetical account values and expenses may not be used to estimate the actual ending account balance or expenses you paid for the period. You may use this information to compare the ongoing costs of investing in the Fund and other funds. To do so, compare this 5% hypothetical example with the 5% hypothetical examples that appear in the shareholder reports of the other funds. Please note that the expenses shown in the table are meant to highlight your ongoing costs only and do not reflect any transactional costs, such as brokerage commissions paid on purchases and sales of Fund shares. Therefore, the second line of the table is useful in comparing ongoing costs only and will not help you determine the relative total costs of owning different funds. If these transactional costs were included, your costs would have been higher.
| Fund Name | | Beginning Account Value October 1, 2020 | | | Ending Account Value March 31, 2021 | | | Expenses Paid During the Period ^ | | | Annualized Expense Ratio During the Period October 1, 2020 to March 31, 2021 | |
| Wedbush ETFMG Global Cloud Technology ETF | | | | | | | | | | | | | | | | |
| Actual | | $ | 1,000.00 | | | $ | 1,135.40 | | | $ | 3.62 | | | | 0.68 | % |
| Hypothetical (5% annual) | | $ | 1,000.00 | | | $ | 1,021.54 | | | $ | 3.43 | | | | 0.68 | % |
| Wedbush ETFMG Video Game Tech ETF | | | | | | | | | | | | | | | | |
| Actual | | $ | 1,000.00 | | | $ | 1,434.90 | | | $ | 4.55 | | | | 0.75 | % |
| Hypothetical (5% annual) | | $ | 1,000.00 | | | $ | 1,021.19 | | | $ | 3.78 | | | | 0.75 | % |
^ The dollar amounts shown as expenses paid during the period are equal to the annualized six-month expense ratio multiplied by the average account value during the period, multiplied by 182/365 (to reflect the period from October 1, 2020 to March 31, 2021).
Wedbush ETFMG TM ETFs
Statement Regarding Liquidity Risk Management Program (Unaudited)
ETF Managers Trust (the “Trust”) has adopted a liquidity risk management program (the “Program”). The Trust’s Board of Trustees (the “Board”) has designated ETF Managers Group LLC (the “Program Administrator”) as the administrator of the Program. The Program Administrator has designated a committee (the “Committee”), composed of personnel from multiple departments, including investment operations and compliance, that is responsible for the implementation and ongoing administration of the Program, which includes assessing the liquidity risk of the Wedbush ETFMG Global Cloud Technology ETF and Wedbush ETFMG Video Game Tech ETF (the “Funds”) under both normal and reasonably foreseeable stressed conditions.
Under the Program, the Program Administrator assesses, manages and periodically reviews the Funds’ liquidity risk, based on factors specific to the circumstances of the Funds. Liquidity risk is the risk that each Fund could not meet shareholder redemption requests without significant dilution of remaining shareholders’ interests in each Fund. This risk is managed by monitoring the degree of liquidity of each Fund’s investments and limiting the amount of each Fund’s illiquid investments, among other means. The Program Administrator’s process of determining the degree of liquidity of the Funds’ investments is supported by one or more third-party liquidity assessment vendors.
At a meeting of the Board on March 30, 2021, the Adviser provided a written report to the Board addressing the operation, and the adequacy and effectiveness of the implementation, of the Program, including, the operation of any Highly Liquid Investment Minimum, where applicable, and any material changes to the Program, for the initial period from February 29, 2020 through March 30, 2021 (the “Reporting Period”). No significant liquidity events impacting the Funds were noted in the report and it was represented that, as of March 30, 2021, the Funds were primarily highly liquid and, during the Reporting Period, the Funds held less than 15% in illiquid securities. In addition, the Program Administrator provided its assessment that Program implementation was effective and that the Program operated adequately and effectively to enable the Program Administrator to oversee and manage liquidity risk and ensure the Funds are able to meet requests to redeem shares without significant dilution to the remaining investors’ interest in each Fund.
There can be no assurance that the Program will achieve its objectives in the future. Please refer to the Funds’ prospectus for more information regarding each Fund’s exposure to liquidity risk and other principal risks to which an investment in the Funds may be subject.
Wedbush ETFMG TM ETFs
SUPPLEMENTARY INFORMATION
March 31, 2021 (Unaudited)
NOTE 1 – FREQUENCY DISTRIBUTION OF PREMIUMS AND DISCOUNTS
Information regarding how often shares of the Funds traded on the Exchange at a price above (i.e., at a premium) or below (i.e., at a discount) the NAV is available on the Funds’ website at www.etfmgfunds.com.
NOTE 2 – FEDERAL TAX INFORMATION
Qualified Dividend Income/Dividends Received Deduction
For the fiscal year ended September 30, 2020, certain dividends paid by the Funds may be subject to a maximum tax rate of 15%, as provided for by the Jobs and Growth Tax Reconciliation Act of 2003. The percentage of dividends declared from ordinary income designated as qualified dividend income was as follows:
| Fund Name | QDI |
| Wedbush ETFMG Global Cloud Technology ETF | 78.85% |
| Wedbush ETFMG Video Game Tech ETF | 63.71% |
For corporate shareholders, the percent of ordinary income distributions qualifying for the corporate dividends received deduction for the fiscal year ended September 30, 2020 was as follows:
| Fund Name | DRD |
| Wedbush ETFMG Global Cloud Technology ETF | 40.02% |
| Wedbush ETFMG Video Game Tech ETF | 11.05% |
Short Term Capital Gain
The percentage of taxable ordinary income distributions that are designated as short-term capital gain distributions under Internal Revenue Section 871 (k)(2)(C) for the Fund was as follows:
| Fund Name | Short-Term Capital Gain |
| Wedbush ETFMG Global Cloud Technology ETF | 0.00% |
| Wedbush ETFMG Video Game Tech ETF | 0.00% |
During the year ended September 30, 2020, the Funds did not declare any long-term realized gains distributions.
Pursuant to Section 853 of the Internal Revenue Code the Fund designated the following amounts as foreign taxes paid for the year ended September 30, 2020. Foreign taxes paid for purposes of Section 853 may be less than actual foreign taxes paid for financial statement purposes.
| | | | | | | | | Per Share | | | | |
| Fund | | Gross Foreign Source Income | | | Foreign Taxes Passthrough | | | Gross Foreign Source Income | | | Foreign Taxes Passthrough | | | Shares Outstanding at September 30, 2020 | |
| Wedbush ETFMG Video Game Tech ETF | | $ | 1,021,980 | | | $ | 64,668 | | | $ | 0.56776649 | | | $ | 0.03592684 | | | | 1,800,000 | |
Wedbush ETFMG TM ETFs
SUPPLEMENTARY INFORMATION
March 31, 2021 (Unaudited) (Continued)
Foreign taxes paid or withheld should be included to taxable income with an offsetting deduction from gross income or as a credit for taxes paid to foreign governments.
Above figures may differ from those cited elsewhere in this report due to difference in the calculation of income and gains under GAAP purposes and Internal Revenue Service purposes.
Shareholders are strongly advised to consult their own tax advisors with respect to their investments in the Funds.
NOTE 3 – INFORMATION ABOUT PORTFOLIO HOLDINGS
The Funds file their complete schedule of portfolio holdings with the SEC for their first and third fiscal quarters on Part F of Form N-PORT. Once filed, each Fund’s Part F of Form N-PORT is available without charge, on the SEC’s website at www.sec.gov and the Funds’ website at www.etfmgfunds.com. Each Fund’s portfolio holdings are posted on their website at www.etfmgfunds.com daily.
NOTE 4 - INFORMATION ABOUT PROXY VOTING
A description of the policies and procedures the Funds use to determine how to vote proxies relating to portfolio securities is provided in the Statement of Additional Information (“SAI”). The SAI is available without charge upon request by calling toll-free at 1-877-756-7873, by accessing the SEC’s website at www.sec.gov, or by accessing the Funds’ website at www.etfmgfunds.com.
Information regarding how the Funds voted proxies relating to portfolio securities during the period ending June 30 is available by calling toll-free at 1-877-756-7873 or by accessing the SEC’s website at www.sec.gov.
Carefully consider the Fund’s investment objectives, risk factors, charges, and expenses before investing. This and additional information can be found in the Fund’s prospectus, which may be obtained by calling 1-844-ETF-MGRS (1-844-383-6477) or by visiting www.etfmgfunds.com. Read the prospectus carefully before investing.
Wedbush ETFMG TM ETFs
Board of Trustees (Unaudited)
Set forth below are the names, birth years, positions with the Trust, length of term of office, and the principal occupations and other directorships held during at least the last five years of each of the persons currently serving as a Trustee of the Trust, as well as information about each officer. The business address of each Trustee and officer is 30 Maple Street, 2nd Floor, Summit, New Jersey 07901. The SAI includes additional information about Fund directors and is available, without charge, upon request by calling 1-844-ETF-MGRS (1-844-383-6477).
Name and Year of Birth | Position(s) Held with the Trust, Term of Office and Length of Time Served | Principal Occupation(s) During Past 5 Years | Number of Portfolios in Fund Complex Overseen By Trustee | Other Directorships Held by Trustee During Past 5 Years |
| Interested Trustee and Officers |
Samuel Masucci, III (1962) | Trustee, Chairman of the Board and President (since 2012); Secretary (since 2014) | Chief Executive Officer, Exchange Traded Managers Group LLC (since 2013); Chief Executive Officer, ETF Managers Group LLC (since 2016); Chief Executive Officer, ETF Managers Capital LLC (commodity pool operator) (since 2014); Chief Executive Officer (2012-2016) and Chief Compliance Officer (2012-2014), Factor Advisors, LLC (investment adviser); President and Chief Executive Officer, Factor Capital Management LLC (2012-2014) (commodity pool operator). | 11 | None |
| John A. Flanagan, (1946) | Treasurer (since 2015) | President, John A. Flanagan CPA, LLC (accounting services) (since 2010); Treasurer, ETF Managers Trust (since 2015); Chief Financial Officer, ETF Managers Capital, LLC (commodity pool operator) (since 2015). | n/a | n/a |
Reshma A. Tanczos (1978) | Chief Compliance Officer (since 2016) | Chief Compliance Officer of ETFMG Financial LLC (since 2017); Chief Compliance Officer, ETF Managers Group LLC (since 2016); Chief Compliance Officer, ETF Managers Capital LLC (since 2016); Partner, Crow & Cushing (law firm) (2007-2016). | n/a | n/a |
* Mr. Masucci is an interested Trustee by virtue of his role as the Chief Executive Officer of the Adviser.
Wedbush ETFMG TM ETFs
Board of Trustees (Unaudited) (Continued)
Name and Year of Birth | Position(s) Held with the Trust, Term of Office and Length of Time Served | Principal Occupation(s) During Past 5 Years | Number of Portfolios in Fund Complex Overseen By Trustee | Other Directorships Held by Trustee During Past 5 Years |
| Matthew J. Bromberg (1973) | Assistant Secretary (since 2020) | General Counsel and Secretary of Exchange Traded Managers Group LLC (since 2020); ETF Managers Group LLC (since 2020); ETFMG Financial LLC (since 2020); ETF Managers Capital LLC (since 2020); Partner of Dorsey & Whitney LLP (law firm) (2019-2020); General Counsel of WBI Investments, Inc. (2016-2019); Millington Securities, Inc. (2016-2019); and Partner of Reed Smith (law firm) (2015-2016). | n/a | n/a |
| Independent Trustees |
| Terry Loebs (1963) | Trustee (since 2014); Lead Independent Trustee (since 2020) | Founder and Managing Member, Pulsenomics LLC (index product development and consulting firm) (since 2011); Managing Director, MacroMarkets, LLC (exchange-traded products firm) (2006-2011). | 11 | None |
Eric Wiegel (1960) | Trustee (since 2020) | Senior Portfolio Manager, Little House Capital (2019-present); Managing Partner, Global Focus Capital LLC (2013-present); Chief Investment Officer, Insight Financial Strategist LLC (2017-2018). | 11 | None |
Advisor
ETF Managers Group, LLC
30 Maple Street, Suite 2, Summit, NJ 07901
Distributor
ETFMG Financial LLC
30 Maple Street, Suite 2, Summit, NJ 07901
Custodian
U.S. Bank National Association
Custody Operations
1555 North River Center Drive, Suite 302, Milwaukee, Wisconsin 53212
Transfer Agent
U.S. Bancorp Fund Services, LLC doing business as U.S. Bank Global Fund Services
615 East Michigan Street, Milwaukee, Wisconsin 53202
Securities Lending Agent
U.S. Bank, National Association Securities Lending
800 Nicolet Mall
Minneapolis, MN 55402-7020
Independent Registered Public Accounting Firm
WithumSmith + Brown, PC
1411 Broadway, 9th Floor, New York, NY 10018
Legal Counsel
Sullivan & Worcester LLP
1666 K Street NW, Washington, DC 20006

Semi-Annual Report March 31, 2021 ETFMG Alternative Harvest ETF Ticker: MJ

The fund is a series of ETF Managers Trust.
|
ETFMG Alternative Harvest ETF
TABLE OF CONTENTS
March 31, 2021 (Unaudited)
ETFMG Alternative Harvest ETF
Dear Shareholder,
On behalf of the entire team, we want to express our appreciation for the confidence you have placed in the ETFMG Alternative Harvest Exchange-Traded Fund (“MJ” or the “Fund”). The following information pertains to the fiscal period from October 1, 2020 to March 31, 2021.
The Fund seeks to provide investment results that, before fees and expenses, correspond generally to the price and yield performance of the Prime Alternative Harvest Index (the “Index”).
Over the period, the total return for the Fund was 121.55%, while the total return for the Index was 120.18%. The best performers based on contribution to return were Aphria, Inc., Tilray, Inc., Canopy Growth Corp. and GW Pharmaceuticals while the worst performers were Hydrofarm Holdings Group, Inc., Arena Pharmaceuticals, Inc., Medipharm Labs Corp. and Swedish Match AB.
Shortly after the 2020 Vice Presidential debate where the Democratic nominee pledged to decriminalize marijuana the securities in our portfolio gained momentum which continued throughout the period. In addition to the prospect of federal decriminalization, multiple states took steps to approve legal cannabis adding to this positive momentum. As we write this letter in late April, several companies have announced acquisitions; most notably Tilray, Inc. announced the acquisition of Aphria, Inc. for CAD 2.5 billion. The transaction was announced on December 16, 2020 and is expected to be completed by June 30, 2021.
We thank you for your interest in the Fund. You can find further details about MJ by visiting www.etfmg.com, or by calling 1-844-ETF-MGRS (1-844-383-6477).
Sincerely,

Samuel Masucci III
Chairman of the Board
ETFMG Alternative Harvest ETF
Growth of $10,000 (Unaudited)
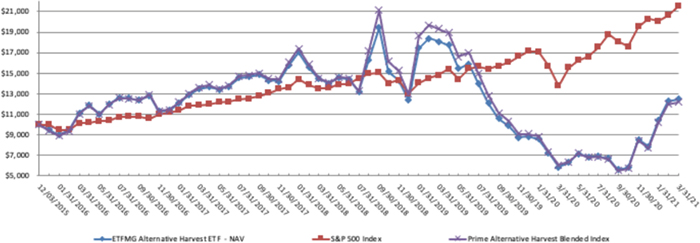
The Fund’s performance figures* for the periods ended March 31, 2021, as compared to its benchmarks:
| | | Six
Months | | One
Year | | Annualized
Three Year | | Annualized
Five Year | | Annualized
Since
Inception** -
March 31, 2021 |
| ETFMG Alternative Harvest ETF - NAV | | 121.55% | | 111.76% | | -4.83% | | 2.31% | | 4.21% |
| ETFMG Alternative Harvest ETF - Market Price | | 122.30% | | 108.95% | | -4.57% | | 1.85% | | 3.56% |
| S&P 500 Index *** (1) | | 19.07% | | 56.35% | | 16.78% | | 16.29% | | 15.49% |
| Prime Alternative Harvest Blended Index **** (1) | | 120.18% | | 101.30% | | -5.72% | | 1.97% | | 3.76% |
| Total Fund Operating Expenses (2) | | | | | | | | | | 0.75% |
*The Fund’s past performance does not guarantee future results. The investment return and principal value of an investment in the Fund will fluctuate so that an investor’s shares, when redeemed, may be worth more or less than their original cost. The returns shown do not reflect the deduction of taxes a shareholder would pay on Fund distributions or the redemption of the Fund shares. Current performance of the Fund may be lower or higher than the performance quoted. Returns are calculated using the traded Net Asset Value “NAV” on March 31, 2021. Performance data current to the most recent month end may be obtained by visiting www.etfmj.com or by calling 1-844-383-6477.
The Fund’s per share NAV is the value of one share of the Fund as calculated in accordance with the standard formula for valuing shares. The NAV return is based on the NAV of the Fund and the market return is based on the market price per share of the Fund. The price used to calculate market return (“Market Price”) is determined by using the closing price on the primary stock exchange on which shares of the Fund are listed for trading, as of the time that the Fund’s NAV is calculated. Market and NAV returns assume that dividends and capital gain distributions have been reinvested in the Fund at Market Price and NAV, respectively. The Fund’s total annual operating expenses are 0.75% per the January 29, 2021 prospectus. Please see the Financial Highlights for a more recent expense ratio.
**As of the close of business on the day of commencement of trading on December 3, 2015.
*** The S&P 500 Index is a widely accepted, unmanaged index of U.S. stock market performance which does not take into account charges, fees and other expenses.
**** Please be aware that as of December 26, 2017 the following changes went into effect for the Tierra XP Latin America Real Estate ETF (LARE): (i) The Fund’s name was changed to the ETFMG Prime Alternative Harvest ETF; (ii) The Fund’s previous underlying index, the Solactive Latin America Real Estate Index (the “Previous Index”), was replaced with the Prime Alternative Harvest Index; (iii) The Fund’s investment objective was changed to the following: “The ETFMG Alternative Harvest ETF (the “Fund”) seeks to provide investment results that, before fees and expenses, correspond generally to the total return performance of the Prime Alternative Harvest Index (the “Index”).”; (iv) The Fund’s ticker was changed to “MJ”; and (v) The non-fundamental policy that, under normal circumstances, the Fund will not invest less than 80% of its net assets, plus the amount of any borrowings for investment purposes, in securities of real estate related companies in Latin America was eliminated.
(1) The return reflects the actual performance through March 31, 2021 (the last day of the semi-annual period that the New York Stock Exchange was open) to maintain consistency with the Fund’s net asset value calculations used for shareholder transactions. The table reflects performance of the Solactive Latin America Real Estate Index through December 26, 2017 and the Prime Alternative Harvest Index thereafter.
(2) The expense ratio is taken from the Fund’s most recent prospectus dated January 29, 2021.
ETFMG Alternative Harvest ETF
Top Ten Holdings
as of March 31, 2021* (Unaudited)
| Security | | % of Total
Investments † | |
| GW Pharmaceuticals PLC | | 10.4 | % |
| Aphria, Inc. | | 10.1 | % |
| Tilray, Inc. | | 6.5 | % |
| GrowGeneration Corp. | | 5.8 | % |
| Canopy Growth Corp. | | 5.7 | % |
| Cronos Group, Inc. | | 4.8 | % |
| Schweitzer-Mauduit International, Inc. | | 4.0 | % |
| Altria Group, Inc. | | 3.8 | % |
| Vector Group Ltd. | | 3.7 | % |
| HEXO Corp. | | 3.6 | % |
| Top Ten Holdings of Total Investments† | | 58.4 | % |
* Current Fund holdings may not be indicative of future Fund holdings.
† Percentage of total investments less cash.
Please refer to the Portfolio of Investments in this Semi-Annual report for a detailed listing of the Fund’s holdings.
ETFMG Alternative Harvest ETF
Important Disclosures and Key Risk Factors
Investing involves risk, including the possible loss of principal. Shares of any ETF are bought and sold at market price (not NAV), may trade at a discount or premium to NAV and are not individually redeemed from the Fund. Brokerage commissions will reduce returns. Narrowly focused investments typically exhibit higher volatility.
This is not a complete list of risks that may affect the Fund. For additional information concerning the risks applicable to the Fund, please see the Fund’s prospectus.
The possession and use of marijuana, even for medical purposes, is illegal under federal and certain states’ laws, which may negatively impact the value of the Fund’s investments. Use of marijuana is regulated by both the federal government and state governments, and state and federal laws regarding marijuana often conflict. Even in those states in which the use of marijuana has been legalized, its possession and use remains a violation of federal law. Federal law criminalizing the use of marijuana pre-empts state laws that legalizes its use for medicinal and recreational purposes. Cannabis companies and pharmaceutical companies may never be able to legally produce and sell products in the United States or other national or local jurisdictions.
The Fund’s investments will be concentrated in an industry or group of industries to the extent that the Index is so concentrated. In such event, the value of the Fund’s shares may rise and fall more than the value of shares of a fund that invests in securities of companies in a broader range of industries.
The consumer staples sector may be affected by the permissibility of using various product components and production methods, marketing campaigns and other factors affecting consumer demand. Tobacco companies, in particular, may be adversely affected by new laws, regulations and litigation. The consumer staples sector may also be adversely affected by changes or trends in commodity prices, which may be influenced or characterized by unpredictable factors.
ETF shares are not individually redeemable and owners of the shares may acquire those shares from the Fund and tender those shares for redemption to the Fund in Creation Units only and Redemption Units only, typically consisting of aggregations of 50,000 shares.
ETFMG Alternative Harvest ETF
PORTFOLIO ALLOCATIONS (Unaudited)
As of March 31, 2021
| | | ETFMG
Alternative Harvest
ETF | |
| As a percent of Net Assets: | | | |
| Canada | | 43.7 | % |
| United States | | 36.4 | % |
| United Kingdom | | 16.6 | % |
| Sweden | | 1.4 | % |
| Japan | | 0.9 | % |
| Mexico | | 0.0 | ^% |
| Short-Term and other Net Assets (Liabilities) | | 1.0 | % |
| | | 100.0 | % |
^ Less than 0.05%.
ETFMG Alternative Harvest ETF
Schedule of Investments (Unaudited)
March 31, 2021
| | | Shares | | | Value | |
| COMMON STOCKS - 99.0% | | | | | | | | |
| Canada - 43.7% | | | | | | | | |
| Investment Companies - 4.8% | | | | | | | | |
| Cronos Group, Inc. (a) ^ | | | 9,137,725 | | | $ | 86,442,879 | |
| | | | | | | | | |
| Pharmaceuticals - 38.9% | | | | | | | | |
| Aphria, Inc. (a) ^ | | | 9,894,592 | | | | 181,763,655 | |
| Aurora Cannabis, Inc. (a) ^ | | | 5,456,595 | | | | 50,800,899 | |
| Auxly Cannabis Group, Inc. (a) | | | 44,344,941 | | | | 13,408,990 | |
| Canopy Growth Corp. (a) | | | 3,165,984 | | | | 101,406,467 | |
| Charlottes Web Holdings, Inc. (a) ^ | | | 6,492,023 | | | | 29,239,158 | |
| Green Organic Dutchman Holdings Ltd. (a) ^ | | | 34,795,476 | | | | 8,444,832 | |
| HEXO Corp. (a) ^ | | | 9,862,329 | | | | 63,907,892 | |
| MediPharm Labs Corp. (a) ^ | | | 9,759,048 | | | | 3,533,355 | |
| Organigram Holdings, Inc. (a) ^ | | | 16,644,239 | | | | 57,755,509 | |
| Tilray, Inc. (a) ^ | | | 5,141,701 | | | | 116,870,864 | |
| Valens Groworks Corp. (a) ^ | | | 8,017,194 | | | | 17,352,405 | |
| Village Farms International, Inc. (a) ^ | | | 4,566,038 | | | | 60,408,683 | |
| Total Pharmaceuticals | | | | | | | 704,892,709 | |
| Total Canada | | | | | | | 791,335,588 | |
| | | | | | | | | |
| Japan - 0.9% | | | | | | | | |
| Tobacco - 0.9% | | | | | | | | |
| Japan Tobacco, Inc. | | | 892,758 | | | | 17,133,536 | |
| | | | | | | | | |
| Mexico - 0.0% | | | | | | | | |
| Construction & Engineering - 0.0% | | | | | | | | |
| Empresas ICA SAB de CV (a)(b) | | | 155,893 | | | | — | |
| | | | | | | | | |
| Sweden - 1.4% | | | | | | | | |
| Tobacco - 1.4% | | | | | | | | |
| Swedish Match AB | | | 321,711 | | | | 25,115,225 | |
| | | | | | | | | |
| United Kingdom - 16.6% | | | | | | | | |
| Pharmaceuticals - 10.4% | | | | | | | | |
| GW Pharmaceuticals PLC - ADR (a) | | | 862,727 | | | | 187,125,486 | |
| Tobacco - 6.2% | | | | | | | | |
| British American Tobacco PLC | | | 1,505,190 | | | | 57,562,069 | |
| Imperial Brands PLC | | | 2,713,386 | | | | 55,810,899 | |
| Total Tobacco | | | | | | | 113,372,968 | |
| Total United Kingdom | | | | | | | 300,498,454 | |
The accompanying notes are an integral part of these financial statements
ETFMG Alternative Harvest ETF
Schedule of Investments (Unaudited) (Continued)
March 31, 2021
| | | Shares | | | Value | |
| United States - 36.4% | | | | | | | | |
| Biotechnology - 4.0% | | | | | | | | |
| Arena Pharmaceuticals, Inc. (a) | | | 726,447 | | | $ | 50,408,157 | |
| Corbus Pharmaceuticals Holdings, Inc. (a) ^ | | | 6,020,395 | | | | 11,860,178 | |
| Zynerba Pharmaceuticals Inc. (a) ^ | | | 1,987,786 | | | | 9,243,205 | |
| Total Biotechnology | | | | | | | 71,511,540 | |
| Chemicals - 3.4% | | | | | | | | |
| Scotts Miracle-Gro Co. | | | 248,410 | | | | 60,852,998 | |
| Machinery - 4.0% | | | | | | | | |
| Hydrofarm Holdings Group, Inc. (a) | | | 274,620 | | | | 16,565,078 | |
| Paper & Forest Products - 4.0% | | | | | | | | |
| Schweitzer-Mauduit International, Inc. | | | 1,477,449 | | | | 72,350,678 | |
| Specialty Retail - 2.4% | | | | | | | | |
| GrowGeneration Corporation (a) | | | 2,089,079 | | | | 103,806,335 | |
| Tobacco - 18.6% | | | | | | | | |
| 22nd Century Group, Inc. (a) | | | 13,304,013 | | | | 43,770,203 | |
| Altria Group, Inc. | | | 1,320,041 | | | | 67,533,297 | |
| Philip Morris International, Inc. | | | 692,647 | | | | 61,465,495 | |
| Turning Point Brands, Inc. | | | 1,191,540 | | | | 62,162,642 | |
| Universal Corp. | | | 579,385 | | | | 34,177,921 | |
| Vector Group Ltd. | | | 4,739,422 | | | | 66,114,937 | |
| Total Tobacco | | | | | | | 335,224,495 | |
| Total United States | | | | | | | 660,311,124 | |
| TOTAL COMMON STOCKS (Cost $1,325,468,889) | | | | | | | 1,794,393,927 | |
| | | | | | | | | |
| COLLATERAL FOR SECURITIES LOANED - 10.5% + | | | | | | | | |
| Stock Loan Cash Collateral - 10.5% | | | | | | | | |
| Stock Loan Cash Collateral (Cost $190,021,606) | | | | | | | 190,021,606 | |
| | | | | | | | | |
| Total Investments (Cost $1,515,490,495) - 109.5% | | | | | | $ | 1,984,415,533 | |
| Liabilities in Excess of Other Assets - (9.5)% | | | | | | | (172,795,745 | ) |
| NET ASSETS - 100.0% | | | | | | $ | 1,811,619,788 | |
Percentages are stated as a percent of net assets.
AB - Aktiebolag
ADR - American Depositary Receipt
PLC - Public Limited Company
| (a) | Non-income producing security. |
| (b) | Includes a security that is categorized as Level 3 per the Trust’s fair value hierachy. This security represents $0 or 0.00% of the Fund’s net assets and is classified as a Level 3 security. |
| + | Total cash collateral has a value of $190,021,606 as of March 31, 2021. |
| ^ | All or a portion of this security is out on loan as of March 31, 2021. Total value of securities out on loan is $190,021,606. |
The Global Industry Classification Standard (GICS®) was developed by and/or is the exclusive property of MSCI, Inc. and Standard & Poor’s Financial Services LLC (“S&P”). GICS® is a service mark of MSCI, Inc. and S&P,
ETFMG Alternative Harvest ETF
STATEMENT OF ASSETS AND LIABILITIES (Unaudited)
As of March 31, 2021
| ASSETS | | | |
| Investments in securities, at value* | | $ | 1,984,415,533 | |
| Cash | | | 12,981,804 | |
| Foreign Currency* | | | 1,768,450 | |
| Receivables: | | | | |
| Securities lending income receivable | | | 227,145 | |
| Dividends and interest receivable | | | 3,323,578 | |
| TOTAL ASSETS | | | 2,002,716,510 | |
| | | | | |
| LIABILITIES | | | | |
| Collateral received for securities loaned (Note 7) | | | 190,021,606 | |
| Payables: | | | | |
| Management fees payable | | | 1,075,116 | |
| TOTAL LIABILITIES | | | 191,096,722 | |
| NET ASSETS | | $ | 1,811,619,788 | |
| | | | | |
| NET ASSETS CONSIST OF: | | | | |
| Paid in capital | | $ | 2,096,317,794 | |
| Total accumulated deficit | | | (284,698,006 | ) |
| NET ASSETS | | $ | 1,811,619,788 | |
| | | | | |
| *Identified Cost: | | | | |
| Investments in securities | | $ | 1,515,490,495 | |
| Foreign Currency | | | 1,768,450 | |
| | | | | |
| NET ASSET VALUE PER SHARE: | | | | |
| Net Assets | | $ | 1,811,619,788 | |
| Shares of beneficial interest outstanding ($0 par value, unlimited shares authorized) | | | 79,450,000 | |
| Net asset value (Net Assets ÷ Shares Outstanding) | | $ | 22.80 | |
The accompanying notes are an integral part of these financial statements.
ETFMG Alternative Harvest ETF
STATEMENT OF OPERATIONS (Unaudited)
Six Months Ended March 31, 2021
| INVESTMENT INCOME | | | |
| Dividends (Net of Foreign tax withholdings of $61,286) | | $ | 11,066,013 | |
| Securities Lending Income | | | 4,736,152 | |
| TOTAL INVESTMENT INCOME | | | 15,802,165 | |
| | | | | |
| EXPENSES | | | | |
| Management fees | | | 4,510,173 | |
| TOTAL EXPENSES | | | 4,510,173 | |
| NET INVESTMENT INCOME | | | 11,291,992 | |
| | | | | |
| REALIZED AND UNREALIZED GAIN (LOSS) ON INVESTMENTS | | | | |
| Net realized gain (loss) on: | | | | |
| In-kind redemptions | | | 68,465,211 | |
| Investments | | | (241,629,385 | ) |
| Foreign currency transactions | | | (26,002 | ) |
| | | | (173,190,176 | ) |
| | | | | |
| Net change in unrealized appreciation on: | | | | |
| Investments | | | 967,437,296 | |
| Foreign currency translations | | | 2,147 | |
| | | | 967,439,443 | |
| | | | | |
| NET REALIZED AND UNREALIZED GAIN ON INVESTMENTS | | | 794,249,267 | |
| | | | | |
| NET INCREASE IN NET ASSETS RESULTING FROM OPERATIONS | | $ | 805,541,259 | |
The accompanying notes are an integral part of these financial statements.
ETFMG Alternative Harvest ETF
STATEMENTS OF CHANGES IN NET ASSETS
| | | Six Months
Ended
March 31,
2021
(Unaudited) | | | Year Ended
September 30,
2020 | |
| FROM OPERATIONS | | | | | | | | |
| Net investment income | | $ | 11,291,992 | | | $ | 38,371,401 | |
| Net realized loss on investments and foreign currency transactions | | | (173,190,176 | ) | | | (316,504,714 | ) |
| Net change in unrealized appreciation (depreciation) on investments and foreign currency transactions | | | 967,439,443 | | | | (135,942,672 | ) |
| Net increase (decrease) in net assets resulting from operations | | | 805,541,259 | | | | (414,075,985 | ) |
| | | | | | | | | |
| DISTRIBUTIONS TO SHAREHOLDERS | | | | | | | | |
| Total distributions paid: | | | (8,134,000 | ) | | | (37,958,000 | ) |
| Net decrease in net assets resulting from distributions to shareholders | | | (8,134,000 | ) | | | (37,958,000 | ) |
| | | | | | | | | |
| FROM SHARES OF BENEFICIAL INTEREST | | | | | | | | |
| Proceeds from shares sold | | | 650,529,600 | | | | 203,682,152 | |
| Cost of shares redeemed | | | (132,362,212 | ) | | | (56,673,991 | ) |
| Transaction Fees (Note 1) | | | 74,344 | | | | 39,219 | |
| Net increase in net assets resulting from shares of beneficial interest | | | 518,241,732 | | | | 147,047,380 | |
| | | | | | | | | |
| TOTAL INCREASE (DECREASE) IN NET ASSETS | | | 1,315,648,991 | | | | (304,986,605 | ) |
| | | | | | | | | |
| NET ASSETS | | | | | | | | |
| Beginning of Period | | | 495,970,797 | | | | 800,957,402 | |
| End of Period | | $ | 1,811,619,788 | | | $ | 495,970,797 | |
| | | | | | | | | |
| SHARE ACTIVITY | | | | | | | | |
| Shares Sold | | | 37,700,000 | | | | 13,200,000 | |
| Shares Redeemed | | | (6,100,000 | ) | | | (3,800,000 | ) |
| Net increase in shares of beneficial interest outstanding | | | 31,600,000 | | | | 9,400,000 | |
| Beginning Shares | | | 47,850,000 | | | | 38,450,000 | |
| Ending Shares | | | 79,450,000 | | | | 47,850,000 | |
The accompanying notes are an integral part of these financial statements.
ETFMG Alternative Harvest ETF
FINANCIAL HIGHLIGHTS
Per Share Data and Ratios for a Share of Beneficial Interest Outstanding Throughout Each Period
| | | Six Months | | | | | | | | | | | | | | | | |
| | | Ended | | | | | | | | | | | | | | | | |
| | | March 31, | | | Year Ended | | | Year Ended | | | Year Ended | | | Year Ended | | | Period Ended | |
| | | 2021 | | | September 30, | | | September 30, | | | September 30, | | | September 30, | | | September 30, | |
| | | (Unaudited) | | | 2020 | | | 2019 | | | 2018 | | | 2017 | | | 2016(1) | |
| Net asset value, beginning of period | | $ | 10.37 | | | $ | 20.83 | | | $ | 39.74 | | | $ | 31.36 | | | $ | 29.64 | | | $ | 25.00 | |
| | | | | | | | | | | | | | | | | | | | | | | | | |
| Activity from investment operations: | | | | | | | | | | | | | | | | | | | | | | | | |
| Net investment income (2) | | | 0.17 | | | | 0.91 | | | | 1.02 | | | | 0.37 | | | | 0.57 | | | | 0.98 | |
| Net realized and unrealized gain (loss) on investments | | | 12.38 | | | | (10.49 | ) | | | (18.96 | ) | | | 8.95 | | | | 4.42 | | | | 4.59 | |
| Total from investment operations | | | 12.55 | | | | (9.58 | ) | | | (17.94 | ) | | | 9.32 | | | | 4.99 | | | | 5.57 | |
| | | | | | | | | | | | | | | | | | | | | | | | | |
| Less distributions from: | | | | | | | | | | | | | | | | | | | | | | | | |
| Net investment income | | | (0.12 | ) | | | (0.88 | ) | | | (0.97 | ) | | | (0.74 | ) | | | (2.56 | ) | | | (0.93 | ) |
| Net realized gains | | | — | | | | — | | | | — | | | | (0.20 | ) | | | (0.71 | ) | | | — | |
| Total distributions | | | (0.12 | ) | | | (0.88 | ) | | | (0.97 | ) | | | (0.94 | ) | | | (3.27 | ) | | | (0.93 | ) |
| | | | | | | | | | | | | | | | | | | | | | | | | |
| Net asset value, end of period | | $ | 22.80 | | | $ | 10.37 | | | $ | 20.83 | | | $ | 39.74 | | | $ | 31.36 | | | $ | 29.64 | |
| | | | | | | | | | | | | | | | | | | | | | | | | |
| Total return (3)(4) | | | 121.55 | %(6) | | | (46.83 | )% | | | (45.60 | )% | | | 33.85 | % | | | 20.23 | % | | | 22.63 | %(6) |
| | | | | | | | | | | | | | | | | | | | | | | | | |
| Ratios/Supplemental Data: | | | | | | | | | | | | | | | | | | | | | | | | |
| Net assets, at end of period (000s) | | $ | 1,811,620 | | | $ | 495,971 | | | $ | 800,957 | | | $ | 679,559 | | | $ | 6,271 | | | $ | 2,964 | |
| | | | | | | | | | | | | | | | | | | | | | | | | |
| Ratio of net expenses to average net assets (5) | | | 0.75 | % | | | 0.75 | % | | | 0.75 | % | | | 0.75 | % | | | 0.79 | % | | | 0.79 | % |
| Ratio of net investment income to average net assets (5) | | | 1.87 | % | | | 6.27 | % | | | 3.26 | % | | | 1.18 | % | | | 1.98 | % | | | 5.88 | % |
| | | | | | | | | | | | | | | | | | | | | | | | | |
| Portfolio Turnover Rate | | | 38 | %(6) | | | 46 | % | | | 71 | % | | | 97 | % | | | 44 | % | | | 44 | %(6) |
| (1) | Commencement of operations on December 2, 2015. |
| (2) | Per share amounts calculated using the average shares method. |
| (3) | Total return is calculated assuming a purchase of shares at net asset value on the first day and a sale at net asset value on the last day of the period. Distributions are assumed, for the purpose of this calculation, to be reinvested at the ex-dividend date net asset value per share on their respective payment dates. |
| (4) | Includes adjustments in accordance with accounting principles generally accepted in the United States and, consequently, the net asset value for financial reporting purposes and the returns based upon those net asset values may differ from the net asset values and returns for shareholder transactions. |
| (5) | Annualized for periods less than one year. |
The accompanying notes are an integral part of these financial statements.
ETFMG Alternative Harvest ETF
NOTES TO FINANCIAL STATEMENTS (Unaudited)
March 31, 2021
ETFMG Alternative Harvest ETF (the “Fund”) is a series of ETF Managers Trust (the “Trust”), an open-end management investment company consisting of multiple investment series, organized as a Delaware statutory trust on July 1, 2009. The Trust is registered with the SEC under the Investment Company Act of 1940, as amended (the “1940 Act”), as an open-end management investment company and the offering of the Fund’s shares (“Shares”) is registered under the Securities Act of 1933, as amended (the “Securities Act”).
The Fund commenced operations on December 2, 2015 as the Tierra XP Latin America Real Estate ETF. Effective December 26, 2017, the Board of Trustees of the Trust approved the following changes to the Fund: a) The Fund’s name was changed to the ETFMG Alternative Harvest ETF; b) the Fund’s underlying index, the Solactive Latin America Real Estate Index, was replaced with the Prime Alternative Harvest Index; c) The Fund’s investment objective was changed to the following: “The ETFMG Alternative Harvest ETF seeks to provide investment results that, before fees and expenses, correspond generally to the total return performance of the Prime Alternative Harvest Index” (the “Index”); and d) the non-fundamental policy that, under normal circumstances, the Fund will not invest less than 80% of its net assets, plus the amount of any borrowings for investment purposes, in securities of real estate related companies in Latin America was eliminated.
The Fund currently offers one class of shares, which has no front-end sales load, no deferred sales charges, and no redemption fees. The Fund may issue an unlimited number of shares of beneficial interest, with no par value. All shares of the Fund have equal rights and privileges.
Shares of the Fund are listed and traded on the NYSE Arca, Inc. Market prices for the Shares may be different from their net asset value (“NAV”). The Fund issues and redeems Shares on a continuous basis at NAV only in blocks of 50,000 shares, called “Creation Units.” Creation Units are issued and redeemed principally in-kind for securities included in the Index. Once created, Shares generally trade in the secondary market at market prices that change throughout the day in quantities less than a Creation Unit. Except when aggregated in Creation Units, Shares are not redeemable securities of the Fund. Shares of the Fund may only be purchased or redeemed by certain financial institutions (“Authorized Participants”). An Authorized Participant is a DTC participant and, in each case, must have executed a Participant Agreement with the Distributor. Most retail investors do not qualify as Authorized Participants nor have the resources to buy and sell whole Creation Units. Therefore, they are unable to purchase or redeem the Shares directly from the Fund. Rather, most retail investors may purchase Shares in the secondary market with the assistance of a broker and are subject to customary brokerage commissions or fees.
Authorized Participants transacting in Creation Units for cash may pay an additional variable charge to compensate the Fund for certain transaction costs (i.e., brokerage costs) and market impact expenses relating to investing in portfolio securities. Such variable charges are included in “Transaction Fees” in the Statement of Changes in Net Assets.
| 2. | SIGNIFICANT ACCOUNTING POLICIES |
The following is a summary of significant accounting policies consistently followed by the Fund. These policies are in conformity with accounting principles generally accepted in the United States of America (“U.S. GAAP”).
ETFMG Alternative Harvest ETF
NOTES TO FINANCIAL STATEMENTS (Unaudited) (Continued)
March 31, 2021
The Fund follows the investment company accounting and reporting guidance of the Financial Accounting Standards Board Accounting Standard Codification Topic 946 Financial Services – Investment Companies.
The Fund may invest in certain other investment companies (underlying funds). For specific investments in underlying funds, please refer to the complete schedule of portfolio holdings on Form N-CSR(S) for this reporting period, which is filed with the U.S. Securities and Exchange Commission (SEC). For more information about the underlying Fund’s operations and policies, please refer to those Funds’ semiannual and annual reports, which are filed with the SEC.
Security Valuation - Securities listed on a securities exchange, market or automated quotation system for which quotations are readily available (except for securities traded on NASDAQ), including securities traded over the counter, are valued at the last quoted sale price on the primary exchange or market (foreign or domestic) on which they are traded on the valuation date (or at approximately 4:00 pm Eastern Time if a security’s primary exchange is normally open at that time), or, if there is no such reported sale on the valuation date, at the most recent quoted bid price. For securities traded on NASDAQ, the NASDAQ Official Closing Price will be used.
Securities for which quotations are not readily available are valued at their respective fair values as determined in good faith by the Board of Trustees (the “Board”). When a security is “fair valued,” consideration is given to the facts and circumstances relevant to the particular situation, including a review of various factors set forth in the pricing procedures adopted by the Fund’s Board. The use of fair value pricing by the Fund may cause the net asset value of its shares to differ significantly from the net asset value that would be calculated without regard to such considerations. As of March 31, 2021, the Fund held one fair valued security which was valued by the board.
As described above, the Fund utilizes various methods to measure the fair value of its investments on a recurring basis. U.S. GAAP establishes a hierarchy that prioritizes inputs to valuation methods. The three levels of inputs are:
Level 1 – Unadjusted quoted prices in active markets for identical assets and liabilities that the Fund has the ability to access.
Level 2 – Observable inputs other than quoted prices included in Level 1 that are observable for the asset or liability, either directly or indirectly. These inputs may include quoted prices for the identical instrument in an inactive market, prices for similar instruments, interest rates, prepayment speeds, credit risk, yield curves, default rates and similar data.
Level 3 – Unobservable inputs for the asset or liability, to the extent relevant observable inputs are not available, representing the Fund’s own assumptions about the assumptions a market participant would use in valuing the asset or liability, and would be based on the best information available.
The availability of observable inputs can vary from security to security and is affected by a wide variety of factors, including, for example, the type of security, whether the security is new and not yet established in the marketplace, the liquidity of markets, and other characteristics particular to the security. To the extent that valuation is based on models or inputs that are less observable or unobservable in the market, the determination of fair value requires more judgment. Accordingly, the degree of judgment exercised in determining fair value is greatest for instruments categorized in Level 3.
ETFMG Alternative Harvest ETF
NOTES TO FINANCIAL STATEMENTS (Unaudited) (Continued)
March 31, 2021
The inputs used to measure fair value may fall into different levels of the fair value hierarchy. In such cases, for disclosure purposes, the level in the fair value hierarchy within which the fair value measurement falls in its entirety, is determined based on the lowest level input that is significant to the fair value measurement in its entirety.
The following table presents a summary of the Funds’ assets measured at fair value as of March 31, 2021:
| ETFMG Alternative Harvest ETF | | |
| Assets^ | | Level 1 | | | Level 2 | | | Level 3 | | | Total | |
| Common Stocks | | $ | 1,794,393,927 | | | $ | — | | | $ | — | (a) | | $ | 1,794,393,927 | |
| Collateral for Securities Loaned* | | | — | | | | — | | | | — | | | | 190,021,606 | |
| Total Investments in Securities | | $ | 1,794,393,927 | | | $ | — | | | $ | — | | | $ | 1,984,415,533 | |
^ See Schedule of Investments for classifications by country and industry.
(a) Includes a security valued at $0.
The ETFMG Alternative Harvest ETF held a Level 3 security at the end of the period. The security classified as Level 3 is deemed immaterial.
* Certain investments that are measured at fair value using the net asset value per share (or its equivalent) practical expedient have not been categorized in the fair value hierarchy. The fair value amounts presented in the table are intended to permit reconciliation of the fair value hierarchy to the amounts presented in the Schedule of Investments.
Federal Income Taxes - The Fund has elected to be taxed as a “regulated investment company” and intends to distribute substantially all taxable income to its shareholders and otherwise comply with the provisions of the Internal Revenue Code applicable to regulated investment companies. Therefore, no provisions for federal income taxes or excise taxes have been made.
To avoid imposition of the excise tax applicable to regulated investment companies, the Fund intends to declare each year as dividends, in each calendar year, at least 98.0% of its net investment income (earned during the calendar year) and 98.2% of its net realized capital gains (earned during the twelve months ended October 31) plus undistributed amounts, if any, from prior years.
Net capital losses incurred after October 31, within the taxable year are deemed to arise on the first business day of the Fund’s next taxable year.
The Fund recognizes the tax benefits of uncertain tax positions only where the position is “more likely than not” to be sustained assuming examination by tax authorities. Management has analyzed the Fund’s tax positions, and has concluded that no liability for unrecognized tax benefits should be recorded related to uncertain tax positions taken in the Fund’s September 30, 2018 – September 30, 2020 tax returns or expected to be taken in the Fund’s September 30, 2021 tax returns. The Fund identifies its major tax jurisdictions as U.S. Federal, the State of New Jersey, and the State of Delaware; however the Fund is not aware of any tax positions for which it is reasonably possible that the total amounts of unrecognized tax benefits will change materially in the next twelve months.
Management has reviewed the tax positions for open periods (for federal purposes, three years from the date of filing and for state purposes, four years from the date of filing) as applicable to the Fund, and has determined that no provision for income tax is required in the Fund’s financial statements.
Security transactions and Investment Income – Investment securities transactions are accounted for on the trade date. Gains and losses realized on sales of securities are determined on a specific identification basis. Discounts/premiums on debt securities purchased are accreted/amortized over the life of the respective securities using the effective interest method. Dividend income is recorded on the ex-dividend date. Interest income is recorded on an accrual basis. Income, including gains from investments in foreign securities received by the Fund may be subject to income, withholding or other taxes imposed by foreign countries.
ETFMG Alternative Harvest ETF
NOTES TO FINANCIAL STATEMENTS (Unaudited) (Continued)
March 31, 2021
Foreign Currency Translations and Transactions - The Fund may engage in foreign currency transactions. Foreign currency transactions are translated into U.S. dollars on the following basis:
(i) market value of investment securities, assets and liabilities at the daily rates of exchange, and
(ii) purchases and sales of investment securities, dividend and interest income and certain expenses at the rates of exchange prevailing on the respective dates of such transactions. For financial reporting purposes, the Fund does not isolate changes in the exchange rate of investment securities from the fluctuations arising from changes in the market prices of securities for unrealized gains and losses. However, for federal income tax purposes, the Fund does isolate and treat as ordinary income the effect of changes in foreign exchange rates on realized gains or losses from the sale of investment securities and payables and receivables arising from trade-date and settlement-date differences.
Distributions to shareholders – Distributions to shareholders from net investment income are declared and paid by the Fund on a quarterly basis. Distributions to Shareholders from net realized gains on securities of the Fund normally are declared and paid on an annual basis. Distributions are recorded on the ex-dividend date.
Use of Estimates - The preparation of financial statements in conformity with U.S. GAAP requires management to make estimates and assumptions that affect the reported amounts of assets and liabilities at the date of the financial statements, as well as the reported amounts of revenues and expenses during the period. Actual results could differ from those estimates.
Share Valuation - The net asset value (“NAV”) per share of the Fund is calculated by dividing the sum of the value of the securities held by the Fund, plus cash and other assets, minus all liabilities (including estimated accrued expenses) by the total number of shares outstanding of the Fund, rounded to the nearest cent. The Fund’s shares will not be priced on the days on which the NYSE is closed for trading. The offering and redemption price per share for the Fund is equal to the Fund’s net asset value per share.
Guarantees and Indemnification – In the normal course of business, the Fund enters into contracts with service providers that contain general indemnification clauses. The Fund’s maximum exposure under these arrangements is unknown as this would involve future claims that may be made against the Fund that have not yet occurred. However, based on experience, the Fund expects the risk of loss to be remote.
Investing in the ETFMG Alternative Harvest ETF may involve certain risks, as discussed in the Fund’s prospectus, including, but not limited to, those described below. Any of these risks could cause an investor to lose money.
ETFMG Alternative Harvest ETF
NOTES TO FINANCIAL STATEMENTS (Unaudited) (Continued)
March 31, 2021
United States Regulatory Risks of the Marijuana Industry: The possession and use of marijuana, even for medical purposes, is illegal under federal and certain states’ laws, which may negatively impact the value of the Fund’s investments. Use of marijuana is regulated by both the federal government and state governments, and state and federal laws regarding marijuana often conflict. Even in those states in which the use of marijuana has been legalized, its possession and use remains a violation of federal law. Federal law criminalizing the use of marijuana pre-empts state laws that legalizes its use for medicinal and recreational purposes. Members of the Trump Administration, including former Attorney General Jeff Sessions, have made statements indicating that the Trump Administration intends to take a harsher stance on federal marijuana laws. Any such change in the federal government’s enforcement of current federal laws could adversely affect the ability of the companies in which the Fund invests to possess or cultivate marijuana, including in connection with pharmaceutical research, or it could shrink the customer pool for certain of the Fund’s portfolio companies. Any of these outcomes would negatively affect the profitability and value of the Fund’s investments. The Cannabis Companies and Pharmaceutical Companies may never be able to legally produce and sell products in the United States or other national or local jurisdictions.
Marijuana is a Schedule I controlled substance under the Controlled Substances Act (“CSA”) (21 U.S.C. § 811), meaning that it has a high potential for abuse, has no currently “accepted medical use” in the United States, lacks accepted safety for use under medical supervision, and may not be prescribed, marketed or sold in the United States. No drug product containing natural cannabis or naturally -derived cannabis extracts have been approved by the FDA for use in the United States or obtained registrations from the United States Drug Enforcement Administration (“DEA”) for commercial production and the DEA may never issue the registrations required for the commercialization of such products.
Facilities conducting research, manufacturing, distributing, importing or exporting, or dispensing controlled substances must be registered (licensed) to perform these activities and have the security, control, recordkeeping, reporting and inventory mechanisms required by the DEA to prevent drug loss and diversion. Failure to obtain the necessary registrations or comply with necessary regulatory requirements may significantly impair the ability of certain companies in which the Fund invests to pursue medical marijuana research or to otherwise cultivate, possess or distribute marijuana.
Non-U.S. Regulatory Risks of the Marijuana Industry - The companies in which the Fund invests are subject to various laws, regulations and guidelines relating to the manufacture, management, transportation, storage and disposal of marijuana, as well as being subject to laws and regulations relating to health and safety, the conduct of operations and the protection of the environment. Even if a company’s operations are permitted under current law, they may not be permitted in the future, in which case such company may not be in a position to carry on its operations in its current locations. Additionally, controlled substance legislation differs between countries and legislation in certain countries may restrict or limit the ability of certain companies in which the Fund invests to sell their products.
Operational Risks of the Marijuana Industry - Companies involved in the marijuana industry face intense competition, may have limited access to the services of banks, may have substantial burdens on company resources due to litigation, complaints or enforcement actions, and are heavily dependent on receiving necessary permits and authorizations to engage in medical marijuana research or to otherwise cultivate, possess or distribute marijuana. Since the use of marijuana is illegal under United States federal law, federally regulated banking institutions may be unwilling to make financial services available to growers and sellers of marijuana.
Concentration Risk - The Fund’s investments will be concentrated in an industry or group of industries to the extent that the Index is so concentrated. In such event, the value of the Fund’s shares may rise and fall more than the value of shares of a fund that invests in securities of companies in a broader range of industries.
ETFMG Alternative Harvest ETF
NOTES TO FINANCIAL STATEMENTS (Unaudited) (Continued)
March 31, 2021
Consumer Staples Sector Risk - The consumer staples sector may be affected by the permissibility of using various product components and production methods, marketing campaigns and other factors affecting consumer demand. Tobacco companies, in particular, may be adversely affected by new laws, regulations and litigation. The consumer staples sector may also be adversely affected by changes or trends in commodity prices, which may be influenced or characterized by unpredictable factors.
Equity Market Risk - The equity securities held in the Fund’s portfolio may experience sudden, unpredictable drops in value or long periods of decline in value. This may occur because of factors that affect securities markets generally or factors affecting specific issuers, industries, or sectors in which the Fund invests such as political, market and economic developments, as well as events that impact specific issuers.
Non- Diversification Risk - Because the Fund is “non-diversified,” it may invest a greater percentage of its assets in the securities of a single issuer or a small number of issuers than if it was a diversified fund. As a result, a decline in the value of an investment in a single issuer or a small number of issuers could cause the Fund’s overall value to decline to a greater degree than if the Fund held a more diversified portfolio. This may increase the Fund’s volatility and have a greater impact on the Fund’s performance.
Securities Lending Risk - Securities lending involves exposure to certain risks, including operational risk (i.e., the risk of losses resulting from problems in the settlement and accounting process), “gap” risk (i.e., the risk of a mismatch between the return on cash collateral reinvestments and the fees a Fund has agreed to pay a borrower), and credit, legal, counterparty and market risk. In the event a borrower does not return a Fund’s securities as agreed, the Fund may experience losses if the proceeds received from liquidating the collateral do not at least equal the value of the loaned security at the time the collateral is liquidated plus the transaction costs incurred in purchasing replacement securities.
Natural Disaster/Epidemic Risk - Natural or environmental disasters, such as earthquakes, fires, floods, hurricanes, tsunamis and other severe weather-related phenomena generally, and widespread disease, including pandemics and epidemics (for example, the novel coronavirus COVID- 19), have been and can be highly disruptive to economies and markets and have recently led, and may continue to lead, to increased market volatility and significant market losses. Such natural disaster and health crises could exacerbate political, social, and economic risks previously mentioned, and result in significant breakdowns, delays, shutdowns, social isolation, and other disruptions to important global, local and regional supply chains affected, with potential corresponding results on the operating performance of the Funds and their investments. A climate of uncertainty and panic, including the contagion of infectious viruses or diseases, may adversely affect lobal, regional, and local economies and reduce the availability of potential investment opportunities, and increases the difficulty of performing due diligence and modeling market conditions, potentially reducing the accuracy of financial projections. Under the circumstances, the Funds may have difficulty achieving their investment objectives which may adversely impact performance. Further, such events can be highly disruptive to economies and markets, significantly disrupt the operations of individual companies (including, but not limited to, the Funds’ Sponsor and third party service providers), sectors, industries, markets, securities and commodity exchanges, currencies, interest and inflation rates, credit ratings, investor sentiment, and other factors affecting the value of the Funds’ investments. These factors can cause substantial market volatility. exchange trading suspensions and closures and can impact the ability of the Funds to complete redemptions and otherwise affect Fund performance and Fund trading in the secondary market. A wide spread crisis may also affect the global economy in ways that cannot necessarily be foreseen at the current time. How long such events will last and whether they will continue or recur cannot be predicted. Impacts from these events could have significant impact on a Fund’s performance, resulting in losses to the Funds.
ETFMG Alternative Harvest ETF
NOTES TO FINANCIAL STATEMENTS (Unaudited) (Continued)
March 31, 2021
| 4. | MANAGEMENT AND OTHER CONTRACTS |
ETF Managers Group, LLC (the “Advisor”), serves as the investment advisor to the Fund. Pursuant to an Investment Advisory Agreement (“Advisory Agreement”) between the Trust, on behalf of the Fund, and the Advisor, the Advisor provides investment advice to the Fund and oversees the day-to-day operations of the Fund, subject to the direction and control of the Board and the officers of the Trust. Under the Advisory Agreement, the Advisor is also responsible for arranging transfer agency, custody, fund administration and accounting, and other non-distribution related services necessary for the Fund to operate.
Under the Investment Advisory Agreement with the Fund, the Advisor has overall responsibility for the general management and administration of the Fund and arranges for sub-advisory, transfer agency, custody, fund administration, securities lending, and all other non -distribution related services necessary for the Fund to operate. The Advisor bears the costs of all advisory and non -advisory services required to operate the Fund, in exchange for a single management fee. For services provided the Fund pays the Advisor at an annual rate of 0.75% of the Fund’s average daily net assets. Under the Investment Advisory Agreement, the Advisor has agreed to pay all expenses of the Fund, except for: the fee paid to the Advisor pursuant to the Investment Advisory Agreement, interest charges on any borrowings, taxes, brokerage commissions and other expenses incurred in placing orders for the purchase and sale of securities and other investment instruments, acquired fund fees and expenses, accrued deferred tax liability, extraordinary expenses, and distribution (12b-1) fees and expenses (collectively, “Excluded Expenses”). The Advisor has entered into an Agreement with its affiliate, ETFMG Financial, LLC (the “Distributor”). The Distributor provides marketing support for the Fund, including distributing marketing materials related to the Fund. Level ETF Ventures, LLC (“Level”) serves as the index provider for the Fund. Level is not affiliated with the Fund or the Advisor.
Ultimus Fund Solutions, LLC (“Ultimus”) acts as sub-administrative and sub- accounting agent of the Fund. For its services in this capacity, Ultimus is entitled to a fee based on the average daily net assets of the Fund and subject to a minimum annual fee. In addition to the asset-based fee, Ultimus is entitled to certain non-material fees, as well as out of pocket expenses. The fee paid to Ultimus is paid out of the investment advisory fee paid to the Adviser by the Fund.
Wedbush Securities Inc. (“Wedbush”), a broker-dealer that is a member of a national securities exchange, as defined in the Exchange Act, serves as the custodian of the Fund. Wedbush holds cash, securities and other assets of the Fund as required by the 1940 Act. In May, 2020, Wedbush acquired a minority, non-voting, equity interest in the parent company of the Advisor, Exchange Traded Managers Group, LLC.
The Advisor pays each independent Trustee a quarterly fee for service to the Fund. Each Trustee is also reimbursed by the Advisor for all reasonable out-of-pocket expenses incurred in connection with his duties as Trustee, including travel and related expenses incurred in attending Board meetings.
The Fund has adopted a Plan of Distribution pursuant to Rule 12b- 1 under the 1940 Act. Under the Plan, the Fund may pay compensation to the Distributor or any other distributor or financial institution with which the Trust has an agreement with respect to the Fund, with the amount of such compensation not to exceed an annual rate of 0.25% of each Fund’s average daily net assets. For the six months ended March 31, 2021, the Fund did not incur any 12b-1 expenses.
ETFMG Alternative Harvest ETF
NOTES TO FINANCIAL STATEMENTS (Unaudited) (Continued)
March 31, 2021
| 6. | PURCHASES AND SALES OF SECURITIES |
The costs of purchases and sales of securities, excluding short-term securities and in-kind transactions, for the six months ended March 31, 2021:
| Purchases | | | Sales | |
| $ | 435,392,505 | | | $ | 437,555,828 | |
The costs of purchases and sales of in-kind transactions associated with creations and redemptions for the six months ended March 31, 2021:
| Purchases In-Kind | | | Sales In-Kind | |
| $ | 639,179,641 | | | $ | 129,148,335 | |
Purchases in-kind are the aggregate of all in-kind purchases and sales in-kind are aggregate of all proceeds from in-kind sales. Net capital gains or losses resulting from in-kind redemptions are excluded from the determination of the Fund’s taxable gains and are not distributed to shareholders.
There were no purchases or sales of U.S. Government obligations for the six months ended March 31, 2021.
The Fund may lend up to 33 1⁄3% of the value of the Fund’s total assets to brokers, dealers and financial institutions (but not individuals) under terms of participation in a securities lending program administered by Wedbush Securities Inc (“the Custodian”). The securities lending agreement requires that loans are collateralized at all times in an amount equal to at least 100% of the value of any loaned securities at the time of the loan. The Fund receives compensation in the form of loan fees. The amount of loan fees depends on a number of factors including the type of security, demand to borrow such security and the length of the loan. The Fund continues to receive interest payments or dividends on the securities loaned during the borrowing period. Gain or loss in the fair value of securities loaned that may occur during the term of the loan will be for the account of the Fund. The Fund has the right under the terms of the securities lending agreement to recall the securities from the borrower on demand. The cash collateral is held by the Custodian in accordance with the custody agreement. The Custodian and its associated persons will receive compensation in connection with the use of the loaned securities of the Fund. The Fund could experience delays in recovering its securities and possible loss of income or value if the borrower fails to return the borrowed securities, although the Fund is indemnified from this risk by contract with the Custodian.
ETFMG Alternative Harvest ETF
NOTES TO FINANCIAL STATEMENTS (Unaudited) (Continued)
March 31, 2021
As of March 31, 2021, the value of the securities on loan and payable for collateral due to broker were as follows:
Value of Securities on Loan Collateral Received
| Values of Securities on Loan | | | Fund Collateral Received* | |
| $ | 190,021,606 | | | $ | 190,021,606 | |
* The securities on loan were collateralized in full with cash, as shown on the Schedule of Investments.
| 8. | TAX COMPONENTS OF CAPITAL |
As of September 30, 2020, the components of accumulated earnings/(deficit) on a tax basis were as follows:
Undistributed
Ordinary
Income | | | Undistributed
Long-Term
Gains | | | Post October Loss
and
Late Year Loss | | | Capital Loss
Carry
Forwards | | | Other
Book/Tax
Differences | | | Unrealized
Appreciation/
(Depreciation) | | | Total
Accumulated
Earnings/(Deficits) | |
| $ | 932,023 | | | $ | — | | | $ | (317,435,569 | ) | | $ | (161,494,108 | ) | | $ | — | | | $ | (604,107,611 | ) | | $ | (1,082,105,265 | ) |
The difference between book basis and tax basis undistributed net investment income, unrealized depreciation and accumulated net realized losses from investments is attributable to the tax deferral of losses on wash sales and mark -to-market on passive foreign investment companies. The unrealized depreciation in the table above includes unrealized foreign currency gains of $5,234.
Capital losses incurred after October 31 within the fiscal year are deemed to arise on the first business day of the following fiscal year for tax purposes. The Fund incurred and elected to defer such capital losses of $317,435,569.
At September 30, 2020, the Fund had capital loss carry forwards for federal income tax purposes available to offset future capital gains as follows:
Non-Expiring
Short-Term | | | Non-Expiring
Long-Term | | | Total | | | CLCF Utilized | |
| $ | 128,346,757 | | | $ | 33,147,351 | | | $ | 161,494,108 | | | $ | — | |
Permanent book and tax differences, primarily attributable to tax adjustments for realized gains (losses) on in-kind redemptions and tax return updates related to fiscal year ended September 30, 2019, resulted in reclassifications for the year ended September 30, 2020 as follows:
Paid
In
Capital | | | Accumulated
Earnings (Losses) | |
| $ | (14,942,937 | ) | | $ | 14,942,397 | |
ETFMG Alternative Harvest ETF
NOTES TO FINANCIAL STATEMENTS (Unaudited) (Continued)
March 31, 2021
| 9. | DISTRIBUTIONS TO SHAREHOLDERS |
The tax character of distributions paid during the following years was as follows:
| Year Ended September 30, 2020 | | | Year Ended September 30, 2019 | |
From
Ordinary Income | | | From
Capital Gains | | | From
Ordinary Income | | | From
Capital Gains | |
| $ | 38,259,296 | | | $ | — | | | $ | 30,165,500 | | | $ | — | |
The difference between ordinary distributions paid from book and ordinary distributions paid from tax relates to allowable foreign tax credits of $301,296 for year ended September 30, 2020 for the Fund which have been passed through to the Fund’s underlying shareholders and are deemed dividends for tax purposes.
| 10. | AGGREGATE UNREALIZED APPRECIATION AND DEPRECIATION – TAX BASIS |
| Tax Cost | | | Gross Unrealized
Appreciation | | | Gross Unrealized
Depreciation | | | Net Unrealized
Depreciation | |
| $ | 1,621,091,082 | | | $ | 495,739,589 | | | $ | (132,415,138 | ) | | $ | 363,324,451 | |
The Trust, a former and current trustee of the Trust, the Adviser and certain officers of the Adviser were defendants in an action filed May 2, 2017 in the Superior Court of New Jersey captioned PureShares, LLC d/b/a PureFunds et al. v. ETF Managers Group, LLC et al., Docket No. C-63-17. The PureShares action alleged claims based on disputes arising out of contractual relationships with the Adviser relating to certain series of the Trust. The action sought damages in unspecified amounts and injunctive relief based on breach of contract, wrongful termination, and several other claims.
The Adviser and its parent, Exchange Traded Managers Group, LLC (“ETFMG”), were defendants in a case filed on October 26, 2017 in the United States District Court for the Southern District of New York by NASDAQ, Inc. (“Nasdaq”) captioned Nasdaq, Inc. v. Exchange Traded Managers Group, LLC et al., Case 1:17-cv -08252. This action arose out of the same facts and circumstances, and relates to the same series of the Trust, as the New Jersey litigation and asserted claims for breach of contract, conversion and certain other claims. The matter was the subject of a bench trial in May 2019, and on December 20, 2019, the Court issued an Opinion and Order awarding compensatory damages to Plaintiff in the amount of $78,403,172.36, plus prejudgment interest. The Court also denied Plaintiffs requests for punitive damages and equitable relief.
On May 1, 2020, Nasdaq, PureShares LLC (“PureShares”), and ETFMG announced a global settlement that resolves all claims in both the PureShares action and the Nasdaq action. The settlement is subject to future negotiations and approvals among independent third parties. As part of the settlement, Nasdaq and ETFMG have agreed to certain cash payments from ETFMG to Nasdaq and PureShares, and have executed an asset purchase agreement to transfer certain ETFMG intellectual property and related assets, to a Nasdaq affiliate. The transaction is expected to close prior to July 31, 2021. The Adviser does not believe that the resolution of these matters will have a material adverse effect on the Fund’s financial statements. If the events set forth in the settlement agreement do not occur, and a subsequent settlement is not reached, the resulting conditions may adversely affect the Adviser’s future operations.
ETFMG Alternative Harvest ETF
NOTES TO FINANCIAL STATEMENTS (Unaudited) (Continued)
March 31, 2021
Subsequent events after the date of the Statement of Assets and Liabilities have been evaluated through the date the financial statements were issued.
Effective May 17, 2021, The Trust and U.S. Bancorp Fund Services, LLC, doing business as U.S. Bank Global Fund Services (the “Administrator”), have entered into an administration agreement (the “Administration Agreement”), under which the Administrator provides the Trust, including as related to the Fund, with administrative services. Such services include regulatory reporting and all necessary office space, equipment, personnel and facilities. Pursuant to a schedule to the Administration Agreement, the Administrator also serves as the shareholder servicing agent for the Fund whereby the Administrator provides certain shareholder services to the Fund. The Administrator also serves as the Fund’s transfer agent and dividend disbursing agent under a transfer agency agreement with the Trust. Also effective on May 17, 2021, U.S. Bank National Association (the “Custodian”), was appointed to serve as the custodian of the Fund. The Custodian holds cash, securities and other assets of the Fund as required by the 1940 Act.
Management has determined that no events or transactions occurred requiring adjustment or disclosure in the financial statements other than as disclosed in Note 11 above.
ETFMG Alternative Harvest ETF
APPROVAL OF ADVISORY AGREEMENT AND BOARD CONSIDERATIONS For the Period Ended March 31, 2021 (Unaudited)
Pursuant to Section 15(c) of the Investment Company Act of 1940 (the “1940 Act”), at a meeting held on March 30, 2021, the Board of Trustees (the “Board”) of ETF Managers Trust (the “Trust”) considered the renewal of the Amended and Restated Investment Advisory Agreement (the “Advisory Agreement”) between ETF Managers Group LLC (the “Adviser”) and the Trust, on behalf of ETFMG Alternative Harvest ETF (the “Fund”).
Pursuant to Section 15(c) of the 1940 Act, the Board must annually review and approve the Advisory Agreement after its initial two-year term: (i) by the vote of the Trustees or by a vote of the shareholders of the Fund; and (ii) by the vote of a majority of the Trustees who are not parties to the Advisory Agreement or “interested persons” of any party thereto, as defined in the 1940 Act (the “Independent Trustees”), cast in person at a meeting called for the purpose of voting on such approval. Each year, the Board calls and holds a meeting to decide whether to renew the Advisory Agreement for an additional one-year term. In preparation for such meeting, the Board requests and reviews a wide variety of information from the Adviser.
In reaching its decision, the Board, including the Independent Trustees, considered all factors it believed relevant, including: (i) the nature, extent and quality of the services provided to the Fund’s shareholders by the Adviser; (ii) the investment performance of the Fund; (iii) the Adviser’s costs and profits realized in providing services to the Fund, including any fall-out benefits enjoyed by the Adviser; (iv) comparative fee and expense data for the Fund in relation to other similar investment companies; (v) the extent to which economies of scale would be realized as the Fund grows and whether the advisory fees for the Fund reflects these economies of scale for the benefit of the Fund; and (vi) other financial benefits to the Adviser and its affiliates resulting from services rendered to the Fund. The Board’s review included written and oral information furnished to the Board prior to and at the meeting held on March 30, 2021, and throughout the year. Among other things, the Adviser provided responses to a detailed series of questions, which included information about the Adviser’s operations, service offerings, personnel, compliance program and financial condition. The Board then discussed the written and oral information that it received before the meeting and throughout the year, and the Adviser’s oral presentations and any other information that the Board received at the meeting, and deliberated on the renewal of the Advisory Agreement in light of this information.
The Independent Trustees were assisted throughout the contract review process by independent legal counsel. The Independent Trustees relied upon the advice of such counsel and their own business judgment in determining the material factors to be considered in evaluating the renewal of the Advisory Agreement, and the weight to be given to each such factor. The conclusions reached with respect to the Advisory Agreement were based on a comprehensive evaluation of all the information provided and not any single factor. Moreover, each Trustee may have placed varying emphasis on particular factors in reaching conclusions with respect to the Fund. The Independent Trustees conferred amongst themselves and independent legal counsel during a telephonic contract renewal meeting held prior to the March 30, 2021 meeting and also conferred in executive sessions both with and without representatives of management before and during the March 30th meeting. The Independent Trustees requested, received and considered additional information arising out of these executive sessions.
Nature, Extent and Quality of Services Provided by the Adviser
The Trustees considered the scope of services provided under the Advisory Agreement, noting that the Adviser provides investment management services to the Fund. The Board discussed the responsibilities of the Adviser, including: responsibility for the general management of the day-to-day investment and reinvestment of the assets of the Fund; determining the daily baskets of deposit securities and cash components; executing portfolio security trades for purchases and redemptions of Fund shares conducted on a cash-in-lieu basis; responsibility for daily monitoring of tracking error and quarterly reporting to the Board; and implementation of Board directives as they relate to the Fund. In considering the nature, extent and quality of the services provided by the Adviser, the Board considered the qualifications, experience and responsibilities of the Adviser’s investment personnel and the quality of the Adviser’s compliance and risk assessment infrastructure. The Board also considered the Adviser’s experience managing exchange-traded funds (“ETFs”), as well as the Adviser’s response to the market volatility and uncertainty during the recent pandemic.
ETFMG Alternative Harvest ETF
APPROVAL OF ADVISORY AGREEMENT AND BOARD CONSIDERATIONS For the Period Ended March 31, 2021 (Unaudited) (Continued)
The Board also considered other services provided to the Fund, such as overseeing the Fund’s service providers, monitoring adherence to the Fund’s investment restrictions, and monitoring compliance with various policies and procedures and with applicable securities laws.
Based on the factors above, as well as those discussed below, the Board concluded that it was satisfied with the nature, extent and quality of the services provided to the Fund by the Adviser.
Historical Performance
The Board then considered the past performance of the Fund. The Board reviewed information regarding the Fund’s performance with the performance of a group of peer funds and with the performance of the Fund’s underlying index for various time periods. The Board noted management’s explanation that analysis of investment performance, in absolute terms, is less relevant for the Fund than it is for actively managed funds, given the Fund’s index-based investment objectives. The Board also noted management’s further explanation that it is more relevant to review the performance of the Fund by focusing on the extent to which the Fund tracked its underlying index. The Board reviewed information regarding the Fund’s index tracking, discussing, as applicable, factors which contributed to the Fund’s tracking error. The Board noted that the Fund had underperformed its underlying index over certain periods, but that such underperformance was, at least in part, a result of costs incurred by the Fund not incurred by its underlying index. The Board also considered that the Fund’s underlying index was changed during the time period for which performance information was presented. The Board noted management’s representations that the Fund’s performance satisfactorily tracked its underlying index, and the Board concluded that the Fund satisfactorily tracked its underlying index. The Board further noted that it had received and would continue to receive regular reports regarding the Fund’s performance, including with respect to its tracking error, at its quarterly meetings.
Cost of Services Provided, Profits and Economies of Scale
The Board reviewed the advisory fee for the Fund and compared it to the total operating expenses of comparable ETFs, as determined by an independent third party and the Adviser. The Board noted that the advisory fee of the Fund was higher than the average and equal to the median expense ratios of its peer ETFs. The Board took into consideration management’s discussion of the fees, including that the Fund has a niche investment strategy that is substantially different than the strategies of many of the peer ETFs and, therefore, the information provided by the third party report may not provide meaningful direct comparisons to the Fund.
The Board noted the importance of the fact that the advisory fee for the Fund is a “unified fee,” meaning that the shareholders of the Fund pay no expenses other than the advisory fee and certain other costs such as interest charges on any borrowings, taxes, brokerage commissions and other expenses incurred in placing orders for the purchase and sale of securities and other investment instruments, acquired fund fees and expenses, accrued deferred tax liability, extraordinary expenses (such as, among other things and subject to Board approval, non-standard Board-related expenses and litigation against the Board, Trustees, Fund, Adviser, and officers of the Adviser), and distribution (12b-1) fees and expenses. The Board also noted that the Adviser was responsible for compensating the Trust’s other service providers and paying the Fund’s other expenses (except as noted above) out of its own fees and resources. The Board concluded that the advisory fee for the Fund is reasonable in light of the factors considered.
ETFMG Alternative Harvest ETF
APPROVAL OF ADVISORY AGREEMENT AND BOARD CONSIDERATIONS For the Period Ended March 31, 2021 (Unaudited) (Continued)
The Board also evaluated the compensation and other benefits received by the Adviser from its relationship with the Fund, taking into account profitability information provided by the Adviser. The Board received and reviewed profitability information with respect to the Fund and considered how profit margins could affect the Adviser’s long-term viability and ability to attract and retain high-quality personnel. The Board also considered the impact on the Adviser’s profitability of payments made to partners involved with the Fund. Based on the information provided to the Trustees, the Trustees concluded that the net revenue retained by the Adviser from providing services to the Fund was not excessive in view of the nature, extent and quality of services provided to the Fund. The Board further considered other benefits derived by the Adviser and its affiliates from the Adviser’s relationship with the Fund.
In addition, the Board considered whether economies of scale may be realized for the Fund. The Board noted that the Adviser regularly considers whether fee reductions are appropriate as the Fund grows in size. The Board noted that a unitary fee provides a level of certainty in expenses for the Fund and effectively acts as a cap on the fees and expenses (except as noted above) that are borne by the Fund. The Board also took into account the significant investments that the Adviser has made in its business to help ensure the continued provision of high -quality services to the Funds, such as the hiring of new trading, legal and compliance personnel, and enhancements to technology and related systems. The Board concluded that no changes to the advisory fee structure of the Fund were necessary.
In its deliberations, the Board did not identify any single piece of information discussed above that was all-important, controlling or determinative of its decision.
Based on the Board’s deliberations and its evaluation of the information described above, the Board, including the Independent Trustees, unanimously: (a) concluded that the terms of the Advisory Agreement are fair and reasonable; (b) concluded that the Adviser’s fees are reasonable in light of the services that the Adviser provides to the Fund; and (c) approved the renewal of the Advisory Agreement for another year.
ETFMG Alternative Harvest ETF
EXPENSE EXAMPLE (Unaudited)
Six Months Ended March 31, 2021
As a shareholder of the Fund, you incur two types of costs: (1) transaction costs, including brokerage commissions on purchases and sales of Fund shares; (2) ongoing costs, including management fees and other Fund expenses. This example is intended to help you understand your ongoing costs (in dollars) of investing in the Fund and to compare these costs with the ongoing costs of investing in other mutual funds.
The example is based on an investment of $1,000 invested at the beginning of the period and held for the entire period from October 1, 2020 through March 31, 2021.
Actual Expenses
The “Actual” line in the table below provides information about actual account values and actual expenses. You may use the information below, together with the amount you invested, to estimate the expenses that you paid over the period. Simply divide your account value by $1,000 (for example, an $8,600 account value divided by $1,000 = 8.6), then multiply the result by the number in the table under the heading entitled “Expenses Paid During Period” to estimate the expenses you paid on your account during this period.
Hypothetical Example for Comparison Purposes
The “Hypothetical” line in the table below provides information about hypothetical account values and hypothetical expenses based on the Fund’s actual expense ratio and an assumed rate of return of 5% per year before expenses, which is not the Fund’s actual return. The hypothetical account values and expenses may not be used to estimate the actual ending account balances or expenses you paid for the period. You may use this information to compare this 5% hypothetical example with the 5% hypothetical examples that appear in the shareholder reports of other funds.
Please note that the expenses shown in the table are meant to highlight your ongoing costs only and do not reflect any transactional costs, such as brokerage commissions paid on purchases and sales of Fund shares. Therefore, the table is useful in comparing ongoing costs only, and will not help you determine the relative total costs of owning different funds. In addition, if these transactional costs were included, your costs would have been higher.
| | | Beginning
Account Value
10/1/2020 | | Ending
Account Value
3/31/2021 | | Expenses Paid
During Period*
10/1/20 - 3/31/21 | | Expenses Paid
During Period**
10/1/20 - 3/31/21 |
| Actual | | $1,000.00 | | $2,215.50 | | $6.01 | | 0.75% |
| Hypothetical | | $1,000.00 | | $1,021.19 | | $3.78 | | 0.75% |
| (5% return before expenses) | | | | | | | | |
*”Actual” expense information for the Fund is for the period from October 1, 2020 to March 31, 2021. Actual expenses are equal to the Fund’s annualized net expense ratio multiplied by 182/365 (to reflect the period from October 1, 2020 to March 31, 2021). “Hypothetical” expense information for the Fund is presented on the basis of the full one-half year period to enable comparison to other funds. It is based on assuming the same net expense ratio and average account value over the period, but it is multiplied by 182/365 (to reflect the full half-year period).
** Annualized.
ETFMG Alternative Harvest ETF
Statement Regarding Liquidity Risk Management Program (Unaudited)
ETF Managers Trust (the “Trust”) has adopted a liquidity risk management program (the “Program”). The Trust’s Board of Trustees (the “Board”) has designated ETF Managers Group LLC (the “Program Administrator”) as the administrator of the Program. The Program Administrator has designated a committee (the “Committee”), composed of personnel from multiple departments, including investment operations and compliance, that is responsible for the implementation and ongoing administration of the Program, which includes assessing the liquidity risk of the AI Powered Equity ETF (the “Fund”) under both normal and reasonably foreseeable stressed conditions.
Under the Program, the Program Administrator assesses, manages and periodically reviews the Fund’s liquidity risk, based on factors specific to the circumstances of the Fund. Liquidity risk is the risk that the Fund could not meet shareholder redemption requests without significant dilution of remaining shareholders’ interests in the Fund. This risk is managed by monitoring the degree of liquidity of the Fund’s investments and limiting the amount of the Fund’s illiquid investments, among other means. The Program Administrator’s process of determining the degree of liquidity of the Fund’s investments is supported by one or more third-party liquidity assessment vendors.
At a meeting of the Board on March 30, 2021, the Adviser provided a written report to the Board addressing the operation, and the adequacy and effectiveness of the implementation, of the Program, including, the operation of any Highly Liquid Investment Minimum, where applicable, and any material changes to the Program, for the initial period from February 29, 2020 through March 30, 2021 (the “Reporting Period”). No significant liquidity events impacting the Fund were noted in the report and it was represented that, as of March 30, 2021, the Fund was primarily highly liquid and, during the Reporting Period, the Fund held less than 15% in illiquid securities. In addition, the Program Administrator provided its assessment that Program implementation was effective and that the Program operated adequately and effectively to enable the Program Administrator to oversee and manage liquidity risk and ensure the Fund is able to meet requests to redeem shares without significant dilution to the remaining investors’ interest in the Fund.
There can be no assurance that the Program will achieve its objectives in the future. Please refer to the Fund’s prospectus for more information regarding the Fund’s exposure to liquidity risk and other principal risks to which an investment in the Fund may be subject.
ETFMG Alternative Harvest ETF
SUPPLEMENTARY INFORMATION (Unaudited)
March 31, 2021
INFORMATION ABOUT PORTFOLIO HOLDINGS
Funds file a complete schedule of portfolio holdings with the Securities and Exchange Commission (the “SEC”) for the first and third quarters of each fiscal year as an exhibit to its reports on Part F of Form N-PORT, within sixty days after the end of the period. The Funds Part F of Form N-PORT reports are available at the SEC’s website at www.sec.gov. The Fund’s portfolio holdings are posted on the Fund’s website at www.etfmj.com daily.
INFORMATION ABOUT PROXY VOTING
A description of the policies and procedures the Fund uses to determine how to vote proxies relating to portfolio securities is provided in the Statement of Additional Information (“SAI”). The SAI is available without charge upon request by calling toll-free at 1- 844 -ETF-MGRS (1 -844-383-6477), by accessing the SEC’s website at www.sec.gov, or by accessing the Fund’s website at www.etfmj.com.
Information regarding how the Fund voted proxies relating to portfolio securities during the period ending June 30 is available by calling toll-free at 1-844-ETF-MGRS (1-844-383-6477) or by accessing the SEC’s website at www.sec.gov.
Carefully consider the Fund’s investment objectives, risk factors, charges, and expenses before investing. This and additional information can be found in the Fund’s prospectus, which may be obtained by calling 1-844- ETF-MGRS (1-844-383-6477) or by visiting www.etfmj.com. Read the prospectus carefully before investing.
Advisor
ETF Managers Group, LLC
30 Maple Street, Suite 2, Summit, NJ 07901
Distributor
ETFMG Financial, LLC
30 Maple Street, Suite 2, Summit, NJ 07901
Custodian
Wedbush Securities Inc.
1000 Wilshire Boulevard, Los Angeles, California 90017
Transfer Agent
Computershare Investor Services
480 Washington Boulevard, Jersey City, New Jersey 07310
Securities Lending Agent
Wedbush Securities Inc.
1000 Wilshire Boulevard, Los Angeles, California 90017
Independent Registered Public Accounting Firm
WithumSmith + Brown, PC
1411 Broadway, 9th Floor, New York, NY 10018
Legal Counsel
Sullivan & Worcester LLP
1666 K Street NW, Washington, DC 20006

Semi-Annual Report
March 31, 2021
(Unaudited)
BlueStar Israel Technology ETF
Ticker: ITEQ

The Fund is a series of ETF Managers Trust.
BlueStar Israel Technology ETF
TABLE OF CONTENTS
March 31, 2021 (Unaudited)
BlueStar Israel Technology ETF
Dear Shareholder,
On behalf of the entire team, we want to express our appreciation for the confidence you have placed in the BlueStar Israel Technology Exchange-Traded Fund (“ITEQ” or the “Fund”). The following information pertains to the fiscal period from October 1, 2020 to March 31, 2021.
The Fund seeks to provide investment results that, before fees and expenses, correspond generally to the total return performance of the BlueStar Israel Global Technology IndexTM (the “Index”).
Over the 6-month period ending March 31, 2021, the total return for the Fund was 17.52% while the total return for the Index, which does not incur Fund expenses, was 17.75%. The best performers in the Fund on the basis of contribution to its return were SolarEdge Technologies, Novocure Ltd., Verint Systems Inc., Amdocs Ltd. and Kornit Digital Ltd. while the worst performers were Jfrog Ltd., Brainstorm Cell Therapeutics, Compugen Ltd., Check Point Software Technologies Ltd. and Lemonade Inc.
At the end of the reporting period, the Fund saw an approximate allocation of 31.1% to Software, 16.3% to IT Services, 13.0% to Semiconductors & Semiconductor Equipment, 8.1% to Health Care Equipment & Supplies and 2.1% to Independent Power and Renewable Electricity Producers. The Fund was exposed predominately to Israel 62.0%, followed by the United States 23.5%.
We continue to believe Israeli companies play an essential role in the global high technology value chain. Most technology users, from online shoppers to Fortune 500 companies, use Israeli technology applications and solutions every day without ever being aware of it. From cybersecurity and defense to clean energy and agriculture, Israeli innovations power some of the biggest names in the tech industry today.
Even in industries where Israeli companies do not have dominant individual market share, the collective footprint of Israeli companies is significant in many key technology subsectors, and Israel-based Research & Development and non-public companies are usually significant contributors to that same sub-industry’s ecosystem.
There is much ahead for Israeli Technology companies and we are thankful you have joined us. You can find further details about ITEQ by visiting www.etfmg.com, or by calling 1-844-ETF-MGRS. (1- 844-383-6477).
Sincerely,

Samuel Masucci III
Chairman of the Board
BlueStar Israel Technology ETF
Growth of $10,000 (Unaudited)
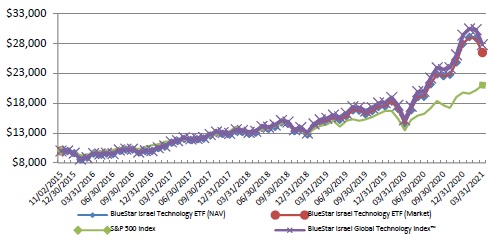
Average Annual Returns | | 1 Year | | | 5 Year | | | Since Inception | | | Value of $10,000 | |
Period Ended March 31, 2021 | | Return | | | Return | | | (11/2/2015) | | | (3/31/2021) | |
BlueStar Israel Technology ETF (NAV) | | | 80.73 | % | | | 22.58 | % | | | 19.69 | % | | $ | 26,449 | |
BlueStar Israel Technology ETF (Market) | | | 82.88 | % | | | 22.47 | % | | | 19.73 | % | | $ | 26,489 | |
S&P 500 Index | | | 56.35 | % | | | 16.29 | % | | | 14.73 | % | | $ | 21,031 | |
BlueStar Israel Global Technology IndexTM | | | 83.08 | % | | | 23.76 | % | | | 20.82 | % | | $ | 27,830 | |
Performance data quoted represents past performance and does not guarantee future results. The investment return and principal value of an investment will fluctuate so that an investor’s shares, when redeemed, may be worth more or less than their original cost. Current performance of the Fund may be lower or higher than the performance quoted. All performance is historical and includes reinvestment of dividends and capital gains. Performance data current to the most recent month end may be obtained by calling 1-844-ETF-MGRS (1-844-383-6477).
The chart illustrates the performance of a hypothetical $10,000 investment made on November 2, 2015, and is not intended to imply any future performance. The returns shown do not reflect the deduction of taxes that a shareholder would pay on fund distributions from the sales of Fund shares. The chart assumes reinvestment of capital gains and dividends, if any. The Index Returns do not reflect fees or expenses and are not available for direct investment.
BlueStar Israel Technology ETF
Top Ten Holdings as of March 31, 2021 (Unaudited)*
| | Security | | % of Total Investments |
1 | | Wix.com, Ltd. | 7.85% |
2 | | SolarEdge Technologies, Inc. | 7.52% |
3 | | Check Point Software Technologies, Ltd. | 6.66% |
4 | | Nice, Ltd. | 6.42% |
5 | | Amdocs, Ltd. | 6.38% |
6 | | Novocure, Ltd. | 5.48% |
7 | | CyberArk Software, Ltd. | 4.02% |
8 | | Ormat Technologies, Inc. | 3.71% |
9 | | Fiverr International, Ltd. | 3.26% |
10 | | Elbit Systems, Ltd. | 3.20% |
Top Ten Holdings = 54.50% of Total Investments
* Current Fund holdings may not be indicative of future Fund holdings.
BlueStar Israel Technology ETF
Important Disclosures and Key Risk Factors
Past performance is not indicative of future return. A fund’s performance for very short time periods may not be indicative of future performance.
ITEQ
The BlueStar Israel Technology ETF (the “Fund”) seeks to provide investment results that, before fees and expenses, correspond generally to the price and yield performance of the BlueStar Israel Global Technology Index (the “Index”).
Investing involves risk, including the possible loss of principal. Shares of any ETF are bought and sold at market price (not NAV), may trade at a discount or premium to NAV and are not individually redeemed from the Fund. Brokerage commissions will reduce returns. Narrowly focused investments typically exhibit higher volatility. Investment in securities of Israeli companies involves risks that may negatively affect the value of your investment in the Fund. Among other things, Israel’s economy depends on imports of certain key items, such as crude oil, coal, grains, raw materials and military equipment. Foreign investing involves special risks such as currency fluctuations and political uncertainty. Funds that invest in smaller companies may experience greater volatility. Funds that emphasize investments in technology generally will experience greater price volatility. The Fund’s return may not match or achieve a high degree of correlation with the return of the Index. To the extent the Fund utilizes a sampling approach, it may experience tracking error to a greater extent than if the Fund had sought to replicate the Index. Diversification does not guarantee a profit, nor does it protect against a loss in a declining market.
Unlike with an actively managed fund, the Fund’s adviser does not use techniques or defensive strategies designed to lessen the effects of market volatility or to reduce the impact of periods of market decline. This means that, based on market and economic conditions, the Fund’s performance could be lower than other types of funds that may actively shift their portfolio assets to take advantage of market opportunities or to lessen the impact of a market decline.
Natural or environmental disasters, such as earthquakes, fires, floods, hurricanes, tsunamis and other severe weather-related phenomena generally, and widespread disease, including pandemics and epidemics, have been and may be highly disruptive to economies and markets, adversely impacting individual companies, sectors, industries, markets, currencies, interest and inflation rates, credit ratings, investor sentiment, and other factors affecting the value of the Fund’s investments. Given the increasing interdependence among global economies and markets, conditions in one country, market, or region are increasingly likely to adversely affect markets, issuers, and/or foreign exchange rates in other countries, including the U.S. Any such events could have a significant adverse impact on the value of the Fund’s investments.
ETF Managers Group LLC is the investment advisor to the Fund.
The Fund is distributed by ETFMG Financial LLC. ETF Managers Group LLC and ETFMG Financial LLC are wholly owned subsidiaries of Exchange Traded Managers Group LLC (collectively, “ETFMG”). ETFMG is not affiliated with MV Index Solutions GmbH or its affiliates.
BlueStar Israel Technology ETF
PORTFOLIO ALLOCATIONS
As of March 31, 2021 (Unaudited)
| | | BlueStar Israel Technology ETF | |
| | | | |
| As a percent of Net Assets: | | | | |
| Gibraltar | | | 1.2 | % |
| Guernsey | | | 6.4 | |
| Israel | | | 62.0 | |
| Jersey | | | 5.5 | |
| United Kingdom | | | 0.9 | |
| United States | | | 23.5 | |
| Short-Term and other Net Assets (Liabilities) | | | 0.5 | |
| | | | 100.0 | % |
BlueStar Israel Technology ETF
Schedule of Investments
March 31, 2021 (Unaudited)
| | | Shares | | | Value | |
| COMMON STOCKS - 99.5% | | | | | | | | |
| Gibraltar - 1.2% | | | | | | | | |
| Hotels, Restaurants & Leisure - 1.2% | | | | | | | | |
| 888 Holdings PLC | | | 430,342 | | | $ | 2,343,426 | |
| | | | | | | | | |
| Guernsey - 6.4% | | | | | | | | |
| IT Services - 6.4% | | | | | | | | |
| Amdocs, Ltd. | | | 182,972 | | | | 12,835,486 | |
| | | | | | | | | |
| Israel - 62.0% | | | | | | | | |
| Aerospace & Defense - 3.7% | | | | | | | | |
| Elbit Systems, Ltd. | | | 45,467 | | | | 6,428,839 | |
| RADA Electronic Industries, Ltd. (a) | | | 83,939 | | | | 1,008,107 | |
| Total Aerospace & Defense | | | | | | | 7,436,946 | |
| Biotechnology - 0.7% | | | | | | | | |
| Kamada, Ltd. (a) | | | 109,088 | | | | 665,994 | |
| UroGen Pharma, Ltd. (a)(b) | | | 39,692 | | | | 773,200 | |
| Total Biotechnology | | | | | | | 1,439,194 | |
| Capital Markets - 0.4% | | | | | | | | |
| Electreon Wireless, Ltd. (a) | | | 12,314 | | | | 800,773 | |
| Communications Equipment - 3.7% | | | | | | | | |
| AudioCodes, Ltd. | | | 49,776 | | | | 1,342,956 | |
| BATM Advanced Communications, Ltd. (a) | | | 664,055 | | | | 888,007 | |
| Ceragon Networks, Ltd. (a)(b) | | | 218,770 | | | | 824,763 | |
| Gilat Satellite Networks, Ltd. | | | 108,386 | | | | 1,129,215 | |
| Ituran Location and Control, Ltd. | | | 36,964 | | | | 784,746 | |
| Radware, Ltd. (a) | | | 68,580 | | | | 1,788,566 | |
| Silicom, Ltd. (a) | | | 14,730 | | | | 664,618 | |
| Total Communications Equipment | | | | | | | 7,422,871 | |
| Diversified Financial Services - 1.5% | | | | | | | | |
| Plus500, Ltd. | | | 156,777 | | | | 3,025,874 | |
| Health Care Equipment & Supplies - 2.6% | | | | | | | | |
| Inmode, Ltd. (a) | | | 37,247 | | | | 2,695,565 | |
| Nano-X Imaging, Ltd. (a)(b) | | | 62,818 | | | | 2,603,806 | |
| Total Health Care Equipment & Supplies | | | | | | | 5,299,371 | |
| Household Durables - 0.8% | | | | | | | | |
| Maytronics, Ltd. | | | 85,583 | | | | 1,553,665 | |
| Independent Power & Renewable Electricity | | | | | | | | |
| Producers - 2.1% | | | | | | | | |
| Doral Group Renewable Energy Resources, Ltd. (a) | | | 177,654 | | | | 815,175 | |
| Energix-Renewable Energies, Ltd. | | | 394,448 | | | | 1,492,557 | |
| Enlight Renewable Energy, Ltd. (a) | | | 1,006,000 | | | | 1,883,749 | |
| Total Independent Power & Renewable Electricity Producers | | | | | | | 4,191,481 | |
| Internet & Direct Marketing Retail - 3.2% | | | | | | | | |
| Fiverr International, Ltd. (a)(b) | | | 30,180 | | | | 6,554,492 | |
The accompanying notes are an integral part of these financial statements.
BlueStar Israel Technology ETF
Schedule of Investments
March 31, 2021 (Unaudited) (Continued)
| | | Shares | | | Value | |
| IT Services - 9.9% | | | | | | | | |
| Formula Systems 1985, Ltd. | | | 15,462 | | | $ | 1,363,927 | |
| Matrix IT, Ltd. | | | 57,151 | | | | 1,367,959 | |
| One Software Technologies, Ltd. | | | 6,234 | | | | 811,533 | |
| Splitit, Ltd. (a)(b) | | | 958,672 | | | | 538,837 | |
| Wix.com, Ltd. (a) | | | 56,495 | | | | 15,774,534 | |
| Total IT Services | | | | | | | 19,856,790 | |
| Life Sciences Tools & Services - 0.5% | | | | | | | | |
| Compugen, Ltd. (a)(b) | | | 121,817 | | | | 1,046,408 | |
| Machinery - 3.1% | | | | | | | | |
| Kornit Digital, Ltd. (a) | | | 63,080 | | | | 6,252,490 | |
| Media - 1.4% | | | | | | | | |
| Perion Network, Ltd. (a) | | | 78,570 | | | | 1,406,403 | |
| Tremor International, Ltd. (a) | | | 156,066 | | | | 1,506,076 | |
| Total Media | | | | | | | 2,912,479 | |
| Pharmaceuticals - 0.3% | | | | | | | | |
| Redhill Biopharma, Ltd. - ADR (a)(b) | | | 78,633 | | | | 575,594 | |
| Semiconductors & Semiconductor Equipment - 4.2% | | | | | | | | |
| Camtek, Ltd. (a) | | | 53,027 | | | | 1,585,507 | |
| Nova Measuring Instruments, Ltd. (a) | | | 35,246 | | | | 3,089,072 | |
| Tower Semiconductor, Ltd. (a) | | | 133,855 | | | | 3,726,447 | |
| Total Semiconductors & Semiconductor Equipment | | | | | | | 8,401,026 | |
| Software - 22.5% (d) | | | | | | | | |
| Allot, Ltd. (a) | | | 59,786 | | | | 954,782 | |
| Check Point Software Technologies, Ltd. (a) | | | 119,553 | | | | 13,386,350 | |
| Cognyte Software, Ltd. (a) | | | 88,888 | | | | 2,471,975 | |
| CyberArk Software, Ltd. (a) | | | 62,523 | | | | 8,086,725 | |
| Hilan, Ltd. | | | 24,408 | | | | 1,155,019 | |
| JFrog, Ltd. (a)(b) | | | 103,613 | | | | 4,597,309 | |
| Magic Software Enterprises, Ltd. | | | 54,785 | | | | 850,510 | |
| Nice, Ltd. (a) | | | 59,778 | | | | 12,910,089 | |
| Tufin Software Technologies, Ltd. (a)(b) | | | 69,931 | | | | 734,276 | |
| Total Software | | | | | | | 45,147,035 | |
| Technology Hardware, Storage & Peripherals - 1.4% | | | | | | | | |
| Nano Dimension, Ltd. - ADR (a)(b) | | | 113,314 | | | | 973,367 | |
| Stratasys, Ltd. (a)(b) | | | 74,528 | | | | 1,930,275 | |
| Total Technology Hardware, Storage & Peripherals | | | | | | | 2,903,642 | |
| Total Israel | | | | | | | 124,820,131 | |
| | | | | | | | | |
| Jersey - 5.5% | | | | | | | | |
| Health Care Equipment & Supplies - 5.5% | | | | | | | | |
| Novocure, Ltd. (a)(b) | | | 83,292 | | | | 11,009,537 | |
| | | | | | | | | |
| United Kingdom - 0.9% | | | | | | | | |
| Software - 0.9% (d) | | | | | | | | |
| Sapiens International Corp. NV | | | 56,337 | | | | 1,769,431 | |
The accompanying notes are an integral part of these financial statements.
BlueStar Israel Technology ETF
Schedule of Investments
March 31, 2021 (Unaudited) (Continued)
| | | Shares | | | Value | |
| United States - 23.5% | | | | | | |
| Biotechnology - 0.7% | | | | | | |
| 89bio, Inc. (a) | | | 28,467 | | | $ | 674,099 | |
| BrainStorm Cell Therapeutics, Inc. (a)(b) | | | 114,318 | | | | 437,838 | |
| Pluristem Therapeutics, Inc. (a) | | | 74,988 | | | | 337,581 | |
| Total Biotechnology | | | | | | | 1,449,518 | |
| Electric Utilities - 3.7% | | | | | | | | |
| Ormat Technologies, Inc. | | | 95,253 | | | | 7,456,465 | |
| Electronic Equipment, Instruments & Components - 0.4% | | | | | | | | |
| Powerfleet, Inc. (a)(b) | | | 96,850 | | | | 796,107 | |
| Insurance - 2.2% | | | | | | | | |
| Lemonade, Inc. (a)(b) | | | 47,002 | | | | 4,377,296 | |
| Semiconductors & Semiconductor Equipment - 8.8% | | | | | | | | |
| CEVA, Inc. (a) | | | 36,262 | | | | 2,036,111 | |
| DSP Group, Inc. (a) | | | 47,455 | | | | 676,234 | |
| SolarEdge Technologies, Inc. (a)(b) | | | 52,575 | | | | 15,112,159 | |
| Total Semiconductors & Semiconductor Equipment | | | | | | | 17,824,504 | |
| Software - 7.7% (d) | | | | | | | | |
| LivePerson, Inc. (a) | | | 106,698 | | | | 5,607,621 | |
| Varonis Systems, Inc. (a) | | | 112,559 | | | | 5,778,779 | |
| Verint Systems, Inc. (a)(b) | | | 88,888 | | | | 4,043,515 | |
| Total Software | | | | | | | 15,429,915 | |
| Total United States | | | | | | | 47,333,805 | |
| TOTAL COMMON STOCKS (Cost $161,966,472) | | | | | | | 200,111,816 | |
| | | | | | | | | |
| INVESTMENTS PURCHASED WITH PROCEEDS FROM SECURITIES LENDING COLLATERAL - 24.5% | | | | | | | | |
| Mount Vernon Liquid Assets Portfolio, LLC, 0.11% (c) | | | 49,122,664 | | | | 49,122,664 | |
| TOTAL INVESTMENTS PURCHASED WITH PROCEEDS FROM SECURITIES LENDING COLATTERAL (Cost $49,122,664) | | | | | | | 49,122,664 | |
| | | | | | | | | |
| SHORT-TERM INVESTMENTS - 0.4% | | | | | | | | |
| Money Market Funds - 0.4% | | | | | | | | |
| Invesco Advisers, Inc. STIT - Treasury Portfolio - Institutional Class, 0.01% (c) | | | 811,524 | | | | 811,524 | |
| TOTAL SHORT-TERM INVESTMENTS (Cost $811,524) | | | | | | | 811,524 | |
| | | | | | | | | |
| Total Investments (Cost $211,900,660) - 124.4% | | | | | | | 250,046,004 | |
| Liabilities in Excess of Other Assets - (24.4)% | | | | | | | (48,982,748 | ) |
| TOTAL NET ASSETS - 100.0% | | | | | | $ | 201,063,256 | |
The accompanying notes are an integral part of these financial statements.
BlueStar Israel Technology ETF
Schedule of Investments
March 31, 2021 (Unaudited) (Continued)
Percentages are stated as a percent of net assets.
| ADR | American Depositary Receipt |
| PLC | Public Limited Company |
| (a) | Non-income producing security. |
| (b) | All or a portion of this security is out on loan as of March 31, 2021. |
| (c) | The rate quoted is the annualized seven-day yield at March 31, 2021. |
| (d) | As of March 31, 2021, the Fund had a significant portion of its assets invested in the Software Industry. |
The Global Industry Classification Standard (GICS®) was developed by and/or is the exclusive property of MSCI, Inc. and Standard & Poor’s Financial Services LLC (“S&P”). GICS is a service mark of MSCI and S&P and has been licensed for use by U.S. Bancorp Fund Services, LLC, doing business as U.S. Bank Global Fund Services (“Fund Services”).
The accompanying notes are an integral part of these financial statements.
BlueStar Israel Technology ETF
STATEMENT OF ASSETS AND LIABILITIES
As of March 31, 2021 (Unaudited)
| | | BlueStar Israel Technology ETF | |
| ASSETS | | | |
| Investments in securities, at value* | | $ | 250,046,004 | |
| Foreign currency* | | | 209 | |
| Receivables: | | | | |
| Dividends and interest receivable | | | 248,285 | |
| Securities lending income receivable | | | 21,551 | |
| Total Assets | | $ | 250,316,049 | |
| | | | | |
| LIABILITIES | | | | |
| Collateral received for securities loaned (Note 7) | | | 49,122,664 | |
| Payables: | | | | |
| Unitary fees payable | | | 130,129 | |
| Total Liabilities | | | 49,252,793 | |
| Net Assets | | $ | 201,063,256 | |
| | | | | |
| NET ASSETS CONSIST OF: | | | | |
| Paid-in capital | | $ | 152,268,490 | |
| Total Distributable Earnings | | | 48,794,766 | |
| Net Assets | | $ | 201,063,256 | |
| | | | | |
| *Identified Cost: | | | | |
| Investments in securities | | $ | 211,900,660 | |
| Foreign currency | | | 209 | |
| | | | | |
| Shares Outstanding^ | | | 3,100,000 | |
| Net Asset Value, Offering and Redemption Price per Share | | $ | 64.86 | |
| ^ | No par value, unlimited number of shares authorized |
The accompanying notes are an integral part of these financial statements.
BlueStar Israel Technology ETF
STATEMENT OF OPERATIONS
For the Period Ended March 31, 2021 (Unaudited)
| | | BlueStar Israel Technology ETF | |
| INVESTMENT INCOME | | | |
| Income: | | | |
| Dividends from securities (net of foreign withholdings tax and issuance fees of $78,483) | | $ | 463,559 | |
| Interest | | | 37 | |
| Securities lending income | | | 473,166 | |
| Total Investment Income | | | 936,762 | |
| | | | | |
| Expenses: | | | | |
| Unitary Fees | | | 648,844 | |
| Total Expenses | | | 648,844 | |
| Net Investment Income | | | 287,918 | |
| | | | | |
| REALIZED & UNREALIZED GAIN (LOSS) ON INVESTMENTS | | | | |
| Net Realized Gain (Loss) on: | | | | |
| Unaffiliated investments | | | (1,285,730 | ) |
| Affiliated investments | | | (23,355 | ) |
| In-Kind redemptions | | | 16,210,857 | |
| Foreign currency and foreign currency translation | | | (11,640 | ) |
| Net Realized Gain on Investments and In-Kind Redemptions | | | 14,890,132 | |
| Net Change in Unrealized Appreciation of: | | | | |
| Unaffiliated investments | | | 2,142,038 | |
| Affiliated investments | | | 23,606 | |
| Foreign currency and foreign currency traslation | | | 3 | |
| Net Change in Unrealized Appreciation of Investments | | | 2,165,647 | |
| Net Realized and Unrealized Gain on Investments | | | 17,055,779 | |
| NET INCREASE IN NET ASSETS RESULTING FROM OPERATIONS | | $ | 17,343,697 | |
The accompanying notes are an integral part of these financial statements.
BlueStar Israel Technology ETF
STATEMENTS OF CHANGES IN NET ASSETS
| | | Period Ended March 31, 2021 (Unaudited) | | | Year Ended September 30, 2020 | |
| OPERATIONS | | | | | | |
| Net investment income (loss) | | $ | 287,918 | | | $ | (117,631 | ) |
| Net realized gain on investments and in-kind redemptions | | | 14,890,132 | | | | 8,325,852 | |
| Net change in unrealized appreciation of investments | | | 2,165,647 | | | | 23,883,271 | |
| Net increase in net assets resulting from operations | | | 17,343,697 | | | | 32,091,492 | |
| | | | | | | | | |
| DISTRIBUTIONS TO SHAREHOLDERS | | | | | | | | |
| Total distributions from distributable earnings | | | (1,110,500 | ) | | | — | |
| | | | | | | | | |
| CAPITAL SHARE TRANSACTIONS | | | | | | | | |
| Net increase in net assets derived from net change in outstanding shares | | | 57,028,010 | | | | 21,863,905 | |
| Net increase in net assets | | $ | 73,261,207 | | | $ | 53,955,397 | |
| | | | | | | | | |
| NET ASSETS | | | | | | | | |
| Beginning of Period | | | 127,802,049 | | | | 73,846,652 | |
| End of Period | | $ | 201,063,256 | | | $ | 127,802,049 | |
Summary of share transactions is as follows:
| | | | Period Ended | | | Year Ended | |
| | | | March 31, 2021 (Unaudited) | | | September 30, 2020 | |
| | | | Shares | | | Amount | | | Shares | | | Amount | |
| Shares Sold | | | | 1,200,000 | | | $ | 83,109,965 | | | | 900,000 | | | $ | 42,363,755 | |
| Shares Redeemed | | | | (400,000 | ) | | | (26,081,955 | ) | | | (450,000 | ) | | | (20,499,850 | ) |
| Net Transactions in Fund Shares | | | | 800,000 | | | $ | 57,028,010 | | | | 450,000 | | | $ | 21,863,905 | |
| | | | | | | | | | | | | | | | | | |
| Beginning Shares | | | | 2,300,000 | | | | | | | | 1,850,000 | | | | | |
| Ending Shares | | | | 3,100,000 | | | | | | | | 2,300,000 | | | | | |
The accompanying notes are an integral part of these financial statements.
BlueStar Israel Technology ETF
FINANCIAL HIGHLIGHTS
For a capital share outstanding throughout the year/period
| | | Period Ended March 31, 2021 (Unaudited) | | | Year Ended September 30, 2020 | | | Year Ended September 30, 2019 | | | Year Ended September 30, 2018 | | | Year Ended September 30, 2017 | | | Period Ended September 30, 20161 | |
| Net Asset Value,Beginning of Period/Year | | $ | 55.57 | | | $ | 39.92 | | | $ | 36.03 | | | $ | 31.38 | | | $ | 25.58 | | | $ | 25.00 | |
| Income (Loss) from Investment Operations: | | | | | | | | | | | | | | | | | | | | | | | | |
| Net investment income (loss)2 | | | 0.11 | | | | (0.06 | ) | | | (0.04 | ) | | | 0.04 | | | | 0.02 | | | | 0.05 | |
| Net realized and unrealized gain on investments | | | 9.62 | | | | 15.71 | | | | 4.03 | | | | 4.78 | | | | 5.87 | | | | 0.53 | |
| Total from investment operations | | | 9.73 | | | | 15.65 | | | | 3.99 | | | | 4.82 | | | | 5.89 | | | | 0.58 | |
| Less Distributions: | | | | | | | | | | | | | | | | | | | | | | | | |
| Distributions from net investment income | | | (0.44 | ) | | | — | | | | (0.09 | ) | | | (0.17 | ) | | | (0.09 | ) | | | — | |
| Return of Capital | | | — | | | | — | | | | (0.01 | ) | | | — | | | | — | | | | — | |
| Total Distributions | | | (0.44 | ) | | | — | | | | (0.10 | ) | | | (0.17 | ) | | | (0.09 | ) | | | — | |
| Net Asset Value, end of period/year | | $ | 64.86 | | | $ | 55.57 | | | $ | 39.92 | | | $ | 36.03 | | | $ | 31.38 | | | $ | 25.58 | |
| Total Return | | | 17.52 | %3 | | | 39.20 | % | | | 11.17 | % | | | 15.41 | % | | | 23.16 | % | | | 2.31 | %3 |
| | | | | | | | | | | | | | | | | | | | | | | | | |
| Ratios/Supplemental Data: | | | | | | | | | | | | | | | | | | | | | | | | |
| Net assets at end of period/year (000’s) | | $ | 201,063 | | | $ | 127,802 | | | $ | 73,847 | | | $ | 61,243 | | | $ | 23,538 | | | $ | 5,116 | |
| Expenses to Average Net Assets | | | 0.75 | %4 | | | 0.75 | % | | | 0.75 | % | | | 0.75 | % | | | 0.75 | % | | | 0.75 | %4 |
| Net Investment Income (Loss) to Average Net Assets | | | 0.33 | %4 | | | -0.12 | % | | | -0.12 | % | | | 0.12 | % | | | 0.07 | % | | | 0.23 | %4 |
| Portfolio Turnover Rate | | | 11 | %3 | | | 19 | % | | | 24 | % | | | 11 | % | | | 19 | % | | | 14 | %3 |
| 1 | Commencement of operations on November 2, 2015. |
| 2 | Calculated based on average shares outstanding during the year/period. |
| 3 | Not annualized. |
| 4 | Annualized. |
The accompanying notes are an integral part of these financial statements.
BlueStar Israel Technology ETF
NOTES TO FINANCIAL STATEMENTS
March 31, 2021 (Unaudited)
NOTE 1 – ORGANIZATION
BlueStar Israel Technology ETF (the “Fund”) is a series of ETF Managers Trust (the “Trust”), an open-end management investment company consisting of multiple investment series, organized as a Delaware statutory trust on July 1, 2009. The Trust is registered with the SEC under the Investment Company Act of 1940, as amended (the “1940 Act”), as an open-end management investment company and the offering of the Fund’s shares (“Shares”) is registered under the Securities Act of 1933, as amended (the “Securities Act”). The Fund seeks to provide investment results that, before fees and expenses, correspond generally to the total return performance of the BlueStar Israel Global Technology IndexTM (“BIGITech®TM” or the “Index”). The Fund commenced operations on November 2, 2015.
The Fund currently offers one class of shares, which has no front end sales load, no deferred sales charges, and no redemption fees. The Fund may issue an unlimited number of shares of beneficial interest, with no par value. All shares of the Fund have equal rights and privileges.
Shares of the Fund are listed and traded on the NASDAQ Stock Market, LLC. Market prices for the Shares may be different from their net asset value (“NAV”). The Fund issues and redeems Shares on a continuous basis at NAV only in blocks of 50,000 shares, called “Creation Units.” Creation Units are issued and redeemed principally in-kind for securities included in the Index. Once created, Shares generally trade in the secondary market at market prices that change throughout the day in quantities less than a Creation Unit. Except when aggregated in Creation Units, Shares are not redeemable securities of the Fund. Shares of the Fund may only be purchased or redeemed by certain financial institutions (“Authorized Participants”). An Authorized Participant is either (i) a broker-dealer or other participant in the clearing process through the Continuous Net Settlement System of the National Securities Clearing Corporation or (ii) a DTC participant and, in each case, must have executed a Participant Agreement with the Distributor. Most retail investors do not qualify as Authorized Participants nor have the resources to buy and sell whole Creation Units. Therefore, they are unable to purchase or redeem the Shares directly from the Fund. Rather, most retail investors may purchase Shares in the secondary market with the assistance of a broker and may be subject to customary brokerage commissions or fees.
Authorized Participants transacting in Creation Units for cash may pay an additional variable charge to compensate the relevant Fund for certain transaction costs (i.e., brokerage costs) and market impact expenses relating to investing in portfolio securities. Such variable charges, if any, are included in “Transaction Fees” in the Statements of Changes in Net Assets.
NOTE 2 – SIGNIFICANT ACCOUNTING POLICIES
The following is a summary of significant accounting policies consistently followed by the Fund. These policies are in conformity with accounting principles generally accepted in the United States of America (“U.S. GAAP”).
The Fund follows the investment company accounting and reporting guidance of the Financial Accounting Standards Board Accounting Standard Codification Topic 946 Financial Services – Investment Companies.
The Fund may invest in certain other investment companies (underlying funds). For specific investments in underlying funds, please refer to the complete schedule of portfolio holdings on Form N-CSR(S) for this reporting period, which is filed with the U.S. Securities and Exchange Commission (“SEC”). For more information about the underlying fund’s operations and policies, please refer to those funds’ semiannual and annual reports, which are filed with the SEC.
BlueStar Israel Technology ETF
NOTES TO FINANCIAL STATEMENTS
March 31, 2021 (Unaudited) (Continued)
A. | Security Valuation. Securities listed on a securities exchange, market or automated quotation system for which quotations are readily available (except for securities traded on NASDAQ), including securities traded over the counter, are valued at the last quoted sale price on the primary exchange or market (foreign or domestic) on which they are traded on the valuation date (or at approximately 4:00 pm Eastern Time if a security’s primary exchange is normally open at that time), or, if there is no such reported sale on the valuation date, at the most recent quoted bid price. For securities traded on NASDAQ, the NASDAQ Official Closing Price will be used. |
Securities for which quotations are not readily available are valued at their respective fair values as determined in good faith by the Board of Trustees (the “Board”). When a security is “fair valued,” consideration is given to the facts and circumstances relevant to the particular situation, including a review of various factors set forth in the pricing procedures adopted by the Fund’s Board. The use of fair value pricing by the Fund may cause the NAV of its shares to differ significantly from the NAV that would be calculated without regard to such considerations. As of March 31, 2021, the Fund did not hold any fair valued securities.
As described above, the Fund utilizes various methods to measure the fair value of its investments on a recurring basis. U.S. GAAP establishes a hierarchy that prioritizes inputs to valuation methods. The three levels of inputs are:
| Level 1 | Unadjusted quoted prices in active markets for identical assets or liabilities that the Fund has the ability to access. |
| Level 2 | Observable inputs other than quoted prices included in Level 1 that are observable for the asset or liability, either directly or indirectly. These inputs may include quoted prices for the identical instrument on an inactive market, prices for similar instruments, interest rates, prepayment speeds, credit risk, yield curves, default rates and similar data. |
| Level 3 | Unobservable inputs for the asset or liability, to the extent relevant observable inputs are not available; representing the Fund’s own assumptions about the assumptions a market participant would use in valuing the asset or liability, and would be based on the best information available. |
The availability of observable inputs can vary from security to security and is affected by a wide variety of factors, including, for example, the type of security, whether the security is new and not yet established in the marketplace, the liquidity of markets, and other characteristics particular to the security. To the extent that valuation is based on models or inputs that are less observable or unobservable in the market, the determination of fair value requires more judgment. Accordingly, the degree of judgment exercised in determining fair value is greatest for instruments categorized in Level 3.
The inputs used to measure fair value may fall into different levels of the fair value hierarchy. In such cases, for disclosure purposes, the level in the fair value hierarchy within which the fair value measurement falls in its entirety, is determined based on the lowest level input that is significant to the fair value measurement in its entirety.
BlueStar Israel Technology ETF
NOTES TO FINANCIAL STATEMENTS
March 31, 2021 (Unaudited) (Continued)
The following is a summary of the inputs used to value the Fund’s net assets as of March 31, 2021:
BlueStar Israel Technology ETF
Assets^ | | Level 1 | | | Level 2 | | | Level 3 | | | Total |
Common Stocks | | $ | 200,111,816 | | | $ | — | | | $ | — | | | $ | 200,111,816 |
Short-Term Investments | | | 811,524 | | | | — | | | | — | | | | 811,524 |
Investments Purchased with Securities Lending | | | | | | | | | | | | | | | |
Collateral* | | | — | | | | — | | | | — | | | | 49,122,664 |
Total Investments in Securities | | $ | 200,923,340 | | | $ | — | | | $ | — | | | $ | 250,046,004 |
^ See Schedule of Investments for classifications by country and industry.
* Certain investments that are measured at fair value using the NAV per share (or its equivalent) practical expedient have not been categorized in the fair value hierarchy. The fair value amounts presented in the table are intended to permit reconciliation of the fair value hierarchy to the amounts presented in the Schedule of Investments.
B. | Federal Income Taxes. The Fund has elected to be taxed as a “regulated investment company” and intends to distribute substantially all taxable income to its shareholders and otherwise comply with the provisions of the Internal Revenue Code applicable to regulated investment companies. Therefore, no provisions for federal income taxes or excise taxes have been made. |
To avoid imposition of the excise tax applicable to regulated investment companies, the Fund intends to declare each year as dividends, in each calendar year, at least 98.0% of its net investment income (earned during the calendar year) and 98.2% of its net realized capital gains (earned during the twelve months ended October 31) plus undistributed amounts, if any, from prior years.
Net capital losses incurred after October 31, within the taxable year are deemed to arise on the first business day of the Fund’s next taxable year.
The Fund recognizes the tax benefits of uncertain tax positions only where the position is “more likely than not” to be sustained assuming examination by tax authorities. The Fund has analyzed its tax position and has concluded that no liability for unrecognized tax benefits should be recorded related to uncertain tax positions expected to be taken in the Fund’s 2020 tax returns. The Fund identifies its major tax jurisdictions as U.S. Federal, the State of New Jersey, and the State of Delaware; however the Fund is not aware of any tax positions for which it is reasonably possible that the total amounts of unrecognized tax benefits will change materially in the next twelve months.
As of March 31, 2021, management has reviewed the tax positions for open periods (for federal purposes, three years from the date of filing and for state purposes, four years from the date of filing) as applicable to the Fund, and has determined that no provision for income tax is required in the Fund’s financial statements.
C. | Investment securities transactions are accounted for on the trade date. Gains and losses realized on sales of securities are determined on a specific identification basis. Discounts/premiums on debt securities purchased are accreted/amortized over the life of the respective securities using the effective interest method. Dividend income is recorded on the ex-dividend date. Interest income is recorded on an accrual basis. Income, including gains, from investments in foreign securities received by the Fund may be subject to income, withholding or other taxes imposed by foreign countries. |
BlueStar Israel Technology ETF
NOTES TO FINANCIAL STATEMENTS
March 31, 2021 (Unaudited) (Continued)
D. | Foreign Currency Translations and Transactions. The Fund may engage in foreign currency transactions. Foreign currency transactions are translated into U.S. dollars on the following basis: (i) market value of investment securities, assets and liabilities at the daily rates of exchange, and (ii) purchases and sales of investment securities, dividend and interest income and certain expenses at the rates of exchange prevailing on the respective dates of such transactions. For financial reporting purposes, the Fund does not isolate changes in the exchange rate of investment securities from the fluctuations arising from changes in the market prices of securities for unrealized gains and losses. However, for federal income tax purposes, the Fund does isolate and treat as ordinary income the effect of changes in foreign exchange rates on realized gains or losses from the sale of investment securities and payables and receivables arising from trade-date and settlement-date differences. |
E. | Distributions to Shareholders. Distributions to shareholders from net investment income, if any are generally declared and paid by the Fund on a quarterly basis. Net realized gains on securities of the Fund normally are declared and paid on an annual basis. Distributions are recorded on the ex-dividend date. |
F. | Use of Estimates. The preparation of financial statements in conformity with U.S. GAAP requires management to make estimates and assumptions that affect the reported amounts of assets and liabilities at the date of the financial statements, as well as the reported amounts of revenues and expenses during the period. Actual results could differ from those estimates. |
G. | Share Valuation. The NAV per share of the Fund is calculated by dividing the sum of the value of the securities held by the Fund, plus cash and other assets, minus all liabilities (including estimated accrued expenses) by the total number of shares outstanding of the Fund, rounded to the nearest cent. The Fund’s shares will not be priced on the days on which the NYSE is closed for trading. The offering and redemption price per share for the Fund is equal to the Fund’s NAV share. |
H. | Guarantees and Indemnifications. In the normal course of business, the Fund enters into contracts with service providers that contain general indemnification clauses. The Fund’s maximum exposure under these arrangements is unknown as this would involve future claims that may be made against the Fund that have not yet occurred. However, based on experience, the Fund expects the risk of loss to be remote. |
NOTE 3 – RISK FACTORS
Investing in the BlueStar Israel Technology ETF may involve certain risks, as discussed in the Fund’s prospectus, including, but not limited to, those described below. Any of these risks could cause an investor to lose money.
Market Risk. Financial markets rise and fall in response to a variety of factors, sometimes rapidly and unpredictably. As with any investment whose performance is tied to these markets, the value of an investment in a fund will fluctuate, which means that an investor could lose money over short or long periods.
Investment Style Risk. The Fund is not actively managed. Therefore, the Fund follows the securities included in its respective index during upturns as well as downturns. Because of its indexing strategy, the Fund does not take steps to reduce market exposure or to lessen the effects of a declining market. In addition, because of the Fund’s expenses, the Fund’s performance may be below that of its index.
Equity Risk. The prices of equity securities rise and fall daily. These price movements may result from factors affecting individual companies, industries or the securities market as a whole. In addition, equity markets tend to move in cycles which may cause stock prices to fall over short or extended periods of time.
BlueStar Israel Technology ETF
NOTES TO FINANCIAL STATEMENTS
March 31, 2021 (Unaudited) (Continued)
Securities Lending Risk. Securities lending involves the risk of loss of rights in, or delay in recovery of, the loaned securities if the borrower fails to return the security loaned or becomes insolvent.
Concentration Risk. To the extent that the Fund’s or its underlying index’s portfolio is concentrated in the securities of issuers in a particular market, industry, group of industries, sector or asset class, the Fund may be adversely affected by the performance of those securities, may be subject to increased price volatility and may be more vulnerable to adverse economic, market, political or regulatory occurrences affecting that market, industry, group of industries, sector or asset class.
Natural Disaster/Epidemic Risk. Natural or environmental disasters, such as earthquakes, fires, floods, hurricanes, tsunamis and other severe weather related phenomena generally, and widespread disease, including pandemics and epidemics (for example, the novel coronavirus COVID-19), have been and can be highly disruptive to economies and markets and have recently led, and may continue to lead, to increased market volatility and significant market losses. Such natural disaster and health crises could exacerbate political, social, and economic risks previously mentioned, and result in significant breakdowns, delays, shutdowns, social isolation, and other disruptions to important global, local and regional supply chains affected, with potential corresponding results on the operating performance of the Fund and its investments. A climate of uncertainty and panic, including the contagion of infectious viruses or diseases, may adversely affect global, regional, and local economies and reduce the availability of potential investment opportunities, and increases the difficulty of performing due diligence and modeling market conditions, potentially reducing the accuracy of financial projections. Under these circumstances, the Fund may have difficulty achieving its investment objective which may adversely impact performance. Further, such events can be highly disruptive to economies and markets, significantly disrupt the operations of individual companies (including, but not limited to, the Fund’s third party service providers), sectors, industries, markets, securities and commodity exchanges, currencies, interest and inflation rates, credit ratings, investor sentiment, and other factors affecting the value of the Fund’s investments. These factors can cause substantial market volatility, exchange trading suspensions and closures and can impact the ability of the Fund to complete redemptions and otherwise affect Fund performance and Fund trading in the secondary market. A widespread crisis may also affect the global economy in ways that cannot necessarily be foreseen at the current time. How long such events will last and whether they will continue or recur cannot be predicted. Impacts from these events could have significant impact on the Fund’s performance, resulting in losses to the Fund.
NOTE 4 – MANAGEMENT AND OTHER CONTRACTS
ETF Managers Group, LLC (the “Advisor”), serves as the investment advisor to the Fund. Pursuant to an Investment Advisory Agreement (“Advisory Agreement”) between the Trust, on behalf of the Fund, and the Advisor, the Advisor provides investment advice to the Fund and oversees the day-today operations of the Fund, subject to the direction and control of the Board and the officers of the Trust.
Under the Investment Advisory Agreement with the Fund, the Advisor has overall responsibility for the general management and administration of the Fund and arranges for sub-advisory, transfer agency, custody, fund administration, securities lending, and all other non -distribution related services necessary for the Fund to operate. The Advisor bears the costs of all advisory and non-advisory services required to operate the Fund, in exchange for a single unitary fee. For services provided the Fund pays the Advisor at an annual rate of 0.75% of the Fund’s average daily net assets. Under the Investment Advisory Agreement, the Advisor has agreed to pay all expenses of the Fund, except for: the fee paid to the Advisor pursuant to the Investment Advisory Agreement, interest charges on any borrowings, taxes, brokerage commissions and other expenses incurred in placing orders for the purchase and sale of securities and other investment instruments, acquired fund fees and expenses, accrued deferred tax liability, extraordinary expenses, and distribution (12b-1) fees and expenses (collectively, “Excluded Expenses”). The Advisor has entered into an agreement with its affiliate, ETFMG Financial LLC, to serve as distributor to the Fund (the “Distributor”). The Distributor provides marketing support for the Fund, including distributing marketing materials related to the Fund.
BlueStar Israel Technology ETF
NOTES TO FINANCIAL STATEMENTS
March 31, 2021 (Unaudited) (Continued)
The Advisor has entered into an Agreement with BlueStar Global Investors LLC ( “BlueStar”), under which BlueStar agrees to sublicense the use of the Underlying Index from BlueStar Indexes for use by the Advisor and the Fund. BlueStar also provides marketing support for the Fund, including distributing marketing materials related to the Fund. BlueStar does not make investment decisions, provide investment advice, or otherwise act in the capacity of an investment adviser to the Fund. Additionally, BlueStar is not involved in the maintenance of the Underlying Index and does not otherwise act in the capacity of an index provider.
U.S. Bancorp Fund Services, LLC, doing business as U.S. Bank Global Fund Services (the “Administrator”), provides fund accounting, fund administration, and transfer agency services to the Fund. The Advisor compensates the Administrator for these services under an administration agreement between the two parties.
The Advisor pays each independent Trustee a quarterly fee for service to the Fund. Each Trustee is also reimbursed by the Advisor for all reasonable out-of-pocket expenses incurred in connection with his duties as Trustee, including travel and related expenses incurred in attending Board meetings.
NOTE 5 – DISTRIBUTION PLAN
The Fund has adopted a Plan of Distribution pursuant to Rule 12b- 1 under the 1940 Act. Under the Plan, the Fund may pay compensation to the Distributor or any other distributor or financial institution with which the Trust has an agreement with respect to the Fund, with the amount of such compensation not to exceed an annual rate of 0.25% of each Fund’s average daily net assets. For the period ended March 31, 2021, the Fund did not incur any 12b-1 expenses.
NOTE 6 – PURCHASES AND SALES OF SECURITIES
The costs of purchases and sales of securities, excluding short-term securities and in-kind transactions, for the period ended March 31, 2021:
| | Purchases | | | Sales |
BlueStar Israel Technology ETF | | $ | 18,008,720 | | | $ | 22,666,338 |
The costs of purchases and sales of in-kind transactions associated with creations and redemptions for the period ended March 31, 2021:
| | Purchases In- | | | Sales In- |
| | Kind | | | Kind |
BlueStar Israel Technology ETF | | $ | 82,839,739 | | | $ | 24,740,062 |
Purchases in-kind are the aggregate of all in-kind purchases and sales in-kind are the aggregate of all proceeds from in-kind sales. Net capital gains or losses resulting from in-kind redemptions are excluded from the determination of the Fund’s taxable gains and are not distributed to shareholders.
There were no purchases or sales of U.S. Government obligations for the period ended March 31, 2021.
BlueStar Israel Technology ETF
NOTES TO FINANCIAL STATEMENTS
March 31, 2021 (Unaudited) (Continued)
NOTE 7 – SECURITIES LENDING
The Fund may lend up to 33 1/3% of the value of the securities in its portfolio to brokers, dealers and financial institutions (but not individuals) under terms of participation in a securities lending program administered by U.S. Bank N.A. (“the Custodian”). The securities lending agreement requires that loans are collateralized at all times in an amount equal to at least 102% of the value of any loaned securities at the time of the loan, plus accrued interest. The Fund receives compensation in the form of fees and earns interest on the cash collateral. The amount of fees depends on a number of factors including the type of security and length of the loan. The Fund continues to receive interest payments or dividends on the securities loaned during the borrowing period. Gain or loss in the fair value of securities loaned that may occur during the term of the loan will be for the account of the Fund. The Fund has the right under the terms of the securities lending agreement to recall the securities from the borrower on demand. The cash collateral is invested by the Custodian in accordance with approved investment guidelines. Those guidelines require the cash collateral to be invested in readily marketable, high quality, short -term obligations, either directly on behalf of the Fund or through one or more joint accounts, money market funds, or short-term bond funds, including those advised by or affiliated with the Advisor; however, all such investments are subject to risk of payment delays or default on the part of the issuer or counterparty or otherwise may not generate sufficient interest to support the costs associated with securities lending. Other investment companies in which the Fund may invest cash collateral can be expected to incur fees and expenses for operations, such as investment advisory and administration fees, which would be in addition to those incurred by the Fund, and which may be received in full or in part by the Advisor. Pursuant to guidance issued by the SEC staff, fees and expenses of money market funds used for cash collateral received in connection with loans of securities are not treated as Acquired Fund Fees and Expenses, which reflect a fund’s pro rata share of the fees and expenses incurred by other investment companies in which the Fund invests (as disclosed in the Prospectus, as applicable). The Fund could also experience delays in recovering its securities and possible loss of income or value if the borrower fails to return the borrowed securities, although the Fund is indemnified from this risk by contract with the securities lending agent.
As of March 31, 2021, the value of the securities on loan and payable for collateral due to broker were as follows:
Value of Securities on Loan Collateral Received
| | Values of | | | Fund |
| | Securities | | | Collateral |
Fund | | on Loan | | | Received |
BlueStar Israel Technology ETF | | $ | 50,441,817 | | | $ | 49,122,664 |
* The cash collateral received was invested in the Mount Vernon Liquid Assets Portfolio, an investment with an overnight and continuous maturity, as shown on the Schedule of Investments.
NOTE 8 – FEDERAL INCOME TAXES
The components of distributable earnings (losses) and cost basis of investments for federal income tax purposes at September 30, 2020, the Fund’s most recent fiscal year end, were as follows:
| | Cost | | | Gross
Unrealized Appreciation | | | Gross
Unrealized Depreciation | | | Net
Unrealized Appreciation (Depreciation) |
BlueStar Israel Technology ETF | | $ | 117,071,095 | | | $ | 42,259,445 | | | $ | (9,501,084 | ) | | $ | 32,758,361 |
BlueStar Israel Technology ETF
NOTES TO FINANCIAL STATEMENTS
March 31, 2021 (Unaudited) (Continued)
| | Undistributed | | | Undistributed | | | Total | | | Other | | | Total |
| | Ordinary | | | Long-Term | | | Distributable | | | Accumulated | | | Accumulated |
| | Income | | | Gain | | | Earnings | | | (Loss) | | | Gain |
BlueStar Israel | | | | | | | | | | | | | | | | | | | |
Technology ETF | | $ | 945,391 | | | $ | — | | | $ | 945,391 | | | $ | (1,142,183 | ) | | $ | 32,561,569 |
As of September 30, 2020, the Fund’s most recent fiscal year end, the Fund had accumulated capital loss carryovers of:
| | Capital | | | Capital | | | |
| | Loss | | | Loss | | | |
| | Carryover | | | Carryover | | | |
| | ST | | | LT | | | Expires |
BlueStar Israel Technology ETF | | $ | (913,699 | ) | | $ | (228,481 | ) | | Indefinite |
Under current tax law, capital and currency losses realized after October 31 of a fund’s fiscal year may be deferred and treated as occurring on the first business day of the following fiscal year for tax purposes. The Fund had deferred post -October capital and currency losses, which will be treated as arising on the first business day of the year ended September 30, 2020, the Fund’s most recent fiscal year end, as follows:
| | Late Year Ordinary Loss | | | Post-October
Capital Loss |
BlueStar Israel Technology ETF | | None | | | None |
The tax character of distributions paid by the Fund during the fiscal periods ended March 31, 2021 and September 30, 2020 are as follows:
| | Period Ended | | | Year Ended |
| | March 31. 2021 | | | September 30, 2020 |
| | From | | | From | | | From | | | From |
| | Ordinary | | | Capital | | | Ordinary | | | Capital |
| | Income | | | Gains | | | Income | | | Gains |
BlueStar Israel Technology ETF | | $ | 1,110,500 | | | $ | — | | | $ | — | | | $ | — |
NOTE 9 – INVESTMENTS IN AFFILIATES
BlueStar Israel Technology ETF
BlueStar Israel Technology ETF owned the following company during the period ended March 31, 2021. ETFMG Sit Ultra Short ETF was deemed to be an affiliate of the Fund as defined by the 1940 Act during the period ended March 31, 2021, however, was no longer held as of March 31, 2021. Transactions during the period in this security were as follows:
| |
| | | | | | | | |
| | |
| | |
| | |
| | |
|
Security Name | | Value, at
September 30,
2020 | | | Purchases | | | Sales | | | Gain
Realized
(Loss) | | | Change in
Unrealized
Appreciation
(Depreciation) | | | Dividend
Income | | | Value, at
March 31,
2021 | | | Ending
Shares |
ETFMG Sit Ultra Short ETF | | $ | 2,489,250 | | | $ | — | | | $ | 2,489,500 | | | $ | (23,355 | ) | | $ | 23,606 | | | $ | — | | | $ | — | | | $ | — |
BlueStar Israel Technology ETF
NOTES TO FINANCIAL STATEMENTS
March 31, 2021 (Unaudited) (Continued)
NOTE 10 – LEGAL MATTERS
The Trust, a former and current trustee of the Trust, the Adviser and certain officers of the Adviser were defendants in an action filed May 2, 2017 in the Superior Court of New Jersey captioned PureShares, LLC d/b/a PureFunds et al. v. ETF Managers Group, LLC et al., Docket No. C-63-17. The PureShares action alleged claims based on disputes arising out of contractual relationships with the Adviser relating to certain series of the Trust. The action sought damages in unspecified amounts and injunctive relief based on breach of contract, wrongful termination, and several other claims.
The Adviser and its parent, Exchange Traded Managers Group, LLC (“ETFMG”), were defendants in a case filed on October 26, 2017 in the United States District Court for the Southern District of New York by NASDAQ, Inc. (“Nasdaq”) captioned Nasdaq, Inc. v. Exchange Traded Managers Group, LLC et al., Case 1:17-cv -08252. This action arose out of the same facts and circumstances, and relates to the same series of the Trust, as the New Jersey litigation and asserted claims for breach of contract, conversion and certain other claims. The matter was the subject of a bench trial in May 2019, and on December 20, 2019, the Court issued an Opinion and Order awarding compensatory damages to Plaintiff in the amount of $78,403,172.36, plus prejudgment interest. The Court also denied Plaintiffs requests for punitive damages and equitable relief.
On May 1, 2020, Nasdaq, PureShares LLC (“PureShares”), and ETFMG announced a global settlement that resolves all claims in both the PureShares action and the Nasdaq action. The settlement is subject to future negotiations and approvals among independent third parties. As part of the settlement, Nasdaq and ETFMG have agreed to certain cash payments from ETFMG to Nasdaq and PureShares, and have executed an asset purchase agreement to transfer certain ETFMG intellectual property and related assets, to a Nasdaq affiliate. The transaction is expected to close prior to July 31, 2021. The Adviser does not believe that the resolution of these matters will have a material adverse effect on the Fund’s financial statements. If the events set forth in the settlement agreement do not occur, and a subsequent settlement is not reached, the resulting conditions may adversely affect the Adviser’s future operations.
NOTE 11 – SUBSEQUENT EVENTS
In preparing these financial statements, the Fund has evaluated events and transactions for potential recognition or disclosure through the date the financial statements were issued. The evaluation did not result in any subsequent events that necessitated disclosures and/or adjustments to the Financial Statements.
BlueStar Israel Technology ETF
APPROVAL OF ADVISORY AGREEMENT AND BOARD CONSIDERATIONS
For the Period Ended March 31, 2021 (Unaudited)
Pursuant to Section 15(c) of the Investment Company Act of 1940 (the “1940 Act”), at a meeting held on March 30, 2021, the Board of Trustees (the “Board”) of ETF Managers Trust (the “Trust”) considered the renewal of the Amended and Restated Investment Advisory Agreement (the “Advisory Agreement”) between ETF Managers Group LLC (the “Adviser”) and the Trust, on behalf of BlueStar Israel Technology ETF (the “Fund”).
Pursuant to Section 15(c) of the 1940 Act, the Board must annually review and approve the Advisory Agreement after its initial two-year term: (i) by the vote of the Trustees or by a vote of the shareholders of the Fund; and (ii) by the vote of a majority of the Trustees who are not parties to the Advisory Agreement or “interested persons” of any party thereto, as defined in the 1940 Act (the “Independent Trustees”), cast in person at a meeting called for the purpose of voting on such approval. Each year, the Board calls and holds a meeting to decide whether to renew the Advisory Agreement for an additional one-year term. In preparation for such meeting, the Board requests and reviews a wide variety of information from the Adviser.
In reaching its decision, the Board, including the Independent Trustees, considered all factors it believed relevant, including: (i) the nature, extent and quality of the services provided to the Fund’s shareholders by the Adviser; (ii) the investment performance of the Fund; (iii) the Adviser’s costs and profits realized in providing services to the Fund, including any fall-out benefits enjoyed by the Adviser; (iv) comparative fee and expense data for the Fund in relation to other similar investment companies; (v) the extent to which economies of scale would be realized as the Fund grows and whether the advisory fees for the Fund reflects these economies of scale for the benefit of the Fund; and (vi) other financial benefits to the Adviser and its affiliates resulting from services rendered to the Fund. The Board’s review included written and oral information furnished to the Board prior to and at the meeting held on March 30, 2021, and throughout the year. Among other things, the Adviser provided responses to a detailed series of questions, which included information about the Adviser’s operations, service offerings, personnel, compliance program and financial condition. The Board then discussed the written and oral information that it received before the meeting and throughout the year, and the Adviser’s oral presentations and any other information that the Board received at the meeting, and deliberated on the renewal of the Advisory Agreement in light of this information.
The Independent Trustees were assisted throughout the contract review process by independent legal counsel. The Independent Trustees relied upon the advice of such counsel and their own business judgment in determining the material factors to be considered in evaluating the renewal of the Advisory Agreement, and the weight to be given to each such factor. The conclusions reached with respect to the Advisory Agreement were based on a comprehensive evaluation of all the information provided and not any single factor. Moreover, each Trustee may have placed varying emphasis on particular factors in reaching conclusions with respect to the Fund. The Independent Trustees conferred amongst themselves and independent legal counsel during a telephonic contract renewal meeting held prior to the March 30, 2021 meeting and also conferred in executive sessions both with and without representatives of management before and during the March 30th meeting. The Independent Trustees requested, received and considered additional information arising out of these executive sessions.
Nature, Extent and Quality of Services Provided by the Adviser
The Trustees considered the scope of services provided under the Advisory Agreement, noting that the Adviser provides investment management services to the Fund. The Board discussed the responsibilities of the Adviser, including: responsibility for the general management of the day-to-day investment and reinvestment of the assets of the Fund; determining the daily baskets of deposit securities and cash components; executing portfolio security trades for purchases and redemptions of Fund shares conducted on a cash-in-lieu basis; responsibility for daily monitoring of tracking error and quarterly reporting to the Board; and implementation of Board directives as they relate to the Fund. In considering the nature, extent and quality of the services provided by the Adviser, the Board considered the qualifications, experience and responsibilities of the Adviser’s investment personnel and the quality of the Adviser’s compliance and risk assessment infrastructure. The Board also considered the Adviser’s experience managing exchange-traded funds (“ETFs”), as well as the Adviser’s response to the market volatility and uncertainty during the recent pandemic.
BlueStar Israel Technology ETF
APPROVAL OF ADVISORY AGREEMENT AND BOARD CONSIDERATIONS
For the Period Ended March 31, 2021 (Unaudited) (Continued)
The Board also considered other services provided to the Fund, such as overseeing the Fund’s service providers, monitoring adherence to the Fund’s investment restrictions, and monitoring compliance with various policies and procedures and with applicable securities laws.
Based on the factors above, as well as those discussed below, the Board concluded that it was satisfied with the nature, extent and quality of the services provided to the Fund by the Adviser.
Historical Performance
The Board then considered the past performance of the Fund. The Board reviewed information regarding the Fund’s performance with the performance of a group of peer funds and with the performance of the Fund’s underlying index for various time periods. The Board noted management’s explanation that analysis of investment performance, in absolute terms, is less relevant for the Fund than it is for actively managed funds, given the Fund’s index-based investment objectives. The Board also noted management’s further explanation that it is more relevant to review the performance of the Fund by focusing on the extent to which the Fund tracked its underlying index. The Board reviewed information regarding the Fund’s index tracking, discussing, as applicable, factors which contributed to the Fund’s tracking error. The Board noted that the Fund had underperformed its underlying index over certain periods, but that such underperformance was, at least in part, a result of costs incurred by the Fund not incurred by its underlying index. The Board considered other factors that contributed to the Fund’s tracking error, including cash drag and the process of rebalancing the Fund’s portfolio. The Board noted management’s representations that the Fund’s performance satisfactorily tracked its underlying index. The Board concluded that, after taking these factors into account, the Fund satisfactorily tracked its underlying index. The Board further noted that it had received and would continue to receive regular reports regarding the Fund’s performance, including with respect to its tracking error, at its quarterly meetings.
Cost of Services Provided, Profits and Economies of Scale
The Board reviewed the advisory fee for the Fund and compared it to the total operating expenses of comparable ETFs, as determined by an independent third party and the Adviser. Among other information, the Board noted that the advisory fee for the Fund was higher than the average and median expense ratios for its peer ETFs. The Trustees also considered the total expense ratios of other ETFs that they considered to be comparable, based on the investment objectives and strategies of the ETFs. The Board took into consideration management’s discussion of the fees, including the research involved in the construction of the underlying index.
The Board noted the importance of the fact that the advisory fee for the Fund is a “unified fee,” meaning that the shareholders of the Fund pay no expenses other than the advisory fee and certain other costs such as interest charges on any borrowings, taxes, brokerage commissions and other expenses incurred in placing orders for the purchase and sale of securities and other investment instruments, acquired fund fees and expenses, accrued deferred tax liability, extraordinary expenses (such as, among other things and subject to Board approval, non-standard Board-related expenses and litigation against the Board, Trustees, Fund, Adviser, and officers of the Adviser), and distribution (12b-1) fees and expenses. The Board also noted that the Adviser was responsible for compensating the Trust’s other service providers and paying the Fund’s other expenses (except as noted above) out of its own fees and resources. The Board concluded that the advisory fee for the Fund is reasonable in light of the factors considered.
BlueStar Israel Technology ETF
APPROVAL OF ADVISORY AGREEMENT AND BOARD CONSIDERATIONS
For the Period Ended March 31, 2021 (Unaudited) (Continued)
The Board also evaluated the compensation and other benefits received by the Adviser from its relationship with the Fund, taking into account profitability information provided by the Adviser. The Board received and reviewed profitability information with respect to the Fund and considered how profit margins could affect the Adviser’s long-term viability and ability to attract and retain high-quality personnel. The Board also considered the impact on the Adviser’s profitability of payments made to partners involved with the Fund. Based on the information provided to the Trustees, the Trustees concluded that the net revenue retained by the Adviser from providing services to the Fund was not excessive in view of the nature, extent and quality of services provided to the Fund. The Board further considered other benefits derived by the Adviser and its affiliates from the Adviser’s relationship with the Fund.
In addition, the Board considered whether economies of scale may be realized for the Fund. The Board noted that the Adviser regularly considers whether fee reductions are appropriate as the Fund grows in size. The Board noted that a unitary fee provides a level of certainty in expenses for the Fund and effectively acts as a cap on the fees and expenses (except as noted above) that are borne by the Fund. The Board also took into account the significant investments that the Adviser has made in its business to help ensure the continued provision of high -quality services to the Funds, such as the hiring of new trading, legal and compliance personnel, and enhancements to technology and related systems. The Board concluded that no changes to the advisory fee structure of the Fund were necessary.
In its deliberations, the Board did not identify any single piece of information discussed above that was all-important, controlling or determinative of its decision.
Based on the Board’s deliberations and its evaluation of the information described above, the Board, including the Independent Trustees, unanimously: (a) concluded that the terms of the Advisory Agreement are fair and reasonable; (b) concluded that the Adviser’s fees are reasonable in light of the services that the Adviser provides to the Fund; and (c) approved the renewal of the Advisory Agreement for another year.
BlueStar Israel Technology ETF
EXPENSE EXAMPLE
Period Ended March 31, 2021 (Unaudited)
As a shareholder of BlueStar Israel Technology ETF (the “Fund”) you incur two types of costs: (1) transaction costs, including brokerage commissions on purchases and sales of Fund shares, and (2) ongoing costs, including management fees and other Fund expenses. These examples are intended to help you understand your ongoing costs (in dollars) of investing in the Fund and to compare these costs with the ongoing costs of investing in other funds. The example is based on an investment of $1,000 invested at the beginning of the period and held for the entire period (October 1, 2020 to March 31, 2021).
Actual Expenses
The first line of the table provides information about actual account values based on actual returns and actual expenses. You may use the information in this line, together with the amount you invested, to estimate the expenses that you paid over the period. Simply divide your account value by $1,000 (for example, an $8,600 account value divided by $1,000 = 8.6), then, multiply the result by the number in the first line under the heading entitled “Expenses Paid During Period’’ to estimate the expenses you paid on your account during this period.
Hypothetical Example for Comparison Purposes
The second line of the table provides information about hypothetical account values based on a hypothetical return and hypothetical expenses based on the Fund’s actual expense ratio and an assumed rate of return of 5% per year before expenses, which is not the Fund’s actual return. The hypothetical account values and expenses may not be used to estimate the actual ending account balance or expenses you paid for the period. You may use this information to compare the ongoing costs of investing in the Fund and other funds. To do so, compare this 5% hypothetical example with the 5% hypothetical examples that appear in the shareholder reports of the other funds. Please note that the expenses shown in the table are meant to highlight your ongoing costs only and do not reflect any transactional costs, such as brokerage commissions paid on purchases and sales of Fund shares. Therefore, the second line of the table is useful in comparing ongoing costs only and will not help you determine the relative total costs of owning different funds. If these transactional costs were included, your costs would have been higher.
| BlueStar Israel Technology ETF | | Beginning
Account
Value
October 1,
2020 | | | Ending
Account Value
March 31,
2021 | | | Expenses
Paid
During the
Period^ | | | Annualized
Expense Ratio
During Period
October 1, 2020
to March 31,
2021 | |
| Actual | | $ | 1,000.00 | | | $ | 1,175.20 | | | $ | 4.07 | | | | 0.75 | % |
| | | | | | | | | | | | | | | | | |
| Hypothetical (5% annual) | | $ | 1,000.00 | | | $ | 1,021.19 | | | $ | 3.78 | | | | 0.75 | % |
^ The dollar amounts shown as expenses paid during the period are equal to the annualized six-month expense ratio multiplied by the average account value during the period, multiplied by 182/365 (to reflect the period from October 1, 2020 to March 31, 2021).
BlueStar Israel Technology ETF
Statement Regarding Liquidity Risk Management Program (Unaudited)
ETF Managers Trust (the “Trust”) has adopted a liquidity risk management program (the “Program”). The Trust’s Board of Trustees (the “Board”) has designated ETF Managers Group LLC (the “Program Administrator”) as the administrator of the Program. The Program Administrator has designated a committee (the “Committee”), composed of personnel from multiple departments, including investment operations and compliance, that is responsible for the implementation and ongoing administration of the Program, which includes assessing the liquidity risk of the BlueStar Israel Technology ETF (the “Fund”) under both normal and reasonably foreseeable stressed conditions.
Under the Program, the Program Administrator assesses, manages and periodically reviews the Fund’s liquidity risk, based on factors specific to the circumstances of the Fund. Liquidity risk is the risk that the Fund could not meet shareholder redemption requests without significant dilution of remaining shareholders’ interests in the Fund. This risk is managed by monitoring the degree of liquidity of the Fund’s investments and limiting the amount of the Fund’s illiquid investments, among other means. The Program Administrator’s process of determining the degree of liquidity of the Fund’s investments is supported by one or more third-party liquidity assessment vendors.
At a meeting of the Board on March 30, 2021, the Adviser provided a written report to the Board addressing the operation, and the adequacy and effectiveness of the implementation, of the Program, including, the operation of any Highly Liquid Investment Minimum, where applicable, and any material changes to the Program, for the initial period from February 29, 2020 through March 30, 2021 (the “Reporting Period”). No significant liquidity events impacting the Fund were noted in the report and it was represented that, as of March 30, 2021, the Fund was primarily highly liquid and, during the Reporting Period, the Fund held less than 15% in illiquid securities. In addition, the Program Administrator provided its assessment that Program implementation was effective and that the Program operated adequately and effectively to enable the Program Administrator to oversee and manage liquidity risk and ensure the Fund is able to meet requests to redeem shares without significant dilution to the remaining investors’ interest in the Fund.
There can be no assurance that the Program will achieve its objectives in the future. Please refer to the Fund’s prospectus for more information regarding the Fund’s exposure to liquidity risk and other principal risks to which an investment in the Fund may be subject.
BlueStar Israel Technology ETF
SUPPLEMENTARY INFORMATION
March 31, 2021 (Unaudited)
NOTE 1 – FREQUENCY DISTRIBUTION OF PREMIUMS AND DISCOUNTS
Information regarding how often shares of the Fund traded on the Exchange at a price above (i.e., at a premium) or below (i.e., at a discount) the NAV is available on the Fund’s website at www.iteqetf.com.
NOTE 2 – FEDERAL TAX INFORMATION
Qualified Dividend Income/Dividends Received Deduction
For the fiscal year ended September 30, 2020, certain dividends paid by the Fund may be subject to a maximum tax rate of 15%, as provided for by the Jobs and Growth Tax Reconciliation Act of 2003. The percentage of dividends declared from ordinary income designated as qualified dividend income was as follows:
| Fund Name | QDI |
| BlueStar Israel Technology ETF | 0.00% |
For corporate shareholders, the percent of ordinary income distributions qualifying for the corporate dividends received deduction for the fiscal year ended September 30, 2020 was as follows:
| Fund Name | DRD |
| BlueStar Israel Technology ETF | 0.00% |
Short Term Capital Gain
The percentage of taxable ordinary income distributions that are designated as short-term capital gain distributions under Internal Revenue Section 871 (k)(2)(C) for the Fund was as follows:
| Fund Name | Short-Term Capital Gain |
| BlueStar Israel Technology ETF | 0.00% |
NOTE 3 – INFORMATION ABOUT PORTFOLIO HOLDINGS
The Fund files a complete schedule of portfolio holdings with the SEC for its first and third fiscal quarters on Part F of Form N-PORT. Once filed, the Fund’s Part F of Form N-PORT is available without charge, upon request on the SEC’s website (www.sec.gov), the Fund’s website (www.iteqetf.com) and is available by calling (877) 756-7873. The Fund’s portfolio holdings are posted on the Fund’s website www.iteqetf.com daily.
NOTE 4 - INFORMATION ABOUT PROXY VOTING
A description of the policies and procedures the Fund uses to determine how to vote proxies relating to portfolio securities is provided in the Statement of Additional Information (“SAI”). The SAI is available without charge upon request by calling toll-free at 1 -844-ETF-MGRS (1-844-383-6477), by accessing the SEC’s website at www.sec.gov, or by accessing the Fund’s website at www.iteqetf.com.
Information regarding how the Fund voted proxies relating to portfolio securities during the period ending June 30 is available by calling toll-free at 1-844-ETF-MGRS (1-844-383-6477) or by accessing the SEC’s website at www.sec.gov.
Carefully consider the Fund’s investment objectives, risk factors, charges, and expenses before investing. This and additional information can be found in the Fund’s prospectus, which may be obtained by calling 1-844-ETF-MGRS (1-844-383-6477) or by visiting www.iteqetf.com. Read the prospectus carefully before investing.
BlueStar Israel Technology ETF
Board of Trustees (Unaudited)
Set forth below are the names, birth years, positions with the Trust, length of term of office, and the principal occupations and other directorships held during at least the last five years of each of the persons currently serving as a Trustee of the Trust, as well as information about each officer. The business address of each Trustee and officer is 30 Maple Street, 2nd Floor, Summit, New Jersey 07901. The SAI includes additional information about Fund directors and is available, without charge, upon request by calling 1-844-ETF-MGRS (1-844-383-6477).
Name
and Year
of Birth | Position(s)
Held with the
Trust, Term
of Office and
Length of
Time Served | Principal Occupation(s) During Past
5 Years | Number of
Portfolios in
Fund
Complex
Overseen
By Trustee | Other
Directorships
Held by
Trustee During
Past 5 Years |
| Interested Trustee and Officers |
Samuel Masucci, III
(1962) | Trustee, Chairman of the Board and President (since 2012); Secretary (since 2014) | Chief Executive Officer, Exchange Traded Managers Group LLC (since 2013); Chief Executive Officer, ETF Managers Group LLC (since 2016); Chief Executive Officer, ETF Managers Capital LLC (commodity pool operator) (since 2014); Chief Executive Officer (2012-2016) and Chief Compliance Officer (2012-2014), Factor Advisors, LLC (investment adviser); President and Chief Executive Officer, Factor Capital Management LLC (2012-2014) (commodity pool operator). | 11 | None |
John A. Flanagan,
(1946) | Treasurer (since 2015) | President, John A. Flanagan CPA, LLC (accounting services) (since 2010); Treasurer, ETF Managers Trust (since 2015); Chief Financial Officer, ETF Managers Capital, LLC (commodity pool operator) (since 2015). | n/a | n/a |
Reshma A. Tanczos
(1978) | Chief Compliance Officer (since 2016) | Chief Compliance Officer of ETFMG Financial LLC (since 2017); Chief Compliance Officer, ETF Managers Group LLC (since 2016); Chief Compliance Officer, ETF Managers Capital LLC (since 2016); Partner, Crow & Cushing (law firm) (2007-2016). | n/a | n/a |
| * | Mr. Masucci is an interested Trustee by virtue of his role as the Chief Executive Officer of the Adviser. |
BlueStar Israel Technology ETF
Board of Trustees (Unaudited) (Continued)
Name and
Year of
Birth | Position(s)
Held with the
Trust, Term of
Office and
Length of Time
Served | Principal Occupation(s) During
Past 5 Years | Number of
Portfolios in
Fund
Complex
Overseen By
Trustee | Other
Directorships
Held by Trustee
During Past 5
Years |
Matthew J. Bromberg
(1973) | Assistant Secretary (since 2020) | General Counsel and Secretary of Exchange Traded Managers Group LLC (since 2020); ETF Managers Group LLC (since 2020); ETFMG Financial LLC (since 2020); ETF Managers Capital LLC (since 2020); Partner of Dorsey & Whitney LLP (law firm) (2019-2020); General Counsel of WBI Investments, Inc. (2016-2019); Millington Securities, Inc. (2016-2019); and Partner of Reed Smith (law firm) (2015-2016). | n/a | n/a |
| Independent Trustees |
Terry Loebs
(1963) | Trustee (since 2014); Lead Independent Trustee (since 2020) | Founder and Managing Member, Pulsenomics LLC (index product development and consulting firm) (since 2011); Managing Director, MacroMarkets, LLC (exchange-traded products firm) (2006-2011). | 11 | None |
Eric Wiegel
(1960) | Trustee (since 2020) | Senior Portfolio Manager, Little House Capital (2019-present); Managing Partner, Global Focus Capital LLC (2013-present); Chief Investment Officer, Insight Financial Strategist LLC (2017-2018). | 11 | None |
Advisor
ETF Managers Group, LLC
30 Maple Street, Suite 2, Summit, NJ 07901
Distributor
ETFMG Financial LLC
30 Maple Street, Suite 2, Summit, NJ 07901
Custodian
U.S. Bank National Association
Custody Operations
1555 North River Center Drive, Suite 302, Milwaukee, Wisconsin 53212
Transfer Agent
U.S. Bancorp Fund Services, LLC doing business as U.S. Bank Global Fund Services
615 East Michigan Street, Milwaukee, Wisconsin 53202
Securities Lending Agent
U.S. Bank, National Association
Securities Lending
800 Nicolet Mall
Minneapolis, MN 55402-7020
Independent Registered Public Accounting Firm
WithumSmith + Brown, PC
1411 Broadway, 9th Floor, New York, NY 10018
Legal Counsel
Sullivan & Worcester LLP
1666 K Street NW, Washington, DC 20006

Semi-Annual Report
March 31, 2021
(Unaudited)
Etho Climate Leadership U.S. ETF
Ticker: ETHO

The Fund is a series of ETF Managers Trust.
Etho Climate Leadership U.S. ETF
TABLE OF CONTENTS
March 31, 2021 (Unaudited)
Etho Climate Leadership U.S. ETF
Dear Shareholder,
On behalf of the entire team, we want to express our appreciation for the confidence you have placed in the Etho Climate Leadership U.S. Exchange-Traded Fund (“ETHO” or the “Fund”). The following information pertains to the fiscal period from October 1, 2020 to March 31, 2021.
The Fund seeks to provide investment results that, before fees and expenses, correspond generally to the total return performance of the Etho Climate Leadership Index – U.S. (the “Index”).
For the period ended March 31, 2021, the total return for the Fund was 29.89% while the total return for the Index was 29.83%. The best performers in the Fund, on the basis of contribution to its return were, Sunpower Corp, Tesla, Inc. Genmark Diagonstics, Inc., Wesco International Inc. and SVB Financial Group, while the worst performers were Zoom Video Communications, Beyond Meat, Inc., Prog Holdings, Inc., Seagen, Inc. and Splunk, Inc.
At the end of the reporting period, the Fund saw an approximate allocation of 12.1% to Semiconductors & Semiconductor Equipment, 5.6% to Software, 5.4% to Capital Markets and 6.2% to Health Care Equipment & Supplies. The Fund invests primarily in the United States.
As you may know, the Etho Climate Leadership U.S. ETF offers broad diversification across companies that have demonstrated efficiency and leadership with their use of resources and their supply chains when compared to industry peers. The Fund holds roughly 270 equities equally weighted and results in a carbon emissions profile that is, on average, 50- 70% lower per dollar invested than conventional U.S. benchmark indices.1 ETHO avoids investment in any direct fossil fuel companies, as well as enablers of that industry, along with a series of other unsustainable industries such as Tobacco/Weapons/Gambling, etc. Equal weighting of the Fund allows for the elimination of equities that do not meet ETHO’s standards without there being a significant impact on the diversification or performance of the Fund. It also creates broad exposure to both the sectors and factors that potentially make for greater stability and higher performance.
There is much ahead for environmentally sustainable and socially responsible investing. We are thankful you have joined us by investing in the Etho Climate Leadership U.S. ETF. You can find further details about ETHO by visiting www.etfmg.com, or by calling 1- 844-ETF-MGRS (1-844-383-6477).
Sincerely,

Samuel Masucci III
Chairman of the Board
1 Etho Capital. www.ethocapital.com
Etho Climate Leadership U.S. ETF
Growth of $10,000 (Unaudited)
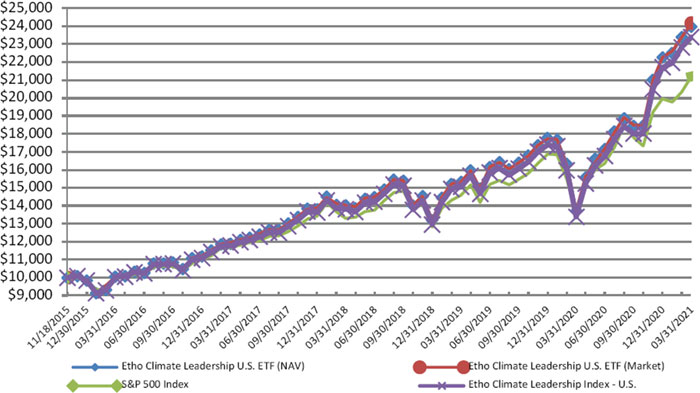
Average Annual Returns Period Ended March 31, 2021 | 1 Year Return | 5 Year Return | Since Inception (11/18/2015) | Value of $10,000 (3/31/2021) |
Etho Climate Leadership U.S. ETF (NAV) | 74.86% | 19.00% | 17.70% | $23,978 |
Etho Climate Leadership U.S. ETF (Market) | 76.39% | 19.14% | 17.87% | $24,171 |
S&P 500 Index | 56.35% | 16.29% | 15.03% | $21,199 |
Etho Climate Leadership Index – U.S. | 74.62% | 18.46% | 17.15% | $23,386 |
Performance data quoted represents past performance and does not guarantee future results. The investment return and principal value of an investment will fluctuate so that an investor’s shares, when redeemed, may be worth more of less than their original cost. Current performance of the Fund may be lower or higher than the performance quoted. All performance is historical and includes reinvestment of dividends and capital gains. Performance data current to the most recent month end may be obtained by calling 1-844-ETF-MGRS (1-844-383-6477).
The chart illustrates the performance of a hypothetical $10,000 investment made on November 18, 2015, and is not intended to imply any future performance. The returns shown do not reflect the deduction of taxes that a shareholder would pay on fund distributions from the sales of Fund shares. The chart assumes reinvestment of capital gains and dividends, if any. The Index Returns do not reflect fees or expenses and are not available for direct investment.
Etho Climate Leadership U.S. ETF
Top Ten Holdings as of March 31, 2021 (Unaudited)* |
| Security | % of Total Investments |
1 | SunPower Corp. | 1.42% |
2 | Tesla, Inc. | 1.38% |
3 | GenMark Diagnostics, Inc. | 1.26% |
4 | WESCO International, Inc. | 0.82% |
5 | Advanced Drainage Systems, Inc. | 0.76% |
6 | Gernerac Holdings, Inc. | 0.76% |
7 | ON Semiconductor Corp. | 0.72% |
8 | SVB Financial Group | 0.70% |
9 | United Rentals, Inc. | 0.69% |
10 | Align Technology, Inc. | 0.67% |
Top Ten Holdings = 9.18% of Total Investments 
* Current Fund holdings may not be indicative of future Fund holdings.
Etho Climate Leadership U.S. ETF
Important Disclosures and Key Risk Factors
Past performance is not indicative of future return. A fund’s performance for very short time periods may not be indicative of future performance.
ETHO
The ETHO Climate Leadership U.S. ETF (the “Fund”) seeks to provide investment results that, before fees and expenses, correspond generally to the price and yield performance of the Etho Climate Leadership Index – U.S. (the “Index”).
Investing involves risk, including the possible loss of principal. Shares of any ETF are bought and sold at market price (not NAV), may trade at a discount or premium to NAV and are not individually redeemed from the Fund. Brokerage commissions will reduce returns. Narrowly focused investments typically exhibit higher volatility. The Fund’s return may not match or achieve a high degree of correlation with the return of the Etho Climate Leadership Index — U.S. To the extent the Fund utilizes a sampling approach, it may experience tracking error to a greater extent than if the Fund had sought to replicate the Index.
Unlike with an actively managed fund, the Fund’s adviser does not use techniques or defensive strategies designed to lessen the effects of market volatility or to reduce the impact of periods of market decline. This means that, based on market and economic conditions, the Fund’s performance could be lower than other types of funds that may actively shift their portfolio assets to take advantage of market opportunities or to lessen the impact of a market decline.
Natural or environmental disasters, such as earthquakes, fires, floods, hurricanes, tsunamis and other severe weather- related phenomena generally, and widespread disease, including pandemics and epidemics, have been and may be highly disruptive to economies and markets, adversely impacting individual companies, sectors, industries, markets, currencies, interest and inflation rates, credit ratings, investor sentiment, and other factors affecting the value of the Fund’s investments. Given the increasing interdependence among global economies and markets, conditions in one country, market, or region are increasingly likely to adversely affect markets, issuers, and/or foreign exchange rates in other countries, including the U.S. Any such events could have a significant adverse impact on the value of the Fund’s investments.
ETF Managers Group LLC serves as the investment adviser to the Fund.
The Fund is distributed by ETFMG Financial LLC. ETF Managers Group LLC and ETFMG Financial LLC are wholly owned subsidiaries of Exchange Traded Managers Group LLC (collectively, “ETFMG”). ETFMG is not affiliated with Etho Capital.
Etho Climate Leadership U.S. ETF
PORTFOLIO ALLOCATIONS
As of March 31, 2021 (Unaudited)
| Etho Climate Leadership U.S. ETF | |
As a percent of Net Assets: | | |
Puerto Rico | 0.4 | % |
Singapore | 0.2 | |
United States | 98.5 | |
Closed-End Funds | 0.4 | |
Short-Term and other Net Assets (Liabilities) | 0.5 | |
| 100.0 | % |
Etho Climate Leadership U.S. ETF
| Schedule of Investments |
| March 31, 2021 (Unaudited) |
| |
| | | Shares | | | Value | |
| | | | | | | |
| COMMON STOCKS - 99.1% | | | | | | | | |
| Puerto Rico - 0.4% | | | | | | | | |
| Banks - 0.4% | | | | | | | | |
| Popular, Inc. | | | 9,513 | | | $ | 668,954 | |
| | | | | | | | | |
| Singapore - 0.2% | | | | | | | | |
| Semiconductors & Semiconductor Equipment - 0.2% | | | | | | | | |
| Maxeon Solar Technologies, Ltd. (a)(b) | | | 7,918 | | | | 249,892 | |
| | | | | | | | | |
| United States - 98.5% | | | | | | | | |
| Automobiles - 1.4% | | | | | | | | |
| Tesla, Inc. (a)(b) | | | 3,068 | | | | 2,049,208 | |
| Banks - 4.3% | | | | | | | | |
| Bank of Hawaii Corp. | | | 5,850 | | | | 523,517 | |
| Comerica, Inc. | | | 11,088 | | | | 795,453 | |
| Commerce Bancshares, Inc. (a) | | | 6,718 | | | | 514,666 | |
| Cullen/Frost Bankers, Inc. | | | 5,945 | | | | 646,578 | |
| First Republic Bank | | | 3,912 | | | | 652,326 | |
| M&T Bank Corp. | | | 3,295 | | | | 499,555 | |
| South State Corp. | | | 5,497 | | | | 431,569 | |
| SVB Financial Group (b) | | | 2,116 | | | | 1,044,585 | |
| Truist Financial Corp. | | | 11,002 | | | | 641,637 | |
| Zions Bancorp NA | | | 12,544 | | | | 689,418 | |
| Total Banks | | | | | | | 6,439,304 | |
| Biotechnology - 1.3% | | | | | | | | |
| Agios Pharmaceuticals, Inc. (b) | | | 9,055 | | | | 467,600 | |
| Alnylam Pharmaceuticals, Inc. (b) | | | 3,012 | | | | 425,264 | |
| Ionis Pharmaceuticals, Inc. (b) | | | 6,975 | | | | 313,596 | |
| Seagen, Inc. (b) | | | 2,778 | | | | 385,753 | |
| Vertex Pharmaceuticals, Inc. (b) | | | 1,339 | | | | 287,738 | |
| Total Biotechnology | | | | | | | 1,879,951 | |
| Building Products - 2.2% | | | | | | | | |
| Advanced Drainage Systems, Inc. | | | 10,928 | | | | 1,129,846 | |
| Apogee Enterprises, Inc. | | | 15,628 | | | | 638,873 | |
| Armstrong World Industries, Inc. | | | 4,042 | | | | 364,144 | |
| Lennox International, Inc. | | | 1,771 | | | | 551,826 | |
| Simpson Manufacturing Co., Inc. | | | 5,336 | | | | 553,503 | |
| Total Building Products | | | | | | | 3,238,192 | |
| Capital Markets - 5.4% | | | | | | | | |
| Ares Management Corp. - Class A | | | 10,463 | | | | 586,242 | |
| Cboe Global Markets, Inc. | | | 3,604 | | | | 355,679 | |
| Charles Schwab Corp. | | | 9,816 | | | | 639,806 | |
| CME Group, Inc. | | | 1,922 | | | | 392,530 | |
| FactSet Research Systems, Inc. | | | 1,226 | | | | 378,331 | |
| Federated Hermes, Inc. | | | 18,100 | | | | 566,530 | |
| Intercontinental Exchange, Inc. | | | 4,082 | | | | 455,878 | |
| KKR & Co, Inc. | | | 13,740 | | | | 671,198 | |
| MarketAxess Holdings, Inc. | | | 960 | | | | 478,003 | |
| Morningstar, Inc. | | | 2,765 | | | | 622,236 | |
The accompanying notes are an integral part of these financial statements.
Etho Climate Leadership U.S. ETF
| Schedule of Investments |
| March 31, 2021 (Unaudited) (Continued) |
| |
| | | Shares | | | Value | |
| MSCI, Inc. | | | 1,109 | | | $ | 464,982 | |
| Nasdaq, Inc. | | | 3,471 | | | | 511,834 | |
| Northern Trust Corp. | | | 4,278 | | | | 449,661 | |
| S&P Global, Inc. | | | 1,378 | | | | 486,255 | |
| SEI Investments Co. | | | 7,133 | | | | 434,614 | |
| T. Rowe Price Group, Inc. | | | 3,412 | | | | 585,499 | |
| Total Capital Markets | | | | | | | 8,079,278 | |
| Chemicals - 1.2% | | | | | | | | |
| Air Products and Chemicals, Inc. | | | 1,615 | | | | 454,364 | |
| Albemarle Corp. | | | 5,707 | | | | 833,849 | |
| Ecolab, Inc. | | | 2,127 | | | | 455,327 | |
| Total Chemicals | | | | | | | 1,743,540 | |
| Commercial Services & Supplies - 2.0% | | | | | | | | |
| Brink’s Co. | | | 6,204 | | | | 491,543 | |
| Cintas Corp. | | | 1,847 | | | | 630,400 | |
| Clean Harbors, Inc. (b) | | | 6,255 | | | | 525,795 | |
| Rollins, Inc. (a) | | | 13,660 | | | | 470,177 | |
| Stericycle, Inc. (b) | | | 6,612 | | | | 446,376 | |
| Waste Management, Inc. (a) | | | 3,569 | | | | 460,472 | |
| Total Commercial Services & Supplies | | | | | | | 3,024,763 | |
| Communications Equipment - 1.9% | | | | | | | | |
| Arista Networks, Inc. (b) | | | 1,580 | | | | 476,986 | |
| Ciena Corp. (a)(b) | | | 8,069 | | | | 441,536 | |
| Cisco Systems, Inc. | | | 8,219 | | | | 425,004 | |
| F5 Networks, Inc. (b) | | | 3,002 | | | | 626,278 | |
| Motorola Solutions, Inc. | | | 2,418 | | | | 454,705 | |
| Viavi Solutions, Inc. (a)(b) | | | 28,662 | | | | 449,993 | |
| Total Communications Equipment | | | | | | | 2,874,502 | |
| Construction & Engineering - 0.7% | | | | | | | | |
| EMCOR Group, Inc. | | | 5,238 | | | | 587,494 | |
| Northwest Pipe Co. (b) | | | 14,433 | | | | 482,351 | |
| Total Construction & Engineering | | | | | | | 1,069,845 | |
| Consumer Finance - 0.8% | | | | | | | | |
| American Express Co. | | | 3,843 | | | | 543,554 | |
| PROG Holdings, Inc. | | | 14,110 | | | | 610,822 | |
| Total Consumer Finance | | | | | | | 1,154,376 | |
| Containers & Packaging - 0.7% | | | | | | | | |
| AptarGroup, Inc. | | | 3,238 | | | | 458,727 | |
| Avery Dennison Corp. | | | 3,245 | | | | 595,945 | |
| Total Containers & Packaging | | | | | | | 1,054,672 | |
| Distributors - 0.4% | | | | | | | | |
| Genuine Parts Co. | | | 4,798 | | | | 554,601 | |
| Diversified Consumer Services - 1.1% | | | | | | | | |
| Graham Holdings Co. - Class B | | | 945 | | | | 531,506 | |
| H&R Block, Inc. | | | 23,994 | | | | 523,069 | |
| Service Corp. International | | | 8,238 | | | | 420,550 | |
| Strategic Education, Inc. | | | 2,301 | | | | 211,485 | |
| Total Diversified Consumer Services | | | | | | | 1,686,610 | |
The accompanying notes are an integral part of these financial statements.
Etho Climate Leadership U.S. ETF
| Schedule of Investments |
| March 31, 2021 (Unaudited) (Continued) |
| |
| | | Shares | | | Value | |
| Diversified Financial Services - 0.6% | | | | | | | | |
| Cannae Holdings, Inc. (b) | | | 9,589 | | | $ | 379,916 | |
| Voya Financial, Inc. | | | 8,286 | | | | 527,321 | |
| Total Diversified Financial Services | | | | | | | 907,237 | |
| Diversified Telecommunication Services - 0.8% | | | | | | | | |
| Cincinnati Bell, Inc. (b) | | | 21,948 | | | | 336,902 | |
| Lumen Technologies, Inc. (a) | | | 36,302 | | | | 484,632 | |
| Verizon Communications, Inc. | | | 6,063 | | | | 352,563 | |
| Total Diversified Telecommunication Services | | | | | | | 1,174,097 | |
| Electrical Equipment - 2.0% | | | | | | | | |
| AMETEK, Inc. | | | 4,682 | | | | 598,032 | |
| Emerson Electric Co. | | | 6,783 | | | | 611,962 | |
| Generac Holdings, Inc. (b) | | | 3,445 | | | | 1,128,065 | |
| Rockwell Automation, Inc. | | | 2,136 | | | | 566,980 | |
| Total Electrical Equipment | | | | | | | 2,905,039 | |
| Electronic Equipment, Instruments & Components - 4.6% | | | | | | | | |
| Amphenol Corp. - Class A | | | 9,176 | | | | 605,341 | |
| Badger Meter, Inc. | | | 6,000 | | | | 558,420 | |
| CDW Corp. | | | 3,533 | | | | 585,595 | |
| Dolby Laboratories, Inc. - Class A | | | 5,941 | | | | 586,496 | |
| IPG Photonics Corp. (b) | | | 2,913 | | | | 614,468 | |
| Itron, Inc. (b) | | | 5,836 | | | | 517,361 | |
| Keysight Technologies, Inc. (b) | | | 3,904 | | | | 559,834 | |
| Littelfuse, Inc. | | | 2,409 | | | | 637,036 | |
| National Instruments Corp. | | | 9,754 | | | | 421,226 | |
| Trimble, Inc. (b) | | | 10,293 | | | | 800,692 | |
| Vontier Corp. (b) | | | 2,321 | | | | 70,257 | |
| Zebra Technologies Corp. - Class A (b) | | | 1,766 | | | | 856,828 | |
| Total Electronic Equipment, Instruments & Components | | | | | | | 6,813,554 | |
| Entertainment - 1.7% | | | | | | | | |
| Activision Blizzard, Inc. | | | 5,530 | | | | 514,290 | |
| Electronic Arts, Inc. | | | 3,200 | | | | 433,184 | |
| Netflix, Inc. (b) | | | 870 | | | | 453,844 | |
| Take-Two Interactive Software, Inc. (b) | | | 2,708 | | | | 478,504 | |
| Walt Disney Co. (b) | | | 3,315 | | | | 611,684 | |
| Total Entertainment | | | | | | | 2,491,506 | |
| Food & Staples Retailing - 0.8% | | | | | | | | |
| Casey’s General Stores, Inc. (a) | | | 2,478 | | | | 535,719 | |
| PriceSmart, Inc. | | | 6,108 | | | | 590,949 | |
| Total Food & Staples Retailing | | | | | | | 1,126,668 | |
| Food Products - 1.4% | | | | | | | | |
| Beyond Meat, Inc. (a)(b) | | | 4,885 | | | | 635,636 | |
| Hain Celestial Group, Inc. (b) | | | 12,362 | | | | 538,983 | |
| Lamb Weston Holdings, Inc. | | | 5,637 | | | | 436,755 | |
| McCormick & Co., Inc. | | | 4,576 | | | | 407,996 | |
| Total Food Products | | | | | | | 2,019,370 | |
The accompanying notes are an integral part of these financial statements.
Etho Climate Leadership U.S. ETF
| Schedule of Investments |
| March 31, 2021 (Unaudited) (Continued) |
| |
| | | Shares | | | Value | |
| Health Care Equipment & Supplies - 6.2% | | | | | | | | |
| ABIOMED, Inc. (b) | | | 2,243 | | | $ | 714,911 | |
| Align Technology, Inc. (b) | | | 1,841 | | | | 996,957 | |
| Becton Dickinson & Co. | | | 1,390 | | | | 337,979 | |
| Boston Scientific Corp. (b) | | | 9,843 | | | | 380,432 | |
| Cooper Cos. | | | 1,161 | | | | 445,928 | |
| Danaher Corporation | | | 2,315 | | | | 521,060 | |
| DexCom, Inc. (a)(b) | | | 1,217 | | | | 437,378 | |
| Edwards Lifesciences Corp. (b) | | | 5,107 | | | | 427,149 | |
| GenMark Diagnostics, Inc. (b) | | | 78,523 | | | | 1,876,699 | |
| IDEXX Laboratories, Inc. (b) | | | 1,355 | | | | 663,015 | |
| Intuitive Surgical, Inc. (b) | | | 643 | | | | 475,138 | |
| ResMed, Inc. | | | 2,185 | | | | 423,934 | |
| Stryker Corp. | | | 1,932 | | | | 470,597 | |
| Teleflex, Inc. | | | 1,097 | | | | 455,760 | |
| Varian Medical Systems, Inc. (b) | | | 3,128 | | | | 552,186 | |
| Total Health Care Equipment & Supplies | | | | | | | 9,179,123 | |
| Health Care Providers & Services - 2.7% | | | | | | | | |
| AMN Healthcare Services, Inc. (b) | | | 5,548 | | | | 408,888 | |
| Anthem, Inc. | | | 1,468 | | | | 526,939 | |
| Centene Corp. (b) | | | 5,409 | | | | 345,689 | |
| Cigna Corp. | | | 1,803 | | | | 435,857 | |
| Humana, Inc. | | | 1,016 | | | | 425,958 | |
| Laboratory Corp. of America Holdings (b) | | | 2,585 | | | | 659,253 | |
| RadNet, Inc. (b) | | | 30,563 | | | | 664,744 | |
| UnitedHealth Group, Inc. | | | 1,323 | | | | 492,249 | |
| Total Health Care Providers & Services | | | | | | | 3,959,577 | |
| Health Care Technology - 0.5% | | | | | | | | |
| Cerner Corp. | | | 5,107 | | | | 367,091 | |
| Teladoc Health, Inc. (a)(b) | | | 2,110 | | | | 383,493 | |
| Total Health Care Technology | | | | | | | 750,584 | |
| Household Durables - 0.5% | | | | | | | | |
| Newell Brands, Inc. | | | 25,238 | | | | 675,874 | |
| Household Products - 0.3% | | | | | | | | |
| Church & Dwight Co., Inc. | | | 5,012 | | | | 437,798 | |
| Independent Power & Renewable Electricity Producers - 0.2% | | | | | | | | |
| Ormat Technologies, Inc. | | | 4,749 | | | | 372,939 | |
| Insurance - 4.2% | | | | | | | | |
| Aflac, Inc. | | | 9,726 | | | | 497,777 | |
| American Financial Group, Inc. | | | 4,628 | | | | 528,055 | |
| Arthur J Gallagher & Co. | | | 3,954 | | | | 493,341 | |
| Brown & Brown, Inc. | | | 9,069 | | | | 414,544 | |
| Cincinnati Financial Corp. | | | 4,413 | | | | 454,936 | |
| Erie Indemnity Co. - Class A (a) | | | 2,165 | | | | 478,270 | |
| Fidelity National Financial, Inc. | | | 13,297 | | | | 540,656 | |
| Globe Life, Inc. | | | 4,473 | | | | 432,226 | |
| Hanover Insurance Group, Inc. | | | 3,556 | | | | 460,360 | |
| Hartford Financial Services Group, Inc. | | | 9,489 | | | | 633,769 | |
The accompanying notes are an integral part of these financial statements.
Etho Climate Leadership U.S. ETF
| Schedule of Investments |
| March 31, 2021 (Unaudited) (Continued) |
| |
| | | Shares | | | Value | |
| Markel Corp. (b) | | | 338 | | | $ | 385,192 | |
| Marsh & McLennan Cos., Inc. | | | 3,861 | | | | 470,270 | |
| W R Berkley Corp. | | | 6,161 | | | | 464,231 | |
| Total Insurance | | | | | | | 6,253,627 | |
| Interactive Media & Services - 1.0% | | | | | | | | |
| Alphabet, Inc. - Class A (b) | | | 283 | | | | 583,692 | |
| IAC/InterActiveCorp (b) | | | 1,834 | | | | 396,713 | |
| Match Group, Inc. (b) | | | 3,862 | | | | 530,562 | |
| Total Interactive Media & Services | | | | | | | 1,510,967 | |
| Internet & Direct Marketing Retail - 1.2% | | | | | | | | |
| Amazon.com, Inc. (b) | | | 163 | | | | 504,335 | |
| Booking Holdings, Inc. (b) | | | 242 | | | | 563,821 | |
| eBay, Inc. | | | 10,901 | | | | 667,578 | |
| Total Internet & Direct Marketing Retail | | | | | | | 1,735,734 | |
| IT Services - 4.2% | | | | | | | | |
| Akamai Technologies, Inc. (b) | | | 3,506 | | | | 357,261 | |
| Automatic Data Processing, Inc. | | | 2,356 | | | | 444,035 | |
| Broadridge Financial Solutions, Inc. | | | 3,395 | | | | 519,775 | |
| Fidelity National Information Services, Inc. | | | 2,810 | | | | 395,114 | |
| Fiserv, Inc. (b) | | | 3,382 | | | | 402,593 | |
| FleetCor Technologies, Inc. (b) | | | 1,721 | | | | 462,312 | |
| Global Payments, Inc. | | | 2,219 | | | | 447,306 | |
| Jack Henry & Associates, Inc. | | | 2,063 | | | | 312,998 | |
| MasterCard, Inc. - Class A | | | 1,353 | | | | 481,736 | |
| Paychex, Inc. | | | 5,377 | | | | 527,054 | |
| PayPal Holdings, Inc. (b) | | | 3,350 | | | | 813,514 | |
| Switch, Inc. - Class A | | | 19,004 | | | | 309,005 | |
| VeriSign, Inc. (b) | | | 1,781 | | | | 353,992 | |
| Visa, Inc. - Class A (a) | | | 2,040 | | | | 431,929 | |
| Total IT Services | | | | | | | 6,258,624 | |
| Leisure Products - 0.3% | | | | | | | | |
| Hasbro, Inc. | | | 4,672 | | | | 449,073 | |
| Life Sciences Tools & Services - 0.7% | | | | | | | | |
| Bio-Techne Corp. | | | 1,689 | | | | 645,079 | |
| Illumina, Inc. (b) | | | 1,194 | | | | 458,568 | |
| Total Life Sciences Tools & Services | | | | | | | 1,103,647 | |
| Machinery - 6.3% | | | | | | | | |
| Deere & Co. | | | 2,324 | | | | 869,501 | |
| Donaldson Co., Inc. | | | 8,604 | | | | 500,409 | |
| Dover Corp. | | | 3,831 | | | | 525,345 | |
| Energy Recovery, Inc. (b) | | | 43,183 | | | | 791,976 | |
| Flowserve Corp. | | | 13,506 | | | | 524,168 | |
| Fortive Corp. | | | 5,826 | | | | 411,549 | |
| Hillenbrand, Inc. | | | 17,371 | | | | 828,770 | |
| Lincoln Electric Holdings, Inc. | | | 4,949 | | | | 608,430 | |
| Lindsay Corp. | | | 3,510 | | | | 584,836 | |
| Mueller Water Products, Inc. - Class A | | | 40,278 | | | | 559,461 | |
| Stanley Black & Decker, Inc. | | | 3,225 | | | | 643,936 | |
| Tennant Co. | | | 5,548 | | | | 443,230 | |
| | | | | | | | | |
The accompanying notes are an integral part of these financial statements.
Etho Climate Leadership U.S. ETF
| Schedule of Investments |
| March 31, 2021 (Unaudited) (Continued) |
| |
| | | Shares | | | Value | |
| Toro Co. | | | 5,123 | | | $ | 528,386 | |
| Trinity Industries, Inc. (a) | | | 20,281 | | | | 577,806 | |
| Watts Water Technologies, Inc. - Class A | | | 3,802 | | | | 451,716 | |
| Xylem, Inc. | | | 4,946 | | | | 520,220 | |
| Total Machinery | | | | | | | 9,369,739 | |
| Media - 2.5% | | | | | | | | |
| Charter Communications, Inc. - Class A (b) | | | 735 | | | | 453,510 | |
| Discovery, Inc. - Class A (a)(b) | | | 16,519 | | | | 717,916 | |
| Interpublic Group of Cos., Inc. | | | 20,720 | | | | 605,024 | |
| New York Times Co. - Class A | | | 10,469 | | | | 529,941 | |
| Omnicom Group, Inc. | | | 5,894 | | | | 437,040 | |
| Sirius XM Holdings, Inc. (a) | | | 65,143 | | | | 396,721 | |
| TEGNA, Inc. | | | 30,256 | | | | 569,720 | |
| Total Media | | | | | | | 3,709,872 | |
| Pharmaceuticals - 1.5% | | | | | | | | |
| Bristol-Myers Squibb Co. | | | 5,790 | | | | 365,523 | |
| Eli Lilly and Co. | | | 2,316 | | | | 432,675 | |
| Merck & Co, Inc. | | | 4,190 | | | | 323,007 | |
| Nektar Therapeutics (a)(b) | | | 18,000 | | | | 360,000 | |
| Pfizer, Inc. | | | 9,970 | | | | 361,213 | |
| Viatris, Inc. (b) | | | 1,230 | | | | 17,183 | |
| Zoetis, Inc. | | | 2,805 | | | | 441,732 | |
| Total Pharmaceuticals | | | | | | | 2,301,333 | |
| Professional Services - 1.4% | | | | | | | | |
| CoreLogic, Inc. | | | 10,543 | | | | 835,533 | |
| CoStar Group, Inc. (b) | | | 541 | | | | 444,642 | |
| FTI Consulting, Inc. (b) | | | 2,676 | | | | 374,934 | |
| Verisk Analytics, Inc. | | | 2,304 | | | | 407,094 | |
| Total Professional Services | | | | | | | 2,062,203 | |
| Real Estate Investment Trusts (REITs) - 2.9% | | | | | | | | |
| Alexandria Real Estate Equities, Inc. | | | 2,406 | | | | 395,306 | |
| Duke Realty Corp. | | | 9,966 | | | | 417,874 | |
| Extra Space Storage, Inc. (a) | | | 3,367 | | | | 446,296 | |
| Hannon Armstrong Sustainable Infrastructure Capital, Inc. (a) | | | 16,208 | | | | 909,269 | |
| Mid-America Apartment Communities, Inc. | | | 3,230 | | | | 466,282 | |
| Prologis, Inc. | | | 4,013 | | | | 425,378 | |
| Public Storage, Inc. | | | 1,677 | | | | 413,817 | |
| Regency Centers Corp. | | | 8,957 | | | | 507,951 | |
| SBA Communications Corp. | | | 1,181 | | | | 327,787 | |
| Total Real Estate Investment Trusts (REITs) | | | | | | | 4,309,960 | |
| Road & Rail - 0.5% | | | | | | | | |
| Lyft, Inc. - Class A (b) | | | 11,966 | | | | 756,012 | |
| Semiconductors & Semiconductor Equipment - 12.1% | | | | | | | | |
| Advanced Micro Devices, Inc. (a)(b) | | | 7,055 | | | | 553,818 | |
| Analog Devices, Inc. (a) | | | 3,596 | | | | 557,668 | |
| Applied Materials, Inc. | | | 7,030 | | | | 939,208 | |
| Broadcom, Inc. | | | 1,362 | | | | 631,505 | |
| Cree, Inc. (a)(b) | | | 9,156 | | | | 990,038 | |
| First Solar, Inc. (a)(b) | | | 9,031 | | | | 788,406 | |
| | | | | | | | | |
The accompanying notes are an integral part of these financial statements.
Etho Climate Leadership U.S. ETF
| Schedule of Investments |
| March 31, 2021 (Unaudited) (Continued) |
| |
| | | Shares | | | Value | |
| Intel Corp. | | | 6,184 | | | $ | 395,776 | |
| KLA Corp. | | | 2,241 | | | | 740,426 | |
| Lam Research Corp. | | | 1,333 | | | | 793,455 | |
| Maxim Integrated Products, Inc. | | | 6,839 | | | | 624,879 | |
| Microchip Technology, Inc. | | | 4,748 | | | | 736,985 | |
| Micron Technology, Inc. (b) | | | 7,629 | | | | 672,954 | |
| NVIDIA Corp. | | | 1,214 | | | | 648,191 | |
| ON Semiconductor Corp. (b) | | | 25,822 | | | | 1,074,454 | |
| Power Integrations, Inc. | | | 7,440 | | | | 606,211 | |
| Qorvo, Inc. (b) | | | 3,978 | | | | 726,781 | |
| Qualcomm, Inc. | | | 4,945 | | | | 655,658 | |
| Rambus, Inc. (a)(b) | | | 28,941 | | | | 562,613 | |
| Skyworks Solutions, Inc. | | | 3,601 | | | | 660,711 | |
| SunPower Corp. (a)(b) | | | 63,674 | | | | 2,129,896 | |
| Teradyne, Inc. | | | 6,053 | | | | 736,529 | |
| Texas Instruments, Inc. | | | 3,377 | | | | 638,219 | |
| Universal Display Corp. | | | 2,429 | | | | 575,114 | |
| Xilinx, Inc. | | | 4,129 | | | | 511,583 | |
| Total Semiconductors & Semiconductor Equipment | | | | | | | 17,951,078 | |
| Software - 5.4% | | | | | | | | |
| Adobe Systems, Inc. (b) | | | 1,005 | | | | 477,747 | |
| Ansys, Inc. (b) | | | 1,375 | | | | 466,895 | |
| Autodesk, Inc. (b) | | | 2,101 | | | | 582,292 | |
| Cadence Design System, Inc. (b) | | | 4,973 | | | | 681,252 | |
| Intuit, Inc. | | | 1,390 | | | | 532,453 | |
| Microsoft Corp. | | | 2,038 | | | | 480,499 | |
| Palo Alto Networks, Inc. (b) | | | 1,996 | | | | 642,832 | |
| salesforce.com, Inc. (b) | | | 2,221 | | | | 470,563 | |
| ServiceNow, Inc. (b) | | | 1,115 | | | | 557,623 | |
| Slack Technologies, Inc. - Class A (b) | | | 11,969 | | | | 486,300 | |
| Splunk, Inc. (b) | | | 2,534 | | | | 343,306 | |
| Synopsys, Inc. (b) | | | 2,557 | | | | 633,573 | |
| VMware, Inc. - Class A (a)(b) | | | 2,653 | | | | 399,144 | |
| Workday, Inc. - Class A (b) | | | 2,462 | | | | 611,635 | |
| Zoom Video Communications, Inc. - Class A (b) | | | 2,224 | | | | 714,550 | |
| Total Software | | | | | | | 8,080,664 | |
| Specialty Retail - 2.2% | | | | | | | | |
| Aaron’s Co., Inc. | | | 7,050 | | | | 181,044 | |
| Advance Auto Parts, Inc. | | | 3,444 | | | | 631,940 | |
| Lowe’s Cos., Inc. | | | 3,756 | | | | 714,316 | |
| O’Reilly Automotive, Inc. (b) | | | 1,061 | | | | 538,192 | |
| The Home Depot, Inc. | | | 1,725 | | | | 526,556 | |
| Tractor Supply Co. | | | 3,806 | | | | 673,966 | |
| Total Specialty Retail | | | | | | | 3,266,014 | |
| Technology Hardware, Storage & Peripherals - 1.3% | | | | | | | | |
| Apple, Inc. | | | 5,153 | | | | 629,439 | |
| NCR Corp. (a)(b) | | | 18,804 | | | | 713,612 | |
| NetApp, Inc. | | | 7,954 | | | | 578,017 | |
| Total Technology Hardware, Storage & Peripherals | | | | | | | 1,921,068 | |
The accompanying notes are an integral part of these financial statements.
Etho Climate Leadership U.S. ETF
| Schedule of Investments |
| March 31, 2021 (Unaudited) (Continued) |
| |
| | | Shares | | | Value | |
| Textiles, Apparel & Luxury Goods - 0.9% | | | | | | | | |
| Hanesbrands, Inc. | | | 42,746 | | | $ | 840,814 | |
| VF Corp. | | | 6,176 | | | | 493,586 | |
| Total Textiles, Apparel & Luxury Goods | | | | | | | 1,334,400 | |
| Thrifts & Mortgage Finance - 0.3% | | | | | | | | |
| Washington Federal, Inc. | | | 12,933 | | | | 398,336 | |
| Trading Companies & Distributors - 2.6% | | | | | | | | |
| Fastenal Co. | | | 10,367 | | | | 521,253 | |
| GATX Corp. (a) | | | 5,162 | | | | 478,724 | |
| MSC Industrial Direct Co., Inc. - Class A | | | 6,329 | | | | 570,813 | |
| United Rentals, Inc. (b) | | | 3,122 | | | | 1,028,106 | |
| WESCO International, Inc. (b) | | | 14,058 | | | | 1,216,438 | |
| Total Trading Companies & Distributors | | | | | | | 3,815,334 | |
| Water Utilities - 1.0% | | | | | | | | |
| American States Water Co. | | | 3,933 | | | | 297,413 | |
| American Water Works Co., Inc. | | | 2,686 | | | | 402,685 | |
| California Water Service Group | | | 6,404 | | | | 360,801 | |
| Middlesex Water Co. | | | 5,541 | | | | 437,851 | |
| Total Water Utilities | | | | | | | 1,498,750 | |
| Wireless Telecommunication Services - 0.3% | | | | | | | | |
| T-Mobile US, Inc. (b) | | | 3,828 | | | | 479,610 | |
| Total United States | | | | | | | 146,228,253 | |
| TOTAL COMMON STOCKS (Cost $101,564,539) | | | | | | | 147,147,099 | |
| | | | | | | | | |
| INVESTMENT COMPANIES - 0.4% | | | | | | | | |
| Closed-End Funds - 0.4% | | | | | | | | |
| Oaktree Specialty Lending Corp. | | | 105,512 | | | | 654,174 | |
| TOTAL INVESTMENT COMPANIES (Cost $528,726) | | | | | | | 654,174 | |
| | | | | | | | | |
| INVESTMENTS PURCHASED WITH PROCEEDS | | | | | | | | |
| FROM SECURITIES LENDING COLLATERAL - 11.0% | | | | | | | | |
| Mount Vernon Liquid Assets Portfolio, LLC, 0.11% (c) | | | 16,330,584 | | | | 16,330,584 | |
| TOTAL INVESTMENTS PURCHASED WITH PROCEEDS FROM SECURITIES LENDING COLLATERAL (Cost $16,330,584) | | | | | | | 16,330,584 | |
| | | | | | | | | |
| SHORT-TERM INVESTMENTS - 0.5% | | | | | | | | |
| Money Market Funds - 0.5% | | | | | | | | |
| Invesco Advisers, Inc. STIT - Treasury Portfolio - Institutional Class, 0.01% (c) | | | 680,616 | | | | 680,616 | |
| TOTAL SHORT-TERM INVESTMENTS (Cost $680,616) | | | | | | | 680,616 | |
| | | | | | | | | |
| Total Investments (Cost $119,104,465) - 111.0% | | | | | | | 164,812,473 | |
| Liabilities in Excess of Other Assets - (11.0)% | | | | | | | (16,305,298 | ) |
| TOTAL NET ASSETS - 100.0% | |
|
| | | $ | 148,507,175 | |
The accompanying notes are an integral part of these financial statements.
Etho Climate Leadership U.S. ETF
| Schedule of Investments |
| March 31, 2021 (Unaudited) (Continued) |
| |
Percentages are stated as a percent of net assets.
| (a) | All or a portion of this security is out on loan as of March 31, 2021. |
| (b) | Non-income producing security. |
| (c) | The rate quoted is the annualized seven-day yield at March 31, 2021. |
The Global Industry Classification Standard (GICS®) was developed by and/or is the exclusive property of MSCI, Inc. and Standard & Poor’s Financial Services LLC (“S&P”). GICS is a service mark of MSCI and S&P and has been licensed for use by U.S. Bancorp Fund Services, LLC, doing business as U.S. Bank Global Fund Services (“Fund Services”).
The accompanying notes are an integral part of these financial statements.
| Etho Climate Leadership U.S. ETF |
| |
| STATEMENT OF ASSETS AND LIABILITIES |
| As of March 31, 2021 (Unaudited) |
| |
| | | Etho Climate
Leadership
U.S. ETF | |
| ASSETS | | | |
| Investments in securities, at value* | | $ | 164,812,473 | |
| Receivables: | | | | |
| Dividends and interest receivable | | | 79,595 | |
| Securities lending income receivable | | | 1,228 | |
| Total Assets | | | 164,893,296 | |
| | | | | |
| LIABILITIES | | | | |
| Collateral received for securities loaned (Note 7) | | | 16,330,584 | |
| Payables: | | | | |
| Management fees payable | | | 55,537 | |
| Total Liabilities | | | 16,386,121 | |
| Net Assets | | $ | 148,507,175 | |
| | | | | |
| NET ASSETS CONSIST OF: | | | | |
| Paid-in capital | | $ | 108,253,881 | |
| Total Distributable Earnings | | | 40,253,294 | |
| Net Assets | | $ | 148,507,175 | |
| | | | | |
| | | | | |
| *Identified Cost: | | | | |
| Investments in securities | | $ | 119,104,465 | |
| | | | | |
| Shares Outstanding^ | | | 2,600,000 | |
| Net Asset Value, Offering and Redemption Price per Share | | $ | 57.12 | |
| | | | | |
| ^ No par value, unlimited number of shares authorized | | | | |
The accompanying notes are an integral part of these financial statements.
| Etho Climate Leadership U.S. ETF |
| |
| STATEMENT OF OPERATIONS |
| For the Period Ended March 31, 2021 (Unaudited) |
| |
| | | Etho Climate
Leadership
U.S. ETF | |
| INVESTMENT INCOME | | | |
| Income: | | | |
| Dividends from unaffiliated securities (net of foreign withholding tax of $687) | | $ | 746,733 | |
| Interest | | | 30 | |
| Securities lending income | | | 12,026 | |
| Total Investment Income | | | 758,789 | |
| | | | | |
| Expenses: | | | | |
| Management fees | | | 267,941 | |
| Total Expenses | | | 267,941 | |
| Net Investment Income | | | 490,848 | |
| | | | | |
| REALIZED & UNREALIZED GAIN (LOSS) ON INVESTMENTS | | | | |
| Net Realized Gain (Loss) on: | | | | |
| Unaffiliated investments | | | 297,905 | |
| Affiliated investments | | | (23,355 | ) |
| In-Kind redemptions | | | 168 | |
| Net Realized Gain (Loss) on Investments and In-Kind Redemptions | | | 274,718 | |
| Net Change in Unrealized Appreciation (Depreciation) of: | | | | |
| Unaffiliated investments | | | 27,775,035 | |
| Affiliated Investments | | | 23,606 | |
| Net Change in Unrealized Appreciation of Investments | | | 27,798,641 | |
| Net Realized and Unrealized Gain (Loss) on Investments | | | 28,073,359 | |
| NET INCREASE (DECREASE) IN NET ASSETS RESULTING FROM OPERATIONS | | $ | 28,564,207 | |
The accompanying notes are an integral part of these financial statements.
| Etho Climate Leadership U.S. ETF |
| |
| STATEMENTS OF CHANGES IN NET ASSETS |
| |
| | | Period Ended
March 31, 2021
(Unaudited) | | | Year Ended
September 30,
2020 | |
| OPERATIONS | | | | | | |
| Net investment income | | $ | 490,848 | | | $ | 746,997 | |
| Net realized gain (loss) on investments and In-Kind Redemptions | | | 274,718 | | | | (4,238,356 | ) |
| Net change in unrealized appreciation of investments | | | 27,798,641 | | | | 12,770,763 | |
| Net increase in net assets resulting from operations | | $ | 28,564,207 | | | $ | 9,279,404 | |
| | | | | | | | | |
| DISTRIBUTIONS TO SHAREHOLDERS | | | | | | | | |
| Total Distributions to Shareholders | | | (556,000 | ) | | | (660,500 | ) |
| | | | | | | | | |
| CAPITAL SHARE TRANSACTIONS | | | | | | | | |
| Net increase in net assets derived from net change in outstanding shares | | | 29,938,285 | | | | 28,510,725 | |
| Net increase in net assets | | $ | 57,946,492 | | | $ | 37,129,629 | |
| | | | | | | | | |
| NET ASSETS | | | | | | | | |
| Beginning of Period | | | 90,560,683 | | | | 53,431,054 | |
| End of Period | | $ | 148,507,175 | | | $ | 90,560,683 | |
Summary of share transactions is as follows:
| | | | Period Ended
March 31, 2021 (Unaudited) | | | Year Ended
September 30, 2020 | |
| | | | Shares | | | Amount | | | Shares | | | Amount | |
| Shares Sold | | | | 550,000 |
| | $ | 29,938,285 | | | | 800,000 | | | $ | 32,325,825 | |
| Shares Redeemed | | | | — | | | | — | | | | (100,000 | ) | | | (3,815,100 | ) |
| Net Transactions in Fund Shares | | | | 550,000 |
| | $ | 29,938,285 | | | | 700,000 | | | $ | 28,510,725 | |
| | | | | | | | | | | | | | | | | | |
| Beginning Shares | | | | 2,050,000 | | | | | | | | 1,350,000 | | | | | |
| Ending Shares | | | | 2,600,000 | | | | | | | | 2,050,000 | | | | | |
The accompanying notes are an integral part of these financial statements.
| Etho Climate Leadership U.S. ETF |
| |
| FINANCIAL HIGHLIGHTS |
| For a capital share outstanding throughout the period/year |
| |
| | | Period Ended
March 31,
2021
(Unaudited) | | | Year Ended
September 30,
2020 | | | Year Ended
September 30,
2019 | | | Year Ended
September 30,
2018 | | | Year Ended
September 30,
2017 | | | Period Ended
September 30,
20161 | |
| | | | | | | | | | | | | | | | | | | | | | | | | |
| Net Asset Value, Beginning of Period/Year | | $ | 44.18 | | | $ | 39.58 | | | $ | 37.50 | | | $ | 32.01 | | | $ | 27.00 | | | $ | 25.00 | |
| Income from Investment Operations: | | | | | | | | | | | | | | | | | | | | | | | | |
| Net Investment Income2 | | | 0.22 | | | | 0.41 | | | | 0.33 | | | | 0.29 | | | | 0.31 | | | | 0.23 | |
| Net realized and unrealized gain (loss) on investments | | | 12.96 | | | | 4.54 | | | | 2.08 | | | | 5.51 | | | | 5.09 | | | | 1.87 | |
| Total from investment operations | | | 13.18 | | | | 4.95 | | | | 2.41 | | | | 5.80 | | | | 5.40 | | | | 2.10 | |
| Less Distributions: | | | | | | | | | | | | | | | | | | | | | | | | |
| From net investment income | | | (0.24 | ) | | | (0.35 | ) | | | (0.33 | ) | | | (0.29 | ) | | | (0.25 | ) | | | (0.10 | ) |
| From net realized gains | | | — | | | | — | | | | — | | | | (0.02 | ) | | | (0.14 | ) | | | — | |
| Total distributions | | | (0.24 | ) | | | (0.35 | ) | | | (0.33 | ) | | | (0.31 | ) | | | (0.39 | ) | | | (0.10 | ) |
| Net asset value, end of period/year | | $ | 57.12 | | | $ | 44.18 | | | $ | 39.58 | | | $ | 37.50 | | | $ | 32.01 | | | $ | 27.00 | |
| Total Return | | | 29.89 | %3 | | | 12.59 | % | | | 6.53 | % | | | 18.16 | % | | | 20.14 | % | | | 8.43 | %3 |
| | | | | | | | | | | | | | | | | | | | | | | | | |
| Ratios/Supplemental Data: | | | | | | | | | | | | | | | | | | | | | | | | |
| Net assets at end of period/year (000’s) | | $ | 148,507 | | | $ | 90,561 | | | $ | 53,431 | | | $ | 35,627 | | | $ | 19,208 | | | $ | 6,751 | |
| Expenses to Average Net Assets | | | 0.45 | %4 | | | 0.45 | % | | | 0.45 | % | | | 0.45 | % | | | 0.45 | % | | | 0.50 | %4 |
| Net Investment Income to Average Net Assets | | | 0.82 | %4 | | | 1.00 | % | | | 0.88 | % | | | 0.82 | % | | | 1.03 | % | | | 1.04 | %4 |
| Portfolio Turnover Rate | | | 1 | %3 | | | 37 | % | | | 41 | % | | | 19 | % | | | 45 | % | | | 25 | %3 |
| 1 | Commencement of operations on November 18, 2015. |
| 2 | Calculated based on average shares outstanding during the period/year. |
The accompanying notes are an integral part of these financial statements.
| Etho Climate Leadership U.S. ETF |
| |
| NOTES TO FINANCIAL STATEMENTS |
| March 31, 2021 (Unaudited) |
| |
NOTE 1 – ORGANIZATION
Etho Climate Leadership U.S. ETF (the “Fund”) is a series of ETF Managers Trust (the “Trust”), an open-end management investment company consisting of multiple investment series, organized as a Delaware statutory trust on July 1, 2009. The Trust is registered with the SEC under the Investment Company Act of 1940, as amended (the “1940 Act”), as an open-end management investment company and the offering of the Fund’s shares (“Shares”) is registered under the Securities Act of 1933, as amended (the “Securities Act”). The Fund seeks to provide investment results that, before fees and expenses, correspond generally to the price and yield performance of the Etho Climate Leadership Index – U.S. (“the Index”). The Fund commenced operations on November 18, 2015.
The Fund currently offers one class of shares, which has no front end sales load, no deferred sales charges, and no redemption fees. The Fund may issue an unlimited number of shares of beneficial interest, with no par value. All shares of the Fund have equal rights and privileges.
Shares of the Fund are listed and traded on the NYSE Arca, Inc. Market prices for the Shares may be different from their net asset value (“NAV”). The Fund issues and redeems Shares on a continuous basis at NAV only in blocks of 50,000 shares, called “Creation Units.” Creation Units are issued and redeemed principally in-kind for securities included in the Index. Once created, Shares generally trade in the secondary market at market prices that change throughout the day in quantities less than a Creation Unit. Except when aggregated in Creation Units, Shares are not redeemable securities of the Fund. Shares of the Fund may only be purchased or redeemed by certain financial institutions (“Authorized Participants”). An Authorized Participant is either (i) a broker-dealer or other participant in the clearing process through the Continuous Net Settlement System of the National Securities Clearing Corporation or (ii) a DTC participant and, in each case, must have executed a Participant Agreement with the Distributor. Most retail investors do not qualify as Authorized Participants nor have the resources to buy and sell whole Creation Units. Therefore, they are unable to purchase or redeem the Shares directly from the Fund. Rather, most retail investors may purchase Shares in the secondary market with the assistance of a broker and may be subject to customary brokerage commissions or fees.
Authorized Participants transacting in Creation Units for cash may pay an additional variable charge to compensate the relevant Fund for certain transaction costs (i.e., brokerage costs) and market impact expenses relating to investing in portfolio securities. Such variable charges, if any, are included in “Transaction Fees” in the Statements of Changes in Net Assets.
NOTE 2 – SIGNIFICANT ACCOUNTING POLICIES
The following is a summary of significant accounting policies consistently followed by the Fund. These policies are in conformity with accounting principles generally accepted in the United States of America (“U.S. GAAP”).
The Fund follows the investment company accounting and reporting guidance of the Financial Accounting Standards Board Accounting Standard Codification Topic 946 Financial Services – Investment Companies.
The Fund may invest in certain other investment companies (underlying funds). For specific investments in underlying funds, please refer to the complete schedule of portfolio holdings on Form N-CSR(S) for this reporting period, which is filed with the U.S. Securities and Exchange Commission (“SEC”). For more information about the underlying fund’s operations and policies, please refer to those funds’ semiannual and annual reports, which are filed with the SEC.
| Etho Climate Leadership U.S. ETF |
| |
| NOTES TO FINANCIAL STATEMENTS |
March 31, 2021 (Unaudited) (Continued)
|
| |
| A. | Security Valuation. Securities listed on a securities exchange, market or automated quotation system for which quotations are readily available (except for securities traded on NASDAQ), including securities traded over the counter, are valued at the last quoted sale price on the primary exchange or market (foreign or domestic) on which they are traded on the valuation date (or at approximately 4:00 pm Eastern Time if a security’s primary exchange is normally open at that time), or, if there is no such reported sale on the valuation date, at the most recent quoted bid price. For securities traded on NASDAQ, the NASDAQ Official Closing Price will be used. |
Securities for which quotations are not readily available are valued at their respective fair values as determined in good faith by the Board of Trustees (the “Board”). When a security is “fair valued,” consideration is given to the facts and circumstances relevant to the particular situation, including a review of various factors set forth in the pricing procedures adopted by the Fund’s Board. The use of fair value pricing by the Fund may cause the net asset value of its shares to differ significantly from the net asset value that would be calculated without regard to such considerations. As of March 31, 2021, the Fund did not hold any fair valued securities.
As described above, the Fund utilizes various methods to measure the fair value of its investments on a recurring basis. U.S. GAAP establishes a hierarchy that prioritizes inputs to valuation methods. The three levels of inputs are:
| Level 1 | Unadjusted quoted prices in active markets for identical assets or liabilities that the Fund has the ability to access. |
| Level 2 | Observable inputs other than quoted prices included in Level 1 that are observable for the asset or liability, either directly or indirectly. These inputs may include quoted prices for the identical instrument on an inactive market, prices for similar instruments, interest rates, prepayment speeds, credit risk, yield curves, default rates and similar data. |
| Level 3 | Unobservable inputs for the asset or liability, to the extent relevant observable inputs are not available; representing the Fund’s own assumptions about the assumptions a market participant would use in valuing the asset or liability, and would be based on the best information available. |
The availability of observable inputs can vary from security to security and is affected by a wide variety of factors, including, for example, the type of security, whether the security is new and not yet established in the marketplace, the liquidity of markets, and other characteristics particular to the security. To the extent that valuation is based on models or inputs that are less observable or unobservable in the market, the determination of fair value requires more judgment. Accordingly, the degree of judgment exercised in determining fair value is greatest for instruments categorized in Level 3.
The inputs used to measure fair value may fall into different levels of the fair value hierarchy. In such cases, for disclosure purposes, the level in the fair value hierarchy within which the fair value measurement falls in its entirety, is determined based on the lowest level input that is significant to the fair value measurement in its entirety.
| Etho Climate Leadership U.S. ETF |
| |
| NOTES TO FINANCIAL STATEMENTS |
| March 31, 2021 (Unaudited) (Continued) |
| |
The following table presents a summary of the inputs used to value the Fund’s net assets as of March 31, 2021:
| Etho Climate Leadership U.S. ETF | | | | | | | | | | | | |
| Assets^ | | Level 1 | | | Level 2 | | | Level 3 | | | Total | |
| Common Stocks | | $ | 147,147,099 | | | $ | — | | | $ | — | | | $ | 147,147,099 | |
| Closed-End Funds | | | 654,174 | | | | — | | | | — | | | | 654,174 | |
| Short-Term Investments | | | 680,616 | | | | — | | | | — | | | | 680,616 | |
| Investments Purchased with Securities Lending | | | | | | | | | | | | | | | | |
| Collateral* | | | — | | | | — | | | | — | | | | 16,330,584 | |
| Total Investments in Securities | | $ | 148,481,889 | | | $ | — | | | $ | — | | | $ | 164,812,473 | |
^ See Schedule of Investments for classifications by sector or country.
* Certain investments that are measured at fair value using the net asset value per share (or its equivalent) practical expedient have not been categorized in the fair value hierarchy. The fair value amounts presented in the table are intended to permit reconciliation of the fair value hierarchy to the amounts presented in the Schedule of Investments.
| B. | Federal Income Taxes. The Fund has elected to be taxed as a “regulated investment company” and intends to distribute substantially all taxable income to its shareholders and otherwise comply with the provisions of the Internal Revenue Code applicable to regulated investment companies. Therefore, no provisions for federal income taxes or excise taxes have been made. |
To avoid imposition of the excise tax applicable to regulated investment companies, the Fund intends to declare each year as dividends, in each calendar year, at least 98.0% of its net investment income (earned during the calendar year) and 98.2% of its net realized capital gains (earned during the twelve months ended October 31) plus undistributed amounts, if any, from prior years.
Net capital losses incurred after October 31, within the taxable year are deemed to arise on the first business day of the Fund’s next taxable year.
The Fund recognizes the tax benefits of uncertain tax positions only where the position is “more likely than not” to be sustained assuming examination by tax authorities. The Fund has analyzed its tax position and has concluded that no liability for unrecognized tax benefits should be recorded related to uncertain tax positions expected to be taken in the Fund’s 2020 tax returns.
The Fund identifies its major tax jurisdictions as U.S. Federal, the State of New Jersey, and the State of Delaware; however the Fund is not aware of any tax positions for which it is reasonably possible that the total amounts of unrecognized tax benefits will change materially in the next twelve months.
As of March 31, 2021, management has reviewed the tax positions for open periods (for federal purposes, three years from the date of filing and for state purposes, four years from the date of filing) as applicable to the Fund, and has determined that no provision for income tax is required in the Fund’s financial statements.
| C. | Security Transactions and Investment Income. Investment securities transactions are accounted for on the trade date. Gains and losses realized on sales of securities are determined on a specific identification basis. Discounts/premiums on debt securities purchased are accreted/amortized over the life of the respective securities using the effective interest method. Dividend income is recorded on the ex-dividend date. Interest income is recorded on an accrual basis. Income, including gains, from investments in foreign securities received by the Fund may be subject to income, withholding or other taxes imposed by foreign countries. |
Etho Climate Leadership U.S. ETF
NOTES TO FINANCIAL STATEMENTS
March 31, 2021 (Unaudited) (Continued)
| D. | Foreign Currency Translations and Transactions. The Fund may engage in foreign currency transactions. Foreign currency transactions are translated into U.S. dollars on the following basis: (i) market value of investment securities, assets and liabilities at the daily rates of exchange, and (ii) purchases and sales of investment securities, dividend and interest income and certain expenses at the rates of exchange prevailing on the respective dates of such transactions. For financial reporting purposes, the Fund does not isolate changes in the exchange rate of investment securities from the fluctuations arising from changes in the market prices of securities for unrealized gains and losses. However, for federal income tax purposes, the Fund does isolate and treat as ordinary income the effect of changes in foreign exchange rates on realized gains or losses from the sale of investment securities and payables and receivables arising from trade-date and settlement-date differences. E. Distributions to Shareholders. Distributions to shareholders from net investment income, if any, are declared and paid by the Fund on a quarterly basis. Distributions to shareholders from net realized gains on securities of the Fund normally are declared and paid on an annual basis. Distributions are recorded on the ex-dividend date. |
| F. | Use of Estimates. The preparation of financial statements in conformity with U.S. GAAP requires management to make estimates and assumptions that affect the reported amounts of assets and liabilities at the date of the financial statements, as well as the reported amounts of revenues and expenses during the period. Actual results could differ from those estimates. |
| G. | Share Valuation. The NAV per share of the Fund is calculated by dividing the sum of the value of the securities held by the Fund, plus cash and other assets, minus all liabilities (including estimated accrued expenses) by the total number of shares outstanding by the Fund, rounded to the nearest cent. The Fund’s shares will not be priced on the days on which the NYSE is closed for trading. The offering and redemption price per share for the Fund is equal to the Fund’s net asset value per share. |
| H. | Guarantees and Indemnifications. In the normal course of business, the Fund enters into contracts with service providers that contain general indemnification clauses. The Fund’s maximum exposure under these arrangements is unknown as this would involve future claims that may be made against the Fund that have not yet occurred. However, based on experience, the Fund expects the risk of loss to be remote. |
NOTE 3 – RISK FACTORS
Investing in the Etho Climate Leadership U.S. ETF may involve certain risks, as discussed in the Fund’s prospectus, including, but not limited to, those described below. Any of these risks could cause an investor to lose money.
Market Risk. Financial markets rise and fall in response to a variety of factors, sometimes rapidly and unpredictably. As with any investment whose performance is tied to these markets, the value of an investment in a fund will fluctuate, which means that an investor could lose money over short or long periods.
Investment Style Risk. The Fund is not actively managed. Therefore, the Fund follows the securities included in its respective index during upturns as well as downturns. Because of its indexing strategy, the Fund does not take steps to reduce market exposure or to lessen the effects of a declining market. In addition, because of the Fund’s expenses, the Fund’s performance may be below that of its index.
Etho Climate Leadership U.S. ETF
NOTES TO FINANCIAL STATEMENTS
March 31, 2021 (Unaudited) (Continued)
Equity Risk. The prices of equity securities rise and fall daily. These price movements may result from factors affecting individual companies, industries or the securities market as a whole. In addition, equity markets tend to move in cycles which may cause stock prices to fall over short or extended periods of time.
Securities Lending Risk. Securities lending involves the risk of loss of rights in, or delay in recovery of, the loaned securities if the borrower fails to return the security loaned or becomes insolvent.
Concentration Risk. To the extent that the Fund’s or its underlying index’s portfolio is concentrated in the securities of issuers in a particular market, industry, group of industries, sector or asset class, the Fund may be adversely affected by the performance of those securities, may be subject to increased price volatility and may be more vulnerable to adverse economic, market, political or regulatory occurrences affecting that market, industry, group of industries, sector or asset class.
Natural Disaster/Epidemic Risk. Natural or environmental disasters, such as earthquakes, fires, floods, hurricanes, tsunamis and other severe weather related phenomena generally, and widespread disease, including pandemics and epidemics (for example, the novel coronavirus COVID-19), have been and can be highly disruptive to economies and markets and have recently led, and may continue to lead, to increased market volatility and significant market losses. Such natural disaster and health crises could exacerbate political, social, and economic risks previously mentioned, and result in significant breakdowns, delays, shutdowns, social isolation, and other disruptions to important global, local and regional supply chains affected, with potential corresponding results on the operating performance of the Fund and its investments. A climate of uncertainty and panic, including the contagion of infectious viruses or diseases, may adversely affect global, regional, and local economies and reduce the availability of potential investment opportunities, and increases the difficulty of performing due diligence and modeling market conditions, potentially reducing the accuracy of financial projections. Under these circumstances, the Fund may have difficulty achieving its investment objective which may adversely impact performance. Further, such events can be highly disruptive to economies and markets, significantly disrupt the operations of individual companies (including, but not limited to, the Fund’s third party service providers), sectors, industries, markets, securities and commodity exchanges, currencies, interest and inflation rates, credit ratings, investor sentiment, and other factors affecting the value of the Fund’s investments. These factors can cause substantial market volatility, exchange trading suspensions and closures and can impact the ability of the Fund to complete redemptions and otherwise affect Fund performance and Fund trading in the secondary market. A widespread crisis may also affect the global economy in ways that cannot necessarily be foreseen at the current time. How long such events will last and whether they will continue or recur cannot be predicted. Impacts from these events could have significant impact on the Fund’s performance, resulting in losses to the Fund.
NOTE 4 – MANAGEMENT AND OTHER CONTRACTS
ETF Managers Group, LLC (the “Advisor”), serves as the investment advisor to the Fund. Pursuant to an Investment Advisory Agreement (“Advisory Agreement”) between the Trust, on behalf of the Fund, and the Advisor, the Advisor provides investment advice to the Fund and oversees the day-to-day operations of the Fund, subject to the direction and control of the Board and the officers of the Trust. Under the Advisory Agreement, the Advisor is also responsible for arranging transfer agency, custody, fund administration and accounting, and other non-distribution related services necessary for the Fund to operate.
Etho Climate Leadership U.S. ETF
NOTES TO FINANCIAL STATEMENTS
March 31, 2021 (Unaudited) (Continued)
Under the Investment Advisory Agreement with the Fund, the Advisor has overall responsibility for the general management and administration of the Fund and arranges for sub-advisory, transfer agency, custody, fund administration, securities lending, and all other non-distribution related services necessary for the Fund to operate. The Advisor bears the costs of all advisory and non-advisory services required to operate the Fund, in exchange for a single unitary fee. For services provided the Fund pays the Advisor at an annual rate of 0.45% of the Fund’s average daily net assets. Under the Investment Advisory Agreement, the Advisor has agreed to pay all expenses of the Fund, except for: the fee paid to the Advisor pursuant to the Investment Advisory Agreement, interest charges on any borrowings, taxes, brokerage commissions and other expenses incurred in placing orders for the purchase and sale of securities and other investment instruments, acquired fund fees and expenses, accrued deferred tax liability, extraordinary expenses, and distribution (12b-1) fees and expenses (collectively, “Excluded Expenses”). The Advisor has entered into an agreement with its affiliate, ETFMG Financial LLC, to serve as distributor to the Fund (the “Distributor”). The Distributor provides marketing support for the Fund, including distributing marketing materials related to the Fund.
The Advisor has entered into an Agreement with Etho Capital, LLC ( “Etho”), under which Etho agrees to sublicense the use of the Underlying Index to the Advisor. Etho also provides marketing support for the Fund. Etho does not make investment decisions, provide investment advice, or otherwise act in the capacity of an investment Advisor to the Fund.
U.S. Bancorp Fund Services, LLC doing business as U.S. Bank Global Fund Services (the “Administrator”) provides fund accounting, fund administration, and transfer agency services to the Fund. The Advisor compensates the Administrator for these services under an administration agreement between the two parties.
The Advisor pays each independent Trustee a quarterly fee for service to the Fund. Each Trustee is also reimbursed by the Advisor for all reasonable out-of-pocket expenses incurred in connection with his duties as Trustee, including travel and related expenses incurred in attending Board meetings.
NOTE 5 – DISTRIBUTION PLAN
The Fund has adopted a Plan of Distribution pursuant to Rule 12b-1 under the 1940 Act. Under the Plan, the Fund may pay compensation to the Distributor or any other distributor or financial institution with which the Trust has an agreement with respect to the Fund, with the amount of such compensation not to exceed an annual rate of 0.25% of each Fund’s average daily net assets. For the period ended March 31, 2021, the Fund did not incur any 12b-1 expenses.
NOTE 6 - PURCHASES AND SALES OF SECURITIES
The costs of purchases and sales of securities, excluding short-term securities and in-kind transactions, for the period ended March 31, 2021:
| | | Purchases | | | Sales | |
| Etho Climate Leadership U.S. ETF | | $ | 1,293,218 | | | $ | 3,578,015 | |
The costs of purchases and sales of in-kind transactions associated with creations and redemptions for the period ended March 31, 2021:
| | | Purchases In- | | | Sales In- | |
| | | Kind | | | Kind | |
| Etho Climate Leadership U.S. ETF | | $ | 29,528,490 | | | $ | — | |
Purchases in-kind are the aggregate of all in-kind purchases and sales in-kind are the aggregate of all proceeds from in-kind sales. Net capital gains or losses resulting from in-kind redemptions are excluded from the determination of the Fund’s taxable gains and are not distributed to shareholders. There were no purchases or sales of U.S. Government obligations for the period ended March 31, 2021.
Etho Climate Leadership U.S. ETF
NOTES TO FINANCIAL STATEMENTS
March 31, 2021 (Unaudited) (Continued)
NOTE 7 — SECURITIES LENDING
The Fund may lend up to 33 1⁄3% of the value of the securities in its portfolio to brokers, dealers and financial institutions (but not individuals) under terms of participation in a securities lending program administered by U.S. Bank N.A. (“the Custodian”). The securities lending agreement requires that loans are collateralized at all times in an amount equal to at least 102% of the value of any loaned securities at the time of the loan, plus accrued interest. The Fund receives compensation in the form of fees and earn interest on the cash collateral. The amount of fees depends on a number of factors including the type of security and length of the loan. The Fund continues to receive interest payments or dividends on the securities loaned during the borrowing period. Gain or loss in the fair value of securities loaned that may occur during the term of the loan will be for the account of the Fund. The Fund has the right under the terms of the securities lending agreement to recall the securities from the borrower on demand. The cash collateral is invested by the Custodian in accordance with approved investment guidelines. Those guidelines require the cash collateral to be invested in readily marketable, high quality, short-term obligations either directly on behalf of the Fund or through one or more joint accounts, money market funds, or short-term bond funds, including those advised by or affiliated with the Advisor; however, such investments are subject to risk of payment delays or default on the part of the issuer or counterparty or otherwise may not generate sufficient interest to support the costs associated with securities lending. Other investment companies, in which the Fund may invest cash collateral, can be expected to incur fees and expenses for operations, such as investment advisory and administration fees, which would be in addition to those incurred by the Fund, and which may be received in full or in part by the Advisor. Pursuant to guidance issued by the SEC staff, fees and expenses of money market funds used for cash collateral received in connection with loans of securities are not treated as Acquired Fund Fees and Expenses, which reflect a fund’s pro rata share of the fees and expenses incurred by other investment companies in which the Fund invests (as disclosed in the Prospectus, as applicable). The Fund could also experience delays in recovering its securities and possible loss of income or value if the borrower fails to return the borrowed securities, although the Fund is indemnified from this risk by contract with the securities lending agent.
As of March 31, 2021, the value of the securities on loan and payable for collateral due to broker were as follows:
Value of Securities on Loan Collateral Received
| | | Values of | | | Fund | |
| | | Securities | | | Collateral | |
| Fund | | on Loan | | | Received* | |
| Etho Climate Leadership U.S. ETF | | $ | 16,340,653 | | | $ | 16,330,584 | |
* The cash collateral received was invested in the Mount Vernon Liquid Assets Portfolio as shown on the Schedule of Investments, an investment with an overnight and continuous maturity.
NOTE 8 – FEDERAL INCOME TAXES
The components of distributable earnings (losses) and cost basis of investments for federal income tax purposes at September 30, 2020, the Fund’s most recent fiscal year end, were as follows:
| | | | | | | | | | | | Net | |
| | | | | | Gross | | | Gross | | | Unrealized | |
| | | | | | Unrealized | | | Unrealized | | | Appreciation | |
| | | Cost | | | Appreciation | | | Depreciation | | | (Depreciation) | |
| Etho Climate Leadership U.S. ETF | | $ | 88,161,127 | | | $ | 20,317,710 | | | $ | (2,827,863 | ) | | $ | 17,489,847 | |
| | | | | | | | | | | | | | | | | |
Etho Climate Leadership U.S. ETF
NOTES TO FINANCIAL STATEMENTS
March 31, 2021 (Unaudited) (Continued)
| | | Undistributed | | | Undistributed | | | Total | | | Other | | | Total | |
| | | Ordinary | | | Long-Term | | | Distributable | | | Accumulated | | | Accumulated | |
| | | Income | | | Gain | | | Earnings | | | (Loss) | | | Gain | |
| Etho Climate | | | | | | | | | | | | | | | | | | | | |
| Leadership U.S. ETF | | $ | 88,247 | | | $ | — | | | $ | 88,247 | | | $ | (5,333,007 | ) | | $ | 12,245,087 | |
As of September 30, 2020, the Fund’s most recent fiscal year end, the Fund had accumulated capital loss carryovers of:
| | | Capital | | | Capital | | | | |
| | | Loss | | | Loss | | | | |
| | | Carryover | | | Carryover | | | | |
| | | ST | | | LT | | | Expires | |
| Etho Climate Leadership U.S. ETF | | $ | (4,735,312 | ) | | $ | (597,695 | ) | | | Indefinite | |
Under current tax law, capital and currency losses realized after October 31 of a fund’s fiscal year may be deferred and treated as occurring on the first business day of the following fiscal year for tax purposes. The Fund had deferred post-October capital and currency losses, which will be treated as arising on the first business day of the year ended September 30, 2020, the Fund’s most recent fiscal year end, as follows:
| | | Late Year | | Post-October |
| | | Ordinary Loss | | Capital Loss |
| Etho Climate Leadership U.S. ETF | | None | | None |
The tax character of distributions paid by the Fund during the fiscal periods ended March 31, 2021 and September 30, 2020 are as follows:
| | | Period Ended | | | Year Ended | |
| | | March 31. 2021 | | | September 30, 2020 | |
| | | From | | | From | | | From | | | From | |
| | | Ordinary | | | Capital | | | Ordinary | | | Capital | |
| | | Income | | | Gains | | | Income | | | Gains | |
| Etho Climate Leadership U.S. ETF | | $ | 556,000 | | | $ | — | | | $ | 660,500 | | | $ | — | |
NOTE 9 – INVESTMENTS IN AFFILIATES
Etho Climate Leadership U.S. ETF owned the following company during the period ended March 31, 2021. ETFMG Sit Ultra Short ETF was deemed to be an affiliate of the Fund as defined by the 1940 Act during the period ended March 31, 2021, however, was no longer held as of March 31, 2021. Transactions during the period in this security were as follows:
| | | | | | | | | | | | | | | Change in | | | | | | | | | | |
| | | Value, at | | | | | | | | | Realized | | | Unrealized | | | | | | Value, at | | | | |
| | | September 30, | | | | | | | | | Gain | | | Appreciation | | | | | | March 31, | | | Ending | |
| Security Name | | 2020 | | | Purchases | | | Sales | | | (Loss) | | | (Depreciation) | | | Income | | | 2021 | | | Shares | |
| ETFMG Sit Ultra Short ETF | | $ | 2,489,250 | | | $ | — | | | $ | 2,489,500 | | | $ | (23,355 | ) | | $ | 23,606 | | | $ | — | | | $ | — | | | $ | — | |
Etho Climate Leadership U.S. ETF
NOTES TO FINANCIAL STATEMENTS
March 31, 2021 (Unaudited) (Continued)
NOTE 10 – LEGAL MATTERS
The Trust, a former and current trustee of the Trust, the Adviser and certain officers of the Adviser were defendants in an action filed May 2, 2017 in the Superior Court of New Jersey captioned PureShares, LLC d/b/a PureFunds et al. v. ETF Managers Group, LLC et al., Docket No. C-63-17. The PureShares action alleged claims based on disputes arising out of contractual relationships with the Adviser relating to certain series of the Trust. The action sought damages in unspecified amounts and injunctive relief based on breach of contract, wrongful termination, and several other claims.
The Adviser and its parent, Exchange Traded Managers Group, LLC (“ETFMG”), were defendants in a case filed on October 26, 2017 in the United States District Court for the Southern District of New York by NASDAQ, Inc. (“Nasdaq”) captioned Nasdaq, Inc. v. Exchange Traded Managers Group, LLC et al., Case 1:17-cv-08252. This action arose out of the same facts and circumstances, and relates to the same series of the Trust, as the New Jersey litigation and asserted claims for breach of contract, conversion and certain other claims. The matter was the subject of a bench trial in May 2019, and on December 20, 2019, the Court issued an Opinion and Order awarding compensatory damages to Plaintiff in the amount of $78,403,172.36, plus prejudgment interest. The Court also denied Plaintiffs requests for punitive damages and equitable relief.
On May 1, 2020, Nasdaq, PureShares LLC (“PureShares”), and ETFMG announced a global settlement that resolves all claims in both the PureShares action and the Nasdaq action. The settlement is subject to future negotiations and approvals among independent third parties. As part of the settlement, Nasdaq and ETFMG have agreed to certain cash payments from ETFMG to Nasdaq and PureShares, and have executed an asset purchase agreement to transfer certain ETFMG intellectual property and related assets, to a Nasdaq affiliate. The transaction is expected to close prior to July 31, 2021. The Adviser does not believe that the resolution of these matters will have a material adverse effect on the Fund’s financial statements. If the events set forth in the settlement agreement do not occur, and a subsequent settlement is not reached, the resulting conditions may adversely affect the Adviser’s future operations.
NOTE 11 – SUBSEQUENT EVENTS
In preparing these financial statements, the Fund has evaluated events and transactions for potential recognition or disclosure through the date the financial statements were issued. The evaluation did not result in any subsequent events that necessitated disclosures and/or adjustments to the Financial Statements.
Etho Climate Leadership U.S. ETF
APPROVAL OF ADVISORY AGREEMENT AND BOARD CONSIDERATIONS
For the Period Ended March 31, 2021 (Unaudited)
Pursuant to Section 15(c) of the Investment Company Act of 1940 (the “1940 Act”), at a meeting held on March 30, 2021, the Board of Trustees (the “Board”) of ETF Managers Trust (the “Trust”) considered the renewal of the Amended and Restated Investment Advisory Agreement (the “Advisory Agreement”) between ETF Managers Group LLC (the “Adviser”) and the Trust, on behalf of Etho Climate Leadership U.S. ETF (the “Fund”).
Pursuant to Section 15(c) of the 1940 Act, the Board must annually review and approve the Advisory Agreement after its initial two-year term: (i) by the vote of the Trustees or by a vote of the shareholders of the Fund; and (ii) by the vote of a majority of the Trustees who are not parties to the Advisory Agreement or “interested persons” of any party thereto, as defined in the 1940 Act (the “Independent Trustees”), cast in person at a meeting called for the purpose of voting on such approval. Each year, the Board calls and holds a meeting to decide whether to renew the Advisory Agreement for an additional one-year term. In preparation for such meeting, the Board requests and reviews a wide variety of information from the Adviser.
In reaching its decision, the Board, including the Independent Trustees, considered all factors it believed relevant, including: (i) the nature, extent and quality of the services provided to the Fund’s shareholders by the Adviser; (ii) the investment performance of the Fund; (iii) the Adviser’s costs and profits realized in providing services to the Fund, including any fall-out benefits enjoyed by the Adviser; (iv) comparative fee and expense data for the Fund in relation to other similar investment companies; (v) the extent to which economies of scale would be realized as the Fund grows and whether the advisory fees for the Fund reflects these economies of scale for the benefit of the Fund; and (vi) other financial benefits to the Adviser and its affiliates resulting from services rendered to the Fund. The Board’s review included written and oral information furnished to the Board prior to and at the meeting held on March 30, 2021, and throughout the year. Among other things, the Adviser provided responses to a detailed series of questions, which included information about the Adviser’s operations, service offerings, personnel, compliance program and financial condition. The Board then discussed the written and oral information that it received before the meeting and throughout the year, and the Adviser’s oral presentations and any other information that the Board received at the meeting, and deliberated on the renewal of the Advisory Agreement in light of this information.
The Independent Trustees were assisted throughout the contract review process by independent legal counsel. The Independent Trustees relied upon the advice of such counsel and their own business judgment in determining the material factors to be considered in evaluating the renewal of the Advisory Agreement, and the weight to be given to each such factor. The conclusions reached with respect to the Advisory Agreement were based on a comprehensive evaluation of all the information provided and not any single factor. Moreover, each Trustee may have placed varying emphasis on particular factors in reaching conclusions with respect to the Fund. The Independent Trustees conferred amongst themselves and independent legal counsel during a telephonic contract renewal meeting held prior to the March 30, 2021 meeting and also conferred in executive sessions both with and without representatives of management before and during the March 30th meeting. The Independent Trustees requested, received and considered additional information arising out of these executive sessions.
Nature, Extent and Quality of Services Provided by the Adviser
The Trustees considered the scope of services provided under the Advisory Agreement, noting that the Adviser provides investment management services to the Fund. The Board discussed the responsibilities of the Adviser, including: responsibility for the general management of the day-to-day investment and reinvestment of the assets of the Fund; determining the daily baskets of deposit securities and cash components; executing portfolio security trades for purchases and redemptions of Fund shares conducted on a cash-in-lieu basis; responsibility for daily monitoring of tracking error and quarterly reporting to the Board; and implementation of Board directives as they relate to the Fund. In considering the nature, extent and quality of the services provided by the Adviser, the Board considered the qualifications, experience and responsibilities of the Adviser’s investment personnel and the quality of the Adviser’s compliance and risk assessment infrastructure. The Board also considered the Adviser’s experience managing exchange-traded funds (“ETFs”), as well as the Adviser’s response to the market volatility and uncertainty during the recent pandemic.
Etho Climate Leadership U.S. ETF
APPROVAL OF ADVISORY AGREEMENT AND BOARD CONSIDERATIONS
For the Period Ended March 31, 2021 (Unaudited) (Continued)
The Board also considered other services provided to the Fund, such as overseeing the Fund’s service providers, monitoring adherence to the Fund’s investment restrictions, and monitoring compliance with various policies and procedures and with applicable securities laws.
Based on the factors above, as well as those discussed below, the Board concluded that it was satisfied with the nature, extent and quality of the services provided to the Fund by the Adviser.
Historical Performance
The Board then considered the past performance of the Fund. The Board reviewed information regarding the Fund’s performance with the performance of a group of peer funds and with the performance of the Fund’s underlying index for various time periods. The Board noted management’s explanation that analysis of investment performance, in absolute terms, is less relevant for the Fund than it is for actively managed funds, given the Fund’s index-based investment objectives. The Board also noted management’s further explanation that it is more relevant to review the performance of the Fund by focusing on the extent to which the Fund tracked its underlying index. The Board reviewed information regarding the Fund’s index tracking, discussing, as applicable, factors which contributed to the Fund’s tracking error. The Board noted management’s representations that the Fund’s performance satisfactorily tracked its underlying index, and the Board concluded that the Fund satisfactorily tracked its underlying index. The Board further noted that it had received and would continue to receive regular reports regarding the Fund’s performance, including with respect to its tracking error, at its quarterly meetings.
Cost of Services Provided, Profits and Economies of Scale
The Board reviewed the advisory fee for the Fund and compared it to the total operating expenses of comparable ETFs, as determined by an independent third party and the Adviser. Among other information, the Board noted that the advisory fee of the Fund was lower than the average and median expense ratios of its peer ETFs. The Trustees also considered the total expense ratios of other ETFs that they considered to be comparable, based on the investment objectives and strategies of the ETFs. The Board took into consideration management’s discussion of the fees, including that the Fund has a niche investment strategy that is substantially different than the strategies of many of the peer ETFs and, therefore, the information provided about the comparable ETFs may not provide meaningful direct comparisons to the Funds.
The Board noted the importance of the fact that the advisory fee for the Fund is a “unified fee,” meaning that the shareholders of the Fund pay no expenses other than the advisory fee and certain other costs such as interest charges on any borrowings, taxes, brokerage commissions and other expenses incurred in placing orders for the purchase and sale of securities and other investment instruments, acquired fund fees and expenses, accrued deferred tax liability, extraordinary expenses (such as, among other things and subject to Board approval, non-standard Board-related expenses and litigation against the Board, Trustees, Fund, Adviser, and officers of the Adviser), and distribution (12b-1) fees and expenses. The Board also noted that the Adviser was responsible for compensating the Trust’s other service providers and paying the Fund’s other expenses (except as noted above) out of its own fees and resources. The Board concluded that the advisory fee for the Fund is reasonable in light of the factors considered.
Etho Climate Leadership U.S. ETF
APPROVAL OF ADVISORY AGREEMENT AND BOARD CONSIDERATIONS
For the Period Ended March 31, 2021 (Unaudited) (Continued)
The Board also evaluated the compensation and other benefits received by the Adviser from its relationship with the Fund, taking into account profitability information provided by the Adviser. The Board received and reviewed profitability information with respect to the Fund and considered how��profit margins could affect the Adviser’s long-term viability and ability to attract and retain high-quality personnel. The Board also considered the impact on the Adviser’s profitability of payments received from partners involved with the Fund. Based on the information provided to the Trustees, the Trustees concluded that the net revenue retained by the Adviser from providing services to the Fund was not excessive in view of the nature, extent and quality of services provided to the Fund. The Board further considered other benefits derived by the Adviser and its affiliates from the Adviser’s relationship with the Fund.
In addition, the Board considered whether economies of scale may be realized for the Fund. The Board noted that the Adviser regularly considers whether fee reductions are appropriate as the Fund grows in size. The Board noted that a unitary fee provides a level of certainty in expenses for the Fund and effectively acts as a cap on the fees and expenses (except as noted above) that are borne by the Fund. The Board also took into account the significant investments that the Adviser has made in its business to help ensure the continued provision of high-quality services to the Funds, such as the hiring of new trading, legal and compliance personnel, and enhancements to technology and related systems. The Board concluded that no changes to the advisory fee structure of the Fund were necessary.
In its deliberations, the Board did not identify any single piece of information discussed above that was all-important, controlling or determinative of its decision.
Based on the Board’s deliberations and its evaluation of the information described above, the Board, including the Independent Trustees, unanimously: (a) concluded that the terms of the Advisory Agreement are fair and reasonable; (b) concluded that the Adviser’s fees are reasonable in light of the services that the Adviser provides to the Fund; and (c) approved the renewal of the Advisory Agreement for another year.
Etho Climate Leadership U.S. ETF
Expense Example
Period Ended March 31, 2021 (Unaudited)
As a shareholder of Etho Climate Leadership U.S. ETF (the “Fund”) you incur two types of costs: (1) transaction costs, including brokerage commissions on purchases and sales of Fund shares, and (2) ongoing costs, including management fees and other Fund expenses. These examples are intended to help you understand your ongoing costs (in dollars) of investing in the Fund and to compare these costs with the ongoing costs of investing in other funds. The example is based on an investment of $1,000 invested at the beginning of the period and held for the entire period (October 1, 2020 to March 31, 2021).
Actual Expenses
The first line of the table provides information about actual account values based on actual returns and actual expenses. You may use the information in this line, together with the amount you invested, to estimate the expenses that you paid over the period. Simply divide your account value by $1,000 (for example, an $8,600 account value divided by $1,000 = 8.6), then, multiply the result by the number in the first line under the heading entitled “Expenses Paid During Period” to estimate the expenses you paid on your account during this period.
Hypothetical Example for Comparison Purposes
The second line of the table provides information about hypothetical account values based on a hypothetical return and hypothetical expenses based on the Fund’s actual expense ratio and an assumed rate of return of 5% per year before expenses, which is not the Fund’s actual return. The hypothetical account values and expenses may not be used to estimate the actual ending account balance or expenses you paid for the period. You may use this information to compare the ongoing costs of investing in the Fund and other funds. To do so, compare this 5% hypothetical example with the 5% hypothetical examples that appear in the shareholder reports of the other funds. Please note that the expenses shown in the table are meant to highlight your ongoing costs only and do not reflect any transactional costs, such as brokerage commissions paid on purchases and sales of Fund shares. Therefore, the second line of the table is useful in comparing ongoing costs only and will not help you determine the relative total costs of owning different funds. If these transactional costs were included, your costs would have been higher.
Etho Climate Leadership U.S. ETF
| | | | | | | | | | | | Annualized | |
| | | | | | | | | | | | | | | Expense Ratio | |
| | | | | | | | | | | | | | | During Period | |
| | | Beginning | | | | | | | | | | | October 1, | |
| | | Account Value | | | Ending | | | Expenses Paid | | | 2020 to | |
| | | October 1, | | | Account Value | | | During the | | | March 31, | |
| | | 2020 | | | March 31, 2021 | | | Period^ | | | 2021 | |
| Actual | | $ | 1,000.00 | | | $ | 1,298.90 | | | $ | 2.58 | | | | 0.45 | % |
| | | | | | | | | | | | | | | | | |
| Hypothetical (5% annual) | | $ | 1,000.00 | | | $ | 1,022.69 | | | $ | 2.27 | | | | 0.45 | % |
^ The dollar amounts shown as expenses paid during the period are equal to the annualized six-month expense ratio multiplied by the average account value during the period, multiplied by 182/365 (to reflect the period from October 1, 2020 to March 31, 2021).
Etho Climate Leadership U.S. ETF
Statement Regarding Liquidity Risk Management Program (Unaudited)
ETF Managers Trust (the “Trust”) has adopted a liquidity risk management program (the “Program”). The Trust’s Board of Trustees (the “Board”) has designated ETF Managers Group LLC (the “Program Administrator”) as the administrator of the Program. The Program Administrator has designated a committee (the “Committee”), composed of personnel from multiple departments, including investment operations and compliance, that is responsible for the implementation and ongoing administration of the Program, which includes assessing the liquidity risk of the Etho Climate Leadership U.S. ETF (the “Fund”) under both normal and reasonably foreseeable stressed conditions.
Under the Program, the Program Administrator assesses, manages and periodically reviews the Fund’s liquidity risk, based on factors specific to the circumstances of the Fund. Liquidity risk is the risk that the Fund could not meet shareholder redemption requests without significant dilution of remaining shareholders’ interests in the Fund. This risk is managed by monitoring the degree of liquidity of the Fund’s investments and limiting the amount of the Fund’s illiquid investments, among other means. The Program Administrator’s process of determining the degree of liquidity of the Fund’s investments is supported by one or more third-party liquidity assessment vendors.
At a meeting of the Board on March 30, 2021, the Adviser provided a written report to the Board addressing the operation, and the adequacy and effectiveness of the implementation, of the Program, including, the operation of any Highly Liquid Investment Minimum, where applicable, and any material changes to the Program, for the initial period from February 29, 2020 through March 30, 2021 (the “Reporting Period”). No significant liquidity events impacting the Fund were noted in the report and it was represented that, as of March 30, 2021, the Fund was primarily highly liquid and, during the Reporting Period, the Fund held less than 15% in illiquid securities. In addition, the Program Administrator provided its assessment that Program implementation was effective and that the Program operated adequately and effectively to enable the Program Administrator to oversee and manage liquidity risk and ensure the Fund is able to meet requests to redeem shares without significant dilution to the remaining investors’ interest in the Fund.
There can be no assurance that the Program will achieve its objectives in the future. Please refer to the Fund’s prospectus for more information regarding the Fund’s exposure to liquidity risk and other principal risks to which an investment in the Fund may be subject.
Etho Climate Leadership U.S. ETF
SUPPLEMENTARY INFORMATION
March 31, 2021 (Unaudited)
NOTE 1 – FREQUENCY DISTRIBUTION OF PREMIUMS AND DISCOUNTS
Information regarding how often shares of the Fund traded on the Exchange at a price above (i.e., at a premium) or below (i.e., at a discount) the NAV is available on the Fund’s website at www.ethoetf.com.
NOTE 2 – FEDERAL TAX INFORMATION
Qualified Dividend Income/Dividends Received Deduction
For the fiscal year ended September 30, 2020, certain dividends paid by the Fund may be subject to a maximum tax rate of 15%, as provided for by the Jobs and Growth Tax Reconciliation Act of 2003. The percentage of dividends declared from ordinary income designated as qualified dividend income was as follows:
| Fund Name | QDI |
| Etho Climate Leadership U.S. ETF | 100.00% |
For corporate shareholders, the percent of ordinary income distributions qualifying for the corporate dividends received deduction for the fiscal year ended September 30, 2020 was as follows:
| Fund Name | DRD |
| Etho Climate Leadership U.S. ETF | 100.00% |
Short Term Capital Gain
The percentage of taxable ordinary income distributions that are designated as short-term capital gain distributions under Internal Revenue Section 871 (k)(2)(C) for the Fund was as follows:
| Fund Name | Short-Term Capital Gain |
| Etho Climate Leadership U.S. ETF | 0.00% |
NOTE 3 – INFORMATION ABOUT PORTFOLIO HOLDINGS
The Fund files a complete schedule of portfolio holdings with the SEC for its first and third fiscal quarters on Part F of Form N-PORT. Once filed, the Fund’s Part F of Form N-PORT is available without charge, upon request on the SEC’s website (www.sec.gov), the Fund’s website (www.ethoetf.com) and is available by calling (877) 756-7873. The Fund’s portfolio holdings are posted on the Fund’s website at www.ethoetf.com daily.
NOTE 4 - INFORMATION ABOUT PROXY VOTING
A description of the policies and procedures the Fund uses to determine how to vote proxies relating to portfolio securities is provided in the Statement of Additional Information (“SAI”). The SAI is available without charge upon request by calling toll-free at 1-844-ETF-MGRS (1-844-383-6477), by accessing the SEC’s website at www.sec.gov, or by accessing the Fund’s website at www.ethoetf.com.
Information regarding how the Fund voted proxies relating to portfolio securities during the period ending June 30 is available by calling toll-free at 1-844-ETF-MGRS (1-844-383-6477) or by accessing the SEC’s website at www.sec.gov.
Carefully consider the Fund’s investment objectives, risk factors, charges, and expenses before investing. This and additional information can be found in the Fund’s prospectus, which may be obtained by calling 1-844-ETF-MGRS (1-844-383-6477) or by visiting www.ethoetf.com. Read the prospectus carefully before investing.
Etho Climate Leadership U.S. ETF
Board of Trustees (Unaudited)
Set forth below are the names, birth years, positions with the Trust, length of term of office, and the principal occupations and other directorships held during at least the last five years of each of the persons currently serving as a Trustee of the Trust, as well as information about each officer. The business address of each Trustee and officer is 30 Maple Street, 2nd Floor, Summit, New Jersey 07901. The SAI includes additional information about Fund directors and is available, without charge, upon request by calling 1-844-ETF-MGRS (1-844-383-6477).
Name and Year of Birth | Position(s) Held with the Trust, Term of Office and Length of Time Served | Principal Occupation(s) During Past 5 Years | Number of Portfolios in Fund Complex Overseen By Trustee | Other Directorships Held by Trustee During Past 5 Years |
| Interested Trustee and Officers |
Samuel Masucci, III (1962) | Trustee, Chairman of the Board and President (since 2012); Secretary (since 2014) | Chief Executive Officer, Exchange Traded Managers Group LLC (since 2013); Chief Executive Officer, ETF Managers Group LLC (since 2016); Chief Executive Officer, ETF Managers Capital LLC (commodity pool operator) (since 2014); Chief Executive Officer (2012-2016) and Chief Compliance Officer (2012- 2014), Factor Advisors, LLC (investment adviser); President and Chief Executive Officer, Factor Capital Management LLC (2012- 2014) (commodity pool operator). | 11 | None |
John A. Flanagan, (1946) | Treasurer (since 2015) | President, John A. Flanagan CPA, LLC (accounting services) (since 2010); Treasurer, ETF Managers Trust (since 2015); Chief Financial Officer, ETF Managers Capital, LLC (commodity pool operator) (since 2015). | n/a | n/a |
Reshma A. Tanczos (1978) | Chief Compliance Officer (since 2016) | Chief Compliance Officer of ETFMG Financial LLC (since 2017); Chief Compliance Officer, ETF Managers Group LLC (since 2016); Chief Compliance Officer, ETF Managers Capital LLC (since 2016); Partner, Crow & Cushing (law firm) (2007-2016). | n/a | n/a |
* Mr. Masucci is an interested Trustee by virtue of his role as the Chief Executive Officer of the Adviser.
Etho Climate Leadership U.S. ETF
Board of Trustees (Unaudited) (Continued)
Name and Year of Birth | Position(s) Held with the Trust, Term of Office and Length of Time Served | Principal Occupation(s) During Past 5 Years | Number of Portfolios in Fund Complex Overseen By Trustee | Other Directorships Held by Trustee During Past 5 Years |
Matthew J. Bromberg (1973) | Assistant Secretary (since 2020) | General Counsel and Secretary of Exchange Traded Managers Group LLC (since 2020); ETF Managers Group LLC (since 2020); ETFMG Financial LLC (since 2020); ETF Managers Capital LLC (since 2020); Partner of Dorsey & Whitney LLP (law firm) (2019-2020); General Counsel of WBI Investments, Inc. (2016-2019); Millington Securities, Inc. (2016-2019); and Partner of Reed Smith (law firm) (2015-2016). | n/a | n/a |
| Independent Trustees |
Terry Loebs (1963) | Trustee (since 2014); Lead Independent Trustee (since 2020) | Founder and Managing Member, Pulsenomics LLC (index product development and consulting firm) (since 2011); Managing Director, MacroMarkets, LLC (exchange-traded products firm) (2006-2011). | 11 | None |
Eric Wiegel (1960) | Trustee (since 2020) | Senior Portfolio Manager, Little House Capital (2019-present); Managing Partner, Global Focus Capital LLC (2013-present); Chief Investment Officer, Insight Financial Strategist LLC (2017-2018). | 11 | None |
Advisor
ETF Managers Group, LLC
30 Maple Street, Suite 2, Summit, NJ 07901
Distributor
ETFMG Financial LLC
30 Maple Street, Suite 2, Summit, NJ 07901
Custodian
U.S. Bank National Association
Custody Operations
1555 North River Center Drive, Suite 302, Milwaukee, Wisconsin 53212
Transfer Agent
U.S. Bancorp Fund Services, LLC doing business as U.S. Bank Global Fund Services
615 East Michigan Street, Milwaukee, Wisconsin 53202
Securities Lending Agent
U.S. Bank, National Association
Securities Lending
800 Nicolet Mall
Minneapolis, MN 55402-7020
Independent Registered Public Accounting Firm
WithumSmith + Brown, PC
1411 Broadway, 9th Floor, New York, NY 10018
Legal Counsel
Sullivan & Worcester LLP
1666 K Street NW, Washington, DC 20006