FY 2019 RESULTS LONDON 14 FEBRUARY 2020 ©VEON Ltd 2020
AGENDA OPENING Nik Kershaw - Head of IR OVERVIEW AND ACHIEVEMENTS Ursula Burns - Chairman and CEO STRATEGY AND FINANCIAL RESULTS Alex Kazbegi - CSO RUSSIA AND KAZAKHSTAN REVIEW Kaan Terzioglu - COO PAKISTAN AND UKRAINE REVIEW Sergi Herrero - COO CAPITAL ALLOCATION AND DIVIDEND POLICY Alex Kazbegi - CSO CLOSING REMARKS Ursula Burns - Chairman and CEO 2
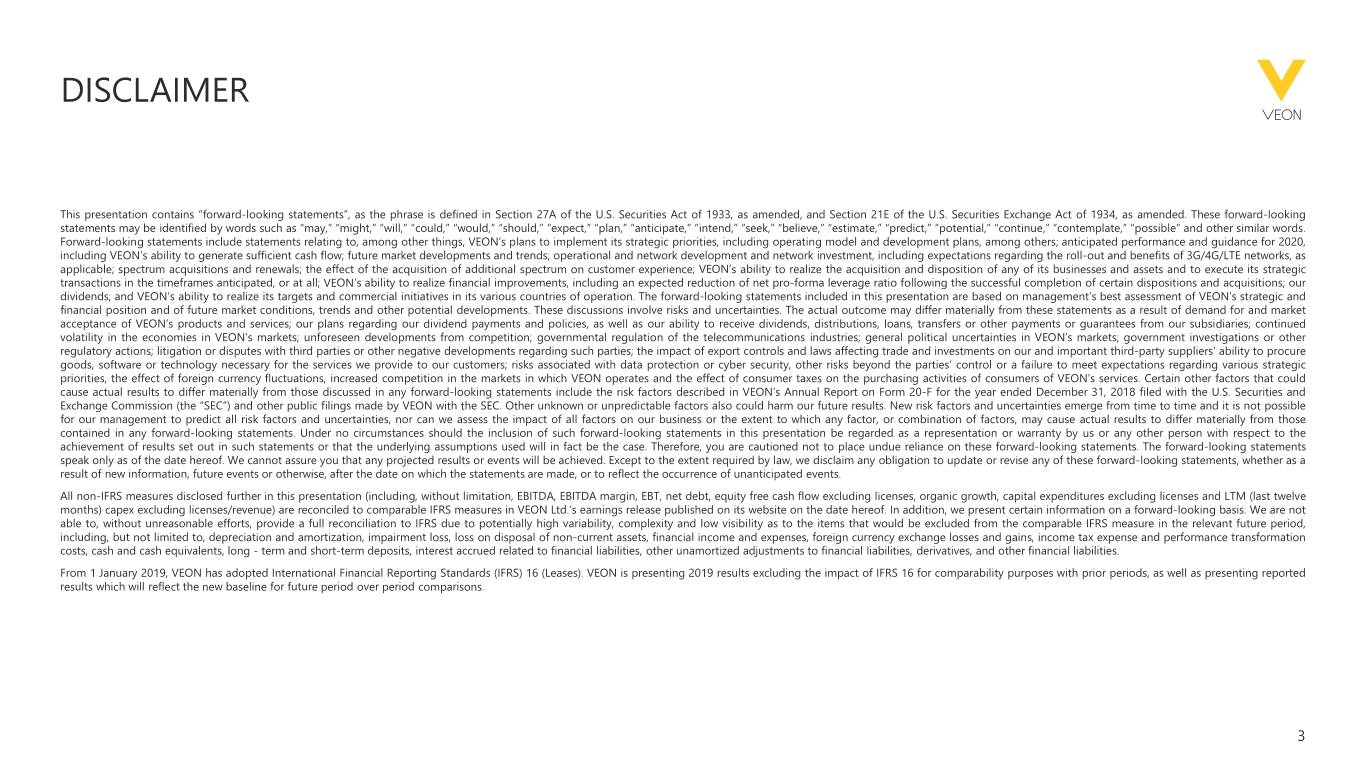
DISCLAIMER This presentation contains “forward-looking statements”, as the phrase is defined in Section 27A of the U.S. Securities Act of 1933, as amended, and Section 21E of the U.S. Securities Exchange Act of 1934, as amended. These forward-looking statements may be identified by words such as “may,” “might,” “will,” “could,” “would,” “should,” “expect,” “plan,” “anticipate,” “intend,” “seek,” “believe,” “estimate,” “predict,” “potential,” “continue,” “contemplate,” “possible” and other similar words. Forward-looking statements include statements relating to, among other things, VEON’s plans to implement its strategic priorities, including operating model and development plans, among others; anticipated performance and guidance for 2020, including VEON’s ability to generate sufficient cash flow; future market developments and trends; operational and network development and network investment, including expectations regarding the roll-out and benefits of 3G/4G/LTE networks, as applicable; spectrum acquisitions and renewals; the effect of the acquisition of additional spectrum on customer experience; VEON’s ability to realize the acquisition and disposition of any of its businesses and assets and to execute its strategic transactions in the timeframes anticipated, or at all; VEON’s ability to realize financial improvements, including an expected reduction of net pro-forma leverage ratio following the successful completion of certain dispositions and acquisitions; our dividends; and VEON’s ability to realize its targets and commercial initiatives in its various countries of operation. The forward-looking statements included in this presentation are based on management’s best assessment of VEON’s strategic and financial position and of future market conditions, trends and other potential developments. These discussions involve risks and uncertainties. The actual outcome may differ materially from these statements as a result of demand for and market acceptance of VEON’s products and services; our plans regarding our dividend payments and policies, as well as our ability to receive dividends, distributions, loans, transfers or other payments or guarantees from our subsidiaries; continued volatility in the economies in VEON’s markets; unforeseen developments from competition; governmental regulation of the telecommunications industries; general political uncertainties in VEON’s markets; government investigations or other regulatory actions; litigation or disputes with third parties or other negative developments regarding such parties; the impact of export controls and laws affecting trade and investments on our and important third-party suppliers' ability to procure goods, software or technology necessary for the services we provide to our customers; risks associated with data protection or cyber security, other risks beyond the parties’ control or a failure to meet expectations regarding various strategic priorities, the effect of foreign currency fluctuations, increased competition in the markets in which VEON operates and the effect of consumer taxes on the purchasing activities of consumers of VEON’s services. Certain other factors that could cause actual results to differ materially from those discussed in any forward-looking statements include the risk factors described in VEON’s Annual Report on Form 20-F for the year ended December 31, 2018 filed with the U.S. Securities and Exchange Commission (the “SEC”) and other public filings made by VEON with the SEC. Other unknown or unpredictable factors also could harm our future results. New risk factors and uncertainties emerge from time to time and it is not possible for our management to predict all risk factors and uncertainties, nor can we assess the impact of all factors on our business or the extent to which any factor, or combination of factors, may cause actual results to differ materially from those contained in any forward-looking statements. Under no circumstances should the inclusion of such forward-looking statements in this presentation be regarded as a representation or warranty by us or any other person with respect to the achievement of results set out in such statements or that the underlying assumptions used will in fact be the case. Therefore, you are cautioned not to place undue reliance on these forward-looking statements. The forward-looking statements speak only as of the date hereof. We cannot assure you that any projected results or events will be achieved. Except to the extent required by law, we disclaim any obligation to update or revise any of these forward-looking statements, whether as a result of new information, future events or otherwise, after the date on which the statements are made, or to reflect the occurrence of unanticipated events. All non-IFRS measures disclosed further in this presentation (including, without limitation, EBITDA, EBITDA margin, EBT, net debt, equity free cash flow excluding licenses, organic growth, capital expenditures excluding licenses and LTM (last twelve months) capex excluding licenses/revenue) are reconciled to comparable IFRS measures in VEON Ltd.’s earnings release published on its website on the date hereof. In addition, we present certain information on a forward-looking basis. We are not able to, without unreasonable efforts, provide a full reconciliation to IFRS due to potentially high variability, complexity and low visibility as to the items that would be excluded from the comparable IFRS measure in the relevant future period, including, but not limited to, depreciation and amortization, impairment loss, loss on disposal of non-current assets, financial income and expenses, foreign currency exchange losses and gains, income tax expense and performance transformation costs, cash and cash equivalents, long - term and short-term deposits, interest accrued related to financial liabilities, other unamortized adjustments to financial liabilities, derivatives, and other financial liabilities. From 1 January 2019, VEON has adopted International Financial Reporting Standards (IFRS) 16 (Leases). VEON is presenting 2019 results excluding the impact of IFRS 16 for comparability purposes with prior periods, as well as presenting reported results which will reflect the new baseline for future period over period comparisons. 3
AGENDA OPENING Nik Kershaw - Head of IR OVERVIEW AND ACHIEVEMENTS Ursula Burns - Chairman and CEO STRATEGY AND FINANCIAL RESULTS Alex Kazbegi - CSO RUSSIA AND KAZAKHSTAN REVIEW Kaan Terzioglu - COO PAKISTAN AND UKRAINE REVIEW Sergi Herrero - COO CAPITAL ALLOCATION AND DIVIDEND POLICY Alex Kazbegi - CSO CLOSING REMARKS Ursula Burns - Chairman and CEO 4
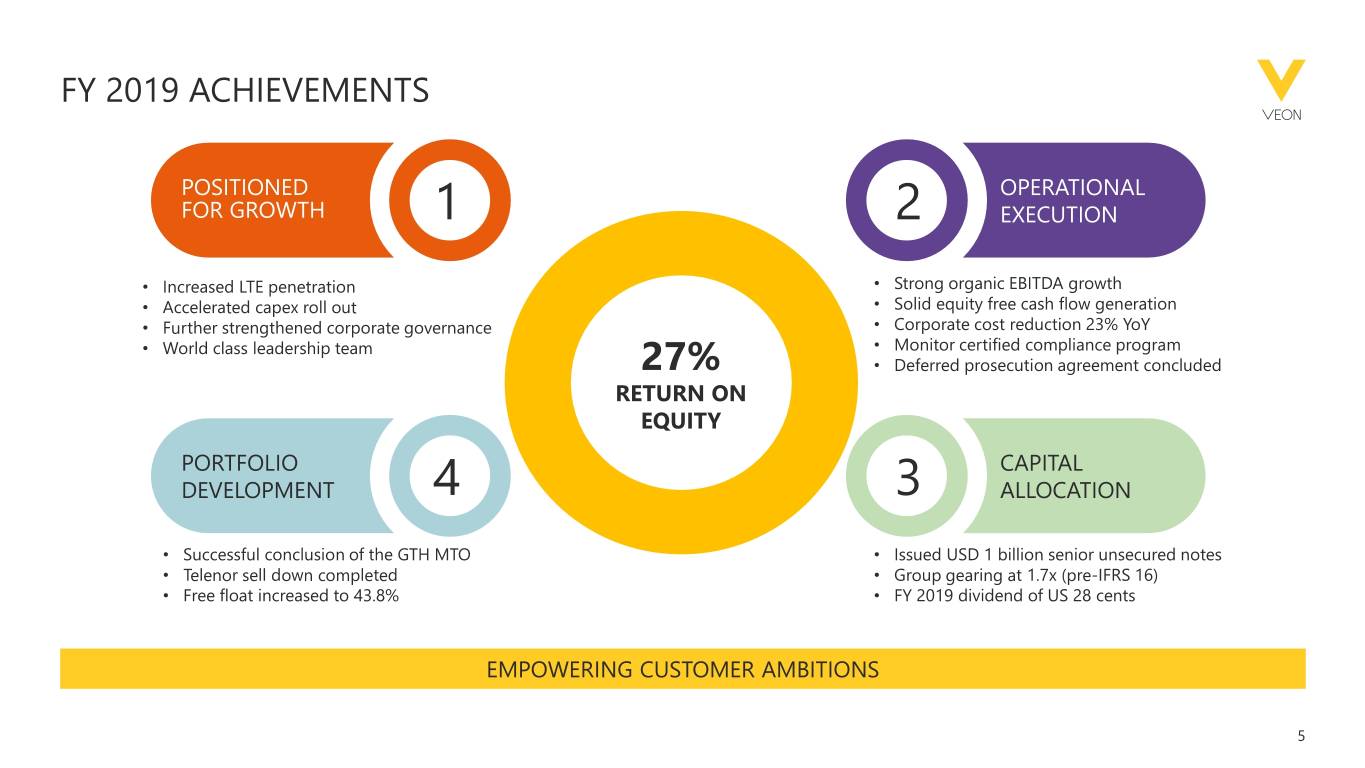
FY 2019 ACHIEVEMENTS POSITIONED OPERATIONAL FOR GROWTH 1 2 EXECUTION • Increased LTE penetration • Strong organic EBITDA growth • Accelerated capex roll out • Solid equity free cash flow generation • Further strengthened corporate governance • Corporate cost reduction 23% YoY • World class leadership team • Monitor certified compliance program 27% • Deferred prosecution agreement concluded RETURN ON EQUITY PORTFOLIO CAPITAL DEVELOPMENT 4 3 ALLOCATION • Successful conclusion of the GTH MTO • Issued USD 1 billion senior unsecured notes • Telenor sell down completed • Group gearing at 1.7x (pre-IFRS 16) • Free float increased to 43.8% • FY 2019 dividend of US 28 cents EMPOWERING CUSTOMER AMBITIONS 5
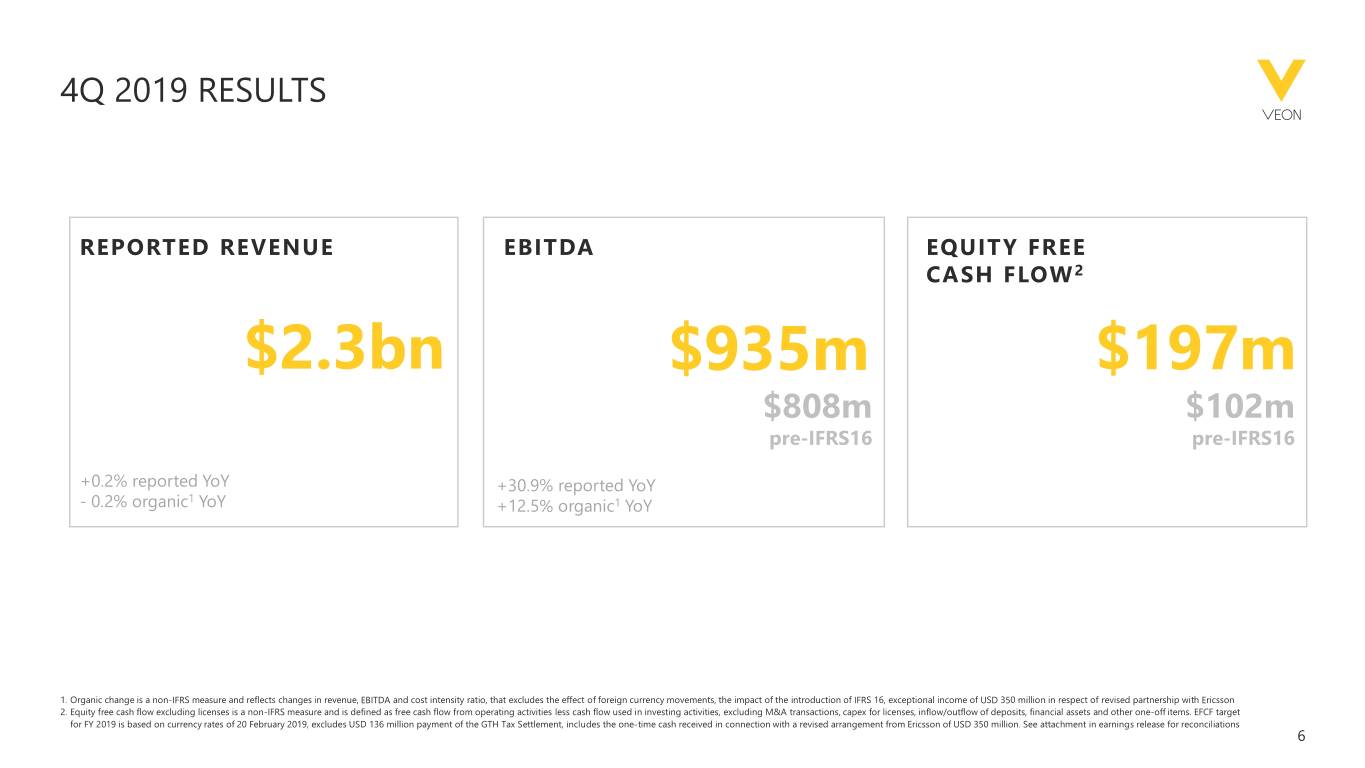
4Q 2019 RESULTS REPORTED REVENUE EBITDA EQUITY FREE 2 $567m CASH FLOW •$54m $2.3bn $935m $197m $808m $102m pre-IFRS16 pre-IFRS16 +0.2% reported YoY +30.9% reported YoY - 0.2% organic1 YoY +12.5% organic1 YoY 1. Organic change is a non-IFRS measure and reflects changes in revenue, EBITDA and cost intensity ratio, that excludes the effect of foreign currency movements, the impact of the introduction of IFRS 16, exceptional income of USD 350 million in respect of revised partnership with Ericsson 2. Equity free cash flow excluding licenses is a non-IFRS measure and is defined as free cash flow from operating activities less cash flow used in investing activities, excluding M&A transactions, capex for licenses, inflow/outflow of deposits, financial assets and other one-off items. EFCF target for FY 2019 is based on currency rates of 20 February 2019, excludes USD 136 million payment of the GTH Tax Settlement, includes the one-time cash received in connection with a revised arrangement from Ericsson of USD 350 million. See attachment in earnings release for reconciliations 6
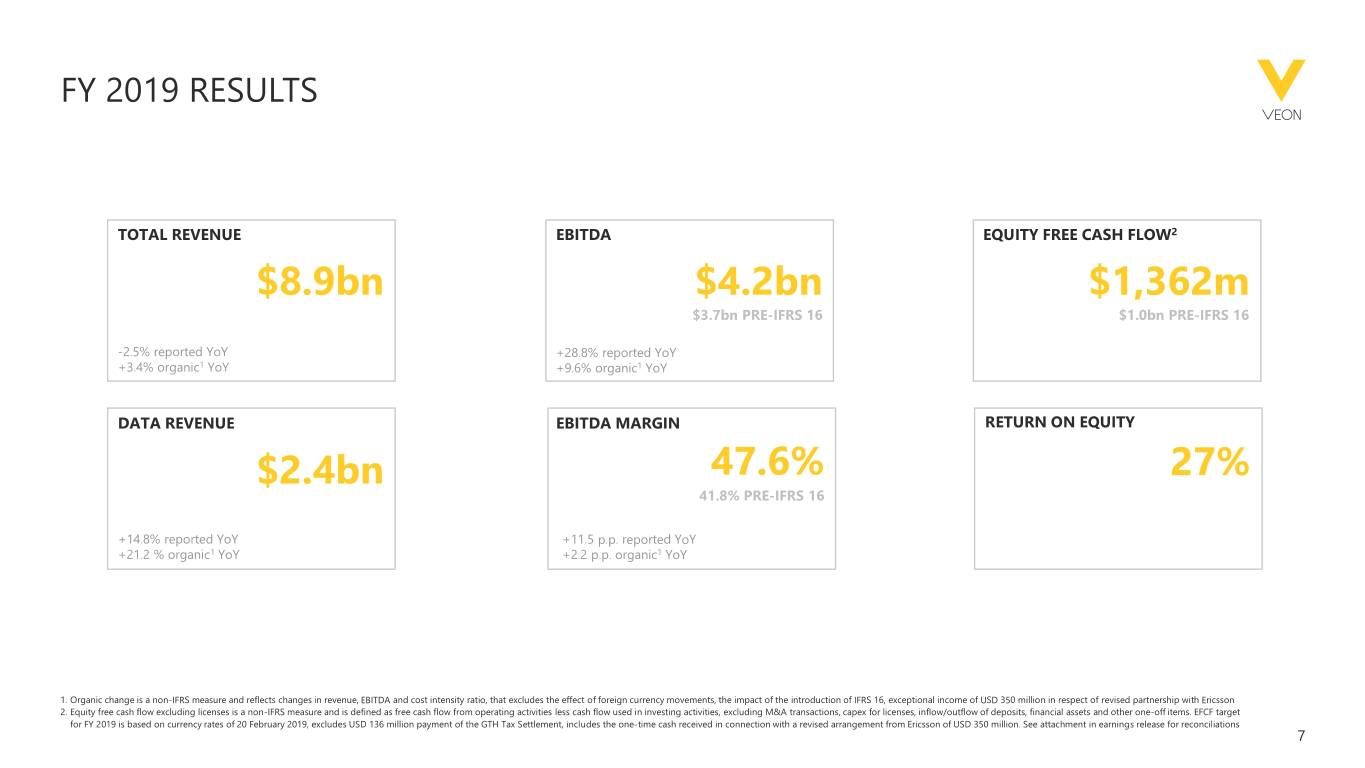
FY 2019 RESULTS TOTAL REVENUE EBITDA EQUITY FREE CASH FLOW2 $8.9bn $4.2bn $1,362m $3.7bn PRE-IFRS 16 $1.0bn PRE-IFRS 16 -2.5% reported YoY +28.8% reported YoY +3.4% organic1 YoY +9.6% organic1 YoY DATA REVENUE EBITDA MARGIN RETURN ON EQUITY $2.4bn 47.6% 27% 41.8% PRE-IFRS 16 +14.8% reported YoY +11.5 p.p. reported YoY +21.2 % organic1 YoY +2.2 p.p. organic1 YoY 1. Organic change is a non-IFRS measure and reflects changes in revenue, EBITDA and cost intensity ratio, that excludes the effect of foreign currency movements, the impact of the introduction of IFRS 16, exceptional income of USD 350 million in respect of revised partnership with Ericsson 2. Equity free cash flow excluding licenses is a non-IFRS measure and is defined as free cash flow from operating activities less cash flow used in investing activities, excluding M&A transactions, capex for licenses, inflow/outflow of deposits, financial assets and other one-off items. EFCF target for FY 2019 is based on currency rates of 20 February 2019, excludes USD 136 million payment of the GTH Tax Settlement, includes the one-time cash received in connection with a revised arrangement from Ericsson of USD 350 million. See attachment in earnings release for reconciliations 7
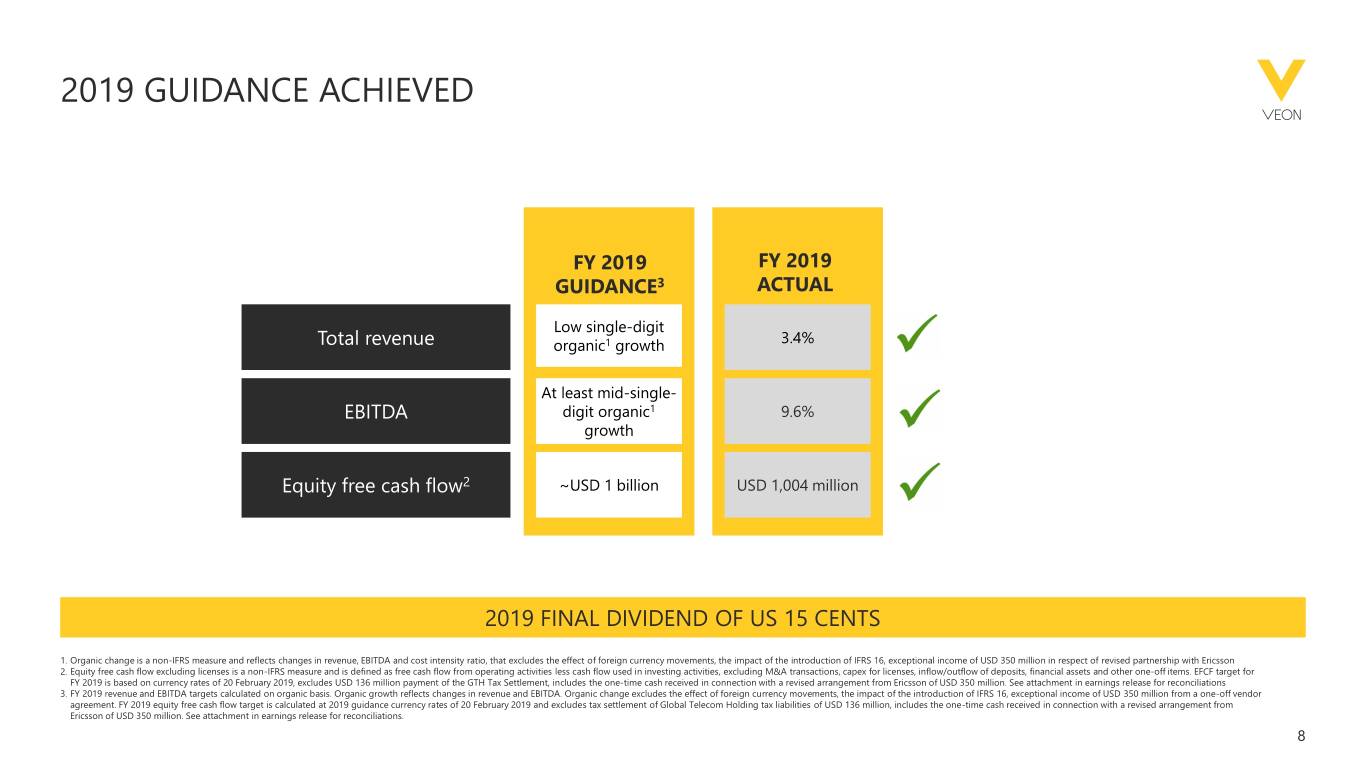
2019 GUIDANCE ACHIEVED FY 2019 FY 2019 GUIDANCE3 ACTUAL Low single-digit Total revenue organic1 growth 3.4% At least mid-single- EBITDA digit organic1 9.6% growth Equity free cash flow2 ~USD 1 billion USD 1,004 million 2019 FINAL DIVIDEND OF US 15 CENTS 1. Organic change is a non-IFRS measure and reflects changes in revenue, EBITDA and cost intensity ratio, that excludes the effect of foreign currency movements, the impact of the introduction of IFRS 16, exceptional income of USD 350 million in respect of revised partnership with Ericsson 2. Equity free cash flow excluding licenses is a non-IFRS measure and is defined as free cash flow from operating activities less cash flow used in investing activities, excluding M&A transactions, capex for licenses, inflow/outflow of deposits, financial assets and other one-off items. EFCF target for FY 2019 is based on currency rates of 20 February 2019, excludes USD 136 million payment of the GTH Tax Settlement, includes the one-time cash received in connection with a revised arrangement from Ericsson of USD 350 million. See attachment in earnings release for reconciliations 3. FY 2019 revenue and EBITDA targets calculated on organic basis. Organic growth reflects changes in revenue and EBITDA. Organic change excludes the effect of foreign currency movements, the impact of the introduction of IFRS 16, exceptional income of USD 350 million from a one-off vendor agreement. FY 2019 equity free cash flow target is calculated at 2019 guidance currency rates of 20 February 2019 and excludes tax settlement of Global Telecom Holding tax liabilities of USD 136 million, includes the one-time cash received in connection with a revised arrangement from Ericsson of USD 350 million. See attachment in earnings release for reconciliations. 8
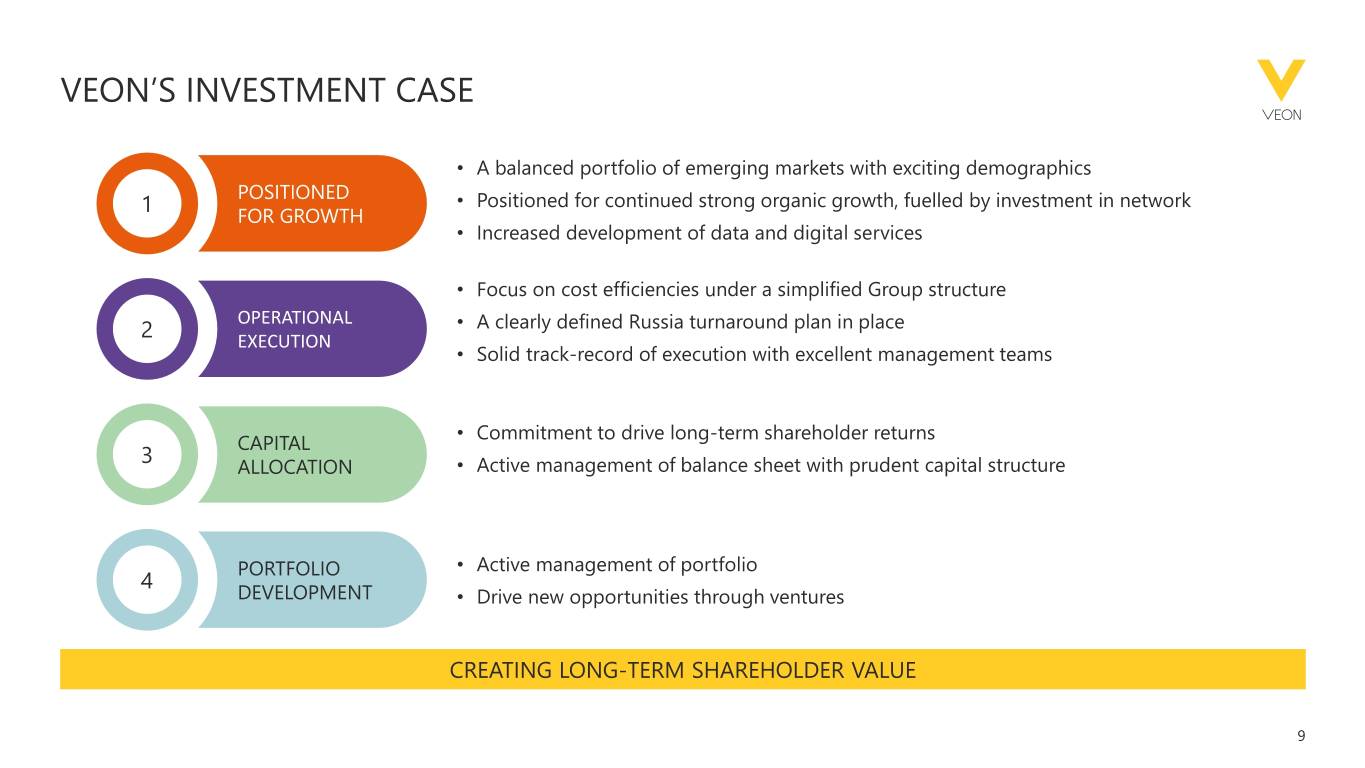
VEON’S INVESTMENT CASE • A balanced portfolio of emerging markets with exciting demographics POSITIONED 1 • Positioned for continued strong organic growth, fuelled by investment in network FOR GROWTH • Increased development of data and digital services • Focus on cost efficiencies under a simplified Group structure OPERATIONAL 2 • A clearly defined Russia turnaround plan in place EXECUTION • Solid track-record of execution with excellent management teams • Commitment to drive long-term shareholder returns CAPITAL 3 ALLOCATION • Active management of balance sheet with prudent capital structure PORTFOLIO • Active management of portfolio 4 DEVELOPMENT • Drive new opportunities through ventures CREATING LONG-TERM SHAREHOLDER VALUE 9
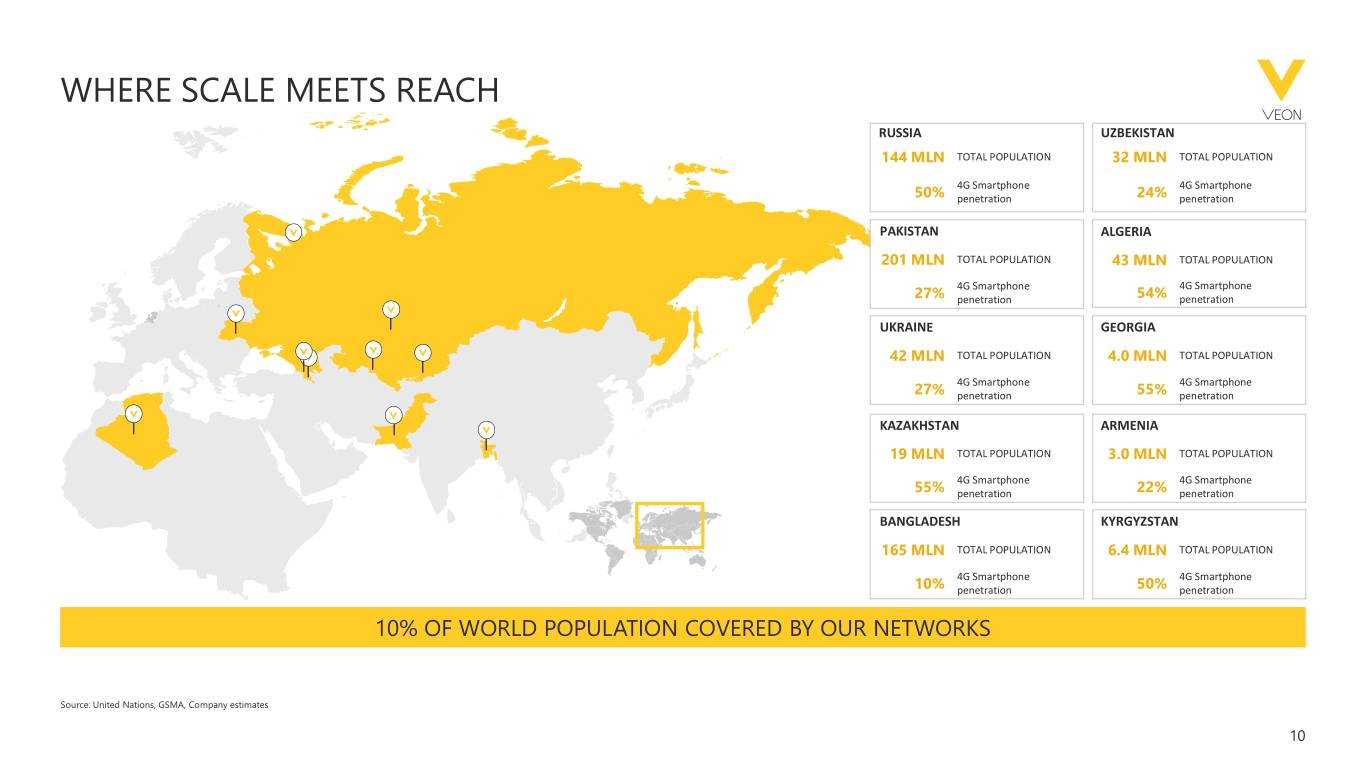
WHERE SCALE MEETS REACH RUSSIA UZBEKISTAN 144 MLN TOTAL POPULATION 32 MLN TOTAL POPULATION 4G Smartphone 4G Smartphone 50% penetration 24% penetration PAKISTAN ALGERIA 201 MLN TOTAL POPULATION 43 MLN TOTAL POPULATION 4G Smartphone 4G Smartphone 27% penetration 54% penetration UKRAINE GEORGIA 42 MLN TOTAL POPULATION 4.0 MLN TOTAL POPULATION 4G Smartphone 4G Smartphone 27% penetration 55% penetration KAZAKHSTAN ARMENIA 19 MLN TOTAL POPULATION 3.0 MLN TOTAL POPULATION 4G Smartphone 4G Smartphone 55% penetration 22% penetration BANGLADESH KYRGYZSTAN 165 MLN TOTAL POPULATION 6.4 MLN TOTAL POPULATION 4G Smartphone 4G Smartphone 10% penetration 50% penetration 10% OF WORLD POPULATION COVERED BY OUR NETWORKS Source: United Nations, GSMA, Company estimates 10
AGENDA OPENING Nik Kershaw - Head of IR OVERVIEW AND ACHIEVEMENTS Ursula Burns - Chairman and CEO STRATEGY AND FINANCIAL RESULTS Alex Kazbegi - CSO RUSSIA AND KAZAKHSTAN REVIEW Kaan Terzioglu - COO PAKISTAN AND UKRAINE REVIEW Sergi Herrero - COO CAPITAL ALLOCATION AND DIVIDEND POLICY Alex Kazbegi - CSO CLOSING REMARKS Ursula Burns - Chairman and CEO 11

SOLID GROUP PERFORMANCE CORNERSTONE GROWTH ENGINES FRONTIER MARKETS RUSSIA PAKISTAN UKRAINE OTHER MARKETS • Weak operational • Strong revenue and EBITDA growth2 • Top line strong double-digit growth performance, investing • Data customers growth of 18% YoY • Data customers growth of 15% YoY ALGERIA for the future • 4G/LTE network coverage of 52% • 4G/LTE network coverage of 74% • Growing market share in • Further focus on a challenging macro customer experience environment • Retail optimization KAZAKHSTAN UZBEKISTAN BANGLADESH • Data customer growth of 10% YoY • Strong underlying performance • Good performance • 4G/LTE network coverage of 68% • 4G network coverage of 26% supported by continued network investment 15% FY 2019 43% 42% FY2019 FY 2019 1 EBITDA contribution EBITDA1 contribution EBITDA1 contribution STRENGTH IN GROWTH MARKETS OFFSETTING WEAKNESS IN RUSSIA 1. EBITDA and capex is presented excluding IFRS 16 impact. Financials of growth engines and frontier markets are aggregations of the results of the respective individual countries 2. Adjusted for the negative impact of tax regime change, Total revenue and EBITDA of Pakistan grew by 14.1% and 5.3% respectively for 4Q19. Pakistan reported revenues +1.9% and EBITDA (incl. IFRS 16) +7.1% for 4Q19 12
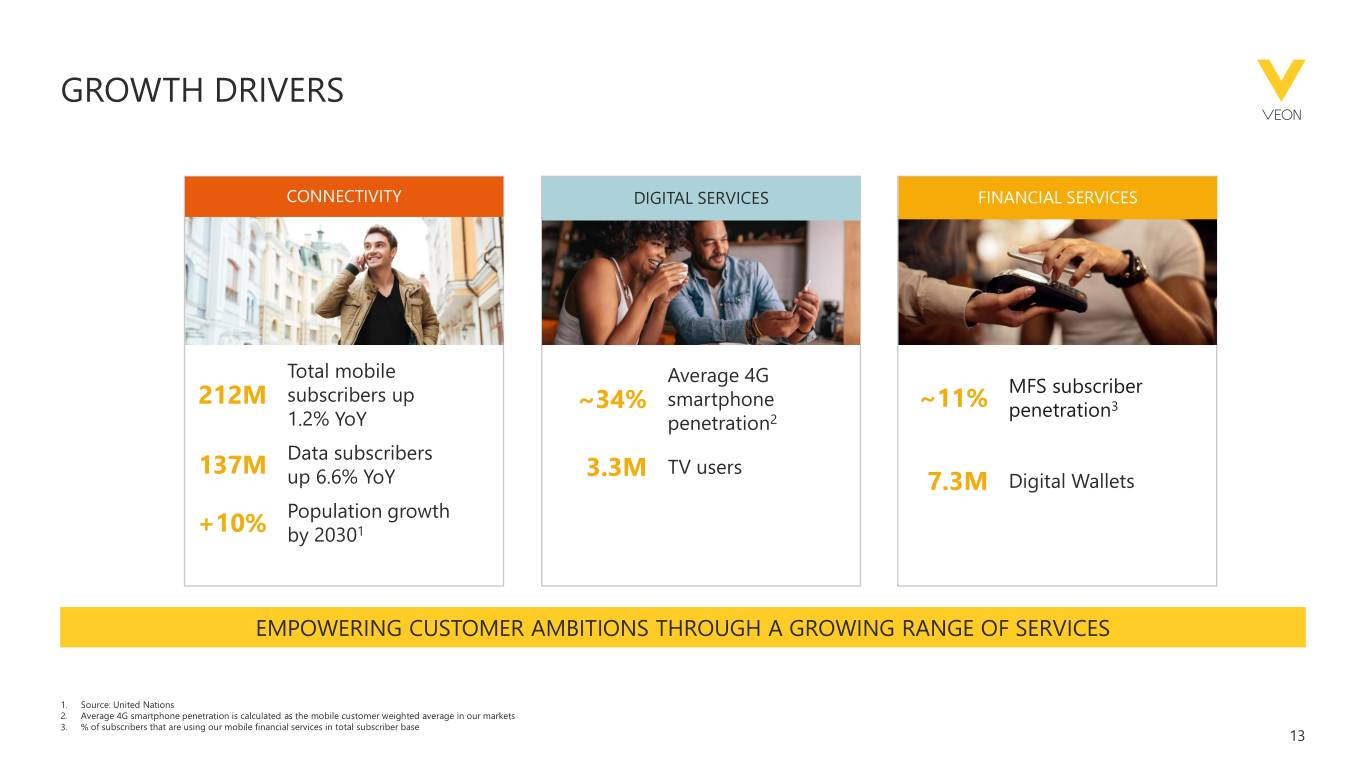
GROWTH DRIVERS CONNECTIVITY DIGITAL SERVICES FINANCIAL SERVICES Total mobile Average 4G MFS subscriber 212M subscribers up smartphone ~34% ~11% penetration3 1.2% YoY penetration2 Data subscribers 137M 3.3M TV users up 6.6% YoY 7.3M Digital Wallets Population growth +10% by 20301 EMPOWERING CUSTOMER AMBITIONS THROUGH A GROWING RANGE OF SERVICES 1. Source: United Nations 2. Average 4G smartphone penetration is calculated as the mobile customer weighted average in our markets 3. % of subscribers that are using our mobile financial services in total subscriber base 13

EXPANDING DIGITAL ROUTES AND DEPLOYING NEW SERVICES ECOSYSTEMS CONTENT FINANCIAL SERVICES (SELF-CARE APPS) (TV) (MFS2, DFS) MAU1 TV MAU1 Total MFS users Digital Wallets (million) (million) (million) (million) Total… 19.6 Russia 10.1 Russia 2.2 Russia 4.9 Pakistan 3.5 3 Ukraine 1.6 Pakistan 0.5 Pakistan 1.7 7.3 9.0 Kazakhstan 0.9 Ukraine 0.1 Ukraine 1.6 Uzbekistan 0.7 Kazakhstan 0.3 Kazakhstan 2.5 Algeria 0.2 Bangladesh 0.5 Uzbekistan 0.2 Uzbekistan 0.2 Kyrgyzstan 0.5 Georgia 0.3 1. MAU refers to Monthly Active Users 2. MFS (mobile financial services) is a variety of innovative services, such as mobile commerce or m-commerce, that use a mobile phone as the primary payment user interface and allow mobile customers to conduct money transfers to pay for items such as goods at an online store, utility payments, fines and state fees, loan repayments, domestic and international remittances, mobile insurance and tickets for air and rail travel, all via their mobile phone 3. Total MFS users in Pakistan amount to 9.0 million of which 7.3 are digital wallets 14
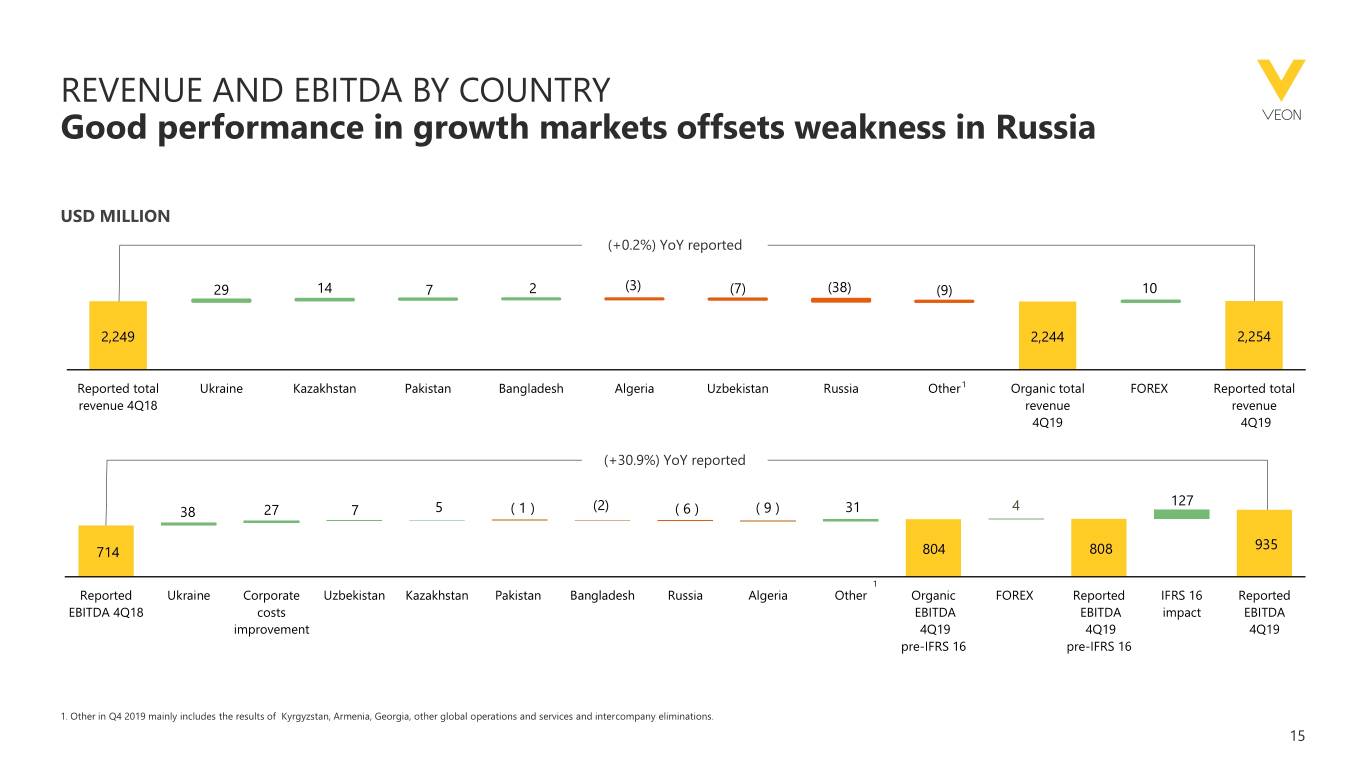
REVENUE AND EBITDA BY COUNTRY Good performance in growth markets offsets weakness in Russia USD MILLION (+0.2%) YoY reported 29 14 7 2 (3) (7) (38) (9) 10 2,249 2,244 2,254 Reported total Ukraine Kazakhstan Pakistan Bangladesh Algeria Uzbekistan Russia Other1 Organic total FOREX Reported total revenue 4Q18 revenue revenue 4Q19 4Q19 (+30.9%) YoY reported 127 38 27 7 5 ( 1 ) (2) ( 6 ) ( 9 ) 31 4 935 714 804 808 1 Reported Ukraine Corporate Uzbekistan Kazakhstan Pakistan Bangladesh Russia Algeria Other Organic FOREX Reported IFRS 16 Reported EBITDA 4Q18 costs EBITDA EBITDA impact EBITDA improvement 4Q19 4Q19 4Q19 pre-IFRS 16 pre-IFRS 16 1. Other in Q4 2019 mainly includes the results of Kyrgyzstan, Armenia, Georgia, other global operations and services and intercompany eliminations. 15
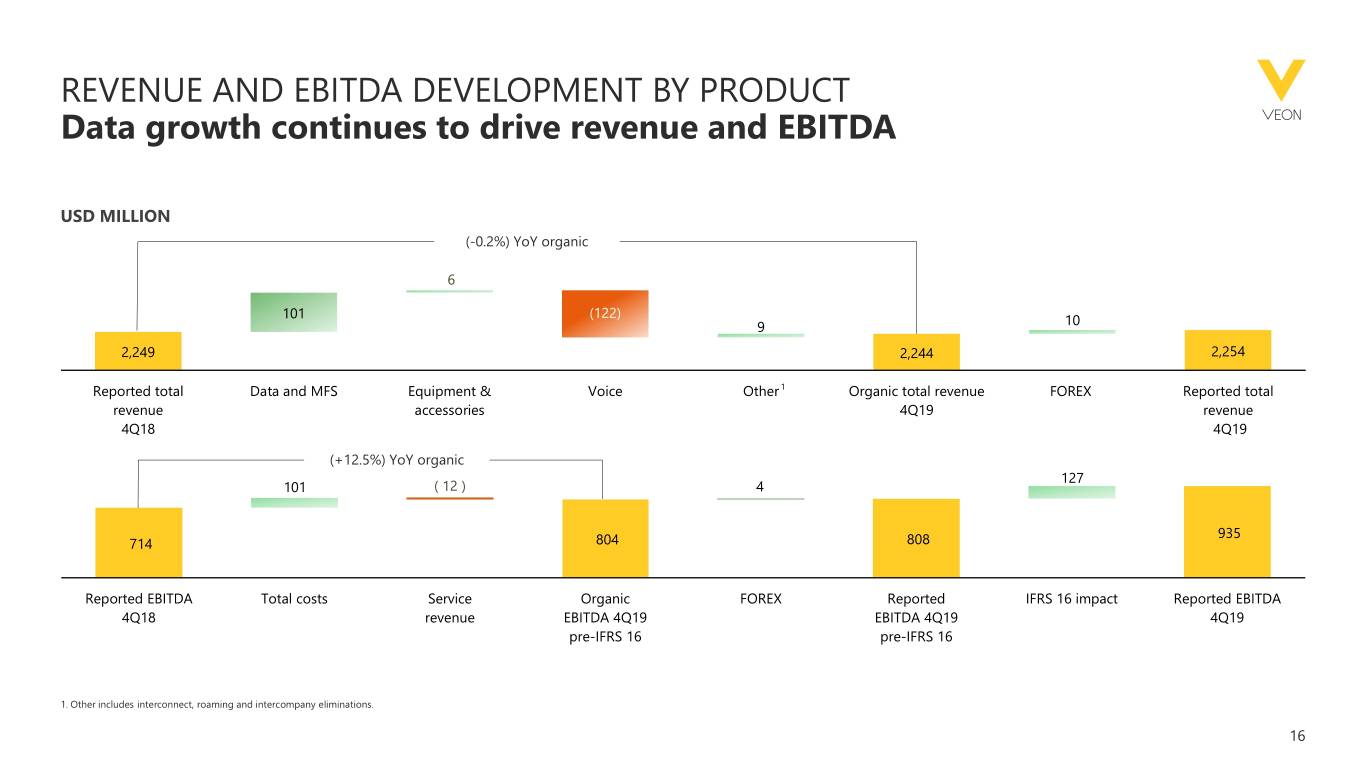
REVENUE AND EBITDA DEVELOPMENT BY PRODUCT Data growth continues to drive revenue and EBITDA USD MILLION (-0.2%) YoY organic 6 101 (122) 9 10 2,249 2,244 2,254 Reported total Data and MFS Equipment & Voice Other 1 Organic total revenue FOREX Reported total revenue accessories 4Q19 revenue 4Q18 4Q19 (+12.5%) YoY organic 127 101 ( 12 ) 4 935 714 804 808 Reported EBITDA Total costs Service Organic FOREX Reported IFRS 16 impact Reported EBITDA 4Q18 revenue EBITDA 4Q19 EBITDA 4Q19 4Q19 pre-IFRS 16 pre-IFRS 16 1. Other includes interconnect, roaming and intercompany eliminations. 16
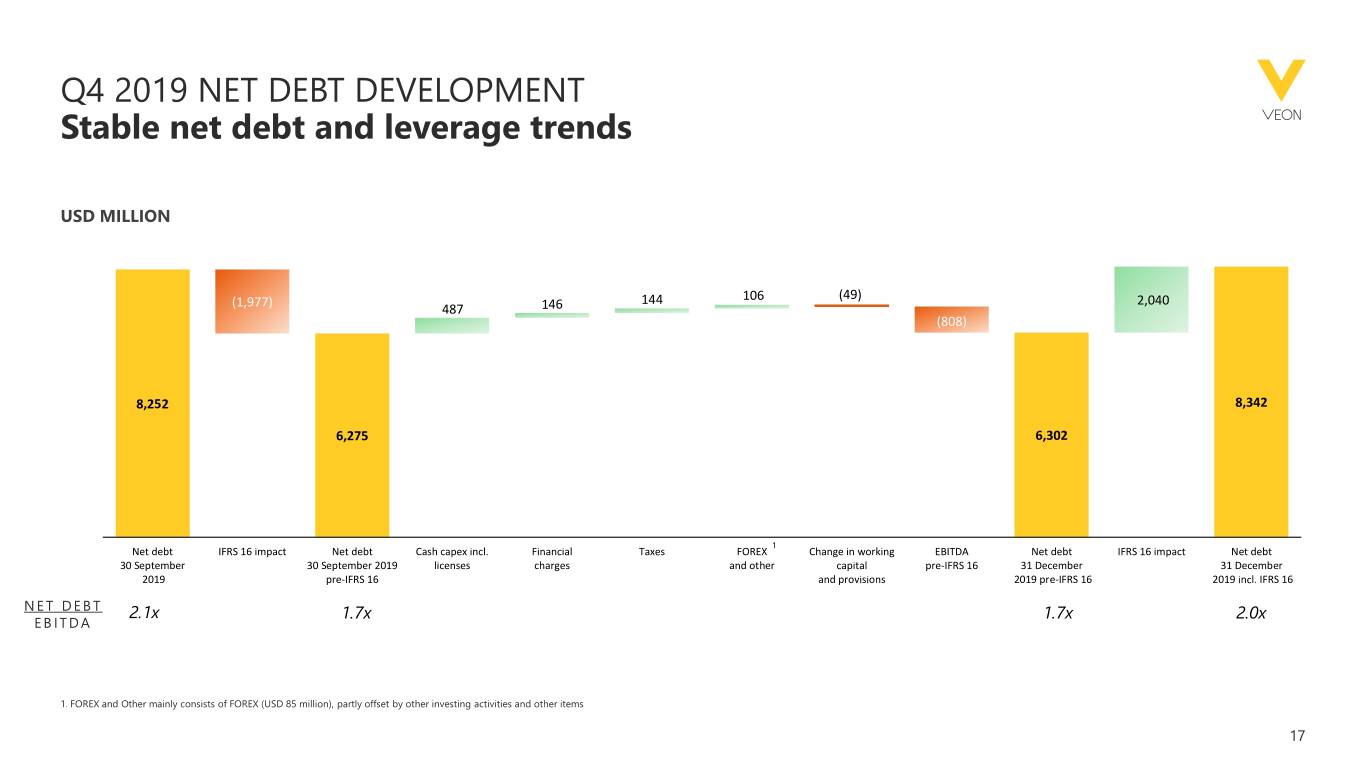
Q4 2019 NET DEBT DEVELOPMENT Stable net debt and leverage trends USD MILLION (49) (1,977) 144 106 2,040 487 146 (808) 8,252 8,342 6,275 6,302 1 Net debt IFRS 16 impact Net debt Cash capex incl. Financial Taxes FOREX Change in working EBITDA Net debt IFRS 16 impact Net debt 30 September 30 September 2019 licenses charges and other capital pre-IFRS 16 31 December 31 December 2019 pre-IFRS 16 and provisions 2019 pre-IFRS 16 2019 incl. IFRS 16 N E T D E B T 2.1x 1.7x 1.7x 2.0x EBITDA 1. FOREX and Other mainly consists of FOREX (USD 85 million), partly offset by other investing activities and other items 17
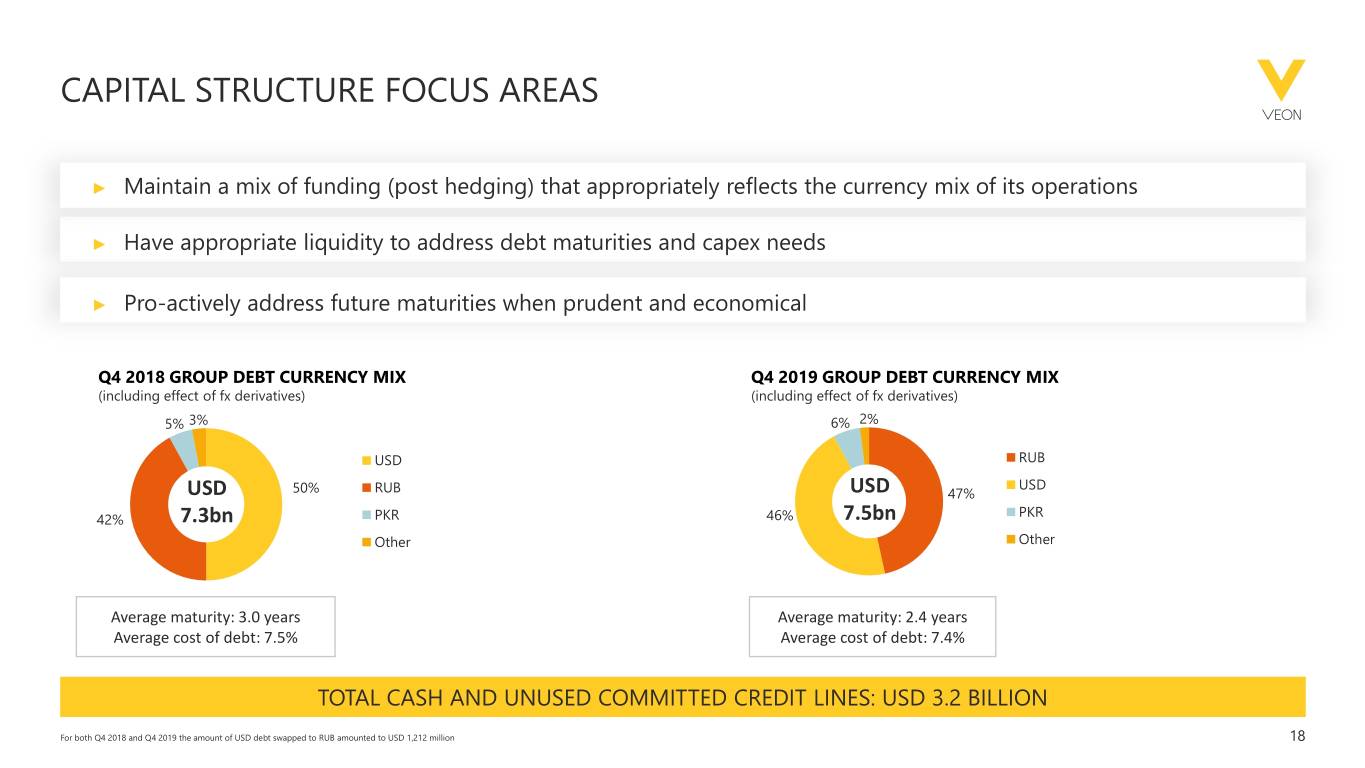
CAPITAL STRUCTURE FOCUS AREAS ► Maintain a mix of funding (post hedging) that appropriately reflects the currency mix of its operations ► Have appropriate liquidity to address debt maturities and capex needs ► Pro-actively address future maturities when prudent and economical Q4 2018 GROUP DEBT CURRENCY MIX Q4 2019 GROUP DEBT CURRENCY MIX (including effect of fx derivatives) (including effect of fx derivatives) 5% 3% 6% 2% USD RUB USD USD 50% RUB USD 47% PKR 42% 7.3bn PKR 46% 7.5bn Other Other Average maturity: 3.0 years Average maturity: 2.4 years Average cost of debt: 7.5% Average cost of debt: 7.4% TOTAL CASH AND UNUSED COMMITTED CREDIT LINES: USD 3.2 BILLION For both Q4 2018 and Q4 2019 the amount of USD debt swapped to RUB amounted to USD 1,212 million 18
AGENDA OPENING Nik Kershaw - Head of IR OVERVIEW AND ACHIEVEMENTS Ursula Burns - Chairman and CEO STRATEGY AND FINANCIAL RESULTS Alex Kazbegi - CSO RUSSIA AND KAZAKHSTAN REVIEW Kaan Terzioglu - COO PAKISTAN AND UKRAINE REVIEW Sergi Herrero - COO CAPITAL ALLOCATION AND DIVIDEND POLICY Alex Kazbegi - CSO CLOSING REMARKS Ursula Burns - Chairman and CEO 19
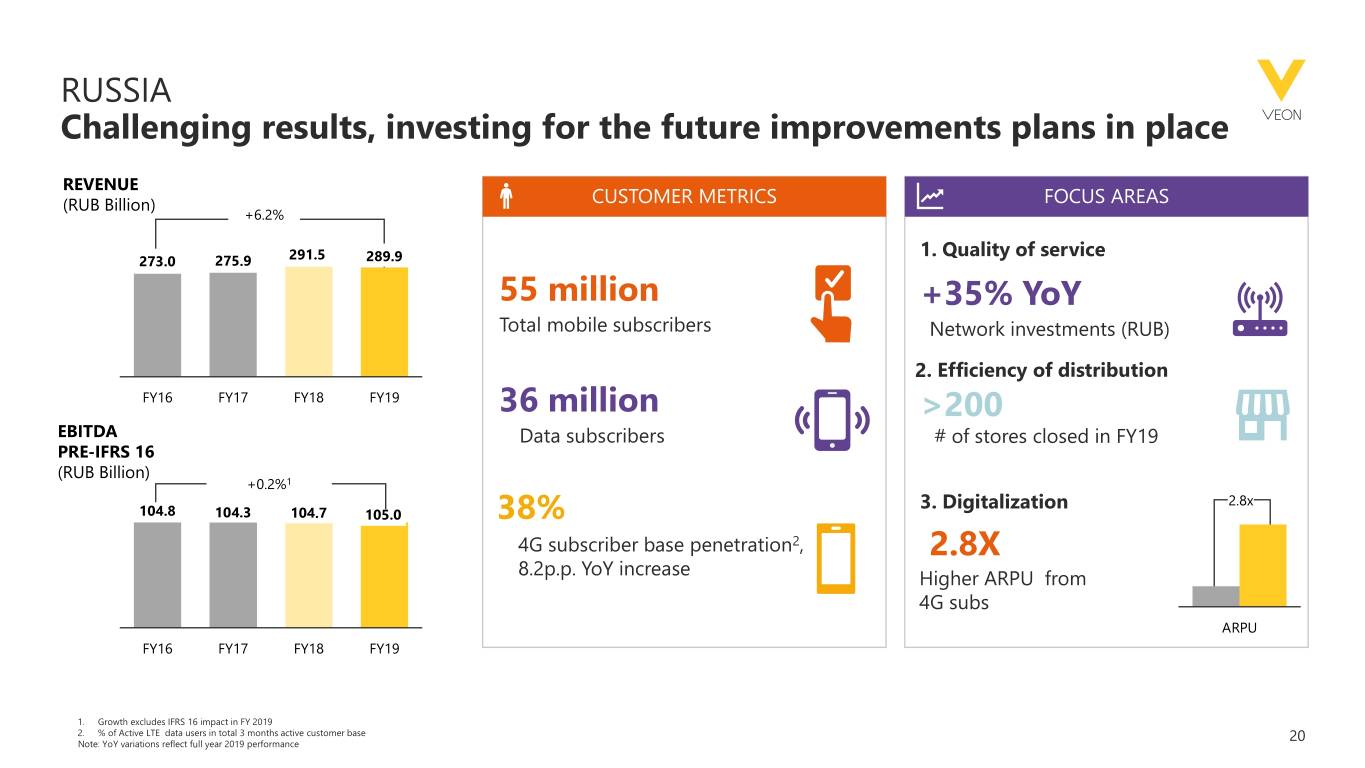
RUSSIA Challenging results, investing for the future improvements plans in place REVENUE (RUB Billion) CUSTOMER METRICS FOCUS AREAS +6.2% 1. Quality of service 273.0 275.9 291.5 289.9 55 million +35% YoY Total mobile subscribers Network investments (RUB) 2. Efficiency of distribution FY16 FY17 FY18 FY19 36 million >200 EBITDA Data subscribers # of stores closed in FY19 PRE-IFRS 16 (RUB Billion) +0.2%1 3. Digitalization 2.8x 104.8 104.3 104.7 105.0 38% 4G subscriber base penetration2, 2.8X 8.2p.p. YoY increase Higher ARPU from 4G subs ARPU FY16 FY17 FY18 FY19 1. Growth excludes IFRS 16 impact in FY 2019 2. % of Active LTE data users in total 3 months active customer base 20 Note: YoY variations reflect full year 2019 performance

RUSSIA Customer-driven open ecosystem SELF CARE (MAU) BEELINE TV (MAU) MFS (MAU) 10.1M 2.2M 4.9M 21
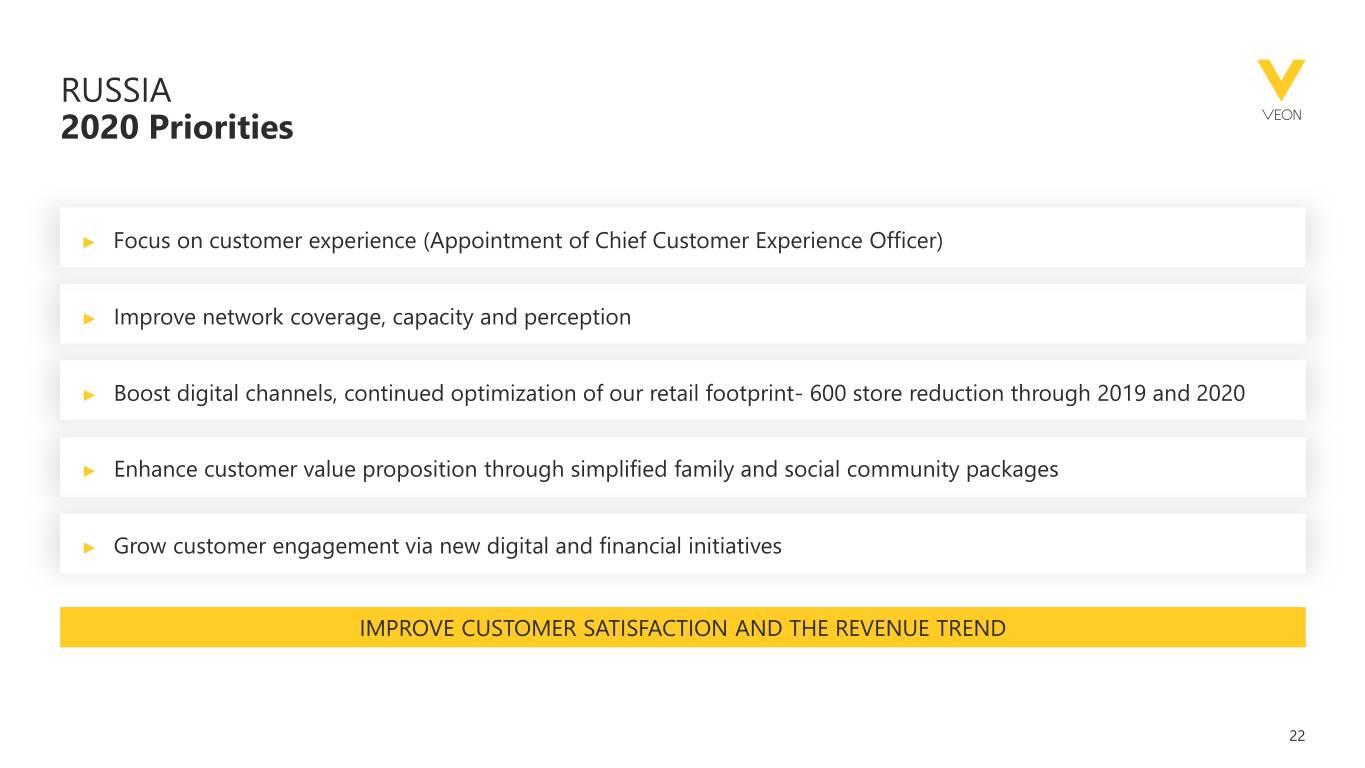
RUSSIA 2020 Priorities ► Focus on customer experience (Appointment of Chief Customer Experience Officer) ► Improve network coverage, capacity and perception ► Boost digital channels, continued optimization of our retail footprint- 600 store reduction through 2019 and 2020 ► Enhance customer value proposition through simplified family and social community packages ► Grow customer engagement via new digital and financial initiatives IMPROVE CUSTOMER SATISFACTION AND THE REVENUE TREND 22

KAZAKHSTAN Strong operational performance REVENUE (KZT Billion) CUSTOMER METRICS FOCUS AREAS +49.6% 186.0 151.8 124.3 135.6 +76% YoY 10.2 million Convergent product revenue Total mobile subscribers FY16 FY17 FY18 FY19 6.9 million +65% YoY EBITDA Data subscribers TV revenue (mobile + fixed) PRE IFRS 16 (KZT Billion) +77.0%1 41% 97.0 71.1 2 +117% YoY 54.8 58.5 4G subscriber base penetration , MFS revenue YoY growth FY16 FY17 FY18 FY19 1. Growth excludes IFRS 16 impact in FY 2019 2. % of Active LTE data users in total 3 months active customer base 23 Note: YoY variations reflect full year 2019 performance. Both revenue and EBITDA for FY 2019 were positively impacted by special compensation of USD 38 million related to the termination of a network sharing agreement in Kazakhstan between our subsidiary KaR-Tel LLP and Kcell Joint Stock Company ("Kcell”) due to Kazakh telecom JSC’s acquisition of 75% of Kcell's shares.

AGENDA OPENING Nik Kershaw - Head of IR OVERVIEW AND ACHIEVEMENTS Ursula Burns - Chairman and CEO STRATEGY AND FINANCIAL RESULTS Alex Kazbegi - CSO RUSSIA AND KAZAKHSTAN REVIEW Kaan Terzioglu - COO PAKISTAN AND UKRAINE REVIEW Sergi Herrero - COO CAPITAL ALLOCATION AND DIVIDEND POLICY Alex Kazbegi - CSO CLOSING REMARKS Ursula Burns - Chairman and CEO 24
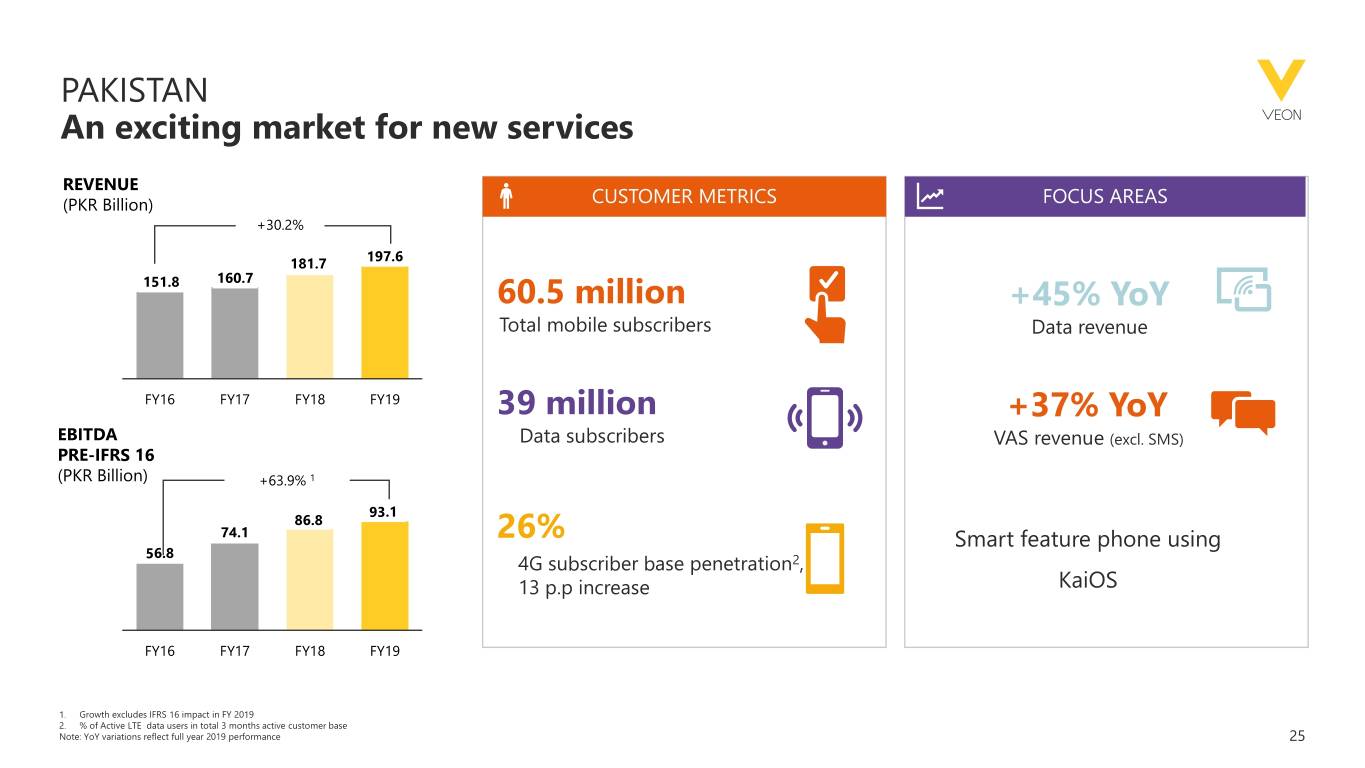
PAKISTAN An exciting market for new services REVENUE (PKR Billion) CUSTOMER METRICS FOCUS AREAS +30.2% 197.6 181.7 151.8 160.7 60.5 million +45% YoY Total mobile subscribers Data revenue FY16 FY17 FY18 FY19 39 million +37% YoY EBITDA Data subscribers VAS revenue (excl. SMS) PRE-IFRS 16 (PKR Billion) +63.9% 1 93.1 86.8 74.1 26% Smart feature phone using 56.8 4G subscriber base penetration2, 13 p.p increase KaiOS FY16 FY17 FY18 FY19 1. Growth excludes IFRS 16 impact in FY 2019 2. % of Active LTE data users in total 3 months active customer base Note: YoY variations reflect full year 2019 performance 25
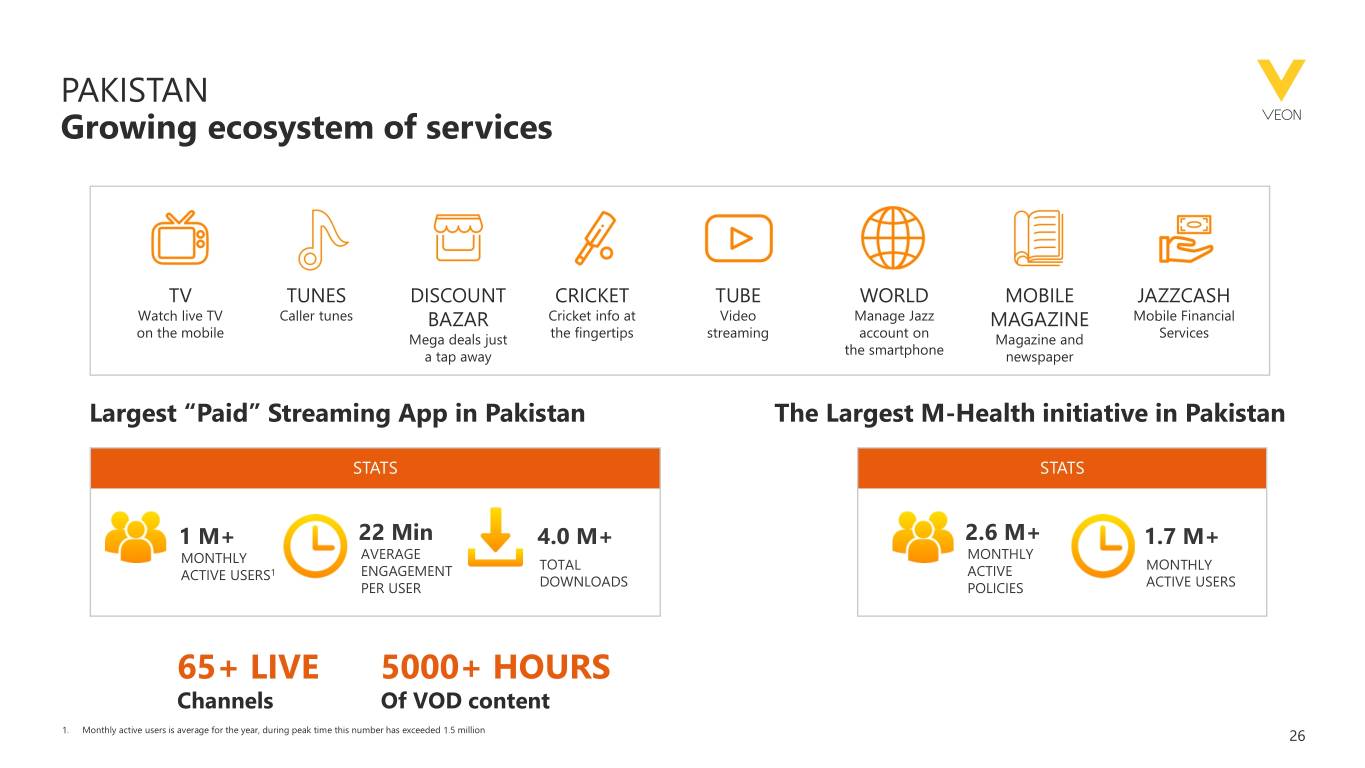
PAKISTAN Growing ecosystem of services TV TUNES DISCOUNT CRICKET TUBE WORLD MOBILE JAZZCASH Watch live TV Caller tunes BAZAR Cricket info at Video Manage Jazz MAGAZINE Mobile Financial on the mobile Mega deals just the fingertips streaming account on Magazine and Services a tap away the smartphone newspaper Largest “Paid” Streaming App in Pakistan The Largest M-Health initiative in Pakistan STATS STATS 1 M+ 22 Min 4.0 M+ 2.6 M+ 1.7 M+ AVERAGE MONTHLY MONTHLY TOTAL MONTHLY ACTIVE USERS1 ENGAGEMENT ACTIVE PER USER DOWNLOADS POLICIES ACTIVE USERS 65+ LIVE 5000+ HOURS Channels Of VOD content 1. Monthly active users is average for the year, during peak time this number has exceeded 1.5 million 26

PAKISTAN 2020 Priorities ► Drive customer conversion to 4G and aiming more that 50% growth in 4G customer base in 2020 ► Drive customer engagement through expanding native app and value based pricing ► Position Jazz Cash for accelerated growth REALIZE DOUBLE DIGIT UNDERLYING REVENUE GROWTH 27
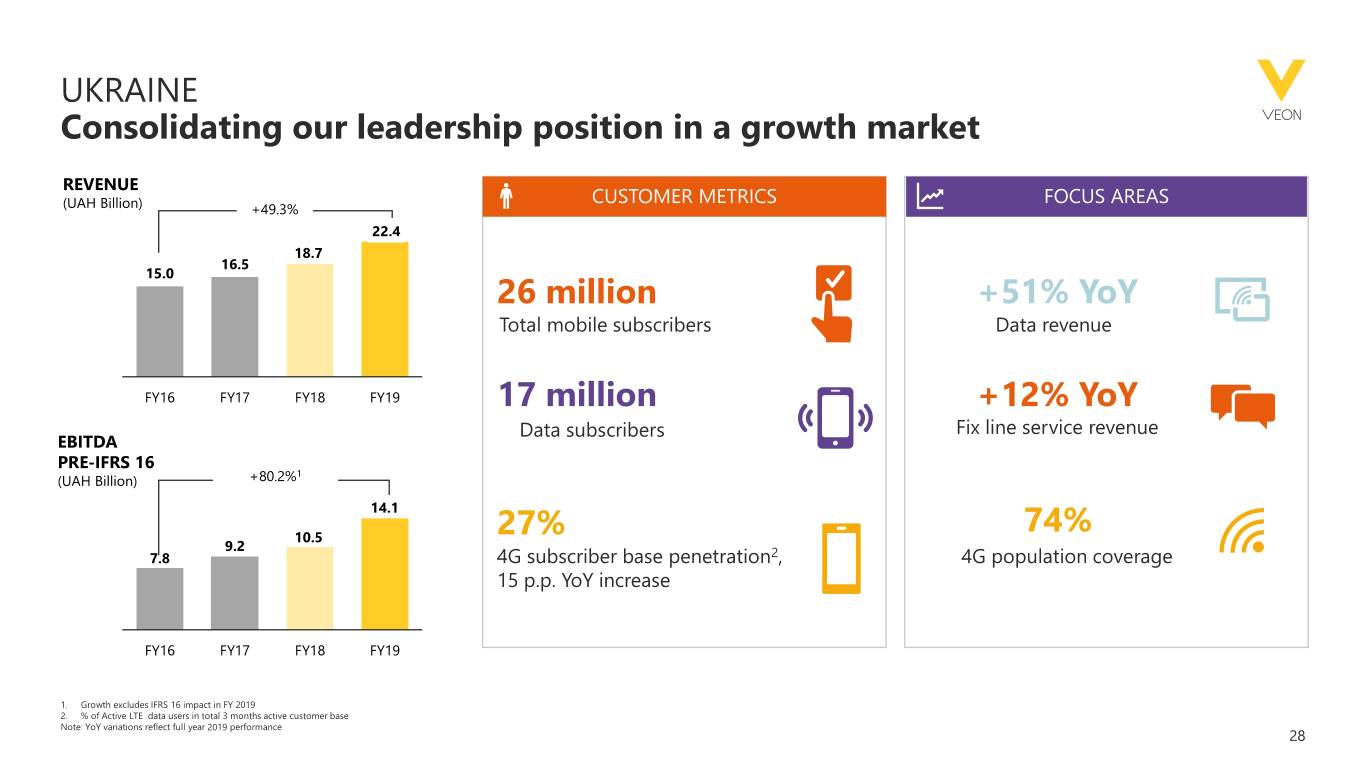
UKRAINE Consolidating our leadership position in a growth market REVENUE CUSTOMER METRICS FOCUS AREAS (UAH Billion) +49.3% 22.4 18.7 16.5 15.0 26 million +51% YoY Total mobile subscribers Data revenue FY16 FY17 FY18 FY19 17 million +12% YoY Data subscribers Fix line service revenue EBITDA PRE-IFRS 16 1 (UAH Billion) +80.2% 14.1 10.5 27% 74% 9.2 7.8 4G subscriber base penetration2, 4G population coverage 15 p.p. YoY increase FY16 FY17 FY18 FY19 1. Growth excludes IFRS 16 impact in FY 2019 2. % of Active LTE data users in total 3 months active customer base Note: YoY variations reflect full year 2019 performance 28

AGENDA OPENING Nik Kershaw - Head of IR OVERVIEW AND ACHIEVEMENTS Ursula Burns - Chairman and CEO STRATEGY AND FINANCIAL RESULTS Alex Kazbegi - CSO RUSSIA AND KAZAKHSTAN REVIEW Kaan Terzioglu - COO PAKISTAN AND UKRAINE REVIEW Sergi Herrero - COO CAPITAL ALLOCATION AND DIVIDEND POLICY Alex Kazbegi - CSO CLOSING REMARKS Ursula Burns - Chairman and CEO 29

CAPITAL ALLOCATION: 2020 PRIORITIES ► Committing capex to improve position in Russia and enhance 4G services in our growth markets FUTURE ASSETS ► Investing to support digitalization and new revenue streams Future Assets ► Accelerating investment in JazzCash Pakistan to secure and scale its NEW SERVICES market leadership New Services ► Allocating capital to Future Assets on a case-by-case basis CONNECTIVITY BUSINESS Connectivity ► Investing in growth opportunities across our three pillars Leadership, Culture, Values CREATING LONG-TERM SHAREHOLDER VALUE 30
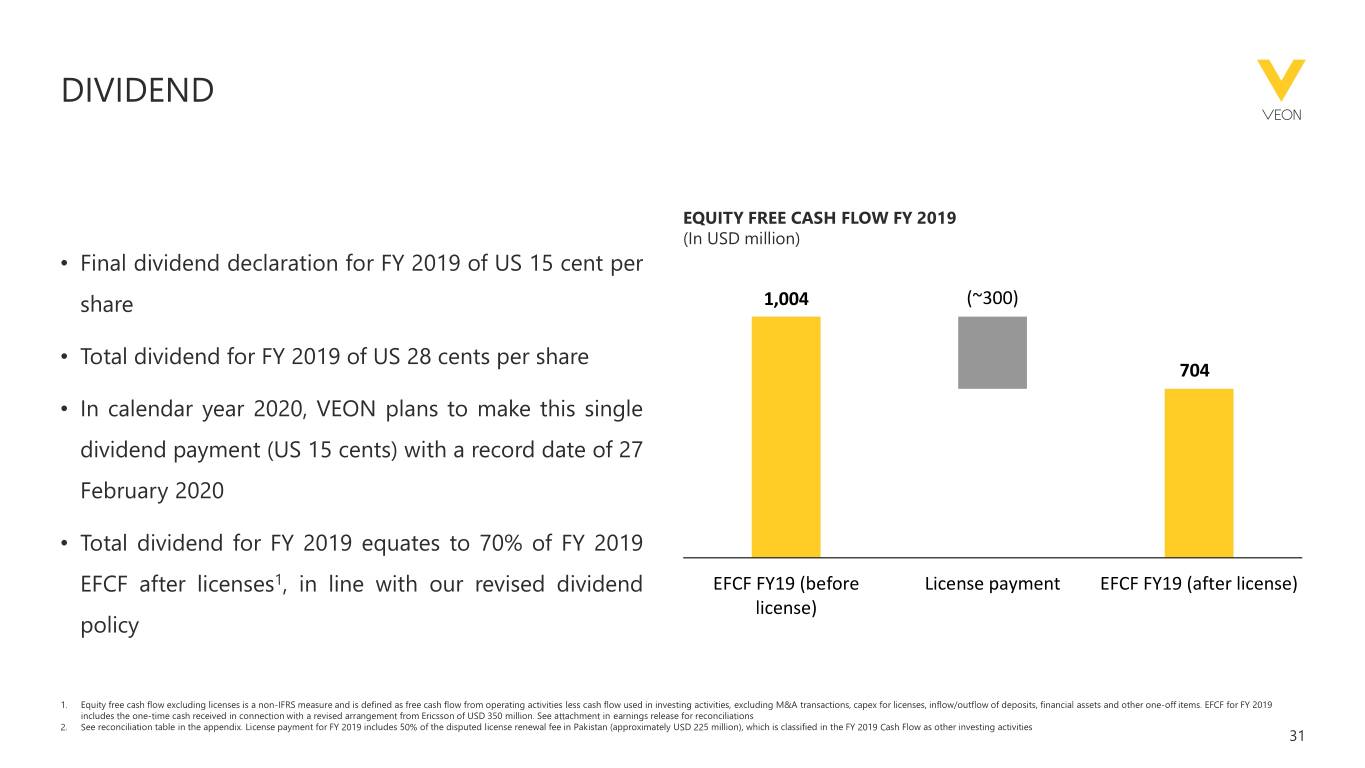
DIVIDEND EQUITY FREE CASH FLOW FY 2019 (In USD million) • Final dividend declaration for FY 2019 of US 15 cent per share 1,004 (~300) • Total dividend for FY 2019 of US 28 cents per share 704 • In calendar year 2020, VEON plans to make this single dividend payment (US 15 cents) with a record date of 27 February 2020 • Total dividend for FY 2019 equates to 70% of FY 2019 EFCF after licenses1, in line with our revised dividend EFCF FY19 (before License payment EFCF FY19 (after license) license) policy 1. Equity free cash flow excluding licenses is a non-IFRS measure and is defined as free cash flow from operating activities less cash flow used in investing activities, excluding M&A transactions, capex for licenses, inflow/outflow of deposits, financial assets and other one-off items. EFCF for FY 2019 includes the one-time cash received in connection with a revised arrangement from Ericsson of USD 350 million. See attachment in earnings release for reconciliations 2. See reconciliation table in the appendix. License payment for FY 2019 includes 50% of the disputed license renewal fee in Pakistan (approximately USD 225 million), which is classified in the FY 2019 Cash Flow as other investing activities 31
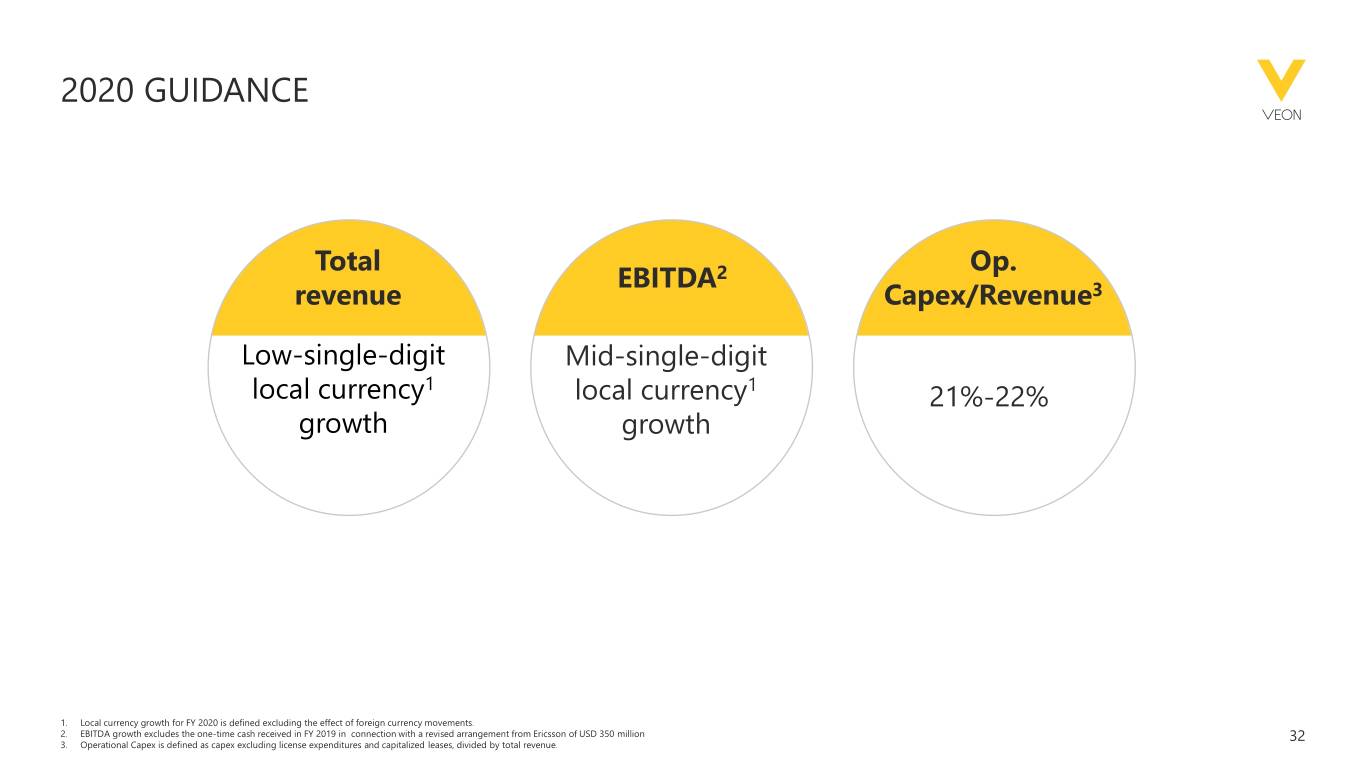
2020 GUIDANCE Total Op. EBITDA2 revenue Capex/Revenue3 Low-single-digit Mid-single-digit local currency1 local currency1 21%-22% growth growth 1. Local currency growth for FY 2020 is defined excluding the effect of foreign currency movements. 2. EBITDA growth excludes the one-time cash received in FY 2019 in connection with a revised arrangement from Ericsson of USD 350 million 32 3. Operational Capex is defined as capex excluding license expenditures and capitalized leases, divided by total revenue.
AGENDA OPENING Nik Kershaw - Head of IR OVERVIEW AND ACHIEVEMENTS Ursula Burns - Chairman and CEO STRATEGY AND FINANCIAL RESULTS Alex Kazbegi - CSO RUSSIA AND KAZAKHSTAN REVIEW Kaan Terzioglu - COO PAKISTAN AND UKRAINE REVIEW Sergi Herrero - COO CAPITAL ALLOCATION AND DIVIDEND POLICY Alex Kazbegi - CSO CLOSING REMARKS Ursula Burns - Chairman and CEO 33
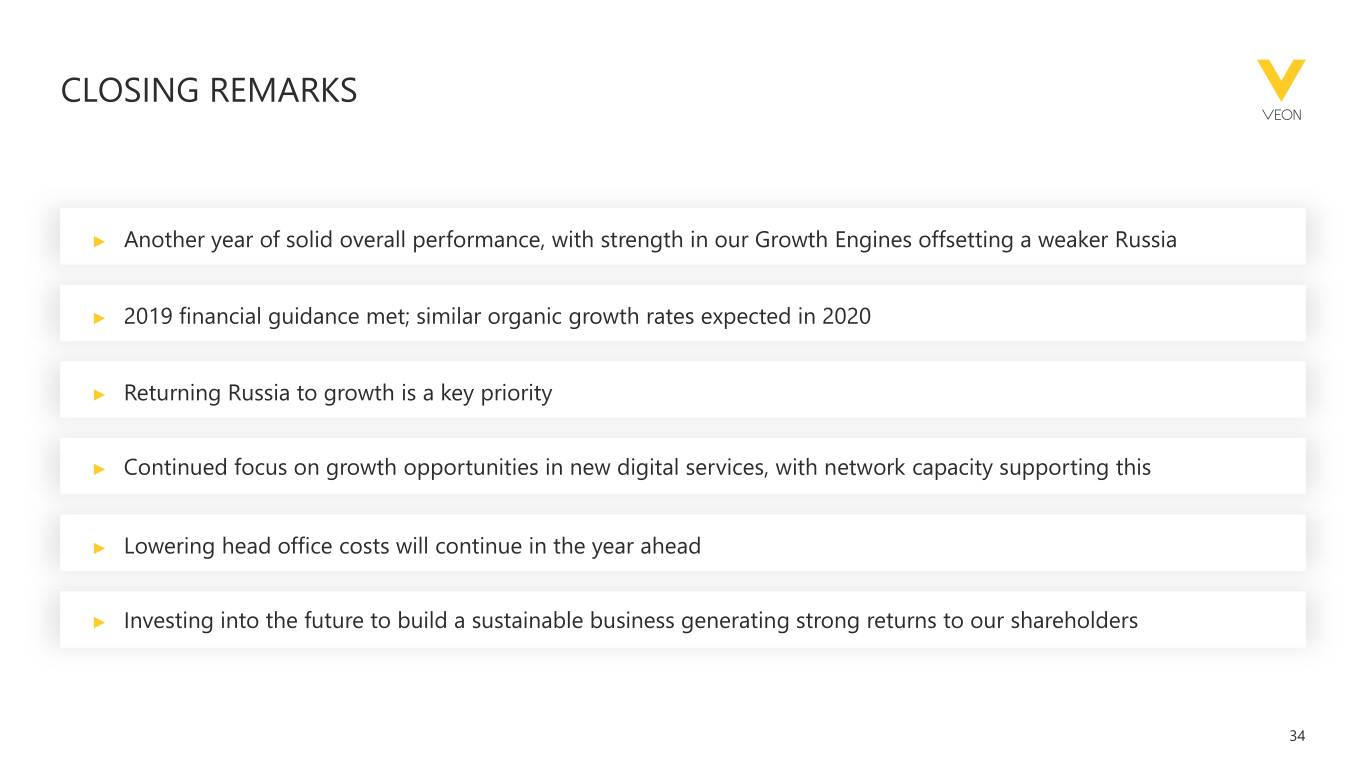
CLOSING REMARKS ► Another year of solid overall performance, with strength in our Growth Engines offsetting a weaker Russia ► 2019 financial guidance met; similar organic growth rates expected in 2020 ► Returning Russia to growth is a key priority ► Continued focus on growth opportunities in new digital services, with network capacity supporting this ► Lowering head office costs will continue in the year ahead ► Investing into the future to build a sustainable business generating strong returns to our shareholders 34

APPENDIX ©VEON Ltd 2020
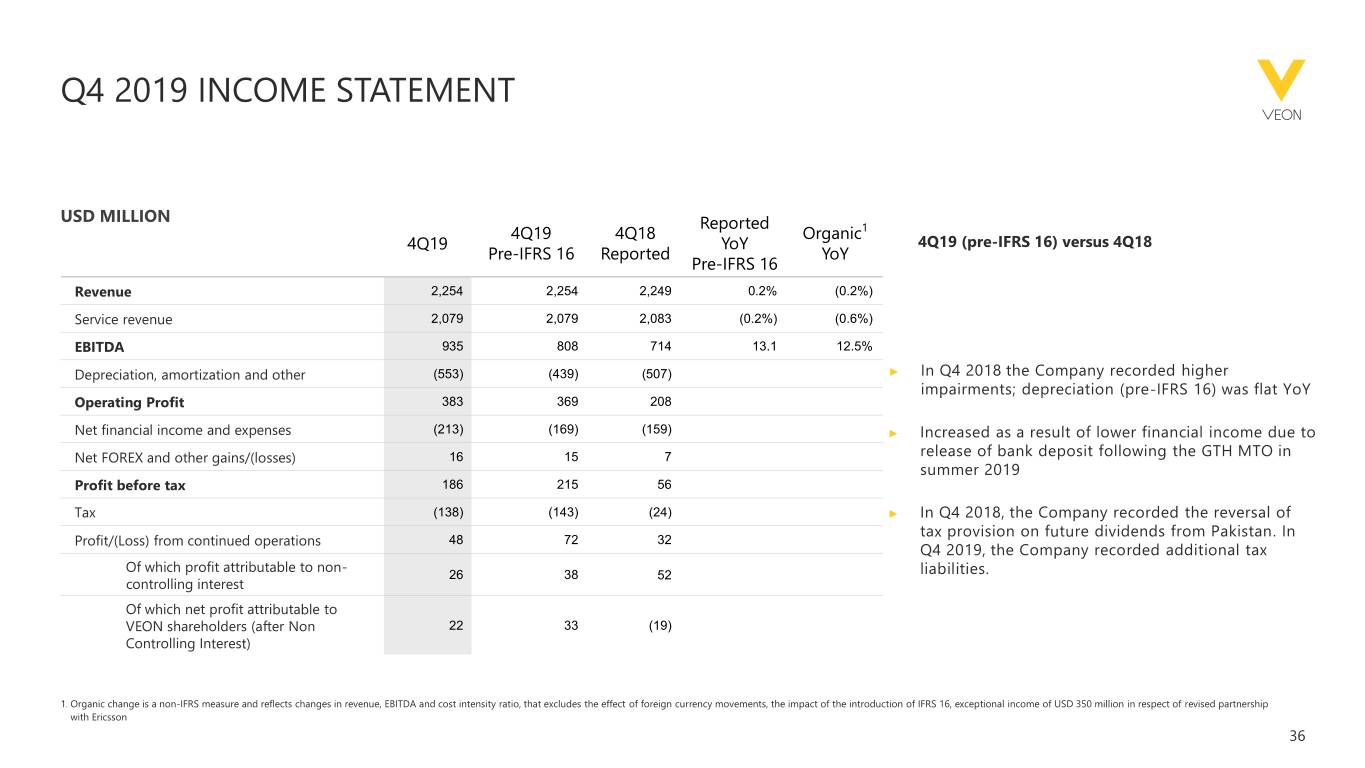
Q4 2019 INCOME STATEMENT USD MILLION Reported 4Q19 4Q18 Organic1 4Q19 YoY 4Q19 (pre-IFRS 16) versus 4Q18 Pre-IFRS 16 Reported YoY Pre-IFRS 16 Revenue 2,254 2,254 2,249 0.2% (0.2%) Service revenue 2,079 2,079 2,083 (0.2%) (0.6%) EBITDA 935 808 714 13.1 12.5% Depreciation, amortization and other (553) (439) (507) ► In Q4 2018 the Company recorded higher impairments; depreciation (pre-IFRS 16) was flat YoY Operating Profit 383 369 208 Net financial income and expenses (213) (169) (159) ► Increased as a result of lower financial income due to Net FOREX and other gains/(losses) 16 15 7 release of bank deposit following the GTH MTO in summer 2019 Profit before tax 186 215 56 Tax (138) (143) (24) ► In Q4 2018, the Company recorded the reversal of tax provision on future dividends from Pakistan. In Profit/(Loss) from continued operations 48 72 32 Q4 2019, the Company recorded additional tax Of which profit attributable to non- 26 38 52 liabilities. controlling interest Of which net profit attributable to VEON shareholders (after Non 22 33 (19) Controlling Interest) 1. Organic change is a non-IFRS measure and reflects changes in revenue, EBITDA and cost intensity ratio, that excludes the effect of foreign currency movements, the impact of the introduction of IFRS 16, exceptional income of USD 350 million in respect of revised partnership with Ericsson 36

GROUP DEBT MATURITY SCHEDULE1 GROUP DEBT MATURITY SCHEDULE BY CURRENCY – EXCLUDING LEASE LIABILITIES1 Currency breakdown 2020 2021 2022 2023 2024 2025 >2025 Currency breakdown incl. fx derivatives2 USD 0.9 0.9 0.4 1.2 0.6 0.7 0.0 62% 46% RUB 0.5 1.1 0.7 0.0 0.0 0.0 0.0 31% 47% PKR 0.1 0.1 0.1 0.1 0.0 0.0 0.0 6% 6% OTHER 0.1 0.0 0.0 0.0 0.0 0.0 0.0 2% 2% GROUP DEBT MATURITY SCHEDULE1 31 DECEMBER 2019 HQ Pakistan Other GTH Russia Bangladesh USD BILLION 2.1 1.6 1.2 1.3 0.7 0.6 0.0 2020 2021 2022 2023 2024 2025 >2025 37
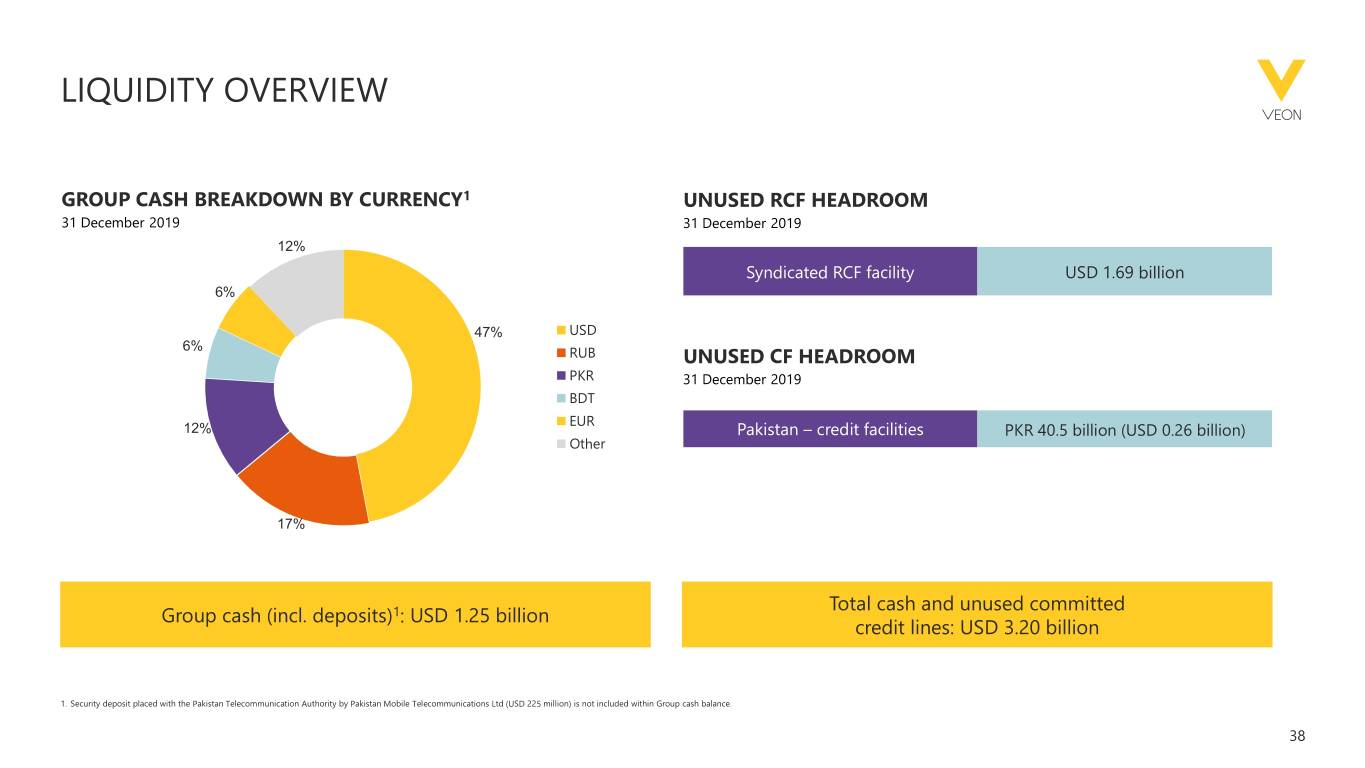
LIQUIDITY OVERVIEW GROUP CASH BREAKDOWN BY CURRENCY1 UNUSED RCF HEADROOM 31 December 2019 31 December 2019 12% Syndicated RCF facility USD 1.69 billion 6% 47% USD 6% RUB UNUSED CF HEADROOM PKR 31 December 2019 BDT EUR 12% Pakistan – credit facilities PKR 40.5 billion (USD 0.26 billion) Other 17% Total cash and unused committed Group cash (incl. deposits)1: USD 1.25 billion credit lines: USD 3.20 billion 1. Security deposit placed with the Pakistan Telecommunication Authority by Pakistan Mobile Telecommunications Ltd (USD 225 million) is not included within Group cash balance. 38

DEBT BY ENTITY1 31 DECEMBER 2019 USD MILLION Outstanding debt Type of debt Cash-pool Entity Bonds Loans overdrafts2 and Total other VEON Holdings B.V. 2,779 2,303 1 5,083 GTH Finance B.V. 1,200 - - 1,200 PJSC VimpelCom 279 - - 279 Pakistan Mobile Communications Limited - 494 - 494 Banglalink Digital Communications Ltd. - 416 - 416 Others - - 47 47 Total 3,562 3,867 48 7,519 Total excl. cash pool overdrafts 7,473 1 Excluding lease liabilities 2 As of December 31, 2019, some bank accounts forming part of a cash pooling program and being an integral part of VEON’s cash management remained overdrawn by USD 46 million. Even though the total balance of the cash pool remained positive, VEON has no legally enforceable right to set- off and therefore the overdrawn accounts are presented as financial liabilities and form part of our debt in our financial statements. 39

UZBEKISTAN Stable performance REVENUE (UZS Billion) CUSTOMER METRICS FOCUS AREAS +15.7% 2537.8 2341.8 2275.3 1967.0 8 million -27 UZS billion Total mobile subscribers Impact of tax regime changes FY16 FY17 FY18 FY19 5 million +23% YoY EBITDA Data subscribers Network investments (UZS) PRE-IFRS 16 (UZS Billion) -0.7%1 24% +182% YoY 1173.3 1160.1 1097.9 1,165.0 4G subscriber base 4G sites penetration2 FY16 FY17 FY18 FY19 1. Growth excludes IFRS 16 impact in FY 2019 40
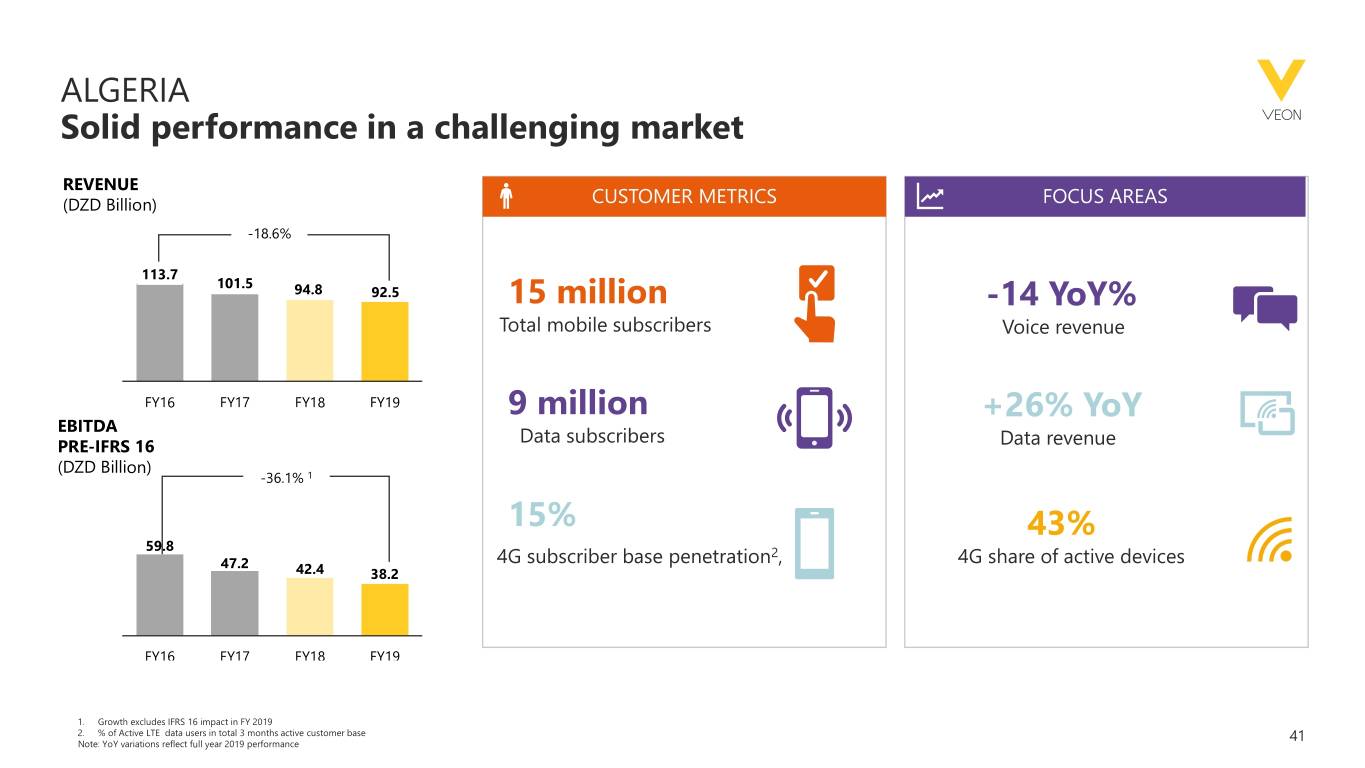
ALGERIA Solid performance in a challenging market REVENUE (DZD Billion) CUSTOMER METRICS FOCUS AREAS -18.6% 113.7 101.5 94.8 92.5 15 million -14 YoY% Total mobile subscribers Voice revenue FY16 FY17 FY18 FY19 9 million +26% YoY EBITDA Data subscribers PRE-IFRS 16 Data revenue (DZD Billion) -36.1% 1 15% 43% 59.8 2 47.2 4G subscriber base penetration , 4G share of active devices 42.4 38.2 FY16 FY17 FY18 FY19 1. Growth excludes IFRS 16 impact in FY 2019 2. % of Active LTE data users in total 3 months active customer base 41 Note: YoY variations reflect full year 2019 performance
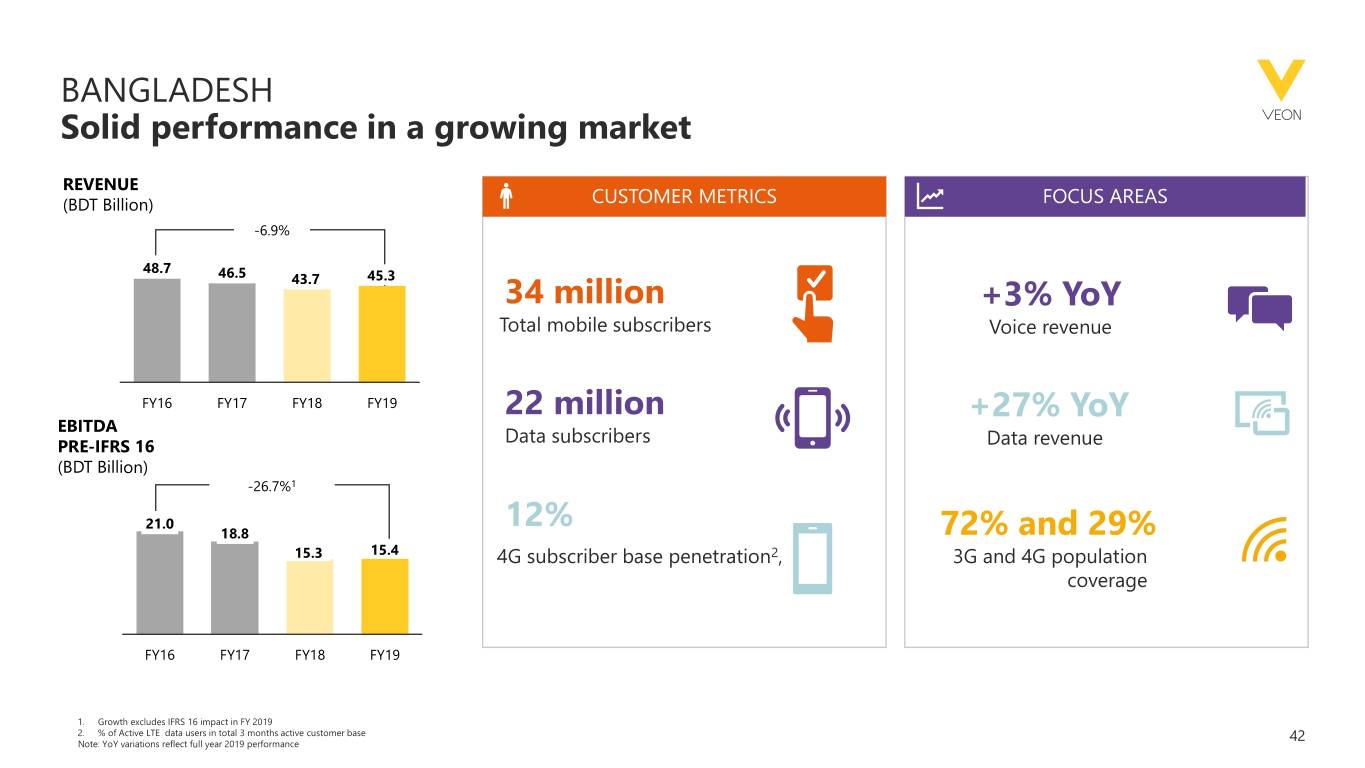
BANGLADESH Solid performance in a growing market REVENUE (BDT Billion) CUSTOMER METRICS FOCUS AREAS -6.9% 48.7 46.5 45.3 43.7 34 million +3% YoY Total mobile subscribers Voice revenue FY16 FY17 FY18 FY19 22 million +27% YoY EBITDA Data subscribers PRE-IFRS 16 Data revenue (BDT Billion) -26.7%1 21.0 12% 18.8 72% and 29% 15.3 15.4 4G subscriber base penetration2, 3G and 4G population coverage FY16 FY17 FY18 FY19 1. Growth excludes IFRS 16 impact in FY 2019 2. % of Active LTE data users in total 3 months active customer base 42 Note: YoY variations reflect full year 2019 performance


